Embed Size (px)
Citation preview
Assessment of Appalachian Basin Oil and Gas Resources: Devonian Gas Shales of the Devonian Shale-Middle and Upper Paleozoic Total Petroleum System
By Robert C. Milici and Christopher S. Swezey
Chapter G.9 ofCoal and Petroleum Resources in the Appalachian Basin:Distribution, Geologic Framework, and Geochemical CharacterEdited by Leslie F. Ruppert and Robert T. Ryder
Professional Paper 1708
U.S. Department of the InteriorU.S. Geological Survey
Suggested citation:Milici, R.C., and Swezey, C.S., 2014, Assessment of Appalachian basin oil and gas resources; Devonian gas shales of the Devonian Shale-Middle and Upper Paleozoic Total Petroleum System, chap. G.9 of Ruppert, L.F., and Ryder, R.T., eds., Coal and petroleum resources in the Appalachian basin; Distribution, geologic framework, and geochemical character: U.S. Geological Survey Professional Paper 1708, 81 p., http://dx.doi.org/10.3133/pp1708G.9.
iii
Figures[Figures follow References Cited]
1. Map showing the location of the Appalachian Basin Petroleum Province and the location of the Drake oil well ......................................................................................25
2. Map showing the extent of the the Devonian Shale-Middle and Upper Paleozoic Total Petroleum System within the Appalachian Basin Petroleum Province ....................................................................................................................27
3. Chart showing the generalized stratigraphy of the Appalachian Basin Petroleum Province and total petroleum system data .........................................................28
4. Chart showing generalized stratigraphic nomenclature for Lower Devonian through Upper Mississippian strata in the northern part of Appalachian Basin Petroleum Province ....................................................................................................................29
5. Map showing the extent of the Devonian Shale-Middle and Upper Paleozoic Total Petroleum System and thickness of Devonian siliciclastic strata in the Appalachian Basin Petroleum Province .................................................................................30
6. Map showing the extent of Devonian strata in the Appalachian Basin Petroleum Province and the location of geologic cross section A–A’ ..............................31
Contents
Abstract ...........................................................................................................................................................1Introduction.....................................................................................................................................................1Stratigraphy ....................................................................................................................................................2
Middle Devonian Through Upper Devonian Siliciclastic Strata Below the Kaskaskia I–Kaskaskia II Unconformity ..............................................................................2
Hamilton Group and Equivalent Strata .....................................................................................3Tully Limestone and the Acadian Unconformity .....................................................................3Post-Acadian Unconformity Siliciclastic Strata .....................................................................3
Upper Devonian Through Lower Mississippian Siliciclastic Strata Above the Kaskaskia I–Kaskaskia II Unconformity ..............................................................................4
Devonian and Mississippian Shale Depositional Models .......................................................................4Petroleum Geology ........................................................................................................................................5
Assessment Model ...............................................................................................................................5Thermal Maturity Data .........................................................................................................................5Petroleum System Data .......................................................................................................................6Devonian Gas Shale Assessment Units ............................................................................................6
Greater Big Sandy Assessment Unit ........................................................................................7Northwestern Ohio Shale Assessment Unit ............................................................................8Devonian Siltstone and Shale Assessment Unit ..................................................................10Marcellus Shale Assessment Unit ..........................................................................................12
Summary........................................................................................................................................................13Acknowledgments .......................................................................................................................................13References Cited..........................................................................................................................................14
iv
7. Geologic cross section of Devonian strata from New York to Alabama showing generalized facies of Harper ....................................................................................32
8. Generalized cross section of Devonian siliciclastic strata across eastern Ohio and western Pennsylvania ...............................................................................................33
9. Chart showing the correlation of Devonian and Mississippian black shale units and some related strata in the Appalachian Basin Petroleum Province ................34
10. Chart showing stratigraphic nomenclature for the Upper Devonian through Upper Mississippian strata in the eastern part of the Appalachian Basin Petroleum Province ....................................................................................................................35
11. Map of the Appalachian Basin Petroleum Province, illustrating the extent of the Devonian and Lower Mississippian shale, the extent of oil in Devonian shale, and vitrinite-reflectance contours ...............................................................................36
12. Map showing the four Devonian gas shale assessment units and the distribution of oil and gas wells within the assessment units .............................................37
13. Map showing the extent of the Devonian Marcellus Shale and Millboro Shale, and the extent of Devonian shale beyond the area of the Marcellus and Millboro Shales ...................................................................................................................39
14. Chart showing petroleum system events for the Devonian Shale-Middle and Upper Paleozoic Total Petroleum System in the Appalachian Basin Petroleum Province ....................................................................................................................41
15. Map of Devonian shale assessment units, showing net thickness of black shale and areas of closely spaced oil and gas wells ...........................................................43
16. Map showing the extent of the Greater Big Sandy Assessment Unit, thermal maturity isolines, and net thickness of black shale ..............................................................45
17. Stratigraphic cross section D–D’, showing Devonian and Lower Mississippian strata across the Greater Big Sandy Assessment Unit in eastern Kentucky and western West Virginia ........................................................................................................46
18. Stratigraphic cross section C–C’, showing Devonian and Lower Mississippian strata across the Greater Big Sandy Assessment Unit in southern Ohio, eastern Kentucky, and West Virginia ......................................................................................47
19. Map showing the qualitative assessment of gas recoverability from Devonian shale within each gas play of the Appalachian Basin Petroleum Province .....................49
20. Map showing the relation of the Greater Big Sandy Assessment Unit to regional geologic structure .......................................................................................................51
21. Map showing the locations of gas wells and named gas fields producing from Devonian shale in the Greater Big Sandy Assessment Unit ......................................51
22. Map showing the geological settings and partitioned areas in the Greater Big Sandy Assessment Unit ......................................................................................................53
23. Graph showing the distribution of estimated ultimate recovery values per well for wells in Devonian shale of eastern Kentucky .........................................................53
24. Map showing the outline of the Northwestern Ohio Shale Assessment Unit, the location of the Amerada No.1 Ullman well, and the locations of cross sections E–E’ and F–F’ ...............................................................................................................55
25. Cross section E–E’, showing the Devonian and Lower Mississippian strata across western Pennsylvania and northeastern Ohio .........................................................56
26. Cross section F–F’, showing the Devonian and Lower Mississippian strata across western West Virginia and east-central Ohio ..........................................................57
27. Map showing the relation of the Northwestern Ohio Shale Assessment Unit to geologic structure ..................................................................................................................59
v
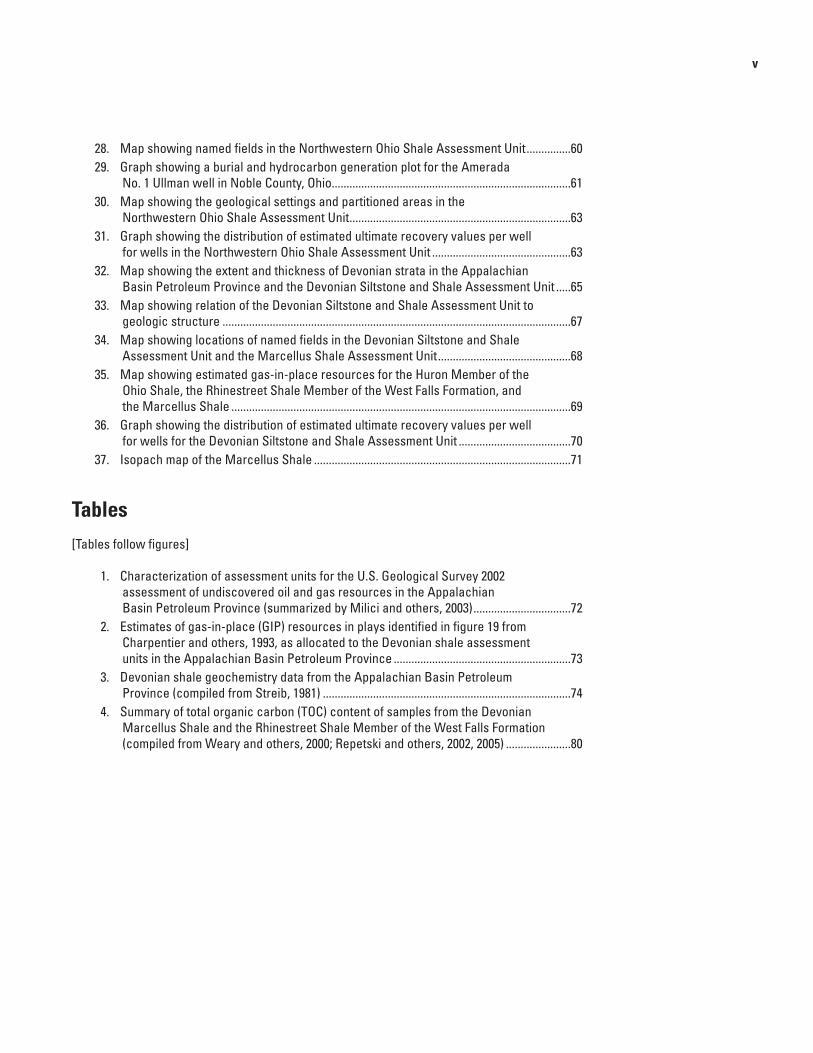
28. Map showing named fields in the Northwestern Ohio Shale Assessment Unit ...............60 29. Graph showing a burial and hydrocarbon generation plot for the Amerada
No. 1 Ullman well in Noble County, Ohio.................................................................................61 30. Map showing the geological settings and partitioned areas in the
Northwestern Ohio Shale Assessment Unit ...........................................................................63 31. Graph showing the distribution of estimated ultimate recovery values per well
for wells in the Northwestern Ohio Shale Assessment Unit ...............................................63 32. Map showing the extent and thickness of Devonian strata in the Appalachian
Basin Petroleum Province and the Devonian Siltstone and Shale Assessment Unit .....65 33. Map showing relation of the Devonian Siltstone and Shale Assessment Unit to
geologic structure ......................................................................................................................67 34. Map showing locations of named fields in the Devonian Siltstone and Shale
Assessment Unit and the Marcellus Shale Assessment Unit .............................................68 35. Map showing estimated gas-in-place resources for the Huron Member of the
Ohio Shale, the Rhinestreet Shale Member of the West Falls Formation, and the Marcellus Shale ...................................................................................................................69
36. Graph showing the distribution of estimated ultimate recovery values per well for wells for the Devonian Siltstone and Shale Assessment Unit ......................................70
37. Isopach map of the Marcellus Shale .......................................................................................71
Tables[Tables follow figures]
1. Characterization of assessment units for the U.S. Geological Survey 2002 assessment of undiscovered oil and gas resources in the Appalachian Basin Petroleum Province (summarized by Milici and others, 2003) .................................72
2. Estimates of gas-in-place (GIP) resources in plays identified in figure 19 from Charpentier and others, 1993, as allocated to the Devonian shale assessment units in the Appalachian Basin Petroleum Province ............................................................73
3. Devonian shale geochemistry data from the Appalachian Basin Petroleum Province (compiled from Streib, 1981) ....................................................................................74
4. Summary of total organic carbon (TOC) content of samples from the Devonian Marcellus Shale and the Rhinestreet Shale Member of the West Falls Formation (compiled from Weary and others, 2000; Repetski and others, 2002, 2005) ......................80
vi
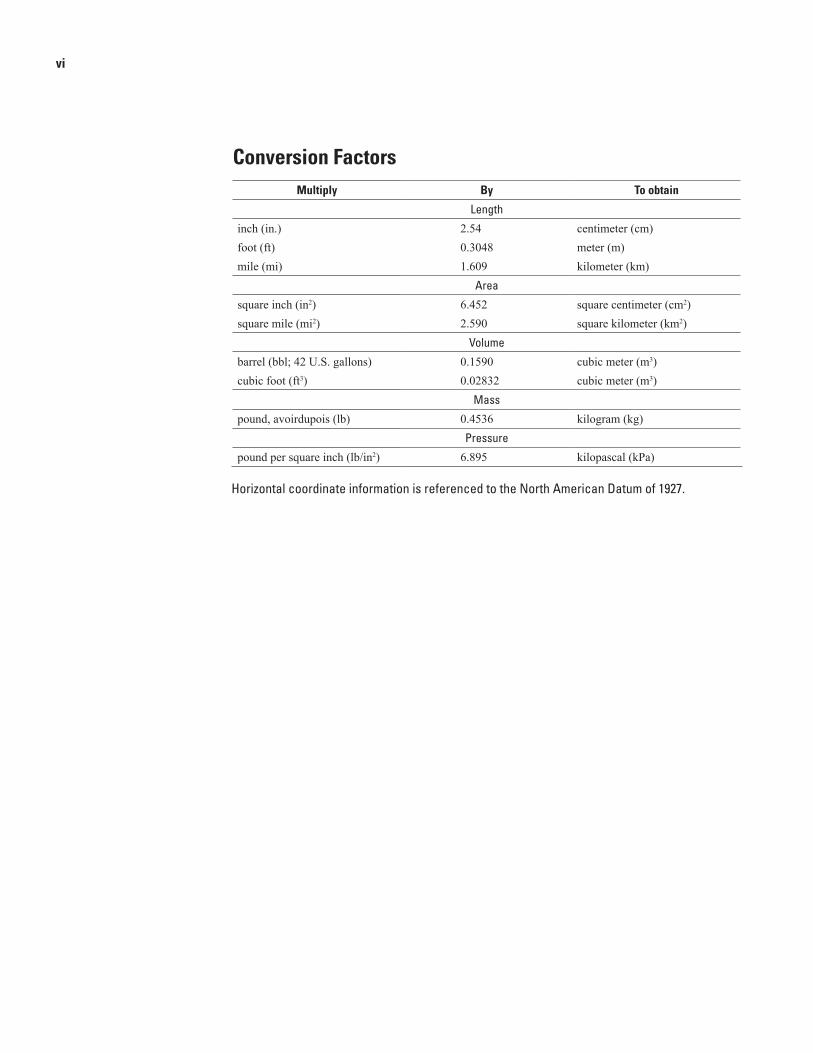
Conversion FactorsMultiply By To obtain
Length
inch (in.) 2.54 centimeter (cm)foot (ft) 0.3048 meter (m)mile (mi) 1.609 kilometer (km)
Area
square inch (in2) 6.452 square centimeter (cm2)square mile (mi2) 2.590 square kilometer (km2)
Volume
barrel (bbl; 42 U.S. gallons) 0.1590 cubic meter (m3)cubic foot (ft3) 0.02832 cubic meter (m3)
Mass
pound, avoirdupois (lb) 0.4536 kilogram (kg)Pressure
pound per square inch (lb/in2) 6.895 kilopascal (kPa)
Horizontal coordinate information is referenced to the North American Datum of 1927.
Assessment of Appalachian Basin Oil and Gas Resources: Devonian Gas Shales of the Devonian Shale-Middle and Upper Paleozoic Total Petroleum System
By Robert C. Milici1 and Christopher S. Swezey1
1U.S. Geological Survey, Reston, Va.
AbstractThis report presents the results of a U.S. Geological
Survey (USGS) assessment of the technically recoverable undiscovered natural gas resources in Devonian shale in the Appalachian Basin Petroleum Province of the eastern United States. These results are part of the USGS assessment in 2002 of the technically recoverable undiscovered oil and gas resources of the province. This report does not use the results of a 2011 USGS assessment of the Devonian Marcellus Shale because the area considered in the 2011 assessment is much greater than the area of the Marcellus Shale described in this report. The USGS assessment in 2002 was based on the identification of six total petroleum systems, which include strata that range in age from Cambrian to Pennsylvanian. The Devonian gas shales described in this report are within the Devonian Shale-Middle and Upper Paleozoic Total Petroleum System, which extends generally from New York to Tennes-see. This total petroleum system is divided into ten assessment units (plays), four of which are classified as conventional and six as continuous. The Devonian shales described in this report make up four of these continuous assessment units. The assessment results are reported as fully risked fractiles (F95, F50, F5, and the mean); the fractiles indicate the probability of recovery of the assessment amount. The products reported are oil, gas, and natural gas liquids. The mean estimates for technically recoverable undiscovered hydrocarbons in the four gas shale assessment units are 12,195.53 billion cubic feet (12.20 trillion cubic feet) of gas and 158.91 million barrels of natural gas liquids.
IntroductionThis report is part of the U.S. Geological Survey (USGS)
Appalachian basin coal and petroleum resources framework study. The study area includes resources in strata tradition-ally assigned to both the Appalachian basin and the Black
Warrior basin. For energy assessment purposes, however, the Appalachian and Black Warrior basins are merged because the resources can be continuous from one basin to the other. The boundary of the structural Appalachian basin differs from that of the Appalachian Basin Petroleum Province (067), which was defined for the USGS 1995 National Oil and Gas Assess-ment (Gautier and others, 1998); in that assessment, the Black Warrior Basin Province (065) also was separately defined and assessed.
The 2002 U.S. Geological Survey assessment of the tech-nically recoverable undiscovered oil and gas resources in the Appalachian Basin Petroleum Province of the United States identified six total petroleum systems (Milici and others, 2003). One of these petroleum systems is the Devonian Shale-Middle and Upper Paleozoic Total Petroleum System (TPS), which consists of Devonian shale petroleum source rocks and various reservoir intervals in Middle and Upper Paleozoic strata. The reservoir intervals of this TPS were assigned to 10 assessment units, four of which are Devonian gas shale units. This report presents a summary of these four gas shale units, using the 2002 assessment results reported by Milici and others (2003) and additional descriptions and interpretations reported by Milici and Swezey (2006). This report does not use the results of a 2011 USGS assessment of the Devonian Marcellus Shale (Coleman and others, 2011) because the area considered in the 2011 assessment is much greater than the area of the Marcellus Shale Assessment Unit (AU) described in this report.
The first well drilled specifically for natural gas in the United States was operated by William A. Hart in 1821, in the village of Fredonia, Chautauqua County, New York (Weeks, 1886). The well was drilled into the Devonian Dunkirk Shale Member of the Perrysburg Formation, produced gas from depths of 30 to 70 feet (ft), and supplied gas to Fredonia for several years (de Witt, 1997). The modern petroleum indus-try had its beginnings in the Appalachian Basin Petroleum Province on August 27, 1859, when Colonel Edwin L. Drake (Seneca Oil Company) produced oil from a well drilled to a depth of 69.5 ft on Oil Creek, near Titusville in northwestern Pennsylvania (fig. 1). The well was located near surface seeps where oil had been collected and used locally, first by Native
2 Coal and Petroleum Resources in the Appalachian Basin
Americans and then by early settlers. The production was from a relatively thin bed of sandstone in the Upper Devonian Riceville Formation (Carter and Flaherty, 2011). The well reportedly produced at least 10 barrels of oil per day for a year and was the first oil produced commercially from a well drilled in the United States. The success of the well ignited an “industrial explosion” that spread rapidly throughout the region and into other areas of the country. A brief history of the Drake well and oil development in the Titusville area was compiled by the U.S. Department of the Interior (1976). Drake did not realize it at the time, but he had discovered the Devonian Shale-Middle and Upper Paleozoic Total Petroleum System, which is the foremost petroleum system in the Appa-lachian Basin Petroleum Province (figs. 2, 3).
The Devonian Shale-Middle and Upper Paleozoic TPS contains some of the more productive petroleum source rocks and reservoirs in the Appalachian Basin Petroleum Province (fig. 2). The regional stratigraphy and geologic framework of the Devonian System in the Appalachian Basin Petroleum Province and depositional models for these strata have been described by numerous writers (for example, Oliver and oth-ers, 1967, 1971; Piotrowski and Krajewski, 1977; Piotrowski and Harper, 1979; Ettensohn, 1985a,b; Lundegard and others, 1985; Sevon, 1985; Bjerstedt, 1986; Dennison and others, 1986, 1996; Kammer and Bjerstedt, 1986; Bjerstedt and Kam-mer, 1988; Boswell and Donaldson, 1988; Boswell and Jewell, 1988; Denkler and Harris, 1988; Hasson and Dennison, 1988; Milici and de Witt, 1988; Woodrow and others, 1988; de Witt and others, 1993; Boswell, 1996; Boswell, Heim, and others, 1996; Boswell, Thomas, and others, 1996; Donaldson and oth-ers, 1996; Matchen and Vargo, 1996; Milici, 1996a,c; Tomas-tik, 1996; Van Tyne, 1996; Vargo and Matchen, 1996; Faill, 1997; Harper, 1999; Swezey, 2002; Filer, 2003; Ettensohn, 2008).
StratigraphyThe Devonian through Lower Mississippian strata in the
Appalachian Basin Petroleum Province may be divided into the following two groups: (1) Lower Devonian predominantly carbonate strata; and (2) Middle Devonian through Lower Mississippian predominantly siliciclastic strata (figs. 3, 4). Most of the Lower Devonian carbonate strata (for example, the Helderberg Group) are interpreted as pre-orogenic stable-shelf sediments, whereas most of the Middle Devonian through Lower Mississippian siliciclastic strata are interpreted as syn- to post-orogenic turbidite and deltaic sediments that accumulated in a foreland basin in association with the Aca-dian orogeny.
A regional unconformity is present throughout the basin immediately below the Upper Devonian Berea Sandstone and equivalent strata. This regional unconformity is referred to as the Kaskaskia I–Kaskaskia II unconformity (Sloss, 1988; Swezey, 2002). In some older publications, some Middle
Devonian through Upper Devonian siliciclastic strata (for example, the Needmore Shale through Hampshire Formation; fig. 4) below the Kaskaskia I–Kaskaskia II unconformity are informally referred to as the “Catskill delta” and some Upper Devonian through Lower Mississippian siliciclastic strata (for example, the Price Formation, Rockwell Formation, and Purslane Sandstone; fig. 4) above the Kaskaskia I–Kaskaskia II unconformity are sometimes informally referred to as the “Price-Rockwell delta.” The Lower Mississippian siliciclas-tic strata are overlain by Mississippian carbonate strata (for example, the Greenbrier Limestone; fig. 4) that are interpreted as stable-shelf sediments that accumulated before the Allegha-nian orogeny began.
Middle Devonian Through Upper Devonian Siliciclastic Strata Below the Kaskaskia I–Kaskaskia II Unconformity
The Middle Devonian through Upper Devonian siliciclas-tic strata below the Kaskaskia I–Kaskaskia II unconformity consist of a coarsening-upward sequence that is thickest (up to 12,000 ft) in eastern Pennsylvania (fig. 5). The strata thin westward across the basin into central Ohio, where they are about 400 ft thick, and southwestward to Tennessee, where Middle Devonian strata are absent and the Upper Devonian to Lower Mississippian strata are approximately 8 ft thick (Hayes, 1891). The geographic extent of the Devonian strata and a generalized cross section along the depositional strike of these strata are shown in figures 6 and 7 (Oliver and others, 1967; de Witt and others, 1975).
From west to east, the Middle to Upper Devonian siliciclastic strata below the Kaskaskia I–Kaskaskia II uncon-formity consist of several distinct lithologic units that extend widely across the basin (Boswell and Donaldson, 1988). Black mudstone (interpreted as distal marine deposits) in the western part of the basin grades laterally eastward and vertically into gray and green, silty shale and then into mudstone and fine-grained sandstone (interpreted as distal-shelf turbidite depos-its). These strata grade farther eastward into coarser-grained sandstone (interpreted as shallow-marine-shelf deposits that grade eastward into paralic to fluvial-deltaic deposits). The section is capped by red beds (interpreted as fluvial deposits and paleosols). The cross section (fig. 7) illustrates the overall coarsening-upward nature of the strata, with black mudstone at the base grading upward into red beds.
Harper (1999, table 7–1, figure 7–15) described and illus-trated five facies (Facies I through V) of the Middle to Upper Devonian siliciclastic strata below the Kaskaskia I–Kaskaskia II unconformity in Pennsylvania and Ohio (fig. 8). Facies I consists of “dark-gray to black, somewhat calcareous, pyritic, sparsely fossiliferous shales” (Harper, 1999, table 7–1) that are interpreted as distal marine muds that accumulated under anoxic conditions (Ettensohn, 1985a). Facies I includes at least eight repetitive lithologic sequences, each represented
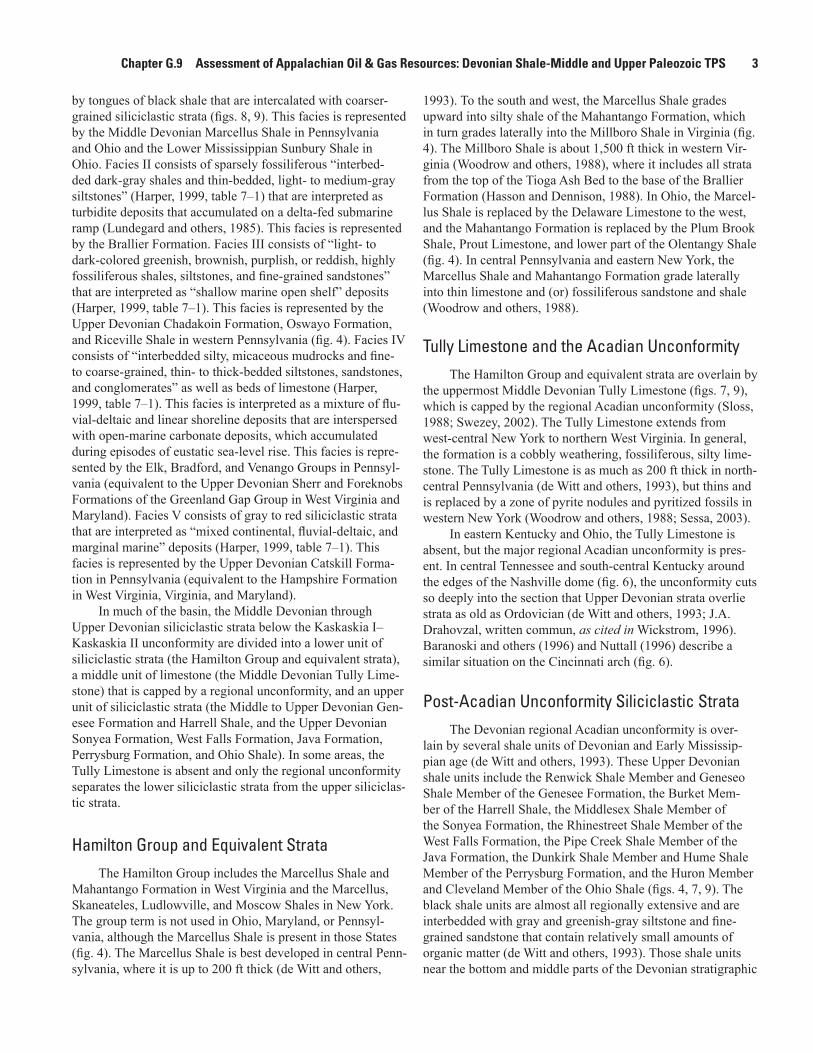
Chapter G.9 Assessment of Appalachian Oil & Gas Resources: Devonian Shale-Middle and Upper Paleozoic TPS 3
by tongues of black shale that are intercalated with coarser-grained siliciclastic strata (figs. 8, 9). This facies is represented by the Middle Devonian Marcellus Shale in Pennsylvania and Ohio and the Lower Mississippian Sunbury Shale in Ohio. Facies II consists of sparsely fossiliferous “interbed-ded dark-gray shales and thin-bedded, light- to medium-gray siltstones” (Harper, 1999, table 7–1) that are interpreted as turbidite deposits that accumulated on a delta-fed submarine ramp (Lundegard and others, 1985). This facies is represented by the Brallier Formation. Facies III consists of “light- to dark-colored greenish, brownish, purplish, or reddish, highly fossiliferous shales, siltstones, and fine-grained sandstones” that are interpreted as “shallow marine open shelf” deposits (Harper, 1999, table 7–1). This facies is represented by the Upper Devonian Chadakoin Formation, Oswayo Formation, and Riceville Shale in western Pennsylvania (fig. 4). Facies IV consists of “interbedded silty, micaceous mudrocks and fine- to coarse-grained, thin- to thick-bedded siltstones, sandstones, and conglomerates” as well as beds of limestone (Harper, 1999, table 7–1). This facies is interpreted as a mixture of flu-vial-deltaic and linear shoreline deposits that are interspersed with open-marine carbonate deposits, which accumulated during episodes of eustatic sea-level rise. This facies is repre-sented by the Elk, Bradford, and Venango Groups in Pennsyl-vania (equivalent to the Upper Devonian Sherr and Foreknobs Formations of the Greenland Gap Group in West Virginia and Maryland). Facies V consists of gray to red siliciclastic strata that are interpreted as “mixed continental, fluvial-deltaic, and marginal marine” deposits (Harper, 1999, table 7–1). This facies is represented by the Upper Devonian Catskill Forma-tion in Pennsylvania (equivalent to the Hampshire Formation in West Virginia, Virginia, and Maryland).
In much of the basin, the Middle Devonian through Upper Devonian siliciclastic strata below the Kaskaskia I–Kaskaskia II unconformity are divided into a lower unit of siliciclastic strata (the Hamilton Group and equivalent strata), a middle unit of limestone (the Middle Devonian Tully Lime-stone) that is capped by a regional unconformity, and an upper unit of siliciclastic strata (the Middle to Upper Devonian Gen-esee Formation and Harrell Shale, and the Upper Devonian Sonyea Formation, West Falls Formation, Java Formation, Perrysburg Formation, and Ohio Shale). In some areas, the Tully Limestone is absent and only the regional unconformity separates the lower siliciclastic strata from the upper siliciclas-tic strata.
Hamilton Group and Equivalent StrataThe Hamilton Group includes the Marcellus Shale and
Mahantango Formation in West Virginia and the Marcellus, Skaneateles, Ludlowville, and Moscow Shales in New York. The group term is not used in Ohio, Maryland, or Pennsyl-vania, although the Marcellus Shale is present in those States (fig. 4). The Marcellus Shale is best developed in central Penn-sylvania, where it is up to 200 ft thick (de Witt and others,
1993). To the south and west, the Marcellus Shale grades upward into silty shale of the Mahantango Formation, which in turn grades laterally into the Millboro Shale in Virginia (fig. 4). The Millboro Shale is about 1,500 ft thick in western Vir-ginia (Woodrow and others, 1988), where it includes all strata from the top of the Tioga Ash Bed to the base of the Brallier Formation (Hasson and Dennison, 1988). In Ohio, the Marcel-lus Shale is replaced by the Delaware Limestone to the west, and the Mahantango Formation is replaced by the Plum Brook Shale, Prout Limestone, and lower part of the Olentangy Shale (fig. 4). In central Pennsylvania and eastern New York, the Marcellus Shale and Mahantango Formation grade laterally into thin limestone and (or) fossiliferous sandstone and shale (Woodrow and others, 1988).
Tully Limestone and the Acadian UnconformityThe Hamilton Group and equivalent strata are overlain by
the uppermost Middle Devonian Tully Limestone (figs. 7, 9), which is capped by the regional Acadian unconformity (Sloss, 1988; Swezey, 2002). The Tully Limestone extends from west-central New York to northern West Virginia. In general, the formation is a cobbly weathering, fossiliferous, silty lime-stone. The Tully Limestone is as much as 200 ft thick in north-central Pennsylvania (de Witt and others, 1993), but thins and is replaced by a zone of pyrite nodules and pyritized fossils in western New York (Woodrow and others, 1988; Sessa, 2003).
In eastern Kentucky and Ohio, the Tully Limestone is absent, but the major regional Acadian unconformity is pres-ent. In central Tennessee and south-central Kentucky around the edges of the Nashville dome (fig. 6), the unconformity cuts so deeply into the section that Upper Devonian strata overlie strata as old as Ordovician (de Witt and others, 1993; J.A. Drahovzal, written commun, as cited in Wickstrom, 1996). Baranoski and others (1996) and Nuttall (1996) describe a similar situation on the Cincinnati arch (fig. 6).
Post-Acadian Unconformity Siliciclastic StrataThe Devonian regional Acadian unconformity is over-
lain by several shale units of Devonian and Early Mississip-pian age (de Witt and others, 1993). These Upper Devonian shale units include the Renwick Shale Member and Geneseo Shale Member of the Genesee Formation, the Burket Mem-ber of the Harrell Shale, the Middlesex Shale Member of the Sonyea Formation, the Rhinestreet Shale Member of the West Falls Formation, the Pipe Creek Shale Member of the Java Formation, the Dunkirk Shale Member and Hume Shale Member of the Perrysburg Formation, and the Huron Member and Cleveland Member of the Ohio Shale (figs. 4, 7, 9). The black shale units are almost all regionally extensive and are interbedded with gray and greenish-gray siltstone and fine-grained sandstone that contain relatively small amounts of organic matter (de Witt and others, 1993). Those shale units near the bottom and middle parts of the Devonian stratigraphic
4 Coal and Petroleum Resources in the Appalachian Basin
section (Marcellus Shale through Rhinestreet Shale Member of the West Falls Formation) are located mainly in the east-ern part of the basin, and those shale units in the middle and upper parts of the section (Ohio Shale) are located mainly in the western part of the basin and, in part, overlie the Cincin-nati arch (de Witt and others, 1993).The beds of gas-bearing Middle Devonian black shale grade upward and eastward into coarser-grained siliciclastic strata of the Brallier Formation. Partial equivalents of the Brallier Formation include the Scherr and Foreknobs Formations of the Greenland Gap Group in West Virginia and Maryland (fig. 4) and the Trimmers Rock, Lock Haven, and Catskill Formations in eastern Pennsylvania (Harper, 1999, figure 7–4).
Upper Devonian Through Lower Mississippian Siliciclastic Strata Above the Kaskaskia I–Kaskaskia II Unconformity
A regional unconformity is present within the uppermost Devonian strata, in most places beneath the Upper Devonian Berea Sandstone (fig. 4). This unconformity is overlain by Upper Devonian through Lower Mississippian siliciclastic strata (for example, the Sunbury Shale, the Rockwell Forma-tion, Purslane Sandstone, and Burgoon Sandstone; see figures 3 and 4). In southwestern Virginia and adjacent West Virginia, these Upper Devonian through Lower Mississippian siliciclas-tic strata above the Kaskaskia I–Kaskaskia II Unconformity include the upper part of the Devonian-Mississippian Chat-tanooga Shale and the overlying Lower Mississippian Price Formation (fig. 10). In outcrops in this area, the Chattanooga Shale consists of the following three members: (1) a lower black shale member, (2) a middle gray siltstone member, and (3) the Big Stone Gap Member (black shale). The upper 131 ft of the Big Stone Gap Member consist of gray and grayish-black shale and are equivalent to the Lower Mississippian Sunbury Shale (Filer and others, 1996). In the subsurface, the Sunbury Shale is a 110-ft-thick unit of grayish-black to gray shale, which is overlain by the Price Formation (Filer and oth-ers, 1996).
Devonian and Mississippian Shale Depositional Models
Numerous interpretations of depositional environments have been applied to the Devonian and Mississippian strata in the Appalachian basin. Some models interpret the black shale as deposits of black mud that was rich in organic matter and that accumulated in the distal parts of the foreland basin, perhaps during periods of marine transgression (Ettensohn and Barron, 1981, 1982; Ettensohn, 1985a,b; Kepferle, 1993; Leone and Smith, 2011). Dennison (1985) proposed a model where Middle Devonian sea-level transgressions generally resulted in the deposition of limestone, and Late Devonian
transgressions (after the deposition of the Tully Limestone) resulted in the deposition of black shale. He suggested that the following black shale units may have been deposited dur-ing periods of relative sea-level rise, as deltaic environments generally shifted eastward: (1) the Middle to Upper Devonian Geneseo Shale Member of the Genesee Formation, the Middle to Upper Devonian Harrell Shale, the Upper Devonian Rhine-street Member of the West Falls Formation, and the Upper Devonian Pipe Creek Shale Member of the Java Formation; (2) the Famennian Dunkirk Shale Member of the Perrysburg Formation (Over, 2002); and (3) the unnamed lower black shale member and Big Stone Gap Member of the Upper Devo-nian to Lower Mississippian Chattanooga Shale (fig. 9).
Lundegard and others (1985) interpreted the Brallier Formation and overlying siliciclastic beds as having accumu-lated in the following five depositional environments: (1) delta front, (2) turbidite slope, (3) interlobe slope, (4) lobe margin, and (5) deep basin. Their paleocurrent map shows a consistent westward trend for the direction of transport of the Brallier sediments.
Boswell and Donaldson (1988) compared the sea-level curve of Johnson and others (1985) with the inferred positions of Late Devonian deltaic shorelines. They showed a correla-tion between sea level and late Late Devonian (Famennian) shoreline positions, but not between sea level and early Late Devonian (Frasnian) shoreline positions. From this compari-son, they concluded that a global change in sea level, perhaps driven by glaciation in Gondwanaland, was an important fac-tor for controlling Famennian sediment accumulation. During the Frasnian, however, the supply of sediments resulting from erosion during the Acadian orogeny may have overwhelmed the effects of glacially driven sea-level changes and could explain why there is no correlation between Frasnian shoreline positions and the Euramerican sea-level curve.
Many studies noted that Devonian and Mississippian black shale in the Appalachian basin displays an apparently cyclical nature. Ettensohn (1985a,b), for example, described five depositional cycles of finer-grained to coarser-grained rock within the Devonian siliciclastic strata. Each cycle is interpreted to have begun with a period of rapid subsidence in the basin, when black shale in the lower part of a cycle accu-mulated during a period of relative sea-level rise. This initial basin subsidence occurred in conjunction with (or was fol-lowed closely by) a period of tectonic uplift. According to this model, the coarser-grained clastic strata in the upper part of each cycle accumulated during a second period of subsidence, which followed the main tectonic event. Each of the following five black shale units described by Ettensohn (1985a,b) com-prise the base of a cycle: (1) the Middle Devonian Marcellus Shale and the Mahantango Shale, (2) the Middle Devonian Geneseo Shale Member of the Genesee Formation and Burket Member of the Harrell Shale, (3) the Upper Devonian Middle-sex Shale Member of the Sonyea Formation, (4) the Upper Devonian Rhinestreet Shale Member of the West Falls Forma-tion, and (5) the Upper Devonian Dunkirk Shale Member of the Perrysburg Formation (fig. 4). Each of the black shale units
Chapter G.9 Assessment of Appalachian Oil & Gas Resources: Devonian Shale-Middle and Upper Paleozoic TPS 5
and the immediately overlying beds of coarser-grained strata constitute one cycle.
Cyclical patterns were also noted by Kepferle (1993), Filer (1994), and Schieber (1998). For example, Kepferle (1993) cited evidence for four to eight transgressive and regressive events in the Appalachian basin during the Devo-nian and Mississippian. Filer (1994) proposed that there are seven or more basinwide third-order cycles of organic-matter-rich black shale (including the Marcellus Shale and associ-ated strata) intercalated generally with coarser-grained strata that contain much less organic material. Schieber (1998) recognized numerous extensive unconformities within the Upper Devonian to Lower Mississippian Chattanooga Shale in central Tennessee and adjacent Kentucky. He interpreted these unconformities as subtle sequence boundaries that reflect a temporary lowering of sea level, and he used these uncon-formities to divide the Chattanooga Shale into 14 regional sequences.
More recently, Filer (2002) described 11 cyclic litholo-gies in an interval of Upper Devonian strata from the upper part of the Rhinestreet Shale Member of the West Falls Formation to the Dunkirk Shale Member of the Perrysburg Formation in New York. These cycles were correlated through equivalent strata (parts of the Brallier Formation, Greenland Gap Group, Ohio Shale, and lower black shale member of the Chattanooga Shale) in a region that extends 435 miles (mi) or more along the length of the Appalachian Basin Petroleum Province from New York southwestward through Pennsylva-nia, Ohio, and West Virginia to eastern Kentucky and Ten-nessee and southwestern Virginia. In the western (distal) part of the basin, each of these cycles consists of dark, organic-matter-rich shale at the base that grades upward into lighter-colored shale that contains less organic material. In the eastern (proximal) part of the basin, each of these cycles consists of relatively thin shale beds at the base that grade upward into relatively thick beds of siltstone and sandstone. In general, the cycles range from 2 to 3 ft thick in the western part of the basin to as much as 230 ft thick in the eastern part of the basin. Filer (2002) concluded that these basinwide high-frequency cycles were affected by glacially induced sea-level changes.
Petroleum GeologySeveral estimates of undiscovered hydrocarbon resources
of the Appalachian Basin Petroleum Province have been published. In 1995, for example, the USGS published assess-ments of the undiscovered hydrocarbon resources in Devonian shale in the Appalachian Basin Petroleum Province (Gautier and others, 1995). Briggs and Tatlock (1999) estimated the undiscovered recoverable natural gas resources in Pennsylva-nia. The 2002 USGS assessment (Milici and others, 2003) dif-fers from these earlier assessments in that it was based on the concept of total petroleum systems, which considers source rocks, maturation, migration, reservoir rocks, and reservoir seals (Magoon and Dow, 1994).
Assessment Model
For assessment purposes, oil and gas reservoirs are commonly divided into the following two distinct types: conventional and continuous (unconventional). Conventional resources are characterized by discrete structural, stratigraphic, or combination traps in which water and oil and natural gas are separated into layers by their immiscibility and rela-tive buoyancies. In contrast, continuous accumulations are accumulations of hydrocarbons (generally gas) that are not segregated into discrete fields with well-defined fluid contacts. Instead, continuous accumulations produce hydrocarbons, if only in small and potentially noneconomic amounts, wherever they are drilled. Such continuous reservoirs include coal (as coalbed methane), shale that is rich in organic material, and low-porosity (tight) sandstone (Schmoker, 1999, 2002). In the Appalachian Basin Petroleum Province, continuous accumula-tions commonly consist of multiple coal beds, sandstone beds, or shale beds that are amalgamated into larger stratigraphic units in which multiple zones may be drilled, perforated, and completed within a single well.
Thermal Maturity Data
For the 2002 USGS assessment of the Devonian Shale-Middle and Upper Paleozoic TPS, thermal maturity data were obtained by vitrinite-reflectance (Milici and Swezey, 2006). These data were obtained from the following shale units in the lower part of the Devonian siliciclastic section: (1) the Marcellus Shale in the eastern part of the Appalachian Basin Petroleum Province, and (2) the slightly younger basal shale units to the west where the Marcellus Shale has pinched out. The vitrinite in samples of these shale units consisted of dispersed fragments of organic matter within a shale and siltstone matrix. Shale samples were collected under the direc-tion of Robert T. Ryder (USGS) in cooperation with staff from the State geological surveys, and were analyzed by Humble Geochemical Services, Humble, Texas. The analyses of these data, as well as the vitrinite-reflectance isolines and the limits of oil generation and preservation in Devonian shale shown in figure 11, are taken from Weary and others (2000, 2001), Repetski and others (2002, 2005, 2008), and John R. Repetski (USGS, oral commun., 2008). Vitrinite-reflectance data are expressed as percentages (%Ro) of light reflected back from a sample that is illuminated when compared with material that provides 100 percent reflectance (such as a mirror). In general, 0.6 %Ro is regarded as the approximate lower limit of thermal maturity for oil generation, and 2.0 %Ro is the approximate upper limit for oil preservation (Tissot and Welte, 1984; Taylor and others, 1998). Additional data on thermal maturity of Devonian shale may be found in East and others (2012).
During the 2002 USGS assessment, estimates of vitrinite-reflectance values from Devonian dispersed vitrinite in Ohio, northwestern Pennsylvania, and New York may have been lower than the true vitrinite-reflection values because of a phenomenon described by Lo (1993) as “vitrinite reflectance
6 Coal and Petroleum Resources in the Appalachian Basin
suppression.” Recent work by Rowan, Ryder, Repetski and others (2004); Rowan, Ryder, Swezey and others (2004); Rowan (2006); and Ruppert and others (2010) has determined that the vitrinite-reflectance values obtained from Pennsyl-vanian coal beds are, in general, equal to or greater than the values obtained from dispersed vitrinite in underlying Devo-nian shale, especially in the western part of the basin. Thermal or burial history models constructed along Appalachian Basin Petroleum Province cross section E–E′ (fig. 12) of Ryder and others (2008) have determined that the 0.6-%Ro isoline in Devonian shale may well lie 20 to 60 miles to the west of the line determined from dispersed vitrinite (Rowan, Ryder, Repetski and others, 2004; Rowan, Ryder, Swezey and oth-ers, 2004; Rowan, 2006; Ruppert and others, 2008). Indeed, vitrinite-reflection data obtained after the 2002 assessment, as well as older data corrected for vitrinite suppression (Repetski and others, 2008), have shown that the 0.6-%Ro isoline could lie along the westernmost occurrence of the Devonian shale (fig. 13). Thus, much of the oil in the Devonian shale of cen-tral Ohio may have been generated in place, with little or no lateral migration from source rocks to the east.
Since the 2002 USGS assessment, basin modeling by Elisabeth L. Rowan (USGS, written commun., December 2004; Rowan, 2006) has indicated that the base of the Devo-nian shale entered the oil window during the Early Devonian at about 275 million years ago (Ma) in central Ohio and at about 340 Ma (Early Pennsylvanian) in west-central West Virginia. Near the Ohio-West Virginia border, basal Devonian shale entered the oil window at about 330 Ma (Middle Missis-sippian) and entered the gas window at about 230 Ma (Middle Triassic).
Petroleum System Data
Petroleum system data for the Devonian Shale-Middle and Upper Paleozoic TPS include descriptions of petroleum source rocks, petroleum generation, petroleum migration, reservoir rocks, and reservoir seals (fig. 14). The petroleum source rocks are Middle and Upper Devonian and Lower Mis-sissippian shale. The total organic carbon (TOC) content (in weight percent) of Devonian black shale of the Appalachian Basin Petroleum Province ranges widely from less than 1 percent to about 12 percent, but locally it can be as high as 27 percent (Zielinski and McIver, 1982). Hydrocarbon generation occurred from Early Devonian to Early Triassic, and hydrocar-bon migration and accumulation occurred during hydrocarbon generation and shortly thereafter. The reservoirs range in age from Ordovician (strata in the Cumberland saddle region, which is located outside of the Appalachian Basin Petroleum Province in Kentucky and Tennessee; fig. 6) to Mississippian (strata in the Appalachian Plateau; fig. 6). Local seals include siltstone and shale throughout the section. Stratigraphic traps occur in sandstone and limestone throughout the section (de Witt and others, 1979). Some structural traps may have formed by extensional deformation during the late Precambrian and early Paleozoic formation of the Rome trough, but most
structural traps formed by compression during the late Paleo-zoic Alleghanian orogeny, when the eastern part of the basin was folded and faulted.
The critical moment, which is considered to be the time when a large volume of the source rocks reaches thermal maturity and when large amounts of petroleum are generated and expelled from their source rocks, occurred during the Early Permian. During the critical moment, the source rocks and carrier beds were sufficiently fractured to facilitate migra-tion and accumulation of liquid and gaseous hydrocarbons in porous reservoirs within available stratigraphic and structural traps. The residual hydrocarbons that remain within the source rocks after the critical moment constitute the continuous accu-mulations that are the subject of this paper.
In the Appalachian Basin Petroleum Province, methane and smaller amounts of other gases occur within Devonian shale in fractures of various sizes and (or) are adsorbed onto the surfaces of the large amounts of organic matter (de Witt and others, 1993). Charpentier and others (1993) classified these modes of occurrence as domains that contain macrofrac-ture gas, microfracture gas, and sorbed gas. During production of these gases, the reservoir pressure is initially reduced as fractures are drained of formation waters, if present. Subse-quently, as gas is produced from the fractures, additional gas is desorbed from the organic matter into microfractures and then into macrofractures on the way to the well bore. These pro-cesses are similar to the desorption and production of methane from coal beds (for a summary, see Markowski, 2001). Bustin and others (2006), however, demonstrated that the application of coalbed-methane-desorption techniques to most overmature gas shale units resulted in an overestimation of the adsorbed gas content and an underestimation of the free gas capacity of the shale. Instead, the use of production isotherms may result in a better estimation of the total reservoir capacity of gas in shale reservoirs.
Devonian Gas Shale Assessment Units
Most of the undiscovered petroleum resources in the Appalachian Basin Petroleum Province occur either within Devonian black shale as continuous autogenic (self-sourced) reservoirs (Milici, 1993) or within overlying and intertonguing Devonian siltstone and sandstone reservoirs (Schmoker, 1999, 2002). Of the 10 assessment units identified in the Devonian Shale-Middle and Upper Paleozoic TPS, 4 are conventional and 6 are continuous (table 1). This chapter focuses on the 4 continuous Devonian shale assessment units, which are named the Greater Big Sandy Assessment Unit (AU), the Northwest-ern Ohio Shale AU, the Devonian Siltstone and Shale AU, and the Marcellus Shale AU (fig. 15). The petroleum geology of these assessment units is summarized in Boswell (1996), Milici (1996a), and Milici and Swezey (2006). In addition, gas data were compiled from Roen and Kepferle (1993), Roen and Walker (1996), and the U.S. Department of Energy Eastern Gas Shales Project (U.S. Department of Energy, National Energy Technology Laboratory, 2007).
Chapter G.9 Assessment of Appalachian Oil & Gas Resources: Devonian Shale-Middle and Upper Paleozoic TPS 7
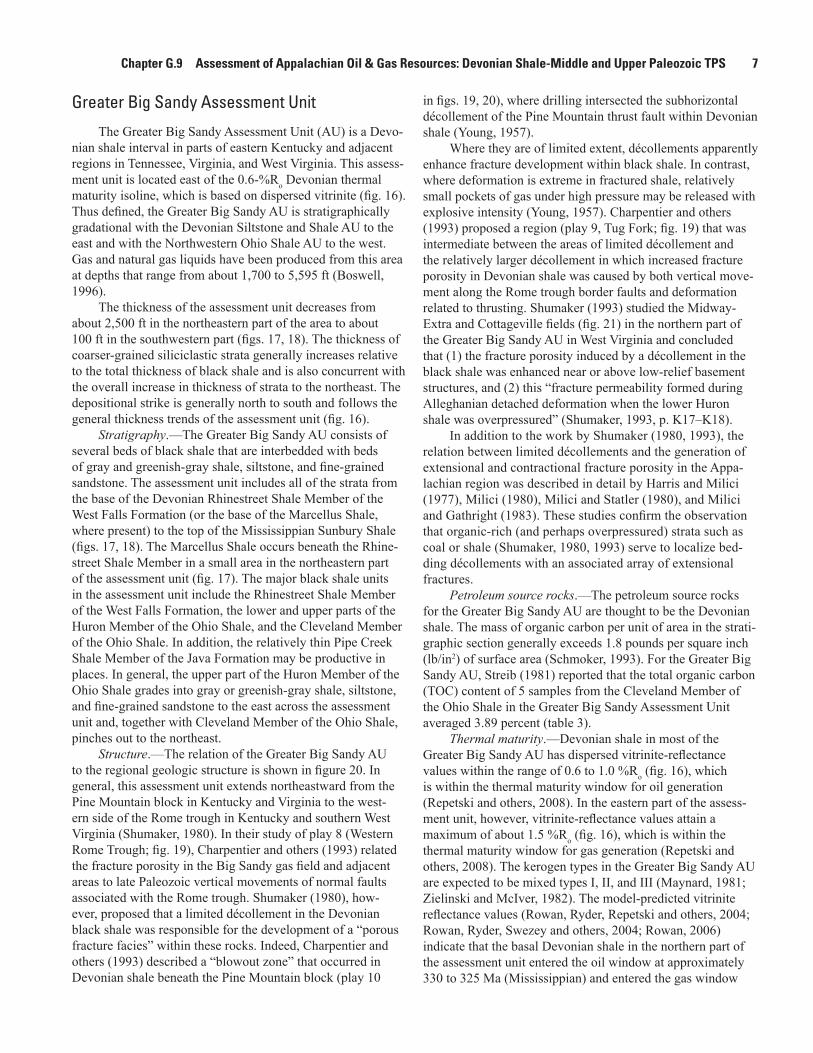
Greater Big Sandy Assessment Unit
The Greater Big Sandy Assessment Unit (AU) is a Devo-nian shale interval in parts of eastern Kentucky and adjacent regions in Tennessee, Virginia, and West Virginia. This assess-ment unit is located east of the 0.6-%Ro Devonian thermal maturity isoline, which is based on dispersed vitrinite (fig. 16). Thus defined, the Greater Big Sandy AU is stratigraphically gradational with the Devonian Siltstone and Shale AU to the east and with the Northwestern Ohio Shale AU to the west. Gas and natural gas liquids have been produced from this area at depths that range from about 1,700 to 5,595 ft (Boswell, 1996).
The thickness of the assessment unit decreases from about 2,500 ft in the northeastern part of the area to about 100 ft in the southwestern part (figs. 17, 18). The thickness of coarser-grained siliciclastic strata generally increases relative to the total thickness of black shale and is also concurrent with the overall increase in thickness of strata to the northeast. The depositional strike is generally north to south and follows the general thickness trends of the assessment unit (fig. 16).
Stratigraphy.—The Greater Big Sandy AU consists of several beds of black shale that are interbedded with beds of gray and greenish-gray shale, siltstone, and fine-grained sandstone. The assessment unit includes all of the strata from the base of the Devonian Rhinestreet Shale Member of the West Falls Formation (or the base of the Marcellus Shale, where present) to the top of the Mississippian Sunbury Shale (figs. 17, 18). The Marcellus Shale occurs beneath the Rhine-street Shale Member in a small area in the northeastern part of the assessment unit (fig. 17). The major black shale units in the assessment unit include the Rhinestreet Shale Member of the West Falls Formation, the lower and upper parts of the Huron Member of the Ohio Shale, and the Cleveland Member of the Ohio Shale. In addition, the relatively thin Pipe Creek Shale Member of the Java Formation may be productive in places. In general, the upper part of the Huron Member of the Ohio Shale grades into gray or greenish-gray shale, siltstone, and fine-grained sandstone to the east across the assessment unit and, together with Cleveland Member of the Ohio Shale, pinches out to the northeast.
Structure.—The relation of the Greater Big Sandy AU to the regional geologic structure is shown in figure 20. In general, this assessment unit extends northeastward from the Pine Mountain block in Kentucky and Virginia to the west-ern side of the Rome trough in Kentucky and southern West Virginia (Shumaker, 1980). In their study of play 8 (Western Rome Trough; fig. 19), Charpentier and others (1993) related the fracture porosity in the Big Sandy gas field and adjacent areas to late Paleozoic vertical movements of normal faults associated with the Rome trough. Shumaker (1980), how-ever, proposed that a limited décollement in the Devonian black shale was responsible for the development of a “porous fracture facies” within these rocks. Indeed, Charpentier and others (1993) described a “blowout zone” that occurred in Devonian shale beneath the Pine Mountain block (play 10
in figs. 19, 20), where drilling intersected the subhorizontal décollement of the Pine Mountain thrust fault within Devonian shale (Young, 1957).
Where they are of limited extent, décollements apparently enhance fracture development within black shale. In contrast, where deformation is extreme in fractured shale, relatively small pockets of gas under high pressure may be released with explosive intensity (Young, 1957). Charpentier and others (1993) proposed a region (play 9, Tug Fork; fig. 19) that was intermediate between the areas of limited décollement and the relatively larger décollement in which increased fracture porosity in Devonian shale was caused by both vertical move-ment along the Rome trough border faults and deformation related to thrusting. Shumaker (1993) studied the Midway-Extra and Cottageville fields (fig. 21) in the northern part of the Greater Big Sandy AU in West Virginia and concluded that (1) the fracture porosity induced by a décollement in the black shale was enhanced near or above low-relief basement structures, and (2) this “fracture permeability formed during Alleghanian detached deformation when the lower Huron shale was overpressured” (Shumaker, 1993, p. K17–K18).
In addition to the work by Shumaker (1980, 1993), the relation between limited décollements and the generation of extensional and contractional fracture porosity in the Appa-lachian region was described in detail by Harris and Milici (1977), Milici (1980), Milici and Statler (1980), and Milici and Gathright (1983). These studies confirm the observation that organic-rich (and perhaps overpressured) strata such as coal or shale (Shumaker, 1980, 1993) serve to localize bed-ding décollements with an associated array of extensional fractures.
Petroleum source rocks.—The petroleum source rocks for the Greater Big Sandy AU are thought to be the Devonian shale. The mass of organic carbon per unit of area in the strati-graphic section generally exceeds 1.8 pounds per square inch (lb/in2) of surface area (Schmoker, 1993). For the Greater Big Sandy AU, Streib (1981) reported that the total organic carbon (TOC) content of 5 samples from the Cleveland Member of the Ohio Shale in the Greater Big Sandy Assessment Unit averaged 3.89 percent (table 3).
Thermal maturity.—Devonian shale in most of the Greater Big Sandy AU has dispersed vitrinite-reflectance values within the range of 0.6 to 1.0 %Ro (fig. 16), which is within the thermal maturity window for oil generation (Repetski and others, 2008). In the eastern part of the assess-ment unit, however, vitrinite-reflectance values attain a maximum of about 1.5 %Ro (fig. 16), which is within the thermal maturity window for gas generation (Repetski and others, 2008). The kerogen types in the Greater Big Sandy AU are expected to be mixed types I, II, and III (Maynard, 1981; Zielinski and McIver, 1982). The model-predicted vitrinite reflectance values (Rowan, Ryder, Repetski and others, 2004; Rowan, Ryder, Swezey and others, 2004; Rowan, 2006) indicate that the basal Devonian shale in the northern part of the assessment unit entered the oil window at approximately 330 to 325 Ma (Mississippian) and entered the gas window
8 Coal and Petroleum Resources in the Appalachian Basin
at approximately 230 Ma (Triassic). In comparison, the upper part of the Ohio Shale appears to have entered the oil window at approximately 260 Ma (Permian).
Reservoir and production data.—In the Greater Big Sandy AU, gas has been produced from the Marcellus Shale, the Rhinestreet Shale Member of the West Falls Forma-tion, the Huron and Cleveland Members of the Ohio Shale, and the Sunbury Shale (fig. 8). Reservoir depths range from approximately 1,700 ft to nearly 6,000 ft (Boswell, 1996). The reservoir is extremely underpressured and has very low permeability values of <0.0001 millidarcies (Kendrick, 2009; Wrightstone, 2009). Log-derived porosity values in the Big Sandy field range from 1.5 to 11 percent, with an average of 4.3 percent (Boswell, 1996). The better gas shale reservoirs within the AU are characterized by pervasive gas-filled micro-pores in laminated black shale, siltstone, and fine-grained sandstone that contain networks of natural fractures (Patchen and Hohn, 1993).
The database that accompanies Roen and Walker (1996) lists 61 named fields that lie within the boundaries of the Greater Big Sandy AU (fig. 21). Several of these fields are located near or on the boundaries of adjacent assessment units. Although these fields are administrative entities for State regu-latory agencies, the fields are part of the continuous accumula-tion that constitutes the Greater Big Sandy AU. In these fields, the average completion thicknesses range generally from 189 to 980 ft, with the greatest average thickness completed from the Fourmile-Branchland field in West Virginia. Cumulative production data (as of September 30, 1996) are not available for all of the fields, but the available data indicate that at least 3.7 trillion cubic feet (TCF) of gas have been produced from named fields in the Greater Big Sandy AU, and about 2.5 TCF of gas have been produced from the Big Sandy gas field alone. Although much of the gas production from the Big Sandy field (and from many other fields) is commingled with production from other stratigraphic units, most of the gas is apparently produced from the Devonian shale.
Several published estimates of gas resources in the area of the Greater Big Sandy AU exist, although they did not use the same methodology that was used in the 2002 USGS assessment. For example, Kuuskraa and Wicks (1984) and Kuuskraa and others (1985) estimated the gas-in-place resources in the Cleveland and Huron Members of the Ohio Shale and the Rhinestreet Shale Member of the West Falls For-mation (within the area of the Greater Big Sandy Assessment Unit) at about 60 TCF. Charpentier and others (1993), how-ever, estimated the mean gas-in-place resources in the approxi-mate area of the assessment unit at about 76 TCF (table 2, fig. 19). The difference between these two estimates may be the result of the relatively low values for the estimated gas-in-place resources that Kuuskraa and others (1985) assigned to the counties in the western part of the assessment unit (their Setting II) (fig. 22), which is the area associated with the West-ern Rome Trough (play 8 of Charpentier and others, 1993). In addition, the estimated gas-in-place resources that Kuuskraa and Wicks (1984) and Kuuskraa and others (1985) assigned to
all stratigraphic intervals are more than double the estimated gas-in-place resources that they assigned to the target intervals in their Setting I (fig. 22).
In the database that accompanies Roen and Walker (1996), the original gas-in-place resources for the Big Sandy field were estimated at approximately 20 TCF. In this data-base, the original gas reserves for this field were estimated as 3.4 TCF, the gas produced was estimated as 2.5 TCF, and the remaining reserves were estimated as approximately 900 BCF. Using data from Roen and Walker (1996), the distribution (by thirds) of estimated ultimate recovery (EUR) values of gas per well calculated for shale gas wells in this assessment unit in eastern Kentucky is illustrated in figure 23. At the median, the early third of the wells attained an EUR of about 73 mil-lion cubic feet (MMCF), the middle third attained about 105 MMCF, and the late third attained about 90 MMCF.
USGS assessment results.—For the 2002 assessment of undiscovered, technically recoverable petroleum resources of the Appalachian Basin Petroleum Province, the USGS esti-mated a range of 3,877.33 to 9,562.42 BCF of gas and 34.06 to 104.50 million barrels (MMB) of natural gas liquids in the Greater Big Sandy AU. The mean values for these estimates are 6,322.67 BCF of gas and 63.23 MMB of natural gas liq-uids in the Greater Big Sandy AU (Milici and others, 2003).
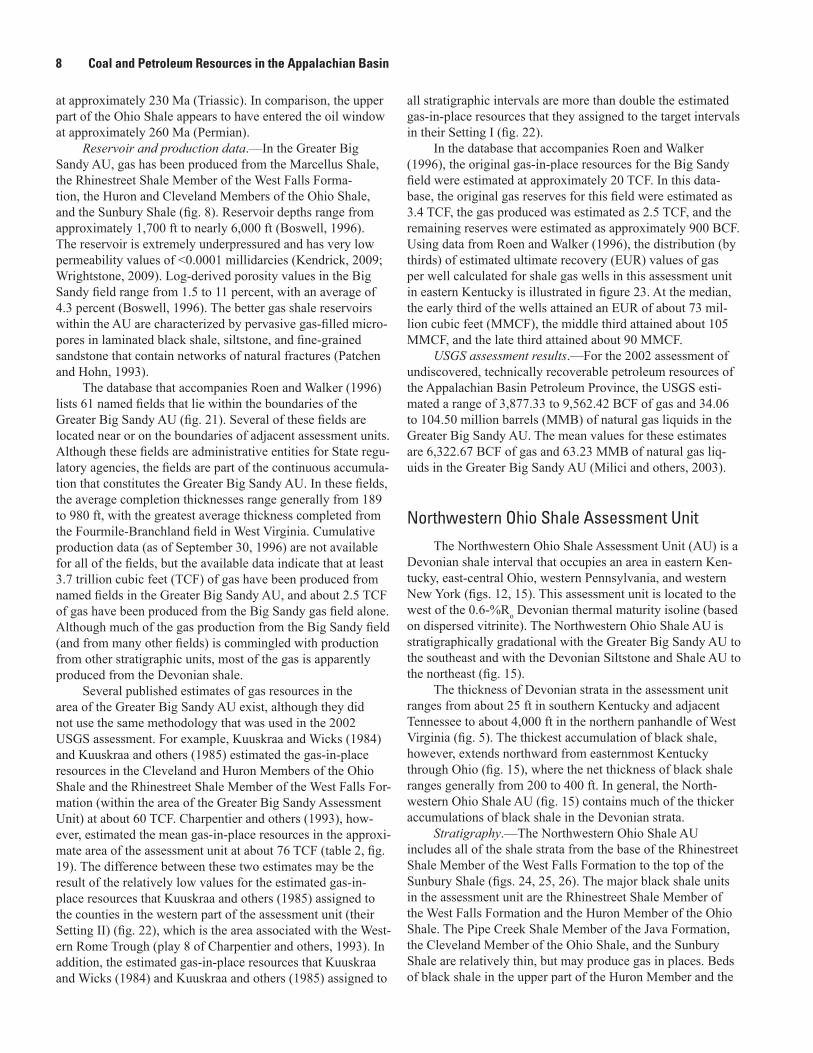
Northwestern Ohio Shale Assessment UnitThe Northwestern Ohio Shale Assessment Unit (AU) is a
Devonian shale interval that occupies an area in eastern Ken-tucky, east-central Ohio, western Pennsylvania, and western New York (figs. 12, 15). This assessment unit is located to the west of the 0.6-%Ro Devonian thermal maturity isoline (based on dispersed vitrinite). The Northwestern Ohio Shale AU is stratigraphically gradational with the Greater Big Sandy AU to the southeast and with the Devonian Siltstone and Shale AU to the northeast (fig. 15).
The thickness of Devonian strata in the assessment unit ranges from about 25 ft in southern Kentucky and adjacent Tennessee to about 4,000 ft in the northern panhandle of West Virginia (fig. 5). The thickest accumulation of black shale, however, extends northward from easternmost Kentucky through Ohio (fig. 15), where the net thickness of black shale ranges generally from 200 to 400 ft. In general, the North-western Ohio Shale AU (fig. 15) contains much of the thicker accumulations of black shale in the Devonian strata.
Stratigraphy.—The Northwestern Ohio Shale AU includes all of the shale strata from the base of the Rhinestreet Shale Member of the West Falls Formation to the top of the Sunbury Shale (figs. 24, 25, 26). The major black shale units in the assessment unit are the Rhinestreet Shale Member of the West Falls Formation and the Huron Member of the Ohio Shale. The Pipe Creek Shale Member of the Java Formation, the Cleveland Member of the Ohio Shale, and the Sunbury Shale are relatively thin, but may produce gas in places. Beds of black shale in the upper part of the Huron Member and the
Chapter G.9 Assessment of Appalachian Oil & Gas Resources: Devonian Shale-Middle and Upper Paleozoic TPS 9
Cleveland Member of the Ohio Shale grade eastward across the assessment unit area into gray and greenish-gray shale, siltstone, and fine-grained sandstone of the Chagrin Shale (figs. 25, 26).
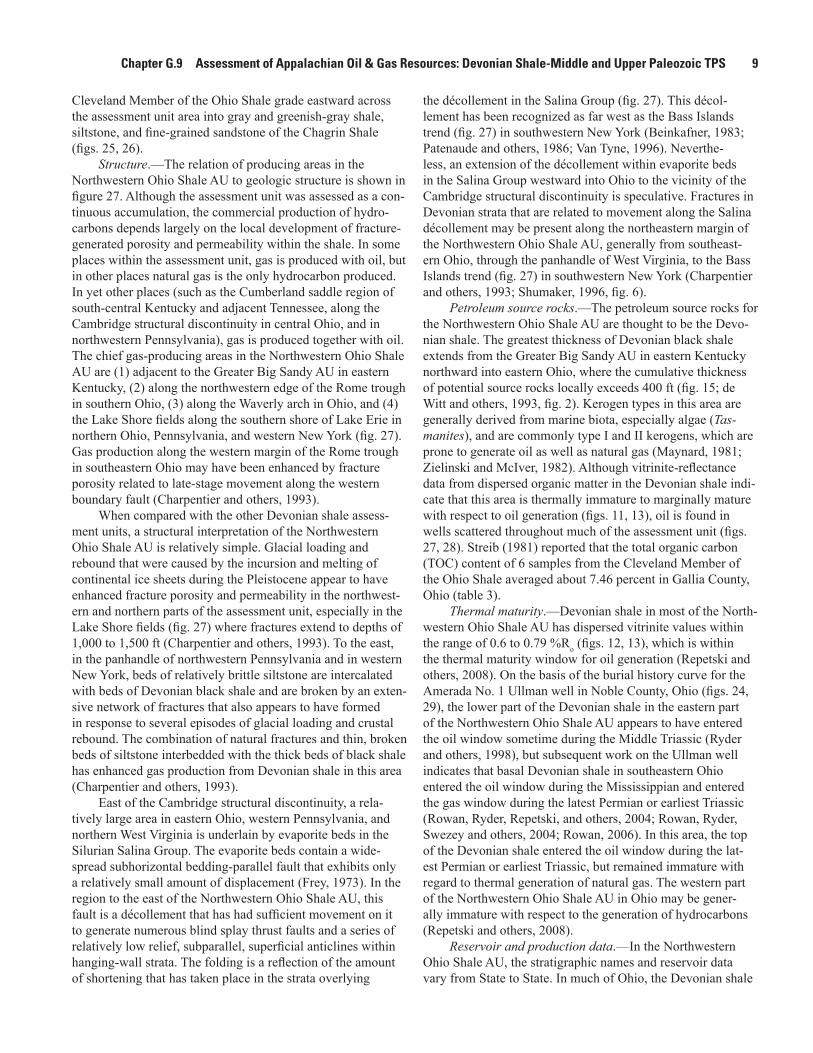
Structure.—The relation of producing areas in the Northwestern Ohio Shale AU to geologic structure is shown in figure 27. Although the assessment unit was assessed as a con-tinuous accumulation, the commercial production of hydro-carbons depends largely on the local development of fracture-generated porosity and permeability within the shale. In some places within the assessment unit, gas is produced with oil, but in other places natural gas is the only hydrocarbon produced. In yet other places (such as the Cumberland saddle region of south-central Kentucky and adjacent Tennessee, along the Cambridge structural discontinuity in central Ohio, and in northwestern Pennsylvania), gas is produced together with oil. The chief gas-producing areas in the Northwestern Ohio Shale AU are (1) adjacent to the Greater Big Sandy AU in eastern Kentucky, (2) along the northwestern edge of the Rome trough in southern Ohio, (3) along the Waverly arch in Ohio, and (4) the Lake Shore fields along the southern shore of Lake Erie in northern Ohio, Pennsylvania, and western New York (fig. 27). Gas production along the western margin of the Rome trough in southeastern Ohio may have been enhanced by fracture porosity related to late-stage movement along the western boundary fault (Charpentier and others, 1993).
When compared with the other Devonian shale assess-ment units, a structural interpretation of the Northwestern Ohio Shale AU is relatively simple. Glacial loading and rebound that were caused by the incursion and melting of continental ice sheets during the Pleistocene appear to have enhanced fracture porosity and permeability in the northwest-ern and northern parts of the assessment unit, especially in the Lake Shore fields (fig. 27) where fractures extend to depths of 1,000 to 1,500 ft (Charpentier and others, 1993). To the east, in the panhandle of northwestern Pennsylvania and in western New York, beds of relatively brittle siltstone are intercalated with beds of Devonian black shale and are broken by an exten-sive network of fractures that also appears to have formed in response to several episodes of glacial loading and crustal rebound. The combination of natural fractures and thin, broken beds of siltstone interbedded with the thick beds of black shale has enhanced gas production from Devonian shale in this area (Charpentier and others, 1993).
East of the Cambridge structural discontinuity, a rela-tively large area in eastern Ohio, western Pennsylvania, and northern West Virginia is underlain by evaporite beds in the Silurian Salina Group. The evaporite beds contain a wide-spread subhorizontal bedding-parallel fault that exhibits only a relatively small amount of displacement (Frey, 1973). In the region to the east of the Northwestern Ohio Shale AU, this fault is a décollement that has had sufficient movement on it to generate numerous blind splay thrust faults and a series of relatively low relief, subparallel, superficial anticlines within hanging-wall strata. The folding is a reflection of the amount of shortening that has taken place in the strata overlying
the décollement in the Salina Group (fig. 27). This décol-lement has been recognized as far west as the Bass Islands trend (fig. 27) in southwestern New York (Beinkafner, 1983; Patenaude and others, 1986; Van Tyne, 1996). Neverthe-less, an extension of the décollement within evaporite beds in the Salina Group westward into Ohio to the vicinity of the Cambridge structural discontinuity is speculative. Fractures in Devonian strata that are related to movement along the Salina décollement may be present along the northeastern margin of the Northwestern Ohio Shale AU, generally from southeast-ern Ohio, through the panhandle of West Virginia, to the Bass Islands trend (fig. 27) in southwestern New York (Charpentier and others, 1993; Shumaker, 1996, fig. 6).
Petroleum source rocks.—The petroleum source rocks for the Northwestern Ohio Shale AU are thought to be the Devo-nian shale. The greatest thickness of Devonian black shale extends from the Greater Big Sandy AU in eastern Kentucky northward into eastern Ohio, where the cumulative thickness of potential source rocks locally exceeds 400 ft (fig. 15; de Witt and others, 1993, fig. 2). Kerogen types in this area are generally derived from marine biota, especially algae (Tas-manites), and are commonly type I and II kerogens, which are prone to generate oil as well as natural gas (Maynard, 1981; Zielinski and McIver, 1982). Although vitrinite-reflectance data from dispersed organic matter in the Devonian shale indi-cate that this area is thermally immature to marginally mature with respect to oil generation (figs. 11, 13), oil is found in wells scattered throughout much of the assessment unit (figs. 27, 28). Streib (1981) reported that the total organic carbon (TOC) content of 6 samples from the Cleveland Member of the Ohio Shale averaged about 7.46 percent in Gallia County, Ohio (table 3).
Thermal maturity.—Devonian shale in most of the North-western Ohio Shale AU has dispersed vitrinite values within the range of 0.6 to 0.79 %Ro (figs. 12, 13), which is within the thermal maturity window for oil generation (Repetski and others, 2008). On the basis of the burial history curve for the Amerada No. 1 Ullman well in Noble County, Ohio (figs. 24, 29), the lower part of the Devonian shale in the eastern part of the Northwestern Ohio Shale AU appears to have entered the oil window sometime during the Middle Triassic (Ryder and others, 1998), but subsequent work on the Ullman well indicates that basal Devonian shale in southeastern Ohio entered the oil window during the Mississippian and entered the gas window during the latest Permian or earliest Triassic (Rowan, Ryder, Repetski, and others, 2004; Rowan, Ryder, Swezey and others, 2004; Rowan, 2006). In this area, the top of the Devonian shale entered the oil window during the lat-est Permian or earliest Triassic, but remained immature with regard to thermal generation of natural gas. The western part of the Northwestern Ohio Shale AU in Ohio may be gener-ally immature with respect to the generation of hydrocarbons (Repetski and others, 2008).
Reservoir and production data.—In the Northwestern Ohio Shale AU, the stratigraphic names and reservoir data vary from State to State. In much of Ohio, the Devonian shale
10 Coal and Petroleum Resources in the Appalachian Basin
source rocks and reservoirs consist predominantly of the Huron and Cleveland Members of the Ohio Shale (figs. 25, 26). In western New York, the producing units are the Dunkirk Shale Member of the Perrysburg Formation, the Rhinestreet Member of the West Falls Formation, and the Marcellus Shale (fig. 9). The available gas field data (fig. 29) show that the average thickness completed (by field) ranges up to 352 ft in northeastern Kentucky (Naples field), up to 600 ft in eastern Ohio (Brookville field), and up to 378 ft in western West Virginia (Apple Grove field). The depths to the producing res-ervoirs range generally from about 365 ft in north-central Ohio (Lewin and Associates, 1983) to 2,300 ft in southern Ohio and to 4,000 ft or more in western West Virginia and adjacent Kentucky. The average log-derived porosity values range from about 3 to 14 percent in the Newton field in central Ohio, and up to 16 percent in the Darlington field in western Pennsyl-vania (Roen and Walker, 1996). Maximum porosity values of 8 and 9 percent have been reported for other fields (Boswell, 1996). Lewin and Associates (1983) used nominal values of 1 percent for shale matrix porosity and 5×10⁻⁶ millidarcies for shale matrix permeability. Soeder and others (1986) observed that shale samples from wells in the lower part of the Huron Member of the Ohio Shale in southeastern Ohio and north-western West Virginia contain liquid petroleum in their pores. As a result, the ratio of matrix permeability to gas is very low (in the range of tens of nanodarcies), and gas-filled porosity is generally less than 0.1 percent (Soeder and others, 1986).
The database that accompanies Roen and Walker (1996) lists 49 named gas fields within the boundaries of the North-western Ohio Shale AU (fig. 28). Although these fields are administrative entities for State regulatory agencies, the fields are part of the continuous accumulation that constitutes the Northwestern Ohio Shale AU. Cumulative production data are generally not available from these fields, and much of the gas production from the Northwestern Ohio Shale AU is com-mingled with production from other stratigraphic units.
Several published estimates of gas resources in the area of the Northwestern Ohio Shale Assessment Unit exist, although they did not use the same methodology that was used in the 2002 USGS assessment. For example, Lewin and Associates (1983), Kuuskraa and Wicks (1984), and Kuuskraa and others (1985) portioned areas of Ohio, West Virginia, and Kentucky into different geological settings (fig. 30), and they estimated the gas-in-place resources in the Ohio Shale and the Rhine street Shale Member of the West Falls Formation (within the area of the Northwestern Ohio Shale Assessment Unit) to be about 112 TCF. Charpentier and others (1993), however, estimated the mean gas-in-place resources in the approximate area of the assessment unit to be about 245 TCF (table 2, fig. 19).
Using data from Roen and Walker (1996), the distribution (by thirds) of estimated ultimate recovery (EUR) values of gas per well calculated for shale gas wells in the Northwest-ern Ohio Shale AU is shown in figure 31. At the median, the early third of the wells attained an EUR of about 37 MMCF,
the middle third attained about 48 MMCF, and the late third attained about 40 MMCF.
USGS assessment results.—For the 2002 assessment of undiscovered, technically recoverable petroleum resources of the Appalachian Basin Petroleum Province, the USGS esti-mated a range from 1,453.59 to 4,338.99 BCF of gas and from 25.95 to 93.32 million barrels (MMB) of natural gas liquids in the Northwestern Ohio Shale AU. The mean values for these estimates are 2,654.07 BCF of gas and 53.08 MMB of natural gas liquids in the Northwestern Ohio Shale AU (Milici and others, 2003).
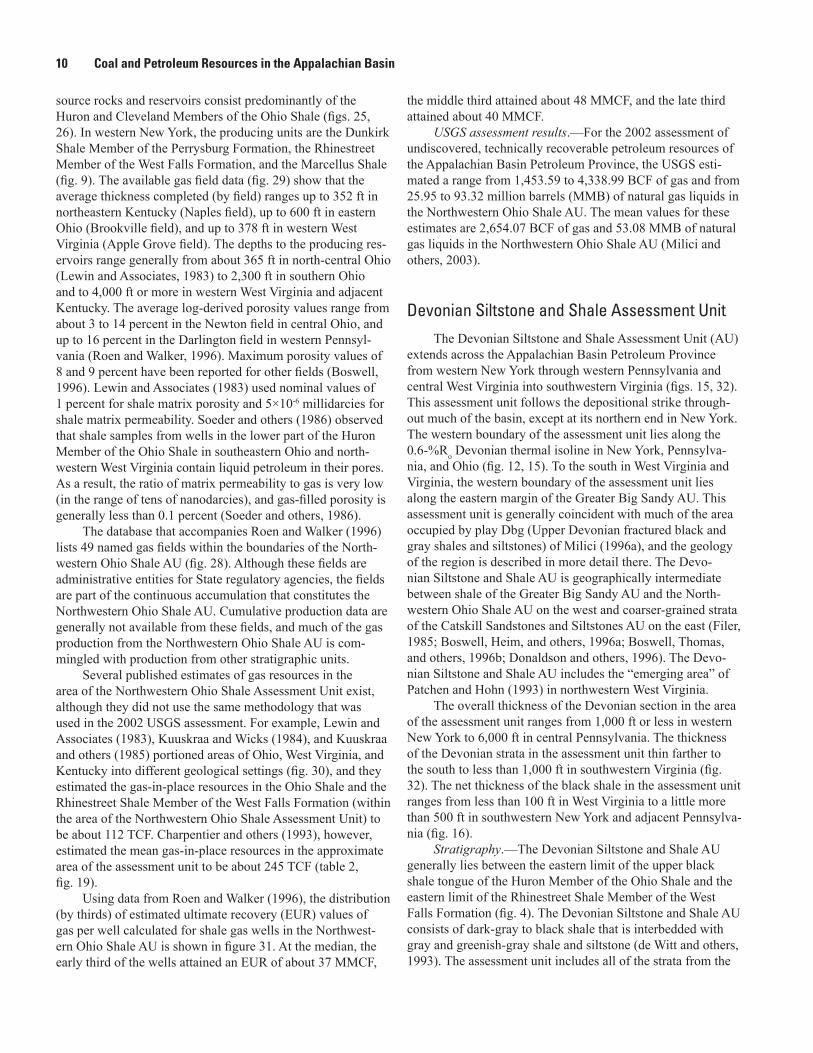
Devonian Siltstone and Shale Assessment UnitThe Devonian Siltstone and Shale Assessment Unit (AU)
extends across the Appalachian Basin Petroleum Province from western New York through western Pennsylvania and central West Virginia into southwestern Virginia (figs. 15, 32). This assessment unit follows the depositional strike through-out much of the basin, except at its northern end in New York. The western boundary of the assessment unit lies along the 0.6-%Ro Devonian thermal isoline in New York, Pennsylva-nia, and Ohio (fig. 12, 15). To the south in West Virginia and Virginia, the western boundary of the assessment unit lies along the eastern margin of the Greater Big Sandy AU. This assessment unit is generally coincident with much of the area occupied by play Dbg (Upper Devonian fractured black and gray shales and siltstones) of Milici (1996a), and the geology of the region is described in more detail there. The Devo-nian Siltstone and Shale AU is geographically intermediate between shale of the Greater Big Sandy AU and the North-western Ohio Shale AU on the west and coarser-grained strata of the Catskill Sandstones and Siltstones AU on the east (Filer, 1985; Boswell, Heim, and others, 1996a; Boswell, Thomas, and others, 1996b; Donaldson and others, 1996). The Devo-nian Siltstone and Shale AU includes the “emerging area” of Patchen and Hohn (1993) in northwestern West Virginia.
The overall thickness of the Devonian section in the area of the assessment unit ranges from 1,000 ft or less in western New York to 6,000 ft in central Pennsylvania. The thickness of the Devonian strata in the assessment unit thin farther to the south to less than 1,000 ft in southwestern Virginia (fig. 32). The net thickness of the black shale in the assessment unit ranges from less than 100 ft in West Virginia to a little more than 500 ft in southwestern New York and adjacent Pennsylva-nia (fig. 16).
Stratigraphy.—The Devonian Siltstone and Shale AU generally lies between the eastern limit of the upper black shale tongue of the Huron Member of the Ohio Shale and the eastern limit of the Rhinestreet Shale Member of the West Falls Formation (fig. 4). The Devonian Siltstone and Shale AU consists of dark-gray to black shale that is interbedded with gray and greenish-gray shale and siltstone (de Witt and others, 1993). The assessment unit includes all of the strata from the
Chapter G.9 Assessment of Appalachian Oil & Gas Resources: Devonian Shale-Middle and Upper Paleozoic TPS 11
base of the Hamilton Group (Marcellus Shale) to the top of the Sunbury Shale. The major black shale units in the assessment unit are the Marcellus Shale at the base, the Pipe Creek Shale Member of the Java Formation, the lower part of the Huron Member of the Ohio Shale, and the Dunkirk Shale Member of the Perrysburg Formation (figs. 4, 25, 26).
Structure.—The relation of producing areas in the Devonian Siltstone and Shale AU to geologic structure is shown in figure 33. Much of the assessment unit is deformed to some extent by a limited décollement in Devonian shale in the area south of the Rome trough in southern West Virginia and southwestern Virginia. North of the trough, in northwest-ern Pennsylvania, a limited décollement within evaporite beds of the Silurian Salina Group has resulted in shortening and folding of the hanging wall into a series of relatively low amplitude folds (fig. 27). The coincidence of a subhorizontal décollement within the black shale, the fractured superficial anticlines that were formed by splay faults from the décolle-ment in the underlying Silurian evaporite beds (Filer, 1985; Sweeney, 1986), and perhaps any late-stage movement on steeply dipping faults associated with the Rome trough (Cara-manica, 1988) appear to have increased the fracture porosity within the assessment unit, especially where siltstone and fine-grained sandstone are intercalated with black shale. In the “emerging area” of Patchen and Hohn (1993) in northwestern West Virginia, the two main plays are the Huron Member of the Ohio Shale and the Rhinestreet Shale Member of the West Falls Formation. The fracture porosity within these shale units appears to be related to folds that were formed by a limited décollement in the underlying Silurian evaporite beds (Shu-maker, 1993).
Petroleum source rocks.—The petroleum source rocks for the Devonian Siltstone and Shale AU are thought to be the Devonian shale. Except in southwestern New York and west-ern Pennsylvania, the Devonian Siltstone and Shale AU lies along the eastern margin of thick shale, where the net thick-ness of black shale ranges from about 100 ft to as much as 250 ft. In northern Pennsylvania, however, the net thickness of black shale is 500 ft or more (fig. 15). Because the assessment unit is located in the center of the basin and presumably was close to the source of terrigenous clastic sediments, the Devo-nian Siltstone and Shale AU should contain greater propor-tions of type III kerogen than the assessment units to the west (Maynard, 1981; Zielinski and McIver, 1982). The geochemi-cal characteristics of samples from the Devonian Siltstone and Shale AU are listed in table 3 (Streib, 1981). Streib (1981) reported that the total organic carbon (TOC) content of one sample from the Marcellus Shale in a well in Wetzel County, West Virginia, was 6.19 percent (table 3).
Thermal maturity.—On the basis of dispersed vitrinite-reflectance data, the Devonian shale in the Devonian Siltstone and Shale AU is located to the east of the 0.6-%Ro thermal isoline (fig. 11). The assessment unit, therefore, is thermally mature with respect to the generation of hydrocarbons. To the east, the assessment unit reaches the 2.0-%Ro isoline (the
eastern limit of oil preservation) in western Pennsylvania and the 4.0-%Ro isoline in southern West Virginia (figs. 11, 12). Oil is commonly produced with gas in much of the assess-ment unit area because of the increased fracture porosity in the interbedded siltstones of the Devonian Siltstone and Shale AU (fig. 32). Where thermal maturity is the greatest in central Pennsylvania and in the southern part of the assessment unit, however, gas is the primarily produced hydrocarbon.
Model-predicted vitrinite-reflection values from three wells in the Devonian Siltstone and Shale AU in western West Virginia indicate that the base of the Devonian shale entered the oil window during the Pennsylvanian and entered the gas window during the Permian (Rowan, Ryder, Repetski, and oth-ers, 2004; Rowan, Ryder, Swezey, and others, 2004; Rowan, 2006). Calculated vitrinite-reflectance values for these wells (the No. 1 Gainer-Lee, the No. 1 McCoy, and the No. 1 Deem wells) are based on vitrinite-reflectance values from Pennsyl-vanian coal beds and are significantly greater than the values determined from dispersed vitrinite in the basal Devonian shale (fig. 12). For example, the calculated vitrinite-reflectance value for the No. 1 Gainer-Lee well is 2.17 %Ro, which is sig-nificantly greater than the 1.5-%Ro value to the east that was determined from vitrinite dispersed in the shale.
Reservoir and production data.—In the Devonian Silt-stone and Shale AU, the principal gas-producing units are the Rhinestreet Shale Member of the West Falls Formation, the lower part of the Huron Member of the Ohio Shale, and (to a lesser extent) the Marcellus Shale (figs. 25, 26). Completion intervals range generally from 10 to nearly 1,600 ft, final open flow rates range from 30 to 1,500 thousand cubic feet (MCF) per day, and initial reservoir pressures range from 125 to 2,529 lb/in2. Although the data are limited, log-derived porosity values are as high as 8 percent (see database that accompanies Roen and Walker, 1996). Drilling depths range from several hundred feet or more in New York to about 5,000 ft in West Virginia.
The database that accompanies Roen and Walker (1996) lists 68 named gas fields within the boundaries of the Devo-nian Siltstone and Shale AU (fig. 34). Of the few fields for which data are available, the average thickness completed was greatest at 1,590 ft in the Blue Creek field in Kanawha County, West Virginia (fig. 34). Although oil and gas exploration has occurred over much of the assessment unit (fig. 32), explo-ration has been concentrated in west-central West Virginia, which is the “emerging area” of Patchen and Hohn (1993). Patchen and Hohn (1993, p. L26) concluded “…that the over-all emerging area of Devonian shale oil and gas production has been overpromoted and will prove to be non-commercial to many operators and investors.” Subsequently, Douglas Patchen (West Virginia Geological and Economic Survey, written commun., 2005) indicated that production from wells drilled more recently has improved since their 1993 publica-tion. In addition, production from many of the newer shale-gas wells is commingled with production from Devonian sand-stone reservoirs.
12 Coal and Petroleum Resources in the Appalachian Basin
Several published estimates of gas resources in the area of the Devonian Siltstone and Shale AU exist, although they did not use the same methodology that was used in the 2002 USGS assessment. For example, Tetra Tech, Inc. (1981) estimated 482 TCF (black shale thickness determined from log data) to 790 TCF (black shale thickness determined from sam-ple data) of gas-in-place resources in the approximate area of the assessment unit in Pennsylvania, with relatively favorable areas for shale gas occurring in the Rhinestreet Shale Member of the West Falls Formation and the Dunkirk Shale Member of the Perrysburg Formation in northeastern Pennsylvania and in the Marcellus Shale in west-central Pennsylvania (fig. 35). Lewin and Associates (1983) estimated that the Devo-nian shale in the approximate area of the assessment unit in Ohio contained 3.5 TCF (figure 35), and Kuuskraa and Wicks (1984) estimated that the Devonian shale in the approximate area of the assessment unit in West Virginia contained 53.4 TCF (figure 35). Charpentier and others (1993) estimated the mean gas-in-place resources in the approximate area of the assessment unit to be about 228 TCF (fig. 19, table 2).
Using data from Roen and Walker (1996), the distribution (by thirds) of estimated ultimate recovery (EUR) values of gas per well calculated for shale gas wells in this assessment unit is shown in figure 36. At the median, the early third of the wells attained an EUR of about 55 MMCF, the middle third attained about 33 MMCF, and the late third attained about 30 MMCF.
USGS assessment results.—For the 2002 assessment of undiscovered, technically recoverable petroleum resources of the Appalachian Basin Petroleum Province, the USGS esti-mated a range from 829.34 to 1,925.18 BCF of gas and from 4.50 to 23.14 MMB of natural gas liquids in the Devonian Siltstone and Shale AU. The mean values for these estimates are 1,293.61 BCF of gas and 31.05 MMB of natural gas liquids in the Devonian Siltstone and Shale AU (Milici and others, 2003).
Marcellus Shale Assessment UnitThe Marcellus Shale Assessment Unit (AU) extends
southward from central Pennsylvania, southwestern New York, and eastern Ohio through West Virginia to southwest-ern Virginia. This assessment unit lies generally to the east of the Devonian Siltstone and Shale AU, where the thickness of Marcellus Shale is greater than 50 ft (fig. 37).
Stratigraphy.—The Marcellus Shale AU includes the Hamilton Group (Marcellus Shale and Mahantango Forma-tion) in much of the Appalachian basin and the Millboro Shale in Virginia (fig. 4). Although the Hamilton Group and the Millboro Shale may attain thicknesses of 1,000 ft and 1,500 ft, respectively, the net thickness of the black shale within these units ranges generally from less than 50 ft in Ohio and the western parts of New York, Pennsylvania, and northern West Virginia to about 200 ft in northeastern Pennsylvania (de Witt and others, 1993).
Structure.—The Marcellus Shale AU is underlain by a regional décollement in evaporite beds of the Silurian Salina Group (fig. 3) in the Appalachian Plateau region of Pennsyl-vania, northern West Virginia, and eastern Ohio (Frey, 1973). In this region, the Marcellus Shale is folded into numerous rootless folds, and interstratal slip during folding may have increased the fracture porosity within the shale.
Petroleum source rocks.—The petroleum source rocks for the Marcellus Shale AU are thought to be the Devonian shale. The total organic carbon (TOC) contents of samples from the Marcellus Shale (table 4) show that the organic richness of the Marcellus Shale decreases generally from New York southward to West Virginia (Weary and others, 2000, 2001; Repetski and others, 2002, 2005). These variations appear to reflect the overall paleogeography, with the higher TOC content in the more distal parts (New York) and the lower TOC content in the more proximal parts (West Virginia) of the siliciclastic depositional system. The TOC data presented in table 4 include samples of the Marcellus Shale that were col-lected from wells distributed across several of the assessment units. In general, the higher TOC values for the Marcellus Shale in New York occur in the Northwestern Ohio Shale AU and in counties that lie along the border of the Northwest-ern Ohio Shale AU and Devonian Siltstone and Shale AU (table 4). In New York, the TOC content of 19 samples of the Marcellus Shale averaged 4.3 percent (table 4), but only 8 of these 19 samples were collected within the area of the USGS Marcellus Shale Assessment Unit. In Pennsylvania, however, the TOC content of 36 samples averaged 3.61 percent (table 4), but only 23 of these 36 samples were collected from within the area of the USGS Marcellus Shale Assessment Unit. In West Virginia, the TOC content of 22 samples of the Marcellus Shale averaged 1.40 percent (table 4), but only 13 of these 22 samples were collected within the area of the USGS Marcellus Shale Assessment Unit.
Thermal maturity.—Devonian shale in much of the Marcellus Shale AU has dispersed vitrinite values of 1.5 to 3.0 %Ro (figs. 11, 12), which is within thermal maturity windows for gas generation (Repetski and others, 2008). In the Amerada No. 1 Ullman well, the maximum depth of burial of the Mar-cellus Shale ranges from about 7,000 to 10,000 ft (fig. 29). Because of its more eastward location and greater depth of burial, the Marcellus Shale probably attained thermal maturity earlier during the Paleozoic than did stratigraphically higher Devonian shale to the west.
Reservoir and production data.—The database that accompanies Roen and Walker (1996) lists only one field (Genegants field in New York) in the Marcellus Shale AU (fig. 34). Wells in this field have been drilled to 2,000 ft or more and may bottom in Lower Devonian limestone.
Several published estimates of gas resources in the area of the Marcellus Shale AU exist although they did not use the same methodology that was used in the 2002 USGS assess-ment. For example, Kuuskraa and Wicks (1984) estimated the gas-in-place resources in the Marcellus Shale in eastern West Virginia to be about 101 TCF. In comparison, Charpentier and
Chapter G.9 Assessment of Appalachian Oil & Gas Resources: Devonian Shale-Middle and Upper Paleozoic TPS 13
others (1993) estimated the mean gas-in-place resources in the Marcellus Shale in northern West Virginia, central Pennsylva-nia, and southwestern New York (in an area that is larger than the Marcellus Shale AU described in this publication) to be about 295 TCF (table 2). At a 10 percent recovery factor, these estimates would yield almost 30 TCF of gas.
USGS assessment results.—For the 2002 assessment of undiscovered, technically recoverable petroleum resources of the Appalachian Basin Petroleum Province, the USGS esti-mated a range from 821.83 to 3,667.59 BCF of gas and from 4.50 to 23.14 MMB of natural gas liquids in the Marcellus Shale AU. The mean values for these estimates are 1,925.18 BCF of gas 11.55 MMB of natural gas liquids in the Marcellus Shale AU (Milici and others, 2003). USGS oil and gas assess-ments of the Appalachian Basin Petroleum Province are based largely on previous well performance within the assessment units. At the time of the 2002 assessment, very little drilling had occurred within the Marcellus Shale AU. Accordingly, the Greater Big Sandy AU was used as a partial analog for assess-ing the Marcellus Shale AU.
The area of the Marcellus Shale AU, as it was assessed by the USGS in the 2002, does not encompass the entire extent of the Marcellus Shale geologic unit. Some of the mapped extent of the Marcellus Shale extends to the east of the Marcellus Shale AU and into the Devonian Siltstone and Shale AU. A vitrinite reflectance value of 2 %Ro is taken as the boundary between the two assessment units. Although large amounts of gas are produced from Devonian shale to the west of the 2-%Ro isoline, the thickness of the Marcellus Shale is less than 50 ft to the west of this isoline in western New York, western Pennsylvania, western West Virginia, and eastern Ohio. Residual oil in this area of lower thermal maturity may clog porosity and interfere with gas production. Accordingly, the most productive area (“sweet spot”) for the Marcellus Shale is thought to extend from south-central New York to southwesternmost Pennsylvania and then into adjacent West Virginia (fig. 37). In 2002, the USGS estimated that techni-cally recoverable undiscovered gas resources in the Marcellus Shale AU ranged from a minimum of 0.83 TCF to a maximum of 3.67 TCF (Milici and others, 2003). In 2008, Engelder (in Kane, 2008) estimated that the Marcellus Shale contained 1,307 TCF of gas. Engelder’s study encompassed a larger area than the Marcellus Shale AU described in this publication and Engelder’s estimates were based largely on estimated gas-in-place resources that he calculated for that area. Engelder and Lash (2008) estimated that the Marcellus Shale might contain more than 500 TCF of gas-in-place resources, of which about 10 percent (50 TCF) might be recoverable. More recently, Engelder (2009) estimated that, after a 50-year decline, the estimated ultimate recovery (EUR) values from the Marcellus Shale would range from about 221 TCF (a 90 percent chance of at least this amount) to 867 TCF (a 10 percent chance of at least this amount), with a 50 percent probability that the Marcellus Shale would ultimately yield 489 TCF. In 2011, the USGS published a revised study of the Marcellus Shale (Coleman and others, 2011) that estimated that technically
recoverable undiscovered gas resources in the Marcellus Shale ranged from 43 to 144 TCF. This revised USGS estimate, however, considered an area that is much larger than the Mar-cellus Shale AU of the 2002 USGS assessment.
SummaryIn 2002, the U.S. Geological Survey (USGS) conducted
an assessment of the technically recoverable undiscovered oil and gas resources of the Appalachian Basin Petroleum Province in the eastern United States. This assessment identi-fied six total petroleum systems, one of which is the Devonian Shale-Middle and Upper Paleozoic Total Petroleum System (TPS). The oil and gas of this TPS are derived from Devo-nian shale, and the reservoir intervals encompass a variety of middle and upper Paleozoic strata. This TPS is divided into 10 assessment units (reservoir intervals), including the following four Devonian shale-gas assessment units: (1) the Greater Big Sandy AU, which is located primarily in eastern Kentucky; (2) the Northwestern Ohio Shale AU, which is located in eastern Kentucky, east-central Ohio, western Pennsylvania, and western New York; (3) the Devonian Siltstone and Shale AU, which extends across western New York through western Pennsylvania and central West Virginia into southwestern Vir-ginia; and (4) the Marcellus Shale AU, which extends south-ward from central Pennsylvania, southwestern New York, and eastern Ohio through West Virginia to southwestern Virginia. These four AUs are composed of Devonian shale, siltstone, and fine-grained sandstone. They are considered to be continu-ous (unconventional) assessment units in which the shale is both the petroleum source rock and the reservoir interval. In the 2002 USGS assessment, the Greater Big Sandy AU was estimated to contain 3,877.33 to 9,562.42 billion cubic feet (BCF) of gas and 34.06 to 104.50 million barrels (MMB) of natural gas liquids. The Northwest Oil Shale AU was esti-mated to contain 1,453.59 to 4,338.99 BCF of gas and 25.95 to 93.32 MMB of natural gas liquids. The Devonian Siltstone and Shale AU was estimated to contain 829.34 to 1,894.48 BCF of gas and 17.35 to 50.08 MMB of natural gas liquids. The Marcellus Shale AU was estimated to contain 821.83 to 3,667.59 BCF of gas and 4.50 to 23.14 MMB of natural gas liquids.
AcknowledgmentsThe writers thank Robert T. Ryder and Peter D. Warwick
for their reviews, which substantially improved the quality of the manuscript. They are also indebted to the members of the USGS Appalachian Basin Petroleum Province Assessment Team (Robert T. Ryder, Ronald R. Charpentier, Troy A. Cook, Robert A. Crovelli, Timothy R. Klett, Richard M. Pollastro, and Christopher J. Schenk) for their part in conducting the 2002 Appalachian Basin Petroleum Province Assessment.
14 Coal and Petroleum Resources in the Appalachian Basin
References Cited
Baranoski, M.T., Riley, R.A., and Wolfe, M.E., 1996, Play COk; Cambrian-Ordovician Knox Group unconformity play, in Roen, J.B., and Walker, B.J., eds., The atlas of major Appalachian gas plays: West Virginia Geological and Economic Survey Publication V–25, p. 181–187.
Beinkafner, K.J., 1983, Terminal expression of decollement in Chautauqua County, New York: Northeastern Geology, v. 5, nos. 3–4, p. 160–171.
Berg, T.M., 1999, Devonian-Mississippian transition, chap. 8 of Shultz, C.H., ed., The geology of Pennsylvania: Pennsyl-vania Geological Survey and Pittsburgh Geological Society Special Publication 1, p. 128–137.
Bjerstedt, T.W., 1986, Regional stratigraphy and sedimentol-ogy of the Lower Mississippian Rockwell Formation and Purslane Sandstone based on the new Sideling Hill road cut, Maryland: Southeastern Geology, v. 27, no. 2, p. 69–94.
Bjerstedt, T.W., and Kammer, T.W., 1988, Genetic stratigraphy and depositional systems of the Upper Devonian-Lower Mississippian Price-Rockwell deltaic complex in the central Appalachians, U.S.A.: Sedimentary Geology, v. 54, no. 4, p. 265–301, doi:10.1016/0037-0738(88)90037-1.
Boswell, Ray, 1996, Play UDs; Upper Devonian black shales, in Roen, J.B., and Walker, B.J., eds., The atlas of major Appalachian gas plays: West Virginia Geological and Eco-nomic Survey Publication V–25, p. 93–99.
Boswell, R.M., and Donaldson, A.C., 1988, Depositional architecture of the Upper Devonian Catskill delta com-plex; central Appalachian basin, U.S.A., in McMillan, N.J., Embry, A.F., and Glass, D.J., eds., Devonian of the world; Proceedings of the Second International Symposium on the Devonian System, Calgary, Canada; v. II; Sedimentation: Canadian Society of Petroleum Geologists Memoir 14, p. 65–84.
Boswell, Ray, Heim, L.R., Wrightstone, G.R., and Donaldson, Alan, 1996, Play Dvs; Upper Devonian Venango sandstones and siltstones, in Roen, J.B., and Walker, B.J., eds., The atlas of major Appalachian gas plays: West Virginia Geo-logical and Economic Survey Publication V–25, p. 63–69.
Boswell, R.M., and Jewell, G.A., 1988, Atlas of Upper Devo-nian/Lower Mississippian sandstones in the subsurface of West Virginia: West Virginia Geological and Economic Survey Circular C–43, 144 p.
Boswell, Ray, Thomas, B.W., Hussing, R.B., Murin, T.M., and Donaldson, Alan, 1996, Play Dbs; Upper Devonian Brad-ford sandstones and siltstones, in Roen, J.B., and Walker, B.J., eds., The atlas of major Appalachian gas plays: West Virginia Geological and Economic Survey Publication V–25, p. 70–76.
Brezinski, D.K., 1989a, Upper Mississippian depositional patterns in the north-central Appalachian basin, and their implications to Chesterian hierarchal stratigraphy: South-eastern Geology, v. 30, no. 1, p. 1–23.
Brezinski, D.K., 1989b, The Mississippian System in Mary-land: Maryland Geological Survey Report of Investigations 52, 75 p.
Brezinski, D.K., 1999, Mississippian, chap. 9 of Shultz, C.H., ed., The geology of Pennsylvania: Pennsylvania Geological Survey and Pittsburgh Geological Society Special Publica-tion 1, p. 138–147.
Briggs, R.P., and Tatlock, D.B., 1999, Petroleum—Guide to undiscovered natural gas resources, chap. 38C of Shultz, C.H., ed., The geology of Pennsylvania: Pennsylvania Geo-logical Survey and Pittsburgh Geological Society Special Publication 1, p. 530–547.
Bustin, R.M., Ross, Daniel, and Chalmers, Gareth, 2006, Rethinking methodologies of characterizing gas in place in gas shales: American Association of Petroleum Geolo-gists Annual Convention Program, v. 15, p. 16. (Also available online at http://www.searchanddiscovery.com/documents/2006/06088houston_abs/abstracts/bustin.htm.)
Butts, Charles, 1940, Geology of the Appalachian Valley in Virginia; Part 1, Geologic text and illustrations: Virginia Geological Survey Bulletin 52, 568 p.
Caramanica, F.P., 1988, Oil and gas report and maps of Kanawha and Boone counties, West Virginia: West Virginia Geological and Economic Survey Bulletin B–19A, 115 p., 6 pls.
Carter, K.M., and Flaherty, K.J., 2011, The old, the crude, and the muddy; Oil history in western Pennsylvania, in Ruf-falo, R.M., and Ciampaglio, C.N., eds., From the shield to the sea; Geological field trips from the 2011 joint meet-ing of the GSA Northeastern and North-Central sections: Geological Society of America Field Guide 20, p. 169–185, doi:10.1130/2011.0020(08).
Chadwick, G.H., 1933a, Catskill as a geologic name: Ameri-can Journal of Science, 5th series, v. 26, p. 479–484, doi:10.2475/ajs.s5-26.155.479.
Chadwick, G.H., 1933b, Great Catskill delta, and revision of late Devonic succession: The Pan-American Geologist, v. 60, no. 2, p. 91–107.
Charpentier, R.R., de Witt, Wallace, Jr., Claypool, G.E., Harris, L.D., Mast, R.F., Megeath, J.D., Roen, J.B., and Schmoker, J.W., 1993, Estimates of unconventional natural gas resources of the Devonian shales of the Appalachian basin, in Roen, J.B., and Kepferle, R.C., eds., Petroleum geology of the Devonian and Mississippian black shale of eastern North America: U.S. Geological Survey Bulletin
Chapter G.9 Assessment of Appalachian Oil & Gas Resources: Devonian Shale-Middle and Upper Paleozoic TPS 15
1909–B, p. N1–N20. (Also available online at http://pubs.er.usgs.gov/publication/b1909.)
Coleman, J.L., Milici, R.C., Cook, T.A., Charpentier, R.R., Kirschbaum, Mark, Klett, T.R., Pollastro, R.M., and Schenk, C.J., 2011, Assessment of undiscovered oil and gas resources of the Devonian Marcellus Shale of the Appala-chian Basin Province, 2011: U.S. Geological Survey Fact Sheet 2011–3092, 2 p., available only at http://pubs.usgs.gov/fs/2011/3092/.
Colton, G.W., 1970, The Valley and Ridge and Appalachian Plateau; stratigraphy and sedimentation; the Appalachian basin; its depositional sequences and their geologic relation-ships, in Fisher, G.W., Pettijohn, F.J., Reed, J.C., Jr., and Weaver, K.N., eds., Studies of Appalachian geology, central and southern: New York, N.Y., Interscience Publishers, p. 5–47.
Conant, L.C., and Swanson, V.E., 1961, Chattanooga Shale and related rocks of central Tennessee and nearby areas: U.S. Geological Survey Professional Paper 357, 91 p. (Also available online at http://pubs.er.usgs.gov/publication/pp357.)
Demaison, G.J., and Moore, G.T., 1980, Anoxic environ-ments and oil source bed genesis: American Association of Petroleum Geologists Bulletin, v. 64, no. 8, p. 1179–1209. (Also available online at http://search.datapages.com/data/bulletns/1980-81/images/pg/00640008/1150/11790.pdf.)
Denkler, K.E., and Harris, A.G., 1988, Conodont-based determination of Silurian-Devonian boundary in the Valley and Ridge province, northern and central Appalachians: U.S. Geological Survey Bulletin 1837–B, p. B1–B13. (Also available online at http://pubs.er.usgs.gov/publication/b1837.)
Dennison, J.M., 1985, Catskill delta shallow marine strata, in Woodrow, D.L., and Sevon, W.D., eds., The Catskill delta: Geological Society of America Special Paper 201, p. 91–106.
Dennison, J.M., Beuthin, J.D., and Hasson, K.O., 1986, Latest Devonian-Earliest Carboniferous marine transgressions, central and southern Appalachians, USA: Annales de la Société Géologique de Belgique, v. 109, p. 123–129. (Also available online at http://popups.ulg.ac.be/ASGB/document.php?id=2418.)
Dennison, J.M., Filer, J.K., and Rossbach, T.J., 1996, Devo-nian strata of southeastern West Virginia and adjacent Virginia, in Dennison, J.M., ed., Geologic field guide to Devonian hydrocarbon stratigraphy of southeastern West Virginia and adjacent Virginia: Charleston, W. Va., Appala-chian Geological Society, p. 3–54.
de Witt, Wallace, Jr., 1993, Principal oil and gas plays in the Appalachian basin (Province 131): U.S. Geological Survey
Bulletin 1839–I, 37 p. (Also available online at http://pubs.er.usgs.gov/publication/b1839I.)
de Witt, Wallace, Jr., 1997, Devonian shale gas along Lake Erie’s south shore: Northeastern Geology and Environmen-tal Sciences, v. 19, nos. 1–2, p. 34–38.
de Witt, Wallace, Jr., Cohee, G.V., and McGrew, L.W., 1979, Oil and gas in Mississippian rocks in part of the Eastern United States: U.S. Geological Survey Professional Paper 1010–U, p. 441–455. (Also available online at http://pubs.er.usgs.gov/publication/pp1010.)
de Witt, Wallace, Jr., and Milici, R.C., 1991, Petroleum geol-ogy of the Appalachian basin, in Gluskoter, H.J., Rice, D.D., and Taylor, R.B., eds., Economic geology, U.S., v. P–2 of The geology of North America: Boulder, Colo., Geological Society of America, p. 273–286.
de Witt, Wallace, Jr., Perry, W.J., Jr., and Wallace, L.G., 1975, Oil and gas data from Devonian and Silurian rocks in the Appalachian basin: U.S. Geological Survey Miscella-neous Investigations Series Map I–917–B, 4 sheets, scale: 1:2,500,000. (Also available online at http://pubs.er.usgs.gov/publication/i917B.)
de Witt, Wallace, Jr., Roen, J.B., and Wallace, L.G., 1993, Stratigraphy of Devonian black shales and associated rocks in the Appalachian basin, in Roen, J.B., and Kepferle, R.C., eds., Petroleum geology of the Devonian and Mississip-pian black shale of eastern North America: U.S. Geological Survey Bulletin 1909–B, p. B1–B57. (Also available online at http://pubs.er.usgs.gov/publication/b1909.)
Donaldson, Alan, Boswell, Ray, Zou, Xiangdong, Cavallo. Larry, Heim, L.R., and Canich, Michael, 1996, Play Des; Upper Devonian Elk sandstones and siltstones, in Roen, J.B., and Walker, B.J., eds., The atlas of major Appalachian gas plays: West Virginia Geological and Economic Survey Publication V–25, p. 77–85.
Drozd, R.J., and Cole, G.A., 1994, Point Pleasant-Brassfield(!) petroleum system, Appalachian basin, U.S.A., in Magoon, L.B., and Dow, W.G., eds., The petroleum system—From source to trap: American Association of Petroleum Geolo-gists Memoir 60, p. 387–398. (Also available online at http://search.datapages.com/data/specpubs/methodo2/data/a077/a077/0001/0350/0387.htm.)
East, J.A., Swezey, C.S., Repetski, J.E., and Hayba, D.O., 2012, Thermal maturity map of Devonian shale in the Illi-nois, Michigan, and Appalachian basins of North America: U.S. Geological Survey Scientific Investigations Map 3214, 1 sheet. (Also available at http://pubs.usgs.gov/sim/3214/.)
Engelder, Terry, 2009, Marcellus 2008; Report card on the breakout year for gas production in the Appalachian basin: Fort Worth Basin Oil & Gas Magazine, August 2009, p. 18–22. (Also available online at http://www.marcellus.psu.edu/resources/PDFs/marcellusengelder.pdf.)
16 Coal and Petroleum Resources in the Appalachian Basin
Engelder, Terry, and Lash, G.G., 2008, Marcellus Shale play’s vast resource potential creating stir in Appalachia: American Oil and Gas Reporter, May 2008, 7 p. (Also available online at http://www.aogr.com/index.php/magazine/cover-story/marcellus-shale-plays-vast-resource-potential-creating-stir-in-appalachia.)
Ettensohn, F.R., 1985a, Controls on development of Catskill delta complex basin-facies, in Woodrow, D.L., and Sevon, W.D., eds., The Catskill delta: Geological Society of America Special Paper 201, p. 65–77.
Ettensohn, F.R., 1985b, The Catskill delta complex and the Acadian orogeny; a model, in Woodrow, D.L., and Sevon, W.D., eds., The Catskill delta: Geological Society of America Special Paper 201, p. 39–49.
Ettensohn, F.R., 2008, The Appalachian foreland basin in eastern United States, in Miall, A.D., ed., The sedimentary basins of the United States and Canada, v. 5 of Sedimentary basins of the world: Amsterdam, The Netherlands, Elsevier, p. 105–179, doi:10.1016/S1874-5997(08)00022-1.
Ettensohn, F.R., and Barron, L.S., 1981, Depositional model for the Devonian-Mississippian black shales of North America—A paleoclimate-paleogeographic approach, in Roberts, T.G., ed. Field trip guidebooks for the annual meet-ing of the Geological Society of America, 1981, Cincinnati, Ohio, v. 2—Economic geology, structure: Falls Church, Va., American Geological Institute, p. 344–361.
Ettensohn, F.R., and Barron, L.S., 1982, A tectonic-climatic approach to the deposition of the Devonian-Mississippian black-shale sequence of North America, in Appalachian Industrial Associates, Program—Fall Meeting, October 14–15, 1982: Blacksburg, Va., Virginia Polytechnic Institute and State University, p. 161–249.
Faill, R.T., 1985, The Acadian orogeny and the Catskill delta, in Woodrow, D.L., and Sevon, W.D., eds., The Catskill delta: Geological Society of America Special Paper 201, p. 15–37.
Faill, R.T., 1997, A geologic history of the north-central Appa-lachians; Part 2, The Appalachian basin from the Silurian through the Carboniferous: American Journal of Science, v. 297, no. 7, p. 729–761, doi:10.2475/ajs.297.7.729.
Filer, J.K., 1985, Oil and gas report and maps of Pleasants, Wood, and Ritchie Counties, West Virginia: West Virginia Geological and Economic Survey, Bulletin B–11A, 87 p.
Filer, J.K., 1994, High frequency eustatic and siliciclastic sedimentation cycles in a foreland basin, Upper Devonian, Appalachian basin, in Dennison, J.M., and Ettensohn, F.R., eds., Tectonic and eustatic controls on sedimentary cycles: Concepts in Sedimentology and Paleontology, v. 4, p. 133–145, doi:10.2110/csp.94.04.0133.
Filer, J.K., 2002, Late Frasnian sedimentation cycles in the Appalachian basin—Possible evidence for high frequency eustatic sea-level changes: Sedimentary Geology, v. 154, nos. 1–2, p. 31–52, doi:10.1016/S0037-0738(02)00159-8.
Filer, J.K., 2003, Stratigraphic evidence for a Late Devo-nian possible back-bulge basin in the Appalachian basin, United States: Basin Research, v. 15, no. 3, p. 417–429, doi:10.1046/j.1365-2117.2003.00213.x.
Filer, J.K., Dennison, J.M., and Warne, A.G., 1996, Composite Devonian and Lower Mississippian section near Norton, Virginia: Virginia Division of Mineral Resources Publica-tion 145, 2 sheets. (Also available at http://www.dmme.virginia.gov/commercedocs/PUB_145.pdf.)
Frey, M.G., 1973, Influence of Salina salt on structure in New York-Pennsylvania part of Appalachian Plateau: American Association of Petroleum Geologists Bulletin, v. 57, no. 6, p. 1027–1037. (Also available online at http://search.datapages.com/data/bulletns/1971-73/images/pg/00570006/1000/10270.pdf.)
Gautier, D.L., Dolton, G.L., Attanasi, E.D., comps., 1998, 1995 National oil and gas assessment and onshore Federal lands: U.S. Geological Survey Open-File Report 95–75–N, 64 p. (Also available online at http://pubs.er.usgs.gov/publication/ofr9575N.)
Gautier, D.L., Dolton, G.L., Takahashi, K.I., and Varnes, K.L., eds., 1995, 1995 National Assessment of United States oil and gas resources—Results, methodology, and support-ing data: U.S. Geological Survey Digital Data Series 30, 1 CD-ROM.
Harland, W.B., Armstrong, R.L., Cox, A.V., Craig, L.E., Smith, A.G., and Smith, D.G., 1990, A geologic time scale: Cambridge, United Kingdom, Cambridge University Press, 263 p.
Harper, J.A., 1999, Devonian, chap. 7 of Shultz, C.H., ed., The geology of Pennsylvania: Pennsylvania Geological Survey and Pittsburgh Geological Society Special Publication 1, p. 108–127.
Harris, L.D., and Milici, R.C., 1977, Characteristics of thin-skinned style of deformation in the southern Appalachians, and potential hydrocarbon traps: U.S. Geological Survey Professional Paper 1018, 40 p., 9 pls. (Also available online at http://pubs.er.usgs.gov/publication/pp1018.)
Hasson, K.O., and Dennison, J.M., 1988, Devonian shale lithostratigraphy, central Appalachians, U.S.A., in McMil-lan, N.J., Embry, A.F., and Glass, D.J., eds., Devonian of the world; Proceedings of the Second International Symposium on the Devonian System, Calgary, Canada; v. II; Sedimenta-tion: Canadian Society of Petroleum Geologists Memoir 14, p. 157–177.
Chapter G.9 Assessment of Appalachian Oil & Gas Resources: Devonian Shale-Middle and Upper Paleozoic TPS 17
Hayes, C.W., 1891, The overthrust faults of the southern Appalachians, with discussion by C.D. Walcott, W.M. Davis, and Bailey Willis: Geological Society of America Bulletin, v. 2, p. 141–154.
Ibach, L.E.J., 1982, Relationship between sedimentation rate and total organic carbon content in ancient marine sedi-ments: American Association of Petroleum Geologists Bulletin, v. 66, no. 2, p. 170–188. (Also available online at http://search.datapages.com/data/bulletns/1982-83/images/pg/00660002/0150/01700.pdf.)
Johnson, J.G., Klapper, Gilbert, and Sandberg, C.A., 1985, Devonian eustatic fluctuations in Euramerica: Geologi-cal Society of America Bulletin, v. 96, no. 5, p. 567–587, doi:10.1130/0016-7606(1985)96<567:DEFIE>2.0.CO;2.
Kammer, T.W., and Bjerstedt, T.W., 1986, Stratigraphic framework of the Price Formation (Upper Devonian-Lower Mississippian) in West Virginia: Southeastern Geology, v. 27, no. 1, p. 13–33.
Kane, Tom, 2008, Marcellus Shale is bigger than estimated: The River Reporter, v. 34, no. 47, available only online at http://www.riverreporter.com/issues/08-11-20/news-shale.html. (Accessed April 11, 2012.)
Kendrick, Daniel, 2009, Horizontal well stimulation; what we know and what to look for; Workshop 5, Indiana Oil and Gas Association Annual Dinner Meeting and Expo, Evansville, Ind., October 2, 2009: Indiana Oil and Gas Association Web page at http://www.inoga.org/archive/2009/Workshop5.pdf. (Accessed April 11, 2012.)
Kepferle, R.C., 1993, A depositional model and basin analysis for the gas-bearing black shale (Devonian and Mississippian) in the Appalachian basin, in Roen, J.B., and Kepferle, R.C., eds., Petroleum geology of the Devonian and Mississippian black shale of eastern North America: U.S. Geological Survey Bulletin 1909, p. F1–F23. (Also avail-able online at http://pubs.er.usgs.gov/publication/b1909.)
Kuuskraa, V.A., Sedwick, K.B., Thompson, K.B., and Wicks, D.E., 1985, Technically recoverable Devonian shale gas in Kentucky: U.S. Department of Energy Morgantown Energy Technology Center Report DOE/MC/19239-1834 (DE85008608), 120 p.
Kuuskraa, V.A., and Wicks, D.E., 1984, Technically recover-able Devonian shale gas in West Virginia: U.S. Department of Energy Morgantown Energy Technology Center Report DOE/MC/19239-1750 (DE85003367), 119 p.
Langbein, W.B., and Schumm, S.A., 1958, Yield of sedi-ment in relation to mean annual precipitation: Transactions American Geophysical Union, v. 39, no. 6, p. 1076–1084.
Leone, James, and Smith, Langhorne, 2011, Vertical and lat-eral extent and TOC content of Middle and Upper Devonian
organic-rich shales, New York State [abs.], in Proceedings, 40th Eastern Section Meeting, American Association of Petroleum Geologists, Arlington, Va., September 24–29, 2011: Tulsa, Okla., American Association of Petroleum Geologists, p. 39.
Lewin and Associates, Inc., 1983, Technically recoverable Devonian shale gas in Ohio: U.S. Department of Energy Morgantown Energy Technology Center Report DOE/MC/19239-1525 (DE84003057), 101 p. (Also available online at http://www.osti.gov/energycitations/product.biblio.jsp?osti_id=5357761.)
Lo, H.B., 1993, Correction criteria for suppression of vitrinite reflectance in hydrogen-rich kerogens; preliminary guide-lines: Organic Geochemistry, v. 20, no. 6, p. 653–657, doi:10.1016/0146-6380(93)90051-C.
Lundegard, P.D., Samuels, N.D., and Pryor, W.D., 1985, Upper Devonian turbidite sequence, central and southern Appalachian basin; contrasts with submarine fan deposits, in Woodrow, D.L., and Sevon, W.D., eds., The Catskill delta: Geological Society of America Special Paper 201, p. 107–121.
Magoon, L.B., and Dow, W.G., eds., 1994, The petroleum system—From source to trap: American Association of Petroleum Geologists Memoir 60, 655 p.
Markowski, A.K., 2001, Reconnaissance of the coal-bed methane resources in Pennsylvania: Pennsylvania Bureau of Topographic and Geologic Survey Mineral Resources Report 95, 134 p.
Matchen, D.L., and Vargo, A.G., 1996, Play Mws; Lower Mississippian Weir sandstones, in Roen, J.B., and Walker, B.J., eds., The atlas of major Appalachian gas plays: West Virginia Geological and Economic Survey Publication V–25, p. 46–50.
Maynard, J.B., 1981, Some geochemical properties of the Devonian-Mississippian shale sequence, in Kepferle, R.C., and Roen, J.B., eds., Field Trip no. 3, Chattanooga and Ohio Shales of the southern Appalachians, in Roberts, T.G., ed., Field trip guidebooks for the annual meeting of the Geological Society of America, 1981, Cincinnati, Ohio, v. 2, Economic Geology, Structure: Falls Church, American Geological Institute, p. 336–343.
Milici, R.C., 1980, Relationship of regional structure to oil and gas producing areas in the Appalachian basin: U.S. Geological Survey Miscellaneous Investigations Series Map I–917–F, scale 1:2,500,000.
Milici, R.C., 1993, Autogenic gas (self-sourced) from shales—An example from the Appalachian basin, in Howell, D.G., ed., The future of energy gases: U.S. Geological Survey Professional Paper 1570, p. 253–278. (Also available online at http://pubs.er.usgs.gov/publication/pp1570.)
18 Coal and Petroleum Resources in the Appalachian Basin
Milici, R.C., 1995, Devonian black shale gas plays, in Ryder, R.T., Appalachian basin province (067), in Gautier, D.L., Dolton, G.L., Takahashi, K.I., and Varnes, K.L., 1995 National assessment of United States oil and gas resources—Results, methodology, and supporting data: U.S. Geological Survey Digital Data Series DDS–30, p. 57–63, 1 CD-ROM.
Milici, R.C., 1996a, Play Dbg; Upper Devonian fractured black and gray shales and siltstones, in Roen, J.B., and Walker, B.J., eds., The atlas of major Appalachian gas plays: West Virginia Geological and Economic Survey Publication V–25, p. 86–92.
Milici, R.C., 1996b, Play Mfp; The Lower Mississippian Fort Payne carbonate mound play, in Roen, J.B., and Walker, B.J., eds., The atlas of major Appalachian gas plays: West Virginia Geological and Economic Survey Publication V–25, p. 51–55.
Milici, R.C., 1996c, Stratigraphic history of the Appalachian basin, in Roen, J.B., and Walker, B.J., eds., The atlas of major Appalachian gas plays: West Virginia Geological and Economic Survey Publication V–25, p. 4–7.
Milici, R.C., and de Witt, Wallace, Jr., 1988, The Appalachian basin, in Sloss, L.L., ed., Sedimentary cover; North Ameri-can craton; U.S., v. D–2 of The geology of North America: Boulder, Colo., Geological Society of America, p. 427–469.
Milici, R.C., and Gathright, T.M., II, 1983, Fracture porosity and hydrocarbon potential of the Valley and Ridge of south-western Virginia and adjacent Tennessee, in Luther, M.K., Proceedings of the technical sessions, Kentucky Oil and Gas Association Forty-Third Annual Meeting, June 13–15, 1979: Kentucky Geological Survey Special Publication 7, p. 89–96.
Milici, R.C., and Roen, J.B., 1981, Stratigraphy of the Chat-tanooga Shale in the Newman Ridge and Clinch Mountain areas, Tennessee: Tennessee Division of Geology Report of Investigations 40, 102 p.
Milici, R.C., Ryder, R.T., Swezey, C.S., Charpentier, R.R., Cook, T.A, Crovelli, R.A., Klett, T.R., Pollastro, R.M., and Schenk, C.J., 2003, Assessment of undiscovered oil and gas resources of the Appalachian Basin Province, 2002: U.S. Geological Survey Fact Sheet 009–03, 2 p. (Also available at http://pubs.usgs.gov/fs/fs-009-03/.)
Milici, R.C. and Statler, A.T., 1980, Fractures related to major thrusts—Possible analogues to tectonically fractured Chat-tanooga Shale in Tennessee, in Wheeler, R.L., and Dean, C.S., eds., Proceedings, Western limits of detachment and related structures in the Appalachian foreland, Southeast-ern section, Geological Society of America, Chattanooga, Tenn., April 6, 1978: U.S. Department of Energy Morgan-town Energy Technology Center DOE/METC/SP-80/23,
p. 157–166. (Also available online at http://www.netl.doe.gov/kmd/cds/disk7/disk1/EGS%5CProceedings,%20Western%20Limits%20of%20Detachment%20&%20Related%20Structur.pdf.)
Milici, R.C., and Swezey, C.S., 2006, Assessment of Appala-chian basin oil and gas resources; Devonian Shale-Middle and Upper Paleozoic Total Petroleum System: U.S. Geolog-ical Survey Open-File Report 2006–1237, 70 p., figures and tables as separate files, available only online at http://pubs.usgs.gov/of/2006/1237/.
Murphy, D.C., 2006, The first forests, in Devonian Times (4th ed.): Devonian Times Web page at http://www.devoniantimes.org/opportunity/forests.html. (Accessed February 29, 2012.)
Nuttall, B.C., 1996, Play Obc; Middle and Upper Ordovician bioclastic carbonate (“Trenton”) play, in Roen, J.B., and Walker, B.J., eds., The atlas of major Appalachian gas plays: West Virginia Geological and Economic Survey Publication V–25, p. 168–171.
Oliver, W.A., Jr., de Witt, Wallace, Jr., Dennison, J.M., Hoskins, D.M., and Huddle, J.W., 1967, Devonian of the Appalachian basin, United States, in Oswald, D.H., ed., International Symposium on the Devonian System: Calgary, Alberta, Canada, Alberta Society of Petroleum Geologists, p. 1001–1040.
Oliver, W.A., Jr., de Witt, Wallace, Jr., Dennison, J.M., Hoskins, D.M., and Huddle, J.W., 1971, Isopach and lithofacies maps of the Devonian in the Appalachian basin: Pennsylvania Bureau of Topographic and Geologic Survey Progress Report 182, 7 sheets, scale 1:1,204,000.
Over, D.J., 2002, The Frasnian/Famennian boundary in central and eastern United States: Palaeogeography, Palaeocli-matology, Palaeoecology, v. 181, nos. 1–3, p. 153–159, doi:10.1016/S0031-0182(01)00477-1.
Patchen, D.G., and Hohn, M.E., 1993, Production and production controls in Devonian shales, West Virginia, in Roen, J.B., and Kepferle, R.C., eds., Petroleum geology of the Devonian and Mississippian black shale of eastern North America: U.S. Geological Survey Bulletin 1909–B, p. L1–L28. (Also available online at http://pubs.er.usgs.gov/publication/b1909.)
Patchen, D.G., Avary, K.L., and Erwin, R.B., comps., 1985a, Correlation of stratigraphic units of North America (COSUNA)—Northern Appalachian region: Tulsa, Ola., American Association of Petroleum Geologists, 1 sheet.
Patchen, D.G., Avary, K.L., and Erwin, R.B., comps., 1985b, Correlation of stratigraphic units of North America (COSUNA)—Southern Appalachian region: Tulsa, Okla., American Association of Petroleum Geologists, 1 sheet.

Chapter G.9 Assessment of Appalachian Oil & Gas Resources: Devonian Shale-Middle and Upper Paleozoic TPS 19
Patenaude, M.W., Beardsley, R.W., and Campbell, R.C., 1986, Onondaga-Bass Island trend—Salt detachment structure in western New York [abs.]: American Association of Petroleum Geologists Bulletin, v. 70, no. 5, p. 629. (Also available online at http://searchanddiscovery.com/abstracts/html/1986/annual/abstracts/0629b.htm.)
Pederson, T.F., and Calvert, S.E., 1990, Anoxia vs. productiv-ity—What controls the formation of organic-carbon-rich sediments and sedimentary rocks?: American Association of Petroleum Geologists Bulletin, v. 74, no. 4, p. 454–466. (Also available online at http://search.datapages.com/data/bulletns/1990-91/data/pg/0074/0004/0000/0454.htm.)
Pederson, T.F., and Calvert, S.E., 1991, Anoxia vs. productivity—What controls the formation of organic-carbon-rich sediments and sedimentary rocks? Reply: American Association of Petroleum Geologists Bul-letin, v. 75, no. 3, p. 500–501. (Also available online at http://search.datapages.com/data/bulletns/1990-91/data/pg/0075/0003/0000/0500.htm.)
Piotrowski, R.G., and Harper, J.A., 1979, Black shale and sandstone facies of the Devonian “Catskill” clastic wedge in the subsurface of western Pennsylvania: U.S. Department of Energy Morgantown Energy Technology Center Eastern Gas Shales Project Series 13, 40 p., 39 pls.
Piotrowski, R.G., and Krajewski, S.A., 1977, Preliminary stratigraphic cross section (C1-C3) showing radioactive black shale zones and sandstones in the Middle and Upper Devonian, western Pennsylvania: U.S. Department of Energy Morgantown Energy Technology Center Eastern Gas Shales Project Series 1, 2 sheets.
Repetski, J.E., Ryder, R.T., Avary, K.L., and Trippi, M.H., 2005, Thermal maturity patterns (CAI and %Ro) in the Ordovician and Devonian rocks of the Appalachian basin in West Virginia: U.S. Geological Survey Open-File Report 2005–1078, 72 p., tables. (Also available online at http://pubs.usgs.gov/of/2005/1078/.)
Repetski, J.E., Ryder, R.T., Harper, J.A., and Trippi, M.H., 2002, Thermal maturity patterns (CAI and %Ro) in the Ordovician and Devonian rocks of the Appalachian basin in Pennsylvania: U.S. Geological Survey Open-File Report 02–302, 57 p., available only online at http://pubs.usgs.gov/of/2002/of02-302/.
Repetski, J.E., Ryder, R.T., Weary, D.J., Harris, A.G., and Trippi, M.H., 2008, Thermal maturity patterns (CAI and %Ro) in Upper Ordovician and Devonian rocks of the Appalachian basin; a major revision of USGS Map I–917–E using new subsurface collections: U.S. Geological Survey Scientific Investigations Map 3006, 1 CD-ROM. (Also available online at http://pubs.usgs.gov/sim/3006/.)
Roen, J.B., and Kepferle, R.C., eds., 1993, Petroleum geology of the Devonian and Mississippian black shale of eastern North America: U.S. Geological Survey Bulletin 1909, 432 p. (Also available online at http://pubs.er.usgs.gov/publication/b1909.)
Roen, J.B., and Walker, B.J., eds., 1996, The atlas of major Appalachian gas plays: West Virginia Geological and Eco-nomic Survey Publication V–25, 201 p.
Rowan, E.L., 2006, Burial and thermal history of the central Appalachian basin, based on three 2-D models of Ohio, Pennsylvania, and West Virginia: U.S. Geological Survey Open-File Report 2006–1019, 35 p., available only online at http://pubs.usgs.gov/of/2006/1019/.
Rowan, E.L., Ryder, R.T., Repetski, J.E., Trippi, M.H., and Ruppert, L.F., 2004, Initial results of a 2D burial/thermal history model, central Appalachian basin, Ohio and West Virginia: U.S. Geological Survey Open-File Report 2004–1445, 28 p. (Also available online at http://pubs.usgs.gov/of/2004/1445/.)
Rowan, E.L., Ryder, R.T., Swezey, C.S., Repetski, J.E., Crangle, R.D., Trippi, M.H., and Ruppert, L.F., 2004, Burial/thermal history and hydrocarbon generation model of a cross-section through the north-central Appalachian basin, Ohio and West Virginia: Geological Society of America, Abstracts with Programs, v. 36, no. 2, p. 147. (Also avail-able at http://gsa.confex.com/gsa/2004NE/finalprogram/abstract_69047.htm.)
Ruppert, L.F., Hower, J.C., Ryder, R.T., Levine, J.R., Trippi, M.H., and Grady, W.C., 2010, Geologic controls on thermal maturity patterns in Pennsylvanian coal-bearing rocks in the Appalachian basin: International Journal of Coal Geology, v. 81, no. 3, p. 169–181, doi:10.1016/j.coal.2009.12.008.
Russell, D.J., 1993, Stratigraphy of the Kettle Point Forma-tion (Upper Devonian of southwestern Ontario, Canada)—Implications for depositional setting and resource potential, in Roen, J.B. and Kepferle, R.C., eds., Petroleum geology of the Devonian and Mississippian black shale of eastern North America: U.S. Geological Survey Bulletin 1909–E, p. E1–E11. (Also available online at http://pubs.er.usgs.gov/publication/b1909.)
Ryder, R.T., Burruss, R.C., and Hatch, J.R., 1998, Black shale source rocks and oil generation in the Cambrian and Ordovician of the central Appalachian basin, USA: Ameri-can Association of Petroleum Geologists Bulletin, v. 82, no. 3, p. 412–441. (Also available online at http://archives.datapages.com/data/bulletns/1998/03mar/0412/0412.htm.)
Ryder, R.T., Swezey, C.S., Crangle, R.D., Jr., and Trippi, M.H., 2008, Geologic cross section E–E′ through the Appa-lachian basin from the Findlay arch, Wood County, Ohio, to the Valley and Ridge province, Pendleton County, West
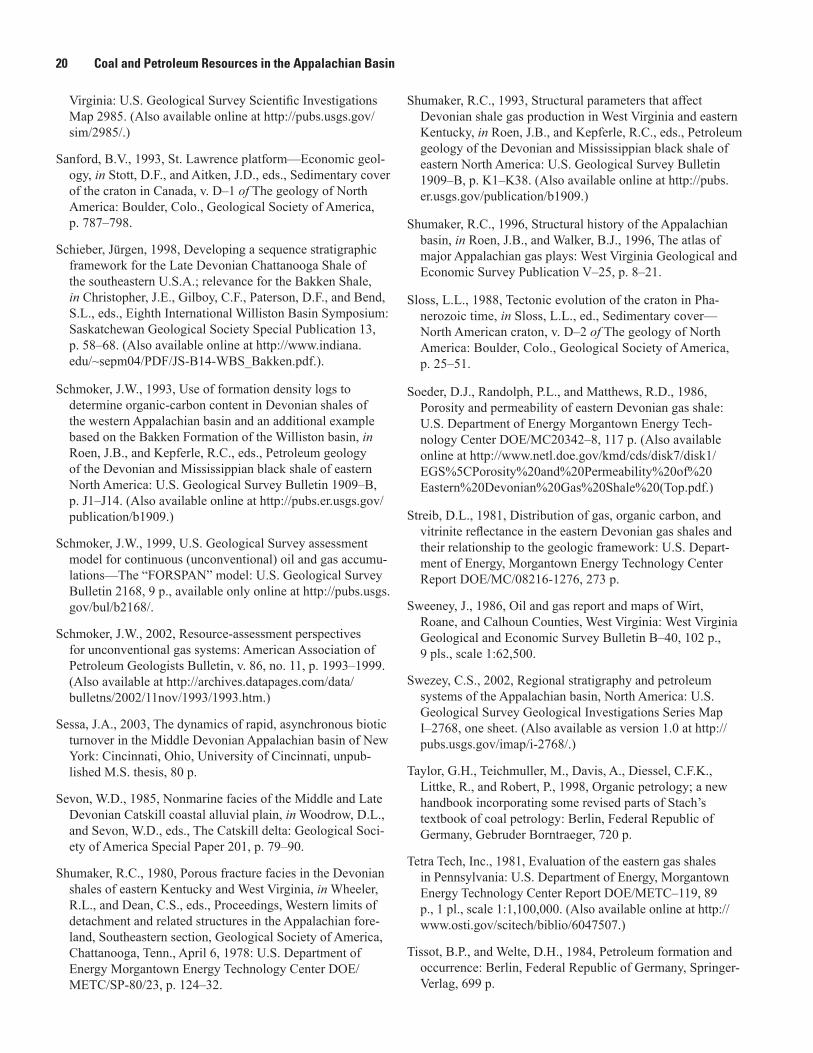
20 Coal and Petroleum Resources in the Appalachian Basin
Virginia: U.S. Geological Survey Scientific Investigations Map 2985. (Also available online at http://pubs.usgs.gov/sim/2985/.)
Sanford, B.V., 1993, St. Lawrence platform—Economic geol-ogy, in Stott, D.F., and Aitken, J.D., eds., Sedimentary cover of the craton in Canada, v. D–1 of The geology of North America: Boulder, Colo., Geological Society of America, p. 787–798.
Schieber, Jürgen, 1998, Developing a sequence stratigraphic framework for the Late Devonian Chattanooga Shale of the southeastern U.S.A.; relevance for the Bakken Shale, in Christopher, J.E., Gilboy, C.F., Paterson, D.F., and Bend, S.L., eds., Eighth International Williston Basin Symposium: Saskatchewan Geological Society Special Publication 13, p. 58–68. (Also available online at http://www.indiana.edu/~sepm04/PDF/JS-B14-WBS_Bakken.pdf.).
Schmoker, J.W., 1993, Use of formation density logs to determine organic-carbon content in Devonian shales of the western Appalachian basin and an additional example based on the Bakken Formation of the Williston basin, in Roen, J.B., and Kepferle, R.C., eds., Petroleum geology of the Devonian and Mississippian black shale of eastern North America: U.S. Geological Survey Bulletin 1909–B, p. J1–J14. (Also available online at http://pubs.er.usgs.gov/publication/b1909.)
Schmoker, J.W., 1999, U.S. Geological Survey assessment model for continuous (unconventional) oil and gas accumu-lations—The “FORSPAN” model: U.S. Geological Survey Bulletin 2168, 9 p., available only online at http://pubs.usgs.gov/bul/b2168/.
Schmoker, J.W., 2002, Resource-assessment perspectives for unconventional gas systems: American Association of Petroleum Geologists Bulletin, v. 86, no. 11, p. 1993–1999. (Also available at http://archives.datapages.com/data/bulletns/2002/11nov/1993/1993.htm.)
Sessa, J.A., 2003, The dynamics of rapid, asynchronous biotic turnover in the Middle Devonian Appalachian basin of New York: Cincinnati, Ohio, University of Cincinnati, unpub-lished M.S. thesis, 80 p.
Sevon, W.D., 1985, Nonmarine facies of the Middle and Late Devonian Catskill coastal alluvial plain, in Woodrow, D.L., and Sevon, W.D., eds., The Catskill delta: Geological Soci-ety of America Special Paper 201, p. 79–90.
Shumaker, R.C., 1980, Porous fracture facies in the Devonian shales of eastern Kentucky and West Virginia, in Wheeler, R.L., and Dean, C.S., eds., Proceedings, Western limits of detachment and related structures in the Appalachian fore-land, Southeastern section, Geological Society of America, Chattanooga, Tenn., April 6, 1978: U.S. Department of Energy Morgantown Energy Technology Center DOE/METC/SP-80/23, p. 124–32.
Shumaker, R.C., 1993, Structural parameters that affect Devonian shale gas production in West Virginia and eastern Kentucky, in Roen, J.B., and Kepferle, R.C., eds., Petroleum geology of the Devonian and Mississippian black shale of eastern North America: U.S. Geological Survey Bulletin 1909–B, p. K1–K38. (Also available online at http://pubs.er.usgs.gov/publication/b1909.)
Shumaker, R.C., 1996, Structural history of the Appalachian basin, in Roen, J.B., and Walker, B.J., 1996, The atlas of major Appalachian gas plays: West Virginia Geological and Economic Survey Publication V–25, p. 8–21.
Sloss, L.L., 1988, Tectonic evolution of the craton in Pha-nerozoic time, in Sloss, L.L., ed., Sedimentary cover—North American craton, v. D–2 of The geology of North America: Boulder, Colo., Geological Society of America, p. 25–51.
Soeder, D.J., Randolph, P.L., and Matthews, R.D., 1986, Porosity and permeability of eastern Devonian gas shale: U.S. Department of Energy Morgantown Energy Tech-nology Center DOE/MC20342–8, 117 p. (Also available online at http://www.netl.doe.gov/kmd/cds/disk7/disk1/EGS%5CPorosity%20and%20Permeability%20of%20Eastern%20Devonian%20Gas%20Shale%20(Top.pdf.)
Streib, D.L., 1981, Distribution of gas, organic carbon, and vitrinite reflectance in the eastern Devonian gas shales and their relationship to the geologic framework: U.S. Depart-ment of Energy, Morgantown Energy Technology Center Report DOE/MC/08216-1276, 273 p.
Sweeney, J., 1986, Oil and gas report and maps of Wirt, Roane, and Calhoun Counties, West Virginia: West Virginia Geological and Economic Survey Bulletin B–40, 102 p., 9 pls., scale 1:62,500.
Swezey, C.S., 2002, Regional stratigraphy and petroleum systems of the Appalachian basin, North America: U.S. Geological Survey Geological Investigations Series Map I–2768, one sheet. (Also available as version 1.0 at http://pubs.usgs.gov/imap/i-2768/.)
Taylor, G.H., Teichmuller, M., Davis, A., Diessel, C.F.K., Littke, R., and Robert, P., 1998, Organic petrology; a new handbook incorporating some revised parts of Stach’s textbook of coal petrology: Berlin, Federal Republic of Germany, Gebruder Borntraeger, 720 p.
Tetra Tech, Inc., 1981, Evaluation of the eastern gas shales in Pennsylvania: U.S. Department of Energy, Morgantown Energy Technology Center Report DOE/METC–119, 89 p., 1 pl., scale 1:1,100,000. (Also available online at http://www.osti.gov/scitech/biblio/6047507.)
Tissot, B.P., and Welte, D.H., 1984, Petroleum formation and occurrence: Berlin, Federal Republic of Germany, Springer-Verlag, 699 p.
Chapter G.9 Assessment of Appalachian Oil & Gas Resources: Devonian Shale-Middle and Upper Paleozoic TPS 21
Tomastik, T.E., 1996, Play MDe; Lower Mississippian-Upper Devonian Berea and equivalent sandstones, in Roen, J.B., and Walker, B.J., eds., The atlas of major Appalachian gas plays: West Virginia Geological and Economic Survey Pub-lication V–25, p. 56–62.
U.S. Department of Energy, National Energy Technology Laboratory, 2007, DOE’s unconventional gas research pro-grams 1976–1995; An archive of important results: Morgan-town, W. Va., U.S. Department of Energy National Energy Technology Laboratory, Natural Gas Program archive disks 1 and 2. (Also available at: http://www.netl.doe.gov/KMD/cds/disk7/disk1/frontend.pdf and http://www.netl.doe.gov/KMD/cds/disk7/disk2/frontend.pdf.)
U.S. Department of the Interior, 1976, Success at Oil Creek: Washington, D.C., U.S. Department of Interior, 16 p.
Van Tyne, A.M., 1996, Play SBi; Upper Silurian Bass Islands trend, in Roen, J.B., and Walker, B.J., eds., The atlas of major Appalachian gas plays: West Virginia Geological and Economic Survey Publication V–25, p. 130–132.
Vargo, A.G., and Matchen, D.L., 1996, Play Mbi; Lower Mis-sissippian Big Injun sandstones, in Roen, J.B., and Walker, B.J., eds., The atlas of major Appalachian gas plays: West Virginia Geological and Economic Survey Publication V–25, p. 41–45.
Weary, D.J., Ryder, R.T., and Nyahay, Richard, 2000, Thermal maturity patterns (CAI and %Ro) in the Ordovician and Devonian of the Appalachian basin in New York State: U.S. Geological Survey Open-File Report 00–496, 39 p. (Also available online at http://pubs.usgs.gov/of/2000/of00-496/.)
Weary, D.J., Ryder, R.T., and Nyahay, R.E., 2001, Thermal maturity patterns in New York State using CAI and %Ro: Northeastern Geology and Environmental Sciences, v. 23, no. 4, p. 356–376.
Weeks, J.D., 1886, Natural gas, in Day, D.T., ed., Min-eral resources of the United States; calendar year 1885: Washington, D.C., U.S. Geological Survey, p. 155–179. (Also available at http://archive.org/details/mineralresources1885unit.)
Wickstrom, L.H., 1996, Play MOf; Middle Ordovician frac-tured carbonates, in Roen, J.B., and Walker, B.J., eds., 1996, The atlas of major Appalachian gas plays: West Virginia Geological and Economic Survey Publication V–25, p. 172–176.
Woodrow, D.L., Dennison, J.M., Ettensohn, F.R., Sevon, W.T., and Kirchgasser, W.T., 1988, Middle and Upper Devonian stratigraphy and paleogeography of the central and southern Appalachians and eastern midcontinent, U.S.A., in McMil-lan, N.J., Embry, A.F., and Glass, D.J., eds., Devonian of the world; Proceedings of the Second International Symposium on the Devonian System, Calgary, Canada; v. 1; Regional synthesis: Canadian Society of Petroleum Geologists Mem-oir 14, p. 277–301.
Wrightstone, Gregory, 2009, Marcellus Shale—Geologic controls on production: American Association of Petroleum Geologists Search and Discovery article 10206, available only online at http://www.searchanddiscovery.net/documents/2009/10206wrightstone/. (Accessed on April 13, 2012.)
Young, D.M., 1957, Deep drilling through Cumberland over-thrust block in southwestern Virginia: American Association of Petroleum Geologists Bulletin, v. 41, no. 11, p. 2567–2573. (Also available online at http://search.datapages.com/data/bulletns/1957-60/data/pg/0041/0011/2550/2567.htm.)
Zielinski, R.E., and McIver, R.D., 1982, Resource and exploration assessment of the oil and gas potential in the Devonian shales of the Appalachian basin: U.S. Department of Energy, Morgantown Energy Technology Center Report DOE/DP/0053–1125, MLM–MU–82–61–0002, 423 p.


Figures 1–37 and Tables 1–4
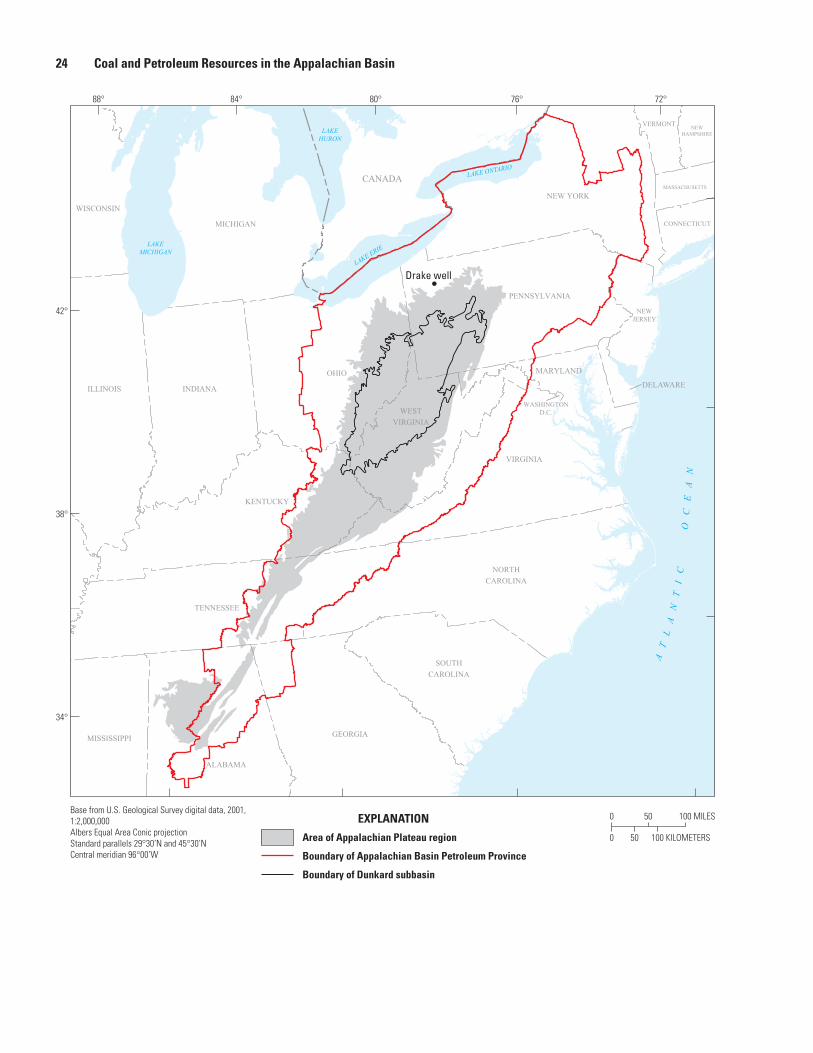
24 Coal and Petroleum Resources in the Appalachian Basin
0 50 100 MILES
100 KILOMETERS500
EXPLANATION
Area of Appalachian Plateau region
Boundary of Appalachian Basin Petroleum Province
Boundary of Dunkard subbasin
Base from U.S. Geological Survey digital data, 2001, 1:2,000,000Albers Equal Area Conic projectionStandard parallels 29°30’N and 45°30’NCentral meridian 96°00’W
AT
LA
NT
IC
O
CE
AN
LAKEMICHIGAN
LAKEHURON
LAKE ERIE
LAKE ONTARIO
MICHIGAN
WISCONSIN
NEWHAMPSHIRE
VERMONT
MASSACHUSETTS
ILLINOIS
CONNECTICUT
INDIANA
NEWJERSEY
DELAWARE
MARYLAND
VIRGINIA
KENTUCKY
WASHINGTOND.C.
TENNESSEE
GEORGIAMISSISSIPPI
NORTH
CAROLINA
SOUTH
CAROLINA
OHIO
NEW YORK
PENNSYLVANIA
WEST
VIRGINIA
ALABAMA
CANADA
Drake well
72°76°80°84°88°
42°
38°
34°
Chapter G.9 Assessment of Devonian Gas Shales 25
Figure 1 (facing page). Map showing the location of the Appalachian Basin Petroleum Province and the location of the Drake oil well. In 2002, the U.S. Geological Survey assessed the undiscovered oil and gas resources of the United States’ portion of this province (Milici and others, 2003).
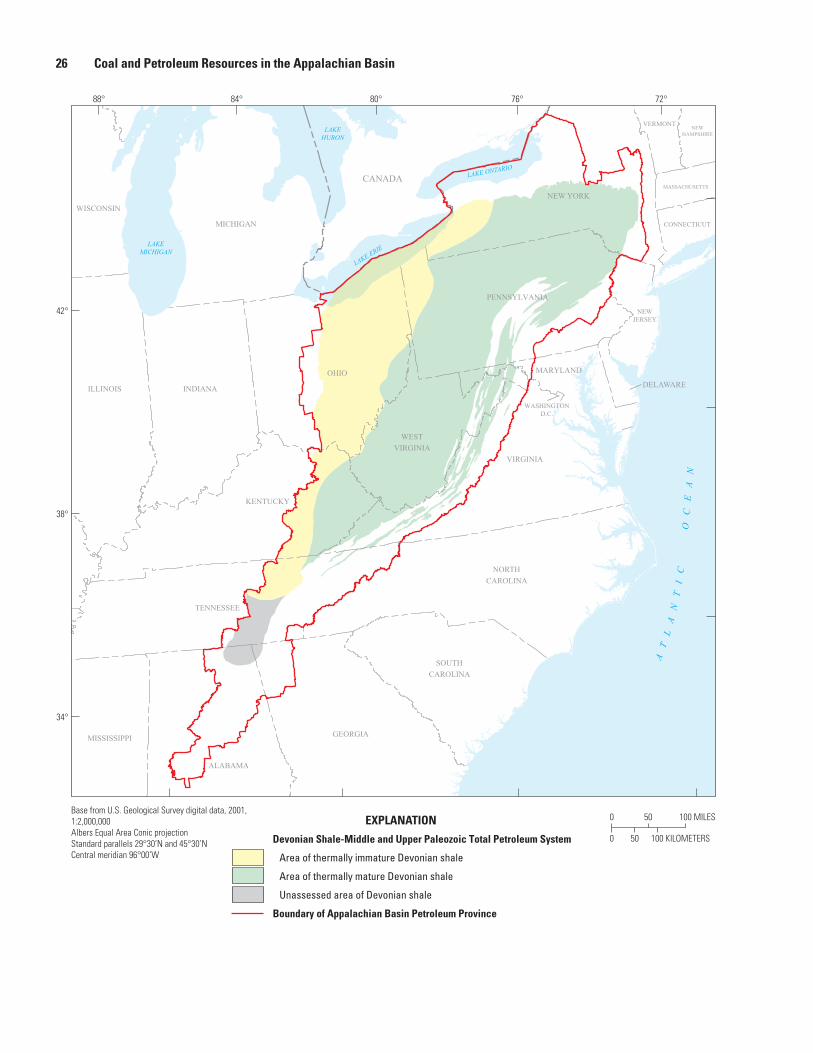
26 Coal and Petroleum Resources in the Appalachian Basin
EXPLANATION
Devonian Shale-Middle and Upper Paleozoic Total Petroleum System
Area of thermally immature Devonian shale
Area of thermally mature Devonian shale
Unassessed area of Devonian shale
Boundary of Appalachian Basin Petroleum Province
Base from U.S. Geological Survey digital data, 2001, 1:2,000,000Albers Equal Area Conic projectionStandard parallels 29°30’N and 45°30’NCentral meridian 96°00’W
0 50 100 MILES
100 KILOMETERS500
LAKEMICHIGAN
LAKE ERIE
LAKE ONTARIO
AT
LA
NT
IC
O
CE
AN
LAKEHURON
MICHIGAN
WISCONSIN
NEWHAMPSHIRE
VERMONT
MASSACHUSETTS
ILLINOIS
CONNECTICUT
INDIANA
NEWJERSEY
DELAWARE
MARYLAND
VIRGINIA
KENTUCKY
WASHINGTOND.C.
TENNESSEE
GEORGIAMISSISSIPPI
NORTH
CAROLINA
SOUTH
CAROLINA
OHIO
NEW YORK
PENNSYLVANIA
WEST
VIRGINIA
ALABAMA
CANADA
72°76°80°84°88°
42°
38°
34°
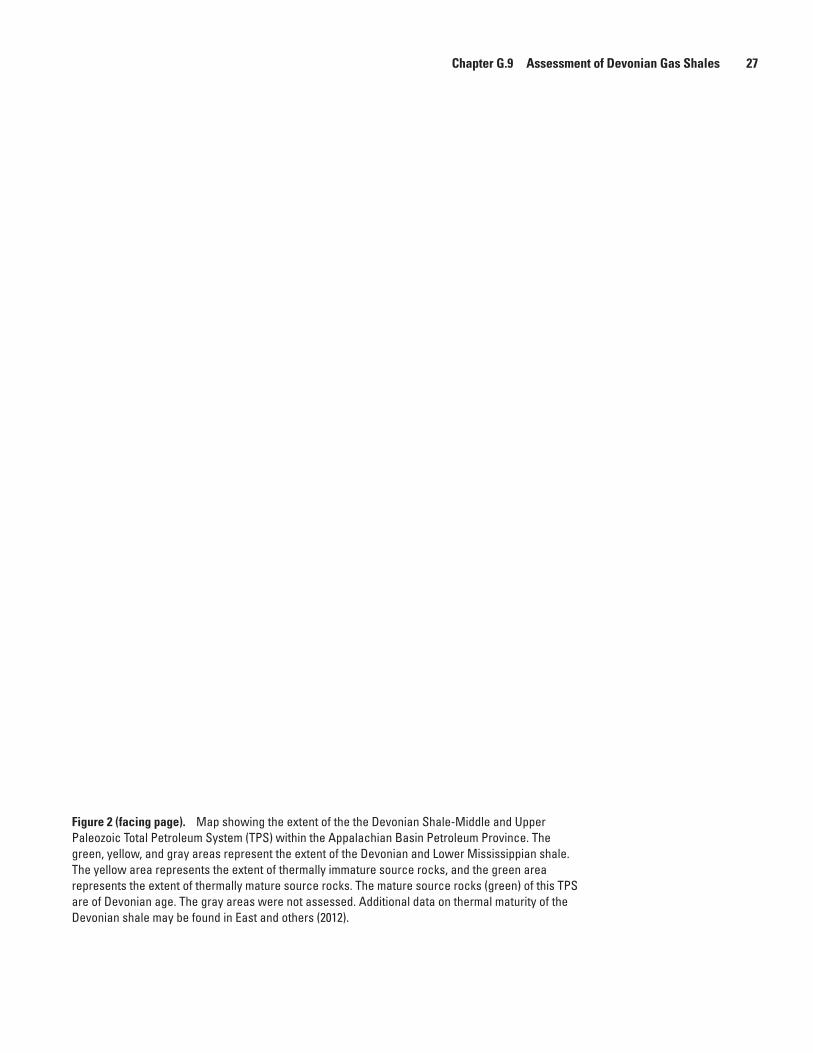
Chapter G.9 Assessment of Devonian Gas Shales 27
Figure 2 (facing page). Map showing the extent of the the Devonian Shale-Middle and Upper Paleozoic Total Petroleum System (TPS) within the Appalachian Basin Petroleum Province. The green, yellow, and gray areas represent the extent of the Devonian and Lower Mississippian shale. The yellow area represents the extent of thermally immature source rocks, and the green area represents the extent of thermally mature source rocks. The mature source rocks (green) of this TPS are of Devonian age. The gray areas were not assessed. Additional data on thermal maturity of the Devonian shale may be found in East and others (2012).
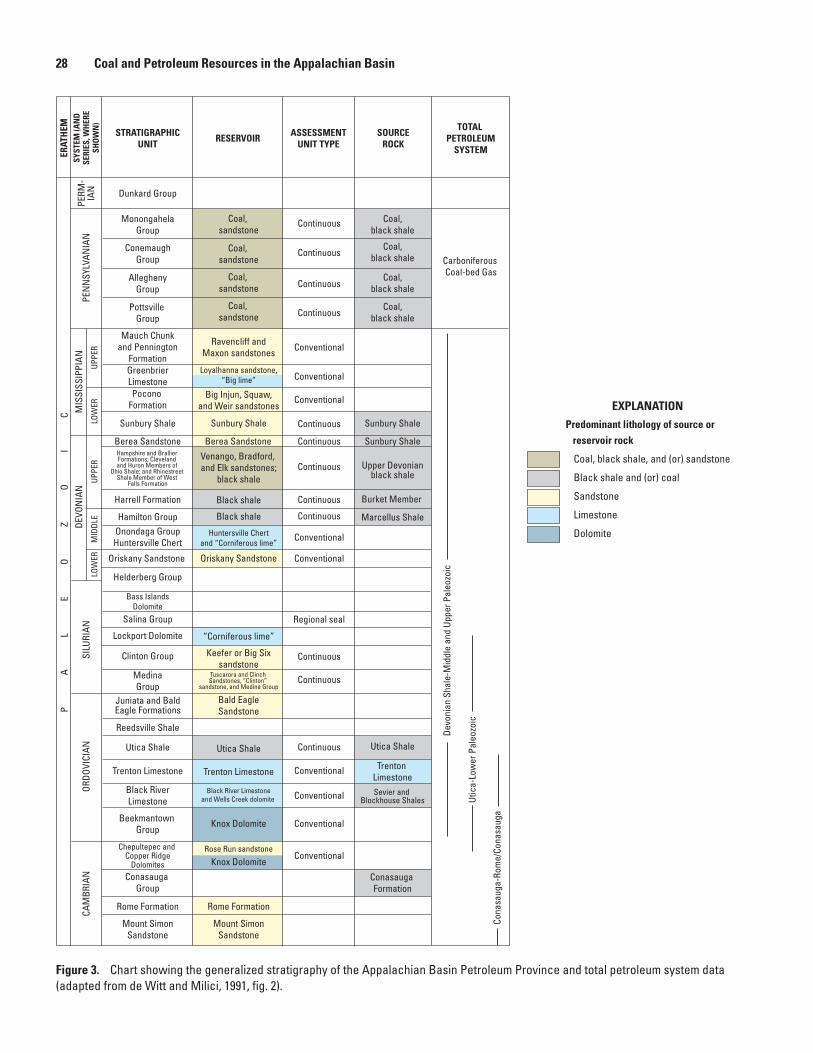
28 Coal and Petroleum Resources in the Appalachian BasinER
ATH
EMSY
STEM
(AN
DSE
RIES
, WH
ERE
SHO
WN
)
STRATIGRAPHICUNIT
RESERVOIR ASSESSMENTUNIT TYPE
SOURCEROCK
Dunkard Group
MonongahelaGroup
Coal, sandstone
Coal,black shale
Coal,black shale
Coal,black shale
Coal,black shale
ConemaughGroup
AlleghenyGroup
Pottsville Group
Continuous
Continuous
Continuous
Continuous
Conventional
PEN
NSY
LVAN
IAN
MIS
SISS
IPPI
AN
UPPE
RLO
WER
UPPE
RM
IDDL
ELO
WER
Mauch Chunkand Pennington
Formation
Ravencliff andMaxon sandstones
GreenbrierLimestone
Loyalhanna sandstone,“Big lime” Conventional
Pocono Formation
Big Injun, Squaw,and Weir sandstones
Conventional
Sunbury Shale
Berea Sandstone
Continuous
Venango, Bradford, and Elk sandstones;
black shaleContinuous
Harrell Formation Burket Member
Hamilton Group Marcellus ShaleOnondaga GroupHuntersville Chert
Huntersville Chertand “Corniferous lime”
Continuous
Continuous
Continuous
Conventional
Oriskany Sandstone Oriskany Sandstone Conventional
PERM
-IA
N
Helderberg Group
Bass IslandsDolomite
Salina Group
Lockport Dolomite “Corniferous lime”
Regional seal
TOTAL PETROLEUM
SYSTEM
Carboniferous Coal-bed Gas
Devo
nian
Sha
le-M
iddl
e an
d Up
per P
aleo
zoic
Clinton Group Keefer or Big Sixsandstone
Utic
a-Lo
wer
Pal
eozo
ic
Cona
saug
a-Ro
me/
Cona
saug
a
Bald EagleSandstone
Reedsville Shale
Utica Shale Utica Shale
Trenton Limestone Trenton LimestoneTrenton Limestone Conventional
Continuous
Black RiverLimestone
Beekmantown Group
Knox Dolomite
Rose Run sandstone
Knox DolomiteConventional
Conventional
Conventional
Conasauga Group
Conasauga Formation
Mount SimonSandstone
Rome Formation Rome Formation
Mount SimonSandstone
DEVO
NIA
NSI
LURI
ANOR
DOVI
CIAN
CAM
BRIA
N
P
A
L
E
O
Z
O
I
C
Black shale
Black shale
MedinaGroup
Utica Shale
Black River Limestoneand Wells Creek dolomite
Continuous
Coal, sandstone
Coal, sandstone
Coal, sandstone
Berea Sandstone
Sunbury Shale
Sunbury Shale
Sunbury Shale
ContinuousHampshire and Brallier Formations; Cleveland and Huron Members of
Ohio Shale; and Rhinestreet Shale Member of West
Falls Formation
Chepultepec and Copper Ridge
Dolomites
Sevier and Blockhouse Shales
Upper Devonianblack shale
Tuscarora and Clinch Sandstones, “Clinton”
sandstone, and Medina Group
Juniata and BaldEagle Formations
Predominant lithology of source or
reservoir rock
Coal, black shale, and (or) sandstone
Black shale and (or) coal
Sandstone
Limestone
Dolomite
EXPLANATION
Figure 3. Chart showing the generalized stratigraphy of the Appalachian Basin Petroleum Province and total petroleum system data (adapted from de Witt and Milici, 1991, fig. 2).
Chapter G.9 Assessment of Devonian Gas Shales 29
Shale, siltstone, and (or) sandstone
Black “gas” shale
Sandstone
Chert
Red beds
Limestone
EXPLANATION
Unconformity
Lithology
NORTHERN VIRGINIAAND WEST VIRGINIASERIES
WESTERNMARYLAND
WESTERNPENNSYLVANIA
NORTHWESTERN NEW YORK
REGIONAL UNCONFORMITIES
FROM SWEZEY (2002)OHIO
Oswayo FormationOswayo Fm. Riceville Sh. Riceville Shale
Cattaraugus Formation
Chadakoin Formation
Perrysburg Fm.Java Formation
Pipe Creek Shale Member
West Falls Formation
Sonyea Formation
Genesee Formation
Moscow Shale
LudlowvilleShale
SkaneatelesShale
Marcellus Shale
Onondaga Limestone
Cats
kill
Form
atio
nBr
allie
r Fm
.
Harrell ShaleTully Limestone
MahantangoFormation
Marcellus Shale
Selinsgrove Limestone
Needmore Shale
Ridgeley Sandstone
NeedmoreShale
HuntersvilleChert
Oriskany Sandstone Oriskany Sandstone
Helderberg Group(upper part)
Helderberg Group(upper part)
Helderberg Group(upper part)
Marcellus Shale
MahantangoFormationMahantango
Formation
Harrell ShaleBrallier Formation
Scherr Formation
ForeknobsFormation
HampshireFormation
Hampshire Formation
Brallier Formation
Mill
boro
Sha
le
LOW
ER D
EVON
IAN
MID
DLE
DEVO
NIA
NUP
PER
DEVO
NIA
N
Tioga Ash Bed
Sunbury Shale
Rockwell Formation
PurslaneSandstone
PurslaneSandstone
Bedford ShaleBerea Sandstone
ChagrinShale
Huron Member
Cleveland Member
Ohio
Sha
le
?Olentangy Shale
Olentangy Shale?
Prout Limestone
Plum Brook Shale
Delaware Limestone
Columbus LimestoneBois Blanc Limestone
Oriskany Ss.
RockwellFormation
Rockwell Formation
Rhinestreet Sh. Member
Marcellus Shale
Ham
ilton
Gro
up
Tully Limestone
Sonyea Fm.Rhinestreet Mbr.
Java Formation
Brad
ford
Gr
oup
Venango Group
Elk Group
Marcellus Shale
Ham
ilton
Gro
up
Tully LimestoneHarrell Shale
Gree
nlan
dGa
p Gr
oup
Gree
nlan
dGa
p Gr
oup
Scherr Formation
ForeknobsFormation
Wymps GapMember
Wymps GapMember
Mauch ChunkFormation
Loyalhanna Member
Burgoon Sandstone(Big Injun sandstone)
Sub-Absarokaunconformity
Kaskaskia I–Kaskaskia II
unconformity
Acadianunconformity
Wallbridgeunconformity
Gree
nbrie
r Lim
esto
ne
Loyalhanna Member
Mauch ChunkFormation
Logan Sandstone
CuyahogaFormation
Black Hand Mbr.
?
?
MaxvilleLimestone
MaxvilleLimestone
?
?Pr
ice
Form
atio
nGreenbrierLimestone
LOW
ER M
ISSI
SSIP
PIAN
UPPE
R M
ISSI
SSIP
PIAN
Deer Valley Ls. Member
Savage Dam Member
Deer Valley Ls. Member
Mauch Chunk Formation
Sunbury Sh.Berea Ss.
Bedford Sh.
ChadakoinFormation
Lock
Hav
en F
m.
Dunkirk Sh. Mbr.
Bluefield Formation
ShenangoFormation
Needmore Shale
Maccrady Formation
Helderberg Group(upper part)
Cuyahoga Fm., Berea Ss.,
Bedford Sh., Cussewago Ss.
Figure 4. Chart showing generalized stratigraphic nomenclature for Lower Devonian through Upper Mississippian strata in the northern part of Appalachian Basin Petroleum Province (adapted from Patchen and others, 1985a,b; Bjerstedt and Kammer, 1988; Brezinski, 1989a,b, 1999; Filer and others, 1996; Matchen and Vargo, 1996; Milici, 1996c; Vargo and Matchen, 1996; Harper, 1999; Berg, 1999). Abbreviations are as follows: Fm., Formation; Gp., Group; Ls., Limestone; Mbr., Member; Sh., Shale; Ss., Sandstone; undiv., undivided.
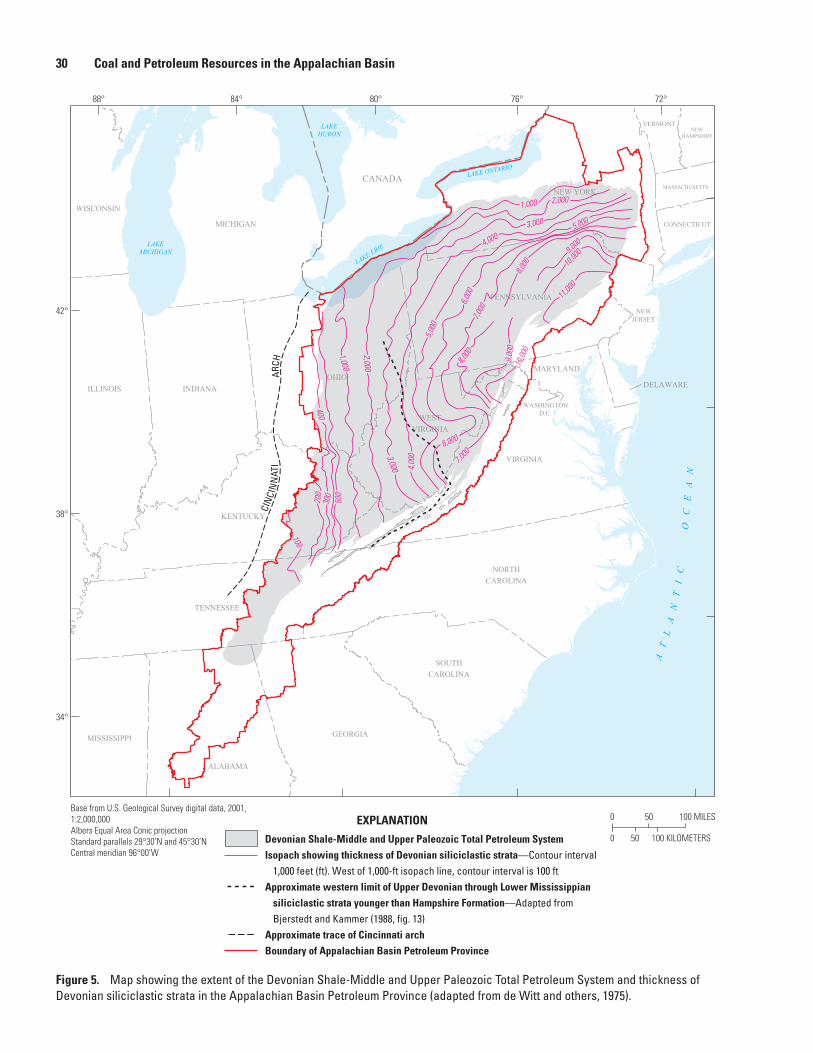
30 Coal and Petroleum Resources in the Appalachian Basin
0 50 100 MILES
100 KILOMETERS500
EXPLANATION
Devonian Shale-Middle and Upper Paleozoic Total Petroleum System
Isopach showing thickness of Devonian siliciclastic strata—Contour interval 1,000 feet (ft). West of 1,000-ft isopach line, contour interval is 100 ft
Approximate western limit of Upper Devonian through Lower Mississippian
siliciclastic strata younger than Hampshire Formation—Adapted from Bjerstedt and Kammer (1988, fig. 13)
Approximate trace of Cincinnati arch
Boundary of Appalachian Basin Petroleum Province
Base from U.S. Geological Survey digital data, 2001, 1:2,000,000Albers Equal Area Conic projectionStandard parallels 29°30’N and 45°30’NCentral meridian 96°00’W
MICHIGAN
WISCONSIN
NEWHAMPSHIRE
VERMONT
MASSACHUSETTS
ILLINOIS
CONNECTICUT
INDIANA
NEWJERSEY
DELAWARE
MARYLAND
VIRGINIA
KENTUCKY
WASHINGTOND.C.
TENNESSEE
GEORGIAMISSISSIPPI
NORTH
CAROLINA
SOUTH
CAROLINA
OHIO
NEW YORK
PENNSYLVANIA
WEST
VIRGINIA
ALABAMA
CANADA
AT
LA
NT
IC
O
CE
AN
LAKEMICHIGAN
LAKE ERIE
LAKE ONTARIO
LAKEHURON
4,000
11,00
010
,000
10,0
00
7,000
8,000
8,000
1,000 2,000
3,0005,000
9,000
9,00
0
6,00
0
5,00
0
1,000
2,000
400
200
300
500
100
3,000 4,00
0
6,000
7,000
CIN
CIN
NAT
I
A
RCH
72°76°80°84°88°
42°
38°
34°
Figure 5. Map showing the extent of the Devonian Shale-Middle and Upper Paleozoic Total Petroleum System and thickness of Devonian siliciclastic strata in the Appalachian Basin Petroleum Province (adapted from de Witt and others, 1975).
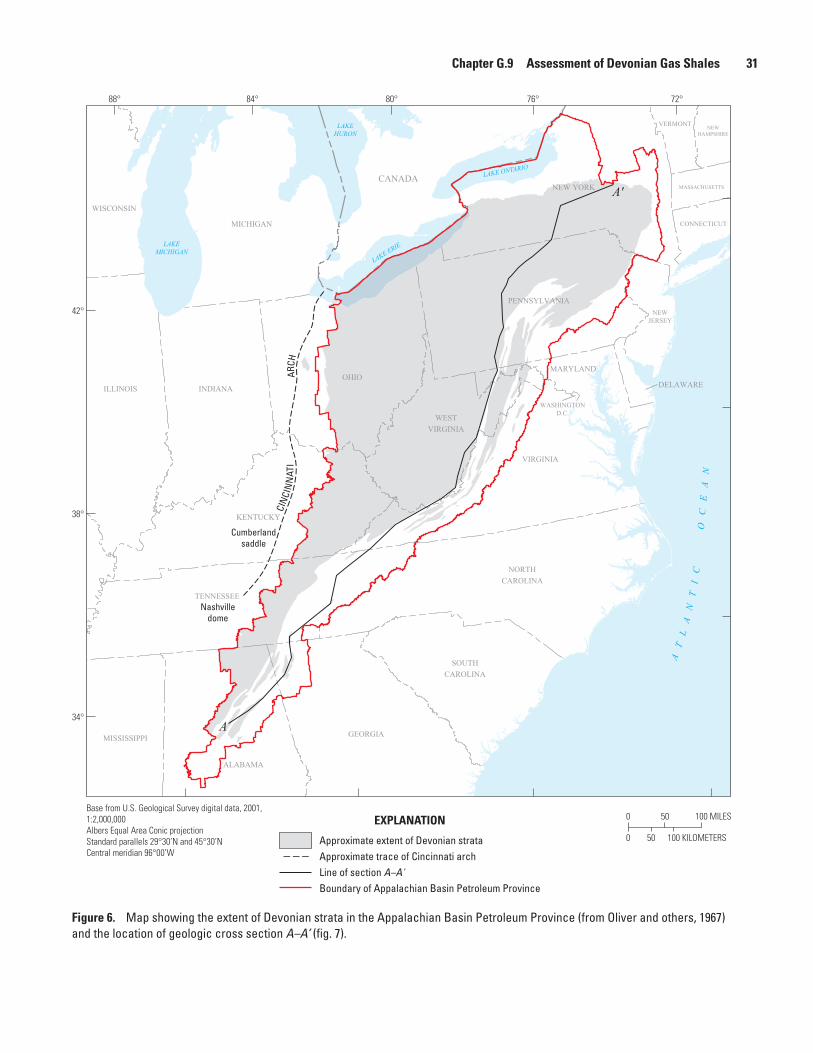
Chapter G.9 Assessment of Devonian Gas Shales 31
CIN
CIN
NAT
I
A
RCH
AT
LA
NT
IC
O
CE
AN
LAKEMICHIGAN
LAKE ERIE
LAKE ONTARIO
LAKEHURON
MICHIGAN
WISCONSIN
NEWHAMPSHIRE
VERMONT
MASSACHUSETTS
ILLINOIS
CONNECTICUT
INDIANA
NEWJERSEY
DELAWARE
MARYLAND
VIRGINIA
KENTUCKY
WASHINGTOND.C.
TENNESSEE
GEORGIAMISSISSIPPI
NORTH
CAROLINA
SOUTH
CAROLINA
OHIO
NEW YORK
PENNSYLVANIA
WEST
VIRGINIA
ALABAMA
CANADA
A
A'
Cumberlandsaddle
Nashvilledome
0 50 100 MILES
100 KILOMETERS500
EXPLANATION
Approximate extent of Devonian strata Approximate trace of Cincinnati archLine of section A–A'Boundary of Appalachian Basin Petroleum Province
Base from U.S. Geological Survey digital data, 2001, 1:2,000,000Albers Equal Area Conic projectionStandard parallels 29°30’N and 45°30’NCentral meridian 96°00’W
72°76°80°84°88°
42°
38°
34°
Figure 6. Map showing the extent of Devonian strata in the Appalachian Basin Petroleum Province (from Oliver and others, 1967) and the location of geologic cross section A–A’ (fig. 7).
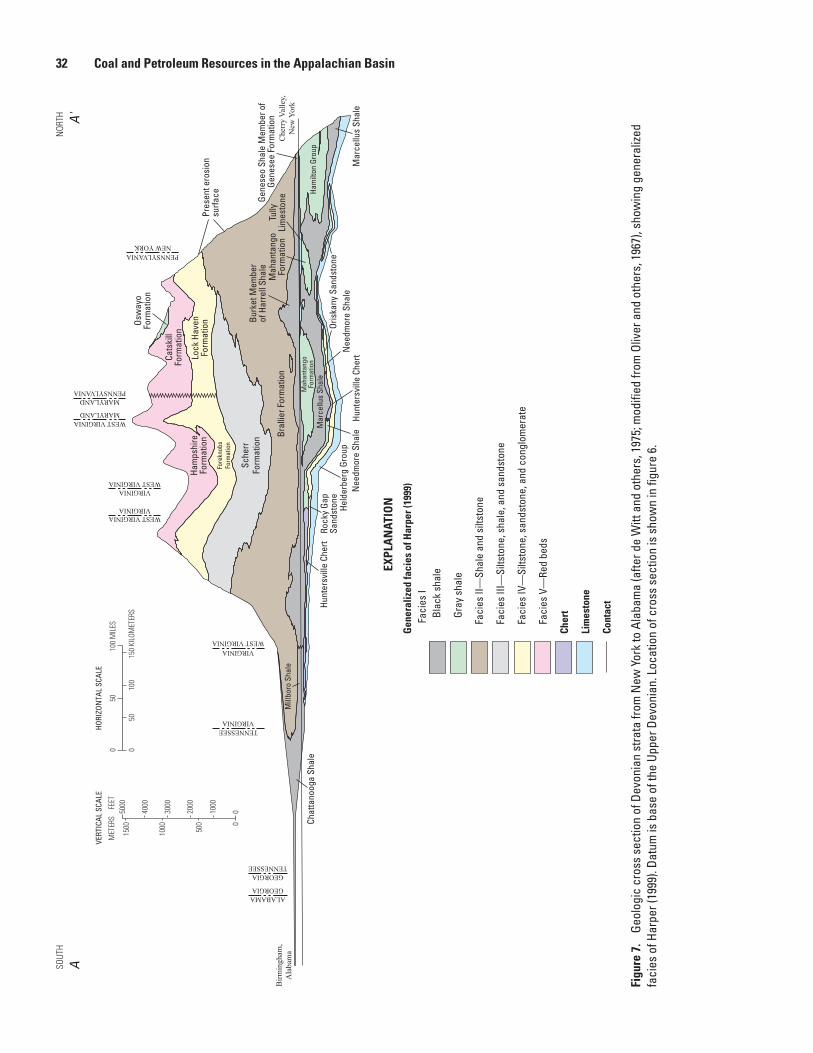
32 Coal and Petroleum Resources in the Appalachian Basin
Gen
eral
ized
faci
es o
f Har
per (
1999
)Fa
cies
IBl
ack
shal
e
Gray
sha
le
Faci
es II
—Sh
ale
and
silts
tone
Faci
es II
I—Si
ltsto
ne, s
hale
, and
san
dsto
ne
Faci
es IV
—Si
ltsto
ne, s
ands
tone
, and
con
glom
erat
e
Faci
es V
—Re
d be
ds
Cher
t
Lim
esto
ne
Cont
act
EXPL
AN
ATIO
N
HORI
ZON
TAL
SCAL
EVE
RTIC
AL S
CALE
050
100
MIL
ES
150
KILO
MET
ERS
5010
00
00
1000
500
2000
3000
1000
4000
1500
5000
MET
ERS
FE
ET
NOR
TH
PENNSYLVANIANEW YORK
WEST VIRGINIAVIRGINIA
VIRGINIATENNESSEE
TENNESSEEGEORGIA
GEORGIAALABAMA
Ham
ilton
Gro
up
Cats
kill
Form
atio
n
Osw
ayo
Form
atio
n
Ham
pshi
reFo
rmat
ion
Burk
et M
embe
rof
Har
rell
Shal
e
Mar
cellu
s Sh
ale
Mah
anta
ngo
Form
atio
nTu
llyLi
mes
tone
Mah
anta
ngo
Form
atio
n
Mar
cellu
s Sh
ale
Mill
boro
Sha
le
Chat
tano
oga
Shal
e
Bral
lier F
orm
atio
n
Gene
seo
Shal
e M
embe
r of
Gen
esee
For
mat
ion
Oris
kany
San
dsto
neN
eedm
ore
Shal
eN
eedm
ore
Shal
e
Rock
y Ga
pSa
ndst
one
Hunt
ersv
ille
Cher
t
Hunt
ersv
ille
Cher
tHe
lder
berg
Gro
up
Lock
Hav
enFo
rmat
ion
Fore
knob
sFo
rmat
ion
Sche
rrFo
rmat
ion
SOUT
H
Pres
ent e
rosi
onsu
rface
Che
rry
Valle
y,N
ew Y
ork
Birm
ingh
am,
Ala
bam
a
AA'
PENNSYLVANIAMARYLAND
MARYLANDWEST VIRGINIA
WEST VIRGINIA
WEST VIRGINIA
VIRGINIA
VIRGINIA
Figu
re 7
. Ge
olog
ic c
ross
sec
tion
of D
evon
ian
stra
ta fr
om N
ew Y
ork
to A
laba
ma
(afte
r de
Witt
and
oth
ers,
197
5; m
odifi
ed fr
om O
liver
and
oth
ers,
196
7), s
how
ing
gene
raliz
ed
faci
es o
f Har
per (
1999
). Da
tum
is b
ase
of th
e Up
per D
evon
ian.
Loc
atio
n of
cro
ss s
ectio
n is
sho
wn
in fi
gure
6.
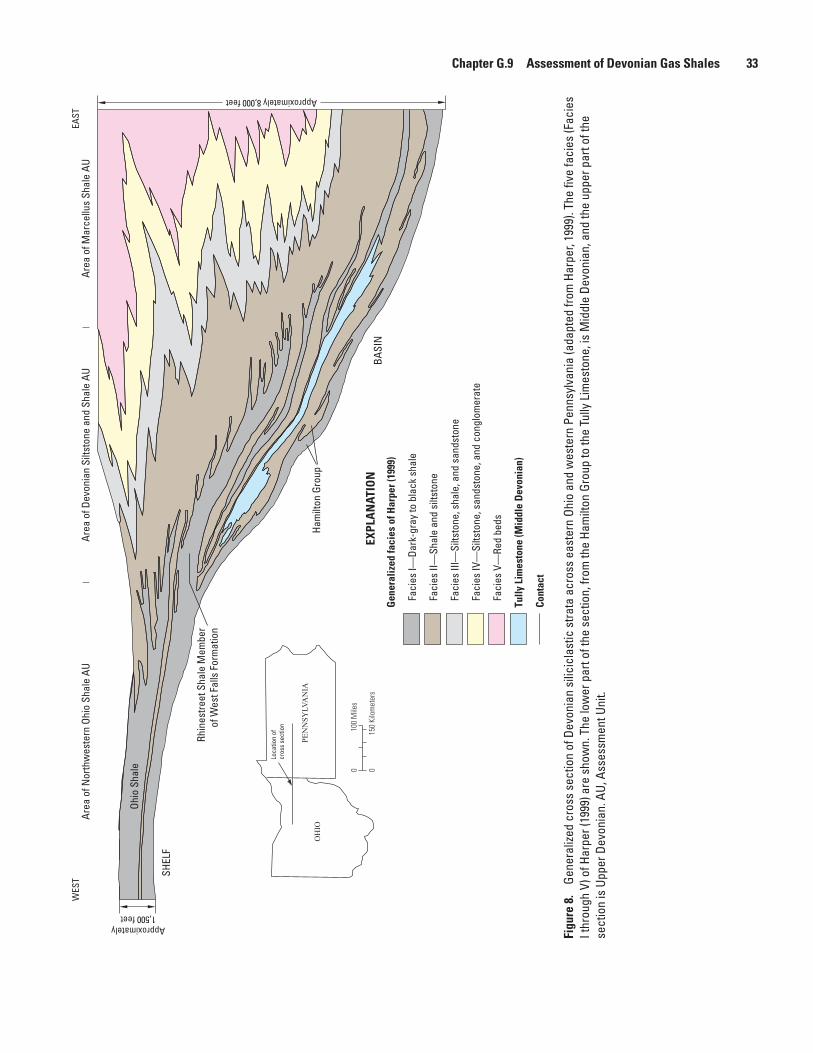
Chapter G.9 Assessment of Devonian Gas Shales 33
Gen
eral
ized
faci
es o
f Har
per (
1999
)
Faci
es I—
Dark
-gra
y to
bla
ck s
hale
Faci
es II
—Sh
ale
and
silts
tone
Faci
es II
I—Si
ltsto
ne, s
hale
, and
san
dsto
ne
Faci
es IV
—Si
ltsto
ne, s
ands
tone
, and
con
glom
erat
e
Faci
es V
—Re
d be
ds
Tully
Lim
esto
ne (M
iddl
e D
evon
ian)
Cont
act
EXPL
AN
ATIO
N
OH
IO
PEN
NSY
LVA
NIA
Loca
tion
ofcr
oss
sect
ion 100
Mile
s0
150
Kilo
met
ers
0
Approximately 8,000 feet
BASI
N
SHEL
F
Ham
ilton
Gro
up
Ohio
Sha
le
Rhin
estre
et S
hale
Mem
ber
of W
est F
alls
For
mat
ion
Area
of N
orth
wes
tern
Ohi
o Sh
ale
AUAr
ea o
f Dev
onia
n Si
ltsto
ne a
nd S
hale
AU
Area
of M
arce
llus
Shal
e AU
Approximately1,500 feet
EAST
WES
T
Figu
re 8
. Ge
nera
lized
cro
ss s
ectio
n of
Dev
onia
n si
licic
last
ic s
trata
acr
oss
east
ern
Ohio
and
wes
tern
Pen
nsyl
vani
a (a
dapt
ed fr
om H
arpe
r, 19
99).
The
five
faci
es (F
acie
s I t
hrou
gh V
) of H
arpe
r (19
99) a
re s
how
n. T
he lo
wer
par
t of t
he s
ectio
n, fr
om th
e Ha
milt
on G
roup
to th
e Tu
lly L
imes
tone
, is
Mid
dle
Devo
nian
, and
the
uppe
r par
t of t
he
sect
ion
is U
pper
Dev
onia
n. A
U, A
sses
smen
t Uni
t.
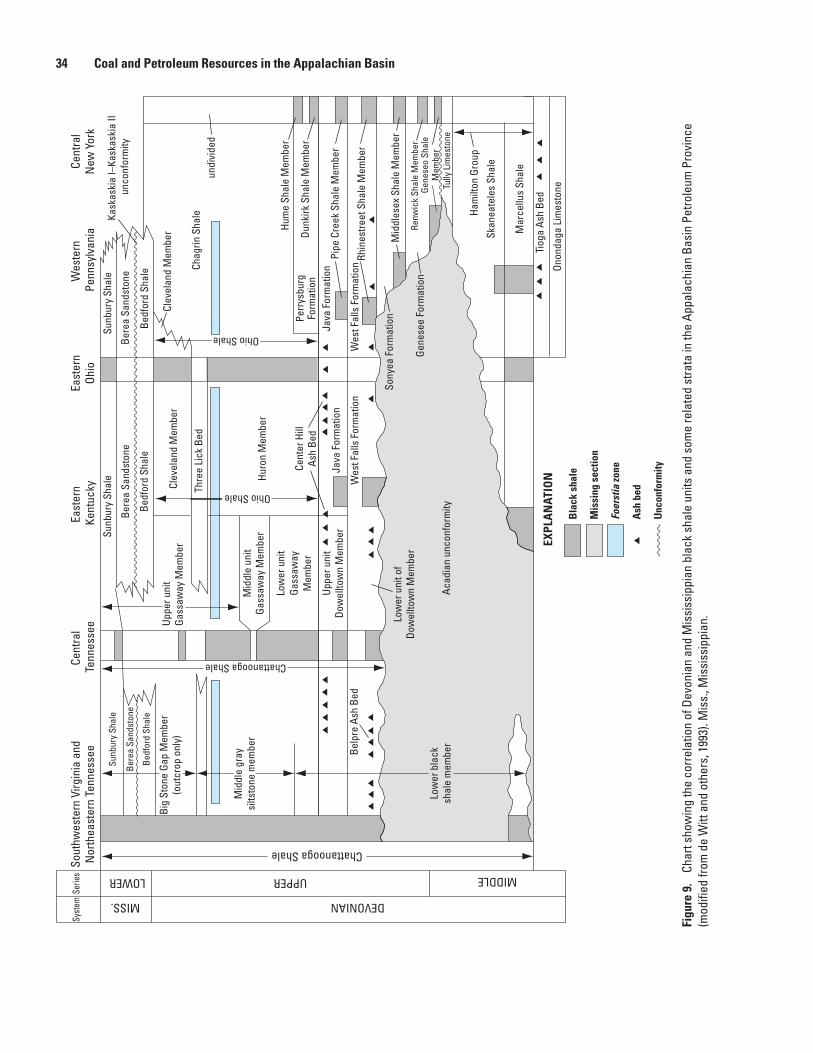
34 Coal and Petroleum Resources in the Appalachian Basin
Bla
ck s
hale
Mis
sing
sec
tion
Foer
stia
zon
e
Ash
bed
Unc
onfo
rmity
EXPL
AN
ATIO
N
Syst
emSe
ries
DEVONIANMISS.
MIDDLEUPPERLOWER
Chattanooga Shale
Cent
ral
Tenn
esse
eEa
ster
n Ke
ntuc
kyEa
ster
nOh
ioW
este
rn
Penn
sylv
ania
Cent
ral
New
Yor
kSo
uthw
este
rn V
irgin
ia a
ndN
orth
east
ern
Tenn
esse
e
Uppe
r uni
tGa
ssaw
ay M
embe
rCl
evel
and
Mem
ber
Thre
e Li
ck B
ed
Mid
dle
unit
Gass
away
Mem
ber
Ohio Shale
Low
er u
nit
Gass
away
Mem
ber
Huro
n M
embe
r
Cent
er H
illAs
h Be
dUp
per u
nit
Dow
ellto
wn
Mem
ber
Java
For
mat
ion
Low
er b
lack
shal
e m
embe
r
Big
Ston
e Ga
p M
embe
r(o
utcr
op o
nly)
Sunb
ury
Shal
e
Chattanooga Shale
Mid
dle
gray
silts
tone
mem
ber
Sony
ea F
orm
atio
n
Gene
see
Form
atio
n
Chag
rin S
hale
Clev
elan
d M
embe
r
undi
vide
d
Ohio Shale
Perr
ysbu
rgFo
rmat
ion
Hum
e Sh
ale
Mem
ber
Dunk
irk S
hale
Mem
ber
Java
For
mat
ion
Pipe
Cre
ek S
hale
Mem
ber
Rhin
estre
et S
hale
Mem
ber
Belp
re A
sh B
ed
Low
er u
nit o
fDo
wel
ltow
n M
embe
rM
iddl
esex
Sha
le M
embe
r
Gene
seo
Shal
eM
embe
r
Renw
ick
Shal
e M
embe
r
Tully
Lim
esto
ne
Ham
ilton
Gro
up
Skan
eate
les
Shal
e
Mar
cellu
s Sh
ale
Tiog
a As
h Be
d
Onon
daga
Lim
esto
ne
Wes
t Fal
ls F
orm
atio
n
Bere
a Sa
ndst
one
Bedf
ord
Shal
e
Sunb
ury
Shal
e
Bere
a Sa
ndst
one
Bedf
ord
Shal
e
Kask
aski
a I–
Kask
aski
a II
unco
nfor
mity
Wes
t Fal
ls F
orm
atio
n
Acad
ian
unco
nfor
mity
Sunb
ury
Shal
e
Bere
a Sa
ndst
one
Bedf
ord
Shal
e
Figu
re 9
. Ch
art s
how
ing
the
corr
elat
ion
of D
evon
ian
and
Mis
siss
ippi
an b
lack
sha
le u
nits
and
som
e re
late
d st
rata
in th
e Ap
pala
chia
n Ba
sin
Petro
leum
Pro
vinc
e (m
odifi
ed fr
om d
e W
itt a
nd o
ther
s, 1
993)
. Mis
s., M
issi
ssip
pian
.
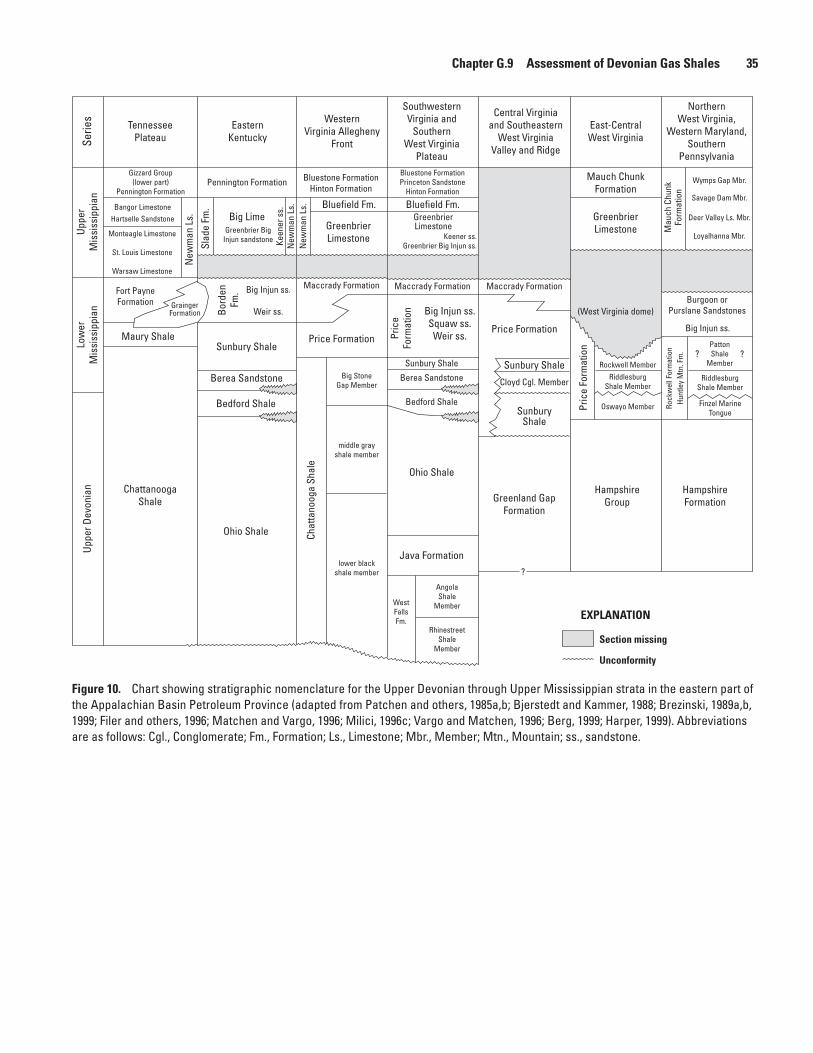
Chapter G.9 Assessment of Devonian Gas Shales 35
Section missing
Unconformity
EXPLANATION
lower blackshale member
Chat
tano
oga
Shal
e
middle grayshale member
Big StoneGap Member
Price Formation
Maccrady Formation
GreenbrierLimestone
Uppe
r Dev
onia
nLo
wer
Mis
siss
ippi
an
Pric
eFo
rmat
ion
Maccrady Formation
Sunbury Shale
Berea Sandstone
Bedford Shale
Ohio Shale
Java Formation
WestFallsFm.
AngolaShale
Member
RhinestreetShale
Member
Price Formation
Maccrady Formation
Cloyd Cgl. Member
Greenland GapFormation
Central Virginiaand Southeastern
West VirginiaValley and Ridge
SouthwesternVirginia and
SouthernWest Virginia
Plateau
WesternVirginia Allegheny
Front
?
Rock
wel
l For
mat
ion
HampshireFormation
Burgoon orPurslane Sandstones
RiddlesburgShale Member
PattonShale
Member
Loyalhanna Mbr.
Mau
ch C
hunk
Form
atio
n
NorthernWest Virginia,
Western Maryland,Southern
Pennsylvania
East-CentralWest Virginia
GreenbrierLimestone
Pric
e Fo
rmat
ion
Oswayo Member Finzel MarineTongue
Rockwell Member
RiddlesburgShale Member
HampshireGroup
? ?
Mauch ChunkFormation
Uppe
rM
issi
ssip
pian Bluefield Fm. Bluefield Fm.
New
man
Ls.
Deer Valley Ls. Mbr.
Savage Dam Mbr.
Wymps Gap Mbr.
Big Injun ss.
(West Virginia dome)
SunburyShale
Sunbury Shale
EasternKentucky
New
man
Ls.
Keen
er s
s.
Big Lime
Bedford Shale
Ohio Shale
Berea Sandstone
Sunbury Shale
Big Injun ss.Squaw ss.Weir ss.
Bord
enFm
. Big Injun ss.
Weir ss.
Pennington Formation
TennesseePlateauSe
ries
Fort PayneFormation
ChattanoogaShale
Maury Shale
Monteagle Limestone
St. Louis Limestone
Warsaw Limestone
Gizzard Group(lower part)
Pennington Formation
Bangor LimestoneHartselle Sandstone
Slad
e Fm
.
Hunt
ley
Mtn
. Fm
.
GraingerFormation
New
man
Ls.
Bluestone FormationHinton Formation
Bluestone FormationPrinceton Sandstone
Hinton Formation
GreenbrierLimestoneGreenbrier Big
Injun sandstone Keener ss.Greenbrier Big Injun ss.
Figure 10. Chart showing stratigraphic nomenclature for the Upper Devonian through Upper Mississippian strata in the eastern part of the Appalachian Basin Petroleum Province (adapted from Patchen and others, 1985a,b; Bjerstedt and Kammer, 1988; Brezinski, 1989a,b, 1999; Filer and others, 1996; Matchen and Vargo, 1996; Milici, 1996c; Vargo and Matchen, 1996; Berg, 1999; Harper, 1999). Abbreviations are as follows: Cgl., Conglomerate; Fm., Formation; Ls., Limestone; Mbr., Member; Mtn., Mountain; ss., sandstone.
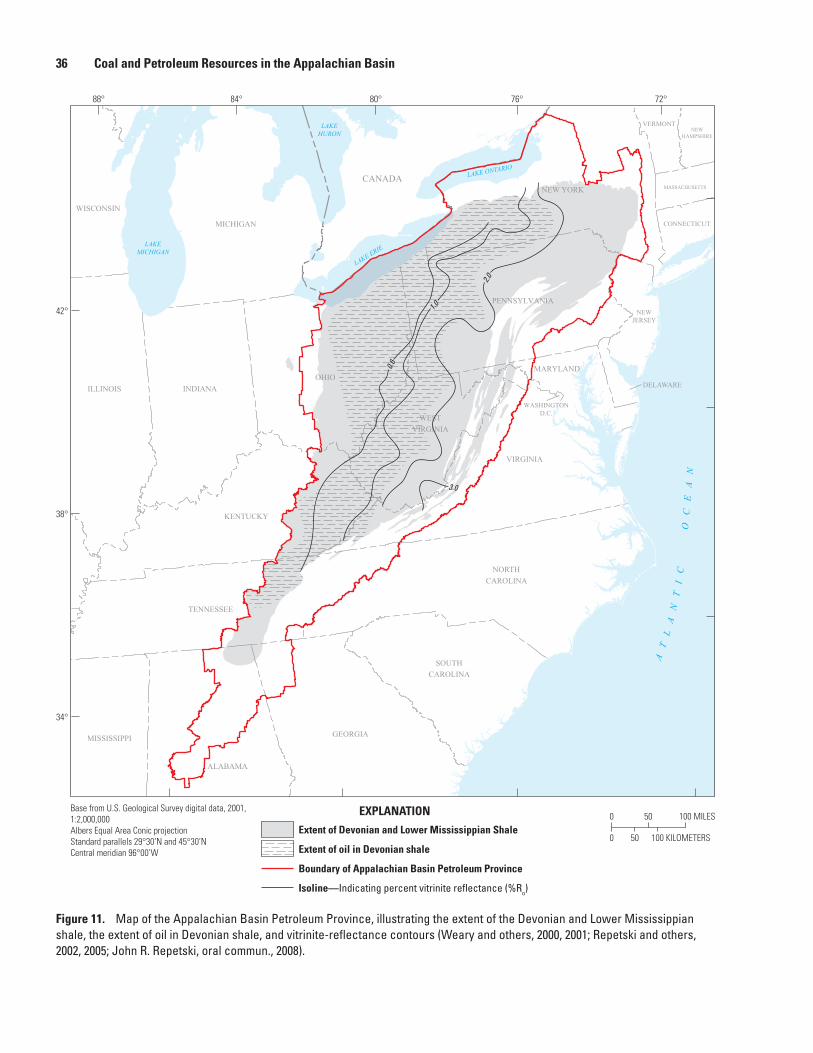
36 Coal and Petroleum Resources in the Appalachian Basin
0 50 100 MILES
100 KILOMETERS500
EXPLANATION
Extent of Devonian and Lower Mississippian Shale
Extent of oil in Devonian shale
Boundary of Appalachian Basin Petroleum Province
Isoline—Indicating percent vitrinite reflectance (%Ro)
Base from U.S. Geological Survey digital data, 2001, 1:2,000,000Albers Equal Area Conic projectionStandard parallels 29°30’N and 45°30’NCentral meridian 96°00’W
MICHIGAN
WISCONSIN
NEWHAMPSHIRE
VERMONT
MASSACHUSETTS
ILLINOIS
CONNECTICUT
INDIANA
NEWJERSEY
DELAWARE
MARYLAND
VIRGINIA
KENTUCKY
WASHINGTOND.C.
TENNESSEE
GEORGIAMISSISSIPPI
NORTH
CAROLINA
SOUTH
CAROLINA
OHIO
NEW YORK
PENNSYLVANIA
WEST
VIRGINIA
ALABAMA
CANADA
0.6
1.0
2.03.0
AT
LA
NT
IC
O
CE
AN
LAKEMICHIGAN
LAKE ERIE
LAKE ONTARIO
LAKEHURON
72°76°80°84°88°
42°
38°
34°
Figure 11. Map of the Appalachian Basin Petroleum Province, illustrating the extent of the Devonian and Lower Mississippian shale, the extent of oil in Devonian shale, and vitrinite-reflectance contours (Weary and others, 2000, 2001; Repetski and others, 2002, 2005; John R. Repetski, oral commun., 2008).
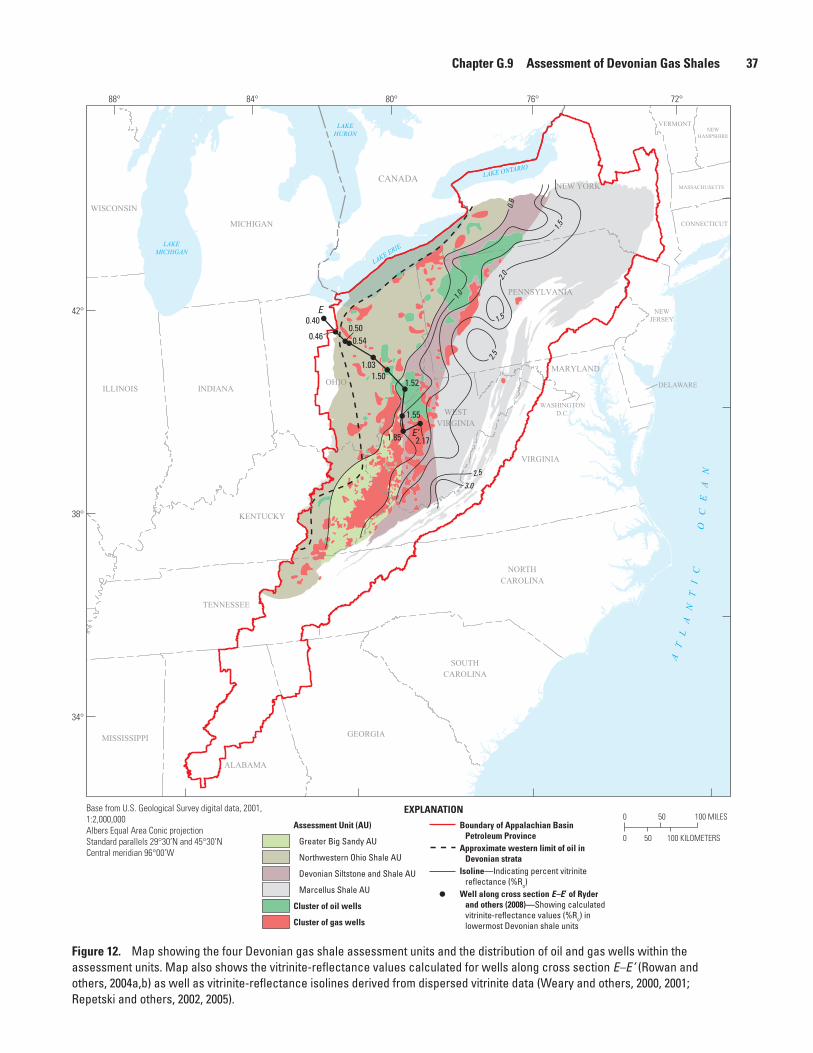
Chapter G.9 Assessment of Devonian Gas Shales 37
0 50 100 MILES
100 KILOMETERS500
EXPLANATION
Assessment Unit (AU)
Greater Big Sandy AU
Northwestern Ohio Shale AU
Devonian Siltstone and Shale AU
Marcellus Shale AU
Cluster of oil wells
Cluster of gas wells
Boundary of Appalachian Basin Petroleum Province
Approximate western limit of oil in Devonian strata
Isoline—Indicating percent vitrinite reflectance (%Ro)
Well along cross section E–E’ of Ryder and others (2008)—Showing calculated vitrinite-reflectance values (%Ro) in lowermost Devonian shale units
Base from U.S. Geological Survey digital data, 2001, 1:2,000,000Albers Equal Area Conic projectionStandard parallels 29°30’N and 45°30’NCentral meridian 96°00’W
MICHIGAN
WISCONSIN
NEWHAMPSHIRE
VERMONT
MASSACHUSETTS
ILLINOIS
CONNECTICUT
INDIANA
NEWJERSEY
DELAWARE
MARYLAND
VIRGINIA
KENTUCKY
WASHINGTOND.C.
TENNESSEE
GEORGIAMISSISSIPPI
NORTHCAROLINA
SOUTHCAROLINA
OHIO
NEW YORK
PENNSYLVANIA
WESTVIRGINIA
ALABAMA
CANADA
AT
LA
NT
IC
O
CE
AN
LAKEMICHIGAN
LAKE ERIE
LAKE ONTARIO
LAKEHURON
2.5
1.5
1.0
0.6
2.0
1.5
3.02.5
0.500.40
0.46
E
E’
1.031.50
1.52
0.54
1.55
1.85 2.17
72°76°80°84°88°
42°
38°
34°
Figure 12. Map showing the four Devonian gas shale assessment units and the distribution of oil and gas wells within the assessment units. Map also shows the vitrinite-reflectance values calculated for wells along cross section E–E’ (Rowan and others, 2004a,b) as well as vitrinite-reflectance isolines derived from dispersed vitrinite data (Weary and others, 2000, 2001; Repetski and others, 2002, 2005).
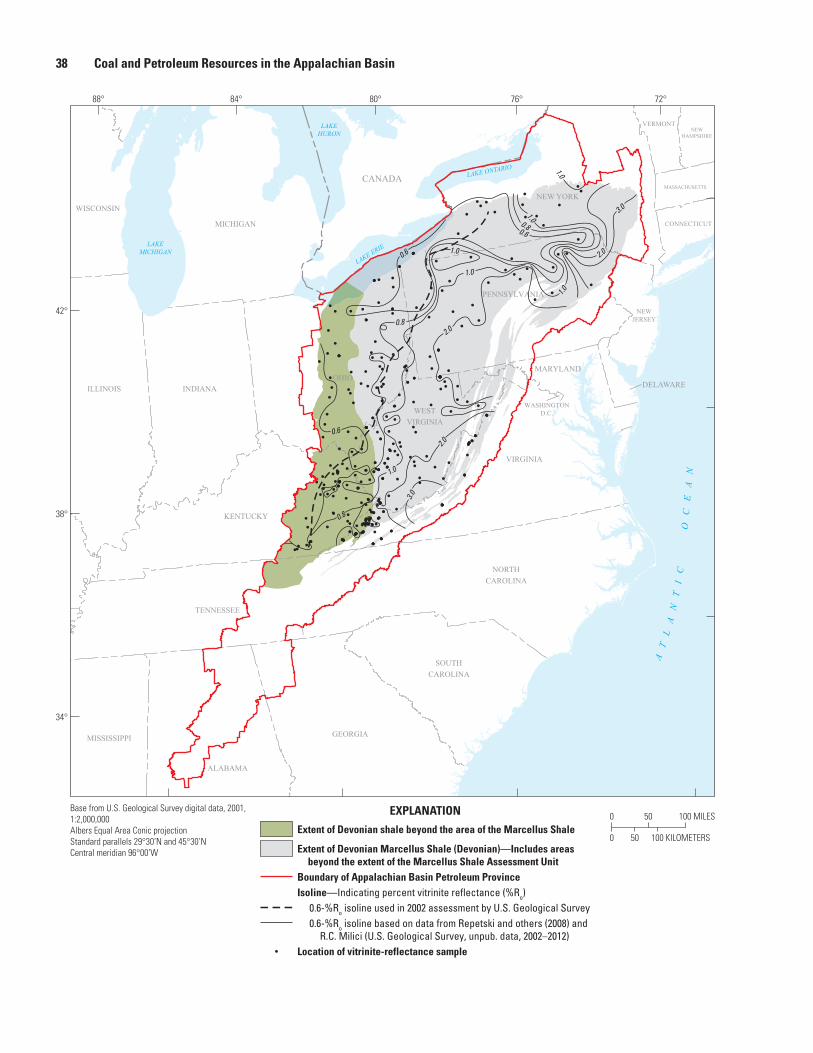
38 Coal and Petroleum Resources in the Appalachian Basin
0 50 100 MILES
100 KILOMETERS500
EXPLANATION
Extent of Devonian shale beyond the area of the Marcellus Shale
Extent of Devonian Marcellus Shale (Devonian)—Includes areas beyond the extent of the Marcellus Shale Assessment Unit
Boundary of Appalachian Basin Petroleum ProvinceIsoline—Indicating percent vitrinite reflectance (%Ro)
0.6-%Ro isoline used in 2002 assessment by U.S. Geological Survey0.6-%Ro isoline based on data from Repetski and others (2008) and
R.C. Milici (U.S. Geological Survey, unpub. data, 2002–2012)Location of vitrinite-reflectance sample
Base from U.S. Geological Survey digital data, 2001, 1:2,000,000Albers Equal Area Conic projectionStandard parallels 29°30’N and 45°30’NCentral meridian 96°00’W
AT
LA
NT
IC
O
CE
AN
LAKEMICHIGAN
LAKE ERIE
LAKE ONTARIO
LAKEHURON
MICHIGAN
WISCONSIN
NEWHAMPSHIRE
VERMONT
MASSACHUSETTS
ILLINOIS
CONNECTICUT
INDIANA
NEWJERSEY
DELAWARE
MARYLAND
VIRGINIA
KENTUCKY
WASHINGTOND.C.
TENNESSEE
GEORGIAMISSISSIPPI
NORTH
CAROLINA
SOUTH
CAROLINA
OHIO
NEW YORK
PENNSYLVANIA
WEST
VIRGINIA
ALABAMA
CANADA
1.0
1.0
1.0
1.0
1.0
1.0
0.6
0.6
0.6
0.8
0.8
0.8
2.0
2.0
2.0
3.0
3.0
72°76°80°84°88°
42°
38°
34°
Chapter G.9 Assessment of Devonian Gas Shales 39
Figure 13 (facing page). Map showing the extent of the Devonian Marcellus Shale and Millboro Shale, and the extent of Devonian shale beyond the area of the Marcellus and Millboro Shales. Map also shows the 0.6-%Ro vitrinite-reflectance isoline used in the 2002 USGS assessment, and vitrinite-reflectance isolines based on data from Repetski and others (2008) and R.C. Milici (USGS, unpub. data, 2002–2012).
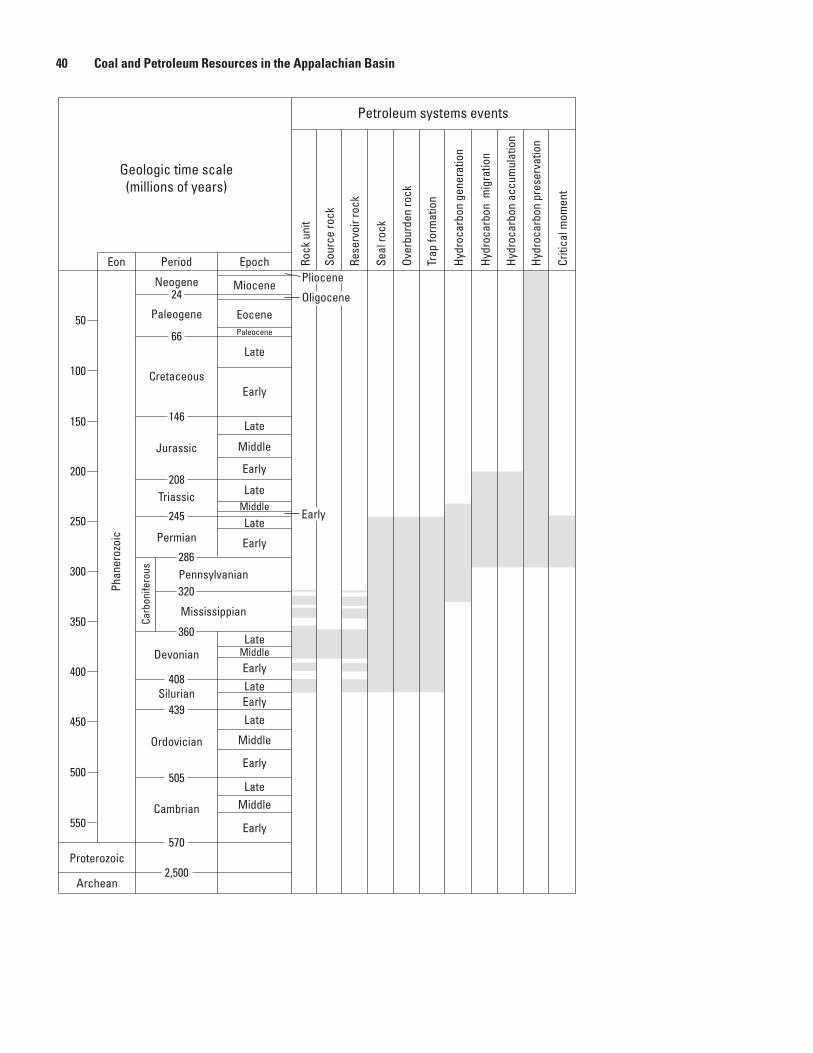
40 Coal and Petroleum Resources in the Appalachian Basin
Rock
uni
t
Sour
ce ro
ck
Rese
rvoi
r roc
k
Seal
rock
Over
burd
en ro
ck
Trap
form
atio
n
Hydr
ocar
bon
pres
erva
tion
Criti
cal m
omen
t
Hydr
ocar
bon
gene
ratio
n
Hydr
ocar
bon
accu
mul
atio
n
Hydr
ocar
bon
mig
ratio
n
Miocene
Eocene
Pliocene
Oligocene
Paleocene
Late
Early
Late
Middle
Early
LateMiddle
Late
Early
LateMiddleEarlyLateEarlyLate
Middle
Early
LateMiddle
Early
24
66
146
208
245
286
320
360
408
439
505
2,500
570
Neogene
Paleogene
Cretaceous
Jurassic
Triassic
Permian
Pennsylvanian
Mississippian
Devonian
Silurian
Ordovician
Cambrian
Proterozoic
Archean
Petroleum systems events
Geologic time scale(millions of years)
50
100
150
200
250
300
350
400
450
500
550
Phan
eroz
oic
Carb
onife
rous
Early
Eon Period Epoch
Chapter G.9 Assessment of Devonian Gas Shales 41
Figure 14 (facing page). Chart showing petroleum system events for the Devonian Shale-Middle and Upper Paleozoic Total Petroleum System in the Appalachian Basin Petroleum Province. Time scale is from Harland and others (1990).
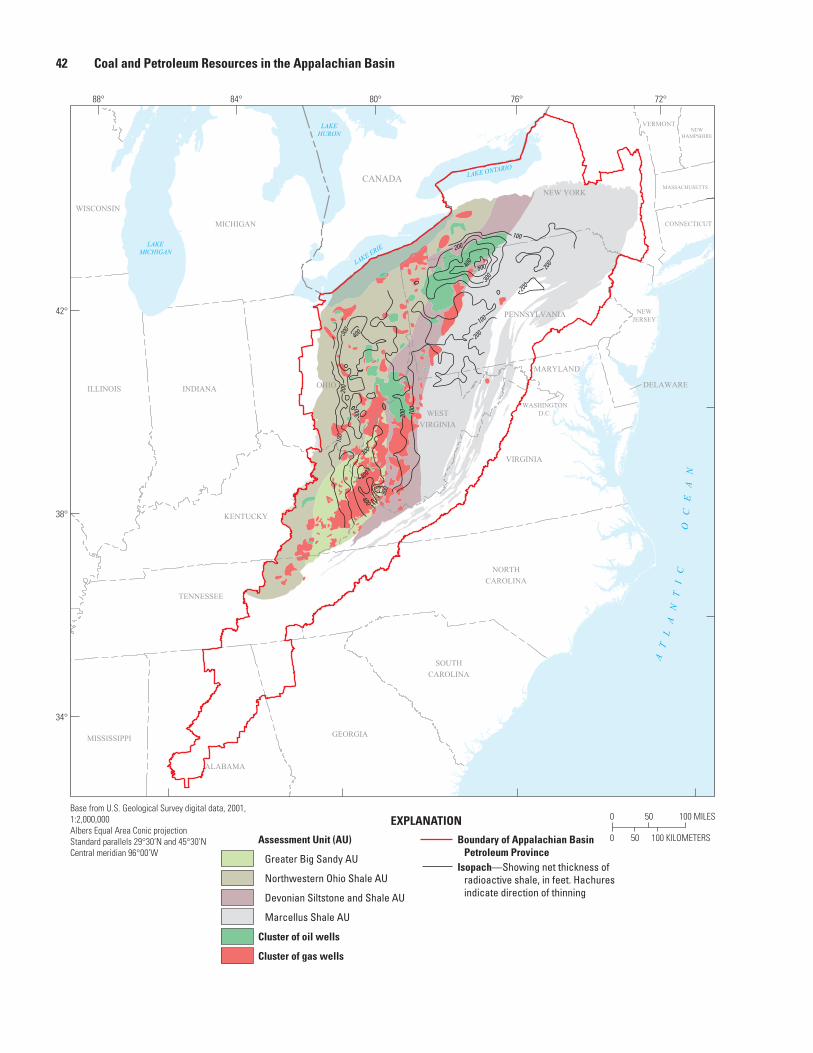
42 Coal and Petroleum Resources in the Appalachian Basin
0 50 100 MILES
100 KILOMETERS500
EXPLANATION
Assessment Unit (AU)
Greater Big Sandy AU
Northwestern Ohio Shale AU
Devonian Siltstone and Shale AU
Marcellus Shale AU
Cluster of oil wells
Cluster of gas wells
Boundary of Appalachian Basin Petroleum Province
Isopach—Showing net thickness of radioactive shale, in feet. Hachures indicate direction of thinning
Base from U.S. Geological Survey digital data, 2001, 1:2,000,000Albers Equal Area Conic projectionStandard parallels 29°30’N and 45°30’NCentral meridian 96°00’W
AT
LA
NT
IC
O
CE
AN
LAKEMICHIGAN
LAKE ERIE
LAKE ONTARIO
LAKEHURON
MICHIGAN
WISCONSIN
NEWHAMPSHIRE
VERMONT
MASSACHUSETTS
ILLINOIS
CONNECTICUT
INDIANA
NEWJERSEY
DELAWARE
MARYLAND
VIRGINIA
KENTUCKY
WASHINGTOND.C.
TENNESSEE
GEORGIAMISSISSIPPI
NORTHCAROLINA
SOUTHCAROLINA
OHIO
NEW YORK
PENNSYLVANIA
WESTVIRGINIA
ALABAMA
CANADA
200
100
300
100
200
200
100
200
300
100
300
200
400
400
500
400
400
300
200
300
72°76°80°84°88°
42°
38°
34°
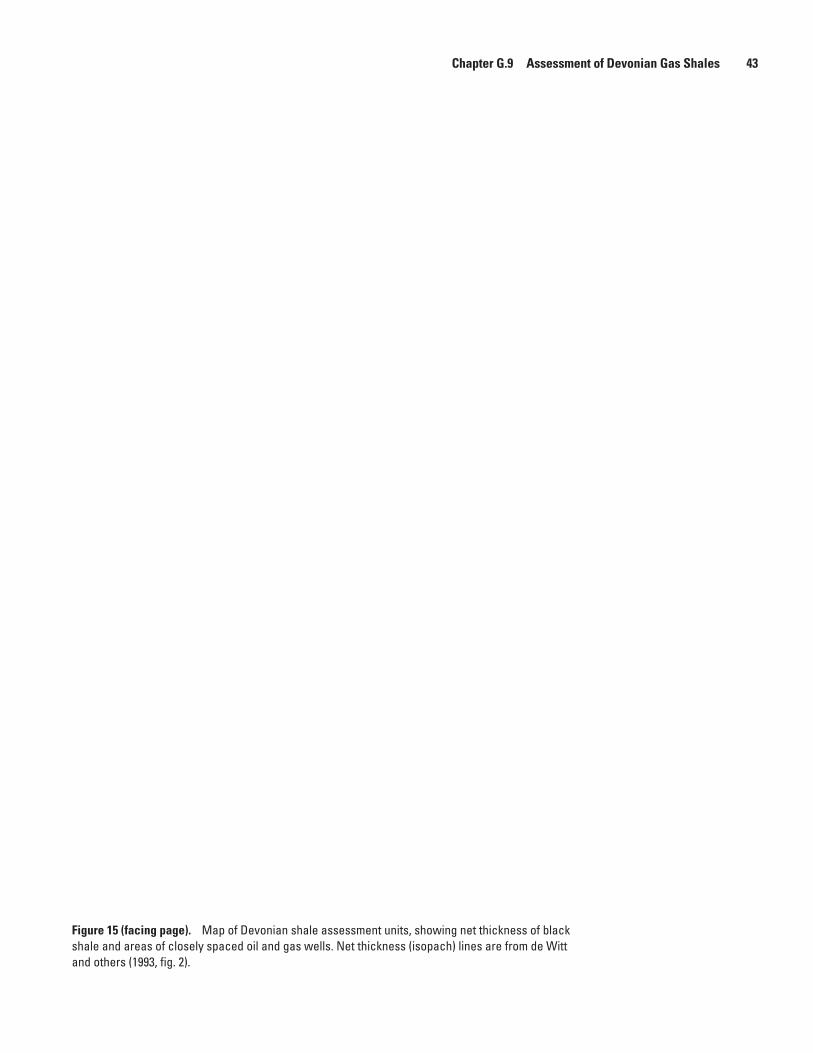
Chapter G.9 Assessment of Devonian Gas Shales 43
Figure 15 (facing page). Map of Devonian shale assessment units, showing net thickness of black shale and areas of closely spaced oil and gas wells. Net thickness (isopach) lines are from de Witt and others (1993, fig. 2).
44 Coal and Petroleum Resources in the Appalachian Basin
0 10 20 MILES
20 KILOMETERS100Extent of Greater Big Sandy Assessment Unit
Boundary of Appalachian Basin Petroleum Province
Isoline—Indicating percent vitrinite reflectance (%Ro)
Isopach—Showing net thickness of radioactive shale, in feet
Line of section, showing wells—See figures 17 and 18
EXPLANATIONBase from U.S. Geological Survey digital data, 2001, 1:2,000,000Albers Equal Area Conic projectionStandard parallels 29°30’N and 45°30’NCentral meridian 96°00’W
OHIO
VIRGINIA
TENNESSEENORTH
CAROLINA
KENTUCKY
WESTVIRGINIA
2.0
3.0
1.0
0.6
100
200
300
300
200
300
400
400
300
200
100
500
400
300
300
D
CD'102
103
105
104
107
106
108
35
36
37
38
34
3332
31
7
C’
109
81°82°83°84°
39°
38°
37°
Chapter G.9 Assessment of Devonian Gas Shales 45
Figure 16 (facing page). Map showing the extent of the Greater Big Sandy Assessment Unit, thermal maturity isolines, and net thickness of black shale. Well numbers and lines of cross sections are from de Witt and others (1993). Cross sections C–C’ and D–D’ are shown on figures 17 and 18, respectively. See figure 15 for source of vitrinite-reflectance data.
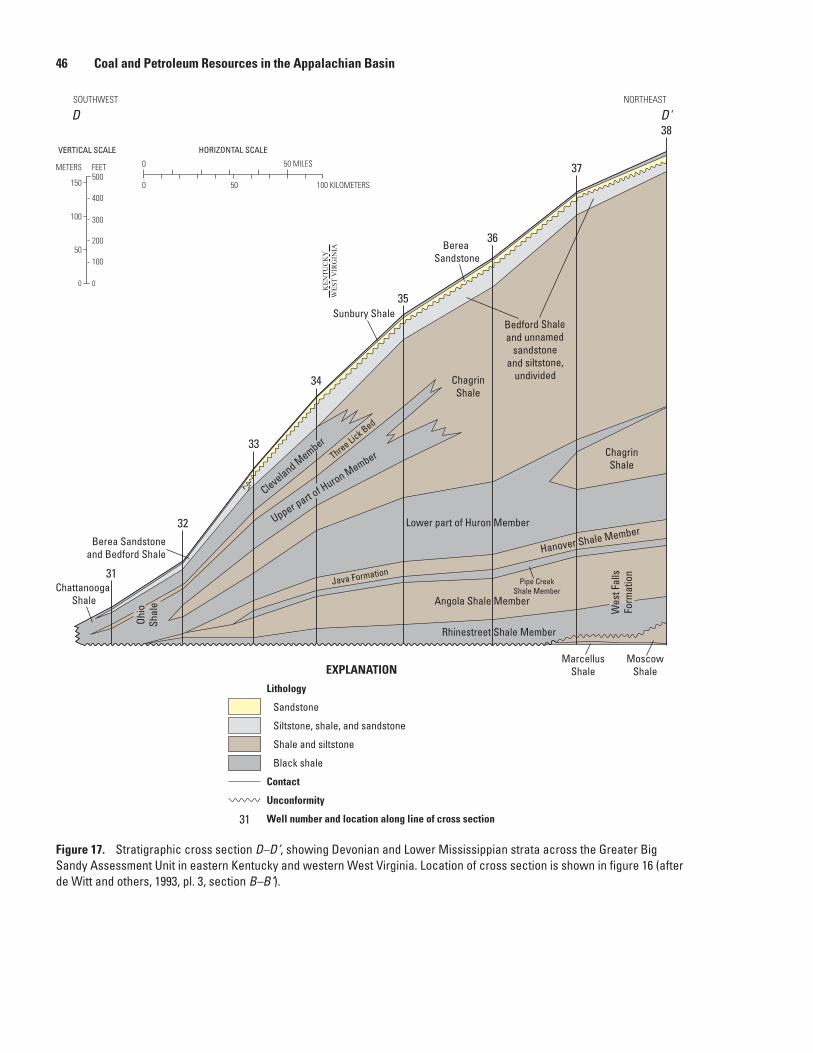
46 Coal and Petroleum Resources in the Appalachian Basin
HORIZONTAL SCALEVERTICAL SCALE
0 50 MILES
100 KILOMETERS500
0 0
10050
200
300100
400
150500
METERS FEET
EXPLANATION
Lithology
Sandstone
Siltstone, shale, and sandstone
Shale and siltstone
Black shale
Contact
Unconformity
Well number and location along line of cross section31
31
32
33
34
35
36
37
38
ChagrinShale
Wes
t Fal
lsFo
rmat
ion
Hanover Shale MemberUpper part o
f Huron Member
Cleveland Member
Three Lick Bed
ChagrinShale
Ohio
Shal
e
Berea Sandstoneand Bedford Shale
Berea Sandstone
Chattanooga Shale
MoscowShale
MarcellusShale
Bedford Shaleand unnamed
sandstoneand siltstone,
undivided
Sunbury Shale
Rhinestreet Shale Member
Angola Shale Member
Pipe CreekShale Member
Java Formation
Lower part of Huron Member
NORTHEASTSOUTHWEST
D D'
WE
ST V
IRG
INIA
KE
NT
UC
KY
Figure 17. Stratigraphic cross section D–D’, showing Devonian and Lower Mississippian strata across the Greater Big Sandy Assessment Unit in eastern Kentucky and western West Virginia. Location of cross section is shown in figure 16 (after de Witt and others, 1993, pl. 3, section B–B’).
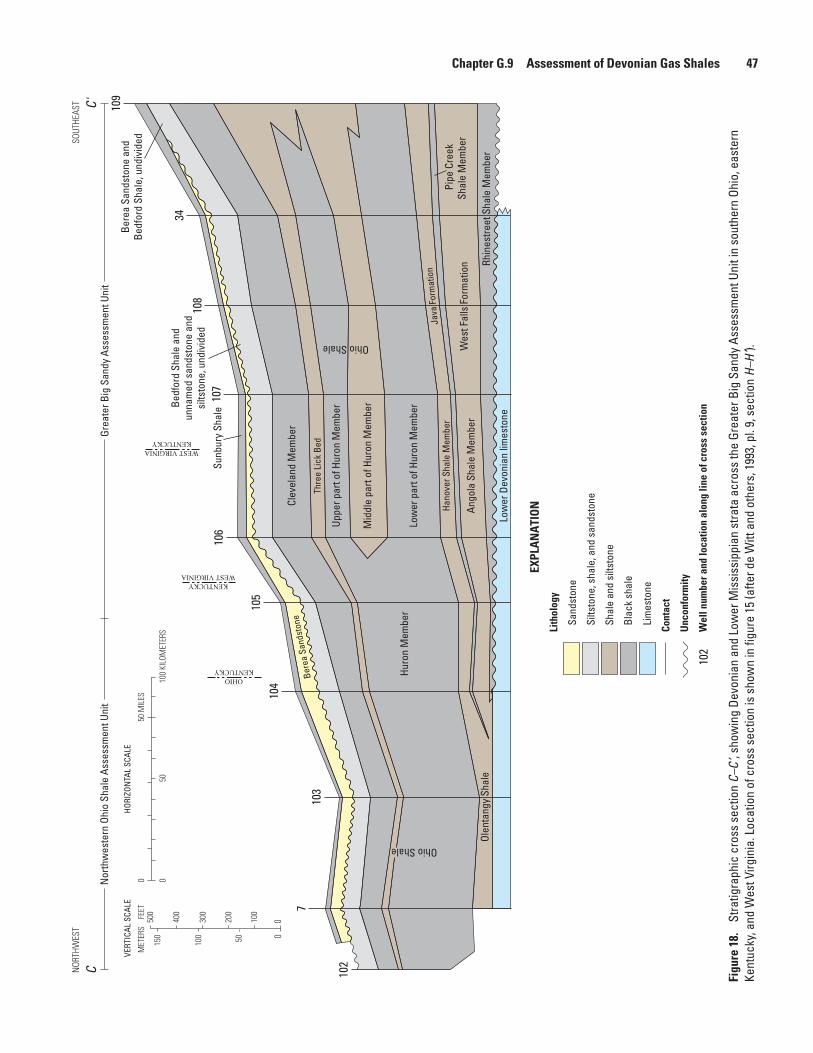
Chapter G.9 Assessment of Devonian Gas Shales 47
Bere
a Sa
ndst
one
Uppe
r par
t of H
uron
Mem
ber
Clev
elan
d M
embe
r
Thre
e Li
ck B
ed
Low
er p
art o
f Hur
on M
embe
r
Mid
dle
part
of H
uron
Mem
ber
Ango
la S
hale
Mem
ber
Rhin
estre
et S
hale
Mem
ber
Huro
n M
embe
r
Low
er D
evon
ian
limes
tone
Wes
t Fal
ls F
orm
atio
n
Ohio Shale
Ohio Shale
Olen
tang
y Sh
ale
Grea
ter B
ig S
andy
Ass
essm
ent U
nit
Nor
thw
este
rn O
hio
Shal
e As
sess
men
t Uni
t
102
103
104
105
106
107
108
109
34
7
Bere
a Sa
ndst
one
and
Bedf
ord
Shal
e, u
ndiv
ided
Sunb
ury
Shal
eBedf
ord
Shal
e an
dun
nam
ed s
ands
tone
and
silts
tone
, und
ivid
ed
Hano
ver S
hale
Mem
ber
KENTUCKYOHIO
WEST VIRGINIAKENTUCKY
KENTUCKYWEST VIRGINIA
SOUT
HEAS
T C'N
ORTH
WES
T
C
Pipe
Cre
ekSh
ale
Mem
ber
Java
For
mat
ion
Lith
olog
y
Sand
ston
e
Silts
tone
, sha
le, a
nd s
ands
tone
Shal
e an
d si
ltsto
ne
Blac
k sh
ale
Lim
esto
ne
Cont
act
Unc
onfo
rmity
Wel
l num
ber a
nd lo
catio
n al
ong
line
of c
ross
sec
tion
102
EXPL
AN
ATI
ON
HORI
ZON
TAL
SCAL
EVE
RTIC
AL S
CALE
050
MIL
ES
100
KILO
MET
ERS
500
0
0100
5020
0
300
100
400
150
500
MET
ERS
FE
ET
Figu
re 1
8.
Stra
tigra
phic
cro
ss s
ectio
n C–
C’, s
how
ing
Devo
nian
and
Low
er M
issi
ssip
pian
stra
ta a
cros
s th
e Gr
eate
r Big
San
dy A
sses
smen
t Uni
t in
sout
hern
Ohi
o, e
aste
rn
Kent
ucky
, and
Wes
t Virg
inia
. Loc
atio
n of
cro
ss s
ectio
n is
sho
wn
in fi
gure
15
(afte
r de
Witt
and
oth
ers,
199
3, p
l. 9,
sec
tion
H–H
’).
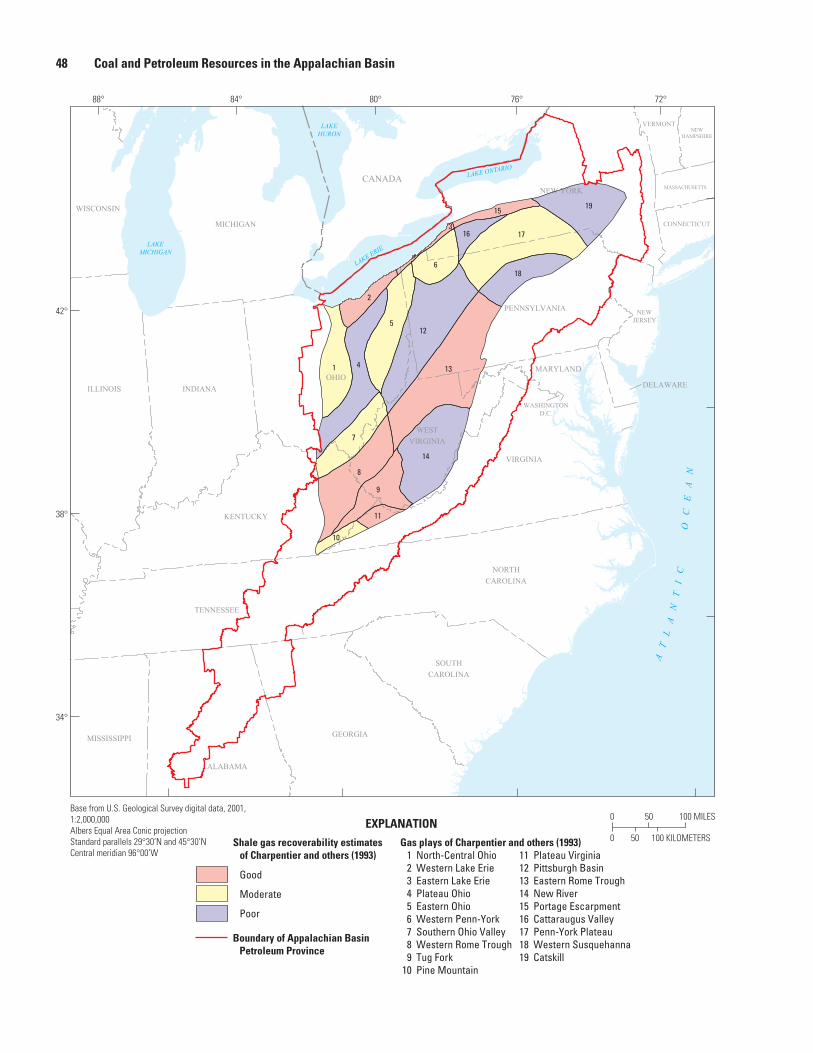
48 Coal and Petroleum Resources in the Appalachian Basin
0 50 100 MILES
100 KILOMETERS500EXPLANATION
Shale gas recoverability estimatesof Charpentier and others (1993)
Good
Moderate
Poor
Boundary of Appalachian BasinPetroleum Province
11 Plateau Virginia12 Pittsburgh Basin13 Eastern Rome Trough14 New River15 Portage Escarpment16 Cattaraugus Valley17 Penn-York Plateau18 Western Susquehanna19 Catskill
Gas plays of Charpentier and others (1993) 1 North-Central Ohio 2 Western Lake Erie 3 Eastern Lake Erie 4 Plateau Ohio 5 Eastern Ohio 6 Western Penn-York 7 Southern Ohio Valley 8 Western Rome Trough 9 Tug Fork10 Pine Mountain
Base from U.S. Geological Survey digital data, 2001, 1:2,000,000Albers Equal Area Conic projectionStandard parallels 29°30’N and 45°30’NCentral meridian 96°00’W
CANADA
MICHIGAN
WISCONSIN
NEWHAMPSHIRE
VERMONT
MASSACHUSETTS
ILLINOIS
CONNECTICUT
INDIANA
NEWJERSEY
DELAWARE
MARYLAND
VIRGINIA
KENTUCKY
WASHINGTOND.C.
TENNESSEE
GEORGIAMISSISSIPPI
NORTHCAROLINA
SOUTHCAROLINA
OHIO
NEW YORK
PENNSYLVANIA
WESTVIRGINIA
ALABAMA
AT
LA
NT
IC
O
CE
AN
LAKEMICHIGAN
LAKE ERIE
LAKE ONTARIO
LAKEHURON
19
1
2
3
4
5
6
7
8
9
10
11
12
13
14
16 17
15
18
72°76°80°84°88°
42°
38°
34°
Chapter G.9 Assessment of Devonian Gas Shales 49
Figure 19 (facing page). Map showing the qualitative assessment of gas recoverability from Devonian shale within each gas play of the Appalachian Basin Petroleum Province (from Charpentier and others, 1993). Estimates of gas-in-place resources in these plays are given in table 2.
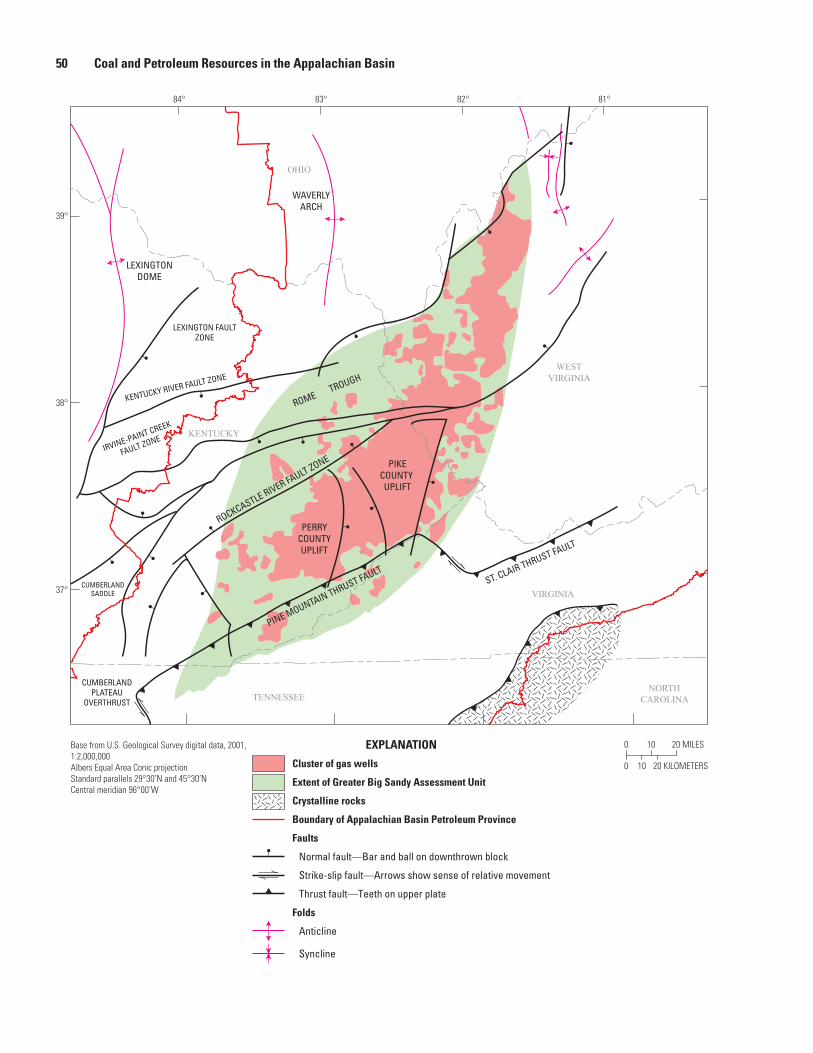
50 Coal and Petroleum Resources in the Appalachian Basin
EXPLANATION
Cluster of gas wells
Extent of Greater Big Sandy Assessment Unit
Crystalline rocks
Boundary of Appalachian Basin Petroleum Province
Faults
Normal fault—Bar and ball on downthrown block
Strike-slip fault—Arrows show sense of relative movement
Thrust fault—Teeth on upper plate
Folds
Anticline
Syncline
Base from U.S. Geological Survey digital data, 2001, 1:2,000,000Albers Equal Area Conic projectionStandard parallels 29°30’N and 45°30’NCentral meridian 96°00’W
0 10 20 MILES
20 KILOMETERS100
OHIO
VIRGINIA
TENNESSEENORTH
CAROLINA
KENTUCKY
WESTVIRGINIA
ROME TROUGH
ST. CLAIR THRUST FAULT
PINE MOUNTAIN THRUST FAULT
KENTUCKY RIVER FAULT ZONE
IRVINE-PAINT CREEK
FAULT ZONE
WAVERLYARCH
PIKECOUNTY UPLIFT
PERRYCOUNTYUPLIFT
CUMBERLANDSADDLE
CUMBERLANDPLATEAU
OVERTHRUST
LEXINGTONDOME
LEXINGTON FAULTZONE
ROCKCASTLE RIVER FAULT ZONE
81°82°83°84°
39°
38°
37°
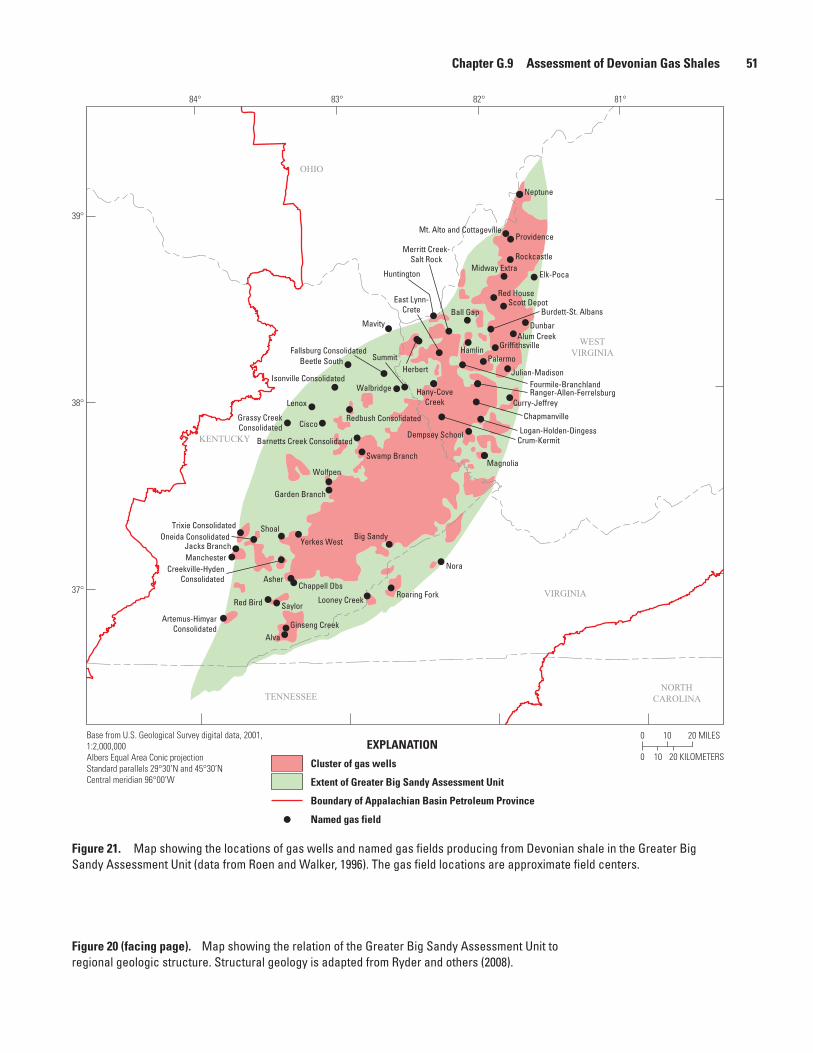
Chapter G.9 Assessment of Devonian Gas Shales 51
Figure 21. Map showing the locations of gas wells and named gas fields producing from Devonian shale in the Greater Big Sandy Assessment Unit (data from Roen and Walker, 1996). The gas field locations are approximate field centers.
Figure 20 (facing page). Map showing the relation of the Greater Big Sandy Assessment Unit to regional geologic structure. Structural geology is adapted from Ryder and others (2008).
EXPLANATION
Cluster of gas wells
Extent of Greater Big Sandy Assessment Unit
Boundary of Appalachian Basin Petroleum Province
Named gas field
Base from U.S. Geological Survey digital data, 2001, 1:2,000,000Albers Equal Area Conic projectionStandard parallels 29°30’N and 45°30’NCentral meridian 96°00’W
0 10 20 MILES
20 KILOMETERS100
OHIO
VIRGINIA
TENNESSEENORTH
CAROLINA
KENTUCKY
WESTVIRGINIA
Neptune
Mt. Alto and Cottageville
Rockcastle
Red HouseScott Depot
Dunbar
Ball Gap
Alum CreekGriffithsville
Midway ExtraHuntington
Mavity
Herbert
Elk-Poca
Julian-MadisonBeetle South
Fallsburg Consolidated
Fourmile-BranchlandIsonville Consolidated
Walbridge
Summit
Hany-CoveCreek
Magnolia
Dempsey SchoolCrum-Kermit
Chapmanville
Curry-Jeffrey
Logan-Holden-Dingess
Lenox
Redbush ConsolidatedCisco
Barnetts Creek Consolidated
Swamp Branch
Wolfpen
Garden Branch
Big Sandy
Looney Creek
ShoalYerkes WestJacks Branch
Creekville-HydenConsolidated Asher
Chappell Dbs
Red Bird Saylor
AlvaGinseng Creek
Artemus-HimyarConsolidated
Oneida Consolidated
Providence
Palermo
Ranger-Allen-Ferrelsburg
Nora
Roaring Fork
Manchester
Trixie Consolidated
Grassy Creek Consolidated
Merritt Creek-Salt Rock
Hamlin
East Lynn-Crete Burdett-St. Albans
81°82°83°84°
39°
38°
37°
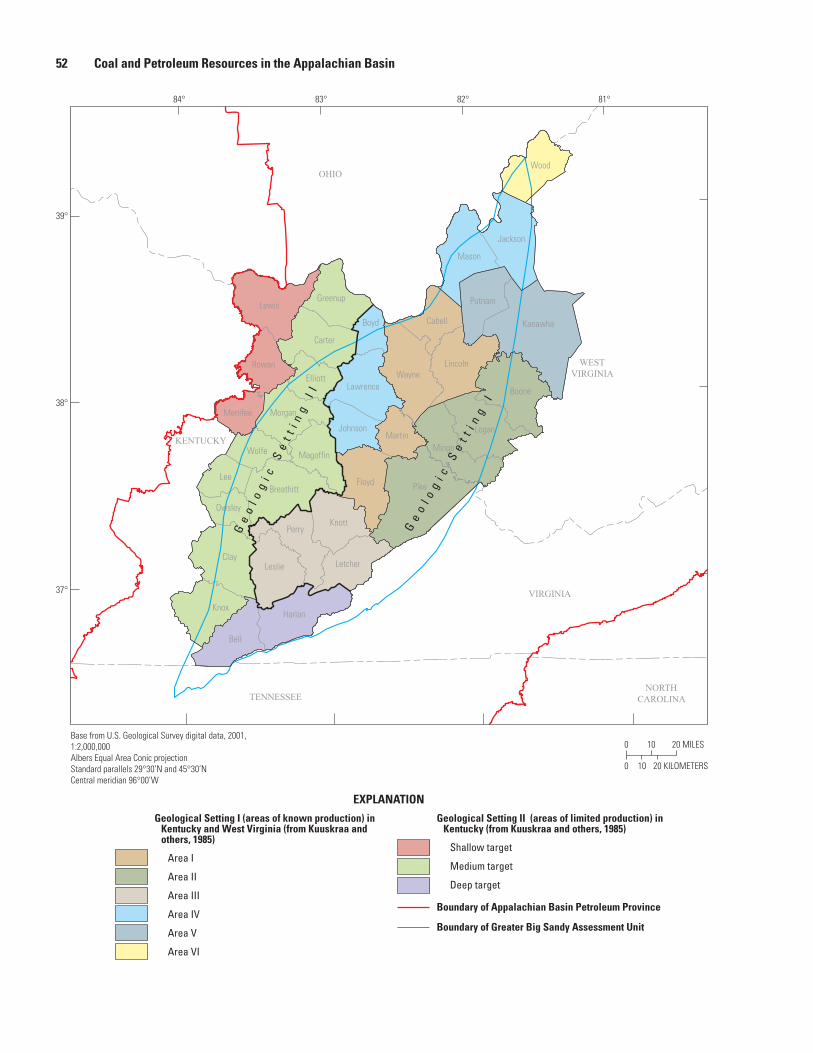
52 Coal and Petroleum Resources in the Appalachian Basin
0 10 20 MILES
20 KILOMETERS100
EXPLANATION
Geological Setting I (areas of known production) in Kentucky and West Virginia (from Kuuskraa and others, 1985)
Area I
Area II
Area III
Area IV
Area V
Area VI
Geological Setting II (areas of limited production) in Kentucky (from Kuuskraa and others, 1985)
Shallow target
Medium target
Deep target
Boundary of Appalachian Basin Petroleum Province
Boundary of Greater Big Sandy Assessment Unit
Base from U.S. Geological Survey digital data, 2001, 1:2,000,000Albers Equal Area Conic projectionStandard parallels 29°30’N and 45°30’NCentral meridian 96°00’W
Pike
Clay
Kanawha
Bell
Lewis
Boone
Knox
Floyd
Logan
Wayne
Harlan
Leslie
Perry
Carter
Knott
Mingo
Mason
Wood
Lincoln
Lee
Jackson
Breathitt
Morgan
Putnam
Letcher
Cabell
Lawrence
Greenup
RowanElliott
Wolfe
Martin
Magoffin
Boyd
Johnson
Owsley
Menifee
Ge
ol o
gi c
Se
t ti n
g I
I
Ge
ol o
gi c
Se
t ti n
g I
OHIO
VIRGINIA
TENNESSEENORTH
CAROLINA
KENTUCKY
WESTVIRGINIA
81°82°83°84°
39°
38°
37°
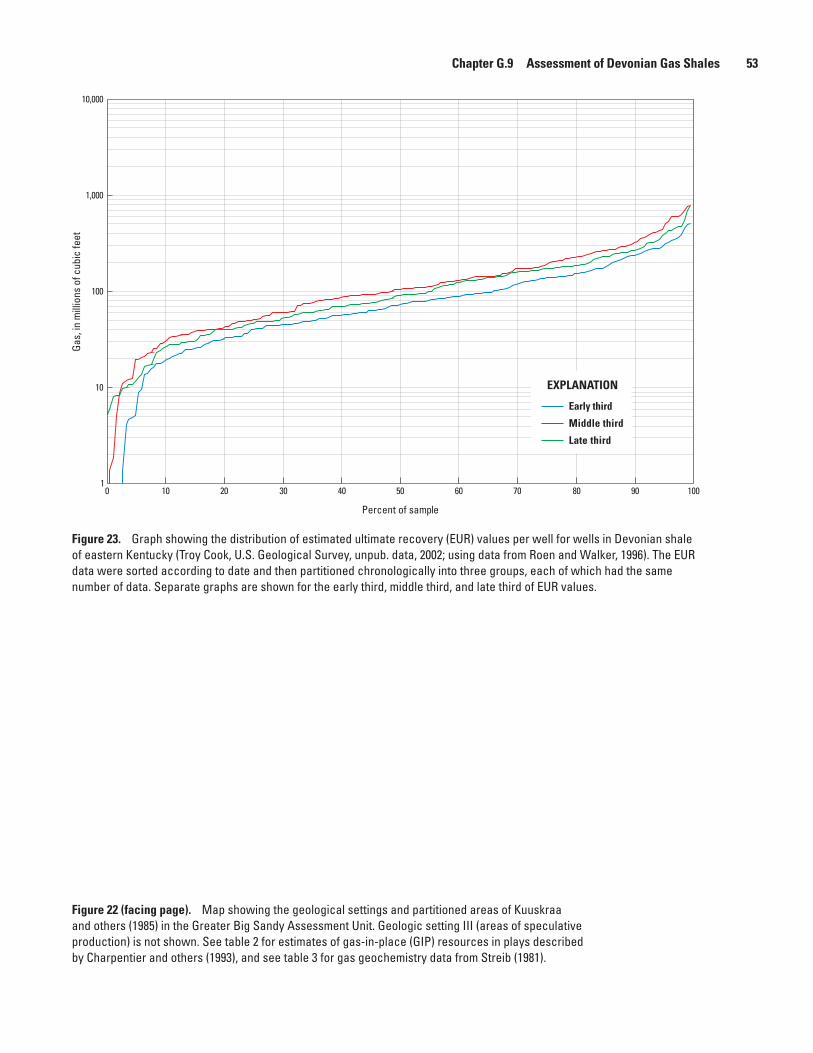
Chapter G.9 Assessment of Devonian Gas Shales 53
Figure 22 (facing page). Map showing the geological settings and partitioned areas of Kuuskraa and others (1985) in the Greater Big Sandy Assessment Unit. Geologic setting III (areas of speculative production) is not shown. See table 2 for estimates of gas-in-place (GIP) resources in plays described by Charpentier and others (1993), and see table 3 for gas geochemistry data from Streib (1981).
Early third
Middle third
Late third
EXPLANATION
Gas,
in m
illio
ns o
f cub
ic fe
et
1
10
100
1,000
10,000
10 20 30 40 50 60 70 80 90 1000
Percent of sample
Figure 23. Graph showing the distribution of estimated ultimate recovery (EUR) values per well for wells in Devonian shale of eastern Kentucky (Troy Cook, U.S. Geological Survey, unpub. data, 2002; using data from Roen and Walker, 1996). The EUR data were sorted according to date and then partitioned chronologically into three groups, each of which had the same number of data. Separate graphs are shown for the early third, middle third, and late third of EUR values.
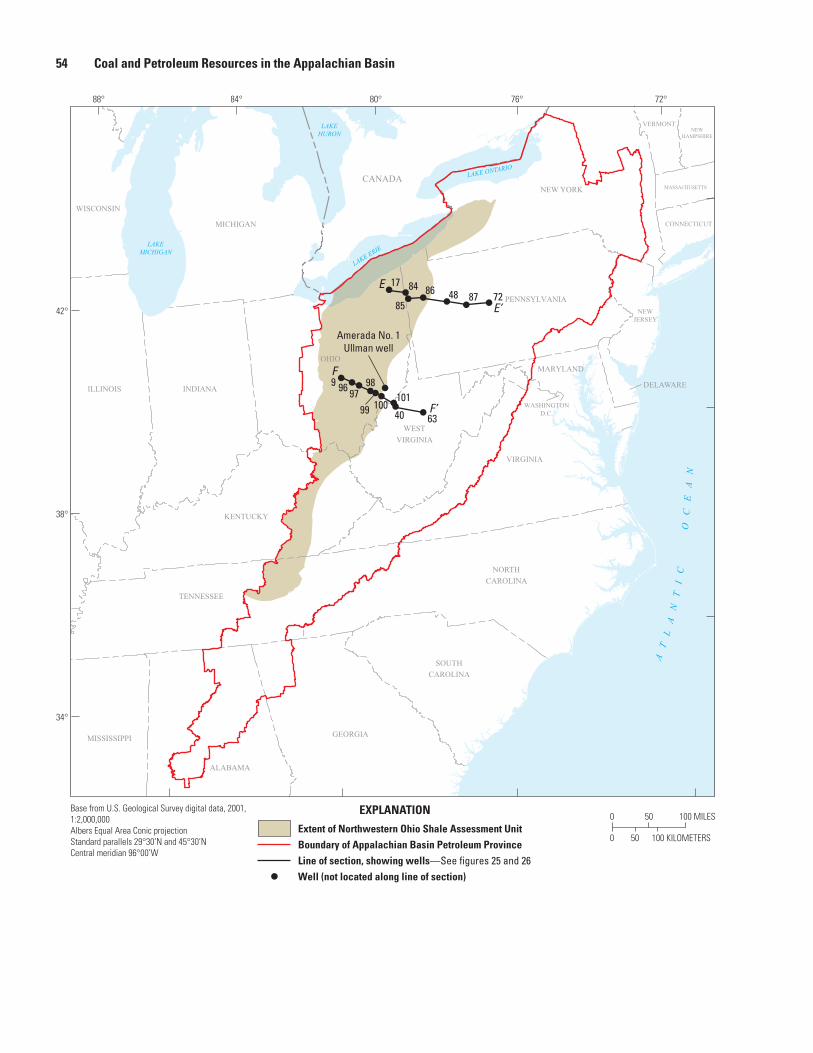
54 Coal and Petroleum Resources in the Appalachian Basin
0 50 100 MILES
100 KILOMETERS500
EXPLANATION
Extent of Northwestern Ohio Shale Assessment Unit
Boundary of Appalachian Basin Petroleum Province
Line of section, showing wells—See figures 25 and 26Well (not located along line of section)
Base from U.S. Geological Survey digital data, 2001, 1:2,000,000Albers Equal Area Conic projectionStandard parallels 29°30’N and 45°30’NCentral meridian 96°00’W
MICHIGAN
WISCONSIN
NEWHAMPSHIRE
VERMONT
MASSACHUSETTS
ILLINOIS
CONNECTICUT
INDIANA
NEWJERSEY
DELAWARE
MARYLAND
VIRGINIA
KENTUCKY
WASHINGTOND.C.
TENNESSEE
GEORGIAMISSISSIPPI
NORTH
CAROLINA
SOUTH
CAROLINA
OHIO
NEW YORK
PENNSYLVANIA
WEST
VIRGINIA
ALABAMA
CANADA
AT
LA
NT
IC
O
CE
AN
LAKEMICHIGAN
LAKE ERIE
LAKE ONTARIO
LAKEHURON
17
9 96 9798
99 100101
40 63
84
8586 48 87 72
E
F
E’
F’
Amerada No. 1Ullman well
72°76°80°84°88°
42°
38°
34°

Chapter G.9 Assessment of Devonian Gas Shales 55
Figure 24 (facing page). Map showing the outline of the Northwestern Ohio Shale Assessment Unit, the location of the Amerada No.1 Ullman well, and the locations of cross sections E–E’ (fig. 25) and F–F’ (fig. 26). Well locations are from de Witt and others (1993) and Ryder and others (1998).
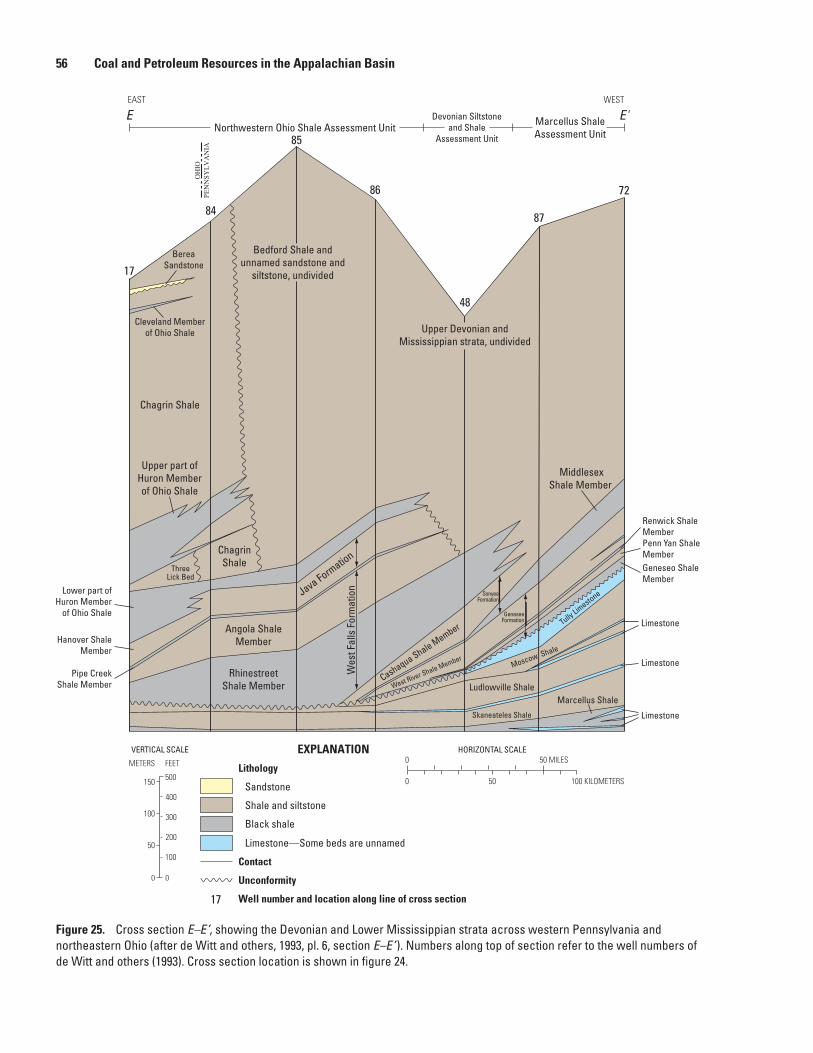
56 Coal and Petroleum Resources in the Appalachian Basin
48
Moscow Shale
Tully LimestoneJava Formation
Wes
t Fal
ls F
orm
atio
n
Cashaqua Shale Member
West River Shale Member
72
87
86
85
84
17Berea
Sandstone
Cleveland Memberof Ohio Shale
Chagrin Shale
Upper part ofHuron Memberof Ohio Shale
ThreeLick Bed
ChagrinShale
Angola ShaleMember
RhinestreetShale Member Ludlowville Shale
Skaneateles Shale
Marcellus Shale
MiddlesexShale Member
Renwick ShaleMemberPenn Yan ShaleMemberGeneseo ShaleMember
Limestone
Limestone
Limestone
Lower part ofHuron Member
of Ohio Shale
Hanover ShaleMember
Pipe CreekShale Member
Bedford Shale andunnamed sandstone and
siltstone, undivided
Upper Devonian andMississippian strata, undivided
GeneseeFormation
SonyeaFormation
PEN
NSY
LV
AN
IAO
HIO
Marcellus ShaleAssessment Unit
Devonian Siltstoneand Shale
Assessment UnitNorthwestern Ohio Shale Assessment Unit
WEST
E'EAST
E
HORIZONTAL SCALEVERTICAL SCALE0 50 MILES
100 KILOMETERS500
0 0
10050
200
300100
400
150 500
METERS FEET Lithology
Sandstone
Shale and siltstone
Black shale
Limestone—Some beds are unnamed
Contact
Unconformity
Well number and location along line of cross section17
EXPLANATION
Figure 25. Cross section E–E’, showing the Devonian and Lower Mississippian strata across western Pennsylvania and northeastern Ohio (after de Witt and others, 1993, pl. 6, section E–E’ ). Numbers along top of section refer to the well numbers of de Witt and others (1993). Cross section location is shown in figure 24.
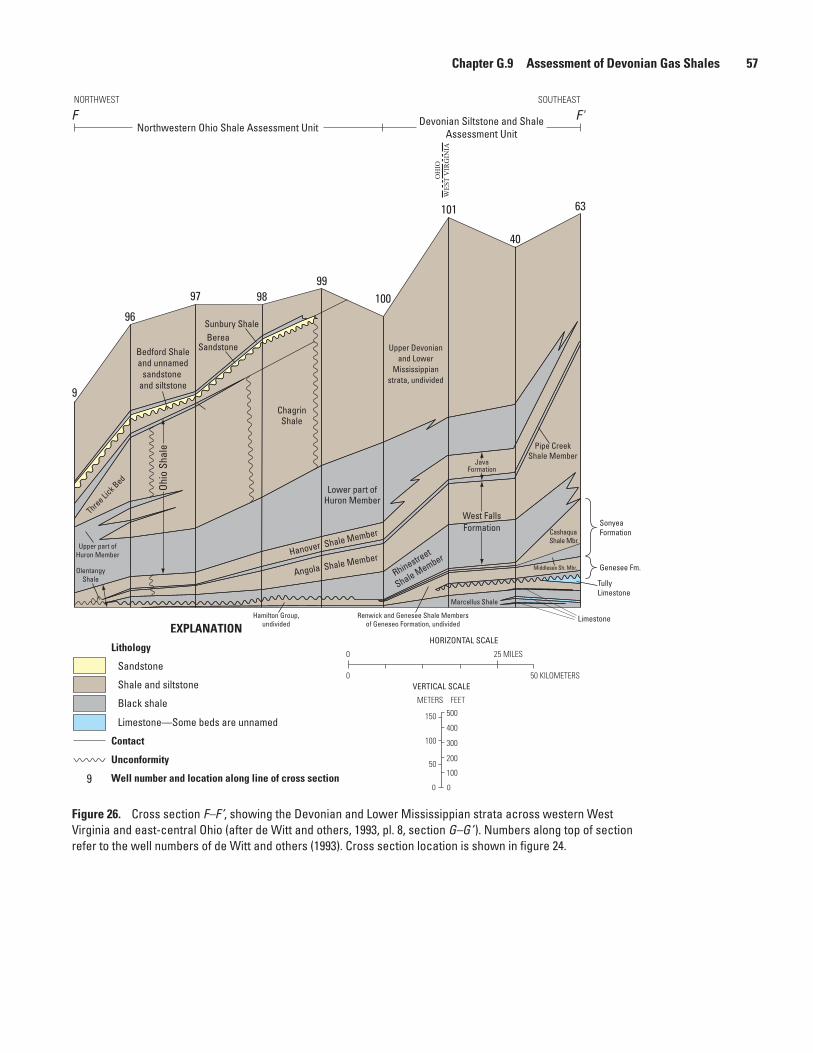
Chapter G.9 Assessment of Devonian Gas Shales 57
VERTICAL SCALE
0 0
10050
200
300100
400150 500
METERS FEET
HORIZONTAL SCALE
0
0
25 MILES
50 KILOMETERS
Lithology
Sandstone
Shale and siltstone
Black shale
Limestone—Some beds are unnamed
Contact
Unconformity
Well number and location along line of cross section9
EXPLANATION
101
999897
96
9
63
40
Hanover Shale Member
Rhinestreet
Shale Member
Angola Shale Member
Hamilton Group,undivided
Ohio
Sha
le
Three Lick B
ed
TullyLimestone
Limestone
Sonyea Formation
Genesee Fm.
100
Bedford Shaleand unnamed
sandstone and siltstone
JavaFormation
Cashaqua Shale Mbr.
Renwick and Genesee Shale Membersof Geneseo Formation, undivided
Upper part ofHuron Member
Middlesex Sh. Mbr.OlentangyShale
BereaSandstone
Sunbury Shale
ChagrinShale
Upper Devonianand Lower
Mississippianstrata, undivided
Lower part ofHuron Member
Marcellus Shale
Pipe CreekShale Member
West FallsFormation
Devonian Siltstone and ShaleAssessment UnitNorthwestern Ohio Shale Assessment Unit
SOUTHEAST
F'NORTHWEST
F
WE
ST V
IRG
INIA
OH
IO
Figure 26. Cross section F–F’, showing the Devonian and Lower Mississippian strata across western West Virginia and east-central Ohio (after de Witt and others, 1993, pl. 8, section G–G’ ). Numbers along top of section refer to the well numbers of de Witt and others (1993). Cross section location is shown in figure 24.
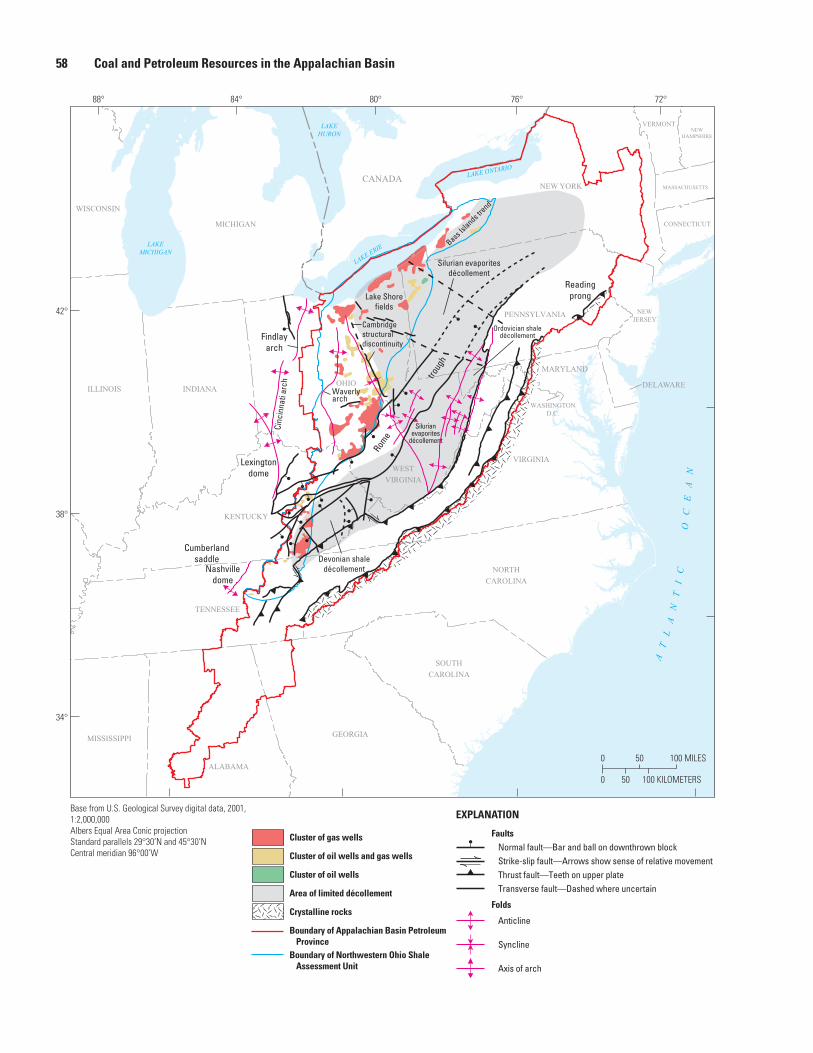
58 Coal and Petroleum Resources in the Appalachian Basin
Cluster of gas wells
Cluster of oil wells and gas wells
Cluster of oil wells
Area of limited décollement
Crystalline rocks
Boundary of Appalachian Basin Petroleum Province
Boundary of Northwestern Ohio Shale Assessment Unit
FaultsNormal fault—Bar and ball on downthrown blockStrike-slip fault—Arrows show sense of relative movementThrust fault—Teeth on upper plateTransverse fault—Dashed where uncertain
Folds
Anticline
Syncline
Axis of arch
EXPLANATIONBase from U.S. Geological Survey digital data, 2001, 1:2,000,000Albers Equal Area Conic projectionStandard parallels 29°30’N and 45°30’NCentral meridian 96°00’W
0 50 100 MILES
100 KILOMETERS500
MICHIGAN
WISCONSIN
NEWHAMPSHIRE
VERMONT
MASSACHUSETTS
ILLINOIS
CONNECTICUT
INDIANA
NEWJERSEY
DELAWARE
MARYLAND
VIRGINIA
KENTUCKY
WASHINGTOND.C.
TENNESSEE
GEORGIAMISSISSIPPI
NORTH
CAROLINA
SOUTH
CAROLINA
OHIO
NEW YORK
PENNSYLVANIA
WEST
VIRGINIA
ALABAMA
CANADA
AT
LA
NT
IC
O
CE
AN
LAKEMICHIGAN
LAKE ERIE
LAKE ONTARIO
LAKEHURON
Cinc
inna
ti ar
chLake Shore
fields
Bass Isl
ands trend
Readingprong
Silurianevaporites
décollement
Rome
Devonian shaledécollementNashville
dome
Cumberlandsaddle
Lexingtondome
Cambridgestructuraldiscontinuity
Silurian evaporitesdécollement
Ordovician shaledécollement
troug
h
Waverlyarch
Findlayarch
72°76°80°84°88°
42°
38°
34°
Chapter G.9 Assessment of Devonian Gas Shales 59
Figure 27 (facing page). Map showing the relation of the Northwestern Ohio Shale Assessment Unit to geologic structure. Structural geology is adapted from Ryder and others (2008). Décollement data are from Colton (1970), Frey (1973), Patenaude and others (1986), and Sanford (1993).
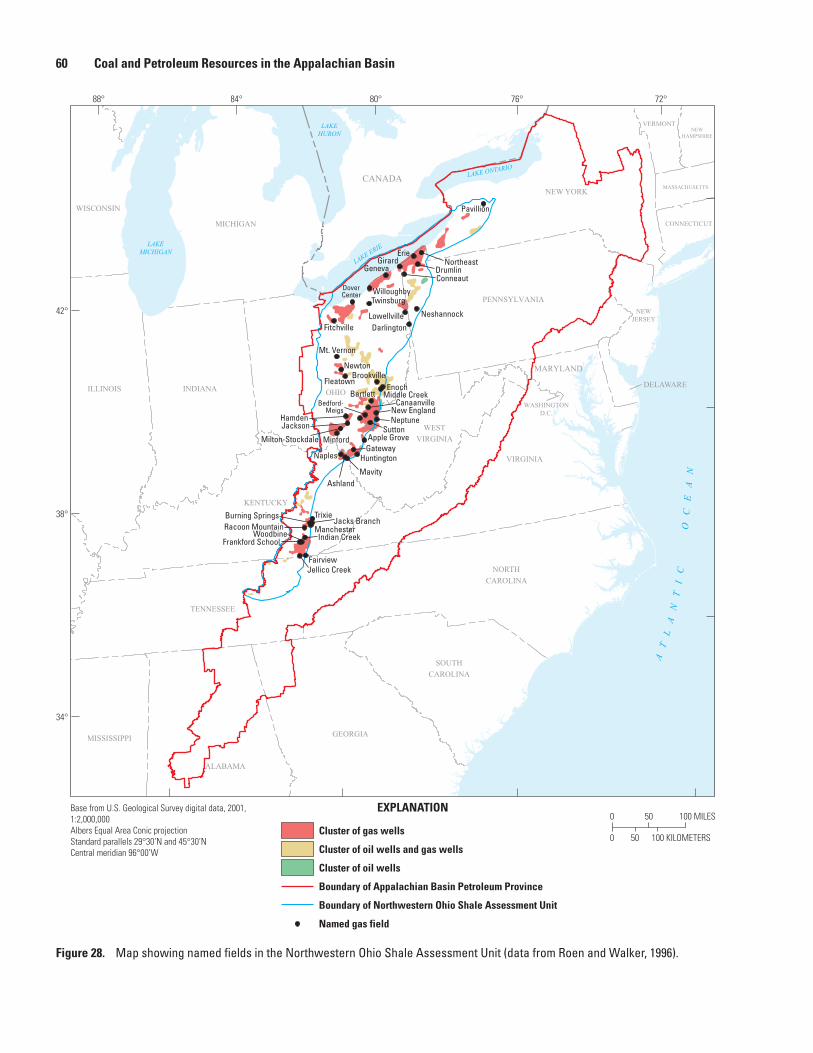
60 Coal and Petroleum Resources in the Appalachian Basin
0 50 100 MILES
100 KILOMETERS500Cluster of gas wells
Cluster of oil wells and gas wells
Cluster of oil wells
Boundary of Appalachian Basin Petroleum Province
Boundary of Northwestern Ohio Shale Assessment Unit
Named gas field
EXPLANATIONBase from U.S. Geological Survey digital data, 2001, 1:2,000,000Albers Equal Area Conic projectionStandard parallels 29°30’N and 45°30’NCentral meridian 96°00’W
MICHIGAN
WISCONSIN
NEWHAMPSHIRE
VERMONT
MASSACHUSETTS
ILLINOIS
CONNECTICUT
INDIANA
NEWJERSEY
DELAWARE
MARYLAND
VIRGINIA
KENTUCKY
WASHINGTOND.C.
TENNESSEE
GEORGIAMISSISSIPPI
NORTH
CAROLINA
SOUTH
CAROLINA
OHIO
NEW YORK
PENNSYLVANIA
WEST
VIRGINIA
ALABAMA
CANADA
AT
LA
NT
IC
O
CE
AN
LAKEMICHIGAN
LAKE ERIE
LAKE ONTARIO
LAKEHURON
Northeast
Twinsburg
Drumlin
Bartlett
New England
Apple GroveGateway
HuntingtonNaples
FairviewJellico Creek
Woodbine
Geneva
Willoughby
Erie
Darlington
Neshannock
Newton
FleatownBrookville
EnochMiddle Creek
Bedford-Meigs
MinfordMilton-Stockdale
Jackson
AshlandMavity
SuttonNeptuneHamden
Canaanville
TrixieJacks Branch
Manchester
Burning SpringsRacoon Mountain
Frankford School Indian Creek
Mt. Vernon
Girard
DoverCenter
LowellvilleFitchville
Conneaut
Pavillion
72°76°80°84°88°
42°
38°
34°
Figure 28. Map showing named fields in the Northwestern Ohio Shale Assessment Unit (data from Roen and Walker, 1996).
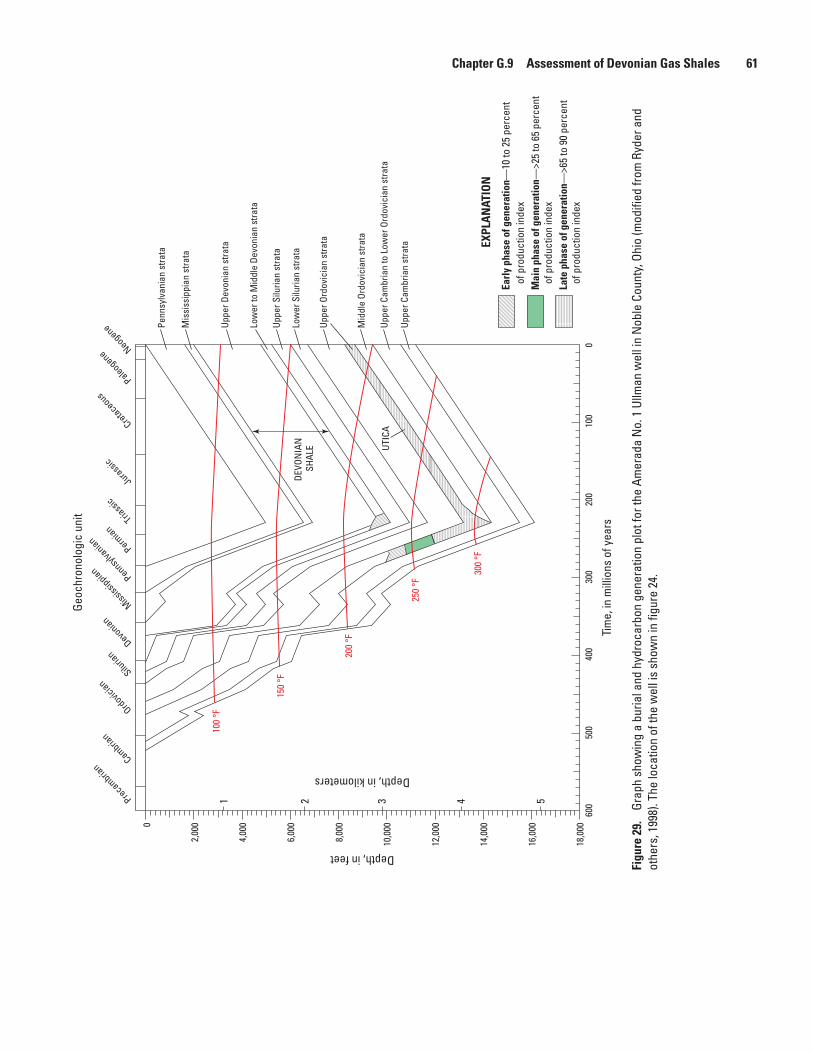
Chapter G.9 Assessment of Devonian Gas Shales 61
Figu
re 2
9.
Grap
h sh
owin
g a
buria
l and
hyd
roca
rbon
gen
erat
ion
plot
for t
he A
mer
ada
No.
1 U
llman
wel
l in
Nob
le C
ount
y, O
hio
(mod
ified
from
Ryd
er a
nd
othe
rs, 1
998)
. The
loca
tion
of th
e w
ell i
s sh
own
in fi
gure
24.
100
°F
150
°F
200
°F
250
°F
300
°F
2,00
00
4,00
0
6,00
0
8,00
0
10,0
00
12,0
00
14,0
00
16,0
00
18,0
0060
050
040
030
020
010
00
Depth, in feet
54321
Depth, in kilometers
Precambrian
Cambrian
Ordovician
Siluria
nDevo
nian
Mississ
ippianPennsy
lvanian
Permian
Triass
ic
Jurassic
Cretaceous
Paleogene Neogene
Tim
e, in
mill
ions
of y
ears
Earl
y ph
ase
of g
ener
atio
n—10
to 2
5 pe
rcen
t of
pro
duct
ion
inde
xM
ain
phas
e of
gen
erat
ion—
>25
to 6
5 pe
rcen
t of
pro
duct
ion
inde
xLa
te p
hase
of g
ener
atio
n—>6
5 to
90
perc
ent
of p
rodu
ctio
n in
dex
EXPL
AN
ATIO
N
Penn
sylv
ania
n st
rata
Mis
siss
ippi
an s
trata
Uppe
r Dev
onia
n st
rata
Uppe
r Silu
rian
stra
ta
Low
er S
iluria
n st
rata
Uppe
r Ord
ovic
ian
stra
ta
Mid
dle
Ordo
vici
an s
trata
Uppe
r Cam
bria
n to
Low
er O
rdov
icia
n st
rata
Uppe
r Cam
bria
n st
rata
Low
er to
Mid
dle
Devo
nian
stra
ta
UTIC
A
DEVO
NIA
N
SHAL
E
Geoc
hron
olog
ic u
nit
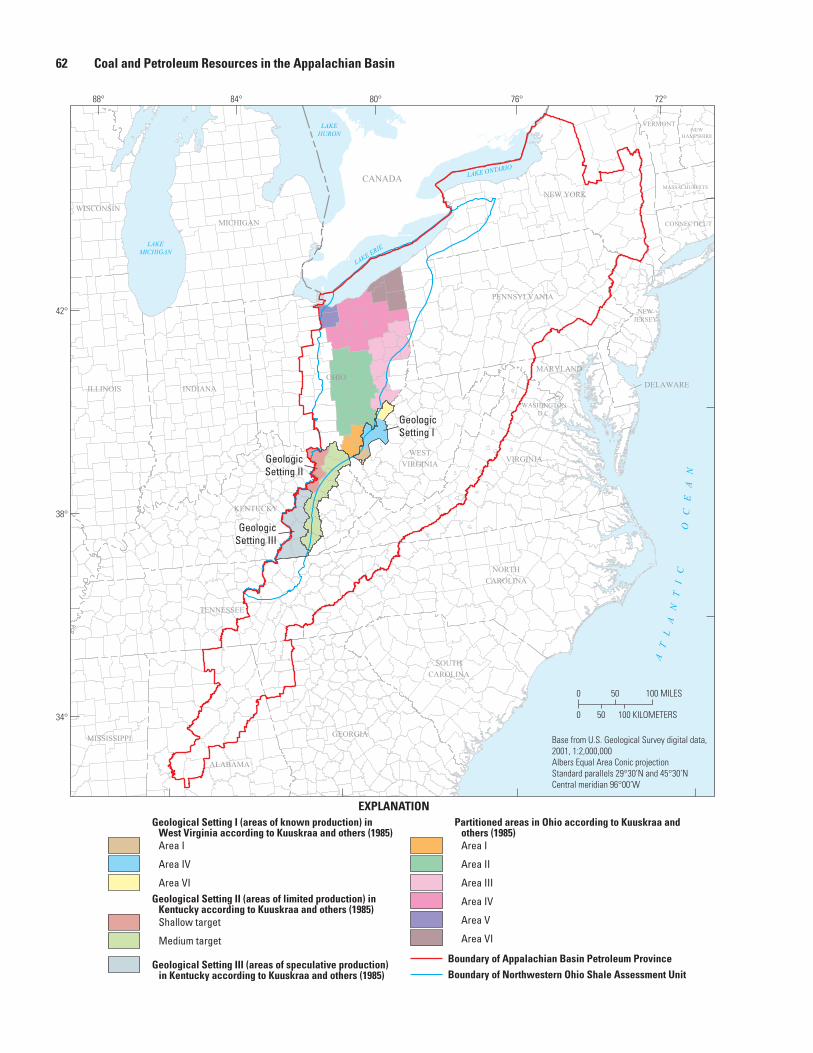
62 Coal and Petroleum Resources in the Appalachian Basin
Geological Setting I (areas of known production) in West Virginia according to Kuuskraa and others (1985)Area I
Area IV
Area VIGeological Setting II (areas of limited production) in
Kentucky according to Kuuskraa and others (1985)Shallow target
Medium target
Geological Setting III (areas of speculative production) in Kentucky according to Kuuskraa and others (1985)
EXPLANATIONPartitioned areas in Ohio according to Kuuskraa and
others (1985)Area I
Area II
Area III
Area IV
Area V
Area VI
Boundary of Appalachian Basin Petroleum Province
Boundary of Northwestern Ohio Shale Assessment Unit
Base from U.S. Geological Survey digital data, 2001, 1:2,000,000Albers Equal Area Conic projectionStandard parallels 29°30’N and 45°30’NCentral meridian 96°00’W
0 50 100 MILES
100 KILOMETERS500
MICHIGAN
WISCONSIN
NEWHAMPSHIRE
VERMONT
MASSACHUSETTS
ILLINOIS
CONNECTICUT
INDIANA
NEWJERSEY
DELAWARE
MARYLAND
VIRGINIA
KENTUCKY
WASHINGTOND.C.
TENNESSEE
GEORGIAMISSISSIPPI
NORTH
CAROLINA
SOUTH
CAROLINA
OHIO
NEW YORK
PENNSYLVANIA
WEST
VIRGINIA
ALABAMA
CANADA
GeologicSetting II
GeologicSetting I
GeologicSetting III
AT
LA
NT
IC
O
CE
AN
LAKEMICHIGAN
LAKE ERIE
LAKE ONTARIO
LAKEHURON
72°76°80°84°88°
42°
38°
34°
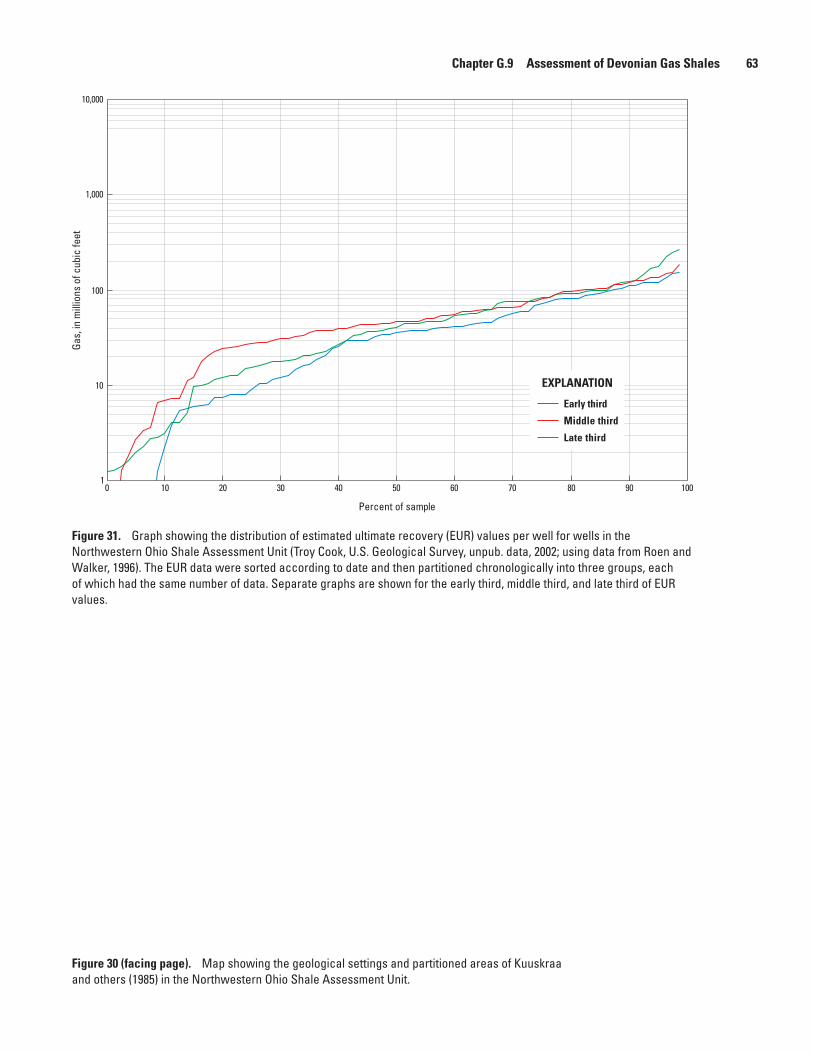
Chapter G.9 Assessment of Devonian Gas Shales 63
Figure 30 (facing page). Map showing the geological settings and partitioned areas of Kuuskraa and others (1985) in the Northwestern Ohio Shale Assessment Unit.
Early third
Middle third
Late third
EXPLANATION
Gas,
in m
illio
ns o
f cub
ic fe
et
1
10
100
1,000
10,000
10 20 30 40 50 60 70 80 90 1000
Percent of sample
Figure 31. Graph showing the distribution of estimated ultimate recovery (EUR) values per well for wells in the Northwestern Ohio Shale Assessment Unit (Troy Cook, U.S. Geological Survey, unpub. data, 2002; using data from Roen and Walker, 1996). The EUR data were sorted according to date and then partitioned chronologically into three groups, each of which had the same number of data. Separate graphs are shown for the early third, middle third, and late third of EUR values.
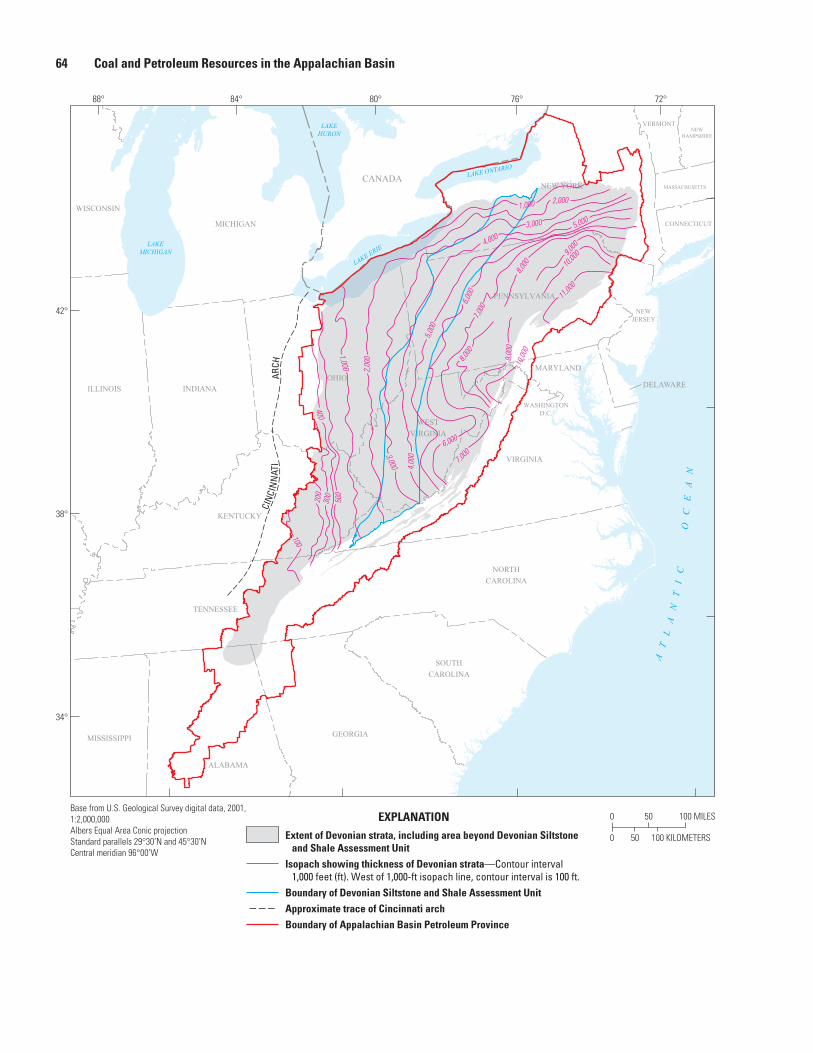
64 Coal and Petroleum Resources in the Appalachian Basin
0 50 100 MILES
100 KILOMETERS500
EXPLANATION
Extent of Devonian strata, including area beyond Devonian Siltstone and Shale Assessment Unit
Isopach showing thickness of Devonian strata—Contour interval 1,000 feet (ft). West of 1,000-ft isopach line, contour interval is 100 ft.
Boundary of Devonian Siltstone and Shale Assessment Unit
Approximate trace of Cincinnati arch
Boundary of Appalachian Basin Petroleum Province
Base from U.S. Geological Survey digital data, 2001, 1:2,000,000Albers Equal Area Conic projectionStandard parallels 29°30’N and 45°30’NCentral meridian 96°00’W
MICHIGAN
WISCONSIN
NEWHAMPSHIRE
VERMONT
MASSACHUSETTS
ILLINOIS
CONNECTICUT
INDIANA
NEWJERSEY
DELAWARE
MARYLAND
VIRGINIA
KENTUCKY
WASHINGTOND.C.
TENNESSEE
GEORGIAMISSISSIPPI
NORTH
CAROLINA
SOUTH
CAROLINA
OHIO
NEW YORK
PENNSYLVANIA
WEST
VIRGINIA
ALABAMA
CANADA
CIN
CIN
NAT
I
A
RCH
4,000
11,00
010
,000
10,0
00
9,00
0
7,000
8,000
8,000
1,000 2,000
3,000 5,000
9,000
6,00
0
5,00
0
1,000
2,00
0
400
200
300
500
100
3,000 4,00
0
6,000
7,000
AT
LA
NT
IC
O
CE
AN
LAKEMICHIGAN
LAKE ERIE
LAKE ONTARIO
LAKEHURON
72°76°80°84°88°
42°
38°
34°
Chapter G.9 Assessment of Devonian Gas Shales 65
Figure 32 (facing page). Map showing the extent and thickness of Devonian strata in the Appalachian Basin Petroleum Province and the Devonian Siltstone and Shale Assessment Unit (adapted from de Witt and others, 1975).
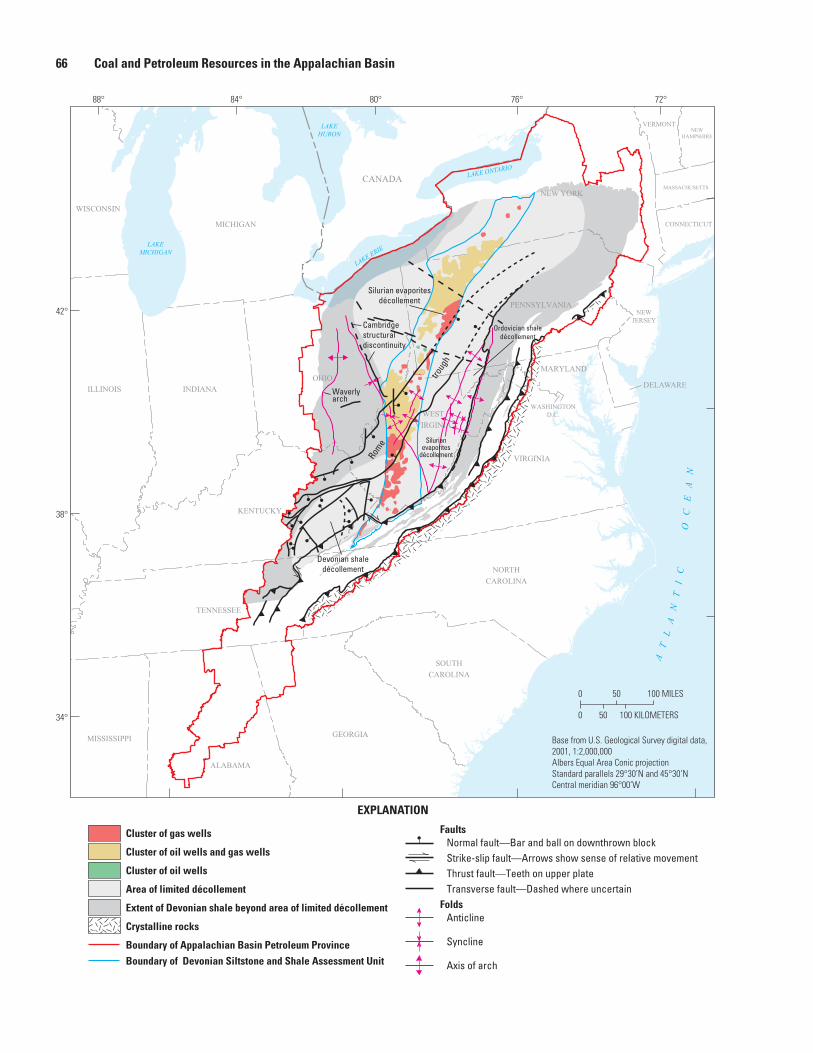
66 Coal and Petroleum Resources in the Appalachian Basin
Cluster of gas wells
Cluster of oil wells and gas wells
Cluster of oil wells
Area of limited décollement
Extent of Devonian shale beyond area of limited décollement
Crystalline rocks
Boundary of Appalachian Basin Petroleum Province
Boundary of Devonian Siltstone and Shale Assessment Unit
FaultsNormal fault—Bar and ball on downthrown blockStrike-slip fault—Arrows show sense of relative movementThrust fault—Teeth on upper plateTransverse fault—Dashed where uncertain
FoldsAnticline
Syncline
Axis of arch
EXPLANATION
0 50 100 MILES
100 KILOMETERS500
Base from U.S. Geological Survey digital data, 2001, 1:2,000,000Albers Equal Area Conic projectionStandard parallels 29°30’N and 45°30’NCentral meridian 96°00’W
MICHIGAN
WISCONSIN
NEWHAMPSHIRE
VERMONT
MASSACHUSETTS
ILLINOIS
CONNECTICUT
INDIANA
NEWJERSEY
DELAWARE
MARYLAND
VIRGINIA
KENTUCKY
WASHINGTOND.C.
TENNESSEE
GEORGIAMISSISSIPPI
NORTH
CAROLINA
SOUTH
CAROLINA
OHIO
NEW YORK
PENNSYLVANIA
WEST
VIRGINIA
ALABAMA
CANADA
AT
LA
NT
IC
O
CE
AN
LAKEMICHIGAN
LAKE ERIE
LAKE ONTARIO
LAKEHURON
Cambridgestructuraldiscontinuity
Silurian evaporitesdécollement
Ordovician shaledécollement
Silurianevaporites
décollementRome
troug
h
Devonian shaledécollement
Waverlyarch
72°76°80°84°88°
42°
38°
34°

Chapter G.9 Assessment of Devonian Gas Shales 67
Figure 33 (facing page). Map showing relation of the Devonian Siltstone and Shale Assessment Unit to geologic structure. Structural geology is adapted from Ryder and others (2008). Décollement data are from Colton (1970), Frey (1973), Patenaude and others (1986), and Sanford (1993).
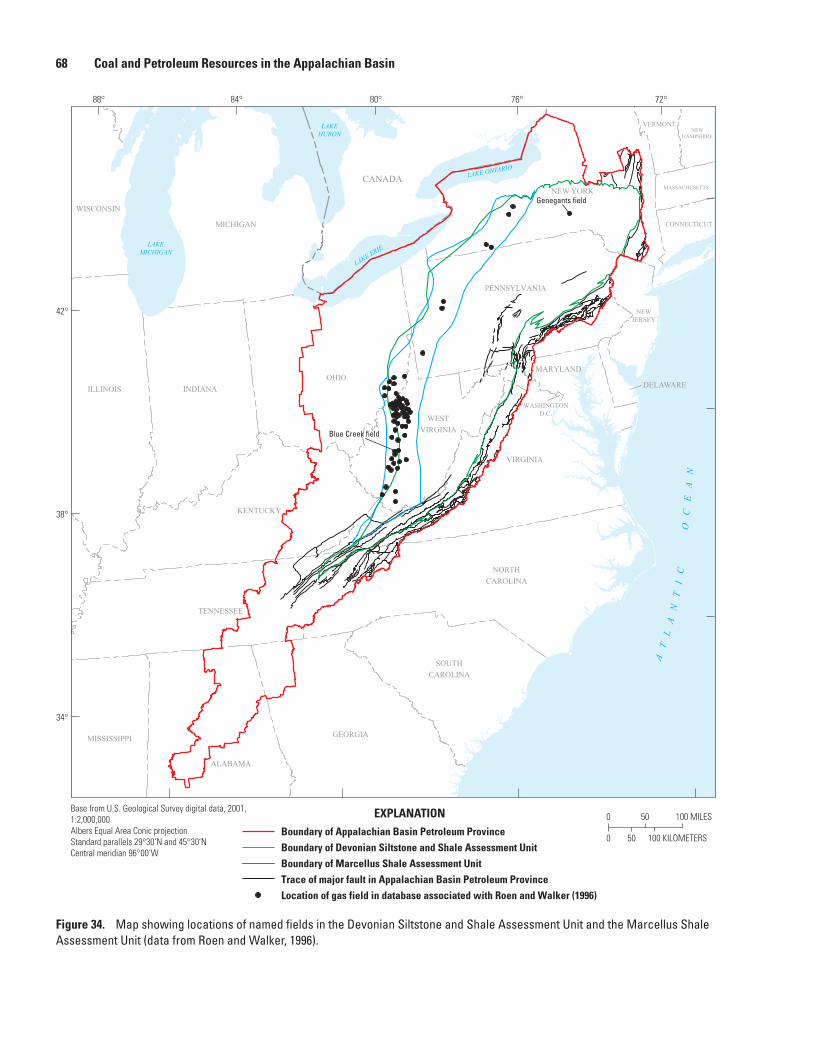
68 Coal and Petroleum Resources in the Appalachian Basin
Figure 34. Map showing locations of named fields in the Devonian Siltstone and Shale Assessment Unit and the Marcellus Shale Assessment Unit (data from Roen and Walker, 1996).
0 50 100 MILES
100 KILOMETERS500
EXPLANATION
Boundary of Appalachian Basin Petroleum Province
Boundary of Devonian Siltstone and Shale Assessment Unit
Boundary of Marcellus Shale Assessment Unit
Trace of major fault in Appalachian Basin Petroleum Province
Location of gas field in database associated with Roen and Walker (1996)
Base from U.S. Geological Survey digital data, 2001, 1:2,000,000Albers Equal Area Conic projectionStandard parallels 29°30’N and 45°30’NCentral meridian 96°00’W
MICHIGAN
WISCONSIN
NEWHAMPSHIRE
VERMONT
MASSACHUSETTS
ILLINOIS
CONNECTICUT
INDIANA
NEWJERSEY
DELAWARE
MARYLAND
VIRGINIA
KENTUCKY
WASHINGTOND.C.
TENNESSEE
GEORGIAMISSISSIPPI
NORTH
CAROLINA
SOUTH
CAROLINA
OHIO
NEW YORK
PENNSYLVANIA
WEST
VIRGINIA
ALABAMA
CANADA
AT
LA
NT
IC
O
CE
AN
LAKEMICHIGAN
LAKE ERIE
LAKE ONTARIO
LAKEHURON
Blue Creek field
Genegants field
72°76°80°84°88°
42°
38°
34°
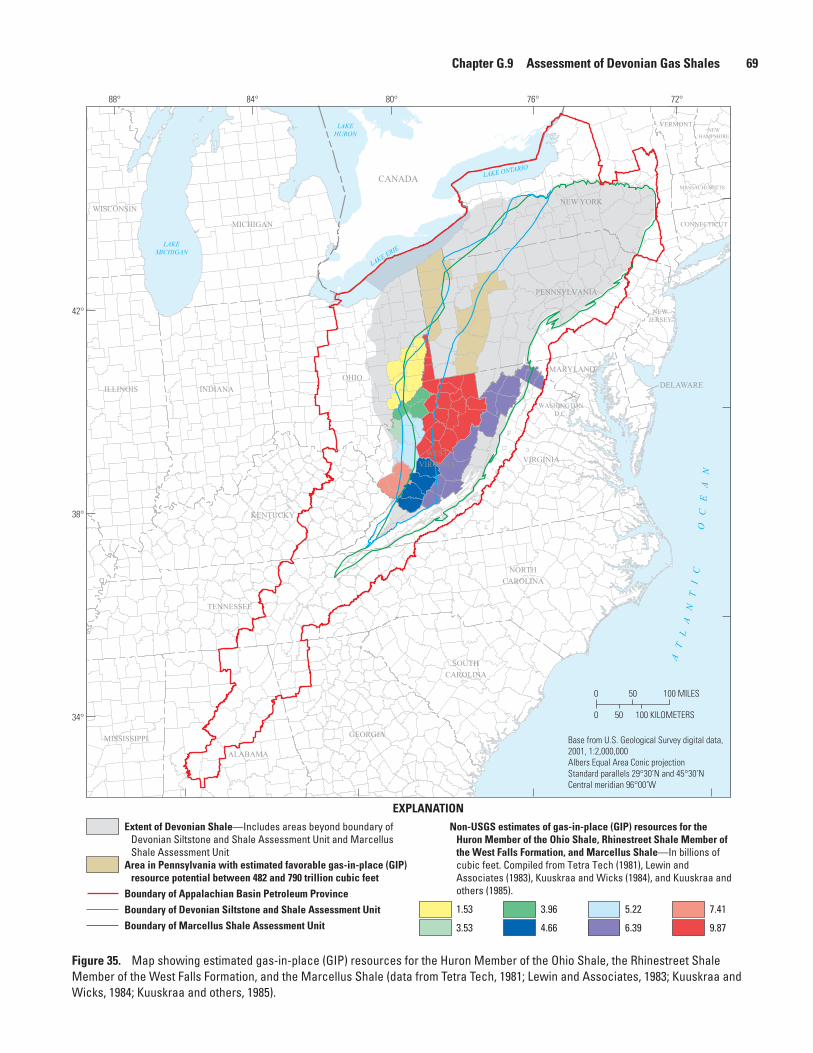
Chapter G.9 Assessment of Devonian Gas Shales 69
Figure 35. Map showing estimated gas-in-place (GIP) resources for the Huron Member of the Ohio Shale, the Rhinestreet Shale Member of the West Falls Formation, and the Marcellus Shale (data from Tetra Tech, 1981; Lewin and Associates, 1983; Kuuskraa and Wicks, 1984; Kuuskraa and others, 1985).
EXPLANATION
Extent of Devonian Shale—Includes areas beyond boundary of Devonian Siltstone and Shale Assessment Unit and Marcellus Shale Assessment Unit
Area in Pennsylvania with estimated favorable gas-in-place (GIP) resource potential between 482 and 790 trillion cubic feet
Boundary of Appalachian Basin Petroleum Province
Boundary of Devonian Siltstone and Shale Assessment Unit
Boundary of Marcellus Shale Assessment Unit
Non-USGS estimates of gas-in-place (GIP) resources for the Huron Member of the Ohio Shale, Rhinestreet Shale Member of the West Falls Formation, and Marcellus Shale—In billions of cubic feet. Compiled from Tetra Tech (1981), Lewin and Associates (1983), Kuuskraa and Wicks (1984), and Kuuskraa and others (1985).
1.53
3.53
3.96
4.66
5.22
6.39
7.41
9.87
0 50 100 MILES
100 KILOMETERS500
Base from U.S. Geological Survey digital data, 2001, 1:2,000,000Albers Equal Area Conic projectionStandard parallels 29°30’N and 45°30’NCentral meridian 96°00’W
MICHIGAN
WISCONSIN
NEWHAMPSHIRE
VERMONT
MASSACHUSETTS
ILLINOIS
CONNECTICUT
INDIANA
NEWJERSEY
DELAWARE
MARYLAND
VIRGINIA
KENTUCKY
WASHINGTOND.C.
TENNESSEE
GEORGIAMISSISSIPPI
NORTH
CAROLINA
SOUTH
CAROLINA
OHIO
NEW YORK
PENNSYLVANIA
WEST
VIRGINIA
ALABAMA
CANADA
AT
LA
NT
IC
O
CE
AN
LAKEMICHIGAN
LAKE ERIE
LAKE ONTARIO
LAKEHURON
72°76°80°84°88°
42°
38°
34°
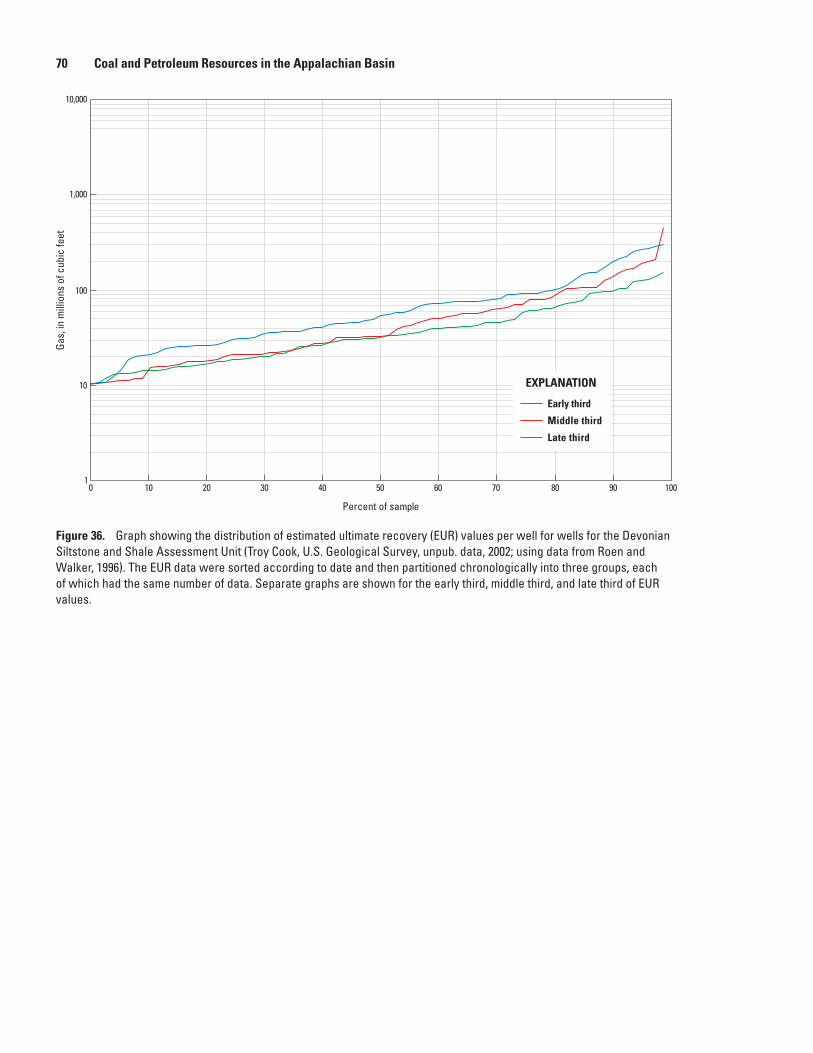
70 Coal and Petroleum Resources in the Appalachian Basin
Early third
Middle third
Late third
EXPLANATION
Gas,
in m
illio
ns o
f cub
ic fe
et
1
10
100
1,000
10,000
10 20 30 40 50 60 70 80 90 1000
Percent of sample
Figure 36. Graph showing the distribution of estimated ultimate recovery (EUR) values per well for wells for the Devonian Siltstone and Shale Assessment Unit (Troy Cook, U.S. Geological Survey, unpub. data, 2002; using data from Roen and Walker, 1996). The EUR data were sorted according to date and then partitioned chronologically into three groups, each of which had the same number of data. Separate graphs are shown for the early third, middle third, and late third of EUR values.
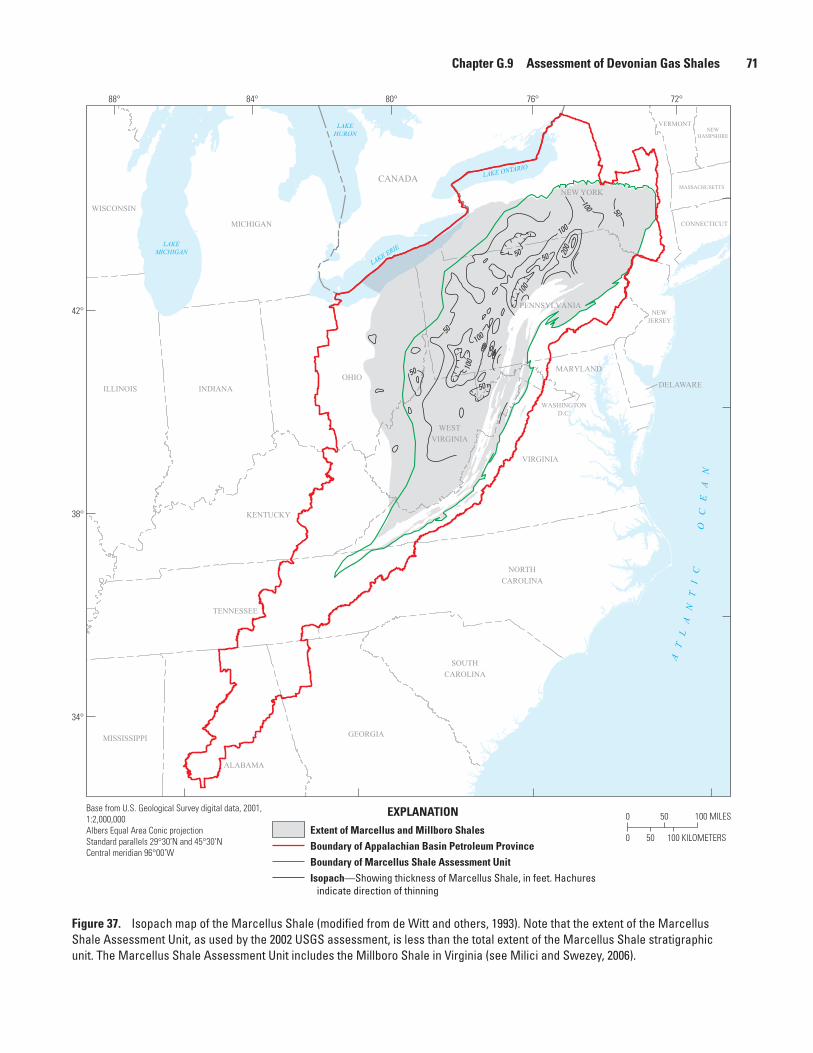
Chapter G.9 Assessment of Devonian Gas Shales 71
Figure 37. Isopach map of the Marcellus Shale (modified from de Witt and others, 1993). Note that the extent of the Marcellus Shale Assessment Unit, as used by the 2002 USGS assessment, is less than the total extent of the Marcellus Shale stratigraphic unit. The Marcellus Shale Assessment Unit includes the Millboro Shale in Virginia (see Milici and Swezey, 2006).
0 50 100 MILES
100 KILOMETERS500
EXPLANATIONExtent of Marcellus and Millboro ShalesBoundary of Appalachian Basin Petroleum ProvinceBoundary of Marcellus Shale Assessment UnitIsopach—Showing thickness of Marcellus Shale, in feet. Hachures
indicate direction of thinning
Base from U.S. Geological Survey digital data, 2001, 1:2,000,000Albers Equal Area Conic projectionStandard parallels 29°30’N and 45°30’NCentral meridian 96°00’W
MICHIGAN
WISCONSIN
NEWHAMPSHIRE
VERMONT
MASSACHUSETTS
ILLINOIS
CONNECTICUT
INDIANA
NEWJERSEY
DELAWARE
MARYLAND
VIRGINIA
KENTUCKY
WASHINGTOND.C.
TENNESSEE
GEORGIAMISSISSIPPI
NORTHCAROLINA
SOUTHCAROLINA
OHIO
NEW YORK
PENNSYLVANIA
WESTVIRGINIA
ALABAMA
CANADA
50
50
50
50
50
100
100
100
100 50
200
100
AT
LA
NT
IC
O
CE
AN
LAKEMICHIGAN
LAKE ERIE
LAKE ONTARIO
LAKEHURON
72°76°80°84°88°
42°
38°
34°
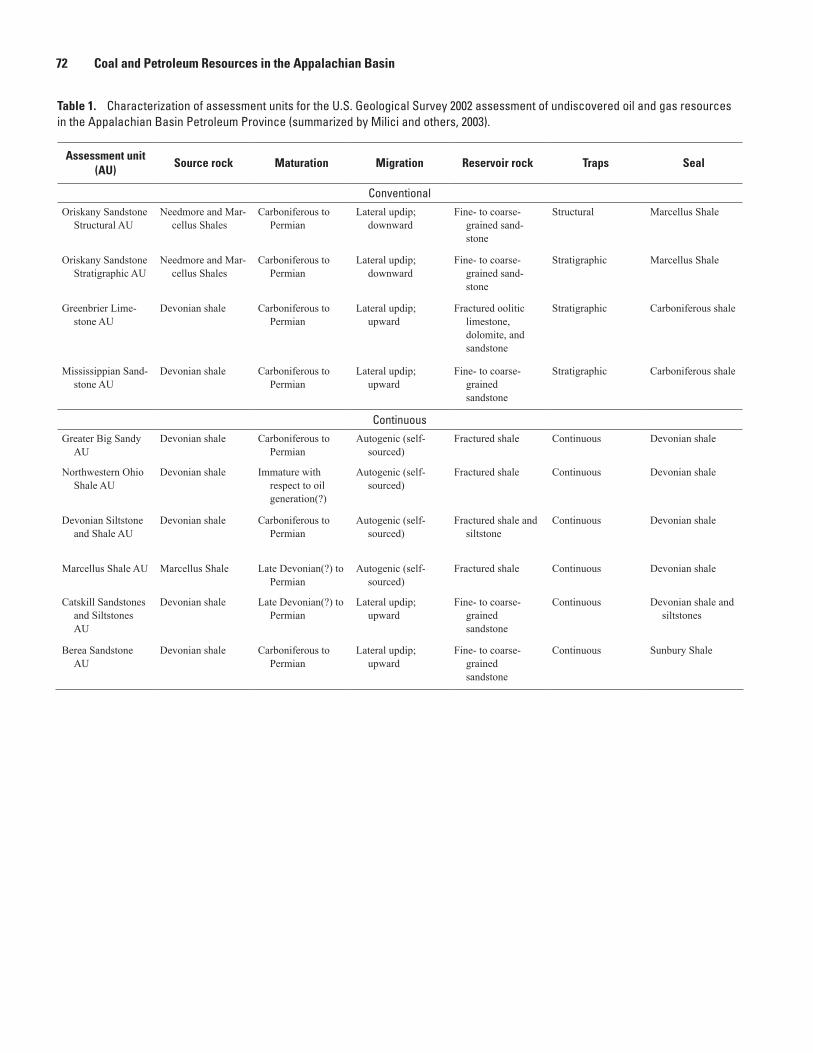
72 Coal and Petroleum Resources in the Appalachian Basin
Table 1. Characterization of assessment units for the U.S. Geological Survey 2002 assessment of undiscovered oil and gas resources in the Appalachian Basin Petroleum Province (summarized by Milici and others, 2003).
Assessment unit (AU)
Source rock Maturation Migration Reservoir rock Traps Seal
ConventionalOriskany Sandstone
Structural AUNeedmore and Mar-
cellus ShalesCarboniferous to
PermianLateral updip;
downwardFine- to coarse-
grained sand-stone
Structural Marcellus Shale
Oriskany Sandstone Stratigraphic AU
Needmore and Mar-cellus Shales
Carboniferous to Permian
Lateral updip; downward
Fine- to coarse-grained sand-stone
Stratigraphic Marcellus Shale
Greenbrier Lime-stone AU
Devonian shale Carboniferous to Permian
Lateral updip; upward
Fractured oolitic limestone, dolomite, and sandstone
Stratigraphic Carboniferous shale
Mississippian Sand-stone AU
Devonian shale Carboniferous to Permian
Lateral updip; upward
Fine- to coarse-grained sandstone
Stratigraphic Carboniferous shale
ContinuousGreater Big Sandy
AUDevonian shale Carboniferous to
PermianAutogenic (self-
sourced)Fractured shale Continuous Devonian shale
Northwestern Ohio Shale AU
Devonian shale Immature with respect to oil generation(?)
Autogenic (self-sourced)
Fractured shale Continuous Devonian shale
Devonian Siltstone and Shale AU
Devonian shale Carboniferous to Permian
Autogenic (self-sourced)
Fractured shale and siltstone
Continuous Devonian shale
Marcellus Shale AU Marcellus Shale Late Devonian(?) to Permian
Autogenic (self-sourced)
Fractured shale Continuous Devonian shale
Catskill Sandstones and Siltstones AU
Devonian shale Late Devonian(?) to Permian
Lateral updip; upward
Fine- to coarse-grained sandstone
Continuous Devonian shale and siltstones
Berea Sandstone AU
Devonian shale Carboniferous to Permian
Lateral updip; upward
Fine- to coarse-grained sandstone
Continuous Sunbury Shale
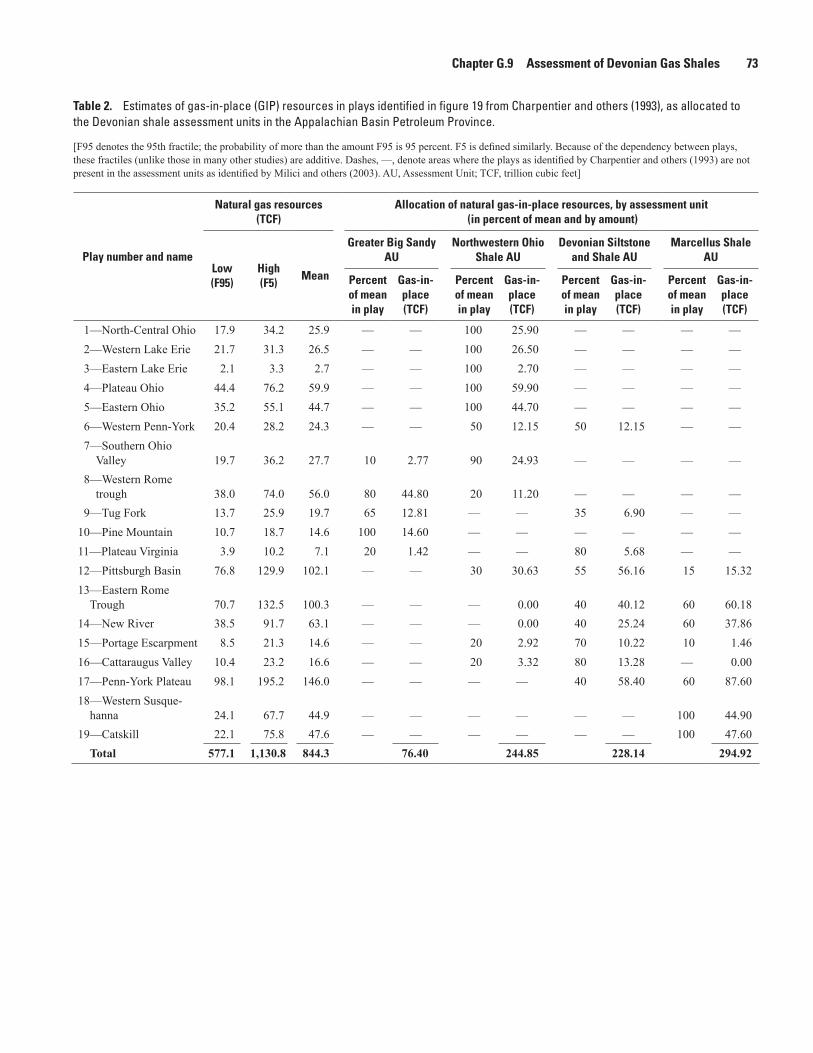
Chapter G.9 Assessment of Devonian Gas Shales 73
Table 2. Estimates of gas-in-place (GIP) resources in plays identified in figure 19 from Charpentier and others (1993), as allocated to the Devonian shale assessment units in the Appalachian Basin Petroleum Province.
[F95 denotes the 95th fractile; the probability of more than the amount F95 is 95 percent. F5 is defined similarly. Because of the dependency between plays, these fractiles (unlike those in many other studies) are additive. Dashes, —, denote areas where the plays as identified by Charpentier and others (1993) are not present in the assessment units as identified by Milici and others (2003). AU, Assessment Unit; TCF, trillion cubic feet]
Play number and name
Natural gas resources (TCF)
Allocation of natural gas-in-place resources, by assessment unit (in percent of mean and by amount)
Low (F95)
High (F5)
Mean
Greater Big Sandy AU
Northwestern Ohio Shale AU
Devonian Siltstone and Shale AU
Marcellus Shale AU
Percent of mean in play
Gas-in-place (TCF)
Percent of mean in play
Gas-in-place (TCF)
Percent of mean in play
Gas-in-place (TCF)
Percent of mean in play
Gas-in-place (TCF)
1—North-Central Ohio 17.9 34.2 25.9 — — 100 25.90 — — — —2—Western Lake Erie 21.7 31.3 26.5 — — 100 26.50 — — — —3—Eastern Lake Erie 2.1 3.3 2.7 — — 100 2.70 — — — —4—Plateau Ohio 44.4 76.2 59.9 — — 100 59.90 — — — —5—Eastern Ohio 35.2 55.1 44.7 — — 100 44.70 — — — —6—Western Penn-York 20.4 28.2 24.3 — — 50 12.15 50 12.15 — —7—Southern Ohio
Valley 19.7 36.2 27.7 10 2.77 90 24.93 — — — —8—Western Rome
trough 38.0 74.0 56.0 80 44.80 20 11.20 — — — —9—Tug Fork 13.7 25.9 19.7 65 12.81 — — 35 6.90 — —
10—Pine Mountain 10.7 18.7 14.6 100 14.60 — — — — — —11—Plateau Virginia 3.9 10.2 7.1 20 1.42 — — 80 5.68 — —12—Pittsburgh Basin 76.8 129.9 102.1 — — 30 30.63 55 56.16 15 15.3213—Eastern Rome
Trough 70.7 132.5 100.3 — — — 0.00 40 40.12 60 60.1814—New River 38.5 91.7 63.1 — — — 0.00 40 25.24 60 37.8615—Portage Escarpment 8.5 21.3 14.6 — — 20 2.92 70 10.22 10 1.4616—Cattaraugus Valley 10.4 23.2 16.6 — — 20 3.32 80 13.28 — 0.0017—Penn-York Plateau 98.1 195.2 146.0 — — — — 40 58.40 60 87.6018—Western Susque-
hanna 24.1 67.7 44.9 — — — — — — 100 44.9019—Catskill 22.1 75.8 47.6 — — — — — — 100 47.60
Total 577.1 1,130.8 844.3 76.40 244.85 228.14 294.92
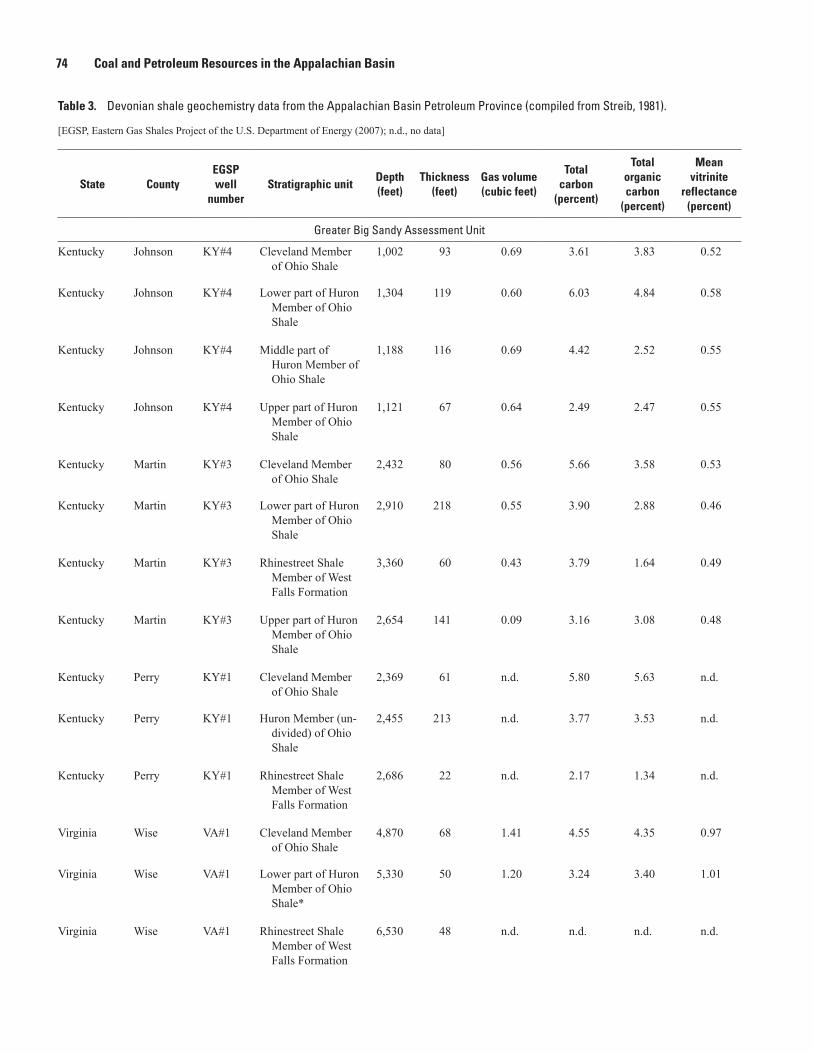
74 Coal and Petroleum Resources in the Appalachian Basin
Table 3. Devonian shale geochemistry data from the Appalachian Basin Petroleum Province (compiled from Streib, 1981).—Continued
[EGSP, Eastern Gas Shales Project of the U.S. Department of Energy (2007); n.d., no data]
State CountyEGSP well
numberStratigraphic unit
Depth (feet)
Thickness (feet)
Gas volume (cubic feet)
Total carbon
(percent)
Total organic carbon
(percent)
Mean vitrinite
reflectance (percent)
Greater Big Sandy Assessment Unit
Kentucky Johnson KY#4 Cleveland Member of Ohio Shale
1,002 93 0.69 3.61 3.83 0.52
Kentucky Johnson KY#4 Lower part of Huron Member of Ohio Shale
1,304 119 0.60 6.03 4.84 0.58
Kentucky Johnson KY#4 Middle part of Huron Member of Ohio Shale
1,188 116 0.69 4.42 2.52 0.55
Kentucky Johnson KY#4 Upper part of Huron Member of Ohio Shale
1,121 67 0.64 2.49 2.47 0.55
Kentucky Martin KY#3 Cleveland Member of Ohio Shale
2,432 80 0.56 5.66 3.58 0.53
Kentucky Martin KY#3 Lower part of Huron Member of Ohio Shale
2,910 218 0.55 3.90 2.88 0.46
Kentucky Martin KY#3 Rhinestreet Shale Member of West Falls Formation
3,360 60 0.43 3.79 1.64 0.49
Kentucky Martin KY#3 Upper part of Huron Member of Ohio Shale
2,654 141 0.09 3.16 3.08 0.48
Kentucky Perry KY#1 Cleveland Member of Ohio Shale
2,369 61 n.d. 5.80 5.63 n.d.
Kentucky Perry KY#1 Huron Member (un-divided) of Ohio Shale
2,455 213 n.d. 3.77 3.53 n.d.
Kentucky Perry KY#1 Rhinestreet Shale Member of West Falls Formation
2,686 22 n.d. 2.17 1.34 n.d.
Virginia Wise VA#1 Cleveland Member of Ohio Shale
4,870 68 1.41 4.55 4.35 0.97
Virginia Wise VA#1 Lower part of Huron Member of Ohio Shale*
5,330 50 1.20 3.24 3.40 1.01
Virginia Wise VA#1 Rhinestreet Shale Member of West Falls Formation
6,530 48 n.d. n.d. n.d. n.d.
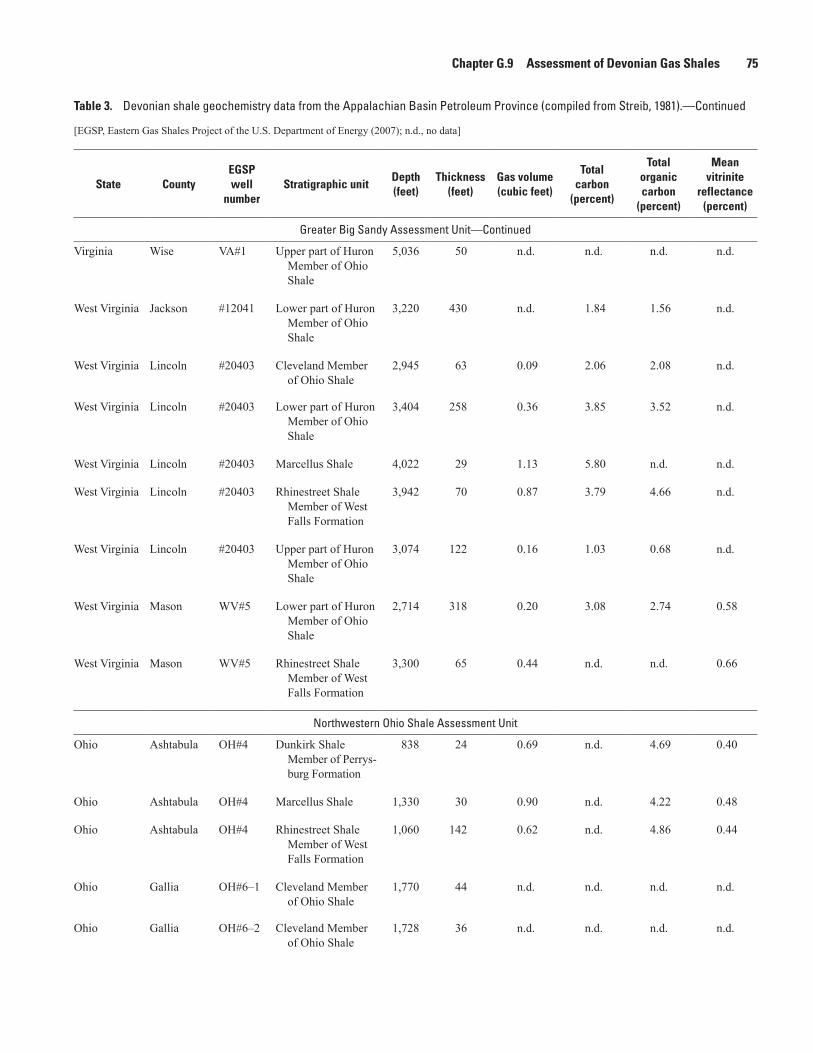
Chapter G.9 Assessment of Devonian Gas Shales 75
Table 3. Devonian shale geochemistry data from the Appalachian Basin Petroleum Province (compiled from Streib, 1981).—Continued
[EGSP, Eastern Gas Shales Project of the U.S. Department of Energy (2007); n.d., no data]
State CountyEGSP well
numberStratigraphic unit
Depth (feet)
Thickness (feet)
Gas volume (cubic feet)
Total carbon
(percent)
Total organic carbon
(percent)
Mean vitrinite
reflectance (percent)
Greater Big Sandy Assessment Unit—Continued
Virginia Wise VA#1 Upper part of Huron Member of Ohio Shale
5,036 50 n.d. n.d. n.d. n.d.
West Virginia Jackson #12041 Lower part of Huron Member of Ohio Shale
3,220 430 n.d. 1.84 1.56 n.d.
West Virginia Lincoln #20403 Cleveland Member of Ohio Shale
2,945 63 0.09 2.06 2.08 n.d.
West Virginia Lincoln #20403 Lower part of Huron Member of Ohio Shale
3,404 258 0.36 3.85 3.52 n.d.
West Virginia Lincoln #20403 Marcellus Shale 4,022 29 1.13 5.80 n.d. n.d.
West Virginia Lincoln #20403 Rhinestreet Shale Member of West Falls Formation
3,942 70 0.87 3.79 4.66 n.d.
West Virginia Lincoln #20403 Upper part of Huron Member of Ohio Shale
3,074 122 0.16 1.03 0.68 n.d.
West Virginia Mason WV#5 Lower part of Huron Member of Ohio Shale
2,714 318 0.20 3.08 2.74 0.58
West Virginia Mason WV#5 Rhinestreet Shale Member of West Falls Formation
3,300 65 0.44 n.d. n.d. 0.66
Northwestern Ohio Shale Assessment Unit
Ohio Ashtabula OH#4 Dunkirk Shale Member of Perrys-burg Formation
838 24 0.69 n.d. 4.69 0.40
Ohio Ashtabula OH#4 Marcellus Shale 1,330 30 0.90 n.d. 4.22 0.48
Ohio Ashtabula OH#4 Rhinestreet Shale Member of West Falls Formation
1,060 142 0.62 n.d. 4.86 0.44
Ohio Gallia OH#6–1 Cleveland Member of Ohio Shale
1,770 44 n.d. n.d. n.d. n.d.
Ohio Gallia OH#6–2 Cleveland Member of Ohio Shale
1,728 36 n.d. n.d. n.d. n.d.
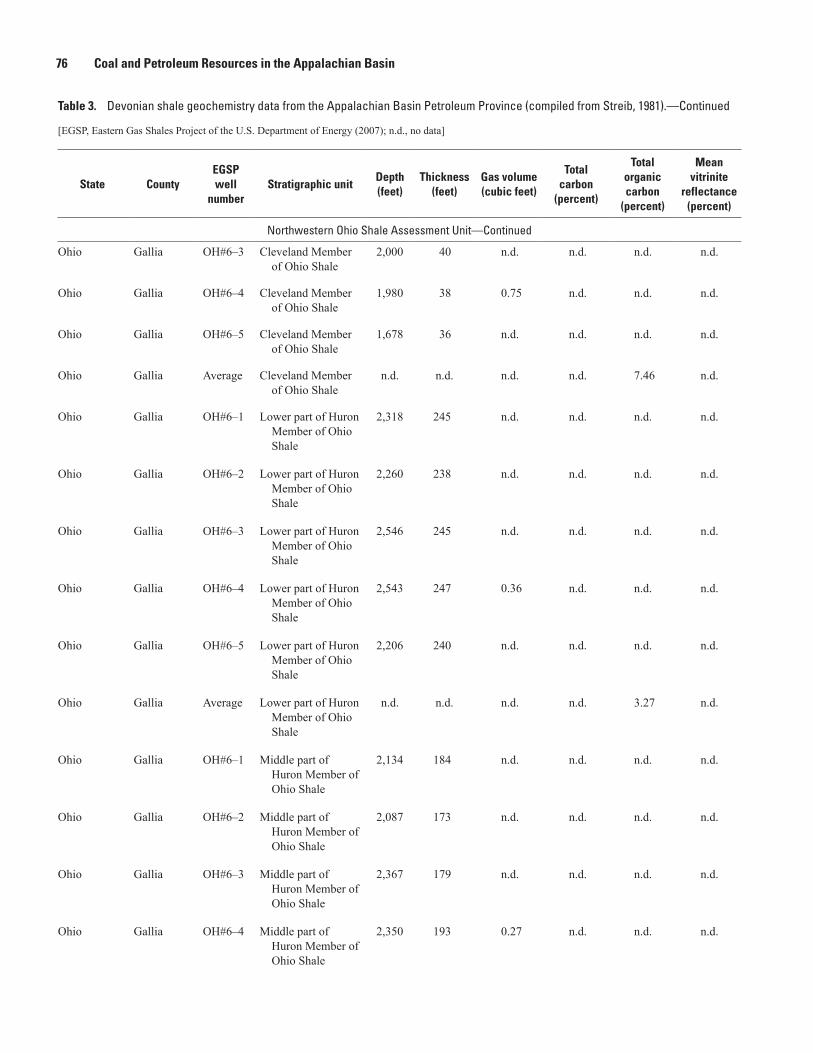
76 Coal and Petroleum Resources in the Appalachian Basin
Table 3. Devonian shale geochemistry data from the Appalachian Basin Petroleum Province (compiled from Streib, 1981).—Continued
[EGSP, Eastern Gas Shales Project of the U.S. Department of Energy (2007); n.d., no data]
State CountyEGSP well
numberStratigraphic unit
Depth (feet)
Thickness (feet)
Gas volume (cubic feet)
Total carbon
(percent)
Total organic carbon
(percent)
Mean vitrinite
reflectance (percent)
Northwestern Ohio Shale Assessment Unit—Continued
Ohio Gallia OH#6–3 Cleveland Member of Ohio Shale
2,000 40 n.d. n.d. n.d. n.d.
Ohio Gallia OH#6–4 Cleveland Member of Ohio Shale
1,980 38 0.75 n.d. n.d. n.d.
Ohio Gallia OH#6–5 Cleveland Member of Ohio Shale
1,678 36 n.d. n.d. n.d. n.d.
Ohio Gallia Average Cleveland Member of Ohio Shale
n.d. n.d. n.d. n.d. 7.46 n.d.
Ohio Gallia OH#6–1 Lower part of Huron Member of Ohio Shale
2,318 245 n.d. n.d. n.d. n.d.
Ohio Gallia OH#6–2 Lower part of Huron Member of Ohio Shale
2,260 238 n.d. n.d. n.d. n.d.
Ohio Gallia OH#6–3 Lower part of Huron Member of Ohio Shale
2,546 245 n.d. n.d. n.d. n.d.
Ohio Gallia OH#6–4 Lower part of Huron Member of Ohio Shale
2,543 247 0.36 n.d. n.d. n.d.
Ohio Gallia OH#6–5 Lower part of Huron Member of Ohio Shale
2,206 240 n.d. n.d. n.d. n.d.
Ohio Gallia Average Lower part of Huron Member of Ohio Shale
n.d. n.d. n.d. n.d. 3.27 n.d.
Ohio Gallia OH#6–1 Middle part of Huron Member of Ohio Shale
2,134 184 n.d. n.d. n.d. n.d.
Ohio Gallia OH#6–2 Middle part of Huron Member of Ohio Shale
2,087 173 n.d. n.d. n.d. n.d.
Ohio Gallia OH#6–3 Middle part of Huron Member of Ohio Shale
2,367 179 n.d. n.d. n.d. n.d.
Ohio Gallia OH#6–4 Middle part of Huron Member of Ohio Shale
2,350 193 0.27 n.d. n.d. n.d.
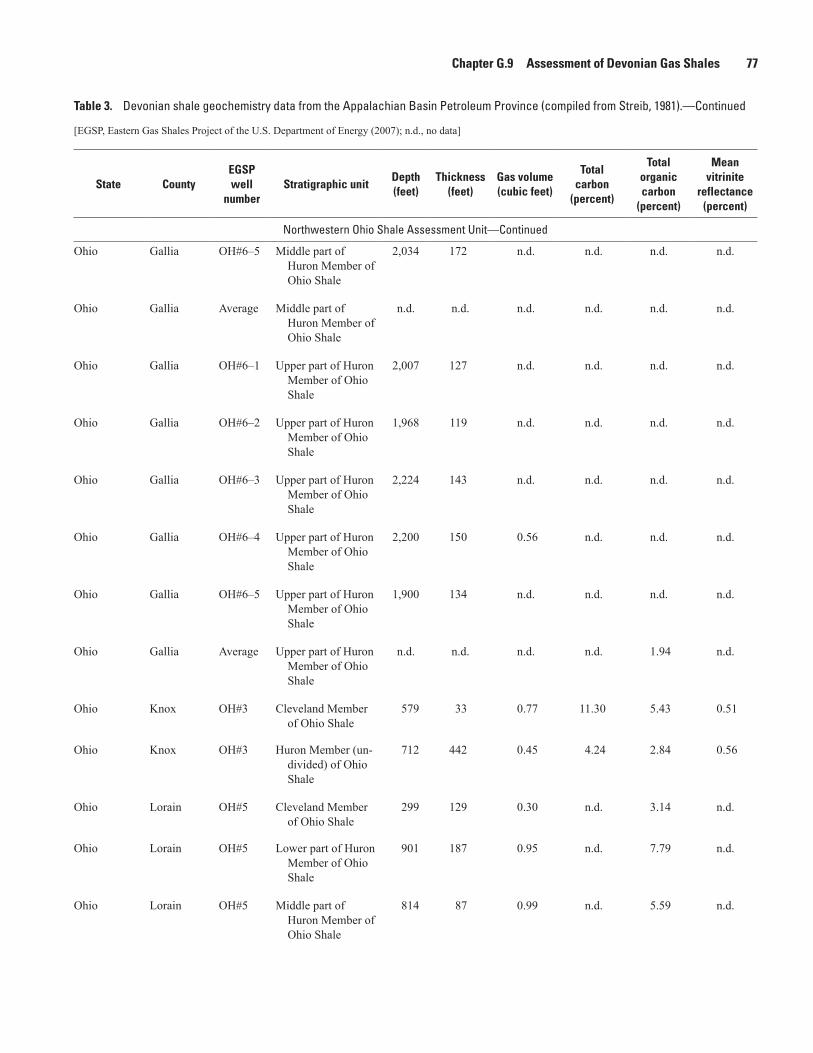
Chapter G.9 Assessment of Devonian Gas Shales 77
Table 3. Devonian shale geochemistry data from the Appalachian Basin Petroleum Province (compiled from Streib, 1981).—Continued
[EGSP, Eastern Gas Shales Project of the U.S. Department of Energy (2007); n.d., no data]
State CountyEGSP well
numberStratigraphic unit
Depth (feet)
Thickness (feet)
Gas volume (cubic feet)
Total carbon
(percent)
Total organic carbon
(percent)
Mean vitrinite
reflectance (percent)
Northwestern Ohio Shale Assessment Unit—Continued
Ohio Gallia OH#6–5 Middle part of Huron Member of Ohio Shale
2,034 172 n.d. n.d. n.d. n.d.
Ohio Gallia Average Middle part of Huron Member of Ohio Shale
n.d. n.d. n.d. n.d. n.d. n.d.
Ohio Gallia OH#6–1 Upper part of Huron Member of Ohio Shale
2,007 127 n.d. n.d. n.d. n.d.
Ohio Gallia OH#6–2 Upper part of Huron Member of Ohio Shale
1,968 119 n.d. n.d. n.d. n.d.
Ohio Gallia OH#6–3 Upper part of Huron Member of Ohio Shale
2,224 143 n.d. n.d. n.d. n.d.
Ohio Gallia OH#6–4 Upper part of Huron Member of Ohio Shale
2,200 150 0.56 n.d. n.d. n.d.
Ohio Gallia OH#6–5 Upper part of Huron Member of Ohio Shale
1,900 134 n.d. n.d. n.d. n.d.
Ohio Gallia Average Upper part of Huron Member of Ohio Shale
n.d. n.d. n.d. n.d. 1.94 n.d.
Ohio Knox OH#3 Cleveland Member of Ohio Shale
579 33 0.77 11.30 5.43 0.51
Ohio Knox OH#3 Huron Member (un-divided) of Ohio Shale
712 442 0.45 4.24 2.84 0.56
Ohio Lorain OH#5 Cleveland Member of Ohio Shale
299 129 0.30 n.d. 3.14 n.d.
Ohio Lorain OH#5 Lower part of Huron Member of Ohio Shale
901 187 0.95 n.d. 7.79 n.d.
Ohio Lorain OH#5 Middle part of Huron Member of Ohio Shale
814 87 0.99 n.d. 5.59 n.d.
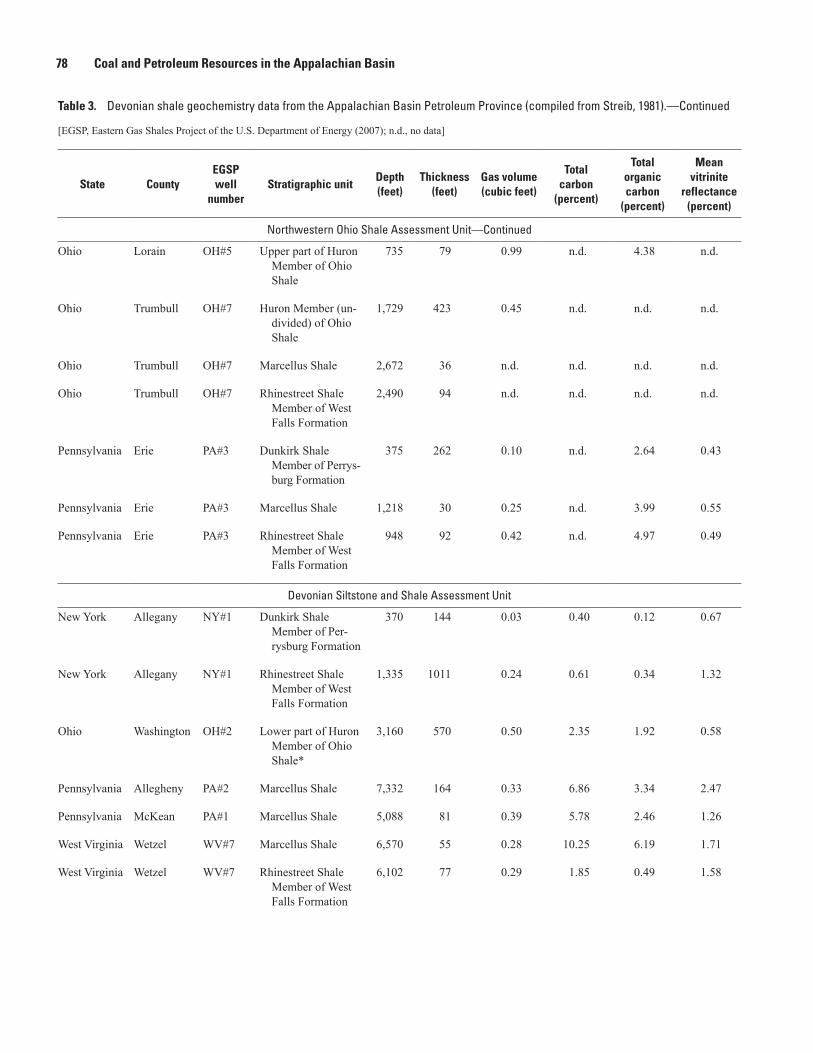
78 Coal and Petroleum Resources in the Appalachian Basin
Table 3. Devonian shale geochemistry data from the Appalachian Basin Petroleum Province (compiled from Streib, 1981).—Continued
[EGSP, Eastern Gas Shales Project of the U.S. Department of Energy (2007); n.d., no data]
State CountyEGSP well
numberStratigraphic unit
Depth (feet)
Thickness (feet)
Gas volume (cubic feet)
Total carbon
(percent)
Total organic carbon
(percent)
Mean vitrinite
reflectance (percent)
Northwestern Ohio Shale Assessment Unit—Continued
Ohio Lorain OH#5 Upper part of Huron Member of Ohio Shale
735 79 0.99 n.d. 4.38 n.d.
Ohio Trumbull OH#7 Huron Member (un-divided) of Ohio Shale
1,729 423 0.45 n.d. n.d. n.d.
Ohio Trumbull OH#7 Marcellus Shale 2,672 36 n.d. n.d. n.d. n.d.
Ohio Trumbull OH#7 Rhinestreet Shale Member of West Falls Formation
2,490 94 n.d. n.d. n.d. n.d.
Pennsylvania Erie PA#3 Dunkirk Shale Member of Perrys-burg Formation
375 262 0.10 n.d. 2.64 0.43
Pennsylvania Erie PA#3 Marcellus Shale 1,218 30 0.25 n.d. 3.99 0.55
Pennsylvania Erie PA#3 Rhinestreet Shale Member of West Falls Formation
948 92 0.42 n.d. 4.97 0.49
Devonian Siltstone and Shale Assessment Unit
New York Allegany NY#1 Dunkirk Shale Member of Per-rysburg Formation
370 144 0.03 0.40 0.12 0.67
New York Allegany NY#1 Rhinestreet Shale Member of West Falls Formation
1,335 1011 0.24 0.61 0.34 1.32
Ohio Washington OH#2 Lower part of Huron Member of Ohio Shale*
3,160 570 0.50 2.35 1.92 0.58
Pennsylvania Allegheny PA#2 Marcellus Shale 7,332 164 0.33 6.86 3.34 2.47
Pennsylvania McKean PA#1 Marcellus Shale 5,088 81 0.39 5.78 2.46 1.26
West Virginia Wetzel WV#7 Marcellus Shale 6,570 55 0.28 10.25 6.19 1.71
West Virginia Wetzel WV#7 Rhinestreet Shale Member of West Falls Formation
6,102 77 0.29 1.85 0.49 1.58
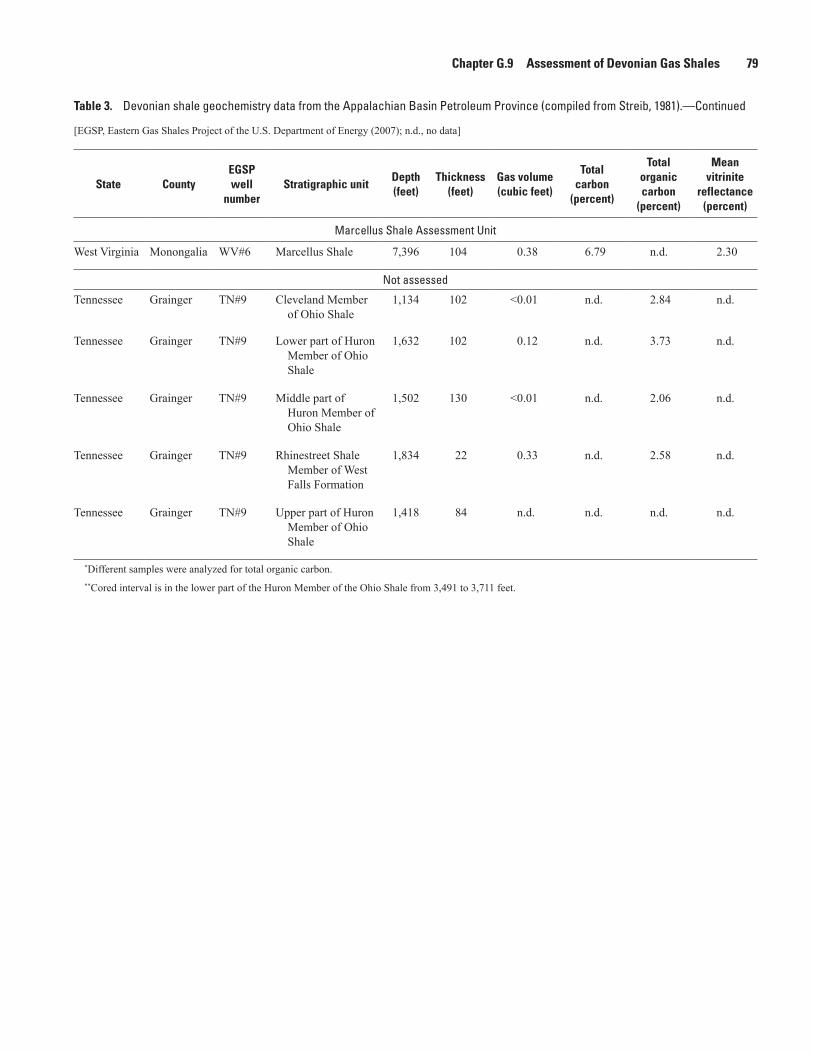
Chapter G.9 Assessment of Devonian Gas Shales 79
Table 3. Devonian shale geochemistry data from the Appalachian Basin Petroleum Province (compiled from Streib, 1981).—Continued
[EGSP, Eastern Gas Shales Project of the U.S. Department of Energy (2007); n.d., no data]
State CountyEGSP well
numberStratigraphic unit
Depth (feet)
Thickness (feet)
Gas volume (cubic feet)
Total carbon
(percent)
Total organic carbon
(percent)
Mean vitrinite
reflectance (percent)
Marcellus Shale Assessment Unit
West Virginia Monongalia WV#6 Marcellus Shale 7,396 104 0.38 6.79 n.d. 2.30
Not assessed
Tennessee Grainger TN#9 Cleveland Member of Ohio Shale
1,134 102 <0.01 n.d. 2.84 n.d.
Tennessee Grainger TN#9 Lower part of Huron Member of Ohio Shale
1,632 102 0.12 n.d. 3.73 n.d.
Tennessee Grainger TN#9 Middle part of Huron Member of Ohio Shale
1,502 130 <0.01 n.d. 2.06 n.d.
Tennessee Grainger TN#9 Rhinestreet Shale Member of West Falls Formation
1,834 22 0.33 n.d. 2.58 n.d.
Tennessee Grainger TN#9 Upper part of Huron Member of Ohio Shale
1,418 84 n.d. n.d. n.d. n.d.
*Different samples were analyzed for total organic carbon.**Cored interval is in the lower part of the Huron Member of the Ohio Shale from 3,491 to 3,711 feet.
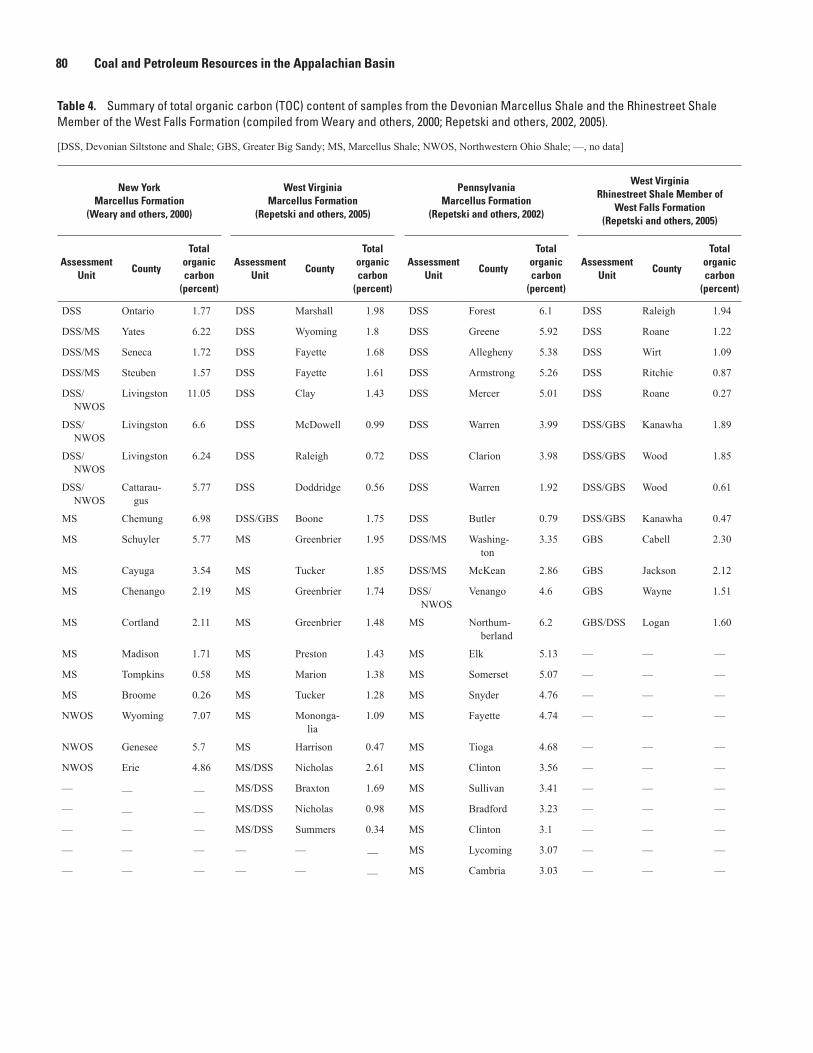
80 Coal and Petroleum Resources in the Appalachian Basin
Table 4. Summary of total organic carbon (TOC) content of samples from the Devonian Marcellus Shale and the Rhinestreet Shale Member of the West Falls Formation (compiled from Weary and others, 2000; Repetski and others, 2002, 2005).—Continued
[DSS, Devonian Siltstone and Shale; GBS, Greater Big Sandy; MS, Marcellus Shale; NWOS, Northwestern Ohio Shale; —, no data]
New York Marcellus Formation
(Weary and others, 2000)
West Virginia Marcellus Formation
(Repetski and others, 2005)
Pennsylvania Marcellus Formation
(Repetski and others, 2002)
West Virginia Rhinestreet Shale Member of
West Falls Formation (Repetski and others, 2005)
Assessment Unit
County
Total organic carbon
(percent)
Assessment Unit
County
Total organic carbon
(percent)
Assessment Unit
County
Total organic carbon
(percent)
Assessment Unit
County
Total organic carbon
(percent)
DSS Ontario 1.77 DSS Marshall 1.98 DSS Forest 6.1 DSS Raleigh 1.94
DSS/MS Yates 6.22 DSS Wyoming 1.8 DSS Greene 5.92 DSS Roane 1.22
DSS/MS Seneca 1.72 DSS Fayette 1.68 DSS Allegheny 5.38 DSS Wirt 1.09
DSS/MS Steuben 1.57 DSS Fayette 1.61 DSS Armstrong 5.26 DSS Ritchie 0.87
DSS/NWOS
Livingston 11.05 DSS Clay 1.43 DSS Mercer 5.01 DSS Roane 0.27
DSS/NWOS
Livingston 6.6 DSS McDowell 0.99 DSS Warren 3.99 DSS/GBS Kanawha 1.89
DSS/NWOS
Livingston 6.24 DSS Raleigh 0.72 DSS Clarion 3.98 DSS/GBS Wood 1.85
DSS/NWOS
Cattarau-gus
5.77 DSS Doddridge 0.56 DSS Warren 1.92 DSS/GBS Wood 0.61
MS Chemung 6.98 DSS/GBS Boone 1.75 DSS Butler 0.79 DSS/GBS Kanawha 0.47
MS Schuyler 5.77 MS Greenbrier 1.95 DSS/MS Washing-ton
3.35 GBS Cabell 2.30
MS Cayuga 3.54 MS Tucker 1.85 DSS/MS McKean 2.86 GBS Jackson 2.12
MS Chenango 2.19 MS Greenbrier 1.74 DSS/NWOS
Venango 4.6 GBS Wayne 1.51
MS Cortland 2.11 MS Greenbrier 1.48 MS Northum-berland
6.2 GBS/DSS Logan 1.60
MS Madison 1.71 MS Preston 1.43 MS Elk 5.13 — — —
MS Tompkins 0.58 MS Marion 1.38 MS Somerset 5.07 — — —
MS Broome 0.26 MS Tucker 1.28 MS Snyder 4.76 — — —
NWOS Wyoming 7.07 MS Mononga-lia
1.09 MS Fayette 4.74 — — —
NWOS Genesee 5.7 MS Harrison 0.47 MS Tioga 4.68 — — —
NWOS Erie 4.86 MS/DSS Nicholas 2.61 MS Clinton 3.56 — — —
— — — MS/DSS Braxton 1.69 MS Sullivan 3.41 — — —
— — — MS/DSS Nicholas 0.98 MS Bradford 3.23 — — —
— — — MS/DSS Summers 0.34 MS Clinton 3.1 — — —
— — — — — — MS Lycoming 3.07 — — —
— — — — — — MS Cambria 3.03 — — —
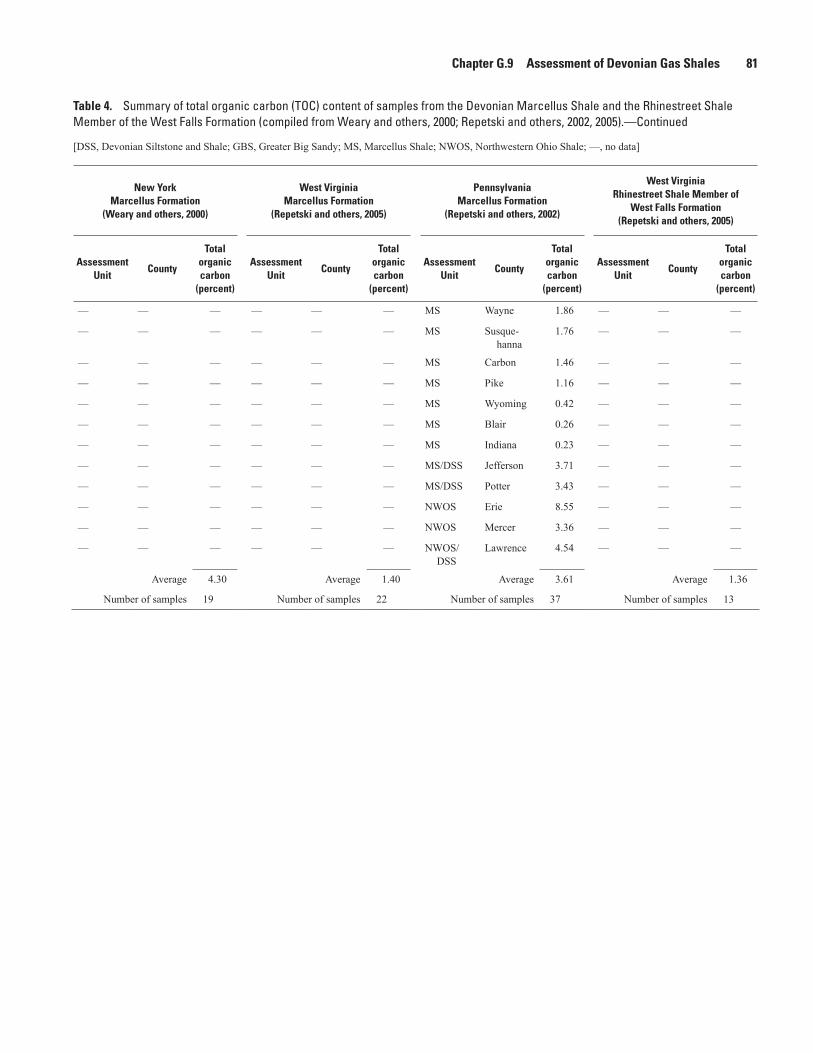
Chapter G.9 Assessment of Devonian Gas Shales 81
Table 4. Summary of total organic carbon (TOC) content of samples from the Devonian Marcellus Shale and the Rhinestreet Shale Member of the West Falls Formation (compiled from Weary and others, 2000; Repetski and others, 2002, 2005).—Continued
[DSS, Devonian Siltstone and Shale; GBS, Greater Big Sandy; MS, Marcellus Shale; NWOS, Northwestern Ohio Shale; —, no data]
New York Marcellus Formation
(Weary and others, 2000)
West Virginia Marcellus Formation
(Repetski and others, 2005)
Pennsylvania Marcellus Formation
(Repetski and others, 2002)
West Virginia Rhinestreet Shale Member of
West Falls Formation (Repetski and others, 2005)
Assessment Unit
County
Total organic carbon
(percent)
Assessment Unit
County
Total organic carbon
(percent)
Assessment Unit
County
Total organic carbon
(percent)
Assessment Unit
County
Total organic carbon
(percent)
— — — — — — MS Wayne 1.86 — — —
— — — — — — MS Susque-hanna
1.76 — — —
— — — — — — MS Carbon 1.46 — — —
— — — — — — MS Pike 1.16 — — —
— — — — — — MS Wyoming 0.42 — — —
— — — — — — MS Blair 0.26 — — —
— — — — — — MS Indiana 0.23 — — —
— — — — — — MS/DSS Jefferson 3.71 — — —
— — — — — — MS/DSS Potter 3.43 — — —
— — — — — — NWOS Erie 8.55 — — —
— — — — — — NWOS Mercer 3.36 — — —
— — — — — — NWOS/DSS
Lawrence 4.54 — — —
Average 4.30 Average 1.40 Average 3.61 Average 1.36
Number of samples 19 Number of samples 22 Number of samples 37 Number of samples 13


