Embed Size (px)
Citation preview

Author Date
JULIETTE MALLEY ET AL 2006
Background Paper
wanlesssocialcare
review
Download full report,Securing Good Care for Older People, fromwww.kingsfund.org.uk/publications
THE KING’S FUND IS AN INDEPENDENT CHARITABLE FOUNDATION WORKING FOR BETTER HEALTH, ESPECIALLY IN LONDON. WE CARRY OUT
RESEARCH, POLICY ANALYSIS AND DEVELOPMENT ACTIVITIES, WORKING ON OUR OWN, IN PARTNERSHIPS, AND THROUGH FUNDING. WE ARE
A MAJOR RESOURCE TO PEOPLE WORKING IN HEALTH AND SOCIAL CARE, OFFERING LEADERSHIP DEVELOPMENT PROGRAMMES; SEMINARS
AND WORKSHOPS; PUBLICATIONS; INFORMATION AND LIBRARY SERVICES; AND CONFERENCE AND MEETING FACILITIES.
KING’S FUND11–13 CAVENDISH SQUARELONDON W1G 0ANTelephone 020 7307 2400www.kingsfund.org.uk
Expenditure onSocial Care forOlder Peopleto 2026


EXPENDITURE ON SOCIAL CAREFOR OLDER PEOPLE TO 2026 PROJECTED FINANCIAL IMPLICATIONS OF THE WANLESS REPORT
Juliette Malley,1 Adelina Comas-Herrera,1 Ruth Hancock,2 Ariadna Juarez-Garcia,3 Derek King1 andLinda Pickard1
1 Personal Social Services Research Unit, London School of Economics2 Department of Health and Human Sciences, University of Essex3 Health Services Management Centre, University of Birmingham
wanlesssocialcare
review

© King’s Fund 2006
First published 2006 by the King’s Fund.
Charity registration number: 207401
All rights reserved, including the right of reproduction in whole or in part in any form.
www.kingsfund.org.uk/publications
Typeset by Andrew Haig and AssociatesFront cover image by Sara Hannant www.sarahannant.com
This is one of a series of appendices to Securing Good Care for Older People. Download full reportfrom www.kingsfund.org.uk/publications

Acknowledgements vi
Introduction 1
Description of models 2PSSRU Wanless review model 2CARESIM model description 12
Key projections 14Patterns of care 16
What happens if the key assumptions change? 35Changing assumptions about trends in disability rates 35Changing assumptions about the unit cost of services 38Availability of informal care scenarios 40Variations in take-up of services 43
Discussion 47
Summary of projections under variant scenarios 48
Bibliography 49
Contents

This paper arises from research financed by the King’s Fund on behalf of the Wanlessreview. It builds on the Personal Social Services Research Unit (PSSRU) model, which wasdeveloped with financial support from the Department of Health, the CARESIM model,which was developed with financial support from the Nuffield Foundation, and linkagesbetween the models, which were funded by the Institute for Public Policy Research (IPPR)and the Nuffield Foundation.
Material from the Family Resources Survey and the General Household Survey is crowncopyright, made available by the Office for National Statistics via the UK Data Archive, andis used with permission.
The authors are grateful to the Wanless review team for funding the modelling and analysisset out in this paper, and in particular to Julien Forder and Jose-Luis Fernandez for theircontribution to the modelling and their helpful comments on an earlier version of thispaper.
All responsibility for the analysis and views expressed in this paper rests with the authors.It should be made clear, however, that the authors of this paper are independent of theWanless review team and have not participated in the development of the normativeapproach adopted by them.
Acknowledgements
vi EXPENDITURE ON SOCIAL CARE FOR OLDER PEOPLE TO 2026

As part of the Wanless review of social care for older people, the King’s Fundcommissioned the Personal Social Services Research Unit (PSSRU) at the London School ofEconomics and the University of Essex to make projections of expenditure on socialservices for older people. This paper presents the results of the research. It reports onprojections to 2026 of demand for social services for older people and associatedexpenditure in England.
The approach taken by the Wanless review team is described in detail in its report,Securing Good Care for Older People: Taking a long-term view (Wanless 2006) and can becharacterised as ‘normative’; projections are based on various assumptions about how, inthe view of the Wanless review team, services should be allocated to achieve statedoutcomes. This represents a departure from the ‘positive’ approach taken by the PSSRUlong-term care team, where projections are based on analyses of how services arecurrently allocated. A separate version of the PSSRU long-term care finance model hasbeen developed to produce the analysis commissioned by the Wanless review team. Thestructure and basis of the Wanless review version of the model draw, however, on existingwork carried out by the PSSRU long-term care team and established links with theCARESIM model at the University of Essex.
It should be emphasised that the estimates provided by this report are not forecasts aboutthe future; they are projections made on the basis of specific assumptions about futuretrends. This is of particular importance to the Wanless review version of the model becauseit assumes a completely different pattern of services, based on explicitly stated outcomesthat, in the view of the Wanless review team, should be delivered by social services. Wecan never know with any degree of certainty how people will react to changes in a system,especially one as complex as social services; we can only extrapolate how they mightbehave according to past behaviour.
The paper has five sections. A description of the models used to produce the projectionsin this report is given in the second section. The third discusses the main projections.Three different scenarios are presented that model the two possible future service modelscommended by the Wanless review team and a further scenario reflecting existing patternsof care. In the fourth section we explore the sensitivity of these projections to changes inkey assumptions and the final section concludes the paper with a brief discussion.
INTRODUCTION 1
Introduction

In this section we describe the models used to produce the projections reported in thispaper. The Personal Social Services Research Unit (PSSRU) Wanless review model isdescribed first because this model was used to produce the projections of numbers ofservice users and overall expenditure; the CARESIM model is then described. The modelshave been used together with other studies in order to address the question of how costswould be divided between public and private sources of finance under different chargingsystems. In effect, the models work together by examining the effect of changing thecharging system on the split between sources of funding. Several different scenarios havebeen developed over a series of papers (Wittenberg et al 2002, Hancock et al 2003, 2006).For the purposes of this report we have considered only two of the scenarios: howexpenditure would be broken down by source under the current funding system and undera policy of ‘free’ personal care; a detailed discussion of how changes to the chargingsystem would alter the balance between public and private contributions to financingsocial services is found in Hancock et al (2006). Figure 1 opposite provides an overview ofthe PSSRU Wanless review model and linkages between the models and sets out thesources of data.
PSSRU Wanless review modelThe PSSRU long-term care finance model is a cell-based (or macro-simulation) model andtakes the form of an Excel spreadsheet. It is described in detail by Wittenberg andcolleagues (2006). It was designed to make projections of the likely demand for long-termcare in England to 2041 under different scenarios. For the purposes of the study reportedin this paper, an adapted version of the model was developed, the PSSRU social careprojections model for the Wanless review, which makes projections of demand for socialservices for older people in England to 2026.
The adapted version is outlined in Figure 1 overleaf, with sources of data shown. It consistsof five main parts. The first part estimates the numbers of older people with differentdegrees of functional disability by age group, gender, household type, receipt of informalcare and housing tenure. The second part estimates the level of demand for serviceswithin the population. The third part covers total social services expenditure, and thefourth part allocates the expenditure to the various sources of funding. The final partestimates the workforce providing social services for older people.
The principal difference between the PSSRU model for social care projections for theWanless review (referred to as the PSSRU Wanless model) and that for long-term carefinance (referred to as the standard model) is in the way that service receipt is treated(second part). The standard model starts by asking what services older people receiveunder current patterns of care. Data on service receipt taken from Department of Health
Description of models
2 EXPENDITURE ON SOCIAL CARE FOR OLDER PEOPLE TO 2026

statistical bulletins and the 2001/2 General Household Survey (GHS) are used to estimatethe numbers of older users of services by age, gender, degree of disability, householdcomposition, receipt of informal care and housing tenure.
The PSSRU Wanless model starts from a different position. It asks first who should receiveservices and then what services they should receive, on the basis of desired outcomes (asdetermined by the Wanless review team) and the costs of achieving those outcomes.
DESCRIPTION OF MODELS 3
STRUCTURE OF THE PSSRU WANLESS MODEL
Source: Office of National Statistics 2005a
1
Allocation of older people to sub-groupsaccording to functional disability,household type and housing tenure
Source: Office for National Statistics 2001
Assignment of informal care, by source ofcare (children, spouse and other), to sub-groups of functionally disabled older people
Source: Office for National Statistics 2001
Functions assigning demand for services, byinput type, to the older population accordingto functional disability, and householdcomposition or receipt of informal care
Source: Wanless analysis
Projected level of demand for formalinstitutional and community-based socialservices
Intensity of use of community-based formalcare services and informal care
Source: Wanless analysis
Projected real expenditure on formal careservices
Projected expenditure on formal services bysource of finance: social services and serviceusers
Unit cost of formal care services
Sources: Curtis and Netten 2004; Laing & Buisson2004
Projected numbers of actual recipients offormal institutional and community-basedsocial services
Subtraction of those who decline servicesaccording to functional disability, andhousehold composition or receipt ofinformal care
Source: Wanless analysis
Distribution of costs to funding sources
Source: CARESIM microsimulation model
Projected numbers of potential recipients offormal institutional and community-basedsocial services
Projected numbers of functionally disabledpeople in receipt of informal help, byhousehold composition and functionaldisability
Projected numbers of older people, by agegroup, gender, functional disability,household type and housing tenure
England’s population aged 65+, by agegroup, gender and marital status
Sources: Government Actuary’s Department 2005;Office for National Statistics 2005

Development of the PSSRU Wanless model has been conducted together with the Wanlessreview team and draws on their analyses (reported in Chapter 10 of their report) of needand demand for services in 2002. The picture produced from these analyses is used topopulate the base year of the PSSRU Wanless model, 2002, from which all subsequentyears are derived. The technical details of the model are described in more detail below.
Projected numbers of older people by disability and householdtype/informal careAs in the standard model, the PSSRU Wanless model uses the 2004-based populationprojections of the Government Actuary’s Department (GAD 2005) as the basis for thenumbers of people by age band and sex in each year under consideration until 2026. TheGAD also produces a number of variant projections because of uncertainty about changingmortality and migration rates. Such uncertainty is not explored in this report; however, ithas been shown in previous reports by the long-term care finance team that the GADvariants do not have a substantial impact on demand for and expenditure on services to2026. The first part of the model splits the older population according to a number ofcharacteristics, such as the level of functional disability (measured in terms of activities ofdaily living or ADLs), marital status, whether living alone, with a partner or children,housing tenure, and receipt of informal care (by spouses, children or others). These are allrelevant to the use of services but two of the breakdowns are of special relevance in thisversion of the model: functional disability and household type/receipt of informal care.
Following the method used in the standard model, the projected older population by ageband and gender are separated into disability groups. Disability is a crucial factor inconsidering need for long-term care from social services, because it is disability ratherthan age that influences need for care. For this reason it is an important driving force indetermining receipt of services in the PSSRU social care projections model. Previousstudies have shown that projections of long-term care expenditure are sensitive toassumptions about future rates of disability among older people (Nuttall et al 1994; Houseof Commons Health Committee 1996; Lagergren and Batljan 2000; Wittenberg et al 2001,2006; Rothgang et al 2003; Karlsson et al 2005). The model uses as a measure of disabilitythe ability to perform ADLs and instrumental activities of daily living (IADLs). Data from the2001/2 GHS is used to break the older population into five categories of disability (see boxopposite), ranging from no disability to inability to perform two or more ADLs without help.
Disability groups used in the PSSRU Wanless modelAnother key factor in the receipt of long-term care is household type (Arber et al 1988;Davies et al 1990; McNamee et al 1999). In general, older people who live alone are morelikely to receive formal services than those living with others (Evandrou 2005), whereasthose living with others are more likely to receive informal care (Pickard et al 2000). As aresult of the close relationship between household type and informal care, there is a singleclassification in the standard model for household type/informal care, and the PSSRUWanless model utilises this classification to separate the population into furthergroupings.
The household type/informal care classification in the standard model is based, in the firstinstance, on de facto marital status. Older people who are married or cohabiting are
4 EXPENDITURE ON SOCIAL CARE FOR OLDER PEOPLE TO 2026
distinguished from those who are single, separated, divorced or widowed. The two maritalstatus groups, those who are de facto married and those who are de facto single, arebroken down into five household types using official national statistics for 2002 and the2001/2 GHS. The propensity within marital status groups to live alone, with children orwith others, is based on multivariate (logit) analysis of the GHS data and is assumed toremain constant in the projections (Wittenberg et al 2006). The following five householdtype categories are distinguished: single alone, single with children, single with others,couple alone and couple with others.
The five groups of household type are further broken down by receipt of informal care toproduce an eightfold classification by household type and informal care (see box below).Informal care in the model is based on analyses of receipt of unpaid help with domestictasks by disabled older people using the 2001/2 GHS (Wittenberg et al 2006). Thepropensity within household type groups to receive informal care is based on multivariate(logit) analysis of the GHS data and is assumed to remain constant in the projections(Wittenberg et al 2006). For the purpose of the Wanless model, the eightfold classificationof household type/informal care is collapsed into four categories: alone with help, alonewithout help, not alone with help and not alone without help.
Household type/informal care classification used in the PSSRU modelThe model includes a simple breakdown by housing tenure between those living in owner-occupied tenure and those in rented accommodation. This variable is an important linkbetween the PSSRU model and the CARESIM model and is included because it is relevant, in
DESCRIPTION OF MODELS 5
DISABILITY GROUPS USED IN PSSRU WANLESS MODEL
The five disability groups used in the model are as follows:1. People able to perform ADL (personal care) tasks and IADL (domestic care) tasks
without difficulty or need for help.2. People who are unable to perform IADL tasks and/or report difficulty with bathing but
not with other ADL tasks.3. People reporting difficulty with other ADL tasks.4. People who cannot perform at least one ADL task without help.5. People who cannot perform two or more ADL tasks without help.
HOUSEHOLD TYPE/INFORMAL CARE CLASSIFICATION USED IN PSSRU MODEL
The eight different categories used in the model are as follows:1. Single, living alone, no informal care2. Single, living alone, with informal care3. Single, living with children4. Single, living with others5. Couple, living with partner only, no informal care6. Couple, living with partner only, with informal care from partner7. Couple, living with partner only, with informal care from outside the household8. Couple, living with partner and others

the case of older people living alone, to the division between those who fund their ownresidential care and those who are funded by their local authority. The current means test forpublic support in residential care generally takes account of the value of the person’s home(unless it is occupied by the person’s spouse or an older or disabled relative). This meansthat older homeowners who live alone generally need to fund their residential or nursinghome care privately, whereas older tenants and older homeowners living with their spouseare often eligible for public funding. This variable is not used to project demand for services.
The rates of home ownership, by age, sex and marital status, for 2002 are from the FamilyResources Survey. Projected rates for future years to 2022 are from projections that arederived from the CARESIM model (Hancock et al 2006). Home ownership rates are thenassumed to remain constant to 2026.
The older population is broken down into about 1,000 cells by age, sex, disability,household type/informal care and tenure. However, for most purposes in the PSSRUWanless model, these are combined to form just 20 cells, comprising five levels ofdisability, according to ability to perform various IADL and ADL tasks, by four householdtype/informal care categories.
Projecting demand for informal careDemand for informal care is modelled after the method used in the standard model (seeWittenberg et al 2006), based on the analyses described above. The projections ofhousehold type/informal care in the PSSRU Wanless model assume that marital statusrates remain constant into the projection years.
In modelling receipt of informal care in future years, it is important to distinguish betweeninformal care by spouses/partners and informal care by (adult) children (Pickard et al2006). Whereas care by partners is likely to increase in future years, care by children maydecrease (Allen and Perkins 1995; Evandrou and Falkingham 2000; Pickard et al 2000).The PSSRU standard model now distinguishes between different sources of informal carefor disabled older people, using additional data supplied for the first time with the 2001/2GHS (Pickard et al 2006). Three principal sources of informal care are identified using datafrom the 2001/2 GHS: from children, partners and others. The projections assume a steadystate with regard to the propensity, within household type/informal care groups, to receivecare from a partner, child, partner and child, or others.
The numbers of disabled older people receiving informal care in the PSSRU Wanless modelare almost the same as in the standard PSSRU model. The volume of informal care, interms of hours per week, is not modelled on the standard PSSRU model (because data onhours of informal care are not available in the 2000/1 GHS). The PSSRU Wanless modeldoes, however, model hours of informal personal care based on analyses performed by theWanless review team, shown in Chapter 10 (Table 44) of their report (Wanless 2006) andreplicated here in Table 1 opposite for clarity. The average hours of informal help receivedper week vary by household type, with those living alone receiving fewer hours of careprovision than those living with others. The projections assume that hours of informal carereceived per week remain constant by household type and disability category into thefuture. Implicit to this assumption is the understanding that the supply of informal helpwill rise to meet the volume demanded. The effect of relaxing this assumption isconsidered in the fourth section (see pp 40–43).
6 EXPENDITURE ON SOCIAL CARE FOR OLDER PEOPLE TO 2026

Projecting the demand for servicesThe demand for services can be distinguished from the need for services, which in turn canbe distinguished from the need for care. Although the need for care is determined purely,in this context, by the person’s degree of disability, the need for services depends also onthe individual’s personal circumstances, such as the availability of equipment andadaptations that allow the person to continue living independently (Wittenberg et al 1998).(These factors may also be considered as factors affecting the demand for services,because they might also affect the likelihood that a person comes forward to receiveservices. However, for the purposes of the modelling they have been considered as factorsaffecting the need for services.) The demand for services, however, depends on manydifferent factors, for example, ability to pay for services that are means tested or personalcharacteristics that stop a person from wanting to take up services. There is a complexrelationship between need and demand for services, which the Wanless review version ofthe model seeks to address in projecting demand for services. (It should be emphasisedthat the modelling of service receipt described in this section relates to the Wanless reviewversion of the model. The modelling of service receipt under the standard PSSRU model isbased on current patterns of service receipt, as described in Wittenberg et al 2006.)
The relationship between need and demand for services is modelled by the Wanlessreview team and the output from their work is used in the PSSRU Wanless model (seeChapter 10 of the Wanless report). The Wanless review team’s model provides three typesof data for incorporation into the PSSRU Wanless model.
The probability of the need for a service (the potential population in demand ofservices) for each service specified in the model for each sub-group of the olderpopulation.The probability of each sub-group of the older population declining to take up formalservices. Subtracting this proportion from the potential population leaves the actualpopulation in demand of services.The intensity of service receipt for all community-based services and informal help foreach sub-group of the older population.
The Wanless review team makes the link between the need for care and the demand forservices through focusing on the outcomes that, in the view of the Wanless review team,social services should provide and users want. The need for a service is determinedbroadly according to a person’s need for care and the person’s capacity to benefit from the
DESCRIPTION OF MODELS 7
TABLE 1: PROVISION OF INFORMAL PERSONAL CARE (HOURS PER WEEK), BY LEVEL OFDISABILITY AND LIVING ARRANGEMENT
Level of disability Living situation of person cared for
Alone Not alone
No impairment 2.8 9.51 IADL/bathing difficulty 2.8 9.8IADL + ADL difficulty (other than bathing) 2.8 9.71 ADL 3.0 10.12+ ADLs 3.2 10.4
Source: Wanless model estimates

services. Clearly a person’s capacity to benefit from services is not independent of theoutcome(s) that the person seeks to achieve. The Wanless review team distinguisheddifferent types of outcomes that could, in its view, be realised by social services: personalcare outcomes (including nutrition), safety, well-being and reduction of carer stress. Theseoutcomes for people are achieved with personal care inputs, supervision support forpeople and measures that promote people’s well-being. (The inputs required to meet thefourth outcome of freeing carers from undue stress are equivalent to those required tomeet the first three outcomes; achievement of this outcome is modelled throughidentifying those people who are receiving a high level of informal care and supplyingcarer-break services to relieve them of their caring duties.) An older person may be in needof more than one of these inputs and may require a service to achieve several outcomes.The intensity and mix of the care inputs are determined for each disability group in thepopulation. The numbers from the review team’s model that correspond to the intensityand mix of care inputs are passed to the PSSRU long-term care team and are incorporateddirectly into the PSSRU Wanless model. All formal services are allocated in a similar way inthe model to sub-groups of the older population and are discussed together.
Three types of formal services are considered in the Wanless model. The formal servicesare defined as care-with-housing (or institutional) services, community-based careservices and community-based other-care services. These three categories include,respectively, nursing home care, home care and day care, and for modelling purposesthese exemplars of the category are used to describe the entire category. In the future,these service categories are likely to develop and will encompass a range of specificservice types and variants (see Chapter 10 of the Wanless report). Each service providescertain of the inputs described above and helps to achieve one or more of the outcomesdescribed.
In brief, care-with-housing services are allocated to those people who require high levelsof supervision as well as personal care, driven by the incidence of severe dementia in thepopulation, or by people with substantial personal care needs only who choose housing-based care options. The proportions of people that fall into this category are shown inTable 2 below. Community-based services are allocated to people requiring personal careinputs. The intensity – number of hours of care per week – with which these services aredelivered to people in the community are set at economically justified ‘benchmark’ levels
8 EXPENDITURE ON SOCIAL CARE FOR OLDER PEOPLE TO 2026
TABLE 2: ESTIMATED PROPORTION OF PEOPLE WITHIN THE OLDER POPULATIONRECEIVING CARE-WITH-HOUSING SERVICES, BY LEVEL OF DISABILITY AND LIVINGARRANGEMENT
Level of disability Living situation of person cared for
Alone Not alone
No impairment 0.0 0.01 IADL/bathing difficulty 0.0 0.0IADL + ADL difficulty (other than bathing) 0.0 0.01 ADL 0.2 0.22+ ADLs 0.4 0.2
Source: Wanless model estimates

where the value of the extra outcomes that they produce for recipients is balanced againstthe cost that society is willing to support. These benchmark service levels are determinedby the Wanless review team’s model. Other community-based services are allocated topeople either to provide their informal carers with a break or to achieve well-beingoutcomes. Most people require either or both types of community-based services. Asservices are allocated to the older population by type of input required, it is thereforepossible to determine the size of the potential population in demand of services for eachinput type for each service.
Total demand for care in the population is a combination of the numbers of people takingup services and the intensity of care that they use. The amount of time services spendcaring for their clients, the intensity of service receipt, will vary from person to person,depending on needs, by receipt of informal care and so on. As noted above, intensity ofservice receipt is estimated by the Wanless review. For community-based care services theestimate is in hours per week and for other community-based services in sessions perweek. For institutional services intensity is not a relevant concept because volume isequivalent to the number of clients. The intensity of service receipt is multiplied by the sizeof the population in demand of services, for each service individually, to provide a weeklyvolume of demand for services.
As well as variation between sub-groups of the older population in the benchmarkintensity of service receipt, intensity can also vary within a sub-group of the population. Inparticular, in the Wanless review team model, those sub-groups receiving informal care arelikely to require quite different numbers of hours of formal services. Within each sub-groupof the population receiving informal care, the Wanless model estimates that there aresome people who receive all the hours of care that they need from their informal carers.This situation is modelled by subtracting these people from the total number in need offormal community-based services, using proportions supplied by the Wanless reviewteam. The number of people falling into this category varies according to whether or notthe person lives alone and also to the level of disability. Analyses produced by theWanless review team show an inverse relationship between level of disability and numberof people receiving all their hours of care from informal sources. The proportions areshown in Chapter 10 in the Wanless (2006) report.
In the view of the Wanless review team, the willingness of society to support people withneeds can be at odds with what the individuals themselves are willing to pay, in charges,for services. In particular, people with low preferences for receipt of care might be
DESCRIPTION OF MODELS 9
TABLE 3: ESTIMATED PROPORTION OF PEOPLE WITHIN THE OLDER POPULATION WHODECLINE TO TAKE UP COMMUNITY-BASED SERVICES, BY LEVEL OF DISABILITY
Level of disability Proportion declining services
No impairment 0.001 IADL/bathing difficulty 0.34IADL + ADL difficulty (other than bathing) 0.181 ADL 0.182+ ADLs 0.16
Source: Wanless model estimates

unwilling to pay for any charge that is made for services even if that charge is less than thecost of care offered. As a result, there will be variability within each sub-group as todemand for services. Further analysis by the Wanless review team was used to estimatetake-up of services by each sub-group of the older people’s population – in other words, todetermine the proportion of each sub-group of the older population who would turn downthe offer of services. These estimated proportions are shown in Table 3 (see p 9)andfurther details of how these figures were obtained are given in the Wanless report. Theproportions shown in Table 3 enable two figures for demand for services to be produced:the potential demand for services, or need for services, which provides a figurecorresponding to the number of people who, under normative assumptions, need services(the volume of services reported under the potential demand does exclude those peoplewho receive all their care from informal sources) and the actual demand for services, whichexcludes all those identified as needing services, under normative assumptions, butdeclining to take them up.
In summary, in accordance with the normative approach adopted by the Wanless reviewteam, demand for services is estimated in the PSSRU Wanless review model in thefollowing way.
A cost-effective package of care is posited for each sub-group of the older populationby degree of disability and household composition, as explained in the Wanless report.For a minority of disabled older people, the package comprises care with housing; forthe majority it comprises a set number of hours of community-based care, which maybe provided by formal services, informal carers or a combination of both.Those requiring formal community-based care are assumed to use the benchmarknumber of hours of care minus the number of hours (if any) supplied by informal carers.A proportion of those people with informal carers will receive all their care needs fromthis source and are therefore subtracted from the total requiring community-basedservices. This leaves the potential population in demand of services.A proportion of those requiring formal community-based services are assumed eithernot to seek or to decline services. This leaves the actual population in demand ofservices.Demand for services, in terms of number of recipients (SERNO) for each service (j) canbe summarised formulaically as:
SERNOj = ∑20
i=1pij.ni – ∑
20
i=1qij.ni – ∑
20
i=1rij.ni
where pij is the probability of a person in cell i (i = 1–20) receiving service j (j = 1–3); qij
is the probability of a person in cell i not receiving service j as a result of receiving allthe hours of care from informal sources; rij is the probability of a person in cell i notreceiving service j because he or she declines the service; and ni is the number of olderpeople in cell i.
Assessment and care managementThe number of assessments and the number of clients receiving care management are alsoincluded in the model. The standard model assumes that the number of assessments risesin line with the projected number of disabled older people starting from a base figure,taken from 2002/3 Department of Health Referrals, Assessments and Packages of Care(RAP) data (Department of Health 2004), of 900,000 in 2002. As the PSSRU Wanless
10 EXPENDITURE ON SOCIAL CARE FOR OLDER PEOPLE TO 2026

model assumes a different system, these data based on the current system cannot beused. For the purposes of the PSSRU Wanless model we have assumed that all potentialrecipients of formal care services are assessed – in other words, everyone who isestimated to require care is assessed. Therefore, the number of assessments rises in linewith the projected number of potential recipients of services. All recipients of formal careservices are assumed to receive care management. This means that the number of clientsreceiving care management is assumed to rise in line with the projected number ofrecipients of these services.
Projected aggregate expenditure on long-term care servicesA third part of the model projects total expenditure on the formal services demanded,applying unit costs of formal care to the volume of services projected in the second part ofthe model. It is assumed that the costs for community-based care services are equivalentto the average cost of publicly funded home care services; those for other community-based services are equivalent to publicly funded day care services; and those in care-with-housing services are equivalent to publicly funded nursing home services (excluding thenursing care component of the cost that is paid for through NHS funds). All unit costs forcommunity-based services are sourced from the PSSRU Unit Costs of Health and SocialCare Report 2004 (Curtis and Netten 2004) and all care-with-housing unit costs aresourced from the Laing & Buisson (2004) Market Survey and are deflated to 2002/3 prices,using Department of Health service-specific deflators. Cost assumptions for the base year,2002, are shown in detail in the box below.
In summary, the model estimates total expenditure on social services (Et), for each year (t),as the sum across all formal social services considered, j (j = 1–3) of the following:projected number of service recipients in year t (SERNOjt) multiplied by the intensity ofservice receipt in terms of hours per week (intj) and the unit cost of care inflated to the yearto which the projection year relates (cjt). This can be shown as:
Et = ∑3
j=1SERNOjt
. intj . cjt
DESCRIPTION OF MODELS 11
ASSUMPTIONS ABOUT COST OF SERVICES
All care-with-housing services are assumed to be equivalent to the cost of nursing homeservices for publicly supported residents, minus the nursing element of £83.60, which ispaid for by the NHS. The cost is £369.40 per week.
Community-based services are costed as equivalent to local authority-supported homecare services. The cost of home care services is £11.58 per hour.
Other community-based services are assumed to be equivalent to local authority-supported day care services, which cost £25 per attendance.
Costs for assessment are estimated at £250 per assessment and those for caremanagement are estimated to cost £600 per client-year (see Wittenberg et al 2006 forassumptions underlying these costs).

Projected breakdown of expenditure by funding sourceThe fourth part of the model breaks down projected aggregate expenditure by source offunding: social services and service users (either as private purchase or through usercharges). The proportion of service users who are publicly and privately funded areprovided by the CARESIM model and are applied to three community-based packages ofcare and care-with-housing care separately (the derivation of the packages of care aredescribed in more detail on page 13).
Local authority gross expenditure on care-with-housing and community-based careservices for publicly funded service users is divided between local authority social servicesand users, according to the rules of the funding arrangement under consideration asestimated by the CARESIM model. The full costs of privately funded care-with-housing careand community-based care, and a proportion of the costs of publicly funded socialservices, are thus assigned to users.
Social care workforceA fifth part of the model makes projections of the numbers of social care staff required toprovide the projected volume of social services, for different categories of staff. Included inthe model are social workers, occupational therapists, home helps/care assistants,managers and support staff. Estimates of the ratio of staff to volume of services providedhave been calculated using Department of Health estimates of whole-time equivalent(WTE) staff numbers by category of staff and service for 2002. For care staff, it is assumedthat the ratio of staff to service volume remains constant to 2026. For administrative andmanagerial staff, it is assumed that the ratio of such staff to care staff remains constantover the projection years.
CARESIM model descriptionCARESIM uses data from the British Family Resources Survey (FRS) to simulate what eacholder participant in the survey would have to pay towards care-with-housing fees or thecost of care provided in his or her own home, should he or she need such care. The modelperforms simulations for single people currently aged 65 and over, and for the olderpartner in couples where at least one partner is aged at least 65 years. The simulations areperformed for a base year and for future years. Simulations for future years involve: ageingthe sample of those currently aged 65 and over, allowing for deaths and the consequenteffects of widowhood; modelling the evolution of their incomes and capital under certainassumptions; and making assumptions about future costs of care and the care charging,social security benefit and income tax regimes that will be in place for the year of interest.As it is more difficult to predict the future incomes of people who are not yet retired than itis for those who are already drawing pensions, the base-year sample is not ‘refreshed’ as itis aged. This restricts the years and age ranges for which the model can produceprojections. For the base year (2002) simulations are performed for people aged 65 andover. By 2022 the simulations are representative only of people aged 85 and over.However, it is at these oldest ages that the need for care is highest and institutionalisationrates rise sharply, so this restriction is not as limiting as it might seem. Details of how thesample is aged and how the evolution of income and capital is modelled can be found inHancock (2000).
12 EXPENDITURE ON SOCIAL CARE FOR OLDER PEOPLE TO 2026

In the analysis reported here the model uses data from the 1999/2000, 2000/1 and2001/2 FRS with money values uprated to the price levels prevailing in 2002. In the baseyear, simulations are performed for 21,334 older people. Separate simulations areperformed for care-with-housing care and for three packages of community-based care(including other community-based services) corresponding to low-, medium- and high-intensity care. The model starts by simulating what each older person would have to pay,per week, on starting to receive care in each of these four categories. The current means-testing arrangements, as set out in Department of Health guidance for councils with socialservice responsibilities (Department of Health 2003), are used for this purpose. Most ofthose having to meet the full costs of care with housing will need to draw on their capital,so over time their capital will fall. Once capital has fallen to the upper capital limit, theymay be eligible for local authority help with the fees. Each older person is randomlyassigned an uncompleted length of stay in care with housing. His or her contribution tocare costs is calculated for that point. In this respect the model can be thought of asmimicking a cross-sectional survey of care home residents. Community-based care clientsmay also have to draw on their capital to meet charges, although this is less likely underthe base-charging regime than for residents in care homes. As there are no data onuncompleted periods of receipt of community-based care we assume that the mean lengthof time for which recipients of community-based care have been receiving services is 18months and their contributions to charges calculated for that period.
Linkages between the CARESIM and PSSRU modelThe CARESIM model provides projections of two variables for incorporation in the PSSRUWanless model:
the proportion of care home residents and community-based care clients eligible forlocal authority support under the current or an alternative charging regime.the proportion of gross costs met by users, in the case of those eligible for localauthority support.
The technical detail of the linkage between the CARESIM model and the PSSRU model, andthe rationale for the process, are described in detail by Hancock and colleagues (2006).Two main revisions to the models have been made to accommodate each other. First, theeight different packages of community-based care (including other community-basedservices) in the PSSRU Wanless model are reduced to three packages of varying intensity(low, medium and high). (The low package corresponds to less than 7 hours of combinedcommunity-based and/or other community-based services; the medium package tobetween 7 and 14 hours; and the high package to over 14 hours.) Second, the figures ofdemand for these four packages (including the care-with-housing population), brokendown by age, gender, marital status and housing tenure, are passed to the CARESIM modelfor each projection year. These data are used to weight the representative sample thatforms the base of the CARESIM model. The contribution of each person towards the costsof care-with-housing or community-based care can then be calculated using the CARESIMmodel.
DESCRIPTION OF MODELS 13

14 EXPENDITURE ON SOCIAL CARE FOR OLDER PEOPLE TO 2026
The Personal Social Services Research Unit (PSSRU) Wanless model produces projectionsbased on specific assumptions about what services are required to deliver specifiedoutcomes and about future trends in the key factors affecting demand for and expenditureon social services, for example demographic trends or the funding system. The Wanlessreview has specified three base scenarios that, in their own words, ‘capture the degree towhich these sets of outcomes are to be achieved in the future’. Two of the scenarios,referred to as the Wanless review scenarios, are modelled using the PSSRU Wanlessmodel, described in the preceding section. The first scenario, describing the currentservice model, is modelled using the PSSRU long-term care finance model (see Wittenberget al (2006) for details of this model and its assumptions). A description of the scenarios isprovided in the box for clarity.
The projections under the base-case scenarios take account of expected changes in keyfactors affecting demand for and expenditure on social services. The main assumptionsused in the base case of the PSSRU Wanless model are summarised in the box opposite.The base case is used as a point of comparison when the assumptions of the model aresubsequently varied in alternative scenarios.
The Government Actuary’s Department (GAD) 2004-based principal population projectionsfor England are that, between 2002 and 2026, the numbers of people aged 65 and overwill rise by about 47 per cent (see Table 4, p 16). The numbers of those aged 85 and over isexpected to rise much faster during the same period from 956,000 to 1,775,000, an
Key projections
THE BASE-CASE SCENARIOS
Scenario 1 (current service model): the rolling forward of the (implicit) outcomesembodied in the current social care system. This scenario is used as a baseline forcomparison. It is chosen because it would give essentially the same configuration ofservices to people in the future. What would then change are mainly the demographicand supply-side factors.Scenario 2 (core business): the achievement of highest levels of personal care andsafety outcomes that can be justified, given their cost. This scenario focuses on whatmight be considered to be the core business of the social care system.Scenario 3 (well-being): as scenario 2 but where well-being outcomes for olderpeople are also improved, including being able to participate socially, achieving asense of self-esteem, and so on.
Source: adapted from Chapter 10, Wanless report.

increase of about 85 per cent. This means that, by 2026, not only will the numbers ofoldest old (those over 85) increase but the proportion of older people defined as oldest oldwill also increase. Much of this increase is a result of a rise in male life expectancy. Thenumbers of men aged 85 years and over is projected to increase by almost 170 per centbetween 2002 and 2026 compared with 54 per cent for women. The changing structure ofthe older population has the potential to have a large impact on demand for andexpenditure on social services as the PSSRU long-term care finance team and others haveshown (Wittenberg et al 2006).
Disability is an important driver of need for services and is correlated with age as shown inthe 2001/2 General Household Survey (GHS). Under base case assumptions of constant
KEY PROJECTIONS 15
KEY ASSUMPTIONS IN THE BASE CASES OF THE PSSRU AND CARESIM MODELS
Numbers of older people and their characteristicsThe number of older people by age and gender changes in line with the latest GAD’s2004-based population projections (Government Actuary’s Department 2005).Age-/gender-specific prevalence rates of disability remain unchanged, as reported inthe 2001/2 GHS.Marital status rates remain unchanged from the base year.There is a constant ratio of single people living alone to single people living withchildren or others and of married people living with their partners only to marriedpeople living with partner and others.Home ownership rates, as reported in the 2001/2 Family Resources Survey, change inline with projections produced by the University of Essex (Hancock et al 2006).
Demand for services/helpThe proportions of older people receiving informal help, formal community careservices or residential care services remain constant for each sub-group by disabilityand other needs-related characteristics.
Supply of services/workforceThe supply of formal care will adjust to meet demand.The ratio of staff to service users will remain constant throughout the projectionyears.
Expenditure and economic contextSocial care unit costs rise by 2 per cent per year in real terms (but non-revenue staffcosts remain constant in real terms). Real gross domestic product rises in line withassumptions by the HM Treasury (2005).
Breakdown between sources of fundingThe proportion of residents in institutions or receiving community-based services whoare privately funded rises in line with the results of the CARESIM model.The proportion of care fees met by local authority-supported residents in institutionsor receiving community-based services changes in line with the results of theCARESIM model.The division of funding responsibilities between agencies is unchanged, that is thecurrent means-tested system continues into the projection years.

age-specific prevalence rates for disability, the number of disabled people (defined ashaving problems with at least one instrumental activity of daily living (IADL) or one activityof daily living (ADL) is projected to grow by over 50 per cent between 2002 and 2026 (seeTable 5 above). Over the same period, the number with more severe functionalimpairments (defined as those who cannot perform one or more ADLs) is projected toincrease by about 55 per cent. As constant prevalence rates of functional impairment byage are assumed, the growth in the size of this population can be explained by theincreased number of people living to older ages, particularly the more significant increasein the size of the population aged 85 and over.
Patterns of careThe concept of ‘patterns of care’ is used to refer to variations in service models or, putmore simply, variations in who gets what amount of what type of service or care. Thesource of such variation is multifarious; for example it can be the result of specific policiesaround eligibility or policies that set funding levels. It is of special relevance to thisdiscussion because each of the base cases represents, in effect, a different service modelengendering a different pattern of care. Whereas scenario 1 is based on current patterns of
16 EXPENDITURE ON SOCIAL CARE FOR OLDER PEOPLE TO 2026
TABLE 4: PROJECTED OLDER POPULATION SIZE, BY AGE, ENGLAND, 2002 TO 2026
Age group Older population (thousands) % change 2002–26
2002 2007 2012 2017 2022 2026
65–69 2,176 2,245 2,762 2,843 2,760 3,033 3970–74 1,954 1,972 2,070 2,565 2,651 2,550 3075–79 1,625 1,647 1,712 1,829 2,290 2,474 5280–84 1,180 1,220 1,282 1,382 1,508 1,758 4985+ 956 1,085 1,215 1,370 1,577 1,775 86
All 7,891 8,169 9,0401 9,989 10,7871 11,5891 47
Source: GAD 2004-based population projections1 Discrepancies due to rounding.
TABLE 5: PROJECTED DISABLED POPULATION SIZE, BY LEVEL OF DISABILITY, ENGLAND, 2002 TO 2026
Level of disability Older population (thousands) % change 2002–26
2002 2007 2012 2017 2022 2026
No disability 5,550 5,720 6,370 7,040 7,520 8,020 441 IADL 600 620 680 760 830 910 51Bathing difficulty 280 290 320 360 390 420 49ADL difficulty (other than bathing) 530 550 600 670 740 810 511 ADL without help 370 390 430 480 530 580 562+ ADLs without help 550 580 630 690 770 850 54
All 2,340 2,450 2,670 2,950 3,270 3,560 53
Source: PSSRU Wanless model and PSSRU long-term care finance model estimates

care, scenarios 2 and 3 are based on patterns of care that the Wanless review teamcommend as more cost-effective than the current pattern of care.
The service/care mix for the base year, 2002, and beyond, for each of the base scenarios,is shown in Table 6 below. As Table 6 demonstrates, the difference in mix is considerablebetween scenario 1, which represents the current system, and the Wanless reviewscenarios (scenarios 2 and 3), which represent alternative systems developed by theWanless review team. Some key differences are as follows.
Although there are currently around 340,000 older people in residential care (about 4.2per cent of the older population), including some 20,000 fully funded by the NHS, theWanless review scenarios have only 250,000 older people (3.1 per cent of the total)receiving care-with-housing services.Around 85 per cent of disabled older people receive informal care under the currentsystem and under the Wanless review scenarios: the numbers receiving informal careunder the latter are higher than those under the former because of the lower use ofresidential care. In all scenarios the overwhelming majority of care is provided byinformal sources.
KEY PROJECTIONS 17
TABLE 6: PROJECTED NUMBERS OF OLDER PEOPLE RECEIVING FORMAL SOCIAL SERVICES AND INFORMALCARE, UNDER BASE CASE ASSUMPTIONS, ENGLAND, 2002 TO 2026
Type of services/care Older people (thousands) % change 2002–26
2002 2007 2012 2017 2022 2026
Scenario 1Informal help 1,720 1,800 1,960 2,180 2,400 2,600 51Institutional care1 320 340 360 400 450 500 56Local authority-funded home help 340 360 380 420 470 520 53Private home help 390 420 450 510 570 630 62Day centre services2 120 120 130 150 160 180 51Meals 260 270 290 320 360 400 50
Scenario 2Informal help 1,780 1,860 2,030 2,250 2,480 2,700 51Institutional care 250 270 290 320 360 390 55Community-based services 910 950 1,030 1,140 1,270 1,390 53Other community-based services
for personal care 270 280 310 340 380 410 52for supervision 60 60 70 70 80 90 53for well-being – – – – – – –
Scenario 3Informal help 1,780 1,860 2,030 2,250 2,480 2,700 51Institutional care 250 270 290 320 360 390 55Community-based services 910 950 1,030 1,140 1,270 1,390 53Other community-based services
for personal care 270 280 310 340 380 410 52for supervision 60 60 70 70 80 90 53for well-being 490 500 550 600 660 720 47
Source: PSSRU long-term care finance model (scenario 1) and PSSRU Wanless model (scenarios 2 and 3) estimates1 Excludes all those in nursing homes or hospitals whose care is paid for by the NHS.2 Does not include day care services funded through the NHS.

Although around 340,000 older people receive local authority home care and around390,000 disabled older people receive private home care under the present system – atotal of around 650,000 (about 8 per cent of the total older population), allowing forreceipt of both types of home care by some older people – more than 900,000 olderpeople (11 per cent of the older population) receive community-based services(assumed to be equivalent to home care) under the Wanless review scenarios.Although around 120,000 older people receive local authority day care under thepresent system, 270,000 older people receive other community-based services (basedon day care services) under the Wanless review scenarios.
The differences between the systems are considered in more detail in the sections thatfollow.
Demand for informal careThe number of disabled older people receiving informal care is estimated in the same wayunder all three base-case scenarios. The estimates of informal care recipients are based onanalyses of the 2001/2 GHS data, carried out as part of the development of the PSSRUlong-term care finance model (Pickard et al 2006; Wittenberg et al 2006), as explainedabove on pages 6–7. Demand for informal care in future years is projected on the basis ofconstant probabilities of receiving informal care by age, sex, degree of disability andhousehold type.
The greater level of demand for informal care in the base-case scenarios of the Wanlessreview team, compared with the PSSRU standard model base case, is a result of the largerproportion of people living in a community rather than a residential care setting in theformer compared with the latter. The implication of the Wanless review team scenarios isthat about 60,000 more disabled older people would have been receiving informal care in2002 than did. By 2026, under the Wanless review base case scenarios, about 100,000more older people would receive informal care than under the base case of the standardmodel (see Table 6, p 17).
The different base cases differ, however, in the way in which they allocate formal servicesto older people receiving informal care. Although the projections under the base-casescenarios of the Wanless review team anticipate a greater increase in the numbers of olderpeople receiving informal care in future years, the Wanless team explicitly identifies, as anoutcome of social services, the relief of some of the ‘burden of caring’ from carers, suchthat their quality of life is improved (see Chapter 10 of the Wanless report for furtherdiscussion of this outcome). Such an outcome is included in both scenarios 2 and 3 and isto be delivered through carer-support services, which are discussed in more detail onpages 24–25. (The support services have been modelled only to ‘replace’ personal careand supervision inputs. For this reason the projections for scenarios 2 and 3 are equivalentand are reported as one in this section.) As carer stress is related to the number of hours ofcare that a carer undertakes, modelling an outcome that seeks to reduce carer stressnecessitates estimating the volume of informal care provided. This has been discussed onpages 6–7.
Potential demand for informal care, in the context of demand for all types of community-based care, both formal and informal, in future years is illustrated in Figure 2 opposite. (Itshould be noted that estimates of hours of informal help provided include only help
18 EXPENDITURE ON SOCIAL CARE FOR OLDER PEOPLE TO 2026

provided for personal care and supervision inputs. If care for IADL tasks andcompanionship were included, the input in terms of hours would be much greater and thereliance on informal help accentuated further. Scenario 1 is not reported because thePSSRU long-term care finance model does not, at present, make any assumptions abouthours of informal help provided. This is because data on hours of informal care received byolder people are not included in the 2001/2 GHS.) Figure 2 shows projections to 2026 ofthe hours of care received by older people under scenario 2 of the Wanless review team;about 22 million hours of informal personal care/supervision would be received by olderpeople in England in 2002 and this would rise to about 30 million hours by 2026.
There is, however, scope for debate about the availability of any additional informal carers,either in the present or in the future. Indeed, there is concern that informal care,particularly care from the children of older people, may decline in future (Allen and Perkins1995; Evandrou and Falkingham 2000; Organisation for Economic Co-operation andDevelopment 2006; Pickard et al 2006). The future supply of informal care is examinedbelow through a scenario that allows for a decline in receipt of informal care by disabledolder people from their (adult) children.
Demand for and expenditure on servicesDemand can be considered in terms of both numbers of people taking up services andvolume of services provided. Estimates of demand for services are presented by servicetype in the following sections.
KEY PROJECTIONS 19
PROJECTED TOTAL WEEKLY HOURS OF COMMUNITY-BASED FORMAL AND INFORMAL CARE, BYSOURCE, FOR SCENARIO 2, UNDER BASE ASSUMPTIONS, ENGLAND, 2002 TO 2026
2
Hou
rs o
f car
e pe
r wee
k (m
illio
ns)
0
2002
Year
20072012
20172022
10
20
30
40
50
60
20032004
20052006
20082009
20102011
20132014
20152016
20182019
20202021
20232024
20252026
KEY
Other community-based services*
Community-based services
Informal care
Source: PSSRU Wanless model estimates* Other community-based services, which are allocated as sessions per week, have been converted into home care hours perweek using a conversion factor of 2.16. This is based on the average length of a session in hours.

CARE-WITH-HOUSING SERVICESThe Wanless scenarios assume that between 16 and 44 per cent of older people unable toperform one or more ADL without help receive care with housing. These proportionsdepend mainly on the prevalence of cognitive impairment and whether or not theindividual lives alone. Most people receive care with housing because cognitiveimpairment requires levels of supervision as well as personal care that are very difficult forinformal carers to provide at home. Figure 3 above shows how demand for care-with-housing services is projected to change under the base-case scenarios (scenarios 2 and 3are considered together because the inclusion of well-being outcomes does not have animpact on the numbers of people needing care-with-housing services; for more details,see Chapter 10 of the Wanless report). It can be seen that a much lower level of care-with-housing services is required under the Wanless review scenarios than under scenario 1,which represents the current system (NHS-funded beds in hospitals and nursing homeshave been excluded from the figures presented in scenario 1). This result occurs mainlybecause no individual without either substantial physical or cognitive impairment is incare-with-housing/institutional settings in scenarios 2 and 3.
Associated expenditure is reported in Table 7 opposite. Projected expenditure divergesmore sharply between the scenarios than projected numbers of care-with-housing clients.This is because of different assumptions about the unit costs of institutional care. In theWanless review scenarios, all care with housing is costed at £369.40 per resident week.Scenario 1, however, includes three different types of residential services – nursinghomes, independent residential homes and local authority homes – all of which havedifferent unit costs, and it also differentiates between privately funded and local authority-
20 EXPENDITURE ON SOCIAL CARE FOR OLDER PEOPLE TO 2026
PROJECTED DEMAND FOR CARE-WITH-HOUSING SERVICES, UNDER BASE ASSUMPTIONS, ENGLAND,2002 TO 2026
Source: Hyde and Janevic 2003
3
0
100
200
300
400
500
600
2000 2005 2010 2015 2020 2025 2030
Num
ber o
f res
iden
ts (t
hous
ands
)
YearKEY
Scenario 1
Scenario 2 (and 3) Source: PSSRU Wanless model estimates

supported places, which also have different unit costs. For example, the cost of localauthority homes is £560 per resident week, which is significantly higher than the unit costassumed under the Wanless scenarios. This means that the comparison of projectedexpenditure between scenarios needs to be treated with caution. Nevertheless, to theextent that scenarios 2 and 3 are based on more cost-effective patterns of care, thecomparison is informative.
COMMUNITY-BASED SERVICESThe Wanless review team has modelled community-based services on current home careservices and have designated them as services to provide the outcomes associated withpersonal care (for more details, see Chapter 10 of the Wanless report). A comparison of the
KEY PROJECTIONS 21
TABLE 7: PROJECTED GROSS EXPENDITURE ON CARE-WITH-HOUSING/INSTITUTIONAL SERVICES, UNDERBASE CASE ASSUMPTIONS, ENGLAND, 2002 TO 2026
Gross expenditure (£million) % change 2002–26
2002 2007 2012 2017 2022 2026
Scenario 1 6,300 7,300 8,500 10,100 12,300 14,600 131Scenario 2 (and 3) 4,900 5,600 6,600 8,000 9,700 11,400 134
Source: PSSRU Wanless model estimates
PROJECTED WEEKLY HOURS OF COMMUNITY-BASED SERVICES (OR EQUIVALENT) FOR ALL BASESCENARIOS, UNDER BASE CASE ASSUMPTIONS, ENGLAND, 2002 TO 2026
Source: Hyde and Janevic 2003
4
0
14
2000 2005 2010 2015 2020 2025 2030
Hou
rs o
f car
e pe
r wee
k (m
illio
ns)
Year
12
10
8
6
4
2
KEY
Scenario 1
Scenario 2 (and 3) Source: PSSRU Wanless model estimates

level of demand for the service across the base-case scenarios is given in Figure 4 (seep 21). As can be seen, the model estimates that, in scenario 2 (and 3), demand forcommunity-based services for disabled people would be much greater than in the currentsystem. However, in the current system a significant number of people with no self-reported functional impairments, about 430,000 in 2002, are in receipt of privately fundedhome help services. These people have been excluded from this analysis because theWanless review team does not allocate any services designed to achieve personal careoutcomes to people with no functional impairments; it is effectively assumed that all thosepeople receiving home care services who have no self-reported functional impairments arereceiving home care services for reasons other than achieving personal care outcomes, forexample, domestic help. Including these people would probably make the numbers ofrecipients of services about equivalent across all scenarios, possibly even higher forscenario 1, accounting for those people who receive both privately funded and localauthority-supported home help services. However, if the volume of services received isconsidered, scenarios 2 and 3 continue to be more generous as the privately funded homehelp is provided at a very much lower intensity than local authority-funded home care. Asmall proportion of those with no functional impairments are also estimated to bereceiving local authority-supported, community-based services such as meals, home careand day care. As the number is small and these people have been assessed as needingservices, they have been included in the totals for comparison. It is likely that self-reportedIADLs/ADLs do not perfectly predict need for services.
The cost of these services is shown in Table 8 above. The costs for scenario 1 include thecost of meals, for comparison, because these services are implicit in the broad descriptiongiven by the Wanless review team of services designed to achieve personal care outcomes.The estimated costs of scenario 2 (and 3) are about twice as large as those in the currentsystem. There is again a caveat about different unit costs, because the PSSRU Wanlessmodel does not differentiate costs of privately and publicly funded care.
OTHER COMMUNITY-BASED SERVICESThe services reported under this heading are of two types: carer-support services andservices to provide well-being outcomes. In the PSSRU standard model, carer-supportservices and services to enhance well-being are not separately identified. With regard tocarer-support services, for example, the PSSRU model includes support for carers as partof the core services provided to disabled older people. The Wanless review team scenarios,on the other hand, define support for carers in terms of specific carer services, inparticular, breaks from caring. The Wanless scenarios envisage that day care would be amainstay of these specific carer services, although the type of day care envisioned for the
22 EXPENDITURE ON SOCIAL CARE FOR OLDER PEOPLE TO 2026
TABLE 8: PROJECTED GROSS EXPENDITURE ON COMMUNITY-BASED SERVICES, UNDER BASE CASEASSUMPTIONS, ENGLAND, 2002 TO 2026
Gross expenditure (£million) % change 2002–26
2002 2007 2012 2017 2022 2026
Scenario 1 2,300 2,700 3,200 3,900 4,800 5,800 152Scenario 2 (and 3) 4,600 5,400 6,400 7,800 9,600 11,500 148
Source: PSSRU Wanless model estimates

future might be quite different, with more active participation by those attending, forexample. In Figure 5 above, which shows the variation in volume of services between thethree base-case scenarios, the Wanless scenarios are therefore compared with provision ofday care under the standard PSSRU model.
As is apparent from Figure 5, the Wanless review scenarios are substantially moregenerous in their provision of day-care services aimed at supporting carers and enhancingthe well-being of the older person. Expenditure on these services is reported in Table 9below. As with the volume of services provided, the projections show that much more is tobe spent on these services under scenarios 2 and 3. The reasons for this are discussed inmore detail below where the other community-based service category is split into itscomponent parts: carer support services and well-being services.
KEY PROJECTIONS 23
PROJECTED WEEKLY HOURS OF OTHER COMMUNITY-BASED SERVICES (OR EQUIVALENT) FOR ALLBASE SCENARIOS, UNDER BASE CASE ASSUMPTIONS, ENGLAND, 2002 TO 2026
Source: Hyde and Janevic 2003
5
0
500
1,000
1,500
2,000
2,500
3,000
2000 2010 2020 2030
Hou
rs o
f car
e pe
r wee
k (t
hous
ands
)
Year
KEY
Scenario 1
Scenario 2
Scenario 3 Source: PSSRU Wanless model estimates
TABLE 9: PROJECTED GROSS EXPENDITURE ON OTHER COMMUNITY-BASED SERVICES, UNDER BASE CASEASSUMPTIONS, ENGLAND, 2002 TO 2026
Gross expenditure (£million) % change 2002–26
2002 2007 2012 2017 2022 2026
Scenario 1 300 300 400 500 600 700 146Scenario 2 1,600 1,900 2,300 2,800 3,400 4,000 146Scenario 3 2,200 2,500 3,000 3,700 4,500 5,300 145
Source: PSSRU Wanless model estimates

CARER-SUPPORT SERVICESThere has been a great deal of policy emphasis on support for carers over the last 15 yearsor so (Pickard 2001, 2004). Current policies are embodied in the National Strategy forCarers (1999), the principles of which have recently been endorsed (Department of Health2006). The emphasis in the National Strategy for Carers is on the provision of breaks fromcaring. The strategy introduced the Carers’ Special Grant, renewed on a regular basis,which provides ring-fenced funding to enable carers in England to take a break from caring.The National Strategy for Carers has, however, been criticised, in part, for providing toolittle funding for carers (Parker and Clarke 2002; Audit Commission 2004). As Parker andClarke wrote in relation to the Carers’ Special Grant, ‘It was real money, but £140 millionover three years and over the whole of England, did not signal a major change in supportstructures’ (Parker and Clarke 2002, p 354). Although the Carers’ Special Grant has sincebeen extended to 2006 and the funding increased to £185 million, the assessment of theAudit Commission recently was that ‘given the number of carers, resources per head arestill modest’ (Audit Commission 2004, p 41).
As discussed already, carer-support services, in the form of breaks from caring, are animportant part of the service models described by the Wanless review scenarios. Indeed,the approach to carer support adopted in the Wanless review scenarios is, in somerespects, similar to that adopted in the National Strategy for Carers, in that both placegreat emphasis on breaks from caring. Both also emphasise home-based respite supportfor carers, rather than overnight stays in residential/nursing care homes (compareDepartment of Health 2006). There are, however, very large differences in the resourcesthat would be devoted to the support of carers under the Wanless review scenarioscompared with the current system.
24 EXPENDITURE ON SOCIAL CARE FOR OLDER PEOPLE TO 2026
PROJECTED NUMBER OF RECIPIENTS OF CARER-SUPPORT SERVICES FOR SCENARIO 2 (AND 3), UNDERBASE CASE ASSUMPTIONS, ENGLAND, 2002 TO 2026
Source: Hyde and Janevic 2003
6
0
450
2000
Num
ber o
f rec
ipie
nts
(tho
usan
ds)
Year
2005 2010 2015 2020 2025 2030
400
350
300
250
200
150
100
50
Source: PSSRU Wanless model estimates

Figure 6 opposite presents the estimated demand for carer-support services under theWanless review (scenarios 2 and 3). It is estimated that about 270,000 people wouldrequire carer-support services in 2002, rising to about 410,000 in 2026. This is an increaseof just over 50 per cent between 2002 and 2026. The cost implications of carer-supportservices are shown in Table 10 above (this cost forms a proportion of the cost of othercommunity-based services in scenario 3 and the total cost in scenario 2). Table 10 showsthat expenditure on carer-support services under the Wanless review team scenarioswould amount to £1,600 million in 2002, rising to £4,000 million in 2026. Expenditure oncarer support under the Wanless review scenarios is very much higher, even in 2002, thanis currently allocated under the Carers’ Special Grant. Some of the enhanced expenditureon carers in 2002 arises because it is assumed that there are more informal carers underthe Wanless review scenarios than there are at present. However, most of the increasedexpenditure under the Wanless review scenarios in 2002 derives from an increase in theamount of support provided to carers.
Nevertheless, expenditure on carer-support services in the Wanless review scenarios is notlarge compared with the cost of community-based services and institutional services.Under the Wanless review scenarios, expenditure on carer support amounts to £4,000million by 2026, compared with £11,400 million on care with housing (residential care)and £11,500 million on community-based services (see Table 7, p21, Table 8, p 22, andTable 10 above). The comparatively low expenditure on carer support arises partlybecause, under the assumptions used, the estimated proportion of older people withcarers who provide a level of support that is significant enough to constitute the carerbeing ‘stressed’ is a relatively small proportion of those receiving informal care (for moredetails on the derivation of these proportions, see Chapter 10 of the Wanless report). (Theproportion of older people with ‘stressed’ carers might, however, also be greater if allhours of informal care provided were taken into account, rather than personalcare/supervision hours only.)
SERVICES FOR WELL-BEINGAs discussed in the Wanless report, there is no well-developed evidence base to flesh outa picture of what services designed to promote well-being would look like or indeed thecost-effectiveness of the equivalent day-care services in delivering the outcome of well-being. The assumptions made by the Wanless review team are discussed in greater detailin Chapter 10 of the Wanless report; the implications of trying to achieve this outcome arepresented here. Figure 7 overleaf shows the projected numbers of people requiring theseservices to 2026 in scenario 3 and under base case assumptions.
KEY PROJECTIONS 25
TABLE 10: PROJECTED GROSS EXPENDITURE ON CARER-SUPPORT SERVICES, UNDER BASE CASEASSUMPTIONS, ENGLAND, 2002 TO 2026
Gross expenditure (£million) % change 2002–26
2002 2007 2012 2017 2022 2026
Scenario 2 (and 3) 1,600 1,900 2,300 2,800 3,400 4,000 146
Source: PSSRU Wanless model estimates

It is estimated that there will be almost 500,000 people requiring services to improve well-being outcomes in 2002, rising to just over 700,000 in 2026 (see Figure 7 above). This isan increase of close to 50 per cent. The cost implications of these services are not largecompared with the other services reported here. This is mostly because the estimatednumbers requiring these services are quite small, representing only 17 per cent of thedisabled older population living alone. Also, as noted in the Wanless report, services tohelp improve social participation outcomes will be only a small part of what might bepossible. The cost implications of these services are shown in Table 11 below, and the costof these services forms a proportion of the cost of other community-based servicesreported (see pp 21–23) for scenario 3; the rest of the cost is a result of spending on carer-support services.
26 EXPENDITURE ON SOCIAL CARE FOR OLDER PEOPLE TO 2026
PROJECTED NUMBER OF RECIPIENTS OF WELL-BEING SERVICES FOR SCENARIO 3, UNDER BASE CASEASSUMPTIONS, ENGLAND, 2002 TO 2026
Source: Hyde and Janevic 2003
7
0
800
2000
Num
ber o
f rec
ipie
nts
(tho
usan
ds)
Year
2005 2010 2015 2020 2025 2030
100
700
600
500
400
300
200
Source: PSSRU Wanless model estimates
TABLE 11: PROJECTED GROSS EXPENDITURE ON WELL-BEING SERVICES FOR SCENARIO 3, UNDER BASECASE ASSUMPTIONS, ENGLAND, 2002 TO 2026
Gross expenditure (£million) % change 2002–26
2002 2007 2012 2017 2022 2026
Scenario 3 600 600 700 900 1,100 1,300 117
Source: PSSRU Wanless model estimates
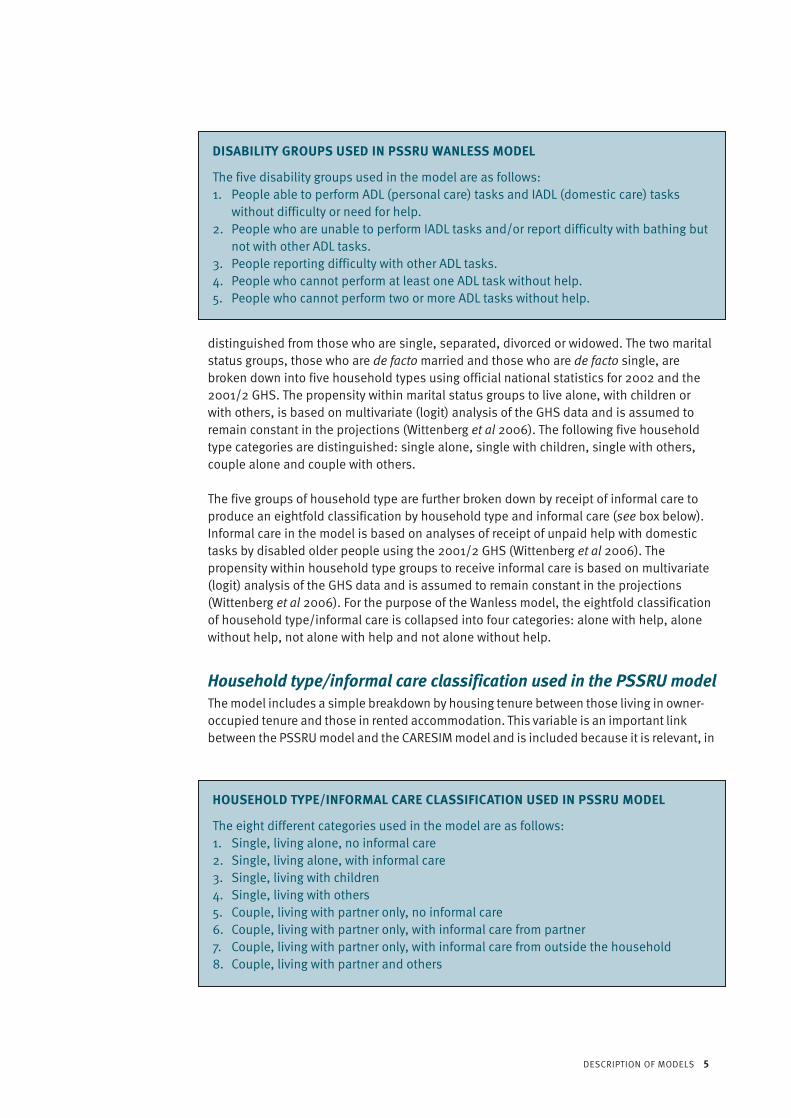
ASSESSMENT AND CARE MANAGEMENTIn addition to the services described above, the models include estimates for spend oncare management and assessments. Table 12 above shows how this expenditure variesbetween scenarios. Expenditure on care management and assessment, under the Wanlessreview scenarios, is roughly double that for scenario 1 in the base year. By 2026, the modelestimates that, under scenario 2, care management and assessment will cost roughly £1billion more than under the current system. Under scenario 3, the difference is estimatedto be about £1.5 billion. The increase in expenditure is a result of both more assessmentsand more care management under the Wanless review scenarios. Both scenarios assumethat more people are receiving care so more people are in need of care management. Thecost of assessments is also greater largely a result of the differences in the way in whichassessments are modelled between the Wanless and standard models. In the former,assessments are assumed to be provided to the entire potential population in demand ofservices, whereas, in the latter, the number of assessments is derived from Department ofHealth Referrals, Assessments and Packages of Care (RAP) data for 2002/3 and isassumed to rise in line with the number of disabled people. In the base year these twomethods arrive at very different estimates for the number of assessments. The standardmodel estimates that there are about 900,000 assessments; the Wanless review modelestimates that for scenario 2 there would be 1,500,000 assessments.
Overall expenditureFigure 8 overleaf compares total expenditure on social services across the three base-casescenarios. As can be seen, both of the alternative service models to the currentconfiguration of services are estimated to be more expensive. Under scenario 1, totalexpenditure, public and private, is estimated to increase from about £10 billion in 2002 toabout £24 billion in 2026 (the cost of privately funded home help services for thosewithout disability is included in the total expenditure for scenario 1). In contrast, underscenario 2, which is estimated to be about £2 billion more expensive than scenario 1 in2002, expenditure is estimated to rise to close to £30 billion in 2026, with scenario 3being marginally more expensive than scenario 2.
In Figure 9 (see p 29), expenditure on social services is considered relative to the grossdomestic product (GDP), assuming that the GDP increases in line with the projectionsproduced by HM Treasury (2005). The model estimates that, although scenarios 2 and 3are more expensive than the current system, expenditure on social services for olderpeople would not rise beyond 2 per cent of GDP by 2026, even under the most generousservice model.
KEY PROJECTIONS 27
TABLE 12: PROJECTED GROSS EXPENDITURE ON CARE MANAGEMENT AND ASSESSMENT, UNDER BASECASE ASSUMPTIONS, ENGLAND, 2002 TO 2026
Gross expenditure (£million) % change 2002–26
2002 2007 2012 2017 2022 2026
Scenario 1 600 700 900 1,100 1,300 1,500 143Scenario 2 1,100 1,200 1,500 1,800 2,200 2,600 147Scenario 3 1,300 1,500 1,800 2,100 2,600 3,100 145
Source: PSSRU Wanless model estimates

BREAKDOWN OF EXPENDITURE BETWEEN SOURCES OF FUNDINGTo what extent people should fund their own care and to what extent long-term care, ormore specifically social services, should be publicly funded continues to be a source ofcontention and debate. Work by the PSSRU long-term care finance team at LSE, and RuthHancock at Essex University, has focused on developing various scenarios to explore thefinancial and distributional implications for service users and the public purse of changesto the current system of funding. These implications are reported on by Hancock andcolleagues (2006). Here we explore the financial implications for service users and forpublic expenditure of the various base-case scenarios, or service models, assuming thatthe current funding system remains in place. The analysis has been conducted using theCARESIM model, as described earlier. The current funding system is taken to mean thecurrent national system of charging for residential care in England and a system ofcharging for home care that corresponds to the principles of Department of Healthguidance (Department of Health 2003).
Table 13 opposite shows total expenditure on social services broken down by source offunding, where public expenditure is net expenditure on personal social services andprivate expenditure is a combination of user charges and privately purchased care.
Assuming that the current funding system remains in place, private expenditure would bebroadly similar under the three scenarios, although public expenditure would besignificantly higher. It would be around 44 per cent higher under scenario 2 and 48 per
28 EXPENDITURE ON SOCIAL CARE FOR OLDER PEOPLE TO 2026
PROJECTED TOTAL EXPENDITURE ON SOCIAL SERVICES, UNDER BASE CASE ASSUMPTIONS, ENGLAND,2002 TO 2026
Source: Hyde and Janevic 2003
8
02000 2005 2010 2015 2020 2025 2030
Expe
ndit
ure
on s
ocia
l ser
vice
s (£
mill
ion)
Year
35,000
30,000
25,000
20,000
15,000
10,000
5,000
KEY
Scenario 1
Scenario 2
Scenario 3 Source: PSSRU Wanless and standard model estimates

cent higher under scenario 3 in the base year than under current patterns of care(scenario 1). Public expenditure accounts for 50 per cent of total expenditure underscenario 1 in 2002, falling to 47 per cent in 2026, although it accounts for 59 per cent of
KEY PROJECTIONS 29
PROJECTED EXPENDITURE ON SOCIAL SERVICES EXPRESSED AS A PERCENTAGE OF GDP, UNDER BASECASE ASSUMPTIONS, ENGLAND, 2002 TO 2026
Source: Hyde and Janevic 2003
9
0
2.5
2000 2010 2020 2030
Expe
ndit
ure
as a
per
cent
age
of G
DP
Year
2.0
1.5
1.0
0.5
KEY
Scenario 1
Scenario 2
Scenario 3 Source: PSSRU long-term care finance model and Wanless model estimates
TABLE 13: PROJECTED TOTAL EXPENDITURE ON SOCIAL SERVICES FOR OLDER PEOPLE, BY FUNDINGSOURCE, UNDER BASE CASE ASSUMPTIONS, ENGLAND, 2002 TO 2026
Funding Total expenditure (£million) % change source 2002–26
2002 2007 2012 2017 2022 2026
Scenario 1Public 5,000 5,700 6,700 8,000 9,500 11,300 126Private 5,100 5,900 7,000 8,400 10,700 12,700 149
Scenario 2Public 7,200 8,300 10,000 12,000 14,600 17,300 140Private 5,100 5,900 6,900 8,300 10,400 12,200 139
Scenario 3Public 7,400 8,600 10,400 12,600 15,300 18,200 146Private 5,500 6,400 7,400 9,000 11,100 13,200 140
Source: PSSRU long-term care finance model and Wanless model estimates

total expenditure under scenario 2 and 57 per cent under scenario 3. An importantreason for the different balance of public and private funding between the scenarios isthe different balance of residential and community-based care. Service users meet,through user charges, a higher proportion of the costs of residential care than of homecare.
Figure 10 above demonstrates this pattern more clearly, showing that public expenditurewill grow at a faster rate under scenarios 2 and 3, whereas private expenditure will grow ata roughly similar rate under all scenarios, although slightly more steeply under scenario 1.As already noted, in addition to the differences in growth rates, the contributions from thepublic purse are estimated to be greater under the Wanless scenarios compared with thecurrent service model. In scenario 2, public expenditure is expected to rise from £7.2billion in 2002 to £17.3 billion in 2026, compared with a rise from £5 billion in 2002 to£11.3 billion in 2026 under scenario 1. In effect most of the extra expenditure estimated tobe incurred under scenarios 2 and 3 is estimated to fall to the public purse, assuming thatthe current system of funding remains.
30 EXPENDITURE ON SOCIAL CARE FOR OLDER PEOPLE TO 2026
PROJECTED PUBLIC AND PRIVATE EXPENDITURE ON SOCIAL SERVICES, UNDER BASE CASEASSUMPTIONS, ENGLAND, 2002 TO 2026
Source: Hyde and Janevic 2003
10
02000 2030
Expe
ndit
ure
on s
ocia
l ser
vice
s (£
mill
ion)
Year
2005 2010 2015 2020 2025
20,000
18,000
16,000
14,000
12,000
10,000
8,000
6,000
4,000
2,000
KEY
Public expenditure, scenario 1
Public expenditure, scenario 2
Public expenditure, scenario 3
Private expenditure, scenario 1
Private expenditure, scenario 2
Private expenditure, scenario 3 Source: PSSRU long-term care finance model and Wanless model estimates

CHANGING THE FUNDING SYSTEMThe question of who should pay for social care is a continuing subject of debate. In thissection we consider how a different funding system might alter the balance of fundingbetween private and public sources. As the central theme of the debate has been on theprovision of ‘free’ personal care (Royal Commission on Long Term Care 1999; Bell andBowes 2006), where ‘free’ denotes that personal care is fully funded by the state, weexamine the effects that a policy of free personal care might have on the balance ofexpenditure between funding sources in England.
The scenario utilises both the CARESIM and PSSRU models. The effects of a policy of freepersonal care on the relative contributions of service users in terms of user charges areestimated in CARESIM and these proportions are fed back into the PSSRU model aspreviously described (see pp 12–13). A flat rate of £175.95 per week is assumed as thecontribution by social services towards personal care in institutional care settings. This isthe difference between the total care home fee and the estimated ‘hotel costs’ in carehomes. The latter is estimated with reference to social security benefits, as described byHancock and colleagues (2006). (It should be noted that this is only one method by whichfree personal care could be modelled. Different approaches to the modelling of freepersonal care are described in Hancock et al (2006).) Social services are assumed to meetthe full costs of personal care in home care settings. An increase in demand for servicesthat might be expected after the introduction of free personal care (see Bell and Bowes(2006) for details of the Scottish experience) has not been modelled. In effect the modeldemonstrates how the balance of expenditure would shift, assuming that all other factors
KEY PROJECTIONS 31
PROJECTED PUBLIC EXPENDITURE ON SOCIAL SERVICES FOR OLDER PEOPLE, SCENARIO 2 ONLY,UNDER THE CURRENT MEANS-TESTED FUNDING SYSTEM AND UNDER FREE PERSONAL CARE, ENGLAND, 2002 TO 2026
Source: Hyde and Janevic 2003
11
0
5,000
25,000
2000 2005 2010 2015 2020 2025 2030
Expe
ndit
ure
on s
ocia
l ser
vice
s (£
mill
ion)
Year
20,000
15,000
10,000
KEY
Free personalcare
Means-testing (base case) Source: Wanless model estimates

remained the same. Although this scenario does not capture all the implications of such apolicy, it does demonstrate how such a policy may be expected to redistribute the balanceof funding compared with the current funding system.
Table 14 above shows how expenditure by funding source varies across the base casesunder a policy of free personal care. Under all scenarios there is a significant redistributionfrom funding by private sources towards public sources. (The slight difference betweentotal expenditure, under scenario 1, under a funding system of free personal carecompared with the current funding system is a result of the differences in the unit costs ofprivately and publicly funded services.) This is shown more clearly in Figure 11 (see p 31),which compares the level of public funding under the current funding system and a policyof free personal care for scenario 2 only.
Workforce requirementsA change in demand for services has obvious implications for supply, most notablyworkforce supply. The picture with regard to the future workforce supply is not clear(please refer to Chapter 10 of the Wanless report for discussion of this point). Theimplications for workforce supply of the various base-case scenarios are presented inTable 15 opposite. The most significant difference in the three scenarios is in the number ofhome helps/care assistants required. There are estimated to have been around 250,000whole-time equivalent (WTE) home helps/care assistants providing care for older people inEngland in 2002. Under the Wanless review scenarios, the model estimates that a further150,000–200,000 extra home helps/care assistants would have been needed in 2002 todeliver the services specified by the Wanless review team. The number of home helps/careassistants required to deliver these services into the future is projected to be around620,000 for scenario 2 and 690,000 for scenario 3 in 2026. This should be compared with390,000 if the current service configuration is assumed to continue. A greater number ofsocial workers, occupational therapists, managers and support staff will also be requiredto deliver the Wanless review scenarios but the increase is not as significant as that
32 EXPENDITURE ON SOCIAL CARE FOR OLDER PEOPLE TO 2026
TABLE 14: PROJECTED TOTAL EXPENDITURE ON SOCIAL SERVICES FOR OLDER PEOPLE, BY FUNDINGSOURCE, UNDER A FREE PERSONAL CARE POLICY, ENGLAND, 2002 TO 2026
Funding Total expenditure (£million) % change source 2002–26
2002 2007 2012 2017 2022 2026
Scenario 1Public 6,500 7,400 8,600 7,600 12,200 14,500 123Private 3,600 4,200 5,100 8,900 7,900 9,400 161
Scenario 2Public 9,700 11,100 13,200 15,800 19,100 22,700 134Private 2,500 3,000 3,700 4,600 5,800 6,900 176
Scenario 3Public 10,200 11,700 13,900 16,800 20,300 24,000 135Private 2,700 3,200 3,900 4,900 6,200 7,300 170
Source: PSSRU long-term care finance model and Wanless model estimates

required for home helps/care assistants. Overall, the model estimates that the size of theworkforce would need to increase significantly to deliver the Wanless review scenarios.
TransitionsThe PSSRU Wanless model incorporates each of the Wanless scenarios for every year, from2002 to 2026. This approach allows us to examine the relative cost of each serviceconfiguration or scenario at each point in time. It does not, however, represent the realityof introducing a new service model where significant changes will need to be made to thesupply side to, for example, build capacity as is demonstrated above. To allow for theproviders to develop their services and for a smooth transition, changes are usuallyimplemented over an extended period of time. In the following scenario, shown in Figure12 overleaf, we show schematically the likely financial implications of moving from thecurrent system to either of the other two base scenarios considered in this review. We haveassumed, for the purposes of this analysis, that by 2012 the changes needed to the systemunder both scenarios will have been partly implemented, and that by 2026 they will havebeen fully implemented. In modelling terms, this means that by 2012 expenditure will becomposed of about half the estimated costs of scenario 1 and half the estimated costs ofthe Wanless review scenarios; by 2026, expenditure will be composed entirely of theWanless review scenario estimate for expenditure.
KEY PROJECTIONS 33
TABLE 15: PROJECTED WORKFORCE REQUIREMENTS FOR SOCIAL SERVICES FOR OLDER PEOPLE, WHOLE-TIMEEQUIVALENTS, UNDER BASE CASE ASSUMPTIONS, ENGLAND, 2002 TO 2026
Occupational group Workforce requirement (thousands) % change 2002–26
2002 2007 2012 2017 2022 2026
Scenario 1Social workers 11.0 12.0 13.0 14.0 16.0 17.0 53Occupational therapists 0.8 0.9 0.9 1.0 1.2 1.3 53Home helps/care assistants 251.0 266.0 287.0 316.0 353.0 391.0 56Managers 66.0 70.0 75.0 83.0 93.0 103.0 56Support staff 63.0 67.0 72.0 80.0 89.0 99.0 56Total1 393.0 416.0 449.0 494.0 551.0 611.0 56
Scenario 2Social workers 18.0 19.0 21.0 23.0 26.0 28.0 53Occupational therapists 1.4 1.4 1.6 1.7 1.9 2.1 54Home helps/care assistants 403.0 424.0 461.0 509.0 566.0 620.0 54Managers 95.0 99.0 108.0 120.0 133.0 146.0 54Support staff 91.0 95.0 104.0 115.0 127.0 140.0 54Total1 608.0 639.0 695.0 769.0 854.0 935.0 54
Scenario 3Social workers 18.0 19.0 21.0 23.0 26.0 28.0 53Occupational therapists 1.4 1.4 1.6 1.7 1.9 2.1 54Home helps/care assistants 448.0 471.0 512.0 565.0 628.0 688.0 54Managers 105.0 110.0 120.0 132.0 147.0 161.0 54Support staff 100.0 105.0 115.0 127.0 141.0 154.0 54Total1 673.0 707.0 768.0 849.0 943.0 1,032.0 53
Source: PSSRU Wanless model estimates1 Discrepancies due to rounding.

Figure 12 shows that expenditure would have to rise more steeply in future years if we wereto implement either of the service configurations described by the Wanless reviewscenarios. If the service model to be implemented were scenario 2 then expenditure wouldhave to increase from the 2002 level of about £10 billion to an estimated £30 billion in2026; for scenario 3, expenditure would have to increase to an estimated £31.3 billion.
34 EXPENDITURE ON SOCIAL CARE FOR OLDER PEOPLE TO 2026
PROJECTED IMPLICATIONS FOR EXPENDITURE OF TRANSITION TO NEW SYSTEM, UNDER BASE CASEASSUMPTIONS, ENGLAND, 2002 TO 2026
Source: Hyde and Janevic 2003
12
0
5,000
35,000
2000 2010 2020 2030
Expe
ndit
ure
(£m
illio
n)
Year
30,000
25,000
20,000
15,000
10,000
KEY
Scenario 1
Transition to scenario 2
Transition to scenario 3 Source: PSSRU long-term care finance model and Wanless model estimates
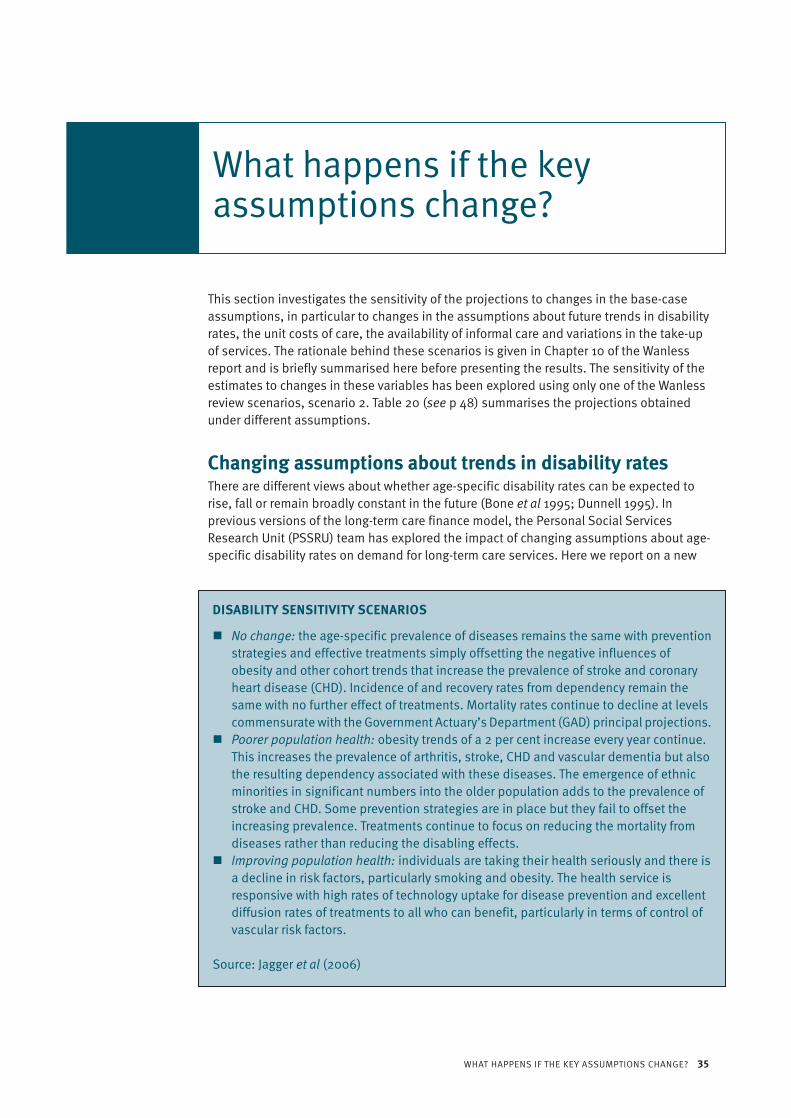
WHAT HAPPENS IF THE KEY ASSUMPTIONS CHANGE? 35
This section investigates the sensitivity of the projections to changes in the base-caseassumptions, in particular to changes in the assumptions about future trends in disabilityrates, the unit costs of care, the availability of informal care and variations in the take-upof services. The rationale behind these scenarios is given in Chapter 10 of the Wanlessreport and is briefly summarised here before presenting the results. The sensitivity of theestimates to changes in these variables has been explored using only one of the Wanlessreview scenarios, scenario 2. Table 20 (see p 48) summarises the projections obtainedunder different assumptions.
Changing assumptions about trends in disability ratesThere are different views about whether age-specific disability rates can be expected torise, fall or remain broadly constant in the future (Bone et al 1995; Dunnell 1995). Inprevious versions of the long-term care finance model, the Personal Social ServicesResearch Unit (PSSRU) team has explored the impact of changing assumptions about age-specific disability rates on demand for long-term care services. Here we report on a new
What happens if the keyassumptions change?
DISABILITY SENSITIVITY SCENARIOS
No change: the age-specific prevalence of diseases remains the same with preventionstrategies and effective treatments simply offsetting the negative influences ofobesity and other cohort trends that increase the prevalence of stroke and coronaryheart disease (CHD). Incidence of and recovery rates from dependency remain thesame with no further effect of treatments. Mortality rates continue to decline at levelscommensurate with the Government Actuary’s Department (GAD) principal projections.Poorer population health: obesity trends of a 2 per cent increase every year continue.This increases the prevalence of arthritis, stroke, CHD and vascular dementia but alsothe resulting dependency associated with these diseases. The emergence of ethnicminorities in significant numbers into the older population adds to the prevalence ofstroke and CHD. Some prevention strategies are in place but they fail to offset theincreasing prevalence. Treatments continue to focus on reducing the mortality fromdiseases rather than reducing the disabling effects.Improving population health: individuals are taking their health seriously and there isa decline in risk factors, particularly smoking and obesity. The health service isresponsive with high rates of technology uptake for disease prevention and excellentdiffusion rates of treatments to all who can benefit, particularly in terms of control ofvascular risk factors.
Source: Jagger et al (2006)

approach to modelling the growth of the disabled population that involves an innovativelinkage with a research team led by Carol Jagger at the Leicester Nuffield Research Unit(Jagger et al 2006).
The Leicester team has developed a model that can examine the effects of changingincidence rates of disability on the size of the disabled population, based on assumptionsabout the prevalence rates of specific diseases, for example, arthritis, stroke, heartdisease and dementia. Inclusion of trends in age-specific disability rates, based onchanges in the incidence rates of disability, represents a significant departure from thescenarios previously considered in the PSSRU model. The link to the Leicester modelallows more detailed assumptions to be made about the changing health of the olderpopulation. The Leicester team has produced three main scenarios, which are described indetail in Jagger et al (2006) and are outlined in the box on page 35.
To introduce the Leicester results into the PSSRU model, several steps need to be taken toadjust the Leicester data into a format that is compatible with the PSSRU model. TheLeicester model produces results in terms of prevalence of disability, by five-year agegroups, for the base year (1991) and every two years until 2031. There are some differencesbetween the PSSRU model and the Leicester model in the way in which disability ismeasured (both models use activities of daily living (ADLs) to measure disability, but themeasure of ADLs is slightly different between the models; that said, they do produce
36 EXPENDITURE ON SOCIAL CARE FOR OLDER PEOPLE TO 2026
PROJECTED NUMBERS OF ADL DISABLED PEOPLE, UNDER VARYING ASSUMPTIONS ABOUT TRENDS INDISABILITY RATES, ENGLAND, 2002 TO 2026
Source: Hyde and Janevic 2003
13
0
1,800
2000 2010 2020 2030
Num
ber o
f AD
L di
sabl
ed p
eopl
e (t
hous
ands
)
Year
1,600
1,400
1,200
1,000
800
600
400
200
KEY
No change scenario
Poorer healthscenario
Better healthscenario
Central base casescenario Source: PSSRU Wanless model estimates

comparable estimates of disability rates when disability is defined as ability to perform atleast one ADL without help) and in the prevalence of disability at baseline. Thesedifferences mean that the output of the Leicester model cannot be fed directly into thePSSRU model. To overcome these differences, the data incorporated in the PSSRU modelcomprise the trend in changes in disability rates over time that emerges from the Leicesterestimates, rather than the disability rates.
Figure 13 opposite presents the estimated size of the older disabled population, under thevarious scenarios described in the box on p 35. The disabled population in the figureincludes only those who are unable to perform one or more ADLs for consistency, with thedefinition of disability used in the Leicester model. As Figure 13 demonstrates, the betterhealth scenario provides a very similar picture with respect to the growth of the disabledpopulation, as projected under the base-case assumption of constant age-specificprevalence rates of disability. Both scenarios estimate that the disabled population willincrease from around 920,000 in 2002 to around 1,430,000 in 2026, an increase of about55 per cent. The converse scenario, which assumes that the population will be in poorerhealth, estimates that the disabled population will increase to 1,600,000 by 2026, anincrease of close to 75 per cent. The no-change scenario assumption, that the age-specificincidence and recovery rates from disability will remain unchanged, estimates that the
WHAT HAPPENS IF THE KEY ASSUMPTIONS CHANGE? 37
PROJECTED EXPENDITURE EXPRESSED AS A PERCENTAGE OF GDP, UNDER VARYING ASSUMPTIONSABOUT TRENDS IN DISABILITY RATES, ENGLAND, 2002 TO 2026
Source: Hyde and Janevic 2003
14
0
2.5
2000 2010 2020 2030
Expe
ndit
ure
as a
per
cent
age
of G
DP
Year
0.5
2.0
1.5
1.0
KEY
No change scenario
Poorer healthscenario
Better healthscenario
Central base casescenario Source: PSSRU Wanless model estimates

disabled population will be around 1,550,000 in 2026, an increase of almost 70 per cent.This assumption is significantly more pessimistic than that considered in the base case.
Growth in the disabled population drives growth in demand for services, because there aremore people who require assistance. The financial implications of the increase in demandfor services under each of the scenarios considered in this section are shown in Table 16above. The model estimates that, if incidence rates were to remain unchanged, by 2026expenditure on social services would rise to £31.1 billion, compared with £29.6 billion ifthe health of the older population improved and £31.8 billion if health were to worsen.This difference equates to a rise in expenditure of about 155, 140 and 160 per cent,respectively. Expressed as a share of the gross domestic product (GDP), if the health of theolder population were to improve, expenditure on social services would represent about1.9 per cent of the GDP, compared with 2.0 per cent of the GDP if older people’s healthwere to worsen (see Figure 14, p 37).
Changing assumptions about the unit cost of servicesPrevious reports by the PSSRU long-term care finance team have highlighted the sensitivityof future long-term care expenditure to relatively small changes in the future unit costs oflong-term care (Wittenberg et al 1998, 2001, 2002, 2006). The key driver of rises in the unitcosts of care is a rise in the earnings of staff providing social care. Community-based careservices are clearly highly labour intensive. Care with housing/institutional care is alsolabour intensive, with staff costs accounting for most of the overall costs. For example,data from a UK study show that, in public sector homes, staff costs accounted for 85 percent of the total unit cost (Netten et al 1998). This suggests that it would be plausible toassume that the real unit costs of care will rise broadly in line with average earnings of carestaff, or perhaps by somewhat less, allowing for non-staff costs (Wittenberg and Comas-Herrera 2003). The PSSRU Wanless model takes this assumption for its base case andassumes that the real unit costs of care, such as the cost of an hour’s community-basedcare, will rise by 2 per cent per year, in line with the HM Treasury’s assumption for averageearnings. An exception is that non-staff revenue costs are assumed to remain constant inreal terms. The GDP is also assumed to rise in line with the HM Treasury’s assumption,which is also 2 per cent per year in real terms over the long term.
Alternative scenarios have been explored that make adjustments to the increase in unitcosts to account for potential improvements in the quality of care and increased use ofnew technology. The scenarios are presented in the box opposite, and a discussion of the
38 EXPENDITURE ON SOCIAL CARE FOR OLDER PEOPLE TO 2026
TABLE 16: PROJECTED GROSS EXPENDITURE ON SOCIAL SERVICES FOR OLDER PEOPLE, UNDER DIFFERENTPOPULATION HEALTH SCENARIOS, ENGLAND, 2002 TO 2026
Scenario Gross expenditure (£million) % change 2002–26
2002 2007 2012 2017 2022 2026
No change 12,200 14,200 17,200 21,200 26,200 31,100 155Poorer health 12,200 14,400 17,500 21,500 26,700 31,800 160Better health 12,200 14,300 17,100 20,700 25,200 29,600 142Central base 12,200 14,100 16,800 20,400 24,900 29,500 142
Source: PSSRU Wanless model estimates

rationale for these scenarios is given in more detail in Chapter 10 of the Wanless report.Table 17 above presents the estimated expenditure for each of these scenarios comparedwith the base case (for scenario 2).
The scenario that assumes an initial 20 per cent increase in costs to deliver qualityimprovements, followed by a 2 per cent increase per year thereafter, would have the mostsubstantial impact on expenditure. Expenditure would have to rise from £12.2 billion in2002 to £34.5 billion in 2026, an increase of over 180 per cent. By contrast the scenariothat assumes both an increase in the quality of services and an investment in (andincreased use of) technology is estimated to require only an increase in expenditure ofclose to 130 per cent by 2026, compared with roughly 140 per cent for the central basecase. In Figure 15 (see p 40), estimated expenditure is expressed as a proportion of theGDP. Under the most expensive option considered here (the 20 per cent and then 2 percent rise in unit costs per year), expenditure is estimated to represent about 2.2 per cent ofthe GDP by 2026, compared with an estimated 1.9 per cent under base-case assumptionsabout unit costs. Under the most optimistic scenario (a 20 per cent and then a 1 per centrise in unit costs per year), on the other hand, expenditure is estimated to represent about1.8 per cent of the GDP by 2026.
WHAT HAPPENS IF THE KEY ASSUMPTIONS CHANGE? 39
TABLE 17: PROJECTED GROSS EXPENDITURE ON SOCIAL SERVICES FOR OLDER PEOPLE, UNDER DIFFERENTUNIT COST SENSITIVITY SCENARIOS, ENGLAND, 2002 TO 2026
Scenario Gross expenditure (£million) % change 2002–26
2002 2007 2012 2017 2022 2026
10% then 2% 12,200 15,200 18,100 21,900 26,800 31,800 16020% then 1% 12,200 15,900 18,000 20,900 24,400 27,800 12820% then 2% 12,200 16,500 19,600 23,800 29,100 34,500 183Central base 12,200 14,100 16,800 20,400 24,900 29,500 142
Source: PSSRU Wanless model estimates
UNIT COST SENSITIVITY SCENARIOS
Real increase of 10 per cent in year 1 followed by a 2 per cent real increase per annumthereafter: initial increase to allow for improvements in quality to be made; for theyears thereafter it is assumed that unit costs rise in line with the HM Treasury’sassumptions about increases in average earnings.Real increase of 20 per cent in year 1 followed by a 1 per cent real increase per annumthereafter: initial increase to allow for improvements in quality to be made; for theyears thereafter it is assumed that increased use of technology will drive overall costsdownwards. The latter is modelled by assuming that unit costs increase by 1 per centper annum.Real increase of 20 per cent in year 1 followed by a 2 per cent real increase per annumthereafter: Initial increase to allow for improvements in quality to be made; for theyears thereafter it is assumed that unit costs rise in line with the HM Treasury’sassumptions about increases in average earnings.

Availability of informal care scenariosThere is a great deal of uncertainty about the future supply of informal care, particularly thesupply of care by adult children to their older parents (compare Pickard et al 2006).Evidence shows that the proportion of older people living with an adult child has declinedfrom 42 per cent in 1962 to 11 per cent in 2001–2 (Grundy 1995; Grundy and Glaser 1997;authors’ analysis of 2001/2 GHS). If this trend continues, it may be compounded in futureyears by increased levels of childlessness, although this effect will become apparent onlyonce the ‘baby boom’ cohort reaches old age (Evandrou and Falkingham 2000; Dixon andMargo 2006). In addition, it is anticipated that increasing labour market participation ratesof women may reduce the provision of intergenerational care to older people (Salvage1995; Organisation for Economic Co-operation and Development 2006).
A scenario has been developed to examine the possibility that disabled older people nolonger receive informal care from their (adult) children. This is obviously an extreme casescenario because it is unlikely that care by children will cease entirely; however, as theresults below indicate, it illustrates the important contribution that children make to thecare of their older parents (compare Pickard et al 2006).
Another scenario assumes that the supply of informal help remains constant into thefuture, and explores the consequences of an increase in the volume of informal helpprovided by current carers. It assumes that 20 per cent more people receiving informal
40 EXPENDITURE ON SOCIAL CARE FOR OLDER PEOPLE TO 2026
PROJECTED EXPENDITURE EXPRESSED AS A PERCENTAGE OF GDP, UNDER DIFFERENT UNIT COSTASSUMPTIONS, ENGLAND, 2002 TO 2026
Source: Hyde and Janevic 2003
15
0
2.5
2000 2010 2020 2030
Expe
ndit
ure
as a
per
cent
age
of G
DP
Year
0.5
1.0
1.5
2.0
KEY
10% then 2%
20% then 1%
20% then 2%
Central base casescenario Source: PSSRU Wanless model estimates

help have all their needs met by their informal carers and no longer require formalservices. The informal care scenarios are summarised in the box above and are discussedin more detail in Chapter 10 of the Wanless report.
Figure 16 below illustrates graphically the effect of there being no older people in receipt ofinformal care from their children. The numbers of recipients of informal help would fallfrom an estimated 1,800,000 in 2002 under base-case assumptions to about 1,000,000.By 2026 the model estimates that the difference would grow, such that there would bemore than 1,100,000 fewer people receiving informal help (compare Pickard et al 2006;Wittenberg et al 2006).
WHAT HAPPENS IF THE KEY ASSUMPTIONS CHANGE? 41
INFORMAL CARE SENSITIVITY SCENARIOS
No informal care from children: all those who under the base case receive informalhelp from children are treated as if they receive no informal help.Twenty per cent more people receive full informal help packages: of those receivinginformal help, it is assumed that 20 per cent more than under the base case receiveall the hours of care that they need from informal sources, such that they no longerrequire formal services.
PROJECTED NUMBER OF RECIPIENTS OF INFORMAL CARE, UNDER VARIOUS ASSUMPTIONS ABOUTAVAILABILITY OF INFORMAL CARE, ENGLAND, 2002 TO 2026
Source: Hyde and Janevic 2003
16
0
3,000
2000 2010 2020 2030
Num
ber o
f rec
ipie
nts
(tho
usan
ds)
Year
2,500
2,000
1,500
1,000
500
KEY
No care from children
20% more receiving fullinformal care/central base casescenario Source: PSSRU Wanless model estimates

The assumption that 20 per cent more people receive full informal help packages has noeffect on the number of recipients of informal help; rather it affects the volume of informalhelp received and, through this, impacts on the volume of formal services received. Thefinancial implications of such changes in the demand for formal services are shown inTable 18 above.
Changing volumes of informal help are assumed in these scenarios to have an impact onthe cost of community-based services. As Table 18 demonstrates, there is a largedifference in the cost of these services between the informal care scenarios. The impact ofthere being no informal care by children is estimated to increase the costs of community-based care from £6.2 billion under base assumptions to £7.1 billion in 2002, rising to £15.5billion under base-care assumptions and £17.4 billion under assumptions about decreasedavailability of care by children in 2026. This increase is found even though the scenarioinvolves a decrease in carer-support services, as well as a rise in community-based homecare services to replace informal help.
The effect of 20 per cent more people receiving all their care from informal sources is lessmarked than the ‘no informal care by children’ scenario, but is estimated to reduce overallexpenditure by about £0.6bn by 2026. There is an overall reduction in estimatedexpenditure despite the increased expenditure that this scenario implies for carer-supportservices.
Figure 17 opposite shows graphically the estimated increase in expenditure relative to theGDP, under current assumptions about the predicted growth of the economy. Expenditure
42 EXPENDITURE ON SOCIAL CARE FOR OLDER PEOPLE TO 2026
TABLE 18: PROJECTED EXPENDITURE ON SOCIAL SERVICES FOR OLDER PEOPLE, UNDER VARIOUSASSUMPTIONS ABOUT AVAILABILITY OF INFORMAL CARE, ENGLAND, 2002 TO 2026
Type of care Expenditure (£million) % change 2002–26
2002 2007 2012 2017 2022 2026
No care from childrenInstitutional 4,900 5,600 6,600 8,000 9,700 11,400 134Community-based 7,100 8,200 9,800 12,000 14,700 17,400 147All care services 11,900 13,800 16,400 19,900 24,400 28,900 143Total expenditure* 13,100 15,100 18,000 21,800 26,700 31,700 142
20% more receiving full informal careInstitutional 4,900 5,600 6,600 8,000 9,700 11,400 134Community-based 6,100 7,000 8,400 10,300 12,600 15,000 148All care services 10,900 12,700 15,100 18,200 22,300 26,400 142Total expenditure* 12,000 13,800 16,500 20,000 24,400 28,900 142
Central baseInstitutional 4,900 5,600 6,600 8,000 9,700 11,400 134Community-based 6,200 7,300 8,700 10,600 13,000 15,500 148All care services 11,100 12,900 15,300 18,600 22,700 26,900 142Total expenditure* 12,200 14,100 16,800 20,400 24,900 29,500 142
Source: PSSRU Wanless model estimates* Includes expenditure on care management and assessment as well as expenditure on care services.

is projected to be 2.0 per cent of the GDP in 2026, under the scenario in which there is noinformal care by children, as against 1.9 per cent under the base case.
Variations in take-up of servicesThere are two ways that people can exercise the choice not to take up services; they caneither decline to use services outright or decide to have a reduced package of weekly carehours. There are many reasons why people might choose to decline all or part of a servicepackage, and these have already been discussed. For the purpose of the modelling, it hasbeen assumed that all those declining to take up services or reducing the hours of theirpackages of care do so because they are unwilling to pay for the services – a phenomenonknown as the ‘demand effect’. The base case of the model, which assumes that the currentfunding system is in place, includes within it an assumption that a certain proportion ofpeople within each sub-group of the older population declines to take up services. Thesize of this ‘demand effect’ has been estimated by the Wanless review team and is shownon pages 6–7. The rationale is discussed in more detail in Chapter 10 of the Wanlessreport.
Two scenarios are explored here. The first assumes that all those who are estimated to beeligible for services under the base case of the model, the potential population of serviceusers, decide to take up full packages of care. Under this scenario the proportions
WHAT HAPPENS IF THE KEY ASSUMPTIONS CHANGE? 43
PROJECTED EXPENDITURE AS A PERCENTAGE OF GDP, UNDER VARIOUS ASSUMPTIONS ABOUT AVAILABILITY OF INFORMAL CARE, ENGLAND, 2002 TO 2026
Source: Hyde and Janevic 2003
17
0
2.5
2000 2010 2020 2030
Expe
ndit
ure
as a
per
cent
age
of G
DP
Year
0.5
2.0
1.5
1.0
KEY
No care from children
20% more receiving fullinformal care
Central base casescenario Source: PSSRU Wanless model estimates

declining services shown in Table 3 (see p 9) are set to zero. The introduction of freepersonal care, for example, could be expected to lead to increased demand for services.
The second scenario assumes that people choose to have packages of care that are lessthan benchmark levels, as defined by the Wanless review team. This scenario works byvarying the intensity of all types of community-based services received, so that the averageweekly package of care for each sub-group of the older population is reduced usingpercentages specified by the Wanless review team. The degree to which people choose toreduce their packages of care depends on both their level of functional impairment andwhether they live alone or with others. The reduction in intensity, therefore, varies from
44 EXPENDITURE ON SOCIAL CARE FOR OLDER PEOPLE TO 2026
TAKE-UP OF SERVICES: SENSITIVITY SCENARIOS
All those who are eligible take up services: it is assumed that all those who areestimated under the base case to be in need of services, the potential population ofservice users, decide to take up full service packages.Reduced weekly package of community-based care: of those receiving community-based services under base-case assumptions, it is assumed that a certain proportiondecides to reduce its weekly package of care, such that the average intensity ofservice receipt is reduced by a given percentage for each sub-group of the population.
PROJECTED DEMAND FOR ALL COMMUNITY-BASED SERVICES, UNDER VARIOUS ASSUMPTIONS ABOUT TAKE-UP OF SERVICES, ENGLAND, 2002 TO 2026
Source: Hyde and Janevic 2003
18
0
3,000
2000 2010 2020 2030
Num
ber o
f rec
ipie
nts
(tho
usan
ds)
Year
500
2,500
2,000
1,500
1,000
KEY
All those eligibletake up services
Reduced packageof care/centralbase case scenario Source: PSSRU Wanless model estimates
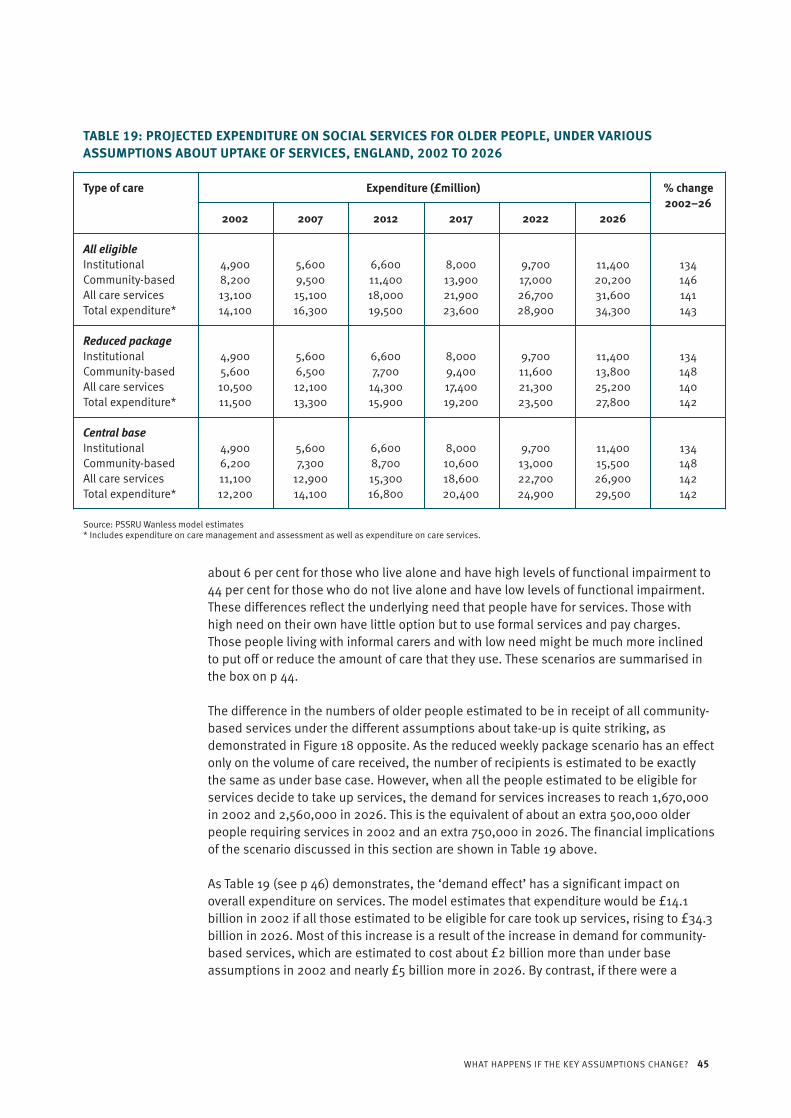
about 6 per cent for those who live alone and have high levels of functional impairment to44 per cent for those who do not live alone and have low levels of functional impairment.These differences reflect the underlying need that people have for services. Those withhigh need on their own have little option but to use formal services and pay charges.Those people living with informal carers and with low need might be much more inclinedto put off or reduce the amount of care that they use. These scenarios are summarised inthe box on p 44.
The difference in the numbers of older people estimated to be in receipt of all community-based services under the different assumptions about take-up is quite striking, asdemonstrated in Figure 18 opposite. As the reduced weekly package scenario has an effectonly on the volume of care received, the number of recipients is estimated to be exactlythe same as under base case. However, when all the people estimated to be eligible forservices decide to take up services, the demand for services increases to reach 1,670,000in 2002 and 2,560,000 in 2026. This is the equivalent of about an extra 500,000 olderpeople requiring services in 2002 and an extra 750,000 in 2026. The financial implicationsof the scenario discussed in this section are shown in Table 19 above.
As Table 19 (see p 46) demonstrates, the ‘demand effect’ has a significant impact onoverall expenditure on services. The model estimates that expenditure would be £14.1billion in 2002 if all those estimated to be eligible for care took up services, rising to £34.3billion in 2026. Most of this increase is a result of the increase in demand for community-based services, which are estimated to cost about £2 billion more than under baseassumptions in 2002 and nearly £5 billion more in 2026. By contrast, if there were a
WHAT HAPPENS IF THE KEY ASSUMPTIONS CHANGE? 45
TABLE 19: PROJECTED EXPENDITURE ON SOCIAL SERVICES FOR OLDER PEOPLE, UNDER VARIOUSASSUMPTIONS ABOUT UPTAKE OF SERVICES, ENGLAND, 2002 TO 2026
Type of care Expenditure (£million) % change 2002–26
2002 2007 2012 2017 2022 2026
All eligibleInstitutional 4,900 5,600 6,600 8,000 9,700 11,400 134Community-based 8,200 9,500 11,400 13,900 17,000 20,200 146All care services 13,100 15,100 18,000 21,900 26,700 31,600 141Total expenditure* 14,100 16,300 19,500 23,600 28,900 34,300 143
Reduced packageInstitutional 4,900 5,600 6,600 8,000 9,700 11,400 134Community-based 5,600 6,500 7,700 9,400 11,600 13,800 148All care services 10,500 12,100 14,300 17,400 21,300 25,200 140Total expenditure* 11,500 13,300 15,900 19,200 23,500 27,800 142
Central baseInstitutional 4,900 5,600 6,600 8,000 9,700 11,400 134Community-based 6,200 7,300 8,700 10,600 13,000 15,500 148All care services 11,100 12,900 15,300 18,600 22,700 26,900 142Total expenditure* 12,200 14,100 16,800 20,400 24,900 29,500 142
Source: PSSRU Wanless model estimates* Includes expenditure on care management and assessment as well as expenditure on care services.

reduction in the average size of the weekly package of care people received, then themodel estimates that expenditure on services would be lower than under base case.Expenditure, under the reduced package, is estimated to total £11.5 billion in 2002, risingto £27.8 billion in 2026. This compares with an estimated cost under base assumptions of£12.2 billion in 2002 and £29.5 billion in 2026.
Assuming that the economy expands at the rate reported by the HM Treasury, the modelestimates that, if all those who were eligible for services took up that service, expenditurewould represent about 1.6 per cent of the GDP in 2002 and 2.2 per cent in 2026 (see Figure19 above). This represents about a 0.3 per cent greater spend on social services as aproportion of the GDP in 2002 than under the base-case assumptions. A reduced packageof care is estimated, in terms of the GDP, to be approximately equivalent to expenditureunder base assumptions in 2002, but, by 2026, expenditure under this scenario isestimated to represent about 1.8 per cent of the GDP – 0.1 per cent less than is estimatedunder base assumptions.
46 EXPENDITURE ON SOCIAL CARE FOR OLDER PEOPLE TO 2026
PROJECTED EXPENDITURE AS A PERCENTAGE OF GDP, UNDER VARIOUS ASSUMPTIONS ABOUT TAKE-UP OF SERVICES, ENGLAND, 2002 TO 2026
Source: Hyde and Janevic 2003
19
0
2.5
2000 2010 2020 2030
Expe
ndit
ure
as a
per
cent
age
of G
DP
Year
0.5
2.0
1.5
1.0
KEY
All those eligibletake up services
Reduced packageof care
Central base case scenario Source: PSSRU Wanless model estimates

DISCUSSION 47
This paper has presented projections to 2026 of future expenditure on social services forolder people in England. In the paper, projections based on the standard PSSRU/CARESIMmodel, which projects existing patterns of care into the future, have been compared withprojections based on scenarios developed by the Wanless review team. The Wanlessreview team scenarios were based on a specified set of base-case assumptions aboutwhat services are required to deliver specified outcomes. The outcomes of personal care(including nutrition), safety, well-being and reduction of carer stress were specified by theWanless review team. Two base scenarios were designed by the Wanless review team that,in their own words, ‘capture the degree to which these sets of outcomes are to be achievedin the future’. In the view of the Wanless review team, these scenarios can be consideredto represent different service models, each engendering a different pattern of careservices.
The projections presented here should not be regarded as forecasts of the future, forseveral reasons. First, the Wanless review scenarios have been developed using datacollected under the current system, that is to say the data have been extrapolated to try todetermine what, in the view of the Wanless review team, an ‘ideal’ service might look like.There are potential problems associated with this approach (for discussion of these,please refer to Chapter 10 of the Wanless report). Second, the projections are highlysensitive to changes in the assumptions about future trends in drivers of demand for care.As the sensitivity analyses show, projected future demand for social services for olderpeople is sensitive to assumptions about future numbers of disabled older people and thefuture availability of informal care. It is also sensitive to variations in the degree to whichpeople decide to take up services, which is assumed to stem from the willingness ofindividuals to pay for means-tested services. Projected future expenditure on socialservices for older people is also sensitive to assumptions about future rises in the real unitcosts of services, such as the cost of an hour’s community-based care. Third, theexpenditure projections do not constitute the total costs of care for older people to society.That would require inclusion of the costs of a wider range of services to a wider range ofpublic agencies and service users and the opportunity costs of informal care.
Notwithstanding these limitations, the projections have potential implications for policy.Some potential policy implications of the projections presented here are discussed in theWanless report.
Discussion

48 EXPENDITURE ON SOCIAL CARE FOR OLDER PEOPLE TO 2026
Table 20 summarises the projections for 2026 obtained under the various sensitivityscenarios discussed in the fourth section of this paper. Where results are the same as forthe base case (scenario 2 in this instance), they are not shown.
Summary of projections undervariant scenarios
TABLE 20: SUMMARY OF PROJECTIONS FOR 2026 UNDER VARIANTS AROUND THE BASE CASE SCENARIO 2
Projected Projected Projected Projected Projected Projected number of number of number of number of total total
people with people with people in recipients expenditure expenditure disability informal help institutional of all (£million) (% of GDP)
(thousands) (thousands) care community-(thousands) based
services* (thousands)
Base case (scenario 2 only)Scenario 2 base year, 2002 920 1,780 250 1,180 12,200 1.3Scenario 2 projection, 2026 1,430 2,700 390 1,800 29,500 1.9
Disability assumptionsNo change 1,550 2,680 430 1,770 31,100 2.0Poorer health 1,600 2,670 440 1,760 31,800 2.0Better health 1,430 2,700 390 1,800 29,600 1.9
Unit costs assumptions10% then 2% – – – – 31,800 2.020% then 1% – – – – 27,800 1.820% then 2% – – – – 34,500 2.2
Informal care assumptionsNo care from children – 1,610 – 1,820 31,700 2.020% more receiving full
informal care – 2,700 – 1,610 28,900 1.8
Demand assumptionsAll eligible – – – 2,560 34,300 2.2Reduced package – – – 1,800 27,800 1.8
Source: PSSRU Wanless model estimates* Includes community-based and other community-based services.

BIBLIOGRAPHY 49
Allen I, Perkins E eds (1995). The Future of Family Care for Older People. London: HMSO.
Arber S, Gilbert GN, Evandrou M (1988). ‘Gender, household composition and receipt of domiciliaryservices by elderly disabled people’. Journal of Social Policy, vol 17, pp 153–75.
Audit Commission (2004). Support for Carers of Older People. Independence and well-being 5.London: Audit Commission (www.audit-commission.gov.uk/olderpeople).
Bell D, Bowes A (2006). Financial Care Models in Scotland and the UK. York: Joseph RowntreeFoundation.
Bone MR, Bebbington AC, Jagger C, Morgan K, Nicholaas G (1995). Health Expectancy and Its Uses.London: The Stationery Office.
Curtis L, Netten A (2004). Unit Costs of Health and Social Care 2004. Kent: PSSRU, University of Kent.
Davies B, Bebbington A, Charnley H, in collaboration with Baines B, Ferlie E, Hughes M, Twigg J(1990). Resources, Needs and Outcomes in Community-based Care. A comparative study of theproduction of welfare for elderly people in ten local authorities in England and Wales. Aldershot:Avebury.
Department of Health (2006). Our Health, Our Care, Our Say: A new direction for community services.London: Department of Health.
Department of Health (2004). Community Care Statistics 2002–2003. Referrals, assessments andpackages of care, for adults. London: Department of Health. Available online at: http://www.dh.gov.uk/assetRoot/04/08/14/41/04081441.pdf (accessed on 30 June 2006).
Department of Health (2003). Fairer Charging Policies for Home Care and Other Non-residentialSocial Services. Guidance for councils with social services responsibilities. London: The StationeryOffice.
Dixon M, Margo J (2006). Population Politics. London: IPPR.
Dunnell K (1995). ‘Population review: (2) Are we healthier?’ Population Trends, vol 82, pp 12–18.
Evandrou M (2005). ‘Health and social care’ in Focus on Older People, Office for National Statisticsed. London: The Stationery Office, pp 51–65.
Evandrou M, Falkingham J (2000). ‘Looking back to look forward: lessons from four birth cohorts forageing in the 21st century’. Population Trends, vol 99, pp 27–36.
Bibliography

Government Actuary’s Department (2005). National Population Projections: 2004-based. Availablefrom www.gad.gov.uk.
Grundy E (1995). ‘Demographic influences on the future of family care’ in The Future Of Family CareFor Older People, Allen I, Perkins E eds. London: The Stationery Office.
Grundy E, Glaser K (1997). ‘Trends in and transitions to institutional residence among older people inEngland and Wales, 1971–1991’. Journal of Epidemiology and Community Health, vol 51, pp 531–40.
Hancock R (2000). Charging for Care in Later Life: Analysing the effects of reforming the means test.Working Paper no. NF86. Leicester: Nuffield Community Care Studies Unit, University of Leicester.
Hancock R, Pickard L, Wittenberg R, Comas-Herrera A, Juarez-Garcia A, King D, Malley J (2006). Payingfor Long-term Care for Older People in the UK: Modelling the costs and incidence of a range ofoptions. Report to the Nuffield Foundation. PSSRU discussion paper 2336. London: PSSRU.
Hancock R, Comas-Herrera A, Wittenberg R, Pickard L (2003). ‘Who will pay for long-term care in theUK? Projections linking macro- and micro-simulation models’. Fiscal Studies, vol 24, pp 387–426.
HM Treasury (2005). Budget Report. London: HMSO. Available online at: www.hm-treasury.gov.uk/budget
House of Commons Health Committee (1996). Long-term Care Finance: Memorandum of evidence.London: The Stationery Office.
Jagger C, Matthews R, Spiers N, Brayne C, Comas-Herrara A, Robinson T, Lindesay J, Croft P (2006).Compression or Expansion of Disability? Forecasting future disability levels under changing patternsof diseases. Working Paper number KF117 02/06. Leicester: Nuffield Research Unit.
Karlsson M, Mayhew L, Plumb R, Rickaysen B (2005). ‘Future costs for long-term care. Costprojections for long-term care for older people in the United Kingdom’. Health Policy, vol 75, pp187–213.
Lagergren M, Batljan I (2000). Will There be a Helping Hand? Macroeconomic scenarios of futureneeds and costs of health and social care for the elderly in Sweden, 2000–30. Annex 8 to the LongTerm Survey 1999/2000. Stockholm: Ministry of Finance.
Laing & Buisson (2004). Care of Elderly People Market Survey 2004. London: Laing & BuissonPublications Ltd.
McNamee P, Gregson BA, Buck D, Bamford CH, Bond J, Wright K (1999). ‘Costs of formal care for frailolder people in England: the resource implications study of the MRC cognitive function and ageingstudy (RIS MRC CFAS)’. Social Science and Medicine, vol 48, pp 331–41.
National Strategy for Carers (1999) Caring About Carers. London: HM Government.
Netten A, Bebbington A, Darton R, Forder J, Miles K (1998). 1996 Survey of Care Homes for ElderlyPeople: Final report. Discussion Paper 1423/2. Kent: PSSRU, University of Kent.
Nuttall SR, Blackwood RJL, Bussell BMH, Cliff JP, Cornall MJ, Cowley A, Gatenby PL, Webber JM (1994).‘Financing long-term care in Great Britain’. Journal of the Institute of Actuaries, vol 121, part 1, pp1–68.
50 EXPENDITURE ON SOCIAL CARE FOR OLDER PEOPLE TO 2026
Organisation for Economic Co-operation and Development (2006). Projecting OECD Health and Long-term Care Expenditure: What are the main drivers? Economics Department Working Papers No. 477,ECO/WKP (2006) 5. Paris: OECD.
Parker G, Clarke H (2002). ‘Making the ends meet: do carers and disabled people have a commonagenda?’ Policy and Politics, vol 30, pp 347–59.
Pickard L (2004). The Effectiveness and Cost-effectiveness of Support and Services to Informal Carersof Older People. A review of the literature prepared for the Audit Commission. London: AuditCommission (www.audit-commission.gov.uk/olderpeople).
Pickard L (2001). ‘Carer break or carer blind? Policies for informal care in the UK’. Social Policy andAdministration, vol 35, pp 441–58.
Pickard L, Wittenberg R, Comas-Herrera A, King D, Malley J (2006). ‘Care by spouses, care by children:Projections of informal care for older people in England to 2031’. Social Policy and Society in press.
Pickard L, Wittenberg R, Comas-Herrera A, Davies B, Darton R (2000). ‘Relying on informal care in thenew century? Informal care for elderly people in England to 2031’. Ageing and Society, vol 20, pp745–72.
Rothgang H, Comas-Herrera A, Wittenberg R (2003). ‘Dependency rates and health expectancy’ inEuropean Study of Long-Term Care Expenditure. Report to the European Commission, Employmentand Social Affairs DG, Comas-Herrera A, Wittenberg R eds. PSSRU discussion paper 1840. London:PPSRU.
Royal Commission on Long Term Care (1999). With Respect to Old Age. Cmnd 4192. London: TheStationery Office.
Salvage A (1995). Who Will Care? Future prospects for family care of older people in the EuropeanUnion. Dublin: European Foundation for the Improvement of Living and Working Conditions.
Wanless D (2006). Securing Good Care for Older People: Taking a long-term view. London: King’sFund.
Wittenberg R, Comas-Herrera A, King D, Malley, J, Pickard L, Darton R (2006). Future Demand forLong-term Care, 2002 to 2041: Projections of demand for long-term care for older people in England.PSSRU Discussion Paper 2330. Kent: PSSRU. (Available online: www.pssru.ac.uk/pdf/dp2330.pdf)
Wittenberg R, Comas-Herrera A (2003). ‘Trends in economic growth and real costs of care’ inEuropean Study of Long-Term Care Expenditure. Report to the European Commission, Employmentand Social Affairs DG, Comas-Herrera A, Wittenberg R, eds. PSSRU Discussion Paper 1840. Kent:PSSRU.
Wittenberg R, Hancock R, Comas-Herrera A, Pickard L (2002). ‘Demand for long-term care in the UK:Projections of long-term care finance for older people to 2051’ in A New Contract for Retirement:Modelling policy options to 2050, Brooks R, Regan S, Robinson P, eds. London: IPPR.
Wittenberg R, Pickard L, Comas-Herrera A, Davies B, Darton R (2001). ‘Demand for long-term care forelderly people in England to 2031’. Health Statistics Quarterly 12.
Wittenberg R, Pickard L, Comas-Herrera A, Davies B, Darton R (1998). Demand for Long-term Care:Projections of long-term care finance for elderly people. Kent: PSSRU, University of Kent.
BIBLIOGRAPHY 51