Embed Size (px)
Citation preview

EXECUTIVE COMMITTEE MEMBERS WILL RECEIVE A UNIQUE PANELIST LINK BY EMAIL. PLEASE USE THIS LINK TO PARTICIPATE IN THIS MEETING.
EXECUTIVE COMMITTEE AGENDA
MONDAY, APRIL 25, 2022
Regular Session: 4:30 p.m.
Pursuant to Assembly Bill 361 and the findings made by CVAG, this meeting will only be conducted via video/teleconferencing.
INSTRUCTIONS FOR PUBLIC PARTICIPATION
Members of the public may use the following link:
https://us02web.zoom.us/j/82961717228?pwd=eEtaRm9wTHRTZ3Zyd2pqYktrRzdTdz09 Password: 817108
One Tap Mobile: +16699009128,,82961717228#
Dial In: +1 669 900 9128 Webinar ID: 829 6171 7228
Password: 817108
This will provide listening access and ability to address the Executive Committee when called upon.
IF YOU ARE UNABLE TO CONNECT VIA DIAL IN OPTION, PLEASE CALL 760-346-1127.
Public Comment is encouraged to be emailed to the Executive Committee prior to the Meeting at [email protected] by 5:00 p.m. on the day prior to the committee meeting.
Comments intended to be read aloud should beno more than 300 characters.
THIS MEETING IS HANDICAPPED ACCESSIBLE. ACTION MAY RESULT ON ANY ITEMS ON THIS AGENDA.

1. CALL TO ORDER – Chair Christy Holstege, Councilmember, City of Palm Springs
2. ROLL CALL – Jennifer Nelson A. Member Roster 5 3. PLEDGE OF ALLEGIANCE 4. PUBLIC COMMENTS ON AGENDA ITEMS
This is the time and place for members of the public to address the Executive Committee on agenda items. At the discretion of the Chair, comments may be taken at the time items are presented. Please limit comments to three (3) minutes.
5. CHAIR / EXECUTIVE DIRECTOR ANNOUNCEMENTS
6. CONSENT CALENDAR A. Approve the February 28, 2022 Executive Committee Meeting Minutes 6 B. Reaffirm that findings still exist, pursuant to Assembly Bill 361, and authorize 14
continuation of remote teleconference/virtual meetings of CVAG committees C. Authorize the Executive Director to extend the federal and state lobbying 15
Efforts by executing one-year contracts with The Ferguson Group for an annual not-to-exceed $100,000 and with the Politico Group for an annual not -to-exceed $50,000, with an option to extend an additional one-year term at the Executive Director’s discretion
D. Appoint the CVAG Vice Chair as the primary delegate to the California Joint 17
Powers Insurance Authority’s Board of Directors, with the CVAG Director of Finance/ Administration serving as the alternate, for the current and future years
E. Authorize the Executive Director to execute a contract amendment with 18 Koff & Associates to perform a Performance Management Review Analysis at a not-to-exceed cost of $27,540
F. Authorize the Executive Director to take the necessary actions and execute 33
the required agreement with the County of Riverside to receive $80,000 from the Coachella Valley Air Quality Enhancement Grant Program for the region’s Smart Scalping and Landscape Certification Program
G. Support Senate Bill 379 and authorize the Chair and/or Executive Director to 35
sign letters of support and advocate for its approval H. Authorize the Executive Director to take the necessary actions to execute a six- 39
month contract extension with M&M Sweeping, Inc., for Regional PM 10 Street Sweeping Services

I. Authorize the Executive Director to negotiate a memorandum of understanding 41 with Inland Counties Legal Fund to accept a $300,000, three-year grant from the State Bar of California for homelessness services
J. Accept the TUMF Annual and Five-Year Report for Fiscal Year 2020/2021 43 K. Adopt an 8.2-percent increase in the Transportation Uniform Mitigation Fee rates 77
to adjust for inflation, and update the TUMF Handbook to reflect the revised fee upon its effective date of January 1, 2023
L Authorize the CVAG Executive Director to take the necessary steps to 82
accept $1,063,044 of developer-obligated payments in the City of Palm Springs to offset construction costs related to CV Link
6.1 ITEM(S) HELD OVER FROM CONSENT CALENDAR 7. DISCUSSION / ACTION A. Statewide Update from the California Association of Councils of Governments – 85
Bill Higgins Recommendation: Information
B. Grant Funding for Connecting CV Link to Parks in Cathedral City and Coachella – 86
Gustavo Gomez Recommendation: Adopt CVAG Resolution 2022-03 and authorize the Executive Director to take the necessary steps to accept $1,153,341 for the Coachella Valley Community Connectors project
C. Amendment No. 1 to the Reimbursement Agreement with City of Indio for the 89
Avenue 44 Bridge Project – Eric Cowle Recommendation: Approve Amendment No. 1 to the Reimbursement Agreement between CVAG and the City of Indio for the Avenue 44 Bridge Project, increasing CVAG’s regional share of the project by $1,561,740 for a not-to-exceed total of $3,216,000 for design and construction
D. Contract Amendment with Alta Planning & Design for CV Link – Jonathan Hoy 93
Recommendation: Authorize the Executive Director to execute Amendment No. 10 to the agreement with Alta Planning & Design for a total not-to-exceed amount of $551,352; and authorize the Executive Director and/or Legal Counsel to make clarifying changes/revisions before execution
8. INFORMATION
a) Executive Committee Attendance 101
b) Status of I-10 Interchange Projects 102

c) CVAG Regional Arterial Program – Project Status Report 103 d) Bicycle/Pedestrian Safety Program – Project Status Report 104 e) Update on Middle-Mile Broadband Efforts 105 f) Coordination with the Coachella Valley Energy Commission 107 g) Inland Regional Energy Network Update 109 h) Update on Property Assessed Clean Energy (PACE) program 110
i) Update on the Revenue Stream Feasibility Study for Affordable Housing and 112
Associated Transportation Needs j) CV Housing First: First Quarter Report for 2022 142
k) Update on Ad Hoc Efforts to Explore Additional Homelessness Resources and 145 Policies l) Monitoring Report for CVAG's CV Housing First Program 150 m) CV Housing First’s Behavioral Health Partnerships 151 n) Riverside County’s Homeless and Housing Strategic Action Plan 153
9. LEGISLATIVE ITEMS – Emmanuel Martinez and Erin Sasse, League of California Cities
a) Update on Federal and State Advocacy Efforts 231
b) Update from the League of California Cities 234 10. PUBLIC COMMENTS ON NON-AGENDA ITEMS
This is the time and place for members of the public to address the Executive Committee on items of general interest within the purview of this committee. Please limit comments to two (2) minutes.
11. ANNOUNCEMENTS
The next meeting of the Executive Committee will be held on Monday, June 6, 2022, at 4:30 p.m. via Zoom webinar.
12. ADJOURNMENT

EXECUTIVE COMMITTEE
2021-2022 ROSTER
Jurisdiction Members
City of Indio, Past Chair Waymond Fermon Mayor
Twenty-Nine Palms Band of Mission Indians Darrell Mike Tribal Chair
Torres Martinez Desert Cahuilla Indians Joseph Mirelez Tribal Vice Chair
Cabazon Band of Mission Indians Brenda Soulliere Tribal Member
Agua Caliente Band of Cahuilla Indians Reid Milanovich Chairman
City of Indian Wells Dana Reed Mayor
City of Cathedral City Ernesto Gutierrez Mayor
City of Palm Desert Kathleen Kelly Councilmember
City of La Quinta Linda Evans Mayor
City of Blythe Joseph DeConinck Vice Mayor
County of Riverside
Kevin Jeffries, 1st District Supervisor Karen Spiegel, 2nd District Supervisor Chuck Washington, 3rd District Supervisor V. Manuel Perez, 4th District Supervisor Jeff Hewitt, 5th District Supervisor
City of Rancho Mirage Ted Weill Mayor
City of Desert Hot Springs Scott Matas Mayor
City of Coachella, Vice Chair Steven Hernandez Mayor
City of Palm Springs, Chair Christy Holstege Councilmember
ITEM 2A

EXECUTIVE COMMITTEE MINUTES OF FEBRUARY 28, 2022 PAGE 1
EXECUTIVE COMMITTEE MINUTES OF MEETING
February 28, 2022
1. CALL TO ORDER The Executive Committee meeting was called to order by Chair Christy Holstege, Councilmember, City of Palm Springs, at 4:31 p.m. via a Zoom webinar, which was pursuant to Gov. Newsom’s executive order governing how meetings are held during the COVID-19 pandemic.
2. ROLL CALL
A roll call was taken, and it was determined that a quorum was present. Those in attendance were as follows: MEMBERS PRESENT AGENCY Mayor Waymond Fermon City of Indio Tribal Vice Chair Joseph Mirelez Torres Martinez Desert Cahuilla Indians (Arrived During Item 6) Tribal Member Brenda Soulliere Cabazon Band of Mission Indians Councilmember Christy Holstege City of Palm Springs Mayor Steven Hernandez City of Coachella (Arrived During Item 5)
Mayor Dana Reed City of Indian Wells (Left During Item 9) Mayor Ernesto Gutierrez City of Cathedral City Councilmember Kathleen Kelly City of Palm Desert Mayor Linda Evans City of La Quinta Vice Mayor Joseph DeConinck City of Blythe Supervisor Jeff Hewitt County of Riverside 5th District (Arrived During Item 7A)
Supervisor V. Manuel Perez County of Riverside 4th District Mayor Ted Weill City of Rancho Mirage Mayor Scott Matas City of Desert Hot Springs
MEMBERS NOT PRESENT AGENCY Tribal Chair Darrell Mike Twenty-Nine Palms Band of Mission Indians Tribal Chair Jeff Grubbe Agua Caliente Band of Cahuilla Indians Supervisor Karen Spiegel County of Riverside 2nd District
Supervisor Kevin Jeffries County of Riverside 1st District Supervisor Chuck Washington County of Riverside 3rd District
OTHERS PRESENT AGENCY Councilmember Megan Beaman Jacinto City of Coachella Jeff Stahl KESQ Trinidad Arredondo Imperial Irrigation District
ITEM 6A
The audio file for this committee meeting can be found at: http://www.cvag.org/audio.htm Any handouts distributed during the meeting will placed in the meeting file.
EXECUTIVE COMMITTEE MINUTES OF FEBRUARY 28, 2022 PAGE 2
Erin Sasse League of California Cities Greg Rodriguez County of Riverside Charlie McClendon City of Cathedral City Paul Slama County of Riverside Mark Lancaster County of Riverside Paul Vallandigham County of Riverside Margaret Park Agua Caliente Band of Cahuilla Indians David Salgado SCAG Anthony Madrigal Twenty-Nine Palms Band of Mission Indians Jon McMillen City of La Quinta Anne Azzu KOA Luke Rainey City of Desert Hot Springs STAFF PRESENT Tom Kirk Erica Felci Claude Kilgore Mike Jenkins Jonathan Hoy Eric Cowle Gustavo Gomez Emmanuel Martinez Jennifer Nelson Allen McMillen David Freedman Peter Satin Joanna Stueckle Kathleen Brundige
3. PLEDGE OF ALLEGIANCE Mayor Waymond Fermon, City of Indio, led the Executive Committee in the Pledge of Allegiance. 4. PUBLIC COMMENTS ON AGENDA ITEMS
None.
5. CHAIR / EXECUTIVE DIRECTOR ANNOUNCEMENTS
Executive Director Tom Kirk gave a brief update on various valley projects, including the construction of CV Link and CV Sync.
6. CONSENT CALENDAR IT WAS MOVED BY MAYOR WEILL AND SECONDED BY MAYOR EVANS TO APPROVE THE CONSENT CALENDAR.
A. Approve the December 6, 2021 Executive Committee Meeting Minutes
B. Affirm that findings still exist, pursuant to Assembly Bill 361, and authorize continuation
of remote teleconference/virtual meetings of CVAG committees
C. Approve Resolution No. 2022-01, adopting Caltrans Local Assistance Procedures

EXECUTIVE COMMITTEE MINUTES OF FEBRUARY 28, 2022 PAGE 3
Manual Chapter 10 regarding Procurement Requirements for Architectural and Engineering (A&E) consultant contracts
D. Adopt Resolution 2022-02 in support of Net Energy Metering and direct staff
to distribute the resolution to Governor Newsom, the region’s legislative delegation and members of the California Public Utilities Commission
E. Authorize the Executive Director to execute Amendment No. 2 to the
Professional Services Agreement with Hoy Civil Engineering, providing for an additional $371,360 annually and extending the contract to December 2025 in order to add additional personnel necessary for regional transportation efforts, and authorize the Executive Director and/or Legal Counsel to make clarifying revisions before finalizing
F. Adopt the updated Transportation Uniform Mitigation Fee (TUMF) Handbook, reflecting the current assessment rates and appeals process
G. Authorize the Executive Director to execute a Memorandum of Understanding with Riverside County Department of Waste Resources, providing up to $25,000 annually for activities that implement waste diversion legislation and organics recycling programs THE MOTION TO CARRIED FOR ITEM 6A WITH 12 AYES, 1 ABSTENTION AND 6 MEMBERS ABSENT AND FOR ITEMS 6B-6G WITH 13 AYES AND 6 MEMBERS ABSENT.
MAYOR FERMON AYE (ABSTAINED ON ITEM 6A ONLY) TRIBAL CHAIR MIKE ABSENT TRIBAL VICE CHAIR MIRELEZ AYE TRIBAL COUNCILMEMBER SOULLIERE AYE TRIBAL CHAIR GRUBBE ABSENT MAYOR REED AYE MAYOR GUTIERREZ AYE COUNCILMEMBR KELLY AYE MAYOR EVANS AYE VICE MAYOR DECONINCK AYE SUPERVISOR JEFFRIES ABSENT SUPERVISOR SPIEGEL ABSENT SUPERVISOR WASHINGTON ABSENT SUPERVISOR PEREZ AYE SUPERVISOR HEWITT ABSENT MAYOR WEILL AYE MAYOR MATAS AYE MAYOR HERNANDEZ AYE COUNCILMEMBER HOLSTEGE AYE
6.1 ITEM(S) HELD OVER FROM CONSENT CALENDAR
None. 7. DISCUSSION / ACTION A. Update on Federal and State Advocacy Efforts – Emmanuel Martinez

EXECUTIVE COMMITTEE MINUTES OF FEBRUARY 28, 2022 PAGE 4
Emmanuel Martinez presented the staff report. Member discussion ensued. IT WAS MOVED BY SUPERVISOR PEREZ AND SECONDED BY MAYOR REED TO ADOPT CVAG’S 2022 FEDERAL AND STATE LEGISLATIVE PLATFORM
THE MOTION TO CARRIED WITH 14 AYES, AND 5 MEMBERS ABSENT. MAYOR FERMON AYE TRIBAL CHAIR MIKE ABSENT TRIBAL VICE CHAIR MIRELEZ AYE TRIBAL COUNCILMEMBER SOULLIERE AYE TRIBAL CHAIR GRUBBE ABSENT MAYOR REED AYE MAYOR GUTIERREZ AYE MAYOR KELLY AYE MAYOR EVANS AYE VICE MAYOR DECONINCK AYE SUPERVISOR JEFFRIES ABSENT SUPERVISOR SPIEGEL ABSENT SUPERVISOR WASHINGTON ABSENT SUPERVISOR PEREZ AYE SUPERVISOR HEWITT AYE MAYOR WEILL AYE MAYOR MATAS AYE MAYOR HERNANDEZ AYE COUNCILMEMBER HOLSTEGE AYE
B. Memorandum of Understanding between CVAG and IID – Emmanuel Martinez
Mr. Martinez presented the staff report. A brief discussion followed that included an update on the Energy Commission from Mayor Evans.
IT WAS MOVED BY MAYOR EVENS AND SECONDED BY TRIBAL VICE CHAIR MIRELEZ TO APPROVE A MEMORANDUM OF UNDERSTANDING WITH THE IMPERIAL IRRIGATION DISTRICT TO PROVIDE A COACHELLA VALLEY ENERGY COMMISSION COORDINATOR, AND AUTHORIZE THE EXECUTIVE DIRECTOR AND/OR LEGAL COUNSEL TO MAKE CLARIFYING CHANGES PRIOR TO EXECUTION THE MOTION TO CARRIED WITH 14 AYES, AND 5 MEMBERS ABSENT. MAYOR FERMON AYE TRIBAL CHAIR MIKE ABSENT TRIBAL VICE CHAIR MIRELEZ AYE TRIBAL COUNCILMEMBER SOULLIERE AYE TRIBAL CHAIR GRUBBE ABSENT MAYOR REED AYE MAYOR GUTIERREZ AYE MAYOR KELLY AYE MAYOR EVANS AYE VICE MAYOR DECONINCK AYE SUPERVISOR JEFFRIES ABSENT SUPERVISOR SPIEGEL ABSENT

EXECUTIVE COMMITTEE MINUTES OF FEBRUARY 28, 2022 PAGE 5
SUPERVISOR WASHINGTON ABSENT SUPERVISOR PEREZ AYE SUPERVISOR HEWITT AYE MAYOR WEILL AYE MAYOR MATAS AYE MAYOR HERNANDEZ AYE COUNCILMEMBER HOLSTEGE AYE
C. Funding Regional Projects in Cycle 6 of the State’s Active Transportation
Program–Emmanuel Martinez Mr. Martinez presented the staff report. IT WAS MOVED BY COUNCILMEMBER KELLY AND SECONDED BY MAYOR MATAS TO AUTHORIZE THE EXECUTIVE DIRECTOR TO TAKE THE NECESSARY ACTIONS TO: 1. AMEND THE COST-SHARING AGREEMENTS BETWEEN CVAG AND CITIES OF LA
QUINTA, INDIO AND COACHELLA FOR DESIGN COSTS RELATED TO THE ARTS AND MUSIC LINE, ADDING NO ADDITIONAL COSTS TO CVAG AND REFLECTING PROJECT BOUNDARY CHANGES TO THE PROJECT; AND
2. COMMIT REGIONAL TRANSPORTATION FUNDING TO THE ARTS AND MUSIC LINE AND THE CV LINK EXTENSION TO DESERT HOT SPRINGS SO THAT PROJECTS CAN MAXIMIZE LEVERAGING POINTS IN APPLICATONS FOR THE STATE’S ATP CYCLE 6 GRANT PROGRAM, WITH THE CONDITION THAT ACTUAL EXPENDITURE OF FUNDS WOULD BE DEPENDENT ON SECURING THE GRANT FUNDING AND FUNDING CONTRIBUTIONS BY LOCAL JURISDICTIONS
THE MOTION TO CARRIED WITH 14 AYES, AND 5 MEMBERS ABSENT. MAYOR FERMON AYE TRIBAL CHAIR MIKE ABSENT TRIBAL VICE CHAIR MIRELEZ AYE TRIBAL COUNCILMEMBER SOULLIERE AYE TRIBAL CHAIR GRUBBE ABSENT MAYOR REED AYE MAYOR GUTIERREZ AYE MAYOR KELLY AYE MAYOR EVANS AYE VICE MAYOR DECONINCK AYE SUPERVISOR JEFFRIES ABSENT SUPERVISOR SPIEGEL ABSENT SUPERVISOR WASHINGTON ABSENT SUPERVISOR PEREZ AYE SUPERVISOR HEWITT AYE MAYOR WEILL AYE MAYOR MATAS AYE MAYOR HERNANDEZ AYE COUNCILMEMBER HOLSTEGE AYE
D. Reimbursement Agreement with the City of Indio for the Avenue 50 Widening
Project (Jefferson Street to Jackson Street) – Jonathan Hoy
Mr. Hoy presented the staff report. Brief discussion followed.

EXECUTIVE COMMITTEE MINUTES OF FEBRUARY 28, 2022 PAGE 6
IT WAS MOVED BY MAYOR HERNANDEZ AND SECONDED BY MAYOR FERMON TO APPROVE THE REIMBURSEMENT AGREEMENT WITH THE CITY OF INDIO AS THE LEAD AGENCY FOR THE AVENUE 50 WIDENING PROJECT (JEFFERSON STREET – JACKSON STREET), PROVIDING A NOT-TO-EXCEED AMOUNT OF $675,000 IN REGIONAL FUNDING FOR THE PRELIMINARY DESIGN AND ENVIRONMENTAL STUDIES (PS&E) PHASE
THE MOTION TO CARRIED WITH 14 AYES, AND 5 MEMBERS ABSENT. MAYOR FERMON AYE TRIBAL CHAIR MIKE ABSENT TRIBAL VICE CHAIR MIRELEZ AYE TRIBAL COUNCILMEMBER SOULLIERE AYE TRIBAL CHAIR GRUBBE ABSENT MAYOR REED AYE MAYOR GUTIERREZ AYE MAYOR KELLY AYE MAYOR EVANS AYE VICE MAYOR DECONINCK AYE SUPERVISOR JEFFRIES ABSENT SUPERVISOR SPIEGEL ABSENT SUPERVISOR WASHINGTON ABSENT SUPERVISOR PEREZ AYE SUPERVISOR HEWITT AYE MAYOR WEILL AYE MAYOR MATAS AYE MAYOR HERNANDEZ AYE COUNCILMEMBER HOLSTEGE AYE
E. Terminate the Reimbursement Agreement with the City of Rancho Mirage for the Frank Sinatra Drive Bridge – Jonathan Hoy Mr. Hoy presented the staff report. A brief discussion ensued including the rising costs of building along the stormwater channel due to new design requirements. IT WAS MOVED BY MAYOR EVANS AND SECONDED BY COUNCILMEMBER KELLY TO RECEIVE AND FILE THE ENVIRONMENTAL DOCUMENTS ACKNOWLEDGING THE CITY OF RANCHO MIRAGE’S ACCEPTANCE OF A NO-BUILD OPTION FOR THE FRANK SINATRA BRIDGE PROJECT AND TERMINATE THE EXISTING REIMBURSEMENT AGREEMENT WITH THE CITY OF END THE PROJECT
THE MOTION TO CARRIED WITH 14 AYES, AND 5 MEMBERS ABSENT. MAYOR FERMON AYE TRIBAL CHAIR MIKE ABSENT TRIBAL VICE CHAIR MIRELEZ AYE TRIBAL COUNCILMEMBER SOULLIERE AYE TRIBAL CHAIR GRUBBE ABSENT MAYOR REED AYE MAYOR GUTIERREZ AYE MAYOR KELLY AYE MAYOR EVANS AYE

EXECUTIVE COMMITTEE MINUTES OF FEBRUARY 28, 2022 PAGE 7
VICE MAYOR DECONINCK AYE SUPERVISOR JEFFRIES ABSENT SUPERVISOR SPIEGEL ABSENT SUPERVISOR WASHINGTON ABSENT SUPERVISOR PEREZ AYE SUPERVISOR HEWITT AYE MAYOR WEILL AYE MAYOR MATAS AYE MAYOR HERNANDEZ AYE COUNCILMEMBER HOLSTEGE AYE
8. INFORMATION
a) Executive Committee Attendance Roster
b) CVAG Regional Arterial Program - Project Status Report c) Status of I-10 Interchange Program d) Bicycle/Pedestrian Safety Program - Project Status Report
e) Update on Middle-Mile Broadband Efforts f) 2022 Used Oil & Oil Filter Recycling Events
g) Inland Regional Energy Network Governance
h) Update on the Navigation Center in the City of Palm Springs i) CV Housing First: 2021 Year in Review
j) Update on Ad Hoc Efforts Additional Homelessness Resources and
Policies
These items were placed in the agenda packet for members’ information. 9. LEGISLATIVE ITEMS
Erin Sasse, League of California Cities, provided updates on state funding and other grant programs that are available. Ms. Sasse updated the committee on pending legislation and the next League of California Division meeting.
10. PUBLIC COMMENTS ON NON-AGENDA ITEMS None.
11. ANNOUNCEMENTS
The next meeting of the Executive Committee will be held on Monday, April 25, 2022, at 4:30 p.m. via Zoom webinar.

EXECUTIVE COMMITTEE MINUTES OF FEBRUARY 28, 2022 PAGE 8
12. ADJOURNMENT There being no further business, Chair Holstege adjourned the meeting at 5:20 p.m.
Respectfully submitted, Jennifer Nelson CVAG Executive Assistant/Clerk

ITEM 6B
Coachella Valley Association of Governments Executive Committee
April 25, 2022
STAFF REPORT Subject: Remote Teleconference/Virtual Meetings Pursuant to Assembly Bill 361 Contact: Jennifer Nelson, Executive Assistant/Clerk ([email protected]) Recommendation: Reaffirm that findings still exist, pursuant to Assembly Bill 361, and authorize continuation of remote teleconference/virtual meetings of CVAG committees
Background: All meetings of CVAG’s standing committees are subject to the Ralph M. Brown Act (Gov. Code §§ 54950 et seq.), and must be open and public so that any member of the public may attend and participate in the meetings.
Starting in March 2020, Governor Newsom issued a series of executive orders aimed at preventing the spread of COVID-19, as it was determined that social distancing was an important factor addressing the pandemic. Among these were Executive Orders N-25-20, N-29-20 and N-35-20 (collectively, the “Brown Act Orders”) that waived the teleconferencing requirements of the Brown Act to allow legislative bodies to meet virtually.
On June 11, 2021, the Governor issued Executive Order N-08-21 to begin winding down some of the prior measures that were adopted to respond to COVID-19. Notably, this order rescinds the Brown Act Orders, effective September 30, 2021. On September 16, 2021, Governor Newsom signed Assembly Bill 361 (AB 361), which effective October 1, 2021, allows legislative bodies to meet virtually provided the legislative body makes specific findings.
Specific Findings Required under AB 361:
The CVAG Executive Committee has previously made the following findings pursuant to AB 361:
1. A statewide state of emergency is currently in place;
2. State or local officials have imposed or recommended measures to promote social distancing in connection with COVID-19; and
3. Meeting in person would present imminent risks to the health or safety of attendees.
With this item, staff is recommending the CVAG Executive Committee confirm these findings still exist and continue remote/ virtual meetings, pursuant to AB 361. Fiscal Analysis: There are no additional costs to CVAG hosting virtual meetings. Committee members are paid the same stipends as they would in person.

ITEM 6C Coachella Valley Association of Governments
Executive Committee April 25, 2022
STAFF REPORT Subject: Federal and State Advocacy Efforts Contact: Emmanuel Martinez, Senior Programs Manager ([email protected]) Recommendation: Authorize the Executive Director to extend the federal and state lobbying efforts by executing one-year contracts with The Ferguson Group for an annual not-to-exceed $100,000 and with the Politico Group for an annual not-to-exceed $50,000, with an option to extend an additional one-year term at the Executive Director’s discretion Administrative/ Personnel Committee: Concurred (Meeting of April 21st) Background: On September 27, 2021, the Executive Committee authorized the Executive Director to seek proposals for both state and federal lobbying services for a term of six months and in an amount not to exceed $100,000 for both state and federal advocacy. Authorization was also given to issue a request for proposals for longer-term services. The purpose of this arrangement was to evaluate the short-term effectiveness of selected firms, allowing CVAG to determine if another firm would be better suited to meet CVAG needs. CVAG staff solicited proposals and received three responses for federal and five responses for state lobbying services. After review and scoring of the proposals, CVAG selected the Politico Group for representation in Sacramento and The Ferguson Group to represent CVAG in Washington, D.C. Both firms officially started on November 1, 2021. They were both introduced to the Administrative/ Personnel Committee when it met in November 2021. As was discussed at that meeting, CVAG staff’s immediate priority was to increase their understanding of, and assess challenges and opportunities for, CVAG’s projects and programs. Both firms were also tasked with developing a legislative platform that could guide efforts moving forward. The legislative platform was reviewed by the Administrative/ Personnel Committee in January 2022, and adopted by the CVAG Executive Committee in February 2022. The contracts for both firms are set to expire on April 30, 2022. Although the impetus to retain lobbyists was due to issues related to decreased outside funding for CVAG’s transportation projects, there are other policy and funding related issue areas that have been identified as important for CVAG and its member jurisdictions. Given adoption of the platform, tracking of legislation and taking position on bills that impact CVAG’s priorities is pertinent to advancing the interests of the region. Additionally, the legislative cycles are still ongoing, making consistency important for purposes of elevating regional projects and advancing regional interests for CVAG to remain engage in the federal and state legislative process. For example, in Sacramento the budget process is underway and the May Budget Revise will impact funding allocations to programs of interest. Additionally, given the return of earmarks, CVAG and both its federal and state lobbying team have worked

with the Coachella Valley’s representatives to submit earmark requests. At the state level, CVAG submitted a $5 million state budget request to assist in helping get communities connected to CV Link by helping connecting projects with preconstruction costs. At the federal level, CVAG has submitted to its congressional delegation a request for design costs related to projects identified in the recent Western Coachella Valley flooding and blowsand study. To help shepherd these requests through the state and federal budget process, the respective lobbying firms will help play a key role in communication and coordination with CVAG’s representatives in Washington, D.C., and in Sacramento. The existing firms were procured through a competitive process. CVAG staff is recommending contract extensions with the existing firms in order to maintain momentum and consistency. The recommended contracts would be for a one-year term, with the option to extend a second year based on the Executive Director’s discretion. This will help ensure advocacy efforts compliment other regional and local advocacy efforts to help elevate CVAG’s regional projects to improve their financial viability by optimizing collective resources and improving regional coordination through the legislative, regulatory and grant procurement processes. By increasing access to legislators and relevant agencies in Sacramento and Washington, CVAG can better position its projects to compete for funding and ensure the region’s fair share is secured.
Fiscal Analysis: The authorization the Executive Committee provided in September allocated a not-to-exceed amount of $100,000 for short-term federal and state advocacy services. CVAG executed six-month agreements with the Ferguson Group and Politico Group, whose month retainers are $10,000 and $5,000 per month respectively. An extension would total $100,000 annually for the Ferguson Group and $50,000 for the Politico Group. Regional transportation funding is available for these costs. CVAG staff would note that there is a strong return on the investment in services if this advocacy results in additional state and federal resources or better positions projects for funding opportunities.
ITEM 6D Coachella Valley Association of Governments
Executive Committee April 25, 2022
STAFF REPORT
Subject: CVAG representation at the California Joint Powers Insurance Authority’s
Board of Directors Contact: Erica Felci, Assistant Executive Director ([email protected]) Recommendation: Appoint the CVAG Vice Chair as the primary delegate to the California Joint Powers Insurance Authority’s Board of Directors, with the CVAG Director of Finance/ Administration serving as the alternate, for the current and future years Administrative/ Personnel Committee: Concurred (Meeting of April 21st) Background: CVAG and a number of its member jurisdictions are longtime members of the California Joint Powers Insurance Authority, which was formed more than 40 years ago to provide risk management solutions and strategic oversight to its members. The Authority is governed by elected officials from its member agencies, with an Executive Committee that is elected by members and guided by the California JPIA’s mission. Each year, the California JPIA Director requests that CVAG certify a primary delegate and an alternate to California JPIA Board of Directors. The primary delegate must be an elected official who serves on the governing body. The primary delegate has voting rights and if the alternate would vote should the delegate not be present. In October 2002, the CVAG Executive Committee took action that designated the CVAG Vice Chair as the director on record and designated CVAG staff – specifically the Director of Administrative Services – to serve as the alternate “for the current and future years.” Because this policy was done long before CVAG had a formal officer rotation and before CVAG staff had some positions renamed, CVAG staff is recommending that the policy approach be re-affirmed. Upon approval, CVAG will file a certification form so it is represented at the next Annual Board of Directors meeting, which is currently scheduled for July 20, 2022 at 7 p.m. at the Authority's campus in La Palma. Fiscal Analysis: There is no cost to CVAG for this item.

ITEM 6E Coachella Valley Association of Governments
Executive Committee April 25, 2022
STAFF REPORT
Subject: Update on Classification and Total Compensation Study Contact: Claude T. Kilgore, Director of Finance/Administration ([email protected]) Recommendation: Authorize the Executive Director to negotiate a contract amendment with Koff & Associates to perform a Performance Management Review Analysis at a not-to-exceed cost of $27,540 Administrative/ Personnel Committee: Concurred (Meeting of April 21st) Background: CVAG has been providing regular updates to the Administrative/Personnel Committee on staffing needs now and long-term. On September 14, 2021, staff provided a report that sought feedback on releasing a request for proposal to pursue an independent expert to conduct a classification and compensation analysis. At the meeting, staff presented various needs to the Committee and further identified that such a study had not been conducted for CVAG by an external service provider in its nearly 50 years of existence. Additionally, CVAG has been confronted with the fallout of the Great Resignation of 2021 and the changes that it created in the workforce marketplace. CVAG management has used this as an opportunity, with the guidance from the Administrative/Personnel Committee, to assess its internal staffing structure and better position the agency to address such needs in the long-term. Following that September meeting, CVAG staff held informal discussions with numerous local agencies. It turned into more formal discussion with Western Riverside Council of Governments (WRCOG), as CVAG and WRCOG staff identified potential synergies in doing a combined study as the two agencies are both regional agencies of similar size, have similar programs and have similar organizational structures. Additionally, CVAG staff learned that in 2018 WRCOG engaged Koff & Associates to perform a classification and compensation study. During this time, Koff and Associates used CVAG data and information as part of its study and already has some working knowledge of CVAG and its organizational structure. In December, based on the recommendation from the Administrative/Personnel Committee, the Executive Committee authorized the Executive Director to negotiate and execute an agreement with Koff & Associates to conduct a Classification and Total Compensation Study (the Study) as part of a joint effort with WRCOG and authorize the Administrative/Personnel Committee to direct the related next steps. The Executive Director negotiated the contract with Koff & Associates along with WRCOG and the study launched in January 2022 with a kick-off meeting and virtual orientations with all CVAG and WRCOG staff, which outlined the study and each staff’s responsibilities that were needed to gather data for an extensive survey which would then be followed by an interview from Koff and Associates. Staff’s input on their survey related to items such as overall responsibilities, decision-

making levels, and additional knowledge and abilities needed to perform their job. The surveys took an average of 4-6 hours to complete for each staff member and CVAG staff had a 100% completion rate by the due date as established by Koff & Associates. Following completion of these surveys in early February 2022, supervisors reviewed the survey feedback and were able to add additional observations and input. Virtual interviews with each staff member were then conducted in March 2022 by the Koff team. The Executive Director was also interviewed by Koff team for his agencywide input and vision. Koff & Associates have now prepared draft classification concepts/categories and are currently working to finalize the classification results. CVAG staff was scheduled to provide an overview of the initial findings to the Administrative/Personnel Committee when it met on April 21. Staff is also recommending a review of the performance evaluation process for CVAG employees. During the Executive Director’s interview with Koff & Associates, the conversation of employee performance was discussed. CVAG has used the same evaluation criteria for decades and staff wants to ensure it is not outdated. Knowing there was previously interest from members of the Administrative/Personnel Committee to reevaluate CVAG’s current performance evaluation system, the Executive Director identified this as an opportunity to take a look at the current system of evaluations and subsequent step increases (or not) and promotions and demotions as the Study moves along. Koff and Associates has provided a separate scope of work for a Performance Management Review (attached), and CVAG staff recommends that a contract be authorized to conduct the work. CVAG staff also is exploring additional organizational assessments, such as human resources, but those are not being recommended for action at this time. The recommendations of the ongoing compensation study will be useful as CVAG addresses both near-term and long-term opportunities. Unfortunately, the final Study recommendations will not be completed until this summer – which is after the Fiscal Year 2022/23 Budget needs to be adopted. CVAG staff is expecting initial findings from Koff will be ready sooner, and will factor them into the agency’s personnel budget for Fiscal Year 2022/23 in order to leave options available for the Administrative/Personnel Committee to consider in the coming year. At the completion of the study, the Executive Director will be working with the Administrative/Personnel Committee to implement any recommended changes and finalize the CVAG organizational chart and salary schedule within the adopted personnel budget. Fiscal Analysis: The ongoing Study by Koff & Associates was authorized in December 2021 as part of a joint effort along with the Western Riverside Council of Governments (WRCOG) in an amount not to exceed $38,527.50, which is CVAG’s portion of the total amount $77,055. The Performance Management Review would be for a not-to-exceed amount of $27,540, which would be built into FY 2022/23 budget. Attachment: Koff proposed scope of work for Organizational Assessment and Performance Management Review

April 12, 2022
Proposal for Organizational Assessment and Performance Management Review Coachella Valley Association of Governments
Submitted by:
Koff & Associates GEORG S. KRAMMER Chief Executive Officer 2835 Seventh Street Berkeley, CA 94710 www.KoffAssociates.com [email protected] Tel: 510.658.5633 Fax: 510.652.5633

2835 Seventh Street, Berkeley, California 94710 | 510.658.5633 | www.KoffAssociates.com
April 12, 2022
Mr. Tom Kirk Executive Director Coachella Valley Association of Governments 73-710 Fred Waring Drive, Suite 200 Palm Desert, CA 92260 Dear Mr. Kirk: Thank you for the opportunity to respond to your request for an Organizational Assessment and Performance Management Review Proposal for the Coachella Valley Association of Governments (“CVAG”). We are most interested in assisting CVAG with these important studies and feel that we are uniquely qualified to provide value to your organization based on our experience working with other special districts, cities, counties, JPAs, and non-profit agencies throughout California. Koff & Associates, now a Gallagher company, is an experienced Human Resources and Recruitment Services firm providing human resources services to cities, counties, special districts, courts, educational institutions, and other public agencies for 38 years. The firm has achieved a reputation for working successfully with management, employees, and governing bodies. We believe in a high level of dialogue and input from study stakeholders and our proposal speaks to that level of effort. Our firm’s extra effort has resulted in close to 100% implementation of all our classification and compensation studies. Koff & Associates ensures that each of our projects is given the appropriate resources and attention, resulting in a high level of quality control, excellent communication between clients and our office, commitment to meeting timelines and budgets, and a consistently high-caliber work product. As a Managing Director of Koff & Associates, I would assume the role of Project Director and be responsible for the successful completion of project. I can be reached at our Berkeley address and the phone number listed on the cover page and my email is [email protected]. This proposal will remain valid for at least 90 days from the date of submittal. Please call if you have any questions or wish additional information. We look forward to the opportunity provide professional services to the Coachella Valley Association of Governments. Sincerely,
Georg S. Krammer Managing Director, Compensation and Rewards Consulting

Organizational Assessment / Performance Management Review Coachella Valley Association of Governments
2835 Seventh Street, Berkeley, California 94710 | 510.658.5633 | www.KoffAssociates.com
TABLE OF CONTENTS Methodology – Organizational Assessment 1 Organizational Assessment Timeline / Cost Proposal 5 Methodology – Performance Evaluation 6 Performance Evaluation Timeline / Cost Proposal 9 Signature Page

Organizational Assessment / Performance Management Review Coachella Valley Association of Governments
2835 Seventh Street, Berkeley, California 94710 | 510.658.5633 | www.KoffAssociates.com
1
METHODOLOGY – ORGANIZATIONAL ASSESSMENT Deliverable A. Initial Documentation Review/Meeting with Project Team This phase includes identifying the key client project team, contract administrator, and reporting relationships. Our team will meet with CVAG’s team to create the specific work plan and work schedule; reaffirm the primary objectives; determine deadline dates; determine who will be responsible for coordinating/scheduling communications with employees and management; and develop a timetable for conducting the same. Also included will be the gathering of written documentation including assembling the current organizational charts, class descriptions, operational budgets, documentation on current operational and human resources practices, information regarding in-house and outsourced/contracted HR services, and any other relevant documentation. This initial step will also include a discussion of our methodology and the components of the survey instrument that will be used when comparing CVAG to other, comparable agencies. We will meet with CVAG Management to discuss the major elements of the study and which areas will be studied. We will respond to any questions. Deliverable B. Determination of Comparator Agencies In order to provide CVAG with best practices information regarding what other, similarly organized/ structured agencies’ HR practices are, we recommend conducting a market survey. The selection of comparator agencies is considered a critical step in the study process. Using the following factors to identify appropriate comparators, we will receive approval before proceeding with the survey. The factors that we review when selecting and recommending appropriate comparator agencies include: Organizational type and structure – While various agencies may provide overlapping services and
employ some staff having similar duties and responsibilities, the role of each agency is somewhat unique, particularly regarding its relationship to the citizens it serves and level of service expectation. During this iterative process, potential comparator agencies and the advantages and disadvantages of including them and/or others will be discussed before we begin our analysis of developing a list or recommended comparators.
Similarity of population served, CVAG demographics, CVAG staff, and operational budgets – These elements provide guidelines in relation to resources required (staff and funding) and available for the provision of departmental services. They also speak to the diversity of the community that they serve and the common issues that CVAG might face to best serve that community.
Scope of services provided – While having an agency that provides all the services at the same level of citizen expectation is ideal for comparators if the majority of services are provided in a similar manner, sufficient data should be available for analysis.
The agencies may include some, or all, of the agencies we are currently surveying for compensation purposes, if appropriate. This will be discussed with CVAG management.

Organizational Assessment / Performance Management Review Coachella Valley Association of Governments
2835 Seventh Street, Berkeley, California 94710 | 510.658.5633 | www.KoffAssociates.com
2
Deliverable C. Survey Questionnaire
For the market survey, we will develop a survey instrument/questionnaire to ensure that the right questions are asked. The survey will include questions regarding organizational structure, ratios of staffing, HR programs and services provided, financial and other resources in relation to assignments and expected work products and best management practices. In addition, we will ascertain who within CVAG is currently performing any HR-related duties and tasks. We will do this by re-reviewing the PDQs that were completed during the classification study. Deliverable D. Online Survey Review (optional)
An additional value-added tool that K&A utilizes in order to assess organizational customer satisfaction and engagement, is an online survey that is completed anonymously by all CVAG employees. We would recommend this approach to provide additional opportunities for CVAG’s workforce to communicate what works and what doesn’t work when it comes to various HR areas. This is an optional service. We will analyze the results of the anonymous online survey and identify trends regarding organizational strengths and weaknesses in HR.
Deliverable E. Employee/Supervisory/Management Interviews
Based on the trends identified above, we will design whom we interview to delve into those trends and obtain more information. The assumption is that some individual employee interviews may be needed to clarify certain information that was contained, or perhaps we found to be missing, in the online survey. The goal of the interviews and the review of additional documentation is to identify/ determine the following: HR assignments, responsibilities, duties, and tasks; Process efficiencies, time spent, and frequency of the above; Competencies, knowledge, skills, and abilities required to perform the above; Reporting relationships and span of control; Staffing ratios; Available resources, including deficiencies and redundancies; and Equipment, computer and automation technologies used.
Deliverable F. Industry/Market Data Collection
For an external market survey, K&A does not collect market data by merely sending out a written questionnaire. We conduct all the data collection and analysis ourselves to ensure validity of the data and quality control. Typically, we collect organizational charts, classification descriptions, employee allocation lists, policies and procedures, HR programs that are handled inhouse vs. those that are outsourced, and other information via websites or in person, by telephone, or email. With this prior knowledge and our experience in the public human resources field, our professional staff will then schedule appointments with knowledgeable individuals to answer specific questions. We find that the information collected using

Organizational Assessment / Performance Management Review Coachella Valley Association of Governments
2835 Seventh Street, Berkeley, California 94710 | 510.658.5633 | www.KoffAssociates.com
3
these methods has a very high validity rate and is generally substantiated with management, employees, as well as governing bodies. The goal of the industry/market survey is to obtain information on the following:
Organizational structure, reporting relationships, span of control, and staffing levels; HR requirements, services and ratios of staffing to programs and services provided, and
other productivity measures; Outsourcing and in-sourcing practices per functional area of assignment; Resources available, including human, financial, technological resources; Computer and automation technologies used to improve efficiencies and/or customer
service, including an evaluation of existing systems (i.e., pros and cons); and Best management practices and standards.
Deliverable G. Data and Trend Analysis Surveying up to 8 comparator agencies should yield sufficient data and information to identify industry/market trends. Including agencies in the study that are known to be on the cutting edge of providing the highest quality services will uncover trends for best management practices that will be invaluable to CVAG. We will analyze the data and trends from the market survey and incorporate those into our recommendations for organizational and operational changes for CVAG. Deliverable H. Development of Recommendations and Implementation Strategy
Depending on the results of the internal and external assessments, we will develop or formulate specific recommendations for organizational and operational changes for CVAG. Recommendations and implementation strategies will include the following (as appropriate):
Organizational restructuring, including reassigning HR functions, reporting relationships, updating classifications/assignments, and reorganizing functional areas of assignment;
Staffing levels, including ratios of staff with HR responsibilities compared to workloads as well as ratios of “rank-and-file” staff to supervisory and management staff with HR responsibilities;
Outsourcing and in-sourcing opportunities, including areas of assignment at the functional and specific task levels;
Process efficiencies, including redundancies and deficiencies as well as assignments of functions and tasks;
Automated technologies: we will report the results of the market survey and identify any trends in this area, including feedback regarding the successfulness of current and/or newly implemented systems used by the comparator agencies;
Best management practices, including trends observed in the identified survey market regarding providing HR services and programs; and
Provide an implementation plan incorporating all our recommendations.

Organizational Assessment / Performance Management Review Coachella Valley Association of Governments
2835 Seventh Street, Berkeley, California 94710 | 510.658.5633 | www.KoffAssociates.com
4
Deliverable I. Management Review/Reanalysis and Feedback
We will share our findings and recommendations with stakeholders before our report, recommendations, and implementation plans are finalized. Our experience has been that this can be one of the most critical phases of the project to ensure that deliverables are vetted through the individuals who are most familiar with operations. Deliverable J. Preparation of Draft Final and Final Report and Deliverables
A Draft Interim Report of the Organizational Study will be completed and submitted to CVAG for review and comments. The report will provide detailed internal and external survey findings, documentation, and recommendations. The report will include a set of all survey instruments and documentation, data and trend analysis results, as well as recommendations and the implementation issues surrounding our recommendations. It will summarize and communicate all findings and information reviewed. Once all the CVAG’s questions/concerns are addressed and discussed, a Final Organizational Study Report will be created and submitted in bound format. Deliverable K. Final Presentation
In addition to ongoing periodic meetings and communication with the Project Team, the CVAG Manager, management, employees, and other stakeholders throughout the various phases of the study, as well as continuous status reports per email and conference calls, our proposal includes one final presentation to the Board of Directors, if desired.

Organizational Assessment / Performance Management Review Coachella Valley Association of Governments
2835 Seventh Street, Berkeley, California 94710 | 510.658.5633 | www.KoffAssociates.com
5
ORGANIZATIONAL ASSESSMENT TIMELINE Deliverables Organizational Assessment Completion by:
A. Initial Documentation Review/Meeting with Project Team Week 1 B. Determination of Comparator Agencies Week 2 C. Survey Questionnaire Week 3 D. Online Survey Review Week 6 E. Employee/ Supervisory/ Management Interviews Week 8 F. Industry/Market Data Collection Week 11 G. Data and Trend Analysis Week 13 H. Development of Recommendations and Implementation Strategy Week 15 I. Management Review/Reanalysis and Feedback Week 17 J. Preparation of Draft Final and Final Report and Deliverables Week 19 K. Final Presentation As Scheduled
ORGANIZATIONAL ASSESSMENT COST PROPOSAL
Deliverables Organizational Assessment Hours A. Initial Documentation Review/Meeting with Project Team 5 B. Determination of Comparator Agencies 8 C. Survey Questionnaire 5 D. Online Survey Review (optional) 30 E. Employee/ Supervisory/ Management Interviews 16 F. Industry/Market Data Collection 20 G. Data and Trend Analysis 8 H. Development of Recommendations and Implementation Strategy 12 I. Management Review/Reanalysis and Feedback 8 J. Preparation of Draft Final and Final Report and Deliverables 16 K. Final Presentation 4 Total Professional Hours 132
Combined professional and clerical composite rate: $170/Hour $22,440
Expenses (included in the hourly composite rate): N/A Expenses include but are not limited to duplicating documents, binding reports,
phone, fax, supplies, postage, etc.
TOTAL COST FOR ORGANIZATIONAL ASSESSMENT NOT TO EXCEED: $22,440 TOTAL COST FOR ORGANIZATIONAL ASSESSMENT NOT TO EXCEED
(EXCLUDING ONLINE SURVEY): $17,340
*Additional consulting will be honored at composite rate ($170)

Organizational Assessment / Performance Management Review Coachella Valley Association of Governments
2835 Seventh Street, Berkeley, California 94710 | 510.658.5633 | www.KoffAssociates.com
6
METHODOLOGY – PERFORMANCE EVALUATION Performance Evaluation System Objectives (some objectives are optional, per CVAG’s needs)
To meet the needs of CVAG for a performance evaluation system that is congruent with the updated classification and compensation system and is up-to-date with current HR trends;
To develop a Performance Management System that ties individual employee performance to organizational goals and core and functional competencies;
To ensure that the performance appraisal program is fair and equitable across the organization;
To facilitate a workshop with CVAG leadership (management, other stakeholders, etc.) to understand CVAG’s overall strategic needs, goals, and objectives and compensation philosophy, to discuss best management practices, and to receive general direction as to their compensation preferences;
To conduct an organizational assessment, including focus groups with representatives of all staff levels and all functional areas, to understand the history, culture, and foundation of CVAG, and to analyze and examine knowledge, skills, abilities, and competencies required of current staff members;
To develop and implement the new Performance Management System and train and educate the organization through classes and workshops regarding the fair and objective administration of the new system;
To ensure sufficient documentation and training throughout the project so that the plan can be implemented and maintained in a competent and fair manner.
DEVELOP / UPDATE PERFORMANCE EVALUATION STRATEGIES/SYSTEM
Deliverable A. Development of New Performance Evaluation System
1. Initial Review of Current Program: this will include the review of existing background materials, including CVAG’s current performance evaluation system/process/forms, classification and compensation plans (as developed during the classification and compensation phases of the project), organizational charts, budgets, CVAG rules and regulations, and related information. We will conduct orientation and briefing meetings with management and supervisory staff regarding the anticipated scope of work, preliminary project direction, and cost. The goal of this first step is to discuss with CVAG staff the system that is currently in place, meet with management staff to discuss parameters, goals, and objectives for the new Performance Management System, and discuss overall options and alternatives of performance management systems, depending on CVAG’s needs.
2. Develop/Update Performance Management System: based on the responsibilities, duties, and requirements for all existing CVAG classifications developed during the classification phase of the project, we will identify core competencies within each job specification and potential metrics associated with those competencies.

Organizational Assessment / Performance Management Review Coachella Valley Association of Governments
2835 Seventh Street, Berkeley, California 94710 | 510.658.5633 | www.KoffAssociates.com
7
This step of the process includes the following:
Review the current system’s performance factors, per any information and documentation about CVAG’s current performance management system, if any.
Identifying the competencies (performance factors) according to which each employee will be evaluated, and developing a detailed description of what each competency means to the organization and how they interrelate to each staff level within CVAG (executive, management, supervisory, line staff, and individual contributors);
Developing performance ratings, such as excellent, exceeds standards, meets standards, needs improvement, unacceptable (or any alternative systems based on CVAG’s preference and per your current performance management system);
Developing guidelines and definitions as to what each performance rating means for each competency (again, this will include a review of what the current performance report contains and making recommendations for changes, as appropriate);
Developing guidelines as to how to develop SMART (Specific, Measurable, Attainable, Relevant, and Time-bound) goals and assisting CVAG in determining goals for each level that interrelate to overall agency goals;
Developing metrics/scorecards revolving around determined goals; and Developing a step-by-step performance evaluation process and timelines.
3. Review and Update Performance Objectives: we recommend reviewing the newly developed performance recommendations with the organization; this includes staff work sessions and focus groups for input and review. It is critical to build consensus and organizational understanding and buy-in for any new systems or system updates. We recommend including the entire organization in the process of developing core competencies as well as functional competencies that are based on technical knowledge and abilities in each functional area of the organization. This will ensure that all employees, individual contributors as well as supervisors and managers, not only understand but also buy into the new Performance Management System. We accomplish this by holding focus group meetings with various groups of employees to learn about which competencies each group feels are at the core of their particular function as well as CVAG overall. Of course, we will work with management and other stakeholders to determine the optimal composition of each working group.
4. Develop/Customize Performance Management Tools: this involves working to
develop/customize the various components of the Performance Management System, forms, process, timelines, and other tools, including implementing core competencies, functional competencies, ratable metrics for each employee classification, and a SMART goal section. CVAG may also want to consider a performance evaluation software – there are many options on the market that will make performance management a much easier, streamlined, and efficient process.

Organizational Assessment / Performance Management Review Coachella Valley Association of Governments
2835 Seventh Street, Berkeley, California 94710 | 510.658.5633 | www.KoffAssociates.com
8
Deliverable B. Pay-for-Performance Compensation Structure Development (Optional) This phase, if desired, includes a review of CVAG’s salary structure (developed during the compensation study) within which the classifications are allocated. We will develop recommendations based on our experience with PFP (pay for performance) appraisal programs and best management practices. There are many options CVAG has in terms of remunerating its employees based on performance. Two major factors that play a role in developing performance incentive compensation programs are: 1) the design of individual salary ranges, and 2) how to factor in the level of performance the employee has attained. Regarding the design of salary ranges, the decision will be as to whether CVAG has any interest and/or flexibility in modifying its current salary ranges (this question will be asked during the compensation phase of the project). Alternatively, we can look at developing merit-based pay that is non-base building. Regarding level of performance, the decision will be as to whether employees receive different levels of rewards or incentives for the following performance levels:
1. Excellent/Outstanding/Exemplary; 2. Exceeds Expectations/Standards; or 3. Meets Expectations/Standards.
We will facilitate a discussion among CVAG leadership as to what their considerations should be when it comes to the above factors and assist with presenting best management practices to CVAG. Deliverable C. Design Training Programs and Conduct Workshops (Optional)
As mentioned above, organizational buy-in is critical and the general employee population as well as supervisors may need to be trained and educated in the new Performance Management System. Employees will need to understand how their individual performance ties to overall organizational goals and objectives and what they need to do to receive a positive performance rating. Most important for organizational buy-in will be the employees’ understanding of how their performance ties into incentive compensation, if CVAG wishes to integrate the two. Managers and supervisors will need to be trained on how to make performance and pay decisions that are based on fair, equitable, and consistent practices. The training workshops will include the following:
Performance core competencies; Performance level rating scale; How to develop performance goals and objectives and employee work plans; How to track, evaluate, and communicate work plan performance; How to write and conduct a meaningful performance appraisal; How to administer the employee compensation program and apply merit increase
guidelines; and A review of all performance appraisal and work plan tools and instruments.
Training workshops containing the above components will be held for groups of managers, supervisors, and employees to roll out the new Performance Management System to the entire organization.

Organizational Assessment / Performance Management Review Coachella Valley Association of Governments
2835 Seventh Street, Berkeley, California 94710 | 510.658.5633 | www.KoffAssociates.com
9
PERFORMANCE MANAGEMENT TIMELINE: Deliverables Performance Management Completion by:
A. Development of New Performance Management System 1. Initial Review of Current Program Week 1 2. Develop/Update Performance Management System Week 4 3. Review and Update Performance Objectives Week 12 4. Develop/Customize Performance Management Tools Week 16
B. Pay-for-Performance Compensation Structure Development Week 16 C. Design Training Programs and Conduct Training Workshops Week 21
PERFORMANCE MANAGEMENT COST PROPOSAL In our experience, developing a performance management system is challenging to anticipate in terms of the scope of work. The table below provides a very comprehensive approach and, of course, CVAG may choose a less comprehensive approach. If so, we’ll be happy to tailor the scope of work and cost accordingly.
Deliverables Performance Management System Development Hours A. Development of New Performance Management System -- 1. Initial Review of Current Program 16 2. Develop/Update Performance Management System 40 3. Review and Update Performance Objectives 40 4. Develop/Customize Performance Management Tools 12
B. Pay-for-Performance Compensation Structure Development 16 C. Design Training Programs and Conduct Training Workshops 30 Additional anticipated hours for ongoing support throughout the year 8 Total Professional Hours 162 Combined professional and clerical composite rate: $170/Hour $27,540 Expenses (included in the hourly composite rate): N/A Expenses include but are not limited to duplicating documents, binding reports,
phone, fax, supplies, postage, etc.
TOTAL COST FOR PERFORMANCE MANAGEMENT SYSTEM DEVELOPMENT NOT TO EXCEED:
$27,540
*Additional consulting will be honored at composite rate ($170)

Organizational Assessment / Performance Management Review Coachella Valley Association of Governments
Signature Page
Koff & Associates intends to adhere to all the provisions described above. This proposal is valid for ninety (90) days. Respectfully submitted, By: KOFF & ASSOCIATES State of California
Georg S. Krammer April 12, 2022 Managing Director, Compensation and Rewards Consulting

ITEM 6F Coachella Valley Association of Governments
Executive Committee April 25, 2022
STAFF REPORT Subject: Smart Scalping and Landscape Certification Program Contact: Emmanuel Martinez, Senior Programs Manager ([email protected]) Recommendation: Authorize the Executive Director to take the necessary actions and execute the required agreement with the County of Riverside to receive $80,000 from the Coachella Valley Air Quality Enhancement Grant Program for the region’s Smart Scalping and Landscape Certification Program Energy and Environmental Resources Committee: CONCURS (Meeting of April 14th)
Background: Since the early 1990s, CVAG has coordinated efforts to improve air quality and help the Coachella Valley address its non-attainment status for particulate matter. For example, CVAG has coordinated regional air quality programs such as the street sweeping program to control PM10 (particulate matter of less than 10 microns). PM10 in the Coachella Valley comes from dust-generating activities, including vehicles traveling over paved or unpaved streets and construction. It also comes from landscaping activities, such as scalping grass in the fall season in preparation for the winter rye grass. To enhance air quality improvement efforts, CVAG launched a landscape certification program to mitigate air quality issues related to scalping and re-seeding of winter rye grass. CVAG recently applied to the County of Riverside’s Coachella Valley Air Quality Enhancement Projects grant program, which had a call for projects that closed on January 5, 2022. In coordination and collaboration with College of the Desert, CVAG sought funding to cover the $40,000 per year it costs to run the Landscape Certification Program. Many homeowners, homeowner associations and landscapers across the Coachella Valley have traditionally used scalping as a tool to grow winter rye grass on their property. However, turf experts have developed a winter rye grass planting technique that does not require scalping, helping to improve air quality and public health. Scalping is the process of mowing summer’s crop of Bermuda grass all the way down to the roots so that winter rye grass can be planted. The process creates enormous amounts of dust, including tiny PM10 particles that can be harmful to the lungs and that contribute to the surge of valley-wide allergy problems each fall. By working with the cities, landscaping companies, homeowner associations and golf resorts, CVAG helps reduce the amount of dust generated from scalping activities. In the early 2000’s, CVAG worked with the South Coast Air Quality Management District, the University of California, Riverside, and the Hi-Lo Desert Golf Course Superintendents Association to conduct studies and research to reduce the harmful dust particles generated from scalping. CVAG’s non-scalping technique helps to reduce harmful dust particles by 99 percent.

Therefore, creating healthier grass through efficient, effective and environmentally sound turf re-seeding practices. In turn, helping to reduce dust and improve air quality and public health for the region. As an alternative to using scalping as a technique to prepare for the winter rye grass, the program educates landscapers, through a certification course, to use a technique that does not scrape down to the dirt before winter rye grass is planted. By waiting until the Bermuda gras goes dormant, scalping can be eliminated from this traditional process, helping to keep the air clean and healthy for tourists and residents of the Coachella Valley. CVAG in partnership with the College of the Desert, works with all the Coachella Valley cities so that landscapers who are renewing or receiving a new business license at each city, are educated and certified on the non-scalping re-seeding process. By helping to increase educational opportunities for landscapers, widespread use of winter rye grass re-seeding technique can increase. With this funding, College of the Desert will continue to host CVAG’s Landscape Certification program online. COD will also promote the course on its website on the Partnership and Community Education webpage. To evaluate proposals and make funding recommendations, the Coachella Valley Air Quality Advisory Committee met in January 2022. The Committee recommended CVAG be awarded two years of funding, a total of $80,000, for the Landscape Certification Program. This project will be implemented in two phases: Phase 1 is to aggressively promote the program in coordination with CVAG’s member jurisdictions; and Phase 2, is to enlist landscapers in all nine-cities via tracking of business license permits, to help track performance of the program. With this item, CVAG staff is recommending that the Executive Director be authorized to take the steps to accept the funds. Fiscal Analysis: The costs for the Landscape Certification Program is $40,000 per year. The grant from the County of Riverside’s Coachella Valley Air Quality Enhancement Program will fund two years of the program, for a total of $80,000.

ITEM 6G Coachella Valley Association of Governments
Executive Committee April 25, 2022
STAFF REPORT
Subject: State Legislation Related to Automated Rooftop Solar Permitting Programs Contact: David Freedman, Program Manager ([email protected]) Recommendation: Support Senate Bill 379 and authorize the Chair and/or Executive Director to sign letters of support and advocate for its approval
Energy and Environmental Resources Committee: CONCURS (Meeting of April 14th)
Background: In 2014, the California Legislature required local governments to streamline their permitting processes for certain solar systems. Assembly Bill 2188 required every city and county, including charter cities, to adopt an ordinance that creates an expedited, streamlined permitting process for small residential rooftop solar energy systems.
Despite the existing requirements regarding solar energy system permitting, the solar industry remains concerned with permitting delays – which can add weeks or months, as well as higher costs, to the process. Additionally, while the costs of solar hardware have decreased by 80 percent in the past 15 years, the “soft” costs associated with permitting account for a significant share of the total price of a solar system and are thus a major hindrance to California’s clean energy goals, including 100 percent renewable energy by 2045. For a residential customer, the soft costs specifically associated with solar installation, including costs for permitting and inspection, can amount to as much as $1 per watt of the installation, which can represent $6,000 or more for a typical rooftop system in the Coachella Valley.
To address permit delays and the costs associated with permitting, SB 379, introduced by Senator Scott Wiener (D-San Francisco), would require jurisdictions of a certain size (including all of CVAG’s member cities and Riverside County) to implement an automated online solar permitting system for residential rooftop solar systems. The implementation deadline for SB 379, if adopted, is September 30, 2023 for cities and counties with populations greater than 50,000 and September 30, 2024 for cities with a population of 50,000 or fewer. The National Renewable Energy Laboratory (NREL), in coordination with the Department of Energy, solar industry partners, and building safety experts, has created an open-source software called SolarAPP+, which would satisfy the technical requirements of SB 379. SolarAPP+ is a standardized plan review software that can run compliance checks and process building permit approvals for eligible rooftop solar systems, allowing for a simplified onboarding and adoption of automated permitting. SolarAPP+ does not charge jurisdictions for adoption, but it does charge $25.00 per permitted system that a solar contractor runs through the application (in addition to the jurisdiction’s regular solar permit fee). SB 379 does not require that SolarAPP+ be utilized but ensures that some form of automated online permitting be available so that residents can be efficiently approved for solar systems, and so that building departments are no longer inundated and slowed by solar permits. The Budget Act of 2021 appropriates $20 million in funding to the California Energy Commission (CEC) to support a funding program for cities and counties to establish automated, online solar

permitting, as would be required by SB 379. The CEC is in the process of developing the California Automated Permit Processing (CalAPP) program to provide funding for cities and counties to establish automated online solar permitting, including the adoption of SolarAPP+ and potentially other automated permit processing systems. CVAG member cities with a population less than 50,000 can be awarded up to $40,000 from the CEC, and those with a population of 50,000 to 99,999 can be awarded up to $60,000. Riverside County as the solar permitting agency for unincorporated areas can be awarded up to $100,000. Noting that SB 379 creates a state-mandated local program by requiring local jurisdictions to adopt an automated online permitting system and report information on the numbers of permits issued and the characteristics of solar energy and storage systems to the CEC, staff contacted the League of California Cities for its views on the bill. The League worked with Senator Wiener and the sponsors to get some amendments to the bill and currently has no position on it. However, the League did express caution about whether nearly all cities and counties should be required to do this right now and how the bill would be implemented. To facilitate adoption of SolarAPP+ and promote the CalAPP grant program that the CEC will launch in the next few months, CVAG staff is now working with NREL and the California Solar & Storage Association on a training program for local permitting and planning staffs as well as solar installers. This training will be conducted under the auspices of the new Inland Regional Energy Network (I-REN). This item was presented to the Energy and Environmental Resources Committee at the April meeting, where Committee members expressed support for the bill. But there was some interest in seeing whether the threshold for the $60,000 grant could be reduced, as only three of the CVAG member agencies would be eligible for that higher level. Staff has since done further research on the concept. The funding thresholds are in the CalAPP program terms, because the funds were appropriated last year. SB 379 does not have any determination on the funding levels and does not appropriate any additional money. Staff will investigate other sources to assist in SolarAPP+ implementation, such as the I-REN training noted above. Staff is recommending that CVAG issue a letter of support for SB 379, which is consistent with goals and objectives previously adopted by CVAG’s Energy & Environmental Resources Committee, including promoting opportunities that benefit energy consumers, reducing greenhouse gas emissions, increasing renewable energy usage, and advancing climate action and resilience. The bill is also consistent with CVAG’s 2022 Federal and State Legislative Platform, which was adopted by the Executive Committee at its February 28 meeting.
Fiscal Analysis: There is no cost to CVAG for adopting a support position for SB 379. The CalAPP program will provide funding to cover certain costs of implementing SB 379. Staff time dedicated to SolarAPP+ and CalAPP training is covered through the I-REN budget.
Attachment: Draft support letter for SB 379

April 25, 2022 The Honorable Assemblymember Eduardo Garcia Chair, Assembly Utilities and Energy Committee State Capitol, Room 8120 Sacramento, CA 95814 Re: SB 379 (Wiener) – SUPPORT Dear Assemblymember Garcia, On behalf of the Coachella Valley Association of Governments (CVAG), I am writing to express support for Senate Bill 379. This bill would require specified cities and counties to implement an online, automated permitting platform for residential solar energy systems, such as SolarAPP+. The National Renewable Energy Laboratory (NREL) developed SolarAPP+ in collaboration with the various code compliance and solar industry entities. Before any homeowner can install a solar energy system, they need to apply for a permit from their local building department. While permits are often processed in just a few days, permitting delays can add weeks or months, as well as higher costs for both local governments and solar customers, to the process. SB 379 ensures that some form of automated online permitting be available so that residents can be efficiently approved for solar systems, and so that building departments are no longer inundated and slowed by solar permits. In a recent study NREL conducted of three pilot jurisdictions in California and two in Arizona that implemented SolarAPP+, NREL concluded that SolarAPP+ saved staff hours and reduced the average permit review time to less than one day. Projects submitted through SolarAPP+ were installed and inspected on average 12 days faster than projects using the traditional process. SolarApp+ also eliminates the need for costly third-party plan review services that impact city budgets. The California Energy Commission (CEC) is now developing the California Automated Permit Processing (CalAPP) program to provide $20 million in funding appropriated in the Budget Act of 2021 for cities and counties to establish automated online solar permitting, including the adoption of SolarAPP+ and potentially other automated permit processing systems. Faster and cheaper permitting of solar energy systems resulting from SB 379 together with the CEC funding would benefit our communities and help California achieve its clean energy goals, including 100% renewable energy by 2045. Solar energy generates carbon-free electricity and prevents other pollutants from fossil fuel power plants. Solar energy, tied with battery storage systems, lowers residents’ electric bills, readies the grid for electric vehicles, and keeps lights and medical devices on during blackouts and public safety power shutoffs. Solar installations also create local, accessible, and good-paying jobs for our residents in a growing industry. CVAG supports expanding clean energy access by making it cheaper and easier for people to adopt rooftop solar and energy storage to meet California's ambitious clean energy targets and deploy solar in all communities and households, particularly those struggling to pay for electricity. For these reasons, CVAG is pleased to support SB 379. We urge you and the other members of the Assembly Utilities and Energy Committee to vote “AYE” when the bill comes before you.

Thank you for your leadership on this important issue. If you have questions, or wish to discuss our position, please do not hesitate to contact CVAG Executive Director Tom Kirk at [email protected] or (760) 346-1127. Sincerely, Christy Gilbert Holstege, Esq. CVAG Chair
cc: The Honorable Senator Scott Wiener The Honorable Members of the Assembly Committee on Utilities and Energy The Honorable Senator Melissa Melendez The Honorable Assemblymember Chad Mayes

ITEM 6H Coachella Valley Association of Governments
Executive Committee April 25, 2022
STAFF REPORT
Subject: Regional PM10 Street Sweeping Contact: Emmanuel Martinez, Senior Programs Manager ([email protected]) Recommendation: Authorize the Executive Director to take the necessary actions to execute a six-month contract extension with M&M Sweeping, Inc., for Regional PM 10 Street Sweeping Services Energy and Environmental Resources Committee: CONCURS (Meeting of April 14th)
Background: The Regional Street Sweeping program is an air quality program focused on addressing PM10 (particulate matter less than 10 microns) by removing sand and entrained dust from regional streets in the Coachella Valley. As an area in non-attainment for PM10, the program is a key air quality strategy for the Coachella Valley to minimize entrained dust from roadways from suspending into the air due to vehicular traffic. Since the 1990s, Coachella Valley’s cities have cooperated on the regional street sweeping program. The program is also considered a best available control measure (BACM) to reduce PM-10 which comes from dust generating activities such as vehicles traveling over paved and unpaved streets and construction activities. In 2019, SCAQMD approved a five-year grant for $1.15 million for CVAG’s Regional Street Sweeping Program. The grant appropriates $220,000 annually for street sweeping operations for a period of five years and $50,000 for a Regional PM10 Street Sweeping Efficiency and Effectiveness Study. Under the grant terms, funding beyond the first year is contingent on the completion and approval of the study. Specifically, the study will investigate the efficiency and effectiveness of the current street sweeping schedule, identify problem areas and possible improvements to the program. Additionally, the study will conduct a cost-benefit analysis, to help optimize the resources allocated to the program. The study is now underway, under the contract that the Executive Committee approved with ECORP Consulting at the September 2021 meeting. The total cost of the study, including contingency, is $28,511. This will be paid form the for the study. The remaining balance of the $50,000 grant fund allocation will help cover CVAG staff time for managing and implementing the grant and the program. While the study is ongoing, the contract with CVAG’s street sweeper M&M Sweeping, Inc. – is nearing an end. The term of the two-year agreement is set to expire on June 30, 2022. This was the second two-year agreement with said contractor. CVAG staff has coordinated with member jurisdictions’ staff, and there is general interest in issuing a request for proposals for street sweeping to take advantage of competitive bidding at the end of the contract term. However, any new contract should be completed with the efficiency and effectiveness data in mind. The

study is anticipated to be completed in the fall of 2022. Once completed, its recommendations to improve the program could then be incorporated into the request for proposals for street sweeping services. CVAG staff has met with the designated staffs of each of the cities to provide them an update on the efforts related to street sweeping, as well to receive comments and feedback regarding the program. Although they recommended issuing an RFP for the street sweeping services, there was consensus for the approach of extending the current street sweeping contract for six months to allow for the completion of the efficiency and effectiveness study. Fiscal Analysis: The costs for the six-month extension of the regional street will not exceed $331,438.32. Currently, the total not to exceed compensation for the two-year agreement is $1,325,753.26, which includes “regular sweeping,” “seasonal impact streets cleaning” and “special impact streets cleaning,” and a street sweeping of Highway 111 within the City of Palm Springs. Based on the two-year figure, the six-month contract costs were prorated. The Regional PM 10 Street Sweeping Program is funded through various funding sources including Col-Mac (Desert View) funds apportioned to the program by Riverside County, AB 2766 Vehicle Subvention funds received from all nine cities and through the aforementioned grant funds from the SCAQMD. The grant agreement for the SCAQMD was bifurcated, one agreement for year one of funding and another agreement for years 2-5 of funding including the for the study. The agreement for year one of funding was fully executed September 2021 and CVAG has submitted three reimbursement requests from SCAQMD totaling $152,958.20, all of which have been approved. This leaves a remaining balance of $67,041.81 under year one of the grant. The agreement for years 2-5 and the study was fully executed February 2022 and staff will submit reimbursement requests to SCAQMD when key tasks of the study are completed.

ITEM 6I Coachella Valley Association of Governments
Executive Committee April 25, 2022
STAFF REPORT
Subject: Additional Funding Support for CV Housing First Contact: Anyse Smith, Management Analyst ([email protected])
Recommendation: Authorize the Executive Director to negotiate a memorandum of understanding with Inland Counties Legal Fund to accept a $300,000, three-year grant from the State Bar of California for homelessness services Homelessness Committee: CONCURS (Meeting of April 20th)
Background: The CV Housing First Program focuses primarily on providing intensive case management services to the CV200 – a by name list of chronically homeless individuals who are high utilizers of public emergency services and who have frequent contact with law enforcement. Chronically homeless individuals often face difficulty with accessing housing due to barriers such as having no income, or not having their vital documents (such as a birth certificate or ID).
CVAG staff, over the course of the past year, has worked to build partnerships with organizations that can bolster the services available to the CV 200 clients. One of those partnerships has been with Inland County Legal Services (ICLS), and it has been focused on providing legal services to CVHF clients. ICLS recently was successful in obtaining grant funding from the State Bar of California that will be used for homeless services ICLS provides throughout the region. The grant, which is for three years, identified CVAG as one of its partners.
CVAG’s portion of the grant will largely go to costs associated with the legal clinics. These are held on a regular basis and provide an opportunity for CV 200 clients, who are case managed by CVAG, to work with legal experts in order to receive assistance with acquiring their vital documents, as well as being connected to mainstream benefits such as Social Security, Supplemental Security Income (SSI), and Supplemental Security Disability Income (SSDI). Clients who are unsheltered often have limited access to phones, computers, and email – all of which present a barrier to acquiring and, in some cases, maintaining income. Without income, individuals face extreme difficulty qualifying for housing, even if housing is identified. Case managers will schedule an appointment for clients to meet with an advocate who can assist with addressing their particular needs as determined by an assessment tool administered by the case manager. Once clients have been qualified and assigned an advocate, case managers will continue to assist by coordinating transportation for the client to future appointments and providing any follow up documentation. This direct assistance will increase clients’ access to permanent housing, thereby ending their homelessness. ICLS offers these services to CVAG’s program participants and clients who are referred by other homeless services providers in the desert region.

Legal services will also be provided to unsheltered individuals where they reside through the Mobile Access Center (MAC). Advocates from ICLS and Housing First staff work collaboratively to offer these services to individuals and families experiencing homelessness through a combination of in-person and virtual meetings, which can take place in the MAC.
Details of the funding agreement are still being worked out between ICLS and the State Bar. Once they are finalized, ICLS and CVAG will need a memorandum of understanding to execute their partnership. CVAG staff is recommending that authorization be provided to the Executive Director to negotiate the agreement and accept the funding.
Fiscal Analysis: ICLS is receiving a $1.2 million, three-year grant through the State Bar of California to fund legal aid that addresses homelessness and homeless prevention. ICLS’ grant proposal identified $300,000 for CVAG – or $100,000 a year – to cover costs associated with the legal clinic. This also will help the program supplement previous funding sources, such as the California Emergency Solutions and Housing (CESH) Program, which CVAG had utilized but have been drawn down. ICLS is also working with Step up on Second, a non-profit that provides permanent supportive housing solutions, in order to expand homeless services across eastern Riverside County and San Bernardino County.

ITEM 6J Coachella Valley Association of Governments
Executive Committee April 25, 2022
STAFF REPORT
Subject: TUMF Annual and Five-year Report for Fiscal Year 2020/2021 Contact: Peter Satin, Regional Planner ([email protected])
Recommendation: Accept the TUMF Annual and Five-Year Report for Fiscal Year 2020/2021 Transportation Committee: CONCURS (Meeting of April 4th)
Background: The Mitigation Fee Act (Government Code §66006) requires local agencies receiving development mitigation fees in connection with the approval of a development project to deposit those fees in separate accounts based on the purpose for which each fee was adopted, and to annually report to the public the collection and use of the fees in each such account. The Mitigation Fee Act also requires a report every five years as to the unexpended portion of fees in each account. The Transportation Uniform Mitigation Fee (TUMF) Annual and Five-Year Report is prepared each year to satisfy the requirement of the Mitigation Fee Act.
CVAG’s TUMF program is comprised of TUMF and Measure A regional arterial funds; all in-lieu collection obligations have been met as of September 2019. The two sources combined generated a total of $32,047,751 during fiscal year 2020/2021, which represents a 23 percent increase in revenues over fiscal year 2019/2020 (Table 1). Local Measure A funds are received by TUMF-collecting jurisdictions for their local street and road projects in the Coachella Valley, and are determined via a formula quantifying total dwelling units and taxable sales. Dwelling unit data is collected annually from each jurisdiction and is forwarded on to the Riverside County Transportation Commission (RCTC).
Table 1: TUMF program revenues in fiscal year 2020/2021 compared to fiscal year 2019/2020.
Fund FY 20/21 FY 19/20 Difference % Difference TUMF $6,029,562 $5,217,884 $811,678 16%
Measure A $26,018,189 $20,916,167 $5,102,022 24% Total $32,047,751 $26,124,711 $5,923,040 23%
The TUMF program began in fiscal year 1989/1990 and saw a steady increase in local Measure A funding received by CVAG’s member jurisdictions until the Great Recession, which began in 2008 and resulted in significant downturns in revenues generated. Since then, revenues from both Measure A funding and TUMF assessments have again begun to climb. The COVID-19 pandemic caused a brief plateau; however, this plateau did not continue into the most recently completed fiscal year.

The report was provided to the Desert Valleys Builders Association on March 21, 2022 for comment. No requests for clarifications or changes were received.
Fiscal Analysis: There is no fiscal impact from receiving and filing the Annual and Five-year Report. Attachments: TUMF Annual and Five-Year Report for Fiscal Year 2020/2021 DVBA comment letter

TRANSPORTATION UNIFORM MITIGATION FEE ANNUAL AND
FIVE-YEAR REPORT FISCAL YEAR 2020-2021
COACHELLA VALLEY ASSOCIATION OF GOVERNMENTS 73-710 Fred Waring Dr., Ste. 200
Palm Desert, CA 92260

i
COACHELLA VALLEY ASSOCIATION OF GOVERNMENTS
Transportation Uniform
Mitigation Fee Fiscal Year 2020-2021
Annual Report
CVAG Transportation Department
Cover photo courtesy of Christopher Parman, City of Cathedral City Ofelia Bringas Memorial Bridge

ii
Table of Contents Introduction ................................................................................................................................ 1
Fiscal Year 2020-2021 Summary ........................................................................................... 3
TUMF Collections by Jurisdiction, Fiscal Year 2020-2021 .......................................................... 5
All Jurisdictions ....................................................................................................................... 5
Cathedral City ......................................................................................................................... 7
Coachella ............................................................................................................................... 8
Desert Hot Springs ................................................................................................................. 9
Indian Wells ...........................................................................................................................10
Indio ......................................................................................................................................11
La Quinta ...............................................................................................................................12
Palm Desert...........................................................................................................................13
Palm Springs .........................................................................................................................14
Rancho Mirage ......................................................................................................................15
Riverside County ...................................................................................................................16
TUMF Collections by Land Use Category, Fiscal Year 2020-2021 ............................................17
Measure A Collections ..............................................................................................................20
All Jurisdictions ......................................................................................................................20
Cathedral City ........................................................................................................................22
Coachella ..............................................................................................................................22
Desert Hot Springs ................................................................................................................23
Indian Wells ...........................................................................................................................23
Indio ......................................................................................................................................24
La Quinta ...............................................................................................................................24
Palm Desert...........................................................................................................................25
Palm Springs .........................................................................................................................25
Rancho Mirage ......................................................................................................................26
Riverside County ...................................................................................................................26
Congestion Management Program ............................................................................................27
CVAG Monitoring Process .....................................................................................................27
1
Introduction
In November 1988, Riverside County voters approved Measure A, a one-half cent increase in sales tax over a twenty-year period to be used for transportation purposes. A major factor contributing to the support of Measure A was the “return to source” concept which requires the additional sales tax revenue generated in a specific geographic area be used to finance projects within that same area, and that a new development impact fee, the Transportation Uniform Mitigation Fee (TUMF) be adopted valley wide on all new development. The program has been so successful that, in November 2002, Riverside County voters approved a 30-year extension of Measure A (2009 - 2039). Despite its success, Measure A funds will only contribute a portion of the transportation improvement funding necessary to prevent a potential breakdown of the regional transportation system. The TUMF program was developed to generate additional funds required for necessary improvements to the regional transportation system. Local jurisdictions may choose not to collect TUMF, however, jurisdictions not collecting TUMF forfeit their share of local Measure A funds to the regional arterial program. TUMF, like all development impact fees, requires a nexus be demonstrated between the proposed development and the impacts to be mitigated. In TUMF’s case, the assessment is based on the number of vehicle trips new development or site improvements may generate. The most recent nexus study1, conducted in 2018, determined that by 2040, over one million trips will be added to the Coachella Valley due to novel development. At the same time, a Transportation Project Prioritization Study2 (TPPS) was conducted to provide an unbiased, methodological way to provide CVAG direction in determining funding for regional arterials by identifying and ranking discrete segments to be improved. Factoring the increase in trips into the anticipated costs of projects considered in the 2018 TPPS using the same time horizon results in a per trip cost of $2453. With the new $245 trip rate, the actual development fees are then calculated for individual land uses. The Institute of Transportation Engineers (ITE) has exhaustively analyzed different land uses with respect to trip generation and publishes the ITE Trip Generation Manual. This manual is the accepted industry standard with respect to trip generation data. The actual fees are determined by multiplying the trip rate established in the Nexus Study by the ITE factor for trips per land use. For example, ITE shows a residential single-family dwelling unit generates, on average, 9.44 trips per day. Hence, $245/trip x 9.44 trips/dwelling unit = $2,312.80/dwelling unit, which CVAG has rounded to a final fee assessment of $2,310 for a single family residence.
1 https://www.cvag.org/library/pdf_files/trans/TUMF/2018%20CVAG%20Nexus%20Report%20(FINAL)%2010-17-18.pdf 2 https://www.cvag.org/library/pdf_files/trans/TPPS%20with%20Graphics.pdf 3 The previous trip rate, from 2006, was $192/trip.

2
Development occurs within many different land uses. In previous TUMF Handbooks, CVAG had utilized as many as 70 land-use categories and sub-categories. During the most recent Nexus Study, CVAG’s TUMF Advisory Committee determined that consolidating the land-use categories would simplify the process without impacting the amount of TUMF collected. CVAG has since aggregated all land use categories into twelve general categories. Their associated TUMF fee are listed below:
Land-use Category Fee per Unit
Residential Single-Family Detached $2,310/dwelling unit Multi-Family, Mobile Home $1,330/dwelling unit Nursing/Congregate Care $495/dwelling unit Transit Oriented Development 15% discount Low-Income Housing Exempt from Fee Non-Residential Industrial $1,215/1,000SF Office $2,390/1,000SF Retail $6,010/1,000SF Fuel – Gas $8,610/dispenser Fuel – Electric $91/dispenser Golf Course $920/acre Hotel $3,510/room TUMF works in conjunction with CVAG’s allocation of Measure A to fund the CVAG share of regional transportation projects. CVAG apportions 55% of the CVAG share of the cost of each regional transportation project identified in the TPPS to TUMF. The balance is paid with Measure A funds. No portion of a project is funded until sufficient funding to complete the project has been committed. TUMF revenues are applied to the TPPS projects in order of priority, such that a new project will only be funded when sufficient revenues for projects underway are assured. Because the project priorities set out in the TPPS control the order of funding, it also controls generally the approximate timeline for the commencement of each listed project.

3
Fiscal Year 2020-2021 Summary
The following information pertains to the TUMF fund for the year ending June 30, 2021. There were no interfund transfers or loans from the TUMF Fund. No fees were re-allocated pursuant to Gov Code Section 66001 for sums that remain unspent after five years and for which a date of commencement of the improvement has not been provided.
Fund Balance – July 1, 2020 $2,522,851
Balance of fees collected (accrual basis) - June 30, 2021 $6,029,562
Interest earnings from Investment Pool $39,911
Refunds ($6,457)
Other Miscellaneous revenues/receipts $208,950
Project costs ($3,691,699)
Program management expenditures ($340,255)
Projected Fund Balance - June 30, 2021 $4,762,863
Five Year Test Using First In First Out Method Revenues Collected from 2017 3,083,965 Revenues Collected from 2018 4,198,419 Revenues Collected from 2019 4,867,459 Revenues Collected from 2020 4,990,263 Revenues Collected from 2021 6,029,562
Total Revenue for Last Five Years 23,169,668 As of June 30, 2021, $135,911,244 has been collected by the assessment of TUMF and an additional $24,360,250 of Measure A In-Lieu funds were collected for a total of $160,271,594 since program inception on July 1, 1989.

4
Figure 1: TUMF assessment boundary and participating jurisdictions. Projects eligible for TUMF funding are described more fully in the Transportation Project Prioritization Study, 2018, and are displayed here only for context.

5
TUMF Collections by Jurisdiction, Fiscal Year 2020-2021
This section sorts TUMF collections for fiscal year 2020-2021 by jurisdiction. As of 2013, each of the regional municipalities within the Coachella Valley, along with the County of Riverside, are participating in CVAG’s TUMF program. All TUMF shortfalls have been collected and no in-lieu payments were made during the reporting period. The total TUMF collected for fiscal year 2020-2021 was $6,029,562, with 26 percent generated by the City of Indio. An additional $26,018,189 of Measure A funding was disbursed to CVAG for regional arterial projects. The monthly collection totals for each jurisdiction are displayed below, along with a break down of the land use for which fees were collected. More detailed land use analyses are provided in the following section. All Jurisdictions
TUMF FY 20/21 % FY Total TUMF to Date % Total Cathedral City $712,711.53 12% $12,421,243.33 9%
Coachella $470,768.64 8% $6,612,466.00 5%
County $388,954.47 6% $18,079,986.26 13%
Desert Hot Springs $448,268.97 7% $6,862,331.27 5%
Indian Wells $69,300.00 1% $3,184,013.21 2%
Indio $1,572,734.44 26% $33,494,198.44 25%
La Quinta $393,685.92 7% $4,591,628.73 3%
Palm Desert $583,701.46 10% $23,123,358.69 17%
Palm Springs $643,058.03 11% $15,865,997.92 12%
Rancho Mirage $746,378.85 12% $11,676,020.10 9%
Total TUMF $6,029,562.31 100% $135,911,243.95 100%
Total In Lieu -
$24,360,349.83
Regional Arterials $26,018,188.89
$361,371,235.89
Sum Total $32,047,751.20
$521,642,829.67

6
Figure 2: Proportion of total TUMF collections per jurisdiction for fiscal year 2020-2021.
Cathedral City12%
Coachella8%
County6%
Desert Hot Springs7%
Indian Wells1%
Indio26%
La Quinta7%
Palm Desert10%
Palm Springs11%
Rancho Mirage12%

7
Cathedral City
Collected Refunds Total Jul $62,370.00 $0.00 $62,370.00
Aug $41,300.00 $0.00 $41,300.00
Sep $2,310.00 $0.00 $2,310.00
Oct $92,400.00 $0.00 $92,400.00
Nov $181,691.53 $0.00 $181,691.53
Dec $94,710.00 $0.00 $94,710.00
Jan $23,100.00 $0.00 $23,100.00
Feb $41,580.00 $0.00 $41,580.00
Mar $48,510.00 $0.00 $48,510.00
Apr $64,680.00 $0.00 $64,680.00
May $4,620.00 $0.00 $4,620.00
Jun $55,440.00 $0.00 $55,440.00
Total $712,711.53 $0.00 $712,711.53
Figure 3: Cathedral City TUMF collections per land use category, fiscal year 2020-2021.
$6,650
$103,320
$32,172
$570,570
$0 $100,000 $200,000 $300,000 $400,000 $500,000 $600,000
Attached Multi-family
Fuel - Gas
Retail
Single Family Detached

8
Coachella
Collected Refunds Total Jul $50,820.00 $0.00 $50,820.00
Aug $64,680.00 $0.00 $64,680.00
Sep $34,650.00 $0.00 $34,650.00
Oct $73,285.38 $0.00 $73,285.38
Nov $16,170.00 $0.00 $16,170.00
Dec $0.00 $0.00 $0.00
Jan $43,136.85 $0.00 $43,136.85
Feb $27,720.00 $0.00 $27,720.00
Mar $27,720.00 $0.00 $27,720.00
Apr $27,720.00 $0.00 $27,720.00
May $36,904.41 $0.00 $36,904.41
Jun $0.00 $0.00 $0.00
Total $402,806.64 $0.00 $402,806.64
Figure 4: Coachella TUMF collections per land use category, fiscal year 2020-2021.
$55,603
$22,465
$392,700
$0 $50,000 $100,000 $150,000 $200,000 $250,000 $300,000 $350,000 $400,000 $450,000
Industrial
Retail
Single Family Detached

9
Desert Hot Springs Collected Refunds Total
Jul $50,820.00 $0.00 $50,820.00
Aug $11,550.00 $0.00 $11,550.00
Sep $11,016.33 $0.00 $11,016.33
Oct $4,620.00 $0.00 $4,620.00
Nov $27,074.05 $0.00 $27,074.05
Dec $43,230.00 $0.00 $43,230.00
Jan $2,310.00 $0.00 $2,310.00
Feb $26,812.80 $0.00 $26,812.80
Mar $21,719.56 $0.00 $21,719.56
Apr $91,254.27 $0.00 $91,254.27
May $46,200.00 $0.00 $46,200.00
Jun $111,661.96 $0.00 $111,661.96
Total $448,268.97 $0.00 $448,268.97
Figure 5: Desert Hot Springs TUMF collections per land use category, fiscal year 2020-2021.
$5,320
$38,610
$61,107
$27,694
$54,691
$260,846
$0 $50,000 $100,000 $150,000 $200,000 $250,000 $300,000
Attached Multi-family
Hotel
Industrial
Office
Retail
Single Family Detached

10
Indian Wells Collected Refunds Total
Jul $0.00 $0.00 $0.00
Aug $0.00 $0.00 $0.00
Sep $0.00 $0.00 $0.00
Oct $6,930.00 $0.00 $6,930.00
Nov $2,310.00 $0.00 $2,310.00
Dec $4,620.00 $0.00 $4,620.00
Jan $18,480.00 $0.00 $18,480.00
Feb $9,240.00 $0.00 $9,240.00
Mar $6,930.00 $0.00 $6,930.00
Apr $9,240.00 $1,837.44 $7,402.56
May $4,620.00 $0.00 $4,620.00
Jun $6,930.00 $0.00 $6,930.00
Total $69,300.00 $1837.44 $67,462.56
Figure 6: Indian Wells TUMF collections per land use category, fiscal year 2020-2021. Does not include refunded monies.
$69,300
$0 $10,000 $20,000 $30,000 $40,000 $50,000 $60,000 $70,000 $80,000
Single Family Detached

11
Indio Collected Refunds Total
Jul $46,200.00 $0.00 $46,200.00
Aug $128,505.00 $0.00 $128,505.00
Sep $90,489.57 $0.00 $90,489.57
Oct $107,228.83 $0.00 $107,228.83
Nov $176,878.91 $0.00 $176,878.91
Dec $108,570.00 $0.00 $108,570.00
Jan $349,393.89 $0.00 $349,393.89
Feb $64,680.00 $0.00 $64,680.00
Mar $147,840.00 $0.00 $147,840.00
Apr $55,440.00 $0.00 $55,440.00
May $106,618.24 $0.00 $106,618.24
Jun $190,890.00 $0.00 $190,890.00
Total $1,572,734.44 $0.00 $1,572,734.44
Figure 7: Indio TUMF collections per land use category, fiscal year 2020-2021.
$137,760
$6,075
$9,598
$361,321
$1,057,980
$0 $200,000 $400,000 $600,000 $800,000 $1,000,000 $1,200,000
Fuel - Gas
Industrial
Office
Retail
Single Family Detached

12
La Quinta
Collected Refunds Total Jul $9,240.00 $0.00 $9,240.00
Aug $51,245.30 $0.00 $51,245.30
Sep $9,800.62 $0.00 $9,800.62
Oct $20,790.00 $0.00 $20,790.00
Nov $23,100.00 $0.00 $23,100.00
Dec $11,550.00 $0.00 $11,550.00
Jan $20,790.00 $0.00 $20,790.00
Feb $48,510.00 $0.00 $48,510.00
Mar $43,890.00 $0.00 $43,890.00
Apr $73,920.00 $0.00 $73,920.00
May $25,410.00 $0.00 $25,410.00
Jun $55,440.00 $0.00 $55,440.00
Total $393,685.92 $0.00 $393,685.92
Figure 8: La Quinta TUMF collections per land use category, fiscal year 2020-2021.
$26,396
$367,290
$0 $50,000 $100,000 $150,000 $200,000 $250,000 $300,000 $350,000 $400,000
Retail
Single Family Detached

13
Palm Desert
Collected Refunds Total Jul $350,820.00 $0.00 $350,820.00
Aug $6,930.00 $0.00 $6,930.00
Sep $23,100.00 $0.00 $23,100.00
Oct $28,475.38 $0.00 $28,475.38
Nov $2,310.00 $0.00 $2,310.00
Dec $4,620.00 $0.00 $4,620.00
Jan $36,821.25 $0.00 $36,821.25
Feb $63,717.74 $0.00 $63,717.74
Mar $25,410.00 $0.00 $25,410.00
Apr $19,995.00 $0.00 $19,995.00
May $19,192.09 $0.00 $19,192.09
Jun $2,310.00 $0.00 $2,310.00
Total $583,701.46 $0.00 $583,701.46
Figure 9: Palm Desert TUMF collections per land use category, fiscal year 2020-2021.
$336,960
$27,637
$4,481
$66,783
$147,840
$0 $50,000 $100,000 $150,000 $200,000 $250,000 $300,000 $350,000 $400,000
Hotel
Industrial
Office
Retail
Single Family Detached

14
Palm Springs
Collected Refunds Total Jul $40,925.80 $0.00 $40,925.80
Aug $106,750.00 $0.00 $106,750.00
Sep $4,389.30 $0.00 $4,389.30
Oct $43,295.00 $0.00 $43,295.00
Nov $26,211.80 $0.00 $26,211.80
Dec $57,772.80 $0.00 $57,772.80
Jan $22,600.32 $0.00 $22,600.32
Feb $48,548.16 $0.00 $48,548.16
Mar $88,200.00 $0.00 $88,200.00
Apr $69,548.85 $0.00 $69,548.85
May $106,610.00 $0.00 $106,610.00
Jun $28,206.00 $0.00 $28,206.00
Total $643,058.03 $0.00 $643,058.03
Figure 10: Palm Springs TUMF collections per land use category, fiscal year 2020-2021.
$131,670
$14,327
$107,454
$33,866
$355,740
$0 $50,000 $100,000 $150,000 $200,000 $250,000 $300,000 $350,000 $400,000
Attached Multi-family
Industrial
Office
Retail
Single Family Detached

15
Rancho Mirage
Collected Refunds Total Jul $73,920.00 $0.00 $73,920.00
Aug $48,510.00 $0.00 $48,510.00
Sep $16,170.00 $0.00 $16,170.00
Oct $60,060.00 $0.00 $60,060.00
Nov $30,030.00 $0.00 $30,030.00
Dec $53,130.00 $0.00 $53,130.00
Jan $76,230.00 $0.00 $76,230.00
Feb $64,680.00 $0.00 $64,680.00
Mar $85,470.00 $0.00 $85,470.00
Apr $64,680.00 $0.00 $64,680.00
May $94,958.85 $0.00 $94,958.85
Jun $78,540.00 $0.00 $78,540.00
Total $746,378.85 $0.00 $746,378.85
Figure 11: Rancho Mirage TUMF collections per land use category, fiscal year 2020-2021.
$23,349
$723,030
$0 $100,000 $200,000 $300,000 $400,000 $500,000 $600,000 $700,000 $800,000
Retail
Single Family Detached

16
Riverside County
Collected Refunds Total Jul $27,797.76 $0.00 $27,797.76
Aug $11,627.76 $0.00 $11,627.76
Sep $22,120.00 $0.00 $22,120.00
Oct $29,205.52 $0.00 $29,205.52
Nov $11,550.00 $0.00 $11,550.00
Dec $47,853.12 $2,310.00 $45,543.12
Jan $33,675.00 $0.00 $33,675.00
Feb $31,672.41 $0.00 $31,672.41
Mar $23,527.68 $0.00 $23,527.68
Apr $49,418.61 $0.00 $49,418.61
May $59,720.92 $0.00 $59,720.92
Jun $40,785.69 $2,310.00 $38,475.69
Total $388,954.47 $4,620.00 $384,334.47
Figure 12: Riverside County TUMF collections per land use category, fiscal year 2020-2021.
$79,664
$2,949
$306,341
$0 $50,000 $100,000 $150,000 $200,000 $250,000 $300,000 $350,000
Industrial
Office
Single Family Detached

17
TUMF Collections by Land Use Category, Fiscal Year 2020-2021 This section sorts each jurisdiction’s TUMF collections into different land use categories. Residential development was by far the dominant source of TUMF revenue, contributing to 71% of the total collected fees, with the next highest categories being Retail at 10% and Hotel at 6%.
This space intentionally left blank.

18
Figure 13: Proportion of total TUMF collections per land use category.
Attached Multi-family2% Fuel - Gas
4%Hotel
6%Industrial
4%Office
3%
Retail10%
Single Family Detached71%

19
Table 1: TUMF collections per land use.
Single Family
Detached Attached Multi-
family Fuel - Gas Hotel Industrial Office Retail Cathedral City $570,570 $6,650 $103,320 $0 $0 $0 $32,172
Coachella $392,700 $0 $0 $0 $55,603 $0 $22,465 County $306,341 $0 $0 $0 $79,664 $2,949 $0
Desert Hot Springs $260,846 $5,320 $0 $38,610 $61,107 $27,694 $54,691 Indian Wells $69,300 $0 $0 $0 $0 $0 $0
Indio $1,057,980 $0 $137,760 $0 $6,075 $9,598 $361,321 La Quinta $367,290 $0 $0 $0 $0 $0 $26,396
Palm Desert $147,840 $0 $0 $336,960 $27,637 $4,481 $66,783 Palm Springs $355,740 $131,670 $0 $0 $14,327 $107,454 $33,866
Rancho Mirage $723,030 $0 $0 $0 $0 $0 $23,349 Total $4,251,638 $143,640 $241,080 $375,570 $244,414 $152,178 $621,043
Table 2: Development units per land use.
Single Family Detached (du)
Attached Multi-family (du)
Fuel - Gas (pump)
Hotel (room)
Industrial (sqft)
Office (sqft)
Retail (sqft)
Cathedral City 247 5 12 0 0 0 5,353 Coachella 170 0 0 0 45,764 0 3,738
County 133 0 0 0 65,567 1,234 0 Desert Hot Springs 109 4 0 11 50,294 11,588 9,100
Indian Wells 30 0 0 0 0 0 0 Indio 458 0 16 0 5,000 4,016 60,120
La Quinta 159 0 0 0 0 0 4,392 Palm Desert 64 0 0 96 22,747 1,875 11,112
Palm Springs 154 99 0 0 11,792 44,960 5,635 Rancho Mirage 313 0 0 0 0 0 3,885
Total 1,524 108 28 107 201,164 63,673 103,335

20
Measure A Collections Jurisdictions participating in the collection of TUMF receive 100% of their local Measure A for street and road projects. The formula for local Measure A distribution involves two variables in equal proportions: 1) dwelling units, and 2) taxable sales. These variables are updated on an annual basis for use beginning July 1st of each fiscal year. As of June 30, 2021, the cumulative amount of regional Measure A received – $361,371,236 – has exceeded the amount of TUMF collected – $135,911,244. In all jurisdictions, the cumulative local Measure A received has exceeded the cumulative TUMF collected. The graphs on the following pages illustrate the comparison on an all-jurisdiction cumulative basis as well as individual jurisdictions by fiscal year. All Jurisdictions
TUMF Collections Measure A Collections Cathedral City $12,421,243.33 $36,598,639.32
Coachella $6,612,466.00 $10,624,573.62
County $18,079,986.26 $41,053,020.71
Desert Hot Springs $6,862,331.27 $8,860,174.78
Indian Wells $3,184,013.21 $5,991,858.66
Indio $33,494,198.44 $35,549,620.78
La Quinta $4,591,628.73 $7,392,886.06
Palm Desert $23,123,358.69 $63,251,303.15
Palm Springs $15,865,997.92 $49,552,220.55
Rancho Mirage $11,676,020.10 $21,533,348.15
Grand Total $135,911,243.95 $280,407,645.78

21
Figure 14: Local Measure A received compared to TUMF collected per jurisdiction, 1989-2021
$0.00 $10,000,000.00 $20,000,000.00 $30,000,000.00 $40,000,000.00 $50,000,000.00 $60,000,000.00 $70,000,000.00
Cathedral City
Coachella
County
Desert Hot Springs
Indian Wells
Indio
La Quinta
Palm Desert
Palm Springs
Rancho Mirage
Measure A Collections TUMF Collections

22
Cathedral City
Figure 15: Cumulative TUMF collected by CVAG compared to Measure A funds collected by Cathedral City.
Coachella
Figure 16: Cumulative TUMF collected by CVAG compared to Measure A funds collected by Coachella.
$-
$200,000
$400,000
$600,000
$800,000
$1,000,000
$1,200,000
$1,400,000
$1,600,000
$1,800,000
$2,000,000
TUMF Collections Measure A Collections
$-
$200,000
$400,000
$600,000
$800,000
$1,000,000
$1,200,000
TUMF Collections Measure A Collections

23
Desert Hot Springs
Figure 17: Cumulative TUMF collected by CVAG compared to Measure A funds collected by Desert Hot Springs.
Indian Wells
Figure 18: Cumulative TUMF collected by CVAG compared to Measure A funds collected by Indian Wells.
$-
$100,000
$200,000
$300,000
$400,000
$500,000
$600,000
$700,000
$800,000
$900,000
TUMF Collections Measure A Collections
$-
$50,000
$100,000
$150,000
$200,000
$250,000
$300,000
$350,000
TUMF Collections Measure A Collections

24
Indio
Figure 19: Cumulative TUMF collected by CVAG compared to Measure A funds collected by Indio.
La Quinta
Figure 20: Cumulative TUMF collected by CVAG compared to Measure A funds collected by La Quinta.
$-
$500,000
$1,000,000
$1,500,000
$2,000,000
$2,500,000
$3,000,000
$3,500,000
TUMF Collections Measure A Collections
$-
$500,000
$1,000,000
$1,500,000
$2,000,000
$2,500,000
TUMF Collections Measure A Collections

25
Palm Desert
Figure 21: Cumulative TUMF collected by CVAG compared to Measure A funds collected by Palm Desert.
Palm Springs
Figure 22: Cumulative TUMF collected by CVAG compared to Measure A funds collected by Palm Springs.
$-
$500,000
$1,000,000
$1,500,000
$2,000,000
$2,500,000
$3,000,000
$3,500,000
$4,000,000
TUMF Collections Measure A Collections
$-
$500,000
$1,000,000
$1,500,000
$2,000,000
$2,500,000
$3,000,000
$3,500,000
TUMF Collections Measure A Collections

26
Rancho Mirage
Figure 23: Cumulative TUMF collected by CVAG compared to Measure A funds collected by Rancho Mirage.
Riverside County
Figure 24: Cumulative TUMF collected by CVAG compared to Measure A funds collected by Riverside County.
$-
$200,000
$400,000
$600,000
$800,000
$1,000,000
$1,200,000
$1,400,000
TUMF Collections Measure A Collections
$-
$500,000
$1,000,000
$1,500,000
$2,000,000
$2,500,000
TUMF Collections Measure A Collections

27
Congestion Management Program
The Congestion Management Program (CMP) is an effort to link land use, transportation, and air quality, to promote reasonable growth management programs that will effectively utilize new transportation funds, alleviate traffic congestion and related impacts, and improve air quality. The CMP states: "Any jurisdiction that adopts a multi-jurisdictional Transportation Uniform Mitigation Fee (TUMF) which complements the objectives of the CMP, will be found in compliance with the CMP requirements." All jurisdictions, regardless of whether or not they participate in the TUMF Program, must comply with other required elements of the CMP, such as development of deficiency plans if the actual level of service (LOS) falls below the minimum CMP requirement standard of "E", a Transportation Demand Management (TDM) plan, and adherence to the Conformance and Monitoring Process. Measure A funds are distributed to local jurisdictions for local street and road projects. These funds are distributed by the Riverside County Transportation Commission (RCTC), based on a Coachella Valley formula that applies a 50% weight to the proportionate share of dwelling units and a 50% weight to taxable sales generated. The CMP requires, as of January 1, 1992, that all new development be tracked in non-TUMF jurisdictions, and calculations performed annually, to demonstrate an equitable share of Measure A funds towards the Regional Arterial Program. CVAG Monitoring Process
To meet requirements of the CMP, In-Lieu jurisdictions forward copies of their approved Building Activity Report (or its equivalent) to CVAG on a monthly basis. CVAG staff reviews the report and requests copies of building permits issued for all development subject to TUMF. Data is then extracted from the building permits and entered into the jurisdiction’s database as if the jurisdiction was participating in the TUMF program. Estimation is obtained when fees are calculated on development subject to TUMF. The city of La Quinta began participation in the TUMF Program in April 2013. Prior to its participation in the collection of TUMF, La Quinta forfeited its local Measure A to the Regional Arterial Program on a monthly basis. The amount of local Measure A was tracked and compared with estimated revenue that would have been generated if TUMF had been collected. CVAG has recovered all Measure A funds from La Quinta as of September 30, 2019.

28
Table 3: Expenditures on TUMF eligible projects.
Approved Actual Actual Actual Actual Actual TotalProject Description Lead Project CVAG Expenditures Expenditures Expenditures Expenditures Expenditures Expenditures
Agency1 Cost Share Prior to FY 17/18 FY 17/18 FY 18/19 FY 19/20 FY 20/21 to Date
Interchanges (IC)Interchange Preparation Fund Various 14,049,238.75$ 14,049,238.75$ 5,126,986.94$ 827,756.80$ 3,451,214.96$ 1,304,285.39$ 123,407.25$ 10,833,651.34$ Indian Ave./I-10 IC PS 26,476,137.00$ 3,142,835.00$ 2,604,198.31$ -$ -$ -$ -$ 2,604,198.31$ Palm Dr./Gene Autry Tr./I-10 IC COR 38,603,000.00$ 25,931,000.00$ 5,997,055.54$ -$ -$ -$ -$ 5,997,055.54$ Date Palm Dr./I-10 IC incl. RR bridge Various 31,721,000.00$ 17,181,000.00$ 11,678,993.37$ -$ -$ -$ -$ 11,678,993.37$ Monterey Ave./I-10 Ramp Improvements PD 8,100,000.00$ 5,150,000.00$ 3,990,633.40$ -$ -$ -$ -$ 3,990,633.40$ Portola Ave./I-10 IC Various 72,100,000.00$ 54,075,000.00$ -$ -$ 1,199,789.65$ 1,338,714.64$ 732,777.22$ 3,271,281.51$ Jefferson St./I-10 IC Indio/COR 77,886,000.00$ 42,160,000.00$ 24,794,743.50$ 2,526,375.42$ 839,987.59$ -$ 45,660.46$ 28,206,766.97$ Ave. 50/I-10 IC COA 2,800,000.00$ 2,300,768.00$ 1,361,229.00$ 654,736.92$ 259,613.98$ 180,354.16$ -$ 2,455,934.06$ Subtotal Interchanges 271,735,375.75$ 163,989,841.75$ 55,553,840.06$ 4,008,869.14$ 5,750,606.18$ 2,823,354.19$ 901,844.93$ 69,038,514.50$
BridgesIndian Canyon Ave. (from Garnet to and incl. RR crossing) PS 21,500,000.00$ 4,642,150.00$ 1,342,311.90$ -$ 75,509.09$ 369,637.89$ 197,060.49$ 1,984,519.37$ Cathedral Canyon Bridge CC 22,038,000.00$ 2,577,092.58$ 204,229.30$ -$ 58,910.30$ 84,518.63$ 566,210.51$ 913,868.74$ Date Palm Bridge (across WWR) CC 18,703,000.00$ 1,608,925.00$ 193,820.80$ 1,083,342.32$ -$ -$ -$ 1,277,163.12$ Ave. 56 Grade Separation COR 22,218,043.00$ 14,884,000.00$ 12,421,562.59$ 952,902.31$ -$ -$ -$ 13,374,464.90$ Ave. 66 Grade Separation COR $23,490,000 12,597,417.00$ 2,355,213.07$ 379,345.70$ 3,105,748.25$ 4,279,140.40$ 3,618,244.59$ 13,737,692.01$ Ramon Bridge Widening PS 35,998,000.00$ 8,146,500.00$ 657,611.09$ 56,906.56$ 263,238.65$ 492,089.93$ 309,686.89$ 1,779,533.12$ Frank Sinatra Bridge over WWR RM 35,290,000.00$ 3,035,822.00$ 128,982.29$ 39,199.50$ 20,825.41$ 24,265.56$ 37,034.59$ 250,307.35$ Vista Chino Bridge over WWR PS 114,700.00$ 8,172,375.00$ 107,911.44$ 38,714.95$ 72,223.89$ 104,122.20$ 4,761.79$ 327,734.27$ Dune Palms Bridge over WWR LQ 19,993,000.00$ 3,369,000.00$ 150,060.14$ 414,810.68$ 691,953.59$ 558,541.61$ 235,140.63$ 2,050,506.65$ South Palm Canyon Bridge PS 101,968.00$ 865,326.00$ 49,809.73$ 12,790.28$ 28,677.48$ 12,772.62$ 32,812.83$ 136,862.94$ East Palm Canyon Bridge PS 102,083.00$ 1,109,611.00$ 25,714.78$ 18,193.23$ 16,963.55$ 5,299.66$ 133,408.85$ 199,580.07$ Ave. 50 Bridge (WWR & SR86) Coa 4,696,500.00$ 1,108,500.00$ 356,093.43$ 86,569.99$ 125,156.01$ 180,354.16$ 43,737.66$ 791,911.25$ Avenue 44 Bridge (across WWR) Indio 19,230,000.00$ 1,654,260.00$ -$ 264,329.98$ 127,864.02$ 68,121.63$ 78,529.13$ 538,844.76$ Subtotal Bridges 223,475,294.00$ 63,770,978.58$ 17,993,320.56$ 3,347,105.50$ 4,587,070.24$ 6,178,864.29$ 5,256,627.96$ 37,362,988.55$
Arterial LinksAvenue 56 (Harrison to 111) Future 27/28 COR 10,531,470.00$ 7,898,603.00$ -$ -$ -$ -$ -$ -$ Monterey Ave. (from Dinah Shore to Gerald Ford) Future RM 1,877,072.00$ 770,034.00$ -$ -$ -$ -$ -$ -$ Portola Ave. (north of Geral Ford Dr.) Future 2021/22 PD 2,139,739.00$ 534,934.83$ -$ -$ -$ -$ -$ -$ North Indian Canyon (19th to Dillon) Various 4,788,000.00$ 3,591,000.00$ -$ 636,489.56$ 1,036,124.06$ 369,637.89$ 194,697.22$ 2,236,948.73$ Avenue 48 - Van Buren to Dillon COR 1,250,000.00$ 937,500.00$ -$ 245,314.68$ 319,933.84$ 21,559.82$ 135,207.55$ 722,015.89$ Madison St. (from Ave. 52 to Indio Blvd.) Indio 46,250,000.00$ 24,204,794.00$ 8,665,329.99$ 4,072,772.29$ 6,448,163.54$ 1,798,595.70$ 242,336.24$ 21,227,197.76$ Frank Sinatra at Hwy 111 - Future RM 1,794,282.00$ 670,712.00$ -$ -$ -$ -$ -$ -$ Jefferson St./Varner Road north of I-10 Indio 6,000,000.00$ 4,500,000.00$ 1,611,753.83$ -$ -$ -$ -$ 1,611,753.83$ Hwy. 111 in Indio Indio 11,400,000.00$ 7,074,009.15$ 1,029,586.71$ 1,255,770.12$ 4,626,430.62$ 140,653.66$ -$ 7,052,441.11$ Ave. 48 between Jackson and Van Buren COA 3,622,000.00$ 991,500.00$ 83,066.23$ 26,418.04$ 41,773.56$ 840,242.17$ -$ 991,500.00$ Date Palm Drive North of I-10 CC 3,116,000.00$ 2,337,000.00$ 464,133.55$ -$ -$ -$ -$ 464,133.55$ Jackson Street Signal Improvements Indio 3,000,000.00$ 2,655,900.00$ 198,081.05$ 2,278,420.28$ 176,398.67$ 167,959.27$ -$ 2,820,859.27$ Avenue 50 (Calhoun to Harrison) COA 4,500,000.00$ 3,375,000.00$ -$ -$ 197,149.72$ 88,705.68$ 91,132.10$ 376,987.50$ Avenue 50 (SR86 to I-10) COA 1,820,000.00$ 1,365,000.00$ -$ 692,970.11$ 37,776.05$ -$ -$ 730,746.16$ Traffic Signals Project (Coachella) COA 1,950,000.00$ 1,725,000.00$ 247,389.04$ 1,477,610.96$ -$ -$ -$ 1,725,000.00$ Regional Bicycle/Pedestrian Safety Program 2017 Various -$ 10,000,000.00$ -$ 726,160.61$ 2,806,701.25$ 1,015,388.02$ 187,224.00$ 4,735,473.88$ Fred Waring/Washinton Street Intersection LQ 1,860,745.00$ 1,395,555.00$ -$ -$ -$ 252,092.04$ 929,945.27$ 1,182,037.31$ Avenue 50 and Jackson Street Intersection Improvement Indio 1,594,600.00$ 1,195,950.00$ -$ -$ 8,797.73$ -$ 85,616.55$ 94,414.28$ Subtotal Arterial Links 107,493,908.00$ 75,222,491.98$ 12,299,340.40$ 11,411,926.65$ 15,699,249.04$ 4,694,834.25$ 1,866,158.93$ 45,971,509.27$
602,704,577.75$ 302,983,312.31$ 85,846,501.02$ 18,767,901.29$ 26,036,925.46$ 13,697,052.73$ 8,024,631.82$ 152,373,012.32$
COR-County of Riverside, RM-Rancho Mirage, IW-Indian Wells, PD-Palm Desert, PS-Palm Springs, CC-Cathedral City, COA-Coachella LQ-La Quinta;
Total:


ITEM 6K Coachella Valley Association of Governments
Executive Committee April 25, 2022
Subject: TUMF Inflation Adjustment for Calendar Year 2023 Contact: Peter Satin, Regional Planner ([email protected])
Recommendation: Adopt an 8.2-percent increase in the Transportation Uniform Mitigation Fee rates to adjust for inflation, and update the TUMF Handbook to reflect the revised fee upon its effective date of January 1, 2023 Transportation Committee: CONCURS (Meeting of April 4th)
Background: The Transportation Uniform Mitigation Fee (TUMF) was established in 1989 as a one-time impact fee charged on all new development occurring within the CVAG region. Monies collected through the TUMF program are applied to transportation-related capital facilities and infrastructure required to serve new growth within the Coachella Valley and are intended to compliment revenue generated through Riverside County’s Measure A sales tax. To date, TUMF has provided less than the intended share of match toward Measure A funding.
The current TUMF rates were adopted in 2018 upon the completion of a revised Nexus Study, Transportation Project Prioritization Study, Regional Arterial Cost Estimate, and Active Transportation Plan. Prior to their adoption, the fee had remained unchanged at $192/trip for over a decade. The 2018 Nexus Study originally proposed a revised fee of $751/trip; however, this fee was reduced to the current $245/trip after re-evaluating which regional transportation projects would likely be built in the near-term. This rate equates to $2,313 for a single-family dwelling, as compared to the $10,104 currently charged by Western Riverside Council of Governments for similar development.
The 2018 TUMF Handbook also allows for the consideration of an annual inflation adjustment:
The inflation factor shall be the same one utilized by the Coachella Valley Local Development Mitigation Fee, based on the Riverside-San Bernardino-Ontario Consumer Price Index (CPI). Such CPI will be reviewed annually by the Executive Committee which will determine whether or not to apply the inflation factor.
The Local Development Mitigation Fee inflation factor is calculated on the CPI for All Urban Consumers (CPI-U), All items, as the over-the-year percent change, which is measured as of December in the calendar year which ends in the previous fiscal year. The Riverside-San Bernardino-Ontario CPI is measured every other month, and does not include data for the month of December. To approximate a data point for an unrecorded month, the Bureau of Labor Statistics (BLS) recommends taking the square root of the product of the indexes for the preceding and subsequent months, in this case November and January. This approximated December data point can then be used to calculate the over-the-year percent change.

CVAG staff would note that applying regular increases due to inflation is a preferred approach to infrequent increases to catch up over time. An inflation factor of 2.1-percent was applied across each of CVAG’s TUMF categories by the Executive Committee at their June 2021 meeting. In accordance with California’s Mitigation Fee Act, and to allow member jurisdictions time to update their local TUMF ordinances as needed, implementation of the inflation factor did not go into effect until January 1, 2022.
The CPI-U, All items, for the Riverside-San Bernardino-Ontario metropolitan area rose by 8.24-percent in 2021, largely due to steep increases in the cost of motor fuel, and, to a lesser extent, household energy. Motor fuel prices increased by almost 50-percent over the course of 2021, rebounding from a marked low point during the initial wave of the coronavirus pandemic. BLS notes that some entities choose to calculate “core” inflation on the CPI-U, less food and energy (which includes motor fuel), as these items tend to be more volatile in their pricing. Removing these volatile items from the regional CPI results in an inflation factor of 5.83-percent. However, because motor fuel constitutes a significant cost component for the construction of TUMF-supported projects, CVAG staff recommends applying the full inflation factor to the current fee assessments, as described in the below table.
TUMF Category Current Rate Proposed Rate Difference Residential (per dwelling unit)
Single family detached $2,358 $2,550 $192 Multi-family attached $1,358 $1,470 $112
Nursing/congregate care $505 $545 $40 Transit oriented single family $2,004 $2,170 $166 Transit oriented multi-family $1,154 $1,250 $96
Non Residential (per 1,000 sq. ft) Retail $6,135 $6,640 $505 Office $2,440 $2,640 $200
Industrial $1,240 $1,340 $100 Fuel - gas (per dispensing unit) $8,790 $9,515 $725
Fuel - electric (per dispensing unit) $93 $100 $7 Hotel (per room) $3,583 $3,880 $297
Golf course (per acre) $939 $1,015 $76
The revised rates would be implemented on January 1, 2023, so that member jurisdictions will have sufficient time to amend local ordinances. The rates listed in the TUMF Handbook will also be updated at that time to reflect the adjustment.
This information was provided to the Desert Valleys Builder’s Association (DVBA) for comment on March 15, 2022. Their response letter is attached. As part of the correspondence, DVBA questioned what rate is “economically responsible.” Staff would note that inflation factor for the CPI-U, All items, for the Riverside-San Bernardino-Ontario metropolitan area has been the rate used by the Coachella Valley Conservation Commission in adjusting the Local Development Mitigation Fee (LDMF) since its inception, and that the TUMF adjustment shall follow a similar metric. Additionally, it is lower than an alternative index calculated by the State of California’s Department of General Services. The California Construction Cost Index (CCCI), based on the Building Cost Index for Los Angeles and San Francisco provided by Engineering News-Record, has the inflation factor for this index at 13.4-percent.

Fiscal Analysis: Based on TUMF revenues generated in fiscal year 2020-2021, adjusting current TUMF rates based on the 13.4-percent inflation factor calculated by the CCCI would result in additional revenue of $835,129, while adjusting existing rates by the CPI-U, All items inflation rate of 8.24-percent would result in additional revenue of $513,852. Using the CPI-U, less food and energy inflation rate of 5.83-percent would yield $363,424 above current revenues. Revising the TUMF Handbook will have no fiscal impact. Attachments: DVBA Comment Letter


ITEM 6L Coachella Valley Association of Governments
Executive Committee April 25, 2022
STAFF REPORT
Subject: Transfer of private developer funds related to construction of CV Link within the
City of Palm Springs Contact: Martin Magaña, CVAG consultant ([email protected]) Recommendation: Authorize the CVAG Executive Director to take the necessary steps to accept $1,063,044 of developer-obligated payments in the City of Palm Springs to offset construction costs related to CV Link Transportation Committee: CONCURS (Meeting of April 4th)
Background: The City of Palm Springs routinely conditions development projects to provide pedestrian and bicycle facilities in and around their proposed projects. This was a condition set for both the Escena and Miralon housing projects, which are located adjacent to the Whitewater River storm water channel. Both projects were conditioned to build a dual bike/pedestrian facility adjacent to their project, and the pathway for both projects was planned to be constructed of asphalt. The location of both requirements overlaps with the route that the CVAG Executive Committee approved for CV Link, which is being built along the levee bank of the storm water channel. CV Link is wider than a standard asphalt bike path. It also is constructed of concrete and includes wayfinding features, colored seeded glass and amenities such as shade structures. City staff has coordinated with CVAG on how to ensure the developers will still uphold their obligations even as CV Link is built in lieu of an asphalt bikepath. The Escena development is located adjacent to the 2.3-mile stretch of CV Link that was opened in 2018 under an agreement with the City of Cathedral City. Given that CVAG and Cathedral City constructed CV Link, the city required the developer to provide the city with payment for their estimated construction cost of the obligated bike path, which was $364,500. Construction of CV Link will be coming soon in the northern part of the City, where Miralon is located. The city also required Miralon to provide the city with payment for their estimated construction cost which was $698,544. Both developer-obligated funds are to be transferred to CVAG. On February 24, 2022, the Palm Springs City Council authorized an agreement with CVAG to allow the transfer of these private developer-obligated funds to CVAG for the two segments of CV Link adjacent to Escena and Miralon, within the City of Palm Springs. CVAG staff is recommending that the Executive Director be authorized to take the necessary steps to accept the funds, including signing any agreements with the City.

Fiscal Analysis: CVAG would receive a total amount of $1,063,044, which includes the $364,500 that the City of Palm Springs required from Escena’s developer and the $698,544 that was required of Miralon. These funds will be added to the CV Link account and help CVAG offset its project costs. Attachment:
1. Map of Miralon and Escena projects in the City of Palm Springs

MIRALON CV LINK SEGMENT
ESCENA CV LINK SEGMENT
l l ___ ,
i r ,.,.,_t7" .. -P -.A L M
VlL'TU.Klo\. PARK
1--
T
r j ~ · l r ~..:"!~~;!,;~~~~~ -~ __ J __ i_t~+---~....::~~~--~~~-JI:.
RINGS i i - --+----~---'111)---j"---'--'--'--------,----'-----~ L.._ _ _____:V~IS:_::T.:::,A_::C:_::Hl::,:N;:::O __ - -_ i ____ _J
SHT
' 111) VlA
V1 A
l SUW
PALM Sl'RINGS INTER:-IA TJONAI,
AIRPORT
MIRALON
ESCENA
Attachment A
------ ---
---- -----
LANDA
U BLVD �-
-
I
� %.
.
.
.
� R
ESCENA CV LINK SEGMENT
ESCENA
Ram
on R
oad
Vis
ta C
hino

ITEM 7A Coachella Valley Association of Governments
Executive Committee April 25, 2022
STAFF REPORT
Subject: Statewide Update from the California Association of Councils of
Governments Contact: Erica Felci, Assistant Executive Director ([email protected]) Recommendation: Information
Background: The California Association of Councils of Governments (CALCOG) is a 47-member organization that serves councils of governments such as CVAG, metropolitan planning organizations, and regional transportation planning agencies. CALCOG works to improve the working relationships between member agencies, local governments, transit agencies, and state regulatory authorities. CALCOG also develops statewide consensus between its members on issues related to transportation, regional planning, climate change and funding. Additionally, CALCOG works to improve the inter-relationship between regional and local government by coordinating policy development with agencies such as the California State Association of Counties and the League of California Cities. CVAG has been a CALCOG member since 2014 and is represented by Palm Desert Mayor Jan Harnik on the CALCOG Board of Directors. CALCOG Executive Director Bill Higgins, who was the keynote speaker for the 2017 CVAG General Assembly, will attend the April meeting of the Executive Committee to provide an update on statewide policy and legislative issues that are of interest to CVAG’s member jurisdictions. Fiscal Analysis: There is no cost to CVAG for this update.

ITEM 7B Coachella Valley Association of Governments
Executive Committee April 25, 2022
STAFF REPORT Subject: Grant Funding for Connecting CV Link to Parks in Cathedral City and
Coachella Contact: Gustavo Gomez, Management Analyst ([email protected]) Recommendation: Adopt CVAG Resolution 2022-03 and authorize the Executive Director to take the necessary steps to accept $1,153,341 for the Coachella Valley Community Connectors project Transportation Committee: CONCURS (Meeting of April 4th)
Background: The Clean California Local Grant Program (CCLGP) is a competitive statewide program created to beautify and clean up local streets and road, tribal lands, parks, pathways, transit centers and other public spaces. The program is part of the nearly $1.1 billion Clean California initiative the State launched to take direct aim at litter abatement, state beautification, safety projects, and education campaigns. The program is funded by $296 million dollars in fiscal year 2021/2022. CVAG, in partnership with the Cities of Cathedral City and Coachella, were recently successful in securing funding for the Coachella Valley Community Connectors project. This project will make much needed improvements along two community connectors in disadvantaged communities along CV Link. The first will provide direct access from CV Link to the new Dream Homes Park in Cathedral City and the second will provide access to the new Central Park in Coachella. Both parks are now being developed after securing funding from Round Four of California’s Statewide Park Development and Community Revitalization Program. The funds secured with CVAG will cover design and construction costs, providing access for cyclists and pedestrians. It also includes landscaping, installation of benches, wayfinding signs and trash receptacles and planting of shade trees. The community connectors are designed to improve access to the parks as well as CV Link. CVAG’s award is one of many that the region secured in the Clean California Local Grant Program. Projects in the City of Blythe, City of Indio and the unincorporated area of Oasis also were awarded - resulting in more than $11.2 million dollarsa in grant funding to the region. It is worth noting that awards were given to 105 projects out of the 329 applications received, or approximately 30% of the submitted applications. Caltrans has scheduled a press conference for April 7 in the City of Indio to celebrate this investment.
a https://cleancalifornia.dot.ca.gov/local-grants

In order to accept the funds, a formal resolution is required. CVAG staff is also recommending that the Executive Director be authorized to take any and all steps to accept state grant funding and enter into a grant agreement with the California Department of Transportation. Fiscal Analysis: CVAG was awarded $1,153,341 for the project, which includes the work in both Cathedral City and Coachella. Based on the California Department of Transportation’s guidelines for the CCLGP, the Coachella Valley Community Connectors project qualified for a zero-dollar local match Attachments: Resolution 2022-03

Resolution No: 2022-03
RESOLUTION OF THE COACHELLA VALLEY ASSOCIATION OF GOVERNMENTS AUTHORIZING THE ACCEPTANCE OF STATE GRANT FUNDS AND ENTERING
INTO A GRANT AGREEMENT WITH THE CALIFORNIA DEPARTMENT OF TRANSPORTATION FOR THE COACHELLA VALLEY COMMUNITY CONNECTOR
PROJECT
WHEREAS, state grant funds are made available on a competitive statewide basis by the California Department of Transportation for the Clean California Local Grants Program (CCLGP); and
WHEREAS, the grants are awarded pursuant to guidelines established by the California
Department of Transportation for determination of project eligibility for funds; and WHEREAS, said procedures established by the California Department of Transportation require
the Grantee to certify by resolution the approval to accept grant funds and provide authorization to enter into an agreement with the California Department of Transportation to implement activities related to the CCLGP project.
NOW, THEREFORE, BE IT RESOLVED that the Executive Committee of the Coachella Valley
Association of Governments approves the acceptance of state grant funds for the project, Coachella Valley Community Connectors, in the amount of $1,153,341.
IT IS FURTHER RESOLVED that the Coachella Valley Association of Governments appoints the
Executive Director as agent to conduct all negotiations, execute and submit all documents including, but not limited to grant agreements, payment requests and so on, which may be necessary for the completion of the aforementioned project.
The foregoing Resolution was passed and adopted by the Executive Committee this 25th day of April 2022.
APPROVED:
___________________________ ___________________________ Christy Gilbert Holstege, Esq. Tom Kirk CVAG Chair Executive Director

ITEM 7C Coachella Valley Association of Governments
Executive Committee April 25, 2022
STAFF REPORT Subject: Amendment No. 1 to the Reimbursement Agreement with City of Indio for the
Avenue 44 Bridge Project Contact: Eric V. Cowle, Transportation Engineer ([email protected]) Recommendation: Approve Amendment No. 1 to the Reimbursement Agreement between CVAG and the City of Indio for the Avenue 44 Bridge Project, increasing CVAG’s regional share of the project by $1,561,740 for a not-to-exceed total of $3,216,000 for design and construction Transportation Committee: CONCURS (Meeting of April 4th)
Background: In July 2014, the CVAG Executive Committee approved a Reimbursement Agreement with the City of Indio to design and construct the Avenue 44 bridge over the Whitewater River, which is also known as the Coachella Valley stormwater channel. The City has completed the right-of-way phase and is finalizing the design to include the improvements required by the Coachella Valley Water District (CVWD). Construction of the new bridge is expected to be authorized by Caltrans this fall and ready to begin construction by mid-2023. The project includes a provision for a CV Link underpass below the bridge within the Avenue 44 right-of-way. Connection to CV Link will be made by CVAG as construction continues through the City of Indio. In order to fund the project, the City of Indio successfully acquired a Highway Bridge Program (HBP) grant to construct the Avenue 44 bridge. The total estimated cost of the bridge project was $19,230,000 at the time. The HBP grant provides 88.53 percent – totaling up to $17,024,319 – toward eligible costs associated with the project. Unfortunately, costs have increased significantly since the agreement was signed. As noted to CVAG committees in a recent presentation, part of these increased costs with bridge projects are associated with new CVWD requirements along the channel. For Avenue 44, there is a grade-control structure and other improvements not originally included in the original estimate. The new estimate for the design and construction of this project is $30,142,000, with the portion eligible for federal reimbursement at $29,116,750. The City has submitted a cost change request to Caltrans increasing the federal HBP share to $25,778,000, and is now requesting an additional $1,561,740 in regional funding. CVAG staff is recommending approval of Amendment No. 1 with the City of Indio to provide CVAG’s share of the additional project costs.

Fiscal Analysis: Amendment No. 1 would have CVAG provide an additional $1,561,740 in regional funding, bringing CVAG’s not-to-exceed share of the project costs to $3,216,000. There are sufficient regional transportation funds available for this amendment. Attachments: City of Indio request letter


ITEM 7D Coachella Valley Association of Governments
Executive Committee April 25, 2022
STAFF REPORT Subject: Contract Amendment with Alta Planning & Design for CV Link Contact: Jonathan Hoy, Director of Transportation ([email protected]) Recommendation: Authorize the Executive Director to execute Amendment No. 10 to the agreement with Alta Planning & Design for a total not-to-exceed amount of $551,352; and authorize the Executive Director and/or Legal Counsel to make clarifying changes/revisions before execution Transportation Committee: CONCURS (Meeting of April 4th)
Background: Construction is now underway for the largest segment of CV Link to date, which includes work in the Cities of Palm Springs, Palm Desert, La Quinta, Indio, and Coachella as well as unincorporated Riverside County. In addition, CVAG recently completed work with the City of Palm Desert for the on-street segment of CV Link in the city. In order to prepare for the bid advertisement of the next segment, complete additional design changes required by local agencies, and ensure on-call construction support, CVAG staff is now recommending a contract amendment with Alta Planning & Design. Alta’s work with the project dates back to July 18, 2014, when the CVAG Executive Committee approved a contract with for planning, design and engineering services related to CV Link in an amount of $6,217,000, plus a 10 percent contingency. The contract has been amended by the Executive Committee several times over the years, with the most recent amendment in June 2021, when the Executive Committee approved a not-to-exceed amount of $578,211. The scope of the current contract includes various tasks, such as survey work, low water crossing design work and construction support. Alta has played an integral role in the development of CV Link, and their experience with the project cannot be replicated. The team has extensive expertise in the field of active transportation and has been a resource not only to CVAG but to member jurisdictions as the design was being finalized. Alta provided the construction support/management for the first 2.3-mile section of CV Link between Vista Chino Road in Palm Springs and Ramon Road in Cathedral City. They also were an on-location resource as the City of Palm Springs built nearly one mile of the project along Demuth Park and the Tahquitz Creek Golf Course. Alta continues to play an integral part of CV Link as CVAG obtains the remaining right-of-way to construct the rest of the project. Alta and its subconsultants are now involved in responding to request for information (RFIs) to assist the contractor leading the current construction efforts, providing continued coordination with CVAG staff and sub-consultants, and work for areas where outside public agencies requested additional design changes. There also are challenges in finalizing the design of CV
Link based on feedback from outside agencies in order to finalize construction plans. As other projects along the Whitewater River/ Coachella Valley stormwater channel have experienced, the Coachella Valley Water District (CVWD) has extensive requirements that can lead to unexpected design revisions and sometimes lengthy reviews. Alta’s team has been utilized to respond to CVWD’s required redesigns and modifications for approval of the CV Link under-crossings and other segments. This task includes hydraulic modeling, design modifications and coordination with CVWD. Alta’s work also is helping CVAG prepare for the next stages of the project. This work includes the preparation of bid documents for the next segment, which extends through the reservation lands of the Cabazon Band of Mission Indians and the Twenty-Nine Palms Band of Cahuilla Indians in order to provide an uninterrupted connection between the Cities of Indio and Coachella. Additionally, Alta is responding to CVAG’s project team’s requests for changes at a number of locations that will reduce overall cost, increase safety and expedite project delivery. This includes the realignments at Gene Autry Trail, Highway 111 and Avenue 34 in Palm Springs to reduce impacts and stay in the public right of way; and adjustments at Washington Street in La Quinta to avoid conflicts with proposed signal modifications. In addition – in order to streamline the work funded by the Clean California Grant – CVAG staff is recommending that funding is included for designing the CV Link connections to the parks in Cathedral City and Coachella. Finally, Alta will continue to provide construction support work through the end of 2022 to respond to requests for information, attend construction coordination meetings and make necessary plan revisions as required for permitting, including the ongoing work with CVAG, CVWD and Union Pacific Railroad to design and get approval for the railroad undercrossing in Indio. Responding to these agencies requires immediate attention to keep the project moving forward. These tasks also require Alta to prepare additional exhibits and revise construction documents. With Alta being the lead designer of CV Link, they are a critical part of the overall project design and will continue to be involved with the project while it is under construction. If there are design changes that need to be made in the field during construction, Anser Advisory Group – the CV Link construction management team that the CVAG Executive Committee hired in January 2020 – will coordinate with the construction contractor to provide a solution. Those contractors will then work with Alta to get the final sign off on the design changes so work can continue. The terms of the contract amendment align with the work anticipated for the next segment of construction. It should be noted that additional amendments to Alta’s contract may be required as construction cost estimates are determined for the remaining segments and sub-segments of CV Link. Fiscal Analysis: Amendment No. 10 includes a not to exceed amount of $551,352. The cost of services will be paid for from existing funding sources for CV Link. Attachments: Amendment No. 10 to Alta’s contract and scope of work

AMENDMENT NUMBER TEN
to the ALTA PLANNING + DESIGN - CVAG
DESIGN AND ENGINEERING SERVICES AGREEMENT for the
CV LINK PROJECT
This AMENDMENT NUMBER TEN is made and entered into this ____ day of April 2022, by and between the Coachella Valley Association of Governments, a California joint powers agency (CVAG), and Alta Planning + Design (Consultant), and is made with reference to the following background facts and circumstances. All other terms and conditions shall remain the same as stated in the original Agreement for the CV Link Project. This Amendment Number Ten authorizes CVAG funds in the amount not to exceed $551,352.00. Summary Previously authorized Active Transportation Program federal funds $ 6,217,000 as noted in Revised Executive Committee report 9-29-15 Amendment Number One $ 239,000 Amendment Number Two $ 204,238 Amendment Number Three $ 106,302 Amendment Number Four (Contract Extension Only) $ 0 Amendment Number Five $ 1,260,287 Amendment Number Six $ 1,359,550 Amendment Number Seven (Contract Extension Only) $ 0 Amendment Number Eight $ 438,438 Amendment Number Nine $ 578,211 Amendment Number Ten $ 551,352 Current Cost for CV Link Project $10,954,378 IN WITNESS WHEREOF, the parties hereto have caused this Amendment Number Ten to be executed by their duly authorized representatives on this date:
COACHELLA VALLEY ASSOCIATION ALTA PLANNING + DESIGN OF GOVERNMENTS By: _______________________________ By: _________________________ Tom Kirk, CVAG Executive Director George Hudson, Principal Date: Date:


ITEM 8a
CVAG JURISDICTION JUL AUG SEP OCT NOV(Dec) DEC JAN FEB MAR APR MAY(JUN) JUNBlythe - - - - - -Cathedral City - - - - - -Coachella - - - - - -Desert Hot Springs - - - - - -Indian Wells - - - - - -Indio - - - - - -La Quinta - - - - - -Palm Desert - - - - - -Palm Springs - - - - - -Rancho Mirage - - - - - -Riverside County - - - - - -Agua Caliente Band of Cahuilla Indians - - - - - -Cabazon Band of Mission Indians - - - - - -Torres Martinez Desert Cahuilla Indians - - - - - -Twenty-Nine Palms Band of Mission Indians - - - - - -
AbsentNo Meeting -
Present
2020/2021 EXECUTIVE COMMITTEE ATTENDANCE ROSTER

ITEM 8b Coachella Valley Association of Governments
Executive Committee April 25, 2022
STAFF REPORT Subject: Status of I-10 Interchange Projects Contact: Gustavo Gomez, Management Analyst ([email protected]) Recommendation: Information Background: Attached is the latest status for Interstate 10 interchange projects as of March 2022: Completed
1) Indian Canyon @ I-10 (Mar ’12) 4) Monterey Avenue Ramp @ I-10 (Apr ’15) 2) Gene Autry/Palm Drive @ I-10 (Mar ’12) 5) Bob Hope/Ramon @ I-10 (Sep ’11) 3) Date Palm Drive @ I-10 (May ’14) 6) Jefferson Street @ I-10:
Post-construction closeout underway Portola @ I-10 Final PA&ED completed. ROW on hold until funding is identified. PS&E is nearing completion. Project will be shelved until ROW and construction funding are secured. Monroe @ I-10 Final environmental document approved by Caltrans. PS&E phase began April 2021 and is ongoing. ROW acquisition funding has been approved by CVAG for City of Indio. Jackson @ I-10 Environmental document was approved in September 2021. CVAG approved funding for PS&E. Avenue 50 @ I-10 PS&E contract underway. Avenue 50 @ SR 86 PA&ED completed in May 2019. Funding agreement amendment for PS&E and ROW acquisition approved by Executive Committee in September 2020. PA&ED underway. Dillon Road @ I-10 @ SR 86 PA&ED underway. Caltrans Approved Preliminary Environmental Study (PES) on July 13, 2020. Golf Center Parkway @ I-10 PSR on hold. Da Vall Drive @ I-10 Intersection Control Evaluation submitted to Caltrans. Fiscal Analysis: Funding for these projects has been budgeted through the project phase indicated and secured through various funding sources. There is no additional fiscal impact.

ITEM 8c
Lead CVAG Funded Project Description Agency PEng ENV PSE ROW CON Through Status
InterchangesAvenue 50 @ 86S COA Environmental PA & ED underwayAvenue 50 @ I-10 COA PSE PS&E contract under way. Jackson @ I-10 COR PSE Final Env Doc approved by Caltrans. CVAG approved PS&E funds. City moving forward with PSE by MBIMonroe @ I-10 COR PSE Final Env Doc approved by Caltrans. City moving forward with PSE by MBI. CVAG approved PS&E and ROW funds.Jefferson @ I-10 COR Construction Completed. Working on post-construction close out
Arterial LinksAve. 48 (Jackson St. to Van Buren St.) COA Construction CompletedAve. 50 (Calhoun St. to Harrison St) COA Construction PA/ED completed. PS&E under way.Coachella Traffic Signal Conversion COA Construction CompletedDate Palm Drive from I-10 to Varner CC PSE Phase II is completed. The final design for Phase III in underway.North Indian Canyon Widening COR/DHS/PS Construction Phase I paving completed. Phase II construction completed.Monterey Av. Corridor (fr. Gerald Ford to Dinah Shore) RM Construction Construction completed.Madison Street Widening (Highway 111 to Ave 48) Indio ROW PS&E complete, City moving forwards with ROWJackson Street Widening (Ave 49 to Ave 52) Indio Environmental Environmental filed on October 2021. City moving forward with PS&E phase.
BridgesAvenue 66 Grade Separation over UPRR COR Construction Bridge grand opening celebrated March 12.Avenue 44 Bridge over WWR Indio Construction Enviro cleared. Plans are at 99%. Pending permits from CVWD and Caltrans to clear ROW.Avenue 50 Bridge over WWR COA PSE PS&E underway. Funding agreement amendment approved by CVAG in September 2020Cathedral Canyon Bridge CC Construction Construction ongoingDate Palm Bridge (Across WWR) CC Construction Completed Dune Palms Bridge over WWR LQ Construction City constructing project by advancing HBP funding. Construction planned in 2022Frank Sinatra Bridge over WWR RM Construction City approved no-build alternative.CVAG terminated the reimbursement agreement with the City of Rancho Mirage.South Palm Canyon Bridge over Tahquitz Creek PS PSE In final design. Plans submitted for reviewEast Palm Canyon Drive Bridge over Palm Canyon Wash PS PSE In final design. Plans submitted for reviewIndian Canyon (fr. Garnet to & Incl. RR Crossing) PS Construction Advanced Construction Funding authorized by CaltransRamon Bridge Widening PS Construction Continuing ROW and utility phaseVista Chino Bridge over WWR PS PE Project is in PE phase. Extensive negotiations with SCE for utility relocation
Interchange Preparation Fund ProjectsPortola @ I-10 PD/COR ROW ROW on hold due to Union Pacific stalemate. 100% PS&E expected by early 2022Golf Center Parkway @ I-10 Indio PSR PSR on holdDa Vall Drive @ I-10 CC PSR PSR-PDS returned to Caltrans for their reviewDillon Road @ I-10, SR86, WWR COA PSR PA&E underway. Jackson @ I-10 Indio PSE Enviro complete. CVAG approved PS&E funding.Monroe @ I-10 Indio ROW Enviro complete. CVAG approved PS&E and ROW funding.
Regional ProjectsCV Sync - Phase 1 CVAG Construction Phase I Construction underway on Hwy 111, Ramon & WashingtonCV Sync - Phase 2 CVAG Construction Phase II design and environmental documents completed in February for 21 corridorsCOR-County of Riverside; RM-Rancho Mirage; IW-Indian Wells; PD-Palm Desert, PS-Palm Springs; CC-Cathedral City; COA-Coachella LQ-La Quinta;PE = Preliminary Engineering; Env=Environmental; PSE=Plans, Specifications and Estimate; ROW=Right of Way; CON=Construction
COACHELLA VALLEY ASSOCIATION OF GOVERNMENTSRegional Arterial Program - Project Status Report
4/21/2022

Lead CVAG Funded Project Description Agency Design CON Through Status
Bike/Pedestrian Safety ProjectsPalm Drive Signals and Lighting DHS Construction Project completed.Palm Canyon Intersection Pedestrian Enhancements PS Construction Construction underway.S. Palm Canyon, E. Palm Canyon Improvements PS Construction Project completed.Indian Canyon Intersection Pedestrian Enhancements PS Construction Project completed.Date Palm Sidewalk Gaps CC Construction Project completed.Calhoun Street Improvements Indio Construction Project completed.Vista Chino Signals PS Construction Project completed.Dinah Shore Mid-Block Crossing CC Construction Project completed.Palm Canyon Crosswalks PS Construction Project completed.Avenue 48 Bicycle Lanes Indio Construction Project completed.
COR-County of Riverside; RM-Rancho Mirage; IW-Indian Wells; PD-Palm Desert, PS-Palm Springs; CC-Cathedral City; COA-Coachella; LQ-La Quinta; DHS-Desert Hot Springs
Lead GrantProject Description Agency Design App CON Status
CV Link CVAG Construction ongoing. Additional groundbreakings forthcoming, including Palm Springs in March.ATP - Arts & Music Line CVAG Under design, with plans to submit for ATP Cycle 6 funding.ATP - DHS CV Link Extension DHS Under design, with plans to submit for ATP Cycle 6 funding.ATP - Cathedral City Downtown Connectors CC Working on final plans and bid documents.
COACHELLA VALLEY ASSOCIATION OF GOVERNMENTSBicycle/Pedestrian Safety Program - Project Status Report
4/21/2022ITEM 8d

ITEM 8e Coachella Valley Association of Governments
Executive Committee April 25, 2022
STAFF REPORT Subject: Update on Middle-Mile Broadband Efforts Contact: Jonathon Hoy, Transportation Director ([email protected]) Recommendation: Information Background: CVAG’s CV Sync project has been identified by the state as one of 18 locations that will be receiving an initial middle-mile broadband investment under Senate Bill 156. This positions the regional signal synchronization project as an opportunity to also create an open-access middle-mile network that provides needed infrastructure to connect unserved and underserved areas in the Coachella Valley and increase competition in areas already being served. Members of the Transportation Committee have requested updates on this promising opportunity. This staff report serves as a recap of the steps taken in recent months. On March 17, 2022, CVAG staff met with the State’s third-party administrator – GoldenStateNet, also known as CENIC – to provide an update on the preliminary engineering costs and design status. Initial estimates show that it will cost $44 million, which includes a 15 percent contingency, to build the middle-mile connection to CV Sync, which is a first of this type of project. It is important to note this preliminary cost estimate includes the Coachella Valley work, as well as a state request to extend infrastructure to the Imperial County line. CVAG will continue to work with the State and the engineering to refine this estimate. As it relates to the design, staff discussed route refinements that would loop from Desert Hot Springs to Palm Springs and goes down Highway 111 to Coachella. At that point, the project routes loops around west along Varner Road and back to the City of Desert Hot Springs. This change differs from initial concepts that would have created a singular route running west to east. The new design will allow for increased reliability and redundancy needed to have a robust middle-mile system in the Coachella Valley. This specific Coachella Valley loop is in line with the project foot-print for CV Sync. It is expected that costs for the trenching and boring will be shared between the State and CVAG, and the State would fully cover costs assocated with the extension from Coachella to the Imperial County border. Staff continues to work with the State to finalize the contract. In addition to paying for the capital costs, staff was also able to negotiate administrative costs for staff time dedicated to the project. It is anticipated that the middle-mile project would be transferred to State ownership once complete. These details will continue to be discussed and be incorporated into the final contract, which will come before CVAG committees for approval.

The Middle-Mile Advisory Committee also met on March 18 to receive an update from the Caltrans, the California Public Utilities Commission and GoldenStateNet on the initial 18 projects. Efforts are focused on preconstruction work, such as environmental clearances, subsurface utility investigations, project design and field reviews. At this meeting, the CPUC released its data and mapping analysis for all 18 projects. The analysis shows underserved areas, areas without affordable rates and areas that lack open-access middile-mile networks. The CPUC also provided an update on technical assistance grants for last-mile connections. These grants are open to local agencies and California’s Tribal Nations, including those without federal recognition, to receive technical assistance to expand broadband to communities lacking sufficient internet. Workshops will take place in April, and more information can be found at https://www.cpuc.ca.gov/industries-and-topics/internet-and-phone/broadband-implementation-for-california/local-agency-technical-assistance. CVAG staff will continue to seek opportunities for funding for last-mile connections that can be facilitated via completion of the middle-mile. This includes the Local Agency Technical Assistance Grant Program (LATA), which has a $50 million allocation to the program. Of these funds, $5 million is set-aside for Tribes. Eligible costs under the program include the development of broadband network deployment projects to benefit unserved Californians, including the costs of joint powers authority formation, environmental studies, network design, and engineering study expenses. Staff will also continue to coordinate with local stakeholders, including cities, school districts and community institutions to identify opportunities to reap the benefits of the investments being made in broadband to benefit the Coachella Valley, particularly unserved and underserved areas. Lastly, CVAG staff will continue to keep its committees apprised of progress on the Coachella Valley’s middle-mile project development and work with the state. Fiscal Analysis: There is no additional cost for this update. Costs related to planning for the broadband effort are included in the CV Sync project, including the contract amendment the CVAG Executive Committee authorized in September 2021 with Advantec Consulting Engineer’s Environmental and Engineering Services Phase II Contract to incorporate design of redundant fiber optic cable.

ITEM 8f Coachella Valley Association of Governments
Executive Committee April 25, 2022
STAFF REPORT Subject: Coordination with the Coachella Valley Energy Commission Contact: Emmanuel Martinez, Senior Programs Manager ([email protected]) Recommendation: Information Background: The Coachella Valley Energy Commission was formed by the Imperial Irrigation District (IID) to address the expiring 1934 Agreement of Compromise between the Coachella Valley Water District and IID. This 99-year agreement, which is set to expire in 2033, is a power lease that allows the IID to service the Coachella Valley as an energy provider. In addition to allowing eastern Coachella Valley ratepayers to be served by a publicly owned utility, CVWD receives five percent of the net proceeds of energy sales. Because said agreement is set to expire soon, the CVEC was formed to address concerns related infrastructure needs in the Coachella Valley, but most importantly, to address representation and governance options for IID’s Coachella Valley ratepayers. As such, one of the main goals of the CVEC is to develop a long-term strategic plan for continued energy service to the Coachella Valley following the 2033 expiration of the 99-year lease between IID and the Coachella Valley Water District. In February 2022, the CVAG Executive Committee authorized a memorandum of understanding that would provide funding to CVAG to have a staff member serve as a coordinator who assists in carrying out and overseeing the actions, activities and affairs of the Commission. The MOU will allow CVAG to provide some staff support to the CVEC and its activities, which would be largely carried out by the Senior Programs Manager serving in a coordinator role. The term of the MOU ends on December 31, 2022, but may be extended by mutual consent of the IID and CVAG. The activities of the coordinator include being a liaison between CVAG and the CVEC; attending monthly CVEC meetings and provide CVAG updates or reports; assisting with CVEC agenda planning and setting; attending IID Board of Directors meetings and relaying updates to CVAG; and providing updates on CVEC related matters to CVAG’s Energy and Environmental Resources and Executive Committees, as needed. To address Coachella Valley service area needs and governance options post-2033, the CVEC and its subcommittees have regular meetings to explore options for governance and infrastructure needs. Moreover, the CVEC has spent considerable amount of time on getting educated and familiar with the legal structure, regulatory and legislative requirements, capital and operational budgets and other requirements of a publicly owned utility. The CVEC’s members will be touring IID infrastructure facilities on April 28, 2022. The purpose of the tour builds on conversations regarding a vertically integrated utility which has balancing authority and generation assets to meet local energy demand. Additionally, discussion regarding reliance on energy markets, such as the California Independent System Operator, to supplement its

generation and meet is energy demand has taken place. Regarding governance options, the CVEC has most recently spent time exploring various publicly owned utility structures but has focused mostly on municipal utility district (MUD) structure. This conversation is still on-going and is being facilitated by a third-party independent facilitator. The goal is to help guide committee members’ understanding of whether a MUD is a viable option, including its challenges and opportunities to meet the future energy needs of the Coachella Valley. Further, to address infrastructure and economic needs and plans, on February 23, the City of Indio presented to the CVEC’s Growth and Economic Development Committee regarding implementing an infrastructure investment fee through a Coachella Valley Financing Authority. The goal of the fee is to help critical energy projects to increase reliability and spur local economic development. The City’s consultant on this matter, Bell Burnell and Associates, also assisted in the presentation and touched on the need to develop an actionable plan to build critical energy infrastructure and develop a long-term strategy. In short, the proposal recommends implementing a surcharge of 0.0013 cents per kilowatt hour which would have a relative impact of 1 percent to rates. In sum, the study suggest that this fee could generate $17 million, $12 million and $9 million for the cities of Indio, La Quinta and Coachella, respectively. Although the infrastructure investment surcharge is subject to further review, such as legal considerations, project eligibility and asset ownership, to name a few, the recommendation was to evaluate further and, if viable, implement before expiration of the lease agreement. Ultimately, however, each city would need to consider its own approach. Fiscal Analysis: There is no cost to this update. The memorandum of understanding with IID helps to cover CVAG staff time associated with coordinating and updating stakeholders regarding this matter.

ITEM 8g Coachella Valley Association of Governments
Executive Committee April 25, 2022
STAFF REPORT
Subject: Inland Regional Energy Network Update Contact: David Freedman, Program Manager ([email protected]) Recommendation: Information
Background: As noted in previous reports to the Energy & Environmental Resources Committee, CVAG has been collaborating with Western Riverside Council of Governments (WRCOG) and San Bernardino Associated Governments (SANBAG) on creating a new joint Regional Energy Network for the Inland Empire, known as Inland Regional Energy Network or I-REN. The California Public Utilities Commission (CPUC) approved the I-REN application and business plan in November 2021.
Staff of the three Councils of Governments are continuing their discussions on the I-REN governance structure outlined in the report for the February 14 Energy & Environmental Resources Committee meeting. The discussions focus on the authority of WRCOG to administer I-REN on a day-to-day basis and the authority of the I-REN Executive Committee to make all executive decisions for I-REN. The staffs are also discussing a Program Agreement with SoCalGas, which the CPUC designated as the fiscal and contracting agent for I-REN.
Following resolution of remaining issues, CVAG staff anticipates bringing the I-REN governance documents to the Energy & Environmental Resources and Executive Committees for further review and approval later this spring. This step will also confirm the approach to CVAG’s representation on I-REN’s Executive Committee, which was discussed at the February 14 meeting of the Energy & Environmental Resources Committee. The consensus approach was to allow the Energy & Environmental Resources Committee to review and provide direction on all items being considered at the I-REN Executive Committee, then delegate voting on such items to the Energy & Environmental Resources Committee Chair, or, in the Chair’s absence, to the CVAG Executive Director and/or the Executive Director’s designee. I-REN’s formal launch will occur once all necessary agreements are signed. However, CVAG staff has already begun work on I-REN programming, as CVAG will serve as the lead agency on developing and implementing programs and policies in I-REN's Codes and Standards sector. The first program will be a training for local permitting and planning staffs as well as solar installers on the requirements for automated rooftop solar permitting, which is further described in Agenda item 6C. Staff is also scheduled to present an introduction to I-REN at the April 18 meeting of the City of Palm Desert’s Resource Preservation & Enhancement Committee. Fiscal Analysis: Staff time dedicated to I-REN is covered through the I-REN budget, which is nearly $65.6 million through period 2022-2027. This funding comes from customers of Investor-Owned Utilities (IOUs) such as SCE and SoCalGas through the on-bill Public Goods Charge levied by the IOUs. The I-REN Executive Committee will, as part of its budget process, determine amounts to be allocated in furtherance of I-RENs programs.

ITEM 8h Coachella Valley Association of Governments
Executive Committee April 25, 2022
Staff Report
Subject: Update on Property Assessed Clean Energy (PACE) program Contact: Elizabeth Barnwell, Management Analyst ([email protected]) Recommendation: Information Background: Property Assessed Clean Energy (PACE) programs provide financing to property owners to implement energy saving, renewable energy, water conservation, and seismic strengthening improvements to their homes and businesses, with little or no money out of pocket. Financing for these improvements is paid back through a lien placed on the property and collected through the annual tax bill. PACE programs continue their activities in the Coachella Valley, but due to the COVID-19 pandemic and as demonstrated in the attached status report, participation dropped. Staff would also note a recent change in the HERO program. In 2020, the HERO Program filed bankruptcy and effective October 16, 2020, Renovate America discontinued accepting new HERO applications and begun winding down the program for residential customers. Existing HERO customers have transitioned to Western Riverside Council of Governments (WRCOG), which is now responsible for providing customer payoffs and inquiries about the residential HERO program. WRCOG will not pursue continued operations of the residential portion of the program but will continue to administer the commercial portion. CVAG will continue to monitor and report on the status of the PACE residential and commercial PACE providers that operate in CVAG’s member jurisdictions. Fiscal Analysis: There is no cost associated with this update. CVAG’s staff time spent on these programs is recovered by a participation fee collected from each provider. Attachment:
1. PACE Report

51890 Other PACE providers have interest rate ranges from 5.99%-10.98%
1321 Updated for March 31, 2022JOBS CREATED:
CARS REMOVED FROM ROAD:
CVAG PACE REPORTBlythe, $2,172,101
Cathedral City, $16,041,274
Coachella, $4,731,292
Desert Hot Springs, $47,468,144
Indian Wells, $3,014,067
Indio, $13,853,169
La Quinta, $8,776,678
Palm Desert, $18,340,859
Palm Springs, $17,837,598
Rancho Mirage, $8,272,664
Riverside County Cities:$4,784,379
PACE Funding by City
2.00%
3.00%
4.00%
5.00%
6.00%
7.00%
8.00%
9.00%
10.00%
JAN FEB MAR APR MAY JUN JUL AUG SEP OCT NOV DEC
PACE Interest Rates
Ygrene 5 YR Ygrene 20 YR.
$- $10,000,000 $20,000,000 $30,000,000 $40,000,000 $50,000,000 $60,000,000 $70,000,000 $80,000,000 $90,000,000
$100,000,000
Completed Projects
Funded Amounts
PACE Provider Comparison

ITEM 8i Coachella Valley Association of Governments
Executive Committee April 25, 2022
STAFF REPORT
Subject: Update on the Revenue Stream Feasibility Study for Affordable Housing and Associated Transportation Needs
Contact: Peter Satin, Regional Planner ([email protected])
Recommendation: Information Background: The State’s Fiscal Year 2019/2020 budget included funding for the Regional Early Action Planning (REAP) program to address the housing crisis from a planning perspective at the regional level. Through REAP, $47 million was allocated to the Southern California Association of Governments (SCAG) to administer on behalf of the region. Of this, $23 million was set aside for noncompetitive subregional partnerships. As a subregional partner, CVAG was eligible to receive approximately $558,000 to be used toward one or more planning efforts that boost housing production and related supportive infrastructure.
In April 2021, the Executive Committee authorized the Executive Director to execute the agreements necessary to move forward with two projects. One of those projects was to conduct a revenue stream feasibility study for housing and associated transportation needs. The study was designed in response to feedback from CVAG’s Transportation, Homelessness, and Executive Committees to identify funding alternatives that could support affordable housing and infrastructure. In December 2021, after a competitive procurement process, the Executive Committee authorized the Executive Director to enter into a contract with Kosmont Companies (Kosmont) to conduct the feasibility study. The study involves an evaluation of existing revenue sources both within the Coachella Valley and in other communities, a quantitative analysis of the most promising funding tools, an assessment of potential policy initiatives needed to implement the tools, and stakeholder engagement. The study will result in a regional strategic plan to streamline the creation of affordable housing and associated transportation needs.
To date, Kosmont has conducted a survey of existing revenue sources within the CVAG region that support the development of affordable housing, and have also identified a number of tools being used in other communities in California. Kosmont representatives presented their initial findings to the Homelessness Committee at the April meeting for feedback and direction. The Committee had a brief discussion that included a question about also looking at ways to address costs of affordable housing development, not just revenue. While this is not part of the REAP-funded scope of work, staff noted there are other efforts – including those led by the County and Lift to Rise – that will provide that additional data. Additionally, Kosmont subcontractor, Arellano Associates, is collaborating with CVAG staff to create a stakeholder database, and detailed an outreach strategy and timeline for conducting community engagement that will involve stakeholder briefings, community meetings, and the creation of project toolkits to assist key stakeholders share information with their communities. This engagement will start this spring, and

include community meetings over the summer. Community engagement and opportunities for feedback will continue for the length of the study, which continues through June 2023.
The second REAP project is the implementation of an Affordable Housing Catalyst Fund by Lift to Rise. An update on the Fund was provided by Lift to Rise to the Homelessness Committee in February 2022, and a progress report for the first quarter of 2022 has since been provided to CVAG staff. As of March 31, 2022, the Fund has invested in seven projects totaling 307 units, and has an additional 5,600 units identified in its pipeline. The Fund manager has further identified $3,500,000 in additional funding that can be used to in conjunction with Fund resources.
Fiscal Analysis: This item has no additional cost to CVAG. At least $558,000 in REAP funds are coming to CVAG, with up to $254,000 of the funding allocated to this revenue stream feasibility study. REAP funding must be expended by June 2023. Attachment: Data Gathering and Existing Conditions Draft Report

DRAFT
1230 Rosecrans Ave., Suite 630Manhattan Beach, CA 90266TEL: 424-297-1070 | URL: www.kosmont.com
COACHELLA VALLEY ASSOCIATION OF GOVERNMENTS (CVAG)
REAP REVENUE STUDY TASK 2 – REVIEW OF EXISTING TOOLS
April 2022

DRAFT
KOSMONT COMPANIES | 2
EXECUTIVE SUMMARY
Kosmont and Arellano Associates (“Consultant Team”) were retained by CVAG in accordance with Regional Early Action Plan (REAP) guidelines for the evaluation of revenue tools for the funding of housing and associated transportation needs in the CVAG region
Evaluation includes a variety of potential one-time and ongoing / sustainable revenue tools, along with potential policy initiatives that would support such funding tools
Scope of Work includes stakeholder engagement and formulation of a roadmap for implementation
This report is intended to summarize Consultant Team Scope of Work Tasks 2.1 and 2.2, focused on identification of existing revenue tools in use within the CVAG region, and existing revenue tools in other communities
Immediate next steps include more detailed, quantitative evaluation of preferred potential revenue tools (subject to stakeholder feedback), in parallel with initial stakeholder engagement activities

DRAFT
KOSMONT COMPANIES | 3
OUTLINE AND SCOPE OF WORK
1. Data Gathering & Existing Conditionsa. Evaluation of Existing Revenue Sources within the CVAG region
b. Evaluation of Revenue Sources in Use in Other Communities
2. Next stepsa. Quantitative Evaluation of Preferred Potential Funding Tools
b. Analysis of Potential Policy Initiatives and Public Support
c. Stakeholder Engagement
d. Regional Strategic Plan

DRAFT
KOSMONT COMPANIES | 4
CVAG – REAP REVENUE STUDY
1.A.EVALUATION OF EXISTING REVENUE SOURCES WITHIN CVAG REGION

DRAFT
KOSMONT COMPANIES | 5
OVERVIEW OF TOOLS IN USE WITHIN CVAG REGION
a. Impact fees for housing-related infrastructure – common among CVAG communities (e.g., TUMF)
b. Inclusionary housing policies – not common among CVAG communities, though under study in several jurisdictions (e.g., Cathedral City, Indio, Palm Springs)
c. Housing and sustainability districts, such as tax increment financing (TIF) / enhanced infrastructure financing districts (EIFD) – none formed, but several under study and discussion in several communities (e.g., Salton Sea, Indian Wells)
d. Housing-related Grants – Limited awards so far (e.g., Coachella Infill Infrastructure Grant), but competitive positioning in several jurisdictions with Disadvantaged Community (DAC) census tracts (e.g., Blythe, Coachella, Indio)

DRAFT
KOSMONT COMPANIES | 6
OVERVIEW OF TOOLS IN USE WITHIN CVAG REGION
e. Zoning Incentives – beyond state density bonus law, several communities have local density bonus provisions and other incentives for developments that include affordability restrictions (e.g., Cathedral City, Coachella, Desert Hot Springs, Indian Wells, Indio, La Quinta, Palm Desert, Palm Springs, Rancho Mirage)
f. Other Relevant Programs:
Self-help development and funding assistance (e.g., Blythe, Cathedral City, Palm Desert)
Lift-to-Rise Catalyst Fund / pre-development loans (e.g., Desert Hot Springs, La Quinta)
Habitat for Humanity funding assistance (e.g., Palm Desert)
Community Benefit Program (e.g., Thermal Beach Club)

DRAFT
KOSMONT COMPANIES | 7
SUMMARY MATRIX: HOUSING TOOLS WITHIN CVAG
Programs in Place or under Study Fee Programs Inclusionary
Housing Req. Special Districts State Housing Grants Zoning Incentives Other Assistance
Blythe X X
Cathedral City X X X X
Coachella X X X X
Desert Hot Springs X X X
Indian Wells X X X X
Indio X X X X
La Quinta X X X
Palm Desert X X X
Palm Springs X X X X
Rancho Mirage X X X
Uninc. Communities X X X X
Agua Caliente Tribe X
Cabazon Tribe
Torres Martinez Tribe
29 Palms Tribe

DRAFT
KOSMONT COMPANIES | 8
A. IMPACT FEES / RELATED PROGRAMS
Blythe Cathedral City Coachella Desert Hot
Springs Indian Wells Indio La Quinta Palm Desert Palm Springs Rancho Mirage
• Designated fees include $500 per dwelling unit for residential and $500 for first 5,000 SF of commercial space with $0.10 PSF thereafter
• No housing linkage fees
• City Council sets specific amount for development impact fee(established on all permits for development)
• Cathedral City's impact fees are considerably less compared to surrounding jurisdictions
• Estimated development impact fee per Housing Element is $1,850 for a single or multi-family residential building.
• Development impact fees represent 90% of development fees
• 22% increase from 2007-2017
• City imposes development impact fees on a variety of projects. $297 per dwelling unit, per room, or PSF for residential, hotel, and office, respectively; $371 per 1,000 SF for commercial
• Per Housing Element, total impact fees for a single family unit is $17,400 and $8,500 for a multifamily unit
• Development impact fees are 80% of total developer fees
• 33% increase in fees from 2007-2017
• City imposes development impact fees on residential developments
• Single-family detached dwellings ($9,100 per unit); single-family attached dwellings ($10,000 per unit); multi-family units ($10,000 per unit)
• Development impact fees are 80% of total developer fees
• 19% increase from 2007-2017
• City charges impact fees to finance new or expanded infrastructure and public facilities required to serve residents
• City charges fees to offset impacts to public streets, drainage facilities, water quality, and parks
• Development impact fees are 85% of developer fees
• 19% fee increase from 2007-2017
• Development impact fees are imposed on the issuance of development approvals for projects within the City to finance the cost of public facilities and improvements related to the project
• Development impact fees are 85% of developer fees
• 30% fee increase from 2007-2017
• Development impact fees are imposed
• Costs per unit are $6,113 for multifamily and $9,380 for single-family development projects
• Development impact fees are 90% of developer fees
• 36% fee increase from 2007-2017
• Development impact fees are applied to new residential projects
• Typical impact fees for a 32-unit subdivision and multifamily complex are $11,900 and $7,600, respectively
• Development impact fees are 85% of developer fees
• 57% fee increase from 2007-2017
• City does charge development impact fees on residential developments. Fees are typically on a per unit basis
• Some fees are eligible for reduction if affordable housing is built
• Development impact fees are 85% of developer fees
• 14% fee increase from 2007-2017
• City issues development impact fees for residential and non-residential development
• For a typical single-family residential building, the total development impact fee is $8,800 per unit.
• For a multi-family residential building it is $6,300 per unit
• Development impact fees make up 90% of developer fees
• 25% fee increase from 2007-2017

DRAFT
KOSMONT COMPANIES | 9
B. INCLUSIONARY HOUSING POLICIES
Blythe Cathedral City Coachella Desert Hot
Springs Indian Wells Indio La Quinta Palm Desert Palm Springs Rancho Mirage
• While there do not seem to be any housing in-lieu fees, there are parking in-lieu fees in cases where parking requirements of a new development may not be satisfied
• Neither General Plan nor Zoning Ordinance exclusively reserve land for multifamily and none for affordable housing
• No min. figure in terms of density
• No inclusionary housing has been required on any project to date within the 5th cycle RHNA
• City Council has directed staff to prepare an inclusionary housing ordinance for the City
• City has an Accessory Dwelling Unit (“ADU”) ordinance
• There have been 10 ADUs permitted, 3 constructed from 2018-2020
• The City's Zoning Ordinance does not have an inclusionary housing policy or ordinance
• City has ADU language in Municipal Code
• 0 ADUs permitted and constructed between 2018-2020
• City currently has no local ordinances that directly impact cost and supply of residential development, including inclusionary ordinances, short-term rental units, or moratoriums on development types
• City has adopted an ADU ordinance in 2020
• 0 ADUs permitted or constructed between 2018-2020
• City does not have any requirements that obligate developers to provide or fund housing at specific affordability levels
• City has ADU language in Municipal Code
• 1 ADU constructed between 2018-2020
• Currently, there are no inclusionary housing policies
• City is evaluating the feasibility of a local inclusionary housing ordinance
• City adopted an ADU ordinance in 2017
• 0 ADUs permitted or constructed between 2018-2020
• Currently, there are no inclusionary housing policies in the City
• City is exploring other avenues to include affordable housing in new developments besides reducing development fees and offering density bonuses
• City adopted an ADU ordinance in 2019
• 2 ADUs permitted between 2018-2020
• Currently, the City does not have inclusionary housing policies
• City has ADU language in Municipal Code
• 0 ADUs permitted or constructed between 2018-2020
• City currently does not have inclusionary housing, but is exploring the feasibility and effectiveness of an inclusionary housing ordinance (IHO) on production of affordable housing
• City adopted an ADU ordinance in 2019
• 23 ADUs constructed and 39 permitted between 2018-2020
• The City does not appear to have inclusionary housing policies
• City adopted an ADU ordinance in 2019
• 3 ADU permitted from 2018-2020

DRAFT
KOSMONT COMPANIES | 10
C. SPECIAL DISTRICTS & D. PRIORITY FOR GRANTS
Blythe Cathedral City Coachella Desert Hot
Springs Indian Wells Indio La Quinta Palm Desert Palm Springs Rancho Mirage
• Two Federal Opportunity Zone census tracts are located within Blythe;
• One of the two OZ tracts is also considered a SB 535 Disadvantaged Community census tract
• Cathedral city contains three Federal Opportunity Zones;
• City also contains several New Market Tax Credit Qualified census tracts;
• City does not contain any SB 535 Disadvantaged Community census tracts
• City has considered EIFD at a high-level;
• City contains 4 federal OZ census tracts;
• City contains 3 SB 535 Disadvantaged Community census tracts;
• Coachella was awarded $2.9M in Infill Infrastructure Grants in 2019-2020
• City has considered EIFD at a high-level;
• City contains 3 federal OZ census tracts
• City has initiated an EIFD study
• City contains 2 federal OZ census tracts and 4 SB 535 Disadvantaged Community tracts
• City contains a small portion of a federal OZ census tract in the southern portion of the City
• None identified • Small portion of a federal OZ census tract located on the southeast corner of Palm Springs Int'l Airport
• None identified

DRAFT
KOSMONT COMPANIES | 11
E. ZONING INCENTIVES
Blythe Cathedral City Coachella Desert Hot
Springs Indian Wells Indio La Quinta Palm Desert Palm Springs
Rancho Mirage
Uninc. Communities
• No zoning incentive programs listed
• Per Housing Element, City plans to develop incentives for subdividing large lots (>10 acres) to make the development of affordable housing more feasible
• Affordable housing projects will be allowed by-right and City will consider fee waivers, flexible development standards, and expedited processing in its incentive program
• Density bonuses are available depending on # of units allocated for lower income groups
• Maximum density bonus is 35%
• Two incentives can be available for projects that include at least 20% low-income units;
• Other available concessions include reduction in site devtstandards, approval of mixed use with housing, priority processing, and other regulatory incentives
• City has a density bonus ordinance that allows a 15% increase in the maximum permitted density, with further increases of up to 15% based on additional criteria
• Developer shall guarantee rental units be continually used and available to low and moderate income HH for 55 years and initial occupants for for-sale housing are very low, low, and moderate income
• 1996 - City updated Zoning Code to establish an Affordable Housing Overlay Zone and Senior Housing Overlay Zone that allow for density bonuses for both types of projects in accordance with State Density Bonus Law.
• Sect. 21.12.040 of zoning code also allows for development incentives such as fast track processing, land acquisition and subsidization, and waiver of city fees
• City has a Density Bonus Program Ordinance that allows for a density increase of at least 25% over the maximum allowable residential density for low income or senior housing devts
• City to include provision of a bonus for 100% affordable and student affordable projects
• City has an Affordable Housing Overlay in its zoning code that offers increased opportunities for affordable housing devt by allowing higher densities within commercial zones and residential site
• Sect. 9.60.260 of City Code allows for up to 35% density bonus.
• In March 2020, City adopted Housing Overlay District that applies to properties owned by the City, Housing Authority, and those identified in Housing Element.
• Overlay zone provides incentives to developers building affordable housing, such as devt fee waivers, devt standard reductions, parking reductions, and density bonuses (in accordance with State Code)
• City offers Density Bonus Ordinance that offers concessions for construction of affordable housing
• City offers a Density Bonus Ordinance (per State Code)
• Thermal Community Benefit Program example: In Oct. 2020, Riverside County Board of Supervisors approved Thermal Beach Club, a privately funded development for a resort plus 326 dwelling units. The developer agreed to be conditioned a fee of up to $2,300 per unit to provide money to a community benefit fund. Ultimately, ~$750,000 was paid by the developer and can be used for community needs (e.g., clean water, park development, affordable housing, etc.)

DRAFT
KOSMONT COMPANIES | 12
F. OTHER MECHANISMS
Blythe Cathedral City Coachella Desert Hot
Springs Indian Wells Indio La Quinta Palm Desert Palm Springs
Rancho Mirage
Uninc. Communities
• 2004 Housing Element: Riverside County Home Improvement Program offers policies such as single-family self-help home development and funding assistance for low/very low-income families to encourage affordable housing
• Local / Regional policies include:Self-Help Housing (Coachella Valley Housing Coalition and partners provide down payment assistance earned by homeowner helping in construction of home);
• City allows rent-control for mobile homes and allows mobile homes in parks, subdivisions, and res. lots)
• City Devt Services Dept to remove barriers to production of a variety of housing types to minimize housing devt costs
• Amend zoning code to eliminate req for minimum dwelling size by unit type
• Amend zoning to increase max density bonus to up to 50% (per State law)
• City to continue to participate in CVAG housing discussions
• City to consider additional land use policies and standards to allow for a range of residential densities and products for housing of all types
• City to continue encouraging the utilization of federal, state, and county subsidies to meet needs of lower income HH
• City is a CDBG/HOME cooperating city
• City Council approved Lift to Rise Pledge in March 2021
• City's Housing Authority will commit up to $4M in assistance through its Low Moderate Income Housing Asset Fund to ensure Indian Wells Villas units are preserved for affordable housing
• City to continue to provide incentives and flexibility in devtstandards to encourage affordable housing
• City contracts with Inland Fair Housing and Mediation Board to provide fair housing services for its residents
• City plans to continue to work with Riverside County Housing Authority to monitor affordable housing units as being at risk of conversion to market rate housing
• City coordinates regularly with affordable housing partners such as Lift to Rise and assists affordable housing developers in securing third party financing
• City has also worked with Coachella Valley Housing Coalition in development of sweat equity homes (self-help housing)
• City continues to implement the Self-Help Housing Program
• City works with agencies such as Habitat for Humanity and Coachella Valley Housing Coalition to identify and fund housing for low income HH
• City's Housing Authority owns and operates over 1,100 affordable housing units in 15 buildings
• City has an Affordable and Multifamily Housing Incentive Program to reduce, defer, and/or waive application and impact fees for affordable and multifamily housing
• City continues to allocate CDBG and other funds to support housing and community development
• City to consider and implement fee reductions or subsidies whenever deemed feasible and necessary
• City Housing Authority previously had a Home Improvement Program that provided financial assistance to lower income households
• Other Countywide programs include:Section 8 Assistance; Permanent Local Housing Allocation (PLHA) – provides grant funds for down payment assistance programs and gap financing for new construction of affordable units; Housing Authority of County of Riverside offers down payment and closing cost assistance for qualified first timehome buyers through First Time Home Buyer Down Payment Assistance Program (FTHB)

DRAFT
KOSMONT COMPANIES | 13
RHNA ALLOCATIONS & GENERAL PLAN STATUS
Blythe Cathedral City Coachella Desert Hot
Springs Indian Wells Indio La Quinta Palm Desert Palm Springs
Rancho Mirage
Uninc. Communities
• Per RHNA 2021-2029: 494 units -82 very low, 71 low, 96 moderate, and 245 above moderate;
• Last Housing Element was revised and adopted in 2014
• Proposals to prepare the next Housing Element were due Jan. 20, 2022
• General Plan was last updated in 2007 (for 2025)
• Per RHNA 2021-2029: 2,549 units -270 extremely low, 270 very low, 353 low, 457 moderate, and 1,199 above moderate
• General Plan last amended in Nov. 2009
• Housing Element last updated Oct. 2021
• Planned Unit Development ordinance allows flexibility in devtstandards to encourage housing construction
• Per RHNA 2021-2029: 7,886 units - 516 extremely low, 517 very low, 999 low, 1,367 moderate, 4,487 above moderate
• Housing Element draft updated Sept. 2021
• 2035 General Plan approved in Apr. 2015
• Per RHNA 2021-2029: 3,873 units -284 extremely low, 285 very low, 535 low, 688 moderate, 2,081 above moderate
• GP adopted May 2020
• Housing Element adopted Nov. 2021
• Per RHNA 2021-2029: 382 units -117 extremely / very low, 81 low, 91 moderate, 83 above moderate
• General Plan is currently being updated - Existing Conditions and Infrastructure Background Reports have been produced (Oct. 2020 and Jan. 2021, respectively)
• Public draft of Housing Element produced in Nov. 2021
• Per RHNA 2021-2029: 7,812 units - 1,793 extremely / very low, 1,170 low, 1,315 moderate, 3,534 above moderate
• 2040 General Plan adopted in Sept. 2019
• Draft Housing Element produced Aug. 2021
• Per RHNA 2021-2029: 1,530 units -210 extremely low, 210 very low, 269 low, 297 moderate, 544 above moderate
• 2035 GP Update last amended Nov. 2013
• 2021-2029 Housing Element Draft completed in Oct. 2021
• Per RHNA 2021-2029: 2,790 units -675 extremely / very low, 460 low, 461 moderate, 1,194 above moderate
• General Plan adopted in Nov. 2016
• 2021-2029 Housing Element Draft submitted in Nov. 2021
• Per RHNA 2021-2029: 2,557 units -272 extremely low, 273 very low, 408 low, 461 moderate, 1,143 above moderate
• Currently undergoing 2040 General Plan update
• 2021-2029 Housing Element draft submitted Nov. 2021
• Per RHNA 2021-2029: 1,746 units -215 extremely low, 215 very low, 318 low, 328 moderate, 670 above moderate
• General Plan update adopted Nov. 2017
• 2021-2029 Housing Element update completed in Jan. 2022
• Per RHNA 2021-2029: 40,647 units –10,371 very low, 6,627 low, 7,347 moderate, 16,302 above moderate units

DRAFT
KOSMONT COMPANIES | 14
NATIVE AMERICAN TRIBES IN CVAG REGION
Impact Fees / Related Programs Inclusionary Housing Policies Special Districts /
Priorities for Grants Zoning Incentives
Agua Caliente Band of Cahuilla Indians
• Development fees shall be applicable to allotted trust lands and may be imposed and collected by each local govt within its city limits
• Tribe does not have inclusionary housing policies in their Tribal Code
• None identified • Section 14 and Section 24 Specific Plans allow higher density residential and mixed-use
• No density bonus measures are stated in their Tribal Code
Cabazon Band of Mission Indians
(Note: Complete text Code not available online)
• None identified • None identified • Some pieces of tribal land fall within a Disadvantaged Community census tract located in Indio and Coachella
• Another section of tribal land falls within both a Disadvantaged Community and Opportunity Zone census tract (located outside of the CVAG cities
• High density residential is allowed per their Zoning Code, however, density level is uncertain
Torres Martinez Desert Cahuilla Indians
(Note: Complete text Code not available online)
• None identified • None identified • Much of their tribal land is located outside of the CVAG cities and fall within either both Disadvantaged Community and Opportunity Zone census tracts or solely Opportunity Zone tracts
• None identified
Twentynine Palms Band of Mission Indians
(Note: Complete text Code not available online)
• None identified • None identified • Tribal land is located within a Disadvantaged Community census tract located in Coachella
• None identified

DRAFT
KOSMONT COMPANIES | 15
CVAG – REAP REVENUE STUDY
1.B.EVALUATION OF EXISTING REVENUE SOURCES IN OTHER COMMUNITIES

DRAFT
KOSMONT COMPANIES | 16
OVERVIEW OF TOOLS IN USE IN OTHER COMMUNITIES
a. Housing linkage fees and in-lieu fees – common as an alternative for on-site inclusionary requirements (e.g., City of Los Angeles Housing Linkage Fee, City of Pasadena Housing In-lieu Fee)
b. Inclusionary housing policies – increasingly common, typically ranging from 10% to 20% (e.g., former Redevelopment Agency requirement of 15% inclusionary – in addition to 20% set-aside requirement)
c. Housing and sustainability districts, such as tax increment financing (TIF) / enhanced infrastructure financing districts (EIFD) – 15 formed statewide, closest in Unincorporated Riverside County Wine Country, some with inclusionary and set-aside requirements (e.g., County of Los Angeles Participation Policy), ongoing and sustainable funding vs. one-time funding
d. Housing-related Grants – Competitive but extremely well-funded programs for housing, housing-supportive infrastructure, and transit-supportive infrastructure (e.g., Infill Infrastructure Grant, Affordable Housing and Sustainable Communities program, Multifamily Housing Program)

DRAFT
KOSMONT COMPANIES | 17
OVERVIEW OF TOOLS IN USE IN OTHER COMMUNITIES
e. Zoning Incentives – community benefit and similar programs for value-capture, that incentivize and reward developers that perform and contribute to community benefits and amenities identified through stakeholder outreach (e.g., City of Buellton Development Opportunity Reserve [D.O.R.®])
f. Community Land Trusts (CLT) – Nonprofit land-ownership model to subsidize housing costs for low-income households (e.g., Northern California Land Trust in Bay Area)
g. Public Finance / Liquidity Strategies – Leveraging low interest rates to reduce debt costs and generate liquidity for economic development (e.g., Placentia Pension Obligation Bonds)
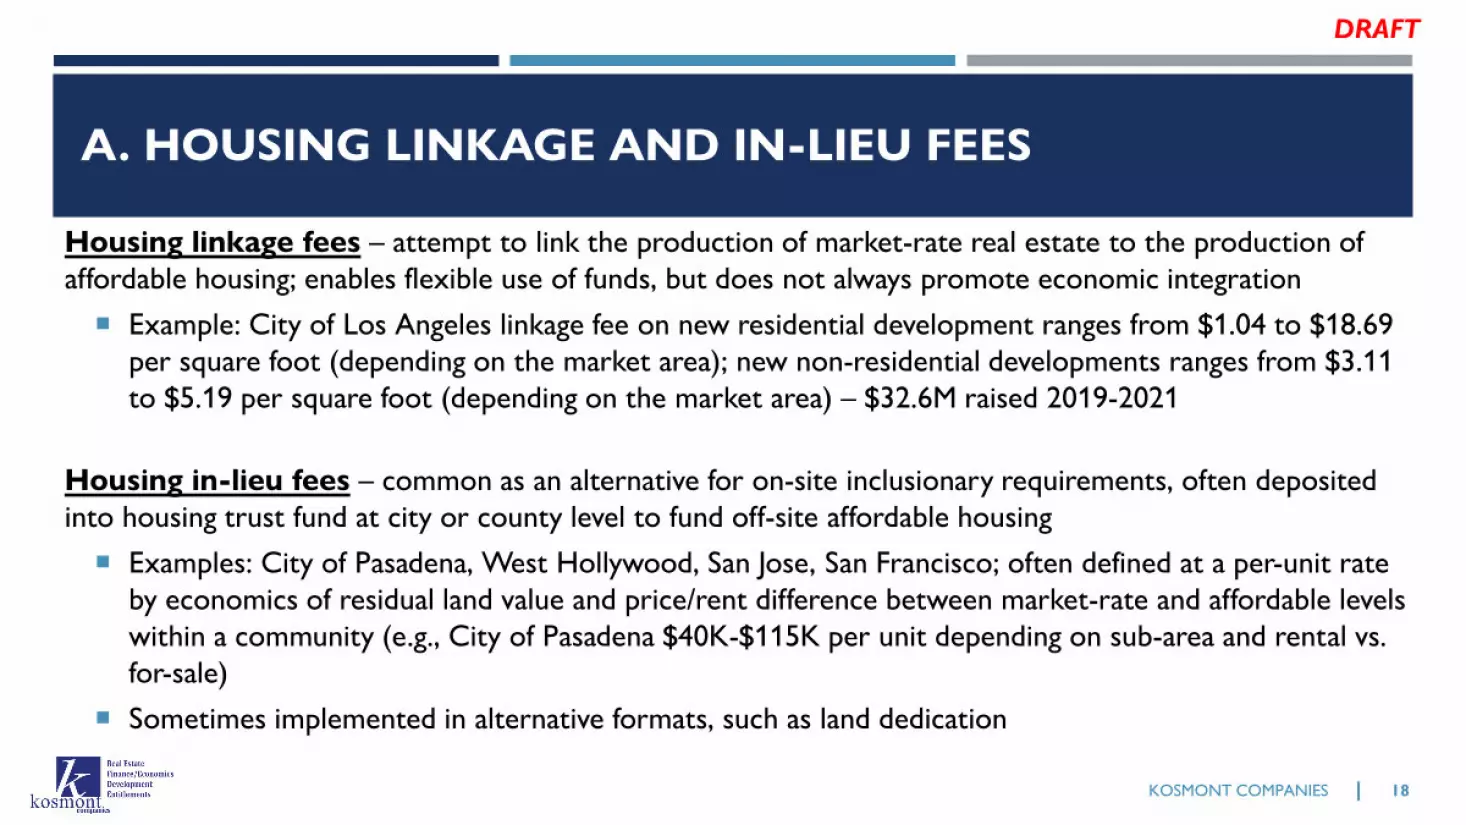
DRAFT
KOSMONT COMPANIES | 18
A. HOUSING LINKAGE AND IN-LIEU FEES
Housing linkage fees – attempt to link the production of market-rate real estate to the production of affordable housing; enables flexible use of funds, but does not always promote economic integration
Example: City of Los Angeles linkage fee on new residential development ranges from $1.04 to $18.69 per square foot (depending on the market area); new non-residential developments ranges from $3.11 to $5.19 per square foot (depending on the market area) – $32.6M raised 2019-2021
Housing in-lieu fees – common as an alternative for on-site inclusionary requirements, often deposited into housing trust fund at city or county level to fund off-site affordable housing
Examples: City of Pasadena, West Hollywood, San Jose, San Francisco; often defined at a per-unit rate by economics of residual land value and price/rent difference between market-rate and affordable levels within a community (e.g., City of Pasadena $40K-$115K per unit depending on sub-area and rental vs. for-sale)
Sometimes implemented in alternative formats, such as land dedication

DRAFT
KOSMONT COMPANIES | 19
C. HOUSING AND SUSTAINABILITY DISTRICTS
Tax increment financing (TIF) districts include enhanced infrastructure financing districts (EIFD), community revitalization and investment authorities (CRIA), and others
Communities can use these districts to motivate private investment, fund housing and infrastructure, and attract grant funds.
$0M
$100M
$200M
$300M
$400M
$500M
$600M
$700M
0 5 10 15 20 25 30 35 40 45Years from District Formation
Incremental A/V from New Development
Baseline A/V
Incremental Growth of Existing A/V
Increment Available
to TIF District
Assessed Value (A/V) within TIF
District Boundaries
Period of New Development

DRAFT
KOSMONT COMPANIES | 20
EXAMPLE TIF DISTRICT FOR HOUSING INFRASTRUCTURE: PLACENTIA / ORANGE COUNTY TOD EIFD PARTNERSHIP
Tax Increment Financing DistrictsLeverage assessed value growth to fund infrastructure improvements
• No new taxes• No public vote required• Attract EDA, SCAG & other
funds for startup
Placentia / Orange County EIFD Partnership• Upgraded zoning, aligned with OZs and TOD• Will fund streets, sewer, parking, transit connectivity• >$460M expected in new AV from residential, retail,
restaurant development• Net Fiscal Benefit: $22M to City, $15M to County

DRAFT
KOSMONT COMPANIES | 21
TIF DISTRICTS IN PROGRESS STATEWIDE (PARTIAL LIST)
Fully Formed In Formation Process Under Evaluation
Jurisdiction PurposeAzusa Housing and transit-supportive infrastructureBrentwood Housing and transit-supportive infrastructureBuena Park Mall reimagination, housing-supportive infrastructureCarson + L.A. County Remediation, housing infrastructure, recreationCoachella Valley Association of Govts (CVAG) Cities Housing and transit-supportive infrastructureCovina Housing and transit-supportive infrastructureEl Cajon Housing and transit-supportive infrastructureEl Segundo + L.A. County Various infrastructure, regional connectivityFairfield Housing and transit-supportive infrastructureFresno Housing and transit-supportive infrastructureFresno County Industrial and commercial supportive infrastructureHumboldt County Coastal mixed-use & energy supportive infrastructureIndian Wells Housing and tourism-supportive infrastructureImperial County Housing and greenfield infrastructureLa Verne + L.A. County Housing and transit-supportive infrastructureLong Beach (Multiple Districts) Housing and transit-supportive infrastructureLos Angeles (Downtown, San Pedro) Housing and transit-supportive infrastructureLos Angeles County Uninc. West Carson Housing / bio-science / tech infrastructureMadera County (Two Districts) Greenfield infrastructure (water / sewer)Modesto + Stanislaus County Housing, transit, recreation-supportive infrastructureMount Shasta + Siskoyou County Rural Brownfield site mixed-use infrastructureNapa Housing and transit-supportive infrastructureOntario Housing and transit-supportive infrastructurePalmdale + L.A. County Housing and transit-supportive infrastructurePittsburg Housing and transit-supportive infrastructurePlacentia + Orange County Housing and transit-supportive infrastructureRancho Cucamonga Housing and transit-supportive infrastructureRedondo Beach + L.A. County Parks / open space, recreation infrastructureRiverside Housing and transit-supportive infrastructureSacramento County (Unincorporated) Industrial / commercial supportive infrastructureSan Bernardino County (Unincorporated) Transit-supportive infrastructureSan Jose Housing and transit-supportive infrastructureSanger Housing and commercial supportive infrastructureSanta Ana Housing and transit-supportive infrastructureSouth Gate Housing and transit-supportive infrastructureWest Santa Ana Branch Transit Corridor Cities Housing and transit-supportive infrastructureYucaipa Housing and transit-supportive infrastructure

DRAFT
KOSMONT COMPANIES | 22
D. GRANTS
Example Federal Programs Example State Programs
American Rescue Plan Act (ARPA)
Congressional Infrastructure Bills (INVEST Act, IIJ Act, etc)
Affordable Housing and Sustainability Communities Program (AHSC)
Infill Infrastructure Grants (IIG)
Multifamily Housing Program (MHP)
ARPA direct relief to cities is not just for COVID relief:
Funds for water, sewer, and broadband, upgrading facilities and distribution systems, climate change upgrades, lead pipe replacement and more
In process, likely to include:
Funds for roads, bridges, railroads, broadband, water, cyber security, climate resiliency, transit, brownfield cleanup, electric vehicles, affordable housing
CA Program:
$1 - $30 million awards for affordable housing, housing infrastructure, transportation, related amenities, program costs
CA Program:
$1 - $7.5 million grants for infill projects / areas, gap funding for infrastructure for residential / mixed-use with some affordability requirements
CA Program:
Funding for rental housing; includes land lease payments, construction / rehab, offsite infrastructure improvements

DRAFT
KOSMONT COMPANIES | 23
• Zoning and Entitlements create value for potential use as currency to drive housing and community benefits
• Zoning changes that are needed for new development can provide significant economic benefits to property owners, who may likely be non-developers.
• Prematurely up-zoning can also increase land values, which can limit the possibility of development & affordability.
• Specific plans often “give away” density with entitlements without tying density to projects that deliver community benefits and public amenities.
• By reserving new housing density in a “reserve” bucket, cities can comply with RHNA while also retaining some control over new development.
• Reserve lets a community dole out new density for specific projects that comply with a benefit agreement and in compliance with RHNA –ensuring projects come with amenities and other community benefits.
E. ZONING AND ENTITLEMENTS AS CURRENCY

DRAFT
KOSMONT COMPANIES | 24
D.O.R.® CASE STUDY ILLUSTRATIONS
• Goal: Induce housing development in downtown area
• Benefits & Amenities: public restrooms, off-site improvements, public parking, parking district, public art, parks, green buildings, other
• Incentives: Increase density up to 40 units / acre, increase heights, reduce on-site parking , reduced setbacks, reduced traffic and application fees
City of Buellton: Avenue of Flags City of El Monte: Downtown Main St.• Goal: Increase downtown density along with community benefits
and public improvements
• Benefits & Amenities: streets, bicycle facilities, parking, open space, beautification, transit, arts / cultural spaces, lot consolidation; developer can either install improvements or make payment into public improvement fund; value based on a portion of residual land value (~75%)
• Incentives: Increase density, heights, FAR, dwelling units per acre
Implementation Steps1. Conduct market housing / economic
study to match RHNA needs2. Discuss new density and public amenities
with community3. Create DOR mechanism as new Zoning /
Specific Plan provision 4. Implement on project basis via
Development Agreement

DRAFT
KOSMONT COMPANIES | 25
F. COMMUNITY LAND TRUSTS (CLT)
Community Land Trusts (CLTs) are typically non-profits who receive money from cities and counties in theform of grants to acquire and provide affordable housingunits for low-income households
Examples of CLTs in California San Francisco CLT (SFCLT)
Founded in 2003 Focuses on acquiring and
rehabilitating buildings that are in danger with losing their affordability
Recently acquired 285 Turk St. (40-unit building) for $9.4M using two private lenders
Northern California Land Trust (founded 1973, 15 projects, 78 housing units and one community center), operates in San Francisco, Berkeley, Oakland, and Palo Alto
Irvine CLT (founded 2006, 6 projects, 475 housing units)
Oakland CLT (founded 2009, 6 projects, 35 housing units, along with commercial space and community centers)
How do they work? CLTs buy real estate and secure mortgages on the open
market then sell the properties to low-income households while retaining ownership of the land (CLT owns land, buyer owns house)
CLTs then lease the land to a low-income homebuyer for a low monthly rate over a long period of time (99-year lease)
If homebuyer sells house, they agree to sell to individuals who need CLT assistance. In doing so, the homebuyer will receive 25% profit, while CLT retains equity in the land
Thus, CLTs create an affordable housing option that can last in perpetuity, while helping the homebuyer amass enough wealth upon a sale to enter the housing market

DRAFT
KOSMONT COMPANIES | 26
G. PUBLIC FINANCE / LIQUIDITY STRATEGIES
Current low interest rate environment is an opportunity to generate savings and create general fund resources for community reinvestment, such as with housing- and transit-supportive infrastructure
Revenue Bonds to fund vital projects
Lease – Leaseback (P3) Structures can cut costs and deliver public projects (no vote needed)
Pension Obligation Bonds and other refinancing structures can generate savings (no vote needed)
Reducing debt payments can create capacity to pursue housing and infrastructure programs to reset the local economy.

DRAFT
KOSMONT COMPANIES | 27
NEXT STEPS
1. Address questions, incorporate feedback from Committee on evaluation of existing tools
2. Quantitative evaluation of preferred potential funding tools:
a) Housing and sustainability districts (TIF / EIFD / CRIA)
b) Relevant grant programs
c) Community Land Trust
d) Committee preferred tools?
3. Analysis of Potential Policy Initiatives and Public Support
4. Stakeholder Engagement

DRAFT
KOSMONT COMPANIES | 28
COACHELLA VALLEY ASSOCIATION OF GOVERNMENTS (CVAG)
REAP REVENUE STUDY
1230 Rosecrans Ave., Suite 630Manhattan Beach, CA 90266TEL: 424-297-1070 | URL: www.kosmont.com

ITEM 8j Coachella Valley Association of Governments
Executive Committee April 25, 2022
STAFF REPORT
Subject: CV Housing First: First Quarter Report for 2022 Contact: Anyse Smith, Management Analyst ([email protected]) Recommendation: Information Background: CVAG is now in its second year of operating the CV Housing First program with staff. The program is focused on the CV200, a by-name list of chronically homeless individuals residing in desert cities that have frequent contacts with law enforcement and who are likely to be shelter resistant or who have already fallen out of housing. The list was developed in partnership with CVAG’s member jurisdictions and local law enforcement. CVAG staff has committed to adjusting CV Housing First programming based on the data, and provides quarterly updates to its members about the program. The CV Housing First team uses two primary methods to get clients to housing solutions: rapid resolution and crisis stabilization units:
• Rapid resolution is an urgent, cost-saving solution that the Housing First staff use to help overcome the barriers that keep people from getting housing. This could include options such as helping them secure their identifying paperwork, which then can help them qualify for benefits. It also includes sorting out the process for housing, medical, mental health, substance abuse, employment, and mainstream benefits.
• The crisis stabilization units allow CVAG to connect CV200 individuals to housing. These are apartments and hotel rooms where clients stay, generally up to 90 days, that keep them off the streets. Through case management and frequent interactions with the team, CVAG is helping them achieve the goal of permanent housing, programs, and family reunifications
On a weekly basis, staff also conducts valley-wide coordinated outreach, and participates in regular planning meetings with law enforcement, healthcare providers, county behavioral health teams, and other service providers. In the first year, 75 CV200 clients were in permanent housing solutions and another 32 non-CV200 clients were housed. CVAG staff will continue to provide quarterly reports as it provides services in 2022. In the first quarter of 2022, 15 CV200 clients were in permanent housing solutions and another seven non-CV200 clients were housed. This represents a small uptick in statistics as compared to the latter half of 2021.

CV Housing First Clients – By the Numbers through March 31, 2022
CV200 as of 3/31/2022 Q1 Q2 Q3 Q4 TOTAL
Clients housed in Crisis Stabilization Units (CSH) 33 33
Clients being helped through Rapid Resolution (RR) 0 0
Clients returned to the street (failures) 5 5
Clients moved into permanent housing from CSH (successes) 15 15
Clients moved into permanent housing through RR (successes) 0 0
TOTAL HOUSED FROM LIST OF 200 15 15
NON CV200 as of 3/31/2022 Q1 Q2 Q3 Q4 TOTAL
Households Housed in CSH Units 1 1
Households being helped through RR 6 6
Households returned to the street (failures) 0 0
Households moved into permanent housing from CSH (successes) 1 1
Households moved into permanent housing from RR (successes) 6 6
TOTAL HOUSEHOLDS HOUSED 7 7
TOTAL INDIVIDUALS HOUSED 7 7

CVAG staff continues to track program metrics, such as the length of stay in the units. For the first quarter, the CV200 clients who successfully exited the program into permanent housing stayed in a crisis stabilization unit for 69 days. Those CV200 clients who exited the program unsuccessfully stayed 115 days. This is longer than CVAG staff aims to keep clients in the units. However, this quarter’s figures – based on five people – were skewed by a couple of individuals who could not secure housing based on their low voucher level and no credit history. CVAG staff had hoped to not disrupt their progress by finding a solution, but had to exit them to emergency shelters when it became apparent no permanent solution would be found. Throughout the year, CVAG staff also added additional program metrics to track the permanent housing resolutions. Knowing the type of housing where clients resolve will help with identifying future opportunities and options for housing, while also highlighting where we face challenges in finding placement for clients. Of the 15 permanent housing resolutions in the first quarter, the breakdown of clients’ Exit Destination is as follows:
• Family/Friends – 0 • Permanent Supportive Housing (PSH) – 2 • Rental With Ongoing Subsidy (Low Income Senior Housing) – 1 • Rental With Ongoing Subsidy (VASH Voucher) – 0 • Rental With Ongoing Subsidy (Housing Choice Voucher) – 6 • Rental with No Ongoing Subsidy - 5 • Rapid Rehousing - 1 • Shared Housing - 0
CVAG staff will continue to track the housing status of permanently resolved clients at the six- and 12- month period after they were initially housed to determine which clients still remain in housing and which have returned to homelessness. For the clients who are still in housing or who have been recently housed, CVHF staff remains ready and available to assist with providing supportive services and linkages to services to prevent a return to homelessness. Fiscal Analysis: The CV Housing First program, including the staffing and CV200 program, is incorporated into the CV Housing First budget, which has been funded by contributions from cities, Riverside County, the Desert Healthcare District/Foundation, and grants.

ITEM 8k Coachella Valley Association of Governments
Executive Committee April 25, 2022
STAFF REPORT
Subject: Update on Ad Hoc Efforts to Explore Additional Homelessness Resources and Policies
Contact: Erica Felci, Assistant Executive Director ([email protected]) and Greg Rodriguez,
CVAG contract staff, ([email protected])
Recommendation: Information Background: Since September 2021, the Homelessness Committee’s ad hoc committee has been meeting to consider additional approaches to addressing homelessness, particularly for those who are refusing current services. The goal of the ad hoc has been to evaluate optional programs that would be in addition to CV Housing First, then return to the full Homelessness Committee with a report and recommendations in 2022. The following members of the Homelessness Committee are on the ad hoc: Cathedral City Councilmember Mark Carnevale, Desert Healthcare District/ Foundation Director Carole Rogers, Indio Mayor Waymond Fermon, Palm Desert Mayor Pro Tem Sabby Jonathan, and Palm Springs Councilmember Christy Holstege, who is chair of the Homelessness Committee.
The ad hoc members have provided regular updates to the Homelessness Committee. This included an update in February 2022, where the ad hoc detailed the exploration of the City of Sacramento’s policy proposal to have the City adopt a first-in-the-nation right to housing, which includes an obligation of homeless individuals to accept housing if offered. The proposal, which is still being vetted, would have applied to every unsheltered resident who was previously housed for at least one year in the city limits. According to the City, “each person offered at least two forms of shelter or housing would have an obligation to accept one, or they could be moved from their camping site.” The general consensus from the Homelessness Committee at the February 2022 meeting was that the ad hoc was on track and they should continue exploring options.
Around the same time, ad hoc members had learned of an initiative supported by Riverside County District Attorney Mike Hestrin and Sheriff Chad Bianco that would establish a new sentencing program to help homeless facing criminal prosecution for low-level crimes. The Homeless Outreach Mediation and Education (HOME) program is a collaborative court approach that is being launched in partnership with a number of agencies and organizations, including the county’s behavioral health services. CVAG ad hoc committee members were provided a briefing from the District Attorney’s office on February 8. The program will focus on providing treatment for willing and mentally competent homeless individuals who have low-level offenses. The goal is that up to two years of case management would be provided, ultimately leading to their offenses being removed from their record. The HOME program is starting as a pilot program, primarily in the City of Riverside.

As a next step, the ad hoc committee will explore the roll out of Gov. Gavin Newsom’s proposed Community Assistance, Recovery and Empowerment (CARE) Court. The CARE Court, which must be approved by the Legislature, would allow courts to order CARE plans, which would require counties to provide comprehensive treatment to the most severely impaired and untreated Californians and hold patients accountable to following their treatment plans. As described by the Governor’s office, “CARE Court is a paradigm shift; it focuses on providing individuals with mental health and substance use services before they end up cycling through prison, emergency rooms, and encampments. CARE Court prioritizes the sickest Californians, helping many who live on our streets without shelter or medical care.” CVAG staff will be scheduling a briefing on the CARE Court proposal for ad hoc’s consideration in the near future.
Fiscal Analysis: There is no cost to CVAG for this update. However, depending on the extent of the ad hoc’s scope and analysis in the future, CVAG staff may ask the Homelessness and Executive Committee to consider allocating additional resources beyond staff time. Attachments:
1. News release from Riverside County District Attorney’s Office, February 15, 2022 2. Gov. Newsom’s outline of CARE court

NEWPROGRAMTOHELPTHEHOMELESSFACINGPROSECUTION
WILLBEGINSOONINRIVERSIDECOUNTY RIVERSIDE–A new alternative sentencing program to help the homeless who are facing criminal prosecution for low-level crimes is expected to start in Riverside County Superior Court in next few weeks. The Riverside County Partnership for the Homeless Outreach Mediation and Education (HOME) program promotes community-based treatment to assist homeless individuals with underlying issues such as mental illness, substance abuse disorders, joblessness, and familial issues with their transition to a stable environment of health, family, and employment. The HOME program will promote a therapeutic approach to sentencing for non-violent and low-level crimes instead of incarceration and fines and fees. “The two main factors driving the increase in homelessness are substance abuse or addiction and mental illness, and can often be a combination of both,” DA Mike Hestrin said. “This new Collaborative Court will allow us to use innovative approaches to getting people into the drug treatment and rehabilitation programs they need.” The DA’s Office will work in conjunction with the following agencies in the HOME program: the Riverside County Sheriff’s Department, the Office of the Public Defender, Riverside University Health System – Behavioral Health Department, Riverside County Probation Department, Riverside City Attorney’s Office, Riverside Police Department, and several other community partners. “The Public Defender’s Office is very pleased to welcome the new Homeless Court to Riverside,” said Public Defender Steve Harmon. “We will work together to help these vulnerable members of our community. Many lives will be changed for the better, and our community will be proud of what we all do here. We in the Public Defender’s Office will dedicate ourselves to working hard and doing everything possible to make this a success.” Riverside County Sheriff Chad Bianco said: “Being able to address substance abuse and mental health is the most important aspect of confronting the issues we face with the homeless. This program will not only allow offenders to detox in a safe environment where they will receive proper medical and mental health treatments, it will provide the structure and assistance for participants to break the cycle of addiction that contributed to the situation they find themselves in.” The partnership of all those dedicated to the HOME program shows the mutual goal of providing a collaborative response to the issue of homelessness and crime within our communities -- all with the intent to work cooperatively to benefit these offenders by offering treatment and rehabilitation while still holding them accountable for their actions. The HOME program will work to reduce homelessness and crime while promoting accountability, integrity, independence, and personal development of its participants through supervision, support, and treatment.
###
FOR IMMEDIATE RELEASE FEB. 15, 2022
CONTACT: JOHN HALL PUBLIC INFORMATION OFFICER
951.955.8662

GOVERNOR NEWSOM’S NEW PLAN TO GET CALIFORNIANS IN CRISISOFF THE STREETS AND INTO HOUSING, TREATMENT, AND CARE
● Community Assistance, Recovery and Empowerment (CARE) Court is a new framework to getpeople with mental health and substance use disorders the support and care they need.
● CARE Court is aimed at helping the thousands of Californians who are suffering from untreatedmental health and substance use disorders leading to homelessness, incarceration or worse.
● California is taking a new approach to act early and get people the support they need and addressunderlying needs - and we’re going to do it without taking away people’s rights.
● CARE Court includes accountability for everyone – on the individual and on local governments –with court orders for services.
HOW CARE COURT WORKS
CARE Court connects a person struggling with untreated mental illness – and often also substance usechallenges – with a court-ordered Care Plan for up to 24 months. Each plan is managed by a care team in thecommunity and can include clinically prescribed, individualized interventions with several supportive services,medication, and a housing plan. The client-centered approach also includes a public defender and supporterto help make self-directed care decisions in addition to their full clinical team

CARE Court is designed on the evidence that many people can stabilize, begin healing, and exit homelessnessin less restrictive, community-based care settings. It's a long-term strategy to positively impact the individual incare and the community around them. The plan focuses on people with schizophrenia spectrum and otherpsychotic disorders, who may also have substance use challenges, and who lack medical decision-makingcapacity and advances an upstream diversion from more restrictive conservatorships or incarceration.
The court-ordered response can be initiated by family, county and community-based social services,behavioral health providers, or first responders. Individuals exiting a short-term involuntary hospital hold or anarrest may be especially good candidates for CARE Court. The Care Plan can be ordered for up to 12 months,with periodic review hearings and subsequent renewal for up to another 12 months. Participants who do notsuccessfully complete Care Plans may, under current law, be hospitalized or referred to conservatorship - with anew presumption that no suitable alternatives to conservatorship are available.
All counties across the state will participate in CARE Court under the proposal. If local governments do notmeet their specified duties under court-ordered Care Plans, the court will have the ability to order sanctionsand, in extreme cases, appoint an agent to ensure services are provided.
CARE Court builds on Governor Newsom’s $14 billion multi-year investment to provide 55,000 new housing unitsand treatment slots as well as a more than $10 billion annual investment in community behavioral healthservices. The Governor’s comprehensive approach combines a focus on bridge housing to quickly rehouseunsheltered individuals with behavioral health issues, all while more new units come online, while alsotransforming Medi-Cal to provide more behavioral health services to people struggling the most.

ITEM 8l Coachella Valley Association of Governments
Executive Committee April 25, 2022
STAFF REPORT
Subject: Monitoring Report for CVAG's CV Housing First Program Contact: Erica Felci, Assistant Executive Director ([email protected])
Recommendation: Information Background: The California Emergency Solutions and Housing (CESH) Program was created in 2018 under Senate Bill 850. The program provides funds through the Building Homes and Jobs Trust Fund to be used for a variety of activities for individuals experiencing or at risk of homelessness, including housing relocation and stabilization services (including rental assistance), operating support for emergency housing interventions, and systems support for homelessness services. In 2019, CVAG was successful in securing nearly $552,000 for the CV Housing First program, which initially was used to help fund contracted services.
From February 7-10, 2022, a team from Riverside County’s Housing Homelessness Prevention and Workforce Solutions (HHPWS) conducted a remote desk monitoring review of CVAG’s case files. This is a condition to the grant funding. At the time of the monitoring, there were 62 individual client files eligible for review. Of those, six files were randomly chosen – three of which were from when CVAG had a contractor, and the other three were clients CVAG staff managed once operations were brought in-house.
The HHPWS issued a letter on March 7, 2022 that noted one finding, three concerns and three recommendations. As the County noted in their letter, all of the issues raised related to files that had been managed by CVAG’s former contractor – not CVAG staff. The most serious of the notes was a finding that one of the client files did not have any housing status documented. There were no issues raised related to fiscal compliance or contract compliance. All files for clients managed by CVAG staff were sufficient.
CVAG staff has worked with the County team and partners to address the old Path of Life files. The monitoring report requires that CVAG file a corrective action plan to respond to the report, which was filed by the April 6, 2022 deadline.
Fiscal Analysis: There is no cost to CVAG for this update. CVAG was awarded $551,930.57 in CESH funding, and has been reimbursed for the entire amount.

ITEM 8m Coachella Valley Association of Governments
Executive Committee April 25, 2022
STAFF REPORT
Subject: CV Housing First’s Behavioral Health Partnerships Contact: Greg Rodriguez, CVAG contract staff, ([email protected]) Recommendation: Information Background: In June 2021, the CVAG Executive Committee authorized the Executive Director to negotiate and execute no-cost Memorandums of Understanding providers who can expand the services to assist the CV Housing First program. The Executive Director is also provided with certain signature authorities for contracts related to ongoing programs. One of the priority areas identified by the CV Housing First team was securing additional behavioral health partnership. While the CV 200 focus continues to see demonstrate successes in housing the valley’s most chronically homeless residents, the program has had some challenges in the ability to obtain behavioral health intake and clinical referrals, which can lead to delays in housing and services. To address these challenges, the CV Housing First team has entered into two new partnerships. The first partnership is an MOU with Diane Vines from Beacon Associates. Dr. Vines is well known among service providers, as she is heavily involved in street outreach medicine through California State University, San Bernardino (CSUSB) and other organizations. Dr. Vines will be working closely with CV Housing First staff to coordinate behavioral health services for people experiencing homelessness. This will streamline CV 200 clients’ access to needed services, where many programs are experiencing a significant backlog and wait time. Under the MOU, CVAG staff will perform initial intakes and pre-screen clients to determine their individual needs. From there, clients will be referred to Dr. Vines for analysis, and to determine if the client is eligible for Permanent Supportive Housing (PSH) or other housing program that requires a showing of a disability as defined by Housing and Urban Development (HUD). Dr. Vines will also assist CVAG staff with referring clients to behavioral health services (RUHS Behavioral Health, Recovery Innovations, Adult Behavioral Health) as determined by their behavioral health assessment and desire to participate in ongoing services and follow up care. The second partnership will be with Dr. Kendrick Davis from the University of California, Riverside (UCR) School of Psychiatry. The MOU details are being finalized, but UCR psychiatric resident students will work with Housing First staff in the mobile access center to provide behavioral health outreach and assessments. They also will assist in complimenting the assessment and outreach provided by Beacon Associates. Additionally, Dr. Davis is working with the Riverside County’s data-tracking team to create a geomapping program to identify common locations of those clients assisted by CVAG’s Housing First program and other agency outreach staff. This will assist in

decreasing any unnecessary duplication and identify locations that may need more intense outreach and service delivery. These two partnerships advance the collaborative efforts that CV Housing First has developed in recent years. These partnerships, as well as future increases in county behavioral outreach and crisis management teams, will further enhance the ability to address the very challenging issues of behavioral health and substance abuse among the homeless population. Fiscal Analysis: The MOU with Dr. Vines provides up to $25,000 in services for up to one year, which is reimbursed on an hourly rate based on the services provided. The agreement with UCR will be at no cost. By investing in direct access to behavioral health services, CVAG can eliminate wait times for its clients and get them into permanent housing solutions faster.

ITEM 8n Coachella Valley Association of Governments
Executive Committee April 25, 2022
STAFF REPORT
Subject: Riverside County’s Homeless and Housing Strategic Action Plan Contact: Greg Rodriguez, CVAG contract staff, ([email protected]) Recommendation: Information Background: A Continuum of Care is well-established model for streamlining effective homeless services. They are made up of groups of organizations, including local government agencies and homeless service providers, that set shared goals and performance measurement mechanisms in order to redistribute pooled resources for homelessness response in a specific geographic area. CoCs are designated by and beholden to the US Department of Housing and Urban Development. In return, CoCs receive direct allocation of state and federal funds. In 2020, Riverside County created the new Department of Housing Homeless Prevention and Workforce Solutions (HHPWS) in an effort for greater cross department collaboration, increased communication and more effective delivery of programs and funding for county and community service providers. HHPWS also took over as the lead agency for the County’s CoC and Board of Governance (BOG). In 2020, the BOG and the CoC members decided they needed to update their individual homeless and housing plans and revisit a10-year plan that Riverside County had released in 2018. The goal was to create one plan for the entire county. HHPWS entered into a consulting agreement with LeSar Development Consultants for a two-step process. The first was a performance assessment and gaps analysis of the County’s homeless services. The second phase was to develop a strategic action plan for the County to implement. In June 2021, LeSar completed the performance assessment and gaps analysis. The report, which was presented to the CVAG Homelessness Committee in September 2021, highlighted some of the challenges that have been faced in the homeless provider system, which was described as fragmented. The report also stated that Riverside County’s consolidated department is “now better positioned to address other systems challenges like cross-sector alignment, data integration and management, and service provider capacity.” Additionally, the report also looked at the impact of new approaches to addressing the needs, whether it is the county’s new data management system or statewide initiatives like Project Homekey and Project Roomkey that were utilized during the COVID-19 pandemic. The second phase of the work for LeSar was to produce a Homeless Action Plan that enumerates actionable steps that the CoC, the County, and its partners can take to end homelessness in Riverside County. The plan is based five action areas, which also that are part of the state’s Action Plan for Preventing and Ending Homelessness in California:
1. Strengthen system to better prevent and end homelessness;

2. Equitably address the health, safety, and service needs of people experiencing unsheltered homelessness; 3. Expand communities’ capacity to provide safe and effective shelter and interim housing; 4. Expand and ensure equitable access to permanent housing; and 5. Prevent people from experiencing the crisis of homelessness.
The Riverside County CoC Homeless Action Plan is designed to provide an actionable strategy to preventing and ending homelessness within Riverside County. This plan lays out the guiding principles, action areas, performance metrics, goals, funding sources, and collaborating agencies necessary to achieving this goal. Each action area has strategies that, when implemented, will help to achieve the goal of the action area. In turn, each of the strategies has goals and performance metrics against which progress will be measured. Taken together, the plan has the pieces needed to help shape, over the next five years, the homelessness and supportive housing response system in Riverside County and work toward ending homelessness, by reaching functional zero in Riverside County. This plan promotes evidenced-based, person-centered approaches to tailor and right-size the homeless response to address the inflow, service delivery, and outflow relevant to ending homelessness. The plan’s regional approach will require ongoing partnership with service providers, cities, regional governments and Riverside County. Fiscal Analysis: There is no cost to CVAG for this report. Attachment: Riverside County Homeless and Housing Strategic Action Plan

COUNTY OF RIVERSIDE DEPARTMENT OF HOUSING AND WORKFORCE SOLUTIONS AND CONTINUUM OF CARE HOMELESS ACTION PLAN
HWSE N G A G E . E N C O U R A G E . E Q U I P .
H O U S I N G A N DW O R K F O R C ES O L U T I O N S
Prepared by
January 2022

2 / HOMELESS ACTION PLAN
Acknowledgments 3Executive Summary 4Letter From the Housing and Workforce Solutions Director 5Letter From the CoC and Board of Goverance Chairs and Vice Chairs 5Introduction 6Guiding Principles 7 System Level 7
Uplifting Lived Experience 7
Equity Centered 7
Housing First 7
Housing as a Human Right 8
Person-Centered 8
Outcomes Focused 8
Moving Towards Functional Zero 8
Homelessness in County of Riverside 8Findings from Gaps Analysis 10 System Strengths 10
System Challenges 10
Alignment with Existing Frameworks and Plans 11Overview of Action Areas, Strategies, and Goals 12 Action Areas and Strategies 12
Five Year Regional Goals 13
Future State 13Action Area 1: Strengthen System to Better Prevent and End Homelessness 14 Current Response 14
Proposed Strategies 14
Strategy 1: Strategy 1: Strengthen Leadership and Departmental Capacity 14
Strategy 2: Strategy 2: Improve County’s Ability to Track, Leverage, and Manage Data 15
Strategy 3:Strategy 3: Implement Prioritization Framework to Address System Flow 15
Strategy 4:Strategy 4: Utilize Funding Principles Informed by the Prioritization Framework,
Provider, City, and Regional Government Performance, and Regional Deficiencies
and Needs 16
Strategy 5:Strategy 5: Strengthen Coordinated Access 16
Strategy 6:Strategy 6: Enhance Provider, City and Regional Government’s Capacity
and System Infrastructure 16
Strategy 7: Strategy 7: Support Regional, Cross-Sector Alignment and Partnership 17
Strategy 8: Strategy 8: Refine Communications Efforts Around Homelessness in
Riverside County 18
Strategy 9:Strategy 9: Expand Accountability to Clients 18
Strategy 10:Strategy 10: Develop Lived Experience Knowledge, Leadership,
and Decision-Making 19
Strategy 11:Strategy 11: Center Race Equity in Homeless Response 19
Performance Metrics 20
Five Year Goals 21
Funding Principles 22
Action Area 2: Equitably Address the Health, Safety, and Services Needs of People Experiencing Unsheltered Homelessness 22 Current Response 22
Proposed Strategies 23
Strategy 12: Strategy 12: Increase Regional Capacity of Homeless Street Outreach 23
Strategy 13:Strategy 13: Support the Health of People Experiencing Unsheltered
Homelessness through Cross-Departmental/Cross-Sector Supports 23
Strategy 14:Strategy 14: Improve Access for People Experiencing Homelessness 24
Strategy 15: Strategy 15: Develop Countywide Encampment Management Protocols 24
Strategy 16:Strategy 16: Support the Decriminalization of Homelessness 25
Strategy 17:Strategy 17: Develop Training for First Responders 25
Strategy 18: Strategy 18: Establish Key Resources for Special Populations
Experiencing Unsheltered Homelessness 25
Performance Metrics 26
Five Year Goals 27
Funding Principles 27
Action Area 3: Expand Communities Capacity to Provide Safe and Effective Shelter and Interim Housing 27
Current Response 27
Proposed Strategies 27
Strategy 19: Strategy 19: Increase the Number of Crisis Housing Beds Regionally 27
Strategy 20: Strategy 20: Refine Crisis Housing Policies and Procedures 28
Performance Metrics 29
Five Year Goals 30
Funding Principles 30
Action Area 4: Expand and Ensure Equitable Access to Permanent Housing in Our Communities 30 Current Response 30
Proposed Strategies 31
Strategy 21:Strategy 21: Advocate for the Increased Production of Affordable Housing 31
Strategy 22:Strategy 22: Increase Permanent Supportive Housing Units and Capacity 31
Strategy 23:Strategy 23: Increase Rapid Rehousing Housing Units and Capacity 32
Strategy 24:Strategy 24: Develop Centralized Landlord Outreach, Engagement, and
Retention Strategies 32
Strategy 25:Strategy 25: Innovate Approaches to Expand Existing Housing Stock 33
Strategy 26:Strategy 26: Increase Flexible Housing Funds 33
Strategy 27: Strategy 27: Address Housing Needs of Unique Subpopulations 33
Strategy 28: Strategy 28: Develop Strategies to Reduce Barriers for People Experiencing
Homelessness in Obtaining Housing and to Increase the Speed of
Lease-Up Process 33
Strategy 29:Strategy 29: Expand Housing Access to High Opportunity Neighborhoods,
With a Focus on Those with High Social Determinants Of Health (SDOH) 34
Strategy 30: Strategy 30: Strengthen Approaches to Case Management 34
Strategy 31:Strategy 31: Leverage Housing Authority Division Resources for People
Experiencing Homelessness 34
Strategy 32:Strategy 32: Continue to Advocate for Legislation Protecting Against
Housing Discrimination in Housing Search 34
Performance Metrics 35
Five Year Goals 36
Funding Principles 37
Action Area 5: Prevent People from Experiencing the Crisis of Homelessness 37 Current Response 37
Proposed Strategies 38
Strategy 33: Strategy 33: Increase Homelessness Prevention, Diversion,
and Mediation Services 38
Strategy 34: Strategy 34: Address Inflows of Homelessness Through Cross-Sector
Collaboration, Discharge Planning, and Early Identification 38
Strategy 35:Strategy 35: Expand Opportunities to Achieve Financial Stability/Economic
Mobility Through Employment, Educational, Income Supports, and
Wealth Generation Programs and Services. 40
Strategy 36: Strategy 36: Reduce Reentries into Homeless Response System 40
Strategy 37: Strategy 37: Preserve Vulnerable Housing and Prevent Community Displacement 40
Strategy 38: Strategy 38: Expand Protections for Renter/Tenants 40
Strategy 39: Strategy 39: Advocate for the Expansion of a Social Safety Net 41
Performance Metrics 41
Five Year Goals 42
Funding Principles 43
Funding Sources 44Collaborating Agencies/Departments 51Partner Cities in County of Riverside Continuum of Care 52Glossary 53Exhibit A: Tabulated Riverside County Homeless Action Plan 54Exhibit B: Transitional Aged Youth (TAY) Homeless Action Summary 73Exhibit C: Family Homeless Action Summary 73Exhibit D: Encampment Homeless Action Summary 74Exhibit E: Veteran Homeless Action Summary 74Exhibit F: Domestic Violence Homeless Action Summary 74Exhibit G: Racial Equity Homeless Action Summary 74Exhibit H: LGBTQIA+ Homeless Action Summary 75Exhibit I: Older Adults/Seniors Homeless Action Summary 75Exhibit J: Other Special Populations Homeless Action Summary 76
TABLE OF CONTENTS

3 / HOMELESS ACTION PLAN
ACKNOWLEDGMENT
This Homeless Action Plan represents the road map for the County of Riverside, our partner cities, and provider agencies to use as we move to address the crisis of homelessness in Riverside County. The development of this plan, like the work being done and that will be done to address homelessness, has been an effort by people and organizations across the county. This plan could not have been developed without the wholehearted commitment of the those who provided information for this plan, who met with our consulting team, and who provided the support for the plan.
We would like to take this opportunity to thank all the people and organizations that have helped to create this Action plan. First and foremost, I would like to thank the leadership of the County of Riverside, the leadership of the Continuum of Care and the Board of Governance, the incredible non-profit partners, and the dedicated hardworking staff of Housing Workforce Solutions Department.
County of Riverside Board of Supervisors:
Kevin Jeffries, District 1
Karen Spiegel, District 2
Chuck Washington, District 3
V. Manuel Perez, District 4
Jeff Hewitt, District 5
County of Riverside:
Jeffrey Van Wagenen, CEO
County of Riverside Continuum of Care (CoC):
Greg Rodriguez, Chair
Karen Roper, Vice Chair
County of Riverside CoC Board of Governance:
Tammy Marine, Chair
Leticia De Lara, Vice Chair
Department of Housing and Workforce Solutions:
Heidi Marshall, Director
Carrie Harmon, Assistant Director
Michael Walsh, Deputy Director
Tanya Torno, Deputy Director
All Staff Members of the Department of Housing and Workforce Solutions
All Cities and Local Governments in the County of Riverside
All County of Riverside Continuum of Care Members and Partners
Woven throughout this Homeless Action Plan is the concept that ending homelessness – a mission that can only be carried out when all levels of government, businesses, non-profit organizations, faith-based community, and the community at large in every part of the County join together behind a common vision. We hope that as we read this Action Plan, we will all be inspired to renew our commitment to help in this important effort.

4 / HOMELESS ACTION PLAN
EXECUTIVE SUMMARYThe County of Riverside Continuum of Care (CoC) has, over the past few years, worked very hard to recognize, quantify, and address system needs and gaps. This work is best highlighted by the creation of the Housing and Workforce Solutions Department (HWS). This new department was formed with the recognition that addressing homelessness requires a systems level approach, one that addresses the myriad of factors that contribute to homelessness.
The department continued its work to recognize, quantify, and address system needs and gaps by engaging LeSar Development Consultants (LDC) to add to the work they had done in helping the Board of Governance to develop a strategic plan. As the first stage in the new engagement, LDC produced a Performance Assessment and Gaps Analysis. That document looked at the performance of the CoC through both a qualitative and a quantitative lens. The Performance Assessment identified a number of system challenges and strengths.
The second phase of the work for LDC in the new engagement was to produce a Homeless Action Plan that enumerates actionable steps that the CoC, the County, and its partners can take to end homelessness in Riverside County. The Plan is based on the following five action areas that are the basis for the California Homeless Coordinating and Financing Council’s Action Plan for Preventing and Ending Homelessness in California.
1. Strengthen System to Better Prevent and End Homelessness
2. Equitably Address the Health, Safety, and Service Needs of People Experiencing Unsheltered Homelessness
3. Expand Communities Capacity to Provide Safe and Effective Shelter and Interim Housing
4. Expand and Ensure Equitable Access to Permanent Housing in Our Communities
5. Prevent People from Experiencing the Crisis of Homelessness
Each action area has strategies that, when implemented, will help to achieve the goal of the action area. In turn, each of the strategies has goals and performance metrics against which progress will be measured. Taken together, the plan has the pieces needed to help shape, over the next five years, the homelessness and supportive housing response system in Riverside County to make it possible to end homelessness, by reaching functional zero in Riverside County.
The plan is an ambitious one. It is deliberately designed to address one of the main themes that came up in the performance assessment – that the system reflects degrees of disunity in the approach to ending homelessness across the region. This was characterized by differing approaches to addressing homelessness and disconnected services, most notably in the differing responses to outreach and engagement. As the performance assessment notes, this results in a system that could be difficult to navigate for people experiencing homelessness and that may not be as effective as it could be.
In order to impact this system fragmentation, the CoC and Riverside County will need to address each action area simultaneously. Changes in one part of the system, like addressing the availability of services in under resourced areas, will require changes in another part of the system, such as the approach to funding. Although the CoC could decide to implement the plan in a linear fashion, efforts will be much more effective if they are done in parallel across the five action areas.
LDC staff has had the opportunity over the past two years to work closely with the BoG, the leadership of the CoC, and the staff of the newly formed Department Housing and Workforce Solutions. In that time, we have seen the capacity of the system grow enormously. Although the Action Plan is ambitious, it is the opinion of LDC that the Riverside County Continuum of Care and its’ partners have the ability, the will, and the capacity to implement it.

5 / HOMELESS ACTION PLAN
LETTER FROM THE HOUSING AND WORKFORCE SOLUTIONS DIRECTORHomelessness is one of the most challenging and complex social issues that we face today. To meet this challenge, we must move forward collectively, with a strong private-public partnership committed to a shared mission and vision. We must also move forward with clear strategies and goals that deliver the result we are all looking for – an end to homelessness within Riverside County.
As the Director of the Housing and Workforce Solutions Department of the County of Riverside, I am pleased to share our most recent Homeless Action Plan which will guide our work onward. This plan is the culmination of two years of comprehensive planning led by LeSar Development Consultants, the Board of Governance and the Continuum of Care.
In this Homeless Action Plan, we commit our energies to five action areas which will define our focus and programming. We believe that these action areas will enhance the homeless system of care, increase shelter capacity and permanent supportive housing units and will significantly improve outcomes. I look forward to working with all of you to achieve these goals and to provide a home for all of our homeless residents in Riverside County.
Heidi MarshallDirector
Housing and Workforce Solutions
LETTER FROM THE CONTINUUM OF CARE & BOARD OF GOVERNANCE CHAIRS & VICE CHAIRSWe are very pleased to be able to present this Homeless Action Plan to you. This Plan represents the culmination of two years of work with our dedicated homeless service providers, county agencies, cities, and regional governments. The work to develop this plan has helped the Board of Governance and the Continuum of Care to continue their evolution to become more guided by data and focused on best practices and outcomes.
We too would like to thank everyone who has helped to create this Action Plan, with a special acknowledgment to the County of Riverside Board of Supervisors for their support in creating overarching systems to address the crisis of homelessness in the county. Additionally, this plan would not have been possible without the work of our incredible Housing and Workforce Solutions management and staff as well as the team from LeSar Development Consultants.
Writing the Action Plan is just the beginning. The real work comes with the implementation of the goals and strategies in the plan. This is a living document, and we will only accomplish the goals and objectives within this plan through a collaborative approach amongst public, private, and non-profit organizations.
We are excited to start this work and hope that you will join us in our efforts to make this Action Plan a reality as, without your help, we would never be able to solve the homeless and housing crisis we face. Together we will make a difference and meaningful impact on people’s lives in Riverside County.
Greg RodriguezChair
Continuum of Care
Karen Roper Vice Chair
Continuum of Care
Tammy Marine Chair
Board of Governance
Leticia De Lara Vice Chair
Board of Governance

6 / HOMELESS ACTION PLAN
The Riverside County CoC Homeless Action Plan
is designed to provide an actionable strategy
to preventing and ending homelessness within
Riverside County. This plan lays out the guiding principles, action areas, performance metrics, goals, funding sources, and collaborating agencies necessary to achieving this goal. This
plan promotes evidence-based, person-centered
approaches to tailor and right-size the homeless
response to address the inflow, service delivery, and
outflow relevant to ending homelessness. The plan’s
regional approach will require ongoing partnership
with service providers, cities, regional governments,
and Riverside County.

7 / HOMELESS ACTION PLAN
GUIDING PRINCIPLES The County of Riverside’s homeless responses system is driven by the following guiding principles. These guiding principles inform our understanding of, and guide our response to, all aspects of our work. They are the foundation of our efforts to preventing and ending homelessness.
SYSTEM LEVEL
Ending homelessness in the County requires coordinated efforts from multiple systems and sectors. We recognize that an effective homeless response prioritizes multi-system, cross-sector regional collaboration to address the inflows, service delivery, and outflows relevant to ending homelessness. Doing this requires key community leaders to develop capacity and infrastructure around county-level governance, strategic planning, and systems change to support the work toward the articulated goals.
UPLIFTING LIVED EXPERIENCE
The experiences of clients and people with lived experience are legitimate and important primary data sources, and their voices need to be included in the planning and system design. We strive to move away from a paternalistic system that assumes we know what is best for individuals, families, and communities but instead opens the dialogue for regular feedback and partnership in planning and decision-making. Through the development of systematized feedback mechanisms that integrate the daily lived experiences of clients and their perspectives, we will begin to shift the normative culture to one that prioritizes clients’ perspectives as key data points on which to measure the quality and success of systems. By designing with the end-user in mind, centering client experiences as important primary data sources, including those most overrepresented in the system, and increasing client agency in decisions, we can build a more effective, person-centered response. We, as a system, must be accountable for this input because it is a key to our success.
EQUITY CENTERED
Centering a homeless response system on the needs of those most vulnerable and overrepresented within the homeless population builds the capacity of the system to better respond to the needs of all people experiencing homelessness. Black, Indigenous, and People of Color (BIPOC) are significantly overrepresented in the homeless population, a legacy of historical and contemporary structural racism. We will continue to center race equity in our homeless response, disaggregate data to better develop solutions, and look upstream at the inflows and structural roots of homelessness. Alongside these strategies, we will apply a targeted universalism approach, which will set universal goals pursued by targeted processes for specific groups to achieve those goals. Through these strategies, we will rebuild our homeless response system to be anti-racist, ensuring that our outcomes begin to dismantle these historical and contemporary legacies.
HOUSING FIRST
Housing ends homelessness. The Housing First Model is an evidenced-based practice that prioritizes rapid placement and stabilization in permanent housing without service participation requirements or preconditions for entry (such as sobriety, minimum income requirements, criminal record, completion of treatment, participation in services or other conditions that create barriers to entry). Supportive services are offered to maximize housing stability and prevent returns to homelessness. Participation in these services is voluntary and based on the needs and desires of each person. We adhere to and promote the Housing First philosophy in our work to end homelessness. We believe that housing should never be preconditioned, and that, ultimately, a person is no longer homeless when they have a home.

8 / HOMELESS ACTION PLAN
HOUSING AS A HUMAN RIGHT
We will continue to push for the goal that every person has a safe, stable, and affordable place to call home. Our approach to housing is one that merges with a human-rights based approach, which strives for equal opportunity of all residents to adequate housing and to healthy and sustainable communities. We support proposals that move toward a rights-based approach to housing, such as housing as an entitlement, and the expansion of universal housing vouchers, both of which could significantly move the needle towards addressing housing instability and homelessness.
PERSON-CENTERED
We believe that all people deserve to be treated with respect regardless of their housed status. Throughout this document, we refer to “people experiencing homelessness” and “clients” interchangeably. Demeaning language like “the homeless” or “homeless people”, attaches an individual, family, or community to their situational housed status without acknowledging their ability to change. We hope to position people experiencing homelessness as individuals with agency, decision-making, and dignity within a system that provides services to them. We believe in the strengths of people experiencing homelessness and will adopt person-centered approaches that account for past trauma, personal strengths, client confidentiality, and individual choice.
OUTCOMES FOCUSED
We embrace the value of creatively looking for solutions that expand on current best practices and person-centered approaches. We will measure our success not on our intentions, but on our outcomes to preventing and ending homelessness and creating healthy and equitable communities for all.
MOVING TOWARDS FUNCTIONAL ZERO
Functional Zero recognizes that as long as there is poverty, there will always be people who experience homelessness or who are at risk of experiencing homelessness. The functional zero approach describes the situation in a community where homelessness has become manageable — where the availability of services and resources match or exceed the demand for them from the target population. In a system that has achieved functional zero, the inflow, the number of persons experiencing homelessness for the first time, does not exceed the outflow, the number of persons who gain access to permanent housing. When this balance is achieved, the rate of persons experiencing homelessness will be effectively or functionally zero.
HOMELESSNESS IN COUNTY OF RIVERSIDEAccording to the 2020 Point-in-Time (PIT) count, there were 2,884 individuals experiencing homelessness in Riverside County, a 3% increase from 2019 and 16.8% increase from 2015. About 75% of the individuals counted in 2020 were unsheltered — sleeping in cars, outdoors, or in other places not intended for human habitation. From 2019 to 2020, there was a 5% increase in unsheltered homelessness and a 5% decrease in sheltered homelessness. There was also a 19.4% decrease in chronic homelessness. Within the chronically homeless population, there was a 29% decrease in the unsheltered population and a 68% increase in the sheltered population. The overall increase in homelessness from 2019 to 2020 may be due to the 13% increase in the number of volunteers for the PIT count, in addition to increased engagement from leadership in Riverside County.
Some residents of Riverside County are precariously housed, doubled-up or living with friends or family, and are therefore vulnerable to falling into homelessness. Although estimating the number of persons who are precariously housed is difficult given current data, some signals are available. In Riverside County, 3.9% of the households are made up of non-relatives, and 12.1% are made up of non-spouse, non-child family members. In addition, 8.3% of occupied housing units in Riverside County are occupied by more than one person. These are indicators of households that are doubled up and are potentially precariously housed.

9 / HOMELESS ACTION PLAN
The Riverside-San Bernardino-Ontario metropolitan area has one of the most severe shortages of affordable homes in the country, with only 18 affordable and available homes per 100 renter households. 58.6% of Riverside County renters are considered rent burdened by HUD, paying more than 30% of household income on rent.
The population of persons experiencing homelessness in Riverside County includes families with children and school-aged children, some of whom are going unsheltered. 22,002 total public-school students, or 5.1% of the public-school system’s student population, experienced homelessness in 2020. School districts count children as experiencing homelessness when they doubled up. There were 256 youth experiencing unsheltered homelessness, a 41% increase from 2019. This shift was accompanied by a 65% decrease in the count of sheltered youth experiencing homelessness.
The population of persons experiencing homelessness in Riverside County is disproportionately male, Hispanic, Black, and Native American. Males are overrepresented in the population of persons experiencing homelessness at 63%. 55% of the population of persons experiencing homelessness in the PIT Count was classified as Hispanic, compared to 48.9% in 2019 Riverside County’s overall population. 18% were classified as Black, compared to 7.8% in Riverside County’s overall population. 2.5% of the homeless population was classified as Native American, compared to 1.8% of Riverside County’s overall population. 58% of the homeless population were classified as White, compared to 59.9% in Riverside County’s overall population.
Homelessness in Riverside County must be understood in context of Riverside County’s overall lack of affordable housing. The Riverside-San Bernardino-Ontario metropolitan area has one of the most severe shortages of affordable homes in the country, with only 18 affordable and available homes per 100 renter households. 58.6% of Riverside County renters are considered rent burdened by HUD, paying more than 30% of household income on rent. This is higher than state and national averages as, in the same year, 49.6% of American renters and 54.8% of Californian renters were considered rent burdened.
Riverside County’s housing stock is mostly composed of single family detached homes, which make up 68.3% of the housing stock. Only 17.4% of the county’s housing stock is in a complex with 2 or more units, compared to 31.4% at the state level and 26.3% at the national level. Riverside County also has a rental vacancy rate of 4.8% and a homeowner vacancy rate of 1.9% compared to state vacancy rates of 3.6% for rentals and 1.1% for homeowners.
Homelessness in Riverside County should also be viewed in relation to poverty, economic inequality, and overall social vulnerability. The median household income in Riverside County was $67,005, lower than the state-level median household income of $75,235. 13.7% of all people in Riverside County had an income below the federal poverty level. This percentage had been steadily decreasing for at least the past five years, falling from 2015’s 16.8%. Despite decreases in poverty, Riverside County also had a 7.5% unemployment rate, higher than the national’s 5.3% and the state’s 6.1%. In addition, the Agency for Toxic Substances and Disease Registry ranks Riverside County as an area of high social vulnerability. Calculating based off risk factors such as poverty, income, minority status, language, age, and crowding, the agency concluded Riverside County had a social vulnerability index (SVI) score of .7939, with a score of 1 representing the highest possible social vulnerability.
The Southern California Association of Governments allocated 167,351 total units to Riverside County in the 6th cycle Regional Housing Needs Assessment (RHNA). Of these units, 41,995 were for very low-income, 26,473 were for low income, 29,167 were for moderate income, and 69,716 were for above moderate income.

10 / HOMELESS ACTION PLAN
FINDINGS FROM GAPS ANALYSISIn preparation for the Homeless Plan, LDC conducted a Needs Assessment and Gaps Analysis of the County of Riverside (see appendix). The findings reflected below informed the County of Riverside’s Homeless Action Plan.
SYSTEM STRENGTHS
• Creation of the Housing and Workforce Solutions Department
• A Prevention Program that targets the right populations and has strong positive outcomes
• Implementation of a new Homeless Management Information System (HMIS)
• Starting the integration of the Coordinated Entry System (CES) with the new HMIS
• Strong response to the COVID-19 pandemic
SYSTEM CHALLENGES
• A regionalized and fragmented system with underdeveloped services and infrastructure in various parts of the county
• Differing approaches to providing services to persons experiencing homelessness that make the system difficult to access
• Insufficient housing affordable to the extremely low-income population
• Insufficient Permanent Supportive and Rapid Rehousing opportunities
• A need to provide more services to key sub-populations, like Chronically Homeless, Individuals with Mental Illness, Individuals with Substance Use Disorders, Older Adults/Seniors, and Transitional Aged Youth (TAY)
• Significant barriers to entry for people experiencing homelessness to obtain housing in the private rental market
• Fragmented approach to landlord outreach, engagement, and retention
• The lack of flex funds and funding for move-in assistance
• Ineffective cross-sector integration and alignment to address the inflows into homelessness
• System flow where entries into the system outpace successful exits, leading to a net gain of persons in the homeless response system

11 / HOMELESS ACTION PLAN
ALIGNMENT WITH EXISTING FRAMEWORKS AND PLANSIn developing the Homeless Action Plan, the Riverside County CoC ensured alignment with existing frameworks and plans at the national, state, and regional level. The Riverside County CoC Homeless Action plan builds upon and expands on these strategies and efforts.
The national framework set forth by the United States Interagency Council on Homelessness (USICH)- Home Together: The Federal Strategic Plan to Prevent and End Homelessness is focused on strategies that will support communities to make homelessness a rare, brief, and one-time experience. The Home Together plan outlines key objectives, like strengthening system capacity, improving access to low barrier shelter, streamlining coordinated entry, rapidly moving people into permanent housing, and preventing returns to homelessness through homelessness prevention and targeting systems.
To achieve success, the Home Together plan outlines that every community must be able to:
• Quickly identify and engage people at risk of and experiencing homelessness
• Intervene to prevent people from losing their housing and divert people from entering the homelessness services system
• Provide people with immediate access to shelter and crisis services without barriers to entry if homelessness does occur
• Quickly connect people experiencing homelessness to housing assistance and services tailored to their unique needs and strengths to help them achieve and maintain stable housing
In the development of the Riverside County CoC Homeless Action Plan, we have ensured that core strategies and objectives outlined in the Home Together plan were included in our plan.
At the state level, the California Homeless Coordinating and Financing Council’s Action Plan for Preventing and Ending Homelessness in California guides the State’s response to homelessness to ensure it is rare, brief, and one-time. The Action Plan outlines key principles and practices that include race equity, lived experience, Housing First, and balancing crisis response and permanent housing solutions.
The Action Plan is divided into five key action areas.
1. Strengthening Our System to Better Prevent and End Homelessness in California The Action Plan focuses on racial equity, including people with lived experience, strengthening interjurisdictional coordination, and leveraging cross-sector partnerships.
2. Equitably Addressing the Health, Safety, and Services Needs of Californians Experiencing Unsheltered Homelessness To address the needs of people experiencing unsheltered homelessness, the Action Plan focuses on addressing health and safety needs and increasing access to State supported services and supports.
3. Expanding Communities’ Capacity to Provide Safe and Effective Shelter and Interim Housing The Action Plan looks to expand the availability of housing-placement focused shelter and interim housing.
4. Expanding and Ensuring Equitable Access to Permanent Housing in Our Communities Using Housing First approaches, development strategies, and rental assistance programs, the State will expand permanent housing opportunities.
5. Preventing Californians from Experiencing the Crisis of Homelessness The Action Plan will focus on reducing entries into homelessness through institutional alignment and providing targeted homelessness prevention and diversion services.
In developing the Riverside County Homeless Action Plan, we oriented the structure to directly align with the California Homeless Coordinating and Financing Council to ensure that, as new initiatives come down from the state, the County of Riverside is well-positioned and aligned in focus and strategies. Many of the sub-strategies outlined in the State’s Action Plan are expanded on and made more relevant to the local context within Riverside County.
To ensure effective alignment regionally, the Riverside County CoC has also incorporated existing frameworks and plans from the Riverside County CoC Board of Governance (BoG) Strategic Plan, plans from neighboring Counties (San Diego and Los Angeles), and local city plans.
The goals outlined in the Board of Governance Strategic Plan have been merged and incorporated into the strategies of the Riverside County Homeless Action Plan. The BoG strategic goals include:
• Increase CoC participation
• Improve regional coordination and collaborative efforts
• Streamline CoC structure and committees
• Create a CoC Action Plan
• Create a Core Leadership Working Body focused on Action Orientation
• Plan for the future
• Build capacity among providers, cities, and regional governments
• Launch PR efforts around homelessness, housing, and the CoC
• Use data more effectively
• Evaluate performance consistently
Many of these strategic goals are directly included in Action Area 1: Strengthen System to Better Prevent and End Homelessness.

12 / HOMELESS ACTION PLAN
OVERVIEW OF ACTION AREAS, STRATEGIES, AND GOALSThe vision of homelessness of the Riverside County CoC Homeless Action Plan is to build toward a functional zero system where homelessness is rare, brief, and non-recurring.
Rare: Homelessness will be rare
when individuals, families, and
communities have protections,
services, and supports in place to
prevent homelessness.
Brief: Homelessness will be brief
when individuals, families, and
communities have access to shelter,
services, supports, and housing
available to help people experiencing
homelessness quickly return to
permanent housing.
Non-Recurring: Homelessness will
be non-recurring when individuals,
families, and communities have the
protections, services, and supports
they need to successfully maintain
their housing.
ACTION AREAS AND STRATEGIES
As described above, the Riverside County Homeless Action Plan is aligned with the framework of the California Homeless Coordinating and Financing Council’s Action Plan to Prevent and End Homelessness. The Homeless Action Plan also incorporates the strategies of the County of Riverside CoC Board of Governance Strategic Plan adopted in March 2020. The five action areas below comprise the actions necessary to prevent and end homelessness in Riverside County and move towards a functional zero system.
1. Strengthen System to Better Prevent and End Homelessness
• Strategy 1: Strengthen Leadership and Departmental Capacity
• Strategy 2: Improve County’s Ability to Track, Leverage, and Manage Data
• Strategy 3: Implement Prioritization Framework to Address System Flow
• Strategy 4: Utilize Funding Principles Informed by the Prioritization Framework, Provider, City, and Regional Government Performance, and Regional Deficiencies and Needs
• Strategy 5: Strengthen Coordinated Access
• Strategy 6: Enhance Provider, City, and Regional Government’s Capacity and System Infrastructure
• Strategy 7: Support Regional, Cross-Sector Alignment and Partnership
• Strategy 8: Refine Communications Efforts Around Homelessness in Riverside County
• Strategy 9: Expand Accountability to Clients
• Strategy 10: Develop Lived Experience Knowledge, Leadership, and Decision-Making
• Strategy 11: Center Race Equity in Homeless Response
2. Equitably Address the Health, Safety, and Service Needs of People Experiencing Unsheltered Homelessness
• Strategy 12: Increase Regional Capacity of Homeless Street Outreach
• Strategy 13: Support the Health of People Experiencing Unsheltered Homelessness through Cross-Departmental/Cross-Sector Supports
• Strategy 14: Improve Access for People Experiencing Homelessness
• Strategy 15: Develop Countywide Encampment Management Protocols
• Strategy 16: Support the Decriminalization of Homelessness
• Strategy 17: Develop Training for First Responders
• Strategy 18: Establish Key Resources for Special Populations Experiencing Unsheltered Homelessness
3. Expand Communities Capacity to Provide Safe and Effective Shelter and Interim Housing
• Strategy 19: Increase the Number of Crisis Housing Beds Regionally
• Strategy 20: Refine Crisis Housing Policies and Procedures

13 / HOMELESS ACTION PLAN
4. Expand and Ensure Equitable Access to Permanent Housing in Our Communities
• Strategy 21: Advocate for the Increased Production of Affordable Housing
• Strategy 22: Increase Permanent Supportive Housing Units and Capacity
• Strategy 23: Increase Rapid Rehousing Housing Units and Capacity
• Strategy 24: Develop Centralized Landlord Outreach, Engagement, and Retention Strategies
• Strategy 25: Innovate Approaches to Expand Existing Housing Stock
• Strategy 26: Increase Flexible Housing Funds
• Strategy 27: Address Housing Needs of Unique Subpopulations
• Strategy 28: Develop Strategies to Reduce Barriers for People Experiencing Homelessness in Obtaining Housing and to Increase the Speed of Lease-Up Process
• Strategy 29: Expand Housing Access to High Opportunity Neighborhoods, With a Focus on Those with High Social Determinants Of Health
• Strategy 30: Strengthen Approaches to Case Management
• Strategy 31: Leverage Housing Authority Division Resources for People Experiencing Homelessness
• Strategy 32: Continue to Advocate for Legislation Protecting Against Housing Discrimination in Housing Search
5. Prevent People from Experiencing the Crisis of Homelessness
• Strategy 33: Increase Homelessness Prevention, Diversion, and Mediation Services
• Strategy 34: Address Inflows of Homelessness Through Cross-Sector Collaboration, Discharge Planning, and Early Identification
• Strategy 35: Expand Opportunities to Achieve Financial Stability/Economic Mobility Through Employment, Education, Income Supports, and Wealth Generation Programs and Services.
• Strategy 36: Reduce Reentries into Homeless Response System
• Strategy 37: Preserve Vulnerable Housing and Prevent Community Displacement
• Strategy 38: Expand Protections for Renter/Tenants
• Strategy 39: Advocate for the Expansion of a Social Safety Net
FIVE YEAR REGIONAL GOALS
The following goals are some of the key goals highlighted throughout the remainder of the plan.
ACTION AREA 1
Total number of people successfully exiting to housing each month/year exceeds the people entering homelessness each month/year.
ACTION AREA 1 & 2
50% reduction in the length of stay for people experiencing homelessness on the streets and in shelters, such as Street Outreach (SO), Emergency Shelter (ES), Safe Haven (SH), and Transitional Housing (TH).
ACTION AREA 2, 3, & 5
75% reduction in the number of people experiencing unsheltered and sheltered homelessness discharged from institutions or re-entering from the homeless response system.
ACTION AREA 3
25% increase in the number of crisis housing beds (ES, SH, TH) in the system, geographically distributed.
ACTION AREA 4
Increase the number (unit count) of Permanent Housing Units by 75% from baseline year (including Permanent Supportive Housing [PSH] and Rapid Rehousing [RRH]).
ACTION AREA 5
75% reduction in the number of people experiencing homelessness for first time.
FUTURE STATEAs the Riverside County CoC continues to move toward the goals outlined in this plan, it aims to right-size the homeless response system to ensure that homelessness in Riverside County truly is rare, brief, and nonrecurring. By consolidating leadership, supporting coordination, and addressing regional gaps in services and infrastructure, it will strengthen the system as a whole and build the capacity to better serve the population. Services, resources, and infrastructure will be uniformly administered and distributed equitably across the region so that each subregion has the capacity to address homelessness within their community to help meet larger regional goals.
A robust system of cross-sector alignment will open new opportunities for collaboration and integration that will significantly increase the impact of the homeless response system. Cross-sector initiatives will curb the inflows into homelessness, with targeted measures for

14 / HOMELESS ACTION PLAN
early identification, effective discharge planning, and rapid supports when someone faces housing instability. With advances in data integration and management, a new cross-sector data system, anchored around a unique identifier, could unlock new opportunities for equity analysis, client choice, service utilization, automated connections, and preventative supports.
With new funding frameworks, Riverside County CoC will right-size the homeless response to address the system flow gap by decreasing inflows and increasing successful outflows. By focusing on these strategies in tandem, it will also serve to strengthen the capacity of the system to respond to the housing and shelter needs of the people experiencing homelessness. Increases in prevention strategies, like preservation of vulnerable housing, tenant protections, economic stability supports, and the expansion of social safety net programs, will effectively reduce the number of individuals, families, and communities from falling into homelessness.
By strengthening system capacity, it will significantly reduce the number of people experiencing unsheltered homelessness. As crisis housing options become radically accessible, it will eventually reduce some of the needs for homeless street outreach. Outreach services, when necessary, will be focused on person-centered engagement strategies focused on rapidly ending a person’s housing crisis. If an individual does experience homelessness, there will be effective housing supports in rapid rehousing, permanent supportive housing, and other housing interventions to ensure that they can quickly move into safe, decent, and affordable housing in neighborhoods of their choosing. Through leadership, targeted strategies, and vital advocacy, the system can develop enough affordable units to both prevent and end homelessness.
ACTION AREA 1: STRENGTHEN SYSTEM TO BETTER PREVENT AND END HOMELESSNESS CURRENT RESPONSE
During the analysis of the system structure, stakeholders highlighted challenges in the regionalized and fragmented nature of the system. This was characterized by contradicting approaches to homelessness, geographic challenges, and the inconsistent administration of direct services across each sub-region. This fragmented approach produces challenges for navigating people experiencing homelessness to access
consistent services and supports across the county. Feedback from stakeholders often characterized access to resources as being geographically siloed, with certain regions having critically underdeveloped resources in outreach, shelter, and housing supports.
The inequitable development of services and infrastructure across the system can be attributed in part to certain localities not funding homeless services or housing solutions in their cities. Paired with the increases in people experiencing homelessness, this has led to underdeveloped provider networks and system capacity, placing an inequitable burden on those cities who had invested in such programs or provider networks. The plan’s regional approach will require ongoing partnership with service providers, cities, regional governments, and the County of Riverside.
Stakeholders highlighted that data integration and management is underdeveloped and inconsistently applied across the County of Riverside, creating system challenges for administrators to leverage data and difficulties for clients navigating the system.
The creation of the Housing and Workforce Solutions Department (HWS) has started the process to provide the necessary leadership and structure to coalesce these fragmented approaches into a more unified framework and to develop and uphold community-wide standards. The consolidated department is now better positioned to address other system challenges, like cross-sector alignment, data integration and management, service provider, city, regional government capacity, and regional advocacy.
PROPOSED STRATEGIES
Strategy 1: Strengthen Leadership and Departmental Capacity
Leadership by the Housing and Workforce Solutions Department (HWS) around the five focus areas, and corresponding strategies will be important in achieving many of the goals outlined in this plan. To respond to the massive influxes of new funding from state and federal programs, the CoC will continue to develop service provider, city, and regional government capacity. HWS will further develop its own administrative capacity to support initiatives of the CoC. As leaders of the system, HWS will be responsible for addressing system capacity, evaluation, accountability, and advocacy. A key component of this leadership lies within the alignment of the goals and strategies of the CoC and BoG.
• Instill shared values into CoC culture and work to increase CoC participation
• Gain deeper insight into CoC performance and adopt a continuous improvement framework through the use of data
• Develop system for monitoring progress of Homeless Action Plan and other actions of the CoC

15 / HOMELESS ACTION PLAN
• Continue to streamline the CoC structure & committees in alignment with goals outlined in this Homeless Action Plan
• Leverage political will of regional stakeholders over the adoption of priorities and goals outlined in this Homeless Action Plan
• Develop internal operational capacity to support the influx of new spending related activities like RFP responses, HUD technical assistance, etc.
• Lead cross-sector initiatives around data-sharing and discharge planning
• Lead system mapping and regional coordination
• Spearhead the initiative to transform the county’s data capacity
• Lead in the development of new funding opportunities with private, philanthropic, and public sources, including cross-sector braiding of funding with housing/homeless system resources
• Develop Riverside County CoC Policy Agenda to address items like tenant protections, decriminalization, etc.
• Refine and develop program specific guidance, policies, procedures, and trainings to develop capacity regionally
• Support the enhancement/development of sub-regional infrastructure, specifically in subregions without developed infrastructure, to implement Homeless Action Plan strategies
• Engage cities and tribal lands to implement goals outlined in the Homeless Action Plan
Strategy 2: Improve County’s Ability to Track, Leverage, and Manage Data
Building a complete picture of a client’s movement within the homeless response system will require eliminating data silos. This necessitates greater usage of HMIS/CES across the region and cross-department data sharing with the HWS division. Riverside County CoC will continue to establish processes that allow the CoC to govern and improve data collection practices and evaluation system wide. Data-driven decision-making and strategic use of resources will be essential for transforming our homeless services system.
• Increase the use of HMIS data for evaluating and reporting on program and system outcomes
• Expand system and program level reporting to inform funding and policy decisions
• Ensure that all contracts that fund services to address homelessness require participation in HMIS protocol, trainings, monitoring, and procedures
• Expand services and programs in HMIS so that HMIS is the main repository for all programs addressing homelessness
• Create public-facing dashboards based on the goals outlined in the Homeless Action Plan and System Performance Measures
• Use data to assess the intersectionality of race, ethnicity, disability, gender, and age within the homeless response system across program types to ensure equitable access and delivery of services for overrepresented groups
• Refine mechanisms for improving HMIS data entry and data quality, especially for front-line staff at shelters, day centers, and access centers where client turnover creates challenges for data quality
• Develop mechanisms to track real-time availability of shelter and housing units within the system
• Develop reporting structure to report on key data indicators at sub-regional and city specific level
Strategy 3: Implement Prioritization Framework to Address System Flow
Implementing the strategies of the Homeless Action Plan will involve developing and adopting funding principles and a countywide prioritization framework that are rooted in the five action areas of the plan. Future funded projects will look to be aligned with a best practice model, such as the All Home California’s 1-2-4 Framework1. In order to address system flow, the homeless response system needs to place an emphasis on reducing the inflows into homelessness and increasing the outflows, or exits, from homelessness. Currently, the County of Riverside has a net gain, as inflows are outpacing outflows.
To correct for this system flow gap, the County of Riverside and its partners will reorient the system’s resources and investments to prioritize interventions focused on reducing inflows through prevention activities and increasing outflows to permanent housing, with less prioritization on interventions intended to support interim solutions like emergency shelter. This prioritization framework centers the need to invest in multiple strategies simultaneously while recognizing that there will be regional variation in applying this framework. Some cities or sub-regions that currently have underdeveloped capacity might need to frontload investments in interim solutions, like purchasing motels, while others will orientate their investments in reducing inflows and increasing outflows.
This document does not present specific percentages, proportions, or funding allocations to be assigned to each category, as they are not intended to be fixed, but instead, this framework represents a strategic shift in orientation and investments for all resources that address homelessness and its root causes that prioritize reducing inflows and outflows to end homelessness. The goal of this prioritization framework is to right-size the system flow by decreasing the rate at which people become homeless while reaching equilibrium of interim and permanent housing resources. 1 www.allhomeca.org/regionalactionplan

16 / HOMELESS ACTION PLAN
• Reducing Inflow: Root Causes and Homelessness Prevention
- Curtailing the inflows into the homeless response system will require addressing the root causes of homelessness and preventing new individuals, families, or communities from falling into homelessness.
- Upstreaming solutions by developing equity-centered, regional, and cross-sector collaboration that focuses on preventing people from becoming homeless through homelessness prevention programs, preservation of vulnerable housing and communities, tenant protections, and the production of affordable housing, all of which will begin to address the system flow.
• Increasing Outflow: Housing Solutions and Supportive Services
- Housing solutions with corresponding supportive services rooted in Housing First, like supportive housing, rapid rehousing, and other flexible housing subsidies and supports are necessary tools to end homelessness.
• Supporting Interim Solutions: Interim and Emergency Options
- Supporting the needs of unsheltered people experiencing homelessness will be a critical component to humanely addressing homelessness.
Strategy 4: Utilize Funding Principles Informed by the Prioritization Framework, Provider, City, and Regional Government Performance, and Regional Deficiencies and Needs
When allocating new awards, the Riverside County CoC’s Funding Principles will consider the prioritization framework, provider’s performance, and the gaps in regional deficiencies. The Funding Principles, adopted by the CoC, are attached to each Action Area.
Aligning Funding
Additionally, the Riverside County CoC will work to align funding and strategies across all public sector entities. The system will ensure that public funding aligns with goals and strategies of this plan, will leverage the commitments of private and philanthropic funders, and will align investments to fill gaps and create greater impact. The Riverside County CoC will develop the infrastructure for public and private sectors to come together regularly to discuss funding needs, strategies, and partnerships.
• Map out the number of units/interventions needed for each component of prioritization
• Establish how to quantify and evaluate provider performance
• Identify gaps in regional deficiencies across the system
• Provide technical assistance and training opportunities and adapt program guidelines and guidance
• Expand partnerships with corporations, philanthropic institutions, and individual donors to secure private funding to reduce and prevent homelessness
Strategy 5: Strengthen Coordinated Access
The Riverside County CoC will need to continue to strengthen the Coordinated Entry System (CES) across Riverside County to ensure the system is equipped to correctly identify and prioritize clients for housing and service interventions through a progressive engagement approach.
• Evaluate and refine current system functionality, including access, assessment, prioritization, and matching/referrals to ensure that the system is connecting the highest need, most vulnerable persons in the community to available housing and supportive services equitably
• Conduct an analysis of the VI-SPDAT, highlighting areas of concern around equity, such as racial identity, gender identity, sexual orientation, etc., and identify whether it is the correct assessment tool for Riverside County CoC
• Evaluate, refine, and implement standardized Riverside County CoC CES Policies and Procedures
• Increase housing and program resources connected to CES by targeting and bringing onboard programs and services currently operating outside of CES and HMIS
• Systematize CES reporting, accountability, and evaluation, and align with the Homeless Management Information System (HMIS)
• Integrate cross-departmental referrals into intake processes, like standardized employment readiness assessments that leads to appropriate linkages with employment services or departments
• Integrate case conferencing component within CES
Strategy 6: Enhance Provider, City and Regional Government’s Capacity and System Infrastructure
To address gaps in service provider, city, and regional government’s capacity and system infrastructure, the Riverside County CoC will invest in increasing service provider, city, and regional government’s capacity and system infrastructure in under-resourced regions of the county, addressing the current regionalized response. The County of Riverside will support homeless services providers, cities, and regional governments in building capacity through training, technical assistance, and learning collaboratives. The Riverside County CoC will support cities and regional governments that are investing in the CoC infrastructure by incentivizing city matching funds and city in-kind donations, thereby maximizing Continuum of Care grant investments. Providing this type of support and incentive to cities and regional governments will not only reward those entities

17 / HOMELESS ACTION PLAN
who are investing in addressing homelessness, but it will also encourage other cities to take steps to address the homeless issue.
Improving the service delivery of the region will also require investments in the staff, working to improve the client experience and the health of the system. Staff need to be appropriately compensated, work reasonable hours, and receive regular training. The strains on frontline service provider staff are compounded by the fact that organizations tend to be resource constrained, which limits their ability to hire multidisciplinary teams that could meet the dynamic needs of clients with targeted services. Given these factors, staff turnover is incredibly high, which has a significant impact on the system to deliver services. System and resource knowledge is difficult to develop without consistent staffing, which results in organizations that struggle to maintain consistent procedures, practices, and partnerships, and which do not have the capacity to innovate and improve. An investment in frontline staff, especially staff who have lived experience, is simultaneously an investment in client experience and system performance. Lastly, there needs to be an increase in opportunities to hire individuals with lived experience to bolster relationships and improve service offerings. Career pathways will be developed to provide individuals with lived experience the ability to join the workforce on a provider and administrative level. Recognizing the essential role that frontline staff have in clients’ lives, Riverside County must develop mechanisms to staff up, train, and evaluate to support the needs of clients.
- Explicit emphasis on racial equity and cultural humility
- Workshops to identify common errors and mistakes on CoC Grant Applications
- Workshops to identify common errors and mistakes in performance reports and payment requests
- Presentations before City Councils on best practices, good neighbor strategies, and leveraging city resources with CoC resources
- Developing provider, city, and regional government partnerships to fill gaps, enhance services, and collaborate on grant opportunities
• Increase the capacity of providers to implement tailored services, utilizing progressive engagement and Housing First practices that are flexible and responsive to the needs and priorities of individuals. Ensure support for culture shift for providers
• Strengthen provider tables/forums and create learning collaboratives for more frequent capacity building opportunities
• Promote hiring and retention practices to further diversify system staff at all levels to better reflect populations served. Track results of hiring practices to ensure diversity and inclusion are expanded. Encourage organizations to ensure that diverse staff are not limited to entry-level positions but can access the full range of organizational leadership positions
• Improve investments in workforce development for positions who provide direct homeless services by partnering with universities and community colleges to increase the scale and quality of homeless service workers
Strategy 7: Support Regional, Cross-Sector Alignment and Partnership
As inflows into the homeless response system increase, so does the need for cross-sector components and regional alignment necessary to ending homelessness. When communities reach the limits of their ability to optimize the homeless-service sector, there will still be challenges that stand in the way of ending homelessness. This cross-sector alignment initiative is necessary to curb the inflows of people entering the homeless response system. Cross-sector initiatives with healthcare, behavioral/mental health, substance use disorder, criminal justice, child welfare, juvenile justice, education, immigration, employment, land use, and code enforcement will be developed with the goal of seeking to end a person’s housing crisis before it begins. These will be based on targeted measures for early identification, effective discharge planning, and rapid supports when someone faces housing instability.
Riverside County will push to align procurement priorities, goals, deliverables, and timelines according to cross-system or multi-jurisdictional policy priorities and to
• Support service provider expansion to strengthen regional deficiencies
• Develop/Refine CoC community standards/program guidelines for all program types
• Enhance reporting and monitoring procedures to track and support provider performance
• Develop training strategies to improve provider, city, and regional government’s capacity. Identify training requirements and required competencies. Training strategies include but are not limited to:

18 / HOMELESS ACTION PLAN
develop and institutionalize mechanisms to inform and shape cross-system, multi-jurisdictional policies, and priorities. The Riverside County CoC will work to align funding across sectors.
The Riverside County CoC will look to support shared frameworks and data sharing agreements to align metrics that are centered on customer experience, outcomes, and cross-system policy priorities. Riverside County CoC will work to transform the homeless response system, by integrating data with cross-sector partners with the goal of building a client facing data collection infrastructure anchored by a unique identifier. Riverside County CoC will facilitate working groups that aim to develop the technology to interface with cross-departmental agencies.
• Facilitate working groups around cross-sector/departmental/multi-jurisdictional collaboration
• Ensure that each sub-region in Riverside County has an effective regular meeting structure around issues related to homelessness aligned with the Riverside County CoC
• Implement unified approach for tracking homelessness across mainstream, cross-sector systems that touch or serve a large proportion of homeless residents and identify ways to “flag” homelessness and respond to “flags” in departmental data systems by rapidly connecting clients to housing and supportive services
• Identify the feasibility, costs, and legality of integrating and sharing data across disparate systems like healthcare, behavioral/mental health, substance use disorder, criminal justice, child welfare, juvenile justice, education, immigration, employment, land use, and code enforcement
• Develop plans to address the feasibility, costs, and legality of integrating and sharing data across systems towards a central data lake that could spur new opportunities in machine learning and client ownership of data
• Develop standardized screening tools and related protocols for identifying needs across systems and connecting individuals to the right community-based services
• Align strategic planning efforts, task force initiatives and planning committees across all system partners, including all counties, cities, faith communities, philanthropic and business sectors
• Identify internal staff responsible for cross-sector data sharing
• Investigate ways to improve client care coordination through multidisciplinary teams that include the healthcare, mental, and behavioral health sectors
• Strengthen partnerships with the state to increase access to healthcare and supportive services. Improve data sharing across providers, cities, regional governments, and systems to facilitate continuity of care and integrated service delivery
Strategy 8: Refine Communications Efforts Around Homelessness in Riverside County
An important part of the homeless response will be obtaining the necessary buy-in from the public around the efforts that Riverside County CoC is taking to prevent and end homelessness. Due to the visibility of unsheltered street homelessness and encampments, it is important to proactively engage the public around the challenges, activities, and implementations of homeless programs and resources.
• Provide regular, coordinated public communication to inform the public about actions underway, results achieved, and ways to support those efforts
• Prepare public-facing educational materials and articles based on data and information to educate the public on challenges and activities, and to provide updates on the implementation of programs and resources
• Create public facing dashboards around performance toward achieving adopted goals
• Designate a CoC spokesperson/PR representative to manage CoC communications
• Expand public and private sector support for ending and preventing homelessness through increased community engagement. Create a business leaders task force to establish goals and strategies for the business community to support the strategic plan. Areas of focus for the task force could include fundraising, advocacy, job creation, and housing access
• Create a countywide education/PR campaign/communication strategy that increases awareness about the causes and impacts of homelessness, the ongoing efforts to end homelessness, and addressing NIMBYism concerns
• As a part of a communications strategy, invest in a client facing component that targets those experiencing or at-risk of homelessness through robust multi-media strategies to make access to services intuitive and radically accessible
• Develop opportunities to include the voices of those with lived experience
• Provide opportunities for action and compassion among all residents, housed and homeless, through advocacy, volunteerism, donations, and other initiatives
• Increase community engagement and support for affordable and supportive housing development throughout Riverside County

19 / HOMELESS ACTION PLAN
• Increase the visibility and expand the efforts of successful initiatives that engage faith institutions and individual congregants; initiatives could include advocacy, recruitment of landlords, and hosting of day centers, meals, shelter, and encampments
Strategy 9: Expand Accountability to Clients
True accountability to clients will be rooted in increasing client autonomy in decision-making. Currently, clients do not have a role in determining their own service paths or in shaping the system. System transformation requires that clients have power throughout the system to ensure the services, approaches, and outcomes meet their stated needs. To become accountable to clients, the Riverside County CoC must establish system-wide structures and processes to prioritize client feedback as primary data points in the system. That process should be facilitated by a digital transformation process that makes it easier to integrate client data across services and systems to improve experience, coordination, and the ability of system administrators to identify and respond to strengths and weaknesses. This shift to client-centric metrics will represent an important change in how quality and success are measured in this system and bring it closer to representing the realities that clients experience.
• Develop processes and technology for clients to provide feedback on services, with mechanisms to apply feedback data toward service delivery and process improvement
• Continue to develop a system where client choice is paramount
• Ensure that new and existing programs develop within this new framework
• When developing cross-sector data sharing, center the efforts on the benefits to the client experience for people experiencing homelessness
• Work with data team to continue to adopt client-centric metrics
• Provide technical assistance and training opportunities, and adapt program guidelines and guidance
Strategy 10: Develop Lived Experience Knowledge, Leadership, and Decision-Making
Riverside recognizes that integrating the voices of those with lived experience in decision making processes is necessary to developing an effective, person-centered system.
• Actively develop opportunities for persons with lived experience to participate in the development and implementation of regional and sub-regional plans
• Expand the hiring of people with lived experience in regular staff positions (not just peer support roles), and promote leadership development for people with lived experience
• Develop peer certification trainings to prepare individuals for peer support positions in the homeless service system
• Encourage service providers to modify requirements for specific positions to allow the substitution of lived experience in place of education or work experience
• Explore the benefit and feasibility of creating a Lived Experience Advisory Board
Strategy 11: Center Race Equity in Homeless Response
The Riverside County CoC will continue to strengthen a race equity focused response. As the data suggests, Black, Indigenous and People of Color (BIPOC) are significantly overrepresented in the homeless population, a legacy of historical and contemporary structural racism. The homeless response system also plays a role in perpetuating inequities in service provision, access, and mobility. We will continue to center race equity in the homeless response, disaggregate data to better develop solutions, and look upstream at the inflows and structural roots of homelessness. To achieve goals, we will apply a targeted universalism approach, which will set universal goals pursued by targeted processes for specific groups to achieve those goals. Through these strategies we will rebuild the homeless response system to be anti-racist, to ensure all people, especially people of color, have equitable access and opportunity.
• Embed a racial equity lens into all homelessness and housing decisions
• Develop a racial equity impact assessment that will forecast and assess the impacts of new programs and funding decisions
• Incorporate a focus on racial equity data, analysis, and planned activities when submitting and reviewing applications for funding
• Utilize HMIS to analyze data and create public-facing dashboards around racial inequities in experiences of homelessness, provision of services, and outcomes
• Analyze whether housing outcomes and placements perpetuate residential segregation
• Adapt program guidelines, policies, procedures focused on racial equity
• Incorporate a focus on racial equity data, analysis, and planned activities within applications for CoC funded projects and analyze the data and information gathered in response
• Create a plan to move forward on racial equity work that will include system and programmatic actions
• Institute standardized cultural humility, trauma informed care, and anti-racist trainings for CoC programs and system partners
• Align racial equity work in the homelessness sector with other racial equity initiatives in Riverside County

20 / HOMELESS ACTION PLAN
PERFORMANCE METRICS
STRATEGY PERFORMANCE METRICS MECHANISMS
SYSTEM PERFORMANCE MEASURESStrategy 5: Strengthen Coordinated Access Number days between referral and contact
Various HUD reporting tools – System Performance Measures Report, Longitudinal Systems Analysis, Stella, and others
Riverside County CoC Public Data Dashboards
Strategy 5: Strengthen Coordinated Access Length of stay in shelter or street
Strategy 2: Improve County’s Ability to Track, Leverage, and Manage Data
Number of System Performance Measures/goals of Homeless Action Plan reflected in public facing dashboards
Strategy 2: Improve County’s Ability to Track, Leverage, and Manage Data
Strategy 11: Center Race Equity in Homeless Response
Number of programs with demographic data disaggregated in public facing dashboards
Strategy 9: Expand Accountability to Clients Client program satisfaction results
Strategy 3: Implement Prioritization Framework to Address System Flow
Total number of people entering homeless each month
Strategy 3: Implement Prioritization Framework to Address System Flow
Total number of people exiting to housing each month
Strategy 3: Implement Prioritization Framework to Address System Flow
Total active people experiencing homelessness each month
HOUSING INVENTORY MEASURES
Strategy 2: Improve County’s Ability to Track, Leverage, and Manage Data
Real time shelter and housing unit inventory reflected in public facing dashboards
Annual Housing Inventory Count Report, Regional Housing Need Assessment, and other real-time housing inventory tracking mechanisms
PROCESS MEASURESStrategy 5: Strengthen Coordinated Access Functionality of Coordinated Entry System
Various Riverside County and Riverside County CoC process reporting tools. Some process measures will likely need to include the creation of new tools and reporting mechanisms
Strategy 5: Strengthen Coordinated AccessEffectiveness of access, assessment, prioritization, and matching/referrals
Strategy 5: Strengthen Coordinated Access
Strategy 6: Enhance Provider, City, and Regional Government Capacity and System Infrastructure
Number of programs/services adhering to Riverside County CoC CES Policies and Procedures
Strategy 2: Improve County’s Ability to Track, Leverage, and Manage Data
Strategy 6: Enhance Provider, City, and Regional Government Capacity and System Infrastructure
Percentage of programs/services integrated within CES and HMIS
Strategy 7: Support Regional, Cross-Sector Alignment and Partnership
Number of mainstream/cross-sector systems with data sharing agreements or integrations with homeless response system
Strategy 7: Support Regional, Cross-Sector Alignment and Partnership
Number of mainstream/cross-sector systems utilizing developed homeless tracking metrics
Strategy 6: Enhance Provider, City, and Regional Government Capacity and System Infrastructure
Number of/participation trainings, learning collaboratives, provider forums provided
Strategy 6: Enhance Provider, City, and Regional Government Capacity and System Infrastructure
Program staffing/Caseload ratio per program, Increase provider, city, and regional government capacity
Strategy 10: Develop Lived Experience Knowledge, Leadership, and Decision-Making
Strategy 11: Center Race Equity in Homeless Response
Percentage of CoC and service provider staff with Black, Indigenous and People of Color and people with Lived Experience
Strategy 1: Strengthen Leadership and Departmental Capacity
Strategy 7: Support Regional, Cross-Sector Alignment and Partnership
Number of new positions created in response to Homeless Action Plan, especially around cross-sector alignment, and partnership

21 / HOMELESS ACTION PLAN
PROCESS MEASURES CONTINUEDStrategy 1: Strengthen Leadership and Departmental Capacity
Strategy 8: Refine Communications Efforts Around Homelessness in Riverside County
Riverside County CoC Policy Agenda
Various Riverside County and Riverside County CoC process reporting tools. Some process measures will likely need to include the creation of new tools and reporting mechanisms
Strategy 3: Implement A Prioritization Framework to Address System Flow
Strategy 4: Utilize Funding Principles Informed by the Prioritization Framework, Provider, City, and Regional Government Performance, and Regional Deficiencies and Needs
Allocation of Riverside County CoC Awards reflecting units of “Reducing Inflow”, “Increasing Outflow”, and “Supporting Interim Solutions”
Strategy 1: Strengthen Leadership and Departmental Capacity
Strategy 4: Utilize Funding Principles Informed by the Prioritization Framework, Provider, City, and Regional Government Performance, and Regional Deficiencies and Needs
Number of new opportunities generated through private and philanthropic funding
Strategy 7: Support Regional, Cross-Sector Alignment and Partnership
Number of active cross-sector or regional working groups/partnerships
Strategy 11: Center Race Equity in Homeless Response
Number of awarded programs/projects that address racial equity
Strategy 11: Center Race Equity in Homeless Response
Number of Riverside County CoC Policy and Procedures that address racial equity
Strategy 8: Refine Communications Efforts Around Homelessness in Riverside County
Effectiveness of PR/Communication Campaign
FIVE YEAR GOALS
The following Five-Year Goals will be tracked utilizing various existing and new reporting tools. These tools may include but are not limited to: HUD Reporting Tools, Point in Time Count, System Performance Measures, Longitudinal Systems Analysis, Stella, Riverside County CoC Public Data Dashboards, Annual Housing Inventory Count, Regional Housing Need Assessment, other real-time housing inventory tracking mechanisms, and County and Riverside County CoC process reporting tools.
• Total number of people successfully exiting to housing each month/year exceeds the people entering homelessness each month/year
• 100% of the programs/services adhere to CES Policies and Procedures
• 100% of programs/services are integrated within CES and HMIS
• 50% reduction in the length of stay (SO, ES, SH, TH)
• System Performance Measures are reflected in public facing dashboards
• 100% of data reports, dashboards, etc. have data disaggregated demographically
• Disparities of Black, Indigenous and People of Color (BIPOC) experiencing homelessness are reduced across all program types
• Riverside County CoC has increased the number of active partnerships with cross-sector/mainstream systems
• 100% of identified cross-sector/mainstream systems utilize developed homeless tracking metrics and processes
• Riverside County CoC has an effective provider training, learning collaborative, provider forum schedule in place to develop service provider capacity regionally
• Riverside County CoC has adopted Policy Agenda
• Riverside County CoC tracks client program satisfaction results and uses them to inform decision making
• Increases in Riverside County CoC staff that have lived experience and/or are Black, Indigenous and People of Color (BIPOC)
• 100% of awarded projects address racial equity disparities
• 100% of CoC staff and service providers are trained in cultural humility, trauma-informed care, and anti-racist trainings
• Riverside County CoC Framework implemented to right-size system flow

22 / HOMELESS ACTION PLAN
FUNDING PRINCIPLES
• Invest in strategies and programs that support the Homeless Strategic Action Plan, emphasizing the expansion of system coordination, housing resources, outreach, navigation, and supportive services and provider, city, regional government, and system capacity
• Invest in programs that demonstrate ongoing, long-term, or sustainable data-informed results that are consistent with benchmarks established in the Homeless Strategic Action Plan
• Utilizing a data-driven approach (HMIS, annual Point-In-Time Count, System Performance Measures, and CES By-Name List), invest in programs addressing significant service gaps and priority needs by targeting high-need communities, under-served or hard to-serve geographic areas, or special subpopulations, such as the chronically homeless, individuals with mental illness and substance use disorders, older adults/seniors, and Transitional Age Youth (TAY)
• Strengthen equity-focused strategies, programs, and partnerships that reduce racial disparities, support equitable access to services and resources, and produce equitable outcomes and communities
• Advance client-centered strategies, programs, and partnerships that are informed by people with lived experience of homelessness and provide legitimate feedback mechanisms for clients experiencing homelessness
• Support strategies to address regional inequities in homeless response infrastructure, approaches, and service delivery capacity. These include adopting and implementing regional planning, coordination, decision-making, data-sharing, and accountability measures
ACTION AREA 2: EQUITABLY ADDRESS THE HEALTH, SAFETY, AND SERVICES NEEDS OF PEOPLE EXPERIENCING UNSHELTERED HOMELESSNESS CURRENT RESPONSE
Stakeholder feedback from the Needs Assessment and Gaps Analysis of the County of Riverside highlighted differing regional approaches to outreach and engagement, with some regions utilizing more enforcement approaches and others implementing more engagement approaches. Enforcement approaches often highlighted a shortage of homeless street outreach services and/or mental and behavioral health services, which results in law enforcement needing to respond to homeless related crises. People experiencing homelessness have far more positive outcomes when engaging with homeless street outreach teams and mental health crisis intervention teams than with law enforcement. This emphasizes the need to further invest these resources and increase the shift to the decriminalization of the homeless response.
Stakeholders highlighted various challenges for people experiencing unsheltered homelessness. The most common challenge reported was the lack of sufficient low-barrier shelter options across the county. In certain regions of the county, there are underdeveloped shelter response systems often resulting in the misalignment of core homeless outreach duties, like shelter service connection to law enforcement. This dynamic places an inequitable burden on communities who already have shelters in their communities. Second, outreach service capacity needs to be expanded across the county to cities that are currently under resourced. While services need to be expanded, this also calls for the need to develop more uniform standards and operating procedures for outreach and engagement across the county, which shifts the responsibilities currently held by law enforcement in certain cities to homeless street outreach teams and mental health response teams. Shifting the entity responding to homeless related issues would be a continued step in decriminalizing the response to homelessness. The complexities of outreach and engagement often come to a point when responding

23 / HOMELESS ACTION PLAN
to encampments, which vary significantly from region to region, encampment to encampment. There currently is not a unified approach to encampment management.
Additionally, accessing services can be difficult for people experiencing unsheltered homelessness, as shelter programs in various parts of the county often require a referral from an organization. The HMIS Administrators Council and CES Oversight Committee have adopted a hybrid “No Wrong Door Approach”. Based on the stated procedures of the current system, a homeless individual or family can present at any homeless, housing, and service provider in the geographic area or by accessing a mobile hotline. The CES Lead Agency also highlighted that they have trained Navigators to assist those presenting at any access point within the geographic area. Despite these systems and processes in place, however, stakeholders repeatedly highlighted in interviews the challenges in accessing shelter beds. Keeping staff informed and trained on access to various programs can be difficult given the regionalization, high turnover among frontline staff, and changes in the processes. This lack of consistent and clear flow on how to access the services of the system puts the burden of navigating shelter and housing programs on individuals experiencing homelessness.
There is a need to streamline connection to other vital services, including but not limited to: nutrition assistance, hygiene assistance, substance abuse care, transportation assistance, identification support, income, and benefits support.
PROPOSED STRATEGIES
Strategy 12: Increase Regional Capacity of Homeless Street Outreach
As highlighted above, there are certain regions with underdeveloped homeless street outreach networks. This has led to fragmented outreach responses that are more enforcement focused in some areas and more engagement focused in other areas. The Riverside County CoC will further enhance countywide street outreach services by addressing the gaps in regional variation to create a unified approach centered around engagement, connection to services, harm reduction strategies, and addressing the health, safety, and service needs for people experiencing unsheltered homelessness.
We know that the longer people remain unhoused, the more it negatively effects their physical and mental health, employability, and connection with support networks. One of the key system components for outreach services is to diminish the inflows into chronic homelessness and long-term homelessness. Establishing consistent outreach across the county will reduce the need for more intense housing interventions. The Riverside County CoC will establish a proactive, non-punitive, engagement focused, countywide response to homeless street outreach that focuses on reducing
entries into chronic homelessness and increasing street to housing placements.
• Create CoC Homeless Street Outreach Protocol with regional stakeholder that include the standardization of outreach practices, schedules, and engagement strategies and corresponding training across all outreach efforts
• Establish outreach coordination infrastructure in each sub-region
• Leverage person-centered, housing-focused case management with enhanced training in evidence based best practices (e.g., trauma-informed care, critical time intervention, motivational interviewing, and housing first strategies) for service delivery
• Develop encampment management and resolution policies
• Increase access and safety for all to basic hygiene resources, such as bathrooms, showers, and laundry, that accommodate their self-identified race, gender identity, gender expression, etc.
• Increase the number of free public transportation options for people who are unhoused to access services
• Expand the number of outreach teams and staff to ensure appropriate coverage to all sub-regions throughout the county, with specific emphasis on under-resourced communities
• Further develop data initiatives to better track, target, and ensure comprehensive, efficient, and effective delivery of outreach and permanent housing assistance for people experiencing chronic homelessness
• Connect unsheltered individuals directly with rental assistance with the understanding that shelter or transitional housing is not a requirement for unsheltered individuals working with outreach teams to qualify for rental assistance
• Develop programs that support frequent users of public systems, including hospitals, jails or prisons, and shelters, and provide them with supportive housing, significantly reducing returns to the streets
• Develop systems for mental health professionals to intervene in place of law enforcement
• Identify technological strategies to enhance street outreach coordination
Strategy 13: Support the Health of People Experiencing Unsheltered Homelessness through Cross-Departmental/Cross-Sector Supports
Meeting the health needs of people experiencing unsheltered homelessness will require increased behavioral health, mental health, and substance use disorder services and housing supports from Riverside County and its partners. The Riverside County CoC will need to leverage

24 / HOMELESS ACTION PLAN
cross-departmental/cross-sector collaboration to address regionalized service gaps for individuals with conditions related to physical health, Serious Mental Illness (SMI), and Substance Use Disorder (SUD).
• Identify strategies to improve ongoing connectivity for clients referred for mental health services and/or substance use services
• Support communities in implementing multi-agency, multi-jurisdictional outreach and protective measures addressing the health and safety needs of people experiencing unsheltered homelessness
• Increase the number of mobile crisis teams with clinical staff and expand their hours to support individuals experiencing severe mental health and substance use crises
• Increase the number of beds available for substance use treatment and provide the follow-up supportive services needed to prevent relapses
• Increase access to mental health treatment for people who are unhoused and struggling with mental illness
• Develop a plan to eliminate service access and treatment gaps for unsheltered people struggling with chronic and severe mental illness
• Improve health access for people experiencing unsheltered homelessness, including through CalAIM services like Enhanced Care Management and In Lieu of Services
• Develop new, and enhance existing, partnerships between behavioral health and social service providers, neighborhood associations, cities, and regional governments, including law enforcement and other first responders. Engage partners in proactive strategies that link individuals who are homeless with housing and services with the additional goal of reducing criminal justice system involvement
• Ensure adequate resources are available for proactive and consistent outreach efforts
• Develop multi-disciplinary teams that include homeless street outreach, mental health services, etc.
• Ensure people living outside have adequate access to basic needs
• Engage regional stakeholders to ensure appropriate responses to persons living in vehicles and to ensure adequate safe zones for people to park and receive services while working towards housing
Strategy 14: Improve Access for People Experiencing Homelessness
The Riverside County CoC currently utilizes a hybridized “No Wrong Door Approach,” meaning that a homeless individual or family can present at any homeless housing and service provider in the geographic area or by accessing a mobile hotline. A decentralized system is often difficult to navigate for individuals newly experiencing
homelessness and makes administering prevention assistance challenging. The number of locations, the varied regional capacities, and the different agencies conducting intakes and providing orientation to the system often results in discrepancies, compromised data, and a wide range of client experiences. The Riverside County CoC will need to continue to refine its hybridized “No Wrong Door Approach,” establishing access centers across the region to serve as key nodes, or front doors, within the system. The Riverside County CoC will work to establish system access that is radically accessible to all.
• Refine hybridized “No Wrong Door Approach” by establishing Access Centers/Navigation Centers in key subregions that are focused on providing access to services with a focus on connecting to housing
• Enhance training, standard orientation messaging, and client facing materials to help people experiencing or at-risk of homelessness understand what services and resources are available to them and what the process looks like to access services/housing across the CoC
• Develop a culture of housing-focused problem-solving across all programs that serve as access points (outreach, drop-in centers, access centers, navigation centers, etc.)
• Streamline intake processes for individuals and families experiencing homelessness, including a review of the desirability of the VI-SPDAT through the lens of equity
• Improve protocols for prioritization into emergency shelter, interim housing, medical respite, etc. to ensure that bed availability is real-time
• Improve roles and responsibilities for assisting clients in obtaining housing-related documentation, like IDs, social security cards, proof of income, birth certificates, etc.
• Implement diversion/problem-solving conversations at all points of entry
Strategy 15: Develop Countywide Encampment Management Protocols
As part of the development of Homeless Street Outreach Protocols, the Riverside County CoC will need to develop a Countywide Encampment Management Protocol. This will include best practices in encampment management and person-centered approaches.
• Enhance coordination between agencies engaging people living in encampments to ensure consistent and humane approaches to encampment resolution across the county
• Coordinate between department and agencies to create a coordinated encampment management strategy
• As part of CoC Homeless Street Outreach Protocol, establish guidance on Encampment Management and Resolution Protocols

25 / HOMELESS ACTION PLAN
• Engage cities and other local government entities to utilize encampment guidance of CoC Homeless Street Outreach Protocol
Strategy 16: Support the Decriminalization of Homelessness
As part of the Riverside County CoC’s commitment to racial equity and a person-centered approach, the Riverside County CoC will also support policies that move towards the decriminalization of homelessness. Black, Indigenous and People of Color (BIPOC) are disproportionately affected by homelessness and are disproportionately represented in the criminal justice system. Moving towards a decriminalized system will decrease the likelihood of further trauma, decrease time spent outdoors, and reduce criminal charges that are often barriers to housing, employment, and other resources. Not prosecuting chronically or unsheltered homeless people for minor offenses reduces the likelihood that police officers and other system officials will attempt to arrest or institutionalize people experiencing unsheltered homelessness and may reduce interactions between police and people experiencing homelessness overall. Homeless Courts are also another key strategy to resolve these barriers through voluntary, individualized action to satisfy fines, fees, and case dismissal. The County of Riverside should continue to push for alternatives to criminalization policies that are focused on engagement and housing.
• Develop Homeless Street Outreach Protocols to compliment decriminalization advocacy
• Advocate for decriminalizing homelessness responses across the county and state that include pre-adjudication and sentencing alternatives to minimize involvement of people experiencing homelessness in criminal justice system
• Develop processes to ensure greater collaboration between judicial agencies and local alternative courts like Homeless Court and pre-booking diversion resources
• Ensure that Riverside County does not disproportionately enforce existing county ordinances against homeless individuals and families
• Develop an inclusive approach to public space management with non-punitive policies
Strategy 17: Develop Training for First Responders
First responders, like emergency medical services, fire, and law enforcement, frequently respond to homeless related emergencies. In moving towards a responsive, engagement-focused outreach system, the Riverside County CoC will also need to engage and train first responders in integrating evidence based best practices (e.g., trauma-informed care, critical time intervention, motivational interviewing, and housing first strategies) for service delivery. The Riverside County CoC will work in partnership with first responders to develop
targeted trainings and protocols for first responders when engaging people experiencing unsheltered homelessness on streets or encampments.
• Co-develop protocol for first responders when engaging people on the streets and encampments with key considerations when engaging with key subpopulations (survivors of domestic violence, individuals with Severe Mental Illness (SMI) or Substance Use Disorder (SUD), Transitional Aged Youth (TAY), older adults/seniors, and dependent adults)
• Ensure that the first responder training and protocol is in alignment with CoC initiated Homeless Outreach Strategy and Encampment Protocols
• Co-design and implement outreach training for first responders that focuses on evidence based best practices in homeless street outreach and service coordination
Strategy 18: Establish Key Resources for Special Populations Experiencing Unsheltered Homelessness
There are specific subpopulations of people experiencing unsheltered homelessness that will need additional considerations and resources to address their health, safety, and service needs. This will include unsheltered chronically homeless, individuals with Severe Mental Illness (SMI), individuals with Substance Use Disorder (SUD), Transitional Aged Youth (TAY), high utilizers of emergency services, survivors fleeing domestic violence, families, and older adults/seniors.
• Refine specific policies and procedures as it relates to needs of unsheltered chronically homeless
• Refine specific policies and procedures as it relates to needs of unsheltered individuals with Severe Mental Illness (SMI)
• Refine specific policies and procedures as it relates to needs of unsheltered individuals with Substance Use Disorder (SUD)
• Refine specific policies and procedures as it relates to needs of unsheltered Transitional Aged Youth (TAY).
• Refine specific policies and procedures as it relates to needs of unsheltered high utilizers of emergency services
• Refine specific policies and procedures as it relates to needs of unsheltered survivors fleeing domestic violence
• Refine specific policies and procedures as it relates to needs of unsheltered families
• Refine specific policies and procedures as it relates to needs of unsheltered older adults/seniors
• Refine specific policies and procedures as it relates to needs of unsheltered LGBTQIA+ individuals

26 / HOMELESS ACTION PLAN
PERFORMANCE METRICS
STRATEGY PERFORMANCE METRICS MECHANISMS
SYSTEM PERFORMANCE MEASURESStrategy 12: Increase Regional Capacity of Homeless Street Outreach
Strategy 18: Establish Key Resources for Special Populations Experiencing Unsheltered Homelessness
Number of people experiencing unsheltered homelessness at a point in time and month to month, including key subpopulations
Various HUD reporting tools – System Performance Measures Report, Longitudinal Systems Analysis, Stella, and others
Riverside County CoC Public Data Dashboards
Strategy 12: Increase Regional Capacity of Homeless Street Outreach
Strategy 13: Support the Health of People Experiencing Unsheltered Homelessness through Cross-Departmental/Cross-Sector Supports
Strategy 14: Improve Access for People Experiencing Homelessness
Length of time a person remains homeless (street and shelter)
Strategy 12: Increase Regional Capacity of Homeless Street Outreach
Successful placement from Street Outreach
Strategy 12: Increase Regional Capacity of Homeless Street Outreach
Number of permanent housing placements from Street Outreach
Strategy 12: Increase Regional Capacity of Homeless Street Outreach
Number of successful contacts with people experiencing unsheltered homelessness
Strategy 15: Develop Countywide Encampment Management Protocols
Number of encampments
Strategy 12: Increase Regional Capacity of Homeless Street Outreach
Number of people entering into chronic homelessness
Strategy 12: Increase Regional Capacity of Homeless Street Outreach
Geographic distribution of people experiencing unsheltered homelessness (including encampments)
Strategy 18: Establish Key Resources for Special Populations Experiencing Unsheltered Homelessness
Number of people experiencing unsheltered homelessness discharged from mainstream institutions or re-entering from homeless response system.
Strategy 14: Improve Access for People Experiencing Homelessness
Geographic distribution of housing access in to CES
Strategy 14: Improve Access for People Experiencing Homelessness
Demographics of people experiencing homelessness utilizing access and outreach services
PROCESS MEASURESStrategy 12: Increase Regional Capacity of Homeless Street Outreach
Geographic distribution and make-up of homeless street outreach teams/programs
Various Riverside County and Riverside County CoC process reporting tools. Some process measures will likely need to include the creation of new tools and reporting mechanisms
Strategy 16: Support the Decriminalization of Homelessness
Strategy 17: Develop Training for First Responders
Number of emergency calls, citations, arrests made by law enforcement for homeless related disturbances.
Strategy 18: Establish Key Resources for Special Populations Experiencing Unsheltered Homelessness
Number of successful referrals to support services (mental health, employment, hygiene, nutrition, etc.)

27 / HOMELESS ACTION PLAN
FIVE YEAR GOALS
The following Five-Year Goals will be tracked utilizing various existing and new reporting tools. These tools may include but are not limited to: HUD Reporting Tools, Point in Time Count, System Performance Measures, Longitudinal Systems Analysis, Stella, Riverside County CoC Public Data Dashboards, Annual Housing Inventory Count, Regional Housing Need Assessment, other real-time housing inventory tracking mechanisms, and County and Riverside County CoC process reporting tools.
• 50% reduction in the number of people experiencing unsheltered homelessness at a point in time and month to month, including key subpopulations across all regions
• 50% reduction in the length of stay (SO, ES, SH, TH)
• 50% increase in successful housing placement from street outreach
• 25% reduction in the number of emergency calls, citations, arrests made by law enforcement for homeless related disturbances
• 75% reduction in the number of people experiencing unsheltered homelessness discharged from institutions or re-entering from the homeless response system
• Resources are uniformly accessible across Riverside County regardless of sub-region or client demographics, reflected in CES access data
• 50% increase in successful street outcomes
• Riverside County CoC has adopted Homeless Street Outreach Protocol, including First Responder Training and Encampment Management
FUNDING PRINCIPLES
• Invest in multi-agency, multi-jurisdictional solutions to address the health, safety, and housing needs of people experiencing unsheltered homelessness and staying in encampments.
• Participate in the development of CalAIM initiatives that seek to extend a whole person care approach through the Enhanced Care Management and In Lieu of Services to serve people experiencing unsheltered homelessness.
ACTION AREA 3: EXPAND COMMUNITIES CAPACITY TO PROVIDE SAFE AND EFFECTIVE SHELTER AND INTERIM HOUSINGCURRENT RESPONSE
Presently there are not enough year-round beds in the Riverside Homeless Response system to provide adequate temporary shelter or interim housing to people experiencing unsheltered homelessness. This was supported by data reflected in Housing Inventory Count and HMIS data underline the increase in unsheltered homelessness.
Stakeholder reported the shelter and interim housing options available as being inaccessible and hard to navigate for people experiencing homelessness. In addition to the system fragmentation, other stakeholders described the inaccessibility reflected in the policies of shelters themselves that place additional barriers on people experiencing homelessness, such as no accommodations for couples, no pets allowed, or curfews.
The COVID-19 pandemic brought new challenges to the region’s shelter response. Despite these challenges, however, stakeholders highlighted successes that can be expanded on. The region was able to leverage state-level resources, like Project Roomkey and Project Homekey, to secure hotel and motel rooms for vulnerable people experiencing homelessness. Because of these innovative programs, providers noted that there was an increase in the capacity of low barrier non-congregate shelter options for people experiencing homelessness. With the threat of the pandemic on people experiencing homelessness, there was increased collaboration and problem solving between various agencies to get those most vulnerable into shelter.
PROPOSED STRATEGIES
Strategy 19: Increase the Number of Crisis Housing Beds Regionally
In order to meet the needs of people experiencing unsheltered homelessness, the Riverside County CoC will need to expand the number of crisis housing beds across the region. Through various funding sources and models, including new CalAIM programs and Project Homekey 2.0, the Riverside County CoC will need to increase the number of crisis housing (ES, SH, TH) units to meet the

28 / HOMELESS ACTION PLAN
system needs. As described earlier, to reduce the entries into chronic/long-term homelessness, which is more costly, the Riverside County CoC will ensure coordinated access and a housing focus to ensure throughputs into the system.
• Create more crisis housing, which includes emergency shelter, interim housing, medical respite, domestic violence shelters, faith-based shelters, family shelters, transitional housing, stabilization beds, recuperative care beds, and motel vouchers to meet the specific needs by population and region
• Develop and advance CalAIM proposals seeking to extend statewide the service options available under Whole Person Care and Health Homes Program through the Enhanced Care Management program and In Lieu of Services care coordination and housing services to better address the health care needs of people who are staying in shelter and interim housing sites
• Ensure that there are more public services in neighborhoods developing crisis housing to meet community needs
• Ensure that crisis housing account for the unique needs of specific subpopulations
• Mobilize Homekey resources and other funding sources to support acquisition of sites for use as crisis housing
Strategy 20: Refine Crisis Housing Policies and Procedures
The Riverside County CoC will further refine the policies and procedures of crisis housing, which includes emergency shelter, interim housing, medical respite, domestic violence shelters, faith-based shelters, family shelters, transitional housing, and motel vouchers to be radically accessible, low-barrier, and housing focused. The Riverside County CoC will assess the current state of crisis housing, reform policies and procedures, build capacity in certain regions, and develop real-time bed availability.
• Assess crisis housing coordinated entry and referral patterns to identify regional gaps and under resourced crisis housing capacity
• Ensure that shelter access is equitable through review of data
• Refine best practices for crisis housing that focus on accessibility and are low barrier. Barriers can include lack of privacy, sobriety, curfews, engaging in treatment, animal policy, storage, couples, people of non-binary gender identity
• Move towards a system where shelters are open 24/7
• Establish system wide procedures to track and utilize real-time crisis housing bed availability
• Assess and refine policies and procedures to ensure that crisis housing is centered on housing-focused problem-solving
• Provide technical assistance and guidance that will support the continued application of Housing First practices, including lowered barriers and housing-focused services and supports, within shelter and interim housing programs
• Ensure that policies and procedures account for the unique needs of specific subpopulations: Transitional Aged Youth (TAY), high utilizers of emergency services, survivors fleeing domestic violence, families, and LGBTQAI+

29 / HOMELESS ACTION PLAN
PERFORMANCE METRICS
STRATEGY PERFORMANCE METRICS MECHANISMS
SYSTEM PERFORMANCE MEASURESStrategy 19: Increase the Number of Crisis Housing Beds Regionally
Strategy 20: Refine Crisis Housing Policies and Procedures
Number of people experiencing sheltered homelessness at a point in time and month to month, including key subpopulations
Various HUD reporting tools – System Performance Measures Report, Longitudinal Systems Analysis, Stella, and others
Riverside County CoC Public Data Dashboards
Strategy 19: Increase the Number of Crisis Housing Beds Regionally
Strategy 20: Refine Crisis Housing Policies and Procedures
Demographics of people utilizing crisis housing options
Strategy 19: Increase the Number of Crisis Housing Beds Regionally
Strategy 20: Refine Crisis Housing Policies and Procedures
Length of time a person remains homeless (ES, SH, TH)
Strategy 19: Increase the Number of Crisis Housing Beds Regionally
Strategy 20: Refine Crisis Housing Policies and Procedures
Number of successful housing placements from crisis housing
Strategy 19: Increase the Number of Crisis Housing Beds Regionally
Strategy 20: Refine Crisis Housing Policies and Procedures
Percent of returns to homelessness in 6, 12, and 24 months for people connected to crisis housing
Strategy 19: Increase the Number of Crisis Housing Beds Regionally
Strategy 20: Refine Crisis Housing Policies and Procedures
Number of people experiencing sheltered homelessness discharged from institutions or re-entering from homeless response system
HOUSING INVENTORY MEASURESStrategy 19: Increase the Number of Crisis Housing Beds Regionally
Strategy 20: Refine Crisis Housing Policies and Procedures
Number of crisis housing beds in the system and geographic distribution
Annual Housing Inventory Count Report, Regional Housing Need Assessment, and other real-time housing inventory tracking mechanisms
Strategy 19: Increase the Number of Crisis Housing Beds Regionally
Strategy 20: Refine Crisis Housing Policies and Procedures
Crisis housing bed utilization
PROCESS MEASURES
Strategy 19: Increase the Number of Crisis Housing Beds Regionally
Strategy 20: Refine Crisis Housing Policies and Procedures
Number of successful referrals to support services (mental health, employment, hygiene, nutrition, etc.)
Various County and Riverside County CoC process reporting tools. Some process measures will likely need to include the creation of new tools and reporting mechanisms

30 / HOMELESS ACTION PLAN
FIVE YEAR GOALS
The following Five-Year Goals will be tracked utilizing various existing and new reporting tools. These tools may include but are not limited to: HUD Reporting Tools, Point in Time Count, System Performance Measures, Longitudinal Systems Analysis, Stella, Riverside County CoC Public Data Dashboards, Annual Housing Inventory Count, Regional Housing Need Assessment, other real-time housing inventory tracking mechanisms, and County and Riverside County CoC process reporting tools.
• 100% of crisis housing adhere to CoC Policies and Procedures
• 25% increase in the number of crisis housing beds (ES, SH, TH) in the system, geographically distributed
• Increase in the ratio of sheltered to unsheltered homelessness at a point in time and month to month, including key subpopulations
• 50% reduction in the length of stay in crisis housing (ES, SH, TH)
• 50% increase in the number of successful housing placements from crisis housing
• 75% reduction in the number of people experiencing unsheltered homelessness discharged from institutions or re-entering from homeless response system
FUNDING PRINCIPLES
• Invest in innovative approaches to expand the supply of safe, humane, housing-placement focused shelter and interim housing models, like Project Homekey/Roomkey for people experiencing homelessness
• Expand alignment and engagement of healthcare, behavioral health, mental health, and substance use disorder resources in efforts to address health disparities and service needs among people experiencing unsheltered and sheltered homelessness
ACTION AREA 4: EXPAND AND ENSURE EQUITABLE ACCESS TO PERMANENT HOUSING IN OUR COMMUNITIESCURRENT RESPONSE
The shortage of affordable housing is a core driver of the County of Riverside’s homelessness crisis. Low vacancy rates, rising rents, low incomes, precarious employment, and a lack of effective social safety nets are all significant contributors to homeless system pressures. The impact of this housing shortage is reflected by challenges of people experiencing homelessness in obtaining housing. Due to the shortage of housing, people experiencing homelessness sometimes spend months or longer on waitlists, searching for suitable units, which exacerbate not only their social and economic instability but also their physical and behavioral health conditions. Research has shown that the increased instability that people experience while waiting for housing directly undermines their ability to achieve long-term stabilization and leads to an increased utilization of services.
A major step in solving homelessness is ensuring that every extremely low-income (ELI) household has access to a home they can afford. Currently in Riverside County, there is a gap of roughly 38,000 homes affordable to ELI households, those earning 30% or less of Area Median Income (AMI), the group most at risk of homelessness. According to two methods of analysis, Riverside County will need an additional 21,000 to 46,000 homes affordable to ELI households to address the homelessness crisis for those currently experiencing homelessness and those facing housing instability. The RHNA estimate of 21,000 is primarily a production goal, meaning it represents the number of homes that must be built. This goal can only be met primarily by producing new homes or converting existing buildings—such as motels, offices, or commercial buildings—into housing. Each locality’s RHNA is based on a number given to each region from the state, and then distributed across the region by Southern California Association of Governments (SCAG). The need of about 46,000 additional homes affordable to ELI households does not need to be met by new construction of ELI-affordable units alone. It can be met in a variety of ways, including new construction, maintaining affordability, and reducing cost of housing. This 46,000-unit threshold will secure

31 / HOMELESS ACTION PLAN
enough stable, decent, and affordable housing for those most at-risk of homelessness. This reflects a critical need to increase the development of affordable housing solutions in the region.
When looking at housing interventions, Permanent Supportive Housing (PSH) and Rapid Rehousing (RRH) need to be further scaled up to meet the need. This will require supportive strategies in streamlining development and increasing housing stock. Stakeholders highlighted other challenges of the housing response like the accessibility of Housing Choice Vouchers, a fragmented approach to landlord outreach, engagement, and retention, and the unavailability of flex funds, shallow subsidies, and funding for move-in assistance. In feedback from stakeholders, they described that the housing stock of certain cities’ is largely inaccessible to people experiencing homelessness, underlining the need to better track housing outcomes geographically to ensure equitable access and opportunity.
When looking at key subpopulations, stakeholders described that Chronically Homeless, Individuals with Mental Illness, Individuals with Substance Use Disorders, Older Adults /Seniors, and Transition Aged Youth (TAY) had inadequate resources or services available to them in Riverside County.
The County of Riverside CoC will work with cities and community partners on a multipronged approach that implements innovative approaches, provides critical support services, and expands housing stock.
PROPOSED STRATEGIES
Strategy 21: Advocate for the Increased Production of Affordable Housing
There currently is a shortfall of units available for the extremely low-income population in the County of Riverside. In order to address the housing and homelessness crises, the County of Riverside will need to work towards developing and implementing a strategy to build enough affordable housing to meet the region’s housing needs. The Riverside County CoC, alongside other regional partners, will need to identify and coordinate clear unit production goals and targets. This will require the County of Riverside to leverage a wide array of private, local, state, and federal funding to support the expansion of affordable housing. For individuals, families, and communities that are experiencing homelessness, or are at-risk of homelessness, it will require the equitable development of housing affordable to extremely low-income households.
• Advocate for federal, state, county, and local policies and funding to increase and preserve affordable housing for households earning below 30% Area Median Income (AMI)
• Pursue lower-cost housing typologies, like tiny homes, accessory dwelling units, mobile homes, hotel and motel conversions, prefabricated modular housing, and shipping containers, and innovative housing and financing models
• Identify feasibility to develop affordable and supportive housing on underutilized state, county, and city owned land
• Ensure Riverside County utilizes full funding opportunities from the federal and state governments for housing development
• Advocate for inclusionary housing policies, up zoning, and infill development
• As part of communication strategy, develop strategies to address NIMBY sentiments
Strategy 22: Increase Permanent Supportive Housing Units and Capacity
To meet the needs of people experiencing homelessness, the Riverside County CoC will need to develop additional Permanent Supportive Housing (PSH) units, including site-based, scattered site, and tenant-based. Not only will the Riverside County CoC work towards increasing the total number of units but will also focus on increasing PSH capacity by optimizing utilization, refining system-wide guidelines, and supporting moving on strategies.
• Increase the number of permanent supportive housing stock
• Identify costs associated with developing adequate supply of permanent supportive housing
• Increase access to tenant-based, scattered site Permanent Supportive Housing programs
• Assess coordinated entry, referral patterns to identify regional gaps, and under resourced PSH capacity
• Ensure that PSH programs access is equitable through review of data
• Expand partnerships with behavioral health treatment services through Riverside County and local behavioral health providers to ensure that PSH units are paired with adequate supportive services
• Implement a “moving on” strategy, targeting up to 20% of current PSH residents for transition to general population affordable housing, thus freeing up PSH for new tenants
• Convene stakeholders (housing developers, planning departments, service providers, cities, regional governments) to explore ways to create and streamline permanent supportive housing within context of local housing elements
• Leverage a wide array of private, local, state, and federal funding, including CalAIM and Project Homekey, to support the expansion of a Permanent Supportive Housing

32 / HOMELESS ACTION PLAN
• Improve PSH service quality and fidelity by refining community standards, facilitating trainings, and creating learning collaboratives
• Advocate for the local conditions to develop enough permanent supportive housing to meet the need in our community
• Identify feasibility to develop permanent supportive housing on underutilized State or county owned land
• Optimize utilization through progressive engagement by enabling clients to move to less or more service-intensive housing based on identified need
• Ensure sufficient level of supportive services, which are voluntary, housing first oriented, trauma-informed, and incorporate harm reduction principles
Strategy 23: Increase Rapid Rehousing Housing Units and Capacity
The Riverside County CoC will need to expand Rapid Rehousing (RRH) capacity to meet the needs of single adults, families, and youth as identified in the gaps analysis. Additionally, the Riverside County CoC will also focus on increasing RRH capacity by improving outcomes, refining system-wide guidelines, standardizing assistance, reducing competition among programs, and strengthening move-in supports. Scaling Rapid Rehousing will prevent inflows into long-term homelessness.
• Increase the number of rapid rehousing programs/units
• Identify costs associated with developing adequate supply of rapid rehousing
• Assess coordinated entry, referral patterns to identify CES integrations, regional gaps, and under resourced RRH capacity
• Ensure that RRH programs access is equitable through review of data
• Improve RRH service quality and fidelity by refining community standards, facilitating trainings, and facilitating learning collaboratives. For those with higher needs, provide longer-term housing assistance and critical time intervention
• Advocate for the local conditions so that expanded RRH is effective in the private rental market
• Optimize utilization through progressive engagement by enabling clients to move to less or more service-intensive housing based on identified need
• Assess outcomes for expanded rapid rehousing programs
• Identify effective practices for rapid rehousing to be effective in high-cost, high-SDOH housing markets
• Strengthen the integration of workforce development/employment services with RRH
Strategy 24: Develop Centralized Landlord Outreach, Engagement, and Retention Strategies
The current system of landlord outreach, engagement, and retention is decentralized, with homeless service providers, cities, regional governments, housing authorities, and other homeless serving entities each managing their own network of contacts and partnerships. Managing tenant-based programs, like Housing Choice Vouchers and Rapid Rehousing, requires homeless service providers to build up individual networks of partnering landlords or property management companies; if this are not done, it requires clients to find units themselves. This dynamic often leads to competition among providers, resulting in varying quality of housing available to clients from program to program based on the relative success of a program’s housing location team. This often leads to unnecessary competition and a prolonged housing search for tenant-based rental assistance programs like RRH, HCV, etc. The County’s Housing Authority Division launched its Landlord Incentive Program to expand existing and new relationships with property managers and landlords that should continue to address the disconnected approach to landlord engagement, outreach, and retention in the region. The Riverside County CoC will work towards developing a centralized landlord outreach, engagement, and retention strategy.
• Assess the viability of development of a centralized landlord engagement program with one entity conducting housing outreach for the entire county
• Develop provider facing real-time listings of rental units available to people experiencing homelessness
• Increase the stock of units available to programs, homeless service providers, etc., especially in neighborhoods with high SDOH
• Develop service provider performance standards for issuing timely payments, documentation, processing, and inspections so that experiences for landlords are uniform, regardless of which provider or payment source is being utilized
• Develop additional incentives and supports, like contingency funds, flex funds, mediation services, landlord incentive payments, security deposits, etc.

33 / HOMELESS ACTION PLAN
• Work with property management companies, owners, landlords, apartment associations, and housing developers to secure housing units through developed and formalized partnerships, MOUs, master leasing, etc.
• Incentivize the reduction of screening criteria that screens out prospective tenants with evictions, poor credit, and/or criminal histories
• Track key metrics associated with the housing search and housing lease-up process
• Ensure that trained Housing Locators or Housing Specialists are designated as representatives for the system to ensure consistent messaging and service delivery
Strategy 25: Innovate Approaches to Expand Existing Housing Stock
Alongside some of the other strategies outlined above, the Riverside County CoC will develop innovative approaches to increase housing stock to reduce the time spent locating an adequate unit. These methods of increasing housing stock can also meet the unique need of specific subpopulations and expand housing access and mobility.
• Explore lower-cost housing typologies, like tiny homes, accessory dwelling units, hotel and motel conversions, prefabricated modular housing, and shipping containers
• Explore master leasing at-scale to secure units for people experiencing homelessness
• Develop shared housing program to increase rental options and affordability for clients, with emphasis on private rooms, split leases, etc.
• Expand and scale the use of shallow subsidies and longer-term subsidies
Strategy 26: Increase Flexible Housing Funds
To ensure easier move-ins to permanent housing, mitigate concerns with landlords, and increase access to high-opportunity communities, the Riverside County CoC will need to increase the availability of flexible housing funds. These funds could take the form of one-time payments but could also be more long-term in the form of shallow subsidies.
• Explore possibility of developing Flexible Housing Subsidy Pool similar to other communities
• Expand flexible housing subsidy funds, like shallow subsidies and longer-term subsidies, especially for instances of homelessness prevention, where families are rent burdened
• Expand flexible housing funds to cover one-time expenses like move-in costs
Strategy 27: Address Housing Needs of Unique Subpopulations
As highlighted in the Gaps Analysis, there are key subpopulations of people experiencing homelessness that have insufficient resources and housing supports available to them in Riverside County: Chronically Homeless, Individuals with Mental Illness and/or Substance Use Disorders, Older Adults/Seniors, and Transition Aged Youth (TAY). The Riverside County CoC will work to increase the service and housing supports to meet the unique needs of these subpopulations.
• Assess and expand current programs serving Chronically Homeless
• Assess and expand current programs serving Individuals with Severe Mental Illness (SMI)
• Assess and expand current programs serving Individuals with Substance Use Disorders (SUD)
• Assess and expand current programs serving Transition Aged Youth (TAY)
• Assess and expand current programs serving Older Adults/Seniors
• Assess and expand current programs serving LGBTQAI+
Strategy 28: Develop Strategies to Reduce Barriers for People Experiencing Homelessness in Obtaining Housing and to Increase the Speed of Lease-Up Process
Once connected to services, people experiencing homelessness still face many barriers to obtaining housing. Some of these are addressed in previous strategies around landlord engagement and flexible spending. The Riverside County CoC will look to develop programs and processes that address some of these barriers to housing like, poor credit/debt, evictions on record, criminal background, and housing documentation. By reducing these barriers, it will decrease the time it takes for the housing search.
• Assess and establish programs and processes for individuals experiencing homelessness to improve credit and pay off debts
• Assess and establish programs and processes for individuals experiencing homelessness that have evictions on record
• Assess and establish programs and processes for individuals experiencing homelessness that have criminal justice issues on record
• Assess and establish programs and processes for individuals experiencing homelessness to expedite documentation necessary for housing, like social security card, identification card, birth certificates, and proof of income documentation
• Assess and establish universal housing application for all programs across Riverside County

34 / HOMELESS ACTION PLAN
• Clarify, contractually and through training, the expectations regarding roles and responsibilities of shelter case managers, outreach workers, and housing case managers in getting clients document-ready and establish & record performance metrics to track progress
• Identify additional ways to expedite the housing search and lease up process
Strategy 29: Expand Housing Access to High Opportunity Neighborhoods, With a Focus on Those with High Social Determinants Of Health (SDOH)
Due to market and other factors, not all cities in the County of Riverside are accessible to people experiencing homelessness to obtain housing. These cities are often characterized as high-income cities. Cities that were characterized as having high social determinants of health were inaccessible for people experiencing homelessness. Cities with high social determinants of health have access to quality employment, education, healthcare, transportation, supermarkets, housing, green spaces, clean air and water, public safety, etc.
Riverside will track housing placements at the ZIP code level for Permanent Supportive Housing, Rapid Rehousing, Housing Choice Voucher (Section 8), or other types of housing interventions to analyze larger trends around racial equity, concentrations of poverty, and social determinants of health. The County of Riverside will use this data to make informed policy or programmatic design modifications to ensure that neighborhoods with high social determinants of health are accessible to people experiencing homelessness and that the outcomes of the homeless response system do not perpetuate residential segregation or the concentration of poverty. Instead, they are centered on equity, access, and mobility. Changes to policy could include revised payment standards or shallow subsidies to incentivize landlords in high social determinants of health areas.
• Track housing placements in HMIS at the zip code level to analyze regional trends
• Create a framework and policy recommendations to increase housing placements in opportunity neighborhoods with high social determinants of health
• Ensure homeless housing stock and services are geographically located to allow, whenever possible, for the needs of individuals and families to be met in their own communities.
• Explore incentivization strategies to promote move-ins in neighborhoods with high SDOH
Strategy 30: Strengthen Approaches to Case Management
As part of developing service provider, city, and regional government capacity, the Riverside County CoC will continue to push for person-centered, housing-focused case management with enhanced training in evidence
based best practices such as: trauma-informed care, non-violent crisis intervention, peer supports, strength-based case management, critical time intervention, motivational interviewing, progressive engagement, cultural humility, racial equity, and housing first strategies.
• Assess and refine policies and procedures to ensure that services are applying best practices in case management
• Develop training around best practice approaches to case management to improve provider, city, and regional government capacity
• Strengthen provider tables/forums and create learning collaborative for more frequent capacity building opportunities around best practice approaches to case management
Strategy 31: Leverage Housing Authority Division Resources for People Experiencing Homelessness
The County of Riverside will continue leveraging Housing Authority Division resources, like the Housing Choice Voucher program, to better serve people experiencing homelessness.
• Increase advocacy for the expansion of the Housing Choice Voucher program
Strategy 32: Continue to Advocate for Legislation Protecting Against Housing Discrimination in Housing Search
The intersections of homelessness on race, ethnicity, gender, sexual orientation, age, family size, criminal history, disability status, and income source often is seen clearly in the various forms of discrimination that people experiencing homelessness face when applying for units in the private rental market and, in some cases, in homeless dedicated housing. The County of Riverside will continue to push for better protections against housing discrimination. The County of Riverside will also seek to increase its partnerships with legal aid organizations to develop mechanisms for better enforcement of existing protections. As part of the centralized landlord engagement described above, the County of Riverside will also elevate this in partnership with industry leaders.
• Advocate for the legislation protecting against housing discrimination
• Establish partnerships and mechanisms for better tracking and enforcement of existing protections

35 / HOMELESS ACTION PLAN
PERFORMANCE METRICS
STRATEGY PERFORMANCE METRICS MECHANISMS
SYSTEM PERFORMANCE MEASURESStrategy 22: Increase Permanent Supportive Housing Units and Capacity
Strategy 23: Increase Rapid Rehousing Housing Units and Capacity
Number of people utilizing housing intervention, including PSH and RRH, at a point in time and month to month, including key subpopulations
Various HUD reporting tools – System Performance Measures Report, Longitudinal Systems Analysis, Stella, and others
Riverside County CoC Public Data Dashboards
Strategy 22: Increase Permanent Supportive Housing Units and Capacity
Strategy 23: Increase Rapid Rehousing Housing Units and Capacity
Demographics of different housing interventions, including PSH and RRH
Strategy 22: Increase Permanent Supportive Housing Units and Capacity
Strategy 23: Increase Rapid Rehousing Housing Units and Capacity
Number of clients that successfully exit housing interventions, including PSH and RRH
Strategy 22: Increase Permanent Supportive Housing Units and Capacity
Strategy 23: Increase Rapid Rehousing Housing Units and Capacity
Number of clients that successfully retain housing, including PSH and RRH, for 6,12, 24 months
Strategy 24: Develop Centralized Landlord Outreach, Engagement, and Retention Strategies
Strategy 25: Innovate Approaches to Expand Existing Housing Stock
Strategy 26: Increase Flexible Housing Funds
Strategy 28: Develop Strategies to Reduce Barriers for People Experiencing Homelessness in Obtaining Housing and to Increase the Speed of Lease-Up Process
Length of time during housing search
Strategy 26: Increase Flexible Housing FundsOutcomes of flexible funds issued, including one-time payments and shallow subsidies
HOUSING INVENTORY MEASURES
Strategy 21: Advocate for the Increased Production of Affordable Housing
Number of housing units affordable to extremely low-income population, both currently and in the pipeline
Annual Housing Inventory Count Report, Regional Housing Need Assessment, and other real-time housing inventory tracking mechanisms
Strategy 22: Increase Permanent Supportive Housing Units and Capacity
Number of Permanent Supportive Housing Units, both tenant-based and project-based, currently and in pipeline
Strategy 23: Increase Rapid Rehousing Housing Units and Capacity
Number of Rapid Rehousing Program Units
Strategy 22: Increase Permanent Supportive Housing Units and Capacity
Strategy 23: Increase Rapid Rehousing Housing Units and Capacity
Utilization rates for housing interventions, including PSH and RRH
Strategy 22: Increase Permanent Supportive Housing Units and Capacity
Strategy 23: Increase Rapid Rehousing Housing Units and Capacity/ Strategy 29: Expand Housing Access to High Opportunity Neighborhoods, With a Focus on Those with High Social Determinants of Health
Zip codes of housing placements for housing interventions, including PSH and RRH
Strategy 24: Develop Centralized Landlord Outreach, Engagement, and Retention Strategies
Strategy 25: Innovate Approaches to Expand Existing Housing Stock
Strategy 29: Expand Housing Access to High Opportunity Neighborhoods, With a Focus on Those with High Social Determinants of Health
Number of units secured for people experiencing homelessness through centralized landlord engagement program, especially in neighborhoods with high SDOH, including through master leasing and shared housing

36 / HOMELESS ACTION PLAN
HOUSING INVENTORY MEASURES CONTINUEDStrategy 24: Develop Centralized Landlord Outreach, Engagement, and Retention Strategies
Average number of real-time unit availability secured by centralized landlord engagement program Annual Housing Inventory Count Report,
Regional Housing Need Assessment, and other real-time housing inventory tracking mechanisms
Strategy 31: Leverage Housing Authority Division Resources for People Experiencing Homelessness
Number of Housing Authority Division vouchers, utilization rate, length of time during housing search, zip code of housing placements, and vouchers set aside for people experiencing homelessness
PROCESS MEASURESStrategy 22: Increase Permanent Supportive Housing Units and Capacity
Strategy 23: Increase Rapid Rehousing Housing Units and Capacity
Referral pattern for housing interventions, including PSH and RRH
Various County and Riverside County CoC process reporting tools; some process measures will likely need to include the creation of new tools and reporting mechanisms
Strategy 27: Address Housing Needs of Unique Subpopulations
Strategy 30: Strengthen Approaches to Case Management
Number of successful referrals to support services (mental health, employment, hygiene, nutrition, etc.)
Strategy 30: Strengthen Approaches to Case Management
Strategy 22: Increase Permanent Supportive Housing Units and Capacity
Strategy 23: Increase Rapid Rehousing Housing Units and Capacity
Number of programs adhering to Riverside CoC Policies and Procedures for PSH and RRH
Strategy 24: Develop Centralized Landlord Outreach, Engagement, and Retention Strategies
Number of incentives and supports issued through centralized landlord engagement program
Strategy 24: Develop Centralized Landlord Outreach, Engagement, and Retention Strategies
Number of landlords participating in centralized landlord engagement program, including formalized partnerships
Strategy 26: Increase Flexible Housing FundsNumber of flexible funds issued, including one-time payments and shallow subsides
Strategy 28: Develop Strategies to Reduce Barriers for People Experiencing Homelessness in Obtaining Housing and to Increase the Speed of Lease-Up Process
Number of clients with housing barriers, including credit, debt, evictions, criminal justice issues, documentation (social security card, identification card, birth certificate, proof of income, etc.)
Strategy 32: Continue to Advocate for Legislation Protecting Against Housing Discrimination in Housing Search
Number of housing discrimination instances within Riverside County
FIVE YEAR GOALS
The following Five-Year Goals will be tracked utilizing various existing and new reporting tools. These tools may include but are not limited to: HUD Reporting Tools, Point in Time Count, System Performance Measures, Longitudinal Systems Analysis, Stella, Riverside County CoC Public Data Dashboards, Annual Housing Inventory Count, Regional Housing Need Assessment, other real-time housing inventory tracking mechanisms, and County and Riverside County CoC process reporting tools.
• Promote the development of 21,000 units affordable to extremely low-income population
• Increase the number (unit count) of Permanent Housing Units by 75% from baseline year (including Permanent Supportive Housing [PSH] and Rapid Re-Housing [RRH])
• Increase the number of clients that successfully exit housing interventions, including PSH and RRH by 25%
• Increase the number of clients that successfully retain housing, including PSH and RRH by 25%
• Over 50% of new housing placements occur in opportunity neighborhoods/zip codes with high social determinants of health
• 100% of programs adhering to Riverside CoC Policies and Procedures for PSH and RRH
• Length of time during housing search is reduced by 50%

37 / HOMELESS ACTION PLAN
• Increase in the number of units secured for people experiencing homelessness through centralized landlord engagement program, especially in neighborhoods with high SDOH, including through master leasing and shared housing
• Increase in the number of landlords participating in centralized landlord engagement program, including formalized partnerships
• Increase in the number of real-time unit availability secured by centralized landlord engagement program
FUNDING PRINCIPLES
• Strengthen the implementation of Housing First approaches and other best practices that support equitable access in housing markets with high social determinants of health (SDOH), including but not limited to: supportive housing, rapid rehousing, short- and longer-term forms of rental subsidy and assistance, shallow subsidies, move-in assistance, and landlord outreach, engagement, and retention
• Invest in the creation of an expanded supply of affordable and supportive housing opportunities, paired with appropriate health and behavioral health care resources, and accessible and culturally responsive services to people exiting homelessness, low-income individuals and families, and to people from historically marginalized communities
ACTION AREA 5: PREVENT PEOPLE FROM EXPERIENCING THE CRISIS OF HOMELESSNESSCURRENT RESPONSE
In order to address the inflow/outflow gap, there will need to be a marked shift towards focusing on prevention whenever possible and on providing housing focused services, which ensure that when homelessness does occur, the experience is rare, brief, and non-recurring. Preventative approaches to homelessness result in better outcomes for individuals and families and provide a higher return on investment, resulting in reduced costs in healthcare, correctional services, and emergency services. Shifting investment away from reactive, emergency solutions towards a strengthened focus on preventative strategies will be critical to reducing the flow of people becoming homeless. This includes increasing early intervention approaches that help people to avoid evictions and maintain their homes as well as diversion services. Enhanced integration with cross-sector regional partners, like healthcare, behavioral/mental health, substance use disorder, criminal justice, child welfare, juvenile justice, education, immigration, employment, land use and code enforcement systems, are required to reduce pathways into homelessness.
In the Gaps Analysis, stakeholders highlighted the need to improve discharge planning from regional mainstream institutions for people experiencing homelessness. This included institutions like healthcare, mental health, substance use disorder, criminal justice/correctional, child welfare/foster care, and juvenile justice. Similarly, these sectors could improve their efforts to identify people at risk for homelessness and rapidly connect them to services before entering homelessness.
While prevention and diversion program performance has been successful, these programs need to be made more readily accessible to those facing housing instability. Stakeholders noted that resources and programs that assist those at-risk of entering homelessness when faced with eviction, displacement, or housing discrimination could be improved. Stakeholders described that the homeless response system is often ineffective at preventing people from reentering into homelessness, underlining the need for more tracking around reentry and longer term supports.

38 / HOMELESS ACTION PLAN
Lastly, stakeholders often linked economic instability with housing instability. When clients obtain housing, they often need supports to meet their basic financial needs and to gain stable employment. Those supports are essential for homelessness prevention and for eliminating bounce back when individuals return to homelessness after “exiting” the system. Respondents highlighted that the system does not account for this and should begin to prioritize not only permanent housing development but also economic mobility supports that serve as buffers to homelessness.
PROPOSED STRATEGIES
Strategy 33: Increase Homelessness Prevention, Diversion, and Mediation Services
To curtail the inflows into the homeless system, Riverside County CoC will need to strengthen and expand homelessness prevention, diversion, housing problem solving, and rapid resolution programs across Riverside County. As rent relief and COVID-19 eviction protections end, there will be a renewed need for these types of services.
• Ensure right-sized funding from state and federal resources to homelessness prevention, diversion, housing problem solving, and rapid resolution services and programs. with identification of clear goals and targets for the number of households to receive diversion and prevention services through each program
• Ensure program models utilize flexible financial assistance and housing focused case management to prevent individuals and families from experiencing homelessness
• Develop standardized best practices and procedures for the delivery of homelessness prevention, diversion, housing problem solving, and rapid resolution services and programs; guidance should include baseline standards for housing-focused case management, strengths-based service planning and delivery, and effective strategies for reducing barriers to housing retention
• Evaluate the effectiveness of these interventions as programs are scaled further across the CoC; all homelessness prevention efforts should be tracked in the Homeless Management Information System (HMIS)
• Expand targeted homelessness prevention and diversion outreach and engagement; target services to highest-risk populations and geographies to ensure people and communities at highest risk for homelessness are engaged with housing supports before experiencing literal homelessness
• Develop an automatic process to provide information on homelessness prevention and diversion services when someone is issued a notice to pay or quit or receives an unlawful detainer; by better tracking evictions in the city, programs can target specific zip
codes, apartment complexes for prevention services
• Incentivize landlords, apartment associations, etc. to make referrals for their tenants to homelessness prevention and diversion programs
• Target populations should include people who previously exited the homelessness system with housing supports and are at risk of returning to homelessness
• Develop early identification, discharge planning, and cross-sector collaboration
• Include automated referrals for employment, income supports, social safety net services, etc.
• More accurately track at the city and zip code level where an individual and family fell into homelessness and target outreach and supports to those communities
• Disaggregate data by demographics, to identify and address any trends in access and utilization
• Radically increase client facing materials across Riverside County to help people at-risk of homelessness understand what services and resources are available to them and what the process looks like to access prevention services/supports
Strategy 34: Address Inflows of Homelessness Through Cross-Sector Collaboration, Discharge Planning, and Early Identification
To further prevent the system flow gap, the homeless response system will need to address the inflows into homelessness through cross-sector collaboration, discharge planning, and early identification of individuals at-risk for homelessness. Cross-sector collaboration with mainstream system providers, such as healthcare, behavioral/mental health, substance use disorder, criminal justice, child welfare, juvenile justice, education, immigration, employment, land use and code enforcement, are necessary to create aligned strategies and policies centered on preventing people from falling into homelessness.
• Through data sharing agreements, analyze mainstream system data to understand involvement of people experiencing homeless in mainstream systems before they fell into homelessness to better target solutions
• At points of intake, ensure there is a thorough questioning of how and where an individual became homeless, with an understanding of mainstream systems they may have touched in advance
• Identify and develop specific staff positions responsible for cross-sector collaboration
• Develop strategies based on national best practices for improving discharge planning models and coordination to prevent mainstream systems from discharging individuals without stable housing

39 / HOMELESS ACTION PLAN
• Develop strategies based on national best practices for early identification of people at-risk for homelessness and get them connected to homeless and other mainstream services
• Advocate for necessary resources to incorporate or bring to scale cross-sector collaboration, discharge planning, and early identification
• Set cross-sector goals
• Develop and adopt a universal housing/economic stability screening tool and automated referral processes for individuals and families accessing safety net services
• Expand on initiatives of Whole Person Care and CalAIM to target high utilizers of emergency services
Healthcare (Behavioral Health, Mental Health, Physical Health, Substance Use Disorders)
• Improve care coordination and connections to services and housing for people discharged from hospitals who are homeless
• Continue to develop communication, procedures, processes among hospitals, substance use treatment centers, mental health facilities, health plans, and the homeless system to improve care coordination, early identification, and effective discharge planning for people experiencing homelessness
• Implement CalAIM to provide medically necessary recuperative care placements for unhoused people who are exiting acute inpatient facilities and/or were recently hospitalized
• Identify feasibility of creating targeted positions, like homeless services liaison, at hospitals to assist with discharge planning and care coordination and to prevent discharge of clients to the street
Child Welfare/ Juvenile Justice
• Develop strategies for effective discharge planning for youth exiting foster care and juvenile justice systems, with a focus on earlier interventions and supports for youth around housing and economic stability
• Expand housing programs for families involved in the child welfare system
• Expand and diversify housing programs for foster youth to meet their long-term housing needs, so no foster youth become homeless
• Conduct data match with child welfare system and juvenile legal system to establish baseline data on the number and characteristics of system-involved youth that experience homelessness, with an emphasis on racial disparities within the population; establish targeted intervention strategies
• Continue to develop a long-term plan and strategy for improving health outcomes and the delivery of fully integrated health care services for youth in foster care
Education
• Provide guidance to support schools and universities to develop community collaborations and stronger referral systems to address housing instability and homelessness, and other service needs, among students and their families
Criminal Justice
• Improve coordination and connection to services and housing for people being discharged from criminal justice settings, like incarceration, detention, probation, who are homeless or at risk of homelessness
• Develop process and outcome metrics to support cross-system coordination and goals
• Support the implementation of CalAIM proposals seeking to address needs of people exiting corrections settings through expedited enrollment in Medi-Cal
• Increase supports for households with incarcerated family members to prevent homelessness
• Expand existing and develop new housing and workforce development programs to successfully reintegrate people leaving probation, parole, jails, and prisons into the community
• Offer all homeless inmates’ jail in reach services from the beginning of incarceration
• Identify the feasibility of creating targeted positions, like homeless services liaison, at hospitals to assist with discharge planning and care coordination and to prevent discharge of clients to the street
• Promote the creation and implementation of effective re-entry networks and supports with integrated services or robust links to mental health, substance use disorder, housing, case management, employment, and other social services in the community
• Conduct data analysis projects with reentry partners to improve our understanding of individuals at heightened risk of experiencing homelessness upon release, racial disparities that exist among this population, patterns of shelter system utilization, and opportunities to intervene sooner
Older Adults/Seniors
• Identify strategies to serve older adults and people with disabilities at risk of experiencing homelessness, including meeting the need for in-home supports and access to licensed adult and senior care facilities
• Improve identification and stabilization of older adults/seniors at greatest risk of housing loss
• Develop targeted homelessness prevention strategies for older adults/seniors, including development of a data-driven framework for identifying older adults/seniors at greatest risk of housing loss

40 / HOMELESS ACTION PLAN
• Provide subsidized housing to homeless disabled individuals pursuing SSI
• Support in-home care and long-term care options for older adults/seniors
Strategy 35: Expand Opportunities to Achieve Financial Stability/Economic Mobility Through Employment, Educational, Income Supports, and Wealth Generation Programs and Services.
There is a clear linkage between economic instability and housing instability, with economic instability driving the latter. When clients obtain housing, they often need supports to meet their basic financial needs and to gain stable employment. Those supports are essential for homelessness prevention and for eliminating bounce back when individuals return to homelessness after “exiting” the system. The homeless response system will need to prioritize opportunities to achieve financial stability/economic mobility through employment, education, income support, and wealth generation programs and services.
• Increase the connectivity between the Riverside County Workforce Development Center, income supports, and education and homeless services, like prevention, rapid rehousing, etc. to increase and sustain income
• Expand partnerships with businesses and social enterprises to train and hire people who have experienced homelessness
• Increase access to appropriate services to gain and sustain employment and educational opportunities, such as childcare (or financial assistance for childcare)
• Formalize cross-system agreements to improve access to employment and education programs, and outcomes of people experiencing homelessness
• Improve data collection on the employment and education needs and outcomes of people experiencing homelessness
• Provide training, internships, and mentorships to help people who are unhoused or at risk of homelessness to obtain access to living wage jobs
• Establish countywide SSI and veteran’s benefits advocacy programs for people experiencing homelessness or at risk of homelessness, including those in the criminal justice system
• Explore opportunities to expand assessment tools to also screen for income-generating pathways, like employment, and income supports; provide automated referrals
• Identify programs and solutions to develop wealth/equity for people experiencing homelessness and those at-risk of homelessness
• Assess the viability of cash transfers and/or universal basic income (UBI) models to empower people experiencing homelessness or at risk of experiencing homelessness to meet their immediate financial needs
• Support efforts to increase the minimum wage to a living wage in Riverside County
Strategy 36: Reduce Reentries into Homeless Response System
A key component of ending homelessness within Riverside County CoC will be to prevent the reentry of individuals and families back into the homeless response system.
• Track and analyze causes for reentry into the homeless response system
• Identify targeted solutions for anyone re-entering the homeless response system
Strategy 37: Preserve Vulnerable Housing and Prevent Community Displacement
Vital to address the system flow gap is ensuring the preservation of housing affordable to extremely low-income populations to prevent community displacement. As neighborhoods change through processes of development and gentrification, it is essential to ensure that lower-income households are not priced out of the rental market. The Riverside County CoC will work to promote solutions to preserve vulnerable housing and reduce neighborhood displacement.
• Advocate for the creation of a fund to preserve naturally occurring, affordable housing and income restricted affordable housing
• Promote the investments of infill area infrastructure, inclusionary zoning, community land trusts, adaptive reuse, etc.
• Promote the preservation of existing housing stock through long-term affordability covenants
• Advocate for the increased access to homeownership, especially for Black, Indigenous and People of Color (BIPOC) communities
• Advocate for right of first refusal policies
Strategy 38: Expand Protections for Renter/Tenants
To better address the inflows into homelessness, the Riverside County CoC will advocate and push to expand tenant protections and services that support tenants. This will include better tracking of evictions, centralizing and coordinating eviction prevention programs, and supporting other tenant protections.
• Develop a streamlined approach and public facing database to better track evictions/unlawful detainers across Riverside County, greatest impact on older adults/seniors and Black, Indigenous and People of Color (BIPOC)

41 / HOMELESS ACTION PLAN
• Coordinate and centralize eviction prevention programs across Riverside County
• Advocate for the establishment of rent stabilization policies paired with enforceable building standards
• Advocate for the establishment of “just cause” eviction policies
• Develop and support tenant counseling and legal services for tenant facing housing instability and dislocation
• Support a legal right to counsel policy for tenants to prevent evictions
• Support right to remain and right to return ordinances
• Support tenant option to purchase
• Consider developing a tenant advisory council to provide guidance and advice to the city on actions to support tenants and those at-risk of homelessness
• Increase access to civil legal aid in situations where legal advocacy will prevent homelessness (e.g., access to State and Federal benefit programs, SSI/SSDI, etc., foreclosure prevention, immigration, tenant representation, unemployment benefits, ABD, etc.)
• Strengthen local tenant protections impacting people experiencing homelessness and those at-risk of homelessness
Strategy 39: Advocate for the Expansion of a Social Safety Net
Necessary to ending homelessness, the Riverside CoC will continue to advocate for the expansion of social safety net services and mainstream anti-poverty initiatives. This will include expanding supports to housing, healthcare, welfare, income supports, nutrition, and childcare.
• Advocate for the state and the federal government to increase funding and access to safety net services
PERFORMANCE METRICS
STRATEGY PERFORMANCE METRICS MECHANISMS
SYSTEM PERFORMANCE MEASURESStrategy 33: Increase Homelessness Prevention, Diversion, and Mediation Services
Strategy 34: Address Inflows of Homelessness Through Cross-Sector Collaboration, Discharge Planning, and Early Identification
Number of people experiencing homelessness for first time, including regional and demographic breakdown
Various HUD reporting tools – System Performance Measures Report, Longitudinal Systems Analysis, Stella, and others.
Riverside County CoC Public Data Dashboards
Strategy 36: Reduce Reentries into Homeless Response System
Number of people returning to homelessness, including regional and demographic breakdown
Strategy 34: Address Inflows of Homelessness Through Cross-Sector Collaboration, Discharge Planning, and Early Identification
Number of people exiting mainstream institutions that experience sheltered and unsheltered homelessness
Strategy 34: Address Inflows of Homelessness Through Cross-Sector Collaboration, Discharge Planning, and Early Identification
Number of people who would have been homeless upon discharge from mainstream institutions and are successfully placed into housing
Strategy 37: Preserve Vulnerable Housing and Prevent Community Displacement
Strategy 38: Expand Protections for Renter/Tenants
Number of low-income households that are considered rent-burdened
Strategy 33: Increase Homelessness Prevention, Diversion, and Mediation Services
Percentage successful households receiving prevention services, including regional and demographic breakdown
Strategy 35: Expand Opportunities to Achieve Financial Stability/Economic Mobility Through Employment, Educational, Income Supports, and Wealth Generation Programs and Services
Increases to employment, income, and wealth generation among people experiencing homelessness

42 / HOMELESS ACTION PLAN
SYSTEM PERFORMANCE MEASURES CONTINUEDStrategy 33: Increase Homelessness Prevention, Diversion, and Mediation Services
Strategy 39: Advocate for the Expansion of a Social Safety Net
Strategy 35: Expand Opportunities to Achieve Financial Stability/Economic Mobility Through Employment, Educational, Income Supports, and Wealth Generation Programs and Services
Percent of clients still in permanent housing at 6,12-, and 24-months following assistance
Various HUD reporting tools – System Performance Measures Report, Longitudinal Systems Analysis, Stella, and others.
Riverside County CoC Public Data Dashboards
Strategy 34: Address Inflows of Homelessness Through Cross-Sector Collaboration, Discharge Planning, and Early Identification
Readmissions and recidivism rates
Strategy 37: Preserve Vulnerable Housing and Prevent Community Displacement
Strategy 38: Expand Protections for Renter/Tenants
Number of evictions across Riverside County, including regional and demographic breakdown
PROCESS MEASURESStrategy 34: Address Inflows of Homelessness Through Cross-Sector Collaboration, Discharge Planning, and Early Identification
Cost saving for discharge planning
Various Riverside County and Riverside County CoC process reporting tools; some process measures will likely need to include the creation of new tools and reporting mechanisms
Strategy 33: Increase Homelessness Prevention, Diversion, and Mediation Services
Number of programs adhering to Riverside CoC Policies and Procedures for Prevention and Diversion
Strategy 34: Address Inflows of Homelessness Through Cross-Sector Collaboration, Discharge Planning, and Early Identification
Number of mainstream systems with data sharing agreements or integrations with homeless response system
Strategy 34: Address Inflows of Homelessness Through Cross-Sector Collaboration, Discharge Planning, and Early Identification
Number of mainstream systems utilizing developed homeless tracking metrics
Strategy 34: Address Inflows of Homelessness Through Cross-Sector Collaboration, Discharge Planning, and Early Identification
Number of referrals for housing related services from mainstream institutions
FIVE YEAR GOALS
The following Five-Year Goals will be tracked utilizing various existing and new reporting tools. These tools may include but are not limited to: HUD Reporting Tools, Point in Time Count, System Performance Measures, Longitudinal Systems Analysis, Stella, Riverside County CoC Public Data Dashboards, Annual Housing Inventory Count, Regional Housing Need Assessment, other real-time housing inventory tracking mechanisms, and Riverside County and Riverside County CoC process reporting tools.
• 75% reduction in the number of people experiencing homelessness for first time
• 75% reduction in the number of people returning to homelessness
• 75% reduction in the number of people exiting mainstream institutions that experience sheltered and unsheltered homelessness
• Increase in the number of people who would have been homeless upon discharge from mainstream institutions and are successfully placed into housing
• Reduction in the number of low-income households that are considered rent-burdened
• Quadruple the number of households receiving prevention services
• Increase employment, income, and wealth generation among people experiencing homelessness
• 25% increase in the percentage of clients still in permanent housing at 6,12-, and 24-months following assistance
• Decrease in the number of evictions across Riverside County, demographics, and geographic breakdown
• 100% of programs adhering to Riverside CoC Policies and Procedures for Prevention and Diversion

43 / HOMELESS ACTION PLAN
FUNDING PRINCIPLES
• Invest in programs that will immediately address the needs of data-informed special populations, like homeless youth, older adults/seniors, veterans, individuals, and/or families, or prevent them from becoming homeless
• Reduce entries into homelessness as people exit and/or receive services from institutional settings through cross-sector collaborative programs
- Invest in programs focused on reducing entries into homelessness for people re-entering communities from jails and prisons
- Invest in programs focused on reducing entries into homelessness for youth and young adults connected to the child welfare and/or juvenile justice systems
- Invest in programs focused on reducing entries into homelessness for people exiting health care settings and programs, including mental health and substance use
• Enhance communities’ capacity to provide targeted homelessness prevention interventions and to successfully divert people from entering shelter or experiencing unsheltered homelessness
• Invest in cross-sector partnerships between homelessness services systems and other systems which can support asset and wealth building, including access to educational opportunities and employment services that address the economic instability for people experiencing and exiting homelessness
• Support programs and cross-sector partnerships that prioritize the early identification of households at-risk for homelessness and quickly connect them to services
• Invest in upstream homelessness prevention programs that stabilize individuals, families, and communities, protect vulnerable housing, prevent displacement, and expand tenant protections

44 / HOMELESS ACTION PLAN
FUNDING SOURCESLEGEND
URGENT: Items requiring immediate consideration and response within next 30 - 120 days
CATEGORY PROGRAM AVAILABLE FUNDS ELIGIBLE APPLICANTS ELIGIBLE USES TIMELINE ADDITIONAL
INFORMATION
Affordable Housing
HOME-American Rescue Plan Act
California received ~$667M (direct formula allocation to local jurisdictions + state funding to be further distributed). Riverside was allocated $4.3M.
Direct Allocation: “Participating Jurisdictions (PJs)” that qualified for an annual FY 2021 HOME Program allocation.
State funding: cities, counties, developers, and nonprofit Community Housing Development Organizations (CHDOs) that did not receive HOME-ARP funds from HUD.
Tenant-based Rental Assistance
Development and support of affordable housing.
Supportive housing services (e.g., housing counseling, other services under McKinney-Vento)
Acquisition and development of non-congregate shelter.
HUD implementation notice released Sept 2021; PJs can receive 5% of their allocation for planning and administration currently.
For PJs to receive the remainder of HOME-ARP funds, they need to develop a HOME-ARP allocation plan and submit it as a substantial amendment to the FY 2021 annual action plan. There is no deadline for submission. CA state is probably also undergoing this process.
The State of California received approximately $155 million in HOME-ARP resources. California cities and counties that are HOME Participating Jurisdictions received allocations of more than $512 million.
Affordable Housing
HOME (2020/21 funding)
$72M Cities, counties, developers, and nonprofit Community Housing Development Organizations (CHDOs) that did not receive HOME-ARP funds from HUD.
Rental new construction and rehab, First-time Homebuyer Program, Owner-occupied rehab, Tenant-based Rental Assistance
NOFA released from CA HCD on Dec 1, 2021. Applications due at 5pm, March 10, 2022. NOFA workshop webinars are available.
CA HCD NOFA
Affordable Housing
Permanent Local Housing Allocation
~$340M 2021 NOFA Entitlement formula: metropolitan cities and urban counties allocated a grant for the federal fiscal year 2017 pursuant to the federal CDBG formula non-entitlement formula and competitive grant program: non-entitlement jurisdictions.
Predevelopment, development, acquisition, rehabilitation, and preservation of affordable multifamily, residential live-work, rental housing (including Accessory Dwelling Units), including necessary operating subsidies, Rapid re-housing, rental assistance, supportive/case management services, operating and capital costs for navigation centers and emergency shelters, and the new construction, rehabilitation, and preservation of permanent and transitional housing.
2021 Entitlement and Non-Entitlement Formula Component NOFA released May 2021 with deadline of Dec 31, 2021.
PLHA 2021 NOFA
Community Development
Behavioral Health Continuum Infrastructure Program (BHCIP)
$2.2B Counties, tribal entities, non-profit, and for-profit entities.
Construct, acquire, and rehabilitate real estate assets, or invest in mobile crisis infrastructure to expand the community continuum of behavioral health treatment resources. Facility types include BH Wellness Centers, Short-term crisis stabilization, Acute and subacute care, Crisis residential, community, and outpatient.
Round 1B: Crisis Care Mobile Units Program Re-Release was available in Nov 2021 with a deadline of Jan 2022.
Round 3: applications for Launch-Ready projects will be available in Jan 2022.
RFAs and Applications
NEW: Updated information on funding awards, potential opportunities, and pending announcements to look into/out for within the next 6 months
NOT NEW: Do not require immediate response
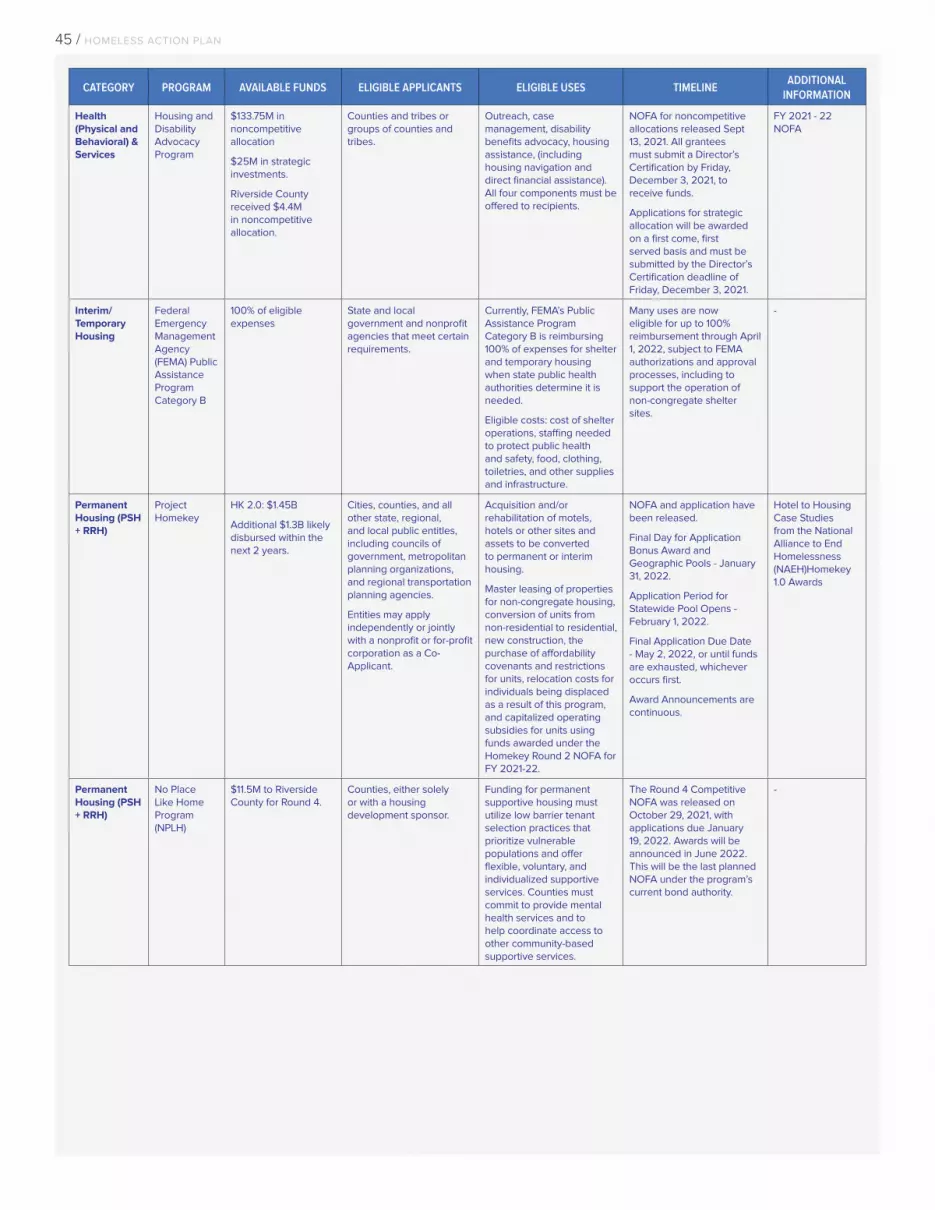
45 / HOMELESS ACTION PLAN
CATEGORY PROGRAM AVAILABLE FUNDS ELIGIBLE APPLICANTS ELIGIBLE USES TIMELINE ADDITIONAL
INFORMATION
Health (Physical and Behavioral) & Services
Housing and Disability Advocacy Program
$133.75M in noncompetitive allocation
$25M in strategic investments.
Riverside County received $4.4M in noncompetitive allocation.
Counties and tribes or groups of counties and tribes.
Outreach, case management, disability benefits advocacy, housing assistance, (including housing navigation and direct financial assistance). All four components must be offered to recipients.
NOFA for noncompetitive allocations released Sept 13, 2021. All grantees must submit a Director’s Certification by Friday, December 3, 2021, to receive funds.
Applications for strategic allocation will be awarded on a first come, first served basis and must be submitted by the Director’s Certification deadline of Friday, December 3, 2021.
FY 2021 - 22 NOFA
Interim/ Temporary Housing
Federal Emergency Management Agency (FEMA) Public Assistance Program Category B
100% of eligible expenses
State and local government and nonprofit agencies that meet certain requirements.
Currently, FEMA’s Public Assistance Program Category B is reimbursing 100% of expenses for shelter and temporary housing when state public health authorities determine it is needed.
Eligible costs: cost of shelter operations, staffing needed to protect public health and safety, food, clothing, toiletries, and other supplies and infrastructure.
Many uses are now eligible for up to 100% reimbursement through April 1, 2022, subject to FEMA authorizations and approval processes, including to support the operation of non-congregate shelter sites.
-
Permanent Housing (PSH + RRH)
Project Homekey
HK 2.0: $1.45B
Additional $1.3B likely disbursed within the next 2 years.
Cities, counties, and all other state, regional, and local public entitles, including councils of government, metropolitan planning organizations, and regional transportation planning agencies.
Entities may apply independently or jointly with a nonprofit or for-profit corporation as a Co-Applicant.
Acquisition and/or rehabilitation of motels, hotels or other sites and assets to be converted to permanent or interim housing.
Master leasing of properties for non-congregate housing, conversion of units from non-residential to residential, new construction, the purchase of affordability covenants and restrictions for units, relocation costs for individuals being displaced as a result of this program, and capitalized operating subsidies for units using funds awarded under the Homekey Round 2 NOFA for FY 2021-22.
NOFA and application have been released.
Final Day for Application Bonus Award and Geographic Pools - January 31, 2022.
Application Period for Statewide Pool Opens - February 1, 2022.
Final Application Due Date - May 2, 2022, or until funds are exhausted, whichever occurs first.
Award Announcements are continuous.
Hotel to Housing Case Studies from the National Alliance to End Homelessness (NAEH)Homekey 1.0 Awards
Permanent Housing (PSH + RRH)
No Place Like Home Program (NPLH)
$11.5M to Riverside County for Round 4.
Counties, either solely or with a housing development sponsor.
Funding for permanent supportive housing must utilize low barrier tenant selection practices that prioritize vulnerable populations and offer flexible, voluntary, and individualized supportive services. Counties must commit to provide mental health services and to help coordinate access to other community-based supportive services.
The Round 4 Competitive NOFA was released on October 29, 2021, with applications due January 19, 2022. Awards will be announced in June 2022. This will be the last planned NOFA under the program’s current bond authority.
-

46 / HOMELESS ACTION PLAN
CATEGORY PROGRAM AVAILABLE FUNDS ELIGIBLE APPLICANTS ELIGIBLE USES TIMELINE ADDITIONAL
INFORMATION
Street Outreach/ Engagement
Encampment Resolution Grants
$47.5M CoCs, counties, and cities. Direct Services and Housing Options: street outreach and engagement, housing and/or systems navigation, interim housing, and permanent housing.
Capacity Building: service coordination efforts, establishing and strengthening cross-system partnerships, and workforce development, including specialized training and contracting with providers of culturally specific interventions.
Sustainable Outcomes: activities and interventions to ensure sustained outcomes for those served and to support sustained restoration of encampment sites to their intended or original state.
HCFC released the request for applications on October 29, 2021. Applications will be due to HCFC no later than December 31, 2021, and initial award determinations shall be made no later than March 1, 2022.
Request for Applications (Oct 2021)
Affordable Housing
California Housing Accelerator
$1.6B Project sponsors who have been awarded HCD funding for an affordable housing project but were unable to secure tax credits.
Tier 1 prioritizes HCD-funded projects which have previously applied to CDLAC for bonds and 4% tax credits. Tier 2 project criteria may still be in development.
Tier 1 application deadline has already passed. The Tier 2 Project Solicitation and application release date are expected late 2021 or early 2022.
Eligible Uses/Projects for Tier 1 Details on eligible funding costs for Tier 1
Affordable Housing
Multifamily Housing Program (MHP)
45% of distribution to SoCal, 30% for projects in NorCal, and 20% for projects in rural areas.
Sponsors or their principals must have successfully developed at least one affordable housing project. Individual, JV, partnership, LP, trust, corporation, LLC, Local Public Entity, duly constituted governing body of an Indian reservation or Rancheria, other legal entity, organized on a for-profit, including limited profit, or nonprofit basis.
New construction, rehabilitation, and preservation of permanent and transitional rental housing for lower income households.
HCD SuperNOFA. Expected release Feb 2022; application closing date May - June 2022.
AB 434 SuperNOFA Updates
Affordable Housing
Joe Serna, Jr. Farmworker Housing Grant (FWHG) Program
$50M Local government agencies, nonprofit corporations, cooperative housing corporations, limited partnerships where all the general partners are nonprofit mutual or public benefit corporations, and federally recognized Indian tribes.
New construction, rehabilitation, and acquisition of owner-occupied and rental units for agricultural workers, with a priority for lower income households.
Eligible beneficiaries of funds are households who derive, or prior to retirement or disability derived, a substantial portion of household income from agricultural employment.
HCD SuperNOFA. Draft guidelines end 2021. Expected NOFA release Feb 2022; application closing date May - June 2022.
AB 434 SuperNOFA Updates
Affordable Housing
Infill Infrastructure Grant (IIG) Program
$534.1M - $90M set-aside for small jurisdictions; $160M for large jurisdictions.
One of, or any combination of, the following: (1) A nonprofit or for-profit Developer of a Qualifying Infill Project; (2) A city, county, city and county, public housing authority, or redevelopment agency, or other governing body that has jurisdiction over a Qualifying Infill Area.
A Capital Improvement Project must be an integral part of, or necessary for, the development of either a Qualifying Infill Project or housing designated within a Qualifying Infill Area. Eligible costs include the construction, rehabilitation, demolition, relocation, preservation, and acquisition of infrastructure.
HCD SuperNOFA. Draft guidelines end 2021. Expected NOFA release Feb 2022; application closing date May - June 2022.
AB 434 SuperNOFA Updates

47 / HOMELESS ACTION PLAN
CATEGORY PROGRAM AVAILABLE FUNDS ELIGIBLE APPLICANTS ELIGIBLE USES TIMELINE ADDITIONAL
INFORMATION
Building Capacity
SDS Supportive Housing Fund
$150M TBD Sole-source financing of permanent supportive housing. RMG serves as the developer and long-term owner of each apartment community.
Not publicly available As of Oct 2021, currently funding 30 projects in CA, 22 projects in LA County;
Video on one project (from May 2021)
Building Capacity
Providing Access and Transforming Health (PATH) funds
$300M in one-time funds (FY 21 - 22). Requesting federal funding of $1.25B over 5 years.
Homeless and Direct Care Providers
Support bridge funding for transitioning services from Whole Person Care pilots to ECM and ILOS; strengthen the IT infrastructure of CBOs that are providing ECM and ILOS services; provide capacity support for CBOs; provide on-the-ground capacity support to facilitate the justice-involved initiative
TBD Summary of new programs under CalAIM
Community Development
Community Care Expansion Program
$805M Counties, tribes, non-profit and for-profit entities
Acquisition, construction, and rehabilitation of adult and senior care facilities that serve applicants and recipients of Social Security Income (SSI), including individuals who are at risk of or are experiencing homelessness and those who have behavioral health conditions.
A Request for Applications (RFA) will be released in January 2022.
Listening Session Slides
Flexible Use Homeless Housing, Assistance and Prevention (HHAP) Grant Program
HHAP 3: $4.2M for Riverside City & County; $1B total
HHAP 4: $1B total
CoCs, counties, and cities. Rapid rehousing, operating subsidies and reserves, street outreach, services coordination, systems support to create regional partnerships, delivery of permanent housing, innovative solutions, including motel/hotel conversion, prevention and shelter diversion to permanent housing, new navigation centers and emergency shelters, with requirement to demonstrate need. For HHAP round 3 (HHAP-3), at least 10% must be for programs serving youth.
HHAP-3 standard agreements for initial allocations (20% - 25% of base funds) were released by the state on September 15, 2021. All eligible grantees submitted their SAA by the statutory deadline of October 15.
HHAP 3 NOFA should be released soon (2021 - 22).
HHAP 4 funds likely disbursed during FY 22 - 23.
Round 3 allocations
Flexible Use Coronavirus State and Local Fiscal Recovery Funds
Riverside County received $240M.
Riverside County nonprofits.
The County of Riverside preliminary spending plan proposes an allocation of $50M to housing and homelessness.
Funds can be used to cover costs incurred by December 31, 2024. The County is currently developing the scope of the programs to be funded under each category.
Presentation during the Oct. 20, 2021 board meeting with the framework of allocations within the above categories
Health (Physical and Behavioral) & Services
Pet Assistance and Support (PAS) Program
$10M (FY 21 - 22) City or county, or a nonprofit corporation that is a "qualified homeless shelter" that commits to meeting a number of conditions relating to provision of services to clients and their pets.
Shelter, food, and basic veterinary services for pets owned by individuals experiencing homelessness, along with staffing and liability insurance related to providing those services.
Program grants will be between $100,000 and $200,000.
A NOFA is expected to be released before the end of 2021.
For future funding opportunities, interested parties can subscribe to the Homelessness emailing list to receive notifications and announcements.

48 / HOMELESS ACTION PLAN
CATEGORY PROGRAM AVAILABLE FUNDS ELIGIBLE APPLICANTS ELIGIBLE USES TIMELINE ADDITIONAL
INFORMATION
Health (Physical and Behavioral) & Services
Enhanced Care Management (ECM)
- CalAIM program that will eventually expand to all Medi-Cal members in the state.
Replaces Whole Person Care pilots and Health Homes Program.
Services: Outreach and Engagement; Comprehensive Assessment and Care Management Plan; Enhanced Coordination of Care; Health Promotion; Comprehensive Transitional Care; Member and Family Supports; and Coordination of and Referral to Community and Social Support Services.
Phased in by county and Population of Focus from January 2022 through July 2023. Goes live for Riverside County in Jan 2022 for the following populations: Individuals and Families Experiencing Homelessness; High Utilizer Adults; and Adults with SMI/SUD.
Enhanced Care Management and In Lieu of Services
Permanent Housing (PSH + RRH)
Housing for a Healthy California (HHC) Program
$170M Organization, agency, or other entity (including a public housing agency, a for-profit entity, or a nonprofit entity) that is an Owner or Developer.
Permanent loans for acquisition, rehab, and/or new construction for existing and new supportive housing opportunities. Grants for Capitalized Operating Subsidy Reserves (COSRs).
Target population: people who are chronically homeless or homeless and a high-cost health user.
The next NOFA for $170 million is expected to be released at end of 2021.
2021 NOFA Listening Session Slides - Details about upcoming NOFA
Preservation, Community Displacement
Portfolio Reinvestment Program
$300M Likely local jurisdictions with qualifying projects.
Provide capital to HCD legacy projects about to go market-rate to extend affordability covenants and preserve the state’s affordable housing stock. Initial target of 60 to 80 projects, including projects with expired loans and regulatory agreements, as well as other projects at risk of conversion to market-rate over a five-year period.
NOFA Spring 2022 Approved in FY 21 - 22 budget; likely updated on this site.
Prevention, Diversion, Problem-Solving
In Lieu of Services (ILOS)
- Medi-Cal Managed Care Providers (MCPs); MCPs must applying to the State and obtain State approval to offer the ILOS by demonstrating that all the requirements will be met.
Housing Transition Navigation Services; Recuperative Care (Medical Respite); Day Habilitation Programs; Nursing Facility Transition/Diversion to Assisted Living Facilities; Community Transition Services/Nursing Facility Transition to a Home; Personal Care and Homemaker Services; Environmental Accessibility Adaptations (Home Modifications); Medically Supportive Food/Meals/Medically Tailored Meals; Sobering Centers; Asthma Remediation
ILOS may be offered by MCPs beginning January 1, 2022. Additional ILOS may be added thereafter on a six-month cadence.
Enhanced Care Management and In Lieu of Services
Special Populations
Veterans Housing and Homelessness Prevention (VHHP) Program
~$300M per funding round
Sponsors cannot have more than two corporate entities between itself and the borrowing entity. Sponsors and Borrowers may be for profit or not-for-profit entities. Any public agency or private entity capable of entering into a contract is eligible to apply, provided they meet the threshold requirements in Guidelines, Section 102.
Acquisition, construction, rehabilitation, and preservation of affordable multifamily housing for veterans and their families to allow veterans to access and maintain housing stability.
HCD SuperNOFA. Draft guidelines end 2021. Expected NOFA release Feb 2022; application closing date May - June 2022.
AB 434 SuperNOFA Updates

49 / HOMELESS ACTION PLAN
CATEGORY PROGRAM AVAILABLE FUNDS ELIGIBLE APPLICANTS ELIGIBLE USES TIMELINE ADDITIONAL
INFORMATION
Special Populations
CalWORKs Housing Support Program (HSP)
$190M yearly for FY 21-22 and FY 22-23
County Welfare Departments.
Financial assistance and housing-related wrap-around supportive services, including rental assistance, housing navigation, case management, security deposits, utility payments, legal services, and credit repair. Some funds can be set-aside for purchasing property.
FY 21 - 22 NOFA released in May 2021 with deadlines in June 2021.
FY 21 - 22 RFA Letter
Special Populations
Transitional Housing Program (THP)
$8M for Round 3 (FY 21 - 22)
County child welfare services agencies that demonstrate a need to provide housing for young adults aged 18 to 25 years of age.
Funds shall be used to help young adults who are 18 to 25 years of age secure and maintain housing.
Eligible uses: Identifying and assisting housing services, helping this population secure and maintain housing (with priority given to those formerly in the state’s foster care or probation system); improving coordination of services and linkages to community resources within the child welfare system and the Homeless Continuum of Care; outreach and targeting to serve those with the most-severe needs.
TBD. The deadline to submit Round 2 THP application was November 12, 2020. No further Round 3 information has been released.
-
Special Populations
Bringing Families Home Program
$92.5M yearly in FY 21-22 and FY 22-23, available over three years
Counties and tribes. 22 counties and one tribe are participating in the July 2019 – June 2022 cycle -- Riverside County is not one of them.
Financial assistance and housing-related wrap-around supportive services for eligible families experiencing homelessness in the child welfare system, including rental assistance, housing navigation, case management, security deposits, utility payments, legal services, and credit repair.
Program was expanded following FY 21 - 22 budget. Announcement of funding availability for new and continuing grantees is forthcoming.
Information on Program Expansion
Special Populations
CalWORKS Homeless Assistance Program
Varies by county - combination of Federal, State, and County funds.
Counties Temporary HA, which helps families pay the costs of temporary shelter; permanent HA, which helps families secure housing or prevent eviction; security deposit and last month’s rent or 2 months arrearages to prevent eviction.
Target population: CalWORKs recipients or CalWORKs eligible applicants who are experiencing homelessness or at risk of homelessness.
SB 1065, passed in 2020, streamlines and expands eligibility for HA. Likely implemented mid-late 2022.
All County Letter Regarding Implementation of SB 1065
Building Capacity
FY 2021 Continuum of Care Competition and Noncompetitive Award of Youth Homeless Demonstration Program Renewal and Replacement Grants
~$2.65B was available for FY 2021 NOFO
Continuum’s of Care CoC activities, including: Quickly rehousing homeless individuals, families, persons fleeing domestic violence(and dating violence, sexual assault, and stalking) and youth while minimizing the trauma and dislocation caused by homelessness; promoting access to and effective utilization of mainstream programs by homeless individuals and families; optimizing self-sufficiency among those experiencing homelessness.
NOFO released in Sept 2021 with deadline of Nov 2021.
CoC Program Competition | HUD.gov / U.S. Department of Housing and Urban Development (HUD)

50 / HOMELESS ACTION PLAN
CATEGORY PROGRAM AVAILABLE FUNDS ELIGIBLE APPLICANTS ELIGIBLE USES TIMELINE ADDITIONAL
INFORMATION
Community Development
Riverside County CDBG Program
Riverside County received $8M in 2020
Non-Profits, 501(c)(3) Higher Education Institutions, Cooperating Cities, and other Government Agencies/Special Districts.
Community Development (CD) uses: Housing, public improvements, community facilities, public services, planning and technical assistance (PTA), Native American housing and housing-related activities, and Colonia housing needs.
Economic Development (ED) uses enterprise funds, planning and technical assistance (PTA), and over-the-counter grants.
Application deadline was Nov 12, 2021.
Riverside County 2022 – 23 CDBG Awards Application
Flexible Use Emergency Solutions Grants Program in CARES Act (ESG-CV)
California received $949M (direct formula allocation to local jurisdictions + state funding to be further distributed)
Direct Allocation: Distributed to currently approved units of general-purpose local government, known as Administrative Entities (Aes), or directly to the COC, depending on capacity.
State funding: Continuum of Care (CoC) service areas that have at least one jurisdiction that does not receive ESG funds directly from HUD.
Street Outreach, Emergency Shelter, Rapid Re-Housing, Homelessness Prevention, and Homeless Management Information System.
Direct allocation: Substantial Amendment/Action Plan Submission to HUD due Aug 2021.
State allocation: applications due by October 2021.
HUD Emergency Solutions Grants - CV
Flexible Use Mental Health Services Act
~$2.3B annually Counties -- must expend the funds for the required components consistent with a local plan.
Can be used to fund homeless and housing assistance services through the Community Services and Supports (CSS), Prevention and Early Intervention (PEI), Innovation (INN), and Capital Facilities and Technological Needs (CF/TN) components of MHSA.
TBD. Counties with population above 200,000 have three years to expend funds distributed for CSS, PEI, and INN components. Counties with less than 200,000 have five years to expend funds distributed for CSS, PEI and INN components. All counties have ten years to expend funds distributed for CF/TN and WET components.
Riverside County MHSA Plan Update
Health (Physical and Behavioral) & Services
Whole Person Care Pilots
$7M annually for four years
County, a city and county, a health or hospital authority, or a consortium of any of the above entities serving a county or region.
Facilitates the coordination of health, behavioral health, and social services, as applicable, in a patient-centered manner with the goals of improved beneficiary health and wellbeing through more efficient and effective use of resources.
Will be replaced by Enhanced Care Management (ECM) starting Jan 2022.
Riverside County WPC Application
Special Populations
Home Safe Program
$15M from July 2018 to June 2021. Noncompetitive allocations. Riverside received $3.7M for FY 21 - 22.
$92.5M yearly for FY 21 - 22 and FY 22 - 23.
Counties or tribes. Adult Protective Services (APS) clients who are experiencing homelessness or are at imminent risk of homelessness as determined by the adult protective services agency.
Financial Assistance: Rental Assistance, utility payments, moving costs, and/or deep cleaning to maintain safe housing.
Supportive Services: housing-related intensive case management, eviction prevention, and/or landlord mediation.
On October 15, 2021, CDSS released NOFA on Oct 15, 2021. These funds include non-competitive allocations available to all 58 counties or groups of counties and/or tribes.
The deadline for accepting funds is December 3, 2021.
Latest NOFA

51 / HOMELESS ACTION PLAN
CATEGORY PROGRAM AVAILABLE FUNDS ELIGIBLE APPLICANTS ELIGIBLE USES TIMELINE ADDITIONAL
INFORMATION
Special Populations
Housing Opportunities for People with AIDS (HOPWA)
FY 2021: $41M Formula program (90% of funds): MSAs with more than 500,000 people and at least 2,000 HIV/AIDS cases and States with more than 2,000 HIV/AIDS cases outside of eligible MSAs. Awards are contingent upon the submission and approval by HUD of a jurisdiction’s Consolidated Plan.
Competitive program (10% of funds): States, local governments, and nonprofit organizations.
Formula program: housing information, resource identification, and permanent housing placement; acquisition, rehabilitation, conversion, lease, and repair of facilities to provide short-term shelter and services; new construction; project or tenant-based rental assistance, including for shared housing; and short-term rent, mortgage, and utility payments.
Competitive program: Special Projects of National Significance (SPNS): Projects of innovative nature or their potential for replication.
New Long-Term Projects: These projects provide housing and services for eligible persons in areas of the nation that did not qualify for HOPWA Formula Program allocations.
FY 2021 competitive program NOFO was announced in April 2021 with an application deadline of June 2021. Awardees announced on 12/1/2021.
-
COLLABORATING AGENCIES/DEPARTMENTSA number of the Action Areas and their associated strategies require developing and/or deepening partnerships with agencies and partners in both the homeless and the homeless serving sectors. The table below shows groups with which the Continuum of Care and its administrative support systems should work to cultivate relationships.
AGENCY/DEPARTMENT AREAS OF PARTNERSHIP
CHILD WELFARE SERVICESTAY support, family support, homeless prevention, early identification, and resolution.
CORONA REGIONAL MEDICAL CENTERCalAIM coordination and healthcare for those experiencing homelessness.
DESERT HEALTHCARE DISTRICTCalAIM coordination and healthcare for those experiencing homelessness.
FAITH BASED ORGANIZATIONSAssistance with supplying food, clothing, and toiletries. Emergency shelters, safe parking, and construction of affordable housing on church properties.
LAW ENFORCEMENT (SHERIFF, CITY POLICE DEPARTMENTS, PROBATION, PAROLE, JAIL, DISTRICT ATTORNEY, PUBLIC DEFENDER)
Outreach, encampment resolution, discharge planning, jail in reach, early identification, and resolution.
REGIONAL ASSOCIATIONS OF GOVERNMENT Coordination and integration of services.
RIVERSIDE COUNTY ANIMAL SERVICESJointly develop strategies to support pet friendly solutions for persons experiencing homelessness.
RIVERSIDE COUNTY BEHAVIORAL HEALTH Outreach and behavioral health services and support.
RIVERSIDE COUNTY CODE ENFORCEMENTWork to proactively address encampments in a coordinated manner.
RIVERSIDE COUNTY DEPARTMENT OF EMERGENCY SERVICESWork to proactively address encampments in a coordinated manner.
RIVERSIDE COUNTY OFFICE OF ECONOMIC DEVELOPMENTJointly develop strategies to increase the overall economic stability of the ELI population in the county.

52 / HOMELESS ACTION PLAN
AGENCY/DEPARTMENT AREAS OF PARTNERSHIP
RIVERSIDE COUNTY OFFICE OF EDUCATION
Early identification of and support for children and families at risk of and/or experiencing homelessness. Establish/enhance year-round breakfast and lunch programs.
RIVERSIDE COUNTY OFFICE ON AGINGEarly identification of and support for older adults at risk of and/or experiencing homelessness.
RIVERSIDE COUNTY PARK AND OPEN SPACE DISTRICTWork to proactively address encampments in a coordinated manner.
RIVERSIDE COUNTY PLANNING DEPARTMENTWork to identify opportunities to develop more housing affordable to everyone and to increase the production of Permanent Supportive Housing.
RIVERSIDE COUNTY WORKFORCE DEVELOPMENT BOARDJointly develop strategies to enhance training programs for persons experiencing homelessness.
RIVERSIDE FLOOD CONTROLWork to proactively address encampments in a coordinated manner.
RIVERSIDE UNIVERSITY PUBLIC HEALTH SYSTEMCalAIM coordination and healthcare for those experiencing homelessness.
VETERANS ADMINISTRATION AND RIVERSIDE COUNTY VETERANS SERVICES OFFICE
Funding and services for veterans experiencing homelessness and their families.
PARTNER CITIES IN COUNTY OF RIVERSIDE CONTINUUM OF CARECity of Banning
City of Beaumont
City of Blythe
City of Calimesa
City of Canyon Lake
City of Cathedral City
City of Coachella
City of Corona
City of Desert Hot Springs
City of Eastvale
City of Hemet
City of Indian Wells
City of Indio
City of Jurupa Valley
City of Indio
City of Jurupa Valley
City of Lake Elsinore
City of La Quinta
City of Menifee
City of Moreno Valley
City of Murrieta
City of Norco
City of Palm Desert
City of Palm Springs
City of Perris
City of Rancho Mirage
City of Riverside
City of San Jacinto
City of Temecula
City of Wildomar

53 / HOMELESS ACTION PLAN
GLOSSARYAHAR: Annual Homeless Assessment Report
APR: Annual Performance Report (for HUD homeless programs)
CALAIM: California Advancing and Innovating Medi-Cal
CDBG: Community Development Block Grant (CPD program – federal)
CES: Coordinated Entry System
CSBG: Community Services Block Grant
COC: Continuum of Care
CPD: Community Planning and Development (HUD Office)
ES: Emergency Shelter
ESG: Emergency Solutions Grant (CPD – federal program)
FMR: Fair Market Rent (maximum rent for Section 8 rental assistance/CoC grants)
GR: General Relief
HCD: Housing and Community Development (State office)
HEARTH: Homeless Emergency and Rapid Transition to Housing (HEARTH) Act of 2009
HIC: Housing Inventory Count
HMIS: Homeless Management Information System
HOME: Home Investment Partnerships (CPD program)
HOPWA: Housing Opportunities for Persons with AIDS (CPD program)
HUD: U.S. Department of Housing and Urban Development (federal)
MHSA: Mental Health Services Act
NOFA: Notice of Funding Availability
PHA: Public Housing Authority
PIT COUNT: Point in Time Count
PH: Permanent Housing
PSH: Permanent Supportive Housing
RHNA: Regional Housing Needs Assessment
RRH: Rapid Rehousing
SAMHSA: Substance Abuse & Mental Health Services Administration
SH: Supportive Housing
SMI: Severe Mental Illness
SNAPS: Office of Special Needs Assistance Program (HUD office overseeing CoC)
SO: Street Outreach
SOAR: SSI/SSDI Outreach, Access, and Recovery (SSI/SSDI Application program)
SRO: Single-Room Occupancy housing units
SSA: Social Security Administration
SSDI: Social Security Disability Income
SSI: Supplemental Security Income
SUD: Substance Use Disorder
TA: Technical Assistance
TANF: Temporary Assistance to Needy Families
TAY: Transition Age Youth (usually ages 16-24)
TH: Transitional Housing
VA: Veterans Affairs (U.S. Department of)
VASH: Veterans Affairs Supportive Housing
VI-SPDT: Vulnerability Index and Service Prioritization Decision Assistance Tool

54 / HOMELESS ACTION PLAN
ACTION AREA
STRATEGY CORRESPONDING ACTIONS PERFORMANCE METRICS GOALS FUNDING PRINCIPLES
AC
TIO
N A
RE
A 1
: S
TR
EN
GT
HE
N S
YS
TE
M T
O B
ET
TE
R P
RE
VE
NT
& E
ND
HO
ME
LE
SS
NE
SS
ST
RA
TE
GY
1: S
TR
EN
GT
HE
N L
EA
DE
RS
HIP
& D
EP
AR
TM
EN
TA
L C
AP
AC
ITY
• Instill shared values into CoC culture and work to increase CoC participation
• Gain deeper insight into CoC performance and adopt a continuous improvement framework through the use of data
• Develop system for monitoring progress of Homeless Action Plan and other actions of the CoC
• Continue to streamline the CoC structure & committees in alignment with goals outlined in this Homeless Action Plan
• Leverage political will of regional stakeholders over the adoption of priorities and goals outlined in this Homeless Action Plan
• Develop internal operational capacity to support the influx of new spending related activities like RFP responses, HUD technical assistance, etc.
• Lead cross-sector initiatives around data-sharing and discharge planning
• Lead system mapping and regional coordination
• Spearhead the initiative to transform the county’s data capacity
• Lead in the development of new funding opportunities with private, philanthropic, and public sources, including cross-sector braiding of funding with housing/ homeless system resources
• Develop Riverside County CoC Policy Agenda to address items like tenant protections, decriminalization, etc.
• Refine and develop program specific guidance, policies, procedures, and trainings to develop capacity regionally
• Support the enhancement/ development of sub-regional infrastructure, specifically in subregions without developed infrastructure, to implement Homeless Action Plan strategies
• Engage cities and tribal lands to implement goals outlined in the Homeless Action Plan
• Number of new positions created in response to Homeless Action Plan, especially around cross-sector alignment, and partnership.
• Riverside County CoC Policy Agenda.
• Number of new opportunities generated through private and philanthropic funding.
• Total number of people successfully exiting to housing each month/year exceeds the people entering homelessness each month/year.
• 100% of the programs/services adhere to CES Policies and Procedures.
• 100% of programs/services are integrated within CES and HMIS.
• 50% reduction in the length of stay (SO, ES, SH, TH).
• System Performance Measures are reflected in public facing dashboards.
• 100% of data reports, dashboards, etc. have data disaggregated demographically
• Disparities of Black, Indigenous and People of Color (BIPOC) experiencing homelessness are reduced across all program types.
• Riverside County CoC has increased the number of active partnerships with cross-sector/mainstream systems.
• 100% of identified cross-sector/mainstream systems utilize developed homeless tracking metrics and processes.
• Riverside County CoC has an effective provider training, learning collaborative, provider forum schedule in place to develop service provider capacity regionally.
• Riverside County CoC has adopted Policy Agenda.
• Riverside County CoC tracks client program satisfaction results and uses them to inform decision making.
• Increases in Riverside County CoC staff that have lived experience and/or are Black, Indigenous and People of Color (BIPOC).
• 100% of awarded projects address racial equity disparities
• 100% of CoC staff and service providers are trained in cultural humility, trauma-informed care, and anti-racist trainings
• Riverside County CoC Framework implemented to right-size system flow
• Invest in strategies and programs that support the Homeless Strategic Action Plan, emphasizing the expansion of system coordination, housing resources, outreach, navigation, and supportive services and provider, city, regional government, and system capacity
• Invest in programs that demonstrate ongoing, long-term, or sustainable data-informed results that are consistent with benchmarks established in the Homeless Strategic Action Plan
• Utilizing a data-driven approach (HMIS, annual Point-In-Time Count, System Performance Measures, and CES By-Name List), invest in programs addressing significant service gaps and priority needs by targeting high-need communities, under-served or hard to-serve geographic areas, or special subpopulations, such as the chronically homeless, individuals with mental illness and substance use disorders, older adults/seniors, and Transitional Age Youth (TAY)
• Strengthen equity-focused strategies, programs, and partnerships that reduce racial disparities, support equitable access to services and resources, and produce equitable outcomes and communities
• Advance client-centered strategies, programs, and partnerships that are informed by people with lived experience of homelessness and provide legitimate feedback mechanisms for clients experiencing homelessness
• Support strategies to address regional inequities in homeless response infrastructure, approaches, and service delivery capacity. These include adopting and implementing regional planning, coordination, decision-making, data-sharing, and accountability measures
EXHIBIT A: TABULATED RIVERSIDE COUNTY HOMELESS ACTION PLAN

55 / HOMELESS ACTION PLAN
ACTION AREA
STRATEGY CORRESPONDING ACTIONS PERFORMANCE METRICS GOALS FUNDING PRINCIPLESA
CT
ION
AR
EA
1: S
TR
EN
GT
HE
N S
YS
TE
M T
O B
ET
TE
R P
RE
VE
NT
& E
ND
HO
ME
LE
SS
NE
SS
ST
RA
TE
GY
2: I
MP
RO
VE
CO
UN
TY
’S A
BIL
ITY
TO
TR
AC
K,
LE
VE
RA
GE
, & M
AN
AG
E D
ATA
• Increase the use of HMIS data for evaluating and reporting on program and system outcomes
• Expand system and program level reporting to inform funding and policy decisions
• Ensure that all contracts that fund services to address homelessness require participation in HMIS protocol, trainings, monitoring, and procedures
• Expand services and programs in HMIS so that HMIS is the main repository for all programs addressing homelessness
• Create public-facing dashboards based on the goals outlined in the Homeless Action Plan and System Performance Measures
• Use data to assess the intersectionality of race, ethnicity, disability, gender, and age within the homeless response system across program types to ensure equitable access and delivery of services for overrepresented groups
• Refine mechanisms for improving HMIS data entry and data quality, especially for front-line staff at shelters, day centers, and access centers where client turnover creates challenges for data quality
• Develop mechanisms to track real-time availability of shelter and housing units within the system
• Develop reporting structure to report on key data indicators at sub-regional and city specific level
• Number of System Performance Measures/goals of Homeless Action Plan reflected in public facing dashboards.
• Number of programs with demographic data disaggregated in public facing dashboards.
• Real time shelter and housing unit inventory reflected in public facing dashboards.
• Percentage of programs/services integrated within CES and HMIS.
• Total number of people successfully exiting to housing each month/year exceeds the people entering homelessness each month/year.
• 100% of the programs/services adhere to CES Policies and Procedures.
• 100% of programs/services are integrated within CES and HMIS.
• 50% reduction in the length of stay (SO, ES, SH, TH).
• System Performance Measures are reflected in public facing dashboards.
• 100% of data reports, dashboards, etc. have data disaggregated demographically
• Disparities of Black, Indigenous and People of Color (BIPOC) experiencing homelessness are reduced across all program types.
• Riverside County CoC has increased the number of active partnerships with cross-sector/mainstream systems.
• 100% of identified cross-sector/mainstream systems utilize developed homeless tracking metrics and processes.
• Riverside County CoC has an effective provider training, learning collaborative, provider forum schedule in place to develop service provider capacity regionally.
• Riverside County CoC has adopted Policy Agenda.
• Riverside County CoC tracks client program satisfaction results and uses them to inform decision making.
• Increases in Riverside County CoC staff that have lived experience and/or are Black, Indigenous and People of Color (BIPOC).
• 100% of awarded projects address racial equity disparities
• 100% of CoC staff and service providers are trained in cultural humility, trauma-informed care, and anti-racist trainings
• Riverside County CoC Framework implemented to right-size system flow
• Invest in strategies and programs that support the Homeless Strategic Action Plan, emphasizing the expansion of system coordination, housing resources, outreach, navigation, and supportive services and provider, city, regional government, and system capacity
• Invest in programs that demonstrate ongoing, long-term, or sustainable data-informed results that are consistent with benchmarks established in the Homeless Strategic Action Plan
• Utilizing a data-driven approach (HMIS, annual Point-In-Time Count, System Performance Measures, and CES By-Name List), invest in programs addressing significant service gaps and priority needs by targeting high-need communities, under-served or hard to-serve geographic areas, or special subpopulations, such as the chronically homeless, individuals with mental illness and substance use disorders, older adults/seniors, and Transitional Age Youth (TAY)
• Strengthen equity-focused strategies, programs, and partnerships that reduce racial disparities, support equitable access to services and resources, and produce equitable outcomes and communities
• Advance client-centered strategies, programs, and partnerships that are informed by people with lived experience of homelessness and provide legitimate feedback mechanisms for clients experiencing homelessness
• Support strategies to address regional inequities in homeless response infrastructure, approaches, and service delivery capacity. These include adopting and implementing regional planning, coordination, decision-making, data-sharing, and accountability measures
ST
RA
TE
GY
3: I
MP
LE
ME
NT
PR
IOR
ITIZ
AT
ION
F
RA
ME
WO
RK
TO
AD
DR
ES
S S
YS
TE
M F
LOW
• Reducing Inflow: Root Causes and Homelessness Prevention
• Curtailing the inflows into the homeless response system will require addressing the root causes of homelessness and preventing new individuals, families, or communities from falling into homelessness. Upstreaming solutions by developing equity-centered, regional, and cross-sector collaboration that focuses on preventing people from becoming homeless through homelessness prevention programs, preservation of vulnerable housing and communities, tenant protections, and the production of affordable housing, all of which will begin to address the system flow.
• Increasing Outflow: Housing Solutions and Supportive Services
• Housing solutions with corresponding supportive services rooted in Housing First, like supportive housing, rapid rehousing, and other flexible housing subsidies and supports are necessary tools to end homelessness.
• Supporting Interim Solutions: Interim and Emergency Options
• Supporting the needs of unsheltered people experiencing homelessness will be a critical component to humanely addressing homelessness.
• Total number of people entering homeless each month.
• Total number of people exiting to housing each month.
• Total active people experiencing homelessness each month.
• Allocation of Riverside County CoC Awards reflecting units of “Reducing Inflow”, “Increasing Outflow”, and “Supporting Interim Solutions”.
ST
RA
TE
GY
4: U
TIL
IZE
FU
ND
ING
PR
INC
IPLE
S IN
FO
RM
ED
BY
TH
E
PR
IOR
ITIZ
AT
ION
FR
AM
EW
OR
K, P
RO
VID
ER
, CIT
Y, &
RE
GIO
NA
L G
OV
ER
NM
EN
T P
ER
FO
RM
AN
CE
, & R
EG
ION
AL
DE
FIC
IEN
CIE
S &
NE
ED
S • Map out the number of units/interventions needed for each component of prioritization
• Establish how to quantify and evaluate provider performance
• Identify gaps in regional deficiencies across the system
• Provide technical assistance and training opportunities and adapt program guidelines and guidance
• Expand partnerships with corporations, philanthropic institutions, and individual donors to secure private funding to reduce and prevent homelessness
• Allocation of Riverside County CoC Awards reflecting units of “Reducing Inflow”, “Increasing Outflow”, and “Supporting Interim Solutions”.
• Number of new opportunities generated through private and philanthropic funding.

56 / HOMELESS ACTION PLAN
ACTION AREA
STRATEGY CORRESPONDING ACTIONS PERFORMANCE METRICS GOALS FUNDING PRINCIPLESA
CT
ION
AR
EA
1: S
TR
EN
GT
HE
N S
YS
TE
M T
O B
ET
TE
R P
RE
VE
NT
& E
ND
HO
ME
LE
SS
NE
SS
ST
RA
TE
GY
5: S
TR
EN
GT
HE
N C
OO
RD
INA
TE
D A
CC
ES
S
• Evaluate and refine current system functionality, including access, assessment, prioritization, and matching/referrals to ensure that the system is connecting the highest need, most vulnerable persons in the community to available housing and supportive services equitably
• Conduct an analysis of the VI-SPDAT, highlighting areas of concern around equity, such as racial identity, gender identity, sexual orientation, etc., and identify whether it is the correct assessment tool for Riverside County CoC
• Evaluate, refine, and implement standardized Riverside County CoC CES Policies and Procedures
• Increase housing and program resources connected to CES by targeting and bringing onboard programs and services currently operating outside of CES and HMIS
• Systematize CES reporting, accountability, and evaluation, and align with the Homeless Management Information System (HMIS)
• Integrate cross-departmental referrals into intake processes, like standardized employment readiness assessments that leads to appropriate linkages with employment services or departments
• Integrate case conferencing component within CES
• Number days between referral and contact.
• Length of stay in shelter or street.
• Functionality of Coordinated Entry System.
• Effectiveness of access, assessment, prioritization, and matching/referrals.
• Number of programs/services adhering to Riverside County.
• Total number of people successfully exiting to housing each month/year exceeds the people entering homelessness each month/year.
• 100% of the programs/services adhere to CES Policies and Procedures.
• 100% of programs/services are integrated within CES and HMIS.
• 50% reduction in the length of stay (SO, ES, SH, TH).
• System Performance Measures are reflected in public facing dashboards.
• 100% of data reports, dashboards, etc. have data disaggregated demographically
• Disparities of Black, Indigenous and People of Color (BIPOC) experiencing homelessness are reduced across all program types.
• Riverside County CoC has increased the number of active partnerships with cross-sector/mainstream systems.
• 100% of identified cross-sector/mainstream systems utilize developed homeless tracking metrics and processes.
• Riverside County CoC has an effective provider training, learning collaborative, provider forum schedule in place to develop service provider capacity regionally.
• Riverside County CoC has adopted Policy Agenda.
• Riverside County CoC tracks client program satisfaction results and uses them to inform decision making.
• Increases in Riverside County CoC staff that have lived experience and/or are Black, Indigenous and People of Color (BIPOC).
• 100% of awarded projects address racial equity disparities
• 100% of CoC staff and service providers are trained in cultural humility, trauma-informed care, and anti-racist trainings
• Riverside County CoC Framework implemented to right-size system flow
• Invest in strategies and programs that support the Homeless Strategic Action Plan, emphasizing the expansion of system coordination, housing resources, outreach, navigation, and supportive services and provider, city, regional government, and system capacity
• Invest in programs that demonstrate ongoing, long-term, or sustainable data-informed results that are consistent with benchmarks established in the Homeless Strategic Action Plan
• Utilizing a data-driven approach (HMIS, annual Point-In-Time Count, System Performance Measures, and CES By-Name List), invest in programs addressing significant service gaps and priority needs by targeting high-need communities, under-served or hard to-serve geographic areas, or special subpopulations, such as the chronically homeless, individuals with mental illness and substance use disorders, older adults/seniors, and Transitional Age Youth (TAY)
• Strengthen equity-focused strategies, programs, and partnerships that reduce racial disparities, support equitable access to services and resources, and produce equitable outcomes and communities
• Advance client-centered strategies, programs, and partnerships that are informed by people with lived experience of homelessness and provide legitimate feedback mechanisms for clients experiencing homelessness
• Support strategies to address regional inequities in homeless response infrastructure, approaches, and service delivery capacity. These include adopting and implementing regional planning, coordination, decision-making, data-sharing, and accountability measures
ST
RA
TE
GY
6: E
NH
AN
CE
PR
OV
IDE
R, C
ITY
& R
EG
ION
AL G
OV
ER
NM
EN
T’S
CA
PA
CIT
Y &
SY
ST
EM
IN
FR
AS
TR
UC
TU
RE
• Support service provider expansion to strengthen regional deficiencies
• Develop/Refine CoC community standards/program guidelines for all program types
• Enhance reporting and monitoring procedures to track and support provider performance
• Develop training strategies to improve provider, city, and regional government’s capacity.
• Identify training requirements and required competencies.
• Training strategies include but are not limited to:
• Explicit emphasis on racial equity and cultural humility
• Workshops to identify common errors and mistakes on CoC Grant Applications
• Workshops to identify common errors and mistakes in performance reports and payment requests
• Presentations before City Councils on best practices, good neighbor strategies, and leveraging city resources with CoC resources
• Developing provider, city, and regional government partnerships to fill gaps, enhance services, and collaborate on grant opportunities
• Increase the capacity of providers to implement tailored services, utilizing progressive engagement and Housing First practices that are flexible and responsive to the needs and priorities of individuals.
• Ensure support for culture shift for providers
• Strengthen provider tables/forums and create learning collaboratives for more frequent capacity building opportunities
• Promote hiring and retention practices to further diversify system staff at all levels to better reflect populations served.
• Track results of hiring practices to ensure diversity and inclusion are expanded.
• Encourage organizations to ensure that diverse staff are not limited to entry-level positions but can access the full range of organizational leadership positions
• Improve investments in workforce development for positions who provide direct homeless services by partnering with universities and community colleges to increase the scale and quality of homeless service workers
• CoC CES Policies and Procedures. Percentage of programs/services integrated within CES and HMIS.
• Number of/participation trainings, learning collaboratives, provider forums provided.
• Program staffing/Caseload ratio per program,
• Increase provider, city, and regional government capacity.

57 / HOMELESS ACTION PLAN
ACTION AREA
STRATEGY CORRESPONDING ACTIONS PERFORMANCE METRICS GOALS FUNDING PRINCIPLESA
CT
ION
AR
EA
1: S
TR
EN
GT
HE
N S
YS
TE
M T
O B
ET
TE
R P
RE
VE
NT
& E
ND
HO
ME
LE
SS
NE
SS
ST
RA
TE
GY
7: S
UP
PO
RT
RE
GIO
NA
L, C
RO
SS
-SE
CT
OR
ALIG
NM
EN
T &
PA
RT
NE
RS
HIP
• Facilitate working groups around cross-sector/departmental/multi-jurisdictional collaboration
• Ensure that each sub-region in Riverside County has an effective regular meeting structure around issues related to homelessness aligned with the Riverside County CoC
• Implement unified approach for tracking homelessness across mainstream, cross-sector systems that touch or serve a large proportion of homeless residents and identify ways to “flag” homelessness and respond to “flags” in departmental data systems by rapidly connecting clients to housing and supportive services
• Identify the feasibility, costs, and legality of integrating and sharing data across disparate systems like healthcare, behavioral/mental health, substance use disorder, criminal justice, child welfare, juvenile justice, education, immigration, employment, land use, and code enforcement
• Develop plans to address the feasibility, costs, and legality of integrating and sharing data across systems towards a central data lake that could spur new opportunities in machine learning and client ownership of data
• Develop standardized screening tools and related protocols for identifying needs across systems and connecting individuals to the right community-based services
• Align strategic planning efforts, task force initiatives and planning committees across all system partners, including all counties, cities, faith communities, philanthropic and business sectors
• Identify internal staff responsible for cross-sector data sharing
• Investigate ways to improve client care coordination through multidisciplinary teams that include the healthcare, mental, and behavioral health sectors
• Strengthen partnerships with the state to increase access to healthcare and supportive services.
• Improve data sharing across providers, cities, regional governments, and systems to facilitate continuity of care and integrated service delivery
• Number of mainstream/cross-sector systems with data sharing agreements or integrations with homeless response system.
• Number of mainstream/cross-sector systems utilizing developed homeless tracking metrics.
• Number of new positions created in response to Homeless Action Plan, especially around cross-sector alignment, and partnership.
• Number of active cross-sector or regional working groups/partnerships.
• Total number of people successfully exiting to housing each month/year exceeds the people entering homelessness each month/year.
• 100% of the programs/services adhere to CES Policies and Procedures.
• 100% of programs/services are integrated within CES and HMIS.
• 50% reduction in the length of stay (SO, ES, SH, TH).
• System Performance Measures are reflected in public facing dashboards.
• 100% of data reports, dashboards, etc. have data disaggregated demographically
• Disparities of Black, Indigenous and People of Color (BIPOC) experiencing homelessness are reduced across all program types.
• Riverside County CoC has increased the number of active partnerships with cross-sector/mainstream systems.
• 100% of identified cross-sector/mainstream systems utilize developed homeless tracking metrics and processes.
• Riverside County CoC has an effective provider training, learning collaborative, provider forum schedule in place to develop service provider capacity regionally.
• Riverside County CoC has adopted Policy Agenda.
• Riverside County CoC tracks client program satisfaction results and uses them to inform decision making.
• Increases in Riverside County CoC staff that have lived experience and/or are Black, Indigenous and People of Color (BIPOC).
• 100% of awarded projects address racial equity disparities
• 100% of CoC staff and service providers are trained in cultural humility, trauma-informed care, and anti-racist trainings
• Riverside County CoC Framework implemented to right-size system flow
• Invest in strategies and programs that support the Homeless Strategic Action Plan, emphasizing the expansion of system coordination, housing resources, outreach, navigation, and supportive services and provider, city, regional government, and system capacity
• Invest in programs that demonstrate ongoing, long-term, or sustainable data-informed results that are consistent with benchmarks established in the Homeless Strategic Action Plan
• Utilizing a data-driven approach (HMIS, annual Point-In-Time Count, System Performance Measures, and CES By-Name List), invest in programs addressing significant service gaps and priority needs by targeting high-need communities, under-served or hard to-serve geographic areas, or special subpopulations, such as the chronically homeless, individuals with mental illness and substance use disorders, older adults/seniors, and Transitional Age Youth (TAY)
• Strengthen equity-focused strategies, programs, and partnerships that reduce racial disparities, support equitable access to services and resources, and produce equitable outcomes and communities
• Advance client-centered strategies, programs, and partnerships that are informed by people with lived experience of homelessness and provide legitimate feedback mechanisms for clients experiencing homelessness
• Support strategies to address regional inequities in homeless response infrastructure, approaches, and service delivery capacity. These include adopting and implementing regional planning, coordination, decision-making, data-sharing, and accountability measures

58 / HOMELESS ACTION PLAN
ACTION AREA
STRATEGY CORRESPONDING ACTIONS PERFORMANCE METRICS GOALS FUNDING PRINCIPLESA
CT
ION
AR
EA
1: S
TR
EN
GT
HE
N S
YS
TE
M T
O B
ET
TE
R P
RE
VE
NT
& E
ND
HO
ME
LE
SS
NE
SS
ST
RA
TE
GY
8: R
EF
INE
CO
MM
UN
ICA
TIO
NS
EF
FO
RT
S A
RO
UN
D H
OM
ELE
SS
NE
SS
IN
RIV
ER
SID
E C
OU
NT
Y
• Provide regular, coordinated public communication to inform the public about actions underway, results achieved, and ways to support those efforts
• Prepare public-facing educational materials and articles based on data and information to educate the public on challenges and activities, and to provide updates on the implementation of programs and resources
• Create public facing dashboards around performance toward achieving adopted goals
• Designate a CoC spokesperson/PR representative to manage CoC communication
• Expand public and private sector support for ending and preventing homelessness through increased community engagement.
• Create a business leaders task force to establish goals and strategies for the business community to support the strategic plan.
• Areas of focus for the task force could include fundraising, advocacy, job creation, and housing access
• Create a countywide education/PR campaign/communication strategy that increases awareness about the causes and impacts of homelessness, the ongoing efforts to end homelessness, and addressing NIMBYism concerns
• As a part of a communications strategy, invest in a client facing component that targets those experiencing or at-risk of homelessness through robust multi-media strategies to make access to services intuitive and radically accessible
• Develop opportunities to include the voices of those with lived experience
• Provide opportunities for action and compassion among all residents, housed and homeless, through advocacy, volunteerism, donations, and other initiatives
• Increase community engagement and support for affordable and supportive housing development throughout Riverside County
• Increase the visibility and expand the efforts of successful initiatives that engage faith institutions and individual congregants; initiatives could include advocacy, recruitment of landlords, and hosting of day centers, meals, shelter, and encampments
• Riverside County CoC Policy Agenda.
• Effectiveness of PR/Communication Campaign.
• Total number of people successfully exiting to housing each month/year exceeds the people entering homelessness each month/year.
• 100% of the programs/services adhere to CES Policies and Procedures.
• 100% of programs/services are integrated within CES and HMIS.
• 50% reduction in the length of stay (SO, ES, SH, TH).
• System Performance Measures are reflected in public facing dashboards.
• 100% of data reports, dashboards, etc. have data disaggregated demographically
• Disparities of Black, Indigenous and People of Color (BIPOC) experiencing homelessness are reduced across all program types.
• Riverside County CoC has increased the number of active partnerships with cross-sector/mainstream systems.
• 100% of identified cross-sector/mainstream systems utilize developed homeless tracking metrics and processes.
• Riverside County CoC has an effective provider training, learning collaborative, provider forum schedule in place to develop service provider capacity regionally.
• Riverside County CoC has adopted Policy Agenda.
• Riverside County CoC tracks client program satisfaction results and uses them to inform decision making.
• Increases in Riverside County CoC staff that have lived experience and/or are Black, Indigenous and People of Color (BIPOC).
• 100% of awarded projects address racial equity disparities
• 100% of CoC staff and service providers are trained in cultural humility, trauma-informed care, and anti-racist trainings
• Riverside County CoC Framework implemented to right-size system flow
• Invest in strategies and programs that support the Homeless Strategic Action Plan, emphasizing the expansion of system coordination, housing resources, outreach, navigation, and supportive services and provider, city, regional government, and system capacity
• Invest in programs that demonstrate ongoing, long-term, or sustainable data-informed results that are consistent with benchmarks established in the Homeless Strategic Action Plan
• Utilizing a data-driven approach (HMIS, annual Point-In-Time Count, System Performance Measures, and CES By-Name List), invest in programs addressing significant service gaps and priority needs by targeting high-need communities, under-served or hard to-serve geographic areas, or special subpopulations, such as the chronically homeless, individuals with mental illness and substance use disorders, older adults/seniors, and Transitional Age Youth (TAY)
• Strengthen equity-focused strategies, programs, and partnerships that reduce racial disparities, support equitable access to services and resources, and produce equitable outcomes and communities
• Advance client-centered strategies, programs, and partnerships that are informed by people with lived experience of homelessness and provide legitimate feedback mechanisms for clients experiencing homelessness
• Support strategies to address regional inequities in homeless response infrastructure, approaches, and service delivery capacity. These include adopting and implementing regional planning, coordination, decision-making, data-sharing, and accountability measures
ST
RA
TE
GY
9: E
XP
AN
D A
CC
OU
NTA
BIL
ITY
T
O C
LIE
NT
S
• Develop processes and technology for clients to provide feedback on services, with mechanisms to apply feedback data toward service delivery and process improvement
• Continue to develop a system where client choice is paramount
• Ensure that new and existing programs develop within this new framework
• When developing cross-sector data sharing, center the efforts on the benefits to the client experience for people experiencing homelessness
• Work with data team to continue to adopt client-centric metrics
• Provide technical assistance and training opportunities, and adapt program guidelines and guidance
• Client program satisfaction results.
ST
RA
TE
GY
10
: DE
VE
LOP
LIV
ED
E
XP
ER
IEN
CE
KN
OW
LE
DG
E,
LE
AD
ER
SH
IP, &
DE
CIS
ION
-MA
KIN
G
• Actively develop opportunities for persons with lived experience to participate in the development and implementation of regional and sub-regional plans
• Expand the hiring of people with lived experience in regular staff positions (not just peer support roles), and promote leadership development for people with lived experience
• Develop peer certification trainings to prepare individuals for peer support positions in the homeless service system
• Encourage service providers to modify requirements for specific positions to allow the substitution of lived experience in place of education or work experience
• Explore the benefit and feasibility of creating a Lived Experience Advisory Board
• Percentage of CoC and service provider staff with Black, Indigenous and People of Color and people with Lived Experience

59 / HOMELESS ACTION PLAN
ACTION AREA
STRATEGY CORRESPONDING ACTIONS PERFORMANCE METRICS GOALS FUNDING PRINCIPLESA
CT
ION
AR
EA
1: S
TR
EN
GT
HE
N S
YS
TE
M T
O B
ET
TE
R P
RE
VE
NT
& E
ND
HO
ME
LE
SS
NE
SS
ST
RA
TE
GY
11:
CE
NT
ER
RA
CE
EQ
UIT
Y IN
HO
ME
LE
SS
RE
SP
ON
SE
• Embed a racial equity lens into all homelessness and housing decisions
• Develop a racial equity impact assessment that will forecast and assess the impacts of new programs and funding decisions
• Incorporate a focus on racial equity data, analysis, and planned activities when submitting and reviewing applications for funding
• Utilize HMIS to analyze data and create public-facing dashboards around racial inequities in experiences of homelessness, provision of services, and outcomes
• Analyze whether housing outcomes and placements perpetuate residential segregation
• Adapt program guidelines, policies, procedures focused on racial equity
• Incorporate a focus on racial equity data, analysis, and planned activities within applications for CoC funded projects and analyze the data and information gathered in response
• Create a plan to move forward on racial equity work that will include system and programmatic actions
• Institute standardized cultural humility, trauma informed care, and anti-racist trainings for CoC programs and system partners
• Align racial equity work in the homelessness sector with other racial equity initiatives in Riverside County
• Number of programs with demographic data disaggregated in public facing dashboards.
• Percentage of CoC and service provider staff with Black, Indigenous and People of Color and people with Lived Experience.
• Number of awarded programs/projects that address racial equity.
• Number of Riverside County CoC Policy and Procedures that address racial equity.
• Total number of people successfully exiting to housing each month/year exceeds the people entering homelessness each month/year.
• 100% of the programs/services adhere to CES Policies and Procedures.
• 100% of programs/services are integrated within CES and HMIS.
• 50% reduction in the length of stay (SO, ES, SH, TH).
• System Performance Measures are reflected in public facing dashboards.
• 100% of data reports, dashboards, etc. have data disaggregated demographically
• Disparities of Black, Indigenous and People of Color (BIPOC) experiencing homelessness are reduced across all program types.
• Riverside County CoC has increased the number of active partnerships with cross-sector/mainstream systems.
• 100% of identified cross-sector/mainstream systems utilize developed homeless tracking metrics and processes.
• Riverside County CoC has an effective provider training, learning collaborative, provider forum schedule in place to develop service provider capacity regionally.
• Riverside County CoC has adopted Policy Agenda.
• Riverside County CoC tracks client program satisfaction results and uses them to inform decision making.
• Increases in Riverside County CoC staff that have lived experience and/or are Black, Indigenous and People of Color (BIPOC).
• 100% of awarded projects address racial equity disparities
• 100% of CoC staff and service providers are trained in cultural humility, trauma-informed care, and anti-racist trainings
• Riverside County CoC Framework implemented to right-size system flow
• Invest in strategies and programs that support the Homeless Strategic Action Plan, emphasizing the expansion of system coordination, housing resources, outreach, navigation, and supportive services and provider, city, regional government, and system capacity
• Invest in programs that demonstrate ongoing, long-term, or sustainable data-informed results that are consistent with benchmarks established in the Homeless Strategic Action Plan
• Utilizing a data-driven approach (HMIS, annual Point-In-Time Count, System Performance Measures, and CES By-Name List), invest in programs addressing significant service gaps and priority needs by targeting high-need communities, under-served or hard to-serve geographic areas, or special subpopulations, such as the chronically homeless, individuals with mental illness and substance use disorders, older adults/seniors, and Transitional Age Youth (TAY)
• Strengthen equity-focused strategies, programs, and partnerships that reduce racial disparities, support equitable access to services and resources, and produce equitable outcomes and communities
• Advance client-centered strategies, programs, and partnerships that are informed by people with lived experience of homelessness and provide legitimate feedback mechanisms for clients experiencing homelessness
• Support strategies to address regional inequities in homeless response infrastructure, approaches, and service delivery capacity. These include adopting and implementing regional planning, coordination, decision-making, data-sharing, and accountability measures

60 / HOMELESS ACTION PLAN
ACTION AREA
STRATEGY CORRESPONDING ACTIONS PERFORMANCE METRICS GOALS FUNDING PRINCIPLESA
CT
ION
AR
EA
2: E
QU
ITA
BLY
AD
DR
ES
S T
HE
HE
ALT
H, S
AF
ET
Y, &
SE
RV
ICE
S N
EE
DS
OF
PE
OP
LE
E
XP
ER
IEN
CIN
G U
NS
HE
LTE
RE
D H
OM
EL
ES
SN
ES
S
ST
RA
TE
GY
12
: IN
CR
EA
SE
RE
GIO
NA
L C
AP
AC
ITY
OF
HO
ME
LE
SS
ST
RE
ET
OU
TR
EA
CH
• Create CoC Homeless Street Outreach Protocol with regional stakeholder that include the standardization of outreach practices, schedules, and engagement strategies and corresponding training across all outreach efforts
• Establish outreach coordination infrastructure in each sub-region
• Leverage person-centered, housing-focused case management with enhanced training in evidence based best practices (e.g., trauma-informed care, critical time intervention, motivational interviewing, and housing first strategies) for service delivery
• Develop encampment management and resolution policies
• Increase access and safety for all to basic hygiene resources, such as bathrooms, showers, and laundry, that accommodate their self-identified race, gender identity, gender expression, etc.
• Increase the number of free public transportation options for people who are unhoused to access services
• Expand the number of outreach teams and staff to ensure appropriate coverage to all sub-regions throughout the county, with specific emphasis on under-resourced communities
• Further develop data initiatives to better track, target, and ensure comprehensive, efficient, and effective delivery of outreach and permanent housing assistance for people experiencing chronic homelessness
• Connect unsheltered individuals directly with rental assistance with the understanding that shelter or transitional housing is not a requirement for unsheltered individuals working with outreach teams to qualify for rental assistance
• Develop programs that support frequent users of public systems, including hospitals, jails or prisons, and shelters, and provide them with supportive housing, significantly reducing returns to the streets
• Develop systems for mental health professionals to intervene in place of law enforcement
• Identify technological strategies to enhance street outreach coordination
• Number of people experiencing unsheltered homelessness at a point in time and month to month, including key subpopulations.
• Length of time a person remains homeless (street and shelter).
• Successful placement from Street Outreach.
• Number of permanent housing placements from Street Outreach.
• Number of successful contacts with people experiencing unsheltered homelessness.
• Number of people entering into chronic homelessness.
• Geographic distribution of people experiencing unsheltered homelessness (including encampments).
• Geographic distribution and make-up of homeless street outreach teams/programs.
• 50% reduction in the number of people experiencing unsheltered homelessness at a point in time and month to month, including key subpopulations across all regions.
• 50% reduction in the length of stay (SO, ES, SH, TH).
• 50% increase in successful housing placement from street outreach.
• 25% reduction in the number of emergency calls, citations, arrests made by law enforcement for homeless related disturbances.
• 75% reduction in the number of people experiencing unsheltered homelessness discharged from institutions or re-entering from the homeless response system.
• Resources are uniformly accessible across Riverside County regardless of sub-region or client demographics, reflected in CES access data.
• 50% increase in successful street outcomes.
• Riverside County CoC has adopted Homeless Street Outreach Protocol, including First Responder Training and Encampment Management.
• Invest in multi-agency, multi-jurisdictional solutions to address the health, safety, and housing needs of people experiencing unsheltered homelessness and staying in encampments.
• Participate in the development of CalAIM initiatives that seek to extend a whole person care approach through the Enhanced Care Management and In Lieu of Services to serve people experiencing unsheltered homelessness.

61 / HOMELESS ACTION PLAN
ACTION AREA
STRATEGY CORRESPONDING ACTIONS PERFORMANCE METRICS GOALS FUNDING PRINCIPLESA
CT
ION
AR
EA
2: E
QU
ITA
BLY
AD
DR
ES
S T
HE
HE
ALT
H, S
AF
ET
Y, &
SE
RV
ICE
S N
EE
DS
OF
PE
OP
LE
EX
PE
RIE
NC
ING
UN
SH
ELT
ER
ED
HO
ME
LE
SS
NE
SS
ST
RA
TE
GY
13
: SU
PP
OR
T T
HE
HE
ALT
H O
F P
EO
PLE
EX
PE
RIE
NC
ING
UN
SH
ELT
ER
ED
H
OM
ELE
SS
NE
SS
TH
RO
UG
H C
RO
SS
-DE
PA
RT
ME
NTA
L/C
RO
SS
-SE
CT
OR
SU
PP
OR
TS
• Identify strategies to improve ongoing connectivity for clients referred for mental health services and/or substance use services
• Support communities in implementing multi-agency, multi-jurisdictional outreach and protective measures addressing the health and safety needs of people experiencing unsheltered homelessness
• Increase the number of mobile crisis teams with clinical staff and expand their hours to support individuals experiencing severe mental health and substance use crises
• Increase the number of beds available for substance use treatment and provide the follow-up supportive services needed to prevent relapses
• Increase access to mental health treatment for people who are unhoused and struggling with mental illness
• Develop a plan to eliminate service access and treatment gaps for unsheltered people struggling with chronic and severe mental illness
• Improve health access for people experiencing unsheltered homelessness, including through CalAIM services like Enhanced Care Management and In Lieu of Services
• Develop new, and enhance existing, partnerships between behavioral health and social service providers, neighborhood associations, cities, and regional governments, including law enforcement and other first responders.
• Engage partners in proactive strategies that link individuals who are homeless with housing and services with the additional goal of reducing criminal justice system involvement
• Ensure adequate resources are available for proactive and consistent outreach efforts
• Develop multi-disciplinary teams that include homeless street outreach, mental health services, etc.
• Ensure people living outside have adequate access to basic needs
• Engage regional stakeholders to ensure appropriate responses to persons living in vehicles and to ensure adequate safe zones for people to park and receive services while working towards housing
• Length of time a person remains homeless (street and shelter).
• 50% reduction in the number of people experiencing unsheltered homelessness at a point in time and month to month, including key subpopulations across all regions.
• 50% reduction in the length of stay (SO, ES, SH, TH).
• 50% increase in successful housing placement from street outreach.
• 25% reduction in the number of emergency calls, citations, arrests made by law enforcement for homeless related disturbances.
• 75% reduction in the number of people experiencing unsheltered homelessness discharged from institutions or re-entering from the homeless response system.
• Resources are uniformly accessible across Riverside County regardless of sub-region or client demographics, reflected in CES access data.
• 50% increase in successful street outcomes.
• Riverside County CoC has adopted Homeless Street Outreach Protocol, including First Responder Training and Encampment Management.
• Invest in multi-agency, multi-jurisdictional solutions to address the health, safety, and housing needs of people experiencing unsheltered homelessness and staying in encampments.
• Participate in the development of CalAIM initiatives that seek to extend a whole person care approach through the Enhanced Care Management and In Lieu of Services to serve people experiencing unsheltered homelessness.
ST
RA
TE
GY
14
: IM
PR
OV
E A
CC
ES
S F
OR
P
EO
PLE
EX
PE
RIE
NC
ING
HO
ME
LE
SS
NE
SS
• Refine hybridized “No Wrong Door Approach” by establishing Access Centers/Navigation Centers in key subregions that are focused on providing access to services with a focus on connecting to housing
• Enhance training, standard orientation messaging, and client facing materials to help people experiencing or at-risk of homelessness understand what services and resources are available to them and what the process looks like to access services/housing across the CoC
• Develop a culture of housing-focused problem-solving across all programs that serve as access points (outreach, drop-in centers, access centers, navigation centers, etc.)
• Streamline intake processes for individuals and families experiencing homelessness, including a review of the desirability of the VI-SPDAT through the lens of equity
• Improve protocols for prioritization into emergency shelter, interim housing, medical respite, etc. to ensure that bed availability is real-time
• Improve roles and responsibilities for assisting clients in obtaining housing-related documentation, like IDs, social security cards, proof of income, birth certificates, etc.
• Implement diversion/problem-solving conversations at all points of entry
• Length of time a person remains homeless (street and shelter).
• Geographic distribution of housing access in to CES.
• Demographics of people experiencing homelessness utilizing access and outreach services.

62 / HOMELESS ACTION PLAN
ACTION AREA
STRATEGY CORRESPONDING ACTIONS PERFORMANCE METRICS GOALS FUNDING PRINCIPLESA
CT
ION
AR
EA
2: E
QU
ITA
BLY
AD
DR
ES
S T
HE
HE
ALT
H, S
AF
ET
Y, &
SE
RV
ICE
S N
EE
DS
OF
PE
OP
LE
EX
PE
RIE
NC
ING
UN
SH
ELT
ER
ED
HO
ME
LE
SS
NE
SS
ST
RA
TE
GY
15
: DE
VE
LOP
C
OU
NT
YW
IDE
EN
CA
MP
ME
NT
M
AN
AG
EM
EN
T P
RO
TO
CO
LS • Enhance coordination between agencies
engaging people living in encampments to ensure consistent and humane approaches to encampment resolution across the county
• Coordinate between department and agencies to create a coordinated encampment management strategy
• As part of CoC Homeless Street Outreach Protocol, establish guidance on Encampment Management and Resolution Protocols
• Engage cities and other local government entities to utilize encampment guidance of CoC Homeless Street Outreach Protocol
• Number of encampments. • 50% reduction in the number of people experiencing unsheltered homelessness at a point in time and month to month, including key subpopulations across all regions.
• 50% reduction in the length of stay (SO, ES, SH, TH).
• 50% increase in successful housing placement from street outreach.
• 25% reduction in the number of emergency calls, citations, arrests made by law enforcement for homeless related disturbances.
• 75% reduction in the number of people experiencing unsheltered homelessness discharged from institutions or re-entering from the homeless response system.
• Resources are uniformly accessible across Riverside County regardless of sub-region or client demographics, reflected in CES access data.
• 50% increase in successful street outcomes.
• Riverside County CoC has adopted Homeless Street Outreach Protocol, including First Responder Training and Encampment Management.
• Invest in multi-agency, multi-jurisdictional solutions to address the health, safety, and housing needs of people experiencing unsheltered homelessness and staying in encampments.
• Participate in the development of CalAIM initiatives that seek to extend a whole person care approach through the Enhanced Care Management and In Lieu of Services to serve people experiencing unsheltered homelessness.
ST
RA
TE
GY
16
: SU
PP
OR
T T
HE
D
EC
RIM
INA
LIZ
AT
ION
OF
HO
ME
LE
SS
NE
SS • Develop Homeless Street Outreach Protocols to
compliment decriminalization advocacy
• Advocate for decriminalizing homelessness responses across the county and state that include pre-adjudication and sentencing alternatives to minimize involvement of people experiencing homelessness in criminal justice system
• Develop processes to ensure greater collaboration between judicial agencies and local alternative courts like Homeless Court and pre-booking diversion resources
• Ensure that Riverside County does not disproportionately enforce existing county ordinances against homeless individuals and families
• Develop an inclusive approach to public space management with non-punitive policies
• Number of emergency calls, citations, arrests made by law enforcement for homeless related disturbances.
ST
RA
TE
GY
17
: DE
VE
LOP
TR
AIN
ING
F
OR
FIR
ST
RE
SP
ON
DE
RS
• Co-develop protocol for first responders when engaging people on the streets and encampments with key considerations when engaging with key subpopulations (survivors of domestic violence, individuals with Severe Mental Illness (SMI) or Substance Use Disorder (SUD), Transitional Aged Youth (TAY), older adults/seniors, and dependent adults)
• Ensure that the first responder training and protocol is in alignment with CoC initiated Homeless Outreach Strategy and Encampment Protocols
• Co-design and implement outreach training for first responders that focuses on evidence based best practices in homeless street outreach and service coordination
• Number of emergency calls, citations, arrests made by law enforcement for homeless related disturbances.
ST
RA
TE
GY
18
: ES
TA
BLIS
H K
EY
RE
SO
UR
CE
S F
OR
SP
EC
IAL
P
OP
ULA
TIO
NS
EX
PE
RIE
NC
ING
UN
SH
ELT
ER
ED
HO
ME
LE
SS
NE
SS • Refine specific policies and procedures as it
relates to needs of unsheltered chronically homeless
• Refine specific policies and procedures as it relates to needs of unsheltered individuals with Severe Mental Illness (SMI)
• Refine specific policies and procedures as it relates to needs of unsheltered individuals with Substance Use Disorder (SUD)
• Refine specific policies and procedures as it relates to needs of unsheltered Transitional Aged Youth (TAY).
• Refine specific policies and procedures as it relates to needs of unsheltered high utilizers of emergency services
• Refine specific policies and procedures as it relates to needs of unsheltered survivors fleeing domestic violence
• Refine specific policies and procedures as it relates to needs of unsheltered families
• Refine specific policies and procedures as it relates to needs of unsheltered older adults/seniors
• Refine specific policies and procedures as it relates to needs of unsheltered LGBTQIA+ individuals
• Number of people experiencing unsheltered homelessness at a point in time and month to month, including key subpopulations.
• Number of people experiencing unsheltered homelessness discharged from mainstream institutions or re-entering from homeless response system.
• Number of successful referrals to support services (mental health, employment, hygiene, nutrition, etc.)

63 / HOMELESS ACTION PLAN
ACTION AREA
STRATEGY CORRESPONDING ACTIONS PERFORMANCE METRICS GOALS FUNDING PRINCIPLESA
CT
ION
AR
EA
3: E
XP
AN
D C
OM
MU
NIT
IES
CA
PA
CIT
Y T
O P
RO
VID
E S
AF
E &
EF
FE
CT
IVE
SH
ELT
ER
& I
NT
ER
IM H
OU
SIN
G
ST
RA
TE
GY
19
: IN
CR
EA
SE
TH
E N
UM
BE
R O
F C
RIS
IS H
OU
SIN
G
BE
DS
RE
GIO
NA
LLY
• Create more crisis housing, which includes emergency shelter, interim housing, medical respite, domestic violence shelters, faith-based shelters, family shelters, transitional housing, stabilization beds, recuperative care beds, and motel vouchers to meet the specific needs by population and region
• Develop and advance CalAIM proposals seeking to extend statewide the service options available under Whole Person Care and Health Homes Program through the Enhanced Care Management program and In Lieu of Services care coordination and housing services to better address the health care needs of people who are staying in shelter and interim housing sites
• Ensure that there are more public services in neighborhoods developing crisis housing to meet community needs
• Ensure that crisis housing account for the unique needs of specific subpopulations
• Mobilize Homekey resources and other funding sources to support acquisition of sites for use as crisis housing
• Number of people experiencing sheltered homelessness at a point in time and month to month, including key subpopulations.
• Demographics of people utilizing crisis housing options.
• Length of time a person remains homeless (ES, SH, TH).
• Number of successful housing placements from crisis housing.
• Percent of returns to homelessness in 6,12, and 24 months for people connected to crisis housing.
• Number of people experiencing sheltered homelessness discharged from institutions or re-entering from homeless response system.
• Number of crisis housing beds in the system and geographic distribution.
• Crisis housing bed utilization.
• Number of successful referrals to support services (mental health, employment, hygiene, nutrition, etc.).
• 100% of crisis housing adhere to CoC Policies and Procedures
• 25% increase in the number of crisis housing beds (ES, SH, TH) in the system, geographically distributed.
• Increase in the ratio of sheltered to unsheltered homelessness at a point in time and month to month, including key subpopulations.
• 50% reduction in the length of stay in crisis housing (ES, SH, TH).
• 50% increase in the number of successful housing placements from crisis housing.
• 75% reduction in the number of people experiencing unsheltered homelessness discharged from institutions or re-entering from homeless response system
• Invest in innovative approaches to expand the supply of safe, humane, housing-placement focused shelter and interim housing models, like Project Homekey/Roomkey for people experiencing homelessness.
• Expand alignment and engagement of healthcare, behavioral health, mental health, and substance use disorder resources in efforts to address health disparities and service needs among people experiencing unsheltered and sheltered homelessness
ST
RA
TE
GY
20
: RE
FIN
E C
RIS
IS H
OU
SIN
G P
OLIC
IES
& P
RO
CE
DU
RE
S
• Assess crisis housing coordinated entry and referral patterns to identify regional gaps and under resourced crisis housing capacity
• Ensure that shelter access is equitable through review of data
• Refine best practices for crisis housing that focus on accessibility and are low barrier.
• Barriers can include lack of privacy, sobriety, curfews, engaging in treatment, animal policy, storage, couples, people of non-binary gender identity
• Move towards a system where shelters are open 24/7
• Establish system wide procedures to track and utilize real-time crisis housing bed availability
• Assess and refine policies and procedures to ensure that crisis housing is centered on housing-focused problem-solving
• Provide technical assistance and guidance that will support the continued application of Housing First practices, including lowered barriers and housing-focused services and supports, within shelter and interim housing programs
• Ensure that policies and procedures account for the unique needs of specific subpopulations: Transitional Aged Youth (TAY), high utilizers of emergency services, survivors fleeing domestic violence, families, and LGBTQAI+
• Number of people experiencing sheltered homelessness at a point in time and month to month, including key subpopulations.
• Demographics of people utilizing crisis housing options.
• Length of time a person remains homeless (ES, SH, TH).
• Number of successful housing placements from crisis housing.
• Percent of returns to homelessness in 6,12, and 24 months for people connected to crisis housing.
• Number of people experiencing sheltered homelessness discharged from institutions or re-entering from homeless response system.
• Number of crisis housing beds in the system and geographic distribution. Crisis housing bed utilization.
• Number of successful referrals to support services (mental health, employment, hygiene, nutrition, etc.).

64 / HOMELESS ACTION PLAN
ACTION AREA
STRATEGY CORRESPONDING ACTIONS PERFORMANCE METRICS GOALS FUNDING PRINCIPLESA
CT
ION
AR
EA
4: E
XP
AN
D &
EN
SU
RE
EQ
UIT
AB
LE
AC
CE
SS
T
O P
ER
MA
NE
NT
HO
US
ING
IN
OU
R C
OM
MU
NIT
IES
ST
RA
TE
GY
21:
AD
VO
CA
TE
FO
R T
HE
IN
CR
EA
SE
D P
RO
DU
CT
ION
OF
AF
FO
RD
AB
LE
HO
US
ING
• Advocate for federal, state, county, and local policies and funding to increase and preserve affordable housing for households earning below 30% Area Median Income (AMI)
• Pursue lower-cost housing typologies, like tiny homes, accessory dwelling units, mobile homes, hotel and motel conversions, prefabricated modular housing, and shipping containers, and innovative housing and financing models
• Identify feasibility to develop affordable and supportive housing on underutilized state, county, and city owned land
• Ensure Riverside County utilizes full funding opportunities from the federal and state governments for housing development
• Advocate for inclusionary housing policies, up zoning, and infill development
• As part of communication strategy, develop strategies to address NIMBY sentiments
• Number of housing units affordable to extremely low-income population, both currently and in the pipeline.
• Promote the development of 21,000 units affordable to extremely low-income population.
• Increase the number (unit count) of Permanent Housing Units by 75% from baseline year (including Permanent Supportive Housing [PSH] and Rapid Re-Housing [RRH]).
• Increase the number of clients that successfully exit housing interventions, including PSH and RRH by 25%.
• Increase the number of clients that successfully retain housing, including PSH and RRH by 25%.
• Over 50% of new housing placements occur in opportunity neighborhoods/zip codes with high social determinants of health.
• 100% of programs adhering to Riverside CoC Policies and Procedures for PSH and RRH.
• Length of time during housing search is reduced by 50%.
• Increase in the number of units secured for people experiencing homelessness through centralized landlord engagement program, especially in neighborhoods with high SDOH, including through master leasing and shared housing.
• Increase in the number of landlords participating in centralized landlord engagement program, including formalized partnerships.
• Increase in the number of real-time unit availability secured by centralized landlord engagement program
• Strengthen the implementation of Housing First approaches and other best practices that support equitable access in housing markets with high social determinants of health (SDOH), including but not limited to: supportive housing, rapid rehousing, short- and longer-term forms of rental subsidy and assistance, shallow subsidies, move-in assistance, and landlord outreach, engagement, and retention.
• Invest in the creation of an expanded supply of affordable and supportive housing opportunities, paired with appropriate health and behavioral health care resources, and accessible and culturally responsive services to people exiting homelessness, low-income individuals and families, and to people from historically marginalized communities

65 / HOMELESS ACTION PLAN
ACTION AREA
STRATEGY CORRESPONDING ACTIONS PERFORMANCE METRICS GOALS FUNDING PRINCIPLESA
CT
ION
AR
EA
4: E
XP
AN
D &
EN
SU
RE
EQ
UIT
AB
LE
AC
CE
SS
TO
PE
RM
AN
EN
T H
OU
SIN
G I
N O
UR
CO
MM
UN
ITIE
S
ST
RA
TE
GY
22
: IN
CR
EA
SE
PE
RM
AN
EN
T S
UP
PO
RT
IVE
HO
US
ING
UN
ITS
& C
AP
AC
ITY
• Increase the number of permanent supportive housing stock
• Identify costs associated with developing adequate supply of permanent supportive housing
• Increase access to tenant-based, scattered site Permanent Supportive Housing programs
• Assess coordinated entry, referral patterns to identify regional gaps, and under resourced PSH capacity
• Ensure that PSH programs access is equitable through review of data
• Expand partnerships with behavioral health treatment services through Riverside County and local behavioral health providers to ensure that PSH units are paired with adequate supportive services
• Implement a “moving on” strategy, targeting up to 20% of current PSH residents for transition to general population affordable housing, thus freeing up PSH for new tenants
• Convene stakeholders (housing developers, planning departments, service providers, cities, regional governments) to explore ways to create and streamline permanent supportive housing within context of local housing elements
• Leverage a wide array of private, local, state, and federal funding, including CalAIM and Project Homekey, to support the expansion of a Permanent Supportive Housing
• Improve PSH service quality and fidelity by refining community standards, facilitating trainings, and creating learning collaboratives
• Advocate for the local conditions to develop enough permanent supportive housing to meet the need in our community
• Identify feasibility to develop permanent supportive housing on underutilized State or county owned land
• Optimize utilization through progressive engagement by enabling clients to move to less or more service-intensive housing based on identified need
• Ensure sufficient level of supportive services, which are voluntary, housing first oriented, trauma-informed, and incorporate harm reduction principles
• Number of people utilizing housing intervention, including PSH and RRH, at a point in time and month to month, including key subpopulations.
• Demographics of different housing interventions, including PSH and RRH.
• Number of clients that successfully exit housing interventions, including PSH and RRH.
• Number of clients that successfully retain housing, including PSH and RRH, for 6,12, 24 months.
• Number of Permanent Supportive Housing Units, both tenant-based and project-based, currently and in pipeline.
• Utilization rates for housing interventions, including PSH and RRH.
• Zip codes of housing placements for housing interventions, including PSH and RRH.
• Referral pattern for housing interventions, including PSH and RRH.
• Number of programs adhering to Riverside CoC Policies and Procedures for PSH and RRH.
• Promote the development of 21,000 units affordable to extremely low-income population.
• Increase the number (unit count) of Permanent Housing Units by 75% from baseline year (including Permanent Supportive Housing [PSH] and Rapid Re-Housing [RRH]).
• Increase the number of clients that successfully exit housing interventions, including PSH and RRH by 25%.
• Increase the number of clients that successfully retain housing, including PSH and RRH by 25%.
• Over 50% of new housing placements occur in opportunity neighborhoods/zip codes with high social determinants of health.
• 100% of programs adhering to Riverside CoC Policies and Procedures for PSH and RRH.
• Length of time during housing search is reduced by 50%.
• Increase in the number of units secured for people experiencing homelessness through centralized landlord engagement program, especially in neighborhoods with high SDOH, including through master leasing and shared housing.
• Increase in the number of landlords participating in centralized landlord engagement program, including formalized partnerships.
• Increase in the number of real-time unit availability secured by centralized landlord engagement program
• Strengthen the implementation of Housing First approaches and other best practices that support equitable access in housing markets with high social determinants of health (SDOH), including but not limited to: supportive housing, rapid rehousing, short- and longer-term forms of rental subsidy and assistance, shallow subsidies, move-in assistance, and landlord outreach, engagement, and retention.
• Invest in the creation of an expanded supply of affordable and supportive housing opportunities, paired with appropriate health and behavioral health care resources, and accessible and culturally responsive services to people exiting homelessness, low-income individuals and families, and to people from historically marginalized communities
ST
RA
TE
GY
23
: IN
CR
EA
SE
RA
PID
RE
HO
US
ING
H
OU
SIN
G U
NIT
S &
CA
PA
CIT
Y
• Increase the number of rapid rehousing programs/units
• Identify costs associated with developing adequate supply of rapid rehousing
• Assess coordinated entry, referral patterns to identify CES integrations, regional gaps, and under resourced RRH capacity
• Ensure that RRH programs access is equitable through review of data
• Improve RRH service quality and fidelity by refining community standards, facilitating trainings, and facilitating learning collaboratives.
• For those with higher needs, provide longer-term housing assistance and critical time intervention
• Advocate for the local conditions so that expanded RRH is effective in the private rental market
• Optimize utilization through progressive engagement by enabling clients to move to less or more service-intensive housing based on identified need
• Assess outcomes for expanded rapid rehousing programs
• Identify effective practices for rapid rehousing to be effective in high-cost, high-SDOH housing markets
• Strengthen the integration of workforce development/employment services with RRH
• Number of people utilizing housing intervention, including PSH and RRH, at a point in time and month to month, including key subpopulations.
• Demographics of different housing interventions, including PSH and RRH.
• Number of clients that successfully exit housing interventions, including PSH and RRH.
• Number of clients that successfully retain housing, including PSH and RRH, for 6,12, 24 months.
• Number of Rapid Rehousing Program Units.
• Utilization rates for housing interventions, including PSH and RRH.
• Zip codes of housing placements for housing interventions, including PSH and RRH.
• Referral pattern for housing interventions, including PSH and RRH.
• Number of programs adhering to Riverside CoC Policies and Procedures for PSH and RRH.

66 / HOMELESS ACTION PLAN
ACTION AREA
STRATEGY CORRESPONDING ACTIONS PERFORMANCE METRICS GOALS FUNDING PRINCIPLESA
CT
ION
AR
EA
4: E
XP
AN
D &
EN
SU
RE
EQ
UIT
AB
LE
AC
CE
SS
TO
PE
RM
AN
EN
T H
OU
SIN
G I
N O
UR
CO
MM
UN
ITIE
S
ST
RA
TE
GY
24
: DE
VE
LOP
CE
NT
RA
LIZ
ED
LA
ND
LOR
D O
UT
RE
AC
H,
EN
GA
GE
ME
NT,
& R
ET
EN
TIO
N S
TR
AT
EG
IES
• Assess the viability of development of a centralized landlord engagement program with one entity conducting housing outreach for the entire county
• Develop provider facing real-time listings of rental units available to people experiencing homelessness
• Increase the stock of units available to programs, homeless service providers, etc., especially in neighborhoods with high SDOH
• Develop service provider performance standards for issuing timely payments, documentation, processing, and inspections so that experiences for landlords are uniform, regardless of which provider or payment source is being utilized
• Develop additional incentives and supports, like contingency funds, flex funds, mediation services, landlord incentive payments, security deposits, etc.
• Work with property management companies, owners, landlords, apartment associations, and housing developers to secure housing units through developed and formalized partnerships, MOUs, master leasing, etc.
• Incentivize the reduction of screening criteria that screens out prospective tenants with evictions, poor credit, and/or criminal histories
• Track key metrics associated with the housing search and housing lease-up process
• Ensure that trained Housing Locators or Housing Specialists are designated as representatives for the system to ensure consistent messaging and service delivery
• Length of time during housing search.
• Number of units secured for people experiencing homelessness through centralized landlord engagement program, especially in neighborhoods with high SDOH, including through master leasing and shared housing.
• Average number of real-time unit availability secured by centralized landlord engagement program.
• Number of incentives and supports issued through centralized landlord engagement program.
• Number of landlords participating in centralized landlord engagement program, including formalized partnerships.
• Promote the development of 21,000 units affordable to extremely low-income population.
• Increase the number (unit count) of Permanent Housing Units by 75% from baseline year (including Permanent Supportive Housing [PSH] and Rapid Re-Housing [RRH]).
• Increase the number of clients that successfully exit housing interventions, including PSH and RRH by 25%.
• Increase the number of clients that successfully retain housing, including PSH and RRH by 25%.
• Over 50% of new housing placements occur in opportunity neighborhoods/zip codes with high social determinants of health.
• 100% of programs adhering to Riverside CoC Policies and Procedures for PSH and RRH.
• Length of time during housing search is reduced by 50%.
• Increase in the number of units secured for people experiencing homelessness through centralized landlord engagement program, especially in neighborhoods with high SDOH, including through master leasing and shared housing.
• Increase in the number of landlords participating in centralized landlord engagement program, including formalized partnerships.
• Increase in the number of real-time unit availability secured by centralized landlord engagement program
• Strengthen the implementation of Housing First approaches and other best practices that support equitable access in housing markets with high social determinants of health (SDOH), including but not limited to: supportive housing, rapid rehousing, short- and longer-term forms of rental subsidy and assistance, shallow subsidies, move-in assistance, and landlord outreach, engagement, and retention.
• Invest in the creation of an expanded supply of affordable and supportive housing opportunities, paired with appropriate health and behavioral health care resources, and accessible and culturally responsive services to people exiting homelessness, low-income individuals and families, and to people from historically marginalized communities
ST
RA
TE
GY
25
: IN
NO
VA
TE
A
PP
RO
AC
HE
S T
O E
XP
AN
D E
XIS
TIN
G
HO
US
ING
ST
OC
K
• Explore lower-cost housing typologies, like tiny homes, accessory dwelling units, hotel and motel conversions, prefabricated modular housing, and shipping containers
• Explore master leasing at-scale to secure units for people experiencing homelessness
• Develop shared housing program to increase rental options and affordability for clients, with emphasis on private rooms, split leases, etc.
• Expand and scale the use of shallow subsidies and longer-term subsidies
• Length of time during housing search.
• Number of units secured for people experiencing homelessness through centralized landlord engagement program, especially in neighborhoods with high SDOH, including through master leasing and shared housing.
ST
RA
TE
GY
26
: IN
CR
EA
SE
FLE
XIB
LE
H
OU
SIN
G F
UN
DS
• Explore possibility of developing Flexible Housing Subsidy Pool similar to other communities
• Expand flexible housing subsidy funds, like shallow subsidies and longer-term subsidies, especially for instances of homelessness prevention, where families are rent burdened
• Expand flexible housing funds to cover one-time expenses like move-in costs
• Length of time during housing search.
• Outcomes of flexible funds issued, including one-time payments and shallow subsidies.
• Number of flexible funds issued, including one-time payments and shallow subsides.
ST
RA
TE
GY
27
: AD
DR
ES
S
HO
US
ING
NE
ED
S O
F U
NIQ
UE
S
UB
PO
PU
LA
TIO
NS
• Assess and expand current programs serving Chronically Homeless
• Assess and expand current programs serving Individuals with Severe Mental Illness (SMI)
• Assess and expand current programs serving Individuals with Substance Use Disorders (SUD)
• Assess and expand current programs serving Transition Aged Youth (TAY)
• Assess and expand current programs serving Older Adults/Seniors
• Assess and expand current programs serving LGBTQAI+
• Number of successful referrals to support services (mental health, employment, hygiene, nutrition, etc.)

67 / HOMELESS ACTION PLAN
ACTION AREA
STRATEGY CORRESPONDING ACTIONS PERFORMANCE METRICS GOALS FUNDING PRINCIPLESA
CT
ION
AR
EA
4: E
XP
AN
D &
EN
SU
RE
EQ
UIT
AB
LE
AC
CE
SS
TO
PE
RM
AN
EN
T H
OU
SIN
G I
N O
UR
CO
MM
UN
ITIE
S
ST
RA
TE
GY
28
: DE
VE
LOP
ST
RA
TE
GIE
S T
O R
ED
UC
E B
AR
RIE
RS
F
OR
PE
OP
LE
EX
PE
RIE
NC
ING
HO
ME
LE
SS
NE
SS
IN
OB
TA
ININ
G
HO
US
ING
& T
O IN
CR
EA
SE
TH
E S
PE
ED
OF
LE
AS
E-U
P P
RO
CE
SS
• Assess and establish programs and processes for individuals experiencing homelessness to improve credit and pay off debts
• Assess and establish programs and processes for individuals experiencing homelessness that have evictions on record
• Assess and establish programs and processes for individuals experiencing homelessness that have criminal justice issues on record
• Assess and establish programs and processes for individuals experiencing homelessness to expedite documentation necessary for housing, like social security card, identification card, birth certificates, and proof of income documentation
• Assess and establish universal housing application for all programs across Riverside County
• Clarify, contractually and through training, the expectations regarding roles and responsibilities of shelter case managers, outreach workers, and housing case managers in getting clients document-ready and establish & record performance metrics to track progress
• Identify additional ways to expedite the housing search and lease up process
• Length of time during housing search.
• Number of clients with housing barriers, including credit, debt, evictions, criminal justice issues, documentation (social security card, identification card, birth certificate, proof of income, etc.).
• Promote the development of 21,000 units affordable to extremely low-income population.
• Increase the number (unit count) of Permanent Housing Units by 75% from baseline year (including Permanent Supportive Housing [PSH] and Rapid Re-Housing [RRH]).
• Increase the number of clients that successfully exit housing interventions, including PSH and RRH by 25%.
• Increase the number of clients that successfully retain housing, including PSH and RRH by 25%.
• Over 50% of new housing placements occur in opportunity neighborhoods/zip codes with high social determinants of health.
• 100% of programs adhering to Riverside CoC Policies and Procedures for PSH and RRH.
• Length of time during housing search is reduced by 50%.
• Increase in the number of units secured for people experiencing homelessness through centralized landlord engagement program, especially in neighborhoods with high SDOH, including through master leasing and shared housing.
• Increase in the number of landlords participating in centralized landlord engagement program, including formalized partnerships.
• Increase in the number of real-time unit availability secured by centralized landlord engagement program
• Strengthen the implementation of Housing First approaches and other best practices that support equitable access in housing markets with high social determinants of health (SDOH), including but not limited to: supportive housing, rapid rehousing, short- and longer-term forms of rental subsidy and assistance, shallow subsidies, move-in assistance, and landlord outreach, engagement, and retention.
• Invest in the creation of an expanded supply of affordable and supportive housing opportunities, paired with appropriate health and behavioral health care resources, and accessible and culturally responsive services to people exiting homelessness, low-income individuals and families, and to people from historically marginalized communities
ST
RA
TE
GY
29
: EX
PA
ND
HO
US
ING
AC
CE
SS
TO
HIG
H
OP
PO
RT
UN
ITY
NE
IGH
BO
RH
OO
DS
, WIT
H A
FO
CU
S O
N
TH
OS
E W
ITH
HIG
H S
OC
IAL D
ET
ER
MIN
AN
TS
OF
HE
ALT
H
• Track housing placements in HMIS at the zip code level to analyze regional trends
• Create a framework and policy recommendations to increase housing placements in opportunity neighborhoods with high social determinants of health
• Ensure homeless housing stock and services are geographically located to allow, whenever possible, for the needs of individuals and families to be met in their own communities.
• Explore incentivization strategies to promote move-ins in neighborhoods with high SDOH
• Zip codes of housing placements for housing interventions, including PSH and RRH.
• Number of units secured for people experiencing homelessness through centralized landlord engagement program, especially in neighborhoods with high SDOH, including through master leasing and shared housing.
ST
RA
TE
GY
30
: ST
RE
NG
TH
EN
A
PP
RO
AC
HE
S T
O C
AS
E
MA
NA
GE
ME
NT
• Assess and refine policies and procedures to ensure that services are applying best practices in case management
• Develop training around best practice approaches to case management to improve provider, city, and regional government capacity
• Strengthen provider tables/forums and create learning collaborative for more frequent capacity building opportunities around best practice approaches to case management
• Number of successful referrals to support services (mental health, employment, hygiene, nutrition, etc.).
• Number of programs adhering to Riverside CoC Policies and Procedures for PSH and RRH.
ST
RA
TE
GY
31:
LE
VE
RA
GE
HO
US
ING
A
UT
HO
RIT
Y D
IVIS
ION
RE
SO
UR
CE
S F
OR
P
EO
PLE
EX
PE
RIE
NC
ING
HO
ME
LE
SS
NE
SS
• Increase advocacy for the expansion of the Housing Choice Voucher program
• Number of Housing Authority Division vouchers, utilization rate, length of time during housing search, zip code of housing placements, and vouchers set aside for people experiencing homelessness.

68 / HOMELESS ACTION PLAN
ACTION AREA
STRATEGY CORRESPONDING ACTIONS PERFORMANCE METRICS GOALS FUNDING PRINCIPLESA
CT
ION
AR
EA
4: E
XP
AN
D &
EN
SU
RE
EQ
UIT
AB
LE
AC
CE
SS
T
O P
ER
MA
NE
NT
HO
US
ING
IN
OU
R C
OM
MU
NIT
IES
ST
RA
TE
GY
32
: CO
NT
INU
E T
O A
DV
OC
AT
E F
OR
LE
GIS
LA
TIO
N P
RO
TE
CT
ING
AG
AIN
ST
HO
US
ING
D
ISC
RIM
INA
TIO
N IN
HO
US
ING
SE
AR
CH
• Advocate for the legislation protecting against housing discrimination
• Establish partnerships and mechanisms for better tracking and enforcement of existing protections
• Number of housing discrimination instances within Riverside County
• Promote the development of 21,000 units affordable to extremely low-income population.
• Increase the number (unit count) of Permanent Housing Units by 75% from baseline year (including Permanent Supportive Housing [PSH] and Rapid Re-Housing [RRH]).
• Increase the number of clients that successfully exit housing interventions, including PSH and RRH by 25%.
• Increase the number of clients that successfully retain housing, including PSH and RRH by 25%.
• Over 50% of new housing placements occur in opportunity neighborhoods/zip codes with high social determinants of health.
• 100% of programs adhering to Riverside CoC Policies and Procedures for PSH and RRH.
• Length of time during housing search is reduced by 50%.
• Increase in the number of units secured for people experiencing homelessness through centralized landlord engagement program, especially in neighborhoods with high SDOH, including through master leasing and shared housing.
• Increase in the number of landlords participating in centralized landlord engagement program, including formalized partnerships.
• Increase in the number of real-time unit availability secured by centralized landlord engagement program
• Strengthen the implementation of Housing First approaches and other best practices that support equitable access in housing markets with high social determinants of health (SDOH), including but not limited to: supportive housing, rapid rehousing, short- and longer-term forms of rental subsidy and assistance, shallow subsidies, move-in assistance, and landlord outreach, engagement, and retention.
• Invest in the creation of an expanded supply of affordable and supportive housing opportunities, paired with appropriate health and behavioral health care resources, and accessible and culturally responsive services to people exiting homelessness, low-income individuals and families, and to people from historically marginalized communities
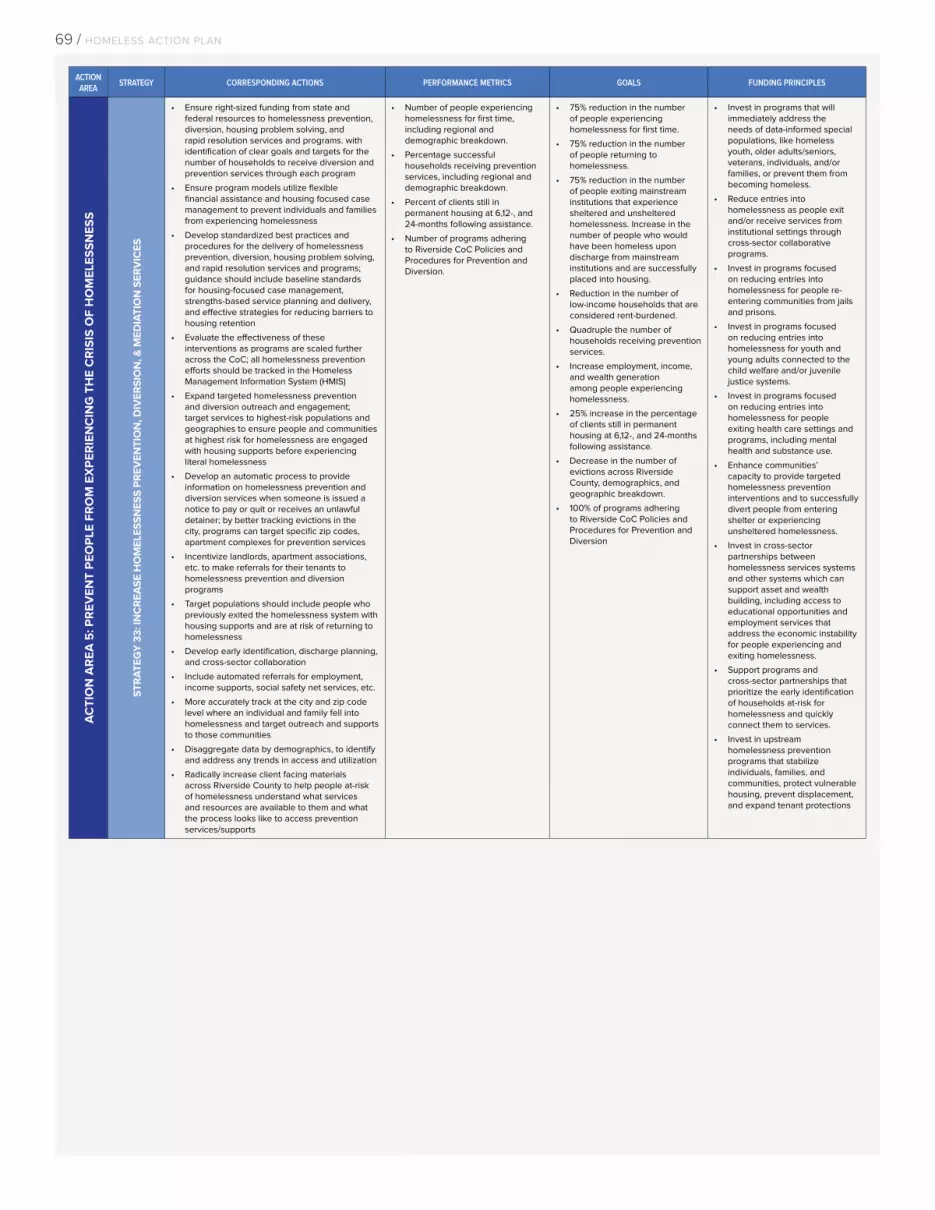
69 / HOMELESS ACTION PLAN
ACTION AREA
STRATEGY CORRESPONDING ACTIONS PERFORMANCE METRICS GOALS FUNDING PRINCIPLESA
CT
ION
AR
EA
5: P
RE
VE
NT
PE
OP
LE
FR
OM
EX
PE
RIE
NC
ING
TH
E C
RIS
IS O
F H
OM
EL
ES
SN
ES
S
ST
RA
TE
GY
33
: IN
CR
EA
SE
HO
ME
LE
SS
NE
SS
PR
EV
EN
TIO
N, D
IVE
RS
ION
, & M
ED
IAT
ION
SE
RV
ICE
S
• Ensure right-sized funding from state and federal resources to homelessness prevention, diversion, housing problem solving, and rapid resolution services and programs. with identification of clear goals and targets for the number of households to receive diversion and prevention services through each program
• Ensure program models utilize flexible financial assistance and housing focused case management to prevent individuals and families from experiencing homelessness
• Develop standardized best practices and procedures for the delivery of homelessness prevention, diversion, housing problem solving, and rapid resolution services and programs; guidance should include baseline standards for housing-focused case management, strengths-based service planning and delivery, and effective strategies for reducing barriers to housing retention
• Evaluate the effectiveness of these interventions as programs are scaled further across the CoC; all homelessness prevention efforts should be tracked in the Homeless Management Information System (HMIS)
• Expand targeted homelessness prevention and diversion outreach and engagement; target services to highest-risk populations and geographies to ensure people and communities at highest risk for homelessness are engaged with housing supports before experiencing literal homelessness
• Develop an automatic process to provide information on homelessness prevention and diversion services when someone is issued a notice to pay or quit or receives an unlawful detainer; by better tracking evictions in the city, programs can target specific zip codes, apartment complexes for prevention services
• Incentivize landlords, apartment associations, etc. to make referrals for their tenants to homelessness prevention and diversion programs
• Target populations should include people who previously exited the homelessness system with housing supports and are at risk of returning to homelessness
• Develop early identification, discharge planning, and cross-sector collaboration
• Include automated referrals for employment, income supports, social safety net services, etc.
• More accurately track at the city and zip code level where an individual and family fell into homelessness and target outreach and supports to those communities
• Disaggregate data by demographics, to identify and address any trends in access and utilization
• Radically increase client facing materials across Riverside County to help people at-risk of homelessness understand what services and resources are available to them and what the process looks like to access prevention services/supports
• Number of people experiencing homelessness for first time, including regional and demographic breakdown.
• Percentage successful households receiving prevention services, including regional and demographic breakdown.
• Percent of clients still in permanent housing at 6,12-, and 24-months following assistance.
• Number of programs adhering to Riverside CoC Policies and Procedures for Prevention and Diversion.
• 75% reduction in the number of people experiencing homelessness for first time.
• 75% reduction in the number of people returning to homelessness.
• 75% reduction in the number of people exiting mainstream institutions that experience sheltered and unsheltered homelessness. Increase in the number of people who would have been homeless upon discharge from mainstream institutions and are successfully placed into housing.
• Reduction in the number of low-income households that are considered rent-burdened.
• Quadruple the number of households receiving prevention services.
• Increase employment, income, and wealth generation among people experiencing homelessness.
• 25% increase in the percentage of clients still in permanent housing at 6,12-, and 24-months following assistance.
• Decrease in the number of evictions across Riverside County, demographics, and geographic breakdown.
• 100% of programs adhering to Riverside CoC Policies and Procedures for Prevention and Diversion
• Invest in programs that will immediately address the needs of data-informed special populations, like homeless youth, older adults/seniors, veterans, individuals, and/or families, or prevent them from becoming homeless.
• Reduce entries into homelessness as people exit and/or receive services from institutional settings through cross-sector collaborative programs.
• Invest in programs focused on reducing entries into homelessness for people re-entering communities from jails and prisons.
• Invest in programs focused on reducing entries into homelessness for youth and young adults connected to the child welfare and/or juvenile justice systems.
• Invest in programs focused on reducing entries into homelessness for people exiting health care settings and programs, including mental health and substance use.
• Enhance communities’ capacity to provide targeted homelessness prevention interventions and to successfully divert people from entering shelter or experiencing unsheltered homelessness.
• Invest in cross-sector partnerships between homelessness services systems and other systems which can support asset and wealth building, including access to educational opportunities and employment services that address the economic instability for people experiencing and exiting homelessness.
• Support programs and cross-sector partnerships that prioritize the early identification of households at-risk for homelessness and quickly connect them to services.
• Invest in upstream homelessness prevention programs that stabilize individuals, families, and communities, protect vulnerable housing, prevent displacement, and expand tenant protections

70 / HOMELESS ACTION PLAN
ACTION AREA
STRATEGY CORRESPONDING ACTIONS PERFORMANCE METRICS GOALS FUNDING PRINCIPLESA
CT
ION
AR
EA
5: P
RE
VE
NT
PE
OP
LE
FR
OM
EX
PE
RIE
NC
ING
TH
E C
RIS
IS O
F H
OM
EL
ES
SN
ES
S
ST
RA
TE
GY
34
: AD
DR
ES
S IN
FLO
WS
OF
HO
ME
LE
SS
NE
SS
TH
RO
UG
H C
RO
SS
-S
EC
TO
R C
OLLA
BO
RA
TIO
N, D
ISC
HA
RG
E P
LA
NN
ING
, & E
AR
LY ID
EN
TIF
ICA
TIO
N • Through data sharing agreements, analyze
mainstream system data to understand involvement of people experiencing homeless in mainstream systems before they fell into homelessness to better target solutions
• At points of intake, ensure there is a thorough questioning of how and where an individual became homeless, with an understanding of mainstream systems they may have touched in advance
• Identify and develop specific staff positions responsible for cross-sector collaboration
• Develop strategies based on national best practices for improving discharge planning models and coordination to prevent mainstream systems from discharging individuals without stable housing
• Develop strategies based on national best practices for early identification of people at-risk for homelessness and get them connected to homeless and other mainstream services
• Advocate for necessary resources to incorporate or bring to scale cross-sector collaboration, discharge planning, and early identification
• Set cross-sector goals
• Develop and adopt a universal housing/economic stability screening tool and automated referral processes for individuals and families accessing safety net services
• Expand on initiatives of Whole Person Care and CalAIM to target high utilizers of emergency services
• Number of people experiencing homelessness for first time, including regional and demographic breakdown.
• Readmissions and recidivism rates.
• Cost saving for discharge planning.
• Number of mainstream systems with data sharing agreements or integrations with homeless response system.
• Number of mainstream systems utilizing developed homeless tracking metrics.
• Number of referrals for housing related services from mainstream institutions.
• 75% reduction in the number of people experiencing homelessness for first time.
• 75% reduction in the number of people returning to homelessness.
• 75% reduction in the number of people exiting mainstream institutions that experience sheltered and unsheltered homelessness. Increase in the number of people who would have been homeless upon discharge from mainstream institutions and are successfully placed into housing.
• Reduction in the number of low-income households that are considered rent-burdened.
• Quadruple the number of households receiving prevention services.
• Increase employment, income, and wealth generation among people experiencing homelessness.
• 25% increase in the percentage of clients still in permanent housing at 6,12-, and 24-months following assistance.
• Decrease in the number of evictions across Riverside County, demographics, and geographic breakdown.
• 100% of programs adhering to Riverside CoC Policies and Procedures for Prevention and Diversion
• Invest in programs that will immediately address the needs of data-informed special populations, like homeless youth, older adults/seniors, veterans, individuals, and/or families, or prevent them from becoming homeless.
• Reduce entries into homelessness as people exit and/or receive services from institutional settings through cross-sector collaborative programs.
• Invest in programs focused on reducing entries into homelessness for people re-entering communities from jails and prisons.
• Invest in programs focused on reducing entries into homelessness for youth and young adults connected to the child welfare and/or juvenile justice systems.
• Invest in programs focused on reducing entries into homelessness for people exiting health care settings and programs, including mental health and substance use.
• Enhance communities’ capacity to provide targeted homelessness prevention interventions and to successfully divert people from entering shelter or experiencing unsheltered homelessness.
• Invest in cross-sector partnerships between homelessness services systems and other systems which can support asset and wealth building, including access to educational opportunities and employment services that address the economic instability for people experiencing and exiting homelessness.
• Support programs and cross-sector partnerships that prioritize the early identification of households at-risk for homelessness and quickly connect them to services.
• Invest in upstream homelessness prevention programs that stabilize individuals, families, and communities, protect vulnerable housing, prevent displacement, and expand tenant protections
ST
RA
TE
GY
35
: EX
PA
ND
OP
PO
RT
UN
ITIE
S T
O A
CH
IEV
E F
INA
NC
IAL S
TA
BIL
ITY
/EC
ON
OM
IC M
OB
ILIT
Y
TH
RO
UG
H E
MP
LOY
ME
NT,
ED
UC
AT
ION
AL, I
NC
OM
E S
UP
PO
RT
S, &
WE
ALT
H G
EN
ER
AT
ION
PR
OG
RA
MS
&
SE
RV
ICE
S.
• Increase the connectivity between the Riverside County Workforce Development Center, income supports, and education and homeless services, like prevention, rapid rehousing, etc. to increase and sustain income
• Expand partnerships with businesses and social enterprises to train and hire people who have experienced homelessness
• Increase access to appropriate services to gain and sustain employment and educational opportunities, such as childcare (or financial assistance for childcare)
• Formalize cross-system agreements to improve access to employment and education programs, and outcomes of people experiencing homelessness
• Improve data collection on the employment and education needs and outcomes of people experiencing homelessness
• Provide training, internships, and mentorships to help people who are unhoused or at risk of homelessness to obtain access to living wage jobs
• Establish countywide SSI and veteran’s benefits advocacy programs for people experiencing homelessness or at risk of homelessness, including those in the criminal justice system
• Explore opportunities to expand assessment tools to also screen for income-generating pathways, like employment, and income supports; provide automated referrals
• Identify programs and solutions to develop wealth/equity for people experiencing homelessness and those at-risk of homelessness
• Assess the viability of cash transfers and/or universal basic income (UBI) models to empower people experiencing homelessness or at risk of experiencing homelessness to meet their immediate financial needs
• Support efforts to increase the minimum wage to a living wage in Riverside County
• Increases to employment, income, and wealth generation among people experiencing homelessness

71 / HOMELESS ACTION PLAN
ACTION AREA
STRATEGY CORRESPONDING ACTIONS PERFORMANCE METRICS GOALS FUNDING PRINCIPLESA
CT
ION
AR
EA
5: P
RE
VE
NT
PE
OP
LE
FR
OM
EX
PE
RIE
NC
ING
TH
E C
RIS
IS O
F H
OM
EL
ES
SN
ES
S
ST
RA
TE
GY
36
: RE
DU
CE
RE
EN
TR
IES
IN
TO
HO
ME
LE
SS
RE
SP
ON
SE
SY
ST
EM
• Track and analyze causes for reentry into the homeless response system
• Identify targeted solutions for anyone re-entering the homeless response system
• Number of people returning to homelessness, including regional and demographic breakdown.
• Number of people exiting mainstream institutions that experience sheltered and unsheltered homelessness.
• Number of people who would have been homeless upon discharge from mainstream institutions and are successfully placed into housing.
• 75% reduction in the number of people experiencing homelessness for first time.
• 75% reduction in the number of people returning to homelessness.
• 75% reduction in the number of people exiting mainstream institutions that experience sheltered and unsheltered homelessness. Increase in the number of people who would have been homeless upon discharge from mainstream institutions and are successfully placed into housing.
• Reduction in the number of low-income households that are considered rent-burdened.
• Quadruple the number of households receiving prevention services.
• Increase employment, income, and wealth generation among people experiencing homelessness.
• 25% increase in the percentage of clients still in permanent housing at 6,12-, and 24-months following assistance.
• Decrease in the number of evictions across Riverside County, demographics, and geographic breakdown.
• 100% of programs adhering to Riverside CoC Policies and Procedures for Prevention and Diversion
• Invest in programs that will immediately address the needs of data-informed special populations, like homeless youth, older adults/seniors, veterans, individuals, and/or families, or prevent them from becoming homeless.
• Reduce entries into homelessness as people exit and/or receive services from institutional settings through cross-sector collaborative programs.
• Invest in programs focused on reducing entries into homelessness for people re-entering communities from jails and prisons.
• Invest in programs focused on reducing entries into homelessness for youth and young adults connected to the child welfare and/or juvenile justice systems.
• Invest in programs focused on reducing entries into homelessness for people exiting health care settings and programs, including mental health and substance use.
• Enhance communities’ capacity to provide targeted homelessness prevention interventions and to successfully divert people from entering shelter or experiencing unsheltered homelessness.
• Invest in cross-sector partnerships between homelessness services systems and other systems which can support asset and wealth building, including access to educational opportunities and employment services that address the economic instability for people experiencing and exiting homelessness.
• Support programs and cross-sector partnerships that prioritize the early identification of households at-risk for homelessness and quickly connect them to services.
• Invest in upstream homelessness prevention programs that stabilize individuals, families, and communities, protect vulnerable housing, prevent displacement, and expand tenant protections

72 / HOMELESS ACTION PLAN
ACTION AREA
STRATEGY CORRESPONDING ACTIONS PERFORMANCE METRICS GOALS FUNDING PRINCIPLESA
CT
ION
AR
EA
5: P
RE
VE
NT
PE
OP
LE
FR
OM
EX
PE
RIE
NC
ING
TH
E C
RIS
IS O
F H
OM
EL
ES
SN
ES
S
ST
RA
TE
GY
37
: PR
ES
ER
VE
VU
LN
ER
AB
LE
HO
US
ING
& P
RE
VE
NT
C
OM
MU
NIT
Y D
ISP
LA
CE
ME
NT
• Advocate for the creation of a fund to preserve naturally occurring, affordable housing and income restricted affordable housing
• Promote the investments of infill area infrastructure, inclusionary zoning, community land trusts, adaptive reuse, etc.
• Promote the preservation of existing housing stock through long-term affordability covenants
• Advocate for the increased access to homeownership, especially for Black, Indigenous and People of Color (BIPOC) communities
• Advocate for right of first refusal policies
• Number of low-income households that are considered rent-burdened.
• Number of evictions across Riverside County, including regional and demographic breakdown.
• 75% reduction in the number of people experiencing homelessness for first time.
• 75% reduction in the number of people returning to homelessness.
• 75% reduction in the number of people exiting mainstream institutions that experience sheltered and unsheltered homelessness. Increase in the number of people who would have been homeless upon discharge from mainstream institutions and are successfully placed into housing.
• Reduction in the number of low-income households that are considered rent-burdened.
• Quadruple the number of households receiving prevention services.
• Increase employment, income, and wealth generation among people experiencing homelessness.
• 25% increase in the percentage of clients still in permanent housing at 6,12-, and 24-months following assistance.
• Decrease in the number of evictions across Riverside County, demographics, and geographic breakdown.
• 100% of programs adhering to Riverside CoC Policies and Procedures for Prevention and Diversion
• Invest in programs that will immediately address the needs of data-informed special populations, like homeless youth, older adults/seniors, veterans, individuals, and/or families, or prevent them from becoming homeless.
• Reduce entries into homelessness as people exit and/or receive services from institutional settings through cross-sector collaborative programs.
• Invest in programs focused on reducing entries into homelessness for people re-entering communities from jails and prisons.
• Invest in programs focused on reducing entries into homelessness for youth and young adults connected to the child welfare and/or juvenile justice systems.
• Invest in programs focused on reducing entries into homelessness for people exiting health care settings and programs, including mental health and substance use.
• Enhance communities’ capacity to provide targeted homelessness prevention interventions and to successfully divert people from entering shelter or experiencing unsheltered homelessness.
• Invest in cross-sector partnerships between homelessness services systems and other systems which can support asset and wealth building, including access to educational opportunities and employment services that address the economic instability for people experiencing and exiting homelessness.
• Support programs and cross-sector partnerships that prioritize the early identification of households at-risk for homelessness and quickly connect them to services.
• Invest in upstream homelessness prevention programs that stabilize individuals, families, and communities, protect vulnerable housing, prevent displacement, and expand tenant protections
ST
RA
TE
GY
38
: EX
PA
ND
PR
OT
EC
TIO
NS
FO
R R
EN
TE
R/T
EN
AN
TS
• Develop a streamlined approach and public facing database to better track evictions/unlawful detainers across Riverside County, greatest impact on older adults/seniors and Black, Indigenous and People of Color (BIPOC)
• Coordinate and centralize eviction prevention programs across Riverside County
• Advocate for the establishment of rent stabilization policies paired with enforceable building standards
• Advocate for the establishment of “just cause” eviction policies
• Develop and support tenant counseling and legal services for tenant facing housing instability and dislocation
• Support a legal right to counsel policy for tenants to prevent evictions
• Support right to remain and right to return ordinances
• Support tenant option to purchase
• Consider developing a tenant advisory council to provide guidance and advice to the city on actions to support tenants and those at-risk of homelessness
• Increase access to civil legal aid in situations where legal advocacy will prevent homelessness (e.g., access to State and Federal benefit programs, SSI/SSDI, etc., foreclosure prevention, immigration, tenant representation, unemployment benefits, ABD, etc.)
• Strengthen local tenant protections impacting people experiencing homelessness and those at-risk of homelessness
• Number of low-income households that are considered rent-burdened.
• Number of evictions across Riverside County, including regional and demographic breakdown.
ST
RA
TE
GY
39
: AD
VO
CA
TE
FO
R T
HE
E
XP
AN
SIO
N O
F A
SO
CIA
L S
AF
ET
Y N
ET
• Advocate for the state and the federal government to increase funding and access to safety net services
• Percent of clients still in permanent housing at 6,12-, and 24-months following assistance.

73 / HOMELESS ACTION PLAN
EXHIBIT B: TRANSITIONAL AGED YOUTH (TAY) HOMELESS ACTION SUMMARYThe following section summarizes actions, strategies, and funding principles of the Riverside County CoC Homeless Action Plan for Transition Aged Youth (TAY) at-risk of and experiencing homelessness.
In 2020 there were 256 youth experiencing unsheltered homelessness, a 41% increase from 2019. Surprisingly, this increase in youth experiencing unsheltered homelessness was accompanied by a 65% decrease in the count of sheltered youth experiencing homelessness. As part of the Needs Assessment and Gaps Analysis of the County of Riverside, stakeholders highlighted the need to provide more services to key sub-populations like Transition Aged Youth (TAY).
Action Area 1: Strengthen System the Better Prevent and End Homelessness, highlights the need to utilize a data-driven approach to invest in programs addressing significant service gaps for high-need communities, under-served or hard to-serve geographic areas, or special subpopulations such as transitional age youth.
Action Area 3: Expand Communities Capacity to Provide Safe and Effective Shelter and Interim Housing, focuses on developing training and protocols for first responders when engaging people on the streets and encampments, with considerations for interacting with key subpopulations like Transition Aged Youth. These strategies also call for the need to establish resources and refine policies and procedures for existing programs accessed by Transition Aged Youth. Additionally, this action area calls
for the refinement of crisis housing policies and procedures like emergency shelter, interim housing, medical respite, domestic violence shelters, faith-based shelters, family shelters, transitional housing, and motel vouchers to ensure they are accessible, low barrier, and housing focused. Policies and procedures will account for the unique shelter needs of Transition Aged Youth.
Strategies in Action Area 4: Expand and Ensure Equitable Access to Permanent Housing in Our Communities call for the need to increase housing resources available to Transition Aged Youth, like Rapid Rehousing. This section calls out the need to expand housing supports and programs for Transition Aged Youth.
Action Area 5: Prevent People from Experiencing the Crisis of Homelessness, highlights the need to address the inflows of youth homelessness through cross-sector collaboration, discharge planning, early identification, and housing supports within child welfare, juvenile justice, and education systems. Funding Principles call for the need to invest in programs that will immediately address the needs of homeless youth and programs that reduce entries into homelessness as people exit and/or receive services from institutional settings through cross-sector collaboration.
EXHIBIT C: FAMILY HOMELESS ACTION SUMMARY The following section summarizes actions, strategies, and funding principles of the Riverside County CoC Homeless Action Plan for families at-risk of and experiencing homelessness.
There is a significant number of families experiencing homelessness in Riverside County and numerous households and families that are
precariously housed: doubled-up, living with friends or family, and are therefore at-risk of falling into homelessness.
Action Area 1: Strengthen System to Better Prevent and End Homelessness calls for strengthening of the homeless response system to address the root causes of homelessness, preventing increases of new families falling into homelessness.
Action Area 2: Equitably Address the Health, Safety, and Services Needs of People Experiencing Unsheltered Homelessness highlights the need to expand the accessibility of the homeless response system and the need to establish designated resources for special populations experiencing unsheltered homelessness like homeless families.
Action Area 3: Expand Communities Capacity to Provide Safe and Effective Shelter and Interim Housing focuses on increasing crisis housing available to homeless families and refining crisis housing policies and procedures to ensure they are radically accessible, low-barrier, and housing focused.
Action Area 4: Expand and Ensure Equitable Access to Permanent Housing in Our Communities highlights the advocacy of increased production of affordable housing that will expand housing available to families at-risk or currently experiencing homelessness. Strategies include increasing rapid rehousing for families experiencing homelessness, increasing the availability of flexible housing funds to support move-in costs and flexible housing subsidies, and continuing to leverage housing authority division resources for families experiencing homelessness. Expanding housing access in high opportunity neighborhoods through centralized landlord outreach will have a significant impact on the health of families, most significantly for families with children. Lastly, this action area calls for the advocacy of legislation protecting against housing discrimination in the housing search, which has a

74 / HOMELESS ACTION PLAN
significant impact on families looking to utilize rental assistance, subsidies, or vouchers.
Action Area 5: Prevent People from Experiencing the Crisis of Homelessness focuses on increasing homelessness prevention, diversion, and mediation services, which will greatly benefit families at-risk of homelessness. By collaborating with cross-sector partners, the Action Plan will address the inflows into homelessness for families through effective discharge planning, early identification, and the expansion of social and housing supports.
EXHIBIT D: ENCAMPMENT HOMELESS ACTION SUMMARYStakeholder feedback from the Needs Assessment and Gaps Analysis of the County of Riverside highlighted differing regional approaches to outreach and engagement. Some regions utilize more enforcement approaches and others more engagement approaches. The complexities of outreach and engagement often come to a point when responding to encampments, which vary significantly from region to region, encampment to encampment. There currently is not a unified approach to encampment management.
Action Area 1: Strengthen System to Better Prevent and End Homelessness of the Homeless Action Plan calls for the need to refine communications efforts around homelessness in Riverside County. Due to the visibility of unsheltered street homelessness and encampments, it is important to proactively engage the public around the challenges, activities, and implementations of homeless programs and resources.
Action Area 2: Equitably Address the Health, Safety, and Services Needs of People Experiencing Unsheltered Homelessness includes a specific strategy to develop county wide encampment management protocols. This will include establishing best practice in encampment management, incorporating person-centered approaches, enhancing coordination with providers, cities, regional governments, and developing formal Encampment Management and Resolution Protocols. Funding Principles call for the investment in multi-agency, multi-jurisdictional solutions to address the health, safety, and housing needs of people experiencing unsheltered homelessness and staying in encampments.
EXHIBIT E: VETERAN HOMELESS ACTION SUMMARYThe successful response to veteran Homelessness in Riverside County represents a roadmap on how to effectively respond to the unique needs of subpopulations. While veteran homelessness is included in all the action areas of the plan, it is most referenced in Action Area 5: Prevent People from Experiencing the Crisis of Homelessness. The plan calls for the need to continue to expand upstream early identification, housing, and social supports for veterans at-risk of homelessness. Funding Principles call for the investment in programs that immediately address the needs of data-informed special populations like veterans through housing and supports.
EXHIBIT F: DOMESTIC VIOLENCE HOMELESS ACTION SUMMARYAction Area 2: Equitably Address the Health, Safety, and Services Needs of People Experiencing Unsheltered Homelessness, highlights the need to develop training for first responders when engaging people experiencing unsheltered homelessness who are survivors of domestic violence. Additionally, this action area focused on establishing key resources for special subpopulations experiencing unsheltered homelessness like survivors fleeing domestic violence.
Action Area 3: Expand Communities Capacity to Provide Safe and Effective Shelter and Interim Housing calls to increase the number of crisis housing beds regionally, with emphasis on domestic violence shelter beds and capacity. Part of this action area addressed the need to expand access to resources and refine crisis housing policies and procedures to ensure that they are accessible, low-barrier, and housing focused. Part of this process will be to assess regional capacity and develop real-time bed availability.
EXHIBIT G: RACIAL EQUITY HOMELESS ACTION SUMMARYAction Area 1: Strengthen System to Better Prevent and End Homelessness calls to center race equity in the County of Riverside CoC’s Homeless Response. Black, Indigenous, and Communities of

75 / HOMELESS ACTION PLAN
Color (BIPOC) are significantly overrepresented in the homeless population, a legacy of historical and contemporary structural racism. The homeless response system also plays a role in perpetuating inequities in service provision, access, and mobility. The County of Riverside CoC will continue to center race equity in the homeless response, disaggregate data to better develop solutions, and look upstream at the inflows and structural roots of homelessness. Furthermore, this strategy calls to embed racial equity lens into all homelessness and housing decisions, develop a racial equity impact assessment that will forecast and assess the impacts of new programs and funding decisions, and incorporate a focus on racial equity data, analysis, and planned activities when submitting and reviewing applications for funding. The strategy emphasizes the need to utilize HMIS to analyze data and create public-facing dashboards around racial inequities in experiences of homelessness, provision of services, and outcomes. The strategy calls to adapt program guidelines, policies, procedures focused on racial equity and institute standardized cultural humility, trauma informed care, and anti-racist trainings for CoC programs and system partners. Lastly it highlights the need to create plan to move forward on racial equity work that will include system and programmatic actions and alignment with other regional equity initiatives.
EXHIBIT H: LGBTQIA+ HOMELESS ACTION SUMMARYAction Area 2: Equitably Address the Health, Safety, and Services Needs of People Experiencing Unsheltered Homelessness, highlights the need to establish resources for key special
populations experiencing unsheltered homelessness, including LGBTQAI+ individuals and families.
Action Area 3: Expand Communities Capacity to Provide Safe and Effective Shelter and Interim Housing calls for the need to refine crisis housing policies and procedures to ensure they are safe and accessible for key subpopulations, including LGBTQAI+ individuals and families.
Action Area 4: Expand and Ensure Equitable Access to Permanent Housing in Our Communities addresses the expanding resources to meet the housing needs of key subpopulations, including LGBTQAI+ individuals and families.
EXHIBIT I: OLDER ADULTS/SENIORS HOMELESS ACTION SUMMARYStakeholder feedback from the Needs Assessment and Gaps Analysis of the County of Riverside highlighted the need to provide more services to key sub-populations like Seniors/Older Adults.
Action Area 1: Strengthen System to Better Prevent and End Homelessness of the Homeless Action Plan calls for utilizing a data-driven approach to invest in programs addressing significant service gaps and priority needs for under-served or hard to-serve geographic areas, or special subpopulations such as older adults/seniors.
Action Area 2: Equitably Address the Health, Safety, and Services Needs of People Experiencing Unsheltered Homelessness, highlights the need to establish resources for key special populations experiencing unsheltered homelessness, including older adults/seniors. Strategies also include co-developing protocols for first responders when engaging people on the streets and
encampments, with special focus on key subpopulations like older adults/seniors.
Action Area 3: Expand Communities Capacity to Provide Safe and Effective Shelter and Interim Housing calls for the need to refine crisis housing policies and procedures to ensure they are safe and accessible for key subpopulations, including older adults/seniors.
Action Area 4: Expand and Ensure Equitable Access to Permanent Housing in Our Communities addresses the expanding resources to meet the housing needs of key subpopulations, including older adults/seniors.
Action Area 5: Prevent People from Experiencing the Crisis of Homelessness outlines strategies to address inflows into homelessness through cross-sector collaboration, discharge planning, and early identification. To specifically target older adults/seniors, this strategy includes identifying supports to serve older adults and people with disabilities at risk of experiencing homelessness, including meeting the need for in home supports and access to licensed adult and senior care facilities. It also calls for improving identification and stabilization of older adults/seniors at greatest risk of housing loss, developing targeted homelessness prevention strategies for older adults/seniors, including development of a data-driven framework for identifying older adults/seniors at greatest risk of housing loss. Additionally, this strategy highlights the need for providing subsidized housing to homeless disabled individuals pursuing SSI and supporting in-home care and long-term care options for older adults/seniors. Lastly, to better address the inflows into homelessness, the Riverside County CoC will advocate and push to expand tenant protections and services that support tenants, which will have a significant impact on older adults/seniors.

76 / HOMELESS ACTION PLAN
EXHIBIT J: OTHER SPECIAL POPULATIONS HOMELESS ACTION SUMMARYWhile these subpopulations are addressed throughout the plan, they are specially called out in the following action areas.
Action Area 2: Equitably Address the Health, Safety, and Services Needs of People Experiencing Unsheltered Homelessness, highlights the need to establish resources for key special populations experiencing unsheltered homelessness, including chronically homeless individuals, individuals with Severe Mental Illness (SMI), individuals with Substance Use Disorders (SUD), and high utilizers of emergency services.
Action Area 3: Expand Communities Capacity to Provide Safe and Effective Shelter and Interim Housing calls for the need to refine crisis housing policies and procedures to ensure they are safe and accessible for key subpopulations, including chronically homeless individuals, individuals with Severe Mental Illness (SMI), individuals with Substance Use Disorders (SUD), and high utilizers of emergency services.
Action Area 4: Expand and Ensure Equitable Access to Permanent Housing in Our Communities addresses the expanding resources to meet the housing needs of key subpopulations, including chronically homeless individuals, individuals with Severe Mental Illness (SMI), individuals with Substance Use Disorders (SUD), and high utilizers of emergency services.

ITEM 9a Coachella Valley Association of Governments
Executive Committee April 25, 2022
STAFF REPORT
Subject: Update on Federal and State Advocacy Efforts Contact: Emmanuel Martinez, Senior Programs Manager ([email protected]) Recommendation: Information Background: In September 2021, the CVAG Executive Committee approved the hiring of state and federal advocacy firms in order to help take advantage of funding opportunities and help the Coachella Valley receive its fair share. CVAG retained the Ferguson Group for representation in Washington, D.C., and the Politico Group for representation in Sacramento. Both these firms began November 2021. With the adoption of the legislative platform in February 2022, CVAG staff intends to provide regular reports to the Executive Committee that highlight the most recent efforts. To date, CVAG staff and respective lobbying team has been focused on a few funding opportunities that address regional needs. As it relates to broadband and middle-mile infrastructure, CVAG staff was successful in having the state make an initial investment for open-access dark fiber infrastructure in the Coachella Valley. This was done through formal comment filings at the California Public Utilities Commission that discussed the dig-once opportunity presented by the CV Sync regional signal synchronization program, as well as stakeholder coordination, particularly school districts, to address unserved and underserved areas of the Coachella Valley. Preliminary estimate for the middle-mile project in the Coachella Valley is $44 million and staff is working on finalizing agreements with the state. CVAG staff and lobbying team continue to monitor the Middle Mile Advisory Committee and keep our state delegation apprised on these efforts. Also, the CPUC will begin holding local technical assistance workshops for last-mile project, which staff will attend to identify potential funding opportunities related to this endeavor. The Politico Group is working closely with CVAG staff to track the state’s Active Transportation Program and potential funding augmentation, which has been on a rollercoaster of possible approval status in recent months. If augmentation of the program occurs, the Arts and Music Line and the Desert Hot Springs Extension would be in line to receive $16.9 million and $29 million, respectively. The Governor’s budget that was release in January includes a $500 million augmentation to the program. Also, the Governor recently released details on a proposed $11 billion transportation package that modified his January Budget gas tax holiday and transportation funding proposals. His gas tax relief proposal also included an additional $500 million, bringing the total to $1 billion. However, the ATP program remains entangled to funding disagreements on high-speed rail between the legislative leadership and the governor. The California Transportation Commission will be holding a meeting regarding augmentation on April 27 that CVAG will attend. Staff and CVAG’s lobbying team will be closely monitoring the May budget revise and will advocate for augmentation of ATP Cycle 5, particularly given that both

the Desert Hot Springs extension and the Arts and Music Line would be in the queue for funding. Given the state budget process has been underway and the May budget revise is forthcoming, advocacy efforts will be also be focused on the state budget request that was submitted by CVAG. Specifically, CVAG submitted a $5 million state budget ask to help fund the preconstruction phases of six community connectors to the CV link in the eastern Coachella Valley. This specific budget request was chosen given the state’s strong interest in advancing investments in disadvantaged areas of the state while also investing in projects that address climate issues, such as reducing greenhouse gas emission and creating overall healthier communities. Working with the Politico Group and Assemblymember Eduardo Garcia’s office, the request was submitted in February 2022. The legislature has until April 29 to reconcile all their state budget request and submit them to leadership for consideration of one-time discretionary funds tied to the surplus. At the federal level, Members of Congress also still have earmarks. A Community Project funding request was submitted to cover the planning and engineering costs of the Western Coachella Valley Flooding and Blowsand Projects. One major change from last year is that members can submit 15 requests, an increase of five in comparison to last year. In coordination and consultation with the Ferguson Group, CVAG staff requested $3 million to members of the regional congressional delegation – U.S. Senator Dianne Feinstein, Senator Alex Padilla, Rep. Raul Ruiz and Rep. Ken Calvert, who would represent the Coachella Valley should he win election after redistricting. To avoid any reconciling issues when various budget asks are made to different members, the strategy for this earmark request was to submit the same request to all members. This will also help to increase the opportunities for the request to be prioritized by at least one member. Congressional members in both the House and the Senate have until the end of the month to submit their request to the Appropriations Committee for consideration of the request into the appropriate spending bill. The Ferguson Group and staff will continue to monitor the request and will be facilitating follow-up meeting with appropriate staff for each office to answer and questions regarding the request and help to lobby for its consideration. In late March, the White House released the President’s $5.8 trillion Fiscal Year (FY) 2023 Budget, featuring nearly $90 billion for pandemic preparedness and response. President Biden called the budget a statement of values, spoke about the progress in combating COVID-19, and acknowledged the work still left to complete. The Biden Administration also proposed a modest, two percent increase to $105 billion in mandatory and discretionary funding for the U.S. Department of Transportation (DOT) in Fiscal Year 2023, which begins on October 1, 2022. However, combined with another $37 billion in advance appropriations guaranteed under the Bipartisan Infrastructure Law (BIL), it totals $142.3 billion in funding for DOT next year, an increase of about $1.6 billion from the FY22 enacted levels. USDOT’s FY23 budget highlights are available on their website and the detailed justifications for each program administration for FY23 are available as well. Staff is also continuing to monitor implementation of the IIJA and associated grants. Most recently, Secretary Pete Buttigieg announced $2.9 billion of funding for major infrastructure projects through a combined Notice of Funding Opportunity (NOFO) under the Bipartisan Infrastructure Law (BIL, formerly known as the IIJA). The deadline for applications is May 23, 2022. Combining three major discretionary grant programs into one Multimodal Projects Discretionary Grant opportunity reduces the burden for state and local applicants and increases the pipeline of “shovel-worthy” projects. The three major grant programs combined in the NOFO include: MEGA, INFRA and RURAL.

On the legislative front, much political attention has been given to inflationary pressures, particularly related to gas prices. Both at the state and federal levels proposals to relieve Americans of significant price increases on gas, which have mainly been attributed to the Russian and Ukraine conflict, have been presented. CVAG and respective lobbying teams will continue to monitor these proposals, specifically as they relate to any financial impact they may have on transportation revenue generated from gas taxes. Fiscal Analysis: In September, the Executive Committee approved $100,000 for state and federal lobbying services for a period of six-months. The monthly retainers for The Ferguson Group and the Politico Group are $10,000 and $5,000, respectively. A separate agenda item recommends one-year extension of these contracts.

League of California Cities - Hot Bill List
As of 4/20/2022 AB 1737 (Holden D) Children’s camps: local registration and inspections.
Status: 4/6/2022-From committee: Do pass and re-refer to Com. on PUB. S. (Ayes 10. Noes 0.) (April 5). Re-referred to Com. on PUB. S. Location: 4/5/2022-A. PUB. S. Calendar: 4/26/2022 9 a.m. - State Capitol, Room 126 ASSEMBLY PUBLIC SAFETY, JONES-SAWYER, Chair Attachments: AB 1737 (Holden) Concerns City Sample Letter Asm Health AB 1737 (Holden) Concerns Letter Asm Health
Primary Lobbyist: Caroline Cirrincione Cal Cities Position: Concerns Policy Committee (primary): Community Services Bill Summary: This measure would implement a series of new reporting and inspection requirements for children's camps. Specifically, this measure: o Requires children's camps to register with local agencies and at least 90 days before starting; o Requires local agencies to make announced and unannounced visits to each children's camp; o If violations are found during an on-site visit, local agencies must conduct follow up inspections of the violations; o Local agencies must also keep records of all violations and make those available to the public; o Local agencies must also submit an annual report to the Department of Public Health that includes the names of the children's camps in its jurisdiction, the number of attending campers, and any violations cited; o This measure also requires children's camps to submit emergency action plans, health and safety policies, and any high-risk activities to local agencies; and o Lastly, this measure requires background and sex offender checks of all prospective camp staff and makes full-time employees mandated reporters of child abuse or neglect.

AB 1951 (Grayson D) Sales and use tax: exemptions: manufacturing. Status: 2/18/2022-Referred to Com. on REV. & TAX. Location: 2/18/2022-A. REV. & TAX Calendar: 4/25/2022 2:30 p.m. - State Capitol, Room 126 ASSEMBLY REVENUE AND TAXATION, IRWIN, Chair
Primary Lobbyist: Nick Romo Cal Cities Position: Concerns Policy Committee (primary): Revenue and Taxation Bill Summary: The measure would apply the existing state sales and use tax exemption for large manufacturing to city and county sales tax rates (converting a partial sales and use tax exemption to a full exemption). The measure would also extend the program until 2033.
AB 1976 (Santiago D) Planning and zoning: housing element compliance: very low and lower income households.
Status: 3/21/2022-Re-referred to Com. on H. & C.D. Location: 3/17/2022-A. H. & C.D.
Primary Lobbyist: Jason Rhine Cal Cities Position: Oppose Policy Committee (primary): Housing Community and Economic Development Bill Summary: This measure would subject all cities and counties in the Southern California Association of Governments (SCAG) that have not rezoned to accommodate 100 percent of the need for housing for very low and lower income households, to the following: -Up to $10,000 per day fine; or -The Department of Housing and Community Development shall complete the rezoning on behalf of the local jurisdiction.
AB 1985 (Rivas, Robert D) Organic waste: list: available products.
Status: 3/22/2022-From committee: Do pass and re-refer to Com. on APPR. with recommendation: To Consent Calendar. (Ayes 11. Noes 0.) (March 21). Re-referred to Com. on APPR. Location: 3/21/2022-A. APPR. Attachments: AB 1985 (R. Rivas) CITY SAMPLE Author Support Letter 3.7.22 AB 1985 (R Rivas) Author CoSponsor Letter 2.24.22
Primary Lobbyist: Derek Dolfie Cal Cities Position: Support Policy Committee (primary): Environmental Quality Bill Summary: This bill would create an online database of organic waste products on the market to enable local governments to connect with local farmers and community members seeking their products. The bill is attempting to help cities and counties figure out what to do with the compost they are required to procure under SB 1383 regulations.

AB 2097 (Friedman D) Residential and commercial development: remodeling, renovations, and additions: parking requirements.
Status: 2/24/2022-Referred to Coms. on L. GOV. and H. & C.D. Location: 2/24/2022-A. L. GOV. Calendar: 4/20/2022 9:30 a.m. - State Capitol, Room 127 ASSEMBLY LOCAL GOVERNMENT, AGUIAR-CURRY, Chair Attachments: AB 2097 (Friedman) Oppose, Author 4-13-22
Primary Lobbyist: Jason Rhine Cal Cities Position: Oppose Policy Committee (primary): Housing Community and Economic Development Bill Summary: This measure would significantly restrict parking requirements within one half-mile of public transit. Public transit is defined as: 1) A high-quality transit corridor with 15-minute headways; 2) Major transit stop — ferry terminal, rapid transit stop, or the intersection of multiple major bus routes with 15-minute headways.
AB 2120 (Ward D) Transportation finance: federal funding: bridges.
Status: 3/29/2022-From committee: Do pass and re-refer to Com. on APPR. (Ayes 14. Noes 0.) (March 28). Re-referred to Com. on APPR. Location: 3/29/2022-A. APPR. Attachments: AB 2120 Asm Approps SUPPORT AB 2120 (Ward) Sample Support, 3-30-22 AB 2120 (Ward) Author, Support 3-30-22 Primary Lobbyist: Damon Conklin Cal Cities Position: Support Policy Committee (primary): Transportation, Communications and Public Works Bill Summary: AB 2120 would invest billions of dollars over the next few years in repairing and replacing local bridges in communities across the state to address critical safety issues and deferred maintenance.
AB 2237 (Friedman D) Transportation planning: regional transportation improvement plan: sustainable communities strategies: climate goals.
Status: 4/7/2022-In committee: Set, first hearing. Hearing canceled at the request of author. Location: 3/29/2022-A. NAT. RES. Calendar: 4/25/2022 2:30 p.m. - State Capitol, Room 447 ASSEMBLY NATURAL RESOURCES, RIVAS, LUZ, Chair Attachments: AB 2237 Coalition OPPOSE
Primary Lobbyist: Damon Conklin Cal Cities Position: Oppose Policy Committee (primary): Transportation, Communications and Public Works

Bill Summary: This bill would make a number of changes to SB 375 sustainable community strategy plans and the role MPOs play in implementing such plans. This bill is a follow up to Friedman's AB 1147, which did similar things but was vetoed last year. This bill is also related to SB 1217 (Allen)'s efforts on "SB 375 2.0."
AB 2328 (Flora R) Local ordinances: home experience sharing.
Status: 3/3/2022-Referred to Coms. on L. GOV. and JUD. Location: 3/3/2022-A. L. GOV. Calendar: 4/27/2022 1:30 p.m. - State Capitol, Room 447 ASSEMBLY LOCAL GOVERNMENT, AGUIAR-CURRY, Chair
Primary Lobbyist: Nick Romo Cal Cities Position: Concerns Policy Committee (primary): Revenue and Taxation Bill Summary: This measure preempts explicit or implicit local prohibitions on “home experience sharing units.” A home sharing unit is noncommercial property that is rented for no more than 18 continuous hours. Experiences include renting a pool, backyard, and docked boats for large gatherings.
AB 2631 (O'Donnell D) Government Claims Act.
Status: 3/10/2022-Referred to Coms. on L. GOV. and JUD. Location: 3/10/2022-A. L. GOV. Attachments: AB 2631 (O'Donnell) Coalition Asm Local Gov Oppose Letter 4.13.22
Primary Lobbyist: Caroline Cirrincione Cal Cities Position: Pending Opposition Policy Committee (primary): Community Services Bill Summary: This measure would allow cities and counties to sue one another if a neighboring jurisdiction’s failure to effectively address this crisis results in another community being negatively impacted. “A public entity is liable for injury relating to the effects of that public entity’s homelessness policies on another public entity.”
AB 2887 (Garcia, Eduardo D) Public resources: Sales and Use Tax Law: exclusions.
Status: 3/28/2022-Re-referred to Com. on REV. & TAX. Location: 3/24/2022-A. REV. & TAX Calendar: 5/2/2022 2:30 p.m. - State Capitol, Room 126 ASSEMBLY REVENUE AND TAXATION, IRWIN, Chair
Primary Lobbyist: Nick Romo Cal Cities Position: Concerns Policy Committee (primary): Revenue and Taxation Bill Summary: The measure would increase the existing limit on sales and use tax exclusions to $150,000,000 each year for manufacturers that promote alternative energy and advanced transportation.

SB 932 (Portantino D) General plans: circulation element: bicycle and pedestrian plans and traffic calming plans.
Status: 3/30/2022-Set for hearing April 26. Location: 3/17/2022-S. TRANS. Calendar: 4/26/2022 1:30 p.m. - 1021 O Street, Room 1200 SENATE TRANSPORTATION, GONZALEZ, LENA, Chair Attachments: SB 932 (Portantino) Oppose unless Amended SB 932 (Portantino) Oppose Unless Amended, Sample Letter SB 932 (Portantino) Oppose Unless Amended, Coalition Letter, 3-11-22
Primary Lobbyist: Damon Conklin Cal Cities Position: Oppose Unless Amend Policy Committee (primary): Transportation, Communications and Public Works Bill Summary: SB 932 would make significant, unprecedented, and overly prescriptive changes to the requirements of the circulation element of local general plans; impose costly, unfunded mandates for physical changes to local transportation infrastructure; and expose local governments to significant legal liability.
SB 1038 (Bradford D) Law enforcement: facial recognition and other biometric surveillance.
Status: 3/16/2022-Read second time. Ordered to third reading. Location: 3/16/2022-S. THIRD READING Calendar: 4/21/2022 #13 SENATE SENATE BILLS -THIRD READING FILE Attachments: SB 1038 (Bradford) Oppose, Author 4-5-22
Primary Lobbyist: Elisa Arcidiacono Cal Cities Position: Oppose Policy Committee (primary): Public Safety Bill Summary: This measure would extend indefinitely the current prohibition on a law enforcement agency or law enforcement officer from installing, activating, or using any biometric surveillance system in connection with an officer camera.
SB 1044 (Durazo D) Employers: state of emergency or emergency condition: retaliation.
Status: 4/4/2022-April 4 hearing: Placed on APPR suspense file. Location: 4/4/2022-S. APPR. SUSPENSE FILE Attachments: SB 1044 (Durazo) Coalition Opposition Senate Approps SB 1044 (Durazo) Coalition Opposition Author letter
Primary Lobbyist: Johnnie Piña Cal Cities Position: Oppose Policy Committee (primary): Governance, Transparency, and Labor Relations Bill Summary: This measure would prohibit an employer, in the event of a state of emergency, from taking or threatening adverse action against any employee for refusing to report to, or leaving, a workplace within the affected area because the employee feels unsafe due to the emergency.

SB 1067 (Portantino D) Housing development projects: automobile parking requirements. Status: 4/7/2022-Set for hearing April 28. Location: 3/31/2022-S. HOUSING Calendar: 4/27/2022 9 a.m. - 1021 O Street, Room 1200 SENATE HOUSING, WIENER, Chair
Primary Lobbyist: Jason Rhine Cal Cities Position: Oppose Policy Committee (primary): Housing Community and Economic Development Bill Summary: This measure would significantly restrict parking requirements within one half-mile of public transit. Public transit is defined as: 1) A high-quality transit corridor with 15-minute headways; 2) Major transit stop — ferry terminal, rapid transit stop, or the intersection of multiple major bus routes with 15-minute headways.
SB 1127 (Atkins D) Workers’ compensation: liability presumptions.
Status: 4/4/2022-April 4 hearing: Placed on APPR suspense file. Location: 4/4/2022-S. APPR. SUSPENSE FILE Attachments: SB 1127 (Atkins) Coalition Opposition - S-LABOR, PUBLIC EMPLOYMENT AND RETIREMENT
Primary Lobbyist: Johnnie Piña Cal Cities Position: Oppose Policy Committee (primary): Governance, Transparency, and Labor Relations Bill Summary: This measure would fundamentally alter longstanding rules and timeframes for determining eligibility for workers’ compensation claims. This measure would reduce the timeline for employers to make a decision about covering a claimed injury and would change the rules for all claims.
SB 1186 (Wiener D) Medicinal Cannabis Patients’ Right of Access Act.
Status: 4/6/2022-Set for hearing April 21. Location: 4/5/2022-S. GOV. & F. Calendar: 4/20/2022 9 a.m. - 1021 O Street, Room 2200 SENATE GOVERNANCE AND FINANCE, CABALLERO, Chair Attachments: SB 1186 (Wiener) Joint Oppose, Sen. Bus, Prof., Econ. Dev. Comm., 4-4-22
Primary Lobbyist: Elisa Arcidiacono Cal Cities Position: Oppose Policy Committee (primary): Public Safety Bill Summary: This measure would enact the Medicinal Cannabis Patients' Right of Access Act, which would require a local jurisdiction to allow for delivery of medicinal cannabis to satisfy "reasonable access" for patients.

SB 1393 (Archuleta D) Energy: appliances: local requirements. Status: 4/6/2022-Set for hearing April 21. Location: 3/28/2022-S. GOV. & F. Calendar: 4/20/2022 9 a.m. - 1021 O Street, Room 2200 SENATE GOVERNANCE AND FINANCE, CABALLERO, Chair Attachments: SB 1393 (Archuleta) Joint Cal Cites CSAC Sen Gov and Fi Oppose Unless Amended Letter 4.19.22 SB 1393 (Archuleta) CITY SAMPLE Oppose Letter Sen Gov and Fi 4.4.22 SB 1393 (Archuleta) Cal Cities CSAC Oppose Letter Sen Gov and Fi 4.4.22 Primary Lobbyist: Derek Dolfie Cal Cities Position: Oppose Policy Committee (primary): Environmental Quality Bill Summary: This bill would require a city, including a charter city, or county to submit an application to, and receive approval from, the CA Energy Commission before the city or county could require that a fossil fuel-fired appliance be replaced with an electric appliance upon the alteration or retrofit of a residential or nonresidential building. Some exemptions are included in the bill.


