Embed Size (px)
Citation preview

This article appeared in a journal published by Elsevier. The attachedcopy is furnished to the author for internal non-commercial researchand education use, including for instruction at the authors institution
and sharing with colleagues.
Other uses, including reproduction and distribution, or selling orlicensing copies, or posting to personal, institutional or third party
websites are prohibited.
In most cases authors are permitted to post their version of thearticle (e.g. in Word or Tex form) to their personal website orinstitutional repository. Authors requiring further information
regarding Elsevier’s archiving and manuscript policies areencouraged to visit:
http://www.elsevier.com/authorsrights

Author's personal copy
Estimation of parameters in sewage sludge by near-infrared reflectancespectroscopy (NIRS) using several regression tools
Luis Galvez-Sola a, Javier Morales b, Asuncion M. Mayoral b, Concepcion Paredes a,Marıa A. Bustamante a,n,1, Frutos C. Marhuenda-Egea c, J. Xavier Barber b, Raul Moral a
a Department of Agrochemistry and Environment, Miguel Hernandez University, EPS-Orihuela, ctra. Beniel Km 3.2, 03312-Orihuela, Alicante, Spainb Applied Statistical Unit, Operations Research Center, Miguel Hernandez University, Elche, Alicante, Spainc Department of Agrochemistry and Biochemistry, University of Alicante. Ap. 99, E-03080 Alicante, Spain
a r t i c l e i n f o
Article history:
Received 31 August 2012
Received in revised form
30 January 2013
Accepted 5 February 2013Available online 13 February 2013
Keywords:
NIRS
Biosolids
Partial least square regression (PLSR)
Penalized signal regression (PSR)
Chemical properties
Heavy metals
a b s t r a c t
Sewage sludge application to agricultural soils is a common practice in several countries in the
European Union. Nevertheless, the application dose constitutes an essential aspect that must be taken
into account in order to minimize environmental impacts. In this study, near infrared reflectance
spectroscopy (NIRS) was used to estimate in sewage sludge samples several parameters related to
agronomic and environmental issues, such as the contents in organic matter, nitrogen and other
nutrients, metals and carbon fractions, among others. In our study (using 380 biosolid samples), two
regression models were fitted: the common partial least square regression (PLSR) and the penalized
signal regression (PSR). Using PLSR, NIRS became a feasible tool to estimate several parameters with
good goodness of fit, such as total organic matter, total organic carbon, total nitrogen, water-soluble
carbon, extractable organic carbon, fulvic acid-like carbon, electrical conductivity, Mg, Fe and Cr, among
other parameters, in sewage sludge samples. For parameters such as C/N ratio, humic acid-like carbon,
humification index, the percentage of humic acid-like carbon, the polymerization ratio, P, K, Cu, Pb, Zn,
Ni and Hg, the performance of NIRS calibrations developed with PLSR was not sufficiently good.
Nevertheless, the use of PSR provided successful calibrations for all parameters.
& 2013 Elsevier B.V. All rights reserved.
1. Introduction
The encouragement of the wastewater purification processeshas aggravated the storage and management problems of thesludge generated after wastewater treatment. After reducing themoisture content and treating sewage sludge, when it isappropriate, the main destinations of this waste are the agricul-tural use, incineration with energy recovery and removal inrefuse dump.
Sludge application to agricultural soils can imply severalbenefits, provided that this application is in accordance with thecurrent legislation and a proper fertilization. For this, it isnecessary to know the sludge composition and the crop needsto calculate the application dose. The incorporation of sewagesludge to agricultural soils must be done properly, paying specialattention to the form and timing of the application, in order to
improve soil properties, such as soil structure or nutrient contentand because of the positive effects on soil microbial activity. Soilmicroorganisms are key players in the turnover of plant nutrientsand organic material and have important roles in maintaining soilstructure [1]. But, despite the benefits of this application onagricultural soil, there are some disadvantages, for example, therisk for humans and animals due to the presence of xenobioticsand pathogenic microorganisms [2]. Furthermore, pollution pro-blems may arise from toxic heavy metals that are mobilized intothe soil solution and are either taken up by plants or transportedin drainage water [3]. After the biosolids have been separatedfrom wastewater, land applied sludges must be treated to reducepathogens through one of a number of processes includinganaerobic digestion, lime stabilization or composting. Each ofthese processes has effects on the fate of both pathogens and theorganic contaminants in the sludge [4], so the contaminationpotential is lower after a treatment process.
Sewage sludge production in Spain was about 1205,124 t (indry matter) in 2009, 82.6% of this amount being used foragricultural purposes [5]. The best strategy to decide the applica-tion rate should be based on the specific composition of thebiosolids in each area, in order to verify the maximum sewagesludge application. However, in many cases, sewage sludge is
Contents lists available at SciVerse ScienceDirect
journal homepage: www.elsevier.com/locate/talanta
Talanta
0039-9140/$ - see front matter & 2013 Elsevier B.V. All rights reserved.
http://dx.doi.org/10.1016/j.talanta.2013.02.009
n Corresponding author. Tel.: þ34 968 39 6395.
E-mail addresses: [email protected],
[email protected] (M.A. Bustamante).1 Department of Soil and Water Conservation and Organic Waste Manage-
ment, Centro de Edafologıa y Biologıa Aplicada del Segura, CSIC, PO Box 164,
30100 Murcia, Spain.
Talanta 110 (2013) 81–88

Author's personal copy
applied to soils without this information, due to the cost and timetaken for a full characterization.
A promising alternative could be the estimation of differentparameters in the sewage sludge samples, based on the use ofnear infrared reflectance spectroscopy (NIRS). There are severalstudies using NIRS for estimating some parameters in sewagesludge or in composted sewage sludge samples. Albrecht et al. [6]reported the use of NIRS technology to determinate carbon andnitrogen contents in sewage sludge and green waste compost andVergnoux et al. [7] studied physico-chemical parameters, organicmatter, total organic carbon and concentrations of differentnitrogen forms in sewage sludge compost. The heavy metalcontents have been studied in sewage sludge samples [8] and incompost from sewage sludge [9,10]. Also, Galvez-Sola et al. [11]evaluated the nitrogen content in sewage sludge samples.
On the other hand, different mathematical tools, such as theuse of multivariate calibration [12], have been considered toestablish a model that helps to understand the signal obtainedfrom NIRS and to optimize the output of information. Severalaspects raised in this framework are non-trivial and include: [a]the number of regressors (p wavenumbers) can widely exceedtraining observations (n); [b] the regressors are highly correlatedand thus, it appears a very ill-conditioned statistical problem [13].There are two general approaches that can be used to solve theseaspects: (1) a reduction of the regression bases, including partialleast squares, principal components, or projection onto bases ofsplines [14] and (2) penalized regression, such as ridge regressionor penalized signal regression [15]. With smooth spectra, pena-lized signal regression constitutes a very promising approach,since it forces the vector of regressor coefficients to vary smoothlywith wavenumber.
Therefore, the aim of this study was to explore the potential ofNIRS technique for the estimation of several parameters insewage sludge samples, using different regression tools: thecommonly used partial least square regression (PLSR) and thepromising penalized signal regression (PSR).
2. Materials and methods
2.1. Sewage sludge samples
Three hundred and eighty sewage sludge samples were col-lected from 82 different wastewater treatment plants located insouthern Spain, during the period 2001–2008. The accumulatedequivalent population of the considered area is over 400,000inhabitants. The treated volume of wastewater per year wasabout 200 hm3, with a sludge production of 80,000 t, approxi-mately. All samples were dried at 50 1C, ground, dried again at105 1C and stored prior to their analysis.
2.2. Analytical methods
The electrical conductivity (EC) and pH of the sewage sludgesamples were determined in a 1:10 (w/v) water extract; totalorganic matter content (TOM) was determined by loss on ignitionat 540 1C for 4 h after the extraction of inorganic matter with HCl[16]. Total organic carbon (TOC) and total nitrogen (TN) weredetermined by dry combustion at 950 1C using elemental analyzer(Truspec CN, Leco, St. Joseph, Mich., USA) according to Navarro et al.[17] and Paredes et al. [18]. After microwave digestion with HNO3, Pwas assessed colorimetrically as molybdovanadate phosphoric acid[19], K and Na were determined by flame photometry (Jenway PFP7Flame Photometer, Jenway Ltd., Felsted, Dunmow, Essex, UK) andCa, Mg, Fe, Mn, Cd, Cr, Cu, Pb, Zn, Ni and Hg by atomic absorption(Varian 220FS Atomic Absorption Spectrometer, Varian Inc.,
Melbourne, Australia). Water-soluble carbon and nitrogen frac-tions (CWS and NWS) and organic carbon fractions were deter-mined by automatic microanalysis [17] (TOC-VCSN, ShimadzuCorporation, Kyoto, Japan), as were the 0.1 M NaOH-extractableorganic carbon (CEX) and fulvic acid-like carbon (CFA), the latterafter precipitation of the humic acid-like carbon (CHA) at pH 2.0[20]. The CHA was calculated by subtracting the CFA from the CEX.The humification ratio (HR), the humification index (HI) and thepercentage of humic acid-like carbon (PHA) were calculated as(CEX/TOC)�100; (CHA/TOC)�100 and (CHA/CEX)�100, respec-tively. The polymerization ratio (PR) was calculated as CHA/CAF.All the analytical determinations were done in quadruplicate.
2.3. NIRS analysis
NIRS analyses were performed using a Fourier transform NIRspectrometer (MPA, Bruker Optik GMBH, Germany) in the range ofwavenumber from 12,000 to 3800 cm�1 (830–2600 nm) with a stepof 8 cm�1, producing a spectrum with 2126 data points per sample.Each sample was poured in a glass plate and scanned three timesusing Opus software, version 6.0 (Bruker Optik) remixing theindividual sample between scans. The three spectra of each samplewere averaged obtaining a new one used for calibration andvalidation. Fig. 1 shows the NIRS spectra of the sewage sludgesamples. Partial least square regression (PLSR) was used in thecalibration step. The validation step was carried out using the fullcross-validation method, following the leave-one-out procedure. Toensure a good correlation between the spectral data and theconcentration values and find the best one, different pre-treatments of the spectra and combinations of them were tested
(1) Vector normalization (VN): normalizes a spectrum by aninitial calculation of the average intensity value and subse-quent subtraction of this value from the spectrum. Then, theaddition of the squared intensities is calculated and thespectrum is divided by the square root of this addition.
(2) Minimum–maximum normalization (Nmin–max): first sub-tracts a linear offset and then sets the y-maximum to a valueof 2 by multiplication with a constant. Used similar to thevector normalization.
(3) First derivative (FD): it calculates the first derivative of thespectrum. This method emphasizes steep edges of a peak. It isused to emphasize pronounced, but small features over abroad background. Spectral noise is also enhanced.
(4) Second derivative (SED): similar to the first derivative, it isanother treatment carried out separately from the firstderivative and that provides a more drastic result.
(5) Multiplicative scatter correction (MSC): performs a lineartransformation of each spectrum for it to best match themean spectrum of the whole set.
(6) Straight line subtraction (SLS): fits a straight line to thespectrum and subtracts it. This accounts for a tilt in therecorded spectrum.
(7) Linear offset subtraction (LOS): shifts the spectra in order toset the y-minimum to zero.
To evaluate the estimation, several statistical parameters wereperformed, such as: R2 (coefficient of determination for calibra-tion); RMSEE (root mean square error of estimation); F (numberof factors or principal components); r2 (coefficient of determina-tion for validation); RMSECV (root mean square error of crossvalidation) and RPD (calculated as the standard deviation of thereference data of the validation set divided by the standard errorof prediction). Malley et al. [21] suggested a guideline fordescribing the performance of calibrations for environmental
L. Galvez-Sola et al. / Talanta 110 (2013) 81–8882

Author's personal copy
samples, as follows: excellent calibrations R240.95, RPD44;successful, R2
¼0.9–0.95, RPD¼3–4; moderately successful,R2¼0.8–0.9, RPD¼2.25–3; and moderately useful, R2
¼0.7–0.8,RPD¼1.75–2.25. Some calibrations with R2o0.7 may be usefulfor screening purposes.
2.4. Mathematical model
A penalized signal regression (PSR) procedure was used toestablish a prediction model for all the parameters from theabsorbance signal given by the NIRS, similar to that proposed byEilers and Marx [15]. This is the notation of the model
Yi, i ¼1,y,n, the value of the parameters measured by theanalytic procedure in every sample.X¼[xij], i¼1,y,n y j¼1,y,p is the absorbance matrix observedfrom the spectra, where p denotes the number of wavelengthsconsidered and n the number of samples.
Then, the model corresponding to the concentration of eachparameter can be formulated by
logðffiffiffiffiYp
iÞ ¼ a0þXp
j ¼ 1
xij � aji, ð1Þ
where a0 represents intercept and aji gives the weight of thewavenumber wj to predict the concentration of the parameter ofinterest. However, this formulation encounters a conditioningproblem as the number of samples is quite fewer than thenumber of the wavelengths considered. To solve this problem,Eilers and Marx [15] proposed to project a onto a known basis ofsmooth functions, so making use of the ordered feature of thewavenumbers.
In this model, the number of initial predictors p is given by thenumber of wavelengths considered. To reduce that number, a fixed
number of nodes are established on the wavelength range con-sidered, nw, small enough to solve the problem of estimation andlarge enough to capture the general behavior of the spectrum. Theproposed modelization states that the coefficients a of the predic-tion model (1) can be written in terms of a B-spline basisconformed from wavenumbers as
a¼Xnw
m ¼ 1
Bmgm ¼ BC,
where C¼[gm] is the vector of unknown coefficients associatedwith the base of B-splines. Then, (1) can be rewritten as
logðffiffiffiffiffiYi
pÞ ¼ a0þXBa¼ a0þUG,
with U¼XB, where B is the base of cubic B-splines presented alongthe axis defined by the wavenumber considered.
Galvez-Sola et al. [22] used a similar model to estimate thephosphorous content in compost samples. To verify the predictiveability of the model proposed, the set of samples was divided intotwo groups. The first one, with the 66% of the samples was used toadjust the proposed model, while the other 33% of the sampleswas used in the validation step.
The analysis has been resolved with the R package, version2.9.2 [23]. The functions used are based on those programmed byBrian D. Marx and are available at http://www.stat.lsu.edu/faculty/marx. To obtain the value of a and G the criteria of thesmallest prediction mean square was used.
3. Results and discussion
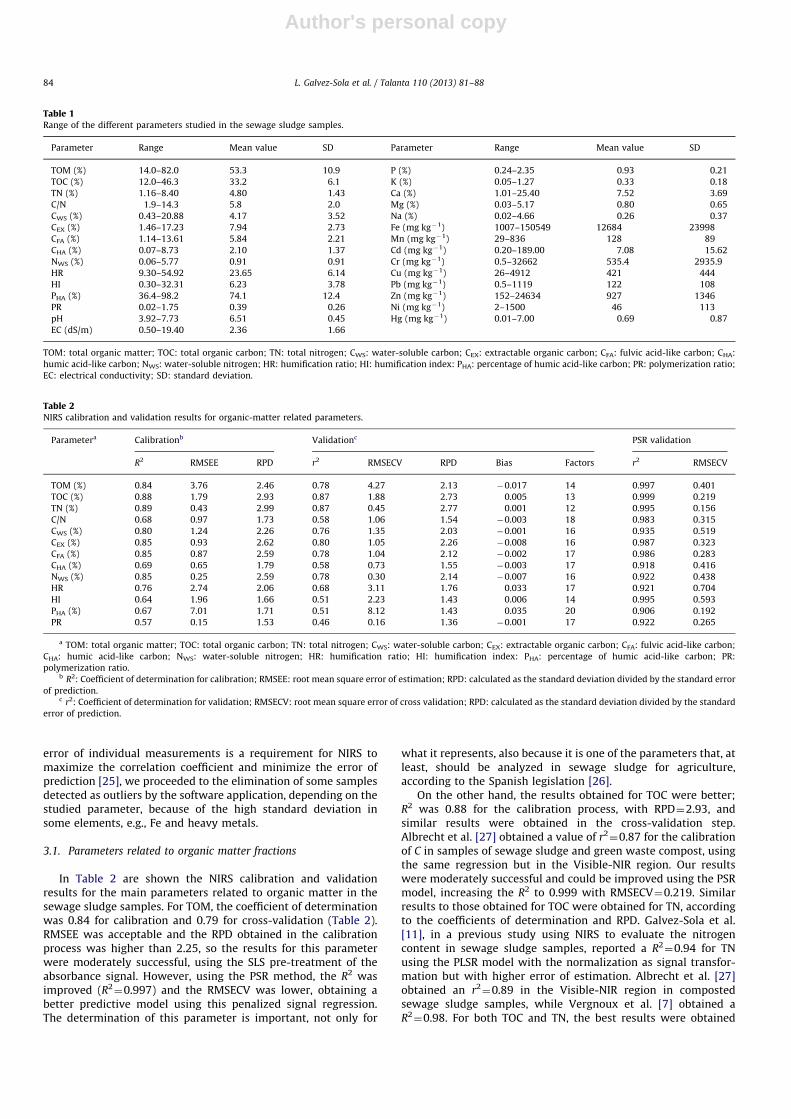
Table 1 shows the range of values of the different parametersstudied in the sewage sludge samples. A wide range was obtainedin most of the parameters considered, as a result of the highvariability among the different wastewater treatment systems,but mainly due to the nature of the influent water quality [24]. Inspite of a wide range in the constituent values as compared to the
Fig. 1. NIRS spectra of sewage sludge samples (wavenumber (cm�1) in abscissa and absorbance in ordinate).
L. Galvez-Sola et al. / Talanta 110 (2013) 81–88 83
Author's personal copy
error of individual measurements is a requirement for NIRS tomaximize the correlation coefficient and minimize the error ofprediction [25], we proceeded to the elimination of some samplesdetected as outliers by the software application, depending on thestudied parameter, because of the high standard deviation insome elements, e.g., Fe and heavy metals.
3.1. Parameters related to organic matter fractions
In Table 2 are shown the NIRS calibration and validationresults for the main parameters related to organic matter in thesewage sludge samples. For TOM, the coefficient of determinationwas 0.84 for calibration and 0.79 for cross-validation (Table 2).RMSEE was acceptable and the RPD obtained in the calibrationprocess was higher than 2.25, so the results for this parameterwere moderately successful, using the SLS pre-treatment of theabsorbance signal. However, using the PSR method, the R2 wasimproved (R2
¼0.997) and the RMSECV was lower, obtaining abetter predictive model using this penalized signal regression.The determination of this parameter is important, not only for
what it represents, also because it is one of the parameters that, atleast, should be analyzed in sewage sludge for agriculture,according to the Spanish legislation [26].
On the other hand, the results obtained for TOC were better;R2 was 0.88 for the calibration process, with RPD¼2.93, andsimilar results were obtained in the cross-validation step.Albrecht et al. [27] obtained a value of r2
¼0.87 for the calibrationof C in samples of sewage sludge and green waste compost, usingthe same regression but in the Visible-NIR region. Our resultswere moderately successful and could be improved using the PSRmodel, increasing the R2 to 0.999 with RMSECV¼0.219. Similarresults to those obtained for TOC were obtained for TN, accordingto the coefficients of determination and RPD. Galvez-Sola et al.[11], in a previous study using NIRS to evaluate the nitrogencontent in sewage sludge samples, reported a R2
¼0.94 for TNusing the PLSR model with the normalization as signal transfor-mation but with higher error of estimation. Albrecht et al. [27]obtained an r2
¼0.89 in the Visible-NIR region in compostedsewage sludge samples, while Vergnoux et al. [7] obtained aR2¼0.98. For both TOC and TN, the best results were obtained
Table 1Range of the different parameters studied in the sewage sludge samples.
Parameter Range Mean value SD Parameter Range Mean value SD
TOM (%) 14.0–82.0 53.3 10.9 P (%) 0.24–2.35 0.93 0.21
TOC (%) 12.0–46.3 33.2 6.1 K (%) 0.05–1.27 0.33 0.18
TN (%) 1.16–8.40 4.80 1.43 Ca (%) 1.01–25.40 7.52 3.69
C/N 1.9–14.3 5.8 2.0 Mg (%) 0.03–5.17 0.80 0.65
CWS (%) 0.43–20.88 4.17 3.52 Na (%) 0.02–4.66 0.26 0.37
CEX (%) 1.46–17.23 7.94 2.73 Fe (mg kg�1) 1007–150549 12684 23998
CFA (%) 1.14–13.61 5.84 2.21 Mn (mg kg�1) 29–836 128 89
CHA (%) 0.07–8.73 2.10 1.37 Cd (mg kg�1) 0.20–189.00 7.08 15.62
NWS (%) 0.06–5.77 0.91 0.91 Cr (mg kg�1) 0.5–32662 535.4 2935.9
HR 9.30–54.92 23.65 6.14 Cu (mg kg�1) 26–4912 421 444
HI 0.30–32.31 6.23 3.78 Pb (mg kg�1) 0.5–1119 122 108
PHA (%) 36.4–98.2 74.1 12.4 Zn (mg kg�1) 152–24634 927 1346
PR 0.02–1.75 0.39 0.26 Ni (mg kg�1) 2–1500 46 113
pH 3.92–7.73 6.51 0.45 Hg (mg kg�1) 0.01–7.00 0.69 0.87
EC (dS/m) 0.50–19.40 2.36 1.66
TOM: total organic matter; TOC: total organic carbon; TN: total nitrogen; CWS: water-soluble carbon; CEX: extractable organic carbon; CFA: fulvic acid-like carbon; CHA:
humic acid-like carbon; NWS: water-soluble nitrogen; HR: humification ratio; HI: humification index: PHA: percentage of humic acid-like carbon; PR: polymerization ratio;
EC: electrical conductivity; SD: standard deviation.
Table 2NIRS calibration and validation results for organic-matter related parameters.
Parametera Calibrationb Validationc PSR validation
R2 RMSEE RPD r2 RMSECV RPD Bias Factors r2 RMSECV
TOM (%) 0.84 3.76 2.46 0.78 4.27 2.13 �0.017 14 0.997 0.401
TOC (%) 0.88 1.79 2.93 0.87 1.88 2.73 0.005 13 0.999 0.219
TN (%) 0.89 0.43 2.99 0.87 0.45 2.77 0.001 12 0.995 0.156
C/N 0.68 0.97 1.73 0.58 1.06 1.54 �0.003 18 0.983 0.315
CWS (%) 0.80 1.24 2.26 0.76 1.35 2.03 �0.001 16 0.935 0.519
CEX (%) 0.85 0.93 2.62 0.80 1.05 2.26 �0.008 16 0.987 0.323
CFA (%) 0.85 0.87 2.59 0.78 1.04 2.12 �0.002 17 0.986 0.283
CHA (%) 0.69 0.65 1.79 0.58 0.73 1.55 �0.003 17 0.918 0.416
NWS (%) 0.85 0.25 2.59 0.78 0.30 2.14 �0.007 16 0.922 0.438
HR 0.76 2.74 2.06 0.68 3.11 1.76 0.033 17 0.921 0.704
HI 0.64 1.96 1.66 0.51 2.23 1.43 0.006 14 0.995 0.593
PHA (%) 0.67 7.01 1.71 0.51 8.12 1.43 0.035 20 0.906 0.192
PR 0.57 0.15 1.53 0.46 0.16 1.36 �0.001 17 0.922 0.265
a TOM: total organic matter; TOC: total organic carbon; TN: total nitrogen; CWS: water-soluble carbon; CEX: extractable organic carbon; CFA: fulvic acid-like carbon;
CHA: humic acid-like carbon; NWS: water-soluble nitrogen; HR: humification ratio; HI: humification index: PHA: percentage of humic acid-like carbon; PR:
polymerization ratio.b R2: Coefficient of determination for calibration; RMSEE: root mean square error of estimation; RPD: calculated as the standard deviation divided by the standard error
of prediction.c r2: Coefficient of determination for validation; RMSECV: root mean square error of cross validation; RPD: calculated as the standard deviation divided by the standard
error of prediction.
L. Galvez-Sola et al. / Talanta 110 (2013) 81–8884
Author's personal copy
with no pre-treatments of the absorbance signal. On the otherhand, for C/N ratio, results were not satisfactory, because of thelow determination coefficients and RPD and the high residualerrors. This situation could be arranged using the PSR model,obtaining a R2
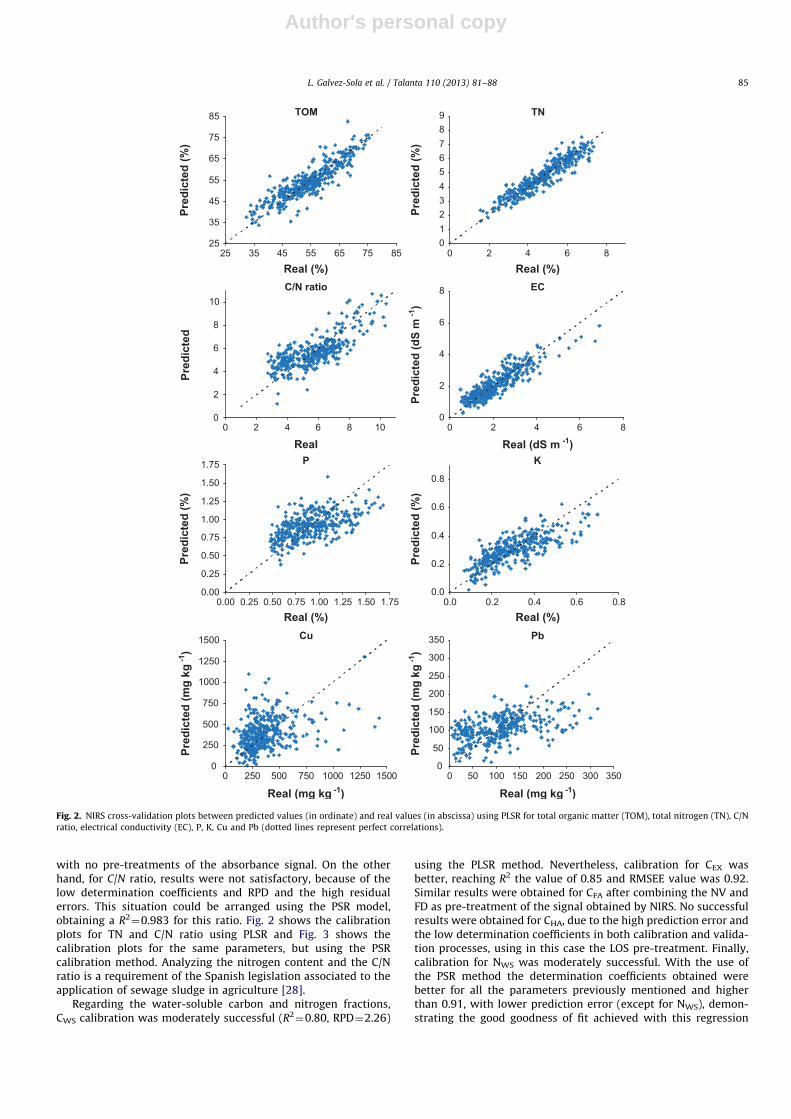
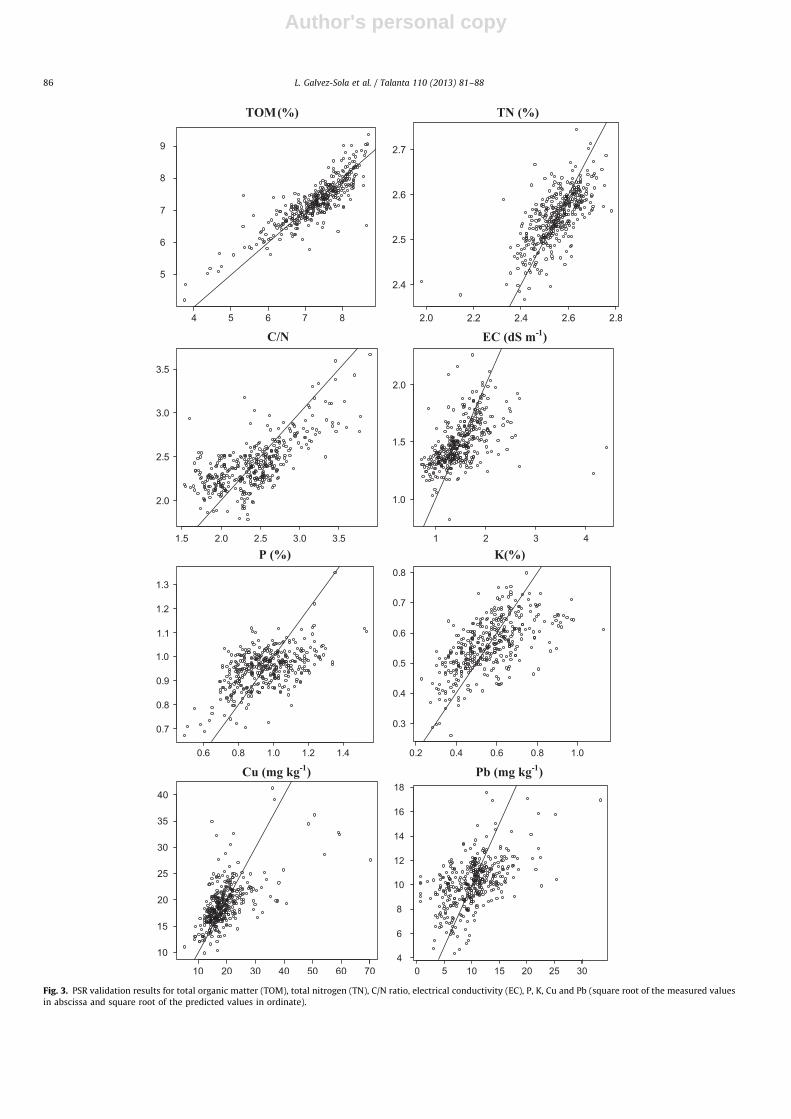
¼0.983 for this ratio. Fig. 2 shows the calibrationplots for TN and C/N ratio using PLSR and Fig. 3 shows thecalibration plots for the same parameters, but using the PSRcalibration method. Analyzing the nitrogen content and the C/Nratio is a requirement of the Spanish legislation associated to theapplication of sewage sludge in agriculture [28].
Regarding the water-soluble carbon and nitrogen fractions,CWS calibration was moderately successful (R2
¼0.80, RPD¼2.26)
using the PLSR method. Nevertheless, calibration for CEX wasbetter, reaching R2 the value of 0.85 and RMSEE value was 0.92.Similar results were obtained for CFA after combining the NV andFD as pre-treatment of the signal obtained by NIRS. No successfulresults were obtained for CHA, due to the high prediction error andthe low determination coefficients in both calibration and valida-tion processes, using in this case the LOS pre-treatment. Finally,calibration for NWS was moderately successful. With the use ofthe PSR method the determination coefficients obtained werebetter for all the parameters previously mentioned and higherthan 0.91, with lower prediction error (except for NWS), demon-strating the good goodness of fit achieved with this regression
Fig. 2. NIRS cross-validation plots between predicted values (in ordinate) and real values (in abscissa) using PLSR for total organic matter (TOM), total nitrogen (TN), C/N
ratio, electrical conductivity (EC), P, K, Cu and Pb (dotted lines represent perfect correlations).
L. Galvez-Sola et al. / Talanta 110 (2013) 81–88 85
Author's personal copy
Fig. 3. PSR validation results for total organic matter (TOM), total nitrogen (TN), C/N ratio, electrical conductivity (EC), P, K, Cu and Pb (square root of the measured values
in abscissa and square root of the predicted values in ordinate).
L. Galvez-Sola et al. / Talanta 110 (2013) 81–8886

Author's personal copy
method. The performed calibrations for humification rates werenot successful by PLSR, except for HR (R2
¼0.76). However, withthe PSR model, we obtained good correlations for all rates withdetermination coefficients higher than 0.90 (Table 2).
3.2. Chemical parameters and elements
The NIRS calibration and validation results for chemical para-meters and elements are shown in Table 3. In relation to thechemical parameters, the calibration obtained for pH was mod-erately good. The resulting RPD was 2.18, with a R2
¼0.79.However, in case of EC, the performed model was better, obtain-ing a RPD higher than 2.25 and a R2
¼0.85 and pre-treating thesignal using the SLS pre-treatment. Once again, with the PSRmodel, measures of goodness of fit improve, reaching moreaccurate results. R2 for pH and EC were 0.999 and 0.942,respectively, and RMSECV were low enough for both parameters,as it is shown in Table 3.
For P, the resulting calibration was not satisfactory using thePLSR model, this fact being confirmed by the low values obtainedfor R2. For K, although the statistics were better than for P(Table 3), these were not good enough, even when using themodel for monitoring purposes. Using the PSR model, the coeffi-cients of determination were 0.98 and 0.96, respectively (Fig. 3).On the other hand, results for Ca were moderately useful,according to the values of R2 and RPD obtained using PLSR, whichwere higher than 0.75 and 1.75, respectively. In addition, nosignal pre-treatment was needed for K and Ca. With PSR, the r2
was 0.978, improving the goodness of fit of the prediction and
decreasing the estimation error. Similar results were performedfor Mn. For Na, the coefficient of determination obtained with PSRwas also better than the obtained with PLSR, which constituted amoderately useful calibration with this regression. However,better results were obtained for Mg (R2
¼0.89). This calibrationwas moderately successful with PLSR, improving the results withPSR. For Fe, R2 was 0.84 for calibration and r2
¼0.79 for the cross-validation process with the minimum–maximum normalizationpre-treatment. So, the result obtained was moderately successfulfor this element, but with less estimation error using the calibra-tion performed with the penalized regression tool. The analyses ofP, K, Ca, Mg and Fe are essential from the point of view of plantnutrition; also, the Spanish legislation about the use of sewagesludge in agriculture requires that the determination of theseparameters prior to sludge application [28].
3.3. Heavy metal content
The estimation of the heavy metal contents in sewage sludgesamples using NIRS is complex, as it was reported by Moral et al.[8] in a study to evaluate the efficiency of NIRS to ascertain heavymetal contents in sewage sludge samples. Table 4 shows the NIRScalibration and validation results for the heavy metal contents inthe sewage sludge samples studied. Using PLSR, R2 for Cd was0.73 with RPD¼1.91, but this result can improve with the PSRmodel, increasing the coefficient of determination up to 0.83. Onthe other hand, the prediction of Cr using PLSR and the VN pre-treatment was possible, because the results were moderatelysuccessful, with R2
¼0.89 and RPD¼3.07. The cross-validation
Table 3NIRS calibration and validation results for chemical parameters and elements.
Parametera Calibrationb Validationc PSR Validation
R2 RMSEE RPD r2 RMSECV RPD Bias Factors r2 RMSECV
pH 0.79 0.19 2.18 0.71 0.22 1.87 �0.001 17 0.999 0.065
EC (dS m�1) 0.85 0.42 2.55 0.77 0.5 2.09 0.004 18 0.942 0.370
P (%) 0.49 0.19 1.39 0.31 0.22 1.21 0.001 8 0.981 0.134
K (%) 0.64 0.08 1.66 0.60 0.08 1.57 0.001 9 0.96 0.114
Ca (%) 0.77 1.51 2.09 0.74 1.58 1.95 0.009 13 0.978 0.404
Mg (%) 0.89 0.18 3 0.86 0.19 2.68 0.002 12 0.923 0.249
Na (%) 0.79 0.10 2.16 0.65 0.12 1.7 0.019 18 0.834 0.208
Fe (mg kg�1) 0.84 9840 2.49 0.79 1110 2.17 �34.80 15 0.868 42.727
Mn (mg kg�1) 0.75 27.9 2.00 0.68 30.7 1.77 0.294 18 0.970 1.962
a EC: Electrical conductivity.b R2: Coefficient of determination for calibration; RMSEE: root mean square error of estimation; RPD: calculated as the standard deviation divided by the standard error
of prediction.c r2: Coefficient of determination for validation; RMSECV: root mean square error of cross validation; RPD: calculated as the standard deviation divided by the standard
error of prediction.
Table 4NIRS calibration and validation results for heavy metal content.
Parameter Calibrationa Validationb PSR Validation
R2 RMSEE RPD r2 RMSECV RPD Bias Factors r2 RMSECV
Cd (mg kg�1) 0.73 3.53 1.91 0.62 4.09 1.62 �0.040 13 0.829 1.102
Cr (mg kg�1) 0.89 981 3.07 0.81 1280 2.3 9.140 17 0.732 1211.2
Cu (mg kg�1) 0.67 258 1.74 0.44 334 1.33 9.060 8 0.925 5.638
Pb (mg kg�1) 0.28 56.7 1.18 0.21 58.6 1.13 �0.095 8 0.891 3.648
Zn (mg kg�1) 0.56 188 1.51 0.47 204 1.37 0.304 11 0.924 8.418
Ni (mg kg�1) 0.60 72.4 1.58 0.24 98.7 1.15 0.621 6 0.787 3.148
Hg (mg kg�1) 0.42 0.48 1.31 0.32 0.51 1.21 0.004 7 0.745 0.418
a R2: Coefficient of determination for calibration; RMSEE: root mean square error of estimation; RPD: calculated as the standard deviation divided by the standard error
of prediction.b r2: Coefficient of determination for validation; RMSECV: root mean square error of cross validation; RPD: calculated as the standard deviation divided by the standard
error of prediction.
L. Galvez-Sola et al. / Talanta 110 (2013) 81–88 87

Author's personal copy
process confirmed the good results obtained. In this case, despitethe value of r2 is lower using PSR, it is also lower using RMSECVand therefore, the method PSR supposes lower estimation error.The coefficient of determination was 0.73 and the estimationerror was higher (Table 4).
For Cu, the estimation model was better with PSR, with acoefficient of determination higher than 0.90 and obtaining nosuccessful results using PLSR (Figs. 2 and 3). Similar results wereobtained for Pb and Zn, these results being successful andmoderately successful with the PSR model respectively and notsuccessful using PLSR. For Ni, the coefficient of determinationby PSR was moderately useful (r2
¼0.79 and RMSECV¼3.148 mg kg�1) and not successful with PLSR using the VN pre-treatment. Similar outcomes were obtained for the estimation ofHg in the sewage sludge samples using the PSR model (r2
¼0.75and RMSECV¼0.418 mg kg�1). In relation to the calibrations forthe heavy metal content using PLSR, the results in this study weresimilar to those obtained in a previous research by Galvez-Solaet al. [29], but improving in this case the coefficient of determina-tion for Cd and Hg and reducing the RMSEE for all heavy metalsexcept for Cr. As it has been previously mentioned for otherelements, these heavy metals must be analyzed in sewage sludgefor agriculture, according to the Spanish legislation.
As it was shown, PSR calibrations in this study were betterthan the typical PLSR calibrations widely used for NIRS predictionmodels. PSR attacks the high dimensionality and correlation inthe regressors by projecting the regression coefficients onto afewer basis of smooth functions, linearly related to them. More-over, penalties are included in order to smooth the curve byavoiding neighbour regressors. Details and comparisons areexplained in Marx and Eilers [14] for a similar example on NIRSsignals.
4. Conclusions
Our results indicated that near infrared reflectance spectro-scopy is a feasible tool for estimating total organic matter, totalorganic carbon, total nitrogen, water-soluble carbon, extractablecarbon, fulvic acid-like carbon, electrical conductivity, Mg, Fe andCr in sewage sludge samples using the PLSR tool. Besides, with thesame regression tool, for pH, Ca, Na, Mn, Cd and also thehumification ratio, the goodness of fit in the validation processwas lower but useful. For C/N ratio, humic acid-like carbon,humification index, the percentage of humic acid-like carbon,the polymerization ratio, P, K, Cu, Pb, Zn, Ni and Hg, the goodnessof fit between observed and predicted values of NIRS with PLSRwas not good enough. Using PSR, all the parameters can beestimated with better goodness of fit than with PLSR, withcoefficient of determination in the validation step higher than0.90 for most of the studied parameters.
Acknowledgements
This work has been financed by the Ministerio de Ciencia eInnovacion (currently Economıa y Competitividad) of Spain andEuropean Regional Development Funds (FEDER, ‘‘Una manera de
hacer Europa’’) (Project AGL2009-12371-C02-01) and also by theGeneralitat Valenciana (ACOMP/2010/177).
References
[1] M. Odlare, V. Arthurson, M. Pell, K. Svensson, E. Nehrenheim, J. Abubaker,Appl. Energy 88 (2011) 2210–2218.
[2] P.G. Gaspard, J. Schwartzbrod, Int. J. Hyg. Environ. Health 206 (2003)117–122.
[3] J.Y. Dai, L. Chen, J.F. Zhao, N. Ma, J. Environ. Sci. 18 (2006) 1094–1100.[4] H.R. Rogers, Sci. Total Environ. 185 (1996) 3–26.[5] Perfil Ambiental de Espana. Spanish Ministry of Agriculture, Food and
Enviroment. 2010. Available at: /http://www.magrama.gob.es/es/calidad-y-evaluacion-ambiental/temas/informacion-ambiental-indicadores-ambientales/S.
[6] R. Albrecht, R. Joffre, R. Gros, J. Le Petit, G. Terrom, C. Perissol, Bioresour.Technol. 99 (2008) 448–455.
[7] A. Vergnoux, M. Guiliano, Y. Le Dreau, J. Kister, N. Dupuy, P. Doumenq, Sci.Total Environ. 407 (2009) 2390–2403.
[8] Moral, R., Galvez-Sola, L., Moreno-Caselles, J., Perez-Murcia, M.D., Perez-Espinosa, A., Paredes, C., A. Kungolos, K. Aravossis, A. Karagiannidis, P.Samaras (Eds.),First Conference on Environmental Management, Engineering,Planning and Economics, Skiathos Island, Greece, 2007, pp. 1683–1688.
[9] L. Galvez-Sola, F.C. Marhuenda-Egea, M.D. Perez-Murcia, A. Perez Espinosa,J. Moreno-Caselles, J. Morales, R. Moral, in: L. Shengcai, W. Yajun, C. Fengxia,H. Ping, Z. Yao (Eds.), Progress in Environmental Science and Technology, vol.II, Science Press, Beijing, China, 2009, pp. 643–648.
[10] L. Galvez-Sola, R. Moral, M.D. Perez-Murcia, A. Perez-Espinosa,M.A. Bustamante, E. Martinez-Sabater, C. Paredes, Sci. Total Environ. 408(2010) 14114-1421.
[11] L. Galvez-Sola, R. Moral, J. Moreno-Caselles, M.D. Perez-Murcia, A. Perez-Espinosa, M.A. Bustamante, C. Paredes, Commun. Soil Sci. Plant Anal. 40(2009) 726–735.
[12] P.H.C. Eilers, L. Bin, B.D. Marx, Chemometr. Intell. Lab. Syst. 96 (2009)196–202.
[13] I.E. Frank, J.H. Friedman, Technometrics 35 (1993) 109–148.[14] B.D. Marx, P.H.C. Eilers, Technometrics 41 (1999) 1–13.[15] P.H.C. Eilers, B.D. Marx, Chemometr. Intell. Lab. Syst. 66 (2003) 159–174.[16] MAPA. Metodos Oficiales de Analisis. Tomo III; Secretarıa General Tecnica.
Ministerio de Agricultura, Pesca y Alimentacion, Madrid, Spain, 1994.[17] A.F. Navarro, J. Cegarra, A. Roig, M.P. Bernal, Commun. Soil Sci. Plant Anal. 22
(1991) 2137–2144.[18] C. Paredes, M.P. Bernal, A. Roig, J. Cegarra, M.A. Sanchez-Monedero, Int
Biodeterior. Biodegrad. 38 (1996) 205–210.[19] R.E. Kitson, M.G. Mellon, Ind. Eng. Chem. Anal. Ed. 16 (1944) 379–383.[20] M.A. Sanchez-Monedero, A. Roig, C. Martınez-Pardo, J. Cegarra, C. Paredes,
Bioresour. Technol. 57 (1996) 291–295.[21] D.F. Malley, Near Infrared Spectroscopy in Agriculture, in: C. Robert,
J. Workman, J.B. Reeves (Eds.), American Society of Agronomy, Soil ScienceSociety of America and Crop Science Society of America, Madison, WI, USA,2004, pp. 729–784.
[22] L. Galvez-Sola, J. Morales, A.M. Mayoral, F.C. Marhuenda-Egea, E. Martinez-Sabater, M.D. Perez-Murcia, M.A. Bustamante, C. Paredes, R. Moral, Chemo-sphere 78 (2010) 13–21.
[23] R Development Core Team. R: A Language and Environment for StatisticalComputing. R Foundation for Statistical Computing, 2009. /http://www.R-project.orgS.
[24] J. Moreno-Caselles, M.D. Perez-Murcia, A. Perez-Espinosa, R. Moral, FreseniusEnviron. Bull. 6 (1997) 519–524.
[25] D.F. Malley, P.C. Williams, Environ. Sci. Technol. 31 (1997) 3461–3467.[26] BOE, Real Decreto 1310/1990, de 29 de Octubre, por el que se regula la
utilizacion de lodos de depuracion en el sector agrario, Boletın Oficial delEstado 262 (1990) 32339–32340.
[27] R. Albrecht, R. Joffre, J. Le Petit, G. Terrom, C. Perissol, Environ. Sci. Technol. 43(2009) 804–811.
[28] BOE, Orden de 26 de Octubre de 1993 sobre utilizacion de lodos dedepuracion en el sector agrario, Boletın Oficial del Estado 265 (1993)31073–31076.
[29] Galvez-Sola, L., Marhuenda-Egea F.C., Perez-Murcia M.D., Perez Espinosa A.,Moreno-Caselles J., Morales, J., Moral R., in: Proceedings of the SecondInternational Symposium on Agricultural and Agroindustrial WasteManagement—II SIGERA, vol. II, D.D. Junior, , G. Dalmedico, , J.C.P. Palhares,V. Fracasso (Eds), Foz do Iguac-u, Brazil 2008.
L. Galvez-Sola et al. / Talanta 110 (2013) 81–8888


