Embed Size (px)
Citation preview

ePubWU Institutional Repository
Susanne Fuchs
Organizational Adoption Models for Early ASP Technology Stages. Adoptionand Diffusion of Application Service Providing (ASP) in the Electric UtilitySector.
Thesis
Original Citation:Fuchs, Susanne (2005) Organizational Adoption Models for Early ASP Technology Stages.Adoption and Diffusion of Application Service Providing (ASP) in the Electric Utility Sector. Doctoralthesis, WU Vienna University of Economics and Business.
This version is available at: http://epub.wu.ac.at/1876/Available in ePubWU: November 2005
ePubWU, the institutional repository of the WU Vienna University of Economics and Business, isprovided by the University Library and the IT-Services. The aim is to enable open access to thescholarly output of the WU.
http://epub.wu.ac.at/

Page 1
Organizational Adoption Models for Early ASP Technology Stages
Adoption and Diffusion of
Application Service Providing (ASP)
in the Electric Utility Sector
Mag. Susanne Fuchs
Mat.Nr.: 9650311
Scientific Advisor:
Hon. Prof. Dkfm. Dr. Rainer Hasenauer

Executive Summary
Page i
EXECUTIVE SUMMARY (ENGLISH)
Application Service Providing (ASP) is a recently emerged software delivery model under which an Application Service Provider hosts, manages and delivers software as a service to customers via the Internet or a private network. The ASP model offers benefits from cost savings, specialized expertise, a faster time to market, and a reduced risk due to a lower capital investment. ASP also allows for connectivity within a company and across trading partners and provides financial and technological flexibility. However, customers who are unsure about the value of ASP services and their demands may be reluctant to commit to ASP contracts. Many are also concerned with security, performance and loss of control.
The underlying research identifies determinants influencing adoption intentions in the early technology stages of ASP within electric utilities. The theoretical framework is based on the findings of studies from van Everdingen (1995; 2002) and Frambach (1998; 2002), and is adapted from Rogers’ work on the diffusion of innovations. The tested model includes characteristics of the innovation, such as relative (dis-) advantage of ASP, as well as characteristics of the environment, the adopting company and importance of social influence.
After a broad qualitative study a quantitative web-based survey generated 158 data sets. Multiple linear regression and logistic regression were used to analyse the relationships between multi-item constructs. Results show that the perceived improved service provided by ASP, the perceived calculation accuracy of load and price forecasts, the perceived benefits from the provision of external competence, and the trust in the reliability of the service provider as well as the image gains a company has by using ASP are significant factors influencing the formation of attitude for or against ASP solutions. Furthermore, the dependent variable in this research—the intention to adopt—is determined by the behavioural intention to try, the attitude towards ASP, the perceived cost of ASP, and the company size of the adopting firm.
All constructs rank high in measurement quality and the overall model reveals food for an improved conception of ASP as well as managerial practices. Results also indicate the lapse of the diffusion curve of ASP in the electric utilities industry in Austria and Germany.
The work concludes with an in-depth discussion of the relevant results, followed by the limitations and future paths of research. Possible practical and theoretical contributions as well as implications are given.

Executive Summary
Page ii
EXECUTIVE SUMMARY (DEUTSCH)
Das so genannte Application Service Providing (ASP) ist ein erst kürzlich entstandenes Modell zur Bereitstellung von Software. Dabei übernimmt ein Dienstleister, der so genannte Application Service Provider, als Dienstleistung für Kunden das Hosting, die Verwaltung und den Betrieb einer Softwareanwendung über das Internet oder ein privates Netzwerk. Der durch das ASP-Modell erzielte Nutzen ergibt sich aus Kosteneinsparungen, Zugang zu Fachwissen, kürzerer Time-To-Market sowie einem verringerten Risiko auf Grund geringerer Kapitalinvestitionen. Das ASP-Modell ermöglicht auch Anbindungen innerhalb eines Unternehmens sowie auf geschäftspartnerübergreifender Basis und gewährleistet Flexibilität sowohl in finanzieller wie auch technischer Hinsicht. Kunden, die sich des Werts von ASP-Diensten nicht sicher sind, legen jedoch manchmal eine gewisse Zurückhaltung beim Abschluss von ASP-Verträgen an den Tag. Viele haben auch Bedenken in Bezug auf Sicherheit, Leistung und Kontrollverlust.
Bei der diesem Papier zugrundeliegenden Forschungsarbeit wurden Faktoren festgestellt, welche im Frühstadium der ASP-Technologie einen Einfluss auf die beabsichtigte Annahme dieser Technologie im Bereich von Elektrizitätsversorgungsunternehmen (EVU) haben. Das theoretische Gerüst gründet sich auf die Ergebnisse von durch van Everdingen (1995; 2002) und Frambach (1998; 2002) durchgeführten Untersuchungen und wurde in adaptierter Form aus Rogers Arbeit über die Diffusion von Innovationen übernommen. Das überprüfte Model umfasst Merkmale der Innovation an sich, wie beispielsweise relative Vor/Nachteile von ASP, sowie Merkmale des Geschäftsumfeldes, des die Technologie einsetzenden Unternehmens, sowie der Bedeutung sozialer Einflussfaktoren.
Im Anschluss an eine breit angelegte qualitative Studie wurden im Zuge einer web-basierten quantitativen Umfrage 158 Datensätze erzeugt. Mit Hilfe multipler linearer Regression und logistischer Regression wurden die Beziehungen zwischen Multi-Item Konstrukten analysiert. Die Ergebnisse zeigen, dass die wahrgenommene Verbesserung im Service durch ASP, die wahrgenommene Berechnungsgenauigkeit von Last- und Preisprognosen, die wahrgenommenen, sich aus der Bereitstellung externer Kompetenz ergebenden Vorteile, sowie das Vertrauen in die Verlässlichkeit des Dienstleisters und der Imagegewinn eines Unernehmens durch die Nutzung von ASP-Leistungen maßgeblichen Einfluß auf die Meinungsbildung für oder gegen den Einsatz von ASP-Lösungen zeigen. Darüber hinaus unterliegt die abhängige Variable in dieser Forschungsarbeit – die Einsatzabsicht – dem Einfluss folgender Faktoren: Neigung zum Ausprobieren der Innovation, Einstellung gegenüber ASP, wahrgenommene Kosten von ASP sowie Größe des Unternehmens.

Executive Summary
Page iii
Sämtliche Konstrukte sind bezüglich Messqualität sehr hoch einzuordnen. Das Gesamtmodell zeigt Möglichkeiten für eine verbesserte Konzeption von ASP sowie für Managementpraktiken. Die Ergebnisse zeigen auch den Verlauf der ASP-Diffusionskurve in der EVU-Branche in Österreich und Deutschland.
In der vorliegenden Untersuchung werden zuerst die relevanten Ergebnisse im Detail besprochen, um danach die Grenzen dieser Arbeit und künftige vielversprechende Forschungsrichtungen aufzuzeigen. Zum Schluß werden die Beiträge zu sowohl Theorie als auch Praxis und die sich ergebenden Schlussfolgerungen ausführlich dargelegt.

Danksagung
Page i
DANKSAGUNG
Die Autorin möchte hier jenen Personen danken, ohne deren Hilfe die vorliegende Arbeit in dieser Form nicht zustande gekommen wäre: Dr. Rainer Hasenauer, meinem Doktorvater, der mir während aller Phasen dieser Arbeit als wissenschaftlicher Ratgeber und Motivator zur Seite stand, der es mir ermöglichte, eine vielschichtige Sichtweise auf das von mir beforschte Feld beizubehalten und dessen faire Unterstützung eine solide Basis für diese Zeit war. Allen mitwirkenden aus dem Umfeld der Energiewirtschaft, die sich bereit erklärten mit mir über dieses Thema zu diskutieren, mir als Gesprächspartner für meine qualitative empirische Erhebung zur Verfügung zu stehen und jenen, die dem Aufruf gefolgt sind und mit der Beantwortung des Fragebogens meine quantitative Studie ermöglicht und bereichert haben. Allen Kollegen der Wirtschaftsuniversität Wien für die tatkräftige Unterstützung bei wissenschaftlichen Fragen und praktischen Problemen. Für die tatkräftige Unterstützung der Mitarbeiter der Siemens AG Österreich, Programm und System Entwicklung Energie & Information in Wien. Meinen lieben Kolleginnen und Kollegen bei HiTec Marketing, die mir in allen Phasen dieser Arbeit wertvolle Unterstützung und interessante Diskussionen ermöglichten. Mein spezieller Dank gilt meiner Forschungskollegin Christina Hainbuchner für ihre Freunschaft und den wertvollen wissenschaftlichen Austausch. Diese Arbeit wäre jedoch nie zustande gekommen ohne die ununterbrochene Unterstützung von Jimmy, meinen Freunden und meinen Eltern, denen ich an dieser Stelle meinen besonderen Dank ausdrücken möchte.

Contents
Page 1
TABLE OF CONTENTS EXECUTIVE SUMMARY (ENGLISH) ................................................................................................ I
EXECUTIVE SUMMARY (DEUTSCH).............................................................................................. II
DANKSAGUNG ............................................................................................................................ I
1 INTRODUCTION ...................................................................................................................1
1.1 Field of Investigations ................................................................................................1 1.2 Genesis of the Underlying Work ................................................................................3 1.3 High Tech Marketing..................................................................................................4 1.4 The Energy Supply Industry.......................................................................................8
1.4.1 General Considerations ......................................................................................8 1.4.2 From Regulation to Liberalization .......................................................................9 1.4.3 Organisation of the Market ...............................................................................11 1.4.4 Electricity Consumption and Generation ..........................................................13 1.4.5 Energy Exchanges in Central Europe...............................................................15
1.5 Application Service Providing ..................................................................................18 1.5.1 General Considerations ....................................................................................18 1.5.2 Outsourcing ......................................................................................................18 1.5.3 Conceptual Classifications-From Netsourcing to xSP’s....................................20 1.5.4 Application Service Providing ...........................................................................22
1.6 ASP in the Electric Utilities Industry.........................................................................25 1.6.1 General Considerations ....................................................................................25 1.6.2 Selection of Relevant Applications ...................................................................25
1.6.2.1 Introduction................................................................................................25 1.6.2.2 Short-Term Load forecasting.....................................................................26 1.6.2.3 Short-Term Price forecasting.....................................................................28 1.6.2.4 Excursus: Calculations of STPF for the European Energy Exchange.......29
1.7 Research Gap..........................................................................................................35 1.8 Research Questions ................................................................................................37
2 THEORETICAL BACKGROUND-STATE OF THE FIELD ...........................................................38
2.1 Introduction ..............................................................................................................38 2.2 Organizational Buying Behavior...............................................................................39 2.3 Theory of Adoption and Diffusion.............................................................................44
2.3.1 General Considerations ....................................................................................44 2.3.2 ‘Attitude’ vs ‘Intention’ vs ‘Adoption’ vs ‘Acceptance’........................................45 2.3.3 Object of Adoption and Diffusion Research: Innovation ...................................51 2.3.4 Diffusion Research History ...............................................................................52 2.3.5 The Innovation Decision Process .....................................................................53 2.3.6 Individual Innovativeness and Adopter Categories...........................................54 2.3.7 Perceived Innovation Attributes ........................................................................56 2.3.8 Organizational versus Individual Adoption........................................................57 2.3.9 The Different Adoption Stages and Rejection...................................................58 2.3.10 Cross-Country Adoption ...................................................................................59 2.3.11 Fuzzy Theory in Adoption .................................................................................59

Contents
Page 2
2.3.12 The Assimilation Gap Concept .........................................................................61 2.3.13 Summary of Theoretical Approach ...................................................................62
2.4 Theoretical Framework ............................................................................................63 2.4.1 General Considerations ....................................................................................63 2.4.2 Perceived Innovation Characteristics ...............................................................64
2.4.2.1 Relative (Dis-) Advantage..........................................................................64 2.4.2.2 Compatibility ..............................................................................................67 2.4.2.3 Complexity.................................................................................................67 2.4.2.4 Observability..............................................................................................67
2.4.3 Environment......................................................................................................68 2.4.4 Social Influence ................................................................................................69 2.4.5 Organizational Adopter Related Characteristics...............................................71
2.4.5.1 Receptiveness/Innovativeness ..................................................................71 2.4.5.2 Strategy .....................................................................................................72 2.4.5.3 Organization Size ......................................................................................72
2.4.6 Individual Adopter Related Characteristics.......................................................73 2.4.6.1 Age ............................................................................................................73 2.4.6.2 Gender.......................................................................................................73 2.4.6.3 Education...................................................................................................74
2.4.7 Attitude..............................................................................................................75 2.4.8 Intention to Try (Trialability) ..............................................................................76
2.5 Hypotheses Generated ............................................................................................77 2.6 Research Model.......................................................................................................80
3 METHODOLOGICAL APPROACH .........................................................................................81
3.1 General Considerations ...........................................................................................81 3.2 The Deductive-Nomological Explanation Model (H/O-Model) .................................82 3.3 Nomological versus Autopoietic Reality...................................................................83 3.4 Research Epistemologies ........................................................................................83
3.4.1 Quantitative Approach: Critical Rationalism .....................................................84 3.4.2 Qualitative Approach: Positivism ......................................................................84
4 METHODICAL APPROACH..................................................................................................86
4.1 Introduction ..............................................................................................................86 4.2 The Triangular Approach .........................................................................................87 4.3 Approach of the Qualitative Study ...........................................................................88
4.3.1 General Considerations ....................................................................................88 4.3.2 Explorative Social Research.............................................................................89 4.3.3 Collection of Qualitative Data ...........................................................................90 4.3.4 Sources of Biases.............................................................................................90 4.3.5 Qualitative Text Analysis ..................................................................................92
4.4 Approach of the Quantitative Study .........................................................................93 4.4.1 General Considerations ....................................................................................93 4.4.2 Collection of Quantitative Data .........................................................................93 4.4.3 Design of the Survey Instrument ......................................................................96 4.4.4 Sampling...........................................................................................................99

Contents
Page 3
4.4.5 Online Data Collection ....................................................................................100 4.4.6 Quantitative Data Analysis..............................................................................101
4.5 Actual Methodical Approach ..................................................................................101
5 QUALITATIVE STUDY.......................................................................................................106
5.1 Introduction ............................................................................................................106 5.1.1 Survey Design ................................................................................................106 5.1.2 Software..........................................................................................................107 5.1.3 Objectives .......................................................................................................108
5.2 Survey Participation ...............................................................................................108 5.3 Results ...................................................................................................................109 5.4 Excursus: Scientific Interchange............................................................................120
5.4.1 Meeting Researchers in the Netherlands .......................................................120 5.4.2 Meeting Researchers in Sweden....................................................................120
5.5 Reporting ...............................................................................................................121
6 QUANTITATIVE STUDY.....................................................................................................123
6.1 Introduction ............................................................................................................123 6.1.1 Survey Design ................................................................................................123 6.1.2 Software..........................................................................................................126 6.1.3 Objectives .......................................................................................................127
6.2 Survey Participation ...............................................................................................127 6.3 Respondent’s Demographics.................................................................................129 6.4 Wishlist of Applications ..........................................................................................135 6.5 Descriptive Analysis...............................................................................................137 6.6 Examination of the Research Model ......................................................................141 6.7 Reduction of Dimensions-Factor Analysis .............................................................143
6.7.1 Independent Variables....................................................................................143 6.7.2 Dependent Variables ......................................................................................150
6.8 Mode of Distribution Examination ..........................................................................153 6.9 Examination of the Research Model ......................................................................157
6.9.1 Multiple Linear Regression Analysis...............................................................157 6.9.2 Logistic Regression ........................................................................................162
7 RESULTS AND DISCUSSION .............................................................................................167
7.1 Introduction ............................................................................................................167 7.2 Diffusion of ASP in the Electric Utilities Industry....................................................167 7.3 Hypothesis Testing and Discussion .......................................................................169
7.3.1 Characteristics of the Innovation ....................................................................170 7.3.1.1 Service.....................................................................................................171 7.3.1.2 Forecasting Accuracy ..............................................................................173 7.3.1.3 Competence ............................................................................................174 7.3.1.4 Cost .........................................................................................................176 7.3.1.5 Know-how................................................................................................178 7.3.1.6 Trust ........................................................................................................179 7.3.1.7 Data Security ...........................................................................................180

Contents
Page 4
7.3.1.8 Dependency ............................................................................................181 7.3.1.9 Transparency...........................................................................................182
7.3.2 Characteristics of the Environment.................................................................182 7.3.2.1 Competition .............................................................................................182 7.3.2.2 ASP Diffusion ..........................................................................................183
7.3.3 Social Influence ..............................................................................................183 7.3.3.1 Image.......................................................................................................184 7.3.3.2 Contact ....................................................................................................185
7.3.4 Characteristics of the Organization.................................................................185 7.3.4.1 Size..........................................................................................................186 7.3.4.2 Strategy-Application Importance .............................................................187 7.3.4.3 Outsourcing Strategy...............................................................................187
7.3.5 Attitude............................................................................................................188 7.3.6 Intention to Try (Trialability) ............................................................................189
7.4 Summary of Results...............................................................................................190 7.5 Limitations and Future Directions of Research ......................................................191 7.6 Contribution............................................................................................................195
7.6.1 Theoretical Contribution..................................................................................195 7.6.2 Practical Contribution......................................................................................196
7.7 Implications ............................................................................................................197 7.8 Conclusions ...........................................................................................................198
8 APPENDIX.......................................................................................................................200
8.1 Qualitative Interview Guide ....................................................................................200 8.2 Quantitative Survey Instruments............................................................................201
8.2.1 Introduction Letter by Mail ..............................................................................201 8.2.2 Letter of Welcome at the Start of the Web-Survey .........................................203 8.2.3 Quantitative Questionnaire .............................................................................204 8.2.4 Screenshots of the Web Survey .....................................................................210
8.3 Technical Realization of Load-and Price-forecasting via ASP...............................211 8.4 Curriculum Vitae ....................................................................................................213
9 REFERENCES..................................................................................................................218

Contents
Page 5
RESEARCH QUESTIONS
Research Question 1: Which factors influence the intentions of electric utilities to adopt Application Service Providing? ............................................................................................................ 37
Research Question 2: How does Application Service Providing diffuse, as measured by adoption intentions, among electric utilities in Austria and Germany? ............................................ 37
DEFINITIONS
Definition 1: High Tech Marketing ........................................................................................................... 5 Definition 2: Technology.......................................................................................................................... 5 Definition 3: Outsourcing ....................................................................................................................... 18 Definition 4: Netsourcing ....................................................................................................................... 20 Definition 5: Web Service ...................................................................................................................... 22 Definition 6: Application Service Providing............................................................................................ 22 Definition 7: Working definition of Application Service Providing.......................................................... 23 Definition 8: Short-term Load forecasting (STLF).................................................................................. 27 Definition 9: Short-term Price forecasting (STPF)................................................................................. 29 Definition 10: Attitude ............................................................................................................................ 46 Definition 11: Intention towards adoption .............................................................................................. 47 Definition 12: Adoption .......................................................................................................................... 47 Definition 13: Diffusion........................................................................................................................... 49 Definition 14: Acceptance...................................................................................................................... 49 Definition 15: Innovation........................................................................................................................ 51 Definition 16: The innovation-decision process..................................................................................... 53 Definition 17: Organization .................................................................................................................... 57 Definition 18: Assimilation Gap ............................................................................................................. 61 Definition 19: Relative Advantage ......................................................................................................... 64 Definition 20: Uncertainty ...................................................................................................................... 65 Definition 21: Compatibility .................................................................................................................... 67 Definition 22: Complexity....................................................................................................................... 67 Definition 23: Complexity....................................................................................................................... 67 Definition 24: Trialability ........................................................................................................................ 76 Definition 25: Theory ............................................................................................................................. 81 Definition 26: Triangulation.................................................................................................................... 87 Definition 27: Bias.................................................................................................................................. 90 Definition 28: Objectivity ........................................................................................................................ 97 Definition 29: Reliability ......................................................................................................................... 97 Definition 30: Validity ............................................................................................................................. 98

Contents
Page 6
LIST OF FIGURES1 Figure 1: The adjusted opportunity curve-contribution of High Tech Marketing ..................................... 7 Figure 2: Levels of competition in the EU electricity and gas markets.................................................. 10 Figure 3: Organisation of the power market before and after liberalization .......................................... 12 Figure 4: World Net Electricity Consumption by Region 1990-2025..................................................... 14 Figure 5: Share of generation mix ......................................................................................................... 15 Figure 6: Peak and Base Prices at the EEX in 2003............................................................................. 16 Figure 7: Comparison of traded volume and realised price at EEX and EXAA .................................... 17 Figure 8: Advantages and disadvantages of IS outsourcing................................................................. 19 Figure 9: Mapping Netsourcing Options by Acronym............................................................................ 21 Figure 10: Relationships in the ASP business model ........................................................................... 24 Figure 11: A general model of Application Service Providing ............................................................... 24 Figure 12: Differences of Load-and Price forecasting........................................................................... 26 Figure 13: Graphical display of system load in a week ......................................................................... 26 Figure 14: Factors influencing wholesale prices for electricity .............................................................. 28 Figure 15: Results in detail of the Trivial forecast ................................................................................. 30 Figure 16: Tabular presentation of results for the 1st forecast............................................................... 30 Figure 17: Graphical results for the 1st forecast .................................................................................... 31 Figure 18: Tabular presentation of results for the 2nd forecast.............................................................. 31 Figure 19: Graphical results for the 1st forecast .................................................................................... 32 Figure 20: Results in detail for forecast of www.spotpreisprognose.de ................................................ 32 Figure 21: forecast of www.spotpreisprognose.de................................................................................ 33 Figure 22: Phases of short-term load/price forecast using artificial neural networks............................ 34 Figure 23: The risk continuum in organisational buying behaviour....................................................... 42 Figure 24: Dynamics of organisational buying behaviour ..................................................................... 43 Figure 25: From Attitude towards Acceptance ...................................................................................... 45 Figure 26: Conceptual demarcation Adoption/Diffusion........................................................................ 48 Figure 27: The different stages in the innovation decision process ...................................................... 50 Figure 28: Adoption and diffusion-process............................................................................................ 54 Figure 29: Exact set to characterize body height .................................................................................. 60 Figure 30: Fuzzy set to characterize body height ................................................................................. 60 Figure 31: Fuzzy classes of adoption accepted in this research........................................................... 61 Figure 32: The assimilation gap concept............................................................................................... 62 Figure 33: Literature overview-perceived innovation characteristics .................................................... 65 Figure 34: Literature overview-competition and social influence characteristics .................................. 71 Figure 35: Literature overview-adopter related characteristics ............................................................. 74 Figure 36: List of hypotheses ................................................................................................................ 78 Figure 37: Schematic representation of the hypotheses within the research model............................. 80 Figure 38: The deductive-nomological explanation model.................................................................... 82 Figure 39: Qualitative Research and underlying philosophical assumptions........................................ 84 Figure 40: Categories of methods and examples of their application ................................................... 87 Figure 41: Sources of response bias..................................................................................................... 91 Figure 42: Semiotic model in a four dimensional form.......................................................................... 92
1 No differentiation between tables and figures is made in this work. This was done to improve readability of the text, as for the reader it can be hard to differentiate whether information is containted in a figure or table.

Contents
Page 7
Figure 43: Typical Survey Tasks, Skills, and Resources ...................................................................... 96 Figure 44: Sliders used in the questionnaire....................................................................................... 104 Figure 45: Research methodology and process ................................................................................. 105 Figure 46: Nationality of the respondents of the qualitative study ...................................................... 108 Figure 47: Professional backgrounds of the respondents of the qualitative study.............................. 109 Figure 48: First recognition of the term ‘ASP’...................................................................................... 110 Figure 49: Selected responses ‘first recognition of ASP’ .................................................................... 110 Figure 50: Selected responses ‘Involvement in the field of ASP’........................................................ 111 Figure 51: Selected responses ‘factors influencing the decision to adopt forecasting applications’... 112 Figure 52: Selected responses ‘factors influencing the decision to adopt STLF applications’ ........... 114 Figure 53: Selected responses ‘factors influencing the decision to adopt STPF applications’ ........... 115 Figure 54: Relevance of characteristics influencing the decision to adopt ......................................... 116 Figure 55: Influencing factors according to respondent’s organisational backgrounds-STPF............ 117 Figure 56: Influencing factors according to respondent’s organisational backgrounds-STLF ............ 118 Figure 57: Selected responses ‘decision making process-roles involved’ .......................................... 119 Figure 58: Selected additional comment ............................................................................................. 119 Figure 59: Factors influencing the decision to adopt ASP-results of the qualitative survey ............... 122 Figure 60: Population of possible adopters relevant for the underlying investigation......................... 125 Figure 61: Frequency table of respondent’s intention towards adopting ASP .................................... 128 Figure 62: Respondent’s intention towards adopting ASP.................................................................. 128 Figure 63: Respondent’s Job Positions............................................................................................... 130 Figure 64: Frequency table of company size (in employees).............................................................. 131 Figure 65: Respondent’s company size (in Employees) ..................................................................... 131 Figure 66: Frequency table of company size (in electricity generation).............................................. 132 Figure 67: Respondent’s company size (in electricity generation per year) ....................................... 133 Figure 68: Frequency table of company size (in electricity sales quantity)......................................... 133 Figure 69: Respondent’s company size (in electricity sales quantity)................................................. 134 Figure 70: Independent samples test ‘already adopted’ vs. ‘intention to adopt’ on attitude ............... 134 Figure 71: Independent samples test ‘no intention’ vs. ‘intention to adopt’ on attitude....................... 135 Figure 72: Applications desired via ASP ............................................................................................. 136 Figure 73: Selected descriptive statistics for the variable ‘intention’................................................... 137 Figure 74: Comprising observation of the descriptive analysis for the data gathered ........................ 140 Figure 75: Classification of strength of statistical correlations ............................................................ 141 Figure 76: Scree Plot of independent variables .................................................................................. 144 Figure 77: Initial statistics .................................................................................................................... 145 Figure 78: Rotated Component Matrix ................................................................................................ 146 Figure 79: Aggregation of independent variables to factors................................................................ 148 Figure 80: Correlation matrix ............................................................................................................... 149 Figure 81: Reliability analysis for the examined aggregate ‘attitude’ .................................................. 150 Figure 82: Factor analysis: aggregation of dependent variables ‘attitude’-Scree Plot ........................ 151 Figure 83: Factor analysis: aggregation of dependent variables ‘attitude’-Initial statistics ................. 151 Figure 84: Factor analysis: aggregation of dependent variables ‘attitude’-Rotated factor matrix ....... 152 Figure 85: Factor analysis: reduction of dependent variables ‘attitude’-Component Matrix ............... 153 Figure 86: Aggregation of dependent variables to factors .................................................................. 153 Figure 87: Histogram of dependent variable ‘attitude’......................................................................... 154 Figure 88: Normal distribution check of ‘attitude’ factor: Kolmogorov-Smirnov test............................ 154 Figure 89: Normal distribution plot for ‘attitude’ factor......................................................................... 155 Figure 90: Trend adjusted normal distribution plot for ’attitude’ factor ................................................ 156 Figure 91: Examination of the research model-model summary......................................................... 157 Figure 92: Examination of the research model-ANOVA...................................................................... 158

Contents
Page 8
Figure 93: Regression Analysis-coefficients ....................................................................................... 159 Figure 94: Regression Analysis – Variables excluded ........................................................................ 160 Figure 95: Summary of analysis performed for hypotheses testing.................................................... 161 Figure 96: Logistic regression with dependent variable ‘intention to adopt’........................................ 164 Figure 97: Logistic regression with dependent variable ‘intention to try’............................................. 166 Figure 98: ASP adoption intentions within electric utilities .................................................................. 167 Figure 99: Population of addressable adopters .................................................................................. 168 Figure 100: ASP diffusion in the electric utilities industry according to adoption intentions ............... 169 Figure 101: Scatterplot Regression ‘improved service’....................................................................... 172 Figure 102: Independent Samples Test ‘no intention’ vs. ‘intention to adopt’ on ‘service’.................. 173 Figure 103: Scatterplot Regression ‘accuracy’.................................................................................... 173 Figure 104: Independent Samples Test ‘no intention’ vs. ’intention to adopt’ on ‘accuracy’............... 174 Figure 105: Scatterplot Regression ‘competence’ .............................................................................. 175 Figure 106: Independent Samples Test ‘no intention’ vs. ‘intention to adopt’ on ‘competence’ ......... 176 Figure 107: Independent Samples Test ‘no intention’ vs. ‘intention to adopt’ on ‘cost’ ...................... 177 Figure 108: Scatterplot Regression ‘trust’ ........................................................................................... 179 Figure 109: Independent Samples Test ‘no intention’ vs. ‘intention to adopt’ on ‘trust’ ...................... 180 Figure 110: Scatterplot Regression ‘image’ ........................................................................................ 184 Figure 111: Independent Samples Test ‘intention to adopt’, ‘no intention to adopt’ on ‘image’.......... 185 Figure 112: Independent Samples Test ‘no intention’ vs. ‘intention to adopt’ on ‘size’....................... 187 Figure 113: Independent Samples Test ‘no intention’ vs. ‘intention to adopt’ on ‘attitude’ ................. 189 Figure 114: Independent Samples Test ‘no intention’ vs. ‘intention to try’ on ‘attitude’ ...................... 189 Figure 115: Presentation of results within the research model ........................................................... 190 Figure 116: Functional correlations in the technical ASP model......................................................... 211

Contents
Page 9
LIST OF ABBREVIATIONS Abbreviation Meaning
APX Amsterdam Power Exchange
ASP Application Service Providing
BSP Business Service Provider
CSP Commerce Service Provider
EC European Community
EDI Electronic Data Interchange
EEC European Economic Community
EEX European Energy Exchange
ERP Enterprise Resource Planning
EU European Union
EXAA Energy Exchange Austria
FSP Full Service Provider
FTP File Transfer Protocol
GUI Graphical User Interface
GWh Giga Watt hours
http Hypertext Transfer Protocol
IS Information System
ISV Independent Software Vendor
IT Information Technology
MIS Management Information System
MSP Managed Service Provider
MWh Mega Watt hours
R&D Research and Development
SMTP Simple Mail Transport Protocol
SSP Storage Service Provider
STLF Short Term Load forecast
STPF Short Term Price forecast
TWh Terra Watt hours
VSP Vertical Service Provider
www World Wide Web
XML Extensible Markup Language

Introduction
Page 1
1 INTRODUCTION
Researchers have viewed Marketing as an applied area concerned largely with the improvement of managerial practice (Razzaque 1998). Already Parsuraman (1982) noted that the raison d’être for any Marketing theory is its potential application in Marketing practice.
1.1 FIELD OF INVESTIGATIONS
Why do some companies adopting a technological innovation that pronounces to yield both operational and strategic benefits while others hesitate, or decide not to adopt for the time being? This question is particularly relevant especially in the case of highly specialized software systems for a specific industry exemplified by ASP (Application Service Providing) due to the earnest attention this particular technology had received throughout the 1990s from academia, practitioners, and governments all over the world. Surprisingly, few organizations within Germany and Austria have adopted ASP. If their technical capabilities and their high degree of computerization are considered then the organizations’ reluctance to adopt ASP appears to be even more irrational and incomprehensible. The phenomenon of organizations lagging behind adoption of Information Technology (IT) regardless of their opportunities to do so is well known (Harrison, Mykytyn et al. 1997). What is missing so far are the factors explaining the reason for this situation.
While models of information technology implementation (Lucas 1978; Ginzberg 1981; Markus 1983) and outsourcing decision making do exist (Gupta and Gupta 1992; Loh and Venkatraman 1992b), these deal largely with the development stages of Information Systems (IS) implementation and focus extensively on user involvement and user relations. As a result, they are less applicable to the issue of organisational change in general, and to the case of ASP adoption and use in particular.

Introduction
Page 2
The subject of innovation adoption has attracted continuing attention because of the critical role played by innovation in social and economic development (Schumpeter 1970 pp. 165; Van de Ven 1986) and in industrial competitiveness (Dosi 1988; Eisenhardt and Schoonhoven 1990; Freeman 1997). Recent work in the area of organisational innovation has helped specify the properties of organizations that enhance or hinder innovation adoption (Damanpour 1991): the influence of informal boundary-spanning communication on the innovation process (Conway 1995), the conditions under which dominant designs emerge from innovations (Anderson and Tushman 1990), and the effects of technological discontinuities on environmental change (Tushman and Anderson 1986; Anderson and Tushman 1997). Despite the range of theoretical and empirical work that has examined the influence of organisational characteristics on innovation, there is still a lack of consensus regarding the role that specific variables play in either helping or hindering innovation adoption (Kimberly and Evanisko 1981; Damanpour 1991). As a result, neither researchers nor practitioners have been able to gain clear guidance from this body of literature.
The present study examines factors that have been identified in the literature (on the subject) and some derived from expert discussions as being important to innovation adoption. This study examines how the extent of relative advantage, environmental factors, social influence and company characteristics facilitates or impedes the adoption of a technological innovation. The research setting is the electric utilities industry. Herewith the adoption of Application Service Providing (ASP) by the decision makers is examined.
The underlying work is based on a largely acknowledged logic of research of empirical examinations (Friedrichs 1990 p. 51). Thus, the structure of this work does not necessarily correspond to the chronological process of the project but follows the approach often used in academic journals (Murray 2005 pp. 104) and scientific writing (White 2000 pp. 135).
The first chapter describes the considerations that have led to the conceptual formulation of this research project. From the outset this work positions itself in the field of High Tech Marketing. Subsequently, it gives a brief overview on the electric utilities industry and the liberalization the market has recently undergone. The concept of Application Service Providing (ASP) is then defined; leading to the gap this research is trying to fill and verbalisation of possible contributions. The first chapter concludes with the formulation of the research questions to be addressed.
A broad theoretical framework of diffusion theory and organisational adoption behaviour is presented in chapter two. Relevant determinants identified in the literature as influencing organisational adoption decisions are given—confirmed or rejected by a qualitative study for the specific underlying problem—and leads to the formulation of the hypotheses and the conceptual research model for this project.
The methodological approach and guidelines taken while carrying out this research are briefly described in chapter four.
The subsequent chapter explains the methodical approach and describes the concept of triangulation. The important concepts for the underlying qualitative study are described, followed by the theoretical description of the quantitative survey.

Introduction
Page 3
Chapter six describes the results of the qualitative pilot study in depth. An overview of characteristics of the responding population is followed by the description of the relevant findings. This part is accomplished by exemplary presentation of original wording derived by qualitative interviews and expert discussions. The chapter is rounded off by an excursus where the scientific interchange with prominent researchers in the field of organisational adoption and diffusion is described.
The results of the quantitative study are presented and described in chapter seven of this research work. In the beginning an overview of the participating individuals is given, including respondent’s demographics. Afterwards the analysis of the quantitative data with the statistic software SPSS is presented in detail. A descriptive analysis of the data is followed by the statistical examination of the research model. Factor analysis, multiple linear regression and logistic regression analysis results can be found in this chapter.
In chapter eight the results of hypotheses testing and additional discussion of the findings are given. This is followed by the limitations of the underlying research, which is complemented with suggestions for possible future research paths. The contributions derived from this doctoral research for both practitioners and researchers are described in more detail afterwards. The chapter finishes with implications and the conclusions to be drawn.
The appendix in chapter nine and the broad reference section in the final chapter complete this thesis.
1.2 GENESIS OF THE UNDERLYING WORK
The main objective of this doctoral thesis is to illuminate adoption decisions regarding Application Service Providing (ASP) in electric utilities. Developing a valid and reliable measurement tool of factors influencing these adoption decisions and identifying which roles are involved in these decisions are the basis for a better insight in these processes. A side effect of the practical and theoretical work involved in this research project is the building of awareness for this specific topic within expert circles and networks in the electric utilities industry. This can be achieved on the one hand by the involvement of a broad field of experts in the electric utilities field through discussing this topic on various industry-specific conferences and workshops and on the other hand by addressing a large number of electric utilities in Austria and Germany for the quantitative survey.
Before completing this thesis the author had the chance to work in research and development in the field of IT supply for electric utilities. The idea for this work evolved out of the professional experience in this field and was realised with the help of colleagues and scientific research fellows and of course all the people working in the electric utilities field and making valuable contributions to this research project.

Introduction
Page 4
Electric utilities are considered to be worthwhile examining in the detail of a doctoral thesis because of the transition phase facing the industry at the moment. Heavily regulated in the past, it was forced to privatise due to European Union (EU) policy, implicitly bringing new challenges to the organisation and management of the companies. Another reason for choosing this specific industry was the complex nature of the industry and its basic importance to society; without electricity the face of the world today wouldn’t be the same.
Taking into consideration that especially in Austria and Germany the electric supplier market is characterized by a number of small companies considering Application Service Providing (ASP) as an option for these firms to use highly sophisticated information processing software for reasonable costs seemed considerable. When doing an initial literature review in the year 2002, the author noted that scientific research in the field of organisational ASP adoption was not existent then. One objective of this research is to fill this gap in the existing literature. Another is to spur innovation in the field of application providing for the electric utilities industry.
1.3 HIGH TECH MARKETING
Two scholars who have tried to address the field of high tech marketing in more detail and are probably the most widely published in the area are William Davidow and Regis McKenna. Davidow’s major contribution has been to demonstrate conclusively the need to apply marketing principles to the management of high technology products from conception onwards (Davidow 1986). McKenna on the other hand, concentrates on the communication strategies and tactics required for this type of product (McKenna 1985). Various textbooks were published in this field (eg. Brockhoff, Chakrabarti et al. 1999; Chapman 2003; Viardot 2004), which tend to concentrate on specialist aspects of marketing in the high technology arena, such as market segmentation (Born 2003) or the Marketing/R&D interface, based on observation of specific research projects (Meldrum 1995). Exceptions are the marketing high-technology textbooks by Shanklin and Ryans (1984a; 1987). In their judgement businesses must meet three criteria to be labelled ‘high technology’ (Shanklin and Ryans 1984b):
1) the business requires a strong scientific-technical basis,
2) new technology can quickly make existing technology obsolete and
3) as new technologies come on stream their applications create or revolutionize markets (supply as well as demand).
The stressing of an interdisciplinary and scientific focus of high tech is also covered by the definition of Hasenauer.

Introduction
Page 5
Definition 1: High Tech Marketing
Hasenauer (1999 slide 5 and following) characterizes High Tech Marketing as a field of interdisciplinary research and education. He further assesses interdisciplinary as a basic requirement for generating research results about the behaviour of supply and demand in high tech product markets.
High Tech Marketing basically deals with the whole breadth of questions related to the way of new testing arrangements and its arrangement of investment goods until the consumption/usage and recycling (Hasenauer, Scheuch et al. 1994 p. 12).
Schaible and Hönig (1991 pp. 8) state that High Tech Marketing is concerned with the particularities of the commercialisation of products and services, which are based on foundations so far not used in science or its new kind of application.
McKenna (1985) asserts that high-tech industries are characterized by complex products, large numbers of entrepreneurial competitors, customer confusion, and rapid change.
Moriarty and Kosnik (1989) make an approach in differentiating High Tech Marketing from other kinds of marketing by first of all defining Technology and than High Tech.
Definition 2: Technology
Technology has been defined by Burgelman, Kosnik et al. (1987) as ‘the practical knowledge, know-how, skills, and artefacts that can be used to develop a new product or service and/or a new production/delivery system. Technology can be embodied in people, materials, cognitive and physical processes, plant, equipment, and tools.’
This definition includes both product technology (which is embedded in the product itself) and process technology (which is part of the production/delivery system). It also encompasses ‘management technology’, the knowledge of how to market the product and run the business (Capon and Glazer 1987).

Introduction
Page 6
However, two underlying dimensions link the definitions and distinguish high-tech from low-tech Marketing situations. The first dimension is market uncertainty, ambiguity about the type and extent of customer needs that can be satisfied by the technology. Why are the needs in the marketplace likely to be more uncertain in a high-tech situation? First, confronted with a radically new technology, customers may not understand what needs the technology could satisfy. Second, customer needs, once known, may be subject to rapid and unpredictable changes as the environment evolves. Third, there may be questions about whether the market will eventually establish technical standards with which the products must be compatible if the buyer hopes to use them with other products, people, or organizations. Fourth, predicting how fast a high-tech innovation will spread is difficult. Finally, all the preceding questions make it difficult to determine the size of the potential market (Moriarty and Kosnik 1989).
A second dimension is technological uncertainty. Market uncertainty stems from not knowing what the customer wants from the new technology. Technological uncertainty is not knowing whether the technology can deliver on its promise to meet needs, once they have been articulated (Moriarty and Kosnik 1989). There are several sources of technological uncertainty. The first is a lack of information about a technology’s and thus a product’s functional performance, whether it will do what the seller promises. Second, the company supplying the technology may not have an established track record for delivery. Third, there is uncertainty about whether the supplier of a high-tech product or a technology will be able to provide prompt, effective service. Fourth, the technology may have unanticipated side effects. Finally, technological uncertainty may arise because of questions about technological obsolescence, whether and when the market will turn to another technology to replace the current generation of products (Moriarty and Kosnik 1989).
However, the question remains what the specific role of marketing in this special environment might be. People working in the field of High Tech Marketing usually are having a hard time explaining to others what their job is about, especially to people that are not involved in High Technology fields. However, Miller and Morris (1999 pp. xiv) give a quite clear overview what the objective of marketing in the High Tech field could be. The main idea of this approach is displayed in Figure 1.

Introduction
Page 7
Figure 1: The adjusted opportunity curve-contribution of High Tech Marketing
Source: (Miller and Morris 1999 p. xvi)
When ideas for products or services are truly new, only weak evidence supports their validity. As time passes, more evidence accumulates in the form of experience and knowledge, but waiting too long for knowledge hinders opportunities. The inverse trajectories of these two curves show the temperamental relationship between knowledge and opportunity, whereas increased knowledge can lead to reduced perceived investment risk. Although risk is inherent to innovation decision makers want to minimize that risk without missing opportunities. Complex decision making and timing trade-offs (between clarity and opportunity, cp. Figure 1) are therefore inherent to innovation, and these frequently do not involve clear-cut alternatives between competing ideas, but rather a high tolerance for ambiguity and the willingness to live with paradox (Miller and Morris 1999 pp. xvi).
This research raises the claim of being positioned in the field of High Tech Marketing, thus fitting in existing research in this field and providing results and contributions for further development in this branch of study. In order to do so theoretical demarcation of the field is given above. In conclusion, High Tech Marketing can reduce risk by focusing on the creation and management of relevant knowledge that enables one to grasp the essence of a weak signal and bring it to bear earlier in the innovation process. By achieving clarity earlier, opportunities remain substantial and attractive. This doctoral thesis contributes to the creation of knowledge about factors influencing organisational innovation adoption. It helps to clarify determinants affecting the adoption intentions within electric utilities towards ASP. This may support marketers and potential customers of ASP in achieving clarity earlier in the innovation process and thus being prepared timely for a valid business opportunity.
opportunity
clarity
The point of action

Introduction
Page 8
1.4 THE ENERGY SUPPLY INDUSTRY
‘The position that electric energy has come to occupy in our civilization is a result of its unique characteristics of ease in transportation and distribution, ease of application to the widest range of processes requiring energy, and its potential for application to almost all energy-using processes with the utmost flexibility, complete cleanliness, and safety, and with the largest and most sensitive susceptibility to control.’ (Sporn 1971 p. 3)
Some specific attributes do make electricity a unique good, thus hardly comparable with other products: storage of electricity is complex, it has no substitute in many of its uses, and it is traditionally produced in capital-intensive power stations with long planning and construction times (Green 2004).
1.4.1 GENERAL CONSIDERATIONS
Opening up electricity production to competition is an important tool to improve the efficiency of the industry and thereby to benefit consumers. In the past, a monopoly supplier could recover any costs regardless of whether it used its power sources efficiently or not. As soon as the rules of the market economy come into operation, producers cease to be sheltered by their exclusive rights to generate and supply electricity.
Competitive forces provide the driving power for producers to innovate and operate in the most efficient way in order to keep their clients and recover their investments. In order to stay competitive market players are forced to innovate. Innovation is the key underlying this change. Innovation not only leads to lower prices, but also helps to use energy resources more efficiently (e.g. load levelling, peak shaving) (EC p. 5). Liberalization is a tool to stimulate efficiency of the single firms and productivity gains by providing the incentive for innovation and adaptation to the needs of consumers (ICC 1998). Cost savings due to increased efficiency gains will be realized and lower prices for electricity users are expected that would otherwise not be possible. Service standards have also been improved in countries that have already undergone liberalization. Facing a unified European electricity market, competition will favour the least costly plant and reduce the required reserve capacity for the demand peaks of each country. The operation of a single market provides more outlets, better interconnections, and increased reliability. Competition is the driving force for utilities to operate as economically as possible in order to maintain their competitive advantage with all the anticipated benefits to consumers.
However there are also drawbacks to be reported due to the liberalisation of the market. Examples from the US show that the reliability of power supply can suffer due to how the new market rules apply. Additionally investments in the existing infrastructure such as the building of new generation capacity and the maintenance and replacement of the networks seem not to be profitable enough to be done by players in a liberalized market. These issues will need further attention by policy makers.

Introduction
Page 9
1.4.2 FROM REGULATION TO LIBERALIZATION
The European Union (EU) was founded as the European Economic Community (EEC) by the Treaty of Rome in 1957 to promote economic and political integration in Europe. The most recent accession treaty comprised the central and east European countries of Cyprus, Czech Republic, Estonia, Hungary, Latvia, Lithuania, Malta, Poland, Slovak Republic and Slovenia.
All former Communist states have worked near miracles over the last 15 years before their accession in reforming their energy sectors to comply with EU legislation (Burdett 2004). The entry into force of the two new directives will make the enlarged European Union the most integrated energy market in the world.2 These two directives adopted in 2003 represent a major step towards the completion of the internal market for electricity and gas. This package gave deadlines for the full opening of the market-July 2004 for all business customers and July 2007 for households. Equally it strengthened the independence of transport system operators from other activities (production and supply) through legal and operational unbundling of these activities (EC 2004b).
In November 2000, a European Commission Green Paper on Energy Security outlined the EU’s unified energy strategy. The paper identifies four main principles of European energy policy: 1) security of supply, 2) completion of the internal market, 3) environmental responsibility and 4) promoting renewable energy and demand management.
To these ends, the European Union has acted over the years to coordinate the member countries’ energy policies and the infrastructure that links them (Esser 2005). EU policy will, over a period of time, allow all sized purchasers of electricity to freely choose their suppliers (Daly 2002). It introduces full competition amongst generators immediately and is leading to significant price reductions across the EU to the benefit of business and consumers. By the end of 2003, electricity prices for industrial users remained 15% lower in real terms than in 1995.3
Beyond the institutional features for the opening of the market related to proper transposition of Community legislation by national governments, what is also important is the impact the opening of the market will have in terms of the real number of consumers that have changed supplier. A report issued by the EC in March 2004 indicates an average figure of only around 15 to 20% for large users that changed suppliers since market opening within the EU, with a range of figures from zero percent for Greece, five to ten percent for Belgium towards more than 50% for Nordic countries and the United Kingdom (EC 2004b).
2 Directive 2003/54/EC of the European Parliament and the Council of 26 June 2003 concerning common rules for the internal electricity market; Official Journal L 176, 15/07/2003 and Directive 2003/55/EC of the European Parliament and the Council of 26 June 2003 concerning common rules for the internal gas market; Official Journal L 176, 15/07/2003 3 This figure includes the recent increases in the wholesale market linked to higher prices for coal and oil as well as the cost of support to renewable energy, since Europe has given itself ambitious targets for green electricity.

Introduction
Page 10
In some Member States the introduction of competition in electricity and gas has been made more difficult by the existence of companies with an excessive degree of market power at the national or regional level. Figure 2 gives an overview on the degree of competition for the electricity and gas markets in the EU-25 countries in March 2004.
Level of competition Electricity Gas
Not functioning Greece, Estonia, Latvia All new Member States4, Finland, Portugal, Greece
Initial steps only Belgium (fr)5, Luxembourg, Portugal, Poland, Czech Republic, Slovenia, Slovakia, Lithuania
Germany, Luxembourg, Sweden, Belgium (fr)
Some progress Germany, Spain, Belgium (nl), Ireland, Italy, France, Hungary
Austria, Belgium (nl), France, Italy, Denmark
Well developed Austria, Netherlands Netherlands, Ireland, Spain Complete UK, Sweden, Finland, Norway,
Denmark UK
Figure 2: Levels of competition in the EU electricity and gas markets
Source: (EC 2004b)
The successful introduction of competition will lead to a more efficient industry (EC 2004b). Generators will make better use of their plant in order to retain or extend the number of clients they can cover. Effective regulation of unbundled networks will also encourage cost reduction. Suppliers will interact more efficiently with clients and should offer a greater range of services and contractual arrangements. As a result of this reorganization, new forms of relationships between vendors and their clients will develop. Increasingly demanding customers will be able to freely choose their energy suppliers. The suppliers will have to differentiate themselves from their competitors by providing additional services. Over the long term a sufficient degree of competition should mean that prices are, on average, lower than they would be under a regulated market. Hence, the previously monopolistic segment of the economy is transformed into a customer-oriented market.
Under these new conditions in the market energy becomes a trading commodity and exchange platforms like energy auctions and energy portals are able to quickly establish themselves on the market. Current examples in Germany and Austria are the European Energy Exchange EEX6 and the Energy Exchange Austria EXAA.7
4 Accession in 2004 5 Belgium (fr)-francophone Belgium (Brussels and Wallonia), Belgium (nl) = Flanders 6 www.eex.de 7 www.exaa.at

Introduction
Page 11
The new market rules force participating members in the market to adopt new business processes and consider new options for the realisation of these processes, such as electricity trading on the newly emerging energy exchanges. Additionally due to new districts and areas the electric utilities are servicing in the liberalised market, forecasting system loads becomes a new challenge for these companies.
1.4.3 ORGANISATION OF THE MARKET
In order to facilitate competition, the Directives lay down that the network operators have to be separated effectively from the parts of the gas and electricity activities where competition is possible, mainly production and supply. In addition, all Member States have to appoint an independent regulator to prevent any discrimination. Finally the Directives foresee the possibility for the Member States to impose public service obligations including security of supply, regularity, quality, price of supplies and environmental protection. They can particularly ensure the provision of universal service to small enterprises-that is the right to be supplied with quality electricity at a reasonable, easily and clearly comparable and transparent price.8 In the long-term the effects of the regulation on cross-border trade for electricity and a better inter-connection should help further opening the market (EC 2004a).9 Figure 3 gives an overview on the electricity market organisation in a regulated environment and in comparison in a liberalized market. It shows the functional unbundling in generation, transmission and distribution required by EU legislation.
8 Namely enterprises with fewer than 50 occupied persons and an annual turn-over or balance sheet not exceeding € 20 million 9 Regulation 1228/2003 on Conditions for Access to the Network for Cross-Border Exchanges in Electricity; OJ L 176, 15/07/2003

Introduction
Page 12
Figure 3: Organisation of the power market before and after liberalization
Source: (Haege 2004)
Generation Transmission network
Distribution network/Sales
Electric Power Company
Independent Generators
Customer
Generation
Generation plant operator
Transmission network
Transmission network operator
Distribution network
Distribution network operator
Customer
Electricity trader
Electricity exchanges
Broker
Distribution company
Regulated electricity market
Liberalised electricity market
Physical electric power flow
Electricity supply contracts
Network access contracts
Price basis: Wholesalemarket prices

Introduction
Page 13
Due to the forced changes within this industry and the required alterations in the organization of the market as displayed in Figure 3, participating companies felt the necessity to respond to the new conditions. As a result the implementation of the European Electricity Directive there has been a sharp acceleration of cross-border mergers and acquisitions in Western European electricity markets (EIA 2001 p. 129). Unlike the mergers and acquisitions in the UK electricity sector, which were largely made by U.S. utilities, those in Western Europe have typically involved other European firms, with U.S. companies playing a minor role. In 2000 and 2001 there were 35 mergers and acquisitions in Western Europe, compared with 15 in 1998 and 1999 (EIA 2003 p. 143).
Among European nations Germany has seen the most activity, much of which has involved German companies purchasing other German companies. Between 1998 and 2002 there were 23 mergers in the German electricity sector. The largest of all European mergers involved E.ON, Germany’s second largest electric power producer, and Ruhrgas, Germany’s largest natural gas producer (Dodognet, Glachant et al. 2002 pp. 114). Western Europe’s electricity sector is increasingly being dominated by a handful of multinationals, and growth in electricity trade has paralleled the continent’s electricity industry consolidation. Between 1999 and 2000, electricity trade in Western Europe grew by thirteen percent, compared with an average annual increase of four percent for the 1990-2000 period (IEA 2002).
Due to this high number of mergers and acquisitions in the electricity supply sector over the last five years the share of the top five companies in the EU has risen from 49% to 58% (Green 2004).
As a result, the current situation in the electric utilities industry is an oligopoly market structure. Control over the supply of electricity is in the hands of a few multinational producers, such as E.ON in Germany, that can influence prices and thus affect competitors. The strategic behaviour of those key players in the market is hard to predict, but can have a significant impact on the formation of the energy exchange prices.
1.4.4 ELECTRICITY CONSUMPTION AND GENERATION
Perhaps the most ubiquitous force leading to structural change, besides liberalisation, is a change in the long-term industry growth rate. Industry growth is a key variable in determining the intensity of rivalry in the industry and it sets the pace of expansion required to maintain share, thereby influencing the supply and demand balance and the inducement the industry offers to new entrants (Porter 1980 pp. 5). The most important variable for growth in the electric utilities sector is electricity consumption.
In 1999 the global energy consumption constituted 9,600 Mio. t crude oil units, this corresponds a primary energy consumption of 112,000 TWh. The consumption of electricity has a share of 13,000 TWh or twelve percent; this figure varies according to region and continent. Forecasted is an increase in demand up to 22,000 TWh by 2020, but because of the increasing total energy consumption (up to 178,000 TWh in 2020) the share of twelve percent will remain stable overall.

Introduction
Page 14
History Projections Region 1990 2000 2001 2005 2010 2015 2020 2025 Change10
Industrialized Countries
6,368 7,950 8,016 8,307 9,200 10,106 11,030 11,994 1.7
North America 3,369 4,297 4,293 4,422 4,972 5,512 6,042 6,628 1.8Western Europe
2,069 2,487 2,540 2,664 2,902 3,156 3,438 3,708 1.6
Industrialized Asia
930 1,165 1,183 1,221 1,326 1,438 1,550 1,658 1.4
EE/FSU 1,906 1,504 1,528 1,768 1,982 2,204 2,423 2,642 2.3Developing Countries
1,259 2,542 2,730 3,103 3,851 4,697 5,634 6,604 3.7
Figure 4: World Net Electricity Consumption by Region 1990-202511
Source: EIA (2003 p. 135)
As can be depicted in Figure 4, electricity consumption in the industrialized world is expected to grow at a more modest pace than in the developing world, at 1.7%per year. In addition to expected slower growth in population and economic activity in the industrialized nations, market saturation and efficiency gains for some electronic appliances are expected to slow the growth of electricity consumption from historical rates (EIA 2003 p. 135).
The mix of generating plants in a market-hydroelectric, nuclear, coal, gas turbine, and combined-cycle gas turbine (CCGT) affects not only average prices (because of differing costs of production) but also the volatility of prices. Countries with mostly nuclear and coal-fired generators will probably have low average prices. But if such a country (i.e., Italy) uses gas-or oil-based plants to satisfy a surge in demand, the price level will vary widely around the mean as a result of start-up costs and higher fuel prices (Birnbaum, Grobbel et al. 2000).
The Austrian electricity generation is characterised by a high percentage of hydroelectricity (more than two-thirds) and the rest being generated mainly by thermic plants that amounts to 60.000 GWh per year (e-control 2004). The German electricity generation is characterised by a high percentage of coal fired plants (more than 50%) and nuclear plants (one-third), some gas and renewable energies (10%) (Brinker 2004). The following table gives an overview on the electricity generating mix in some European countries.
10 Average Annual Percent Change, 2001-2025 11 In billion kilowatthours

Introduction
Page 15
Type of plant Country
Hydroelectric Nuclear Coal Gas Oil, other Austria 72 0 11 13 4Belgium, the Netherlands 1 36 28 32 3Denmark 0 0 96 0 4France 14 78 5 0 3Germany, Luxembourg 4 34 54 6 2Italy 18 0 10 22 50Poland 3 0 91 0 6Scandinavia 59 27 11 3 0Spain 32 15 23 20 10Switzerland 58 39 0 1 2United Kingdom 6 15 39 34 6
Figure 5: Share of generation mix
Source: (Birnbaum, Grobbel et al. 2000)
The different electricity generation mixes in the two countries examined, Austria and Germany, provide a special challenge for the purposes of system load forecasting and energy exchange price forecasting in these environments. On the one hand, there is a preference for the least costly plant as a result of load forecasting while on the other hand fluctuating prices due to different generation sources bear considerable need for decision support for the companies acting in this market.
1.4.5 ENERGY EXCHANGES IN CENTRAL EUROPE
Due to its specific geographical position central Europe will play an ever more important role for cross national transactions in the trading of electricity. As a result of the expansion of the European Union by the acceding countries12 in May 2004, and the therewith combined necessity of liberalising the local energy markets, the number of potential trading partners is likely to increase quickly, and thus raise the potential of the central European energy exchanges.
Liberalisation of the European energy markets featured innovations, which favoured development and growth of cross national energy trading:
• Electric utilities now have the possibility to sell their products beyond the boarders of their supply area
• External trading companies or trading floors were formed
• Electricity supply can be optimised in consideration of all offers on the market-and is not restricted to the own generation capacity any more
• New independent domestic and foreign energy traders have entered the market, as well as such that do not hold own generation capacity
12 Estonia, Latvia, Lithuania, Malta, Poland, Slovakia, Slovenia, Czech Republic, Hungary, and Cyprus

Introduction
Page 16
• Mergers and acquisitions between electric utilities potentiate the utilisation of synergy potentials
• Few big players in central Europe were established: the Amsterdam Power Exchange (APX), the Nordic Power Exchange (Nord Pool), the European Energy Exchange (EEX), and at the moment the rather small Energy Exchange Austria (EXAA) has huge potential.
Geographically the main focus of the underlying work lies on Germany and Austria and the following remarks will concentrate on the European Energy Exchange, located in Leipzig, Germany and the Energy Exchange Austria, located in Graz, Austria.
The European Energy Exchange is one of the most important energy trading platforms in Europe. In January 2004, there were around 100 registered international participants at the EEX-from Germany, Switzerland, the United Kingdom, Austria, the Netherlands, Denmark, Italy, Spain, Norway, Luxembourg, Belgium, and France.
As an example, the following figure displays the curve of the peak and base prices for electricity traded at the EEX in the year 2003.
0,0050,00
100,00150,00200,00250,00300,00350,00400,00450,00500,00
Jan
Feb Mar AprMay Ju
n Jul
Aug Sep OctNov Dec
2003
€/M
Wh Peak
Base
Figure 6: Peak and Base Prices at the EEX in 200313
Another, in comparison with the EEX rather small, but increasingly important exchange is the Energy Exchange Austria (EXAA). EXAA started its trading activities in 2002, in January 2004, there were approximately 20 participants from Austria, Germany, Switzerland, the United Kingdom, Italy, Belgium, and the Netherlands listed.
13 Single data values available at www.eex.de

Introduction
Page 17
Average daily
traded volume (MWh)
Growth rate of average daily traded volume (from 2002 to 2003)
Average peak price14 (€/MWh)
Average base price15 (€/MWh)
2003 EEX16 134.618 +56,20 % 37,00 29,49 EXAA17 3.629 +65,71 % 39,97 31,14 2002 EEX18 86.182 28,49 22,55 EXAA19 2.190 28,16 22,14
Figure 7: Comparison of traded volume and realised price at EEX and EXAA
As with other commodity markets, electricity and gas prices will tend to fluctuate according to the latest information available to the market and to external factors as well such as weather conditions or the price level of imported coal that is used in thermal power plants. This does not mean, however, that consumers should be exposed to such volatility. It is important that consumers have the possibility to choose a wide range of products that may, for example, allow for a more stable price for a suitable period of time. It is usually the task of national regulators to ensure this is the case through the monitoring of the market and through conditions in the licences of retail suppliers.
Forecasting prices at Energy Exchanges increasingly becomes a vital task for market participants in order to make active economical decisions. This information is a precondition for decision-making, whether to buy the electricity needed for peak demands in the time coming or to generate it from their own plants.
Another task involved in this decision-making process is the forecasting of electricity levels actually needed in the future. This is a vital task for electric utilities, as electricity can only be limited stored in an economic way. Therefore accurate information about electricity load for the customer base of the utility is needed.
For this purpose the use of software supporting these forecasting activities as well as advanced professional know-how in combination with the sure instinct of the trading experts will be a firm basis for the best results. A possibility to supply such price and load forecasting application to the liberalized electric utilities market for IT suppliers might be Application Service Providing (ASP). The changing environment in which electric utilities have to act nowadays requires flexible acting. ASP with short implementation spans and low investment costs seems to be a reasonable alternative to traditionally supplied software functionality.
14 EEX Peak Load: 9-21 o’clock, EXAA Peak Load: 9-20 o’clock 15 EEX and EXAA Base Load: 0-24 o’clock 16 Average values 1.1.2003-31.12.2003 17 Average volume 1.1.2003-31.12.2003, Average price 11.2.2003-31.12.2003, missing value: 16.5.2003 18 Average values 1.1.2002-31.12.2002 19 Trading at the EXAA started at the 22.03.2002, therefore all average values fort he year 2002 are calculated of values fort he time span of 22.03.2002-31.12.2002.

Introduction
Page 18
1.5 APPLICATION SERVICE PROVIDING
1.5.1 GENERAL CONSIDERATIONS
The Application Service Providing (ASP) market has grown dramatically over the past few years, with many experts believing that it will re-shape both the software industry and corporate computing (Jayatilaka, Schwarz et al. 2003). Although the term ASP is new, the concept of application hosting dates back to the 1960s (Braunstein 1999). The concept of application hosting has evolved into the business model for ASP. Even though the ASP market has begun to see its share of consolidations, indications are that the concept of ASP is here to stay (Hirschheim and Lacity 2000).
The roots of ASP can be traced to three main developments (Daylami 2004 pp. 1):
1) Outsourcing
2) Packaged enterprise applications
3) Internet computing
ASP benefits include providing organizations with the ability to access a broader range of applications and achieving on-demand scalability, while keeping implementation short and total cost of ownership low and predictable.
1.5.2 OUTSOURCING
Over the past twenty-five years the concept of outsourcing certain functional areas of the organization has gained general acceptance. Organizations are starting to realize that outsourcing IT related business processes can be advantageous, and in some cases the preferable option (Sahlin 1999). Several authors have defined the concept of information technology outsourcing.
Definition 3: Outsourcing
Gupta and Gupta (1992) defined it as: ‘…outsourcing refers to using external agencies to process, manage or maintain internal data and provide information related services. IS outsourcing covers a variety of services-for example, data processing, …, systems integration, facility management, contract programming, global networking,…’
Saunders et al. (1997) defined outsourcing as: ‘the purchase of a good or service that was previously provided internally.’

Introduction
Page 19
Organizations look to outsource their IT function to enable management and IT staff to function in ways more beneficial to the organization. Outsourcing allows the staff to avoid distractions so that they can concentrate on the organization’s core competencies (Lacity, Hirschheim et al. 1994; Cross 1995). Organizations also look to outsourcing to allow them to imitate the activities of other prominent organizations (Loh and Venkatraman 1992a; Lacity, Hirschheim et al. 1994), as a political move aimed at enhancing the position of the IT manager or to resolve constraints on hiring (Lacity, Hirschheim et al. 1994).
The following table outlines some of the reported advantages and disadvantages of outsourcing information technology by an organization.
Advantages Disadvantages
Cost reductions (overhead, hardware, software, personnel)
Unexpected costs (conversion, transition, management)
Access to state-of-the-art technology Lower internal staff morale/productivity Economies of scale Loss of competitive advantage Superior management techniques Slower adoption of technology to business Just-in-time (JIT) services Mismanagement of outsourcing effort Market responsiveness Loss of control Fast product cycle times Market risks Tax write-offs Dissolution/mismanagement of outsourcing firm
(business uncertainty) Cash and capital redirection Communication and timetable breakdowns Staff redeployment Quality control lapses Core business function emphasis Adverse contract terms (payment structure,
remedies) Elimination of complex accounting methods Risk to patents, intellectual property rights,
copyrights Clarification and allocation of costs Adverse payment structures Supplement to constrained labour force Hidden costs Sharing of risk Lack of organisational learning Endemic uncertainty Loss of innovative capacity Fuzzy focus on what is expected.
Figure 8: Advantages and disadvantages of IS outsourcing
Source: (Meyer 1994; Earl 1996; Sahlin 1999; Gehling 2002 pp. 21)
Some authors have reported that before outsourcing IT functions, the organization needs to determine if the function in question is strategic in nature. It is well established that a function is strategic if it provides a sustainable competitive advantage which is valued by the organization’s customers, it is unique to the organization, and it is difficult for competitors to replicate (Skinner and Bond 1997). However, the decision to outsource the IT function often comes down to the issue of money. It is one way to reduce operating costs. Over the years, organizations have found it is cheaper to outsource some phases of functions of their operations, such as IT, than to own all phases of their operations (Gehling 2002 pp. 14).
The concept of netsourcing is described in more depth in the following section.

Introduction
Page 20
1.5.3 CONCEPTUAL CLASSIFICATIONS-FROM NETSOURCING TO
XSP’S
In the past, business managers were able to focus on their core business responsibilities while delegating technology support to inside or outside experts. But with the emergence of the Internet, nearly every product, service, process, and function is enabled by, and embedded in, networked information technology (IT). Among the most important decisions business managers make is to determine the most effective way of sourcing IT solutions, and beyond those, IT-enabled business processes. Thus, those responsible within organizations need to understand the principles of sound sourcing. For managers within small to medium-sized enterprises, netsourcing will probably become a popular choice for sourcing business applications and services. For large enterprises, netsourcing will become part of an overall sourcing strategy, one important option among others (Kern, Lacity et al. 2002).20
With the success of the internet new technologies related to the World Wide Web (www) and its potential to reach an ever growing audience quickly and cost-effective emerged. The Internet is a network of interconnected services based on open established Internet standards. Basic services have been file servers (FTP), mail servers (SMTP) and web servers (HTTP). A key feature of many Internet services today is decentralization. Web services are also protocol independent, they are not bound to a single protocol-even though HTTP is the most common implementation currently other protocols can be used such as SMTP or message oriented middleware. The use of XML for data exchange is the key for web services to be platform and development language agnostic. The consumer of a service has no implicit or explicit knowledge about the implementation and deployment environment of a service. Trimmel and Rehak (2002) differentiate three different service categories, the user services, the business services, and the data services.
Netsourcing is already a growing phenomenon. The revenues generated in the netsourcing space-depending on the research company’s report-are between one and two billion U.S. dollars in 2000. But research firms such as Gartner Group’s Dataquest, Info Tech Trends, Phillips Group, International Data Corporation (IDS), and DataMonitor are predicting that the market will grow significantly over the next few years. Total netsourcing estimated spending ranges from a low of $7 billion to a high of $132 billion by 2006.
Definition 4: Netsourcing
‘Netsourcing is the practice of renting or ‘paying as you use’ access to centrally managed business applications, made available to multiple users from a shared facility over the internet or other networks via browser-enabled devices.’ (Kern, Lacity et al. 2002)
20 Other options might be to develop and maintain software in-house, optimising vertical integration, etc.

Introduction
Page 21
Netsourcing allows customers to receive business applications as a service. Rather than purchase software directly from an independent software vendor (ISV), customers may use netsourcing to access ISV applications. Customers usually pay for the service with an installation fee and a monthly subscription fee based on number of users, number of transactions, or percentage of the value of the transactions.
Nowadays customers are using netsourcing to hand over entire business processes to service providers. In this scenario, access to ISV software to support these business processes is just one component of the total packaged service. In addition, customers are also using netsourcing to remotely host and manage customer-grown applications, reducing the expense and need for internal information technology resources. More broadly, netsourcing can be viewed as an alternative delivery channel for business applications, services, and infrastructure provision (Kern, Lacity et al. 2002).
ExSourcer
Manage the infrastructure, application(s), integration,
consulting, data, and business processes for inter company
transactions
Business Service Provider
BSP
Manage the infrastructure, application(s), integration,
consulting, data, and business processes
Full Service Provider FSP
Manage the infrastructure,
application(s), integration, and consulting
Bus
ines
s A
pplic
atio
n S
ervi
ce P
rovi
sion
Application Service
Providing ASP
Manage the infrastructure and
application(s)
Verti
cal S
ervi
ce P
rovi
der-
VSP
Targ
et c
usto
mer
s in
an
indu
stry
C
omm
erce
Ser
vice
Pro
vide
r-C
SP
Targ
et p
rodu
cts
Tech
nica
l P
rovi
sion
Managed Service Provider
MSP Manage the infrastructure
Storage Service Provider
SSP
Figure 9: Mapping Netsourcing Options by Acronym
Source: compare Kern et al. (2002)

Introduction
Page 22
A variety of acronyms in the netsourcing space exist, including ASP, BSP, VSP, CSP, FSP, MSP, and SSP, also summarized as xSPs. Figure 9 gives an overview on these acronyms. The terms netsourcing can be seen as the overarching name, because the common element of any xSP is the delivery of a product or service over a network. Although there are no standard definitions for these xSP acronyms, Kern et al. (2002) placed them within a service stack based on the product or service, as shown in Figure 9. Other authors summarize these acronyms as ‘web services’.
Definition 5: Web Service
‘A web service provides programmable access to a capability that can be used independently of its implementation via a self-describing interface based on open internet standards’ (SearchWebServices.com)
There have been numerous authors who did considerable research in the discipline of outsourcing and ASP from different points of views. Some authors concentrate on economic, strategic or even global perspectives (Lacity, Hirschheim et al. 1994; Willcocks and Lacity 1997; Currie 2000); while others deal with issues such as customer or client relationships (Lee and Kim 1999; Susarla, Barua et al. 2002; Yao 2002). A variety of conceptual frameworks and business models (Tamm and Günther 2000) have been developed in order to categorize the various approaches on the market.
This section gave an overview on different acronyms that are commonly used in the field. However clarification on the various acronyms used in relation with outsourcing IT functions is difficult. For the underlying research the construct of Application Service Providing as defined in the next chapter is used for the further purposes of this work.
1.5.4 APPLICATION SERVICE PROVIDING
For the underlying research project, the author selected the term ‘Application Service Providing-ASP’, because the author’s experience in the field showed that most of the individuals interviewed for this research knew this concept and could figure the meaning.
Definition 6: Application Service Providing
The web-site ‘SearchWebServices.com’ (SearchWebServices.com) defines an Application Service Provider as ‘a company that offers individuals or enterprises access over the internet (or other networks, annotation by the author) to applications and related services that would otherwise have to be located in their own personal or enterprise computers’.
The Bundesverband digitale Wirtschaft (BVDW 2005) defines Application Service Providing as ‘a service which enables the users to utilize software solutions via internet or other networks’.

Introduction
Page 23
Aware of different definitions that exist in this field, the author provides a working definition of Application Service Providing, as follows:
Definition 7: Working definition of Application Service Providing
‘An operator (Application Service Provider) rents an application, which provides program functionality to users.’ Thus the User is not the owner of the software-license; instead he/she pays a utilization fee (i.e. per month, per User or per transaction, or a combination of the above). The ASP-provider is responsible for the software license, the operation, regular updates, etc. A legal basis for ASP is created by so called Service Level Agreements. The users have access to the application through standard browsers, windows-terminals or specific client-software via the internet or other networks. This is done without having to install software on the user terminal.
The defining variables of Application Service Providing in the underlying research are:
• ASP is a service
• Main players: Provider of ASP and the customer/user (i.e., the electric utility)
• Object: software functionality
• Via Internet, fixed line, etc.
• User rents instead of buying (utilization fee)
• Provider is responsible for: 1) Software licenses, 2) Operation, 3) Maintenance, and 4) Development, etc.
• Regulated by so called ‘Service Level Agreements’
The potential of the ASP-model consists mainly of the possibility to provide potential customers with various business-applications by using a browser-based Application-portal. Therefore the whole complexity of an Application (which is partly responsible for increasingly high operating expenditure) can be based in a data-centre instead of performing computing power at the PC and thus having increasing operating expenses.
The graphical representation of the possible relationships within the ASP business model is shown below. This model provides a basis for the better understanding of the general aspects of this business model. The working definition and the graphical presentation as can be seen in Figure 10 was used as the basis for all further assumptions in this research. Therefore it was also made available for all individuals participating in the qualitative and quantitative studies.

Introduction
Page 24
Figure 10: Relationships in the ASP business model
The figure above illustrates the relationships between the different partners involved in the ASP business model. A general ASP model, including the technical presentation of IT service delivery, is depicted in Figure 11.
Figure 11: A general model of Application Service Providing
Source: Chen and Soliman (2002)
Payment of rent, data, contact person
Data input
Data processing Consulting, implementation, application
integration, support (expert know-how), User training, contact person, software
functionality, R&D
Application Service Provider
Clients i.e. Utility Communication
IndependentSoftware- producer
Infrastructure-support: i.e.
Network, Hosted Server
Site, etc.
Rules and regulations
Interest groups
Paym
ents Sof
twar
e Paym
ents Ser
vice
s

Introduction
Page 25
To conclude it can be said that this research examines ASP as special means of IT outsourcing. Despite several disadvantages reported in the literature (Earl 1996; Sahlin 1999 pp. 21; Gehling 2002), there are advantages that promise a high potential for ASP. The netsourcing market looks up-and-coming for the future and therefore ASP seems to be a field where further investigation is worthwhile. The following section will highlight the potentials of ASP in the energy sector - a market segment that is characterized by a long history of legal regulations and that is now facing dramatic changes as far as its business environment is concerned.
1.6 ASP IN THE ELECTRIC UTILITIES INDUSTRY
1.6.1 GENERAL CONSIDERATIONS
The special situation of the electric utilities industry has already been described in detail above (c.f. chapter 1.4). However, the conditions that seem to make this market especially considerable for the application of ASP are described in more detail below.
According to the statements of various interviewees (Fuchs 2005b; Fuchs 2005d; Fuchs 2005a; Fuchs 2005c), the electric utilities sector is still characterised of being a rather traditional industry. Innovation is slow and decisions for investments take long. Contrary to other industries, where investment cycles are rather short, the electric utilities industry faces investment cycles of about 30 years. This continues to be a major barrier to innovation adoption and has to be taken into consideration by companies bringing innovations to this market.
Regardless, Application Service Providing offers itself as the ideal solution for the liberalised power market. Fast implementation, standardized applications and outsourcing of the responsibility for development, operation and maintenance are the driving forces that can ensure an enormous competitive advantage for the energy companies competing in the liberalised market.
1.6.2 SELECTION OF RELEVANT APPLICATIONS
1.6.2.1 INTRODUCTION
In order to make decisions of electric utility companies comparable, two branch-specific applications were chosen. The first one is an application that deals with company-critical data and has been done in every electric utility for decades (in different ways, i.e.: manually, in excel sheets or with highly sophisticated applications including neural networks, etc.): short term load forecasting (STLF). The second application chosen is an application where no sensitive company data are needed in order to run the application. Additionally this application is relatively new for this branch: short-term price forecasting (STPF) for Power Exchanges. Price forecasting has not been a business task that was necessary in the regulated market. Figure 12 summarizes the main differences of load and price forecasting, relevant for this research.

Introduction
Page 26
Load forecasting Price forecasting Data Sensitive (company-specific) data
necessary No sensitive data necessary
Know-how Companies usually have Load forecasting know-how
Companies usually do not have (or very limited) Price forecasting know-how
Recentness Relevant in the business for decades Relevant in the business only since the liberalization of the market
Time-critical Data provision very time-critical Data provision very time-critical Core competency
Usually a core competency of an electric utility
Not a core competency of an electric utility
Outsourcing Rather different to outsource Outsourcing easy
Figure 12: Differences of Load-and Price forecasting
Two relevant applications for the further investigation in this research were chosen: short-term load forecasting and short-term price forecasting. These applications are described in more detail below.
1.6.2.2 SHORT-TERM LOAD FORECASTING
Short-term load forecasting (STLF) plays an important role in the operational planning and the security and safety functions of an energy management system. The STLF is aimed at predicting electric loads for a period of minutes, hours, days or weeks for the purpose of providing fundamental load profiles (Song 2003). STLF provides vital information for decision-makers in electric utilities.
Figure 13: Graphical display of system load in a week
Source: Siemens (1999)

Introduction
Page 27
STLF can perform load forecasting for a power system consisting of a single load area or multiple load areas. Power system load is the sum of all the individual demands that results in a distinct consumption pattern that is statistically predictable. System load behaviour is influenced by:
• Economic factors (e.g.: long term trends)
• Time factors (e.g.: seasonal trends, holidays)
• Weather effects (e.g.: temperature, light intensity, humidity)
• Special events (e.g.: strikes, special TV programs)
• Random effects
STLF is basically structured into the following parts (Siemens 1999):
• Updating/adaptation of historical data
• Rescaling of weather data
• Data analysis
• Short term prediction
• Very short term prediction
• Manual load forecast, pattern matching, similar days, and
• After the fact error analysis
Taking into account the information on influencing factors as well as the structure of load
forecasting, the following definition can be discerned.
Definition 8: Short-term Load forecasting (STLF)
‘Short-term Load forecasting is the prediction of the electrical energy quantity to be delivered in time intervals for a specified area for one day up to two weeks in advance.’
A large variety of statistical and artificial intelligence techniques have been developed for short-term load forecasting (Feinberg and Genethliou): Similar-day approach, regression methods, time series, expert systems, fuzzy logic, support vector machines, and neural networks.
STLF based on artificial neural networks is able to forecast all days of a year, including legal and religious holidays. Compared with traditional statistical forecasting methods (such as regression, etc.), neural networks can provide improved accuracy in terms of mean absolute deviation and averaging (Nam, Yi et al. 1996; Wesso 1997; McMenamin and Monforte 1998; Mirmirani and Li 2003).

Introduction
Page 28
1.6.2.3 SHORT-TERM PRICE FORECASTING
Doing Price forecasting has become a necessity for electric power companies operating in liberalised markets. Price forecasts have various purposes and are an important basis for investment decisions, commercialisation strategies, portfolio analysis and short term generation plant planning:
• Investment decisions are supported by price forecasting using calculations of usage hours and achievable revenues according to the type of a generation plant.
• Analysing the ratios between different products and assessment of the actual electricity prices establish important basics for the commercialisation strategies of electric power companies.
• Using results of price forecasts to assess different contracts and doing financial forecasts can support portfolio analysis.
• Price forecasting can also provide valuable inputs\ for the assessment of different types of generation plants.
However, wholesale prices for electricity at power exchanges are determined by various influencing factors. These factors include:
• Regulation: the rules of trading at such a power exchange (access to these exchanges is usually connected with some kind of fee, etc.), network access rules, taxes, rules for stranded cost.
• Strategic behaviour of market participants: concentration of supply, and reserve capacities. This factor is the hardest to forecast for market analysts.
• Competition for end customers: vertical integration, and end customer competition.
• Margin cost dispatch: cost, demand.
A graphical presentation of the factors influencing electricity wholesale prices is presented below.
Figure 14: Factors influencing wholesale prices for electricity
Source: Riechmann (2000)
Cost, Demand
Margincost-Dispatch
Marketresult
Strategic behavior
Competition for endcustomer
Regulation Vertical
integration, endcustomer competition
Trading rules, network access
rules, taxes, rules for stranded cost
Concentration of supply, reserve capacities

Introduction
Page 29
Therefore Short-term Price forecasting is defined as follows for this research.
Definition 9: Short-term Price forecasting (STPF)
‘Short-term Price forecasting in this context means the hourly forecast of energy spot market prices up to three days ahead, i.e., for the EEX-The European Energy Exchange.’
1.6.2.4 EXCURSUS: CALCULATIONS OF STPF FOR THE EUROPEAN ENERGY
EXCHANGE
For the purpose of giving the reader of this work a better understanding of the task of forecasting prices for electricity exchanges, some exemplary calculations are presented. 21 The forecasts are done one day ahead, for the Energy Spot-Prices of the European Power Exchange (EEX). The error is measured as absolute error in €/MWh. Historical prices, which were used for calculating these forecasts, were generated from the freely available download-service of the EEX-Homepage.22
First, a trivial forecast was calculated. This very simply calculated forecast is used as a levelling rule for the subsequent forecast calculations. This forecast is based on the assumption that a certain day acts completely the same as the last day of the same type of day (i.e.: a Thursday has the same values as the prior Wednesday).23
After fixing the levelling rule, the first attempt using neural networks was made using only a basic configuration, which includes calendar information (such as season, number of day in course of the year, type of day, summer-time, and holiday) and additional historical price values. Only every 7th day was included in the training. 1% of the days that included peak values were excluded from the training and defined as day-type ‘holiday’. For the detailed results of this attempt please compare to the 2nd forecast.
The next effort included the same configuration as used in the 2nd forecast, but now every single day was included in the training. For the improved results of this attempt in detail compare the 3rd forecast.
21 All the calculations presented here were done by the author during the author’s professional work for Siemens PSE E&I in Vienna with the help of colleagues at Siemens. The department of Program and System Engineering (PSE) Energy & Information (E&I) Energy Market Applications (EMA) has more than 30 years of experience in the energy industry. The business field covers the areas of: 1) Development and client-specific adaptation of products 2) Project delivery using Siemens products as well as third party products and 3) Provision of services for clients and the clients customers – like training, acquisition support, consulting and after sales services. Applications offered include: Power applications, forecasting applications, long term planning, resource optimisation, scheduling applications, trading applications, transaction management, network applications, expert systems and dispatcher training simulator. 22 www.eex.de 23 Day types used for the calculations are: Monday (which is defined as the day after Sunday plus the day after a holiday, i.e., when a Thursday is a holiday, the following Friday is a Monday per definition), Weekday (Tuesday, Wednesday, Thursday), Friday, Saturday, Sunday and Holiday

Introduction
Page 30
After the presentation of the calculations an introduction into artificial neural networks is given; a future outlook follows this.
1. Trivial forecast
Configuration: A certain day acts completely the same as the last day of the same type of day.
Type of day Mean absolute deviation
Mean deviation Sample size
Monday 15.9671 -10.3967 14 Weekday (Tue-Thu) 8.75037 2.39548 38 Friday 6.09359 1.98756 13 Saturday 4.68609 -0.783802 16 Sunday 3.26612 0.0932025 16 Holiday 6.55741 -2.26059 10
Figure 15: Results in detail of the Trivial forecast
2. 1st forecast
Basic configuration, historical prices, simulation with training of every 7th day, 1% of days with peak values excluded from training.24
Type of day Mean absolute
deviation Mean deviation Sample size
Monday 3.38214 -1.41461 10 Weekday (Tue-Thu) 2.89858 -1.20237 28 Friday 2.61831 -1.54082 8 Saturday 3.55118 2.98457 8 Sunday 6.48548 6.4406 9 Holiday 3.36093 3.03381 7
Figure 16: Tabular presentation of results for the 1st forecast
24 Basic configuration: Calendar information (Season, Number of day in course of the year, Type of day, Summer-time, Holiday)

Introduction
Page 31
0,00
5,00
10,00
15,00
20,00
25,00
30,00
35,00
40,00
45,00
50,00
1.4.03 2.4.03 3.4.03 4.4.03 5.4.03 6.4.03 7.4.03 8.4.03 9.4.03 10.4.03
Tue Wed Thu Fri Sat Sun M on Tue Wed Thu
Time
€/M
Wh
Price Trivial STPF
Figure 17: Graphical results for the 1st forecast25
3. 2nd forecast
Basic configuration, historical prices, simulation with daily training, 1% of days with peak values excluded from training
Type of day Mean absolute
deviation Mean deviation Sample size
Monday 3.74602 -2.5981 10 Weekday (Tue-Thu) 2.30048 -1.11571 30 Friday 2.2059 -1.10456 8 Saturday 4.03817 3.17399 8 Sunday 6.47234 6.45835 9 Holiday 4.74252 4.22742 8
Figure 18: Tabular presentation of results for the 2nd forecast
25 Using neural networks and training for every 7th day, calculation for the period from 1st of April 2003 24:00 until 10th of April 2003 13:00 for the Energy Spot-Prices of the European Power Exchange

Introduction
Page 32
0,00
5,00
10,00
15,00
20,00
25,00
30,00
35,00
40,00
45,00
50,00
18.3.03 19.3.03 20.3.03 21.3.03 22.3.03 23.3.03 24.3.03 25.3.03 26.3.03 27.3.03 28.3.03
Tue Wed Thu Fri Sat Sun Mon Tue Wed Thu Fr i
Day
€/M
Wh
Price Trivial STPF
Figure 19: Graphical results for the 1st forecast26
4. Forecast of www.spotpreisprognose.de
In order to make the results described above comparable to other calculations of providers of STPF, results achieved by www.spotpreisprognose.de are presented underneath.
The supplier of this forecast also uses neural networks, the configuration and influencing variables are not known. Values are taken from the period of 26 February 2003 until 4 March 2003. Forecasts are for whole blocks available only, not for single hours. The values indicated below are average values from Base (includes hours 9-20)-and Peak (includes hours 0-24)-blocks. Forecasts were taken from the free available download-service at www.spotpreisprognose.de.
Type of day Peak Block
Mean absolute deviation
Base Block Mean absolute deviation
Monday 4.79 2.90 Weekday (Tue-Thu) 5.41 3.23 Friday 6.43 2.50 Saturday 6.52 3.69 Sunday 1.01 0.70
Figure 20: Results in detail for forecast of www.spotpreisprognose.de
26 Using neural networks and training for every day for the period from 18th of March 2003 24:00 until 28th of March February 2003 13:00 for the Energy Spot-Prices of the European Power Exchange

Introduction
Page 33
0,00
5,00
10,00
15,00
20,00
25,00
30,00
35,00
40,00
45,00
50,00
1.4.03 2.4.03 3.4.03 4.4.03 5.4.03 6.4.03 7.4.03 8.4.03 9.4.03 10.4.03
Tue Wed Thu Fri Sat Sun M on Tue Wed Thu
Time
€/M
Wh
Price Trivial STPF
Figure 21: forecast of www.spotpreisprognose.de27
Comparison of the results of price short term price forecasting computed by the author and those computed by www.spotpreisprognose.de show that the results derived by the author of this work are more accurate.
A short description of the functionality of neural networks is presented below.
5. Neural Networks
All computations presented are calculated using Neural networks within the software ECANSE. ECANSE is a flexible development system, developed by the Siemens AG, which is able to perform various tasks i.e.: data analysis, design, prototypes, simulation, monitoring, testing and optimisation.
An artificial neural network is designed similarly to the human brain. It is a collection of simple interconnected processors ‘neurons’. As neurons are able to work independently, a parallel distributed structure can be built which is able to process information extremely fast and fault tolerant. Weighting the connections between the neurons to adapt the network to different situations can control the cooperation of the neurons. This process is called ‘training’. The network learns from a sequence of examples (input/output pairs). This is an advantage especially if basic connections are less known.
27 Comparison: Actual realized Price for the base-block (blue bar), Price forecast for the base-block (red bar), actual realized Price for the peak-block (yellow bar), Price forecasted for the peak-block (bright blue bar) for the period from 1st of April 2003 until 10th of April 2003 for the Energy Spot-Prices of the European Power Exchange

Introduction
Page 34
The neural network used in the underlying calculations is called ‘Multi-Layer Perceptron (MLP)’. The Multi-Layer Perceptron is the commonly used type of neural networks, e.g. for forecasts, pattern recognition, etc. Its is characterized by being a feed forward network with only straight forward directed connections and by being structured in layers, while more layers increase the complexity of the network. The underlying learning algorithm is a back propagation, which is a supervised learning algorithm. Back propagation is a method of supervised learning where the network is trained by repeated processing of input and desired output. Price or load forecasts based on neural networks are performed in two phases:
1. Training phase: The historical database is analysed periodically once a day (or on request). Training of the neural network is performed after midnight when the temperature and load values of the previous day are complete.
2. Application phase: After being trained, the neural network can be used for load or price forecasting. The forecast can be performed at any time, except during the training phase.
Figure 22: Phases of short-term load/price forecast using artificial neural networks
Source: Siemens (1997)
6. Conclusion
The above-illustrated computations are a result of first attempts to forecast the Spot prices at the EEX. It can be assumed that using different influencing factors and amending the underlying configurations of the forecast can achieve improved forecasting quality.
The influences mostly suggesting themselves are weather influences. It is assumed that temperature, cloudiness and solarisation have an influence on the trading behaviour of the participating members of the power exchange. In order to further improve the quality of the results of the spot price forecast, the above-mentioned weather data will have to be tested. Another quite important factor is the amount of rainfall in those areas, where many hydroelectric power stations are situated. In those areas, where a lot of wind energy is installed, wind speed will be an important variable. These influences could be tested in future attempts. An attempt forecast the energy spot prices for the Austrian Power Exchange (EXAA) seems worthwhile.
Historical data Training phase
Trained neural network
Load/Price Forecast
Temperature j+1 Temperature j Load j Day j
j = j + 1
Load/Price Forecast j+1

Introduction
Page 35
Even though the above stated values are results of first attempts, it was possible to achieve comparably better results to existing providers of price forecasts. The weekdays especially, plus Monday and Friday, show improved results. This is very important considering that these are the most relevant days for trading. More accurate results can be achieved by calculating forecast for blocks (peak, base, etc.) compared to the results achieved when forecasting single hours.
1.7 RESEARCH GAP
One of the most important, and for potential readers interesting, questions that emerges when writing a PhD thesis is: ‘What contribution will this research make to our general body of knowledge about marketing?’ In order to answer this question as a first step it is necessary to review the existing body of knowledge. For this purpose recent research on the topic of adoption and diffusion of Application Service Providing is introduced subsequently. Then the underlying research project is positioned within the existing research. Most of the research that has been done in the area of adoption and diffusion of Application Service Providing, respectively web services has been conducted in the years from 2000 to 2005. Important work in the organisational ASP adoption field is introduced in this chapter.
Yao (2004) develops in her analysis an integrative model for ASP adoption that incorporates economic, strategic, and social determinants. This integrative model includes the individual effects of these determinants, as well as the moderating effects of the social determinants upon the economic and strategic determinants. In order to test the research model and its associated hypotheses, she conducts two self-administered surveys, one among clients of a leading ASP and the other among selected top computer executives. Her research model integrates three outsourcing perspectives in order to study the key factors that influence the ASP adoption decision for a company. The three perspectives are described as 1) the economic perspective which suggests that uncertainty, asset specificity and cost benefit are determining factors; 2) the strategic perspective which suggests that application importance and IT deficiency removal are determining factors; and 3) the social perspective which suggests that ASP’s capability, social and personal relationships, and trust are determining factors. The research model also suggests that the factors associated with these three perspectives will work both individually and interactively to influence the ASP adoption decision. The findings from the two surveys show that economic, strategic and social factors impact a client’s decision on ASP adoption. Moreover, among prospective ASP adopters, trust has a strong tendency to influence the effect of cost benefits and IT deficiency removal on ASP adoptions.

Introduction
Page 36
Daylami (2004) addresses the ASP phenomenon both as a method of outsourcing and as an innovation in his doctoral thesis. He asks which factors affect ASP adoption and what factors determine an organization’s propensity to adopt the ASP innovation. Daylami uses Tornatzky and Fleisher’s (1990) theoretical framework and adapts it as a starting point in his study. He identifies specific determinants, including concepts from innovation diffusion and ASP/outsourcing research literature that are generally deemed to influence ASP adoption. The study finds support for significant relationship between four predictors and diffusion and infusion: 1) top management orientation; 2) internal IS expertise; 3) ASP industry characteristics; and 4) competitive pressure and ASP adoption.
Chen and Soliman (2002) develop a value-driven approach to outsourcing using ASP based outsourcing theories and the industry’s best practices. The value-driven approach used in this article is an adaptation and extension of Simon’s (1977) decision making process. Chen and Soliman recommend to follow these identified phases in the outsourcing decision making process: Identification, Analysis, Design, Implementation and Assessment. They also point out factors influencing the propensity to outsourcing using ASP vendors: Production Cost Advantage, Transaction Costs, Asset Specificity, Internal Expertise, Maturity of Technology, ASP Value Chain and application Media Fit.
Kavan et al. (2002) adopt in their paper a socio-technical perspective to distinguish among ASP relationships. This distinction is based on the levels of organisational change that the ASP relationship will evoke. This paper then proposes levels or resource allocation that best fit each type of relationship. Three specific resources important to ASP-client relationships are economic outlays, social networks and knowledge.
Smith and Kumar (2004) develop in their paper a theory of ASP adoption and use from the client’s perspective based on analysis of primary and secondary data on ASP use and analysis of literature on IS outsourcing and EDI. They present a model and highlight similarities and differences between conventional IS outsourcing, ASP use, and EDI. Using the grounded theory approach, they create a comprehensive theory of ASP use from the client’s perspective.
This research focuses on Application Service Providing the electric utilities industry. Due to the public interest in this industry and the related requirement of seamless and reliable electricity supply the provisioning of software functionality that assists the therefore necessary business processes is a crucial task. Because of the specific characteristics of the industry examined the research model had to be adjusted accordingly based on qualitative surveys. The broad design of the qualitative study secured the inclusion of a wide variety of different influencing factors hypothesized to have an impact on innovation adoption.
Most of the research identified in the literature review builds general models of ASP or innovation adoption, but does not focus on specific industries. Therefore the research project in question can be seen as the first one focusing on ASP adoption within the electric utilities industry.

Introduction
Page 37
This research especially focuses on early adoption and technology stages within the adoption process. Research in marketing on the influence of perceived innovation characteristics on the stages of the adoption process is scarce and indicates the need for more studies. Little has been found that deals with the specialities of the adoption process in the innovation’s early technology stages. This is especially relevant for marketers to understand the adoption process of innovations when they are in the early stages and therefore this field seems to be worthwhile for further investigations.
Also the explicit inclusion of non-adopters requires more research to understand the specific factors leading to rejection of an innovation. This work explicitly takes into account both adopters and rejecters of ASP. By explicitly including rejecters of ASP into the empirical study, valuable insight is gathered, and the phenomenon of rejection-which was addressed by very little research so far-is examined in closer depth.
These considerations lead to the formulation of the relevant research questions for this project. These questions determine the further progress of this work and are highly relevant for the outcome of this research.
1.8 RESEARCH QUESTIONS
Research Question 1: Which factors influence the intentions of electric utilities to adopt Application Service Providing?
Research Question 2: How does Application Service Providing diffuse, as measured by adoption intentions, among electric utilities in Austria and Germany?
This chapter gave an overview on the genesis of the underlying research topic and what the special interest of the author is in that field. It summarized key features of the electric utilities industry and subsequently showed how ASP fits into the special situation of this field of business. Example calculations of price forecasting were given in order to make the concepts and necessary tasks involved more visible. Concluding the research gap identified is described and directions for contributions of this research are given. This rounded off the presentation of the two research questions.
The following section deals with the theoretical background of this field of research, leading to the formulation of the hypotheses and the presentation of the research model.

Theoretical Background – State of the Field
Page 38
2 THEORETICAL BACKGROUND-STATE OF THE FIELD
2.1 INTRODUCTION
The study of the existing body of literature relevant for a research project provides an essential basis for the research in question. It is a pre-condition to lead the researcher and important to connect new literature with existing one for it establishes the ground for new ideas and approaches.
The chapter first describes the theoretical background of organisational buying behaviour and subsequently leads to a special case study within the field of adoption and diffusion of innovations within organizations. It establishes the relevant theoretical framework for the subsequent research project by providing definitions on important terms, such as adoption and acceptance. It reveals the history of adoption and diffusion research and provides the authors that have a notable influence on the underlying work. After a discussion of different constructs and theories found in the literature, such as the construct of the innovation decision process, individual innovativeness and the adopter categories, and perceived innovation attributes, some special fields of adoption research which are relevant for this project are described in more detail. The differentiation between organisational and individual adoption behaviour is presented, then specific considerations are allowed for the different adoption stages and explicit rejection of innovations. Very briefly the topic of cross-country adoption is touched upon. Afterwards the application of fuzzy theory within adoption research and the connection to the underlying work is given. The first part of this chapter ends with the presentation of the assimilation gap concept. The second large part of the chapter contains the relevant constructs and literature necessary for the formulation of the hypotheses. These hypotheses are defined after the literature review and considerations taken into account from the findings of the qualitative survey. Concluding the chapter is a presentation of the research model.

Theoretical Background – State of the Field
Page 39
2.2 ORGANIZATIONAL BUYING BEHAVIOR
Organizational buying behaviour determines the buying decision-making process of an organization rather than by an individual customer. Organizational buying behaviour differs from consumer buying behaviour in that 1) normally, multiple individuals are involved, 2) buying decision rules or standards may be applicable, and 3) purchases occur as a result of derived demand (Dictionary 2004). Organizational buying behaviour is often a multiphase, multiperson, mulitdepartmental, and multiobjective process. This dynamic and intricate process frequently confronts sellers with a complex set of issues and situational factors that directly or indirectly influence buying firm behaviour (Johnston and Lewin 1996).
In the late 1960s, interest in studying and understanding the organisational buying process began to increase dramatically. In 1967, Robinson, Faris, and Wind published their seminal book ‘Industrial Buying and Creative Marketing’, which included a model of ‘the industrial buying process’ and the ‘buy grid framework’. A few years later (1972) Webster and Wind presented their ‘general model for understanding organisational buying behaviour’ and in 1973 Seth published his ‘model of industrial buyer behaviour’. Together, these three works laid the conceptual foundation for the study of organisational buying behaviour. Since then hundreds of conceptual and empirical articles have been published that either extend or test (part or all) of the models proposed by the authors (Johnston and Lewin 1996).
Various authors empirically proved and expanded upon the frameworks proposed by Sheth (1973) and Webster and Wind (1972). They focused on:
• The decision making process (e.g. Dempsey 1978; Vyas and Woodside 1984; Anderson and Chambers 1985; Banting, Beracs et al. 1991; Rangan, Moriarty et al. 1992; Bunn 1993; Dholakia, Johnson et al. 1993; Schmittlein and Peterson 1994; Brown 1995);
• The influence on members of the buying centre (e.g. Silk and Kalwani 1982; Thomas 1982; Jackson, Keith et al. 1984; Thomas 1984; Berkowitz 1986; Lynn 1987; Kohli and Zaltman 1988; Martin, Daley et al. 1988; Kohli 1989; McQuiston 1989; Ronchetto, Hutt et al. 1989);
• The buying centre structure (e.g. Choffray and Lilien 1980; Woodside and Sherrell 1980; Johnston and Bonoma 1981; Moriarty and Bateson 1982);
• Environmental influences (e.g. Grønhaug 1976; Spekman and Stern 1979; Drumwright 1994);
• Information search (e.g. Webster 1970; Martilla 1971; Moriarty and Spekman 1984; Deshpande and Zaltman 1987; Bunn and Clopton 1993; Weiss and Heide 1993);
• Organizational climate and role perceptions (e.g. Robertson and Wind 1980; Spekman 1981; Thomas 1982; Michaels, Day et al. 1987; e.g. Qualls and Puto 1989; Henthorne, LaTour et al. 1993); and
• Conflict resolution (e.g. Ryan and Holbrook 1982; Barclay 1991).

Theoretical Background – State of the Field
Page 40
Central to the models proposed by Robinson, Faris, and Wind; Webster and Wind; and Sheth is the concept that organisational buying behaviour is a process. Within their ‘buy grid framework’, Robinson, Faris, and Wind introduced their ‘buy phases’. These phases (or stages) represent the sequence of activities often performed in an organisational buying situation. Briefly, these activities are:
• Recognition of need and a general solution
• Determination of characteristics and quantity
• Description of characteristics and quantity
• Search for potential sources
• Acquire and analyse proposals
• Evaluate proposals and select supplier(s)
• Select an order routine
• Performance feedback and evaluation
Similarly, both the Webster and Wind and Sheth models presented organisational buying behaviour as a process composed of a sequence of phases or stages (Johnston and Lewin 1996). In addition, the three above mentioned original models share several other important constructs. First, each model contains environmental influences such as physical, political, economic, suppliers, competitors, technological, legal, cultural, and global (in the Sheth model the two last ones are called situational influences). Second, each model contains organisational influences, such as size, structure, orientation, technology, rewards, tasks, and goals. Finally, all three models contain individual participants’ characteristics that include education, motivation, perceptions, personality, risk reduction, and experience (Johnston and Lewin 1996).
The Robinson, Faris, and Wind model and the Sheth model have two additional constructs in common. The first of these, purchase (product) characteristics, includes variables such as buy task, product type, perceived risk, prior experience, product complexity, and time pressure. The second, seller characteristics, include price, the ability to meet specifications, product quality, delivery time, and after-sale service (Johnston and Lewin 1996). A sixth construct, group characteristics, is introduced in Webster and Wind’s general model for understanding organisational buying behaviour. These characteristics include size, structure, authority, membership, experiences, expectations, leadership, objectives, and backgrounds (Johnston and Lewin 1996). Two final constructs are introduced in Sheth’s model of industrial buyer behaviour. The first is informational characteristics or the source and type of information each decision-maker is exposed to and his/her participation in the active search for this information. Suggested sources and types of information include salespeople, conferences and trade shows, word-of-mouth, trade news, direct mail, and advertising. The second construct introduced by Sheth is conflict negotiation characteristics. Sheth posited that decision-makers employ a variety of methods to resolve the inevitable conflicts associated with joint decision-making. Sheth argued that these resolution methods include problem solving and persuasions (which are useful and rational), as well as bargaining and politicking (which are nonrational and inefficient) (Johnston and Lewin 1996).

Theoretical Background – State of the Field
Page 41
These nine constructs (environmental, organisational, group, participant, purchase, seller, conflict/negotiation, informational and process or stages) broadly represent the variables found in the original three models that combine to affect organisational buying behaviour. These constructs have been tested empirically in the last years and have proven to be correct in proposing that environmental, organisational, group, participant, purchase, seller, informational, and conflict/negotiation characteristics, as well as the stages in the buying process significantly affect organisational buying behaviour (Johnston and Lewin 1996).
According to (Johnston and Lewin 1996) increasing perceived risk within an organisational buying decision has several impacts on the interacting participants involved. These risks are quoted in the following paragraphs and summarized in Figure 23.
The buying group (centre) becomes larger and thus more complex. That is, more people will be involved in the purchase decision and these people will be drawn from, or represent, a greater variety of departmental and/or organisational interests. Additionally, buying centre participants will generally be of higher organisational status and authority, or, if not, the buying centre will not have authority to make the final purchase decision.
Participants in the purchase decision-making process will be more educated and possess greater levels of experience in their particular area of expertise.
Sellers who offer proven products and solutions will be favoured. Product quality and after-sale service will be of the utmost importance. Price, while always important, will be considered only after product and service criteria have been fully met. In general, only when two or more sellers appear equally capable of satisfying purchase requirements, will price play a dominant role in the purchase decision.
Information search will be active and a wide variety of information sources will be used to guide and support an important purchase decision. Buying centre participants may rely more heavily on impersonal, commercial information sources (i.e., trade publications, sales literature) during earlier stages of the decision process. However, as the procurement decision progresses, personal, non-commercial information sources (i.e., outside consultants, other organizations that have already made similar purchases) may become more important.
Within the buying firm, conflict between buying centre participants will increase because more departments will be involved in the purchase decision - a greater diversity in departmental perspectives and motivations will lead to greater conflict, and as the purchase outcome is important, buying centre participants will be reluctant to make concessions without some form of reciprocal reward.
The decision rules used in any given purchase situation are fundamentally firm specific. In general, most firms have some formalized purchase control mechanisms and decision-making guidelines, especially for recurring purchase situations. In new task purchase situations (where outcome uncertainty is increased) it may be difficult or inappropriate to use established procedures and guidelines. Thus, buyers may be forced to use a ‘decide-as-you-go’ approach to the purchase decision process.
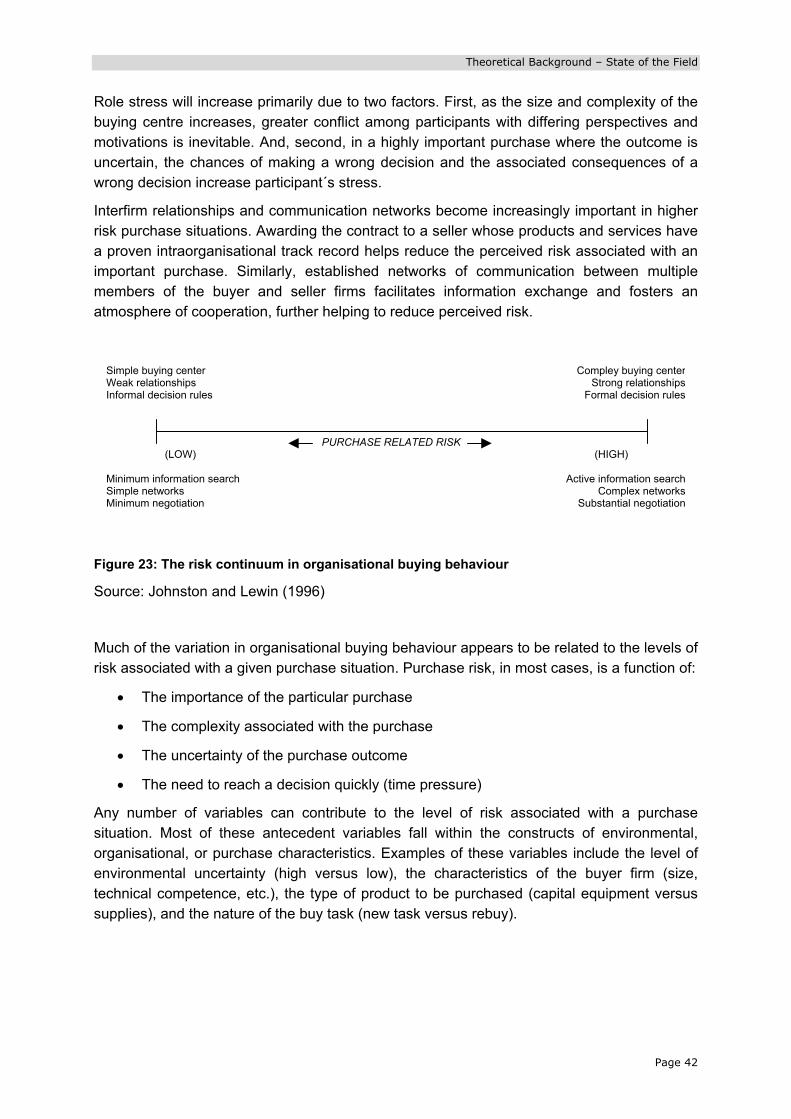
Theoretical Background – State of the Field
Page 42
Role stress will increase primarily due to two factors. First, as the size and complexity of the buying centre increases, greater conflict among participants with differing perspectives and motivations is inevitable. And, second, in a highly important purchase where the outcome is uncertain, the chances of making a wrong decision and the associated consequences of a wrong decision increase participant´s stress.
Interfirm relationships and communication networks become increasingly important in higher risk purchase situations. Awarding the contract to a seller whose products and services have a proven intraorganisational track record helps reduce the perceived risk associated with an important purchase. Similarly, established networks of communication between multiple members of the buyer and seller firms facilitates information exchange and fosters an atmosphere of cooperation, further helping to reduce perceived risk.
Figure 23: The risk continuum in organisational buying behaviour
Source: Johnston and Lewin (1996)
Much of the variation in organisational buying behaviour appears to be related to the levels of risk associated with a given purchase situation. Purchase risk, in most cases, is a function of:
• The importance of the particular purchase
• The complexity associated with the purchase
• The uncertainty of the purchase outcome
• The need to reach a decision quickly (time pressure)
Any number of variables can contribute to the level of risk associated with a purchase situation. Most of these antecedent variables fall within the constructs of environmental, organisational, or purchase characteristics. Examples of these variables include the level of environmental uncertainty (high versus low), the characteristics of the buyer firm (size, technical competence, etc.), the type of product to be purchased (capital equipment versus supplies), and the nature of the buy task (new task versus rebuy).
(LOW)
Minimum information search Simple networks Minimum negotiation
(HIGH)
Active information searchComplex networks
Substantial negotiation
Simple buying center Weak relationships Informal decision rules
Compley buying centerStrong relationships
Formal decision rules
PURCHASE RELATED RISK

Theoretical Background – State of the Field
Page 43
Figure 24: Dynamics of organisational buying behaviour
Source: Johnston and Lewin (1996)
Two aspects of both buyer-seller relationships and communication networks have the ability to influence the amount of risk associated with a particular purchase situation. The first is simply whether or not a prior relationship or channel of communication exists between the buying firm and one or more potential suppliers. If none exists, the level of risk associated with an important purchase situation is expected to increase. Second, if buyer-seller relationships and channels of communication already exist, the relative strength and depth of these relationships and channels have the ability to influence perceived levels of purchase related risk (Johnston and Lewin 1996).
These findings are important when talking about innovation adoption by organizations. This is usually a very special situation within organisational decision-making, where much of the perceived risk for participating individuals is involved. Theory of organisational adoption as described below focuses on the specifics of non-routinized decision-making, as is the case when adopting innovations. Therefore this theoretical field takes into account the basics of organisational buying behaviour and additionally refines theory for the situations of decision-making in the case of innovation adoption.
ANTECEDENTS
Environmental Characteristics Organizational Characteristics Purchase Characteristics Buyer-Seller Relationships Communication Networks
PURCHASE RELATED RISK
(Importance) (Complexity) (Uncertainty)
(Time pressure)
OUTCOMES
Group CharacteristicsParticipant Characteristics
Seller CharacteristicsConflict/Negotiation
Informational CharacteristicsDecision Rules
Role StressBuyer-Seller RelationshipsCommunication Networks

Theoretical Background – State of the Field
Page 44
2.3 THEORY OF ADOPTION AND DIFFUSION
2.3.1 GENERAL CONSIDERATIONS
Extensive research has been conducted to identify factors discriminating between new product success and failure (Montoya-Weiss and Calantone 1994). A central outcome is that many innovations fail because marketers are not able to fulfil potential adopter requirements and needs, respectively, primarily because the innovation lacks superiority over other available alternatives.28 Thus, in order for a company to be successful in bringing innovations to the market, an understanding of potential customers and the factors influencing their adoption decision is integral. Research on the adoption and diffusion of innovations offers significant contributions to such understanding (Frambach and Schillewaert 2002).
Along with the decision for developing and introducing innovations, grave forecasting and planning problems are a concern for management. Compared to existing products, versions of products or product differentiation, where it is relatively easy to forecast the future sales quantity with market research tools, it is quite difficult to make statements about the probability of adoption by the potential population for new products (Urban, Weinberg et al. 1996). Bass (1969) supports this point of view: ‘Long-range forecasting of new product sales is a guessing game at best’.
It is highly relevant to solve this forecasting problem in the face of enormous investments, which the development of innovations usually require. In the case of service innovations the costs for setting up and growing of the necessary infrastructure is often very high and it often takes a lengthy time frame time to amortize (Ihde 1996 pp. 257). Additionally one must consider that many examples from the praxis show that the failure rate of new products is very high (Brockhoff 1999).
Aside from the difficulty in predicting precise forecasts for sales of new products decision makers also face challenging planning problems. This problem results from insecurity, i.e., which factors are influencing the diffusion of innovations. The identification of these influencing factors and characteristics is of central concern for the supplier companies because of two reasons: first, to optimise their sales and marketing efforts and second, to measure the results within the controlling of marketing. Only when the factors influencing the diffusion of an innovation in a market are known it is possible to say if an increase in the sales quantity of the product is due to a company’s own marketing efforts or if the inherent, endogenous diffusion-effects of the innovation are responsible (Albers 1998).
28 The product features of the innovation-compared to the product features of old, existing products on the market were not superior enough for the customers to buy the innovation instead of the old, existing products.

Theoretical Background – State of the Field
Page 45
Given these problems that are raised by the decision to develop and introduce innovations, management needs tools to estimate the diffusion of an innovation and knowledge of the factors influencing adoption decisions. These tools are provided by the diffusion research: diffusion-models serve to explain and forecast the diffusion of innovative products after their market introduction (Mahajan and Muller 1979). These models are based on the observation that innovations are not adopted abruptly from the entirety of the respective population, but rather first only from a small amount so called ‘innovators’. Because diffusion models picture the estimated market penetration over a period of time, it is possible to forecast the payback period of the investments as well as the further sales trend of an innovation (Jochims 2002 pp. 87).
In the discussion concerning the measurement and/or prognosis of success of new technologies and technological innovations within business research, primary consideration is given to processes associated with attitude and adoption/diffusion research (Kollmann 2004).
In the following section an attempt is being made in order to conceptually demarcate different terms and constructs found in the literature.
2.3.2 ‘ATTITUDE’ VS ‘INTENTION’ VS ‘ADOPTION’ VS
‘ACCEPTANCE’
In the adoption diffusion literature often the terms ‘acceptance’, ‘adoption’, and ‘attitude’ are used in myriad ways. Therefore an attempt is made to conceptually demarcate the different terms, which are considered relevant for the underlying research ‘attitude’, ‘intention’, ‘adoption’, ‘acceptance’ and ‘diffusion’. Figure 25 shows the different stages from attitude towards acceptance on a chronological line.
Figure 25: From Attitude towards Acceptance
Attitude
Intention
Adoption
Acceptance
time
Diffusion

Theoretical Background – State of the Field
Page 46
1. Attitude
Within attitude research one speaks of market success if a customer has an inner positive readiness to buy the product. The construct attitude is composed of three components (Triandis 1971; Williams 1984; Wilkie 1994 p. 282-283):
1. The cognitive component refers to the knowledge, values, and opinions the person has about the attitude object.
2. The affective component reflects feelings (positive and negative), evaluations, or emotions regarding the attitude object.
3. The conative component reflects behaviour tendencies toward the attitude object.
Attitude toward adopting (or continuing to use) an IT is generated by the individual's salient beliefs about the consequences of adopting (continuing to use) the IT (behavioural beliefs) and evaluation of these consequences. Thus, attitude is derived by the strength of the person's beliefs that adopting (or continuing to use) the IT will lead to certain consequences, each weighted by the evaluation of each belief's behavioural consequences (Ajzen and Fishbein 1980 pp. 53).
Definition 10: Attitude
Attitudes towards behaviour refer to the degree to which a person has a favourable or unfavourable evaluation or appraisal of the behaviour in question (Ajzen 1991).
2. Intention
Perhaps the two best known general theoretical models of behaviour, including ‘behavioural intention’, that have been proposed are the Theory of Reasoned Action (TRA) and the Theory of Planned Behaviour (TPB).
The TRA was developed by Ajzen and Fishbein (Fishbein and Ajzen 1975; Ajzen and Fishbein 1980 pp. 5); it proposed that one’s intention to perform or not to perform an action (behavioural intention) is the immediate precursor to the actual behaviour. It contends that ‘behavioural intentions’ are antecedents to specific behaviours that an individual will perform. More specifically, an individual's attitudes, perceptions, and subjective norms will influence that individual's actions in a particular manner when he or she believes that their behaviour will result in or be linked to a specific outcome. Furthermore, subjective norms that influence behavioural intentions can be determined by an individual's positive or negative evaluation of certain behaviour or by social pressures to perform or not perform a particular behaviour. The relative strength of these beliefs may vary from person to person based upon their experiences (Ajzen and Fishbein 1980 pp. 57) or even possibly by their culture. Subsequently, a customer's perception and attitudes regarding privacy and trust should influence his or her behavioural intentions in adopting an innovation.

Theoretical Background – State of the Field
Page 47
The TRA model introduced two factors that affect behavioural intention: attitude toward the behaviour and subjective norms. Attitude involves judgment whether the behaviour is good or bad and whether the actor is in favour of or against performing it. Subjective norm is the perception of how one ought to behave. Ajzen (1991) later extended the model and called it the TPB, which added perceived behavioural control as another factor influencing behavioural intention. Perceived behavioural control is the perception of how easy or difficult it would be to perform the behaviour.
Definition 11: Intention towards adoption
Intention towards adopting refers to the degree to which a person has a favourable or unfavourable purpose of adopting or rejecting a product or service.
3. Adoption
Adoption can be defined in several ways. In the innovation literature, adoption is typically considered as a discrete or dichotomous phenomenon (Gatignon and Robertson 1985; Westphal, Gulati et al. 1997).
In the context of adoption research one speaks of a market success when a product is purchased or adopted by the customer, i.e. the construct ‘adoption’ compared to the construct ‘attitude’ goes one step further and focuses the analysis primarily on the actual time of adopting a product or service (the act of purchasing) (Kollmann 2004). As a logical conclusion, the decision of the customer to purchase a product formed the focus of the original considerations (Rogers 1983). Although usage is expected as a result of adoption, this usage refers primarily to a repetition of the trial phase of the adoption process and/or to a confirmation of the purchase decision in order to avoid discord (Rogers and Shoemaker 1971 p. 101)
Definition 12: Adoption
Adoption is considered a dichotomous phenomenon. It refers to the decision of any individual or organization to make use of an innovation.
4. Diffusion
‘Adoption’ refers to the decision of any individual or organization to make use of an innovation, whereas ‘diffusion’ refers to the accumulated level of users of an innovation in a market (Rogers 1995).
The term diffusion refers to the development or the time after adoption of an innovation from the first to the last purchaser in a social system (Rogers 1983). Within diffusion research, one speaks of a market success where this temporal development proceeds rapidly. The construct of ‘diffusion’ cumulates in individual adoption decisions over time to explain the distribution of product novelties/service innovations in the market. The result of the temporal development of the adoptions is expressed in so-called diffusion curves which describe the adoptions from the first to the last customer (Rogers 1983).

Theoretical Background – State of the Field
Page 48
Especially the microeconomic diffusion research is dealing with business-related questions as (Weiber 1992 p. 1):
- Which factors influence the timely dispersion of innovations in a market?
- Which speed has the dispersion of an innovation within a market?
- Which dispersion lapse has to be expected from the first until the last adoption by members of a social system?
The differences of the constructs of adoption and diffusion are summarized in the subsequent table.
Constancy variables Dynamic variables Diffusion Population:
Potential entirety Diffusion dispersion
Adoption Innovation Adopter-Non-adopter
Adoption-Non-adoption
Figure 26: Conceptual demarcation Adoption/Diffusion
Source: Following Kuhlmann (1997 p. 144)
The object of the theory of diffusion is the examination of changes of collectivities in the course of time. Collectivities can, for example, be amounts of liquidity, populations of animal species, or market segments (Kuhlmann 1997 pp. 138). The approach of the theory of diffusion is to take two different perspectives at the same time by considering the single entity on the one hand, while considering the entirety of it on the other hand (Lutschewitz 1977). This entirety is divided into constituents and described on the basis of a saturation level (diffusion perspective). The change of the single constituents can be described as a flow of phases (adoption perspective). If a single constituent achieves the critical phase (i.e., the end-stage) its modification is regarded to be terminated and its contribution is added to the saturation level of the entirety (Kuhlmann 1997 pp. 138).
Both perspectives render a substantial contribution in order to explain the whole process. The diffusion perspective interprets the development of the saturation level as a quasi-automatically running process depending on time. In the adoption perspective this development is ascribed to processes, which can be determined by the characteristics of the constituents. These constituents are viewed by the socio-scientific theory of diffusion as deciders, and the adoption is explained by their decision behaviour.
Diffusion is the process by which an innovation is adopted and gains acceptance by members of a certain community. A number of factors interact to influence the diffusion of an innovation. The four major factors influencing the diffusion process are the innovation itself, how information about the innovation is communicated, time, and the nature of the social system into which the innovation is being introduced (Rogers 1995). Diffusion research, in its simplest form, investigates how these major factors, and a multitude of other factors, interact to facilitate or impede the adoption of a specific product or practice among members of a particular adopter group.

Theoretical Background – State of the Field
Page 49
Definition 13: Diffusion
‘Diffusion’ is defined as the process of dispersion of innovative products in social systems (Nieschlag, Dichtl et al. 1997).
‘Diffusion refers to the accumulated level of users of an innovation in a market’ (Rogers 1995).
4. Acceptance
While ‘adoption’ in the innovation literature typically is considered as a discrete or dichotomous phenomenon (Gatignon and Robertson 1985; Westphal, Gulati et al. 1997) studies in the field of information systems on the other hand assess ‘user acceptance’ by means of 1) frequency or the number of times a computer system is used, 2) the duration of user sessions and 3) the number of different computer applications used (Schillewaert, Ahearne et al. 2000 pp. 5).
However, Rogers (1995 p. 190) proposes that after the stages of the adoption decision and trial use, the innovating unit goes through an implementation and confirmation stage. ‘Using the innovation on a regular bases’, ‘continued use of the innovation’ and ‘integration of the innovation into one’s ongoing routine’, are characteristics for these stages.
Based on these considerations ‘adoption’ can be interpreted as the decision to purchase, and ‘acceptance’ as the decision to use the product. Compared to the decision to purchase, which is related to one point in time, the intensity of usage is a variable parameter, which is subject to temporal changes. Therefore acceptance can be viewed fundamentally as a dynamic construct, which, over time, goes through several phases and covers multidimensional levels of interpretation.
Definition 14: Acceptance
Technology acceptance is defined as the degree to which individual users will use a given system when usage is voluntary or discretionary. (Morris 1996)
The acceptance of a product or service refers to the continued usage of it. It can be measure two parameter values: 1) frequency of use and 2) intensity of use.
The following table summarises the different conceptual constructs and its respective stages, interpretations and authors that have dealt with it.

Theoretical Background – State of the Field
Page 50
Construct Stages Interpretation Authors
Attitude • Awareness • Interest • Knowledge • Expectation
/Assessment
• Inner positive readiness to buy the product
• Cognitive, affective and conative component
Rogers (1995) Triandis (1971) Wilkie (1994 p. 282-283) Williams (1984)
Intention • Persuasion • Trial /Experience
• Describes an intended behaviour • Antecedents to individual
performance
Ajzen et al. (1980 pp. 53) Kollmann (2004)
Adoption • Decision • Purchase /Adoption • Implementation
• The act of purchasing • Yes-no distinction between adoption
and rejection
Kollmann (2004) Rogers (1983)
Acceptance • Decision to use • Experience
/Assessment • Confirmation
• The act of usage • Describe the extent/intensity of the
usage • No yes-no distinction; span of
usage/continued usage (between high acceptance = tendency for frequent and intensive usage, and low acceptance = tendency for low usage) dynamic construct which over time goes through several phases and covers multidimensional levels of interpretation
Davis (1989) Kollmann (2004)
Diffusion • Adds up the individual adoption decisions over time
• Describes the adoptions from the first to the last customer
Rogers (1983; 1995) Weiber (1992 p. 2-3)
Figure 27: The different stages in the innovation decision process
For clarification of the terms used in the literature and the understanding of the subsequent research project the different terms relevant for the underlying research in the field of adoption and diffusion were defined in this chapter. A table summarizes these conceptual demarcations and introduces some authors that have published work in this field.
The subsequent section introduces the object of diffusion theory, the innovation. The innovation of the underlying research is Application Service Providing.

Theoretical Background – State of the Field
Page 51
2.3.3 OBJECT OF ADOPTION AND DIFFUSION RESEARCH: INNOVATION
The term innovation has been defined in many different ways.
Definition 15: Innovation
Zaltman (1973) defines an innovation as ’any idea, practice, or material artefact perceived to be new by the relevant unit of adoption. The adopting unit can vary from a single individual to a business firm, a city, or a state legislature’.
Rogers and Shoemaker (1971) define an innovation as ’an idea, practice or object perceived as new by the individual. It matters little, as far as human behaviour is concerned, whether or not an idea is objectively new as measured by the lapse of time since its first use or discovery… If the idea seems new and different to the individual, it is an innovation’.
Innovations can be differentiated in market and organisations innovations (Robertson 1971). While some innovations cannot be seen as a market innovation anymore, for several supplier or client companies it can still be an organisation innovation. Thus innovation is not an absolute characteristic of single products or services, but rather it has to be determined in the respective context of use (Pfetsch 1975).
Since the late 1960s a number of studies of innovation adoption and diffusion were conducted; consumer adoption dominated these research activities (Verhoef and Langerak 2001). Nowadays many contemporary studies choose to investigate the factors that influence the acceptance or the rejection of IT innovations (Brancheau and Wetherbe 1990; Taylor and Todd 1995; Agarwal and Prasad 1998; Benbasat and Zmud 1999; Thong 1999). Frequently the focus of these studies is on building and testing adoption models that are inspired by the work of Rogers (1995). Many adoption models have tried to establish relationships between various blocks of explanatory variables and the decision of organizations to accept or reject an innovation (Brancheau and Wetherbe 1990; Chau and Tam 1997; Wierenga and Oude Ophius 1997; Frambach, Barkema et al. 1998; Thong 1999; Van Everdingen and Bamossy 2000).
The most important fact to consider in discussing diffusion theory is that it is not one, well-defined, unified, and comprehensive theory. It is, rather, a large number of theories, drawn from a wide variety of disciplines, each focusing on a different element of the innovation process, combined to create a meta-theory of diffusion (Surry 1997). For this reason the following chapter tries to give an overview on the development and historical routes of diffusion theory.

Theoretical Background – State of the Field
Page 52
2.3.4 DIFFUSION RESEARCH HISTORY
The most likely reason why there is not a unified theory of diffusion is that the study of innovation diffusion is a fairly recent field. Rogers (1995) points out that a 1943 study by Ryan and Gross (1943) at Iowa State University provided the genesis of modern diffusion research. The Ryan and Gross study, from the field of rural sociology, used interviews with adopters of an innovation to examine a number of factors related to adoption. The interview-based methodology used in the Ryan and Gross study remains the predominant diffusion research methodology (Rogers 1995).
A number of researchers from rural sociology and other disciplines have built on Ryan and Gross' work to conduct studies and develop theories related to the diffusion of innovations. Gabriel Tarde was the main European forefather of the diffusion field. He observed certain generalizations about the diffusion of innovations that he called the laws of imitation; today it is called the ‘adoption of an innovation’.
The British and German-Austrian diffusionists were a group of anthropologists that emerged in England and in Germany-Austria in the late nineteenth century. Both tried to explain cultural similarities, and both are considered to be the founders of diffusion research (McCormack Brown 1999). The British diffusionists (Grafton Elliot Smith, W. H. R. Rivers, and William James Perry) felt that most aspects of higher civilization were first developed in Egypt and diffused throughout the world as people came into contact with Egyptians. Parallel evolution in two widely removed areas of the world was extremely rare. People, they felt, are inherently uninventive and prefer to borrow rather than invent. The German-Austrian diffusionists (Fredrick Ratzel, Leo Frobenius, Fritz Graebner, and Vater Wilhelm Schmidt) argued that there were several cultural complexes (not just Egypt) out of which culture was diffused. These were called ‘Kulturkreise’. Like the British diffusionists, they also felt that humans were unimaginative and that cultural traits could diffuse over vast distances (Coe 1999).
Diffusion theory first appeared in the context of the emerging consumer behaviour literature in the mid-1960s (Silk 1966; Arndt 1967). Since that time, a large volume of marketing literature related to the adoption and diffusion of products and services has developed. This literature clearly illustrates that diffusion theory represents an important perspective and that its basic constructs have been of value in conceptualising the information dissemination process (Gatignon and Robertson 1985).
The researcher who has done the most to synthesize the most significant findings and compelling theories related to diffusion of innovations is Everett M. Rogers. Rogers' book ‘Diffusion of Innovations’, first published in 1960, and now in its fifth edition (Rogers 2003), is the closest any researcher has come to presenting a unified theory of diffusion (Surry 1997). Four of the theories discussed by Rogers are among the most widely used theories of diffusion: Innovation Decision Process, Individual Innovativeness, Rate of Adoption, and Perceived Attributes. These theories are discussed in more detail below.

Theoretical Background – State of the Field
Page 53
2.3.5 THE INNOVATION DECISION PROCESS
The process of adoption is determined by product-adopter and environment specific influencing factors (Clement and Litfin 1998). Depending on the parameter values the lapse, result and duration of adoption processes can turn out differently. The adoption process does not obligatorily lead to the adoption of an innovation (Jochims 2002 pp. 87).
The adoption process is a sequence of stages a potential adopter of an innovation passes through before acceptance of a new product, service or idea.
Definition 16: The innovation-decision process
Rogers (1995) defines the innovation-decision process as ‘the process through which an individual-or other decision-making unit-passes from first knowledge of an innovation to forming an attitude toward the innovation to a decision to adopt or reject, to implementation and use of the new idea, and to confirmation of this decision’.
The adoption decision occurs between the initiation and the implementation stage. The confirmation stage signals the acceptance of the innovation. The referring stages are (Zaltman, Duncan et al. 1973; Rogers 1983; Gatignon and Robertson 1985; Pohl 1996; Clement and Litfin 1998; Kollmann 1998):
1. Knowledge: Either of the innovation itself or of the need for something that can solve a particular problem or satisfy a need.
2. Persuasion: The stage at which the individual forms a favourable or unfavourable attitude towards the innovation.
3. Decision: The stage at which the individual engages in activities that leads to a choice to adopt or non-adopt the innovation.
4. Implementation: Putting into practice of the decision stage, actually putting an innovation to use.
5. Confirmation Stage: The individual seeks reinforcement for the innovation decision already made.
These adoption stages described in the literature are important for the understanding of the decision process an individual undergoes. However this theory is not the focus of this research and thus is not examined in detail subsequently.

Theoretical Background – State of the Field
Page 54
2.3.6 INDIVIDUAL INNOVATIVENESS AND ADOPTER CATEGORIES
The Individual Innovativeness theory (Rogers 1995) states that individuals who are predisposed to being innovative will adopt an innovation earlier than those who are less predisposed, thus innovativeness is the degree to which a person’s observed time of adoption occurs relatively earlier than that of other people in his/her social system. Consequently, on the basis of the degree to which an individual is relatively earlier in adopting the new product, adopters can be classified into adopter categories. The development of adopter categories requires determination of the number of adopter categories, the percentage of adopters to include in each category, and a method to define categories (Rogers 1983). The most widely accepted method of adopter categorization is that proposed by Rogers (1983), in which one assumes that the non-cumulative adopter distribution takes the form of a bell-shaped curve. As a result of using two basic statistical parameters of the normal adopter distribution-mean time of adoption (t) and its standard deviation (σ)-one obtains five adopter categories (Mahajan, Muller et al. 1990).
Figure 28: Adoption and diffusion-process
Source: compare Mahajan, Muller et al. (1990) and Rogers (1995)
Innovators Early Adopters
Early Majority
Late Majority
Laggards
Limit of market saturation
Adopters
Cumulated number ofadopters
Time t
Time t
% Adopters 2.5 13.5 34.0 34.0 16.0
Area covered under normal curve
Beyond t-2 σ 2.5
Between t-σ and t-2 σ
Between t and t-σ
Between t and t + σ
Between t + σ

Theoretical Background – State of the Field
Page 55
This empirically observed regularity results from the awareness that an innovation in the stage of market implementation is only adopted by few members of the social system, wherefore on the side of the customers the fear of so called ‘children’s diseases’ or the non-existence of complements can be responsible (Brockhoff 1999). During the lapse of time an increasing number of customers per period adopts the innovation. Due to initial purchases of early adopters now various information about the characteristics of the innovation exist and thus the insecurity concerning the potential benefit of the innovation decreases. This can be seen in the increasing lapse of the diffusion curve. But the growth declines again, as soon as the majority of potential adopters have adopted the innovation. When only few potential adopters remain, the rise of the diffusion curve flattens and approaches the absorption point (the market potential). At this point in time the diffusion is completed.
This common s-shaped lapse of the diffusion process is concretised by the specifics of the respective innovation: thus rise, asymptote, and the position of the inflection point can be different in every single case (Mahajan and Peterson 1985). For example, in the case of a fast diffusion the increase of the diffusion curve in the first market periods can be very steep.
From the description of the diffusion curve it is clear that potential adopters differ in respect of the point of time of adoption. This is ascribed to the specific personal characteristics of the adopters (Rogers 1983). So called ‘Innovators’-members of a population that adopt the innovation already in the launch stage- actively search for information about innovations, which they receive because of their distinctive interpersonal contacts and their strong attention to mass media. They accept a higher degree of insecurity of the characteristics of the innovation and do not base their decision to adopt on the subjective evaluations of other members of their social system. Rather, their behaviour is influenced by the employment of mass media. Decisive for the prompt adoption of an innovation by the innovators is primarily the early awareness over the existence, and the shorter time period in which the decision process from the knowledge-to the decision-stage is progressing.
In contrast, later adopters of an innovation, so called ‘Imitators’ need a stronger and more immediate stimulus to be convinced to adopt an innovation. For this purpose they revert to the experiences of previous adopters within the scope of personal communication. Thus: innovators buy because they are interested in the innovation in a particular way. In contrast, imitators buy primarily because they observe that others buy (Schmalen and Pechtl 1989).
The objective of the identification of adopter categories is to determine different groups of potential adopters, which subsequently can be addressed with differentiated marketing strategies. Because this diffusion process is stimulated by the demand of the innovators, it is important for suppliers to identify these special buyer groups before launching new products of services and to address them through target group specific provisions (Lilien 1983 p. 703). Until now it was not possible to identify universally valid and product independent characteristics of innovators (Fantapie Altobelli 1991 p. 28).
The categorization scheme proposed by Rogers offers several advantages (Mahajan, Muller et al. 1990). First, it is easy to use. Second, because it offers mutually exclusive and exhaustive standardized categories, results can be compared, replicated and generalized across studies. Third, because the underlying diffusion curve is assumed to be normal, continued acceptance of the products can be predicted and linked to the adopter categories.

Theoretical Background – State of the Field
Page 56
Despite these advantages, Rogers’ categorization has potential limitations. First, in spite of its theoretical appeal, the assumption that all new products follow a normal-distribution diffusion pattern is questionable. In most marketing situations, new product adoption patterns are likely to exhibit non-normal adopter distributions. Second, in spite of the method’s simplicity, Rogers provides no empirical or analytical justification of why the size of the adopter categories should be the same for all new products (Mahajan, Muller et al. 1990).
The diffusion lapse and the associated adopter categories, as displayed in Figure 28 are an important theoretical basis for the answering of the first research question in this research project. The considerations described in the above section lead to the estimation of the time lapse of ASP diffusion within the electric utilities sector in Germany and Austria, being able to categorize also the different adopter classes.
2.3.7 PERCEIVED INNOVATION ATTRIBUTES
Besides the identification of adopter categories it is important for suppliers to understand those characteristics of the innovation, which have an influence on the adoption, and thus diffusion of the product in order to be able to control the success of the own innovation by marketing provisions (for an empirical investigation of the influence of product characteristics for the diffusion compare: Baehr-Seppelfricke 1999).
The Theory of Perceived Attributes (Rogers 1995) states that potential adopters judge an innovation based on their perceptions in regard to five attributes of the innovation. These attributes are: Trialability, Observability, Relative Advantage, Complexity, and Compatibility. The theory holds that an innovation will experience an increased rate of diffusion if potential adopters perceive that the innovation:
• Can be tried on a limited basis before adoption (Trialability)
• Offers observable result (Observability)
• Has an advantage relative to other innovations (or the status quo) (Relative Advantage)
• Is not overly complex (Complexity)
• Is compatible with existing practices and values (Compatibility)
These determinants provide the basis for the subsequent hypotheses formulation. For a broader description of the perceived innovation characteristics see chapter 2.4.

Theoretical Background – State of the Field
Page 57
2.3.8 ORGANIZATIONAL VERSUS INDIVIDUAL ADOPTION
Consumer adoption differs from organisational adoption in several ways (Day and Herbig 1990). First, whereas personal characteristics determine the degree of innovativeness of consumers (compare Gatignon and Robertson 1985), organisation size and organisation structure are important determinants of organisational innovativeness (Kennedy 1983). Second, innovation adoption by consumers will be driven primarily by the desire to satisfy individual needs, whereas business firms adopt innovations in order to carry out value-adding activities. Organisations aim to achieve and sustain competitive advantages (Chisnall 1989). Consequently, adoption of innovations by businesses usually involves a long-term commitment with a higher degree of perceived risk involved than in the case of consumer products. Considering these factors mentioned above, findings about consumer markets and individual adoption cannot be generalized directly to business markets and organisational adoption.
Adoption and diffusion of innovations in the business-to-business context can be studied at two levels (Van Everdingen and Wierenga 2001), i.e. the inter-firm level and the intra-firm level. The inter-firm level refers to adoption at the organisational level, which, in principle, has occurred when at least one individual in an organization, regardless of where or in which department, has adopted the innovation. Once an organization has adopted an innovation, the diffusion of the particular innovation across the subsidiaries, departments, and individuals within the company still has to follow, i.e. the process of intra-firm adoption and diffusion.
In order to have a common picture on the term ‘organisation’ it is defined subsequently.
Definition 17: Organization
Zaltman (1973) defines organizations as ‘a social system created for attaining some specific goals through the collective efforts of its members. Its most salient characteristic is its structure that specifies its operation’.
Adoption decisions of electric utility companies are the object of the investigation of the underlying research. Therefore organisational adoption decisions will be examined rather then individual adoption. Intra-firm adoption of innovations is also not the closer focus of this research.

Theoretical Background – State of the Field
Page 58
2.3.9 THE DIFFERENT ADOPTION STAGES AND REJECTION
Writings on the adoption of clothing fashions (Arnould 1989) assert that the diffusion of new products is motivated by the pursuit of social rewards from early adoption behaviour. Early adoption behaviour has social or communicational value to the extent that it is socially visible and associated with a super ordinate group. First, social visibility is necessary so that referents are aware of the behaviour and have the opportunity to decode its meaning. Second, the initial adoption by those in super ordinate groups establishes the social desirability of the behaviour. The adoption is an implied endorsement that positions the new products as a symbol of group affiliation or imbues it with relevant and desirable cultural meanings along dimensions such as power, knowledge, and status (Fisher and Price 1992).
However, most research focuses on the factors that enhance adoption rather than the factors that inhibit it. Based on a study of the adoption of laptop computers by sales force departments, Gatignon und Robertson (1989) concluded that ‘non-adoption is not the mirror image of the adoption decision’.
Still some studies have focused on non-adoption (Stevens, Warren et al. 1989) but the phenomenon is complex, because the reasons for non-adoption may lie at earlier stages of the adoption process (Frambach, Agarwal et al. 2002). Potential adopters may have actively decided to reject the innovation, they may have passively decided to reject, or they may have not progressed through certain stages of the adoption process yet (Nabih, Bloem et al. 1997). As most adoption studies do not follow a process approach, little is known about the factors that affect the process prior to actual adoption (Olshavsky and Spreng 1996). Research in health psychology shows that the decision processes in adopting a certain behaviour is dependent on a person’s decisional balance (Velicer, DiClemente et al. 1985). This refers to the extent to which perceived positive attributes outweigh negative ones. Negative decisional balances in the early stages of the adoption process prevent potential adopters from considering adoption (Prochaska, Velicer et al. 1994). In a study dealing with adoption of medical instruments by hospitals, Meyer and Goes (1988) found that organizations in later stages of the innovation process perceived the innovation as having lower risk and being less complex. Such innovation characteristics are likely to play a more important role in the early stages, whereas perceived relative advantage is more important in later stages (Labay and Kinnear 1981).
For any potential adopter aware of an innovation, consideration of adoption is likely to occur when the innovation is perceived to have some relative advantage over currently available alternatives. In business-to-business markets this value will be more functional and objectively determined than in most consumer markets (Anderson and Narus 1999). As a result business customers in the consideration stage should perceive higher relative advantage of the innovation than their counterparts in the awareness stage. The same will hold for the later stages of the adoption process (Frambach, Agarwal et al. 2002). In accordance with results from behavioural change research the highest level of perceived relative advantage will occur at the adoption stage (e.g. Rakowski, Dube et al. 1992; Rakowski, Fulton et al. 1993). This is also consistent with Meyer and Goes (1988) who find that adopters show higher levels of perceived relative advantage than non-adopters.

Theoretical Background – State of the Field
Page 59
2.3.10 CROSS-COUNTRY ADOPTION
Some studies have examined international new product diffusion (Takada and Jain 1991; Kumar, Ganesh et al. 1998), but still relatively little is known about cross-national differences in the determinants of innovation acceptance. Everdingen and Waarts (2003) add a study to the literature that investigates the role of macro-level variables (national culture) to explain differences in innovation penetration levels and adoption decisions by companies across national cultures. The results of this study indicate variables describing national cultural to have a strong, significant influence on the innovation penetration and adoption. Also other studies of international diffusion patterns show that these processes differ significantly by country (e.g. Kumar, Ganesh et al. 1998).
However, as the focus of the underlying research is on two different countries that do have very similar cultures, the same language and similar mentalities the questions of cross-country adoption are not investigated in more depth in this work.
2.3.11 FUZZY THEORY IN ADOPTION
Fuzzy set theory is the extension of conventional (crisp) set theory. It handles the concept of partial truth-truth values between one (completely true) and zero (completely false). It was introduced in the 1960s as a way of explaining uncertainty in data structures (Zadeh 1965) as a mean to model the vagueness and ambiguity in complex systems. It has been used in a wide range of areas (Zimmermann 1993). Example areas include banking (Chen and Chiou 1999), computer science and engineering (Patyra 1996 for hardware implementations compare pp. 141 and for hybrid systems and applications compare pp. 265), decision support (Felix 1997), productivity diagnosis (Chen, Koa et al. 1996), etc.
Social science concepts, due to the specific concept formation process, are in principle more vague than natural science concepts. To that extent the problem of vagueness is particularly important in the social sciences and it is necessary to draw upon suitable formalized theories. In setting up formalized theories in social sciences there are three possibilities (Menges and Skala 1974):
1. Fall back on classical logic and set theory, having in mind that a very strong idealization has been made and therefore it is hardly to be expected that this theory describes reality
2. Use probabilistic concepts; or
3. Accept vague concepts as inherent property of social sciences and try to modify set theory or rather the underlying logic in order to be able to handle vague concepts appropriately.
The third possibility was mentioned by Rosser and Turquette (1952) and has been advocated especially by Zadeh (1965) and Goguen (1967) who introduced the notions of a ‘fuzzy set’ and an ‘L-fuzzy set’ respectively.

Theoretical Background – State of the Field
Page 60
The usual procedure in setting up formalized theories is to eliminate (or reduce) vagueness in order to make classical logic applicable. This is done mostly by more or less arbitrary auxiliary definitions, which can be understood as idealizations (e.g. to define X as successful if it contributes to turnover more than Y). It is widely accepted that the reason why formalized theories in social sciences are often so sterile is due to the fact that they are patterned after the natural social sciences where classical logic was successfully applied. Therefore, the main problem in the social sciences is not how to avoid vagueness but rather how to treat and formalize it in a satisfactory manner (Menges and Skala 1974).
Due to the above stated reasons, fuzzy sets have also been used in marketing. For instance, an empirical study clustered individuals, brands and product usage situations by using fuzzy and non-fuzzy clustering methods and showed that fuzzy clustering provided more insights than non-fuzzy clustering in terms of market and segment information (Hruschka 1986).
In order to illustrate the concept of fuzziness and the inherent possibilities, two figures (Figure 29 and Figure 30) are given. The first figure displays an exact set to characterize body height, whereas the second figure displays the same measures summarized in a fuzzy set.
Figure 29: Exact set to characterize body height
Source: Weseslindtner (1993)
Figure 30: Fuzzy set to characterize body height
Source: Weseslindtner (1993)
170 180 190 Seize X in Centimeter
µ 1 0
µtall
Body height is tall
160 170 180 190 Seize X in Centimeter
Small Medium Tall
µtall
Linguistic: comparatively tall,
less, medium
µ
1
0

Theoretical Background – State of the Field
Page 61
As can be seen from the statements above, the linguistic term intention to adoption is very hard to demarcate. It is clear that a company that uses the service against payment has adopted the technology. But what about those companies that intend to use the service after six months, after one year, etc. It is not clear whether they will decide to actually use ASP after the end of this period or whether they will decide to use other technologies. In order to meet this problem the dependent variable of this research ‘intention to adopt’ is fuzzy. This means that the respondents of the quantitative research are to be arranged on a continuum between to extremes, one extreme being ‘already adopted’ and the other ‘no intention to adopt’. The following figure shows the fuzzy classes of the degree of adoption accepted within this research.
Figure 31: Fuzzy classes of adoption accepted in this research
2.3.12 THE ASSIMILATION GAP CONCEPT
Widespread acquisition of a technology is not necessarily followed by widespread deployment and use, as shown by the assimilation gap in Figure 32. Traditionally, innovation attributes such as relative advantage, complexity, and compatibility are viewed as the determinants of the rate and level of diffusion. Fichman and Kemerer (1999) propose that acquisition and deployment have different drivers, even though they are related processes. Acquisition is driven by the expectation of future benefits owing to increasing returns, but knowledge barriers impede deployment.
Definition 18: Assimilation Gap
Fichman and Kemerer (1999) define an assimilation gap as ‘the difference between the pattern of cumulative acquisitions and cumulative deployments of an innovation across a population of potential adopters.’
The operational measure of the assimilation gap concept proposed here is the area between the cumulative acquisition and cumulative deployment curves at time t as a proportion of the area under the cumulative acquisition curve at time t.
Already adopted
Intention in 6 month
Intention in 1 year
Intention within 2 years
Intention after 2 years
Degree of adoption intention
Degree of adoption
100 % membership in the class
‘adopter’
0 %
No intention

Theoretical Background – State of the Field
Page 62
Figure 32: The assimilation gap concept
Source: Fichman and Kemerer (1999)
When a pronounced assimilation gap exists, the common practice of using cumulative first purchases or acquisitions as the basis for diffusion modelling presents an illusory picture of the diffusion process-leading to potentially erroneous judgements about the robustness of the diffusion process already observed, and the technology’s future prospect (Fichman and Kemerer 1999).
To address the assimilation gap via organisational learning (or process management) implies that the organization recognizes the difference between acquiring and deploying a technology and is proactive in tracking and addressing deployment issues. This means understanding the factors influencing returns to adoption (such as network externalities, learning-by-doing, and technological interrelatedness) and knowledge barriers (such as complexity and scaling).
The main objective of the underlying research project is to study the adoption and diffusion of an innovation. Thus the field of examination is the inter-firm level. The problem related to intra-firm diffusion and the assimilation gap is not object of this investigation.
2.3.13 SUMMARY OF THEORETICAL APPROACH
This chapter summarizes important theories related to the adoption and diffusion of innovations found in the literature. First, important demarcations of conceptual terms as ‘attitude’, ‘intention’, ‘adoption’ and ‘acceptance’ were given. This is a vital pre-condition for the understanding of the subsequent considerations in this research. Afterwards the term ‘innovation’ has been defined. The history of adoption and diffusion research was briefly presented, followed by the description of the innovation decision process. The presentation of the process stages provides a basis for the understanding of the adoption process, however this theory does not find any further attention in the underlying research.
100%
Cum
ulat
ive
Adop
tion
Time
Acquisition
Deployment
Assimilation Gap

Theoretical Background – State of the Field
Page 63
In order to address the first research question formulated herewith, the theory of individual innovativeness and adopter categories was depicted subsequently. The next section containing the perceived innovation attributes lays the basis for the formulation of the hypotheses in this research and is described in more depth in the section to come. As this work focuses on the adoption of innovations by organizations a brief demarcation between individual and organisational adoption is given. The topic of cross-country adoption is addressed in brief, as the focus of investigation here are two countries, Austria and Germany. The fundamentals of fuzzy theory are given because fuzzy adoption classes are allowed. The chapter concludes with the description of the assimilation gap concept, which again shows the differences of ‘adoption’ and ‘acceptance’ and has important implications for both, practitioners and researchers. However, the assimilation gap theory is not the object of closer investigation here.
2.4 THEORETICAL FRAMEWORK
2.4.1 GENERAL CONSIDERATIONS
This chapter presents the findings of the literature review on factors influencing adoption decisions. It compares these perceptions with the results of the qualitative study (c.f. chapter 5), thus enabling to identify the determinants being relevant for adoption decisions concerning ASP within electric utilities.
The central question of the organisational adoption debate is: What factors influence the adoption of new technologies by firms operating in a market? Not only does the point in time vary, when potential adopters register an innovation, but also the readiness to adopt the product or service differs within the members of a social system, some members will even reject the innovation. Consequently, the adoption processes begins at different points, lasts different time spans, and ends with different outcomes.
In the diffusion and adoption literature the discrimination between characteristics of the innovation itself, characteristics of the company or individual to adopt, and environment-related characteristics is undertaken. It should be noted that it is not possible to allocate the single factors exactly because all three above-mentioned areas determine the perception. Nevertheless, it seems reasonable to systematize the influencing parameters according to these three areas because dominant spheres of influence can be identified.
At the heart of the most commonly used framework in the adoption and diffusion literature are the perceived characteristics of the innovation. In addition to organisational adopter characteristics and individual adopter characteristics, these factors drive the adoption process and are, in turn, influenced by external variables (i.e., the potential adopter’s environment.)

Theoretical Background – State of the Field
Page 64
The perceived innovation characteristics can be considered as cognitive indices (or beliefs) reflected in an attitude towards the innovation (Rosenberg and Howland 1960; Le Bon and Merunka 1998 pp. 6). Conceptual and empirical evidence is given, that in organisational settings, attitudinal components mediate the influence of external variables, such as motivation, on behavioural intentions (Le Bon and Merunka 1998 pp. 6). Similarly, attitude theory e. g. Triandis (Triandis 1971) or Fishbein and Ajzen (1975) hypothesize that beliefs mediate the impact of external influences, such as persuasive communication and/or active participation on decisions. Based on this, Frambach and Schillewaert (2002) propose that perceived innovation characteristics mediate the supplier, social network, and other environmental influences on adoption behaviour.
The framework is consistent with classical models of organisational buying behaviour (Webster and Wind 1972; Sheth 1973; Choffray and Lilien 1980). These models include individual characteristics, interpersonal and organisational factors, as important variables affecting the organisational buying decision process.
2.4.2 PERCEIVED INNOVATION CHARACTERISTICS
Perceptions of the innovation characteristics are generally hypothesized to influence a company’s adoption decision (Robertson and Gatignon 1986; Rogers 1995).
It is important to note that the objective characteristics of a product are not decisive, but the perceived qualities of the individual, when making adoption-decisions. The perceptions of an innovation by members of an organization’s decision-making unit affect their evaluation of and likeliness to adopt a new product. Generally, a company’s adoption decision will be made on the basis of comparing the expected situation after adoption to the current situation or available alternatives. The value of an innovation - that is the total additional functionality or performance of the innovation for the organization in terms of increased revenues - will be considered together with the costs of adoption, to make the adoption decisions (Anderson and Thomson 2000).
Innovation characteristics that influence the adoption decision according to the literature review include relative advantage, perceived compatibility, complexity, observability, and trialability (in the context of this thesis, not the ability to try the innovation is hypothesized to influence the adoption decision, but rather the intention of the individual to try the innovation “intention to try”).
2.4.2.1 RELATIVE (DIS-) ADVANTAGE
The construct ‘relative advantage’ is one of the best predictors for the rate of adoption of innovations (Tornatzky and Klein 1982; Rogers 1983; Robinson 1990). Especially in industrial markets, organizations will seek increased efficiency or effectiveness of their activities by adopting an innovation (Webster and Wind 1972; Chisnall 1989).
Definition 19: Relative Advantage
Relative advantage is the degree to which an innovation is perceived as being better than alternatives to that innovation used before or other innovative products (Robinson 1990; Mansfield 1993).

Theoretical Background – State of the Field
Page 65
The degree of relative advantage can be expressed as economic profitability, social prestige, or other benefits. The nature of the innovation determines what specific type of relative advantage (such as economic, social, etc.) is important to adopters, although the characteristics of the potential adopters also affects which sub-dimensions of relative advantage are most important (Robinson 1990; Mansfield 1993). Those dimensions explaining the relative perceived advantage can also be seen from the opposite site and can turn into perceived relative disadvantage or uncertainty. For example the perceived high degree of data security can lead to improved positive attitude towards ASP, but at the same time a perceived low degree of data security can lead to rather negative attitude towards ASP. Therefore also a short definition of uncertainty is given below.
Definition 20: Uncertainty
Uncertainty is the degree to which the results of using an innovation are insecure, the results are less predictable due to absence of experience with the innovation. Adopting an innovation is risky and the outcomes can be different according the special circumstances of the adopting unit (Ostlund 1974; Batz, Janssen et al. 2003).
Figure 33: Literature overview-perceived innovation characteristics
Source: Following Litfin (2000 p. 26) and Frambach and Schillewaert (2002)
Perceived Innovation characteristics
Compat-ibility
Perceived degree of
compliance with values, experiences
and requirements
(Holak 1988)
Positive
Complexity
Perceived degree of difficulty
Determined
by the expense for learning how
to use the innovation
(Rogers 1995) (Batz,
Janssen et al. 2003)
Negative
Trialability
Perceived degree of
risk-reduction by testing the
innovation on limited basis
(Rogers 1995)
(Mathur 1998)
Positive
Observ-ability
Perceived degree of ability to
communicate the
characteristics of the
innovation
(Rogers 1995)
Positive
Relative dis-advantage
Perceived degree of risk resp.
insecurity of non-
achievement of buying objectives
(Ostlund 1974) (Batz,
Janssen et al. 2003)
Negative
Probability of innovation adoption
Relative or economic advantage
Perceived degree of
advantage of an innovation
Determined by product attributes,
applications, and aspects of statues
(Robinson 1990)
(Mansfield 1993)
Positive
Selected research
Reported relationship

Theoretical Background – State of the Field
Page 66
Results of the preliminary qualitative study show that for this research relative (dis-) advantage has the following parameter values:
• Cost
• Know-how
• Improved Service
• Accuracy
• Competence
• Data Security
• Trust
• Dependency
• Transparency
On the basis of the literature research and the qualitative study the following hypotheses (hypotheses 1a-1j) in the context of relative (dis-) advantage as a determinant influencing the adoption decision of an electric utility concerning ASP can be formulated:
Hypotheses 1a: Decreased perceived cost related to ASP leads to increased positive attitude towards forecasting applications via ASP.
Hypotheses 1b: Decreased perceived cost related to ASP leads to positive intention to adopt forecasting applications via ASP.
Hypotheses 1c: Perceived gains in know-how due to the use of ASP leads to increased positive attitude towards forecasting applications via ASP.
Hypotheses 1d: Perceived improved service due to the use of ASP leads to increased positive attitude towards forecasting applications via ASP.
Hypotheses 1e: Increased perceived forecasting accuracy due to the use of ASP leads to increased positive attitude towards forecasting applications via ASP.
Hypotheses 1f: Perceived improved competence due to the use of ASP leads to increased positive attitude towards forecasting applications via ASP.
Hypotheses 1g: Increased perceived data security related to the use of ASP leads to increased positive attitude towards forecasting applications via ASP.
Hypotheses 1h: Increased perceived trust in Application Service Providers leads to increased positive attitude towards forecasting applications via ASP.
Hypotheses 1i: Increased perceived dependency on the provider of ASP leads to decreased positive attitude towards forecasting applications via ASP.
Hypotheses 1j: Increased perceived transparency due to the use of ASP leads to increased positive attitude towards forecasting applications via ASP.

Theoretical Background – State of the Field
Page 67
2.4.2.2 COMPATIBILITY
For software innovations it is especially important that they fit with the most commonly installed hardware platform and operating systems (Thong 1999). Especially for Application Service Providing the provision of interfaces to existing applications is a vital task.
Definition 21: Compatibility
Compatibility is the degree to which an innovation is perceived as consistent with existing values, past experiences, and needs of potential adopters. An innovation can be compatible or incompatible with socio-cultural values and beliefs, with previously introduced ideas, or with client needs for the innovation. (Holak 1988)
Compatibility was not identified as a relevant factor influencing the decision to adopt or reject ASP within the qualitative study. Therefore compatibility is not included in the research model.
2.4.2.3 COMPLEXITY
The degree of complexity can be determined by the expense for learning how to use the innovation. This construct, the Ease of Use of an innovation, is also used in the Technology Acceptance model proposed by Davis (1989; 1996).
Definition 22: Complexity
Complexity is the degree to which an innovation is perceived as relatively difficult to understand and use (Rogers 1995; Batz, Janssen et al. 2003).
Within the qualitative survey, complexity could not be identified as a factor influencing the decision to adopt or reject ASP. For that reason this determinant is not considered in the research model.
2.4.2.4 OBSERVABILITY
The results of some ideas are easily observed and communicated to others, whereas some innovations are difficult to observe and to describe to others.
Definition 23: Complexity
‘Observability is the degree to which the results of an innovation are visible to others.’ (Rogers 1995).
Observability did not prove to be a relevant factor influencing adoption intentions towards ASP within the qualitative study and was therefore not included in the research model.

Theoretical Background – State of the Field
Page 68
2.4.3 ENVIRONMENT
Empirical studies in the industrial organization literature corroborate the hypothesis that the higher the degree of competitiveness and intensity of innovative activities in an industry, the more likely organizations in that industry are to adopt an innovation (Gatignon and Robertson 1989; Frambach, Barkema et al. 1998; Waarts, van Everdingen et al. 2002).
The environment is recognized as one of the important contextual factors that influences innovation adoption (Gatignon and Robertson 1989; Damanpour and Gopalakrishnan 1998) and environmental change is often seen as a driving force for organisational innovation adoption (Burns and Stalker 1961 pp. 52; Damanpour 1991).
Intense market competition appears to stimulate the rapid diffusion of an innovation. Market and environmental factors, such as the degree of competition, the stability of demand for products, and the degree of customer loyalty, cannot be controlled by the management of the organization, but can affect the way the business is conducted. From an IT viewpoint, as companies are facing an uncertain market environment, the competitive atmosphere demands more responsiveness and flexibility in IT support. Non-adoption of an innovation that is adopted by others in highly competitive markets may result in competitive disadvantage. This depends on the strategic importance of the innovation and its potential implications for the effectiveness and efficiency of the firm’s activities (Frambach, Agarwal et al. 2002).
Katz and Shapiro (1985) found that there are many innovations for which an adopter’s utility increases with the number of other adopters, which they called the network externality concept. Soon after the innovation is introduced, technical and commercial features of the innovation are not well established and are not clearly understood. As more firms adopt the innovation, adoption costs tend to decline, economies of scale appear more attainable, suppliers are more willing to invest in complementary parts, and distributors find it more attractive to carry the new items (Farrell and Saloner 1985). The fact that a large number of organizations has adopted a new technology can help legitimise its use and facilitate the adoption of the innovation by others (Abrahamson 1991). Once legitimacy concerns are overcome and the innovation proves to be successful, the propensity of an individual firm to adopt the innovation increases as the number of adopting organizations increases. Assuming that the innovation proves successful, most organizations will eventually adopt the innovation (Boeker and Huo 1998).
Additionally the results of the preliminary qualitative study show that for the underlying research ‘environment’ has the following parameter value:
• Competition
• Expected ASP diffusion
Due to the literature review and the qualitative study the following hypotheses (hypotheses 2a-2b) concerning the influence of the environmental context on ASP adoption decisions can be formulated:
Hypotheses 2a: An increased perceived degree of competition leads to increased positive attitude towards forecasting applications via ASP.

Theoretical Background – State of the Field
Page 69
Hypotheses 2b: An increased perceived degree of expected ASP diffusion leads to increased positive attitude towards forecasting applications via ASP.
2.4.4 SOCIAL INFLUENCE
The following characteristics, hypothesized to have an influence on the adoption behaviour, ‘Social Influence’ and ‘Values and Beliefs’ were included in this research due to the results of discussions with peer researchers. After scientific interexchange with leading Senior Researchers at the field of Innovation adoption and diffusion, those two independent variables were included in the research model, and thus subsequently examined in the empirical study.29
But also literature assists this point of view. Already Zaltman et al. (1973) and later also Valente (1995) state that the interaction between members of a social system (network participation) can also enhance the speed and rate of the adoption and diffusion process. The participation of organization members in informal networks facilitates the spread of information about an innovation, which may positively influence the probability of an organization adopting the innovation. Such an informal network may either connect organizations within the industry or organizations in different industries. Several studies have shown that higher levels of network participation are associated with a higher rates of awareness of an innovation, and thus with a higher likelihood of adopting it (Abrahamson and Rosenkopf 1997).
In Theory of Reasoned Action, a person’s behavioural intentions are influenced by subjective norms as well as attitude. Innovation diffusion research also suggests that user adoption decisions are influenced by a social system beyond and individual’s decision style and the characteristics of the IT (Hsu and Lu 2003).
From social psychological and economic perspectives, two types of social influence are distinguished: social norms and critical mass. Theories of conformity in social psychological have suggested that group members tend to comply with the group norm, and moreover that these in turn influence the perceptions and behaviour of members (Lascu and Zinkhan 1999). In economics, the effects of network externality often form perceived critical mass, in turn influencing technology adoption. Social norms consist of two distinct influences (Deutsch and Gerard 1995):
• Informational Influence occurs when a user accepts information obtained from other users as evidence about reality, and
• Normative Influence occurs when a person conforms to the expectations of others to obtain a reward or avoid punishment.
29 Special thanks to Prof. Yvonne van Everdingen from the Erasmus Universiteit in Rotterdam and Prof. Ruud Frambach from the Vrije Universiteit in Amsterdam for their contribution.

Theoretical Background – State of the Field
Page 70
These two kinds of influence generally operate through three distinct processes-internalisation, identification, and compliance. Informational Influence is an internalisation process, which occurs when a user perceives information as enhancing his or her knowledge above that of reference groups (Kelman 1961). Normative influence is a form of identification and compliance. Identification occurs when a user adopts an opinion held by others because he or she is concerned with defining himself or herself as related to the group. Compliance occurs when a user conforms to the expectations of another to receive a reward or avoid rejection and hostility.
Reference group theory: Reference group theory indicates that individuals look for guidance from opinion leaders or from a group with appropriate expertise. Accordingly, individuals may develop values and standards for their behaviour by referring to information, normative practices and value expressions of a group or another individual (Park and Lessig 1977; Bearden and Etzel 1982).
Group influence processes: This theory proposes that groups influence an individual. An individual attempts to adopt the behavioural norms of the group to strengthen relationships with its members, since he or she desires to be closely identified with the group (Goodwin 1987).
Social exchange theory: Social exchange theory views interpersonal interactions from a cost-benefit perspective. According to this theory, individuals usually expect reciprocal benefits, such as personal affection, trust, gratitude, and economic return, when they act according to social norms (Hsu and Lu 2003).
Expert discussion suggested that for the underlying research the parameter values for social influence are:
• Image
• Contact
The following hypotheses (hypotheses 3a-3b) in the context of social influence effecting electric utilities’ adoption decisions concerning ASP can be formulated:
Hypotheses 3a: Increased contact to other members of the industry leads to increased positive attitude towards forecasting applications via ASP.
Hypotheses 3b: An increased perceived positive image due to the use of ASP leads to increased positive attitude towards forecasting applications via ASP.

Theoretical Background – State of the Field
Page 71
Figure 34: Literature overview-competition and social influence characteristics
2.4.5 ORGANIZATIONAL ADOPTER RELATED CHARACTERISTICS
Organizational facilitators are the equivalent of supplier marketing activities in the organization adoption model. Several studies indicate that individual usage of innovations not only depend upon attitudes but also on management strategies, policies, and actions (Lucas 1978; Ives and Olson 1984; Leonard-Barton and Deschamps 1988).
For an overview of the variables proposed to influence the decision to adopt/not adopt at the organisational level and the decision maker level see Figure 35.
2.4.5.1 RECEPTIVENESS/INNOVATIVENESS
The receptiveness of an organization toward new ideas is also a characteristic that encourages innovation adoption (Baldwin and Scott 1991).
Probability of innovation adoption
Social Influence
Interaction between members of a social
system
(Valente 1995) (Zaltman, Duncan et
al. 1973) (Abrahamson and Rosenkopf 1997)
Positive
Competition
Perceived degree of competition in the
industry
(Frambach, Barkema et al. 1998)
(Gatignon, Eliashberg et al.
1989) (Waarts, van
Everdingen et al. 2002)
Positive
Selected research
Reported relationship
Selected research
Reported relationship

Theoretical Background – State of the Field
Page 72
Innovativeness has been conceptualised at a higher level of abstraction, as a persistent personal predisposition to innovate (Schillewaert, Ahearne et al. 2000 p. 8). This perspective recognizes that complex influences and communication processes (e.g., marketing and interpersonal contact) within a social system may intervene and determine a unit’s final adoption behaviour. In other words, people high in innovativeness might not always be among the first to actually adopt an innovation because of these intervening factors. This notion of innovativeness has gained wide acceptance in consumer marketing research in terms of explaining the adoption of innovations (Midgley and Dowling 1978; Hirschman 1980; Midgley 1983; Gatignon and Robertson 1985; Venkatraman and Price 1990; Steenkamp, Hofstede et al. 1999). This system openness, also often referred to as ‘Cosmopolitanism’ refers to an external rather than an internal (local) orientation, and increases access to new information, which encourages a more rapid diffusion process (Robertson and Gatignon 1986). This has been found at the individual level (Gatignon and Robertson 1985; Rogers 1995), at the organisational level (Ozanne and Churchill Jr. 1971; Kimberly 1978), at the industry level (Robertson and Gatignon 1986) and even at the country level (Gatignon, Eliashberg et al. 1989).
Receptiveness/innovativeness was not identified as a relevant factor influencing the decision to adopt or reject ASP within the qualitative preliminary study. Therefore it is not included in the revised research model.
2.4.5.2 STRATEGY
A company’s strategy (Zaltman, Duncan et al. 1973) may either encourage or discourage the acceptance of new ideas and products within the organization.
The results of the preliminary qualitative study show that for the underlying research the company strategy seems to be an important influencing factor.
Application Importance
Outsourcing Strategy
Subsequently the following hypotheses can be formulated:
Hypotheses 4a: An increased importance of the application in question for the company leads to increased positive attitude towards forecasting applications via ASP.
Hypotheses 4b: An increased tendency to outsourcing leads to increased positive attitude towards forecasting applications via ASP.
2.4.5.3 ORGANIZATION SIZE
Chau and Tam (2000) found that the size of an organization has the largest impact on the decision-making process, whether to adopt or to not adopt an innovation. It is generally assumed that bigger firms lead the innovation and diffusion processes due to the existence of economies of scale and scope in R&D activities and in the application of their results (Buzzacchi, Colombo et al. 1995). Given that large firms have a larger volume of sales than their smaller counterparts, they are supposed to be able to spread the fixed cost invested in innovation over a higher number of units (Cohen and Levin 1989).

Theoretical Background – State of the Field
Page 73
Another argument focuses on the existence of capital market imperfections to justify the proposed positive effect. If the availability of internal funds is higher in bigger firms they should be able to finance investment associated with innovation and diffusion processes and engage in these activities. A similar argument is the one that points to the fact that more profitable entities are able to secure the stable need of funds required. Other authors suggest the idea that large companies are more likely to possess the specialized complementary assets required for the commercial success of innovations (Buzzacchi, Colombo et al. 1995).
Counter-arguments focus on the loss of managerial control in large firms (Cohen and Levin 1989) and the fact that they may suffer from what has been termed structural inertia (Crozier 1979). This would make bigger firms the slowest at diffusing the new technology. The empirical evidence for the case of the diffusion of new technologies tends to confirm a positive effect on size (Kennedy 1983; Rose and Joskow 1990; Buzzacchi, Colombo et al. 1995; Dewan, Michael et al. 1998; Frambach, Barkema et al. 1998; Thong 1999). ASP seems to be an especially interesting option for small and medium sized companies.
Therefore the positive influence of decreasing firm size is assumed in the underlying research and thus the hypotheses are formulated as follows:
Hypotheses 4c: Decreasing firm size leads to increased positive attitude towards forecasting applications via ASP.
Hypotheses 4d: Decreasing firm size leads to positive intention to adopt forecasting applications via ASP.
Hypotheses 4e: Decreasing firm size leads to positive intention to adopt forecasting applications via ASP.
2.4.6 INDIVIDUAL ADOPTER RELATED CHARACTERISTICS
2.4.6.1 AGE
The age of the decision makers and/or the organization may (negatively) influence the degree to which new ideas and products are welcomed by the company (Lancaster and Taylor 1988 pp. 35; Litfin 2000).
Age was not identified as a relevant factor influencing the decision to adopt or reject ASP within the qualitative preliminary study. Therefore age is not included in the revised research model.
2.4.6.2 GENDER
It is proposed in the literature that men tend to favour innovations because of their affinity to engineering in contrast to woman (Litfin 2000 pp. 35).
The results of the qualitative survey indicate that gender is not a relevant factor influencing adoption intentions towards ASP. For this reason gender is not included in the revised research model.

Theoretical Background – State of the Field
Page 74
2.4.6.3 EDUCATION
Litfin (2000 pp. 35) assumes that with increasing education it is reasonable to have a higher problem solving capability. Balancing advantages and disadvantages of an innovation occurs faster and more thoroughly because the potential adopter can penetrate even complex circumstances more easily. The same is true for the required learning processes after the decision to adopt in order to use the innovation.
Education is not included in the research model, as it did not prove to be a factor influencing adoption decisions during the qualitative study.
Figure 35: Literature overview-adopter related characteristics
Probability of innovation adoption
Adopter related characteristics
Receptive-ness
Susceptibility of the
organization to new ideas
(Baldwin and Scott 1991)
Positive
Strategy
Decision making
structure and organization structure – degree of
centralisation
(Robertson and Wind
1980) (Zaltman,
Duncan et al. 1973)
Negative
Age
Age of the decision maker
(Lancaster and Taylor
1988) (Litfin 2000)
Negative
Gender
Gender of the decision
maker
(Litfin 2000)
Positive when male
Education
Level of education of the decision
maker
(Litfin 2000)
Positive
Organi-sation size
Size of the organization
(Chau and Tam 2000; Litfin 2000) (Buzzacchi, Colombo et
al. 1995) (Cohen and Levin 1989) (Rose and
Joskow 1990)
Indifferent
Organizational level Decision-maker level
Network partici-pation
Interaction between
members of a social system
(Zaltman, Duncan et al.
1973)
Positive
Selected research
Reported relationship

Theoretical Background – State of the Field
Page 75
2.4.7 ATTITUDE
A recurrent topic in models explaining individual acceptance of innovations is that acceptance is based on perceived beliefs and affects held towards the innovation in question (Tornatzky and Klein 1982; Davis, Bagozzi et al. 1989). These cognitive beliefs and affects are reflected in an individual’s attitude towards a particular innovation (Rosenberg and Howland 1960; Triandis 1971; Le Bon and Merunka 1998 pp. 6). Fishbein and Ajzen’s (1975) theory of reasoned action is a useful model for explaining individual acceptance behaviour. In the information systems literature, the theory was successfully used to develop a model of technology acceptance (TAM) (Davis, Bagozzi et al. 1989) and many follow-up studies have been reported (Straub, Keil et al. 1997; Doll, Hendrickson et al. 1998; Dishaw and Strong 1999; Lederer, Maupin et al. 2000; Roberts and Henderson 2000; Venkatesh and Davis 2000; Moon and Kim 2001; Hsu and Lu 2003; Legris, Ingham et al. 2003). The model posits that the beliefs, ‘perceived usefulness’ and ‘perceived ease of use’, and an individual’s ‘affects’ are central to computer acceptance (Davis, Bagozzi et al. 1989). These beliefs are similar to those proposed in the innovation adoption literature discussed above (Moore and Benbasat 1991).
Attitudes can change and be influenced and there is evidence, as already noted, that a person’s attitudes mediate the influence of external variables and stimuli. For instance the technology acceptance model hypothesizes that the beliefs are affected by external influences (Davis, Bagozzi et al. 1989). Also research in the innovation adoption field uses attitude as a moderating variable (Frambach and Schillewaert 2002), hypothesizing that independent variables play an important role in forming an attitude toward the innovation in question (Van Everdingen and Bamossy 2000).
TRA suggests that the best predictor of adoption (or continued use) behaviour is intention to adopt (or continue to use) the IT (behavioural intention) (Ajzen and Fishbein 1980 pp. 5). An individual's intention to adopt (or continue to use) the IT is determined by two basic factors: one reflecting personal interests and one reflecting social influence. The personal factor, attitude toward adopting (or continuing to use) the IT, reflects the individual's positive and negative evaluations of performing the behaviour. The social influence factor, subjective norm, refers to the individual's perceptions of the social pressures to adopt or not adopt (continue using or stop using) the IT.
Therefore in the underlying research the variable attitude is hypothesized to moderate between the independent variables and the intention to adopt.
Hypotheses 5a Increased positive attitude towards forecasting applications via ASP leads to positive intention to adopt forecasting applications via ASP.
Hypotheses 5b Increased positive attitude towards forecasting applications via ASP leads to positive intention to try forecasting applications via ASP.

Theoretical Background – State of the Field
Page 76
2.4.8 INTENTION TO TRY (TRIALABILITY)
The author of the underlying research project furthermore hypothesizes that a potential adopters intention to try or test an ASP does have a significant influence on the individual’s intention to adopt ASP.
New ideas that can be tried are generally adopted more rapidly than innovations that are not divisible. The personnel experimenting with can give an idea to the potential adopter of the nature of the innovation, how and under which circumstances it can work, and whether it is useful for the potential adopter or not (Rogers 1995; Mathur 1998). The innovation may be offered on trial for a certain period of time (Fisher and Price 1992; Ram and Jung 1994) or the supplier may absorb some of the major risks of adoption by offering the potential adopters the innovation at a low introduction price (Kotler 1991 pp. 161). In high technology markets, this may even be necessary to reduce the risks associated with early adoption of an innovation and thus gain market acceptance.
Definition 24: Trialability
Trialability is the degree to which an innovation may be experimented with on a limited basis. (Rogers 1995; Mathur 1998)
Therefore the following hypotheses is formulated:
Hypotheses 6 Increased intention to try forecasting applications via ASP leads to positive intention to adopt forecasting applications via ASP.

Theoretical Background – State of the Field
Page 77
2.5 HYPOTHESES GENERATED
Perceived Innovation Characteristics
Hypotheses 1a: Decreased perceived cost related to ASP leads to increased positive attitude towards forecasting applications via ASP.
Hypotheses 1b: Decreased perceived cost related to ASP leads to positive intention to adopt forecasting applications via ASP.
Hypotheses 1c: Perceived gains in know-how due to the use of ASP leads to increased positive attitude towards forecasting applications via ASP.
Hypotheses 1d: Perceived improved service due to the use of ASP leads to increased positive attitude towards forecasting applications via ASP.
Hypotheses 1e: Increased perceived forecasting accuracy due to the use of ASP leads to increased positive attitude towards forecasting applications via ASP.
Hypotheses 1f: Perceived improved competence due to the use of ASP leads to increased positive attitude towards forecasting applications via ASP.
Hypotheses 1g: Increased perceived data security related to the use of ASP leads to increased positive attitude towards forecasting applications via ASP.
Hypotheses 1h: Increased perceived trust in Application Service Providers leads to increased positive attitude towards forecasting applications via ASP.
Hypotheses 1i: Increased perceived dependency on the provider of ASP leads to decreased positive attitude towards forecasting applications via ASP.
Hypotheses 1j: Increased perceived transparency due to the use of ASP leads to increased positive attitude towards forecasting applications via ASP.
Environment characteristics
Hypotheses 2a: An increased perceived degree of competition leads to increased positive attitude towards forecasting applications via ASP.
Hypotheses 2b: An increased perceived degree of expected ASP diffusion leads to increased positive attitude towards forecasting applications via ASP.
Social Influence
Hypotheses 3a: Increased contact to other members of the industry leads to increased positive attitude towards forecasting applications via ASP.
Hypotheses 3b: An increased perceived positive image due to the use of ASP leads to increased positive attitude towards forecasting applications via ASP.
Company characteristics
Hypotheses 4a: An increased importance of the application in question for the company leads

Theoretical Background – State of the Field
Page 78
to increased positive the attitude towards forecasting applications via ASP.
Hypotheses 4b: An increased tendency to outsourcing leads to increased positive attitude towards forecasting applications via ASP.
Hypotheses 4c: Decreasing firm size leads to increased positive attitude towards forecasting applications via ASP.
Hypotheses 4d: Decreasing firm size leads to positive intention to adopt forecasting applications via ASP.
Hypotheses 4e: Decreasing firm size leads to positive intention to try forecasting applications via ASP.
Attitude
Hypotheses 5a: Increased positive attitude towards forecasting applications via ASP leads to a positive intention to adopt forecasting applications via ASP.
Hypotheses 5b: Increased positive attitude towards forecasting applications via ASP leads to positive intention to try forecasting applications via ASP.
Intention to try
Hypotheses 6: Increased intention to try forecasting applications via ASP leads to positive intention to adopt forecasting applications via ASP.
Figure 36: List of hypotheses
Based on the results of the previous studies as included and discussed in chapter 2.4 as well as the results of the qualitative survey as presented in chapter 5, a conceptual research model for adoption intentions has been developed and is depicted in Figure 37.
Studies by Webster (1969), Ozanne and Churchill (1971), Rogers (1983), and Robertson and Gatignon (1986) revealed that organization characteristics, perceptions of the innovation characteristics, environmental variables and communication behavior influence the adoption decision process. Consequently these variables are considered the predictor variables in the adoption decision process regarding ASP.
The most distinguishing feature of the conceptual research model in Figure 37 as opposed to previous adoption models (Ozanne and Churchill Jr. 1971; Robertson and Gatignon 1986) is the special attention paid to social influence. This was done by including perceived image gains due to the use of the innovation and the social contact of the individuals as predictors of ASP adoption intentions. This model allows for the determination of relationships between the predictor variables and the adoption intentions across electric utilities.

Theoretical Background – State of the Field
Page 79
Since the adoption rate of ASP within the electric utility sector at the organisational level is still very limited, it is not yet worthwhile to investigate which factors influence the amount of usage within each department. Consequently, depth of adoption will be considered to be beyond the scope of this study.
In this chapter the literature review relevant for the underlying research was presented. State of the art research on adoption and diffusion is given and constructs related to this field, but not dealt within this research were also introduced (i.e. the assimilation gap). The theoretical overview leads to the formulation of the hypotheses for the underlying research project and to conclude this section the research model is presented.
The methodological approach is presented in the next section, followed by methods for qualitative and quantitative research used that are described in more detail in the next chapter.

Theoretical Background-State of the Field
Page 80
2.6 RESEARCH MODEL
Figure 37: Schematic representation of the hypotheses within the research model
Cost
Attitude towards
forecasting applications via
ASP
Method: Multiple linear
Regression
Behavioral intention to
Adopt / Reject
Method: Logistic
Regression
Know-how
Improved Service
Data Security
Trust
Dependency
Competition
ASP diffusion
Image
Contact
Application Importance
Outsourcing Strategy
Accuracy
Transparency
Size
Perc
eive
d En
viro
n-m
enta
l C
hara
cter
i-st
ics
So
cial
In
fluen
ce
C
ompa
ny
Cha
ract
er-
istic
s
Comeptence
H1a H1bH1c
H1d
H1e
H1f
H1h
H1i
H21j
H2a
H2b
H4a
H4b
H4c
H4d
H3b
H3a
H5a
Perc
eive
d In
nova
tion
Cha
ract
eris
tics
- R
elat
ive
(dis
) adv
anta
ge
Behavioral intention to Try/not Try
Method: Logistic
Regression
H5bH6
H4e
H1g

Methodological Approach
Page 81
3 METHODOLOGICAL APPROACH
3.1 GENERAL CONSIDERATIONS
A preliminary objective of empirical social research is the validation of hypotheses. Theories and hypotheses take over such an important position because with their aid three major problems of scientific research can be solved (Diekmann 2002 p. 147):
1. The problem of explaining singular events and coherences
2. The problem of forecasting
3. The problem of social planning
A definition of theory is given underneath.
Definition 25: Theory Bacharach (1989) defines theory as ‘a statement of relations among concepts within a set of boundary assumptions and constraints’. It is no more than a linguistic device used to organize a complex empirical world.’ The two primary criteria upon which any theory may be evaluated are: 1) falsifiability and 2) utility. Falsifiability determines whether a theory is constructed such that empirical refutation is possible, and utility refers to the usefulness of theoretical systems.
Hunt (1983) defines theory as ‘a systematically related set of statements, including some law like generalizations, that is empirically testable. The purpose of theory is to increase scientific understanding through a systematized structure capable of both explaining and predicting phenomena’. Thus, any structure, which purports to be theoretical, must be capable of explaining and predicting phenomena.
These coherences can be best reconstructed on the basis of the explication of the scientific explanation following Hempel and Oppenheim (H/O-Model, 1948).

Methodological Approach
Page 82
Explanans
Explanandum
3.2 THE DEDUCTIVE-NOMOLOGICAL EXPLANATION MODEL (H/O-MODEL)
The deductive-nomological; nomology is the teachings of the laws of thinking (Duden 1997 p. 555); an explanation model depicts the appearance of an event by deduction of the singular proposition, which describes the events by using a nomological hypothesis and ancillary conditions. This offers an explanation as to ’why’ always requires the knowledge of a nomological hypothesis.
1) Context-hypothesis, Individual-hypothesis and aggregation-rule
2) Ancillary condition(s): Value(s) of the explaining collective-characteristics
3) Value of the collective-characteristic to be explained (=Macro-effect)
Figure 38: The deductive-nomological explanation model
The dominant scientific paradigm in German-speaking marketing research is the deductive-nomological explanation-model in connection with techniques of empirical market-and social research. This scientific approach is characterised by the fact that hypotheses are examined by using relatively elaborate instruments.
This is usually done in these steps:
1. Formulating of a hypotheses
2. Confrontation with reality
3. The decision to accept or reject the hypotheses
Representativeness, large samples, the usage of multivariate data analysis, and highly significant testing results are parameters that distinguish between the ‘well done’ and ‘sub-optimal’ marketing research (Tomczak 1992).

Methodological Approach
Page 83
3.3 NOMOLOGICAL VERSUS AUTOPOIETIC REALITY
Both Critical Rationalism and Constructivism propose (for different reasons) a unified concept of science and neglect in their epistemic reasoning differences in the objects with which theories deal. In doing so they forfeit the chance to draw upon the distinct structures of objects in order to explain the distinct features of theories (Schuelein and Reitze 2002). Traditional attempts at basing epistemology on a logic of objects are regarded as failures, while more recent versions usually focus on methodological issues and lack a common theoretical ground. A way out of this problematic situation may be found in treating differences in objects not on an empirical level (e.g., nature vs. history) but on a logical level. Furthermore, empirical reality should be regarded as a continuum and not as binarily structured. In this view, empirical reality is a mixture of different logical types of reality, which require different theoretical approaches: While nomological reality can be captured in denotative theories, autopoietic reality demands connotative theories (empirical theories always being a mixture of the two). It is the distinctive feature of autopoietic reality—self-reproduction, heterogeneity, autonomy—which determines the profile of connotative theories, such as: multi-paradigmatism, the distinction between the general and the particular, structural openness and fuzziness, the necessity of analogous thinking, the dependence on applications. Those features interact with the overlap of subject and object occurring in connotative theories (Schuelein and Reitze 2002). The result is an at least partial dependence of theory development on institutional conditions. Thus, the peculiarities of the social sciences must be regarded as systematically grounded features which can be handled better but which cannot be disposed of.
The underlying work deals in extracts of different realities. Therefore it is not possible to put this work on a consistent epistemic footing. The assignment of epistemic concepts to sciences is problematic, because sciences are always a result of random demarcations and classifications that change over the course of time (Schuelein and Reitze 2002). On the continuum between nomological and autopoietical realities, the technical aspects of the underlying work can be classified to be more on the nomological side. ASP Software in general, a graphical user interface (GUI), etc. will always work the same under equal conditions. At the other end of this continuum one finds the empirical part of this work. Respondents views change and develop, and are influenced by different determinants. In this case one can speak of a reflexive autopoiesis, because the individuals concerned are capable of acting, and thus are able to control and develop their behaviour themselves.
3.4 RESEARCH EPISTEMOLOGIES
Leinfellner (1980) states that for modern epistemic approaches all three philosophical tenors are necessary: the rationalistic tenor, the empirical tenor, and the pragmatic tenor. This supports the above stated view that it is not exhaustively possible to define an epistemic approach for the underlying research. Nevertheless it is important to indicate the approach to obtain scientific progresses in the underlying research.

Methodological Approach
Page 84
3.4.1 QUANTITATIVE APPROACH: CRITICAL RATIONALISM
The methodology of the quantitative part of this work is critical rationalism (with its main representative Sir Karl Raimund Popper). According the postulates of ‘critical rationalism’ it is never possible to definitively verify statements, because in principle truth is not accessible. But statements can definitively be falsified. Only such statements reveal something about the actuality of experience, and can be subjected to such a methodical reconsideration and possibly disproved by means of the therefore attained results.
Scientific hypotheses can never be verified justifiably. Nevertheless, given hypotheses A it can, owing to particular circumstances, perform better than hypotheses B (i.e., because B disagrees with certain observation results by which B is falsified, while A is not falsified by them or because by using A it is possible to derive a more comprehensive amount of forecasts than it is by using B.) What one can say about a hypothesis at best, is that until today it was able to stand the test and that it performed better than any other available hypotheses. This evaluation is exclusively based on deductive results, which can be derived from hypotheses. The acceptance of hypotheses does not result from truth content, but rather from the fact that it has proved itself. This acceptance is valid until another hypotheses has proved to be better (Schuelein and Reitze 2002).
A problem is empirically examined; theories are created, tested and (preliminary) accepted in case they are superior to others and compatible with the available knowledge about problems and solutions. Progress in knowledge always results where new facts are found that in turn force scientists to revise and/or advance existing theories.
3.4.2 QUALITATIVE APPROACH: POSITIVISM
The epistemological stance influences the approach of interpretation of data. It is especially interesting how the qualitative data gathered in this research project are interpreted. The research epistemologies can be classified into three types: positivistic, interpretive, and critical studies (Orlikowski and Baroudi 1991). An overview on the types of qualitative research epistemologies can be seen in the following figure.
Figure 39: Qualitative Research and underlying philosophical assumptions
Source: Myers (1997)
Underlying epistemology
Qualitative Research
Positivists Interpretive Critical
Influences/guides

Methodological Approach
Page 85
Orlikowski and Baroudi (1991) define the three types as follows:
Positivists generally assume that reality is objectively given and can be described by measurable properties that are independent of the observer (researcher) and his or her instruments. Positivist studies generally attempt to test theory in an attempt to increase the predictive understanding of phenomena. In line with this Orlikowski and Baroudi (1991) classified research as positivist if there was evidence of formal propositions, quantifiable measures of variables, hypothesis testing, and the drawing of inferences about a phenomenon from the sample to a stated population (Myers 1997). Examples of a positivist approach to qualitative research include Yin’s (1994) and Benbasat et al’s (1987) work on case study research. The underlying qualitative research can be classified as positivist research.
Studies based on the interpretive approach assume that people create and associate their own subjective and intersubjective meanings as they interact with the world around them.
The aim of critical studies is to critically look at the status quo, through exposures of what are believed to be deep-seated, structural contradictions within social systems, thereby transforming these alienating and restrictive social conditions. Due to the nature of the present study the critical approach is not given further consideration.
The presentation of the methodological approach for this research project is followed now by a description of the methodical approaches used.

Methodical Approach
Page 86
4 METHODICAL APPROACH
4.1 INTRODUCTION
Although most researchers do either quantitative or qualitative research work, some researchers have suggested combining one or more research methods in one study. This approach is called triangulation (Ragin 1987; Kaplan and Duchon 1988; Lee 1991; Gable 1994; Mingers 2001). In order to gain insight and forecast the adoption behaviour of energy supplying companies, a triangular approach (Compare Definition 26: Triangulation) was chosen. A qualitative, explorative, preliminary study shall define and validate the factors influencing the decision to adopt or reject found in the literature review. The second step is to conduct a quantitative study to determine the weight and strength of the single influencing factors identified and thus to examine the hypotheses formulated. Concluding the findings, both the quantitative and the qualitative studies are used for the interpretation of the results.
Conducting a research project, such as the underlying requires active process participation rather than passive alignment within a position or doctrine. Defining a research strategy and thus also research methods involves making decisions about every aspect of the research, in a very grounded way in relation to the research questions and its changing context. This means however that fantasy and creativeness is required when conducting a research project. Theoretical models, methods, doctrines, etc. do provide a basis and are very important pillars for a research, but they must be made connectable to the research community. They are neither a blueprint nor a detailed or fluid enough proposition to be translated readily into a working strategy. For this reason the following chapter provides an overview on theoretical methods described in literature, while only those are described in more detailed that are found relevant for the underlying research project. Therefore it shall not be seen as a comprehensive overview on qualitative and quantitative research approaches, but rather as a basis for understanding chapters 5 and 6, where the practical empirical investigations are outlined.
The triangulation approach is used in this research and described at the beginning of this section in depth. Combining both, the advantages of qualitative and quantitative research gives the author of this study a powerful tool, enabling the identification of factors influencing adoption decisions in a reasonable and accurate manner. Afterwards a presentation of the single methodical steps of the qualitative study is given. This is followed by theoretically describing process stages of the quantitative survey. The chapter finishes with a short overview of the empirical design of the underlying research.

Methodical Approach
Page 87
4.2 THE TRIANGULAR APPROACH
Traditionally, qualitative and quantitative approaches are distinguished and therewith defined on the basis of the type of data used (textual or numeric, structured or unstructured), the logic employed (inductive or deductive), the type of investigation (exploratory of confirmatory), the method of analysis (interpretive or statistical), the approach to explanation (variance theory or process theory) and the presumed underlying paradigm (positivist or interpretive/critical, rationalistic or naturalistic) (Bazeley 2004). Nevertheless drawing a clear borderline between qualitative and quantitative research is rather hard. When analysing data, interpretation still is involved, in case the data is a text, counting may still be appropriate. Variables do not necessarily have clear-cut meanings.
Triangulation was initially conceived as the conduct of parallel studies using different methods to achieve the same purpose with a view to providing corroborating evidence for the conclusions drawn, that is, as a validation technique (drawn from the concept of triangulation in surveying). In more recent years it has often been used loosely as a synonym for mixed methods without regard to either of the conditions inherent in the original concept, and as a consequence it has lost its original meaning. It has been argued that, in any case, triangulation does not assist validation as each source must be understood on its own terms (Fielding and Fielding 1986; Flick 1992).
In the third edition of his book Denzin (1989) abandons the idea of triangulation as a validation tool, suggesting instead that it overcomes personal biases arising from single methodologies. The goal of multiple triangulation is a fully grounded interpretive research approach. Objective reality will never be captured. In-depth understanding, not validity, is sought in any interpretive study (Denzin 1989 p. 246).
Definition 26: Triangulation
‘Triangulation is the measurement of the same phenomenon by the use of different tools.’ (Kromrey 2002/2003 p. 9)
Figure 40 gives a basic overview on quantitative and qualitative methods.
Method Information available Examples Quantitative Sufficient quantitative
information is available Time series: Predicting the continuation of historical patterns such as the growth in sales or gross national product. Explanatory: Understanding how explanatory variables such as prices and advertising affect sales.
Qualitative Little or no quantitative information is available, but sufficient qualitative knowledge exists
Predicting the speed of telecommunications around the year 2020. Forecasting how a large increase in oil prices will affect the consumption of oil.
Unpredictable Little or no information is available
Predicting the effects of interplanetary travel. Predicting the discovery of a new, very cheap form of energy that produces no pollution.
Figure 40: Categories of methods and examples of their application
Source: Makridakis (1998)

Methodical Approach
Page 88
Flick (2004 pp. 12) states that the execution of an exploratory qualitative study before the accomplishment of the actual study with standardised methods does not constitute triangulation as such, in case the study is not a single and independent part of the whole study but rather servers solely for the development of the questionnaire and additionally the results of the study are not included into the results of the whole study.
In the underlying research project the scope of the qualitative study does exceed the above stated requirements and in connection with the quantitative survey executed, the approach of this research project can therefore be quoted as triangular. The qualitative study in this research has an exploratory character, as it helps to formulate the hypotheses for this research. Not only did it contribute to the design and development of the quantitative survey, but also it served as support for interpreting the results of the quantitative survey data. Thus, concluding, it is to state that this research includes a triangular approach, due to the fact that the qualitative study is an independent survey within this research. The qualitative survey addressed a partly different audience than the quantitative survey did. However, in the following the methods of the qualitative study and subsequently also that of the quantitative study are described in more detail.
4.3 APPROACH OF THE QUALITATIVE STUDY
4.3.1 GENERAL CONSIDERATIONS
In the following section, reflections related to collecting and interpreting qualitative data are presented. The purpose is to describe the different approaches to research design, data collection and interpretation, and especially to clarify which research method and methodology has driven this underlying research project.
In the underlying research documenting the term method is related to research design and how the field study can be conducted and is described in more detail in the present chapter. The term methodology is related to the epistemological stance of the researcher and is dealt with in depth in chapter 3. Method and methodology are closely related, and although an attempt is made to discuss them separately some overlaps between these two constructs have to be taken into account.
According to Rubin and Rubin (1996 p. 17) ‘You don’t need the detail of qualitative interviews to find out how frequently people wash their hair, watch a television program, or buy a particular product, but if you want to know what people think about personal hygiene, why they watch so much television, or whether people feel that they gain status by buying a particular product, qualitative interviewing is the right approach.’ Therefore qualitative interviewing method is appropriate to find out, how people think about Application Service Providing, about the advantages and disadvantages of this technology, etc.

Methodical Approach
Page 89
4.3.2 EXPLORATIVE SOCIAL RESEARCH
Barton and Lazarsfeld (1979) see the main importance of qualitative social research mainly in the preliminary stages of quantitative analysis. They describe the single steps of exploration as follows:
1. Analysis of single observations: Starting point is data material that contains surprising observations. These surprising observations have the duty to stimulate the search for explanations.
2. Creating descriptive systems: Based on a set of preliminary categories, the examination of these types leads to a small number of basic characteristics. These characteristics illustrate the basis for a systematical typology. For the knowledge progress it is of low significance whether all logically possible or empirically available combinations or only a part of them are examined, rather it is important to discover the important ones.
The qualitative survey in this research project is of an exploratory nature. Blumer (1973) noted that when using exploratory social research techniques it is especially important for the researcher to constantly observe the necessity to control and modify his/her perceptions, views and conceptual design of the spheres examined. So that it is possible to develop a preferably comprehensive and exact picture of the examined area. Additionally it is desirable to recognize theoretical correlations by using the descriptive information won by explorative methods.
Exploration is a method to develop and verify/falsify hypotheses, that can be described in three functions (Lamnek 1993 p. 9-12):
1. Formulation of hypotheses and theories
2. Modification of hypotheses and theories
3. Partial verification of hypotheses and theories
Qualitative research methods were developed in the social sciences to enable researchers to study social and cultural phenomena. Kaplan and Maxwell (1994) argue that the goal of understanding a phenomenon from the point of view of the participants and its particular social and institutional context is largely lost when textual data are quantified. Just as there are various philosophical perspectives that inform qualitative research, so there are various qualitative research methods. A research method is a strategy of inquiry which moves from the underlying philosophical assumptions to research design and data collection. The choice of the research method influences the way in which the researcher collects data. Specific research methods also imply different skills, assumptions and research practices. Qualitative data sources include observation and participant observation (fieldwork), interviews and questionnaires, documents and texts, and the researcher’s impressions and reactions.

Methodical Approach
Page 90
4.3.3 COLLECTION OF QUALITATIVE DATA
Different approaches are suggested in the literature for the gathering of qualitative data. Mason (2002 pp. 54) differentiates between the ethnographic approaches, interpretivist approaches, biographical, life history and humanist approaches, conversation analysis and discourse analyses, and psychoanalytic approaches. Silverman (2001) introduces ethnography and observation, interviews, texts, naturally occurring talk, and visual images as methods of qualitative research. Interviews are used for the gathering of data in the underlying research project. For this reason only this method is described underneath.
Silverman (2001) described three versions of interview data in his book: positivistic, emotionalistic and constructionistic ones. According to positivism, interview data give access to facts about the world. The primary issue is to generate data that are valid and reliable, independently of the research setting. The main ways to achieve this are the random selection of the interview sample and the administration of standardized questions with multiple-choice answers, which can be readily tabulated. In emotionalism, interviewees are viewed as experiencing subjects who actively construct their social worlds. The primary issue is to generate data, which gives an authentic insight into people’s experiences. The main ways to achieve this are unstructured, open-ended interviews usually based upon prior, in-depth participation observation. According to constructionism, interviewers and interviewees are always actively engaged in constructing meaning. Rather than treat this as standing in the way of accurate depictions of facts or experiences, how meaning is mutually constructed becomes the researcher’s topic. A particular focus is on how interviewees construct narratives of events and people and the turn-by-turn construction of meaning.
Collection of qualitative data for this research can be described as emotionalisitic as defined above, while the quantitative data were generated in a more positivistic way.
4.3.4 SOURCES OF BIASES
Independent of the method of data collection there are a number of sources of biases, which have to be considered.
Definition 27: Bias ‘Bias here refers to a systematic distortion of data opposed to a random distortion of a measure as a result of a sampling procedure’ (Silverman 2001)

Methodical Approach
Page 91
Demarcation is sometimes difficult, nevertheless Diekmann (2002 pp. 382) differentiates among three classes of sources of error:
1. Characteristics of the respondent (social desirability, response-set, ‘viewless’)
2. Characteristics of the questions (formulation of question, position of the question, effect of categories for the answers)
3. Characteristics of the interviewer and the interview situation (presence of third party, characteristics of the interviewer, characteristics of the interview)
The following figures give an overview on the different sources of bias.
Figure 41: Sources of response bias
Source: Diekmann (2002 p. 403)
Although an image of reality is always biased, in the underlying research project a great effort has been assumed to avoid mistakes and biases in the course of data collection. The bias due to characteristics of the respondents could be minimized in this research as the sample size for the qualitative study was rather big and the respondents where selected by different categories: different roles they have in the working environment (researchers, consultants, working in electric utilities, and such employed by the government), different countries of origin, age classes and gender, different working experiences, etc.
The questions used for the gathering of the qualitative data were discussed with both experts from the theoretical and the practical field engaged in the topic of the underlying research. Thus the bias due to formulation of the questions was taken into account as well when designing the qualitative study.
As interviews were done in different locations and by different means of communication (personal, telephone and e-mail) the bias due to these circumstances was at least spread.
Answering reaction
Formulation of question
Sponsor-ship effect
Forgery of interviews
Viewless-ness
(other) situational
effects
Presence of third party
Response-set
Character-istics of the Interviewer
Context of questions
Categories for answers
Social desirability
True value of the attribute
of the respondent
Random error

Methodical Approach
Page 92
4.3.5 QUALITATIVE TEXT ANALYSIS
Although a clear distinction between data gathering and data analysis is commonly made in quantitative research, such a distinction is problematic for many qualitative researchers. For example, from a hermeneutic perspective it is assumed that the researcher’s presuppositions affect the gathering of the data-the questions posed to informants largely determine what you are going to find out. The analysis affects the data and the data affect the analysis in significant ways. Therefore it is perhaps more accurate to speak of ‘modes of analysis’ rather than ‘data analysis’ in qualitative research. These modes of analysis are different approaches to gathering, analysing and interpreting qualitative data. The common thread is that all qualitative modes of analysis are concerned primarily with textual analysis (whether verbal or written) (Myers 1997).
Although there are many different modes of analysis in qualitative research, such as hermeneutics, grounded theory, semiotics, and approaches which focus on narrative and metaphor, only the one used in the underlying research, semiotics, is described here.
The semiotic model in a four dimensional form (Rothermel) is displayed in Figure 42.
Figure 42: Semiotic model in a four dimensional form
Semiotics is primarily concerned with the meaning of signs and symbols in language. The essential idea is that words/signs can be assigned to primary conceptual categories, and these categories represent important aspects of the theory to be tested. The importance of an idea is revealed in the frequency with which it appears in the text. Three different forms of semiotic textual analysis are known:
SIGNS Pragmatics
Semantics
Sigmatics
Syntax
Relations of the signs in a
symbolic context
Reference of the signs to reality
Relation of the signs amongst
each other Relations of the signs to actions
interrelated

Methodical Approach
Page 93
1. One form of semiotics is ‘content analysis’ Krippendorff (1980) defines content analysis as ‘a research technique for making replicable and valid references from data to their contexts.’ The general assumption is that intention and meaning are discoverable in the frequency with which words, phrases, idioms or ideas occur in a text and the meaning can be captured in a set of predefined content variables. Meanings are assumed to be inherent in the word or idiom. Those meanings are defined in a limited set of definitions in a dictionary or concordance of meanings and are, therefore, relatively fixed. Classes of meanings are assignable to a predefined ‘content variable’ and it is the frequency of word/idiom meanings assigned to the content variables that are studied and analysed statistically to look for patterns of meaning. In traditional content analysis the unit of analysis is generally limited to a rather small unit of text. Clearly it is a structural tool, typically used to search for patterns and structures in the data at the word or phrase level (Truex 1996). Content analysis is used in the underlying qualitative study.
2. Another form of semiotics is ‘conversation analysis’.’ In conversation analysis, it is assumed that the meanings are shaped in the context of the exchange (Wynn 1979). The researcher immerses himself/herself in the situation to reveal the background of practices.
3. A third form of semiotics is ‘discourse analysis’.’ Discourse analysis builds on both content analysis and conversation analysis but focuses on ‘language games’.’ A language game refers to a well-defined unit of interaction consisting of a sequence of verbal moves in which turns of phrases, the use of metaphor and allegory all play an important part (Myers 1997).
The actual analysis of the qualitative data took place by using the software QSR NUD*IST Release V 4.0. The reporting of the qualitative study was done with the software MindManager Business Edition Version 4.0. (c.f.: Figure 59).
4.4 APPROACH OF THE QUANTITATIVE STUDY
4.4.1 GENERAL CONSIDERATIONS
In the following section reflections related to collecting and analysing quantitative data are presented. The purpose is to describe the quantitative approaches used for the underlying research project. However, the quantitative methodology is described more in-depth in chapter 3.
4.4.2 COLLECTION OF QUANTITATIVE DATA
Gathering of quantitative data is usually (as in the underlying research) related to survey research. Survey research can be classified as field studies with a quantitative orientation (Kerlinger 1992).

Methodical Approach
Page 94
The quantitative survey method has three distinct characteristics (Pinsonneault and Kraemer 1993):
1. Firstly, to produce quantitative descriptions of some aspects of the studied population either leading to uncovering of relationships between variable of projecting findings descriptively to a predefined population.
2. Secondly, it is a method based on structured and predefined questions.
3. Thirdly, information is generally collected from a fraction, a sample, of the study population; however, it is collected in such a way that results from the sample hopefully can be generalized to the study population.
Kraemer and Dutton (1991) stated that, survey research is both the most widely used and most widely questioned method in the MIS field. Orlikowski and Baroudi (1991) reported that of 155 information systems research articles published between 1983 and 1985, 49 percent of their research analysis sample were surveys, whereas the share of case studies was 14 percent. In a recent analysis of research in IS (Claver, Gonzalez et al. 2000) these figures remained similar. The values of survey research and case studies were in 1996/1997 respectively 52 percent and 18 percent. In comparison to the above-mentioned studies should only be done with due care to the different sources of information and different definitions applied. Nevertheless these studies can be used as an indicator of the distribution of research methods applied in IS research (Henriksen 2002).
Although the survey research method is often used it is somewhat problematic. A number of disadvantages related to the survey research method have been reported (Kerlinger 1992). These include:
• The scope of information is often emphasized at the expense of depth. The reason being that survey information does not normally penetrate very deeply below the surface.
• Another weakness is that the survey situation can temporarily lift the respondent out of his or her own social context, which may invalidate the results of the survey. In relation to organisational studies problems particularly arise in relation to survey research. The first problem is related to selection of the respondent.
• One problem is to find a single person in the organization that can give a reliable answer to the broad variety of questions often included in the survey instrument.
• Another aspect is that answering questionnaires may not have a high priority in the organisation. The questionnaire is often sent to the managing director. She or he may pass the survey on to a subordinate who may not be able to provide the correct answer to the questions that were targeted to a specific person in a specific job function. The answers may therefore be invalid.
• This last condition is known as the ‘assumption of continuity’; it is an underlying premise of all quantitative and many qualitative forecasting methods, no matter how sophisticated they may be.
Figure 43 gives an overview on the different tasks involved in a survey as well as the skills and the resources needed.

Methodical Approach
Page 95
Survey task
Skills needed Other resources
Identify survey objectives
Conduct focus groups Convene advisors Conduct literature reviews
Honorariums for participants Transportation for participants Room rental for meeting Refreshments Materials to guide discussion Honorariums Telephone Mail Librarian Reproduction of materials Standardization of forms for recording contents of literature Computer time for searches Training reviewers
Design survey
Knowledge of alternative research designs and their implementation Technical expertise in selecting sampling methods, determining sample size, and selecting sample
Research design expert Computer expert Software Hardware
Prepare survey instrument
Conduct literature reviews Ability to write questions Knowledge of the survey’s topic Knowledge of how to assemble questions into an instrument
Same as those needed for survey design Questionnaire expert
Pilot-test survey instrument
Ability to analyse pilot-test data Ability to interpret data in order to revise pilot-tested instrument and make it final
Room rental to administer the survey Refreshments for pilot-test sample
Administer survey
Interviews: Ask questions in standardized, efficient manner Record answers in a standardized, efficient manner Ability to monitor Mail: Understand logistic s of mailed surveys (e.g., include self-addressed return envelope) Ability to monitor (what?)
Questionnaire expert Training materials expert Expert trainers Room for training Materials for training Materials for retraining Telephones Telephone time Incentives to complete Interview Postage Paper Graphics consultant Incentives for completion
Organize data
Code data Enter data Clean data Prepare codebook
Programmer Consultant in data analysis (e.g., what to do with missing data)
Analyse data
Select appropriate data-analytic methods Perform data analysis Select appropriate psychometric analysis Conduct appropriate psychometric analysis
Programmer Statistician Software Hardware

Methodical Approach
Page 96
Survey task
Skills needed Other resources
Report results
Write reports Prepare slides, transparencies Present reports
Duplicating reports Dissemination of materials/information (e.g., mail) Travel to orally present report Honorariums for reviewers Editorial consultant Slide preparation expert
Figure 43: Typical Survey Tasks, Skills, and Resources
Source: Fink (1995)
4.4.3 DESIGN OF THE SURVEY INSTRUMENT
An empirical part of this research was carried out using a quantitative web-based questionnaire. A questionnaire is a series of predetermined questions that can be self-administered, administered by mail, or asked by interviewers. The purposes for which questionnaires are used, and the type of information sought, vary from study to study (Berdie, Anderson et al. 1986 pp. 1). The use of questionnaires in research is based on one basic, underlying assumption: each individual question will work. This means the respondent will be both willing and able to give truthful answers (Klein, Maher et al. 1967; Allen and Colfax 1968).
Research concerning the use of questionnaires often reports seemingly inconsistent results. These reports usually have not been based on an experimental design chosen exclusively to test questionnaire methodology; typically, they are offshoots of surveys designed for other purposes. Consequently, the inconsistent findings concerning questionnaire methods are not surprising, as they are based on results from different questionnaires used for different reasons with different people at different times (Berdie, Anderson et al. 1986 pp. 3).
One of the most important stages in the development of a new survey instrument involves trying it out on a sample population. Pilot testing almost always identifies errors in a survey’s form and presentation. It allows the author of a questionnaire a chance to correct these errors before the survey is distributed or used on a wider scope to gather real data. It allows for time and opportunity to redesign problematic parts of the survey before it is actually administered. Pilot testing allows many potential impediments to be identified and corrected in advance before too many resources have been expended (Litwin 1995).

Methodical Approach
Page 97
In general questionnaires have to conform to at least three quality criteria: 1) objectivity, 2) reliability, and 3) validity. These criteria are described in more detail as follows.
1. Objectivity
Definition 28: Objectivity
‘Objectivity is the degree to which an instrument is not influenced or distorted by the beliefs or prejudices of the individual using the instrument.’ (Jared 2004)
Research can be labelled as objective when its findings are free from bias. Every researcher brings his/her biases into the research setting. Every interview and observation is a disturbance of the field of study. It is through reflexivity that both the qualitative and the quantitative researcher control for bias. Bias in positivistic epistemology is the elimination of both passion of the researcher and subjectivity.
2. Reliability
A reliable questionnaire is one, which consists of reliable items. A reliable questionnaire item is an item that consistently conveys the same meaning to all people in the population being surveyed (Goode and Hatt 1952 pp. 152-153 and 160-161; Berdie, Anderson et al. 1986 pp. 2).
Definition 29: Reliability
‘The level of consistency of the measuring device.’ (Jared 2004)
Reliability is commonly assessed in different forms: test-retest, intraobserver, alternate-form, internal consistency, and interobserver reliability.
Test-Retest reliability is the most commonly used indicator of survey instrument reliability. It is measured by having the same set of respondents complete a survey at two different points in time to see how stable the responses are. It is a measure of how reproducible a set of results is. Correlation coefficients, or r-values, are calculated to compare the two sets of responses. These correlation coefficients are collectively referred to as the survey instrument’s test-retest reliability. In general, r-values are considered good if they equal or exceed 0.70 (Litwin 1995). A comparison of the first fifty questionnaires submitted with the last fifty in the present research showed no significant differences in the answering behaviour of the respondents.

Methodical Approach
Page 98
Intraobserver reliability measures the stability of responses over time in the same individual respondent. It requires completion of a survey by an individual at two different and appropriate points in time. Time points that are too far apart may produce diminished reliability estimates that reflect actual changes over time in the variable of interest. Intraobserver reliability is a form of test-retest reliability. However, the responses in this research project were collected anonymously, therefore it is not possible to make the same respondent complete a questionnaire in different points of time.
Alternate-Form reliability involves using differently worded items to measure the same attribute. Questions and responses are reworded or their order changed to produce two items that are similar but not identical. One common way to test alternate-form reliability is simply to change the order of the response set. When testing alternate-form reliability, the different forms may be administered at separate points in time to the same population. Alternatively, if the sample is large enough it can be divided in half and each alternate form administered to half of the group. Results from the two halves are then compared with each other. This technique, called the split halves method, is generally accepted as being as good as administering the different forms to the same sample at different time points (Litwin 1995). In the underlying research questionnaire some items were used that had already been tested in other research projects, while others were designed specifically for this survey. Additionally multi items were used for the single constructs.
Internal consistency reliability is another commonly used psychometric measure in assessing survey instruments and scales. It is applied not to single items but to groups of items that are thought to measure different aspects of the same concept. Internal consistency is an indicator of how well the different items measure the same issue. Internal consistency is measured by calculating a statistic known as Cronbach’s coefficient Alpha. Coefficient Alpha measures internal consistency reliability among a group of items combined to form a single scale. That is, it is a reflection of how well the different items complement each other in their measurement of different aspects of the same variable or quality (Litwin 1995). For the results of the calculations of the Cronbach Alphas, see also chapter 6.
Interobserver (interrater) reliability provides a measure of how well two or more evaluators agree in their assessment of a variable. It is usually reported as a correlation coefficient between different data collectors. When survey instruments are self-administered by the respondent and designed to measure his or her own behaviours or attitudes, interobserver reliability is not used (Litwin 1995).
3. Validity
A valid questionnaire is one that consists of valid items. A valid questionnaire item is one that stimulates accurate, relevant data. A questionnaire item cannot be valid unless it is also reliable. Question selection and phrasing both influence validity. If questions are asked that the respondent is unqualified to answer, the responses may be purely guess work and almost certainly invalid.
Definition 30: Validity ‘A generic term used to define the degree to which the test measures what it claims to measure.’ (Jared 2004)

Methodical Approach
Page 99
Four types of validity can be differentiated: content, face, concurrent and construct.
Content validity refers to the extent to which a measure thoroughly and appropriately assesses the skills or characteristics it is intended to measure (Fink 1995). The assessment of content validity typically involves an organized review of the survey’s contents to ensure that it includes everything it should and does not include anything it should not. Content validity is not quantified with statistics. Rather, it is presented as an overall opinion of a group of trained judges (Litwin 1995).
Face validity refers to how a measure appears on the surface: Does it seem to ask all the needed questions? Does it use the appropriate language and language level to do so (Fink 1995)? Face validity, unlike content validity, does not rely on established theory for support. In fact, many researchers do not consider face validity a measure of validity at all.
Criterion validity compares responses to future performance or to those obtained from other, better-established surveys (Litwin 1995).
Construct validity is established experimentally to demonstrate that a survey distinguishes between people who do and do not have certain characteristics (Fink 1995):
4.4.4 SAMPLING
Since surveying an entire population of interest is cost prohibitive, the practice of sampling is a widely used method. Traditionally researchers decide who participate in a survey by devising a sampling method. With the widespread penetration of the Internet targeting an entire population of interest is becoming increasingly possible. By advertising on the Web and/or newsgroups, respondents ‘self-select' ‘themselves into the survey sample (Crawford, Couper et al. 2001; Schonlau, Fricker et al. 2001).
Broadly speaking, there are two categories of sampling: random (which is probability-based) and non-random (Sproull 1995). A sample is considered random when the probability of each member selected in the sample can be calculated, in a non-random sampling, the probability of inclusion of each member in the sample cannot be determined. Under non-random sampling Sproull (1995 p. 112) lists systematic, convenience, purposive, and quota sampling.
The goal of any research survey is to make sure that the data collected represents the population. In practice, even when a sample is random, the respondents are not. This situation is especially the case when the response rate is low; those who choose to respond may have certain non-representative characteristics. According to Schonlau et al. (2001), an uncontrolled survey instrument’s distribution or self-selection is a form of the non-random survey that the authors call a ‘convenient’ survey (Schonlau, Fricker et al. 2001).

Methodical Approach
Page 100
Response rates are one of the most important indicators of survey quality and one of the indicators most likely to be reported. Response rates are frequently used to compare survey quality between surveys, survey organisations and countries and over time. Response rates are important as non-response can introduce bias. Methodological research (Groves 2002; Groves 2004) (Assael and Keon 1982) shows that non-respondents generally differ from respondents in important characteristics. In the presence of bias, high precision does not guarantee accurate estimation. A second reason for the importance of response rates is that low response means that fewer cases are available for analysis, thus reducing the precision of estimates.
4.4.5 ONLINE DATA COLLECTION
With the rising penetration of the Internet, web-based surveys are now increasingly common. There are several methods for collecting data online. The two most common are e-mail surveys and web-based surveys. Web-based surveys require the instrument to be available on a web site, and individuals are solicited either by traditional mail, e-mail, telephone, or through other web sites to participate in the survey. The latter approach is suitable for random sampling, while the former is characteristic of a convenient survey. Participants are given access information to enter the survey web site; they complete the form online and then click on a submit button when they have completed it. Both of these methods have advantages and disadvantages.
Online surveys have several important advantages over paper-and-pencil surveys that make them particularly attractive to researchers. These include reduced response time, lower cost, ease of data entry, flexibility of and control over format, advances in technology, recipient acceptance of the format, and the ability to obtain additional response-set information (Mann and Stewart 2000; Granello and Wheaton 2004 pp. 17).
Despite the many advantages of web-based surveys, researchers in many fields in which this methodology has been used have raised concerns about their use. These concerns focus on the following limitations: representativeness of the sample, response rates, measurement errors, and technical difficulties (Mann and Stewart 2000; Granello and Wheaton 2004 pp. 17).
However, the data gathering for the underlying research took place by means of online data collection through a web-based questionnaire. Screenshots of the survey can be found in the Appendix of this work, pp 210.
Methodical Approach
Page 101
4.4.6 QUANTITATIVE DATA ANALYSIS
The most common method used to assess whether different items belong together in a scale is a technique called factor analysis. A factor is a hypothesized trait that is thought to be measured with items in a scale. In factor analysis, a computer-executed algorithm is used to test many different possible combinations of items to determine which of them vary together. Factor analysis is used to evaluate and select items from a larger pool for inclusion in a scale or index. The resulting scale is used to produce a score, which in turn is thought to reflect the factor. The factor itself is a theoretical trait or attribute that is only approximated by the scale (Fink 1995).
Additionally to factor analysis, the two most important analysis performed while the quantitative data analysis in this research are multiple linear regression and logistic regression. According to Backhaus (2003 pp. 45) regression analysis is a flexible, multi-purpose tool, which is used for both, the description and explanation of correlations as well as for the performance of forecasts. Regression analysis is especially used in those cases, where correlation effects between a dependent and one or more independent variables shall be examined. By using this tool, these interdependencies can be quantified and hence be described in an accurate manner. Additionally it is used to examine hypotheses about correlations and to execute forecasts. In the underlying research multiple linear regression is used in order to explain the correlations between the dependent variable ‘attitude’ and the independent variables, such as ‘cost’, ‘dependency’, ‘image’, etc.
Logistic regression is a tool that enables the calculation of the probability of the membership of a group in relation of one or more independent variables. The independent variables can have either nominal or metric scale level. Logistic regression uses for the estimation of the probability of occurrence of the categories of the dependent variable the s-shaped logistic function, therefore this mode of analysis is categorized under the non-linear analysis methods (Backhaus 2003 pp. 417). In the underlying research logistic regression was used to calculate the probability of the membership in the group of ‘intention to adopt’ in subject to the parameter value of the independent variables and the moderating variable ‘attitude’.
4.5 ACTUAL METHODICAL APPROACH
The main objective of the presented empirical analysis is to achieve explanation and understanding of, and to anticipate adoption behaviour of electric utilities concerning Application Service Providing. At the aggregate level it will then also be possible to estimate the diffusion of ASP in this branch. In order to meet scientific requirements, and to produce reliable, valid, and objective results, it is important to consider different methodical approaches. For this reason, the instrument of triangulation (a qualitative and a quantitative survey) supported the empirical investigation in this work. The qualitative interview guide as well as the quantitative questionnaire, screenshots of the web-based survey can be found in the Appendix (chapter 8).

Methodical Approach
Page 102
A qualitative survey was conducted with exploratory character additionally to the literature research with the objective to create descriptive systems and therefore help specifying the hypotheses. The qualitative survey also aimed in helping the designing and development of the quantitative survey, especially the questionnaire for it. Furthermore the qualitative survey played an important role in interpreting the results of the quantitative survey.
The collection of qualitative data in this research project was done in an emotionalisitc way, whereas the interview partners were viewed as individuals who experience and actively construct their social worlds. The main objective was to generate data, which gives an authentic insight into a respondent’s point of view and experiences.
In order to avoid sources of bias, various precautionary measures have been taken. Different groups were addressed for the qualitative data gathering, i.e.: different roles the individuals addressed have in the working environment, different countries of origin, age classes and gender, different working experiences, etc. Additionally, the questions used for the gathering of the qualitative data were discussed with both experts from the theoretical and the practical field engaged in the topic of the underlying research. As the interviews were done in different locations, but also by different means of communication (personal, telephone and e-mail) the bias due to these circumstances was at least spread.
The mode of data analysis employed here is semiotic. The idea of semiotics that words or signs can be assigned to primary conceptual categories and that these categories represent important aspects of the theory to be tested was the underlying basic for the qualitative data analysis. The conceptual categories of determinants likely to influence organisational adoption intentions towards ASP were derived from the literature review (i.e.: relative advantage, environmental characteristics, etc.), and the data derived from qualitative data analyses were allocated to these categories accordingly. The importance of these categories was subsequently revealed in the frequency with which they appeared in the qualitative interviews and discussions conducted. Of course the ideas did not always come up in the same wording with the different individuals interviewed. Therefore content analysis was used in order to categorize intentions and meanings. For an in depth description of the qualitative study c.f.: chapter 5.
The data for the quantitative survey in this research project were collected by a web-based survey. The main objective was to be able to test the hypotheses formulated and thus uncover relationships between the variables. Various obstacles reported to be inherent in quantitative survey research could be overcome by the combination of qualitative and quantitative methods in this research project. Additionally, the selection of respondents was done very carefully, in accordance with the results of the qualitative study that also included the question of selecting the appropriate respondents for the quantitative survey.

Methodical Approach
Page 103
The questionnaire for the underlying research was designed in different steps. First, for the design of the questionnaire intense literature research helped to find out different constructs that have already been used and validated (e.g. Gatignon and Robertson 1989; Rogers 1995; Van Everdingen 1995; Schillewaert, Ahearne et al. 2000; Van Everdingen and Bamossy 2000; e.g. Henriksen 2002; Van Everdingen and Wierenga 2002; Frambach, Van Herk et al. 2003). This complemented the author’s previous professional experience in the field and with the input of various experts interviewed during the qualitative survey, brought forward a first draft for the quantitative questionnaire. This draft was then given again to both theory and practice people. Comments and feedback were gathered and included into the next draft, and then again given to a selected audience. This feedback-loop was done several times with varying experts involved, revealing an objective, reliable and valid questionnaire, respectively questions and thus questionnaire items. An attempt was made to include as many experts from different fields as possible, each of whom discussing parts of the research and thus taking into account different point of views. Only then the pilot testing with selected people out of the population in question was done.
Pilot testing with a number of randomly selected individuals out of the population was done. A total 40 individuals were asked to complete the questionnaire and provide feedback, 14 responded to the request. In designing the questionnaire how these individuals understood the questions was taken into consideration, how long it took them to finish the questionnaire, etc. Some comments and alterations due to this pilot testing were included in the final questionnaire.
Reliability could be assured by comparing the first 50 submitted questionnaires with the last 50 submitted, by using already partly validated items (such as derived from literature research or from the qualitative survey) and employing multi-items for the single constructs, and by the calculation of Cronbach Alphas in the quantitative data analysis. Additionally, conducting a qualitative survey and pretesting the contents of the quantitative survey derived a valid survey. Comparison of the first fifty respondents with the last fifty respondents showed that there were no significant differences between the responses of these two groups. While the possibility of non-response bias cannot be ruled out, evaluation of the respondent characteristics and the responses over time suggests that the respondents are representative of the total population of electric utilities in Austria and Germany. The response rate is quoted in more detail in chapter 6.2.

Methodical Approach
Page 104
For the actual quantitative study, a letter introducing the aim and objectives of the survey was sent out to the individuals addressed by mail. Afterwards the link to this survey was sent out per e-mail (compare chapter 8.2.1) to the individuals selected. The link led to a web page with a welcome letter (compare chapter 8.2.2). By pressing a button at this welcome page the respondents were led to the first page containing questions. Each page included two to four questions. A number on the upper right side of the screen indicated how many pages the individual had already seen, and how many remained until the end of the questionnaire. Most of the questions could be answered by using a hundred-point likert scale, which was hidden behind a slider. The respondent could answer to the question by moving the slider with the mouse to the desired position. Therefore the respondents had the impression that they could agree or disagree to the statements made infinitely variable. Some respondents said that this mode of answering questions was especially convenient for them and that they thought it was a very innovative way of conducting such a survey. The last page of the survey contained a thank you note and the possibility to leave feedback and a means of contact in order to receive the results of this survey. Screenshots of the questionnaire can be found in chapter 8.2.4. The following figure shows the slider used in this survey, which hides a hundred point likert scale.
Figure 44: Sliders used in the questionnaire
The sampling method in order to select organizations to be addressed with the aim of completing the quantitative questionnaire was random. The total population of electric utilities in Austria and Germany consists of 1102 companies; 500 companies were chosen. Out of these 500 companies, 436 correct relevant contact persons with e-mail-access could be identified. These 436 individuals were addressed, and the survey retrieved 158 duly completed questionnaires, which corresponds to a response rate of 36,2 %.
The mode of data analysis for the quantitative survey can be described as being positivistic.
The most important statistical analysis methods employed here in order to examine the data gathered during the quantitative survey are factor analysis, multiple linear regression and logistic regression analysis. For an in-depth description of the quantitative data analysis see chapter 6.

Methodical Approach
Page 105
The following table provides an overview on the methods used and their position and relevance for this research.
Qualitative Study
Goals • Gain insight on ASP adoption decision process • Identify the roles involved in the ASP adoption decision process • Clarify the research model and constructs • Develop a tailor made questionnaire • Provide explanation for findings from the survey studies
Instrument • Expert discussions at conferences and workshops • Expert interviews • Validation of results in personal talks, via telephone and e-mail
Participants • 65 respondents from thirteen different countries. • Respondents include consultants and suppliers of IT for the electric
utility industry, government agencies, universities and electric utilities.
Quantitative Study
Goals • Develop a valid and reliable measurement instrument • Test the ASP adoption decision model • Test the hypotheses formulated
Pretest • Involvement of a variety of experts from the field in four subsequent phases
• 20 experts from electric utilities and universities involved • Design and content of the questionnaire discussed with an expert in
survey design Pilot Test • Questionnaire was distributed among 20 randomly selected
companies • Feedback on the survey gathered via e-mail/telephone
Formal Surveys
• Conduct a survey among decision makers concerning ASP adoption within electric utilities
• Survey distribution o Introduction letter by mail o E-mail with link to survey o Reminder o Thanks notes and provision of results
• Survey media o Web-based survey
Data analysis and discussion
• Multiple linear regression and logistic regression were used to analyse relationships between the multi-item constructs.
Figure 45: Research methodology and process
The sections below present the actual design of the qualitative survey (c.f. chapter 5), of the quantitative study (c.f. chapter 6) as well as the results of the empirical surveys conducted (c.f. chapter 7).

Qualitative Study
Page 106
5 QUALITATIVE STUDY
5.1 INTRODUCTION
In this chapter the findings of the preliminary qualitative study are presented. A brief introduction discusses the design and the time frame in which this study took place. Afterwards the nationalities and professional backgrounds of the responding person are summarized. Subsequently the results and original respondents’ comments are represented in detail. The chapter concludes with the reporting of the results, displayed in a MindManager map.
5.1.1 SURVEY DESIGN
The study draws on a variety of experts from the energy industry, governmental organisations, research institutions as well as consultants to this industry, all of whom provided valuable insights for the building of the theoretical research model and the subsequent empirical quantitative data gathering. This study was conducted as expert discussion and by interviewing participants of the seminars and workshops attended. This took place during various workshops and conferences, where the author submitted a paper and presented the underlying research project. Discussion took place in the audience after the oral presentations and additionally during coffee breaks, and at social events that were related to these meetings. The most important gatherings were:
• 8th Symposium Energieinnovation in Graz, Austria from 4-5 February 2004
• 7th International Workshop on Electric Power Control Centres in Ortisei, Italy from 25-28 May 2003
• 3rd Internationale Energiewirtschaftstagung in Vienna, Austria from 12-14 February 2003
• Infofest in Budva, Montenegro from 22-28 September 2002.

Qualitative Study
Page 107
Additionally experts in the field were interviewed personally and by e-mail. These experts were, for example, sales experts from companies supplying IT-solutions to electric utilities, experts from universities and governmental organisations, as well as employees of electric utilities itself. These interviews were conducted with experts situated in European countries as well as in the U.S. Representatives of companies from the U.S. were interviewed because their ASP market is very mature and their experiences were a valuable contribution to this research that assisted well for the purpose of understanding the rate of adoption in the European market.
When selecting the individuals for the interviews the main emphasis was laid on their various organizational backgrounds, their professional experience and their position within the organization. The 65 individuals interviewed for the qualitative study present 56 different organizations. Some of them have professional experience within the electric utilities sector of 30 years and more; some were relatively new in this business. Some of them have upper management positions in their organizations; most of them have an expert position with regard to energy business and energy trading. The survey includes interviewees that hold a professorship in energy industry departments at universities, some that represent public organizations such as ministries or regulatory bodies, but also consultants and suppliers to the electric utilities industry were included. Last but not main emphasis was put on the selection of representatives from electric utilities itself. The interviewees were able to contribute to the topic from various points of views, i.e. from a technical side, from economic sides as well as from organizational and personal points of views. Additionally the organizations they represent are public and private ones as well as profit and not for profit institutions. A presentation of the professional and national backgrounds of the interviewees is given in chapter 5.2. The interview guide used for these expert talks can be found in the Annex (chapter 8.1). The survey was conducted in late summer/autumm 2003.
The results presented here are derived from the qualitative study that was conducted in order to generate a more specific understanding of factors influencing the decision of electric utilities to adopt or reject Application Service Providing (ASP). Two branch-specific applications were selected for this purpose:
Short-term Load forecasting applications
Short-term Price forecasting applications
5.1.2 SOFTWARE
The analysis of the data gathered during the qualitative study was conducted using the software QSR*NUDIST. Additionally for the reporting of the results the software MindManager 4.0 was used.

Qualitative Study
Page 108
5.1.3 OBJECTIVES
After finding an appropriate research design from the literature research in order to determine the characteristics that influence organisational adoption, it was necessary to adopt the general model to the specific underlying research problem. For this purpose a preliminary qualitative study was conducted in order to generate a more specific research design. Nevertheless this study is not to seen as the first step for the quantitative survey, but rather as an independent study. It gives valuable input for the formulation of the hypotheses, supports the design of the quantitative survey, the development and wording of the quantitative questionnaire and last but not least assists the interpretation of the main survey findings.
The qualitative preliminary study has been done in order to:
• Evaluate when people have recognized the technology ‘Application Service Providing’ and the possibility to apply it to the electric utilities industry
• Determine variables influencing the adoption of Application Service Providing in the electric utility sector besides the variables found in the literature research
• Generate new hypotheses, deliberate about the hypotheses generated during the literature research and the qualitative studies, and finally find few significant hypotheses that will be tested
• Determine the decision makers (i.e., the decision making structure) for branch-specific IT solutions within electric utilities.
5.2 SURVEY PARTICIPATION
The 65 respondents of the qualitative survey are located in a wide variety of countries. The main emphasis however is on the German-speaking countries: Austria, Germany and Switzerland.
29
94
12
38
AustriaGermanySwitzerlandUSAFinlandOther
Figure 46: Nationality of the respondents of the qualitative study
Other countries included are, France,
Hungary, Ireland, Italy, the Philippines Sweden, Taiwan and
the UK

Qualitative Study
Page 109
In order to gain insight into different point of views from diverse professional backgrounds it was necessary to receive a well-weighted mix from various professional backgrounds among the respondents. Therefore special attention was paid to the fact that the survey contains different respondents from different organisational backgrounds within the electric utilities environment.
32%
17%22%
29%Consulter/SupplierGovernment agencyUniversityUtility
Figure 47: Professional backgrounds of the respondents of the qualitative study
5.3 RESULTS
For the purpose of providing a picture about the knowledge of the term ‘Application Service Providing’ among the respondents, the interviewees were asked to indicate when they first became aware of the term ‘Application Service Providing’. Some of the respondents indicated that they recognised the term ‘Application Service Providing’ ‘as early as 1990. Many respondents stated that they have been aware of ASP since 2000/2001. Almost half of the respondents said that they only recognised the term after receiving my study and reading the definition.
The grey line indicates the first recognition of the term ‘Application Service Providing’ in general; the black line indicates recognition of Application Service Providing in connection with the electric utilities industry.

Qualitative Study
Page 110
0
10
20
30
40
50
60
1990 1991 1992 1993 1994 1995 1996 1997 1998 1999 2000 2001 2002 2003
Year
Cum
mul
ated
num
ber o
f re
spon
ses
ASP in general ASP/Electric Utilities
Figure 48: First recognition of the term ‘ASP’
Underneath examples of responses from the interviewees in the qualitative survey are given.
Interview Guideline: When did you first recognize the term ‘Application Service Providing’? When did you realize the option of maintaining software for the electric utilities industry via Application Service Providing?
‘soeben’ [just now] ‘ebenfalls soeben’ [also just now] ‘In Ortisei, although the service is common in other environments in Utilities and non Utilities’ [the author gave an presentation on ASP in Ortisei, annotation of the author] ‘In the USA a few years ago in different applications than the two mentioned here’ ‘We provided internet based services to clients using the ASP model starting in mid 2000’ ‘During 2000’ ‘Vor rund vier Jahren’ [Approximately four years ago] ‘Noch nicht, da gerade bei den beschriebenen Anwendungen sensible Daten gehandelt werden, welche ein EVU nicht (oder nur selten) außerhalb der eigenen Verfügbarkeit haben will (Old-Economy, konservative Branche, etc.)’ [not yet, especially because the described applications handle sensitive data, which a utility does not (or only seldom) want to have outside its own availability (old-economy, conservative industry, etc.)] ‘The term as such, ASP, when reading above. But independent of this I was aware of the idea (possibility) for by this type of service via internet etc.’ ‘So far not so much and not yet concerning the ‘sharp’ applications (control of the power system itself). But we have some other examples: registration system for trouble-shooting in common SW service (Office etc) (external SW), techn.info system for our entrepreneurs (internal SW), thunderstorm warning for control centres (internal SW).’
Figure 49: Selected responses ‘first recognition of ASP’

Qualitative Study
Page 111
After the question about the first recognition of ASP, a more detailed inquiry about active involvement within ASP in the electric utilities industry was conducted.
Interview Guideline: Did you actively deal with ASP in the electric utilities industry? If yes, how? (i.e., searching for information, etc.) ‘Beispielsweise im Rahmen eines Projektes, bei dem wir für Kunden eine Dienstleistungsgesellschaft zur Erbringung von Abrechnungsleistungen gegründet haben. Das Unternehmensmodell berücksichtigte dabei für potenzielle Mandanten neben der Möglichkeit BPP (Business Process Providing) auch ASP-Leistungen bereit zu stellen. Inhalt dieses Projektes war neben der organisatorischen und rechtlichen Unternehmensgründung der Aufbau des ‘Werkzeugs’ der neuen Gesellschaft, die Schaffung einer Systemplattform für Billing, CRM, EDM und nebengelagerter Dienstleistungen (auf Grundlage von SAP-Produkten).’ [for instance in the context of a project, where we set up a service company for our customers for the provision of billing services. The business model incorporated the possibility to provide, besides BPP (business process providing), also ASP-services. Content of the project was besides organisationally and legally formation of a company, the development of ‘tools’ for the new company, the creation of a system platform for Billing, CRM. EDM and auxiliary services (on the basis of SAP-products)] ‘Verantwortung für die Produktentwicklung ‘Kundenverrechnung für ‘Klein-EVU´s auf Basis des ASP-Modells’ [Responsibility for the product development ‘Billing for small-utilities on the basis of an ASP-model’] ‘I built an ASP application in 2000 for a company that collected utility billing data and facility information from multi-site customers. We then analysed the data for billing errors and energy conservation opportunities.’ ‘We have a risk management system which we are offering to our clients (electricity utilities) with ASP.’ ‘Informationssuche, Diskussion auf GF-Ebene über die Bedeutung von ASP und die Unmöglichkeit der Realisierung im Zusammenhang mit spezifischen Aufgabenstellungen (bspw. Abrechnung) aufgrund zu hoher Komplexität der Prozesse’ [Search for information, discussion on executive level about the importance of ASP and the impossibility of realisation in connection with specific tasks (i.e. billing) due to excessive complexity of the processes] ‘Wir haben selbst eine Lösung entwickelt, die die Möglichkeit zum ASP bietet. Mittlerweile laufen drei unserer Systeme im ASP-Betrieb’ [We have developed a solution, which offers the possibility of ASP. Meanwhile three of our systems are running in ASP-mode] ‘Entwicklung von kundenspezifischen Lösungen für den Stromhandel über internet’ [Development of customer specific solutions for electricity trading via internet] ‘Purchased services when working for a utility and later as Director of Product Development for an ASP.’
Figure 50: Selected responses ‘Involvement in the field of ASP’

Qualitative Study
Page 112
In order to find out which characteristics influence an electric utility’s decision to adopt or reject an Load respectively Price forecasting application via Application Service Providing, the respondents of the qualitative study were asked to state their opinion as to which factors they think influenced the decision of an electric utility to adopt ASP or not. Respondents were also asked to state the respective advantages and disadvantages in using Application Service Providing in the electric utilities environment.
Interview Guideline: What are the most important determinants/factors for a company when making the decision to use forecasting applications via ASP? What do you think are the main advantages/disadvantages of forecasting applications via ASP? ‘seine individuelle Kosten-Nutzen-Rechnung und die Offenheit sich mit dieser neuen Dienstleistung überhaupt zu befassen bzw. die Transaktionskosten/Opportunitätskosten welche dadurch entstehen.’ [the individual cost-benefit calculation and the openness to deal with this new service, respectively the transaction cost/opportunity cost that arise thereby] ‘Vorteile: Verteilung von Kosten (nicht zwingend geringere Kosten), Nutzung neuer Technologien, evtl. externes know-how. Nachteile: Sicherheitsthematik, Komplexität, Standardisierung versus individueller Bedarf’ [Advantages: allocation of cost (not obligatory lower cost), usage of new technologies, potentially external know-how. Disadvantages: security topic, complexity, standardisation versus individual requirements] ‘1. Kosten, 2. Kosten, 3. Kosten Soft facts: Abhängigkeit, Datensicherheit, Seriosität und Stabilität des Dienstleisters, Erhöhung der Flexibilität, know-how-Gewinn’ [1. cost 2. cost3. cost soft facts: dependency, data security, seriousness and stability of the service provider, increase in flexibility, know-how benefit] ‘+ Kostenreduktion, Erhöhung Flexibilität, know-how Gewinn, Serviceverbesserung, Abhängigkeit, Datensicherheit, Kompetenzverlust’ [+ reduction of costs, increase in flexibility, know-how benefit, service improvement,-dependency, data security, loss of competence] A new big advantage for ASPs has arised following the attacks of September, 11th: the advantage of security because of decentralized servers and software
Figure 51: Selected responses ‘factors influencing the decision to adopt forecasting applications’
Interview Guidelines: What are the most important determinants/factors for a company when making the decision to use Load forecasting applications via ASP? What do you think are the main advantages / disadvantages of Load forecasting applications via ASP? ‘Vertrauen, Kostenvergl. mit Eigenrealisierung’ [trust, comparison of costs with proprietary realisation] ‘Vorteile: Bereitstellung, Datensicherheit, Preis, Nachteile: Abgabe von know-how (systemtechnisch)’ [advantages: allocation, data security, price disadvantages: release of know-how (system-technically)] ‘Load forecasting is a traditional task for electric utilities and therefore there should be enough competence and expertise within them to perform this vital task. The new competitive scenario

Qualitative Study
Page 113
introduced some changes; load forecasting is now similar to a market investigation, therefore new expertise is required. Outsourcing is an option often adopted by utilities to solve problems like this. Of course the costs (internal or external) to perform this task is a very important factor.’ ‘Advantages: continuous update of know-how and techniques adopted (very important in a continuous changing scenario and changing market rule and operators); probably cheaper Disadvantages: security of data and of strategic decisions; non development of internal staff know-how.’ ‘Degree of inaccuracy of local Load forecasting method versus that of the ASP. The decision to use the ASP should be based on a verification that the ASP forecasting method is much better than the method currently being used by the utility. A benefit/cost ratio analysis should then be made.’ ‘How data is processed is not really an issue. ASP, to be successful, must be bundled with appropriate services. That said, the main advantage to an ASP for the utility is its ability to outsource significant technical work.’ ‘Hauptsächlich die Entscheidung, sensible Daten, wie Lastgänge, Kundendaten oder Fahrpläne extern zu kommunizieren. Und natürlich der Preis der Dienstleistung. ‘ [basically the decision to communicate sensitive data such as load, customer data or load-schedules external. And of course the price of the service.] ‘Kostenreduktion, Outsourcing, Mitarbeiterabbau, technischer IT-Support’ [reduction in cost, outsourcing, reduction of employees, technical IT-support] ‘Exakterer Prognose’ [more accurate forecast] ‘Nachteile: Sicherheitsbedenken, Konkurrenzschutz, in der Ferne betriebenes System kennt nie die Eigenheiten der Kunden des EVU, ... Vorteile: Weiterentwicklung, automatische Weiterentwicklung der Modelle, freilich attraktiver als Inhouse-Lösung oder selbst gestrickte Modelle ... ‘ [Disadvantages: security concerns, protection against competition, a system that is operated in the distance never knows the peculiarities of the customers of the Utility, advantages: advancement, automatically advancement of the models, financially more attractive than in-house-solutions or homemade models] ‘Vorteile: Aktuelle Software und Methoden, externes Expertenwissen in einem wichtigen Bereich, der zunehmend außerhalb der Kernkompetenz der EVU liegt. Nachteil: Ausgliederung eines wichtigen Aufgabenbereichs, Abhängigkeit, hohe Qualitätsanforderungen an den Provider.’ [Advantages: up-to-date software and methods, external expert know-how within an important area, which is increasingly outside the core competence of a utility. Disadvantage: outsourcing of an important area, dependency, high-quality requirements to the provider.] ‘Das Programm darf sich nicht nur auf Regression abstützen, sondern muss externe Faktoren, nicht nur Wetter, sondern Streiks, etc berücksichtigen können. Szenarienbildung musss möglich sein, siehe Norwegen 2002, SWEP 2003’ [the application has to be not only based on regressions, but also has to incorporate external factors, not only weather, but strikes, etc. Creation of scenarios must be possible, see Norway 2002, SWEP 2003] ‘Wenn das Programm einfach zu benutzen ist und trotzdem auf hohem Niveau arbeitet, bestehen keine Nachteile, abgesehen von der Lizenz.’ [If the application is easy to use and still operates on a high level there are no disadvantages apart from the licence] ‘Wenn er selbst keine Möglichkeit hätte, Prognosen durchzuführen. …. Fast alle Elektrizitätsversorgungsunternehmen verwende(te)n Prognoseprogramme. Durch die Liberalisierung - Unbundling in Erzeuger-, Übertrager-, Verteilerunternehmen hat sich die Situation der Elektrizitätswirtschaft stark verändert. Bilanzgruppen müssen einen Fahrplan erstellen und benötigen

Qualitative Study
Page 114
die Last-und Erzeugungsprognosen ihrer Kunden bzw. Erzeuger. ASP hat nur Chancen, wenn der Províder die organisatorisch/wirtschaftlichen Zusammenhänge laut ElWOG und die Funktion der einzelnen Organe genau kennt.’ [If one/he does not have the possibility to execute forecasts oneself/himself.... Almost all Utilities use(d) forecasting applications. As a consequence of the liberalisation-Unbundling into generation-, transmission-and distribution-companies-the situation of the utilities has changed significantly. Accounting groups have to generate a load schedule and thus require the load-and generation forecasts of their customers respectively generators. ASP only has a chance, when the provider knows exactly the organisational/economical coherences according to ElWOG and the functionalities of the single participants.] ‘keine Wartung und Updates der Software nötig, vermutlich keine oder geringe Fixkosten, Abhängigkeit vom Anbieter, Verlust eigener Kompetenz und Assets (Personal, Software), sensible Daten gehen massenweise außer Haus.’ [no maintenance and updates of the software necessary, presumably no or only low fixed cost, dependency on the provider, loss of own competence and assets (personnel, software), sensitive data are given away in great quantities]
Figure 52: Selected responses ‘factors influencing the decision to adopt STLF applications’
The following table gives an overview of responses on the question about factors influencing an electric utility’s decision about adopting price forecasting applications via ASP. Additionally perceived quoted disadvantages and advantages of price forecasting applications via ASP are presented.
Interview Guidelines: What are the most important determinants/factors for a company when making the decision to use Price forecasting applications via ASP? What do you think are the main advantages/disadvantages of Price forecasting applications via ASP? ‘Hier ist die Genauigkeit der Prognose von großer Bedeutung für die finanziellen Konsequenzen zu treffender Entscheidungen in Bezug auf Stromeinkauf und Ausbau von Kapazitäten. In den verwendeten Finanzmodellen kann die Streubreite möglicher Szenarien verringert werden, das Risiko der Investitionen wird kleiner.’ [In this case that forecast accuracy is of great importance for the financial considerations and will affect decisions made regarding the purchasing of electricity and the expansion of capacities. In the financial-models used, the spread of possible scenarios can be reduced, thus the risk of the investments becomes smaller] ‘Größe bzw. Struktur des EVUs’ [size in particular structure of the utility] ‘Price forecasting is a new task introduced by the new competitive scenario. In general utilities, at least in Italy, have not yet developed enough expertise. Price forecasting application via ASP is an interesting option. Of course the costs (internal or external) to perform this task is a very important factor.’ ‘Advantages: creation of a new expertise that need to be continuously updated due to the expected changes in the market rules and in the market structure (new operators) .’ ‘The factors to be considered are: 1) How good is the price forecasting procedure offered by the ASP? 2) Has it been field-proven? 3) Should the company keep its price forecasts to itself and not have it known by other parties?’‘ ‘The companies interested in spot market price forecasting are the generators and brokers. Bilateral contracts have taken over the bulk of the market transactions. Spot market trading is becoming

Qualitative Study
Page 115
restricted to ancillary services for congestion management and load balancing. As a result, a generating company has a need for some kind of forecasting such that it can optimise the mix of bilateral and spot market trading that it can offer. Because of competition and the gaming aspects of spot market bidding I would think that a generator should keep its price forecasts to itself and not publicize it. If the forecast is produced via ASP and the ASP is widely used by many players then its price forecast for a given market would be the same for all subscribers. I do not know enough of microeconomics to judge whether this is good or bad.’ ‘Price forecasting is as much an art as it is a science. The ASP advantage to a utility is the ability to access professional who have the gift. Running their own models internally is merely a side benefit. ‘ ‘strong statistical foundation. incorporation of significant parameters’ ‘Nachteil: sensible Daten werden nach außen getragen, Sicherheit ist nicht gegeben. Vorteil sicher der Preis und der geringe Aufwand’ [Disadvantage: sensitive data are handled outwards-security is not given. Advantage: surely the price and the low expenses] ‘Produktportfolio und strategische Ausrichtung als erstes (kleine/große Bilanzgruppen die international/national tätig sind, Produkte die Lieferanten anbieten, Marktstrukturen & Entwicklungen die die Genauigkeit beeinflussen, usw.)’ [product portfolio and strategical orientation first of all (small/big accounting groups which are acting international/national, products that are offered by suppliers, market structures & developments which influence the accuracy, etc.] ‘Objektivität, Möglichkeit auf mehrere Anbieter & Modelle zuzugreifen, langfristige Entwicklungen (Futures) mit Erfahrung, usw.’ [objectivity, possibility to revert to more providers & models, long-term developments (futures) with experiences, etc.] ‘wenn im ASP nicht nur ökomische und umwelt-parameter wie kraftwerksmix, temperatur, etc. vorhanden sind, sondern auch stratgisches verhalten abgebildet werden kann, denn die großen 3-4 in mitteleuropa können jederzeit, wenn sie lust haben, viele kleine stromhändler und evu in den ruin treiben (EdF, E.ON, RWE, Vattenfall). die im letzten jahr gezeigt price-spikes an den spotmätkte können diese unternehmen zu jedem zeitpunkt diese jahres beliebig herbeiführen und so lange durchhalten, bis viele kleine fische im teich des grosshandels bankrott sind…’ [in case, within the ASP there are not only economical and environment-parameters such as power-plant-mix, temperature, etc, but when also strategical behaviour can be included, because the 3-4 big ones in central Europe are able to ruin a lot of electricity traders and utilities whenever they feel like doing so(EdF, E.ON, RWE, Vattenfall). These companies are able to bring about the price-spikes that occurred last year at the spot markets anytime in the year they want and stay the course, until a lot of small potatoes dealing in the wholesale market are bankrupt...] ‘Vorteile: Aktuelle Software und Methoden, externes Expertenwissen in einem wichtigen Bereich, der zunehmend außerhalb der Kernkompetenz der EVU liegt. Nachteil: Ausgliederung eines wichtigen Aufgabenbereichs, Abhängigkeit, hohe Qualitätsanforderungen an den Provider.’ [Advantages: up-to-date software and methods, external expert know-how within an important area, which is increasingly outside the core competence of an utility. Disadvantage: outsourcing of an important area, dependency, high quality requirements to the provider.] ‘keine Eigenentwicklungen oder teure Zukäufe von Software und Ausbildung von Personal notwendig / wenn ein potenter Provider alle beliefert => Korrelationen = selbsterfüllende Prophezeihung oder das Gegenteil? => ev. Vorteil einer eigenen unabhängigen Prognose?!’ [no proprietary development or expensive acquisition of software and education of personnel necessary / in case a potent provider serves all => correlations = self fulfilling prophecy or the opposite? => possibly the advantage of an own, independent forecast?!]
Figure 53: Selected responses ‘factors influencing the decision to adopt STPF applications’

Qualitative Study
Page 116
The survey found, that the most important characteristics influencing the decision to adopt/reject are perceived relative advantage, respectively perceived uncertainty/risk of the innovation:
1) Perceived relative (dis-)advantage:
• Quality of the application (accuracy, transparency, etc.)
• Cost (cost/benefit, low investments, etc.)
• External know-how (lack of internal know-how, usage of latest methods and technology, etc.)
• Improved service (maintenance, support, up-dates, etc.)
• Data security (data transmission and -storage, etc.)
• Trust (seriousness and stability of the provider, liability, references, competency, etc.)
• Dependency (on expertise, performance, etc.)
• Competence
Also characteristics of the company in question influence the decision to adopt/reject:
2) Characteristics of the company:
• Company strategy (core competency, own resources, outsourcing strategy, application importance, etc.)
• Company size
3) External characteristics:
• Environment (intensity of competition, market un-certainty, ASP diffusion etc.)
The light grey bars indicate the importance of the characteristic when making the decision to do Price forecasting via ASP, the dark grey bars indicate the importance of the characteristics when making the decision to do Load forecasting via ASP.
05
101520253035
Tota
l num
ber o
f no
min
atio
ns
AccuracyCost
Strategy
Data Security
Know-how Trust
SizeService
Dependency
Competence
Environment
Price Load
Figure 54: Relevance of characteristics influencing the decision to adopt

Qualitative Study
Page 117
A very interesting picture can be drawn from analysing the answers according to professional backgrounds as can be seen from Figure 55 for the case of the application ‘Price forecasting’. The respondents - independently of their professional backgrounds-agreed on the importance of the quality of the application, which was found to be the most important factor for the adoption-decision. Consulters/Suppliers thought the cost of the application of being a very relevant characteristic, but cost had less relevance for professionals employed by government agencies. Employees from electric utilities found data security as a vital factor in the decision to adopt or reject, whereas University staff found this rather unimportant.
0,00
10,00
20,00
30,00
40,00
50,00
60,00
%
Quality
App
Cost
Strateg
y
Know-H
ow
Data S
ecuri
tyTrus
t
Enviro
nmen
tSize
Depen
denc
y
Compe
tence
Loss
Consulter/Supplier Government agency University Utility
Figure 55: Influencing factors according to respondent’s organisational backgrounds-STPF
In the case of Price forecasting, the environment of the electric utility is perceived to have greater influence on the adoption decision compared to the situation of Load forecasting. Another difference in the two applications Load-and Price forecasting is the influence of know-how. Know-how for Load-forecasting has been built up within the electric utilities for decades, and qualified staff is available within the companies. Price forecasting is a relatively new task, which only has come to importance with the liberalization of the energy markets. Therefore there is a lack of Price-forecasting know-how within the electric utilities and the perceived benefit of gaining this know-how from outside suppliers is therefore of greater importance.
Figure 56 shows the analysis according to professional backgrounds for the application ‘Load forecasting’. Again, interesting insight can be drawn from this result. Quality of the application is, as can already be seen from the results for the application ‘Price forecasting’, the most important influencing factor for the adoption decision. Cost is viewed as the most important factors influencing the majority consulters/suppliers, but has rather less importance from the point of view of government agency’s employees.

Qualitative Study
Page 118
0,0010,0020,0030,0040,0050,0060,0070,0080,00
%
Quality App
Cost
Strategy
Data Security Trust
Know-How
Size
Competence Loss
Dependency
Environment
Consulter/Supplier Government agency University Utility
Figure 56: Influencing factors according to respondent’s organisational backgrounds-STLF
Overall the picture for Load-and Price-forecasting is quite similar and shows the same influencing characteristics for both applications. There are different weights on especially the characteristics of ‘environment’ and ‘know-how’. Nevertheless, analysing the emphasis and importance of the single characteristics is task of the quantitative survey.
The purpose of the following question was to identify roles within the companies that are involved in the organisational buying process concerning Application Service Providing for Load and Price forecasting.
Interview Guideline: Which roles are incorporated when making the decision to use (adopt) Application Service Providing in an electric utility? ‘Die letztendliche Entscheidungsfindung beruft sich auf die Wirtschaftlichkeit. Daher ist meines Erachtens der Auslöser im idealen Fall beim Leiter IT-in der Wirklichkeit allerdings oft auch auf Geschäftsführungsebene zu finden.’ [The ultimate decision-making refers to profitability. Therefore in my judgement, the starting point is in an ideal case at the head of IT-in reality often also to find at executive level] ‘Vertrieb , Einkauf bzw. e-procurement’ [Sales, purchasing department respectively e-procurement] ‘Regulatory environment may constrain freedom to choose ASP; head of company IT for business case; corporate management for decision on company strategy.’ ‘Neben den Fachabteilungen, die die Funktionalitäten nutzen (Vertrieb, Netznutzungsabteilung der Geschäftsführer, der Einkauf und zu einem geringen Maße die IT-Fachabteilung’ [besides the specialist departments, which use the functionality (sales, network-access-department), the CEO, the purchasing department and to a low degree the IT-department] ‘Leiter IT, Stromeinkauf, Leiter Privatkunden, Leiter Geschäftskunden ‘ [chief of IT, electricity purchasing, head/director of private customers department, director of business customers department] ‘Heute haben die EVUs Handelsabteilungen mit Risikomanagement, in der Schweiz z.B. ATEL und EGL, Diese sind die Adressaten ‘

Qualitative Study
Page 119
[The Utilities have trading departments with risk-management today, i.e. in Switzerland ATEL and EGL, these are the addressees] ‘Vorstände, GeschäftsführerInnen, LeiterInnen-IT, IT-SpezialistInnen, LeiterInnen Bilanzgruppenmanagement, LeiterInnen Handel, LeiterInnen Vertrieb, LeiterInnen Marketing. ‘ [board of directors, CEOs, heads of IT, IT specialists, heads of balance group management, heads of trade, heads of sale, heads of marketing] ‘Leiter der IT, betroffener Abteilungsleiter, Projektleiter (z.B. Projekt: ‘Einführung von Prognosen im EVU.’) ‘ [head of IT, affected head of department, head of project (i.e., project ‘introduction of forecast in the electric utility’] ‘Geschäftsführer (generelle Strategievorgabe), Bereichsleiter (Strategie, Controlling Nutzen/Kosten), Unternehmenseinheitsleiter (Vergabevorschlag), Experte (Qualitätstest), IT ist Dienstleister und soll Service sicherstellen, kann aber technische Restriktionen vorgeben (Datensicherheit, Firewall,....)’ [CEO (general strategic specification), area manager (strategy, controlling (cost/benefit), head of company unit (suggestion for placings), experts (test of quality), IT is service provider an has to assure the service, but can imply technical restrictions (data security, firewall,…)] ‘In the case of the Load forecasting the head of IT, at the Price forecasting the management board.’
Figure 57: Selected responses ‘decision making process-roles involved’
Results of the qualitative study show that particularly the board of directors and the management board, as well as heads of IT and energy departments are those involved in the buying decision process.
The following table shows further interesting remarks made by respondents during the qualitative interviewing.
Interview Guideline: Additional Comments ‘If I were to consider using the services of ASP, I would look at the types of analysis which, because of dimensionality and complexity problems, would require computer or programming resources not within the capability of my control center or the technical expertise of the in-house engineering team Dimensionality is a growing problem with the establishment of large RTOs (MegaRTOs) in the US or of the UCTE requirements in Europe. Network models in the order of 20,000 to 50,000 nodes are needed for network analysis functions for Operation Planning. For planning purposes, members of RTOs or of UCTE have already agreed to provide base case (mid-term and short-term) information to be processed centrally to obtain transfer capabilities, congestion management constraints or pre-dispatch. Another application with dimensionality and complexity problems is hydro-thermal coordination (HTC) particularly market-based HTC. Since most of these generation systems are owned by a single entity, generally public rather than private. it would be worthwhile considering using an ASP. Another possible application is to use an ASP as an operator training simulator center for a group of interconnected utilities. This ASP facility can be used to train operators with different levels of experience, from a beginner to a senior operator, not only in the fundamentals of system static and dynamic phenomena, but in the tools and techniques for preventive, emergency, and restorative control.’
Figure 58: Selected additional comment

Qualitative Study
Page 120
5.4 EXCURSUS: SCIENTIFIC INTERCHANGE
In addition to the qualitative study, peer discussions with researchers in the field of organisational behaviour theory were conducted for this research project. Those meetings, which are considered important milestones for the process of this thesis, are described in more detail below.
5.4.1 MEETING RESEARCHERS IN THE NETHERLANDS
A trip to the Netherlands with my research fellow Christina Hainbuchner was undertaken in January 2004.30 During this trip we had the opportunity to meet several contemporary researchers working in this field at the Vrije Universiteit in Amsterdam and Erasmus University in Rotterdam.
Professor Ruud Frambach, Head of the Department of Marketing at the Vrije Universiteit Amsterdam, Faculteit der Economische Wetenschappen en Bedrijfskunde, Informatiekunde, Marketing en Logistiek, and Associate Professor Yvonne van Everdingen from the Department of Marketing Management at the Rotterdam School of Management, received us in the Netherlands for exceptionally fruitful discussions. The scientific debates with these two experts were especially supportive regarding the theoretical research framework as both are continuously contributing valuable research results to the area of innovation adoption/diffusion (Van Everdingen 1995; Frambach, Barkema et al. 1998; Van Everdingen and Bamossy 2000; Van Everdingen and Wierenga 2001; Frambach, Agarwal et al. 2002; Frambach and Schillewaert 2002; Van Everdingen and Wierenga 2002; Frambach, Prabhu et al. 2003; Frambach, Van Herk et al. 2003; Van Everdingen 2003; Van Everdingen and Waarts 2003). Their most recent research outcomes and connected practical experiences were discussed and consequently considered here in this dissertation. In more detail, the variables ‘Social influence: contact’ and ‘Social influence: image’-influencing the dependent variables in my research model were emphasized by Professor Yvonne van Everdingen and are thus included in this study. Special thanks to the Dutch research fellows for the valuable contribution to my PhD study.
5.4.2 MEETING RESEARCHERS IN SWEDEN
Christina Hainbuchner and myself followed the invitation of Professor Anders Pehrsson to visit the Centre of Industrial Competitiveness (CIC) at the Växjö University for one week in February 2004. The objective of this research journey was twofold as I gave a lecture in the Master’s course ‘International Marketing Strategy’ together with Christina Hainbuchner respectively followed the PhD-course ‘Contemporary Strategy Research’.
30 Christina Hainbuchner carried out her doctoral dissertation at the Vienna University of Economics and Business Administration in the field of High Tech Marketing under the supervision of Prof. Hasenauer in a similar time frame as the author of this thesis (2002-2005). Her research deals with technology acceptance related to TETRA.

Qualitative Study
Page 121
International market entry of technology-based firms was the theme of the lecture that 30 international students attended. As the students were in the process of setting up their master thesis, the lecture incorporated research design examples derived from my own personal research experience. This experience helped a lot for the author’s self-reflection on the research process.
Herewith I would like to thank the CIC research fellows, especially Professor Pehrsson, for the productive meetings and scientific discussions that I have experienced at Växjö University.
5.5 REPORTING
Figure 59 shows the factors said to influence organisational adoption decisions discussed in the literature review. According to the qualitative survey not all of them play a role in the decision to adopt or reject ASP. The bracket beside each influencing factor quotes the number of nominations made by the participants of the qualitative survey. All factors dyed in grey were eliminated for the further investigation, due to not being seen as influential for the underlying research. Social influence was incorporated into the further investigation due to the recommendation of Prof. Van Everdingen and Prof. Frambach (c.f. chapter 5.4). The results are displayed underneath in a graph that was designed with the software MindManager. This is a tool for graphical visualisation and representation. The graph is to be read from the inside to the outside, i.e.: an influencing factor are the characteristics of the innovation, they are expressed by trialability, relative advantage, etc. The presentation and the formation of the single influencing factors in this graph occur randomly. The main purpose of the illustration below is to give an overview of the influencing factors identified by literature research and subsequently examined by the qualitative study. It shows which factors are included in the research model for further investigation and which influencing variables are left out.

Qualitative Study
Page 122
Environment Characteristics
Social Influence
Organizational Adopter Characteristics
Individual Adopter Characteristics
Innovation Characteristics
Influencing Factors10.04.2005 - v33
Expected ASP Diffusion (12)Behavior of Competitors (11)
ContactImage
Strategy (17)Core Competency (13)Own Ressources (13)
Size (20)
Receptiveness (4)
Age (0)
Gender (0)
Education (0)
Trialability (Intention to try)
Relative (Dis-) Advantage
Accuracy (60)Cost (57)Data Security (35)Know-how (31)Trust (27)Transparency (23) Improved Service (15)Dependency (13)Competence (12)
Availability (10)
Flexibility (8)
Customizing (8)
Time Sensitivity (6)
Synergy Potentials (5
Trialability (0)
Complexity (8)
Compatibility (7)
Observability (1)
Figure 59: Factors influencing the decision to adopt ASP-results of the qualitative survey

Quantitative Study
Page 123
6 QUANTITATIVE STUDY
6.1 INTRODUCTION
The aim of the quantitative study is to empirically investigate the research model designed and the hypotheses formulated. The main objective of this attempt is to preliminary adopting the formulated hypotheses or falsify them. From the verification or falsification of the single hypotheses valid factors influencing adoption decisions can be identified and thus assumptions and recommendations are drawn for the actors involved in such decisions.
6.1.1 SURVEY DESIGN
In order to get a more comprehensive and broader view of the factors determining adoption decisions of ASP this survey was designed specifically for the electric utilities sector in Austria and Germany. Both individuals that have already adopted such a service and those who have not adopted it were included in the survey.
The basis for this survey was built by conducting:
• Intense literature research (see chapter 1 and chapter 2);
• The qualitative study described above, including expert discussions and interviews (see chapter 5); and
• Discussions with experts researching in the adoption/diffusion field (see section 5.4).
By involving practitioners in the development of the questionnaire the research items tended to be exploratory and practice-driven rather than theory-driven due to the practical approach of this research topic. Such an approach is also supported by Zmud (1998).

Quantitative Study
Page 124
The most appropriate form for data collection in the underlying research project is a web-based questionnaire. The questionnaire has been developed in order to collect the data for the quantitative field study. The content of this questionnaire was based on theoretical considerations suggested in the literature as well as the results of the preliminary qualitative study. Based on existing organizational adoption surveys (Gatignon and Robertson 1989; Rogers 1995; Van Everdingen 1995; Schillewaert, Ahearne et al. 2000; Van Everdingen and Bamossy 2000; Henriksen 2002; Van Everdingen and Wierenga 2002; Frambach, Van Herk et al. 2003), questions have been formulated with respect to the perceptions of the innovation characteristics, the organization characteristics, the environment, and social influence.
Following this a first draft of the questionnaire was shown to experts from the electric utility field to gather feedback on the content and on the questions as well as on the survey in general. The web-based questionnaire was altered according to their suggestions and comments and the new draft was again presented to different experts from the field. This approach was done until the experts did not request any more changes. In this pre-test approximately 20 experts from the field were involved. Afterwards, the design and content was discussed with an expert in development of questionnaires. These discussions led to small adjustments to the questionnaire and to re-formulations and alterations to the layout of a number of items and questions.
Subsequently the ready-made questionnaire was pilot tested among a number of randomly selected firms in the electric utilities industry. Feedback on the content as well as the form and design of the questions and the questionnaire was collected from these companies and some improvements were included for the final version of the questionnaire.
Before-mailing the final questionnaire, as in the case in other similar studies (Johnston and Gregor 2000) it became necessary to analyse the actions of the individual firm. Even at this level it was sensible to choose a specific responder among the individuals in the organization who would interpret and explain activities at the specific industrial level. The selection of the respondent within the companies was based on the findings of the preliminary qualitative study.
The relevant population is defined as the energy supply sector in Germany and Austria. Companies addressed were electric utilities in these two countries. As can be seen from Figure 60 the population in its entirety contains approximately 1102 relevant companies of all sizes. All of these organizations are taken into account.

Quantitative Study
Page 125
Country Communal electric utilities Regional electric utilities
Austria 14231 -
Germany 900 60
Sum 1102
Figure 60: Population of possible adopters relevant for the underlying investigation
In the quantitative survey different roles within potential and real adopter organizations were addressed. These roles included those individuals that already adopted the innovation, those that intended to adopt it and those who explicitly rejected to adopt. By including these different roles among the respondents it was expected that a more multifaceted picture of the motivators for adoption in the different stages of the adoption decision could be revealed. The strategy of including both adopters and non-adopters has been applied in previous research (e.g. Cox and Ghoneim 1996; e.g. Lai 1997) the reason being that it is as appropriate to consider rejection of an innovation as a form of action similar to adoption (Abrahamson 1996).
For a thorough presentation of the questionnaire see Appendix (page 204), where the questionnaire is printed. In this section of this work some snapshots of the web-based survey can also be found (page 210).
The questionnaire for the quantitative survey was designed according to the requirements depicted in the literature (Schumann 2000; Diekmann 2002 pp. 410). The questionnaire consisted in a total of 59 items including sub-questions. Most questions were questions relating to opinion/perceptual matters and presented on a hundred-point likert scale (see chapter 8.2.4). Only those questions relating to the individuals intention towards ASP, company type, company size, job position, and opinion about other possible applications via ASP were presented in the form of checkboxes. As recommended in previous research (Grover and Goslar 1993) a definition of ASP (see chapter 1.5.4) was included in the questionnaire to ensure that the respondents had a common understanding of the phenomena under investigation.
31 Registered at e-control Ltd, the Austrian regulation authority for electric Utilities.

Quantitative Study
Page 126
The individuals chosen for this survey were contacted with an introduction letter by post. This letter included a short description of the research project and the objectives targeted. A week later the same individuals were contacted by e-mail. The e-mail included the link to the web survey. Approximately two weeks after this e-mail, a reminder was sent per e-mail to the individuals. No distinction could be made between those who had already responded, and those who had not because the survey participation was anonymous. Finally, four weeks after the initial e-mail a second reminder was sent.
The dependent variable of concern in this research is the individual’s intention to adopt or not adopt forecasting applications via ASP rather than their intention to use. This is an important distinction since, according to TRA; studies need to be specific as to the target behaviour of interest. If adoption is of interest, then the dependent variable should be intention to adopt or adoption behaviour. The independent variables are defined as the determinants described in the final research model (chapter 2.6). Also a moderating variable between the independent variables and the dependent variable, the attitude towards ASP, is taken into account in the underlying research.
For the underlying research the ‘intention to adopt’ is defined as an intention to adopt forecasting applications within six months, within a year, within two years, or later than two years and no intention to adopt. Therefore for the underlying research the intention to adopt is not seen as a dichotomous yes/no decision, but rather from the fuzzy point of view, allowing fuzzy classes for the categorization of the dependent variable. Thus, in case of the dependent variable ‘intention to adopt’ fuzzy classes are accepted.
For the examination of the hypotheses linear multiple regression analysis will be used. A logistic regression will be calculated for the purpose of estimating probability of adoption, derived from the values of the moderating variables.
6.1.2 SOFTWARE
The questionnaire for this research was designed as web-based questionnaire. The technical realization of the web-based survey has been done with the great help of an Austrian company specializing in web-based survey solutions.32 All responses were automatically transformed into a SPSS compatible database, which made it easy to get started with SPSS immediately after having collected all responses.
The statistical analysis of the quantitative research was done with the software SPSS for windows, in different versions (V8.0 –11.01) in German as well as in the English language.
32 Special thanks to Mag. Thomas Gieler of Gieler Marktforschungssoftware, who never hesitated in supporting every single aspect of this survey, but was also open for the idea of programming a new question-category for this research, enabling 100 point likert scales for responses.

Quantitative Study
Page 127
6.1.3 OBJECTIVES
The main objectives from the quantitative study in this research project can be formulated as follows:
• Identify adopters and non-adopters of Application Service Providing
• Identify the characteristics that positively/negatively influence the decision to adopt/reject
• Compare values of the characteristics of adopters versus rejecters
• Identify the probability of adoption and time to adoption
• Testing hypotheses
• Support for answering the research questions
6.2 SURVEY PARTICIPATION
In this chapter the number of individuals participating in this quantitative survey and their intention towards adopting ASP is presented.
The gathering of the quantitative data for the underlying research was conducted in spring and early summer 2004. As the whole gathering of data was finished within two months no bias due to time lag between answering the questionnaire is to be expected.
Out of the 158 retrieved questionnaires, 17 (11%) of the respondents had already adopted the system in question. 63 respondents, which corresponds to 41%, stated that they intended to adopt such a system, whereas 73 (48%) of the respondents indicated there was no intention to adopt the system in question. In five returned questionnaires this information was missing. Due to other relevant information found in those data sets these were included in the subsequent analysis. Figure 61 shows the respondent’s intention to adopt forecasting applications via ASP in more detail.

Quantitative Study
Page 128
Figure 61: Frequency table of respondent’s intention towards adopting ASP33
Figure 62 graphically displays the intention to adopt forecasting applications via ASP among the respondents of the quantitative study in a frequency table. When analysing the graph, it can be seen that 73 out of 153 respondents do not intend to adopt forecasting applications via ASP.
Intention1
no intentionlater than 2 years
within 2 yearswithin a year
within 6 monthalready adopted
Freq
uenc
y
80
60
40
20
0
Figure 62: Respondent’s intention towards adopting ASP34
Intention1
17 10,8 11,1 11,16 3,8 3,9 15,0
12 7,6 7,8 22,920 12,7 13,1 35,9
25 15,8 16,3 52,3
73 46,2 47,7 100,0153 96,8 100,0
5 3,2158 100,0
Already adoptedIntention within 6 monthIntention within a yearIntention within 2 yearsIntention later than 2yearsNo intentionTotal
Valid
SystemMissingTotal
Frequency PercentValid
PercentCumulative
Percent

Quantitative Study
Page 129
6.3 RESPONDENT’S DEMOGRAPHICS
In this section, the demographic profile of both the responding decision makers within companies and the participating companies will be described. A description of the decision makers’ job position within his company is given. Next, descriptive data regarding the size of the participating companies in terms of number of employees, electricity generation per year and electricity sales quantity per year is presented.
Figure 63 gives an overview of the spreading of the respondents’ job positions. It shows that a major part of the respondents is involved in the upper management level, i.e. the executive board or the board of directors. Another large share of individuals is involved in energy trading or the energy business.35
33 SPSS Command: Analyze-Summarize-Frequencies-Charts: Bar Charts, Frequencies-Variable: INTENTION1 34 SPSS Command: Analyze-Summarize-Frequencies-Charts: Bar Charts, Frequencies-Variable: INTENTION1 35 Multiple nominations were allowed

Quantitative Study
Page 130
Respondent's job position
CEOCOO
IT
Energy Business
Sales
Marketing
Other
Energy Trading
Key Account Management
Administration
Public RelationsProject Management
Plant Management
Purchasing
EngineeringRisk Management
Board of Directors
Business Development
Management Board
CEO: 20 nominations, COO: 16, Management Board: 6, Board of Directors: 1, IT: 28, Energy Trading: 29, Energy Business: 45, Engineering: 19, Risk Management: 8, Sales: 26, Marketing: 12, Purchasing: 9, Key Account Management: 11, Plant Management: 15, Project Management: 15, Public Relations:
5, Business Development: 11, Administration: 3, Other: 9.
Figure 63: Respondent’s Job Positions
Figure 64 shows the frequency table of reported company size in terms of the number of employees. It shows that the majority of companies participating in this survey are rather small companies with less than 100 employees (40%), or companies with less than 1.000 employees (32%).

Quantitative Study
Page 131
Figure 64: Frequency table of company size (in employees) 36
Figure 65 gives a graphical overview of the participating company’s number of employees. When analysing the graph it can be seen that according to the structure of the German and Austrian electric utility sector the respondents were mainly smaller companies with less than 100 employees.
Company size (in employees)
Employees
othermore than 10.001
1.001-10.000101-1.000
1-100
Perc
enta
ge
50
40
30
20
10
0
Figure 65: Respondent’s company size (in Employees) 37
Company Size Employees
64 40,5 40,8 40,851 32,3 32,5 73,2
29 18,4 18,5 91,7
8 5,1 5,1 96,8
5 3,2 3,2 100,0157 99,4 100,0
1 ,6158 100,0
1 - 100 employees101 - 1.000 employees1.001 - 10.000 employees
more than 10.000employeesotherTotal
Valid
SystemMissingTotal
Frequency PercentValid
PercentCumulative
Percent

Quantitative Study
Page 132
As a next step in the analysis of the demographic data the size of the participating companies in terms of annual electricity generation is indicated. Figure 66 shows the frequency table for the annual electricity generation of the respondent’s companies.
Figure 66: Frequency table of company size (in electricity generation) 38
When analysing Figure 67 it can clearly be seen that the annual electricity generation from own generation facilities is less than one GWh at the bigger part of the responding electric utilities.
36 SPSS Command: Analyze-Summarize-Frequencies-Charts: Bar Charts, Frequencies-Variable: Company Size Employees 37 SPSS Command: Analyze-Summarize-Frequencies-Charts: Bar Charts, Frequencies-Variable: Company Size Employees 38 SPSS Command: Analyze-Summarize-Frequencies-Charts: Bar Charts, Frequencies-Variable: Company Size Generation
Company Size Generation
44 27,8 33,3 33,335 22,2 26,5 59,8
9 5,7 6,8 66,713 8,2 9,8 76,5
3 1,9 2,3 78,86 3,8 4,5 83,35 3,2 3,8 87,1
17 10,8 12,9 100,0132 83,5 100,0
26 16,5158 100,0
< 1 GWh1 GWh - 500 GWh500 GWh - 1 TWh1 TWh - 5 TWh5 TWh - 10 TWh10 TWh - 50 TWh> 50 TWhotherTotal
Valid
SystemMissingTotal
Frequency PercentValid
PercentCumulative
Percent

Quantitative Study
Page 133
Company size (in electricity generation)
Electricity generation
other> 50 TW
h
10 TWh - 50 TWh
5 TWh - 10 TW
h
1 TWh - 5 TWh
500 GWh - 1 TWh
1 GWh - 500 GWh
< 1 GWh
Per
cent
age
40
30
20
10
0
Figure 67: Respondent’s company size (in electricity generation per year) 39
Especially in times of a deregulated electricity market not only the electricity generation from the company’s own plants but rather the annual sales quantity can be seen as a main indicator for gathering an overview of the participating companies size. Figure 68 therefore gives an overview of the sales quantities of the participating companies in form of a frequency table.
Figure 68: Frequency table of company size (in electricity sales quantity) 40
39 SPSS Command: Analyze-Summarize-Frequencies-Charts: Bar Charts, Frequencies-Variable: Company Size Generation 40 SPSS Command: Analyze-Summarize-Frequencies-Charts: Bar Charts, Frequencies-Variable: Company Size Sale
Company Size Sale
14 8,9 9,7 9,765 41,1 45,1 54,9
8 5,1 5,6 60,422 13,9 15,3 75,713 8,2 9,0 84,7
8 5,1 5,6 90,38 5,1 5,6 95,86 3,8 4,2 100,0
144 91,1 100,014 8,9
158 100,0
< 1 GWh1 GWh - 500 GWh500 GWh - 1 TWh1 TWh - 5 TWh5 TWh - 10 TWh10 TWh - 50 TWh> 50 TWhotherTotal
Valid
SystemMissingTotal
Frequency PercentValid
PercentCumulative
Percent

Quantitative Study
Page 134
Figure 69 clearly indicates that the larger share of companies in the sample has an annual sales quantity between one GWh and 500 GWh.
Company size (in sales quantity)
Sales quantity
other> 50 TW
h
10 TWh - 50 TWh
5 TWh - 10 TW
h
1 TWh - 5 TW
h
500 GWh - 1 TWh
1 GWh - 500 GWh
< 1 GWh
Per
cent
age
50
40
30
20
10
0
Figure 69: Respondent’s company size (in electricity sales quantity) 41
Figure 70 shows that there is a significant difference in the factor attitude (p=0,001) between the two groups of adopters and of those who intend to adopt the service. This indicates that prior experience with the application adopted has a significant influence on attitudes towards such applications.
Figure 70: Independent samples test ‘already adopted’ vs. ‘intention to adopt’ on attitude 42
41 SPSS Command: Analyze-Summarize-Frequencies-Charts: Bar Charts, Frequencies-Variable: Company Size Sale 42 SPSS Command: Analyze-Compare Means-Independent Samples T Test-Test Variable: Attitude-Grouping Variable Inbuy (0,2)
Independent Samples Test
12,621 ,001 ,713 75 ,478 ,1559579 ,2188035 -,2799211 ,5918368
,509 18,536 ,617 ,1559579 ,3065286 -,4867028 ,7986185
Equal variancesassumedEqual variances notassumed
Attitude FactorF Sig.
Levene's Test forEquality of Variances
t dfSig.
(2-tailed)Mean
DifferenceStd. ErrorDifference Lower Upper
95% ConfidenceInterval of the
Difference
t-test for Equality of Means

Quantitative Study
Page 135
Figure 71 shows that there is a significant difference in the factor attitude (p=0,005) between the two groups of those who intend to adopt the service and those who do not. The attitude towards forecasting applications thus has a significant influence on the intention to adopt such a service or not.
Figure 71: Independent samples test ‘no intention’ vs. ‘intention to adopt’ on attitude 43
6.4 WISHLIST OF APPLICATIONS
While answering the quantitative questionnaire, the participating individuals had the chance to indicate which applications they would want ASP providers to offer for electric utilities. The two applications under close investigation in this research were the ones most of the respondents wanted to be offered by ASP. Applications supporting the following processes within electric utilities as indicated by the respondents are (in descending order):
1. Load forecasting
2. Price forecasting
3. Energy Data Management
4. Energy Trading
5. Simulation and Analysis
6. Market Information
43 SPSS Command: Analyze-Compare Means-Independent Samples T Test-Test Variable: Attitude-Grouping Variable Inbuy (0,2)
Group Statistics
78 -,4920070 ,9443324 ,106924663 ,4451045 ,6604001 8,320E-02
IN1BUY,002,00
Factor AttitudeN Mean
Std.Deviation
Std. ErrorMean
Independent Samples Test
7,961 ,005 -6,667 139 ,000 -,9371115 ,1405574 -1,21502 -,6592046
-6,917 136,380 ,000 -,9371115 ,1354826 -1,20503 -,6691931
Equal variancesassumedEqual variances notassumed
Factor AttitudeF Sig.
Levene's Test forEquality of Variances
t dfSig.
(2-tailed)Mean
DifferenceStd. ErrorDifference Lower Upper
95% ConfidenceInterval of the
Difference
t-test for Equality of Means

Quantitative Study
Page 136
7. Congestion Management
8. Billing
9. Risk Management
10. Portfolio Management
11. Customer Relationship Management
12. Asset Management
13. Long Term Resource Optimisation
14. Medium Term Resource Optimisation
15. Short Term Resource Optimisation
The following figure summarises in a frequency table the findings for this question.
0
10
20
30
40
50
60
70
Load
Foreca
sting
Price F
oreca
sting
Energy
Data
Mgm
t
Energy
Trading
Simula
tion A
nalys
is
Market
Inform
ation
System
Conge
stion
Man
agem
ent
Billing
Risk M
anag
emen
t
Portfol
io Man
agem
ent
CRM
Asset
Manag
emen
t
Long
Term R
O
Short T
erm R
O
Medium
Term R
O
Frequen
cy
Figure 72: Applications desired via ASP

Quantitative Study
Page 137
6.5 DESCRIPTIVE ANALYSIS
For the purpose of evaluating the gathered data, they are subsequently examined in a descriptive analysis. The displayed frequency counting as well as the descriptive statistics is the basis for a general description of the data gathered as well as for a deducible structural analysis. As an example the analysis of the variable Intention1 is performed.
Figure 73: Selected descriptive statistics for the variable ‘intention’44
44 SPSS Command: Analyze-Descriptive Statistics-Frequencies-Statistics: Quartiles, Std. Deviation, S.E. Mean, Mean, Median, Mode, Skewness-Variable: Intention1
Statistics
Intention1153
54,63,14
5,006
1,71-1,044
,1964,005,006,00
ValidMissing
N
MeanStd. Error of MeanMedianModeStd. DeviationSkewnessStd. Error of Skewness
255075
Percentiles
Intention1
17 10,8 11,1 11,16 3,8 3,9 15,0
12 7,6 7,8 22,920 12,7 13,1 35,9
25 15,8 16,3 52,3
73 46,2 47,7 100,0153 96,8 100,0
5 3,2158 100,0
Already adoptedIntention within 6 monthIntention within a yearIntention within 2 yearsIntention later than 2yearsNo intentionTotal
Valid
SystemMissingTotal
Frequency PercentValid
PercentCumulative
Percent

Quantitative Study
Page 138
As can be seen from the table of frequency counting, for the variable Intention1 there exist 153 valid cases. In five data sets the corresponding indication was missing. The most frequently used value of the variable is six, which corresponds with no intention to adopt. 46% of the observed cases indicated that value.

Quantitative Study
Page 139
Figure 74: Comprising observation of the descriptive analysis for the data gathered displays the descriptive statistics for all empirical variables gathered during quantitative research.
Variables Valid Missing Mean Median Mode Std.
DeviationSkew-ness Min Max Percentiles
25 50 75 Cost1 158 0 43,747 50 1 26,228 -0,137 1 100 22,75 50 66
Cost2 158 0 61,4241 67 50 26,4634 -0,522 1 100 49,75 67 81,25
Cost3 158 0 43,892 50 50 19,676 0,102 1 100 29,75 50 50
Cost4 158 0 59,627 62 50 19,963 -0,756 1 100 50 62 73
Know-how1 158 0 63,8544 66 50 24,6845 -0,659 1 100 50 66 81,25
Know-how2 158 0 61,3671 61 50 23,0448 -0,557 1 100 50 61 77 Improved Service1
158 0 58,5696 63 50 28,405 -0,411 1 100 35 63 81,25
Improved Service2
158 0 68,1392 70 50 21,1797 -0,897 1 100 58,5 70 81,25
Improved Service3
158 0 65,0823 67 50 22,5032 -0,586 1 100 50 67 81
Data Security1 158 0 49,297 50 50 22,42 0,044 1 100 33 50 67,25
Data Security2 158 0 55,6266 50 50 23,5981 -0,096 1 100 39,75 50 74
Data Security3 158 0 49,7342 50 50 21,1878 0,173 1 100 36 50 62
Trust1 158 0 58,981 53,5 50 18,9012 -0,165 1 100 50 53,5 71
Trust2 158 0 55,1772 50 50 19,1825 0,039 1 100 50 50 66
Trust3 158 0 56,532 50 50 26,712 -0,139 1 100 37 50 76,5
Dependency1 158 0 76,4557 79 100 20,4745 -1,1 1 100 66 79 91
Dependency2 158 0 71 76 100 23,5705 -1,037 1 100 59,75 76 88
Environment1 158 0 59,7532 62,5 50 27,4 -0,387 1 100 49,75 62,5 80 Social
Influence1 158 0 33,728 34 50 21,859 0,246 1 91 16,75 34 50
Social Influence2
158 0 40,082 44 50 23,436 0,025 1 96 21,75 44 55,5
Social Influence3
158 0 83,6329 87,5 100 17,788 -1,025 25 100 71,75 87,5 100
Social Influence4
158 0 72,3924 76 100 22,1434 -0,788 3 100 58,75 76 89
Strategy4 158 0 79,5253 86,5 100 24,4946 -1,612 1 100 66 86,5 99
Environment2 158 0 54,4747 52 50 29,4075 -0,11 1 100 27,75 52 78
Strategy2 158 0 71,9114 80 100 27,1219 -0,98 1 100 53,75 80 95,25
Strategy1 158 0 30,2215 16,5 1 31,1617 0,771 1 100 1 16,5 53
Quality2 158 0 62,3228 62 50 26,4429 -0,411 1 100 50 62 83 Loss of
Competence1 158 0 39,259 49 50 24,825 0,16 1 100 17,75 49 55
Quality1 158 0 54,392 50 50 20,168 -0,291 1 100 50 50 68
Environment3 158 0 48,4937 50 50 20,81 -0,148 1 100 37 50 62,25
AttitudeX 158 0 42,38 50 50 25,746 -0,205 1 100 19,75 50 62
Attitude6 158 0 61,032 59 50 15,192 -0,222 1 99 50 59 71,25
Attitude7 158 0 54,215 50 50 15,298 -0,354 6 100 50 50 64

Quantitative Study
Page 140
Strategy7 158 0 70,4747 77 100 28,7911 -0,98 1 100 50 77 95
Environment4 158 0 50,3987 50 50 28,6987 0,029 1 100 25 50 72
Strategy6 158 0 56,5443 61,5 50 29,144 -0,262 1 100 33,75 61,5 82
Strategy5 158 0 41,8354 50 1 31,8687 0,155 1 100 9,75 50 70,25
Quality5 158 0 55,6076 50 50 24,5279 -0,166 1 100 49,25 50 73 Loss of
Competence3 158 0 46,133 50 50 22,105 -0,073 1 100 27 50 61,25
Quality4 158 0 51,146 50 50 15,411 -0,133 1 99 50 50 53,5
Environment5 158 0 49,1456 50 50 19,487 -0,276 1 100 35,75 50 61
Attitude8 158 0 48,4684 50 50 23,0526 -0,452 1 100 32,75 50 64
Attitude9 158 0 61,3354 58,5 50 15,591 0,142 1 100 50 58,5 72
Attitude0 158 0 56,07 50 50 17,526 -0,472 1 100 50 50 66
Attitude1 158 0 49,696 50 50 20,911 -0,341 1 98 36,75 50 65,25
Attitude2 158 0 40,918 50 50 21,921 -0,162 1 100 25 50 50
Attitude3 158 0 50,0759 50 50 20,4134 -0,478 1 100 41,25 50 62,25
Attitude5 158 0 49,9937 50 50 19,6882 -0,498 1 100 41,5 50 64
Intention1 153 5 4,63 5 6 1,71 -1,044 1 6 4 5 6
Intention%2 158 0 38,9367 50 50 28,0851 0,205 1 100 10 50 54,25
Intention3 144 14 4,15 4 6 1,76 -0,32 1 6 3 4 6
Intention%4 158 0 42,8924 50 50 28,8646 0,003 1 100 15 50 61,25Company Type
Electric 142 16 1 1 0 1 1 1 1 1
Company Type Gas
85 73 1 1 0 1 1 1 1 1
Company Type Heat
80 78 1 1 0 1 1 1 1 1
Company Type Water
71 87 1 1 0 1 1 1 1 1
Comp. Size Employees
157 1 1,97 2 1 1,04 1,011 1 5 1 2 3
Comp. Size Generation
132 26 3,14 2 1 2,46 0,998 1 8 1 2 4
Comp. Size Sale
144 14 3,28 2 2 1,93 0,953 1 8 2 2 4
Figure 74: Comprising observation of the descriptive analysis for the data gathered45
45 SPSS Command: Analyze-Descriptive Statistics-Frequencies-Statistics: Quartiles, Std. Deviation, Minimum, Maximum, Mean, Median, Mode, Skewness-Variables: compare the first column of the table

Quantitative Study
Page 141
6.6 EXAMINATION OF THE RESEARCH MODEL
Before the examination of the formulated hypotheses the research model undergoes a statistical inquiry. The research model, which was formulated on the basis of the literature review and the qualitative study, consists of 15 simultaneous influencing factors that are assumed to have an influence on the intention to adopt ASP. Also taken into account is the presence of a moderating variable- ‘attitude’-in the research model.
In the following the results of the examination of the research model are presented. The examination aims at identifying interaction effects between the variables in order to have a closer insight as to whether or not it could be useful to merge certain variables into independent factors.
For the purpose of identifying linear interrelations between the independent variables of the research model as well as their direction and strength, a correlation analysis is performed. The calculation of the correlation coefficients is carried out due to the form of distribution of the variables examined following Spearman and Kendall. Thus, the calculated coefficient is always a number between –1 and +1, whereas a value close to +/-1 indicates a very strong correlation; and a value close to 0 a very weak one. A verbal description is performed according to the following table (Buehl and Zoefel 1995):
Correlation Coefficients Interpretation < 0,20 Very low correlation 0,21-0,50 Low correlation 0,51-0,70 Medium correlation 0,71-0,90 High correlation > 0,90 Very high correlation
Figure 75: Classification of strength of statistical correlations
The results generated from the correlation analysis are presented in the following table. From this table it can be depicted that in general the items that are intended to explain one construct, i.e. cost1, cost2, cost3 and cost4, which explain that the construct cost do correlate significantly to each other. This is a good indicator in order to reduce the dimensions in the research model and compress the multiple items to factors. This step, the factor analysis, is described in the subsequent chapter.

Quantitative Study
Page 142/251
1,000 ,433** ,279** ,403** ,403** ,317** ,172* ,324** ,392** ,359** ,210** ,276** ,285** ,167* ,237** -,003 -,028 ,038 ,284** ,350** ,029 ,119 -,038 -,007 -,131 ,082 -,333** ,416** ,331** ,364** ,053 ,023 ,015 ,026 -,113 ,352** ,249** ,309**, ,000 ,000 ,000 ,000 ,000 ,031 ,000 ,000 ,000 ,008 ,000 ,000 ,036 ,003 ,966 ,723 ,633 ,000 ,000 ,721 ,137 ,640 ,933 ,102 ,305 ,000 ,000 ,000 ,000 ,507 ,772 ,851 ,743 ,159 ,000 ,002 ,000
,433** 1,000 ,308** ,466** ,427** ,425** ,387** ,527** ,491** ,314** ,329** ,258** ,461** ,367** ,249** ,265** ,142 ,010 ,117 ,247** ,238** ,296** ,154 ,073 ,070 -,050 -,065 ,020 ,224** ,279** ,047 -,088 -,063 ,128 -,103 ,176* ,162* ,254**,000 , ,000 ,000 ,000 ,000 ,000 ,000 ,000 ,000 ,000 ,001 ,000 ,000 ,002 ,001 ,075 ,898 ,142 ,002 ,003 ,000 ,054 ,365 ,381 ,529 ,416 ,804 ,005 ,000 ,559 ,274 ,435 ,110 ,198 ,027 ,042 ,001,279** ,308** 1,000 ,278** ,137 ,144 ,213** ,128 ,222** ,235** ,085 ,167* ,196* ,195* ,164* ,003 -,025 ,139 ,283** ,360** ,092 ,076 ,079 ,130 ,132 ,051 -,178* ,112 ,155 ,181* ,111 ,069 ,128 ,111 -,087 ,098 ,175* ,110,000 ,000 , ,000 ,087 ,071 ,007 ,109 ,005 ,003 ,289 ,036 ,014 ,014 ,040 ,969 ,759 ,080 ,000 ,000 ,251 ,342 ,324 ,103 ,098 ,528 ,025 ,162 ,052 ,023 ,165 ,389 ,110 ,166 ,278 ,220 ,028 ,168,403** ,466** ,278** 1,000 ,345** ,310** ,253** ,417** ,447** ,309** ,163* ,249** ,345** ,277** ,169* ,119 ,045 ,019 ,241** ,252** ,107 ,181* -,026 ,008 ,028 ,057 -,148 ,172* ,335** ,259** ,066 ,003 -,043 ,095 -,047 ,227** ,269** ,199*,000 ,000 ,000 , ,000 ,000 ,001 ,000 ,000 ,000 ,040 ,002 ,000 ,000 ,033 ,138 ,577 ,811 ,002 ,001 ,181 ,023 ,746 ,925 ,728 ,473 ,064 ,031 ,000 ,001 ,409 ,967 ,590 ,234 ,560 ,004 ,001 ,012,403** ,427** ,137 ,345** 1,000 ,466** ,291** ,475** ,465** ,296** ,275** ,296** ,448** ,364** ,275** ,177* ,091 ,086 ,221** ,292** ,159* ,170* ,019 -,028 -,118 ,108 -,262** ,252** ,313** ,350** -,010 -,011 -,162* ,140 -,232** ,315** ,223** ,281**,000 ,000 ,087 ,000 , ,000 ,000 ,000 ,000 ,000 ,000 ,000 ,000 ,000 ,000 ,026 ,253 ,282 ,005 ,000 ,046 ,033 ,812 ,724 ,138 ,176 ,001 ,001 ,000 ,000 ,900 ,893 ,042 ,079 ,003 ,000 ,005 ,000,317** ,425** ,144 ,310** ,466** 1,000 ,270** ,537** ,448** ,180* ,169* ,120 ,283** ,318** ,234** ,074 ,093 ,169* ,191* ,176* ,264** ,207** ,136 ,099 -,030 ,058 -,096 ,201* ,148 ,325** ,141 ,216** -,110 ,123 -,174* ,178* ,244** ,300**,000 ,000 ,071 ,000 ,000 , ,001 ,000 ,000 ,024 ,034 ,132 ,000 ,000 ,003 ,357 ,244 ,034 ,016 ,027 ,001 ,009 ,089 ,217 ,711 ,473 ,229 ,011 ,063 ,000 ,076 ,006 ,167 ,123 ,029 ,025 ,002 ,000,172* ,387** ,213** ,253** ,291** ,270** 1,000 ,582** ,466** ,069 ,219** ,169* ,415** ,286** ,129 ,255** ,276** ,119 ,048 ,019 ,088 ,233** ,091 ,045 ,053 ,013 -,068 -,012 ,059 ,198* ,053 ,057 -,045 ,036 -,079 ,081 ,129 ,209**,031 ,000 ,007 ,001 ,000 ,001 , ,000 ,000 ,388 ,006 ,034 ,000 ,000 ,106 ,001 ,000 ,137 ,551 ,814 ,269 ,003 ,256 ,577 ,512 ,873 ,397 ,878 ,463 ,013 ,508 ,477 ,577 ,652 ,323 ,313 ,107 ,008,324** ,527** ,128 ,417** ,475** ,537** ,582** 1,000 ,662** ,261** ,318** ,217** ,376** ,277** ,176* ,324** ,298** ,053 ,062 ,116 ,232** ,240** ,198* ,012 -,001 -,024 -,094 ,057 ,082 ,228** ,064 -,010 -,063 ,152 -,126 ,224** ,131 ,229**,000 ,000 ,109 ,000 ,000 ,000 ,000 , ,000 ,001 ,000 ,006 ,000 ,000 ,027 ,000 ,000 ,508 ,442 ,146 ,003 ,002 ,013 ,878 ,992 ,769 ,240 ,478 ,309 ,004 ,422 ,898 ,435 ,057 ,115 ,005 ,100 ,004,392** ,491** ,222** ,447** ,465** ,448** ,466** ,662** 1,000 ,345** ,373** ,278** ,360** ,253** ,217** ,171* ,155 ,093 ,104 ,131 ,231** ,338** ,156* ,001 ,025 ,073 -,131 ,120 ,201* ,309** ,168* ,045 ,023 ,100 -,031 ,200* ,155 ,265**,000 ,000 ,005 ,000 ,000 ,000 ,000 ,000 , ,000 ,000 ,000 ,000 ,001 ,006 ,032 ,053 ,246 ,192 ,102 ,004 ,000 ,050 ,995 ,756 ,363 ,100 ,132 ,011 ,000 ,035 ,574 ,772 ,212 ,696 ,012 ,051 ,001,359** ,314** ,235** ,309** ,296** ,180* ,069 ,261** ,345** 1,000 ,670** ,648** ,365** ,296** ,154 -,018 -,100 -,086 ,294** ,277** ,188* ,246** -,060 -,142 -,123 ,178* -,133 ,224** ,167* ,291** -,084 -,158* -,053 ,184* -,156 ,291** ,316** ,303**,000 ,000 ,003 ,000 ,000 ,024 ,388 ,001 ,000 , ,000 ,000 ,000 ,000 ,053 ,825 ,210 ,285 ,000 ,000 ,018 ,002 ,455 ,074 ,124 ,025 ,095 ,005 ,036 ,000 ,294 ,047 ,510 ,021 ,050 ,000 ,000 ,000,210** ,329** ,085 ,163* ,275** ,169* ,219** ,318** ,373** ,670** 1,000 ,623** ,369** ,368** ,178* ,028 -,010 -,046 ,134 ,090 ,149 ,306** -,043 -,083 ,017 ,065 -,024 ,094 ,087 ,201* -,094 -,163* -,027 ,213** -,080 ,167* ,191* ,243**,008 ,000 ,289 ,040 ,000 ,034 ,006 ,000 ,000 ,000 , ,000 ,000 ,000 ,025 ,731 ,899 ,566 ,093 ,262 ,061 ,000 ,588 ,298 ,836 ,414 ,767 ,242 ,276 ,011 ,238 ,040 ,732 ,007 ,315 ,036 ,016 ,002,276** ,258** ,167* ,249** ,296** ,120 ,169* ,217** ,278** ,648** ,623** 1,000 ,423** ,354** ,310** -,016 -,014 ,033 ,288** ,262** ,182* ,245** -,022 ,014 -,067 ,152 -,030 ,151 ,269** ,226** -,044 ,031 -,073 ,227** -,020 ,241** ,328** ,203*,000 ,001 ,036 ,002 ,000 ,132 ,034 ,006 ,000 ,000 ,000 , ,000 ,000 ,000 ,843 ,862 ,683 ,000 ,001 ,022 ,002 ,784 ,865 ,406 ,056 ,709 ,059 ,001 ,004 ,580 ,701 ,360 ,004 ,799 ,002 ,000 ,010,285** ,461** ,196* ,345** ,448** ,283** ,415** ,376** ,360** ,365** ,369** ,423** 1,000 ,677** ,314** ,187* ,193* ,026 ,062 ,151 ,174* ,232** ,091 ,062 ,031 ,073 -,056 ,149 ,299** ,304** -,020 -,044 ,023 ,078 -,024 ,145 ,288** ,246**,000 ,000 ,014 ,000 ,000 ,000 ,000 ,000 ,000 ,000 ,000 ,000 , ,000 ,000 ,019 ,015 ,744 ,435 ,058 ,029 ,003 ,258 ,439 ,697 ,364 ,483 ,063 ,000 ,000 ,802 ,582 ,772 ,328 ,760 ,069 ,000 ,002,167* ,367** ,195* ,277** ,364** ,318** ,286** ,277** ,253** ,296** ,368** ,354** ,677** 1,000 ,301** ,107 ,021 ,093 ,214** ,181* ,128 ,131 ,059 ,103 ,055 ,027 -,068 ,116 ,118 ,258** -,033 ,074 ,052 ,060 -,126 ,171* ,258** ,234**,036 ,000 ,014 ,000 ,000 ,000 ,000 ,000 ,001 ,000 ,000 ,000 ,000 , ,000 ,179 ,791 ,245 ,007 ,023 ,109 ,102 ,462 ,198 ,491 ,740 ,395 ,145 ,140 ,001 ,685 ,355 ,512 ,452 ,113 ,032 ,001 ,003,237** ,249** ,164* ,169* ,275** ,234** ,129 ,176* ,217** ,154 ,178* ,310** ,314** ,301** 1,000 ,117 ,003 ,105 ,105 ,138 ,111 ,178* ,068 ,242** -,022 ,082 -,172* ,140 ,184* ,332** -,013 ,152 -,082 ,088 -,198* ,142 ,183* ,222**,003 ,002 ,040 ,033 ,000 ,003 ,106 ,027 ,006 ,053 ,025 ,000 ,000 ,000 , ,144 ,969 ,188 ,187 ,084 ,165 ,025 ,394 ,002 ,780 ,306 ,031 ,080 ,021 ,000 ,869 ,057 ,308 ,269 ,013 ,075 ,021 ,005
-,003 ,265** ,003 ,119 ,177* ,074 ,255** ,324** ,171* -,018 ,028 -,016 ,187* ,107 ,117 1,000 ,653** ,074 -,220** -,073 ,357** ,182* ,216** ,124 ,196* -,132 ,019 -,222** ,119 -,028 ,174* ,087 ,074 -,074 ,054 -,053 ,082 ,078,966 ,001 ,969 ,138 ,026 ,357 ,001 ,000 ,032 ,825 ,731 ,843 ,019 ,179 ,144 , ,000 ,354 ,005 ,365 ,000 ,022 ,006 ,120 ,014 ,099 ,816 ,005 ,137 ,725 ,029 ,278 ,353 ,354 ,503 ,509 ,303 ,329
-,028 ,142 -,025 ,045 ,091 ,093 ,276** ,298** ,155 -,100 -,010 -,014 ,193* ,021 ,003 ,653** 1,000 ,110 -,153 -,054 ,137 ,097 ,143 ,095 ,156* -,003 ,099 -,141 ,136 -,015 ,061 ,068 ,043 -,013 ,067 -,093 ,109 ,083,723 ,075 ,759 ,577 ,253 ,244 ,000 ,000 ,053 ,210 ,899 ,862 ,015 ,791 ,969 ,000 , ,169 ,055 ,499 ,086 ,226 ,072 ,235 ,050 ,975 ,216 ,076 ,088 ,854 ,443 ,393 ,594 ,873 ,405 ,245 ,173 ,299,038 ,010 ,139 ,019 ,086 ,169* ,119 ,053 ,093 -,086 -,046 ,033 ,026 ,093 ,105 ,074 ,110 1,000 ,079 ,109 ,080 ,016 ,133 ,224** ,206** ,087 -,012 -,039 ,080 ,074 ,182* ,319** ,138 ,040 ,216** ,018 ,132 ,020,633 ,898 ,080 ,811 ,282 ,034 ,137 ,508 ,246 ,285 ,566 ,683 ,744 ,245 ,188 ,354 ,169 , ,324 ,174 ,316 ,842 ,097 ,005 ,009 ,279 ,879 ,629 ,315 ,354 ,022 ,000 ,085 ,614 ,006 ,823 ,099 ,807,284** ,117 ,283** ,241** ,221** ,191* ,048 ,062 ,104 ,294** ,134 ,288** ,062 ,214** ,105 -,220** -,153 ,079 1,000 ,723** -,161* -,037 -,024 ,049 -,127 ,253** -,138 ,290** ,066 ,202* -,077 ,133 -,102 ,134 -,170* ,359** ,332** ,308**,000 ,142 ,000 ,002 ,005 ,016 ,551 ,442 ,192 ,000 ,093 ,000 ,435 ,007 ,187 ,005 ,055 ,324 , ,000 ,044 ,640 ,768 ,539 ,112 ,001 ,085 ,000 ,410 ,011 ,334 ,097 ,203 ,093 ,033 ,000 ,000 ,000,350** ,247** ,360** ,252** ,292** ,176* ,019 ,116 ,131 ,277** ,090 ,262** ,151 ,181* ,138 -,073 -,054 ,109 ,723** 1,000 -,006 ,007 ,032 ,126 -,053 ,302** -,182* ,277** ,158* ,267** -,041 ,065 ,013 ,172* -,091 ,323** ,240** ,229**,000 ,002 ,000 ,001 ,000 ,027 ,814 ,146 ,102 ,000 ,262 ,001 ,058 ,023 ,084 ,365 ,499 ,174 ,000 , ,943 ,927 ,692 ,116 ,509 ,000 ,022 ,000 ,048 ,001 ,609 ,415 ,876 ,031 ,254 ,000 ,002 ,004,029 ,238** ,092 ,107 ,159* ,264** ,088 ,232** ,231** ,188* ,149 ,182* ,174* ,128 ,111 ,357** ,137 ,080 -,161* -,006 1,000 ,595** ,341** ,090 ,250** -,219** ,036 -,131 ,128 ,000 ,310** -,026 ,129 -,025 ,065 -,042 ,049 ,025,721 ,003 ,251 ,181 ,046 ,001 ,269 ,003 ,004 ,018 ,061 ,022 ,029 ,109 ,165 ,000 ,086 ,316 ,044 ,943 , ,000 ,000 ,261 ,002 ,006 ,652 ,102 ,110 ,995 ,000 ,744 ,107 ,755 ,414 ,599 ,538 ,759,119 ,296** ,076 ,181* ,170* ,207** ,233** ,240** ,338** ,246** ,306** ,245** ,232** ,131 ,178* ,182* ,097 ,016 -,037 ,007 ,595** 1,000 ,322** ,100 ,063 ,007 ,057 -,020 ,025 ,077 ,185* -,063 -,040 ,201* -,052 ,031 ,108 ,197*,137 ,000 ,342 ,023 ,033 ,009 ,003 ,002 ,000 ,002 ,000 ,002 ,003 ,102 ,025 ,022 ,226 ,842 ,640 ,927 ,000 , ,000 ,213 ,432 ,926 ,473 ,803 ,756 ,334 ,020 ,435 ,617 ,011 ,520 ,695 ,178 ,013
-,038 ,154 ,079 -,026 ,019 ,136 ,091 ,198* ,156* -,060 -,043 -,022 ,091 ,059 ,068 ,216** ,143 ,133 -,024 ,032 ,341** ,322** 1,000 ,379** ,553** -,258** ,091 -,207** ,018 -,025 ,489** ,186* ,336** -,072 -,002 -,183* -,099 -,067,640 ,054 ,324 ,746 ,812 ,089 ,256 ,013 ,050 ,455 ,588 ,784 ,258 ,462 ,394 ,006 ,072 ,097 ,768 ,692 ,000 ,000 , ,000 ,000 ,001 ,257 ,009 ,827 ,757 ,000 ,019 ,000 ,371 ,980 ,021 ,218 ,405
-,007 ,073 ,130 ,008 -,028 ,099 ,045 ,012 ,001 -,142 -,083 ,014 ,062 ,103 ,242** ,124 ,095 ,224** ,049 ,126 ,090 ,100 ,379** 1,000 ,302** -,021 ,011 -,144 -,042 -,105 ,257** ,594** ,206** ,101 -,038 -,108 -,057 -,075,933 ,365 ,103 ,925 ,724 ,217 ,577 ,878 ,995 ,074 ,298 ,865 ,439 ,198 ,002 ,120 ,235 ,005 ,539 ,116 ,261 ,213 ,000 , ,000 ,798 ,887 ,071 ,599 ,191 ,001 ,000 ,010 ,205 ,632 ,176 ,474 ,347
-,131 ,070 ,132 ,028 -,118 -,030 ,053 -,001 ,025 -,123 ,017 -,067 ,031 ,055 -,022 ,196* ,156* ,206** -,127 -,053 ,250** ,063 ,553** ,302** 1,000 -,511** ,243** -,400** -,035 -,107 ,367** ,200* ,497** -,204* ,121 -,306** -,144 -,182*,102 ,381 ,098 ,728 ,138 ,711 ,512 ,992 ,756 ,124 ,836 ,406 ,697 ,491 ,780 ,014 ,050 ,009 ,112 ,509 ,002 ,432 ,000 ,000 , ,000 ,002 ,000 ,663 ,182 ,000 ,012 ,000 ,010 ,128 ,000 ,071 ,022,082 -,050 ,051 ,057 ,108 ,058 ,013 -,024 ,073 ,178* ,065 ,152 ,073 ,027 ,082 -,132 -,003 ,087 ,253** ,302** -,219** ,007 -,258** -,021 -,511** 1,000 -,183* ,311** ,065 ,131 -,164* ,066 -,232** ,493** -,097 ,224** ,159* ,139,305 ,529 ,528 ,473 ,176 ,473 ,873 ,769 ,363 ,025 ,414 ,056 ,364 ,740 ,306 ,099 ,975 ,279 ,001 ,000 ,006 ,926 ,001 ,798 ,000 , ,022 ,000 ,419 ,100 ,039 ,411 ,003 ,000 ,227 ,005 ,046 ,081
-,333** -,065 -,178* -,148 -,262** -,096 -,068 -,094 -,131 -,133 -,024 -,030 -,056 -,068 -,172* ,019 ,099 -,012 -,138 -,182* ,036 ,057 ,091 ,011 ,243** -,183* 1,000 -,394** -,268** -,171* ,059 ,019 ,057 -,033 ,356** -,292** -,062 -,065,000 ,416 ,025 ,064 ,001 ,229 ,397 ,240 ,100 ,095 ,767 ,709 ,483 ,395 ,031 ,816 ,216 ,879 ,085 ,022 ,652 ,473 ,257 ,887 ,002 ,022 , ,000 ,001 ,032 ,463 ,809 ,474 ,682 ,000 ,000 ,437 ,415,416** ,020 ,112 ,172* ,252** ,201* -,012 ,057 ,120 ,224** ,094 ,151 ,149 ,116 ,140 -,222** -,141 -,039 ,290** ,277** -,131 -,020 -,207** -,144 -,400** ,311** -,394** 1,000 ,289** ,469** -,247** ,014 -,264** ,195* -,306** ,580** ,291** ,340**,000 ,804 ,162 ,031 ,001 ,011 ,878 ,478 ,132 ,005 ,242 ,059 ,063 ,145 ,080 ,005 ,076 ,629 ,000 ,000 ,102 ,803 ,009 ,071 ,000 ,000 ,000 , ,000 ,000 ,002 ,861 ,001 ,014 ,000 ,000 ,000 ,000,331** ,224** ,155 ,335** ,313** ,148 ,059 ,082 ,201* ,167* ,087 ,269** ,299** ,118 ,184* ,119 ,136 ,080 ,066 ,158* ,128 ,025 ,018 -,042 -,035 ,065 -,268** ,289** 1,000 ,406** ,106 -,032 -,015 ,104 -,048 ,305** ,469** ,303**,000 ,005 ,052 ,000 ,000 ,063 ,463 ,309 ,011 ,036 ,276 ,001 ,000 ,140 ,021 ,137 ,088 ,315 ,410 ,048 ,110 ,756 ,827 ,599 ,663 ,419 ,001 ,000 , ,000 ,185 ,686 ,852 ,192 ,548 ,000 ,000 ,000,364** ,279** ,181* ,259** ,350** ,325** ,198* ,228** ,309** ,291** ,201* ,226** ,304** ,258** ,332** -,028 -,015 ,074 ,202* ,267** ,000 ,077 -,025 -,105 -,107 ,131 -,171* ,469** ,406** 1,000 -,017 -,053 -,098 ,081 -,220** ,419** ,364** ,669**,000 ,000 ,023 ,001 ,000 ,000 ,013 ,004 ,000 ,000 ,011 ,004 ,000 ,001 ,000 ,725 ,854 ,354 ,011 ,001 ,995 ,334 ,757 ,191 ,182 ,100 ,032 ,000 ,000 , ,832 ,506 ,220 ,311 ,005 ,000 ,000 ,000,053 ,047 ,111 ,066 -,010 ,141 ,053 ,064 ,168* -,084 -,094 -,044 -,020 -,033 -,013 ,174* ,061 ,182* -,077 -,041 ,310** ,185* ,489** ,257** ,367** -,164* ,059 -,247** ,106 -,017 1,000 ,361** ,494** -,091 ,277** -,163* -,061 -,083,507 ,559 ,165 ,409 ,900 ,076 ,508 ,422 ,035 ,294 ,238 ,580 ,802 ,685 ,869 ,029 ,443 ,022 ,334 ,609 ,000 ,020 ,000 ,001 ,000 ,039 ,463 ,002 ,185 ,832 , ,000 ,000 ,253 ,000 ,041 ,449 ,298,023 -,088 ,069 ,003 -,011 ,216** ,057 -,010 ,045 -,158* -,163* ,031 -,044 ,074 ,152 ,087 ,068 ,319** ,133 ,065 -,026 -,063 ,186* ,594** ,200* ,066 ,019 ,014 -,032 -,053 ,361** 1,000 ,249** ,123 ,044 ,015 ,043 -,073,772 ,274 ,389 ,967 ,893 ,006 ,477 ,898 ,574 ,047 ,040 ,701 ,582 ,355 ,057 ,278 ,393 ,000 ,097 ,415 ,744 ,435 ,019 ,000 ,012 ,411 ,809 ,861 ,686 ,506 ,000 , ,002 ,123 ,582 ,850 ,591 ,364,015 -,063 ,128 -,043 -,162* -,110 -,045 -,063 ,023 -,053 -,027 -,073 ,023 ,052 -,082 ,074 ,043 ,138 -,102 ,013 ,129 -,040 ,336** ,206** ,497** -,232** ,057 -,264** -,015 -,098 ,494** ,249** 1,000 -,297** ,324** -,325** -,172* -,176*,851 ,435 ,110 ,590 ,042 ,167 ,577 ,435 ,772 ,510 ,732 ,360 ,772 ,512 ,308 ,353 ,594 ,085 ,203 ,876 ,107 ,617 ,000 ,010 ,000 ,003 ,474 ,001 ,852 ,220 ,000 ,002 , ,000 ,000 ,000 ,031 ,027,026 ,128 ,111 ,095 ,140 ,123 ,036 ,152 ,100 ,184* ,213** ,227** ,078 ,060 ,088 -,074 -,013 ,040 ,134 ,172* -,025 ,201* -,072 ,101 -,204* ,493** -,033 ,195* ,104 ,081 -,091 ,123 -,297** 1,000 -,238** ,312** ,210** ,141,743 ,110 ,166 ,234 ,079 ,123 ,652 ,057 ,212 ,021 ,007 ,004 ,328 ,452 ,269 ,354 ,873 ,614 ,093 ,031 ,755 ,011 ,371 ,205 ,010 ,000 ,682 ,014 ,192 ,311 ,253 ,123 ,000 , ,003 ,000 ,008 ,078
-,113 -,103 -,087 -,047 -,232** -,174* -,079 -,126 -,031 -,156 -,080 -,020 -,024 -,126 -,198* ,054 ,067 ,216** -,170* -,091 ,065 -,052 -,002 -,038 ,121 -,097 ,356** -,306** -,048 -,220** ,277** ,044 ,324** -,238** 1,000 -,342** -,194* -,312**,159 ,198 ,278 ,560 ,003 ,029 ,323 ,115 ,696 ,050 ,315 ,799 ,760 ,113 ,013 ,503 ,405 ,006 ,033 ,254 ,414 ,520 ,980 ,632 ,128 ,227 ,000 ,000 ,548 ,005 ,000 ,582 ,000 ,003 , ,000 ,015 ,000,352** ,176* ,098 ,227** ,315** ,178* ,081 ,224** ,200* ,291** ,167* ,241** ,145 ,171* ,142 -,053 -,093 ,018 ,359** ,323** -,042 ,031 -,183* -,108 -,306** ,224** -,292** ,580** ,305** ,419** -,163* ,015 -,325** ,312** -,342** 1,000 ,521** ,506**,000 ,027 ,220 ,004 ,000 ,025 ,313 ,005 ,012 ,000 ,036 ,002 ,069 ,032 ,075 ,509 ,245 ,823 ,000 ,000 ,599 ,695 ,021 ,176 ,000 ,005 ,000 ,000 ,000 ,000 ,041 ,850 ,000 ,000 ,000 , ,000 ,000,249** ,162* ,175* ,269** ,223** ,244** ,129 ,131 ,155 ,316** ,191* ,328** ,288** ,258** ,183* ,082 ,109 ,132 ,332** ,240** ,049 ,108 -,099 -,057 -,144 ,159* -,062 ,291** ,469** ,364** -,061 ,043 -,172* ,210** -,194* ,521** 1,000 ,496**,002 ,042 ,028 ,001 ,005 ,002 ,107 ,100 ,051 ,000 ,016 ,000 ,000 ,001 ,021 ,303 ,173 ,099 ,000 ,002 ,538 ,178 ,218 ,474 ,071 ,046 ,437 ,000 ,000 ,000 ,449 ,591 ,031 ,008 ,015 ,000 , ,000,309** ,254** ,110 ,199* ,281** ,300** ,209** ,229** ,265** ,303** ,243** ,203* ,246** ,234** ,222** ,078 ,083 ,020 ,308** ,229** ,025 ,197* -,067 -,075 -,182* ,139 -,065 ,340** ,303** ,669** -,083 -,073 -,176* ,141 -,312** ,506** ,496** 1,000,000 ,001 ,168 ,012 ,000 ,000 ,008 ,004 ,001 ,000 ,002 ,010 ,002 ,003 ,005 ,329 ,299 ,807 ,000 ,004 ,759 ,013 ,405 ,347 ,022 ,081 ,415 ,000 ,000 ,000 ,298 ,364 ,027 ,078 ,000 ,000 ,000 ,
Correlation CoefficientSig. (2-tailed)Correlation CoefficientSig. (2-tailed)Correlation CoefficientSig. (2-tailed)Correlation CoefficientSig. (2-tailed)Correlation CoefficientSig. (2-tailed)Correlation CoefficientSig. (2-tailed)Correlation CoefficientSig. (2-tailed)Correlation CoefficientSig. (2-tailed)Correlation CoefficientSig. (2-tailed)Correlation CoefficientSig. (2-tailed)Correlation CoefficientSig. (2-tailed)Correlation CoefficientSig. (2-tailed)Correlation CoefficientSig. (2-tailed)Correlation CoefficientSig. (2-tailed)Correlation CoefficientSig. (2-tailed)Correlation CoefficientSig. (2-tailed)Correlation CoefficientSig. (2-tailed)Correlation CoefficientSig. (2-tailed)Correlation CoefficientSig. (2-tailed)Correlation CoefficientSig. (2-tailed)Correlation CoefficientSig. (2-tailed)Correlation CoefficientSig. (2-tailed)Correlation CoefficientSig. (2-tailed)Correlation CoefficientSig. (2-tailed)Correlation CoefficientSig. (2-tailed)Correlation CoefficientSig. (2-tailed)Correlation CoefficientSig. (2-tailed)Correlation CoefficientSig. (2-tailed)Correlation CoefficientSig. (2-tailed)Correlation CoefficientSig. (2-tailed)Correlation CoefficientSig. (2-tailed)Correlation CoefficientSig. (2-tailed)Correlation CoefficientSig. (2-tailed)Correlation CoefficientSig. (2-tailed)Correlation CoefficientSig. (2-tailed)Correlation CoefficientSig. (2-tailed)Correlation CoefficientSig. (2-tailed)Correlation CoefficientSig. (2-tailed)
CO1
CO2
CO3
CO4
KH1
KH2
IS1
IS2
IS3
DS1
DS2
DS3
TR1
TR2
TR3
DE1
DE2
EN1
SI1
SI2
SI3
SI4
ST4
EN2
ST2
ST1
QU2
LC1
QU1
EN3
ST7
EN4
ST6
ST5
QU5
LC3
QU4
EN5
TSpearman'srho
CO1 CO2 CO3 CO4 KH1 KH2 IS1 IS2 IS3 DS1 DS2 DS3 TR1 TR2 TR3 DE1 DE2 EN1 SI1 SI2 SI3 SI4 ST4 EN2 ST2 ST1 QU2 LC1 QU1 EN3 ST7 EN4 ST6 ST5 QU5 LC3 QU4 EN5
Correlation is significant at the .01 level (2-tailed).**.
Correlation is significant at the .05 level (2-tailed). N=158 for all variables*.

Quantitative Study
Page 143
6.7 REDUCTION OF DIMENSIONS-FACTOR ANALYSIS
In order to examine advisability of the generation of factors regarding the independent variables within the research model, a factor analysis is executed. This method employed is taken from Backhaus’ (2003 pp. 259) method to discover structures, which tries to trace back a large number of variables on the basis of given cases into a smaller number of independent influencing factors. Therefore the factor analysis serves, according to Stewart (1981), to minimise variables and at the same time maximise information. This is particularly true when examining large quantities of data, as well as in the case of statistically testing of hypothetically assumed underlying factors.
Based on this fundamental considerations in the following it will be determined which independent variables can statistically be merged into factors in order to be able to avoid and exclude larger effects of interaction between the single influencing factors. The results of the factor analysis performed are displayed subsequently for the independent variables in a first step and then for the dependent variable ‘attitude’.
6.7.1 INDEPENDENT VARIABLES
The Scree Plot (compare Figure 76) at the beginning of the factor analysis shows how many factors from the independent variables can be generated. An exact determination of the number of factors can be seen in Figure 77.

Quantitative Study
Page 144
Scree Plo t
Component Number
4037343128252219161310741
Eige
nval
ue
10
8
6
4
2
0
Figure 76: Scree Plot of independent variables46
Figure 76 shows how the factor analysis can be used to examine the usefulness of combining independent variables in a Scree Plot. The Scree Plot shows the sorted Eigenvalues, from large to small, as a function of the Eigenvalue index.
Nevertheless the question remains as to how many factors should be retained for analysis. There is no clear answer but a couple of rules of thumb do apply. One is to consider only those with Eigenvalues over 1. Another rule of thumb is to plot all the Eigenvalues in their decreasing order. The plot looks like the side of a mountain, and ‘scree’ refers to the debris fallen from a mountain and lying at its base.
46 SPSS command: Analyze-Data Reduction-Factor-Descriptives: Initial Solution-Extraction: Eigenvalues Over 1, Unrotated Factor Solution, Scree Plot-Rotation: Varimax, Rotated Solution-Options: Exclude Cases Listwise, Sorted by Size-Variables: Data Security1, Data Security3, Data Security1, Trust1, Environment3, Environment5, Quality4, Quality1, Loss of Competence3, Loss of Competence1, Improved Service2, Improved Service3, know-how2, Improved Service1, know-how1, Environment4, Environment2, Environment1, Strategy7, Strategy4, Strategy1, Strategy2, Strategy5, Strategy6, Quality2, Cost1, Cost3, Cost4, Company Size Sale, Company Size Employees, Company Size Generation, Dependency1, Dependency2, Cost2, Social Influence2, Social Influence1, Social Influence3, Social Influence4, Trust2, Trust3, Quality5

Quantitative Study
Page 145
Figure 77: Initial statistics47
47 SPSS command: Analyze – Data Reduction – Factor – Descriptives: Initial Solution – Extraction: Eigenvalues over 1, Unrotated Factor Solution, Scree Plot – Rotation: Varimax, Rotated Solution – Options: Exclude Cases Listwise, Sorted by Size – Variables: Data Security1, Data Security2, Data Security3, Trust1, Environment3, Environment5, Quality4, Quality1, Loss of Competence3, Loss of Competence1, Improved Service2, Improved Service3, Know-how2, Improved Service1, Know-how1, Environment4, Environment2, Environment1, Strategy7, Strategy4, Strategy1, Strategy2, Strategy5, Strategy6, Quality2, Cost1, Cost3, Cost4, Company Size Sales, Company Size Employees, Company Size Generation, Dependency1, Dependency2, Cost2, Social Influence1, Social Influence2, Social Influence3, Social Influence4, Trust2, Trust3, Quality5
Total Variance Explained
8,163 19,909 19,909 8,163 19,909 19,909 3,276 7,991 7,9913,998 9,750 29,659 3,998 9,750 29,659 3,153 7,690 15,6812,813 6,860 36,519 2,813 6,860 36,519 3,123 7,616 23,2972,274 5,546 42,065 2,274 5,546 42,065 2,514 6,132 29,4301,878 4,581 46,646 1,878 4,581 46,646 2,381 5,808 35,2381,700 4,147 50,793 1,700 4,147 50,793 2,345 5,720 40,9571,535 3,745 54,537 1,535 3,745 54,537 2,336 5,699 46,6561,449 3,534 58,071 1,449 3,534 58,071 2,236 5,452 52,1081,357 3,310 61,382 1,357 3,310 61,382 2,069 5,046 57,1551,305 3,182 64,564 1,305 3,182 64,564 1,917 4,675 61,8301,195 2,914 67,478 1,195 2,914 67,478 1,728 4,215 66,0451,105 2,695 70,173 1,105 2,695 70,173 1,692 4,128 70,173
,994 2,423 72,596,892 2,175 74,771,806 1,965 76,736,789 1,924 78,660,766 1,869 80,529,680 1,658 82,187,644 1,571 83,758,603 1,470 85,228,559 1,364 86,592,556 1,356 87,948,521 1,271 89,220,473 1,153 90,372,406 ,989 91,362,385 ,939 92,301,359 ,876 93,177,330 ,804 93,981,313 ,763 94,744,302 ,736 95,481,278 ,678 96,159,245 ,598 96,757,222 ,541 97,299,196 ,479 97,777,181 ,441 98,219,160 ,391 98,610,133 ,323 98,933,117 ,285 99,218,113 ,276 99,494,110 ,269 99,763
9,714E-02 ,237 100,000
Component1234567891011121314151617181920212223242526272829303132333435363738394041
Total% of
VarianceCumulative
% Total% of
VarianceCumulative
% Total% of
VarianceCumulative
%
Initial Eigenvalues Extraction Sums of Squared Loadings Rotation Sums of Squared Loadings
Extraction Method: Principal Component Analysis.

Quantitative Study
Page 146
Figure 77 shows the factor analysis for the purposes of examining the usefulness of the combination of independent variables. According to this calculation there are twelve Eigenvalues above 1, which corresponds to an extraction of twelve factors. The first factor explains 19,9% of the total variance, the second factor 9,75%, the third 6,9%, the fourth 5,5%, the fifth 4,6%, etc. The rotated component matrix reveals which single items could be suppressed from a statistical point of view to a factor. The results of the rotated component matrix can be seen in Figure 78.
Figure 78: Rotated Component Matrix48
48 Compare SPSS command for Figure 77
Rotated Component Matrixa
,852 ,103 ,159 -9,87E-02 -1,93E-03 -3,17E-02 -1,13E-04 1,327E-02 3,900E-02 ,113 5,575E-02 -8,96E-02,786 ,127 6,205E-02 3,089E-02 7,970E-02 ,168 -,111 -2,07E-02 6,378E-02 ,100 ,230 7,610E-02,767 ,175 ,185 -,155 5,690E-02 ,152 -4,12E-02 -,115 ,204 9,026E-02 -1,17E-02 -8,56E-02,531 ,231 ,322 -4,47E-03 2,188E-02 ,167 6,300E-02 ,165 -4,26E-02 7,878E-02 ,513 7,474E-02
6,293E-02 ,770 ,209 -5,37E-02 6,625E-02 9,210E-02 1,741E-02 1,337E-02 9,594E-02 1,883E-02 ,219 -6,00E-02,225 ,731 ,157 -,117 ,110 -,109 -,127 9,364E-02 ,178 9,131E-02 ,115 -,118,280 ,636 5,753E-02 1,181E-02 9,598E-02 ,139 -,195 7,295E-02 ,156 -1,54E-02 -3,29E-02 -2,56E-02
3,419E-02 ,634 -9,00E-02 -2,62E-03 9,647E-03 ,529 3,115E-02 6,284E-02 -,123 5,966E-02 5,058E-02 3,468E-02,152 ,503 ,168 8,544E-03 ,327 ,157 -,154 -3,52E-02 ,205 -,106 -7,90E-02 -,370
-2,70E-02 ,477 9,435E-02 -,103 ,452 ,244 5,927E-02 -,165 ,167 -,156 5,048E-02 -,249,146 7,435E-03 ,859 3,077E-03 -6,94E-03 4,644E-02 -4,22E-02 ,233 7,449E-02 6,223E-02 -3,31E-02 -9,79E-02,337 ,151 ,685 3,265E-02 2,112E-02 ,263 3,316E-02 ,159 -2,78E-02 ,153 -,101 9,503E-02
-3,07E-02 ,184 ,672 ,152 5,474E-02 1,647E-02 -7,07E-02 -,129 ,143 ,254 ,306 -1,16E-02,291 7,021E-02 ,564 7,674E-02 -3,63E-03 3,990E-02 -,120 ,444 -3,91E-02 -3,84E-02 -3,72E-02 -2,75E-02
9,484E-02 ,182 ,552 -2,87E-02 ,143 ,290 -,141 -3,67E-02 ,113 -2,23E-03 ,275 -,103-9,96E-02 -8,69E-02 9,159E-02 ,835 7,622E-02 -6,95E-03 6,986E-02 -5,75E-03 -2,56E-02 -,117 7,518E-02 -1,70E-02-5,93E-02 -,148 -7,25E-02 ,722 -7,26E-02 -3,32E-02 ,210 ,164 5,595E-02 ,121 ,276 -,180-2,34E-02 -5,98E-03 9,750E-03 ,541 ,114 1,348E-02 -,119 -9,52E-03 ,203 -8,18E-02 2,200E-02 ,376-7,57E-02 ,132 ,184 ,504 -,192 ,225 8,715E-02 -,174 -7,92E-02 ,283 -,346 ,224-1,87E-02 ,104 9,569E-02 ,432 -,375 -8,76E-02 ,214 8,933E-02 ,168 ,404 -,151 -,2017,226E-02 ,135 4,252E-02 ,138 ,819 2,311E-02 -6,32E-02 -5,61E-03 ,101 1,058E-02 -2,83E-02 4,905E-028,913E-02 -,110 -,129 ,331 -,672 -6,63E-02 ,278 9,883E-02 5,222E-03 ,182 -,130 -,104
,249 ,122 -4,57E-02 ,186 ,610 -2,63E-02 -3,13E-02 ,121 8,097E-02 ,283 -,178 -,3037,148E-02 -5,48E-02 7,930E-02 ,376 -,439 5,699E-02 ,436 -,146 -8,38E-02 -4,57E-02 -,163 ,2235,500E-02 -2,28E-02 -,122 -2,40E-02 -,136 -,659 5,914E-02 ,129 4,839E-02 2,550E-02 -9,10E-02 ,454
,143 ,265 ,331 -2,34E-02 9,554E-03 ,596 9,565E-02 2,555E-02 ,153 -3,44E-02 1,185E-02 3,768E-02,170 -1,47E-02 2,763E-02 ,120 -7,79E-02 ,535 2,834E-02 5,983E-02 ,400 6,374E-02 ,102 1,248E-02,228 ,216 ,227 -5,99E-02 ,100 ,520 6,858E-02 ,179 ,132 ,136 2,466E-03 ,108
-6,71E-02 -,129 -4,59E-02 1,116E-02 -,119 9,419E-02 ,862 -6,44E-02 5,152E-02 2,364E-02 -2,73E-02 ,148
-3,66E-02 ,133 -7,53E-02 ,141 -,133 -,248 ,694 4,412E-02 -3,33E-02 6,536E-02 -,112 -2,01E-02
-1,65E-02 -,224 -5,77E-02 3,301E-02 3,108E-03 ,235 ,683 -,116 7,742E-02 -8,18E-02 ,117 -1,53E-02
-2,29E-02 -2,27E-02 9,237E-02 1,101E-02 -5,40E-02 6,927E-02 -5,84E-02 ,859 -5,05E-02 ,102 6,638E-02 -4,68E-02-,101 9,048E-02 ,105 4,566E-02 4,467E-02 -5,20E-02 -6,24E-02 ,818 -5,61E-02 3,379E-03 -2,47E-02 1,192E-02,267 9,506E-02 ,352 -7,08E-02 -6,17E-02 ,300 6,198E-02 ,461 ,156 ,249 ,192 -1,31E-02
5,399E-02 ,171 8,444E-02 3,413E-02 ,125 ,147 ,154 1,879E-02 ,862 5,571E-02 6,305E-02 1,315E-02,163 ,185 9,518E-02 6,436E-02 8,358E-02 6,531E-02 -7,85E-02 -,138 ,845 -,114 2,538E-02 -3,66E-02
4,969E-02 -8,54E-02 ,162 -7,87E-02 -9,14E-02 4,479E-02 1,072E-02 1,980E-02 -3,95E-02 ,803 ,190 9,834E-02,299 8,954E-02 8,701E-02 4,409E-02 ,115 5,271E-02 -3,86E-02 ,137 -3,05E-02 ,744 -6,25E-02 -4,84E-03,472 ,158 ,302 9,175E-02 4,845E-03 3,428E-02 7,378E-02 -3,45E-02 ,133 4,176E-02 ,606 -4,11E-02,188 ,264 -1,73E-02 ,307 -4,07E-02 ,184 -,179 8,551E-02 6,482E-02 ,121 ,588 -,123
-4,57E-02 -,185 -5,27E-02 1,569E-02 -2,51E-02 -2,95E-02 ,126 -5,88E-02 -2,59E-02 6,904E-02 -7,94E-02 ,851
Data Security2Data Security3Data Security1Trust1Environment3Environment5Quality4Quality1Loss of Competence3Loss of Competence1Improved Service2Improved Service3Know-how2Improved Service1Know-how1Environment4Environment2Environment1Strategy7Strategy4Strategy1Strategy2Strategy5Strategy6Quality2Cost1Cost3Cost4Company Size SaleCompany SizeEmployeesCompany Size Generation
Dependency1Dependency2Cost2Social Influence2Social Influence1Social Influence3Social Influence4Trust2Trust3Quality5
1 2 3 4 5 6 7 8 9 10 11 12Component
Extraction Method: Principal Component Analysis. Rotation Method: Varimax with Kaiser Normalization.
Rotation converged in 16 iterations.a.

Quantitative Study
Page 147
As can be seen from Figure 78 it is possible to statistically extract thirteen factors, which combine strongly correlated variables, out of the 41 concurrent influencing factors. The factors generated include the variables:
• Data Security2, Data Security3, Data Security1, Trust1
• Environment3, Environment5, Quality4, Quality1, Loss of Competence3, Loss of Competence1
• Improved Service2, Improved Service3, Know-how2, Improved Service1, know-how1
• Environment4, Environment2, Environment1, Strategy7, Strategy4
• Strategy1, Strategy2, Strategy5, Strategy6, Quality2
• Cost1, Cost3, Cost4
• Company Size Sale, Company Size Employees, Company Size Generation
• Dependency1, Dependency2, Cost2
• Social Influence2, Social Influence1
• Social Influence3, Social Influence4
• Trust2, Trust3
• Quality5
In order to increase the explanatory power of the analysis to be performed subsequently, the combining of variables as suggested in the analysis above is not used in the analysis to come. Rather, the single variables are combined according to the theoretical assumptions as argued in chapter 2.4 for the purpose of examining the hypotheses formulated. Only by doing this it can be assured to have a comprehensible examination of the hypotheses without any loss of information. The calculation of the Cronbach Alpha’s among these items compacted to the factors shows that the internal consistency has good values. Hence it can be assumed that the different items combined measure the same issue.

Quantitative Study
Page 148
The following table shows how the single variables are combined into factors. These are the basis for the subsequent calculations.
Factor Variables combined Cronbach
Alpha COST CO1, CO2, CO3, CO4 0,7284
KNOW-HOW KH1, KH2 0,6693 IMPROVED SERVICE IS1, IS2, IS3 0,7947
DATA SECURITY DS1, DS2, DS3 0,8629 TRUST TR1, TR2, TR3 0,7042
DEPENDENCY DE1, DE2 0,7590 COMPETITION EN3, EN5 0,8149
ASP DIFFUSION EN1, EN2, EN4 0,6376 IMAGE SI1, SI2 0,8545
CONTACT SI3, SI4 0,6820 APPLICATION IMPORTANCE ST4, ST2, ST7, ST6 0,7343 OUTSOURCING STRATEGY ST1, ST5 0,6267
ACCURACY QU1, QU4 0,6493 TRANSPARENCY QU2, QU5 0,5153
COMPETENCE LC1, LC3 0,7411 SIZE SZEMP, SZGEN,
SZSALE 0,6674
Figure 79: Aggregation of independent variables to factors49
The following figure (Figure 80) shows the correlation matrix for the factors formed (Figure 79) for the subsequent analysis.
49 SPSS Command for factor COST: Analyze-Scale-Reliability Analysis-Model: Alpha-Statistics: Scale if Item Deleted-Items: Cost1, Cost2, Cost3, Cost4

Quantitative Study
Page 149
Figure 80: Correlation matrix
Correlations
1,000 ,472** ,504** ,315** ,400** ,082 ,320** ,060 ,369** ,207** ,069 ,084 ,365** -,245** ,277** ,065, ,000 ,000 ,000 ,000 ,308 ,000 ,455 ,000 ,010 ,394 ,301 ,000 ,002 ,000 ,461
155 155 155 155 155 155 155 155 155 155 155 155 155 155 155 129,472** 1,000 ,537** ,230** ,432** ,098 ,370** ,100 ,259** ,256** -,038 ,158* ,300** -,257** ,282** -,178*,000 , ,000 ,004 ,000 ,224 ,000 ,214 ,001 ,001 ,643 ,050 ,000 ,001 ,000 ,043155 155 155 155 155 155 155 155 155 155 155 155 155 155 155 129,504** ,537** 1,000 ,294** ,360** ,296** ,332** ,049 ,098 ,304** ,026 ,089 ,149 -,130 ,135 -,082,000 ,000 , ,000 ,000 ,000 ,000 ,547 ,226 ,000 ,751 ,270 ,065 ,106 ,093 ,358155 155 155 155 155 155 155 155 155 155 155 155 155 155 155 129,315** ,230** ,294** 1,000 ,420** -,073 ,301** -,115 ,236** ,302** -,105 ,211** ,273** -,100 ,212** -,083,000 ,004 ,000 , ,000 ,366 ,000 ,153 ,003 ,000 ,192 ,009 ,001 ,215 ,008 ,351155 155 155 155 155 155 155 155 155 155 155 155 155 155 155 129,400** ,432** ,360** ,420** 1,000 ,143 ,316** ,148 ,194* ,222** ,006 ,096 ,287** -,170* ,168* -,102,000 ,000 ,000 ,000 , ,076 ,000 ,065 ,016 ,005 ,943 ,233 ,000 ,035 ,036 ,248155 155 155 155 155 155 155 155 155 155 155 155 155 155 155 129,082 ,098 ,296** -,073 ,143 1,000 ,029 ,141 -,125 ,210** ,174* -,029 ,138 ,047 -,150 -,142,308 ,224 ,000 ,366 ,076 , ,723 ,080 ,123 ,009 ,031 ,722 ,088 ,562 ,063 ,108155 155 155 155 155 155 155 155 155 155 155 155 155 155 155 129,320** ,370** ,332** ,301** ,316** ,029 1,000 ,001 ,274** ,101 -,061 ,131 ,454** -,258** ,489** -,199*,000 ,000 ,000 ,000 ,000 ,723 , ,989 ,001 ,209 ,452 ,104 ,000 ,001 ,000 ,023155 155 155 155 155 155 155 155 155 155 155 155 155 155 155 129,060 ,100 ,049 -,115 ,148 ,141 ,001 1,000 ,133 ,033 ,409** ,134 ,022 ,029 ,001 ,231**,455 ,214 ,547 ,153 ,065 ,080 ,989 , ,100 ,685 ,000 ,097 ,784 ,719 ,988 ,008155 155 155 155 155 155 155 155 155 155 155 155 155 155 155 129,369** ,259** ,098 ,236** ,194* -,125 ,274** ,133 1,000 -,034 -,016 ,254** ,263** -,187* ,387** ,066,000 ,001 ,226 ,003 ,016 ,123 ,001 ,100 , ,672 ,847 ,001 ,001 ,020 ,000 ,458155 155 155 155 155 155 155 155 155 155 155 155 155 155 155 129,207** ,256** ,304** ,302** ,222** ,210** ,101 ,033 -,034 1,000 ,185* ,044 ,042 ,017 -,061 -,013,010 ,001 ,000 ,000 ,005 ,009 ,209 ,685 ,672 , ,021 ,585 ,603 ,836 ,450 ,885155 155 155 155 155 155 155 155 155 155 155 155 155 155 155 129,069 -,038 ,026 -,105 ,006 ,174* -,061 ,409** -,016 ,185* 1,000 -,300** -,043 ,206* -,323** ,418**,394 ,643 ,751 ,192 ,943 ,031 ,452 ,000 ,847 ,021 , ,000 ,594 ,010 ,000 ,000155 155 155 155 155 155 155 155 155 155 155 155 155 155 155 129,084 ,158* ,089 ,211** ,096 -,029 ,131 ,134 ,254** ,044 -,300** 1,000 ,168* -,169* ,311** -,219*,301 ,050 ,270 ,009 ,233 ,722 ,104 ,097 ,001 ,585 ,000 , ,036 ,036 ,000 ,013155 155 155 155 155 155 155 155 155 155 155 155 155 155 155 129,365** ,300** ,149 ,273** ,287** ,138 ,454** ,022 ,263** ,042 -,043 ,168* 1,000 -,201* ,428** -,133,000 ,000 ,065 ,001 ,000 ,088 ,000 ,784 ,001 ,603 ,594 ,036 , ,012 ,000 ,134155 155 155 155 155 155 155 155 155 155 155 155 155 155 155 129
-,245** -,257** -,130 -,100 -,170* ,047 -,258** ,029 -,187* ,017 ,206* -,169* -,201* 1,000 -,440** ,118,002 ,001 ,106 ,215 ,035 ,562 ,001 ,719 ,020 ,836 ,010 ,036 ,012 , ,000 ,184155 155 155 155 155 155 155 155 155 155 155 155 155 155 155 129,277** ,282** ,135 ,212** ,168* -,150 ,489** ,001 ,387** -,061 -,323** ,311** ,428** -,440** 1,000 -,189*,000 ,000 ,093 ,008 ,036 ,063 ,000 ,988 ,000 ,450 ,000 ,000 ,000 ,000 , ,032155 155 155 155 155 155 155 155 155 155 155 155 155 155 155 129,065 -,178* -,082 -,083 -,102 -,142 -,199* ,231** ,066 -,013 ,418** -,219* -,133 ,118 -,189* 1,000,461 ,043 ,358 ,351 ,248 ,108 ,023 ,008 ,458 ,885 ,000 ,013 ,134 ,184 ,032 ,129 129 129 129 129 129 129 129 129 129 129 129 129 129 129 129
Correlation CoefficientSig. (2-tailed)NCorrelation CoefficientSig. (2-tailed)NCorrelation CoefficientSig. (2-tailed)NCorrelation CoefficientSig. (2-tailed)NCorrelation CoefficientSig. (2-tailed)NCorrelation CoefficientSig. (2-tailed)NCorrelation CoefficientSig. (2-tailed)NCorrelation CoefficientSig. (2-tailed)NCorrelation CoefficientSig. (2-tailed)NCorrelation CoefficientSig. (2-tailed)NCorrelation CoefficientSig. (2-tailed)NCorrelation CoefficientSig. (2-tailed)NCorrelation CoefficientSig. (2-tailed)NCorrelation CoefficientSig. (2-tailed)NCorrelation CoefficientSig. (2-tailed)NCorrelation CoefficientSig. (2-tailed)N
Cost Factor
Know-how Factor
Improved Service Factor
Data Security Factor
Trust Factor
Dependency Factor
Competition Factor
ASP Diffusion Factor
Image Factor
Contact Factor
Application Importance
Outsourcing Factor
Accuracy Factor
Transparency Factor
Competence Factor
Size Factor
Spearman's rho
CostFactor
Know-howFactor
ImprovedServiceFactor
DataSecurityFactor
TrustFactor
DependencyFactor
CompetitionFactor
ASPDiffusionFactor
ImageFactor
ContactFactor
ApplicationImportance
OutsourcingFactor
AccuracyFactor
TransparencyFactor
CompetenceFactor Size Factor
Correlation is significant at the .01 level (2-tailed).**.
Correlation is significant at the .05 level (2-tailed).*.

Quantitative Study
Page 150
According to the correlation matrix only cost and improved service, know-how and improved service have a correlation coefficient slightly above 0,5. Therefore the factors can be assumed to be sufficiently independent for further analysis.
6.7.2 DEPENDENT VARIABLES
For the purpose of further improving the clarity of the research model, examination as to whether it is possible to aggregate single criteria for attitude is conducted in this step. The single values of the variables for attitude are merged into an aggregate and subsequently the reliability and validity of this aggregate is examined.
In order to assess the reliability of the aggregate attitude reliability analysis is used, whereas for the calculation of the reliability coefficient the Cronbach’s Alpha method is used. The result is displayed in Figure 81, whereas it is to note that the value of the reliability coefficient is with a value of 0,9063 very high and thus to be judged as very promising for the underlying research project. Furthermore the reliability coefficient cannot be improved by eliminating a variable, which means that all items (single criteria for attitude) will be used for the aggregate attitude.
****** Method 1 (space saver) will be used for this analysis ****** R E L I A B I L I T Y A N A L Y S I S -S C A L E (A L P H A) Item-total Statistics Scale Scale Corrected Mean Variance Item- Alpha if Item if Item Total if Item Deleted Deleted Correlation Deleted ATX 462,3284 15117,9515 ,7292 ,8941 AT6 442,9925 17700,3082 ,5680 ,9026 AT7 450,2910 17386,0124 ,6871 ,8973 AT8 456,2910 15788,6590 ,7165 ,8937 AT9 443,0299 17835,0066 ,5379 ,9041 AT0 448,1791 16876,5692 ,7133 ,8947 AT1 455,0597 15733,0942 ,8037 ,8877 AT2 463,7239 16266,8781 ,6409 ,8989 AT3 454,7388 16843,3674 ,5831 ,9021 AT5 455,2015 16256,9290 ,7393 ,8922 Reliability Coefficients N of Cases = 134,0 N of Items = 10 Alpha = ,9063
Figure 81: Reliability analysis for the examined aggregate ‘attitude’50
50 SPSS Command: Analyze-Scale-Reliability Analysis-Model: Alpha-Statistics: Scale if Item Deleted-Items: ATX, AT6, AT7, AT8, AT9, AT0, At1, AT2, AT3, AT5

Quantitative Study
Page 151
Subsequently in addition to the reliability analysis the validity of the aggregate attitude will be examined. For this purpose factor analysis is used. The therewith-generated results can be found as follows.
The Scree Plot at the beginning of this analysis shows how many factors can be generated from the variables attitude. The exact determination of the number of factors can be found in the initial statistic.
Scree Plot
Component Number
10987654321
Eige
nval
ue
6
5
4
3
2
1
0
Figure 82: Factor analysis: aggregation of dependent variables ‘attitude’-Scree Plot51
Figure 83: Factor analysis: aggregation of dependent variables ‘attitude’-Initial statistics52
Total Variance Explained
5,544 55,438 55,438 5,544 55,438 55,438 3,689 36,886 36,8861,220 12,196 67,634 1,220 12,196 67,634 3,075 30,748 67,634,873 8,732 76,366,638 6,377 82,743,462 4,618 87,361,360 3,597 90,958,309 3,094 94,053,258 2,579 96,631,231 2,309 98,941,106 1,059 100,000
Component12345678910
Total% of
VarianceCumulative
% Total% of
VarianceCumulative
% Total% of
VarianceCumulative
%
Initial Eigenvalues Extraction Sums of Squared Loadings Rotation Sums of Squared Loadings
Extraction Method: Principal Component Analysis.

Quantitative Study
Page 152
From Figure 83 it can be seen that there are two Eigenvalues over 1, which means that two factors can be extracted. The first factor explains 55,4 % of the total variance, the second factor 12,2 %. The result of the rotated factor matrix is presented in the following table.
Figure 84: Factor analysis: aggregation of dependent variables ‘attitude’-Rotated factor matrix53
Figure 84 shows that from a statistical point of view two factors can be deducted from the ten empirically gathered single indicators, which underlie the potential aggregate attitude. Factor 1 comprises the variables AT2, AT5, AT1, AT3, ATX and AT8, whereas factor 2 encompasses AT9, AT6, AT0 and AT7.
In order to improve the significance of the examinations the aggregation of the variables as a result of the above analysis will not be performed. Rather for the purpose of testing the formulated hypotheses the single variables of attitude will be aggregated to a single factor. Doing so seems to be the most reasonable way in order to comprehensibly examine the hypotheses without loss of information.
51 SPSS Command: Analyze-Data Reduction-Factor-Descriptives: Initial Solution-Extraction: Eigenvalues Over 1, Unrotated Factor Solution, Scree Plot-Rotation: Varimax, Rotated Solution-Scores: Save as Variables, Regression-Options: Exclude Cases Listwise, Sorted by Size-Variables: ATX, AT6, AT7, AT8, AT9, AT0, At1, AT2, AT3, AT5 52 SPSS Command: Analyze-Data Reduction-Factor-Descriptives: Initial Solution-Extraction: Eigenvalues Over 1, Unrotated Factor Solution, Scree Plot-Rotation: Varimax, Rotated Solution-Scores: Save as Variables, Regression-Options: Exclude Cases Listwise, Sorted by Size-Variables: ATX, AT6, AT7, AT8, AT9, AT0, At1, AT2, AT3, AT5 53 SPSS Command: Analyze-Data Reduction-Factor-Descriptives: Initial Solution-Extraction: Eigenvalues Over 1, Unrotated Factor Solution, Scree Plot-Rotation: Varimax, Rotated Solution-Scores: Save as Variables, Regression-Options: Exclude Cases Listwise, Sorted by Size-Variables: ATX, AT6, AT7, AT8, AT9, AT0, At1, AT2, AT3, AT5
Rotated Component Matrixa
,840 ,109,831 ,242,748 ,433,726 ,164,688 ,418,569 ,539,101 ,847,164 ,814,424 ,716,438 ,656
Attitude2Attitude5Attitude1Attitude3AttitudeXAttitude8Attitude9Attitude6Attitude0Attitude7
1 2Component
Extraction Method: Principal Component Analysis. Rotation Method: Varimax with Kaiser Normalization.
Rotation converged in 3 iterations.a.

Quantitative Study
Page 153
The following table shows the reduction of the single variables to one factor attitude. This step is done to be able to examine the hypotheses in a reasonable and clear way.
Figure 85: Factor analysis: reduction of dependent variables ‘attitude’-Component Matrix54
Factor Variables combined Alpha ATT55 ATX, AT6, AT7, AT8,
AT9, AT0, AT1, AT2, AT3, AT5
0,9160
Figure 86: Aggregation of dependent variables to factors
6.8 MODE OF DISTRIBUTION EXAMINATION
The question whether the values of the empirical variables are in a sufficient manner distributed normally is the main focus of this step of the analysis. Normal distribution of the dependent variable is a precondition for performing multiple linear regression analysis.
The analysis necessary to do so is executed by the use of graphical assessment methods, which are supplemented by an objective examination of the data for normal distribution with an adequate statistical test. The resulting findings suggest, that the moderating variable attitude factor is sufficiently normal distributed, whereas the independent variables are not.
54 SPSS Command: Analyze-Data Reduction-Factor-Descriptives: Initial Solution-Extraction: Number of Factors: 1, Unrotated Factor Solution, Scree Plot-Rotation: Varimax, Rotated Solution-Scores: Save as Variables, Regression-Options: Exclude Cases Listwise, Sorted by Size-Variables: ATX, AT6, AT7, AT8, AT9, AT0, At1, AT2, AT3, AT5 55 SPSS Command: Analyze-Data Reduction-Factor-Descriptives: Initial Solution-Extraction: Number of Factors: 1, Unrotated Factor Solution, Scree Polot-Rotation: Varimax, Rotaded Solution-Scores: Save as Variables, Method: Regression-Options: Exclude Cases Listwise, Sorted by Size-Variables: ATX, AT6, AT7, AT8, AT9, AT0, AT1, AT2, AT3, AT5
Component Matrixa
,849,793,789,787,783,761,706,657,656,631
Attitude1AttitudeXAttitude0Attitude5Attitude8Attitude7Attitude2Attitude6Attitude3Attitude9
1
Component
Extraction Method: Principal Component Analysis.1 components extracted.a.

Quantitative Study
Page 154
As an example the examination of normal distribution of the variable attitude is displayed in the following. As can be seen from both, the Histogram as well as the Kolmogorov-Smirnov-Test, the dependent variable attitude factor is distributed normally.
Regression Standardized Residual
3,002,50
2,001,50
1,00,500,00
-,50-1,00
-1,50-2,00
-2,50-3,00
Histogram
Dependent Variable: Attitude FactorFr
eque
ncy
30
20
10
0
Std. Dev = ,99 Mean = -,07N = 134,00
Figure 87: Histogram of dependent variable ‘attitude’56
Graphical demonstration of the distribution of the factor attitude in Figure 87 gives evidence, that it is distributed normally. The calculation of the Kolmogorov-Smirnov-test provides certainty for the normal distribution of a given variable (compare Figure 88).
Figure 88: Normal distribution check of ‘attitude’ factor: Kolmogorov-Smirnov test57
One-Sample Kolmogorov-Smirnov Test
158-3,18E-09
1,0000000,085,047
-,0851,067
,205
NMeanStd. Deviation
Normal Parametersa,b
AbsolutePositiveNegative
Most ExtremeDifferences
Kolmogorov-Smirnov ZAsymp. Sig. (2-tailed)
FactorAttitude
Test distribution is Normal.a.
Calculated from data.b.

Quantitative Study
Page 155
The Kolmogorov-Smirnov test is used to decide if a sample comes from a population with a specific distribution.
H0: The data follow a normal distribution
Ha: The data do not follow a normal distribution
The result analysis shows, that there is no significant divergence from the assumption of H0, i.e.: the distribution of the variable from normal distribution (for p<0,005). As already expected after investigation of Figure 87, the Kolmogorov-Smirnov-Test (see Figure 88) gives further evidence that the variable attitude factor is normally distributed.
The following graph shows the Q-Q diagram of the variable attitude factor. This plot is a possibility to graphically decide whether the distribution given can be seen as sufficiently normally distributed. For this purpose each observed value is paired with its under normal distribution expected value. Under the precondition of an exact normality distribution the scores would be located exactly at a straight line. The values observed are presented on the x-axis, while the values expected are displayed on the y-axis; thereby the values are transformed into z-values.
Q-Q-diagramm of attitude factor
observed value
43210-1-2-3-4
expe
cted
nor
mal
val
ue
3
2
1
0
-1
-2
-3
Figure 89: Normal distribution plot for ‘attitude’ factor58
56 SPSS Command: Graphs-Histogram-Display Normal Curve-Variable: Attitude Factor 57 SPSS Command: Analyze-Nonparametric Tests-One Sample Kolmogorov-Smirnov Test-Test Distrubtion: Normal-Test Variable List: Attitude Factor 58 SPSS Command: Analyze-Descriptive Statistics-Explorative Data analysis-Plots: Normality Plots with tests-Dependent List: Attitude Factor

Quantitative Study
Page 156
Figure 89 shows the QQ-diagram of the factor Attitude. The QQ-diagram displays the discrepancy of the points from the even line (the even line in the QQ-distribution corresponds with the expected values in case of a normal distribution), and thus shows how intense the deviation from the normal distribution is. One can depict from Figure 89 that the deviation of the factor Attitude from normal distribution is little.
The trend adjusted normal distribution plot displays the deviations between the observed and the expected values in dependency of the observed values. In case of an exact normal distribution the scores are displayed on a horizontal straight line, which runs through the zero-point. Also in this plot the values were transformed into z-values (Buehl and Zoefel 1995).
Trendadjusted Q-Q-diagramm of attitude factor
observed value
43210-1-2-3-4
devi
atio
n fr
om n
orm
al
,6
,4
,2
,0
-,2
-,4
-,6
-,8
-1,0
Figure 90: Trend adjusted normal distribution plot for ’attitude’ factor59
In the trend adjusted QQ-diagram in Figure 90 the points on the even line are assumed as basis values. Deviations of the points are displayed as discrepancies of the zero line.
Evidence of the above calculations (compare Figure 88, Figure 89, and Figure 90) shows that normal distribution of the variable attitude factor can be assumed and thus multiple linear regression analysis can be performed in the next step.
59 SPSS Command: Analyze-Descriptive Statistics-Explore-Plots: Normality Plots with Tests-Dependent List: Attitude Factor

Quantitative Study
Page 157
6.9 EXAMINATION OF THE RESEARCH MODEL
6.9.1 MULTIPLE LINEAR REGRESSION ANALYSIS
In order to examine the research model a regression analysis is carried out in this step. Regression analysis is used to explore the nature of the interrelation between two variables, respectively to predict the value of a (dependent) variable from the values of other (independent) variables.
The purpose of the multiple linear regression is to estimate the coefficients of the following equation:
y = b1 * x1 + b2 * x2 + … + bn * xn + a
Whereas n is the number of independent variables that are labelled with x1 to xn and a is a constant.
The independent variables thereby correlate among themselves, which is taken into account accordingly when estimating the coefficients for eliminating spurious correlations.
The multiple regression analysis is performed considering the independent variables ‘cost’, ‘know-how’, ‘improved service’, ‘data security’, ‘trust’, ‘dependency’, ‘competition’, ‘ASP diffusion’, ‘image’, ‘contact’, ‘application importance’, ‘outsourcing’, ‘accuracy’, ‘transparency’, ‘competence’ and ‘size’. The results for this analysis are represented in the following table:
Figure 91: Examination of the research model-model summary60
60 SPSS Command: Analyze-Regression-Linear-Method: Enter-Statistics: Estimates, Model Fit, Durbin-Watson-Dependent: ATTITUDE, Independent: SIZE, COST, QUALITY TRANSPARENCY, DEPENDENCY, SOCIAL INFLUENCE CONTACT; ENVIRONMENT; STRATEGY EXTERNAL; QUALITY ACCURACY, SOCIAL INFLUENCE IMAGE, DATA SECURITY, ENVIRONMENT EXTERNAL, STRATEGY, KNOW-HOW, IMPROVED SERVICE, LOSS OF COMPETENCE, TRUST
Model Summaryf
,646a ,417 ,413 ,7788490 ,417 91,007 1 127 ,000,755b ,570 ,564 ,6714818 ,153 44,861 1 126 ,000,796c ,633 ,624 ,6232492 ,062 21,257 1 125 ,000,812d ,659 ,648 ,6029538 ,026 9,557 1 124 ,002,827e ,684 ,671 ,5830257 ,025 9,622 1 123 ,002 2,067
Model12345
R R SquareAdjusted R
Square
Std. Errorof the
EstimateR SquareChange F Change df1 df2
Sig. FChange
Change Statistics
Durbin-Watson
Predictors: (Constant), Competence Factora.
Predictors: (Constant), Competence Factor, Trust Factorb.
Predictors: (Constant), Competence Factor, Trust Factor, Accuracy Factorc.
Predictors: (Constant), Competence Factor, Trust Factor, Accuracy Factor, Improved Service Factord.
Predictors: (Constant), Competence Factor, Trust Factor, Accuracy Factor, Improved Service Factor, Image Factore.
Dependent Variable: Attitude Factorf.

Quantitative Study
Page 158
Figure 92: Examination of the research model-ANOVA61
The ANOVA table shows the share of the variance that is explained by the regression equation. The ratio of the explained part of the variance and the total variance:
90,434/(90,434+41,810)= 0,6838
This number is called a coefficient of determination and is displayed under the heading ‘R-Square’ in Figure 91, which measures the fit by the regression line. The coverage against zero results from the test statistics F and the respective significance level.
As can be seen by analysing Figure 91, the potential influencing factors explain 68% of the variance in attitude towards ASP. With the help of the Durbin-Watson-Test, it is possible to test whether there are systematical connections between the residuals of neighbouring cases. In case this value is near 2, no autocorrelations exist. The value in the underlying case is 2,067 and therefore no autocorrelations exist here.
61 SPSS Command: Analyze-Regression-Linear-Method: Enter-Statistics: Estimates, Model Fit, Durbin-Watson-Dependent: ATTITUDE, Independent: SIZE, COST, TRANSPARENCY, DEPENDENCY, CONTACT; COMPETITION; OUTSOURCING; ACCURACY, IMAGE, DATA SECURITY, ASP DIFFUSION, APPLICATION IMPORTANCE, KNOW-HOW, IMPROVED SERVICE, COMPETENCE, TRUST
ANOVAf
55,205 1 55,205 91,007 ,000a
77,039 127 ,607132,244 12875,432 2 37,716 83,649 ,000b
56,812 126 ,451132,244 12883,689 3 27,896 71,817 ,000c
48,555 125 ,388132,244 12887,164 4 21,791 59,939 ,000d
45,081 124 ,364132,244 12890,434 5 18,087 53,209 ,000e
41,810 123 ,340132,244 128
RegressionResidualTotalRegressionResidualTotalRegressionResidualTotalRegressionResidualTotalRegressionResidualTotal
Model1
2
3
4
5
Sum ofSquares df
MeanSquare F Sig.
Predictors: (Constant), Competence Factora.
Predictors: (Constant), Competence Factor, Trust Factorb.
Predictors: (Constant), Competence Factor, Trust Factor, Accuracy Factorc.
Predictors: (Constant), Competence Factor, Trust Factor, Accuracy Factor,Improved Service Factor
d.
Predictors: (Constant), Competence Factor, Trust Factor, Accuracy Factor,Improved Service Factor, Image Factor
e.
Dependent Variable: Attitude Factorf.

Quantitative Study
Page 159
Figure 93: Regression Analysis-coefficients62
In Figure 93 the regression coefficients b as well as the value for the constant a are given. According to this the regression equation is:
Attitude Factor = 0,375 * Competence Factor + 0,249 * Trust Factor + 0,272 * Accuracy Factor + 0,176 * Improved Service Factor + 0,179 * Image Factor + 0,04147
The ratio of the calculated coefficients and their standard errors form the test statistics t, the corresponding level of significance refers to the coverage of these coefficients against zero. The beta coefficients are standardized regression coefficients for their respective ranges and indicate the importance of the included independent variables.
The following figure shows the values derived from the multiple linear regression analysis that were not included.
62 SPSS Command: Analyze-Regression-Linear-Method: Stepwise-Dependent: ATTITUDE-Independent: SIZE, COST, TRANSPARENCY, DEPENDENCY, CONTACT; COMPETITION; OUTSOURCING; ACCURACY, IMAGE, DATA SECURITY, ASP DIFFUSION, APPLICATION IMPORTANCE, KNOW-HOW, IMPROVED SERVICE, COMPETENCE, TRUST
Coefficientsa
5,872E-02 ,069 ,856 ,394,659 ,069 ,646 9,540 ,000
4,411E-02 ,059 ,745 ,457,564 ,061 ,554 9,225 ,000,393 ,059 ,402 6,698 ,000
3,221E-02 ,055 ,586 ,559,444 ,063 ,435 7,099 ,000,337 ,056 ,344 6,034 ,000,293 ,064 ,288 4,610 ,000
3,365E-02 ,053 ,633 ,528,432 ,061 ,423 7,124 ,000,274 ,058 ,280 4,750 ,000,285 ,062 ,280 4,635 ,000,177 ,057 ,177 3,091 ,002
4,147E-02 ,051 ,805 ,422,375 ,061 ,368 6,114 ,000,249 ,056 ,254 4,412 ,000,272 ,060 ,267 4,559 ,000,176 ,055 ,176 3,181 ,002,179 ,058 ,174 3,102 ,002
(Constant)Competence Factor(Constant)Competence FactorTrust Factor(Constant)Competence FactorTrust FactorAccuracy Factor(Constant)Competence FactorTrust FactorAccuracy FactorImproved Service Factor(Constant)Competence FactorTrust FactorAccuracy FactorImproved Service FactorImage Factor
Model1
2
3
4
5
B Std. Error
UnstandardizedCoefficients
Beta
Standardized
Coefficients
t Sig.
Dependent Variable: Attitude Factora.

Quantitative Study
Page 160
Excluded Variablesf
Model Beta In t Sig.Partial
Correlation Tolerance
Collinearity
Statistics
,080e 1,167 ,246 ,105 ,545,042e ,615 ,540 ,056 ,560,078e 1,232 ,220 ,111 ,631
-,055e -1,006 ,316 -,091 ,868,094e 1,401 ,164 ,126 ,561
-,003e -,056 ,956 -,005 ,952,050e ,920 ,359 ,083 ,863,081e 1,498 ,137 ,134 ,872,033e ,593 ,555 ,054 ,821
-,060e -1,060 ,291 -,096 ,794,067e 1,276 ,205 ,115 ,923
Cost FactorKnow-how FactorData Security FactorDependency FactorCompetition FactorASP Diffusion FactorContact FactorApplication ImportanceOutsourcing FactorTransparency FactorSize Factor
5
Predictors in the Model: (Constant), Competence Factora.
Predictors in the Model: (Constant), Competence Factor, Trust Factorb.
Predictors in the Model: (Constant), Competence Factor, Trust Factor, Accuracy Factorc.
Predictors in the Model: (Constant), Competence Factor, Trust Factor, Accuracy Factor,Improved Service Factor
d.
Predictors in the Model: (Constant), Competence Factor, Trust Factor, Accuracy Factor,Improved Service Factor, Image Factor
e.
Dependent Variable: Attitude Factorf.
Figure 94: Regression Analysis – Variables excluded
Calculation of regression analysis showed, that the following variables do significantly influence the dependent variable ‘attitude’:
1. Competence
2. Trust
3. Accuracy
4. Improved Service
5. Image
The following table summarizes the findings of the statistical analysis of the formulated hypotheses. It presents the statistical influence of the factors examined and their importance for the attitude towards ASP. Those variables identified as having a significant influence are shaded in grey.

Quantitative Study
Page 161
Dependent: Attitude Independent Variable Analysis
Beta t-value Sig. Correlation ,54563** ,00064 Cost Regression Coefficient ,08065 1,17666 ,24667 Correlation ,534** ,000 Know-how Regression Coefficient ,042 ,615 ,540 Correlation ,392** ,000 Improved Service Regression Coefficients ,173 3,143 ,002 Correlation ,392** ,000 Data Security Regression Coefficient ,078 1,232 ,220 Correlation ,490** ,000 Trust Regression Coefficients ,249 4,332 ,000 Correlation -,057 ,511 Dependency Regression Coefficient -,055 -1,006 ,316 Correlation ,567** ,000 Competition Regression Coefficient ,094 1,401 ,164 Correlation ,097 ,265 ASP diffusion Regression Coefficient -,003 -,056 ,956 Correlation ,446** ,000 Social Influence Image Regression Coefficients ,188 3,427 ,001 Correlation ,138 ,111 Social Influence Contact Regression Coefficient ,050 ,920 ,359 Correlation -,034 ,697 Application Importance Regression Coefficient ,081 1,498 ,137 Correlation ,346** ,000 Outsourcing Strategy Regression Coefficient ,033 ,593 ,555 Correlation ,555** ,000 Quality Accuracy Regression Coefficients ,257 4,381 ,000 Correlation -,319** ,000 Quality Transparency Regression Coefficient -,060 1,060 ,291 Correlation ,670** ,000 Competence Regression Coefficients ,365 6,089 ,000 Correlation -,081 398 Size Regression Coefficient ,067 1,276 ,205
Figure 95: Summary of analysis performed for hypotheses testing
63 Pearson Correlation between the independent variable and the dependent variable ‘attitude’ 64 Sig. (2-tailed) of the correlation coefficient 65 Standardized Coefficients: Beta 66 t-value 67 Sig.

Quantitative Study
Page 162
6.9.2 LOGISTIC REGRESSION
Logistic regression is a tool to analyse the dependency of a dichotomous variable from other independent variables (Buehl and Zoefel 1995). Usually, the dichotomous variable is an event that can occur or not. In this case it is the intention to adopt forecasting applications via ASP (2) respectively no intention to adopt such applications (1).68 The logistic regression calculates the probability of the occurrence of that event dependent on the values of the independent variables. The probability for the occurrence of the event is calculated according to the following formula:
p= 1/(1+e-z)
whereas
z= b1 * x1 + b2 * x2 + ...+ bn * xn + a
xi are the values of the independent variables, bi are the coefficients, the calculation of which is the task of the logistic regression, a is a constant. In the case the value for p is smaller than 0,5 it is assumed that the event will not occur, in the case the value for p is bigger than 0,5 the assumption is that the event will occur.
The Goodness of fit is assessed with the Likelihood function, for this purpose the double negative value of the logarithm is used as a measure. For this initial value -2LL, the value is used which results from the regression model that has only one constant, in the underlying case this value is 139,96961. After five iterations the final solution was achieved; the new -2LL value is 84,551 and thus 55,41861 less than the initial value. A reduction of this value means an improvement of the fit; the difference is labelled as Chi-Square and highly significant in the underlying case. This means that the initial model was highly improved by adding the variables attitude and cost.
Subsequently, a classification table is displayed where the observed group membership (2 = intention to adopt, 1 = no intention to adopt) is opposed to the predicted group membership, which is calculated on account of the model. As can be seen from the table (Figure 96), out of 43 individuals with an intention to adopt, 33 were correctly assessed, whereas ten were identified incorrectly as having an intention to adopt, even though they do not have an intention to adopt. Out of the 60 individuals with no intention to adopt 49 were assessed correctly to have no intention to adopt, whereas eleven individuals with no intention to adopt were identified to have an intention to adopt wrongly.
Altogether 82 out of 103 cases were assessed correctly; a 79,61% accuracy rate.
68 For this calculation only those data sets were used where the individuals stated to not have adopted yet. Then the variable Intention1 was recoded, all cases with an intention to adopt were coded 2, all cases with no intention to adopt were coded 1.

Quantitative Study
Page 163
The bottom of the table gives the calculated coefficients and the respective significance examination. The examination as to whether the coefficient differs significantly from zero is done by the Chi-square distributed Wald-statistics. It squares the ratio from the respective coefficients and its standard error. In the underlying case the coefficient b0= -1,9177 and the highly significant coefficients are b1= 1,9063, b2= 0,8615, b3=-0,7080 and b4= 1,0572 is calculated. With the values of those two coefficients it is possible to calculate for every value of the variable attitude factor the corresponding probability p.
z=-1,9177 + 1,9063*Intention to try + 0,8615 * Cost Factor-0,7080 * Size Factor + 1,0572*Attitude Factor
p= 1/(1+e z)
The calculated probability p always refers to the occurrence of the event that is connected with the higher of the two codings of the dependent variable; in this case it is the arrival of the event intention to adopt (2=intention to adopt, 1= no intention to adopt).
Results of the calculation of the logistic regression show that the following independent variables have an influence on the dependent variable ‘intention to adopt’:
1. Intention to try
2. Cost
3. Size
4. Attitude
The following figure shows the calculation of the logistic regression with the software SPSS.
Total number of cases: 133 (Unweighted) Number of selected cases: 133 Number of unselected cases: 0 Number of selected cases: 133 Number rejected because of missing data: 30 Number of cases included in the analysis: 103 Dependent Variable Encoding: Original Internal Value Value 1,00 0 2,00 1 Dependent Variable.. IN1BUY Beginning Block Number 0. Initial Log Likelihood Function -2 Log Likelihood 139,96961 * Constant is included in the model. Beginning Block Number 1. Method: Forward Stepwise (COND)

Quantitative Study
Page 164
Improv. Model Correct Step Chi-Sq. df sig Chi-Sq. df sig Class % Variable 1 30,232 1 ,000 30,232 1 ,000 72,82 IN: INTRY 2 14,187 1 ,000 44,420 2 ,000 78,64 IN: FA_ATT 3 5,604 1 ,018 50,023 3 ,000 79,61 IN: FA_SZ 4 5,395 1 ,020 55,419 4 ,000 79,61 IN: FA_CO No more variables can be deleted or added. End Block Number 1 PIN = ,0500 Limits reached. Final Equation for Block 1 Estimation terminated at iteration number 5 because Log Likelihood decreased by less than ,01 percent. -2 Log Likelihood 84,551 Goodness of Fit 87,247 Cox & Snell-R^2 ,416 Nagelkerke-R^2 ,560 Chi-Square df Significance Model 55,419 4 ,0000 Block 55,419 4 ,0000 Step 5,395 1 ,0202 Classification Table for IN1BUY The Cut Value is ,50 Predicted 1,00 2,00 Percent Correct 1 I 2 Observed +-------+-------+ 1,00 1 I 49 I 11 I 81,67% +-------+-------+ 2,00 2 I 10 I 33 I 76,74% +-------+-------+ Overall 79,61% ----------------------Variables in the Equation----------------------- Variable B S.E. Wald df Sig R Exp(B) INTRY 1,9063 ,6640 8,2415 1 ,0041 ,2112 6,7284 FA_CO ,8615 ,3996 4,6471 1 ,0311 ,1375 2,3667 FA_SZ -,7080 ,3092 5,2437 1 ,0220 -,1522 ,4926 FA_ATT 1,0572 ,4476 5,5778 1 ,0182 ,1599 2,8783 Constant -1,9177 ,5836 10,7961 1 ,0010
Figure 96: Logistic regression with dependent variable ‘intention to adopt’69
69 SPSS Command: Analyze-Regression-Logistic-Method: Enter-Dependent: Inbuy-Covariates: Attitude Factor, Size Factor, Cost Factor and Intention to try

Quantitative Study
Page 165
In the next step a logistic regression analysis is performed for the dependent variable ‘intention to try’. The Log Likelihood value improves after five iterations from 137,60884 to 107,035. The difference between these two values, Chi-Square is significant, thus the initial model could be improved by adding the variable ‘attitude’.
The classification table shows the observed group membership (1 = intention to try, 0 = no intention to try) opposed to the predicted group membership. The table shows that out of 73 individuals with intention to try, 56 were correctly assessed to belong to the group intention to try, and seven were predicted to have no intention to try, while they in fact had an intention to try. Out of 40 cases with no intention to try, 20 were predicted correctly to have no intention to try, whereas 20 individuals who in fact had no intention to try were predicted to be a member in the group intention to try. Overall 73,79% of the cases were predicted correctly.
The last part of the table displays the calculated coefficients: b0 = 0,5956 and the highly significant coefficient is b1=1,4528. Thus, the corresponding equation is:
z=0,5956 + 1,4528*attitude
p= 1/(1+e z)
The following figure shows the calculation of the logistic regression for the dependent variable ‘intention to try’.
Total number of cases: 133 (Unweighted) Number of selected cases: 133 Number of unselected cases: 0 Number of selected cases: 133 Number rejected because of missing data: 30 Number of cases included in the analysis: 103 Dependent Variable Encoding: Original Internal Value Value ,00 0 1,00 1 Dependent Variable.. INTRY intention to try Beginning Block Number 0. Initial Log Likelihood Function -2 Log Likelihood 137,60884 * Constant is included in the model. Beginning Block Number 1. Method: Forward Stepwise (COND)

Quantitative Study
Page 166
Improv. Model Correct Step Chi-Sq. df sig Chi-Sq. df sig Class % Variable 1 30,574 1 ,000 30,574 1 ,000 73,79 IN: FA_ATT No more variables can be deleted or added. End Block Number 1 PIN = ,0500 Limits reached. Final Equation for Block 1 Estimation terminated at iteration number 4 because Log Likelihood decreased by less than ,01 percent. -2 Log Likelihood 107,035 Goodness of Fit 115,463 Cox & Snell-R^2 ,257 Nagelkerke-R^2 ,348 Chi-Square df Significance Model 30,574 1 ,0000 Block 30,574 1 ,0000 Step 30,574 1 ,0000 Classification Table for INTRY The Cut Value is ,50 Predicted ,00 1,00 Percent Correct 0 I 1 Observed +-------+-------+ ,00 0 I 20 I 20 I 50,00% +-------+-------+ 1,00 1 I 7 I 56 I 88,89% +-------+-------+ Overall 73,79% ----------------------Variables in the Equation----------------------- Variable B S.E. Wald df Sig R Exp(B) FA_ATT 1,4528 ,3246 20,0324 1 ,0000 ,3620 4,2751 Constant ,5956 ,2402 6,1500 1 ,0131
Figure 97: Logistic regression with dependent variable ‘intention to try’
Subsequently, the information gathered through the statistical examination will be summarized for each single hypotheses defined. Only information that is to be considered stable and relevant is incorporated into this interpretation. Therefore, only the single analysis independent of the whole research model will be described underneath. The inclusion of the significance of the model parameters enables a reasonable access to cognition.

Results and Discussion
Page 167
7 RESULTS AND DISCUSSION
7.1 INTRODUCTION
‘…they must treat conclusions as beginnings. This attitude doesn’t come naturally to everyone. Real detectives prefer closing cases, not opening new ones, and they hate reopening new ones. This propensity to conclude can severely damage a marketer’s ability to think differently…managers must actively seek new questions rather than answer existing ones. Research findings -solved crimes- are great for formulating new interrogations.’ (Zaltman 2003 pp. 247)
In this chapter, the results of the empirical surveys are presented. This chapter discusses further the results from the perspective of the underlying theories assumed. The limitations of this study are then addressed, followed by the contributions. Finally, future research directions are given.
7.2 DIFFUSION OF ASP IN THE ELECTRIC UTILITIES INDUSTRY
According to the findings of the empirical studies in this research the graphical presentation of the diffusion curve that was displayed as an example in chapter 2.3.6 has to be altered accordingly. The entire population of electric utilities in Germany and Austria is displayed in Figure 60. However, the following table shows the adoption intentions according to the quantitative survey findings.
Adoption Intentions
Adopters 57,8 % Cumulated Already adopted - 21,25 % - 21,25 % Intention within six month - 7,5 % - 28,75 % Intention within a year - 15 % - 43,75 % Intention within two years - 25 % - 68,75 % Intention later than two years - 31,25 % - 100 % Rejecters 46,2 %
Figure 98: ASP adoption intentions within electric utilities

Quantitative Study
Page 168
According to the findings of the qualitative study, the first recognition of ASP for maintaining software for the electric utilities industry was in the early 1990s. The data for the quantitative survey were gathered mid 2004. 48 percent of the respondents stated that they had no intention to adopt ASP, 11 percent indicated to have already adopted ASP and 41 percent intend to adopt ASP in the future. The following table shows again the total number of electric utilities in Austria and Germany.
Population of addressable adopters
Country Communal EU’s Regional EU’s Austria70 142 Germany71 900 60 Sum 1102
Figure 99: Population of addressable adopters
According to this data around 40 percent of the electric utilities in Austria and Germany that is more than 440 companies will adopt ASP, whereas approximately 110 will have already adopted ASP. Figure 100 gives an overview on how ASP will diffuse in Austria and Germany in the electric utilities industry.
70 Registered at e-control, the Austrian regulation authority for electric utilites. 71 Figures according to estimates of the author

Quantitative Study
Page 169
Figure 100: ASP diffusion in the electric utilities industry according to adoption intentions
When presenting such figures, it has to be noted that these shall not be interpreted as accurate forecasts, but rather as a direction indicating the trend.
7.3 HYPOTHESIS TESTING AND DISCUSSION
This thesis investigates the factors influencing the ASP adoption decision. A quantitative survey was conducted among electric utilities in Austria and Germany. In addition, some qualitative data from case interviews were collected to examine the decision factors associated with outsourcing forecasting applications. Based on the statistical results presented in the previous chapter, this section interprets the results and shows the impact of these factors on the ASP adoption decision and further implications.
In chapter 2.4 the theoretical framework and the literature review was presented as a basis for the formulation of the hypotheses. The results of the qualitative study are described from which four groups of hypotheses were formulated with the objective to empirically test them by means of the quantitative survey.
Innovators Early Adopters
Early Majority
Late Majority
Laggards
Limit of market saturation ~ 50 % of addressable market
Adopters
Cumulated number of adopters
Time t
Time t
% Adopters
Area covered under normal curve
Early 1990s ~ 2002
2002 ~ 2004
2005 ~ 2006
2007 ~ 2008
2009 and after
Cumulated % Adopters
2.5
2,5
13.5
16
34.0
50
34.0
84
16.0
100
current state (t)
t + 6 m t + 12
t + 24

Quantitative Study
Page 170
Intention to adopt ASP at the organisational level is the dependent variable and may involve three distinctive groups:
1. Organisations that do not yet use ASP for forecasting purposes and do not have any plans to change over to ASP in the near future
2. Organisations that do not yet use ASP, but do have plans to change over to ASP, and finally
3. Organisations that already use ASP for forecasting purposes
Based on the literature study, four groups of hypotheses regarding attitude towards ASP have been formulated in chapter 2.4 in order to test the influence of 1) perceived innovation characteristics, 2) perceptions about the organisation’s environment, 3) social influence, 4) organisational characteristics of attitudes towards ASP. To test the influence of these variables on attitudes towards ASP, multiple linear regression analysis has been performed. Logistic regression analysis has been used to test the influence of the independent variables and the moderating variable attitude towards ASP on the depending variables intention to adopt and intention to try. Taking into account all predictor variables at once was considered to be appropriate, since the group sizes of those intending to adopt (63) and those who had no intention (73) were almost equal. If multicollinearity between the independent variables exists, then it is difficult to separate the effects of the different independent variables on the dependent variables. Thus, before using these variables in the multiple linear regression, any possible multicollinearity between the independent variables should be detected. For that purpose, the correlation matrix of the independent variables has been studied and is reported in Figure 80. Although some of the correlations between the independent variables differ significantly from zero, only two of the predictor variables are correlated above 0,50, so that problems related to multicollinearity will be minimal.
In the following discussion of the results the latest research results are incorporated in the text in order to compare the results of this research with existing findings.
7.3.1 CHARACTERISTICS OF THE INNOVATION
Hypotheses 1: Testing the hypotheses regarding perceptions of the innovation characteristics.
The perceived innovation characteristics refer to the perceived relative advantages and the perceived relative disadvantages of using ASP. Based on the results of factor analysis nine factors in this context were formed:

Quantitative Study
Page 171
• Cost
• Know-how
• Improved Service
• Accuracy (Quality)
• Competence
• Data Security
• Trust
• Dependency
• Transparency (Quality)
To test the first group of hypotheses multiple linear regression analysis was performed, the results are reported in chapter 6.9. Based on this analysis, hypothesis 1d, 1e, 1f and 1h are confirmed. Figure 93 and Figure 95 show that perceived improved service, perceived increased forecasting accuracy, perceived gains in competence and perceived trust significantly influences the attitude towards ASP. It appears that competence plays an especially major role in the formation of attitudes towards ASP. The higher the perceived gains in competence, the greater the influence on the formation of positive attitudes towards ASP. Variables that did not prove significant in explaining the formation of attitude towards ASP are ‘perceived cost’, ‘gains in know-how’, ‘data security’, ‘dependency’ and ‘transparency-quality’. Additionally hypothesis 1b could be confirmed. The calculation of the logistic regression (see Figure 96) shows that cost has a significant influence on the intention to adopt ASP.
Prior innovation diffusion literature reports a significant relationship between relative (dis-) advantage and innovation adoption (Tornatzky and Klein 1982) as well as ASP/outsourcing literature, which report several measures of relative advantage as being significant drivers for ASP adoption (Kern, Lacity et al. 2002). Perceived uncertainty and risk is on the top of literature lists of ASP barriers. Yet paradoxically, there have been reports that organizations have specifically opted for ASPs to reduce risk (Williams 2003). Due to its multidimensionality, the relative (dis-) advantage construct is being split into separate parts.
7.3.1.1 SERVICE
Hypotheses 1d: Perceived improved service due to the use of ASP leads to increased positive attitude towards forecasting applications via ASP.
The hypothesis relating to perceived improved service influencing the attitude towards ASP (H0: 1d) could be confirmed, with a β-value of 0,176 on a 0,005 level of significance (see Figure 95). This construct was measured by three indicators: ‘using ASP there will be no need for my company to maintain the application provided by the external service provider’, ‘using ASP my company can benefit from regular software updates’ and ‘using ASP my company will benefit from the support of an external service provider’. The Scatterplot (see Figure 101) provides further evidence that the relationship between improved service and Attitude is linear.

Quantitative Study
Page 172
Figure 101: Scatterplot Regression ‘improved service’72
This finding is supported by results of Kern et al. (2002), who report that 66 percent of experienced and 62 percent of potential customers noted the improved application rollout speed of a netsourcing solution. They also reported that customers noted application availability and service response or uptime as the primary technical problem areas in their netsourcing service. A further finding in this survey is that over 60 percent of both potential and existing customers commonly expect hosting, help desk, and system integration skills and services to be integral to a netsourcing provider’s application solution. Yao (2004 p. 148) reports in her PhD thesis that when a company believes that it will complement its internal IT deficiency (i.e., lack of investment in software and hardware, lack of knowledge of handling applications and lack of qualified IT professionals) through ASP services, then the company is more willing to pursue these types of business relationships. Also Daylami (2004 pp. 126) found in his research a significant relationship between internal IS expertise with ASP infusion. Some ASP customers believe that providers of ASP are able to offer a better service than their in-house IT can on measures of improved availability, reliable backup and recovery, and network connectivity (Daylami 2004 pp. 126). A respondent interviewed during the qualitative survey of this research project supports these findings:
‘ASP, to be successful, must be bundled with appropriate services. That said, the main advantage to an ASP for the utility is its ability to outsource significant technical work.’
The independent t-test statistic shows that there is a significant difference (Sig. = 0,001) between the group of those who intend to adopt ASP and those who do not in their rating of perceived improved service of ASP (see Figure 107).
72 SPSS Command: Graphs-Interactive-Scatterplott

Quantitative Study
Page 173
Figure 102: Independent Samples Test ‘no intention’ vs. ‘intention to adopt’ on ‘service’
At the height of the IT resources shortage in the late 1990s, it was quite common to regard IT resource shortages as a major driver of ASPs’ penetration (Kern, Lacity et al. 2002; Jayatilaka, Schwarz et al. 2003). The findings of this study generally support this widely held view. Therefore it will be helpful for ASPs to emphasize their expertise in services and help compensate for the IT deficiency of their clients.
7.3.1.2 FORECASTING ACCURACY
Hypotheses 1e: Perceived improved forecasting accuracy due to the use of ASP leads to increased positive attitude towards forecasting applications via ASP.
The hypothesis relating to increased perceived forecasting accuracy influencing the attitude towards ASP (H0: 1e) could be confirmed, with a β-value of 0,267 on a 0,0005 level of significance (see Figure 95). The indicator ‘ASP can provide accurate results for load/price forecasting’ measured this construct. The Scatterplot (see Figure 103) gives further evidence that the relationship between Accuracy and Attitude is linear.
Figure 103: Scatterplot Regression ‘accuracy’
Independent Samples Test
,416 ,520 -3,247 136 ,001 -,5310770 ,1635804 -,8545672 -,2075868
-3,346 135,872 ,001 -,5310770 ,1587250 -,8449680 -,2171859
Equal variancesassumedEqual variances notassumed
Improved Service FactorF Sig.
Levene's Test forEquality of Variances
t dfSig.
(2-tailed)Mean
DifferenceStd. ErrorDifference Lower Upper
95% ConfidenceInterval of the
Difference
t-test for Equality of Means

Quantitative Study
Page 174
This construct was strongly supported by the qualitative data gathered during this research project. Below, some examples of statements from interview partners are given:
‘…the accuracy of the load forecast is essential for the early purchasing of the required amount of electricity, respectively for the assessment of own generation and transmission capacities because of the thereby possibly attainable financial advantages through lower cost.’
‘Degree of inaccuracy of load forecasting method versus that of the ASP. The decision to use the ASP should be based on a verification that the ASP forecasting method is much better than the method currently being used by the utility.’
‘By the time that the internal forecasts-based on decades of experience-fail, that is: when doing a load forecast there are a maximum of four parameters that are determining: (order according to significance): 1. structural parameters (if available i.e. omission of an aluminium smelter, etc.), 2. GDP, 3. temperature and 4. concerning load often not significant: price. Tip: ASP has to exceed these above analyses, because those you can do quickly by yourself and they are very accurate-particularly because the utilities have their internal data.’
The independent t-test statistic shows that there is a significant difference (Sig. = 0,01) between the group of those who intend to adopt ASP and those who do not in their rating of ASP’s forecasting accuracy (see Figure 104).
Figure 104: Independent Samples Test ‘no intention’ vs. ’intention to adopt’ on ‘accuracy’
This finding is especially important for practitioners. It highlights the view that ASP is not merely a way of delivering low-cost and thus sometimes reduced quality applications. Instead customers expect superior quality with regard to the performance of the application functionality itself to be a major advantage of ASP.
7.3.1.3 COMPETENCE
Hypotheses 1f: Perceived improved competence due to the use of ASP leads to increased positive attitude towards forecasting applications via ASP.
Independent Samples Test
,651 ,421 -2,692 131 ,008 -,4488951 ,1667464 -,7787592 -,1190310
-2,767 129,987 ,006 -,4488951 ,1622154 -,7698191 -,1279710
Equal variancesassumedEqual variances notassumed
Accuracy FactorF Sig.
Levene's Test forEquality of Variances
t dfSig.
(2-tailed)Mean
DifferenceStd. ErrorDifference Lower Upper
95% ConfidenceInterval of the
Difference
t-test for Equality of Means

Quantitative Study
Page 175
Further the hypothesis relating to perceived improved competence and influencing the attitude towards ASP (H0: 1f) could be confirmed with a β-value of 0,368 on a 0,0005 level of significance (see Figure 95). The indicator ‘ASP will improve load/price forecasting competency in my company’ measured this construct. The Scatterplot (see Figure 105) gives further evidence that the relationship between Competence and Attitude is linear.
Figure 105: Scatterplot Regression ‘competence’
Yao (2004 p. 144) found similar results as clients emphasized business capabilities more, such as the ability to understand business processes and business objectives. She also found that the current clients of an ASP generally place a high value on ASP capability, whereas companies that have not adopted ASP had much lower evaluations regarding ASP capabilities in the market. This study also confirmed that another reason for clients to adopt ASP is knowledge transfer. Clients learn from ASPs through collaboration, and this is perhaps the best way to enhance clients’ capabilities. Further validation for this point of view is derived from the qualitative survey, where interviewees quoted:
‘Load forecasting is a traditional task for electric utilities and therefore there should be enough competence and expertise within them to perform this vital task. The new competitive scenario introduced some changes; load forecasting is now similar to a market investigation, therefore new expertise is required. Outsourcing is an option often adopted by utilities to solve problems like this.’
‘Price forecasting is a new task introduced by the new competitive scenario. In general utilities, at least in Italy have not yet developed enough expertise. Price forecasting application via ASP is an interesting option.’
‘Price forecasting is as much an art as it is a science. The ASP advantage to a utility is the ability to access professionals who have the gift.’
Within the qualitative study the perceived gains in competence as main influencing factor were mentioned, but the relation did not seem as strong as the quantitative data analysis revealed.

Quantitative Study
Page 176
The independent t-test statistic shows that there is a significant difference (Sig. = 0,000) between the group of those who intend to adopt ASP and those who do not in their rating of ASP’s competence (see Figure 106).
Figure 106: Independent Samples Test ‘no intention’ vs. ‘intention to adopt’ on ‘competence’
Based on these findings, it can be argued that improved competence is considered to be an important ASP decision factor. The low adoption rate of ASP may be explained by the fact that main ASP prospects perhaps feel that there are no qualified ASP vendors for them to choose from who might be able to improve their competence, however attracted they may be to the ASP business model. ASP companies should try more to increase and present their capabilities to their clients in order to increase client’s positive attitude towards the providers. More specifically, ASPs should demonstrate their strong expertise in understanding the underlying business processes of forecasting price and load. A managerial implication that can be drawn is to increase client’s awareness of the capabilities of ASP and demonstrate strengths in providing expertise and competence to the companies. This could be done by letting the potential customers use applications on a trial basis, or by providing success stories and client references. ASPs should make certain preparations for knowledge transfer so that clients can benefit more from ASPs and enhance their expertise.
7.3.1.4 COST
Hypotheses 1a: Decreased perceived cost related to ASP leads to increased positive attitude towards forecasting applications via ASP.
Hypotheses 1b: Decreased perceived cost related to ASP leads to positive intention to adopt forecasting applications via ASP.
Independent Samples Test
4,789 ,030 -3,808 131 ,000 -,6314364 ,1658268 -,9594813 -,3033914
-3,874 130,939 ,000 -,6314364 ,1630062 -,9539029 -,3089698
Equal variancesassumedEqual variances notassumed
Competence FactorF Sig.
Levene's Test forEquality of Variances
t dfSig.
(2-tailed)Mean
DifferenceStd. ErrorDifference Lower Upper
95% ConfidenceInterval of the
Difference
t-test for Equality of Means

Quantitative Study
Page 177
The hypothesis relating the perceived cost to the intention to adopt ASP (H0: 1b) can be confirmed with an R-value of 0,1375 on a 0,05 level of significance (see Figure 96). The hypothesis relating the perceived cost to the attitude towards ASP (H0: 1a) could not be confirmed (β-value: ,080/t-value: 1,176/Sig.: ,246-see Figure 95). This construct was measured by three indicators: ‘using ASP compared to traditional supplied software, increased gains will be achieved’, ‘using ASP compared to traditional supplied software, investments will decrease’ and ‘ASP solutions are inexpensive’. The circumstance that cost, as an influencing factor did not prove to have a significant influence on the attitude towards ASP in the statistical examination was rather surprising. However, the calculation of the logistic regression (see Figure 96) showed that cost does have a significant influence on the behavioural intention to adopt.
The qualitative data showed that cost was one of the factors that were mentioned the most by the participants in this survey. For example one participant commented that
‘The three most important factors for me are: 1. cost, 2. cost and 3. cost.’
‘The customer can get good information without investing in the purchase of software.’
Moreover in an independent samples test, testing the differences in cost factor between those who already adopted ASP and those that did not use ASP until now showed a significant difference in the attitude towards ASP in these two groups. However, also when testing those who intended to adopt ASP and those who do not intend to adopt ASP, there was a significant difference (Sig. = 0,000) in the factor cost (see Figure 107).
Figure 107: Independent Samples Test ‘no intention’ vs. ‘intention to adopt’ on ‘cost’
Independent Samples Test
4,286 ,040 -5,930 136 ,000 -,9008747 ,1519246 -1,20131 -,6004346
-6,118 135,939 ,000 -,9008747 ,1472388 -1,19205 -,6096998
Equal variancesassumedEqual variances notassumed
Cost FactorF Sig.
Levene's Test forEquality of Variances
t dfSig.
(2-tailed)Mean
DifferenceStd. ErrorDifference Lower Upper
95% ConfidenceInterval of the
Difference
t-test for Equality of Means

Quantitative Study
Page 178
This view supports an international online survey with more than 300 data sets of current and potential netsourcing customers conducted by Ramses Zuiderwijk from Erasmus University and Kern et al. (2002). Their findings show that 70 percent of existing ASP customers experienced significant cost savings, whereas only 43 percent of potential customers expected to be able to achieve savings. They also report that especially smaller companies tend to expect netsourcing setup costs to be higher than experience actually proves them to be. According to this survey, some 85 percent of netsourcing customers are making yearly savings, yet 30 percent of potential customers expect to achieve no savings at all. Therefore this study reports a noticeable discrepancy between results anticipated by potential customers and actual cost savings achieved. Other authors highlight the general trade-off when using ASP between features and cost: The technologies with the most features are also the most expensive (Lawton 2002). Also other surveys found inconsistent results on this issue. Yao (2004 pp. 142) found that among ASP clients cost benefits are not considered to be a very important factor for ASP adoption. Also Daylami’s research (2004 pp. 132) revealed that cost does not have any significant influence on ASP infusion or diffusion.
Based on these findings, it might be argued that to ASP adopters cost benefits are not the only and most important objective potential customers are looking for. In addition to the reported lower and predictable costs, or lower total cost of ownership at the top of all literature lists of ASP drivers, this study supports a positive relationship between cost factor and ASP adoption. These findings support the idea that cost benefits positively impact the decision to adopt ASP. This view is consistent with a report (Williams 2003) that finds that there are considerable variations among ASP users, especially in the value they attach to cost savings. For many organizations when using ASP other determinants (risk reduction, improved service, etc.) are just as important. One explanation may be that ASPs, at this stage of their adoption, are not replacing existing technology with a new or more cost effective one, but are instead providing a new, more accommodating way of acquiring software services (Daylami 2004 pp. 132). The findings may impact ASP marketing strategies. Therefore ASPs need to highlight the cost benefits of using Application Service Providing.
7.3.1.5 KNOW-HOW
Hypotheses 1c: Perceived gains in know-how due to the use of ASP leads to increased positive attitude towards forecasting applications via ASP.
Based on the multiple regression analysis, the hypothesis regarding the influence of perceived gains in know-how on attitude towards ASP (H0: 1b) could not be confirmed (β-value: ,042/t-value: ,615/Sig.: ,540-see Figure 95). This construct was measured by two indicators: ‘using ASP my company can benefit from the know-how of the external service provider’ and ‘using ASP my company can always use the latest mathematical models and algorithms’. A possible reason for the non-significance of this construct might be that gains in know-how alone does not imply as much advantage for the organization as does the construct of competence, which includes not only know-how but rather the expertise of implementing know-how and using it in as advantageous a way as possible for the organization. As an example for the importance of know-how the following example quotes the statement of a respondent of the qualitative survey.

Quantitative Study
Page 179
‘Continuous update of know-how and techniques adopted-very important in a continuous changing scenario and changing market rule and operators.’
Even though know-how seemed to play an important role based on the findings of the qualitative survey, this construct did not prove significant in the quantitative data analysis. These findings provide insights for both researchers and practitioners. For researchers, the construct of know-how is too narrow, but shall rather be included in the broader concept of competence and expertise. For practitioners it will be important to highlight the broader expertise they can offer to ASP customers rather than highlighting the ability to use the latest calculation models, which seems to be a natural precondition for ASP customers and a factor of separating ‘good’ ASP providers from ‘not very good’ ones.
7.3.1.6 TRUST
Hypotheses 1h: Increased perceived trust in Application Service Providers leads to increased positive attitude towards forecasting applications via ASP.
The hypotheses relating to perceived trust influencing the attitude towards ASP (H0: 1h) could be confirmed with a β-value of 0,254 on a 0,0005 level of significance (see Figure 95). This construct was measured by the three indicators: ‘Application Service Providers are serious business partners’, ‘Application Service Providers are stable business partners’ and ‘ The external provider of the application is fully liable for the service offered’. The Scatterplot (see Figure 108) gives further evidence that the relationship between Trust and Attitude is linear.
Figure 108: Scatterplot Regression ‘trust’

Quantitative Study
Page 180
Yao (2004 pp. 145) also finds that trust has a significant impact on the clients ASP adoption decision. She reports that respondents indicate that high levels of trust in ASP vendors will increase the likelihood of a favourable ASP adoption decision. This point of view is supported by Kern et al. (2002) who report that customers rate it important to clarify the ownership of IT, data warehouse, and network infrastructure, yet performance in clarifying these issues for customers is moderate. They indicate that for both potential and existing customers the key to confidence and trust in a netsourcing provider service is generated primarily through alliances, partnerships and industry recognition.
The independent t-test statistic shows that there is a significant difference (Sig. = 0,01) between the group of those who intend to adopt ASP and those who do not in their rating of trust in ASP’s).
Figure 109: Independent Samples Test ‘no intention’ vs. ‘intention to adopt’ on ‘trust’
These findings are in line with the results of the qualitative study. One of the interviewees stated:
‘The trust of the client in the provider of such applications is a crucial factor’
Based on these findings, it can be stated that trust in the provider of ASP plays an important role in the formation of attitudes towards ASP and subsequently in the adoption decision. A strong relationship between trust and the intention to adopt has already been hypothesized in the early stages of this research and was supported by both, the qualitative and the quantitative empirical findings. Therefore, it seems crucial for ASP providers to invest in the building of good and trustful client relations and to alleviate any related concerns of their prospective clients. More specifically small and/or young providers of ASP that do not have a reputation in the market yet could opt for alliances with companies that do have a valued name in the business sector.
7.3.1.7 DATA SECURITY
Hypotheses 1g: Increased perceived data security related to the use of ASP leads to increased positive attitude towards forecasting applications via ASP.
Independent Samples Test
,329 ,567 -2,594 131 ,011 -,4301344 ,1658176 -,7581612 -,1021075
-2,632 130,699 ,010 -,4301344 ,1634099 -,7534051 -,1068636
Equal variancesassumedEqual variances notassumed
Trust FactorF Sig.
Levene's Test forEquality of Variances
t dfSig.
(2-tailed)Mean
DifferenceStd. ErrorDifference Lower Upper
95% ConfidenceInterval of the
Difference
t-test for Equality of Means

Quantitative Study
Page 181
The hypotheses regarding data security influencing the attitude towards ASP (H0: 1g) could not be confirmed (β-value: ,078/t-value: 1,232/Sig.: ,220-see Figure 95). This construct was measured by three indicators: ‘ASP is secure with respect to data transmission’, ‘ASP is secure with respect to data storage’ and ‘Security solutions for ASP are sufficient’.
Even though data security ranked rather high in the perceived disadvantages when using ASP for forecasting applications as a result of the qualitative study, surprisingly this hypotheses was not confirmed. One possible reason for the non-significance of this construct might be that data security seemed to be a hot topic in the beginnings of the internet and thus ASP (Allen 2000; Jones 2003), but recent reports on this topic show that the question of security in data transmission and storage has been more or less satisfactorily solved and thus this topic is not as important as it was some time ago. Kern et al. (2002) report that 63 percent of potential customers rate security as very important, whereas current customers rate providers as 3,7 out of five on security performance. Furthermore, they found that for 55 percent of current netsourcing customers, the internet was found to be sufficiently safe, reliable, and efficient to deliver the required application services, whereas the largest group of potential customers (40%) would seek to access their service via a virtual private network. A respondent of the qualitative survey quoted in this context:
‘Some forecasting information may be confidential; historical information must be provided-can it legitimately be given to an external organisation.’
These findings suggest that data security seems to be an important precondition when considering adopting ASP. And though this topic was hot at the height of the Internet hype in the late 1990s, it seems to be solved by now. An explanation for the findings of these studies may be that potential ASP customers perceive data security to be at an already high level, thus not seeing it as a barrier when considering adopting ASP.
7.3.1.8 DEPENDENCY
Hypotheses 1i: Increased perceived dependency on the provider of ASP leads to decreased positive attitude towards forecasting applications via ASP.
The hypotheses regarding dependency on the provider of ASP (H0: 1i) could not be confirmed (β-value: -,055/t-value: -1,006/Sig.: ,316-see Figure 95). This construct was measured by two indicators: ‘using ASP my company will be dependent on the performance of the external service provider’ and ‘using ASP my company will be dependent on the expertise of the external service provider’.
Kern et al. (2002) report in their study that 56 percent of customers do not believe that there is a loss of control when using ASP, whereas 42 percent suspect that it is very likely that they will become locked in. They also report that current netsourcing customers rate the technical performance of their netsourcing on average as seven on a scale of ten, indicating a good performance rating overall. Daylami (2004 pp. 134) also reports that loss of control has no significant impact on ASP diffusion and infusion.

Quantitative Study
Page 182
Even though trust did prove an important influencing factor on ASP adoption intentions, perceived dependency on the provider did not. One conclusion that can be drawn from this result is that it is okay to be to some extent dependent on the services of an ASP provider, so long as they can rely on the trustworthiness of this provider. From this an important conclusion can be drawn for practitioners: they can take over tasks that require special expertise and thus outsourcing of whole business processes is conceivable. As long as the potential customer and the provider of ASP have a reliable mutual basis of trust it need not be considered as a barrier to ASP adoption.
7.3.1.9 TRANSPARENCY
Hypotheses 1j: Increased perceived transparency due to the use of ASP leads to increased positive attitude towards forecasting applications via ASP.
Finally, the last hypotheses in this group concerning perceived transparency (H0: 1j) could not be confirmed (β-value: -,060/t-value: 1,060/Sig.: ,291-see Figure 95). The indicator ‘doing load/price forecasting in-house is more transparent compared to doing it via ASP’ measured this construct. One reason for the non-significance of this construct might be that transparency is not an issue when using forecasting applications. Therefore transparency does not have an influence on forming attitudes towards ASP.
7.3.2 CHARACTERISTICS OF THE ENVIRONMENT
Hypotheses 2: Testing the hypotheses regarding perceptions of the environmental characteristics.
To test the hypotheses relating to the influence of the perceptions of the organization’s environment on the attitude towards ASP, the following variables have been included in the analysis:
• The influence of the perceived degree of competition on the attitude towards ASP
• The perceived degree of ASP diffusion within the industry.
The multiple regression analysis performed (see Figure 93) and on the basis of other analysis performed (see Figure 95) in order to test these hypotheses none of the hypotheses in this group can be confirmed.
7.3.2.1 COMPETITION
Hypotheses 2a: An increased perceived degree of competition leads to increased positive attitude towards forecasting applications via ASP.
The hypothesis relating the perceived degree of competition to the formation of attitude towards ASP (H0: 2a) could not be confirmed (β-value: ,094/t-value: 1,401/Sig.: ,164-see Figure 95). Two indicators measured this construct: ‘I have the feeling that the competition in my company’s industry sector is very strong’, ‘load/price forecasting is done by all of the companies in the public utility sector’.

Quantitative Study
Page 183
Daylami (2004 pp. 136) reports in his thesis that competitive pressure has no significant relationship to diffusion, but rather a strong relationship with infusion. IS literature reports (although with some variations) a strong relationship between external environmental pressures and IT innovation adoption (Grover and Goslar 1993; Chau and Tam 1997; Chwelos, Benbasat et al. 2001). In contrast, a respondent of the qualitative survey supports the view that competition might be a barrier to ASP adoption:
‘Because of competition and the gaming aspects of spot market biding I would think that a generator should keep its price forecasts to itself and not publicize it.’
Based on these findings it can be assumed that the new environment of the electric utilities with the enforced competition through the liberalisation of the market is not a driver for ASP adoption intentions. On the one hand it seems to be important that ASP can offer expertise that is required by the new market rules, but on the other hand, competition that came into force by this new market organization is not an important precondition for adopting ASP.
7.3.2.2 ASP DIFFUSION
Hypotheses 2b: An increased perceived degree of expected ASP diffusion leads to increased positive attitude towards forecasting applications via ASP.
The hypothesis relating the perceived degree of ASP diffusion to the formation of attitude towards ASP (H0: 2b) could not be confirmed (β-value: -,003/t-value: -,056/Sig.: ,956-see Figure 95). This construct was measured by the indicator: ‘I expect that the number of companies in my country that will use ASP for load/price forecasting purposes within the next two years will: not increase/strongly increase’. A possible reason for the non-significance of this construct might be the low diffusion of ASP amongst electric utilities at the moment. Few companies in that field have already adopted ASP; therefore no experiences about using ASP in this context could be exchanged amongst members of this population.
Another drawback of ASP diffusion all over the electric utilities industry with price forecasting applications was quoted by an individual participating in the qualitative survey as follows:
‘If the forecast is produced via ASP and the ASP is widely used by many players then its price forecast for a given market would be the same for all subscribers. I do not know enough of microeconomics to judge whether this is good or bad.’
7.3.3 SOCIAL INFLUENCE
Hypotheses 3: Testing the hypotheses regarding social influence.
To test the hypotheses relating to the effect of social influence on the attitude towards ASP, the following variables have been included in the analysis:
• The effect of perceived positive image on the formation of attitude towards ASP
• The effect of contact to other members of the industry.

Quantitative Study
Page 184
To test this group of hypotheses multiple linear regression analysis was performed, the results of which are reported in chapter 6.9. Based on this analysis, hypothesis 3b is confirmed. Figure 93 and Figure 95 show that perceived positive image significantly influences attitudes towards ASP.
7.3.3.1 IMAGE
Hypotheses 3b: An increased perceived positive image due to the use of ASP leads to increased positive attitude towards forecasting applications via ASP.
The hypothesis relating to perceived positive image influencing the attitude towards ASP (H0: 3b) could be confirmed with a β-value of 0,174 on a 0,005 level of significance (see Figure 95). This construct was measured by two indicators: ‘using ASP would give my company a high status in the electric utility sector’ and ‘using ASP would give my company an innovative image in the electric utility sector’. The Scatterplot (Figure 110) gives further evidence that the relationship between Image and Attitude is linear.
Figure 110: Scatterplot Regression ‘image’
In an independent samples test, testing the differences in the factor image in the two groups of those who intent to adopt ASP and those who do not intent to adopt ASP, there is a significant difference (Sig. = 0,000) in the factor image (Figure 111).

Quantitative Study
Page 185
Figure 111: Independent Samples Test ‘intention to adopt’, ‘no intention to adopt’ on ‘image’
Including the construct of ‘image’ into such an organisational adoption model is new. The author of this thesis does not know any publication that includes the potential gains in image as a contributing factor to explain organisational adoption behaviour. By proving that this construct has a significant influence on the formation of attitude for or against an innovation this research strongly contributes to the existing literature. This has significant implications for both researchers and practitioners. For researchers the construct of perceived gains in image when adopting an innovation proves to be an important variable, which is worthwhile including and thus examining in further empirical investigations. For practitioners, providing ASP services, the conclusion could be to invest more efforts in the communication of the image of the product, supporting an innovative and high-level service image. Hence, adopting companies can profit from the positive image of the service, which is likely to spread over to the improved perceived innovative status of the company.
7.3.3.2 CONTACT
Hypotheses 3a: Increased contact to other members of the industry leads to increased positive attitude towards forecasting applications via ASP.
The hypothesis relating to contact to other members of the industry influencing the attitude towards ASP (H0: 3a) could not be confirmed (β-value: ,050/t-value: ,920/Sig.: ,359-see Figure 95). Two indicators measured this construct: ‘I have regular contact with other members of the public utility sector’ and ‘I participate regularly in congresses/seminars/meetings or road-shows of the energy sector’. A possible reason why this hypothesis did not prove significant could be the currently rather low diffusion of ASP within the industry. Therefore no positive or negative experiences about ASP can be exchanged among the members of the industry. This circumstance could explain the non-relevance of this variable.
7.3.4 CHARACTERISTICS OF THE ORGANIZATION
Hypotheses 4: Testing the hypotheses regarding organisational characteristics.
Independent Samples Test
1,625 ,205 -3,693 131 ,000 -,5934106 ,1606683 -,9112508 -,2755705
-3,724 129,328 ,000 -,5934106 ,1593452 -,9086714 -,2781499
Equal variancesassumedEqual variances notassumed
Image FactorF Sig.
Levene's Test forEquality of Variances
t dfSig.
(2-tailed)Mean
DifferenceStd. ErrorDifference Lower Upper
95% ConfidenceInterval of the
Difference
t-test for Equality of Means

Quantitative Study
Page 186
To test the hypotheses relating to the organization’s characteristics influencing the attitude towards ASP, the following variables have been included in the analysis:
• The effect of firm size on the formation of attitude towards ASP
• The effect of the organisation’s strategy (application importance)
• The effect of the organisation’s outsourcing strategy.
To test this group of hypotheses multiple linear regression analysis was performed. The results are reported in chapter 6.9. In order to test the possible influence of the variable size on the behavioural intention to adopt and the behavioural intention to try, logistic regression analysis was done. Based on this analysis, the hypothesis concerning the influence of firm size on behavioural intention to adopt was confirmed. Figure 93 and Figure 95 show that neither hypothesis 4a, 4b nor hypothesis 4c significantly influence the attitude towards ASP. However, as can be depicted from Figure 96 size has a significant influence on the behavioural intention to adopt. Figure 97 shows that size is not a significant determinant influencing the behavioural intention to try.
7.3.4.1 SIZE
Hypotheses 4c: Decreasing firm size leads to increased positive attitude towards forecasting applications via ASP.
Hypotheses 4d: Decreasing firm size leads to positive intention to adopt forecasting applications via ASP.
Hypotheses 4e: Decreasing firm size leads to positive intention to try forecasting applications via ASP.
The hypothesis relating to firm size influencing the attitude towards ASP (H0: 4c) could not be confirmed (β-value: ,067/t-value: 1,276/Sig.: ,205-see Figure 95). The hypothesis relating company size to behavioural intention to adopt (H0: 4d) was confirmed (see Figure 96). The hypothesis that states that size has a significant influence on behavioural intention to try could not be confirmed (see Figure 97). This construct was measured by three indicators: ‘my company employs x employees’, ‘my company’s total annual electricity generation from its own plants is x GWh/TWh’ and ‘my company’s total annual sale quantity is x GWh/TWh’. From the findings of the empirical investigation in this context it can be deducted that the company size does play a major role in the actual behavioural intention, whereas smaller companies do have a higher probability of having positive intentions to adopt ASP. However, size considerations do not influence the formation of attitude towards ASP, nor the intention to try ASP.
Moreover an independent samples test, testing the differences in the factor size in the two groups of those who intent to adopt ASP and those who do not intent to adopt ASP, there is a significant difference (Sig. = 0,01) in the factor image (see Figure 112).

Quantitative Study
Page 187
Figure 112: Independent Samples Test ‘no intention’ vs. ‘intention to adopt’ on ‘size’
Therefore a major driver, being often on top of ASP advantage-list that states that especially smaller companies can profit from using ASP services could be confirmed.
7.3.4.2 STRATEGY-APPLICATION IMPORTANCE
Hypotheses 4a: An increased importance of the application in question for the company leads to increased positive attitude towards forecasting applications via ASP.
The hypothesis relating to company strategy influencing the attitude towards ASP (H0: 4a) could not be confirmed (β-value: ,081/t-value: 1,498/Sig.: ,137-see Figure 95). The indicators measured this construct: ‘load/price forecasting is of high importance for my company’ and ‘at this time, in order to do load/price forecasting my company has sufficient internal expertise’. Therefore the statement that only non-core activities can be outsourced to an ASP cannot be confirmed with the underlying research findings.
Yao (2004 p. 146) reports contradictory findings. The results of her survey reveal that the importance of the application for the respective company has a significant impact on ASP adoption. As a result, the group of current ASP clients was more willing to outsource their important applications.
One respondent of the qualitative survey quoted:
‘Advantage: non-core activity that can be outsourced for financial benefit.’
However, the inconsistent findings on this fact require deeper investigation in future research projects.
7.3.4.3 OUTSOURCING STRATEGY
Hypotheses 4d: An increased tendency to outsourcing leads to increased positive attitude towards forecasting applications via ASP.
The hypothesis relating to the outsourcing strategy influencing the attitude towards ASP (H0: 4b) could not be confirmed (β-value: ,033/t-value: ,593/Sig.: ,555-see Figure 95). The indicator measured this construct ‘at this time, in order to do load/price forecasting my company uses external help’. These findings indicate that the general strategy of outsourcing of a company does not have any significant impact on attitudes towards ASP.
Independent Samples Test
2,742 ,101 2,735 107 ,007 ,4935465 ,1804734 ,1357790 ,8513140
2,813 105,041 ,006 ,4935465 ,1754492 ,1456648 ,8414282
Equal variancesassumedEqual variances notassumed
Size FactorF Sig.
Levene's Test forEquality of Variances
t dfSig.
(2-tailed)Mean
DifferenceStd. ErrorDifference Lower Upper
95% ConfidenceInterval of the
Difference
t-test for Equality of Means

Quantitative Study
Page 188
For practitioners this means that all companies independent of their past outsourcing strategy can be addressed with ASP offers.
Based on these findings for application importance and outsourcing strategy the conclusion can be drawn that the strategy of the company has no impact on ASP adoption. These finding may provide some hints for ASP providers to select which applications can be hosted. Contrary to other reports (LeClerc 2003; Wright 2003), it is not necessary to host only non-core applications. ASPs may even host important applications if they possess special expertise in these applications.
7.3.5 ATTITUDE
Hypotheses 5: Testing the hypotheses regarding attitude towards ASP influencing the intention to adopt.
Hypotheses 5a: Increased positive attitude towards forecasting applications via ASP leads to positive intention to adopt forecasting applications via ASP.
Hypotheses 5b: Increased positive attitude towards forecasting applications via ASP leads to positive intention to try forecasting applications via ASP.
To test the hypotheses relating to the attitude towards ASP influencing the intention to adopt ASP and the intention to try ASP, the variable attitude has been included in the analysis. To test this hypothesis a logistic regression analysis was performed, the results of which are reported in chapter 6.9.2. Based on this analysis, the hypotheses concerning the intention to adopt is confirmed with an R-value of 0,2598 on a 0,0005 level of significance, whereas the hypothesis concerning the intention to try is confirmed with an R-value of 0,3620 on a 0,00001 level of significance. The findings of Figure 96 and Figure 97 confirm the influence of attitude towards ASP on the intention to adopt ASP and the intention to try ASP.
The construct attitude towards ASP is measured by the indicators: ‘adopting ASP for load/price forecasting purposes in my company within two years would be: extremely negative/extremely positive; old-fashioned/innovative; extremely harmful/extremely beneficial’, ‘the use of ASP offers an efficient solution for my company’, ‘ASP is the most appropriate solution for my company to use’, ‘ASP is the technology of tomorrow’ and ‘ASP will improve the business performance of my company’.
The importance of formation of attitudes was already highlighted and supported in the literature (Van Everdingen and Bamossy 2000; Frambach and Schillewaert 2002). This spurs the results achieved in the underlying research and gives evidence for future research to include attitude as a moderating variable.
In an independent samples test, testing the differences in the factor attitude in the two groups of those who intend to adopt ASP and those who do not intend to adopt ASP, there is a significant difference (Sig. = 0,000) in the factor attitude (see Figure 113).

Quantitative Study
Page 189
Figure 113: Independent Samples Test ‘no intention’ vs. ‘intention to adopt’ on ‘attitude’
Moreover, in an independent samples test, testing the differences in the factor attitude in the two groups of those who intend to try ASP and those who do not intend to try ASP, there is a significant difference (Sig. = 0,000) in the factor attitude (compare Figure 114).
Figure 114: Independent Samples Test ‘no intention’ vs. ‘intention to try’ on ‘attitude’
7.3.6 INTENTION TO TRY (TRIALABILITY)
Hypotheses 6: Increased intention to try forecasting applications via ASP leads to positive intention to adopt forecasting applications via ASP.
To test the hypotheses relating to the intention to try ASP influencing the intention to adopt ASP a logistic regression analysis was performed, the results are reported in chapter 6.9.2. Based on this analysis, the hypothesis is confirmed with an R-value of 0,2112 on a 0,005 level of significance. The findings of Figure 96 confirm the influence of intention to try ASP on the intention to adopt ASP.
In the following the results of hypotheses testing are summarized and presented in the research model. The strength of the relationship between the independent and the dependent variables are given in the form of β values for those results calculated with multiple linear regression analysis and the related level of significance α. The results of the logistic regression analysis are indicated with the R-value and also the related level of significance α.
Independent Samples Test
9,589 ,002 -6,638 131 ,000 -,9606127 ,1447046 -1,24687 -,6743525
-6,899 125,616 ,000 -,9606127 ,1392325 -1,23616 -,6850675
Equal variancesassumedEqual variances notassumed
Attitude FactorF Sig.
Levene's Test forEquality of Variances
t dfSig.
(2-tailed)Mean
DifferenceStd. ErrorDifference Lower Upper
95% ConfidenceInterval of the
Difference
t-test for Equality of Means
Independent Samples Test
7,836 ,006 -6,027 121 ,000 -,9568221 ,1587580 -1,27113 -,6425188
-5,645 80,262 ,000 -,9568221 ,1695051 -1,29413 -,6195130
Equal variancesassumedEqual variances notassumed
Attitude FactorF Sig.
Levene's Test forEquality of Variances
t dfSig.
(2-tailed)Mean
DifferenceStd. ErrorDifference Lower Upper
95% ConfidenceInterval of the
Difference
t-test for Equality of Means

Results and Discussion
Page 190
7.4 SUMMARY OF RESULTS
Figure 115: Presentation of results within the research model
Cost
Attitude towards
forecasting applications
via ASP
Method: Multiple linear
Regression
Behavioral intention to
Adopt / Reject
Method: Logistic
Regression
Know-how
Improved Service
Data Security
Trust
Dependency
Competition
ASP diffusion
Image
Contact
Application Importance
Outsourcing Strategy
Accuracy
Transparency
Size
Perc
eive
d En
viro
n-m
enta
l C
hara
cter
i-st
ics
So
cial
In
fluen
ce
C
ompa
ny
Cha
ract
er-
istic
s
Comeptence
H1a H1b: R=0,1375 α=0,05H1c
H1d: β=0,176 α=0,005
H1e: β=0,276 α=0,0005
H1f: β=0,368 α=0,0005
H1g
H1h: β=0,254 α=0,0005
H1i
H21j
H2a
H2b
H4a
H4b
H4c
H4d: R=-0,1522 α=0,05
H3b: β=0,174 α=0,005
H3a
H5a: R=0,1599 α=0,05
Pe
rcei
ved
Inno
vatio
n C
hara
cter
istic
s -
Rel
ativ
e (d
is) a
dvan
tage
Behavioral intention to Try/not Try
Method: Logistic
Regression
H5b: R=0,3620 α=0,000
H6: R=0,2112 α=0,005
H4e
Hypotheses in bold letters are supported

Results and Discussion
Page 191
7.5 LIMITATIONS AND FUTURE DIRECTIONS OF RESEARCH
Even though a rigorous and comprehensive study was conducted, there are still some limitations associated with this research. The limitations that apply for the underlying research as well as directives for possible future research paths are described underneath.
• Industrial, regional and application focus
These findings may not apply to the broader ASP range or to the full spectrum of its potential adopters.
The survey was restricted to electric utilities in Austria and Germany. Hence, the findings may only provide limited generalisations to ASP adoption decisions within other industries. However, Grover et al. (1994) indicates that there are no differences of decision factors among different industries, so these results might still provide insights to ASP researchers and practitioners from all industries.
When discussing the results of this research it should be noted that the applications used for the empirical investigation, Load and Price forecasting are very sensible tasks within an electric utility. First, at least load forecasting is usually considered a core competency of an electric utility. And second, data dealt with in load forecasting are highly sensible and valuable for the company. Lastly, results of both load and price forecasting do have a significant impact on decision-making and thus directly on profits.
Therefore, applying the theoretical framework used in this research to other industries or applications is a possible future research path.
• Research Design
Another future research path could be to use alternative research designs. For example, Schroeder, Van de Ven et al. (1986) present a research methodology to substantiate the innovation process models which are largely prescriptive in nature, trying to avoid the three basic problems when examining the innovation process, which are, from his perspective: 1) whether or not innovation is unique from other organisational processes; 2) widespread acceptance of developmental stages; and 3) little empirical evidence-largely limited to retrospective case histories. They suggest a descriptive process model of how innovations evolve over time, to overcome this limitations by conducting a longitudinal study that tracks the development of a variety of innovations over time, and by using a grounded theory approach to identify the developmental processes actually followed in each innovation, instead of entering into the research with a particular process model in mind. Such an inductive approach has also been suggested by Lewin and Minton (1986) as useful and needed in order to begin to appreciate the complexity and ‘messiness’ of organisational processes.

Results and Discussion
Page 192
This study provides a glimpse of the ASP adoption drivers at an early stage. Future longitudinal studies that monitor ASP adoption over time are needed. Even though the underlying research also covers some organizations that have already adopted ASP further emphasis must be focused on those who will adopt ASP within the next month and years. It would be worthwhile to examine in two years time which companies actually adopted ASP. For example, observing a panel or focus groups over time could be an interesting research instrument in this context.
Another research path would be to measure the constructs of attitude and behavioural intention in different points in time. This could reveal further insights in the formation of attitude and the subsequent behavioural intentions of the individuals under investigation.
An interesting future research path could be to address the questions that were dealt with in the underlying research not to such a broad public in different organisations, but rather to focus on a few single companies, researching the problem there in more depth. Goodman (2000) has presented an innovative approach for analysing and understanding organisations by examining how the actions among individuals and groups affect the organisation as a whole. An investigation of the single roles within the firm, their interactions and the effects on the adoption and acceptance behaviour is a field worthy of further attention. Accompanying the entity in question throughout the entire process from the initial stages of awareness and attitude through the intentions, actual adoption and subsequently acceptance of the system. How are these stages interrelated, how do the expectations towards the innovation evolve, how important is social influence throughout these stages? The centre of this research design is not the question ‘What could the potential adopter do with the innovation?’, but rather ‘What is he actually doing with the innovation in the single stages?’ The investigation of adoption, diffusion and acceptance of the innovation within a company on a multi-level basis would therefore be yet another future research direction.
• Variables
In today’s literature the view that behavioural intention to use/adopt leads to actual use is widespread. Research based on the technology acceptance model (TAM) is based on this assumption. The model hypothesises that actual system use is determined by users' behavioural intention to use, which is in turn influenced by users' attitude toward using. Finally, attitude is directly affected by beliefs about the system, which consists of perceived usefulness and perceived ease of use. TAM theorizes this belief-attitude-intention-behaviour relationship to predict user acceptance of technology (Davis 1989; Chen, Gillenson et al. 2004). However, it becomes clear that the variable used in this research ‘attitude’ really reflects internal assessments of an object without necessarily leading to concrete actions (Hawkins, Best et al. 1998). Therefore, attitude solely describes an intended behaviour with respect to an act of purchasing/adoption (Kollmann 2004). Although there is a suspected implication of a positive relationship between attitude and the respective action (the act of purchase): ‘The fact that attitudes are predispositions to respond indicate their relationship with customers’ actual behaviour’ (Wilkie 1994 p. 451). However, a concrete inclusion of actual and continuous usage is not part of the definition of the construct ‘attitude’. Findings indicate that the predictive validity of the dependent variable in this research ‘intention to adopt’ has only limited explanatory power for the actual adoption behaviour. A path for future research and alternative research designs therefore is to examine how behavioural intention influences actual behaviour in the future.

Results and Discussion
Page 193
The assignment of different dependent variables could be a first step for new research. Also the measurement of actual usage and subsequently technology acceptance in relation to the adoption behaviour, hence addressing the problems of the assimilation gap as proposed by Fichman and Kemerer (1999) would be an interesting topic to examine.
The usage of the dependent variable ‘intention to adopt’ assumes that the potential adopter has a vision of a scenario, how to use the innovation in question. However, when researching in the field of innovations, often the problem evolves that the product or service in question does not already exist. This imposes significant problems for the researcher, because even though describing and defining the major features of the innovation, the imagination of individuals can differ widely. For example, some potential users might underestimate the features of the innovation, while others may have exorbitant expectations. In addition, the impacts of the usage of an innovation within a company are hard to predict. For this reason when conducting research as the underlying one, the topic of different imaginations with regard to the innovation always has to be taken into account. Therefore an idea for interesting future research projects would be to let the potential adopters try the innovation so they can learn how to use the innovation in their organisational context. This would effectively network the community and speed up learning on common grounds. It could also be effective in promoting awareness about the innovation within other communities and industries. Hence, the researcher has the possibility to learn how the individuals use the innovation; taking into account network effects and which impacts it can have on an organisational level.
Supply side variables have been explicitly excluded from this research. This is on the one hand a limitation to this study, but it also opens a path for future research. As Backhaus (2003) notes, benefits and returns in the case of industrial commodities are often subject to direct negotiations between representatives of the organisations. A process of mutual interaction characterizes this and hence it is possible to commit to special problems of the customer and adjust the offers to the special requirements of the client. A question that could be addressed is how the patterns in the interaction between provider and client (i.e.: the relationship becomes more trustful, the application is increasingly adapted to the user needs over time, etc.) evolve over time and influence adoption decisions and subsequently ASP acceptance within the company.
• Empirical design
The survey instrument that was used in this research has some drawbacks despite its decisive advantages. By using a web-based survey responses can be forced by technical means. This forced choice in the survey instrument can lead to half-hearted answers, not reflecting the true intentions of the individual respondent.

Results and Discussion
Page 194
The response rate is relatively low, however enough cases were collected to conduct a reasonable study. There are several reasons for this low response rate. First, due to the features of the population, it was very difficult to reach these persons within the electric utilities because especially in this rather traditional industry employees are hesitant to respond to such surveys. Second, as the findings from the qualitative survey show, many may not have enough knowledge of the ASP business model. Almost half of the participants in this survey said that they only realized the term after receiving my study and reading the definition provided. Furthermore, some companies have a policy against responding to surveys. Some individuals stated this reason for not answering the survey. Finally, the questionnaire is relatively long, which is known to reduce response rates.
Future research could also take other empirical methods into account. Even though a triangular approach (with a qualitative study and a quantitative survey) was chosen in this research, additional methods could bring new insights. For example, the usage of grounded theory for in-depth investigation of the individuals within an organization, or a longitudinal panel or focus group would be interesting options.
• Data analysis
The data analysis within this research project has not undergone structural equation modelling (for example with the software package LISREL). This might also be a path for future research.
• Context
Considerations not included in this work are for example, how the original meaning of the application or the Application Service Provider will evolve over time. Some innovations were successful in completely other areas then originally intended. For example the Internet was originally intended to benefit research and development in scientific and military fields. In the early 1960s the overwhelming impact of the Internet on such a wide variation of industry and professional sectors in our daily life could not have been foreseen.
Also the original meanings of organizations change. A good example here is the electric utilities industry itself. It has undergone rapid transition in recent years, from a heavily regulated market, where the first objective for the company was the security of supply to a liberalised market, where profit and market share is the goal. In such a changing environment the tasks of organisations can change rapidly and with them also the tools used to support these tasks (like ASP, for example) have to change and adapt accordingly.
When analysing the results of this thesis research, it is also worthwhile to consider that often newly, disruptive technologies can change the face of markets rapidly. This research only considers the circumstances of today’s environment. However, these facts are subject to alterations over time.
• B2B versus B2C
Considering the wider spread usage of ASP in a B2C context rather than in the B2B environment it seems to be worthwhile examining the phenomenon in this connection. For example, the billing and invoice management for electric utilities is an area, where ASP has already reached popularity (Fisher 2000).

Results and Discussion
Page 195
• General
In general there are no validated constructs in the literature that aim to forecast decisions that are not experienced on a daily basis.
Generally, it can be said that forecasts of innovation adoption and diffusion, and subsequently human behaviour always have to be dealt with in a careful manner. Examples from the past show that forecasting the impacts of innovation can be a difficult and sometimes almost impossible job. Technologies can evolve in fundamentally different ways than forecasted, as for example for laser technology (Grupp and Maital 2001) or the copy machine (Brown 1997 pp. x). The impact of the copier on organisations as well as on individuals has simply not been imagined, while laser technology only started its triumphal procession with the development of computers that made the technology controllable and thus applicable.
7.6 CONTRIBUTION
7.6.1 THEORETICAL CONTRIBUTION
In spite of the limitations discussed the results of this study nonetheless help both researchers and practitioners interested in understanding the ASP adoption decisions of customers and prospective customers.
This study is exploratory in nature: the research framework, constructs, measures, and web-based survey process were all used in ways unique to this research study.
For researchers this is one of the first studies known to the author that empirically examines determinants of ASP adoption, and the first study that is conducted within the electric utilities sector. First, special attention is directed toward ASP adoption decisions and the decision factors specifically for ASP adoption in contrast to focusing on the factors that affect traditional IT outsourcing decisions. This difference in focus is important because traditional IT outsourcing decisions are distinct from ASP adoption decisions in terms of application’s attributes, target clients and vendors. Although prior research has suggested clients should consider a series of determinants when outsourcing an application (Loh and Venkatraman 1992a; Barthelemy and Geyer 2004), the features of the ASP business model, such as online delivery, a predictable monthly fee and possible short term contracts, decisively change customers’ outsourcing concerns. The underlying research highlights the special nature of the ASP business model and draws attention to the factors that are especially important in the ASP adoption decision.
This research contributes to the understanding of early adoption phases in innovation research. By focusing on an innovation that is in the industry analysed only in its embryonic stages, it was possible to analyse in-depth early adoption intentions and the factors influencing the building of attitude towards the innovation. The examination of determinants influencing the early adoption stages so far is an under researched field with only few contributions (Fisher and Price 1992), hence this work can provide valuable contribution to this field.

Results and Discussion
Page 196
Rejectors were explicitly included in this research. The rejection of innovation is a field that has not been emphasized in the literature so far (Frambach, Agarwal et al. 2002). Hence, the underlying research contributes to this field by examining specific groups, those who intend to adopt the innovation and those who intend to reject.
The results of this project add to the cumulative understanding of innovation adoption while they simultaneously clarify the understanding of what actually are the drivers of ASP adoption. In this study, the focus of investigation was to introduce different points of view and to identify variables of various fields (the innovation itself, the adopting company, the environment and social influence) influencing ASP adoption decisions. In this way, this research avoids the bias introduced by focusing on only one perspective and the danger of overlooking the effects of other important variables not included in one single perspective. As a result, the qualitative study has proved to be an important tool in identifying a widespread range of variables. The empirical investigation of the research model has demonstrated the effectiveness of this extensive ASP adoption decision model in practice.
Social influence as a predictor to innovation adoption intentions has so far only been introduced into the literature by very few authors (Hausman and Stock 2003). However, the construct of how the usage of an innovation can change the self-perceived image of a company has until now not been incorporated into the existing literature. By proving that this variable has a significant impact on the formation of attitude towards an innovation, an important contribution to the theoretical framework building in the fields of innovation adoption is done. Contact to other members of the industry did not prove a significant contributor to the formation of attitude towards the innovation.
7.6.2 PRACTICAL CONTRIBUTION
For practitioners this research provides an extensive survey, which focuses on the ASP market. Practitioners and researchers alike show a tendency to equate ASP with traditional IT outsourcing. The notion that ASP is indeed an innovation, however, has been the starting point of this study. In addition to various research on IT outsourcing (Loh and Venkatraman 1992a; Grover, Cheon et al. 1994), because of the unique features of the ASP business model, this study can contribute to the insight on how determinants influence ASP adoption. While others have basically investigated ASP as a low-cost alternative, mostly pursued by small and medium enterprises (SME) during times of capital shortages and lack of skilled personnel (Patnayakuni and Seth 2001), this research study presents a more complex picture that considers ASP from various perspectives. As Tornatzky and Klein (1982) have already indicated, the ontological and epistemological implications of multiple perspectives of this phenomenon under investigation make the research study findings especially unique and interesting.

Results and Discussion
Page 197
These findings can give providers of ASP a better understanding of clients’ expectations towards ASP adoption and alter their marketing or services strategy appropriately. The study found that some factors have an important impact on ASP adoption decisions. Gains in competence, trust, accuracy of the forecast (quality), social influence (image), improved service and attitude play an important role in influencing ASP adoption decisions. Hence, ASPs need to emphasise their capabilities of transferring expertise and competence to the ASP clients. Findings also confirm the importance of the quality of service that ASP providers shall deliver to their clients; the improved service of ASP offers a distinct and significant advantage for ASP users. Another important finding is that the accuracy of the forecasts calculated by the application has a significant impact on the attitude towards adoption of the electric utilities. The results also revealed that the cost does not have a consistent impact on ASP adoption, yet the findings do not resolve the inconsistency of research findings on cost. The advice to ASPs is that they should concentrate on gathering competence and delivering high quality applications to their clients, instead of low-cost and low quality ones. Another important finding is the trust of the potential clients in the seriousness and stableness of the providers of ASP. Customers tend to search for stable companies with a reliable image they can trust. An implication for practitioners stemming from this significant impact might be to try to establish partnerships with traditional, big companies in order to become a trustworthy partner for ASP customers. The perceived gain in image for the company using ASP has a significant impact on the formation of attitude towards ASP. This result might be of special relevance for the marketers of ASP. It is their task to further support the positive image of ASP and thus of the users of ASP. Lastly, the positive impact of attitudes towards ASP on the intention to adopt could be confirmed. This is also a path for marketers of ASP that should concentrate on promoting awareness and encouraging positive attitudes towards ASP applications. This study also reveals that especially smaller companies are keener to adopt ASP. Therefore it is advisable to marketers of ASP to especially target this group.
Furthermore, the presentation of applications desired by the respondents of the quantitative survey (see Figure 72) give strong indications for practitioners on which applications to focus activities.
7.7 IMPLICATIONS
The window of opportunity for ASP applications in the electric utilities market is at the moment open and waiting for suppliers to offer their solutions. Chapter 7.2 describes the estimated lapse of the diffusion curve of ASP within Austria and Germany. As can be depicted from Figure 100 the majority of companies and organisations intend to adopt ASP between the years of 2005 and 2008. Results of the quantitative survey showed that about half of the electric utilities in Austria and Germany intend to adopt ASP. This indicates a valid business opportunity for marketers intending to offer ASP solutions.

Results and Discussion
Page 198
However, this research also gives hints for practitioners on what to focus on when marketing ASP for electric utilities. The perceived improved service has a significant impact on the attitude towards ASP solutions, therefore providers shall emphasise their expertise in services and draw attention to compensate for the IT deficiency of their potential clients. The quality of the applications offered, in this case expressed by the forecasting accuracy, is an important determinant for the attitude towards ASP. Customers expect superior quality with regard to the performance of the application functionality itself. The perceived improved competence by using ASP applications is a significant predictor of attitude towards ASP. Providers shall try to increase and present their capabilities to their potential customers in order to increase positive attitude. Pointing out the strong expertise in understanding the underlying business processes is a must for these providers. Offering the application on a trial basis or publicising success stories of existing ASP customers could be a tool to do so. The costs of the application have a significant impact on the intention to adopt. This finding suggest that providers of ASP shall highlight cost benefits of using ASP in their marketing strategies and make total cost of ownership more transparent for potential customers. Trust plays an important role in the formation of attitude towards ASP. Advice for providers of ASP can thus be to invest in the promotion of strong and trusting client relationships and to alleviate any related concerns. Additionally, small and not yet established providers of ASP that do not have a reputation in the market yet could opt for alliances with companies that do have a known name in the business. The perceived gain in image by using ASP also has had a significant impact on the attitude towards ASP. This opens the doors for ASP providers and marketers to emphasise on the communication, supporting an innovative and high-level service image. Company size has a significant impact on the adoption intentions towards ASP. Therefore the opinion of previous authors that ASP is especially interesting for small- and medium sized companies could be supported. The implication from this result for marketers is to focus their marketing activities and to tailor their applications offered to this target group. The intention to try ASP has a significant impact on the intention to adopt ASP. Therefore providers of ASP are advised to offer possibilities for their potential customers to use ASP on a trial basis (either limited in time or functionality or at a reduced price).
7.8 CONCLUSIONS
Over the past ten years, the ASP market has experienced a rapidly growing process and played an important role in IT services while facing a heavily unstable environment. In this paper, factors that influence electric utilities ASP adoption decisions were investigated. Different theories from the previous literature, such as the theory of reasoned action, the theory of planned behaviour, the theory of innovation diffusion, organisational buying behaviour, and different approaches to organisational innovation adoption were incorporated. This resulted in the development of a holistic model and the formulation of a series of hypotheses to test the proposed research model

Results and Discussion
Page 199
Subsequently, the different research methodologies and the ones used for the study were discussed in detail. Self-administered surveys were adopted to address the research questions under investigation, a qualitative and a quantitative one. The first survey guide involved the collection and analysis of qualitative data in order to identify the specific variables important for adoption decisions in the context of this research. This data was used to gain a deeper understanding of different factors influencing adoption intentions under this specific context. Additionally, they helped in clarifying constructs found in the literature and in designing the questionnaire. They also provided an explanation for findings from the survey study. The second survey study involved the collection and analysis of survey data from randomly selected decision makers within electric utilities in Austria and Germany. The data was carefully analysed to statistically test the proposed hypotheses.
These results indicated that relative advantage, uncertainty/risk, and social factors influence decisions for ASP adoption, and that the potential moderating effects of attitude on the intention to adopt have an important position in the whole model.
After the results were given, an in-depth discussion of the implications of these results was presented with the complements of qualitative data, followed by a discussion of the study’s limitations. Subsequently, the contributions of this study were addressed. This study is suitable to make a contribution to both theoretical and practical fields. For academics, the model adds more to the literature of innovation adoption in general and decision making of ASP adoption in particular. The ASP adoption framework investigated and its findings also add more knowledge to the understanding of ASP adoption. For practitioners, the findings from this research project give a better idea of the potential adopters’ thoughts and concerns and thus provide an improved guidance for their marketing and services strategies.
The Discussion and Results chapter suggests pathways for further research. In order to have a better representation and a deeper investigation of the factors investigated in this study, further research could be done analysing different industries at different time stages, to explore the effects of different factors on ASP adoption decisions.
The ASP business model is still a newly emerging and growing process to deliver software services. ASPs will need a better understanding of the drivers and barriers to adoption and an improved insight into the potential client’s business processes. Thus, it is crucial for providers of ASP to understand the various factors influencing ASP adoption decisions. This study helps to extend that understanding, building a comprehensive knowledge basis.

Appendix
Page 200
8 APPENDIX
8.1 QUALITATIVE INTERVIEW GUIDE
1. Time-frame
When did you first recognize the term ‘Application Service Providing’?
When did you realize the option of maintaining software for the electric utilities industry via Application Service Providing?
2. Experience
Did you actively deal with ASP in the electric utilities industry?
If yes, how? (i.e., searching for information, etc.)
3. Influencing Factors
Important factors can be found when thinking about the characteristics of the application (i.e., the characteristics of the technology, of the adopting company, of the decision maker, environment, etc.)
Load forecasting. What are the most important determinants/factors for a company when making the decision to use a Load forecasting application via ASP?
Price forecasting: What are the most important determinants/factors for a company when making the decision to use a Price forecasting application via ASP?
4. Advantages and disadvantages
What do you think are the main advantages/disadvantages of Load forecasting-applications via ASP?
What do you think are the main advantages/disadvantages of Price forecasting-applications via ASP?
5. Decision making process
Which roles are incorporated when making the decision to use (adopt) Application Service Providing in an electric utility?

Results and Discussion
Page 201
8.2 QUANTITATIVE SURVEY INSTRUMENTS
8.2.1 INTRODUCTION LETTER BY MAIL
Vienna University of Economics
and Business Administration
Augasse 2-6
A-1090 Vienna
Austria
www.wu-wien.ac.at
Dear Mr. XX,
<Job description within company>
<Company Name>
<Company address>, <Country>
Vienna date, 2004
Re: ASP research questionnaire!
Dear X:
In a few days you will receive my questionnaire on the topic ‘Factors influencing the Intention to adopt Application Service Providing (ASP) by electric utilities.’
I am writing to ask you and your colleagues to complete my survey because of your experience in identifying useful new business software as someone in charge of purchasing and the decision making process for Software-tools (i.e., for Load-forecasting or Spot Exchange Price forecasting).

Results and Discussion
Page 202
Your Benefit: Information that I receive from you today will help to develop products and services that you will require tomorrow. Please take the opportunity to influence the development of future products and services available by completing this simple questionnaire! The results of this study will be published and made available to the IT community.
ASP can especially contribute to competitiveness of small-and medium sized companies!
Answering the questionnaire takes approximately 15 minutes. For this purpose please open the following web site: www.rosp.at/asp.asp
Please take advantage of this opportunity to bring in your opinion in my research project at the latest until XX 2004.
This research project is part of my Ph.D. dissertation project and is being conducted under the auspices of Vienna University for Economics and Business Administration, Department of Marketing-High Tech Marketing (http://www2.wu-wien.ac.at/Marketing/). If you would like to learn more about my Ph.D.-project, you can visit my web site at http://www.wu-wien.ac.at/usr/h96d/h9650311/EnglischStartseite.htm. There you can also see the results of my pilot-study, which might be of interest to you.
Please be assured that all responses are used for scientific purposes only and will be treated strictly anonymously. You and your company will not be identified in any way unless approved beforehand. In addition, I will be happy to send you the results of this research after finalizing the survey.
If you have any questions, please do not hesitate to contact me at [email protected].
Thank you for your co-operation in advance!
Yours sincerely,
Susanne Fuchs
Vienna University for Economics and Business Administration-Department of Marketing
Augasse 2-6
A-1090 Vienna, AUSTRIA

Results and Discussion
Page 203
8.2.2 LETTER OF WELCOME AT THE START OF THE WEB-SURVEY
Dear Survey-Participant,
This survey was developed for my dissertation project at Vienna University of Economics and Business Administration, Department of Marketing-High Tech Marketing in spring 2004.
The purpose of this questionnaire is to understand your personal opinion on the subject Application Service Providing-ASP. Therefore, when answering the following questions your INDIVIDUAL VIEWS/BELIEFS are of utmost importance! Although some questions might seem to be irrelevant to you, please try to answer all questions.
Your opinion is indispensable to my research. By answering this questionnaire, you will be making a substantial contribution to the quality and success of my research project.
I will be happy to send you a copy of the results of this study (ready approx. at the end of August 2004). For this purpose, please leave your e-mail-address at the end of this questionnaire.
Thank you very much for your help!
Susanne Fuchs
OF COURSE ALL RESPONSES ARE USED FOR SCIENTIFIC PURPOSES ONLY AND WILL BE TREATED STRICTLY ANONYMOUSLY! ALL THE INFORMATION YOU PROVIDE IS CONFIDENTIAL AND WILL BE PUBLISHED ONLY IN SUMMARY, STATISTICAL FORM. YOU AND YOUR COMPANY WILL NOT BE IDENTIFIED IN ANY WAY.

Appendix
Page 204
8.2.3 QUANTITATIVE QUESTIONNAIRE
The underlying questionnaire was designed following different sources (Schillewaert, Ahearne et al. 2000; Van Everdingen and Bamossy 2000; Frambach and Schillewaert 2002; Henriksen 2002) and results retrieved in the qualitative study.
Influencing factor
Variable Text Type Value
Cost CO1 When using ASP compared to traditional supplied software, increased gains will be achieved.
Slider strongly disagree / strongly agree
Cost CO2 When using ASP compared to traditional supplied software, investments will decrease.
Slider strongly disagree / strongly agree
Cost CO3 ASP-solutions are inexpensive. Slider strongly disagree / strongly agree Cost CO4 ASP offers possibilities for savings. Slider strongly disagree / strongly agree know-how KH1 By using ASP my company can benefit from the know-how of the external
service provider. Slider strongly disagree / strongly agree
know-how KH2 When using ASP my company can always use the latest mathematical models and algorithms.
Slider strongly disagree / strongly agree
Improved Service
IS1 When using ASP there will be no need for my company to maintain the application provided by the external service provider.
Slider strongly disagree / strongly agree
Improved Service
IS2 When using ASP my company can benefit from regular software updates. Slider strongly disagree / strongly agree
Improved Service
IS3 When using ASP my company will benefit from the support of an external service provider.
Slider strongly disagree / strongly agree
Data Security DS1 ASP is secure with respect to data transmission. Slider strongly disagree / strongly agree Data Security DS2 ASP is secure with respect to data storage. Slider strongly disagree / strongly agree Data Security DS3 Security solutions for ASP are sufficient. Slider strongly disagree / strongly agree Trust TR1 Application Service Providers are serious business partners. Slider strongly disagree / strongly agree Trust TR2 Application Service Providers are stable business partners. Slider strongly disagree / strongly agree Trust TR3 The external provider of the application is fully liable for the service
offered. Slider strongly disagree / strongly agree
Dependency DE1 When using ASP my company will be dependent on the performance of the external service provider.
Slider strongly disagree / strongly agree
Dependency DE2 When using ASP my company will be dependent on the expertise of the external service provider.
Slider strongly disagree / strongly agree

Results and Discussion
Page 205
Environment EN1 I have the feeling that the competition in my company's industry sector (the public utility sector) is very strong.
Slider strongly disagree / strongly agree
Social Influence
SI1 Using ASP would give my company a high status in the public utility sector.
Slider strongly disagree / strongly agree
Social Influence
SI2 Using ASP would give my company an innovative image in the public utility sector.
Slider strongly disagree / strongly agree
Social Influence
SI3 I have regular contact with other members of the public utility sector. Slider strongly disagree / strongly agree
Social Influence
SI4 I participate regularly in congresses/seminars/meetings or road-shows of the energy sector.
Slider strongly disagree / strongly agree
The following questions pertain to application ‘(short-term)-LOAD forecasting’. Load forecasting in this context means the prediction of the quantity to be delivered in time intervals (i.e., in a 15 minutes time pattern) for a specified area for one day up to two weeks in advance. Strategy ST4 LOAD forecasting is of high importance for my company. Slider strongly disagree / strongly agree Environment EN2 LOAD forecasting is done by all of the companies in the public utility
sector. Slider strongly disagree / strongly agree
Strategy ST2 At this time, in order to do LOAD forecasting my company has sufficient internal expertise.
Slider strongly disagree / strongly agree
Strategy ST1 At this time, in order to do LOAD forecasting my company uses external help.
Slider strongly disagree / strongly agree
Quality QU2 Doing LOAD forecasting in-house is more transparent compared to doing it via ASP.
Slider strongly disagree / strongly agree
Competence LC1 ASP will improve LOAD forecasting competency in my company. Slider strongly disagree / strongly agree Quality QU1 ASP can provide accurate results for LOAD forecasting. Slider strongly disagree / strongly agree Environment EN3 I expect that the number of companies in my country that will use ASP for
LOAD forecasting purposes within the next two years will: Slider no increase / strong increase
Overall: adopting ASP for LOAD forecasting purposes in my company within two years would be: Attitude ATX a) Slider extremely negative / extremely positive Attitude AT6 b) Slider old-fashioned / innovative Attitude AT7 c) Slider extremely harmful / extremely beneficial The following questions pertain to application ‘(short-term)-PRICE forecasting’. Price forecasting in this context means the hourly forecast of energy spot market prices up to three days ahead, i.e., for the EEX-The European Energy Exchange. Strategy ST7 PRICE forecasting is of high importance for my company. Slider strongly disagree / strongly agree Environment EN4 PRICE forecasting is done by all of the companies in the public utility
sector. Slider strongly disagree / strongly agree
Strategy ST6 At this time, in order to do PRICE forecasting my company has sufficient internal expertise.
Slider strongly disagree / strongly agree

Results and Discussion
Page 206
Strategy ST5 At this time, in order to do PRICE forecasting my company uses external help.
Slider strongly disagree / strongly agree
Quality QU5 Doing PRICE forecasting in-house is more transparent compared to doing it via ASP.
Slider strongly disagree / strongly agree
Competence LC3 ASP will improve PRICE forecasting competency in my company. Slider strongly disagree / strongly agree Quality QU4 ASP will provide accurate results for PRICE forecasting. Slider strongly disagree / strongly agree Environment EN5 I expect that the number of companies in my country that will use ASP for
PRICE forecasting purposes within the next two years will: Slider no increase / strong increase
Overall: adopting ASP for PRICE forecasting purposes in my company within two years would be: Attitude AT8 a) Slider extremely negative / extremely positive Attitude AT9 b) Slider old-fashioned / innovative Attitude AT0 c) Slider extremely harmful / extremely beneficial Attitude AT1 The use of ASP offers an efficient solution for my company. Slider strongly disagree / strongly agree Attitude AT2 ASP is the most appropriate solution for my company to use. Slider strongly disagree / strongly agree Attitude AT3 ASP is the technology of tomorrow. Slider strongly disagree / strongly agree Attitude AT5 Using ASP will improve the business performance of my company. Slider strongly disagree / strongly agree Intention IN1 I intend to ADOPT ASP for forecasting applications (using an application
against a fee) within the next: Radio-button
I already use ASP 6 months 1 year 2 years later than 2 years not at all
Intention IN2 The probability of adopting ASP within the above stated time period is: Slider Intention IN3 I would like to TEST ASP for forecasting applications (using an
application for a specified period free of charge) within the next: Radio-button
I already use ASP 6 months 1 year 2 years later than 2 years not at all
Intention IN4 The probability of TESTING ASP within the above stated time period is: Slider Company Type
TYPE My company mainly supplies its customers with: Checkbox Free text
electricity gas heat water other (please specify):
Company Size
SZ2 My company employs approx: Radio-button
1 to 100 employees 101 to 1,000 employees

Results and Discussion
Page 207
1,001 to 10,000 employees more than 10,001 employees other (please specify):
Company Size
SZ3 My company's total annual electricity GENERATION from its own plants is:
Radio-button Free text
< 1 GWh) GWh-500 GWh 500 GWh-1 TWh 1TWh-5 TWh 5 TWh-10 TWh 10 TWh-50 TWh >50 TWh other (please specify):
Size SZ4 My company's total annual SALE quantity is: Radio-button Free text
< 1 GWh) GWh-500 GWh 500 GWh-1 TWh 1TWh-5 TWh 5 TWh-10 TWh 10 TWh-50 TWh >50 TWh other (please specify):
Job JOB1 My office is based in: Radio-button Free text
Austria Germany Switzerland Other (please specify):
Job JOB2 Which describes your job position best: (multiple selection possible here) Checkbox
CEO Member of the board of directors Member of the management board Operations IT Energy Trading Energy Business Engineering Risk Manager Sales Marketing Purchasing Key Account Management

Results and Discussion
Page 208
Free text
Plant Management Project Management Public Relations Business Development Administration Other (please specify):
Other applications
OA Which applications would you want to be offered by ASP? (multiple selection possible here)
Checkbox Free text
Load forecast Price forecast Congestion Management/Power Flow Energy Data Management Asset Management Short term Resource Optimisation Medium term Resource Optimisation Long term Resource Optimisation Simulation & Analysis Billing Energy Trading Portfolio Management Risk Management Expansion Planning Customer Relationship Management Market Information System Other (please specify):
Comment COMMENT If you have comments or questions regarding this survey, please use the space provided below:
Free text
Contact CONTACT If you would like to receive a copy of the results of this study, please leave your e-mail-address below:
Free text
YOUR DATA WILL EXCLUSIVELY BE USED FOR THE PURPOSE OF SENDING YOU THE RESULTS AND WILL NOT BE GIVEN TO ANY THIRD PARTIES!

Results and Discussion
Page 209
Thank you very much for participating in this survey! If you have any further questions regarding this survey, please contact: Mag. Susanne Fuchs Department of Marketing-High Tech Marketing Vienna University of Economics and Business Administration [email protected] If you want to learn more about this research project, please visit the project web site Solutions for web-based surveys

Appendix
Page 210
8.2.4 SCREENSHOTS OF THE WEB SURVEY

Results and Discussion
Page 211
8.3 TECHNICAL REALIZATION OF LOAD-AND PRICE-FORECASTING VIA ASP
Figure 116: Functional correlations in the technical ASP model
Application on the ASP side Functionalities Load forecasting The calculations for load forecasting can be activated client-specifically
by the trigger-function when the necessary input-data are changed. In order to make it possible to run automatic and manual forecasts side by side, the forecasts only begins at a given point in time. The necessary input-data are read from an ASCI-file and the calculated result is written into an ASCI-file. The application consists of the following parts: Read input-data from the database Calculation of forecast Write results into database Controlling the procedure
Price forecasting The calculations for price forecasting will be activated once a day after updating the necessary input-data. The necessary input-data are read from an ASCII-file and the calculated result is written into an ASCII-file. Using neural networks will do the calculations. The application consists of the following parts: Read input-data from the database Calculation of forecast Write results into database
Encryption
Customer 1. ASP
Web-Server
Navigation Access-management
Object-Editor Tabular display
Graphical display Import/Export
Load-forecasting Price-forecasting Trigger-function
Automatic data administrator Manual data administrator
csv XML
Database
Web-Browser
GUI
Application internet

Results and Discussion
Page 212
Controlling the procedure
Trigger Function Reacts to changes in the input-data and triggers specific for each client the load-forecasting calculations.
Automatic data administrator Does regularly: Deletion of data that were produced for tests in demo versions Data backup
Manual data administrator Interactive tool for the administration of the database: Deletion of data from former customers from the database
Interactive applications Navigation On the desktop the user is able to select the interactive applications
Access Management Controls customer access to data and applications. It consists of:
User identification Access restrictions to exclusively to the customers own data Restrictions to the contractually fixed memory requirements Access restrictions to the contractually fixed functionalities
Object Editor Creates and deletes customer objects: forecasting objects
Tabular Display Displays customer data in a table. Is used for data manipulation: Input and deletion of single values Selecting of an area with copy/cut and paste functionality
Graphical display Displays customer data in a graphical form. Data manipulation is not possible, but colours can be customized.
Import Scans customer data from an ASCII-file in csv or XML format locally saved on the customer’s computer and imports the data to the corresponding table. The customer’s data are parsed by using a file-description-string.
Export Writes the data from the corresponding table in a local ASCII-file in csv or XML format. The output format is predetermined and is in accordance with the requirements to import data into an Excel-table.
Data transmission Web Server Transmits data and applications via internet
Web Browser Reads data and applications from the internet and is used as
environment for applications
Encryption Secures data against manipulation and spying. It is a sub-function of the web server, or web browser.

Results and Discussion
Page 213
8.4 CURRICULUM VITAE
CURRICULUM VITAE
May, 19th 1977
St. Pölten
single
Austria
Senior Researcher
High Technology Marketing
Innovation Research
Mag. Susanne Fuchs Laudongasse 60/11 1080 Wien [email protected] Personal Data Date of birth Place of birth Marital status Nationality Position Service Industry

Results and Discussion
Page 214
CURRICULUM VITAE
Vereinigung HiTec MarketingSenior Researcher
Business development inInnovation projects
Support of students majoring in High Tech Marketing at the
Vienna University of Economics and Business Administration
Siemens AG ÖsterreichVienna
Doctoral positionDissertation in the area of High Tech
Marketing in the Energy industry
Master Thesis „Energymanagementvia Application Service Providing“
Area: Marketing
Siemens AG and Power ITHelsinki
Project lead„Market Survey - Energy IT“
in Finland and the baltic states
Origin IT AustriaVienna
FreelancerProject management
in the e-commerce area
Mag. Susanne Fuchs Laudongasse 60/11 1080 Wien [email protected] Professional Experience 07. 2004 10. 2004 08. 2002 – 06. 2004 07. 2001 – 01. 2002 02. 2002 – 06. 2002 10. 2000 – 05. 2001

Results and Discussion
Page 215
CURRICULUM VITAE
Vienna University of Economics and Business Administration
Vienna
Doctoral studies in MarketingGraduated in 11. 2005
Dr. rer. soc. oec.
Degree in Business AdministrationMajors:
- Project management - Information Business
- Economics of SME’s- Graduated in 11. 2002
- Mag. rer. soc. oec.
Commercial AcademySt. Pölten
Final leaving school examination „A-level“
Bundesrealgymnasium der englischen FräuleinSt. Pölten
Lower Grade
Mag. Susanne Fuchs Laudongasse 60/11 1080 Wien [email protected] Educational Background 11. 2002 – 11. 2005 10. 1996 - 11. 2002 06. 1996 09. 1987 – 06. 1991

Results and Discussion
Page 216
CURRICULUM VITAE
Växjö UniversitetSweden
Participation in PhD-CourseSupport in teaching a Masters Course
School of Economics andBusiness Administration
Helsinki
Semester abroad
Rias ShoesSan Francisco
Sales Clerk
Garfunkels RestaurantLondon
Waitress
Mag. Susanne Fuchs Laudongasse 60/11 1080 Wien [email protected] Experience abroad 02. 2004 01. 2002 – 06. 2002 07. 1999 – 09. 1999 07. 1998 – 08. 1998

Results and Discussion
Page 217
CURRICULUM VITAE
German: mother tongueEnglish: fluentFrench: basic
MS Office, Internet, SPSS, QSR*NUDISTBasic Knowledge in HTML
Car, Motorcycle, Truck
Self-contained, team player, and motivatedCommunicative and assertive
Mag. Susanne Fuchs Laudongasse 60/11 1080 Wien [email protected] Other qualifications Languages Computer Driving licence Working commitment

References
Page 218
9 REFERENCES
Abrahamson, E. (1991). 'Managerial fads and fashion: The diffusion and rejection of innovations' The Academy of Management Review 16 (3) July, 586-612.
Abrahamson, E. (1996). 'Management fashion' The Academy of Management Review 21 (1), 254-285.
Abrahamson, E. and L. Rosenkopf (1997). 'Social network effects on the extent of innovation diffusion: a computer simulation' Organization Science 8 (3), 289-309.
Agarwal, R. and J. Prasad (1998). 'The antecedents and consequents of user perceptions in information technology adoption' Decision Support Systems 22, 15-29.
Ajzen, I. (1991). 'The theory of planned behavior' Organizational behavior and human decision processes 50 (2), 179-211.
Ajzen, I. and M. Fishbein (1980). 'Understanding attitudes and predicting social behavior'. Englewood Cliffs, NJ, Prentice-Hall.
Albers, S. (1998). 'Marketing mit interaktiven Medien: Strategien zum Markterfolg'. Frankfurt, Main, Verlagsgruppe Frankfurter Allgemeine Zeitung GmbH.
Allen, D. (2000). 'Application service providers: Should we get excited yet?' Network Magazine 15 (10) October, 148-152.
Allen, I. L. and J. D. Colfax (1968). 'Respondents' attitudes toward legitimate surveys in four cities' Journal of Marketing Research 5 (4) November, 431-433.
Anderson, J. C. and J. A. Narus (1999). 'Business market management: understanding, creating and delivering value'. Upper Saddle River, NJ, Prentice Hall.
Anderson, J. C. and J. B. L. Thomson (2000). 'Combining value and price to make purchase decisions in business markets' International Journal of Research in Marketing 17 (4), 307-329.
Anderson, P. and M. L. Tushman (1990). 'Technological discontinuities and dominant designs: A cyclical model of technological change' Administrative Science Quarterly 35 (4) December, 604-633.
Anderson, P. and M. L. Tushman (1997). 'Managing through cycles of technological change'. Managing strategic innovation and change. M. L. T. P. Anderson. New York, Oxford Univ. Press, 45-52.
Anderson, P. F. and T. M. Chambers (1985). 'A reward/measurement model of organizational buying behavior' Journal of Marketing 49 (2) Spring, 7-23.
Arndt, J. (1967). 'Role of product-related conversations in the diffusion of a new product' Journal of Marketing Research 4 August, 291-295.

References
Page 219
Arnould, E. J. (1989). 'Toward a broadened theory of preference formation and the diffusion of innovations: cases from Zinder province, Niger Republic' Journal of Consumer Research 16 (2) September, 239-267.
Assael, H. and J. Keon (1982). 'Nonsampling vs. sampling errors in survey research' Journal of Marketing 46 (2) Spring, 114-123.
Bacharach, S. B. (1989). 'Organizational theories: Some criteria for evaluation' Academy of Management Review 14 (4), 496-515.
Backhaus, K. (2003). 'Multivariate Analysemethoden - eine anwendungsorientierte Einführung'. Berlin (u.a.), Springer.
Baehr-Seppelfricke, U. (1999). 'Diffusion neuer Produkte: der Einfluss von Produkteigenschaften'. Wiesbaden, Dt. Univ.-Verl.
Baldwin, W. L. and J. T. Scott (1991). 'Market structure and technological change'. Chur, Switzerland, Harwood Academic Publishers.
Banting, P., J. Beracs and A. Gross (1991). 'The industrial buying process in capitalist and socialist countries' Industrial Marketing Management 20 (2) May, 105-113.
Barclay, D. W. (1991). 'Interdepartmental conflict in organizational buying: the impact of the organizational context' Journal of Marketing Research 28 (2) May, 145-159.
Barthelemy, J. and D. Geyer (2004). 'The determinants of total IT outsoucing: an empirical investigation of French and German firms' The Journal of Computer Information Systems 44 (3) Spring, 91-97.
Barton, A. H. and P. F. Lazarsfeld (1979). 'Einige Funktionen von qualitativer Analyse in der Sozialforschung'. Qualitative Sozialforschung. H. C. W. E. Stuttgart, Klett-Cotta, 41-89.
Bass, F. M. (1969). 'A new product growth model for consumer durables' Management Science 15 (5) January, 215-227.
Batz, F. J., W. Janssen and K. J. Peters (2003). 'Predicting technology adoption to improve research priority-setting' Agricultural Economics 28 (2) March, 151-164.
Bazeley, P. (2004). 'Issues in mixing qualitative and quantitative approaches to research'. Applying qualitative methods to marketing management research. J. G. a. L. R. Renate Buber. Hampshire and New York, Palgrave Macmillan, 141-156.
Bearden, W. and M. Etzel (1982). 'Reference group influence on product and brand purchase decisions' Journal of Consumer Research 9 (2) September, 183-194.
Benbasat, I., D. K. Goldstein and M. Mead (1987). 'The case research strategy in studies of information systems' MIS Quarterly 11 (3), 369-386.
Benbasat, I. and R. W. Zmud (1999). 'Empirical research in information systems: the practice of relevance' MIS Quarterly 23 (1), 3-16.
Berdie, D. R., J. F. Anderson and M. A. Niebuhr (1986). 'Questionnaires: Design and use'. Metuchen, N.J. & London, The Scarecrow Press, Inc.
Berkowitz, M. (1986). 'New product adoptation by the buying organization: who are the real influencers?' Industrial Marketing Management 15 (1) February, 33-43.
Birnbaum, L., C. Grobbel, T. Roethel, P. Ninios and A. Volpin (2000). 'A shopper's guide to electricity assets in Europe' McKinsey Quarterly (2 Special Edition) 2000, 60-68.
Blumer, H. (1973). 'Der methodologische Standort des Symbolischen Interaktionismus'. Alltagswissen, Interaktion und gesellschaftliche Wirklichkeit. A. B. Soziologen. Reinbek bei Hamburg, Rowohlt, 80-146.

References
Page 220
Boeker, W. and P. Y. Huo (1998). 'Innovation adoption by established firms: unresolved issues' The Journal of High Technology Management Research 9 (1), 115-130.
Born, C. (2003). 'Investitionsgüter erfolgreich vermarkten. So steigern Sie kontinuierlich Ihre Marktanteile'. München, Wien, Carl Hanser Verlag.
Brancheau, J. C. and J. C. Wetherbe (1990). 'The adoption of spreadsheet software: testing innovation diffusion theory in the context of end-user computing' Information Systems Research 1 (2), 115-143.
Braunstein, A. (1999). 'The state of ASPs', Robert Frances Group Inc. http://www.cio.com/analyst/122799_rfgonline.html, February, 7th 2005.
Brinker, W. (2004). 'Stromwirtschaft braucht Klarheit für Invesititonen', Verband der Elektrizitätswirtschaft VDEW. http://www.strom.de/wysstr/stromwys.nsf/WYSFrameset3?ReadForm&Seite1=/wysstr/stromwys.nsf/Seiten/blanc.html?OpenDocument&Seite2=http://www.strom.de/wysstr/stromwys.nsf/WYSInfoDokumentePunkt1Lookup/1DF530CED3DADAA2C1256EA80041BD24?OpenDocument&, February, 1st 2005, 2004.
Brockhoff, K. (1999). 'Produktpolitik'. Stuttgart, Lucius & Lucius.
Brockhoff, K., A. K. Chakrabarti and J. Hauschildt (1999). 'The dynamics of innovation. Strategic and managerial implications'. Berlin, Heidelberg, Springer Verlag.
Brown, J. S. (1997). 'Research that Reinvents the Corporation'. Seeing Differently. Insights on Innovation. J. S. Brown. Harvard, Harvard Business Review, 245.
Brown, S. P. (1995). 'The moderating effects of insupplier/outsupplier status on organizational buying attitudes' Journal of the Academy of Marketing Science 23 (3), 170-181.
Buehl, A. and P. Zoefel (1995). 'SPSS für Windows 6.1, Praxisorientierte Einführung in die moderne Datananalyse'. Bonn, Paris, Addison-Wesley.
Bunn, M. D. (1993). 'Taxonomy of buying decision approaches' Journal of Marketing 57 (January), 38-56.
Bunn, M. D. and S. W. Clopton (1993). 'Patterns of information source use across industrial purchase situations' Decision Sciences 24 (2), 457-478.
Burdett, M. (2004). 'Old habits die hard for the CEECs', Platts. http://www.platts.com/Electric%20Power/Resources/News%20Features/EU%20Accession%20Members/, February, 3rd 2005, 2004.
Burgelman, R. A., T. J. Kosnik and M. Van den Poel (1987). 'The innovative capabilities audit framework'. Strategic Management of Technology and Innovation. R. A. B. a. M. Maidique. Homewood, Richard D. Irwin, 31-44.
Burns, T. and G. M. Stalker (1961). 'The management of innovation'. London.
Buzzacchi, L., M. G. Colombo and S. Mariotti (1995). 'Technological regimes and innovation in services: the case of the Italien banking industry' Research Policy 24 (1995), 151-168.
BVDW (2005). 'Informationen zum Bereich ASP', Bundesverband digitale Wirtschaft. http://www.bvdw.org/ww/de/7_pub/themen_neu/software/application_service_providing.cfm, March, 9th 2005.
Capon, N. and R. Glazer (1987). 'Marketing and technology: A strategic coalignment' Journal of Marketing 51 (3) July 1987, 1-14.
Chapman, M. R. (2003). 'In search of stupidity. Over 20 years of high-tech marketing disasters'. New York, Springer Verlag.

References
Page 221
Chau, P. Y. K. and K. Y. Tam (1997). 'Factors affecting the adoption of open systems: an exploratory study' MIS Quarterly 21 (1), 1-24.
Chau, P. Y. K. and K. Y. Tam (2000). 'Organizational adoption of open systems: a 'technology-push, need-pull' perspective' Information & Management 37, 229-239.
Chen, L.-d., M. L. Gillenson and D. L. Sherrell (2004). 'Consumer acceptance of virtual stores: a theoretical model and critical success factors for virtual stores' Database for Advances in Information Systems 35 (2) Spring, 8-31.
Chen, L.-d. and K. S. Soliman (2002). 'Managing IT oursourcing: a value-driven approach to outsourcing using application service providers' Logistics Information Management 15 (3), 190-191.
Chen, L.-H. and T.-W. Chiou (1999). 'A fuzzy credit-rating approach for commercial loans: a Taiwan case' Omega 27 (4), 407-419.
Chen, L. H., C. Koa, S. Kuo, T. Y. Wang and Y. C. Jang (1996). 'Productivity diagnosis via fuzzy clustering and classification: an application to machinery industry' Omega 24 (3), 309-319.
Chisnall, P. M. (1989). 'Strategic Industrial Marketing'. Englewood Cliffs, NJ, Prentice Hall.
Choffray, J. M. and G. L. Lilien (1980). 'Industrial market segmentation by the structure of the purchasing process' Industrial Marketing Management 9, 331-342.
Chwelos, P., I. Benbasat and A. S. Dexter (2001). 'Research report: Empirical test of an EDI adoption model' Information Systems Research 12 (3) September, 304.
Claver, E., R. Gonzalez and J. Llopis (2000). 'An analysis of research in information systems (1981-1997)' Information & Management 37 (4), 181-195.
Clement, M. and T. Litfin (1998). 'Adoption Interaktiver Medien'. Marketing mit Interaktiven Medien: Strategien zum Markterfolg. S. C. Albers, M. & Peters, K. Frankfurt Main, 95-108.
Coe, K. (1999). 'Theories in cultural anthropology', Kathryn Coe. http://www.missouri.edu/~anthgr/Classes/ANTH1/ANTH1theories.htm, June, 23th 2003.
Cohen, W. and R. Levin (1989). 'Empirical studies of innovation and market structure'. Handbook of Industrial Organization. R. Schmalensee and R. Willing. Amsterdam. II, 1060-1170.
Conway, S. (1995). 'Informal boundary-spanning communication in the innovation process: An empirical study' Technology Analysis & Strategic Management 7 (3) September, 327-342.
Cox, B. and S. Ghoneim (1996). 'Drivers and barriers to adopting EDI: a sector analysis of UK industry' European Journal of Information Systems 5 (1), 24-33.
Crawford, S. D., M. P. Couper and M. J. Lamias (2001). 'Web surveys: perceptions of burden' Social Science Computer Review 19 (2), 146-162.
Cross, J. (1995). 'IT outsourcing: British petroleum's competitive approach' Harvard Business Review 73 (3), 94-102.
Crozier, M. (1979). 'The bureaucratic phenomenon'. Chicago.
Currie, W. L. (2000). 'Expanding IT outsourcing services through application service providers'. ECIS 8th European Conference on Information Systems - A Cyberspace Odyssey, Vienna
Daly, E. (2002). 'European meeting will focus on freer rein for economy'. The New York Times. March, 15th 2002, New York, W1

References
Page 222
Damanpour, F. (1991). 'Organizational innovation: a meta-analysis of effects of determinants and moderators' Academy of Management Journal 34 (3), 555-590.
Damanpour, F. and S. Gopalakrishnan (1998). 'Theories of organizational structure and innovation adoption: the role of environmental change' Journal of Engineering and Technology Management 15, 1-24.
Davidow, W. H. (1986). 'Marketing high technology: An insider's view'. New York, The Free Press.
Davis, F. D. (1989). 'Perceived usefulness, perceived ease of use, and user acceptance of information technology' MIS Quarterly 13 (3) September, 319-340.
Davis, F. D., R. P. Bagozzi and P. R. Warshaw (1989). 'User accpetance of computer technology: a comparison of two theoretical models'. Management ScienceC:\Documents and Settings\atw1t100\My Documents\Bibliothek\Theorien\User Acceptance of computer technology a comparison of two theoretical models.pdf.
Davis, F. D. and V. Venkatesh (1996). 'A critical assessment of potential measurement biases in the technology acceptance model: three experiments' International Journal of Human-Computer Studies 45 7. 12. 1995, 19-45.
Day, R. L. and P. A. Herbig (1990). 'How the diffusion of industrial innovations is different from new retail products' Industrial Marketing Management 19, 261-266.
Daylami, N. (2004). 'Determinants of application service provider (ASP) innovation adoption: An empirical investigation of ASP diffusion and infusion'. Philosophy. Claremont, The Claremont Graduate University.
Dempsey, W. A. (1978). 'Vendor selection and the buying process' Industrial Marketing Management 7, 257-267.
Denzin, N. K. (1989). 'The research act'. Englewood Cliffs, N.J., Prentice-Hall.
Deshpande, R. and G. Zaltman (1987). 'A comparison of factors affecting use of marketing information in consumer and industrial firms' Journal of Marketing Research 24 February, 114-118.
Deutsch, M. and H. Gerard (1995). 'A study or normative and informational social influences upon individual judgment' Journal of Abnormal and Social Psychology 51, 624-636.
Dewan, S., S. C. Michael and c. Min (1998). 'Firm characteristics and investments in information technology: scale and scope effects' Information Systems Research 9 (3), 219-231.
Dholakia, R. R., J. L. Johnson, A. J. D. Bitta and N. Dholakia (1993). 'Decision making time in organizational buying behavior: an investigation of its antecedents' Journal of the Academy of Marketing Science 21 (4), 281-291.
Dictionary (2004). 'Organizational buying behavior', American Marketing Assocation, Dictionary of Marketing Terms. http://www.marketingpower.com/live/mg-dictionary-view2279.php? January, 20th 2004.
Diekmann, A. (2002). 'Empirische Sozialforschung. Grundlagen, Methoden, Anwendungen'. Reinbek/Hamburg, Rowohlt Taschenbuch Verlag GmbH.
Dishaw, M. T. and D. M. Strong (1999). 'Extending the technology acceptance model with task-technology fit constructs' Information & Management 36 October, 9-21.
Dodognet, M. J., J. M. Glachant and M. A. Plagnet (2002). 'Mergers and acquisitions in the European electricity sector: cases and patterns'. Paris, France, Centre d’ Économie Industrielle Ecole Nationale Superérieure des Mines de Paris. http://www.cerna.ensmp.fr/Documents/FL-MA-MAsEU.pdf

References
Page 223
Doll, W. J., A. Hendrickson and X. Deng (1998). 'Using Davis's perceived usefulness and ease-of-use instruments for desision making: A confirmatory and multigroup invariance analysis' Decision Sciences 29 (4), 839-869.
Dosi, G. (1988). 'The nature of the innovative process'. Technical change and economic theory. R. N. Giovanni Dosi; Christopher Freeman. London, Pinter, 221-238.
Drumwright, M. E. (1994). 'Socially responsible organizational buying: environmental concern as a noneconomic buying criterion' Journal of Marketing 58 July, 1-19.
Duden (1997). 'Duden Fremdwörterbuch'. Mannheim, Augsburg, Brockhaus AG.
e-control (2004). 'Energiestatistik', e-control. http://www.e-control.at/, February, 18th 2005.
Earl, M. J. (1996). 'The risks of outsourcing IT' Sloan Management Review 37 (3), 26-32.
EC 'Opening up to choice the single electricity market', European Comission. http://europa.eu.int/comm/energy/electricity/publications/doc/electricity_brochure_en.pdf, April, 3rd 2003.
EC (2004a). 'Commission urges member states to speed up opening of electricity and gas markets'. European Comission Press Releases. July, 1st. 2004a, Brussels.http://europa.eu.int/rapid/pressReleasesAction.do?reference=IP/04/840&format=HTML&aged=0&language=EN&guiLanguage=en
EC (2004b). 'Towards a competitive and regulated European electricity and gas market', European Comisssion - Directorate general for Energy and Transport, 7. http://europa.eu.int/comm/energy/electricity/publications/doc/2004_07_09_memo_en.pdf
EIA (2001). 'International energy outlook 2001'. Washington DC, DOE/EIA.
EIA (2003). 'International energy outlook 2003'. Washington DC, Energy Information Administration, Office of Integrated Analysis and Forecasting, US Departement of Energy, 249. http://tonto.eia.doe.gov/FTPROOT/forecasting/0484(2003).pdf
Eisenhardt, K. M. and C. B. Schoonhoven (1990). 'Organizational growth: Linking founding team, strategy, environment, and growth among U.S. semiconductor ventures, 1978-1988' Administrative Science Quarterly 35 (3) September, 504-529.
Esser, C. (2005). 'Regional indicators: European Union (EU)'. Washington DC, Energy Information Administration. http://www.eia.doe.gov/emeu/cabs/euro.html, February, 11th 2005
Fantapie Altobelli, C. (1991). 'Die Diffusion neuer Kommunikationstechniken in der Bundesrepublik Deutschland. Erklärung, Prognose und marketingpolitische Implikationen'. Heidelberg, Physica-Verl.
Farrell, J. and G. Saloner (1985). 'Standardization, compatibility, and innovation' The Rand Journal of Economics 16 (1) Spring, 70-83.
Feinberg, E. A. and D. Genethliou 'Load Forecasting', State University of New York, Stony Brook, 17.
Felix, R. (1997). 'Fuzzy-Entscheidungsunterstützung bei Optimierungsentscheidungen in der Automobilmontage'. Fuzzy Set-Theorie in betriebswirtschaftlichen Anwendungen. J. Biethahn. Muenchen, Vahlen, 41-53.
Fichman, R. G. and C. F. Kemerer (1999). 'The illusory diffusion of innovation: An examination of assimilation gaps' Information Systems Research 10 (3) September, 255-275.
Fielding, N. G. and J. L. Fielding (1986). 'Linking data: The articulation of qualitative and quantitative methods in social research'. Beverly Hills, Sage.
Fink, A. (1995). 'The survey handbook'. Thousand Oaks, Calif., Sage Publ.

References
Page 224
Fishbein, M. and I. Ajzen (1975). 'Belief, attitude, intention and behavior: an introduction to theory and research'. MA, Addison-Wesley.
Fisher, R. J. and L. L. Price (1992). 'An investigation into the social context of early adoption behavior' Journal of Consumer Research 19 December, 477-487.
Fisher, S. E. (2000). 'Utility.com company extends e-business model by playing application service provider to heavyweight energy companies'. InfoWorld. 22, 46-47
Flick, U. (1992). 'Triangulation revisited: Strategy of validation or alternative?' Journal for the Theory of Social Behaviour 22 (2), 175-197.
Flick, U. (2004). 'Triangulation. Eine Einführung - Qualitative Sozialforschung'. Wiesbaden, VS Verlag für Sozialwissenschaften.
Frambach, R. R., R. Agarwal and E. J. Nijssen (2002). 'Beyond the adoption/non-adoption dichotomy: The impact of innovation characteristics on potential adopters' transition through adoption process stages'. Amsterdam, Faculteit der Economische Wetenschappen en Econometrie, 32.
Frambach, R. R., H. G. Barkema, B. Nooteboom and M. Wedel (1998). 'Adoption of a service innovation in the business market: An empirical test of supply-side variables' Journal of Business Research 41, 161-174.
Frambach, R. R. and N. Schillewaert (2002). 'Organizational innovation adoption A multi-level framework of determinants and opportunities for future research' Journal of Business Research 55, 163-176.
Frambach, R. T., J. Prabhu and T. M. M. Verhallen (2003). 'The influence of business strategy on new product activity: The role of market orientation' International Journal of Research in Marketing 20, 377-397.
Frambach, R. T., H. Van Herk and M. K. Agarwal (2003). 'Does national culture affect individual innovation adoption? A global study on the moderating influence'. Amsterdam, Vrije Universiteit Amsterdam
Freeman, C. (1997). 'The economics of industrial innovation'. Cambridge, Mass., MIT Press.
Friedrichs, J. (1990). 'Methoden empirischer Sozialforschung', Opladen.
Fuchs, S. (2005a). 'Telephoneinterview with Energy company in Germany'. S. Fuchs. Vienna
Fuchs, S. (2005b). 'Telephoneinterview with Energy company in Italy'. S. Fuchs. Vienna
Fuchs, S. (2005c). 'Workshop with Energy Company in Austria'. S. Fuchs. Eisenstadt
Fuchs, S. (2005d). 'Workshop with Technology supplier to the Energy Industry'. S. Fuchs. Vienna
Gable, G. (1994). 'Integrating case study and survey research methods: an example in information systems' European Journal of Information Systems 3 (2), 112-126.
Gatignon, H., J. Eliashberg and T. S. Robertson (1989). 'Modeling multinational diffusion patterns: An efficient methodology' Marketing Science 8 (3), 231-247.
Gatignon, H. and T. S. Robertson (1985). 'A propositional inventory for new diffusion research' Journal of Consumer Research 11 (4), 849-868.
Gatignon, H. and T. S. Robertson (1989). 'Technology diffusion: An empirical test of competitive effects' Journal of Marketing 53 (1) January, 35-49.
Gehling, R. G. (2002). 'Development of a general application service provider (ASP) model: A case study'. Graduate Faculty. Auburn, Alabama, Auburn University.

References
Page 225
Ginzberg, M. J. (1981). 'Early diagnosis of MIS implementation failure: promising results and unanswered questions' Management Science 27 (4), 459-478.
Goguen, J. A. (1967). 'L-fuzzy sets' Journal of Mathematical Analysis and Applications 23, 145-174.
Goode, W. J. and P. K. Hatt (1952). 'Methods in social research'. New York, MacGraw-Hill.
Goodman, P. S. (2000). 'Missing organizational linkages. Tools for cross-level research'. Thousand Oaks, Calif., Sage Publications, Inc.
Goodwin, C. (1987). 'A social-influence theory of consumer cooperation' Advances in Consumer Research 14, 378-381.
Granello, D. H. and J. E. Wheaton (2004). 'Online data collection: Strategies for research' Journal of Counseling and Development 82 (4) Fall, 387-393.
Green, R. (2004). 'Electricity liberalisation in Europe - how competitive will it be?' Energy Policy Article in Press?
Grønhaug, K. (1976). 'Exploring environmental influences in organizational buying' Journal of Marketing Research 8 August, 225-229.
Grover, V., M. J. Cheon and J. T. C. Teng (1994). 'An evaluation of the impact of corporate strategy and the role of information technology on IS functional outsourcing' European Journal of Information Systems 3 (3) July, 179-190.
Grover, V. and M. D. Goslar (1993). 'The initiation, adoption, and implementation of telecommunications technologies in U.S. organizations' Journal of Management Information Systems 10 (1) Summer, 141-163.
Groves, R. M. (2002). 'Survey nonresponse'. New York, Wiley.
Groves, R. M. (2004). 'Survey methodology'. Hoboken, NJ, Wiley-Interscience.
Grupp, H. and S. Maital (2001). 'Managing new product development and innovation. A microeconomic toolbox'. Cheltenham, UK and Northampton, MA, Edward Elgar.
Gupta, U. G. and A. Gupta (1992). 'Outsourcing the IS function' Information Systems Management 9 (3) Summer, 44-50.
Haege, K. (2004). 'Strommarkt im Umbruch. Entwicklung von Strompreis-Vorhersage-Modellen'. Wertschöpfung in der Geoinformation, Potsdam, GEOkomm IHK
Harrison, D. A., P. P. J. Mykytyn and C. K. Riemenschneider (1997). 'Executive decisions about adoption of information technology in small business: Theory and empirical tests' Information Systems Research 8 (2) June, 171-195.
Hasenauer, R. (1999). 'Efficiency criteria in high tech marketing'. Summary of theoretical content for lecture in High Tech Marketing. Vienna
Hasenauer, R., F. Scheuch, W. Aigner, M. Schreiber and R. Sinkovics (1994). 'High Tech Marketing zur Effizienzsteigerung der Technologiepolitik'. Vienna, Vienna University of Economics and Business Administration, Department for Marketing, 123.
Hausman, A. and J. Stock (2003). 'Adoption and implementation of technological innovations within long-term relationships' Journal of Business Research 56 (8) August, 681-686.
Hawkins, D. I., R. J. Best and K. A. Coney (1998). 'Consumer behavior: building marketing strategy'. Boston, McGraw-Hill.
Henriksen, H. Z. (2002). 'Performance, pressures, and politics: Motivators for adoption of interorganizational information systems'. Departement of Informatics, Center for Electronic Commerce. Copenhagen, Copenhagen Business School, 412.

References
Page 226
Henthorne, T. L., M. S. LaTour and A. J. Williams (1993). 'How organizational buyers reduce risk' Industrial Marketing Management 22, 41-48.
Hirschheim, R. and M. C. Lacity (2000). 'The myths and realities of information technology insourcing' Communications of the ACM 43 (2) February, 99-107.
Hirschman, E. C. (1980). 'Innovativeness, novelty seeking, and consumer creativity' Journal of Consumer Research 7 (December), 283-295.
Holak, S. L. (1988). 'Determinants of innovative durables adoption an empirical study with implications for early product screening' Journal of Production Innovation Management 5 (1), 50-69.
Hruschka, H. (1986). 'Market definition and segmentation using fuzzy clustering methods' International Journal of Research in Marketing 3, 117-134.
Hsu, C.-L. and H.-P. Lu (2003). 'Why do people play on-line games? An extended TAM with social influences and flow experience' Information & Management Article in Press Accepted: August, 11. 2003, 16.
Hunt, S. D. (1983). 'Marketing theory. The philosophy of marketing science'. Homewood, Illinois.
ICC (1998). 'Energy sector liberalization boosts economic benefits', International Chamber of Commerce. http://www.iccwbo.org/home/news_archives/1998/energy_sector_liberalization.asp, February, 11th 2005.
IEA (2002). 'Electricity information'. Paris, France, International Energy Agency, 169.
Ihde, O. B. (1996). 'Internationale Diffusion von Mobilfunk. Erklärung und Prognose länderspezifischer Effekte'. Wiesbaden, Dt. Univ-Verl.
Ives, B. and M. H. Olson (1984). 'User involvement and MIS success: a review of research' Management Science 30, 586-603.
Jackson, D. W. J., J. E. Keith and R. K. Burdick (1984). 'Purchasing agents' perception of industrial buying center influence: a situational approach' Journal of Marketing 48 (4) Fall, 75-83.
Jared, E. (2004). 'Reliability and validity', Indiana State University. http://soe.indstate.edu/jared/eled_259.htm, December, 27th 2004.
Jayatilaka, B., A. Schwarz and R. Hirschheim (2003). 'Determinants of ASP choice: an integrated perspective' European Journal of Information Systems 12 (3) September, 210-224.
Jochims, M. (2002). 'Diffusion innovativer Dienstleistungen. Eine empirische Analyse am Beispiel von Direktbanken'. Hamburg, Dr. Kovac.
Johnston, R. B. and S. Gregor (2000). 'A theory of industry-level activity for understanding the adoption of interorganizational systems' European Journal of Information Systems 9 (4), 243-251.
Johnston, W. J. and T. V. Bonoma (1981). 'The buying center: structure and interaction patterns' Journal of Marketing 45 Summer, 143-156.
Johnston, W. J. and J. E. Lewin (1996). 'Organizational buying behavior: Toward an integrative framework' Journal of Business Research 35, 1-15.
Jones, M. (2003). 'Dealers need to know'. Ward's Dealer Business. 37, 35
Kaplan, B. and D. Duchon (1988). 'Combining qualitative and quantitative methods in information systems research: A case study' MIS Quarterly 12 (4), 571-587.

References
Page 227
Kaplan, B. and J. A. Maxwell (1994). 'Qualitative research methods for evaluating computer information systems'. Evaluating Health Care Information Systems: Methods and Applications. C. E. A. a. S. J. J. J. G. Anderson. Thousand Oaks, CA, Sage, 45-68.
Katz, M. L. and C. Shapiro (1985). 'Network externalities, competition and compatibility' The American Economic Review 75 (3) June, 424-440.
Kavan, B. C., S. M. Miranda and M. T. O'Hara (2002). 'Managing the ASP process: a resource-oriented taxonomy' Logistics Information Management 15 (3), 170-179.
Kelman, H. (1961). 'Process of opinion change' Public Opinion Quarterly 25, 57-78.
Kennedy, A. M. (1983). 'The adoption and diffusion of new industrial products: a literature review' European Journal of Marketing 17, 31-88.
Kerlinger, F. N. (1992). 'Foundations of behavioral research'. Fort Worth, Texas, Harcourt Brace College Publ.
Kern, T., M. C. Lacity and L. P. Willcocks (2002). 'Netsourcing. Renting business applications and services over a network'. Upper Saddle River, New Jersey, Financial Times Prentice Hall.
Kimberly, J. R. (1978). 'Hospital adoption of innovation: The role of integration into external informational environments' Journal of Health and Social Behavior 19 December, 361-373.
Kimberly, J. R. and M. J. Evanisko (1981). 'Organizational Innovation: The influence of individual, organizational, and contextual factors on hospital adoption of technological and administrative innovations' Academy of Management Journal 24 (4) December, 689-713.
Klein, S. M., J. R. Maher and R. A. Dunnington (1967). 'Differences between identified and anonymous subjects in responding to an industrial opinion survey' Journal of Applied Psychology 51 (2) April 1967, 152-160.
Kohli, A. K. (1989). 'Determinants of influence in organizational buying: a contingency approach' Journal of Marketing 53 July, 50-65.
Kohli, A. K. and G. Zaltman (1988). 'Measuring multiple buying influences' Industrial Marketing Management 17 July, 197-204.
Kollmann, T. (1998). 'Akzeptanz innovativer Nutzungsgüter und -systeme: Konsequenzen für die Einführung von Telekommunikations- und Multimediasystemen'. Wiesbaden, Gabler.
Kollmann, T. (2004). 'Attitude, adoption or acceptance? - measuring the market success of telecommunication and multimedial technology' International Journal of Business Performance Management 6 (2), 133-152.
Kotler, P. (1991). 'Marketing management: analysis, planning, implementation, and control'. Englewood Cliffs, NJ, Prentice-Hall Intern.
Kraemer, K. L. and W. H. Dutton (1991). 'Survey research in the study of management information systems'. The Information Systems Research Challenge: Survey Research Methods. K. L. Kraemer. Boston, Harvard Business School, 3-26.
Krippendorff, K. (1980). 'Content analysis: An introduction to its methodology'. Beverly Hills, Sage Publications.
Kromrey, H. (2002/2003). 'Methoden der Datengewinnung'. Empirische Sozialforschung. Berlin, 10http://userpage.fu-berlin.de/~kromrey/Materialien/PPT-Folien_021107.pdf.
Kuhlmann, C. (1997). 'Diffusion von Informationstechnik'. Wiesbaden, Dt. Univ.-Verl.

References
Page 228
Kumar, V., J. Ganesh and R. Echambadi (1998). 'Cross-national diffusion research: what do we know and how certain are we?' Journal of Product Innovation Management 15, 255-268.
Labay, D. G. and T. C. Kinnear (1981). 'Exploring the consumer decision process in the adoption of solar energy systems' Journal of Consumer Research 8 December, 271-278.
Lacity, M. C., R. Hirschheim and L. P. Willcocks (1994). 'Realizing outsourcing expectations: incredible expectations, credible outcomes' Information Systems Management 11 (4) Fall, 7-18.
Lai, V. S. (1997). 'Critical factors of ISDN implementation: An exploratory study' Information & Management 33, 87-97.
Lamnek, S. (1993). 'Qualitative Sozialforschung'. Weinheim, Beltz, Psychologie-Verl.-Union.
Lancaster, G. A. and C. T. Taylor (1988). 'A study of diffusion of innovations in respect of the high speed train' European Journal of Marketing 22 (3), 21-47.
Lascu, D. and G. Zinkhan (1999). 'Consumer conformity: review and applications for marketing theory and practice' Journal of Marketing Theory and Practice 7 (3), 1-12.
Lawton, L. (2002). 'Determine your need for software vs. ASP' Marketing News 36 (24) November, 25th, 19-21.
Le Bon, J. and D. Merunka (1998). 'The role of attitude in competitive intelligence activities of salespersons: evidence and consequence of the mediating effect'. University Park, PA, Institute for the Study of Business Markets. The Pennsylvania State University, 32. http://www.ebusiness.xerox.com/isbm/dscgi/ds.py/Get/File-63/22-1998.pdf
LeClerc, Y. (2003). 'Outsourcing IT: Turning software into service'. Canadian Underwriter. 70, 34
Lederer, A. L., D. J. Maupin, M. P. Sena and Y. Zhuang (2000). 'The technology acceptance model and the world wide web' Decision Support Systems 29 April, 269-282.
Lee, A. (1991). 'Integrating positivist and interpretive approaches to organizational research' Organization Science 2, 342-365.
Lee, J.-N. and Y.-G. Kim (1999). 'Effect of partnership quality on IS outsourcing success: conceptual framework and empirical validation' Journal of Management Information Systems 15 (4), 29-61.
Legris, P., J. Ingham and P. Collerette (2003). 'Why do people use information technology? A critical review of the technology acceptance model' Information & Management 40 (3) January, 191-204.
Leinfellner, W. (1980). 'Einführung in die Erkenntnis- und Wissenschaftstheorie'. Mannheim, Wien, BI-Wissenschaftsverlag.
Leonard-Barton, D. and I. Deschamps (1988). 'Managerial Influence in the Implementation of new technology' Management Science 34 (10) October, 1252-1265.
Lewin, A. Y. and J. W. Minton (1986). 'Determining organizational effectiveness: another look, and an agenda for research' Management Science 32 (5) May, 514-539.
Lilien, G. (1983). 'Marketing decision making: a model-building approach'. New York, Harper & Row.

References
Page 229
Litfin, T. (2000). 'Adoptionsfaktoren Empirische Analyse am Beispiel eines innovativen Telekommunikationsdienstes'. Kiel.
Litwin, M. S. (1995). 'How to measure survey reliability and validity'. Thousand Oaks, California, Sage Publications.
Loh, L. and N. Venkatraman (1992a). 'Determinants of information technology outsourcing: A cross-sectional analysis' Journal of Management Information Systems 9 (1) Summer, 18-24.
Loh, L. and N. Venkatraman (1992b). 'Diffusion of information technology outsourcing: influence sources and the Kodak effect' Information Systems Research 3 (4), 334-358.
Lucas, H. C. J. (1978). 'Empirical evidence for a descriptive model of implementation' MIS Quarterly 2 (2), 27-42.
Lutschewitz, H. (1977). 'Die Diffusion von innovativen Investistionsgütern: theoretische Konzeption und empirische Befunde'. München, Univ.
Lynn, S. A. (1987). 'Identifying buying influences for a professional service: implications for marketing effort' Industrial Marketing Management 16, 119-130.
Mahajan, V. and E. Muller (1979). 'Innovation diffusion and new product growth models in marketing' Journal of Marketing 43, 55-68.
Mahajan, V., E. Muller and R. K. Srivastava (1990). 'Determination of adopter categories by using innovation diffusion models' Journal of Marketing Research 27 (February), 37-50.
Mahajan, V. and R. A. Peterson (1985). 'Models for innovation diffusion'. Newbury Park, California, Sage Publ.
Makridakis, S. (1998). 'Forecasting: methods and applications'. New York, Wiley.
Mann, C. and F. Stewart (2000). 'Internet communication and qualitative research. A handbook for researching online'. London, Thousand Oaks, New Dehli, SAGE.
Mansfield, E. (1993). 'The diffusion of flexible manufacturing systems in Japan, Europe and the United States' Management Science 39 (2), 149-159.
Markus, M. L. (1983). 'Power, politics, and MIS implementation' Communications of the ACM 26 (6), 430-444.
Martilla, J. A. (1971). 'Word-of-mouth communication in the industrial adoptation process' Journal of Marketing Research 8 (May), 173-178.
Martin, J. H., J. M. Daley and H. B. Burdg (1988). 'Buying influences and perceptions of transportation services' Industrial Marketing Management 17, 305-314.
Mason, J. (2002). 'Qualitative researching'. London, Thousand Oakds, New Dehli, SAGE.
Mathur, A. (1998). 'Examining trying as a mediator and control as a moderator of intention-behavior relationship' Psychology and Marketing 15 (3), 241-259.
McCormack Brown, K. (1999). 'Diffusion of innovations', University of South Florida. http://hsc.usf.edu/~kmbrown/Diffusion_of_Innovations_Overview.htm, April, 29th 2003.
McKenna, R. (1985). 'The Regis touch: million-dollar advice from America's topmarketing consultant'. Reading, Mass., Addison-Wesley.
McMenamin, J. S. and F. A. Monforte (1998). 'Short term energy forecasting with neural networks' Energy Journal 19 (4), 43-62.
McQuiston, D. H. (1989). 'Novelty, complexity, and importance as causal determinants of industrial buyer behavior' Journal of Marketing 53 (April), 66-79.

References
Page 230
Meldrum, M. J. (1995). 'Marketing high-tech products: the emerging themes' European Journal of Marketing 29 (10), 45-58.
Menges, G. and H. J. Skala (1974). 'Vagueness in the social sciences'. Information, inference and decision. e. b. G. Menges. Dordrecht, Reidel, 51-62.
Meyer, A. D. and J. B. Goes (1988). 'Organizational assimilation of innovations: A multilevel contextual analysis' Academy of Management Journal 31 (4), 897-923.
Meyer, N. D. (1994). 'A sensible approach to outsourcing: The economic fundamentals' Information Systems Management 11 (4), 23-33.
Michaels, R. E., R. L. Day and E. A. Joachimsthaler (1987). 'Role stress among industrial buyers: and integrative model' Journal of Marketing 51 April, 28-45.
Midgley, D. F. (1983). 'Patterns of interpersonal information seeking for the purchase of a symbolic product' Journal of Marketing Research 20 (1) February 1983, 74-83.
Midgley, D. F. and G. R. Dowling (1978). 'Innovativeness: The concept and its measurement' Journal of Consumer Research 4 (4) March, 229-242.
Miller, W. L. and L. Morris (1999). 'Fourth generation R&D: Managing knowledge, technology, and innovation'. New York, John Wiley & Sons, Inc.
Mingers, J. (2001). 'Combining IS research methods: Towards a pluralist methodology' Information Systems Research 12 (3), 240-259.
Mirmirani, S. and H. C. Li (2003). 'A comparison of VAR and neural networks with genetic algorithm in forecasting price of oil'. International Conference on Artificial Intelligence IC-AI 2003. Las Vegas, Nevada
Montoya-Weiss, M. M. and R. Calantone (1994). 'Determinants of new product performance: A review and meta-analysis' Journal of Product Innovation Management 11 (5), 397-417.
Moon, J.-W. and Y.-G. Kim (2001). 'Extending the TAM for a world-wide-web context' Information & Management 38, 217-230.
Moore, G. C. and I. Benbasat (1991). 'Development of an instrument to measure the perceptions of adopting an information technology innovation' Information Systems Research 2 (3) September, 192-222.
Moriarty, R. T. and J. E. G. Bateson (1982). 'Exploring complex decision making units: a new approach' Journal of Marketing Research 19 (May), 182-191.
Moriarty, R. T. and T. J. Kosnik (1989). 'High-tech marketing: concepts, continuity, and change' Sloan Management Review 30 (4) Summer 1989, 7-17.
Moriarty, R. T. and R. E. Spekman (1984). 'An empirical investigation of the information sources used during the industrial buying process' Journal of Marketing Research 21 (May), 137-147.
Morris, M. G. (1996). 'A longitudinal examination of information technology acceptance'. School of Business. Indiana, Indiana University.
Murray, R. (2005). 'Writing for academic journals'. Berkshire, UK, McGraw-Hill.
Myers, M. D. (1997). 'Qualitative research in information systems' MIS Quarterly 21 (2) June 1997, 241-242.
Nabih, M. I., J. G. Bloem and T. B. C. Poiesz (1997). 'Conceptual issues in the study of innovation adoption behavior' Advanced Consumer Research 24, 1-7.

References
Page 231
Nam, K., J. Yi and V. R. Prybutok (1996). 'Comparison of neural networks and quantitative forecasting techniques with time series data that contains seasonal variations'. Annual Meeting of the Decision Sciences Institute. Toronto, Canada
Nieschlag, R., E. Dichtl and H. Hörschgen (1997). 'Marketing'. Berlin, Duncker & Humblot.
Olshavsky, R. W. and R. A. Spreng (1996). 'An exploratory study of the innovation evaluation process' Journal of Product Innovation Management 13 (6) November, 512-529.
Orlikowski, W. J. and J. J. Baroudi (1991). 'Studying information technology in organizations: research approaches and assumptions' Information Systems Research 2 (1), 1-28.
Ostlund, L. E. (1974). 'Perceived innovation attributes as predictors of innovativeness' Journal of Consumer Research 1 (2).
Ozanne, U. B. and G. A. Churchill Jr. (1971). 'Five dimensions of the industrial adoption process' Journal of Marketing Research 8 August, 322-328.
Park, W. and V. Lessig (1977). 'Students and housewives differences in susceptibility to reference group influence' Journal of Consumer Research 4, 102-110.
Parsuraman, A. (1982). 'Is a 'scientist' versus 'technologist' research orientation conducive to marketing theory development?' Marketing theory: philosophy of science perspectives. B. R. F. and S. D. Hunt. Chicago. III, 315.
Patnayakuni, R. and N. Seth (2001). 'Why license when you can rent? Risks and rewards of the application service provider model'. ACM SIGCPR conference on Computer personnel research, San Diego, California, SIGCPR ACM Press
Patyra, M. J. (1996). 'Fuzzy logic. Implementation and Applications'. Stuttgart, Teubner.
Pfetsch, F. R. (1975). 'Zum Stand der Innovationsforschung'. Innovationsforschung als interdisziplinäre Aufgabe. Beiträge zur Theorie und Wirklichkeit von Innovationen im 19. Jahrhundert. F. R. Pfetsch. Göttingen, Vandenhoeck & Ruprecht, 118-133.
Pinsonneault, A. and K. L. Kraemer (1993). 'Survey research methodology in management information systems: An assessment' Journal of Management Information Systems 10 (2) Fall, 75-106.
Pohl, A. (1996). 'Leapfrogging bei technologischen Innovationen'. Wiesbaden.
Porter, M. E. (1980). 'Competitive strategy. Techniques for analyzing industries and competitors'. New York, The free press.
Prochaska, J. O., W. F. Velicer, J. S. Rossi, M. G. Goldstein, B. H. Marcus, C. Rakowski, C. Fiore, L. L. Harlow, C. A. Redding, D. Roosenbloom and S. R. Rossi (1994). 'Stages of change and decisional balance for 12 problem behaviors' Health Psychology 13, 39-46.
Qualls, W. J. and C. P. Puto (1989). 'Organizational climate and decision framing: an integrated approach to analyzing industrial buying decisions' Journal of Marketing Research 26 May, 179-192.
Ragin, C. C. (1987). 'The comparative method: Moving beyond qualitative and quantitative strategies'. Berkeley and London, University of California Press.
Rakowski, W., C. E. Dube, B. H. Marcus, J. O. Prochaska, W. F. Velicer and D. A. Abrams (1992). 'Assessing elements of woman's decision-marking about mammography' Health Psychology 11, 111-118.

References
Page 232
Rakowski, W., J. P. Fulton and J. P. Feldman (1993). 'Woman's decision-making about mammography: A replication of the relationship between stages of adoption and decisional balance' Health Psychology 12 (3), 209-214.
Ram, S. and H. S. Jung (1994). 'Inovativeness in product usage: a comparison of early adopters and early majority' Psychology and Marketing 11, 57-67.
Rangan, V. K., R. T. Moriarty and G. S. Swartz (1992). 'Segmenting customers in mature industrial markets' Journal of Marketing 56 October, 72-82.
Razzaque, M. A. (1998). 'Scientific method, marketing theory development and academic vs practitioner orientation: a review' Journal of Marketing Theory and Practice 6 (1) Winter, 1-15.
Riechmann, C. (2000). 'Strompreisprognose auf der Basis von Fundamentaldaten und Unternehmensstrategien'. Mannheim, Frontier Economics, 41. http://www.gee.de/old/riechmann_23_okt.pdf
Roberts, P. and R. Henderson (2000). 'Information technology acceptance in a sample of government employees: a test of the technology acceptance model' Interacting with Computers 12 November, 427-443.
Robertson, T. S. (1971). 'Innovative behavior and communication'. New York, Holt, Rinehart and Winston.
Robertson, T. S. and H. Gatignon (1986). 'Competitive effects on technology diffusion' Journal of Marketing 50, 1-12.
Robertson, T. S. and Y. Wind (1980). 'Organizational psychographics and innovativeness' Journal of Consumer Research 7 (1), 24-31.
Robinson, W. T. (1990). 'Product innovation and start-up business market share performance' Management Science 36 (10), 1279-1289.
Rogers, E. M. (1983). 'Diffusion of innovations'. New York.
Rogers, E. M. (1995). 'Diffusion of Innovations'. New York, The Free Press.
Rogers, E. M. (2003). 'Diffusion of innovations'. New York, Free Press.
Rogers, E. M. and F. F. Shoemaker (1971). 'Communication of innovations'. New York, Free Press.
Ronchetto, J. R. J., M. D. Hutt and P. H. Reingen (1989). 'Embedded influence patterns in organizational buying systems' Journal of Marketing 53 October, 51-62.
Rose, N. L. and P. L. Joskow (1990). 'The diffusion of new technologies: evidence from the electric utility industry' RAND Journal of Economics 21 (3), 354-373.
Rosenberg, M. and C. Howland (1960). 'Cognitive, affective, and behavioral components of attitudes'. Attitude organization and change. H. C. Rosenberg M, McGuire WJ, Abelson RP, Brehm JW. New Haven, Yale Univ. Press, 112-163.
Rosser, J. B. and A. R. Turquette (1952). 'Many-valued logics'. Amsterdam, North-Holland.
Rothermel, T. 'Einführung in die Zeichenkritische Theorie', Schule Bremen. http://www.schule.bremen.de/schulen/wallis/zkt/hp_02/lektion/lektion03/folien.htm#Semiotik, August, 30th 2005.
Rubin, H. J. and I. S. Rubin (1996). 'Qualitative Interviewing: the art of hearing data'. Thousand Oaks, Calif., Sage Publ.
Ryan, B. and N. Gross (1943). 'The diffusion of hybrid seed corn in two Iowa communities' Rural Sociology 8 (1), 15-24.
Ryan, M. J. and M. B. Holbrook (1982). 'Decision-specific conflict in organizational buyer behavior' Journal of Marketing 46 Summer, 62-68.

References
Page 233
Sahlin, J. P. (1999). 'Outsourcing electronic commerce', USinternetworking, 9.
Saunders, C., M. Gebelt and Q. Hu (1997). 'Achieving success in information systems outsourcing' California Management Review 39 (2) Winter, 63-79.
Schaible, J. and A. Hönig (1991). 'High-Tech-Marketing in der Praxis'. München, Vahlen.
Schillewaert, N., M. J. Ahearne, R. R. Frambach and R. K. Moenaert (2000). 'The acceptance of information technology in the sales force'. University Park, eBusiness Research Center, 49. http://www.smeal.psu.edu/ebrc/publications/res_papers/2000_07.pdf
Schmalen, H. and H. Pechtl (1989). 'Erweiterung des dichotomen Adoptionsbegriffes in der Diffusionsforschung'. Berlin, Duncker & Humblot.
Schmittlein, D. C. and R. A. Peterson (1994). 'Customer base analysis: and industrial purchase process application' Marketing Science 13 (1), 41-67.
Schonlau, M., R. D. Fricker, Jr. and M. N. Elliott (2001). 'Conducting research surveys via e-mail and the web', RAND Corporation.
Schroeder, R., A. H. Van de Ven, G. Scudder and D. Polley (1986). 'Managing innovation and change processes: Findings from the Minnesota innovation research program' Agribusiness 2 (4) Winter, 501.
Schuelein, J. A. and S. Reitze (2002). 'Wissenschaftstheorie fuer Einsteiger'. Vienna, WUV-Universitäts-Verlag.
Schumann, S. (2000). 'Repräsentative Umfrage: praxisorientierte Einführung in empirische Methoden und statistische Analyseverfahren'. München, Wien, Oldenbourg.
Schumpeter, J. A. (1970). 'Capitalism, socialism, and democracy'. New York.
SearchWebServices.com 'Application service provider', SearchWebServices.com Definitions. April, 28th 2003.
Shanklin, W. L. and J. K. Ryans (1984a). 'Marketing high technology'. Lexington, Mass., Lexington Books.
Shanklin, W. L. and J. K. Ryans (1984b). 'Organizing for high-tech marketing' Harvard Business Review 62 (6) November-December 1984, 164-171.
Shanklin, W. L. and J. K. Ryans (1987). 'Essentials of marketing high technology'. Lexington, Mass., Lexington Books.
Sheth, J. (1973). 'A model of industrial buyer behavior' Journal of Marketing 37 October, 50-56.
Siemens (1997). 'ECANSE Workshop'. Vienna, Program and System Engineering.
Siemens, A. (1999). 'Power systems control sinaut spectrum. Description of functions'. Nuremberg, Minneapolis, Vienna, Siemens AG Austria, 654.
Silk, A. J. (1966). 'Overlap among self-designated opinion leaders: A study of selected dental products and services' Journal of Marketing Research 3 (3) August, 255-259.
Silk, A. J. and M. U. Kalwani (1982). 'Measuring influence in organization purchase decisions' Journal of Marketing Research 19 May, 165-181.
Silverman, D. (2001). 'Interpreting qualitative data'. London, Thousand Oaks, New Dehli, SAGE.
Simon, H. A. (1977). 'The new science of management decisions'. Englewood Cliffs, NJ, Prentice-Hall.

References
Page 234
Skinner, J. and B. Bond (1997). 'The oursourcing decision: Opting for value' Austrialian Accountant 67 (10), 42-44.
Smith, M. A. and R. L. Kumar (2004). 'A theory of application service provider (ASP) use from a client perspective' Information & Management 41 (8) November 2004, 977-1002.
Song, Y.-H. (2003). 'Load and price forecasting via Wavelet transform and neural networks'. Operation of market-oriented power systems. Y.-H. Song. London, Springer Verlag.
Spekman, R. E. (1981). 'Segmenting buyers in differen t types of organizations' Industrial Marketing Management 10 (43-48).
Spekman, R. E. and L. W. Stern (1979). 'Environmental uncertainty and buying group structure: an empirical investigation' Journal of Marketing 43 Spring, 54-64.
Sporn, P. (1971). 'The social organization of electric power supply in modern societies'. Cambridge, The MIT Press.
Sproull, N. L. (1995). 'Handbook of research methods: a guide for practitioners and students in the social sciences'. Metuchen, N.J, Scarecrow Press.
Steenkamp, J.-B. E. M., F. t. Hofstede and M. Wedel (1999). 'A cross-national investigation into the individual and national cultural antecedents of consumer innovativeness' Journal of Marketing 63 (2) April, 55-69.
Stevens, R. E., W. E. Warren and R. T. Martin (1989). 'Nonadopters of automatic teller machines' Akron Business and Economic Review 20 (3), 55-63.
Stewart, D. W. (1981). 'The application and misapplication of factor analysis in marketing research' Journal of Marketing Research 18 February, 51.
Straub, D., M. Keil and W. Brenner (1997). 'Testing the technology acceptance model across cultures: A three country study' Information & Management 33 June, 1-11.
Surry, D. W. (1997). 'Diffusion theory and instructional technology'. Annual conference of the Association for Educational Communications and Technology (AECT), Albuquerque, New Mexicohttp://www.gsu.edu/~wwwitr/docs/diffusion/.
Susarla, A., A. Barua and A. B. Whinston (2002). 'Multitasking and incentives in application service provider contracts for customer relationship management'. 8th Americas Conference on Information Systems AMCIS, Dallas, Texashttp://www.imt.edu.pk/librarynews/v2iss24/articles/marketing.pdf.
Takada, H. and D. Jain (1991). 'Cross-national analysis of diffusion of consumer durable goods in Pacific Rim countries' Journal of Marketing 55 (2) April, 48-54.
Tamm, G. and O. Günther (2000). 'Business models for ASP marketplaces'. ECIS, Vienna, Austria
Taylor, S. and P. A. Todd (1995). 'Decomposition and crossover effects in the theory of planned behavior: a study of consumer adoption intentions' International Journal of Research in Marketing 12 (2), 137-156.
Thomas, R. J. (1982). 'Correlates of interpersonal purchase influence in organizations' Journal of Consumer Research 9 September, 171-182.
Thomas, R. J. (1984). 'Bases of power in organizational buying decisions' Industrial Marketing Management 13, 209-217.
Thong, J. Y. L. (1999). 'An integrated model of information systems adoption in small businesses' Journal of Management Information Systems 15 (4), 187-214.
Tomczak, T. (1992). 'Forschungsmethoden in der Marketingwissenschaft. Ein Plädoyer für den qualitativen Forschungsansatz' Marketing ZFP 2 (II. Quartal), 77-87.

References
Page 235
Tornatzky, L. G. and M. Fleisher (1990). 'The processes of technological innovation'. Lexington, Mass., Lexington Books.
Tornatzky, L. G. and K. J. Klein (1982). 'Innovation characteristics and innovation adoption-implementation: A meta-analysis of findings' IEEE Transactions on Engineering Management 29 (1), 28-45.
Triandis, H. (1971). 'Attitude and attitude change'. New York, Wiley.
Trimmel, P. and R. Rehak (2002). 'Web services - what, why and how'. Graz, Siemens Program- and System Engineering, 94 Slides. http://cit.siemens.at
Truex, D. (1996). 'Text-based analysis: a brief introduction'. ICIS - International Conference on Information Systems, Cleveland
Tushman, M. L. and P. Anderson (1986). 'Technological discontinuities and organizational environments' Administrative Science Quarterly 31 (3) September, 439-465.
Urban, G. L., B. D. Weinberg and J. R. Hauser (1996). 'Premarket forecasting of really-new products' Journal of Marketing 60 January, 47-60.
Valente, T. W. (1995). 'Network models of the diffusion of innovations'. Cresskill, NJ, Hampton Pr.
Van de Ven, A. H. (1986). 'Central problems in the management of innovation' Management Science 32 (5), 590-607.
Van Everdingen, Y. (1995). 'Adoption and diffusion of the European currency unit: an empirical study among European companies'. Business Administration. Amsterdam, Vrije Universiteit Amsterdam, 300.
Van Everdingen, Y. M. (2003). 'Forecasting the international diffusion of innovations: An adaptive estimation approach' ERIM Report Series in Management ERS-2003-073-MKT, 24.
Van Everdingen, Y. M. and G. J. Bamossy (2000). 'Marketing of a financial innovation: commercial use of the Euro by European companies prior to mandatory adoption' Journal of Business Research 48 May, 123-133.
Van Everdingen, Y. M. and E. Waarts (2003). 'A multi-country study of the adoption of ERP systems: The effect of national culture'. Rotterdam, Erasmus Research Institute of Management (ERIM), Erasmus Universiteit Roterdam, 33.
Van Everdingen, Y. M. and B. Wierenga (2001). 'Intra-firm innovation adoption decisions. The role of inter-firm and intra-firm variables applied to the Euro' European Management Journal 20 (6), 649-663.
Van Everdingen, Y. M. and B. Wierenga (2002). 'Intra-firm adoption decisions: Role of inter-firm and intra-firm variables' European Management Journal 20 (6) December, 649-663.
Velicer, W. F., C. C. DiClemente, J. O. Prochaska and N. Brandenburg (1985). 'A decisional balance measure for assessing and predicting smoking status' Journal of Personal Sociology Psychology 48, 1279-1289.
Venkatesh, V. and F. D. Davis (2000). 'A theoretical extension of the technology acceptance model: Four longitudinal field studies' Management Science 46 (2), 186-204.
Venkatraman, M. P. and L. L. Price (1990). 'Differentiating between cognitive and sensory innovativeness. Concepts, measurement, and implications' Journal of Business Research 20 (4), 293-315.

References
Page 236
Verhoef, P. C. and F. Langerak (2001). 'Possible determinants of consumers' adoption of electronic grocery shopping in the Netherlands' Journal of Retailing and Consumer Services 8 (2001), 275-285.
Viardot, E. (2004). 'Successful marketing strategy for high-tech firms'. Norwood, MA, Artech House, Inc.
Vyas, N. and A. G. Woodside (1984). 'An inductive model of industrial supplier choice processes' Journal of Marketing 48 Winter, 30-45.
Waarts, E., Y. M. van Everdingen and J. van Hillegersberg (2002). 'The dynamics of factors affecting the adoption of innovations' The Journal of Product Innovation Management 19, 412-423.
Webster, F. E. and Y. Wind (1972). 'A general model for understanding organizational buying behavior' Journal of Marketing 36 April, 12-19.
Webster, F. E. J. (1970). 'Informal communication in industrial markets' Journal of Marketing Research 7 May, 186-189.
Webster Jr., F. E. (1969). 'New product adoption in industrial markets: A framework for analysis' Journal of Marketing 33 (3) July, 35-39.
Weiber, R. (1992). 'Diffusion von Telekommunikation: Problem der kritischen Masse'. Wiesbaden.
Weiss, A. M. and J. B. Heide (1993). 'The nature of organizational search in high technology markets' Journal of Marketing Research 25 May, 220-233.
Weseslindtner, H. (1993). 'Fuzzy-Logic in der Fertigungstechnik'. Fuzzy-Logic. W. d. Fuehrungskräfte. Vienna, Wirtschaftsforum der Fuehrungskräfte. WdF-Edition, Band 24, 10-18.
Wesso, G. R. (1997). 'Neural networks and econometric methodologies for South African exchange rate forecasting'. Annual Meeting of the Decision Sciences Institute. Houston, Texas
Westphal, J. D., R. Gulati and S. M. Shortell (1997). 'Customization or conformity? An institutional and network persepctive on the content and consequences of TQM adoption' Administrative Science Quarterly 42 (2) June 1997, 366-394.
White, B. (2000). 'Dissertation skills for business and management students'. New York and London, Continuum.
Wierenga, B. and P. A. M. Oude Ophius (1997). 'Marketing decision support systems: adoption, use, and satisfaction' International Journal of Research in Marketing 14 (3), 275-290.
Wilkie, W. L. (1994). 'Consumer behavior'. New York, Wiley.
Willcocks, L. P. and M. C. Lacity (1997). 'Strategic sourcing of information systems: perspectives and practices'. New York, John Wiley & Sons.
Williams, A. (2003). 'ASP outsourcing: the customer experience', ITAA. http://www.itaa.org/asp/docs/aspstudy0303.pdf, February, 6th 2005.
Williams, T. G. (1984). 'Consumer behavior: Fundamentals and strategies'. St. Paul, Minn., West Publ. Co.
Woodside, A. G. and D. L. Sherrell (1980). 'New replacement part buying' Industrial Marketing Management 9, 123-132.
Wright, R. (2003). 'Older, wiser and winning ASPs - How solution providers are succeeding in the managed-services and outsourcing market, where ASPs and start-ups have failed'. VARbusiness. March, 65

References
Page 237
Wynn, E. (1979). 'Office conversation as an information medium'. Berkeley, University of California.
Yao, Y. (2002). 'Client relationship development with different sectors of application service providers: an extended research model'. AMCIS, Dallas, Texas
Yao, Y. (2004). 'An integrative model of clients' decision to adopt an application service provider'. Louisiana, Louisiana State University and Agricultural and Mechanical College.
Yin, R. K. (1994). 'Case study research, design and methods'. Newbury Park.
Zadeh, L. H. (1965). 'Fuzzy sets' Information and Control 8, 338-353.
Zaltman, G. (2003). 'How customers think. Essential insights into the mind of the market'. Boston, MA, Harvard Business School Press.
Zaltman, G., R. Duncan and J. Holbek (1973). 'Innovations and organizations'. New York.
Zimmermann, H.-J. (1993). 'Fuzzy set theory and its applications'. Boston, Kluwer.
Zmud, R. W. (1998). 'Conducting and publishing practice-driven research'. IFIP WG 8.2 and 8.3 joint working conference on information systems, Helsinki, Finland