Embed Size (px)
Citation preview
Epoxy composites filled with high surface area-carbon fillers: Optimizationof electromagnetic shielding, electrical, mechanical, and thermal propertiesP. Kuzhir, A. Paddubskaya, A. Plyushch, N. Volynets, S. Maksimenko et al. Citation: J. Appl. Phys. 114, 164304 (2013); doi: 10.1063/1.4826529 View online: http://dx.doi.org/10.1063/1.4826529 View Table of Contents: http://jap.aip.org/resource/1/JAPIAU/v114/i16 Published by the AIP Publishing LLC. Additional information on J. Appl. Phys.Journal Homepage: http://jap.aip.org/ Journal Information: http://jap.aip.org/about/about_the_journal Top downloads: http://jap.aip.org/features/most_downloaded Information for Authors: http://jap.aip.org/authors
Epoxy composites filled with high surface area-carbon fillers: Optimizationof electromagnetic shielding, electrical, mechanical, and thermal properties
P. Kuzhir,1,a) A. Paddubskaya,1 A. Plyushch,1 N. Volynets,1 S. Maksimenko,1 J. Macutkevic,2
I. Kranauskaite,2 J. Banys,2 E. Ivanov,3 R. Kotsilkova,3 A. Celzard,4 V. Fierro,4 J. Zicans,5
T. Ivanova,5 R. Merijs Meri,5 I. Bochkov,5 A. Cataldo,6 F. Micciulla,6 S. Bellucci,6
and Ph. Lambin7
1Research Institute of Nuclear Problems of Belarus State University, Bobruiskaya Str. 11, 220030 Minsk,Belarus2Radiophysics Department, Vilnius University, Sauletekio 9, LT10022 Vilnius, Lithuania3Open Laboratory of Experimental Mechanics, Institute of Mechanics, Bulgarian Academy of Sciences,Acad. G. Bonchev Street, Block 4, 1113 Sofia, Bulgaria4IJL – UMR CNRS 7198, ENSTIB, 27 rue Philippe S�eguin, CS 60036, 88026 �Epinal Cedex, France5Institute of Polymer Materials, Riga Technical University, Riga, Latvia6Frascati National Laboratory, National Institute of Nuclear Physics, Via E. Fermi 40, 00044 Frascati, Italy7Physics Department, University of Namur, 61 rue de Bruxelles, 5000 Namur, Belgium
(Received 24 July 2013; accepted 6 October 2013; published online 22 October 2013)
A comprehensive analysis of electrical, electromagnetic (EM), mechanical, and thermal properties of
epoxy resin composites filled with 0.25–2.0 wt. % of carbon additives characterized by high surface
area, both nano-sized, like carbon nanotubes (CNTs) and carbon black (CBH), and micro-sized
exfoliated graphite (EG), was performed. We found that the physical properties of both CNTs- and
CBH-based epoxy resin composites increased all together with filler content and even more clearly
for CBH than for CNTs. In the case of EG-based composites, good correlation between properties
and filler amount was observed for concentrations below 1.5 wt. %. We conclude that CBH and, to
a lower extent, EG could replace expensive CNTs for producing effective EM materials
in microwave and low-frequency ranges, which are, in addition, mechanically and thermally stable.VC 2013 AIP Publishing LLC. [http://dx.doi.org/10.1063/1.4826529]
I. INTRODUCTION
Due to the significant progresses of synergistic property
improvement in carbon-based polymer composites,1–6 i.e.,
improvement of mechanical strength, elastic modulus, and
thermal stability along with enhancement of electrical con-
ductivity at a low percolation threshold, etc., carbon-based
composites may have great potential for applications in
many fields either as structural or functional materials. In
particular, polymers filled with carbon nanotubes (CNTs),
graphite and its derivatives, carbon black and carbon onions
can be widely used as lightweight and ultra-thin effective
electric components and sensors, conductive electrodes for
solar cells, antistatic coatings, as well as electromagnetic
(EM) interference (EMI) shields and filters,6,7 and conformal
materials for structurally integrated RF antennas.8,9
The properties of polymer composites filled with
nanometer-scale additives are greatly influenced by the
dimensions of the constitutive phases (from 1 to 200 nm).
Because of the nano-size of the filler and the interaction
processes at the carbon particle � matrix interface, nano-
structural composites exhibit novel and significantly
improved properties. A unique feature of polymer nanocom-
posites is that a major enhancement of their properties is
attained at very low filler contents,7,10,11 which lead to the
development of lightweight materials. The key point is to
transfer the outstanding properties of nanofillers to the
polymer nanocomposites. However, to further commercialize
carbon/polymer composites, many technical problems need
to be overcome. One of them is the good dispersion of nano-
fillers in polymers, which still remains a challenge. For some
particular task one may want to add significant amounts of
filler to improve electrical and EM properties. The key ques-
tion here is whether it is possible to improve continuously
the dc conductivity and EMI shielding ability, and at the
same time not to destroy good mechanical property and ther-
mal stability of the polymer composite. Thus, the question
is to find such a critical concentration, corresponding to an
optimum between electrical, mechanical, thermal, and
electromagnetic properties, depending on possible material
application.
Another decisive question is whether it is always neces-
sary to deal with nanocomposites based on relatively expen-
sive fillers, like single-walled or multi-walled CNTs
(SWCNTs and MWCNTs, respectively), and whether it is
possible to replace them for some particular applications by
cheaper nanocarbons, like carbon black, or even with micro-
sized carbon, e.g., exfoliated graphite (EG).
The goals of the present communication are (i) to inves-
tigate mechanical, thermal, electrical, and EM properties of
epoxy resin filled with commercially available both nano-,
i.e., SWCNT, MWCNTs, carbon black of high surface area,
and micro-carbon (exfoliated graphite); we chose all carbons
of high surface area, because they are more effective for EM
applications due to skin effect at high frequencies; (ii) to
estimate the optimal concentration of carbon filler of eacha)Electronic mail: [email protected]
0021-8979/2013/114(16)/164304/7/$30.00 VC 2013 AIP Publishing LLC114, 164304-1
JOURNAL OF APPLIED PHYSICS 114, 164304 (2013)
type at which the highest values of all mentioned properties
exist; (iii) to discuss the possibility of preparing low-cost
carbon-based polymer materials depending on the
applications.
II. MATERIAL AND METHODS
A. Composites fabrication
Commercially available SWCNTs and MWCNTs by
Heji were utilized for CNT/resin composite fabrication. The
synthesis method of SWCNT and MWCNT was CVD. The
SWCNT data are the following: 1–2 nm diameter, mostly in
bundles of 8–20 nm; apparent density of 0.3 g/cm3 at 25 �C,
10–20 lm length, 90þ% purification degree. The MWCNTs
have 20–40 nm diameter, apparent density of 0.5 g/cm3 at
25 �C, 0.5–200 lm length.
ENSACO conductive carbon black was kindly supplied
by Timcal Ltd. (Bodio, Switzerland). ENSACO carbon black
with a high to very high void volume allows the retention of
a carbon network at low to very low filler content. The void
volume can originate from the interstices between the carbon
black particles, due to their complex arrangement, and from
the porosity. Carbon Black of High surface area - CBH
(ENSACO 350G: Brunauer–Emmett–Teller (BET) surface
area ¼ 770 m2/g; oil absorption ¼ 320 ml/100 g) was used.
EG was supplied by Mersen (France) and obtained by
intercalation of natural graphite flakes, subsequently submit-
ted to a thermal shock. Accordion-like particles were thus
produced, leading to a material of low packing density,
around 3 g/l. Typically, the diameter of the EG particles is in
the range 0.3�0.5 mm, and their aspect ratio is around 20.12
EPIKOTETM
Resin 828 was used for composites fabrica-
tion. EPIKOTE Resin 828 is a medium viscosity liquid ep-
oxy resin produced from bisphenol A resin and
epichlorhydrin. It contains no diluent. EPIKOTE 828 pro-
vides good pigment wetting and good resistance to filler set-
tling, together with a high level of mechanical and chemical
resistance properties in cured state.
A series of CNTs-, CBH-, and EG-based composite
samples, using a Epikote 828 epoxy resin, a curing agent
called A1 (i.e., a modified Tetraethylenepentamine (TEPA))
and 0.25, 0.5, 1.0, 1.5 and 2.0 wt. % of carbon fillers were
fabricated as follows:13 the resin was degassed under vac-
uum (1–3 mbar) for 12–14 h, then it was put into an oven at
65 �C. In the meantime, the carbon was dispersed in propanol
through ultrasonic bath for 1.5 h. Afterwards the solution of
alcohol and carbon fillers was mixed with the resin. The
obtained mixture was inserted inside the oven at 130–150 �Cfor the evaporation of alcohol. The curing agent (A1) was
added to the mixture of resin and filler through slow manual
mixing for about 7 min. The mix was then poured into 1 cm
� 1 cm � 7 cm molds, and left as such for 20 h for the curing
process at room temperature and then 4 h in oven at 80 �C.
When the process was completed, the samples were removed
from the molds. The uniformity of distribution of the carbon
fillers in the polymer samples was studied by scanning elec-
tron microscopy; all fabricated composites demonstrated
good homogeneity, carbon inclusions were reasonably well
dispersed.
B. Measurements
Nanoindentations were carried out using
Nanomechanical Tester (Bruker, USA). The nanohead of the
Nanoindenter performs indentation tests, where the applied
load and displacement are continuously monitored, generat-
ing load versus displacement data for a test specimen.
Young’s modulus and hardness are derived from the unload
data segments through in situ monitoring of the force vs. dis-
placement plot and automatic calculations by utilizing the
Oliver-Pharr method.14 Prior to indentation, the sample sur-
face of the studied composites was polished by means of
Leica RM2245 microtome with stereo microscope Leica
A60S and diamond knife (Leica Microsystems, Germany).
The software program prepared for this experiment con-
sisted of 4 lines with 12 indentations each (total of 48 indenta-
tions) and spacing of 80lm. Each indentation was made with
a force of 200 mN. A typical indentation experiment consisted
of subsequent steps: (i) approaching the surface; (ii) loading
to the maximum force (200 mN) for 15 s; (iii) holding the in-
denter at peak load for 10 s; (iv) unloading from maximum
force (200 mN) to 10% for 15 s; (v) holding at 10% of maxi-
mum force for 15 s; (vi) final complete unloading for 1 s (load
function 15 s-10 s-15 s trapezoid). The hold step was included
to avoid the influence of creep on the unloading characteristics
since the unloading curve was used to obtain the elastic modu-
lus of material. The imprints were visualized by use of optical
microscope and AFM.
Thermal stability was determined by using thermo-
gravimetric analyzer TGA-1/SF (METTLER TOLEDO,
Switzerland). Thermogravimetric analysis (TGA) measure-
ments were performed in air from room temperature
(25 �C) to 800 �C with heating rate of 10 �C/min. The aver-
age mass of the sample was 10 mg.
Complex dielectric permittivity e ¼ e0�ie" was meas-
ured as a function of frequency at room temperature using an
HP4284A precision LCR meter. The sample was placed in a
home-made furnace between two conductors. The equivalent
circuit of such system was selected as capacitance and loss
tangent.
The microwave measurements were carried out with
a scalar network analyzer R2-408R (ELMIKA, Vilnius,
Lithuania). The system is composed of a sweep generator,
waveguide reflectometer, network analyzer and indicator unit
(personal computer). The IEC 62431:2008(E) standard speci-
fying the measurement method for the reflectivity of EM
materials for normal incidence was used. The EM response of
samples as ratios of transmitted/input (S21) and reflected/input
(S11) signals was measured within 26–37 GHz frequency range
(Ka-band). S-parameters were measured by subsequent inser-
tion of the specimen into the waveguide. The measurements
were performed with 0.5 mm thick free-standing samples.
III. RESULTS AND DISCUSSION
A. Mechanical properties of carbon based epoxycomposites
Figure 1 shows examples of optical and AFM micro-
graphs of the indentation imprints after indentation tests.
164304-2 Kuzhir et al. J. Appl. Phys. 114, 164304 (2013)
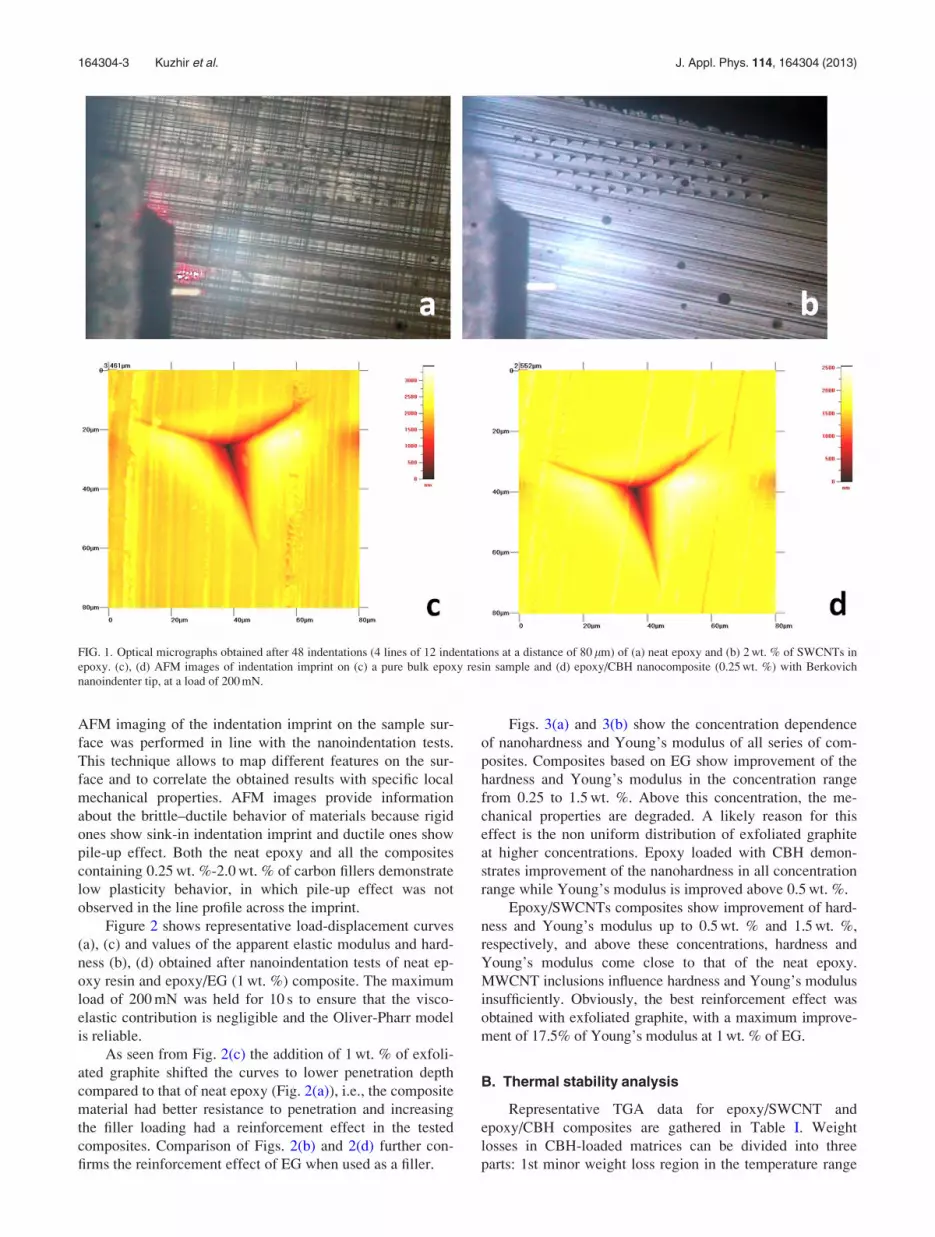
AFM imaging of the indentation imprint on the sample sur-
face was performed in line with the nanoindentation tests.
This technique allows to map different features on the sur-
face and to correlate the obtained results with specific local
mechanical properties. AFM images provide information
about the brittle–ductile behavior of materials because rigid
ones show sink-in indentation imprint and ductile ones show
pile-up effect. Both the neat epoxy and all the composites
containing 0.25 wt. %-2.0 wt. % of carbon fillers demonstrate
low plasticity behavior, in which pile-up effect was not
observed in the line profile across the imprint.
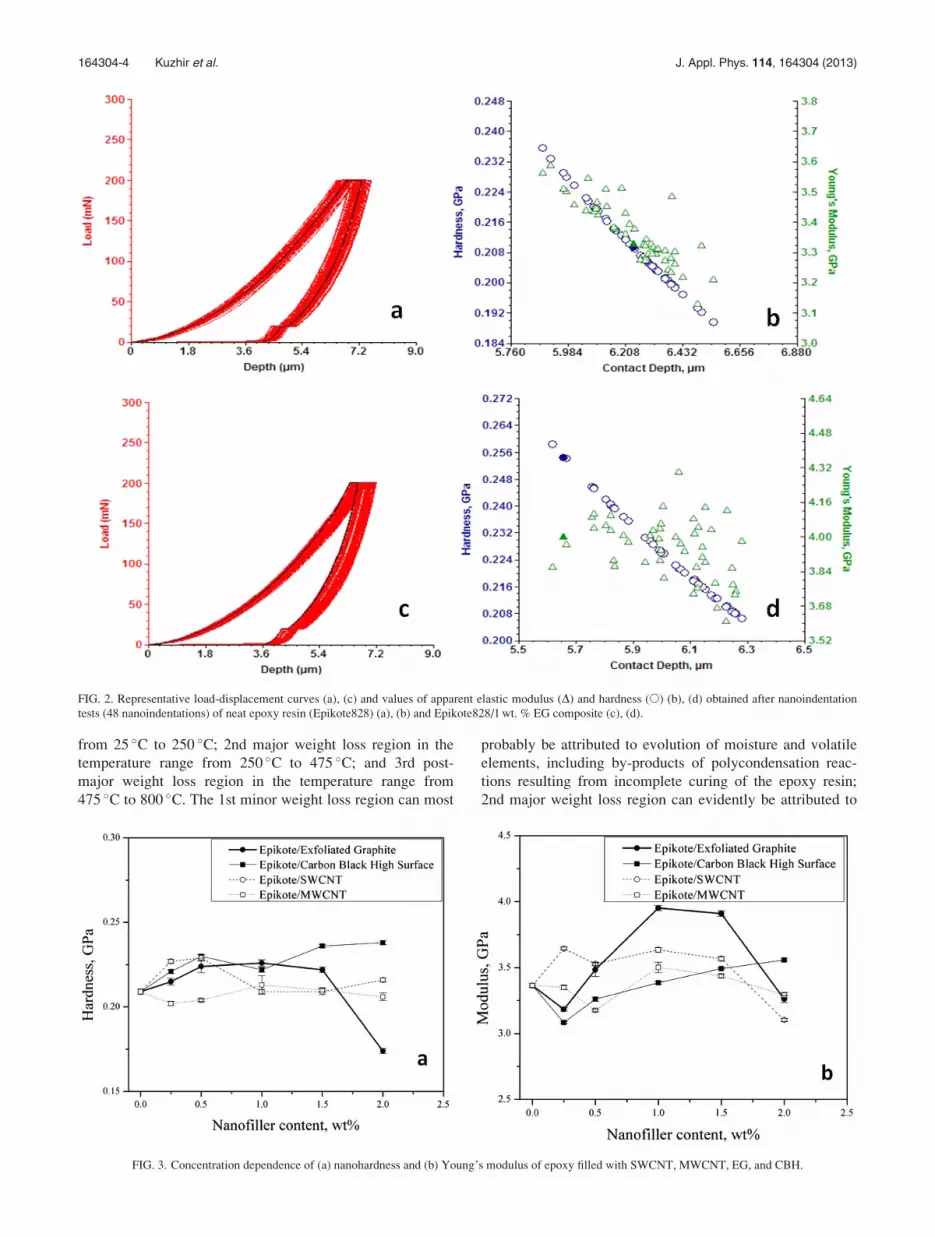
Figure 2 shows representative load-displacement curves
(a), (c) and values of the apparent elastic modulus and hard-
ness (b), (d) obtained after nanoindentation tests of neat ep-
oxy resin and epoxy/EG (1 wt. %) composite. The maximum
load of 200 mN was held for 10 s to ensure that the visco-
elastic contribution is negligible and the Oliver-Pharr model
is reliable.
As seen from Fig. 2(c) the addition of 1 wt. % of exfoli-
ated graphite shifted the curves to lower penetration depth
compared to that of neat epoxy (Fig. 2(a)), i.e., the composite
material had better resistance to penetration and increasing
the filler loading had a reinforcement effect in the tested
composites. Comparison of Figs. 2(b) and 2(d) further con-
firms the reinforcement effect of EG when used as a filler.
Figs. 3(a) and 3(b) show the concentration dependence
of nanohardness and Young’s modulus of all series of com-
posites. Composites based on EG show improvement of the
hardness and Young’s modulus in the concentration range
from 0.25 to 1.5 wt. %. Above this concentration, the me-
chanical properties are degraded. A likely reason for this
effect is the non uniform distribution of exfoliated graphite
at higher concentrations. Epoxy loaded with CBH demon-
strates improvement of the nanohardness in all concentration
range while Young’s modulus is improved above 0.5 wt. %.
Epoxy/SWCNTs composites show improvement of hard-
ness and Young’s modulus up to 0.5 wt. % and 1.5 wt. %,
respectively, and above these concentrations, hardness and
Young’s modulus come close to that of the neat epoxy.
MWCNT inclusions influence hardness and Young’s modulus
insufficiently. Obviously, the best reinforcement effect was
obtained with exfoliated graphite, with a maximum improve-
ment of 17.5% of Young’s modulus at 1 wt. % of EG.
B. Thermal stability analysis
Representative TGA data for epoxy/SWCNT and
epoxy/CBH composites are gathered in Table I. Weight
losses in CBH-loaded matrices can be divided into three
parts: 1st minor weight loss region in the temperature range
FIG. 1. Optical micrographs obtained after 48 indentations (4 lines of 12 indentations at a distance of 80 lm) of (a) neat epoxy and (b) 2 wt. % of SWCNTs in
epoxy. (c), (d) AFM images of indentation imprint on (c) a pure bulk epoxy resin sample and (d) epoxy/CBH nanocomposite (0.25 wt. %) with Berkovich
nanoindenter tip, at a load of 200 mN.
164304-3 Kuzhir et al. J. Appl. Phys. 114, 164304 (2013)
from 25 �C to 250 �C; 2nd major weight loss region in the
temperature range from 250 �C to 475 �C; and 3rd post-
major weight loss region in the temperature range from
475 �C to 800 �C. The 1st minor weight loss region can most
probably be attributed to evolution of moisture and volatile
elements, including by-products of polycondensation reac-
tions resulting from incomplete curing of the epoxy resin;
2nd major weight loss region can evidently be attributed to
FIG. 3. Concentration dependence of (a) nanohardness and (b) Young’s modulus of epoxy filled with SWCNT, MWCNT, EG, and CBH.
FIG. 2. Representative load-displacement curves (a), (c) and values of apparent elastic modulus (D) and hardness (�) (b), (d) obtained after nanoindentation
tests (48 nanoindentations) of neat epoxy resin (Epikote828) (a), (b) and Epikote828/1 wt. % EG composite (c), (d).
164304-4 Kuzhir et al. J. Appl. Phys. 114, 164304 (2013)
degradation of epoxy matrix itself, while 3rd weight loss
region is attributed to thermo-oxidation of the remaining
degradation products of the epoxy resin. In general as a
result of CBH addition, TGA curves are shifted to higher
temperatures, whereas modification of the resin with 1 wt. %
of nanofiller is relatively more effective than using higher
nanofiller concentrations. It should be however mentioned
that in the case of the composition containing 2 wt. % of
CBH, the thermal stability of the nanocomposite is consider-
ably higher at low and high temperatures. Such behaviour in
the low temperature region testifies that curing of the epoxy
resin is improved along with increasing CBH content.
Similarly, in the high temperature region, diffusion of oxy-
gen to the degradation products of the epoxy resin is reduced
along with CBH addition.
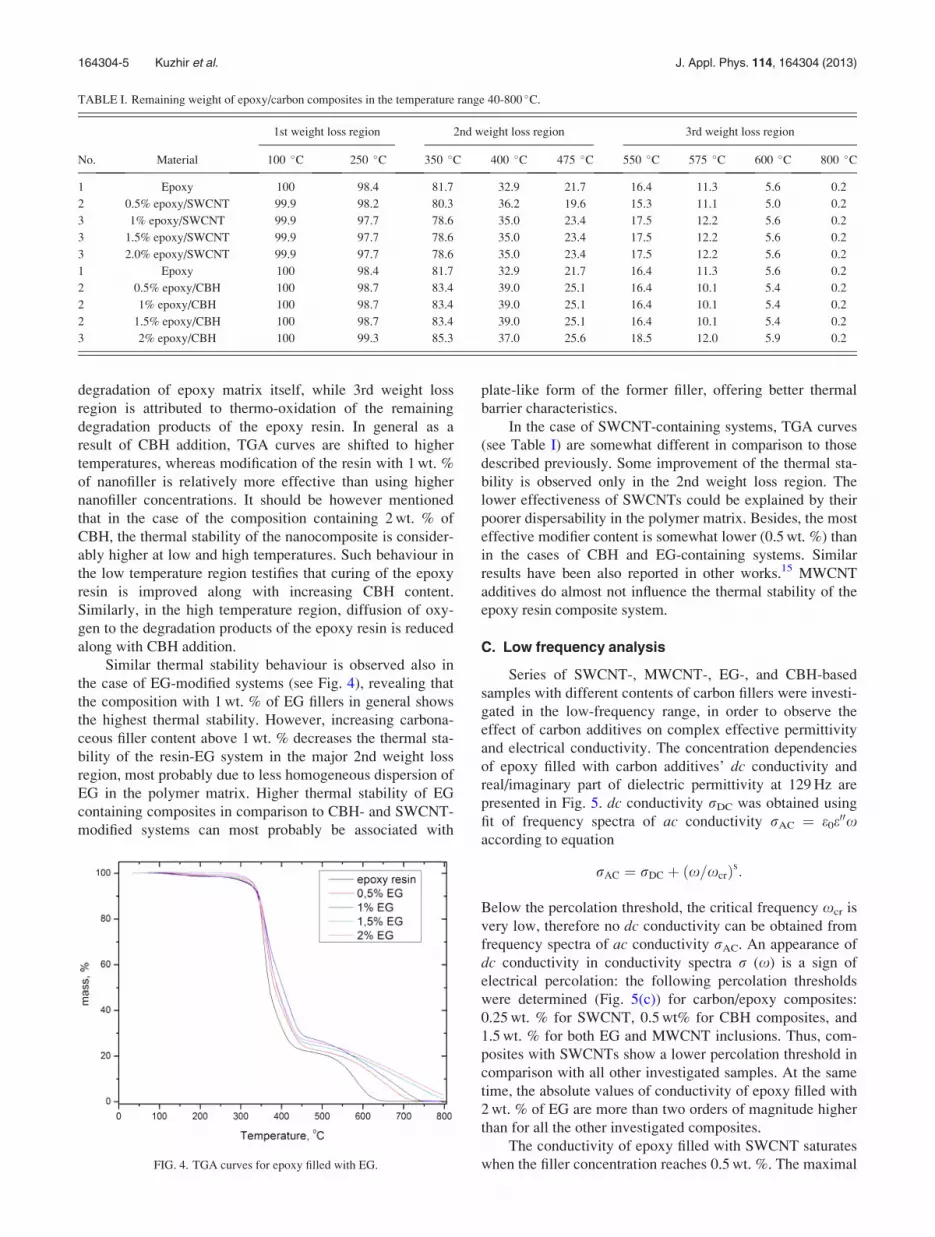
Similar thermal stability behaviour is observed also in
the case of EG-modified systems (see Fig. 4), revealing that
the composition with 1 wt. % of EG fillers in general shows
the highest thermal stability. However, increasing carbona-
ceous filler content above 1 wt. % decreases the thermal sta-
bility of the resin-EG system in the major 2nd weight loss
region, most probably due to less homogeneous dispersion of
EG in the polymer matrix. Higher thermal stability of EG
containing composites in comparison to CBH- and SWCNT-
modified systems can most probably be associated with
plate-like form of the former filler, offering better thermal
barrier characteristics.
In the case of SWCNT-containing systems, TGA curves
(see Table I) are somewhat different in comparison to those
described previously. Some improvement of the thermal sta-
bility is observed only in the 2nd weight loss region. The
lower effectiveness of SWCNTs could be explained by their
poorer dispersability in the polymer matrix. Besides, the most
effective modifier content is somewhat lower (0.5 wt. %) than
in the cases of CBH and EG-containing systems. Similar
results have been also reported in other works.15 MWCNT
additives do almost not influence the thermal stability of the
epoxy resin composite system.
C. Low frequency analysis
Series of SWCNT-, MWCNT-, EG-, and CBH-based
samples with different contents of carbon fillers were investi-
gated in the low-frequency range, in order to observe the
effect of carbon additives on complex effective permittivity
and electrical conductivity. The concentration dependencies
of epoxy filled with carbon additives’ dc conductivity and
real/imaginary part of dielectric permittivity at 129 Hz are
presented in Fig. 5. dc conductivity rDC was obtained using
fit of frequency spectra of ac conductivity rAC ¼ e0e00xaccording to equation
rAC ¼ rDC þ ðx=xcrÞs:
Below the percolation threshold, the critical frequency xcr is
very low, therefore no dc conductivity can be obtained from
frequency spectra of ac conductivity rAC. An appearance of
dc conductivity in conductivity spectra r (x) is a sign of
electrical percolation: the following percolation thresholds
were determined (Fig. 5(c)) for carbon/epoxy composites:
0.25 wt. % for SWCNT, 0.5 wt% for CBH composites, and
1.5 wt. % for both EG and MWCNT inclusions. Thus, com-
posites with SWCNTs show a lower percolation threshold in
comparison with all other investigated samples. At the same
time, the absolute values of conductivity of epoxy filled with
2 wt. % of EG are more than two orders of magnitude higher
than for all the other investigated composites.
The conductivity of epoxy filled with SWCNT saturates
when the filler concentration reaches 0.5 wt. %. The maximal
TABLE I. Remaining weight of epoxy/carbon composites in the temperature range 40-800 �C.
1st weight loss region 2nd weight loss region 3rd weight loss region
No. Material 100 �C 250 �C 350 �C 400 �C 475 �C 550 �C 575 �C 600 �C 800 �C
1 Epoxy 100 98.4 81.7 32.9 21.7 16.4 11.3 5.6 0.2
2 0.5% epoxy/SWCNT 99.9 98.2 80.3 36.2 19.6 15.3 11.1 5.0 0.2
3 1% epoxy/SWCNT 99.9 97.7 78.6 35.0 23.4 17.5 12.2 5.6 0.2
3 1.5% epoxy/SWCNT 99.9 97.7 78.6 35.0 23.4 17.5 12.2 5.6 0.2
3 2.0% epoxy/SWCNT 99.9 97.7 78.6 35.0 23.4 17.5 12.2 5.6 0.2
1 Epoxy 100 98.4 81.7 32.9 21.7 16.4 11.3 5.6 0.2
2 0.5% epoxy/CBH 100 98.7 83.4 39.0 25.1 16.4 10.1 5.4 0.2
2 1% epoxy/CBH 100 98.7 83.4 39.0 25.1 16.4 10.1 5.4 0.2
2 1.5% epoxy/CBH 100 98.7 83.4 39.0 25.1 16.4 10.1 5.4 0.2
3 2% epoxy/CBH 100 99.3 85.3 37.0 25.6 18.5 12.0 5.9 0.2
FIG. 4. TGA curves for epoxy filled with EG.
164304-5 Kuzhir et al. J. Appl. Phys. 114, 164304 (2013)
value of epoxy/SWCNT conductivities above the percolation
threshold is smaller than that of epoxy/MWCNT, epoxy/EG
and even of epoxy/CBH samples, filled with 2 wt. % of car-
bon inclusions. This is because: (i) having higher number of
conductive channels, isolated MWCNTs have lower resist-
ance than isolated SWCNT of the same length,16 (ii) the
number of SWCNTs is several orders of magnitude higher
than the number of MWCNTs, CBH, and EG particles in the
same composites’ volume and with the same wt. content of
carbon additives. This fact assumes a higher number of con-
tacts barriers between the nanotubes in SWCNT-based com-
posites, which contribute significantly to the composites’
resistivity.
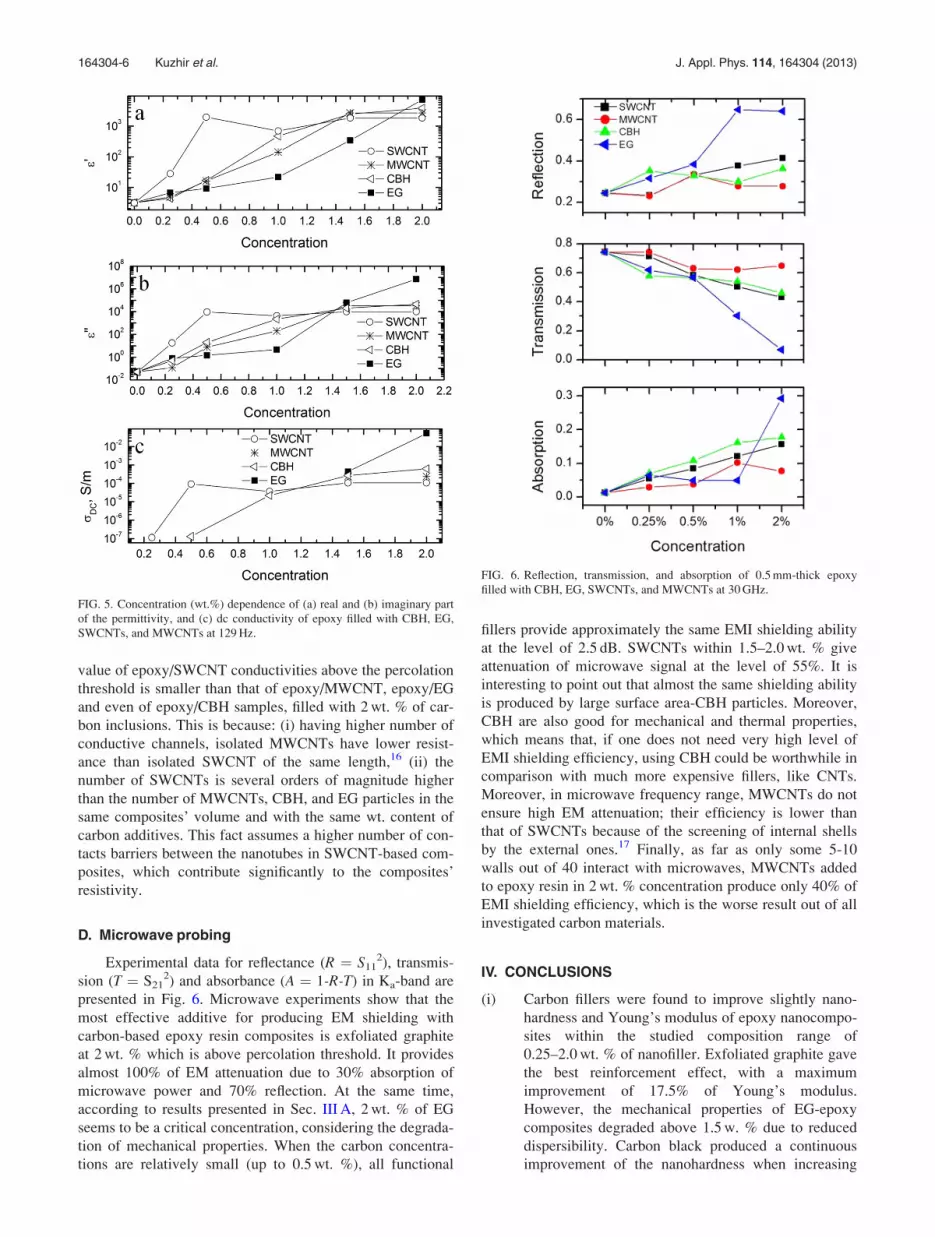
D. Microwave probing
Experimental data for reflectance (R ¼ S112), transmis-
sion (T ¼ S212) and absorbance (A ¼ 1-R-T) in Ka-band are
presented in Fig. 6. Microwave experiments show that the
most effective additive for producing EM shielding with
carbon-based epoxy resin composites is exfoliated graphite
at 2 wt. % which is above percolation threshold. It provides
almost 100% of EM attenuation due to 30% absorption of
microwave power and 70% reflection. At the same time,
according to results presented in Sec. III A, 2 wt. % of EG
seems to be a critical concentration, considering the degrada-
tion of mechanical properties. When the carbon concentra-
tions are relatively small (up to 0.5 wt. %), all functional
fillers provide approximately the same EMI shielding ability
at the level of 2.5 dB. SWCNTs within 1.5–2.0 wt. % give
attenuation of microwave signal at the level of 55%. It is
interesting to point out that almost the same shielding ability
is produced by large surface area-CBH particles. Moreover,
CBH are also good for mechanical and thermal properties,
which means that, if one does not need very high level of
EMI shielding efficiency, using CBH could be worthwhile in
comparison with much more expensive fillers, like CNTs.
Moreover, in microwave frequency range, MWCNTs do not
ensure high EM attenuation; their efficiency is lower than
that of SWCNTs because of the screening of internal shells
by the external ones.17 Finally, as far as only some 5-10
walls out of 40 interact with microwaves, MWCNTs added
to epoxy resin in 2 wt. % concentration produce only 40% of
EMI shielding efficiency, which is the worse result out of all
investigated carbon materials.
IV. CONCLUSIONS
(i) Carbon fillers were found to improve slightly nano-
hardness and Young’s modulus of epoxy nanocompo-
sites within the studied composition range of
0.25–2.0 wt. % of nanofiller. Exfoliated graphite gave
the best reinforcement effect, with a maximum
improvement of 17.5% of Young’s modulus.
However, the mechanical properties of EG-epoxy
composites degraded above 1.5 w. % due to reduced
dispersibility. Carbon black produced a continuous
improvement of the nanohardness when increasing
FIG. 6. Reflection, transmission, and absorption of 0.5 mm-thick epoxy
filled with CBH, EG, SWCNTs, and MWCNTs at 30 GHz.
FIG. 5. Concentration (wt.%) dependence of (a) real and (b) imaginary part
of the permittivity, and (c) dc conductivity of epoxy filled with CBH, EG,
SWCNTs, and MWCNTs at 129 Hz.
164304-6 Kuzhir et al. J. Appl. Phys. 114, 164304 (2013)

the filler amount, reaching about 15% increase of the
hardness at the maximum filler content. By compari-
son, single- and multi-walled carbon nanotubes did
not considerably improve hardness and Young’s mod-
ulus of the epoxy nanocomposites. The nanocompo-
site materials showed a brittle–ductile behavior.
(ii) According to TGA data, all the investigated carbons
fillers either improved slightly the thermal stability of
carbon/epoxy composites or did not deteriorate it. The
highest modification effect was observed for EG-
containing epoxy composites.
(iii) Electrical percolation started earlier for SWCNT
composites (0.25 wt. % concentration). However, per-
colation in EG composites at 1.5 wt. % was very sharp
and electrical conductivity of 2 wt. % EG/epoxy was
two orders of magnitude higher than corresponding
values for SWCNT composites. The absolute values
of the permittivity as well as the conductivity for
composites loaded with high surface area carbon
black and MWCNT were very close, which means
that, taking into account the observed good mechani-
cal and thermal properties of CBH/epoxy composites,
CBH could easily compete with commercial
MWCNTs in different electrical and EM applications.
(iv) EMI shielding efficiency was found to be the largest
for EG/epoxy composites with 2 wt. % of filler
(approx 12 dB), but this concentration was already
critical for mechanical properties. SWCNT and CBH
fillers gave similar EM attenuation, around 50% when
embedded into epoxy at 2 wt. %. Due to high screen-
ing effect of inner shells, relatively thick MWCNTs
(20–40 nm in diameter) did not provide effective EM
shielding in microwave frequency range.
In conclusion, we found that electrical, EM, thermal and
mechanical properties of both CNT- and CBH-based epoxy
composites could be improved all together. There is good
correlation between improved physical properties of CNT-
and CBH-based composites for all investigated concentration
ranges (0.25–2.0 wt. %), especially in favour of CBH for
which the highest mechanical resistance along with
improved ac conductivity and EMI SE ability were observed,
being in the same level as those of SWCNT-composites. In
the case of EG-based composites, simultaneous improve-
ment of physical properties was observed for concentrations
below 1.5 wt. %. EG could be used for producing very effec-
tive thin and lightweight EM material in the Ka-band when
the concentration of fillers reaches 2 wt. %, but for this con-
tent the mechanical properties started to degrade, which
might perhaps be avoided by improving the fabrication pro-
cess. Finally, CBH and sometime EG, being effective in
microwave and low frequency ranges and at the same time
being mechanically and thermally stable, might replace ex-
pensive CNTs for producing EM composite layers.
ACKNOWLEDGMENTS
This research was partly funded by EU FP7 projects FP7-
266529 BY-NanoERA, PIRSES-2012-318617 FAEMCAR,
FP7-PEOPLE-2013-IRSES-610875 NAmiceMC, Belarus-
Latvia project BRFFI F12Lat-007, and the European Social
Fund under the Global Grant measure (Lithuanian team).
1J. H. Du, J. Bai, and H. M. Cheng, Express Polym. Lett. 1(5), 253 (2007).2Q. Wang, J. Dai, W. Li, Zh. Wei, and J. Jiang, Compos. Sci. Technol.
68(7-8), 1644 (2008).3M. Terrones, O. Martin, M. Gonzalez, J. Pozuelo, B. Serrano, J. C.
Cabanelas, S. M. Vega-Diaz, and J. Baselga, Adv. Mater. 23(44), 5302
(2011).4E. Ivanov, R. Kotsilkova, E. Krusteva, E. Logakis, A. Kyritsis, P. Pissis,
C. Silvestre, D. Duraccio, and M. Pezzuto, J. Polym. Sci., Part B: Polym.
Phys. 49(6), 431 (2011).5B. De Vivo, L. Guadagno, P. Lamberti, A. Sorrentino, V. Tucci, L.
Vertuccio, and V. Vittoria, Adv. Polym. Technol. 31(3), 205 (2012).6D. D. L. Chung, Carbon 50, 3342 (2012).7F. Qin and C. Brosseau, J. Appl. Phys. 111, 061301 (2012).8Y. Zhou, Y. Bayram, F. Du, L. Dai, and J. L. Volakis, IEEE Trans.
Antennas Propag. 58(7), 2169 (2010).9Zh. Wang, L. Zhang, Y. Bayram, and J. L. Volakis, IEEE Trans. Antennas
Propag. 60(9), 4141 (2012).10T. Prasse, L. Flandin, K. Schulte, and W. Bauhofer, Appl. Phys. Lett.
72(22), 2903 (1998).11M. Hindermann-Bischoff and F. Ehrburger-Dolle, Carbon 39(3), 375
(2001).12A. Celzard, J. F. Marech�e, and G. Furdin, Prog. Mater. Sci. 50, 93 (2005).13S. Bellucci, L. Coderoni, F. Micciulla, G. Rinaldi, and I. Sacco,
J. Nanosci. Nanotechnol. 11(10), 9110 (2011).14W. C. Oliver and G. M. Pharr, J. Mater. Res. 7(6), 1564 (1992).15J. B. Bai and A. Allaoui, Composites, Part A 34(8), 689 (2003).16A. V. Eletskii, Usp. Fiz. Nauk 179, 225 (2009).17P. Kuzhir, A. Paddubskaya, M. Shuba, S. Maksimenko, A. Celzard, V.
Fierro, G. Amaral-Labat, A. Pizzi, J. Macutkevic, G. Valusis, J. Banys, S.
Bistarelli, M. Mastrucci, F. Micciulla, I. Sacco, and S. Bellucci,
J. Nanophotonics 6(1), 061715 (2012).
164304-7 Kuzhir et al. J. Appl. Phys. 114, 164304 (2013)


