Embed Size (px)
Citation preview
IEEE TRANSACTIONS ON ELECTROMAGNETIC COMPATIBILITY, VOL. 43, NO. 2, MAY 2001 177
Electromagnetic Shielding Characteristics ofOptical-Fiber Feedthroughs
Keith D. Masterson, Member, IEEE, David R. Novotny, and Galen H. Koepke
Abstract—A number of commercially available optical-fiberconnector styles ST, SC, and FC were tested to determine theextent to which their use in bulkhead adapter feedthroughswould compromise the shielding of electromagnetic interferencefor electronic enclosures. Connectors and adapter barrels madefrom metal, ceramic, and polymer materials were included inthe tests. The tests were carried out using a nested reverberationcell and covered a frequency range from 1 to 16 GHz. Althoughwe rely on data acquired by making shielding effectiveness (SE)measurements, we report the results in terms of a transmissioncross section which is the ratio of the power coupled into anenclosure through an aperture to the power per unit area incidenton the aperture. The amount of coupling through the feedthroughswe tested varied over 70 dB. The shielding of an all-metal FCconnector system was nearly equal to that of a blank referenceplate. In some cases, a feedthrough coupled more energy intothe enclosure than was coupled through the empty hole requiredto mount the adapter barrel. Unlike SE, the transmission crosssections do not depend on the volume, shape, or constructionmaterials of the enclosure and can be used to estimate the degra-dation in the SE for enclosures other than our reference cell.The uncertainties in the reported transmission cross sections arecalculated to be 3 dB and are small compared to the differencesbetween the measured cross sections.
Index Terms—Electromagnetic interference, fiber optic adapterbarrels, fiber optic connectors, fiber optics, shielding effectiveness,mode-stirred chamber.
I. INTRODUCTION
WE HAVE tested a number of commercially available op-tical-fiber, adapter-barrel feedthroughs to determine the
extent that they would compromise the shielding of electronicenclosures against electromagnetic interference (EMI) [1]. Inthis paper, we report the measurement techniques, data analysis,and uncertainty analysis together with the results. The result areexpected to be of considerable interest to engineers involved indesigning optical-fiber links for electromagnetic environments,to provide base line data for possible additional studies, andto aid the development of standard procedures to evaluate theshielding effectiveness (SE) of a variety of optoelectronic com-ponents.
Although optical-fiber is immune to EMI, photodiodes, laserdiodes, and their associated electronic circuitry are not. Thesecomponents must be placed in shielded enclosures with filteredsupplies in order to operate satisfactorily in an environment
Manuscript received July 14, 1997; revised December 6, 2000. This workwas supported by the National Institute of Standards and Technology AdvancedTechnology Program Office.
The authors are with the Electromagnetic Fields Division, National Instituteof Standards and Technology, Boulder, CO 80305 USA.
Publisher Item Identifier S 0018-9375(01)04066-2.
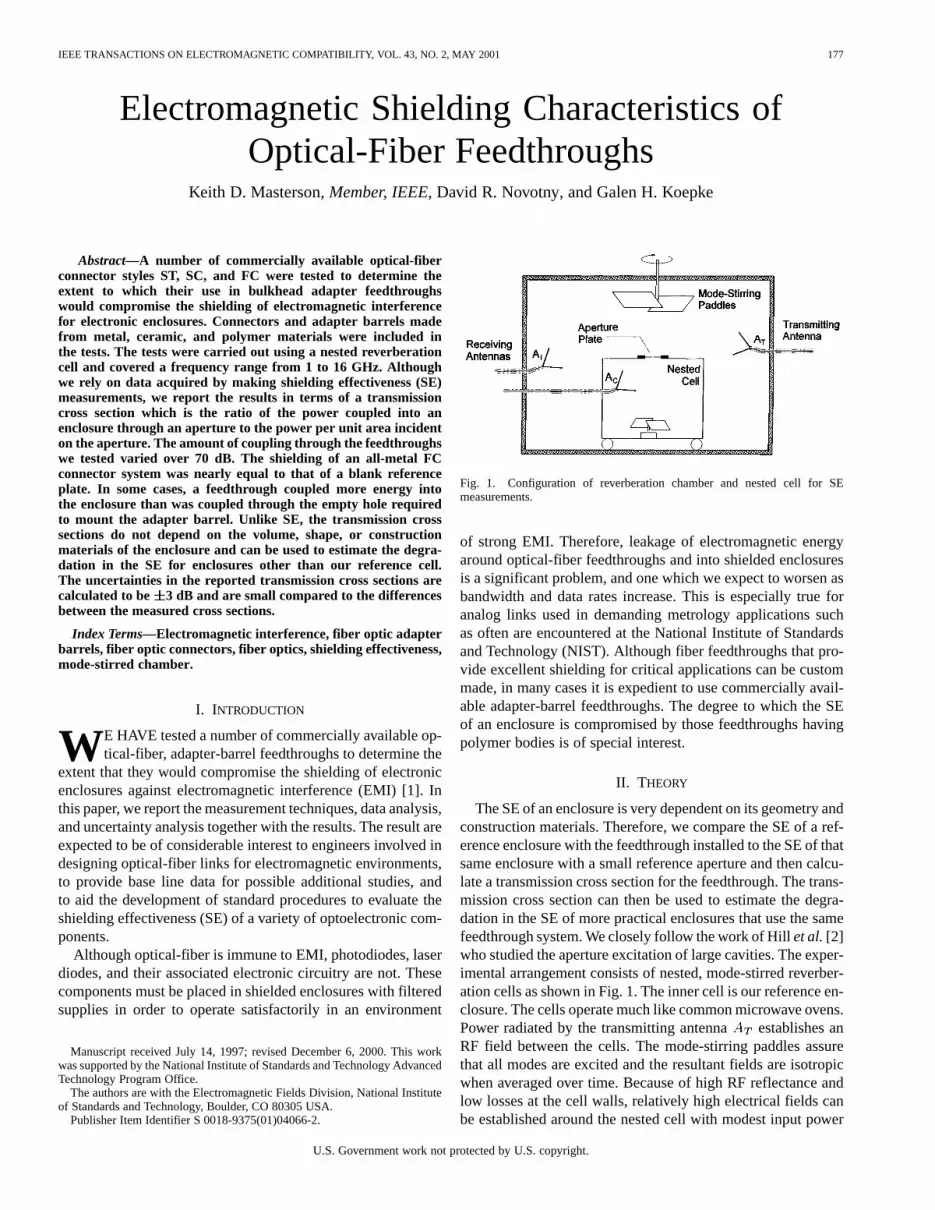
Fig. 1. Configuration of reverberation chamber and nested cell for SEmeasurements.
of strong EMI. Therefore, leakage of electromagnetic energyaround optical-fiber feedthroughs and into shielded enclosuresis a significant problem, and one which we expect to worsen asbandwidth and data rates increase. This is especially true foranalog links used in demanding metrology applications suchas often are encountered at the National Institute of Standardsand Technology (NIST). Although fiber feedthroughs that pro-vide excellent shielding for critical applications can be custommade, in many cases it is expedient to use commercially avail-able adapter-barrel feedthroughs. The degree to which the SEof an enclosure is compromised by those feedthroughs havingpolymer bodies is of special interest.
II. THEORY
The SE of an enclosure is very dependent on its geometry andconstruction materials. Therefore, we compare the SE of a ref-erence enclosure with the feedthrough installed to the SE of thatsame enclosure with a small reference aperture and then calcu-late a transmission cross section for the feedthrough. The trans-mission cross section can then be used to estimate the degra-dation in the SE of more practical enclosures that use the samefeedthrough system. We closely follow the work of Hillet al.[2]who studied the aperture excitation of large cavities. The exper-imental arrangement consists of nested, mode-stirred reverber-ation cells as shown in Fig. 1. The inner cell is our reference en-closure. The cells operate much like common microwave ovens.Power radiated by the transmitting antenna establishes anRF field between the cells. The mode-stirring paddles assurethat all modes are excited and the resultant fields are isotropicwhen averaged over time. Because of high RF reflectance andlow losses at the cell walls, relatively high electrical fields canbe established around the nested cell with modest input power
U.S. Government work not protected by U.S. copyright.
178 IEEE TRANSACTIONS ON ELECTROMAGNETIC COMPATIBILITY, VOL. 43, NO. 2, MAY 2001
to the transmitting antenna (00 V/m with inputs of 10 W).Also, only a slight leakage into the reference cell results in ameasurable signal from the receiving antenna.
The SE of an enclosure is defined from the ratio of the powerdensity incident on the enclosure and monitored with the re-ceiving antenna to the power density inside the enclosureand monitored with the receiving antenna as
SE (1)
For an enclosure with a small aperture and containing no source,SE is always positive. The ratio is given formally by [2]as
(2)
wherewavenumber of the incident EM radiation;transmission cross section of the aperture averaged foruniform, isotropic incident radiation of wavelength
;volume of the enclosure;quality factor for the electrical characteristics of theenclosure;contribution of a particular loss mechanism to the total
of the enclosure.The values of and can be determined directly by ex-perimental measurements. If we also know theof the en-closure, we can obtain the transmission cross section for thefeedthrough. However, an accurate determination of theis dif-ficult by either direct experimental measurements or theoreticalcalculations. Fortunately, we can avoid having to explicitly de-termine the cavity by measuring the SE of the enclosure withan installed feedthrough relative to the SE of the same enclo-sure with a well defined reference aperture and then determinethe transmission cross section of the feedthrough in relation tothat of the reference aperture.
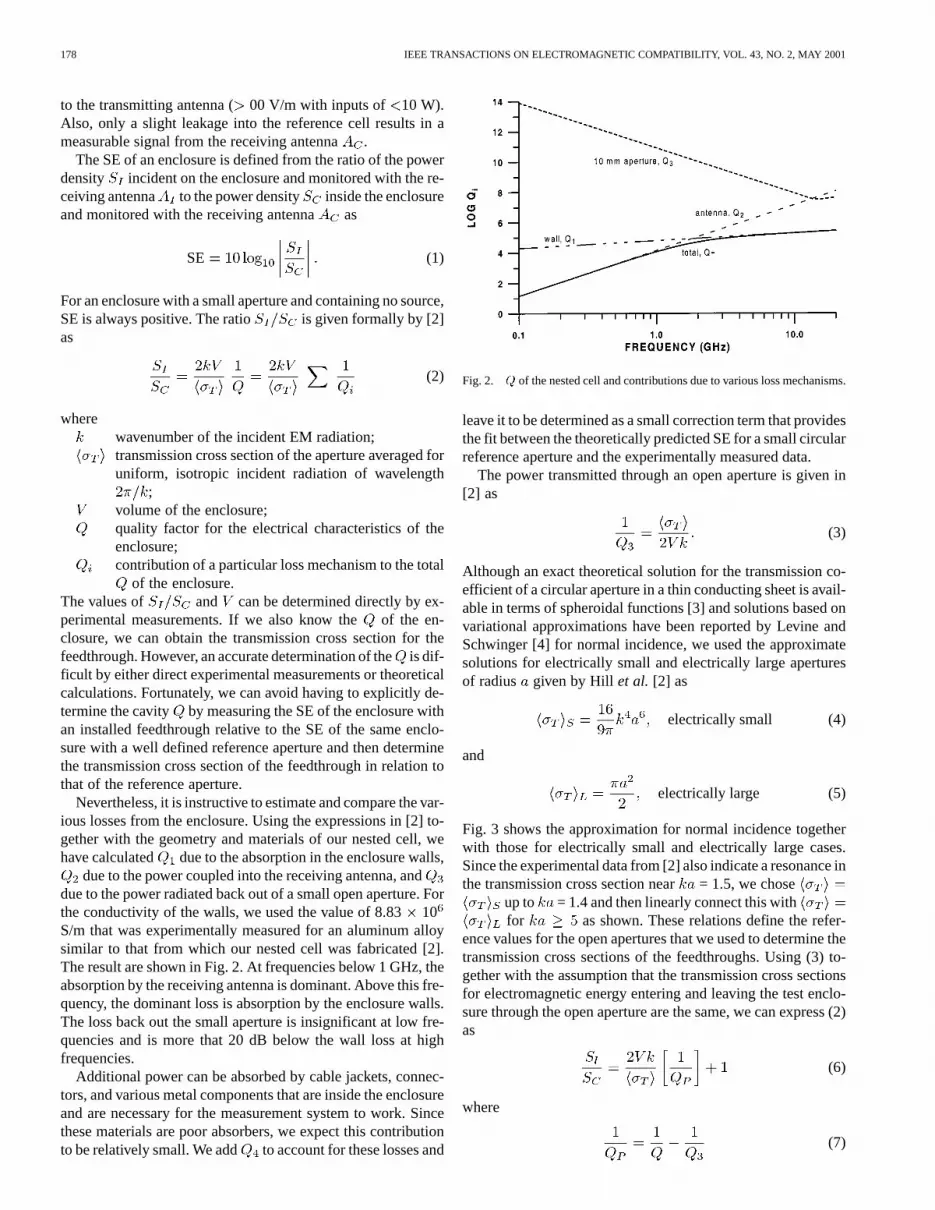
Nevertheless, it is instructive to estimate and compare the var-ious losses from the enclosure. Using the expressions in [2] to-gether with the geometry and materials of our nested cell, wehave calculated due to the absorption in the enclosure walls,
due to the power coupled into the receiving antenna, anddue to the power radiated back out of a small open aperture. Forthe conductivity of the walls, we used the value of 8.8310S/m that was experimentally measured for an aluminum alloysimilar to that from which our nested cell was fabricated [2].The result are shown in Fig. 2. At frequencies below 1 GHz, theabsorption by the receiving antenna is dominant. Above this fre-quency, the dominant loss is absorption by the enclosure walls.The loss back out the small aperture is insignificant at low fre-quencies and is more that 20 dB below the wall loss at highfrequencies.
Additional power can be absorbed by cable jackets, connec-tors, and various metal components that are inside the enclosureand are necessary for the measurement system to work. Sincethese materials are poor absorbers, we expect this contributionto be relatively small. We add to account for these losses and
Fig. 2. Q of the nested cell and contributions due to various loss mechanisms.
leave it to be determined as a small correction term that providesthe fit between the theoretically predicted SE for a small circularreference aperture and the experimentally measured data.
The power transmitted through an open aperture is given in[2] as
(3)
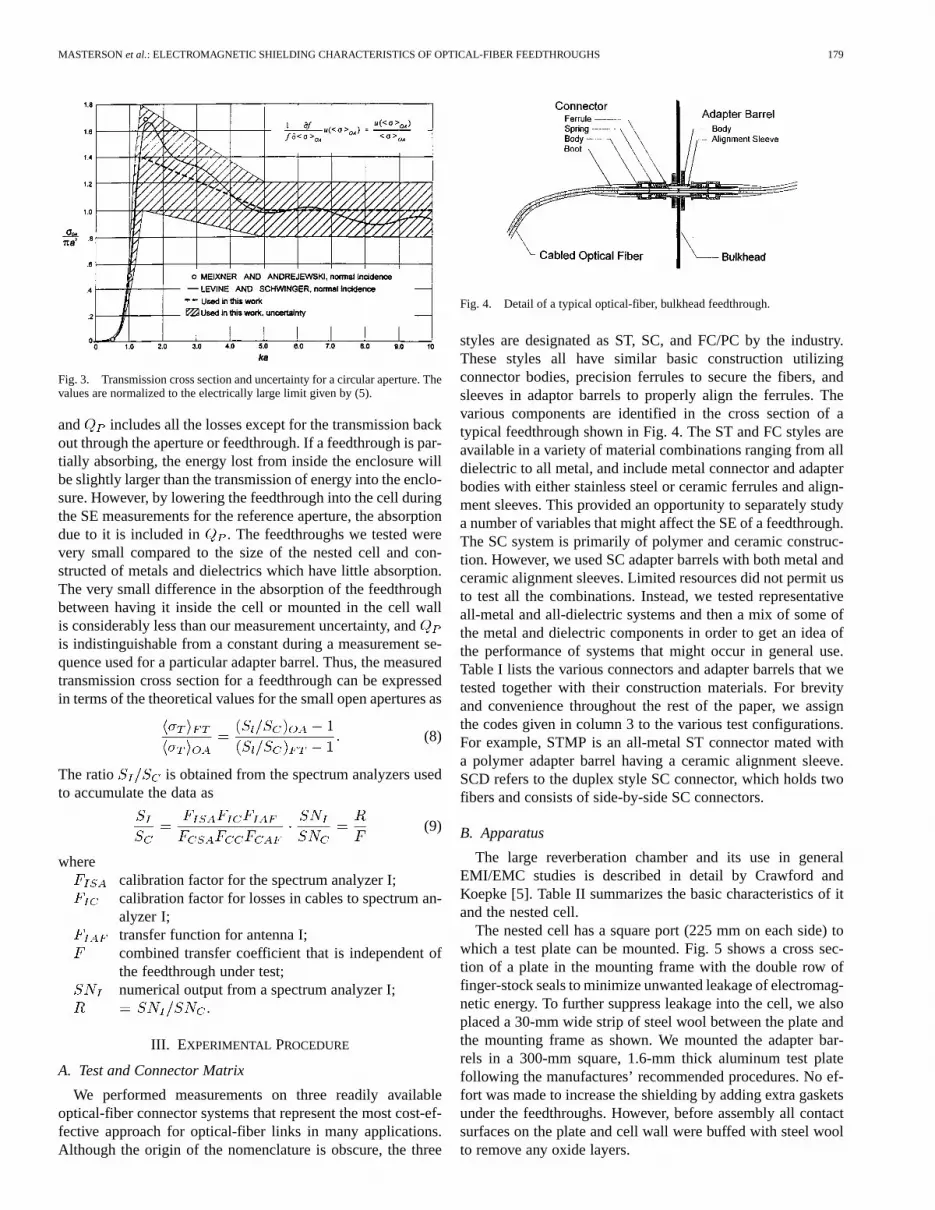
Although an exact theoretical solution for the transmission co-efficient of a circular aperture in a thin conducting sheet is avail-able in terms of spheroidal functions [3] and solutions based onvariational approximations have been reported by Levine andSchwinger [4] for normal incidence, we used the approximatesolutions for electrically small and electrically large aperturesof radius given by Hill et al. [2] as
electrically small (4)
and
electrically large (5)
Fig. 3 shows the approximation for normal incidence togetherwith those for electrically small and electrically large cases.Since the experimental data from [2] also indicate a resonance inthe transmission cross section near= 1.5, we chose
up to = 1.4 and then linearly connect this withfor as shown. These relations define the refer-
ence values for the open apertures that we used to determine thetransmission cross sections of the feedthroughs. Using (3) to-gether with the assumption that the transmission cross sectionsfor electromagnetic energy entering and leaving the test enclo-sure through the open aperture are the same, we can express (2)as
(6)
where
(7)
MASTERSONet al.: ELECTROMAGNETIC SHIELDING CHARACTERISTICS OF OPTICAL-FIBER FEEDTHROUGHS 179
Fig. 3. Transmission cross section and uncertainty for a circular aperture. Thevalues are normalized to the electrically large limit given by (5).
and includes all the losses except for the transmission backout through the aperture or feedthrough. If a feedthrough is par-tially absorbing, the energy lost from inside the enclosure willbe slightly larger than the transmission of energy into the enclo-sure. However, by lowering the feedthrough into the cell duringthe SE measurements for the reference aperture, the absorptiondue to it is included in . The feedthroughs we tested werevery small compared to the size of the nested cell and con-structed of metals and dielectrics which have little absorption.The very small difference in the absorption of the feedthroughbetween having it inside the cell or mounted in the cell wallis considerably less than our measurement uncertainty, andis indistinguishable from a constant during a measurement se-quence used for a particular adapter barrel. Thus, the measuredtransmission cross section for a feedthrough can be expressedin terms of the theoretical values for the small open apertures as
(8)
The ratio is obtained from the spectrum analyzers usedto accumulate the data as
(9)
wherecalibration factor for the spectrum analyzer I;calibration factor for losses in cables to spectrum an-alyzer I;transfer function for antenna I;combined transfer coefficient that is independent ofthe feedthrough under test;numerical output from a spectrum analyzer I;
.
III. EXPERIMENTAL PROCEDURE
A. Test and Connector Matrix
We performed measurements on three readily availableoptical-fiber connector systems that represent the most cost-ef-fective approach for optical-fiber links in many applications.Although the origin of the nomenclature is obscure, the three
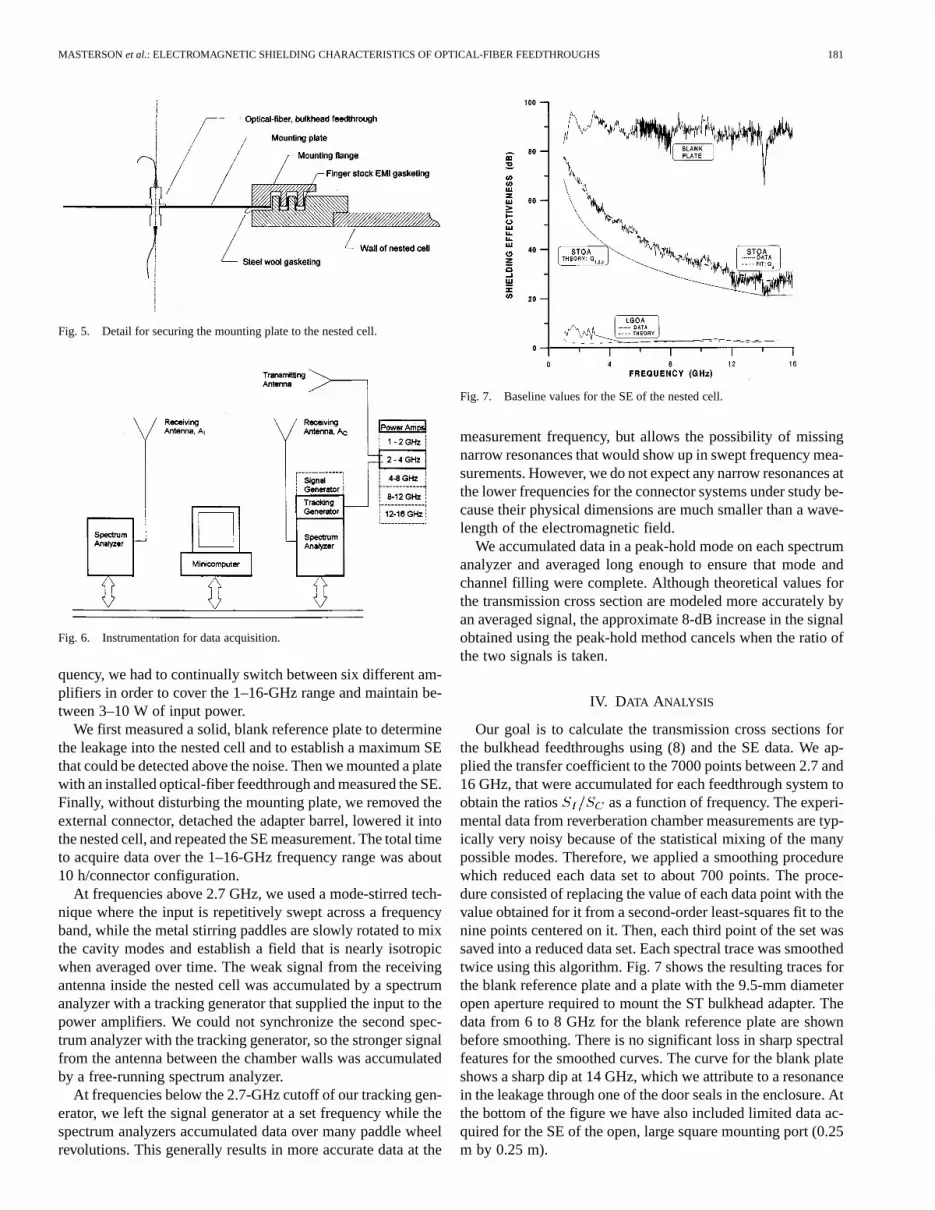
Fig. 4. Detail of a typical optical-fiber, bulkhead feedthrough.
styles are designated as ST, SC, and FC/PC by the industry.These styles all have similar basic construction utilizingconnector bodies, precision ferrules to secure the fibers, andsleeves in adaptor barrels to properly align the ferrules. Thevarious components are identified in the cross section of atypical feedthrough shown in Fig. 4. The ST and FC styles areavailable in a variety of material combinations ranging from alldielectric to all metal, and include metal connector and adapterbodies with either stainless steel or ceramic ferrules and align-ment sleeves. This provided an opportunity to separately studya number of variables that might affect the SE of a feedthrough.The SC system is primarily of polymer and ceramic construc-tion. However, we used SC adapter barrels with both metal andceramic alignment sleeves. Limited resources did not permit usto test all the combinations. Instead, we tested representativeall-metal and all-dielectric systems and then a mix of some ofthe metal and dielectric components in order to get an idea ofthe performance of systems that might occur in general use.Table I lists the various connectors and adapter barrels that wetested together with their construction materials. For brevityand convenience throughout the rest of the paper, we assignthe codes given in column 3 to the various test configurations.For example, STMP is an all-metal ST connector mated witha polymer adapter barrel having a ceramic alignment sleeve.SCD refers to the duplex style SC connector, which holds twofibers and consists of side-by-side SC connectors.
B. Apparatus
The large reverberation chamber and its use in generalEMI/EMC studies is described in detail by Crawford andKoepke [5]. Table II summarizes the basic characteristics of itand the nested cell.
The nested cell has a square port (225 mm on each side) towhich a test plate can be mounted. Fig. 5 shows a cross sec-tion of a plate in the mounting frame with the double row offinger-stock seals to minimize unwanted leakage of electromag-netic energy. To further suppress leakage into the cell, we alsoplaced a 30-mm wide strip of steel wool between the plate andthe mounting frame as shown. We mounted the adapter bar-rels in a 300-mm square, 1.6-mm thick aluminum test platefollowing the manufactures’ recommended procedures. No ef-fort was made to increase the shielding by adding extra gasketsunder the feedthroughs. However, before assembly all contactsurfaces on the plate and cell wall were buffed with steel woolto remove any oxide layers.

180 IEEE TRANSACTIONS ON ELECTROMAGNETIC COMPATIBILITY, VOL. 43, NO. 2, MAY 2001
TABLE ICONNECTORS, COMPONENTS, AND MATERIALS USED IN TEST MATRIX
TABLE IICHARACTERISTICS OF THEREVERBERATION CHAMBER AND THE NESTEDCELL
To obtain high EMI immunity for the signal lines betweenthe nested cell and the bulkhead into the large reverberationchamber, we used semi-rigid coaxial cable. The dc line to themode-stirring paddle in the nested cell was shielded and filtered.All electrical connections were wrapped in steel wool and thencovered with electrically conducting tape.
C. Data Acquisition
Data were acquired for each feedthrough configuration usingthe instrumentation shown in Fig. 6 and described in [1]. Thebroadband, open horn receiving antennas were a matched pairwith frequency responses from 800 MHz to 16 GHz. Since ap-propriate power amplifiers only cover about one octave in fre-
MASTERSONet al.: ELECTROMAGNETIC SHIELDING CHARACTERISTICS OF OPTICAL-FIBER FEEDTHROUGHS 181
Fig. 5. Detail for securing the mounting plate to the nested cell.
Fig. 6. Instrumentation for data acquisition.
quency, we had to continually switch between six different am-plifiers in order to cover the 1–16-GHz range and maintain be-tween 3–10 W of input power.
We first measured a solid, blank reference plate to determinethe leakage into the nested cell and to establish a maximum SEthat could be detected above the noise. Then we mounted a platewith an installed optical-fiber feedthrough and measured the SE.Finally, without disturbing the mounting plate, we removed theexternal connector, detached the adapter barrel, lowered it intothe nested cell, and repeated the SE measurement. The total timeto acquire data over the 1–16-GHz frequency range was about10 h/connector configuration.
At frequencies above 2.7 GHz, we used a mode-stirred tech-nique where the input is repetitively swept across a frequencyband, while the metal stirring paddles are slowly rotated to mixthe cavity modes and establish a field that is nearly isotropicwhen averaged over time. The weak signal from the receivingantenna inside the nested cell was accumulated by a spectrumanalyzer with a tracking generator that supplied the input to thepower amplifiers. We could not synchronize the second spec-trum analyzer with the tracking generator, so the stronger signalfrom the antenna between the chamber walls was accumulatedby a free-running spectrum analyzer.
At frequencies below the 2.7-GHz cutoff of our tracking gen-erator, we left the signal generator at a set frequency while thespectrum analyzers accumulated data over many paddle wheelrevolutions. This generally results in more accurate data at the
Fig. 7. Baseline values for the SE of the nested cell.
measurement frequency, but allows the possibility of missingnarrow resonances that would show up in swept frequency mea-surements. However, we do not expect any narrow resonances atthe lower frequencies for the connector systems under study be-cause their physical dimensions are much smaller than a wave-length of the electromagnetic field.
We accumulated data in a peak-hold mode on each spectrumanalyzer and averaged long enough to ensure that mode andchannel filling were complete. Although theoretical values forthe transmission cross section are modeled more accurately byan averaged signal, the approximate 8-dB increase in the signalobtained using the peak-hold method cancels when the ratio ofthe two signals is taken.
IV. DATA ANALYSIS
Our goal is to calculate the transmission cross sections forthe bulkhead feedthroughs using (8) and the SE data. We ap-plied the transfer coefficient to the 7000 points between 2.7 and16 GHz, that were accumulated for each feedthrough system toobtain the ratios as a function of frequency. The experi-mental data from reverberation chamber measurements are typ-ically very noisy because of the statistical mixing of the manypossible modes. Therefore, we applied a smoothing procedurewhich reduced each data set to about 700 points. The proce-dure consisted of replacing the value of each data point with thevalue obtained for it from a second-order least-squares fit to thenine points centered on it. Then, each third point of the set wassaved into a reduced data set. Each spectral trace was smoothedtwice using this algorithm. Fig. 7 shows the resulting traces forthe blank reference plate and a plate with the 9.5-mm diameteropen aperture required to mount the ST bulkhead adapter. Thedata from 6 to 8 GHz for the blank reference plate are shownbefore smoothing. There is no significant loss in sharp spectralfeatures for the smoothed curves. The curve for the blank plateshows a sharp dip at 14 GHz, which we attribute to a resonancein the leakage through one of the door seals in the enclosure. Atthe bottom of the figure we have also included limited data ac-quired for the SE of the open, large square mounting port (0.25m by 0.25 m).
182 IEEE TRANSACTIONS ON ELECTROMAGNETIC COMPATIBILITY, VOL. 43, NO. 2, MAY 2001
TABLE IIIFITTING PARAMETERS FOROPEN APERTURES
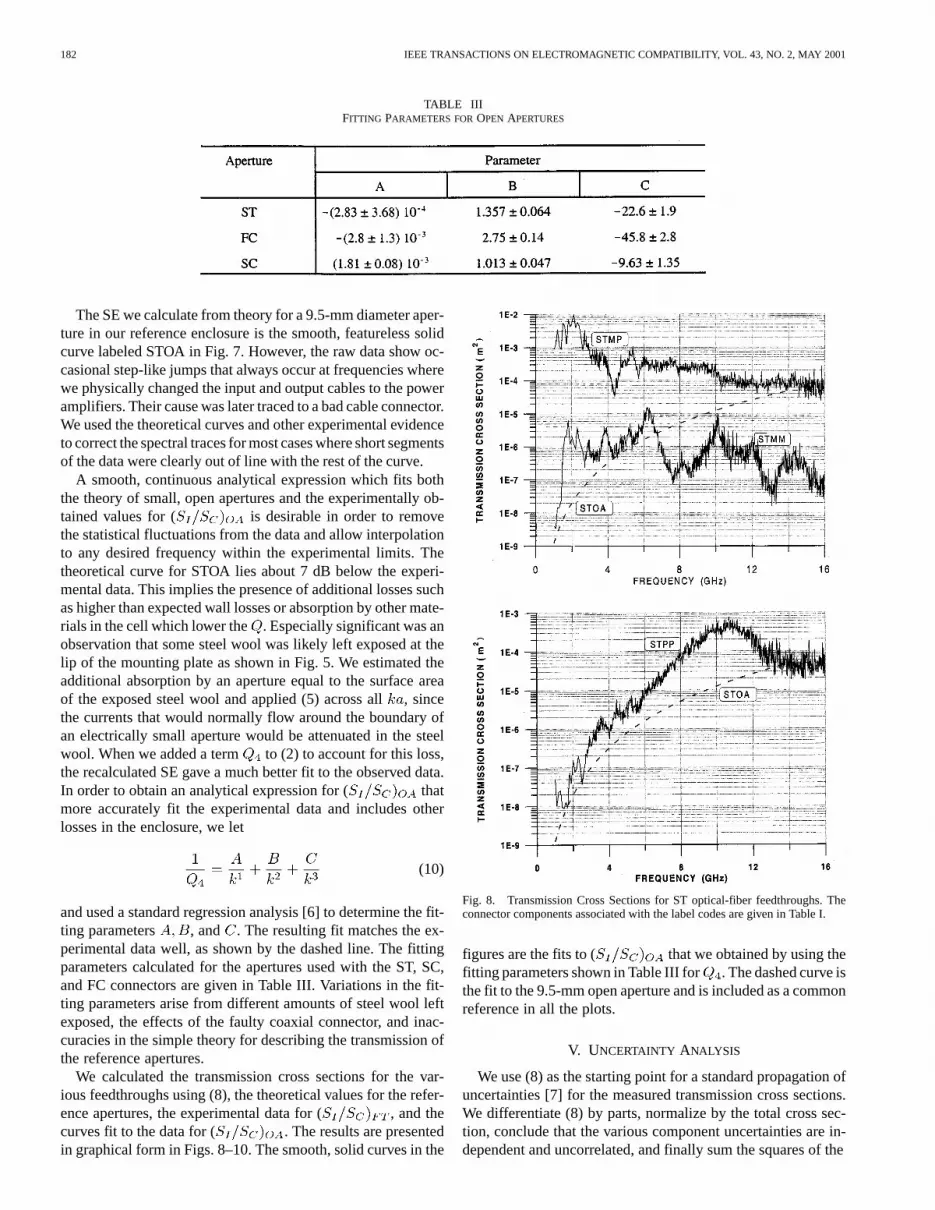
The SE we calculate from theory for a 9.5-mm diameter aper-ture in our reference enclosure is the smooth, featureless solidcurve labeled STOA in Fig. 7. However, the raw data show oc-casional step-like jumps that always occur at frequencies wherewe physically changed the input and output cables to the poweramplifiers. Their cause was later traced to a bad cable connector.We used the theoretical curves and other experimental evidenceto correct the spectral traces for most cases where short segmentsof the data were clearly out of line with the rest of the curve.
A smooth, continuous analytical expression which fits boththe theory of small, open apertures and the experimentally ob-tained values for ( is desirable in order to removethe statistical fluctuations from the data and allow interpolationto any desired frequency within the experimental limits. Thetheoretical curve for STOA lies about 7 dB below the experi-mental data. This implies the presence of additional losses suchas higher than expected wall losses or absorption by other mate-rials in the cell which lower the . Especially significant was anobservation that some steel wool was likely left exposed at thelip of the mounting plate as shown in Fig. 5. We estimated theadditional absorption by an aperture equal to the surface areaof the exposed steel wool and applied (5) across all, sincethe currents that would normally flow around the boundary ofan electrically small aperture would be attenuated in the steelwool. When we added a term to (2) to account for this loss,the recalculated SE gave a much better fit to the observed data.In order to obtain an analytical expression for ( thatmore accurately fit the experimental data and includes otherlosses in the enclosure, we let
(10)
and used a standard regression analysis [6] to determine the fit-ting parameters , and . The resulting fit matches the ex-perimental data well, as shown by the dashed line. The fittingparameters calculated for the apertures used with the ST, SC,and FC connectors are given in Table III. Variations in the fit-ting parameters arise from different amounts of steel wool leftexposed, the effects of the faulty coaxial connector, and inac-curacies in the simple theory for describing the transmission ofthe reference apertures.
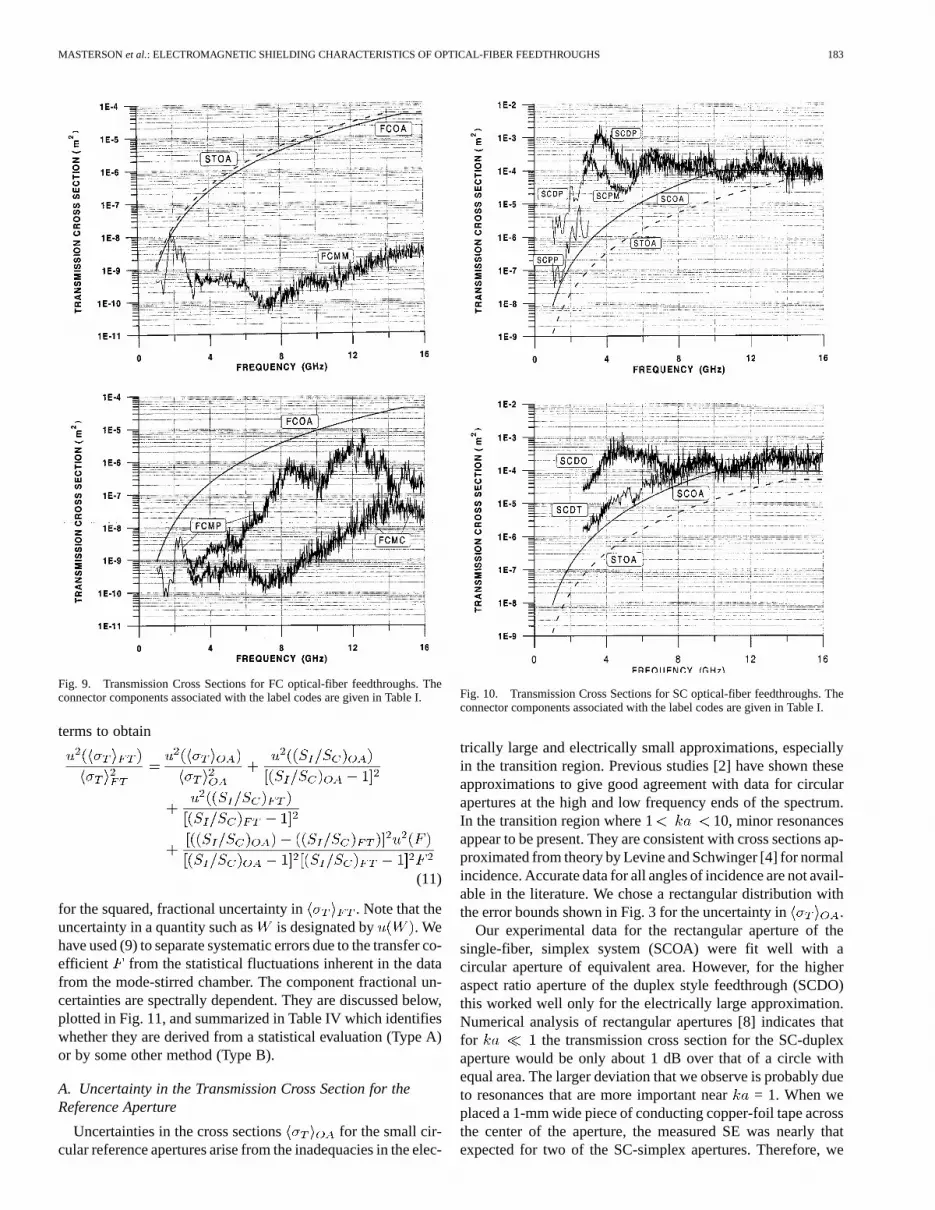
We calculated the transmission cross sections for the var-ious feedthroughs using (8), the theoretical values for the refer-ence apertures, the experimental data for ( , and thecurves fit to the data for ( . The results are presentedin graphical form in Figs. 8–10. The smooth, solid curves in the
Fig. 8. Transmission Cross Sections for ST optical-fiber feedthroughs. Theconnector components associated with the label codes are given in Table I.
figures are the fits to ( that we obtained by using thefitting parameters shown in Table III for . The dashed curve isthe fit to the 9.5-mm open aperture and is included as a commonreference in all the plots.
V. UNCERTAINTY ANALYSIS
We use (8) as the starting point for a standard propagation ofuncertainties [7] for the measured transmission cross sections.We differentiate (8) by parts, normalize by the total cross sec-tion, conclude that the various component uncertainties are in-dependent and uncorrelated, and finally sum the squares of the
MASTERSONet al.: ELECTROMAGNETIC SHIELDING CHARACTERISTICS OF OPTICAL-FIBER FEEDTHROUGHS 183
Fig. 9. Transmission Cross Sections for FC optical-fiber feedthroughs. Theconnector components associated with the label codes are given in Table I.
terms to obtain
(11)
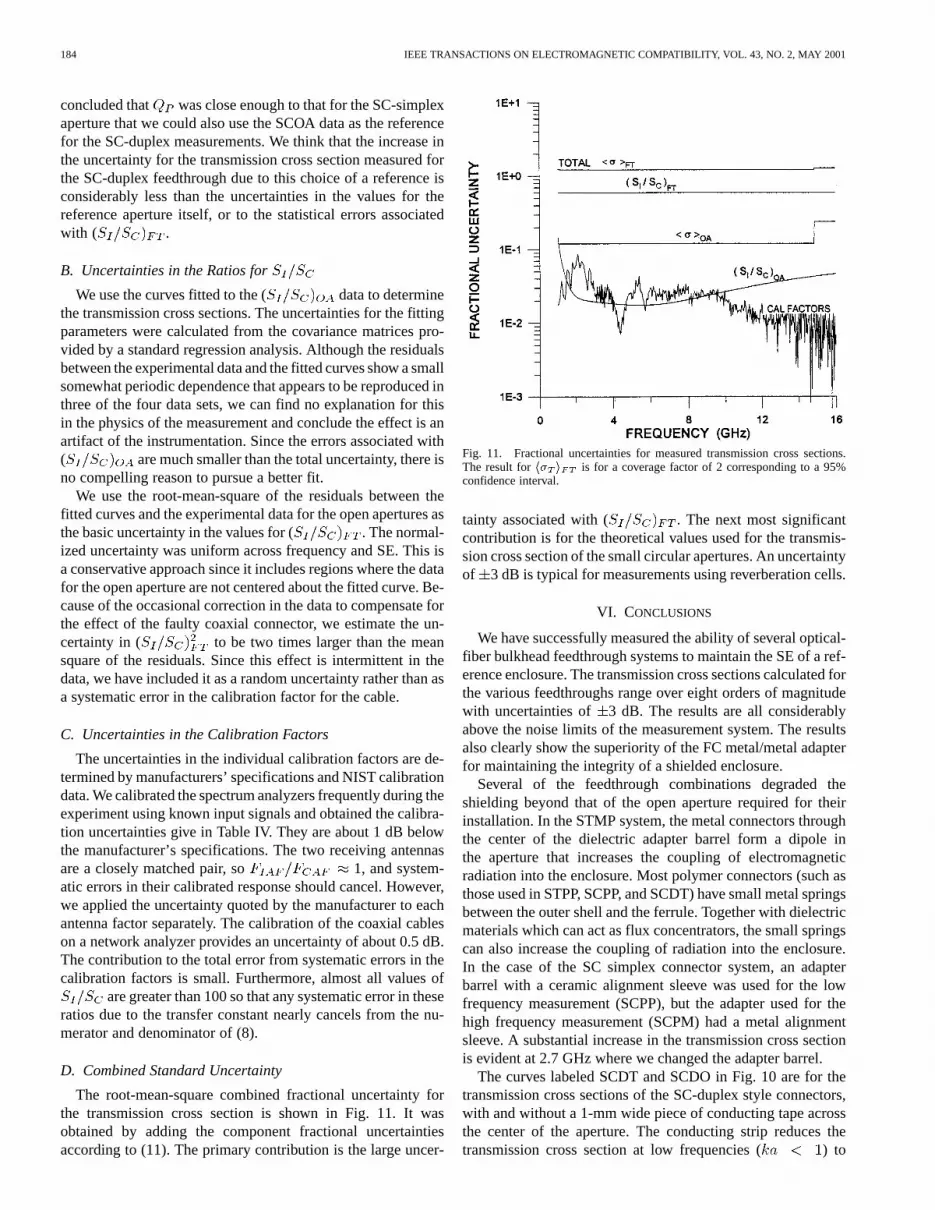
for the squared, fractional uncertainty in . Note that theuncertainty in a quantity such as is designated by . Wehave used (9) to separate systematic errors due to the transfer co-efficient from the statistical fluctuations inherent in the datafrom the mode-stirred chamber. The component fractional un-certainties are spectrally dependent. They are discussed below,plotted in Fig. 11, and summarized in Table IV which identifieswhether they are derived from a statistical evaluation (Type A)or by some other method (Type B).
A. Uncertainty in the Transmission Cross Section for theReference Aperture
Uncertainties in the cross sections for the small cir-cular reference apertures arise from the inadequacies in the elec-
Fig. 10. Transmission Cross Sections for SC optical-fiber feedthroughs. Theconnector components associated with the label codes are given in Table I.
trically large and electrically small approximations, especiallyin the transition region. Previous studies [2] have shown theseapproximations to give good agreement with data for circularapertures at the high and low frequency ends of the spectrum.In the transition region where 1 10, minor resonancesappear to be present. They are consistent with cross sections ap-proximated from theory by Levine and Schwinger [4] for normalincidence. Accurate data for all angles of incidence are not avail-able in the literature. We chose a rectangular distribution withthe error bounds shown in Fig. 3 for the uncertainty in .
Our experimental data for the rectangular aperture of thesingle-fiber, simplex system (SCOA) were fit well with acircular aperture of equivalent area. However, for the higheraspect ratio aperture of the duplex style feedthrough (SCDO)this worked well only for the electrically large approximation.Numerical analysis of rectangular apertures [8] indicates thatfor the transmission cross section for the SC-duplexaperture would be only about 1 dB over that of a circle withequal area. The larger deviation that we observe is probably dueto resonances that are more important near= 1. When weplaced a 1-mm wide piece of conducting copper-foil tape acrossthe center of the aperture, the measured SE was nearly thatexpected for two of the SC-simplex apertures. Therefore, we
184 IEEE TRANSACTIONS ON ELECTROMAGNETIC COMPATIBILITY, VOL. 43, NO. 2, MAY 2001
concluded that was close enough to that for the SC-simplexaperture that we could also use the SCOA data as the referencefor the SC-duplex measurements. We think that the increase inthe uncertainty for the transmission cross section measured forthe SC-duplex feedthrough due to this choice of a reference isconsiderably less than the uncertainties in the values for thereference aperture itself, or to the statistical errors associatedwith ( .
B. Uncertainties in the Ratios for
We use the curves fitted to the ( data to determinethe transmission cross sections. The uncertainties for the fittingparameters were calculated from the covariance matrices pro-vided by a standard regression analysis. Although the residualsbetween the experimental data and the fitted curves show a smallsomewhat periodic dependence that appears to be reproduced inthree of the four data sets, we can find no explanation for thisin the physics of the measurement and conclude the effect is anartifact of the instrumentation. Since the errors associated with( are much smaller than the total uncertainty, there isno compelling reason to pursue a better fit.
We use the root-mean-square of the residuals between thefitted curves and the experimental data for the open apertures asthe basic uncertainty in the values for ( . The normal-ized uncertainty was uniform across frequency and SE. This isa conservative approach since it includes regions where the datafor the open aperture are not centered about the fitted curve. Be-cause of the occasional correction in the data to compensate forthe effect of the faulty coaxial connector, we estimate the un-certainty in ( to be two times larger than the meansquare of the residuals. Since this effect is intermittent in thedata, we have included it as a random uncertainty rather than asa systematic error in the calibration factor for the cable.
C. Uncertainties in the Calibration Factors
The uncertainties in the individual calibration factors are de-termined by manufacturers’ specifications and NIST calibrationdata. We calibrated the spectrum analyzers frequently during theexperiment using known input signals and obtained the calibra-tion uncertainties give in Table IV. They are about 1 dB belowthe manufacturer’s specifications. The two receiving antennasare a closely matched pair, so 1, and system-atic errors in their calibrated response should cancel. However,we applied the uncertainty quoted by the manufacturer to eachantenna factor separately. The calibration of the coaxial cableson a network analyzer provides an uncertainty of about 0.5 dB.The contribution to the total error from systematic errors in thecalibration factors is small. Furthermore, almost all values of
are greater than 100 so that any systematic error in theseratios due to the transfer constant nearly cancels from the nu-merator and denominator of (8).
D. Combined Standard Uncertainty
The root-mean-square combined fractional uncertainty forthe transmission cross section is shown in Fig. 11. It wasobtained by adding the component fractional uncertaintiesaccording to (11). The primary contribution is the large uncer-
Fig. 11. Fractional uncertainties for measured transmission cross sections.The result forh� i is for a coverage factor of 2 corresponding to a 95%confidence interval.
tainty associated with ( . The next most significantcontribution is for the theoretical values used for the transmis-sion cross section of the small circular apertures. An uncertaintyof 3 dB is typical for measurements using reverberation cells.
VI. CONCLUSIONS
We have successfully measured the ability of several optical-fiber bulkhead feedthrough systems to maintain the SE of a ref-erence enclosure. The transmission cross sections calculated forthe various feedthroughs range over eight orders of magnitudewith uncertainties of 3 dB. The results are all considerablyabove the noise limits of the measurement system. The resultsalso clearly show the superiority of the FC metal/metal adapterfor maintaining the integrity of a shielded enclosure.
Several of the feedthrough combinations degraded theshielding beyond that of the open aperture required for theirinstallation. In the STMP system, the metal connectors throughthe center of the dielectric adapter barrel form a dipole inthe aperture that increases the coupling of electromagneticradiation into the enclosure. Most polymer connectors (such asthose used in STPP, SCPP, and SCDT) have small metal springsbetween the outer shell and the ferrule. Together with dielectricmaterials which can act as flux concentrators, the small springscan also increase the coupling of radiation into the enclosure.In the case of the SC simplex connector system, an adapterbarrel with a ceramic alignment sleeve was used for the lowfrequency measurement (SCPP), but the adapter used for thehigh frequency measurement (SCPM) had a metal alignmentsleeve. A substantial increase in the transmission cross sectionis evident at 2.7 GHz where we changed the adapter barrel.
The curves labeled SCDT and SCDO in Fig. 10 are for thetransmission cross sections of the SC-duplex style connectors,with and without a 1-mm wide piece of conducting tape acrossthe center of the aperture. The conducting strip reduces thetransmission cross section at low frequencies ( ) to
MASTERSONet al.: ELECTROMAGNETIC SHIELDING CHARACTERISTICS OF OPTICAL-FIBER FEEDTHROUGHS 185
TABLE IVFRACTIONAL COMPONENTUNCERTAINTIES FOR THETRANSMISSIONCROSSSECTIONS
about twice that for a SC-simplex feedthrough. For applicationsthat require SC-duplex connectors, we recommend the use ofa conducting strip. This would require either an adapter barrelthat would accommodate the strip or two single adapter barrelsmounted with dimensions to match the duplex connectors.
The SE of practical electronic enclosures with optical-fiberfeedthroughs can be estimated by using the transmission crosssections that we have reported. However, the leakage of energyinto an enclosure is also dependent on its particular geometry andorientation with respect to the incident electromagnetic fields.
We have demonstrated a basic measurement technique thatcan be used to test the SE of a variety of connectors. The basictechniques can be applied to other types of devices and couldbe adapted for testing active components such as connector-mounted laser diodes and photodiodes. Data acquisition couldbe speeded up by using two spectrum analyzers that could belocked to a single tracking generator. Both acquisition time andsignal-to-noise ratio could be improved through the use of a net-work analyzer to accumulate data. Finally, better theoretical cal-culations and numerical analysis for the coupling of isotropicradiation through a small circular aperture would reduce the un-certainties in the reference cross sections.
ACKNOWLEDGMENT
The authors wish to thank J. Ladbury and D. Camell forconsiderable help in setting up the experimental equipmentand data acquisition system, D. Hill for the helpful discussionsthroughout the project, D. Vecchia for valuable help in statis-tical and uncertainty analysis, and D. Kuchta and J. Crow ofIBM for their suggestion to place the narrow strip of conductingtape across the aperture for the duplex SC adapter barrel inorder to increase the shielding.
REFERENCES
[1] Electromagnetic shielding characteristics of optical-fiber connectors,Natl. Inst. Stand. Technol. Note 1383, 1997.
[2] D. A. Hill, M. T. Ma, A. R. Ondrejka, B. J. Riddle, M. L. Crawford, andR. T. Johnk, “Aperturee excitation of electrically large, lossy cavities,”IEEE Trans. Electromagn. Compat., vol. 36, pp. 169–177, Aug. 1994.
[3] J. Meixner and W. Andrejewski, “Strenge theorie der beugung ebenerelektromagnetischer wellen an der vollkommen leitenden kreisscheibeund an der kreisformigen offnung im vollkemmen leitenden ebenschirm,”Annal. Phys., vol. 7, no. 3/4, pp. 157–168, 1950.
[4] H. Levine and J. Schwinger, “On the theory of electromagnetic wavediffraction by an aperture in an infinite plane conducting screen,”Comm.Pure Appl. Math., vol. 3, no. 4, pp. 355–391, 1950.
[5] Design, evaluation, and use of a reverberation chamber for performingelectromagnetic susceptibility/vulnerability measurements, Nat. Bur.Stand. (US) Tech. Note 1092, 1986.
[6] D. W. Marquardt, “An algorithm for least squares estimation of non-linear parameters,”J. Soc. Ind. Appl. Math., vol. 11, no. 2, pp. 431–441,1963.
[7] Guidelines for evaluating and expressing the uncertainty of NIST mea-surement results, Natl. Inst. Stand. Technol. Tech. Note 1297, 1994.
[8] F. de Meulenaere and J. Van Bladel, “Polarizability of some small aper-tures,”IEEE Trans. Antennas Propagat., vol. AP-25, pp. 198–205, Mar.1977.
Keith D. Masterson (M’00) received the B.A. degree from Oregon State Uni-versity, Corvallis, OR, in 1963 and the Ph.D. degree in physics from the Univer-sity of Arizona, Tucson, AZ, in 1974, where his graduate work was in the areaof atomic spectroscopy and optical sciences.
During 1966–1967 he worked in the area of laser-microprobe spectroscopy atthe Institute for Spectrochemistry and Applied Spectroscopy, Dortmund, Ger-many. From 1974 to 1984 he worked on optical materials for solar energy con-version, first at the University of Arizona and later as a Senior Scientist at theSolar Energy Research Institute, Golden, CO. Since 1984, he has been at theNational Standards of Technology’s RF Technology Division, Boulder, CO, asproject leader to develop optically sensed probes for measuring electromagneticfields.
Dr. Masterson is a member of the Optical Society of America, SPIE-The In-ternational Society of Optical Engineering.
186 IEEE TRANSACTIONS ON ELECTROMAGNETIC COMPATIBILITY, VOL. 43, NO. 2, MAY 2001
David R. Novotnywas born in Minneapolis, MN in 1968. He received the B.S.and M.S degrees from the University of Colorado, Boulder, in 1990 and 1996.His graduate work focused on designing specialized, nonperturbing dielectricmounts for antennas.
He is currently working at the National Institute of Standards and Technology,Boulder, CO, in the RF Technology Division, where he is working on newprobes for EM field metrology and field generation techniques for antenna cal-ibration purposes.
Galen Koepkereceived the B.S. degree in electrical engineering from the Uni-versity of Nebraska, Lincoln, in 1973 and the M.S.E. E. degree from the Uni-versity of Colorado, Boulder, in 1981.
He held research and teaching assistantships with the University of Colorado,spent several years working in forestry with the U.S.D.A. and was active in otherareas of agriculture. In 1980, he joined the staff of the Radio Frequency Tech-nology Division at the National Institute of Standards and Technology (NIST),where his responsibilities have included research in electromagnetic interfer-ence measurements and facilities, instrumentation, field probe, and antenna de-velopment, antenna calibrations and measurements; and software developmentfor measurement processes.


