Embed Size (px)
Citation preview
The Lichenologist 40(3): 257–266 (2008) � 2008 British Lichen Societydoi:10.1017/S0024282908007664 Printed in the United Kingdom
Epiphytic lichen biomass in a boreal Norway spruce forest
Yngvar GAUSLAA, Marit LIE and Mikael OHLSON
Abstract: Alectorioid and foliose lichens were weighed from full-size branches of Picea abies cut attwo canopy heights in 100 trees in an old subalpine forested area in eastern Norway. The mean lichenbiomass per branch decreased from 46 to 37 g moving upwards from 2–3 to 5–6 m canopy height.The lichen biomass correlated strongly with branch size variables, branch diameter alone explaining48% of the variation in lichen biomass per branch (n=200). The alectorioid/foliose biomass ratioincreased from 0·149 at 2–3 m to 0·316 at 5–6 m. Site factors reflecting openness of the canopy werecomputed for the branch at 2–3 m in all trees. The alectorioid/foliose biomass ratio increasedsignificantly with the indirect site factors, suggesting that light, or factors associated with light,determine the balance between these two growth forms in tree canopies. Within the alectorioidbiomass component, genera with usnic acid (Alectoria, Usnea) decreased with height, whereas thegenus Bryoria with melanic pigments increased. According to the literature, dark melanic pigmentshave higher visible light screening efficiency than the yellowish usnic acid. Such patterns suggest afunctional role for cortical pigments in the niche differentiation of alectorioid lichens.
Key words: Alectoria sarmentosa, boreal forest, Bryoria, canopy gradient, Usnea filipendula, usnic acid
Introduction
Epiphytes are numerous in many borealforest canopies (Hilmo 1994; Kuusinen1996; Ohlson et al. 1997; Boudreault et al.2002). A rich assembly of epiphytic lichenscommonly envelops the canopy branchesand provides hiding places for invertebratesrepresenting important fodder for foragingbirds (Pettersson et al. 1995). Furthermore,canopy lichens represent significant winterfodder for reindeer (Rominger et al. 1996;Arseneault et al. 1997; Goward & Campbell2005), particularly in snow-rich winters.Despite the ecological significance of thisspectacular epiphytic component, there arefew reliable assessments of epiphytic bio-mass in boreal sites. The removal of lichensfrom branches is a time-consuming task,which has prevented many plans to assessepiphytic lichen biomass at an early stagewith some noteworthy exceptions (e.g.
Esseen et al. 1996; McCune 1994;Berryman & McCune 2006). Epiphyticlichen biomass has indirectly been estimatedby measuring the epiphytic litter, but suchapproaches are paved with a number ofpitfalls (recently discussed by Williams &Sillett 2007). In general, high quality bio-mass measurements from forests based on alarge number of observations are rare.
This study aims to quantify epiphyticlichen biomass on Picea abies branches in oldsubalpine forest stands in eastern Norway.Since studies in subalpine Picea engelmanniiforests in North America have shownclear vertical zonation in canopy lichens(Campbell & Coxson 2001; Coxson & Coyle2003; Goward 2003), main branches werestudied at two height levels on each tree.One additional aim of the study is to inves-tigate if site factors for light exposure(Anderson 1964) computed from hemi-spherical photographs taken from the branchbase can account for the recorded lichenbiomass variation at the main branch levelwithin sampled forests. Available light,measured as indirect and direct site factors,
Y. Gauslaa, M. Lie and M. Ohlson: Department ofEcology and Natural Resource Management,Norwegian University of Life Sciences, P.O. Box 5003,NO-1432 Ås, Norway. Email: [email protected]
has recently been shown to explain a sub-stantial part of the biomass gain in epiphyticlichens in studies along wide light gradientsfrom open clear-cuts to dense and youngevergreen canopies (Gauslaa et al. 2006,2007). More specifically, the light incidenton a lichen thallus during hydration periodsdetermines lichen growth (Palmqvist 2000)and should thus be a significant factor forthe accumulation of lichen biomass. Finally,we aim to establish a basis for evaluatingfuture changes in epiphytic lichen biomass,which is important in order to improve theuse of lichen communities as indicators ofenvironmental change in boreal forests.
Methods and Study area
Study area
The field site was situated in a subalpine boreal P.abies-dominated forest east of Dokkfløyvatn, GausdalVestfjell, SE Norway, 61(10#N, 09(90#E, 800 m a.s.l.Annual mean precipitation was 810 mm, and annualmean temperature was �0·1(C. The bedrock consistsof sedimentary rocks of cambro-ordovician age (phyl-lite, shale, sandstone and quartz) covered by thickmoraine deposits (Source: www.NGU.no). The moun-tain forest, situated 100 m below the tree line, was oldand multi-layered with trees varying in age and sizefrom seedlings to mature trees that were 21 m tall. Theage of 20 trees cored 30 cm above the ground variedbetween 68–213 years with a mean age of 131 years.Tree age was not correlated with tree height, and onlyweakly correlated with DBH (r2=0·212; P=0·024; datanot shown). No logging had occurred during the last50 years, but slight selective logging had occurred in thepast. The ground vegetation was dominated by thedwarf shrub Vaccinium myrtillus and bryophytes such asPleurozium schreberi, Hylocomium splendens, Polytrichumcommune and Sphagnum girgensohnii. Flowering plantssuch as Vaccinium vitis-idaea and Avenella flexuosa werealso abundant. The epiphytic vegetation on branches ofP. abies was dominated by lichens classified as foliose,for example Hypogymnia physodes, H. tubulosa, Platisma-tia glauca, Pseudevernia furfuracea, as well as the alec-torioid lichens Alectoria sarmentosa, Bryoria fuscescens s.lat., B. capillaris, Usnea filipendula and local patches withB. nadvornikiana and B. fremontii. Other Usnea specieswere also seen, but in low amounts and frequency. Fewlocalized patches of the vulnerable Evernia divaricata(Norwegian red list) occurred in the area, but not ontrees sampled. Foliose lichens comprising minor bio-mass components were Tuckermanopsis chlorophylla,Parmeliopsis ambigua, Parmelia saxatilis, Hypogymniaausterodes, H. bitteri, and Vulpicidia pinastri.
Ten circular plots of 2000 m2 were selected in an oldforest area of 600 m�300 m by using the following
criteria: 1, the plots should be located on flat ground; 2,the ground vegetation should be dominated by Vaccin-ium myrtillus and 3, the density of trees within the plotshould be homogeneous. Within each plot, 10 treesabove a height of 5 m were randomly selected. Thus, atotal of 100 trees were sampled in a restricted randomprocedure. The mean diameter (�SE) of sampled treeswas 21·7�0·8 cm (total range 9·5–40·9 cm). Themean tree height was 13·0�0·4 m (total range5·7–20·6 m).
Branch and lichen biomass parameters
Two hundred branches from the 100 selected Piceaabies trees were cut down in June 2003. Two brancheswere cut from each tree, one from 2–3 m height abovethe ground and one from 5–6 m. All branches selectedfaced south. The fresh weight of each branch wasrecorded in the field (�0·5 kg) and the length(�1 cm) and the base diameter (�1 mm) weremeasured. The cover of green needles was visuallyestimated to the nearest 10%. The branches were thenwrapped and transported out of the forest. Sampledtrees were not cored in order to avoid possible infectionand weakening of trees for repeated sampling in thefuture. The epiphytic biomass was dominated by mac-rolichens on a weight basis. Macrolichens were sortedinto the functional groups, foliose lichens and alectori-oid lichens. The alectorioid lichens were further sortedinto pendulous species with usnic acid (Alectoria sar-mentosa and Usnea; mainly U. filipendula) and usnic aciddeficient species (Bryoria spp). Among the alectorioidlichens with usnic acid, U. filipendula was the mostcommon species in terms of frequency, A. sarmentosaoccurred on a small number of trees. No cyanobacteriallichens were present on the branches studied. All folioselichens and the two subgroups of alectorioid lichenswere removed separately and dried to constant weightat 70(C before weighing each of these categories.Macrolichen biomass was given as dry weight perbranch. Crustose lichens were not sampled.
Site factors
Image analysis of hemispherical digital photographs(e.g. Englund et al. 2000) was used to quantify thecanopy cover and thus assess the amount of light. Onedigital hemispherical photograph was taken from ahorizontal position inside the tree canopy where thelowermost branch had been attached to the tree.Photographs were taken in September 2003 with aNikon Coolpix 950 camera with a Nikon FisheyeConverter (FC-E8), mounted on a tripod with a lead-line to ensure that the camera was kept in a horizontalposition when the photographs were taken. Images wereanalysed by means of HemiView 2.1 (Delta-T Devices,Burwell, Cambridge, UK) to compute three measuresof light exposure reflecting the canopy openness.These are called direct, indirect, and global site factors(Anderson 1964). The indirect site factor (0·168�0·003; mean�SE; n=96) is the proportion of diffusesolar radiation reaching a given location, relative to a
258 THE LICHENOLOGIST Vol. 40
location with no sky obstructions. The direct site factor(0·212�0·006) is the proportion of direct solar radia-tion reaching a given location, relative to that in alocation with no sky obstructions. The global site factor(0·205�0·006) is the proportion of global solar radia-tion (direct plus diffuse) under a plant canopy relativeto that in the open.
Statistical analyses
Branches where one or more measurements weremissing were excluded from the dataset (lower branchesn=96, upper branches n=94; upper and lower branchpairs n=92). In order to improve the distribution forregression analyses, size and biomass variables werelog-transformed. A one-way ANOVA was run to test forpossible differences between study plots. A pairwiset-test was used to compare branches from the twoheight levels of sampled trees. In order to fulfil therequirements of the t-test, the following transformationswere made: branch weight and alectorioid/foliose ratiowere log-transformed; foliose lichens, total lichens andpercent green needles on branches were root trans-formed. All statistical tests were run in SigmaStatversion 1.0 (SYSTAT Software Inc., Richmond,California).
Results
The variables measured did not differbetween the ten study plots, except forbranch base diameter at a marginally signifi-cant level (P=0·046; ANOVA). Therefore,the study plots were not considered as afactor in further analyses.
The tree variables (DBH, tree height,branch weight, branch length and branchdiameter) were strongly correlated (Tables 1& 2). Lichen biomass was strongly positivelycorrelated with tree and branch size (Tables1 & 2). The best correlations occurred be-tween biomass of lichens per branch invarious categories and branch size, ratherthan tree size. Multiple linear regressionmodels were run for the lichen biomass incategories of lichens studied using tree andbranch variables as predictors. For all cat-egories of lichens, tree size variables gave nosignificant contribution (P>0·05) in combi-nation with branch size (data not shown).Lichen biomass showed the strongest corre-lation between branch diameter or branchweight in multiple analyses (not shown) aswell as in simple correlations (Tables 1 & 2;Fig. 1).
Total lichen biomass was significantlyhigher on the lower branches (46·2 gbranch�1) compared to the branches at5–6 m (36·6 g branch�1; Table 3). Thedecrease in total biomass per branch withheight was proportional to the correspond-ing decrease in branch size variables, mean-ing that the total lichen biomass per unitbranch weight, per length (Table 3) and perdiameter did not differ significantly betweenthe two height levels. However, the twomajor functional groups of epiphytic lichensshowed contrasting patterns between thetwo categories of branches sampled.Whereas the largest total lichen biomasscomponent, foliose lichens, decreased withincreasing height within the canopy, thealectorioid lichen biomass consistently in-creased. These contrasting trends resulted inmore than a doubling of the alectorioid/foliose lichen biomass ratio within a verticaldistance of only a few metres (Table 3).Furthermore, the two subgroups of alectori-oid lichens showed opposite trends, imply-ing that a separation of these subgroupsincreased the level of significance for thedifference between the categories ofbranches (Table 1). Alectoria sarmentosa+U.filipendula, like foliose lichens, occurred inlargest quantities on lowermost branches,whereas Bryoria spp. representing the prin-cipal component of the alectorioid biomasswas significantly more abundant on branchescollected at 5–6 m above the ground.
Analysing branches from both samplingheights together, the quantity of substratummeasured as branch size was still the import-ant predictor for epiphytic lichen biomass.The three measures of branch size (branchfresh weight, length of main axis, and basalbranch diameter) were all strongly corre-lated (r>0·777; P<0·0001). The strongestrelationships occurred between total lichenbiomass and branch size variables. Sincebranch weight was measured to the nearest500 g in the field, we decided to illustrate thelichen biomass dependency on branch sizeby using the more finely graded basal diam-eter of the main axis as a biomass predictor(Fig. 1). The branch diameter explained asmuch as 47·6% of the variation in total
2008 Epiphytic lichen biomass in a boreal forest—Gauslaa et al. 259
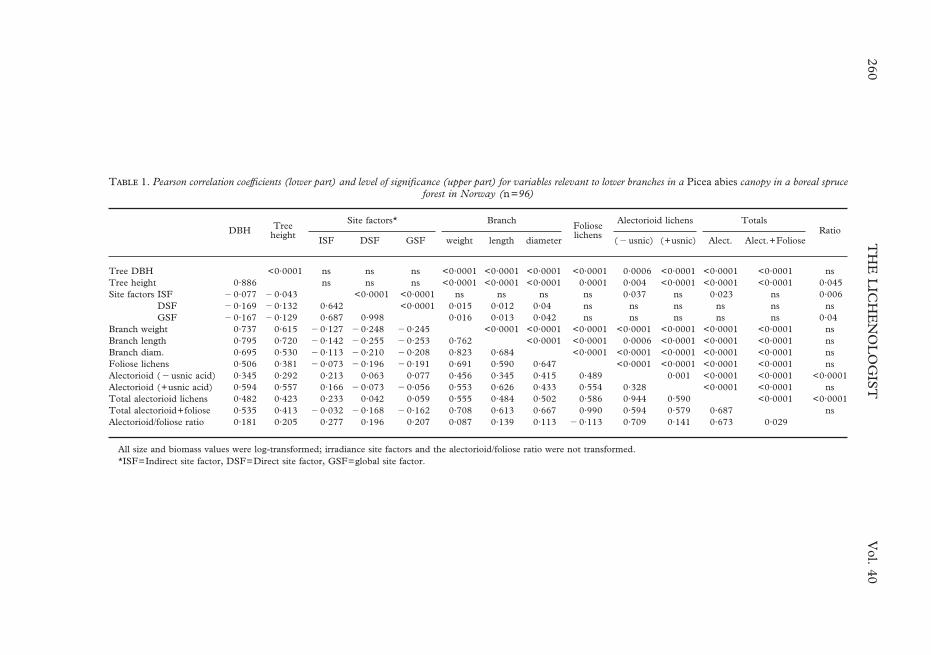
T 1. Pearson correlation coefficients (lower part) and level of significance (upper part) for variables relevant to lower branches in a Picea abies canopy in a boreal spruceforest in Norway (n=96)
DBH Treeheight
Site factors* BranchFolioselichens
Alectorioid lichens TotalsRatio
ISF DSF GSF weight length diameter (�usnic) (+usnic) Alect. Alect.+Foliose
Tree DBH <0·0001 ns ns ns <0·0001 <0·0001 <0·0001 <0·0001 0·0006 <0·0001 <0·0001 <0·0001 nsTree height 0·886 ns ns ns <0·0001 <0·0001 <0·0001 0·0001 0·004 <0·0001 <0·0001 <0·0001 0·045Site factors ISF �0·077 �0·043 <0·0001 <0·0001 ns ns ns ns 0·037 ns 0·023 ns 0·006
DSF �0·169 �0·132 0·642 <0·0001 0·015 0·012 0·04 ns ns ns ns ns nsGSF �0·167 �0·129 0·687 0·998 0·016 0·013 0·042 ns ns ns ns ns 0·04
Branch weight 0·737 0·615 �0·127 �0·248 �0·245 <0·0001 <0·0001 <0·0001 <0·0001 <0·0001 <0·0001 <0·0001 nsBranch length 0·795 0·720 �0·142 �0·255 �0·253 0·762 <0·0001 <0·0001 0·0006 <0·0001 <0·0001 <0·0001 nsBranch diam. 0·695 0·530 �0·113 �0·210 �0·208 0·823 0·684 <0·0001 <0·0001 <0·0001 <0·0001 <0·0001 nsFoliose lichens 0·506 0·381 �0·073 �0·196 �0·191 0·691 0·590 0·647 <0·0001 <0·0001 <0·0001 <0·0001 nsAlectorioid (�usnic acid) 0·345 0·292 0·213 0·063 0·077 0·456 0·345 0·415 0·489 0·001 <0·0001 <0·0001 <0·0001Alectorioid (+usnic acid) 0·594 0·557 0·166 �0·073 �0·056 0·553 0·626 0·433 0·554 0·328 <0·0001 <0·0001 nsTotal alectorioid lichens 0·482 0·423 0·233 0·042 0·059 0·555 0·484 0·502 0·586 0·944 0·590 <0·0001 <0·0001Total alectorioid+foliose 0·535 0·413 �0·032 �0·168 �0·162 0·708 0·613 0·667 0·990 0·594 0·579 0·687 nsAlectorioid/foliose ratio 0·181 0·205 0·277 0·196 0·207 0·087 0·139 0·113 �0·113 0·709 0·141 0·673 0·029
All size and biomass values were log-transformed; irradiance site factors and the alectorioid/foliose ratio were not transformed.*ISF=Indirect site factor, DSF=Direct site factor, GSF=global site factor.
260T
HE
LIC
HE
NO
LO
GIS
TV
ol.40
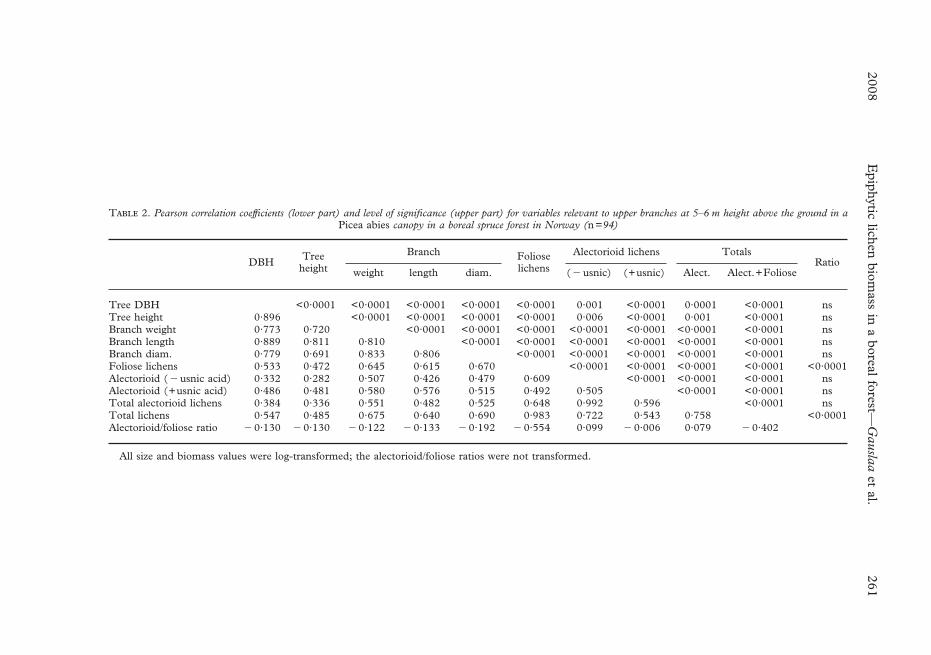
T 2. Pearson correlation coefficients (lower part) and level of significance (upper part) for variables relevant to upper branches at 5–6 m height above the ground in aPicea abies canopy in a boreal spruce forest in Norway (n=94)
DBH Treeheight
Branch Folioselichens
Alectorioid lichens TotalsRatio
weight length diam. (�usnic) (+usnic) Alect. Alect.+Foliose
Tree DBH <0·0001 <0·0001 <0·0001 <0·0001 <0·0001 0·001 <0·0001 0·0001 <0·0001 nsTree height 0·896 <0·0001 <0·0001 <0·0001 <0·0001 0·006 <0·0001 0·001 <0·0001 nsBranch weight 0·773 0·720 <0·0001 <0·0001 <0·0001 <0·0001 <0·0001 <0·0001 <0·0001 nsBranch length 0·889 0·811 0·810 <0·0001 <0·0001 <0·0001 <0·0001 <0·0001 <0·0001 nsBranch diam. 0·779 0·691 0·833 0·806 <0·0001 <0·0001 <0·0001 <0·0001 <0·0001 nsFoliose lichens 0·533 0·472 0·645 0·615 0·670 <0·0001 <0·0001 <0·0001 <0·0001 <0·0001Alectorioid (�usnic acid) 0·332 0·282 0·507 0·426 0·479 0·609 <0·0001 <0·0001 <0·0001 nsAlectorioid (+usnic acid) 0·486 0·481 0·580 0·576 0·515 0·492 0·505 <0·0001 <0·0001 nsTotal alectorioid lichens 0·384 0·336 0·551 0·482 0·525 0·648 0·992 0·596 <0·0001 nsTotal lichens 0·547 0·485 0·675 0·640 0·690 0·983 0·722 0·543 0·758 <0·0001Alectorioid/foliose ratio �0·130 �0·130 �0·122 �0·133 �0·192 �0·554 0·099 �0·006 0·079 �0·402
All size and biomass values were log-transformed; the alectorioid/foliose ratios were not transformed.
2008E
piphyticlichen
biomass
ina
borealforest—
Gauslaa
etal.
261
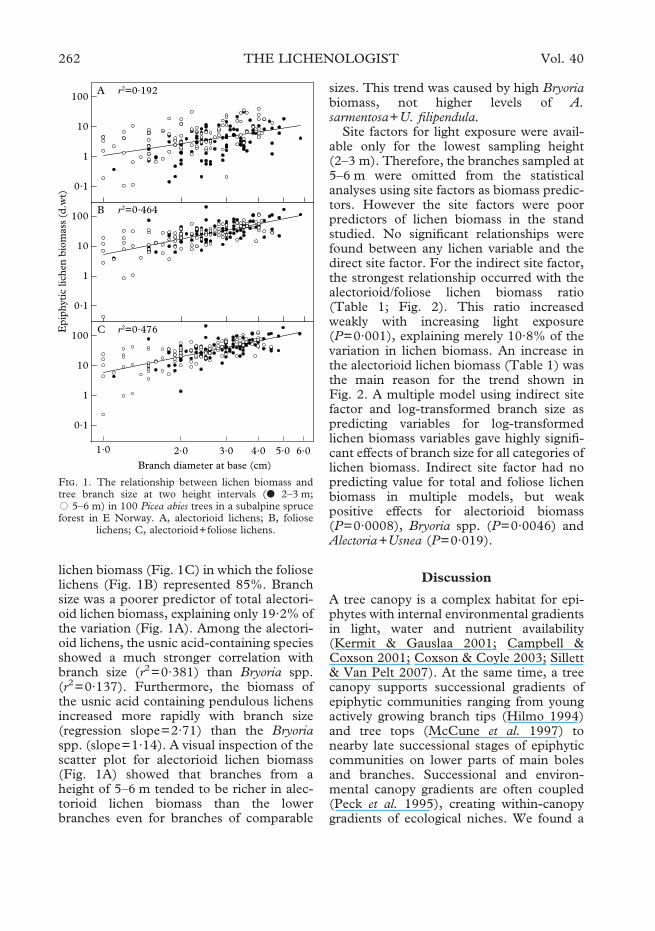
lichen biomass (Fig. 1C) in which the folioselichens (Fig. 1B) represented 85%. Branchsize was a poorer predictor of total alectori-oid lichen biomass, explaining only 19·2% ofthe variation (Fig. 1A). Among the alectori-oid lichens, the usnic acid-containing speciesshowed a much stronger correlation withbranch size (r2=0·381) than Bryoria spp.(r2=0·137). Furthermore, the biomass ofthe usnic acid containing pendulous lichensincreased more rapidly with branch size(regression slope=2·71) than the Bryoriaspp. (slope=1·14). A visual inspection of thescatter plot for alectorioid lichen biomass(Fig. 1A) showed that branches from aheight of 5–6 m tended to be richer in alec-torioid lichen biomass than the lowerbranches even for branches of comparable
sizes. This trend was caused by high Bryoriabiomass, not higher levels of A.sarmentosa+U. filipendula.
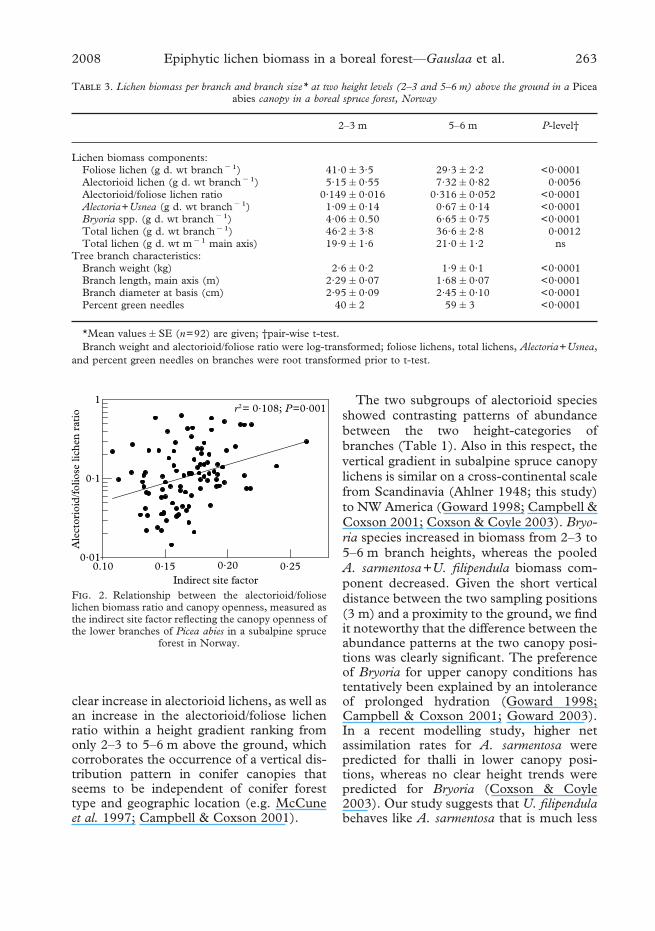
Site factors for light exposure were avail-able only for the lowest sampling height(2–3 m). Therefore, the branches sampled at5–6 m were omitted from the statisticalanalyses using site factors as biomass predic-tors. However the site factors were poorpredictors of lichen biomass in the standstudied. No significant relationships werefound between any lichen variable and thedirect site factor. For the indirect site factor,the strongest relationship occurred with thealectorioid/foliose lichen biomass ratio(Table 1; Fig. 2). This ratio increasedweakly with increasing light exposure(P=0·001), explaining merely 10·8% of thevariation in lichen biomass. An increase inthe alectorioid lichen biomass (Table 1) wasthe main reason for the trend shown inFig. 2. A multiple model using indirect sitefactor and log-transformed branch size aspredicting variables for log-transformedlichen biomass variables gave highly signifi-cant effects of branch size for all categories oflichen biomass. Indirect site factor had nopredicting value for total and foliose lichenbiomass in multiple models, but weakpositive effects for alectorioid biomass(P=0·0008), Bryoria spp. (P=0·0046) andAlectoria+Usnea (P=0·019).
Discussion
A tree canopy is a complex habitat for epi-phytes with internal environmental gradientsin light, water and nutrient availability(Kermit & Gauslaa 2001; Campbell &Coxson 2001; Coxson & Coyle 2003; Sillett& Van Pelt 2007). At the same time, a treecanopy supports successional gradients ofepiphytic communities ranging from youngactively growing branch tips (Hilmo 1994)and tree tops (McCune et al. 1997) tonearby late successional stages of epiphyticcommunities on lower parts of main bolesand branches. Successional and environ-mental canopy gradients are often coupled(Peck et al. 1995), creating within-canopygradients of ecological niches. We found a
F. 1. The relationship between lichen biomass andtree branch size at two height intervals (● 2–3 m;� 5–6 m) in 100 Picea abies trees in a subalpine spruceforest in E Norway. A, alectorioid lichens; B, foliose
lichens; C, alectorioid+foliose lichens.
262 THE LICHENOLOGIST Vol. 40
clear increase in alectorioid lichens, as well asan increase in the alectorioid/foliose lichenratio within a height gradient ranking fromonly 2–3 to 5–6 m above the ground, whichcorroborates the occurrence of a vertical dis-tribution pattern in conifer canopies thatseems to be independent of conifer foresttype and geographic location (e.g. McCuneet al. 1997; Campbell & Coxson 2001).
The two subgroups of alectorioid speciesshowed contrasting patterns of abundancebetween the two height-categories ofbranches (Table 1). Also in this respect, thevertical gradient in subalpine spruce canopylichens is similar on a cross-continental scalefrom Scandinavia (Ahlner 1948; this study)to NW America (Goward 1998; Campbell &Coxson 2001; Coxson & Coyle 2003). Bryo-ria species increased in biomass from 2–3 to5–6 m branch heights, whereas the pooledA. sarmentosa+U. filipendula biomass com-ponent decreased. Given the short verticaldistance between the two sampling positions(3 m) and a proximity to the ground, we findit noteworthy that the difference between theabundance patterns at the two canopy posi-tions was clearly significant. The preferenceof Bryoria for upper canopy conditions hastentatively been explained by an intoleranceof prolonged hydration (Goward 1998;Campbell & Coxson 2001; Goward 2003).In a recent modelling study, higher netassimilation rates for A. sarmentosa werepredicted for thalli in lower canopy posi-tions, whereas no clear height trends werepredicted for Bryoria (Coxson & Coyle2003). Our study suggests that U. filipendulabehaves like A. sarmentosa that is much less
T 3. Lichen biomass per branch and branch size* at two height levels (2–3 and 5–6 m) above the ground in a Piceaabies canopy in a boreal spruce forest, Norway
2–3 m 5–6 m P-level†
Lichen biomass components:Foliose lichen (g d. wt branch�1) 41·0�3·5 29·3�2·2 <0·0001Alectorioid lichen (g d. wt branch�1) 5·15�0·55 7·32�0·82 0·0056Alectorioid/foliose lichen ratio 0·149�0·016 0·316�0·052 <0·0001Alectoria+Usnea (g d. wt branch�1) 1·09�0·14 0·67�0·14 <0·0001Bryoria spp. (g d. wt branch�1) 4·06�0.50 6·65�0·75 <0·0001Total lichen (g d. wt branch�1) 46·2�3·8 36·6�2·8 0·0012Total lichen (g d. wt m�1 main axis) 19·9�1·6 21·0�1·2 ns
Tree branch characteristics:Branch weight (kg) 2·6�0·2 1·9�0·1 <0·0001Branch length, main axis (m) 2·29�0·07 1·68�0·07 <0·0001Branch diameter at basis (cm) 2·95�0·09 2·45�0·10 <0·0001Percent green needles 40�2 59�3 <0·0001
*Mean values�SE (n=92) are given; †pair-wise t-test.Branch weight and alectorioid/foliose ratio were log-transformed; foliose lichens, total lichens, Alectoria+Usnea,
and percent green needles on branches were root transformed prior to t-test.
F. 2. Relationship between the alectorioid/folioselichen biomass ratio and canopy openness, measured asthe indirect site factor reflecting the canopy openness ofthe lower branches of Picea abies in a subalpine spruce
forest in Norway.
2008 Epiphytic lichen biomass in a boreal forest—Gauslaa et al. 263
abundant in the sites studied. On a larger,regional scale there seems to be a trade-offin the abundance of Alectoria and Usnea(Ahlner 1948), suggesting that these twogenera share a common ecological niche andcompete with each other. The contrastingresponses of the two main alectorioid bio-mass components (�usnic acid) show thatthe popular approach of lumping speciestogether in functional groups (e.g. Neitlich& McCune 1996; McCune et al. 1997; Peck& McCune 1997) may hide significantspecies-specific differences. The different re-sponses seem to be more closely related tothe type of cortical pigment (usnic acid inAlectoria and Usnea, versus melanic com-pounds in Bryoria) than to taxonomic rela-tionship (Alectoriaceae with Alectoria andBryoria, versus Parmeliaceae with Usnea;Purvis et al. 1992). This pattern is consistentwith a functional role of cortical second-ary compounds in alectorioid lichens(Nybakken & Gauslaa 2007) with lowervisible solar radiation screening efficiency forthe yellowish usnic acid (McEvoy et al.2007) than for dark brown melanic com-pounds (Gauslaa & Solhaug 2001).
Epiphytic lichen biomass is stronglydependent upon substratum quantitymeasured as branch size (Fig. 1), as reportedin other studies (Esseen et al. 1996; Jaakkolaet al. 2006). However, Esseen et al. (1996)found twice as much lichen biomass,expressed as a percentage of branch mass, inold-growth forest branches compared to old,managed forests. In their study, A. sarmen-tosa had >200 times higher mass in oldgrowth forests than in mature 100 yr stands.In general, accumulation of epiphytic lichenbiomass is slow (McCune 1993). The slowaccumulation suggests that lichen growth inold trees is sustained over time at a higherlong-term rate than tree branch growth,resulting in the very heavy loadings oflichens observed in very old forests (Goward1998). Recent transplantation experimentsindicate that both alectorioid and folioselichens can grow rapidly with seasonalbiomass growth rates of up to 38% inScandinavian boreal forests (Gauslaa et al.2007). This contrasts with the frequently
recorded slow epiphytic biomass accumula-tion and might be caused by a simultaneousheavy lichen litter formation. Apparently,maximal growth rates are rarely realised forlichens in their natural habitats (Antoine &McCune 2004; Gauslaa et al. 2006), andvarious net assimilation rate studies showthat lichens rarely function under optimalconditions in their natural habitats (e.g.Palmqvist & Sundberg 2000; Lange et al.2007). Unfortunately, tree age was notdetermined in the trees sampled. Since treeage and size are fairly uncoupled factors inour study plots, it would have been interest-ing to test tree age data for sampled trees asan additional predicting variable for thebranch-specific variation in lichen biomass.
Lichen growth is strongly dependent uponthe irradiance level during hydration periods(Palmqvist 2000; Dahlman & Palmqvist2003). Previous studies have shown clearrelationships between lichen growth and sitefactors reflecting the openness of the canopy(Gauslaa et al. 2006, 2007). Therefore, theweak correlation between lichen biomassand site factors was unexpected. We believethat one photograph per branch was notsufficient to represent the light climate forone entire branch. Our experience withindirect and direct site factors suggests thatcomputation of site factors from hemi-spherical photos is a powerful tool to studyresponses to light exposure along widenatural irradiance gradients comprising gra-dients from dense young forests to clearcuts(Gauslaa et al. 2006, 2007). For narrowsections of the irradiance gradient such aswithin-stand ranges, the inaccuracies causedby the image quality, by image classificationunder changing sky conditions, and by slightdifferences between the positions of thecamera and the lichen thalli studied,often blurs the effects of small differencesin canopy openness. Nevertheless, thealectorioid/foliose lichen ratio significantlyincreased with the indirect site factor (Fig.2) probably because a foliose growth form ismore efficient at harvesting light comingmainly from above in shady environmentsthan alectorioid lichens that harvest lightfrom all sides.
264 THE LICHENOLOGIST Vol. 40
The effects of forest practices representimportant topics in lichen ecology(Will-Wolf et al. 2006). It is well establishedthat epiphytic lichens are particularly sensi-tive to forestry (Esseen & Renhorn 1998). Inthis context it is interesting to note that ourestimate of the total epiphytic lichen biomassper branch, i.e. 40·3�2·3 g, is in betweenthe level in pristine old-growth and selec-tively cut Norway spruce forests in northernSweden, in which Esseen et al. (1996) esti-mated an epiphytic biomass per branch of74�5 g and 12�1 g (mean�1 SE),respectively, by use of the same accuratehand picking method that we have used inthe present study. The study by Esseen et al.(1996) was also carried out in high altitudeforests. We suggest that the difference inepiphytic biomass between our study siteand both the managed and the old-growthforests studied by Esseen et al. (1996) indi-cates a difference in the degree of distur-bance from forest practices, as the managedstands in Sweden were affected by selectivecutting more recently than our study forest.This emphasises the importance of forestrypractices for the performance of epiphyticlichen communities. For a comparison, ourbiomass values were slightly higher thanestimated values from branches of largePicea engelmanni trees in British Columbiawith an age up to 350 yrs (approximately30–35 g per branch; Campbell & Coxson2001). In conclusion, our data highlight thesignificance of vertical differentiation in bo-real epiphytic lichen communities and indi-cate the importance of careful biomassestimates at different heights in studies ontrends in lichen community change.
We thank Anne F. Hagen, Barbro Dahlberg and StenR. Andersen for their endurance during a seeminglyendless struggle to remove all lichens from sampledbranches. The research was supported by the ResearchCouncil of Norway.
R
Ahlner, S. (1948) Utbredningstyper bland Nordiskabarrtradslavar. Acta Phytogeographica Suecica 22:1–257.
Anderson, M. C. (1964) Studies of woodland lightclimate. I. The photographic computation of lightconditions. Journal of Ecology 52: 27–41.
Antoine, M. E. & McCune, B. (2004) Contrastingfundamental and realized ecological niches withepiphytic lichen transplants in an old-growthPseudotsuga forest. Bryologist 107: 163–172.
Arseneault, D., Villeneuve, N., Boismeny, C., Leblanc,Y. & Deshaye, J. (1997) Estimating lichen biomassand caribou grazing on the wintering grounds ofnorthern Quebec: an application of fire history andLandsat data. Journal of Applied Ecology 34: 65–78.
Berryman, S. & McCune, B. (2006) Estimating epi-phytic macrolichen biomass from topography,stand structure and lichen community data.Journal of Vegetation Science 17: 157–170.
Boudreault, C., Bergeron, Y., Gauthier, S. & Drapeau,P. (2002) Bryophyte and lichen communities inmature to old-growth stands in eastern borealforests of Canada. Canadian Journal of ForestResearch 32: 1080–1093.
Campbell, J. & Coxson, D. S. (2001) Canopy micro-climate and arboreal lichen loading in subalpinespruce-fir forest. Canadian Journal of Botany 79:537–555.
Coxson, D. S. & Coyle, M. (2003) Niche partitioningand photosynthetic response of alectorioid lichensfrom subalpine spruce-fir forest in north-centralBritish Columbia, Canada: the role of canopymicroclimate gradients. Lichenologist 35: 157–175.
Dahlman, L. & Palmqvist, K. (2003) Growth in twofoliose tripartite lichens, Nephroma arcticum andPeltigera aphthosa: empirical modelling of externalvs internal factors. Functional Ecology 17: 821–831.
Englund, S. R., O’Brien, J. J. & Clark, D. B. (2000)Evaluation of digital and film hemispherical pho-tography and spherical densiometry for measuringforest light environments. Canadian Journal ofForest Research 30: 1999–2005.
Esseen, P. A. & Renhorn, K. E. (1998) Edge effectson an epiphytic lichen in fragmented forests.Conservation Biology 12: 1307–1317.
Esseen, P. A., Renhorn, K. E. & Pettersson, R. B.(1996) Epiphytic lichen biomass in managed andold-growth boreal forests: effect of branch quality.Ecological Applications 6: 228–238.
Gauslaa, Y., Lie, M., Solhaug, K. A. & Ohlson, M.(2006) Growth and ecophysiological acclimationof the foliose lichen Lobaria pulmonaria in forestswith contrasting light climates. Oecologia 147:406–416.
Gauslaa, Y., Palmqvist, K., Solhaug, K. A., Holien, H.,Hilmo, O., Nybakken, L., Myhre, L. C. & Ohlson,M. (2007) Growth of epiphytic old forestlichens across climatic and successional gradients.Canadian Journal of Forest Research 37: 1832–1845.
Gauslaa, Y. & Solhaug, K. A. (2001) Fungal melaninsas a sun screen for symbiotic green algae in thelichen Lobaria pulmonaria. Oecologia 126: 462–471.
Goward, T. (1998) Observations on the ecology of thelichen genus Bryoria in high elevation coniferforests. Canadian Field-Naturalist 112: 496–501.
Goward, T. (2003) On the vertical zonation of hairlichens (Bryoria) in the canopies of high-elevation
2008 Epiphytic lichen biomass in a boreal forest—Gauslaa et al. 265
oldgrowth conifer forests. Canadian Field-Naturalist 117: 39–43.
Goward, T. & Campbell, J. (2005) Arboreal hairlichens in a young, mid-elevation conifer stand,with implications for the management of mountaincaribou. Bryologist 108: 427–434.
Hilmo, O. (1994) Distribution and succession of epi-phytic lichens on Picea abies branches in a borealforest, Central Norway. Lichenologist 26: 149–169.
Jaakkola, L. M., Helle, T. P., Soppela, J., Kuitunen, M.T. & Yrjonen, M. J. (2006) Effects of forestcharacteristics on the abundance of alectorioidlichens in northern Finland. Canadian Journal ofForest Research 36: 2955–2965.
Kermit, T. & Gauslaa, Y. (2001) The vertical gradientof bark pH of twigs and macrolichens in a Piceaabies canopy not affected by acid rain. Lichenologist33: 353–359.
Kuusinen, M. (1996) Importance of spruce swamp-forests for epiphyte diversity and flora on Piceaabies in southern and middle boreal Finland.Ecography 19: 41–51.
Lange, O. L., Green, T. G. A., Meyer, A. & Zellner, H.(2007) Water relations and carbon dioxideexchange of epiphytic lichens in the Namib fogdesert. Flora 202: 479–487.
McCune, B. (1993) Gradients in epiphyte biomass inthree Pseudotsuga-Tsuga forests of different ages inwestern Oregon and Washington. Bryologist 96:405–411.
McCune, B. (1994) Using epiphyte litter to estimateepiphyte biomass. Bryologist 97: 396–401.
McCune, B., Amsberry, K. A., Camacho, F. J., Clery,S., Cole, C., Emerson, C., Felder, G., French, P.,Greene, D., Harris, R., Hutten, M., Larson, B.,Lesko, M., Majors, S., Markwell, T., Parker,G. G., Pendergrass, K., Peterson, E. B., Peterson,E. T., Platt, J., Proctor, J., Rambo, T., Rosso, A.,Shaw, D., Turner, R. & Widmer, M. (1997)Vertical profile of epiphytes in a Pacific Northwestold-growth forest. Northwest Science 71: 145–152.
McEvoy, M., Solhaug, K. A. & Gauslaa, Y. (2007)Solar radiation screening in usnic acid-containingcortices of the lichens Nephroma arcticum. Symbiosis43: 143–150.
Neitlich, P. N. & McCune, B. (1996) Hotspots ofepiphytic lichen diversity in two young managedforests. Conservation Biology 11: 172–182.
Nybakken, L. & Gauslaa, Y. (2007) Difference insecondary compounds and chlorophylls between
fibrils and main stems in the lichen Usnea longissimasuggests different functional roles. Lichenologist 39:491–494.
Ohlson, M., Soderstrom, L., Hornberg, G., Zackrisson,O. & Hermansson, J. (1997) Habitat qualitiesversus long-term continuity as determinants ofbiodiversity in boreal old-growth swamp forests.Biological Conservation 81: 221–231.
Palmqvist, K. (2000) Carbon economy in lichens. NewPhytologist 148: 11–36.
Palmqvist, K. & Sundberg, B. (2000) Light use effi-ciency of dry matter gain in five macrolichens:relative impact of microclimatic conditions andspecies-specific traits. Plant, Cell and Environment23: 1–14.
Peck, J. E., Hong, W. S. & McCune, B. (1995)Diversity of epiphytic bryophytes on three host treespecies, Thermal Meadow, Hotsprings Island,Queen Charlotte Islands, Canada. Bryologist 98:123–128.
Peck, J. L. E. & McCune, B. (1997) Remnant trees andcanopy lichen communities in western Oregon: aretrospective approach. Ecological Applications 7:1181–1187.
Pettersson, R. B., Ball, J. P., Renhorn, K. E., Esseen, P.A. & Sjoberg, K. (1995) Invertebrate communitiesin boreal forest canopies as influenced by forestryand lichens with implication for passerine birds.Biological Conservation 74: 57–63.
Purvis, O. W., Coppins, B. J., Hawksworth, D. L.,James, P. W. & Moore, D. M. (Eds) 1992 TheLichen Flora of Great Britain and Ireland. London:Natural History Museum Publications.
Rominger, E. M., Robbins, C. T. & Evans, M. A.(1996) Winter foraging ecology of woodland cari-bou in northeastern Washington. Journal of WildlifeManagement 60: 719–728.
Sillett, S. C. & Van Pelt, R. (2007) Trunk reiterationpromotes epiphytes and water storage in anold-growth redwood forest canopy. EcologicalMonographs 77: 335–359.
Will-Wolf, S., McCune, B. & Esseen, P. A. (2006)Contributions of lichen ecology to understandingand managing ecosystems. Journal of VegetationScience 17: 123–124.
Williams, C. B. & Sillett, S. C. (2007) Epiphyte com-munities on redwood (Sequoia sempervirens) innorthwestern California. Bryologist 110: 420–452.
Accepted for publication 31 March 2008
266 THE LICHENOLOGIST Vol. 40