Embed Size (px)
Citation preview

enErgy series.
INTEGRATEDENERGY SYSTEMSFOR RURAL AREAS
I 14APR1994 J
Edited byJon Niculescu
Giulio Piva
ILO TURIN CENTRE

Copyright © International Labour Organisation 1984
Publications of the International Labour Organisation enjoy copyright under Pro-tocol 2 of the Universal Copyright Convention. Nevertheless, short excerpts fromthem may be reproduced without authorisation, on condition that the source is in-dicated. For rights of reproduction or translation, application should be made tothe Media Production and Documentation Service (MEDOC), International Centrefor Advanced Technical and Vocational Training, corso Unità d'ltalia 125, 10127Turin (Italy). Such applications are welcome.
ILO Turin Centre publications can be obtained directly from MEDOC Distribution,International Centre for Advanced Technical and Vocational Training, corso Unitàd'ltalia 125, 10127 Turin (Italy), through ILO Publications, International Labour Of-fice, CH-1211 Geneva 22 (Switzerland), or through ILO local offices in manycountries.
Graphic arts: MPS. ILO Turin Centre

FOREWORD
This publication, which belongs to the "ENERGY SERIES", reportstwo prefeasibility studies of integrated energy systems adaptedto two identified areas of South Asia.
It is intended for planners employed in Ministries or in Elec-tricity Boards, engineers, professors and researchers, and canalso be used by engineering students as a case study reference.
The contents of this publication were elaborated as project workby two groups of participants in the "ALTERNATIVE ENERGY SOURCESFOR RURAL COMMUNITIES" programme, conducted at the InternationalCentre for Advanced Technical and Vocational Training, Turin(Italy) from 4 February to 30 April 1980, and financed by theEuropean Economic Community.
The curriculum of the energy programme conducted at the Centrewas based on three main phases:
PHASE 1: THEORY, including class lectures, discussions andcase studies given at the Centre, and aimed at
building up a homogeneous background common to allparticipants.
PHASE 2: APPLICATION, based on a series of study visitslasting five three weeks to industrialisedcountries. The purpose of these visits is, essen-tially, to analyse and assess the implementation ofwhat was learnt during the first phase, and to studyany possibilities for technology transfer andadaptation.
PHASE 3: PROJECT WORK, consisting of design work and thereporting of activities developed individually or insmall groups by participants to meet their owntraining needs.
The two project works presented in this publication are theresult of bibliographical research and technological investiga-tion conducted by the two following teams during their stay atthe Turin Centre:
- S. Bhumiratana, C. Chartpolrak, S. Kulapatrapa, C. RutanaPrakarn and W. Yong Chareon from Thailand
- A. Kohar Irwanto, Mucharnad Rosid and I.S. Suwardjaka fromIndonesia.


TABLE OF CONTENTS
PART I:
PREFEASIBILITY STUDY ON A WATER LIFTING STATIONFOR IRRIGATION AND TRAINING BY COMBINED
ALTERNATIVE ENERGY TECHNOLOGIES
Page
1. INTRODUCTION 13
2. PROJECT IDENTIFICATION 14
2.1 OBJECTIVES 14
2.2 SITE 14
2.3 POTENTIAL USES 14
2.4 EXPECTED RESULTS 14
3. BACKGROUND OF THE PROJECT 15
3.1 GENERAL BACKGROUND 15
3.2 IDENTIFICATION OF NEEDS 15
3.2.1 Agricultural Production Aspects 16
3.2.2 Testing and Training Aspects i6
3.3 IDENTIFICATION OF AREAS OF APPLICATION 17
3.4 CHARACTERISTICS OF THE NORTH-EAST VILLAGE 18
3.4.1 General Characteristics 18
3.4.2 Availability of Energy Sources 19
3.5 SELECTION CRITERIA 23
3.6 SOCIAL AND ENVIRONMENTAL CONSIDERATIONS 24
4. DESCRIPTIONS OF THE PROPOSED PILOT PROJECT 25
4.1 GENERAL 25
4.1.1 Preliminary Analysis 25
4.1.2 Overall Flow Sheet 33
4.1.3 Overall Mass and Energy Balance Sheet 33
4.2 EQUIPMENT 44
4.2.1 Technical Descriptions of Each Component 44
4.2.2 Civil Engineering Works 44

-6-
4.3 IMPLEMENTATION 47
4.3.1 Overall Time Schedule 47
4.4 OPERATION 51
4.4.1 Testing and Training Phase 51
4.5 ECONOMIC EVALUATION 53
4.5.1 Cost Evaluation of the Equipment 534.5.2 Cost Evaluation of Civil Works 55
4.5.3 Cost Evaluation of the Operation 55
4.5.4 Benefits 55
5. CONCLUSIONS 57
5.1 SUMMARY OF THE OVERALL TIME SCHEDULE 57
5.2 SUMMARY OF THE TOTAL COST AND THE TIMETABLEOF THE REQUIRED FINANCIAL COMMITMENTS 57
REFERENCES 61
LIST OF TABLES:
Table 3.1 Solar Radiation in Thailand 20
Table 3.2 Amount of Biogas Available in the Village. 22
Table 4.1 Monthly Requirement of Water for Crops,Available Rainfall and Total Need 26
Table 4.2 Comparison of Solar Thermodynamic PumpingSystem 30
Table 4.3 Size of Each Sub-System of the ProposedHybrid System 32
Table 4.4 Amount of Water Supplied by Each System .. 42
Table 4.5 Mass and Energy Balance Sheet 43
Table 4.6 Specifications of the Main Components .... 45
Table 4.7 Specification of Biogas System, Conven-tional System, Measuring Instruments andFacilities for Training 46
Table 4.8 The Overall Time Schedule 48
Table 4.9 Cost Breakdown of the Proposed HybridSystem 54
Table 5.1 Summary of the Total Budget
Table 5.2 Summary of the Overall Time Schedule andFinancial Plan 59

4.
4.1
4.1.14.1.24.1.34.2
4.2.14.2.2
—7—
72
72
727376
76
7685
27
34
35
36
37
38
39
40
41
65
66
68
68
69
69
71
LIST OF FIGURES:
Figure 4.1 Water Requirement and Available Rainfall..
Figure 4.2 Logical Flow Chart of Selection Process
Figure 4.3 Hybrid System for Pumping Water
Figure 4.4 Photovoltaic System
Figure 4.5 Low Temperature Thermodynamic System
Figure 4.6 Medium Temperature Thermodynamic System
Figure 4.7 High Temperature Thermodynamic System
Figure 4.8 Biogas System
Figure 4.9 Conventional Diesel Pumping System
PART II:
PREFEASIBILITY STUDY ON A COMBINED SOLARAND WIND ENERGY ICE-PRODUCTION SYSTEM TO IMPROVEPRESERVATION OF FISHERY PRODUCTS IN RURAL AREAS
1. INTRODUCTION
2. OBJECTIVES OF THE PROJECT
3. BACKGROUND TO THE PROJECT
3.1 SOME ASPECTS OF RURAL DEVELOPMENT
3.2 TENTATIVE IDENTIFICATION OF NEEDS
3.3 TENTATIVE IDENTIFICATION OF AREA OF APPLICATION
3.4 SELECTION SELECTION
DESCRIPTION OF THE PROPOSED PILOT PLANT
GENERAL
Preliminary AnalysisDetailed Schematic DiagramOverall Flowsheet Diagram
EQUIPMENT
Designing of the SystemTechnical Description

—8—
4.3 IMPLEMENTATION 88
4.3.1 Overall Time Schedule 88
4.4 ECONOMIC EVALUATION (PRELIMINARY COST ESTIMATES) 92
5. CONCLUSIONS 95
BIBLIOGRAPHY 97
LIST OF TABLES:
Table 3.1 Monthly average of wind speed in PasirPanjang, south—east part of Indonesia .... 70
Table 4.1 The condition of wind speed in the field(Pasir Panjang) 84
Table 4.2 Estimated wind speed available and thecalculated duration in a year (h/year) ... 85
Table 4.3 Overall time schedule of the project 89
Table 4.4 Detailed time schedule of designing phaseof windmill 91
Table 5.1 Financial commitments schedule 95
LIST OF FIGURES:
Figure 2.1 Schematic diagram of the organisationsystem 67
Figure 4.1 Schematic diagram of absorption -refrigeration system 74
Figure 4.2 Schematic diagram of photovoltaic panelssystem 75
Figure 4.3 The basic schematic diagram of the plant . 77
Figure 4.4 Generator 78
Figure 4.5 Absorber 79
Figure 4.6 Condenser 80
Figure 4.7 Photovoltaic System 83
Figure 4.8 Vertical Axis Wind Machine 87

—9—
LIST OF APPENDICES:
Appendix 1 The performance curve of slice—icemachine "ATLAS - type V 310 A" 101
Appendix 2 The cycle diagram of ammonia in the102
Appendix 3 Solar radiation on horizontal surface inIndonesia 103
Appendix 4 Curve of wind speed and duration(hour/year) 104
Appendix 5 Calculation of yearly water pumpingcapacity using a vertical axis windmill .. 105


PART I:
PREFEASIBILITY STUDY ONA WATER LIFTING STATION FOR IRRIGATION AND TRAINING
BY COMBINED ALTERNATIVE ENERGY TECHNOLOGIES
THAILAND
BYS. BHUMIRATANAC. CHARTPOLRAKS. KULAPATRAPA
C. RUTANA PRAKARNW. YONG CHAREON


— 13 —
1. INTRODUCTION
The main objective of this proposed project is to improve thequality of life in the rural areas without worsening the currentenergy deficit of the country. The water lifting technologiesutilising alternative sources of energy are proposed, with atwo-fold accomplishment, a) to demonstrate the feasibility ofthe new technologies for the region and b) to serve as a train-ing site for further development and future expansion. Theproposed technologies are a hybrid system consisting of a photo-voltaic system, three thermodynamic systems (low, medium andhigh temperature) and a biogas system. A conventional dieselengine system is included to level off the highly fluctuatingnature of the water demand. The pilot plant is designed toirrigate 1300 rai (208 ha) of cultivated land for a village of105 families. Excess energy during the period of low waterdemand is to be utilised for milling and drying of crop productsand for village water distribution.
The total cost of the proposed system is 2.139 million U.S.dollars with the additional detailed design fee of 0.257 millionU.S. dollars. Hence the grand total budget requested is 2.396million U.S. dollars which is to be spanned over a period offive years, commencing from 1980. The economic gains andsavings obtained from this project are estimated to be 121,980U.S. dollars per annum.

- '4 -
2. PROJECT IDENTIFICATION
2.1 OBJECTIVES
The overall objectives of this project are:
— to increase the income and improve living standards in
rural area.
- to implement a water lifting station by alternative energytechnologies in order to supply sufficient water to irrigatethe crops of a village the whole year round.
— to establish an alternative energy training centre for stafftraining and development.
2.2 SITE
A typical village in the north-eastern region of Thailand whichconsists of 105 families with a total population of 677 people.
2.3 POTENTIAL USES
The project has high potential for expansion to include all thevillages of the ASEAN region.
2.4 EXPECTED RESULTS
The results to be achieved by this project are:
— A two—fold increase of agricultural production for thevillage and thus an improvement in the standard of living.
- A training centre for continuous training of ASEAN regionalpersonnel related to alternative energy utilisation.
- A partial solution to the problem of labour migration to thecities.
— A complete analysis of the new technologies as related tothe local conditions.
— A contribution towards regional self—reliance programmes.
— A contribution towards a better understanding and co-
operation between the ASEAN region and the EEC.
— 15 —
3. BACKGROUND OF THE PROJECT
3. 1 GENERAL BACKGROUND
Being an agricultural country, a great majority of the peopleliving in the rural areas of Thailand are farmers. Therefore,to effectively improve the quality of life in the rural areas,an improvement in the agricultural production is essential.This fact is reflected in the Royal Thai Government's (RTG)
National Policy which has given priority to agriculturaldevelopment. However, contrary to the current demand for energyconservation, an increase in agricultural production requiresthat more energy be put into the agricultural system. As modernagricultural techniques become more widely adopted, ruralThailand will exert an increasing demand for energy in the formof fertilizer, irrigation pumping, transportation, etc. Much ofthis demand can be met easily, technology—wise, by conventionalpetrochemical fuel; to do so, however, would contradict theRTG's policy to reduce its dependency on imported energysources. Hence positive steps need to be taken to introducealternatives. The RTG has already undertaken such positivesteps by introducing the Renewable Non—conventional EnergyProject, which, among other aspects, will assist other projectsto work towards reducing imported energy and increase incomeopportunities in rural areas.
This particular project, which is a part of the requirements ofthe European Economic Community's (EEC) sponsored course of
Alternative Energy Sources for Rural Communities prepared byparticipants from Thailand, proposes an implementation projectwith an intention to complement the RTG's on--going projects,briefly mentioned above.
3.2 IDENTIFICATION OF NEEDS
To comply with the intention indicated above, two particularneeds are apparent. Firstly, the need to improve agriculturalproduction and secondly, to do so with as many alternativeenergy sources as possible. The latter would require extensivepilot plant tests of various available systems and facilitiesfor training of personnel. Each of these needs is brieflyoutlined below.

- 16 —
3.2.1 AGRICULTURAL PRODUCTION ASPECTS
Of all the regions of Thailand, the north-east is a region ofspecial interest because it is the poorest and by far the driestregion. Mainly it is a rolling plain, the soil is notespecially fertile and the organic content is low. Though wateris available, it is at least three metres below cultivated land.Agricultural production, which is the chief source of income, isbased entirely on rainfed crops and effective only in a goodyear. In the dry season, lack of adequate water and jobs forcesthe villagers to migrate towards cities, thus causing anotherproblem of great concern.
Much of the increase in regional agricultural production overthe coming decades will derive from improvement of yield fromthe present cultivated land. Therefore, irrigation developmentwill be a critical corollary component of the agriculturalsector. The region's needs, ranked according to urgency, arerespectively:
1. water for irrigation2. fuels for basic need
and 3. electricity.
If the afore-mentioned available water can be utilised to helpavoid the effects of delayed rains, monsoon, droughts or
premature drying of rice fields towards the end of the monsoon,as well as for irrigation of the second crop during the dryseason, agricultural production will be increased, and as a
result, the village's income will increase.
3.2.2 TESTING AND TRAINING ASPECT
In line with the RTG's national energy policy which givespriority to the development of alternative energy in the comingdecades, in order that the future promotional programme may beeffective, extensive tests of various alternative energytechnologies are necessary.
The chosen technologies must be studied and comparedperformance—wise, in terms of economic acceptability,adaptability to local conditions and viability for future large-scale promotion and utilisation which spell out the need fortraining facilities for operators to ensure the successfulimplementation of the programme.

— 17 —
3.3 IDENTIFICATION OF AREAS OF APPLICATION
On the basis of the considerations given in Section 3.2, as wellas the experience of several on—going projects mentioned inSection 3.1, a project on water lifting for irrigation in atypical village of northeast Thailand is proposed. At present,conventional pumping for irrigation is employed on a limitedscale, and is held back by the following disadvantages:
a) it consumes the increasingly expensive imported fossil fuels
b) relatively high maintenance costs in the case of the enginedriven pump
c) high investment of power line, in the case of an electricmotor driven pump.
By utilising the available technology based on alternativeenergy to lift water for a typical village, it is hoped todemonstrate a feasible and practical solution to part of theproblems encountered. The possibility of a year—roundagricultural production on a given plot of land has a multifoldeffect which includes:
1) Permitting a year-round activity and thus eliminating theproblem of migration.
2) Allowing crop rotation planning which will exert positiveeffects on the overall yield of production.
3) Leading to an increase in income level and a higher standardof living for the villagers.
Moreover, once the project has been proved effective, the demon-stration village will also serve as a much—needed centre for thetechnology transfer programme, especially in training personnelin the field of alternative energy application. The trainedpersonnel, as well as the experience gained, will be used toextend the programme not only to other parts of Thailand, butalso to the other countries in the ASEAN region as a whole.
Currently, available technologies based on alternative energysources for water lifting purposes may be identified as follows:
1. Flat-plate solar thermodynamic system.
2. Concentrated solar thermodynamic system.
3. Solar photovoltaic system.
4. Biogas/biomass powered system.

— 18 —
All of these systems are classified as "available" on the basisthat they may be implemented immediately by making use of theequipment which is currently available on the market or bybuilding up the system locally from a model system which hasbeen proved successful elsewhere. The choice of technologies tobe supplied is to be based on the suitability of the location,and on the consideration of using the site as a demonstrationvillage and a training centre. The suitability of thetechnologies depends directly on the available sources, thuscharacteristic information about the village is required.
3.4 CHARACTERISTICS OF THE NORTH-EAST VILLAGE
3.4.1 GENERAL CHARACTERISTICS
In order to provide a context for a meaningful analysis, toexamine and evaluate the worthiness of the proposed project, arepresentation of a typical village in the north-east region ofThailand was constructed. This village is representative in thesense that the per-capita resource endowments, land use patternsand general economic conditions reflect those for the north-eastin general. The information and figurative data of the villageare those of the entire north—east scaled down to village levelquantities. Numerous sources were used in gathering suchinformation, and are listed in the reference section.
The village has 105 families and a total population of 677people. At the centre of the village, there is a primary publicschool and at the outskirts, a temple with adjacent land, and arice mill capable of milling 5 to 6 tons of paddy daily. Nearbythere is a small pond where fish and drinking water areobtained. Of the 105 households in the village, about 100 areprimarily farmers while the remainder include a miller, twoteachers, a store owner and possibly a government official. Theaverage household size for the village is 6.5 people.
With regard to agricultural production, although rice is theprimary crop, there are other minor crops such as cassava,maize, kenaf and groundnut depending on the location of thevillage. In this village, as typical of the north-east, thereis no double cropping and all rice is rainfed only. Thecropping intensity (per cent of farm land actually cultivated)is estimated to be about with 70% of cultivated land plantedwith rice. An average farm size is 28 rai (6.25 rai = 1 ha.).The yield per rai is 220 kg. for rice, 1980 kg. for cassava,

— 19 -
340 kg. for maize, 150 kg. for kenaf and 112 kg. for groundnut.In the village, there are also 98 head of cattle, 188 head ofbuffalo and 40 pigs.
3.4.2 AVAILABILITY OF ENERGY SOURCES
There are at least five sources of alternative energy availableto the village — namely solar, wind, animal manure, firewood andagricultural waste. However, with the aim of lifting water,only solar, wind and animal manure are worth considering. Thefirewood source is considered an endangered source and should,at present, be considered unavailable for water liftingtechnology. The agricultural waste does not appear to havepotential as far as proven technology for immediate use in waterlifting is concerned. The other three available sources arebriefly described in the following paragraphs.
3.4.2.1 Solar Energy
Average solar radiation in is reasonably high, varyingbetween 440 cal/m .d in areas of the north—east to400 cal/n .day around Bangkok in the centre. The climate ofThailand has a strong seasonal nature, with a wet, rainy seasonand a dry season. There is, however, comparatively littlevariation in the amount of available radiation (plus or minus15% from the norm compared with plus or minus 65% for New YorkCity). Even in the rainy season, long unbroken periods ofcloudiness are rare. For the north—east region, the solarradiation is relatively high, and the rainy season is relativelyshort. The wet season for the north-east runs approximatelyfrom May to September, compared to May to November in theCentral and Southern regions. In addition the atnosphere of thenorth-east is generally less hunid than in any other part ofThailand, which is an important factor in considering a
technology which utilises only the direct beam radiation.Although more reliable data is required in order to establishthe relative amount of direct beam radiation to that of theglobal solar radiation, it is safe to conclude that adequatesolar radiation is available to run solar applicationseffectively. Data on solar radiation and rainfall of thenorth—east region are shown in Table 3.1 and Table 4.1
respectively.
However, care must be taken in using the data available. Up topresent, out of the data on solar radiation, only that on totalradiation is reliable. The direct and the diffuse are estimated

- 20 —
TABLE 3.1
Solar Radiation In Thailand
W. hr/m2/day
above (W.hr/m2/day)at by averaging the solar radiation at hourlyeach day; this gives the average solar radiation per day.The figures for each day of the month are then considered,to arrive at the average solar radiation per day for thatmonth.
MonthGlobalRadiation
DirectRadiation
DiffuseRadiation
Jan. 4767.4 2790.7 1976.7Feb. 4883.7 2906.9 1976.7Mar.
I
5116.2 3023.2I
2093.0Apr.
I5232.5 3023.2 2209.3
MayI
4767.4I
2383.7 2383.7Jun.
I4476.7
I2034.9 2441.8
Jul.I
4360.4 1918.6 2441.8Aug.
I
4069.7I
1627.9 2441.8Spt.
I4069.7
I1686.0
I
2383.7Oct.
I4069.7
I1976.7 2093.0
Nov.I
4302.3 2267.4I
2034.9Dec.
I4651.1
I
2674.4 1976.7
The value of the unit used is arrivedintervals

— 21 —
values, derived from available data and mathematical models,which may not give accurate results. Since the analysis in thisproposal has to rely on these estimated data, which aregenerally conservative, equipment which utilises directradiation only, may be unfairly judged.
3.4.2.2 Wind Energy
The potential of wind energy in Thailand was studied by WilliamE. Heronemus in 1974, who concluded in AID's (Agency forInternational Development) Report entitled "A survey of thepossible use of wind power in Thailand and the Philippines",that only two regions of Thailand, i.e. the region along thecoast of the south, and of the Chao Phya Delta, have adequatewind resource for water lifting. However, the wind resourceseven in those regions are not tremendous, and the situation ismuch less favourable in the north-east. The best part of thenorth—east for wind energy resources has an average wind speedof only 7 km/hr. This low average speed cannot be consideredfeasible, unless detailed information on the wind speeddistribution shows otherwise.
However, such detailed data are not currently available, and itis unlikely that the wind speed distribution will change thepicture significantly.
3.4.2.3 Animal Manure
Animal waste or manure is rarely used in Thailand for fuel or asa direct energy source. Nevertheless, a great amount of manureenters the energy system in the form of chemical energy asfertilizer. At this time, there does not seem to be anyestimate available as to the extent of this usage, nor as to itseffectiveness. However, based on observations and qualitativestatements in rural village studies, there does not appear to bea surplus, nor a great deal of unused manure. As beenpointed out in Section 3.4.1, there are 98 head of cattle, 188
head of buffalo, and 40 pigs in the village. Table 3.2summarises that the amount of biogas which may be converted fromthe animal manure, based on the indicated figures, may reach1.85 x 108 kcal/year, which represents a significant amount ofavailable energy. It is also to be noted that in the conversionof manure to biogas, the potential use as fertilizer is not lostbut enhanced. The fertilizer produced as a by—product is
available in the same amount and can be used as needed ratherthan scattering it all ovdr. However, there are potential

TABLE 3.2
Amount of Biogas Available in the Village
II
II
kgof wet
Per cent
Animal
I
man
ure
per
Collectable
animal year
I IN
m3
I
of
of biogas
per kg
wet manure
I I I
Animal
Population
Heads
IP
oten
tial
bio-l
Iga
sI
I
II
II
I
II
II
I
I I I
II
1,24
1I
I I I I I
0.09
72
I I I I
40
I I I I
0.32
5
I
II
I I
I ITOTAL
3.69
4

— 23 —
problems for implementation that have to be worked out, such asthe collection scheme and the best utilisation of the gasproduced.
3.5 SELECTION CRITERIA
The criteria forthe 'selection of the proposed technology havealready been spelled out in the two previous sections. However,to clarify the basis of selection, the criteria used are againsummarised as follows:
1) The technologies selected must be proven technologies, readyfor immediate implementation.
2) The equipment must be readily available on themarket, or easy.'to construct within the ASEAN region. Thelatter will be given top priority whenever possible, in orderto promote local knowhow and technologies, and to contributetoward technological, self—reliance of the region.
3) The chosen technologies will include all likely candidates toprovide a basis for comparison of operating results at localsite on the pilot scale. This is essential, due to ambigui-ties and possible bias in manufacturer's supplied data, andthe uncertainty of the climatic data available. Moreover,each system has its own merit on widely different featureswhich cannot be evaluated on economic considerations alone.Local tests to provide acceptability criteria are thereforenecessary.
4) Obviously, the technologies must comply with the need and befitted to the available resources.
5) The chosen technologies will be utilised for the benefit oflocal farmers as well as for the training of all the regions.Thus the selection of any system will not be based on localsuitability alone, but will serve to make the site an
adequately completed training centre for the ASEAN region.
Based on these criteria a hybrid system for the water liftingtechnology project is proposed. It consists of:
a) Biogas pumping system
b) Solar photovoiLtaic pumping system
c) Solar thermodynamic pumping system
- low temperature application (1000C)
- medium temperature application (150_5000C)
- high temperature application (5000C)

- 24 -
The detailed descriptions of the System are spelled out andanalysed in Chapter 4.
3.6 SOCIAL AND ENVIRONMENTAL CONSIDERATIONS
The nature of the Thai social structure poses no major barrierto the adoption of non traditional technology, nor does theculture function act as an impediment to the adoption of
alternative energy technologies not commonly used at present.The only minor concerns are the cultural barriers to acceptanceand pathways for diffusion which can be evaluated along withimplementation of the project.
In particular, there do not appear to be serious culturalimpediments to the adoption of the biogas technology, eventhough the technology entails the handling of dung, and the useof the resulting methane gas. The solar energy technology canonly exert positive effects on the social and economic benefitsof the region. Since the technologies which are considered inthe context of this project are the so-called "Soft EnergyTechnology", the negative impacts on the environment areextremely unlikely.
— 25 —
4. DESCRIPTIONS OF THE PROPOSED PILOT PROJECT
4.1 GENERAL
4.1.1 PRELIMINARY ANALYSIS
4.1.1.1 General Description
For the village considered (see Section 3.4), the total farmland is 2940 rai (6.25 rai = 1 ha), 1848 rai (63%) of which iscultivated. Of all the cultivated land, 70% is utilised forpaddy fields which are equivalent to 1294 rai. On this sameland, cultivation of paddy twice per year is possible, on thecondition that there is enough water. The normal rainfed cropis planted between July and October, while the second crop, whenpossible, from February to May. During the interval betweenNovember and January, groundnuts are planted. The groundnutserves as an additional income of the village, and also as a
soil enricher due to the nitrogen left behind. The amount ofwater required for the irrigation on a monthly basis is given inTable 4.1; the data of these requirements are plotted in
comparison with the available rainwater.3 The annual averagerainwater available in the area is 2222 m /rai.
The difference between the water requirements and the amount ofavailable rainwater is to be made up with water from theexisting irrigation canal or river passing near the village, butat about 6 metres below the cropland. To ensure sufficient headfor the irrigation of the whole area, taking into account allpossible head losses, a total dynamic head of 12 metres is usedfor calculating the pump characteristics throughout thisanalysis.
4.1.1.2 Semi-qualitative description of the systems
As mentioned in Section 3.5 the system to be employed is a
hybrid consisting of biogas, solar photovoltaic and solarthermodynamic of low, medium and high temperature. It is essen-tial at the beginning to investigate carefully the merits ofeach system, so that at the end, a proper selection of thesubstantial size of each system is obtained.

-. 26 -
TABLE 4.1
Monthly Requirement of Water for CropsAvailable Rainfall and Total Need
I
MonthWater req for
I crops, m/rai
Waterfrom
available Irainfall3/.
Total need3
mI
IJan.
I187
I 7 I
7,548
I Feb. I 94 118.9 I 3,487 I
IMar.
I314 36.5 I
11,637
Apr.I
365 173.9 I 8,281I
IMay
I
246I
325.4 3,372I
I Jun.I — I 331.2 I —
IJul. . 245
I341.4 I —
IAug.
I296
I472.6 —
ISpt.
I267
I449.6 I —
IOct. I
203 I47.2
I6,534
INov.
I38
I6.9 I
1,348
IDec. I
125 I5.0 I
5,032

— 27 —
FIG. 4.1
Water Requirement and Available Rainfall
..•14.)
600 600
500 500I— — — —,
I.————,
200 200
100 100
JA M J J A S 0
Month
Amount of water requiredof rainfall

— 28 —
4.1.1.2.1 Biogas Pumping System
Of the four systems, biogas may be said to offer the mostfavourable system, based on technology and economicconsiderations. The system, when properly designed, will
function as reliably as a conventionally fuelled engine.Previous implementations indicate no acceptability problem.Moreover, its usage is convenient and uninterrupted, as the gaswill be readily available throughout rain or shine. However,the cost of large gas storage may be discouraging. The degreeof availability is limited by the number of animals available,and to a certain extent, the time of year, especially inNovember and June when some of the animals are used for
ploughing the fields, thus posing a minor problem of manurecollection.
Table 3.2 shows the amount of gas available for the village.Based on this amount of gas available and overall3 efficiency of
a biogas pumping system can supply 2290 m of water perday, which is insufficient for the requirements. Hence, othersystems, even though economically less attractive, are needed tomeet the rest of the demand.
4.1.1.2.2 Photovoltaic pumping system
At present, most experts agree that among all solar applicationtechnologies, photovoltaic water pumping of below 10kW capacityseems to be more economically competitive than the thermodynamicsystem. An additional merit of the photovoltaic system is itsvery little or no maintenance requirement. Its technology isproven, but rather sophisticated, hence developing countries,for technical as well as economic reasons, are likely to importthe costly silicon solar cells, rather than develop their own.At present, the estimated cost of a solar cell and a photo—voltaic power plant as quoted by many manufacturers, is in theorder of TJ.S.$1.6/Wp. and U.S.$2.5/Wp. respectively.
4.1.1.2.3 Solar Thermodynamic Pumping System
4.1.1.2.3.1 Low Temperature Application
The flat—plate collectors, without concentration, work at lowtemperature (less than 1000C), hence the overall thermal effi-ciency is quite low, normally in the order of a few per cent.The system is particularly suitable for developing countries toproduce small amounts of power in the range of 10—30 Kw forirrigation purposes, especially in remote areas where it is

— 29 —
highly desirable to install a system which needs minimum or nomaintenance over a long period of time. Moreover, this systemutilises both direct and diffuse radiation and thus it is morefavourable for implementation in the areas where diffusion ishigh. Since 1973, more than 70 units of these flat-plate solarpumps, ranging from 1-100 Kw capacity, have been installed inarid areas around the world. As recommended by many manufac-turers, flat plate collectors should be manufactured orassembled in the developing countries so that the cost of thesystem will be lower as well as contributing towards self—reliance. It will also provide technology transfer for thedeveloping countries. However, the cost of the flat-platecollector is only about 30% of the total system which may rangefrom U.S.$i6,ooo to 30,000 per kilowatt installed.
4.1.1.2.3.2 Medium Temperature Application
A linear—focus collector with a concentration factor rangingfrom 5-100 belongs to this category. The unique characteristicswhich make it different from flat-plate collectors is that itutilises direct insulation only, and it needs at least onerotation axis for the tracking system to follow the sun. Theoverall plant efficiency varies from 6-10%, two or more foldshigher than that of the flat-plate system. The usual operatingtemperature of the operating fluid is around 300°C. However,this does not imply that a linear—focus system is more economi-cally attractive than a flat—plate system, because the cost ofthe former is also higher.
It must be noted here that though the data provided in Tables4.2 and 4.9 do not reflect this fact, the situation has evolvedconsiderably since the preparation of this study (early 1980)and at present the statement is valid. The reader would there-fore be best served by using the tables provided as a model,substituting prevailing valid data, when conducting a similarstudy.
4.1.1.2.3.3 High Temperature Application
A parabolic disk (point-focus concentrator) is suitable for hightemperature solar energy conversion. In fact, it can be designedin order to concentrate the sunlight up to 10,000 times. Steamor air is commonly used as a working fluid with an operatingtemperature of 500°C and 900°C respectively. This systemprovides an impressive plant efficiency, per collector area, ofup to 20%. However, its main drawback results from the

— 30 —
TABLE 4.2
Comparison of Solar Thermodynamic Pumping System
DescriptionsI
Photo-voltaicsystem
Thermodynamic system
Remarks
•
ILowTemp.
.MediumTemp.
I IHighTemp.
I I I I
ITechnical DataI I I
I
I
I I
I- radiationl 491I
491I
W/mI I I
400 I 400I
I I
I- Manufacturer IANSALDO
I SOFRETESI ANSALDO OMNIUM-GII— 9llector Area
I
1793 3835I
rnI I
1471 853 I
I I
I— Rated Output kwl 130I
80I 70 I 70
I
I— Operating Hoursl 10I
10 8 I 8I
I- Efficiency at 6.2 2.9 I ii.6 20I
I I I
I
I I
I I
N.B. Each system can lift 10,000 m3/day of water at 12 m. of totaldynamic head, in March.

— 31 —
extremely high cost of the collector and tracking system, thehigh sensitivity to cloud, haze and pollution as well as thesophisticated technologies involved, both in fabrication andoperation. Up to present, there exists little experience withthis kind of system. But, as claimed by one manufacturer, thisunit is not only ideally suitable for remote areas for itsminimum maintenance, but it is also economically competitive.The cost per peak kilowatt installed is estimated at U.S.$6,000only.
4.1.1.3 Selection of Appropriate System
In general, there are two main systems which can be selected:with or without seasonal storage. Although the merit of theformer lies in the fact that the operating system is smaller insize, the tremendously high storage cost makes its overall costless convenient that that of the latter system. Hence it isuniversally accepted by most of the experts concerned that thesystem with seasonal storage is less economically viable thanthe system without it.
Economic comparison between solar photovoltaic conversion andsolar thermal conversion systems were roughly worked out. Basedupon the of the different systems to pump the sameamount of 10,000 m /day of water at the sante total hydro-dynamichead of 12 metres, along with the same climatic conditions ofthe north-east, it can be concluded that the cost of pumpingwater by each system is approximately the same, as shown inTable 4.2. A further detailed comparison is not yet possiblebecause of insufficient reliable data together with theexistence of major uncertainties regarding the components andthe system costs which could be altered if mass productiontechniques were employed in the future.
The preliminary cost analysis also shows that the cost of theproposed system designed to pump water to cope with the maximumdemand is quite formidable. Thus, based on economic reasoning,it is advisable in this particular situation to employ a
conventional diesel pump to supply the peak demand. On theother hand, a significant advantage in doing so is that a
comparison between utilisation of conventional and non—conventional energy, subjected to the same operating conditions,can be assessed as a by-product.
As guided by the afore-mentioned viewpoints, the sizing of eachsubsystem, including a diesel—powered system, is given in thefollowing paragraphs.


— 33 —
4.1.1.3.1 Biogas Pumping System
The only limitation of biogas utilisation is the problem ofmanure collection and the amount available. Therefore, with itshighest merits, economically and technologically it is mostdesirable to fully utilise all available biogas energy beforeturning to alternative sources.
4.1.1.3.2 Solar Conversion Pumping System
Sizing of each type of solar energy conversion system was per-formed on the basis that the chosen capacity for each typeshould be economically competitive, as confirmed by manufac-turers, or agreed upon among experts, and must be readilyavailable in the market.
4.1.1.3.3 Diesel Pumping System
Part of the water needed for crop requirement during peak demandperiod will be supplied by a diesel-powered engine.
Table 4.3 shows the size of each subsystem of the proposedhybrid system and Fig. 4.2 shows the logical flow chart of theselection process.
4.1.2 OVERALL FLOW SHEET
Figs. 4.3 to 4.9 show the block diagram of the proposed hybridsystem for pumping the water.
4.1.3 OVERALL MASS AND ENERGY BALANCE SHEET
Table 4.4 shows the amount of water supplied by each system ineach month of the year, based on the total dynamic head of 12 m.It is interesting to note that during the rainy season, thedirect solar energy is less than in other seasons. Thus, themedium and high temperature thermodynamic systems using directsolar energy can provide only a small amount of water. If thedirect solar radiation is less than 300 W/m , these particularsystems do not work at all, as seen from Table 4.4. This willhappen from July to September.

— 34 —
FIG. 4.2
LOGICAL FLOW CHART OF SELECTION PROCESS
(m3/day) 2290
(%) 20
909 3617 (m3/day)
13 12 16 8 31 (%)
1538 1408 1875

— 35 —
FIG. 4.3
Hybrid System for Pumping Water
1. PHOTOVOLTAIC SYSTEM
AVAILABLE
ENERGY
H
2. LOW TEMPERATURE THERMODYNAMIC SYSTEM
3. MEDIUM TEMPERATURE THERMODYNAMIC SYSTEM
4. HIGH TEMPERATURE THERMODYNAMIC SYSTEM
5. BIOGAS SYSTEM
6. CONVENTIONAL DIESEL SYSTEM

— 36 —
FIG. 4.4
Photovoltaic System
2c{ %
SUN ENERGY
GLOBAL RADIATION
PHOTOVOLTAIC CELLS
81 %
PUMP
I
WATER
STORAGE
BATTERYDRIVE
MOTOR
D.C.
LMOTOR
ELECTRICITY

— 37 —
FIG. 4.5
Low Temperature Thermodynamic System
SUN ENERGY
GLOBAL RADIATIO
SELECTIVE FLAT—PLATE
COLLECTORS
FLUID STORAGE
THERMODYNAMIC CYCLE THERMAL UTILISATION
WITH ORGANIC TURBINE (DRYING, ETC.)
ELECTRIC PUMP
WATER

— 38 —
FIG. 4.6
Medium Temperature Thermodynamic System
SOLAR ENERGY
DIRECT RADIATION
SIX MODULES OF PARABOLIC
TRACKING COLLECTOR AND
LINEAR RECEIVER
FLUID STORAGE
THERMODYNAMIC CYCLE
WITH ORGANIC TURBINE
GENERATOR
ELECTRIC PUMP
WATER
ELECTRICITYSUPPLY

- 39 -
FIG. 4.7
High Temperature Thermodynamic System
SUN ENERGY
__________________________
I
_________________________________________________________
E
_____________________________
GENERATOR
3 MODULES OF PARABOLIC
TRACKING COLLECTOR AND
POINT RECEIVER
THERMAL STORAGE
THERMODYNAMIC CYCLE
WITH GAS TURBINE
ELECTRIC PUMP
WATER
ELECTRICITY
SUPPLY
— 40 —
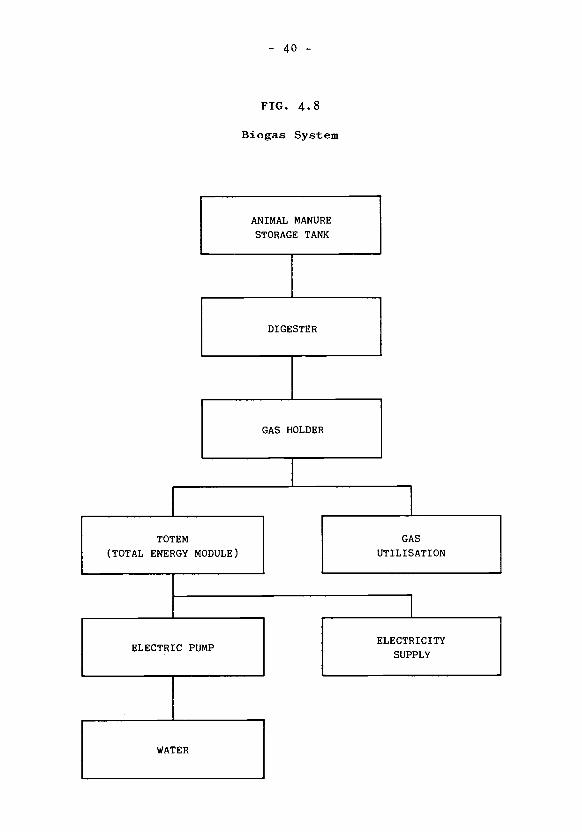
FIG. 4.8
Biogas System
ELECTRIC PUMP
WATER
ANIMAL MANURE
STORAGE TANK
DIGESTER
GAS HOLDER
TOTEM
(TOTAL ENERGY MODULE)
GAS
UTILISATION
ELECTRICITY
SUPPLY

- 41 -
FIG. 4.9
Conventional Diesel Pumping System
FUEL
DIESEL ENGINE
PUMP
WATER

- 42 -
TABLE 4.4
Amount of Water Supplied by Each System3
(m /day)
I
MonthI
Photo—.voltaic
I
I
Thermodynamic I
•Biogas Conven—I tional I
TotalI Low .Medium I .High I
I
I
I
I
I
Jan.I
I
Feb.
1726
1466
I
I
I
I
Temp.
1580
1342
Temp.
I
I 2268
I2109
I
I
I
Temp.
1100
1023
I
I
I
2290
1145
I
I
I —
I —
I
I8964
I
I7085
I
I
I
I I I I I I I I
I Mar.I
1538 I 1408I
1875I 909 I 2290 3617 11637 I
I I I I I I I
I Apr.I
1576I
1442I 1758 I 852 I 2290 363
I8281 I
I I I I I I I I
I MayI
1400 1282 I 967 I 469 2290I — I
6408I
I I I I I I I
I
I
Jun.I
I
1306 I 1196 352 171 I 1636 — 4661
I
I
Jul.I
I
1272I
I
1164I
—
I
—
I
I
I
1145I
—
I
I 3581I
IAug.
I 1173 I 1074 — I — 1636 — I 3883I I I I I
I
Sept.
I
1173 I
I
1074— I — 1636 — I
3883I
I
I
Oct.I
I
ii8i I
I
1081I
I
563I
I
I
273I
I
2290 1147I
I6535
I
I
I
I
I Nov.I
1254I
1148I 1318
I 639I
1145 — I 5504I I I I I
I Dec.I
1379 I 1262 2215I
1074 I 2290 I — I 8220I
I I I I I I

- 43 -
TABLE 4.5
Mass Energy Balance Sheet
I
I
I
MonthI
Water
m /day
I
I
I
I
I
Water9edm /day
I
I
I
Difference I
I
9term /day
I
I
EquivalentI
IThermal Electricitykwh/day kwh/day
I
Jan. 8964 I 7548 I 1416 I — I 77 I
I
I
I
I
Feb.I
I
Mar.I
I
Apr.
7085
11637
8281
I
I
I
3487
11637
8381
I
I
I
I
I
3598
—
—
I
I
I
I
— I 196I
— —
I
— I —
I
I
I
I
IMay
I6408 3372 I 3036 I — I 166 I
I Jun. 4661 I — I 4661 I 900I
189I
IJul.
I3581 I — I 358! I — I 196 I
Aug.I
3883 I — 3883 I — I 212 I
I Sept.I
3883 I — I 3883 I — I 212I
I Oct. 6535 6534I — I — I — I
I Nov.I
5504I
1348 4156 856 I 164 I
Dec. 8220 5032 I 3188 I — 174 I

- 44 -
Table 4.5 shows mass and energy balance for each month of theyear. Since the proposed system does not have seasonal waterstorage (see also 4.1.1.3), it is difficult to cover all fluc-tuations of the water requirement the whole year round,
especially during March when the peak demand occurs. On theother hand, during the rainy season no water is required fromthe system, so there exists surplus energy. This surplus energycan be used for rice drying and milling, village water distribu-tion system, office utilities and processing of data. For ricedrying, the temperature should be kept below 40°C to obtain goodquality of rice and this temperature can be achieved by usingthe surplus heat from the flat plate collector of the lowtemperature thermodynamic system. As seen in Table 4.5, in Junethis system can provide the energy of 900 kw.hr/day or
27,000 kw.hr/ month, which is sufficient to dry 286 tons of ricebringing its moisture content from 22% down to 14%. In order tomill this amount of rice in one month, it requires an electricenergy of 134 kw.hr/day which can also be supplied by thissystem.
4.2 EQUIPMENT
4.2.1 TECHNICAL DESCRIPTION OF EACH MAIN COMPONENT
All the components used for the proposed system are commerciallyavailable. Both the photovoltaic and the medium temperaturethermodynamic system can be supplied off the shelf by ANSALDOcompany. The low temperature, the high temperature and thebiogas system can be supplied by SOFRETES, OMNIUM-G, and SES(FIAT), respectively. The specifications of the main componentsfor the photovoltaic and the thermodynamic system are summarisedin Table 4.6. For biogas and conventional system as well as themeasuring instruments and facilities for training, the specifi-cations are given in Table 4.7.
4.2.2 CIVIL ENGINEERING WORKS
All systems require normal construction materials as well asstandard equipment. Most components are built in standardmodules from the factory and are small in size. Hence simplestructural foundations are needed and will be constructedaccording to the drawings and specifications of the prospectivesuppliers of each system. However, local labour will beutilised. In addition, one building is necessary for datameasuring and training purposes.

TABLE 4.6
Spe
cific
atio
nsof the Main Components
Photo-
Thermodynamic system
I
Des
crip
tions
voltaic
I
syst
emLow temp.
Medium temp.
High temp.
II
II
IC
olle
ctor
type
One sun
I
Sel
ectiv
eParabolic with
I
Par
abol
oid
with I
II
pane
lflat plate
I2
axes tracking I
2axes tracking I
II
I
IA
rea
(m
)I
76I
540
276
I78
I
II
II
I
IM
ode
of storage
Battery
I
Flu
idtank
I
Flu
idtank
IA
lum
iniu
mPack
I
II
II
Bed
I
I1
II
IT
herm
odyn
amic
Loop
II
II
I
Ite
mp
I—
—75
°CI
300°
CI
900°
CI
Ity
peof turbine
IO
rgan
icI
Org
anic
IG
as
II
II
I
IG
ener
ator
/Mot
orI
D.C
.motor
II
II
I9K
WI
—-
I15
KW
I
10K
WI
II
II
IP
ump
(T.D.H.) m
12
I
1212
I12
I1
I
Wat
erRate
I16
0140
235
I11
4I
Im
/hr
II
I
II
II
Man
ufac
ture
rI
AN
SA
LDO
SOFRETES
ANSALDO
IO
MN
IUM
-GI
____
____
____
____
____
____
____
____
____
____
____
__
II

- 46 -
TABLE 4.7
Specifications of Biogas System, Conventional System, MeasuringInstruments and Facilities for Training
BIOGAS SYSTEM
- Animal Waste Storage Tank 10 m33- Digester 120 m
- Gas Holder 40 m3
— Heat Exchanger
- TOTEM (Total Energy Module) 15 kWe
- Electric Water Pump 191 m3/hr at 12 T.D.H.
- Manufacturer SES (FIAT)
CONVENTIONAL SYSTEM
- Diesel Engine 25 kw
- Water Pump 452 jn3/hr at 12 T.D.H.
MEASURING EQUIPMENT AND TRAINING CENTRE
— Pyranometers
- Pyrheliometers— Anemometers: both direction and magnitude
- Thermometers
— Flowmeters
- Pressure Gauges
— Kwh meters
- Recorders
- Building- Audiovisual Equipment

— 47 —
For the irrigation canal, it is necessary to construct:
a) 10 km of main canal with capacity of conveying 0.1 m3/sec.of water
b) 20 km distribution canal with capacity of conveying0.015 m /sec. of water
c) Farm turnouts and appurtenance structures.
4. 3 IMPLEMENTATION
4.3.1 OVERALL TIME SCHEDULE
Upon final approval by the EEC, the proposed project is
tentatively set to be executed within a period of three yearsstarting from October 1, 1980. However, as regards the alterna-tive energy technologies involved in the project, it is feltthat for a project of this calibre a five—year programme wouldbe more reasonable to accomplish the afore-mentioned objectives.On the other hand, unforeseen obstacles may occur; for instance,transportation delays. It will be more desirable to begin withthe installation of a biogas and photovoltaic system, followedby a thermodynamic conversion system. The conventional dieselsystem can be installed at any time, even at the time of peakrequirement when needs rise above the capacity supplied by non—conventional energy. This situation should occur during thelast period of the project.
Table 4.8 shows the overall schedule. Details of the activitiesare discussed as follows.
4.3.1.1 Detailed Design Phase
One of the major obstacles for the development and implementa-tion of alternative sources of energy is the initial capitalcost, which could be reduced by:
— proper design
— adequate site selection
— accurate analysis of climatic conditions
— local energy needs
— available indigenous technologies and custom—designedequipment instead of standard modules.


— 49 —
In the selection of an appropriate site, some environmental andsocial aspects have to be considered, e.g.
a) There should be water in sufficient quantities for thecrops.
b) Local people belonging to the selected site must be willingto grow the second crop in the dry season
1. cultivating in the dry season needs extra effort as
regards soil hardening and weeding;
2. the second crop needs more fertilizer and insecticide.
c) The villagers should be enthusiastic to learn more about newagricultural techniques.
The complete detailed design should be submitted to RTG forpreviewing, commenting, modifying and final approval beforeimplementation.
4.3.1.2 Implementation Phase
It is likely that the Committee on Non-Conventional Energy,which consists of representatives from various RTG's agenciessuch as the Office of the Prime Minister, Ministry of Science,Technology and Energy, Ministry of Agriculture and Co-operatives, various universities and technical institutions,etc., will assign the responsibility of implementation of thewhole project, or particular components of it, to certainorganisations within its committee. However, it can be presumedthat various organisations will share part of the responsibilityin the project according to their specialisation.
The roles of each activity and the names of responsible agenciesin this project are briefly mentioned as follows.
1. National Energy Administration (NEA)
The NEA has the role of co-ordinating and implementingactivities related to alternative sources of energy. Withinthe NEA, there exists the Electrical Pumping Project whichhas covered the major area of the north—east region success-fully, hence the existing facilities and the knowledgegained from this project will assist in the operation of thealternative energy pumping station, as well as in itsconstruction and future promotion.
— 50 —
2. Department of Agriculture (DOA)
Since agriculture is the key element in determining thesuccess of the project, the DOA will play an important rolein supporting the project by giving valuable advice on newagricultural techniques, fertilizer utilisation, croppattern, etc.
3. University and Technical Institutions
Many universities and technical institutions in Thailandhave contributed considerably in research and developmentphases in the field of alternative energy. With theiravailable expertise and manpower, these institutions areexpected to share responsibility in testing, evaluating,data processing and, as the final goal, developing thesystem that is suitable for the region.
4. Department of Technical and Economic Co-operation (DTEC)
The DTEC is the agency authorised by the RTG to deal withforeign grants and assistance. It will be the designatedagency for offshore procurement of all services and equip-ment, if any, and will participate in project evaluation.
4.3.1.2.1 Land Acquisition
Land acquisition should occur as a first step, upon agreement onsite selection. 10 rai of land will be needed for building andequipment installation. It will be decided later whethergovernment land or private land will be used, keeping in viewthe legal aspects involved.
4.3.1.2.2 Site Preparation
Site preparation will include the construction of buildings suchas a control room, office, staff housing, water storage,irrigation canal and appurtenances. These activities should beexecuted by local contractors in Thailand and should be startedas soon as possible, i.e. immediately after completing landacquisition arrangements.
4.3.1.2.3 Tenders, Selection, Negotiation, Erection
The above activities are the responsibility of the EEC with theRTG's approval. The time phase for tenders, selection andnegotiation is assumed to be two months for each activity. Theamount of time needed for construction is one and a half years,since more time—consuming jobs are involved and time needed totransport equipment necessary for the project is included.

— 51 —
4.3.1.3 Operation (Commissioning and Operation)
The test run period is scheduled to cover six weeks during thesecond half of the third year. This will allow ample time forthe RTG's personnel to study and participate in the importantphase of the project when theexperts are present on site. TheRIG's personnel are expected to become totally familiar with thesystem, so that they can independently operate the pilot plantafter the plant is handed over to the RTG.
4.4 OPERATION (AFTER THE COMMISSIONING PHASE)
4.4.1 TESTING AND TRAINING PHASE
The proposed project will not be research orientated, but willexperiment the various aspects of alternative technologies forwater lifting. Selection and adaptation of a promisingtechnology will be made after testing its operation in localconditions. Each technology will be monitored by the RIG agencyin order to get a tangible idea of system reliability, economiceffectiveness, plant efficiency, system adaptability, socialacceptance and system operation.
Training of personnel shall be carried out in conjunction withthe testing phase. Thus, if the RTG decides to establishanother pumping station utilising a certain chosen alternativeenergy technology (or technologies), it will already have theexperienced manpower available. In addition, the NEA andvarious government agencies have been actively involved in ruralenergy programmes. For instance, the NEA has a programme to setup 6 regional energy centres to deal with rural alternativeenergy activities: to provide information dissemination, tomonitor energy activities, to collect data, and to follow up NEArural energy programmes. Therefore, training experience fromthis project for NEA or other RTG personnel will be fullyutilised. At the final stage, these benefits will be propagatedto the other countries of the region.
4.4.1.1 Time Period Proposed for Achieving Final Results
Two more years after commissioning are needed for testing andevaluation in order to achieve the final results. Possibleextension of testing and evaluation should be foreseen in thefuture to achieve long—term objectives.

— 52 —
4.4.1.2 Type of Analysis of Experimental Data
Technical, economical and social analyses are required in orderto be able to make a comparison and evaluation of the technolo-gies proposed. As mentioned previously, the universitiestparticipation in this activity will provide a strong ingredientto the project.
On the ground that each technology has its own merits, technicaland economical analyses should be done together. Optimisationof one or combined technologies can be attained. The importantparameters likely to be evaluated are overall system efficiencysubjected to various conditions, operating and maintenance cost,climatological data, etc.
4.4.1.3 Associated Training Work
Not applicable.
4.4.1.4 Estimates of Manpower Required for 4.4.1.2
4.4.1.4.1 Analysis of Experimental Operation
The analysis will be carried out by RTG officials, possibl.y fromthe designated agencies with the co—operation of the univer-sities. The preliminary estimates of manpower required are asfollows.
Type of Analysis Estimated Man-Month
- Technical data collection 4 x 24
- Biogas system 1 x 24— Solar thermodynamic system 3 x 24- Photovoltaic System 1 x 24— Economic 2 x 24— Social and environmental 2 x 24
Total 13 x 24

— 53 —
4.4. 1.4.2 Training
Since the proposed system is of imported technologies and thetraining is included as part of the package, no additionaltraining by foreign experts is deemed necessary.
4.4.1.5 Estimates of the Maintenance and ComplementaryExperimental Work
Due to lack of appropriate information, maintenance work cannotbe realistically estimated. Most manufacturers do not haveenough experience to provide a guaranteed amount of maintenancework or its cost. Therefore, maintenance items are not includedin this analysis. Nevertheless, all manufacturers claim thatvery little maintenance is required, and thus its cost may beabsorbed by the RTG. Also, in this project every component inthe selected system is of proven technology, hence complementaryexperimental work is not relevant.
4.5 ECONOMIC EVALUATION (PRELIMINARY COST ESTIMATES)
4.5.1 COST EVALUATION OF THE EQUIPMENT
The cost breakdown of the proposed hybrid system is shown inTable 4.9. The instrumentation for data measuring, covering thewhole system, is estimated to be about 0.083 million U.S.$. Fortraining purposes, one building is required and its cost isestimated to be around 0.150 million U.S.$. Of particularinterest, is the ratio of the system cost to the quantity of thewater supply. The biogas system has the smallest ratio, i.e.
1.5 U.S. cents for one cubic metre of water. Another point ofinterest is that it has been widely quoted by many solar expertsthat for an output of more than 10 kw , the concentrated thermo-dynamic system is more economically than the photovoltaicsystem. In this analysis, it does not follow the rule, becausethe concentrated thermodynamic system available on the marketwas not custom—designed for optimum use in large systems, whereits merit lies, but was designed in standard modules of smallcapacity to facilitate transportation. Hence, when they areadded up to build a larger system, the overall cost risesunrealistically.

- 54 -
TABLE 4.9
Cost Breakdown of the Proposed Hybrid System in Million U.S.$
I I Thermodynamic I
Photo-Descriptions
I . I I I . I Biogasvoltaic Low Medium High
I I
Temp. Temp. Temp.
I I I I
Collectors 0.262I0.129 0.225
I0.117
I
0.021
I I I
Mech. or Elec.I
0.038I
0.230System
0.150I
0.045I
0.032I
Pump 0.005 0.021 0.005I0.003 0.008
Completed System 0.305 0.380 0.370I0.165 0.061
Installation 0.076 0.142 0.093 0.009 0.032
Transportation 0.030 0.038 0.037I0.012 0.006
Overall cost 0.411 0.560I0.500 0.186 0.099
Cost/rn3 of 8.22I
12.20I12.20 9.40 1.50
water suppliedI I
(U.S. cents)I I I I I
I I I I
N.B.
1. Transportation cost is based on 10% of completed system cost.2. Cost per cu.rn of water supplied is based on 10 years service life.3. Cost of each system is based on manufacturer's quotation.4. Cost of diesel pumping system for peak demand is not included.

— 55 —
4.5.2 COST EVALUATION OF CIVIL ENGINEERING
The cost of civil engineering required for the equipment of thesystem is included in the installation cost as shown in Table4.8. However, the cost of the irrigation canal was estimated,based on the standard rate used in the NEA's Electrical PumpingProject, to be 0.15 million U.S.$.
4.5.3 COST EVALUATION OF THE OPERATION
4.5.3.1 In the Testing and/or Training Phase
The cost of operation during the test and/or training phase isdivided into two portions, i.e. foreign and local. The formercovers expenditures for the services of the imported expertsduring the test run and training of personnel. This portion isalready included in the installation cost as a part of thepackage sale. The latter covers the expenses of the RTGpersonnel, which is naturally excluded from the proposed budget.
4.5.3.2 In Normal Running Operation
During this period, all the staff will be RIG personnel paidfrom the RTG budget. The only requested budget is the dieselfuel for running the conventional system which is estimated tobe U.S.$1,600 per annum.
4.5.4 BENEFITS
Benefits obtained from this project are both direct andindirect. The indirect benefits, which are also of significantvalue, cannot unfortunately be evaluated in terms of monetaryvalue. They consist of:
1. upgrading the standard of living of the local farmers;
2. providing work in the dry season for rural people, thusstopping the migration to towns;
3. facilitating a test and training centre for the study,implementation and evaluation of the alternative source ofenergy.

- 56 -
The direct benefits, in terms of the additional annual incomefor the local farmers, are estimated to be U.S.$121,380. Theseare the results of:
1. additional production of paddy in the second plantation,which amounts to 286 tons per annum. Based on current priceguaranteed by the Government, it can fetch U.S.$38,610;
2. the production of groundnuts planted during the intervalbetween the two main crops will amount to 146 tons per annum(already milled), and will cash in U.S.$73,000;
3. the effluent obtained from the biogas system is calculatedto be 2053 kilogrammes per annum. This effluent containsabout 3% of nitrogen content and hence can be used as a
fertilizer. In each year, the nitrogen obtained from thebiogas will be equivalent to 977 sacks of urea fertilizer.Therefore, the farmers can save U.S.$9,770 per annum.

— 57 —
5. CONCLUSIONS
5.1 SUMMARY OF THE OVERALL TIME SCHEDULE
The proposed project is scheduled to begin in October 1980, andto cover a period of 3 years for the engineering andimplementation phase. A necessary two—year extension period foroperation after commissioning and for the evaluation phase willbe carried out by RTG agencies. Table 4.8 in the previouschapter shows the details of the overall time schedule.
5.2 SUMMARY OF THE TOTAL COST AND TIMETABLE OF THE REQUIREDFINANCIAL COMMITMENTS
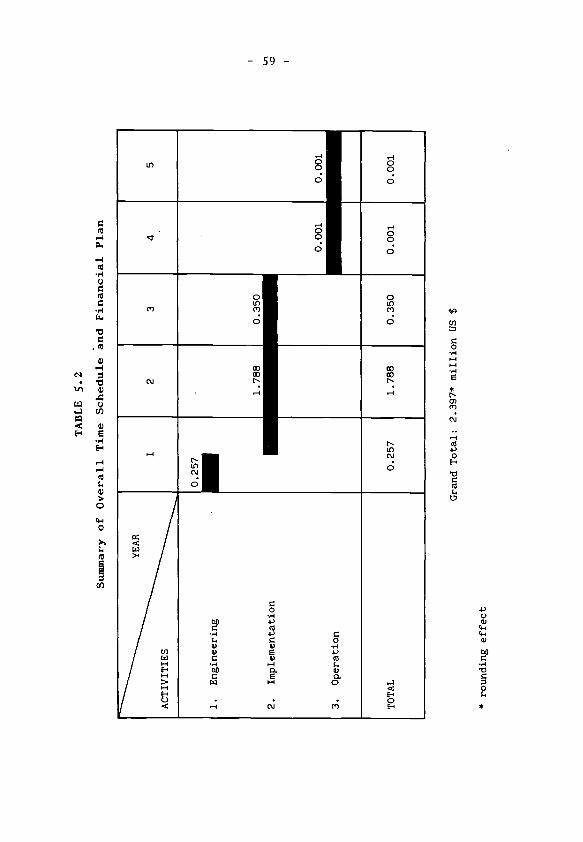
The complete package cost of the proposed hybrid system,including transportation and installation cost, amounts to 1,756million U.S. dollars. Costs for civil engineering work,including building, measuring station and irrigation canals, addup to 0.383 million U.S. dollars. Therefore, the overall costis 2.139 million U.S. dollars. With the additional cost fordetailed design service expenditure, calculated at 12 per centof overall cost, the grand total budget required will amount to2.396 million U.S. dollars. Tables 5.1 and 5.2 show a summaryof the total budget and a summary of the overall time scheduleand financial plan respectively.
It is to be noted that the cost analysis was made in 1980 andshould therefore be adjusted according to the present localinflation rate and variation in equipment and manpower costs.

- 58 —
TABLE 5.1
Summary of the Total Budget
I I I I
Items I Million U.S.$ IPer Cent I
I I I
I I I I
I
I
I
I
Hybrid System
Irrigation Canal
I
I
I
1.756
0.150I
I
I
82
7
I
I
I
I
Measuring StationI
0.083 I
I
4
I
IBuilding for Training I 0.150 I 7 I
I Centre I I
I I I I
I I I
I Sub-total I 2.139 I100
I I I
I Detail Design 12% I0.257
ITotal Budget I
2.396
I I
* ro
undi
ngeffect
TABLE 5.2
Summary of Overall Time Schedule and Financial Plan
Grand Total: 2.397* million US $


- 61 -
REFERENCES
1. Russel Brannon, "Agricultural Sector Assessment — Thailand",January 1978.
2. "Thailand: Toward a Development Strategy of Full Participa-tion, A Basic Economic Report", World Bank, September, 1978.
3. Agricultural Economics Research Bulletins, Division ofAgricultural Economics, Thailand.
4. "Water for the Northeast: A Strategy for the Development ofSmall Scale Water Resources", Asian Institute of Technology,Thailand.
5. "Village Khon Kaen - Social and Economic Conditions of a
Rural Population in Northeast Thailand", Social ResearchInstitute, Chulalongkorn University, Bangkok, 1976.
6. "Pre-Feasibility of the Biogas Technology Application in
Rural Areas of Thailand", Applied Scientific ResearchCorporation of Thailand, 1979.
7. "Solar Energy Thermal Processes", by John A. Duffie andWilliam A. Beckman, John Wiley & Sons, New York.
8. Various Lectures on Alternative Energy given by many expertsduring the course in the Turin Centre.
9. Data and information collected and compiled from variousmanufacturers and technical institutions during study toursin Italy and France.

PART II:
PREFEASIBILITY STUDY ONA COMBINED SOLAR AND WIND ENERGY ICE PRODUCTION SYSTEM
TO IMPROVE PRESERVATION OF FISHERY PRODUCTSIN RURAL AREAS
INDONESIA
BYA. KOHAR IRWANTOMUCHAMAD ROSIDI.S. SUWARDJAKA


- 65 —
1. INTRODUCTION
It is the intention of this prefeasibility study to design andeventually install a pilot plant for applied research in
Indonesia. This plant should ensure self—sufficiency in a
typical fishing village in terms of ice for the preservation offish, and to meet domestic water requirements. In particular, 2
tons of ice would be produced per day by an absorptionrefrigeration process, the electrical supply of whichfully supplied by a photovoltaic system; in addition 2 m perday of water be pumped from the ground for ice production,and another 3 m per day for domestic use.
It must be noted here that, at first impression, one might con-clude that the utilisation rates of the components of the systemwith respect to their designed capacities is very low, e.g. therefrigeration system could produce, at considered operatingconditions, 6.8 tons of ice per 24 hours, however the plannedproduction rate is only 2 tons per day.
The above impression would be valid if conventional sources ofenergy were being utilised. As this project entails the utili-satjon of non—conventional and renewable sources of energy,where the cost of the energy source itself is zero, this impres-sion is no longer valid.

- 66 -
2. OBJECTIVES OF THE PROJECT
The project aims to set up an integrated pilot plant using solarand wind energy for a refrigeration system which will produceice at two tons/day. The proposed site for the project is inthe rural area close to the beach where fishing is the mainsource of livelihood. The project was conceived since ice is anecessary preservation medium for delivering fresh fish to andin the market.
A. Long-term Objectives:
1. Energy diversification policy, to reduce the dependence onpetroleum in the overall energy consumption pattern, andlater, to replace it with the use of other renewable energysources.
2. Energy conservation policy, to economise on energy use andto implement it efficiently and wisely.
3. Increase and expansion in exploration and production of allenergy resources, i.e. oil and natural gas, coal, waterpower, geothermal heat, wind power, solar energy and radio-active minerals.
4. Transfer of technology for rural communities' developmentand development of other high potential areas.
B. Short-term Objectives:
Government policy of increasing the income of the localfishermen through the promotion of better quality of
production and diminishing cost of production.
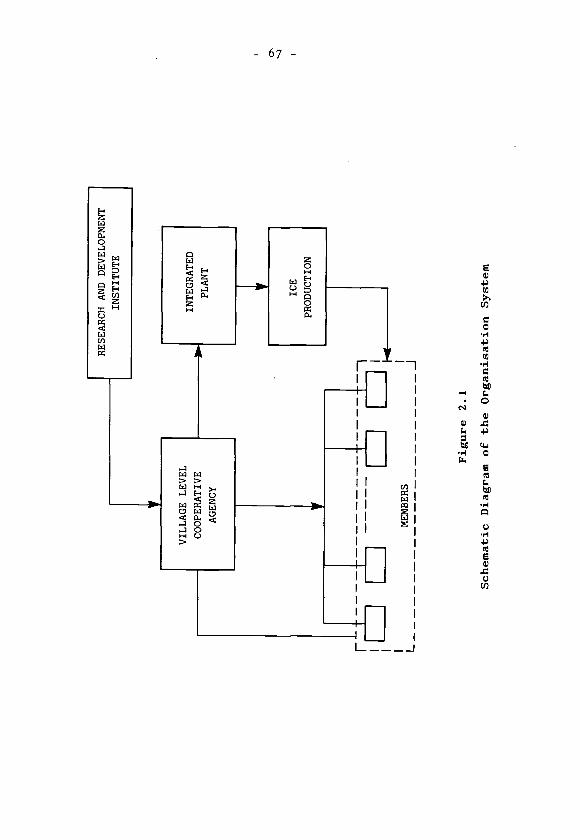
The plant proposed will be managed by the village level FisheryCo—operative Agency, under supervision of the Research andDevelopment Institute. The Agency will sell the ice produced toits members at a proper price. The schematic diagram of thesystem of organisation is shown in Fig. 2.1.
There are possibilities to use the plant for training purposesand to develop it for large—scale introduction in otherpotential areas.
0'
r
J
Fig
ure
2.1
Schematic Diagram of the Organisation System

— 68 —
3. BACKGROUND TO THE PROJECT
3.1 SOME ASPECTS OF RURAL DEVELOPMENT
Indonesia, which is situated in the tropics, can utilise solarenergy in a variety of ways, e.g. for electrical power, heating,mechanical power and also biological and chemical power. In thelong term, the sun constitutes an unending energy resource andwill not cause pollution. What would be implemented immediatelyis the utilisation of solar energy in the thermal field, i.e.
for drying or cooling, utilisation of biomass and utilisation ofwind power, especially in the eastern part of Indonesia and inthe rural areas.
In the rural areas, specifically in a village where fishing isthe main source of livelihood, the loss of production is veryhigh because at present improperly preserved fish suffers fromspoilage. To reduce the loss of production, ice is a necessarypreservation medium for delivering to and in the market. It isat present very expensive and hard to obtain, since the plantsare far away from the fishing site and there are no electricalfacilities in the village either. To increase the income of thesmall-scale farmer for better living, especially of the localfishermen, the government is implementing this policy throughthe promotion of better quality of production and diminishingthe loss of production.
Energy constitutes one of the determining factors for theachievement of the development target. During the first and thesecond of the "Five-Year Development Plan" (1969-1979) energysupply was not a problem because the energy requirements of thesectors could be easily met. This was so because of the variousnatural energy resource potentials possessed by Indonesia, suchas oil and natural gas, coal, water and geothermal heat.Moreover, as a tropical country Indonesia can utilise solar heatand various kinds of plants which produce fuelwood for energysupply in rural areas.
The Republic of Indonesia comprises more than 13,677 islandswith a population of 140 million people (1979), and the popula-tion growth is about 2.5 per cent in a year. However, facingthe problems of rapid population growth and an increasing paceof industrialisation in the years ahead, management of thevarious energy resources should be implemented as early as
possible in a rational and effective manner.

— 69 —
The development of energy consumption during the last 15 yearshas clearly proved the importance of a cohesive energy organisa—tion structure, not only to see to the efficient development andutilisation of various energy resources, but also to pay atten-tion to the protection of the environmental structure. Based onthese considerations, the development of a balanced energypolicy will receive first priority during the third of the"Five—Year Development Plan" (1979/1980 - 1983/1984). Thepolicy will concern various aspects of the daily life of thepeople and have an especially close connection with thepopulation growth and the rate of economic growth.
3.2 TENTATIVE IDENTIFICATION OF NEEDS
Generally, the living conditions in rural communities in
Indonesia are characterised by:
a) Poor living conditions due to low income pro capite,compared to urban areas.
b) Economy of rural areas based on fishing and related produ-cts and activities.
c) Low production income due to wastage of fish throughhandling problems during storage, transportation andmarketing.
3.3 TENTATIVE IDENTIFICATION OF AREA OF APPLICATION
The tentative location of the pilot project is in the easternpart of Indonesia (precisely in Pasir Panjang). In this area theaverage wind speed is about 5.55 meters per second and themaximum is about 23.05 meters per second. The average wind speedfor each month is shown in Table 3.1.
The solar radiation intensity in Indonesia averages 5 kwh per m2per day, and the ambient air temperature 30°C, the relativehumidity of air is between 85-90%.
The latitude of Indonesia lies between 6°N and 11°S, and thelongitude lies between 95°E and 142°E.

— 70 —
Table 3.1
Monthly average of wind speed in Pasir Panjang,south—east part of Indonesia*
I
I
Month
I
Average Wind(m/s)
Speed
I I I
I January I 9.16
I I I
February I 3.05 I
I I I
March I 4.7 I
I I
IApril I 2.5 I
May I 6.66I I
I June I
I
8.61 I
I
I
I
July I
I
7.22 '
August I 6.11 I
I
I SeptemberI
I 6.11I
I
I I
I October 5.27 I
I I I
I
I
November I
I
4.16 I
I
I
I
December 3.05I
* Source: Harijono Djojo Dihardjo, Research and Prospects ofWind Energy Utilization in Indonesia, Expert WorkingGroup Meeting on the Use of Solar and Wind Energy,Escap, Bangkok, 1976.

— 71 —
3.4 SELECTION CRITERIA
The selection of this technology was based on the followingcriteria:
a) Technical Suitability
In the chosen field there is no particular form of energy thatcan be used except solar and wind, particularly in areas whichare still isolated and will probably not be within reach of anelectricity network for the next twenty years. For this reason,the construction of a pilot project of a combined solar and windsystem could be considered.
b) Research and Development Programme
One advantage of utilising renewable energy is the transfer oftechnology which would help the existing programme of researchand development in the country. The exploitation of solarenergy based on photovoltaic conversion, low temperaturethermodynamic conversion, and the exploitation of wind energythrough low—power machines involve the use of simple equipmentwhich requires little maintenance and produces a clean form ofenergy. The difficulty at present is its still prohibitiveprice, but according to some estimates, this price will besufficiently attractive in the mid 1980s. For this reason, itsprospects are fairly bright particularly for isolated ruralareas. In Indonesia, the other problem in this programme is thetechnical know-how. It is still deficient in its capability todevelop and utilise the energy sources required.
c) National Energy Policies
To enable the objectives to be achieved, the following steps aretaken:
ci Intensification and expansion policy, to increase andexpand the survey efforts and exploration of all energysources available in Indonesia
c2 Diversification
c3 Conservation
c4 Indexing, to relate each energy need to a certain type ofenergy source so that its utilisation is most favourable ona national level.
The two main objectives of the National Energy Policies are:
1. Development of the other energy sources.
2. Preservation of the environment.

— 72 —
4. DESCRIPTION OF THE PROPOSED PILOT PLANT
4.1 GENERAL
4.1.1 PRELIMINARY ANALYSIS
The project involves
1. Ice production for preservation of fish
2. Pumping of ground water using windmills
3. Generation of electricity for the absorption-refrigerationplant.
It is now attempted to give on a rational basis the sizing ofthe system; this is because it is difficult to obtain accuratedata on a typical fishing village at the moment. Furthermorevillage sizes are generally not standard in the country.Therefore, average village size is borne in mind in thisanalysis.
The basis of the project is to construct a pilot plant of
manageable proportions. For normal refrigeration systems about2 to 3 tons of ice produced would give a desirable plant size,especially as a research laboratory. Another reason is thatfishermen in any typical village would not require more than 3tons of ice for preservation of fish. For the purpose of thisproject, 2-ton ice production is considered satisfactory. Thisis subjected to a confirmative analysis which would be subse-quently undertaken (refer to Section 4.2.1).
The absorption—refrigeration system requires heat input into thegenerator. This is best achieved using solar collectors.
It is envisaged that a minimum of 5 m3 of water is required perday, and this forms the basis for the design of the windmill.As wind speed as well as the wind direction is highly unpredic-table, storage is necessary.
For the generation of electricity the only alternatives are theuse of wind energy and the application of photovoltaic conver-sion. The use of wind energy requires a battery storage systemas well as expensive electrical generating equipment, whereasphotovoltaic conversion requires minimum maintenance and has a
suitably good conversion efficiency, and this is preferred insmall power requirements in terms of cost.

— 73 —
4.1.2 DETAILED SCHEMATIC DIAGRAM
4. 1. 2.! Absorption-Refrigeration System
The main components of the system are
a. Generator
b. Absorber
c. Condenser
d. Evaporator/Ice Machine
e. Heat Exchanger E1 and E2
f. Solution Pumps and Recirculation Pump
The diagram of the system is shown in Fig. 4.1. At the absorberthe weak solution comes from the generator at a temperature of39°C. This solution absorbs the ammonia from the evaporator.The pump pumps the solution to heat, exchanger E1. The recir-culation pumps are used in order to enable better absorption bythe strong solution. The heat is absorbed by the circulation ofcooling water. From the heat exchanger E1 the solutiontemperature goes up to 77°C and in the generator the solutioncirculates around the tube of hot water. In this part it
evaporates at 88°c. Then the weak solution comes out at 98°Cand enters E1. The temperature outlet from E1 is 38°C with highpressure about 12 atm. This pressure is dropped down to two atmto be equal to the pressure in the absorber.
The ammonia vapour from the generator contains little amounts ofsteam when entering the "column". Because of the cold, ammoniacoming from the condenser (at 30°C) enters the "column", someammonia and water condense and then enter the generator. Theammonia vapour goes to the condenser at 70°C.
4.1.2.2 Photovoltaic Panel System
The main components of the system area. The Panelsb. Charge Controllerc. The Batteries
The basic schematic diagram of the photovoltaic panel system isshown in Fig. 4.2.

For the control of
water flow
I-I
C)
Solar collectors
1628 kg/h
8.7 m3/h
27°C
Cold water
20°C
4.23
m3/
h29
°C
cold
water
—3

32 x
8=
256
PHOTOVOLTAIC PANELS
USER
H C) a
—a
BATTERIES
96V —
135
Ah

— 76 —
4.1.3 OVERALL FLOWSHEET DIAGRAM
The plant utilises the combined energy sources of1. Solar Energy for : electrical utilisation
hot water production
2. Wind Energy, to pump ground water.
Electric power is produced by photovoltaic panels and hot wateris produced by flat-plate solar collectors.
The basic schematic diagram of the plant is shown in Fig. 4.3.
4.2 EQUIPMENT
4.2.1 DESIGNING OF THE SYSTEM
4.2.1.1 Refrigeration System
a) Evaporator/Ice Machine
The machine produces 2 tons of ice per day operating 7 hours a
day.
Consequently, if the machine operates 24 hours in the day, it
will produce:
x 24 = 6.86 tons of ice in 24 hrs.
The thickness of the ice is about 2.5 mm, the temperature ofevaporation —19°C and the temperature of ground water used toproduce ice is 20°C, so using the diagram in Appendix 1, theminimum required power for the refrigerating system to producethe ice with the machine MODEL V 310 A - NH3 (ATLAS SLICE-ICEMACHINE) is about 35,000 k cal/h
It is assumed, therefore, that the required power to produce iceis 35,000 k cal/h.
In the evaporator, the ammonia evaporates at:
temperature = -19°C (T.evap.)
pressure = 2.1 atm (P.evap.)
enthalpy = 295 k cal/kg ammonia (H)

SLIC
E—
ICE
H 0

— 78 —
Because the condensation temperature is 30°C and the subcoolingtemperature is 13°C, the enthalpy at the subcooling phase is 14k cal/kg ammonia. This value is found from the Mollier Diagram.
The difference in enthalpy between the subcooling phase and theevaporating phase is:
H = 295 - 14 k cal/kg = 281 k cal/kg
The required quantity of ammonia is:
35000= 124.55 = 126 kg/h of ammonia
b) Generator
Figure 4.4: Generator
1 kg (example)
88°C
1) = weak solution
(35% concentration)
x = strong solution
(40% concentration)T=77°CMaterial balance:
x (0.40) = 1 + (x — 1) (0.35).
X = 13 kg/h of strong solution for each kg of ammonia whichevaporates in the generator, with the flow rate:
126 x 13 = 1638 kg/h, and then the flow rate of weak solutionis:
1638 - 126 = 1512 kg/h weak ammonia
Heat balance in the generator:
• strong solution (inlet) at T=77°C 11=57.5 k cal/kg
• ammonia vapour (outlet) at T=88°C H=322 k cal/kg(using the MOLLIER DIAGRAM.)
enthalpy of weak solution (Hw) =80 k cal/kg.
Generator

- 79 -
Hg = (322 x 126) + (80 x 1512) - (57.5 x 1638) =
= 67347 k cal/h
(this is the heat exchanged in the generator).
The diagram of cycle of the ammonia is given in Appendix 2.
The flow rate of hot water required for the circulation in
generator is arrived at as follows:
Hg 67347Mass flow rate = 4500 kg/h= s(T2—T1) = 1(120—105)
where S = specific heat (for water = 1)T2—T1 = temperature difference
The flow rate is given by dividing3 the mass flow rate by thedensity (for water this is 1000 kg/rn so that:
so, the flow rate = = 4.5 rn3/h
c) Absorber
Figure 4.5: Absorber
Absorber
The heat absorbed by cooling water: (heat balance) is:
HABS = (12 x 1512)+(381 x 126) — (3 x 1638) =
= (—) 61236 k cal/h
NH3 liquid
Strong sol.
H = 3 kcal/kg
Cold water
T = 20°C
T = 20°CH = 381 kcal/kg

The surface of heat exchanger in the absorber:
HABS 612362S= = = 21.95m
K. T 600 x 4.65in
where the overall heat transmission coefficient is given by:
K = 600 k cai/m2.°C.h
— (29° — 20) — (29° — 27)— 4 65°c
— in (29° — 20°)/(29° — 27°) —
= Log Mean Temperature Difference
The cold water flow rate required for cooling is:
38052 42304.23 m3/h4230 kg/h
lx(29—20) = — 1000 —
The surface o.f heat exchanger inside the condenser:
H 38052con =
= 21.7 2m
K. T 450 x 3.9in
- 80 -
The cold water required:
61236lx(27—20)
= 8700 kg/h
The flow rate is therefore:
- 8.7 m3/h1000 -
Tin
Tin
d) Condenser
Figure 4.6: Condenser
NH3 I 126 kg/h
vapour T = 70°C, H 335 kcal/kg
cold water
T = 29°C; 4.23 m3/h
T = 20°C
liquid T = 30°CH = 33 kcal/kg
The heat energy absorbed by cold water is:
H = (355 — 33) x 126 = 38052 k cal/hcon

- 81 -
where,(300_200) — (300_290) (10 — 1)
in = in (300_200)/300_290) = 10 =inK 450 k cal/m2.°C.h.
The totai cooling water required:
4.23 8.7 = 12.93 m3/h.
e) Electric Power Requirement for Refrigeration System
Power requirement of solution pump: 0.87 kwPower requirement of recirculation pump: 0.37 kwPower requirement of ice machine drum: 0.75 kwPower requirement of ice machine pump: 0.373 kwPower requirement of hot water pump: 0.42 kw
Total power: 2.783 kw
4.2.1.2 Solar Collectors
The heat energy which must be used in the generator is: 67347k cal per hour. The temperature of the hot water required is120°C of inlet and 105°C of outlet water. For this range oftemperature, the average efficiency of the tube collectors (U.)is 0.45 of the average solar radiation.
So, the net energy collected by the collectors corresponds to:2
0.45 x (average solar radiation) = 0.45 x 5 kwh/rn .day =
= 2.25 kwh/m2.day
Because the refrigeration system works 7 hours per day duringthe greater radiation, the surface of solar collector requiredis:
67347 x 7 x 2
2 2= 243 rn of collectors
Based on the circulation of direct solar radiation shown in thecurve in Appendix 3, it is very low. For this reason, the useof the flat-plate solar collector which can give a highefficiency was considered.
4.2.1.3 Photovoltaic System
The electric power required by the pumps in the refrigerationsystem is 2.783 kw (= 2.8 kw). The duration of solar radiationin a day is 8 hour/day.

— 82 —
The energy required is:
2.8 x 7 = 19.6 kwh/day
It must be noted here that this is the average power required.The design of the photovoltaic panel must however consider thepeak wattage required.
From the photovoltaic panel, the peak kwh/day to be produced istaken as 26.02 kwh/day
Radiation intensity: 5 kwh/m2.day
The panel can produce: 20 W at 12V.
The number of panels required to produce 24.4 kwh/day:
kw to be produced= 2 .02
= 5.2 kwp 5 p
5.200the number of panels
= 20= 260 panels.
To make it 8 panels in series and 32 panels in parallel, thenumber is reduced by 4 panels. So the system uses 256 panels(8 x 32 panels). The diagram is shown in Fig. 4.2.
The batteries in the system are required to store the excesspower of 6.5 kwh during the midday. In the day the electricpower, which is fed directly to the D.C. meter, is 19.52 kwh.Due to the efficiency of about 75% (this is a theoretical valueand can sometimes be reached; however, for the great majority ofcases the value would be lower), the output from the batteriesis equal to 4.88 kwh entering the D.C. motor, and the D.C. motorsupplies 24.4 kwh for the requirement, with potential equal to96 V - DC.
Calculation of the required number of batteries:
each battery supplies 12 V and 135 Ampere hour (Ah).
Then, the number of batteries is equal to:
= 8 batteries

— 83 —
and will supply the power about:
96 V x 135 Ah = 12.96 kwh peak (= 13 kwh).
The system is given in the following picture:
Figure 4.7: Photovoltaic System
Photovoltaic
panels
USER
4.2.1.4 'Wind Machine
Using the data of wind speed available at the site (seeTable 3.1), and estimating roughly the hours/day of duration foreach month as shown in the Table 4.1, we can find the wind speedavailable at the minimum and the maximum velocity of the wind(Table 4.2).
The. curve relating to the wind speed V (m/s) and duration(hour/year) is shown in Appendix 4. Using this curve thecalculation shows that the wind machine which is mostappropriate 'for this wind speed condition is the vertical axistype. "Model CSN-0501".
It can produce in a year:
= 200.60(75 + 76 + + 180) +
(200 + 236) =
= 14676 + 2616 = 17292 m3 of water per year.
The detailed calculation is given in Appendix 5. Based on thisresult and the climatic conditions in the area, it is preferableto use two units of this type to produce the required quantityof water. Other reasons for employing two units are to meetpeak demands and provide a standby in case of a breakdown. The
19.52
Batteries

- 84 —
water produced will be stored in an appropriate volume of tank.The machine will pump to the ground water from a well about 15meters deep. The temperature of ground water is20°C, and the water requirement for producing ice is 2 m /day.
Table 4.1
The condition of wind speed in the field (Pasir Panjang)
MonthWind speed
(m/s)
Duration*(h/day)
Duration(h/month)
JanuaryI
9.16 8 248
FebruaryI
3.05I
8 I 232
MarchI 4.7 I
8 I248
AprilI
2.5I
8I
240
MayI
6.66 I 12I
372
JuneI
8.61 I 10I
310
JulyI
7.22I
iiI
341
AugustI
6.11 11I
341
SeptemberI
6.11I
iiI
330
OctoberI
I
NovemberI
5.27I
10 310
I
4.16I
8I
240
DecemberI
3.05I
8 240
* Approximately
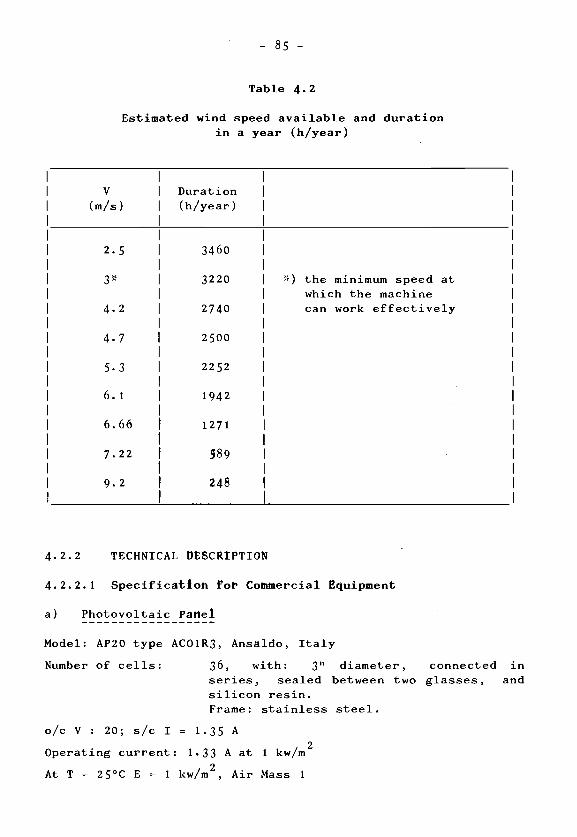
— 85 —
Table 4.2
Estimated wind speed available and durationin a year (h/year)
I I I I
I VI
DurationI I
I (m/s) (h/year)I
I I I I
I I I I
I2.5
I3460
I
I I I I
I
3*I
3220I
*) the minimum speed atI
I I I which the machine
I
4.2I
2740 can work effectivelyI
I I I I
I 4.7 I 2500I I
I I I I
I 5.3 I2252
I
I I I
I 6.1 1942I I
I 6.66 1271I
I7.22 589 I
I9.2 248
4.2.2 TECHNICAL tJtSCRIPTION
4.2.2.1 SpecificatIon Fot' Commercial Equipment
a) Photovoltaic
Model: AP2O type ACO1R3, Ansaldo, Italy
Number of cells: 36, with: 3" diameter, connected in
series, sealed between two glasses, andsilicon resin.Frame: stainless steel.
o/c V : 20; s/c I = 1.35 A
Operating current: 1.33 A at 1 kw/m2
At T = 25°C E 1 kw/m2, Air Mass I

— 86 —
Size of pane].: 590 x 530 x 11 (mm)
Weight: 4.7 kg = 12%
b) Slice-Ice Machine
Model: ATLAS, Type V-310for ammonia
Made in: Copenhagen, Denmark
Capacity: 6-16 Tons/24 hour. At considered operating condi-tions (-19°C, 2.5 mm thick ice) the machine produces6.8 tons/24 hours (2 tons/7 hours)
Drum motor: 1.0 Hp, for pump: 0.5 Hp
Liquid; NH3 - 90 kg.
Shipping weight: Net = 1350 kg, Gross = 1610 kg
Shipping volume: 4.9 m3
Capacity of heat: 35,000 k cal/hour
c) Solar Collector
Manufacturer: Owens — IllinoisCapacity: 97°C (to 147°C) operating temperature
Design features: — evacuated glass tube— selective surface on glass inner
tube- white reflector
Technical specification:
Outlet temperature: 130°C3Flow rate of recirculating water: 17.5 m /hour
4.2.2.2 Characteristics for Non-commercial Equipment
a) Wind Machine
(See Fig. 4.8)
Manufacturer: Ansaldo Impianti AMN (Italy)
Rated Output: 4 kw, at V = 10.5 rn/s
Type: Vertical Axis
Model: CSN-0501
Cut-in wind speed: V = 4 rn/s


— 88 —
Cut-out wind speed: V = 26 rn/s
Frame resistance wind speed: 50 rn/s
Aerodynamical efficiency: Cp = 0.55
Rotor speed: N = 190 rpm
Solidity ratio: NC/R = 0.242
Chord: C = 165 mm
Rotor Radius: R = 2.475 nun
Number of blades: N = 3
Rotor height: 2H = 4.93 m
Tower height: h = 3m
Incidence resistance coefficient = C = 0.01 Nul.
b) Absorption - Refrigeration System
The characteristics requirement of each component is given insection 4.2.1.1.
4. 3 IMPLEMENTATION
4.3.1 OVERALL TIME SCHEDULE
The schedule of activities for the plant will be divided into 5phases, namely: preliminary (feasibility study), designing,implementation, commissioning and operation. The detailedoverall time schedule is shown in Table 4.3.
4.3.1.1 Preliminary
a) Plant site fixation
b) Data collection
Data collection activities include the collection of dataconcerning wind energy, solar energy, ground water potential andsocio-economic aspects. This feasibility study will beimplemented in a period of 7 months in the first year.

0).- 0.00.
0-, 00,0.-. 00- 44000)0. 0.0. 0 0)0 0)-CC4-'C) .44)440-' 0)40+) —(4000 C)CO 00 '—401.0 00'0 0) .-I0C)0) 44 E C)0. C'0O. -I 400 0) 0)004-. .400) EC.4.-I 4. C) I.E— '0lOl..o 0) 0) 4000).4 '—0 0.-I'...> '0 0. 01.— 1. .4 4 0 C) '1 0) C .4 1. 0000 00000) 0.0) --0.0— C 0 0)4-' 0' C) 1.CO 0.4-I 44 '0 C) 00—10.< 04-'0,E .4C'ICOCO -- C'... 0) 1010000 -.404000 00 C)OC'.-.O .00.4C.. 44 0) 4. 0 -- 0 44 0 0 4 (0 0. 4 10—. 10 .4 C) 0 0.1 — 0) 4 4.) 00 4) (40. (0 — C 0 00 4. 0 4.) 44 0 — 400 0) 400 -.400)0) <
0 4 0 00 C .440000 0,0 3. 00 00004.) (-1 0 .4 0)0)10(-4 0)4010.4 00 ..40)00.(C CO — 4-' 4400.00 4444.-CO Z 00 .-4.--1400C CO 4'. 0) 10440.4-) -.40)00 (0 000 100)0)0)0 (-4 < C) 1..4 C/) 0 40 C) — .4 0 C/) 00 CO 0 00 00 0-' I- I ICO CO 3. 00 0000 - . 00 00 0 0.0. .400 0 -, — 00 C') CO It) 0 0 .44 CC)
C.;

- 90 —
4.3.1.2 Design Phase
Designing of the whole plant consists of:
a) Design of the wind machine
b) Design of the solar collectors
c) Design of the refrigeration system
d) Design of the building
Detailed designing phase of wind machine is given in Table 4.4.
4. 3. 1. 3 Implementation
a) Call for tenders
b) Selection of tenders
c) Negotiation
d) Shipment of equipment
e) Civil engineering, electrical work, installation of
windmill, solar collectors, refrigeration system, waterpump and ice storage construction. The construction periodwould be one year.
4.3.1.4 Commissioning
a) Wind machine: measurement of rotation per minute accordingto the wind speed, calculation of electricity production,priming the pump, measurement of the pump capacity.
b) Solar concentrator: measurement of inlet and outlettemperature of fluid, flow rate of fluid requirement, windspeed measurement.
c) Refrigeration system: measurement of inlet and outlettemperature of fluid, flow rate of fluid requirement,measurement of ice production rate.
The commissioning is planned to be carried out in 3 months.
4.3.1.5 Operation
a) Testing the plant: test of pipe performance, test of windand pump machine, test of refrigeration machineperformance, and monitoring the performance of the wholesystem in a period of time: 5 months.
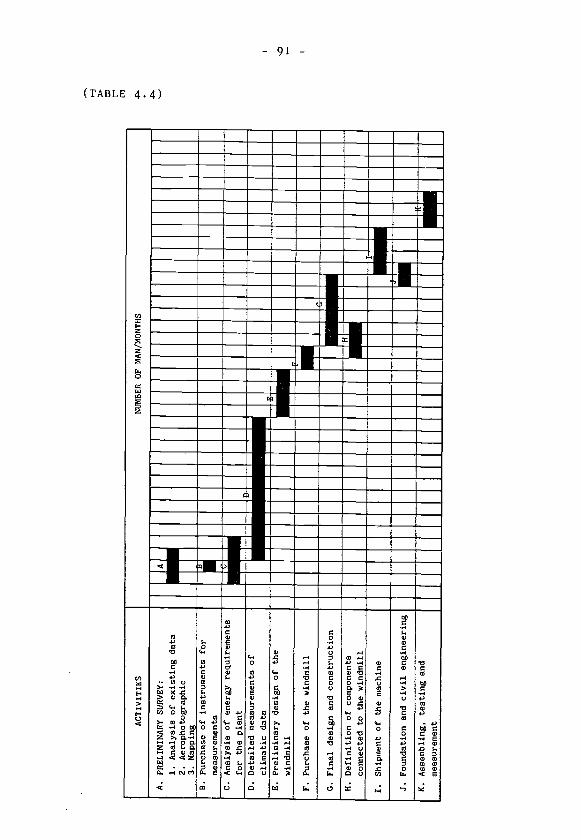


— 93 —
4.4.3 COST EVALUATION OF CIVIL ENGINEERING
1 a) Chiller room (plant room) 50 m2 5,000
b) Ice storage room, 10 m2 1,000
c) Batteries storage room, 25 m2 2,500
d) Control room and office, 50 m2 5,000
e) Workshop, 50 m2 5,000
2 a) Foundation for windmill machine, 2 x 100 m2 6,000
b) Construction of water tank, volume 5 m3 2,000
c) Pipe run, 200 m 4,000
d) Accessories 2,500.
III = US $ 33,000
4.4.4 SHIPMENT OF EQUIPMENT TO INDONESIA 101,530
4.4.5 TRANSPORTATION OF EQUIPMENT TO THE SITE 33,842
IV = US $ 135,372
4.4.6 TRAINING PHASE IN 10 MONTHS
for: 10 persons (technicians) 20,000
4 instructors 15,000
V = US $ 35,000
4.4.7 COMMISSIONING COST, 2 MONTHS 8,500
4.4.8 TESTING PHASE IN 5 MONTHS
a) Equipment 10,000
b) Personnel, 5 persons S 6,000
VI = US $ 24,500
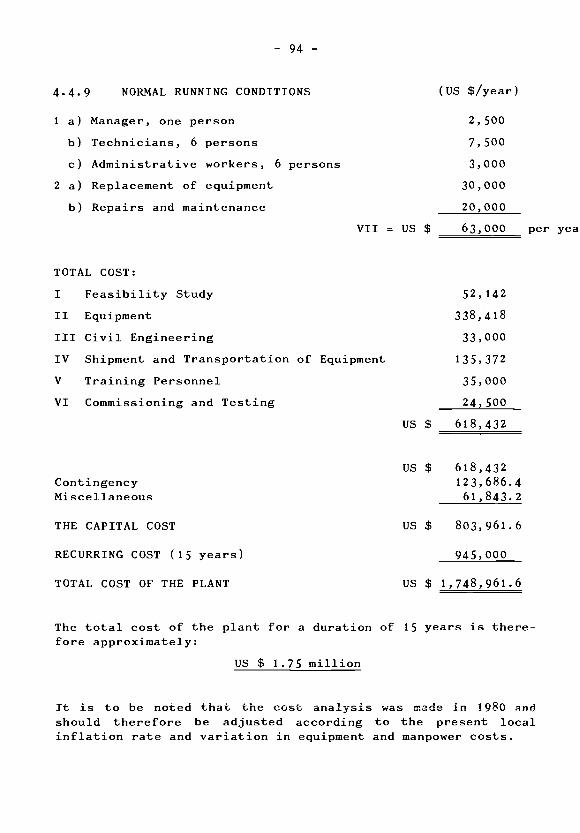
- 94 -
4.4.9 NORMAL RUNNING CONDITIONS (US $/year)
1 a) Manager, one person 2,500
b) Technicians, 6 persons 7,500
c) Administrative workers, 6 persons 3,000
2 a) Replacement of equipment 30,000
b) Repairs and maintenance 20,000
VII = US $ 63,000 per yea
TOTAL COST:
I Feasibility Study 52,142
II Equipment 338,418
III Civil Engineering 33,000
IV Shipment and Transportation of Equipment 135,372
V Training Personnel 35,000
VI Commissioning and Testing 24,500
US $ 618,432
US $ 618,432Contingency 123,686.4Miscellaneous 61,843.2
THE CAPITAL COST US $ 803,961.6
RECURRING COST (15 years) 945,000
TOTAL COST OF THE PLANT VS $ 1,748,961.6
The total cost of the plant for a duration of 15 years is there-fore approximately:
US $ 1.75 million
It is to be noted that the cost analysis was made in 1980 andshould therefore be adjusted according to the present localinflation rate and variation in equipment and manpower costs.

— 95 —
5. CONCLUSIONS
The duration of the project is expected to be three years, ofwhich twenty-one months will be spent on preliminary andfeasibility studies as well as the detailed design ofinstallation. Nineteen months would be required for the callingand selection of tenders, and the construction of the plant.Commissioning and operation would take the last six months(refer to Table 4.3).
The total cost of the project is estimated to be US $ 1.75million, this includes recurring costs. The schedule of
financial commitments for the project is presented in Table 5.1.
TABLE 5.1Financial Commitments Schedule
I
N° I
I
TimeRequested
I
Purpose(us $) I
I
I
I
I
1
I
I
I
Yearmonth
1, at 1stI
I
Preliminary, feasibilitystudies, design: 52,142
I
I
I
I I I I
I
I
2I
I
Yearmonth
2, at 8th I
I
a) Equipment: 338,418b) Civil works: 33,000
I
I
I I c) Shipment: 101,530 I
I I d) Transportation: 33,842 I
I I I
I
I
I
3 I
I
I
Yearmonth
3, at 3rd
I
I
Training personnel: 35,000I
I
I 4 I Year 3, at 7thI
Commissioning: 8,500 I
I I monthI I
I I I I
5 I Year 3, at 8th Testing: i6,00oI
I
I
I
I
monthI I
I 6 I Year 3, at 12thI
Recurring: 945,000I
I I monthI I
I I I
Note: 1) Figures quoted are present values, as at April 1980.2) 20% contingency and 10% miscellaneous have not been
included in the figures.


— 97 —
BIBLIOGRAPHY
1. ASEAN Committee on Science and Technology, Report of thefirst meeting of the ASEAN working group on non-conventional energy research, Bangkok, Thailand, 12—14thSeptember 1979.
2. A survey of solar agricultural dryers, Technical Report Tgg, Bruce Research Institute, Quebec, Canada, 1975.
3. Cheremisinoff, N.P., Fundamentals of wind energy, Ann ArborScience Publishers, inc., Michigan, 1978.
4. Mining and Energy, Third Five-Year Development Plan(1979/1980 - 1983/1984), Department of Mines and Energy ofthe Republic of Indonesia, Jakarta, 1979.
5. Harahap, F., Penelitian dan pengembangan dalam bidangpemanfaatan energi-surya di Institur Teknologi Bandung,Penataran penggunaan Energi—surya dalam teknologi lepaspanen, Bandung, 25-26 Oktober 1978.
6. Kamaruddin Abdullah, Dr., Karakteristik gudang penyimpananhasil pertanian dengan memanfaatkan energi—surya, Penataranpenggunaan energi-surya dalam teknologi lepas panen,Bandung 25-26 Oktober 1978.
7. , Pendinginan dengan tenaga surya, Prospek danpermasalahannya di Indonesia, Lokakanya pengembangan energinonkonvensional, Jakarta, 28—29 Januari 1980.
8. Veziroglu, T.N., Solar Cooling and Heating, Vol. I,
Hemisphere Publishing Corporation, London, Washington,1976. Proceeding of the Solar Cooling and Heating Forum,December 13-15, 1976, Miami Beach, Florida, U.S.A.


APPENDICES


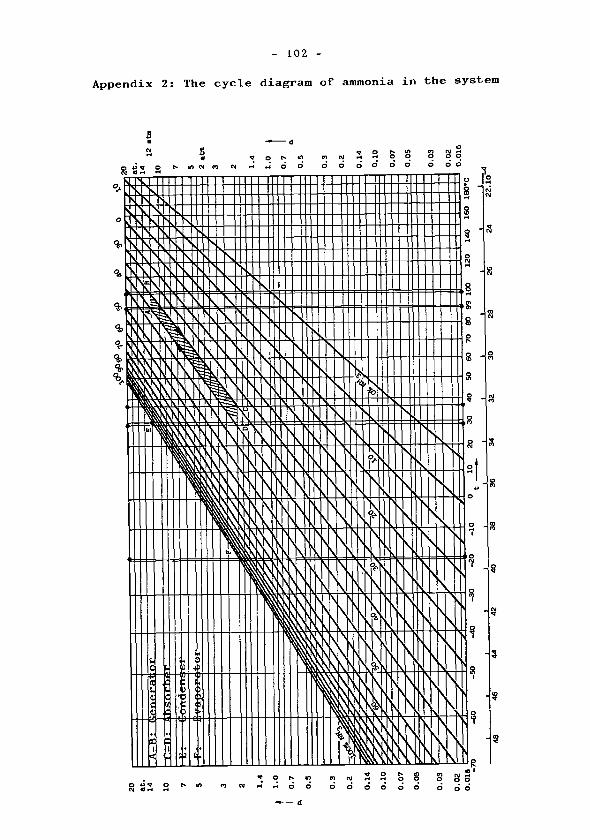


— 105 —
APPENDIX 5
Calculation of Yearly Water Pumping Capacityusing a Vertical Axis Windmill
Amount of water pumped in a year:
200 . 601000
(75 + 76 + 86 + 86 + 99
100 . 60 3
+ 1000(200 + 236) = 14676 + 2676 = 17292 m
I I
No.(m/s) (h)
I
(1/rn)
1 3.1 80I —
—
—
2I 3.5 I
200 I
3 I 4.1 200 I
4 I 4.3 I200 I —
5 I5.1
I200 I 75
6I 5.4 I
200I
767 I 5.8 I 200 I 868 I 6.1 200 869 I
6.4 200 I 9910
I6.6 I 200 I 99
11I
6.9I
200 I116
12I
7.2I
200 I 116
13I
7.6 I200 I 134
14I
8.0 200 I 156
15 8.5 I200 I 180
16 9.1I
100 I 200
17I 9.4 I
100 I 236I I
+ 99 + 116 + 116 + 134 + 156 + 180) +


