Embed Size (px)
Citation preview

ArmeniaNationalChild LabourSurvey2015
NATIONAL STATISTICAL SERVICE OF THE
REPUBLIC OF ARMENIA
ANALYTICAL REPORT

ARMENIA NATIONAL
CHILDLABOUR SURVEY
2015
ANALYTICAL REPORT
YEREVAN 2016

Copyright © International Labour Organization and National Statistical Service of the Republic of
Armenia (NSS) 2016
First published 2016
For rights of reproduction application should be made either to the ILO: ILO Publications (Rights and
Permissions), International Labour Office, CH-1211 Geneva 22, Switzerland, or by email:
[email protected] or to the National Statistical Service of the Republic of Armenia (NSS), Republic Ave.
3, Government House, Yerevan 0010, Armenia or by email: [email protected]. For rights of translation
application should be made to the ILO, acting on behalf of both organizations, to the address
mentioned above.
Libraries, institutions and other users registered with reproduction rights organizations may make
copies in accordance with the licences issued to them for this purpose. Visit www.ifrro.org to find the
reproduction rights organization in your country
FUNDAMENTALS and NSS
Armenia National Child Labour Survey 2015: Analytical Report / International Labour Office,
Fundamental Principles and Rights at Work Branch (FUNDAMENTALS), National Statistical Service
of the Republic of Armenia (NSS). - Geneva: ILO, 2016.
ISBN: 978-92-2-130811-9 (Print); 978-92-2-130812-6 (Web PDF)
International Labour Office, Fundamental Principles and Rights at Work Branch (FUNDAMENTALS),
National Statistical Service of the Republic of Armenia (NSS)
child labour / child worker / working conditions / Armenia - 13.01.2
Also available in Armenian: (г۳ëï³Ý. ºñ»Ë³ÛÇ ³ß˳ï³ÝùÇ ³½·³ÛÇÝ Ñ»ï³½áïáõÃÛáõÝ, 2015),
978-92-2-831207-2 (print); 978-92-2-831208-9 (Web PDF), Geneva, 2016.
ACKNOWLEDGEMENTS
The Armenia National Child Labour Survey (NCLS) 2015 was implemented by the National
Statistical Service of the Republic of Armenia (NSS), and coordinated by Gagik Gevorgyan from
the NSS and Federico Blanco Allais from FUNDAMENTALS.
We thank the International Center for Human Development (ICHD) for their administrative and
financial support to the project.
Funding for this publication was provided by the United States Department of Labor (USDOL)
(Project GLO/13/21/USA)
This publication does not necessarily reflect the views or policies of USDOL, nor does mention of
trade names, commercial products, or organizations imply endorsement by the United States
Government.
The designations employed in this publication and the presentation of data therein do not imply the
expression of any opinion whatsoever on the part of the ILO and the National Statistical Service of
the Republic of Armenia (NSS) concerning the legal status of any country, area or territory or of its
authorities, or concerning the delimitation of its frontiers.
ILO and National Statistical Service of the Republic of Armenia (NSS) do not accept any responsibility
in case of inaccuracy error or omission of for any consequence related of the use of this data.
Printed in Armenia
Photocomposed by Aram Urutyan
Cover photo by S
Contents
Chapter 1. Introduction . . . . . . . . . . . . . . . . . . . . . . . . . . . . . . . . . . . . . . . . . . . . . 11
Chapter 2. National Context . . . . . . . . . . . . . . . . . . . . . . . . . . . . . . . . . . . . . . . . 12
2.1 Demographic structure . . . . . . . . . . . . . . . . . . . . . . . . . . . . . . . . . . . . . . . . . 12
2.2 Economic and labour market characteristics of the country . . . 14
2.3 Child labour situation . . . . . . . . . . . . . . . . . . . . . . . . . . . . . . . . . . . . . . . . . . . 16
2.4 Poverty and inequality . . . . . . . . . . . . . . . . . . . . . . . . . . . . . . . . . . . . . . . . . . 17
Chapter 3. Survey Methodology . . . . . . . . . . . . . . . . . . . . . . . . . . . . . . . . . . . . 19
3.1 Scope and coverage . . . . . . . . . . . . . . . . . . . . . . . . . . . . . . . . . . . . . . . . . . . . 19
3.2 Survey questionnaire . . . . . . . . . . . . . . . . . . . . . . . . . . . . . . . . . . . . . . . . . . . 19
3.3 Sampling design and implementation . . . . . . . . . . . . . . . . . . . . . . . . . . 19
3.4 Weighting and response rates . . . . . . . . . . . . . . . . . . . . . . . . . . . . . . . . . 20
3.5 Pilot survey . . . . . . . . . . . . . . . . . . . . . . . . . . . . . . . . . . . . . . . . . . . . . . . . . . . . . 22
3.6 Training of survey fieldwork staff and fieldwork . . . . . . . . . . . . . . 22
3.7 Data processing . . . . . . . . . . . . . . . . . . . . . . . . . . . . . . . . . . . . . . . . . . . . . . . . . 23
Chapter 4. Concepts and definitions . . . . . . . . . . . . . . . . . . . . . . . . . . . . . . . 24
4.1 International labour standards . . . . . . . . . . . . . . . . . . . . . . . . . . . . . . . . . 24
4.2 National legislation . . . . . . . . . . . . . . . . . . . . . . . . . . . . . . . . . . . . . . . . . . . . . 25
4.2.1 Children . . . . . . . . . . . . . . . . . . . . . . . . . . . . . . . . . . . . . . . . . . . . . . . . . . 25
4.2.2 Child work . . . . . . . . . . . . . . . . . . . . . . . . . . . . . . . . . . . . . . . . . . . . . . . 26
4.2.3 Hazardous work . . . . . . . . . . . . . . . . . . . . . . . . . . . . . . . . . . . . . . . . . 26
4.3 Concepts and definitions used within the scope of the survey . . . . . . . . . . . . . . . . . . . . . . . . . . . . . . . . . . . . . . . . . . 28
4.3.1 Productive and non-productive activities . . . . . . . . . . . . . . . . 28
4.3.2 Measurement framework for child work . . . . . . . . . . . . . . . . . 29
4.3.3 Child Labour . . . . . . . . . . . . . . . . . . . . . . . . . . . . . . . . . . . . . . . . . . . . . 30
Armenia National Child Labour Survey 3

Chapter 5. The main characteristics of activities carried out by children . . . . . . . . . . . . . . . . . . . . . . . . . . . . . . . . . . . . . . . . . . . 33
5.1 Children in economic activity . . . . . . . . . . . . . . . . . . . . . . . . . . . . . . . . . . . 33
5.2 Characteristics of children's activities . . . . . . . . . . . . . . . . . . . . . . . . . . . 37
5.3 Household chores and services carried out by children . . . . . . . 39
Chapter 6. Characteristics of working children . . . . . . . . . . . . . . . . . . . . 41
6.1 Employment of children by activity type . . . . . . . . . . . . . . . . . . . . . . . 41
6.2 Employment of children by occupation . . . . . . . . . . . . . . . . . . . . . . . . 43
6.3 Status in employment . . . . . . . . . . . . . . . . . . . . . . . . . . . . . . . . . . . . . . . . . . . 45
6.4 Weekly hours worked . . . . . . . . . . . . . . . . . . . . . . . . . . . . . . . . . . . . . . . . . . 46
6.5 Children seeking work . . . . . . . . . . . . . . . . . . . . . . . . . . . . . . . . . . . . . . . . . . 49
Chapter 7. Child labour and hazardous work . . . . . . . . . . . . . . . . . . . . . . 50
7.1 Child labour . . . . . . . . . . . . . . . . . . . . . . . . . . . . . . . . . . . . . . . . . . . . . . . . . . . . 50
7.2 Major child labour characteristics . . . . . . . . . . . . . . . . . . . . . . . . . . . . . . . 51
7.3 Hazardous work by children . . . . . . . . . . . . . . . . . . . . . . . . . . . . . . . . . . . . 55
7.3.1 Children in hazardous work by economy sector / type of occupation . . . . . . . . . . . . . . . . . . . . . . . 57
7.3.2 Hazardous working conditions and other characteristics of hazardous work . . . . . . . . . . . . . . . . . . . . 58
7.3.3 Weekly hours of work performed by children in hazardous work . . . . . . . . . . . . . . . . . . . . . . . . . . . . . . . . . 61
Chapter 8. Educational characteristics . . . . . . . . . . . . . . . . . . . . . . . . . . . . . 62
8.1 Educational programs implemented in the country . . . . . . . . . . . . 62
8.2 Current education level of children . . . . . . . . . . . . . . . . . . . . . . . . . . . . . 63
8.2.1 Children's current school / preschool attendance . . . . . . . 64
8.2.2 Children who have never attended school / preschool . . . . . . . . . . . . . . . . . . . . . . . . . . . . . . . . 65
8.2.3 Child literacy . . . . . . . . . . . . . . . . . . . . . . . . . . . . . . . . . . . . . . . . . . . . . 65
8.3 Participation in vocational / skills training outside of school . . . . . . . . . . . . . . . . . . . . . . . . . . . . . . . . . . . . . . . . . . . . . . . . . . . . . . . . . 67
8.4 Children's school / preschool attendance and working status . . . . . . . . . . . . . . . . . . . . . . . . . . . . . . . . . . . . . . . . . . . . . . . . . . . 68
Armenia National Child Labour Survey 2015 Analytical Report4
Contents

Chapter 9. Other characteristics . . . . . . . . . . . . . . . . . . . . . . . . . . . . . . . . . . . 70
9.1 Socio-economic characteristics of the households . . . . . . . . . . . . . . 70
9.1.1 Type of dwelling and ownership status . . . . . . . . . . . . . . . . . 70
9.1.2 Housing conditions by facilities available . . . . . . . . . . . . . . . 72
9.2 Household assets . . . . . . . . . . . . . . . . . . . . . . . . . . . . . . . . . . . . . . . . . . . . . . . 75
9.3 Household expenditures / income and indebtedness . . . . . . . . . . 77
9.4 Migration in households with children . . . . . . . . . . . . . . . . . . . . . . . . 80
9.5 Children's health issues, accidents and illnesses because of work . . . . . . . . . . . . . . . . . . . . . . . . . . . . . . . . . . . . . . . . 82
Chapter 10. Determinants of child labour (education) . . . . . . . . . . . . . 86
10.1 Problems faced by households . . . . . . . . . . . . . . . . . . . . . . . . . . . . . . . . 86
10.2 Household loans . . . . . . . . . . . . . . . . . . . . . . . . . . . . . . . . . . . . . . . . . . . . . . 91
Chapter 11. Conclusion and Recommendations . . . . . . . . . . . . . . . . . . . 98
11.1 Conclusions . . . . . . . . . . . . . . . . . . . . . . . . . . . . . . . . . . . . . . . . . . . . . . . . . . . 98
Annex . . . . . . . . . . . . . . . . . . . . . . . . . . . . . . . . . . . . . . . . . . . . . . . . . . . . . . . . . . . . . . . . 104
Armenia National Child Labour Survey
Contents
5

Abbreviations
NSS National Statistical Service
WC Working children
LFS Labour force survey
SNA System of National Accounts
USA United States of America
ILO International Labour Organization
NCLS National Child Labour Survey
RA Republic of Armenia
GDP Gross Domestic Product
EA Enumeration area
UN United Nations
HW Hazardous work
NACE Classification of types of economic activity
ISCO Classification of occupations
EA Economic activity
HH Household
HILCS Households Integrated Living Conditions Survey
Conventional Symbols
0.0 less than half of unit
- not applicable
... data are not available
In certain cases, the slight differences between the sum of components
and results shall be explained by the rounding-up of data.
Armenia National Child Labour Survey 2015 Analytical Report6

Key findings
Table 1. Key Findings of National Child Labour Survey, Armenia, 2015
Armenia National Child Labour Survey 7
1 97.8% are children up to 7 years, who did not attend school during the 12 month period preceding the survey.
Name of indicator Total Boy Girl
1 No. of child population aged 5-17 (thousands)1a De jure population (including: absentees < 1 year) 459.9 245.3 214.61b De facto child population by age groups 459.2 244.8 214.4
5-11 yrs. 250.9 133.9 117.012-15 yrs. 134.8 72.0 62.816-17 yrs. 73.5 38.9 34.6
1c De facto child population by residenceTotal 459.2 244.8 214.4Urban 253.2 132.7 120.5Rural 205.9 112.1 93.8
2 No. of children (from de facto child population) who responded to the surveyChildren by age groups 453.4 241.3 212.15-11 yrs. 247.8 132.0 115.812-15 yrs. 133.0 71.0 62.016-17 yrs. 72.6 38.3 34.2
2a Children by residenceTotal 453.4 241.3 212.1Urban 247.5 129.2 118.2Rural 205.9 112.1 93.8
3 No. of children attending school (enrolment by age group )Total 430.4 228.7 201.75-11 yrs. 233.2 125.7 107.512-15 yrs. 131.7 70.1 61.616-17 yrs. 65.5 33.0 32.5
4 No. of children not attending school by age groupTotal 23.0 12.6 10.45-11 yrs. 14.6 6.3 8.312-15 yrs. 1.3 0.9 0.416-17 yrs. 7.1 5.4 1.7
5 No. of children who have never attended school by age groupTotal 13.4 6.1 7.45-11 yrs. 13.41 6.0 7.412-15 yrs. 0.1 0.1 0.016-17 yrs. ... ... ...
6 Per cent of children attending school by age groupTotal 94.9 94.8 95.15-11 yrs. 94.1 95.2 92.812-15 yrs. 99.0 98.7 99.416-17 yrs. 90.2 86.2 95.0

Armenia National Child Labour Survey 2015 Analytical Report8
2 Children aged 5-9 were not asked about their status in employment.
7 No. of children aged 5-17 yrs. by current economic activity status Not working 401.4 206.4 195.0of which: unemployed 0.5 0.3 0.2Working (children in employment) 52.0 34.9 17.1of which: unemployedChild labour 39.3 27.4 12.0of which: Hazardous child labour 31.2 22.5 8.7Other child labour 8.1 4.8 3.3
8 No. of working children by age groupTotal 52.0 34.9 17.15-11 yrs. 11.3 7.1 4.112-15 yrs. 20.8 13.6 7.216-17 yrs. 19.9 14.2 5.7
9 Economic activity rate, % to the population of the same age groupTotal 11.6 14.6 8.25-11 yrs. 4.6 5.4 3.612-15 yrs. 15.7 19.2 11.816-17 yrs. 27.7 37.6 16.7
10 No. of working children by status in employment, 10-172 yearsTotal 46.7 31.8 14.9Employee 2.0 1.7 0.3Self-employed 9.2 6.9 2.3Unpaid family worker 35.5 23.1 12.3Other 0.1 0 0.1
11 No. of working children by 1-digit industry sector, 5-17 years, thousands childrenTotal 52.0 34.9 17.1Agriculture, forestry and fishing 47.0 31.1 15.8Mining and quarrying … … …Manufacturing 0.7 0.6 0.1Electricity, gas 0.1 0.1 ...Construction 0.4 0.4 ...Wholesale and retail trade; repair 1.7 1.4 0.3Transportation and storage 0.0 … 0.0Accommodation and food service 0.2 0.1 0.1Information and communication … ... ...Professional, scientific and technical … … …Public administration and defence … … …Education 0.0 0.0 …Arts, entertainment and recreation 0.0 ... 0.0Other service activities 0.3 0.2 0.1Public administration and defence … … …Activities of households as employers; undifferentiated goods- and services-producing activities of households for own use 1.6 1.0 0.6
Name of indicator Total Boy Girl

Armenia National Child Labour Survey 9
3 The same child may engage in more than one type of hazard work.It is important to note that data about childrenon hazardous working conditions, transporting /carrying heavy loads are based on the subjective perception ofchildren about their work (see questions C38-C43 in Annex 1), but not on the law permitted norms (e.g., noisemeasurement by decibel etc.).
12 No. of working hours per week for working children, 5-17 years (thousands) Total 52.0 34.9 17.11 - 14 hrs 37.0 23.6 13.315 - 29 hrs 11.7 8.4 3.330 - 42 hrs 2.2 1.8 0.443 >= hrs 1.2 1.1 0.1
13 Per cent distribution by working hours per week of working children, 5-17 yearsTotal 100 100 1001 - 14 hrs 71.1 67.7 78.115 - 29 hrs 22.4 24.0 19.230 - 42 hrs 4.2 5.1 2.443 > = hrs 2.2 3.1 0.3
14 The mode of payment for the last payment period of child employees, 5-17 years, %Total 100 100 100Piece rate 12.5 14.5 …Hourly 1.0 1.2 …Daily 8.8 10.2 …Weekly 58.3 56.3 71.3Upon completion of task 19.3 17.8 28.7
15 Per cent distribution of children working by main reasonTotal 100 100 100Earn family income 1.3 1.8 0.2Supplement family income 2.0 2.6 0.9Help pay family debt 2.3 2.5 1.9Help household enterprise / farm 84.2 82.5 87.9Have own money 1.7 2.1 0.8Learn skills 4.7 4.1 5.9Schooling not useful for future 0.3 0.4 0.0School too far away or school does not exist … … …Cannot afford school fees 0.4 0.2 0.9Not interested in school 1.9 2.4 0.9Forced to work 0.3 0.4 …Temporarily replacing someone unable to work 0.1 0.2 …Other 0.9 1.0 0.6
16 No. of children who received work related injuries in the last year, 5-17 yearsTotal, thousands children 6.2 4.5 1.7Total,% 100 100 100Superficial injuries or open wounds 6.2 7.6 2.8Dislocations, sprains or stains / fever, extreme fatigue 5.1 5.1 5.0Breathing problems, eye, hearing, skin/ stomach problems 85.6 86.2 83.9Other 3.1 1.1 8.2
17 No. of working children undertaking heavy work or work in difficult conditions3, 5-17 yearsIncluding:No. of working children who lift heavy loads 17.2 14.3 2.9
5-11 yrs. 2.0 1.2 0.812-15 yrs. 6.6 5.2 1.416-17 yrs. 8.6 7.8 0.8
Name of indicator Total Boy Girl

Armenia National Child Labour Survey 2015 Analytical Report10
* The same child may engage in more than one type of hazard work.
No. of working children who work in difficult conditionsTotal, thousands children 23.6 16.5 7.1Total,% 100 100 100Dust, fumes 46.5 42.5 56.0Fire, gas, flames 2.0 0.4 5.7Loud noise or vibration 1.8 1.7 2.1Extremes of temperature (too hot or too cold) 10.7 10.0 12.4Dangerous tools (knife, axe and others) 24.1 30.1 10.2Working at height 8.2 7.6 9.6Insufficient ventilation 2.4 2.8 1.4Chemicals (pesticides, glues, etc.) 3.4 3.8 2.5Other 0.9 1.1 0.1
Name of indicator Total Boy Girl
Figure 1. General child labour measurement framework for children aged 5 -17
Children not in employment
401 400 children (89%)
Children in employment
52 000 children (11%)
Child labour
39 300 children (76%)
Not child labour
12 700 children (24%)
Hazardous work*
31 200 children (79%)
In designatedhazardousindustries
400 children
In designatedhazardous
occupations
600 children
Long hours of work, >= 43
1 200 children
Carrying heavyloads and distance
17 200 children
Other forms ofhazardous
work
23 600 children
Child labour other thanhazardous work
8 100 children (21%)

Armenia National Child Labour Survey 11
Chapter 1.
Introduction
T he National Statistical Service of theRepublic of Armenia (NSS), withinthe framework of the implementa-
tion of Armenia's commitments to the UNConvention on the Rights of the Child (ratified in1993), ILO Minimum Age Convention No. 138(ratified in 2006) and ILO Worst Forms of ChildLabour Convention No. 182 (ratified in 2006),conducted the National Child Labour Survey in2015 with the assistance of the InternationalLabour Organization.
The National Child Labour Survey included chil-dren aged 5-17 living in 6 520 households select-ed from all over the country.The survey question-naire was submitted to six beneficiary govern-ment authorities of the Republic of Armenia andtwo social partners (Confederation of TradeUnions of Armenia and Republican Union ofEmployers of Armenia) to gather their opinions.
The survey collected information on children'seconomic activity, social status, living conditions,employment, type of employment, working con-ditions, sectors of activity and occupation,involvement in household chores, and interac-tions between employment-education andemployment-health. In addition, the survey pro-vided the opportunity to examine the character-istics of child labour in Armenia for the first time,including the involvement of children in haz-ardous labour. This was done in Armenia for thefirst time, statistically and in correspondencewith the provisions and recommendations ofthe Resolution Concerning Statistics of ChildLabour adopted by the 18th InternationalConference of Labour Statisticians (ILO, 2008).
The survey findings will provide up-to-date statis-tical information on children's involvement inthe labour market and enrich Armenia's labourmarket statistics, as well as clarify the situation ofchildren's economic activity in the context ofbefore-mentioned conventions.
We hope that the survey results will raise publicawareness on child labour and will be useful forpolitical decision-making authorities andresearchers, as well as for national projects onchild protection and monitoring.
The National Statistical Service of the Republic ofArmenia (NSS) provided the survey tools (ques-tionnaire, sample, etc.) and all activities connect-ed with the adaptation of the methodology,fieldwork, verification, processing and coding of
the collected data, obtaining of anonymizedsummary results and extrapolation of data to thegeneral population.
The International Center for HumanDevelopment (ICHD) provided financial andadministrative management of the project.
The ILO US-funded project “Global Research onChild Labour Measurement and PolicyDevelopment” (MAP) financed the survey andthe publication of this report. A large amount ofinformation was collected during the survey andto address all the issues within one report is, ofcourse, impossible. Thus, an anonymized data-base has been placed on the NSS webpage(http://armstat.am/am/?nid=642) and can beused for further specialized research.
The National Statistical Service of the Republic ofArmenia (NSS) expresses its gratitude to:
US Department of Labour for full financialsupport of the project.
ILO for the global management of theproject and methodological support.
Mr. Bijoy Raychaudhuriand and Mr. FedericoBlanco Allais, from the ILO, for their invalu-able support in the preparation and imple-mentation of the survey and in the prepa-ration of this report.
Mr. Gagik Gevorgyan, member of the StateCouncil on Statistics of the Republic ofArmenia, Ms. Lusine Kalantaryan, head ofthe Labour Statistics Division (NSS), Ms.Jemma Avoyan, leading specialist, LabourStatistics Division (NSS), as well as the headsof statistical marz (regional) agencies, andthe staff involved in the implementation offieldwork and data processing.
Households for their participation in thesurvey.
Staff of the International Centre forHuman Development (ICHD).
All those who put in a joint effort to ensurethe successful implementation of the sur-vey and preparation of the report.
Ms. Nune Hovhannisyan, National Coordinator,Regional Office for Eastern Europe and CentralAsia, ILO, also made a significant contribution tothe successful implementation of the survey.
Stepan Mnatsakanyan
PresidentNational Statistical Service
of the Republic of Armenia (NSS)

Table 2.1.1 Distribution of de-jure population of the RA by sex, age groups and area, according to the 2011 population census results
Armenia National Child Labour Survey 2015 Analytical Report12
Chapter 2.
National Context2.1 Demographic structure
According to the Republic of Armenia 2011 census-based current resident population enumerationresults, the resident population rate of the Republic of Armenia (RA) amounted to 3 010.6 thousandpeople as of January 1, 2015. This number had reduced by 6.5 thousand, or 0.2% compared to thebeginning of 2014. In the same period, the density of the urban population amounted to 63.3%,while rural areas were 36.7%. Males represented 47.8 % and females 52.2% of the population. Theaverage age of the population was 35.9 years at the beginning of 2015. The average age of menwas 34.1 years and women were 37.6 years.
The population of children aged 5-17 amounted to 488 535 (16.2% of the population in total). Themajority of children - 59.5% (290 833) lived in urban areas and 40.5% (197 702) in rural areas. Malechildren represented 53% or 259 685 children, and female children were 47% or 229 850 children.
Source NSS RA, Population census 2011
Total population Urban Rural
N., 1000 persons % N., 1 000 persons % N., 1 000 persons %
Total 3018. 9 100 1911.3 100 1107.6 100
TOTAL
0 - 4 207.6 6.9 127.7 6.7 79.9 7.2
5 - 17 488.5 16.2 290.8 15.2 197.7 17.9
18 - 64 2005.6 66.4 1285.4 67.3 720.2 65
65 + 317.1 10.5 207.4 10.8 109.8 9.9
MALE
Total 1448.1 100 895.4 100 552.7 100
0 - 4 110.6 7.6 67.5 7.5 43.1 7.8
5 - 17 258.7 17.9 152.7 17.1 106.0 19.2
18 - 64 951.4 65.7 591.2 66 360.1 65.2
65 + 127.4 8.8 83.9 9.4 43.5 7.9
FEMALE
Total 1570.8 100 1015.9 100 554.9 100
0 - 4 97.0 6.2 60.2 5.9 36.8 6.6
5 - 17 229.9 14.6 138.1 13.6 91.7 16.5
18 - 64 1054.2 67.1 694.2 68.3 360.0 64.9
65 + 189.7 12.1 123.4 12.1 66.3 11.9

Armenia National Child Labour Survey 13
The collation of the data of both tables shows that, in the post population census period, the resi-dent population reduced by about 6.5 thousand people in the 5-17 age group of the survey. Thisdid not have a significant impact on the structural proportions of this age group because thechanges were to the extent of decimal percentage points.
Demographic transition: There were 41 815 new-borns in January-December 2015. This num-ber had reduced by 2.8% compared to the same period in 2014. The total fertility rate comprised13.9% per 1 000 people, having reduced by 0.4 per mill points compared to 2014.
Total fertility rate: One woman of child-bearing age (15-49 years) comprised 1.651 points in2014, which was significantly lower than the 2.150 rate required for simple reproduction. The aver-age age of the mother during the birth of her first child was 24.3 years. The average life expectan-cy at birth was 71.8 years for males and 78.1 years for females in 2014. That indicator was almostidentical for the urban and rural populations.
One of the existing demographic issues of Armenia is the demographic ageing of the population,4
the characterizing indicator of which amounted to 10.7% at the beginning of 2015.
27 835 deaths were registered in 2015. The number of deaths increased by 0.4% compared to2014, and the total mortality rate increased by 0.1 per mill points.
A reduction of 1.6% in the number of deaths among infants aged 0-1 was registered in 2015 com-pared to the previous year. The child mortality rate, per 1 000 liveborns, remained at the same levelas the previous year, comprising 8.8%. 435 deaths (where deaths of infants under 1 year old com-prised 85.1%) of children aged 0-4 were registered in the RA in 2015.
National Context
Table 2.1.2 Distribution of average annual de - jure population of the RA by sex and age, 2015
Source: NSS RA, current enumeration
4 According to UN World Population Ageing scale, the population in question is considered to be ageing if the pro-portion of the population aged 65 and older represents more than 7%.
According to the RA 2011 census-based current enumeration data, there have been slight changes inthe age and sex composition of the resident population of the Republic of Armenia due to the demo-graphic transition of the population and to the migration phenomenon.
Total population Male Female
N., 1 000 persons % N., 1 000 persons % N., 1 000 persons %
Total 3004.6 100 1434.1 100 1570.5 100
AGE GROUPS
0 - 4 209.3 7.0 111.3 7.8 97.9 6.2
5 - 11 274.8 9.1 146.7 10.2 128.1 8.2
12 - 15 136.1 4.5 72.8 5.1 63.3 4.0
16 - 17 71.0 2.4 37.6 2.6 33.4 2.1
Total
5 -17 aged 481.9 16.0 257.2 17.9 224.8 14.3
18-64 1987.7 66.2 936.6 65.3 1051.0 66.9
65 + 325.7 10.8 129.0 9.0 196.8 12.5
Armenia National Child Labour Survey 2015 Analytical Report14
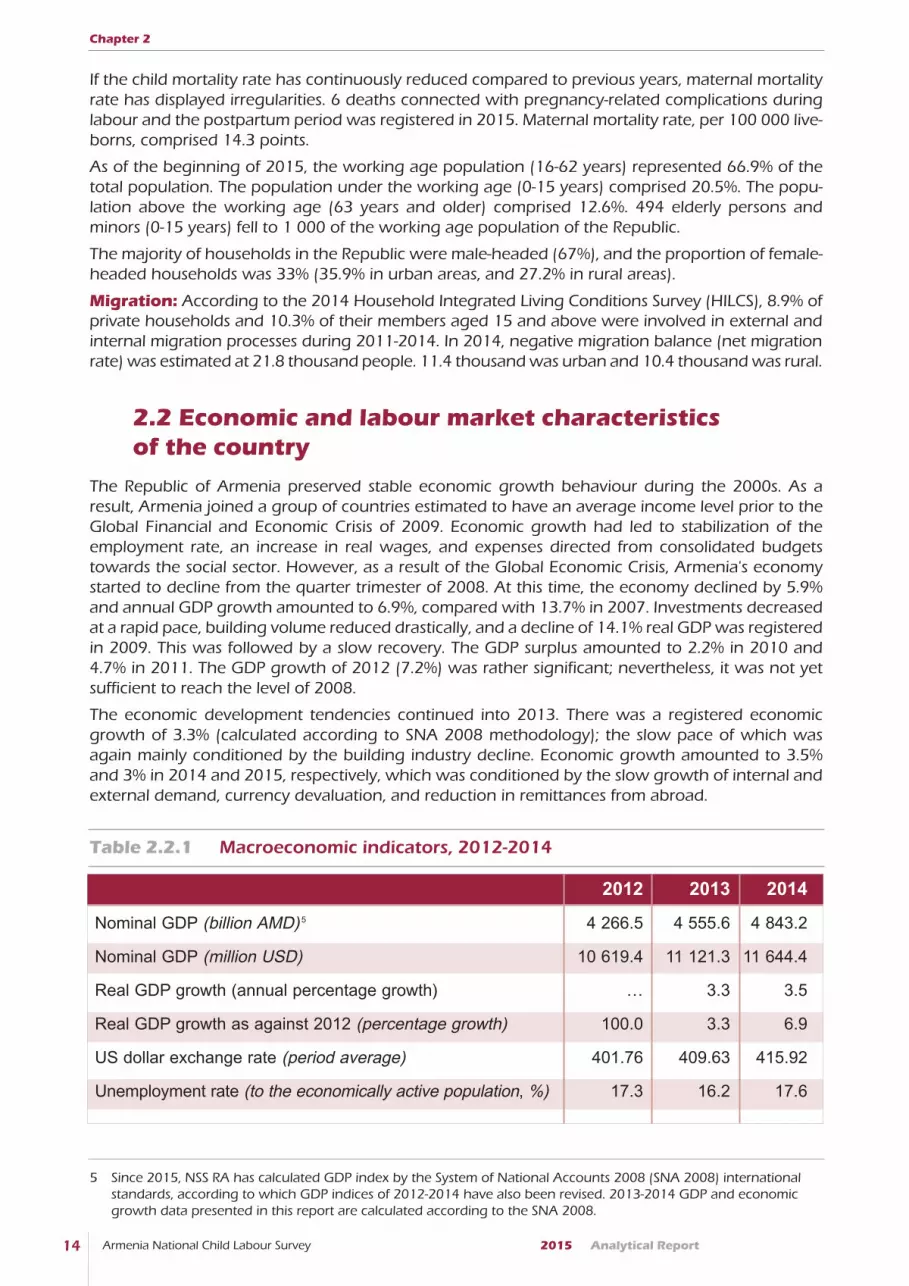
If the child mortality rate has continuously reduced compared to previous years, maternal mortalityrate has displayed irregularities. 6 deaths connected with pregnancy-related complications duringlabour and the postpartum period was registered in 2015. Maternal mortality rate, per 100 000 live-borns, comprised 14.3 points.
As of the beginning of 2015, the working age population (16-62 years) represented 66.9% of thetotal population. The population under the working age (0-15 years) comprised 20.5%. The popu-lation above the working age (63 years and older) comprised 12.6%. 494 elderly persons andminors (0-15 years) fell to 1 000 of the working age population of the Republic.
The majority of households in the Republic were male-headed (67%), and the proportion of female-headed households was 33% (35.9% in urban areas, and 27.2% in rural areas).
Migration: According to the 2014 Household Integrated Living Conditions Survey (HILCS), 8.9% ofprivate households and 10.3% of their members aged 15 and above were involved in external andinternal migration processes during 2011-2014. In 2014, negative migration balance (net migrationrate) was estimated at 21.8 thousand people. 11.4 thousand was urban and 10.4 thousand was rural.
2.2 Economic and labour market characteristics of the country
The Republic of Armenia preserved stable economic growth behaviour during the 2000s. As aresult, Armenia joined a group of countries estimated to have an average income level prior to theGlobal Financial and Economic Crisis of 2009. Economic growth had led to stabilization of theemployment rate, an increase in real wages, and expenses directed from consolidated budgetstowards the social sector. However, as a result of the Global Economic Crisis, Armenia's economystarted to decline from the quarter trimester of 2008. At this time, the economy declined by 5.9%and annual GDP growth amounted to 6.9%, compared with 13.7% in 2007. Investments decreasedat a rapid pace, building volume reduced drastically, and a decline of 14.1% real GDP was registeredin 2009. This was followed by a slow recovery. The GDP surplus amounted to 2.2% in 2010 and4.7% in 2011. The GDP growth of 2012 (7.2%) was rather significant; nevertheless, it was not yetsufficient to reach the level of 2008.
The economic development tendencies continued into 2013. There was a registered economicgrowth of 3.3% (calculated according to SNA 2008 methodology); the slow pace of which wasagain mainly conditioned by the building industry decline. Economic growth amounted to 3.5%and 3% in 2014 and 2015, respectively, which was conditioned by the slow growth of internal andexternal demand, currency devaluation, and reduction in remittances from abroad.
Chapter 2
Table 2.2.1 Macroeconomic indicators, 2012-2014
5 Since 2015, NSS RA has calculated GDP index by the System of National Accounts 2008 (SNA 2008) internationalstandards, according to which GDP indices of 2012-2014 have also been revised. 2013-2014 GDP and economicgrowth data presented in this report are calculated according to the SNA 2008.
2012 2013 2014
Nominal GDP (billion AMD) 5 4 266.5 4 555.6 4 843.2
Nominal GDP (million USD) 10 619.4 11 121.3 11 644.4
Real GDP growth (annual percentage growth) … 3.3 3.5
Real GDP growth as against 2012 (percentage growth) 100.0 3.3 6.9
US dollar exchange rate (period average) 401.76 409.63 415.92
Unemployment rate (to the economically active population, %) 17.3 16.2 17.6

Armenia National Child Labour Survey 15
Labour Market: The information source on the labour market of Armenia is the Labour ForceSurvey (LFS). It is completed annually by NSS RA as a statistical study of households (HH) selectedby using a certain sampling method and aimed at ensuring comprehensive information on indica-tors characterizing the labour market of the country.
The survey methodology mainly corresponds to the definitions and provisions provided by the ILO.For the surveyed phenomena to be as large-scale as possible, the age range of 15-75 years has beendefined as working age.
According to the LFS results, the working age population (aged 15-75) was 2.2 million people in2014, or 75% of the whole population of the country in that year. 1.4 million (63%) of which wereeconomically active in shaping the labour market of the country. 0.8 million of the economicallyinactive population did not participate in the labour market in any way.
1.2 million of 1.4 million were employed, 77% of which had a permanent job. Agriculture was theprimary sector of employment (35% or 395 thousand people). Of this, 52% of all employment wasseasonal or temporary and 19% fell to subsistence farming (making agricultural products for con-sumption exclusively within one's own household). In the non-agricultural sectors, one third ofemployment was provided by education, health and public administration sectors (246 thousandpeople). Accordingly the employment rate of the working age population (aged 15-75) amountedto 52% against the calculated labour force. The employment rate of 62% among men exceeded thecorresponding rate among women (45%) by 17 percentage points.
The highest employment rate (65%) was registered in rural areas, which was higher by 20 percent-age points than the employment rate in urban areas (45%). This is likely to be entirely conditionedby the large-scale engagement of the population in agricultural activities to a greater or lesserextent.
As regards 17.6% of the unemployment rate,15.8% of economically active men and 19.5% of eco-nomically active women were unemployed. The highest unemployment rate was registered in thecity of Yerevan at 27%, compared to 25% in urban areas. The unemployment rate among peopleliving in rural areas was 7%.
Informal employment has a significant share of the labour market in Armenia. This is estimated onthe basis of jobs and not on the number of employed population.
According to the 2014 LFS results, 50% (or 584 thousand) jobs in the RA labour market were esti-mated as informal, 72% of which were in the agricultural sector due to employment in peasant-farms6. This explains why the informal employment rate in rural areas is twice as high as in urbanareas (30%).
In non-agricultural sectors, the informal employment rate is 22% where the ''leading'' sector is,unsurprisingly, construction (62%). The male-female ratio of informal employment was defined bythe fact that, in the agricultural sector the employment rate was almost identical, whereas in non-agricultural sectors men were engaged in unreported employment (as an employee or self-employed) twice as often as women.
It is worth noting that, since 2008, the scale of informal employment has not undergone any signif-icant changes.
National Context
Source: NSS RA
6 The majority of the people employed in farms in Armenia have no organizational and legal status, therefore they areconsidered informal employees in informal sector of economy according to ILO methodology.
2012 2013 2014
Average monthly nominal wages (AMD) 140 739 146 524 158 580
Inflation (average annual) (percentage growth) 2.6 5.8 3.0
Consolidated budget expenditures (as percentage of GDP) 24.3 25.7 26.2
Consolidated budget deficit (as percentage of GDP) -1.4 -1.5 -1.9

Armenia National Child Labour Survey 2015 Analytical Report16
Chapter 2
Figure 2.2.1 Employment and unemployment rates of youth aged 15-29 by sex and age groups, 2014
2.3 Child labour situation
The source of information on the child work situation in Armenia is the LFS and HILCS. Both surveysare conducted in households annually. The Armenia Demographic and Health Survey (ADHS) isimplemented every five years (2000, 2005, 2010, and 2015) by the NSS of the RA. Ad-hoc thematicsurveys are also carried out by the NSS of the RA, in order to fill information gaps in specific areas.
The LFS and HILCS are regularly implemented surveys. The statistical unit studied within the scopeof these surveys is the population of 15-75 year olds, which means that available information onchild labour is limited to the 15-17 age group. Moreover, due to the small number of respondentsin this age group in the sampling frame, the data do not ensure sufficient representation for evi-dence-based analysis. This problem is partially solved by presenting the main rates characterizingthe labour market by the classical five 15-19 age groups. This gives some idea about the subject mat-ter, if only by sex and residence type distribution. On the other hand, as neither of the surveys specif-ically target child related issues, they do not provide comprehensive estimates about the character-istics of child employment and the related cause and effect phenomena.
In terms of surveying child work related issues, the multi-round ADHS can be used. Even though itis not a special thematic survey on those issues, it has significant resemblance to the 2015 NCLS, thescope of which covered the following:
a) Children aged 5-17 aged in households were surveyed.
b) Information was collected on the child's current (at the moment, during the last week) andusual (during the last year) work activity, engagement in the household/household chores,time spent on it/them, involvement in school/education, and living conditions. In generalterms, this could, in a cause and effect relationship, give an overall view of the environmentwhere the working children lived.
0
10
20
30
40
50
60
70
80
15 -75 yrs 15 -29 yrs 15 -29 yrs 15 -19 yrs 20 -24 yrs 25 -29 yrs 15 -29 yrs 15 -19 yrs 20 -24 yrs 25 -29 yrs
Total Male Female
pe
rc
en
t
Employment rate, % Unemployment rate, %
Source: NSS RA, LFS 2014

Armenia National Child Labour Survey 17
It is worth mentioning that the group of questions related to child work was entirely excluded fromthe ADHS in 2015 due to the implementation of NCLS in the same period.
Among the ad-hoc surveys was a ''Labour force and child labour in Armenia'' survey carried out byNSS RA in 2004, with the technical assistance of TACIS, the statistical unit. The survey investigatedchildren aged 7-17. Despite the resemblance of the coverage of questions and interview implemen-tation technique to the NCLS, the survey of 2004 greatly differed from the latter in terms of its sam-ple size and sampling design methodology.
Another ad-hoc survey was one conducted by “Harmonic Society” Social Workers Association NGO,founded by the United Nations Children's Fund (UNICEF), in 2008.
It is noteworthy that all the surveys mentioned so far provide a limited dataset for comparison dueto sampling and methodology differences, different population groups participating in the surveys,content and number of questions, reference period and, most importantly, child labour and prohib-ited work measurement standards.
Despite their differences, by the most generalized estimates of all previous surveys, 4-5% of childrenwere engaged in work activity. Boys outnumbered girls in this, and agriculture was the main sectorof employment.
2.4 Poverty and inequality
The economic downturn in Armenia caused by the 2008 economic crisis led to an increase in povertyrates, which stopped due to later economic growth in 2010-2011. The economic growth rate of 7.2%in 2012 brought a little reduction in poverty. Thanks to the economic growth in 2014, the poverty ratedeclined by 2 percentage points as compared to the previous years, amounting to 30%. This means thatthe monthly consumption of three country residents out of ten was below 40 264 AMD (the upperpoverty line). In 2014, the total number of poor people was around 900 thousand, 37% of whom werevery poor (including the extremely poor). 21% or about 70 thousand people of the latter were extreme-ly poor. The poverty depth for 2014 was estimated at 4.5% and the poverty severity at 1.3%.
In 2014, poverty didn't differ significantly across urban (30.0%) and rural areas (29.9%).Nevertheless, a considerable difference was observed between the poverty levels in Yerevan (25%)and other cities of the country (35.1%).
National Context
Table 2.4.1 Main poverty rates in 2014 (%)
Source: NSS RA, HILCS 2014
The poverty rate among children (0 - 17 years) of all age groups was higher compared to other agegroups of the population.
Area of residence
Extremelypoor
Very poor
Poor % amongthe poor
population
Povertydepth
Povertyseverity
Total 2.3 10.9 30.0 100 4.5 1.3
Urban areas 2.4 11.2 30.0 63.6 4.5 1.3
Yerevan 2.0 9.0 25.2 27.3 3.6 1.0
Other cities 2.9 13.6 35.1 36.3 5.5 1.6
Rural areas 2.0 10.4 29.9 36.4 4.5 1.2

Armenia National Child Labour Survey 2015 Analytical Report18
Children are more exposed to the risks of both general and extreme poverty. The 2014 data showedlittle differences in child poverty by gender or region. 33.5% of girls and 34.4% of boys (34.0% of allchildren) were poor, and 33.8% of children living in urban areas and 34.4% of children living in ruralareas were poor. The rate of extreme child poverty in urban areas was estimated at 3.2%, while inrural areas the estimate was about 3.3%.
The probability of child poverty becomes higher due to the following risks:
The probability of child poverty is higher in large families. In families with three or morechildren under the age of 18, 45.8% of children are poor (compared to 34.0% of all children).Moreover, 5.3% of children from large families are extremely poor (compared to 3.3 % of the totalnumber).
The probability of child poverty in female-headed households is high. About one quarter(24.0%) of the total number of children live in female-headed households. 37.8% of these are poorand 4.6% are extremely poor. Among children living in male-headed households, these figures are33.5% and 3.0%, respectively.
Educational attainment of the household-head. The probability of poverty is significantlyhigher among children who live in households headed by a person with no education or only pri-mary education (50.2%), incomplete secondary education (47.9%), secondary education (39.8%),and middle level professional (vocational) or incomplete higher education (31.2%) as comparedwith children living in households headed by a person with higher education (15.3%).
Employment of the household head. The risk of both poverty and extreme poverty is lowestamong children living in households where the head person has had a profitable job during the lastseven days. The poverty rate among children living in households with an employed head is 29.3%as compared to 40.8% of those with an unemployed head. 41.1% of all children live in householdswith an unemployed head.
Jobless adult household members aged 19-60. The risk of poverty is the highest among chil-dren who live in a household in which none of the adult household members (aged 19-60) isemployed (50.3%). The risk of extreme poverty is the lowest among children in households wherenot only all the working-age adults (aged 19-60) but also all the household members under 19 andabove 60 are employed (1.5%).
According to consumption aggregate and total income rates, inequality increased in 2014. In 2014,the consumption inequality by Gini coefficient rose to 0.277, compared to 0.242 in 2008. Accordingto total income, inequality rose to 0.373 in 2014, compared to 0.339 in 2008.
Chapter 2
Table 2.4.2 Child poverty rates by sex and age groups, 2014 (%)
NSS RA, HILCS2014
Extremely Poor % among the poor % among the total poor population population
Total 2.3 30.0 100 100
SEX
Boy 2.2 29.9 45.2 45.3
Girl 2.3 30.0 54.8 54.7
AGE GROUPS
0-5 3.6 34.4 9.9 8.6
6-9 2.9 34.0 4.3 3.8
10-14 3.1 31.6 6.6 6.2
15-17 3.7 34.8 4.3 3.7

Chapter3.
Survey Methodology3.1 Scope and coverage
The scope of the National Child Labour Survey conducted in the Republic of Armenia in 2015 coveredchildren aged 5-17 living in households (included in sampling population) selected from the whole ter-ritory of the country. The survey was designed to ensure national estimates as complete and credible aspossible relating to children's economic activities, social status, living conditions, employment, type ofactivity (profitable activity, household chores, studying, working, working and studying), their work andworking conditions, scope of activity and occupation, the relationship between education and work,and the necessity to work in hazardous and dangerous conditions.
3.2 Survey questionnaire
The National Child Labour Survey was conducted among both adults and children. Accordingly, thequestionnaire comprised three parts and 11 sections:
PART I. ADULT QUESTIONNAIRE
Section 1. Educational Attainment of all Household Members aged 5 and above.
Section 2. Current Economic Activity Status of all Household Members (5 and above) dur-ing the reference week.
Section 3. Economic Activity Status of all Household Members (5 and above) during thelast 12 months.
Section 4. Household Tasks: About Children (5 - 17 years)
Section 5. Attitude of Parents / Guardians about working children (5 - 17 years).
PART II. HOUSEHOLD CHARACTERISTICS
Section 6. Housing and household characteristics
Section 7. Household socio-economic status
PART III. CHILD QUESTIONNAIRE
Section 8. Educational Attainment of all Children in the household (5 - 17)
Section 9. Current Economic Activities Status of all Children in the household (5 - 17)
Section 10. Health and safety issues about working children (5-17)
Section 11. Household Tasks of Children (5 - 17)
Additionally, a considerable group of standard questions directly relating to children's work, work-ing conditions, education, and involvement in household chores, were included in both question-naires, for both adult and child participants. Such an approach provided an opportunity to obtaininformation that was as complete as possible about the child's economic activity status in the house-hold, as well as their working and educational conditions.
3.3 Sampling design and implementation
The sampling for the child labour survey was performed based on a household address databasefrom the 2011 national census of the Republic of Armenia. The sampling algorithm was built on thebasis of the administrative division of Armenia into 10 provinces (marzes) and the capital city ofYerevan. 2 strata were formed in each province (marz) by rural and urban areas, totalling 20 strata.The capital, Yerevan was taken as a separate stratum. In total, 21 strata were formed for the National
Armenia National Child Labour Survey 19

Armenia National Child Labour Survey 2015 Analytical Report20
Child Labour Survey. The sampling size for each strata was decided on the basis of the 2011 censusdata, i.e. the number of households (HH) with children aged 5 - 17. The sampling size totalled 6 520households (326 census enumeration areas), of which 3 520 households were in urban areas and3 000 households were in rural areas.
Chapter 3
Table 3.3.1 Survey sample allocation
The survey used a two-stage stratified sampling design as follows: 1) Sampling of enumeration areas(EA) and 2) Sampling of households selected from EAs.
1) In each strata, enumeration areas were selected with probability proportional to the numberof households in the EA, using the systematic sampling method. All the households in theselected enumeration areas were listed, whereupon an address database of households withchildren aged 5-17 was created for each EA.
2) In the second stage, 20 households were selected from each EA database by use of a randomsampling method.
3.4 Weighting and response rates
The sampling weight was calculated for each enumeration area and was the same for all the sam-ple households within the given enumeration area. The probability of selection of the sample unit(household) was considered in the calculation of weights. This was also true of the non-responserate of targeted households not interviewed for various reasons, and the RA 2011 census-based cur-rent population enumeration data, which the given survey data had been coordinated with.
The calculation process consisted of the following steps:
1. Calculation of weights.
2. Adjustment of weights considering the non-response households.
3. Calibration of sampling weights based on known indicators.
Province(Marz)
Total number of HH with children
aged 5 -17
Sample allocation
EA EA EA EA EA EA
Total RA 296 097 326 6 520 176 3 520 150 3 000
Yerevan 100 032 46 920 46 920 - -
Aragatsotn 13 341 23 460 8 160 15 300
Ararat 25 644 33 660 13 260 20 400
Armavir 26 970 34 680 14 280 20 400
Gegharkunik 23 326 31 620 12 240 19 380
Lori 23 790 31 620 17 340 14 280
Kotayk 25 675 33 660 17 340 16 320
Shirak 25 156 33 660 18 360 15 300
Syunik 14 110 24 480 14 280 10 200
Vayots Dzor 5 202 14 280 6 120 8 160
Tavush 12 851 24 480 11 220 13 260
Total Total Total

Number ofEAs in stratum
Totalnumber of
HHs in stratum
Number ofHHs in EA
Number ofHHs with
children aged5 -17 in EA
Number ofsample
HH
Number ofresponse
HH
(m) (H) (h) (N) (n) (nr)
46 271 125 100 27 20 17
Step 1. Calculation of weights
The weight (w) was calculated using the following formula:
w =1/p
where p is the probability of selection of a household (HH) from the given enumeration area (EA).
The probability of selection of sample EA was calculated using the following formula:
p1=m h / H
The conditional probability of selection of the HH from the selected enumeration area was calculat-ed using the following formula:
p2=n / N
The overall probability of selection of sample household was calculated by:
p=p1p2.
Step 2. Adjustment of weights considering the non-response households
This step ensured that sampling weights were adjusted to represent the fact that not all householdsfrom the sample provided data points for the survey. The response rate was calculated using the fol-lowing formula:
r = nr / n
where r is the HH response rate/rate of participation in the survey. r = 17 / 20 using values fromTable 2.
New weights were calculated by this formula: w'=w / r
Step 3. Calibration of sampling weights based on known indicators
The weights calculated in the previous step were adjusted in order to conform to the aggregates ofauxiliary variables (see table below). This process of adjustment is called calibration. Calibration pro-vided weights. The application of calibration to auxiliary variables ensured population estimatesknown from other studies, based on the current 2015 population number and structure enumera-tion results.
The calibration was based on the following 6 auxiliary variables:
Indices estimation method: The following formula was used to estimate the indices based onthe collected sample data:
Armenia National Child Labour Survey 21
Survey Methodology
Number ofboys aged
5-11
Number ofboys aged
12-15
Number ofboys aged
16-17
Number ofgirls aged
5-11
Number ofgirls aged
12-15
Number ofgirls aged
16-17
3.4.1 Calculation of weights
Example

where xih is the collected data about the household, wi is the sampling weight of the i-th enumera-tion area, N is the total number of the strata, mj is the number of sample EAs within the jth stratum,ni is the number of sample households within the i-th enumeration area.
When using the NCLS data, it should be noted that the survey results do not cover thewhole RA population, but represent only the population of households with at leastone child aged 5 - 17.
3.5 Pilot survey
Before conducting the actual National Child Labour Survey, a pilot survey was carried out in Araratand Gegharkunik Provinces (Marzes) in September 2015. In total, 120 households were surveyed(80 households in Ararat Marz, 40 households in Gegharkunik Marz). These were in both urban andrural areas of the selected provinces.The pilot survey had the following objectives:
Evaluate the productivity of the sampling methodology.
Evaluate the interviewers' and respondents' capability to understand and maintain thelogical connection between the questions.
Evaluate the households' willingness to participate in the survey and the proportion ofrefusals to participate in the interview.
Measure the average duration needed to complete the questionnaire.
Reveal any problems and difficulties connected with completing the questionnaire.
The pilot survey showed that:
In order to ensure the greatest possible participation of households in the interviews,the population should be informed about the survey through local government bodiesand authoritative individuals in the community.
The most experienced enumerators from a given region should be chosen or given pref-erence to for the implementation of the fieldwork. These will be people who are well-informed about the socioeconomic situation of their province (marz) and community,are acquainted with the environment, enjoy a position of authority and/or trust in theirprovinces (marzes), and have good communication skills.
The most convenient time for conducting the survey should be chosen in order to findhousehold members at home and for other purposes, considering the peculiarities ofeconomic activities in different provinces and climatic and geographical conditions.
The pilot survey showed that a functional questionnaire had been drawn up for the National ChildLabour Survey; adapted to the local context, with formulations as simple as possible, containingmainly clear and understandable questions for adults and children, and supplemented with exam-ples of common or thought-to-be difficult cases.
3.6 Training of survey fieldwork staff and fieldwork
In order to thoroughly and effectively conduct the fieldwork required by the National Child LabourSurvey, a training programme was implemented for staff prior to each stage, as indicated by theworking plan of the programme.
During the training, ILO experts introduced the legal framework, international conventions andconcepts, methodology, goals and objectives of the implementation of the NCLS to staff and themain parties concerned with the survey results. These were mainly state bodies, social partners andrepresentatives of international and non-governmental organisations (approximately 25 persons).The training took place over a two-day period and was held on May 26-27, 2015, prior to the begin-ning of the activities of the programme. Several key aspects were discussed with participants, includ-ing the model questionnaire of the survey, characteristics of statistical measurement, national legis-
Armenia National Child Labour Survey 2015 Analytical Report22
Chapter 3
lations, potential risks and obstacles during sampling design,implementation of fieldwork, and pos-sible ways of overcoming the latter.
Further training, attended by 30 supervisors and enumerators selected from the city of Yerevan andprovinces (marzes), was conducted on July 1-2, 2015. This was done in order to carry out the house-hold listing necessary for the sampling design of the survey. The goal of the training was to imparttheoretical and practical knowledge to the staff who would be conducting the fieldwork, in orderto carry out the listing of households with at least one child aged 5 - 17.
The listing questionnaire and manual were introduced to the training participants. Case studieswere introduced, discussions were organized and tests were carried out, aimed at the reinforce-ment of theoretical knowledge acquired during the training.
Special attention was paid to the fact that household addresses were based on 2011 census addressdata, which implied cases of data mismatch.
The third training event was conducted at the RA NSS head office on September 4, 2015 prior tothe beginning of pilot survey fieldwork. The pilot survey team was trained on the procedure for con-ducting the survey and completing the questionnaire.
On October 8-12, prior to the actual survey fieldwork, a three-day training session was conducted for55 survey staff from Yerevan and 10 provinces (marzes). Considering the importance of the NCLSstage and the sensitivity of the subject, during the selection of fieldwork staff, preference was givento the most experienced and skilled supervisors and enumerators. These people had wide experiencein the labour market and labour force surveys, were acquainted with the environment, enjoyed aposition of authority and trust in their provinces (marzes) and had good communication skills.
The aim of the programme and the expected results were introduced to the participants. All thequestions included in the questionnaire and the manual were thoroughly discussed and explained,placing special emphasis on the possible answers to the obscure and open-ended questions or dif-ficulties in understanding the questions, as well the necessity of maintaining logical connections.
The rules for the main work were fully introduced and explained to the enumerators, including theinterview procedure, the necessity to maintain ethical standards during the interviews, the proce-dure for asking the questions, registering the responses, and answering respondents' questions.The supervisors were introduced to the procedure for organizing and supervising the implementa-tion of the fieldwork, and the requirement to respond quickly to problems stated by the enumera-tors and provide them with feedback. Particular attention was given to the issue of motivatinghouseholds and ensuring their participation in the interviews.
The fieldwork was conducted over the course of 48 days from October 15 to December 15, 2015.
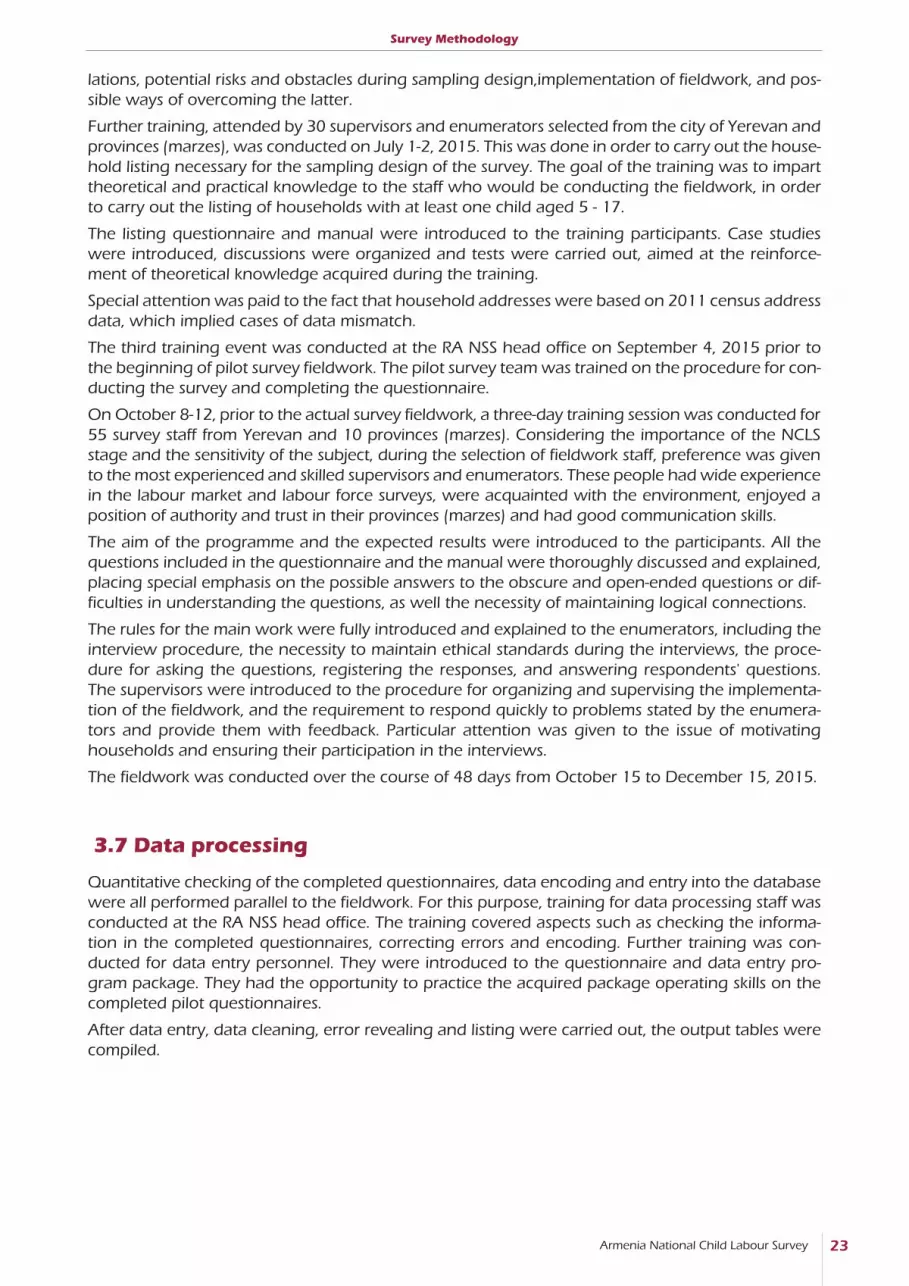
3.7 Data processing
Quantitative checking of the completed questionnaires, data encoding and entry into the databasewere all performed parallel to the fieldwork. For this purpose, training for data processing staff wasconducted at the RA NSS head office. The training covered aspects such as checking the informa-tion in the completed questionnaires, correcting errors and encoding. Further training was con-ducted for data entry personnel. They were introduced to the questionnaire and data entry pro-gram package. They had the opportunity to practice the acquired package operating skills on thecompleted pilot questionnaires.
After data entry, data cleaning, error revealing and listing were carried out, the output tables werecompiled.
Armenia National Child Labour Survey 23
Survey Methodology

Chapter 4.
Concepts and definitions4.1 International labour standards
International labour standards on child labour and protection of the Rights of the Child are definedby a number of UN and ILO conventions, particularly the United Nations Convention on the Rightsof the Child 1989 (ratified by Armenia in 1993). There is also the ILO's Minimum Age Convention1973 (No. 138) and the ILO's Worst Forms of Child Labour Convention 1999 (No. 182). TheRepublic of Armenia has been a member of the ILO since 1992 and ratified the above-mentionedconventions in 2006.
Article 1 of the United Nations Convention on the Rights of the Child defines a 'child' as everyhuman being below the age of eighteen. Article 32 of the Convention recognizes every child's rightto be protected from economic exploitation and from performing any work that is likely to be haz-ardous or interfere with a child's education, be harmful to a child's health or physical, mental, spiri-tual, moral or social development. According to the same article, in regard to the relevant provisionsof other international instruments, state parties shall in particular:
(a) Provide for a minimum age or minimum age for admission to employment.
(b) Provide for appropriate regulation of the hours and conditions of employment.
(c) Provide for appropriate penalties or other sanctions to ensure the effective enforcement ofthe present article.
According to Article 33, state parties shall take all appropriate measures to protect children from theillicit use of narcotic drugs and psychotropic substances and to prevent the use of children in theillicit production and trafficking of such substances. According to Article 34, state parties undertaketo protect the child from all forms of sexual exploitation and sexual abuse, and etc.
The ILO's Minimum Age Convention 1973 (No. 138) contains standards for member states to set theage at which children can legally be employed or work. Particularly, according to the provisions ofArticle 2, the minimum age for admission to employment or work shall not be lower than the endof compulsory education. Notwithstanding these provisions, a member state whose economy andeducational facilities are insufficiently developed may initially specify a minimum age of 14 years.Article 3 defines a subsequent important requirement: the minimum age for admission to any typeof employment or work which, by its nature or the circumstances in which it is carried out, is likelyto jeopardize the health, safety or morals of young persons, usually referred to as hazardous work,shall not be less than 18 years. National laws or regulations or the competent authority may author-ize employment or work from the age of 16 years on the condition that the health, safety andmorals of the young persons concerned are fully protected and that the young persons havereceived adequate specific instruction or vocational training in the relevant branch of activity.
Though Article 5 permits member states to initially limit the scope of the application of thisConvention, the provisions of the Convention shall be applicable as a minimum to the following sec-tors: mining and quarrying; manufacturing; construction; electricity, gas and water; sanitary servic-es; transport, storage and communication; plantations and other agricultural undertakings mainlyproducing for commercial purposes, but excluding family and small-scale holdings producing forlocal consumption and not regularly employing hired workers.
In some cases, the Convention does allow for flexibility with regards to the minimum age. Forinstance, countries may permit the employment or work of persons aged between 13 and 15 years(or it may be between 12 and 14 years in developing countries) for 'light' work, if it is:
(a) Not likely to be harmful to their health or development
(b) Not likely to prejudice their attendance at school, or their participation in vocational orientation or training programmes.
The ILO's Worst Forms of Child Labour Convention 1999 (No. 182) defines the worst forms of ChildLabour as well as the obligations of state governments and relevant institutions to protect children
Armenia National Child Labour Survey 2015 Analytical Report24

from such employment or work. According to Article 3 of the Convention, “the worst” forms of childlabour comprise:
(a) All forms of slavery or practices similar to slavery, such as the sale and trafficking of children,debt bondage and serfdom and forced or compulsory labour, including forced or compulso-ry recruitment of children for use in armed conflict.
(b) The use, procuring or offering of a child for prostitution, for the production of pornographyor for pornographic performances.
(c) The use, procuring or offering of a child for illicit activities, in particular for the productionand trafficking of drugs as defined in the relevant international treaties.
(d) Work which, by its nature or the circumstances in which it is carried out, is likely to harm thehealth, safety or morals of children (usually referred to as hazardous work).
The table below shows the concept of Child Labour, as defined within the framework of the ILOConvention No. 138, according to which different minimum age thresholds have been set for childadmission to employment or work: general minimum age, minimum age for hazardous work andminimum age for light work.
The international methodology (standards, concepts and definitions) on statistical measurement ofchild labour are presented in Section 4.3.2.
4.2 National legislation
In Armenia, the rights of the child and child labour relations are regulated by the constitution andthe laws of the Republic of Armenia. They include the Rights of the Child, the Labour Code of theRepublic of Armenia, International Treaties of the Republic of Armenia, and also the decisions of theRA Government and other regulations.
4.2.1 Children
Article 1 of the law of the Republic of Armenia ''On the Rights of the Child'' defines a 'child' as every-one below the age of eighteen, except the cases when he or she becomes or is recognized as legal-ly capable to act earlier. Within the context of this survey, it is important to note that Article 7 in thesame law recognizes the child's right to health protection and promotion. Moreover, according toArticle 9, “every child is protected from any type of (physical, spiritual, etc) violence, particularly interms of child exploitation it is important that the state and relevant authorities provide protectionto the child from any type of violence, exploitation, procuring of a child for illicit activities, includingthe use, production and trafficking of drugs, beggary, prostitution, gambling, and other violationsof the child's rights and legal interests”.
Parallel to the recognition of the child's right to education, the conditions of child's right to labour areformulated in Article 19 of the law: “Every child has a right to obtain a profession in accordance with
Armenia National Child Labour Survey 25
Concepts and definitions
Table 4.1.1 The minimum age for admission to employment or work accordingto ILO Convention No. 138
Minimum age for admissionto employment or work
Minimum age applicable to any country
Minimum age-exceptions for developing countries
General/Basic minimum age(Article 2)
not less than 15 years not less than 14 years
Minimum age for hazardous work (Article 3)
not less than 18 years
not less than 16 years: oncondition that the health, safety and morals of the childare fully protected
Minimum age for light work(Article 7)
13 - 14 years 12 - 13 years old

his or her age, developmental peculiarities and capabilities and engage in labour activities which arenot prohibited by law.
An employment contract can be concluded with a child of at least 16 years of age, except termemployment contracts. Children under the age of 16 can be accepted for temporary employmentwith the written consent of an adult with legal parental responsibility (eg, a parent, adoptive par-ent or legal guardian) or the Custody and Guardianship Authority, provided that it does not inter-fere with the child's education.
Every child has the right to privileged working conditions. The characteristics of child admission toemployment, privileges and conditions are defined by the ''Labour Code of the Republic ofArmenia'' as follows: “It is prohibited to use, procure or offer a child for the production, use and traf-ficking of alcoholic beverages, drugs and psychotropic substances, cigarettes, erotic and horror lit-erature and video tapes, as well as for the performance of any work that is likely to be harmful tothe child's health or physical, mental, spiritual, moral or social development or to interfere with thechild's education”.
4.2.2 Child work
According to the Labour Code of the Republic of Armenia, children of 14-16 years holding anemployment contract, therewith only a temporary employment which is not harmful to their health,safety, education and morals, with the written consent of one of the parents or adopter or custodi-an, are considered to be working (in employment). Accordingly, a health certificate (health book)should be put on the list of required employment documents during the conclusion of an employ-ment contract with citizens under the age of eighteen.
Persons under the age of fourteen can be involved in creative work, such as the performance of apiece of work in cinematographic, sport, stage acting and concert organizations, circus, televisionand radio. Again, this needs to be with the written consent of one of the parents or adopter orguardian or Custody and Guardianship Authority, and provided that it is not harmful to their healthand morals, and does not interfere with their education and safety.
The National Legislation of Armenia has defined the working conditions of children under the ageof 18 according to the short duration of work-time by age groups.
1) For children under the age of seven, up to two hours daily but not exceeding four hours aweek.
2) For children aged between seven and twelve years, up to three hours daily but not exceed-ing six hours a week.
3) For children aged between twelve and fourteen, up to four hours daily but not exceedingtwelve hours a week.
4) For children aged between fourteen and sixteen, up to 24 hours a week.
5) For young persons aged between sixteen and eighteen, up to 36 hours a week.
4.2.3 Hazardous work
Each country establishes a list of hazardous, dangerous occupations that are prohibited to personsbelow the age of 18 years, which is formalized by the consent of social partners. It is prohibited bythe Labour Code of the Republic of Armenia to engage children in such work that may be harmfulto their health and morals7: “Engaging persons under the age of eighteen in heavy, hazardous,especially heavy, especially hazardous works established by the legislation of the Republic ofArmenia, as well as in other cases prescribed by law, shall be prohibited”.
The list of occupations that are likely to be “heavy and hazardous” is established by the decision ofthe government of the Republic of Armenia “on approval of the list of occupations and work that are
Armenia National Child Labour Survey 2015 Analytical Report26
Chapter 4
7 Labour code of the Republic of Armenia''; Articles 257 and 258

Armenia National Child Labour Survey 27
likely to be heavy and hazardous for persons below the age of 18 years, pregnant women andwomen taking care of a child under the age of one year”, December 29, 2005 N 2308.
The main conditions of work and occupations that are likely to be hazardous for children are:
Child employment in hazardous economic activity (industry), where any kind of work is con-sidered to be hazardous, e.g. construction, mining and quarrying. This group also includesnight-shift jobs, engagement on duty at home or in the organization and sending on a busi-ness trip alone, which is prohibited by law (Labour Code of the Republic of Armenia', Articles148, 149 and 209).
Child employment in working conditions that are established by the decision of the govern-ment of the Republic of Armenia to be hazardous for children below the age of 18 years:
- Hazardous work due to chemical factors.
- Hazardous work due to physical factors.
- Hazardous work due to biological factors.
- Hazardous work due to industrial aerosols.
- Heavy work for persons below the age of 18 years: physical workload (heaviness, distance,required duration of standing).
- Work related with sensitive, emotional, stress and risk factors.
Child involvement in activities that are not likely to be hazardous and where their work is notdefined as hazardous but the children work more than hours the short work-time establishedfor each age group.
Work implemented with dangerous tools, devices and equipment.
4.3 Concepts and definitions used within the scope ofthe survey
This Chapter discusses international concepts, standards and criteria defined by thenational legislation that have been used within the scope of this survey for statisticalmeasurement of child work /employment.
4.3.1 Productive and non-productive activities
The methodology of the UN System of National Accounts (SNA 2008) defines types of productiveand non-productive activities. According to SNA methodology, the production of all the servicesdesigned for own consumption within household are considered non-productive activity. Thisincludes the unpaid activities implemented by the members of the own household, such as themaintenance and regulation of the household, including small renovations, cleaning, repair ofhousehold goods used at home, as well as preparation and delivery of cars and food used by thehousehold, children's lesson preparation, care of children and (or) sick, disabled or elder membersof the household, transfer of family members and more.
A household is considered a physical person, two or more persons living together in a separatedwelling unit or in a part of it or in several buildings, who provide their vital needs driving an overalleconomy combining all or part of their funds.
Employment / Work is considered any economic activity which is carried out on a paid basis(whether monetary or in-kind compensation), in any institution, economy, private home or a fami-ly profit business on an unpaid basis. At the same time, employment is considered the activity car-ried out exclusively for household final consumption during the reference period (gardening, veg-etable growing, breeding of domestic animals and their care, fishing, major construction of ownhouse or business and more), if the produced goods had a significant share in the consumption ofthe economy.
Concepts and definitions

Volunteer activity, which is not defined as an economic activity is not considered employment(such as begging, stealing) and non-profit works: unpaid activity carried out for other householdsor organizations, partial construction or repair of own house or flat, housework.
A person is considered employed if they had paid or non-paid work during the reference week,regardless of the fact that the work was permanent, temporary, seasonal, occasional or casual; evenif that work was only one hour during the reference week. People who are temporarily absent fromwork for various reasons are also considered employed persons.
Unpaid family worker is considered the person who works in an organization belonging to thefamily or household member (relative, friend) and does not receive monetary or in-kind compensa-tion for support and assistance.
Armenia National Child Labour Survey 2015 Analytical Report28
Chapter 4
Graph 4.3.1 Classification of activities according to SNA
1.
PR
OD
UC
TIV
E
AC
TIV
ITY
1.1.1 Market economic production
Production of goodsand services that areintended for sale on
the market
1.1.2 Non-marketeconomic production
Production of goodsfor own consumption
1.2.1 Unpaid household activities/servicesHousehold activities such as cleaning, food preparation, washing up,
ironing, repair of household goods, children's lesson preparation, care of family members and more.
1.2.2 Volunteering and community serviceCommunity services and volunteer work
2. NON-PRODUCTIVEACTIVITY
Education, training, study, culture and leisure, personal care
1.1.2.1 Own-account production of goods
Production of agricultural crops and their storage,wood cutting and firewood collection, hunting, fish-ing, processing of agricultural products, production
of clothes and footwear and more
1.1.2.2 Own-account constructionand substantial repairs
Re-plastering of walls, repairing ofroofes, renovation, major renovation, and extension to dwellings and more.
1.1
Ec
on
om
ic
pro
du
cti
on
1.2
No
n-e
co
no
mic
pro
du
cti
on
General production boundary of SNA
Activities outside SNA production boundary
Activities inside SNA production boundary

Children seeking work. Children seeking work are considered to be aged 10 - 17 and have notheld a job during the last four weeks of the survey, but were seeking a job.
Economically active population: The economically active population (labour force) includeemployed and unemployed persons, who ensure labour supply in the labour market during the ref-erence period for the production of goods and services.
Household chores: Household chores are considered individual services that a child carries out intheir own household and which are not considered an economic activity and are non-profit.Household chores may include food preparation, washing-up, ironing, everyday purchases, care foryoung and sick members of the family, house cleaning, own-account minor repairs to the house,and repair of household goods and equipment belonging to household.
4.3.2 Measurement framework for child work
Children
According to the ILO “Worst Forms of Child Labour” 1999, Convention No. 182 and UN “ChildRights” Convention, a child is considered anyone under 18 years. The target group for the study ofchild labour in this surrey were children aged 5-17 years. Moreover, in terms of defining the scopeof hazardous, prohibited activities, the following three subgroups were used: 5-11 years, 12-15years and 16-17 years. Such classification is based on international standards, on the experiencefrom other countries, and the requirements of National Legislation.
Child Employment (Working Child)
Children who are involved in the production of goods and services within the framework of pro-ductive activity for the intention of sale in the market or for their own consumption are consideredworking children. The framework of productive activities is defined based on the UN System ofNational Accounts (SNA) (Graph 4.3.1)
For this survey, data was collected on both market and non-market types of economic activities forchildren (such as household repair, carrying water for household needs, firewood collection andmore); the exclusion of which would lead to data underestimation for child involvement in workingactivities. At the same time, the definition of “working children”, as stipulated by SNA, excludes allchildren whose scope of employment is limited to non-productive activities, such as unpaid house-hold chores and own services, which are conducted within the household (see Graph 4.3.1).
For this survey, a child had to be involved at least in one of the mentioned economic activities anyday during the week preceding the survey in order to be considered as working child or employed.Children who have been involved in any activity, but during the reference period were not work-ing temporarily for any reason (such as sickness, bad weather or vacation) were also consideredemployed.
The reference period was defined as being at least 1 hour of work during the 7 days preceding thesurvey. The economic activity of children was observed over the previous 12 months in order tocharacterise a child's usual employment; the purpose of which is to have a holistic picture of child'semployment conditions, assess the impact on child education, health and the use of leisure time.
This survey has defined the general framework of child work and its forms differentiat-ed by hazardous works, working conditions and factors based on the (13th, 18th ICLS)resolutions of 13th, 18th International Conferences of Labour Statisticians, other interna-tional conventions and relevant provisions of the National Legislation.
Armenia National Child Labour Survey 29
Concepts and definitions

Armenia National Child Labour Survey 2015 Analytical Report30
4.3.3 Child Labour
“Activities considered prohibited for a child” (hereby Child Labour) are all activitieswhich are mentally, physically, socially or morally considered hazardous or dangerousand that interfere with their school attendance. Although there is no common legal def-inition of Child Labour, international conventions designed a flexible framework of lim-itations / conditions, which can be a basis National Legislation to clarify the legalboundaries for child work.
In accordance with the Resolutions of the 18th International Conference of Labour Statisticians (ILO,2008), the concept of “child labour” is defined and used in order to make the phenomenon statisti-cally measurable and appreciable. It includes all children aged 5-17 years who have been involved inone or more of the forms of employment mentioned below during the observed period.
- The worst forms of child labour other than hazardous work.
- Hazardous work.
- Other forms of child labour.
All activities that are outside the definition boundary of child labour are considered “child work notconsidered prohibited” or “not child labour”.
Worst forms of child labour other than hazardous work
The data collection and assessment of the worst forms of child labour other than hazardous workis beyond the scope of this study due to data collection difficulties within the standard methodolo-gy of household surveys.
Hazardous Child Labour
Hazardous labour is considered any kind of activity carried out by children in certain areas of eco-nomic activities or occupations that, due to its nature, can lead to any possible damage to a child'shealth, safety or morality, and therefore can lead children to physical, psychological or even sexualabuse. Among such types of activities are work in construction, mining industry, underground,under water, at dangerous heights or in confined spaces, work with dangerous cars, equipment or
Chapter 4
Graph 4.3.2 The framework of child labour measurement (Child Labour Status)(18th International Conference of Labour Statisticians, resolution concerning statistics of child labour).
CHILDREN5 - 17 years old
IN EMPLOYMENT NOT IN EMPLOYMENT
CHILD LABOUR (prohibited work)
Hazardouswork
Other childlabour
Permissiblelight work
Other nonchild labouremployment
NOT CHILD LABOUR

Armenia National Child Labour Survey 31
Concepts and definitions
tools, work related to the handling or transport of heavy loads, unhealthy work environments withhazardous materials, temperatures outside of the maximum allowable range, noise or vibrationsthat are harmful to the child's health, or work in particularly difficult conditions, such as long hours,night time work, business trips or work where the child is unreasonably confined to the premises ofthe employer.
The scope of the child labour assessment is presented below according to labour harmfulness com-ponents in accordance with international methodology.
The hazardous forms of employment, the basis for the classification of which is the identicalnational classification (coding with 3 digits) with the international classification of the formsof employment (ISCO-88).
The hazardous areas of the activity, the classification of which is the based on identicalnational classification (coding with 4 digits) with the international classification of the formsof economic activity (NACE Rev.2).
Hazardous labour conditions, factors, environment.
Hazardous (long duration) working hours exceeding the permissible bound of work duration.
Graph 4.3.3 General framework of child labour measurement (18th InternationalConference of Labour Statisticians, resolution concerning statistics of child labour)
The criteria for child hazardous work measurements and the algorithms are in accordance with theRA Legislation and International methodology and their integrated version, utilizing the frameworkof NCLS. These are presented below.
CHILDREN IN EMPLOYMENT(5-17 years old)
In designatedHAZARDOUS INDUSTRIES
In other industries
In designatedHAZARDOUS OCCUPATIONS
In other occupations
LONG HOURS of work43> =hours
Not long hours of work< 43 hours
IN OTHER HAZARDOUSwork conditions
Non-hazardouswork conditions
HAZARDOUS WORKby children
CHILD LABOUR
Hazardousunpaid
householdchores
by children
5 -11 yrs.
14 > = hours
NOT CHILD LABOUR
LIGHT WORK< 14 hours
12 - 14 yrs. 15 -17 yrs.

Armenia National Child Labour Survey 2015 Analytical Report32
Chapter 4
Graph 4.3.4 Criteria of hazardous child work: RA Legislation
Graph 4.3.5 Criteria of hazardous child work: NCLS
* Instead of using the 12-14 and 15-17 age groups, as prescribed by the international methodology, these groups aredefined 12-15 and 15-17 age groups within the framework of NCLS.
Industry
Weekly working hours
C 20
C 22
Clear classification does not exist
>= 4 > = 6 > = 12 >= 24 > = 36
Variable
# of thequestion
in theques-
tionnaire0 - 6 7 - 11 2 - 13. 4 - 15 16 -17
Child age
Occupation C 19 Clear classification does not exist
Workingconditions(factors)
C 39 - 40 - physical workload: local, general(work heaviness, distance, duration of stand)
C 23 - Night work, on duty work, single business trip
C 43
- Chemical (chromium, sulphur, silicon, bromine, and more)- Physical (electromagnetic fields, ionizing radiation, and more)- Biological (viral, bacterial, fungal and parasitic)- Industrial aerosols- Sensory, emotional stress and risk
RA legislation
ILO
NCLS
CHILD LABOUR > = 15 kg and > = 5 meterHeaviness
and distanceC 39 - 40
CHILD LABOUR
Dust, fire, gas, dangerous tools,chemicals, explosive materials,extremes of temperature, too dark,excessive vibration, noise, and more.
Occupation code=711 | =713 | =741 |=820 | =959 | =953 | =931 | =939 |=591 | =532 | =624 | =629 | =641 |=649 | =781 | =628 | (>=721 &<=732) |=749
Mining, Construction
> 14 hours >= 43 hours
5 - 11 12-14 (12 - 15)* 15-17 (16 - 17)*
Child age
Working
conditions
Occupation
Industry
Weekly
working
hours
Variable
C 43
C 19
C 20
C 22
# of theQin the
question-naire

Armenia National Child Labour Survey 33
Other forms of child labour
Activities that exceed the permissible bounds of work duration (working hours) defined for children(not considered light labour, see Graph 4.3.3) and likely to have a negative impact on a child'shealth, education and general development are included in the list of other forms of child labour.
Hazardous unpaid household services
Forms of child labour can include unpaid work and, according to certain criteria (as defined bythe¹190 resolution), hazardous housework and services, if they are included in the SNA nationalframework for production activity. In the framework of the present survey, housework servicescarried out by a child in their own household, regardless of the degree of harmfulness andthe time spent on them, are not considered child employment or, consequently, child labour,although there is collected data on them.
Concepts and definitions
Chapter 5.
The main characteristics of activitiescarried out by children
The results of the National Survey on Child Labour conducted in November and December 2015 arepresented within this Chapter, including the demographic, socio-economic and other characteristicsof children aged 5-17. This Chapter presents data on number of children, current involvement in edu-cation, school attendance, employment, hours worked, working conditions, household chores, andother characteristics.
5.1 Children in economic activity
According to the results, 11.5% of total children are in employment (during the last week preced-ing the survey). The prevalence rate for girls is 8.1% and for boys 14.5%. According to the age dis-tribution, 4.6% of 5 -11 year olds, 15.6% of 12-15 year olds, and 27.4% of 16 -17 year olds wereemployed. In all age groups, boys were more often engaged in economic activities than girls.
Table 5.1.1 Distribution of employed children by sex and age groups
Total 34.9 14.5 17.1 8.1 52.0 11.5
5-11 7.1 5.4 4.1 3.5 11.3 4.6
12-15 13.6 19.2 7.2 11.6 20.8 15.6
16-17 14.2 37.1 5.7 16.7 19.9 27.4
Total 42.8 17.7 21.4 10.1 64.2 14.2
5-11 8.2 6.2 4.6 4.0 12.8 5.2
12-15 17.5 24.6 8.7 14.0 26.2 19.7
16-17 17.1 44.6 8.2 24.0 25.2 34.7
Boy Girl Total
N.,1 000 children
% of totalchildren
N.,1 000 children
% of totalchildren
N.,1 000 children
% of totalchildren
CHILDREN HAVING CURRENT EMPLOYMENT (DURING THE LAST WEEK)
CHILDREN HAVING USUAL EMPLOYMENT (DURING THE LAST 12 MONTHS)

Armenia National Child Labour Survey 2015 Analytical Report34
Chapter 5
Observing children's employment by sex we can note that the majority were boys (67.2%). The ratioof boys by age group fluctuated from 63% to 71%.
The interesting fact is that 14.2% of children aged 5-17 had been employed during the last 12months. This is 2.7% more than those in current employment for the simple reason that the refer-ence time was the late autumn, when the seasonal work is nearly complete. Prevalence rates of chil-dren in employment during the last 12 months were 10.1% for girls aged 5 -17 years and 17.7% forboys. 5.2% of 5 -11 year olds, 19.7% of 12-15 year olds, and 34.7% of 16 -17 year olds wereemployed during the last 12 months.
During the week preceding the survey, 95.2% of employed children were employed during thewhole year as well. The distribution of employed children by sex did not differ substantially from thecurrent employment structure; the ratio of boys is estimated at 66.7% and girls 33.3%.
Figure 5.1.1 Sex distribution of children having current employment status
Figure 5.1.2 Usually employed children by age groups and sex, %
During the week preceding the survey, 2.5% urban children (3.6% boys and 1.2% girls) and 22.3%rural children (27% boys and 16.6% girls) were involved in economic activities. By sex, 77% ofchildren working in urban areas were boys, compared with 65.9% of rural boys.
5-11 years 12-15 years 16-17 years Total
Boy Girl
33 32 3336 33 32 3336
64 67 68 6764 67 68 67
6 3 6 6 7 1 6 7
3 7 3 4 29 3 3
5 -11 ye ars 1 2-1 5 ye ars 1 6-1 7 ye ars T o tal
%
Girl
Boy

Armenia National Child Labour Survey
Concepts and definitions
35
It is noteworthy that employment prevalence increases with age for males and females. For instancethe employment rates for females aged 5-11 is 3.6%, for those aged 12-15 is 11.7% and for those16-17 years-old is 16.6%..
Out of the total working children, it is possible to observe that the overwhelming majority are con-centrated in rural areas (i.e., 86.5% of working boys and 91.2% of working girls reside in rural areas).
By the area of residence, sex and age, proportions were almost identical in the case of childrenemployed during the last 12 months.
Data shows that 27.2% of surveyed children were employed during the last 12 months in ruralareas compared with 3.3% in urban areas.
Figure 5.1.3 Currently employed children by sex and area of residence
Figure 5.1.4 Currently employed children by age groups, sex and area of residence
13.5%8.5%
86.5% 91.5%
Boy Girl
Urban Rural
76 75 72 8066 62 65 70
24 25 28 2034 38 35 30
0%
20%
40%
6 0%
8 0%
1 00%
Urban, total 5-11y. 12-15y. 16-17y. Rural, total 5-11y. 12-15y. 16-17y.
Girl
Boy

Armenia National Child Labour Survey 2015 Analytical Report36
Chapter 5
As the table shows, girls are less likely to be involved in economic activities than boys (difference:4.6%), which is more significant in rural areas.
5.2 Characteristics of children's activities
The majority of children aged 5-17 (84.3%) only attended school. Moreover, the difference in urbanand rural areas is estimated about 23 percentage points (in urban areas: 94.6%, in rural areas:71.9%), due to the differences in other components. If 10.6% of children worked and attendedschool simultaneously, then in urban areas this indicator was estimated at 2.2% and in rural areas20.7%. 0.8% of all children aged 5 to 17 only worked, which was estimated at 0.3% and 1.5 % for
Table 5.1.2 Distribution of employed children by sex, age groups, area of residence
Total 4.7 3.6 1.4 1.2 6.1 2.5
5-11 0.7 0.9 0.2 0.3 0.9 0.6
12-15 1.8 4.8 0.7 2.0 2.4 3.3
16-17 2.2 13.8 0.6 3.6 2.8 8.6
RURAL
Total 30.2 27.0 15.6 16.6 45.8 22.2
5-11 6.4 11.3 3.9 7.8 10.3 9.7
12-15 11.8 35.7 6.6 24.8 18.4 30.8
16-17 12.0 53.5 5.1 29.2 17.1 42.9
CHILDREN HAVING USUAL EMPLOYMENT (ANY JOB DURING THE LAST 12 MONTHS)
URBAN
Total 5.9 4.6 2.2 1.9 8.2 3.3
5-11 0.9 1.2 0.3 0.5 1.2 0.8
12-15 2.2 5.8 0.9 2.5 3.1 4.2
16-17 2.9 18.2 1.1 6.6 3.9 11.9
RURAL
Total 36.9 32.9 19.1 20.4 56.0 27.2
5-11 7.4 13.1 4.3 8.6 11.6 10.9
12-15 15.3 46.2 7.8 29.3 23.1 38.7
16-17 14.2 63.3 7.1 40.7 21.3 53.4
Boy Girl Total
N.,1 000 children
% of totalchildren
N.,1 000 children
% of totalchildren
N.,1 000 children
% of totalchildren
CHILDREN HAVING CURRENT EMPLOYMENT (ANY JOB DURING THE LAST WEEK)
URBAN

Armenia National Child Labour Survey 37
urban and rural areas, respectively. 4.2% of children did not attend school and were not involvedin any economic activity (in urban areas: 2.9% and in rural areas: 5.8%).
Concepts and definitions
Table 5.2.1 Children aged 5-17 by activity status, age groups, sex and area of residence
Boy Girl Total
N.,1 000
children
% of total
children
N.,1 000
children
% of total
children
N.,1 000
children
% of total
children
Total 241.3 100 212.1 100 453.4 100
TOTAL
Working only 3.3 1.4 0.4 0.2 3.7 0.8
Attending school only 197.2 81.7 185.0 87.3 382.2 84.3
Working and attending school 31.6 13.1 16.7 7.9 48.2 10.6
Neither working nor attending school 9.2 3.8 10.0 4.7 19.2 4.2
URBAN
Total 129.2 100 118.2 100 247.5 100
Working only 0.5 0.4 0.1 0.1 0.6 0.3
Attending school only 120.6 93.3 113.5 96.0 234.1 94.6
Working and attending school 4.2 3.2 1.4 1.2 5.5 2.2
Neither working nor attending school 4.0 3.1 3.3 2.8 7.3 2.9
RURAL
Total 112.0 100 93.8 100 205.9 100
Working only 2.8 2.5 0.3 0.4 3.1 1.5
Attending school only 76.6 68.3 71.5 76.3 148.1 71.9
Working and attending school 27.4 24.5 15.3 16.3 42.7 20.7
Neither working nor attending school 5.3 4.7 6.7 7.1 12.0 5.8
5 - 11 YEARS
Total 132.0 100 115.8 100 247.8 100
Working only 0.1 0.1 0.0 0.0 0.1 0.0
Attending school only 118.6 89.9 103.4 89.3 222.0 89.6
Working and attending school 7.0 5.3 4.1 3.6 11.2 4.5
Neither working nor attending school 6.3 4.7 8.3 7.2 14.6 5.9
12 - 15 YEARS
Total 71.0 100 62.0 100 133.0 100
Working only 0.1 0.2 0.0 0.0 0.1 0.1
Attending school only 56.7 79.8 54.4 87.7 111.1 83.5
Working and attending school 13.4 18.9 7.2 11.7 20.7 15.5
Neither working nor attending school 0.7 1.0 0.4 0.6 1.1 0.8
16 - 17 YEARS
Total 38.3 100 34.2 100 72.6 100
Working only 3.1 8.1 0.4 1.2 3.5 4.9
Attending school only 21.9 57.1 27.3 79.6 49.1 67.7
Working and attending school 11.1 28.9 5.3 15.4 16.4 22.6
Neither working nor attending school 2.3 5.9 1.3 3.8 3.5 4.9

Armenia National Child Labour Survey 2015 Analytical Report38
83.8% of only working children and 88.6% of children both working and attending school werechildren from rural areas. 84.6% of only working boys lived in rural areas and 86.7% of boys simul-taneously working and studying. 75% of only working girls and 91.6% of simultaneously workingand studying girls lived in rural areas. Observing by residence area and gender, the data shows thatthe differences between indicators are relatively smaller in the case of unemployed children andthose who do not study. 41% of unemployed children and children who do not study lived in urbanareas and 59% in rural areas. 42.4% of boys in the same age group lived in urban areas and 57.6%in rural areas. The difference was slightly greater in case of girls: 33% in urban areas and 67% inrural areas.
Chapter 5
Figure 5.2.1 Children aged 5-17 by activity status, sex and area of residence, %
Figure 5.2.2 Children aged 5-17 by activity status, sex and age groups
0
20
40
60
80
100
Urban Rural Urban Rural Urban Rural
BOY GIRL TOTAL
Neither working nor attending
school
Working and attending school only
Attending school only
Working only
0
50
100
150
200
250
Total Boy Girl Total Boy Girl Total Boy Girl
5 - 11 y 12- 15 y 16- 17 y
tho
usa
nd
sc
hild
re
n
Neither working nor attending
school
Working and attending school
Attending school only
Working only

Two important facts should be stated. First, the greater frequency of engagement in any economicactivity and, second, the characteristics of residence and content and seasonality of activity typedetermined a higher level of child employment in rural areas, compared with urban areas.
The same indicators also had a decisive influence on activity status by age groups and gender.19 200 children did not work and did not study. Of these children, 75.8% were in the 5 -11 agegroup, 18.4% in the 16-17 age group and 5.8% in the 12 - 15 age group. Naturally, such propor-tions by age groups are due to children aged 5-6 years not attending school and not working because of their age. In the case of 16-17 year old children, this was because of the completion of their education and not having a job. In the case of 12 - 15 year old children, it was due to drop-ping-out of education. 94.0% of only working children were estimated to be in the 16 -17 age groups. 42.9% of both working and studying children were estimated to be in the 12 - 15 age group and 33.9% in the 16-17 age groups.
5.3 Household chores and services carried out by children
According to the results, 38.1% of all children surveyed have, to some extent, been involved inhousehold chores. Of these children, 61.4% were from urban areas and 38.6% from rural areas. Girlsdominated this area by 1.7 times, totalling 63% of children undertaking household chores; in urbanareas this was 61% and in rural areas 65%.
Armenia National Child Labour Survey 39
Concepts and definitions
Table 5.3.1 Distribution of children in household chores by sex, age groups andarea of residence
Total 106.1 42.9 66.6 32.3 172.7 38.1
TOTAL
5-11 36.9 26.1 12.9 12.1 49.8 20.1
12-15 44.8 61.1 28.3 47.4 73.1 55.0
16-17 24.4 74.6 25.5 64.0 49.9 68.8
BOY
Total 41.0 31.7 23.1 20.6 64.1 26.6
5-11 14.3 19.0 3.3 5.8 17.6 13.3
12-15 16.7 44.1 9.3 28.1 26.0 36.6
16-17 10.0 62.8 10.5 46.8 20.5 53.5
GIRL
Total 65.1 55.1 43.5 46.4 108.6 51.2
5-11 22.6 34.2 9.6 19.3 32.2 27.8
12-15 28.1 79.3 18.9 71.0 47.0 75.8
16-17 14.4 85.8 15 85.9 29.4 85.9
URBAN RURAL TOTAL
N.,1000 children
% of totalchildren
N.,1000 children
% of totalchildren
N.,1000 children
% of totalchildren

Objectively, direct linkage was observed between child age and degree of participation in house-hold activity. Thus, 68.8% of children aged 16-17 carried out household chores while the same indi-cator decreased for children aged 12-15 at 55% and 20.1% in case of children aged 5-11.The sameindicator by sex and area of residence shows that the highest degree of participation was observedamong children living in urban areas; 42.9% against 32.3% of rural areas, Involvement in unpaidhousehold chores compared with boys was almost double for the girls at 51.2%.
Armenia National Child Labour Survey 2015 Analytical Report40
Chapter 5
Table 5.3.2 Percent distribution of children aged 5 -17 with household chores by sex, age groups, area of residence and weekly hours spent
According to time spent during the week, children with relatively small workload had a significantproportion. They were involved in household chores for up to 7 hours weekly (62.2%).
1-7 hours 7 - 14 hours 14-24 hours 24 > hours Total
Total 62.2 28.1 8.6 1.1 100
TOTAL
5 - 11 73.4 19.6 6.5 0.5 100
12 - 15 61.5 28.7 8.3 1.5 100
16 - 17 49.6 37.8 11.6 1.0 100
BOY
Total 67.0 25.0 7.1 0.9 100
5 - 11 73.5 18.9 7.4 0.3 100
12 - 15 65.7 26.6 6.2 1.5 100
16 - 17 61.8 29.4 8.1 0.7 100
GIRL
Total 59.3 30.0 9.5 1.1 100
5 - 11 73.3 20.1 6.0 0.7 100
12 - 15 58.9 30.0 9.7 1.5 100
16 - 17 41.6 43.3 13.9 1.2 100
URBAN
Total 67.0 25.8 6.4 0.8 100
5 - 11 76.1 17.4 5.8 0.7 100
12 - 15 63.9 28.4 6.5 1.3 100
16 - 17 56.4 36.2 7.3 0.1 100
RURAL
Total 54.1 32.1 12.4 1.4 100
5 - 11 65.3 26.2 8.6 0.0 100
12 - 15 57.7 29.2 11.4 1.8 100
16 - 17 42.9 39.3 15.9 1.9 100

Armenia National Child Labour Survey 41
Chapter 6.
Characteristics of working childrenFor studying the employment of children, the survey took into account any activities carried out bychildren that resulted in goods and services for the market or goods for self-consumption. Based onthe survey methodology, the work done in a family business or farm is also defined as work.
In this section, the characteristics of employed children are discussed; particularly the field of their activ-ity, occupation type and employment status.
6.1 Employment of children by activity type
The Classification of Types of Economic Activities has been accepted as a basis for the classificationof the economic activity major groups, which allows data to be comparable.
According to the survey results, 90.4% of working children were involved in the agriculture, forestryand fishing sector. This mainly comprised harvesting activities as a family helping member, takingcare of cattle, pasture, mixed livestock and crop farm activities. 3.7% of working children were con-centrated in the sectors of trade, repair, transport, storage, accommodation and food services; main-ly engaged in the sale of food. Children were also involved in the trade of motor fuel, constructionmaterials, medication, vehicle maintenance and repair works.
Table 6.1.1 Children aged 5-17 by sex, age groups, area of residence and types of economic activity
5-11 years 12-15 years 16-17 years Total
N., 1 000 children
% oftotal
N., 1 000 children
% oftotal
N., 1 000children
% oftotal
N., 1 000children
% oftotal
Total 11.3 100 20.8 100 19.9 100 52.0 100
MAJOR GROUPS OF ECONOMIC ACTIVITY
Agriculture, forestry and fishing 10.7 95.2 19.1 91.8 17.6 88.6 47.0 90.4
Industry 0.0 0 0.1 0.5 0.7 3.3 0.7 1.4
Construction 0.0 0 0.1 0.3 0.4 2.2 0.4 0.8
Trade, repair, Transport and storage;Accommodation and food service activities 0.0 0.4 1.0 4.9 0.9 4.5 1.9 3.7
Public administration; compulsory social security; Education; Human health and social work activities ... ... ... ... 0.0 0.2 0.0 0.1
Other services 0.5 4.3 0.5 2.5 0.2 1.2 1.9 3.7
BOY
Total 7.1 100 13.6 100 14.2 100 34.9 100
Agriculture, forestry and fishing 6.7 94.5 12.4 91.2 12.3 86.7 31.1 89.2
Industry 0.0 0 0.1 0.4 0.6 4.4 0.7 2.0
Construction 0.0 0 0.1 0.4 0.4 3.1 0.4 1.2
Trade, repair, Transport and storage; Accommodation and food service activities 0.0 0.7 0.8 5.7 0.7 4.8 1.4 4.0

Armenia National Child Labour Survey 2015 Analytical Report42
Chapter 6
5-11 years 12-15 years 16-17 years Total
N., 1 000 children
% oftotal
N., 1 000 children
% oftotal
N., 1 000children
% oftotal
N., 1 000children
% oftotal
Public administration; compulsory social security; Education; Human health and social work activities ... ... ... ... 0.0 0.3 0.0 0.1
Other services 0.3 4.8 0.3 2.3 0.1 0.8 1.2 3.4
GIRL
Total 4.1 100 7.2 100 5.7 100 17.1 100
Agriculture, forestry and fishing 4.0 96.5 6.7 93.1 5.3 93.5 15.8 92.4
Industry 0.0 0 0.1 0.8 0.0 0.7 0.1 0.6
Construction … … … … … … … …
Trade, repair, Transport and storage; Accommodation and food service activities 0.0 0 0.2 3.3 0.2 3.8 0.5 2.9
Public administration; compulsorysocial security; Education; Humanhealth and social work activities ... ... ... ... ... ... ... ...
Other services 0.1 3.5 0.2 2.9 0.1 2 0.7 4.1
URBAN
Total 0.9 100 2.4 100 2.8 100 6.1 100
Agriculture, forestry and fishing 0.8 84.0 1.6 67.1 1.5 54.6 3.9 64.0
Industry … … 0.03 1.2 0.2 6.1 0.2 4.0
Construction … … … … 0.1 1.8 0.2 3.7
Trade, repair, Transport and storage; Accommodation and food service activities … … … … 0.2 8.3 1.2 19.3
Public administration; compulsory social security; Education; Human health and social work activities 0.0 3.7 0.5 20.5 0.5 19.6 0.0 0.6
Other services … … … … 0.1 3.9 0.5 8.3
RURAL
Total 10.3 100 18.4 100 17.1 100 45.8 100
Agriculture, forestry and fishing 9.8 95.1 17.3 94.2 15.9 93.0 43.0 93.9
Industry … … 0.0 0.2 0.4 2.6 0.5 1.1
Construction … … … … 0.2 1.1 0.2 0.4
Trade, repair, Transport and storage; Accommodation and food service activities 0.0 0.3 0.5 2.6 0.1 0.6 0.7 1.5
Public administration; compulsory social security; Education; Human health and social work activities … … … … 0.0 0.2 … …
Other services … … … … 0.1 0.4 1.4 3.1

Armenia National Child Labour Survey 43
In terms of gender differentials, 89.2% of working boys and 92.4% of working girls were involved inagriculture. 64% of working children in urban areas and 93.9% of their counterparts in rural areaswere employed in agriculture. 19.3% of working children in urban areas and 1.5% of their homo-logues in rural areas were working in the sectors of trade, repair, transport, storage, accommoda-tion and food services.
6.2 Employment of children by occupation
The Classification of Occupations has been accepted as a basis for the classification of the occupa-tions' groups, which allows data to be comparable.
Agriculture was the main area for children's employment, where children were more often involvedin temporary agricultural activities. 90% of employment in this area does not require any qualifica-tion (e.g., harvest collector, carrier, water fetching for their own household use, firewood collection,cattle pasturing, courier, delivery worker, guard). 7.3% of children carried out some skilled work(e.g., grower, truck farmer, baker, confectionery worker, tractor driver, truck drivers). 2.4 % wereservice and sales workers (e.g., gas station fuel tanker, waiter, cook, itinerant trader) and only 0.3%of children were employed in a field requiring professional skills (e.g., choreographer, musician,technician-pharmacist).
Characteristics of working children
Table 6.2.1 Children aged 5 -17 by sex, age groups, type of occupation and area of residence
5-11 years 12-15 years 16-17 years Total
N., 1 000 children
% oftotal
N., 1 000 children
% oftotal
N., 1 000children
% oftotal
N., 1 000children
% oftotal
Total 11.3 100 20.8 100 19.9 100 52.0 100
MAJOR GROUPS OF OCCUPATION
Technicians professionals … … … 0.2 0.1 0.5 0.1 0.3
Service and sales workers … … 0.6 3.0 0.6 3.0 1.2 2.4
Skilled workers … … … … 3.8 19.3 3.8 7.4
Elementary occupations 11.3 100 20.1 96.8 15.3 77.1 46.7 90.0
BOY
Total 7.1 100 13.6 100 14.2 100 34.9 100
Technicians professionals … … … … … … … …
Service and sales workers … … 0.4 3.1 0.4 3.0 0.9 2.4
Skilled workers … … … … 3.4 24.3 3.4 9.9
Elementary occupations 7.1 100 13.2 96.9 10.3 72.7 30.6 87.7
GIRL
Total 4.1 100 7.2 100 5.7 100 17.1 100
Technicians professionals … … 0.0 0.5 0.1 1.9 0.1 0.8
Service and sales workers … … 0.2 2.9 0.2 3.0 0.4 2.2
Skilled workers … … … … 0.4 7.1 0.4 2.4
Elementary occupations 4.1 100 7.0 96.7 5.0 88.1 16.1 94.6
URBAN
Total 0.9 100 2.4 100 2.8 100 6.1 100
Technicians professionals … … … 1.3 0.1 4.5 0.2 2.6
Service and sales workers … … 0.2 7.7 0.4 15.6 0.6 10.1

Armenia National Child Labour Survey 2015 Analytical Report44
With regard to gender distribution, almost the same trends were maintained between age groupsand types of occupations. Working boys were slightly more likely to be involved in the trade andservices sector as compared to working girls (2.4% vs. 2.1%). This trend was mostly observed amongurban children. Overall, 10.1% of urban working children were involved in the trade and servicessector activities, while for rural working children this indicator was only 1.3%.
As expected, children aged 5 -11 were mainly involved in basic, unskilled occupations (72.4%).27.6% of working children in this age group carried out work requiring some skills. Work requiringa certain qualification or skill was performed by 66.3 % of working children aged 16 -17, and 44.3% of working children aged 12 -15.
Chapter 6
Figure 6.2.1 Distribution of children aged 5-17 by age and occupations groups
Figure 6.2.2 Percent distribution of working children by sex, area of residenceand group of occupations, %
3
3
2
19
7
100
97
77
90
0% 20% 40% 60% 80% 100%
5-11 years
12-15 years
16-17 years
Total
Technical workers
Service and sales workers
Skilled workers
Elementary workers
100
31
11
34
0
69
89
66
Te
ch
nic
ians
pro
fessio
nals
Serv
ice
an
dsa
les
wo
rkers
Skill
ed w
ork
ers
Ele
men
tary
occu
patio
ns
Girl Boy 100
50 46
60
50 54
94
Tech
nic
ian
s
pro
fessio
nals
Serv
ice
an
dsa
les
wo
rkers
Skill
ed w
ork
ers
Ele
men
tary
occu
patio
ns
Urban Rural
5 -11 years 12 -15 years 16 -17 years Total
N., 1 000 children
% oftotal
N., 1 000 children
% oftotal
N., 1 000children
% oftotal
N., 1 000children
% oftotal
Skilled workers 0.3 33.6 1.1 45.8 1.3 47.9 2.8 44.9
Elementary occupations 0.6 66.4 1.1 45.2 0.9 32 2.6 42.5
RURAL
Total 10.3 100 18.4 100 17.1 100 45.8 100
Technical workers … … … … … … … …
Service and sales workers … … 0.4 2.4 0.1 0.9 0.6 1.3
Skilled workers … … … … … 19.0 3.3 7.1
Elementary occupations 10.3 100 18.0 97.6 13.7 80.2 42.0 91.6

Armenia National Child Labour Survey 45
Characteristics of working children
6.3 Status in employment
Children's status in employment was studied in two age groups, 10 -15 years and 16 -17 years.Employed children aged 5-9 did not answer the question on status in employment.
Accordingly, from the data presented in Table 6.3.1, children aged 10 -15 accounted for 57.4% ofthat population (26 800 children), while children aged 16-17 years accounted for 42.6% (19 800children).
Table 6.3.1 Children aged 5 -17 by sex, age groups, area of residence and status in employment
10-15 years 16-17 years Total
N., 1 000 children
% of total
N., 1 000 children
% of total
N., 1 000children
% of total
Total 26.8 100 19.9 100 46.7 100
STATUS IN EMPLOYMENT
Employee with a written contract … … 0.1 0.6 0.1 0.2
Employee with a verbal agreement 0.3 1.2 1.6 8.1 1.9 4.1
Own-account worker 4.3 16.1 4.8 24.3 9.2 19.6
Member of producers’ cooperative 0.1 0.2 0.0 0 0.1 0.1
Unpaid family worker 22.1 82.5 13.4 67.1 35.5 76.0
BOY
Total 17.6 100 14.2 100 31.8 100
Employee with a written contract … … 0.1 0.7 0.1 0.3
Employee with a verbal agreement 0.3 1.6 1.4 9.6 1.6 5.2
Own-account 2.7 15.4 4.2 29.5 6.9 21.7
Member of producers’ cooperative … … … … … …
Unpaid family worker 14.6 83 8.6 60.2 23.1 72.8
GIRL
Total 9.2 100 5.7 100 14.9 100
Employee with a written contract … … … 0.3 … 0.1
Employee with a verbal agreement 0.0 0.4 0.2 4.1 0.3 1.8
Own-account worker 1.6 17.5 0.6 11.2 2.3 15.1
Member of producers’ cooperative 0.1 0.6 … … 0.1 0.3
Unpaid family worker 7.5 81.6 4.8 84.4 12.3 82.7
URBAN
Total 3.0 100 2.8 100 5.8 100
Employee with a written contract … … 0.1 4 0.1 1.9
Employee with a verbal agreement 0.2 5.6 0.7 26.7 0.9 15.6
Own-account worker 0.5 15.6 0.5 19.1 1.0 17.3
Member of producers’ cooperative 0.1 1.7 0.0 0 0.1 0.9
Unpaid family worker 2.4 77.2 1.4 50.2 3.7 64.3

Armenia National Child Labour Survey 2015 Analytical Report46
Table 6.3.1 data analysis shows that 88% self-employed and 89.3% unpaid family workers were chil-dren living in rural areas.
6.4 Weekly hours worked
According to the survey results, children worked an average of 13 hours per week. Boys worked onaverage 14.1 hours per week and girls - 10.8 hours per week. In the 16-17 age groups, childrenworked an average of 16.6 hours, children aged 12-15 - 11.8 hours, and children aged 5-11 worked8.7 hours. Children in child labour (CL) worked an average of 14.4 hours per week. Of this, childrenaged 5-11 worked 8.7 hours, children aged 12-15-14.6 hours and children aged 16-17-18.8 hours.
Children working with a written contract amounted to 0.2%, while the share of workers with a ver-bal agreement was 4.1%. A bigger share was registered in relation to unpaid family members at76.0%. The proportion of self-employed children amounted to 19.6%. This indicator was 21.7% forworking boys and 15.1% for working girls. Unpaid family child-workers in rural areas had a greaterproportion at 77.6%, compared to 64.3% in urban settlements.
Chapter 6
Figure 6.3.1 Percent distribution of children aged 5 -17 by status in employment
4%
20%
76%Employee with a written contract
Employee with a verbal agreement
Own-account worker
Unpaid family worker
RURAL
Total 23.8 100 17.1 100 40.9 100
Employee with a written contract … … 0.1 4.0 0.1 1.9
Employee with a verbal agreement 0.1 0.6 0.9 5.0 1.0 2.5
Own-account worker 3.9 16.2 4.3 25.1 8.1 19.9
Member of producers' cooperative … … … … … …
Unpaid family worker 19.8 83.2 12.0 69.9 31.7 77.6
10-15 years 16-17 years Total
N., 1 000 children
% of total
N., 1 000 children
% of total
N., 1 000children
% of total

Armenia National Child Labour Survey 47
Characteristics of working children
Table 6.4.1 Average weekly hours actually worked by age groups and type ofwork, hours
Children not included in CL worked on average 8.8 hours per week. Children aged 16 -17 worked11.5 hours and children aged 12 -15 worked 6.5 hours. It is interesting that, in this age group only,girls worked longer than boys.
Figure 6.4.1 Average weekly working hours, hour
1200 children had a working week exceeding 43 hours. 16.7% of these belonged to the age group12-15 (mainly boys) and 83.3% to the 16-17 age group, 90% of these were boys.
8.7
11.8
16.6
138.7
14.6
18.8
14.4
6.5
11.5
8.8
5 -11 y. 12-15 y. 16-17 y. Total
av
era
ge
ho
urs
age groups
Working children
Children included in CHL
Children not included in CHL
CHILDREN IN EMPLOYMENT
Boy Girl Total
Total 14.1 10.8 13
5-11 8.7 8.8 8.7
12-15 12.4 10.7 11.8
16-17 18.3 12.5 16.6
CHILD LABOUR
Total 15.5 11.8 14.4
5-11 8.7 8.8 8.7
12-15 15.4 12.9 14.6
16-17 19.8 14.8 18.8
NOT CHILD LABOUR
Total 8.8 8.7 8.8
5-11 ... ... ...
12-15 6 7.2 6.5
16-17 12.7 10.2 11.5

Armenia National Child Labour Survey 2015 Analytical Report48
Chapter 6
The number of children working in rural areas for more than 43 hours per week doubles that oftheir urban counterparts. This is due to the greater prevalence of child labour in rural areas and thecontent and features of economic activity, as well as the lack of games, sports and entertainmentopportunities for rural areas.
Table 6.4.2 Children's'weekly hours actually worked by hour-bracket, age groups, sex, area of residence
TOTAL
Total 16.0 30.8 21.0 40.4 11.7 22.4 2.2 4.2 1.2 2.2 52.0 100
5 - 11 7.5 66.9 2.5 22.2 1.1 9.7 0.1 1.2 0.0 0.0 11.3 100
12 - 15 5.0 24.3 9.5 45.8 5.5 26.5 0.6 2.7 0.2 0.8 20.8 100
16 - 17 3.4 17.2 8.9 44.9 5.0 25.4 1.5 7.6 1.0 5.0 19.9 100
BOY
Total 10.4 29.8 13.2 38.0 8.4 24.0 1.8 5.1 1.1 3.2 34.9 100
5 - 11 4.9 69.4 1.5 20.7 0.7 9.3 0.0 0.6 0.0 0.0 7.1 100
12 - 15 3.1 22.9 6.1 45.2 3.8 27.7 0.4 3.1 0.2 1.2 13.6 100
16 - 17 2.4 16.6 5.6 39.7 4.0 27.9 1.3 9.3 0.9 6.6 14.2 100
GIRL
Total 5.6 32.8 7.7 45.3 3.3 19.2 0.4 2.4 0.1 0.4 17.1 100
5 - 11 2.6 62.6 1.0 24.8 0.4 10.4 0.1 2.2 0.0 0.0 4.1 100
12 - 15 1.9 26.8 3.4 47.0 1.8 24.3 0.1 1.9 0.0 0.0 7.2 100
16 - 17 1.1 18.7 3.3 58.0 1.1 19.1 0.2 3.2 0.1 1.0 5.7 100
URBAN
Total 1.5 24.0 2.6 42.8 1.2 19.8 0.4 7.2 0.4 6.2 6.1 100
5 - 11 0.6 58.6 0.3 31.8 0.1 9.6 0.0 0.0 0.0 0.0 0.9 100
12 - 15 0.7 27.0 1.1 45.0 0.5 22.3 0.1 2.3 0.1 3.4 2.4 100
16 - 17 0.3 9.7 1.2 44.6 0.6 21.1 0.4 14.0 0.3 10.7 2.8 100
RURAL
Total 14.5 31.7 18.3 40.0 10.4 22.8 1.7 3.8 0.8 1.7 45.8 100
5 - 11 7.0 67.7 2.2 21.3 1.0 9.7 0.1 1.3 0.0 0.0 10.3 100
12 - 15 4.4 23.9 8.4 45.9 5.0 27.1 0.5 2.7 0.1 0.4 18.4 100
16 - 17 3.1 18.4 7.7 45.0 4.5 26.0 1.1 6.5 0.7 4.1 17.1 100
< 6 6 - 14 15 - 29 30 - 42 43 >= Total
N., 1 000chil-dren
% N., 1 000chil-dren
% N., 1 000chil-dren
% N., 1 000chil-dren
% N., 1 000chil-dren
% N., 1 000chil-dren
%

Armenia National Child Labour Survey 49
6.5 Children seeking work
Within the scope of the survey it was possible to find out children aged 10-17 who were not inemployment during the reference week, but looked for a job and (or) would like to work. This infor-mation allows us to estimate the potential supply of child work.
According to the survey results, the number of job-seeker children is not large. 0.1% of childrenaged 10 -17 years were looking for a job.
Characteristics of working children
Table 6.5.1 Number of children aged 10-17 seeking work (unemployed), thousand children
Most job seekers were boys and belonged to the 16-17 year old age group. Among girls in the sameage group, no girl mentioned that she was seeking work. Instead, 60.9 % of job-seeker girls wereaged 12-15. It is concerning that 33.6 % of children looking for a job were children aged 5 -11. Theunemployment rate among children aged 10-17 was 1%, boys, and girls 0.9%, 1.2%.
Boy Girl Total
Seekingwork
Not seeking
work
Seekingwork
Not seeking
work
Seekingwork
Not seeking
work
Total 0.3 206.1 0.2 194.8 0.5 400.9
AGE GROUPS
5-11 (10) 0.1 124.7 0.1 111.6 0.2 236.4
12-15 0 57.4 0.1 54.7 0.1 112.1
16-17 0.2 24.0 0 28.5 0.2 52.5

Armenia National Child Labour Survey 2015 Analytical Report50
Among working children, the highest prevalence of working activity was found in the age group of16-17 years-old with 27.4% of total children in the age group, followed by 15.7% of children 12-15year-olds and 4.5% of those aged 5-11.
Chapter 7.
Child labour and hazardous work7.1 Child labour
This section presents the results of survey on child labour. Results were estimated /measuredaccording to the methodology used in the framework of NCLS, the “4.3.2 Measurement frameworkof child work” subsection of this report.
Child labour is related to child employment in all activities which are considered physically, sociallyor morally hazardous or dangerous and, therefore, undesirable.
Among the surveyed children, 88.5% had not worked during the week preceding the survey, while11.5% had any kind of job.
Table 7.1.1 Distribution of children aged 5 -17 by economic activity status
WORKING NON-WORKING TOTAL
N. ,1 000
children
% of totalchildren
N.,1 000
children
% of totalchildren
N.,1 000
children
% of total children
Total 52.0 11.5 401.4 88.5 453.4 100
AGE GROUPS
5-11 11.3 4.5 236.6 95.5 247.8 100
12-15 20.8 15.7 112.2 84.3 133.0 100
16-17 19.9 27.4 52.7 72.6 72.6 100
SEX
Boy 34.9 14.5 206.4 85.5 241.3 100
Girl 17.1 8.0 195.0 92.0 212.1 100

Armenia National Child Labour Survey 51
Child labour and hazardous work
Figure 7.1.1 Percent distribution of working and non-working children by age groups
7.2 Major child labour characteristics
According to the methodology:
Each surveyed child (respondent) was classified into the following mutually exclusive groupsby status of economic activity - child labour, working children not in child labour and non-working children.
Data describe the current economic status of respondents for the short reference period (oneweek).
According to the results, 88.5% of children were non-working, 8.7% were in child labour and 2.8%were working children not in child labour.
Among working children, boys were in the majority at 67.2%, while girls made up 32.8%. Amongnon-working children boys represent 52% and girls 48% of the total.
Figure 7.1.2 Working and non-working children aged 5 -17 by sex, %
22%
40%
3 8 % 5-11 yrs.
12-15 yrs.
16-17 yrs.
5 9 %
28 %
1 3 %
Working children Non-working children
6 75 2
3 348
0%
20%
40%
6 0%
8 0%
1 00%
Girl
Boy
Non-workingWorking

Armenia National Child Labour Survey 2015 Analytical Report52
Child labour is much more prevalent among boys than girls (11.4% vs. 5.7%) and among older chil-dren (19.4% for those aged 16-17) than their younger counterparts (10.5% for those aged 12-15and 4.5% for those aged 5-11). Also child labour is fundamentally concentrated in rural areas witha prevalence rate of 16.8% vs. 1.9% in urban areas.
Chapter 7
Table 7.2.1 Classification of children aged 5-17 by economic status, type of work, sex and age groups, area of residence
Figure 7.2.1 Classification of children by economic status and type of work, %
9%3%
88%
Child labour
Working children not in child labour
Non-working children
Total 401.4 88.5 12.7 2.8 39.3 8.7 453.4 100
SEX
Boy 206.4 85.5 7.5 3.1 27.4 11.4 241.3 100
Girl 195.0 91.9 5.2 2.4 12.0 5.7 212.1 100
AGE GROUPS
5-11 236.6 95.5 0 0 11.3 4.6 247.8 100
12-15 112.2 84.4 6.8 5.1 14.0 10.5 133.0 100
16-17 52.7 72.6 5.8 8.0 14.1 19.4 72.6 100
AREA OF RESIDENCE
Urban 241.3 97.6 1.3 0.5 4.8 1.9 247.5 100
Rural 160.1 77.7 11.3 5.5 34.5 16.8 205.9 100
Non-working children
Working childrennot in child labour
Child labour
Total children
N.,1 000
children
% of totalchildren
N.,1 000
children
% of totalchildren
N.,1 000
children
% of totalchildren
N.,1 000
children
% of totalchildren

Armenia National Child Labour Survey 53
Table 7.2.1 data analysis shows that, 89% of children who were working but not in child labourwere rural children, boys were 59.1% and children aged 12-15 were 53.5%. 87.8% of childreninvolved in child labour lived in rural areas and 12.2% in urban areas.
Child labour and hazardous work
Figure 7.2.2 Classification of children by economic status, type of work, sex andage, area of residence
Table 7.2.2 Children in child labour by sex, age groups and area of residence
0%
20%
40%
60%
80%
100%
Non-working children
Working children not inchild labour
Child labour
Boy Girl Urban Rural 5-11y 12-15y 16-17y
CHILD LABOUR
N., 1 000 children % of total working children % in total children
Total 39.3 75.6 8.7
TOTAL
5-11 11.3 100 4.6
12-15 14.0 67.3 10.5
16-17 14.1 70.8 19.4
BOY
Total 27.4 78.5 11.4
5-11 7.1 100 5.4
12-15 9.2 67.6 13.0
16-17 11.1 78.2 29.0
GIRL
Total 12.0 70.2 5.7
5-11 4.1 100 3.5
12-15 4.9 68.1 7.9
16-17 3.0 52.6 8.8

Armenia National Child Labour Survey 2015 Analytical Report54
When examining the survey results, it was important to determine exactly what type of economicactivity and occupation engaged children involved in child labour. Thus, of this children 90.1% wereengaged in agriculture and worked as elementary agricultural workers (88.7%). The work wasmostly carried out without payment as a contribution of family farming enterprise (70%).
Chapter 7
Figure 7.2.3 Proportion of children aged 5 -17 in child labour by age groups, %
Figure 7.2.4 Proportion of child labourer aged 5 -17 by sex and age groups
In general, 75.6% of working children were in child labour. This indicator includes 100% of workingchildren aged 5 to 11, 67.3% of those aged 12 to 15 and 70.8% those aged 16 to 17. The conclu-sion that emerges is that once a child below 18 years-old starts working, he or she is most likely toundertake a type of work prohibited by national legislation and/or international conventions. Theprobability of being in child labour is slightly higher for working boys compared to working girls(78.5% vs. 70.2%).
4.6
10.5
19.4
5-11 years 12-15 years 16-17 years
100
67.3 70.8
5-11 years 12-15 years 16-17 years
% of total children in the same age group % of total working children in the same age group
63 66
79
37 34
21
0
10
20
30
40
50
60
70
80
%
Boy
Girl
5-11 years 12-15 years 16-17 years

Armenia National Child Labour Survey 55
Child labour and hazardous work
Figure 7.2.5 Child labour by status in employment, %
7.3 Hazardous work by children
In terms of developing a clear understanding of child labour, it is important to distinguish betweenhazardous work and other forms of child labour not considered hazardous (for methodology, seeSubsection 4.3.3 Child Labour). According to the results, the number of children involved in haz-ardous work was estimated at 31.2 thousand children. Of these children, 22.5 thousand were boysand 8.7 thousand were girls. In percentage terms, 79.4% of children in child labour were engaged inhazardous work. 82.1% of boys in child labour were engaged in hazardous work and 72.5% of girls.
Table 7.3.1 Children aged 5-17 in child labour by the type of work, sex, age groups and area of residence
5%
25%
70%
Employee with a verbal
agreement
Own-account worker
(His/her own business)
Unpaid family worker
Total 31.2 6.3 1.8 39.3
SEX
Boy 22.5 3.7 1.1 27.3
Girl 8.7 2.6 0.7 12.0
AREA OF RESIDENCE
Urban 4.2 0.4 0.2 4.8
Rural 27.0 5.8 1.7 34.5
CHILDREN IN HAZARDOUS WORK AS A % OF CHILDREN IN CHILD LABOUR
Total 79.4 16.0 4.7 100
SEX
Boy 82.4 13.6 4.0 100
Girl 72.5 21.7 5.8 100
Children in hazardous work
Total childlabour
Children in child labour other than hazardous work
5-11 years old 12-15 years old
Thousands children

Armenia National Child Labour Survey 2015 Analytical Report56
Chapter 7
Figure 7.3.1 Classification of child labour by types of work, by sex and area of residence, %
By area of residence, 86.5% of children involved in hazardous work lived in rural areas; likely due tothe greater number of working children in rural areas, as well as the specifics of their work. Of thesechildren, 72.5% were boys and 27.9% were girls.
7 9 8 2
7 2
8 77 8
21 1 8
28
1 322
%
Total Boy Girl Urban Rural
0.0
20.0
40.0
60.0
80.0
100.0
Children in hazardous work
Children in child labour otherthan hazardous work
Children in hazardous work
Total childlabour
Children in child labour other than hazardous work
5-11 years old 12-15 years old
AREA OF RESIDENCE
Urban 87.5 8.3 4.2 100
Rural 78.3 16.8 4.9 100
CHILDREN IN HAZARDOUS WORK AS A % OF TOTAL CHILDREN
Total 6.9 2.5 1.4 8.7
SEX
Boy 9.3 2.8 1.6 11.4
Girl 4.1 2.2 1.1 5.7
AREA OF RESIDENCE
Urban 1.7 0.3 0.3 1.9
Rural 13.1 5.5 2.8 16.8

Armenia National Child Labour Survey 57
Table 7.3.2 Distribution of children in hazardous work by the sectors of economy, sex, age groups and area of residence, thousand children
7.3.1 Children in hazardous work by economy sector / type of occupation
Agriculture was the main sector of employment for children aged 5-17 years old. This suggests thatthe majority of children working in hazardous conditions (nine in ten children) carried out theiractivities in exactly that field. However, it is important to highlight that agriculture is not considereda “hazardous industry” in itself, according to the applied methodology.
In contrast, only 1.3% of children were engaged in construction, which is considered to be a haz-ardous industry. Of these children, 60.5% carried out that work in their own households, by partic-ipating in the construction or major repair work of their own house as a family member workingwithout pay. Within this survey, any other cases deemed as hazardous child work, such as mining,were not met.
It is clear that 86.5% of children in hazardous work lived in rural areas and 94.8% of them wereengaged in agriculture. In the same sector, three in five children in hazardous work living in urbanareas were engaged in agricultural work (61.3%), which is due to the scarcity of jobs in towns.Therefore, there were not sufficient living conditions for the population. 72.1% of children in haz-ardous work were boys. Of these boys in hazardous work, 88.9% were engaged in agriculture.95.4% of girls in hazardous work were in this sector.
Child labour and hazardous work
By age groups, of children engaged in hazardous work, 39.1% were aged 16 -17 and 45.2% wereaged 12-15. 94% of children aged 5-11 years old in hazardous work were engaged in agriculture.
CHILDREN IN HAZARDOUS WORK, THOUSANDS CHILDREN
Boy Girl 5 - 11
years old
12 - 15
years old
16 - 17
years old
Urban Rural Total
Total 22.5 8.7 5.0 12.2 14.1 4.2 27.0 31.2
Agriculture 20.0 8.3 4.7 11.4 12.2 2.6 25.6 28.2
Industry 0.7 0.1 … 0.1 0.7 0.3 0.5 0.8
Construction 0.4 … … … 0.4 0.2 0.2 0.4
Services 1.6 0.2 0.2 0.7 0.9 1.1 0.7 1.8
% OF TOTAL OF EACH CATEGORY
Total 100 100 100 100 100 100 100 100
Agriculture 88.9 95.4 94.0 93.4 86.5 61.9 94.8 90.4
Industry 3.1 1.1 … 0.8 5.0 7.1 1.9 2.6
Construction 1.8 … … … 2.8 4.8 0.7 1.3
Services 7.1 2.3 4.0 5.7 6.4 26.2 2.6 5.8

Armenia National Child Labour Survey 2015 Analytical Report58
Chapter 7
Table 7.3.3 Children aged 5-17 by characteristic of hazardous work8
8 The same child could mention multiple factors of harmfulness.
7.3.2 Hazardous working conditions and other characteristics of hazardous work
According to the survey results, 1.2 thousand children worked more than 43 hours per week. Ofthese children, 86.2% were aged 16-17 years old and 13.8% were 12-15 years old. In the 12-15 agegroup, hazardous working hours referred exclusively to boys, while in the 16-17 age group, 5.9%were girls.
600 children had a hazardous occupation, 88.4% of which were boys, and 77% of which werechildren aged 16-17 years old. It is alarming that 3.4% of these children were 5-11 years old.
400 boys aged 12-15 and 16-17 years old were engaged in a hazardous industry. 89.3% of themwere 16-17 years old.
HAZARDOUS WORKING HOURS (>=43)
Total 94.8 5.2 100 100 100
5 - 11 … … … … …
12 - 15 100 0 14.6 0.0 13.8
16 - 17 94.1 5.9 85.4 100 86.2
HAZARDOUS OCCUPATION
Total 88.4 11.6 100 100 100
5 - 11 100 0.0 3.8 0.0 3.4
12 - 15 73.6 26.4 16.2 44.1 19.4
16 - 17 91.6 8.4 80.0 55.9 77.2
HAZARDOUS INDUSTRY
Total 100 … 100 … 100
5 - 11 … … … … …
12 - 15 100 … 10.7 … 10.7
16-17 100 … 89.3 … 89.3
HAZARDOUS WORKING CONDITIONS
Total 69.9 30.1 100 100 100
5 - 11 72.8 27.2 18.4 15.9 17.6
12 - 15 60.6 39.4 32.1 48.3 37.0
16 - 17 76.3 23.7 49.6 35.8 45.4
Distribution of children in hazardouswork by sex, % of total
% OF TOTAL OF EACH CATEGORY
Boy Girl Boy Girl Total

Armenia National Child Labour Survey 59
Child labour and hazardous work
9 The same child could mention multiple factors of harmfulness.
Figure 7.3.2 Children aged 5-17 in child labour9 by characteristic of hazardouswork and sex
It is important to note that data about children on hazardous working conditions, trans-porting /carrying heavy loads are based on the subjective perception of children abouttheir work (see questions C38-C43 in Annex 1), but not on the law permitted norms (e.g., noise measurement by decibel etc.).
23 500 childrenwork in hazardous working conditions. Of these children, 17.6% were aged 5 -11, 30.2% were girls.
Children carrying heavy loads (over 15 kg) are likely to experience adverse effects on their imma-turemusculoskeletal, cardiovascular and respiratory systems. 55.1% of children 5 to 17 years-old inhazardous work were involved in carrying heavy loads, mainly due to harvest activities, which mostoften involved children living in villages.
1.1
0.5
0.4
16.5
14.3
0.1
0.1
7.1
2.9
0 5 10 15
Working
hours
Ooccupation
Industry
Working
conditions
Carring
heavy loads
Girl Boy
0.5
0.2
0.2
6.8
5.9
3.3
1.4
0 1 2 3 4 5 6 7
Working
hours
Ooccupation
Industry
Working
conditions
Carring
heavy loads
Girl Boy
per cent to total children1 000 children
CARRYING HEAVY LOADS
Total 82.9 17.1 100 100 100
5 - 11 61.0 39.0 8.6 26.6 11.7
12 - 15 79.1 20.9 36.4 46.8 38.2
16 - 17 91.0 9.0 55.0 26.5 50.1
Distribution of children in hazardouswork by sex, % of total
% OF TOTAL OF EACH CATEGORY
Boy Girl Boy Girl Total

Armenia National Child Labour Survey 2015 Analytical Report60
Figure 7.3.3 Distribution of children aged 5-17 by hazardous working conditionsand other hazardous characteristics, %
Chapter 7
11.7% of children in hazardous work aged 5-11 were involved in transporting heavy loads, 39% ofwhich were girls. 82.9% of children carrying heavy loads were boys, and 55% of them were 16 -17years old.
Among children in hazardous work, the highest prevalence was found among boys working in haz-ardous working conditions with 6.5% of total boys, followed by boys carrying heavy loads with5.9% of total boys (see Figure 7.3.2).
Long working hours Hazardous occupation
Hazardous industry Hazardous working conditions
Carrying heavy loads
100
94
95
0
6
5
0% 50% 100%
12-15 y.
16-17 y.
Total
Boy Girl
100
74
2
88
0
26
8
12
0% 50% 100%
5-11 y.
12-15 y.
16-17 y.
Total
Boy Girl
100
100
0
0
0% 50% 100%
16-17 y.
Total
Boy Girl
73
61
76
70
27
39
24
30
0% 50% 100%
5-11 y.
12-15 y.
16-17 y.
Total
Boy Girl
61
79
91
84
31
21
9
16
0% 50% 100%
5-11 y.
12-15 y.
16-17 y.
Total
Boy Girl

Armenia National Child Labour Survey 61
Child labour and hazardous work
Table 7.3.3.1 Distribution of children in hazardous work by average weekly hoursworked, hour
7.3.3 Weekly hours of work performed by children in hazardous work
According to the results, children in hazardous work worked an average of 16.6 hours per week.By age group, this equates to children aged 16-17 years old working 19.3 hours per week; childrenaged 12 -15 years -14.5 hours per week, and children aged 5 -11-12.5 hours per week. Boys had alonger working week in the age groups of 12-15 and 16 -17 years old. As for girls, the age groupwith the longest working week was that of 5-11 years old.
The average working week of children working in urban areas was longer, comprising 18.5 hours,in comparison to 16.3 hours worked weekly by children in rural areas. This points out to a specificvulnerability factor for working children living in urban areas. Boys living in urban areas aged 16-17years old are working for longer hours per week than in any other category. A significant differencewas reported among girls aged 16-17 years old. Girls in urban areas belonging to this age groupworked on average 4 hours more than girls in rural areas (19.3 hours per week vs. 15.3 hours perweek). Meanwhile, for boys, this difference was only 2.6 hours (22.1 hours per week vs. 19.8 hoursper week).
Boy Girl Total
Total 17.5 14.1 16.6
TOTAL
5 - 11 11.0 15.8 12.5
12 - 15 15.6 12.5 14.5
16 - 17 20.2 15.8 19.3
URBAN
Total 19.4 14.3 18.5
5 - 11 8.7 12.3 9.1
12 - 15 18 9.3 15.9
16 - 17 22.1 19.3 21.6
RURAL
Total 17.2 14.0 16.3
5 - 11 11.4 15.9 13
12 - 15 15.2 12.8 14.3
16 - 17 19.8 15.3 18.8

Armenia National Child Labour Survey 2015 Analytical Report62
Chapter 8.
Educational characteristics8.1 Educational programs implemented in the country
According to the RA Law “On Education” (Article 10), the main general programmes implementedin the country are:
Preschool
Elementary (general, specialized, special).
Basic (general, specialized, special).
Secondary (general, specialized, special).
General education in Armenia begins at age six and is implemented in general educational institu-tions (Article 15).
Secondary education is implemented in three-level general educational schools with total durationof 12 years and with the following sequences:
1) Elementary school (1 - 4 grades).
2) Basic school (5 - 9 grades).
3) High school (10 - 12 grades).
The first two stages of secondary general school constitute basic school. Basic general education iscompulsory. The requirement of compulsory basic education is maintained until the age of 16, if itis not satisfied earlier. After 16 years of age, the student can leave school with the consent of theirparents (adoptive or guardian) (Article 18).
Chapter 7
Figure 7.3.3.1 Average weekly hours worked by children in hazardous work by sex, age groups and area of residence
0
5
1 0
1 5
20
ho
urs
5-11 years old 12-15 years old 16-17 years old Total
Boy
Girl
Urban
Rural

Armenia National Child Labour Survey 63
Educational characteristics
Table 8.2.1 Children aged 5-17 by current educational program and sex
Figure 8.2.1 Children's current school / preschool attendance rate by age groups, %
8.2 Current education level of children
According to the results, 94.9% of children aged 5-17 were involved in any kind of educational pro-gram. 39.0% were in general basic schools, 33.1% in elementary education, and 16.2% in second-ary schools. 6.8% of children were at preschool educational level and schools of crafts or vocation-al schools and higher education; respectively 3.4% and 1.4%.
Within all current educational programs, there were 53% of boys and 47% of girls. The exceptionwas higher education where the numbers were 54% girls and 46% boys.
92%
99%
90%
5-9 y. 10-15 y. 16-17 y.
85
90
95
100
Boy Girl Total
N. ,1 000
children
% N.,1 000
children
% N.,1 000
children
%
Total 228.7 100 201.7 100 430.4 100
LEVEL OF EDUCATIONAL PROGRAM
Pre-school 14.8 6.5 14.6 7.3 29.5 6.8
Primary 78.1 34.2 64.5 32.0 142.6 33.1
General basic 89.4 39.1 78.5 38.9 167.9 39.0
General secondary/ high school 35.3 15.5 34.5 17.1 69.8 16.2
Vocational/Secondary specialized 8.4 3.7 6.3 3.1 14.7 3.4
University 2.7 1.2 3.2 1.6 5.9 1.4

Armenia National Child Labour Survey 2015 Analytical Report64
5% of children in the 5-17 age group did not attend any educational institution. Of these children,55% were boys and 45% were girls. 64% of children not attending schools were those aged 5 -11years and 31% were aged 16-17 years. This is due to children aged 5-6 years not attending pre-school and, in the case of seniors, not going on to secondary education. Moreover, if the differencebetween genders of children aged 5-15 not attending school is small, then in the 16-17 age group,76.1% of children not attending school were boys.
8.2.1 Children's current school / preschool attendance
According to the results, children's current school attendance is quite high (94.9%). The enrollmentrate for boys was 94.8% and for girls 95.1%.
Chapter 8
Table 8.2.2 Children's current school/preschool attendance during the currentschool year by sex, age groups and area of residence
Table 8.2.3 Children aged 5-17 not attending school/preschool during the current school year by sex, age groups and area of residence
Boy Girl Total
N., 1 000
children
% of total
children
N., 1 000
children
% of total
children
N., 1 000
children
% of total
children
Total 228.7 94.8 201.7 95.1 430.4 94.9
AGE GROUPS
5 - 11 125.7 95.2 107.5 92.8 233.2 94.1
12 - 15 70.1 98.7 61.6 99.4 131.7 99.0
16 - 17 33.0 86.2 32.5 95.0 65.5 90.2
AREA OF RESIDENCE
Urban 124.7 96.5 114.9 97.2 239.6 96.8
Rural 104.0 92.8 86.8 92.5 190.8 92.7
Boy Girl Total
N., 1 000
children
% of total
children
N., 1 000
children
% of total
children
N., 1 000
children
% of total
children
Total 12.6 5.2 10.4 4.9 23.0 5.1
AGE GROUPS
5-11 6.3 4.8 8.3 7.2 14.6 5.9
12-15 0.9 1.3 0.4 0.6 1.3 0.1
16-17 5.4 13.8 1.7 5.0 7.1 9.8
AREA OF RESIDENCE
Urban 4.5 3.5 3.3 2.8 7.9 3.2
Rural 8.1 7.2 7.1 7.6 15.1 7.3

Armenia National Child Labour Survey 65
Educational characteristics
Figure 8.2.2 Distribution of children aged 5-17 years who have never attendedschool by reasons of non-attendance, sex and area of residence, %
8.2.2 Children who have never attended school/ preschool
According to the results, 3% of surveyed children have never attended school. Of these children,97.8% were aged up to 7 years old. The number of children who have never attended school in the12-17 age group was statistically insignificant and largely due to child disability (56%) and illness(37.3%).
8.2.3 Child literacy
The assessment of literacy indicators is recognized as the ability of children in the 5-17 age group towrite, read, and make up simple sentences in any language (including their native language). Theresults indicate that 93.3% of surveyed children aged 5-17 are considered literate and 6.7% are con-sidered non-literate. 99.7% of non-literate children were in the 5-11 age group, where the absolutemajority were aged around 5-6 years. 61.6% of them started to attend school / preschool duringthe current school year.
0% 20% 40% 60%
Still small
Disability
Disease
Absence of
school/distance
Lack of acces to education
Family does not allow to
learnGirl Boy
0% 20% 40% 60%
Still small
Disability
Disease
Absence of
school/distance
Lack of acces to
education
Family does not
allow to learnRural Urban

Armenia National Child Labour Survey 2015 Analytical Report66
Chapter 8
Figure 8.2.3 Literacy rate of children aged 5-17 by RA marzes, %
The survey results revealed that the highest literacy rate was observed in Gegharkunik marz at 95%and the lowest literacy rate in Tavush marz at 85% where the proportion of children aged 5-6 yearsold (who were not in school-age) is the highest (20.1% of total surveyed children in this marz).
Table 8.2.3 Distribution of children by the ability to write, read and make up sim-ple sentences in any language by sex, age groups and area of residence
95 95
9194
96
93 93 91
96 95
85
93
76
80
84
88
92
96
100
%
Total 225.9 93.6 15.4 6.4 197.3 93.0 14.7 6.9 423.2 93.3 30.2 6.7
AGE GROUPS
5 - 11 116.6 88.4 15.4 11.6 101.1 87.3 14.7 12.7 217.7 87.9 30.1 12.1
12 - 15 70.9 99.9 0.1 0.1 62.0 100 0.0 0 132.9 100 0.1 0.0
16 - 17 38.3 100 0 0 34.2 100 0 0 72.6 100 0 0
AREA OF RESIDENCE
Urban 121.9 94.3 7.4 5.7 111.8 94.6 6.5 5.4 233.7 94.4 13.8 5.6
Rural 104.0 92.8 8.1 7.2 85.6 91.2 8.3 8.8 189.6 92.1 16.3 7.9
BOY GIRL TOTALL
itera
te,1
000
ch
ild
ren
% o
f to
tal
ch
ild
ren
Illi
tera
te,
1000 c
hil
dre
n
% o
f to
tal
ch
ild
ren
Lit
era
te,1
000
ch
ild
ren
% o
f to
tal
ch
ild
ren
Illi
tera
te,
1000 c
hil
dre
n
% o
f to
tal
ch
ild
ren
Lit
era
te,1
000
ch
ild
ren
% o
f to
tal
ch
ild
ren
Illit
erat
e,1
000
child
ren
% o
f to
tal
ch
ild
ren

Armenia National Child Labour Survey 67
8.3 Participation in vocational / skills training outsideof school
According to the results, 31 900 children participated in vocational and educational programs. Ofthese children, 46.7% were boys and 53.3% were girls. In most rural communities, training centersmay not be accessible. Children from rural areas must visit such institutions in the nearest cities. It is,therefore, unsurprising that 78.1% of children attending vocational and educational programs livedin urban areas and 21.9% in rural areas.
Educational characteristics
Figure 8.3.1 Participation in voctional /skills training courses and educational programs
Table 8.3.1 Distribution of children by participation in vocational / skills trainingcourse by sex, age groups and area of residence
10 13 17 5
9 0 8 7 8 39 5
0%
20%
40%
6 0%
8 0%
1 00%
Boy Girl Urban Rural
Did not attend
Attended/Currently attends
Boy Girl Total
N. ,1 000
children
% of total
N.,1 000
children
% of total
N.,1 000
children
% of total
Total 145.7 100 127.5 100 273.1 100
VOCATIONAL / SKILLS TRAINING COURSES ATTENDANCE
Attended/attending now 14.9 10.2 17.0 13.3 31.9 11.7
Did not attend 130.8 89.8 110.5 86.7 241.3 88.3
URBAN
Total 73.3 100 70.3 100 143.6 100
Attended/attending now 11.3 15.5 13.5 19.3 24.9 17.3
Did not attend 62.0 84.6 56.8 80.8 118.8 82.7
RURAL
Total 72.3 100 57.2 100 129.5 100
Attended/attending now 3.5 4.9 3.5 6.1 7.0 5.4
Did not attend 68.8 95.1 53.7 93.9 122.5 94.6
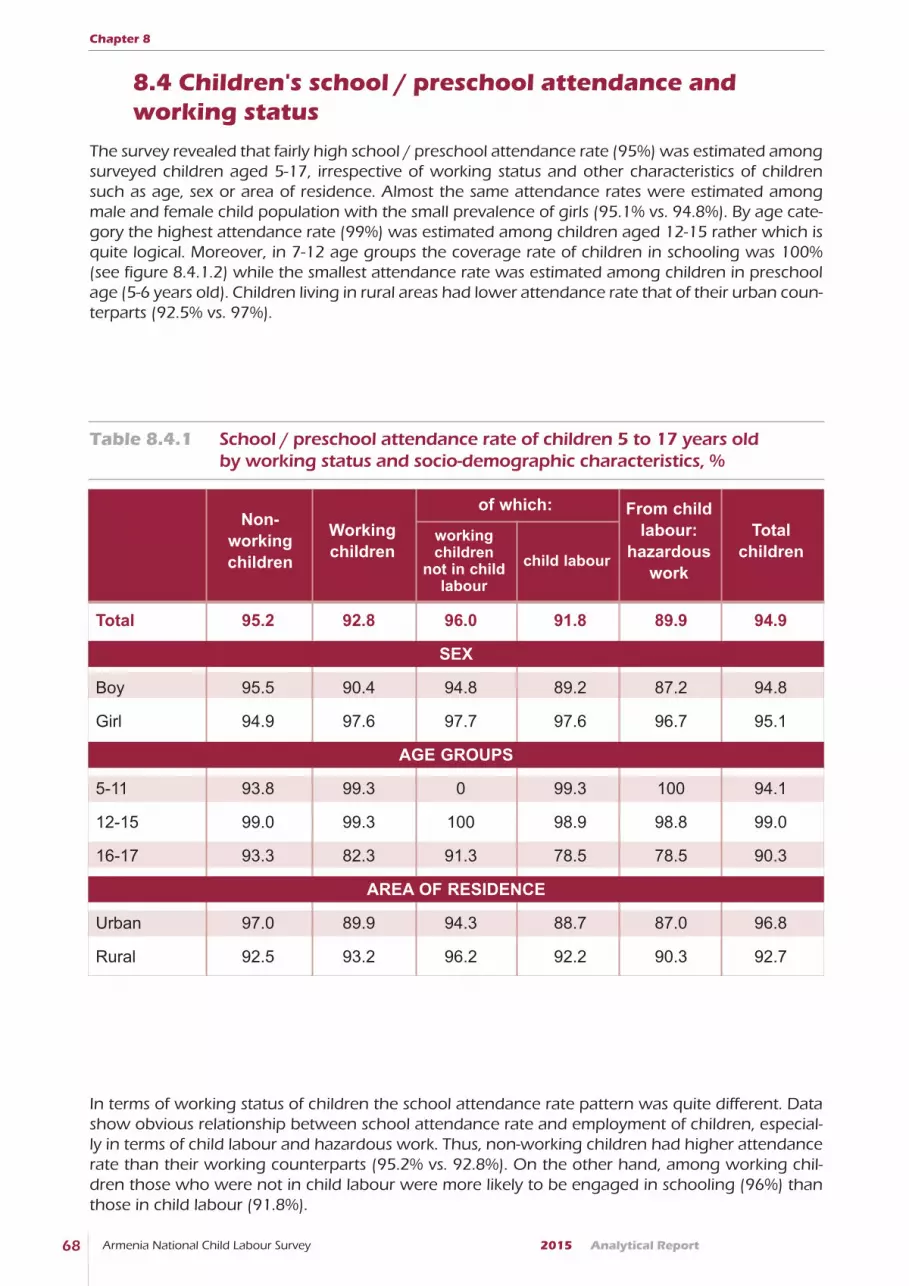
Armenia National Child Labour Survey 2015 Analytical Report68
8.4 Children's school / preschool attendance and working status
The survey revealed that fairly high school / preschool attendance rate (95%) was estimated amongsurveyed children aged 5-17, irrespective of working status and other characteristics of childrensuch as age, sex or area of residence. Almost the same attendance rates were estimated amongmale and female child population with the small prevalence of girls (95.1% vs. 94.8%). By age cate-gory the highest attendance rate (99%) was estimated among children aged 12-15 rather which isquite logical. Moreover, in 7-12 age groups the coverage rate of children in schooling was 100%(see figure 8.4.1.2) while the smallest attendance rate was estimated among children in preschoolage (5-6 years old). Children living in rural areas had lower attendance rate that of their urban coun-terparts (92.5% vs. 97%).
Chapter 8
In terms of working status of children the school attendance rate pattern was quite different. Datashow obvious relationship between school attendance rate and employment of children, especial-ly in terms of child labour and hazardous work. Thus, non-working children had higher attendancerate than their working counterparts (95.2% vs. 92.8%). On the other hand, among working chil-dren those who were not in child labour were more likely to be engaged in schooling (96%) thanthose in child labour (91.8%).
Table 8.4.1 School / preschool attendance rate of children 5 to 17 years old by working status and socio-demographic characteristics, %
Total 95.2 92.8 96.0 91.8 89.9 94.9
SEX
Boy 95.5 90.4 94.8 89.2 87.2 94.8
Girl 94.9 97.6 97.7 97.6 96.7 95.1
AGE GROUPS
5-11 93.8 99.3 0 99.3 100 94.1
12-15 99.0 99.3 100 98.9 98.8 99.0
16-17 93.3 82.3 91.3 78.5 78.5 90.3
AREA OF RESIDENCE
Urban 97.0 89.9 94.3 88.7 87.0 96.8
Rural 92.5 93.2 96.2 92.2 90.3 92.7
Non-workingchildren
Workingchildren
From childlabour:
hazardouswork
Total children
of which:
working children
not in childlabour
child labour

Armenia National Child Labour Survey 69
Gegharkunik is the marz where the highest rate of child employment was observed; almost half ofthe surveyed children aged 5 -17 were engaged in a working activity. Meanwhile, 99% of themcombined employment with education. Gegharkunik was followed by Aragatsotn marz at 41%. Inthis marz 0.2% of children worked and did not attend school.
0.8% of the surveyed children aged 5 -17 were employed and did not attend school. 98.4% of themwere 15-17 years old and completed at least general basic education. The main reason for stoppingeducation was the fact of not being interested in school (38%), followed by 22 % who said theycould not afford schooling, 14 % of those who mentioned they wanted to learn a job and 10 % ofthose who stopped schooling to work for pay.
Educational characteristics
Figure 8.4.1.1 School / preschool attendance rate of children 5 to 17 years old byworking status, %
Figure 8.4.1.2 School / preschool attendance rate of children 5 to 17 years old by working status and age groups, %
50556065707580859095
100
%
5 - 6 yrs 7 - 9 yrs. 10-12 yrs. 13-15 yrs. 16-17 yrs.
Non-workingchildren
Workingchildren
Workingchildren not in
child labour
Child labour Hazardouswork
Workingchildren not in
child labour
95.2
92.8
96
91.8
89.9
87
89
91
93
95
97
Att
an
da
nce
rate
,%
Non-workingchildren
Workingchildren
Child labour Hazardouswork

Armenia National Child Labour Survey 2015 Analytical Report70
Chapter 9.
Other characteristics 9.1 Socio-economic characteristics of the households
The socio-economic characteristics of a household have an important role on children's living stan-dards, education and employment. Any positive or negative change in these characteristics is imme-diately reflected on the household, and especially on children's economic and educational activity.These conditions are discussed in the subsections below by the mutual connection of the factor ofchild's work or non-work.
9.1.1 Type of dwelling and ownership status
There were about 289.9 thousands households having children 5 to 17 years old, according to theresults of the NCLS. Of this number, 10% or 28.9 thousands households had working children.
41.0% of the surveyed children lived in apartments or flats. These children naturally outweighedthose living in rural areas, and of this figure, 94.5% were urban children. 56.2% of children lived inprivate houses, of which, naturally, rural children prevailed, comprising 75%. The remaining 2.8% ofchildren had less typical living conditions, living in hostels or trailers etc. This category was dominat-ed by children living in urban areas, amounting to 63.5%.
Chapter 8
Figure 8.4.1.3 Distribution of children aged 5 -17 by school / preschool attendanceand working status by RA Marzes
Total of children RA marzes
11
4
84
0%
10%
20%
30%
40%
50%
60%
70%
80%
90%
100%
Total surveyed children
aged 5 -17 yrs 0% 50% 100%
Yerevan
Aragatsotn
Ararat
Armavir
Gegharkunik
Lori
Kotayq
Shirak
Syuniq
Vayoc Dzor
Tavush
Not work and
attand
Not work and not
attand
Work and attand
Work and not
attand
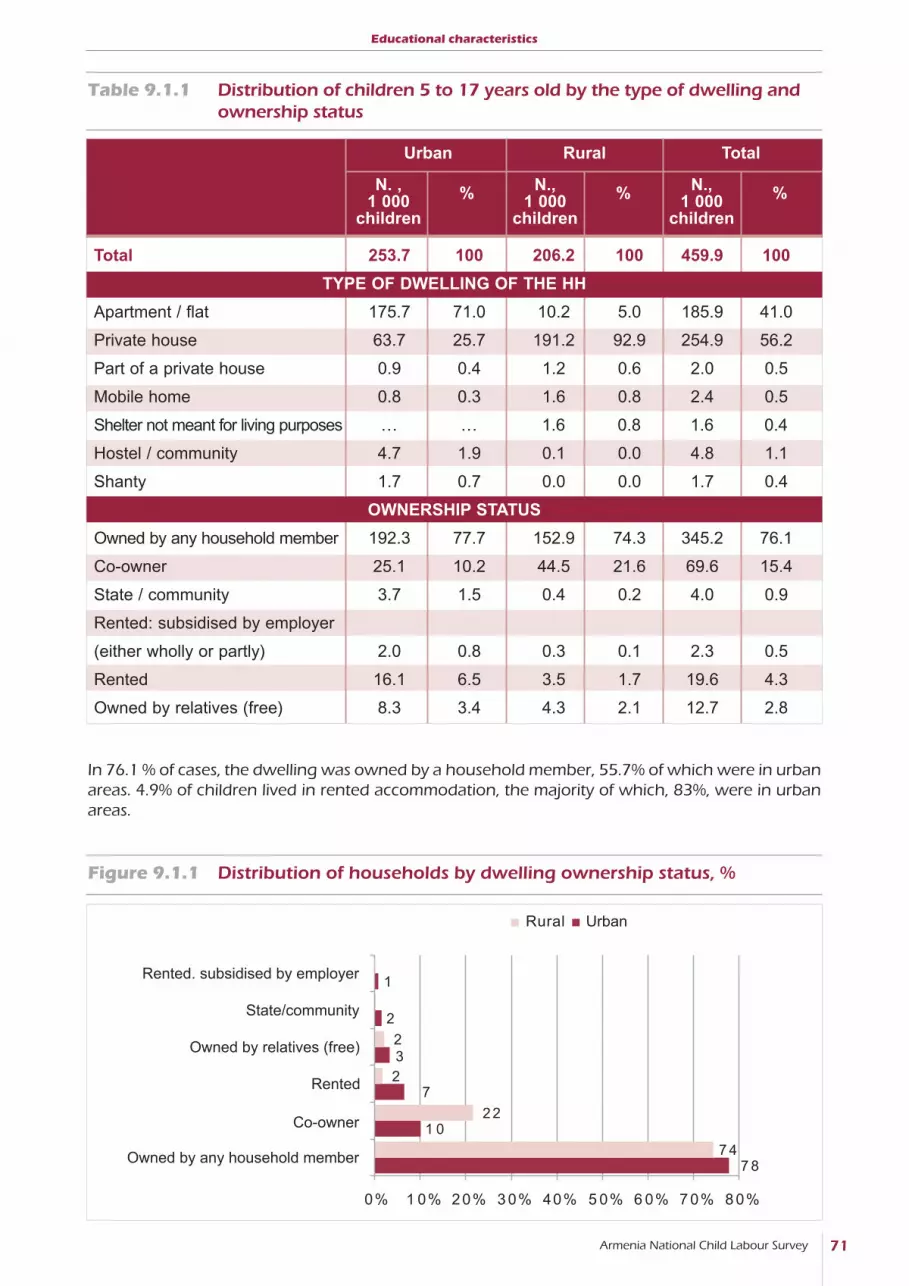
Armenia National Child Labour Survey 71
In 76.1 % of cases, the dwelling was owned by a household member, 55.7% of which were in urbanareas. 4.9% of children lived in rented accommodation, the majority of which, 83%, were in urbanareas.
Educational characteristics
Table 9.1.1 Distribution of children 5 to 17 years old by the type of dwelling andownership status
Figure 9.1.1 Distribution of households by dwelling ownership status, %
0% 1 0% 20% 3 0% 40% 5 0% 6 0% 7 0% 8 0%
Rural Urban
Rented. subsidised by employer
State/community
Owned by relatives (free)
Rented
Co-owner
Owned by any household member7 8
1 0
7
3
2
1
7 4
22
2
2
Urban Rural Total
N. ,1 000
children
% N.,1 000
children
% N.,1 000
children
%
Total 253.7 100 206.2 100 459.9 100
TYPE OF DWELLING OF THE HH
Apartment / flat 175.7 71.0 10.2 5.0 185.9 41.0
Private house 63.7 25.7 191.2 92.9 254.9 56.2
Part of a private house 0.9 0.4 1.2 0.6 2.0 0.5
Mobile home 0.8 0.3 1.6 0.8 2.4 0.5
Shelter not meant for living purposes … … 1.6 0.8 1.6 0.4
Hostel / community 4.7 1.9 0.1 0.0 4.8 1.1
Shanty 1.7 0.7 0.0 0.0 1.7 0.4
OWNERSHIP STATUS
Owned by any household member 192.3 77.7 152.9 74.3 345.2 76.1
Co-owner 25.1 10.2 44.5 21.6 69.6 15.4
State / community 3.7 1.5 0.4 0.2 4.0 0.9
Rented: subsidised by employer
(either wholly or partly) 2.0 0.8 0.3 0.1 2.3 0.5
Rented 16.1 6.5 3.5 1.7 19.6 4.3
Owned by relatives (free) 8.3 3.4 4.3 2.1 12.7 2.8

Armenia National Child Labour Survey 2015 Analytical Report72
The results suggest that housing conditions in households with working children by facilities avail-able were worse than in households without working children.
Gas (including liquid gas) was mostly used by households as the main source of energy for cook-ing, comprising 90.6%. This is likely due to the affordable price. Gas was followed by electricity at5%, wood at 2.9%, and dry manure at 1.3%. The usage of gas was prevalent in urban areas.
Chapter 9
9.1.2 Housing conditions by facilities available
The study of living conditions showed that 99% of households had kitchen appliances. 97.8% hada bathroom and 100% had a toilet. In most of the households, all the facilities were inside the houseand exclusive, kitchen in 93.2 % of households, bathroom in 85.5% and toilet in 77.4%. Of course,there were differences in terms of all facilities between urban and rural areas, which is objectivelydue to the area's characteristics. Broadly, it can be stated that children's living conditions in ruralareas by available facilities ceded to urban areas.
Table 9.1.2.1 Distribution of households by dwelling facilities, activity status of children 5 to 17 years old and area of residence, %
Inside house and exclusive 97.3 97.8 76.0 90 93.2
Inside house and shared 0.4 0.3 0.9 0.5 0.4
Outside house and exclusive 1.5 1.2 20.2 8.2 5.3
Outside house and shared 0 0.1 0.3 0.1 0.1
Not available 0.8 0.6 2.6 1.3 1
BATHROOM
Inside house and exclusive 93.3 94.7 67.7 75.3 85.5
Inside house and shared 0 1.3 1.2 0.6 1.1
Outside house and exclusive 5.9 3 26.3 19.7 10.9
Outside house and shared 0 0.3 0.3 0.3 0.3
Not available 0.8 0.7 4.5 4.1 2.2
TOILET
Inside house and exclusive 80.6 94.2 43.9 58.9 77.4
Inside house and shared 0.5 1.3 0.3 0.6 1
Outside house and exclusive 18.8 4 55.3 39.4 20.9
Outside house and shared 0 0.6 0.4 1.1 0.7
HHs withworking children
HHs withoutworking children
HHs withworking children
HHs withoutworking children
URBAN RURAL
TOTAL
KITCHEN

Armenia National Child Labour Survey 73
43.9% of households used gas as the main source of energy for heating/cooling, 33.8% of house-holds used wood, and 13.9% used electricity. The main source of lighting in both urban and ruralareas was exclusively electricity. The main source of drinking water was the central water supplyinside the house, which was available in 90.8% of households. In comparison with urban areas, thisindicator was lower in rural areas. However, this was often supplemented by a centralized pipe-borne water system outside houses in rural areas. 1.6% of households with working children and4.5% of households without working children in rural areas used a bore-hole or tube well, whichmakes clear the necessity of regular fetching of water and collecting of firewood for rural children.In general, 0.3% of total households bought water, 0.5% used a well.
Educational characteristics
Table 9.1.2.2 Distribution of households by the main source of energy and usageand activity status of children 5 to 17 years old %
Wood 2.7 1.0 10.1 4.2 2.9
Dry manure … 0.1 3.6 2.7 1.3
Coal … … … 0.1 …
Kerosene … … 0.2 0.2 0.1
Gas (including liquid gas) 83.1 93.3 83.4 88.4 90.6
Electricity 14.2 5.5 2.7 4.4 5
Other … 0.1 … … 0.1
THE MAIN SOURCE OF ENERGY FOR HEATING/COOLING
Wood 41.5 15.2 44.2 60.3 33.8
Dry manure 11.7 1.1 37.7 11 7.9
Coal … … … 0.1 …
Kerosene … … … 0.1 …
Gas 33.4 60.8 15.3 24.6 43.9
Electricity 12.6 21.9 2.6 3.9 13.9
Solar 0.8 0.7 0 0 0.4
Other … 0.3 0.2 0.1 0.2
THE MAIN SOURCE OF ENERGY FOR LIGHTING
Electricity 100 100 100 100 100
THE MAIN SOURCE OF DRINKING WATER
Central water supply inside house 97.5 97.3 82.2 82.5 90.8
Central water supply outside
house 1.2 2.1 13.4 11.2 6.3
Brought … … 2.0 2.4 1.1
Bought 1.3 0.1 0.6 0.8 0.3
Spring / well … 0.2 0.8 1.9 0.9
River / stream … 0.1 0.2 0.2 0.1
Well … 0.3 0.7 0.9 0.5
Other … … … 0.1 …
HHs withworking children
HHs withoutworking children
HHs withworking children
HHs withoutworking children
URBAN RURAL
TOTAL
THE MAIN SOURCE OF ENERGY FOR COOKING

Armenia National Child Labour Survey 2015 Analytical Report74
The survey results suggest that although gas (including liquid gas) was the most used source of ener-gy for cooking in both urban and rural areas households with working children had less access togas. The pattern is changing when excluding gas as a source of energy for cooking. The figure aboveshows that households with working children in both urban and rural areas have a more extensiveuse of wood and dry manure as the main source of energy for cooking being considerably high inrural areas. However, the analysis of the data allows us to argue that there is no clear patternbetween usage of wood or dry manure as source of energy for cooking and employment of children.Only 4.7% of employed children in such households were engaged in the collection of firewood orfetching of water, the latter prevailing according to the information received from fieldwork staff.
Chapter 9
Figure 9.1.2.1 Distribution of households by the main sources of energy for cookingby activity status of children 5 to 17 years old and residence of area, %
Figure 9.1.2.2 Distribution of households by the main sources of energy for heatin byactivity status of children 5 to 17 years old and area of residence, %
Main sources of energy for cooking including gas Main sources of energy for cooking excluding gas
83 91
0%
20%
40%
60%
80%
100%
HHs with working
children
HHs without
working children
Electricity Dry manure Gas Wood
16
61
15 36
22
23
84 16 82 38
0%
20%
40%
60%
80%
100%
Urban Rural Urban Rural
HHs with working
children
HHs without working
children
Electricity Dry manure Wood Other
61
Main sources of energy for heating including gas Main sources of energy for heating excluding gas
44 33
18
47
34
15
0%
10%
20%
30%
40%
50%
60%
70%
80%
90%
100%
HHs with working
children
HHs without
working children
Electricity Dry manure Gas Wood
62 52 39 80
18 451519
56
0%
20%
40%
60%
80%
100%
Urban Rural Urban Rural
Electricity Dry manure Wood Other
HHs with working
children
HHs without working
children

Armenia National Child Labour Survey 75
A slightly different picture was observed regarding the HHs' main source of energy for heating. InHHs with working children usage of wood dominated in both urban and rural areas at 44%, fol-lowed by dry manure at 34% - especially typical for rural areas. Meanwhile, the most used source ofenergy for heating in HHs without working children was also gas.
However, the analysis of the data allows us to argue that for both cooking and heating there is noclear pattern between usages of wood or dry manure as source of energy and the employmentand/or activity of children undertaken. In such households only 4.7%-5.1% of employed childrenwere engaged in collection of firewood or fetching of water. The latter prevailing according to theinformation received from fieldwork staff. Contrarily, data suggest that HHs with working childrenhad less access to gas or electricity and were much more likely to be not wealthy / in low-incomegroup than those HHs without working children.
9.2 Household assets
The results suggest that essential household appliances (television, iron, refrigerator, washingmachine, oven, stove, etc.) were available in the majority of households, irrespective of working sta-tus of children in households. Mobile phones were available in almost all households (98%), andcomputers in the vast majority of households (79%). 44.3 % of households mentioned that theyowned a car, while only 20.7% mentioned a bicycle.
Regarding the availability of a tractor or electric hand mower, only 5.1% of households in rural areassaid that they had one. This is alarming given that agriculture is the main sector of employment forone third of the population; yet 94.9 % of households did not have the mentioned machinery. Thissuggests the presence of heavy physical work with low productivity, low income, poor living condi-tions and the use of child labour.
Educational characteristics
Figure 9.2.1 Distribution of households by the availability of machinery and household appliances and activity status of children 5 to 17 years old
0
20
40
60
80
100
%
HHs with working children HHs without working children

Armenia National Child Labour Survey 2015 Analytical Report76
The availability of livestock was an important precondition for identifying both the living conditionsof the household and the potential opportunities for work and income. As illustrated in the figurebelow, more than half of households with children possessed livestock. This is conditioned by theinverse proportion of households in urban and rural areas. 91.6% of households in rural areas pos-sessed livestock while in urban areas this figure was only 17%.
Chapter 9
Figure 9.2.2 Distribution of households by the availability of livestock, activity statusof children aged 5-17 and area of residence, %
Results of the NCLS revealed that there were roughly 87 thousands households (or 30% of all HHshaving children 5 to 17 years old) owning livestock. 25% of these HHs had working children toreach a total of 40 thousands. Noteworthy, that 36% of these children or 3.2% of total surveyed chil-dren were engaged in an activity related to livestock.
Table 9.2.1 Distribution of households by the availability and quantity of livestock
94 39 70
6
61
30
0%
20%
40%
60%
80%
100%
84 74 75
1626 25
0%
20%
40%
60%
80%
100%
Households by availability of livestock Households owning livestock by workingstatus of children
Urban Rural Total Urban Rural Total
Households by thousand
0 1-10 11-20 21-30 31-40 41-50 51-60 61>
Horse 81.9 5.4 0 0 0 0 0 0
Cow / bull / buffalo 30.5 55.0 1.3 0.4 0.1 0 0 0
Sheep 66.2 13.3 5.7 1.5 0.3 0 0.2 0
Goat 82.9 4.4 0 0 0 0 0 0
Pig 60.7 25.8 0.8 0 0 0 0 0
Rabbit 78.2 9.0 0.2 0 0 0 0 0
Bee hive 80.7 5.2 0.6 0.4 0.2 0.1 0 0
Poultry 10.3 31.5 30.7 11.1 2.4 0.7 0.2 0.5
Other 87.1 0.2 0 0 0 0 0 0
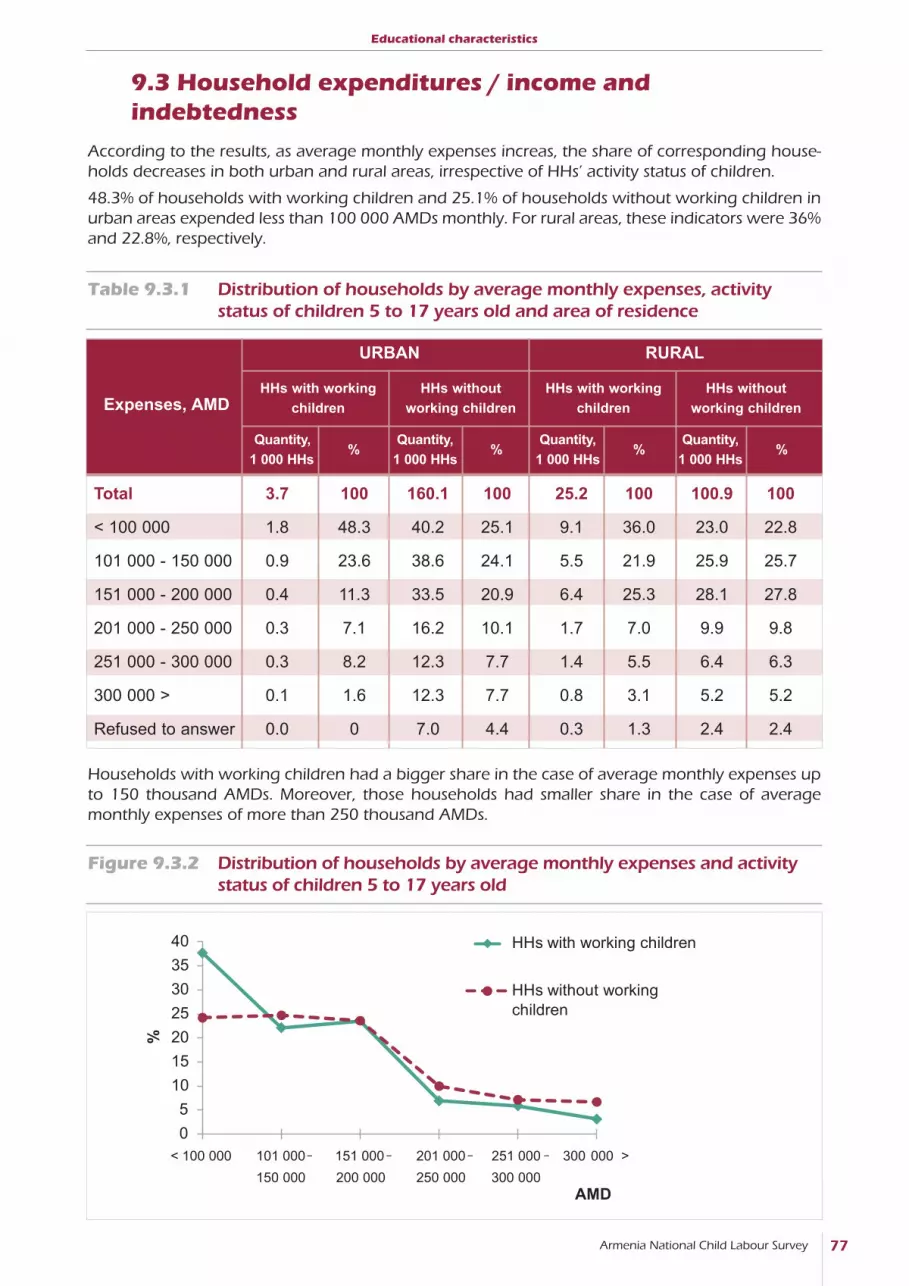
Armenia National Child Labour Survey 77
9.3 Household expenditures / income and indebtedness
According to the results, as average monthly expenses increas, the share of corresponding house-holds decreases in both urban and rural areas, irrespective of HHs’ activity status of children.
48.3% of households with working children and 25.1% of households without working children inurban areas expended less than 100 000 AMDs monthly. For rural areas, these indicators were 36%and 22.8%, respectively.
Educational characteristics
Table 9.3.1 Distribution of households by average monthly expenses, activity status of children 5 to 17 years old and area of residence
Households with working children had a bigger share in the case of average monthly expenses upto 150 thousand AMDs. Moreover, those households had smaller share in the case of averagemonthly expenses of more than 250 thousand AMDs.
Figure 9.3.2 Distribution of households by average monthly expenses and activitystatus of children 5 to 17 years old
0
5
10
15
20
25
30
35
40
< 100 000 101 000 –
150 000
151 000
200 000
201 000
250 000
251 000
300 000
300 000 >
%
AMD
HHs with working children
HHs without working
children
– – –
Total 3.7 100 160.1 100 25.2 100 100.9 100
< 100 000 1.8 48.3 40.2 25.1 9.1 36.0 23.0 22.8
101 000 - 150 000 0.9 23.6 38.6 24.1 5.5 21.9 25.9 25.7
151 000 - 200 000 0.4 11.3 33.5 20.9 6.4 25.3 28.1 27.8
201 000 - 250 000 0.3 7.1 16.2 10.1 1.7 7.0 9.9 9.8
251 000 - 300 000 0.3 8.2 12.3 7.7 1.4 5.5 6.4 6.3
300 000 > 0.1 1.6 12.3 7.7 0.8 3.1 5.2 5.2
Refused to answer 0.0 0 7.0 4.4 0.3 1.3 2.4 2.4
Expenses, AMD
URBAN RURAL
HHs with working
children
HHs without
working children
HHs with working
children
HHs without
working children
Quantity,
1 000 HHs%
Quantity,
1 000 HHs%
Quantity,
1 000 HHs%
Quantity,
1 000 HHs%

Armenia National Child Labour Survey 2015 Analytical Report78
As shown in the figure above, households with working children tended to have smaller monthlyexpenses compared to those without working children. Average monthly expenses of 60% of HHswith working children were below 151 000 AMD while the same indicator for HHs without work-ing children was 49%. The survey results revealed linkage between the low standard of living of thehousehold and the working status of children.
Income
The data on income of households were represented only by the main source. It means that house-holds' additional income contribution from other sources was not observed even being consider-able. 80.1% of total households both in urban and rural areas reported employment as the mainsource of income. This was 78% in urban areas and 82.9 % in rural.
Private transfers (9.5%) had the second biggest share in both urban and rural areas with smallprevalence in rural areas (8.6% vs. 10.7%) which is conditioned by labour migration and a familymember living abroad. This is considered the main source of income by the 8.8% of householdswithout working children, and by 16% of households with working children. 16.5% of householdswith working children and 9.3% of households without working children in rural areas, and 12.6%and 8.6% in urban areas, respectively, mentioned private transfers as the main source of income.Theresults indicate that the absence of a working-age family member was partly supplemented by childlabour, especially in agriculture and during intense seasonal periods of work, such as harvest.
Chapter 9
Table 9.3.2 Distribution of households by the main source of income, activity status of children 5 to 17 years old and area of residence
Total 3.7 100 160.1 100 25.2 100 100.9 100
Employment 3.0 81.1 124.8 77.9 19.9 79.0 84.7 83.9
Private transfers 0.5 12.6 13.7 8.6 4.1 16.5 9.4 9.3
Social transfers (pension, family benefit, child benefit, etc.) 0.2 5.1 10.3 6.4 0.7 2.7 4.2 4.2
Parents /friends/ relatives 0.0 1.2 8.1 5.1 0.4 1.5 2.2 2.1
Other 0.0 0 3.2 1.9 0.1 0.4 0.4 0.4
Main Sources of Income
URBAN RURAL
HHs with working
children
HHs without
working children
HHs with working
children
HHs without
working children
Quantity,
1 000 HHs%
Quantity,
1 000 HHs%
Quantity,
1 000 HHs%
Quantity,
1 000 HHs%

Armenia National Child Labour Survey 79
5.3% of households mentioned social transfers (pensions, family, child support, etc.) as the mainsource of income. This source is about two times more often mentioned by urban households andby households without working children.
The indicator of average monthly income of households with children is consistent with the indica-tor of their average monthly expenditures.
In general, data suggest that there were no significant differences in the main sources of house-holds' income in both urban and rural areas.
Educational characteristics
Figure 9.3.3 Distribution of households by the main source of income and area of residence, %
Table 9.3.3 Average monthly income of the households by the activity status ofchildren 5 to 17 years old and area of residence
78 83
9 11
0%
20%
40%
60%
80%
100%
Urban Rural
Parents / friends /
relatives
Private transfers
Social transfer
Employment
Other
Total 3.7 100 160.1 100 25.2 100 100.9 100
< 100 000 1.2 32.2 34.5 21.5 7.4 29.4 16.8 16.7
101 000 - 150 000 0.8 21.6 33.6 21 5.1 20.2 21.6 21.4
151 000 - 200 000 0.8 22.5 36.1 22.5 6.1 24.2 27.2 27
201 000 - 250 000 0.4 9.5 18.2 11.4 2.8 11.1 13.3 13.1
251 000 - 300 000 0.3 7.7 13.9 8.7 1.8 7.3 10.0 9.9
300 000 > 0.2 6.5 16.8 10.5 1.7 6.6 9.6 9.5
Refused to answer 0 0 7.0 4.4 0.3 1.3 2.4 2.4
Income, AMD
URBAN RURAL
HHs with working
children
HHs without
working children
HHs with working
children
HHs without
working children
Quantity,
1 000 HHs%
Quantity,
1 000 HHs%
Quantity,
1 000 HHs%
Quantity,
1 000 HHs%

Armenia National Child Labour Survey 2015 Analytical Report80
9.4 Migration in households with children
The survey also investigated households that changed their permanent place of residence. Thesemade up 5% of households with children aged 5-17 years old. The most common reasons forchanging a permanent place of residence were job (33%), family/housing reasons (31.6%), andsocial/political problems (27.2%).
It is significant that the reasons for changing a permanent place of residence in urban and ruralareas were different. Households in urban areas changed their permanent place of residence moreoften because of job (37.2%), while in rural areas the main reason was family/ housing reasons(38.6%).
Among households with an average monthly income of up to 200 000 AMDs, households withworking children are more prevalent than those without working children. This finding was reversedfor households with an average monthly income of more than 200 000 AMDs. Households withoutworking children prevailed over households with children. This confirms that, the higher the averageincome of the household, the lower the instances of child work. It is noteworthy that the samebehaviour was observed in rural areas only with one difference: the trend here starts with a lowerlevel of income, namely 101 000 AMDs.
Chapter 9
Figure 9.3.4 Distribution of households by average monthly income, %
Table 9.4.1 Distribution of households by reasons for changing the permanentplace of residence and activity status of children 5 to 17 years old
0
5
10
15
20
25
30
35 Urban, with working children
Urban, without working
children
Rural, with working children
Rural, without working
children< 100 000 101 000 –
150 000
151 000
200 000
201 000
250 000
251 000
300 000
300 000 >– – –
Total 7.8 100 6.4 100 14.2 7.8 100 6.4 100 14.2
Job transfer 0.9 11.9 0.4 5.7 1.3 0.9 11.9 0.4 5.7 1.3
Found a job 0.6 8.1 0.7 11.2 1.3 0.6 8.1 0.7 11.2 1.3
Looking for job 0.3 3.8 0.6 8.8 0.9 0.3 3.8 0.6 8.8 0.9
Looking for better agricultural land 0.1 1.7 0.1 1.3 0.2 0.1 1.7 0.1 1.3 0.2
URBAN RURAL
HHs with
working children
HHs without
working children
HHs with
working children
HHs without
working children
TOTAL
Households
Quantity,1 000HHs
%Quantity,
1 000HHs
%Quantity,
1 000HHs
%Quantity,
1 000HHs
%Quantity,
1 000HHs
%

Armenia National Child Labour Survey 81
Figure 9.4.1 Households by reasons for changing the permanent place of residenceand activity status of children 5 to 17 years old
Educational characteristics
The collected data pointed to the 64 thousands children or 14% of surveyed children aged 5-17who lived in HHs with migration background. One of ten from those children was engaged in eco-nomic activity with the highest concentrations of boys (61.4%) and children living in rural areas(93.5%).
Employment rate of children in HHs that changed their permanent place of residence was lessprevalent than their counterparts from HHs without migration background (1.4% vs.10%). Thus,data suggest that there were no direct linkage between child work and migration behaviour of HHs(Table 9.4.2).
0% 5% 10% 15% 20% 25% 30% 35% 40%
Family/housing reasons
Social/political problems
Proximity to place of work
Job transfer
Found a job
Studies (Schooling/training)
Looking for job
Health issues
Looking for better agricultural land
HH with workingchildren, rural
HH with workingchildren, urban
Studies 0.3 4.1 0.2 2.4 0.5 0.3 4.1 0.2 2.4 0.5
Proximity to place of work 0.9 11.8 0.0 0.7 1.0 0.9 11.8 0.0 0.7 1.0
Family/housing reasons 2.0 25.7 2.5 38.6 4.5 2.0 25.7 2.5 38.6 4.5
Social/political problems 2.1 27.4 1.7 27.1 3.9 2.1 27.4 1.7 27.1 3.9
Health issues 0.2 2.1 0.2 2.4 0.3 0.2 2.1 0.2 2.4 0.3
Other 0.3 3.5 0.1 1.8 0.4 0.3 3.5 0.1 1.8 0.4
URBAN RURAL
HHs with
working children
HHs without
working children
HHs with
working children
HHs without
working children
TOTAL
Households
Quantity,1 000HHs
%Quantity,
1 000HHs
%Quantity,
1 000HHs
%Quantity,
1 000HHs
%Quantity,
1 000HHs
%

Armenia National Child Labour Survey 2015 Analytical Report82
9.5 Children's health issues, accidents and illnesses because of work
The health and wellbeing of working children can provide some understanding relating to haz-ardous factors and working conditions and environment.
According to the results, during the last twelve months, 60.4% of employed children reported somehealth issue. Every tenth child reported frequent health issues. 90% of these were from rural areas.
6 200 children have had problems with their health during the past 12 months because of work.Among the health problems, children most often indicated extreme fatigue (32.3%). This would, ofcourse, affect their health, education quality, and the possibility of using their free time. The next fre-quent problem was superficial injuries (17.1%). 84.2% of these cases were reported by boys. 14.7%of children had digestive problems. 8.3% reported fractures, dislocations, sprains or strains, burns,frostbite, or breathing problems.
Chapter 9
Table 9.4.2 Distribution of children 5-17 years old by activity status and household's migration characteristic by sex and area of residence
Table 9.5.1 Cases of child morbidity because of work during the past 12 months10
among children 5-17 years old
10 The same child can mention more than one injury.
Total 6.5 1.4 57.3 45.4 10.0 344.1 52.0 401.4
SEX
Boy 4.0 1.7 29.0 30.9 12.8 177.4 34.9 206.4
Girl 2.5 1.2 28.3 14.5 6.8 166.7 17.1 195
AREA OF RESIDENCE
Urban 0.4 0.2 26.1 5.7 2.3 215.2 6.1 241.3
Rural 6.1 3.0 31.1 39.7 19.3 128.9 45.8 160.1
HHs ever changing the permanent place of residence
HHs never changing the permanent place of residence
N. ofworkingchildren
% of total children
N. of non-workingchildren
N. ofworkingchildren
% of total children
N. of non-workingchildren
Total HHs
N. ofworking
children
N. of non-workinghildren
Total 10.5 100 8.0 100 2.5 100
Superficial injuries or open wounds 1.9 17.1 1.6 17.7 0.4 14.7
Fractures 0.1 1.1 0.0 0.6 0.1 2.7
Dislocations, sprains or stains 0.7 6.2 0.4 5.6 0.2 8.5
TOTAL BOY GIRL
1 000cases
%1 000cases
%1 000cases
%

Armenia National Child Labour Survey 83
More than half of children with health problems (52.7%) had burns, frostbite, hearing problems,fever, skin problems, etc., because of hazardous physical, chemical and biological aspects of theirwork. When investigating gender distribution, we can see that, although cases of morbidity amongboys are three times more likely, girls are more vulnerable to hazardous working conditions. If dam-age to musculoskeletal system and limbs among boys comprised 6.2% of cases, among girls it wasalmost double, at 11.2%.
Educational characteristics
Figure 9.5.1 Cases of child morbidity among working children 5-17 years old by sex
0% 5% 10% 15% 20% 25% 30% 35%
Extreme fatigue
Superficial injuries
Stomach problems/diarrhea
Skin problemsBreathing problems
Burns, frostbite, etc.
Dislocations, sprains or stains
Fever
Fractures
Other
Girl Boy
Didn't want to answer
Burns, corrosions, scalds or frostbite 0.6 6 0.5 6.7 0.1 3.6
Breathing problems 0.6 6.1 0.6 7.2 0.1 2.6
Hearing problems 0.1 1 0.1 1.4 0.0 0
Skin problems 0.9 8.3 0.7 8.3 0.2 8.4
Stomach problems/diarrhoea 1.5 14.7 1.1 14.3 0.4 15.9
Fever 0.6 5.4 0.4 5.3 0.1 5.6
Extreme fatigue 3.4 32.3 2.6 32.3 0.8 32.3
Other 0.1 1.4 0.0 0.6 0.1 3.9
Didn't want to answer 0.0 0.4 0 0 0.0 1.8
TOTAL BOY GIRL
1 000cases
%1 000cases
%1 000cases
%

Armenia National Child Labour Survey 2015 Analytical Report84
In terms of recovery, 72.7 % of children received treatment at home. Of these children, 74.3 % wereboys and 68.5 % were girls. 4% of children received medical treatment in a health facility. Of these,11.2% were girls and only 1.2 % was boys. 21% of children didn't get any treatment at all.
Chapter 9
Table 9.5.2 Methods of medical treatment and health recovery of working children 5-17years old
Table 9.5.3 Distribution of children aged 5 -17 in hazardous work by working condition and sex
23 600 children dealt with hazardous physical, chemical and biological production factors in theirworkplaces. Children mostly worked in dust/vapour conditions (46.5%). Every fourth child used adangerous instrument at work (scythe, axe, metal, stone cutting equipment, saws, electric mower,hatchet, knife, pitchfork, shovel, rake, hammer, scissors, etc.).
One in ten children worked in extreme cold or hot conditions.
Boy Girl Total
N. ,1 000
children
% of total
N.,1 000
children
% of total
N.,1 000
children
% of total
Total 4.3 100 1.7 100 6.0 100
Treatment at home 3.2 74.3 1.1 68.5 4.3 72.7
Hospital/ clinic 0.0 1.2 0.2 11.5 0.2 4
Didn't get any treatment 0.9 21.3 0.3 20 1.2 20.9
Other 0.1 3.2 0 0 0.1 2.3
Boy Girl Total
N. ,1 000
children
% of total
N.,1 000
children
% of total
N.,1 000
children
% of total
Total 16.5 100 7.1 100 23.6 100
Dust, fumes 7.0 42.5 4.0 56.0 11.0 46.5
Fire, gas, flames 0.1 0.4 0.4 5.7 0.5 2.0
Loud noise or vibration 0.3 1.7 0.1 2.1 0.4 1.8
Extreme cold or heat 1.6 10.0 0.9 12.4 2.5 10.7
Dangerous tools (scythe, axe, hatchet, knife etc.) 5.0 30.1 0.7 10.2 5.7 24.1
Work at heights 1.2 7.6 0.7 9.6 1.9 8.2
Work in water / lake / pond / 0.1 0.8 0.0 0.0 0.1 0.5
Workplace too dark or confined 0.1 0.4 0.0 0.0 0.1 0.3
Insufficient ventilation 0.5 2.8 0.1 1.4 0.6 2.4
Chemicals 0.6 3.8 0.2 2.5 0.8 3.4

Armenia National Child Labour Survey 85
Educational characteristics
In summary, children's health problems were largely due to unfavourable work conditions.
The survey data allow us to estimate to what extent illness or injury affects a child's ability to workand attend school. 88% of boys and 99% of girls didn't consider illness or injury to be serious andthus didn't stop either work or schooling. Although 95% of boys got treatment at home or didn'tget any treatment at all, 4.5% of them stopped school for a short time, 6.3% stopped work for ashort time, and 1.2% stopped both work and school. Only 1% of girls stopped school for a shorttime, although 11.5% of girls received treatment in hospital or a polyclinic. This contradiction isexplained by access to healthcare in non-stationary conditions.
Table 9.5.4 Impact of illness / injury on children's work/schooling
Total 4.3 100 1.7 100 6.0 100
Not serious illness/injury - did not stop work/schooling 3.8 88.1 1.6 99 5.4 91.1
Stopped school for a short time 0.2 4.5 0.0 1 0.2 3.5
Stopped work for a short time 0.3 6.3 0.0 0 0.3 4.5
Stopped both work and school for a short time 0.1 1.2 0.0 0 0.1 0.9
BOY GIRL TOTAL
1 000cases
%1 000cases
%1 000cases
%

Armenia National Child Labour Survey 2015 Analytical Report86
Chapter 10.
Determinants of child labour (education)
This section presents a number of factors associated with child labour that have a certain impact onit. Such factors are numerous. Among them, and especially worthy of attention, are social and eco-nomic problems faced by households. The survey studied household difficulties and possible waysof overcoming impact on children's work and/or study.
10.1 Problems faced by households
The table below presents the various issues and difficult situations faced by children in households.80.2 % of households mentioned inflation as a serious problem. The effect of inflation was more sig-nificant for households with children working in urban areas (82.8 %) and for households withoutworking children (93.7%), than for the same in rural areas, which was 54.9 % and 54.8% respective-ly. 9.7% of households mentioned the decline in prices of agricultural products, 5.5% mentionednatural disasters and the decline in prices of agricultural goods. These factors directly affected thelivelihood and income of households, which was the reason for loans and debts.
Table 10.1.1 Distribution of households by affected countrywide / communitywideproblems in the last 12 months, activity status of children 5-17 years old
HHs with workingchildren
HHs withoutworking children
Total HHs affectedby problems
Q.,1 000HHs
%Q.,
1 000HHs
%Q.,
1 000HHs
%
Total 5.2 100 87.8 100 93.0 100
Natural disaster 0.3 5.8 4.8 5.5 5.1 5.5
Business closing due to economic recession ... ... 0.4 0.5 0.5 0.5
Falling agricultural prices 1.5 28.8 7.6 8.7 9.0 9.7
Price inflation 3.0 57.7 71.6 81.4 74.6 80.2
Currency rate variation, low exchange rate 0.0 0.0 1.8 2.1 1.8 2.0
Others 0.4 7.7 1.7 1.9 2.0 2.1

Armenia National Child Labour Survey 87
Determinants of child labour
Figure 10.1.1 Distribution of households by types of problems in the last 12 months, %
As illustrated in figure below there was not observed direct linkage between activity rates of work-ing children and problems affecting HHs in the last 12 months. On the contrary, employment rateof children aged 5-17 was slightly higher in HHs without such problems than in HHs which facedwith such problems (6.4% vs. 5.1%).
The survey investigated the causes of household problems suffered a fall in income with children inthe last 12 months. Among these, the biggest share was harvest and livestock loss at 29%. Job lossmade up 16.1%; the decline in product prices produced by the family business was at 16% andillness or serious accident of a working member of HH13.7 %.
Figure 10.1.2 Employment rate of children aged 5 -17 in households with and without countrywide problems in the last 12 months, %
5.16.4
44.2
55.8
0
10
20
30
40
50
60
%
Employment rate, %
% of total employment
affectedcountrywide/
communitywideproblems
did not affectedcountrywide/
communitywideproblems
80.2%
9.7%
5.5%
2.0%
0.9%
0.5%
0.5%
Price inflation
Falling agricultural prices
Natural disaster
Currency rate variation, low exchange rate
Epidemics
Business closing due to economic recession
Public protests
0% 10% 20% 30% 40% 50% 60% 70% 80% 90%

Armenia National Child Labour Survey 2015 Analytical Report88
Chapter 10
Table 10.1.2 Distribution of households by suffered a fall in income in the last 12 months and activity status of children 5 to 17 years old
Figure 10.1.3 Causes of problems in households with children aged 5 -17 by area of residence
0% 5 % 1 0% 1 5 % 20% 25 % 3 0% 3 5 % 40%
Declining prices of manufactured goods
Household member's job loss
Harvest loss
Illness of a household member
Loss of livestock
Suspension of financial assistance
Family business bankruptcy / liquidation
Death of a household working member
Departure of a hosehold working member
Territorial disputeUrban Rural
HHs with workingchildren
HHs withoutworking children
Total HHs with fallin income
Q.,1 000HHs
%Q.,
1 000HHs
%Q.,
1 000HHs
%
Total 6.9 100 62.7 100 69.6 100
Loss of employment / casual job of any member 0.3 3.7 11.0 17.5 11.2 16.1
Bankruptcy of a family business 0.0 0.6 2.7 4.3 2.7 3.9
Illness or serious accident of a working member of HH 0.3 4.2 9.2 14.7 9.5 13.7
Death of a working member of HH 0.3 3.7 1.8 2.9 2.1 3.0
Abandonment by the HH head 0.0 0.7 2.1 3.4 2.3 3.2
Fire in the house /business/property 0.0 0.0 0.1 0.2 0.1 0.1
Land dispute 0.0 0.0 0.1 0.2 0.1 0.2
Loss of cash support or in-kind assistance 0.5 6.6 5.1 8.1 5.5 7.9
Fall in prices of products of the family 1.6 22.5 9.6 15.3 11.1 16.0
Loss of harvest 1.8 26.6 10.0 15.9 11.8 16.9
Loss of livestock 1.9 28.0 6.5 10.4 8.5 12.1
Other 0.2 3.5 4.5 7.2 4.8 6.8

Armenia National Child Labour Survey 89
Determinants of child labour
Figure 10.1.4 Employment rates of children aged 5-17 in households with and without problem a fall in income in the last 12 months, %
One of the most common problems in rural households was the decline in prices of goods producedby the family business, which was at 30.2%. Harvest loss was 26.9 %; loss of livestock was 15.7%, andserious accident or illness was 7.7%.
In order to overcome these problems, households turned to help from various sources of financialsupport. Every second household which faced difficulties has cut costs, including costs associatedwith a child's education. The second most common way is to apply for credit, loans or other typesof debt, which has benefited both urban and rural households. Households in urban areas weremore inclined to take out credit, debt or loans than households in rural areas, where the index forhouseholds with a working child was 20.3%. For households without a working child, this figurewas 16.8%. There were also few households who resorted to selling their property or using theirsavings.
As in case of countrywide / communitywide shocks affected by HHs during the last 12 months thefigure above shows that there was no direct linkage between activity rates of working children andfall in income of HHs in the last 12 months. On the contrary, employment rate of children aged 5-17 was 2.7 times higher in HHs without fall in income than in HHs suffered fall in income (8.3% vs. 3.1%).
3.18.3
27.2
72.8
0
10
20
30
40
50
60
70
80
suffered a fall inincome
%
Employment rate, %
% of total employment
did not suffer afall in income
HHsHHs

Armenia National Child Labour Survey 2015 Analytical Report90
Chapter 10
Table 10.1.3 Distribution of households by the means of overcoming problems,activity status of children 5 to 17 years old and area of residence
There is no significant variation in the most used means to overcome problems in households withworking children and in those without working children. Like in households without working chil-dren, the majority of households with working children reduced HH expenditure (48.3%) and everyfifth HH obtained a credit/ loan/ pledge (21.2%). However, in 3.1% of households with working chil-dren the problems were overcome through additional work hours by the child and one in ten HHstook children out of school as they could not afford it.
HHs with working
children
HHs without working
children
Total HHs overcoming
problems
Quantity,1 000HHs
% to totalHHs
Quantity,1 000HHs
% to totalHHs
Quantity,1 000HHs
%
Total 6.9 100 62.7 100 69.6 100
Financial assistance from government agencies 0.1 1.4 1.9 2.1 2.0 2.0
Financial assistance from NGOs /religious organizations / local community organizations 0.0 0.0 0.3 0.3 0.3 0.3
Financial assistance from relatives / friends 1.0 10.2 8.8 9.7 9.8 9.7
Took children out of school as could not afford it 0.1 1.1 0.3 0.3 0.4 0.4
Additional work hours by child 0.3 3.1 0 0 0.3 0.3
Additional work hours by adults 0.5 5.1 3.5 3.9 4.0 4.0
Sold property/used savings 0.6 5.9 7.6 8.4 8.2 8.2
Reduced household expenditures 4.4 44.2 44.0 48.7 48.4 48.3
No serious impact 0.7 7.2 4.6 5.1 5.3 5.3
Credit/ loan/ pledge 2.1 20.6 19.2 21.2 21.3 21.2
Others 0.1 1.2 0.2 0.2 0.3 0.3

Armenia National Child Labour Survey 91
10.2 Household loans
Survey data investigated that there were 121 300 HHs (or 42% of total households with children inthe age 5 to 17 years old) obtained loan in the last 12 months. 8 thousands of these refers to house-holds with working children. Households applied for loans for various reasons; the results of whichare presented in the table below.
Determinants of child labour
Table 10.2.1 Households by the reasons for obtaining a loan, activity status of children 5 to 17 years old
The table shows that most households borrowed to meet the needs of the family. Thereafter, theytook out loans for buying or rebuilding house, then starting a business or completing a scheduledtask, and only then they took out loans for paying treatment costs. It is obvious that most of theloans directly linked to the low standard of living of the household and, therefore, the children.Noteworthy, that 6.2% of HHs were obliged to take loan to pay a previous loan.
Survey results did not investigate any special reasons for taking loan typical for HHs with workingchildren. The patterns are almost similar for both HHs with working children and without workingchildren.
HHs with working
children
HHs without working
children
Total HHs obtaining loan
Quantity,1 000HHs
% to totalHHs
Quantity,1 000HHs
% to totalHHs
Quantity,1 000HHs
%
Total 8.0 100 113.2 100 121.3 100
To meet essential household expenditures 2.8 34.3 50.3 44.5 53.1 43.8
To pay for children's education 0.5 6.4 6.8 6.0 7.3 6.1
To buy a vehicle (bike, motorbike, car) for a household member 0.1 1.3 4.2 3.7 4.3 3.5
To purchase / remodel / repair / construct a house 1.4 16.8 12.5 11.0 13.8 11.4
To meet health-related expenditures for household members (medicine, doctor or hospital fees) 0.8 9.4 12.6 11.1 13.4 11.0
To meet a one-off ritual expenditure: birth, funeral, and wedding 0.6 8.0 2.8 2.5 3.4 2.8
To start or develop a business 1.3 16.3 12.2 10.7 13.5 11.1
To pay off a previous loan 0.4 4.3 7.1 6.3 7.5 6.2
To buy goods or appliances 0.1 1.8 3.2 2.8 3.3 2.7
Other 0.1 1.4 1.6 1.4 1.7 1.4

Armenia National Child Labour Survey 2015 Analytical Report92
The survey results indicate that households with a working child were less likely to apply for loan orcredit than households without a working child. It is not assumed that the situation of the house-holds with a working child is better. The issue is that these are HHs with low income and thereforethey do not have the collateral required (from banks, money lenders, etc.) to obtain them or do nothave guaranties to pay off interest rates. They are discouraged from applying to loans. More thanhalf of these were households in urban areas. It seems obvious that loans are more available forhouseholds in urban areas.
Chapter 10
Figure 10.2.1 Households by the reasons for taken loans, activity status of children 5 to 17 years and area of residence, %
Figure 10.2.2 Employment rate of children aged 5 -17 in HHs that obtained and did not obtain a loan
0% 25% 50% 75% 100% 125% 150% 175%
To meet essential household expenditures(buying food, etc.)
To open / increase business
To purchase / remodel/repair / construct a house
To pay loan
To pay for children's education
To meet the ritual expenditures
Domestic goods, appliance
To buy vehicle (bike, motorbike, car)for household member
Urban, with working child Urban, without working child
Rural , with working child Rural, without working child
To meet health related expendituresfor household members
3.7 7.7
32.4
0
10
20
30
40
50
60
70
%
Employment rate, %
% of total employment
obtaineda loan
did notobtain a loan

Armenia National Child Labour Survey 93
The survey revealed that for obtaining loans the majority of HHs (77.7%) applied to bank/credit cardor micro-credit / pawn shops / leasing companies. HHs without working children were more likelyto use these sources than those who have working children (78.4% vs. 65.2%). The opposite pat-tern was observed regarding the individual money lender or friend/relative of borrower. HHs withworking children were more likely to use these sources (29%) than their counterpart HHs withoutworking children (19.6%).
Obviously, HHs with working children have less opportunity and accessibility to formal sector offinancial resources because of low incomes and therefore more risks in overcoming the financialindebtedness.
Figure 10.2.2 allows us to compare employment rates of children in the ages of 5 to 17 years inhouseholds which obtained a loan in the last 12 months with the employment rate of children liv-ing in HHs which did not indicate about a loan. Employment rate is twice lower among children liv-ing in HHs which obtained a loan than children from HHs without such problem (3.7% vs. 7.7%). Itis not point to assume that low employment rate is an indicator of welfare of HH.
Determinants of child labour
11 Data refer to cases as the same household could indicate multiple sources of taken loan. Thus, its sum can be morethan total number of households.
Table 10.2.2 Distribution of the households11 by the source of taken loan by activitystatus of children aged 5-17 years old
HHs with workingchildren
HHs withoutworking children
Total HHs thathave taken loan
Quantity,1 000HHs
%Quantity,
1 000HHs
%Quantity,
1 000HHs
%
Total 8.0 100 113.2 100 121.3 100
Bank /credit card 5.9 65.2 89.4 73.6 95.3 73.1
Micro-credit / pawn shops / leasing companies 0.2 2.5 5.8 4.8 6.0 4.6
Employer / landowner 0.1 0.8 0.4 0.3 0.4 0.3
Supplier of merchandise, equipment or raw materials 0.2 2.3 1.2 1.0 1.4 1.1
Individual money lender 0.7 8.0 2.8 2.3 3.5 2.7
A friend/relative of borrower 1.9 21.0 21.0 17.3 22.9 17.5
Other 0.0 0.4 0.8 0.7 0.9 0.7

Armenia National Child Labour Survey 2015 Analytical Report94
The return of debt was an important factor in terms of the financial position of households.According to the results, 10.1% of households returned their debts wholly, 70.6% were able toreturn partly, while 19.4% didn't return.
Chapter 10
Figure 10.2.2 Sources of finance for households, %
12 Data refer to cases as the same household could indicate multiple means of debt return/ loan repayment. Thus, itssum can be more than total number of households.
Table 10.2.3 Distribution of households12 by the actual situation and means of debtreturn/loan repayment and activity status of children aged 5-17 yeras old
73.1%
17.5%
4.6%
2.7%
1.1%
0% 10% 20% 30% 40% 50% 60% 70% 80%
Bank/credit card
A friend/relative
Micro-credit/pawn shops/leasing companies
Individual money lender
Supplier of merchandise,equipment or raw materials
HHs with workingchildren
HHs withoutworking children
Total HHs thathave taken loan
Quantity, 1 000 HHs % Quantity,
1 000 HHs % Quantity, 1 000 HHs %
Total 8.0 100 113.2 100 121.3 100
THE SIZE OF DEBT PAID BACK
Debt paid wholly 0.8 10.1 11.4 10.0 12.2 10.1
Debt paid partly 4.9 60.6 80.8 71.3 85.6 70.6
Debt not paid 2.4 29.3 21.1 18.6 23.5 19.4
THE MEANS OF DEBT PAID BACK
Total 5.7 100 92.1 100 97.8 100
Cash, by borrowing money from someone else 0.7 11.0 7.9 8.0 8.6 8.2
Cash, by selling some assets 0.2 4.0 3.6 3.7 3.8 3.7
Cash, by getting income from work 4.6 76.9 79.4 80.7 84.0 80.5
Other (including private and social transfers etc.) 0.5 8.2 6.5 6.6 7.0 6.7
Don't know / Difficult to answer 0.0 0.0 1.0 1.0 1.0 1.0

Armenia National Child Labour Survey 95
the survey data reveal that in terms of returning debts HHs with working children were in lessadvantageous situation than HHs without working children. 29.3% of HHs with working childrenweren't able to return debt while the same indicator was 18.6% in case of HHs without workingchildren. Accordingly, HHs with working children were more likely to return debts through borrow-ing money from someone else or sell some assets than getting income from work (Figure 10.2.3).
Determinants of child labour
Figure 10.2.3 Distribution of households by the actual situation and means of debtreturn/loan repayment and activity status of children aged 5-17 yeras old
The vast majority of households, 80.5%, paid off their debt in cash, mainly using earnings from work.In order to reveal the effect of debt (and its repayment) on a child's access to study or work, therespondent households were asked whether the existence of the debt impacted the child's educa-tion.
72
72
77
81
7
6
11
8
0% 20% 40% 60% 80% 100%
with working children
without working children
with working children
without working children
Debt
not paid
Debt paid
wholly
or
part
ly
Cash, by getting income from work
Cash, by borrowing money fromsomeone else
Cash, by selling some assets
Other (including private and socialtransfers etc.)
Don't know / Difficult to answer
HHs with workingchildren
HHs withoutworking children
Total HHs thathave taken loan
Quantity, 1 000 HHs
%Quantity,
1 000 HHs%
Quantity, 1 000 HHs
%
THE MEANS OF DEBT WILL PAY BACK
Total 7.2 100 101.9 100 109.1 100
Cash, by borrowing money from someone else 0.5 6.7 6 5.5 6.5 5.6
Cash, by selling some assets 0.2 3.0 3.7 3.4 3.9 3.3
Cash, by getting income from work 5.4 71.5 78.7 72.2 84.1 72.2
Other (including private and social transfers etc.) 0.5 7.2 6.2 5.6 6.8 5.8
Don't know / Difficult to answer 0.9 11.6 14.5 13.3 15.4 13.2

Armenia National Child Labour Survey 2015 Analytical Report96
According to the results, 98.1% of households believed that their financial obligations had very lit-tle impact on their child's education. A small percentage, however, did not exclude this possibility.Overall, in both urban and rural areas, children's education was a priority, which suffered only inexceptional cases due to financial liabilities. Indeed, some households even take out new loans tocover the costs of education. On the other hand, the fact that school education in Armenia is freehas a major role in this matter.
Only 1.0% of households with debt said their child left education because of debt, while 0.9% didnot exclude the possibility of such a situation. Moreover, the same answer was given by almost thesame proportion of households in urban and rural areas. In 5 200 households with children withunfinished studies, 31.3% think that their child will continue their studies at school after paying offthe debt, 57.2% do not exclude this possibility and only 11.6% are sure that the child will not con-tinue his/her studies when the situation gets better.
Chapter 10
Table 10.2.4 Distribution of households with debt by the status in education of children, future plans of children to leave education or continue education and activity status of children 5 to 17 years old
HHs with workingchildren
HHs withoutworking children
Total
Quantity, 1 000 HHs
%Quantity,
1 000 HHs%
Quantity, 1 000 HHs
%
LEFT STUDY UNFINISHED
Total 5.6 100 91.9 100 97.5 100
Left study unfinished 0.3 5.4 0.8 0.9 1.1 1.1
Didn't leave unfinished 5.3 94.6 91.1 99.1 96.4 98.9
FUTURE PLANS TO LEAVE STUDY UNFINISHED
Total 8.0 100 113.2 100 121.3 100
Will leave unfinished 0.2 3.0 0.5 0.5 0.8 0.6
Maybe will leave unfinished 0.5 5.9 3.6 3.2 4.1 3.4
Won't leave unfinished 7.3 91.1 109.1 96.3 116.4 96.0
CHILD OPPORTUNITY TO CONTINUE EDUCATION AFTER PAYING DEBT
Total 0.7 100 4.5 100 5.2 100
Will continue 0.1 19.5 1.5 33.2 1.6 31.3
Maybe will continue 0.3 43.1 2.7 59.4 3.0 57.2
Won't continue 0.3 37.5 0.3 7.5 0.6 11.6

Armenia National Child Labour Survey 97
The survey reveals that irrespective of any kind of problems faced by HHs education of children ispriority for parents. 0.4% of children 5 to 17 years old living in HHs with debt left study unfinished.From those categories working children had slightly lower prevalence rate than their non-workingcounterparts (0.1% vs. 0.3%). Almost similar pattern (0.3%) was observed in terms of children withfuture plans to leave study unfinished. The tendency was different regarding the children whothought about plans to continue education. Working children less likely believed to their future edu-cation than non-working children after paying debt. 0.1% of working children did not exclude thepossibility of such a situation against 0.8% of non-working children.
Determinants of child labour
Table 10.2.5 Distribution of children aged 5 to 17 years old living in HHs with debtby the status in education, future plans to leave or continue educationand activity status of children
Working children Non-working children
Total children living in HHs with
debt
N., 1 000 HHs
% of totalchildren
N., 1 000 HHs
% of totalchildren
N.,1 000 HHs
% of totalchildren
LEFT STUDY UNFINISHED
Total 11.8 2.6 141.8 31.3 155.4 34.3
Left study unfinished 0.6 0.1 1.3 0.3 1.8 0.4
Didn't leave unfinished 11.2 2.5 140.6 31.0 153.6 33.9
FUTURE PLANS TO LEAVE STUDY UNFINISHED
Total 16.8 3.7 176.3 38.9 193.1 42.6
Will leave unfinished 0.3 0.1 0.9 0.2 1.2 0.3
Maybe will leave unfinished 0.8 0.2 4.8 1.1 5.5 1.2
Won't leave unfinished 15.8 3.5 170.6 37.6 186.3 41.1
CHILD OPPORTUNITY TO CONTINUE EDUCATION AFTER PAYING DEBT
Total 1.3 0.3 6.3 1.4 7.6 1.7
Will continue 0.4 0.1 2.3 0.5 2.7 0.6
Maybe will continue 0.6 0.1 3.5 0.8 4.1 0.9
Won't continue 0.3 0.1 0.5 0.1 0.8 0.2

Armenia National Child Labour Survey 2015 Analytical Report98
Chapter 11.
Conclusion and Recommendations13
11.1 Conclusions
Children involved in economic activity
Of the 453 000 children aged 5-17 who took part in the survey, 52 000 had been in employ-ment in the preceding seven days of the survey, which is equal to 11.5% of the children. 95%of them were also employed throughout the year.
According to the age distribution, 4.6% of 5-11 year olds, 15.6% of 12-15 year olds, and 27.4%of 16-17 year olds were employed.
22 % of employed children were 5-11 years old. 40% were aged 12-15 and 38% were 16-17years old.
Boys engaged in economic activity (67%) twice as much as girls (33%).
In rural areas, 88% of employed children had current employment. This figure was 12% forchildren in urban areas. As a result, employed children in rural areas exceeded the number oftheir urban peers by almost eight times.
During the week preceding the survey, 2.5% urban children (3.6% boys and 1.2% girls) and22.3% rural children (27% boys and 16.6% girls) were involved in economic activities.
Of the 453 000 children aged 5-17 who took part in the survey,14.2% had been employedduring the twelve months preceding the survey (usual employment). Prevalence rates of chil-dren in employment during the last 12 months were 10.13% for girls aged 5-17 years and17.7% for boys. 5.2% of 5-11 year olds, 19.7% of 12-15 year olds, and 34.7% of 16-17 year oldswere employed during the last 12 months. 27.2% of surveyed children were employed dur-ing the last 12 months in rural areas compared with 3.3% in urban areas.
Working children were mostly involved in agriculture, forestry and fishing. 91% were mainlyengaged in work as a family contributing member, including harvesting activities, taking careof the cattle, their pasture and mixed livestock, and crop farm activities. In trade, repair, trans-port, storage, accommodation and food services, 4% of working children were employed;mainly in the sale of food. Children were also involved in the trade of motor fuel, constructionmaterials, medicine, vehicle maintenance and repair works.
90% of working children were engaged in an unskilled work or elementary work, such asbeing a carrier, courier, delivery worker, guard, etc. 7% of employed children were engaged inwork requiring some skills (production worker, tractor driver, driver), while 2.4 percent wereservice and sales workers (waiter, cook, shop assistant, etc.). 0.3% of working children workedin a trade that required certain skills (choreographer, musician, technician, pharmacist).
Children aged 5-11 were mainly involved in the activities which didn't require any qualifica-tions (72%), even though 28% carried out work which required a certain skill. Work requiringa certain qualification was mostly performed by children aged 16-17 (66%), and children aged12-15 (44%).
4% of working children were employees, 95% of which were employed on the basis of a ver-bal agreement, not having any social guarantees (paid leave, shorter working hours, etc.).
91% of children's employment was in the agricultural sector. 76% of them worked withoutremuneration as unpaid family workers. In rural areas, it was 78% compared to 64% in urbansettlements.
13 The following data may differ from the data presented in the report due to the rounding of decimal points.

Armenia National Child Labour Survey 99
20% of children were considered to be self-employed, independently engaged in income-gen-erating activities.
Children worked on average 13 hours per week. In terms of gender distribution, this was 14hours a week for boys and 11 hours a week for girls.
20% of children in rural areas attended school and simultaneously worked. This was ten timesgreater than the same indicator for urban areas (2%). This is probably due to the fact that ruralchildren cannot remain indifferent to their household's agricultural activities, which has adirect impact on the economic activity of rural children.
Household chores / services
38% of all children aged 5-17 were involved in household chores to some extent. Of this num-ber, 61% were from urban and 39% from rural areas. As expected, in contrast to employmentactivities, in this type of activity girls outweighed boys about two times and amounted to 63%of the figure (in urban areas this was 61% and in rural areas 65%).
62% of children were engaged in household chores for no more than 7 hours per week.
Non-working children
88% of children aged 5-17 were not engaged in any type of economic activity (non-workingchildren). Sex distribution of non-working children was almost equal. 51 % were boys and49% were girls.
Of the non-working children, 0.5 thousand children were seeking work. Accordingly, theunemployment rate among children aged 5-17 was 1%. In terms of gender distribution, thiswas 0.9% for boys and 1.2% for girls.
Child labour and hazardous work
The methodology used in this study indicates that 9% of children aged 5 -17 were involved inchild labour (any type of child's work that is considered physically, socially or morallyhazardous or dangerous). The work done by 2% was not considered prohibited work. 5.7%of surveyed female children and 11.4% of male children were in child labour.
One in five children aged 16-17 years (19%) and one in ten children aged 12 -15 (10%) wereinvolved in child labour. 5% of children aged 5-11 carried out prohibited work.
16.8% of children in rural areas were involved in child labour, which was nine times greaterthan in urban areas (1.9%). On the other hand, 88% of children involved in child labour livedin rural areas.
6.9% of surveyed children 5 to 17 years old were engaged in hazardous work. Prevalencerates of children in hazardous work were 9.3% for girls aged 5 -17 years and 4.1% for boys.13.1% of surveyed children were in hazardous work in rural areas compared with 1.7% inurban areas.
76% of children were employed in child labour, 79% of which were engaged in hazardouswork. Boys were 3 times more likely to be engaged in hazardous work (72%) than girls (28%).
Nine in ten children engaged in hazardous work were employed in agricultural works. Of thesechildren, 55% worked with the transportation of heavy loads, mainly associated with harvestactivities. Accordingly, in 87% of cases, rural children were engaged in hazardous work.
Out of about 31 000 children engaged in hazardous work 45% were aged 16-17 and 39%were 12-15. 11% of children in hazardous work were children aged 5-11. 96% of them wereengaged in agricultural work.
Conclusion and Recommendations

Armenia National Child Labour Survey 2015 Analytical Report100
The average weekly working hours for children in hazardous work exceeded 16 hours perweek. Children aged 16-17 years in hazardous work worked more than 19 hours per week.Children aged 12-15 years in hazardous work worked 14 hours per week. Children aged 5-11worked 12 hours a week. Boys in the age group of 12-17 had a longer working week, as didgirls in the age group of 5-11.
By the components14 of the hazardous work, the most common factor of considering thechild's work hazardous therefore also prohibited was considered hazardous working condi-tions (dust, height work, use of dangerous instruments, etc.), which was mentioned by 24thousand children or 76% of children involved in hazardous work.
Mainly boys worked in hazardous working conditions, 70%.
In terms of long working hours considered to be hazardous, which is more than 43 hours perweek, 12 000 children worked for this length of time or more. 83% of these children wereaged 16-17.
600 children had a hazardous occupation, 88% of which were boys. Three in four childreninvolved in hazardous work were 16-17 years old, and 3 % were boys aged 5-11.
Only boys aged 16-17 were engaged in hazardous industry (0.4 thousand children).
Not in hazardous work, but in other forms of child labour, were 8 100 or 21% of children inchild labour. 78% of them were children aged 5-11, who according to their age, mustn't workat all. 99% of working children aged 5-11 were engaged in temporary agricultural work intheir own households, mostly as non-paid family helping members (89%). Working childrenaged 12-15 made up 22% of these. Their work wasn't hazardous, but it also wasn't light, asduring the reference week they worked more than the permitted 13 hours (but not morethan 42 hours).
Educational characteristics
The survey methodology indicates that the evaluation of literacy is the ability to speak in anylanguage, including the native language, and to be able to write, read and form short simplesentences. According to these metrics, there are 123 200 literate children. Of the non-literatechildren, 99.7% belonged to the age group of 5 -11, and the absolute majority were aged 5 -6 years.
95% of children aged 5 -17 said that they were involved at some level of education. Of thesechildren, 39% were in basic education, 33% were in elementary school, and 16% were in highschool. Pre-school education was mentioned by 7% of children, and vocational and tertiaryeducation, respectively, by 3% and 2% of children.
Children's school attendance rates were quite high at 95%. In terms of gender distribution,the enrolment rate of boys and girls was almost the same, at 94.8% for boys and 95.1% forgirls. Children living in rural areas had lower attendance rate that of their urban counterparts(92.5% vs. 97%).
In the current school year, 5% of children aged 5 -17 didn't attend school or pre-school.Accordingly, 5.2% of surveyed male children and 4.9% of female children didn't attend schoolor pre-school during the current school year. According to the age distribution, 5.9% of 5 -11year olds, 0.1% of 12-15 year olds, and 9.8% of 16-17 year olds did not attend school or pre-school. This is likely due to the fact that children aged 5-6 years old were not at a pre-schoolinstitution, and children aged 16-17 were not continuing their education.
Data show obvious relationship between school attendance rate and employment of chil-dren, especially in terms of child labour and hazardous work. Thus, non-working children hadhigher attendance rate than their working counterparts (95.2% vs. 92.8%). Among workingchildren those who were not in child labour were more likely to be engaged in schooling(96%) than those in child labour (91.8%).
Chapter 11
14 Hazardous occupation or field or working hours or conditions.

Armenia National Child Labour Survey 101
3% of all interviewed children had never attended school. 98% of these were aged 5-7 years.In the 12-15 age group, the number of non-literate children who had never attended schoolwas statistically insignificant. The reason was often child’s special needs or disability.
One of the main reasons for stopping/leaving education before graduation or completionwas a very young age (67%), then disability (14%), and then poor accessibility to school, suchas a very long distance to travel or even a complete absence of a school (10%).
Other characteristics
The living conditions of rural children by existing facilities in shelters were more unfavourablecompared with urban children. The living conditions of households with working children inurban areas were more favourable compared with households without working children.
In urban areas, the following trends were observed:
More often, children from households who had on average a monthly income of upto 200 000 AMD worked.
Children did not work as often when the household had a monthly income of morethan 200 000 AMD.
This reflects the fact that, the higher the household's average monthly income, theytend not to have access to child labour.
The same trend is also present in rural areas, but with a difference, that in rural area the ratiochanges from a lower threshold of 101 000 AMD.
In terms of health issues by gender, illnesses among boys are three times more likely, but girlsare more vulnerable to the hazardous conditions of work. At first glance, both for boys andgirls the risk of exposure to hazardous work is almost identical. However, there are some seri-ous and disturbing exceptions. If a locomotor system damages the limbs of boys, the figure is6%. However, this is almost double for the girls at 11%.
The analysis of the data allows us to conclude that, even if child labour is approved by ahousehold's low living standards, there is insufficient awareness among the population aboutthe negative aspects of child labour. It can be stated that there is also a problem of limitedavailability and accessibility of health services.
Other characteristics affecting the education of children
According to households, their financial obligations have very little influence on their childrenleaving school. Some of them, however, do not exclude this possibility.
The survey results show that households with working children apply less frequently for cred-it or loans than households without working children. Survey data investigated that therewere 121 300 HHs with children in the age 5 to 17 years old that obtained a loan in the last12 months. 8 thousand from those refer to the households with working children.Employment rate is twice lower among children with problem related to a loan than childrenwithout it (3.7% vs. 7.7%) It is not point to assume that low employment rate is an indicator ofwelfare of HH.
32% of households reported that, during the last 12 months, they have been exposed to neg-ative impact at the level of country/community: for four out of five households the reasonwas price inflation, for one out of ten was falling agricultural prices and for 6% it was naturaldisaster. There was not observed direct linkage between activity rates of working children andproblems wich have affected HHs in the last 12 months. On the contrary, employment rate ofchildren aged 5-17 was slightly higher in HHs without such problems than in HHs whichfaced with such problems (6.4% vs. 5.1%).
24% of households had a decline in income at a household level in the last 12 months . 21%mentioned the decline in the prices of goods produced by the family business as a problem,which had a more significant impact in rural areas (30%). 16% mentioned the loss of job of a
Conclusion and Recommendations

Armenia National Child Labour Survey 2015 Analytical Report102
household member, which was a more serious problem in urban areas (34%). The loss of har-vest and livestock was mentioned by 29% of households, which, naturally, was more typicalfor rural areas (42 %). For 9 500 households, illness or serious accident of a working memberof the household was the main reason for a decrease in income, 97% of which were in HHswithout working children in urban areas.
The main problems in rural areas (loss of harvest) determine the most typical problems inurban areas (inflation).
There was no significant variation in the most used means to overcome problems in house-holds with working children and in those without working children. Like in households with-out working children, the majority of households with working children reduced HH expen-diture (48%) and every fifth HH obtained a credit/ loan/ pledge (21%). 10% of householdsreceived financial support from relatives.
According to the survey, financial obligations had very little impact on a child's educationbeing unfinished (98%). Some respondents did not exclude such a possibility. Only 1% ofhouseholds with debt noted that the child had left his/her education unfinished because ofthe debt, and 1% did not exclude the possibility of such a situation.
Of 5 200 households with children with incomplete studies, 31.3% thought that the childwould continue his/her education after the household had paid off the debt. 57% did notexclude this possibility and only 12% were sure that the child would not continue their stud-ies when the situation improved.
The survey reveals that irrespective of any kind of problems faced by HHs education of chil-dren is a priority for parents. 0.4% of children 5 to 17 years old living in HHs with debt leftstudy unfinished. From those categories working children had slightly lower prevalence ratethan their non-working counterparts (0.1% vs. 0.3%). Almost similar pattern (0.3%) wasobserved in terms of children with future plans to leave study unfinished. The tendency wasdifferent regarding the children who thought about plans to continue education. Workingchildren less likely believed to continue their future education than non-working childrenafter paying debt. 0.1% of working children did not exclude the possibility of such a situationagainst 0.8% of non-working children.
11.2 Recommendations
A) Methodological and conceptual recommendations:
To repeat the survey every five years at least, in order to constantly update the database onthe main indicators of child work. In case of a lack of resources, it would be necessary to imple-ment the modular version of the survey with a more limited list of questions.
To collect and analyze data on working children as often as possible through the “IntegratedLiving Conditions Survey”.
The standardized methodology of child work, including definitions, concepts and criteria, tobe applied as much as possible in similar surveys affecting child's problems, in order to ensurecomparability of data.
To take into consideration the more vulnerable situation of children from poor families.
To provide incentives for respondents in similar surveys due to the requirement of respon-dents to provide their information and time. In case of children, chocolate bars or sweets, andin case of households, stationary and/or some money.
Chapter 11

Armenia National Child Labour Survey 103
B) National strategic approaches to child labour:
To raise public awareness on child labour, using advertising campaigns and other popularforms of information transfer (brochures, posters, manuals, radio and television programs,etc.), through government agencies, civil societies and international organizations.
To organize special courses in educational institutions devoted to the coverage of childlabour.
To regularly collect statistical information on child labour and to ensure its use in state target-ed policies, during strategy development as well as in national and monitoring programs forchild protection.
Conclusion and Recommendations

Armenia National Child Labour Survey 2015 Analytical Report104
ANNEX
NATIONAL CHILD LABOUR SURVEY QUESTIONAIRE
Confidentiality of the information guaranteed according to law of RA about the State Statistics
Data collected in the survey will be published only in the form of statistical analysis of child labour.
GENERAL INFORMATION
1. COVER SHEET
2. INTERVIEW RESULT
National Statistics Service of RA
International LabourOrganization
1. Number of Questionnaire
2. Number of Household (H/H)
3. Marz(name)
4. Settlement(name)
5. Urban-1 / Rural-2
6. Observation Period 2015
7. Completed
8. Incomplete
9. The Duration of Interview
(minute)
Used abbreviations
H/H - household

Armenia National Child Labour Survey 105
Annex
In A
2 d
on
't m
ark.
Th
e H
/H m
emb
ers
wh
o a
re a
bse
nt
for
1 y
ears
an
d m
ore
, exc
ept
for
tho
se s
ervi
ng
in t
he
arm
y
Th
ose
wh
o c
ame
to g
ues
t u
p t
o 3
mo
nth
s

Armenia National Child Labour Survey 2015 Analytical Report106
Annex

Armenia National Child Labour Survey 107
Annex

Armenia National Child Labour Survey 2015 Analytical Report108
Annex

Armenia National Child Labour Survey 109
Annex

Armenia National Child Labour Survey 2015 Analytical Report110
Annex

Armenia National Child Labour Survey 111
Annex

Armenia National Child Labour Survey 2015 Analytical Report112
Annex

Armenia National Child Labour Survey 113
Annex

Armenia National Child Labour Survey 2015 Analytical Report114
Annex

Armenia National Child Labour Survey 115
Annex

Armenia National Child Labour Survey 2015 Analytical Report116
Annex

Armenia National Child Labour Survey 117
Annex

Armenia National Child Labour Survey 2015 Analytical Report118
* In
terv
iew
er. G
o t
o t
he
PART
II o
f th
e Q
ues
tion
nai
re, t
o a
sk q
ues
tion
s o
n t
he
ho
use
ho
ld c
har
acte
rist
ics
Annex

Armenia National Child Labour Survey 119
Annex

Armenia National Child Labour Survey 2015 Analytical Report120
Annex

Armenia National Child Labour Survey 121
Annex

Armenia National Child Labour Survey 2015 Analytical Report122
Annex

Armenia National Child Labour Survey 123
Annex
* Interviewer.

Armenia National Child Labour Survey 2015 Analytical Report124
Annex
15 Such as: during the 7 days the interviewer did not meet with the eligible person after 3 visits or communications'problems or related other cases.

Armenia National Child Labour Survey 125
Annex

Armenia National Child Labour Survey 2015 Analytical Report126
Annex

Armenia National Child Labour Survey 127
Annex

Armenia National Child Labour Survey 2015 Analytical Report128
Annex

Armenia National Child Labour Survey 129
Annex

Armenia National Child Labour Survey 2015 Analytical Report130
Annex

Armenia National Child Labour Survey 131
Annex

Armenia National Child Labour Survey 2015 Analytical Report132
Annex

National Statistical Service of the Republic of Armenia (NSS)
Republic Ave. 3, Government HouseYerevan 0010 - ArmeniaTel.: +374 (11) 524 213Fax: +374 (11) 521 921
Fundamental Principles and Rights at Work Branch(FUNDAMENTALS)
International Labour Organization4 route des MorillonsCH-1211 Geneva 22 – SwitzerlandTel.: +41 (0) 22 799 61 11Fax: +41 (0) 22 798 86 95
[email protected]/childlabour
Follow ILO news on child labour on Twitter: @ILO_Childlabour
ISBN 978-92-2-130811-9
9 789221 308119


