Embed Size (px)
Citation preview
Jr
4
V -v :1Eighth Annual Report
of the&
FEDERAL HOUSING
ADMINISTRATIONi:B
m•
f'5>■ ,r.
; .% 'M
■ '3
Abner H. Ferguson
Commissioner;s
••y. *. i
'4
. . !‘I -4'
v, 1; • J
^ T
X
For the year ending
December 31, 1941r t \
% ?■frs-
EIGHTH ANNUAL REPORTOF THEU
FEDERAL HOUSING ADMINISTRATION
LETTERFROM
THE COMMISSIONER, FEDERAL HOUSING ADMINISTRATION
TRANSMITTING
THE EIGHTH ANNUAL REPORT OF THE FEDERAL HOUSING ADMINISTRATION COVERING
THE YEAR 1941
-
\
/
!
II April 14, 1942.—Referred to the Committee on Banking and Currency
and ordered to be printed with illustrations
UNITED STATES
GOVERNMENT PRINTING OFFICE WASHINGTON : 1942f0
Price 10 centsFor sale by tbc Superintendent of Documents, Washington, D. C.
t' •LETTER OF TRANSMITTAL Part I
SUMMARY OF OPERATIONSiFederal Housing Administration,Washington, D. C., April 10, 1942. !
To the Congress of the United States:Pursuant to section 5 of the National Housing Act as amended, I
am transmitting herewith the eighth annual report of the Federal Housing Administration, covering the year 1941. .
In view of the emergency requirements upon our personnel resulting from the FHA’s war-liousing activities and of the desirability of conserving paper, we have materially reduced the size of this report as compared with previous reports. The data eliminated are, however, on file and can be made available upon request.
Respectfully,
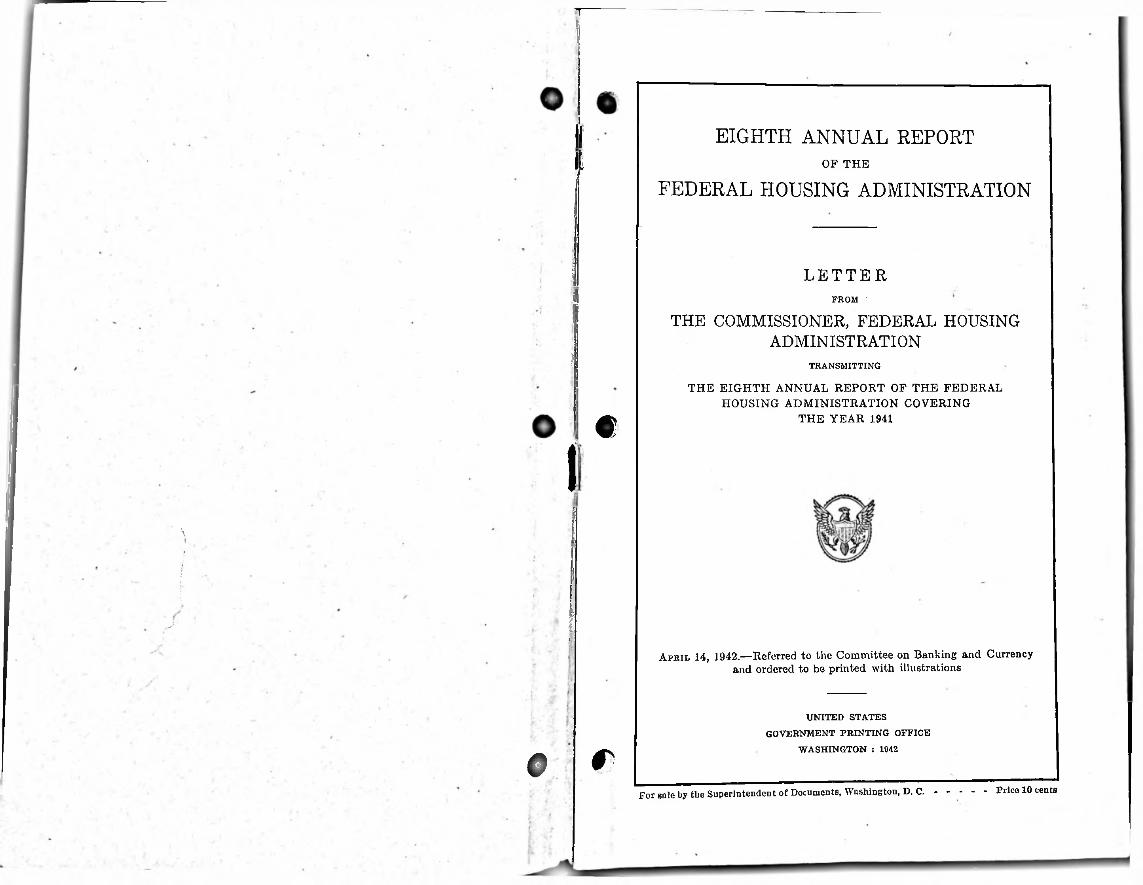
1^\PERATIONS of the Federal Housing Administration during 1941
were concentrated on the task of housing the vast army of Ameri- ' can workers and their families engaged in the defense and wartime production effort of the United States. In furtherance of that objective, the activities of the FHA were directed toward stimulating maximum volume of svar housing construction by private enterprise and also involved full collaboration on the part of its extensive staff of experts, specialists and technicians in the over-all defense housing program sponsored by the Federal Government.
Small-home construction earned out during the year by private builders operating under the FHA insured mortgage program constituted a contribution of great magnitude to the housing supply needed for industrial workers producing the armaments, military sup-
^ plies and other equipment essential for the nation’s victory in the present world conflict. A total of 218,035 new small homes were produced under the FHA program during the year, representing 41 percent of the aggregate 1941 construction of privately financed singlefamily homes. Approximately 185,000 of the small homes constructed under the FHA program in 1941 were located in the areas
YEARLY VOLUME OF F H A INSURANCE WRITTEN 1934 - 1941
::;
a
Abner H. Ferguson,Commissioner.
im iSt
I1
TABLE OF CONTENTS
PajjcParti. Summary of Operations....................................................Part II. The FHA’s Role in War Housing...............................Part III. FHA Insurance Operations During 1941...............Part IV. Accounts and Finances........................................
39
2243
99 1934 1935 1936 1937 1938 1939 1940 1941
IISUMMARY OF OPERATIONS4 FEDERAL HOUSING ADMINISTRATION 5
acute need forspecifically designated by the President as having additional housing for war workers.
Careful observance of the FIIA’s minimum construction require- and property standards provided assurance of good quality
for these small houses. In price, 79 percent of the single-family homes valued at less than $6,000, including land and all utilities, and
thus were well within the income range of a large proportion of industry workers. During the closing months of the year, the proportion located within defense areas and valued below $6,000 was
an during this period and to provide a substantial reserve against possible future losses.
While a great proportion of the new home building stimulated by the FHA program in 1941 was an outgrowth of activities under the established system of Title II home mortgage insurance, operations of this character were broadened during the year by the new program of Title YI, Defense Housing Insurance, authorized by Congress in legislation approved on March 28, 1941. The Title VI program has now become the dominant vehicle for the FHA’s insurance of war housing construction.
In addition to the large volume of new war housing construction stimulated by FHA activities during 1941, repair loans insured under Title I of the National Housing Act were helpful in maintaining adequate upkeep of existing homes in defense areas and in creating additional habitable dwellings through rehabilitation of substandard structures.
The experienced organization and effective operating techniques developed by the FHA in the course of its seven years of insurance activities have also proved valuable in furthering the execution of the over-all war housing program. That program has involved a considerable volume of federally financed defense housing construction to supplement the activities of the private building industry in localities where private enterprise could not feasibly meet the emergency needs. The familiarity of the FHA’s field offices with local market conditions as well as its facilities for research and market analysis were drawn upon extensively in determining the need for housing in defense centers and in allocating the resulting construction between private build ers and public agencies.
The services of the FHA’s field offices also are being utilized by the War Production Board for the processing of preference rating applications for material priorities purposes involving private war housing. Similarly, the technical services of the FHA have been employed on a wide scale on a variety of problems involving the general war housing program and on such related questions as the conservation of critical materials in housing construction. A more complete description of these activities and of the total role played by the FHA in the war housing program will be found in the succeeding section of this report.
f; Oments
werewar
increasing.Since the start of the emergency phase of the defense production
effort in the early summer of 1940, approximately 312,000 new small homes were produced under the FHA program. With the exception of certain Federal contributions to FHA insurance reserves, which are still held intact, this important new supply of housing, built during a period when additional dwelling accommodations were essential to efficient prosecution of the defense production effort, has been provided without cost to the Federal Government. Fees and premiums paid by- the public in return for the benefits of the insured mortgage program have been sufficient to pay all FHA opera ting expenses
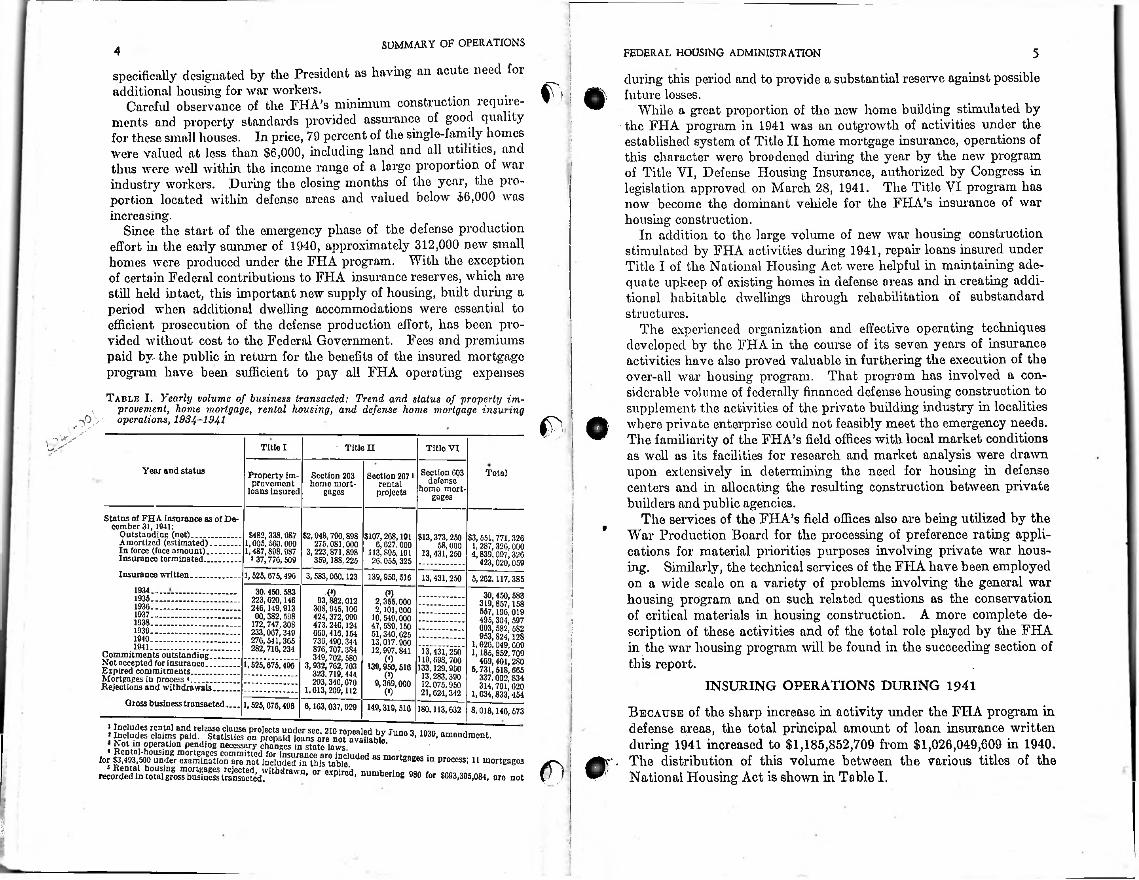
Table I. Yearly volume of business transacted: Trend and status of properly im- , provement, home mortgage, rental housing, and defense home mortgage insuring
cjO V operations, 1934-1941 f): b'>' Title I • Title II Title VI
Year and status Section 603 defense'
homo mortgages
TotalProperty improvement
loans insuredSection 203 homo mort
gages
Section 207i rental
projectsi
Status of FHA insurance as of December 31, 1941:
Outstanding (net).....................Amortized (estimated).............In force (face amount)..............Insurance terminated............ .
Insurance written. ...................
t$482,338.987
1,005,560.000 1,487,898.987
>37,776,509
$2,948,790,898 275,081,000
3,223,871.898 359,18S, 225
$107,268,191 6,627,000
113,895,191 26,055,325
$13,373,250 58,000
13,431,250$3,551.771.320
1,287,326,000 4,839.097,320
423,020,0591,525.675,496 3,583,000,123 139,950,510 13,431,250 5,202.117.385
1934 30.450,583 223,620,140 246,149,913 00,382, 598
172,747, 308 233,067,349 276,541,305 282,716,234
1,525,675,496
0) (*) 30,450,583 319,857,158 557.190,019 495,304,597 093,582, 582 953,824,128
1,026,049,009 1,185,852,709
469,401,280 5,731,518,005
337.002,834 314,791,620
1, G34,833,454
8.018,140,573
1935........................1936.....................1937 ........................1938 ........................1939 ........................1940 ........................1941 ........................
Commitments outstanding. Not accepted for insurance..Expired commitments.........Mortgages in process *.........Rejections and withdrawals
93,882.012 30S, 945,106 424,372,999 473.240.124 009,410,154 730,490, 344 876,707.384 349,702,580
3,932,762,703 323.719,444 293, 340,070
1.613,209,112
2.355.0002.101.000
10,5-49,000 47, 5S9,150 51,340,625 13,017.900 12,997.841
(0139,950,516 (»)
9,369,000
13,431,250 119,698,700 133,129.950 13,283.390 12,075,950 21,024,342 INSURING OPERATIONS DURING 19410)
Gross business transacted___ 1,525,675,496 6,163,037,029 149,319,510 Because of the sharp increase in activity under the FHA program in defense areas, the total principal amount of loan insurance written during 1941 increased to $1,185,852,709 from $1,026,049,609 in 1940. The distribution of this volume between the various titles of the National Housing Act is shown in Table I.
180,113,632
* Not in operation pending necessary changes in state laws, for'- mortgages in process;
1 Rental housing mortgages rejected, withdrawn . recorded in total gross business transacted.
;.
<T) 911 mortgagesor expired, numbering 080 for $093,395,084, are not
£:!
ISUMMARY OF OPERATIONS
By December 31, 1941, the cumulative volume of loans insured since the inception of the FHA program in June 1934 was $5,262,- /~sy > 117,385. This total involved approximately 4,600,000 individual ^ j loan transactions and approximately 14,500,000 persons are now • living in dwellings built, purchased, or improved through the proceeds of FHA-insured loans. Through repayments and terminations, the estimated outstanding amount of loans protected by FHA insurance had been reduced to $3,551,771,326 as of December 31, 1941.
INCOME AND EXPENSES
6 7FEDERAL HOUSING ADMINISTRATION
family dwelling, $8,000 on a three-familv dwelling, and $10,500 on a four-family dwelling. A special Defense Housing Insurance Fund of up to $10,000,000 was established through federal contribution to provide a reserve for possible future losses. The maximum principal amount of mortgage insurance authorized under Title VI was set originally at $100,000,000 and was increased to $300,000,000 in legislation approved on September 2. A more complete discussion of Title VI will be found in the next section of this report.
In legislation approved on June 28, 1941, the principal amendments to the act were as follows:
1. The authority of the Federal Housing Administrator to insure property improvement loans under Title I of the act, which would have expired on July 1, 1941, was extended for two years to July 1, 1943.
2. The maximum amount of any individual loan which may be insured under Title I was raised from $2,500 to $5,000 in the case of loans to finance repair or remodeling of residential structures designed or to be designed for more than one family, and from $2,500 to $3,000 with respect to loans to finance the construction of new structures. For modernization and improvement loans of more than $2,500, the maximum term was extended from three yearn and 32 days to five years and 32 days.
3. The President was authorized to increase by $1,000,000,000 the principal amount of all mortgages insured under Title II
of the act which may be outstanding at any one time. The previous authorization was $4,000,000,000, which thus may be
increased by Presidential approval to $5,000,000,000.4. The authority of the Administrator to insure mortgages on'
existing homes, which would have expired on July 1, 1941, was extended for three years to July 1, 1944. The previous provision limiting the aggregate amount of mortgage insurance involving existing homes to 25 percent of the total amount of insurance authorized imder Title II was amended by increasing that ratio to 35 percent.
5. The authority of the Administrator to include a portion of foreclosure costs in the debentures issued in connection with high-percent-
mortgages insured imder the provisions of Section 203 (b) (2) (B) __ extended for three years to July 1, 1944.
6. The Administrator was authorized to consent to extensions or refinancing of Title I modernization or improvement loans insured since July 1,1939, upon such terms and conditions as he may prescribe, subject to certain limitations.
EFFECT OF WAR ON FHA ACTIVITIES
The war now being waged by the United States and its Allies against the Axis powers has, of course, caused major changes in both the
and the direction of FHA activities. Throughout the war
During 1941, the current revenues of the Federal Housing Administration exceeded its administrative expenses by $13,003,032 as compared with $7,982,342 in 1940. By authorization of Congress, all FHA administrative expenses during the fiscal year ending June 30, 1942, are being paid out of current FHA revenues. The same was true in the fiscal year ended June 30, 1941.
The total income of the Administration from fees and premiumscharged for insurance under Titles I, II, and VI and from interest on investments was $26,877,951 in 1941, compared with $21,241,076 in 1940 and $14,411,416 in 1939.
Total administrative expenses in 1941, exclusive of equipment, amounted to $13,874,919, compared with $13,258,734 in 1940. The increase of 4.6 percent in expense over 1940 contrasted with an expansion of 15.6 percent in the total volume of insurance written.
Pursuant to the provisions of the National Housing Act, current income not required for payment of administrative expenses is deposited to the credit of the various FHA insurance funds, which aggregated $49,841,554 as of December 31, 1941. A description of the status and operation of these funds is contained in Part IV of this report.
maximum
maxnnum
CHANGES IN THE NATIONAL HOUSING ACT
Amendments to the National Housing Act during 1941 involved the creation of a system of defense housing insurance under Title VI of the act, modification of a number of existing provisions of the the interests of more effective execution of the FHA
act in program, and
extension of various important phases of that program which otherwise would have expired on July 1, 1941.
The legislation establishing Title VI was approved by the President on March 28, 1941. It authorized the insurance of new-home mortgages with terms of not more than 20 years in areas designated by the President as having an actual or impending shortage of housing sufficient to impede defense activities. It permits insurance of mortgages of up to 90 percent of FHA valuation to builder-mortgagors as well as to owner-occupant mortgagors. Individual mortgage amounts were limited to $4,000 on a single-family dwelling, $6,000
agewas
&
natureon a two-
SUMMARY OF OPERATIONS
period, the energies of the Federal Housing Administration will be concentrated on those housing functions which are of maximum utility to the successful execution of the war. This means a concerted drive to stimulate that type of privately financed low-cost housing, particularly for rent, which can best meet the housing needs of war workers in the war industry centers. It means extension of the FHA’s services to the war-housing program as a whole. Simultaneously, the necessity of conserving critical materials needed for armament production is causing a sharp curtailment in non war residential construction and a corresponding decline in the FHA's insurance activities involving that type of construction.
The details of the FHA’s participation in the defense and war programs are set forth in the next section of this report.
8
Part IITHE FHA’S ROLE IN WAR HOUSING
rT"1HE important contributions of the Federal Housing Administration to the general program of housing for war workers fall into two main
categories. First, as an operating agency which insures the financing of a large part of private residential construction and thereby exerts a broad influence on home-building trends, the Administration’s operations during the emergency period have been instrumental in channeling construction into those types best suited in price and in location to the'needs of the war-housing program. The scope of the FHA’s influence in the private home-building industry is shown by the fact that 41 percent of the privately financed single-family dwellings built in 1941 were constructed under FHA inspection and thus were planned and executed in accordance with the standards successfully developed and applied in the course of the Administration’s seven-, year experience.
The second broad field for FHA war-housing activities has consisted of cooperative services for the war-housing program as a whole. In these endeavors, the Administration’s technical skills, its familiarity with local housing conditions throughout the country, and its trained personnel both in Washington and in field offices have been brought to bear on problems important to the effective execution of the total war-housing program. As a vital corollary to these activities, the Administration’s services also have been utilized to minimize the impact of necessary war-housing construction on the supply of materials critically needed for expanded war production. A steadily increasing use of FHA facilities and personnel by war agencies is indicated.
ft o
THE WAR-HOUSING PROBLEM
From the outset of the emergency armament-expansion program in May and June 1940, there has been widespread recognition of the need for adequate facilities to house factoiy workers in armament plants and in supplying industries in order to avoid any unnecessary impediment to the production effort. The excessive labor turn-over experienced in numerous armament-producing localities during the first World War because of housing shortages lent particular emphasis to the importance of this problem. As a result, in the first phases
73347—42----- 2
rTHE FHA'S ROLE IN WAR HOUSING
of the present emergency, machinery was set in motion by the Federal Government to study the existing and future requirements for housing /v, ^factory personnel in areas of expanding armament-production activity, \ to provide such housing where and when it was needed, an t ere y
, to minimize the dislocations in production resulting from the sharp increase in armament employment.
The anticipated acute need for war housing, which has been fu y confirmed by experience during the constantly enlarging production effort, was based on two main influences. The most fundamental was an outgrowth of the necessary influx of new workers and their families into the major armament-producing areas in sufficient numbers to satisfy the employment requirements of the production program,
. thereby superimposing a sudden new demand upon the normal housing market of the respective communities.
This influence has been constantly in force throughout the emergency, not only in the vicinity of new armament plants located in areas hitherto undeveloped industrially, but also in most established industrial regions where the existing reserve supply of labor proved insufficient to meet the full needs. In addition, expanded employment in established industrial areas brought an enlarged demand for low-cost housing from workers already residing in the locality but who previously had been sharing quarters with others or inhabiting substandard dwellings because of subnormal earnings or lack of jobs.With full employment and larger earnings, many workers in this category entered the market for modern small houses. This influence
particularly apparent during the earlier phases of the armament production program.
To supply the need for housing accommodations for war workers and thereby to forestall employment dislocations due to housing shortages, immediate expansion was necessary in residential construction suitable for war workers in the specific areas where shortages were threatened or were already existing. In contrast to the experience in the previous world war, the private construction industry
favorably situated to undertake such expansion.The accomplishments of the Federal Housing Administration
program since its establishment in June 1934, were responsible in large degree for the ability of the private home construction industry to readjust its operations rapidly to the needs of the war housing effort. Mainly because of the protection offered by the FHA- insured-mortgage system, the private capital market for home mort- gages had been reopened on a broad scale, after the virtual stoppage of such financing during the depression years. FHA-insured mort gages were m strong demand as a sound investment outlet for lending institutions m all parts of the nation, thereby affording against restriction of war housing activities because of local credit stringencies. By June 30, 1940, when the need for
1110 FEDERAL HOUSING ADMINISTRATION
first became acute, a total of 538,177 home mortgages aggregating $2,288,347,588 had already been insured under Section 203 of the National Housing Act and approximately 7,600 private lending institutions were actively participating in the FHA program.
Furthermore, the liberal provisions of the long-term, high-percentage amortized home mortgages established under the FHA plan had made it possible to finance well-designed, soundly built small homes at a monthly cost commensurate with the incomes of a large proportion of industrial workers. In keeping with this opportunity and under the constant encouragement of the FHA, there had been a steady growth of home building activity in the lower price ranges needed for war housing purposes. Builders were familiar with FHA procedures and approximately 40 percent of all privately
already going forwardfinanced single-family home construction was through the facilities of the FHA.
Similarly, the FHA plan had won widespread public acceptance because of the low monthly financing costs it offered and because of the protection provided to the public by the FHA’s technical standards for home properties securing FHA-insured loans. Finally, as a going organization accustomed to servicing a large volume of individual mortgage insurance applications, with the accompanying architectural inspections, valuations, credit examinations, land-planning activities, and kindred operations, the FHA itself was geared to accommodate increased activity in defense-industry areas without delay.
Through the impact of such factors as these, together with general economic recovery, home-building operations had already attained a high degree of momentum when the defense emergency arrived; a factor which facilitated the further quick expansion needed in the
From the low ebb in 1933, when only 54,000
fi:
' was;
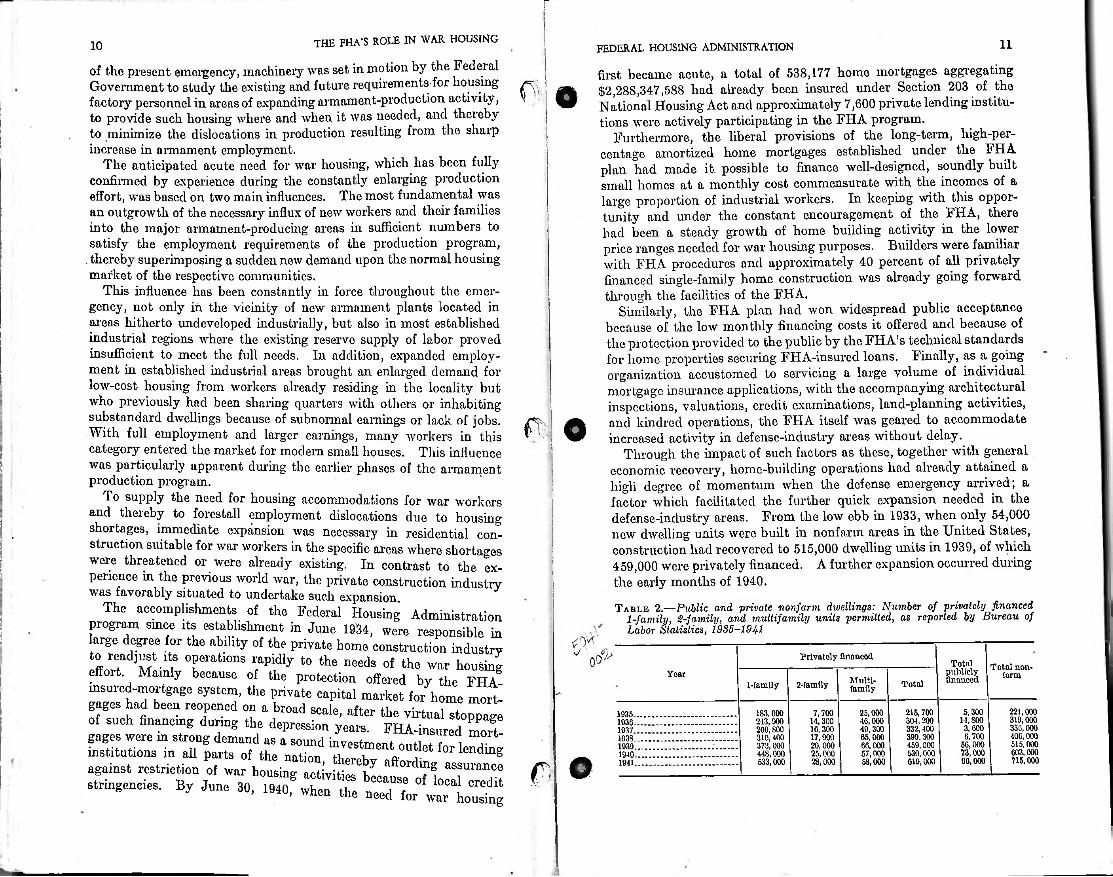
defense-industry areas, new dwelling units were built in nonfarm areas in the United States, construction had recovered to 515,000 dwelling units in 1939, of which 459,000 were privately financed. A further expansion occurred during the early months of 1940.
.i
wasTable 2.—Public and private nonfarm dwellings: Number of privately financed
1-family, 2-family, and multifamily units permitted, as reported by Bureau of Labor Statistics, 1985-1941
.! 0*
Privately financedoo Totalpubliclyfinanced
Total non* farmYear
Multifamily Total2-family1-famlly
221,000319.000330.000400.000515.000603.000715.000
5,300 14, S00 3,600 6,700
56.00073.00090.000
215,700 304,200 332,400 399.300459.000530.000619.000
25.00046.000 49,30065.00066.00057.00058.000
183.000 243,900 260,800 316,400373.000448.000533.000
7,70014.30016.300 17,900 20,00025.00028.000
193519361937193819391940.1941.$assurance
war housing
THE FHA'S ROLE IN WAR HOUSING
Since all ingredients were present for rapid expansion in small liome $ construction, geared to the needs generated by defense industry expansion, the privately financed home-building industry was in a strategic position to undertake a large share of the responsibility for providing the new housing needed to accommodate war-industry workers.
There were and are, of course, important spheres of the defense housing problem in which privately financed operations are not feasible and where the Government necessarily must finance the needed housing directly. These include such situations as housing for married enlisted personnel of the Army and Navy and for other essential workers whose income scale is insufficient to pay economic rents; housing in areas developed exclusively for war-production purposes and where there is serious doubt as to the continued usefulness of the facilities in the post-war period, and housing in established industrial areas where private building cannot feasibly be expected to meet the entire emergency need, whether because of limited local building facilities or because of the absence of any assurance of future need for all the added dwelling units.
In all other respects, privately financed operations were essential for quick action in meeting war housing needs. Furthermore, the sphere of activity in which private operations were feasible represented the greater part of the total war housing need. The response of the private home-building industry is demonstrated by the increase in privately financed construction to 530,000 dwelling units in 1940 and by the further expansion to 619,000 units during 1941.
12FEDERAL HOUSING ADMINISTRATION 13
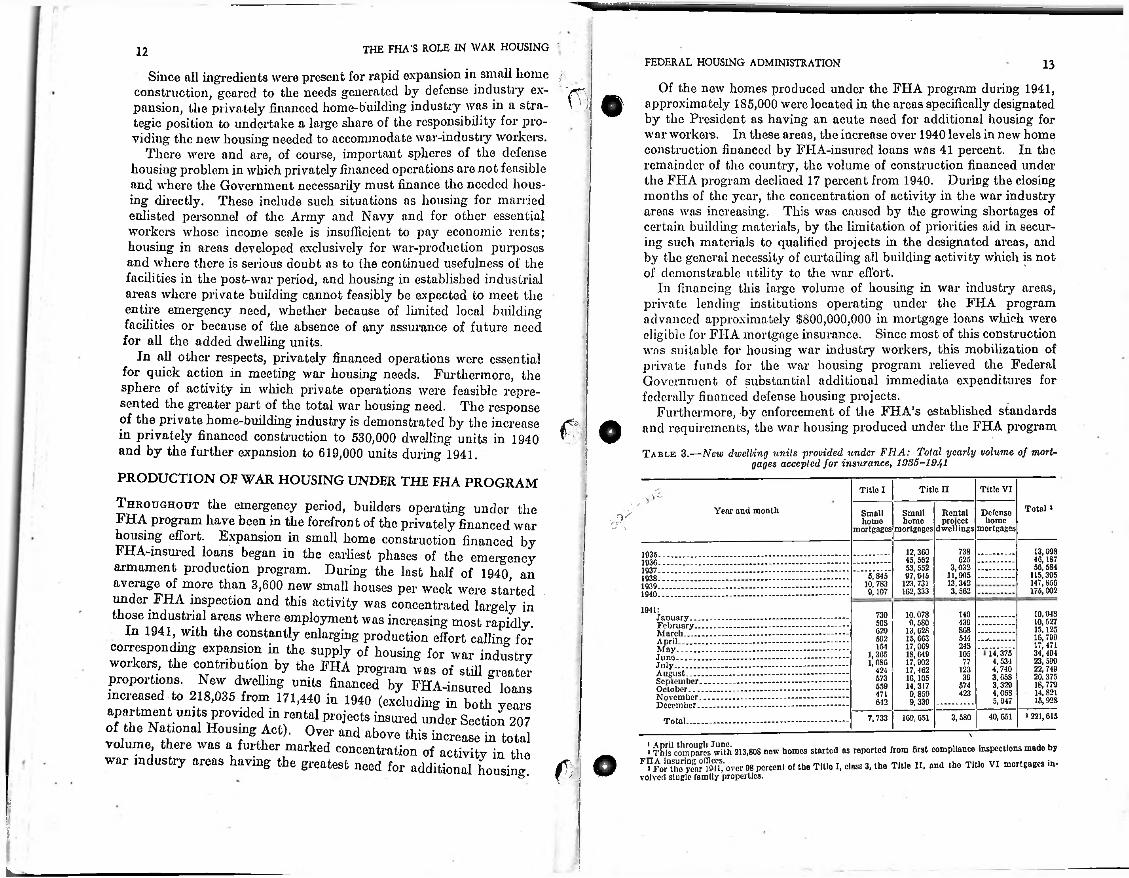
Of the new homes produced under the FHA program during 1941, 4ft approximately 185,000 were located in the areas specifically designated
by the President as having an acute need for additional housing for war workers. In these areas, the increase over 1940 levels in new home construction financed by FHA-insured loans was 41 percent. In the remainder of the country, the volume of construction financed under the FHA program declined 17 percent from 1940. During the closing months of the year, the concentration of activity in the war industry areas was increasing. This was caused by the growing shortages of certain building materials, by the limitation of priorities aid in securing such materials to qualified projects in the designated areas, and by the general necessity of curtailing all building activity which is not of demonstrable utility to the war effort.
In financing this large volume of housing in war industiy areas, private lending institutions operating under the FHA program advanced approximately $800,000,000 in mortgage loans which were eligible for FHA mortgage insurance. Since most of this construction was suitable for housing war industiy workers, this mobilization of private funds for the war housing program relieved the Federal Government of substantial additional immediate expenditures for federally financed defense housing projects.
Furthermore, by enforcement of the FHA’s established standards and requirements, the war housing produced under the FHA program
Table 3.—New dwelling units provided under FHA: Total yearly volume of mortgages accepted for insurance, 1936-1941
&
\
PRODUCTION OF WAR HOUSING UNDER THE FHA PROGRAM
Throughout the
:Titlo n Title VITitlo I
emergency period, builders operating under the -^-^-A program have been in the forefront of the privately financed war housing effort. Expansion in small home construction financed by FHA-insured loans began in the earliest phases of the
Total *Year and month Smnllhome
mortgagesRentalproject
dwellingsDefensehome
mortgagesSmallhome
mortgagesft13,093 46,187 56, 5S4
115,395 147, S56 175,002
12,360 45, 562 53,552 97,6-15
123,731 162,333
7381935. _ em eigen cyarmament production program. During the last half of 1940, anaverage of more than 3,600 new small houses per week were started under FHA inspection and this activity those industrial areas
6251936 3,032 11,905 13,342 3,562
19375,845
10, 783 9,107
193819391940
concentrated largely in where employment was increasing most rapidly.
In 1941 with the constantly enlarging production effort calling for corresponding expansion in the supply of housing for war industry workers, the contribution by the FHA program was of still greater proportions. New dwelling units financed by FHA-insured loans increased to 218,035 from 171,440 in 1940 (excluding “ both years
apartment umts provided in rental projects insured under Section 207 of the National Housing Act). Over and above this increase in total volume there was a further marked concentration of activity in the war industiy areas having the greatest need for additional housing
was 1941: 10.948 10, 527 15,125 16,799 17,471 34,494 23,599 22,749 20. 375 18,779 14.821 15,928
10.078 9,580
13,628 15,663 17,069 18,649 17,902 17,462 16,105 14,317 9,859 9,339
140730January...February..March__April___May....... .Juno........July.........August__September October... November December.
43950SS68629514592 V.24 S15-1
14,375 4,534 4,740 3.658 3,329 4, COS 5,947
1051,3051,086 77
12342439573
574559423471
642
* 221, 61540,6513,5S07,733 169,651Total.\
a compares^wPth 213,808 new homes started as reported from first compliance inspections made byF?FoSyc8a?Twi%ver 98 percent of the Title I, class 3, the Title II, and the Titlo VI mortgages involved single family properties.o0
■;
■;
THE FHA’S ROLE IN WAR HOUSING 15FEDERAL HOUSING ADMINISTRATION14well-plannecl, durable, comfortable structures which
valuable contribution to the nation’s long-term housingneeds of the war
of the FHA program’s contribution to the needed supply of housing. One of the most far-reaching influences of the FHA
plan has been its establishment of a practical financing plan making possible the production of new houses for almost all families able to pay economic rents for standard used dwellings. In reflection of this impetus, there has been a steady increase in the production of low-cost small houses under the FHA program, in contrast to the concentration
higher-priced construction which previously was typical of residential building activity.
In defining defense housing for priorities purposes, governmental authorities determined upon a top sales price limit of $6,000 for a single-family house and lot, including all utilities. In 1937, a total of 59.3 percent of all new houses financed under the FHA program
valued at less than this $6,000 level. By 1939, the percentage
consists of represent asupply, in addition to meeting the pressing
measure
^ O war
emergency.The Title VI Program
The rapid adjustment of FHA operations to the needs of war housing greatly facilitated during 1941 by establishment of the Title VI
Defense Housing Insurance program. Furthermore, during 1942 Title VI is expected to provide the major vehicle for continued large- scale participation in the war housing program by the builders and lending institutions operating under the FHA plan.
The principal objective of the Title VI amendment to the National Housing Act is to apply to emergency war housing needs the operating techniques and insuring policies successfully developed by the FHA in its normal program of small home insurance under Title II. In approaching this objective, Title VI provisions liberalize the requirements of Title II primarily by authorizing the insurance of mortgages covering up to 90 percent of FHA valuation of a property in cases where the builder or other nonoccupant is the mortgagor. Under Title IT, 90-percent mortgages are restricted to owner-occupied new homes.
wason
!
werehad risen to 71.0 percent and in 1940 it rose again to 73.7 percent.
During 1941, the trend was again extended so that 79 percent of the new single-family homes financed by FHA-insurcd loans were valued at less than $6,000. Furthermore, 58.6 percent of the new homes produced under the FHA program iD 1941 were valued at less than $5,000, and 27.3 percent were valued at less than $4,000.
These results represented primarily a further readjustment to the need for low-cost housing generated by the armament production program and reflected only in lesser degree the impact of the defense housing priorities system, which did not become effective until the closing months of the year. Under existing wartime conditions, of course, .virtually all construction proceeding under the FHA program is within the $6,000 maximum price limitation established for priorities
This change constituted important assistance to the financing of housing projects suitable for war workers but built for owner’s account. It also provided the most liberal financing medium ever available for low-cost rental properties. Furthermore, it provided a medium for the sale of low-cost homes to workers lacking ready cash funds to satisfy the 10-percent down payment required under Title II before occupancy. Under Title VI procedure, the purchaser
( •:?
i
f
I i:purposes.
An important corollary of the increased output of FHA-insured low-cost homes has been the steady broadening of the income groups acquiring new homes under the FHA plan. Of the new homes insured during 1941 under Title II, 34.2 percent were purchased by families with annual incomes of less than $2,000, as compared with 28.5 percent in 1940 and 19.8 percent in 1937. Furthermore, 64.1 percent of the new Title II homes were acquired in 1941 by families with incomes of less than $2,500, compared with 56.8 percent in 1940 and 43.7 percent in 1937. The significance of this trend is heightened by the fact that workers’ incomes averaged higher in 1941 than in previous years because of increased wages, fuller employment, and longer working periods. In addition, substantially all houses produced under the Title VI program in 1941 were designed for workers with family incomes of less than $2,500.
can occupythe dwelling while accumulating the required 10-percent equity and meeting the monthly mortgage payments.
construction requirements and property standards developed for new home construction under established FHA procedures were applied to Title VI also, thereby assuring good quality in the war housing produced under the new program. Terms covering issuance of debentures to mortgagees in exchange for foreclosed Title VI properties are largely identical with those established for Title II properties except that more liberal reimbursement for foreclosure costs the early term of the mortgage.
■
.
; The minimum
.
:
provision is made for on. properties which default, ini
FHA Houses for War Workers
In addition to the volume of small home construction stimulated by FHA activities in war industry areas, the availability of the completed houses for occupancy by war industry workers is a fundamental
!
f ■ o
!
the FHA'S role in war housing16 17federal housing administration
The Title I Program and War Housing
As a means of securing maximum use of existing housing facilities in war industry areas, repair and property improvement loans insured under Title I of the National Housing Act provided a ready financing medium in 1941 for rehabilitation of substandard dwellings, foi maintenance of existing dwellings in adequate condition, and for the conversion of large, old houses into a number of modern small apartments. Such operations provided a quick means of creating additional dwelling units, with minimum consumption of critical materials. Larger conversion operations, entailing expenditures of more than $2,500, were made possible under Title I by the increase in maximum insurable loan amount to $5,000 in the case of loans to finance repair or remodeling of dwellings designed or to be designed for more than one family, and by extension of the maximum term for such loans to five years and 32 days. As a further measure to facilitate such operations, the FHA by administrative action reduced the maximum discount rate permitted on Title I loans of more than $2,500 to $4 per $100 from the $5 maximum permitted on smaller loans.
until February 24, 1942, in the Division of Defense Housing Coordination, subject to Presidential review and approval. In reaching decisions on these matters, the Defense Housing Coordinator was assisted in large degree by information and studies prepared by the Federal Housing Administration.
Much of the information made available was based on detailed market studies prepared by the FHA’s Division of Research and Statistics, utilizing an extensive system for analysis of housing conditions in local communities which had been developed in prior years for the guidance of administrative officials in determining operating policies. Under the war housing program, substantially all activities of this nature have been devoted to meeting the urgent need for an increasing volume of reports on the housing situation in war industry
These reports involve analysis of the economic background
fV;
areas.of the areas, the war industry operations involved, prospective increases in employment, the existing housing supply, and current real estate conditions. On the basis of such analysis, estimates are made of the amount of housing required to meet war industry needs and of the proportion of the total need which feasibly can be met by private builders. During 1941, more than 200 reports were completed on individual cities representing all major war industry areas.
In addition to complete statistical surveys of this nature, FHA field, offices have continually supplied current reports upon developing conditions in their respective territories. These reports, prepared by persons thoroughly familiar with the local situation, have been of great supplementary value in providing the Division of Defense Housing Coordination with first-hand information on local needs for war
COOPERATIVE FHA SERVICES IN THE WAR HOUSINGPROGRAM
In addition to the important contribution to war housing represented by the large volume of such construction which has been produced under the FHA program, the Federal Housing Administration has given valuable assistance to the over-all execution of the war Rousing effort through special services and responsibilities undertaken in the interest of the national defense program as a whole.
Since the war housing program involves both publicly financed and privately financed construction, effective integration of these two phases of activity is clearly an essential requirement for efficient opera- tioiH From the outset of war housing activities, therefore, the FHA has maintained daily liaison with the other Governmental agencies engaged in the war housing effort and has made available its services for the desired integration of the program.
One of the most important planning functions of the war housing: program has been the determination of the need for housing in the specific war industry areas and the programming of the necessary construction to satisfy that need as expeditiously as possible. This primary function has involved consideration of such subsidiary questions as the types and price ranges of accommodations required to meet the needs of war industry workers in the various areas the proportion of the tota need in each area which could be met by privately financed budding, and the volume of federally financed construction required. Responsibility for the determination of ne d and for the programming of the federally financed
*
housing and on the extent to which private capital may be expected to produce needed housing within the necessary time limitations.
As a further measure to facilitate the integration and coordination of the publicly and privately financed aspects of the war housing program, a consultative procedure was established between FHA field offices and federal construction agencies in connection with the selection of sites for publicly financed war housing projects. Through this procedure, site selection of scheduled public projects was assisted by the extensive knowledge of local real-estate conditions possessed by FHA field personnel, and possible sources of local friction were minimized which might otherwise have tended both to discourage privately financed war housing operations in the various areas and to interfere with or delay public projects.
Technical Aids to War Housiag
The technical services of the Federal Housing Administration have been widely utilized in the nationwide effort for conservation of critical materials vitally needed for armament production. As a
71347—42------3
f oprojects restedi
i
L -v
THE FHA'S role in war housing18 FEDERAL HOUSING ADMINISTRATION 19result, the activities of the FHA staff in this direction have played an important role in the development of conservation procedures which have sharply reduced the consumption of critical metals in the construction of war housing.
When the imperative need for metals conservation became apparent early in 1941, effective governmental action in the field of housing was handicapped by the lack of information on the quantity of materials normally used in dwelling construction, which could be used to measure the impact of war housing needs on the national economy. To provide this essential information, the FIIA’s Technical Division prepared for the Office of Production Management an extensive analysis of the quantity of materials used in a representative sample of single-family houses constructed under the FHA program. The findings of this analysis permitted the OPM to gauge the maximum impact of war housing on the total available supply of critical materials.
After completion of this report, the Technical Division assisted the OPM in preparing a list of critical materials essential for use in war housing. This list consisted of those items for which priorities assistance was made available for the construction of qualified privately financed war housing projects, in a system established by the OPM in September 1941, and was intended to accomplish the maximum conservation of critical metals in such housing commensurate with adequate construction. The list contained only those items for which there are no acceptable substitutes produced from lioncritical materials.
efficiency. The Administration also cooperated actively in the development by the Central Housing Committee of the Recommended Building Code Requirements for New Dwelling Construction. These recommended requirements were prepared as a model code for war housing, applicable for use in areas where no code exists, as an aid in writing local codes, or for adoption as a supplementary code for war housing purposes.
As a further service to the war housing program, the Administration’s teclmical experts assisted the Division of Defense Housing Coordination and the Public Buildings Administration in their studies of prefabricated construction and demountable houses for use in defense areas. This service dealt especially with the appropriate use of materials, proper structural design for durability and moderate maintenance cost, the adequacy of equipment, the practical qualities of proposed special construction methods, and the conservation of metals.
H o
FHA Services For War Housing Priorities
Upon establishment of a system for priorities assistance for privately financed war housing construction in September 1941, the services of the field offices of the Federal Housing Administration were enlisted to process applications for preference ratings, as agent for the Office of Production Management. This procedure has been con-
^9 tinued by the latter’s successor organization, the War Production Board.
Under these arrangements, builders seeking preference ratings file application at their local FHA office, where it is examined to determine whether the construction is considered to be within the meaning of “defense housing” and to comply with the applicable requirements of the war housing priorities system. The application is then transmitted, with the accompanying findings of the FHA office, to the Division of Defense Housing Coordination and the War Production Board for final action. These services by the FHA have been completely divorced from its underwriting activities as a mortgage
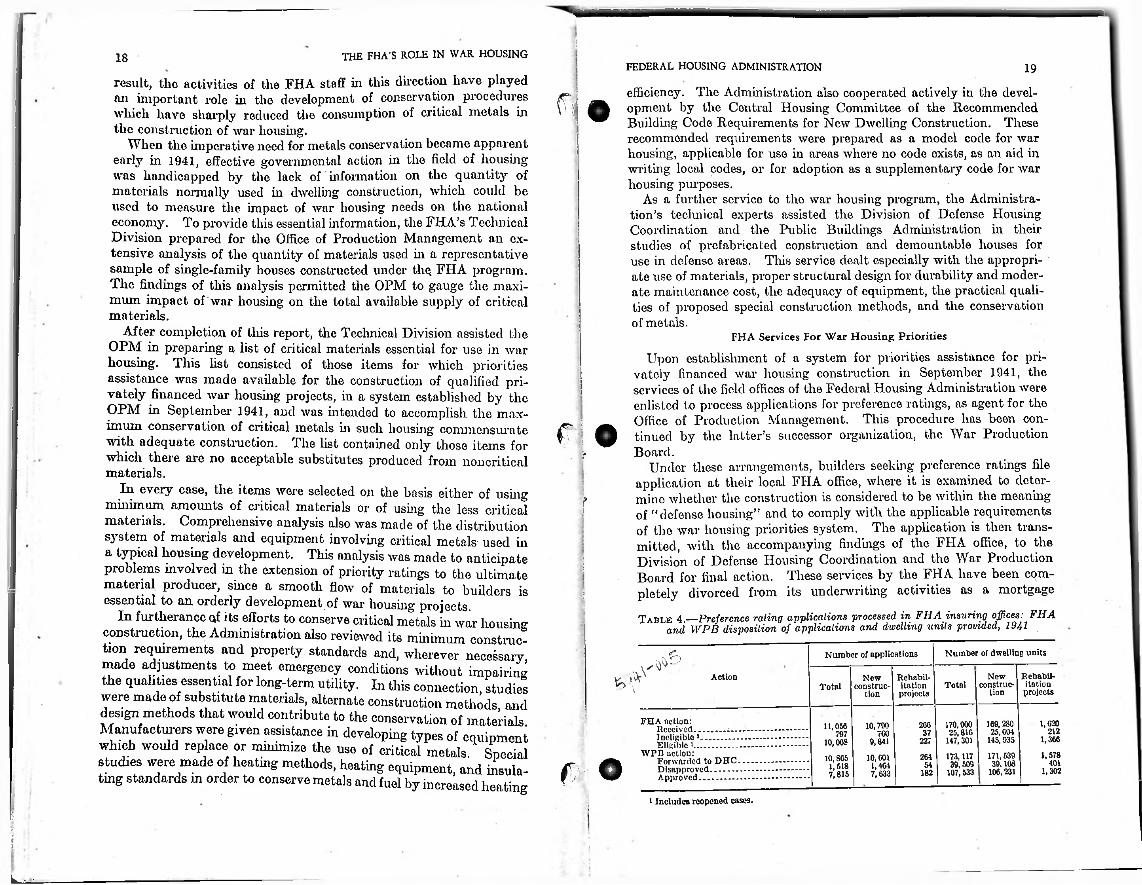
Table 4.—Preference rating applications processed in FHA insuring offices: FHA and WPB disposition of applications and dwelling units provided, 1941
\!■■
In every case, the items were selected on the basis either of using minimum amounts of critical materials or of using the less critical materials. Comprehensive analysis also was made of the distribution system of materials and equipment involving critical metals used in a typical housing development. This analysis was made to anticipate problems involved in the extension of priority ratings to the ultimate material producer, since a smooth flow of materials to builders is essential to an orderly development of war housing projects.
In furtherance of its efforts to conserve critical metals in war housing construction, the Administration also reviewed its minimum construction requirements and property standards and, wherever necessary, made adjustments to meet emergency conditions without impairing the qualities essential for long-term utility. In this connection, studies were made of substitute materials, alternate construction methods, and design methods that would contribute to the conservation of materials. Manufacturers were given assistance in developing types of equipment which would replace or minimize the use of critical metals. Special studies were made of heating methods, heating equipment, and insulating standards in order to conserve metals and fuel by increased heating
f
1j
Number of dwelling unitsNumber of applications
V Rehabilitationprojects
New ' Total construc
tion
Action Rehabilitationprojects
Newconstruc
tiontv Total
FHA action:Received______ ...Ineligible 1................Eligible ».............—
WPB action:Forwarded to DHCDisapproved............Approved.................
1,620212
1,3661,578
4011,302
169,28025.604
145,935
171,539 39.108
106,231
170,900 25,816
147,301
173,117 39,509
107,533
26610,790
9,841
11,056797
10,068
10,865 1,518 7,815
37760227
26110,601f o 541,4641827,633
1 Includes reopened cases.■.
?
THE FHA’S ROLE IN WAR HOUSING20 FEDERAL HOUSING ADMINISTRATION
and to set aside those remaining activities not directly productive from a war standpoint. Thus, the conversion of FHA activities to a wartime basis, which had been under way at an increasing tempo since the start of the emergency armament program in the early summer of 1940, is being completed.
Under wartime conditions, the need for war housing has become more urgent than ever before in view of the unprecedented expansion in armament production now under way in accordance with the President’s wartime production schedules. To gear its operations to these requirements, the FHA at once took steps to expand production of low-cost homes under the FHA program in critical war industry levels even beyond the advanced levels attained during 1941. Utilizing primarily the Title YI insurance machinery, the FHA liberalized its administrative and technical procedures, broadened its technical assistance to builders in planning low-cost projects, and in general accelerated the channeling of all new building into the types needed for the war effort.
Furthermore, an intensive effort was launched in December, 1941, to increase production of low-rental quarters for war industry workers. The relatively small proportion of construction designed for rent rather than for sale had previously been the one important limitation on the contribution of privately financed war housing activities, inasmuch as many war workers prefer to rent quarters rather than to purchase them because of the uncertainties surrounding the length of their employment and residence in the war industry centers.
In response to these efforts, a sharp expansion developed early in 1942 in the volume of war housing operations undertaken imder the FHA program, an expansion which was particularly notable for the large proportion of moderate rental projects.
21insurance agency and all applications for preference ratings have been processed without regard to the type of financing used.
A summarization of the applications processed by the FHA between the effective date of the housing priorities system on September 22 and December 31, 1941, and of the action taken on these applications by the War Production Board is shown in Table 4.
To qualify for priorities assistance in securing critical materials, a private war housing project must (1) be located within reasonable distance of the designated Defense Housing Critical Areas; (2) suitable for and intended primarily for defense workers within those areas; and (3) offered at a sales price or rental within reach of the defense workers for whom the housing is intended. Furthermore, the estimated market price of units built for sale may not exceed $6,000 per family unit including land, and the estimated shelter rent of rental units shall not exceed $50 per family unit. The highest preference ratings were given to qualified projects under construction on September 1, 1941, and to remodeling or rehabilitation which created or made habitable increased dwelling accommodations. A lower rating was granted to new construction for rent, and a still lower rating to new construction for sale.
For projects approved for preference ratings, priorities assistance is given only to secure items on the Defense Housing Critical List. Under regulations, preference ratings involving defense housing terminate 4 months from date of issuance and no preference ratings are issued covering construction of any building to be started than 3 months later than the effective date of the preference rating order.
rmore
As a further service to the administration of governmental priorities, the FHA field offices also acted as agents for the War Production Board in receiving and processing applications for priorities assistance to complete privately-owned and non-defense houses or housing projects started before October 9, 1941. To qualify for such assistance, the foundations under the main part of each structure for which a preference rating was sought must have been in place before that date. The purpose of this priorities procedure was to avoid undue hardship to builders of nondefense projects which were started before the construction industry was placed on notice by the Government as to the desirability of curtailing nondefense construction and which were not completed due to inability to secure essential scarce materials.
!
3i
THE FHA’S ROLE UNDER WAR CONDITIONS
Subsequent to the outbreak of warfare between the United States and the Axis powers, steps were initiated at. °nce to place theFHA program on a complete war basis in order to increase the usefulness of FHA-stimulated building activities to the € •! war effort
.1
:.
23FEDERAL HOUSING ADMINISTRATION
both titles, applications for mortgage insurance are received in FIIA insuring offices from lending institutions rather than from the indivi- • dual borrowers. If a loan is clearly ineligible, the application is returned. If the first review indicates examination is to be made, the mortgage is recorded as “selected for appraisal.”
After preliminary examination, the application undergoes underwriting analysis, involving a determination of its eligibility on the basis of FHA minimum construction requirements and property standards, appraisal of the property, and analysis of the credit of the borrower. If all tests are met, a commitment is issued to the mortgagee to insure the mortgage when it is executed in accordance with the terms of the application. Under Title II, no commitments are entered as “mortgages accepted for insurance” except when the individual borrower is approved. On mortgages covering homes to be constructed for sale by operative builders, a conditional commitment is issued which provides for insurance when the building is completed in accordance with plans and specifications and the property has been purchased by an individual mortgagor meeting the credit risk requirements of the FHA. Under Title VI, which authorizes
of 90-percent mortgages to builder-mortgagors, only firm commitments are issued and mortgages are recorded as “accepted for insurance” when the original commitment is granted.
Under both titles, when the mortgage is executed in accordance with the terms of the commitment and is presented to the FHA
f-v 4u
Part IIIFHA INSURANCE OPERATIONS
DURING 1941
HOME MORTGAGE INSURANCE UNDER TITLES II AND VI
TJOME MORTGAGE insurance operations, which constitute the major field of activity for the Federal Housing Administra
tion, were broadened during 1941 by enactment of the Title VI Defense Housing Insurance Amendment to the National Housing Act, which became operative in April. In reflection of the additional volume of construction generated b}r the Title VI program in defense areas together with increased activity under the Title II program in the same areas, the volume of home mortgage insurance processed and written expanded to the highest level in the seven-year history of the Administration.
Under Title II and Title VI combined, applications for insurance on 339,81C 1- to 4-family home mortgages were selected for appraisal during 1941, an increase of 20.1 percent over the number of mortgages selected under Title II in 1940. A total of 251,030 mortgages accepted for insurance under the two titles in 1941, an increase of 24.1 percent over the Title II mortgages accepted in 1940.
Under Title II alone, the volume of business registered a slight increase over the previous record levels of 1940. This gain resulted from the larger volume of applications submitted during the first seven months of the year, when the number of mortgages selected for appraisal under Title II was 14.4 percent greater than in the corresponding period of 1940. During the last five months of the year, in reflection of the declines in nondefense construction, the number of Title II home mortgages selected for appraisal decreased percent from 1940 levels. The rate of decline, moreover, ing as the year ended.
For 1941 as a whole, the number of mortgages selected for appraisal under Title II increased 2.9 percent over 1940, the number accepted for insurance increased 3.9 percent, and the number which became premium paying increased 18.1 percent.
Operating procedures under the two titles are largely identical, with the exception that operations under Title VI are limited by law to new dwellings in defense areas designated by the President.
insurance;:I
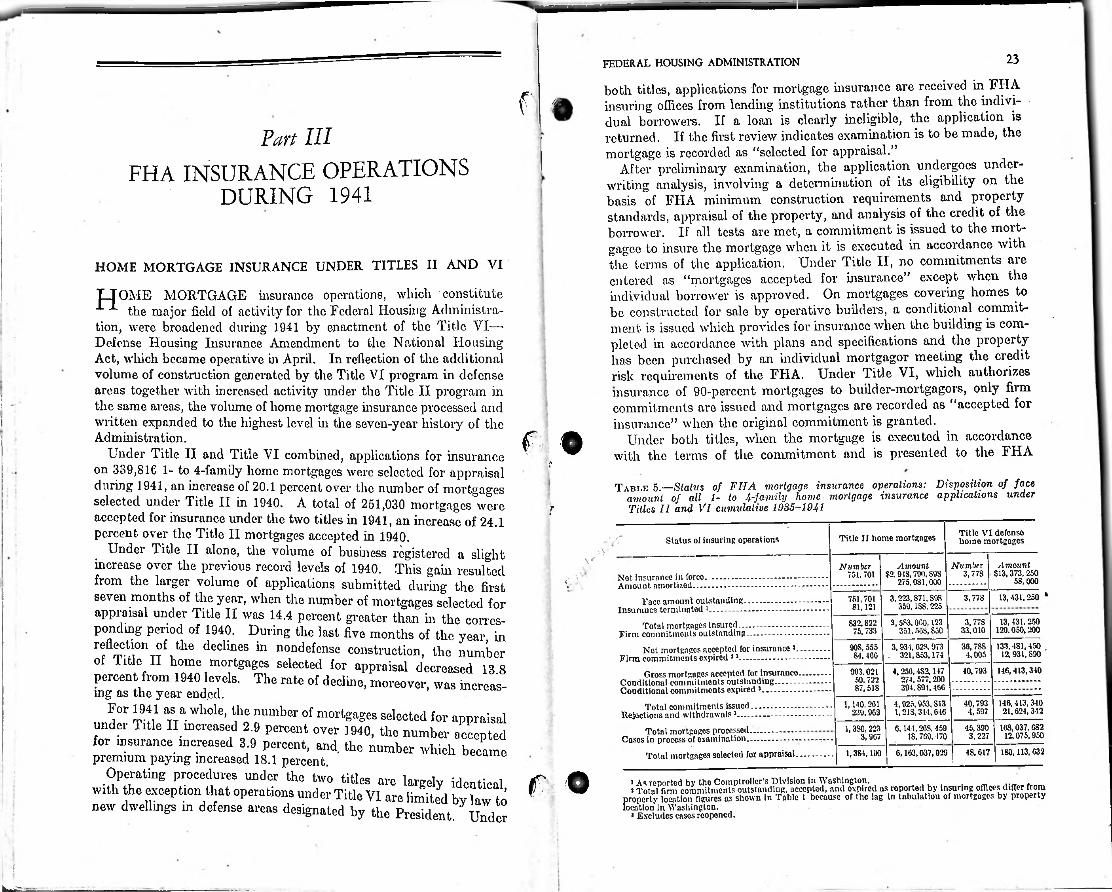
f •Table 5.—Status of FIIA mortgage insurance operations: Disposition of face
amount of all 1- to 4-family home mortgage insurance applications under Titles II and VI cumulative 1935-1941were f
Title VI defense homo mortgagesTitle II home mortgagesStatus of insuring operations
Number 3,77S
Amount$13,373,250
5S.OOO
Amount $2.918,700, SOS
275.0S1.000
Number751,701Net insurance in force....................................
Amount amortized..........................................Face amount outstanding................... .
Insurance terminated 1..................................
Total mortgages insured......................Firm commitments outstanding..................
Not mortgages accepted for insurance Firm commitments expired 33......................
13, 431.2503,223,871, SOS 359,1SS.225
3,778751,701 81,121
13,431,250120.050,200
3,583,000,123 351,50S, 850
3,77S 33,010
832,822 75, 733
133. 481. 450 . 12,931,890
30,78S 4,005
3,931,628,973 . 321,853,174
00S, 555 81, IOC
J,
13.8 was increas-
140,413,3404,256,4S2,147 40.793274.577.200 ...............394. SOI, 456 .............. .
903.02159.72287,518
Gross mortgages accepted for insurance. Conditional commitments outstanding. Conditional commitments expired 3—
146,413,340 21,624,342
40,793 4, 597
4,925,953, S13 1,2 IS, 314,616
1,140, 261 239,062
Total commitments issued............... .Rejections and withdrawals3..........-----—
Total mortgages processed..................Cases in process of examination.....................
Total mortgages selected for appraisal
168,037.6S2 12,075.950
45,390 3,227
0,141,26S, 459 IS. 769.470
1.3S0,223 3,067
48,017 180,113,6326,163,037,0291,384,100
f O J As reported by the Comptroller’s Division in Washington.3 Total firm commitments outstanding, accepted, and oxpired as roported by insuring offices differ from
property location figures as shown in Table l because of the lag in tabulation of mortgages by property location in Washington.
3 Excludes cases reopened.Under
i
INSURANCE OPERATIONS DURING 1941
insuring office, it is endorsed for insurance and the first annual insur- premium is collected. Tlie mortgage is then entered on the books
as a “premium-paying mortgage.” If the mortgage Corel's a house to be constructed, it cannot become a premium-paying mortgage until construction is completed free of liens.
In the case of new dwellings, a period of not more than eight months is allowed between the issuance of the commitment to insure and the final closing of the transaction. For existing homes, a period of 90 days is allowed. If at the end of the stated period the commitment to insure is not converted to a premium-paying mortgage, it is entered as an “expired commitment” and is no longer included in the total reported as “net mortgages accepted for insurance.”
Table 6.—Trend of selected, accepted, and premium paying mortgages: Gross face amount of 1- to 4-family home mortgages under Titles II and VI, as reported by FHA insuring offices, 19S5-1941
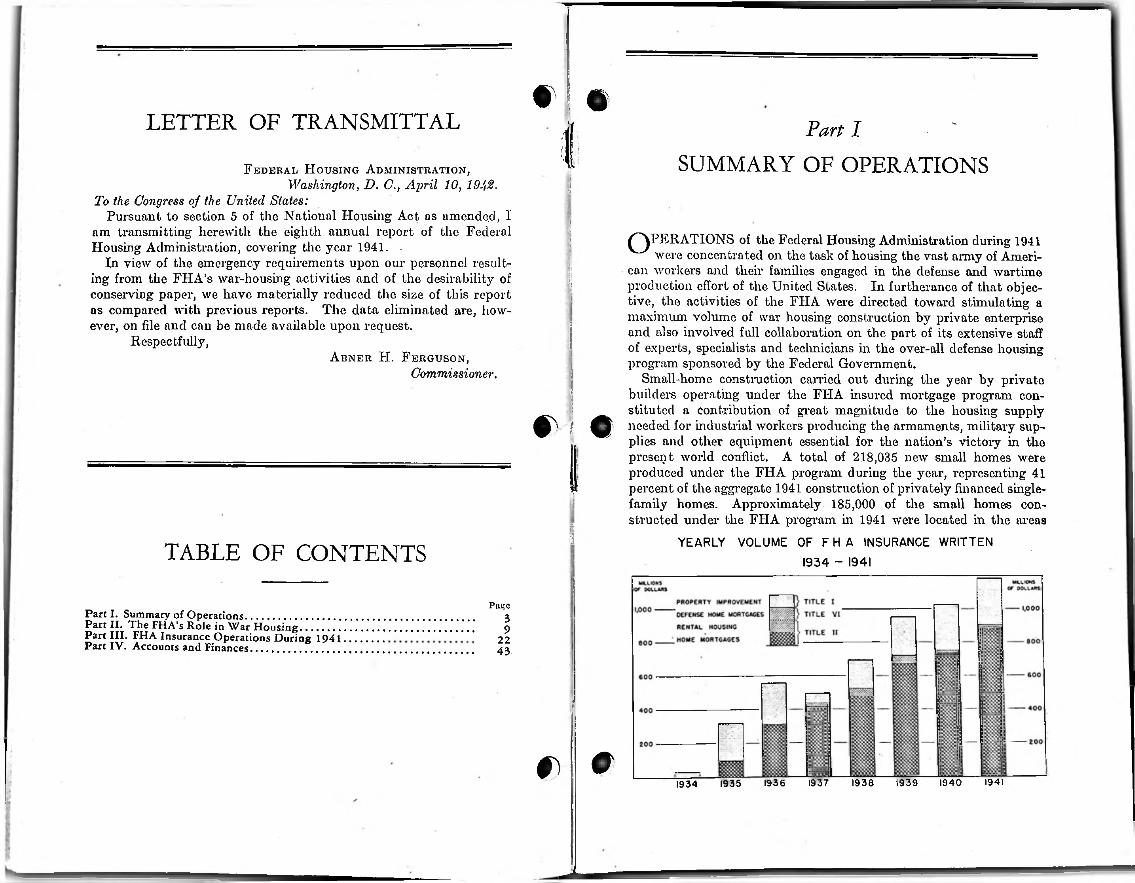
25FEDERAL HOUSING ADMINISTRATIONFHA24Activity of Lending Institutions
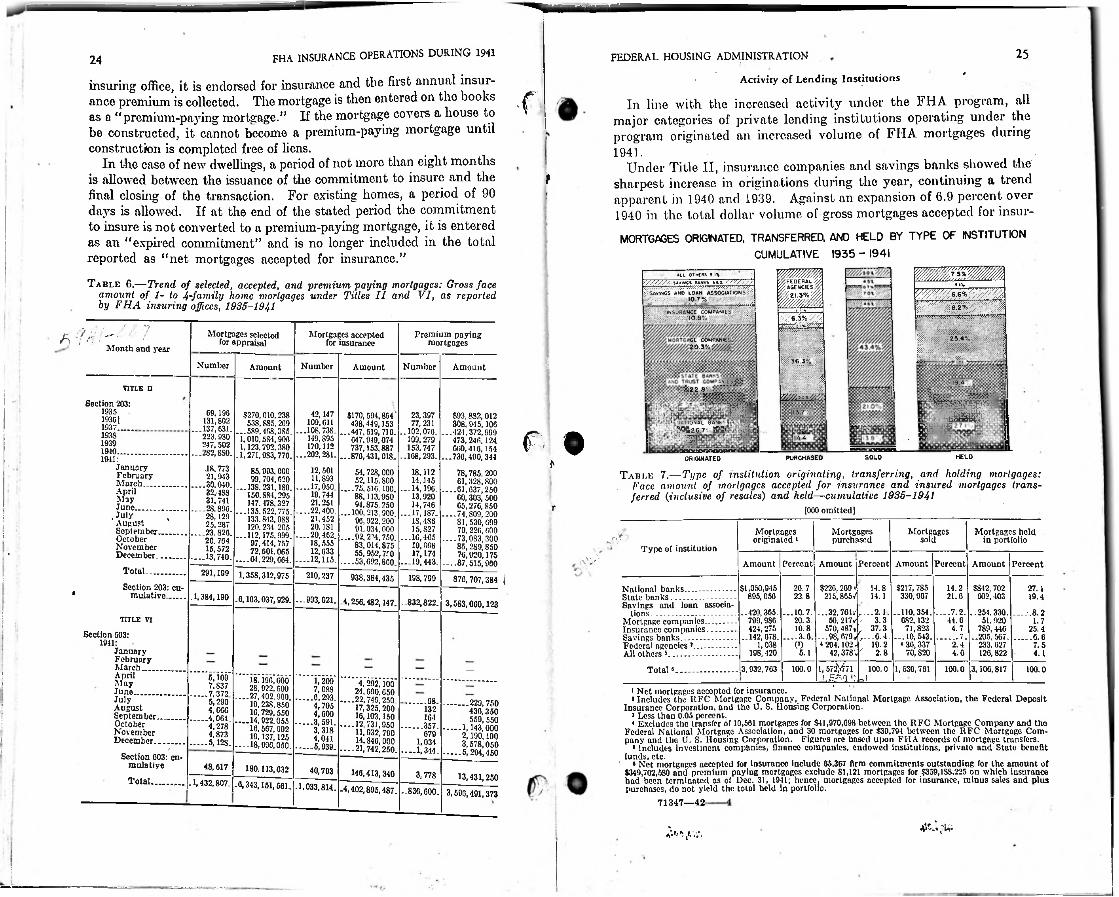
In line with the increased activity under the FHA program, all major categories of private lending institutions operating under the program originated an increased volume of FHA mortgages during 1941.
Under Title II, insurance companies and savings banks showed the sharpest increase in originations during the year, continuing a trend apparent in 1940 and 1939. Against an expansion of 6.9 percent over 1940 in the total dollar volume of gross mortgages accepted for insur-
MORTGAGES ORIGINATED. TRANSFERRED. AND HELD BY TYPE OF INSTITUTION CUMULATIVE 1935 - 1941
fance
I
t
wmwmmW//MM^FEDERAL % %AGENCIES^
iniAIL OTKCRS 5 il
ir/iCcV ^
-"SAVNGS ANO LOAN ASSOCIATIONS'^- ' • 10.7%
’ ........ -8.2%/ ' jCOMPANif SNCE CO .10 9°.
INS UNA6 5%/ T
rogfcffagajj- ’ / -7f) •
Month and year
Mortgages selected for appraisal
Mortgages accepted for insurance
Premium paying mortgages •: 2 5 a --
X • ■ •GC COMPANIES20 ■W'.'//////.
X.\ : 36 3%Number Number Number AmountAmount AmountiNlESSg 119.4 /
5522.0%TITLE U :•Wmm, V.WAyV.yy-yyySection 203: if$170, 594,864
438,449,153 ...447,519, 716.
047,949,074 737,153.887
...870,431,018.
1935
247.502 ...282,8S0.
J8.77321.9-13
“«
-IE-?o.S
113.7%;.as;IS
...202,281.
ass-a&-
21.251 ....22,400.
21,452 20,181
....20,462. 18.555 12,633
--12,115.
■usasta-85,093.00099.704,620
...13S.231.180.150.S84.295
...135:522,775.
“■'w.JSw
as153,747
-168,293.
18,11214,115
-.14,190.13,920-fl
— 16,465.ss— 19,443.
S93.8S2.012 308,945,100
...421,372.999 473, 240.124 009,416,154
...730,490,344
78,785.200 01,328,800
— .01,037,250 60, 303, 500 65,27G, 850
—74,809,200 81,530,699 70. 226,000
-.-.73,083,300 85,2S9,850 76,920,175
--87,515,960
£?!... i-JATIONAL BANKS^26.7% BrSi .ISri/;r o k.’193S 14 4-1939
1940HELDSOLDPURCHASED1941: ORIGINATED
Table 7.—Type of institution originating, transferring, and holding mortgages: Face amount of mortgages accepted for insurance and insured mortgages transferred {inclusive of resales) and held—cumulative 1935-1941
(000 omitted]
i'JanuaryFebruaryMarch......................AprilMayJune........................
. July AugustSeptember..............October November December...............
Total....................
Section 203: cumulative.........
ass94,875.250
-'KS...astsa.83.014.875 55,952,7.r0
-----53,692,860.
rI
Mortgages Mortgages held in portfolio
Mortgages originated 1
Mortgagespurchased sold
Type of institution
xV Amount Percent Amount Percent Amount Percent Amount Percent291,199 1,358,312,975 210,237 938,384,435 876,707,384 j198,799
$226,269« 215,S657
$217, 785 330,967
$812,702 002,403
—254.330. 51,920
789. 446 ..205, 567.
233.027 12G, 822
$1,050,945 895,050
26.7 14. S 14.2National banks........-...............State banks................................Savings and loan associa
tions..................... ....................Mortgage companies.............Insurance companies..............Savings banks..........................Federal agencies *.....................All others »................................
Total •.............................
27.122.8 14. I 21.6.1,384,190 19.4.6,103,037,929. -.993,021. 4,256,482,147. -.832,822. 3,583,060,123
— 32,76l»- 50,217/
-98®" "3.3
--1J0.3M.
70,820
-.420,305. 799,986 424,275
..142, 678. 1,038
198, 420
...10.7. —7.2. . — .8.2TITLE VI 20.3 44.6 1.7I 10.8 4.7 25.4
Section 603: —3.6. ......... 7. ........G. 61941: 0) 10.2 2.4 7.5
JanuaryFebruaryMarch........ .............AprilMayJune......................JulyAugustSeptember.............October November December...............
Section G03: cumulative
Total................
5. 1 2.8 4.0 4.11,572^771i, 5/vi
3,932, 703 100.0 100.0 1,530,761 100.0 3,106,817 100.0!
"V, 290' 4.666
........ 4,064.4.278 4,873
........ 5,128.
-J18.196.60028.922.600
—27,402.900.19.238.850 16,729.550
— 14,922.055 16,567.902 10.137,125
—18,990,050.
1,209 ........ 0,293.
iB ... till-........ 5,939.
4, 202.100 24,690.050
— .22,749.25017,325,200 16,103,150
— .12,731,95011,932,790 14,840,000
— 21,742,250.
i
* Net mortgages accepted for insurance.‘Includes the RFC Mortgage Company, Federal National Mortgage Association, the Federal Deposit
Insurance Corporation, and the U. S. Lionsing Corporation.* Less than 0.05 percent.* Excludes the transfer of 10,561 mortgages for $41,970,698 between the RFC Mortgage Company and tho
Federal National Mortgage Association, and 30 mortgages for $39,791 between the RFC Mortgage Company and the U. S. Housing Corporation. Figures are based upon FHA records of mortgage transfers.
* Includes investment companies, finance companies, endowed institutions, private and State benefit funds, etc.
s Net mortgages accepted for insurance include 65.367 firm commitments outstanding for the amount of $349,702,580 and premium paying mortgages exclude 81,121 mortgages for $359,1SS,225 on which insurance had been terminated as of Dec. 31, 1941; hence, mortgages accepted for insurance, minus sales and plus purchases, do not yield the total held In portfolio.
71347—42-
......... 08. ............ 229, 750436,350 559,550
........ 1.143.0002,190.100 3,578,050
........ 6,294,450
! 132! 164.......... 357.
6791,034
-—1,344.
48,617 180,113,032 40,793 146,413,340 3, 778 13,431,250.1,432,807. -0*343,151,561. ■ 1,033,814. -4,402,895,487. -836,600. 3,606,491,373
j
;FHA INSURANCE OPERATIONS DURING 1941
___ under Title II, mortgages originated by insurance companiesincreased 12.1 percent over the preceding year while those originated by savings banks expanded 32.2 percent. Mortgage companies and savings and loan associations also expanded their originations at a somewhat sharper rate than was shown by total Title II volume.
Under Title VI, mortgage companies, insurance companies, and national banks played an important financial role, originating 29.7 percent, 20.2 percent, and 18.5 percent, respectively, of the total mortgages accepted for insurance. Savings and loan associations originated 9.9 percent of the total volume of Title VI mortgages cepted in 1941, compared with 8.9 percent of the total Title II home mortgages. National banks, state banks, and savings banks were proportionately less active under the Title VI program than under the Title II program during 1941.
An active secondary market was maintained during 1941 in home mortgages insured under Title II. Transfers of insured mortgages during the year amounted to $483,921,000, compared with $400,591,000 in 1940. There has been a steady year-to-year increase in such transfers since the start of mortgage insurance operations in 1935 and by the end of 1941 the cumulative volume of transfers represented 40 percent of the net mortgages accepted for insurance since 1935.
As in earlier years, insurance companies were the most active purchasers of Title II home mortgages during 1941, acquiring 41.1 percent of the total volume transferred. Federal agencies purchased 18.4 percent of the total volume transferred in 1941. Mortgage companies again were the largest sellers of Title II mortgages, accounting for 40.8 percent of the total sales during 1941. For the first time, Federal agencies were active sellers of Title II mortgages, their sales sen ting 9.6 percent of the total volume transferred in 1941.
Tablb 8 —Type of institution originating mortgages: Gross face amount of 1- toVI 1935-1941 m°rlgageS accePted f°r insurance by FHA under Titles II and
[000 omitted]
27FEDERAL HOUSING ADMINISTRATION26 >As the net result of the originations, purchases, sales, and termina
tions of Title II home mortgages, all major categories of lending institutions increased their holdings of such mortgages during 1941. At the year-end, insurance companies and savings banks held a larger percentage of the total volume of outstanding insured mortgages than at the end of 1940 while the percentage held by the other major classifications of institutions was slightly smaller than at the end of 1940.
ance e'v t>
y
Terminations, Foreclosures, and Delinquencies
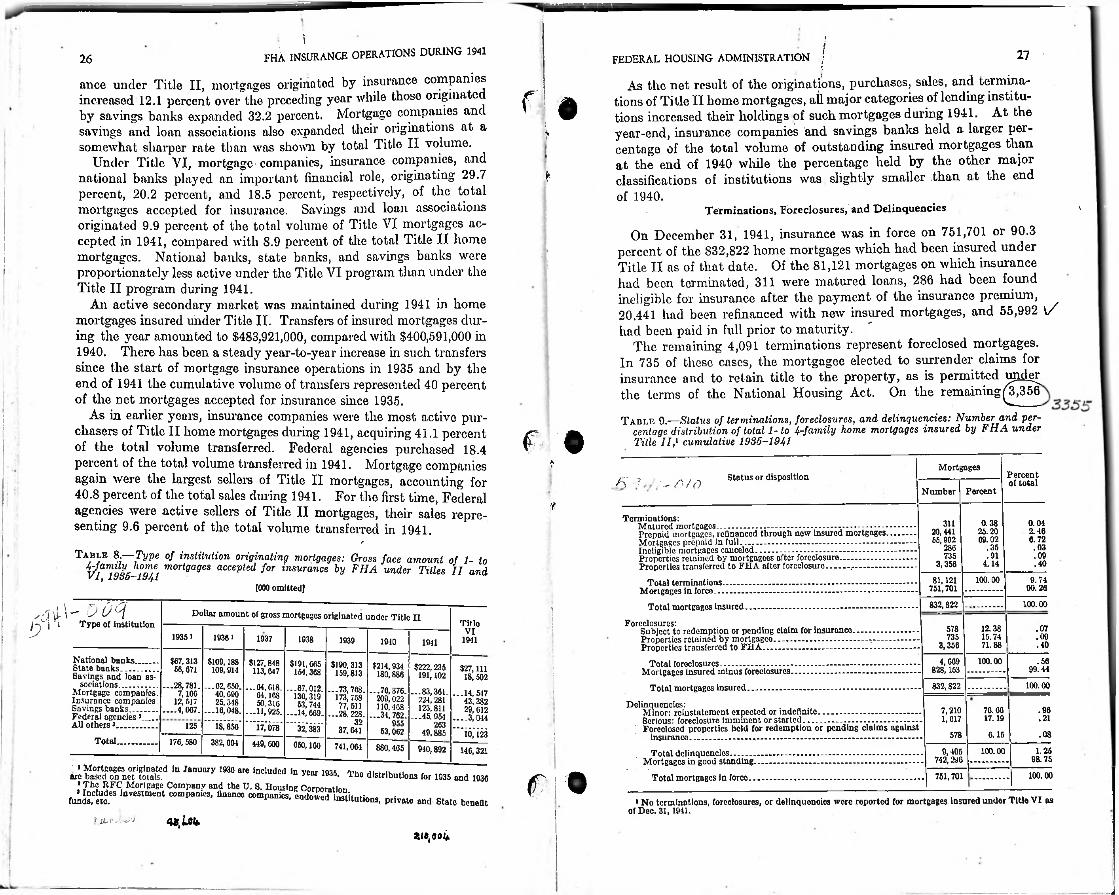
On December 31, 1941, insurance was in force on 751,701 or 90.3 percent of the 832,822 home mortgages which had been insured under Title II as of that date. Of the 81,121 mortgages on which insurance had been terminated, 311 were matured loans, 286 had been found ineligible for insurance after the payment of the insurance premium, 20,441 had been refinanced with new insured mortgages, and 55,992 V had been paid in full prior to maturity.
The remaining 4,091 terminations represent foreclosed mortgages.In 735 of these cases, the mortgagee elected to surrender claims for insurance and to retain title to the property, as is permitted under the terms of the National Housing Act. On the remaining356
Table 9.—Status of terminations, foreclosures, and delinquencies: Number and percentage distribution of total 1- to 4-family home mortgages insured by FHA under Title II,1 cumulative 1935-1941
\ac-
■
f oMortgages
Percent ot totalStatus or dispositiona; ? - tj/o Number Percent
'trepre- Tcrminations:
Matured mortgages................................................... -................................Prepaid mortgages, refinanced through new insured mortgages............Mortgages prepaid in full...........................................................................Ineligible mortgages canceled...........................................................-........Properties retained by mortgagees after foreclosure.................................Properties transferred to FHA after foreclosure.......... -...........................
Total terminations...................................................................................Mortgages in force.......................................................................................
Total mortgages Insured................................................ -.......................
Foreclosures:Subject to redemption or pending claim for insurance............................Properties retained by mortgagee........................................ -....................Properties transferred to FHA.......................—........................................
Total foreclosures................. -..................................................................Mortgages insured minus foreclosures...................................... -...............
Total mortgages insured.........................-...............-..............................
Delinquencies:Minor: reinstatement expected or indefinite............................................Serious: foreclosure imminent or started.......................................... ........
| Foreclosed properties held for redemption or pending claims against insurance.......................... ........................................................................
Total delinquencies.................................................. ...............................Mortgages in good standing...................................................................... .
Total mortgages in force.........................................................................
0.38 0.0431125.20 69. 02
2.4620,441 55,992 6. 72
2SG .35 .03.91 .09735
4.14 .403,356
100.00 9. 7481,121 751, 701 00.26
100.00832,822ooq" | i Type of institution
■Dollar amount of gross mortgages originated under Title IITitle!? 12.38
15.74 71.88
.07578VI .091935 * 73519361 1937 1038 19411939 1910 1941 .403,356National banks..........State banks________Savings and loan as
sociations.................Mortgage companies. Insurance companies.Savings banks............Federal;All others ..................
$67.313 56, 671
—28,781. 7,106
12, 517 —.4,067.
100.00$109,188 109,914
—02.050- 40.690 25,318
—16,048.*18,850
.564,669 828,153
$127,848113,647
-K-“'i7,"078'
$191,665 154,368
...a a* 32,383
$190,313 159,813
—73,768. 173,758 77,511
--.28. 228.
37,641
$214,934 180,886
...76,376. 209,022 110,468
...34,762.
53,062
$222,235 191,102
—83,361. 224, 281 123.811
—45,054
$27,111 18,502
—14, 547 43.382 29, 012
—3,044
***i6,*i23
i 09.44■
100.00832,822
76.60 17.19
.967,210 1,017agencies*___
rsS.2132 055 263125 ;
40.885 .086.15578Total. 176,580 382, 604 449,600 050,100 741,064 880,405 940,892 146,321 1.25100.009,405
742,296 98.75
„c KfS“e°trittd I“DU“ry ar° lnclu,!l!d in year 1935-
tjJLrJ.
■ 1
Tho distributions for 1035 and 1930 f • 100.00751,701
1 No terminations, foreclosures, or delinquencies were reported for mortgages insured under Title VI as of Dec. 31,1941.
and State benefit
Zl9t00l+
J
f.fha INSURANCE OPERATIONS DURING 1941
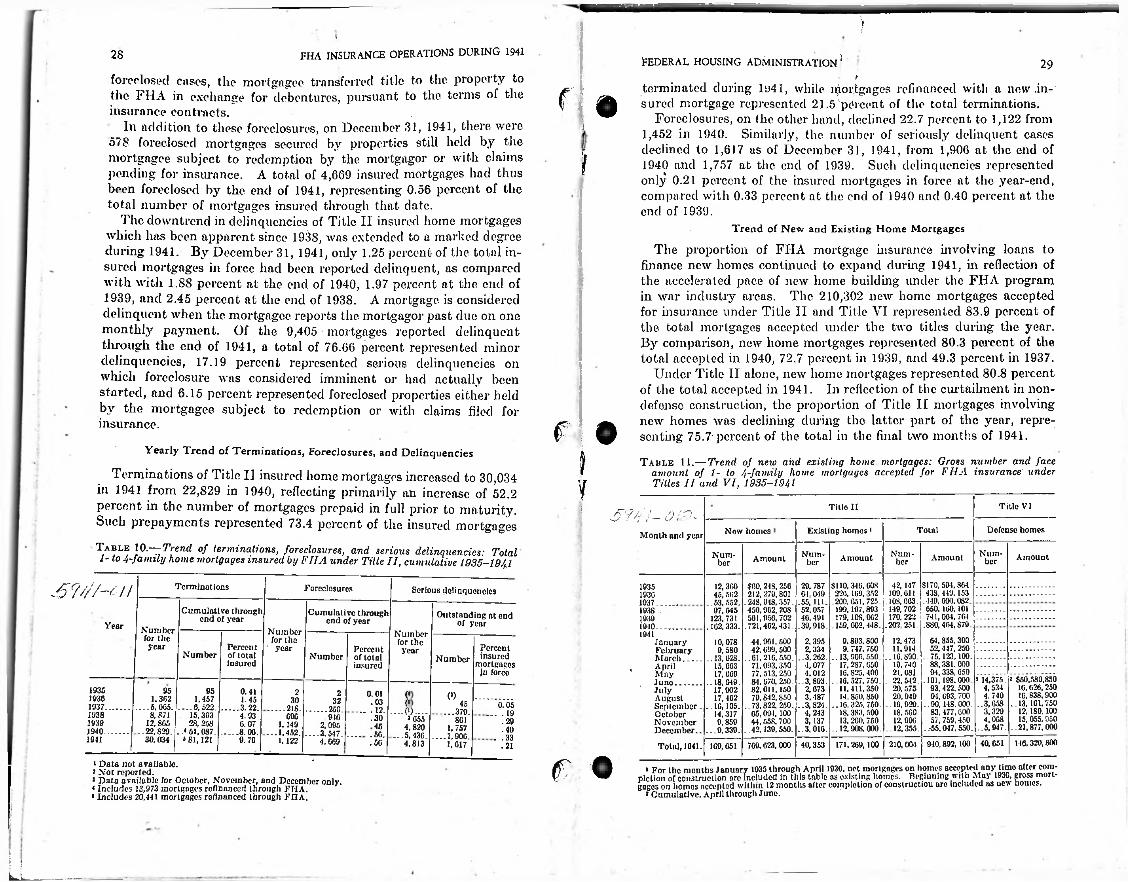
foreclosed cases, the mortgagee transferred title to the property to the FHA in exchange for debentures, pursuant to the terms of the insurance contracts.
In addition to these foreclosures, on December 31, 1941, there were 578 foreclosed mortgages secured by properties still held by the mortgagee subject to redemption by the mortgagor or with claims pending for insurance. A total of 4,669 insured mortgages had thus been foreclosed by the end of 1941, representing 0.56 percent of the total number of mortgages insured through that date.
The downtrend in delinquencies of Title II insured home mortgages which has been apparent since 1938, was extended to a marked degree during 1941. By December 31, 1941, only 1.25 percent of the total insured mortgages in force had been reported delinquent, as compared with with l.SS percent at the end of 1940, 1.97 percent at the end of 1939, and 2.45 percent at the end of 1938. A mortgage is considered delinquent when the mortgagee reports the mortgagor past due on one monthl}7- payment. Of the 9,405 • mortgages reported delinquent through the end of 1941, a total of 76.66 percent represented minor delinquencies, 17.19 percent represented serious delinquencies on which foreclosure was considered imminent or had actually been started, and 6.15 percent represented foreclosed properties either held by the mortgagee subject to redemption or with claims filed for insurance.
2S !Federal housing administration 29
terminated during Ju41, while mortgages refinanced with a new .insured mortgage represented 21.5 percent of the total terminations.
Foreclosures, on the other hand, declined 22.7 percent to 1,122 from 1,452 in 1940. Similarly, the number of seriously delinquent cases declined to 1,617 as of December 31, 1941, from 1,906 at the end of 1940 and 1,757 at the end of 1939. Such delinquencies represented only 0.21 percent of the insured mortgages in force at the year-end, compared with 0.33 percent at the end of 1940 and 0.40 percent at the end of 1939.
f £i
ITrend of New and Existing Home Mortgages
The proportion of FHA mortgage insurance involving loans to finance new homes continued to expand during 1941, in reflection of the accelerated pace of new home building under the FHA program in war industry areas. The 210,302 new home mortgages accepted for Insurance under Title II and Title VI represented 83.9 percent of the total mortgages accepted under the two titles during the year. By comparison, new home mortgages represented 80.3 percent of the total accepted in 1940, 72.7 percent in 1939, and 49.3 percent in 1937.
Under Title II alone, new home mortgages represented 80.8 percent of the total accepted in 1941. In reflection of the curtailment in non- defense construction, the proportion of Title II mortgages involving new homes was declining during the latter part of the year, representing 75.7 percent of the total in the final two months of 1941.
Table 11.—Trend of new and existing home mortgages: Gross number and face amount of t- to 4-family home mortgages accepted for FHA insurance under Titles II and VI, 1935-1941
f oYearly Trend of Terminations, Foreclosures, and Delinquencies
Terminations of Title II insured home mortgages increased to 30,034 In 1941 from 22,S29 in 1940, reflecting primarily an increase of 52.2 percent in the number of mortgages prepaid in full prior to maturity. Such prepayments represented 73.4 percent of the insured mortgages
Table 10.—Trend of terminations, foreclosures, and serious delinquencies: Total 1- to 4-fanaty home mortgages insured by FHA under Title II, cumulative 1935-1941
iy
Titlo VITitle IIi £94!- GiP~Defense homesTotalExisting homes ‘Now homesMonth and year
Nuin-Num-Num-Num- A mountAmountAmountAmount herherberber
J5W-6II 42,147 S170.59-l.8M 109.011 438.440.153
.108,063. .149.600.082. 149.702 i 050.100.101 170,222 741,004.784
.202,251 .880,4M, 879.
‘igiSS 'K S': si.12; 8*: us.
0.893.800
- \Vni.m14.850,850
"Smsoo..IS: ooo.
$00, 248.250 212,279,801
.248,948,357. 450,902.208 501,050, 702
.721,402,431.
44.901.50042.099.500
..01,210, 550.71,093,35077,513,250
..8-1.070,250.82,011,15079.8-42,850
..73,822,250.05,094,10044.55S, 700
..42,139,550.
29, 787 01,049 ;
.55, 111.. 52.057 40.491
.39,918.
2. 395 2,334
..3,262. 4,077 4,012
..3,893. 2,673 3,487
..3,824 4,2433, 137
..3,016.
Terminations 1935 12, 3G0 45, 502
..63,552. 97, 045
123,731 .102,333.
10,078 9,580
..13,028. 15,663 17, 009
..18, M9. 17,002 17, 402
..10, 105. 14,317 9. 859
...9, 339.
Forcclosurcs Serious delinquencies 1930
{Sr-Cumulative through end of year Cumulative through
end of year Outstanding ot end of year 1939
Year 1910...............Number for the year
Number for the
’ year
Number for the year
194112,473n.ow
.. 16, S90. 19.740 21.081
. 22, M2. 20. 57520.049
..19,929. 18.500 12,996
..12,355.
M. 855. 300
»1«S-■ass-..KM.. .-55.0-17. 550.
JanuaryFebruaryMarch____
. April MayJ uno.............JulyAugustSeptember.OctoberNovemberDecember..
Percent of total insured
Percent insured
mortgages In force
Percent of total insured
Number Number Number
i $50,580,850 16.026,250 16,838,900
..13, 161.750 12. ISO. 100 15, 055.950
..21,877,000
J 14,375. 4,534 4.740
..i®.
1935 95 95 0.41 2 2 0.01 (' (»)1936 -ioB. 14 IS
..22,829. 30,034
1,457----6,522........... 3.22.. 15.393
28 258. * 61:087............8.06.
«81,121
1.45 30 32 .03 (' 45 0.051937............ ........ 218. ......... 250. ... .12.......... ........ 379. — .191938 4.93 GOG 946 .30 3 655 8G1 .291939 6. 07 1, 149 ...1,452.
1,122
2,095---3,547. ....
4,069
45 4.820 1, 757 ---.1,900.
1,617
.401940.............56 - .331941 9.70 146,320,80040,651940,892, 100171,269,100 210,00-140,353769,623,000.21 Total, 1941. 109,051
f •1 Data not available.1 Not reported.3 Data available for October, November, and December only. < Includes 13,973 mortgages refinanced through FIIA.* Includes 20,441 mortgages refinanced through FHA.
P>»co^«gages on homos accepted within 12 months after completion of construction arc included as new homes.
1 Cumulative, April through Juno.
!Li
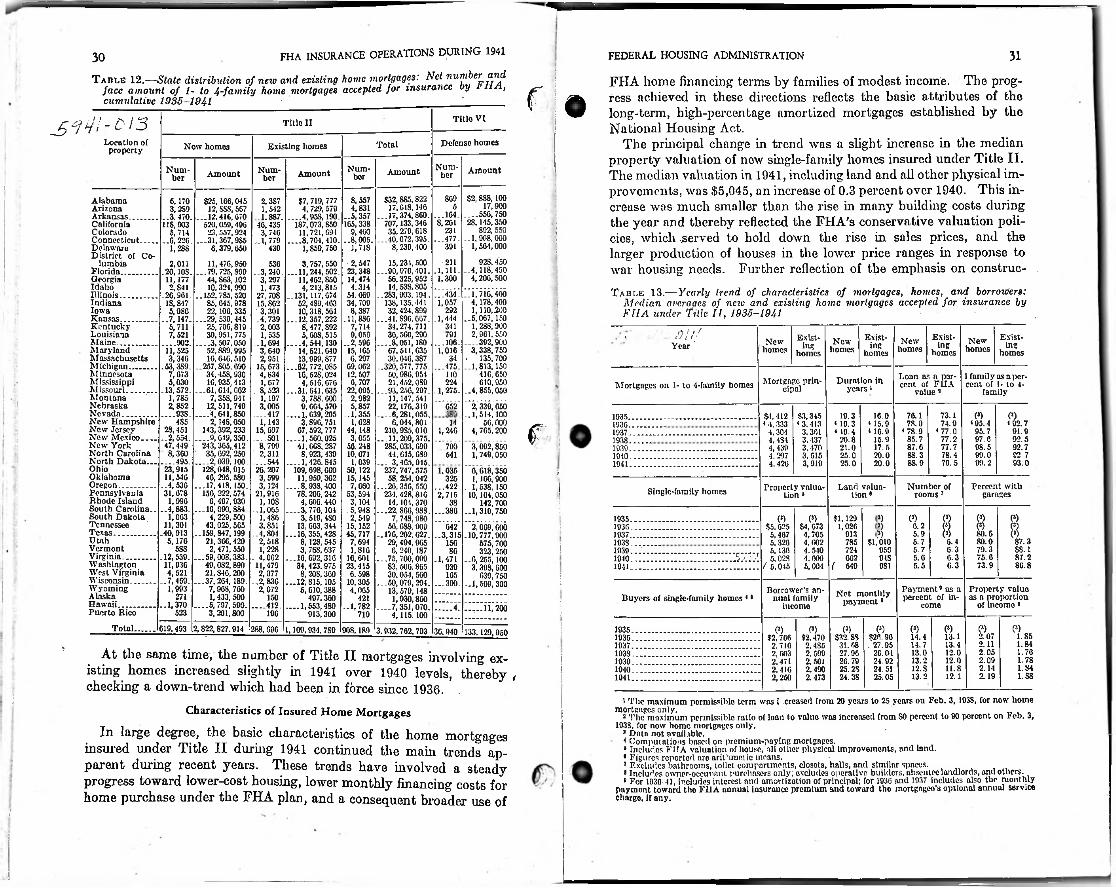
FHA INSURANCE OPERATIONS DURING 1941
Table 12.—State distribution of new and existing home mortgages: Net number and face amount of l- to 4-family home mortgages accepted for insurance oy , cumulative 1935-1941 ______________
FEDERAL HOUSING ADMINISTRATION 3130FHA home financing terms by families of modest income. The progress achieved in these directions reflects the basic attributes of the long-term, high-percentage amortized mortgages established by the National Housing Act.
The principal change in trend was a slight increase in the median property valuation of new single-family homes insured under Title II. The median valuation in 1941, including land and all other physical improvements, was $5,045, an increase of 0.3 percent over 1940. This increase was much smaller than the rise in many building costs during the year and thereby reflected the FHA’s conservative valuation policies, which -served to hold down the rise in sales prices, and the larger production of houses in the lower price ranges in response to war housing needs. Further reflection of the emphasis on construc-
Table 13.—Yearly trend of characteristics of mortgages, homes, and borrowers:Median averages of new and existing home mortgages accepted for insurance byFHA under Title II, 1935-1941
Title VIdi-oi3 Title IILocation of property
Defense homesTotalExisting homesNew homes
Num-N»m-Num- Num- AiflountAmountAmountAmount herberher ber| i
$2,888,100 17,900
....556,750 28, 1-15,350
892, 550 ..1,908,000
1,501,000
928.450 ..4,118,450
4,206,500
"i’bMoo4,178,400 1,110,200
..6.067, 1501.288.900 2,961,550
....392,900 3,338,750
. 135,700..1,813,150
416, 650 610,950
..4,855,050'*2,'330, 650 ..1,514, 100
56,000 4,765,200
”3,'092,850 1,749,050
"0," 618,’3501.166.900
. 1,538,15010,104,050
142.700 ..1,310,750
2.069,600 .10,777.900
675.700 323,250
-.6, 255, 100 3.398, 600
639,750 -1,509,300
869•gsss70L 133.346 35,270,618
-4§;»-00:070:40?.
ass*-?!s:i35:J31-
32,424.899 ...41.S96.667,
34.274,711 30,560,290
....8,051,180. 67,511,635
asss...93,250,297. 11,147,541 22,176.319
....6,281,055. 6,044,801
210.9S5.010 ...11,209,375.
•ass... 3,405,945.
237, 747.575 58, 25-1,942
...26, 356, 550JO?.'370fasts-
56. OSS, 909 ..176,202. 627.
atas?■''SKS..JStJgfeSSL
13.570.H81.0f?.8$S8-
S, 557 4,831
..5,357 165,338
9,460 -8,005.
1,718• 2,547 23,348 14,474 4.314
54.669 34,709 8,387
.11,886 7,714 9,050
..2,596 15,105 6,297
09,062 12,507 0,707
22,095. 2,982 5,857
.1,355 1,628
44, 148 3,055
56. 248 10,071
1,039 50,122 15,145 7,660
53,594 3, 104
.5,948 2,549
15,15245, 717 7,694 1,810
16,601 23,415 6.598
10.305 4,065
AlabamaArizonaArkansas..............CaliforniaColoradoConnecticut.........Delaware District of Co
lumbiaFlorida..................GeorgiaIdahoIllinois...................IndianaIowaKansas..................KentuckyLouisianaMaine...................;MarylandMassachusettsMichigan______ 'M innesota MississippiMissouri...............MontanaNebraskaNevada.................New Hampshire New JerseyNew Mexico____New York North Carolina North Dakota... OhioOklahomaOregon..............Pennsylvania Rhode Island South Carolina.. South Dakota TennesseeTexas.....................UtahVermontVirginia.................Washington West VirginiaWisconsin.............WyomingAlaskaHawaii..................Puerto Rico
§25,166,045 12, SSS, 567
...12,416,670 520,059,496 23,557.924
...31.367,985. 6,370,650
11,476,950 ...79, 725, S99
44,863,102 10.324,990
..152,785,520 85,645,978 22,106,335
...29,539,445 25,796,819 30,951,775
—3,507,050 52,8S9,995 16,646,510
..257,805, 690 34,458, 930 16,935,413
—61.614,662 7,358,941
12,511,749 —4,641,850
2,14S.050 143,392,233
—9,649,350 243,365,412
' 35,692, 250 — .2,030, 100
128,048,015 46, 295.580
...17,418,150. 156, 222,574
9,497,030 ...19,090, SS4
4.229.500 43,025,565
..159,8-17,199 21,366,420 2,471,550
...59,008.383. 49,082,890 21, S46,200
...37,264, 189. 7, 968, 7601.433.500
—5,797,500.3,201,800
§7,719, 777 4, 729, 579
__ 4,95S, 190.187,073,850
11. 721,694 ___8, 701,410.
1.859.750
3,757,550 ...11,244,502.
11,462,850 4,213,815
..131,117,674 52,489,463 10,318,564
...12.357, 222 8,477,892 5,608,515
....4.5-14.130 14,621,640 13,999,877
...62, 772,085 16,628,024 4,516,076
...31,641,635 3, 78S, 600 9,604,570
— 1,639,2053.896.751
67,592,777....1,560,025
41,608, 2878.923.439
....1,426.845109, 698,660 11,959,362
— .8,938,400 78. 206,2424.600.440
—3,776,1043,519, 480
13, 663,344 ...16,355,428
8,128, 545 3,768,037
...16,692,316 34,423.975 8,208,300
—12,815, 105 5,610,388
497.360— 1,553, 480
913, 300
6,170 3,289
„3.470. 118,903
5,714 -6, 220.
1,288
2,011.20,108.11,177 2, S41
.26,961.IS, 847 5,080
..7,147. 5,711 7,521
—902.11,525 3,346
.53,389. 7,673 5,030
.13,572. 1,785 2,852
....93S.
2,387
..iSS.t™
..1,779
5...164.8,261
231...477.
391430
211536.1,111.1,300
..3,240. 3,297 1,473
27,708 15, S62 3,301
.4, 739 2,003 1,535
.1,694 3, 640 2,951
15,673 4,834 1,677
. 8,523 1,197 3,005
....417 1,143
15, 697 ...501
8.799 ' 2,311 ...544 26,207 3,599 3, 124
21,916 1,108
..1,005 1,486 3.851
..4,80-1 2,518 1,228
..4,062 11,479 2,077
-2,836 2,072
...434.1,057 j292
.1,444341
/)!//Year
;791 E.vist-Exist- Exist-Exlst- Newhomes
Newhomes
Newhomes
Newhomes
...106.1,016
ing in?ing inghomes homeshomeshomes34
...475.110 1 family as a per
cent of 1- to 4- family
Loan as a percent of FHA
value3Duration in
years 1Mortgage prin
cipal224 Mortgages on 1- to 4-family homes1,275.
8 :652(s)73.1 (5)§3,345
4 3. 413 3.301 3,437 3,470 3.615 3,919
16.0 76.1$4,412 < 4. 333
4,304 4.4S4 4,439 4,297 4.420
19.319354S5 14 74.9 4 95.4 4 92.74 19.3 4 10.4
4 15.9 4 16.0
78.01936..................f28, 451 -2,554. 47,449 8,3G0
___ 495.23,915 11,546
-.4, 536 31,678
1,996 -4,883.
1,063 11,301
.40,913 5,176
5SS .12,539. 11,036 4,521
-7,469. 1,993
271 -1,370.
1,246 4 77.0 95.74 78.9 91.9193785.7 77.2 97.6 92.520.8 15.91938...........
790 87.0 77.7 08. 5 92.717.521.01939541 SS.3 78.4 99.0 92 725.0 20.01040
8S.9 70.5 99.2 93.020.025.019411,635 i325
Number of rooms7
Percent with garages
...422.2,715
Property valuation 4
Land valuation 6Single-family homes
38—380
0) (3) P) (3)3)<*) <*>_ $1,1291,020
1935
8 P> 83) 0.2$4, 673 4,705 4,602 4. 540 4.000 5,004
$5.025 5,407 5.320 5.130 5.028
( 5,045
642 1936j 3) 5.9 80.59131937-3,315$1,010 SO.O 87.36.7 6.47851938.-.........156
I G. 3 79.3 8S.15.7724 95G19398G ;$;r7 6.3 75.6 87.29tS 5.06G21910.1,471( 649 6.3 73.9 80.8981 5.51941939
165...390. ' Payment8 as a
percent of income
Property value as a proportion
of income5
Borrower’s annual family
incomeNet monthly
payment8Buyers of single-family homes *8150 421 l—412. -1,782 ........ 4. — 11,200523 190 719
!Total. (3) 0)(3) (3) (3)619,493 2,822,827.914 288,696 1,109.934,789 908,189 3.932.762.703 t3) (3)1935 (3)36.940 133.129,950 ■
1.8513.1 2.07$26.90 . 27.95
26.04 24.92 24.5125.05
14.4$2.470 2.4S5 2.599 2,501 2.490 2.473
$32. SS 31. 68 27.96 26.79 25.28 24.38
193G $2,700 2.710 2,603 2,471 2,416 2,250
1.842.1114.7 13.41937At the same time, the number of Title II mortgages involving ex
isting homes increased slightly in 1941 over 1940 levels, thereby , checking a down-trend which had been in force since 1936.
Characteristics of Insured Home Mortgages
In large degree, the basic characteristics of the home mortgages insured under Title II during 1941 continued the main trends apparent during recent years. These trends have involved a steady progress toward lower-cost housing, lower monthly financing costs for home purchase under the FHA plan, and a consequent broader use of
2.05 1.7613.0 12.019381.782.0913.2 12.01939
12. S 11.8 2.14 1.8419401.S82.1913.2 12.11041
: 1 The maximum permissible term was i .creased from 20 years to 25 years on Feb. 3, 1938, for now home
3 Thtfmaximum permissible ratio of loan to value was increased from SO percent to 90 percent on Feb. 3, 193S, for now home mortgages only.
3 Data not available.4 Computations based on premium-paying mortgages.4 Includes FHA valuation of house, all other physical Improvements, and land.9 Figures reported arc arithmetic means.7 Excludes bathrooms, toilet compartments, closets, halls, and similar spaces.8 Includes owner-occunanl purchasers only; excludes operative builders, absentee landlords, and others.8 For 1936-41, includes interest and amortization of principal; for 1936 and 1937 includes also the monthly
payment toward the FHA annual insurance premium and toward the mortgagee’s optional annual service charge, if any.
j
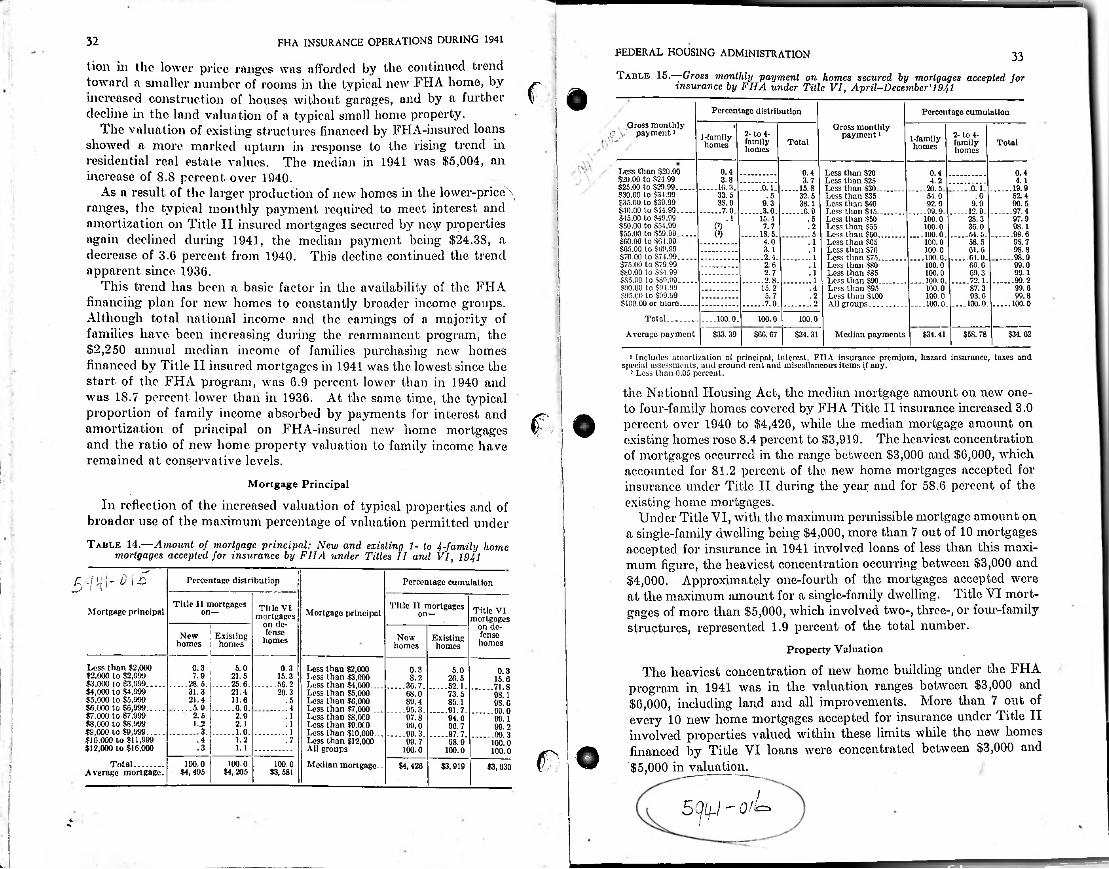
FHA INSURANCE OPERATIONS DURING 1941
lion in the lower price ranges was afforded by the continued trend toward a smaller number of rooms in the typical new FHA home, by increased construction of houses without garages, and by a further decline in the land valuation of a typical small home property.
The valuation of existing structures financed by FHA-insured loans showed a more marked upturn in response to the rising trend in residential real estate values. The median in 1941 was $5,004, an increase of 8.8 percent over 1940.
As a result of the larger production of new homes in the lower-price\ ranges, the typical monthly payment required to meet interest and amortization on Title II insured mortgages secured by ne\y properties again declined during 1941, the median payment being $24.3S, a decrease of 3.6 percent from 1940. This decline continued the trend apparent since 1936.
This trend has been a basic factor in the availability of the FIIA financing plan for new homes to constantly broader income groups. Although total national income and the earnings of a majority of families have been increasing during the rearmament program, the $2,250 annual median income of families purchasing new homes financed by Title II insured mortgages in 1941 was the lowest since the start of the FHA program, was 6.9 percent lower than in 1940 and was 18.7 percent lower than in 1936. At the same time, the typical proportion of family income absorbed by payments for interest and amortization of principal on FHA-insured new home mortgages and the ratio of new home property valuation to family income have remained at conservative levels.
32FEDERAL HOUSING ADMINISTRATION 33Table 15. Gross monthly payment on homes secured by mortgages accepted for
insurance by FHA lender Title VI, April-Dccember'1941f oPercentage distribution Percentage cumulation
Gross monthly payment i Gross monthly
payment1I
.€> 2- to 4- family homes
2- to 4- family homes
1-familyhomes'
1-familyhomesTotal Total
Loss than $20.00520.00 to $24.99$25.00 to $29.99..........$30.00 to $34.99 $35.00 to $39.99$40.00 to $44.99.........$45.00 to $49.99 $50.00 to $5-1.99$55.00 to $59.99.......$00.00 to $04.99 $G5.00 to $09.99$70.00 to $74.99.........$75.00 to $79.99 $€0.00 to $$4.99555.00 to $89.09.........$90.00 to $94.99 $95X0 to $99.99 $100.00 or more........
0.4 0.4 Less than $20 Less than $25Less than $30______Less than $35 Less than $40Less than $15.............Less than $50 Less than $55Less than $60.............Less than $05 Less than $70Less than $75.............Less than $80 Less than $85Less than $90..............Less than $95 Less than $100 All groups...................
0.4 0.43.8 3.7 4.2 4.1
........ 10.3. .......... 0.1............15.8 ........ 0.1..............19.9........ 20. 5.33.5 .5 32.5 .0 52.45-1.038.9 9.3 38.1 92.9 9.9 90.5
.......... 7.0.............. 3.0..............6.9 ..........97.4........99.9.100.0 100.0
....100.0. 100.0 100.0
—■- oo.o. 100.0 100.0
....100.0. 100.0 100.0
....100.0.
........ 12.9.. 1 97.915.4 28.3.5(*) 7.7 .2 30.0 98.1(J) ........18.5. 6 ........ 64.5..............98.6
4.0 9S.7. 1 58.53. 1 98.8.1 01. G2.4 ........ 98.91 ........61.0.2.6 99.0. 1 60. G2.7 .1 69.3 99.12.8 ........72.1.............. 99.21
15.2 .4 S7. 3 99.65.7 .2 93.0
....100.0.99.8
7.0 2 ........ 100.0
Total........... ....100.0. 100.0 100.0
$34.62Average payment $33.39 $60. G7 $31.31 Median payments $34.41 $5S. 78
1 Includes amortization of principal, interest, FIIA insurance premium, hazard insurance, taxes and special assessments, and ground rent and miscellaneous items if auy.
1 Less than 0.05 percent.
the National Housing Act, the median mortgage amount on new one- to four-family homes covered by FIIA Title II insurance increased 3.0 percent over 1940 to $4,426, while the median mortgage amount on existing homes rose 8.4 percent to $3,919. The heaviest concentration of mortgages occurred in the range between $3,000 and $6,000, which accounted for 81.2 percent of the new home mortgages accepted for insurance under Title II during the year and for 58.6 percent of the existing home mortgages.
Under Title VI, with the maximum permissible mortgage amount on a single-family dwelling being $4,000, more than 7 out of 10 mortgages accepted for insurance in 1941 involved loans of less than this maximum figure, the heaviest concentration occurring between $3,000 and $4,000. Approximately one-fourth of the mortgages accepted were at the maximum amount for a single-family dwelling. Title VI mortgages of more than $5,000, which involved two-, three-, or four-family structures, represented 1.9 percent of the total number.
Property Valuation
The heaviest concentration of new home building under the FHA program in 1941 was in the valuation ranges between $3,000 and $6,000, including land and all improvements. More than 7 out of every 10 new home mortgages accepted for insurance under Title II involved properties valued within these limits while the new homes financed by Title VI loans were concentrated between $3,000 and $5,000 in valuation.
C, #
i Mortgage Principal
In reflection of the increased valuation of typical properties and of broader use of the maximum percentage of valuation permitted underTable 14.—Amount of mortgage principal: New and existing 1- to 4-family home
mortgages accepted for insurance by FIIA under Titles II and VI, 1941I
0 i£ Percentage distribution| Percentage cumulation
Title II mortgages on— Title II mortgages
on—Title VI mortgages
on defense
homes
Title VI mortgages
on defense homes
Mortgage principal Mortgage principal
Newhomes
Existinghomes
I Newhomes
Existinghomes
Less than $2,000 $2,000 to 82,999$3,000 to $3,999.........$4,000 to $4,999 $5,000 to $5,999$6,000 to $6,999.......$7,000 10 $7,999 $8,000 to $8,999$9,000 to $9,999.......$J0.000 to $11,999 $12,000 to $16,000
Total..........Average mortgage.
0.3 5.0 0.3 Less than $2,000 Less than $3,000 Less than $4,000.... Less than $5,000 Less than $6,000Less than $7,000__Less than $8,0C0 Less than $9.0(0 Less than $10,000... Less than $12,000 All groupsMedian mortgage.-
0.3 5.0 0.37.9 21.5 15.3 8.2 26.6 15.6........ 28.5. ........25.6. ......... 56.2 ........ 36.7. ........ 52.1. .......... 71.831.3 21.4 26.3 68.0 73.5 98.1\ 21.4 11.6 .5 89.4 85.1 98.6.5.9. .......... 6.6. ........4 ........ 95.3. ........ 91.7. .......... 99.02.5 2.9 .1 97.8 94.0 99.1.1 1..2 2.1 .1 99.0 96.7 99.23 1.0 1 ........ 99.3. .........97.7.
......mo100.0
.4 1.2 .7 99.7 98.9.3 1.1 O100.0 100.01100.0
$4,495100.0
$4,205100.0
$3,581$4,426 $3,919 $3, 030!
/5^/*
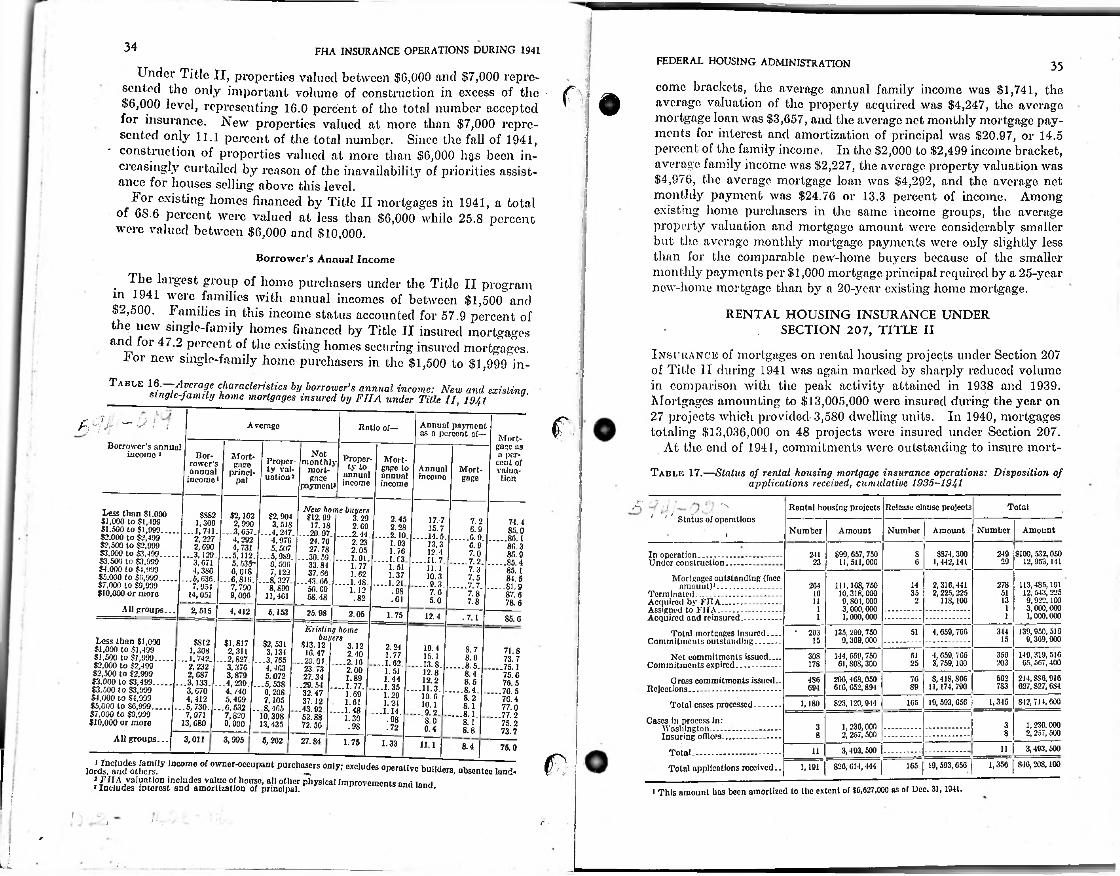
34 FHA INSURANCE OPERATIONS DURING 1941FEDERAL HOUSING ADMINISTRATION
come brackets, the average annual family income was $1,741, the average valuation of the property acquired was $4,247, the average mortgage loan was $3,657, and the average net monthly mortgage payments for interest and amortization of principal was $20.97, or 14.5 percent of the family income. In the $2,000 to $2,499 income bracket, average family income was $2,227, the average property valuation was $4,976, the average mortgage loan was $4,292, and the average net monthly payment was $24.76 or 13.3 percent of income. Among existing home purchasers in the same income groups, the average property valuation and mortgage amount were considerably smaller but the average monthly mortgage payments were only slightly less than for the comparable new-home buyers because of the smaller monthly payments per $1,000 mortgage principal required by a 25-year new-home mortgage than by a 20-year existing home mortgage.
RENTAL HOUSING INSURANCE UNDER SECTION 207, TITLE II
Insurance of mortgages on rental housing projects under Section 207 of Title II during 1941 was again marked by sharply reduced volume in comparison with the peak activitj' attained in 1938 and 1939. Mortgages amounting to $13,005,000 were insured during the year on 27 projects which provided 3,580 dwelling units. In 1940, mortgages totaling $13,036,000 on 48 projects were insured under Section 207.
At the end of 1941, commitments were outstanding to insure mort-
Table 17.—Status of rental housing mortgage insurance operations: Disposition of applications received, cumulative 1935-1941
35Under Title II, properties valued between $6,000 and $7,000 represented the only important volume of construction in excess of the $6,000 level, representing 16.0 percent of the total number accepted for insurance. New properties valued at more than $7,000 represented only 11.1 percent of the total number. Since the fall of 1941,
- construction of properties valued at more than $6,000 h&s been increasingly curtailed by reason of the inavailability of priorities assistance for houses selling above this level.
For existing homes financed by Title II mortgages in 1941, a total of 6S.6 percent were valued at less than $6,000 while 25.8 percent were valued between $6,000 and $10,000.
Borrower’s Annual Income
The largest group of home purchasers under the Title II program in 1941 were families with annual incomes of between $1,500 and $2,500. Families in this income status accounted for 57.9 percent of the new single-family homes financed by Title II insured mortgages and for 47.2 percent of the existing homes securing insured mortgages.
For new single-family home purchasers in the $1,500 to $1,999 in-
T"“2s&®h ->•' rAnnual payment
as a percent of—Average/ Ratio of—
Mortgage 03 a percent of valuation
Borrower’s annual income 1 Not
monthly [ mort-
gagepayment*
Borrower’s annual income1
Mortgage
princi-Proper- ty to
annual income
Mortgage to annunl income
Property valuation * Annunl
incomeMortgagepnl
r- TotalRental housing projects Release clause projects]New home buyers '£8-
—20.07.J 2.44.| 2. JO.
-is. as.--43. 00.) 1.48.
50. ca 68.48
Less than SI.000 Si,000 to SI, 199 $1,500 to $1,999 ... $2,000 to $2,199 $2,500 to $2,999$3,000 to $3,-199.......$3,500 to $3,999 $4,000 to $-1,999$5,000 to $0,999.......$7,000 to $9,999 $10,000 or rnoro
All groups...
i>$8821,309
...1,711.
|Si "Vm
4,380
ks?-14,051
$2,102 2,990
...3,057.4,292 4,731
...5,112.5,535- 0,018
L-0,810.7,790 9,000
2,515) 4,412 5,153
$2.904 3,51S
...4,247. 4,976 5.507
...5, 9S9. 0,500 7,122
...8,327. 8,890
11,401 I
/3. 29 2.45 Status of operations17.715.7
7.2 74. I2.00 2.28 0.0 Number Amount85.0 Number Number AmountAmount....14.5. I.......C. 0.........80.12.23 1.03 13.3 0.9 80.32.05 1.76 12.4 7.0 $874,300 1,442, 141
249 $100,532,050 12,953,141
$99, 057,750 11,511,000
S85. 9 In operation...................... .Under construction..........
241....1.(3. -—11.7. 29-..7.2. 0....... 85.4 231.51 11.1 7.3 85. 11.62 1.37 10.3 7.5 Mortgages outstanding (face amount)1...........................
84.5—.1.21 — .9.3. 113,4S5,191 12, 543,225 9,922.1003.000. 0001.000. 000
2,310.441 2,225,225
118,100278....... 7.7. 111,108,750
10,318,000 9, SOI, 0003.000. 0001.000. 000
14264.......81.91.12 • OS 7.0 35 517.8 Terminated..-..............Acquired by FHA.......Assigned to FIIA.........Acquired and reinsured
1087.0. S2 .01 5.0 1327.8 1178.6 1125.98 | 2.05 1.75 12.4 1.7.1 185.6Brisling home
buyers 113SSo°4,059,700 34451Total mortgages insured — Commitments outstanding...........
Net commitments issued__Commitments expired...................
Gross commitments issued.. Rejections-.....................................
Total coses processed...........
Cases in process in:Washington.........-.....................Insuring ofllccs.........................
Total......................................Total applications received—
• 293 135,290,750 9,309,000 15Loss than $1,000
$1,000 to $1,499$1,500 to $1,999.......$2,000 to $2,499 $2,500 to $2,999$3,000 to $3,499.......$3,500 to $3,999 $4,000 to $4,999$5,000 to -SO,999........$7,000 to .$9,999 $10,000 or more
All groups...
15$SI2 $1,817 2,311
...2,827. 3,370 3,879 4,239. 4. /40 5,409
—0,532 7,820 9,900
$2, 531 3,134
...3, 705 4. 103 5.072
...5,538 0,208 7,105
-.8,405 10,398 13,435
$13.12 10.47
till"ssl
3.12 2.24 19.4 8.7
iS4,412
13,080
71.82.40 149,319,516 65,507,400
1.77 4,059, 7G6 3, 759,100
359144, 650,750 61,80S, 300
5115.1 30S8.0 73.7....2.10 203--.1.02. 2517S..13.8. ....... 8.5. —75.12.00 1.51 12.8 8.4 75.61.89 214, SS6,910 627, S27, 6S4
50270 S, 41S, SOC 89 11,174,790
1.44 200,468,050 010,052,894
•ISO12.2 8.5 70.5. — 1.77. 783—1.35 094—.11.3. .......8.4.........70.51.69 1.29 10.0 S. 2 70.4 1,315 812, 714,600....! :S 19, 593,050823,120,914 1651.24 1,18010.1 8.1 77.0—1.14. -.9.2. .......8.1. —77.21.30 .98 8.0 8. 1 75.2 3.98 1,230,000 2, 257, 500
.72 30.4 S.8 73.7 883,011 3,995 5,262 27.84 1.75 1.33 11.1 8.4 75.0 3,493,500113,493,50011
#31 Includes family income of owner-occupant purchasers only; excludes operative builders, absenteo land-2 FIIA valuation includes value of house, all other physical improvements and land * Includes interest and amortization of principal.
820,614,444 | 816,208,10019,593,056 1,3561651,191
• This amount has been amortized to the extent of $6,627,000 as of Dec. 31,1041.
1 c /' - /* -i
*f
Lx ;
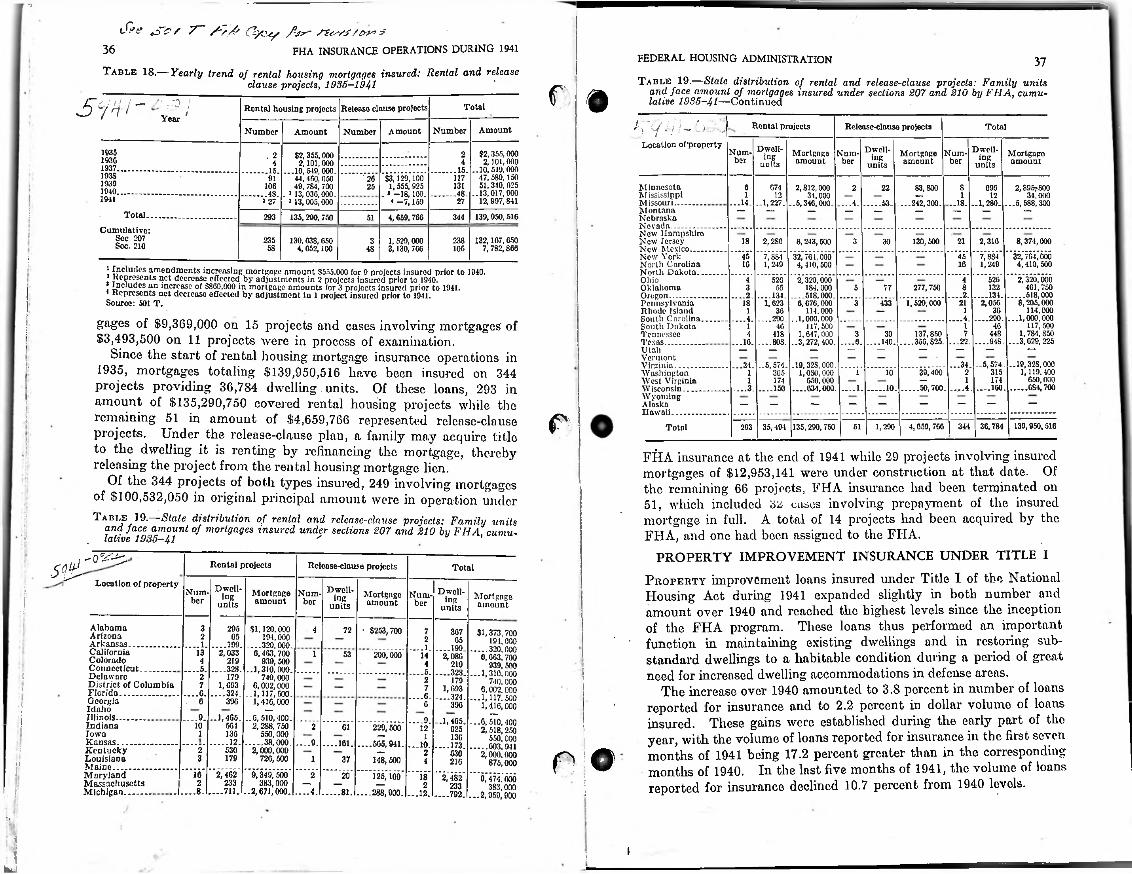
T
S°s 7~~ sty# Optus AFHA INSURANCE OPERATIONS DURING 1941
Table 18.—Yearly trend of rental housing mortgages insured: Rental and releaseclause projects, 1935-1941
36FEDERAL HOUSING ADMINISTRATION 37Table 19.—Stale distribution of rental and release-clause projects: Family units
and face amount of mortgages insured under sections 207 and 210 by FHA, cumulative 1935-41—Continuedf dSW' :o I TotalRelease clause projectsRental housing projects
Year '
Location of'property
Rental projects Release-clause projects TotalAmountNumberAmountNumber Amount Number
Dwell- Dwell-D welling
unitsNum-1935 Mortgage Num-
amount berMortgage Num- amount ber
Mortgageamount
$2,355,000 2,101,000
..10,519,000 -17,589,150 51,340,025
..13,017,900 12,997,841
2$2, 355,000 2,101,000
-.10,549,000. 44,460,050 49, 7S4, 700
* 13,030,000.* 13,005,000
. 2 ing ingber193G 44 units units1937 15.15193S 26 $3,129,100 1,555,925
. * -18,100. < -7,159
117911939 131106 25 MinnesotaMississippiMissouri—........MontanaNebraskaNevada...............New Hampshire New JerseyNew Mexico____New York North Carolina North Dakota... OhioOklahomaOregon................. .Pennsylvania Rhode Island South Carolina.. South Dakota TennesseeTexas....................UtahVermontVirginia...............Washington West VirginiaWisconsin_____WyomingAlaskaHawaii.................
0 674 2.812.00031,000
..5,346,000.
83,800 ...242,300.
8 2,895? S00 34,000
...5, 688,300
2 690221940 ...... -.48.4S 1 12 1 121941 3 27 27 ...14. ..1,227. ..18. ..1,280.—4......... 53.Total. 139,950,516293 135,290,750 4, 659, 766 34451
Cumulative: Sec 207 Sec. 210
235 132,167, 6.50 7,782,866
130, 638,650 4,052,100
1,529,000 3,130,766
2383 18 8.374.000 "swooo
4,410,500
■■'2,'m6o6461,750
........ 518,0008.205.000
114,000...1,000,000
117,5001,781,850
...3,629,225
2,286
7,884 1,249
8,243,500
-M&ooo-114,000
•■‘■ssss-.issa.
3 130,500 21 2,316
7,'884’ 1,249
306S 10648
45 45.1G 16i
1 Includes amendments increasing mortgage amount $555,000 for 9 projects insured prior to 1940. Reoresents net decrease effected by adjustments in 2 projects insured prior to 1940. includes an increase of $S60,000 in mortgage amounts for 3 projects insured prior to 1941.
‘ Represents net decrease effected by adjustment in 1 project insured prior to 1941.Source: 501 T.
4 5264 526277,750
1," 529)666'
8 1323 55 5 772 134.2 134.
2,056IS 1,623 3 433 211 361 36
290.290. .4.4gages of $9,369,000 on 15 projects and cases involving mortgages of $3,493,500 on 11 projects were in process of examination.
Since the start of rental housing mortgage insurance operations in 1935, mortgages totaling $139,950,516 have been insured on 344 projects providing 36,784 dwelling units. Of these loans, 293 in amount of $135,290,750 covered rental housing projects while the remaining 51 in amount of $4,659,766 represented release-clause projects. Under the release-clause plan, a family may acquire title to the dwelling it is renting by refinancing the mortgage, thereby releasing the project from the rental housing mortgage lien.
Of the 344 projects of both types insured, 249 involving mortgages of $100,532,050 in original principal amount were in operation under
461 46 1137,850
....140..........356, S25.7 4483 304 418
...22. -----948....16..........SOS. ....6.
..19,32S, 000MW. 400650,000
........ 6S4,700
34. ..5,574.5,574. -'SffiSjjj..JftS.
j .34.31539,400
........ 10............ 50,700. ~„_4.
21 101 30517411 174
....160.3 ....1..150
r... 139,950,5164,659,766 344 36,7841,290Total 293 35,494 135,290,750 51
j FHA insurance at the end of 1941 while 29 projects involving insured mortgages of $12,953,141 were under construction at that date. Of the remaining 66 projects, FHA insurance had been terminated on 51, which included cases involving prepayment of the insured mortgage in full. A total of 14 projects had been acquired by the FHA, and one had been assigned to the FHA.
PROPERTY IMPROVEMENT INSURANCE UNDER TITLE I
Property improvement loans insured under Title I of the National Housing Act during 1941 expanded slightly in both number and amount over 1940 and reached the highest levels since the inception of the FHA program. These loans thus performed an important function in maintaining existing dwellings and in restoring substandard dwellings to a habitable condition during a period of great need for increased dwelling accommodations in defense areas.
The increase over 1940 amounted to 3.8 percent in number of loans reported for insurance and to 2.2 percent in dollar volume of loans insured. These gains were established during the early part of the year, with the volume of loans reported for insurance in the first seven months of 1941 being 17.2 percent greater than in the corresponding months of 1940. In the last five months of 1941, the volume of loans reported for insurance declined 10.7 percent from 1940 levels.
Table 19.—Stale distribution of rental and release-clause projects: Family units and face amount of mortgages insured under sections 207 and 210 by FHA,!
cumu-
Rental projects Release-clause projects Total
Location of property Dwell- Dwcll-i Dwoll-Num- Mortgageamount
Mum- Mortgageamount
Num- Mortgagoamount
ing ing ingber ber berunits units units:AlabamaArizonaArkansas.....................CaliforniaColoradoConnecticut_________DelawareDistrict of ColumbiaFlorida.................Georgia IdahoIllinois..................Indiana IowaKansas..................Kentucky LouisianaMaine....................Maryland Massachusetts Michigan............. .
3 295 $1,120,000 ...mooo.*SB)5B
....5. ....328. ..1,310, 000.710,000
6.002,000""lj410)000"
-----0. ..1,405. ..0,510,400.
...38,000. 2«
W..I....8.......... 711. ..2,071,000.
4 • $253,70072 7 3G7 $1,373, 700191.000
........320.0000, 603, 700
939, 500 -..1,310.000
740.000 6,002.000
—1,117. 500 1,416,000
...0.510,400 2,518,250
550.000 ........ 603,911
2,000.000875.000
*""6)474)666383.000
...2,959,900
2 65 2 651. 199. —.1. -...199.2,08613 2,033 1 53 200,000 144 219 4 219
.5. 32S< 2 179 2 1797 1, C93 7 1,693—324.
: 6 324. -..6.0 396 G; 396!
9. 1,465.10 561 2 229.500
— - 9..........161...........505,941____ 10...........173.
148.500
125," 166"- -4............81.......... 288,000. ...12........... 702.
61 12 G251 136 112.5302) n o2 5303 179 1 37 4 216;
16 2,462 2 20 18 2,4822332 2 233!
Ii 1
Lk.:
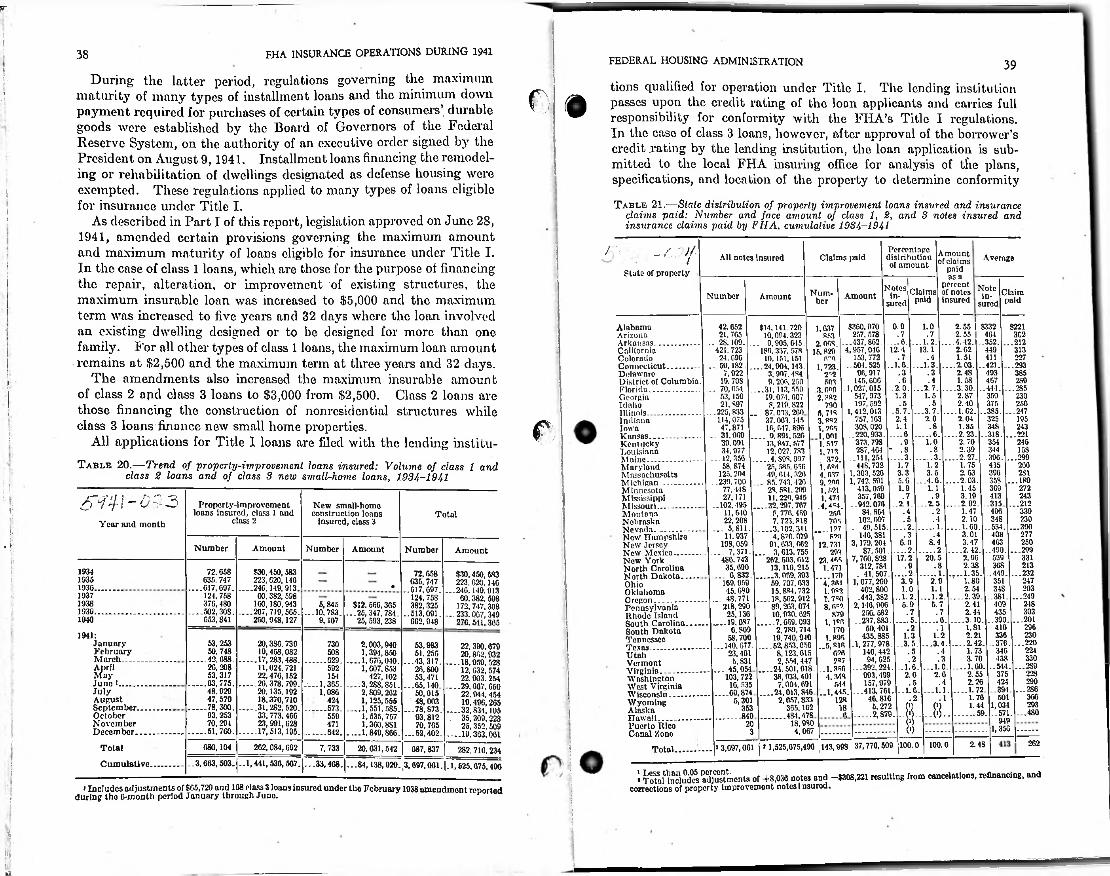
FT
jI
FHA INSURANCE OPERATIONS DURING 1941
During the latter period, regulations governing the maximum maturity of many types of installment loans and the minimum down payment required for purchases of certain types of consumers’ durable goods were established by the Board of Governors of the Federal Reserve System, on the authority of an executive order signed by the President on August 9,1941. Installment loans financing the remodeling or rehabilitation of dwellings designated as defense housing were exempted. These regulations applied to many types of loans eligible for insurance under Title I.
As described in Part I of this report, legislation approved on June 28, 1941, amended certain provisions governing the maximum amount and maximum maturity of loans eligible for insurance under Title I. In the case of class 1 loans, which are those for the purpose of financing the repair, alteration, or improvement of existing structures, the maximum insurable loan was increased to $5,000 and the maximum term was increased to five years and 32 days where the loan involved an existing dwelling designed or to be designed for more than one family. For all other types of class 1 loans, the maximum loan amount remains at $2,500 and the maximum term at three years and 32 days.
The amendments also increased the maximum insurable amount of class 2 apd class 3 loans to $3,000 from $2,500. Class 2 loans are those financing the construction of nonresidential structures while class 3 loans finance new small home properties.
All applications for Title I loans are filed with the lending institu-
Table 20.—Trend of property-improvement loans insured: Volume of class 1 and class 2 loans and of class 8 new small-home loans, 1934-1941
38 FEDERAL HOUSING ADMINISTRATION
tions qualified for operation under Title I. The lending institution (ipasses upon the credit rating of the loon applicants and carries full “ responsibility for conformity with the FHA’s Title I regulations.
In the case of class 3 loans, however, after approval of the borrower’s credit xating by the lending institution, the loan application is submitted to the local FHA insuring office for analysis of tfie plans, specifications, and location of the property to determine conformity
Table 21.—Stale distribution of properly improvement loans insured and insurance claims paid: Number and face amount of class 1, 2, and 3 notes insured and insurance claims paid by FHA, cumulative 1934-1941
39i
f,’
i
I
/■■■' •
Percentage distribution of amount
Amount of claims
paidAll notes insured Claims paid Average/• i State of property1 as a
perrent of notes insured
Notes Notein- ^lnira
suredClaims
paidNum- in-Numbcr AmountAmount paidber sured
$360,970 0.9257,578 .7
...437,8G2.......... 6. ...1.2........ 4.42. .352. ...2124,957,040 12.4 13.1 2.62 449 313
153,772 .7 .4 1.51 411 227.,504.525 ..1.6. -.1.3........ 2.03. ..421. ...293
90,917 .3 .3 2.48 103 385145, GOG .0 .4 1.58 467 2S0
-1.027,015 2.0. ...2.7...... 3.30. ..444. ...2S5547,973 1.3 1.5 2.S7 359 230197,592 . 5 . 5 2.40 375 250
1,412.013 .5.7. ...3.7......... 1.62. ..385. ...247757,103 2.4 2.0 2.04 325 195308,020 1.1 .8 1.85 34S 243
-220.933........ 6 ........ 6..........2.23. ..318. ...221373,798 . 9 1.0 2.70 351 246287,401 ' .8 . 8 2.39 344 1GS
-111.251........3 --------- 3.........2.27. .390. ...299448.732 1.7 1.2 1.75 435 200
1,303,520 3.3 3.5 2.03 396 2811,742,591 5.0. ...4.6........ 2.03. ..35S ...189
413,059 1.9 1.1 1.45 309 272357,769 . 7 . 9 3.19 413 243
..942.070 . 2.1 ...2.5.......2.92. .315. ...21284,801 .4 . 2 1.47 490 339
102.097 . 5 . 4 2.10 348 230- 49,515.........2........... 1......... 1.60. ..534. ...390
146.381 .3 .4 3.01 408 2773,179.204 6.0 8.4 3.47 463 250
87.501........2........ 2 ....... 2.42. ..490. ...2997,760.828 17.2 20.5 2.96 539 331
312,784 . 9 .S 2.38 36S 213- 41,507.........2............1.L.. 1.35. .449. ...232
1,077.260 3.9 2.9 1.80 351 247402.800 1.0 1.1 2.54 348 203
.443,382 .1.2. ...1 2....... 2.39. .381. ...2492,146.900 6.9 5.7 2.41 409 248
200 582 . 7 . 7 2.44 435 303—237’, 883.........5............ 0......... 3.10. ..390. ...201
50.401 .2 .1 1.81 410 296435.885 1.3 1.2 2.21 336 230
.1,277,978. ..3.5. ...3.4.........2.42. ..370. ...2-20140,442 -5 -4 lll\ ?42 2249-1.025 . 2 . 3 3.70 438 330
...392.224. .1.0 ...1.0....... 1.00. ..544 ...£9093,499 2.0 2.6 2.55 3/5 228157,979 . 5 . 4 2.26 424 290
...413,701. -1.6. ...1.1....... 1.72.1..3M. —2S646.810 . 2 .1 1.76 501 3665,272 0) 0) 1.44 1,034 293
...... 2,879. ._(*)............59.1..571. —480
1.042.652 21,705
*11- 59.182.
..isM2
...225,833 "I! 871
- ll-s -"ASfcS34.977 12.027.783
....12,356. ........4.S98.99758.874 25,585. 656125-49,014,320
..239.700 ... 85.743,420 77.448 28.581. 29927.171
..102,495 ....32,297.707...f.
..S.480.743 35.090
... 6,832.169.959 45.680
- 48,771 —18.562.912218,290 89.203.07425,130
..__19.687........... 7.609.093o.eoo
..,K103,722
5,301
2.55 8332 8221AlabamaArizonaArkansas....... ...............CaliforniaColoradoConnecticut................DelawareDistrict of Columbia.Florida.........................GeorgiaIdahoIllinois...........................IndianaIowaKansas..........................KentuckyLouisianaMaine.........................Maryland M nssaehusottsMichigan..................MinnesotaMississippiMissouri.....................MontanaNebraskaNevada.....................Now Hampshire New JerseyNew Mexico.............New York North CarolinaNorth Dakota..........OhioOklahomaOregon..........................Pennsylvania Rhode IslandSouth Carolina----- ..South Dakota TennesseeTexas.............................UtahVermontVirginia.........................Washington West VirginiaWisconsin.....................WyomingAlaskaHawaii..........................Puerto Rico Canal Zone
$14.141720 10.004.323
... 9.905.015,
'Kum—23.S5S
19.074.007 8,219.822
... 87,033.260 37.003. 145 15,647.890
1,037.7 2.55 464 3C2sr<3
2.008. 15. 829
rro1.723.
2"2503
3.009 2,382
7905, 7'8 3.8*2 1.205 1.001 1.517 1,713
372. 1.0O4 4.037 9.3.00 1.521 1.474
.4,4*4.
j
f:•
'Mi
Year and month
11.220.945Proper ty-im pro vem en t
loans insured, class 1 and class 2
New small-home construction loans
insured, class 31.. jisasi
91,033.002 ... 3,613,755
*aiasiI®
15.884.732
250Total70S
i ___ 19.7520
12,731•t; Number Amount Number Amount Number Amount 203■
i 23. 405 1.4711 1934 ...1:1.
124,758376.480
—502,308.G53.841
$30,450, 583 223, G20,140
—246,149,913. 00,382,598
160,180,943 ....207,719,505.
250,948,127
72,058 035,747
-617,697. 124,758 382,325
..513,091. 062,948
$30,450,583 223, 620, 140
—24G.149.913 60.382. 598
172, 747.308 - 233.007,349
276. 541,365
1791935 'Tsoi1.0*2T.7«08.052
!1930.............., 19371938
9,107
$12.506,365 ...25,347, 784.
25,593, 2381930 10.930.625 8791940 1,1*0
170 1.895
-5,810
2.789.714 19.740.940
— .52.853.050
sagAo&lg2«
............ 484.478
1941:JanuaryFebruaryMarch...........................AprilMayJune 1............................JulyAugustSeptember...................October November December....................
53.253..ass.II ..-ass-47,579
........ 78,300.93.253 70.294
.........51,760.
20,386.73919,408.082
.........17,283,488.11,024.72122,476,152
........ 20.378.709,20.135.192.|p-...BIS
730 was--tSffiSS-
427,102'-'kml02’
1.125,555-■«
....!:saa.
as53, .171
-“.MO. 50.015
78* 873 93.812 70,765
—52,402.
22,390.679 20.862.932
— 18.959,528 12,032. 574 22,903.254
—29.667.650
..:.asaaf
508 6*6......... 029. ?«7
592 ..1.35ft4.348154
544-1,445.
12842418......... 673. 353
6849559 949820471 1,3563........ 642.2622.4S100.0* 3,697,001 |» 1,525,675,490 143,998 37,776,509 | 100.020,631,542 | 087,837 j680,104Total 262,084,692 7,733 Total.282,716.234
3,663,593. -1,441,530,507------ 33,468.Cumulative. —84,138,929. 3,097.001. |. 1,625.675,496I ;! TotAHncludcs adjustments of +8.036 notes and -$308,221 resulting from cancelations, refinancing, and
corrections of property improvement notes l nsured.{
* Includes adjustments of $65,720 and 168 class 3 loans insured under the February 1938 amendment reported during the 6-month period January through Juno.':
I.id: ;
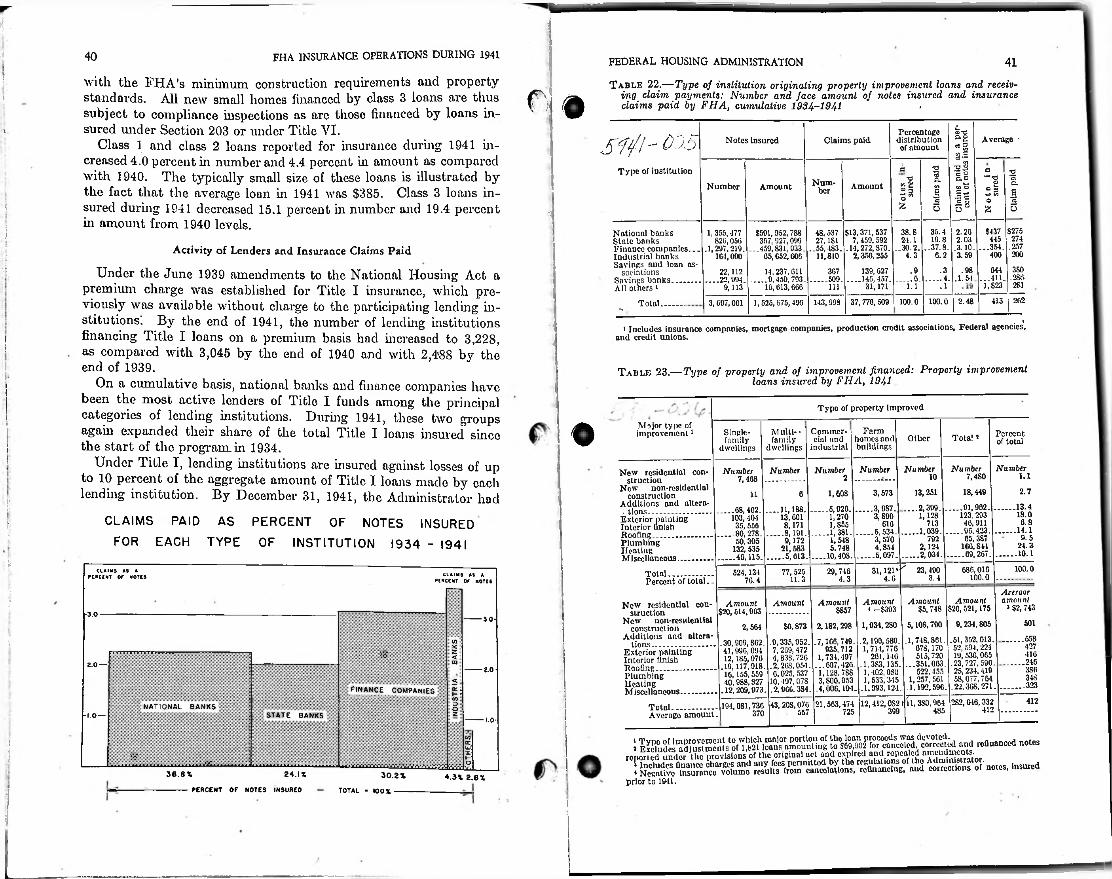
rFHA INSURANCE OPERATIONS DURING 1941
with the FHA’s minimum construction requirements and property standards. All new small homes financed by class 3 loans are thus subject to compliance inspections as are those financed by loans insured under Section 203 or under Title VI.
Class 1 and class 2 loans reported for insurance during 1941 increased 4.0 percent in number and 4.4 percent in amount as compared with 1940. The typically small size of these loans is illustrated by the fact that the average loan in 1941 was $385. Class 3 loans insured during 1941 decreased 15.1 percent in number and 19.4 percent in amount from 1940 levels.
40 FEDERAL HOUSING ADMINISTRATION 41' Table 22.—Type of institution originating properly improvement loans and receiv
ing claim payments: Number and face amount of notes insured and insurance claims paid by FHA, cumulative 1984-1941,1 o
*1Percentage distribution of amount
Average •Notes Insured Claims paid*3a-
l!1aType of institution a 1— •3T3 —* w
Num- £oNumber Amount Amount CO W O11o°
ber O s*-» V3 I
3o o 3.A O o
•; $437 S275271
38. S 35.4 2.26$13,371,537 7,459.592
.14,272, S70. 2,356,255
National banks State banks Finance companies... Industrial banks Savings and loan as
sociationsSavings banks...............All others 1
1,355,477 S26,056
.1,297,219. 164,090
$591,952,788 367,927,099
...459,831,933. 65,652,606
14,237,611........9,459,793.
16,613,666
48,537 27,181
..55,483. 11,810
; 41519.824.1 2.03i ..37.8. .3.10___ 354. .257400 200
..30.2.Activity of Lenders and Insurance Claims Paid 4.3 6.2 3.59:•i 3S0Under the June 1939 amendments to the National Housing Act a
premium charge was established for Title I insurance, which previously was available without charge to the participating lending institutions. By the end of 1941, the number of lending institutions financing Title I loans on a premium basis had increased to 3,228, as compared with 3,045 by the end of 1940 and with 2,488 by the end of 1939.
644.9 .3 .98139,627 131,171*
36722,112....22,994.
9,113.286
i:S23‘.1.54........ 6............4.........509.
2811. 1 .1111
2624132.48100.0 100.037,776,509143,998Total______ 1,525,675,4963,697,061
• Includes insurance companies, mortgage companies, production credit associations, Federal agencies, and credit unions.I i
Table 23.—Type of property and of improvement financed: Properly improvement loans insured by FHA, 1941On a cumulative basis, national banks and finance companies have
been the most active lenders of Title I funds among the principal categories of lending institutions. During 1941, these two
Typo of property improvedgroups
again expanded their share of the total Title I loans insured since the start of the program, in 1934.
Under Title I, lending institutions are insured against losses of up to 10 percent of the aggregate amount of Title I loans made by each lending institution. By December 31, 1941, the Administrator had
Major type of improvement1O Farm
homes and buildings
Multi-* Commcr- fainily cial and
dwellings industrial
Single-family
dwellings
Percent of totalTotal»Other
NumberNumber Number7,480
18,449
......... 01.902.
‘SK..as-....10e°:iS.
NumberNumberNumberNumber7,468
New residential construction
New non-rcsidontlal construction
Additions and altcra-. lions.............................
Extorior painting Interior finishRoofing..............................PlumbingHeatingMiscellaneous..................
Total.......................Percent of total..
1.1102
2.713,251
...........SK.
3,573
■IK-~ll-
4.854 ........ 5,097.
1,608
........6,920.1,2701,855
........ 1,381.1,548 5.748
....10,40S-
611' .......... 13.4....11,188.
13,6018.171
........8,191.9.172
21,583........ 5,013.
.68,462. 103,401 35, 556
..80,278. 50.305
132,535 ..40,115.
18.0CLAIMS PAID AS PERCENT FOR EACH TYPE OF INSTITUTION
OF NOTES INSURED 1934 - 1941
6.8i ..........14.19.5
24.3.......... 10.1
i:31,121*1 23,490 100.06S6.016
100.029,746CLAIMS AS A
percent or notes77,525524,134
76.4CLAIMS AS A
PERCENT OP NOTES 3.44.64.311.3Average amount
s $2,743
n\ Amount
$20,521,175
9,234,805
52, 594, 224.aaa25.234.419
.5SK.
Amount $5,748
Amount * -$393
Amount$857
2,182,298
.7,106,749.935,712
1,734,497 ...607,426. 1,128.788 3,800.953
.4,000,191.
AmountAmount $20,514,903
2,56-4
.30,909,862. 41,996,094 12,185,970
.19,117,918. 10,155,559 40, OSS, 827
.12,209,973.
Now residential construction
New non-rcsidential construction
Additions and alterations..............................-
Exterior painting Interior finishRoofing..............................PlumbingHeatingMiscellaneous..................
Total.......................Average amouut.
-3.0------- 30 5011,934,280 5,108,700
.1,718,861. 678,170 515,720
...351,003.522,455
1,257, 501 .1,192,596.
$0,873
-?«-Soli.ASS.2,900,3S4.
..........558.2,100,589. 1,714,776
261,140 .1,3S3,135. 1,402,0S0 1,533,345
.1,993,121.
w427
%m
416V........... 2462 0 —
------- 20 3S6348<
...........323FINANCE COMPANIES E
ll, 380,964 282,046,332D 41212,412,0S2121,563,47443,20S, 076104,081,736NATIONAL BANKS Q 4124S5399725557370STATE BANKS-10 — --------10
3Se3SS®sSS^^-“-~prior to 1941.
E;UJ:
; o36.8% 24.1% 30.2% 4.3% 2.6%
PERCENT OF NOTES INSUREO TOTAL ■ 100%
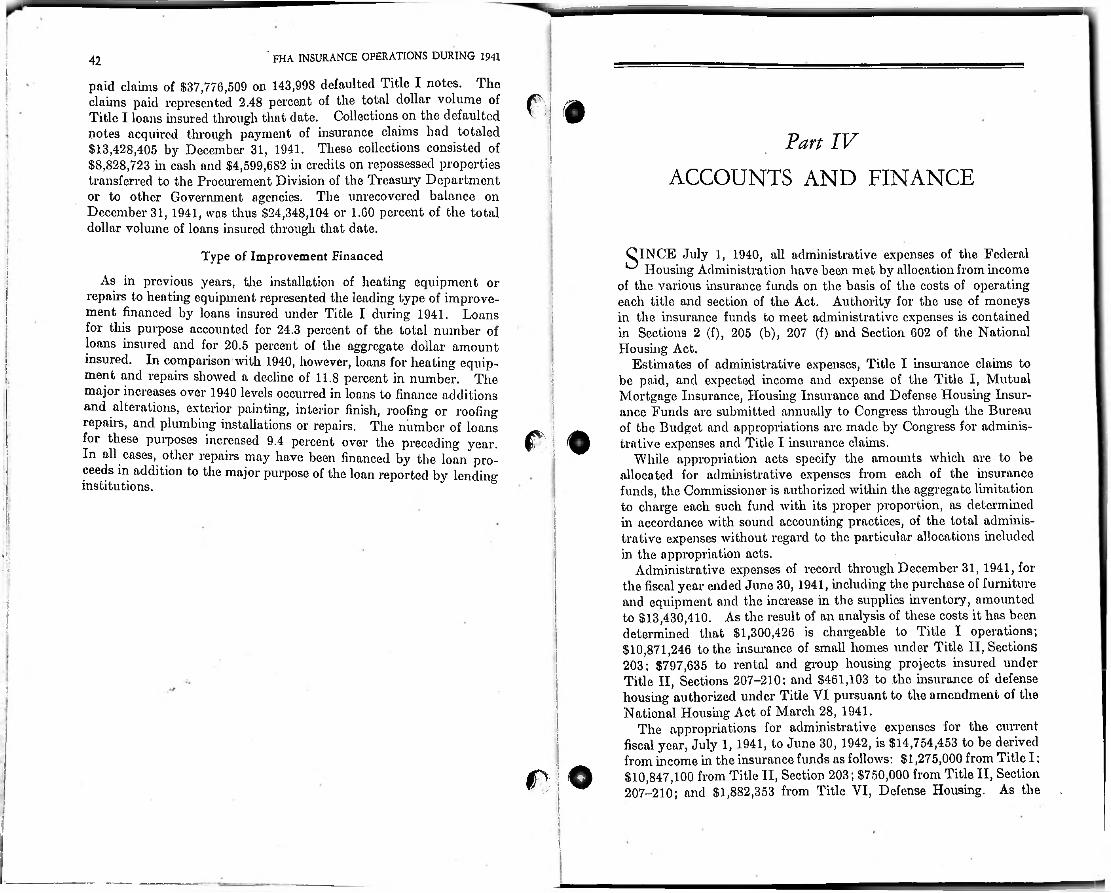
’ FHA insurance OPERATIONS DURING 1941
paid claims of $37,776,509 on 143,998 defaulted Title I notes, claims paid represented 2.48 percent of the total dollar volume of Title I loans insured through that date. Collections on the defaulted notes acquired through payment of insurance claims had totaled $13,428,405 by December 31, 1941. These collections consisted of $8,828,723 in cash and $4,599,6S2 in credits on repossessed properties transferred to the Procurement Division of the Treasury Department or to other Government agencies. The unrecovered balance on December 31, 1941, was thus $24,348,104 or 1.60 percent of the total dollar volume of loans insured through that date.
Type of Improvement Financed
As in previous yearn, the installation of heating equipment or repairs to heating equipment represented the leading type of improvement financed by loans insured under Title I during 1941. Loans for this purpose accounted for 24.3 percent of the total number of loans insured and for 20.5 percent of the aggregate dollar amount insured. In comparison with 1940, however, loans for heating equipment and repairs showed a decline of 11.8 percent in number. The major increases over 1940 levels occurred in loans to finance additions and alterations, exterior painting, interior finish, roofing or roofing repairs, and plumbing installations or repairs. The number of loans for these purposes increased 9.4 percent over the preceding year. In all cases, other repairs may have been financed by the loan proceeds in addition to the major purpose of the loan reported by lending institutions.
42I The
f :. «;
Part IVACCOUNTS AND FINANCE
'
CINCE July 1, 1940, all administrative expenses of the Federal ^ Housing Administration have been met by allocation from income
of the various insurance funds on the basis of the costs of operating each title and section of the Act. Authority for the use of moneys in the insurance funds to meet administrative expenses is contained in Sections 2 (f), 205 (b), 207 (f) and Section 602 of the National Housing Act.
Estimates of administrative expenses, Title I insurance claims to be paid, and expected income and expense of the Title I, Mutual Mortgage Insurance, Housing Insurance and Defense Housing Insurance Funds are submitted annually to Congress through the Bureau of the Budget and appropriations are made by Congress for administrative expenses and Title I insurance claims.
While appropriation acts specify the amounts which are to be allocated for administrative expenses from each of the insurance funds, the Commissioner is authorized within the aggregate limitation to charge each such fund with its proper proportion, as determined in accordance with sound accounting practices, of the total administrative expenses without regard to the particular allocations included in the appropriation acts.
Administrative expenses of record through December 31, 1941, for the fiscal year ended June 30, 1941, including the purchase of furniture and equipment and the increase in the supplies inventory, amounted to $13,430,410. As the result of an analysis of these costs it has been determined that $1,300,426 is chargeable to Title I operations; $10,871,246 to the insurance of small homes under Title II, Sections 203; $797,635 to rental and group housing projects insured under Title II, Sections 207-210; and $461,103 to the insurance of defense housing authorized under Title VI pursuant to the amendment of the National Housing Act of March 28, 1941.
The appropriations for administrative expenses for the current fiscal year, July 1, 1941, to June 30, 1942, is $14,754,453 to be derived from income in the insurance funds as follows: $1,275,000 from Title I: $10,847,100 from Title II, Section 203; $750,000 from Title II, Section 207-210; and $1,882,353 from Title VI, Defense Housing. As the
i
:;
i■
r; 9i I
; <
■
i
I
i
f o;
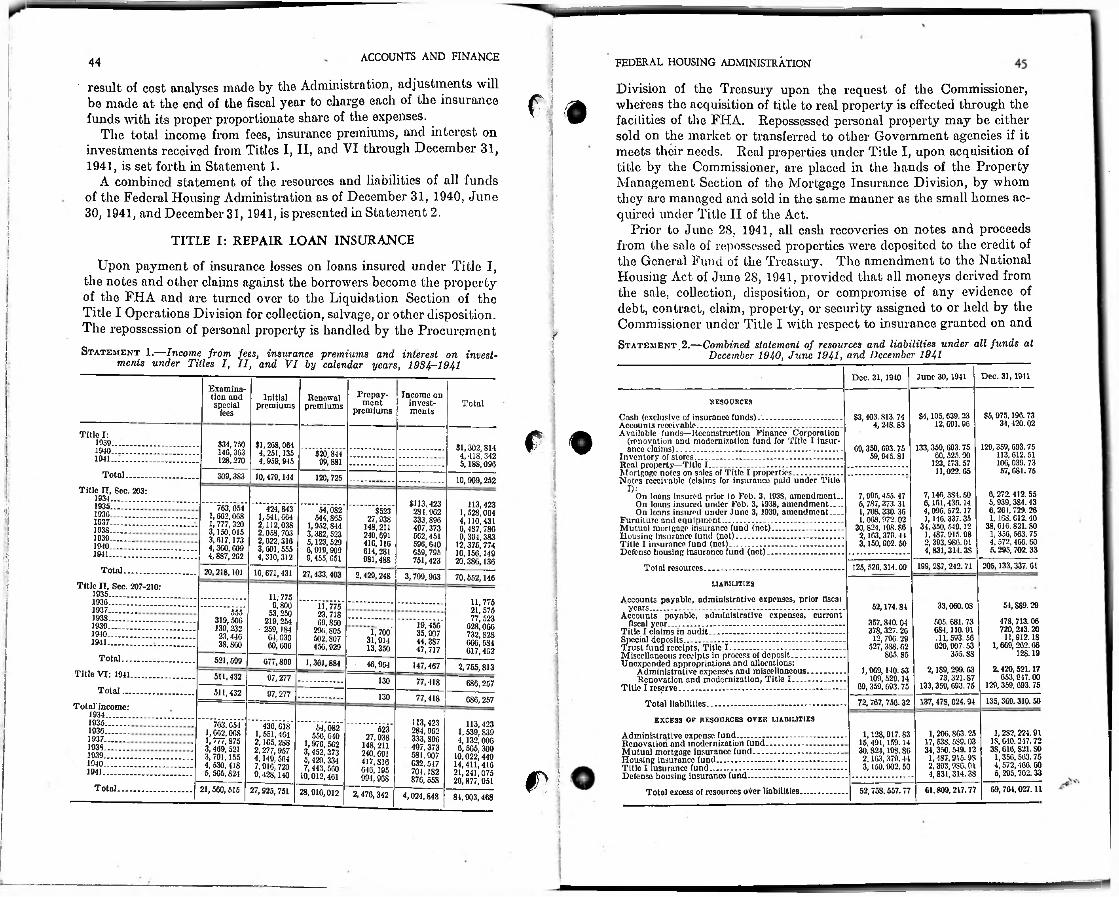
ACCOUNTS AND FINANCE
result of cost analyses made by the Administration, adjustments will be made at the end of the fiscal year to charge each of the insurance funds with its proper proportionate share of the expenses.
The total income from fees, insurance premiums, and interest on investments received from Titles I, II, and VI through December 31, 1941, is set forth in Statement 1.
A combined statement of the resources and liabilities of all funds of the Federal Housing Administration as of December 31, 1940, June 30, 1941, and December 31, 1941, is presented in Statement 2.
TITLE I: REPAIR LOAN INSURANCE
Upon payment of insurance losses on loans insured under Title I, the notes and other claims against the borrowers become the property of the FHA and are turned over to the Liquidation Section of the Title I Operations Division for collection, salvage, or other disposition. The repossession of personal property is handled by the Procurement
Statement 1.—Income from fees, insurance premiums and interest on invest- menls under Titles I, II, and VI by calendar years, 1934-1941
FEDERAL HOUSING ADMINISTRATION
Division of the Treasury upon the request of the Commissioner, whereas the acquisition of title to real property is effected through the facilities of the FHA. Repossessed personal property may be either sold on the market or transferred to other Government agencies if it meets their needs. Real properties under Title I, upon acquisition of title by the Commissioner, are placed in the hands of the Property Management Section of the Mortgage Insurance Division, by whom they are managed and sold in the same manner as the small homes acquired under Title II of the Act.
Prior to June 28, 1941, all cash recoveries on notes and proceeds from the sale of repossessed properties were deposited to the credit of the General Fund of the Treasury. The amendment to the National Housing Act of June 28, 1941, provided that all moneys derived from the sale, collection, disposition, or compromise of any evidence of debt, contract, claim, property, or security assigned to or held by the Commissioner under Title I with respect to insurance granted on andStatement.2.—Combined statement of resources and liabilities under all funds at
December 1940, June 1941, and December 1941
44
;
i
■
i!:,. :'
!
.:Dec. 31,1911June 30,1941Dec. 31, 1940
Examination and special
fees
Prepayment
premiums
Income on investments
Initialpremiums
Renewalpremiums RESOURCESTotal
$5,975,190. 73 34, 420.02
$-1,105, 639.23 12,091.96
Cash (exclusive of insurance funds).........................................Accounts receivable.........................................................................Available funds—Reconstruction Finance Corporation
(renovation and modernization fund for Title I insurance claims)...................................................................................
Inventory of stores..........................................................................Real property—Title I...................................................................Mortgage notes on sales of Title I properties.........................Notes receivable (claims for insurance paid under Title
I):On loans insured prior to Feb. 3, 1938, amendment..On loans insured under Feb. 3, 1938, amendment—On loans insured under June 3, 1939, amendment—
Furniture and equipment............................................................Mutual mortgage insurance fund (net)....................................Housing insurance fund (not)...............................................Title I insurance fund (net)....................................... -...............Dofenso housing insurance fund (net)......................................
Total resources......................................................................
$3,403. 813. 74 4,248.83
I* ©Title I:1939 $34,750
146,363 128,270
$1,268,064 4,251,135 4,959,945
129,359,693.75 113,612.51
$1,302,814 4,418,342 5,188,096
133,359, 693.75 60,525.90
123,173.57 11,022.65
69, 359.693. 75 59,945. 81
19-10 $20,84499,8811941I 106,039. 73
57,681.75: Total. 309,3S3 10,479,144 120,725 10,009,252Title n, Sec. 203: 6, 272.412. 557,146,384.50
6,161, 436.14 4, 096,572.171.146.337.35
34,350, 5-19.121,487.915.98 2, 393,986.014.831.314.35
7,995,455.47 5, 787,373. 31 1,70S, 330. 36 1.068, 972.02
30,824,198.86 2,163,379.44 3.150,002. 50
1934'• 5,939, 3S4.43$113, 423 284, 962 333,896 497,373 562,451 596,640 059,795 751, 123
i113,423 1,528.004 4,110,431 6, 487,786 9, 394,383
12,375,774 16,156,149 20,386,136
1935........... 763,654 1,662,008 1, 777,320 3,150,015 3,617, 173 4,300,009 4,8S7,262
424,843 1,541,064 2,112,038 2,058,703 2,022,316 3, 601,555 4,310,312
54,082 5-14,865
1,952,844 3,382,523 5,123,529 6,919,909 9,455, 051
I1: $5231936 27, 938 148,211 240,691 410,116 614,281 981, 488
1937 38,016.821.80193S............1939............ 1, 356, 563. 75
4.572,466.601940 5.295,702. 331941' 205,133,337. 61! 199, 2S7,242.71125,526, 314.09Total. 20,218,101 16,671,431 27,433,403 2,429,248 3,709,963 70,552,146J LIABILITIES
Accounts payable, administrative expenses, prior fiscalyears.................................................................................................
Accounts payable, administrative expenses, currentfiscal year......................................................................................
Title I claims in audit..................................................................Special deposits...............................................................................Trust fund receipts, Title I........................................................Miscellaneous receipts in process of deposit.........................Unexpended appropriations and allocations:
Administrative expenses and miscellaneous.................Renovation and modernization, Title I........................
Title I reserve..................................................................................
Total liabilities....................................................................
EXCESS OF RESOURCES OVER LIABILITIES
Administrative expense fund.....................................................Renovation and modernization fund......................................Mutual mortgage insurance fund.............................................Housing insurance fund........-..................... ...............................Title I insurance fund...................................................................Defense housing insurance fund................................................
Total excess of resources over liabilities......................
Title II, Sec. 207-210:1935 11,775
9,800 53,250
219,254 • 259,184
64,030 60,606
1936 11,775 21, 575 77, 523
628,066 732,828 666, 584 617,402
54.SS9.2933,060. OS
54)5, 681.73 6S4,110.91 ,11,593.56 620,907. 53
355. SS
11,775 23,718 69,850
296, S05 502,807 456,929
52,174.84
357,840.0-1 378, 327.20
12, 790. 29 527, 388.62
805. S5
1937.............. 555193S 319,506
139,232 23,440 3S.860
478, 713.0619,456 35,907 44,3S7 47,717
1939 720, 243.20 11,912.181,700
31,91413,350
1940 s19-11 1,669,262.6612S. 19Total...
Title VI: 1941.521,599 077,899 1.301,88-1 46,964 147,467 2,755,813 2.420,521.172,1S9,299.63
73,321. S7 133,359, 693.75
1,969,140.53 109, 529.14
69,359,693. 75511,432 653,947.0097,277 130 77,418 6S6,257 129,359, 693.75
Total 511,432 97,277 130 77,418 6S0.257 135,369.310.50137,478,024.9472, 767, 756.32Total'income:1934 ...........1935 ............1936 ..........1937 ............193S............
113,423 284,962 333, S96 407,373 581,007 632,547 704,182 870,558
113,423 1,539,839 4,132,006 6,565,300
10,022,449 14,411,416 21,241,075 20,877,951
703.654 1,662.068 1,777,875 3,409,521 3, 791,155 4,530,418 5,565,824
430,018 1,551,401 2,165, 288 2,277,957 4.149,564 7,910, 720 9,428,140
54,082 550, 010
1,970, 502 3,452,373 5,420, 334 7,443, 560
10,012,401
523 1,282.224.91 IS, 6-10.247.72
1, 206,863.25 17, 538, 5S9.03 34, 350.549.12 1,487,915.9S 2,393,9S0.01 4,831,314.3S
1,128,917.83 15, 191,159.14 30.82-1,198. SO 2.163, 379.44 3,150.902. 50
27,938 148,211 240.091 417,810 640, 195 994,068
! 3S, 610,821. SO 1,356,503.75 4,572,460.60 5,295.702.33
!193919401941
Total. 69.76-l.027.il21,560,515 61.809,217.7727,925,751 52,758, 557.7728,910,012 2,476,342 4,024,848 84,903,468
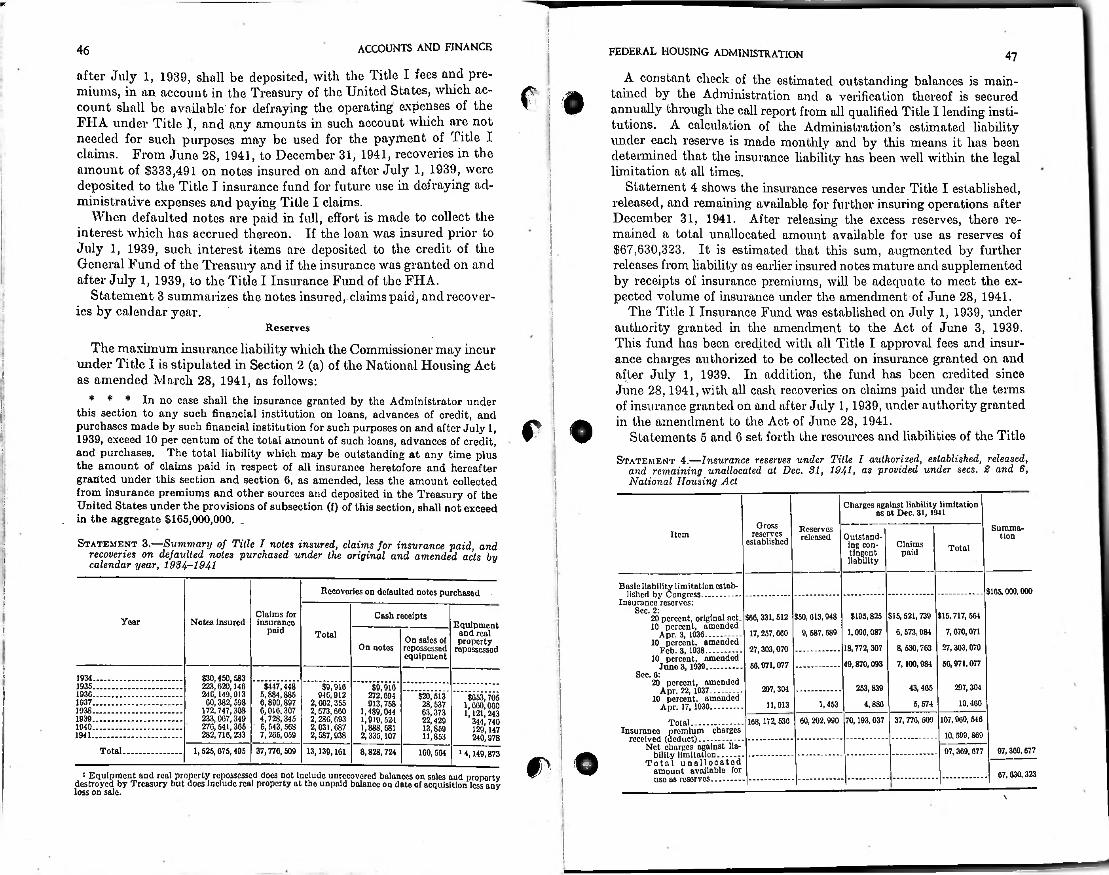
w
accounts and finance
after July 1, 1939, shall be deposited, with the Title I fees and premiums, in an account in the Treasury of the United States, which account shall be available for defraying the operating expenses of the FHA under Title I, and any amounts in such account which are not needed for such purposes may be used for the payment of Title I claims. From June 28, 1941, to December 31, 1941, recoveries in the amount of $333,491 on notes insured on and after July 1, 1939, were deposited to the Title I insurance fund for future use in defraying administrative expenses and paying Title I claims.
When defaulted notes are paid in full, effort is made to collect the interest which has accrued thereon. If the loan was insured prior to July 1, 1939, such interest items are deposited to the credit of the General Fund of the Treasury and if the insurance was granted on and after July 1, 1939, to the Title I Insurance Fund of the FHA.
Statement 3 summarizes the notes insured, claims paid, and recoveries by calendar year.
46 FEDERAL HOUSING ADMINISTRATION
A constant check of the estimated outstanding balances is maintained by the Administration and a verification thereof is secured annually through the call report from all qualified Title I lending institutions. A calculation of the Administration’s estimated liability imder each reserve is made monthly and by this means it has been determined that the insurance liability has been well within the legal limitation at all times.
Statement 4 shows the insurance reserves under Title I established, released, and remaining available for further insuring operations after December 31, 1941. mained a total unallocated amount available for use as reserves of $67,630,323. It is estimated that this sum, augmented by further releases from liability as earlier insured notes mature and supplemented by receipts of insurance premiums, will be adequate to meet the expected volume of insurance under the amendment of June 28, 1941.
The Title I Insurance Fund was established on July 1, 1939, under authority granted in the amendment to the Act of June 3, 1939. This fund has been credited with all Title I approval fees and insurance charges authorized to be collected on insurance granted on and after July 1, 1939. In addition, the fimd has been credited since June 28,1941, with all cash recoveries on claims paid under the terms of insurance granted on and after July 1,1939, imder authority granted in the amendment to the Act of June 28, 1941.
Statements 5 and 6 set forth the resources and liabilities of the TitleStatement 4.—Insurance reserves under Title I authorized, established, released,
and remaining unallocated at Dec. 31, 1941, as 'provided under secs. 2 and 6, National Housing Act
47
c i #
After releasing the excess reserves, there re-
: .
!Reserves
The maximum insurance liability which the Commissioner may incur under Title I is stipulated in Section 2 (a) of the National Housing Act as amended March 28, 1941, as follows:
* * * In no case shall the insurance granted by the Administrator underthis section to any such financial institution on loans, advances of credit, and purchases made by such financial institution for such purposes on and after July 1, 1939, exceed 10 per centum of the total amount of such loans, advances of credit, and purchases. The total liability which may be outstanding at any time plus the amount of claims paid in respect of all insurance heretofore and hereafter granted under this section and section 6, as amended, less the amount collected from insurance premiums and other sources and deposited in the Treasury of the United States under the provisions of subsection (f) of this section, shall not exceed
. in the aggregate $165,000,000. _
i
i; r!
::I
i Charges against liability limitation as at Dec. 31,1941
Grossreserves
establishedSummit-Reserves
releasedItem tionOutstanding contingent liability
Statement 3.—Summary of Title I notes insured, claims for insurance paid, and recoveries on defaulted notes purchased under the original and amended acts by calendar year, 1934-1941
Claimspaid Total
Basic liability limitation established by Congress...............
Insurance reserves:Sec. 2:
Recoveries on defaulted notes purchased $165,000,000
Claims for insurance
paidCash receipts $195,825 $15,521,739 $15,717,504
1,096,087 6,573,984 7,670,071
18,772,307 8, 630,703 27,303,070
49,870,093 7,100, 9S4 56,971,077
$66,331,512 $50,013,948 17,257,660 9, 587, 689
27,303,070 ....... -.........
56,971,077 ..................
20 percent, original act. 10 percent, amended
Apr. 3, 1936...............10 porcent, amended
Feb. 3, 1938...............10 percent, amended
Juno 3, 1939___ ____
20 percent, amendedApr. 22, 1037............
10 percent, amended Apr. 17,1930............
Year Notes insured Equipment and real property
repossessed: Total On sales of
repossessed equipment
On notes
! Sec. 6:1934 $30,450,583 223,620,146 240, 149,013 60,382,598
172,747,308 233,067,319 27G, 541,365 282,716,233
1935 $147,448 6,884,885 6,890,897 6,016,307 4,728,345
' 6,643,56S 7,205,059
$9,916 946,912
2,602,355 2,673,660 2,286,693 2,031,687 2,587,938
$9,016 272,694 913,758
1,489,044 1,919, 52-1 1,888,681 2,335,107
297,30410,460
253,8394,886
43, 465 5,574
297,30411,913
193G $20,513 28,537 63,373 22,429 13,859 11,853
$653,705 1,660,060 1,121,2-13
344, 740 129,147 240,978
1937 1,45319381939 37,770,509 107,969,546
.................. 10,599,86970,193,03760, 202,990108,172,530Total......................
Insurance premium chargesreceived (deduct)...................
Net charges against liability limitation...........
Total unallocated amount available for use as reserves..............
19401941.
Total. 97, 369.6771,525,675,495 37,770,509 13,139,161 97, 369,0778,828,724 ICO, 564 1 4,149,873 er 07,630.323Equipment and real property repossessed docs not include unrccovered balances on sales and property destroyed by Treasury but does include real property at the unpaid balance on date of acquisition less any loss on sale.
i
. \
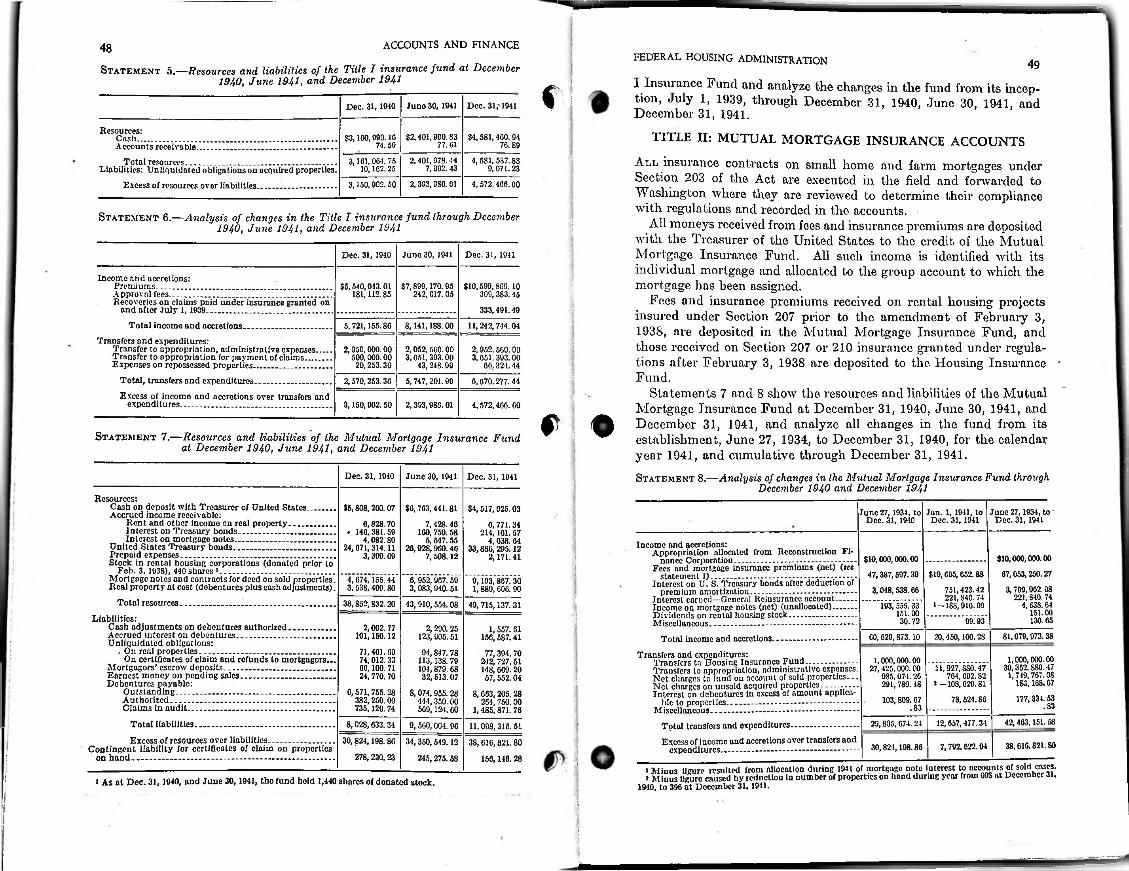
ACCOUNTS AND FINANCE48 i FEDERAL HOUSING ADMINISTRATION
I Insurance Fund and analyze the changes in the fund from its inception, July 1, 1939, through December 31, 1940, June 30, 1941, and December 31, 1941.
TITLE II: MUTUAL MORTGAGE INSURANCE ACCOUNTS
All insurance contracts on small home and farm mortgages under Section 203 of the Act are executed in the field and forwarded to Washington where they are reviewed to determine their compliance with regulations and recorded in the accounts.
All moneys received from fees and insurance premiums are deposited with the Treasurer of the United States to the credit of the Mutual Mortgage Insurance Fund. All such income is identified with its individual mortgage and allocated to the group account to which the mortgage has been assigned.
Fees and insurance premiums received on rental housing projects insured under Section 207 prior to the amendment of February 3, 1938, are deposited in the Mutual Mortgage Insurance Fund, and those received on Section 207 or 210 insurance granted under regulations after February 3, 1938 are deposited to the Housing Insurance • Fund.
Statements 7 and 8 show the resources and liabilities of the Mutual Mortgage Insurance Fund at December 31, 1940, June 30, 1941, and December 31, 1941, and analyze all changes in the fund from its establishment, June 27, 1934., to December 31, 1940, for the calendar year 1941, and cumulative through December 31, 1941.Statement 8.—Analysis of changes in the Mutual Mortgage Insurance Fund through
December 1940 and December 1941
49Statement 5.—Resources and liabilities of the Title I insurance fund at December 1940, June 1941, and December 1941 !
f !Juno 30, 1941 Dec. 31,'1941Dec. 31,19-10
Resources:Cash......................................................................................Accounts receivable...........................................................
Total resources................................................................Liabilities: Unliquidated obligations on acquired properties.
Excess of resources over liabilities..................................
$2,401,900.83 77.61
$4,581, 400. 94 70.89
$3,100,990.10 74.59
2,401,978.44 7,992. 43
4, 581, 537.83 9,071.23
3,161, 064. 75 10.162.25
2, 393,980.01 4,572,406.003,150,902. 50
Statement 6.—Analysis of changes in the Title I insurance fund through December 1940, June 1941, and December 1941 '
June 30, 1941 Dec. 31, 1941Dec. 31, 1940
Income and accretions:Premiums_____________ ________________ _______Approval fees............................. ............................. .........Recoveries on claims paid under insurance granted on
and after July 1, 1939....... ....... ......................................
Total income and accretions......................................Transfers and expenditures:
Transfer to appropriation, administrative expenses......Transfer to appropriation for payment of claims...........Expenses on repossessed properties.......... ......... .............
Total, transfers and expenditures................................
Excess of income and accretions over transfers and expenditures....... .........................................................
i$5,540,043.01 181,112.85
$7,899,170.95 242, 017.05
$10,599,809.10 309,383.45333,491.49
ii
5,721,155.80 8,141, 188.00 11,242,744.04
i2,050,000.00 500,000.00 20,253.30
2.052.560.003.051.393.00
43,248.992.952.500.003.051.393.00
60,324. 4412,570,253.30 5,747,201. 99 6,670,277. 44
13,150,902. 50 2,393,986.01 4,572,400.00
9Statement 7.—Resources and liabilities of the Mutual Mortgage Insurance Fund at December 1940, June 1941, and December 1941
!
Dec. 31, 1940 June 30, 1941 Dec. 31, 1941
Resources:Cash on deposit with Treasurer of United States. Accrued income receivable:
Rent and other income on real property........Interest on Treasury bonds..............................Interest on mortgage notes___ ______ _____
United States Treasury bonds________ —...........Prepaid expenses........ ............................................ ............Stock in rental housing corporations (donated prior to
Feb. 3, 1938), 440 shares 1.................................................Mortgage notes and contracts for deed on sold properties. Real property at cost (debentures plus cash adjustments).
$5,808,200.07
0,828. 70 . 146,381.59
4,082.80 24, 071,314.11
3,399.09
$6,703,441.81
7,428.40 160,759.58
5,647.55 20,928,9G0. 40
7,508.12
$4,517,025.03
6,771.34 214,101.57
4, 038. 04 33,880,295.12
2,171. 41
Jan. 1,1941, to Dec. 31,1911
June 27, 1934, to Dec. 31, 1941
June 27,1934, to Dec. 31, 19-10
Income and accretions:Appropriation allocated from Reconstruction Fi
nance Corporation................................. ...........Fees and mortgage insurance premiums (net) (see
statement 1)........................................... --------------Interest on U. S. Treasury bonds after deduction of
premium amortization.............................................Interest earned—General Reinsurance account.........Income on mortgage notes (net) (unallocated)..........Dividends on rental housing stock.............................Miscellaneous...... ........................................................
Total income and accretions..................................
Transfers and expenditures:Transfers to Housing Insurance Fund................. .Transfers to appropriation, administrative expenses. Net charges to fund on account of sold properties—Net charges on unsold acquired properties.---- ------Interest on debentures in excess of amount applica
ble to properties----------------------------- ------- ------Miscellaneous................................................................
Total transfers and expenditures----------------------Excess of income and accretions over transfers and
expenditures...........................................................
$10,000,000.0067,053,250.27
3,799,902.08 221,840.74
4,638.64 151.00 130.05
I $10,000,000.00
47,387,597.393,048,538.66
193,”555." 33^ 151.00 30.72
i $19,605,652.88751,423.42 221, S40.74
l -188,910.09............... 99." 93"
4,674,155.44 3,538,409.80
6, 952,907. 59 3, 083,940. 51
9,193, 8G7. 30 1,889,600.90
!Total resources. 38,852,832.20 43, 910, 554.08 49, 715,137. 31!Liabilities:
Cash adjustments on debentures authorized....................Accrued interest on debentures...........................................Unliquidated obligations:
/ On real properties...................................................... .On certificates of claim and refunds to mortgagors...
Mortgagors' escrow deposits................................................Earnest money on pending sales.........................................Debentures payable:
Outstanding................................. ........ .........................Authorized.......................................................................Claims in audit...............................................................
2,002. 77 101,160.12
71,401.69 74.012.33 00,100. 71 24,770. 70
C, 571,755.28 382, 250.00 735,129.74
2,290.25 123, 905.51
94,847.78 113,138.79 104,879.68 32,513.07
8,074,955.28 414,350.00 509,12*1.60
1,557. 61 150, 587.41
77,394.70 242, 727.51 148, 009. 20 57, 552.04
8,003, 205. 28 201, 750. 00
1,485, 871. 76
81,079,973.3860,629,873.10 20,450,100.28
1,000,000.00 39,352, SS0.47
1,749,767.08 183,168.67177,331.53
1,000,000.00 27,425,000.00
985,074.26 291,789.48
103,809.07
11,927,8S0.47 764,692.82
> —10S, 020.8173,524. SO
!
.S3.8342,463,151. 5812,657,477.34Total liabilities............................................................
Excess of resources over liabilities............................Contingent liability for certificates of claim on properties
on hand---------------------------------- -------------------------------
29,805, G74. 248,028,633.34 9,500,004. 96 11,098,315.5130,824,198.80
278,230.2334,350,549.12
245, 275.68
38,616,821.80 150,146. 28
38,616,821.807,792,022.9430,824,108.86I! !1940, to 396 at December 31,1911.
i t As at Dec. 31, 1940, and June 30, 1941, the fund held 1,440 shares of donated stock.
! :■:
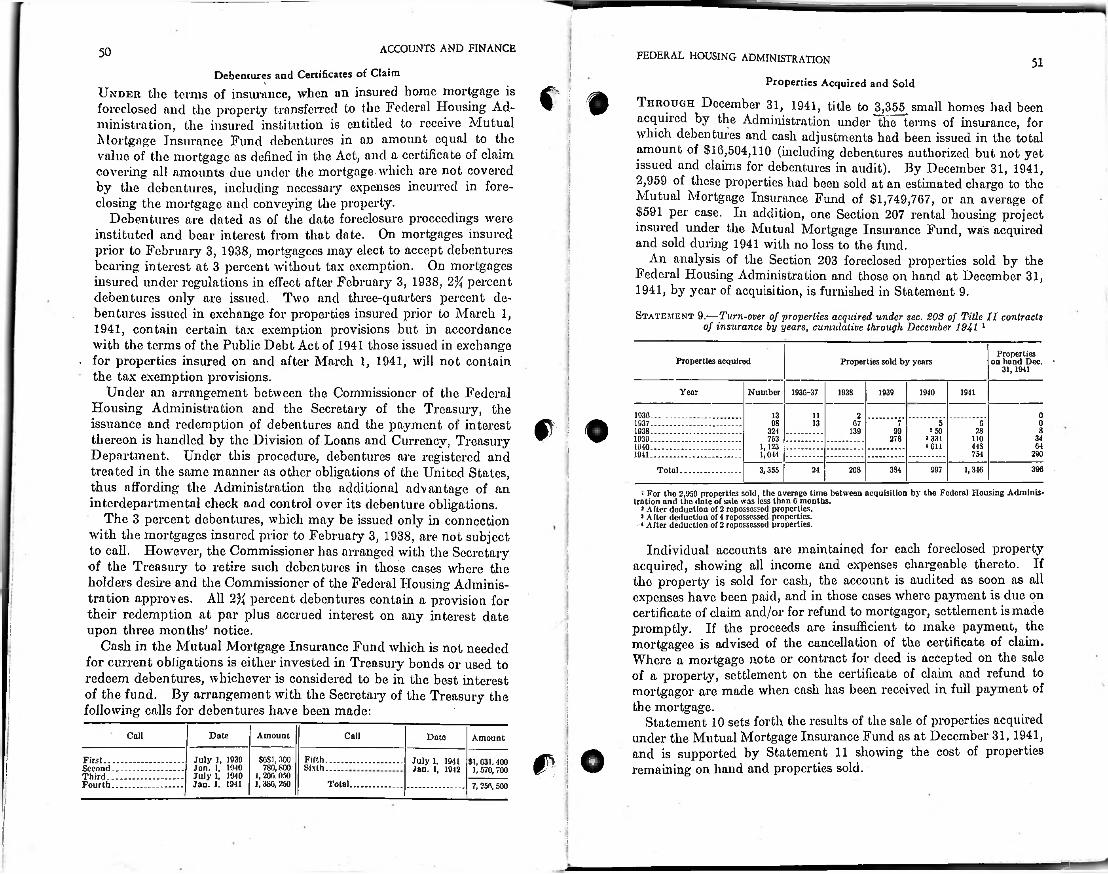
1ACCOUNTS AND FINANCE I50 FEDERAL HOUSING ADMINISTRATION 51■
Debentures and Certificates of Claim
Under the terms of insurance, when an insured home mortgage is foreclosed and the property transferred to the Federal Housing Administration, the insured institution is entitled to receive Mutual Mortgage Insurance Fund debentures in an amount equal to the value of the mortgage as defined in the Act, and a certificate of claim covering all amounts due under the mortgage which are not covered by the debentures, including necessary expenses incurred in foreclosing the mortgage and conveying the property.
Debentures are dated as of the date foreclosure proceedings were instituted and bear interest from that date. On mortgages insured prior to February 3, 1938, mortgagees may elect to accept debentures bearing interest at 3 percent without tax exemption. On mortgages insured under regulations in effect after February 3, 1938, 2% percent debentures only are issued. Two and three-quarters percent debentures issued in exchange for properties insured prior to March 1, 1941, contain certain tax exemption provisions but in accordance with the terms of the Public Debt Act of 1941 those issued in exchange
• for properties insured on and after March 1, 1941, will not contain the tax exemption provisions.
Under an arrangement between the Commissioner of the Federal Housing Administration and the Secretary of the Treasury, the issuance and redemption of debentures and the payment of interest thereon is handled by the Division of Loans and Currency, Treasury Department. Under this procedure, debentures are registered and treated in the same manner as other obligations of the United States, thus affording the Administration the additional advantage of interdepartmental check and control over its debenture obligations.
The 3 percent debentures, which may be issued only in connection with the mortgages insured prior to February 3, 1938, are not subject to call. How'ever, the Commissioner has arranged with the Secretary of the Treasury to retire such debentures in those cases where the holders desire and the Commissioner of the Federal Housing Administration approves. All 2% percent debentures contain a provision for their redemption at par plus accrued interest on any interest date upon three months’ notice.
Cash in the Mutual Mortgage Insurance Fund which is not needed for current obligations is either invested in Treasury bonds or used to redeem debentures, whichever is considered to be in the best interest of the fund. By arrangement with the Secretary of the Treasury the following calls for debentures have been made:
iProperties Acquired and Sold
Through December 31, 1941, title to 3,355 small homes had been acquired by the Administration under the terms of insurance, for which debentures and cash adjustments had been issued in the total mount of $16,504,110 (including debentures authorized but not yet
issued and claims for debentures in audit). By December 31, 1941, 2,959 of these properties had been sold at an estimated charge to the Mutual Mortgage Insurance Fund of $1,749,767, or an average of $591 per case. In addition, one Section 207 rental housing project insured under the Mutual Mortgage Insurance Fund, was acquired and sold during 1941 with no loss to the fund.
An analysis of the Section 203 foreclosed properties sold by the Federal Housing Administration and those on hand at December 31, 1941, by year of acquisition, is furnished in Statement 9.
Statement 9.—Turn-over of properties acquired under sec. SOS of Title II contracts of insurance by years, cunndative through December 1941 1
Cl #I
ii a!
;
i
:::!
II
Properties on hand Dec. '
31, 1941Properties acquired Properties sold by years
■
Year Number 103G-37 1939 19411938 1940
01030 13 11 2
# © 1037 08 013 07 7 5 681038 324 90 * 50 28139
278 3 331 341030 753 11064‘011 44S1040 1,123
1,044I 29075419413S4 39624 208 997 1,316Total 3,355!
an • For tho 2,959 properties sold, the average time between acquisition by the Federal Housing Administration and tho date of sale was less than 6 months.
1 After deduction of 2 repossessed properties.3 After deduction of 4 repossessed properties.* After deduction of 2 repossessed properties.
Individual accounts are maintained for each foreclosed property acquired, showing all income and expenses chargeable thereto. If the property is sold for cash, the account is audited as soon as all expenses have been paid, and in those cases where pajnnent is due on certificate of claim and/or for refund to mortgagor, settlement is made promptly. If the proceeds are insufficient to make payment, the mortgagee is advised of the cancellation of the certificate of claim. Where a mortgage note or contract for deed is accepted on the sale of a property, settlement on the certificate of claim and refund to mortgagor are made when cash has been received in full payment of the mortgage.
Statement 10 sets forth the results of the sale of properties acquired under the Mutual Mortgage Insurance Fund as at December 31, 1941, and is supported by Statement 11 showing the cost of properties remaining on hand and properties sold.
i
i;
. i:
1!:!■
:Call Date Amount Call Date Amount 1
Is ! OJuly 1, 1939 Jan. 1. 1910 July 1, 1940 Jan. 1. 1941
$681, 300 780,800
i, 206.0.50 1, 3S6,250
Fifth.........Sixth.........
First..SecondThird..Fourth.
July 1. 1941 Jan. 1, 1942
$1,031,400 1,570,700:
Total. 7, 256, 500 !
!I
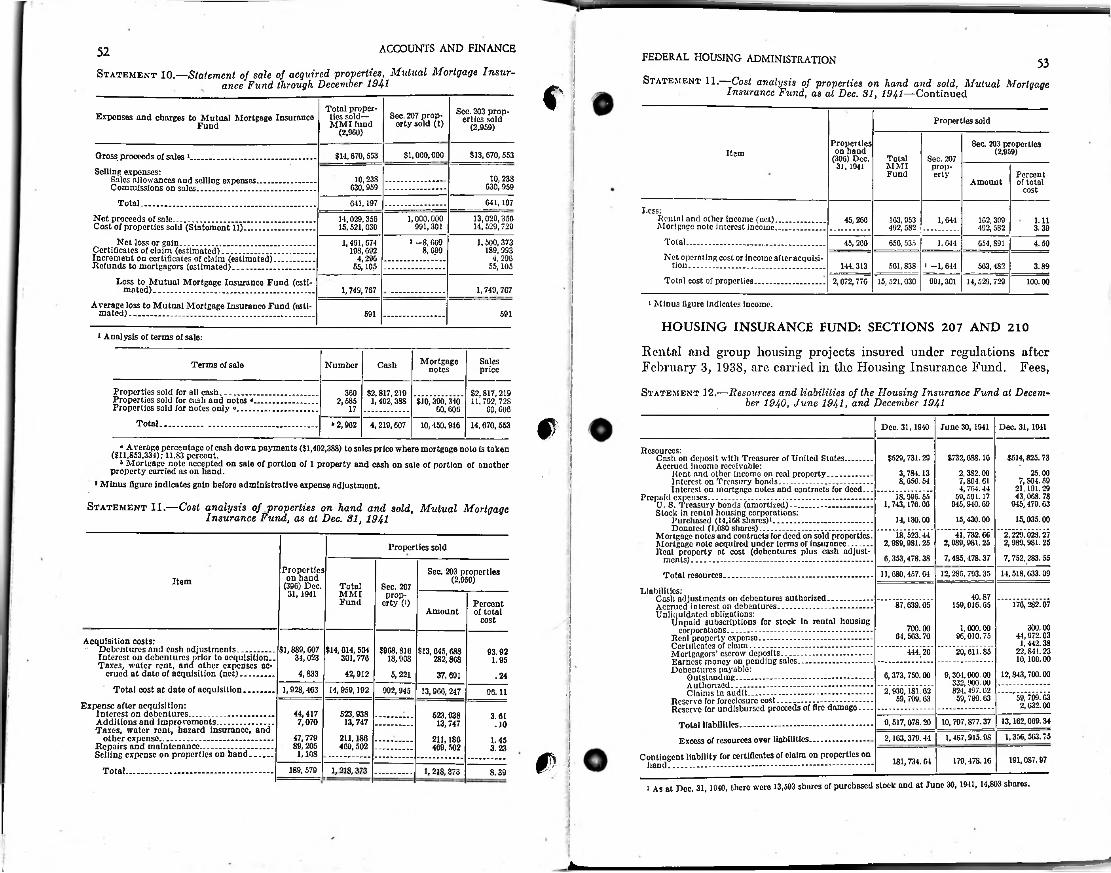
ACCOUNTS AND FINANCE52 FEDERAL HOUSING ADMINISTRATION
Statement 11.—-Cost analysis of properties on hand and sold, Mutual Mortgage Insurance Fund, as at Dec. 81, 1941—Continued
53Statement 10.—Statement of sale of acquired properties, Mutual Mortgage Insur-
Fund through December 1941ance CTotal properties sold— MM I fund
(2,960)
See. 203 properties sold
(2,959)Sec. 207 prop
erty sold (1)Expenses and charges to Mutual Mortgage Insurance Fund Properties sold
Properties on hand
(396) Dec. 31, 1041
Sea 203 properties (2,959)Item$13,670,553$1,000,000Gross proceeds of sales 1.......................................... .........
Selling expenses:Sales allowances and selling expenses.......... ............Commissions on sales.................................................
Total.........................................................................
Net proceeds of sale........................................................... .Cost of properties sold (Statement 11)..............................
Net loss or gain........................................................ .Certificates of claim (estimated)......................................Increment on certificates of claim (estimated).................Refunds to mortgagors (estimated).................................
Loss to Mutual Mortgage Insurance Fund (estimated)...... .............................................................
Average loss to Mutual Mortgage Insurance Fund (estimated)................................................................ ..............
$14,670,553 TotalMMIFund
Sec. 207 property Percent
of total cost
10,238 630,959
10,238 630,959 Amount
641,197641,197Less:
Rental and other income (net)....................Mortgage note interest income....................
Total..........................................................
Net operating cost or income afteracquisition.........................................................
Total cost of properties............................
13,029,356 14,529,729
1,000,000991,301
14.029.356 15,521,030
45,266 163,953 492,582
1,644 162,309 492,582
1.113. 39
* -8,699 8,099
1. 500,373 189,993
4,296 55,105
1,491,674 198,692
4,296 55,105
45, 266 656,535 1,644 654, S91 4.50
144.313 561,838 i -1, 644 563,4S2 3.892,072,776 15, 521,030 991,301 14,529,729 100.00
1,749,7671,749,767i Minus figure indicates income.
591 591HOUSING INSURANCE FUND: SECTIONS 207 AND 210
t Analysis of terms of sale:
Rental and group housing projects insured under regulations after February 3, 1938, are carried in the Housing Insurance Fund. Fees,
Statement 12.—Resources and liabilities of the Housing Insurance Fund at December 1940, June 1941, and December 1941
Mortgagenotes
SalespriceTerms of sale Number Cash
Properties sold for all cash...............Properties sold for cash and notes Properties sold for notes only »____
Total........................................
360 $2,817,219 1,402,388
$2,817,219 11,702, 72S
60,6062,585 $10,390, 310
60,60617
0‘ 2,962 4,219,607 10,450.946 14,670,553 Dec. 31,1910 June 30, 1941 Dec. 31, 19-11
“ Average percentage of cash down payments ($1,402,388) to sales price where mortgage note is taken ($11,853,334); 11.83 percent.
1 Mortgage note nccepted on sale of portion of 1 property and cash on sale of portion of another property carried as on hand.
* Minus figure indicates gain before administrative expense adjustment.
Statement 11.—Cost analysis of properties on hand and sold, Mutual Mortgage Insurance Fund, as at Dec. 81, 1941
Resources:Cash on deposit with Treasurer of United States............Accrued income receivable:
Rent and other income on real property_________Interest on Treasury bonds........................................Interest on mortgage notes and contracts for deed...
Prcpaid expenses................................................. ...................U. S. Treasury bonds (amortized)................. ......... ........Stock in rental housing corporations:
Purchased (14,168 shares)1...........................................Donated (1,080 shares)................................................
Mortgage notes and contracts for deed on sold properties.Mortgage note acquired under terms of insurance..........Real property at cost (debentures plus cash adjust
ments)..................................—.......................................Total resources................................................................
$529, 731.293,784.13 8,656.54
18,*996." 5§" 1,743, 176.06
14,130.00’*"18*523*44 2,989,981.256,353,478.38
$732,6S8.162.3S2.00 7,804.61 4,764.44
59,591.17 945,940.6915,430.0041,732.66"
2,9S9,981.257,485,478.37
$514,825.7325.00
7, S04.59 21,101.29 43,068. 78
945,479.6315,035.00
2*229,028.27 2,9S9,981.257,752, 283.55
Properties sold
Properties on hand
(396) Dec. 31,1941
Sea 203 properties (2,959)
14,518,633.0912,285,793.3511,680,457.04Item Total
MMIFund
Sec. 207 prop
erty (i)Liabilities:
Cash adjustments on debentures authorized..................Accrued interest on debentures.......................................Unliquidated obligations:
Unpaid subscriptions for stock in rental housingcorporations..........................
Real property expense............Certificates of claim................Mortgagors’ escrow deposits..Earnest money on ponding sal Debentures payable:
Outstanding......................Authorized........................Claims in audit.................
Reservo for foreclosure cost—Reserve for uudisbursed proceeds of fire damago...
Total liabilities.......................................................Excess of resources over liabilities............ -...........
Contingent liability for certificates of claim on properties on hand................................................ -....................................
40.87 159,016.65Percent
of total cost
176,282.0787,639.05Amount
300.00 44,972.03
1,442.38 22, S41.23 10,100.00
12,843,700.00
700.00 64,563.70
1,000.00 96,010.75
20,611.85Acquisition costs:
Debentures and cash adjustments................Interest on debentures prior to acquisition.. Taxes, water rent, and other expenses ac
crued at date of acquisition (net)...............
Total cost at date of acquisition.............
Expense after acquisition:Interest on debentures....................................Additions and improvements................... .Taxes, water rent, hazard insurance, and
other expense.................................................Repairs and maintenance...............................Selling expense on properties on hand..........
Total...............................................................
$1,889,607 34,023
4,833
$14,614,504 301,776
42,912
$968,816 18,908
5,221
$13,645,688 282,80837,691
93.92 444.201.95 es
6,373,750.002*930*lSir62
59,799.63
9,304,000.00 332,900.00 824.497.62 59,799.63
.24,i1,928,463 14,959,192 992,945 13,900, 247 96.11 59,799.63
2,632.0044,4177,070
47,779 89, 205 1,108
523, 938 13, 747
211,186 469, 502
523,938 13,747
211,186 469, 502
3.61 13,162,069.3410,797,877.379,517,078.20.10: 1,356, 563.751,4S7.915.9S2,163,379.441.45■3.23
0 i 191.0S7.97179,478.16181,734.64189,579 1,218,373 1, 218,373 8.39
i As at Dec. 31, 1040, there were 13,593 shares of purchased stock and at June 30, 1941, 14,803 shares.1
;u
4.t
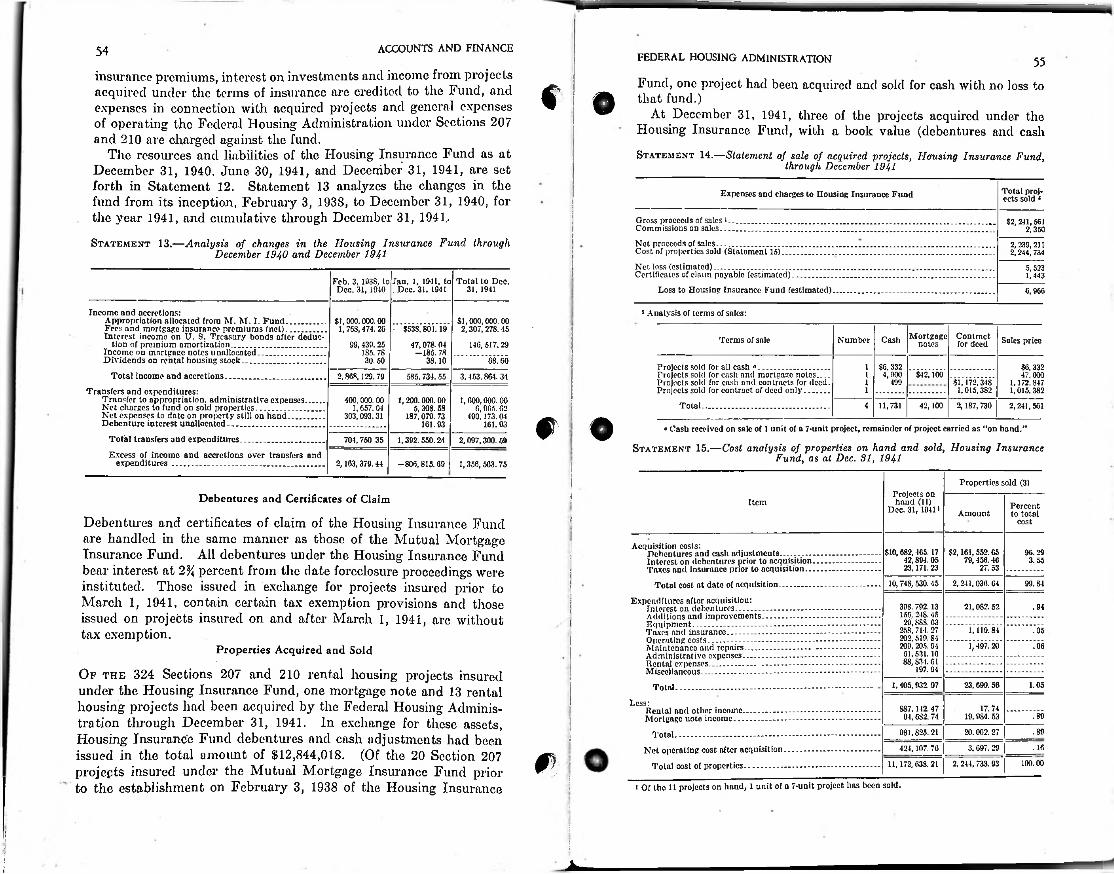
ACCOUNTS AND FINANCE
insurance premiums, interest on investments and income from projects acquired under the terms of insurance are credited to the Fund, and expenses in connection with acquired projects and general expenses of operating the Federal Housing Administration under Sections 207 and 210 are charged against the fund.
The resources and liabilities of the Housing Insurance Fund as at December 31, 1940, June 30, 1941, and December 31, 1941, are set forth in Statement 12. Statement 13 analyzes the changes in the fund from its inception, February 3, 1938, to December 31, 1940, for the year 1941, and cumulative through December 31, 1941..
Statement 13.—Analysis of changes in the Housing Insurance Fund through December 1940 and December 1941
54 FEDERAL HOUSING ADMINISTRATION
Fund, one project had been acquired and sold for cash with no loss to that fund.)
At December 31, 1941, three of the projects acquired under the Housing Insurance Fund, with a book value (debentures and cash
Statement 14.—Statement of sale of acquired projects, Housing Insurance Fund,through December 1941
55
€
Total projects sold JExpenses and charges to Housing Insurance Fund
Gross proceeds of sales 1....................................................Commissions on sales........................................................
Net proceeds of sales................................. ........................Cost of properties sold (Statement 15).........................
Net loss (estimated)........................................................Certificates of claim payable (estimated)....................
Loss to Housing Insurance Fund (estimated)
$2,241,561 2,350
2,239,211 2,244,734
5,523 1,443
Total to Dec. 31,1941
Feb. 3, 1938, to Dec. 31, 1940
Jan. 1, 1941, to . Dec. 31, 1941 6,966
Income and accretions:Appropriation allocated from M. M. I. Fund................ ..Fees and mortgage insurance premiums (net)................ ..Interest income on U. S. Treasury bonds after deduc
tion of premium amortization...............................................Income on mortgage notes unallocated..................................Dividends on rental housing stock........ .................................
Total income and accretions..................... .............................
Transfers and expenditures:Transfer to appropriation, administrative expenses..........Net charges to fund on sold properties..................................Net expenses to date on property still on hand..................Debenture interest unallocated................................................
Total transfers and expenditures...........................................
Excess of income and accretions over transfers and expenditures______ ________________ ______________
• Analysis of terms of sales:SI, 000,000.00 2,307,278. 45
146, 517.29
$1,000,000.00 1,768,474. 26
99,439. 25 185. 78 30. 50
• $538,801." 19*
47-K38.10
Contract for deed
MortgagenotesCashTerms of sale Number Sales price
68.60Projects sold for all cash °....................................Projects sold for cash and mortgage notes___Projects sold for cash and contracts for deed. Projects sold for contract of deed only.............
Total................................................................
$6,332 4,900
$6,332 47,000
1,172,847 1,015.382
1$42,10012,868,129.79 585, 734. 55 3.453,864. 34
499l1
400, 000. 00 1,657. 04
303,093.31
1,200.000. 00 5, 308. 58
187,079. 73 161.93
1,600,000.00 0,965.62
490,173. 04 161.93
4 11,731 42,100 2,187, 730 2,241,561
f O “ Cash received on sale of l unit of a 7-unit project, remainder of project carried as “on hand.”
Statement 15.—Cost analysis of properties on hand and sold, Housing Insurance Fund, as at Dec. 81, 1941
704,750. 35 1,392.550.24 2,097,300. 59
2,163,379.44 -806,815.69 1,356, 563.75
Properties sold (3)Projects on hand (11)
Dec. 31, 1941 >
■Debentures and Certificates of Claim Item Percent to total
costAmount!Debentures and certificates of claim of the Housing Insurance Fund
are handled in the same manner as those of the Mutual Mortgage Insurance Fund. All debentures under the Housing Insurance Fund bear interest at 2% percent from the date foreclosure proceedings instituted. Those issued in exchange for projects insured prior to March 1, 1941, contain certain tax exemption provisions and those issued on projects insured on and after March 1, 1941, are without tax exemption.
Acquisition cosls:Debentures and cash adjustments......... .Interest on debentures prior to acquisition. Taxes and Insurance prior to acquisition...
Total cost at dato of acquisition.................
Expenditures after acquisition:Interest on debentures.......................................Additions and improvements.........................Equipment............................................................Taxes and insurance...........................................Operating cosls............ -......................................Maintenance and repairs.................................Administrative expenses...................................Rental expenses....................................................Miscellaneous........................................................
$10,682,465.17 42,894.05 23,171.23
$2,161,552.65 79,456. 16
27.53
96.293.55
were10,74S, 530.45 2,241,036.64 99.84
398. 792.13 15G, 24S. 45 29,8S8. 03
258,714. 27 202,519.81 209,205.94 01,531.10 88, S34.01
197.94
21,0S2.52 .94
1,119.84 l’497.'20
.05
.06Properties Acquired and Sold
Of the 324 Sections 207 and 210 rental housing projects insured under the Housing Insurance Fund, one mortgage note and 13 rental housing projects had been acquired by the Federal Housing Administration through December 31, 1941. In exchange for these assets, Housing Insurance Fund debentures and cash adjustments had been issued in the total amount of $12,844,018. (Of the 20 Section 207 projects insured under the Mutual Mortgage Insurance Fund prior to the establishment on February 3, 1938 of the Housing Insurance
1.405, 932.97 23,699.56 1.05Tolftl.
Loss: 17.74 19,9S4. 53hSwRental and other income...................
Mortgage note income........................
Total......................................................
Net operating cost after acquisition
Total cost of properties...................
.89;
.8920.002.27981,825.21:
. 163.697.29424, 107. 70
100.002. 244,733. 9311,172, 638. 21
i Of the 11 projects on hand, 1 unit of a 7-unit project has boon sold.I
I
ti
ki
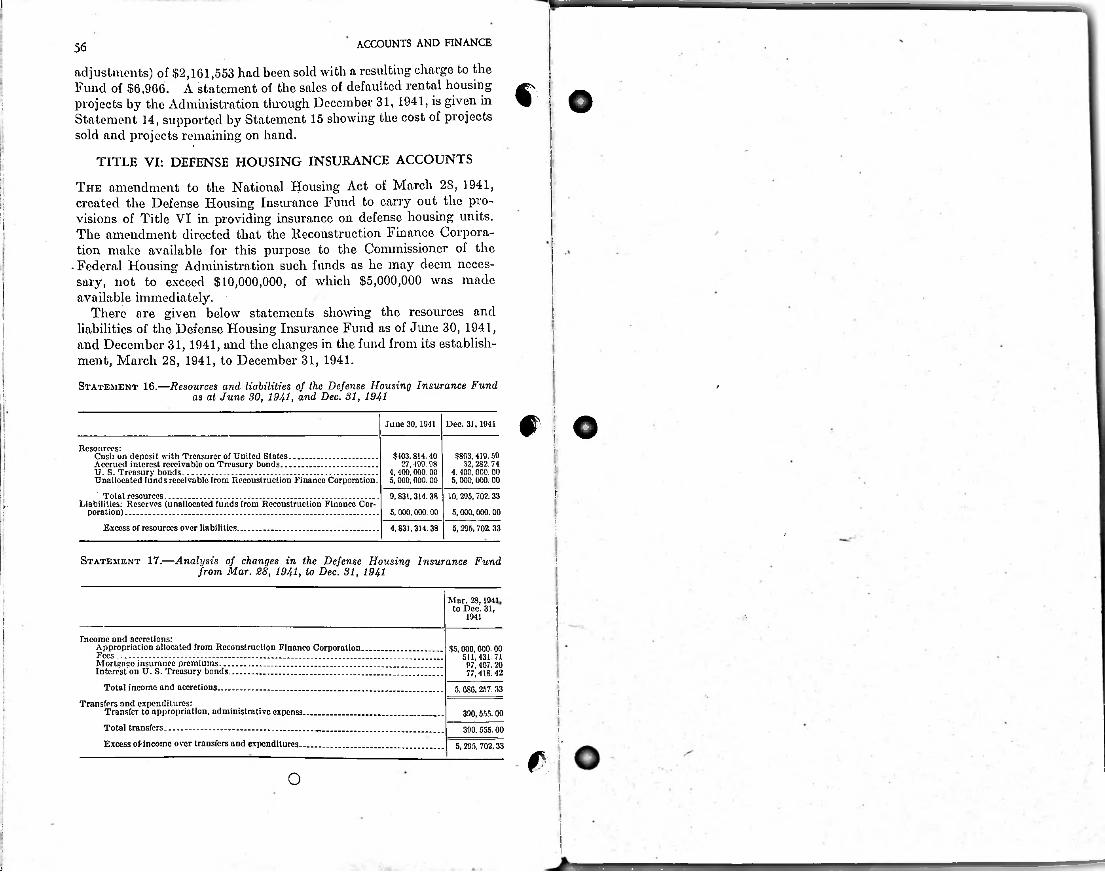
i
accounts and finance
adjustments) of $2,161,553 had been sold with a resulting charge to the Fund of $6,966. A statement of the sales of defaulted rental housing projects by the Administration through December 31, 1941, is given in Statement 14, supported by Statement 15 showing the cost of projects sold and projects remaining on hand.
TITLE VI: DEFENSE HOUSING INSURANCE ACCOUNTS
The amendment to the National Housing Act of March 28, 3941, created the Defense Housing Insurance Fund to carry out the provisions of Title VI in providing insurance on defense housing units. The amendment directed that the Reconstruction Finance Corporation make available for this purpose to the Commissioner of the
• Federal Housing Administration such funds as he may deem necessary, not to exceed $10,000,000, of which $5,000,000 was made available immediately.
There are given below statements showing the resources and liabilities of the Defense Housing Insurance Fund as of June 30, 1941, and December 31, 1941, and the changes in the fund from its establishment, March 28, 1941, to December 31, 1941.Statement 16.—Resources and liabilities of the Defense Housing Insurance Fund
as at June SO, 1941, and Dec. 31, 1941
56
c oI
:I|:
i
'
!/
# oJune 30,1941 Dec. 31,1911i
Resources:Cash on deposit with Treasurer of United States......................................Accrued interest receivable on Treasury bonds.........................................U. S. Treasury bonds.....................................................................-.............Unallocated funds receivable from Reconstruction Finance Corporation.
Total resources........................................................................................ ..Liabilities: Reserves (unallocated funds from Reconstruction Finance Cor
poration)............................................................................................................
Excess of resources over liabilities.............................................................
i$403,814.40 27,499.98
4.400.000. 005.000. 000.00
$803.419.59 32, 282.74
4. 400. 000. 005, 000,000. 00
!■
I9,831,314.38 6,000,000.00
10, 295,702.33 5,000,000.00;
i4,831,314.38 5,295,702.33 ; /
Statement 17.—Analysis of changes in the Defense Housing Insurance Fund from Mar. 28, 1941, to Dec. 31, 1941
i
Mar. 28, 1941 to Dec. 31,
1941!Income and accretions:
Appropriation allocated from Reconstruction Finance Corporation.Fees.........................................................................................................Mortgage insurance premiums............................................................ .Interest on U. S. Treasury bonds....................................................... .
Total income and accretions............................................................. .
Transfers and expenditures:Transfer to appropriation, administrative expenss_____ _______
Total transfers................................................................_..................
Excess of-income over transfers and expenditures.......................... .
$5,000.000.00 511,431.71 97,407.20 77,418.42
I
5. CSG, 257.33 1{
;390,555.00
390.555.00 I
5,295, 702.33
0: i
o 1
i
j