Embed Size (px)
Citation preview
Early Childhood Longitudinal Study, Kindergarten Class of 1998–99 (ECLS-K) Eighth-Grade Methodology Report
NCES 2009–003 U.S. DEPARTMENT OF EDUCATION

Early Childhood Longitudinal Study, Kindergarten Class of 1998–99 (ECLS-K) Eighth-Grade Methodology Report
September 2009
Karen Tourangeau Thanh Lê Christine Nord Alberto G. Sorongon Westat
Chris Chapman Project Officer National Center for Education Statistics
NCES 2009-003 U.S. DEPARTMENT OF EDUCATION

U.S. Department of Education Arne Duncan Secretary
Institute of Education Sciences John Easton Director
National Center for Education Statistics Stuart Kerachsky Acting Commissioner
The National Center for Education Statistics (NCES) is the primary federal entity for collecting, analyzing, and reporting data related to education in the United States and other nations. It fulfills a congressional mandate to collect, collate, analyze, and report full and complete statistics on the condition of education in the United States; conduct and publish reports and specialized analyses of the meaning and significance of such statistics; assist state and local education agencies in improving their statistical systems; and review and report on education activities in foreign countries.
NCES activities are designed to address high-priority education data needs; provide consistent, reliable, complete, and accurate indicators of education status and trends; and report timely, useful, and high-quality data to the U.S. Department of Education, the Congress, the states, and other education policymakers, practitioners, data users, and the general public.
We strive to make our products available in a variety of formats and in language that is appropriate to a variety of audiences. You, as our customer, are the best judge of our success in communicating information effectively. If you have any comments or suggestions about this or any other NCES product or report, we would like to hear from you. Please direct your comments to
National Center for Education Statistics Institute of Education Sciences U.S. Department of Education 1990 K Street NW Washington, DC 20006-5651
September 2009
The NCES World Wide Web Home Page address is http://nces.ed.gov. The NCES World Wide Web Electronic Catalog is http://nces.ed.gov/pubsearch.
This report is available only on the Web at http://nces.ed.gov/pubsearch.
Suggested Citation
Tourangeau, K., Lê, T., Nord, C., and Sorongon, A. G. (2009). Early Childhood Longitudinal Study, Kindergarten Class of 1998–99 (ECLS-K), Eighth-Grade Methodology Report (NCES 2009–003). National Center for Education Statistics, Institute of Education Sciences, U.S. Department of Education. Washington, DC.
Content Contact Chris Chapman (202) 502-7414 [email protected]
iii
TABLE OF CONTENTS
Chapter Page
1 INTRODUCTION ........................................................................................... 1-1
1.1 Background ......................................................................................... 1-4 1.2 Conceptual Model ............................................................................... 1-5 1.3 Study Components .............................................................................. 1-6 1.4 Contents of Report .............................................................................. 1-9
2 DEVELOPMENT OF SURVEY INSTRUMENTS ........................................ 2-1
2.1 Technical Work Group and Content Review Panel ............................ 2-2 2.2 Modifications to the Student Questionnaire ....................................... 2-4
2.2.1 Child Food Consumption Questions ................................... 2-5 2.2.2 Student Questionnaire Timing Study .................................. 2-6 2.2.3 Field Test ............................................................................. 2-7
2.3 Modifications to the Parent Interview ................................................. 2-12
2.3.1 Parent Interview Timing Study ........................................... 2-15
2.4 Modifications to Teacher Questionnaires ........................................... 2-17
2.4.1 Field Test ............................................................................. 2-20
3 SAMPLE DESIGN AND IMPLEMENTATION ............................................ 3-1
3.1 Precision Requirements and Achieved Sample Sizes ......................... 3-3 3.2 Base-Year Sample............................................................................... 3-7
3.2.1 Selecting the Area Sample .................................................. 3-7 3.2.2 Selecting the School Sample ............................................... 3-11
3.2.2.1 School Frame Construction ................................. 3-11 3.2.2.2 School Measure of Size ....................................... 3-12 3.2.2.3 School Allocation ................................................ 3-13
3.2.2.3.1 Public Schools ................................... 3-13 3.2.2.3.2 Private Schools .................................. 3-14
3.2.2.4 Clustering of Small Schools ................................ 3-16
3.2.2.4.1 Public Schools ................................... 3-16 3.2.2.4.2 Private Schools .................................. 3-17
iv
TABLE OF CONTENTS (continued)
Chapter Page
3.2.2.5 Implicit Stratification of Schools/Clusters of Schools ................................................................ 3-18
3.2.2.5.1 Public Schools ................................... 3-18 3.2.2.5.2 Private Schools .................................. 3-19
3.2.2.6 School Selection .................................................. 3-19 3.2.2.7 The ECLS-K Main School Sample ..................... 3-19 3.2.2.8 Supplemental School Sample .............................. 3-21
3.2.2.8.1 Public Schools ................................... 3-21 3.2.2.8.2 Private Schools .................................. 3-21 3.2.2.8.3 Non-Catholic Private Schools ........... 3-22
3.2.3 Sampling Children, Parents, and Teachers Within Schools ................................................................................ 3-23
3.3 Fall-First Grade Subsample ................................................................ 3-24
3.3.1 PSU Sample ........................................................................ 3-24 3.3.2 School Sample ..................................................................... 3-24 3.3.3 Child Sample ....................................................................... 3-25
3.4 Spring-First Grade Sample ................................................................. 3-26
3.4.1 Subsampling Movers ........................................................... 3-27 3.4.2 Sample Freshening .............................................................. 3-28
3.5 Spring-Third Grade Sample ................................................................ 3-29
3.5.1 Estimates from Spring-First Grade ..................................... 3-29 3.5.2 Third-Grade Sample Design ............................................... 3-31 3.5.3 Expected Sample Size ......................................................... 3-32 3.5.4 Protecting the Language Minority Children ........................ 3-34 3.5.5 Precision Requirements ....................................................... 3-35 3.5.6 Spring-Third Grade Sampling Outcome ............................. 3-37
3.6 Spring-Fifth Grade Sample ................................................................. 3-42
3.6.1 Options for Subsampling Movers ....................................... 3-42 3.6.2 Expected Sample Size ......................................................... 3-46 3.6.3 Sample Outcome and Precision Requirements ................... 3-46
v
TABLE OF CONTENTS (continued)
Chapter Page
3.7 Spring-Eighth-Grade Sample .............................................................. 3-51 3.7.1 Expected Sample Size ......................................................... 3-51 3.7.2 Precision Requirements and Sample Outcome ................... 3-53
4 DATA COLLECTION METHODS ................................................................ 4-1
4.1 Overview of Data Collection Methods ............................................... 4-1
4.1.1 Change in Data Collection Methods ................................... 4-3 4.1.2 Pilot Testing of Assessment Procedures ............................. 4-4
4.2 Roles and Responsibilities in the ECLS-K Study ............................... 4-6
4.2.1 School’s Role ...................................................................... 4-6 4.2.2 School Coordinator’s Role .................................................. 4-6 4.2.3 Supervisor’s Role ................................................................ 4-6 4.2.4 Field Manager’s Role .......................................................... 4-8 4.2.5 Field Supervisor’s Role ....................................................... 4-8 4.2.6 Interviewer’s Role ............................................................... 4-9 4.2.7 Test Administrator’s Role ................................................... 4-9
4.3 Field Staff Training ............................................................................. 4-10
4.3.1 Obtaining Parent Consent Training ..................................... 4-11 4.3.2 Parent Interview Training ................................................... 4-14 4.3.3 Advance School Contact and Recruitment Training ........... 4-16 4.3.4 Spring-Eighth Grade Direct Child Assessment Training .... 4-19
4.4 Obtaining Parent Consent ................................................................... 4-21
4.4.1 Advance Mailing ................................................................. 4-21 4.4.2 Follow-Up for Consent ....................................................... 4-22
4.5 Conducting the Parent Interview ........................................................ 4-22 4.6 Advance Preassessment School Contact ............................................. 4-24
4.6.1 Advance Mailings ............................................................... 4-24 4.6.2 Fall Preassessment School Coordinator Contact ................. 4-25 4.6.3 Fall Preassessment Contact Results .................................... 4-31 4.6.4 Tracing Activities During the Eighth-Grade Data Collection ............................................................................ 4-34
vi
TABLE OF CONTENTS (continued)
Chapter Page
4.7 Spring 2007 Eighth-Grade Data Collection ........................................ 4-34
4.7.1 Spring Preassessment Activities.......................................... 4-35 4.7.2 Conducting the Direct Child Assessments .......................... 4-35 4.7.3 Collecting Data for Children Who Had Withdrawn From Their Previous Round School .................................... 4-38 4.7.4 Teacher and School Data Collection ................................... 4-38
4.7.4.1 Hard-Copy Data Retrieval ................................... 4-40
4.7.5 Incentives in the ECLS-K ................................................... 4-41
4.8 Data Collection Quality Control ......................................................... 4-44
4.8.1 Quality Control on the Child Assessment ........................... 4-44 4.8.2 Validation of Parent Interview ............................................ 4-45
5 DATA PREPARATION AND EDITING ....................................................... 5-1
5.1 Coding and Editing Specifications for Computer-Assisted Interviews (CAI) ................................................................................. 5-1
5.1.1 Range Specifications ........................................................... 5-1 5.1.2 Logical Consistency Checks (Logical Edits) ...................... 5-2 5.1.3 Coding ................................................................................. 5-2 5.1.4 Editing the Household Roster in the Parent Interview ........ 5-10
5.2 Coding and Editing Specifications for Hard-Copy Questionnaires .... 5-12
5.2.1 Receipt Control ................................................................... 5-12 5.2.2 Data Scanning ..................................................................... 5-13 5.2.3 Coding ................................................................................. 5-16
5.3 Data Editing Management Process ..................................................... 5-17
5.3.1 Collection Database ............................................................ 5-17 5.3.2 Holding Database ................................................................ 5-19 5.3.3 Editing Database ................................................................. 5-20 5.3.4 Delivery Database ............................................................... 5-20
5.4 Data Editing ........................................................................................ 5-21 5.4.1 Range Specifications ........................................................... 5-22 5.4.2 Consistency Checks (Logical Edits) ................................... 5-22 5.4.3 Teacher Responses to Key Child Items ............................... 5-23
vii
TABLE OF CONTENTS (continued)
Chapter Page
5.4.4 Frequency and Cross-Tabulation Review ........................... 5-25
5.5 Creation of the Socioeconomic Status Variable ................................. 5-25 5.6 Imputation of the School Lunch Composites ...................................... 5-41
6 RESPONSE RATES ........................................................................................ 6-1
6.1 Definition of Response and Completion Rates ................................... 6-2 6.2 Completion Rates ................................................................................ 6-3
6.2.1 Children Sampled in Kindergarten ...................................... 6-4 6.2.2 Children Added to the Sample in First Grade ..................... 6-20 6.2.3 Spring-Eighth Grade Completion Rates for All Children ............................................................................... 6-24
6.3 Overall Response Rates ...................................................................... 6-28 6.4 Item Response Rates ........................................................................... 6-31
7 NONRESPONSE BIAS ANALYSIS .............................................................. 7-1
7.1 Comparison With Frame Data ............................................................ 7-2 7.2 Multivariate Analysis .......................................................................... 7-5 7.3 Attrition Bias ...................................................................................... 7-22 7.4 Summary ............................................................................................. 7-36
8 WEIGHTING AND VARIANCE ESTIMATION .......................................... 8-1
8.1 Types of Weights ................................................................................ 8-2 8.2 Computation of the Eighth-Grade Weights ........................................ 8-6
8.2.1 Initial Child Weights ........................................................... 8-8
8.2.1.1 Base-Year Nonresponse-Adjusted School Weights ................................................................ 8-9
8.2.1.2 Base-Year Child Weights .................................... 8-12
8.2.1.2.1 Base-Year Child Weights for Base-Year Respondents ..................... 8-12
8.2.1.2.2 Base-Year Child Weights for Children Sampled in First Grade ...................... 8-13
8.2.2 Adjustment for Movers Between the Base Year and Fifth Grade .......................................................................... 8-18 8.2.3 Adjustment for Fifth-Grade Unknown Eligibility Status .... 8-20
viii
TABLE OF CONTENTS (continued)
Chapter Page
8.2.4 Eighth-Grade Unknown Eligibility and Nonresponse Adjustment .......................................................................... 8-21 8.2.5 Raking to Sample-Based Control Totals ............................. 8-22 8.2.6 Additional Adjustment for Child-Parent-Teacher Cross-Sectional Weights ..................................................... 8-24 8.2.7 Replicate Weights ............................................................... 8-25
8.2.7.1 Replicate Weights for Samples Not Involving Fall-First Grade ................................................... 8-26
8.2.7.2 Replicate Weights for Samples Involving Fall-First Grade ................................................... 8-28
8.3 Variance Estimation ............................................................................ 8-28
8.3.1 Jackknife Method ................................................................ 8-28 8.3.2 Taylor Series Method .......................................................... 8-29
REFERENCES ..................................................................................................................... R-1
List of Appendixes
Appendix
A ECLS-K Spring 2006 Field Test Report .......................................................... A-1 B Mover Adjustment Cells for Fifth Grade ......................................................... B-1 C Eighth-Grade Unknown Eligibility and Nonresponse Adjustment Cells ........ C-1 D Raking Dimensions .......................................................................................... D-1
List of Tables
Table
2-1 Results of timing tests of revised eighth-grade student questionnaire ............. 2-7 2-2 Number of completed student questionnaires by method of completion: Spring 2006 ...................................................................................................... 2-11 2-3 Interviewer timings for the revised ECLS-K eighth-grade parent interview, by respondent and by section .......................................................... 2-17
ix
TABLE OF CONTENTS (continued)
List of Tables (continued)
Table Page
2-4 Number of completed teacher questionnaires by method of completion ......... 2-21 3-1 ECLS-K sample size from the base year through fifth grade: School years 1998–99, 1999–2000, 2001–02, 2003–04, and 2006–07 ....................... 3-7 3-2 Stratum definitions for the 38 non-self-representing strata: School year 1998–99 .................................................................................................... 3-10 3-3 Distribution of the ECLS-K primary sampling unit (PSU) sample by self- representing (SR) status, Metropolitan Statistical Area (MSA) status, and census region: School year 1998–99 ................................................................ 3-11 3-4 Estimates of the number of kindergarten schools and children, by primary sampling unit (PSU) status: School year 1998–99 ............................. 3-12 3-5 Expected number of clusters, schools, and children—public schools: School year 1998–99 ....................................................................................... 3-14 3-6 Expected number of clusters, schools, and children—private schools: School year 1998–99 ....................................................................................... 3-15 3-7 Number of clusters and schools in the public school frame: School year 1998–99 .................................................................................................... 3-17 3-8 Number of clusters and schools in the private school frame: School year 1998–99 .................................................................................................... 3-18 3-9 Number of sample schools, by school characteristics: School year 1998–99 ........................................................................................................... 3-20 3-10 Characteristics of base-year cooperating schools selected for fall-first grade: School year 1999–2000 ......................................................................... 3-25 3-11 Spring-first grade data collection results by mover status: School year 1999–2000 ....................................................................................................... 3-30 3-12 Expected sample size for selected subgroups for third grade, by mover status: School year 2001–02 ............................................................................ 3-33 3-13 Expected sample size for third grade, by mover status, if standard subsampling rates were used and if language minority children were preserved: School year 2001–02 ...................................................................... 3-36
x
TABLE OF CONTENTS (continued)
List of Tables (continued)
Table Page 3-14 Characteristics of third-grade respondents—number of third-graders by subgroup: School year 2001–02 ....................................................................... 3-39 3-15 Characteristics of third-grade respondents—percent distribution by subgroup: School year 2001–02 ....................................................................... 3-40 3-16 Spring-third-grade data collection results by mover status: School year 2001–02 ........................................................................................................... 3-41 3-17 Number of children eligible after the base year but excluded from the fifth-grade data collection: School year 2003–04 ............................................ 3-43 3-18 ECLS-K options for subsampling movers for fifth grade: School year 2003–04 ........................................................................................................... 3-45 3-19 Expected sample size for selected subgroups for fifth grade, by mover status: School year 2003–04 ............................................................................ 3-46 3-20 Characteristics of fifth-grade respondents—number of fifth-graders by subgroup: School year 2003–04 ....................................................................... 3-48 3-21 Characteristics of fifth-grade respondents—percent distribution by subgroup: School year 2003–04 ....................................................................... 3-49 3-22 Spring-fifth-grade data collection results by mover status: School year 2003–04 ........................................................................................................... 3-50 3-23 Expected sample size for selected subgroups for eighth grade, by mover status: School year 2006–07 ............................................................................ 3-52 3-24 Characteristics of eighth-grade respondents—number of eighth-graders by subgroup: School year 2006–07 .................................................................. 3-56 3-25 Characteristics of eighth-grade respondents—percent distribution by subgroup: School year 2006–07 ....................................................................... 3-57 3-26 Spring-eighth-grade data collection results by mover status: School year 2006–07 ........................................................................................................... 3-59 3-27 Number of children eligible after the base year but excluded from the eighth-grade data collection: School year 2006–07 ......................................... 3-60
xi
TABLE OF CONTENTS (continued)
List of Tables (continued)
Table Page 4-1 Number and percent of completed parent interviews by data collection mode and language: School year 2006–07 ...................................................... 4-23 4-2 Fall preassessment contact productivity report, by week: School year 2006–07 ........................................................................................................... 4-32 4-3 Fall preassessment contact production report: School year 2006–07 .............. 4-33 4-4 Weekly completion of the child assessments: School year 2006–07 ............... 4-36 4-5 Completed child assessments, by accommodation, spring-eighth grade data collection: School year 2006–07: ................................................... 4-37 4-6 Number of child-level questionnaires and percent of teachers: School year 2006–07 .................................................................................................... 4-40 4-7 Results of parent interview validations: School year 2006–07 ........................ 4-47 5-1 “Other, specify” codes added during eighth grade: School year 2006–07 ...... 5-3 5-2 “Other, specify” items added to the coding system: School year 2006–07 ..... 5-5 5-3 Number of text strings by “Other, specify” item, eighth-grade parent interview: School year 2006–07 ...................................................................... 5-5 5-4 Number and percent of occupations coded, by coding status: School year 2006–07 .................................................................................................... 5-10 5-5 Data editing of the parent interview household roster, eighth-grade data collection: School year 2006–07 ...................................................................... 5-11 5-6 Number of questionnaires receipted by week, eighth-grade data collection: School year 2006–07 ...................................................................... 5-14 5-7 Number of assessments and height/weight forms receipted by week, eighth-grade data collection: School year 2006–07 ......................................... 5-15 5-8 Number of assessment routing sheets receipted by week, eighth-grade data collection: School year 2006–07 .............................................................. 5-16 5-9 Hard-copy editing progress report, eighth-grade data collection: School year 2006–07 ....................................................................................... 5-23
xii
TABLE OF CONTENTS (continued)
List of Tables (continued)
Table Page 5-10 Recode of occupation values to 1989 GSS prestige scores, spring- eighth grade: School year 2006–07 .................................................................. 5-26 5-11 Missing data for SES source variables, fall-eighth grade: School year 2006–07 ........................................................................................................... 5-26 5-12 Components of the SES variable, spring-eighth grade: School year 2006–07 ........................................................................................................... 5-27 5-13 Demographic characteristics used in creating imputation cells, spring- eighth grade: School year 2006–07 .................................................................. 5-30 5-14 Imputation of SES components by filling in with values from previous rounds or by hot deck, spring-eighth grade: School year 2006–07 ................. 5-33 5-15 Mother’s education, before and after imputation, spring-eighth grade: School year 2006–07 ....................................................................................... 5-34 5-16 Father’s education, before and after imputation, spring-eighth grade: School year 2006–07 ....................................................................................... 5-34 5-17 Mother’s labor force status, before and after imputation, spring-eighth grade: School year 2006–07............................................................................. 5-35 5-18 Father’s labor force status, before and after imputation, spring-eighth grade: School year 2006–07............................................................................. 5-35 5-19 Mother’s occupation, before and after imputation, spring-eighth grade: School year 2006–07 ....................................................................................... 5-36 5-20 Father’s occupation, before and after imputation, spring-eighth grade: School year 2006–07 ....................................................................................... 5-37 5-21 Household income, before and after imputation, spring-eighth grade: School year 2006–07 ....................................................................................... 5-38 5-22 Distribution of socioeconomic status (SES) values, spring-eighth grade: School year 2006–07 ....................................................................................... 5-39 5-23 Unweighted frequencies of the socioeconomic status (SES) variable, spring-eighth grade: School year 2006–07 ...................................................... 5-40 5-24 Public schools and child-parent respondents with missing value of the school lunch composites, spring-eighth grade: School year 2006–07 ............. 5-41
xiii
TABLE OF CONTENTS (continued)
List of Tables (continued)
Table Page
5-25 Imputation of school lunch composites at the school level, spring- eighth grade: School year 2006–07 .................................................................. 5-42 5-26 Imputation of school lunch composites at the child level, spring-eighth grade: School year 2006–07............................................................................. 5-42 5-27 Free lunch composite at the school level, before and after imputation, spring-eighth grade: School year 2006–07 ...................................................... 5-43 5-28 Free lunch composite at the child level, before and after imputation, spring-eighth grade: School year 2006–07 ...................................................... 5-44 5-29 Reduced-price lunch composite at the school level, before and after imputation, spring-eighth grade: School year 2006–07 ................................... 5-45 5-30 Reduced-price lunch composite at the child level, before and after imputation, spring-eighth grade: School year 2006–07 ................................... 5-46 6-1 Number of completed child-level cases and child-level completion rates for the child assessment and parent interview for children sampled in the base year and eligible for the eighth-grade data collection, by school characteristics: School year 2006–07 .............................................. 6-7 6-2 Number of completed child-level cases and child-level completion rates for the student questionnaire, school administrator questionnaire, and the teacher-level questionnaire for children sampled in the base year and eligible for the eighth-grade data collection, by school characteristics: School year 2006–07 ............................................................... 6-9 6-3 Number of completed child-level cases and child-level completion rates for the child-level teacher questionnaires for children sampled in the base year and eligible for the eighth-grade data collection, by school characteristics: School year 2006–07 ............................................................... 6-11 6-4 Number of completed child-level cases and child-level completion rates for the child assessment and parent interview for children sampled in the base year and eligible for the eighth-grade data collection, by mover’s status: School year 2006–07 ............................................................................ 6-14
xiv
TABLE OF CONTENTS (continued)
List of Tables (continued)
Table Page 6-5 Number of completed child-level cases and child-level completion rates for the student questionnaire, school administrator questionnaire and the teacher-level questionnaire for children sampled in the base year and eligible for the eighth-grade data collection, by mover’s status: School year 2006–07 ....................................................................................... 6-14 6-6 Number of completed child-level cases and child-level completion rates for the child-level teacher questionnaires for children sampled in the base year and eligible for the eighth-grade data collection, by child’s mover status: School year 2006–07 ............................................................................ 6-15
6-7 Number of completed child-level cases and child-level completion rates for the child assessment and parent interview for children sampled in the base year and eligible for the eighth-grade data collection, by child characteristics: School year 2006–07 ................................................. 6-17 6-8 Number of completed child-level cases and child-level completion rates for the student questionnaire, school administrator questionnaire and teacher-level questionnaire for children sampled in the base year and eligible for the eighth-grade data collection, by child characteristics: School year 2006–07 6-18 6-9 Number of completed child-level cases and child-level completion rates for the teacher-level questionnaires for children sampled in the base year and eligible for the eighth-grade data collection, by child’s mover status: School year 2006–07 ....................................................................................... 6-19 6-10 Number of completed instruments and child-level completion rates for the special education teacher questionnaires for children sampled in the base year and eligible for the eighth-grade data collection: School year 2006–07 ....................................................................................... 6-20 6-11 Number of completed child-level cases and child-level completion rates for children sampled in first grade and eligible for the eighth-grade data collection: School year 2006–07 .............................................................. 6-23 6-12 Number of completed child-level cases and child-level completion rates, for all eligible for the eighth-grade data collection, by survey instruments: School year 2006–07 ................................................................... 6-25 6-13 Number of completed child-level cases and child-level completion rates, for children with scorable reading, mathematics or science assessment or children not assessed due to disabilities, by survey instruments: School year 2006–07 ................................................................... 6-27
xv
TABLE OF CONTENTS (continued)
List of Tables (continued)
Table Page 6-14 Kindergarten to eighth-grade overall response rate: School year 2006–07 ..... 6-29 6-15 Number of survey items and percent of nonresponse values: School year 2006–07 .................................................................................................... 6-32 6-16 Item response rates for items on the ECLS-K eighth-grade restricted-use data file: School year 2006–07 ........................................................................ 6-33 6-17 Items on the ECLS-K eighth-grade restricted-use data file with less than 85 percent response rates: School year 2006–07 ..................................... 6-34 7-1 Number of eighth-grade children, by school and child characteristics: 2005-06 CCD, 2003-04 PSS, and ECLS-K: School year 2006–07 ................. 7-4 7-2 Summary of estimates and sample sizes for the different estimates: School year 2006–07 ....................................................................................... 7-26 7-3 Summary statistics of bias for all estimates: School year 2006–07 ................. 7-28 7-4 Summary statistics of bias for estimates of mean scores: School year 2006–07 ........................................................................................................... 7-28 7-5 Summary statistics of bias for estimates of proportions and means: School year 2006–07 ....................................................................................... 7-29 8-1 Size reclassification for school nonresponse adjustment: School year 1998–99 8-11
List of Appendix Tables
Table B-1 Fifth grade mover adjustment cell applied to eighth-grade initial weight: School year 2003–04 ........................................................................... B-1 C-1 Unknown eligibility and nonresponse adjustment cells for C7CW0: School year 2006-07 .................................................................................................... C-3 C-2 Unknown eligibility and nonresponse adjustment cells for C7PW0: School year 2006-07 .................................................................................................... C-3 C-3 Unknown eligibility and nonresponse adjustment cells for C7CPTE0: School year 2006-07 .................................................................................................... C-4
xvi
TABLE OF CONTENTS (continued)
List of Appendix Tables (continued)
Table Page C-4 Unknown eligibility and nonresponse adjustment cells for C7CPTM0: School year 2006-07 .................................................................................................... C-4 C-5 Unknown eligibility and nonresponse adjustment cells for C7CPTS0: School year 2006-07 .................................................................................................... C-5 C-6 Unknown eligibility and nonresponse adjustment cells for C67CW0: School year 2006-07 .................................................................................................... C-5 C-7 Unknown eligibility and nonresponse adjustment cells for C67PW0: School year 2006-07 .................................................................................................... C-6 C-8 Unknown eligibility and nonresponse adjustment cells for C567CW0: School year 2006-07 .................................................................................................... C-6 C-9 Unknown eligibility and nonresponse adjustment cells for C567PW0: School year 2006-07 .................................................................................................... C-6 C-10 Unknown eligibility and nonresponse adjustment cells for C4567C0: School year 2006-07 .................................................................................................... C-7 C-11 Unknown eligibility and nonresponse adjustment cells for C4567P0: School year 2006-07 .................................................................................................... C-7 C-12 Unknown eligibility and nonresponse adjustment cells for C2_7FC0: School year 2006-07 .................................................................................................... C-7 C-13 Unknown eligibility and nonresponse adjustment cells for C2_7FP0: School year 2006-07 .................................................................................................... C-8 C-14 Unknown eligibility and nonresponse adjustment cells for C1_7FC0: School year 2006-07 .................................................................................................... C-8 C-15 Unknown eligibility and nonresponse adjustment cells for C1_7FP0: School year 2006-07 .................................................................................................... C-8 C-16 Unknown eligibility and nonresponse adjustment cells for C1_7SC0: School year 2006-07 .................................................................................................... C-9 C-17 Unknown eligibility and nonresponse adjustment cells for C1_7SP0: School year 2006-07 .................................................................................................... C-9 D-1 Raking dimension 1—gender by age: School year 2006-07 ............................ D-1
xvii
TABLE OF CONTENTS (continued)
List of Appendix Tables (continued)
Table Page D-2 Raking dimension 2—region by locale: School year 2006-07 ........................ D-1 D-3 Raking dimension 3—race/ethnicity by SES quintile: School year 2006-07 .. D-2 D-4 Raking dimension 4—school type: School year 2006-07 ................................ D-2 D-5 Raking dimension 5—LM status: School year 2006-07 .................................. D-2 D-6 Raking dimension 6—mover status in spring-first grade: School year 2006-07 ............................................................................................................ D-3
List of Figures
Figure Page 7-1 Difference between absolute values of relative bias of unraked and raked estimates of mean scores for child respondents using the C weight: School year 2006–07 ........................................................................... 7-30 7-2 Ratio of root mean square errors of unraked and raked estimates of mean scores for child respondents using the C weight: School year 2006–07 ........................................................................................................... 7-31 7-3 Difference between absolute values of relative bias of unraked and raked estimates of proportions and means for child respondents using the C weight: School year 2006–07 ................................................................. 7-31 7-4 Ratio of root mean square errors of unraked and raked estimates of proportions and means for child respondents using the C weight: School year 2006–07 ....................................................................................... 7-32 7-5 Difference between absolute values of relative bias of unraked and raked estimates of mean scores for parent respondents using the P weight: School year 2006–07 ........................................................................... 7-32 7-6 Ratio of root mean square errors of unraked and raked estimates of mean scores for parent respondents using the P weight: School year 2006–07 ........................................................................................................... 7-33 7-7 Difference between absolute values of relative bias of unraked and raked estimates of proportions and means for parent respondents using the P weight: School year 2006–07 ........................................................ 7-33
xviii
TABLE OF CONTENTS (continued)
List of Figures (continued)
Figure Page 7-8 Ratio of root mean square errors of unraked and raked estimates of proportions and means for parent respondents using the P weight: School year 2006–07 ....................................................................................... 7-34 7-9 Difference between absolute values of relative bias of unraked and raked estimates of mean scores for child-parent-teacher respondents using the CPE weight: School year 2006–07 .................................................................. 7-34 7-10 Ratio of root mean square errors of unraked and raked estimates of mean scores for child-parent-teacher respondents using the CPE weight: School year 2006–07 ........................................................................... 7-35 7-11 Difference between absolute values of relative bias of unraked and raked estimates of proportions and means for child-parent-teacher respondents using the CPE weight: School year 2006–07 ................................................... 7-35 7-12 Ratio of root mean square errors of unraked and raked estimates of proportions and means for child-parent-teacher respondents using the CPE weight: School year 2006–07 .................................................................. 7-36
List of Exhibits
Exhibit 1-1 ECLS-K waves of data collection: School years 1998–99, 1999–2000, 2001–02, 2003–04, and 2006–07 ..................................................................... 1-2 1-2 ECLS-K conceptual model .............................................................................. 1-6 1-3 Instruments used in the ECLS-K, by round of data collection: Schools years 1998–99, 1999–2000, 2001–02, 2003–04, and 2006–07 ................................. 1-8 1-4 Direct child assessments, by domain and round of data collection: School years 1998–99, 1999–2000, 2001–02, 2003–04, and 2006–07 ....................... 1-9 2-1 Sections of the fall-eighth grade parent interview: School year 2006–07 ....... 2-12 4-1 Timeline of eighth-grade data collection ......................................................... 4-2 4-2 Sequence of ECLS-K eighth-grade assessment components ........................... 4-4 4-3 Eighth-grade field organization ....................................................................... 4-10
xix
TABLE OF CONTENTS (continued)
List of Exhibits (continued)
Exhibit Page 4-4 Spring 2006 Gaining Parent Consent Training Agenda: School year 2006-07 ............................................................................................................ 4-13 4-5 Summer 2006 Parent Interview Training Agenda: School year 2006-07 ....... 4-16 4-6 Summer 2006 Advance School Contact and School Recruitment Training Agenda: School year 2006–07 ......................................................... 4-17 4-7 Summer 2006 Direct Child Assessment Training Agenda: School year 2006-07. ........................................................................................................... 4-20 4-8 Eighth-grade ECLS-K student work grid (Supervisor Version) ...................... 4-27 4-9 Individualized Education Program (IEP) process, spring eighth-grade: School year 2006-07 ........................................................................................ 4-30 4-10 Critical items by questionnaire type: School year 2006–07 ............................ 4-41 4-11 Types of incentives used in the ECLS-K: School year 2006–07 ..................... 4-43 5-1 Aggregated occupation coding categories in the ECLS-K: School years 1998–99, 2001–02, 2003–04, and 2006–07 ........................................... 5-6 5-2 ECLS-K hard-copy data editing, eighth-grade data collection: School year 2006–07 .................................................................................................... 5-18 5-3 Status codes assigned for data management databases, eighth-grade data collection: School year 2006–07 ...................................................................... 5-21 7-1 Relationship between the child assessment response status and school and child characteristics: School year 2006–07 ............................................... 7-7 7-2 Relationship between the parent interview response status and school and child characteristics: School year 2006–07 ............................................... 7-9 7-3 Relationship between the student questionnaire response status and school and child characteristics: School year 2006–07 ................................... 7-11 7-4 Relationship between the school administrator questionnaire response status and school characteristics: School year 2006–07 .................................. 7-13 7-5 Relationship between the teacher-level questionnaire response status and school characteristics: School year 2006–07 ............................................ 7-16
xx
TABLE OF CONTENTS (continued)
List of Exhibits (continued)
Exhibit Page 7-6 Relationship between the child-level English teacher questionnaire response status and school characteristics: School year 2006–07 ................... 7-18 7-7 Relationship between the child-level mathematics teacher questionnaire response status and school characteristics: School year 2006–07 ................... 7-20 7-8 Relationship between the child-level science teacher questionnaire response status and school characteristics: School year 2006–07 ................... 7-21 7-9 Analysis variables and source of data: School year 2006–07 .......................... 7-24 7-10 List of evaluation statistics: School year 2006–07 ........................................... 7-26 8-1 ECLS-K eighth-grade cross-sectional weights: School year 2006–07 ............ 8-3 8-2 ECLS-K: K–8 longitudinal weights, spring-eighth grade: School year 2006–07 ........................................................................................................... 8-4 8-3 Groups of children defined for mover adjustments: School year 1999–2000 ....................................................................................................... 8-17 8-4 Movers and nonmovers by retention status: School year 2003–04.................. 8-19 8-5 Groups of children defined for unknown eligibility adjustments: School year 2003–04 .................................................................................................... 8-20
1-1
1. INTRODUCTION
This methodology report provides technical information about the development, design, and conduct of the eighth-grade1 data collection of the Early Childhood Longitudinal Study, Kindergarten Class of 1998–99 (ECLS-K). It begins with an overview of the ECLS-K study. Subsequent chapters provide information on the development of the instruments, sample design, data collection methods, data preparation and editing, response rates, and weighting and variance estimation. Please note that this report refers to student respondents in the eighth-grade round as “children” to be consistent with the terminology used in documentation from earlier rounds of the ECLS-K.
The ECLS-K focuses on children’s early school experiences beginning with kindergarten
and ending with eighth grade. It is a multisource, multimethod study that includes interviews with parents, the collection of data from principals and teachers, and student records abstracts, as well as direct child assessments. In the eighth-grade data collection, a student paper-and-pencil questionnaire was added. The ECLS-K was developed under the sponsorship of the U.S. Department of Education, Institute of Education Sciences, National Center for Education Statistics (NCES). Westat conducted this study with assistance provided by Educational Testing Service (ETS) in Princeton, New Jersey.
The ECLS-K followed a nationally representative cohort of children from kindergarten into
middle school. The base-year data were collected in the fall and spring of the 1998–99 school year when the sampled children were in kindergarten. A total of 21,260 kindergartners throughout the nation participated.
Two more waves of data were collected in the fall and spring of the 1999–2000 school year
when most, but not all, of the base-year children were in first grade.2 The fall-first grade data collection was limited to a 30 percent subsample of schools3 (see exhibit 1-1). It was a design enhancement to enable researchers to measure the extent of summer learning loss and the factors that contribute to such loss and to better disentangle school and home effects on children’s learning. The spring-first grade data collection, which included the full sample, was part of the original study design and can be used to measure annual school progress and to describe the first-grade learning environment of children in the 1 The term “eighth grade” is used throughout this document to refer to the data collections that took place in the 2006–07 school year, at which time most of the sampled children—but not all of them—were in eighth grade. 2 Though the majority of base-year children were in first grade during the 1999–2000 school year, about 5 percent of the sampled children were retained in kindergarten and a handful of others were in second grade during the 1999–2000 school year. 3 Approximately 27 percent of the base-year children who were eligible to participate in year 2 attended the 30 percent subsample of schools.
1-2
study. All children assessed during the base year were eligible to be assessed in the spring-first grade data collection regardless of whether they repeated kindergarten, were promoted to first grade, or were promoted to second grade. In addition, children who were not in kindergarten in the United States during the 1998–99 school year, and therefore did not have a chance to be selected to participate in the base year of the ECLS-K, were added to the spring-first grade sample.4 Such children include immigrants to the United States who arrived after fall 1998 sampling, children living abroad during the 1998–99 school year, children who were in first grade in 1998–99 and repeated it in 1999–2000, and children who did not attend kindergarten. Their addition allows researchers to make estimates for all first-graders in the United States rather than just for those who attended kindergarten in the United States in the previous year.
A fifth wave of data was collected in the spring of the 2001–02 school year when most, but
not all, of the sampled children were in third grade.5 In addition to the school, teacher, parent, and child assessment data collection components, children were asked to complete a short self-description questionnaire, which asked them how they thought and felt about themselves both academically and socially. The spring-third grade data collection can be used to measure school progress and to describe the third-grade learning environment of children in the study.
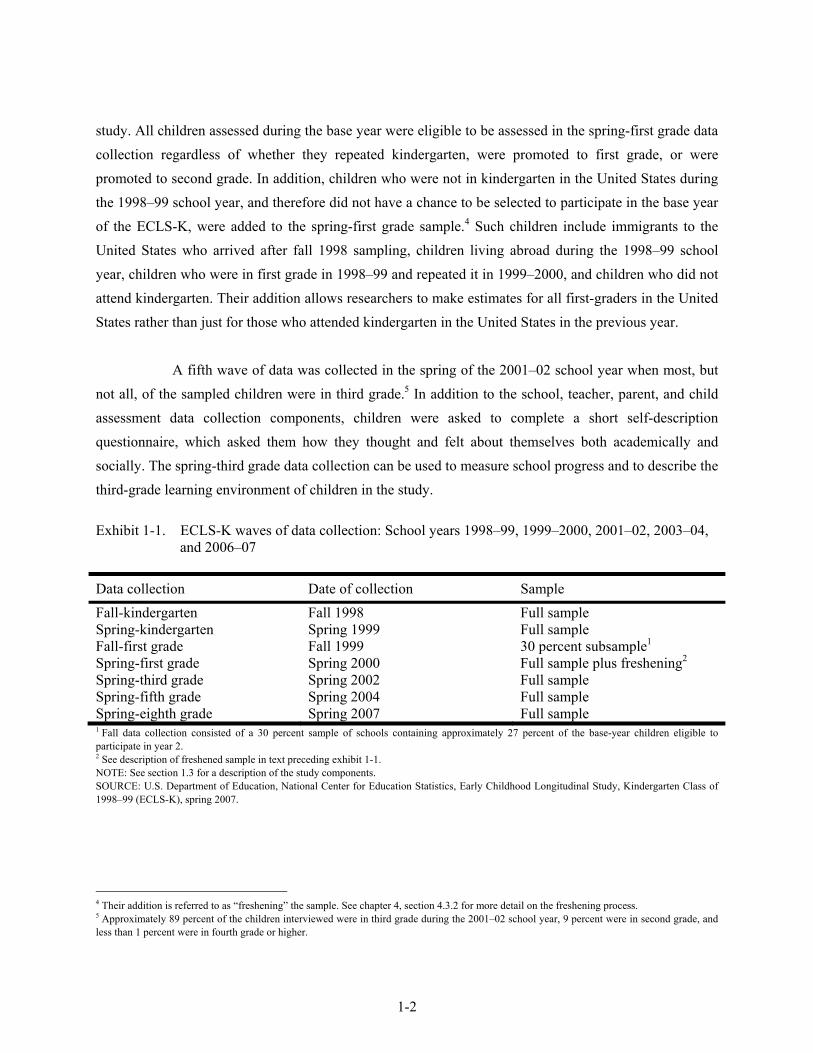
Exhibit 1-1. ECLS-K waves of data collection: School years 1998–99, 1999–2000, 2001–02, 2003–04,
and 2006–07
Data collection Date of collection Sample Fall-kindergarten Fall 1998 Full sample Spring-kindergarten Spring 1999 Full sample Fall-first grade Fall 1999 30 percent subsample1
Spring-first grade Spring 2000 Full sample plus freshening2 Spring-third grade Spring 2002 Full sample Spring-fifth grade Spring 2004 Full sample Spring-eighth grade Spring 2007 Full sample 1 Fall data collection consisted of a 30 percent sample of schools containing approximately 27 percent of the base-year children eligible to participate in year 2. 2 See description of freshened sample in text preceding exhibit 1-1. NOTE: See section 1.3 for a description of the study components. SOURCE: U.S. Department of Education, National Center for Education Statistics, Early Childhood Longitudinal Study, Kindergarten Class of 1998–99 (ECLS-K), spring 2007.
4 Their addition is referred to as “freshening” the sample. See chapter 4, section 4.3.2 for more detail on the freshening process. 5 Approximately 89 percent of the children interviewed were in third grade during the 2001–02 school year, 9 percent were in second grade, and less than 1 percent were in fourth grade or higher.
1-3
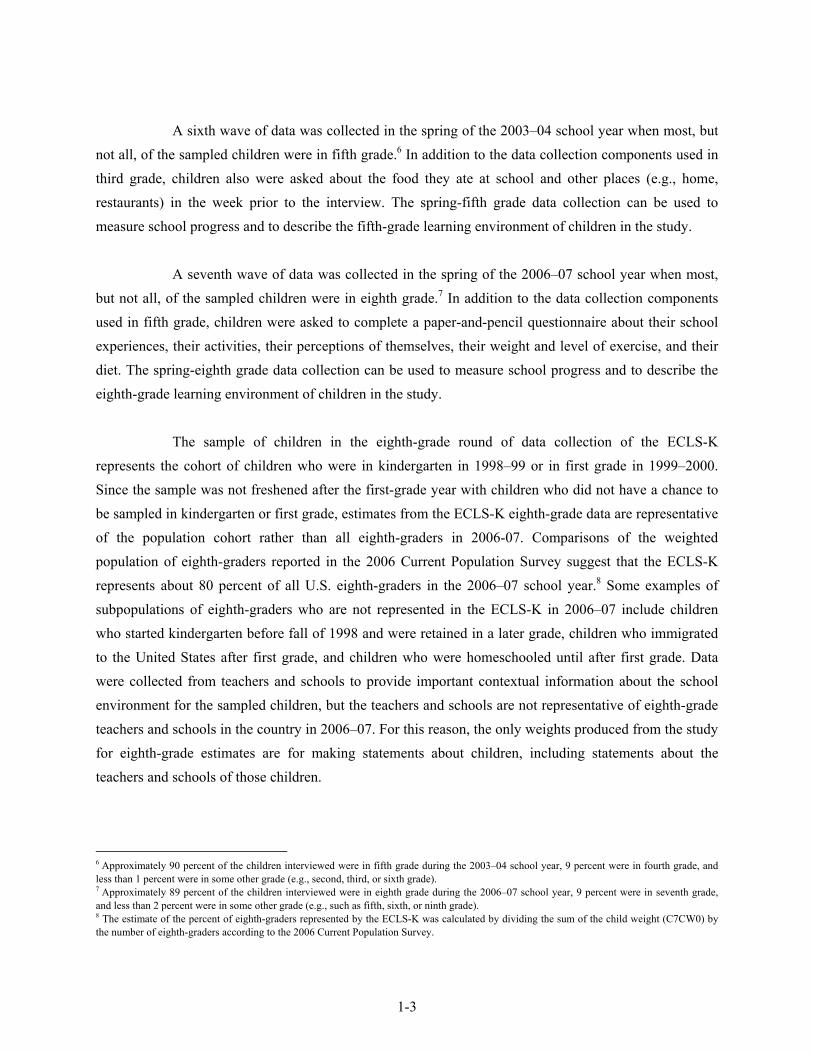
A sixth wave of data was collected in the spring of the 2003–04 school year when most, but not all, of the sampled children were in fifth grade.6 In addition to the data collection components used in third grade, children also were asked about the food they ate at school and other places (e.g., home, restaurants) in the week prior to the interview. The spring-fifth grade data collection can be used to measure school progress and to describe the fifth-grade learning environment of children in the study.
A seventh wave of data was collected in the spring of the 2006–07 school year when most,
but not all, of the sampled children were in eighth grade.7 In addition to the data collection components used in fifth grade, children were asked to complete a paper-and-pencil questionnaire about their school experiences, their activities, their perceptions of themselves, their weight and level of exercise, and their diet. The spring-eighth grade data collection can be used to measure school progress and to describe the eighth-grade learning environment of children in the study.
The sample of children in the eighth-grade round of data collection of the ECLS-K
represents the cohort of children who were in kindergarten in 1998–99 or in first grade in 1999–2000. Since the sample was not freshened after the first-grade year with children who did not have a chance to be sampled in kindergarten or first grade, estimates from the ECLS-K eighth-grade data are representative of the population cohort rather than all eighth-graders in 2006-07. Comparisons of the weighted population of eighth-graders reported in the 2006 Current Population Survey suggest that the ECLS-K represents about 80 percent of all U.S. eighth-graders in the 2006–07 school year.8 Some examples of subpopulations of eighth-graders who are not represented in the ECLS-K in 2006–07 include children who started kindergarten before fall of 1998 and were retained in a later grade, children who immigrated to the United States after first grade, and children who were homeschooled until after first grade. Data were collected from teachers and schools to provide important contextual information about the school environment for the sampled children, but the teachers and schools are not representative of eighth-grade teachers and schools in the country in 2006–07. For this reason, the only weights produced from the study for eighth-grade estimates are for making statements about children, including statements about the teachers and schools of those children.
6 Approximately 90 percent of the children interviewed were in fifth grade during the 2003–04 school year, 9 percent were in fourth grade, and less than 1 percent were in some other grade (e.g., second, third, or sixth grade). 7 Approximately 89 percent of the children interviewed were in eighth grade during the 2006–07 school year, 9 percent were in seventh grade, and less than 2 percent were in some other grade (e.g., such as fifth, sixth, or ninth grade). 8 The estimate of the percent of eighth-graders represented by the ECLS-K was calculated by dividing the sum of the child weight (C7CW0) by the number of eighth-graders according to the 2006 Current Population Survey.
1-4
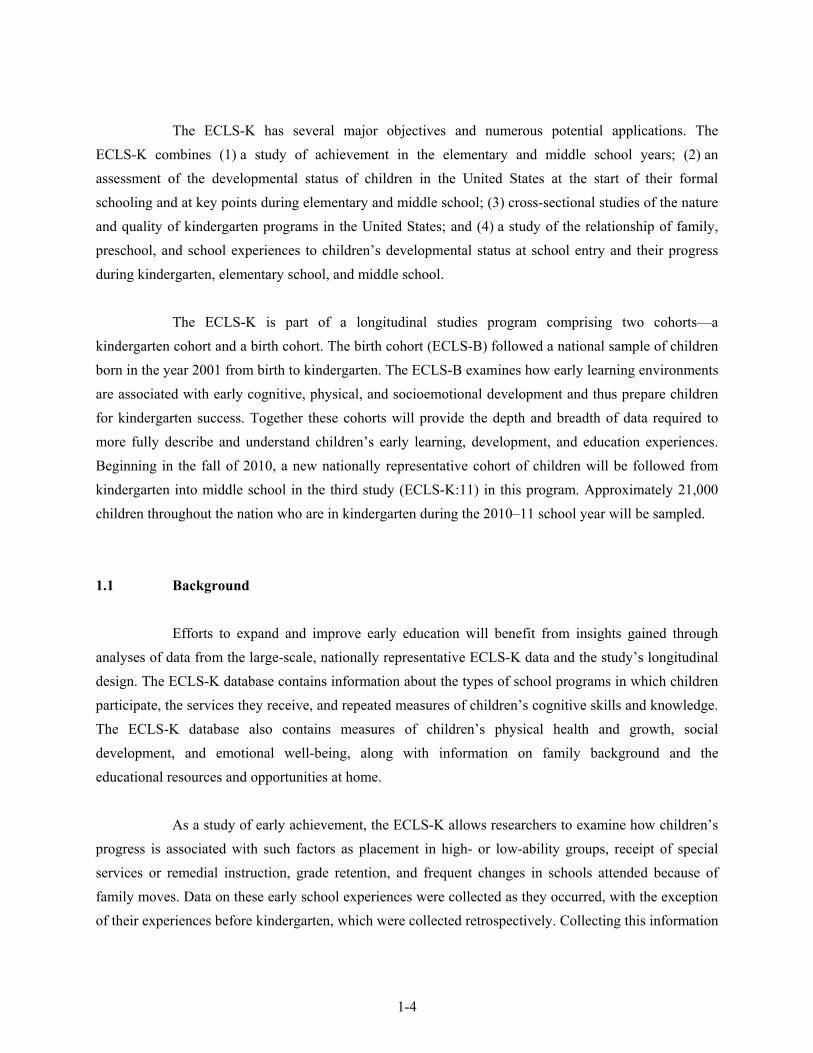
The ECLS-K has several major objectives and numerous potential applications. The ECLS-K combines (1) a study of achievement in the elementary and middle school years; (2) an assessment of the developmental status of children in the United States at the start of their formal schooling and at key points during elementary and middle school; (3) cross-sectional studies of the nature and quality of kindergarten programs in the United States; and (4) a study of the relationship of family, preschool, and school experiences to children’s developmental status at school entry and their progress during kindergarten, elementary school, and middle school.
The ECLS-K is part of a longitudinal studies program comprising two cohorts—a
kindergarten cohort and a birth cohort. The birth cohort (ECLS-B) followed a national sample of children born in the year 2001 from birth to kindergarten. The ECLS-B examines how early learning environments are associated with early cognitive, physical, and socioemotional development and thus prepare children for kindergarten success. Together these cohorts will provide the depth and breadth of data required to more fully describe and understand children’s early learning, development, and education experiences. Beginning in the fall of 2010, a new nationally representative cohort of children will be followed from kindergarten into middle school in the third study (ECLS-K:11) in this program. Approximately 21,000 children throughout the nation who are in kindergarten during the 2010–11 school year will be sampled.
1.1 Background
Efforts to expand and improve early education will benefit from insights gained through analyses of data from the large-scale, nationally representative ECLS-K data and the study’s longitudinal design. The ECLS-K database contains information about the types of school programs in which children participate, the services they receive, and repeated measures of children’s cognitive skills and knowledge. The ECLS-K database also contains measures of children’s physical health and growth, social development, and emotional well-being, along with information on family background and the educational resources and opportunities at home.
As a study of early achievement, the ECLS-K allows researchers to examine how children’s
progress is associated with such factors as placement in high- or low-ability groups, receipt of special services or remedial instruction, grade retention, and frequent changes in schools attended because of family moves. Data on these early school experiences were collected as they occurred, with the exception of their experiences before kindergarten, which were collected retrospectively. Collecting this information
1-5
as the experiences occurred produces a more accurate measurement of antecedent factors and enables inferences to be made about their relationship to later academic progress. The longitudinal nature of the study enables researchers to study children’s cognitive, social, and emotional growth and to relate trajectories of change to variations in their experiences in kindergarten and the early to later grades.
The spring-eighth grade data collection can be used to describe the diversity of the children
in the study and the classrooms and schools they attended. It can also be used to study children’s academic gains in the years following kindergarten. The ECLS-K sample includes substantial numbers of children from various minority groups. Thus, the ECLS-K data present many possibilities for studying cultural and ethnic differences in the educational preferences, home learning practices, and school involvement of families; the developmental patterns and learning styles of children; and the educational resources and opportunities that different groups are afforded in the United States.
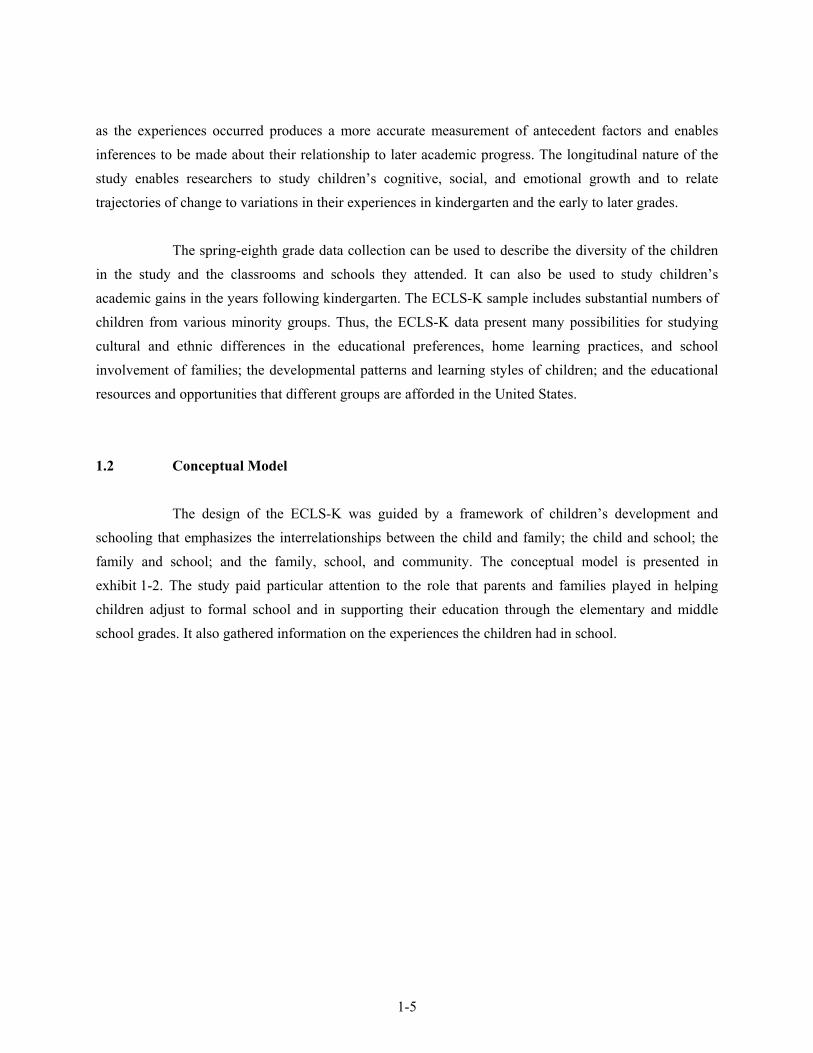
1.2 Conceptual Model
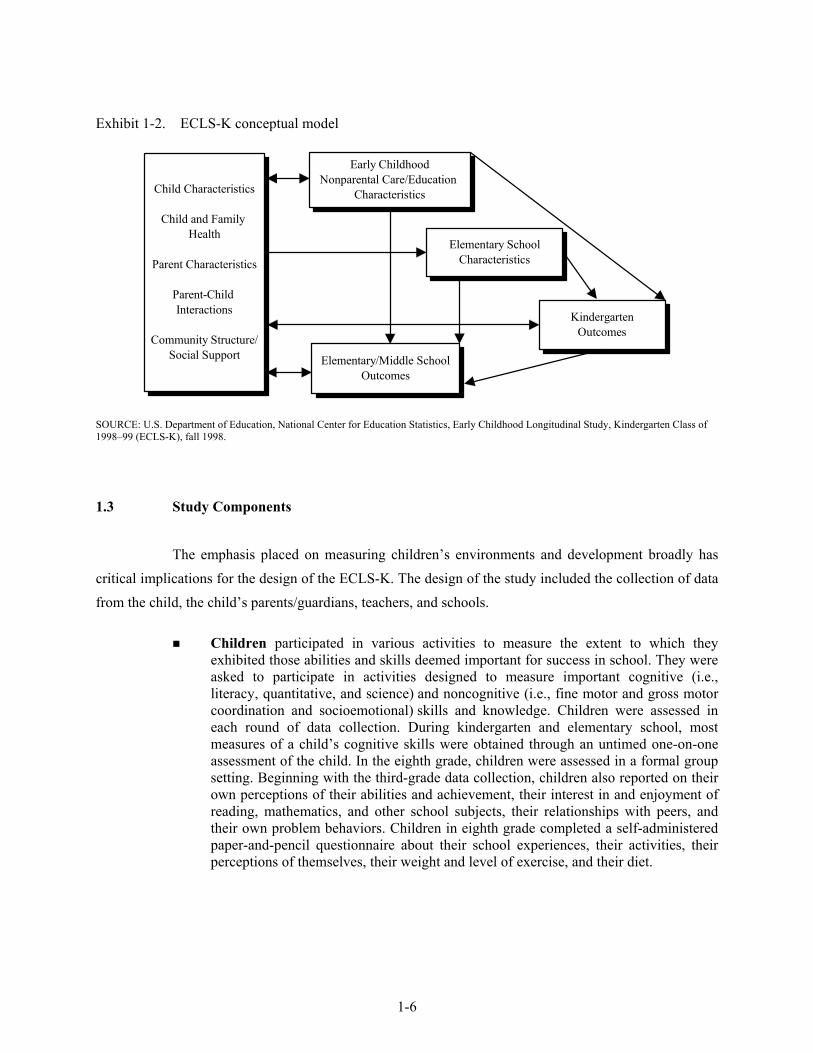
The design of the ECLS-K was guided by a framework of children’s development and schooling that emphasizes the interrelationships between the child and family; the child and school; the family and school; and the family, school, and community. The conceptual model is presented in exhibit 1-2. The study paid particular attention to the role that parents and families played in helping children adjust to formal school and in supporting their education through the elementary and middle school grades. It also gathered information on the experiences the children had in school.
1-6
Exhibit 1-2. ECLS-K conceptual model
Child Characteristics
Child and Family Health
Parent Characteristics
Parent-Child Interactions
Community Structure/Social Support
Early ChildhoodNonparental Care/Education
Characteristics
Elementary SchoolCharacteristics
KindergartenOutcomes
Elementary/Middle SchoolOutcomes
SOURCE: U.S. Department of Education, National Center for Education Statistics, Early Childhood Longitudinal Study, Kindergarten Class of 1998–99 (ECLS-K), fall 1998.
1.3 Study Components
The emphasis placed on measuring children’s environments and development broadly has critical implications for the design of the ECLS-K. The design of the study included the collection of data from the child, the child’s parents/guardians, teachers, and schools.
Children participated in various activities to measure the extent to which they
exhibited those abilities and skills deemed important for success in school. They were asked to participate in activities designed to measure important cognitive (i.e., literacy, quantitative, and science) and noncognitive (i.e., fine motor and gross motor coordination and socioemotional) skills and knowledge. Children were assessed in each round of data collection. During kindergarten and elementary school, most measures of a child’s cognitive skills were obtained through an untimed one-on-one assessment of the child. In the eighth grade, children were assessed in a formal group setting. Beginning with the third-grade data collection, children also reported on their own perceptions of their abilities and achievement, their interest in and enjoyment of reading, mathematics, and other school subjects, their relationships with peers, and their own problem behaviors. Children in eighth grade completed a self-administered paper-and-pencil questionnaire about their school experiences, their activities, their perceptions of themselves, their weight and level of exercise, and their diet.
1-7
Parents/guardians were an important source of information about the families of the children selected for the study and about themselves. Parents provided information about children’s development at school entry and their experiences both with family members and others. Information was collected from parents/guardians in each round of data collection.
Teachers, like parents, represented a valuable source of information on themselves, the children in their classrooms, and the children’s learning environment (i.e., the classroom). Teachers were not only asked to provide information about their own backgrounds, teaching practices, and experience; they were also called on to provide information on the classroom setting for the sampled children they taught and to evaluate each sampled child on a number of critical cognitive and noncognitive dimensions. Special education teachers and service providers of sampled children with disabilities were also asked to provide information on the nature and types of services provided to the child. With the exception of the fall-first grade data collection, teachers completed self-administered questionnaires each time children were assessed.
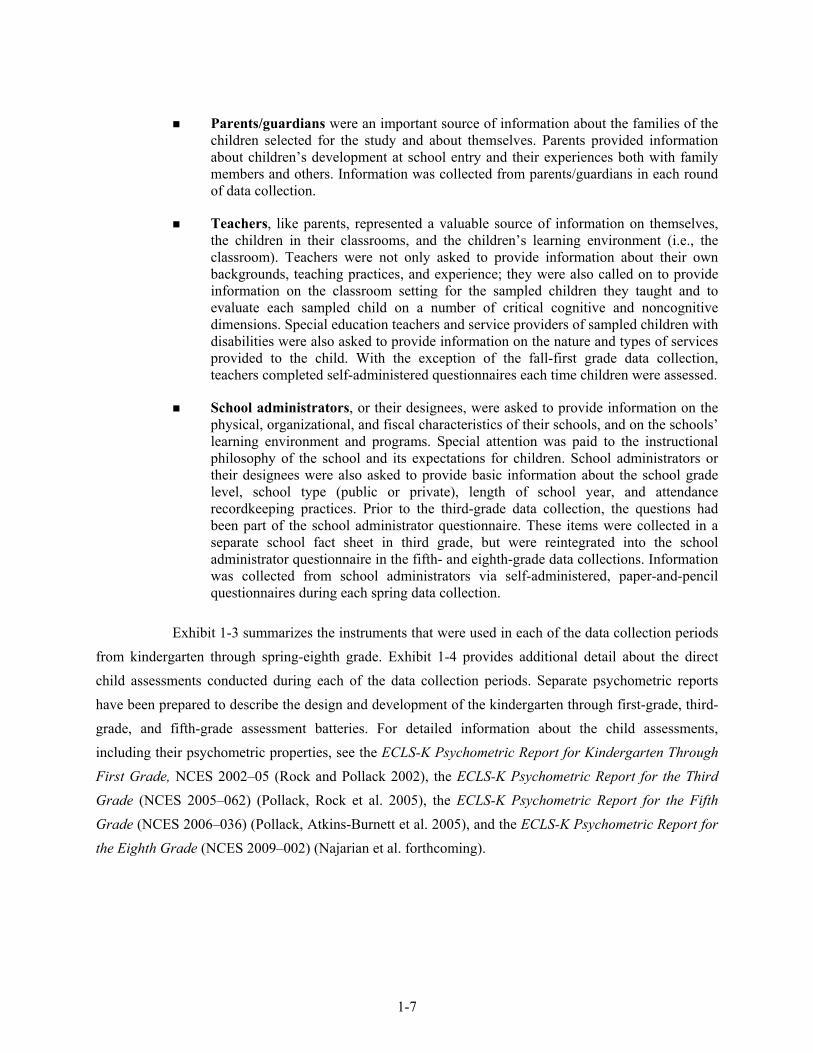
School administrators, or their designees, were asked to provide information on the physical, organizational, and fiscal characteristics of their schools, and on the schools’ learning environment and programs. Special attention was paid to the instructional philosophy of the school and its expectations for children. School administrators or their designees were also asked to provide basic information about the school grade level, school type (public or private), length of school year, and attendance recordkeeping practices. Prior to the third-grade data collection, the questions had been part of the school administrator questionnaire. These items were collected in a separate school fact sheet in third grade, but were reintegrated into the school administrator questionnaire in the fifth- and eighth-grade data collections. Information was collected from school administrators via self-administered, paper-and-pencil questionnaires during each spring data collection.
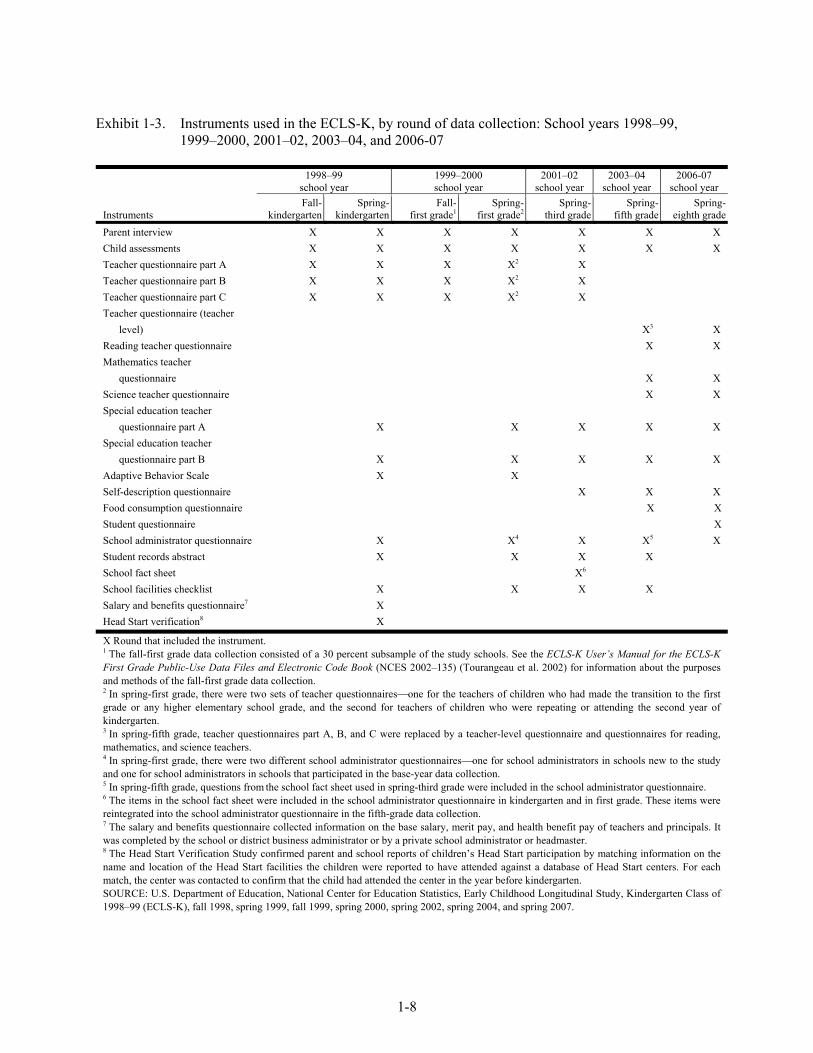
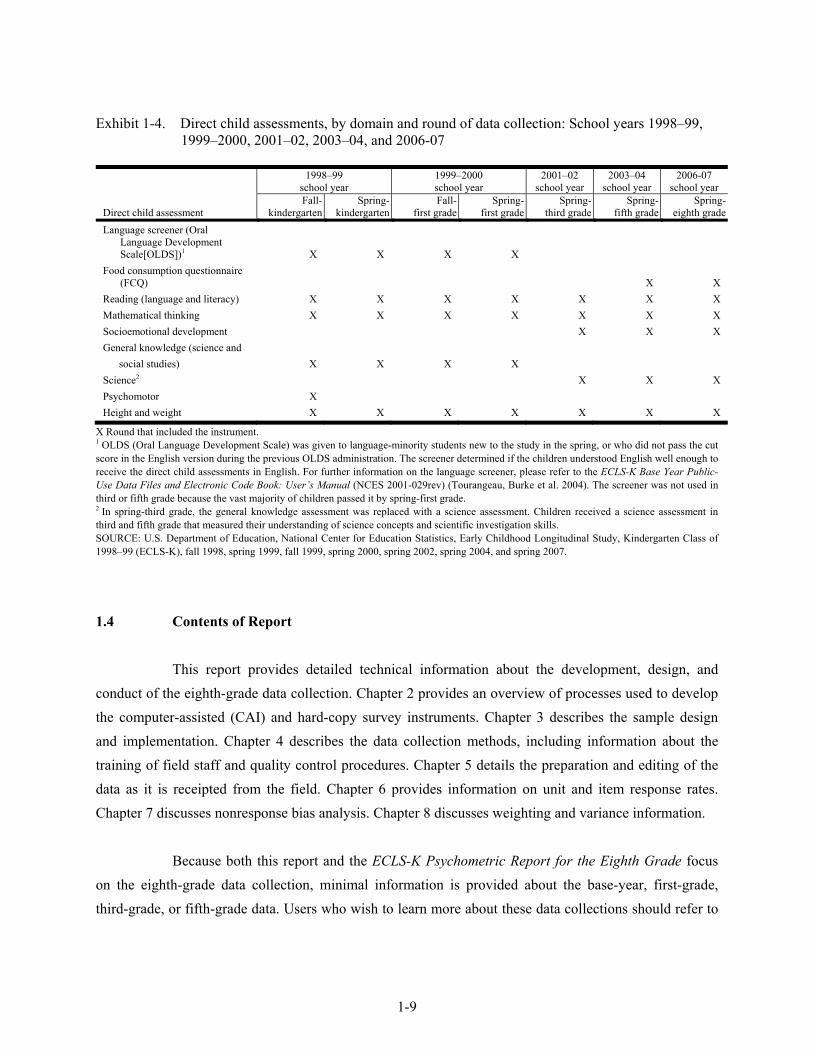
Exhibit 1-3 summarizes the instruments that were used in each of the data collection periods from kindergarten through spring-eighth grade. Exhibit 1-4 provides additional detail about the direct child assessments conducted during each of the data collection periods. Separate psychometric reports have been prepared to describe the design and development of the kindergarten through first-grade, third-grade, and fifth-grade assessment batteries. For detailed information about the child assessments, including their psychometric properties, see the ECLS-K Psychometric Report for Kindergarten Through First Grade, NCES 2002–05 (Rock and Pollack 2002), the ECLS-K Psychometric Report for the Third Grade (NCES 2005–062) (Pollack, Rock et al. 2005), the ECLS-K Psychometric Report for the Fifth Grade (NCES 2006–036) (Pollack, Atkins-Burnett et al. 2005), and the ECLS-K Psychometric Report for the Eighth Grade (NCES 2009–002) (Najarian et al. forthcoming).
1-8
Exhibit 1-3. Instruments used in the ECLS-K, by round of data collection: School years 1998–99, 1999–2000, 2001–02, 2003–04, and 2006-07
Instruments
1998–99 school year
1999–2000 school year
2001–02 school year
2003–04 school year
2006-07 school year
Fall- kindergarten
Spring-kindergarten
Fall-first grade1
Spring-first grade2
Spring- third grade
Spring-fifth grade
Spring-eighth grade
Parent interview X X X X X X X Child assessments X X X X X X X Teacher questionnaire part A X X X X2 X Teacher questionnaire part B X X X X2 X Teacher questionnaire part C X X X X2 X Teacher questionnaire (teacher level) X3 X Reading teacher questionnaire X X Mathematics teacher questionnaire X X Science teacher questionnaire X X Special education teacher questionnaire part A X X X X X Special education teacher questionnaire part B X X X X X Adaptive Behavior Scale X X Self-description questionnaire X X X Food consumption questionnaire X X Student questionnaire X School administrator questionnaire X X4 X X5 X Student records abstract X X X X School fact sheet X6 School facilities checklist X X X X Salary and benefits questionnaire7 X Head Start verification8 X
X Round that included the instrument. 1 The fall-first grade data collection consisted of a 30 percent subsample of the study schools. See the ECLS-K User’s Manual for the ECLS-K First Grade Public-Use Data Files and Electronic Code Book (NCES 2002–135) (Tourangeau et al. 2002) for information about the purposes and methods of the fall-first grade data collection. 2 In spring-first grade, there were two sets of teacher questionnaires⎯one for the teachers of children who had made the transition to the first grade or any higher elementary school grade, and the second for teachers of children who were repeating or attending the second year of kindergarten. 3 In spring-fifth grade, teacher questionnaires part A, B, and C were replaced by a teacher-level questionnaire and questionnaires for reading, mathematics, and science teachers. 4 In spring-first grade, there were two different school administrator questionnaires⎯one for school administrators in schools new to the study and one for school administrators in schools that participated in the base-year data collection. 5 In spring-fifth grade, questions from the school fact sheet used in spring-third grade were included in the school administrator questionnaire. 6 The items in the school fact sheet were included in the school administrator questionnaire in kindergarten and in first grade. These items were reintegrated into the school administrator questionnaire in the fifth-grade data collection. 7 The salary and benefits questionnaire collected information on the base salary, merit pay, and health benefit pay of teachers and principals. It was completed by the school or district business administrator or by a private school administrator or headmaster. 8 The Head Start Verification Study confirmed parent and school reports of children’s Head Start participation by matching information on the name and location of the Head Start facilities the children were reported to have attended against a database of Head Start centers. For each match, the center was contacted to confirm that the child had attended the center in the year before kindergarten. SOURCE: U.S. Department of Education, National Center for Education Statistics, Early Childhood Longitudinal Study, Kindergarten Class of 1998–99 (ECLS-K), fall 1998, spring 1999, fall 1999, spring 2000, spring 2002, spring 2004, and spring 2007.
1-9
Exhibit 1-4. Direct child assessments, by domain and round of data collection: School years 1998–99, 1999–2000, 2001–02, 2003–04, and 2006-07
Direct child assessment
1998–99 school year
1999–2000 school year
2001–02 school year
2003–04 school year
2006-07 school year
Fall- kindergarten
Spring-kindergarten
Fall-first grade
Spring-first grade
Spring- third grade
Spring-fifth grade
Spring-eighth grade
Language screener (Oral Language Development Scale[OLDS])1 X X X X
Food consumption questionnaire (FCQ) X X
Reading (language and literacy) X X X X X X X Mathematical thinking X X X X X X X Socioemotional development X X X General knowledge (science and social studies) X X X X Science2 X X X Psychomotor X Height and weight X X X X X X X
X Round that included the instrument. 1 OLDS (Oral Language Development Scale) was given to language-minority students new to the study in the spring, or who did not pass the cut score in the English version during the previous OLDS administration. The screener determined if the children understood English well enough to receive the direct child assessments in English. For further information on the language screener, please refer to the ECLS-K Base Year Public-Use Data Files and Electronic Code Book: User’s Manual (NCES 2001-029rev) (Tourangeau, Burke et al. 2004). The screener was not used in third or fifth grade because the vast majority of children passed it by spring-first grade. 2 In spring-third grade, the general knowledge assessment was replaced with a science assessment. Children received a science assessment in third and fifth grade that measured their understanding of science concepts and scientific investigation skills. SOURCE: U.S. Department of Education, National Center for Education Statistics, Early Childhood Longitudinal Study, Kindergarten Class of 1998–99 (ECLS-K), fall 1998, spring 1999, fall 1999, spring 2000, spring 2002, spring 2004, and spring 2007.
1.4 Contents of Report
This report provides detailed technical information about the development, design, and conduct of the eighth-grade data collection. Chapter 2 provides an overview of processes used to develop the computer-assisted (CAI) and hard-copy survey instruments. Chapter 3 describes the sample design and implementation. Chapter 4 describes the data collection methods, including information about the training of field staff and quality control procedures. Chapter 5 details the preparation and editing of the data as it is receipted from the field. Chapter 6 provides information on unit and item response rates. Chapter 7 discusses nonresponse bias analysis. Chapter 8 discusses weighting and variance information.
Because both this report and the ECLS-K Psychometric Report for the Eighth Grade focus
on the eighth-grade data collection, minimal information is provided about the base-year, first-grade, third-grade, or fifth-grade data. Users who wish to learn more about these data collections should refer to
1-10
the ECLS-K Base Year Public-Use Data Files and Electronic Codebook: User’s Manual (NCES 2001–029rev) (Tourangeau, Burke et al. 2004); the ECLS-K User’s Manual for the ECLS-K First Grade Public-Use Data Files and Electronic Codebook (NCES 2002–135) (Tourangeau et al. 2002), the ECLS-K Third Grade Methodology Report (NCES 2005–018) (Tourangeau, Brick, Byrne et al. 2004), or the ECLS-K Fifth-Grade Methodology Report (NCES 2006–037) (Tourangeau, Lê, and Nord 2005). Additional information about the ECLS program can be found on the World Wide Web at http://nces.ed.gov/ecls.
2-1
2. DEVELOPMENT OF SURVEY INSTRUMENTS
The Early Childhood Longitudinal Study, Kindergarten Class of 1998–99 (ECLS-K) eighth-grade survey collected data on the achievement and home and school experiences of children who had attended kindergarten in 1998–99 to provide information on the children’s progress in middle school. In the design phase of the ECLS-K kindergarten, first-grade, third-grade, fifth-grade, and eighth-grade waves of data collection, policymakers, teachers, and researchers were consulted, and relevant literature was reviewed to ascertain the specific areas within each of the topical components for which national data were needed. Information gathered from these activities guided the formulation of research questions deemed most important for the ECLS-K to address. Extant research was reviewed to identify surveys that had been fielded to answer similar questions.
The ECLS-K data collection instruments were, for the most part, similar in all seven waves
of the study. The ECLS-K employed two modes of data collection, computer-assisted and self-administered hard-copy instruments. This chapter describes the development of the computer-assisted and hard-copy instruments for the eighth-grade data collection. The procedures for developing the child assessment battery and indirect rating forms are described in a separate psychometric report, the ECLS-K Psychometric Report for the Eighth Grade (NCES 2009–002) (Najarian et al. forthcoming). More information on the assessment battery and indirect rating forms is found in ECLS-K Psychometric Report for Kindergarten Through First Grade (NCES 2002–05) (Rock and Pollack 2002), ECLS-K Psychometric Report for the Third Grade (NCES 2005–062) (Pollack, Rock et al. 2005), and ECLS-K Psychometric Report for the Fifth Grade (NCES 2006–036rev) (Pollack, Atkins-Burnett et al. 2005).
In spring-eighth grade, several modifications were made to the instruments. Many of the
changes were based on advice given by the ECLS-K Technical Work Group and Content Review Panel that was provided for the spring-eighth grade data collection. Modifications were made to the eighth-grade parent interview (see section 2.3) to reduce its length and add other items of interest. A timing study was conducted to assess the effect of these changes. Several changes were also made to the student questionnaire and to the teacher questionnaires. These are discussed in sections 2.2 and 2.4.
2-2
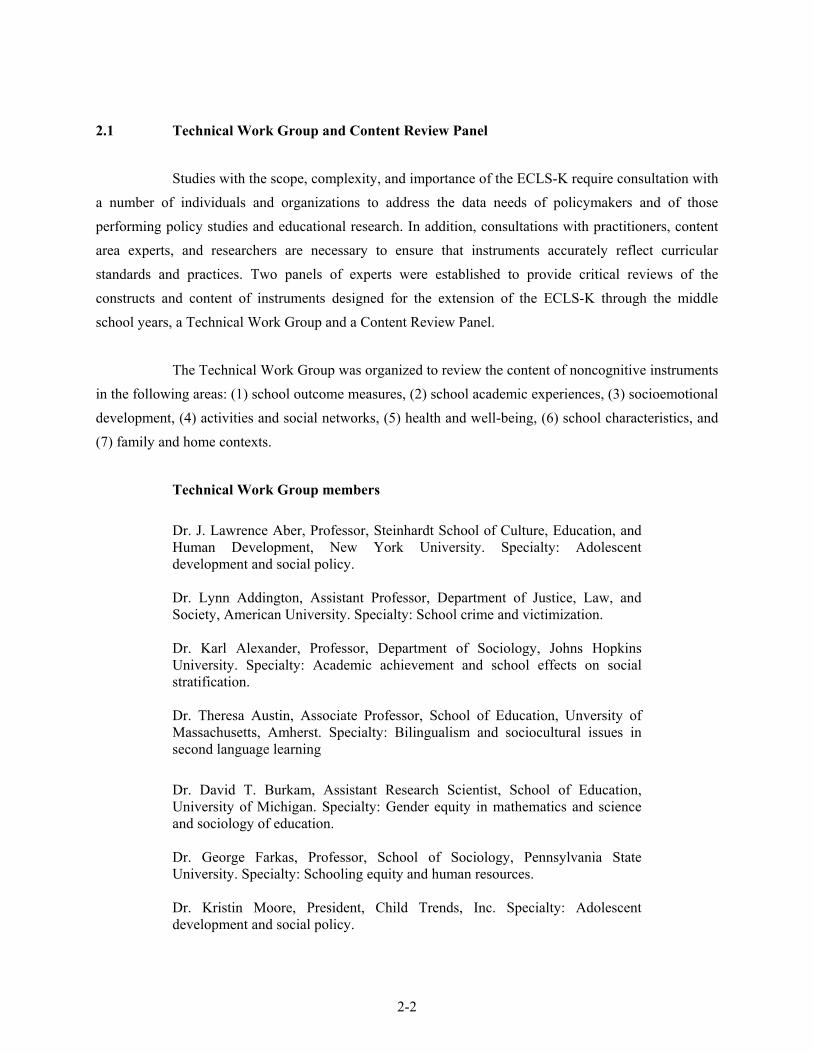
2.1 Technical Work Group and Content Review Panel
Studies with the scope, complexity, and importance of the ECLS-K require consultation with a number of individuals and organizations to address the data needs of policymakers and of those performing policy studies and educational research. In addition, consultations with practitioners, content area experts, and researchers are necessary to ensure that instruments accurately reflect curricular standards and practices. Two panels of experts were established to provide critical reviews of the constructs and content of instruments designed for the extension of the ECLS-K through the middle school years, a Technical Work Group and a Content Review Panel.
The Technical Work Group was organized to review the content of noncognitive instruments
in the following areas: (1) school outcome measures, (2) school academic experiences, (3) socioemotional development, (4) activities and social networks, (5) health and well-being, (6) school characteristics, and (7) family and home contexts.
Technical Work Group members Dr. J. Lawrence Aber, Professor, Steinhardt School of Culture, Education, and Human Development, New York University. Specialty: Adolescent development and social policy. Dr. Lynn Addington, Assistant Professor, Department of Justice, Law, and Society, American University. Specialty: School crime and victimization. Dr. Karl Alexander, Professor, Department of Sociology, Johns Hopkins University. Specialty: Academic achievement and school effects on social stratification. Dr. Theresa Austin, Associate Professor, School of Education, Unversity of Massachusetts, Amherst. Specialty: Bilingualism and sociocultural issues in second language learning
Dr. David T. Burkam, Assistant Research Scientist, School of Education, University of Michigan. Specialty: Gender equity in mathematics and science and sociology of education. Dr. George Farkas, Professor, School of Sociology, Pennsylvania State University. Specialty: Schooling equity and human resources. Dr. Kristin Moore, President, Child Trends, Inc. Specialty: Adolescent development and social policy.
2-3
Dr. Russell Rumberger, Professor, Gervirtz Graduate School of Education, University of California, Santa Barbara. Specialty: School dropouts and ethnic and language minority student achievement. Dr. Martha Thurlow, Director, National Center on Educational Outcomes (NCEO), University of Minnesota. Specialty: Students with disabilities, assessment policies, and effective classroom instruction. Dr. Judith Torney-Purta, Professor, College of Education, University of Maryland, College Park. Specialty: Social development and political cognition. Dr. Barry Zuckerman, Professor, School of Medicine, Boston University. Specialty: Health and environmental factors. The Content Review Panel was established to provide expert review of (1) the validity of the
content of the child assessments, (2) the consistency of the items in the assessment battery with instructional practice, and (3) the non-assessment measures of children’s social-emotional development. The panel included subject matter experts in reading, mathematics, and science, as well as social-emotional development, school assessment, and evaluation administrators.
Content Review Panel Members
Dr. Hyman Bass, Professor, School of Education, University of Michigan. Specialty: Mathematics. Dr. Andrew Porter, Dean, Graduate School of Education, University of Pennsylvania. Specialty: Mathematics. Dr. Stephen Pape, Associate Professor, College of Education, University of Florida. Specialty: Mathematics. Russ Conner, Teacher, Cranbrook Kingswood School, Michigan. Specialty: Science. Patricia Dung, Director of Target Science and Math programs, Los Angeles Educational Partnership/Los Angeles Unified School District, California. Specialty: Science. Christine O'Sullivan, Consultant. Specialty: Science. Dr. Vera Gutierrez-Clellen, Professor, School of Speech, Language, and Hearing Sciences, San Diego State University. Specialty: Reading.
2-4
Dr. Yvonne Goddard, Assistant Professor, School of Education, University of Michigan. Specialty: Reading. Dr. Michael Kamil, Professor, School of Education, Stanford University. Specialty: Reading. Dr. Paula Allen-Meares, Professor, School of Social Work, University of Michigan. Specialty: Social-emotional development. Dr. Hill Walker, Professor, College of Education, University of Oregon. Specialty: Social-emotional development. Dr. Kathryn Wentzel, Professor, College of Education, University of Maryland. Specialty: Social-emotional development. Dr. Sally Atkins-Burnett, Mathematica Policy Research. Specialty: Social-emotional development.
2.2 Modifications to the Student Questionnaire
The content of the self-administered student questionnaire was expanded for the eighth-grade data collection. The self-description questionnaire (SDQ) component and the food consumption components were used in third and fifth grade, but were read aloud to the children. In eighth grade, children completed a student questionnaire. In the eighth-grade data collection, the SDQ was used to determine how children thought and felt about themselves both academically and socially: Children rated their perceived competence and interest in reading and mathematics, and they also reported on feelings of sadness, loneliness, and anxiety with which they might struggle. Items for the reading and mathematics scales were drawn from the Self Description Questionnaire (SDQ) II,1 which was designed for children in middle school. Items on sadness, loneliness, and anxiety were drawn from the fifth-grade Internalizing Problems scale,2 as recommended by the Content Review Panel because these items better reflected the constructs that the study intended to measure and also allowed for comparison with previous rounds of data collection.
Another set of scales assessing children’s socioemotional development consisted of the Self-
Concept and Locus of Control scales adapted from the National Education Longitudinal Study of 1988
1 The items were adapted with permission from the Self Description Questionnaire (SDQ) II), from Self Description Questionnaire (SDQ) II: A theoretical and empirical basis for the measurement of multiple dimensions of adolescent self-concept. An interim test manual and a research monograph, by H.W. Marsh (Sydney: University of Western Sydney, SELF Research Centre, 1992). (Original work published in 1990) 2 The Internalizing Problems scale was developed for the ECLS-K study.
2-5
(NELS:88). The Self-Concept scale comes from the Rosenberg Self-Esteem Scale (RSE) (Rosenberg 1965). These scales asked children about their perceptions about themselves and the amount of control they had of their own lives. Items were drawn from the NELS:88 student questionnaire and asked children to indicate the degree to which they agreed with 13 statements about themselves.
Other topics covered by the student questionnaire included the following:
school experiences—school safety, importance of grades, time spent on homework, peer relationships;
activities—participation in school-sponsored and out-of-school activities;
weight and exercise—level of exercise per week, participation in physical education classes; and
diet—kinds of food they could buy at school and the food they had eaten in the past week.
The items on the children’s diet were presented in the food consumption questionnaire and are described in section 2.2.1.
2.2.1 Child Food Consumption Questions
The children completed the food consumption questionnaire (FCQ), which was part of the self-administered student questionnaire, during the assessment session. The FCQ was used to determine the kinds of food the children could buy at school and other places (e.g., home, restaurant), as well as the foods they had eaten in the past week. The FCQ for children consisted of 19 questions. The first set of questions was about foods that are high in fat, sodium, and/or added sugars (e.g., candy, salty snacks, soda pop). Children were asked if they could buy these foods at school, and if so, how often they bought the food in the past week and where they bought the food (vending machine, cafeteria, or somewhere else in school). In the second set of questions, children were asked about whether they ate particular key foods and beverages in the past 7 days, such as milk, sweetened beverages (e.g., soft drinks), fruits and vegetables, and fast food. They were asked to include food they ate at home, at school, at restaurants, or anywhere else.
2-6
Items for the FCQ were taken mainly from existing surveys, although some were developed for the ECLS-K. Two main sources for questions were two surveys by the Centers for Disease Control and Prevention/Division of Adolescent and School Health Surveys: the Youth Risk Behavior Surveillance Survey (YRBSS) and the School Health Programs and Policies Survey (SHPPS).3 The question on fast-food meals was taken from the California Children’s Healthy Eating and Exercise Practices Survey (CalCheeps). Questions on soft drinks and children’s at-school consumption of snack foods were developed by the U.S. Department of Agriculture (USDA), using YRBSS and CalCheeps questions as models.
2.2.2 Student Questionnaire Timing Study
Prior to field testing, the questionnaire was pilot tested to ascertain the amount of time it would take eighth-graders to complete it. The goal was to have a student questionnaire that was approximately 20 minutes in length. Two sets of pilot timing tests were conducted with the eighth-grade student questionnaire. The first timing test was conducted with seven eighth-grade children (four girls and three boys) and found that the eighth-grade questionnaire took an average of 29 minutes and 34 seconds to complete, with times ranging from about 20 minutes to over 38 minutes. With consultation from a member of the Content Review Panel and other subject matter experts, the student questionnaire was shortened and a second pilot timing test was conducted. The second timing test of the eighth-grade student questionnaire included seven girls and two boys (table 2-1). The results indicated that the revisions were effective in shortening the administration time of the eighth-grade student questionnaire by 6 minutes to an average of about 24 minutes, with times ranging from about 19 minutes to 28 minutes. It should be noted that one respondent (#1) was an English language learner who came to this country in third grade. Excluding respondent #1 from the calculations reduces the overall average time to slightly less than 23 minutes.
Further modifications were implemented to shorten the administration time. In addition, the
Content Review Panel reviewed the revised student questionnaire. Several measures in the student questionnaire were modified or replaced based on recommendations of the Content Review Panel prior to field testing. 3 Information on these Centers for Disease Control and Prevention surveys is available at http://www.cdc.gov/nccdphp/dash/.
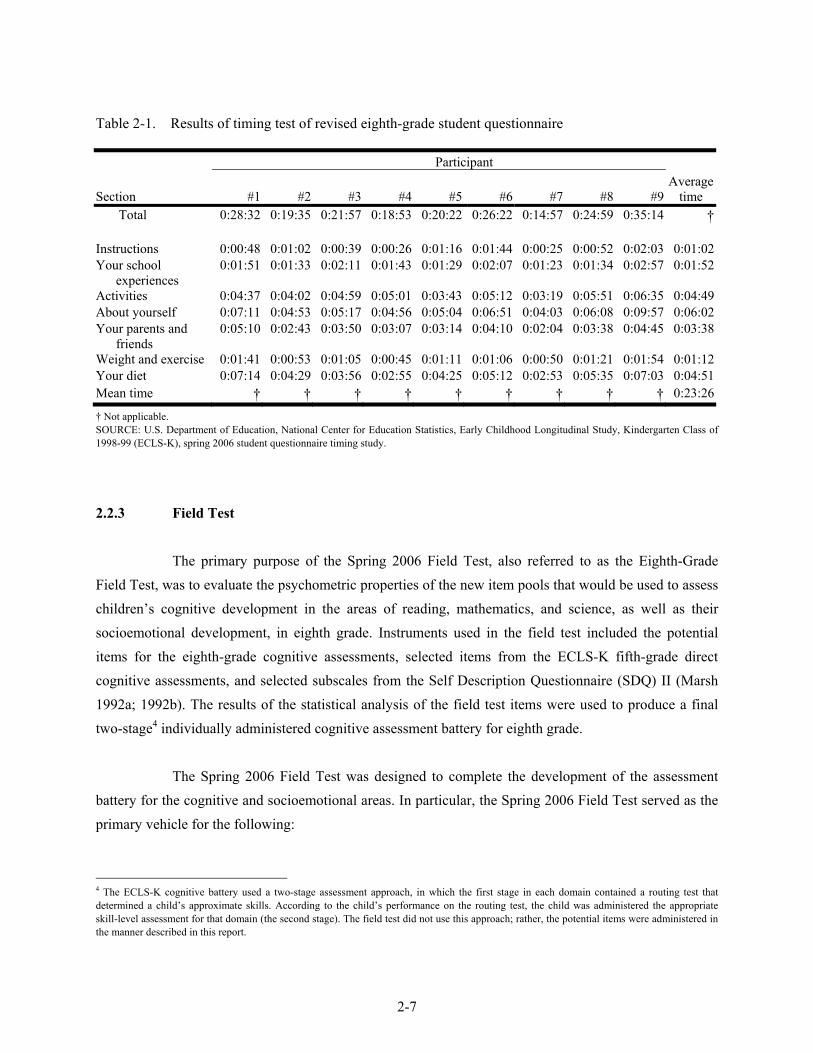
2-7
Table 2-1. Results of timing test of revised eighth-grade student questionnaire Participant
Section #1 #2 #3 #4 #5 #6 #7 #8 #9Average
time Total 0:28:32 0:19:35 0:21:57 0:18:53 0:20:22 0:26:22 0:14:57 0:24:59 0:35:14 †
Instructions 0:00:48 0:01:02 0:00:39 0:00:26 0:01:16 0:01:44 0:00:25 0:00:52 0:02:03 0:01:02Your school
experiences 0:01:51 0:01:33 0:02:11 0:01:43 0:01:29 0:02:07 0:01:23 0:01:34 0:02:57 0:01:52
Activities 0:04:37 0:04:02 0:04:59 0:05:01 0:03:43 0:05:12 0:03:19 0:05:51 0:06:35 0:04:49About yourself 0:07:11 0:04:53 0:05:17 0:04:56 0:05:04 0:06:51 0:04:03 0:06:08 0:09:57 0:06:02Your parents and
friends 0:05:10 0:02:43 0:03:50 0:03:07 0:03:14 0:04:10 0:02:04 0:03:38 0:04:45 0:03:38
Weight and exercise 0:01:41 0:00:53 0:01:05 0:00:45 0:01:11 0:01:06 0:00:50 0:01:21 0:01:54 0:01:12Your diet 0:07:14 0:04:29 0:03:56 0:02:55 0:04:25 0:05:12 0:02:53 0:05:35 0:07:03 0:04:51Mean time † † † † † † † † † 0:23:26
† Not applicable. SOURCE: U.S. Department of Education, National Center for Education Statistics, Early Childhood Longitudinal Study, Kindergarten Class of 1998-99 (ECLS-K), spring 2006 student questionnaire timing study.
2.2.3 Field Test
The primary purpose of the Spring 2006 Field Test, also referred to as the Eighth-Grade Field Test, was to evaluate the psychometric properties of the new item pools that would be used to assess children’s cognitive development in the areas of reading, mathematics, and science, as well as their socioemotional development, in eighth grade. Instruments used in the field test included the potential items for the eighth-grade cognitive assessments, selected items from the ECLS-K fifth-grade direct cognitive assessments, and selected subscales from the Self Description Questionnaire (SDQ) II (Marsh 1992a; 1992b). The results of the statistical analysis of the field test items were used to produce a final two-stage4 individually administered cognitive assessment battery for eighth grade.
The Spring 2006 Field Test was designed to complete the development of the assessment
battery for the cognitive and socioemotional areas. In particular, the Spring 2006 Field Test served as the primary vehicle for the following:
4 The ECLS-K cognitive battery used a two-stage assessment approach, in which the first stage in each domain contained a routing test that determined a child’s approximate skills. According to the child’s performance on the routing test, the child was administered the appropriate skill-level assessment for that domain (the second stage). The field test did not use this approach; rather, the potential items were administered in the manner described in this report.

2-8
estimating the psychometric parameters of all items that could be used in the battery of instruments designed to assess children’s cognitive development (in reading, mathematics, and science) in the eighth grade;
evaluating the content validity of the direct assessment reading, science, and mathematics area items; and
producing psychometrically sound and valid direct and indirect cognitive and socioemotional assessment instruments.
In addition to the primary goal of evaluating the psychometric properties of the cognitive assessment item pools, the field test had several other goals, as follows:
evaluating procedures for collecting height and weight from eighth-grade children;
evaluating the effectiveness of web-based versus paper questionnaires for eighth-grade children and teachers;
obtaining estimates of the length of time it took children and teachers to complete the questionnaires;
obtaining respondent opinions of effectiveness of outreach materials (e.g., student and adult newsletters);
obtaining respondent reactions to proposed incentives;
evaluating procedures related to the optical scanning of paper answer sheets and forms; and
evaluating the ability of children to accurately report the titles of books read and of teachers to accurately report the titles of textbooks used in their classrooms.
Details of the field test procedures can be found in appendix A. A purposive sample of middle and high schools representing different levels of urbanicity from 40 school districts across five states (Maryland, Virginia, Pennsylvania, North Carolina, and Ohio) was selected to participate in the field test. Of the 40 school districts approached, 19 (47 percent) refused to participate. There were 164 schools with eighth-grade classrooms in the 21 participating school districts. Of these, 81 (49 percent) refused to participate. An additional 31 schools were unable to participate because they did not provide school information before the deadline of the school recruitment phase of the field test. This resulted in a purposive sample of 52 schools.
2-9
The sampled schools included private (e.g., Catholic) and public schools in districts and dioceses not participating in the national study. A sample of approximately 1,800 eighth-grade children5 was selected purposively to participate in the field test. All participating children completed a direct assessment that included a reading subtest and either a mathematics or science subtest. In addition, the heights and weights of the eighth-graders were measured to evaluate the need for privacy screens during the measurement. Eighth-grade children were also asked to complete a 20-minute questionnaire on various topics including their experiences in school, their activities, friends, and diet.
Analyses of the internal consistency reliability of the ECLS-K SDQ scales, Locus of Control
scale, and the Self Concept scale show that their Cronbach’s coefficient alphas are generally similar to those reported by the authors of the respective scales (only the SDQ scale: Perceived Competence and Interest in English showed a lower alpha coefficient than that reported by the scale authors). Factor analyses of the respective scales generally supported the findings of the alpha analyses. Examination of the mean scores shows that the mean scores fall in the middle of the possible range of scores, with little ceiling or floor effects.
In the field-tested student questionnaire, children were asked to list the title of the last two
books they had read, not including school assigned reading, with the intention of providing future users of the national dataset the opportunity to examine the reading levels of books that children in the ECLS-K sample were reading. To test accuracy of the book listings, Internet sites such as book retailers (e.g., www.amazon.com) or Internet search engines (e.g., www.google.com) were used to determine if the listed title matched a published book. Of the 857 books reported to have been read by field test participants, 78.9 percent were matched to a published book using either the verbatim reported book title or using minor modifications to the reported title.
In addition, the field test included an experiment to test the feasibility of offering eighth-
grade children the opportunity to complete the questionnaires via the Internet. Web versions of the questionnaires were made available on a secure website that children and teachers accessed with a unique user name and password. A subset of eighth-grade children participated in the student questionnaire Web experiment; approximately 870 children were assigned to complete the student questionnaire on the Web, while approximately 760 children were assigned to complete it on paper.
5 The Spring 2006 Field Test also included 2,100 tenth-grade children who field tested a tenth-grade version of the assessment battery.
2-10
Eighth-grade children participating in the field test were asked to complete a short debriefing questionnaire on their opinions of their participation in the field test, such as the quality and appropriateness of the field test materials, the effectiveness of the monetary incentives, and their opinion on the mode in which they were asked to complete the questionnaires (i.e., Web or paper). Eighth-grade children who completed the student questionnaire were asked about the mode in which they completed the questionnaire, the time it took to complete the questionnaire, and the clarity of the items. Eighth-grade children who didn’t complete the student questionnaire were asked why they did not complete the questionnaire and what could be done to encourage them to complete it.
Based on results of the field test data, children could complete the questionnaire in the spring
2007 eighth-grade data collection. Participating field test children reported that the questionnaire took an average of 21 minutes to complete. They generally provided answers to all questionnaire items and reported that the questions were not difficult to understand.
The results of the field test also suggested that the student questionnaire would yield a higher
response rate if it were offered in paper form only rather than over the Internet only. Only 106 of the 870 (12 percent) children completed the student questionnaire over the Internet, while almost 500 of the 760 (66 percent) children completed and mailed in the paper version of the questionnaire (see table 2-2). The most frequent reasons Web-assigned children gave for failing to complete the questionnaire were computer or Internet connection problems, such as computer “crashing,” loss of Internet connection, too slow Internet connection, or misplacement of user name, password, or URL address. As a result, using a self-administered paper form during the assessment session was the recommended approach for administering the student questionnaire for the spring 2007 eighth-grade data collection.
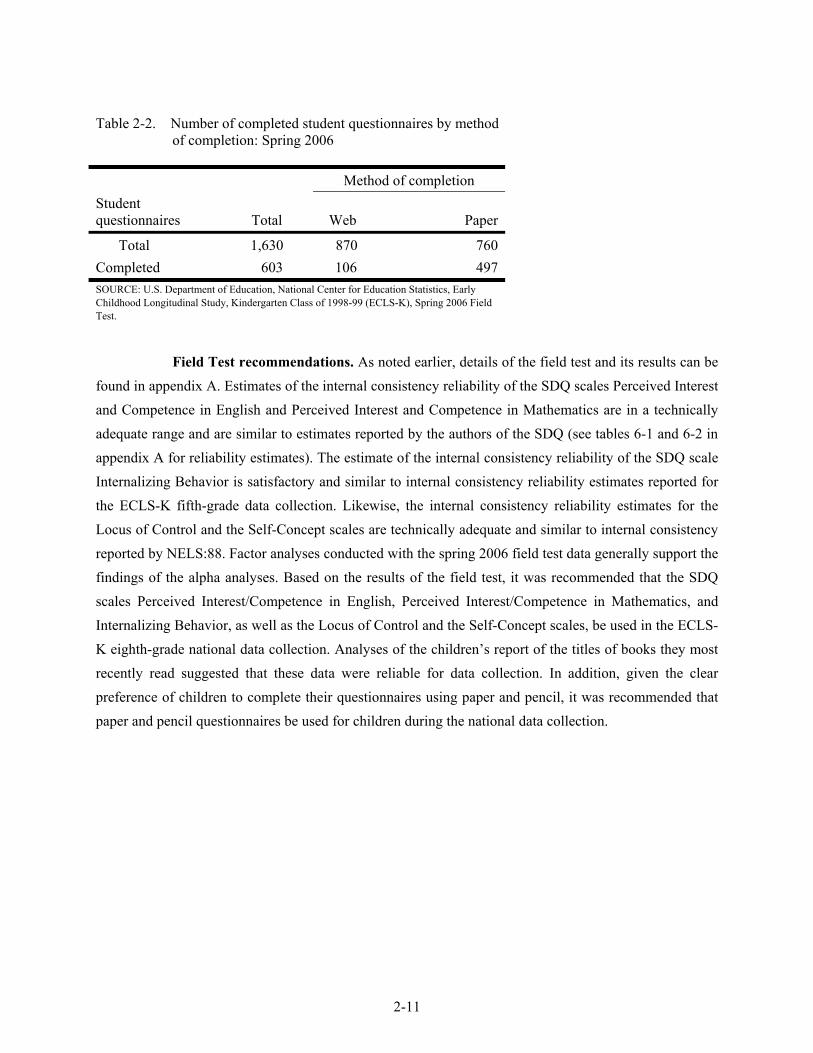
2-11
Table 2-2. Number of completed student questionnaires by method of completion: Spring 2006
Method of completion Student questionnaires Total Web Paper
Total 1,630 870 760Completed 603 106 497SOURCE: U.S. Department of Education, National Center for Education Statistics, Early Childhood Longitudinal Study, Kindergarten Class of 1998-99 (ECLS-K), Spring 2006 Field Test.
Field Test recommendations. As noted earlier, details of the field test and its results can be
found in appendix A. Estimates of the internal consistency reliability of the SDQ scales Perceived Interest and Competence in English and Perceived Interest and Competence in Mathematics are in a technically adequate range and are similar to estimates reported by the authors of the SDQ (see tables 6-1 and 6-2 in appendix A for reliability estimates). The estimate of the internal consistency reliability of the SDQ scale Internalizing Behavior is satisfactory and similar to internal consistency reliability estimates reported for the ECLS-K fifth-grade data collection. Likewise, the internal consistency reliability estimates for the Locus of Control and the Self-Concept scales are technically adequate and similar to internal consistency reported by NELS:88. Factor analyses conducted with the spring 2006 field test data generally support the findings of the alpha analyses. Based on the results of the field test, it was recommended that the SDQ scales Perceived Interest/Competence in English, Perceived Interest/Competence in Mathematics, and Internalizing Behavior, as well as the Locus of Control and the Self-Concept scales, be used in the ECLS-K eighth-grade national data collection. Analyses of the children’s report of the titles of books they most recently read suggested that these data were reliable for data collection. In addition, given the clear preference of children to complete their questionnaires using paper and pencil, it was recommended that paper and pencil questionnaires be used for children during the national data collection.
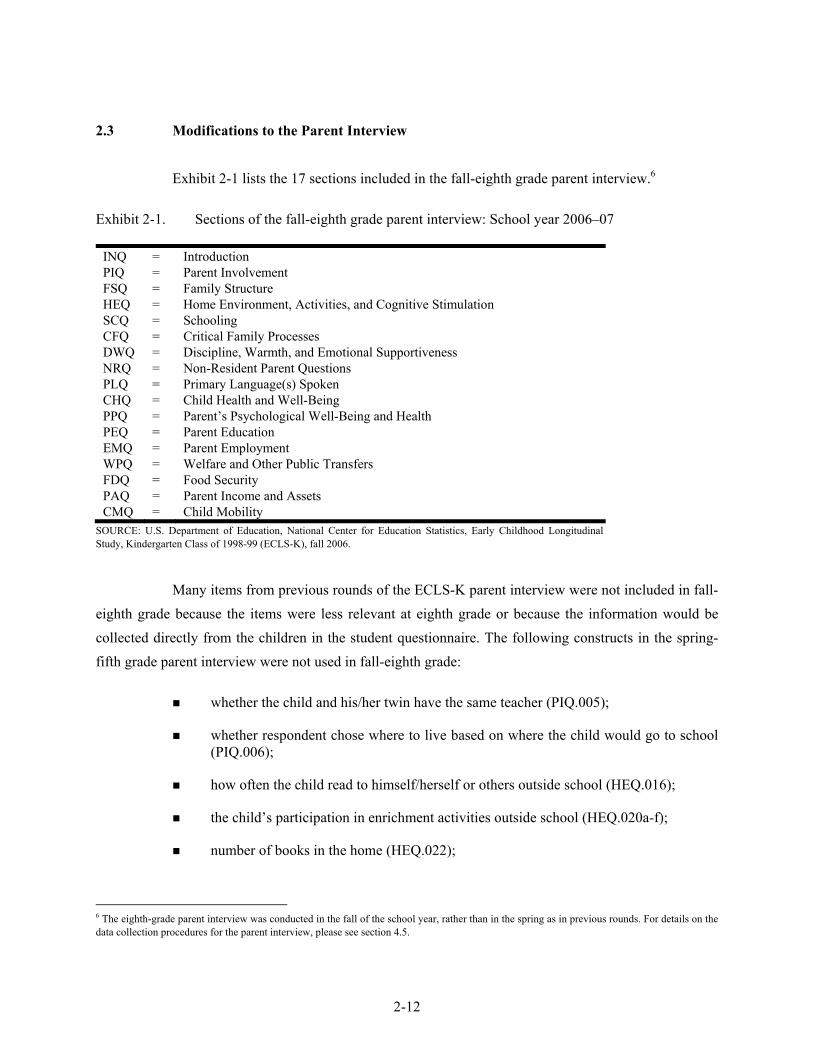
2-12
2.3 Modifications to the Parent Interview
Exhibit 2-1 lists the 17 sections included in the fall-eighth grade parent interview.6
Exhibit 2-1. Sections of the fall-eighth grade parent interview: School year 2006–07
INQ = Introduction PIQ = Parent Involvement FSQ = Family Structure HEQ = Home Environment, Activities, and Cognitive Stimulation SCQ = Schooling CFQ = Critical Family Processes DWQ = Discipline, Warmth, and Emotional Supportiveness NRQ = Non-Resident Parent Questions PLQ = Primary Language(s) Spoken CHQ = Child Health and Well-Being PPQ = Parent’s Psychological Well-Being and Health PEQ = Parent Education EMQ = Parent Employment WPQ = Welfare and Other Public Transfers FDQ = Food Security PAQ = Parent Income and Assets CMQ = Child Mobility
SOURCE: U.S. Department of Education, National Center for Education Statistics, Early Childhood Longitudinal Study, Kindergarten Class of 1998-99 (ECLS-K), fall 2006.
Many items from previous rounds of the ECLS-K parent interview were not included in fall-
eighth grade because the items were less relevant at eighth grade or because the information would be collected directly from the children in the student questionnaire. The following constructs in the spring-fifth grade parent interview were not used in fall-eighth grade:
whether the child and his/her twin have the same teacher (PIQ.005);
whether respondent chose where to live based on where the child would go to school (PIQ.006);
how often the child read to himself/herself or others outside school (HEQ.016);
the child’s participation in enrichment activities outside school (HEQ.020a-f);
number of books in the home (HEQ.022);
6 The eighth-grade parent interview was conducted in the fall of the school year, rather than in the spring as in previous rounds. For details on the data collection procedures for the parent interview, please see section 4.5.
2-13
library use: whether the child had a library card and visited the library (HEQ.024, HEQ.026, HEQ.128);
computer use: whether there was a computer in the home, frequency of use by the child, Internet access, Internet use, use for educational purposes and homework (HEQ.040, HEQ.044, HEQ.045, HEQ.046, HEQ.050);
time spent watching television, videotapes, or DVDs (HEQ.060, HEQ.065, HEQ.070);
amount of time set aside for homework (HEQ.092, HEQ.092b);
bedtime (HEQ.140, HEQ.145, HEQ.150);
child care (section CCQ);
country of origin, age moved to U.S., and U.S. citizenship for nonresident biological parents (section COQ);
what respondent and/or spouse/partner were doing most of last week if not working (EMQ.080);
plans to move (CMQ.500, CMQ.510, CMQ.520; CMQ.530, CMQ.540, CMQ.550, CMQ.560, CMQ.570);
what school the child would be attending during the next round of data collection (CMQ.600, CMQ.605, CMQ.610, CMQ.620, CMQ.630, CMQ.640, CMQ.650, CMQ.660, CMQ.670, CMQ.671, CMQ.672, CMQ.673, CMQ.674);
number of times the child has changed schools (CMQ.675); and
additional contact information (CMQ.060, CMQ.100, CMQ.140, CMQ.150, CMQ.155, CMQ.200, CMQ.205, CMQ.210, CMQ.300, CMQ.305, CMQ.310, CMQ.395, CMQ.400).
Several new construct areas were added for fall-eighth grade. These were as follows:
parent’s level of disappointment if the child did not graduate from high school or college (PIQ.110, PIQ.112);
role that parent would like the child to have in high school (PIQ.120);
family activities (e.g., working on homework together, going shopping, attending concerts, plays, or movies) (HEQ.010a-m);
parent’s reading habits (HEQ.015, HEQ.020; HEQ.025, HEQ.040);
2-14
family rules (e.g., rules new to fall-eighth grade were about the child maintaining a certain grade point average, doing homework, and hours spent on the computer or playing video games) (HEQ.075e-g);
parent monitoring and requirements for work or chores (HEQ.076a-e);
whether parent met and approved of the child’s friends and how often the child spent time with friends of whom the parent did not approve (HEQ.077a-c);
days per week that the child had adult supervision after school (HEQ.080);
whether the child had someone to help him or her with homework in science (HEQ.100, HEQ.101, HEQ.102);
parent discussions with the child (about courses at school, plans for after high school, current events, issues that trouble child) (HEQ.150a-d);
characteristics of parent’s relationship with the child (HEQ.160a-e);
child’s performance in school (SCQ.005, SCQ.010);
whether school was in the assigned district (SCQ.020);
school suspension (SCQ.025, SCQ.030);
parent perceptions of and satisfaction with the school (SCQ.035a-e, SCQ.040);
characteristics of parent’s relationship with spouse (CFQ.101, CFQ.105);
parents’ religious practices (CFQ.110, CFQ.120, CFQ.190);
parents’ political views (CFQ.200, CFQ.210, CFQ.220, CFQ.230);
nonresident parents’ contribution to medical and other expenses (NRQ.253, NRQ.254);
child health questions regarding depression, weight and eating disorders, diabetes, and various treatments (e.g., medicine, individual therapy) (CHQ.370, CHQ.400, CHQ.410, CHQ.590, CHQ.600, CHQ.763, CHQ.764, CHQ.764OS, CHQ.765, CHQ.765OS, CHQ.766, CHQ.767);
child internalizing and externalizing problems (CHQ.900a-y);
stressful life events (PPQ.230a-h);
home ownership, value, and mortgage debt (PAQ.140, PAQ.150, PAQ.160, PAQ.170, PAQ.180, PAQ.190, PAQ.200, PAQ.210, PAQ.220, PAQ.230); and
savings for post-high school education (PAQ.240).
2-15
In addition, two sets of questions were reintroduced from an earlier year of the study:
primary language(s) spoken (section PLQ; note: PLQ.080 was from the fall-kindergarten questionnaire but was limited to focal children and key parent figures in fall-eighth grade.); and
parent depression (PPQ100a-l; the same questions were used in the spring-kindergarten parent questionnaire).
Finally, some questions were modified from a previous round:
In fall-eighth grade, the stem of HEQ.075 was changed to be: “Are there family rules for {CHILD} about any of the following…” In spring-fifth grade, the stem was: “Are there family rules for {CHILD} about any of the following television-related activities?”
The wording of questions related to having help with homework in language arts was changed (HEQ.093, HEQ.095, HEQ.095b). In fall-eighth grade, these questions asked about help with homework for English or language arts class in areas such as literature, grammar, and writing. In spring-fifth grade, these questions asked about help with homework for reading, language arts, or spelling.
The wording of PIQ.065 changed from “class” to “school friends.” (In spring-eighth grade, the wording was “About how many parents of {CHILD}’s school friends do you talk with regularly, either in person or on the phone?”)
The dates in several questions were changed from 2002 to 2004, or changed to include 2004 as a possible date (INQ.010, CHQ.076, CHQ.136, CHQ.186, CHQ.226, CHQ.314, CHQ.346, CHQ.376, CHQ.536, CHQ.690, CHQ.767, CHQ.770, CHQ.800, PEQ.010, EMQ.010; CMQ.010; CMQ.675); and
The numbering was changed for some questions (HEQ.120 in fall-eighth grade was HEQ.400 in spring-fifth grade; HEQ.130a and b in fall-eighth grade were from HEQ.420 in spring-fifth grade; HEQ.140 in fall-eighth grade was HEQ.421 in spring-fifth grade; and SCQ.015 in fall-eighth grade was PIQ.007 in spring-fifth grade).
2.3.1 Parent Interview Timing Study
As with any study instrument, questionnaire length and respondent burden were issues of concern. A timing study was conducted for the draft parent questionnaire. Two Westat staff members conducted interviews with six respondents who had an eighth-grade child. No attempt was made to recruit respondents representative of either racial or economic groups because the objective was to obtain an
2-16
estimate of the length of the questionnaire rather than to examine how individuals interpreted the questions. Westat did attempt to select people who would go through the various questionnaire paths (e.g., married couples, single parents). All of the respondents were parents of eighth-grade children. All interviews were conducted over the telephone using a paper version of the questionnaire. Interviewers used stopwatches to time the individual sections and to get an overall time for the interview. The interviewers stopped the watches for extended interruptions, such as a respondent having to take care of the needs of a family member. In most cases, the respondents were asked to answer questions in sections that required knowledge of data collected from an earlier wave of the data collection as if they had provided the information in a previous round of the survey.
The revised paper version of the questionnaire took an average of 45 minutes and 16 seconds
to complete. Table 2-3 summarizes the overall and section timings for each interviewer and presents the average time expended for each section. The numbers denote the different respondents. One interview was done with a parent of twins (respondent #2). The second twin’s time was included in the overall average time.
Overall, the parent interview required approximately 45 minutes to complete. The timings
for the first interview in the household ranged from a low of 39 minutes to a high of 55 minutes. The approaches used to capture the information (update information provided in a prior round versus obtain new data) and the characteristics of the child and household contributed to the variations in the length of interviews. The twin interview required an additional 22 minutes.
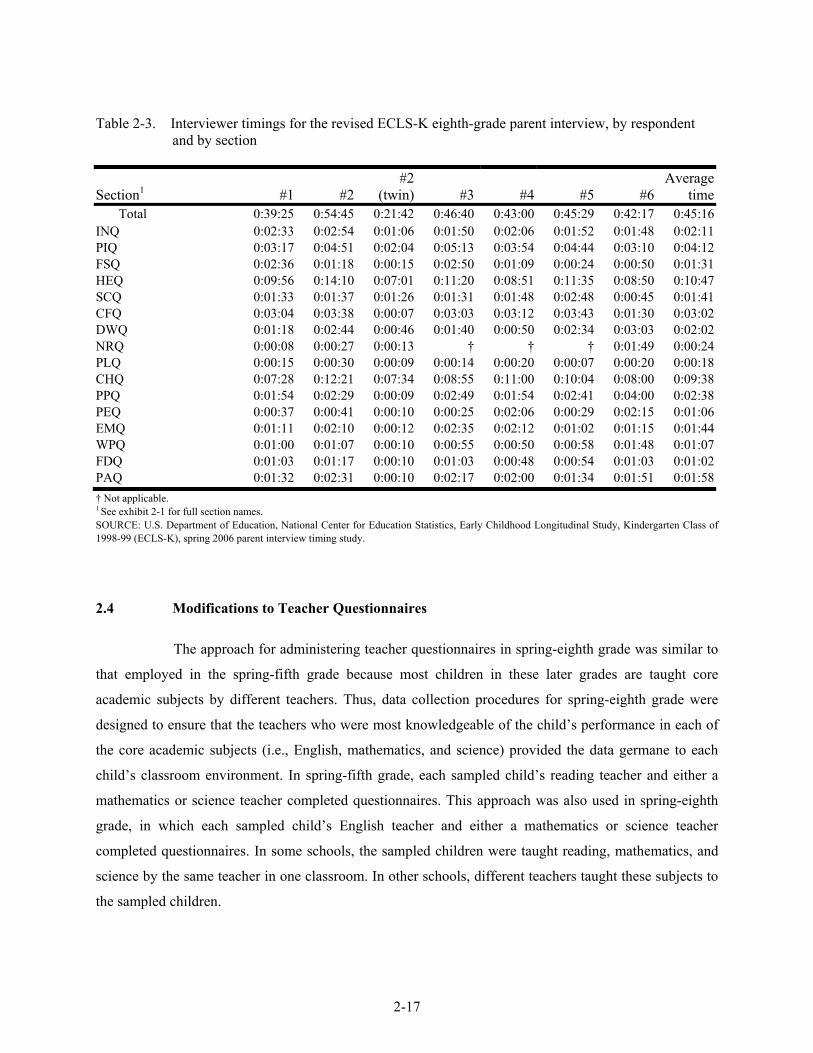
2-17
Table 2-3. Interviewer timings for the revised ECLS-K eighth-grade parent interview, by respondent and by section
Section1 #1 #2#2
(twin) #3 #4 #5 #6Average
timeTotal 0:39:25 0:54:45 0:21:42 0:46:40 0:43:00 0:45:29 0:42:17 0:45:16
INQ 0:02:33 0:02:54 0:01:06 0:01:50 0:02:06 0:01:52 0:01:48 0:02:11PIQ 0:03:17 0:04:51 0:02:04 0:05:13 0:03:54 0:04:44 0:03:10 0:04:12FSQ 0:02:36 0:01:18 0:00:15 0:02:50 0:01:09 0:00:24 0:00:50 0:01:31HEQ 0:09:56 0:14:10 0:07:01 0:11:20 0:08:51 0:11:35 0:08:50 0:10:47SCQ 0:01:33 0:01:37 0:01:26 0:01:31 0:01:48 0:02:48 0:00:45 0:01:41CFQ 0:03:04 0:03:38 0:00:07 0:03:03 0:03:12 0:03:43 0:01:30 0:03:02DWQ 0:01:18 0:02:44 0:00:46 0:01:40 0:00:50 0:02:34 0:03:03 0:02:02NRQ 0:00:08 0:00:27 0:00:13 † † † 0:01:49 0:00:24PLQ 0:00:15 0:00:30 0:00:09 0:00:14 0:00:20 0:00:07 0:00:20 0:00:18CHQ 0:07:28 0:12:21 0:07:34 0:08:55 0:11:00 0:10:04 0:08:00 0:09:38PPQ 0:01:54 0:02:29 0:00:09 0:02:49 0:01:54 0:02:41 0:04:00 0:02:38PEQ 0:00:37 0:00:41 0:00:10 0:00:25 0:02:06 0:00:29 0:02:15 0:01:06EMQ 0:01:11 0:02:10 0:00:12 0:02:35 0:02:12 0:01:02 0:01:15 0:01:44WPQ 0:01:00 0:01:07 0:00:10 0:00:55 0:00:50 0:00:58 0:01:48 0:01:07FDQ 0:01:03 0:01:17 0:00:10 0:01:03 0:00:48 0:00:54 0:01:03 0:01:02PAQ 0:01:32 0:02:31 0:00:10 0:02:17 0:02:00 0:01:34 0:01:51 0:01:58† Not applicable. 1 See exhibit 2-1 for full section names. SOURCE: U.S. Department of Education, National Center for Education Statistics, Early Childhood Longitudinal Study, Kindergarten Class of 1998-99 (ECLS-K), spring 2006 parent interview timing study.
2.4 Modifications to Teacher Questionnaires
The approach for administering teacher questionnaires in spring-eighth grade was similar to
that employed in the spring-fifth grade because most children in these later grades are taught core
academic subjects by different teachers. Thus, data collection procedures for spring-eighth grade were
designed to ensure that the teachers who were most knowledgeable of the child’s performance in each of
the core academic subjects (i.e., English, mathematics, and science) provided the data germane to each
child’s classroom environment. In spring-fifth grade, each sampled child’s reading teacher and either a
mathematics or science teacher completed questionnaires. This approach was also used in spring-eighth
grade, in which each sampled child’s English teacher and either a mathematics or science teacher
completed questionnaires. In some schools, the sampled children were taught reading, mathematics, and
science by the same teacher in one classroom. In other schools, different teachers taught these subjects to
the sampled children.
2-18
Each child’s selected teacher(s) received a self-administered teacher-level background questionnaire. In addition to the teacher-level questionnaire, each teacher received at least one of the three child-level questionnaires (English, mathematics, or science, based on the subject(s) they taught) specifically about the focal child. All children were assigned to have an English teacher complete questionnaires. In fifth grade, half of the children were randomly assigned to have a mathematics teacher complete questionnaires, and the other half of the children were assigned to have a science teacher complete questionnaires. This assignment for the mathematics or science teacher questionnaire made in fifth grade was carried forward in eighth grade so that the same children who had a mathematics teacher questionnaire in fifth grade would have a mathematics questionnaire in eighth grade, and those with a science teacher questionnaire in fifth grade would have a science teacher questionnaire in eighth grade. In cases where the same eighth-grade teacher taught the sampled child English, mathematics, and science, the teacher was asked to complete an English questionnaire and either a mathematics or science questionnaire, depending upon the domain for which the child was sampled in the fifth grade. In eighth grade, 4,661 children were assigned to have a mathematics teacher complete a questionnaire while 4,672 children were assigned to have a science teacher complete a questionnaire. As mentioned earlier, all children were assigned to have an English teacher complete a questionnaire.
During the spring-eighth grade data collection, one teacher-level background and three
child-level subject matter (i.e., English, mathematics, and science) questionnaires were used to collect data from the sampled children’s teachers. The self-administered teacher-level background questionnaire covered a variety of topics, including instructional practices, classroom resources, views on teaching and the school, and teacher background.
The English, mathematics, and science teacher questionnaires were organized in the
following manner. Each questionnaire was divided into three sections. The first section included questions that collected data on the child’s social skills, class performance, and his or her skills in relevant areas. The English teacher questionnaire asked about the child’s skills in written and oral expression. The mathematics teacher questionnaire asked about the child’s skills in mathematics, such as problem solving and demonstrating mathematical reasoning. The science teacher questionnaire asked about the child’s skills in science, such as designing an experiment to solve a scientific question and writing and preparing a presentation of scientific data.
The second section included questions about characteristics of the children in the classroom.
The third section included questions about the instructional practices in the classroom, such as specific
2-19
instructional activities and curricular focus, and assigned books and textbooks. In this last section, the items specified activities and practices that were relevant to the subject domain (i.e., English, mathematics, or science).
Two subject-matter questionnaires were completed for each sampled child. Therefore, data
were gathered on each sampled child’s skills in the areas of English and mathematics, or in the areas of English and science.
Topics covered in the spring-eighth grade teacher questionnaires included the following:
race/ethnicity of children in the classroom;
materials and resources available, such as computers;
instructional time on different topics;
behavior of children in classroom;
instructional information;
teachers’ evaluation and grading practices;
perceptions of school climate;
teacher demographic information;
teacher experience and education;
job satisfaction;
focal child’s domain-relevant skills (i.e., written and oral expression, science, and mathematics skills); and
focal child’s behavior and performance in class.
In addition to the teacher questionnaires described above, the ECLS-K also included special education teacher questionnaires. These were similar to the questionnaires given to special education teachers in previous rounds and had two parts, A and B. Part A of the special education teacher questionnaire was designed to collect information about the special education teacher’s professional background and experience. Part B asked about the special education services provided to the child and the nature of the child’s special education curriculum.
2-20
2.4.1 Field Test
In regards to the teacher questionnaire, one of the objectives for the field test was to assess whether a Web approach was feasible for the national data collection of the teacher questionnaires. One-hundred and seventy-four eighth-grade teachers participated in the Spring 2006 Field Test. Teachers completed a questionnaire on their classroom environment, instruction practices in the core academic subjects, and professional background. Teachers also completed individual ratings scales on a child in their classroom. The ratings scales contained items about the adolescents’ skills in areas of language and literacy, mathematics, or science (depending on the class the teacher taught), the child’s social skills and behaviors; and information about educational placements and special services that the child might receive.
Web versions of the questionnaires were made available on a secure website that children
and teachers accessed with a unique user name and password. All 174 participating eighth-grade teachers were assigned to complete the questionnaires via the Web (n = 58), paper copy (n = 59), or a choice of either Web or paper (n = 57).
Teachers participating in the field test were also asked to complete a short debriefing
questionnaire on their opinions of their participation in the field test, such as the quality and appropriateness of the field test materials, the effectiveness of the monetary incentives, and their opinion on the mode in which they were asked to complete the questionnaires (i.e., Web or paper). Teachers who completed the teacher questionnaires were asked about the mode in which they completed the questionnaire, the time it took to complete the questionnaire, and the clarity of the items. Teachers who didn’t complete the teacher questionnaires were asked why they did not complete them and what could be done to encourage them to complete it.
Based on results of the field test data, the teacher questionnaires were also feasible to
administer in the spring 2007 eighth-grade data collection. Participating field test teachers reported that the questionnaire took an average of 20 minutes to complete. They reported that the questions were appropriate for the classes they taught and were not difficult to understand.
Similar to the results found with the student questionnaire, the field test suggested that the
teacher questionnaire would yield a higher response rate if it were offered in paper form. Of the four sets of questionnaires, only 93 teacher questionnaires were completed over the Web, while 189 paper teacher questionnaires were completed and mailed (see table 2-4). The completion rate for teachers who were
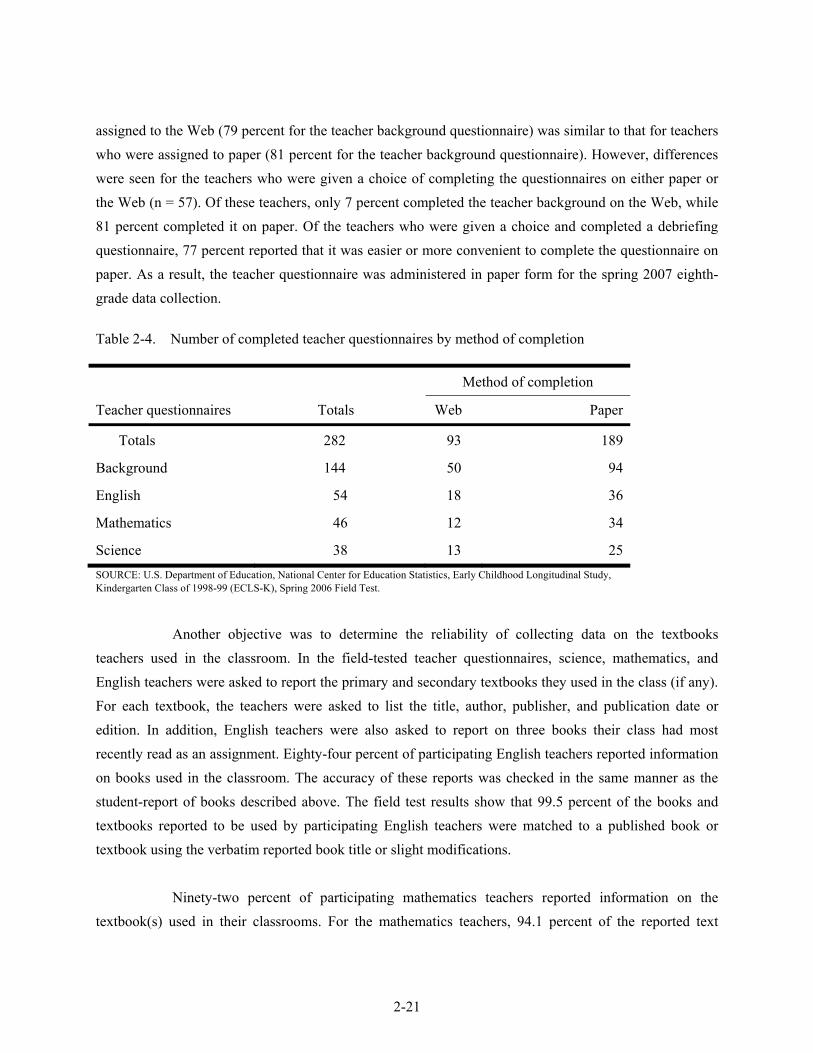
2-21
assigned to the Web (79 percent for the teacher background questionnaire) was similar to that for teachers who were assigned to paper (81 percent for the teacher background questionnaire). However, differences were seen for the teachers who were given a choice of completing the questionnaires on either paper or the Web (n = 57). Of these teachers, only 7 percent completed the teacher background on the Web, while 81 percent completed it on paper. Of the teachers who were given a choice and completed a debriefing questionnaire, 77 percent reported that it was easier or more convenient to complete the questionnaire on paper. As a result, the teacher questionnaire was administered in paper form for the spring 2007 eighth-grade data collection.
Table 2-4. Number of completed teacher questionnaires by method of completion
Method of completion
Teacher questionnaires Totals Web Paper
Totals 282 93 189
Background 144 50 94
English 54 18 36
Mathematics 46 12 34
Science 38 13 25 SOURCE: U.S. Department of Education, National Center for Education Statistics, Early Childhood Longitudinal Study, Kindergarten Class of 1998-99 (ECLS-K), Spring 2006 Field Test.
Another objective was to determine the reliability of collecting data on the textbooks
teachers used in the classroom. In the field-tested teacher questionnaires, science, mathematics, and English teachers were asked to report the primary and secondary textbooks they used in the class (if any). For each textbook, the teachers were asked to list the title, author, publisher, and publication date or edition. In addition, English teachers were also asked to report on three books their class had most recently read as an assignment. Eighty-four percent of participating English teachers reported information on books used in the classroom. The accuracy of these reports was checked in the same manner as the student-report of books described above. The field test results show that 99.5 percent of the books and textbooks reported to be used by participating English teachers were matched to a published book or textbook using the verbatim reported book title or slight modifications.
Ninety-two percent of participating mathematics teachers reported information on the
textbook(s) used in their classrooms. For the mathematics teachers, 94.1 percent of the reported text
2-22
books were matched to a published textbook using the verbatim reported book title with some or no minor modifications. Ninety-two percent of participating science teachers reported information on the textbook(s) used in their classrooms. For the science teachers, the matching rate was 83.0 percent with minor modifications.
Field Test recommendation: Details of the field test and its results can be found in the
appendix A. Given the clear preference of teachers to complete their questionnaires using paper and pencil, it was recommended that paper and pencil questionnaires be used for teachers during the national data collection. Although the overall completion rate for teachers was modestly higher when offered a combined approach (86.8 percent combined versus 81.4 percent paper only), the increase was not sufficiently large to warrant the cost of the Web approach for the ECLS-K eighth-grade data collection. In addition, the teacher-reported data of textbooks used in their classrooms was reliable. As a result, it was recommended to collect these data in the ECLS-K eighth-grade data collection.
3-1
3. SAMPLE DESIGN AND IMPLEMENTATION
This chapter describes the sample design of the Early Childhood Longitudinal Study, Kindergarten Class of 1998–99 (ECLS-K), and how it was modified and implemented for each round of data collection. An overview of the sample design is given here and described in more detail in the following sections.
The ECLS-K employed a multistage probability sample design to select a nationally
representative sample of children attending kindergarten in 1998–99. In the base year the primary sampling units (PSUs) were geographic areas consisting of counties or groups of counties. The second-stage units were schools within sampled PSUs. The third- and final-stage units were children within schools. During the base year, data were collected in both the fall and the spring.
Base-year respondents were eligible for the first-grade data collection, and nonrespondents
were not eligible. A case was considered responding for the base year if there was a completed child assessment or parent interview in fall- or spring-kindergarten. A child with a disability who could not be assessed was also considered a base-year respondent whether or not this child had a complete parent interview. Background characteristics such as sex, race/ethnicity, age, height, and weight are available for children with disabilities who could not be assessed. While all base-year respondents were eligible for the spring-first grade data collection, fall-first grade was limited to a 30 percent subsample. The spring-first grade child sample was freshened to include current first-graders who had not been enrolled in kindergarten in 1998–99 and, therefore, had had no chance of being included in the ECLS-K base-year kindergarten sample. For both fall- and spring-first grade, approximately 50 percent of sampled children who had transferred from their kindergarten schools were followed.
The third-grade data collection included base-year respondents and children sampled in first
grade through the freshening process. The first-grade sample was freshened to include first-graders who had not been enrolled in kindergarten in 1998–99 and therefore had no chance of being included in the ECLS-K base-year kindergarten sample. As in the first-grade data collection in which only a subsample of children who had transferred from their kindergarten schools was followed, a subsampling of movers was also used in third grade. In third grade, however, the subsampling rate applied to transferred children was slightly higher; children whose home language was non-English (also known as children belonging to the language minority group) who moved for the first time between kindergarten or first grade and
3-2
third grade were followed at 100 percent. In other words, children belonging to the language minority group who did not move in first grade but moved in third grade were all followed into their new third-grade schools. Language minority children who had moved between kindergarten and first grade and were not subsampled for follow-up in first grade did not re-enter the third-grade sample; those who were subsampled for follow-up in first grade were followed with certainty into their third-grade schools if they had moved again between first grade and third grade. The higher subsampling rate allowed for the preservation of this group in the sample for analytic reasons. Children not in the language minority group continued to be subsampled for follow-up at a 50 percent rate if they moved in third grade.
In fifth grade, the sample that was fielded was reduced by excluding certain special groups
of children from data collection, and by setting differential sampling rates for movers in different categories. Specifically, children in four groups were not fielded for the fifth-grade survey, irrespective of other subsampling procedures that were implemented. The excluded children were those who became ineligible in an earlier round because they died or moved out of the country, who were subsampled out in previous rounds because they were movers, whose parents emphatically refused to cooperate (hard refusals), and who were eligible for the third-grade data collection but had neither first-grade nor third-grade data. Of the remaining children, those who moved from their original schools during fifth grade or earlier were subsampled for follow-up. Children whose home language was not English (language minority) continued to be a special domain of analytic interest, and were subsampled at higher rates. Children were subsampled at different rates depending on the longitudinal data available for those children.
The eighth-grade sample included all children eligible after fifth grade regardless of their
fifth-grade response status. The ineligible children were those who moved out of the country, were deceased, or moved to another school and were not subsampled for follow-up in fifth grade. There was no subsampling of movers for follow-up as in previous rounds since the vast majority of children were not in the same school from kindergarten to eighth grade (having moved out of elementary schools into middle schools), and subsampling these movers would result in substantial losses in sample size and precision of the estimates for eighth grade.
The precision requirements and achieved sample sizes for the different waves of data
collection are discussed in section 3.1. The base-year, fall-first grade, spring-first grade, spring-third, and spring-fifth samples are discussed in sections 3.2, 3.3, 3.4, 3.5, and 3.6, respectively. Sampling issues that
3-3
were considered prior to the eighth-grade data collection are discussed in section 3.7. Section 3.7.2 includes a discussion of the characteristics of the eighth-grade sample.
3.1 Precision Requirements and Achieved Sample Sizes
The ECLS-K is a nationally representative longitudinal survey of children who attended kindergarten in 1998–1999, supplemented with children who were in first grade in spring 2000 but were not in kindergarten the previous year. Data on these children were collected from a variety of sources at two points in the base year (kindergarten in 1998–1999), two points in the 1999–2000 school year (as noted earlier, the fall collection was limited to a subsample of children) when most of the children were in first grade, in spring of 2002 when most of the children were in third grade, in spring of 2004 when most of the children were in fifth grade, and again in spring 2007 when most of the children were in eighth grade.
The overall design for the survey evolved over time. The initial design study recommended
sampling 23,500 children in approximately 1,000 kindergarten programs sampled from 100 PSUs. The initial plans also called for sampling children in private schools at a higher rate than children in public schools, as well as sampling minorities (children of Black, Hispanic, or Asian or Pacific Islander race or ethnicity) at higher rates than nonminorities. The design study assumed that because of nonresponse and losses due to children moving, the final number of completed interviews at the end of the fifth-grade data collection would be about 10,300. The original plan for the study included data collection through fifth grade. The eighth-grade data collection was an extension to this plan. While the design study was useful in providing overall direction, the final framework for the sample design differed in many ways from its recommendations.
The sample design implemented through the eighth grade in the ECLS-K is described in this
chapter. The remainder of this section gives an overview of the sampling objectives and how the design was revised to accommodate changes in those objectives over the course of the study. Subsequent sections of the chapter give the details of the procedures used to implement the sample in the various rounds or waves of data collection, beginning with the base year in 1998–1999.
3-4
Four precision requirements for the survey were identified and formed the basis for the base-year sample design and plans for the follow-ups through fifth grade. These requirements are the ability to do the following:
Measure a relative change of 20 percent in proportions across waves.
Measure a relative change of 5 percent in a mean assessment score across waves.
Estimate a proportion for each wave with a coefficient of variation (CV) of 10 percent or less.
Estimate a mean assessment score for each wave with a CV of 2.5 percent or less.
The goals were interpreted as being objectives not only for all children, but for subgroups of analytic interest that include children attending public and private schools (Catholic, non-Catholic), and children from different race and ethnic groups (Hispanic, Black, Asian or Pacific Islander, all other races). After the spring-first grade data collection, language minority children were a newly identified subgroup of analytic interest for sample design purposes. A large number of assumptions had to be made to estimate sample sizes sufficient to meet the precision requirements. The key assumptions included projections of the losses due to nonresponse and attrition due to children moving, the design effects1 associated with the sample design, the element mean and standard deviations of the assessment scores, and the correlation of the statistics across waves. Since the ECLS-K was the first study of this population using this methodology, many of the assumptions had to be based on judgments without much supporting empirical data.
The precision requirements that drove the sample design (those demanding the largest
sample size) had to do with estimating changes over time and estimating the precision of estimates in the fifth-grade data collection. Based on assumptions described above, it was determined that a sample in fifth grade of about 10,000 children would be adequate to meet the precision requirements overall and for most subgroups. A sample of about 800 to 1,000 children in a subgroup would be achieved for most of the subgroups with an overall sample of 10,000 children, and these would approximately meet the precision goals. For example, with a sample size of 10,000, the number of Hispanic and Black children would exceed 1,000, as shown in section 3.6.3. Children in private schools and Asians or Pacific Islanders were the two subgroups that were expected to fall short of the goals if higher sampling rates were not
- 1 When a clustered sample with unequal sampling weights is used, the estimates are less precise than those expected from a simple random sample, and the ratio of the actual to simple random sampling variance is called a design effect.
3-5
applied. As noted in the following sections, sampling procedures were implemented to increase the sample size for these two groups.
After the spring-first grade data collection was completed, the assumptions were reviewed,
and the ability of the sample to meet the survey goals was re-examined. At that time, language minority children were identified as a subgroup of analytic interest. The evaluation showed that the sample sizes were adequate for most subgroups, but special efforts were needed to retain language minority children in subsequent rounds. Table 3-11 in section 3.5 shows the outcome of the spring-first grade data collection by type of children. Since funding was made available to support these efforts, sampling procedures for retaining movers were modified. In the first-grade data collection, half of the movers were subsampled and included for follow-up, without taking any characteristics of the children into account. To increase the sample of language minority children, the sampling procedures were revised for the third-grade follow-up to retain as many of these children as possible.
The evaluation also showed that the assumed design effects for assessment scores (reading,
mathematics and general knowledge) were larger than originally expected, ranging from 4.5 to 9.5 (instead of the expected design effect of 2.0). The larger than expected design effects for scores were first identified after the base year. The design effects for percentages, ranging from 1.6 to 6.9 for proportions greater than 30 percent, were close to those originally anticipated (3.8 on average).2 The evaluation showed that the correlation over time of the scores was higher than expected. The higher correlation makes estimates of change in scores over time more precise. Consequently, the only precision objective that is substantially affected by the higher than expected design effects is for the mean assessment scores for fifth grade. This partly offsets the loss in precision due to the higher design effect.
Since the eighth-grade sample size is determined by the sample size achieved in fifth grade
and could not be altered, the eighth-grade precision requirements had to be relaxed somewhat for certain analytical subgroups as explained in section 3.7.2, and summarized as follows:
Measure a relative change of 20 percent in proportions across waves for the overall
level and all but three subgroups, assuming an estimate of 30 percent. This is due to the small sample sizes of these three subgroups expected for eighth-grade: non-Catholic private, Asian or Pacific Islander, and “other” race/ethnicity. For example, for children in non-Catholic private schools, a relative change of 25 percent may be measured given that the design effect for the estimate is between 3.0 or 3.7. For Asian
- 2 See design effects for selected survey items in chapter 4 of the ECLS-K Base Year Public-Use Data Files and Electronic Code Book: User’s Manual (NCES 2001–029rev) (Tourangeau, Burke et al. 2004).
3-6
or Pacific Islander children, a relative change of 20 percent may be measured if the design effect for the estimate is 3.0 but only a relative change of 25 percent may be measured if the design effect is 3.7. For children of “other race,” only a relative change of 30 percent may be measured.
Measure a relative change of 5 percent in a mean assessment score across waves for the overall level and all but one subgroup, those in the “other” race/ethnicity subgroup. For this subgroup, a relative change of more than 5 percent can be measured.
Estimate a proportion for each wave with a CV of 10 percent or less for the overall level and all but three subgroups, the same three subgroups discussed in the first requirement (non-Catholic private, Asian or Pacific Islander, and “other” race/ethnicity). For these subgroups, only a CV of 13 percent or more could be measured, depending on the subgroup and the design effect of the estimate.
Estimate a mean assessment score for each wave with a CV of 2.5 percent or less for the overall level and all but two subgroups (non-Catholic private and “other” race/ethnicity). For these two groups, a CV of 3 percent may be measured.
Table 3-1 tracks the ECLS-K sample from the base year through eighth grade. The table shows that the large initial sample of children has been reduced over time due to subsampling movers and nonresponse, as expected. While the initial assumptions that drove the sample design were not always accurate separately, the overall effect of the losses has been very close to what was expected. For example, in several rounds of the ECLS-K, the assumed moving rate was lower than the actual moving rate, but this was offset by higher completion rates. The overall number of eligible children at the end of the fifth-grade wave was more than 12,000 children, and the final sample size for the fifth-grade sample exceeded the 10,000 children in the initial projections. For eighth grade, the final sample size is 9,725, slightly above the expected sample size discussed in section 3.7.1.
The details on the sample sizes for subgroups at the end of the eighth grade are provided
later in this chapter (see tables 3-23, 3-24, and 3-25). Those tabulations show that the number of eighth-grade respondents for most of the specific subgroups of interest exceeds 1,000, except for children in non-Catholic private schools (639 respondents) and Asian or Pacific Islander children (665). These two small sample sizes do not satisfy the precision requirements set out for the original studies as discussed in section 3.7.2.
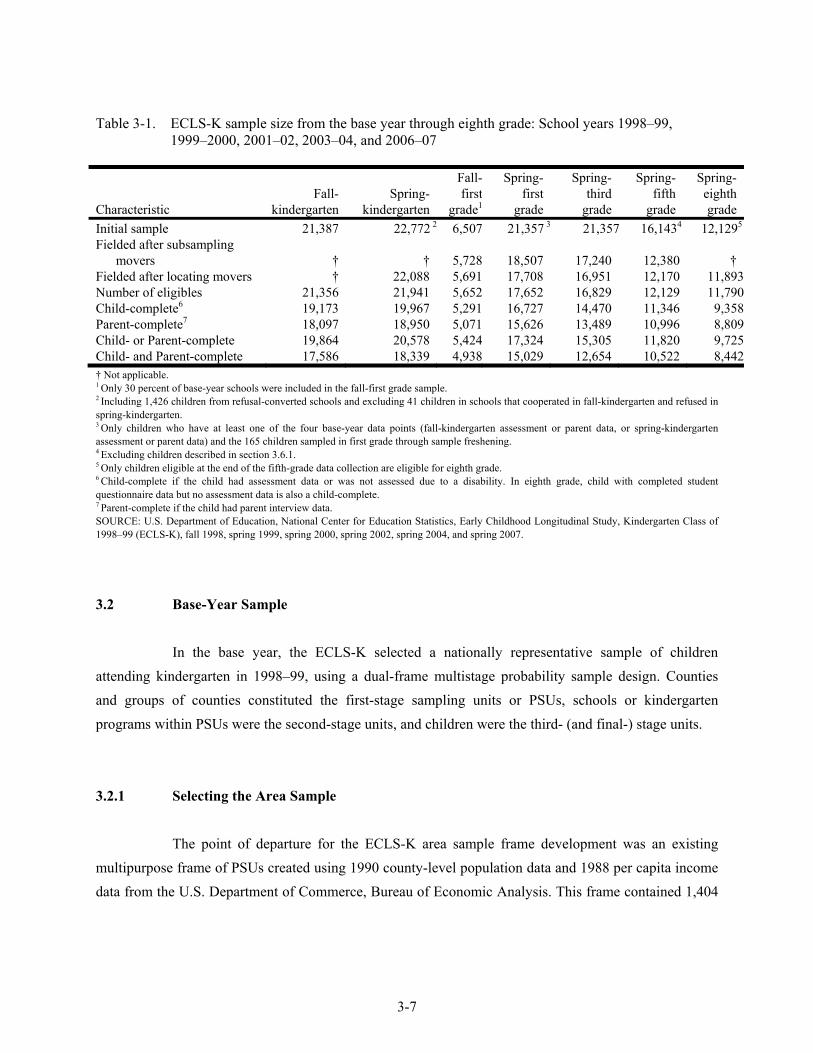
3-7
Table 3-1. ECLS-K sample size from the base year through eighth grade: School years 1998–99, 1999–2000, 2001–02, 2003–04, and 2006–07
Characteristic Fall-
kindergarten Spring-
kindergarten
Fall-first
grade1
Spring- first
grade
Spring- third
grade
Spring-fifth
grade
Spring- eighth grade
Initial sample 21,387 22,772 2 6,507 21,357 3 21,357 16,1434 12,1295
Fielded after subsampling movers † † 5,728 18,507 17,240 12,380 †
Fielded after locating movers † 22,088 5,691 17,708 16,951 12,170 11,893Number of eligibles 21,356 21,941 5,652 17,652 16,829 12,129 11,790Child-complete6 19,173 19,967 5,291 16,727 14,470 11,346 9,358Parent-complete7 18,097 18,950 5,071 15,626 13,489 10,996 8,809Child- or Parent-complete 19,864 20,578 5,424 17,324 15,305 11,820 9,725Child- and Parent-complete 17,586 18,339 4,938 15,029 12,654 10,522 8,442† Not applicable. 1 Only 30 percent of base-year schools were included in the fall-first grade sample. 2 Including 1,426 children from refusal-converted schools and excluding 41 children in schools that cooperated in fall-kindergarten and refused in spring-kindergarten. 3 Only children who have at least one of the four base-year data points (fall-kindergarten assessment or parent data, or spring-kindergarten assessment or parent data) and the 165 children sampled in first grade through sample freshening. 4 Excluding children described in section 3.6.1. 5 Only children eligible at the end of the fifth-grade data collection are eligible for eighth grade. 6 Child-complete if the child had assessment data or was not assessed due to a disability. In eighth grade, child with completed student questionnaire data but no assessment data is also a child-complete. 7 Parent-complete if the child had parent interview data. SOURCE: U.S. Department of Education, National Center for Education Statistics, Early Childhood Longitudinal Study, Kindergarten Class of 1998–99 (ECLS-K), fall 1998, spring 1999, spring 2000, spring 2002, spring 2004, and spring 2007.
3.2 Base-Year Sample
In the base year, the ECLS-K selected a nationally representative sample of children attending kindergarten in 1998–99, using a dual-frame multistage probability sample design. Counties and groups of counties constituted the first-stage sampling units or PSUs, schools or kindergarten programs within PSUs were the second-stage units, and children were the third- (and final-) stage units.
3.2.1 Selecting the Area Sample
The point of departure for the ECLS-K area sample frame development was an existing multipurpose frame of PSUs created using 1990 county-level population data and 1988 per capita income data from the U.S. Department of Commerce, Bureau of Economic Analysis. This frame contained 1,404
3-8
PSUs that were counties or groups of contiguous counties. PSUs did not cut across census regional3 boundaries, but were allowed to cross state boundaries. Each 1990 Metropolitan Statistical Area (MSA)4 constituted a single PSU except where an MSA crossed census regions, and it was split into two PSUs. The minimum size of a PSU in the multipurpose frame was 15,000 persons.
Since the focus of the ECLS-K is kindergarten children, the existing PSU frame was updated
with 1994 population estimates of 5-year-olds by race/ethnicity, the most up-to-date estimates available from the U.S. Bureau of the Census at the time. The counts of 5-year-olds by race/ethnicity were used to revise PSU definitions relative to a different minimum PSU size and to construct a measure of size (MOS) that facilitated the oversampling of Asians or Pacific Islanders. Each PSU in the frame that did not have at least 320 5-year-olds was collapsed with an adjacent PSU. This minimum PSU size was developed on the basis of assumptions concerning anticipated school response rates, the average number of schools that would be selected per PSU, and the target number of children to be sampled per school. After this collapsing, the final ECLS-K PSU frame contained 1,335 records.
The MOS used for selecting PSUs took into account the amount of oversampling of Asians
or Pacific Islanders (API) required to meet the ECLS-K precision goals. The weighted MOS was calculated as follows:
2.5 API otherMOS n n= × + where 2.5 is the oversampling rate for Asians or Pacific Islanders, and nAPI and nother are the counts of 5-
year-old Asian or Pacific Islanders and all others, respectively. The oversampling rate for Asians or Pacific Islanders was calculated as the target number of completed Asian or Pacific Islander cases divided by the expected number of completed Asian or Pacific Islander cases without oversampling. In all, 100 PSUs were selected for the ECLS-K. The 24 PSUs with the largest measures of size were designated as certainty selections or self-representing5 and were set aside. They were included in the sample with certainty. Once the self-representing PSUs were removed, the remaining PSUs, called non-self-representing,6 were partitioned into 38 strata of roughly equal MOS. The frame of non-self-representing PSUs was first sorted into eight superstrata by crossing the two MSA categories (MSA and non-MSA) and the four census regions (Northeast, Midwest, South, and West). Within the four MSA superstrata, the
- 3 A census region is a geographic region defined by the U.S. Bureau of the Census. 4 A Metropolitan Statistical Area (MSA) is a geographic entity designated as one or more counties in a metropolitan area, except in New England, where MSA is defined in terms of county subdivisions. MSAs generally have under 1 million in population. 5 A self-representing PSU is selected into the sample with certainty (i.e., with probability 1). 6 A non-self-representing PSU is selected into the sample with probability proportional to its measure of size (MOS).
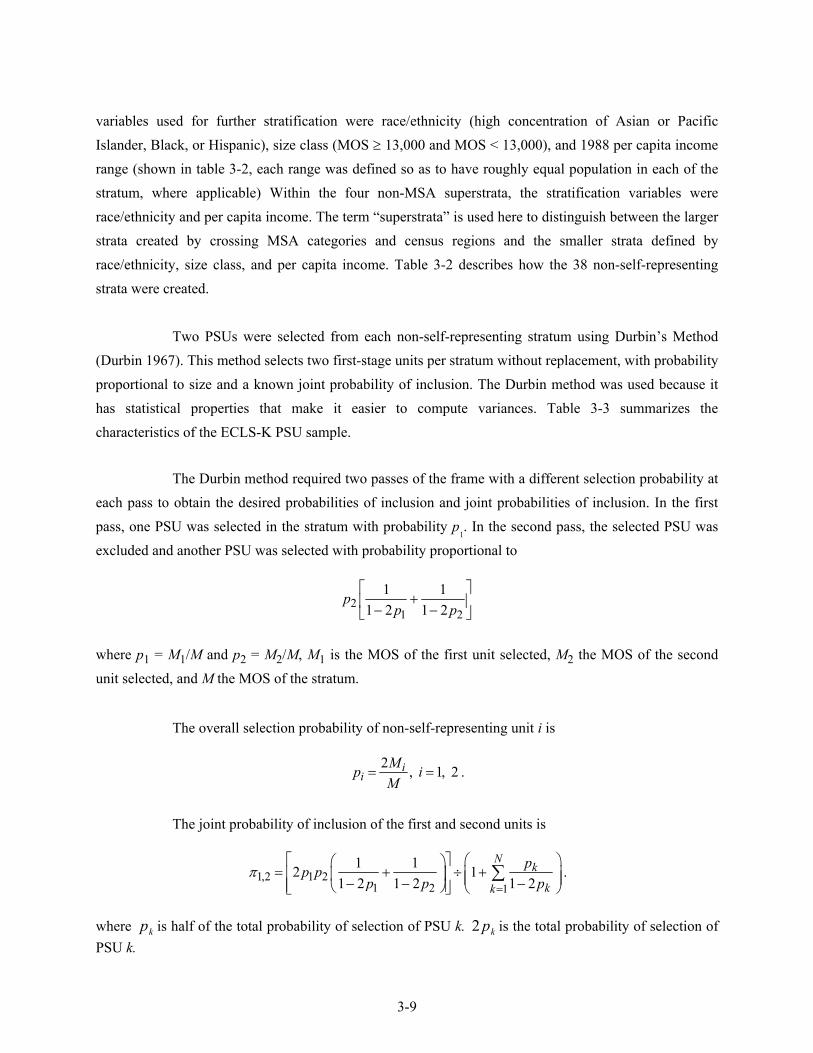
3-9
variables used for further stratification were race/ethnicity (high concentration of Asian or Pacific Islander, Black, or Hispanic), size class (MOS ≥ 13,000 and MOS < 13,000), and 1988 per capita income range (shown in table 3-2, each range was defined so as to have roughly equal population in each of the stratum, where applicable) Within the four non-MSA superstrata, the stratification variables were race/ethnicity and per capita income. The term “superstrata” is used here to distinguish between the larger strata created by crossing MSA categories and census regions and the smaller strata defined by race/ethnicity, size class, and per capita income. Table 3-2 describes how the 38 non-self-representing strata were created.
Two PSUs were selected from each non-self-representing stratum using Durbin’s Method
(Durbin 1967). This method selects two first-stage units per stratum without replacement, with probability proportional to size and a known joint probability of inclusion. The Durbin method was used because it has statistical properties that make it easier to compute variances. Table 3-3 summarizes the characteristics of the ECLS-K PSU sample.
The Durbin method required two passes of the frame with a different selection probability at
each pass to obtain the desired probabilities of inclusion and joint probabilities of inclusion. In the first pass, one PSU was selected in the stratum with probability p
1. In the second pass, the selected PSU was
excluded and another PSU was selected with probability proportional to
21 2
1 11 2 1 2
pp p
⎡ ⎤+⎢ ⎥− −⎣ ⎦
where p1 = M1/M and p2 = M2/M, M1 is the MOS of the first unit selected, M2 the MOS of the second unit selected, and M the MOS of the stratum.
The overall selection probability of non-self-representing unit i is
2 , 1, 2ii
Mp iM
= = .
The joint probability of inclusion of the first and second units is
1,2 1 21 2 1
1 12 11 2 1 2 1 2
Nk
kk
pp pp p p
π=
⎡ ⎤ ⎛ ⎞⎛ ⎞= + ÷ +⎜ ⎟⎢ ⎥⎜ ⎟ ⎜ ⎟− − −⎢ ⎥⎝ ⎠ ⎝ ⎠⎣ ⎦
∑ .
where kp is half of the total probability of selection of PSU k. kp2 is the total probability of selection of PSU k.
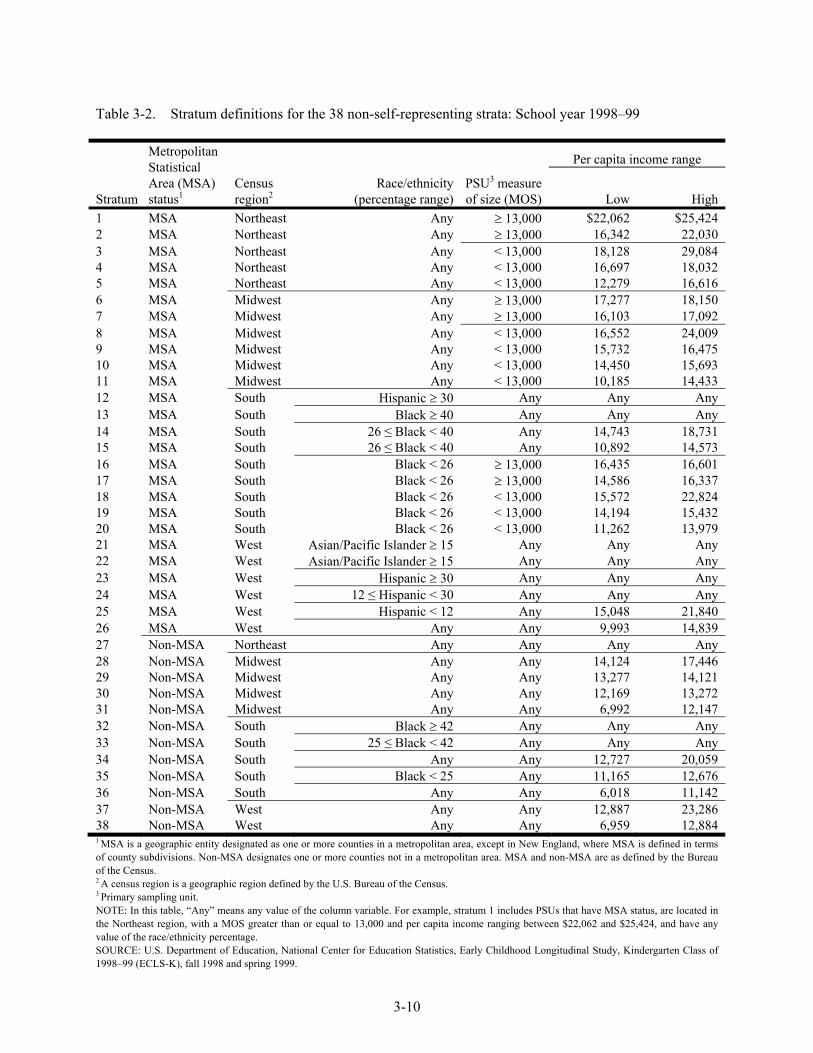
3-10
Table 3-2. Stratum definitions for the 38 non-self-representing strata: School year 1998–99
Stratum
Metropolitan Statistical Area (MSA) status1
Census region2
Race/ethnicity (percentage range)
PSU3 measure of size (MOS)
Per capita income range
Low High 1 MSA Northeast Any ≥ 13,000 $22,062 $25,424 2 MSA Northeast Any ≥ 13,000 16,342 22,030 3 MSA Northeast Any < 13,000 18,128 29,084 4 MSA Northeast Any < 13,000 16,697 18,032 5 MSA Northeast Any < 13,000 12,279 16,616 6 MSA Midwest Any ≥ 13,000 17,277 18,150 7 MSA Midwest Any ≥ 13,000 16,103 17,092 8 MSA Midwest Any < 13,000 16,552 24,009 9 MSA Midwest Any < 13,000 15,732 16,475 10 MSA Midwest Any < 13,000 14,450 15,693 11 MSA Midwest Any < 13,000 10,185 14,433 12 MSA South Hispanic ≥ 30 Any Any Any 13 MSA South Black ≥ 40 Any Any Any 14 MSA South 26 ≤ Black < 40 Any 14,743 18,731 15 MSA South 26 ≤ Black < 40 Any 10,892 14,573 16 MSA South Black < 26 ≥ 13,000 16,435 16,601 17 MSA South Black < 26 ≥ 13,000 14,586 16,337 18 MSA South Black < 26 < 13,000 15,572 22,824 19 MSA South Black < 26 < 13,000 14,194 15,432 20 MSA South Black < 26 < 13,000 11,262 13,979 21 MSA West Asian/Pacific Islander ≥ 15 Any Any Any 22 MSA West Asian/Pacific Islander ≥ 15 Any Any Any 23 MSA West Hispanic ≥ 30 Any Any Any 24 MSA West 12 ≤ Hispanic < 30 Any Any Any 25 MSA West Hispanic < 12 Any 15,048 21,840 26 MSA West Any Any 9,993 14,839 27 Non-MSA Northeast Any Any Any Any 28 Non-MSA Midwest Any Any 14,124 17,446 29 Non-MSA Midwest Any Any 13,277 14,121 30 Non-MSA Midwest Any Any 12,169 13,272 31 Non-MSA Midwest Any Any 6,992 12,147 32 Non-MSA South Black ≥ 42 Any Any Any 33 Non-MSA South 25 ≤ Black < 42 Any Any Any 34 Non-MSA South Any Any 12,727 20,059 35 Non-MSA South Black < 25 Any 11,165 12,676 36 Non-MSA South Any Any 6,018 11,142 37 Non-MSA West Any Any 12,887 23,286 38 Non-MSA West Any Any 6,959 12,884 1 MSA is a geographic entity designated as one or more counties in a metropolitan area, except in New England, where MSA is defined in terms of county subdivisions. Non-MSA designates one or more counties not in a metropolitan area. MSA and non-MSA are as defined by the Bureau of the Census. 2 A census region is a geographic region defined by the U.S. Bureau of the Census. 3 Primary sampling unit. NOTE: In this table, “Any” means any value of the column variable. For example, stratum 1 includes PSUs that have MSA status, are located in the Northeast region, with a MOS greater than or equal to 13,000 and per capita income ranging between $22,062 and $25,424, and have any value of the race/ethnicity percentage. SOURCE: U.S. Department of Education, National Center for Education Statistics, Early Childhood Longitudinal Study, Kindergarten Class of 1998–99 (ECLS-K), fall 1998 and spring 1999.
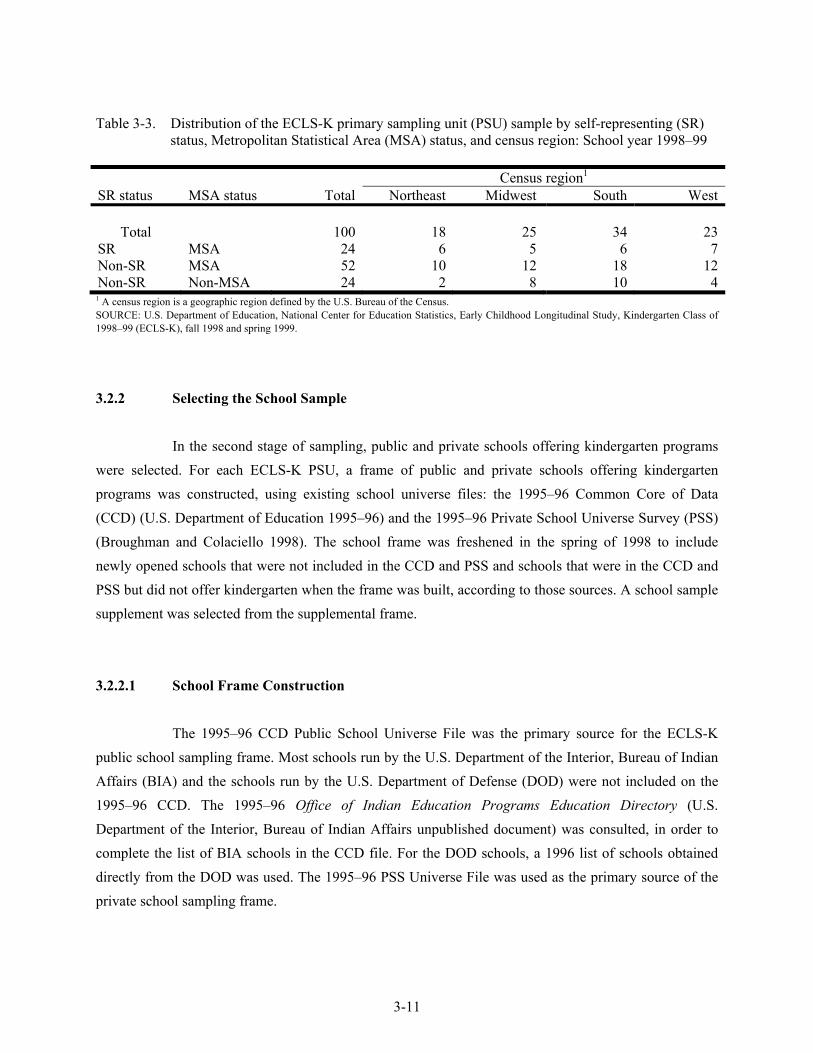
3-11
Table 3-3. Distribution of the ECLS-K primary sampling unit (PSU) sample by self-representing (SR) status, Metropolitan Statistical Area (MSA) status, and census region: School year 1998–99
Census region1 SR status MSA status Total Northeast Midwest South West
Total 100 18 25 34 23
SR MSA 24 6 5 6 7Non-SR MSA 52 10 12 18 12Non-SR Non-MSA 24 2 8 10 4
1 A census region is a geographic region defined by the U.S. Bureau of the Census. SOURCE: U.S. Department of Education, National Center for Education Statistics, Early Childhood Longitudinal Study, Kindergarten Class of 1998–99 (ECLS-K), fall 1998 and spring 1999.
3.2.2 Selecting the School Sample
In the second stage of sampling, public and private schools offering kindergarten programs were selected. For each ECLS-K PSU, a frame of public and private schools offering kindergarten programs was constructed, using existing school universe files: the 1995–96 Common Core of Data (CCD) (U.S. Department of Education 1995–96) and the 1995–96 Private School Universe Survey (PSS) (Broughman and Colaciello 1998). The school frame was freshened in the spring of 1998 to include newly opened schools that were not included in the CCD and PSS and schools that were in the CCD and PSS but did not offer kindergarten when the frame was built, according to those sources. A school sample supplement was selected from the supplemental frame.
3.2.2.1 School Frame Construction
The 1995–96 CCD Public School Universe File was the primary source for the ECLS-K public school sampling frame. Most schools run by the U.S. Department of the Interior, Bureau of Indian Affairs (BIA) and the schools run by the U.S. Department of Defense (DOD) were not included on the 1995–96 CCD. The 1995–96 Office of Indian Education Programs Education Directory (U.S. Department of the Interior, Bureau of Indian Affairs unpublished document) was consulted, in order to complete the list of BIA schools in the CCD file. For the DOD schools, a 1996 list of schools obtained directly from the DOD was used. The 1995–96 PSS Universe File was used as the primary source of the private school sampling frame.
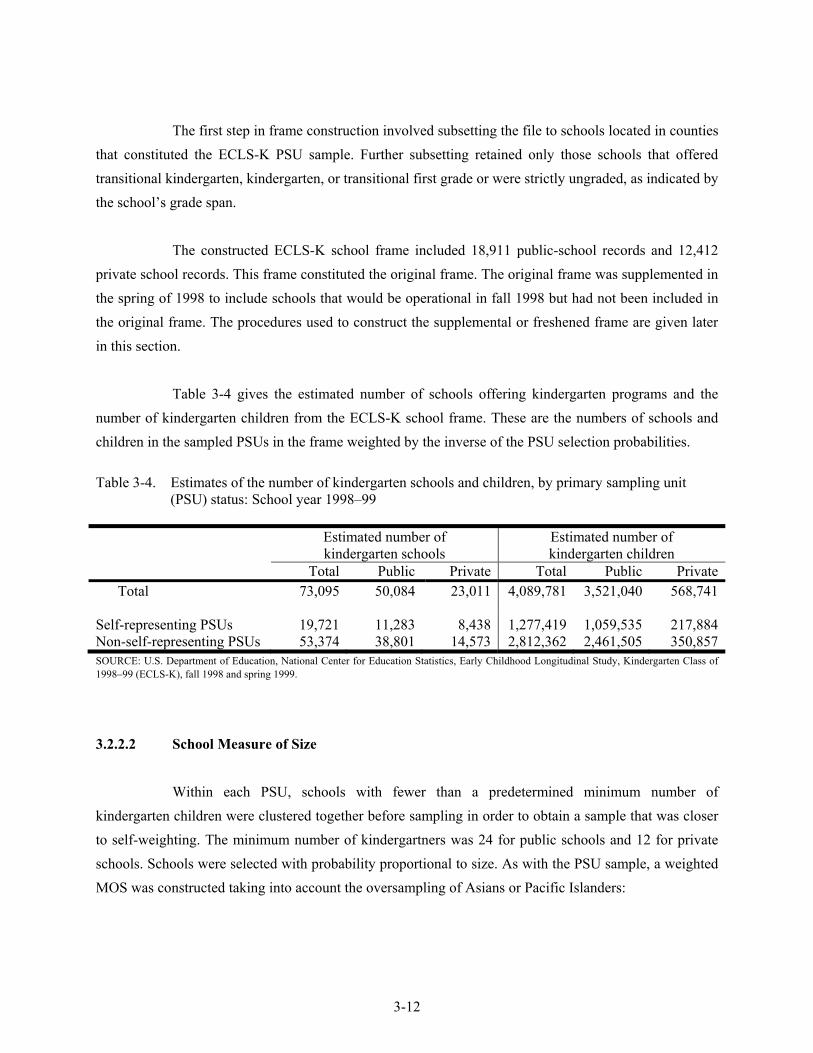
3-12
The first step in frame construction involved subsetting the file to schools located in counties that constituted the ECLS-K PSU sample. Further subsetting retained only those schools that offered transitional kindergarten, kindergarten, or transitional first grade or were strictly ungraded, as indicated by the school’s grade span.
The constructed ECLS-K school frame included 18,911 public-school records and 12,412
private school records. This frame constituted the original frame. The original frame was supplemented in the spring of 1998 to include schools that would be operational in fall 1998 but had not been included in the original frame. The procedures used to construct the supplemental or freshened frame are given later in this section.
Table 3-4 gives the estimated number of schools offering kindergarten programs and the
number of kindergarten children from the ECLS-K school frame. These are the numbers of schools and children in the sampled PSUs in the frame weighted by the inverse of the PSU selection probabilities.
Table 3-4. Estimates of the number of kindergarten schools and children, by primary sampling unit
(PSU) status: School year 1998–99 Estimated number of
kindergarten schools Estimated number of kindergarten children
Total Public Private Total Public Private Total 73,095 50,084 23,011 4,089,781 3,521,040 568,741 Self-representing PSUs 19,721 11,283 8,438 1,277,419 1,059,535 217,884Non-self-representing PSUs 53,374 38,801 14,573 2,812,362 2,461,505 350,857SOURCE: U.S. Department of Education, National Center for Education Statistics, Early Childhood Longitudinal Study, Kindergarten Class of 1998–99 (ECLS-K), fall 1998 and spring 1999.
3.2.2.2 School Measure of Size
Within each PSU, schools with fewer than a predetermined minimum number of kindergarten children were clustered together before sampling in order to obtain a sample that was closer to self-weighting. The minimum number of kindergartners was 24 for public schools and 12 for private schools. Schools were selected with probability proportional to size. As with the PSU sample, a weighted MOS was constructed taking into account the oversampling of Asians or Pacific Islanders:
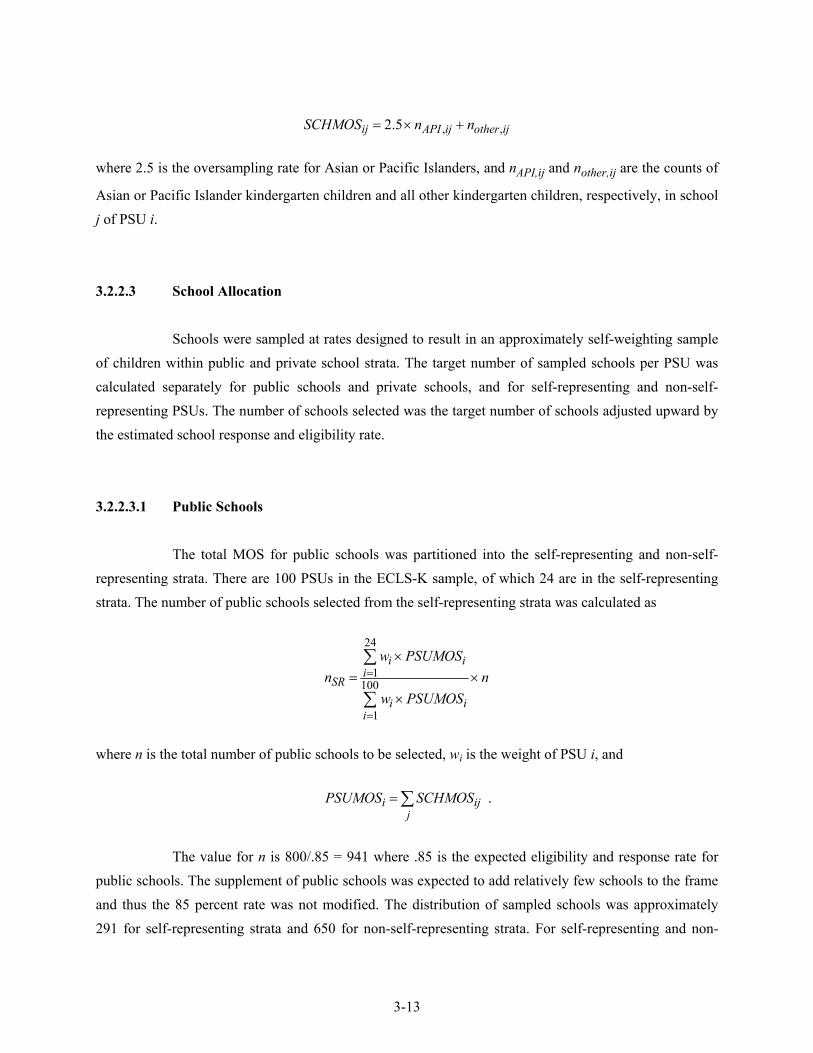
3-13
, ,2.5ij API ij other ijSCHMOS n n= × + where 2.5 is the oversampling rate for Asian or Pacific Islanders, and nAPI,ij and nother,ij are the counts of
Asian or Pacific Islander kindergarten children and all other kindergarten children, respectively, in school j of PSU i.
3.2.2.3 School Allocation
Schools were sampled at rates designed to result in an approximately self-weighting sample of children within public and private school strata. The target number of sampled schools per PSU was calculated separately for public schools and private schools, and for self-representing and non-self-representing PSUs. The number of schools selected was the target number of schools adjusted upward by the estimated school response and eligibility rate.
3.2.2.3.1 Public Schools
The total MOS for public schools was partitioned into the self-representing and non-self-representing strata. There are 100 PSUs in the ECLS-K sample, of which 24 are in the self-representing strata. The number of public schools selected from the self-representing strata was calculated as
24
1100
1
i ii
SR
i ii
w PSUMOSn n
w PSUMOS
=
=
×= ×
×
∑
∑
where n is the total number of public schools to be selected, wi is the weight of PSU i, and
i ij
jPSUMOS SCHMOS= ∑ .
The value for n is 800/.85 = 941 where .85 is the expected eligibility and response rate for public schools. The supplement of public schools was expected to add relatively few schools to the frame and thus the 85 percent rate was not modified. The distribution of sampled schools was approximately 291 for self-representing strata and 650 for non-self-representing strata. For self-representing and non-
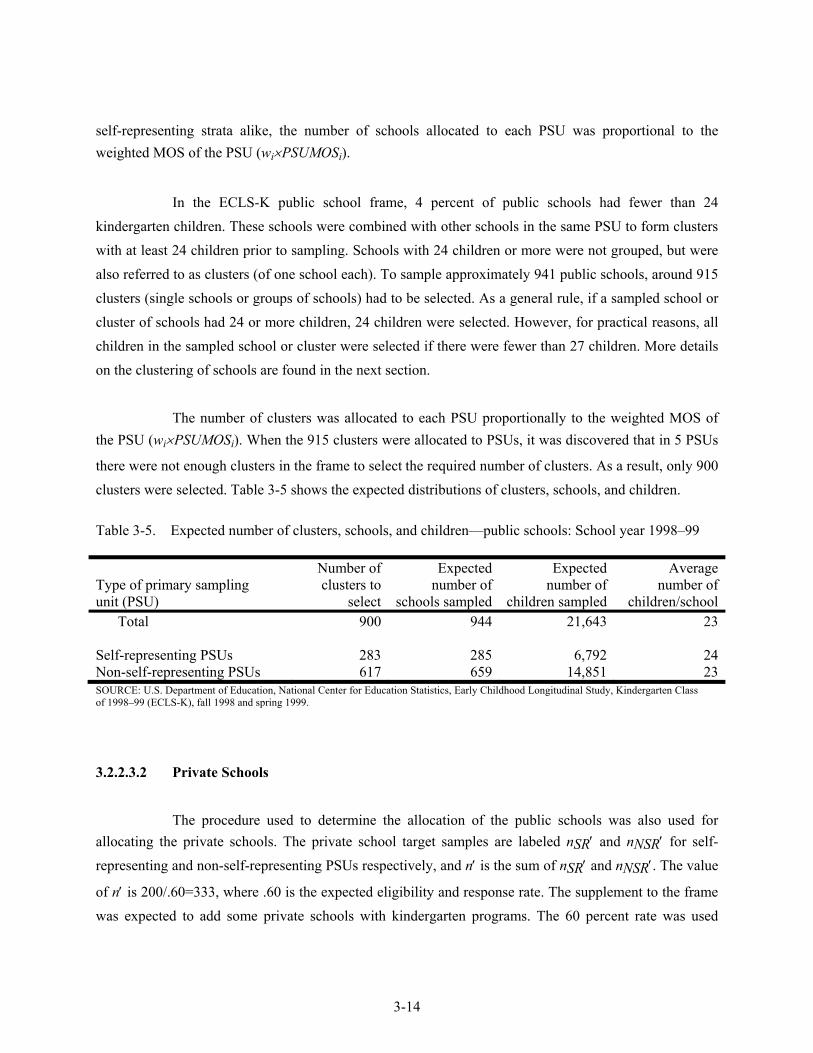
3-14
self-representing strata alike, the number of schools allocated to each PSU was proportional to the weighted MOS of the PSU (wi×PSUMOSi).
In the ECLS-K public school frame, 4 percent of public schools had fewer than 24
kindergarten children. These schools were combined with other schools in the same PSU to form clusters with at least 24 children prior to sampling. Schools with 24 children or more were not grouped, but were also referred to as clusters (of one school each). To sample approximately 941 public schools, around 915 clusters (single schools or groups of schools) had to be selected. As a general rule, if a sampled school or cluster of schools had 24 or more children, 24 children were selected. However, for practical reasons, all children in the sampled school or cluster were selected if there were fewer than 27 children. More details on the clustering of schools are found in the next section.
The number of clusters was allocated to each PSU proportionally to the weighted MOS of
the PSU (wi×PSUMOSi). When the 915 clusters were allocated to PSUs, it was discovered that in 5 PSUs
there were not enough clusters in the frame to select the required number of clusters. As a result, only 900 clusters were selected. Table 3-5 shows the expected distributions of clusters, schools, and children.
Table 3-5. Expected number of clusters, schools, and children—public schools: School year 1998–99
Type of primary sampling unit (PSU)
Number of clusters to
select
Expected number of
schools sampled
Expected number of
children sampled
Average number of
children/school Total 900 944 21,643 23 Self-representing PSUs 283 285 6,792 24Non-self-representing PSUs 617 659 14,851 23SOURCE: U.S. Department of Education, National Center for Education Statistics, Early Childhood Longitudinal Study, Kindergarten Class of 1998–99 (ECLS-K), fall 1998 and spring 1999.
3.2.2.3.2 Private Schools
The procedure used to determine the allocation of the public schools was also used for allocating the private schools. The private school target samples are labeled nSR′ and nNSR′ for self-representing and non-self-representing PSUs respectively, and n′ is the sum of nSR′ and nNSR′. The value
of n′ is 200/.60=333, where .60 is the expected eligibility and response rate. The supplement to the frame was expected to add some private schools with kindergarten programs. The 60 percent rate was used
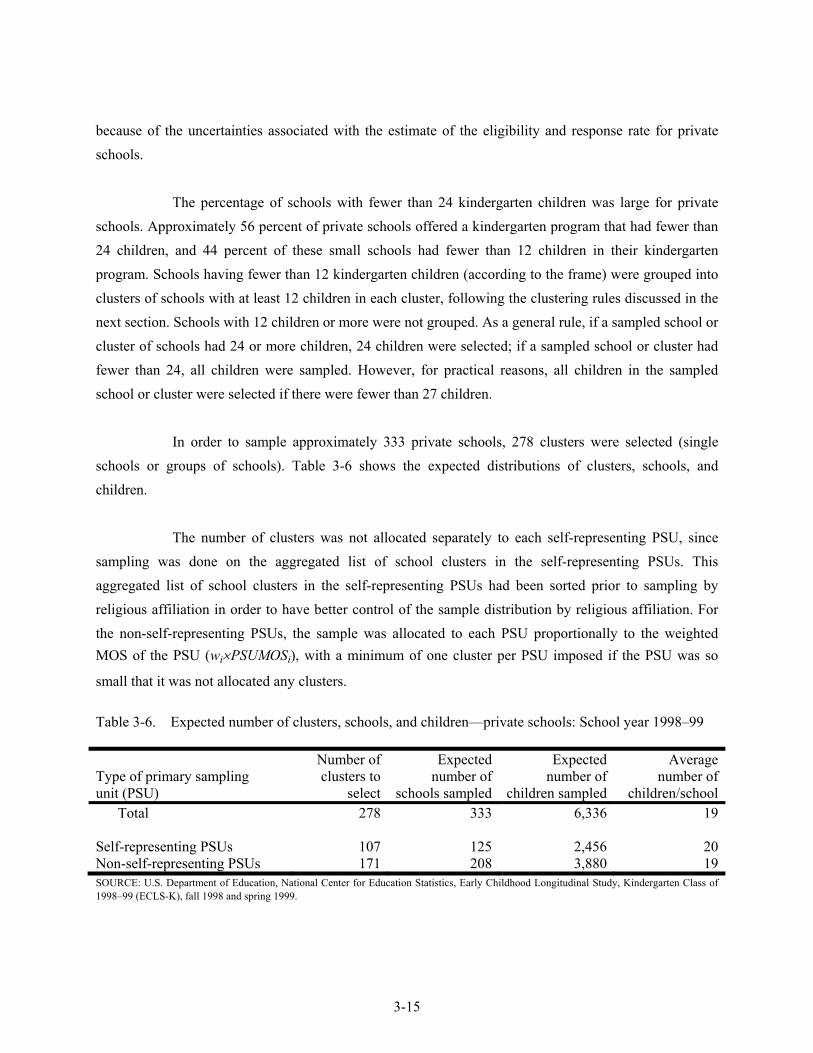
3-15
because of the uncertainties associated with the estimate of the eligibility and response rate for private schools.
The percentage of schools with fewer than 24 kindergarten children was large for private
schools. Approximately 56 percent of private schools offered a kindergarten program that had fewer than 24 children, and 44 percent of these small schools had fewer than 12 children in their kindergarten program. Schools having fewer than 12 kindergarten children (according to the frame) were grouped into clusters of schools with at least 12 children in each cluster, following the clustering rules discussed in the next section. Schools with 12 children or more were not grouped. As a general rule, if a sampled school or cluster of schools had 24 or more children, 24 children were selected; if a sampled school or cluster had fewer than 24, all children were sampled. However, for practical reasons, all children in the sampled school or cluster were selected if there were fewer than 27 children.
In order to sample approximately 333 private schools, 278 clusters were selected (single
schools or groups of schools). Table 3-6 shows the expected distributions of clusters, schools, and children.
The number of clusters was not allocated separately to each self-representing PSU, since
sampling was done on the aggregated list of school clusters in the self-representing PSUs. This aggregated list of school clusters in the self-representing PSUs had been sorted prior to sampling by religious affiliation in order to have better control of the sample distribution by religious affiliation. For the non-self-representing PSUs, the sample was allocated to each PSU proportionally to the weighted MOS of the PSU (wi×PSUMOSi), with a minimum of one cluster per PSU imposed if the PSU was so
small that it was not allocated any clusters.
Table 3-6. Expected number of clusters, schools, and children—private schools: School year 1998–99
Type of primary sampling unit (PSU)
Number of clusters to
select
Expected number of
schools sampled
Expected number of
children sampled
Average number of
children/school Total 278 333 6,336 19 Self-representing PSUs 107 125 2,456 20Non-self-representing PSUs 171 208 3,880 19SOURCE: U.S. Department of Education, National Center for Education Statistics, Early Childhood Longitudinal Study, Kindergarten Class of 1998–99 (ECLS-K), fall 1998 and spring 1999.
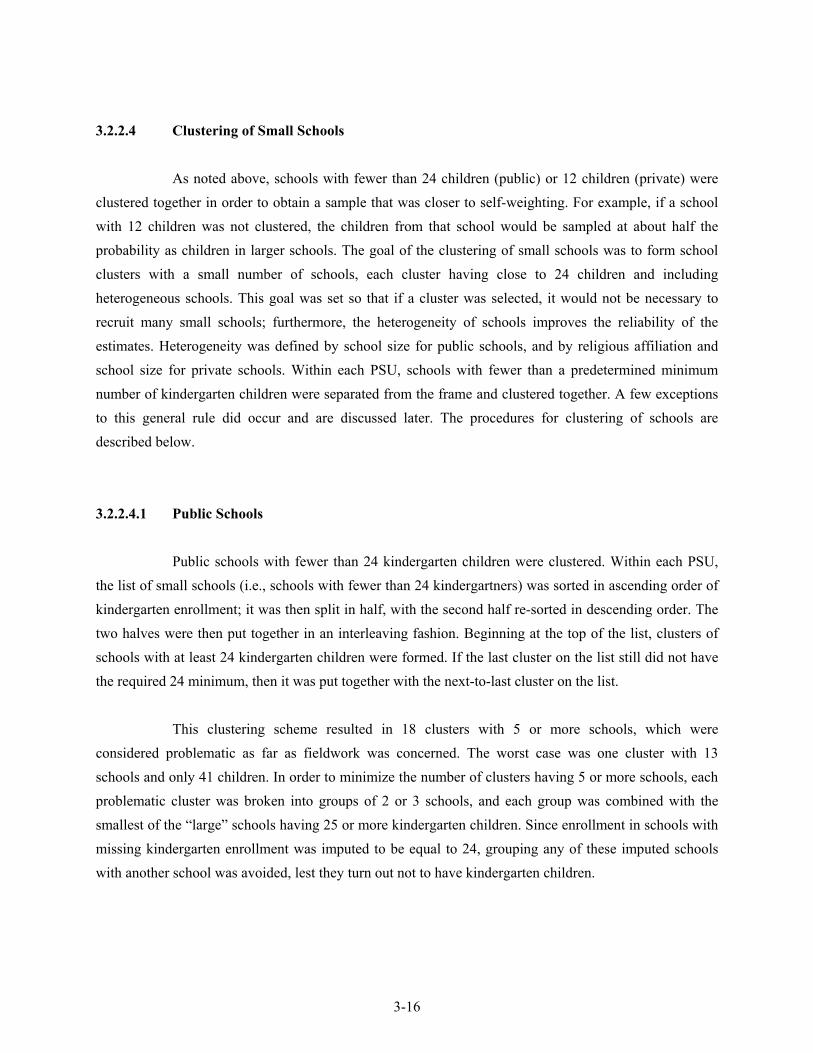
3-16
3.2.2.4 Clustering of Small Schools
As noted above, schools with fewer than 24 children (public) or 12 children (private) were clustered together in order to obtain a sample that was closer to self-weighting. For example, if a school with 12 children was not clustered, the children from that school would be sampled at about half the probability as children in larger schools. The goal of the clustering of small schools was to form school clusters with a small number of schools, each cluster having close to 24 children and including heterogeneous schools. This goal was set so that if a cluster was selected, it would not be necessary to recruit many small schools; furthermore, the heterogeneity of schools improves the reliability of the estimates. Heterogeneity was defined by school size for public schools, and by religious affiliation and school size for private schools. Within each PSU, schools with fewer than a predetermined minimum number of kindergarten children were separated from the frame and clustered together. A few exceptions to this general rule did occur and are discussed later. The procedures for clustering of schools are described below.
3.2.2.4.1 Public Schools
Public schools with fewer than 24 kindergarten children were clustered. Within each PSU, the list of small schools (i.e., schools with fewer than 24 kindergartners) was sorted in ascending order of kindergarten enrollment; it was then split in half, with the second half re-sorted in descending order. The two halves were then put together in an interleaving fashion. Beginning at the top of the list, clusters of schools with at least 24 kindergarten children were formed. If the last cluster on the list still did not have the required 24 minimum, then it was put together with the next-to-last cluster on the list.
This clustering scheme resulted in 18 clusters with 5 or more schools, which were
considered problematic as far as fieldwork was concerned. The worst case was one cluster with 13 schools and only 41 children. In order to minimize the number of clusters having 5 or more schools, each problematic cluster was broken into groups of 2 or 3 schools, and each group was combined with the smallest of the “large” schools having 25 or more kindergarten children. Since enrollment in schools with missing kindergarten enrollment was imputed to be equal to 24, grouping any of these imputed schools with another school was avoided, lest they turn out not to have kindergarten children.
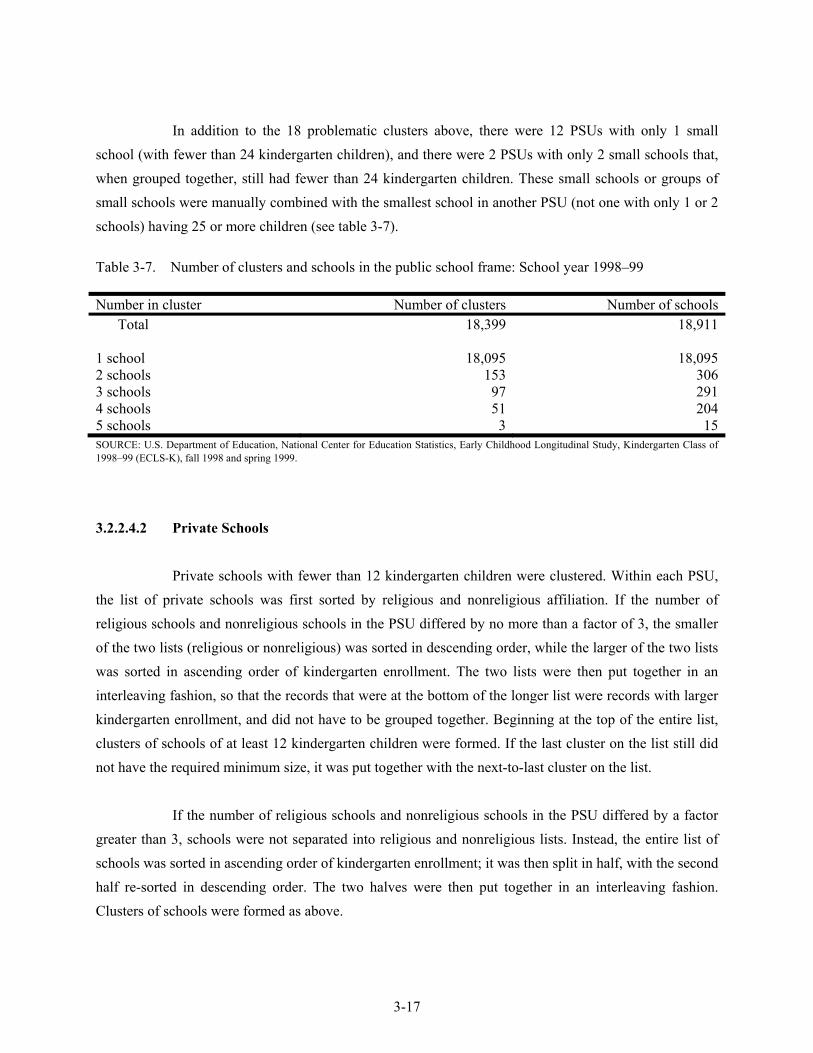
3-17
In addition to the 18 problematic clusters above, there were 12 PSUs with only 1 small school (with fewer than 24 kindergarten children), and there were 2 PSUs with only 2 small schools that, when grouped together, still had fewer than 24 kindergarten children. These small schools or groups of small schools were manually combined with the smallest school in another PSU (not one with only 1 or 2 schools) having 25 or more children (see table 3-7).
Table 3-7. Number of clusters and schools in the public school frame: School year 1998–99 Number in cluster Number of clusters Number of schools Total 18,399 18,911 1 school 18,095 18,0952 schools 153 3063 schools 97 2914 schools 51 2045 schools 3 15SOURCE: U.S. Department of Education, National Center for Education Statistics, Early Childhood Longitudinal Study, Kindergarten Class of 1998–99 (ECLS-K), fall 1998 and spring 1999.
3.2.2.4.2 Private Schools
Private schools with fewer than 12 kindergarten children were clustered. Within each PSU, the list of private schools was first sorted by religious and nonreligious affiliation. If the number of religious schools and nonreligious schools in the PSU differed by no more than a factor of 3, the smaller of the two lists (religious or nonreligious) was sorted in descending order, while the larger of the two lists was sorted in ascending order of kindergarten enrollment. The two lists were then put together in an interleaving fashion, so that the records that were at the bottom of the longer list were records with larger kindergarten enrollment, and did not have to be grouped together. Beginning at the top of the entire list, clusters of schools of at least 12 kindergarten children were formed. If the last cluster on the list still did not have the required minimum size, it was put together with the next-to-last cluster on the list.
If the number of religious schools and nonreligious schools in the PSU differed by a factor
greater than 3, schools were not separated into religious and nonreligious lists. Instead, the entire list of schools was sorted in ascending order of kindergarten enrollment; it was then split in half, with the second half re-sorted in descending order. The two halves were then put together in an interleaving fashion. Clusters of schools were formed as above.
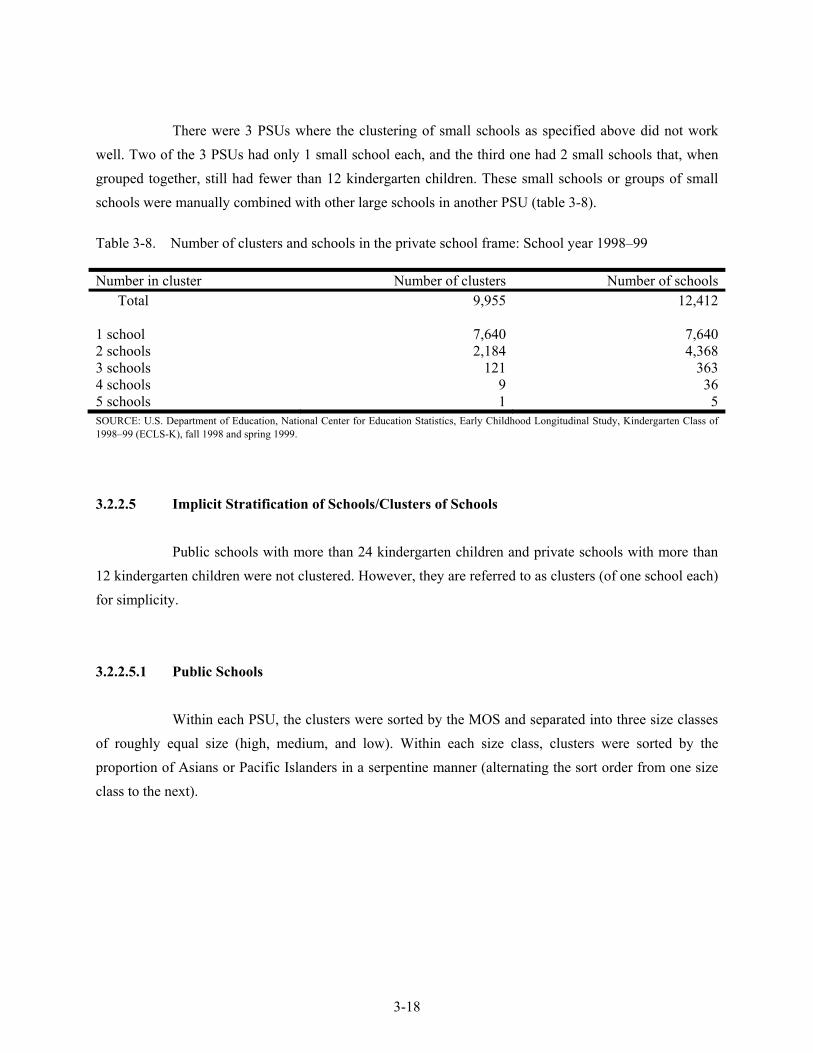
3-18
There were 3 PSUs where the clustering of small schools as specified above did not work well. Two of the 3 PSUs had only 1 small school each, and the third one had 2 small schools that, when grouped together, still had fewer than 12 kindergarten children. These small schools or groups of small schools were manually combined with other large schools in another PSU (table 3-8).
Table 3-8. Number of clusters and schools in the private school frame: School year 1998–99 Number in cluster Number of clusters Number of schools Total 9,955 12,412 1 school 7,640 7,6402 schools 2,184 4,3683 schools 121 3634 schools 9 365 schools 1 5SOURCE: U.S. Department of Education, National Center for Education Statistics, Early Childhood Longitudinal Study, Kindergarten Class of 1998–99 (ECLS-K), fall 1998 and spring 1999.
3.2.2.5 Implicit Stratification of Schools/Clusters of Schools
Public schools with more than 24 kindergarten children and private schools with more than 12 kindergarten children were not clustered. However, they are referred to as clusters (of one school each) for simplicity.
3.2.2.5.1 Public Schools
Within each PSU, the clusters were sorted by the MOS and separated into three size classes of roughly equal size (high, medium, and low). Within each size class, clusters were sorted by the proportion of Asians or Pacific Islanders in a serpentine manner (alternating the sort order from one size class to the next).
3-19
3.2.2.5.2 Private Schools
Within each PSU, each cluster was identified as religious, mixed, or nonreligious.7 The list of clusters was then sorted by these three categories. Within each category, the clusters were sorted in a serpentine manner by the MOS prior to selection. However, for the self-representing PSUs, all clusters were sorted as if they were from the same PSU: the aggregated list of clusters from the 24 self-representing PSUs was sorted by religious affiliation (religious/mixed/nonreligious). This procedure provided better control of the sample distribution of religious/mixed/nonreligious clusters. Across non-self-representing PSUs, clusters were sorted by religious affiliation, and within each category of religious affiliation, by the MOS in a serpentine manner.
3.2.2.6 School Selection
Selection of the clusters of schools was systematic, with probability proportional to the MOS. Sampling of public schools was done independently within the PSU (i.e., each PSU forms a separate sampling stratum) after the clusters of schools were sorted by MOS and proportion of Asians or Pacific Islanders. Sampling of private schools was done separately for self-representing PSUs and for non-self-representing PSUs. All self-representing PSUs were placed in one sampling stratum and all non-self-representing PSUs were placed in a second stratum. In the self-representing stratum, sampling was done with one random start after sorting clusters of schools by religious affiliation and MOS. In the non-self-representing stratum, sampling was done with one random start after sorting clusters of schools by PSU, religious affiliation, and MOS.
3.2.2.7 The ECLS-K Main School Sample
A total of 1,280 schools were selected from the main school frame for the ECLS-K, of which 934 were public and 346 were private schools. The characteristics of the school sample are presented in table 3-9.
- 7 A private school cluster is “religious” if all schools in the cluster are Catholic schools or non-Catholic religious schools; “nonreligious” if all schools in the clusters have no religious affiliation; “mixed” if it has a combination of schools with or without religious affiliation.
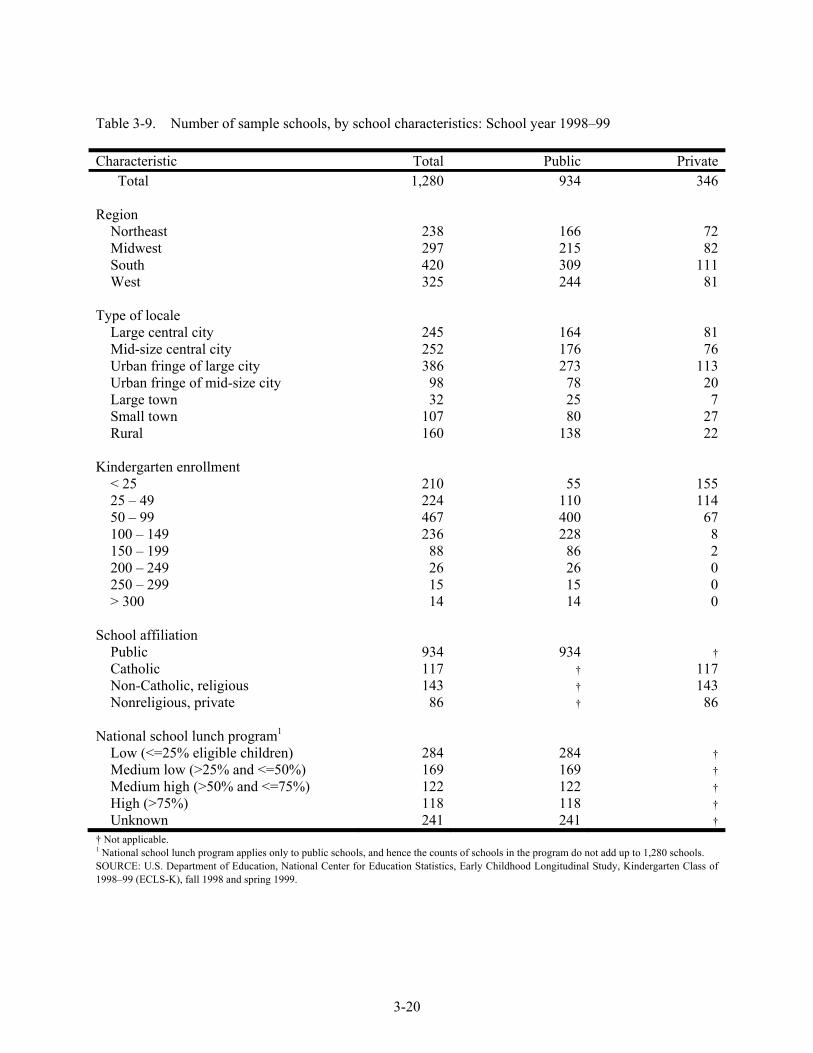
3-20
Table 3-9. Number of sample schools, by school characteristics: School year 1998–99 Characteristic Total Public Private Total 1,280 934 346 Region Northeast 238 166 72 Midwest 297 215 82 South 420 309 111 West 325 244 81 Type of locale Large central city 245 164 81 Mid-size central city 252 176 76 Urban fringe of large city 386 273 113 Urban fringe of mid-size city 98 78 20 Large town 32 25 7 Small town 107 80 27 Rural 160 138 22 Kindergarten enrollment < 25 210 55 155 25 – 49 224 110 114 50 – 99 467 400 67 100 – 149 236 228 8 150 – 199 88 86 2 200 – 249 26 26 0 250 – 299 15 15 0 > 300 14 14 0 School affiliation Public 934 934 † Catholic 117 † 117 Non-Catholic, religious 143 † 143 Nonreligious, private 86 † 86 National school lunch program1 Low (<=25% eligible children) 284 284 † Medium low (>25% and <=50%) 169 169 † Medium high (>50% and <=75%) 122 122 † High (>75%) 118 118 † Unknown 241 241 †
† Not applicable. 1 National school lunch program applies only to public schools, and hence the counts of schools in the program do not add up to 1,280 schools. SOURCE: U.S. Department of Education, National Center for Education Statistics, Early Childhood Longitudinal Study, Kindergarten Class of 1998–99 (ECLS-K), fall 1998 and spring 1999.
3-21
3.2.2.8 Supplemental School Sample
As mentioned earlier, the public and private school frames were supplemented in the spring of 1998. The procedures for supplementing the frames were different for public schools, Catholic schools and non-Catholic private schools. These procedures are discussed below separately.
3.2.2.8.1 Public Schools
Each public school district having one or more schools sampled was sent a sampling frame-based list of all schools offering kindergarten. Districts were asked whether any school that was expected to offer kindergarten in academic year 1998–99 was missing from the list. For each school identified by the district, school name, address, telephone number, grade span, and kindergarten enrollment were obtained. Districts were also contacted that fell within the boundaries of the ECLS-K PSUs, but for which the CCD file listed no schools offering kindergarten, unless it was clear from their name that they were strictly secondary school districts (e.g., Middlebury Union High School District). The information obtained from the school districts was checked against the ECLS-K public school frame to confirm that these schools were truly new or newly eligible. Bona fide new schools were given a chance of being sampled. A new school’s chance of selection was conditioned on the school district’s probability of selection. Overall, 252 new public schools were identified. Of these, 19 were selected, using systematic sampling with probability proportional to size where the MOS was the same as it was for schools sampled from the main sample. Thus, a total of 953 public schools were included in the sample (934 + 19).
3.2.2.8.2 Private Schools
The procedure for obtaining new school information from Catholic dioceses was exactly the same as for public schools. Since a diocese could cut across county or even state lines, each school identified by a diocese had to be associated with the correct county, and hence the correct PSU, before checking to see whether it was truly new. Since dioceses might cross PSU boundaries, a new Catholic school’s chance of being sampled had to be conditioned on the diocese’s probability of selection within the PSU where the new school was located. There were 126 new Catholic schools identified, and 6 were selected using systematic sampling with probability proportional to size. When combined with the main sample, the final Catholic school sample size was 123 (117 + 6).
3-22
3.2.2.8.3 Non-Catholic Private Schools
The search for non-Catholic private schools was considerably more complicated. Three classes of schools that had previously not been given a chance of selection from the PSS were reconsidered. Those were schools that had an unknown grade span because they had not responded to the 1995–96 PSS, those that responded but did not report offering kindergarten, and those that appeared for the first time on the 1997–98 PSS file. Together these accounted for 2,544 potential new non-Catholic private schools. Beyond these additions from PSS, procedures similar to those used by the Bureau of the Census in the PSS area frame search were followed. These procedures included collecting lists of schools from different sources, matching them against the PSS list frame to remove duplicates, and further screening by telephone to verify new school status. The majority of new schools found by the Bureau of the Census for PSS came from telephone book yellow page listings. The yellow pages search was the main source of new non-Catholic private schools in the ECLS-K as well, yielding an additional 8,861 possible new private schools. Since the number of kindergartners enrolled in these schools was unknown, a minimum kindergarten enrollment was assumed for sampling purposes (typically 24, unless the name was suggestive of day care, in which case 12 was assumed).
The supplemental frame contained 11,405 private schools. A sample of 279 schools was
selected, using systematic sampling with a probability proportional to these imputed enrollments. Each sampled school was contacted by telephone and screened to ascertain whether the school was public or private, whether it would be open in academic year 1998–1999; and whether it would offer kindergarten. If the school met all of these conditions and was not Catholic, the school was eligible and released for data collection.
A second supplemental procedure involved contacting local education agencies (LEAs) and
local government offices for information on non-Catholic private schools. This procedure was done only in the smallest ECLS-K PSUs, on the theory that if these PSUs had coverage problems their large weights were likely to introduce a larger bias in the estimates. All LEAs within these PSUs were contacted by telephone. For each city/town within the PSU, a list of local government offices was compiled using the blue pages. Successive government offices were called within a city or town until one was found that could provide information on private schools. As with the yellow pages, new schools identified by LEAs and local government offices were unduplicated against the PSS file before being added to the new school frame. Since kindergarten enrollment was unknown, it was imputed as described in the previous paragraph, and sampling was performed using systematic sampling with probability proportional to size.
3-23
The LEA search resulted in the identification of 30 new private schools after unduplication, of which 14 were sampled. The local government search yielded 19 new schools, of which 8 were sampled. Finally, 3 additional new private schools were reported by field staff based on personal knowledge. Of these, 2 schools were sampled. The same screening procedures to ascertain whether the school was public or private; whether it would be open in academic year 1998–1999; and whether it would offer kindergarten were then applied to these sampled schools.
The total number of non-Catholic private schools that were sampled was 303. After the
screening procedures were applied, only 109 of these schools were eligible. These 109 schools are referred to as the supplemental sample of non-Catholic private schools.
The final ECLS-K school sample for the base year was 1,413 schools, including 953 public
schools, 123 Catholic schools, and 337 non-Catholic private schools. Of these, 136 schools (72 percent private) were later found to be ineligible because they did not have any kindergarten programs; three schools participated in fall-kindergarten, but not in spring-kindergarten (1 public and 2 private); 259 schools (38 percent private) refused to participate in both fall and spring; and 65 schools (42 percent private) refused to participate in the fall but were converted to cooperating schools in the spring during the spring refusal conversion. At the end of the base year, 1,014 schools were still participating in the ECLS-K.
3.2.3 Sampling Children, Parents, and Teachers Within Schools
The goal of the sample design was to obtain an approximately self-weighting sample of children to the extent possible while achieving the minimum required sample size for Asians or Pacific Islanders (the only subgroup that needed to be oversampled to meet the study’s precision goals). Two independent sampling strata were formed within each school, one containing Asian or Pacific Islander children and the second all other children. Within each stratum, children were selected using equal probability systematic sampling, using a higher rate for the Asian or Pacific Islander stratum. In general, the target number of children sampled at any one school was 24. The actual sample size per school ranged from 1 to 28. If one twin was selected into the sample then both twins were included, raising the maximum number of children to sample from 24 to 28 in a small number of schools. Once the sampled children were identified, parent contact information was obtained from the school and was used to identify a parent or guardian for the parent interview.
3-24
During the fall-kindergarten data collection, a census of kindergarten teachers was taken at each school. In spring-kindergarten, new teachers who had joined the schools and teachers in schools participating after the fall were added to the census of teachers. In the spring-first and spring-third grade data collections, the only teachers included were the teachers of the sampled children. For every data collection, each sampled child was linked to his or her teacher. A child could be linked to only one general education teacher. In cases where a child had more than one general education teacher, a “primary” teacher was identified for the child. In addition, special education teachers and service providers were linked to sample cases who received such services. As with the general education teachers, a child would be linked to only one special education teacher or service provider. Details on the linking of teachers to the children are found in chapter 4.
3.3 Fall-First Grade Subsample
The fall data collection consisted of a 30 percent sample of schools containing approximately 25 percent of the base-year children eligible to participate in the second year. The goal of this subsample was to measure the extent of summer learning loss and the factors that contribute to such loss and to better disentangle school and home effects on children’s learning.
3.3.1 PSU Sample
A subsample of ECLS-K PSUs was selected for the fall-first grade data collection. All 24 of the self-representing PSUs were retained. Of the 76 non-self-representing PSUs, 38 were retained by sampling one PSU per stratum with equal probability.
3.3.2 School Sample
Base-year schools in the 62 fall-first grade sampled PSUs were stratified by frame source (original public, original private, supplemental public, and supplemental private as described in section 3.2.2.8) and arranged in their original selection order. A 30 percent equal probability sample of schools was drawn in the 24 self-representing PSUs, and a 60 percent sample of schools was drawn in the 38 non-self-representing PSUs. In total, 311 schools that had cooperated in either fall- or spring-
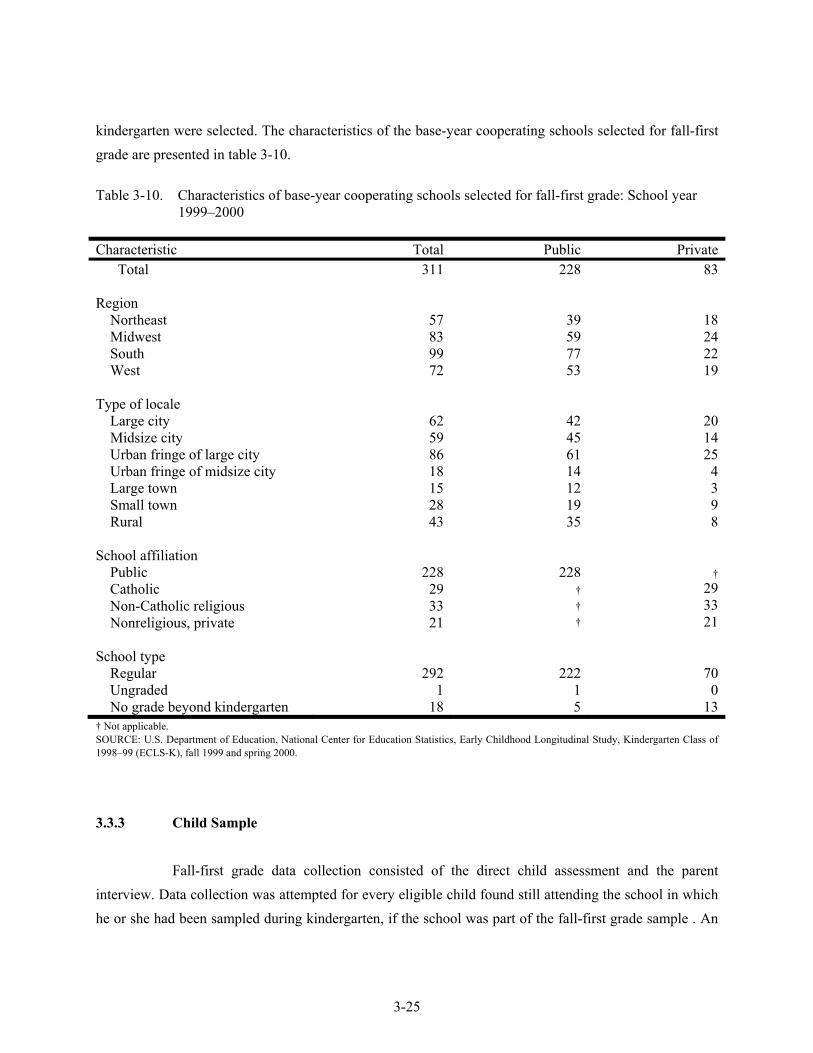
3-25
kindergarten were selected. The characteristics of the base-year cooperating schools selected for fall-first grade are presented in table 3-10.
Table 3-10. Characteristics of base-year cooperating schools selected for fall-first grade: School year
1999–2000 Characteristic Total Public Private Total 311 228 83 Region
Northeast Midwest South West
57 83 99 72
39 59 77 53
18 24 22 19
Type of locale
Large city Midsize city Urban fringe of large city Urban fringe of midsize city Large town Small town Rural
62 59 86 18 15 28 43
42 45 61 14 12 19 35
20 14 25 4 3 9 8
School affiliation
Public Catholic Non-Catholic religious Nonreligious, private
228
29 33 21
228
† † †
†
29 33 21
School type
Regular Ungraded No grade beyond kindergarten
292
1 18
222
1 5
70 0
13† Not applicable. SOURCE: U.S. Department of Education, National Center for Education Statistics, Early Childhood Longitudinal Study, Kindergarten Class of 1998–99 (ECLS-K), fall 1999 and spring 2000.
3.3.3 Child Sample
Fall-first grade data collection consisted of the direct child assessment and the parent interview. Data collection was attempted for every eligible child found still attending the school in which he or she had been sampled during kindergarten, if the school was part of the fall-first grade sample . An
3-26
“eligible” child was defined as a base-year respondent in the school sampled for first grade (i.e., a child who had either a fall- or spring-kindergarten child assessment or parent interview or was excluded from assessment because of a disability or because the child belonged in the language minority [not Spanish] group). Base-year nonrespondents in the sampled schools were not sampled and were handled by adjusting the weights of the base-year respondents (see section 7.2.1.2.1 for details of adjustment for base-year nonresponse).
Because of the additional burden of school recruiting, the cost of collecting data for a child
who had transferred from the school in which he or she was originally sampled exceeded that for a child who stayed enrolled in the originally sampled school. To contain these costs, a random 50 percent of children were subsampled to be followed for fall-first grade data collection in the event that they had transferred.
Except for children who were repeating kindergarten, all base-year children sampled in
schools with a high grade of kindergarten are de facto movers. Since many of these movers might move en masse to the same first-grade school (i.e., destination school), steps were taken to follow these children at a higher rate. Using the information collected during spring-kindergarten, a list of destination schools was compiled for each such school. The destination school having the most movers was designated as primary, unless no such school had more than three movers. Children who moved en masse into a primary destination school in fall-first grade were treated as “nonmovers” and were not subsampled; that is, they continued to be followed and were part of the ECLS-K sample. All other movers were sampled at the rate of 50 percent.
As discussed above, a random 50 percent of children were subsampled to be followed if they
moved out of the kindergarten school. Sampling was done with equal probability. Prior to sampling, children were stratified into groups of nonmovers, movers with information identifying their new schools, and movers without such identifying information. A flag was created for each child indicating whether the child had been sampled to be followed.
3.4 Spring-First Grade Sample
The ECLS-K spring-first grade data collection targeted all base-year respondents and not just the fall-first grade subsample. Hence, the sample includes children who were assessed and whose
3-27
parents were interviewed in fall- or spring-kindergarten, as well as the 70 children who could not be assessed in fall- or spring-kindergarten because of a disability or because they belonged in the language minority group that is not the Spanish minority group.8 In addition, the spring child sample was freshened to include current first-graders who had not been enrolled in kindergarten in 1998–99 and therefore had no chance of being included in the ECLS-K base-year kindergarten sample. This group includes children who skipped kindergarten altogether in 1998–99, children who attended a kindergarten program outside of the U.S. in 1998–99, and children who were in first grade in 1998–99 and repeating it in 1999–2000. While all children still enrolled in their base-year schools were recontacted, only a 50 percent subsample of base-year sampled children who had transferred from their kindergarten school was followed for data collection.
3.4.1 Subsampling Movers
In spring-first grade all children in a random 50 percent subsample of base-year schools were flagged to be followed for data collection if they transferred from their base-year school. (This is in contrast to fall-first grade where a random 50 percent of children in each of the 30 percent of schools subsampled were flagged.) In order to maximize the amount of longitudinal data, care was taken during spring-first grade sampling to ensure that any child who had been flagged to be followed in fall-first grade would continue to be followed.
In selecting the spring-first grade 50 percent subsample of schools where movers would be
flagged for follow-up, the three primary strata were self-representing PSUs, non-self-representing PSUs that had been selected for fall-first grade, and non-self-representing PSUs that had not been selected for fall-first grade. Within these major strata, schools were grouped by frame source (original public, original private, supplemental public, and supplemental private). Finally within each frame source, schools were stratified by whether the school participated in the base-year study, and arranged in original selection order. Schools that had been part of the 30 percent fall-first grade sample were automatically retained. Then equal probability sampling methods were employed to augment the sample to the desired 50 percent of schools. The net result of these procedures was that every base-year selected school had a 50 percent chance of having its ECLS-K movers followed during spring-first grade, and any mover who had been followed in fall-first grade would still be followed in spring-first grade.
- 8 Children in the Spanish minority group were assessed in mathematics only. The reading and general knowledge assessments were not translated into Spanish.
3-28
3.4.2 Sample Freshening
As noted earlier, a sample freshening procedure was used to make it possible to produce estimates of all children enrolled in first grade in the spring of 2000. The spring-first grade child freshening used a half-open interval sampling procedure (Kish 1965). The procedure was implemented in the same 50 percent subsample of ECLS-K base-year schools where movers were flagged for follow-up. Each of these schools was asked to prepare an alphabetic roster of children enrolled in first grade and the names of ECLS-K kindergarten-sampled children were identified on this list. Beginning with the name of the first ECLS-K kindergarten-sampled child, school records were checked to see whether the child directly below in the sorted list attended kindergarten in the United States in fall 1998. If not, (1) that child was considered to be part of the freshened sample and was linked to the base-year sampled child (i.e., was assigned that child’s probability of selection), and (2) the record search procedure was repeated for the next listed child, and so forth. When the record search revealed that a child had been enrolled in kindergarten the previous year, that child was not considered part of the freshened sample and the procedure was resumed with the second base-year ECLS-K sampled child name, and so on.9 Child freshening brought 165 first-graders into the ECLS-K sample, which increased the weighted survey estimate of the number of first-graders in the United States by about 2.6 percent.
The child freshening procedure was not entirely free of bias. A first-grader would have no
chance of being in the ECLS-K first-grade sample if he or she was enrolled in a school where neither the child nor any of his or her classmates had attended kindergarten in the United States in fall 1998. This would be a rare circumstance and is not thought to be an important source of bias. A more significant source of potential bias is nonresponse. One source of nonresponse inherent to the freshening plan was that the procedure only involved children who had not transferred from the school in which they had been sampled during the base year. Another source of nonresponse that also affected the freshening procedure was schools that refused to provide or could not provide the necessary information, such as an alphabetic roster of children enrolled in first grade or whether children had attended kindergarten the previous year. The school freshening completion rate is slightly higher for public schools than for private schools. Of the 494 schools eligible for freshening, 380 are public schools and 114 are private schools. Ninety-four percent of the public schools and 93 percent of the private schools participated in the freshening process.
- 9 The student roster was “circularized” (i.e., the first name on the roster was considered to follow the last name on the roster in the implementation of the procedure).
3-29
3.5 Spring-Third Grade Sample
The procedures used in spring-first grade to subsample movers reduced the loss in sample size and reduced data collection costs since movers cost considerably more to interview than nonmovers. These procedures were also used for the ECLS-K third-grade data collection with some modifications. One reason for modifying the procedures was that some children had already moved out of their original school, and some of the movers were sampled and some were not. In addition, there were concerns about special domains of interest and methods that might be used to increase the sample size for the children in these groups. Results from the first-grade collection were used to address these third-grade sample design issues.
3.5.1 Estimates from Spring-First Grade
Table 3-11 presents data on the outcome of the spring-first grade data collection activities, by subgroups of interest and by mover status. In this table and subsequent tables, school affiliation and type of locale are those of the original sample schools. Race/ethnicity and language characteristics of the children are from the ECLS-K base-year data, which are available for all children. Data from first grade are only available for first-grade respondents. For children sampled in first grade, data are from spring-first grade. The table shows that overall 26 percent (5,477) of the children moved from the school they were sampled in, about 48 percent (2,620) of these movers were sampled, and the unweighted completion rate for movers was 83 percent (1,967 mover respondents). For nonmovers, the completion rate was 97 percent (15,357 nonmover respondents). A child was considered a respondent in these computations if either the child assessment or the parent interview was completed for spring-first grade or the child was not assessed due to a disability. The completion rate in this table was computed as the number of respondents divided by the sum of respondents and nonrespondents. Nonrespondents include those who did not participate fully and movers who could not be located. For first grade, 269 of the movers who were sampled for follow-up could not be located, or about 11 percent of all movers eligible for the first-grade data collection.
The mover rates show the types of variation that had been expected, with higher mover rates
for Black and Hispanic children, for example. A total of 39 percent of the children in non-Catholic private schools moved to other schools when they advanced from kindergarten to first grade (855 movers as shown in table 3-11). Seventy-six percent of children who moved from kindergarten in private schools to
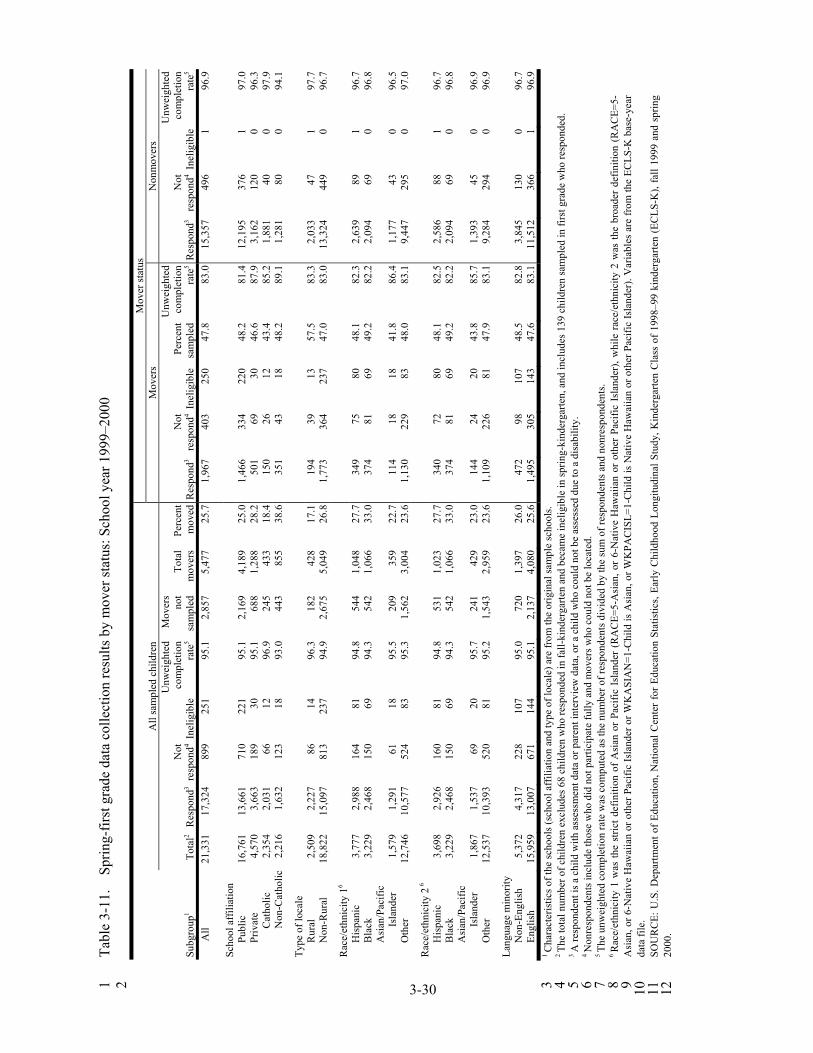
3-30
Tabl
e 3-
11.
Spr
ing-
first
gra
de d
ata
colle
ctio
n re
sults
by
mov
er st
atus
: Sch
ool y
ear 1
999–
2000
1
2
Subg
roup
1
All
sam
pled
chi
ldre
n M
over
stat
us
Mov
ers
Non
mov
ers
Tota
l2 R
espo
nd3
Not
re
spon
d4 Ine
ligib
le
Unw
eigh
ted
com
plet
ion
rate
5
Mov
ers
not
sam
pled
Tota
l m
over
sPe
rcen
t m
oved
Res
pond
3N
ot
resp
ond4 I
nelig
ible
Perc
ent
sam
pled
Unw
eigh
ted
com
plet
ion
rate
5R
espo
nd3
Not
re
spon
d4In
elig
ible
Unw
eigh
ted
com
plet
ion
rate
5
All
21,3
31
17,3
24
899
251
95.1
2,85
75,
477
25.7
1,96
740
3 25
047
.883
.015
,357
496
196
.9
Scho
ol a
ffili
atio
n
Publ
ic
16,7
61
13,6
61
710
221
95.1
2,16
94,
189
25.0
1,46
633
4 22
048
.281
.412
,195
376
197
.0
Priv
ate
4,57
0 3,
663
189
3095
.168
81,
288
28.2
501
69
3046
.687
.93,
162
120
096
.3
Cat
holic
2,
354
2,03
1 66
12
96.9
245
433
18.4
150
26
1243
.485
.21,
881
400
97.9
N
on-C
atho
lic
2,21
6 1,
632
123
1893
.044
385
538
.635
143
18
48.2
89.1
1,28
180
094
.1
Type
of l
ocal
e
Rur
al
2,50
9 2,
227
86
1496
.318
242
817
.119
439
13
57.5
83.3
2,03
347
197
.7
Non
-Rur
al
18,8
22
15,0
97
813
237
94.9
2,67
55,
049
26.8
1,77
336
4 23
747
.083
.013
,324
449
096
.7
Rac
e/et
hnic
ity 1
6
His
pani
c 3,
777
2,98
8 16
4 81
94.8
544
1,04
827
.734
975
80
48.1
82.3
2,63
989
196
.7
Bla
ck
3,22
9 2,
468
150
6994
.354
21,
066
33.0
374
81
6949
.282
.22,
094
690
96.8
A
sian
/Pac
ific
I
slan
der
1,57
9 1,
291
61
1895
.520
935
922
.711
418
18
41.8
86.4
1,17
743
096
.5
Oth
er
12,7
46
10,5
77
524
8395
.31,
562
3,00
423
.61,
130
229
8348
.083
.19,
447
295
097
.0
Rac
e/et
hnic
ity 2
6
H
ispa
nic
3,69
8 2,
926
160
8194
.853
11,
023
27.7
340
72
8048
.182
.52,
586
881
96.7
B
lack
3,
229
2,46
8 15
0 69
94.3
542
1,06
633
.037
481
69
49.2
82.2
2,09
469
096
.8
Asi
an/P
acifi
c
Isl
ande
r 1,
867
1,53
7 69
20
95.7
241
429
23.0
144
24
2043
.885
.71,
393
450
96.9
O
ther
12
,537
10
,393
52
0 81
95.2
1,54
32,
959
23.6
1,10
922
6 81
47.9
83.1
9,28
429
40
96.9
Lang
uage
min
ority
Non
-Eng
lish
5,37
2 4,
317
228
107
95.0
720
1,39
726
.047
298
10
748
.582
.83,
845
130
096
.7
Engl
ish
15,9
59
13,0
07
671
144
95.1
2,13
74,
080
25.6
1,49
530
5 14
347
.683
.111
,512
366
196
.9
1 C
hara
cter
istic
s of t
he sc
hool
s (sc
hool
aff
iliat
ion
and
type
of l
ocal
e) a
re fr
om th
e or
igin
al sa
mpl
e sc
hool
s. 3
2 Th
e to
tal n
umbe
r of c
hild
ren
excl
udes
68
child
ren
who
resp
onde
d in
fall-
kind
erga
rten
and
beca
me
inel
igib
le in
sprin
g-ki
nder
garte
n, a
nd in
clud
es 1
39 c
hild
ren
sam
pled
in fi
rst g
rade
who
resp
onde
d.
4 3 A
resp
onde
nt is
a c
hild
with
ass
essm
ent d
ata
or p
aren
t int
ervi
ew d
ata,
or a
chi
ld w
ho c
ould
not
be
asse
ssed
due
to a
dis
abili
ty.
5 4 N
onre
spon
dent
s inc
lude
thos
e w
ho d
id n
ot p
artic
ipat
e fu
lly a
nd m
over
s who
cou
ld n
ot b
e lo
cate
d.
6 5 Th
e un
wei
ghte
d co
mpl
etio
n ra
te w
as c
ompu
ted
as th
e nu
mbe
r of r
espo
nden
ts d
ivid
ed b
y th
e su
m o
f res
pond
ents
and
non
resp
onde
nts.
7 6 R
ace/
ethn
icity
1 w
as th
e st
rict d
efin
ition
of
Asi
an o
r Pa
cific
Isl
ande
r (R
AC
E=5-
Asi
an, o
r 6-
Nat
ive
Haw
aiia
n or
oth
er P
acifi
c Is
land
er),
whi
le r
ace/
ethn
icity
2 w
as th
e br
oade
r de
finiti
on (
RA
CE=
5-8
Asi
an, o
r 6-N
ativ
e H
awai
ian
or o
ther
Pac
ific
Isla
nder
or W
KA
SIA
N=1
-Chi
ld is
Asi
an, o
r WK
PAC
ISL=
1-C
hild
is N
ativ
e H
awai
ian
or o
ther
Pac
ific
Isla
nder
). V
aria
bles
are
from
the
ECLS
-K b
ase-
year
9
data
file
. 10
SO
UR
CE:
U.S
. Dep
artm
ent o
f Edu
catio
n, N
atio
nal C
ente
r for
Edu
catio
n St
atis
tics,
Early
Chi
ldho
od L
ongi
tudi
nal S
tudy
, Kin
derg
arte
n C
lass
of 1
998–
99 k
inde
rgar
ten
(EC
LS-K
), fa
ll 19
99 a
nd s
prin
g 11
20
00.
12
3-31
first grade in public schools attended non-Catholic private schools in kindergarten. The number of children who moved from non-Catholic schools in kindergarten to public schools in first grade is about three times the number of children who moved from Catholic to public schools (data not shown in table).
One of the concerns in using the kindergarten to first-grade mover rates to make estimates
for future transitions was whether the mover rates for the 1-year time period between kindergarten and first grade were reasonable when applied to the transition between first and third grade. One might argue that a 2-year period should result in a higher mover rate than the 1-year rate. However, parents may be more reluctant to change the school for a child between first and third grade than between kindergarten and first grade. Kindergarten is also special for other reasons. For example, the availability of full- and part-day classes may be an important factor in the choice of the kindergarten. There are no other data sources that could be used to examine differential mover rates between years. As a result, the 1-year moving rates in table 3-11 were applied to the 2-year period between first and third grade after adding another 5 percent to the rates to account for the 2-year period. An exception was made for children who attended non-Catholic private schools in the base year and had the highest rates of moving among all the domains examined. This was assumed to be a special case for kindergarten, and the average mover percentage of 31 percent was applied to these children for the third grade, as shown in table 3-12.
The other main concern was whether the extremely high completion rate for nonmovers
(97 percent) could be duplicated in future years. To be more conservative and to account for the fact that nonrespondents from earlier rounds (i.e., base-year respondents were included in the third-grade sample whether or not they responded in first grade) were included in subsequent rounds of data collection, it was assumed that a 95 percent completion rate would be achieved for nonmovers in third grade.
3.5.2 Third-Grade Sample Design
The basic plan for third grade was the plan implemented for first grade where only 50 percent of the children who had moved from the original sample schools had been followed into their new schools. This plan was modified for third grade as described below. To be eligible for the third-grade sample, a child had to have been a base-year respondent or sampled in first grade. Children who moved out of the country or died were excluded (i.e., ineligible). The following children were fielded for third grade:
All the children responding in the base year who remained in their original schools,
where the original schools also included destination schools (described later), were fielded.
3-32
All the children who moved from an original school in a previous wave of data collection and were retained in the subsample of movers for that wave were fielded. For example, if a child moved between kindergarten and first grade and was part of the 50 percent subsample that was followed, then the child would be retained for future rounds without subsampling as long as the child remained eligible.
A subsample of 50 percent of the children who moved from their original school at any time after the base year were fielded. For example, a child who moved between first grade and third grade would be subject to subsampling and had a 50 percent chance of being included in the third-grade follow-up. In alternatives discussed later, differential subsampling rates were introduced.
To prevent an accumulation of nonresponse, the ECLS-K design does not use the approach of many longitudinal studies that exclude sampled units from future rounds if they did not respond in a particular wave. Instead, the basic plan was modified so that all eligible base-year respondents who were sampled in the first-grade follow-up would be eligible for the third-grade follow-up even if they did not respond in the first grade. Even though the participation rate for first-grade nonrespondents might be lower compared with first-grade respondents in the subsequent follow-ups, the effort was an attempt to increase overall response rates by including first-grade nonrespondents in third grade. The approach is also consistent with the analytic use of the data for the ECLS-K, since many analyses may include less than complete wave responses. For example, a change in scores from kindergarten to third grade for subgroups is an important analytic objective, and it can be estimated without complete data at each wave.
A second procedure that was part of the modification of the basic plan for the third-grade
follow-up was an extension of a procedure that was used in the first-grade follow-up to deal with schools that ended with kindergarten (i.e., kindergarten was the highest grade offered). A school was called a destination school if at least 4 children from a school ending in kindergarten attended this school in first grade. For the third grade, 28 original schools ended in second grade, and 3 of the destination schools identified in first grade ended in second grade. In total, 3 percent of all eligible first-graders in the ECLS-K sample attended schools ending in second grade. As was done for the first-grade sample, children in the destination schools were treated as nonmovers for the third-grade sample. As nonmovers, they were all followed into their new schools, resulting in a 2 percent increase of the third-grade sample size over that which would result if 50 percent of these children were subsampled out as movers.
3.5.3 Expected Sample Size
Table 3-12 gives the expected sample sizes of children in third grade by subgroups of interest and mover status for the basic plan. In this table, a respondent is defined as a child with either a
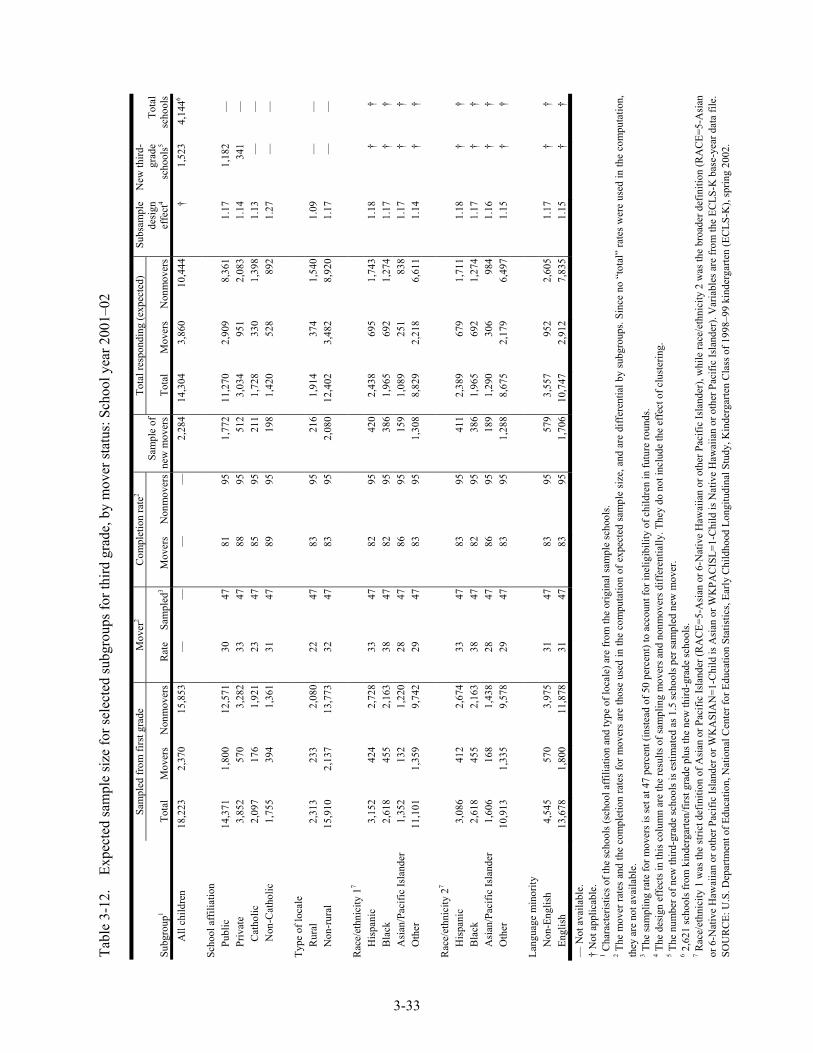
3-33
Tabl
e 3-
12.
Exp
ecte
d sa
mpl
e si
ze fo
r sel
ecte
d su
bgro
ups f
or th
ird g
rade
, by
mov
er st
atus
: Sch
ool y
ear 2
001–
02
Sa
mpl
ed fr
om fi
rst g
rade
M
over
2 C
ompl
etio
n ra
te2
Sam
ple
of
new
mov
ers
Tota
l res
pond
ing
(exp
ecte
d)
Subs
ampl
e de
sign
ef
fect
4
New
third
-gr
ade
scho
ols5
Tota
l sc
hool
sSu
bgro
up1
Tota
l M
over
s N
onm
over
sR
ate
Sam
pled
3M
over
sN
onm
over
sTo
tal
Mov
ers
Non
mov
ers
A
ll ch
ildre
n 18
,223
2,
370
15,8
53—
——
—2,
284
14,3
043,
860
10,4
44†
1,52
34,
1446
Scho
ol a
ffili
atio
n
Publ
ic
14,3
71
1,80
0 12
,571
3047
8195
1,77
2 11
,270
2,90
98,
361
1.17
1,18
2—
Priv
ate
3,85
2 57
0 3,
282
3347
8895
512
3,03
495
12,
083
1.14
341
—
C
atho
lic
2,09
7 17
6 1,
921
2347
8595
211
1,72
833
01,
398
1.13
——
Non
-Cat
holic
1,
755
394
1,36
131
4789
9519
8 1,
420
528
892
1.27
——
Type
of l
ocal
e
Rur
al
2,31
3 23
3 2,
080
2247
8395
216
1,91
437
41,
540
1.09
——
Non
-rur
al
15,9
10
2,13
7 13
,773
3247
8395
2,08
0 12
,402
3,48
28,
920
1.17
——
Rac
e/et
hnic
ity 1
7
His
pani
c 3,
152
424
2,72
833
4782
9542
0 2,
438
695
1,74
31.
18†
†
Bla
ck
2,61
8 45
5 2,
163
3847
8295
386
1,96
569
21,
274
1.17
††
A
sian
/Pac
ific
Isla
nder
1,
352
132
1,22
028
4786
9515
9 1,
089
251
838
1.17
††
O
ther
11
,101
1,
359
9,74
229
4783
951,
308
8,82
92,
218
6,61
11.
14†
†
Rac
e/et
hnic
ity 2
7
His
pani
c 3,
086
412
2,67
433
4783
9541
1 2,
389
679
1,71
11.
18†
†
Bla
ck
2,61
8 45
5 2,
163
3847
8295
386
1,96
569
21,
274
1.17
††
A
sian
/Pac
ific
Isla
nder
1,
606
168
1,43
828
4786
9518
9 1,
290
306
984
1.16
††
O
ther
10
,913
1,
335
9,57
829
4783
951,
288
8,67
52,
179
6,49
71.
15†
†
Lang
uage
min
ority
Non
-Eng
lish
4,54
5 57
0 3,
975
3147
8395
579
3,55
795
22,
605
1.17
††
En
glis
h 13
,678
1,
800
11,8
7831
4783
951,
706
10,7
472,
912
7,83
51.
15†
†
— N
ot a
vaila
ble.
†
Not
app
licab
le.
1 Cha
ract
eris
tics o
f the
scho
ols (
scho
ol a
ffili
atio
n an
d ty
pe o
f loc
ale)
are
from
the
orig
inal
sam
ple
scho
ols.
2 The
mov
er ra
tes
and
the
com
plet
ion
rate
s fo
r mov
ers
are
thos
e us
ed in
the
com
puta
tion
of e
xpec
ted
sam
ple
size
, and
are
diff
eren
tial b
y su
bgro
ups.
Sinc
e no
“to
tal”
rate
s w
ere
used
in th
e co
mpu
tatio
n,
they
are
not
ava
ilabl
e.
3 The
sam
plin
g ra
te fo
r mov
ers i
s set
at 4
7 pe
rcen
t (in
stea
d of
50
perc
ent)
to a
ccou
nt fo
r ine
ligib
ility
of c
hild
ren
in fu
ture
roun
ds.
4 The
des
ign
effe
cts i
n th
is c
olum
n ar
e th
e re
sults
of s
ampl
ing
mov
ers a
nd n
onm
over
s diff
eren
tially
. The
y do
not
incl
ude
the
effe
ct o
f clu
ster
ing.
5 T
he n
umbe
r of n
ew th
ird-g
rade
scho
ols i
s est
imat
ed a
s 1.5
scho
ols p
er sa
mpl
ed n
ew m
over
. 6 2
,621
scho
ols f
rom
kin
derg
arte
n/fir
st g
rade
plu
s the
new
third
-gra
de sc
hool
s. 7 R
ace/
ethn
icity
1 w
as th
e st
rict d
efin
ition
of A
sian
or P
acifi
c Is
land
er (R
AC
E=5-
Asi
an o
r 6-N
ativ
e H
awai
ian
or o
ther
Pac
ific
Isla
nder
), w
hile
race
/eth
nici
ty 2
was
the
broa
der d
efin
ition
(RA
CE=
5-A
sian
or
6-N
ativ
e H
awai
ian
or o
ther
Pac
ific
Isla
nder
or W
KA
SIA
N=1
-Chi
ld is
Asi
an o
r WK
PAC
ISL=
1-C
hild
is N
ativ
e H
awai
ian
or o
ther
Pac
ific
Isla
nder
). V
aria
bles
are
from
the
ECLS
-K b
ase-
year
dat
a fil
e.
SOU
RC
E: U
.S. D
epar
tmen
t of E
duca
tion,
Nat
iona
l Cen
ter f
or E
duca
tion
Stat
istic
s, Ea
rly C
hild
hood
Lon
gitu
dina
l Stu
dy, K
inde
rgar
ten
Cla
ss o
f 199
8–99
kin
derg
arte
n (E
CLS
-K),
sprin
g 20
02.
3-34
complete child assessment or parent interview, or a child who could not be assessed because of a disability but had other data in previous rounds such as height and weight measures. This table shows that the expected number of children with completed child assessments or parent interviews in the third grade was 14,304 under the assumed mover rates (differential by subgroups as shown in the table), subsampling rate (47 percent instead of 50 percent to account for ineligibility in third grade), and completion rate (95 percent). The estimates for the selected groups of high interest are given in the rows below. The third from last column is the estimated design effect resulting from sampling movers and nonmovers differentially. It does not include any other factors such as clustering. The next to last column is an estimate of the number of new schools that would enter the ECLS-K sample. The last column is an estimate of the total number of schools that sampled children would be attending in third grade (old and new), assuming 1.5 movers attended the same school on average.
3.5.4 Protecting the Language Minority Children
Special attention was paid to language minority and Asian or Pacific Islander children to ensure that the sample sizes would be large enough to support analytic goals in developing the sampling plans for the third grade. Children in the language minority group are children whose home language is non-English or who were screened using the Oral Language Development Scale (OLDS) prior to assessments during the base year (or first grade for freshened children).10 Two classifications of Asians or Pacific Islanders are shown in tables 3-11 and 3-12. The first classification was identified using a strict definition of Asian or Pacific Islander: the child was identified only as Asian or Pacific Islander by the composite race variable (RACE = 5-Asian or 6-Native Hawaiian or other Pacific Islander). The second classification was identified using a broader definition: a child was identified only as Asian or Pacific Islander as in the strict definition (RACE = 5-Asian or 6-Native Hawaiian or other Pacific Islander) or if a child had positive answers to the Asian or Pacific Islander race identification variables (WKASIAN = 1-Child is Asian or WKPACISL = 1-Child is Native Hawaiian or other Pacific Islander). The variables RACE, WKASIAN and WKPACISL are in the base-year data file. The broader definition of Asian or Pacific Islander yields a larger population of children.
After reviewing the expected yields without oversampling, it was decided to increase only
the sample size for children belonging to the language minority group. Beginning in third grade, these -
10 Information about home language came from the parent interview. The decision whether or not children were screened with the OLDS was based on information provided by their schools (see the ECLS-K Base Year Public-Use Data Files and Electronic Code Book: User’s Manual (NCES 2001-029rev) (Tourangeau, Burke et al. 2004).
3-35
children would not be subsampled for follow-up if they moved from their original school. Instead, data collection would be attempted for all language minority children. Table 3-13 is analogous to table 3-12 but is adjusted for this approach of retaining all movers in the language minority group (in practice the subsampling rates are shown as 95 percent because some children became ineligible).
One consequence of protecting this subgroup is to increase the sample size and precision for
the subgroup. The design effect due to subsampling is slightly lower under this plan because a smaller proportion of the movers were subsampled than under the basic plan (only the movers that were already subsampled in first grade are subsampled). Another consequence is that the number of schools that the sampled children attended increased. Because all language minority children were followed, table 3-13 shows an expected increase of 395 schools in third grade (1,918 – 1,523 = 395).
3.5.5 Precision Requirements
When the precision estimates were computed from the kindergarten sample at the end of the base year, higher than expected design effects for assessment scores were observed. The design effects for most other statistics, such as proportions of children with a particular characteristic, were moderate and within the range expected (1.6 to 6.9 for proportions greater than 30 percent for an average of 4.0). The design effects for assessment scores (4.5 to 9.5 for an average of 6.9) were investigated and found to be correct and unrelated to data collection artifacts. For example, interviewer effects were found to be negligible and did not bias assessment scores. The design effects for test scores were much larger than the average of 3.8 that was expected at the design stage. For all children, the design effects for mathematics and reading scores were about 6.5, while for general knowledge the design effects were even larger, at 7.7. For design effects from the base year, see chapter 4 of the ECLS-K Base Year Public-Use Data Files and Electronic Code Book: User’s Manual (NCES 2001–029rev) (Tourangeau, Burke et al. 2004). These larger design effects are one component that affects the ability of the survey to meet the precision requirements as described in section 3.1.
The spring-third grade estimates of design effects are similar to those in the earlier rounds
and are larger than had been predicted prior to any data collection. The longitudinal estimates have design effects that are not as large as might be expected given the larger cross-sectional design effects. In fact, the correlations for mean test scores are as high as .8 to .9. The higher than expected correlations make
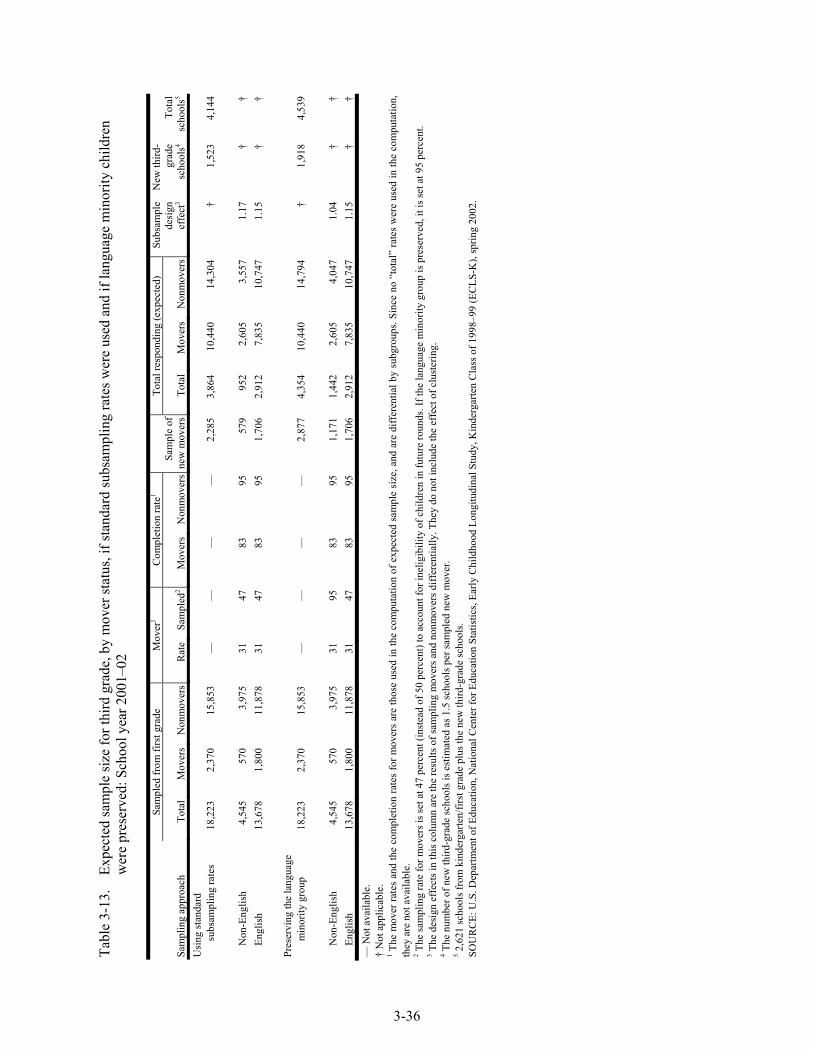
3-36
Tabl
e 3-
13.
Exp
ecte
d sa
mpl
e si
ze fo
r thi
rd g
rade
, by
mov
er st
atus
, if s
tand
ard
subs
ampl
ing
rate
s wer
e us
ed a
nd if
lang
uage
min
ority
chi
ldre
n w
ere
pres
erve
d: S
choo
l yea
r 200
1–02
Sam
pled
from
firs
t gra
de
Mov
er1
Com
plet
ion
rate
1 Sa
mpl
e of
ne
w m
over
s
Tota
l res
pond
ing
(exp
ecte
d)
Subs
ampl
e de
sign
ef
fect
3
New
third
-gr
ade
scho
ols4
Tota
l sc
hool
s5Sa
mpl
ing
appr
oach
To
tal
Mov
ers
Non
mov
ers
Rat
eSa
mpl
ed2
Mov
ers
Non
mov
ers
Tota
lM
over
sN
onm
over
sU
sing
stan
dard
sub
sam
plin
g ra
tes
18,2
23
2,37
0 15
,853
——
——
2,28
5 3,
864
10,4
4014
,304
†1,
523
4,14
4
N
on-E
nglis
h
4,54
5 57
0 3,
975
3147
8395
579
952
2,60
53,
557
1.17
††
Engl
ish
13,6
78
1,80
0 11
,878
3147
8395
1,70
6 2,
912
7,83
510
,747
1.15
††
Pres
ervi
ng th
e la
ngua
ge
m
inor
ity g
roup
18
,223
2,
370
15,8
53—
——
—2,
877
4,35
410
,440
14,7
94†
1,91
84,
539
Non
-Eng
lish
4,54
5 57
0 3,
975
3195
8395
1,17
1 1,
442
2,60
54,
047
1.04
††
Engl
ish
13,6
78
1,80
0 11
,878
3147
8395
1,70
6 2,
912
7,83
510
,747
1.15
††
— N
ot a
vaila
ble.
†
Not
app
licab
le.
1 The
mov
er ra
tes
and
the
com
plet
ion
rate
s fo
r mov
ers
are
thos
e us
ed in
the
com
puta
tion
of e
xpec
ted
sam
ple
size
, and
are
diff
eren
tial b
y su
bgro
ups.
Sinc
e no
“to
tal”
rate
s w
ere
used
in th
e co
mpu
tatio
n,
they
are
not
ava
ilabl
e.
2 The
sam
plin
g ra
te fo
r mov
ers i
s set
at 4
7 pe
rcen
t (in
stea
d of
50
perc
ent)
to a
ccou
nt fo
r ine
ligib
ility
of c
hild
ren
in fu
ture
roun
ds. I
f the
lang
uage
min
ority
gro
up is
pre
serv
ed, i
t is s
et a
t 95
perc
ent.
3 The
des
ign
effe
cts i
n th
is c
olum
n ar
e th
e re
sults
of s
ampl
ing
mov
ers a
nd n
onm
over
s diff
eren
tially
. The
y do
not
incl
ude
the
effe
ct o
f clu
ster
ing.
4 T
he n
umbe
r of n
ew th
ird-g
rade
scho
ols i
s est
imat
ed a
s 1.5
scho
ols p
er sa
mpl
ed n
ew m
over
. 5 2
,621
scho
ols f
rom
kin
derg
arte
n/fir
st g
rade
plu
s the
new
third
-gra
de sc
hool
s. SO
UR
CE:
U.S
. Dep
artm
ent o
f Edu
catio
n, N
atio
nal C
ente
r for
Edu
catio
n St
atis
tics,
Early
Chi
ldho
od L
ongi
tudi
nal S
tudy
, Kin
derg
arte
n C
lass
of 1
998–
99 (E
CLS
-K),
sprin
g 20
02.
3-37
estimates of changes in scores over time more precise, thus it is possible to meet the precision requirements for estimates of change with smaller sample sizes. Table 3-14 shows that the sample sizes for the key analytic subgroups (public, Catholic, non-Catholic, Hispanic, Black, Asian or Pacific Islander, other races together, and language minority) were expected to be at least 1,000.11 Samples of this size were expected to be sufficient for estimating most characteristics. For example, test scores were expected to have a coefficient of variation of about 3 percent with samples of 1,000. More details on estimates of design effects can be found in chapter 4 of the ECLS-K User’s Manual for the First Grade Public-Use Data Files and Electronic Code Book (NCES 2002–135) (Tourangeau et al. 2002) and the ECLS-K User’s Manual for the Third Grade Public-Use Data File and Electronic Code Book (NCES 2004–001) (Tourangeau, Brick, Lê et al. 2004).
3.5.6 Spring-Third Grade Sampling Outcome
To summarize, the sample of children for spring-third grade consists of all children who were base-year respondents and children who were brought into the sample in spring-first grade through the sample freshening procedure. Sample freshening was not implemented in third grade; hence no new children entered the sample.
While all children still enrolled in their base-year schools were recontacted, slightly more
than 50 percent of the base-year sampled children who had transferred from their kindergarten school were followed for data collection. This subsample of children was the same 50 percent subsample of base-year movers followed in spring-first grade, including the movers whose home language was not English (language minority children). Children who were followed in spring-first grade were retained in the sample (i.e., the mover follow-up still targeted the same 50 percent subsample of children in the base-year schools). In addition, children whose home language was not English (language minority children) and who had moved between spring-first grade and spring-third grade were all retained rather than being subsampled at the 50 percent rate. If language minority children had moved before kindergarten and first grade and had not been subsampled for follow-up in the first-grade data collection, they were not brought back into the sample. This modification to the mover follow-up procedure provided a larger sample of children whose home language was not English for analytic purposes. The mover follow-up activities that originally targeted a 50 percent subsample of children in base-year schools resulted in a 54 percent subsample with the addition of language minority children.
- 11 The sample sizes for key analytic groups are the totals for each group, not for each cell, in table 3-14.
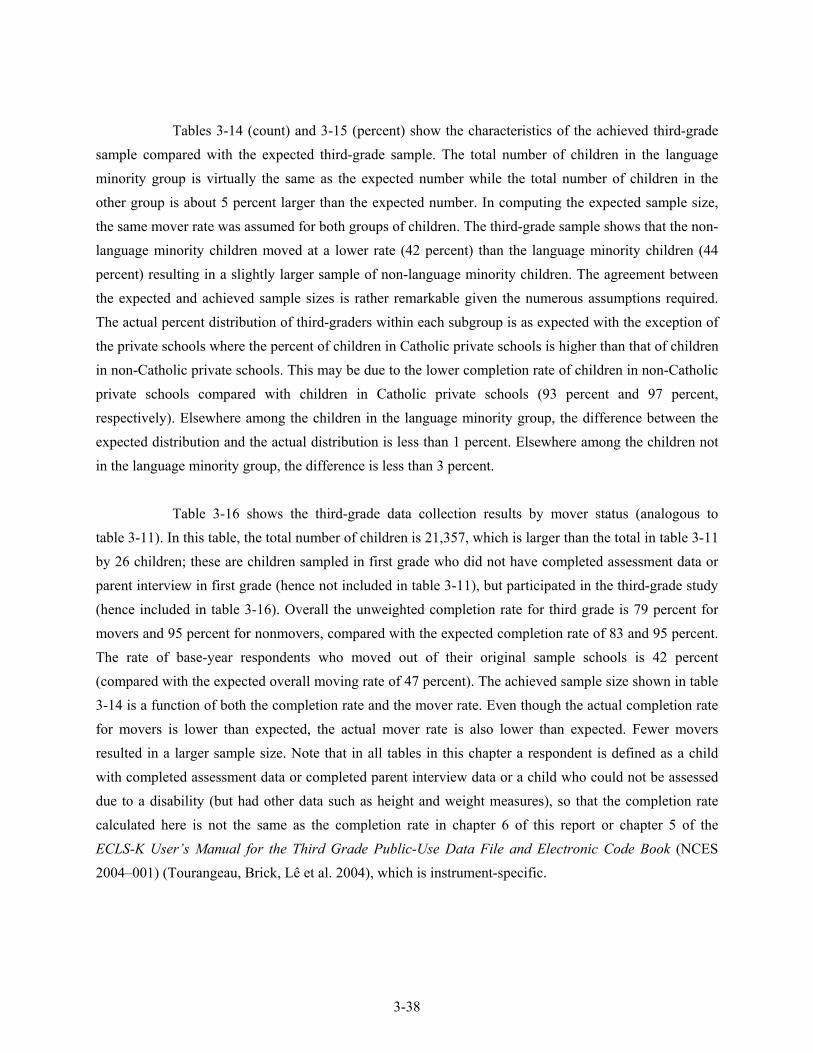
3-38
Tables 3-14 (count) and 3-15 (percent) show the characteristics of the achieved third-grade sample compared with the expected third-grade sample. The total number of children in the language minority group is virtually the same as the expected number while the total number of children in the other group is about 5 percent larger than the expected number. In computing the expected sample size, the same mover rate was assumed for both groups of children. The third-grade sample shows that the non-language minority children moved at a lower rate (42 percent) than the language minority children (44 percent) resulting in a slightly larger sample of non-language minority children. The agreement between the expected and achieved sample sizes is rather remarkable given the numerous assumptions required. The actual percent distribution of third-graders within each subgroup is as expected with the exception of the private schools where the percent of children in Catholic private schools is higher than that of children in non-Catholic private schools. This may be due to the lower completion rate of children in non-Catholic private schools compared with children in Catholic private schools (93 percent and 97 percent, respectively). Elsewhere among the children in the language minority group, the difference between the expected distribution and the actual distribution is less than 1 percent. Elsewhere among the children not in the language minority group, the difference is less than 3 percent.
Table 3-16 shows the third-grade data collection results by mover status (analogous to
table 3-11). In this table, the total number of children is 21,357, which is larger than the total in table 3-11 by 26 children; these are children sampled in first grade who did not have completed assessment data or parent interview in first grade (hence not included in table 3-11), but participated in the third-grade study (hence included in table 3-16). Overall the unweighted completion rate for third grade is 79 percent for movers and 95 percent for nonmovers, compared with the expected completion rate of 83 and 95 percent. The rate of base-year respondents who moved out of their original sample schools is 42 percent (compared with the expected overall moving rate of 47 percent). The achieved sample size shown in table 3-14 is a function of both the completion rate and the mover rate. Even though the actual completion rate for movers is lower than expected, the actual mover rate is also lower than expected. Fewer movers resulted in a larger sample size. Note that in all tables in this chapter a respondent is defined as a child with completed assessment data or completed parent interview data or a child who could not be assessed due to a disability (but had other data such as height and weight measures), so that the completion rate calculated here is not the same as the completion rate in chapter 6 of this report or chapter 5 of the ECLS-K User’s Manual for the Third Grade Public-Use Data File and Electronic Code Book (NCES 2004–001) (Tourangeau, Brick, Lê et al. 2004), which is instrument-specific.
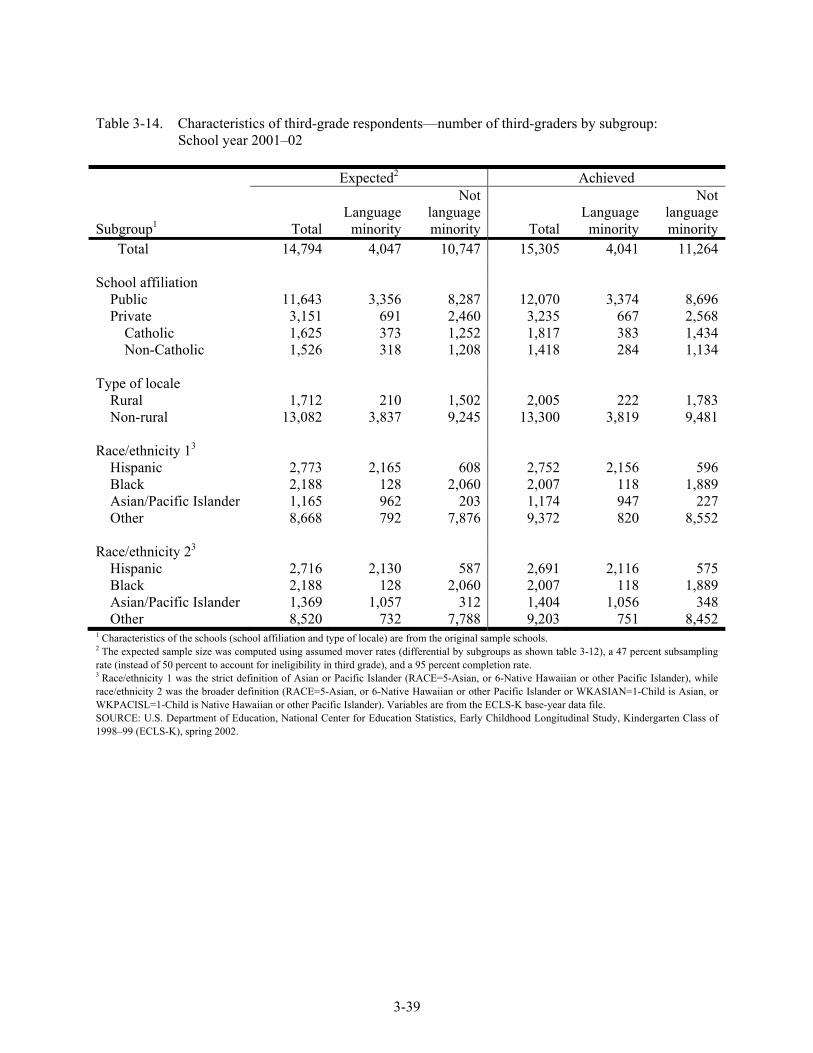
3-39
Table 3-14. Characteristics of third-grade respondents—number of third-graders by subgroup: School year 2001–02
Subgroup1
Expected2 Achieved
Total Language
minority
Not language minority Total
Language minority
Not language minority
Total 14,794 4,047 10,747 15,305 4,041 11,264 School affiliation
Public 11,643 3,356 8,287 12,070 3,374 8,696Private 3,151 691 2,460 3,235 667 2,568
Catholic 1,625 373 1,252 1,817 383 1,434Non-Catholic 1,526 318 1,208 1,418 284 1,134
Type of locale
Rural 1,712 210 1,502 2,005 222 1,783Non-rural 13,082 3,837 9,245 13,300 3,819 9,481
Race/ethnicity 13
Hispanic 2,773 2,165 608 2,752 2,156 596Black 2,188 128 2,060 2,007 118 1,889Asian/Pacific Islander 1,165 962 203 1,174 947 227Other 8,668 792 7,876 9,372 820 8,552
Race/ethnicity 23
Hispanic 2,716 2,130 587 2,691 2,116 575Black 2,188 128 2,060 2,007 118 1,889Asian/Pacific Islander 1,369 1,057 312 1,404 1,056 348Other 8,520 732 7,788 9,203 751 8,452
1 Characteristics of the schools (school affiliation and type of locale) are from the original sample schools. 2 The expected sample size was computed using assumed mover rates (differential by subgroups as shown table 3-12), a 47 percent subsampling rate (instead of 50 percent to account for ineligibility in third grade), and a 95 percent completion rate. 3 Race/ethnicity 1 was the strict definition of Asian or Pacific Islander (RACE=5-Asian, or 6-Native Hawaiian or other Pacific Islander), while race/ethnicity 2 was the broader definition (RACE=5-Asian, or 6-Native Hawaiian or other Pacific Islander or WKASIAN=1-Child is Asian, or WKPACISL=1-Child is Native Hawaiian or other Pacific Islander). Variables are from the ECLS-K base-year data file. SOURCE: U.S. Department of Education, National Center for Education Statistics, Early Childhood Longitudinal Study, Kindergarten Class of 1998–99 (ECLS-K), spring 2002.
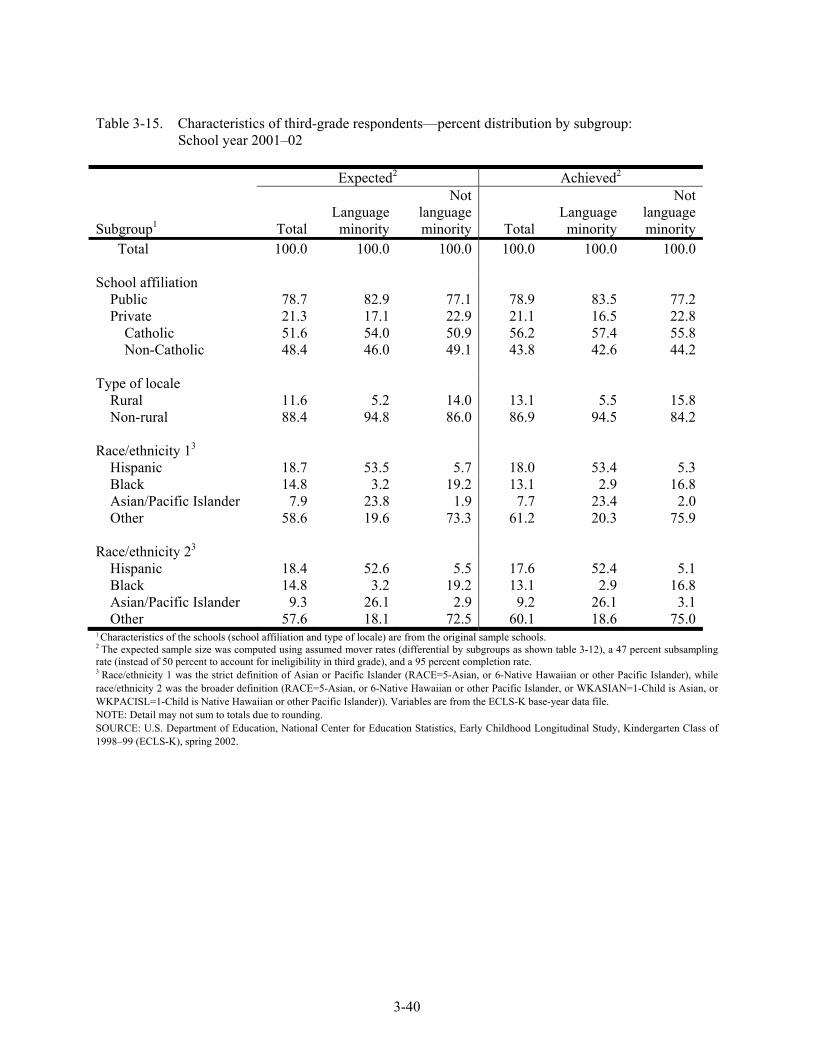
3-40
Table 3-15. Characteristics of third-grade respondents—percent distribution by subgroup: School year 2001–02
Expected2 Achieved2
Subgroup1 Total Language
minority
Not language minority Total
Language minority
Not language minority
Total 100.0 100.0 100.0 100.0 100.0 100.0 School affiliation
Public 78.7 82.9 77.1 78.9 83.5 77.2Private 21.3 17.1 22.9 21.1 16.5 22.8
Catholic 51.6 54.0 50.9 56.2 57.4 55.8Non-Catholic 48.4 46.0 49.1 43.8 42.6 44.2
Type of locale
Rural 11.6 5.2 14.0 13.1 5.5 15.8Non-rural 88.4 94.8 86.0 86.9 94.5 84.2
Race/ethnicity 13
Hispanic 18.7 53.5 5.7 18.0 53.4 5.3Black 14.8 3.2 19.2 13.1 2.9 16.8Asian/Pacific Islander 7.9 23.8 1.9 7.7 23.4 2.0Other 58.6 19.6 73.3 61.2 20.3 75.9
Race/ethnicity 23
Hispanic 18.4 52.6 5.5 17.6 52.4 5.1Black 14.8 3.2 19.2 13.1 2.9 16.8Asian/Pacific Islander 9.3 26.1 2.9 9.2 26.1 3.1Other 57.6 18.1 72.5 60.1 18.6 75.0
1 Characteristics of the schools (school affiliation and type of locale) are from the original sample schools. 2 The expected sample size was computed using assumed mover rates (differential by subgroups as shown table 3-12), a 47 percent subsampling rate (instead of 50 percent to account for ineligibility in third grade), and a 95 percent completion rate. 3 Race/ethnicity 1 was the strict definition of Asian or Pacific Islander (RACE=5-Asian, or 6-Native Hawaiian or other Pacific Islander), while race/ethnicity 2 was the broader definition (RACE=5-Asian, or 6-Native Hawaiian or other Pacific Islander, or WKASIAN=1-Child is Asian, or WKPACISL=1-Child is Native Hawaiian or other Pacific Islander)). Variables are from the ECLS-K base-year data file. NOTE: Detail may not sum to totals due to rounding. SOURCE: U.S. Department of Education, National Center for Education Statistics, Early Childhood Longitudinal Study, Kindergarten Class of 1998–99 (ECLS-K), spring 2002.
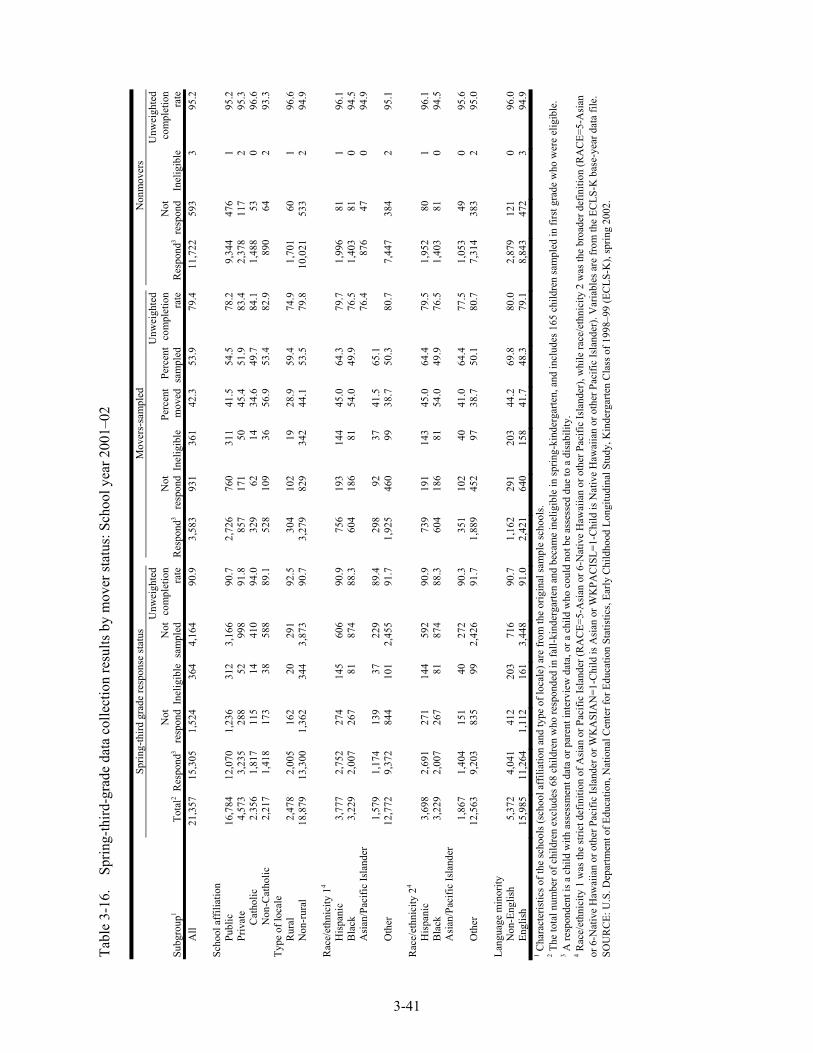
3-41
Tabl
e 3-
16.
Spr
ing-
third
-gra
de d
ata
colle
ctio
n re
sults
by
mov
er st
atus
: Sch
ool y
ear 2
001–
02
Sp
ring-
third
gra
de re
spon
se st
atus
M
over
s-sa
mpl
ed
Non
mov
ers
Subg
roup
1 To
tal2 R
espo
nd3
Not
re
spon
dIn
elig
ible
Not
sa
mpl
ed
Unw
eigh
ted
com
plet
ion
rate
Res
pond
3N
ot
resp
ond
Inel
igib
le
Perc
ent
mov
edPe
rcen
t sa
mpl
ed
Unw
eigh
ted
com
plet
ion
rate
Res
pond
3N
ot
resp
ond
Inel
igib
le
Unw
eigh
ted
com
plet
ion
rate
A
ll 21
,357
15
,305
1,
524
364
4,16
490
.93,
583
931
361
42.3
53.9
79.4
11,7
2259
33
95.2
Scho
ol a
ffili
atio
n
P
ublic
16
,784
12
,070
1,
236
312
3,16
690
.72,
726
760
311
41.5
54.5
78.2
9,34
447
61
95.2
P
rivat
e 4,
573
3,23
5 28
852
998
91.8
857
171
50
45.4
51.9
83.4
2,37
811
72
95.3
C
atho
lic
2.35
6 1,
817
115
1441
094
.032
962
14
34.6
49.7
84.1
1,48
853
096
.6
Non
-Cat
holic
2,
217
1,41
8 17
338
588
89.1
528
109
36
56.9
53.4
82.9
890
642
93.3
Type
of l
ocal
e
R
ural
2,
478
2,00
5 16
220
291
92.5
304
102
19
28.9
59.4
74.9
1,70
160
196
.6
Non
-rur
al
18,8
79
13,3
00
1,36
234
43,
873
90.7
3,27
982
934
2 44
.153
.579
.810
,021
533
294
.9
R
ace/
ethn
icity
14
His
pani
c 3,
777
2,75
2 27
414
560
690
.975
619
314
4 45
.064
.379
.71,
996
811
96.1
B
lack
3,
229
2,00
7 26
781
874
88.3
604
186
81
54.0
49.9
76.5
1,40
381
094
.5
Asi
an/P
acifi
c Is
land
er
1,
579
1,
174
139
3722
989
.429
892
37
41
.565
.176
.487
647
094
.9
O
ther
12
,772
9,
372
844
101
2,45
591
.71,
925
460
99
38.7
50.3
80.7
7,44
738
42
95.1
Rac
e/et
hnic
ity 2
4
H
ispa
nic
3,69
8 2,
691
271
144
592
90.9
739
191
143
45.0
64.4
79.5
1,95
280
196
.1
Bla
ck
3,22
9 2,
007
267
8187
488
.360
418
681
54
.049
.976
.51,
403
810
94.5
A
sian
/Pac
ific
Isla
nder
1,86
7
1,40
4 15
140
272
90.3
351
102
40
41
.064
.477
.51,
053
490
95.6
O
ther
12
,563
9,
203
835
992,
426
91.7
1,88
945
297
38
.750
.180
.77,
314
383
295
.0
La
ngua
ge m
inor
ity
Non
-Eng
lish
5,
372
4,04
1 41
220
371
690
.71,
162
291
203
44.2
69.8
80.0
2,87
912
10
96.0
E
nglis
h 15
,985
11
,264
1,
112
161
3,44
891
.02,
421
640
158
41.7
48.3
79.1
8,84
347
23
94.9
1 Cha
ract
eris
tics o
f the
scho
ols (
scho
ol a
ffili
atio
n an
d ty
pe o
f loc
ale)
are
from
the
orig
inal
sam
ple
scho
ols.
2 The
tota
l num
ber o
f chi
ldre
n ex
clud
es 6
8 ch
ildre
n w
ho re
spon
ded
in fa
ll-ki
nder
garte
n an
d be
cam
e in
elig
ible
in sp
ring-
kind
erga
rten,
and
incl
udes
165
chi
ldre
n sa
mpl
ed in
firs
t gra
de w
ho w
ere
elig
ible
. 3 A
resp
onde
nt is
a c
hild
with
ass
essm
ent d
ata
or p
aren
t int
ervi
ew d
ata,
or a
chi
ld w
ho c
ould
not
be
asse
ssed
due
to a
dis
abili
ty.
4 Rac
e/et
hnic
ity 1
was
the
stric
t def
initi
on o
f Asi
an o
r Pac
ific
Isla
nder
(RA
CE=
5-A
sian
or 6
-Nat
ive
Haw
aiia
n or
oth
er P
acifi
c Is
land
er),
whi
le ra
ce/e
thni
city
2 w
as th
e br
oade
r def
initi
on (R
AC
E=5-
Asi
an
or 6
-Nat
ive
Haw
aiia
n or
oth
er P
acifi
c Is
land
er o
r WK
ASI
AN
=1-C
hild
is A
sian
or W
KPA
CIS
L=1-
Chi
ld is
Nat
ive
Haw
aiia
n or
oth
er P
acifi
c Is
land
er).
Var
iabl
es a
re fr
om th
e EC
LS-K
bas
e-ye
ar d
ata
file.
SO
UR
CE:
U.S
. Dep
artm
ent o
f Edu
catio
n, N
atio
nal C
ente
r for
Edu
catio
n St
atis
tics,
Early
Chi
ldho
od L
ongi
tudi
nal S
tudy
, Kin
derg
arte
n C
lass
of 1
998–
99 (E
CLS
-K),
sprin
g 20
02.
3-42
3.6 Spring-Fifth Grade Sample
For the fifth-grade data collection, different options for subsampling movers were explored to reduce the sample size in order to contain the cost of data collection. The original plan would use the same procedures for third grade to subsample and follow 50 percent of children who moved in fifth grade or earlier and retain all language minority children who had not been subsampled out before fifth grade. Three alternative plans were developed to decrease the sample sizes by reducing the subsampling rates. One of the alternatives was adopted as the final plan. The final subsampling rates maximize the amount of longitudinal data available for key analytic groups.
A new feature of the fifth-grade sample is the subsampling of children for the administration
of the mathematics or science questionnaires. While all children retained for the fifth-grade data collection had child-level questionnaires filled out by their reading teachers, half were subsampled to have child-level questionnaires filled out by their mathematics teachers, and the other half had child-level questionnaires filled out by their science teachers. This affects only the computation of the combined child-parent-teacher weights as discussed in section 7.2.6.
3.6.1 Options for Subsampling Movers
All sampling options considered for fifth grade were based on the beginning sample of 21,357 children: 21,192 base-year respondents who were still eligible after the base year, and 165 children sampled in first grade as part of the freshening procedure (see section 3.4.2). The first decision regarding the fifth-grade sample was to exclude the following groups of children from the fifth-grade survey, irrespective of other subsampling procedures that might be implemented: (1) children who had become ineligible in an earlier round (because they had died or moved out of the country); (2) children who were subsampled out in previous rounds because they had moved out of the original schools and were not subsampled to be followed; (3) children whose parents emphatically refused to cooperate (hard refusals) in any of the data collection rounds since spring-kindergarten; and (4) children eligible for the third-grade sample for whom there are neither first-grade nor third-grade data (i.e., no direct assessment data and no parent interview data from first grade and third grade). The children who met any of these conditions were not eligible for sampling in the fifth grade for any of the sampling options considered. In total, 5,214 children were excluded from the fifth-grade survey; they are distributed as shown in table 3-17.
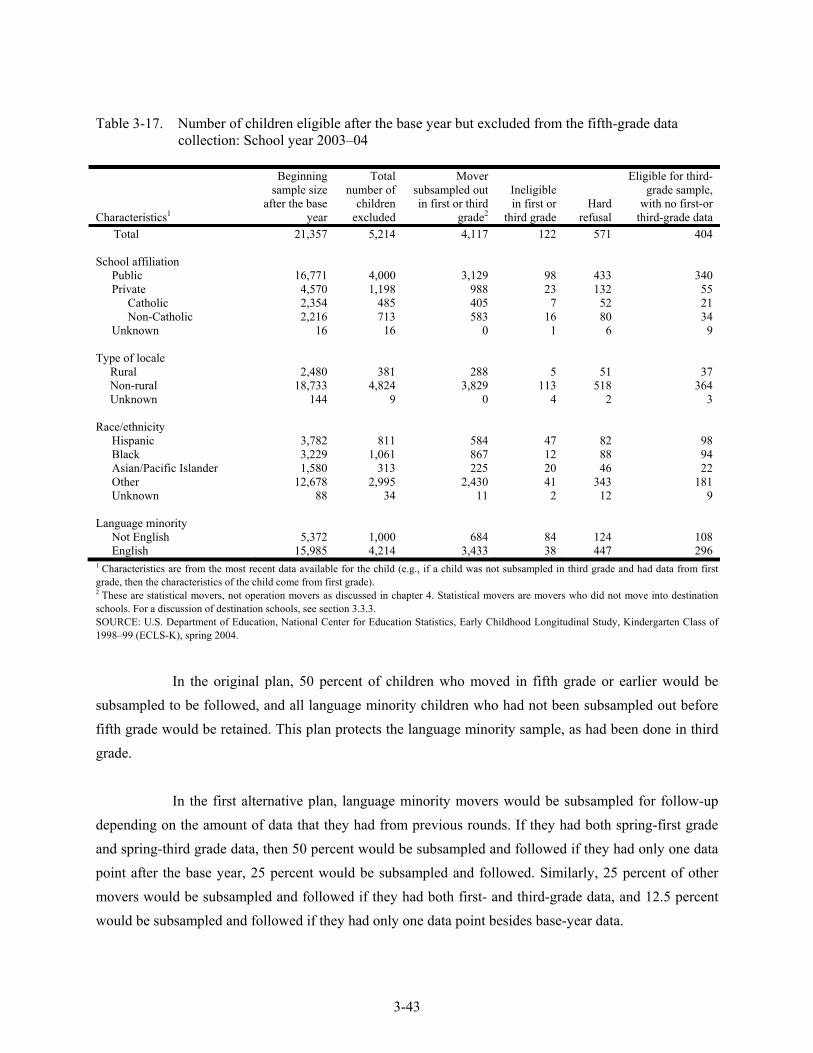
3-43
Table 3-17. Number of children eligible after the base year but excluded from the fifth-grade data collection: School year 2003–04
Characteristics1
Beginning sample size
after the base year
Total number of
children excluded
Mover subsampled out in first or third
grade2
Ineligible in first or
third grade Hard
refusal
Eligible for third-grade sample,
with no first-or third-grade data
Total 21,357 5,214 4,117 122 571 404 School affiliation Public 16,771 4,000 3,129 98 433 340 Private 4,570 1,198 988 23 132 55 Catholic 2,354 485 405 7 52 21 Non-Catholic 2,216 713 583 16 80 34 Unknown 16 16 0 1 6 9 Type of locale
Rural 2,480 381 288 5 51 37 Non-rural 18,733 4,824 3,829 113 518 364 Unknown 144 9 0 4 2 3
Race/ethnicity Hispanic 3,782 811 584 47 82 98 Black 3,229 1,061 867 12 88 94 Asian/Pacific Islander 1,580 313 225 20 46 22 Other 12,678 2,995 2,430 41 343 181 Unknown 88 34 11 2 12 9 Language minority Not English 5,372 1,000 684 84 124 108 English 15,985 4,214 3,433 38 447 296 1 Characteristics are from the most recent data available for the child (e.g., if a child was not subsampled in third grade and had data from first grade, then the characteristics of the child come from first grade). 2 These are statistical movers, not operation movers as discussed in chapter 4. Statistical movers are movers who did not move into destination schools. For a discussion of destination schools, see section 3.3.3. SOURCE: U.S. Department of Education, National Center for Education Statistics, Early Childhood Longitudinal Study, Kindergarten Class of 1998–99 (ECLS-K), spring 2004.
In the original plan, 50 percent of children who moved in fifth grade or earlier would be
subsampled to be followed, and all language minority children who had not been subsampled out before fifth grade would be retained. This plan protects the language minority sample, as had been done in third grade.
In the first alternative plan, language minority movers would be subsampled for follow-up
depending on the amount of data that they had from previous rounds. If they had both spring-first grade and spring-third grade data, then 50 percent would be subsampled and followed if they had only one data point after the base year, 25 percent would be subsampled and followed. Similarly, 25 percent of other movers would be subsampled and followed if they had both first- and third-grade data, and 12.5 percent would be subsampled and followed if they had only one data point besides base-year data.
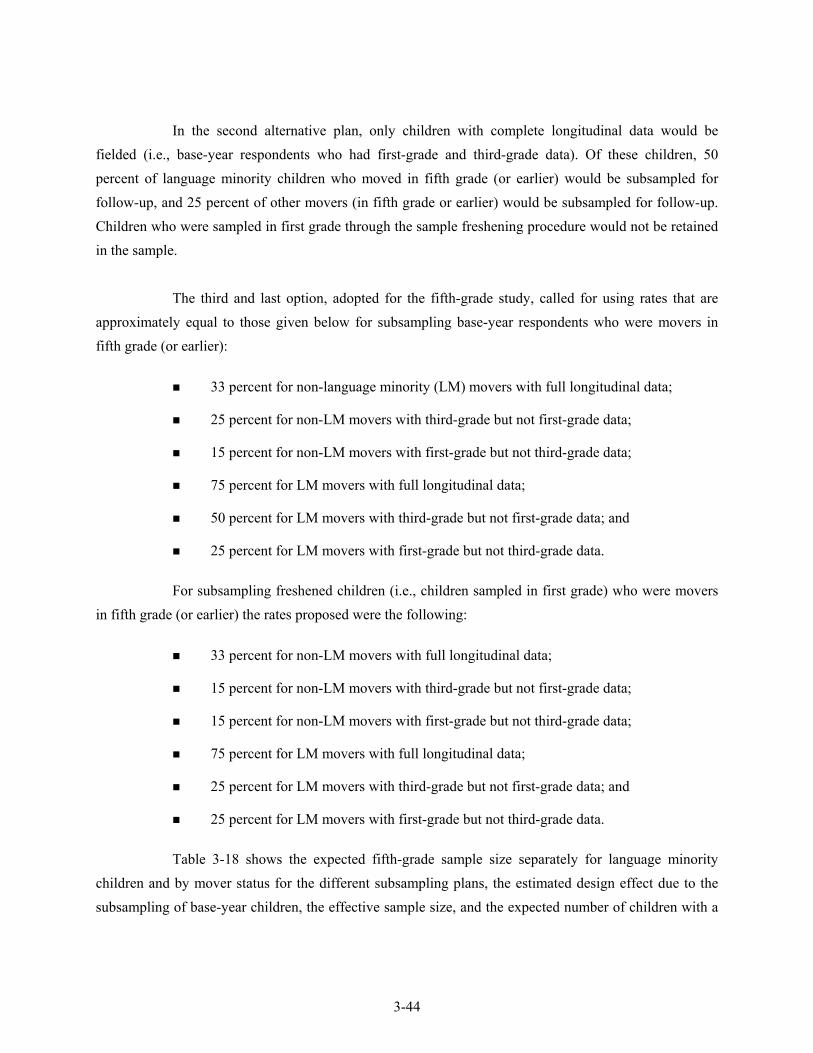
3-44
In the second alternative plan, only children with complete longitudinal data would be fielded (i.e., base-year respondents who had first-grade and third-grade data). Of these children, 50 percent of language minority children who moved in fifth grade (or earlier) would be subsampled for follow-up, and 25 percent of other movers (in fifth grade or earlier) would be subsampled for follow-up. Children who were sampled in first grade through the sample freshening procedure would not be retained in the sample.
The third and last option, adopted for the fifth-grade study, called for using rates that are
approximately equal to those given below for subsampling base-year respondents who were movers in fifth grade (or earlier):
33 percent for non-language minority (LM) movers with full longitudinal data;
25 percent for non-LM movers with third-grade but not first-grade data;
15 percent for non-LM movers with first-grade but not third-grade data;
75 percent for LM movers with full longitudinal data;
50 percent for LM movers with third-grade but not first-grade data; and
25 percent for LM movers with first-grade but not third-grade data.
For subsampling freshened children (i.e., children sampled in first grade) who were movers in fifth grade (or earlier) the rates proposed were the following:
33 percent for non-LM movers with full longitudinal data;
15 percent for non-LM movers with third-grade but not first-grade data;
15 percent for non-LM movers with first-grade but not third-grade data;
75 percent for LM movers with full longitudinal data;
25 percent for LM movers with third-grade but not first-grade data; and
25 percent for LM movers with first-grade but not third-grade data.
Table 3-18 shows the expected fifth-grade sample size separately for language minority children and by mover status for the different subsampling plans, the estimated design effect due to the subsampling of base-year children, the effective sample size, and the expected number of children with a
3-45
completed fifth-grade assessment, assuming that 90 percent of children would be assessed successfully. The completion rate of 90 percent took into account children who had moved and whether they would be located. According to the third-grade collection, the unweighted completion rate for child assessment was 95 percent for nonmovers and 63 percent for movers, with an overall unweighted completion rate of 86 percent. Since fewer movers would be included in fifth grade compared with third grade, the assumption was for a slightly higher completion rate for the child assessment.
Table 3-18. ECLS-K options for subsampling movers for fifth grade: School year 2003–04
Characteristic Sample sizeDesign
effectEffective
sample size Expected number of
children assessed1
Original plan Total 14,135 1.13 12,509 12,722
Non-language minority: Nonmover 4,907 — 4,342 4,416Non-language minority: Mover 4,856 — 4,297 4,371Language minority: Nonmover 1,595 — 1,412 1,436Language minority: Mover 2,777 — 2,458 2,499 Option 1
Total 11,336 1.30 8,720 10,202
Non-language minority: Nonmover 4,908 — 3,775 4,417Non-language minority: Mover 3,219 — 2,476 2,897Language minority: Nonmover 1,595 — 1,227 1,435Language minority: Mover 1,614 — 1,242 1,453 Option 2
Total 10,308 1.26 8,181 9,277
Non-language minority: Nonmover 4,767 — 3,783 4,290Non-language minority: Mover 3,067 — 2,434 2,760Language minority: Nonmover 768 — 610 691Language minority: Mover 1,706 — 1,354 1,536 Option 3 (adopted for fifth grade)
Total 12,635 1.24 10,190 11,372
Non-language minority: Nonmover 4,908 — 3,958 4,417Non-language minority: Mover 3,784 — 3,052 3,406Language minority: Nonmover 1,595 — 1,286 1,436Language minority: Mover 2,348 — 1,894 2,113— Not available. 1 The expected number of children assessed is computed using an assumed completion rate of 90 percent. SOURCE: U.S. Department of Education, National Center for Education Statistics, Early Childhood Longitudinal Study, Kindergarten Class of 1998–99 (ECLS-K), spring 2004.
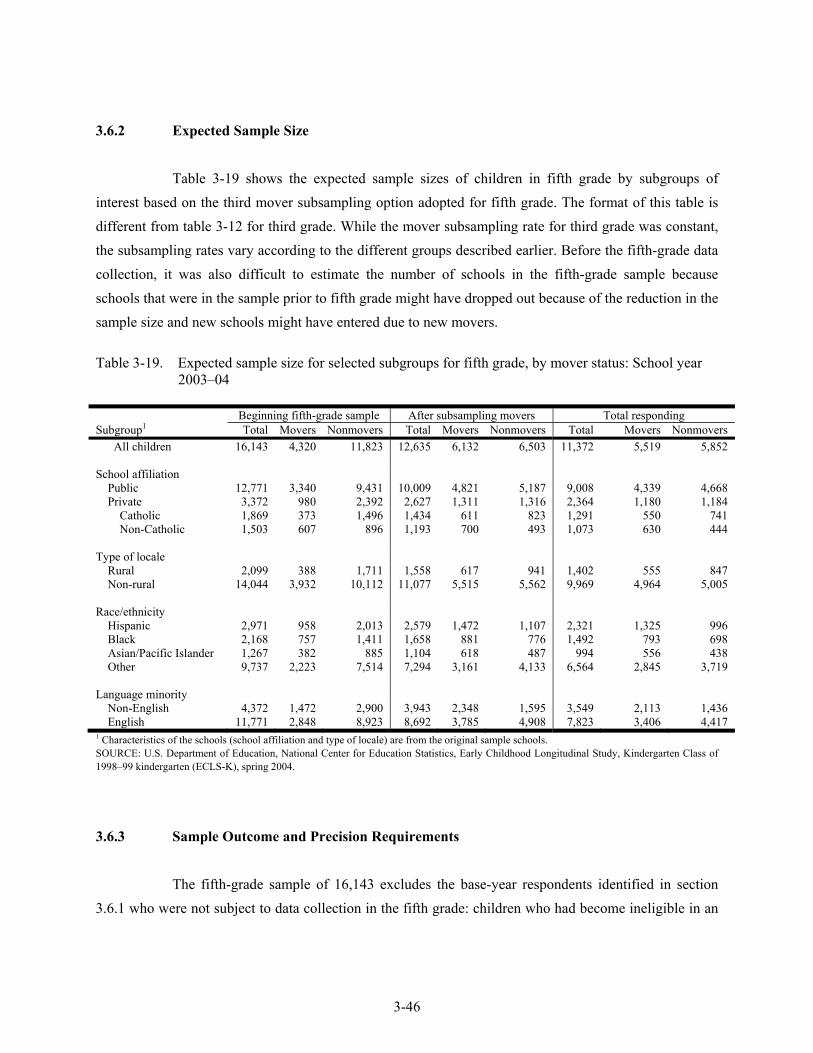
3-46
3.6.2 Expected Sample Size
Table 3-19 shows the expected sample sizes of children in fifth grade by subgroups of interest based on the third mover subsampling option adopted for fifth grade. The format of this table is different from table 3-12 for third grade. While the mover subsampling rate for third grade was constant, the subsampling rates vary according to the different groups described earlier. Before the fifth-grade data collection, it was also difficult to estimate the number of schools in the fifth-grade sample because schools that were in the sample prior to fifth grade might have dropped out because of the reduction in the sample size and new schools might have entered due to new movers.
Table 3-19. Expected sample size for selected subgroups for fifth grade, by mover status: School year
2003–04 Beginning fifth-grade sample After subsampling movers Total responding Subgroup1 Total Movers Nonmovers Total Movers Nonmovers Total Movers Nonmovers All children 16,143 4,320 11,823 12,635 6,132 6,503 11,372 5,519 5,852 School affiliation Public 12,771 3,340 9,431 10,009 4,821 5,187 9,008 4,339 4,668 Private 3,372 980 2,392 2,627 1,311 1,316 2,364 1,180 1,184 Catholic 1,869 373 1,496 1,434 611 823 1,291 550 741 Non-Catholic 1,503 607 896 1,193 700 493 1,073 630 444 Type of locale Rural 2,099 388 1,711 1,558 617 941 1,402 555 847 Non-rural 14,044 3,932 10,112 11,077 5,515 5,562 9,969 4,964 5,005 Race/ethnicity Hispanic 2,971 958 2,013 2,579 1,472 1,107 2,321 1,325 996 Black 2,168 757 1,411 1,658 881 776 1,492 793 698 Asian/Pacific Islander 1,267 382 885 1,104 618 487 994 556 438 Other 9,737 2,223 7,514 7,294 3,161 4,133 6,564 2,845 3,719 Language minority Non-English 4,372 1,472 2,900 3,943 2,348 1,595 3,549 2,113 1,436 English 11,771 2,848 8,923 8,692 3,785 4,908 7,823 3,406 4,417 1 Characteristics of the schools (school affiliation and type of locale) are from the original sample schools. SOURCE: U.S. Department of Education, National Center for Education Statistics, Early Childhood Longitudinal Study, Kindergarten Class of 1998–99 kindergarten (ECLS-K), spring 2004.
3.6.3 Sample Outcome and Precision Requirements
The fifth-grade sample of 16,143 excludes the base-year respondents identified in section 3.6.1 who were not subject to data collection in the fifth grade: children who had become ineligible in an

3-47
earlier round (because they had died or moved out of the country); children who were subsampled out in previous rounds because they had moved out of the original schools and were not subsampled to be followed; children whose parents emphatically refused to cooperate (hard refusals) in any of the data collection rounds since spring-kindergarten; and children eligible for the third-grade data collection for whom there were neither first-grade nor third-grade data (i.e., no direct assessment data and no parent interview data from first grade and third grade). As discussed in section 3.1, a sample in fifth grade of about 10,000 children would be adequate to meet the precision requirements overall and for most subgroups. A sample of about 800 to 1,000 children in a subgroup would be achieved for most of the subgroups with an overall sample of 10,000 children, and these would approximately meet the precision goals described in section 3.1.
Table 3-20 (count) and table 3-21 (percent) show the characteristics of the achieved fifth-
grade sample compared with the expected fifth-grade sample. The numbers of fifth-grade respondents for all of the identified subgroups of interest exceed 1,000, except for children in non-Catholic private schools and Asian or Pacific Islander children. For most of the key analytic groups the numbers of respondents are much larger than 1,000. For Asian or Pacific Islander children, the number of respondents is 970, which exceeds the minimum target of 800 and is very close to 1,000. The number of respondents in non-Catholic private schools is 957. The sample of 11,820 respondents attended 2,008 public schools and 356 private schools.
Two-thirds of the public schools attended by the fifth-grade sample (1,355) are transfer
schools, and almost half of the private schools (166) are transfer schools. The large number of transfer schools corresponds to the heavy movement of the ECLS-K children between schools.
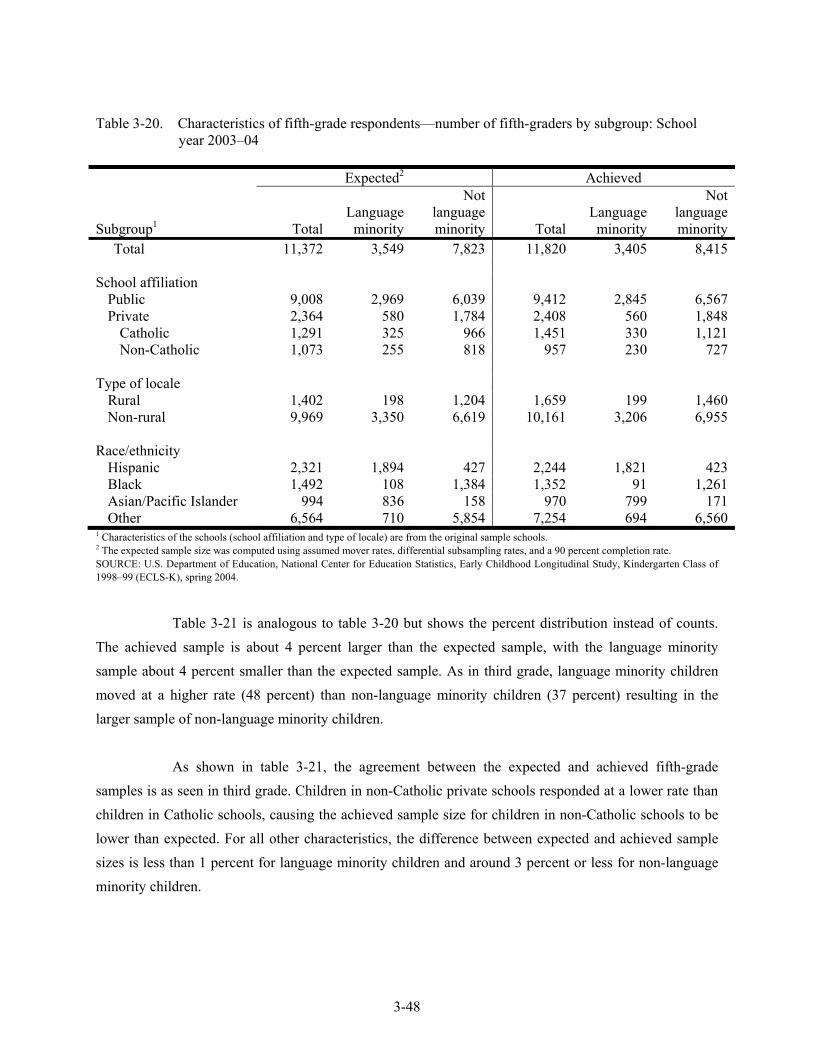
3-48
Table 3-20. Characteristics of fifth-grade respondents—number of fifth-graders by subgroup: School year 2003–04
Expected2 Achieved
Subgroup1 Total Language
minority
Not language minority Total
Language minority
Not language minority
Total 11,372 3,549 7,823 11,820 3,405 8,415 School affiliation Public 9,008 2,969 6,039 9,412 2,845 6,567 Private 2,364 580 1,784 2,408 560 1,848 Catholic 1,291 325 966 1,451 330 1,121 Non-Catholic 1,073 255 818 957 230 727 Type of locale Rural 1,402 198 1,204 1,659 199 1,460 Non-rural 9,969 3,350 6,619 10,161 3,206 6,955 Race/ethnicity Hispanic 2,321 1,894 427 2,244 1,821 423 Black 1,492 108 1,384 1,352 91 1,261 Asian/Pacific Islander 994 836 158 970 799 171 Other 6,564 710 5,854 7,254 694 6,5601 Characteristics of the schools (school affiliation and type of locale) are from the original sample schools. 2 The expected sample size was computed using assumed mover rates, differential subsampling rates, and a 90 percent completion rate. SOURCE: U.S. Department of Education, National Center for Education Statistics, Early Childhood Longitudinal Study, Kindergarten Class of 1998–99 (ECLS-K), spring 2004.
Table 3-21 is analogous to table 3-20 but shows the percent distribution instead of counts.
The achieved sample is about 4 percent larger than the expected sample, with the language minority sample about 4 percent smaller than the expected sample. As in third grade, language minority children moved at a higher rate (48 percent) than non-language minority children (37 percent) resulting in the larger sample of non-language minority children.
As shown in table 3-21, the agreement between the expected and achieved fifth-grade
samples is as seen in third grade. Children in non-Catholic private schools responded at a lower rate than children in Catholic schools, causing the achieved sample size for children in non-Catholic schools to be lower than expected. For all other characteristics, the difference between expected and achieved sample sizes is less than 1 percent for language minority children and around 3 percent or less for non-language minority children.
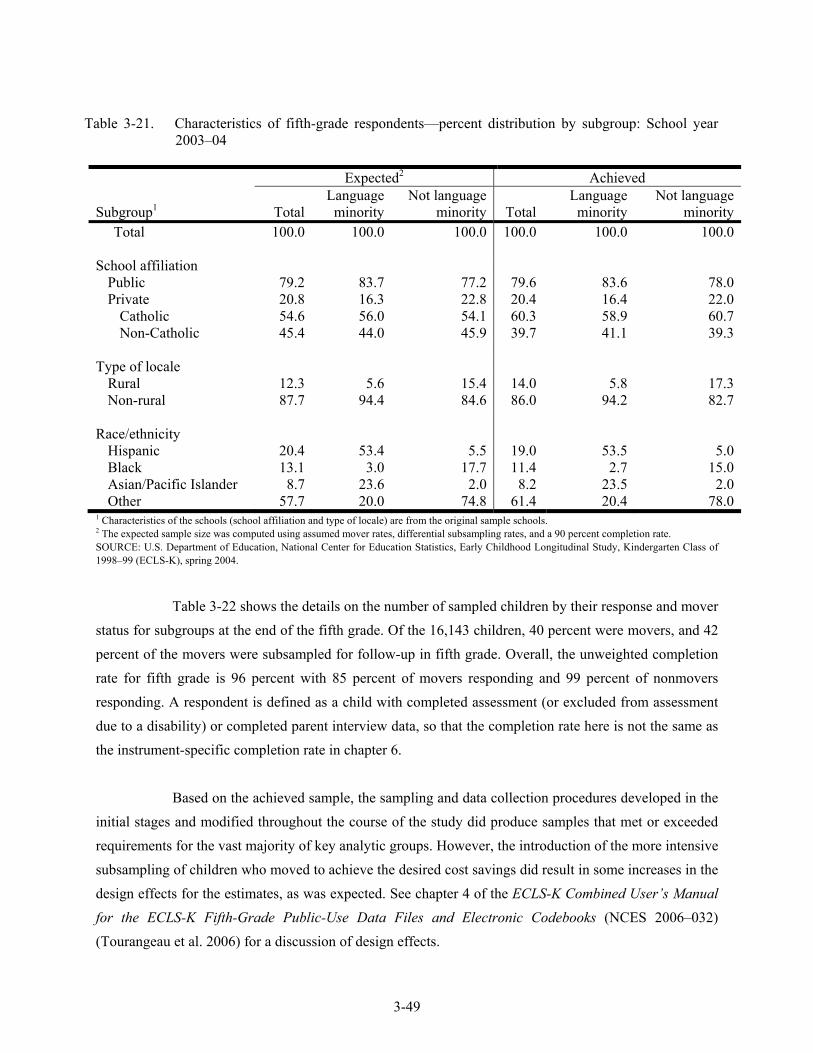
3-49
Table 3-21. Characteristics of fifth-grade respondents—percent distribution by subgroup: School year 2003–04
Expected2 Achieved
Subgroup1 Total Language
minorityNot language
minority TotalLanguage
minority Not language
minority Total 100.0 100.0 100.0 100.0 100.0 100.0 School affiliation Public 79.2 83.7 77.2 79.6 83.6 78.0 Private 20.8 16.3 22.8 20.4 16.4 22.0 Catholic 54.6 56.0 54.1 60.3 58.9 60.7 Non-Catholic 45.4 44.0 45.9 39.7 41.1 39.3 Type of locale Rural 12.3 5.6 15.4 14.0 5.8 17.3 Non-rural 87.7 94.4 84.6 86.0 94.2 82.7 Race/ethnicity Hispanic 20.4 53.4 5.5 19.0 53.5 5.0 Black 13.1 3.0 17.7 11.4 2.7 15.0 Asian/Pacific Islander 8.7 23.6 2.0 8.2 23.5 2.0 Other 57.7 20.0 74.8 61.4 20.4 78.01 Characteristics of the schools (school affiliation and type of locale) are from the original sample schools. 2 The expected sample size was computed using assumed mover rates, differential subsampling rates, and a 90 percent completion rate. SOURCE: U.S. Department of Education, National Center for Education Statistics, Early Childhood Longitudinal Study, Kindergarten Class of 1998–99 (ECLS-K), spring 2004.
Table 3-22 shows the details on the number of sampled children by their response and mover
status for subgroups at the end of the fifth grade. Of the 16,143 children, 40 percent were movers, and 42 percent of the movers were subsampled for follow-up in fifth grade. Overall, the unweighted completion rate for fifth grade is 96 percent with 85 percent of movers responding and 99 percent of nonmovers responding. A respondent is defined as a child with completed assessment (or excluded from assessment due to a disability) or completed parent interview data, so that the completion rate here is not the same as the instrument-specific completion rate in chapter 6.
Based on the achieved sample, the sampling and data collection procedures developed in the
initial stages and modified throughout the course of the study did produce samples that met or exceeded requirements for the vast majority of key analytic groups. However, the introduction of the more intensive subsampling of children who moved to achieve the desired cost savings did result in some increases in the design effects for the estimates, as was expected. See chapter 4 of the ECLS-K Combined User’s Manual for the ECLS-K Fifth-Grade Public-Use Data Files and Electronic Codebooks (NCES 2006–032) (Tourangeau et al. 2006) for a discussion of design effects.
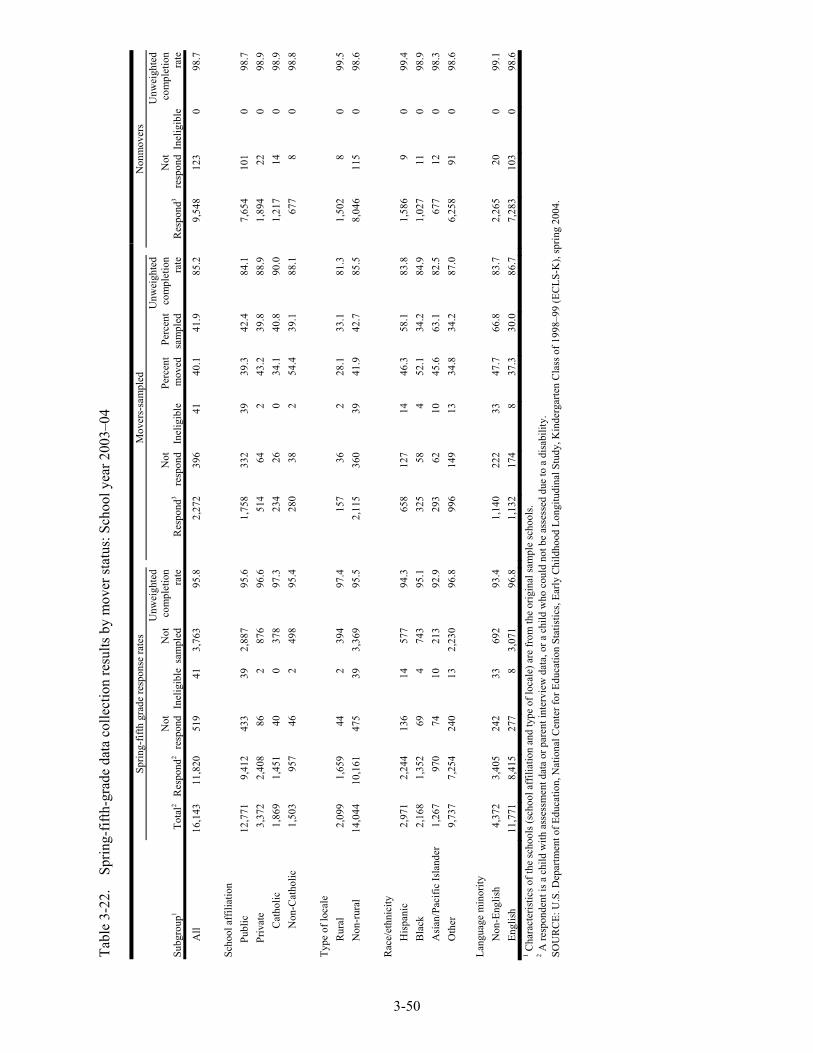
3-50
Tabl
e 3-
22.
Spr
ing-
fifth
-gra
de d
ata
colle
ctio
n re
sults
by
mov
er st
atus
: Sch
ool y
ear 2
003–
04
Sp
ring-
fifth
gra
de re
spon
se ra
tes
Mov
ers-
sam
pled
N
onm
over
s
Subg
roup
1 To
tal2
Res
pond
2 N
ot
resp
ond
Inel
igib
leN
ot
sam
pled
Unw
eigh
ted
com
plet
ion
rate
Res
pond
3N
ot
resp
ond
Inel
igib
le
Perc
ent
mov
edPe
rcen
t sa
mpl
ed
Unw
eigh
ted
com
plet
ion
rate
Res
pond
3N
ot
resp
ond
Inel
igib
le
Unw
eigh
ted
com
plet
ion
rate
A
ll 16
,143
11
,820
51
941
3,76
395
.82,
272
396
41
40.1
41.9
85.2
9,54
812
30
98.7
Scho
ol a
ffili
atio
n
Pu
blic
12
,771
9,
412
433
392,
887
95.6
1,75
833
239
39
.342
.484
.17,
654
101
098
.7
Priv
ate
3,37
2 2,
408
862
876
96.6
514
642
43.2
39.8
88.9
1,89
422
098
.9
Cat
holic
1,
869
1,45
1 40
037
897
.323
426
0 34
.140
.890
.01,
217
140
98.9
N
on-C
atho
lic
1,50
3 95
7 46
249
895
.428
038
2 54
.439
.188
.167
78
098
.8
Ty
pe o
f loc
ale
R
ural
2,
099
1,65
9 44
239
497
.415
736
2 28
.133
.181
.31,
502
80
99.5
Non
-rur
al
14,0
44
10,1
61
475
393,
369
95.5
2,11
536
039
41
.942
.785
.58,
046
115
098
.6
R
ace/
ethn
icity
His
pani
c 2,
971
2,24
4 13
614
577
94.3
658
127
14
46.3
58.1
83.8
1,58
69
099
.4
B
lack
2,
168
1,35
2 69
474
395
.132
558
4 52
.134
.284
.91,
027
110
98.9
Asi
an/P
acifi
c Is
land
er
1,26
7 97
0 74
1021
392
.929
362
10
45.6
63.1
82.5
677
120
98.3
Oth
er
9,73
7 7,
254
240
132,
230
96.8
996
149
13
34.8
34.2
87.0
6,25
891
098
.6
La
ngua
ge m
inor
ity
N
on-E
nglis
h
4,37
2 3,
405
242
3369
293
.41,
140
222
33
47.7
66.8
83.7
2,26
520
099
.1
E
nglis
h 11
,771
8,
415
277
83,
071
96.8
1,13
217
48
37.3
30.0
86.7
7,28
310
30
98.6
1 C
hara
cter
istic
s of t
he sc
hool
s (sc
hool
aff
iliat
ion
and
type
of l
ocal
e) a
re fr
om th
e or
igin
al sa
mpl
e sc
hool
s. 2 A
resp
onde
nt is
a c
hild
with
ass
essm
ent d
ata
or p
aren
t int
ervi
ew d
ata,
or a
chi
ld w
ho c
ould
not
be
asse
ssed
due
to a
dis
abili
ty.
SOU
RC
E: U
.S. D
epar
tmen
t of E
duca
tion,
Nat
iona
l Cen
ter f
or E
duca
tion
Stat
istic
s, Ea
rly C
hild
hood
Lon
gitu
dina
l Stu
dy, K
inde
rgar
ten
Cla
ss o
f 199
8–99
(EC
LS-K
), sp
ring
2004
.
3-51
3.7 Spring-Eighth-Grade Sample
3.7.1 Expected Sample Size
The sample design for eighth grade called for including all 12,129 children eligible after fifth grade (regardless of their fifth-grade response status), and following all movers without any subsampling. In the ECLS-K first-grade to fifth-grade data collections, subsampling of movers was used to reduce data collection costs. The initial sample size was developed taking into account the reduction in sample size and increase in the variability of the weights of the respondents resulting from the subsampling. As the design was extended beyond fifth grade (the initial planning of the ECLS-K did not plan for this extension into eighth grade), a change in the methods of handling movers to avoid subsampling them was needed to achieve the major analytic goals. The vast majority of children were not in the same school from kindergarten to eighth grade (having moved out of elementary schools into middle schools), and subsampling these movers would result in substantial losses in sample size and precision of the estimates for the eighth grade.
A feature of the fifth-grade sample whereby children were subsampled for the administration
of the mathematics or science teacher questionnaires as discussed in section 3.6 was retained for eighth grade. The same subsamples of children selected for these two instruments in the fifth grade were maintained for eighth grade (i.e., children who had been assigned to have mathematics teacher questionnaires in fifth grade had mathematics teacher questionnaires in eighth grade, and likewise for the science teacher questionnaire). This was to allow for longitudinal analyses of data from the mathematics and science teacher questionnaires.
Table 3-23 shows that slightly more than 9,600 respondents to the eighth-grade data
collection were expected. The expected sample size was based on assumptions made about mover rates and completion rates based on the eligible fifth-grade sample. The key assumptions for the sample size projection are the following:
An overall mover rate of 29.4 percent for the children, where the rate is the
expected rate of moving residences between rounds. This mover rate was computed using the definition of home mover as any child whose home mailing zip code changed between fifth grade and an earlier grade. If the fifth-grade zip code was not known, then the comparison was between third grade and a grade prior to third grade, and so on.
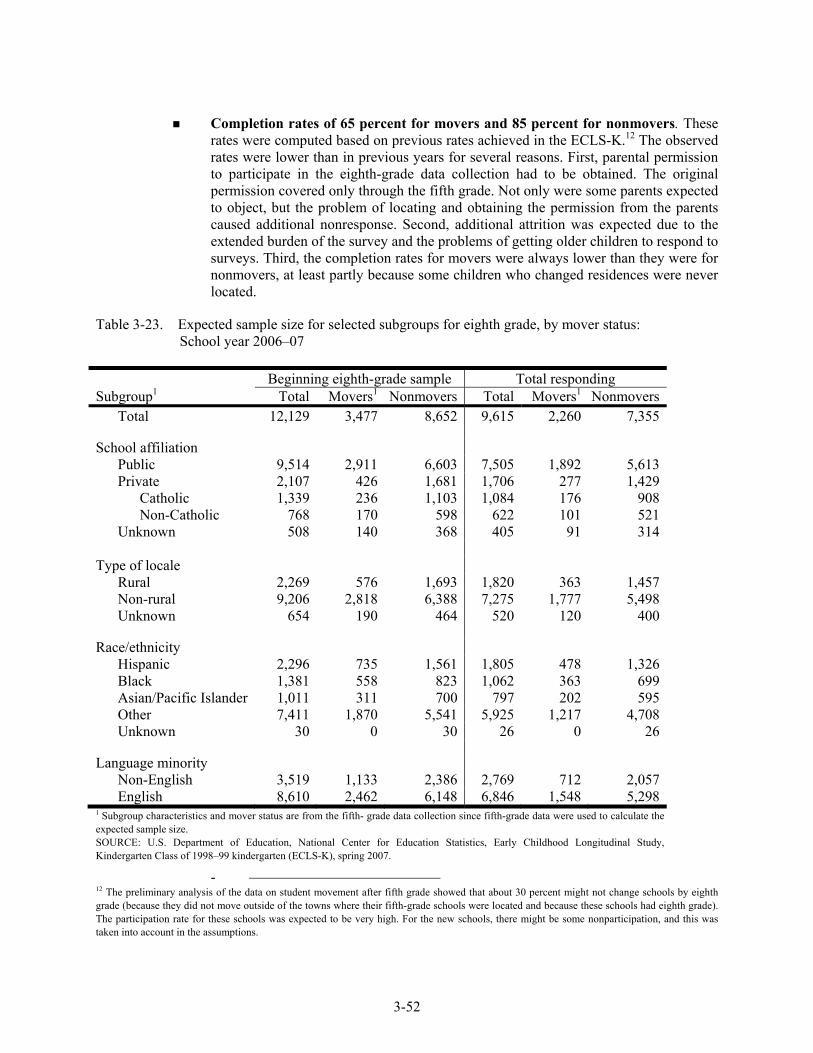
3-52
Completion rates of 65 percent for movers and 85 percent for nonmovers. These rates were computed based on previous rates achieved in the ECLS-K.12 The observed rates were lower than in previous years for several reasons. First, parental permission to participate in the eighth-grade data collection had to be obtained. The original permission covered only through the fifth grade. Not only were some parents expected to object, but the problem of locating and obtaining the permission from the parents caused additional nonresponse. Second, additional attrition was expected due to the extended burden of the survey and the problems of getting older children to respond to surveys. Third, the completion rates for movers were always lower than they were for nonmovers, at least partly because some children who changed residences were never located.
Table 3-23. Expected sample size for selected subgroups for eighth grade, by mover status: School year 2006–07 Beginning eighth-grade sample Total responding Subgroup1 Total Movers1 Nonmovers Total Movers1 Nonmovers Total 12,129 3,477 8,652 9,615 2,260 7,355 School affiliation Public 9,514 2,911 6,603 7,505 1,892 5,613 Private 2,107 426 1,681 1,706 277 1,429 Catholic 1,339 236 1,103 1,084 176 908 Non-Catholic 768 170 598 622 101 521 Unknown 508 140 368 405 91 314 Type of locale Rural 2,269 576 1,693 1,820 363 1,457 Non-rural 9,206 2,818 6,388 7,275 1,777 5,498 Unknown 654 190 464 520 120 400 Race/ethnicity Hispanic 2,296 735 1,561 1,805 478 1,326 Black 1,381 558 823 1,062 363 699 Asian/Pacific Islander 1,011 311 700 797 202 595 Other 7,411 1,870 5,541 5,925 1,217 4,708 Unknown 30 0 30 26 0 26 Language minority Non-English 3,519 1,133 2,386 2,769 712 2,057 English 8,610 2,462 6,148 6,846 1,548 5,2981 Subgroup characteristics and mover status are from the fifth- grade data collection since fifth-grade data were used to calculate the expected sample size. SOURCE: U.S. Department of Education, National Center for Education Statistics, Early Childhood Longitudinal Study, Kindergarten Class of 1998–99 kindergarten (ECLS-K), spring 2007.
- 12 The preliminary analysis of the data on student movement after fifth grade showed that about 30 percent might not change schools by eighth grade (because they did not move outside of the towns where their fifth-grade schools were located and because these schools had eighth grade). The participation rate for these schools was expected to be very high. For the new schools, there might be some nonparticipation, and this was taken into account in the assumptions.
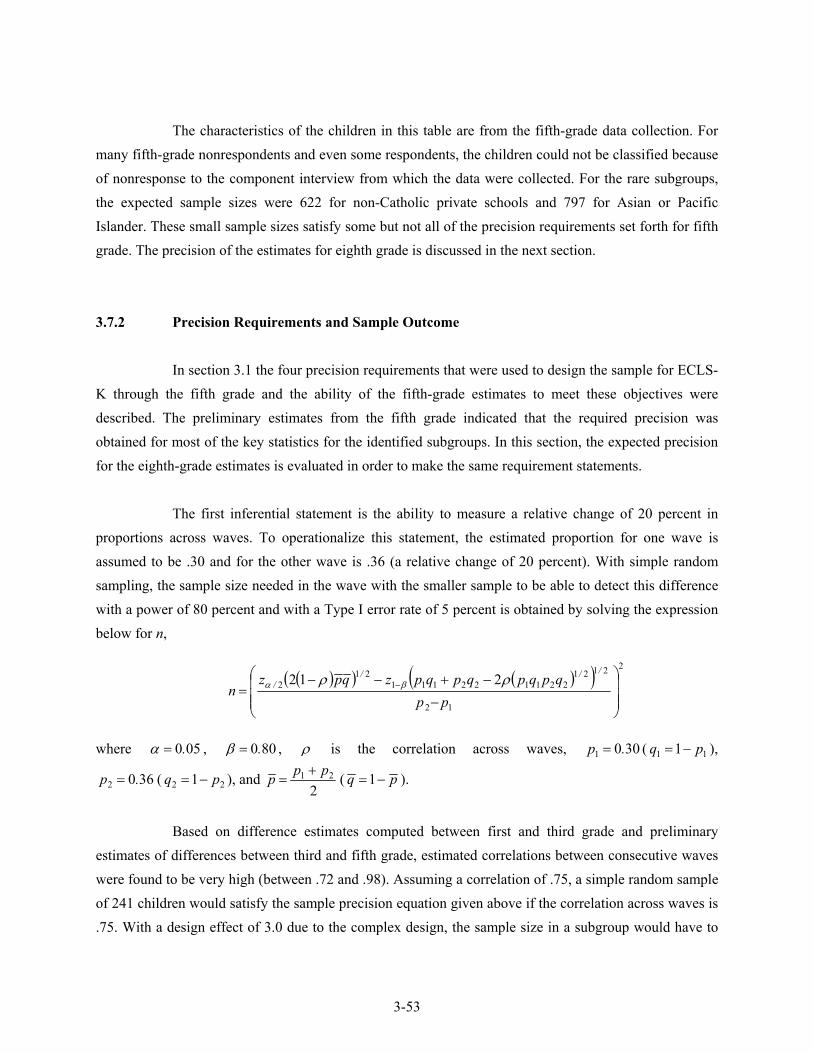
3-53
The characteristics of the children in this table are from the fifth-grade data collection. For many fifth-grade nonrespondents and even some respondents, the children could not be classified because of nonresponse to the component interview from which the data were collected. For the rare subgroups, the expected sample sizes were 622 for non-Catholic private schools and 797 for Asian or Pacific Islander. These small sample sizes satisfy some but not all of the precision requirements set forth for fifth grade. The precision of the estimates for eighth grade is discussed in the next section.
3.7.2 Precision Requirements and Sample Outcome
In section 3.1 the four precision requirements that were used to design the sample for ECLS-K through the fifth grade and the ability of the fifth-grade estimates to meet these objectives were described. The preliminary estimates from the fifth grade indicated that the required precision was obtained for most of the key statistics for the identified subgroups. In this section, the expected precision for the eighth-grade estimates is evaluated in order to make the same requirement statements.
The first inferential statement is the ability to measure a relative change of 20 percent in
proportions across waves. To operationalize this statement, the estimated proportion for one wave is assumed to be .30 and for the other wave is .36 (a relative change of 20 percent). With simple random sampling, the sample size needed in the wave with the smaller sample to be able to detect this difference with a power of 80 percent and with a Type I error rate of 5 percent is obtained by solving the expression below for n,
( )( ) ( )( ) 2
12
2121221122111
212 212
⎟⎟⎟
⎠
⎞
⎜⎜⎜
⎝
⎛
−
−+−−= −
ppqpqpqpqpzqpz
n///
/ ρρ βα
where 050.=α , 800.=β , ρ is the correlation across waves, 3001 .p = ( 11 1 pq −= ),
3602 .p = ( 22 1 pq −= ), and 2
21 ppp += ( pq −=1 ).
Based on difference estimates computed between first and third grade and preliminary
estimates of differences between third and fifth grade, estimated correlations between consecutive waves were found to be very high (between .72 and .98). Assuming a correlation of .75, a simple random sample of 241 children would satisfy the sample precision equation given above if the correlation across waves is .75. With a design effect of 3.0 due to the complex design, the sample size in a subgroup would have to
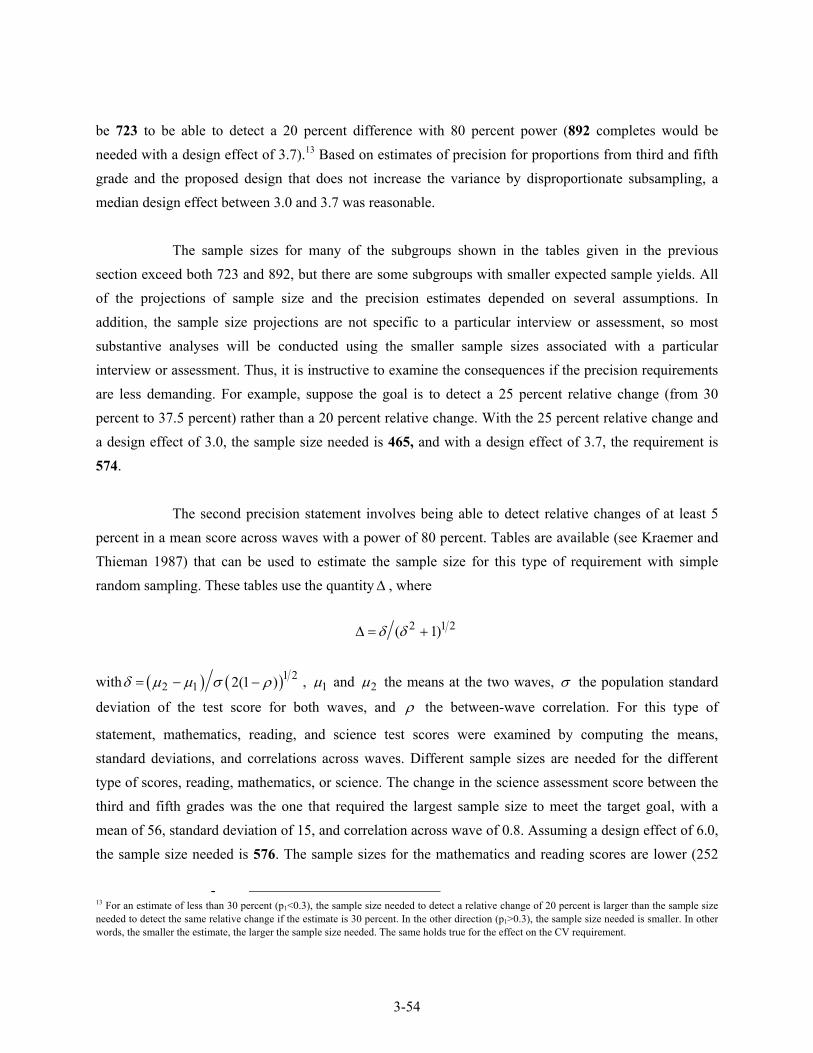
3-54
be 723 to be able to detect a 20 percent difference with 80 percent power (892 completes would be needed with a design effect of 3.7).13 Based on estimates of precision for proportions from third and fifth grade and the proposed design that does not increase the variance by disproportionate subsampling, a median design effect between 3.0 and 3.7 was reasonable.
The sample sizes for many of the subgroups shown in the tables given in the previous
section exceed both 723 and 892, but there are some subgroups with smaller expected sample yields. All of the projections of sample size and the precision estimates depended on several assumptions. In addition, the sample size projections are not specific to a particular interview or assessment, so most substantive analyses will be conducted using the smaller sample sizes associated with a particular interview or assessment. Thus, it is instructive to examine the consequences if the precision requirements are less demanding. For example, suppose the goal is to detect a 25 percent relative change (from 30 percent to 37.5 percent) rather than a 20 percent relative change. With the 25 percent relative change and a design effect of 3.0, the sample size needed is 465, and with a design effect of 3.7, the requirement is 574.
The second precision statement involves being able to detect relative changes of at least 5
percent in a mean score across waves with a power of 80 percent. Tables are available (see Kraemer and Thieman 1987) that can be used to estimate the sample size for this type of requirement with simple random sampling. These tables use the quantity Δ , where
2 1 2( 1)δ δΔ = +
with ( ) ( )1 2
2 1 2(1 )δ σμ μ ρ= − − , 1μ and 2μ the means at the two waves, σ the population standard
deviation of the test score for both waves, and ρ the between-wave correlation. For this type of
statement, mathematics, reading, and science test scores were examined by computing the means, standard deviations, and correlations across waves. Different sample sizes are needed for the different type of scores, reading, mathematics, or science. The change in the science assessment score between the third and fifth grades was the one that required the largest sample size to meet the target goal, with a mean of 56, standard deviation of 15, and correlation across wave of 0.8. Assuming a design effect of 6.0, the sample size needed is 576. The sample sizes for the mathematics and reading scores are lower (252
- 13 For an estimate of less than 30 percent (p1<0.3), the sample size needed to detect a relative change of 20 percent is larger than the sample size needed to detect the same relative change if the estimate is 30 percent. In the other direction (p1>0.3), the sample size needed is smaller. In other words, the smaller the estimate, the larger the sample size needed. The same holds true for the effect on the CV requirement.
3-55
and 216, respectively, still assuming a design effect of 6.0). These are the sample sizes needed to meet the precision requirement of detecting relative changes of at least 5 percent in a mean assessment score across waves, and not the expected sample sizes for eighth grade.
The third type of statement to be supported is the estimation of a proportion for each wave
with a CV of 10 percent or less. Assuming the proportion is .30, the required sample size with simple random sampling is n = 0.7/(0.3*.01)=233. When this sample size is multiplied by an average design effect of 3.7, the sample size needed increases to 863.
The final precision statement deals with the precision for estimates of mean assessment
scores for each wave. The original requirement for the fifth grade was to produce estimates with a CV for assessment scores of 2.5 percent or less. For a simple random sample, the sample size required is simply the CV of the score in the population squared multiplied by 1,600 (the inverse of 0.025 squared). Using the same mean and standard deviation assumptions given above, the science assessment mean requires a larger sample size than the mathematics or the reading assessments. The simple random sample size requirement for the mean science assessment score is 115, but with the design effects for assessment scores of approximately 6.0, the sample size requirement becomes 689. If the precision requirement was to have a CV of 3.0 percent rather than 2.5 percent, then the sample size needed to achieve this level of precision for the mean science assessment would only be 478.
Table 3-24 (count) and table 3-25 (percent) show the characteristics of the achieved eighth-
grade sample compared with the expected eighth-grade sample. The numbers of eighth-grade respondents for all of the identified subgroups of interest exceed 1,000, except for children in non-Catholic private schools and Asian or Pacific Islander children. For most of the key analytic groups the numbers of respondents are larger than 1,000, thus satisfying the precision requirements set forth at the beginning of the study. For the 665 Asian or Pacific Islander children and 639 children in non-Catholic private schools, the original precisions cannot be satisfied. Lower precision requirements as discussed above (and summarized in at the end of section 3.1) apply.
The sample of 9,725 respondents attended 2,266 public schools and 485 private schools. Of
the public schools, 2,172 schools are transfer schools (96 percent), and 2,041 schools are schools that are new to eighth grade. This reflects the fact that the majority of children moved from their elementary schools into middle schools. The pattern is the same for private schools but not as dramatic. Of the private schools, 323 schools are transfer schools (67 percent) and 245 are new schools.
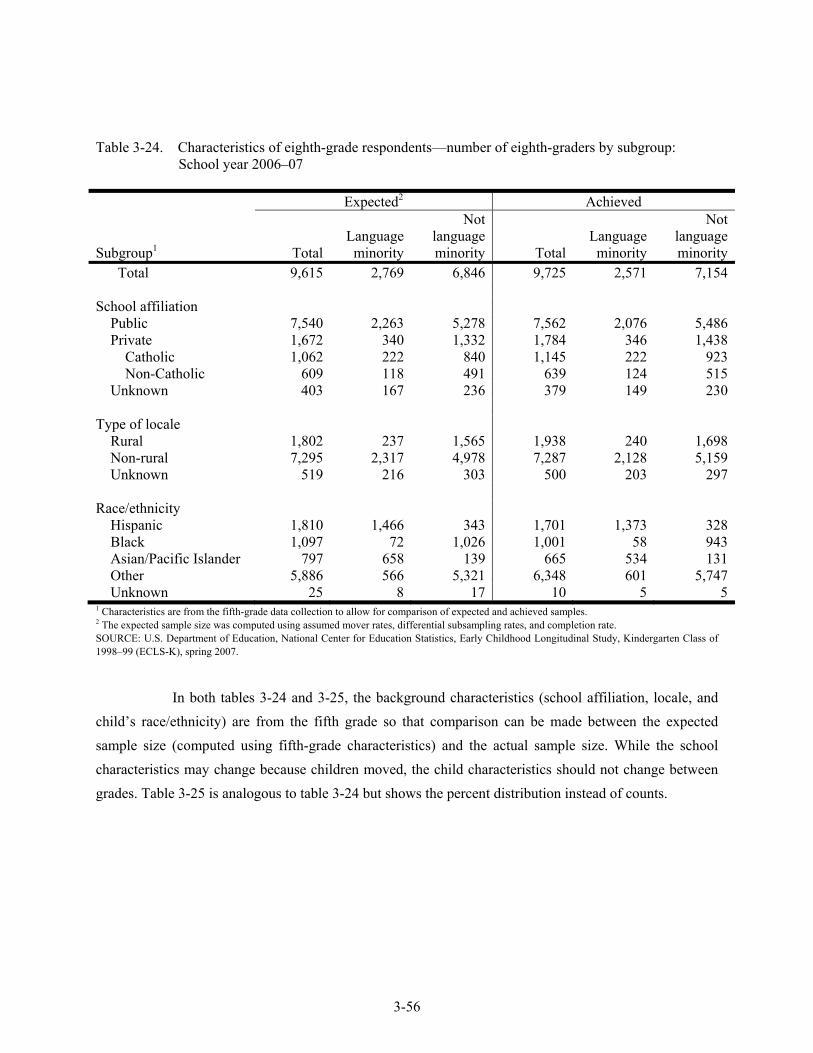
3-56
Table 3-24. Characteristics of eighth-grade respondents—number of eighth-graders by subgroup:
School year 2006–07 Expected2 Achieved
Subgroup1 Total Language
minority
Not language minority Total
Language minority
Not language minority
Total 9,615 2,769 6,846 9,725 2,571 7,154 School affiliation Public 7,540 2,263 5,278 7,562 2,076 5,486 Private 1,672 340 1,332 1,784 346 1,438 Catholic 1,062 222 840 1,145 222 923 Non-Catholic 609 118 491 639 124 515 Unknown 403 167 236 379 149 230 Type of locale Rural 1,802 237 1,565 1,938 240 1,698 Non-rural 7,295 2,317 4,978 7,287 2,128 5,159 Unknown 519 216 303 500 203 297 Race/ethnicity Hispanic 1,810 1,466 343 1,701 1,373 328 Black 1,097 72 1,026 1,001 58 943 Asian/Pacific Islander 797 658 139 665 534 131 Other 5,886 566 5,321 6,348 601 5,747 Unknown 25 8 17 10 5 51 Characteristics are from the fifth-grade data collection to allow for comparison of expected and achieved samples. 2 The expected sample size was computed using assumed mover rates, differential subsampling rates, and completion rate. SOURCE: U.S. Department of Education, National Center for Education Statistics, Early Childhood Longitudinal Study, Kindergarten Class of 1998–99 (ECLS-K), spring 2007.
In both tables 3-24 and 3-25, the background characteristics (school affiliation, locale, and
child’s race/ethnicity) are from the fifth grade so that comparison can be made between the expected sample size (computed using fifth-grade characteristics) and the actual sample size. While the school characteristics may change because children moved, the child characteristics should not change between grades. Table 3-25 is analogous to table 3-24 but shows the percent distribution instead of counts.
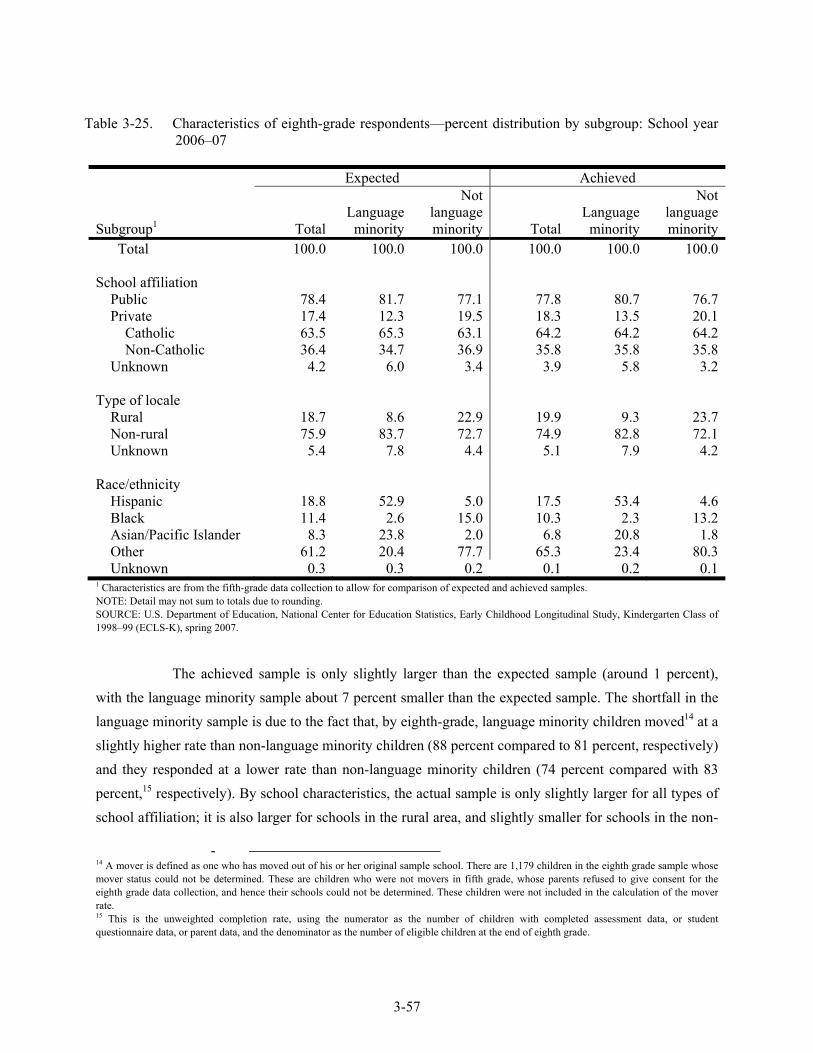
3-57
Table 3-25. Characteristics of eighth-grade respondents—percent distribution by subgroup: School year 2006–07
Expected Achieved
Subgroup1 Total Language
minority
Not language minority Total
Language minority
Not language minority
Total 100.0 100.0 100.0 100.0 100.0 100.0 School affiliation Public 78.4 81.7 77.1 77.8 80.7 76.7 Private 17.4 12.3 19.5 18.3 13.5 20.1 Catholic 63.5 65.3 63.1 64.2 64.2 64.2 Non-Catholic 36.4 34.7 36.9 35.8 35.8 35.8 Unknown 4.2 6.0 3.4 3.9 5.8 3.2 Type of locale Rural 18.7 8.6 22.9 19.9 9.3 23.7 Non-rural 75.9 83.7 72.7 74.9 82.8 72.1 Unknown 5.4 7.8 4.4 5.1 7.9 4.2 Race/ethnicity Hispanic 18.8 52.9 5.0 17.5 53.4 4.6 Black 11.4 2.6 15.0 10.3 2.3 13.2 Asian/Pacific Islander 8.3 23.8 2.0 6.8 20.8 1.8 Other 61.2 20.4 77.7 65.3 23.4 80.3 Unknown 0.3 0.3 0.2 0.1 0.2 0.11 Characteristics are from the fifth-grade data collection to allow for comparison of expected and achieved samples. NOTE: Detail may not sum to totals due to rounding. SOURCE: U.S. Department of Education, National Center for Education Statistics, Early Childhood Longitudinal Study, Kindergarten Class of 1998–99 (ECLS-K), spring 2007.
The achieved sample is only slightly larger than the expected sample (around 1 percent),
with the language minority sample about 7 percent smaller than the expected sample. The shortfall in the language minority sample is due to the fact that, by eighth-grade, language minority children moved14 at a slightly higher rate than non-language minority children (88 percent compared to 81 percent, respectively) and they responded at a lower rate than non-language minority children (74 percent compared with 83 percent,15 respectively). By school characteristics, the actual sample is only slightly larger for all types of school affiliation; it is also larger for schools in the rural area, and slightly smaller for schools in the non-
- 14 A mover is defined as one who has moved out of his or her original sample school. There are 1,179 children in the eighth grade sample whose mover status could not be determined. These are children who were not movers in fifth grade, whose parents refused to give consent for the eighth grade data collection, and hence their schools could not be determined. These children were not included in the calculation of the mover rate. 15 This is the unweighted completion rate, using the numerator as the number of children with completed assessment data, or student questionnaire data, or parent data, and the denominator as the number of eligible children at the end of eighth grade.
3-58
rural area. The drop in the actual sample compared with the expected sample by either school affiliation or school locale occurs only where the school affiliation or school locale is unknown, meaning that children were located more efficiently than in previous years and there were fewer cases where these two school characteristics were unknown. By race/ethnicity, the actual sample sizes are smaller than expected for minority children but larger than expected for White children and children whose race/ethnicity is other than Black, Hispanic, and Asian or Pacific Islander. This is consistent with the shortfall of language minority sample discussed earlier. Language minority (Hispanic and Asian or Pacific Islander) and Black children responded less frequently than White children and children with “other” race. The unweighted completion rates are 66 percent for Asian or Pacific Islander, 73 percent for Black, 75 percent for Hispanic, 83 percent for “other” race, and 86 percent for White.
Table 3-26 shows the details on the number of sampled children by their response and mover
status for subgroups at the end of eighth grade. Of the 12,129 children eligible for the eighth-grade collection, 75 percent moved out of the original sample schools. The difference between public and private schools is striking. The majority of public school children moved from their elementary school into a middle or junior high school. Unlike previous years, all movers were followed into their new school. Overall, the unweighted completion rate for eighth grade is 80 percent with 91 percent of movers responding and 77 percent of nonmovers responding. A respondent is defined as a child with completed assessment (or excluded from assessment due to a disability), student questionnaire data, or completed parent interview data, so that the completion rate here is not the same as the instrument-specific completion rate in chapter 6. In the eighth-grade data collection, there are 1,179 children whose mover status could not be determined. Of these, only 43 children responded (or 4 percent). They are children who were not movers in fifth grade, and whose parents refused consent to the eighth-grade data collection so that their movement was not traced. They could have been assumed to be nonmovers, but doing so would depress further the completion rate of the nonmovers. Note that they were considered respondents because, even though their parents refused consent for the assessment (and thus their school movements were not traced), the parent interviews were completed. In eighth grade, all movers were followed and successfully located. Once they were located, they participated in the study at a high rate.
Table 3-27 shows the characteristics of children who were excluded from the eighth-grade
data collection.
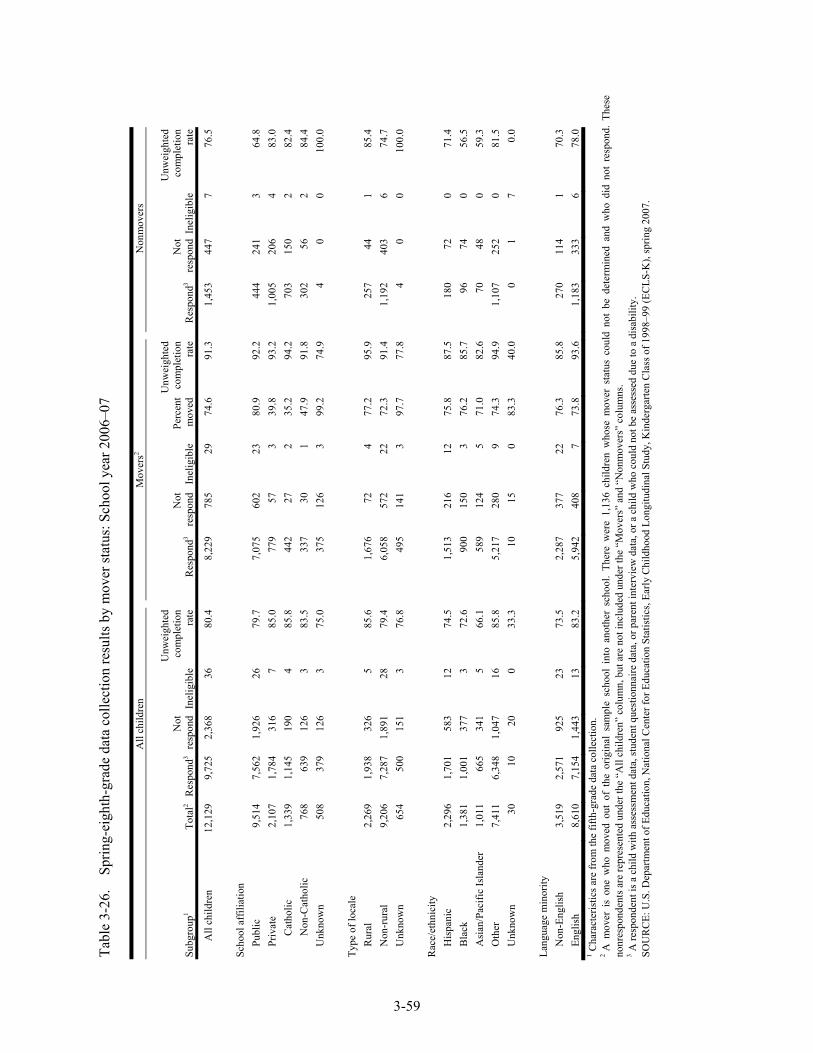
3-59
Tabl
e 3-
26.
Spr
ing-
eigh
th-g
rade
dat
a co
llect
ion
resu
lts b
y m
over
stat
us: S
choo
l yea
r 200
6–07
All
child
ren
Mov
ers2
Non
mov
ers
Subg
roup
1 To
tal2
Res
pond
3 N
ot
resp
ond
Inel
igib
le
Unw
eigh
ted
com
plet
ion
rate
Res
pond
3N
ot
resp
ond
Inel
igib
le
Perc
ent
mov
ed
Unw
eigh
ted
com
plet
ion
rate
Res
pond
3N
ot
resp
ond
Inel
igib
le
Unw
eigh
ted
com
plet
ion
rate
All
child
ren
12,1
29
9,72
5 2,
368
3680
.48,
229
785
29
74.6
91.3
1,45
344
77
76.5
Scho
ol a
ffili
atio
n
Publ
ic
9,51
4 7,
562
1,92
626
79.7
7,07
560
223
80
.992
.244
424
13
64.8
Priv
ate
2,10
7 1,
784
316
785
.077
957
3 39
.893
.21,
005
206
483
.0
Cat
holic
1,
339
1,14
5 19
04
85.8
442
272
35.2
94.2
703
150
282
.4
Non
-Cat
holic
76
8 63
9 12
63
83.5
337
301
47.9
91.8
302
562
84.4
Unk
now
n 50
8 37
9 12
63
75.0
375
126
3 99
.274
.94
00
100.
0
Ty
pe o
f loc
ale
Rur
al
2,26
9 1,
938
326
585
.61,
676
724
77.2
95.9
257
441
85.4
Non
-rur
al
9,20
6 7,
287
1,89
128
79.4
6,05
857
222
72
.391
.41,
192
403
674
.7
Unk
now
n 65
4 50
0 15
13
76.8
495
141
3 97
.777
.84
00
100.
0
R
ace/
ethn
icity
His
pani
c 2,
296
1,70
1 58
312
74.5
1,51
321
612
75
.887
.518
072
071
.4
Bla
ck
1,38
1 1,
001
377
372
.690
015
03
76.2
85.7
9674
056
.5
Asi
an/P
acifi
c Is
land
er
1,01
1 66
5 34
15
66.1
589
124
5 71
.082
.670
480
59.3
Oth
er
7,41
1 6,
348
1,04
716
85.8
5,21
728
09
74.3
94.9
1,10
725
20
81.5
Unk
now
n 30
10
20
033
.310
150
83.3
40.0
01
70.
0
La
ngua
ge m
inor
ity
Non
-Eng
lish
3,
519
2,57
1 92
523
73.5
2,28
737
722
76
.385
.827
011
41
70.3
Engl
ish
8,61
0 7,
154
1,44
313
83.2
5,94
240
87
73.8
93.6
1,18
333
36
78.0
1 Cha
ract
eris
tics a
re fr
om th
e fif
th-g
rade
dat
a co
llect
ion.
2 A
mov
er i
s on
e w
ho m
oved
out
of
the
orig
inal
sam
ple
scho
ol i
nto
anot
her
scho
ol.
Ther
e w
ere
1,13
6 ch
ildre
n w
hose
mov
er s
tatu
s co
uld
not
be d
eter
min
ed a
nd w
ho d
id n
ot r
espo
nd.
Thes
e no
nres
pond
ents
are
repr
esen
ted
unde
r the
“A
ll ch
ildre
n” c
olum
n, b
ut a
re n
ot in
clud
ed u
nder
the
“Mov
ers”
and
“N
onm
over
s” c
olum
ns.
3 A re
spon
dent
is a
chi
ld w
ith a
sses
smen
t dat
a, st
uden
t que
stio
nnai
re d
ata,
or p
aren
t int
ervi
ew d
ata,
or a
chi
ld w
ho c
ould
not
be
asse
ssed
due
to a
dis
abili
ty.
SOU
RC
E: U
.S. D
epar
tmen
t of E
duca
tion,
Nat
iona
l Cen
ter f
or E
duca
tion
Stat
istic
s, Ea
rly C
hild
hood
Lon
gitu
dina
l Stu
dy, K
inde
rgar
ten
Cla
ss o
f 199
8–99
(EC
LS-K
), sp
ring
2007
.
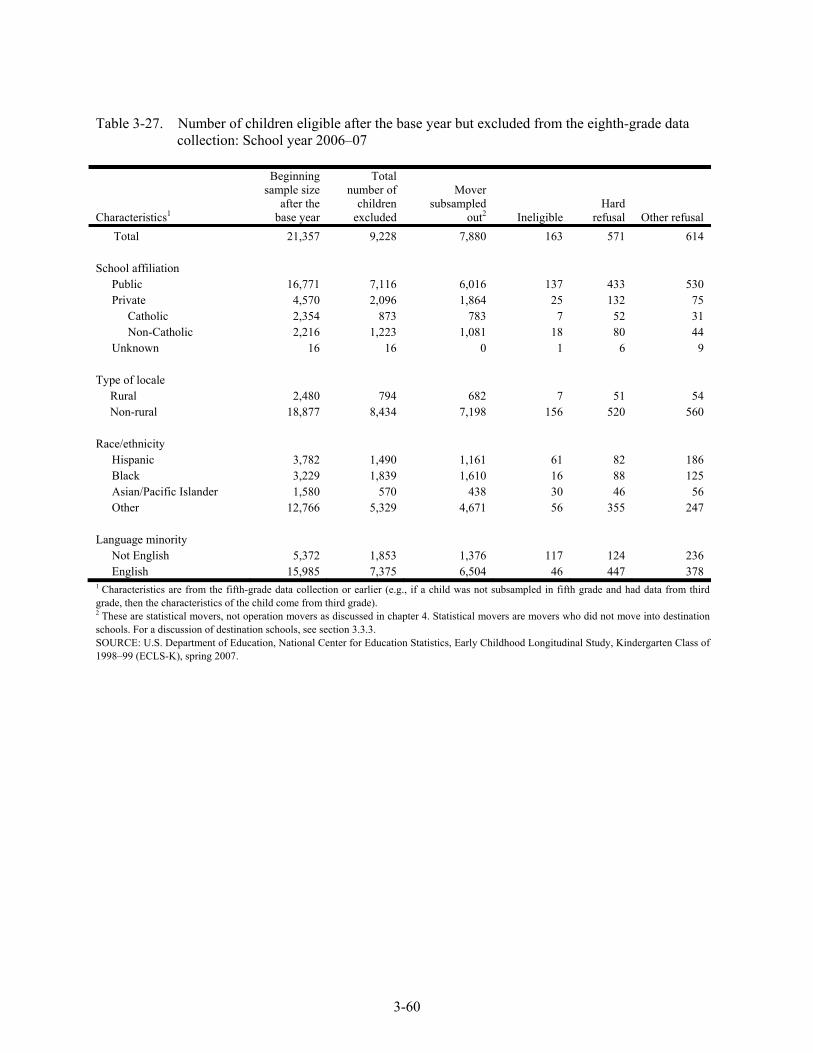
3-60
Table 3-27. Number of children eligible after the base year but excluded from the eighth-grade data collection: School year 2006–07
Characteristics1
Beginning sample size
after the base year
Total number of
children excluded
Mover subsampled
out2 Ineligible Hard
refusal Other refusal Total 21,357 9,228 7,880 163 571 614 School affiliation Public 16,771 7,116 6,016 137 433 530 Private 4,570 2,096 1,864 25 132 75 Catholic 2,354 873 783 7 52 31 Non-Catholic 2,216 1,223 1,081 18 80 44 Unknown 16 16 0 1 6 9 Type of locale
Rural 2,480 794 682 7 51 54 Non-rural 18,877 8,434 7,198 156 520 560
Race/ethnicity Hispanic 3,782 1,490 1,161 61 82 186 Black 3,229 1,839 1,610 16 88 125 Asian/Pacific Islander 1,580 570 438 30 46 56 Other 12,766 5,329 4,671 56 355 247 Language minority Not English 5,372 1,853 1,376 117 124 236 English 15,985 7,375 6,504 46 447 378 1 Characteristics are from the fifth-grade data collection or earlier (e.g., if a child was not subsampled in fifth grade and had data from third grade, then the characteristics of the child come from third grade). 2 These are statistical movers, not operation movers as discussed in chapter 4. Statistical movers are movers who did not move into destination schools. For a discussion of destination schools, see section 3.3.3. SOURCE: U.S. Department of Education, National Center for Education Statistics, Early Childhood Longitudinal Study, Kindergarten Class of 1998–99 (ECLS-K), spring 2007.
4-1
4. DATA COLLECTION METHODS
The following sections discuss the data collection procedures in the eighth-grade data collection phase of the Early Childhood Longitudinal Study, Kindergarten Class of 1998–99 (ECLS-K). Section 4.1 gives an overview of the data collection methods. Detailed information is provided on roles and responsibilities in the study (section 4.2), study training procedures (section 4.3), obtaining parent consent (section 4.4), conducting the parent interview (section 4.5), fall preassessment school contacts (section 4.6), spring-eighth grade data collection (section 4.7), and data collection quality control procedures (section 4.8).
4.1 Overview of Data Collection Methods
The ECLS-K eighth-grade data collection activities began in spring 2006 and continued through spring 2007. Spring 2006 data collection was conducted to obtain consent from parents of sampled children for continued participation in the ECLS-K study and to identify the school their child attended. Fall data collection included conducting parent interviews, obtaining parent consent for outstanding cases, and recruiting schools. Schools were contacted to set appointments to conduct the child assessments in the spring of the 2006–07 school year, link children to teachers, identify children who had withdrawn from the school, and obtain locating information about their new schools. Spring data collection included the direct child assessments, and collection of child, teacher, and school questionnaires. Activities to locate children and confirm or obtain the name of the school in which they were enrolled continued throughout the entire data collection period. The content and timeline of the eighth-grade data collection are shown in exhibit 4-1.
The modes of data collection for obtaining consent and conducting the parent interview was
telephone and in-person computer-assisted interviewing (CAI) and mailed, hard-copy consent forms; the child assessments were timed and group-administered using hard-copy assessment booklets; self-administered questionnaires were used to gather information from teachers, school administrators, and children.
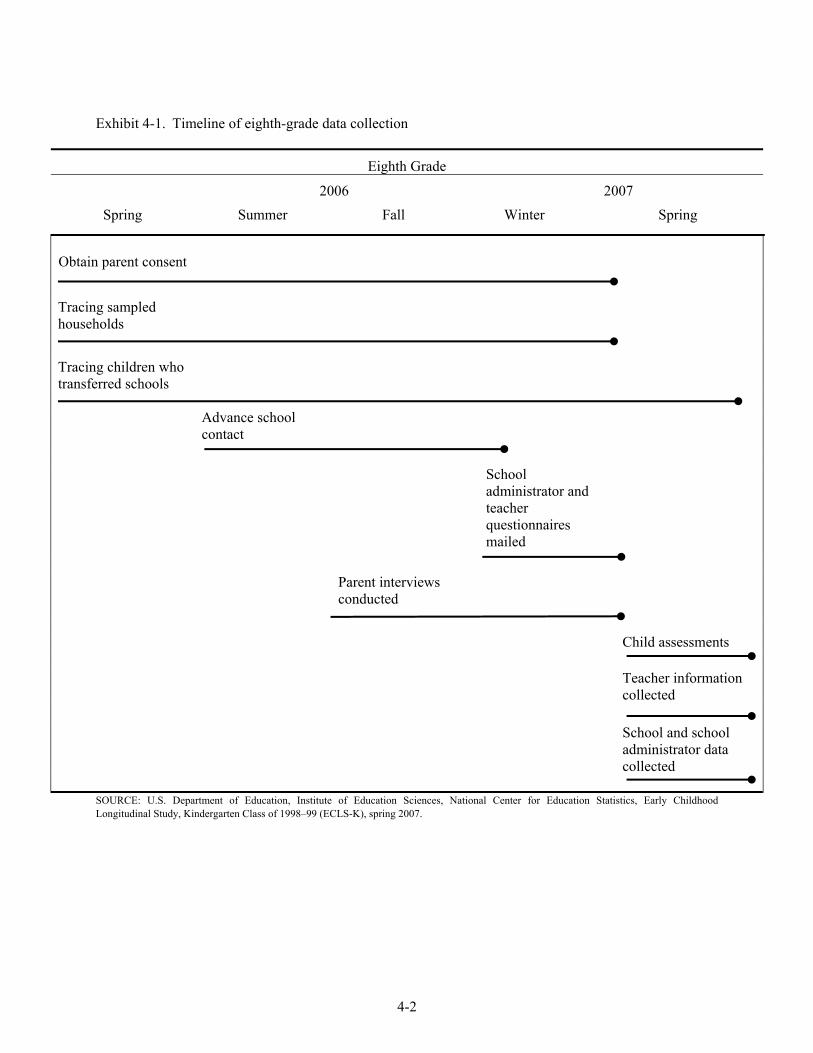
4-2
Exhibit 4-1. Timeline of eighth-grade data collection
Eighth Grade
2006 2007 Spring Summer Fall Winter Spring
Obtain parent consent
Tracing sampled households
Tracing children who transferred schools
Advance school
contact
School
administrator and teacher questionnaires mailed
Parent interviews
conducted
Child assessments Teacher information
collected School and school
administrator data collected
SOURCE: U.S. Department of Education, Institute of Education Sciences, National Center for Education Statistics, Early Childhood Longitudinal Study, Kindergarten Class of 1998–99 (ECLS-K), spring 2007.
4-3
4.1.1 Change in Data Collection Methods
Although the eighth-grade data collection shares many similarities with earlier rounds, some modifications were made to capture important information relevant to children in eighth grade. The major differences between the eighth-grade data collection and the earlier rounds are summarized below. Details on these changes are described in this chapter.
Parent data was collected in the fall rather than in the spring, as was the method in previous rounds. Because the data were collected at the beginning of the school year, items about parent involvement in various school functions were followed by items asking whether parents had yet had an opportunity to be involved in those functions.
In eighth grade, children were assessed in proctored group settings rather than one-on-one. In earlier rounds, the mathematics, reading, and science assessments were conducted via one-on-one direct assessment. In the eighth grade, however, children were expected to be familiar with proctored testing in school. Thus, groups of ECLS-K sampled children who attended the same school were assessed in a single, proctored group administration. The content changes of the assessment are described in section 2.1.2.
Two-level (high versus low) second-stage assessment forms were used, rather than the three-level forms used in previous rounds. In the eighth-grade timed assessment session, all children were given separate routing tests in each subject area to determine the level (high versus low) of their second-stage reading, mathematics, and science assessments. Routing children into two, rather than three, second-stage forms facilitated accurate and efficient distribution of the second-stage forms. Results of the spring 2006 field test showed that there was no loss of data by using a two-level second-stage form. Information on the results of the spring 2006 field test can be found in appendix A. Information on the quality of the eighth-grade assessment data can be found in the ECLS-K Psychometric Report for the Eighth Grade (NCES 2009–002) (Najarian et al. forthcoming).
The procedures for collecting height and weight data were modified. In the previous rounds of the ECLS-K, height and weight data were collected during the one-on-one direct assessment sessions. In the eighth grade, height and weight data were collected during the group assessment sessions. In most cases the groups were small (in many cases there was a single child). However, in some cases, the assessment sessions had several children participating. In the group assessment sessions, children were measured one at a time at a single height and weight station. The average size of the assessment group was three children and ranged from one to nine children per group.
In eighth grade, children completed self-administered paper and pencil questionnaires about their school experiences, their activities, their perceptions
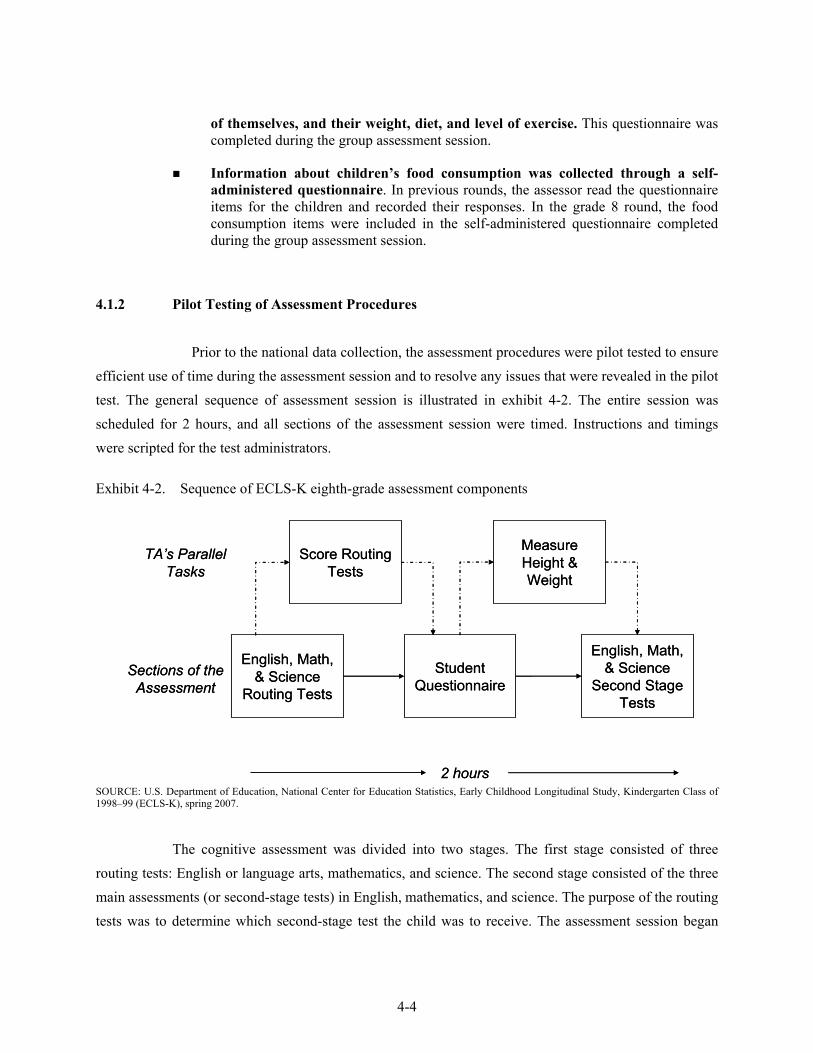
4-4
of themselves, and their weight, diet, and level of exercise. This questionnaire was completed during the group assessment session.
Information about children’s food consumption was collected through a self-administered questionnaire. In previous rounds, the assessor read the questionnaire items for the children and recorded their responses. In the grade 8 round, the food consumption items were included in the self-administered questionnaire completed during the group assessment session.
4.1.2 Pilot Testing of Assessment Procedures
Prior to the national data collection, the assessment procedures were pilot tested to ensure efficient use of time during the assessment session and to resolve any issues that were revealed in the pilot test. The general sequence of assessment session is illustrated in exhibit 4-2. The entire session was scheduled for 2 hours, and all sections of the assessment session were timed. Instructions and timings were scripted for the test administrators.
Exhibit 4-2. Sequence of ECLS-K eighth-grade assessment components
English, Math, & Science
Routing Tests
Student Questionnaire
English, Math, & Science
Second Stage Tests
Measure Height & Weight
2 hours
Score Routing Tests
TA’s Parallel Tasks
Sections of the Assessment
English, Math, & Science
Routing Tests
Student Questionnaire
English, Math, & Science
Second Stage Tests
Measure Height & Weight
2 hours
Score Routing Tests
TA’s Parallel Tasks
Sections of the Assessment
SOURCE: U.S. Department of Education, National Center for Education Statistics, Early Childhood Longitudinal Study, Kindergarten Class of 1998–99 (ECLS-K), spring 2007.
The cognitive assessment was divided into two stages. The first stage consisted of three
routing tests: English or language arts, mathematics, and science. The second stage consisted of the three main assessments (or second-stage tests) in English, mathematics, and science. The purpose of the routing tests was to determine which second-stage test the child was to receive. The assessment session began
4-5
with the administration of the routing tests. Each of the three routing tests was timed, and the children had collectively 29 minutes to complete all three tests.
After the routing tests were administered, children completed the student questionnaire,
which asked about their activities in and out of school, their relationships with their friends and parents, how they felt about themselves socially and academically, and their diet. Children had 20 minutes to complete the student questionnaire, which was also timed. While children were completing the student questionnaire, the test administrator scored the routing tests and identified the appropriate second-stage tests in English, mathematics, and science for each child. When the second-stage test was identified for a child, the test administrator affixed a label to the front of the appropriate test booklet with the child’s identification number.
After the student questionnaire was completed, the children then took the labeled second-
stage tests in English, mathematics, and science. Each of the three second-stage tests was timed, and the children had approximately 50 minutes to complete all three tests. During the assessment session children also had their height and weight measured.
The pilot test of these assessment procedures was conducted with nine eighth-grade children
(four girls and five boys). Two test administrators conducted the assessments in three assessment sessions. Three children participated in each assessment session.
Several potential issues were assessed during the pilot test. The first was whether the test
administrator could accurately and efficiently score the routing tests and correctly identify and label the second-stage test. During the pilot test, test administrators did not make any of these potential errors. All routing tests were accurately scored. Based on that score, the second-stage tests were correctly identified and labeled. Another potential issue examined during the pilot test was whether 2 hours was enough time to complete the measurement of height and weight, as well as all other assessment tasks. Results of the pilot test show that all assessment activities were completed within the 2-hour assessment session. All children successfully had their height and weight measured within this time frame and none of the assessment sessions ran over time. Finally, the pilot test also examined the effectiveness and clarity of the scripted instructions. Feedback was collected from the test administrators and the participants on the wording of the instructions. Several clarifications were made, as well as shortening of the instructions for a clearer presentation.
4-6
4.2 Roles and Responsibilities in the ECLS-K Study
4.2.1 School’s Role
During school recruitment, the schools were asked to designate a staff member to be the school coordinator to assist the ECLS-K staff with all school arrangements.
Since the child assessments were administered at the schools, schools needed to provide
appropriate space for conducting the assessments.
4.2.2 School Coordinator’s Role
A school coordinator was designated by the principal to facilitate the ECLS-K activities in the school. The school coordinator played a significant role in the smooth functioning and successful completion of the ECLS-K child assessments in each cooperating school. He or she knew the personality of the school, the most opportune times to schedule the assessments, the available locations where the group assessments could be conducted, and the best way to notify children, their parents, and their teachers of the assessment.
The coordinator was asked to assist the ECLS-K in four ways:
notify selected children and their teachers of the study;
arrange for suitable space for the assessment activities;
provide information on sampled children, such as their grade and teacher’s name; and
distribute and collect teacher and school questionnaires.
4.2.3 Supervisor’s Role
There were a total of three field managers and 19 supervisors during the eighth-grade data collection who oversaw field staff obtaining parent consent and conducting the parent interviews (7 supervisors managed these activities) and conducting the child assessments (12 supervisors managed this activity). Unlike in previous rounds, the field periods for obtaining parent consent and conducting the

4-7
parent interview and the field period for spring assessments were not concurrent and did not overlap. The field period for obtaining consent and conducting the parent interview was from May 2006 through January 2007, and the field period for conducting the child assessments was from March 2007 through early June 2007. The field staff assigned to each of these field periods were different, with a small amount of overlap between staff who worked on gaining consent and obtaining the parent interview and staff who conducted child assessments.
Seven supervisors managed interviewers assigned to obtain consent and conduct the parent
interview. Supervisors’ responsibilities on these phases of the study were as follows:
Conduct at least weekly report calls with interviewers to monitor their production and hours during the gaining parent consent phase.
Review and approve Time and Expense and Trip Expense Reports.
Strategize with interviewers and field managers about nonresponse cases.
Update the Field Management System (FMS) regularly and report to field manager.
Pick up e-mail regularly.
Return all materials at the end of the field period.
Twelve supervisors managed test administrators assigned to conduct child assessments and
collect school and teacher questionnaires. Supervisors’ responsibilities on this phase of the study were as follows:
Manage and track the progress of all assessments by
- referencing the production goals;
- assigning final codes to pending cases;
- reviewing reports to track progress and work levels;
- linking children to teachers and domains; and
- identifying children who had withdrawn from the school.
Manage and track receipt of hard copy school and teacher questionnaires.
Pick up e-mail regularly.
4-8
Return all materials at the end of the field period.
4.2.4 Field Manager’s Role
Three experienced regional field managers were assigned to oversee the work of the 19 supervisors as well as the 61 field supervisors (see section 4.2.5) who recruited schools to participate in the spring assessments. The field managers held weekly telephone conference calls with each supervisor assigned to them. If a supervisor had an immediate problem, he or she was encouraged to call the field manager at any time.
Depending on the stage of the field period, the telephone conference calls between
supervisors and field managers reviewed those activities that were in the planning stage, in progress, or in the process of being completed. These discussions included the following topics:
status of cases that were pending parent consent and/or the parent interview;
status of telephone contacts with assigned schools to confirm scheduled assessment appointments;
assessment appointment status of assigned cases that had were not scheduled at the time of assignment;
status of linking children to teachers;
status of children who were withdrawn from the school;
any refusal cases;
receipt of all school materials; and
overall and individual costs in the work area.
4.2.5 Field Supervisor’s Role
There were a total of 63 field supervisors during the fall 2006 advance school contact and recruitment phase of data collection. The field supervisors reported to the three field managers. All field supervisors had prior experience in recruiting schools to participate in studies that involved conducting group assessments. The responsibilities of the field supervisors were as follows:
4-9
Contact each school in their assignment to complete the following:
- Verify contact information for the school.
- Verify grade and school enrollment of ECLS-K sampled children.
- Schedule the spring assessment.
- Arrange for space to conduct the assessment.
- Identify withdrawn children and obtain transfer school information.
- Link children to teachers.
Recruit new schools.
4.2.6 Interviewer’s Role
Two different activities were assigned to interviewers in this round of ECLS-K—gaining parent consent for continued participation in the study and conducting the parent interview. 113 interviewers were assigned to the data collection phase of obtaining either hard-copy or verbal consent from parents and obtaining or confirming the name of the school that the sampled child was attending in the 2006–07 school year.
One hundred and eight interviewers were assigned to the parent interview phase of the study.
Eighty-five percent (92 interviewers) of the interviewers who conducted the parent interview had worked on the gaining consent phase of the study and continued to try to obtain consent during the parent interview phase if it had not been obtained. About 98 percent of the parent interviews were conducted by computer-assisted interviews (CAI) on the telephone.
4.2.7 Test Administrator’s Role
Two hundred and seventeen test administrators were assigned to a work area called an ECLS-K ID (KID). The KID represented assessment work associated with schools in a particular geographic area. The primary responsibilities of the test administrators were to conduct the direct child assessments, collect school and teacher questionnaires, and perform various other recordkeeping tasks.
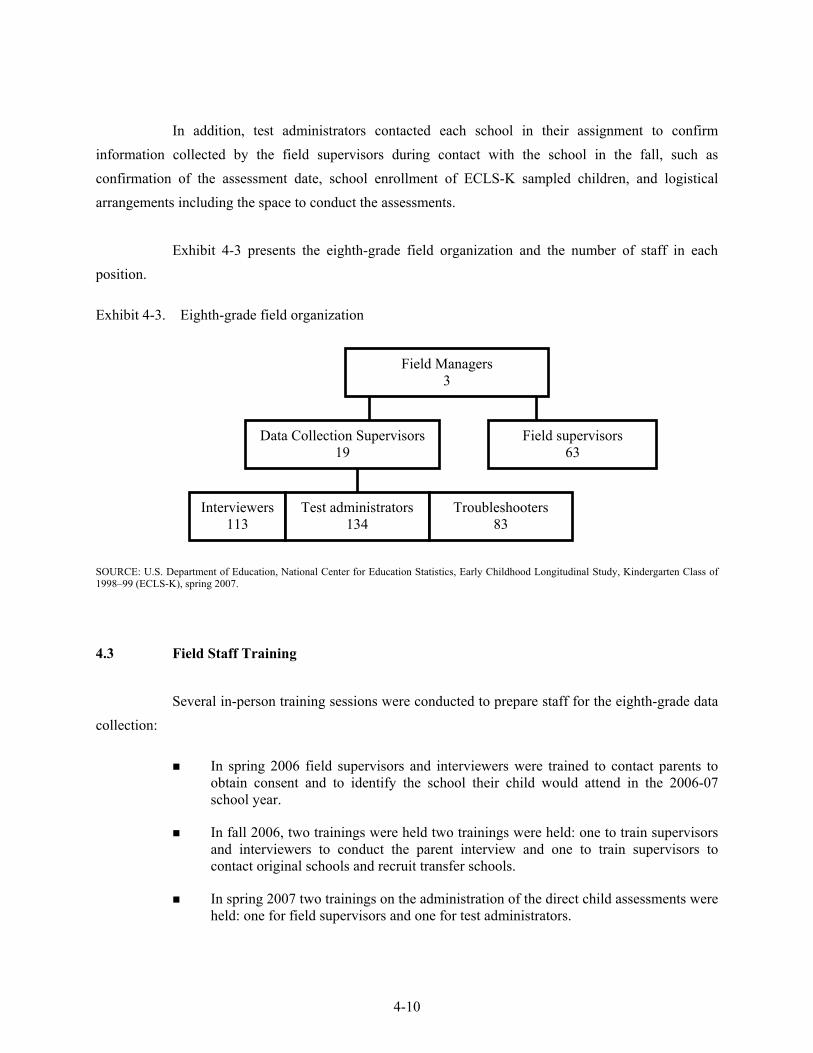
4-10
In addition, test administrators contacted each school in their assignment to confirm information collected by the field supervisors during contact with the school in the fall, such as confirmation of the assessment date, school enrollment of ECLS-K sampled children, and logistical arrangements including the space to conduct the assessments.
Exhibit 4-3 presents the eighth-grade field organization and the number of staff in each
position.
Exhibit 4-3. Eighth-grade field organization SOURCE: U.S. Department of Education, National Center for Education Statistics, Early Childhood Longitudinal Study, Kindergarten Class of 1998–99 (ECLS-K), spring 2007.
4.3 Field Staff Training
Several in-person training sessions were conducted to prepare staff for the eighth-grade data collection:
In spring 2006 field supervisors and interviewers were trained to contact parents to
obtain consent and to identify the school their child would attend in the 2006-07 school year.
In fall 2006, two trainings were held two trainings were held: one to train supervisors and interviewers to conduct the parent interview and one to train supervisors to contact original schools and recruit transfer schools.
In spring 2007 two trainings on the administration of the direct child assessments were held: one for field supervisors and one for test administrators.
Field Managers 3
Data Collection Supervisors 19
Field supervisors 63
Interviewers 113
Test administrators 134
Troubleshooters 83
4-11
The following sections discuss each specific type of training.
All training sessions were conducted using scripted training manuals to ensure that all trainees received the same information. Training sessions consisted of interactive lectures, scripted role plays, interactive exercises, and self-administered exercises. Interactive lectures were lectures with discussion and questions occurring periodically during the lecture. Scripted role plays usually consisted of pairs of trainees each pretending to be, for example, the interviewer and the parent or the assessor and the child. Such role plays gave trainees a chance to become more familiar with their materials and duties. Interactive exercises were group exercises led by the trainer in which all trainees participated. Self-administered exercises were, as the name suggests, completed by trainees working independently. Because of the complexity of the ECLS-K, trainees were required to become familiar with the functionality of their laptop computers and with the programs installed on them. Trainees were also required to become familiar with the different child assessment materials. See chapter 2 of the ECLS-K Psychometric Report for the Eighth Grade (NCES 2009–002) (Najarian et al. forthcoming) for a description of the child assessment materials. The following sections discuss the fall and spring trainings.
4.3.1 Obtaining Parent Consent Training
Field supervisors and interviewers were trained on obtaining parent consent in May 2006. Prior to the May in-person training session, supervisors and interviewers completed 16 hours of home study training that included reading materials and written exercises on the study design and field procedures as well as extensive individual and role play practice in refusal aversion techniques to better answer respondent questions and address respondent concerns. The home study practice included role plays on answering respondent concerns and questions over the telephone with another interviewer as well as with a field supervisor.
Field supervisor training. The topics covered in the field supervisor training included
debriefing interviewers on the home study exercises that supervisors completed with interviewers, principles of supervision, establishing and monitoring production goals, field management issues, using the automated Field Management System, and administrative issues.
The Field Management System was used throughout all phases of data collection to enter
information about the sampled children, parents, teachers, and schools and to monitor production on all data collection activities. Field supervisors entered information into the Field Management System during
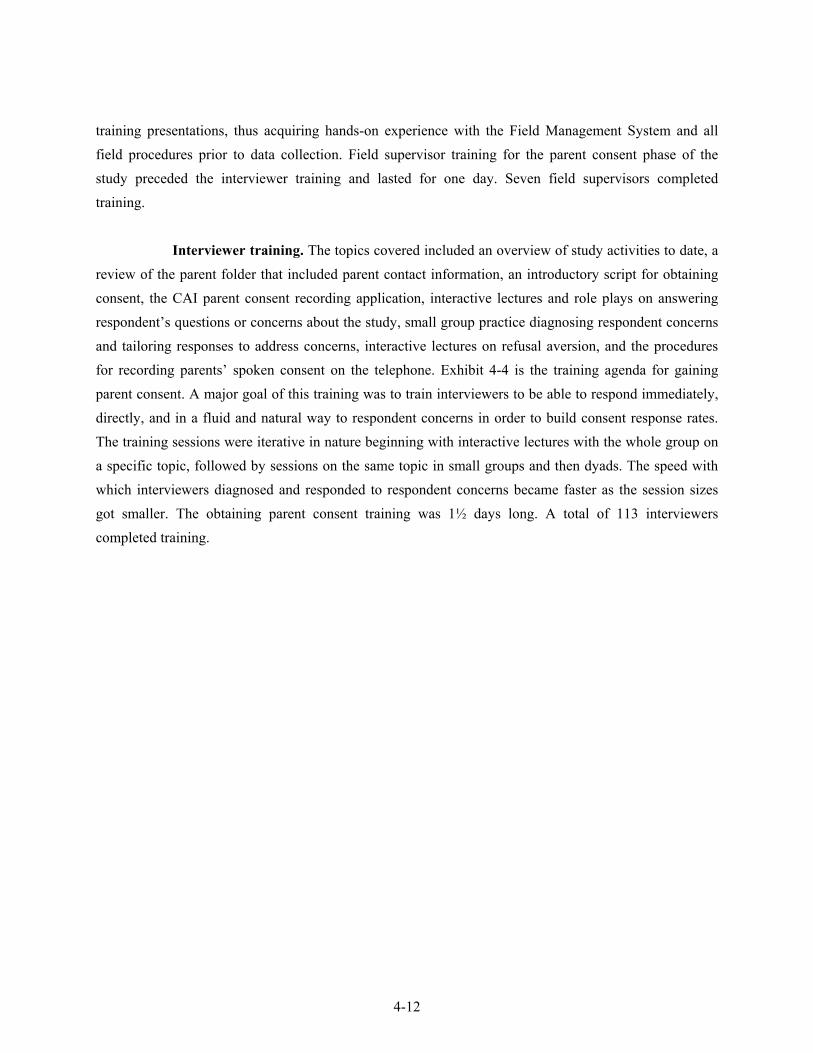
4-12
training presentations, thus acquiring hands-on experience with the Field Management System and all field procedures prior to data collection. Field supervisor training for the parent consent phase of the study preceded the interviewer training and lasted for one day. Seven field supervisors completed training.
Interviewer training. The topics covered included an overview of study activities to date, a
review of the parent folder that included parent contact information, an introductory script for obtaining consent, the CAI parent consent recording application, interactive lectures and role plays on answering respondent’s questions or concerns about the study, small group practice diagnosing respondent concerns and tailoring responses to address concerns, interactive lectures on refusal aversion, and the procedures for recording parents’ spoken consent on the telephone. Exhibit 4-4 is the training agenda for gaining parent consent. A major goal of this training was to train interviewers to be able to respond immediately, directly, and in a fluid and natural way to respondent concerns in order to build consent response rates. The training sessions were iterative in nature beginning with interactive lectures with the whole group on a specific topic, followed by sessions on the same topic in small groups and then dyads. The speed with which interviewers diagnosed and responded to respondent concerns became faster as the session sizes got smaller. The obtaining parent consent training was 1½ days long. A total of 113 interviewers completed training.
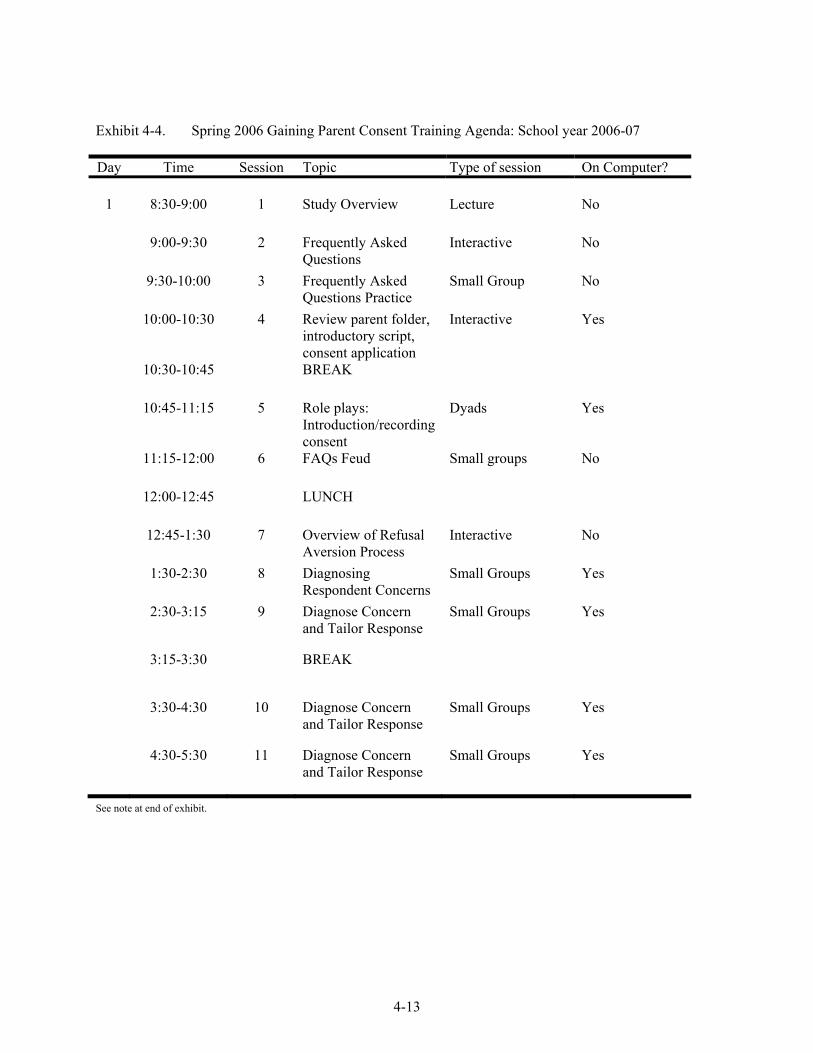
4-13
Exhibit 4-4. Spring 2006 Gaining Parent Consent Training Agenda: School year 2006-07 Day Time Session Topic Type of session On Computer?
1 8:30-9:00 1 Study Overview Lecture No
9:00-9:30 2 Frequently Asked Questions
Interactive No
9:30-10:00 3 Frequently Asked Questions Practice
Small Group No
10:00-10:30 4 Review parent folder, introductory script, consent application
Interactive Yes
10:30-10:45 BREAK
10:45-11:15 5 Role plays: Introduction/recording consent
Dyads Yes
11:15-12:00 6 FAQs Feud Small groups No
12:00-12:45 LUNCH
12:45-1:30 7 Overview of Refusal Aversion Process
Interactive No
1:30-2:30 8 Diagnosing Respondent Concerns
Small Groups Yes
2:30-3:15 9 Diagnose Concern and Tailor Response
Small Groups Yes
3:15-3:30 BREAK
3:30-4:30 10 Diagnose Concern and Tailor Response
Small Groups Yes
4:30-5:30 11 Diagnose Concern and Tailor Response
Small Groups Yes
See note at end of exhibit.
4-14
Exhibit 4-4. Spring 2006 Gaining Parent Consent Training Agenda: School year 2006-07—Continued
SOURCE: U.S. Department of Education, National Center for Education Statistics, Early Childhood Longitudinal Study, Kindergarten Class of 1998–99 (ECLS-K), spring 2007.
4.3.2 Parent Interview Training
Field supervisors and interviewers were trained on conducting the parent interview in August 2006. Prior to the August in-person training session, supervisors and interviewers completed 4 hours of home study training that included reading materials on basic features of the parent interview, CAI, and general interviewing techniques as well as written exercises on the procedures for conducting the parent interview.
Field supervisor training. The field supervisor training preceded the interviewer training
and lasted for a half-day. The same seven field supervisors who managed the interviewers who obtained parent consent continued to manage interviewers as they conducted parent interviews. The supervisor
Day Time Session Topic Type of session On Computer?
2 8:30-9:30 12 Update School Information
Interactive Yes
9:30-10:00 13 Practice Updating School Information
Solo Yes
10:00-11:00 14 Roleplays: Answer questions/Introduction/ recording consent/ update school information
Triads Yes
10:30-10:45 BREAK
11:00-12:00 15 Roleplays: Answer questions/Introduction/ recording consent/update school information
Triads Yes
12:00-12:45 LUNCH
12:45-1:15 16 T& E Interactive No
1:15-2:00 17 Assignment Interactive No
4-15
training included establishing and monitoring production goals, field management issues, and using the Field Management System to organize and track production.
Interviewer training. The training sessions included an overview of the content of the
parent interview, all of its sections, and all procedures associated with conducting the interview. Interviewers practiced using the CAI system on laptop computers during interactive lectures and role plays. The culmination of parent interviewer training was a final role play designed to test all the protocols and techniques reviewed during training. The final role play was conducted using a scripted parent interview and the final parent role play evaluation form. The final role play script was designed to test the trainee’s understanding of the interview content, proper interviewing techniques, including probing, and accurate response recording in CAPI. Trainees were paired up and each completed one-half of a parent interview as the interviewer. As they conducted the interview as the respondent, trainees completed the evaluation form that consisted of a checklist to evaluate key areas, such as contacting and selecting the respondent, asking the questions verbatim, probing properly, and following the correct question path. Exhibit 4-5 is the training agenda for parent interview training. Interviewer training was 1½ days long.
A total of 108 interviewers completed parent interview training. Ninety-two of the 108
interviewers (85 percent) were continuing from the training on obtaining parent consent. Sixteen interviewers were new hires to fill staffing needs as a result of staff attrition and were trained on obtaining parent consent by their supervisors, outside of the in-person training session. Fifteen of the 108 interviewers (14 percent) were certified as Spanish bilingual interviewers and attended a half-day bilingual training after the parent interview training ended. The bilingual training consisted of interactive lectures and role plays on conducting the parent interview in Spanish.
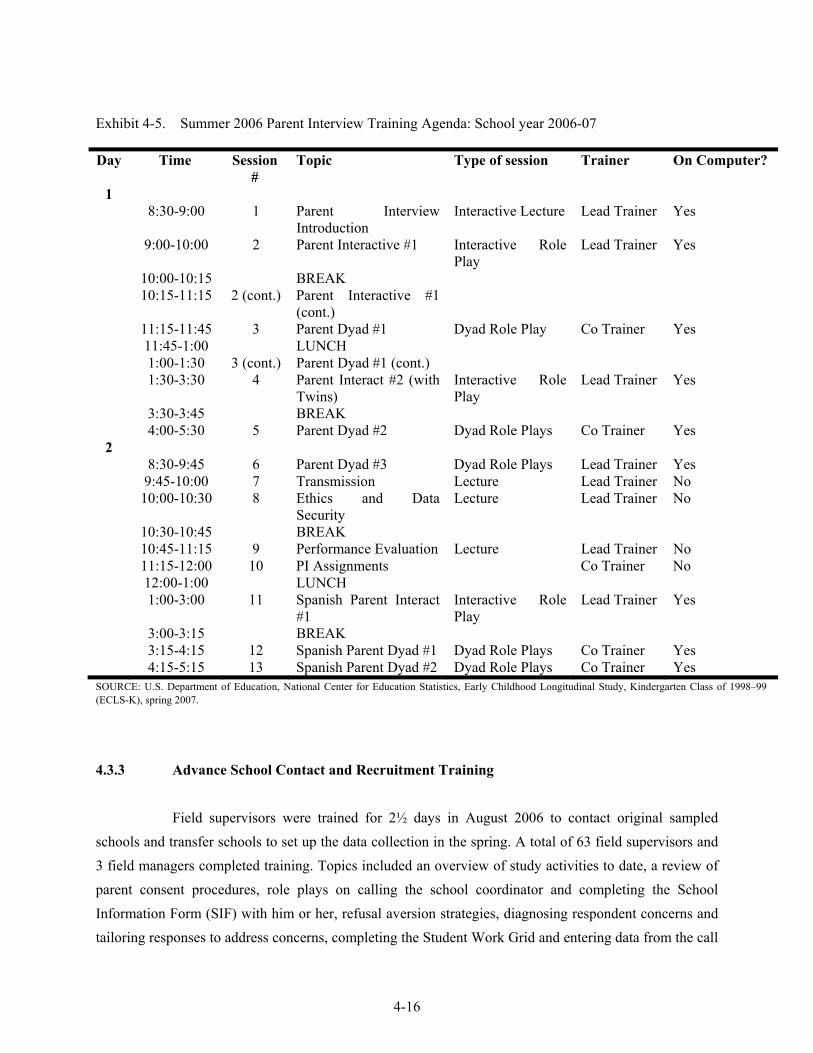
4-16
Exhibit 4-5. Summer 2006 Parent Interview Training Agenda: School year 2006-07 Day Time Session
# Topic Type of session Trainer On Computer?
1 8:30-9:00 1 Parent Interview
Introduction Interactive Lecture Lead Trainer Yes
9:00-10:00 2 Parent Interactive #1 Interactive Role Play
Lead Trainer Yes
10:00-10:15 BREAK 10:15-11:15 2 (cont.) Parent Interactive #1
(cont.)
11:15-11:45 3 Parent Dyad #1 Dyad Role Play Co Trainer Yes 11:45-1:00 LUNCH 1:00-1:30 3 (cont.) Parent Dyad #1 (cont.) 1:30-3:30 4 Parent Interact #2 (with
Twins) Interactive Role Play
Lead Trainer Yes
3:30-3:45 BREAK 4:00-5:30 5 Parent Dyad #2 Dyad Role Plays Co Trainer Yes
2 8:30-9:45 6 Parent Dyad #3 Dyad Role Plays Lead Trainer Yes 9:45-10:00 7 Transmission Lecture Lead Trainer No 10:00-10:30 8 Ethics and Data
Security Lecture Lead Trainer No
10:30-10:45 BREAK 10:45-11:15 9 Performance Evaluation Lecture Lead Trainer No 11:15-12:00 10 PI Assignments Co Trainer No 12:00-1:00 LUNCH 1:00-3:00 11 Spanish Parent Interact
#1 Interactive Role Play
Lead Trainer Yes
3:00-3:15 BREAK 3:15-4:15 12 Spanish Parent Dyad #1 Dyad Role Plays Co Trainer Yes 4:15-5:15 13 Spanish Parent Dyad #2 Dyad Role Plays Co Trainer Yes
SOURCE: U.S. Department of Education, National Center for Education Statistics, Early Childhood Longitudinal Study, Kindergarten Class of 1998–99 (ECLS-K), spring 2007.
4.3.3 Advance School Contact and Recruitment Training
Field supervisors were trained for 2½ days in August 2006 to contact original sampled schools and transfer schools to set up the data collection in the spring. A total of 63 field supervisors and 3 field managers completed training. Topics included an overview of study activities to date, a review of parent consent procedures, role plays on calling the school coordinator and completing the School Information Form (SIF) with him or her, refusal aversion strategies, diagnosing respondent concerns and tailoring responses to address concerns, completing the Student Work Grid and entering data from the call
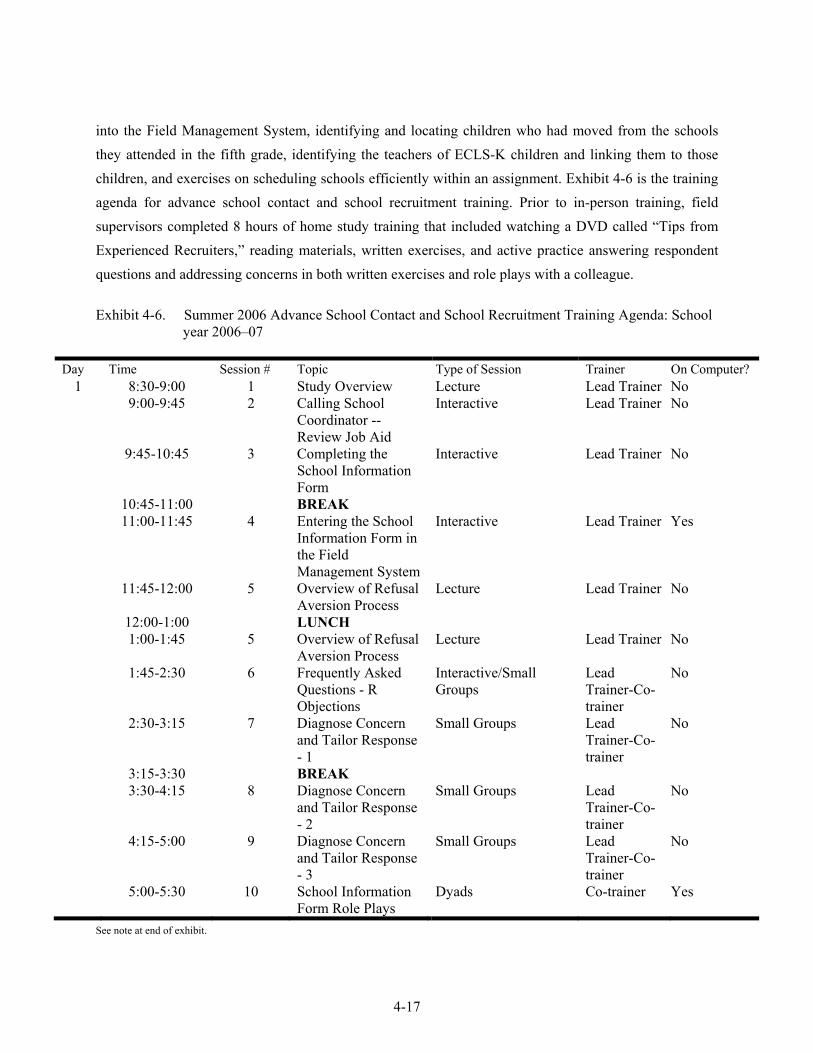
4-17
into the Field Management System, identifying and locating children who had moved from the schools they attended in the fifth grade, identifying the teachers of ECLS-K children and linking them to those children, and exercises on scheduling schools efficiently within an assignment. Exhibit 4-6 is the training agenda for advance school contact and school recruitment training. Prior to in-person training, field supervisors completed 8 hours of home study training that included watching a DVD called “Tips from Experienced Recruiters,” reading materials, written exercises, and active practice answering respondent questions and addressing concerns in both written exercises and role plays with a colleague.
Exhibit 4-6. Summer 2006 Advance School Contact and School Recruitment Training Agenda: School
year 2006–07
Day Time Session # Topic Type of Session Trainer On Computer? 1 8:30-9:00 1 Study Overview Lecture Lead Trainer No 9:00-9:45 2 Calling School
Coordinator -- Review Job Aid
Interactive Lead Trainer No
9:45-10:45 3 Completing the School Information Form
Interactive Lead Trainer No
10:45-11:00 BREAK 11:00-11:45 4 Entering the School
Information Form in the Field Management System
Interactive Lead Trainer Yes
11:45-12:00 5 Overview of Refusal Aversion Process
Lecture Lead Trainer No
12:00-1:00 LUNCH 1:00-1:45 5 Overview of Refusal
Aversion Process Lecture Lead Trainer No
1:45-2:30 6 Frequently Asked Questions - R Objections
Interactive/Small Groups
Lead Trainer-Co-trainer
No
2:30-3:15 7 Diagnose Concern and Tailor Response - 1
Small Groups Lead Trainer-Co-trainer
No
3:15-3:30 BREAK 3:30-4:15 8 Diagnose Concern
and Tailor Response - 2
Small Groups Lead Trainer-Co-trainer
No
4:15-5:00 9 Diagnose Concern and Tailor Response - 3
Small Groups Lead Trainer-Co-trainer
No
5:00-5:30 10 School Information Form Role Plays
Dyads Co-trainer Yes
See note at end of exhibit.
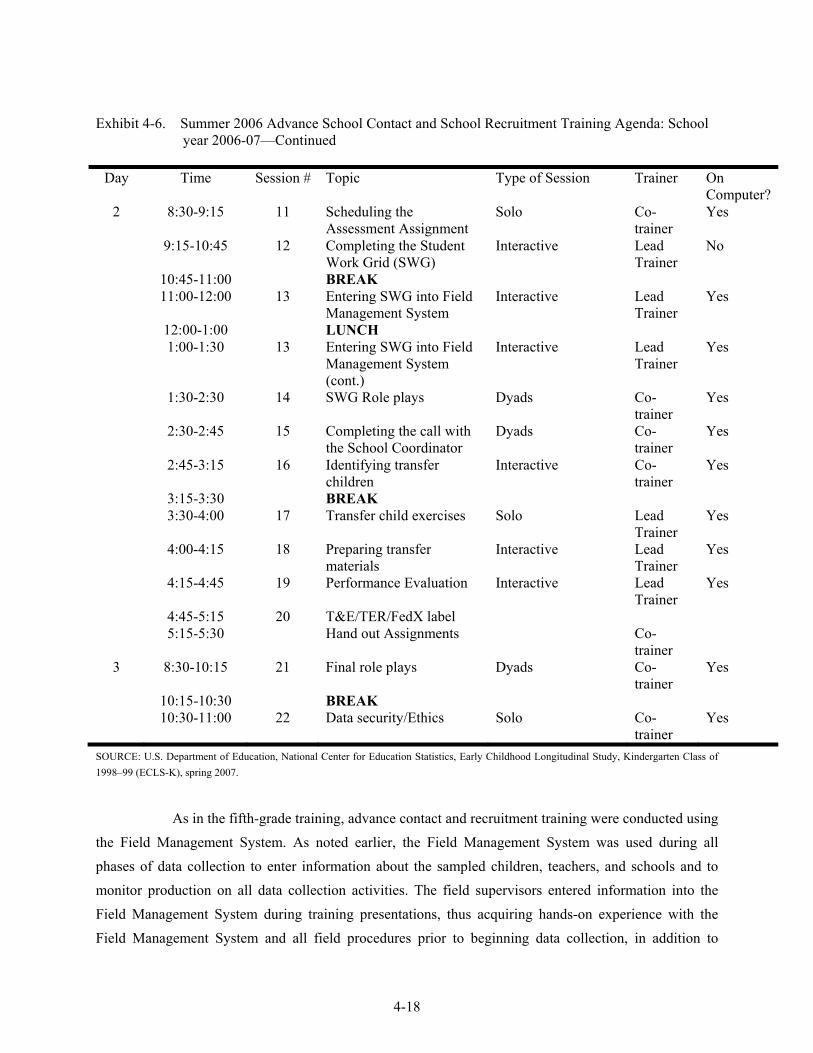
4-18
Exhibit 4-6. Summer 2006 Advance School Contact and School Recruitment Training Agenda: School year 2006-07—Continued
Day Time Session # Topic Type of Session Trainer On
Computer?2 8:30-9:15 11 Scheduling the
Assessment Assignment Solo Co-
trainer Yes
9:15-10:45 12 Completing the Student Work Grid (SWG)
Interactive Lead Trainer
No
10:45-11:00 BREAK 11:00-12:00 13 Entering SWG into Field
Management System Interactive Lead
Trainer Yes
12:00-1:00 LUNCH 1:00-1:30 13 Entering SWG into Field
Management System (cont.)
Interactive Lead Trainer
Yes
1:30-2:30 14 SWG Role plays Dyads Co-trainer
Yes
2:30-2:45 15 Completing the call with the School Coordinator
Dyads Co-trainer
Yes
2:45-3:15 16 Identifying transfer children
Interactive Co-trainer
Yes
3:15-3:30 BREAK 3:30-4:00 17 Transfer child exercises Solo Lead
Trainer Yes
4:00-4:15 18 Preparing transfer materials
Interactive Lead Trainer
Yes
4:15-4:45 19 Performance Evaluation Interactive Lead Trainer
Yes
4:45-5:15 20 T&E/TER/FedX label 5:15-5:30 Hand out Assignments Co-
trainer
3 8:30-10:15 21 Final role plays Dyads Co-trainer
Yes
10:15-10:30 BREAK 10:30-11:00 22 Data security/Ethics Solo Co-
trainer Yes
SOURCE: U.S. Department of Education, National Center for Education Statistics, Early Childhood Longitudinal Study, Kindergarten Class of 1998–99 (ECLS-K), spring 2007.
As in the fifth-grade training, advance contact and recruitment training were conducted using
the Field Management System. As noted earlier, the Field Management System was used during all phases of data collection to enter information about the sampled children, teachers, and schools and to monitor production on all data collection activities. The field supervisors entered information into the Field Management System during training presentations, thus acquiring hands-on experience with the Field Management System and all field procedures prior to beginning data collection, in addition to
4-19
completing role plays and exercises that involved entering information into the Field Management System.
4.3.4 Spring-Eighth Grade Direct Child Assessment Training
Field supervisors and test administrators were trained for the spring-eighth grade data collection in March 2007.
Field supervisor training. Field supervisor training preceded the test administrator training
and lasted for one day. The topics covered in the field supervisor training session included an overview of study activities to date, a review of assignments, and interactive lectures on labeling and shipping school and teacher questionnaires to newly identified schools and teachers. As in earlier trainings, field supervisors were trained to use the Field Management System, and they practiced entering information into the Field Management System during training presentations. Twelve field supervisors completed training.
Test administrator training. The test administrator training sessions included an overview
of study activities to date, interactive lectures based on the child assessments, practice scoring the child assessment routing forms, reviewing materials from the fall school recruitment, role plays to practice contacting school coordinators, identifying and locating children who had moved from their eighth-grade schools identified in the fall, identifying the regular and special education teachers of ECLS-K children and linking them to those children, and distributing and following up on teacher questionnaires and school administrator questionnaires. A major goal of the test administrator training was to train field staff to properly conduct the assessments. This included reading the script word for word, correctly scoring the assessment routing forms, and identifying the appropriate second-stage form and labeling it correctly. Test administrators had multiple sessions to practice scoring the assessment routing forms, and identifying and labeling the second-stage form. The sessions provided trainees with hands-on experience with all the child assessment materials and procedures prior to data collection. Trainees practiced entering information into the Field Management System on laptop computers during training presentations. Test administrator training lasted 2 days. Exhibit 4-7 is the training agenda for test administrator training. Field supervisors were also trained to perform all test administrator activities. A total of 217 test administrators and 12 field supervisors completed training.
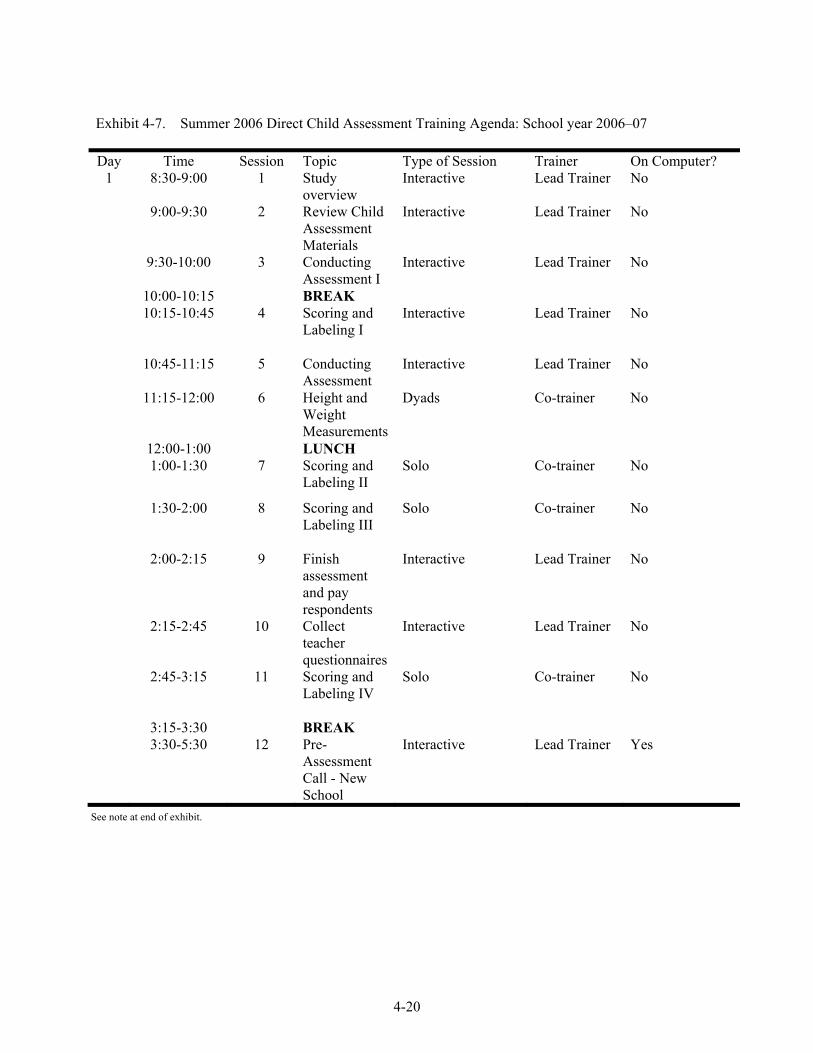
4-20
Exhibit 4-7. Summer 2006 Direct Child Assessment Training Agenda: School year 2006–07 Day Time Session Topic Type of Session Trainer On Computer?
1 8:30-9:00 1 Study overview
Interactive Lead Trainer No
9:00-9:30 2 Review Child Assessment Materials
Interactive Lead Trainer No
9:30-10:00 3 Conducting Assessment I
Interactive Lead Trainer No
10:00-10:15 BREAK 10:15-10:45 4 Scoring and
Labeling I Interactive Lead Trainer No
10:45-11:15 5 Conducting Assessment
Interactive Lead Trainer No
11:15-12:00 6 Height and Weight Measurements
Dyads Co-trainer No
12:00-1:00 LUNCH 1:00-1:30 7 Scoring and
Labeling II Solo Co-trainer No
1:30-2:00 8 Scoring and Labeling III
Solo Co-trainer No
2:00-2:15 9 Finish assessment and pay respondents
Interactive Lead Trainer No
2:15-2:45 10 Collect teacher questionnaires
Interactive Lead Trainer No
2:45-3:15 11 Scoring and Labeling IV
Solo Co-trainer No
3:15-3:30 BREAK 3:30-5:30 12 Pre-
Assessment Call - New School
Interactive Lead Trainer Yes
See note at end of exhibit.
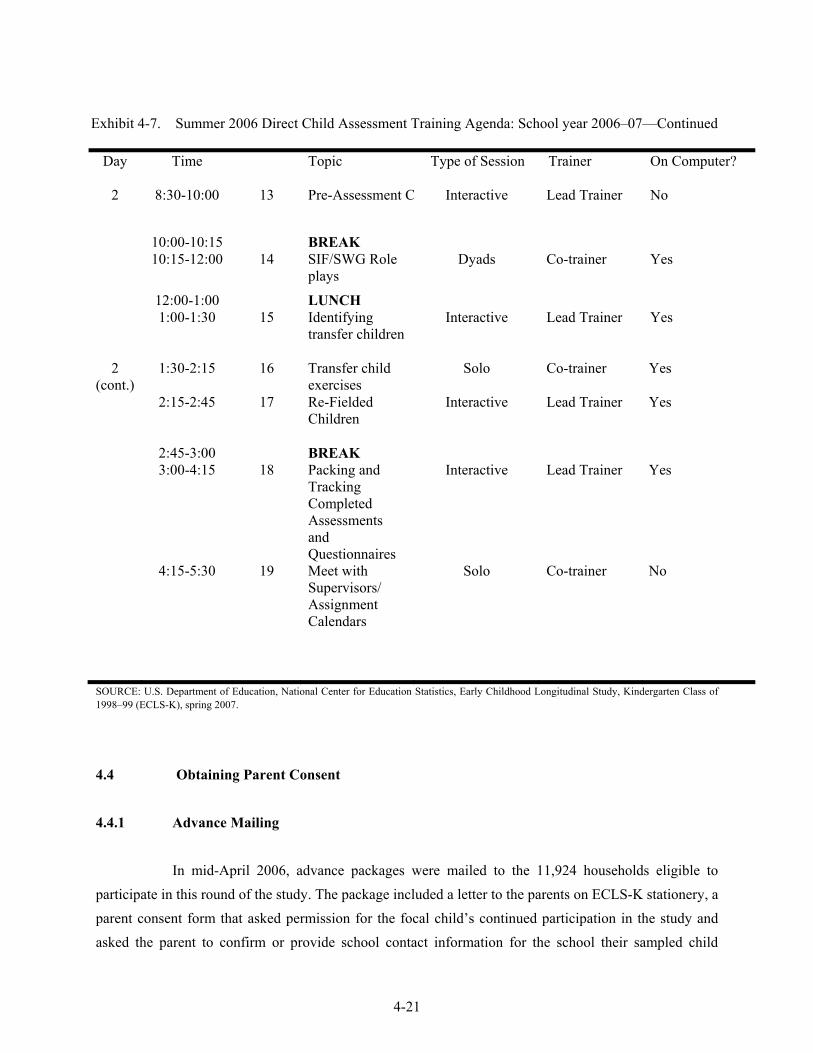
4-21
Exhibit 4-7. Summer 2006 Direct Child Assessment Training Agenda: School year 2006–07—Continued Day Time Topic Type of Session Trainer On Computer?
2 8:30-10:00 13 Pre-Assessment C Interactive Lead Trainer No
10:00-10:15 BREAK 10:15-12:00 14 SIF/SWG Role
plays Dyads Co-trainer Yes
12:00-1:00 LUNCH 1:00-1:30 15 Identifying
transfer children Interactive Lead Trainer Yes
2 (cont.)
1:30-2:15 16 Transfer child exercises
Solo Co-trainer Yes
2:15-2:45 17 Re-Fielded Children
Interactive Lead Trainer Yes
2:45-3:00 BREAK 3:00-4:15 18 Packing and
Tracking Completed Assessments and Questionnaires
Interactive Lead Trainer Yes
4:15-5:30 19 Meet with Supervisors/ Assignment Calendars
Solo Co-trainer No
SOURCE: U.S. Department of Education, National Center for Education Statistics, Early Childhood Longitudinal Study, Kindergarten Class of 1998–99 (ECLS-K), spring 2007.
4.4 Obtaining Parent Consent
4.4.1 Advance Mailing
In mid-April 2006, advance packages were mailed to the 11,924 households eligible to participate in this round of the study. The package included a letter to the parents on ECLS-K stationery, a parent consent form that asked permission for the focal child’s continued participation in the study and asked the parent to confirm or provide school contact information for the school their sampled child
4-22
would be attending in the upcoming school year (2006–07), and a parent newsletter with study results from elementary school years. Three weeks after mailing the parent advance package, a reminder postcard was mailed to all parents. By the second week in May, hard-copy consent forms had been received from 36 percent (4,265) of the eligible households.
4.4.2 Follow-Up for Consent
Beginning in the second week of May and continuing through the end of December, interviewers telephoned all parents who had not responded to the advance mailing, provided consent, and confirmed or updated school contact information. During this data collection period, parent consent was obtained either by the parent signing and returning the consent form or by recording verbal consent on the interviewer’s laptop. Verbal consent was obtained by reading the permission form to the parent and asking her or him for consent to record her or his response to the request. If the parent agreed to give verbal consent, the interviewer read a statement from her laptop that identified the parent and child and stated that the parent had given permission to record her or his verbal consent. All consent recordings were verified by home office staff who listened to the recordings and, when verified, generated a hard-copy parent consent form with a proxy auto-signature of the verifier. For those parents from whom consent was not received and who did not have a telephone, in-person visits to the home were made to obtain their consent. By the end of December 2006, consent had been obtained from approximately 83 percent (9,835) of eligible households.
4.5 Conducting the Parent Interview
Parent interview procedures mirrored those of previous rounds of data collection. The parent interview was conducted in the fall and winter of 2006 in order to first obtain parent consent and school information for the sampled child for any outstanding cases.
The parent interview was administered, primarily as a CAI telephone interview, from
September 2006 through January 2007. For cases lacking parent consent, interviewers attempted to obtain consent and complete a parent interview during the same call. Slightly over 34 percent of the parent interviews were completed in September, 34 percent in October, 18 percent in November, and over 6 percent in December and January. The parent interview averaged 45 minutes. As in previous rounds of data collection, the parent interview was conducted in person if the respondent did not have a telephone.
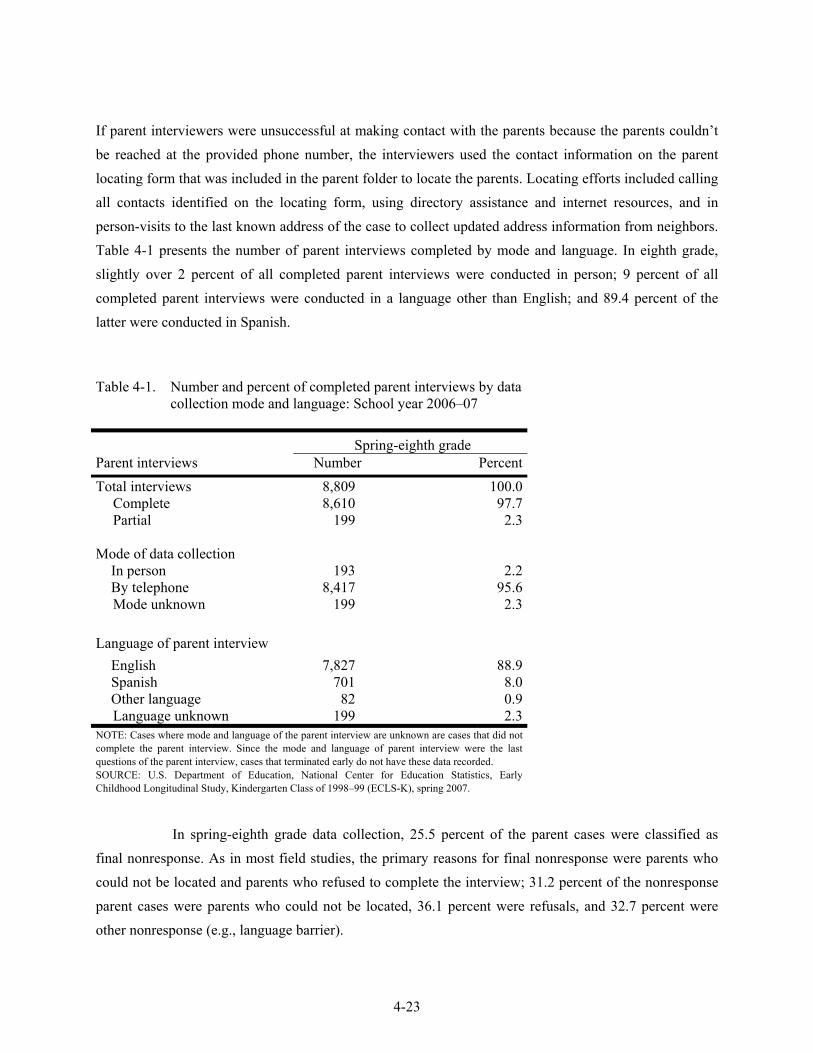
4-23
If parent interviewers were unsuccessful at making contact with the parents because the parents couldn’t be reached at the provided phone number, the interviewers used the contact information on the parent locating form that was included in the parent folder to locate the parents. Locating efforts included calling all contacts identified on the locating form, using directory assistance and internet resources, and in person-visits to the last known address of the case to collect updated address information from neighbors. Table 4-1 presents the number of parent interviews completed by mode and language. In eighth grade, slightly over 2 percent of all completed parent interviews were conducted in person; 9 percent of all completed parent interviews were conducted in a language other than English; and 89.4 percent of the latter were conducted in Spanish.
Table 4-1. Number and percent of completed parent interviews by data collection mode and language: School year 2006–07
Spring-eighth grade Parent interviews Number PercentTotal interviews 8,809 100.0 Complete 8,610 97.7 Partial 199 2.3 Mode of data collection
In person 193 2.2By telephone 8,417 95.6
Mode unknown 199 2.3 Language of parent interview
English 7,827 88.9Spanish 701 8.0Other language 82 0.9
Language unknown 199 2.3NOTE: Cases where mode and language of the parent interview are unknown are cases that did not complete the parent interview. Since the mode and language of parent interview were the last questions of the parent interview, cases that terminated early do not have these data recorded. SOURCE: U.S. Department of Education, National Center for Education Statistics, Early Childhood Longitudinal Study, Kindergarten Class of 1998–99 (ECLS-K), spring 2007.
In spring-eighth grade data collection, 25.5 percent of the parent cases were classified as
final nonresponse. As in most field studies, the primary reasons for final nonresponse were parents who could not be located and parents who refused to complete the interview; 31.2 percent of the nonresponse parent cases were parents who could not be located, 36.1 percent were refusals, and 32.7 percent were other nonresponse (e.g., language barrier).
4-24
4.6 Advance Preassessment School Contact
Beginning in September 2006, all schools confirmed or identified by parents while obtaining consent were contacted by telephone to prepare for the spring data collection. When children were identified as having transferred to another school, the child’s new school (and district, if necessary) was recruited. There were three primary tasks to be accomplished during the fall contact. These were to schedule appointments to conduct the child assessments in the spring, to identify the children’s teachers, and to identify children who had withdrawn from the school and obtain locating information about their new schools. The fall contact activities are described below.
4.6.1 Advance Mailings
In September 2006, an advance package was mailed via Federal Express to all identified schools asking them to prepare for the fall preassessment telephone call. The schools were asked to identify a school staff coordinator to serve as a liaison with the study. (In returning schools, this person was usually the coordinator from previous rounds of data collection). The advance package contained the following materials and was customized by school type—original (the school had participated in the previous round, i.e., the fifth-grade assessment) or transfer schools:
The original schools advance package contained the following:
cover letter printed on ECLS-K letterhead reminding school staff about the study, describing the eighth-grade data collection, and alerting the school coordinator of the advance contact in the fall;
School and Teacher Summary Sheet (original schools)—a two-page document providing a brief overview of the study to date and the eighth-grade data collection activities;
ECLS-K Newsletter—a newsletter designed for schools and teachers describing children’s performance from kindergarten through fifth-grade;
ECLS-K Study Roster—-a form listing all the sampled children enrolled in the school and with instructions for completing the form in preparation for the upcoming advance contact phone call to schedule the assessment; and
Parent Consent Form—a signed hard-copy consent form, a copy of that form was included in the package; if parent consent was verbal and recorded, then a copy of the generated hard-copy consent form with proxy signature was included.
4-25
The transfer schools advance package contained the following:
cover letter printed on ECLS-K letterhead introducing school staff to the study, describing the eighth-grade data collection, and alerting the school coordinator of the advance contact in the fall;
School and Teacher Summary Sheet (transfer schools)—a two-page document providing a brief overview of the study and the eighth-grade data collection activities;
ECLS-K Newsletter—a newsletter designed for schools and teachers describing children’s performance from kindergarten through fifth-grade;
ECLS-K Study Roster—a form listing all the sampled children enrolled in the school and with instructions for completing the form in preparation for the upcoming advance contact phone call to schedule the assessment; and
Parent Consent Form—a signed hard-copy consent form, a copy of that form was included in the package; if parent consent was verbal and recorded, then a copy of the generated hard-copy consent form with proxy signature was included.
4.6.2 Fall Preassessment School Coordinator Contact
The fall preassessment contact was made by telephone between September and December 2006. The fall preassessment school contact was successful in meeting two important goals: (1) contacting original sampled schools to set up the spring assessment and (2) identifying children who had withdrawn from the schools parents had initially reported. Schools were determined to be ineligible for eighth-grade data collection if no ECLS-K sampled children were currently enrolled. More original schools were determined to be ineligible as children transferred out of them into other schools. During the preassessment contact, the field supervisor contacted the school coordinator to schedule the dates of the assessment visits, identify ECLS-K sampled children who were no longer enrolled at the school, collect locating information for those children, identify each enrolled child’s English teacher and mathematics or science teacher, and special education teacher, obtain information on special accommodations1 during the assessment for the enrolled sampled child, and answer any questions that the school coordinator might have about the study.
During the preassessment contact, field supervisors asked the school coordinators to identify
ECLS-K children who had transferred out of the school. If the school records indicated where the children
1 Accommodations included in the data collection protocol were special setting accommodations, scheduling/timing accommodations, large size print accommodations, presence of a health care aide, or use of an assistive device.
4-26
had transferred, then the field supervisor asked the school coordinator to provide the names, addresses, and telephone numbers of these transfer schools. Field supervisors entered this information into the Field Management System and the updated information was distributed to parent interviewers if the parent interview was not completed. Parent interviewers also contacted field supervisors when they were unable to locate a sampled child’s parent/guardian after having exhausted all leads and asked the supervisor for any leads they may have received during the school recruitment phase. All children who transferred were followed to their new school and not subsampled as in previous years. (Refer to the ECLS-K Fifth-Grade Methodology Report (NCES 2006–037) (Tourangeau, Lê, and Nord 2005) for additional details on how transfer children were subsampled in prior rounds.) If the new school belonged to a district that was new to the study, the district was contacted and recruited before any contact was made with the school. If the district was already cooperating, the new school was contacted and recruited directly.
During the preassessment contact, the field supervisor also asked the school coordinator
some basic information about the school and some detailed information about each ECLS-K sampled child. The field supervisor used the School Information Form (SIF) to collect basic information about the school, such as school start and end dates, vacation and holiday schedules, and parking directions. The form was also used to determine if the school was a year-round school and taught eighth grade and to obtain information on class organization. In addition the SIF was used to schedule an assessment date and time.
Collecting information about ECLS-K sampled children. The field supervisor used
another form called the Student Work Grid (exhibit 4-8) to collect information about the ECLS-K sampled children still enrolled in the school, including the child’s current grade, the name and classroom for the child’s regular teacher in order to link the child to a teacher, and whether or not the child had an Individualized Education Program (IEP). The school coordinator was asked to complete the school version of the form in advance of the preassessment phone call to expedite the call.
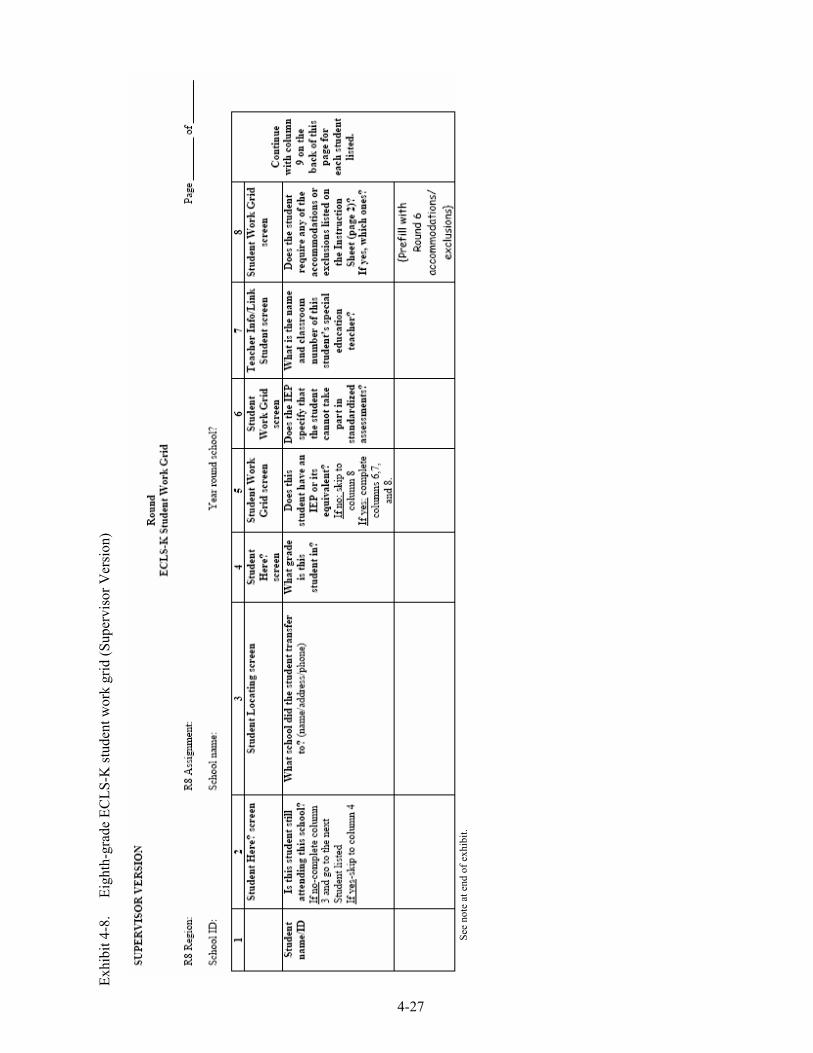
4-27
Exhi
bit 4
-8.
Ei
ghth
-gra
de E
CLS
-K st
uden
t wor
k gr
id (S
uper
viso
r Ver
sion
)
Se
e no
te a
t end
of e
xhib
it.
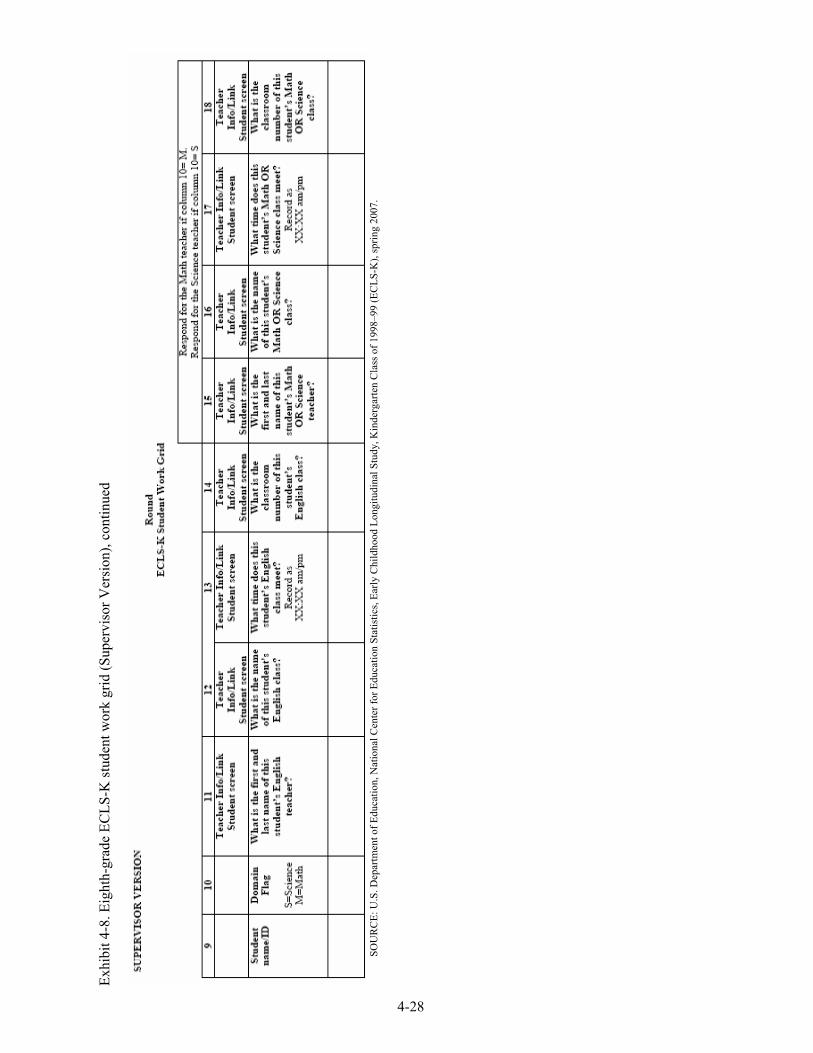
4-28
Exhi
bit 4
-8. E
ight
h-gr
ade
ECLS
-K st
uden
t wor
k gr
id (S
uper
viso
r Ver
sion
), co
ntin
ued
SO
UR
CE:
U.S
. Dep
artm
ent o
f Edu
catio
n, N
atio
nal C
ente
r for
Edu
catio
n St
atis
tics,
Early
Chi
ldho
od L
ongi
tudi
nal S
tudy
, Kin
derg
arte
n C
lass
of 1
998–
99 (E
CLS
-K),
sprin
g 20
07.
4-29
If the child had an IEP (see exhibit 4-9), then the name and classroom of the child’s special education teacher was collected, along with whether the child required any accommodations to participate in the direct cognitive assessment. Through this process, 885 children were identified with IEPs and 793 special education teachers were linked to these children. The accommodations in the eighth-grade direct cognitive assessment included all of those for the kindergarten, first-grade, third-grade, and fifth-grade direct cognitive assessments, with the addition of large print. Field supervisors contacted the teachers of the ECLS-K children as necessary for any of this information.
If a child was identified as having transferred out of the school, the field supervisor asked the
school coordinator to provide the names, addresses, and telephone numbers of these transfer schools. All children who transferred, were followed in their new schools to conduct an assessment, not subsampled out as in previous rounds. (Refer to the ECLS-K Fifth-Grade Methodology Report (NCES 2006–037) (Tourangeau, Lê, and Nord 2005) for additional details on how mover children were subsampled in the previous rounds.) If the new school belonged to a district that was new to the study, the district was mailed a letter with the new school name. A field manager contacted the district by telephone and recruited the district into the study before any contact was made with the school. If the district was already cooperating, the district was notified by mail and the new school was contacted and recruited directly. Field supervisors also verified with the school that no child who had previously transferred had returned to the school.
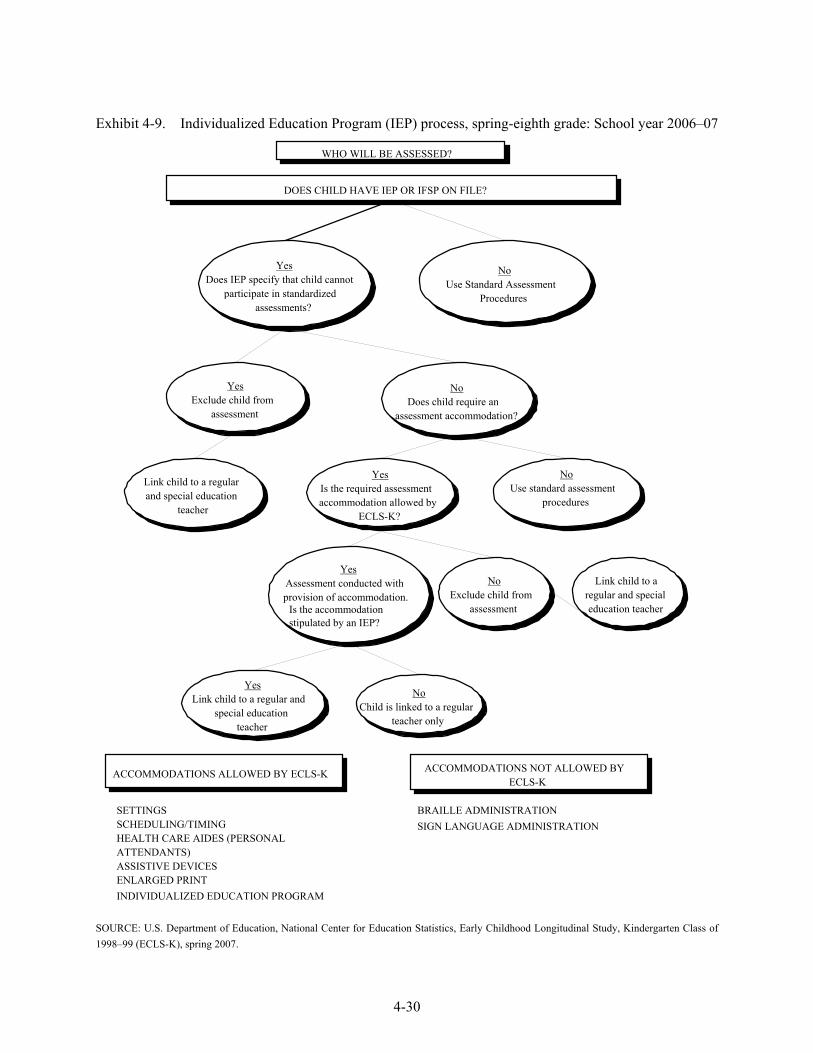
4-30
Exhibit 4-9. Individualized Education Program (IEP) process, spring-eighth grade: School year 2006–07
SOURCE: U.S. Department of Education, National Center for Education Statistics, Early Childhood Longitudinal Study, Kindergarten Class of 1998–99 (ECLS-K), spring 2007.
WHO WILL BE ASSESSED?
DOES CHILD HAVE IEP OR IFSP ON FILE?
Yes Does IEP specify that child cannot
participate in standardized assessments?
NoUse Standard Assessment
Procedures
YesExclude child from
assessment
NoDoes child require an
assessment accommodation?
YesIs the required assessment accommodation allowed by
ECLS-K?
Link child to a regularand special education
teacher
No Use standard assessment
procedures
YesAssessment conducted with provision of accommodation.
Is the accommodation stipulated by an IEP?
NoExclude child from
assessment
YesLink child to a regular and
special educationteacher
NoChild is linked to a regular
teacher only
ACCOMMODATIONS ALLOWED BY ECLS-K ACCOMMODATIONS NOT ALLOWED BY ECLS-K
SETTINGSSCHEDULING/TIMINGHEALTH CARE AIDES (PERSONAL ATTENDANTS)ASSISTIVE DEVICESENLARGED PRINT INDIVIDUALIZED EDUCATION PROGRAM
BRAILLE ADMINISTRATION SIGN LANGUAGE ADMINISTRATION
Link child to a regular and special
education teacher
4-31
Contacting families of homeschooled children. As part of obtaining parent consent, the status of homeschooled children who were identified in rounds 1 through 6 was confirmed with their parents and updated as necessary. As parents of these children were contacted to obtain consent, they were asked to confirm that the child was still homeschooled or if the child had enrolled in a school. If the child had enrolled in a school, the new school was contacted and recruited into the study. Parents of children who were still schooled at home were notified about the next round of data collection in the spring.
Identifying the Key Child in classrooms with multiple study children. In fifth grade, the
design of the child-level teacher questionnaire was changed to include collecting data about the child’s reading class and mathematics or science class. The design of the eighth-grade child-level teacher questionnaire followed this model although English teachers rather than reading teachers were contacted. In elementary schools, children were primarily taught in a self-contained classroom, and teachers reported classroom-level information only once for the classroom. Due to the design change in fifth grade, the teacher-child links were broadened to include the domain (reading, mathematics, or science) as well as information to identify the English, mathematics, or science classroom. In order to reduce data collection burden for teachers who were linked to multiple sampled children in the same class, a “Key Domain Child” was identified for each separate subject and class that each teacher taught. The teachers would be asked to report classroom-level information only once in the questionnaire for the key domain child and child-level information for all sampled children in that class. Field supervisors collected the teacher-child-domain-classroom link information about each child and entered the information into the Field Management System. The information was used to generate the hard-copy teacher questionnaires (see section 4.7.4 for more information on teacher questionnaire data collection). Refer to the ECLS-K Fifth-Grade Methodology Report (NCES 2006–037) (Tourangeau, Lê, and Nord 2005) for additional detail on the Key Child concept.
4.6.3 Fall Preassessment Contact Results
The goals for the fall preassessment contact with schools were the following: (1) set appointments for the spring assessments; (2) confirm the enrollment of ECLS-K children in that school and if not enrolled in the school, collect contact information about the school the child transferred to; (3) link children to teachers and domains (i.e., English, mathematics, science) for the advance school and teacher questionnaire mailings; and (4) contact as many schools as possible within the field period to
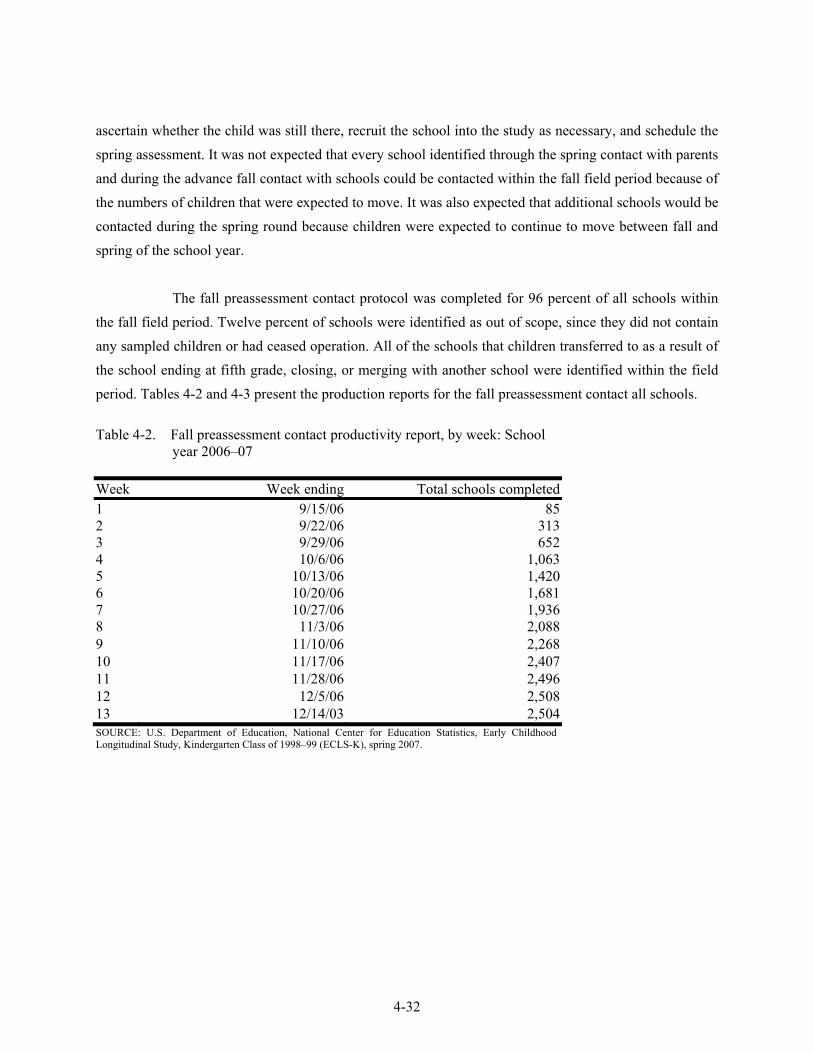
4-32
ascertain whether the child was still there, recruit the school into the study as necessary, and schedule the spring assessment. It was not expected that every school identified through the spring contact with parents and during the advance fall contact with schools could be contacted within the fall field period because of the numbers of children that were expected to move. It was also expected that additional schools would be contacted during the spring round because children were expected to continue to move between fall and spring of the school year.
The fall preassessment contact protocol was completed for 96 percent of all schools within
the fall field period. Twelve percent of schools were identified as out of scope, since they did not contain any sampled children or had ceased operation. All of the schools that children transferred to as a result of the school ending at fifth grade, closing, or merging with another school were identified within the field period. Tables 4-2 and 4-3 present the production reports for the fall preassessment contact all schools.
Table 4-2. Fall preassessment contact productivity report, by week: School
year 2006–07 Week Week ending Total schools completed1 9/15/06 852 9/22/06 3133 9/29/06 6524 10/6/06 1,0635 10/13/06 1,4206 10/20/06 1,6817 10/27/06 1,9368 11/3/06 2,0889 11/10/06 2,26810 11/17/06 2,40711 11/28/06 2,49612 12/5/06 2,50813 12/14/03 2,504SOURCE: U.S. Department of Education, National Center for Education Statistics, Early Childhood Longitudinal Study, Kindergarten Class of 1998–99 (ECLS-K), spring 2007.
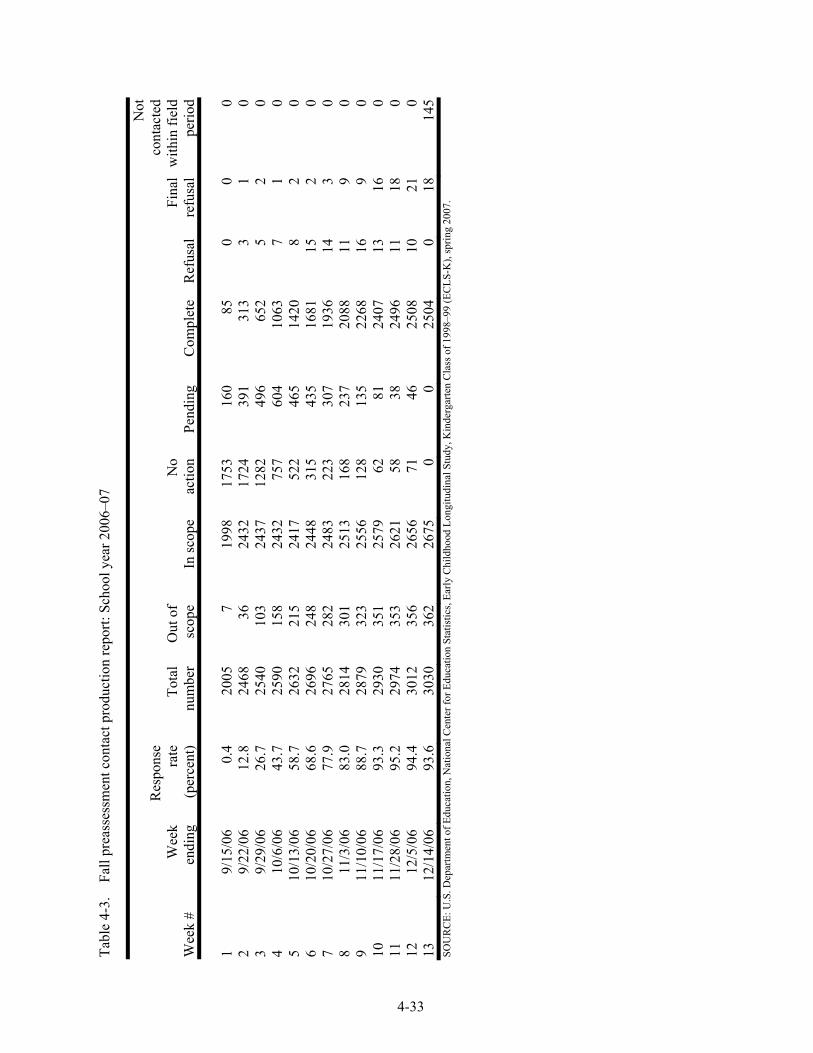
4-33
Tabl
e 4-
3.
Fall
prea
sses
smen
t con
tact
pro
duct
ion
repo
rt: S
choo
l yea
r 200
6–07
W
eek
# W
eek
endi
ng
Res
pons
e ra
te
(per
cent
) To
tal
num
ber
Out
of
scop
eIn
scop
eN
o ac
tion
Pend
ing
Com
plet
eR
efus
alFi
nal
refu
sal
Not
co
ntac
ted
with
in fi
eld
perio
d
1 9/
15/0
6 0.
4 20
057
1998
1753
160
850
00
2 9/
22/0
6 12
.8
2468
3624
3217
2439
131
33
10
3 9/
29/0
6 26
.7
2540
103
2437
1282
496
652
52
04
10/6
/06
43.7
25
9015
824
3275
760
410
637
10
5 10
/13/
06
58.7
26
3221
524
1752
246
514
208
20
6 10
/20/
06
68.6
26
9624
824
4831
543
516
8115
20
7 10
/27/
06
77.9
27
6528
224
8322
330
719
3614
30
8 11
/3/0
6 83
.0
2814
301
2513
168
237
2088
119
09
11/1
0/06
88
.7
2879
323
2556
128
135
2268
169
010
11
/17/
06
93.3
29
3035
125
7962
8124
0713
160
11
11/2
8/06
95
.2
2974
353
2621
5838
2496
1118
012
12
/5/0
6 94
.4
3012
356
2656
7146
2508
1021
013
12
/14/
06
93.6
30
3036
226
750
025
040
1814
5SO
UR
CE:
U.S
. Dep
artm
ent o
f Edu
catio
n, N
atio
nal C
ente
r for
Edu
catio
n St
atis
tics,
Early
Chi
ldho
od L
ongi
tudi
nal S
tudy
, Kin
derg
arte
n C
lass
of 1
998–
99 (E
CLS
-K),
sprin
g 20
07.
4-34
4.6.4 Tracing Activities During the Eighth-Grade Data Collection
In order to ensure that as many of the sampled children as possible were contacted for the eighth-grade data collection, tracing activities were ongoing through all phases of data collection. Tracing began in April of 2006 when the parent consent packages were mailed and continued through the spring data collection. If the parent advance package was returned as undeliverable but had new address information, it was remailed to the parent at the new address, and the updated address was added to the ECLS-K tracking database. If the package was returned as undeliverable with no updated address information, this information was entered into the tracking database and appeared on the parent locating form generated for each case. Interviewers used the parent locating form to attempt to obtain updated telephone numbers and addresses while prompting for consent and conducting the parent interview. Locating efforts included calling all contacts identified on the locating form, using directory assistance and the Internet resources, and in person-visits to the last known address of the case to attempt to collect updated address information from neighbors.
4.7 Spring 2007 Eighth-Grade Data Collection
All children who were assessed during the base year or for whom a parent interview was completed in the base year were eligible to be assessed in the spring-eighth grade data collection, with four exceptions. They are (1) children who became ineligible in an earlier round (because they died or moved out of the country), (2) children who were subsampled out in previous rounds because they moved out of the original schools and were not subsampled to be followed, (3) children whose parents emphatically refused to cooperate (hard refusals) in any of the data collection rounds since spring-kindergarten, and (4) children in the eighth-grade sample for whom there were neither third-grade nor fifth-grade data. Eligibility for the study was not dependent on the child’s current grade; that is, children were eligible whether they had been promoted to eighth grade, promoted to a higher grade, or had been retained.
Test administrators received school assignments with a set of schools in or around a
particular geographic area. An average assignment consisted of 13 schools. Each test administrator was responsible for conducting all direct child assessments and collecting all school and teacher questionnaires in his or her assigned schools. Based on pilot studies of the assessment procedures, it was determined that the test administrators could effectively manage the work associated with conducting an

4-35
assessment session independently if there were nine or fewer children in a session. More than 75 percent of ECLS-K schools had three or fewer ECLS-K children enrolled. In schools in which the number of ECLS-K children was more than nine, the assessments were scheduled across multiple sessions or additional task administrators assisted in conducting the assessments. The average size of an assessment session was three children and ranged from one to nine children per group. A majority of the field staff hired for eighth-grade assessments were continuing from fall school recruiting or had worked on previous rounds of ECLS-K data collection. Any staff hired with no prior experience on the study had experience on the National Assessment of Educational Progress (NAEP) in conducting group assessments.
4.7.1 Spring Preassessment Activities
Based on the information collected in the fall of 2006, packets of hard-copy teacher and school administrator questionnaires and instructions were assembled and mailed to schools beginning in January 2007, along with letters confirming the scheduled visits to the school. Teachers and school administrators were asked to complete the questionnaires and turn them in to the school coordinator for pickup by test administrators on assessment day.
Test administrators conducted preassessment activities by telephone starting in March 2007.
The preassessment activities for these schools were similar to those conducted in previous rounds of data collection and included confirming the assessment date, the school’s receipt of the hard-copy questionnaires, and arranging for space to conduct the spring assessments.
4.7.2 Conducting the Direct Child Assessments
The direct child assessments were conducted from March through early June 2007, the same time of year as in prior spring data collections. About 81 percent of the assessments were completed in March and April, about 18 percent were completed in May and less than 1 percent were completed in June. Table 4-4 presents the weekly completion rates for the child assessments. In year-round schools, multiple assessment visits to the school were done, as needed, to assess all of the sampled children in each track. There were 189 (2 percent) sampled children in year-round schools.
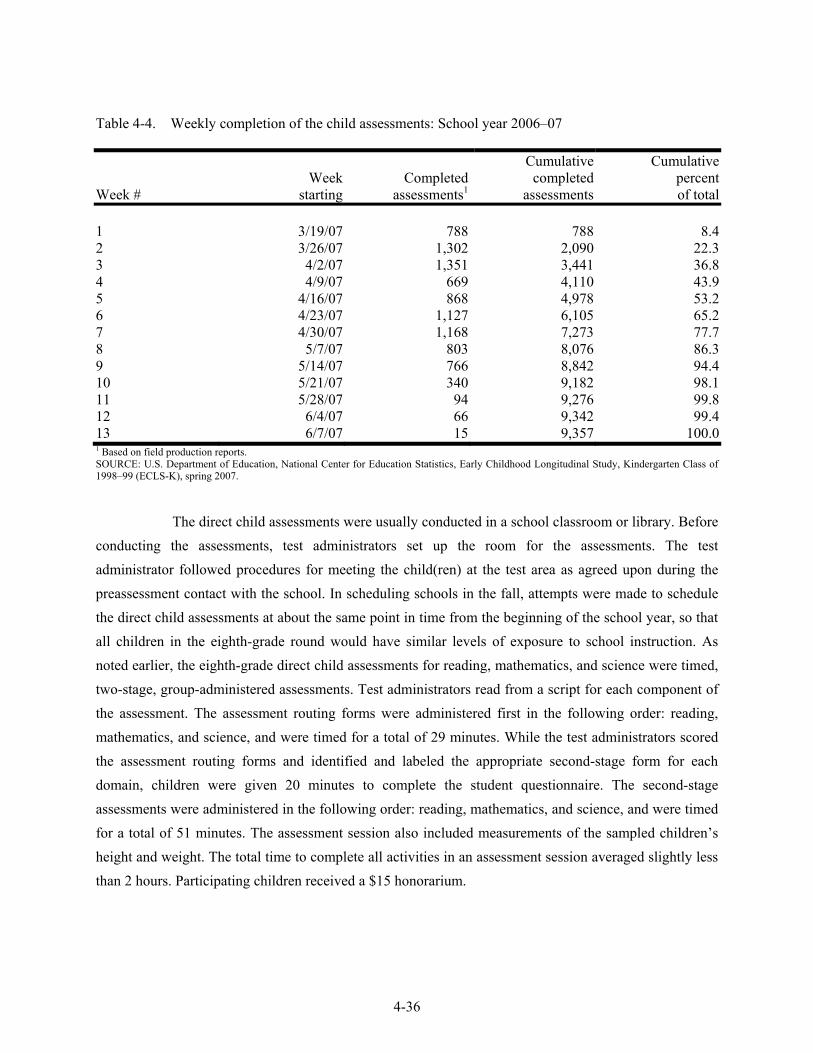
4-36
Table 4-4. Weekly completion of the child assessments: School year 2006–07
Week # Week
startingCompleted
assessments1
Cumulative completed
assessments
Cumulativepercent of total
1 3/19/07 788 788 8.42 3/26/07 1,302 2,090 22.33 4/2/07 1,351 3,441 36.84 4/9/07 669 4,110 43.95 4/16/07 868 4,978 53.26 4/23/07 1,127 6,105 65.27 4/30/07 1,168 7,273 77.78 5/7/07 803 8,076 86.39 5/14/07 766 8,842 94.410 5/21/07 340 9,182 98.111 5/28/07 94 9,276 99.812 6/4/07 66 9,342 99.413 6/7/07 15 9,357 100.01 Based on field production reports. SOURCE: U.S. Department of Education, National Center for Education Statistics, Early Childhood Longitudinal Study, Kindergarten Class of 1998–99 (ECLS-K), spring 2007.
The direct child assessments were usually conducted in a school classroom or library. Before
conducting the assessments, test administrators set up the room for the assessments. The test administrator followed procedures for meeting the child(ren) at the test area as agreed upon during the preassessment contact with the school. In scheduling schools in the fall, attempts were made to schedule the direct child assessments at about the same point in time from the beginning of the school year, so that all children in the eighth-grade round would have similar levels of exposure to school instruction. As noted earlier, the eighth-grade direct child assessments for reading, mathematics, and science were timed, two-stage, group-administered assessments. Test administrators read from a script for each component of the assessment. The assessment routing forms were administered first in the following order: reading, mathematics, and science, and were timed for a total of 29 minutes. While the test administrators scored the assessment routing forms and identified and labeled the appropriate second-stage form for each domain, children were given 20 minutes to complete the student questionnaire. The second-stage assessments were administered in the following order: reading, mathematics, and science, and were timed for a total of 51 minutes. The assessment session also included measurements of the sampled children’s height and weight. The total time to complete all activities in an assessment session averaged slightly less than 2 hours. Participating children received a $15 honorarium.
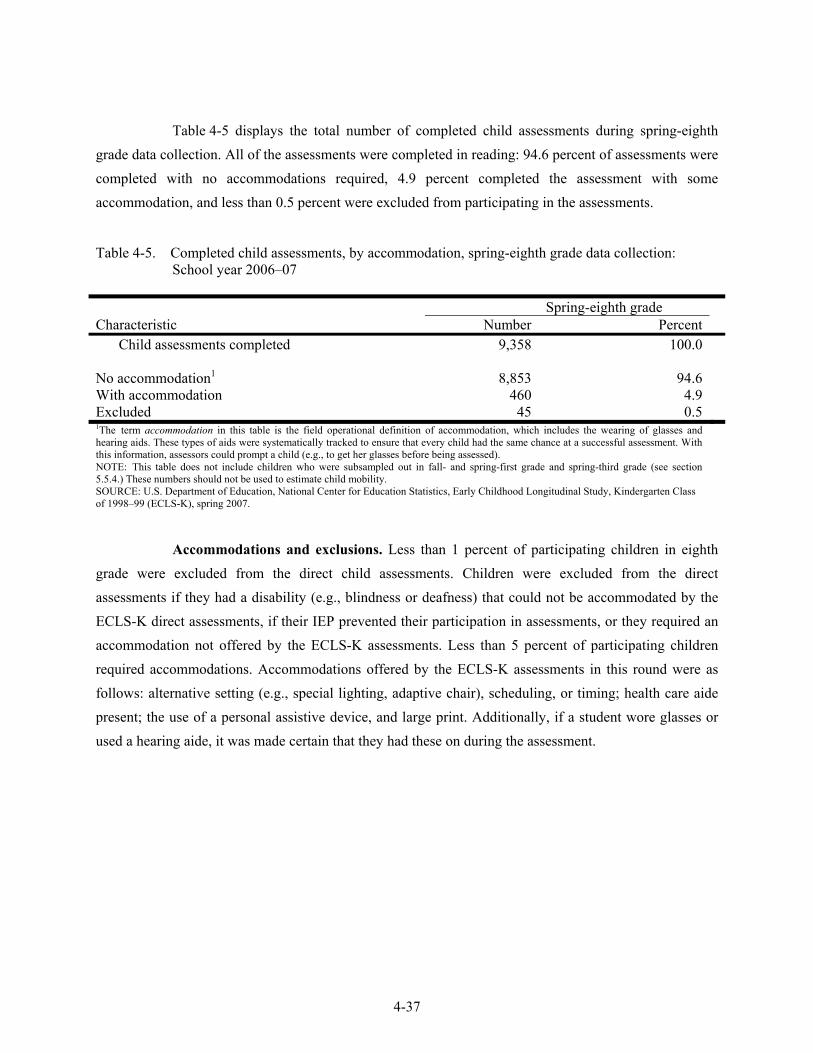
4-37
Table 4-5 displays the total number of completed child assessments during spring-eighth grade data collection. All of the assessments were completed in reading: 94.6 percent of assessments were completed with no accommodations required, 4.9 percent completed the assessment with some accommodation, and less than 0.5 percent were excluded from participating in the assessments. Table 4-5. Completed child assessments, by accommodation, spring-eighth grade data collection:
School year 2006–07
Spring-eighth grade Characteristic Number Percent
Child assessments completed 9,358 100.0 No accommodation1 8,853 94.6With accommodation 460 4.9Excluded 45 0.51The term accommodation in this table is the field operational definition of accommodation, which includes the wearing of glasses and hearing aids. These types of aids were systematically tracked to ensure that every child had the same chance at a successful assessment. With this information, assessors could prompt a child (e.g., to get her glasses before being assessed). NOTE: This table does not include children who were subsampled out in fall- and spring-first grade and spring-third grade (see section 5.5.4.) These numbers should not be used to estimate child mobility. SOURCE: U.S. Department of Education, National Center for Education Statistics, Early Childhood Longitudinal Study, Kindergarten Class of 1998–99 (ECLS-K), spring 2007.
Accommodations and exclusions. Less than 1 percent of participating children in eighth
grade were excluded from the direct child assessments. Children were excluded from the direct assessments if they had a disability (e.g., blindness or deafness) that could not be accommodated by the ECLS-K direct assessments, if their IEP prevented their participation in assessments, or they required an accommodation not offered by the ECLS-K assessments. Less than 5 percent of participating children required accommodations. Accommodations offered by the ECLS-K assessments in this round were as follows: alternative setting (e.g., special lighting, adaptive chair), scheduling, or timing; health care aide present; the use of a personal assistive device, and large print. Additionally, if a student wore glasses or used a hearing aide, it was made certain that they had these on during the assessment.
4-38
4.7.3 Collecting Data for Children Who Had Withdrawn From Their Previous Round School
While contacting schools, field staff asked school coordinators to identify children who had withdrawn from the school since the spring of fifth grade and/or fall of eighth grade. School staff were asked whether they knew the name and address of the school to which the child transferred, as well as any new information about the child’s household address. Field staff also consulted parents and other contacts for information on the child’s new school. This information was entered into the Field Management System and processed at Westat for data collection. Unlike in previous rounds, all in-scope children were followed in this round in an attempt to conduct a parent interview and collect school and assessment data.
4.7.4 Teacher and School Data Collection
Data were collected from school administrators, regular classroom teachers, and special education teachers from March through June 2007. The school and teacher questionnaires were mailed to the school coordinators beginning in late January 2007 on a flow basis, depending on the school’s scheduled assessment date. This schedule allowed additional time for these respondents to complete the questionnaires in advance of the scheduled spring assessment. Using the child-teacher-domain-class linkage information collected in the fall, a packet of questionnaires was assembled for each English, mathematics, science, and special education teacher. The customized teacher questionnaire materials included a cover letter and a $25 check attached to the teacher questionnaire, instruction sheets attached to the child-level questionnaires for each separate class, and a special education instruction sheet attached to the special education questionnaires (if appropriate).
The teacher questionnaire cover letter was a much simplified document from previous
rounds. It laid out the teacher tasks in succinct language on one page and clearly described the questionnaires, including the questionnaire cover colors, to help the teacher easily identify each part of the package. A checklist of instructions, an easy step-by-step guide, was included to aid the teacher in completing the questionnaires and returning them to the school coordinator. Domain instruction sheets (English, mathematics, science, and special education) included all the information the teacher required to correctly identify the class/domain. Teachers only received instruction sheets required for the sampled children in the domains they taught. All questionnaires were labeled with names and ID numbers. Teacher questionnaires were labeled with teacher name and ID number. Child-level teacher questionnaires were labeled with: teacher name and ID number, child name and ID number, domain, English, mathematics, or
4-39
science; classroom; and class time. Child-level questionnaires were assembled in bundles by domain and class identifier (e.g., English, 9:15 am, mathematics, Room A) for each teacher. All materials and questionnaires for each teacher were placed in an envelope and the envelope labeled with the teacher name.
Teachers were asked to complete child-level instruments for the sampled children in their
classrooms. Teachers were asked to complete all items in the English, mathematics, and science questionnaires for the designated Key Child, designated by a blue dot on the questionnaire cover, for the appropriate domains/classes. They were asked to complete only the child-level items, and not the classroom-level items, for the remaining children in that domain/class. Teachers received a remuneration check for completing the questionnaires. The size of the remuneration to teachers was dependent upon the number of child-level questionnaires the teacher had to complete. Teachers with 1–10 children received $25; teachers with 11–15 children received $35; teachers with 16–20 children received $45; teachers with more than 20 children received $55. Over 97 percent of teachers had fewer than 10 ECLS-K children.
A similar packet of materials was also assembled for the school administrator. This packet
included a cover letter with instructions on completing the school administrator questionnaire with a $25 check attached to the questionnaire. Packets were bundled together by school and mailed to the school coordinator for distribution. If the school or teacher and school administrator were not identified in the fall preassessment contact, then the field supervisor gathered the relevant information during the spring preassessment call and mailed the packets.
On assessment day, after collecting completed questionnaires, the test administrator scanned
the questionnaires to ensure that there were no missing critical items. During the field period, the test administrators followed up with the school coordinator by making an in-person visit to the school or prompting by telephone to review the status of the incomplete or missing questionnaires.
Table 4-6 presents the number of child-level questionnaires and percent of teachers asked to
complete them based on fall linkages of children to teachers and domains as well as the percent of teachers completing that number of questionnaires during spring data collection.
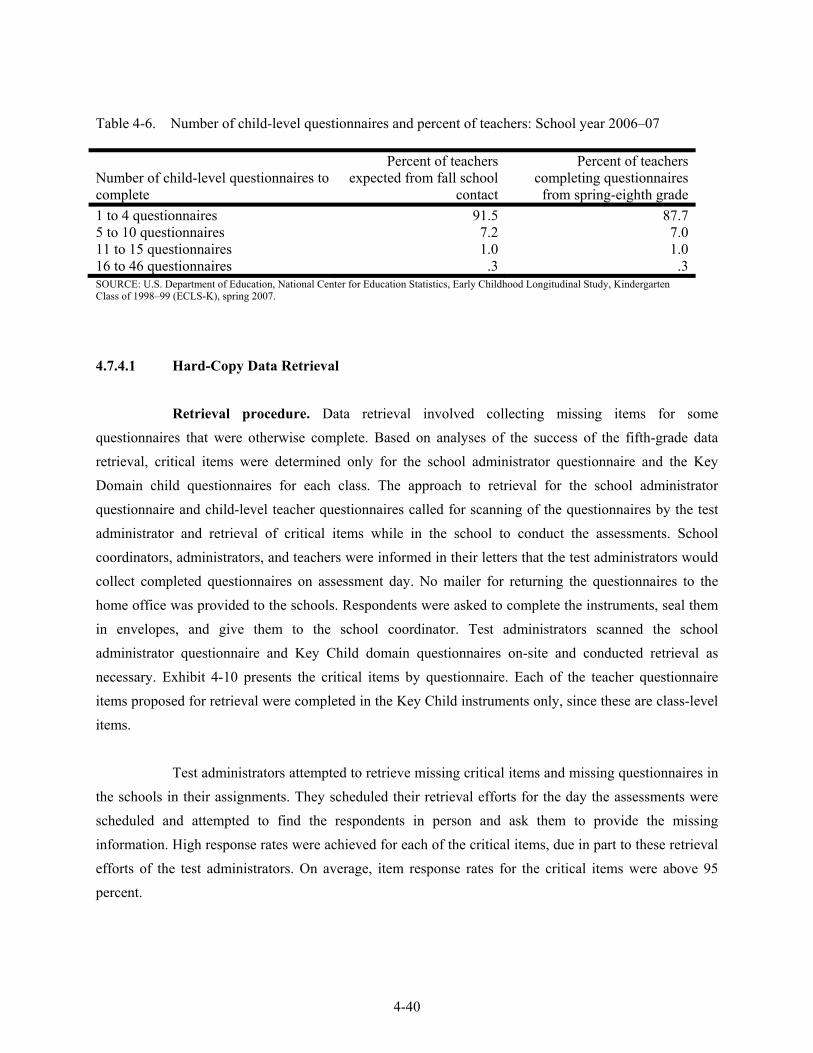
4-40
Table 4-6. Number of child-level questionnaires and percent of teachers: School year 2006–07
Number of child-level questionnaires to complete
Percent of teachers expected from fall school
contact
Percent of teachers completing questionnaires
from spring-eighth grade1 to 4 questionnaires 91.5 87.75 to 10 questionnaires 7.2 7.011 to 15 questionnaires 1.0 1.016 to 46 questionnaires .3 .3SOURCE: U.S. Department of Education, National Center for Education Statistics, Early Childhood Longitudinal Study, Kindergarten Class of 1998–99 (ECLS-K), spring 2007.
4.7.4.1 Hard-Copy Data Retrieval
Retrieval procedure. Data retrieval involved collecting missing items for some questionnaires that were otherwise complete. Based on analyses of the success of the fifth-grade data retrieval, critical items were determined only for the school administrator questionnaire and the Key Domain child questionnaires for each class. The approach to retrieval for the school administrator questionnaire and child-level teacher questionnaires called for scanning of the questionnaires by the test administrator and retrieval of critical items while in the school to conduct the assessments. School coordinators, administrators, and teachers were informed in their letters that the test administrators would collect completed questionnaires on assessment day. No mailer for returning the questionnaires to the home office was provided to the schools. Respondents were asked to complete the instruments, seal them in envelopes, and give them to the school coordinator. Test administrators scanned the school administrator questionnaire and Key Child domain questionnaires on-site and conducted retrieval as necessary. Exhibit 4-10 presents the critical items by questionnaire. Each of the teacher questionnaire items proposed for retrieval were completed in the Key Child instruments only, since these are class-level items.
Test administrators attempted to retrieve missing critical items and missing questionnaires in
the schools in their assignments. They scheduled their retrieval efforts for the day the assessments were scheduled and attempted to find the respondents in person and ask them to provide the missing information. High response rates were achieved for each of the critical items, due in part to these retrieval efforts of the test administrators. On average, item response rates for the critical items were above 95 percent.
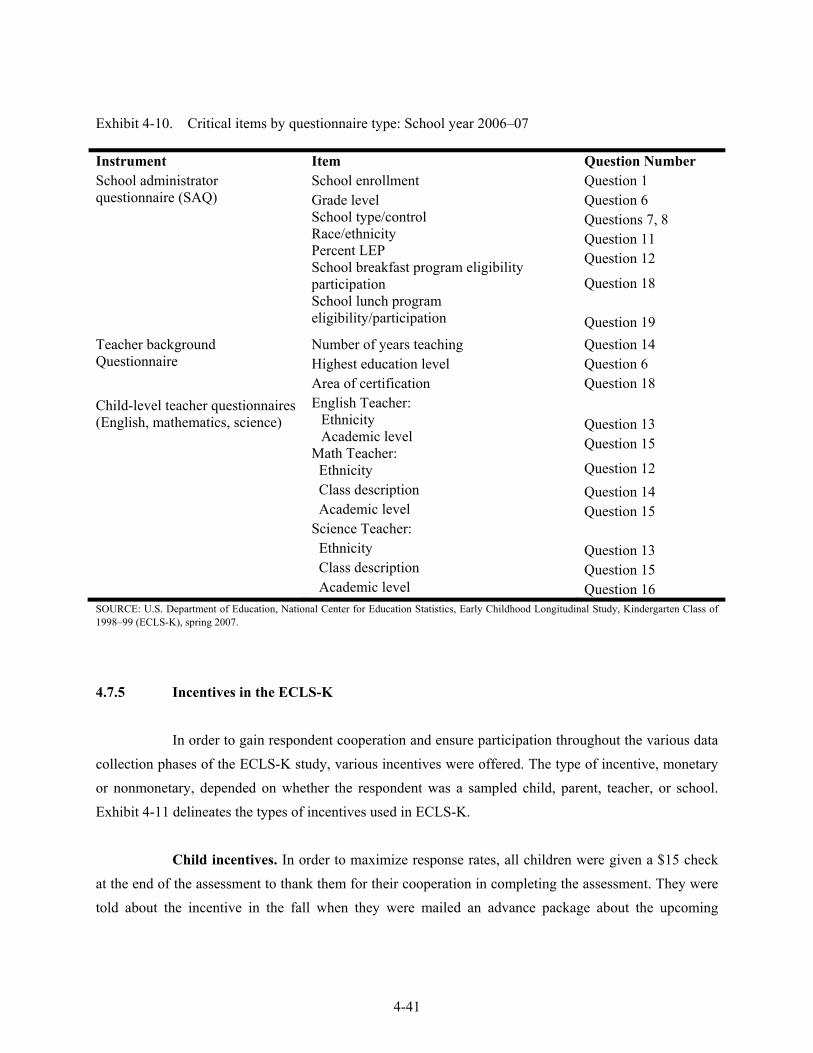
4-41
Exhibit 4-10. Critical items by questionnaire type: School year 2006–07 Instrument Item Question Number School administrator questionnaire (SAQ)
School enrollment Grade level School type/control Race/ethnicity Percent LEP School breakfast program eligibility participation School lunch program eligibility/participation
Question 1 Question 6 Questions 7, 8 Question 11 Question 12
Question 18 Question 19
Teacher background Questionnaire
Number of years teaching Highest education level Area of certification
Question 14 Question 6 Question 18
Child-level teacher questionnaires (English, mathematics, science)
English Teacher: Ethnicity Academic level
Math Teacher: Ethnicity Class description Academic level Science Teacher: Ethnicity Class description Academic level
Question 13 Question 15
Question 12 Question 14 Question 15 Question 13 Question 15 Question 16
SOURCE: U.S. Department of Education, National Center for Education Statistics, Early Childhood Longitudinal Study, Kindergarten Class of 1998–99 (ECLS-K), spring 2007.
4.7.5 Incentives in the ECLS-K
In order to gain respondent cooperation and ensure participation throughout the various data collection phases of the ECLS-K study, various incentives were offered. The type of incentive, monetary or nonmonetary, depended on whether the respondent was a sampled child, parent, teacher, or school. Exhibit 4-11 delineates the types of incentives used in ECLS-K.
Child incentives. In order to maximize response rates, all children were given a $15 check
at the end of the assessment to thank them for their cooperation in completing the assessment. They were told about the incentive in the fall when they were mailed an advance package about the upcoming
4-42
assessment. In addition, each month the home office mailed birthday cards to children whose birthdays fell within that month. Children were sent birthday cards throughout the calendar year, not just during the school year. By mailing these cards, children were not only thanked again for their participation, but parents were also reminded about the study. These periodic reminders are important in a longitudinal study, in which respondents may become apathetic toward the study during later rounds. Not only do these reminders encourage respondent participation, but they help the home office update addresses of families that have moved.
Parent incentives. In the spring of 2006, a newsletter about the study was printed and
mailed to parents. The newsletter served to update respondents on the initial findings from the fifth grade year and inform them about the schedule for the upcoming round of data collection. Regional difference with respect to half- and full-day kindergarten programs, reading and math skills and physical activity were a few of the topics discussed. Not only did the newsletter update parents on the findings of the study and highlight its importance, but it also was an incentive for future rounds of participation. Respondents were able to see the results of their participation in the study. Parents also received an ECLS-K pen and a $2 bill for their continued participation in the study.
School coordinator incentives. The school coordinator served an integral role in
coordinating the assessments activities at his school and distributing and collecting teacher and school questionnaires. He received a $25 check as payment for his assistance in the initial questionnaire package that was sent to him.
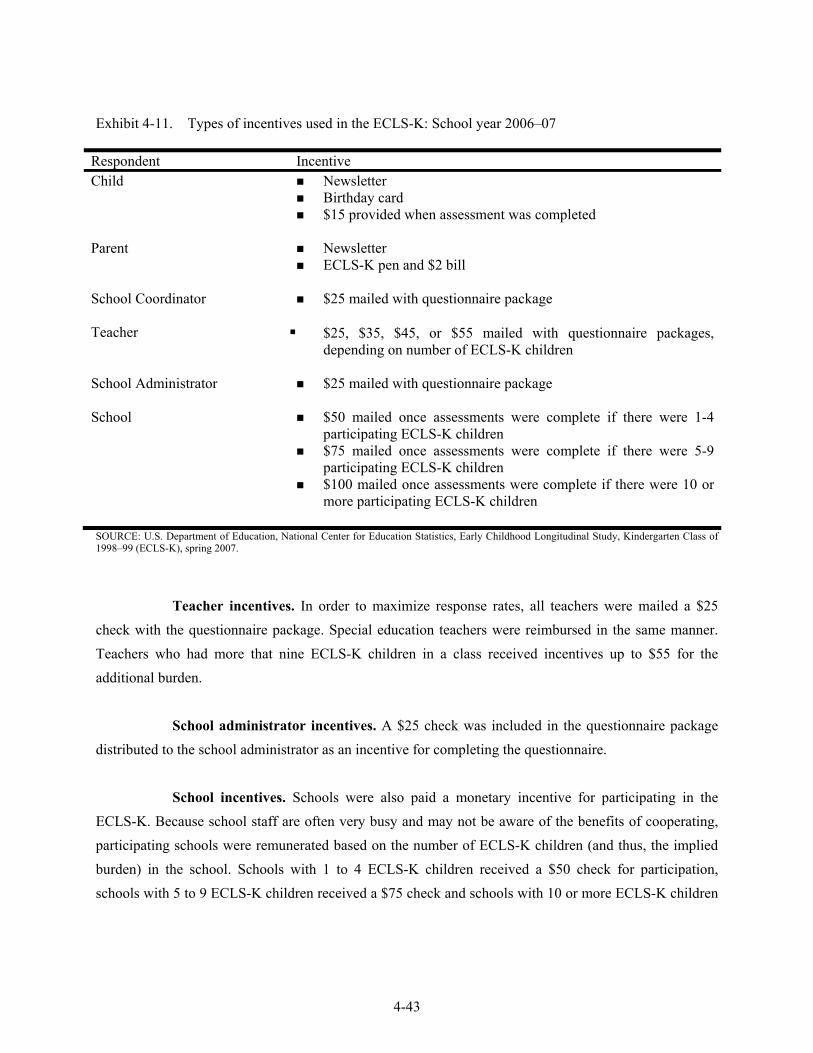
4-43
Exhibit 4-11. Types of incentives used in the ECLS-K: School year 2006–07
Respondent Incentive Child Newsletter
Birthday card $15 provided when assessment was completed
Parent Newsletter
ECLS-K pen and $2 bill School Coordinator $25 mailed with questionnaire package Teacher $25, $35, $45, or $55 mailed with questionnaire packages,
depending on number of ECLS-K children School Administrator $25 mailed with questionnaire package School $50 mailed once assessments were complete if there were 1-4
participating ECLS-K children $75 mailed once assessments were complete if there were 5-9
participating ECLS-K children $100 mailed once assessments were complete if there were 10 or
more participating ECLS-K children SOURCE: U.S. Department of Education, National Center for Education Statistics, Early Childhood Longitudinal Study, Kindergarten Class of 1998–99 (ECLS-K), spring 2007.
Teacher incentives. In order to maximize response rates, all teachers were mailed a $25
check with the questionnaire package. Special education teachers were reimbursed in the same manner. Teachers who had more that nine ECLS-K children in a class received incentives up to $55 for the additional burden.
School administrator incentives. A $25 check was included in the questionnaire package
distributed to the school administrator as an incentive for completing the questionnaire. School incentives. Schools were also paid a monetary incentive for participating in the
ECLS-K. Because school staff are often very busy and may not be aware of the benefits of cooperating, participating schools were remunerated based on the number of ECLS-K children (and thus, the implied burden) in the school. Schools with 1 to 4 ECLS-K children received a $50 check for participation, schools with 5 to 9 ECLS-K children received a $75 check and schools with 10 or more ECLS-K children
4-44
received a $100 check. These checks were mailed to schools on a flow basis as soon as all assessments were completed at the school.
4.8 Data Collection Quality Control
Continuous quality assurance procedures were employed during all data collection activities, with a particular focus on the assessments. The procedures were incorporated throughout all stages of the study (e.g., during instrument development, in the staff training program, and through parent validations).
Data collection quality control efforts began with the additional development and testing of
redesigned sections of the CAI/CAPI applications and the Field Management System. As sections of these applications were re-programmed, extensive testing of the entire system was conducted to verify that the systems were working properly from all perspectives. This testing included review by project design staff, statistical staff, and the programmers themselves. Quality control processes continued with the development of field procedures that maximized cooperation and thereby reduced the potential for nonresponse bias.
Quality control activities continued during training and data collection. During assessor
training, field staff practiced conducting the parent interview in pairs and practiced multiple exercises on scoring the first stage of each assessment and affixing labels to the second stage of each assessment. When the fieldwork began, field supervisors made telephone calls to parents to validate the interview. The teacher and school questionnaire packages were reviewed for accuracy at 100 percent to ensure the correct questionnaires were sent to the schools for distribution and completion.
4.8.1 Quality Control on the Child Assessment
The mode of assessment administration changed in eighth-grade from a one-on-one, CAI- with-easels assessment administration to a group-administered, timed, hard-copy assessment. The hard-copy assessment was a two-stage assessment with a routing assessment for each of three domains, reading, mathematics, and science, and two levels of the second-stage assessment for each domain. Test administrators had to administer the routing assessment, score the three domains, and identify the appropriate second-stage assessment by domain and affix a label with a child’s name and identification
4-45
number. In the training session, test administrators practiced this process multiple times to be able to quickly and accurately score and label assessment forms in the field. All trainees were proficient on the process after completing training.
Test administrators’ accuracy in identifying the appropriate assessment forms was examined
during the field period by comparing the child’s routing test score and the assessment form the test administrator labeled for the child. Test administrators identified the appropriate second-stage assessment with over 99 percent accuracy for each assessment domain: 99.2 percent accuracy for the reading assessment; 99.3 percent accuracy for the science assessment; and 99.5 percent accuracy for the mathematics assessment.
4.8.2 Validation of Parent Interview
Approximately 10 percent of the respondents who completed parent interviews were selected for a short re-interview conducted by a field supervisor (i.e., a “validation” interview). The first parent interview completed by an interviewer was always selected for validation. Over the course of the field period, a running count of an interviewer’s completed parent interviews was maintained, and each tenth completed parent interview was selected for validation, thus ensuring that 10 percent of each interviewer’s cases were selected for validation. The parent validation was approximately 5 minutes long and was conducted by telephone. In spring-eighth grade, a total of 870 parent interviews were validated with 75.8 percent reporting the same answers as the original interview. Field supervisors used a standardized parent validation script to make validation calls to parents. The script covered the following topics:
verification of the child’s full name, date of birth, and sex; and
seven questions repeated from the parent interview.
Field supervisors noted if the validation check was completed with no changes, with “minor” changes, or with “major” changes. “Minor” changes include spelling of parent name, child’s name, parent’s address or telephone number, child’s date of birth, or child’s gender. “Major” changes include any changes to the question responses.
4-46
Table 4-7 shows the results of parent interview validations. According to feedback from supervisors, discrepancies between parents’ responses during the original parent interview and those during the validation may reflect differences in respondent recall, respondent interpretation of the question, or actual change in the data, rather than a validation issue. Thus, the results for major changes may be overreported.
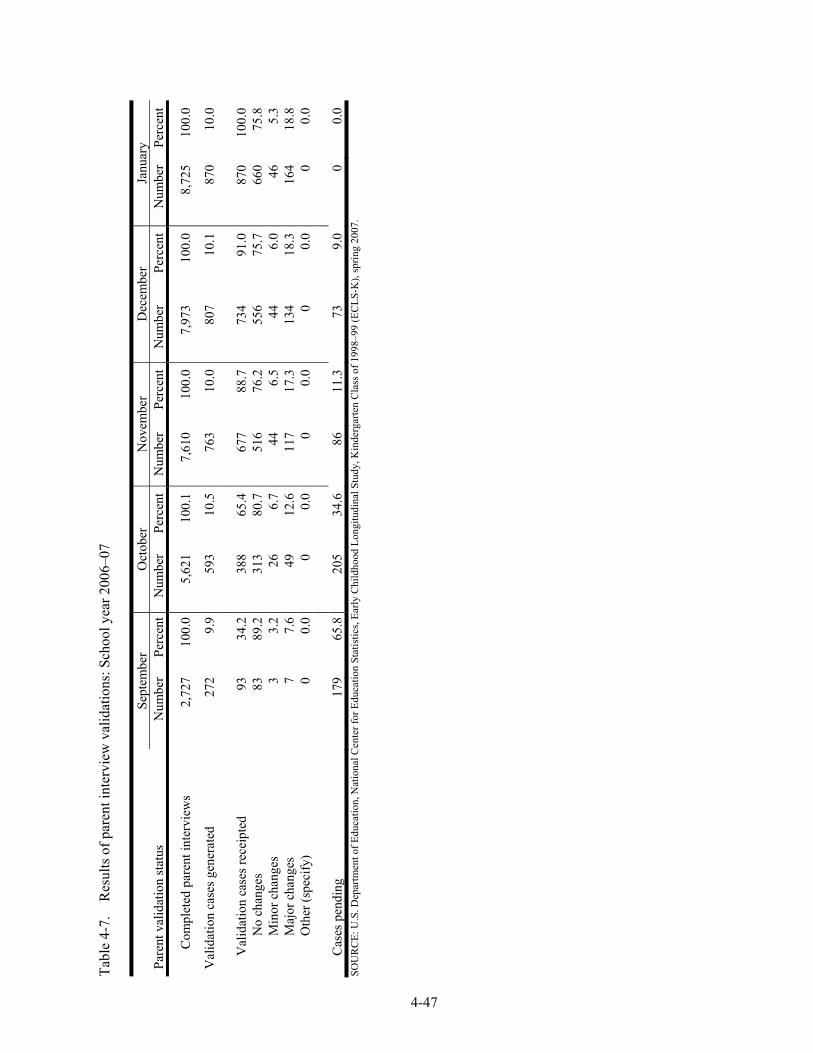
4-47
Tabl
e 4-
7. R
esul
ts o
f par
ent i
nter
view
val
idat
ions
: Sch
ool y
ear 2
006–
07
Pare
nt v
alid
atio
n st
atus
Se
ptem
ber
Oct
ober
N
ovem
ber
Dec
embe
r Ja
nuar
y N
umbe
rPe
rcen
tN
umbe
r Pe
rcen
t N
umbe
r Pe
rcen
t N
umbe
r Pe
rcen
t N
umbe
r Pe
rcen
t
C
ompl
eted
par
ent i
nter
view
s 2,
727
100.
05,
621
100.
1 7,
610
100.
0 7,
973
100.
0 8,
725
100.
0
Val
idat
ion
case
s gen
erat
ed
272
9.9
593
10.5
76
3 10
.0
807
10.1
87
0 10
.0
Val
idat
ion
case
s rec
eipt
ed
9334
.238
8 65
.4
677
88.7
73
4 91
.0
870
100.
0
N
o ch
ange
s 83
89.2
313
80.7
51
6 76
.2
556
75.7
66
0 75
.8
Min
or c
hang
es
33.
226
6.
7 44
6.
5 44
6.
0 46
5.
3
M
ajor
cha
nges
7
7.6
49
12.6
11
7 17
.3
134
18.3
16
4 18
.8
Oth
er (s
peci
fy)
00.
00
0.0
0 0.
0 0
0.0
0 0.
0
C
ases
pen
ding
17
965
.820
5 34
.6
86
11.3
73
9.
0 0
0.0
SOU
RC
E: U
.S. D
epar
tmen
t of E
duca
tion,
Nat
iona
l Cen
ter f
or E
duca
tion
Stat
istic
s, Ea
rly C
hild
hood
Lon
gitu
dina
l Stu
dy, K
inde
rgar
ten
Cla
ss o
f 199
8–99
(EC
LS-K
), sp
ring
2007
.
5-1
5. DATA PREPARATION AND EDITING
As described in chapter 4, two types of data collection instruments were used for the Early Childhood Longitudinal Study, Kindergarten Class of 1998–99 (ECLS-K) data collection in spring-eighth-grade: computer-assisted interviews (CAI) and self-administered paper forms (hard copy). The data preparation approach differed with the mode of data collection. The parent interview was conducted using CAI techniques. Editing specifications were built into the computer programs used by interviewers to collect these data. The child assessments and student questionnaires were administered as hard-copy forms and were completed in a group setting. The teacher and school administrator questionnaires were self-administered on hard-copy forms. When the field supervisors returned these forms, coders recorded the receipt of these forms into a project-specific forms tracking system. The forms were then sent to a scanning subcontractor for transfer into an electronic format. After the data were scanned, upcoding was conducted, and the data were reviewed for range and logic consistency. The following sections describe the data preparation activities for both modes of data collection in more detail.
5.1 Coding and Editing Specifications for Computer-Assisted Interviews (CAI)
The very nature of designing a computer-assisted interview forces decisions about edit specifications to be made up front. Both acceptable ranges and logic consistency checks were preprogrammed into the electronic questionnaire. The following sections describe the coding and editing that were conducted on the CAI parent interview.
5.1.1 Range Specifications
Within the CAI parent interview instruments, respondent answers were subjected to both “hard” and “soft” range edits during the interviewing process. A “soft range” is one that represents the reasonable expected range of values but does not include all possible values. Responses outside the soft range were confirmed with the respondent and entered a second time. For example, the number of times a child changed from one school to another since spring 2004 had a soft range of 0 to 3. A value outside this range could be entered and confirmed as correct by the interviewer as long as it was within the hard range of values (0 to 5).
5-2
“Hard ranges” are those that have a finite set of parameters for the values that can be entered into the computer, for example, “0–5 times” for the number of times the child, in the previous 5 days, ate a breakfast that was not school provided. Out-of-range values for closed-ended questions were not accepted. If the respondent insisted that a response outside the hard range was correct, the assessor or interviewer could enter the information in a comments data file. Data preparation and project staff reviewed these comments. Out-of-range values were accepted and entered into the data file if the comments supported the response.
5.1.2 Logical Consistency Checks (Logical Edits)
Consistency checks, or logical edits, examine the relationship between and among responses to ensure that they do not conflict with one another or that the response to one item does not make the response to another item unlikely. For example, in the household roster, one could not be recorded as both a sister and male. When a logical error such as this occurred during a session, a message appeared requesting verification of the last response and a resolution of the discrepancy. In some instances, if the verified response still resulted in a logical error, the interviewer recorded the problem either in a comment or on a problem report.
5.1.3 Coding
Additional coding was required for some of the items collected in the CAI instrument. These items included “Other, specify” text responses, occupation, and race/ethnicity. Interviewers keyed verbatim responses to these items. Once the data were keyed, staff were trained to code these data using coding manuals designed by Westat and the National Center for Education Statistics (NCES) to support the coding process.
Review of “Other, specify” items. The “Other, specify” open-ended parent interview
responses were reviewed to determine if they should be coded into one of the existing response categories. During data collection, when a respondent selected an “other” response in the parent interview, the interviewer entered the text into a “specify” overlay that appeared on the screen. The data preparation staff reviewed these text “specify” responses and, where appropriate, coded them into one of the existing response categories. If a response did not fit into one of the existing categories, it remained
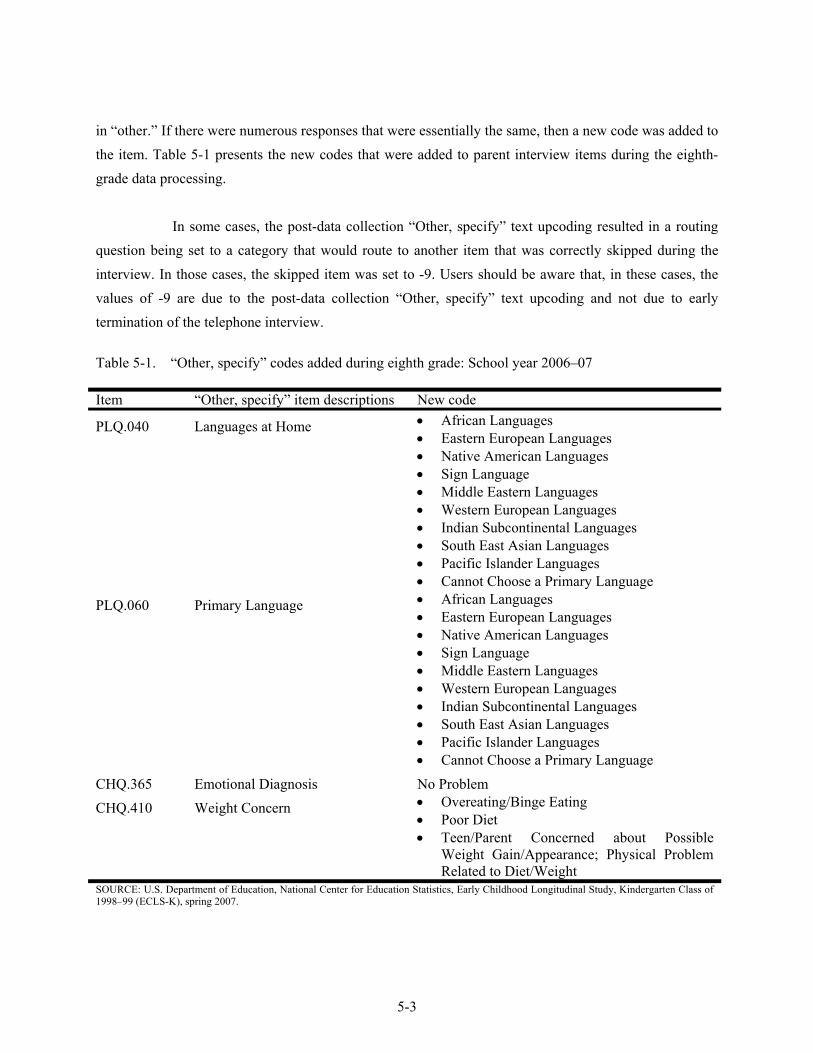
5-3
in “other.” If there were numerous responses that were essentially the same, then a new code was added to the item. Table 5-1 presents the new codes that were added to parent interview items during the eighth-grade data processing.
In some cases, the post-data collection “Other, specify” text upcoding resulted in a routing
question being set to a category that would route to another item that was correctly skipped during the interview. In those cases, the skipped item was set to -9. Users should be aware that, in these cases, the values of -9 are due to the post-data collection “Other, specify” text upcoding and not due to early termination of the telephone interview.
Table 5-1. “Other, specify” codes added during eighth grade: School year 2006–07 Item “Other, specify” item descriptions New code
PLQ.040 Languages at Home • African Languages • Eastern European Languages • Native American Languages • Sign Language • Middle Eastern Languages • Western European Languages • Indian Subcontinental Languages • South East Asian Languages • Pacific Islander Languages • Cannot Choose a Primary Language
PLQ.060 Primary Language • African Languages • Eastern European Languages • Native American Languages • Sign Language • Middle Eastern Languages • Western European Languages • Indian Subcontinental Languages • South East Asian Languages • Pacific Islander Languages • Cannot Choose a Primary Language
CHQ.365 Emotional Diagnosis No Problem CHQ.410 Weight Concern • Overeating/Binge Eating
• Poor Diet • Teen/Parent Concerned about Possible
Weight Gain/Appearance; Physical Problem Related to Diet/Weight
SOURCE: U.S. Department of Education, National Center for Education Statistics, Early Childhood Longitudinal Study, Kindergarten Class of 1998–99 (ECLS-K), spring 2007.
5-4
Other cases of which users should be aware in which a value of -9 is set during the post-data collection editing are in twin households where a non-English language is spoken in the home (PLQ020=1). There are 12 records on the data file in which PLQ083 = -9 and PLQ090 = -9 for the second child of a set of twins. The Blaise CAPI program did not collect child-level language data for the twins in households speaking any language other than English. As a result, the child-level PLQ variables have been set to -9 (not ascertained) for the 12 twins.
The parent “Other, specify” coding system was revised from previous rounds of data
collection and in production testing in April 2004. The revisions consisted of adding new “Other, specify” items that had not been part of the previous rounds (see table 5-2 for new items). Four items that included an “Other, specify” code were new to the parent interview and were added to the system. Two items were included in the Round 1 parent interview, but were not included in the parent interviews again until the current round. A total of 25,722 “Other, specify” text strings were processed through the parent “Other, specify” coding system. All possible upcodes were applied to the 8,473 cases that had at least one “Other, specify” text string. As noted above, whenever appropriate, responses were upcoded to existing categories. Table 5-3 presents the number of text strings for each “Other, specify” item including the new ones added in eighth grade.
Parent occupation coding. As in the kindergarten, first-grade, third-grade, and fifth-grade
data collections, occupations were coded using the Industry and Occupation Coding Manual (NCES 2000–077) (U.S. Department of Education, National Center for Education Statistics 1999). This coding manual was created for the Adult Education Survey of the National Household Education Surveys Program (AE-NHES:1999) and used an aggregated version of industry and occupation codes. The industry and occupation codes used by NHES were originally developed for the 1989–90 National Postsecondary Student Aid Study (NPSAS:1990) and contained one to four digits. Analysis of the NPSAS categories revealed that some categories had very small numbers of cases and some categories that are similar had similar participation rates, suggesting that the separate codes could be collapsed without significant loss of information. The NHES industry and occupation code categories use a two-digit code, the highest level of aggregation, to have sufficient numbers of cases to support analysis without collapsing categories. There are 13 industry codes and 22 occupation codes in the NHES coding scheme. If an industry or occupation could not be coded using this manual, the Index of Industries and Occupations—1980 (U.S. Department of Commerce, Bureau of the Census 1982) and Standard Occupational Classification Manual—1980 (U.S. Department of Commerce, Office of Federal Statistical
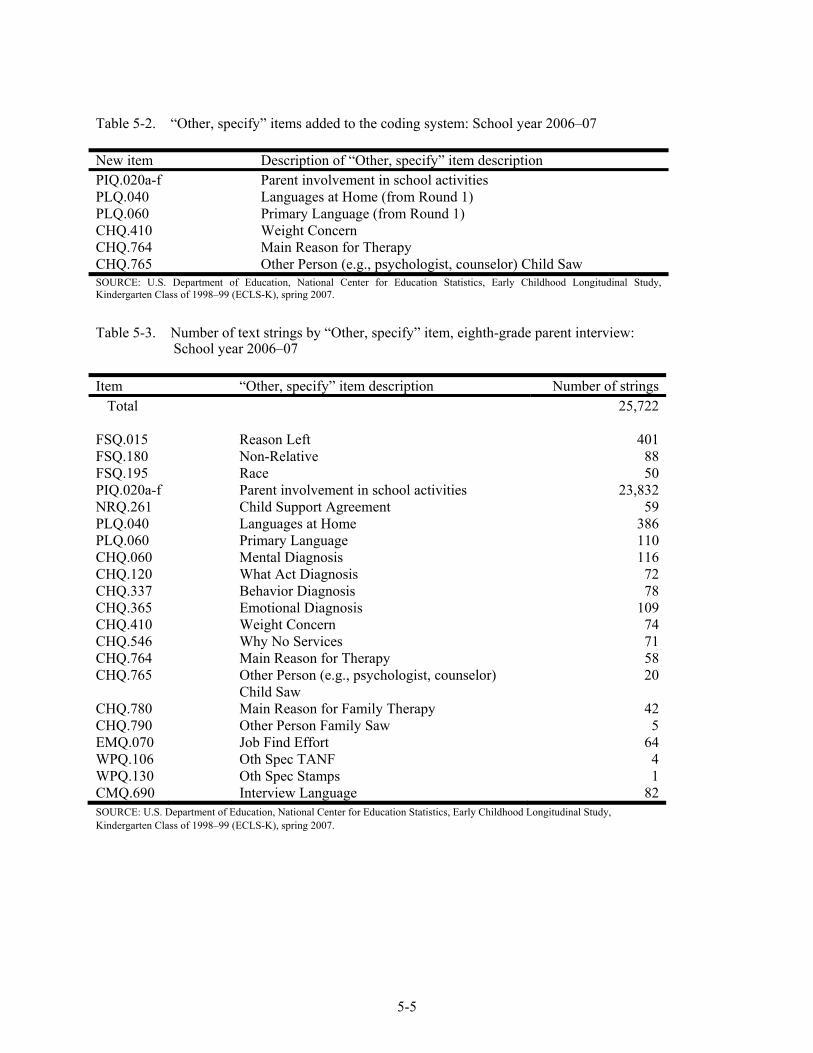
5-5
Table 5-2. “Other, specify” items added to the coding system: School year 2006–07 New item Description of “Other, specify” item descriptionPIQ.020a-f Parent involvement in school activities PLQ.040 Languages at Home (from Round 1) PLQ.060 Primary Language (from Round 1) CHQ.410 Weight Concern CHQ.764 Main Reason for Therapy CHQ.765 Other Person (e.g., psychologist, counselor) Child Saw SOURCE: U.S. Department of Education, National Center for Education Statistics, Early Childhood Longitudinal Study, Kindergarten Class of 1998–99 (ECLS-K), spring 2007.
Table 5-3. Number of text strings by “Other, specify” item, eighth-grade parent interview:
School year 2006–07 Item “Other, specify” item description Number of strings
Total 25,722 FSQ.015 Reason Left 401FSQ.180 Non-Relative 88FSQ.195 Race 50PIQ.020a-f Parent involvement in school activities 23,832NRQ.261 Child Support Agreement 59PLQ.040 Languages at Home 386PLQ.060 Primary Language 110CHQ.060 Mental Diagnosis 116CHQ.120 What Act Diagnosis 72CHQ.337 Behavior Diagnosis 78CHQ.365 Emotional Diagnosis 109CHQ.410 Weight Concern 74CHQ.546 Why No Services 71CHQ.764 Main Reason for Therapy 58CHQ.765 Other Person (e.g., psychologist, counselor)
Child Saw 20
CHQ.780 Main Reason for Family Therapy 42CHQ.790 Other Person Family Saw 5EMQ.070 Job Find Effort 64WPQ.106 Oth Spec TANF 4WPQ.130 Oth Spec Stamps 1CMQ.690 Interview Language 82SOURCE: U.S. Department of Education, National Center for Education Statistics, Early Childhood Longitudinal Study, Kindergarten Class of 1998–99 (ECLS-K), spring 2007.
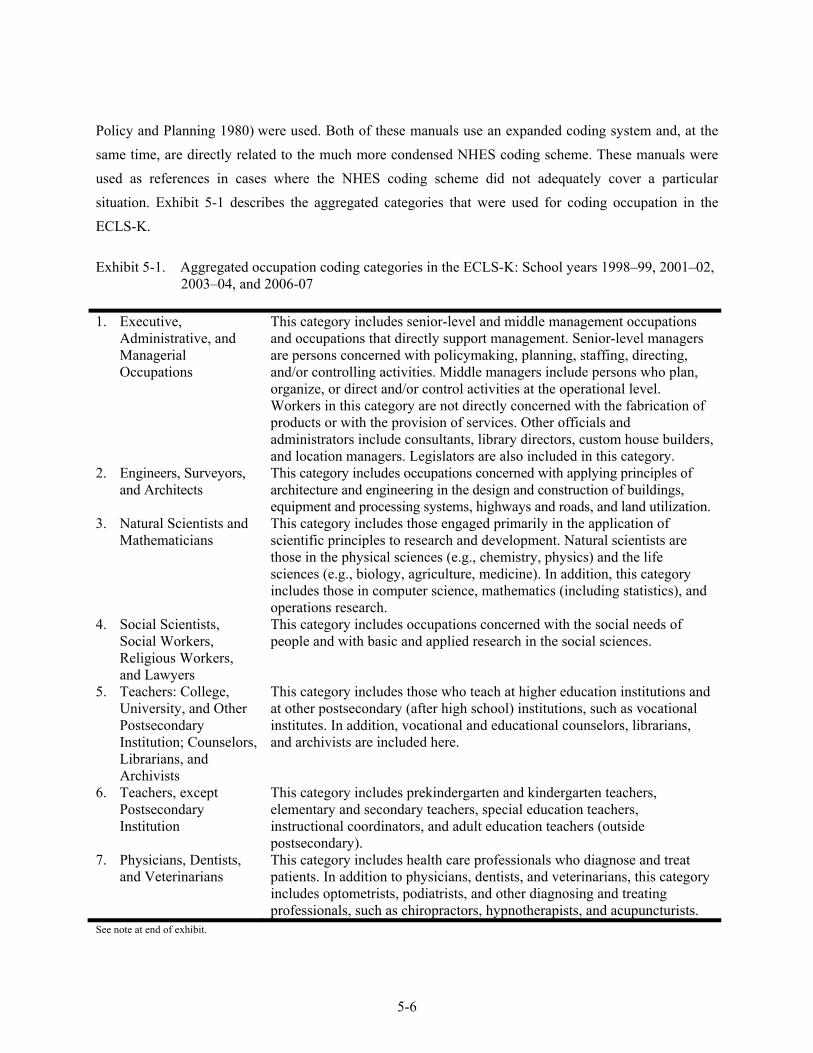
5-6
Policy and Planning 1980) were used. Both of these manuals use an expanded coding system and, at the same time, are directly related to the much more condensed NHES coding scheme. These manuals were used as references in cases where the NHES coding scheme did not adequately cover a particular situation. Exhibit 5-1 describes the aggregated categories that were used for coding occupation in the ECLS-K.
Exhibit 5-1. Aggregated occupation coding categories in the ECLS-K: School years 1998–99, 2001–02,
2003–04, and 2006-07 1. Executive,
Administrative, and Managerial Occupations
This category includes senior-level and middle management occupations and occupations that directly support management. Senior-level managers are persons concerned with policymaking, planning, staffing, directing, and/or controlling activities. Middle managers include persons who plan, organize, or direct and/or control activities at the operational level. Workers in this category are not directly concerned with the fabrication of products or with the provision of services. Other officials and administrators include consultants, library directors, custom house builders, and location managers. Legislators are also included in this category.
2. Engineers, Surveyors, and Architects
This category includes occupations concerned with applying principles of architecture and engineering in the design and construction of buildings, equipment and processing systems, highways and roads, and land utilization.
3. Natural Scientists and Mathematicians
This category includes those engaged primarily in the application of scientific principles to research and development. Natural scientists are those in the physical sciences (e.g., chemistry, physics) and the life sciences (e.g., biology, agriculture, medicine). In addition, this category includes those in computer science, mathematics (including statistics), and operations research.
4. Social Scientists, Social Workers, Religious Workers, and Lawyers
This category includes occupations concerned with the social needs of people and with basic and applied research in the social sciences.
5. Teachers: College, University, and Other Postsecondary Institution; Counselors, Librarians, and Archivists
This category includes those who teach at higher education institutions and at other postsecondary (after high school) institutions, such as vocational institutes. In addition, vocational and educational counselors, librarians, and archivists are included here.
6. Teachers, except Postsecondary Institution
This category includes prekindergarten and kindergarten teachers, elementary and secondary teachers, special education teachers, instructional coordinators, and adult education teachers (outside postsecondary).
7. Physicians, Dentists, and Veterinarians
This category includes health care professionals who diagnose and treat patients. In addition to physicians, dentists, and veterinarians, this category includes optometrists, podiatrists, and other diagnosing and treating professionals, such as chiropractors, hypnotherapists, and acupuncturists.
See note at end of exhibit.
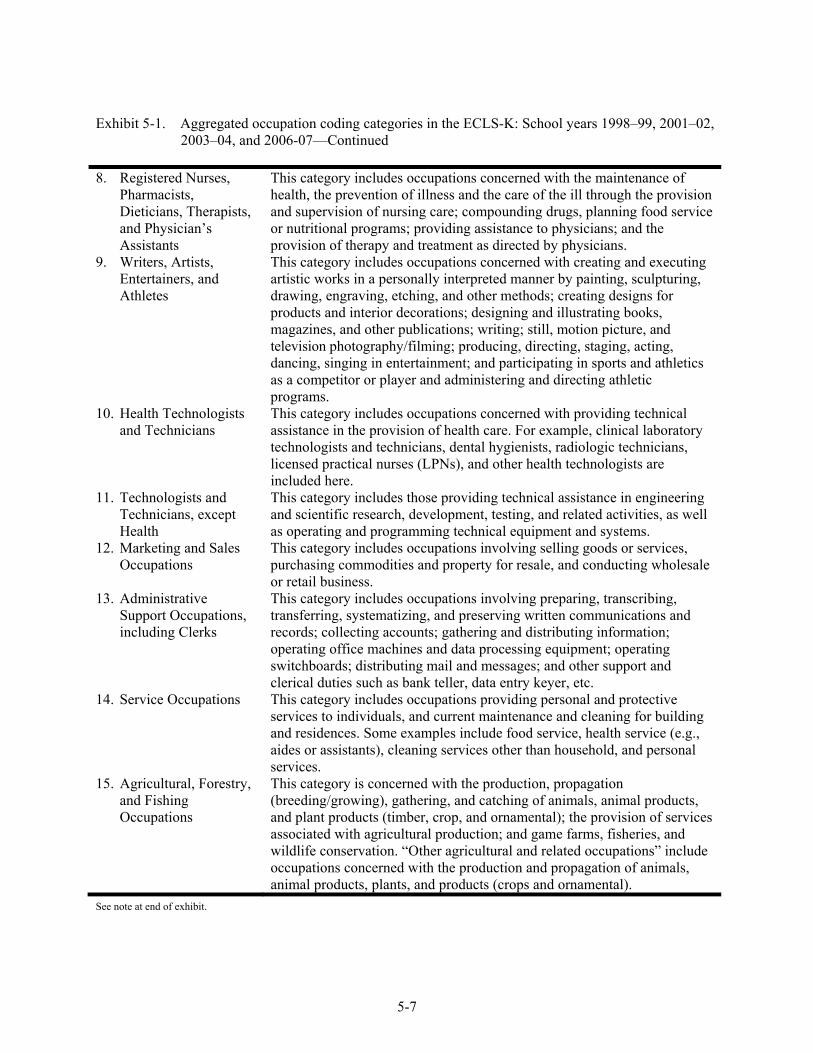
5-7
Exhibit 5-1. Aggregated occupation coding categories in the ECLS-K: School years 1998–99, 2001–02, 2003–04, and 2006-07—Continued
8. Registered Nurses,
Pharmacists, Dieticians, Therapists, and Physician’s Assistants
This category includes occupations concerned with the maintenance of health, the prevention of illness and the care of the ill through the provision and supervision of nursing care; compounding drugs, planning food service or nutritional programs; providing assistance to physicians; and the provision of therapy and treatment as directed by physicians.
9. Writers, Artists, Entertainers, and Athletes
This category includes occupations concerned with creating and executing artistic works in a personally interpreted manner by painting, sculpturing, drawing, engraving, etching, and other methods; creating designs for products and interior decorations; designing and illustrating books, magazines, and other publications; writing; still, motion picture, and television photography/filming; producing, directing, staging, acting, dancing, singing in entertainment; and participating in sports and athletics as a competitor or player and administering and directing athletic programs.
10. Health Technologists and Technicians
This category includes occupations concerned with providing technical assistance in the provision of health care. For example, clinical laboratory technologists and technicians, dental hygienists, radiologic technicians, licensed practical nurses (LPNs), and other health technologists are included here.
11. Technologists and Technicians, except Health
This category includes those providing technical assistance in engineering and scientific research, development, testing, and related activities, as well as operating and programming technical equipment and systems.
12. Marketing and Sales Occupations
This category includes occupations involving selling goods or services, purchasing commodities and property for resale, and conducting wholesale or retail business.
13. Administrative Support Occupations, including Clerks
This category includes occupations involving preparing, transcribing, transferring, systematizing, and preserving written communications and records; collecting accounts; gathering and distributing information; operating office machines and data processing equipment; operating switchboards; distributing mail and messages; and other support and clerical duties such as bank teller, data entry keyer, etc.
14. Service Occupations This category includes occupations providing personal and protective services to individuals, and current maintenance and cleaning for building and residences. Some examples include food service, health service (e.g., aides or assistants), cleaning services other than household, and personal services.
15. Agricultural, Forestry, and Fishing Occupations
This category is concerned with the production, propagation (breeding/growing), gathering, and catching of animals, animal products, and plant products (timber, crop, and ornamental); the provision of services associated with agricultural production; and game farms, fisheries, and wildlife conservation. “Other agricultural and related occupations” include occupations concerned with the production and propagation of animals, animal products, plants, and products (crops and ornamental).
See note at end of exhibit.
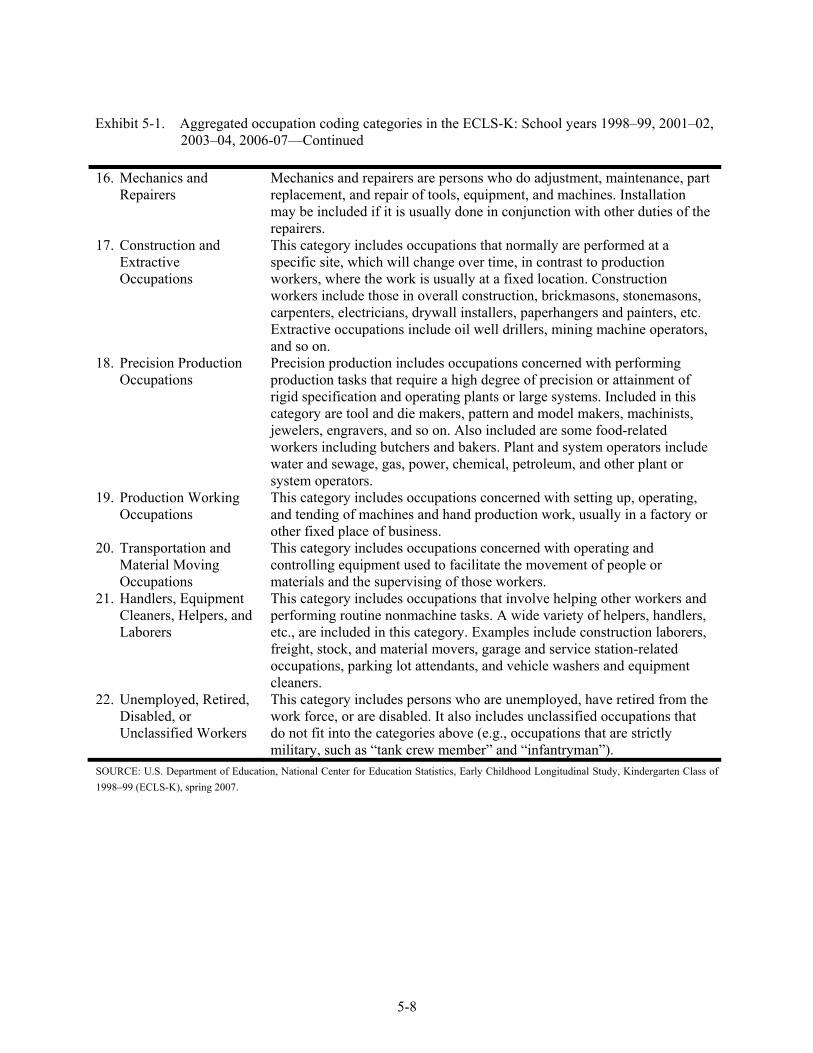
5-8
Exhibit 5-1. Aggregated occupation coding categories in the ECLS-K: School years 1998–99, 2001–02, 2003–04, 2006-07—Continued
16. Mechanics and
Repairers Mechanics and repairers are persons who do adjustment, maintenance, part replacement, and repair of tools, equipment, and machines. Installation may be included if it is usually done in conjunction with other duties of the repairers.
17. Construction and Extractive Occupations
This category includes occupations that normally are performed at a specific site, which will change over time, in contrast to production workers, where the work is usually at a fixed location. Construction workers include those in overall construction, brickmasons, stonemasons, carpenters, electricians, drywall installers, paperhangers and painters, etc. Extractive occupations include oil well drillers, mining machine operators, and so on.
18. Precision Production Occupations
Precision production includes occupations concerned with performing production tasks that require a high degree of precision or attainment of rigid specification and operating plants or large systems. Included in this category are tool and die makers, pattern and model makers, machinists, jewelers, engravers, and so on. Also included are some food-related workers including butchers and bakers. Plant and system operators include water and sewage, gas, power, chemical, petroleum, and other plant or system operators.
19. Production Working Occupations
This category includes occupations concerned with setting up, operating, and tending of machines and hand production work, usually in a factory or other fixed place of business.
20. Transportation and Material Moving Occupations
This category includes occupations concerned with operating and controlling equipment used to facilitate the movement of people or materials and the supervising of those workers.
21. Handlers, Equipment Cleaners, Helpers, and Laborers
This category includes occupations that involve helping other workers and performing routine nonmachine tasks. A wide variety of helpers, handlers, etc., are included in this category. Examples include construction laborers, freight, stock, and material movers, garage and service station-related occupations, parking lot attendants, and vehicle washers and equipment cleaners.
22. Unemployed, Retired, Disabled, or Unclassified Workers
This category includes persons who are unemployed, have retired from the work force, or are disabled. It also includes unclassified occupations that do not fit into the categories above (e.g., occupations that are strictly military, such as “tank crew member” and “infantryman”).
SOURCE: U.S. Department of Education, National Center for Education Statistics, Early Childhood Longitudinal Study, Kindergarten Class of 1998–99 (ECLS-K), spring 2007.
5-9
Occupation coding began with an autocoding procedure using a computer string match program developed for the NHES. The program searched the responses for strings of text for each record/case and assigned an appropriate code. A little over a third of the cases were autocoded (36.8 percent).
Cases that could not be coded using the autocoding system were coded manually using a
customized coding utility program designed for coding occupations. The customized coding utility program brought up each case for coders to assign the most appropriate codes. In addition to the text strings, other information, such as main duties, highest level of education, and name of the employer, was available for the coders. The coders used this information to ensure that the occupation code assigned to each case was appropriate. Over half the cases (63.2 percent) were manually coded.
The cases were then verified. Verification of coding is an important tool for ensuring quality
control and extending coder training. As a verification step, two coders independently assigned codes (i.e., a double-blind coding process) to industry and occupation cases. Coders also independently assigned a second code for autocoded cases. A coding supervisor adjudicated disagreements between the initial code and the verification code. The adjudication by the supervisor served to further train coders by presenting concrete examples of appropriate coding. Of the cases that were autocoded, 16.6 percent required adjudication because the verifier disagreed with the autocoding. Of the cases that were manually coded, 28.3 percent required adjudication because the manual coder and the verifier disagreed. After coding, verification, and adjudication were completed, all of the data were sorted by job title and code to check the coding one last time for consistency and to catch any coding errors that may have been overlooked.
Table 5-4 summarizes the results of the coding and verification process for occupation
coding. In the table, manually coded indicates that occupation was initially coded by a coder as opposed to using the autocoding system. Discrepancies are the count of disagreements between the autocoder and the verifier or between the manual coder and the verifier: the discrepant cases required adjudication. The percentage of times in which the coding supervisor disagreed with the coder’s (or the autocoding system’s) initial coding is referred to as the coder error rate. The percentage of times in which the coding supervisor disagreed with the verifier’s coding is referred to as the verifier error rate. The denominator used in calculating these error rates is the number of cases verified. The error rates for manually coded
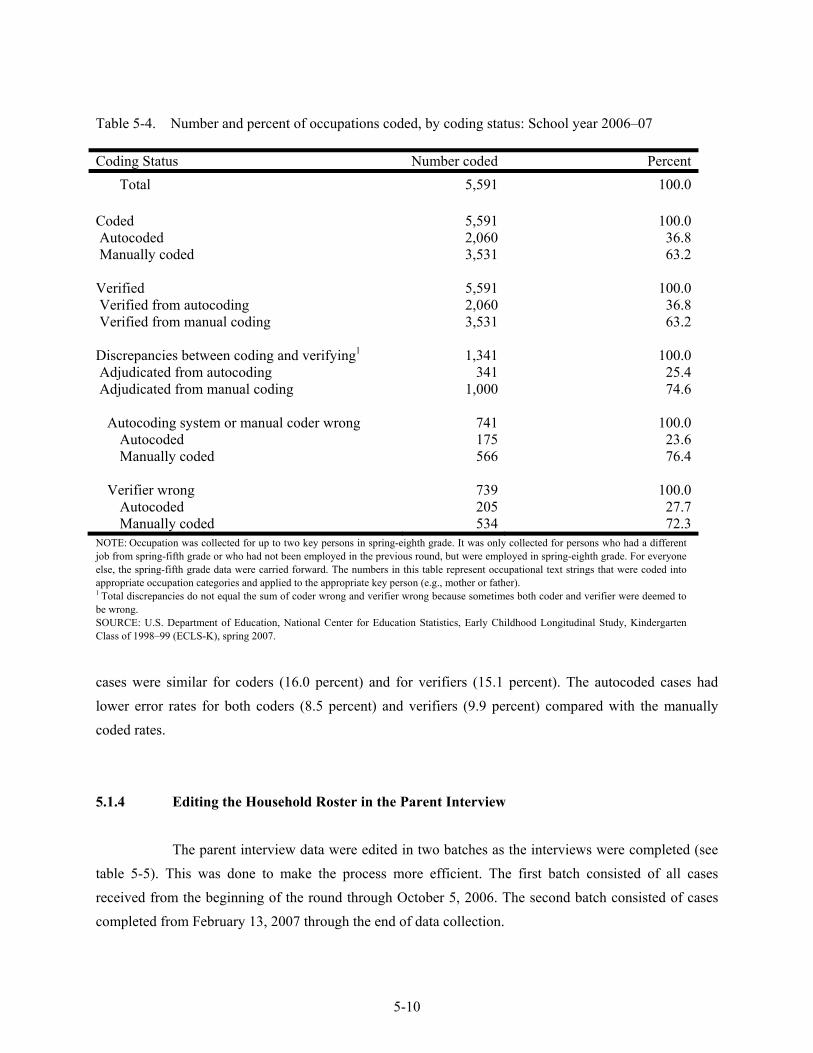
5-10
Table 5-4. Number and percent of occupations coded, by coding status: School year 2006–07 Coding Status Number coded Percent Total 5,591 100.0 Coded 5,591 100.0 Autocoded 2,060 36.8 Manually coded 3,531 63.2 Verified 5,591 100.0 Verified from autocoding 2,060 36.8 Verified from manual coding 3,531 63.2 Discrepancies between coding and verifying1 1,341 100.0 Adjudicated from autocoding 341 25.4 Adjudicated from manual coding 1,000 74.6
Autocoding system or manual coder wrong 741 100.0
Autocoded 175 23.6Manually coded 566 76.4
Verifier wrong 739 100.0Autocoded 205 27.7Manually coded 534 72.3
NOTE: Occupation was collected for up to two key persons in spring-eighth grade. It was only collected for persons who had a different job from spring-fifth grade or who had not been employed in the previous round, but were employed in spring-eighth grade. For everyone else, the spring-fifth grade data were carried forward. The numbers in this table represent occupational text strings that were coded into appropriate occupation categories and applied to the appropriate key person (e.g., mother or father). 1 Total discrepancies do not equal the sum of coder wrong and verifier wrong because sometimes both coder and verifier were deemed to be wrong. SOURCE: U.S. Department of Education, National Center for Education Statistics, Early Childhood Longitudinal Study, Kindergarten Class of 1998–99 (ECLS-K), spring 2007.
cases were similar for coders (16.0 percent) and for verifiers (15.1 percent). The autocoded cases had lower error rates for both coders (8.5 percent) and verifiers (9.9 percent) compared with the manually coded rates.
5.1.4 Editing the Household Roster in the Parent Interview
The parent interview data were edited in two batches as the interviews were completed (see table 5-5). This was done to make the process more efficient. The first batch consisted of all cases received from the beginning of the round through October 5, 2006. The second batch consisted of cases completed from February 13, 2007 through the end of data collection.
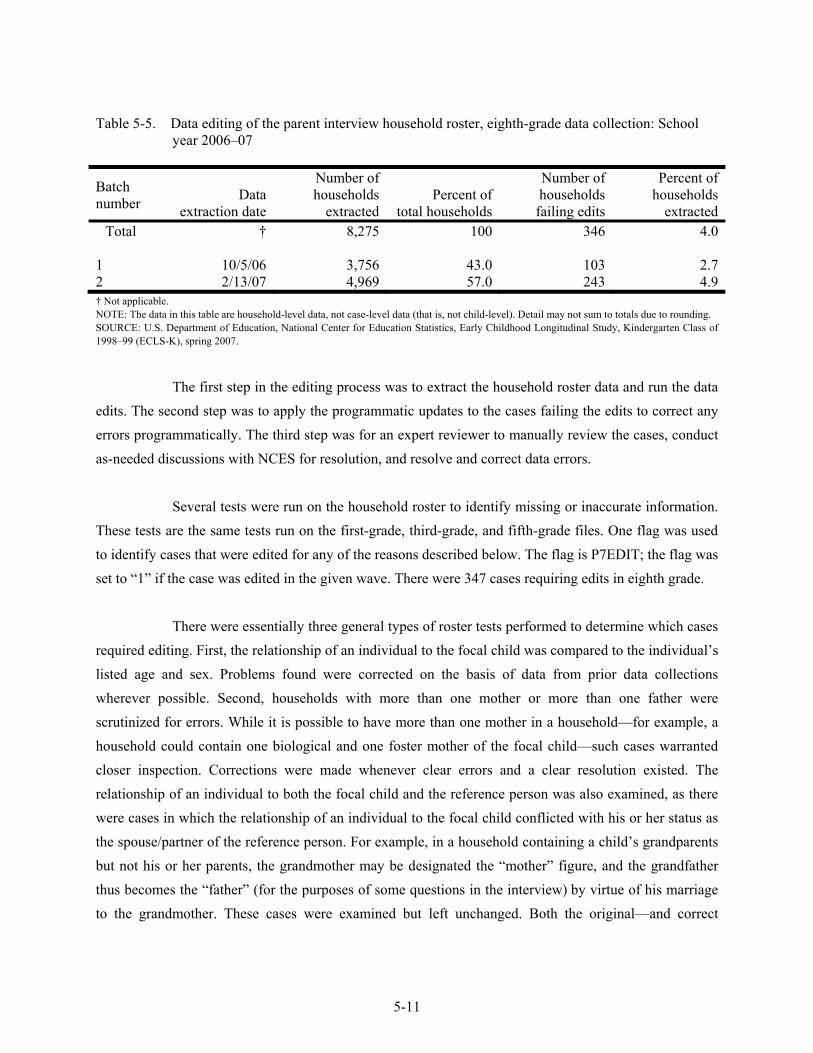
5-11
Table 5-5. Data editing of the parent interview household roster, eighth-grade data collection: School year 2006–07
Batch number Data
extraction date
Number of households
extractedPercent of
total households
Number of households failing edits
Percent of households
extractedTotal † 8,275 100 346 4.0
1 10/5/06 3,756 43.0 103 2.72 2/13/07 4,969 57.0 243 4.9† Not applicable. NOTE: The data in this table are household-level data, not case-level data (that is, not child-level). Detail may not sum to totals due to rounding. SOURCE: U.S. Department of Education, National Center for Education Statistics, Early Childhood Longitudinal Study, Kindergarten Class of 1998–99 (ECLS-K), spring 2007.
The first step in the editing process was to extract the household roster data and run the data
edits. The second step was to apply the programmatic updates to the cases failing the edits to correct any errors programmatically. The third step was for an expert reviewer to manually review the cases, conduct as-needed discussions with NCES for resolution, and resolve and correct data errors.
Several tests were run on the household roster to identify missing or inaccurate information.
These tests are the same tests run on the first-grade, third-grade, and fifth-grade files. One flag was used to identify cases that were edited for any of the reasons described below. The flag is P7EDIT; the flag was set to “1” if the case was edited in the given wave. There were 347 cases requiring edits in eighth grade.
There were essentially three general types of roster tests performed to determine which cases
required editing. First, the relationship of an individual to the focal child was compared to the individual’s listed age and sex. Problems found were corrected on the basis of data from prior data collections wherever possible. Second, households with more than one mother or more than one father were scrutinized for errors. While it is possible to have more than one mother in a household—for example, a household could contain one biological and one foster mother of the focal child—such cases warranted closer inspection. Corrections were made whenever clear errors and a clear resolution existed. The relationship of an individual to both the focal child and the reference person was also examined, as there were cases in which the relationship of an individual to the focal child conflicted with his or her status as the spouse/partner of the reference person. For example, in a household containing a child’s grandparents but not his or her parents, the grandmother may be designated the “mother” figure, and the grandfather thus becomes the “father” (for the purposes of some questions in the interview) by virtue of his marriage to the grandmother. These cases were examined but left unchanged. Both the original—and correct
5-12
(grandfather)—relationship data and the new “parent-figure” designation (father) that had been constructed were kept.
The number of household roster errors by the interviewer were also counted. For example, a
household roster error would occur if an interviewer entered the same sibling into the household roster twice. In that instance, the interviewer would set the duplicate entry to “no longer in the household,” and the reason departed would be set to “roster error.” In the eighth-grade data, there are 14 cases with these types of errors after the roster tests were run; the cases can be identified by the flag “P7ERRFLG.”
5.2 Coding and Editing Specifications for Hard-Copy Questionnaires
5.2.1 Receipt Control
In order to monitor the almost 96,000 documents that were to be received in the eighth- grade year, the project-specific receipt and document control system developed in the kindergarten year was used, with modifications to track hard-copy questionnaires sent to and received from the scanning subcontractor. The receipt and document control system was initially loaded with the identifying information, such as identification numbers for schools, teachers, and children; the links between teachers and children; and the questionnaires that were expected from each school and teacher for each cooperating school in the sample. As data were collected in the field, field supervisors completed transmittal forms for each school to indicate which questionnaires were being mailed to the home office.
Once data collection started, receipt control clerks reviewed the questionnaires returned from
the field for accuracy and completeness. The identification number on each form was matched against the identification numbers in the tracking system to verify that the appropriate number of forms for each school was returned. When the clerks verified that the correct questionnaires were returned, they were logged into the receipt and document control system. Once forms were logged in, they were sorted by instrument type and ID number. Batch forms were generated and included in the batch to indicate which questionnaires were included in the batch. The child assessment forms, the student questionnaires, the teacher questionnaires, and the school administrator questionnaires were batched and sent to the scanning subcontractor to be scanned into electronic form. When these instruments were returned from the scanning subcontractor, the identification number on each form was matched against the identification numbers in the tracking system to verify that the appropriate number of forms for each batch was
5-13
returned. When the clerks verified that the correct questionnaires were returned, they were logged into the receipt and document control system.
Data from two hard-copy forms, the English Stage 1 Routing test and the Mathematics/
Science Stage 1 Routing test, were keyed into electronic format by Westat data entry staff. The data were rekeyed by more senior data entry operators at a rate of 100 percent to verify the data entry. The results of the two data entry passes were compared and differences identified. In the case of differences, the hard-copy form was pulled and examined to determine what corrections had to be made to the keyed data. These corrections were rekeyed, resulting in an accuracy rate exceeding 99 percent. The verified batches were then transmitted electronically to Westat’s study staff and loaded into the computer system for data editing. When these instruments were returned from the Westat data entry staff, the identification number on each form was also matched against the identification number in the tracking system to verify that the appropriate number of forms for each batch was returned. When the clerks verified that the correct forms were returned, they were logged into the receipt and document control system.
5.2.2 Data Scanning
Critical items were identified for the school administrator questionnaire and the child-level reading, mathematics, and science teacher questionnaires. Prior to mailing the school administrator or child-level teacher questionnaires to Westat, the field supervisors reviewed them to ensure that critical items had been completed. If the critical items were missing, field supervisors attempted to retrieve them and recorded the outcome, completed or refused, in green pencil in the questionnaire (please see exhibit 4-10 for eighth-grade critical items for questionnaires).
Upon their return to the home office, questionnaires were logged into the receipt and
document control system and batched to be sent to the scanning vendor to be scanned into electronic format. After the questionnaires and electronic data were returned from the scanning vendor, the data were edited. Questionnaires that contained no data due to respondent refusal were logged into the receipt and document control system as "Refusal" and not sent for scanning. Table 5-6 presents data on the number of questionnaires receipted by week.
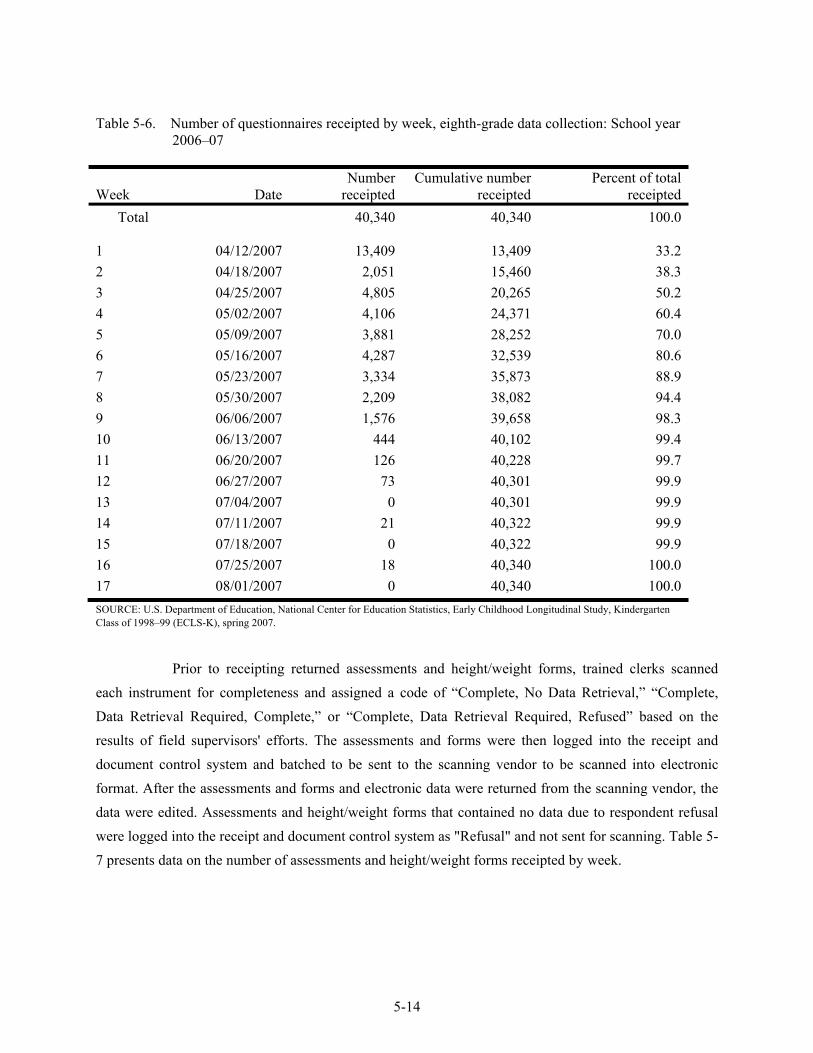
5-14
Table 5-6. Number of questionnaires receipted by week, eighth-grade data collection: School year 2006–07
Week Date Number
receiptedCumulative number
receiptedPercent of total
receipted Total 40,340 40,340 100.0 1 04/12/2007 13,409 13,409 33.22 04/18/2007 2,051 15,460 38.33 04/25/2007 4,805 20,265 50.24 05/02/2007 4,106 24,371 60.45 05/09/2007 3,881 28,252 70.06 05/16/2007 4,287 32,539 80.67 05/23/2007 3,334 35,873 88.98 05/30/2007 2,209 38,082 94.49 06/06/2007 1,576 39,658 98.310 06/13/2007 444 40,102 99.411 06/20/2007 126 40,228 99.712 06/27/2007 73 40,301 99.913 07/04/2007 0 40,301 99.914 07/11/2007 21 40,322 99.915 07/18/2007 0 40,322 99.916 07/25/2007 18 40,340 100.017 08/01/2007 0 40,340 100.0SOURCE: U.S. Department of Education, National Center for Education Statistics, Early Childhood Longitudinal Study, Kindergarten Class of 1998–99 (ECLS-K), spring 2007.
Prior to receipting returned assessments and height/weight forms, trained clerks scanned
each instrument for completeness and assigned a code of “Complete, No Data Retrieval,” “Complete, Data Retrieval Required, Complete,” or “Complete, Data Retrieval Required, Refused” based on the results of field supervisors' efforts. The assessments and forms were then logged into the receipt and document control system and batched to be sent to the scanning vendor to be scanned into electronic format. After the assessments and forms and electronic data were returned from the scanning vendor, the data were edited. Assessments and height/weight forms that contained no data due to respondent refusal were logged into the receipt and document control system as "Refusal" and not sent for scanning. Table 5-7 presents data on the number of assessments and height/weight forms receipted by week.
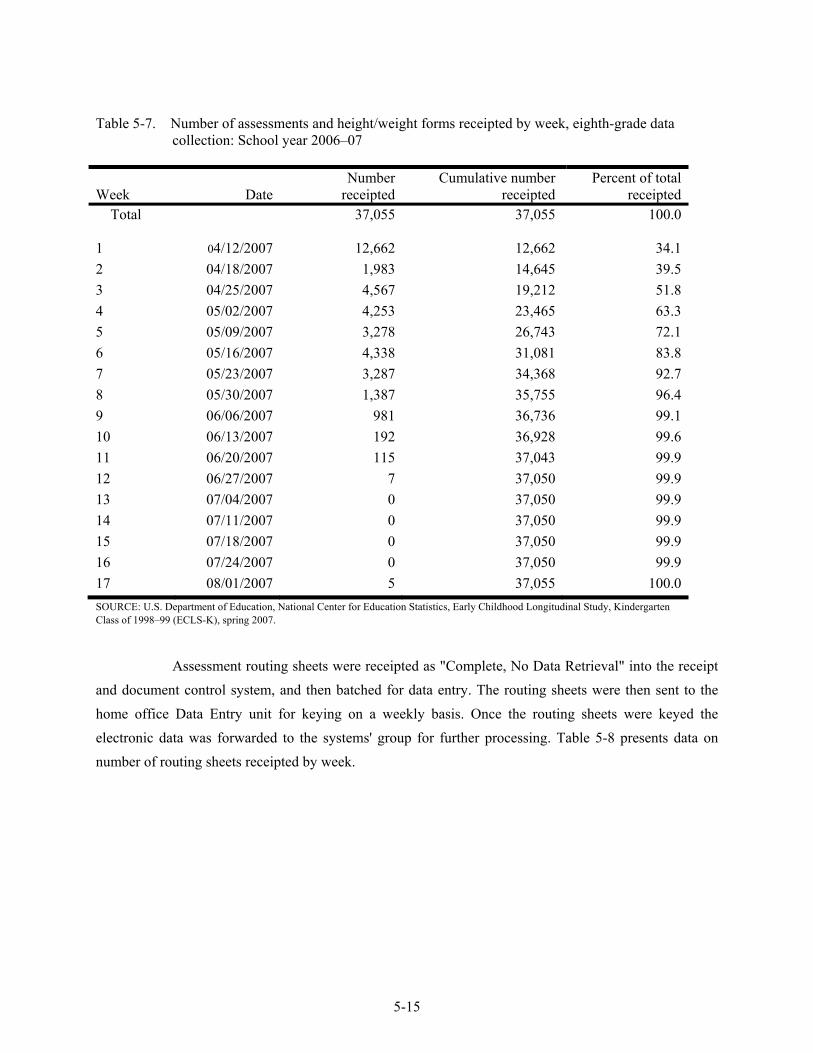
5-15
Table 5-7. Number of assessments and height/weight forms receipted by week, eighth-grade data collection: School year 2006–07
Week Date Number
receiptedCumulative number
receiptedPercent of total
receipted Total 37,055 37,055 100.0 1 04/12/2007 12,662 12,662 34.12 04/18/2007 1,983 14,645 39.53 04/25/2007 4,567 19,212 51.84 05/02/2007 4,253 23,465 63.35 05/09/2007 3,278 26,743 72.16 05/16/2007 4,338 31,081 83.87 05/23/2007 3,287 34,368 92.78 05/30/2007 1,387 35,755 96.49 06/06/2007 981 36,736 99.110 06/13/2007 192 36,928 99.611 06/20/2007 115 37,043 99.912 06/27/2007 7 37,050 99.913 07/04/2007 0 37,050 99.914 07/11/2007 0 37,050 99.915 07/18/2007 0 37,050 99.916 07/24/2007 0 37,050 99.917 08/01/2007 5 37,055 100.0SOURCE: U.S. Department of Education, National Center for Education Statistics, Early Childhood Longitudinal Study, Kindergarten Class of 1998–99 (ECLS-K), spring 2007.
Assessment routing sheets were receipted as "Complete, No Data Retrieval" into the receipt
and document control system, and then batched for data entry. The routing sheets were then sent to the home office Data Entry unit for keying on a weekly basis. Once the routing sheets were keyed the electronic data was forwarded to the systems' group for further processing. Table 5-8 presents data on number of routing sheets receipted by week.
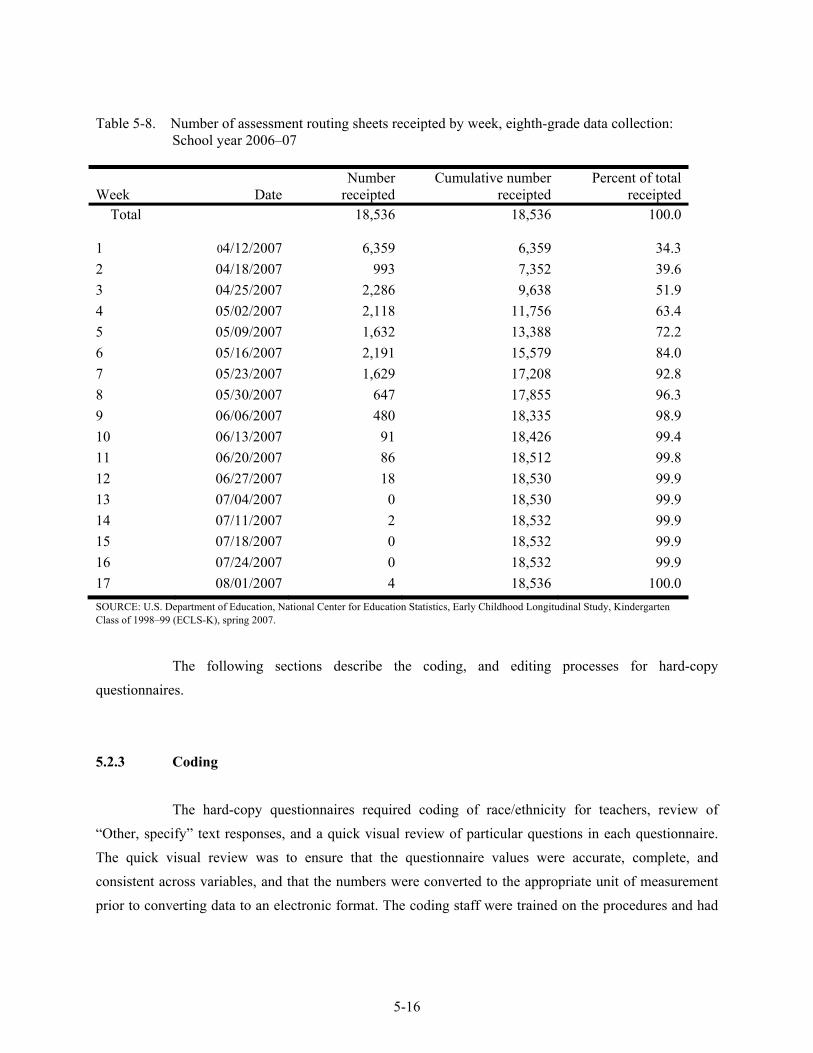
5-16
Table 5-8. Number of assessment routing sheets receipted by week, eighth-grade data collection: School year 2006–07
Week Date Number
receiptedCumulative number
receiptedPercent of total
receipted Total 18,536 18,536 100.0 1 04/12/2007 6,359 6,359 34.32 04/18/2007 993 7,352 39.63 04/25/2007 2,286 9,638 51.94 05/02/2007 2,118 11,756 63.45 05/09/2007 1,632 13,388 72.26 05/16/2007 2,191 15,579 84.07 05/23/2007 1,629 17,208 92.88 05/30/2007 647 17,855 96.39 06/06/2007 480 18,335 98.910 06/13/2007 91 18,426 99.411 06/20/2007 86 18,512 99.812 06/27/2007 18 18,530 99.913 07/04/2007 0 18,530 99.914 07/11/2007 2 18,532 99.915 07/18/2007 0 18,532 99.916 07/24/2007 0 18,532 99.917 08/01/2007 4 18,536 100.0SOURCE: U.S. Department of Education, National Center for Education Statistics, Early Childhood Longitudinal Study, Kindergarten Class of 1998–99 (ECLS-K), spring 2007.
The following sections describe the coding, and editing processes for hard-copy
questionnaires.
5.2.3 Coding
The hard-copy questionnaires required coding of race/ethnicity for teachers, review of “Other, specify” text responses, and a quick visual review of particular questions in each questionnaire. The quick visual review was to ensure that the questionnaire values were accurate, complete, and consistent across variables, and that the numbers were converted to the appropriate unit of measurement prior to converting data to an electronic format. The coding staff were trained on the procedures and had
5-17
coding manuals to support the process. This staff also edited the data after scanning and the data were loaded into the system. Senior coders verified coding.
The “Other, specify” text responses were reviewed by the data editing staff and, where
appropriate, upcoded into one of the existing response categories. The small number of text responses that remained after upcoding did not fit into any preexisting category.
The hard-copy assessments required coding of open-ended items on the reading and
mathematics assessment forms (the science forms had only multiple choice items that were scored programmatically). All open-ended items were coded twice by different coding staff members and compared for agreement. Percent agreement for the open-ended reading items, across the Red and Orange Reading forms, was 95 percent. Percent agreement for the open-ended mathematics items, across the Blue and Green Math forms, was 98 percent. Discrepancies were adjudicated by a senior coder.
5.3 Data Editing Management Process
The management of the data editing process involved the creation of several data files, including the Collection Database, Holding Database, Editing Database, and Delivery Database. Exhibit 5-2 provides a diagram of the process described below.
5.3.1 Collection Database
This database contained the scanned records for hard-copy questionnaires. One Collection Database was created for each instrument, and, as additional data were scanned , the cases were added to the database. The Collection Databases were Blaise databases. The ASCII file resulting from the data entry process was converted to Blaise data in the Collection Database so that they could be merged with the parent interview data and undergo additional data review (see section 5.4)
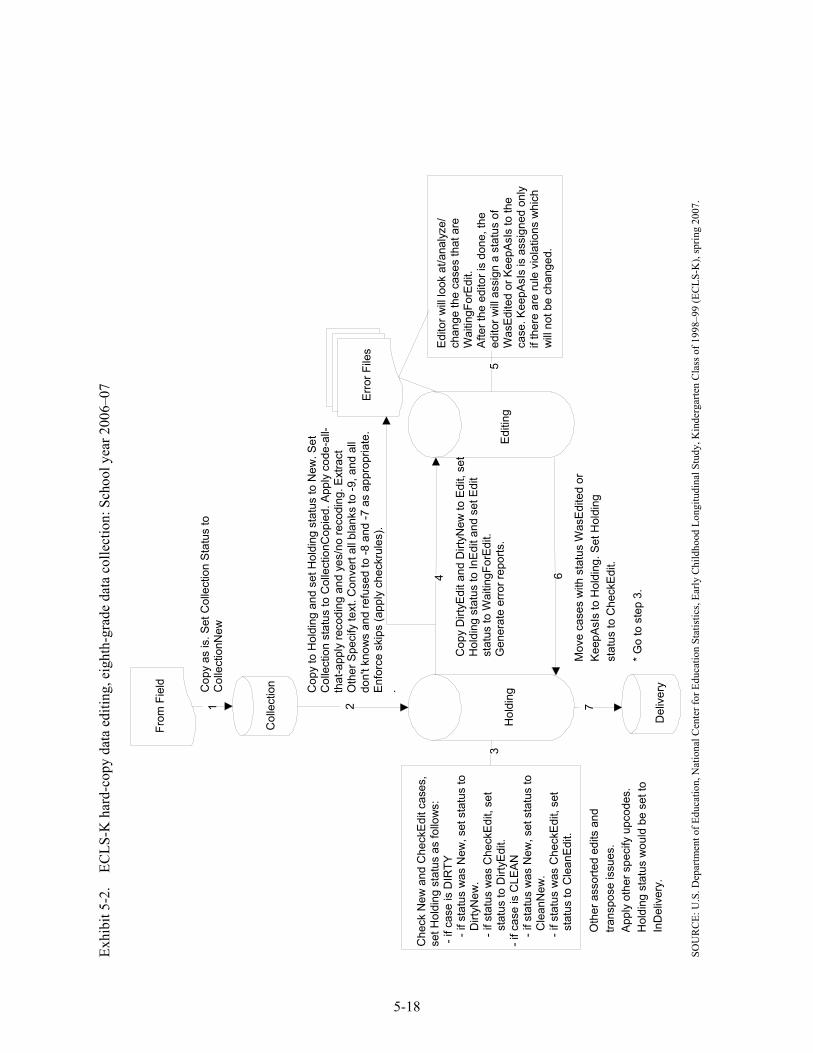
5-18
Exhi
bit 5
-2.
EC
LS-K
har
d-co
py d
ata
editi
ng, e
ight
h-gr
ade
data
col
lect
ion:
Sch
ool y
ear 2
006–
07
SO
UR
CE:
U.S
. Dep
artm
ent o
f Edu
catio
n, N
atio
nal C
ente
r for
Edu
catio
n St
atis
tics,
Early
Chi
ldho
od L
ongi
tudi
nal S
tudy
, Kin
derg
arte
n C
lass
of 1
998–
99 (E
CLS
-K),
sprin
g 20
07.
Col
lect
ion
Hol
ding
From
Fie
ld
Edi
ting
Del
iver
yCop
y as
is. S
et C
olle
ctio
n S
tatu
s to
C
olle
ctio
nNew
Cop
y to
Hol
ding
and
set
Hol
ding
sta
tus
to N
ew. S
e tC
olle
ctio
n st
atus
to C
olle
ctio
nCop
ied.
App
ly c
ode-
all-
that
-app
ly re
codi
ng a
nd y
es/n
o re
codi
ng. E
xtra
ctO
ther
Spe
cify
text
. Con
vert
all b
lank
s to
-9, a
nd a
ll do
n't k
now
s an
d re
fuse
d to
-8 a
nd -7
as
appr
opria
te.
Enf
orce
ski
ps (a
pply
che
ckru
les)
..
Cop
y D
irtyE
dit a
nd D
irtyN
ew to
Edi
t, se
t H
oldi
ng s
tatu
s to
InE
dit a
nd s
et E
dit
stat
us to
Wai
tingF
orE
dit.
Gen
erat
e er
ror r
epor
ts.
Oth
er a
ssor
ted
edits
and
tra
nspo
se is
sues
. A
pply
oth
er s
peci
fy u
pcod
es.
Hol
ding
sta
tus
wou
ld b
e se
t to
InD
eliv
ery.
Mov
e ca
ses
with
sta
tus
Was
Edi
ted
or
Kee
pAsI
s to
Hol
ding
. Set
Hol
ding
st
atus
to C
heck
Edi
t.
* Go
to s
tep
3.
1
4 6
7
Erro
r File
s
Che
ck N
ew a
nd C
heck
Edi
t cas
es,
set H
oldi
ng s
tatu
s as
follo
ws:
-
if ca
se is
DIR
TY
- i
f sta
tus
was
New
, set
sta
tus
to
D
irtyN
ew.
- i
f sta
tus
was
Che
ckE
dit,
set
s
tatu
s to
Dirt
yEdi
t. - i
f cas
e is
CLE
AN
- i
f sta
tus
was
New
, set
sta
tus
to
C
lean
New
.
- if s
tatu
s w
as C
heck
Edi
t, se
t
sta
tus
to C
lean
Edi
t.
3
Edi
tor w
ill lo
ok a
t/ana
lyze
/ ch
ange
the
case
s th
at a
re
Wai
tingF
orE
dit.
Afte
r the
edi
tor i
s do
ne, t
he
edito
r will
ass
ign
a st
atus
of
Was
Edi
ted
or K
eepA
sIs
to th
e ca
se. K
eepA
sIs
is a
ssig
ned
only
if
ther
e ar
e ru
le v
iola
tions
whi
ch
will
not
be
chan
ged.
2
5
5-19
Records in the Collection Databases were assigned status codes reflecting their current status. All new records were assigned a status of CollectionNew. When cases were copied to the Holding Database, the status was updated to CollectionCopied. The data in the Collection Database were retained in their original form; that is, they were not modified based upon later steps.
5.3.2 Holding Database
Data were copied from the Collection Database to the Holding Database for the editing process. The Holding Database for each instrument was also a Blaise database. The copied cases were assigned a status code of New. Cases that had already been involved in a prior editing cycle and had been returned to the Holding Database were assigned a status of CheckEdit or KeepAsIs.
As the data were copied from the Collection Database to the Holding Database, a number of
processes were run. Code-all-that-apply (COTA) recoding and “yes/no” recoding were applied. COTA recoding involved changing the multiple-response values of 0/1, 0/2, 0/3, etc., to a series of yes/no (1/2) responses. Yes/no recoding provided a means to resolve questions left unanswered in a series of yes/no items. If all marked answers were “Yes,” then the unanswered items were converted to “No.” However, if any item was “No,” “Don’t know,” or “Refused,” all unanswered items were converted to -9 (Not ascertained). All blanks were converted to -9 (Not ascertained) and don’t know and refused responses were converted to -7 and -8 as appropriate. It was at this stage that skip patterns were enforced using the Blaise CheckRules function and legitimate skips were assigned the standard code of -1.
Edit programs (range and logical checks) were run against all cases contained in the Holding
Database. As the editing process continued, the Holding Database contained both new cases copied from the Collection Database and edited cases returned from the Editing Database (see section 5.3.3). Each case was assigned a status code that reflected its current status. For cases that were new to the Holding Database, the CheckRules function assigned one of two codes. The status CleanNew was assigned to new cases that contained no edit (range or logical) errors. The status DirtyNew was assigned to new cases that failed one or more edit checks. Those cases that had undergone edit updating were also subjected to edit checks to identify any errors that remained or were inadvertently introduced during edit updating. The CheckRules function assigned the status CleanEdit to cases with no remaining errors. The status DirtyEdit was assigned to cases returned from edit updating that had remaining or new errors. Those cases that were assigned a status of KeepAsIs in a previous editing round were considered clean.
5-20
Cases that were found to have edit errors (DirtyNew and DirtyEdit) were copied to the Editing Database for review and updating. At that time, their status in the Holding Database was set to InEdit. A face sheet was generated for each case with editing errors, giving the batch number, case ID, and edit rules that had been violated.
5.3.3 Editing Database
Cases in the Holding Database that failed edit checks were copied to the Editing Database for the correction of errors. As cases were copied to the Editing Database, they were assigned a status of WaitingForEdit in the Editing Database. Editing staff worked from face sheets produced during the edit checks conducted on the Holding Database to retrieve and correct case records. Using the batch number and case ID number, editors retrieved and reviewed hard-copy instruments as necessary to resolve editing errors.
Once the editor had reviewed and updated each case as necessary, he or she assigned one of
two outcome codes. The status code of WasEdited was assigned when all edit errors had been corrected. A status of KeepAsIs was assigned when the editor’s review indicated that data that violated an edit check should be retained, for example, when the hard-copy instrument indicated that an out-of-range value was correct.
Cases with the statuses of WasEdited and KeepAsIs were moved back to the Holding
Database. Cases that had a status of WasEdited in the Editing Database were assigned the status CheckEdit in the Holding Database. The edit rules were applied to these cases to ensure that they were clean. As noted earlier, cases assigned a status of KeepAsIs in the editing process were considered clean.
5.3.4 Delivery Database
The main purpose of the Delivery Database was to store the instrument data at the school, teacher, or child level in a “rectangular” format consistent with downstream activities in preparation for data delivery. Cases for which editing and coding activities were completed were copied from the Holding Database to the Delivery Database. These were cases with status codes of CleanNew, CleanEdit, or KeepAsIs. When the data were copied to the Delivery Database, the “Other, specify” upcodes and
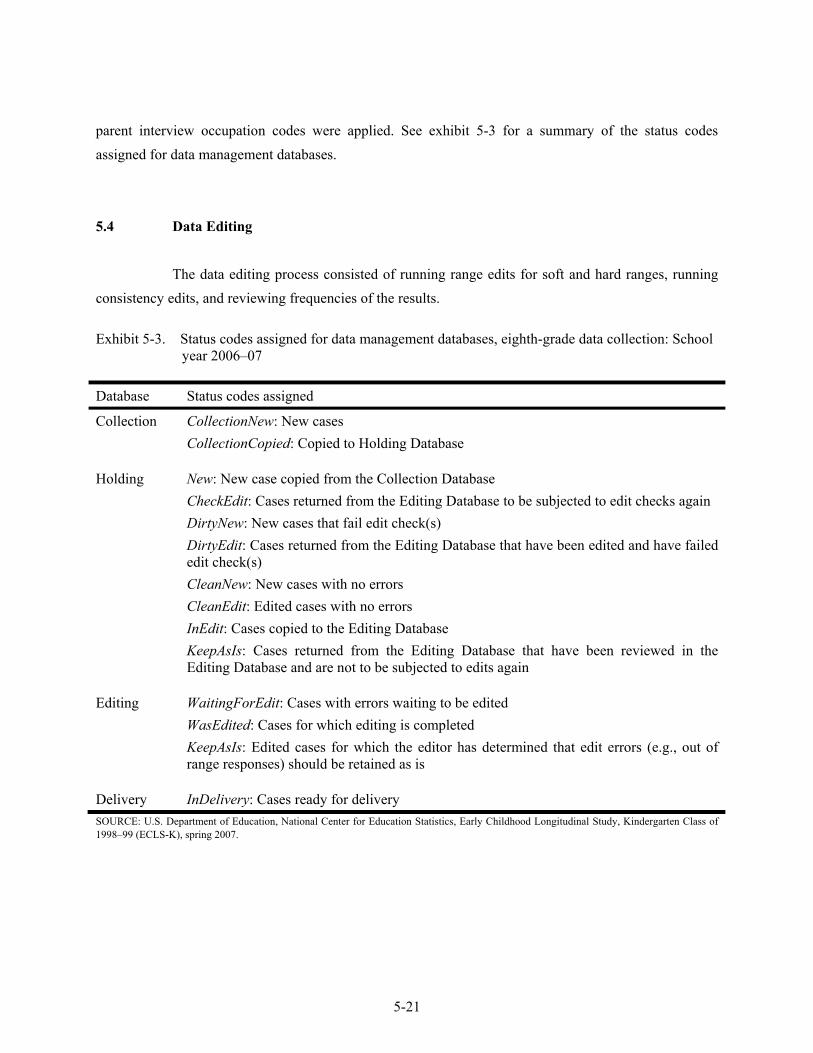
5-21
parent interview occupation codes were applied. See exhibit 5-3 for a summary of the status codes assigned for data management databases.
5.4 Data Editing
The data editing process consisted of running range edits for soft and hard ranges, running consistency edits, and reviewing frequencies of the results.
Exhibit 5-3. Status codes assigned for data management databases, eighth-grade data collection: School
year 2006–07 Database Status codes assigned
Collection CollectionNew: New cases CollectionCopied: Copied to Holding Database
Holding New: New case copied from the Collection Database
CheckEdit: Cases returned from the Editing Database to be subjected to edit checks again DirtyNew: New cases that fail edit check(s) DirtyEdit: Cases returned from the Editing Database that have been edited and have failed edit check(s) CleanNew: New cases with no errors CleanEdit: Edited cases with no errors InEdit: Cases copied to the Editing Database KeepAsIs: Cases returned from the Editing Database that have been reviewed in the Editing Database and are not to be subjected to edits again
Editing WaitingForEdit: Cases with errors waiting to be edited
WasEdited: Cases for which editing is completed KeepAsIs: Edited cases for which the editor has determined that edit errors (e.g., out of range responses) should be retained as is
Delivery InDelivery: Cases ready for delivery SOURCE: U.S. Department of Education, National Center for Education Statistics, Early Childhood Longitudinal Study, Kindergarten Class of 1998–99 (ECLS-K), spring 2007.
5-22
5.4.1 Range Specifications
Hard-copy range specifications set the parameters for high and low acceptable values for a question. Where values were printed on the forms, these were used as the range parameters. For open-ended questions, such as, “Counting this school year, how many years have you taught in your current school including part-time teaching?”, high and low ranges were established as acceptable values. Data frequencies were run on the range of values to identify any errors. Values outside the range were identified as errors and were printed on hard copy for a data editor to review. Cases identified with range errors were identified, and the original response was updated. In some cases, range violations were retained in the data because the value was checked and found to be the value reported by the teacher or school. These were marked as “KeepAsIs” cases. Data frequencies were then rerun and reviewed. This iterative process was repeated until no further range errors were found.
5.4.2 Consistency Checks (Logical Edits)
By programming logical edits between variables, consistency between variables not involved in a skip pattern was confirmed. For example, in the school administrator questionnaire, the number of children eligible for free breakfast could not exceed the total number of children enrolled in the school. These logical edits were run on the whole database after range edits were complete. The logical edits were run separately for each form. All batches of data were combined into one large data file, and data frequencies were produced. The frequencies were reviewed to ensure the data remained logically consistent within the form. When an inconsistency was found, the case was identified and the inconsistency was printed on paper for an editor to review. The original value was corrected (or checked and marked “keep as is”) and the case was then rerun through the consistency edits. Once the case passed the consistency edits, it was appended back into the main dataset. The frequencies were then rerun and reviewed. This was an iterative process; it was repeated until no further inconsistencies were found.
Table 5-9 shows hard-copy questionnaire data preparation production. More than 81 percent
of all questionnaires passed all the edits.
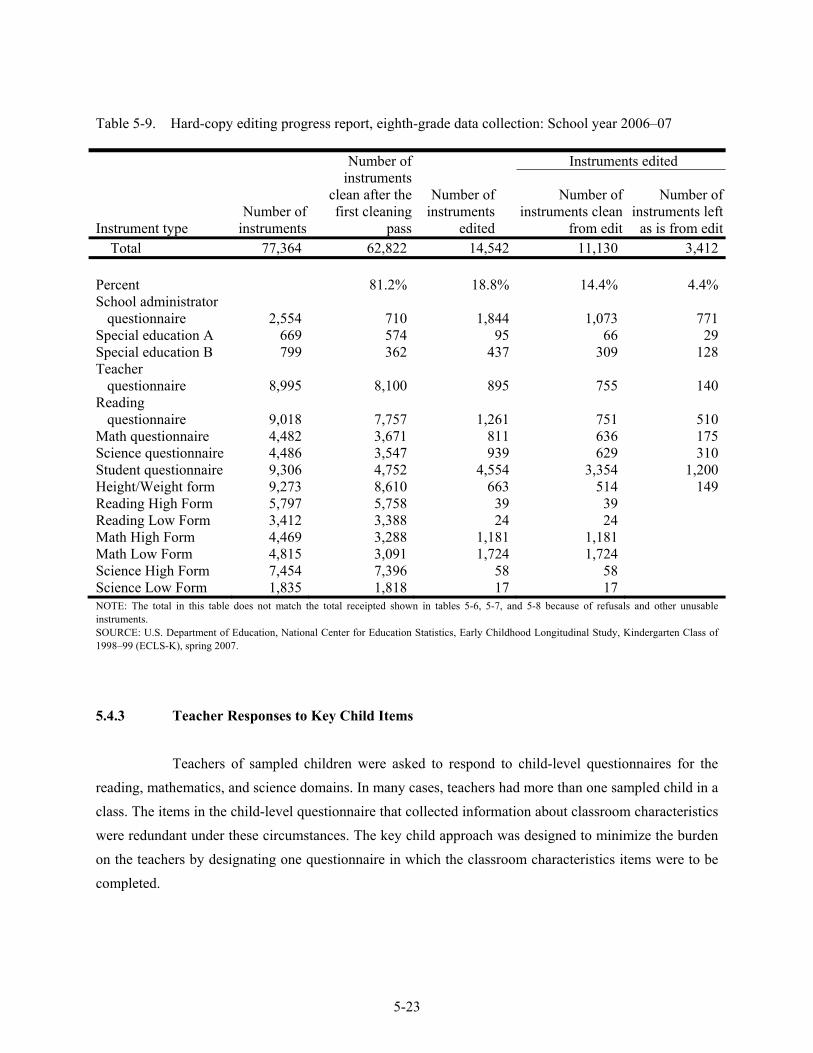
5-23
Table 5-9. Hard-copy editing progress report, eighth-grade data collection: School year 2006–07
Instrument type Number of
instruments
Number of instruments
clean after the first cleaning
pass
Number of instruments
edited
Instruments edited
Number of instruments clean
from edit
Number of instruments left
as is from edit Total 77,364 62,822 14,542 11,130 3,412
Percent 81.2% 18.8% 14.4% 4.4%School administrator
questionnaire 2,554 710 1,844 1,073 771Special education A 669 574 95 66 29Special education B 799 362 437 309 128Teacher
questionnaire 8,995 8,100 895 755 140Reading
questionnaire 9,018 7,757 1,261 751 510Math questionnaire 4,482 3,671 811 636 175Science questionnaire 4,486 3,547 939 629 310Student questionnaire 9,306 4,752 4,554 3,354 1,200Height/Weight form 9,273 8,610 663 514 149Reading High Form 5,797 5,758 39 39 Reading Low Form 3,412 3,388 24 24 Math High Form 4,469 3,288 1,181 1,181 Math Low Form 4,815 3,091 1,724 1,724 Science High Form 7,454 7,396 58 58 Science Low Form 1,835 1,818 17 17 NOTE: The total in this table does not match the total receipted shown in tables 5-6, 5-7, and 5-8 because of refusals and other unusable instruments. SOURCE: U.S. Department of Education, National Center for Education Statistics, Early Childhood Longitudinal Study, Kindergarten Class of 1998–99 (ECLS-K), spring 2007.
5.4.3 Teacher Responses to Key Child Items
Teachers of sampled children were asked to respond to child-level questionnaires for the reading, mathematics, and science domains. In many cases, teachers had more than one sampled child in a class. The items in the child-level questionnaire that collected information about classroom characteristics were redundant under these circumstances. The key child approach was designed to minimize the burden on the teachers by designating one questionnaire in which the classroom characteristics items were to be completed.
5-24
Once the child-level questionnaires were keyed and loaded into the editing system, a review was conducted to identify cases in which teachers reported classroom characteristics on a different questionnaire than the one designated as the key child instrument for the given class. This process involved three steps: the review of missing data for classroom characteristics items within each domain (reading, mathematics, and science) for key child records, a detailed review of all data records in classes with multiple children and missing values for selected classroom characteristics items, and the updating of appropriate records.
In the first step, data records for key children in all classrooms with more than one sampled
child were selected. Frequency distributions of the classroom items were examined for the level of missing data within each domain. All classroom characteristics items were included in this review. The results of this initial review indicated that missingness was largely confined to the items concerning the race composition of the classroom and the percent of instructional time devoted to various subjects.
In the second step, all returned instruments were selected for classrooms with multiple
children that had missing data for the race and percent of instructional time items. These cases were reviewed to ascertain whether the teacher had mistakenly reported the classroom characteristics items on a questionnaire other than that designated for the key child.
In the third step, update specifications were prepared, directing data preparation staff to
apply the classroom characteristics data to the key child record for the classroom. Updates were made to 30 English records, 13 mathematics records, and 20 science records as a result of this review.
A review was also conducted to identify classrooms with multiple sampled children for
which no key child instrument was returned. There were 14 such cases for English, 5 such cases for mathematics, and 10 such cases for science. In some cases, the teacher had reported the classroom characteristic items on a questionnaire other than that designated for the key child, and those data were used for that classroom.
5-25
5.4.4 Frequency and Cross-Tabulation Review
Frequencies and cross-tabulations were run to determine consistency and accuracy across the various forms and matched against the data in the field management system. If discrepancies could not be explained, no changes were made to the data.
5.5 Creation of the Socioeconomic Status Variable
Socioeconomic status (SES) was computed at the household level using data for the set of parents who completed the parent interview in the fall of eighth grade. The SES variable reflects the socioeconomic status of the household at the time of data collection (fall 2006). The components used to create the SES were as follows:
father/male guardian’s education;
mother/female guardian’s education;
father/male guardian’s occupation;
mother/female guardian’s occupation; and
household income.
Occupation was recoded to reflect the average of the 1989 General Social Survey (GSS) prestige score. This was computed as the average of the corresponding prestige scores for the 1980 census occupational categories covered by the ECLS-K occupation. Table 5-10 provides details of the recode of the occupation values to the 1989 GSS prestige score values.
Not all parents completed the parent interview; among those who did, not all responded to
every question. Therefore, there were missing values for some of the components of the SES composite variable. For a description of how data for the components of the SES were collected, see section 7.6.2.7 of the ECLS-K Combined User’s Manual for the ECLS-K Eighth-Grade and K-8 Full Sample Data Files and Electronic Codebooks (NCES 2009–004) (Tourangeau et al. forthcoming). Table 5-11 shows that only a small percentage of values for the education and occupation variables were missing; a much larger proportion of households had missing values for the detailed income range. The total number of
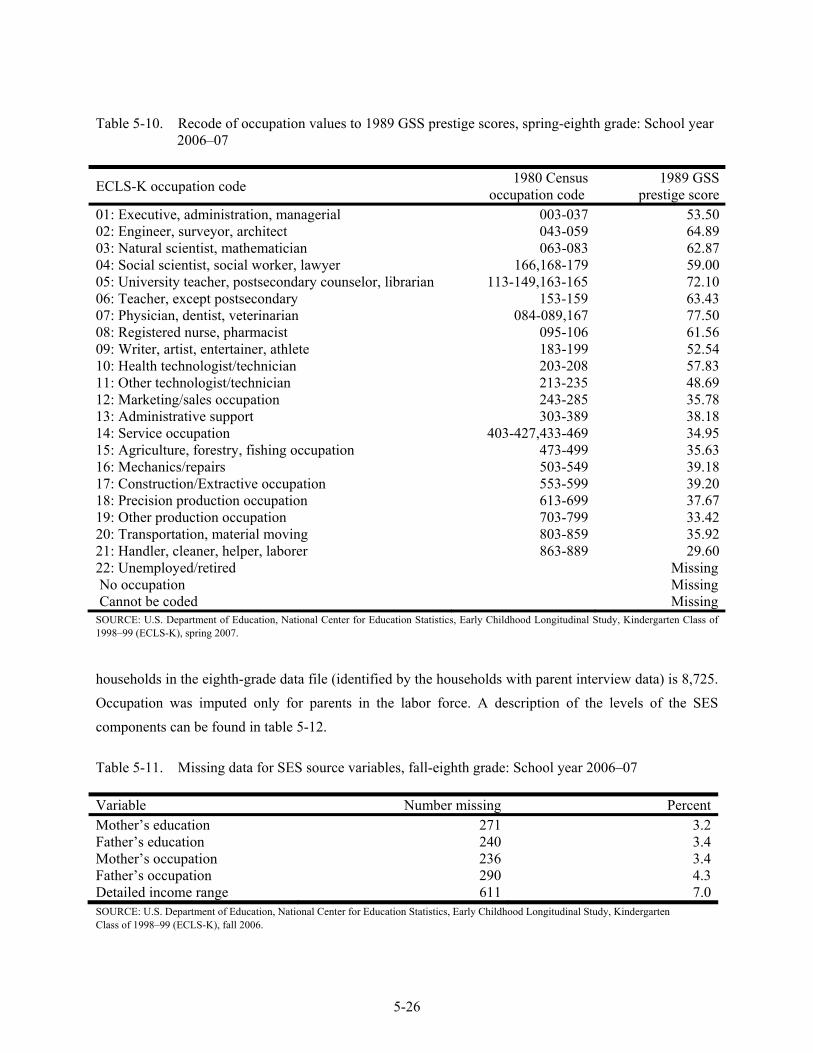
5-26
Table 5-10. Recode of occupation values to 1989 GSS prestige scores, spring-eighth grade: School year 2006–07
ECLS-K occupation code 1980 Census occupation code
1989 GSSprestige score
01: Executive, administration, managerial 003-037 53.5002: Engineer, surveyor, architect 043-059 64.8903: Natural scientist, mathematician 063-083 62.8704: Social scientist, social worker, lawyer 166,168-179 59.0005: University teacher, postsecondary counselor, librarian 113-149,163-165 72.1006: Teacher, except postsecondary 153-159 63.4307: Physician, dentist, veterinarian 084-089,167 77.5008: Registered nurse, pharmacist 095-106 61.5609: Writer, artist, entertainer, athlete 183-199 52.5410: Health technologist/technician 203-208 57.8311: Other technologist/technician 213-235 48.6912: Marketing/sales occupation 243-285 35.7813: Administrative support 303-389 38.1814: Service occupation 403-427,433-469 34.9515: Agriculture, forestry, fishing occupation 473-499 35.6316: Mechanics/repairs 503-549 39.1817: Construction/Extractive occupation 553-599 39.2018: Precision production occupation 613-699 37.6719: Other production occupation 703-799 33.4220: Transportation, material moving 803-859 35.9221: Handler, cleaner, helper, laborer 863-889 29.6022: Unemployed/retired Missing No occupation Missing Cannot be coded MissingSOURCE: U.S. Department of Education, National Center for Education Statistics, Early Childhood Longitudinal Study, Kindergarten Class of 1998–99 (ECLS-K), spring 2007.
households in the eighth-grade data file (identified by the households with parent interview data) is 8,725. Occupation was imputed only for parents in the labor force. A description of the levels of the SES components can be found in table 5-12.
Table 5-11. Missing data for SES source variables, fall-eighth grade: School year 2006–07 Variable Number missing PercentMother’s education 271 3.2Father’s education 240 3.4Mother’s occupation 236 3.4Father’s occupation 290 4.3Detailed income range 611 7.0SOURCE: U.S. Department of Education, National Center for Education Statistics, Early Childhood Longitudinal Study, Kindergarten Class of 1998–99 (ECLS-K), fall 2006.
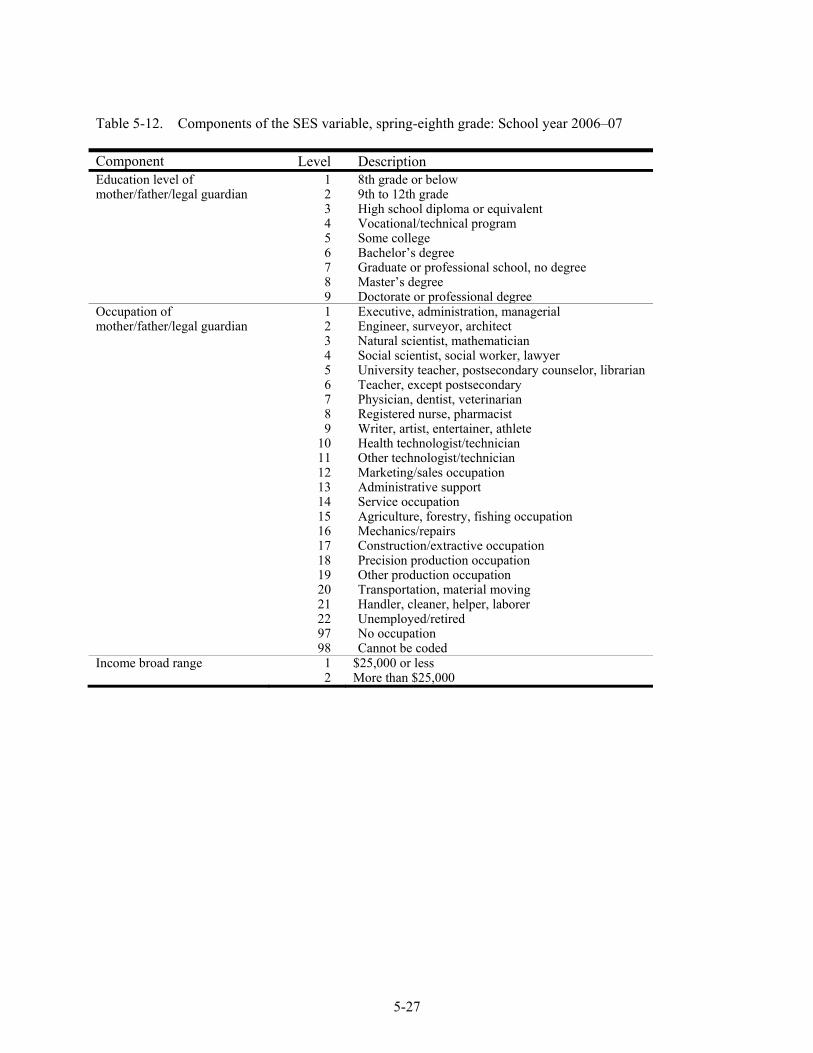
5-27
Table 5-12. Components of the SES variable, spring-eighth grade: School year 2006–07 Component Level DescriptionEducation level of mother/father/legal guardian
12 3 4 5 6 7 8 9
8th grade or below9th to 12th grade High school diploma or equivalent Vocational/technical program Some college Bachelor’s degree Graduate or professional school, no degree Master’s degree Doctorate or professional degree
Occupation of mother/father/legal guardian
12 3 4 5 6 7 8 9
10 11 12 13 14 15 16 17 18 19 20 21 22 97 98
Executive, administration, managerialEngineer, surveyor, architect Natural scientist, mathematician Social scientist, social worker, lawyer University teacher, postsecondary counselor, librarian Teacher, except postsecondary Physician, dentist, veterinarian Registered nurse, pharmacist Writer, artist, entertainer, athlete Health technologist/technician Other technologist/technician Marketing/sales occupation Administrative support Service occupation Agriculture, forestry, fishing occupation Mechanics/repairs Construction/extractive occupation Precision production occupation Other production occupation Transportation, material moving Handler, cleaner, helper, laborer Unemployed/retired No occupation Cannot be coded
Income broad range 12
$25,000 or lessMore than $25,000
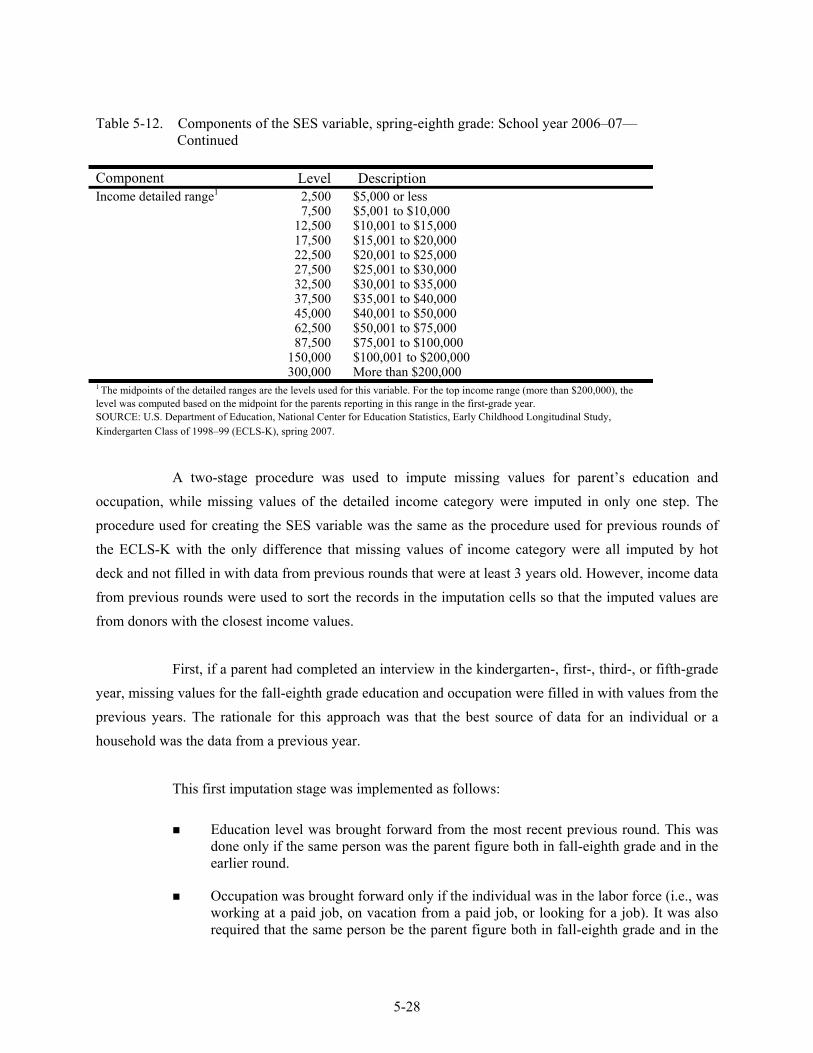
5-28
Table 5-12. Components of the SES variable, spring-eighth grade: School year 2006–07—Continued
Component Level DescriptionIncome detailed range1 2,500
7,500 12,500 17,500 22,500 27,500 32,500 37,500 45,000 62,500 87,500
150,000 300,000
$5,000 or less$5,001 to $10,000 $10,001 to $15,000 $15,001 to $20,000 $20,001 to $25,000 $25,001 to $30,000 $30,001 to $35,000 $35,001 to $40,000 $40,001 to $50,000 $50,001 to $75,000 $75,001 to $100,000 $100,001 to $200,000 More than $200,000
1 The midpoints of the detailed ranges are the levels used for this variable. For the top income range (more than $200,000), the level was computed based on the midpoint for the parents reporting in this range in the first-grade year. SOURCE: U.S. Department of Education, National Center for Education Statistics, Early Childhood Longitudinal Study, Kindergarten Class of 1998–99 (ECLS-K), spring 2007.
A two-stage procedure was used to impute missing values for parent’s education and
occupation, while missing values of the detailed income category were imputed in only one step. The procedure used for creating the SES variable was the same as the procedure used for previous rounds of the ECLS-K with the only difference that missing values of income category were all imputed by hot deck and not filled in with data from previous rounds that were at least 3 years old. However, income data from previous rounds were used to sort the records in the imputation cells so that the imputed values are from donors with the closest income values.
First, if a parent had completed an interview in the kindergarten-, first-, third-, or fifth-grade
year, missing values for the fall-eighth grade education and occupation were filled in with values from the previous years. The rationale for this approach was that the best source of data for an individual or a household was the data from a previous year.
This first imputation stage was implemented as follows:
Education level was brought forward from the most recent previous round. This was done only if the same person was the parent figure both in fall-eighth grade and in the earlier round.
Occupation was brought forward only if the individual was in the labor force (i.e., was working at a paid job, on vacation from a paid job, or looking for a job). It was also required that the same person be the parent figure both in fall-eighth grade and in the
5-29
earlier round. NOTE: Prestige scores were not assigned to individuals unless they were in the labor force, regardless of whether they reported an occupation.
Second, education and occupation data still missing after this initial step were imputed using a hot-deck methodology. In hot-deck imputation, the value reported by a respondent for a particular item is assigned or “donated” to a “similar” person who failed to respond to that question. Auxiliary information known for both donors and nonrespondents is used to form groups of persons having similar characteristics. These groups of similar respondents and nonrespondents are called “imputation cells.” The imputed value for a case with a missing value is taken from a randomly selected donor among the respondents within the cell.
Detailed income category was brought forward from the most recent previous round, but was
used only as a sort variable in the hot-deck procedure. All missing values of the detailed income category were imputed by hot deck. By using filled-in values from the previous rounds as a sort variable, the nearest neighbor was selected as donor for the missing value.
Imputation cells were defined by respondent characteristics that were the best predictors of
the variables to be imputed. These relationships had been determined previously by Chi-Squared Automatic Interaction Detector (CHAID) analyses of the base-year data as shown in table 5-13. Missing values for the education, occupation, and detailed income range variables were imputed by the hot-deck method for all households. Hot-deck imputation was done in a sequential order, separately, by type of household (female single parent, male single parent, and both parents present). For households with both parents present, the mother’s and father’s variables were imputed separately. Imputed as well as reported values were used to define imputation cells; missing values for donor characteristics were treated as a separate category. No imputed value was used as a donor. No donor was used more than once. The order of hot-deck imputation for all the variables was education, occupation, and income category.
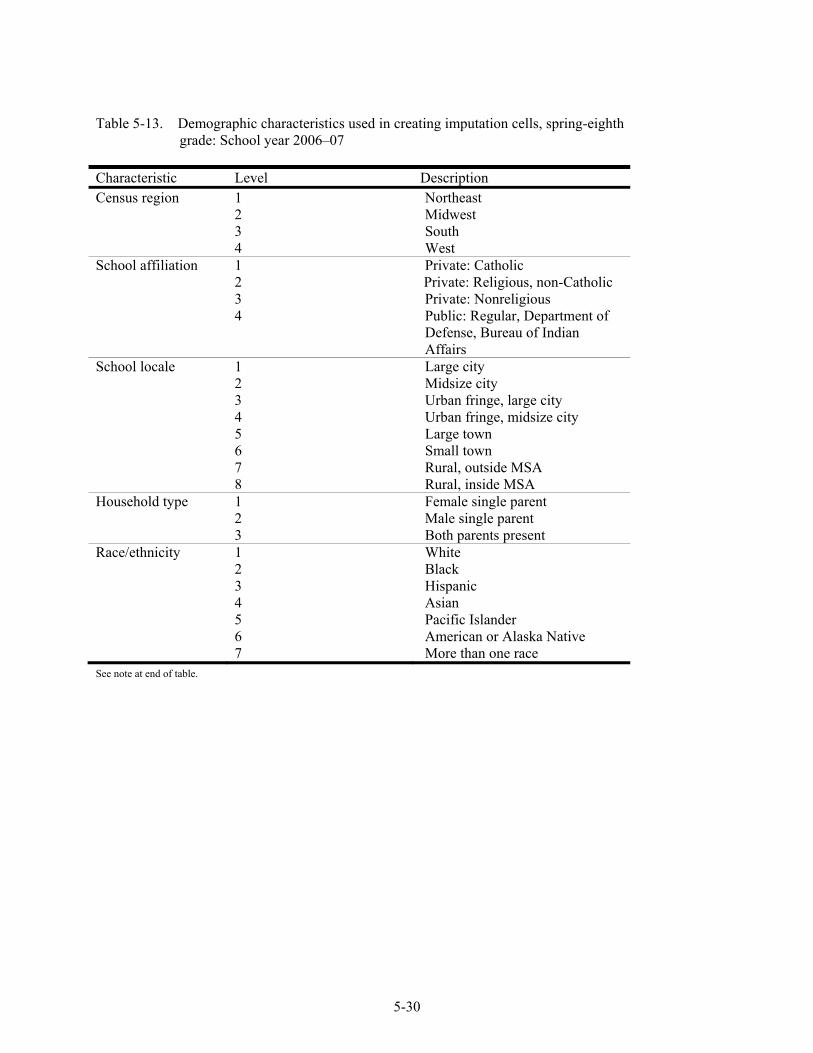
5-30
Table 5-13. Demographic characteristics used in creating imputation cells, spring-eighth grade: School year 2006–07
Characteristic Level Description Census region 1
2 3 4
Northeast Midwest South West
School affiliation 1 2 3 4
Private: Catholic Private: Religious, non-Catholic Private: Nonreligious Public: Regular, Department of Defense, Bureau of Indian Affairs
School locale 1 2 3 4 5 6 7 8
Large city Midsize city Urban fringe, large city Urban fringe, midsize city Large town Small town Rural, outside MSA Rural, inside MSA
Household type 1 2 3
Female single parent Male single parent Both parents present
Race/ethnicity 1 2 3 4 5 6 7
White Black Hispanic Asian Pacific Islander American or Alaska Native More than one race
See note at end of table.
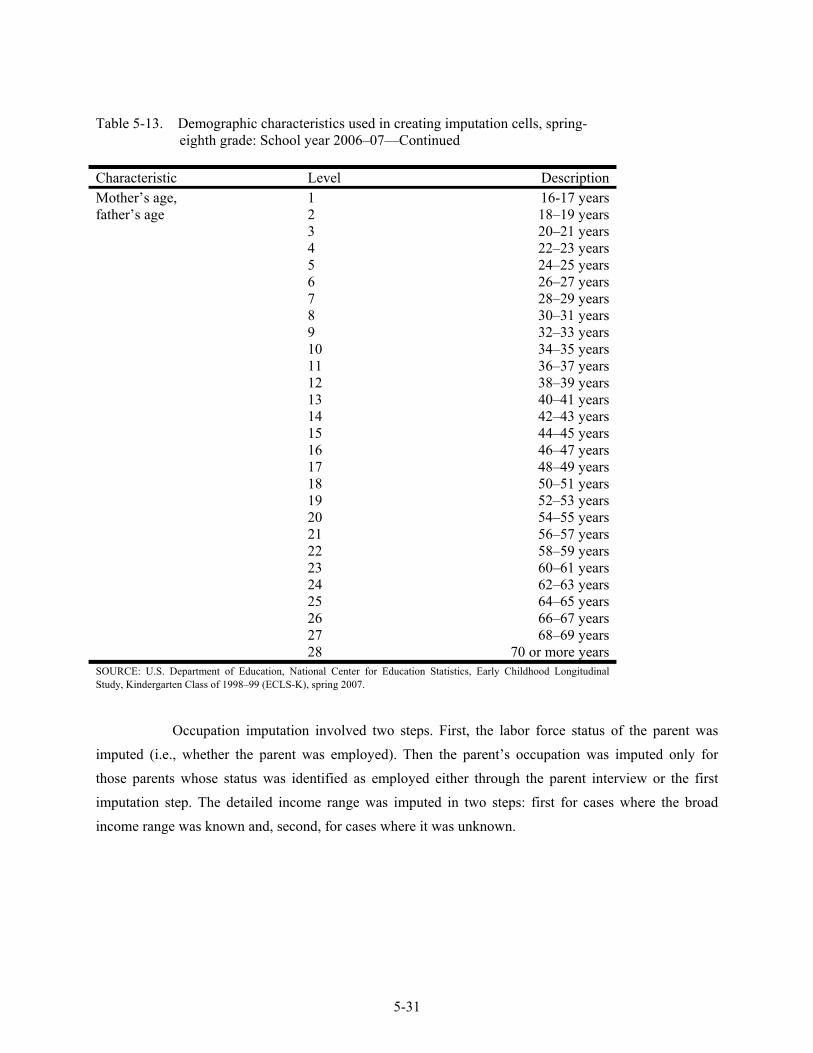
5-31
Table 5-13. Demographic characteristics used in creating imputation cells, spring- eighth grade: School year 2006–07—Continued
Characteristic Level Description Mother’s age, father’s age
1 2 3 4 5 6 7 8 9 10 11 12 13 14 15 16 17 18 19 20 21 22 23 24 25 26 27 28
16-17 years 18–19 years 20–21 years 22–23 years 24–25 years 26–27 years 28–29 years 30–31 years 32–33 years 34–35 years 36–37 years 38–39 years 40–41 years 42–43 years 44–45 years 46–47 years 48–49 years 50–51 years 52–53 years 54–55 years 56–57 years 58–59 years 60–61 years 62–63 years 64–65 years 66–67 years 68–69 years
70 or more years SOURCE: U.S. Department of Education, National Center for Education Statistics, Early Childhood Longitudinal Study, Kindergarten Class of 1998–99 (ECLS-K), spring 2007.
Occupation imputation involved two steps. First, the labor force status of the parent was
imputed (i.e., whether the parent was employed). Then the parent’s occupation was imputed only for those parents whose status was identified as employed either through the parent interview or the first imputation step. The detailed income range was imputed in two steps: first for cases where the broad income range was known and, second, for cases where it was unknown.
5-32
For households where both parents were present, the order of hot-deck imputation was as follows:
Mother’s education;
Father’s education;
Mother’s labor force status;
Mother’s occupation;
Father’s labor force status;
Father’s occupation;
Detailed income range, where the broad income range was known; and
Detailed income range, where the broad income range was unknown.
At this point, all of the missing values had been imputed. However, an exact income value was still required to construct the SES composite. The midpoint of the detailed income range was assigned for this purpose to all households.
The log of the detailed income range midpoint was then used to compute the SES composite.
This value does not vary widely within the levels of the detailed income range, so the midpoint was a reasonable choice. It was used only for the purpose of computing the SES composite and was not retained in the data file.
Table 5-14 summarizes the imputation results. Tables 5-15 to 5-21 summarize the
distribution of the records before and after imputation. The percentage columns may not always add to 100 percent due to rounding.
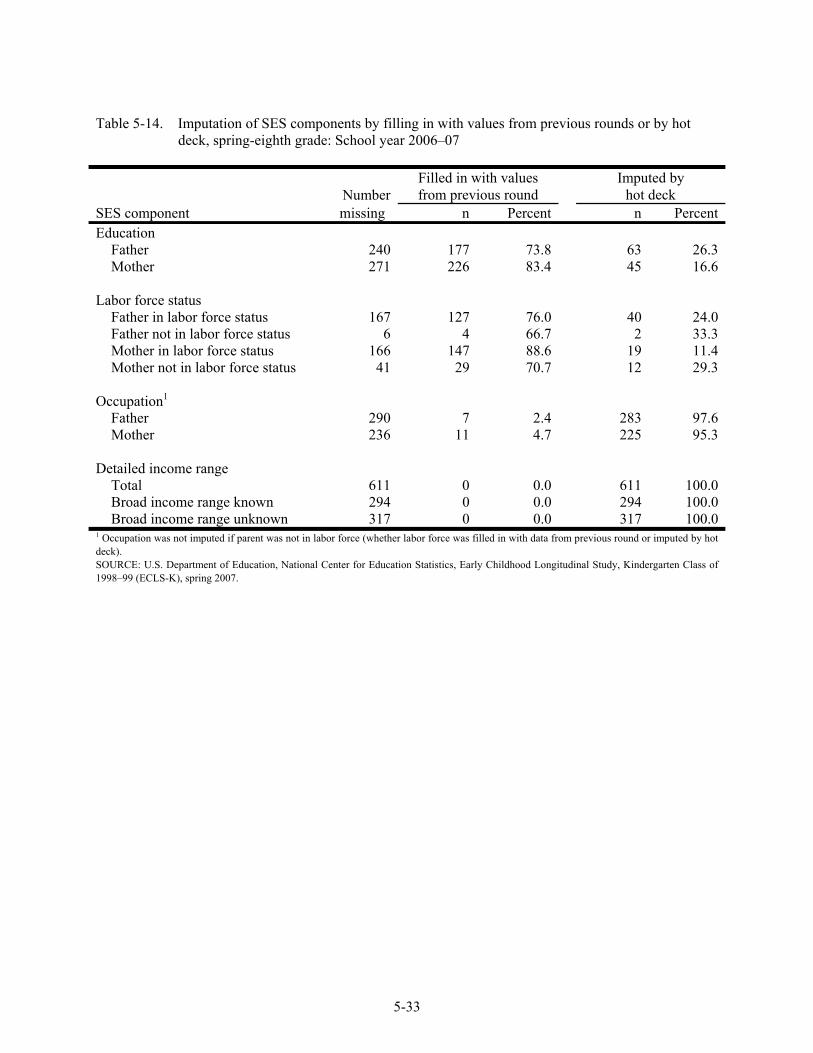
5-33
Table 5-14. Imputation of SES components by filling in with values from previous rounds or by hot deck, spring-eighth grade: School year 2006–07
Filled in with values Imputed by Number from previous round hot deck SES component missing n Percent n PercentEducation
Father 240 177 73.8 63 26.3Mother 271 226 83.4 45 16.6
Labor force status
Father in labor force status 167 127 76.0 40 24.0Father not in labor force status 6 4 66.7 2 33.3Mother in labor force status 166 147 88.6 19 11.4Mother not in labor force status 41 29 70.7 12 29.3
Occupation1
Father 290 7 2.4 283 97.6Mother 236 11 4.7 225 95.3
Detailed income range
Total 611 0 0.0 611 100.0Broad income range known 294 0 0.0 294 100.0Broad income range unknown 317 0 0.0 317 100.0
1 Occupation was not imputed if parent was not in labor force (whether labor force was filled in with data from previous round or imputed by hot deck). SOURCE: U.S. Department of Education, National Center for Education Statistics, Early Childhood Longitudinal Study, Kindergarten Class of 1998–99 (ECLS-K), spring 2007.
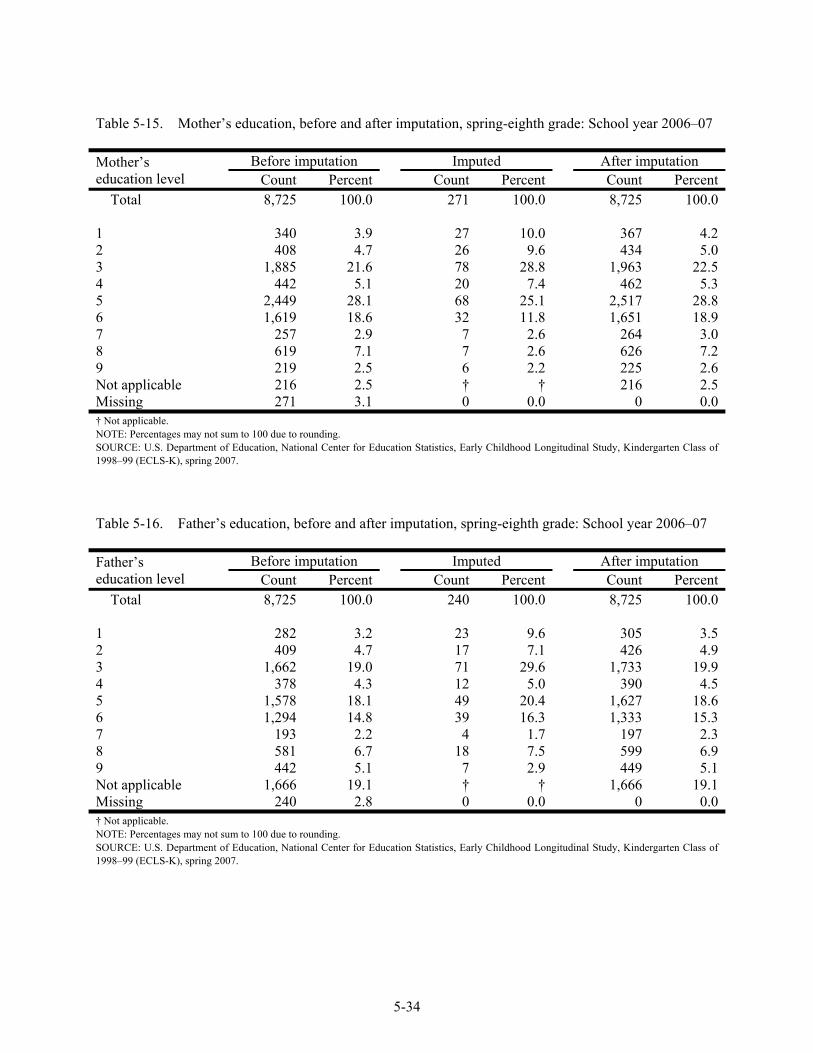
5-34
Table 5-15. Mother’s education, before and after imputation, spring-eighth grade: School year 2006–07 Mother’s education level
Before imputation Imputed After imputation Count Percent Count Percent Count Percent
Total 8,725 100.0 271 100.0 8,725 100.0 1 340 3.9 27 10.0 367 4.22 408 4.7 26 9.6 434 5.03 1,885 21.6 78 28.8 1,963 22.54 442 5.1 20 7.4 462 5.35 2,449 28.1 68 25.1 2,517 28.86 1,619 18.6 32 11.8 1,651 18.97 257 2.9 7 2.6 264 3.08 619 7.1 7 2.6 626 7.29 219 2.5 6 2.2 225 2.6Not applicable 216 2.5 † † 216 2.5Missing 271 3.1 0 0.0 0 0.0† Not applicable. NOTE: Percentages may not sum to 100 due to rounding. SOURCE: U.S. Department of Education, National Center for Education Statistics, Early Childhood Longitudinal Study, Kindergarten Class of 1998–99 (ECLS-K), spring 2007.
Table 5-16. Father’s education, before and after imputation, spring-eighth grade: School year 2006–07 Father’s education level
Before imputation Imputed After imputation Count Percent Count Percent Count Percent
Total 8,725 100.0 240 100.0 8,725 100.0 1 282 3.2 23 9.6 305 3.52 409 4.7 17 7.1 426 4.93 1,662 19.0 71 29.6 1,733 19.94 378 4.3 12 5.0 390 4.55 1,578 18.1 49 20.4 1,627 18.66 1,294 14.8 39 16.3 1,333 15.37 193 2.2 4 1.7 197 2.38 581 6.7 18 7.5 599 6.99 442 5.1 7 2.9 449 5.1Not applicable 1,666 19.1 † † 1,666 19.1Missing 240 2.8 0 0.0 0 0.0† Not applicable. NOTE: Percentages may not sum to 100 due to rounding. SOURCE: U.S. Department of Education, National Center for Education Statistics, Early Childhood Longitudinal Study, Kindergarten Class of 1998–99 (ECLS-K), spring 2007.
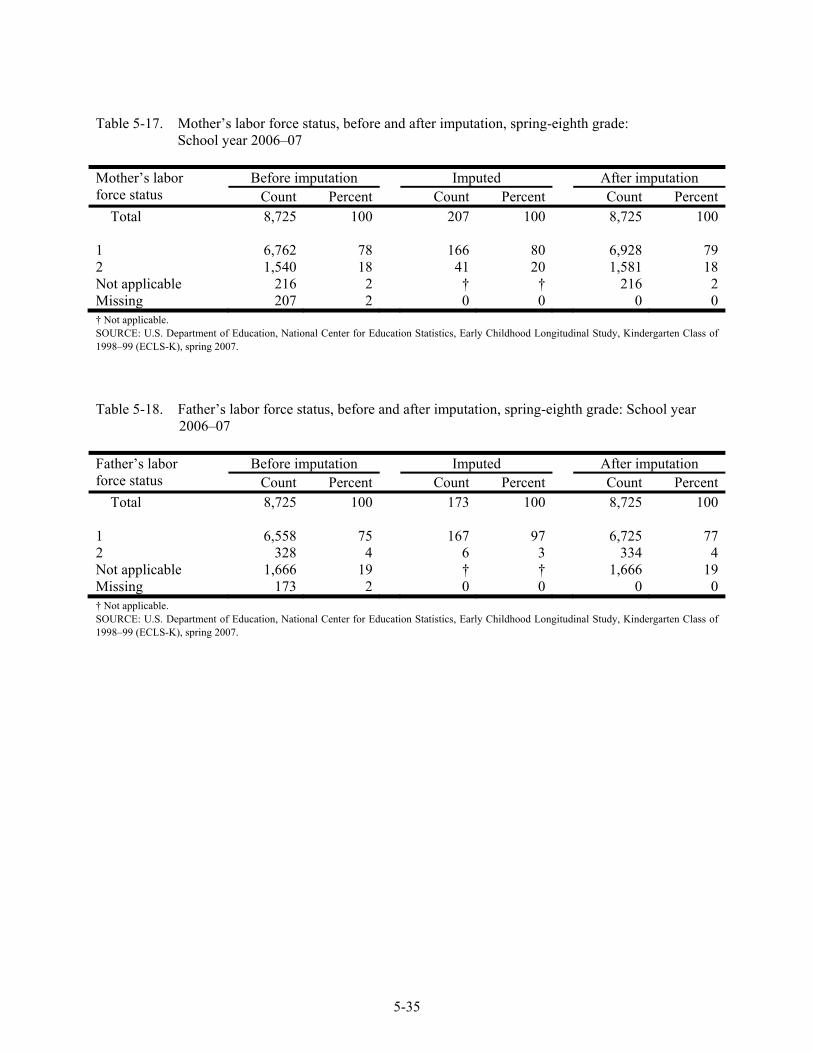
5-35
Table 5-17. Mother’s labor force status, before and after imputation, spring-eighth grade: School year 2006–07
Mother’s labor force status
Before imputation Imputed After imputation Count Percent Count Percent Count Percent
Total 8,725 100 207 100 8,725 100 1 6,762 78 166 80 6,928 792 1,540 18 41 20 1,581 18Not applicable 216 2 † † 216 2Missing 207 2 0 0 0 0† Not applicable. SOURCE: U.S. Department of Education, National Center for Education Statistics, Early Childhood Longitudinal Study, Kindergarten Class of 1998–99 (ECLS-K), spring 2007.
Table 5-18. Father’s labor force status, before and after imputation, spring-eighth grade: School year 2006–07
Father’s labor force status
Before imputation Imputed After imputation Count Percent Count Percent Count Percent
Total 8,725 100 173 100 8,725 100 1 6,558 75 167 97 6,725 772 328 4 6 3 334 4Not applicable 1,666 19 † † 1,666 19Missing 173 2 0 0 0 0† Not applicable. SOURCE: U.S. Department of Education, National Center for Education Statistics, Early Childhood Longitudinal Study, Kindergarten Class of 1998–99 (ECLS-K), spring 2007.
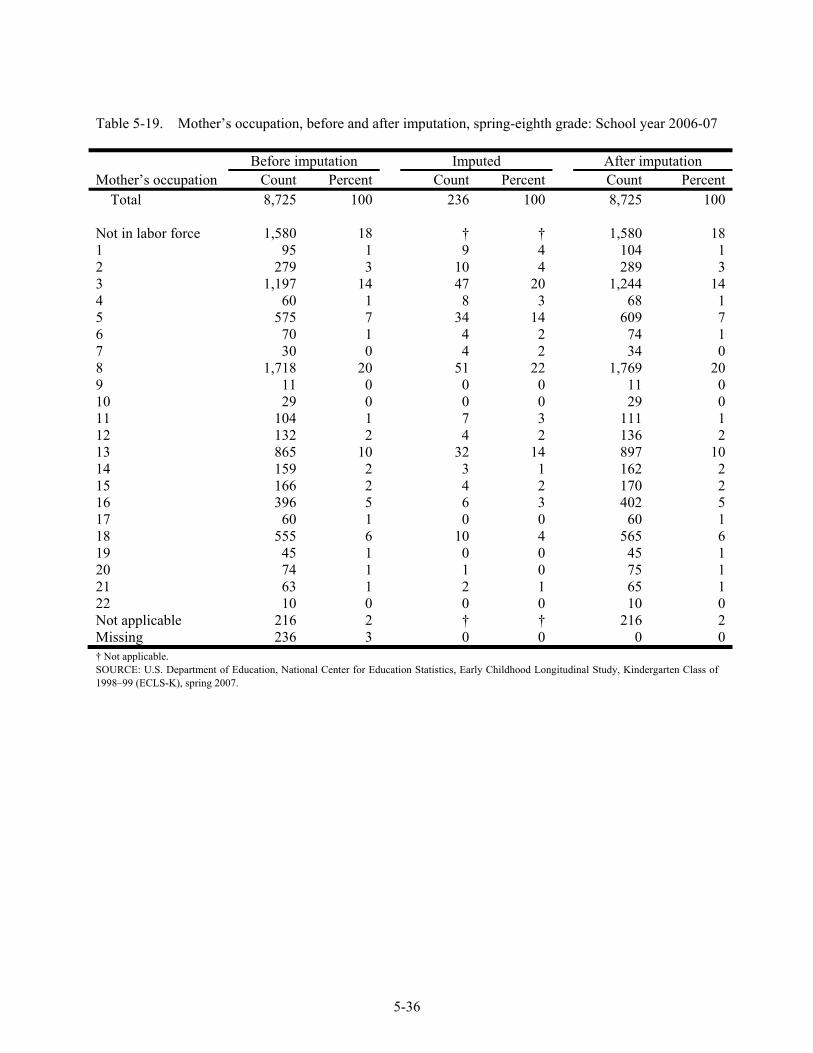
5-36
Table 5-19. Mother’s occupation, before and after imputation, spring-eighth grade: School year 2006-07
Mother’s occupation Before imputation Imputed After imputation
Count Percent Count Percent Count Percent Total 8,725 100 236 100 8,725 100 Not in labor force 1,580 18 † † 1,580 181 95 1 9 4 104 12 279 3 10 4 289 33 1,197 14 47 20 1,244 144 60 1 8 3 68 15 575 7 34 14 609 76 70 1 4 2 74 17 30 0 4 2 34 08 1,718 20 51 22 1,769 209 11 0 0 0 11 010 29 0 0 0 29 011 104 1 7 3 111 112 132 2 4 2 136 213 865 10 32 14 897 1014 159 2 3 1 162 215 166 2 4 2 170 216 396 5 6 3 402 517 60 1 0 0 60 118 555 6 10 4 565 619 45 1 0 0 45 120 74 1 1 0 75 121 63 1 2 1 65 122 10 0 0 0 10 0Not applicable 216 2 † † 216 2Missing 236 3 0 0 0 0† Not applicable. SOURCE: U.S. Department of Education, National Center for Education Statistics, Early Childhood Longitudinal Study, Kindergarten Class of 1998–99 (ECLS-K), spring 2007.
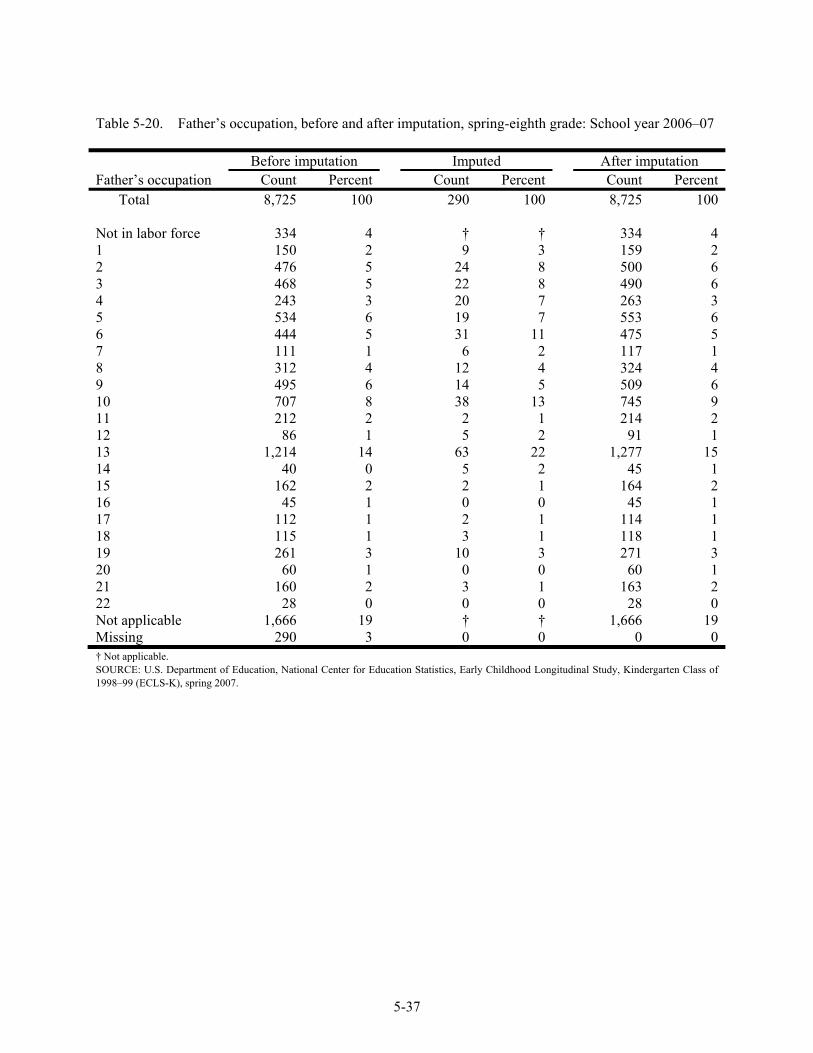
5-37
Table 5-20. Father’s occupation, before and after imputation, spring-eighth grade: School year 2006–07
Father’s occupation Before imputation Imputed After imputation
Count Percent Count Percent Count PercentTotal 8,725 100 290 100 8,725 100
Not in labor force 334 4 † † 334 41 150 2 9 3 159 22 476 5 24 8 500 63 468 5 22 8 490 64 243 3 20 7 263 35 534 6 19 7 553 66 444 5 31 11 475 57 111 1 6 2 117 18 312 4 12 4 324 49 495 6 14 5 509 610 707 8 38 13 745 911 212 2 2 1 214 212 86 1 5 2 91 113 1,214 14 63 22 1,277 1514 40 0 5 2 45 115 162 2 2 1 164 216 45 1 0 0 45 117 112 1 2 1 114 118 115 1 3 1 118 119 261 3 10 3 271 320 60 1 0 0 60 121 160 2 3 1 163 222 28 0 0 0 28 0Not applicable 1,666 19 † † 1,666 19Missing 290 3 0 0 0 0† Not applicable. SOURCE: U.S. Department of Education, National Center for Education Statistics, Early Childhood Longitudinal Study, Kindergarten Class of 1998–99 (ECLS-K), spring 2007.
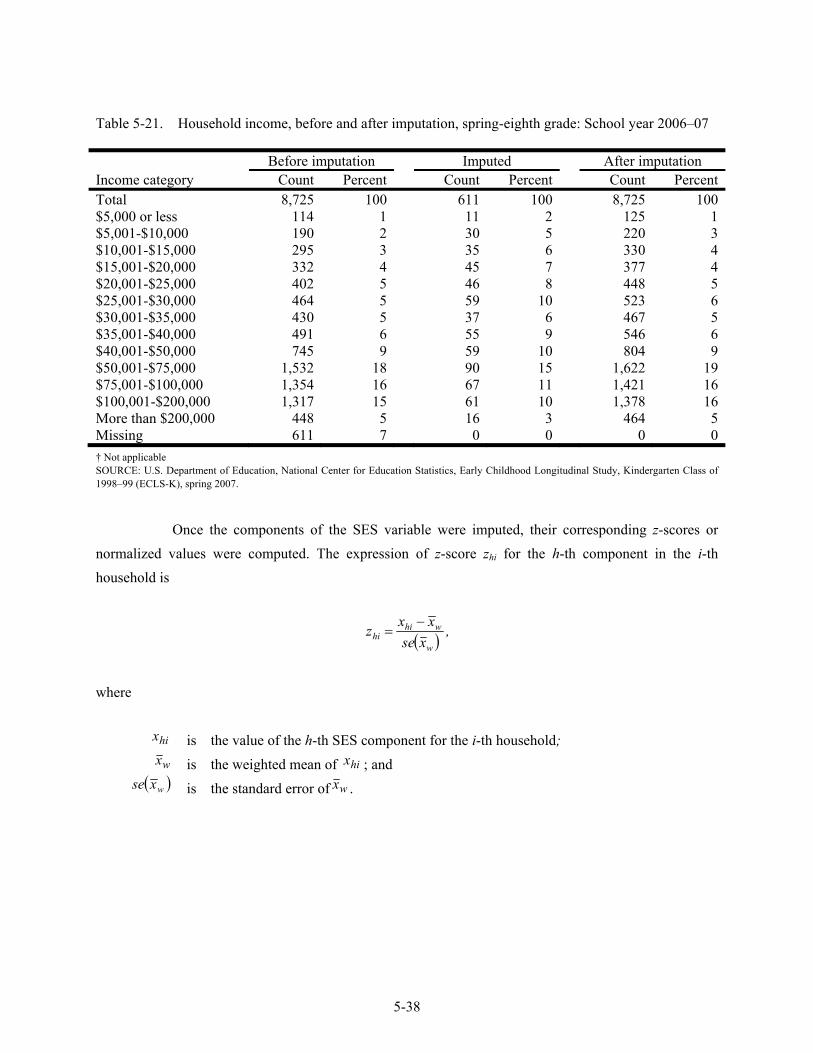
5-38
Table 5-21. Household income, before and after imputation, spring-eighth grade: School year 2006–07
Income category Before imputation Imputed After imputation
Count Percent Count Percent Count PercentTotal 8,725 100 611 100 8,725 100$5,000 or less 114 1 11 2 125 1$5,001-$10,000 190 2 30 5 220 3$10,001-$15,000 295 3 35 6 330 4$15,001-$20,000 332 4 45 7 377 4$20,001-$25,000 402 5 46 8 448 5$25,001-$30,000 464 5 59 10 523 6$30,001-$35,000 430 5 37 6 467 5$35,001-$40,000 491 6 55 9 546 6$40,001-$50,000 745 9 59 10 804 9$50,001-$75,000 1,532 18 90 15 1,622 19$75,001-$100,000 1,354 16 67 11 1,421 16$100,001-$200,000 1,317 15 61 10 1,378 16More than $200,000 448 5 16 3 464 5Missing 611 7 0 0 0 0† Not applicable SOURCE: U.S. Department of Education, National Center for Education Statistics, Early Childhood Longitudinal Study, Kindergarten Class of 1998–99 (ECLS-K), spring 2007.
Once the components of the SES variable were imputed, their corresponding z-scores or
normalized values were computed. The expression of z-score zhi for the h-th component in the i-th household is
( ) ,xse
xxzw
whihi
−=
where
hix is the value of the h-th SES component for the i-th household;
wx is the weighted mean of hix ; and
( )wxse is the standard error of wx .
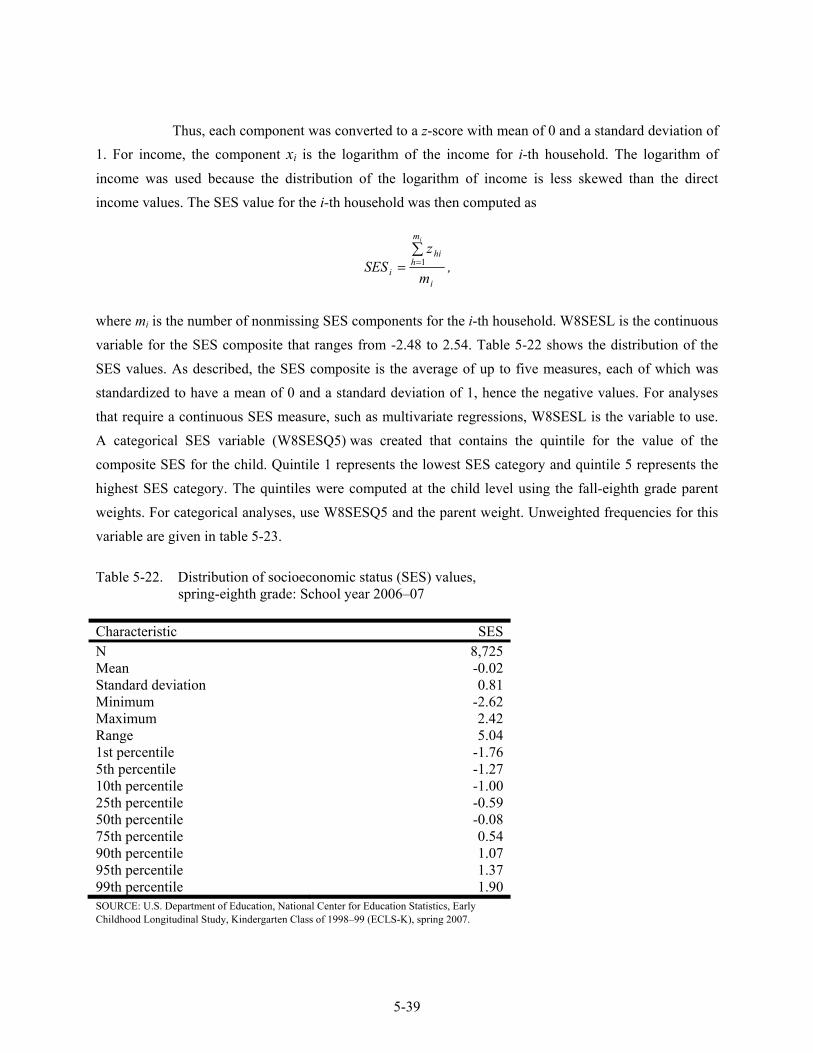
5-39
Thus, each component was converted to a z-score with mean of 0 and a standard deviation of 1. For income, the component xi is the logarithm of the income for i-th household. The logarithm of
income was used because the distribution of the logarithm of income is less skewed than the direct income values. The SES value for the i-th household was then computed as
,
m
zSES
i
m
hhi
i
i
∑== 1
where mi is the number of nonmissing SES components for the i-th household. W8SESL is the continuous variable for the SES composite that ranges from -2.48 to 2.54. Table 5-22 shows the distribution of the SES values. As described, the SES composite is the average of up to five measures, each of which was standardized to have a mean of 0 and a standard deviation of 1, hence the negative values. For analyses that require a continuous SES measure, such as multivariate regressions, W8SESL is the variable to use. A categorical SES variable (W8SESQ5) was created that contains the quintile for the value of the composite SES for the child. Quintile 1 represents the lowest SES category and quintile 5 represents the highest SES category. The quintiles were computed at the child level using the fall-eighth grade parent weights. For categorical analyses, use W8SESQ5 and the parent weight. Unweighted frequencies for this variable are given in table 5-23.
Table 5-22. Distribution of socioeconomic status (SES) values,
spring-eighth grade: School year 2006–07 Characteristic SESN 8,725Mean -0.02Standard deviation 0.81Minimum -2.62Maximum 2.42Range 5.041st percentile -1.765th percentile -1.2710th percentile -1.0025th percentile -0.5950th percentile -0.0875th percentile 0.5490th percentile 1.0795th percentile 1.3799th percentile 1.90SOURCE: U.S. Department of Education, National Center for Education Statistics, Early Childhood Longitudinal Study, Kindergarten Class of 1998–99 (ECLS-K), spring 2007.
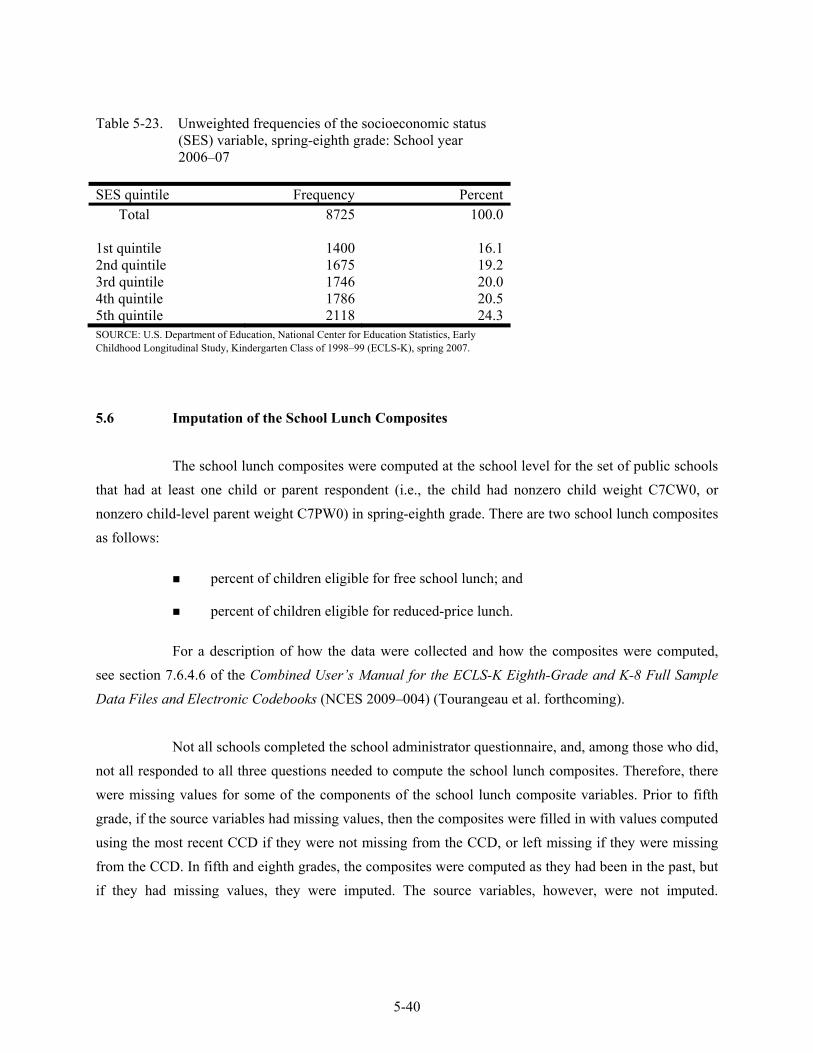
5-40
Table 5-23. Unweighted frequencies of the socioeconomic status (SES) variable, spring-eighth grade: School year 2006–07
SES quintile Frequency Percent
Total 8725 100.0 1st quintile 1400 16.12nd quintile 1675 19.23rd quintile 1746 20.04th quintile 1786 20.55th quintile 2118 24.3SOURCE: U.S. Department of Education, National Center for Education Statistics, Early Childhood Longitudinal Study, Kindergarten Class of 1998–99 (ECLS-K), spring 2007.
5.6 Imputation of the School Lunch Composites
The school lunch composites were computed at the school level for the set of public schools that had at least one child or parent respondent (i.e., the child had nonzero child weight C7CW0, or nonzero child-level parent weight C7PW0) in spring-eighth grade. There are two school lunch composites as follows:
percent of children eligible for free school lunch; and
percent of children eligible for reduced-price lunch.
For a description of how the data were collected and how the composites were computed, see section 7.6.4.6 of the Combined User’s Manual for the ECLS-K Eighth-Grade and K-8 Full Sample Data Files and Electronic Codebooks (NCES 2009–004) (Tourangeau et al. forthcoming).
Not all schools completed the school administrator questionnaire, and, among those who did,
not all responded to all three questions needed to compute the school lunch composites. Therefore, there were missing values for some of the components of the school lunch composite variables. Prior to fifth grade, if the source variables had missing values, then the composites were filled in with values computed using the most recent CCD if they were not missing from the CCD, or left missing if they were missing from the CCD. In fifth and eighth grades, the composites were computed as they had been in the past, but if they had missing values, they were imputed. The source variables, however, were not imputed.
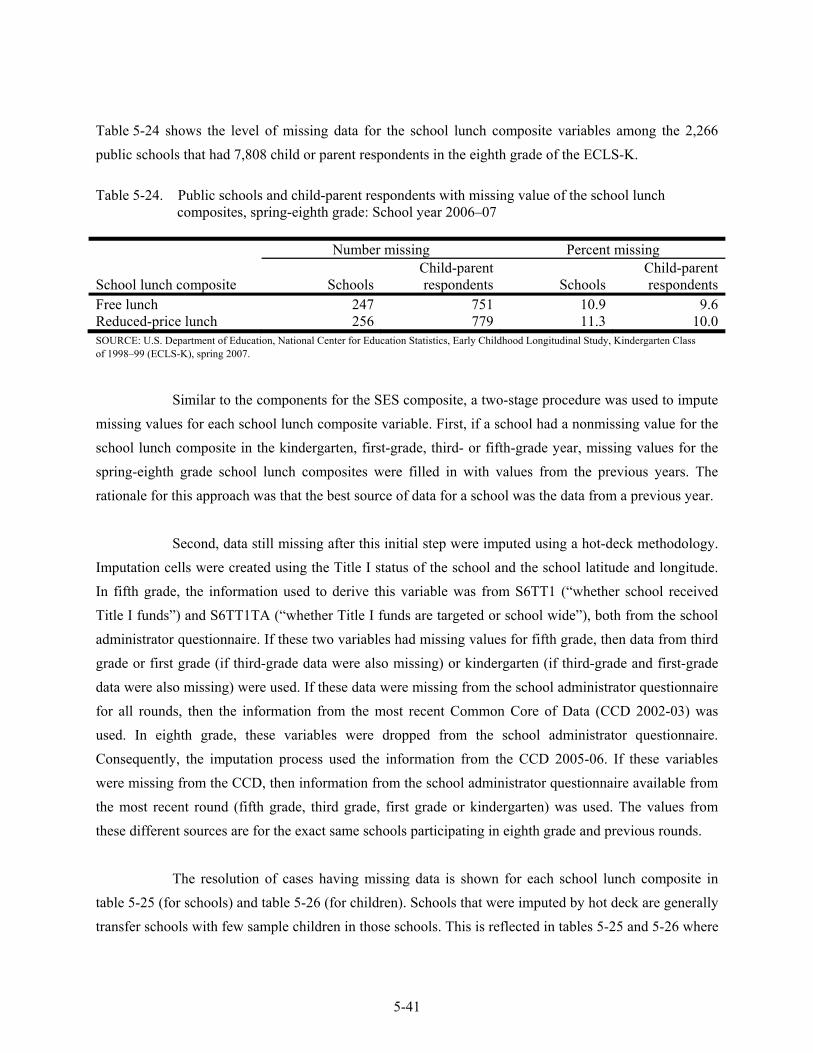
5-41
Table 5-24 shows the level of missing data for the school lunch composite variables among the 2,266 public schools that had 7,808 child or parent respondents in the eighth grade of the ECLS-K.
Table 5-24. Public schools and child-parent respondents with missing value of the school lunch
composites, spring-eighth grade: School year 2006–07 Number missing Percent missing
School lunch composite SchoolsChild-parent respondents Schools
Child-parent respondents
Free lunch 247 751 10.9 9.6Reduced-price lunch 256 779 11.3 10.0SOURCE: U.S. Department of Education, National Center for Education Statistics, Early Childhood Longitudinal Study, Kindergarten Class of 1998–99 (ECLS-K), spring 2007.
Similar to the components for the SES composite, a two-stage procedure was used to impute
missing values for each school lunch composite variable. First, if a school had a nonmissing value for the school lunch composite in the kindergarten, first-grade, third- or fifth-grade year, missing values for the spring-eighth grade school lunch composites were filled in with values from the previous years. The rationale for this approach was that the best source of data for a school was the data from a previous year.
Second, data still missing after this initial step were imputed using a hot-deck methodology.
Imputation cells were created using the Title I status of the school and the school latitude and longitude. In fifth grade, the information used to derive this variable was from S6TT1 (“whether school received Title I funds”) and S6TT1TA (“whether Title I funds are targeted or school wide”), both from the school administrator questionnaire. If these two variables had missing values for fifth grade, then data from third grade or first grade (if third-grade data were also missing) or kindergarten (if third-grade and first-grade data were also missing) were used. If these data were missing from the school administrator questionnaire for all rounds, then the information from the most recent Common Core of Data (CCD 2002-03) was used. In eighth grade, these variables were dropped from the school administrator questionnaire. Consequently, the imputation process used the information from the CCD 2005-06. If these variables were missing from the CCD, then information from the school administrator questionnaire available from the most recent round (fifth grade, third grade, first grade or kindergarten) was used. The values from these different sources are for the exact same schools participating in eighth grade and previous rounds.
The resolution of cases having missing data is shown for each school lunch composite in
table 5-25 (for schools) and table 5-26 (for children). Schools that were imputed by hot deck are generally transfer schools with few sample children in those schools. This is reflected in tables 5-25 and 5-26 where
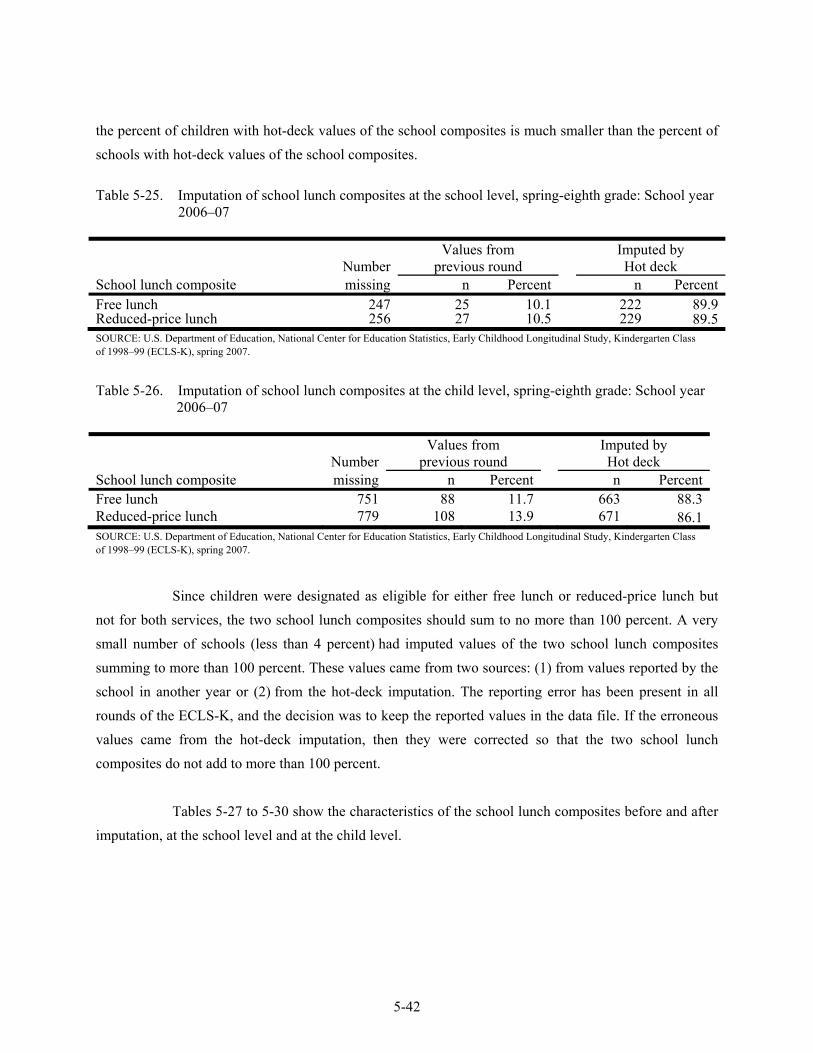
5-42
the percent of children with hot-deck values of the school composites is much smaller than the percent of schools with hot-deck values of the school composites.
Table 5-25. Imputation of school lunch composites at the school level, spring-eighth grade: School year
2006–07
Number Values from
previous round Imputed by
Hot deck School lunch composite missing n Percent n PercentFree lunch 247 25 10.1 222 89.9Reduced-price lunch 256 27 10.5 229 89.5SOURCE: U.S. Department of Education, National Center for Education Statistics, Early Childhood Longitudinal Study, Kindergarten Class of 1998–99 (ECLS-K), spring 2007.
Table 5-26. Imputation of school lunch composites at the child level, spring-eighth grade: School year
2006–07
Number Values from
previous round Imputed by
Hot deck School lunch composite missing n Percent n PercentFree lunch 751 88 11.7 663 88.3Reduced-price lunch 779 108 13.9 671 86.1SOURCE: U.S. Department of Education, National Center for Education Statistics, Early Childhood Longitudinal Study, Kindergarten Class of 1998–99 (ECLS-K), spring 2007.
Since children were designated as eligible for either free lunch or reduced-price lunch but
not for both services, the two school lunch composites should sum to no more than 100 percent. A very small number of schools (less than 4 percent) had imputed values of the two school lunch composites summing to more than 100 percent. These values came from two sources: (1) from values reported by the school in another year or (2) from the hot-deck imputation. The reporting error has been present in all rounds of the ECLS-K, and the decision was to keep the reported values in the data file. If the erroneous values came from the hot-deck imputation, then they were corrected so that the two school lunch composites do not add to more than 100 percent.
Tables 5-27 to 5-30 show the characteristics of the school lunch composites before and after
imputation, at the school level and at the child level.
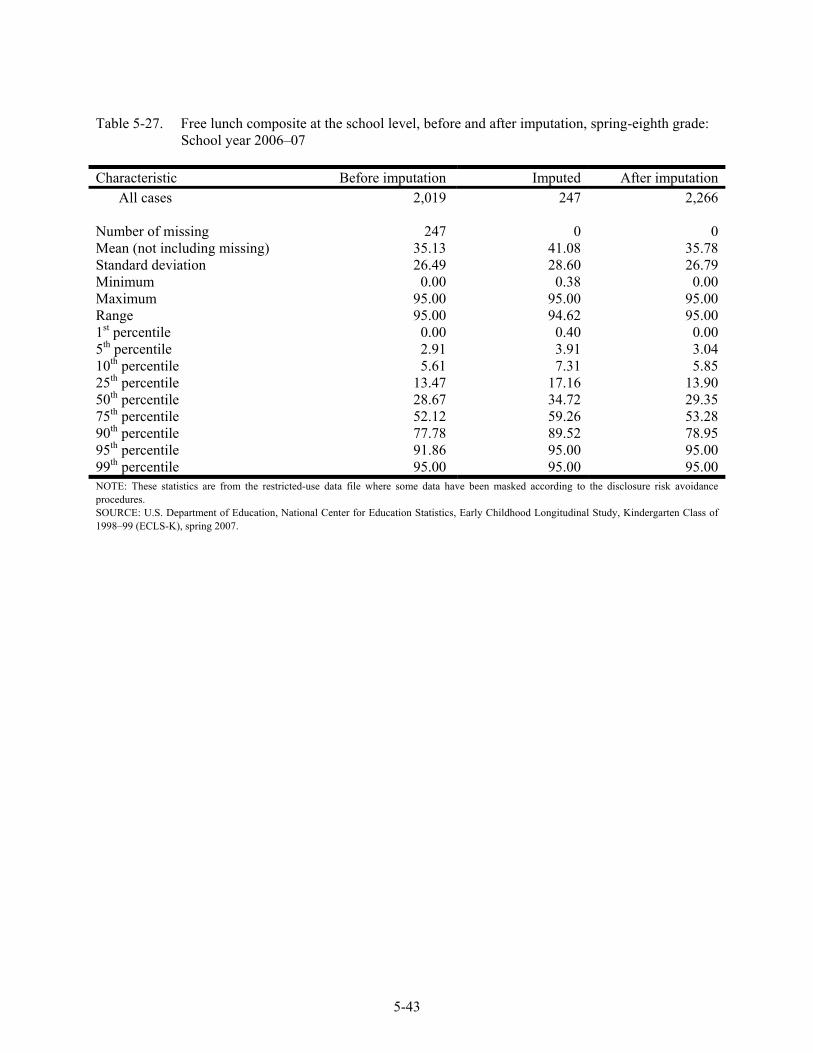
5-43
Table 5-27. Free lunch composite at the school level, before and after imputation, spring-eighth grade: School year 2006–07
Characteristic Before imputation Imputed After imputation
All cases 2,019 247 2,266 Number of missing 247 0 0Mean (not including missing) 35.13 41.08 35.78Standard deviation 26.49 28.60 26.79Minimum 0.00 0.38 0.00Maximum 95.00 95.00 95.00Range 95.00 94.62 95.001st percentile 0.00 0.40 0.005th percentile 2.91 3.91 3.0410th percentile 5.61 7.31 5.8525th percentile 13.47 17.16 13.9050th percentile 28.67 34.72 29.3575th percentile 52.12 59.26 53.2890th percentile 77.78 89.52 78.9595th percentile 91.86 95.00 95.0099th percentile 95.00 95.00 95.00NOTE: These statistics are from the restricted-use data file where some data have been masked according to the disclosure risk avoidance procedures. SOURCE: U.S. Department of Education, National Center for Education Statistics, Early Childhood Longitudinal Study, Kindergarten Class of 1998–99 (ECLS-K), spring 2007.

5-44
Table 5-28. Free lunch composite at the child level, before and after imputation, spring-eighth grade: School year 2006–07
Characteristic Before imputation Imputed After imputation
All cases 7,057 751 7,808 Number of missing 751 0 0Mean (not including missing) 33.60 42.24 34.43Standard deviation 24.77 28.19 25.25Minimum 0.00 0.38 0.00Maximum 95.00 95.00 95.00Range 95.00 94.62 95.001st percentile 0.27 1.87 0.275th percentile 3.05 6.53 3.1310th percentile 5.27 9.52 5.7825th percentile 14.48 18.22 14.9750th percentile 27.81 35.09 28.2175th percentile 47.08 61.13 48.4890th percentile 70.58 89.52 73.6795th percentile 90.25 92.53 90.6999th percentile 95.00 95.00 95.00NOTE: These statistics are from the restricted-use data file where some data have been masked according to the disclosure risk avoidance procedures. SOURCE: U.S. Department of Education, National Center for Education Statistics, Early Childhood Longitudinal Study, Kindergarten Class of 1998–99 (ECLS-K), spring 2007.
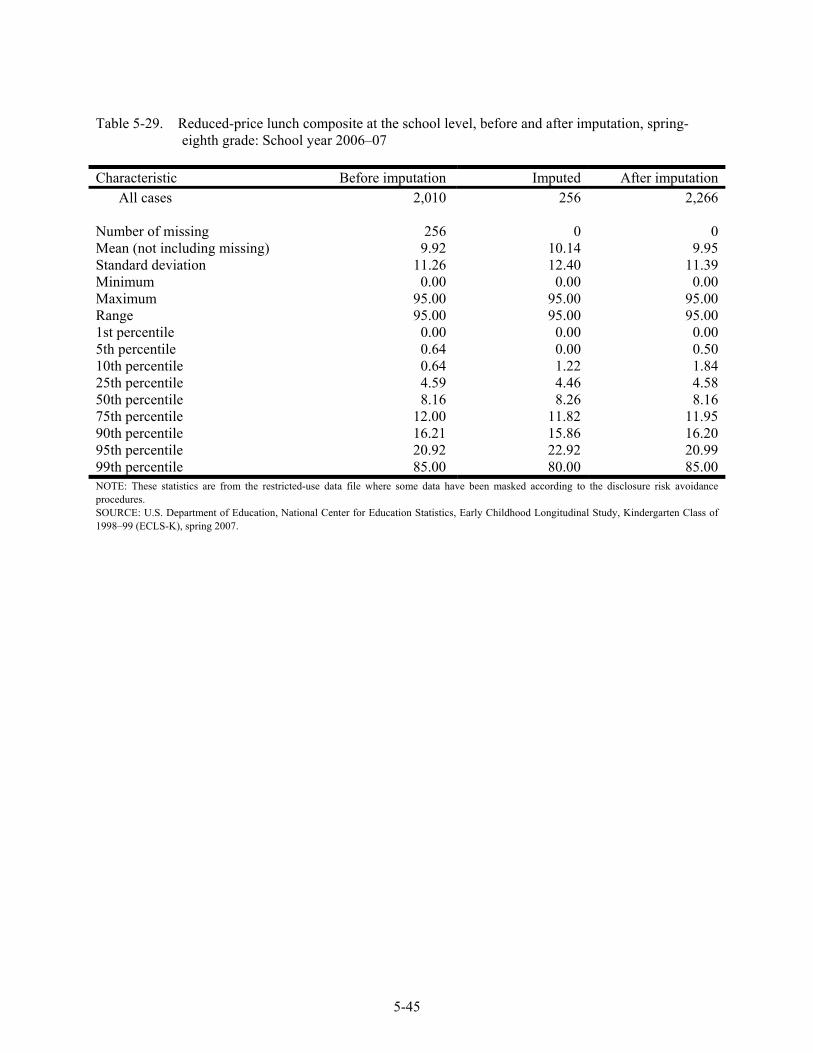
5-45
Table 5-29. Reduced-price lunch composite at the school level, before and after imputation, spring-eighth grade: School year 2006–07
Characteristic Before imputation Imputed After imputation
All cases 2,010 256 2,266 Number of missing 256 0 0Mean (not including missing) 9.92 10.14 9.95Standard deviation 11.26 12.40 11.39Minimum 0.00 0.00 0.00Maximum 95.00 95.00 95.00Range 95.00 95.00 95.001st percentile 0.00 0.00 0.005th percentile 0.64 0.00 0.5010th percentile 0.64 1.22 1.8425th percentile 4.59 4.46 4.5850th percentile 8.16 8.26 8.1675th percentile 12.00 11.82 11.9590th percentile 16.21 15.86 16.2095th percentile 20.92 22.92 20.9999th percentile 85.00 80.00 85.00NOTE: These statistics are from the restricted-use data file where some data have been masked according to the disclosure risk avoidance procedures. SOURCE: U.S. Department of Education, National Center for Education Statistics, Early Childhood Longitudinal Study, Kindergarten Class of 1998–99 (ECLS-K), spring 2007.
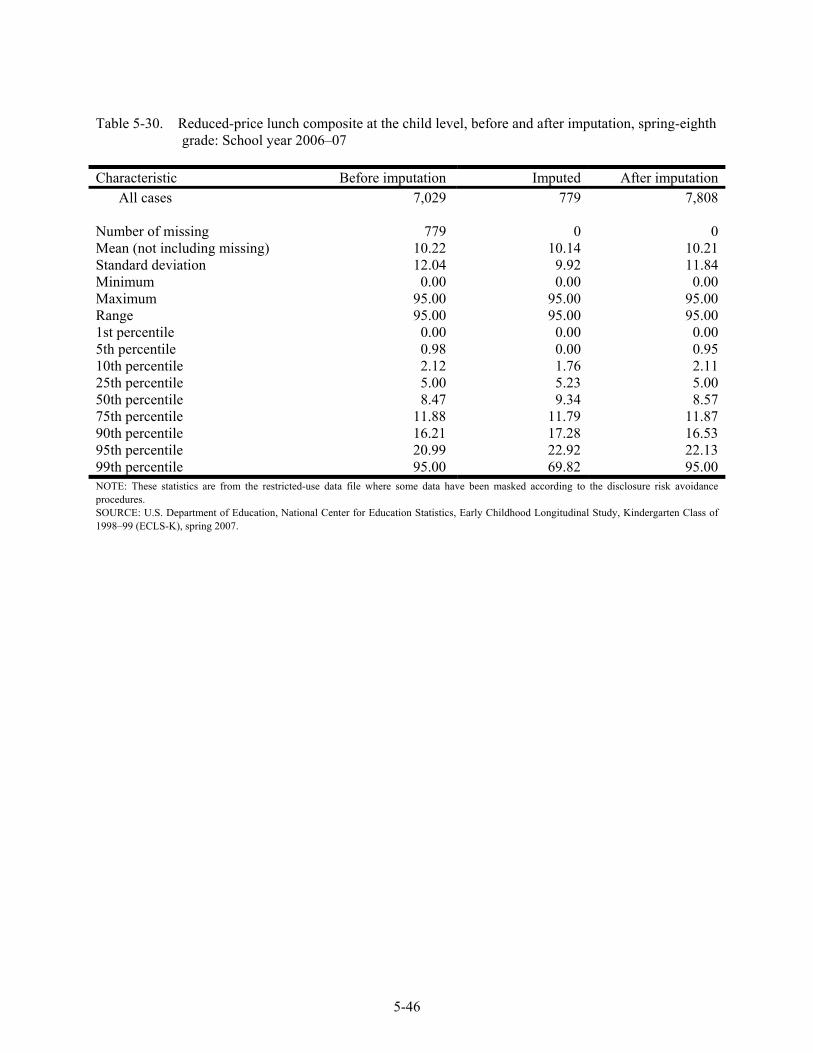
5-46
Table 5-30. Reduced-price lunch composite at the child level, before and after imputation, spring-eighth grade: School year 2006–07
Characteristic Before imputation Imputed After imputation
All cases 7,029 779 7,808 Number of missing 779 0 0Mean (not including missing) 10.22 10.14 10.21Standard deviation 12.04 9.92 11.84Minimum 0.00 0.00 0.00Maximum 95.00 95.00 95.00Range 95.00 95.00 95.001st percentile 0.00 0.00 0.005th percentile 0.98 0.00 0.9510th percentile 2.12 1.76 2.1125th percentile 5.00 5.23 5.0050th percentile 8.47 9.34 8.5775th percentile 11.88 11.79 11.8790th percentile 16.21 17.28 16.5395th percentile 20.99 22.92 22.1399th percentile 95.00 69.82 95.00NOTE: These statistics are from the restricted-use data file where some data have been masked according to the disclosure risk avoidance procedures. SOURCE: U.S. Department of Education, National Center for Education Statistics, Early Childhood Longitudinal Study, Kindergarten Class of 1998–99 (ECLS-K), spring 2007.
6-1
6. RESPONSE RATES
This chapter describes the computation of unit completion rates for the spring-eighth grade data collection of the Early Childhood Longitudinal Study, Kindergarten Class of 1998–99 (ECLS-K), and unit overall response rates for the base-year respondents. Weighted and unweighted unit completion rates are presented for three groups of children: (1) children sampled in kindergarten, (2) children sampled in first grade through the freshening procedure, and (3) both groups combined. Completion rates for the eighth-grade data collection were computed with the same procedures used for spring-first grade, spring-third grade, and spring-fifth grade to allow for comparisons of completion rates for the 4 years of data collection following the base year. Item response rates for selected items from the ECLS-K eighth-grade instruments are also presented.
For spring-first grade and spring-third grade, the sample of children is the same: base-year
respondents (i.e., children who had either a fall- or spring-kindergarten child assessment or parent interview) and children sampled in spring-first grade as part of sample freshening as described in section 3.4.2. For spring-fifth grade, the sample of children was reduced to exclude base-year respondents who belonged in the following special groups as described in section 3.6: (1) children who became ineligible in an earlier round (because they died or moved out of the country), (2) children who were subsampled out in previous rounds because they moved out of the original schools and were not subsampled to be followed, (3) children whose parents emphatically refused to cooperate (hard refusals) in any of the data collection rounds since spring-kindergarten, and (4) children eligible for the third-grade sample for whom there are neither first-grade nor third-grade data. Among the 21,357 children who were eligible for the study after the base year (21,292 base year respondents and 165 children sampled in first grade), only 16,143 were part of the fifth-grade data collection while the remaining 5,214 were excluded for reasons explained in section 3.6.1. For spring-eighth grade, the sample was reduced further by including only children who were respondents or eligible nonrespondents at the end of the fifth-grade data collection. Of the 16,143 children in the fifth-grade data collection, 12,129 were respondents or eligible nonrespondents and were part of the eighth-grade data collection. Children who were excluded were not part of the calculation of response rates.
6-2
6.1 Definition of Response and Completion Rates
Response rates and completion rates are two ways to describe the outcomes of data collection activities. A response rate is the ratio of the number of units with completed interviews (for example, the units could be children, parents, schools or teachers) to the number of units sampled and eligible for the interview. The response rate indicates the percentage of possible interviews completed, taking all survey stages into account. On the other hand, the completion rate measures the percentage of interviews completed for a specific stage of the survey. For example, in the base year of the ECLS-K, children were identified for assessment in a two-stage process. The first stage involved the recruitment of schools to participate in the study. Preassessment visits were made to schools that agreed to participate. During the preassessment visit, field supervisors met with the participating school’s school coordinator to enumerate and sample the kindergartners. Assessments were then conducted for the sampled children whose parents consented. If the school refused to participate in the study, no children were sampled for assessment. Under this design, the completion rate for the child assessment is the percentage of sampled children who completed the assessment. The response rate is the product of the school participation or cooperation rate and the child assessment completion rate.
Response and completion rates can be either unweighted or weighted. The unweighted rate,
computed using the raw number of cases, provides a useful description of the success of the operational aspects of the survey. The weighted rate, computed by summing the weights (usually the reciprocals of the probability of selecting the units) for both the numerator and denominator, gives a better description of the success of the survey with respect to the population sampled since the weights allow for inference of the sample data (including response status) to the population. Both rates are usually not very different unless the probabilities of selection and the response rates in the categories with different selection probabilities vary considerably.
For example, the weighted completion rate of the ECLS-K child assessment (CA) is
computed as
∈
∈ ∪
=
∑
∑CA
CA CA
ii ER
CAi
i ER ENR
W
rW
6-3
where Wi is the weight (inverse of the probability of selection of the child) for child i, and ERCA denotes eligible child assessment respondent and ENRCA eligible child assessment nonrespondent. To compute the unweighted rates, Wi is set to 1 for each child.
The response rate of the child assessment can be computed as
= ×CA S CAR r r
where rS is the school cooperation rate and rCA is the child assessment completion rate.
After the base year, only completion rates were computed for the different ECLS-K
instruments, since the response rates of the schools where the children were sampled remained the same for each subsequent round. Data users could compute the fifth-grade response rate for each ECLS-K instrument by multiplying the school response rate from the base year and the fifth-grade completion rate for each instrument. Overall response rates were computed for the instruments that are common to all seven rounds of the ECLS-K. Each overall response rate is the product of the base-year (spring-kindergarten) school response rate and the completion rate for each round.
Both unweighted and weighted rates are presented in the tables in this chapter. While
unweighted rates are useful for evaluating sample performance as mentioned earlier, only weighted rates are discussed in the text.
6.2 Completion Rates
For the ECLS-K eighth-grade data collection, there were 10 survey instruments: child assessment; student questionnaire, parent interview; school administrator questionnaire; teacher-level questionnaire, subject-specific child-level questionnaires (English, mathematics, and science); and special education teacher questionnaire part A and part B. The mathematics teacher questionnaire was completed for about half of the children in the eighth-grade sample and the science teacher questionnaire was completed for the other half, so that each child would have data from no more than nine instruments. Except for the parent interview, all instruments were paper-and-pencil instruments.
6-4
For each instrument, completion rates were computed separately for children who were sampled as part of the kindergarten cohort in the base year and for children who were sampled in first grade through the child sample freshening procedure. While the completion rate for children sampled in the base year has only one component (to account for nonresponse attrition during data collection), the completion rate for children sampled in first grade has two components (to account for nonresponse attrition during the freshening procedure and during data collection). Section 6.2.2 describes in detail the two components of the completion rates for the freshened children. The two sets of rates were combined to obtain the completion rates for all children in eighth grade.
6.2.1 Children Sampled in Kindergarten
For the ECLS-K, a completion rate is a response rate conditioned on the results of an earlier stage of data collection. In the case of the ECLS-K eighth-grade data collection, the condition is that children who were sampled in kindergarten were base-year respondents since only base-year respondents were eligible for subsequent data collection efforts. Children sampled in first grade were exempt from this condition in the computation of completion rates. They are discussed in section 6.2.2.
For each instrument, the unweighted completion rate is the proportion of base-year
respondents (included in the eighth-grade data collection) with completed data for the eighth-grade instrument to the base-year respondents (included in the eighth-grade data collection) who remained eligible to have the eighth-grade instrument administered. Base-year respondents who died or moved out of the country were not included in the denominator. For the weighted completion rates, the weight used is the product of the school base weight, the within-school child weight, and the factor that was used to adjust for movers between base year and fifth grade who were subsampled out for data collection. Since there was no subsampling of movers in eighth grade, there is no weight adjustment for this step. For a description of these weights and adjustment factors, see chapter 8.
Tables 6-1 to 6-3 present weighted and unweighted child-level completion rates for spring-
eighth-grade data collection, broken out by school characteristics.1 These rates pertain to children who were sampled as part of the kindergarten cohort in the base year. In general, completion rates for eighth
1 Children in schools with unknown characteristics are movers who could not be located (and considered as nonrespondents in the completion rates). Their weights are large because of the fifth-grade mover adjustment where movers who were followed carry the weight of movers who were subsampled-out for follow-up. The categories of school affiliation in the tables in this chapter do not match categories of school affiliation in the tables in chapter 3. This is to allow users to compare completion rates in eighth grade with those in previous years.
6-5
grade are lower than in previous year. Even though hard-to-field cases2 from the fifth-grade collection were excluded, the completion rates are lower for three main reasons: (1) the eighth-grade data collection occurred three years after the fifth-grade data collection, making it harder to find respondents, (2) the children were older and could refuse to cooperate at a much higher rate than younger children, and (3) the change in the field procedure in which explicit parent consent had to be obtained before the children could be approached.
Table 6-1 shows that the completion rates for the child assessment are higher in public
schools than in private schools. Within the private school category, the difference in the rates is not as large. Excluding the “unknown” category, the complete for the child assessment rates range from 82.7 percent for children in non-Catholic private schools to 97.1 percent for children in schools in small towns. The pattern of completion rates is similar for the parent interviews, ranging from 76.5 percent for children in non-Catholic private schools to 89.2 percent for children in schools in large towns, excluding the “unknown” category. The “unknown” category includes children who were unlocatable as their whereabouts were unknown. The category “unknown” also includes 48 children who were homeschooled and thus had no information concerning schools.
Table 6-2 shows that the weighted completion rates are 75.3 for the student questionnaire,
73.3 percent for the school administrator questionnaire, and 74.5 for the teacher-level questionnaire. Excluding the “unknown” category, the completion rates for the student questionnaire follow the same pattern of the rates for child assessment with the lowest rate for children in non-Catholic schools (82.0 percent) to the highest rate for children who were in schools in the rural area outside the Metropolitan Statistical Areas (96.2 percent). The pattern of completion rates for the school and teacher instruments is somewhat different. For the school administrator questionnaire, the rates range from 80.4 percent for schools with the highest minority enrollment to 97.0 percent for schools with the lowest minority enrollment. The rates for the teacher-level questionnaire range from 81.3 percent for non-Catholic private schools to 97.9 for small town. This is a phenomenon observed in previous rounds for the school administrator questionnaire.
Table 6-3 shows that the rates for the child-level teacher questionnaires. All three of these
subject-specific teacher questionnaires were completed at a rate of 72 or 73 percent. Excluding the “unknown” category, the completion rates for the child-level teacher questionnaires are as follows: 80.4 percent (large city) to 97.3 percent (small town) for English; 77.2 percent (large city) to 97.3 percent 2 Hard-to-field cases are the hard-refusal cases and cases that were nonrespondents in both first and third grades as described in section 3.6.
6-6
(small town) for mathematics, and 79.2 percent (non-Catholic private or large city) to 93.7 percent (high total enrollment) for science. These rates are not as high as in fifth grade but higher than in third grade, most likely due to the higher incentives employed in fifth grade and carried on to eighth grade. For a discussion of the incentives used in the ECLS-K, see section 4.7.5.
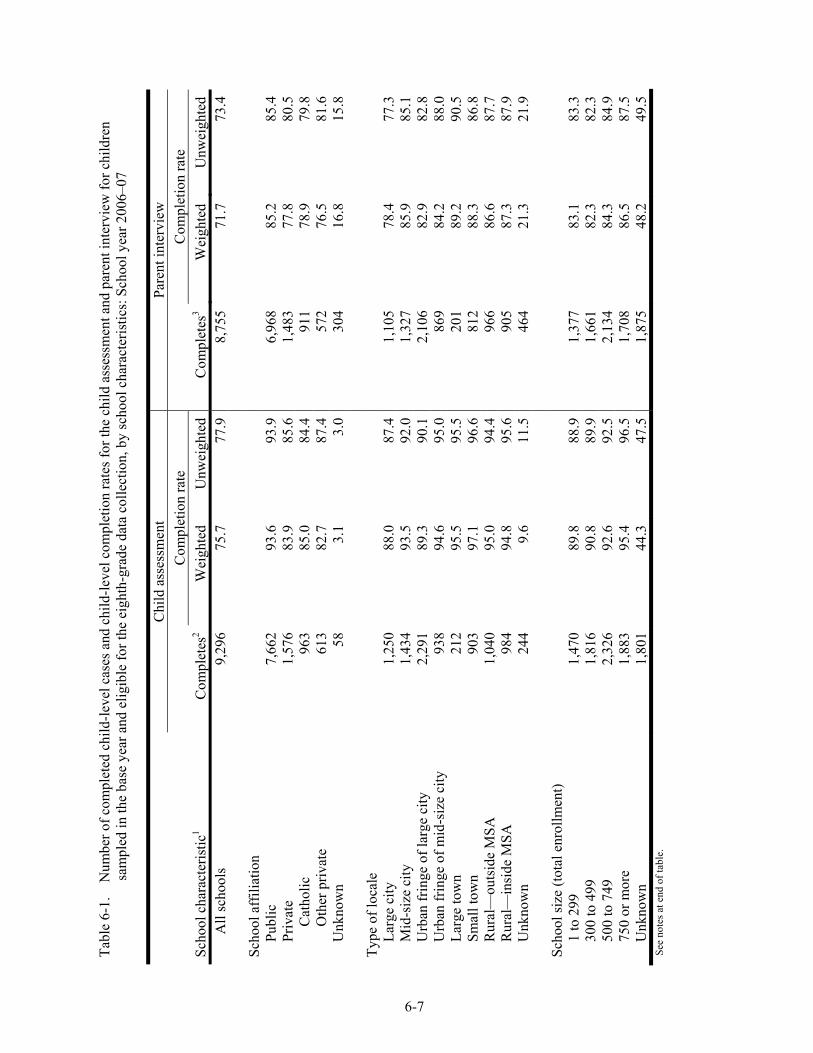
6-7
Tabl
e 6-
1.
Num
ber o
f com
plet
ed c
hild
-leve
l cas
es a
nd c
hild
-leve
l com
plet
ion
rate
s for
the
child
ass
essm
ent a
nd p
aren
t int
ervi
ew fo
r chi
ldre
n sa
mpl
ed in
the
base
yea
r and
elig
ible
for t
he e
ight
h-gr
ade
data
col
lect
ion,
by
scho
ol c
hara
cter
istic
s: S
choo
l yea
r 200
6–07
Sc
hool
cha
ract
eris
tic1
Chi
ld a
sses
smen
t Pa
rent
inte
rvie
w
Com
plet
es2
Com
plet
ion
rate
C
ompl
etes
3C
ompl
etio
n ra
te
Wei
ghte
dU
nwei
ghte
d W
eigh
ted
Unw
eigh
ted
All
scho
ols
9,29
675
.777
.9
8,75
571
.773
.4
Sc
hool
aff
iliat
ion
Pu
blic
7,
662
93.6
93.9
6,
968
85.2
85.4
Priv
ate
1,57
683
.985
.6
1,48
377
.880
.5C
atho
lic
963
85.0
84.4
91
178
.979
.8O
ther
priv
ate
613
82.7
87.4
57
276
.581
.6U
nkno
wn
583.
13.
0 30
416
.815
.8
Ty
pe o
f loc
ale
La
rge
city
1,
250
88.0
87.4
1,
105
78.4
77.3
Mid
-siz
e ci
ty
1,43
493
.592
.0
1,32
785
.985
.1U
rban
frin
ge o
f lar
ge c
ity
2,29
189
.390
.1
2,10
682
.982
.8U
rban
frin
ge o
f mid
-siz
e ci
ty
938
94.6
95.0
86
984
.288
.0La
rge
tow
n 21
295
.595
.5
201
89.2
90.5
Smal
l tow
n 90
397
.196
.6
812
88.3
86.8
Rur
al—
outs
ide
MSA
1,
040
95.0
94.4
96
686
.687
.7R
ural
—in
side
MSA
98
494
.895
.6
905
87.3
87.9
Unk
now
n 24
49.
611
.5
464
21.3
21.9
Scho
ol si
ze (t
otal
enr
ollm
ent)
1
to 2
99
1,47
089
.888
.9
1,37
783
.183
.330
0 to
499
1,
816
90.8
89.9
1,
661
82.3
82.3
500
to 7
49
2,32
692
.692
.5
2,13
484
.384
.975
0 or
mor
e 1,
883
95.4
96.5
1,
708
86.5
87.5
Unk
now
n 1,
801
44.3
47.5
1,
875
48.2
49.5
See
note
s at e
nd o
f tab
le.
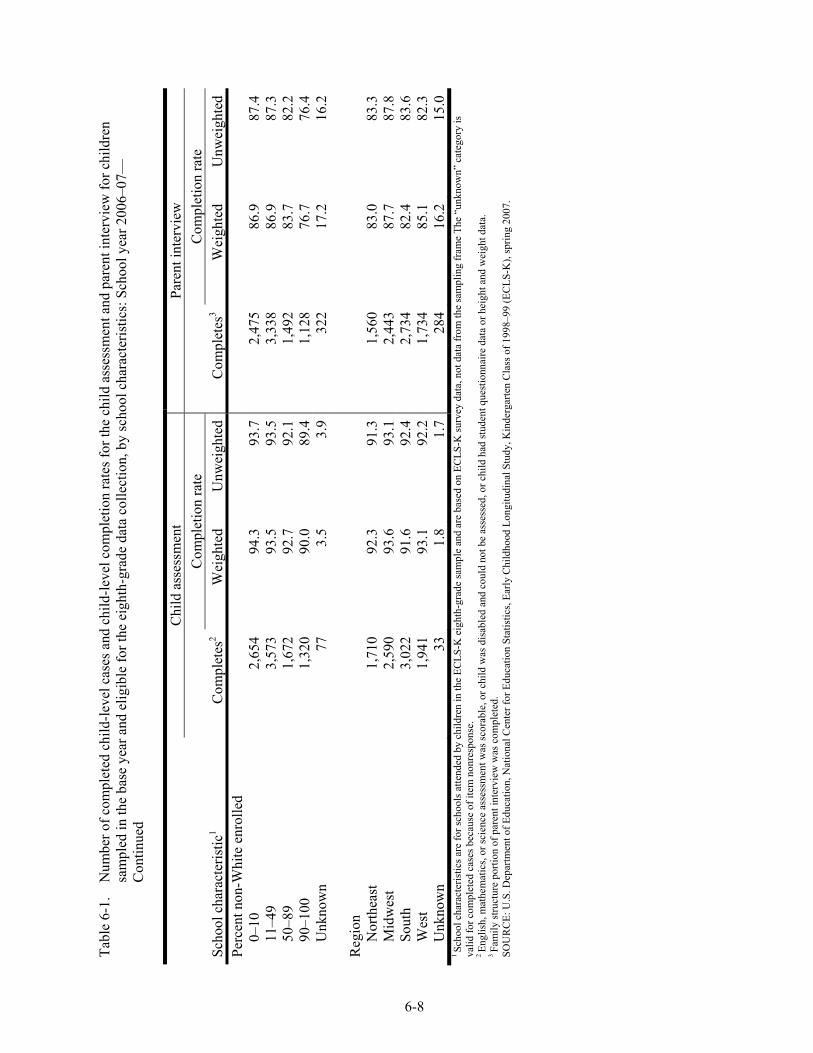
6-8
Tabl
e 6-
1.
Num
ber o
f com
plet
ed c
hild
-leve
l cas
es a
nd c
hild
-leve
l com
plet
ion
rate
s for
the
child
ass
essm
ent a
nd p
aren
t int
ervi
ew fo
r chi
ldre
n sa
mpl
ed in
the
base
yea
r and
elig
ible
for t
he e
ight
h-gr
ade
data
col
lect
ion,
by
scho
ol c
hara
cter
istic
s: S
choo
l yea
r 200
6–07
—C
ontin
ued
Scho
ol c
hara
cter
istic
1
Chi
ld a
sses
smen
t Pa
rent
inte
rvie
w
Com
plet
es2
Com
plet
ion
rate
C
ompl
etes
3C
ompl
etio
n ra
te
Wei
ghte
dU
nwei
ghte
d W
eigh
ted
Unw
eigh
ted
Perc
ent n
on-W
hite
enr
olle
d
0–10
2,
654
94.3
93.7
2,
475
86.9
87.4
11–4
9 3,
573
93.5
93.5
3,
338
86.9
87.3
50–8
9 1,
672
92.7
92.1
1,
492
83.7
82.2
90–1
00
1,32
090
.089
.4
1,12
876
.776
.4U
nkno
wn
773.
53.
9 32
217
.216
.2
R
egio
n
Nor
thea
st
1,71
092
.391
.3
1,56
083
.083
.3M
idw
est
2,59
093
.693
.1
2,44
387
.787
.8So
uth
3,02
291
.692
.4
2,73
482
.483
.6W
est
1,94
193
.192
.2
1,73
485
.182
.3U
nkno
wn
331.
81.
7 28
416
.215
.01 Sc
hool
cha
ract
eris
tics a
re fo
r sch
ools
atte
nded
by
child
ren
in th
e EC
LS-K
eig
hth-
grad
e sa
mpl
e an
d ar
e ba
sed
on E
CLS
-K su
rvey
dat
a, n
ot d
ata
from
the
sam
plin
g fr
ame
The
“unk
now
n” c
ateg
ory
is
valid
for c
ompl
eted
cas
es b
ecau
se o
f ite
m n
onre
spon
se.
2 En
glis
h, m
athe
mat
ics,
or sc
ienc
e as
sess
men
t was
scor
able
, or c
hild
was
dis
able
d an
d co
uld
not b
e as
sess
ed, o
r chi
ld h
ad st
uden
t que
stio
nnai
re d
ata
or h
eigh
t and
wei
ght d
ata.
3 Fa
mily
stru
ctur
e po
rtion
of p
aren
t int
ervi
ew w
as c
ompl
eted
. SO
UR
CE:
U.S
. Dep
artm
ent o
f Edu
catio
n, N
atio
nal C
ente
r for
Edu
catio
n St
atis
tics,
Early
Chi
ldho
od L
ongi
tudi
nal S
tudy
, Kin
derg
arte
n C
lass
of 1
998–
99 (E
CLS
-K),
sprin
g 20
07.
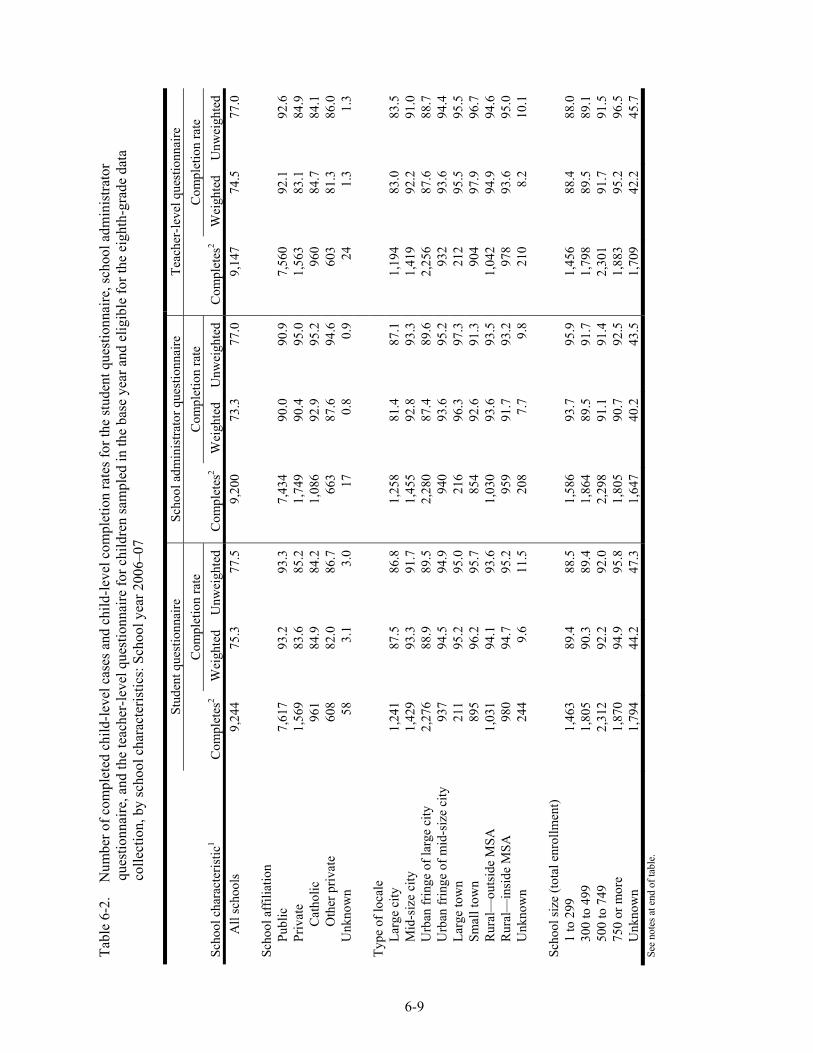
6-9
Tabl
e 6-
2.
Num
ber o
f com
plet
ed c
hild
-leve
l cas
es a
nd c
hild
-leve
l com
plet
ion
rate
s for
the
stud
ent q
uest
ionn
aire
, sch
ool a
dmin
istra
tor
ques
tionn
aire
, and
the
teac
her-
leve
l que
stio
nnai
re fo
r chi
ldre
n sa
mpl
ed in
the
base
yea
r and
elig
ible
for t
he e
ight
h-gr
ade
data
co
llect
ion,
by
scho
ol c
hara
cter
istic
s: S
choo
l yea
r 200
6–07
Sc
hool
cha
ract
eris
tic1
Stud
ent q
uest
ionn
aire
Sc
hool
adm
inis
trato
r que
stio
nnai
re
Teac
her-
leve
l que
stio
nnai
re
Com
plet
es2
Com
plet
ion
rate
C
ompl
etes
2 C
ompl
etio
n ra
te
Com
plet
es2
Com
plet
ion
rate
W
eigh
ted
Unw
eigh
ted
Wei
ghte
d U
nwei
ghte
d W
eigh
ted
Unw
eigh
ted
All
scho
ols
9,24
4 75
.3
77.5
9,
200
73.3
77
.0
9,14
7 74
.5
77.0
Sc
hool
aff
iliat
ion
Pu
blic
7,
617
93.2
93
.3
7,43
4 90
.0
90.9
7,
560
92.1
92
.6
Priv
ate
1,56
9 83
.6
85.2
1,
749
90.4
95
.0
1,56
3 83
.1
84.9
C
atho
lic
961
84.9
84
.2
1,08
6 92
.9
95.2
96
0 84
.7
84.1
O
ther
priv
ate
608
82.0
86
.7
663
87.6
94
.6
603
81.3
86
.0
Unk
now
n 58
3.
1 3.
0 17
0.
8 0.
9 24
1.
3 1.
3
Ty
pe o
f loc
ale
La
rge
city
1,
241
87.5
86
.8
1,25
8 81
.4
87.1
1,
194
83.0
83
.5
Mid
-siz
e ci
ty
1,42
9 93
.3
91.7
1,
455
92.8
93
.3
1,41
9 92
.2
91.0
U
rban
frin
ge o
f lar
ge c
ity
2,27
6 88
.9
89.5
2,
280
87.4
89
.6
2,25
6 87
.6
88.7
U
rban
frin
ge o
f mid
-siz
e ci
ty
937
94.5
94
.9
940
93.6
95
.2
932
93.6
94
.4
Larg
e to
wn
211
95.2
95
.0
216
96.3
97
.3
212
95.5
95
.5
Smal
l tow
n 89
5 96
.2
95.7
85
4 92
.6
91.3
90
4 97
.9
96.7
R
ural
—ou
tsid
e M
SA
1,03
1 94
.1
93.6
1,
030
93.6
93
.5
1,04
2 94
.9
94.6
R
ural
—in
side
MSA
98
0 94
.7
95.2
95
9 91
.7
93.2
97
8 93
.6
95.0
U
nkno
wn
244
9.6
11.5
20
8 7.
7 9.
8 21
0 8.
2 10
.1
Scho
ol si
ze (t
otal
enr
ollm
ent)
1
to 2
99
1,46
3 89
.4
88.5
1,
586
93.7
95
.9
1,45
6 88
.4
88.0
30
0 to
499
1,
805
90.3
89
.4
1,86
4 89
.5
91.7
1,
798
89.5
89
.1
500
to 7
49
2,31
2 92
.2
92.0
2,
298
91.1
91
.4
2,30
1 91
.7
91.5
75
0 or
mor
e 1,
870
94.9
95
.8
1,80
5 90
.7
92.5
1,
883
95.2
96
.5
Unk
now
n 1,
794
44.2
47
.3
1,64
7 40
.2
43.5
1,
709
42.2
45
.7
See
note
s at e
nd o
f tab
le.
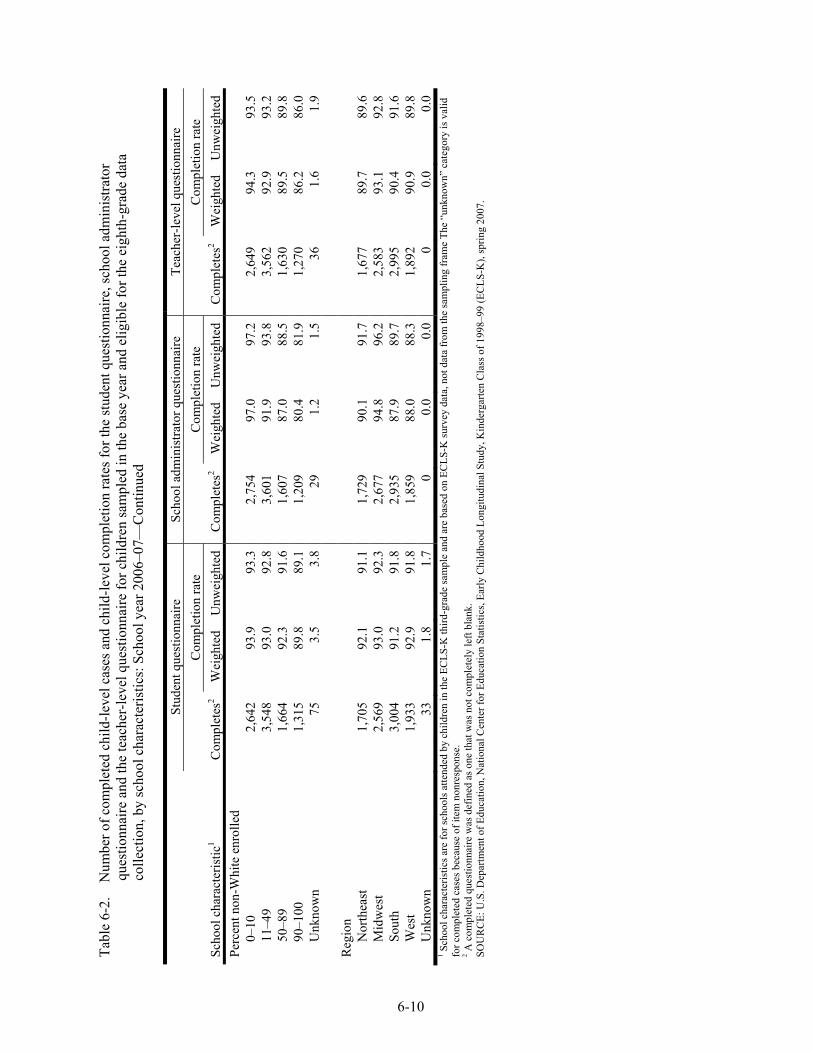
6-10
Tabl
e 6-
2.
Num
ber o
f com
plet
ed c
hild
-leve
l cas
es a
nd c
hild
-leve
l com
plet
ion
rate
s for
the
stud
ent q
uest
ionn
aire
, sch
ool a
dmin
istra
tor
ques
tionn
aire
and
the
teac
her-
leve
l que
stio
nnai
re fo
r chi
ldre
n sa
mpl
ed in
the
base
yea
r and
elig
ible
for t
he e
ight
h-gr
ade
data
co
llect
ion,
by
scho
ol c
hara
cter
istic
s: S
choo
l yea
r 200
6–07
—C
ontin
ued
Scho
ol c
hara
cter
istic
1
Stud
ent q
uest
ionn
aire
Sc
hool
adm
inis
trato
r que
stio
nnai
re
Teac
her-
leve
l que
stio
nnai
re
Com
plet
es2
Com
plet
ion
rate
C
ompl
etes
2 C
ompl
etio
n ra
te
Com
plet
es2
Com
plet
ion
rate
W
eigh
ted
Unw
eigh
ted
Wei
ghte
d U
nwei
ghte
d W
eigh
ted
Unw
eigh
ted
Perc
ent n
on-W
hite
enr
olle
d
0–10
2,
642
93.9
93
.3
2,75
4 97
.0
97.2
2,
649
94.3
93
.5
11–4
9 3,
548
93.0
92
.8
3,60
1 91
.9
93.8
3,
562
92.9
93
.2
50–8
9 1,
664
92.3
91
.6
1,60
7 87
.0
88.5
1,
630
89.5
89
.8
90–1
00
1,31
5 89
.8
89.1
1,
209
80.4
81
.9
1,27
0 86
.2
86.0
U
nkno
wn
75
3.5
3.8
29
1.2
1.5
36
1.6
1.9
Reg
ion
N
orth
east
1,
705
92.1
91
.1
1,72
9 90
.1
91.7
1,
677
89.7
89
.6
Mid
wes
t 2,
569
93.0
92
.3
2,67
7 94
.8
96.2
2,
583
93.1
92
.8
Sout
h 3,
004
91.2
91
.8
2,93
5 87
.9
89.7
2,
995
90.4
91
.6
Wes
t 1,
933
92.9
91
.8
1,85
9 88
.0
88.3
1,
892
90.9
89
.8
Unk
now
n 33
1.
8 1.
7 0
0.0
0.0
0 0.
0 0.
0 1 S
choo
l cha
ract
eris
tics a
re fo
r sch
ools
atte
nded
by
child
ren
in th
e EC
LS-K
third
-gra
de sa
mpl
e an
d ar
e ba
sed
on E
CLS
-K su
rvey
dat
a, n
ot d
ata
from
the
sam
plin
g fr
ame
The
“unk
now
n” c
ateg
ory
is v
alid
fo
r com
plet
ed c
ases
bec
ause
of i
tem
non
resp
onse
. 2 A
com
plet
ed q
uest
ionn
aire
was
def
ined
as o
ne th
at w
as n
ot c
ompl
etel
y le
ft bl
ank.
SO
UR
CE:
U.S
. Dep
artm
ent o
f Edu
catio
n, N
atio
nal C
ente
r for
Edu
catio
n St
atis
tics,
Early
Chi
ldho
od L
ongi
tudi
nal S
tudy
, Kin
derg
arte
n C
lass
of 1
998–
99 (E
CLS
-K),
sprin
g 20
07.
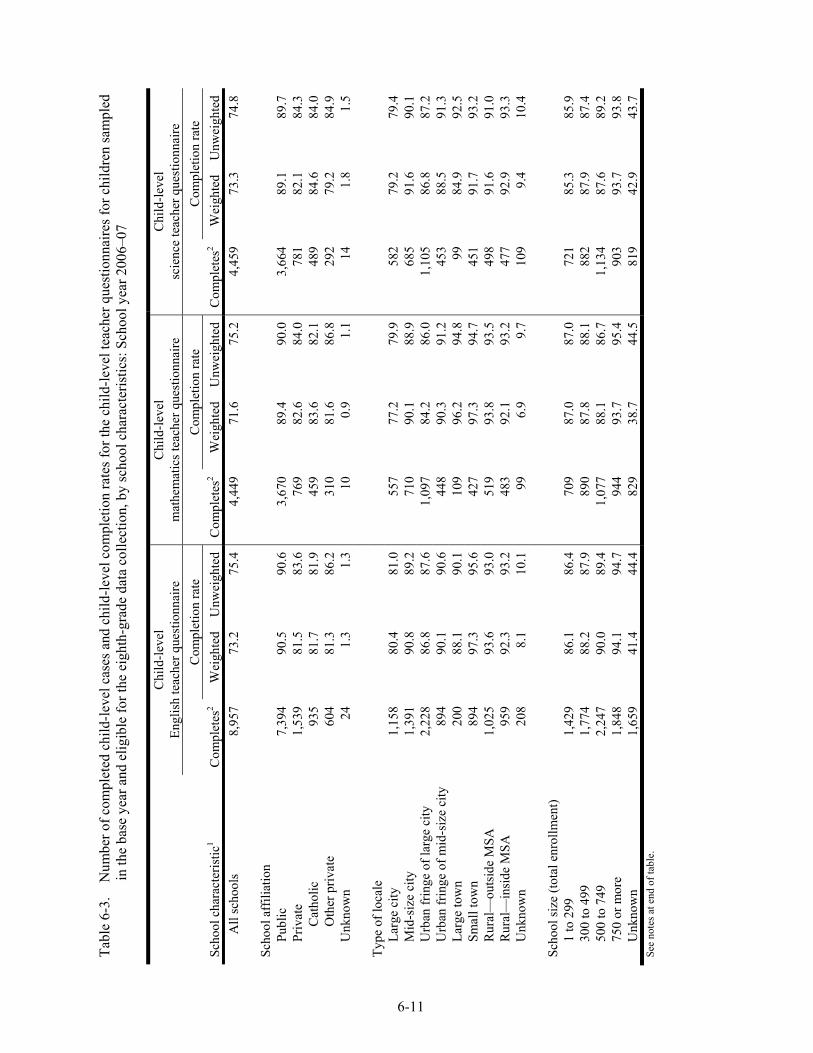
6-11
Tabl
e 6-
3.
Num
ber o
f com
plet
ed c
hild
-leve
l cas
es a
nd c
hild
-leve
l com
plet
ion
rate
s for
the
child
-leve
l tea
cher
que
stio
nnai
res f
or c
hild
ren
sam
pled
in
the
base
yea
r and
elig
ible
for t
he e
ight
h-gr
ade
data
col
lect
ion,
by
scho
ol c
hara
cter
istic
s: S
choo
l yea
r 200
6–07
Sc
hool
cha
ract
eris
tic1
Chi
ld-le
vel
Engl
ish
teac
her q
uest
ionn
aire
C
hild
-leve
l m
athe
mat
ics t
each
er q
uest
ionn
aire
C
hild
-leve
l sc
ienc
e te
ache
r que
stio
nnai
re
Com
plet
es2
Com
plet
ion
rate
C
ompl
etes
2 C
ompl
etio
n ra
te
Com
plet
es2
Com
plet
ion
rate
W
eigh
ted
Unw
eigh
ted
Wei
ghte
d U
nwei
ghte
d W
eigh
ted
Unw
eigh
ted
All
scho
ols
8,95
7 73
.2
75.4
4,
449
71.6
75
.2
4,45
9 73
.3
74.8
Sc
hool
aff
iliat
ion
Pu
blic
7,
394
90.5
90
.6
3,67
0 89
.4
90.0
3,
664
89.1
89
.7
Priv
ate
1,53
9 81
.5
83.6
76
9 82
.6
84.0
78
1 82
.1
84.3
C
atho
lic
935
81.7
81
.9
459
83.6
82
.1
489
84.6
84
.0
Oth
er p
rivat
e 60
4 81
.3
86.2
31
0 81
.6
86.8
29
2 79
.2
84.9
U
nkno
wn
24
1.3
1.3
10
0.9
1.1
14
1.8
1.5
Type
of l
ocal
e
Larg
e ci
ty
1,15
8 80
.4
81.0
55
7 77
.2
79.9
58
2 79
.2
79.4
M
id-s
ize
city
1,
391
90.8
89
.2
710
90.1
88
.9
685
91.6
90
.1
Urb
an fr
inge
of l
arge
city
2,
228
86.8
87
.6
1,09
7 84
.2
86.0
1,
105
86.8
87
.2
Urb
an fr
inge
of m
id-s
ize
city
89
4 90
.1
90.6
44
8 90
.3
91.2
45
3 88
.5
91.3
La
rge
tow
n 20
0 88
.1
90.1
10
9 96
.2
94.8
99
84
.9
92.5
Sm
all t
own
894
97.3
95
.6
427
97.3
94
.7
451
91.7
93
.2
Rur
al—
outs
ide
MSA
1,
025
93.6
93
.0
519
93.8
93
.5
498
91.6
91
.0
Rur
al—
insi
de M
SA
959
92.3
93
.2
483
92.1
93
.2
477
92.9
93
.3
Unk
now
n 20
8 8.
1 10
.1
99
6.9
9.7
109
9.4
10.4
Sc
hool
size
(tot
al e
nrol
lmen
t)
1 to
299
1,
429
86.1
86
.4
709
87.0
87
.0
721
85.3
85
.9
300
to 4
99
1,77
4 88
.2
87.9
89
0 87
.8
88.1
88
2 87
.9
87.4
50
0 to
749
2,
247
90.0
89
.4
1,07
7 88
.1
86.7
1,
134
87.6
89
.2
750
or m
ore
1,84
8 94
.1
94.7
94
4 93
.7
95.4
90
3 93
.7
93.8
U
nkno
wn
1,65
9 41
.4
44.4
82
9 38
.7
44.5
81
9 42
.9
43.7
Se
e no
tes a
t end
of t
able
.
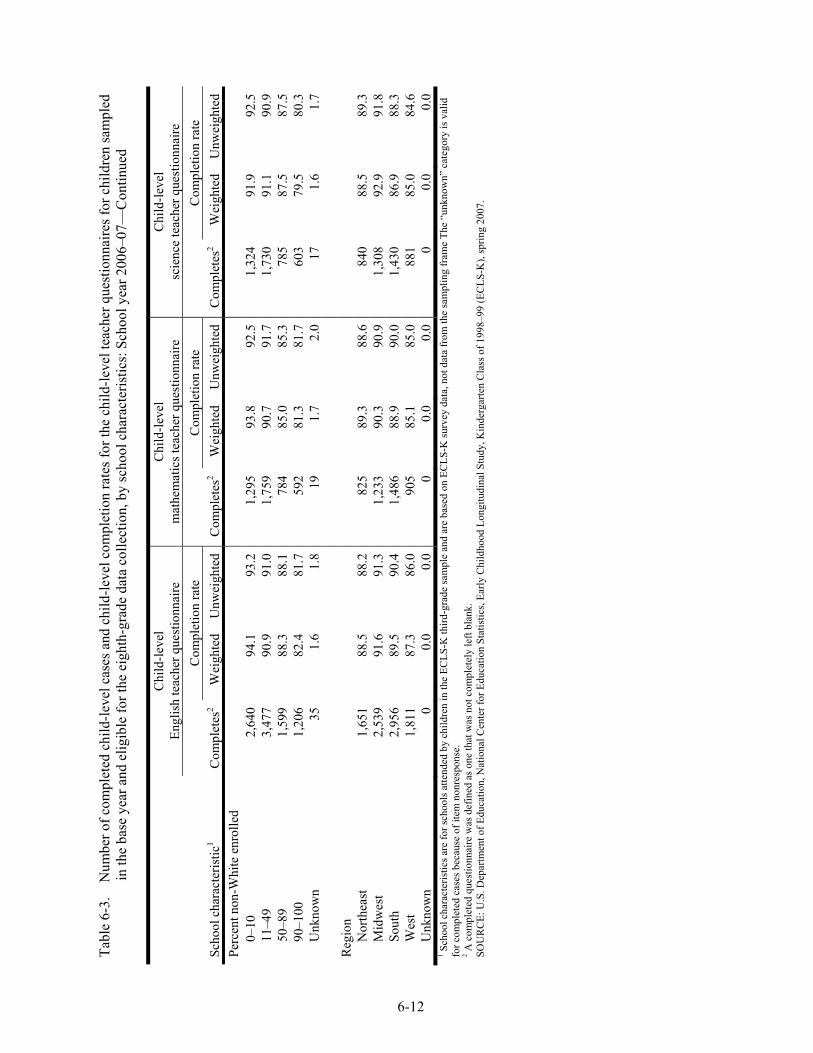
6-12
Tabl
e 6-
3.
Num
ber o
f com
plet
ed c
hild
-leve
l cas
es a
nd c
hild
-leve
l com
plet
ion
rate
s for
the
child
-leve
l tea
cher
que
stio
nnai
res f
or c
hild
ren
sam
pled
in
the
base
yea
r and
elig
ible
for t
he e
ight
h-gr
ade
data
col
lect
ion,
by
scho
ol c
hara
cter
istic
s: S
choo
l yea
r 200
6–07
—C
ontin
ued
Scho
ol c
hara
cter
istic
1
Chi
ld-le
vel
Engl
ish
teac
her q
uest
ionn
aire
C
hild
-leve
l m
athe
mat
ics t
each
er q
uest
ionn
aire
C
hild
-leve
l sc
ienc
e te
ache
r que
stio
nnai
re
Com
plet
es2
Com
plet
ion
rate
C
ompl
etes
2 C
ompl
etio
n ra
te
Com
plet
es2
Com
plet
ion
rate
W
eigh
ted
Unw
eigh
ted
Wei
ghte
d U
nwei
ghte
d W
eigh
ted
Unw
eigh
ted
Perc
ent n
on-W
hite
enr
olle
d
0–10
2,
640
94.1
93
.2
1,29
5 93
.8
92.5
1,
324
91.9
92
.5
11–4
9 3,
477
90.9
91
.0
1,75
9 90
.7
91.7
1,
730
91.1
90
.9
50–8
9 1,
599
88.3
88
.1
784
85.0
85
.3
785
87.5
87
.5
90–1
00
1,20
6 82
.4
81.7
59
2 81
.3
81.7
60
3 79
.5
80.3
U
nkno
wn
35
1.6
1.8
19
1.7
2.0
17
1.6
1.7
Reg
ion
N
orth
east
1,
651
88.5
88
.2
825
89.3
88
.6
840
88.5
89
.3
Mid
wes
t 2,
539
91.6
91
.3
1,23
3 90
.3
90.9
1,
308
92.9
91
.8
Sout
h 2,
956
89.5
90
.4
1,48
6 88
.9
90.0
1,
430
86.9
88
.3
Wes
t 1,
811
87.3
86
.0
905
85.1
85
.0
881
85.0
84
.6
Unk
now
n 0
0.0
0.0
0 0.
0 0.
0 0
0.0
0.0
1 Sch
ool c
hara
cter
istic
s are
for s
choo
ls a
ttend
ed b
y ch
ildre
n in
the
ECLS
-K th
ird-g
rade
sam
ple
and
are
base
d on
EC
LS-K
surv
ey d
ata,
not
dat
a fr
om th
e sa
mpl
ing
fram
e Th
e “u
nkno
wn”
cat
egor
y is
val
id
for c
ompl
eted
cas
es b
ecau
se o
f ite
m n
onre
spon
se.
2 A c
ompl
eted
que
stio
nnai
re w
as d
efin
ed a
s one
that
was
not
com
plet
ely
left
blan
k.
SOU
RC
E: U
.S. D
epar
tmen
t of E
duca
tion,
Nat
iona
l Cen
ter f
or E
duca
tion
Stat
istic
s, Ea
rly C
hild
hood
Lon
gitu
dina
l Stu
dy, K
inde
rgar
ten
Cla
ss o
f 199
8–99
(EC
LS-K
), sp
ring
2007
.
6-13
Tables 6-4 to 6-6 show the completion rates by mover status. Unlike previous years in which only a subsample of movers was followed into their new schools, the eighth-grade data collection followed all movers. The number of movers is larger than the number of nonmovers as children left their elementary schools for middle schools. Because of these changes, the rates are no longer comparable to rates in earlier years. In earlier years, nonmovers responded at a higher rate than movers. This is not the case for eighth grade. Not only the number of nonmovers is much smaller, but they also responded at a lower rate, 73.4 percent compared with 81 percent for movers, in the case of the child assessment. Since all movers were followed and highly successfully located, the difference between the completion rates of located movers and unlocated movers was not as large as shown in previous years. Of those who moved, 97 percent were located. There are cases whose mover status was unknown. These are children whose parents refused consent for their children to be approached for data collection, and the whereabouts of the children were not traced. The parent interview completion rates are 67.8 percent for nonmovers, 76.6 percent for movers, and very low at 3.7 percent for children whose mover status is unknown. The difference in the rates between located movers and all movers is minimal, again because almost all movers were successfully located. There is the peculiar case of a high completion rate of unlocated movers. Even though children could not be located for the child assessment, a parent interview was conducted by telephone, leading to the 91 percent response rate for this category. The same is true for the cases of children with unknown mover status; 43 cases had parent interviews that did not have information about where their children went to school. The pattern of completion rates by mover status is the same for the student questionnaire and the teacher questionnaires. The school administrator questionnaire is the only one where the completion rate for nonmovers is higher than for movers, a 10 percentage point difference. This can be explained by the fact that movers were not always assessed in schools so that the school administrator questionnaire could be administered; schools where nonmovers attended had been in the sample for a long time and tend to cooperate more than schools that were new to the sample, had a lower level of commitment to the ECLS-K, and often refused to complete the school administrator questionnaire.
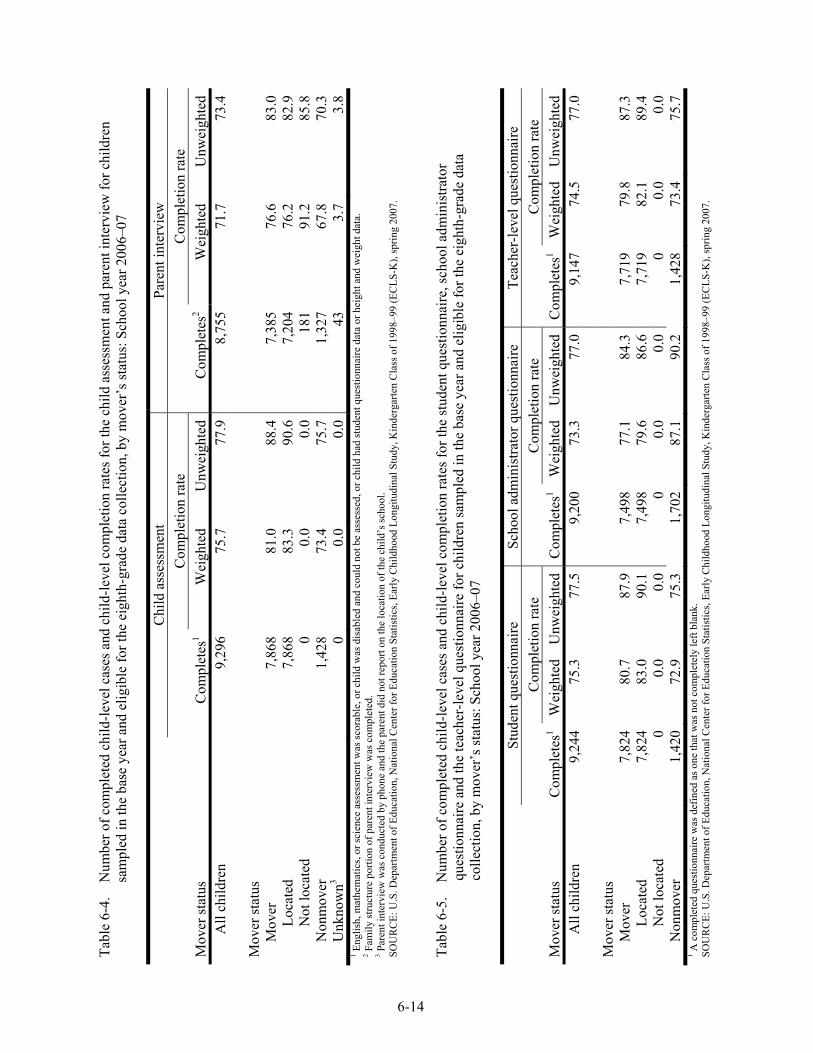
6-14
Tabl
e 6-
4. N
umbe
r of c
ompl
eted
chi
ld-le
vel c
ases
and
chi
ld-le
vel c
ompl
etio
n ra
tes f
or th
e ch
ild a
sses
smen
t and
par
ent i
nter
view
for c
hild
ren
sam
pled
in th
e ba
se y
ear a
nd e
ligib
le fo
r the
eig
hth-
grad
e da
ta c
olle
ctio
n, b
y m
over
’s st
atus
: Sch
ool y
ear 2
006–
07
Mov
er st
atus
Chi
ld a
sses
smen
t Pa
rent
inte
rvie
w
Com
plet
es1
Com
plet
ion
rate
C
ompl
etes
2C
ompl
etio
n ra
te
Wei
ghte
dU
nwei
ghte
d W
eigh
ted
Unw
eigh
ted
All
child
ren
9,29
675
.777
.9
8,75
571
.773
.4
M
over
stat
us
M
over
7,
868
81.0
88.4
7,
385
76.6
83.0
Loca
ted
7,86
883
.390
.6
7,20
476
.282
.9N
ot lo
cate
d 0
0.0
0.0
181
91.2
85.8
Non
mov
er
1,42
873
.475
.7
1,32
767
.870
.3U
nkno
wn3
00.
00.
0 43
3.7
3.8
1 Eng
lish,
mat
hem
atic
s, or
scie
nce
asse
ssm
ent w
as sc
orab
le, o
r chi
ld w
as d
isab
led
and
coul
d no
t be
asse
ssed
, or c
hild
had
stud
ent q
uest
ionn
aire
dat
a or
hei
ght a
nd w
eigh
t dat
a.
2 Fam
ily st
ruct
ure
porti
on o
f par
ent i
nter
view
was
com
plet
ed.
3 Par
ent i
nter
view
was
con
duct
ed b
y ph
one
and
the
pare
nt d
id n
ot re
port
on th
e lo
catio
n of
the
child
’s sc
hool
. SO
UR
CE:
U.S
. Dep
artm
ent o
f Edu
catio
n, N
atio
nal C
ente
r for
Edu
catio
n St
atis
tics,
Early
Chi
ldho
od L
ongi
tudi
nal S
tudy
, Kin
derg
arte
n C
lass
of 1
998–
99 (E
CLS
-K),
sprin
g 20
07.
Tabl
e 6-
5. N
umbe
r of c
ompl
eted
chi
ld-le
vel c
ases
and
chi
ld-le
vel c
ompl
etio
n ra
tes f
or th
e st
uden
t que
stio
nnai
re, s
choo
l adm
inis
trato
r qu
estio
nnai
re a
nd th
e te
ache
r-le
vel q
uest
ionn
aire
for c
hild
ren
sam
pled
in th
e ba
se y
ear a
nd e
ligib
le fo
r the
eig
hth-
grad
e da
ta
colle
ctio
n, b
y m
over
’s st
atus
: Sch
ool y
ear 2
006–
07
Mov
er st
atus
Stud
ent q
uest
ionn
aire
Sc
hool
adm
inis
trato
r que
stio
nnai
re
Teac
her-
leve
l que
stio
nnai
re
Com
plet
es1
Com
plet
ion
rate
C
ompl
etes
1C
ompl
etio
n ra
te
Com
plet
es1
Com
plet
ion
rate
W
eigh
ted
Unw
eigh
ted
Wei
ghte
d U
nwei
ghte
dW
eigh
ted
Unw
eigh
ted
All
child
ren
9,24
4 75
.377
.59,
200
73.3
77
.09,
147
74.5
77.0
M
over
stat
us
Mov
er
7,82
4 80
.787
.97,
498
77.1
84
.37,
719
79.8
87.3
Loca
ted
7,82
4 83
.090
.17,
498
79.6
86
.67,
719
82.1
89.4
Not
loca
ted
0 0.
00.
00
0.0
0.0
00.
00.
0N
onm
over
1,
420
72.9
75.3
1,70
287
.1
90.2
1,42
873
.475
.71 A
com
plet
ed q
uest
ionn
aire
was
def
ined
as o
ne th
at w
as n
ot c
ompl
etel
y le
ft bl
ank.
SO
UR
CE:
U.S
. Dep
artm
ent o
f Edu
catio
n, N
atio
nal C
ente
r for
Edu
catio
n St
atis
tics,
Early
Chi
ldho
od L
ongi
tudi
nal S
tudy
, Kin
derg
arte
n C
lass
of 1
998–
99 (E
CLS
-K),
sprin
g 20
07.
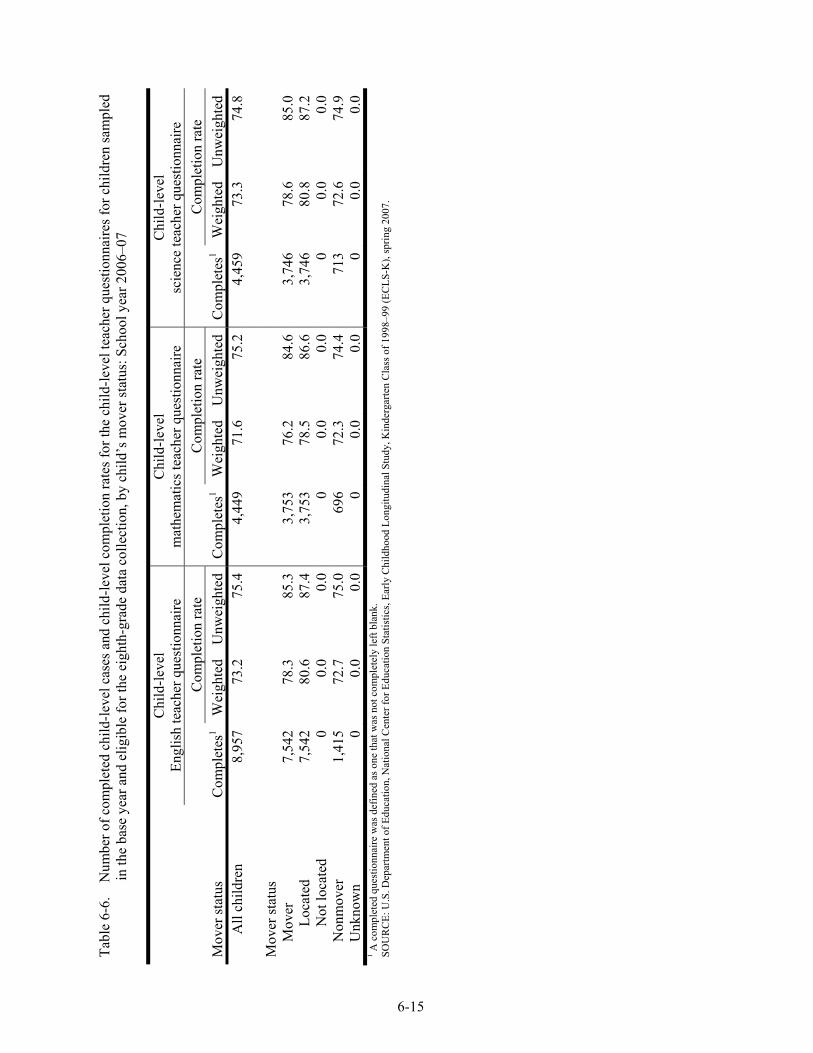
6-15
Tabl
e 6-
6.
Num
ber o
f com
plet
ed c
hild
-leve
l cas
es a
nd c
hild
-leve
l com
plet
ion
rate
s for
the
child
-leve
l tea
cher
que
stio
nnai
res f
or c
hild
ren
sam
pled
in
the
base
yea
r and
elig
ible
for t
he e
ight
h-gr
ade
data
col
lect
ion,
by
child
’s m
over
stat
us: S
choo
l yea
r 200
6–07
M
over
stat
us
Chi
ld-le
vel
Engl
ish
teac
her q
uest
ionn
aire
C
hild
-leve
l m
athe
mat
ics t
each
er q
uest
ionn
aire
C
hild
-leve
l sc
ienc
e te
ache
r que
stio
nnai
re
Com
plet
es1
Com
plet
ion
rate
C
ompl
etes
1 C
ompl
etio
n ra
te
Com
plet
es1
Com
plet
ion
rate
W
eigh
ted
Unw
eigh
ted
Wei
ghte
d U
nwei
ghte
dW
eigh
ted
Unw
eigh
ted
All
child
ren
8,95
7 73
.275
.44,
449
71.6
75
.24,
459
73.3
74.8
M
over
stat
us
Mov
er
7,54
2 78
.385
.33,
753
76.2
84
.63,
746
78.6
85.0
Loca
ted
7,54
2 80
.687
.43,
753
78.5
86
.63,
746
80.8
87.2
Not
loca
ted
0 0.
00.
00
0.0
0.0
00.
00.
0N
onm
over
1,
415
72.7
75.0
696
72.3
74
.471
372
.674
.9U
nkno
wn
0 0.
00.
00
0.0
0.0
00.
00.
01 A
com
plet
ed q
uest
ionn
aire
was
def
ined
as o
ne th
at w
as n
ot c
ompl
etel
y le
ft bl
ank.
SO
UR
CE:
U.S
. Dep
artm
ent o
f Edu
catio
n, N
atio
nal C
ente
r for
Edu
catio
n St
atis
tics,
Early
Chi
ldho
od L
ongi
tudi
nal S
tudy
, Kin
derg
arte
n C
lass
of 1
998–
99 (E
CLS
-K),
sprin
g 20
07.
6-16
Tables 6-7 to 6-9 present child-level weighted and unweighted completion rates for the spring-eighth grade data collection for children who were sampled as part of the kindergarten cohort in the base year, this time broken out by child characteristics. When the “unknown” categories are not included, the differences in completion rates by sex and by year of birth are within 2 percentage points, but for race and ethnicity they are more substantial. Table 6-7 shows that the child assessment completion rate was highest for Whites (80.9 percent) and lowest for Asians (59.9 percent), a reverse in the trend of earlier years. The low response rate for Asians persists for other instruments as well. The unweighted sample of Asians is about 8 percent, about the same proportion as in earlier years. Their moving pattern is the same as in previous years; their relative moving rate is about 50 percent higher compared with fifth grade, the same as their minority counterparts (Hispanics and American Indians3). Therefore, the drop in the completion rates cannot be attributed to a change in the sample. However, 59 percent of the nonresponding Asians were those whose parents could not be contacted or located for consent, and among these 38 percent were movers and 52 percent had undetermined mover status. This is not wildly different from other groups. However, nonresponse due to absence is highest for Asians (except for American Indians) and this explains the low response rate for Asians. Note that nonresponse due to unlocatable parents or parents refusing consent is low for American Indians and thus cancels out the effect of high nonresponse due to absence. The highest completion rate is for Whites, uniform across all instruments. American Indians have a higher completion rate for the parent interview, but the sample size for this group is so small that it should not be compared with Whites.
3 American Indian includes Alaska Native.
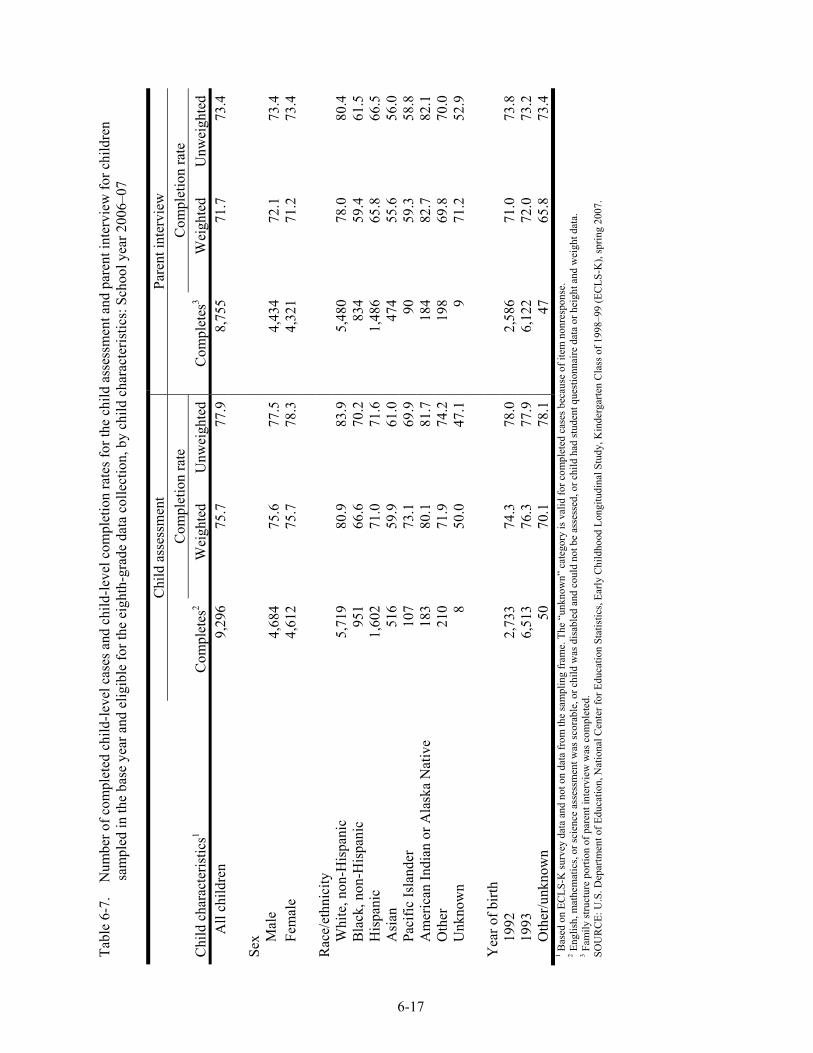
6-17
Tabl
e 6-
7.
Num
ber o
f com
plet
ed c
hild
-leve
l cas
es a
nd c
hild
-leve
l com
plet
ion
rate
s for
the
child
ass
essm
ent a
nd p
aren
t int
ervi
ew fo
r chi
ldre
n sa
mpl
ed in
the
base
yea
r and
elig
ible
for t
he e
ight
h-gr
ade
data
col
lect
ion,
by
child
cha
ract
eris
tics:
Sch
ool y
ear 2
006–
07
Chi
ld c
hara
cter
istic
s1
Chi
ld a
sses
smen
t Pa
rent
inte
rvie
w
Com
plet
es2
Com
plet
ion
rate
C
ompl
etes
3C
ompl
etio
n ra
te
Wei
ghte
dU
nwei
ghte
d W
eigh
ted
Unw
eigh
ted
All
child
ren
9,29
675
.777
.9
8,75
571
.773
.4
Se
x
Mal
e 4,
684
75.6
77.5
4,
434
72.1
73.4
Fem
ale
4,61
275
.778
.3
4,32
171
.273
.4
R
ace/
ethn
icity
Whi
te, n
on-H
ispa
nic
5,71
980
.983
.9
5,48
078
.080
.4B
lack
, non
-His
pani
c 95
166
.670
.2
834
59.4
61.5
His
pani
c 1,
602
71.0
71.6
1,
486
65.8
66.5
Asi
an
516
59.9
61.0
47
455
.656
.0Pa
cific
Isla
nder
10
773
.169
.9
9059
.358
.8A
mer
ican
Indi
an o
r Ala
ska
Nat
ive
183
80.1
81.7
18
482
.782
.1O
ther
21
071
.974
.2
198
69.8
70.0
Unk
now
n 8
50.0
47.1
9
71.2
52.9
Yea
r of b
irth
19
92
2,73
374
.378
.0
2,58
671
.073
.819
93
6,51
376
.377
.9
6,12
272
.073
.2O
ther
/unk
now
n 50
70.1
78.1
47
65.8
73.4
1 Bas
ed o
n EC
LS-K
surv
ey d
ata
and
not o
n da
ta fr
om th
e sa
mpl
ing
fram
e. T
he “
unkn
own”
cat
egor
y is
val
id fo
r com
plet
ed c
ases
bec
ause
of i
tem
non
resp
onse
. 2 E
nglis
h, m
athe
mat
ics,
or sc
ienc
e as
sess
men
t was
scor
able
, or c
hild
was
dis
able
d an
d co
uld
not b
e as
sess
ed, o
r chi
ld h
ad st
uden
t que
stio
nnai
re d
ata
or h
eigh
t and
wei
ght d
ata.
3 F
amily
stru
ctur
e po
rtion
of p
aren
t int
ervi
ew w
as c
ompl
eted
. SO
UR
CE:
U.S
. Dep
artm
ent o
f Edu
catio
n, N
atio
nal C
ente
r for
Edu
catio
n St
atis
tics,
Early
Chi
ldho
od L
ongi
tudi
nal S
tudy
, Kin
derg
arte
n C
lass
of 1
998–
99 (E
CLS
-K),
sprin
g 20
07.
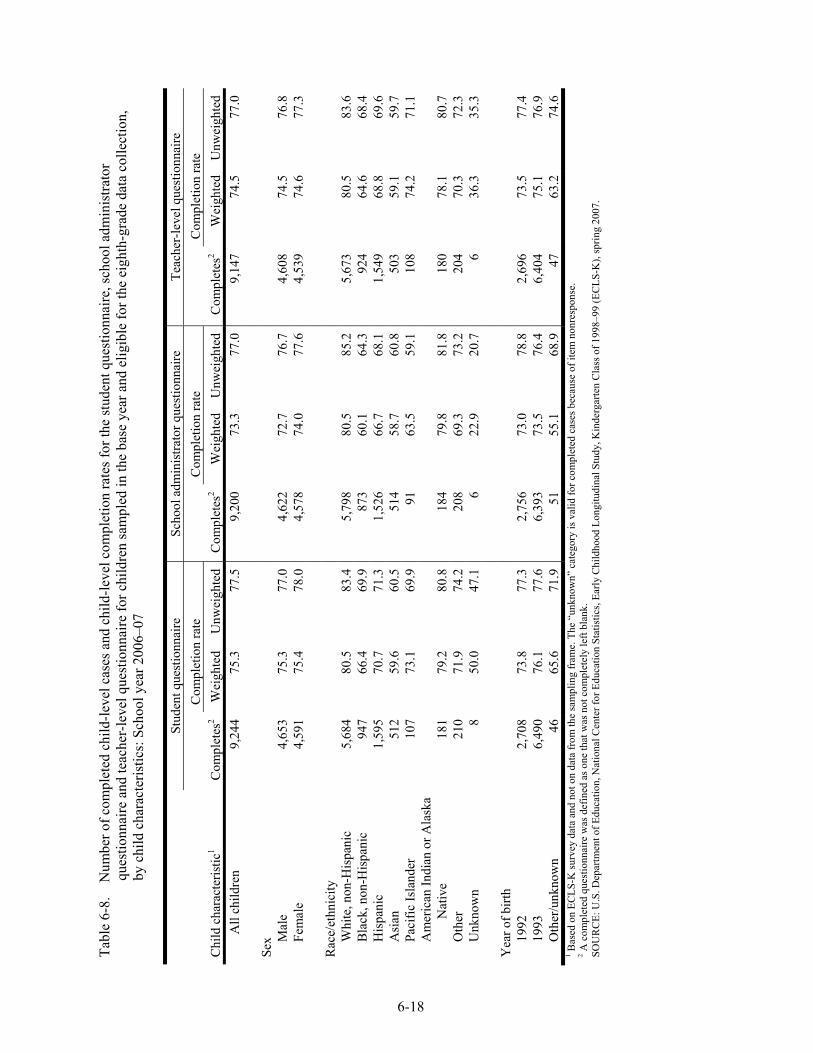
6-18
Tabl
e 6-
8.
Num
ber o
f com
plet
ed c
hild
-leve
l cas
es a
nd c
hild
-leve
l com
plet
ion
rate
s for
the
stud
ent q
uest
ionn
aire
, sch
ool a
dmin
istra
tor
ques
tionn
aire
and
teac
her-
leve
l que
stio
nnai
re fo
r chi
ldre
n sa
mpl
ed in
the
base
yea
r and
elig
ible
for t
he e
ight
h-gr
ade
data
col
lect
ion,
by
chi
ld c
hara
cter
istic
s: S
choo
l yea
r 200
6–07
C
hild
cha
ract
eris
tic1
Stud
ent q
uest
ionn
aire
Sc
hool
adm
inis
trato
r que
stio
nnai
re
Teac
her-
leve
l que
stio
nnai
re
C
ompl
etio
n ra
te
C
ompl
etio
n ra
te
C
ompl
etio
n ra
te
Com
plet
es2
Wei
ghte
d U
nwei
ghte
d C
ompl
etes
2 W
eigh
ted
Unw
eigh
ted
Com
plet
es2
Wei
ghte
d U
nwei
ghte
d A
ll ch
ildre
n 9,
244
75.3
77
.5
9,20
0 73
.3
77.0
9,
147
74.5
77
.0
Sex
M
ale
4,65
3 75
.3
77.0
4,
622
72.7
76
.7
4,60
8 74
.5
76.8
Fe
mal
e 4,
591
75.4
78
.0
4,57
8 74
.0
77.6
4,
539
74.6
77
.3
Rac
e/et
hnic
ity
W
hite
, non
-His
pani
c 5,
684
80.5
83
.4
5,79
8 80
.5
85.2
5,
673
80.5
83
.6
Bla
ck, n
on-H
ispa
nic
947
66.4
69
.9
873
60.1
64
.3
924
64.6
68
.4
His
pani
c 1,
595
70.7
71
.3
1,52
6 66
.7
68.1
1,
549
68.8
69
.6
Asi
an
512
59.6
60
.5
514
58.7
60
.8
503
59.1
59
.7
Paci
fic Is
land
er
107
73.1
69
.9
91
63.5
59
.1
108
74.2
71
.1
Am
eric
an In
dian
or A
lask
a N
ativ
e 18
1 79
.2
80.8
18
4 79
.8
81.8
18
0 78
.1
80.7
O
ther
21
0 71
.9
74.2
20
8 69
.3
73.2
20
4 70
.3
72.3
U
nkno
wn
8 50
.0
47.1
6
22.9
20
.7
6 36
.3
35.3
Y
ear o
f birt
h
1992
2,
708
73.8
77
.3
2,75
6 73
.0
78.8
2,
696
73.5
77
.4
1993
6,
490
76.1
77
.6
6,39
3 73
.5
76.4
6,
404
75.1
76
.9
Oth
er/u
nkno
wn
46
65.6
71
.9
51
55.1
68
.9
47
63.2
74
.6
1 Bas
ed o
n EC
LS-K
surv
ey d
ata
and
not o
n da
ta fr
om th
e sa
mpl
ing
fram
e. T
he “
unkn
own”
cat
egor
y is
val
id fo
r com
plet
ed c
ases
bec
ause
of i
tem
non
resp
onse
. 2 A
com
plet
ed q
uest
ionn
aire
was
def
ined
as o
ne th
at w
as n
ot c
ompl
etel
y le
ft bl
ank.
SO
UR
CE:
U.S
. Dep
artm
ent o
f Edu
catio
n, N
atio
nal C
ente
r for
Edu
catio
n St
atis
tics,
Early
Chi
ldho
od L
ongi
tudi
nal S
tudy
, Kin
derg
arte
n C
lass
of 1
998–
99 (E
CLS
-K),
sprin
g 20
07.
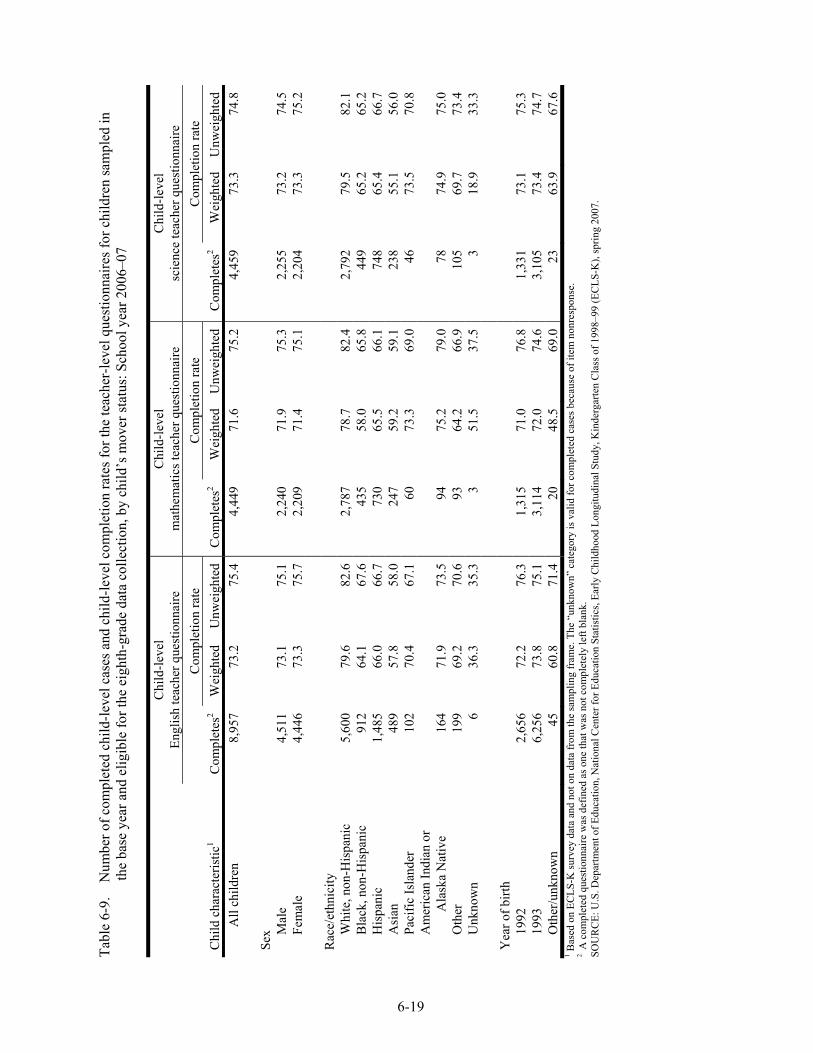
6-19
Tabl
e 6-
9.
Num
ber o
f com
plet
ed c
hild
-leve
l cas
es a
nd c
hild
-leve
l com
plet
ion
rate
s for
the
teac
her-
leve
l que
stio
nnai
res f
or c
hild
ren
sam
pled
in
the
base
yea
r and
elig
ible
for t
he e
ight
h-gr
ade
data
col
lect
ion,
by
child
’s m
over
stat
us: S
choo
l yea
r 200
6–07
C
hild
cha
ract
eris
tic1
Chi
ld-le
vel
Engl
ish
teac
her q
uest
ionn
aire
C
hild
-leve
l m
athe
mat
ics t
each
er q
uest
ionn
aire
C
hild
-leve
l sc
ienc
e te
ache
r que
stio
nnai
re
C
ompl
etio
n ra
te
C
ompl
etio
n ra
te
C
ompl
etio
n ra
te
Com
plet
es2
Wei
ghte
d U
nwei
ghte
d C
ompl
etes
2 W
eigh
ted
Unw
eigh
ted
Com
plet
es2
Wei
ghte
d U
nwei
ghte
d A
ll ch
ildre
n 8,
957
73.2
75
.4
4,44
9 71
.6
75.2
4,
459
73.3
74
.8
Sex
M
ale
4,51
1 73
.1
75.1
2,
240
71.9
75
.3
2,25
5 73
.2
74.5
Fe
mal
e 4,
446
73.3
75
.7
2,20
9 71
.4
75.1
2,
204
73.3
75
.2
Rac
e/et
hnic
ity
W
hite
, non
-His
pani
c 5,
600
79.6
82
.6
2,78
7 78
.7
82.4
2,
792
79.5
82
.1
Bla
ck, n
on-H
ispa
nic
912
64.1
67
.6
435
58.0
65
.8
449
65.2
65
.2
His
pani
c 1,
485
66.0
66
.7
730
65.5
66
.1
748
65.4
66
.7
Asi
an
489
57.8
58
.0
247
59.2
59
.1
238
55.1
56
.0
Paci
fic Is
land
er
102
70.4
67
.1
60
73.3
69
.0
46
73.5
70
.8
Am
eric
an In
dian
or
Ala
ska
Nat
ive
164
71.9
73
.5
94
75.2
79
.0
78
74.9
75
.0
Oth
er
199
69.2
70
.6
93
64.2
66
.9
105
69.7
73
.4
Unk
now
n 6
36.3
35
.3
3 51
.5
37.5
3
18.9
33
.3
Yea
r of b
irth
19
92
2,65
6 72
.2
76.3
1,
315
71.0
76
.8
1,33
1 73
.1
75.3
19
93
6,25
6 73
.8
75.1
3,
114
72.0
74
.6
3,10
5 73
.4
74.7
O
ther
/unk
now
n 45
60
.8
71.4
20
48
.5
69.0
23
63
.9
67.6
1 B
ased
on
ECLS
-K su
rvey
dat
a an
d no
t on
data
from
the
sam
plin
g fr
ame.
The
“un
know
n” c
ateg
ory
is v
alid
for c
ompl
eted
cas
es b
ecau
se o
f ite
m n
onre
spon
se.
2 A
com
plet
ed q
uest
ionn
aire
was
def
ined
as o
ne th
at w
as n
ot c
ompl
etel
y le
ft bl
ank.
SO
UR
CE:
U.S
. Dep
artm
ent o
f Edu
catio
n, N
atio
nal C
ente
r for
Edu
catio
n St
atis
tics,
Early
Chi
ldho
od L
ongi
tudi
nal S
tudy
, Kin
derg
arte
n C
lass
of 1
998–
99 (E
CLS
-K),
sprin
g 20
07.
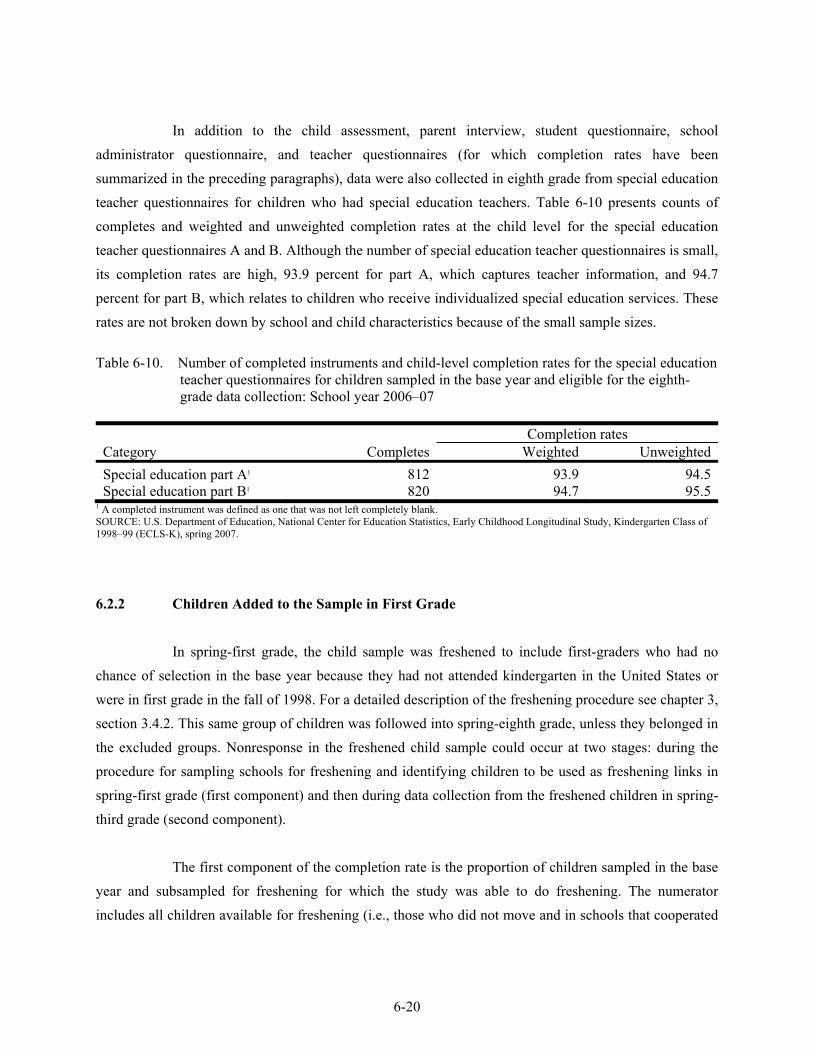
6-20
In addition to the child assessment, parent interview, student questionnaire, school administrator questionnaire, and teacher questionnaires (for which completion rates have been summarized in the preceding paragraphs), data were also collected in eighth grade from special education teacher questionnaires for children who had special education teachers. Table 6-10 presents counts of completes and weighted and unweighted completion rates at the child level for the special education teacher questionnaires A and B. Although the number of special education teacher questionnaires is small, its completion rates are high, 93.9 percent for part A, which captures teacher information, and 94.7 percent for part B, which relates to children who receive individualized special education services. These rates are not broken down by school and child characteristics because of the small sample sizes.
Table 6-10. Number of completed instruments and child-level completion rates for the special education
teacher questionnaires for children sampled in the base year and eligible for the eighth-grade data collection: School year 2006–07
Completion rates Category Completes Weighted UnweightedSpecial education part A1 812 93.9 94.5Special education part B1 820 94.7 95.5
1 A completed instrument was defined as one that was not left completely blank. SOURCE: U.S. Department of Education, National Center for Education Statistics, Early Childhood Longitudinal Study, Kindergarten Class of 1998–99 (ECLS-K), spring 2007.
6.2.2 Children Added to the Sample in First Grade
In spring-first grade, the child sample was freshened to include first-graders who had no chance of selection in the base year because they had not attended kindergarten in the United States or were in first grade in the fall of 1998. For a detailed description of the freshening procedure see chapter 3, section 3.4.2. This same group of children was followed into spring-eighth grade, unless they belonged in the excluded groups. Nonresponse in the freshened child sample could occur at two stages: during the procedure for sampling schools for freshening and identifying children to be used as freshening links in spring-first grade (first component) and then during data collection from the freshened children in spring-third grade (second component).
The first component of the completion rate is the proportion of children sampled in the base
year and subsampled for freshening for which the study was able to do freshening. The numerator includes all children available for freshening (i.e., those who did not move and in schools that cooperated
6-21
with the freshening in first grade); the denominator includes children sampled for freshening (excluding movers not subsampled). For the weighted first component of the completion rate, both numerator and denominator were weighted by the product of the school base weight, the within-school child weight, and the freshening adjustment factor. The school base weight and the within-school child-level weight reflect the multi-stage sampling of the ECLS-K design, while the freshening adjustment factor is necessary because schools were subsampled for freshening in first grade as described in section 3.4.2. These weights and adjustment factor are discussed in more detail in chapter 8. The first component alone can further be decomposed into two sources: attrition due to the refusal of entire schools to implement the freshening procedure (the school term), and attrition due to ECLS-K sampled children moving to other schools (the child term). To contain costs, children who transferred from schools targeted for freshening were not used as links to identify freshened children, even when they were otherwise followed for data collection. These movers were considered freshening nonrespondents in the child term.
The second component is the proportion of freshened children with completed data for the
instrument from within the population brought into the sample by freshening. The weight for this component is the product of the school base weight, the within-school child weight, the school freshening subsample adjustment factor, and the fifth-grade mover subsampling adjustment factor.
The final completion rate is the product of the two components. For example, the final
completion rate for the child assessment is computed as follows:
21
1 2
∈∈
∈ ∈ ∪
= ×∑∑
∑ ∑CA
CA CA
iii ERi A
CAi i
i B i ER ENR
WWr
W W
where A is the set of children who could be freshened from (as described above), B is the set of children sampled for freshening, W1i is the weight for child i for the first component as described above, W2i is the weight for child i for the second component as described above, ERCA denotes eligible child assessment respondent, and ENRCA eligible child assessment nonrespondent. To compute the unweighted rates, W1i and W2u are set to 1 for each child.
Table 6-11 presents weighted and unweighted completion rates for freshened children. The
two components of the completion rates are presented separately in table 6-11. The overall completion rates (i.e., the third set of rates in the table) are the products of the two components. The first component
6-22
is separated into a school term and a child term as described earlier. For this component, the completion rate is defined as the freshening completion rates, as opposed to the survey instrument completion rates found in the second component. The weighted freshening completion rate for children in schools targeted for freshening (the school term) is 77.6 percent. As part of the freshening process, schools were asked to prepare an alphabetic roster of children enrolled in first grade. These schools were also requested to identify which children did not attend kindergarten the previous year. Schools did not participate in the freshening process because they either refused or were unable to provide the requested information. Within the schools that agreed to freshen, the freshening completion rate is 99.2 percent, the slight loss due to children who transferred to other schools (the child term). Multiplying these two terms together gives a first component completion rate of 77 percent. Note that the first component rate for spring-eighth grade is not identical to the first component rate for earlier grades because of the exclusion of children in special groups as explained in section 3.7.
The second component varies by survey instrument, and is much lower than in previous
years. As discussed before, the completion rates dropped in general due to the time gap between the fifth-grade and eighth-grade data collections and the introduction of the explicit parent consent into eighth grade. Also, the number of children sampled is much smaller than in the past, a drop of 40 percent; there were 165 children sampled in first grade in the fifth-grade data collection; there were 100 of such children in the eighth-grade data collection. The rates for the paper-and-pencil instruments range from 54.5 percent for the child-level science teacher questionnaire to 86.1 percent for the special education questionnaire part A or B. The rate for the child assessment, at 60.9 percent, is almost 15 points lower than for the kindergarten sample, and the parent interview, at 51.5 percent, is about 20 points lower. The rates for the school instrument and the teacher instruments are all lower between 14 and 19 points, except for the special education teacher questionnaires where the difference is about 8 percentage points. The eighth-grade overall completion rate for each instrument is the product of the two components. Because of the low rates at the first stage, these range from a high of 66.3 percent for the special education questionnaire part A or B to a low of 39.6 percent for the parent interview.
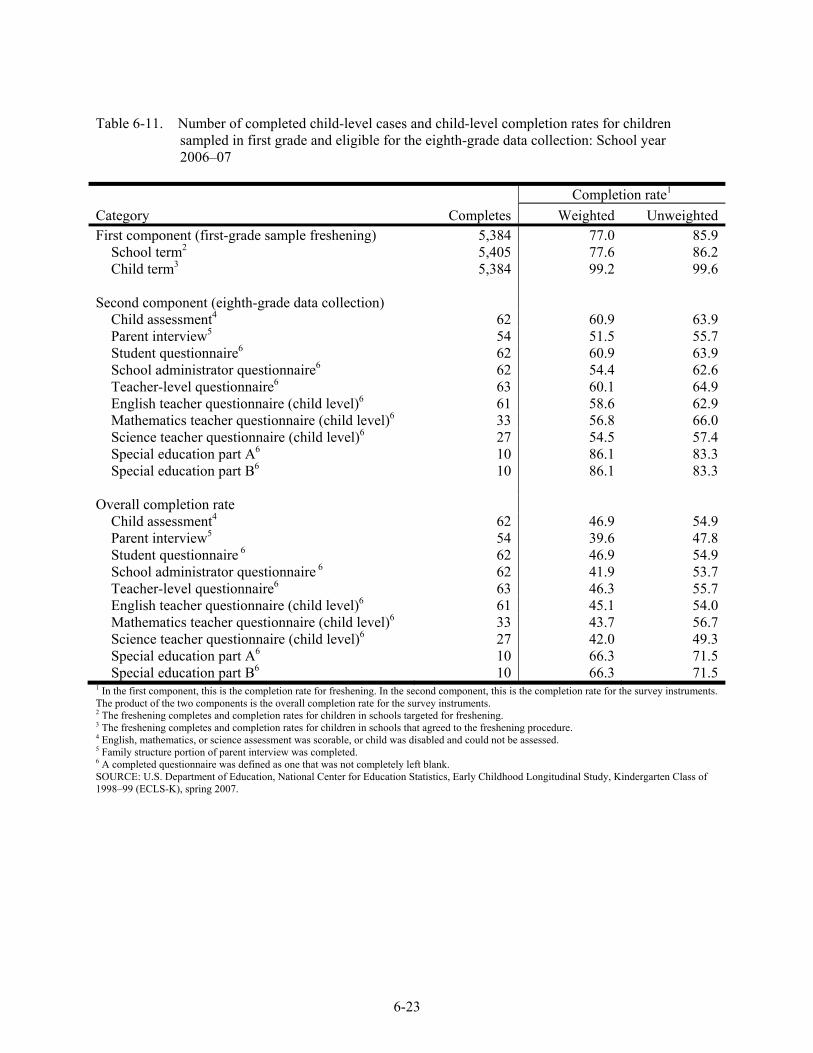
6-23
Table 6-11. Number of completed child-level cases and child-level completion rates for children sampled in first grade and eligible for the eighth-grade data collection: School year 2006–07
Category CompletesCompletion rate1
Weighted UnweightedFirst component (first-grade sample freshening) 5,384 77.0 85.9
School term2 5,405 77.6 86.2Child term3 5,384 99.2 99.6
Second component (eighth-grade data collection)
Child assessment4 62 60.9 63.9Parent interview5 54 51.5 55.7Student questionnaire6 62 60.9 63.9School administrator questionnaire6 62 54.4 62.6Teacher-level questionnaire6 63 60.1 64.9English teacher questionnaire (child level)6 61 58.6 62.9Mathematics teacher questionnaire (child level)6 33 56.8 66.0Science teacher questionnaire (child level)6 27 54.5 57.4Special education part A6 10 86.1 83.3Special education part B6 10 86.1 83.3
Overall completion rate
Child assessment4 62 46.9 54.9Parent interview5 54 39.6 47.8Student questionnaire 6 62 46.9 54.9School administrator questionnaire 6 62 41.9 53.7Teacher-level questionnaire6 63 46.3 55.7English teacher questionnaire (child level)6 61 45.1 54.0Mathematics teacher questionnaire (child level)6 33 43.7 56.7Science teacher questionnaire (child level)6 27 42.0 49.3Special education part A6 10 66.3 71.5Special education part B6 10 66.3 71.5
1 In the first component, this is the completion rate for freshening. In the second component, this is the completion rate for the survey instruments. The product of the two components is the overall completion rate for the survey instruments. 2 The freshening completes and completion rates for children in schools targeted for freshening. 3 The freshening completes and completion rates for children in schools that agreed to the freshening procedure. 4 English, mathematics, or science assessment was scorable, or child was disabled and could not be assessed. 5 Family structure portion of parent interview was completed. 6 A completed questionnaire was defined as one that was not completely left blank. SOURCE: U.S. Department of Education, National Center for Education Statistics, Early Childhood Longitudinal Study, Kindergarten Class of 1998–99 (ECLS-K), spring 2007.
6-24
6.2.3 Spring-Eighth Grade Completion Rates for All Children
To compute the eighth-grade completion rate for the combined set of children sampled in the base year and children sampled in first grade, the eighth-grade completion rate for each group is weighted by the proportion of all children in that group, and the two weighted eighth-grade completion rates were added together. For example, the weighted eighth-grade completion rate for the child assessment (CA) was computed as
1, ,1
1 1
∈ ∈
∈ ∪ ∈ ∪
= × + ×∑ ∑
∑ ∑
i ii BY i ST
CA CA BY CA STi i
i BY ST i BY ST
W Wr r r
W W
where BY denotes base year, 1ST denotes first grade, rCA,BY is the child assessment completion rate for children sampled in the base year, rCA,1ST is the child assessment completion rate for children sampled in first grade, and Wi is the final weight (C7CW0 for the child assessment) for child i.
To get the weighted eighth-grade completion rate for the child assessment (which is 75.7
percent for children sampled in the base year and 46.9 percent for children sampled in first grade), the weighted proportion of children who were sampled in the base year was 0.9751; the weighted proportion of children who were sampled in first grade was 0.0249. The eighth-grade weighted completion rate for the child assessment was 0.757×0.9751+0.469×0.02249=0.839, or 75 percent.
Table 6-12 presents final spring-eighth grade completion rates for children sampled in
kindergarten, children sampled in first grade, and all children combined. Because children sampled in first grade represent such a small fraction of the total population of children, their inclusion in the computation of the completion rate brings down the rates for all children by less than half a percent relative to the rates for children sampled in kindergarten, even though the completion rates for children sampled in first grade are much lower than the kindergarten rates. The spring-eighth grade overall completion rates for the child assessment and the parent interview are 75 percent and 70.9 percent, respectively.
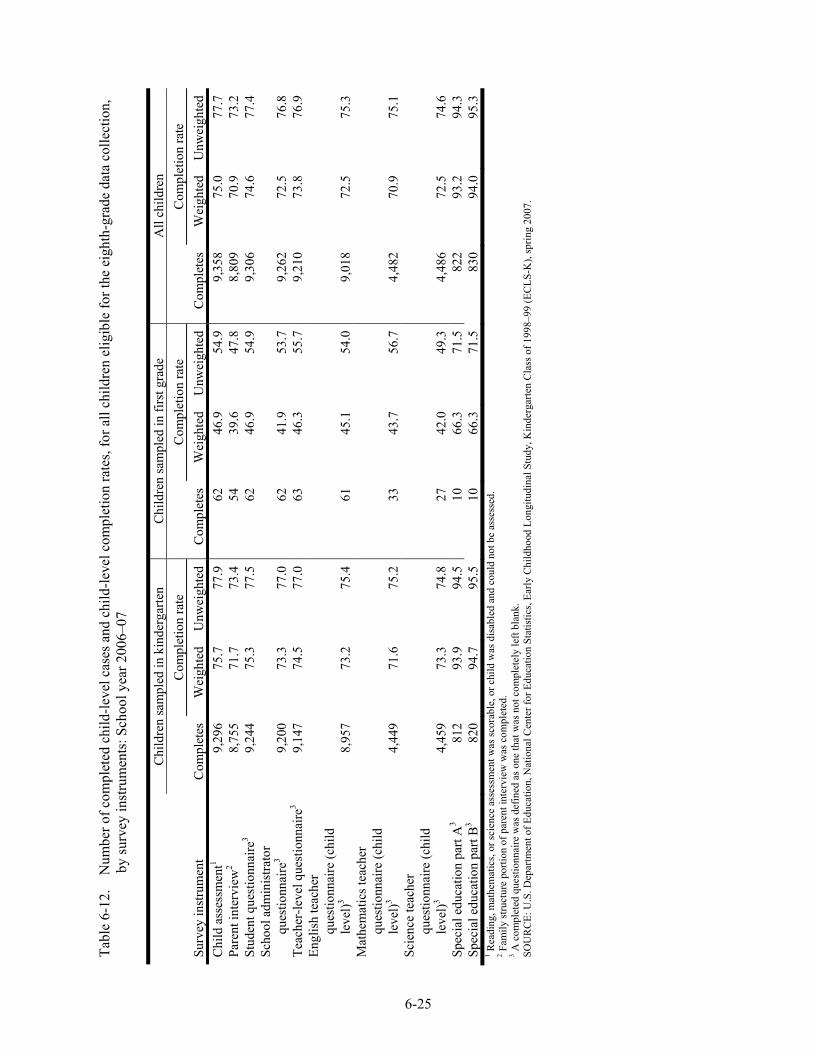
6-25
Tabl
e 6-
12.
Num
ber o
f com
plet
ed c
hild
-leve
l cas
es a
nd c
hild
-leve
l com
plet
ion
rate
s, fo
r all
child
ren
elig
ible
for t
he e
ight
h-gr
ade
data
col
lect
ion,
by
surv
ey in
stru
men
ts: S
choo
l yea
r 200
6–07
Su
rvey
inst
rum
ent
Chi
ldre
n sa
mpl
ed in
kin
derg
arte
n C
hild
ren
sam
pled
in fi
rst g
rade
A
ll ch
ildre
n
Com
plet
ion
rate
Com
plet
ion
rate
Com
plet
ion
rate
C
ompl
etes
W
eigh
ted
Unw
eigh
ted
Com
plet
es
Wei
ghte
d U
nwei
ghte
d C
ompl
etes
W
eigh
ted
Unw
eigh
ted
Chi
ld a
sses
smen
t1 9,
296
75.7
77
.9
62
46.9
54
.9
9,35
8 75
.0
77.7
Pa
rent
inte
rvie
w2
8,75
5 71
.7
73.4
54
39
.6
47.8
8,
809
70.9
73
.2
Stud
ent q
uest
ionn
aire
3 9,
244
75.3
77
.5
62
46.9
54
.9
9,30
6 74
.6
77.4
Sc
hool
adm
inis
trato
r qu
estio
nnai
re3
9,20
0 73
.3
77.0
62
41
.9
53.7
9,
262
72.5
76
.8
Teac
her-
leve
l que
stio
nnai
re3
9,14
7 74
.5
77.0
63
46
.3
55.7
9,
210
73.8
76
.9
Engl
ish
teac
her
ques
tionn
aire
(chi
ld
leve
l)3 8,
957
73.2
75
.4
61
45.1
54
.0
9,01
8 72
.5
75.3
M
athe
mat
ics t
each
er
ques
tionn
aire
(chi
ld
leve
l)3 4,
449
71.6
75
.2
33
43.7
56
.7
4,48
2 70
.9
75.1
Sc
ienc
e te
ache
r qu
estio
nnai
re (c
hild
le
vel)3
4,45
9 73
.3
74.8
27
42
.0
49.3
4,
486
72.5
74
.6
Spec
ial e
duca
tion
part
A3
812
93.9
94
.5
10
66.3
71
.5
822
93.2
94
.3
Spec
ial e
duca
tion
part
B3
820
94.7
95
.5
10
66.3
71
.5
830
94.0
95
.3
1 Rea
ding
, mat
hem
atic
s, or
scie
nce
asse
ssm
ent w
as sc
orab
le, o
r chi
ld w
as d
isab
led
and
coul
d no
t be
asse
ssed
. 2 F
amily
stru
ctur
e po
rtion
of p
aren
t int
ervi
ew w
as c
ompl
eted
. 3 A
com
plet
ed q
uest
ionn
aire
was
def
ined
as o
ne th
at w
as n
ot c
ompl
etel
y le
ft bl
ank.
SO
UR
CE:
U.S
. Dep
artm
ent o
f Edu
catio
n, N
atio
nal C
ente
r for
Edu
catio
n St
atis
tics,
Early
Chi
ldho
od L
ongi
tudi
nal S
tudy
, Kin
derg
arte
n C
lass
of 1
998–
99 (E
CLS
-K),
sprin
g 20
07.
6-26
The unweighted completion rates are almost always higher than the weighted completion rates, by as much as 13 percent at the overall level. Where there is a large difference, it is due to fifth-grade movers who have larger weights than fifth-grade nonmovers. The weights of the fifth-grade movers had been increased in fifth grade to account for the subsampling of movers in fifth grade. The difference between the unweighted and weighted rates for eighth grade is not as large as for the unweighted and weighted rates for fifth grade, because movers in eighth grade were not subsampled out and no mover adjustment was applied to the weight. The fifth-grade mover adjustment, however, did apply to the eighth grade as explained in chapter 8.
Table 6-13 shows the completion rates for the child assessment, the parent interview, the
student questionnaire, and the school and teacher instruments for children who have nonzero child weights (C7CW0>0). These are children whose spring-eighth grade English, mathematics, or science assessments were scorable, children who could not be assessed because of disabilities, or children who completed a student questionnaire. These conditioned completion rates are useful to analysts who want to assess the relationship between the different instruments in term of participation. The completion rates from the different instruments are dependent in that if data from one instrument are missing (e.g., parent instrument) it is likely that data from other instruments are also missing. (e.g., school administrator questionnaire). The conditioned completion rate for the child assessment is by definition 100 percent. The rate slightly less than 100 percent, shown when children sampled in kindergarten are combined with children sampled in first grade, is due to the school freshening nonresponse for children sampled in first grade.
When the completion rates are conditioned on the presence of the child weight (i.e., children
who have completed assessment data or student questionnaire data), they are at least 17.5 points higher than the unconditional completion rates for all instruments but the special education questionnaires. This is useful information since analyses of the ECLS-K data usually combine data from the assessment or student questionnaire with data from other instruments. For these last two instruments, the difference between the number of completes for the conditional and unconditional rates is very small; hence the conditional rates are not affected as much as for the other instruments. For all other instruments, the conditional completion rates are higher by 16.9 points for the parent interview, and as high as 21.2 points for the teacher-level questionnaire. The rate for the student questionnaire is not part of this comparison because almost all children who were assessed also completed the student questionnaire.
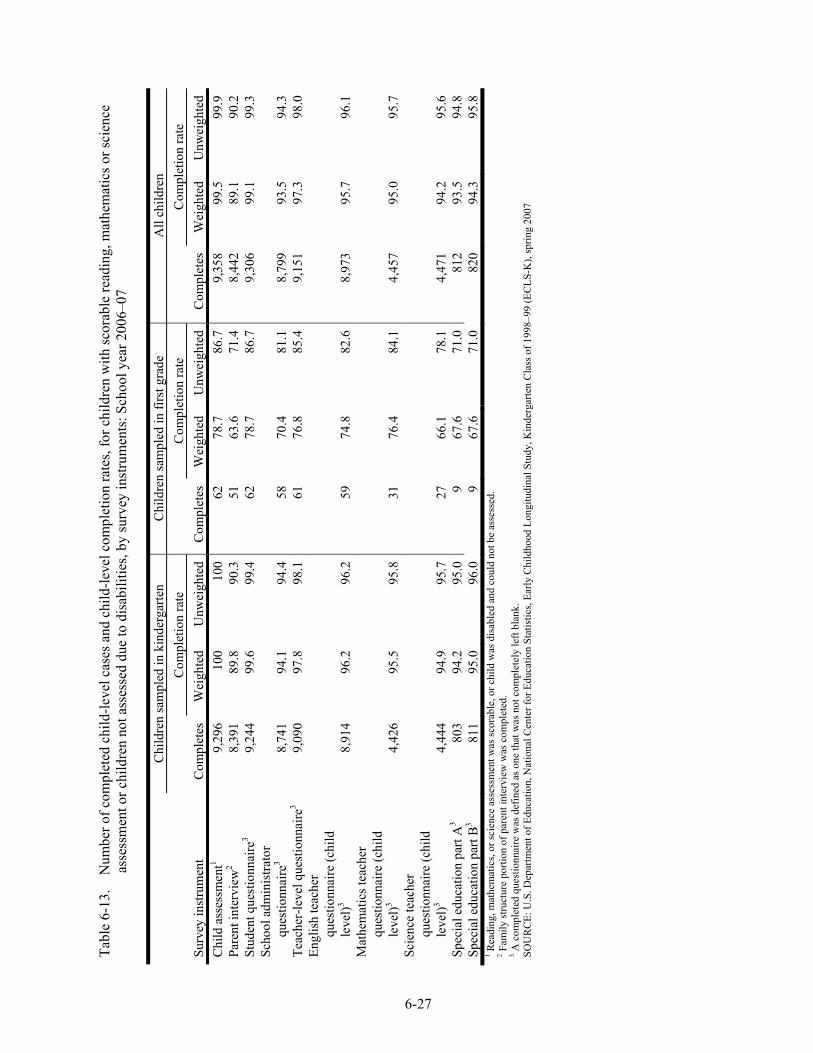
6-27
Tabl
e 6-
13.
Num
ber o
f com
plet
ed c
hild
-leve
l cas
es a
nd c
hild
-leve
l com
plet
ion
rate
s, fo
r chi
ldre
n w
ith sc
orab
le re
adin
g, m
athe
mat
ics o
r sci
ence
as
sess
men
t or c
hild
ren
not a
sses
sed
due
to d
isab
ilitie
s, by
surv
ey in
stru
men
ts: S
choo
l yea
r 200
6–07
Su
rvey
inst
rum
ent
Chi
ldre
n sa
mpl
ed in
kin
derg
arte
n C
hild
ren
sam
pled
in fi
rst g
rade
A
ll ch
ildre
n
Com
plet
ion
rate
Com
plet
ion
rate
Com
plet
ion
rate
C
ompl
etes
W
eigh
ted
Unw
eigh
ted
Com
plet
es
Wei
ghte
d U
nwei
ghte
d C
ompl
etes
W
eigh
ted
Unw
eigh
ted
Chi
ld a
sses
smen
t1 9,
296
100
100
62
78.7
86
.7
9,35
8 99
.5
99.9
Pa
rent
inte
rvie
w2
8,39
1 89
.8
90.3
51
63
.6
71.4
8,
442
89.1
90
.2
Stud
ent q
uest
ionn
aire
3 9,
244
99.6
99
.4
62
78.7
86
.7
9,30
6 99
.1
99.3
Sc
hool
adm
inis
trato
r qu
estio
nnai
re3
8,74
1 94
.1
94.4
58
70
.4
81.1
8,
799
93.5
94
.3
Teac
her-
leve
l que
stio
nnai
re3
9,09
0 97
.8
98.1
61
76
.8
85.4
9,
151
97.3
98
.0
Engl
ish
teac
her
ques
tionn
aire
(chi
ld
leve
l)3 8,
914
96.2
96
.2
59
74.8
82
.6
8,97
3 95
.7
96.1
M
athe
mat
ics t
each
er
ques
tionn
aire
(chi
ld
leve
l)3 4,
426
95.5
95
.8
31
76.4
84
.1
4,45
7 95
.0
95.7
Sc
ienc
e te
ache
r qu
estio
nnai
re (c
hild
le
vel)3
4,44
4 94
.9
95.7
27
66
.1
78.1
4,
471
94.2
95
.6
Spec
ial e
duca
tion
part
A3
803
94.2
95
.0
9 67
.6
71.0
81
2 93
.5
94.8
Sp
ecia
l edu
catio
n pa
rt B
3 81
1 95
.0
96.0
9
67.6
71
.0
820
94.3
95
.8
1 Rea
ding
, mat
hem
atic
s, or
scie
nce
asse
ssm
ent w
as sc
orab
le, o
r chi
ld w
as d
isab
led
and
coul
d no
t be
asse
ssed
. 2 F
amily
stru
ctur
e po
rtion
of p
aren
t int
ervi
ew w
as c
ompl
eted
. 3 A
com
plet
ed q
uest
ionn
aire
was
def
ined
as o
ne th
at w
as n
ot c
ompl
etel
y le
ft bl
ank.
SO
UR
CE:
U.S
. Dep
artm
ent o
f Edu
catio
n, N
atio
nal C
ente
r for
Edu
catio
n St
atis
tics,
Early
Chi
ldho
od L
ongi
tudi
nal S
tudy
, Kin
derg
arte
n C
lass
of 1
998–
99 (E
CLS
-K),
sprin
g 20
07
6-28
6.3 Overall Response Rates
The ECLS-K overall response rate can be computed by the product of the school-level response rate from the base year and the completion rates from each round of data collection after the base year. Table 6-14 presents the overall response rate after data collection for 5 school years: base year, first grade, third grade, fifth grade, and eighth grade, and for each study instrument that is common to all rounds of data collection: child assessment, parent interview, school administrator questionnaire, teacher-level questionnaires A and B (replaced by one single teacher-level questionnaire in fifth and eighth grade), child-level teacher questionnaire part C (replaced by the reading/English child-level questionnaire in fifth and eighth grade), and the two special education questionnaires A and B.
The instrument-specific overall response rates are driven by the school-level response rate in
the base year. Since the overall school response rate is low at 74 percent, overall response rates for all instruments cannot be higher than 74 percent. In fact, they range between 62 and 70 percent in the base year, and steadily drop each year until they range only between 17 and 38 percent in eighth grade. Leaving aside the special education questionnaires that were administered to a small selected sample, the instrument with the highest overall response rate by the end of the study in eighth grade is the child assessment, followed by the parent interview. The school and teacher questionnaires have about the same overall response rates. The drop in the overall response rate from year to year is natural in a longitudinal study.
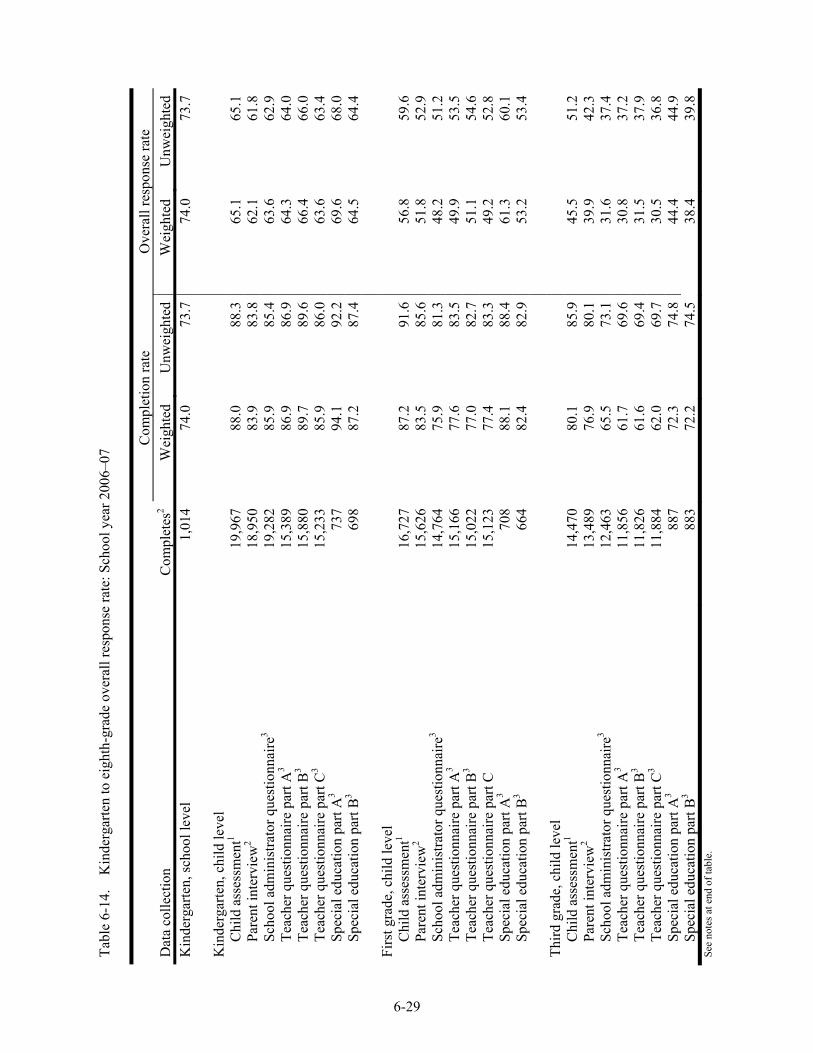
6-29
Tabl
e 6-
14.
Kin
derg
arte
n to
eig
hth-
grad
e ov
eral
l res
pons
e ra
te: S
choo
l yea
r 200
6–07
D
ata
colle
ctio
n C
ompl
etes
2C
ompl
etio
n ra
te
Ove
rall
resp
onse
rate
W
eigh
ted
Unw
eigh
ted
Wei
ghte
dU
nwei
ghte
dK
inde
rgar
ten,
scho
ol le
vel
1,01
474
.0
73.7
74.0
73.7
Kin
derg
arte
n, c
hild
leve
l
Chi
ld a
sses
smen
t1 19
,967
88.0
88
.365
.165
.1Pa
rent
inte
rvie
w2
18,9
5083
.9
83.8
62.1
61.8
Scho
ol a
dmin
istra
tor q
uest
ionn
aire
3 19
,282
85.9
85
.463
.662
.9Te
ache
r que
stio
nnai
re p
art A
3 15
,389
86.9
86
.964
.364
.0Te
ache
r que
stio
nnai
re p
art B
3 15
,880
89.7
89
.666
.466
.0Te
ache
r que
stio
nnai
re p
art C
3 15
,233
85.9
86
.063
.663
.4Sp
ecia
l edu
catio
n pa
rt A
3 73
794
.1
92.2
69.6
68.0
Spec
ial e
duca
tion
part
B3
698
87.2
87
.464
.564
.4
Fi
rst g
rade
, chi
ld le
vel
C
hild
ass
essm
ent1
16,7
2787
.2
91.6
56.8
59.6
Pare
nt in
terv
iew
2 15
,626
83.5
85
.651
.852
.9Sc
hool
adm
inis
trato
r que
stio
nnai
re3
14,7
6475
.9
81.3
48.2
51.2
Teac
her q
uest
ionn
aire
par
t A3
15,1
6677
.6
83.5
49.9
53.5
Teac
her q
uest
ionn
aire
par
t B3
15,0
2277
.0
82.7
51.1
54.6
Teac
her q
uest
ionn
aire
par
t C
15,1
2377
.4
83.3
49.2
52.8
Spec
ial e
duca
tion
part
A3
708
88.1
88
.461
.360
.1Sp
ecia
l edu
catio
n pa
rt B
3 66
482
.4
82.9
53.2
53.4
Third
gra
de, c
hild
leve
l
Chi
ld a
sses
smen
t1 14
,470
80.1
85
.945
.551
.2Pa
rent
inte
rvie
w2
13,4
8976
.9
80.1
39.9
42.3
Scho
ol a
dmin
istra
tor q
uest
ionn
aire
3 12
,463
65.5
73
.131
.637
.4Te
ache
r que
stio
nnai
re p
art A
3 11
,856
61.7
69
.630
.837
.2Te
ache
r que
stio
nnai
re p
art B
3 11
,826
61.6
69
.431
.537
.9Te
ache
r que
stio
nnai
re p
art C
3 11
,884
62.0
69
.730
.536
.8Sp
ecia
l edu
catio
n pa
rt A
3 88
772
.3
74.8
44.4
44.9
Spec
ial e
duca
tion
part
B3
883
72.2
74
.538
.439
.8Se
e no
tes a
t end
of t
able
.
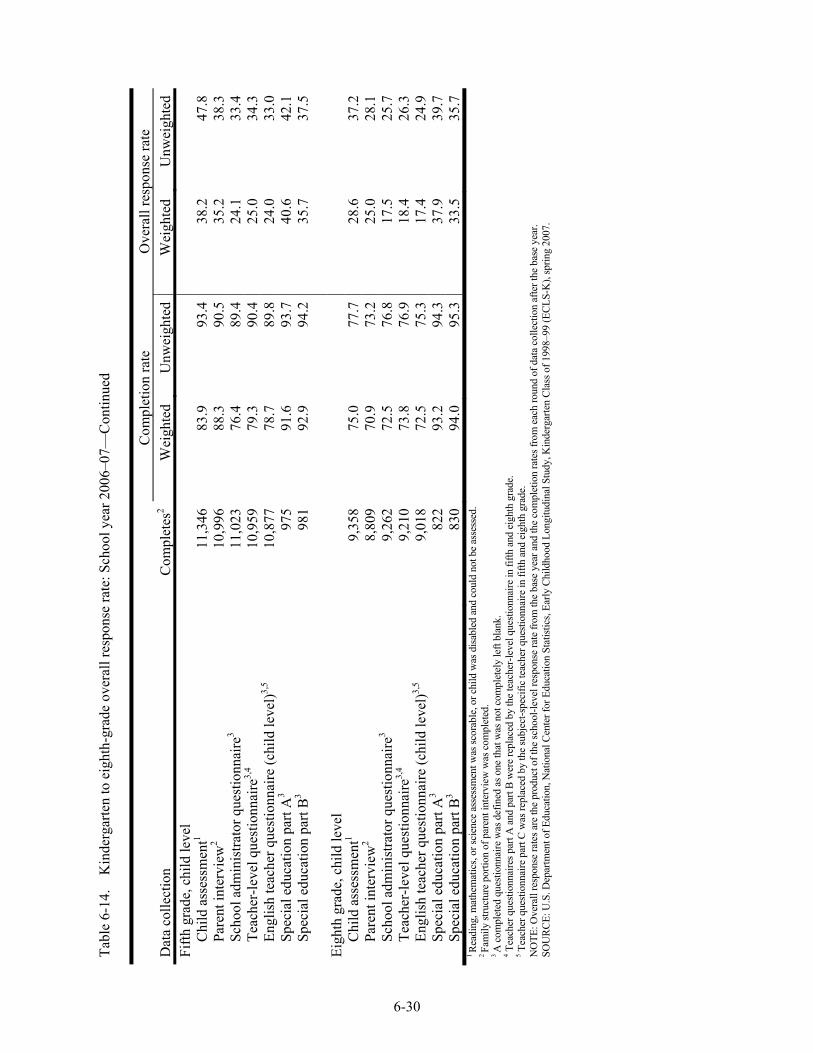
6-30
Tabl
e 6-
14.
Kin
derg
arte
n to
eig
hth-
grad
e ov
eral
l res
pons
e ra
te: S
choo
l yea
r 200
6–07
—C
ontin
ued
Dat
a co
llect
ion
Com
plet
es2
Com
plet
ion
rate
O
vera
ll re
spon
se ra
te
Wei
ghte
d U
nwei
ghte
dW
eigh
ted
Unw
eigh
ted
Fifth
gra
de, c
hild
leve
l
Chi
ld a
sses
smen
t1 11
,346
83.9
93
.438
.247
.8Pa
rent
inte
rvie
w2
10,9
9688
.3
90.5
35.2
38.3
Scho
ol a
dmin
istra
tor q
uest
ionn
aire
3 11
,023
76.4
89
.424
.133
.4Te
ache
r-le
vel q
uest
ionn
aire
3,4
10,9
5979
.3
90.4
25.0
34.3
Engl
ish
teac
her q
uest
ionn
aire
(chi
ld le
vel)3,
5 10
,877
78.7
89
.824
.033
.0Sp
ecia
l edu
catio
n pa
rt A
3 97
591
.6
93.7
40.6
42.1
Spec
ial e
duca
tion
part
B3
981
92.9
94
.235
.737
.5
Ei
ghth
gra
de, c
hild
leve
l
Chi
ld a
sses
smen
t1 9,
358
75.0
77
.728
.637
.2Pa
rent
inte
rvie
w2
8,80
970
.9
73.2
25.0
28.1
Scho
ol a
dmin
istra
tor q
uest
ionn
aire
3 9,
262
72.5
76
.817
.525
.7Te
ache
r-le
vel q
uest
ionn
aire
3,4
9,21
073
.8
76.9
18.4
26.3
Engl
ish
teac
her q
uest
ionn
aire
(chi
ld le
vel)3,
5 9,
018
72.5
75
.317
.424
.9Sp
ecia
l edu
catio
n pa
rt A
3 82
293
.2
94.3
37.9
39.7
Spec
ial e
duca
tion
part
B3
830
94.0
95
.333
.535
.71 Re
adin
g, m
athe
mat
ics,
or sc
ienc
e as
sess
men
t was
scor
able
, or c
hild
was
disa
bled
and
cou
ld n
ot b
e as
sess
ed.
2 Fa
mily
stru
ctur
e po
rtion
of p
aren
t int
ervi
ew w
as c
ompl
eted
. 3 A
com
plet
ed q
uesti
onna
ire w
as d
efin
ed a
s one
that
was
not
com
plet
ely
left
blan
k.
4 Tea
cher
que
stion
naire
s par
t A a
nd p
art B
wer
e re
plac
ed b
y th
e te
ache
r-lev
el q
uesti
onna
ire in
fifth
and
eig
hth
grad
e.
5 Tea
cher
que
stion
naire
par
t C w
as re
plac
ed b
y th
e su
bjec
t-spe
cific
teac
her q
uesti
onna
ire in
fifth
and
eig
hth
grad
e.
NO
TE: O
vera
ll re
spon
se ra
tes a
re th
e pr
oduc
t of t
he sc
hool
-leve
l res
pons
e ra
te fr
om th
e ba
se y
ear a
nd th
e co
mpl
etio
n ra
tes f
rom
eac
h ro
und
of d
ata
colle
ctio
n af
ter t
he b
ase
year
. SO
URC
E: U
.S. D
epar
tmen
t of E
duca
tion,
Nat
iona
l Cen
ter f
or E
duca
tion
Stat
istic
s, Ea
rly C
hild
hood
Lon
gitu
dina
l Stu
dy, K
inde
rgar
ten
Clas
s of 1
998–
99 (E
CLS
-K),
sprin
g 20
07.
6-31
6.4 Item Response Rates
In the ECLS-K, as in most surveys, the responses to some data items were not obtained for all interviews. There are numerous reasons for item nonresponse. Some respondents did not know the answer for the item or did not wish to respond for other reasons. Some item nonresponse arose when an interview was interrupted and not continued later, leaving items at the end of the interview blank. Item nonresponse could also be encountered because responses provided by the respondent were not internally consistent, and this inconsistency was not discovered until after the interview was completed. In these cases, the items that were not internally consistent were set to missing.
Every item in the ECLS-K data file has values that indicate whether the respondent did not
know the answer to the item (-8), or refused to give an answer (-7). The value -9 is used in all other cases where the answer is left blank or set to missing due to reasons mentioned above (described in the data file as “Not ascertained”). However, where an item was left blank due to a valid skip pattern, this is indicated by the value -1. Chapter 7 of the ECLS-K Combined User’s Manual for the ECLS-K Eighth-Grade and K–8 Full Sample Data Files Files and Electronic Codebooks. (NCES 2009-004) (Tourangeau et al. forthcoming) discusses in detail these special values. For each survey item, the response rate was computed as the unweighted number of responses not equal to any of the special values (-1, -7, -8, or -9) divided by the unweighted number of responses not equal to -1. Of all the ECLS-K instruments, only the child assessment and the parent interview had a sizable number of items with special values -7 (“Refused”) or -8 (“Don’t know”). Table 6-15 shows the number of items in each survey instrument and, for each instrument, the percent of items that have at least one nonresponse value. For example, for 36 percent of the items in the parent interview, one respondent refused to answer.
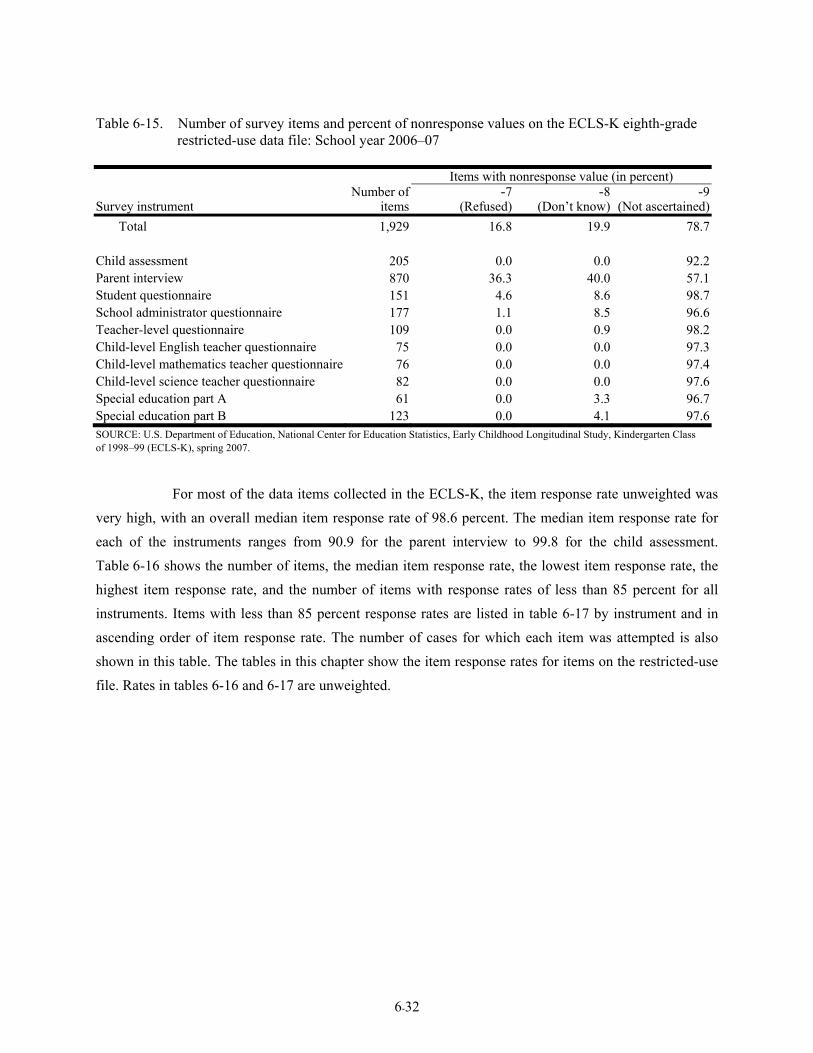
6-32
Table 6-15. Number of survey items and percent of nonresponse values on the ECLS-K eighth-grade restricted-use data file: School year 2006–07
Items with nonresponse value (in percent) Number of -7 -8 -9Survey instrument items (Refused) (Don’t know) (Not ascertained)
Total 1,929 16.8 19.9 78.7 Child assessment 205 0.0 0.0 92.2Parent interview 870 36.3 40.0 57.1Student questionnaire 151 4.6 8.6 98.7School administrator questionnaire 177 1.1 8.5 96.6Teacher-level questionnaire 109 0.0 0.9 98.2Child-level English teacher questionnaire 75 0.0 0.0 97.3Child-level mathematics teacher questionnaire 76 0.0 0.0 97.4Child-level science teacher questionnaire 82 0.0 0.0 97.6Special education part A 61 0.0 3.3 96.7Special education part B 123 0.0 4.1 97.6SOURCE: U.S. Department of Education, National Center for Education Statistics, Early Childhood Longitudinal Study, Kindergarten Class of 1998–99 (ECLS-K), spring 2007.
For most of the data items collected in the ECLS-K, the item response rate unweighted was
very high, with an overall median item response rate of 98.6 percent. The median item response rate for each of the instruments ranges from 90.9 for the parent interview to 99.8 for the child assessment. Table 6-16 shows the number of items, the median item response rate, the lowest item response rate, the highest item response rate, and the number of items with response rates of less than 85 percent for all instruments. Items with less than 85 percent response rates are listed in table 6-17 by instrument and in ascending order of item response rate. The number of cases for which each item was attempted is also shown in this table. The tables in this chapter show the item response rates for items on the restricted-use file. Rates in tables 6-16 and 6-17 are unweighted.
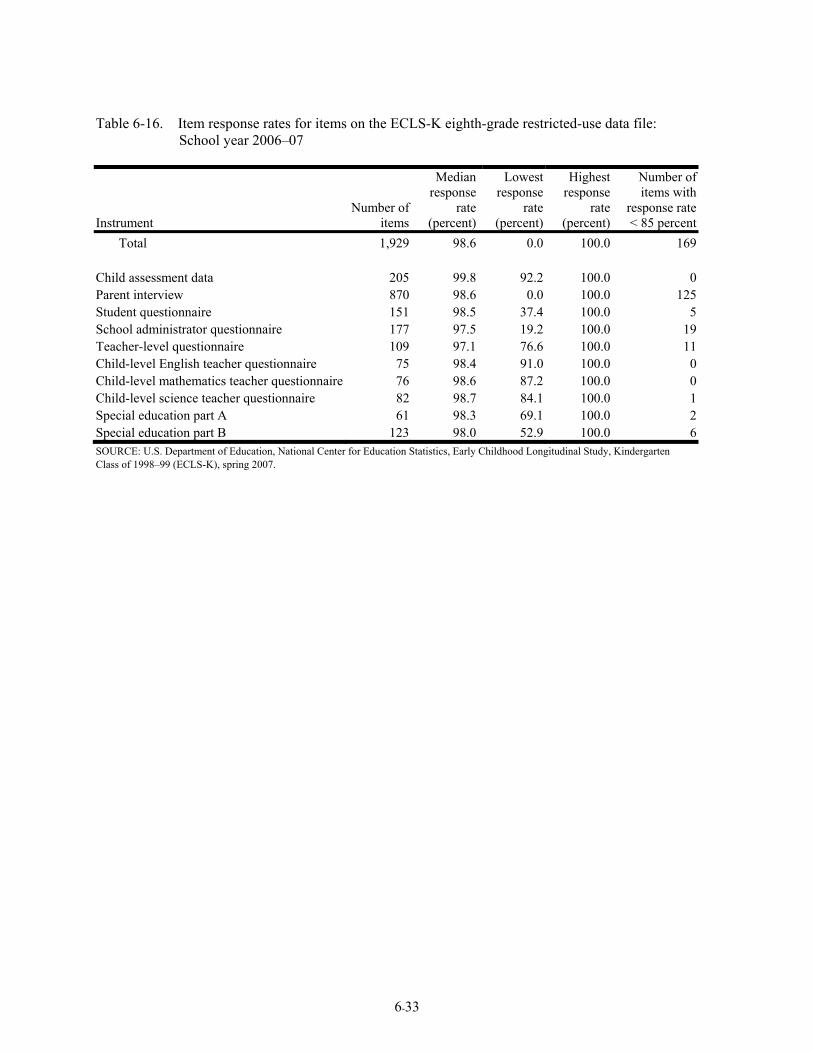
6-33
Table 6-16. Item response rates for items on the ECLS-K eighth-grade restricted-use data file: School year 2006–07
Instrument Number of
items
Median response
rate (percent)
Lowest response
rate(percent)
Highest response
rate (percent)
Number of items with
response rate < 85 percent
Total 1,929 98.6 0.0 100.0 169 Child assessment data 205 99.8 92.2 100.0 0Parent interview 870 98.6 0.0 100.0 125Student questionnaire 151 98.5 37.4 100.0 5School administrator questionnaire 177 97.5 19.2 100.0 19Teacher-level questionnaire 109 97.1 76.6 100.0 11Child-level English teacher questionnaire 75 98.4 91.0 100.0 0Child-level mathematics teacher questionnaire 76 98.6 87.2 100.0 0Child-level science teacher questionnaire 82 98.7 84.1 100.0 1Special education part A 61 98.3 69.1 100.0 2Special education part B 123 98.0 52.9 100.0 6SOURCE: U.S. Department of Education, National Center for Education Statistics, Early Childhood Longitudinal Study, Kindergarten Class of 1998–99 (ECLS-K), spring 2007.
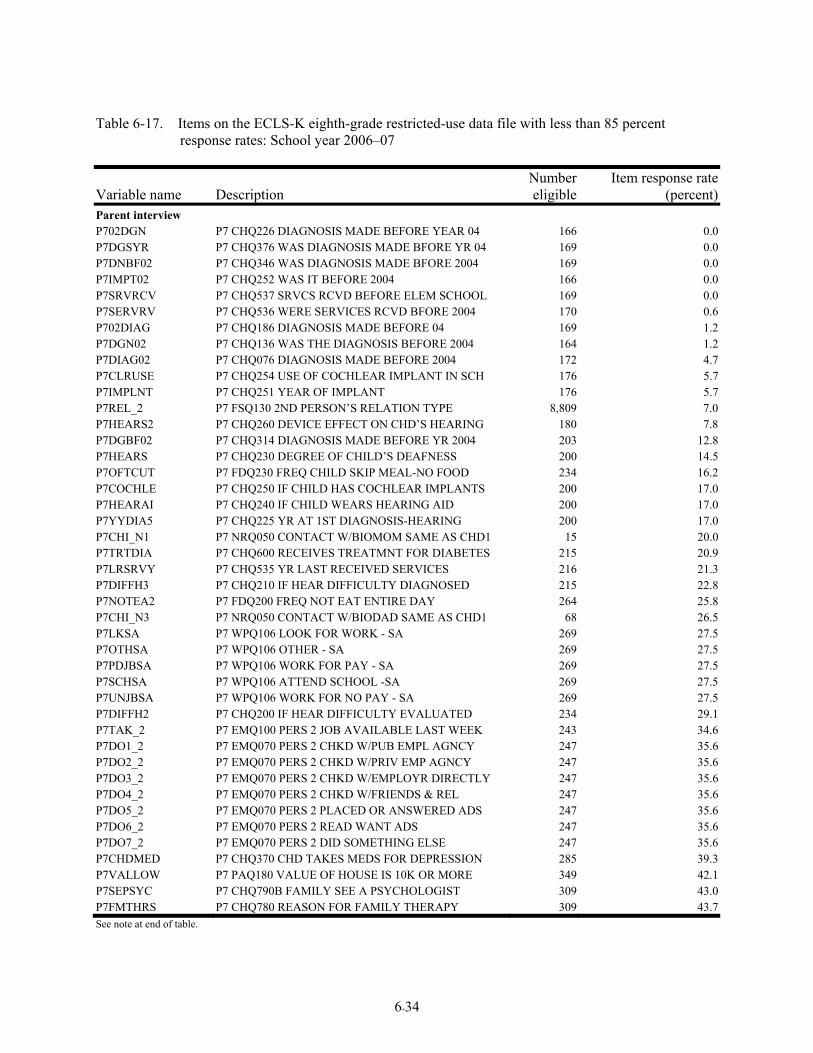
6-34
Table 6-17. Items on the ECLS-K eighth-grade restricted-use data file with less than 85 percent response rates: School year 2006–07
Variable name Description Number eligible
Item response rate (percent)
Parent interview P702DGN P7 CHQ226 DIAGNOSIS MADE BEFORE YEAR 04 166 0.0P7DGSYR P7 CHQ376 WAS DIAGNOSIS MADE BFORE YR 04 169 0.0P7DNBF02 P7 CHQ346 WAS DIAGNOSIS MADE BFORE 2004 169 0.0P7IMPT02 P7 CHQ252 WAS IT BEFORE 2004 166 0.0P7SRVRCV P7 CHQ537 SRVCS RCVD BEFORE ELEM SCHOOL 169 0.0P7SERVRV P7 CHQ536 WERE SERVICES RCVD BFORE 2004 170 0.6P702DIAG P7 CHQ186 DIAGNOSIS MADE BEFORE 04 169 1.2P7DGN02 P7 CHQ136 WAS THE DIAGNOSIS BEFORE 2004 164 1.2P7DIAG02 P7 CHQ076 DIAGNOSIS MADE BEFORE 2004 172 4.7P7CLRUSE P7 CHQ254 USE OF COCHLEAR IMPLANT IN SCH 176 5.7P7IMPLNT P7 CHQ251 YEAR OF IMPLANT 176 5.7P7REL_2 P7 FSQ130 2ND PERSON’S RELATION TYPE 8,809 7.0P7HEARS2 P7 CHQ260 DEVICE EFFECT ON CHD’S HEARING 180 7.8P7DGBF02 P7 CHQ314 DIAGNOSIS MADE BEFORE YR 2004 203 12.8P7HEARS P7 CHQ230 DEGREE OF CHILD’S DEAFNESS 200 14.5P7OFTCUT P7 FDQ230 FREQ CHILD SKIP MEAL-NO FOOD 234 16.2P7COCHLE P7 CHQ250 IF CHILD HAS COCHLEAR IMPLANTS 200 17.0P7HEARAI P7 CHQ240 IF CHILD WEARS HEARING AID 200 17.0P7YYDIA5 P7 CHQ225 YR AT 1ST DIAGNOSIS-HEARING 200 17.0P7CHI_N1 P7 NRQ050 CONTACT W/BIOMOM SAME AS CHD1 15 20.0P7TRTDIA P7 CHQ600 RECEIVES TREATMNT FOR DIABETES 215 20.9P7LRSRVY P7 CHQ535 YR LAST RECEIVED SERVICES 216 21.3P7DIFFH3 P7 CHQ210 IF HEAR DIFFICULTY DIAGNOSED 215 22.8P7NOTEA2 P7 FDQ200 FREQ NOT EAT ENTIRE DAY 264 25.8P7CHI_N3 P7 NRQ050 CONTACT W/BIODAD SAME AS CHD1 68 26.5P7LKSA P7 WPQ106 LOOK FOR WORK - SA 269 27.5P7OTHSA P7 WPQ106 OTHER - SA 269 27.5P7PDJBSA P7 WPQ106 WORK FOR PAY - SA 269 27.5P7SCHSA P7 WPQ106 ATTEND SCHOOL -SA 269 27.5P7UNJBSA P7 WPQ106 WORK FOR NO PAY - SA 269 27.5P7DIFFH2 P7 CHQ200 IF HEAR DIFFICULTY EVALUATED 234 29.1P7TAK_2 P7 EMQ100 PERS 2 JOB AVAILABLE LAST WEEK 243 34.6P7DO1_2 P7 EMQ070 PERS 2 CHKD W/PUB EMPL AGNCY 247 35.6P7DO2_2 P7 EMQ070 PERS 2 CHKD W/PRIV EMP AGNCY 247 35.6P7DO3_2 P7 EMQ070 PERS 2 CHKD W/EMPLOYR DIRECTLY 247 35.6P7DO4_2 P7 EMQ070 PERS 2 CHKD W/FRIENDS & REL 247 35.6P7DO5_2 P7 EMQ070 PERS 2 PLACED OR ANSWERED ADS 247 35.6P7DO6_2 P7 EMQ070 PERS 2 READ WANT ADS 247 35.6P7DO7_2 P7 EMQ070 PERS 2 DID SOMETHING ELSE 247 35.6P7CHDMED P7 CHQ370 CHD TAKES MEDS FOR DEPRESSION 285 39.3P7VALLOW P7 PAQ180 VALUE OF HOUSE IS 10K OR MORE 349 42.1P7SEPSYC P7 CHQ790B FAMILY SEE A PSYCHOLOGIST 309 43.0P7FMTHRS P7 CHQ780 REASON FOR FAMILY THERAPY 309 43.7See note at end of table.
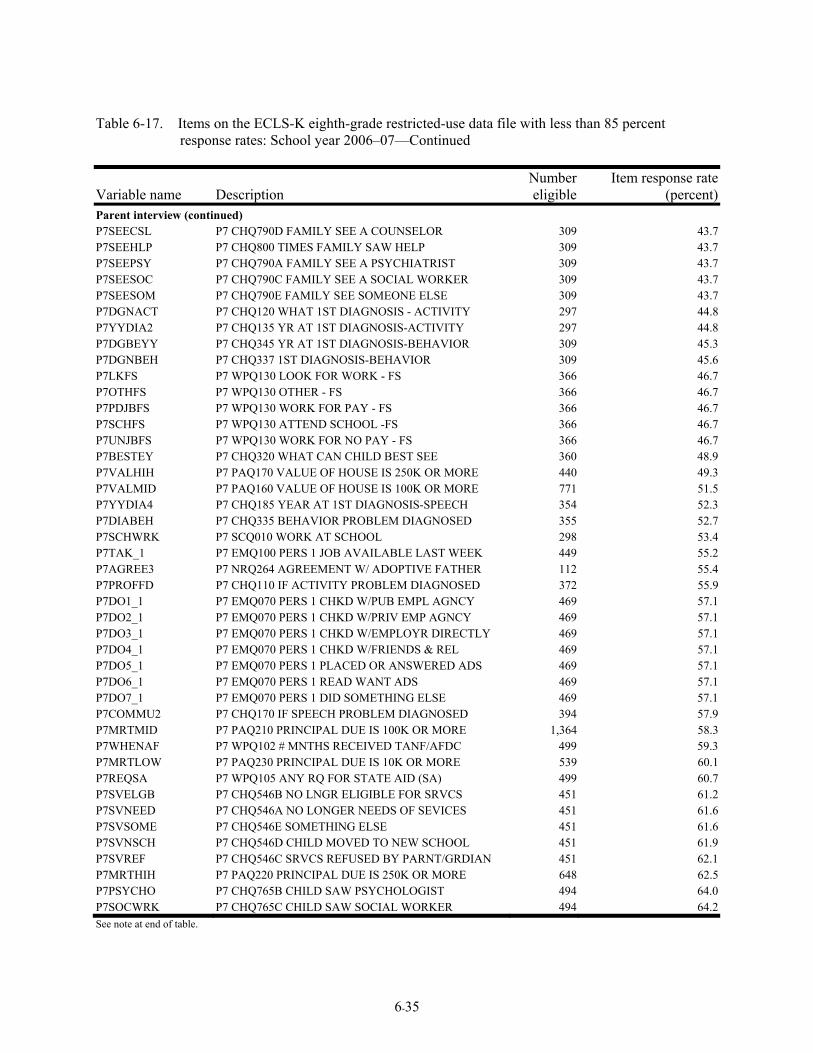
6-35
Table 6-17. Items on the ECLS-K eighth-grade restricted-use data file with less than 85 percent response rates: School year 2006–07—Continued
Variable name Description Number eligible
Item response rate (percent)
Parent interview (continued) P7SEECSL P7 CHQ790D FAMILY SEE A COUNSELOR 309 43.7P7SEEHLP P7 CHQ800 TIMES FAMILY SAW HELP 309 43.7P7SEEPSY P7 CHQ790A FAMILY SEE A PSYCHIATRIST 309 43.7P7SEESOC P7 CHQ790C FAMILY SEE A SOCIAL WORKER 309 43.7P7SEESOM P7 CHQ790E FAMILY SEE SOMEONE ELSE 309 43.7P7DGNACT P7 CHQ120 WHAT 1ST DIAGNOSIS - ACTIVITY 297 44.8P7YYDIA2 P7 CHQ135 YR AT 1ST DIAGNOSIS-ACTIVITY 297 44.8P7DGBEYY P7 CHQ345 YR AT 1ST DIAGNOSIS-BEHAVIOR 309 45.3P7DGNBEH P7 CHQ337 1ST DIAGNOSIS-BEHAVIOR 309 45.6P7LKFS P7 WPQ130 LOOK FOR WORK - FS 366 46.7P7OTHFS P7 WPQ130 OTHER - FS 366 46.7P7PDJBFS P7 WPQ130 WORK FOR PAY - FS 366 46.7P7SCHFS P7 WPQ130 ATTEND SCHOOL -FS 366 46.7P7UNJBFS P7 WPQ130 WORK FOR NO PAY - FS 366 46.7P7BESTEY P7 CHQ320 WHAT CAN CHILD BEST SEE 360 48.9P7VALHIH P7 PAQ170 VALUE OF HOUSE IS 250K OR MORE 440 49.3P7VALMID P7 PAQ160 VALUE OF HOUSE IS 100K OR MORE 771 51.5P7YYDIA4 P7 CHQ185 YEAR AT 1ST DIAGNOSIS-SPEECH 354 52.3P7DIABEH P7 CHQ335 BEHAVIOR PROBLEM DIAGNOSED 355 52.7P7SCHWRK P7 SCQ010 WORK AT SCHOOL 298 53.4P7TAK_1 P7 EMQ100 PERS 1 JOB AVAILABLE LAST WEEK 449 55.2P7AGREE3 P7 NRQ264 AGREEMENT W/ ADOPTIVE FATHER 112 55.4P7PROFFD P7 CHQ110 IF ACTIVITY PROBLEM DIAGNOSED 372 55.9P7DO1_1 P7 EMQ070 PERS 1 CHKD W/PUB EMPL AGNCY 469 57.1P7DO2_1 P7 EMQ070 PERS 1 CHKD W/PRIV EMP AGNCY 469 57.1P7DO3_1 P7 EMQ070 PERS 1 CHKD W/EMPLOYR DIRECTLY 469 57.1P7DO4_1 P7 EMQ070 PERS 1 CHKD W/FRIENDS & REL 469 57.1P7DO5_1 P7 EMQ070 PERS 1 PLACED OR ANSWERED ADS 469 57.1P7DO6_1 P7 EMQ070 PERS 1 READ WANT ADS 469 57.1P7DO7_1 P7 EMQ070 PERS 1 DID SOMETHING ELSE 469 57.1P7COMMU2 P7 CHQ170 IF SPEECH PROBLEM DIAGNOSED 394 57.9P7MRTMID P7 PAQ210 PRINCIPAL DUE IS 100K OR MORE 1,364 58.3P7WHENAF P7 WPQ102 # MNTHS RECEIVED TANF/AFDC 499 59.3P7MRTLOW P7 PAQ230 PRINCIPAL DUE IS 10K OR MORE 539 60.1P7REQSA P7 WPQ105 ANY RQ FOR STATE AID (SA) 499 60.7P7SVELGB P7 CHQ546B NO LNGR ELIGIBLE FOR SRVCS 451 61.2P7SVNEED P7 CHQ546A NO LONGER NEEDS OF SEVICES 451 61.6P7SVSOME P7 CHQ546E SOMETHING ELSE 451 61.6P7SVNSCH P7 CHQ546D CHILD MOVED TO NEW SCHOOL 451 61.9P7SVREF P7 CHQ546C SRVCS REFUSED BY PARNT/GRDIAN 451 62.1P7MRTHIH P7 PAQ220 PRINCIPAL DUE IS 250K OR MORE 648 62.5P7PSYCHO P7 CHQ765B CHILD SAW PSYCHOLOGIST 494 64.0P7SOCWRK P7 CHQ765C CHILD SAW SOCIAL WORKER 494 64.2See note at end of table.
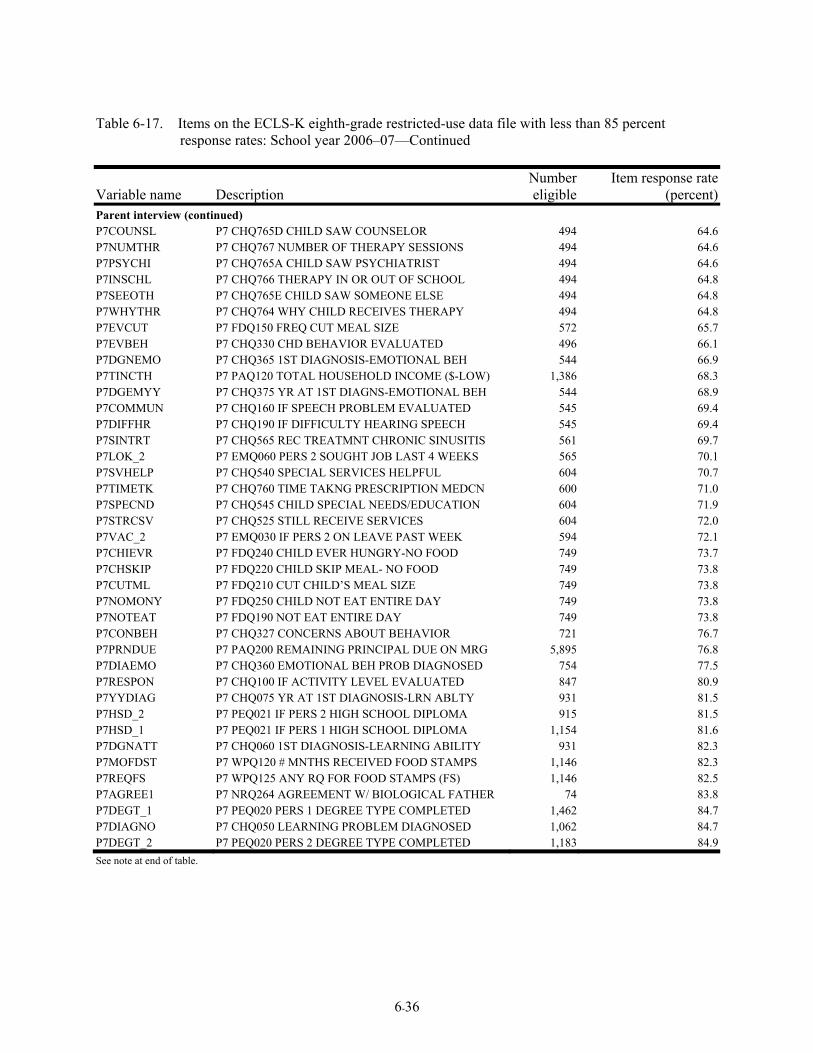
6-36
Table 6-17. Items on the ECLS-K eighth-grade restricted-use data file with less than 85 percent response rates: School year 2006–07—Continued
Variable name Description Number eligible
Item response rate (percent)
Parent interview (continued) P7COUNSL P7 CHQ765D CHILD SAW COUNSELOR 494 64.6P7NUMTHR P7 CHQ767 NUMBER OF THERAPY SESSIONS 494 64.6P7PSYCHI P7 CHQ765A CHILD SAW PSYCHIATRIST 494 64.6P7INSCHL P7 CHQ766 THERAPY IN OR OUT OF SCHOOL 494 64.8P7SEEOTH P7 CHQ765E CHILD SAW SOMEONE ELSE 494 64.8P7WHYTHR P7 CHQ764 WHY CHILD RECEIVES THERAPY 494 64.8P7EVCUT P7 FDQ150 FREQ CUT MEAL SIZE 572 65.7P7EVBEH P7 CHQ330 CHD BEHAVIOR EVALUATED 496 66.1P7DGNEMO P7 CHQ365 1ST DIAGNOSIS-EMOTIONAL BEH 544 66.9P7TINCTH P7 PAQ120 TOTAL HOUSEHOLD INCOME ($-LOW) 1,386 68.3P7DGEMYY P7 CHQ375 YR AT 1ST DIAGNS-EMOTIONAL BEH 544 68.9P7COMMUN P7 CHQ160 IF SPEECH PROBLEM EVALUATED 545 69.4P7DIFFHR P7 CHQ190 IF DIFFICULTY HEARING SPEECH 545 69.4P7SINTRT P7 CHQ565 REC TREATMNT CHRONIC SINUSITIS 561 69.7P7LOK_2 P7 EMQ060 PERS 2 SOUGHT JOB LAST 4 WEEKS 565 70.1P7SVHELP P7 CHQ540 SPECIAL SERVICES HELPFUL 604 70.7P7TIMETK P7 CHQ760 TIME TAKNG PRESCRIPTION MEDCN 600 71.0P7SPECND P7 CHQ545 CHILD SPECIAL NEEDS/EDUCATION 604 71.9P7STRCSV P7 CHQ525 STILL RECEIVE SERVICES 604 72.0P7VAC_2 P7 EMQ030 IF PERS 2 ON LEAVE PAST WEEK 594 72.1P7CHIEVR P7 FDQ240 CHILD EVER HUNGRY-NO FOOD 749 73.7P7CHSKIP P7 FDQ220 CHILD SKIP MEAL- NO FOOD 749 73.8P7CUTML P7 FDQ210 CUT CHILD’S MEAL SIZE 749 73.8P7NOMONY P7 FDQ250 CHILD NOT EAT ENTIRE DAY 749 73.8P7NOTEAT P7 FDQ190 NOT EAT ENTIRE DAY 749 73.8P7CONBEH P7 CHQ327 CONCERNS ABOUT BEHAVIOR 721 76.7P7PRNDUE P7 PAQ200 REMAINING PRINCIPAL DUE ON MRG 5,895 76.8P7DIAEMO P7 CHQ360 EMOTIONAL BEH PROB DIAGNOSED 754 77.5P7RESPON P7 CHQ100 IF ACTIVITY LEVEL EVALUATED 847 80.9P7YYDIAG P7 CHQ075 YR AT 1ST DIAGNOSIS-LRN ABLTY 931 81.5P7HSD_2 P7 PEQ021 IF PERS 2 HIGH SCHOOL DIPLOMA 915 81.5P7HSD_1 P7 PEQ021 IF PERS 1 HIGH SCHOOL DIPLOMA 1,154 81.6P7DGNATT P7 CHQ060 1ST DIAGNOSIS-LEARNING ABILITY 931 82.3P7MOFDST P7 WPQ120 # MNTHS RECEIVED FOOD STAMPS 1,146 82.3P7REQFS P7 WPQ125 ANY RQ FOR FOOD STAMPS (FS) 1,146 82.5P7AGREE1 P7 NRQ264 AGREEMENT W/ BIOLOGICAL FATHER 74 83.8P7DEGT_1 P7 PEQ020 PERS 1 DEGREE TYPE COMPLETED 1,462 84.7P7DIAGNO P7 CHQ050 LEARNING PROBLEM DIAGNOSED 1,062 84.7P7DEGT_2 P7 PEQ020 PERS 2 DEGREE TYPE COMPLETED 1,183 84.9See note at end of table.
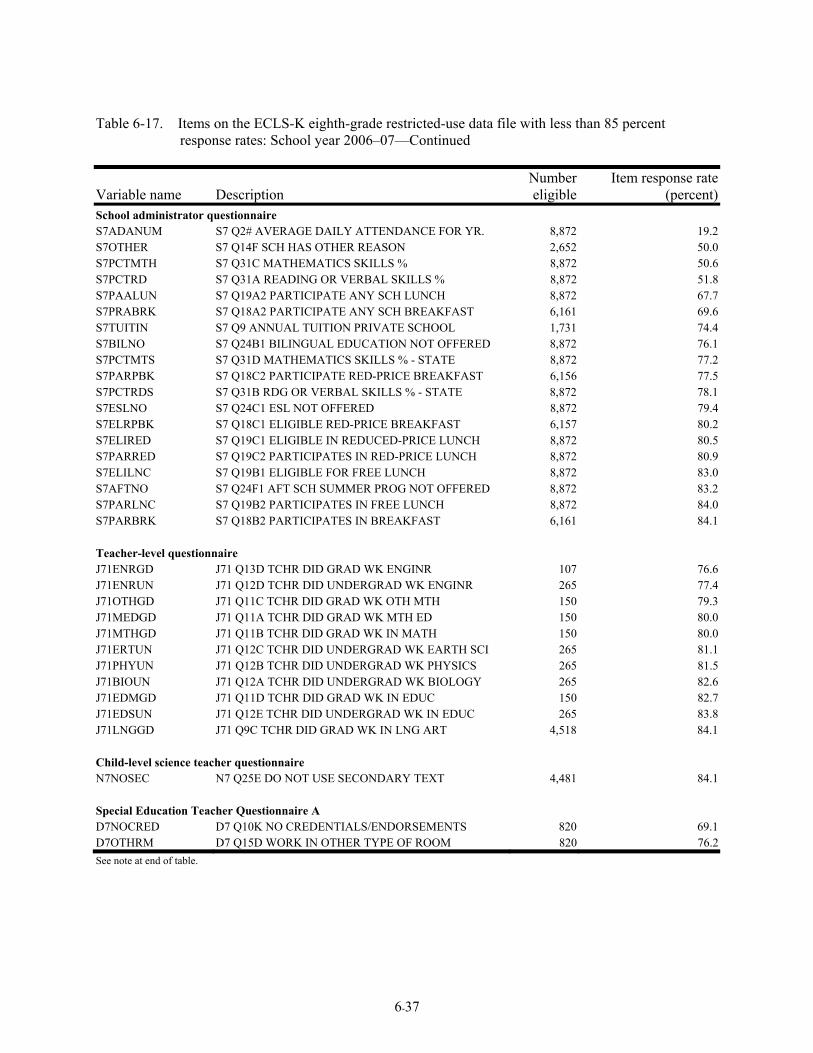
6-37
Table 6-17. Items on the ECLS-K eighth-grade restricted-use data file with less than 85 percent response rates: School year 2006–07—Continued
Variable name Description Number eligible
Item response rate (percent)
School administrator questionnaire S7ADANUM S7 Q2# AVERAGE DAILY ATTENDANCE FOR YR. 8,872 19.2S7OTHER S7 Q14F SCH HAS OTHER REASON 2,652 50.0S7PCTMTH S7 Q31C MATHEMATICS SKILLS % 8,872 50.6S7PCTRD S7 Q31A READING OR VERBAL SKILLS % 8,872 51.8S7PAALUN S7 Q19A2 PARTICIPATE ANY SCH LUNCH 8,872 67.7S7PRABRK S7 Q18A2 PARTICIPATE ANY SCH BREAKFAST 6,161 69.6S7TUITIN S7 Q9 ANNUAL TUITION PRIVATE SCHOOL 1,731 74.4S7BILNO S7 Q24B1 BILINGUAL EDUCATION NOT OFFERED 8,872 76.1S7PCTMTS S7 Q31D MATHEMATICS SKILLS % - STATE 8,872 77.2S7PARPBK S7 Q18C2 PARTICIPATE RED-PRICE BREAKFAST 6,156 77.5S7PCTRDS S7 Q31B RDG OR VERBAL SKILLS % - STATE 8,872 78.1S7ESLNO S7 Q24C1 ESL NOT OFFERED 8,872 79.4S7ELRPBK S7 Q18C1 ELIGIBLE RED-PRICE BREAKFAST 6,157 80.2S7ELIRED S7 Q19C1 ELIGIBLE IN REDUCED-PRICE LUNCH 8,872 80.5S7PARRED S7 Q19C2 PARTICIPATES IN RED-PRICE LUNCH 8,872 80.9S7ELILNC S7 Q19B1 ELIGIBLE FOR FREE LUNCH 8,872 83.0S7AFTNO S7 Q24F1 AFT SCH SUMMER PROG NOT OFFERED 8,872 83.2S7PARLNC S7 Q19B2 PARTICIPATES IN FREE LUNCH 8,872 84.0S7PARBRK S7 Q18B2 PARTICIPATES IN BREAKFAST 6,161 84.1 Teacher-level questionnaire J71ENRGD J71 Q13D TCHR DID GRAD WK ENGINR 107 76.6J71ENRUN J71 Q12D TCHR DID UNDERGRAD WK ENGINR 265 77.4J71OTHGD J71 Q11C TCHR DID GRAD WK OTH MTH 150 79.3J71MEDGD J71 Q11A TCHR DID GRAD WK MTH ED 150 80.0J71MTHGD J71 Q11B TCHR DID GRAD WK IN MATH 150 80.0J71ERTUN J71 Q12C TCHR DID UNDERGRAD WK EARTH SCI 265 81.1J71PHYUN J71 Q12B TCHR DID UNDERGRAD WK PHYSICS 265 81.5J71BIOUN J71 Q12A TCHR DID UNDERGRAD WK BIOLOGY 265 82.6J71EDMGD J71 Q11D TCHR DID GRAD WK IN EDUC 150 82.7J71EDSUN J71 Q12E TCHR DID UNDERGRAD WK IN EDUC 265 83.8J71LNGGD J71 Q9C TCHR DID GRAD WK IN LNG ART 4,518 84.1 Child-level science teacher questionnaire N7NOSEC N7 Q25E DO NOT USE SECONDARY TEXT 4,481 84.1 Special Education Teacher Questionnaire A D7NOCRED D7 Q10K NO CREDENTIALS/ENDORSEMENTS 820 69.1D7OTHRM D7 Q15D WORK IN OTHER TYPE OF ROOM 820 76.2See note at end of table.
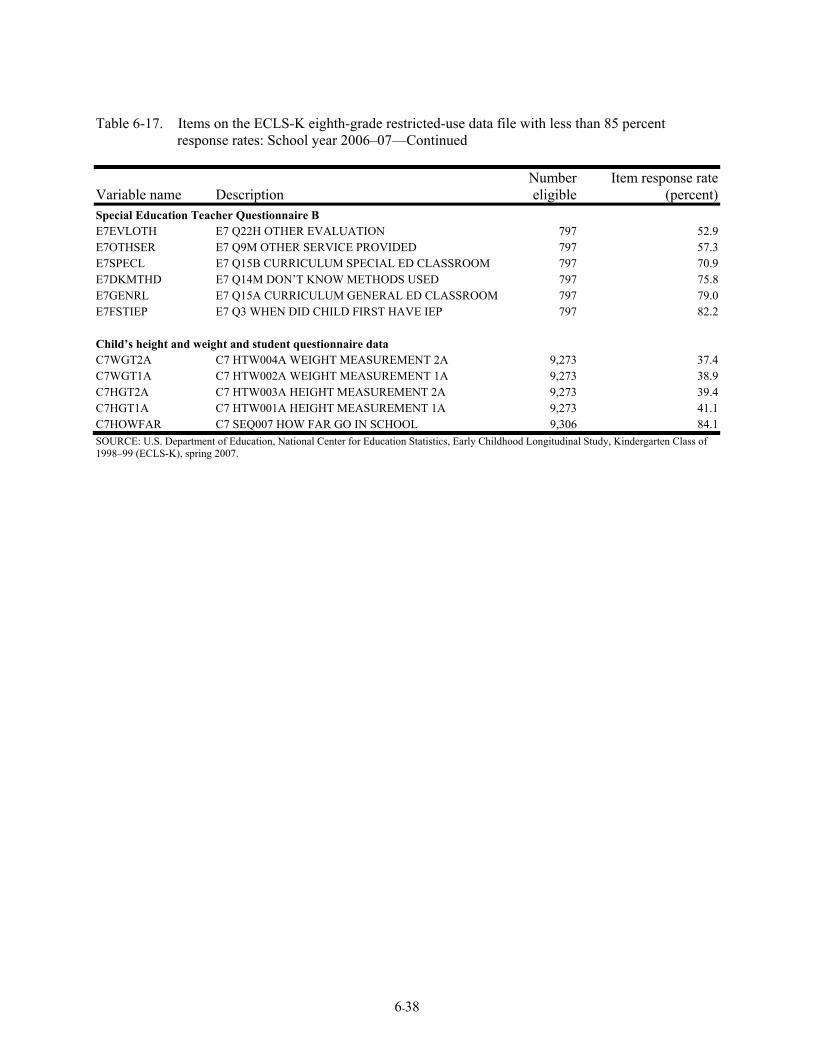
6-38
Table 6-17. Items on the ECLS-K eighth-grade restricted-use data file with less than 85 percent response rates: School year 2006–07—Continued
Variable name Description Number eligible
Item response rate (percent)
Special Education Teacher Questionnaire B E7EVLOTH E7 Q22H OTHER EVALUATION 797 52.9E7OTHSER E7 Q9M OTHER SERVICE PROVIDED 797 57.3E7SPECL E7 Q15B CURRICULUM SPECIAL ED CLASSROOM 797 70.9E7DKMTHD E7 Q14M DON’T KNOW METHODS USED 797 75.8E7GENRL E7 Q15A CURRICULUM GENERAL ED CLASSROOM 797 79.0E7FSTIEP E7 Q3 WHEN DID CHILD FIRST HAVE IEP 797 82.2 Child’s height and weight and student questionnaire data C7WGT2A C7 HTW004A WEIGHT MEASUREMENT 2A 9,273 37.4C7WGT1A C7 HTW002A WEIGHT MEASUREMENT 1A 9,273 38.9C7HGT2A C7 HTW003A HEIGHT MEASUREMENT 2A 9,273 39.4C7HGT1A C7 HTW001A HEIGHT MEASUREMENT 1A 9,273 41.1C7HOWFAR C7 SEQ007 HOW FAR GO IN SCHOOL 9,306 84.1SOURCE: U.S. Department of Education, National Center for Education Statistics, Early Childhood Longitudinal Study, Kindergarten Class of 1998–99 (ECLS-K), spring 2007.
7-1
7. NONRESPONSE BIAS ANALYSIS
Estimates from nearly all surveys are subject to bias due to nonresponse. Two aspects of the ECLS-K that increase the concern about nonresponse bias are its longitudinal design and the use of multiple sources for acquiring data about the sampled children. In the ECLS-K nonresponse bias occurs in the initial base year of collecting data, and then attrition bias occurs in subsequent rounds of data collection. Like most longitudinal surveys, nonresponse in the ECLS-K has been generally increasing as the sample ages. The use of multiple sources in the ECLS-K (e.g., direct child assessment, parent interview, teacher interview) provides the opportunity to obtain valuable data about the child, but it also presents multiple chances for nonresponse. For example, even if the child can be assessed, the parent may decline to be interviewed, and estimates using the parent data are subject to nonresponse.
The base-year nonresponse was already examined in the base-year nonresponse report, and
the bias was found to be generally small. In the base year, the bias for all the assessment scores was found to be less than 0.5 point (the relative bias was less than 2 percent). As a result, this chapter concentrates on nonresponse due to children who were respondents in the base year but were nonrespondents in the eighth-grade data collection. This is an important difference from the analysis done in the base year that focused on the potential bias between the population of kindergartners and those participating in the ECLS-K. As a result of this focus, children who entered the sample in first grade through a sample freshening procedure are not included in any of the analyses of nonresponse bias. These children were not in the base-year data collection and have no base-year data. This is a small limitation since the freshened sample size is very small relative to the base-year sample size.
In chapter 6 eighth-grade completion rates were examined as indicators of potential attrition
nonresponse bias. Nonresponse in previous rounds but after the base year was not accounted for because the inclusion of the sample units in the eighth-grade data collection did not depend on nonresponse between the base year and eighth grade.1 The discussion of the eighth-grade differential response rates for subgroups in chapter 6 is relevant to the examination of the potential bias in the eighth-grade data.
1 The ECLS-K is not the typical longitudinal study where only respondents from one wave are eligible to participate in the next, with the exception of the base year. While only base-year respondents were eligible for subsequent rounds, nonrespondents in first grade could participate in subsequent rounds unless they had been subsampled out. Consequently, students who refused in previous waves had no roles in the computation of the eighth-grade completion rates, as were students in schools who refused and thus counted as student refusals. Subsampling across waves was accounted for in the computation of the completion rates.
7-2
Completion rates are more relevant than response rates in subsequent rounds of a longitudinal study since, by definition, response rates include the nonresponse in the base year. As in the base year, completion rates were examined for the different components of the ECLS-K. This is useful where nonresponse bias is concerned since potential nonresponse bias is often discussed using the form
))(1()( nrrr yyRyB −−= where r and nr denote respondent and nonrespondent, respectively, and R is the completion rate. Large differences in completion rates for subgroups increase the potential for nonresponse biases in the estimates. Therefore, completion rates were also examined for subgroups identified in previous analyses as potential sources of nonresponse bias.
This chapter examines the potential for nonresponse bias using three other methods: (1)
comparison of respondents and nonrespondents using available sample frame information, (2) multivariate analysis to identify the characteristics of cases most likely to respond, and (3) analysis of attrition bias applicable to longitudinal studies. It does not analyze the potential bias in the eighth-grade estimates that arises from attrition nonresponse since the base year and with each subsequent round of data collection. This type of analysis would involve a combination of the base-year nonresponse and attrition and modeling assumptions that are outside the scope of the eighth-grade methodology report. As mentioned earlier, the current approach concentrates on nonresponse due to children who were respondents in the base year but were nonrespondents in the eighth-grade data collection.
7.1 Comparison With Frame Data
Estimates from the ECLS-K are compared with estimates from the school frames to provide another approach to investigating nonresponse bias. For a limited number of items, the ECLS-K estimates were compared with estimates obtained from the 2005-06 Common Core of Data (CCD) and the 2003-04 Private School Survey (PSS).2
The ECLS-K estimates are compared with the frames despite the fact that the ECLS-K
sample of eighth-graders is different from these sources for two reasons: (1) the cohort of ECLS-K children sampled in 1998 for the base-year study have aged into different grades, and (2) the ECLS-K sample was not freshened in third grade, fifth grade, or eighth grade. These limitations are discussed in more detail below.
2 The 2005-06 PSS adjudicated data are not yet available to the public and hence are not used in this comparison.
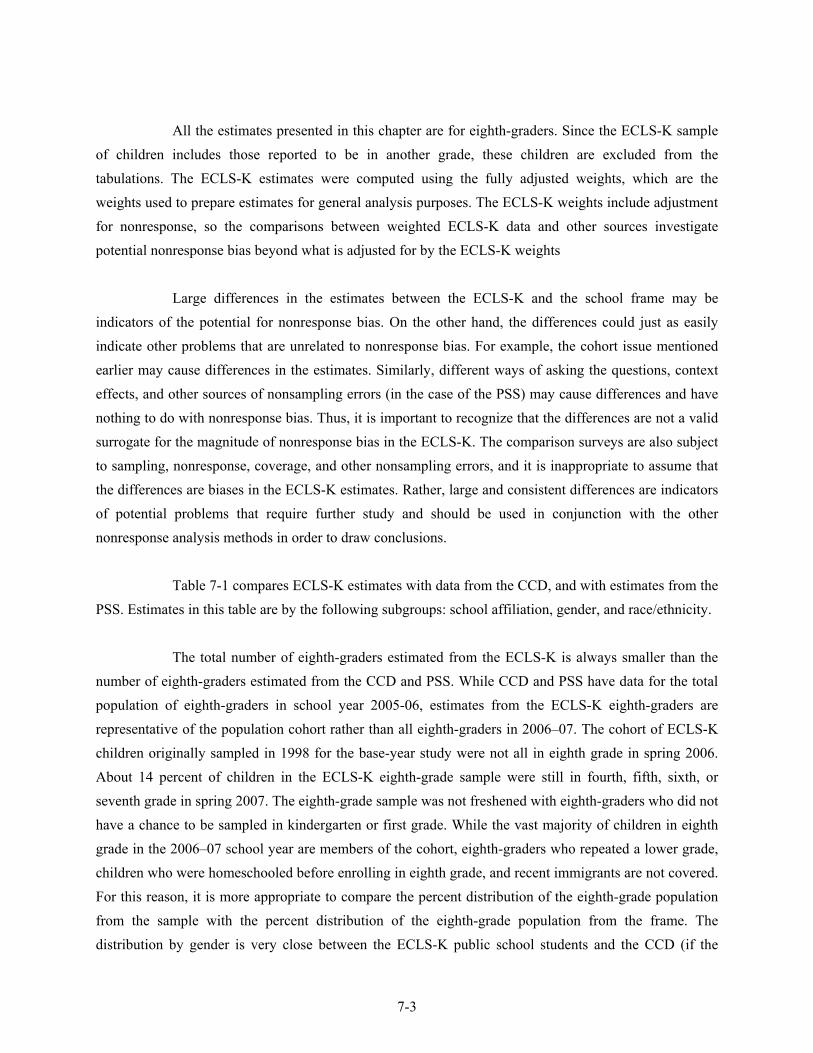
7-3
All the estimates presented in this chapter are for eighth-graders. Since the ECLS-K sample of children includes those reported to be in another grade, these children are excluded from the tabulations. The ECLS-K estimates were computed using the fully adjusted weights, which are the weights used to prepare estimates for general analysis purposes. The ECLS-K weights include adjustment for nonresponse, so the comparisons between weighted ECLS-K data and other sources investigate potential nonresponse bias beyond what is adjusted for by the ECLS-K weights
Large differences in the estimates between the ECLS-K and the school frame may be
indicators of the potential for nonresponse bias. On the other hand, the differences could just as easily indicate other problems that are unrelated to nonresponse bias. For example, the cohort issue mentioned earlier may cause differences in the estimates. Similarly, different ways of asking the questions, context effects, and other sources of nonsampling errors (in the case of the PSS) may cause differences and have nothing to do with nonresponse bias. Thus, it is important to recognize that the differences are not a valid surrogate for the magnitude of nonresponse bias in the ECLS-K. The comparison surveys are also subject to sampling, nonresponse, coverage, and other nonsampling errors, and it is inappropriate to assume that the differences are biases in the ECLS-K estimates. Rather, large and consistent differences are indicators of potential problems that require further study and should be used in conjunction with the other nonresponse analysis methods in order to draw conclusions.
Table 7-1 compares ECLS-K estimates with data from the CCD, and with estimates from the
PSS. Estimates in this table are by the following subgroups: school affiliation, gender, and race/ethnicity. The total number of eighth-graders estimated from the ECLS-K is always smaller than the
number of eighth-graders estimated from the CCD and PSS. While CCD and PSS have data for the total population of eighth-graders in school year 2005-06, estimates from the ECLS-K eighth-graders are representative of the population cohort rather than all eighth-graders in 2006–07. The cohort of ECLS-K children originally sampled in 1998 for the base-year study were not all in eighth grade in spring 2006. About 14 percent of children in the ECLS-K eighth-grade sample were still in fourth, fifth, sixth, or seventh grade in spring 2007. The eighth-grade sample was not freshened with eighth-graders who did not have a chance to be sampled in kindergarten or first grade. While the vast majority of children in eighth grade in the 2006–07 school year are members of the cohort, eighth-graders who repeated a lower grade, children who were homeschooled before enrolling in eighth grade, and recent immigrants are not covered. For this reason, it is more appropriate to compare the percent distribution of the eighth-grade population from the sample with the percent distribution of the eighth-grade population from the frame. The distribution by gender is very close between the ECLS-K public school students and the CCD (if the
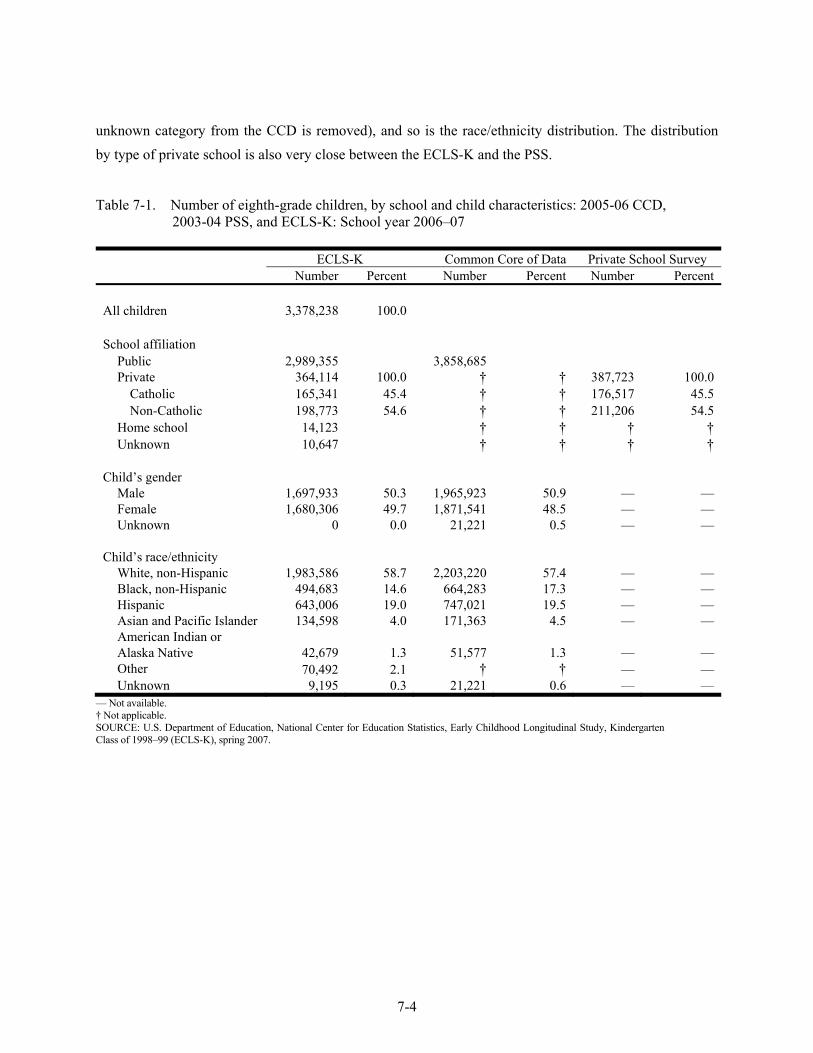
7-4
unknown category from the CCD is removed), and so is the race/ethnicity distribution. The distribution by type of private school is also very close between the ECLS-K and the PSS. Table 7-1. Number of eighth-grade children, by school and child characteristics: 2005-06 CCD,
2003-04 PSS, and ECLS-K: School year 2006–07
ECLS-K Common Core of Data Private School Survey Number Percent Number Percent Number Percent All children 3,378,238 100.0 School affiliation
Public 2,989,355 3,858,685 Private 364,114 100.0 † † 387,723 100.0
Catholic 165,341 45.4 † † 176,517 45.5 Non-Catholic 198,773 54.6 † † 211,206 54.5
Home school 14,123 † † † † Unknown 10,647 † † † †
Child’s gender Male 1,697,933 50.3 1,965,923 50.9 — — Female 1,680,306 49.7 1,871,541 48.5 — — Unknown 0 0.0 21,221 0.5 — —
Child’s race/ethnicity White, non-Hispanic 1,983,586 58.7 2,203,220 57.4 — — Black, non-Hispanic 494,683 14.6 664,283 17.3 — — Hispanic 643,006 19.0 747,021 19.5 — — Asian and Pacific Islander 134,598 4.0 171,363 4.5 — — American Indian or Alaska Native 42,679 1.3 51,577 1.3 — — Other 70,492 2.1 † † — — Unknown 9,195 0.3 21,221 0.6 — —
— Not available. † Not applicable. SOURCE: U.S. Department of Education, National Center for Education Statistics, Early Childhood Longitudinal Study, Kindergarten Class of 1998–99 (ECLS-K), spring 2007.
7-5
7.2 Multivariate Analysis
The Chi-Square Automatic Interaction Detector (CHAID) was used to identify where nonresponse bias may exist but does not provide a measure of the bias. It looked at the relationship of variables with known values for both respondents and nonrespondents, namely all background characteristics for schools and children. They are variables that are available for each round, and if the child was a nonrespondent for that round, then data were taken from the previous round. CHAID is a classification algorithm that uses chi-square tests to divide the sample into subgroups that are related to whether the unit responds.
The analysis in CHAID begins by dividing the sample into two or more groups based on the
categories of the best predictor of response. Each of these groups is divided into smaller subgroups based on the available predictors at each level. The splitting process continues until no statistically significant predictor remains. The CHAID software displays the final subgroups in the form of a tree diagram with branches that correspond to the groups, showing all potential response predictors. The resulting classification tree reveals the response cells, as defined by combination of variables, which identify cells with the lowest response rate. In other words, CHAID divides the sample into cells so that the response rate within cells is as constant as possible, while the response rate between cells is as different as possible.
The response indicators used in CHAID are school characteristics (census region, school
affiliation, type of locale, total enrollment, and percent minority enrollment) and child characteristics (mover status, year of birth, gender, race/ethnicity, and socioeconomic status (SES). These characteristics were chosen because they are known for both respondents and nonrespondents. Exhibits 7-1 to 7-8 show the CHAID trees when the response status for each instrument is analyzed together with these response indicators. For example, in exhibit 7-1, each box represents a group of children with specified characteristics, the weighted completion rate and the number of eighth-graders with completed assessment. The first branch of the tree shows that the percent minority enrollment in the school is the first indicator that was used to divide the child assessment into two groups with response patterns that are different from each other (with significance level of .05). The response rates in the two groups are 93.3 percent (7,949 respondents) in schools with less than 90 percent minority enrollment, and 89.6 percent (1,332 respondents) in schools with 90 percent or more percent minority enrollment. In the next branch of the tree, assessed children can be further split into two groups with different response pattern by mover status. Movers in schools with lower minority enrollment can be next divided by race/ethnicity while movers in schools with higher minority enrollment can be divided by type of locale. Thus, the tree continues and ends after the sample was divided into 25 cells with varying response patterns. Reading
7-6
exhibit 7-1 from left to right shows the most significant to the least significant variable in the CHAID tree. Reading exhibit 7-1 from right to left shows that, for example, cell 1 (very different from other cells 2 to 25) consists of 4,244 respondents in public schools or school of unknown type, who are White, who are movers, and who are in schools with less than 90 percent minority enrollment.
Exhibits 7-1 to 7-3 show the CHAID trees for the child assessment, parent interview, and
student questionnaire, respectively. All five of the school characteristics show up in the trees for child assessment and student questionnaires as significant predictors of response pattern: school type, school size, percent minority enrollment, census region and type of locale, though percent minority enrollment is more prevalent than the other characteristics. For the parent interview, only three of the five school characteristics are significant predictors. Percent minority enrollment and school size are not predictors of response patterns. This is to be expected since the parent interview is done independent of the school where the child attended. For the child instruments and the parent interview, mover status is the most dominant while other characteristics also play a role. Race/ethnicity and SES are strong predictors while age and gender only appear sporadically. The strongest predictor for the parent interview is the SES, followed by mover status. In all, the child assessment has 25 cells with distinct response pattern, while the parent interview has 26 cells and the student questionnaire has 22 cells.
Exhibits 7-4 to 7-8 show the CHAID trees for the school and teacher instruments. For these
instruments, all the school and child characteristics described earlier were used in the analysis but only the school characteristics appear as strong predictors of response. In all instruments, the first branch in the tree is census region showing that response varies by geography, though not with very large difference among the response rates. The children in schools in the Midwest have the highest response rates for these instruments. Percent minority enrollment and type of locale are at the next level of significance (with school size at the same level only for the school administrator questionnaire). The numbers of response cells are 39 for the school administrator questionnaire, 26 for the teacher-level questionnaire, 20 for the child-level English teacher questionnaire, 12 for the child-level mathematics teacher questionnaire, and 16 for child-level science teacher questionnaire. The number of cells is smaller for the mathematics and science questionnaires because these instruments were administered to only each half of the sample of children.
Potential nonresponse bias that may exist is likely to have been lessened by the weighting
adjustment procedures described in chapter 8. School affiliation, type of locale, census region, gender, age, race/ethnicity and SES were used as raking dimensions in the last step of the weighting procedures for all weights.
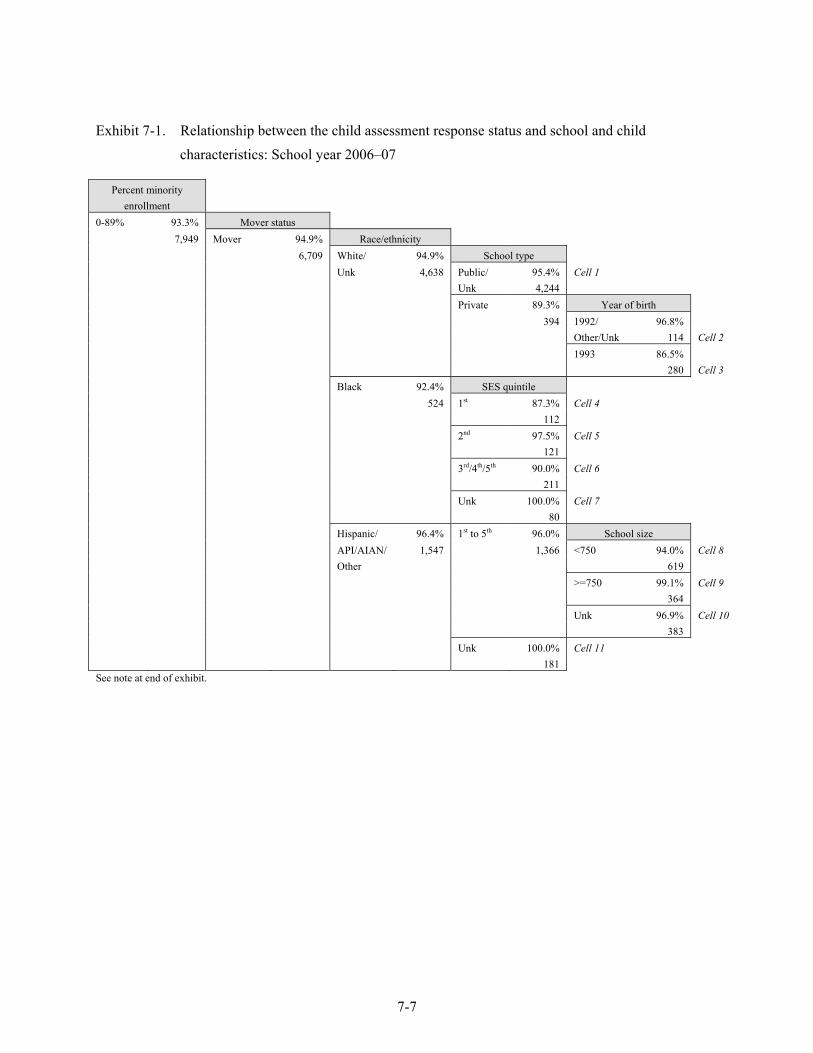
7-7
Exhibit 7-1. Relationship between the child assessment response status and school and child characteristics: School year 2006–07
Percent minority
enrollment
0-89% 93.3% Mover status 7,949 Mover 94.9% Race/ethnicity 6,709 White/ 94.9% School type Unk 4,638 Public/ 95.4% Cell 1 Unk 4,244 Private 89.3% Year of birth 394 1992/ 96.8% Other/Unk 114 Cell 2 1993 86.5% 280 Cell 3 Black 92.4% SES quintile 524 1st 87.3% Cell 4 112 2nd 97.5% Cell 5 121 3rd/4th/5th 90.0% Cell 6 211 Unk 100.0% Cell 7 80 Hispanic/ 96.4% 1st to 5th 96.0% School size API/AIAN/ 1,547 1,366 <750 94.0% Cell 8 Other 619 >=750 99.1% Cell 9 364 Unk 96.9% Cell 10 383 Unk 100.0% Cell 11 181 See note at end of exhibit.
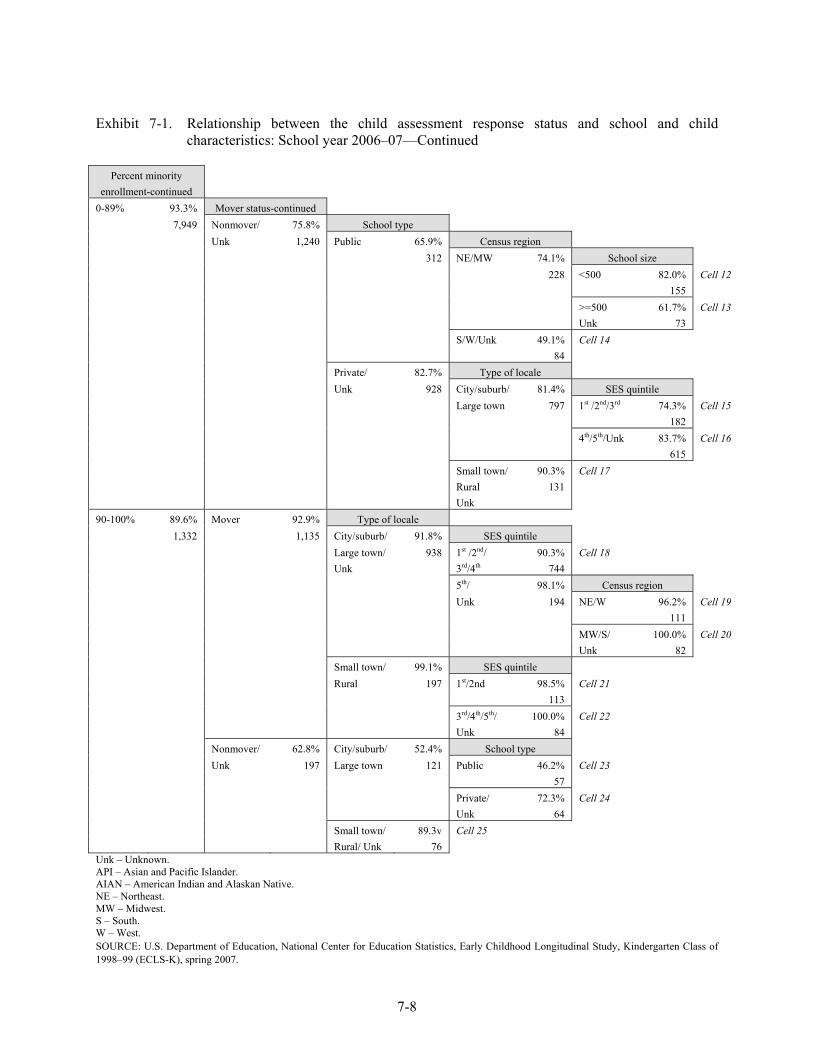
7-8
Exhibit 7-1. Relationship between the child assessment response status and school and child characteristics: School year 2006–07—Continued
Percent minority
enrollment-continued
0-89% 93.3% Mover status-continued 7,949 Nonmover/ 75.8% School type Unk 1,240 Public 65.9% Census region 312 NE/MW 74.1% School size 228 <500 82.0% Cell 12 155 >=500 61.7% Cell 13 Unk 73 S/W/Unk 49.1% Cell 14 84 Private/ 82.7% Type of locale Unk 928 City/suburb/ 81.4% SES quintile Large town 797 1st /2nd/3rd 74.3% Cell 15 182 4th/5th/Unk 83.7% Cell 16 615 Small town/ 90.3% Cell 17 Rural 131 Unk 90-100% 89.6% Mover 92.9% Type of locale 1,332 1,135 City/suburb/ 91.8% SES quintile Large town/ 938 1st /2nd/ 90.3% Cell 18 Unk 3rd/4th 744 5th/ 98.1% Census region Unk 194 NE/W 96.2% Cell 19 111 MW/S/ 100.0% Cell 20 Unk 82 Small town/ 99.1% SES quintile Rural 197 1st/2nd 98.5% Cell 21 113 3rd/4th/5th/ 100.0% Cell 22 Unk 84 Nonmover/ 62.8% City/suburb/ 52.4% School type Unk 197 Large town 121 Public 46.2% Cell 23 57 Private/ 72.3% Cell 24 Unk 64 Small town/ 89.3v Cell 25 Rural/ Unk 76 Unk – Unknown. API – Asian and Pacific Islander. AIAN – American Indian and Alaskan Native. NE – Northeast. MW – Midwest. S – South. W – West. SOURCE: U.S. Department of Education, National Center for Education Statistics, Early Childhood Longitudinal Study, Kindergarten Class of 1998–99 (ECLS-K), spring 2007.
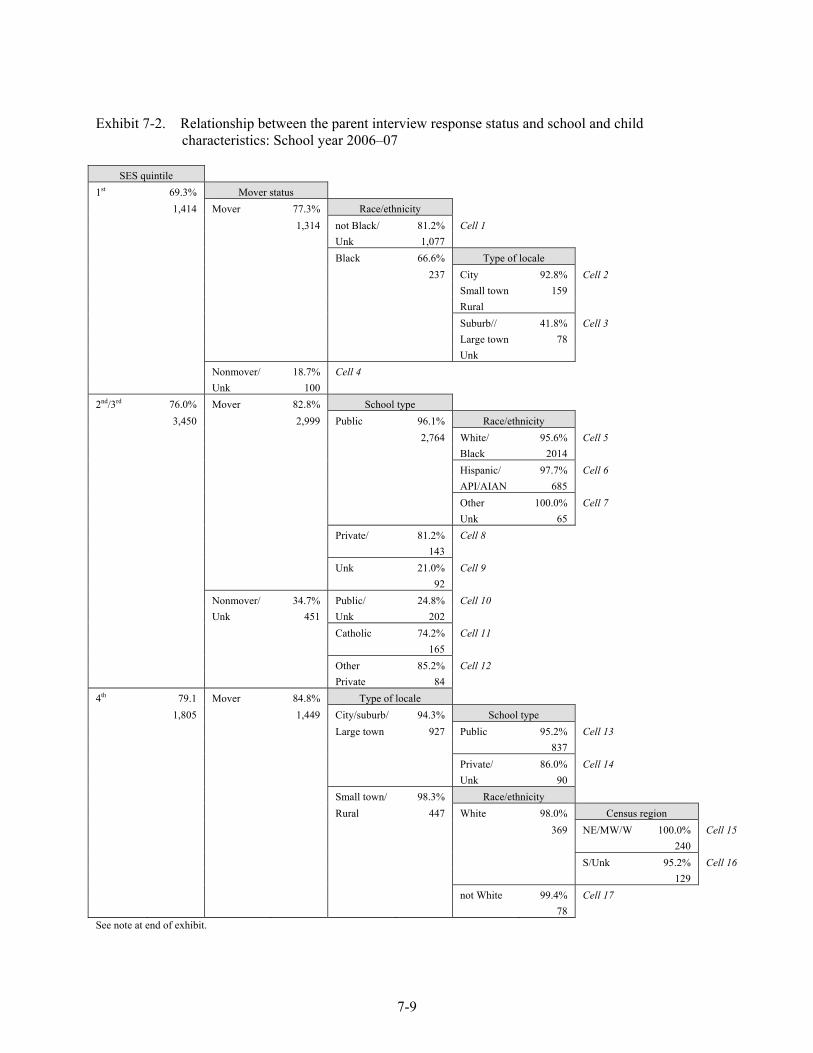
7-9
Exhibit 7-2. Relationship between the parent interview response status and school and child characteristics: School year 2006–07
SES quintile
1st 69.3% Mover status 1,414 Mover 77.3% Race/ethnicity 1,314 not Black/ 81.2% Cell 1 Unk 1,077 Black 66.6% Type of locale 237 City 92.8% Cell 2 Small town 159 Rural Suburb// 41.8% Cell 3 Large town 78 Unk Nonmover/ 18.7% Cell 4 Unk 100 2nd/3rd 76.0% Mover 82.8% School type 3,450 2,999 Public 96.1% Race/ethnicity 2,764 White/ 95.6% Cell 5 Black 2014 Hispanic/ 97.7% Cell 6 API/AIAN 685 Other 100.0% Cell 7 Unk 65 Private/ 81.2% Cell 8 143 Unk 21.0% Cell 9 92 Nonmover/ 34.7% Public/ 24.8% Cell 10 Unk 451 Unk 202 Catholic 74.2% Cell 11 165 Other 85.2% Cell 12 Private 84 4th 79.1 Mover 84.8% Type of locale 1,805 1,449 City/suburb/ 94.3% School type Large town 927 Public 95.2% Cell 13 837 Private/ 86.0% Cell 14 Unk 90 Small town/ 98.3% Race/ethnicity Rural 447 White 98.0% Census region 369 NE/MW/W 100.0% Cell 15 240 S/Unk 95.2% Cell 16 129 not White 99.4% Cell 17 78 See note at end of exhibit.
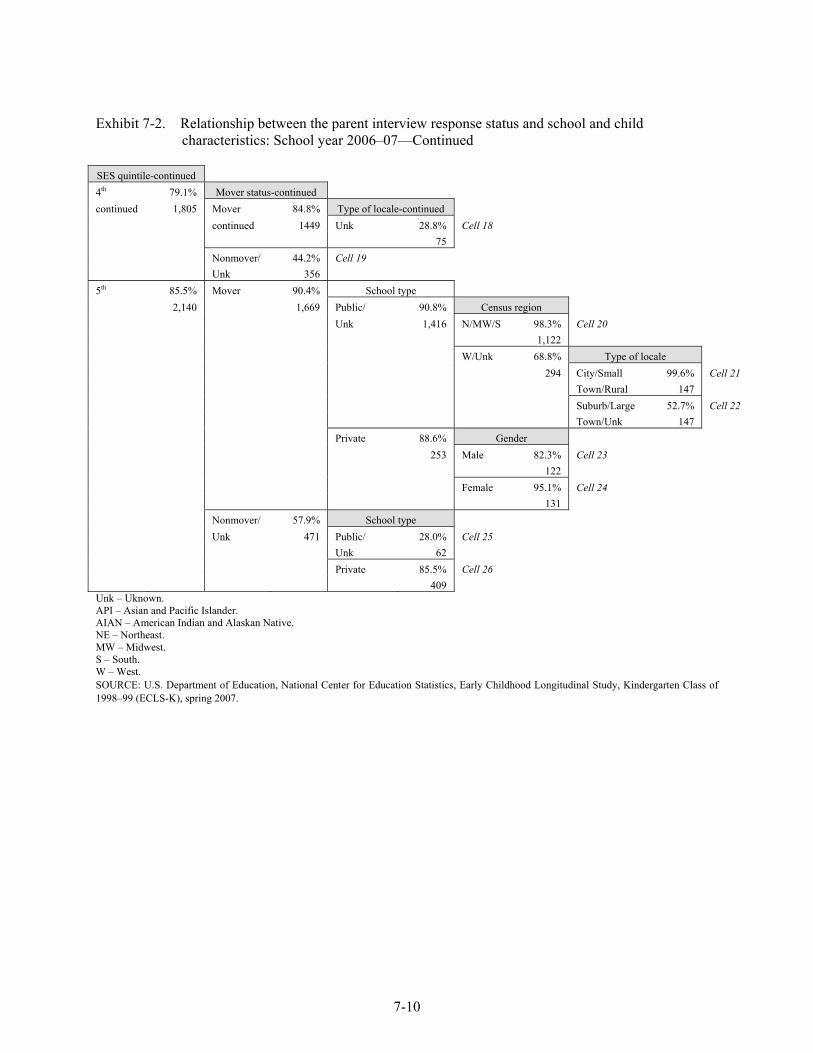
7-10
Exhibit 7-2. Relationship between the parent interview response status and school and child characteristics: School year 2006–07—Continued
SES quintile-continued 4th 79.1% Mover status-continued continued 1,805 Mover 84.8% Type of locale-continued continued 1449 Unk 28.8% Cell 18 75 Nonmover/ 44.2% Cell 19 Unk 356 5th 85.5% Mover 90.4% School type 2,140 1,669 Public/ 90.8% Census region Unk 1,416 N/MW/S 98.3% Cell 20 1,122 W/Unk 68.8% Type of locale 294 City/Small 99.6% Cell 21 Town/Rural 147 Suburb/Large 52.7% Cell 22 Town/Unk 147 Private 88.6% Gender 253 Male 82.3% Cell 23 122 Female 95.1% Cell 24 131 Nonmover/ 57.9% School type Unk 471 Public/ 28.0% Cell 25 Unk 62 Private 85.5% Cell 26 409 Unk – Uknown. API – Asian and Pacific Islander. AIAN – American Indian and Alaskan Native. NE – Northeast. MW – Midwest. S – South. W – West. SOURCE: U.S. Department of Education, National Center for Education Statistics, Early Childhood Longitudinal Study, Kindergarten Class of 1998–99 (ECLS-K), spring 2007.
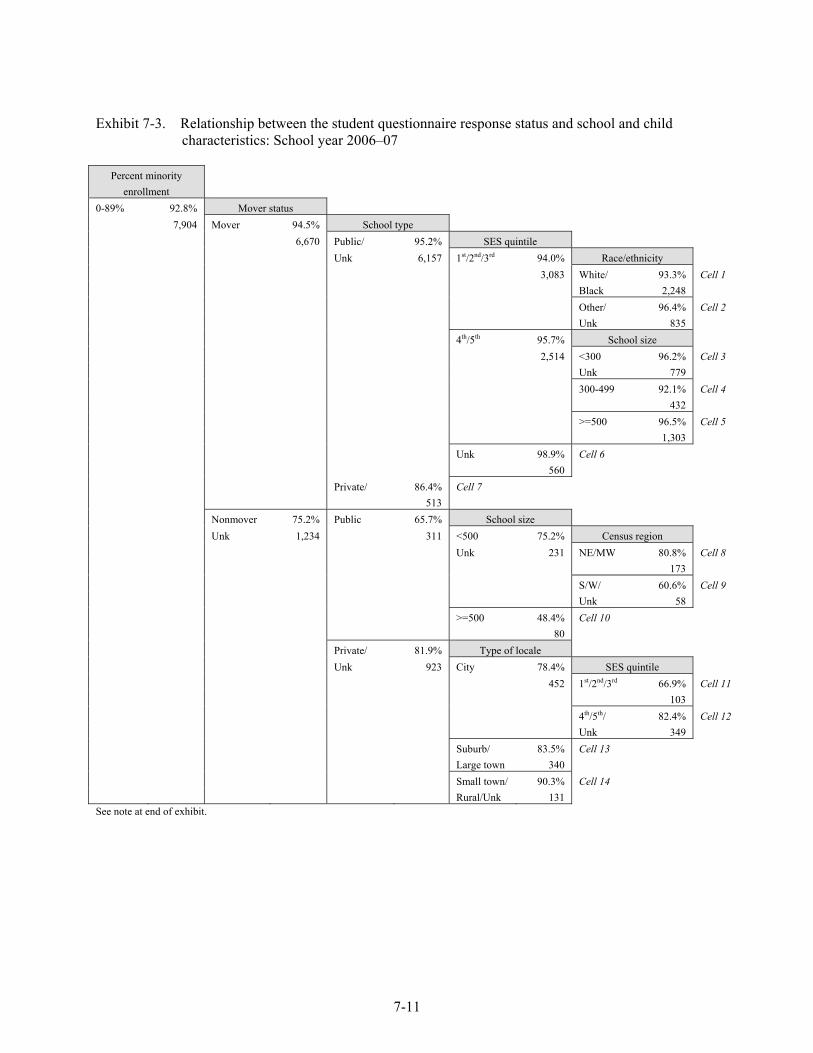
7-11
Exhibit 7-3. Relationship between the student questionnaire response status and school and child characteristics: School year 2006–07
Percent minority
enrollment
0-89% 92.8% Mover status 7,904 Mover 94.5% School type 6,670 Public/ 95.2% SES quintile Unk 6,157 1st/2nd/3rd 94.0% Race/ethnicity 3,083 White/ 93.3% Cell 1 Black 2,248 Other/ 96.4% Cell 2 Unk 835 4th/5th 95.7% School size 2,514 <300 96.2% Cell 3 Unk 779 300-499 92.1% Cell 4 432 >=500 96.5% Cell 5 1,303 Unk 98.9% Cell 6 560 Private/ 86.4% Cell 7 513 Nonmover 75.2% Public 65.7% School size Unk 1,234 311 <500 75.2% Census region Unk 231 NE/MW 80.8% Cell 8 173 S/W/ 60.6% Cell 9 Unk 58 >=500 48.4% Cell 10 80 Private/ 81.9% Type of locale Unk 923 City 78.4% SES quintile 452 1st/2nd/3rd 66.9% Cell 11 103 4th/5th/ 82.4% Cell 12 Unk 349 Suburb/ 83.5% Cell 13 Large town 340 Small town/ 90.3% Cell 14 Rural/Unk 131 See note at end of exhibit.
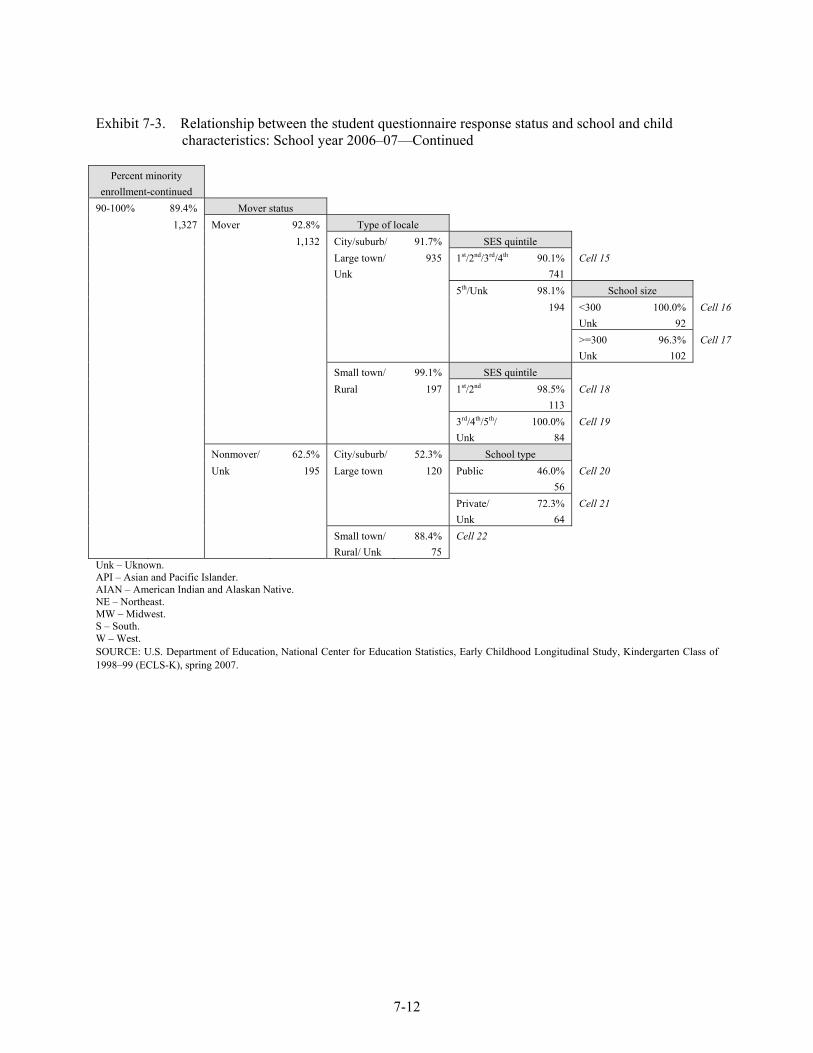
7-12
Exhibit 7-3. Relationship between the student questionnaire response status and school and child characteristics: School year 2006–07—Continued
Percent minority
enrollment-continued
90-100% 89.4% Mover status 1,327 Mover 92.8% Type of locale 1,132 City/suburb/ 91.7% SES quintile Large town/ 935 1st/2nd/3rd/4th 90.1% Cell 15 Unk 741 5th/Unk 98.1% School size 194 <300 100.0% Cell 16 Unk 92 >=300 96.3% Cell 17 Unk 102 Small town/ 99.1% SES quintile Rural 197 1st/2nd 98.5% Cell 18 113 3rd/4th/5th/ 100.0% Cell 19 Unk 84 Nonmover/ 62.5% City/suburb/ 52.3% School type Unk 195 Large town 120 Public 46.0% Cell 20 56 Private/ 72.3% Cell 21 Unk 64 Small town/ 88.4% Cell 22 Rural/ Unk 75 Unk – Uknown. API – Asian and Pacific Islander. AIAN – American Indian and Alaskan Native. NE – Northeast. MW – Midwest. S – South. W – West. SOURCE: U.S. Department of Education, National Center for Education Statistics, Early Childhood Longitudinal Study, Kindergarten Class of 1998–99 (ECLS-K), spring 2007.
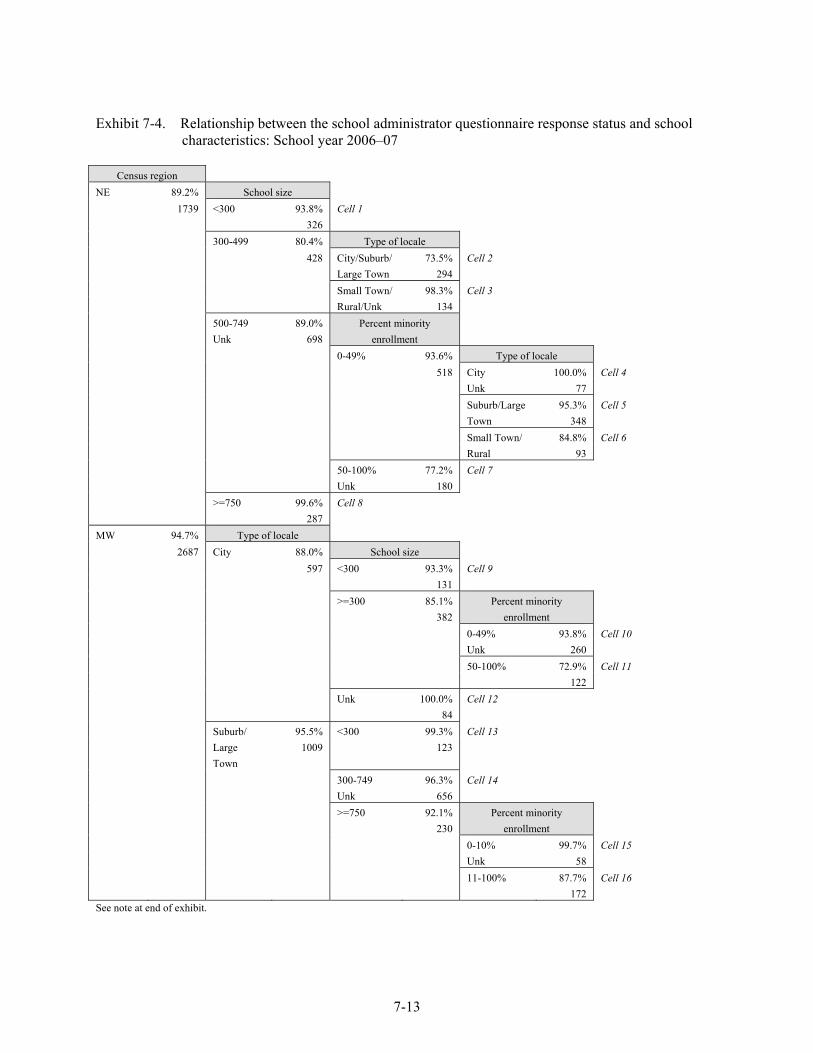
7-13
Exhibit 7-4. Relationship between the school administrator questionnaire response status and school characteristics: School year 2006–07
Census region
NE 89.2% School size 1739 <300 93.8% Cell 1 326 300-499 80.4% Type of locale 428 City/Suburb/ 73.5% Cell 2 Large Town 294 Small Town/ 98.3% Cell 3 Rural/Unk 134 500-749
Unk 89.0%
698 Percent minority
enrollment
0-49% 93.6% Type of locale 518 City 100.0% Cell 4 Unk 77 Suburb/Large 95.3% Cell 5 Town 348 Small Town/ 84.8% Cell 6 Rural 93 50-100% 77.2% Cell 7 Unk 180 >=750 99.6% Cell 8 287 MW 94.7% Type of locale 2687 City 88.0% School size 597 <300 93.3% Cell 9 131 >=300 85.1%
382 Percent minority
enrollment
0-49% 93.8% Cell 10 Unk 260 50-100% 72.9% Cell 11 122 Unk 100.0% Cell 12 84 Suburb/ 95.5% <300 99.3% Cell 13 Large
Town 1009 123
300-749 96.3% Cell 14 Unk 656 >=750 92.1%
230 Percent minority
enrollment
0-10% 99.7% Cell 15 Unk 58 11-100% 87.7% Cell 16 172 See note at end of exhibit.
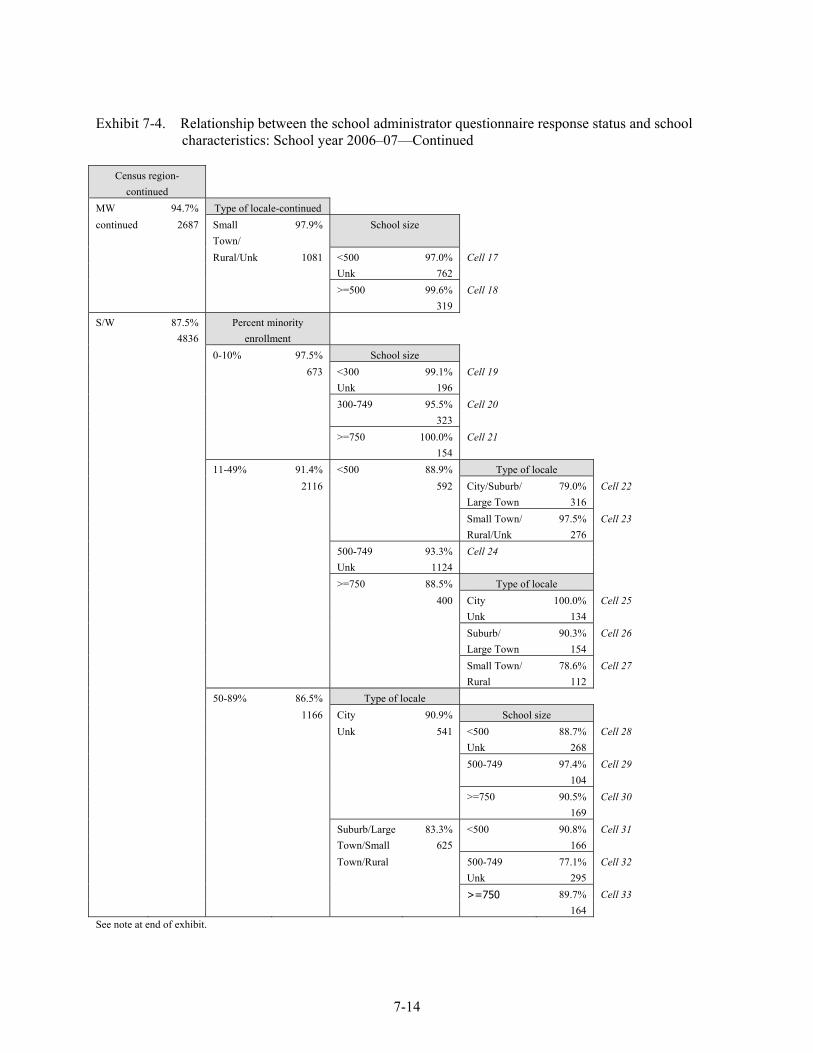
7-14
Exhibit 7-4. Relationship between the school administrator questionnaire response status and school characteristics: School year 2006–07—Continued
Census region-
continued
MW 94.7% Type of locale-continued continued 2687 Small
Town/ 97.9% School size
Rural/Unk 1081 <500 97.0% Cell 17 Unk 762 >=500 99.6% Cell 18 319 S/W 87.5%
4836 Percent minority
enrollment
0-10% 97.5% School size 673 <300 99.1% Cell 19 Unk 196 300-749 95.5% Cell 20 323 >=750 100.0% Cell 21 154 11-49% 91.4% <500 88.9% Type of locale 2116 592 City/Suburb/ 79.0% Cell 22 Large Town 316 Small Town/ 97.5% Cell 23 Rural/Unk 276 500-749 93.3% Cell 24 Unk 1124 >=750 88.5% Type of locale 400 City 100.0% Cell 25 Unk 134 Suburb/ 90.3% Cell 26 Large Town 154 Small Town/ 78.6% Cell 27 Rural 112 50-89% 86.5% Type of locale 1166 City 90.9% School size Unk 541 <500 88.7% Cell 28 Unk 268 500-749 97.4% Cell 29 104 >=750 90.5% Cell 30 169 Suburb/Large 83.3% <500 90.8% Cell 31 Town/Small 625 166 Town/Rural 500-749 77.1% Cell 32 Unk 295 >=750 89.7% Cell 33 164 See note at end of exhibit.
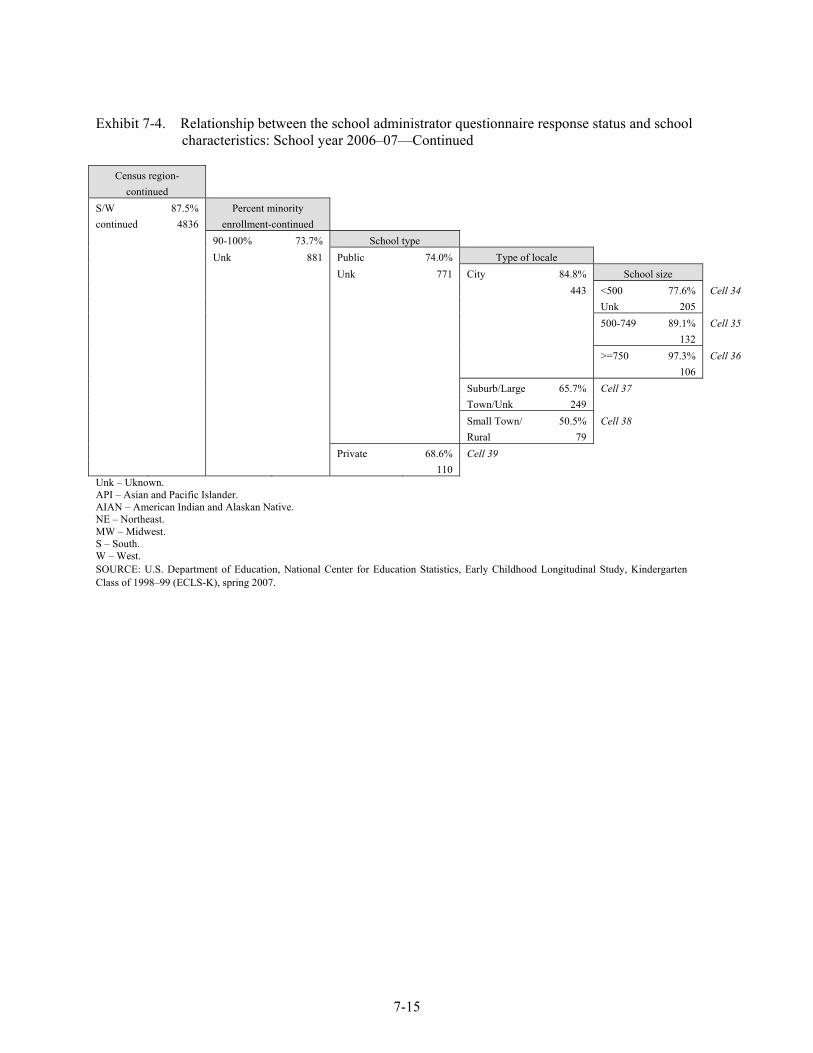
7-15
Exhibit 7-4. Relationship between the school administrator questionnaire response status and school characteristics: School year 2006–07—Continued
Census region-
continued
S/W continued
87.5% 4836
Percent minority enrollment-continued
90-100% 73.7% School type Unk 881 Public 74.0% Type of locale Unk 771 City 84.8% School size 443 <500 77.6% Cell 34 Unk 205 500-749 89.1% Cell 35 132 >=750 97.3% Cell 36 106 Suburb/Large 65.7% Cell 37 Town/Unk 249 Small Town/ 50.5% Cell 38 Rural 79 Private 68.6% Cell 39 110 Unk – Uknown. API – Asian and Pacific Islander. AIAN – American Indian and Alaskan Native. NE – Northeast. MW – Midwest. S – South. W – West. SOURCE: U.S. Department of Education, National Center for Education Statistics, Early Childhood Longitudinal Study, Kindergarten Class of 1998–99 (ECLS-K), spring 2007.
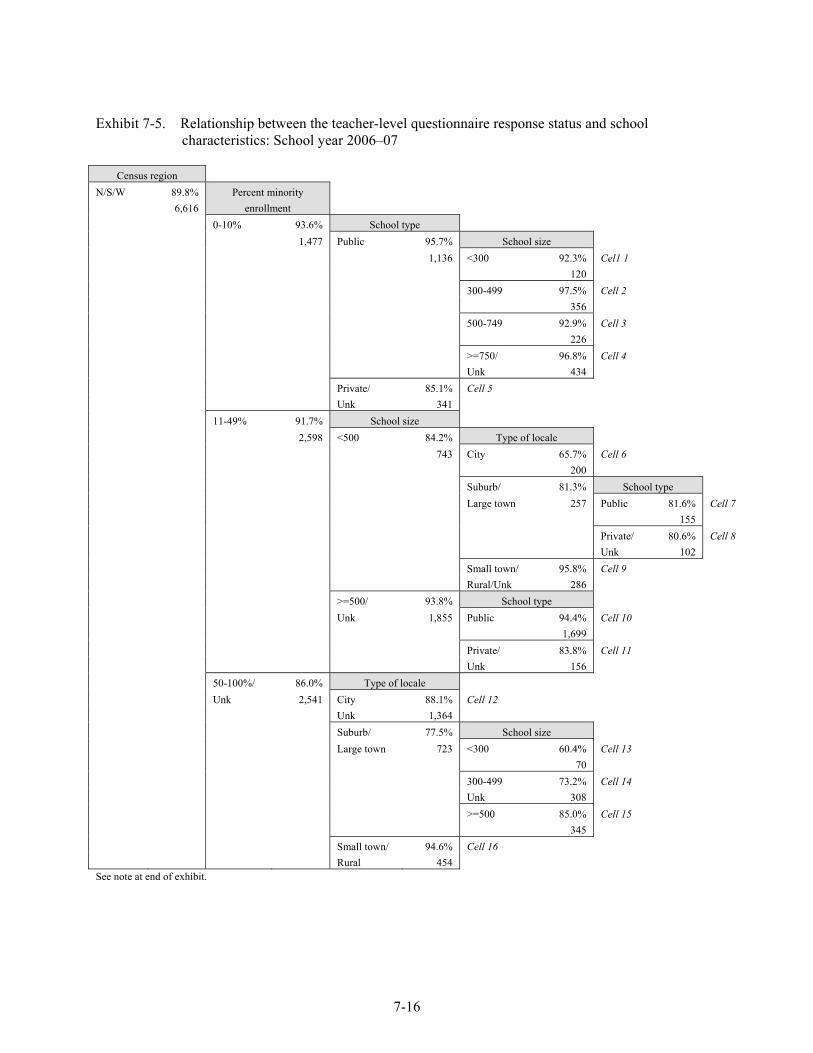
7-16
Exhibit 7-5. Relationship between the teacher-level questionnaire response status and school characteristics: School year 2006–07
Census region
N/S/W 89.8% 6,616
Percent minority enrollment
0-10% 93.6% School type 1,477 Public 95.7% School size 1,136 <300 92.3% Cel1 1 120 300-499 97.5% Cell 2 356 500-749 92.9% Cell 3 226 >=750/ 96.8% Cell 4 Unk 434 Private/ 85.1% Cell 5 Unk 341 11-49% 91.7% School size 2,598 <500 84.2% Type of locale 743 City 65.7% Cell 6 200 Suburb/ 81.3% School type Large town 257 Public 81.6% Cell 7 155 Private/ 80.6% Cell 8 Unk 102 Small town/ 95.8% Cell 9 Rural/Unk 286 >=500/ 93.8% School type Unk 1,855 Public 94.4% Cell 10 1,699 Private/ 83.8% Cell 11 Unk 156 50-100%/ 86.0% Type of locale Unk 2,541 City 88.1% Cell 12 Unk 1,364 Suburb/ 77.5% School size Large town 723 <300 60.4% Cell 13 70 300-499 73.2% Cell 14 Unk 308 >=500 85.0% Cell 15 345 Small town/ 94.6% Cell 16 Rural 454 See note at end of exhibit.
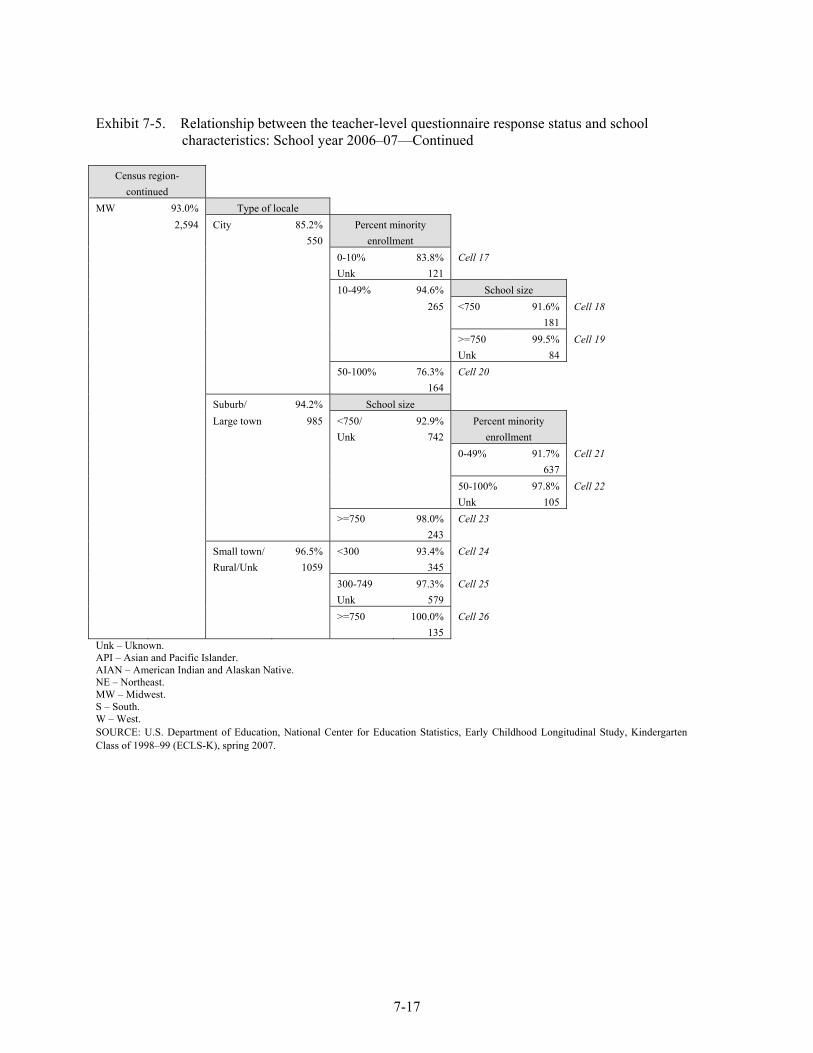
7-17
Exhibit 7-5. Relationship between the teacher-level questionnaire response status and school characteristics: School year 2006–07—Continued
Census region-
continued
MW 93.0% Type of locale 2,594 City 85.2%
550 Percent minority
enrollment
0-10% 83.8% Cell 17 Unk 121 10-49% 94.6% School size 265 <750 91.6% Cell 18 181 >=750 99.5% Cell 19 Unk 84 50-100% 76.3% Cell 20 164 Suburb/ 94.2% School size Large town 985 <750/
Unk 92.9%
742 Percent minority
enrollment
0-49% 91.7% Cell 21 637 50-100% 97.8% Cell 22 Unk 105 >=750 98.0% Cell 23 243 Small town/ 96.5% <300 93.4% Cell 24 Rural/Unk 1059 345 300-749 97.3% Cell 25 Unk 579 >=750 100.0% Cell 26 135 Unk – Uknown. API – Asian and Pacific Islander. AIAN – American Indian and Alaskan Native. NE – Northeast. MW – Midwest. S – South. W – West. SOURCE: U.S. Department of Education, National Center for Education Statistics, Early Childhood Longitudinal Study, Kindergarten Class of 1998–99 (ECLS-K), spring 2007.
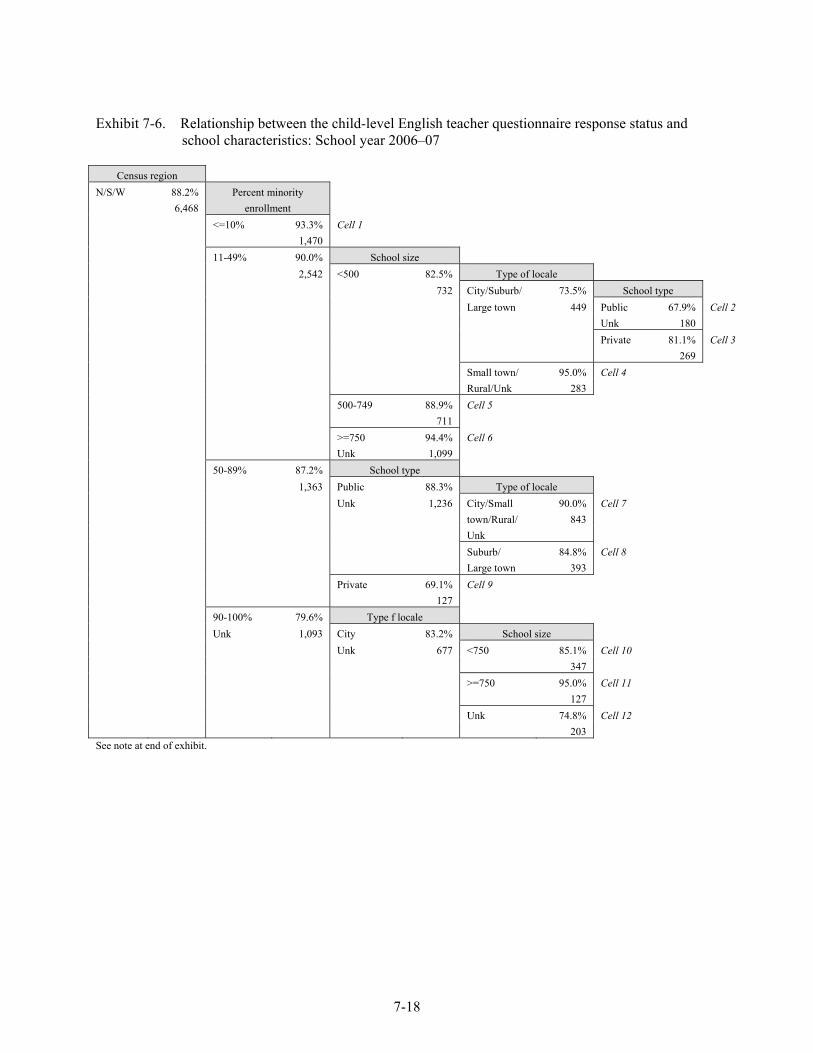
7-18
Exhibit 7-6. Relationship between the child-level English teacher questionnaire response status and school characteristics: School year 2006–07
Census region
N/S/W 88.2% 6,468
Percent minority enrollment
<=10% 93.3% Cell 1 1,470 11-49% 90.0% School size 2,542 <500 82.5% Type of locale 732 City/Suburb/ 73.5% School type Large town 449 Public 67.9% Cell 2 Unk 180 Private 81.1% Cell 3 269 Small town/ 95.0% Cell 4 Rural/Unk 283 500-749 88.9% Cell 5 711 >=750 94.4% Cell 6 Unk 1,099 50-89% 87.2% School type 1,363 Public 88.3% Type of locale Unk 1,236 City/Small
town/Rural/ 90.0%
843 Cell 7
Unk Suburb/ 84.8% Cell 8 Large town 393 Private 69.1% Cell 9 127 90-100% 79.6% Type f locale Unk 1,093 City 83.2% School size Unk 677 <750 85.1% Cell 10 347 >=750 95.0% Cell 11 127 Unk 74.8% Cell 12 203 See note at end of exhibit.
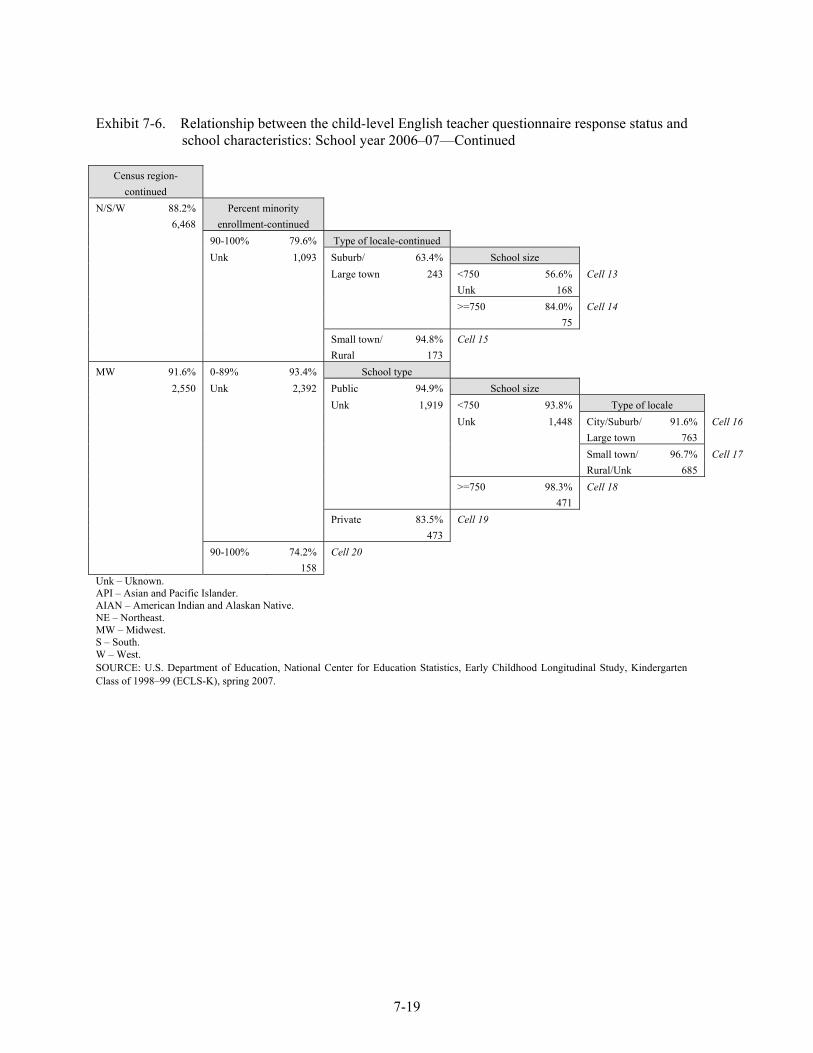
7-19
Exhibit 7-6. Relationship between the child-level English teacher questionnaire response status and school characteristics: School year 2006–07—Continued
Census region-
continued
N/S/W 88.2% 6,468
Percent minority enrollment-continued
90-100% 79.6% Type of locale-continued Unk 1,093 Suburb/ 63.4% School size Large town 243 <750 56.6% Cell 13 Unk 168 >=750 84.0% Cell 14 75 Small town/ 94.8% Cell 15 Rural 173 MW 91.6% 0-89% 93.4% School type 2,550 Unk 2,392 Public 94.9% School size Unk 1,919 <750 93.8% Type of locale Unk 1,448 City/Suburb/ 91.6% Cell 16 Large town 763 Small town/ 96.7% Cell 17 Rural/Unk 685 >=750 98.3% Cell 18 471 Private 83.5% Cell 19 473 90-100% 74.2% Cell 20 158 Unk – Uknown. API – Asian and Pacific Islander. AIAN – American Indian and Alaskan Native. NE – Northeast. MW – Midwest. S – South. W – West. SOURCE: U.S. Department of Education, National Center for Education Statistics, Early Childhood Longitudinal Study, Kindergarten Class of 1998–99 (ECLS-K), spring 2007.
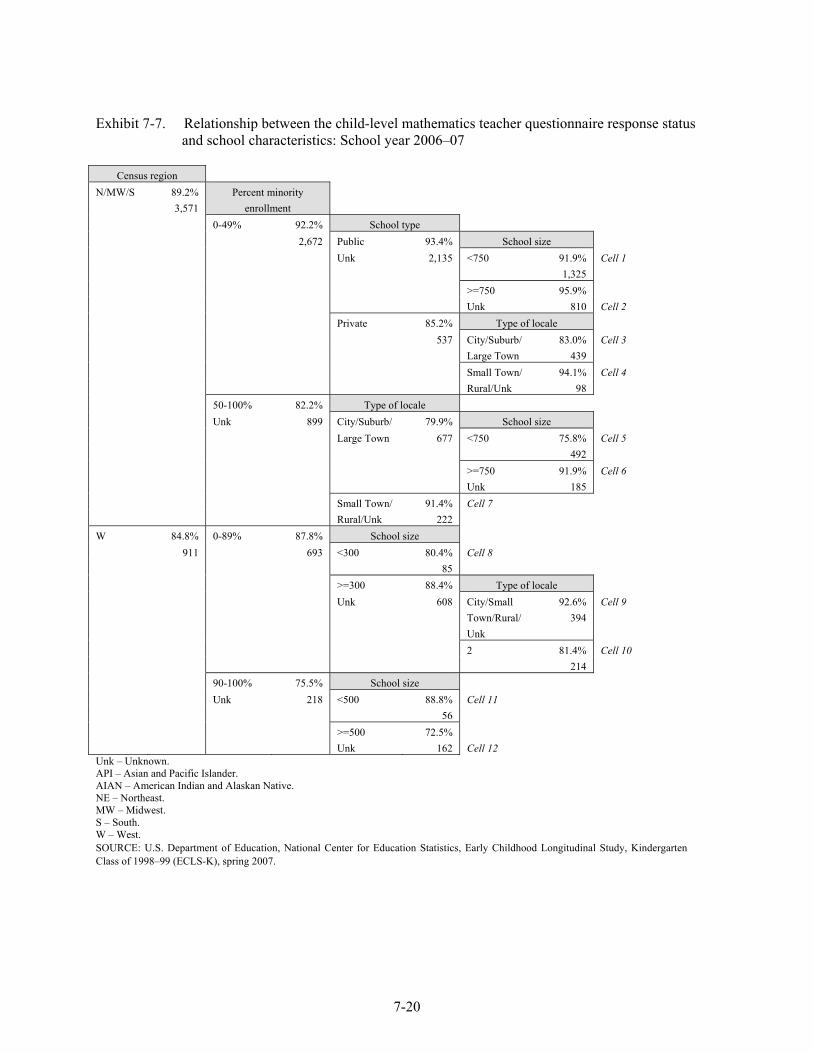
7-20
Exhibit 7-7. Relationship between the child-level mathematics teacher questionnaire response status and school characteristics: School year 2006–07
Census region
N/MW/S 89.2% 3,571
Percent minority enrollment
0-49% 92.2% School type 2,672 Public 93.4% School size Unk 2,135 <750 91.9% Cell 1 1,325 >=750 95.9% Unk 810 Cell 2 Private 85.2% Type of locale 537 City/Suburb/ 83.0% Cell 3 Large Town 439 Small Town/ 94.1% Cell 4 Rural/Unk 98 50-100% 82.2% Type of locale Unk 899 City/Suburb/ 79.9% School size Large Town 677 <750 75.8% Cell 5 492 >=750 91.9% Cell 6 Unk 185 Small Town/ 91.4% Cell 7 Rural/Unk 222 W 84.8% 0-89% 87.8% School size 911 693 <300 80.4% Cell 8 85 >=300 88.4% Type of locale Unk 608 City/Small 92.6% Cell 9 Town/Rural/
Unk 394
2 81.4% Cell 10 214 90-100% 75.5% School size Unk 218 <500 88.8% Cell 11 56 >=500 72.5% Unk 162 Cell 12 Unk – Unknown. API – Asian and Pacific Islander. AIAN – American Indian and Alaskan Native. NE – Northeast. MW – Midwest. S – South. W – West. SOURCE: U.S. Department of Education, National Center for Education Statistics, Early Childhood Longitudinal Study, Kindergarten Class of 1998–99 (ECLS-K), spring 2007.
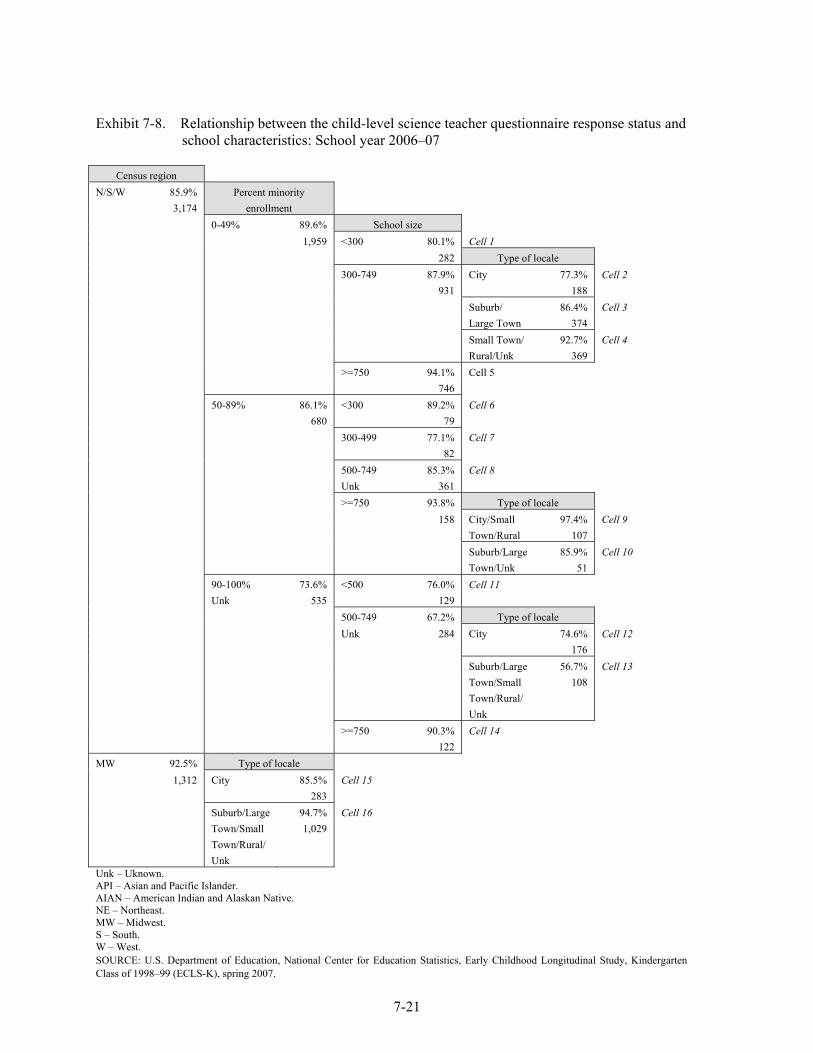
7-21
Exhibit 7-8. Relationship between the child-level science teacher questionnaire response status and school characteristics: School year 2006–07
Census region
N/S/W 85.9% 3,174
Percent minority enrollment
0-49% 89.6% School size 1,959 <300 80.1% Cell 1 282 Type of locale 300-749 87.9% City 77.3% Cell 2 931 188 Suburb/ 86.4% Cell 3 Large Town 374 Small Town/ 92.7% Cell 4 Rural/Unk 369 >=750 94.1% Cell 5 746 50-89% 86.1% <300 89.2% Cell 6 680 79 300-499 77.1% Cell 7 82 500-749 85.3% Cell 8 Unk 361 >=750 93.8% Type of locale 158 City/Small 97.4% Cell 9 Town/Rural 107 Suburb/Large 85.9% Cell 10 Town/Unk 51 90-100% 73.6% <500 76.0% Cell 11 Unk 535 129 500-749 67.2% Type of locale Unk 284 City 74.6% Cell 12 176 Suburb/Large 56.7% Cell 13 Town/Small
Town/Rural/ Unk
108
>=750 90.3% Cell 14 122 MW 92.5% Type of locale 1,312 City 85.5% Cell 15 283 Suburb/Large 94.7% Cell 16 Town/Small
Town/Rural/ Unk
1,029
Unk – Uknown. API – Asian and Pacific Islander. AIAN – American Indian and Alaskan Native. NE – Northeast. MW – Midwest. S – South. W – West. SOURCE: U.S. Department of Education, National Center for Education Statistics, Early Childhood Longitudinal Study, Kindergarten Class of 1998–99 (ECLS-K), spring 2007.
7-22
7.3 Attrition Bias
This section examines the effect of nonresponse due to attrition in the ECLS-K by comparing estimates from the base-year respondents to estimates computed using only respondents in spring-eighth grade with their appropriate weights. This method is related to the methods used in the base year of ECLS-K by Brick and Bose (2001) and in the first grade by Bose and West (2002). The idea is to assess attrition bias by isolating the effect of attrition from the other sources of differences in the estimates. To do this, the same base-year data are used, and the only differences are in the survey weights and the smaller number of respondents available in spring-eighth grade. This method gives a direct and easily interpreted measure of nonresponse bias due to the additional nonresponse arising from the loss in the sample size since the base year. For example, estimates of a child-level characteristics such as a base-year test score are computed using all base-year respondents (with the appropriate base-year weight), and then the same estimates are computed again using only the data from eighth-grade respondents and the weights developed for this smaller group of respondents. The difference between the two estimates is an estimate of attrition bias due to the higher level of nonresponse in the eighth-grade sample
Base-year estimates. The base-year weight was used to estimate characteristics for the base-
year respondents. The form of the estimate is ∑= iiby ywy , where wi is the base-year weight adjusted only for base-year nonresponse for respondent i and yi is the value reported in the base year for respondent i. The base-year weight includes all the school- and child-level adjustments for base-year nonresponse, but no other adjustments. The number of respondents for the base-year estimates is 21,192 children.
Adjusted estimates. The spring-eighth grade estimate was computed using only the respondents in spring-eighth grade, and written as ∑= i
*irak ywy , where *
iw is the spring-eighth grade final weight (i.e., base-year weight adjusted for first-grade sample freshening, fifth-grade mover subsampling, and eighth-grade nonresponse, then raked), yi is the value reported in the base year for respondent i as defined above, and the sum is over all spring-eighth grade respondents.
Attrition bias was estimated by the difference between the spring-eighth grade estimate and
the base year estimate, namely byrakrak yyb −= . This is a direct estimate of the attrition bias in the eighth-grade estimate since it uses the same responses, the observed eighth-grade respondent set, and the weights used to produce eighth-grade estimates. The most serious limitation of rakb as an estimate of bias is that the true bias should be based on eighth-grade responses rather than base-year responses but such a statistic is not available, and rakb is a very reasonable estimate of attrition bias in most cases.
7-23
The spring-eighth grade adjusted estimates were produced using the weights developed for
children who had completed assessment data or who were excluded from direct assessment due to a disability or who had completed student questionnaire data (C);
children who had completed parent interview data (P); and,
children who had completed assessment data (or excluded from direct assessment due to a disability) or who had completed student questionnaire data and parent interview data and teacher-level data (CPE).
The three weights were based on different numbers of respondents (see table 7-19). Estimates are for the base-year survey items in all the major instruments and from base-year respondents. The two types of estimates are percents and means. A total of 50 percents and means were estimated for each weight and each set of respondents. In addition, 13 assessment scores and Social Rating Scale (SRS) scores from parents and teachers were included in the analysis. Exhibit 7-9 lists the specific variables included and the instrument used to collect the item.
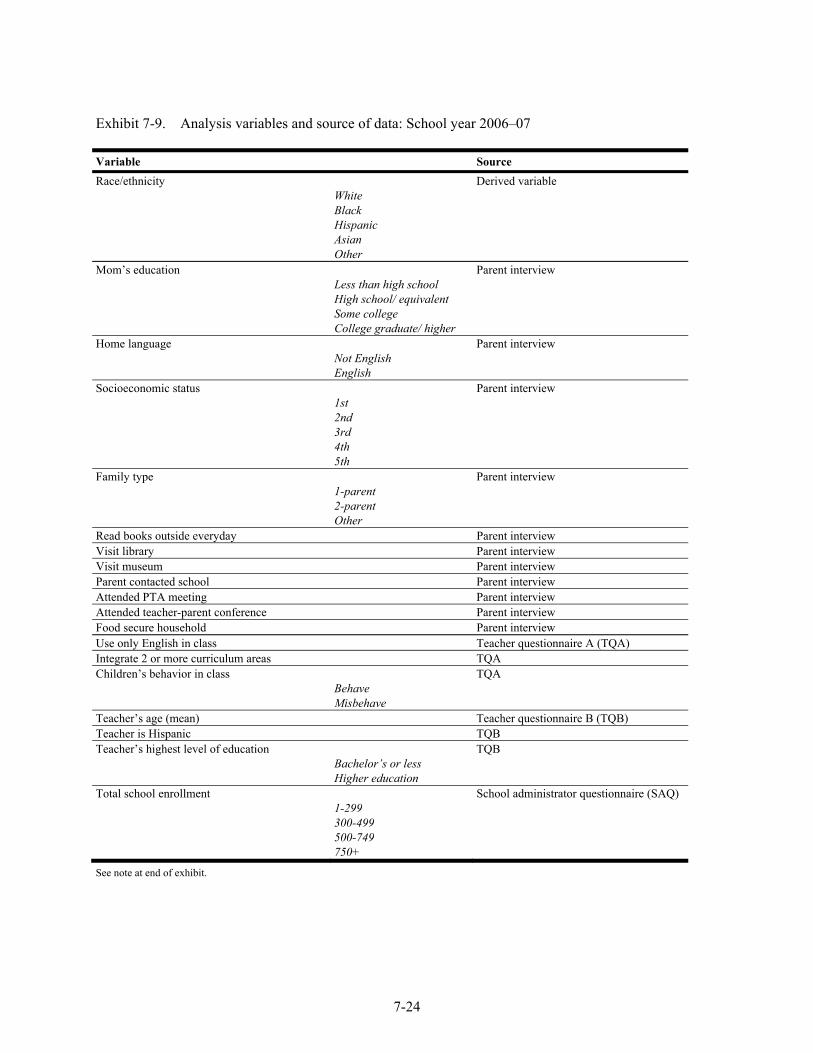
7-24
Exhibit 7-9. Analysis variables and source of data: School year 2006–07 Variable Source Race/ethnicity Derived variable White Black Hispanic Asian Other Mom’s education Parent interview Less than high school High school/ equivalent Some college College graduate/ higher Home language Parent interview Not English English Socioeconomic status Parent interview 1st 2nd 3rd 4th 5th Family type Parent interview 1-parent 2-parent Other Read books outside everyday Parent interview Visit library Parent interview Visit museum Parent interview Parent contacted school Parent interview Attended PTA meeting Parent interview Attended teacher-parent conference Parent interview Food secure household Parent interview Use only English in class Teacher questionnaire A (TQA) Integrate 2 or more curriculum areas TQA Children’s behavior in class TQA Behave Misbehave Teacher’s age (mean) Teacher questionnaire B (TQB) Teacher is Hispanic TQB Teacher’s highest level of education TQB Bachelor’s or less Higher education Total school enrollment School administrator questionnaire (SAQ) 1-299 300-499 500-749 750+
See note at end of exhibit.
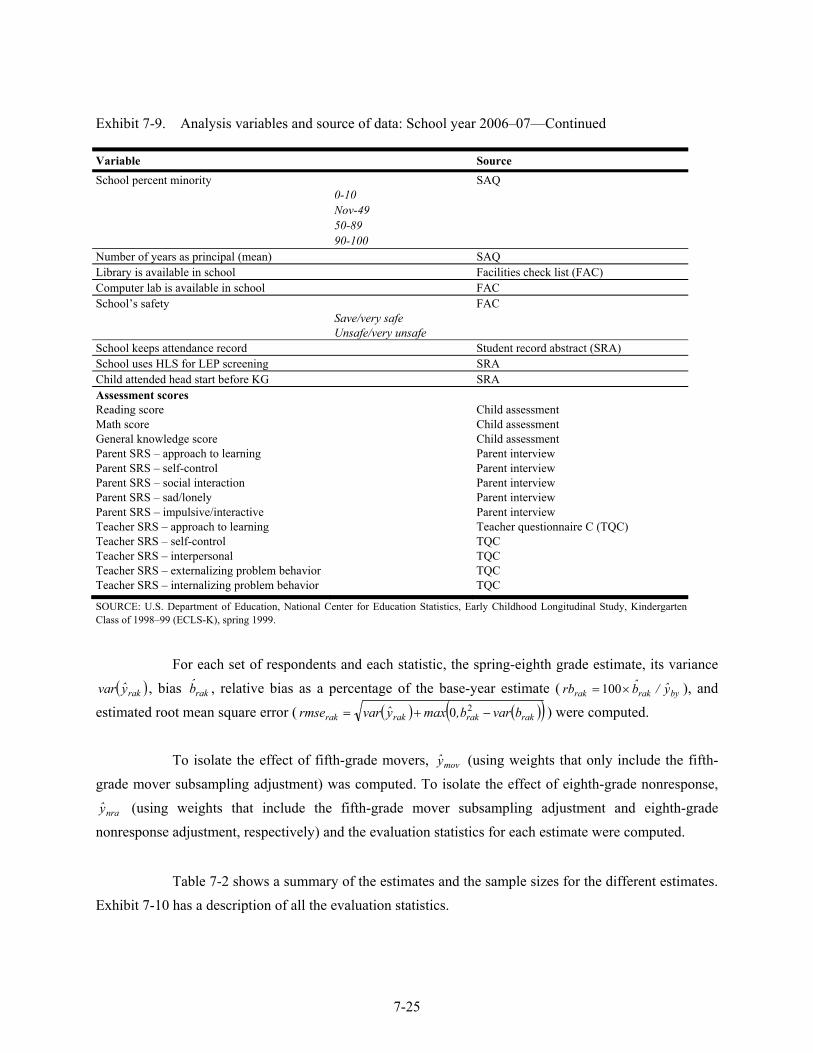
7-25
Exhibit 7-9. Analysis variables and source of data: School year 2006–07—Continued
Variable Source School percent minority SAQ 0-10 Nov-49 50-89 90-100 Number of years as principal (mean) SAQ Library is available in school Facilities check list (FAC) Computer lab is available in school FAC School’s safety FAC Save/very safe Unsafe/very unsafe School keeps attendance record Student record abstract (SRA) School uses HLS for LEP screening SRA Child attended head start before KG SRA Assessment scores Reading score Child assessment Math score Child assessment General knowledge score Child assessment Parent SRS – approach to learning Parent interview Parent SRS – self-control Parent interview Parent SRS – social interaction Parent interview Parent SRS – sad/lonely Parent interview Parent SRS – impulsive/interactive Parent interview Teacher SRS – approach to learning Teacher questionnaire C (TQC) Teacher SRS – self-control TQC Teacher SRS – interpersonal TQC Teacher SRS – externalizing problem behavior TQC Teacher SRS – internalizing problem behavior TQC
SOURCE: U.S. Department of Education, National Center for Education Statistics, Early Childhood Longitudinal Study, Kindergarten Class of 1998–99 (ECLS-K), spring 1999.
For each set of respondents and each statistic, the spring-eighth grade estimate, its variance
( )rakyvar , bias rakb , relative bias as a percentage of the base-year estimate ( byrakrak y/brb ×=100 ), and estimated root mean square error ( ( ) ( )( )rakrakrakrak bvarb,maxyvarrmse −+= 20 ) were computed.
To isolate the effect of fifth-grade movers, movy (using weights that only include the fifth-
grade mover subsampling adjustment) was computed. To isolate the effect of eighth-grade nonresponse,
nray (using weights that include the fifth-grade mover subsampling adjustment and eighth-grade nonresponse adjustment, respectively) and the evaluation statistics for each estimate were computed.
Table 7-2 shows a summary of the estimates and the sample sizes for the different estimates.
Exhibit 7-10 has a description of all the evaluation statistics.
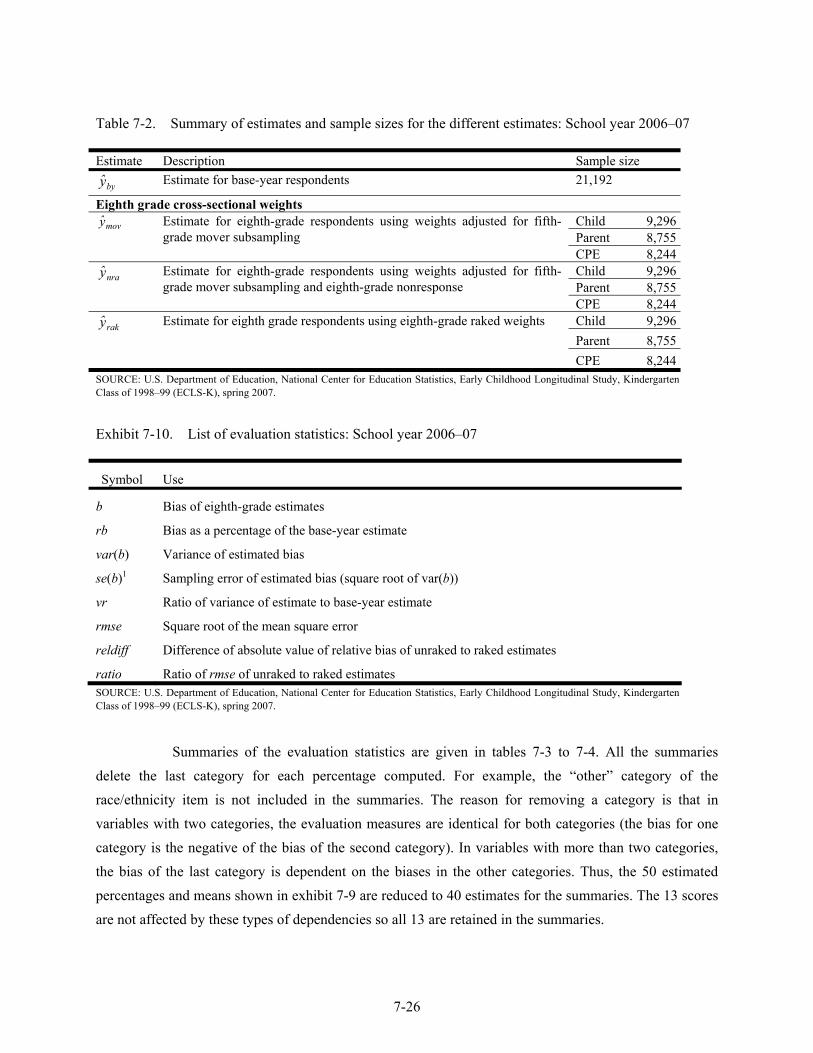
7-26
Table 7-2. Summary of estimates and sample sizes for the different estimates: School year 2006–07 Estimate Description Sample size
byy Estimate for base-year respondents 21,192
Eighth grade cross-sectional weights movy Estimate for eighth-grade respondents using weights adjusted for fifth-
grade mover subsampling Child 9,296Parent 8,755CPE 8,244
nray Estimate for eighth-grade respondents using weights adjusted for fifth-grade mover subsampling and eighth-grade nonresponse
Child 9,296Parent 8,755CPE 8,244
raky Estimate for eighth grade respondents using eighth-grade raked weights Child 9,296Parent 8,755CPE 8,244
SOURCE: U.S. Department of Education, National Center for Education Statistics, Early Childhood Longitudinal Study, Kindergarten Class of 1998–99 (ECLS-K), spring 2007. Exhibit 7-10. List of evaluation statistics: School year 2006–07
Symbol Use
b Bias of eighth-grade estimates
rb Bias as a percentage of the base-year estimate
var(b) Variance of estimated bias
se(b)1 Sampling error of estimated bias (square root of var(b))
vr Ratio of variance of estimate to base-year estimate
rmse Square root of the mean square error
reldiff Difference of absolute value of relative bias of unraked to raked estimates
ratio Ratio of rmse of unraked to raked estimates SOURCE: U.S. Department of Education, National Center for Education Statistics, Early Childhood Longitudinal Study, Kindergarten Class of 1998–99 (ECLS-K), spring 2007.
Summaries of the evaluation statistics are given in tables 7-3 to 7-4. All the summaries
delete the last category for each percentage computed. For example, the “other” category of the race/ethnicity item is not included in the summaries. The reason for removing a category is that in variables with two categories, the evaluation measures are identical for both categories (the bias for one category is the negative of the bias of the second category). In variables with more than two categories, the bias of the last category is dependent on the biases in the other categories. Thus, the 50 estimated percentages and means shown in exhibit 7-9 are reduced to 40 estimates for the summaries. The 13 scores are not affected by these types of dependencies so all 13 are retained in the summaries.
7-27
In table 7-3, the first row gives the mean and median sampling error for the base-year estimate. Since attrition bias is examined only from the base year, the attrition bias for this estimate is zero by definition. The following rows give the mean and median evaluation statistics that address fifth-grade mover subsampling, eighth-grade nonresponse, and eighth-grade raking. Theoretically, movy should
have no attrition bias because the weights were adjusted for the subsampling. However, the eighth-grade estimates show some bias, due mostly to the complex sampling scheme where persistent nonrespondents from earlier grades were excluded from fifth grade, and then excluded again from eighth grade, and since they were excluded, not much was known about their mover status, unless they were movers from before and continued to be classified as movers. Additionally, sample exclusion and subsampling of movers greatly reduces the sample size and increases the variability in the weights. As a result, the sampling error se and the root mean square error rmse for this estimate are greater than those for the base-year estimates. Nonresponse adjustment definitely reduces the bias, and raking produced the smallest bias. This is shown in the relative bias for the mean, and true for all estimates. Even though the estimates of absolute bias are given in these tables, the relative bias gives a better picture of bias since it shows the bias as a percent of the estimate. In table 7-3 the estimates using the child weight show a mean relative bias (rb) of -1.04 percent after mover subsampling adjustment; this was reduced to -0.36 percent after nonresponse adjustment, and reduced further to 0.04 percent after raking. This is true for all three weights in table 7-3. All relative biases are small, mostly less than 2 percent.
Tables 7-4 and 7-5 give the same summarization but separately for estimates of mean scores
and for estimates of percentages and means. In the case of the mean scores, the weighting adjustments work well for child and child-parent-teacher respondents (rb decreases after each adjustment), and less well for parent respondents (rb decreases after mover subsampling adjustment and nonresponse adjustment but increases after raking, though by a very small amount). In the case of other means and proportions, the weighting adjustments work well for all three sets of estimates.
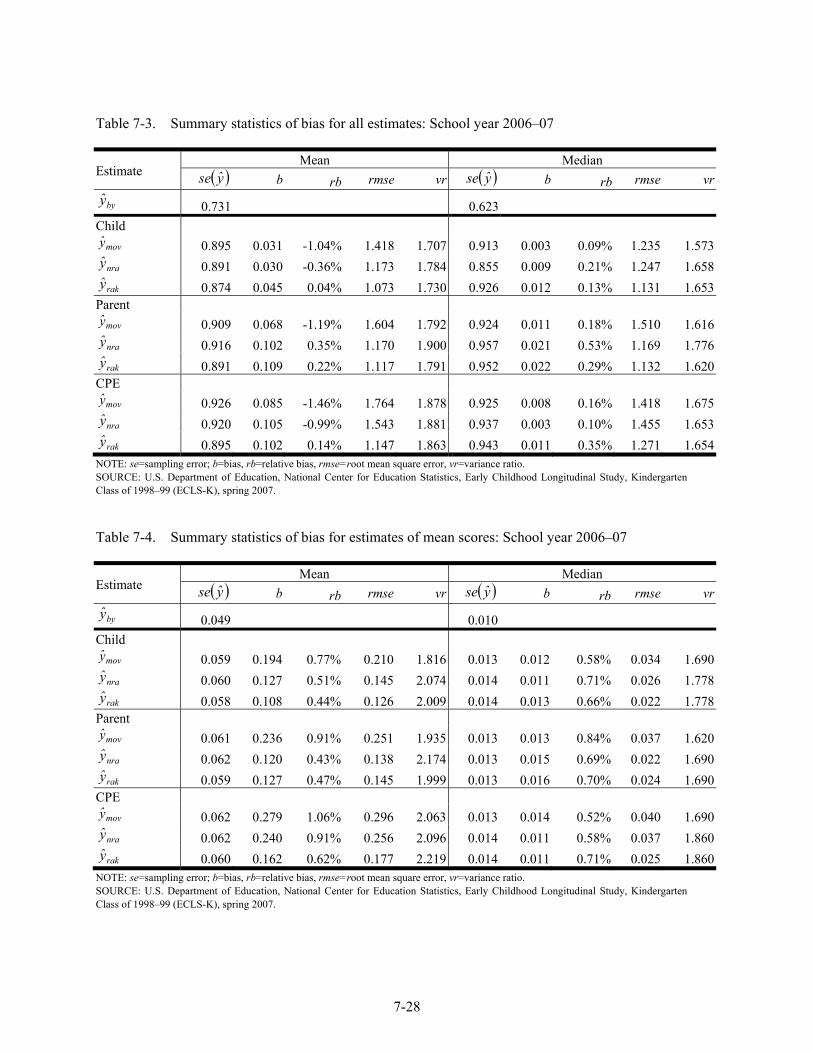
7-28
Table 7-3. Summary statistics of bias for all estimates: School year 2006–07
Estimate Mean Median
( )yse b rb rmse vr ( )yse b rb rmse vr
byy 0.731 0.623 Child
movy 0.895 0.031 -1.04% 1.418 1.707 0.913 0.003 0.09% 1.235 1.573nray 0.891 0.030 -0.36% 1.173 1.784 0.855 0.009 0.21% 1.247 1.658raky 0.874 0.045 0.04% 1.073 1.730 0.926 0.012 0.13% 1.131 1.653
Parent movy 0.909 0.068 -1.19% 1.604 1.792 0.924 0.011 0.18% 1.510 1.616nray 0.916 0.102 0.35% 1.170 1.900 0.957 0.021 0.53% 1.169 1.776raky 0.891 0.109 0.22% 1.117 1.791 0.952 0.022 0.29% 1.132 1.620
CPE movy 0.926 0.085 -1.46% 1.764 1.878 0.925 0.008 0.16% 1.418 1.675nray 0.920 0.105 -0.99% 1.543 1.881 0.937 0.003 0.10% 1.455 1.653raky 0.895 0.102 0.14% 1.147 1.863 0.943 0.011 0.35% 1.271 1.654
NOTE: se=sampling error; b=bias, rb=relative bias, rmse=root mean square error, vr=variance ratio. SOURCE: U.S. Department of Education, National Center for Education Statistics, Early Childhood Longitudinal Study, Kindergarten Class of 1998–99 (ECLS-K), spring 2007. Table 7-4. Summary statistics of bias for estimates of mean scores: School year 2006–07
Estimate Mean Median
( )yse b rb rmse vr ( )yse b rb rmse vr
byy 0.049 0.010 Child
movy 0.059 0.194 0.77% 0.210 1.816 0.013 0.012 0.58% 0.034 1.690nray 0.060 0.127 0.51% 0.145 2.074 0.014 0.011 0.71% 0.026 1.778raky 0.058 0.108 0.44% 0.126 2.009 0.014 0.013 0.66% 0.022 1.778
Parent movy 0.061 0.236 0.91% 0.251 1.935 0.013 0.013 0.84% 0.037 1.620nray 0.062 0.120 0.43% 0.138 2.174 0.013 0.015 0.69% 0.022 1.690 raky 0.059 0.127 0.47% 0.145 1.999 0.013 0.016 0.70% 0.024 1.690
CPE movy 0.062 0.279 1.06% 0.296 2.063 0.013 0.014 0.52% 0.040 1.690nray 0.062 0.240 0.91% 0.256 2.096 0.014 0.011 0.58% 0.037 1.860raky 0.060 0.162 0.62% 0.177 2.219 0.014 0.011 0.71% 0.025 1.860
NOTE: se=sampling error; b=bias, rb=relative bias, rmse=root mean square error, vr=variance ratio. SOURCE: U.S. Department of Education, National Center for Education Statistics, Early Childhood Longitudinal Study, Kindergarten Class of 1998–99 (ECLS-K), spring 2007.
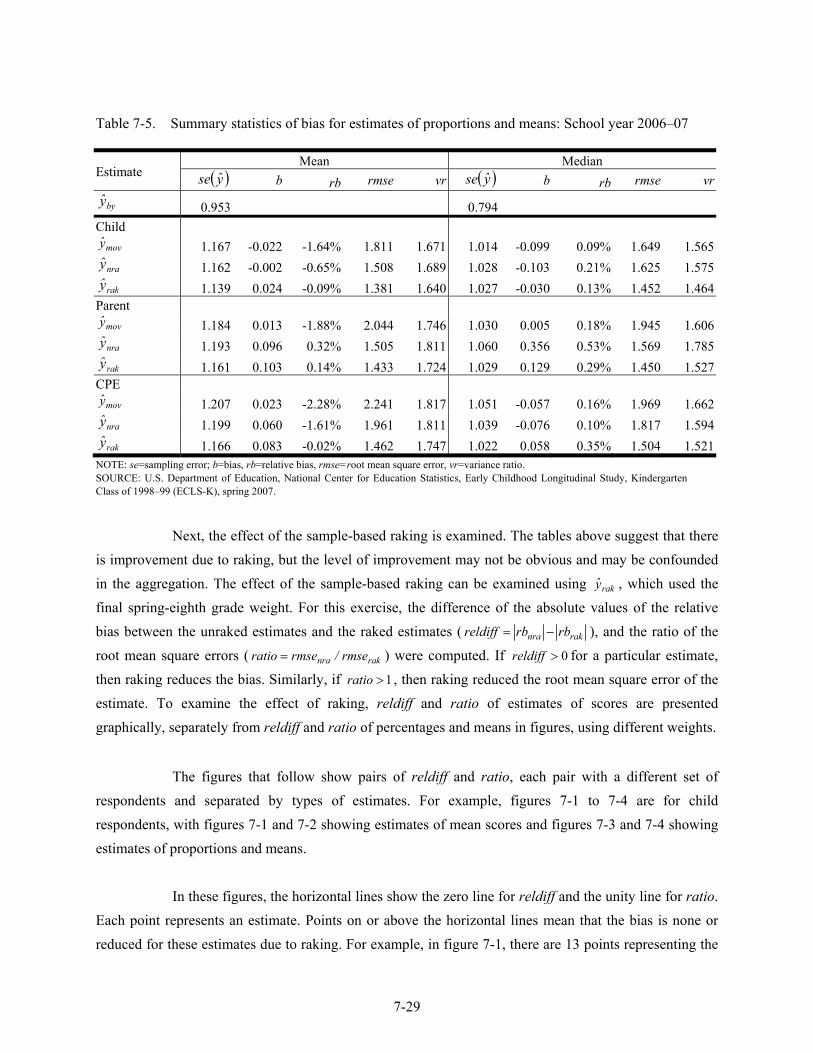
7-29
Table 7-5. Summary statistics of bias for estimates of proportions and means: School year 2006–07
Estimate Mean Median
( )yse b rb rmse vr ( )yse b rb rmse vr
byy 0.953 0.794 Child
movy 1.167 -0.022 -1.64% 1.811 1.671 1.014 -0.099 0.09% 1.649 1.565nray 1.162 -0.002 -0.65% 1.508 1.689 1.028 -0.103 0.21% 1.625 1.575raky 1.139 0.024 -0.09% 1.381 1.640 1.027 -0.030 0.13% 1.452 1.464
Parent movy 1.184 0.013 -1.88% 2.044 1.746 1.030 0.005 0.18% 1.945 1.606nray 1.193 0.096 0.32% 1.505 1.811 1.060 0.356 0.53% 1.569 1.785raky 1.161 0.103 0.14% 1.433 1.724 1.029 0.129 0.29% 1.450 1.527
CPE movy 1.207 0.023 -2.28% 2.241 1.817 1.051 -0.057 0.16% 1.969 1.662nray 1.199 0.060 -1.61% 1.961 1.811 1.039 -0.076 0.10% 1.817 1.594raky 1.166 0.083 -0.02% 1.462 1.747 1.022 0.058 0.35% 1.504 1.521
NOTE: se=sampling error; b=bias, rb=relative bias, rmse=root mean square error, vr=variance ratio. SOURCE: U.S. Department of Education, National Center for Education Statistics, Early Childhood Longitudinal Study, Kindergarten Class of 1998–99 (ECLS-K), spring 2007.
Next, the effect of the sample-based raking is examined. The tables above suggest that there
is improvement due to raking, but the level of improvement may not be obvious and may be confounded in the aggregation. The effect of the sample-based raking can be examined using raky , which used the final spring-eighth grade weight. For this exercise, the difference of the absolute values of the relative bias between the unraked estimates and the raked estimates ( raknra rbrbreldiff −= ), and the ratio of the root mean square errors ( raknra rmse/rmseratio = ) were computed. If 0>reldiff for a particular estimate, then raking reduces the bias. Similarly, if 1>ratio , then raking reduced the root mean square error of the estimate. To examine the effect of raking, reldiff and ratio of estimates of scores are presented graphically, separately from reldiff and ratio of percentages and means in figures, using different weights.
The figures that follow show pairs of reldiff and ratio, each pair with a different set of
respondents and separated by types of estimates. For example, figures 7-1 to 7-4 are for child respondents, with figures 7-1 and 7-2 showing estimates of mean scores and figures 7-3 and 7-4 showing estimates of proportions and means.
In these figures, the horizontal lines show the zero line for reldiff and the unity line for ratio.
Each point represents an estimate. Points on or above the horizontal lines mean that the bias is none or reduced for these estimates due to raking. For example, in figure 7-1, there are 13 points representing the
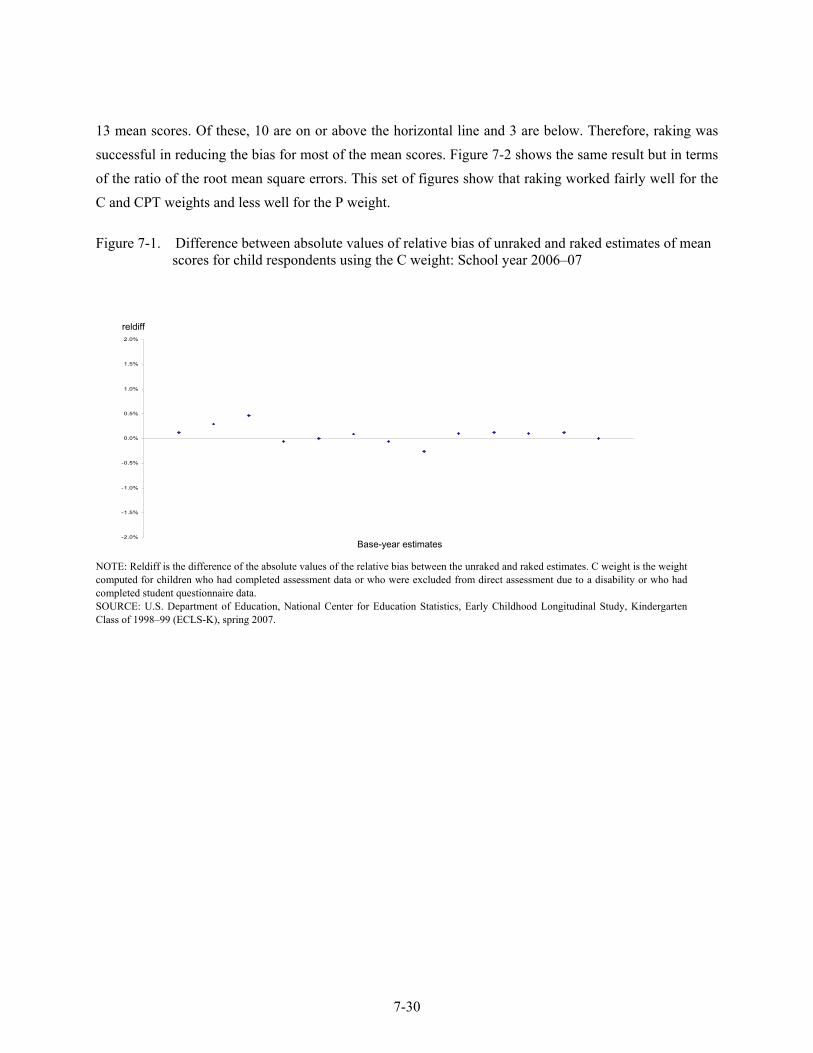
7-30
13 mean scores. Of these, 10 are on or above the horizontal line and 3 are below. Therefore, raking was successful in reducing the bias for most of the mean scores. Figure 7-2 shows the same result but in terms of the ratio of the root mean square errors. This set of figures show that raking worked fairly well for the C and CPT weights and less well for the P weight.
Figure 7-1. Difference between absolute values of relative bias of unraked and raked estimates of mean
scores for child respondents using the C weight: School year 2006–07
-2.0%
-1.5%
-1.0%
-0.5%
0.0%
0.5%
1.0%
1.5%
2.0%
NOTE: Reldiff is the difference of the absolute values of the relative bias between the unraked and raked estimates. C weight is the weight computed for children who had completed assessment data or who were excluded from direct assessment due to a disability or who had completed student questionnaire data. SOURCE: U.S. Department of Education, National Center for Education Statistics, Early Childhood Longitudinal Study, Kindergarten Class of 1998–99 (ECLS-K), spring 2007.
reldiff
Base-year estimates
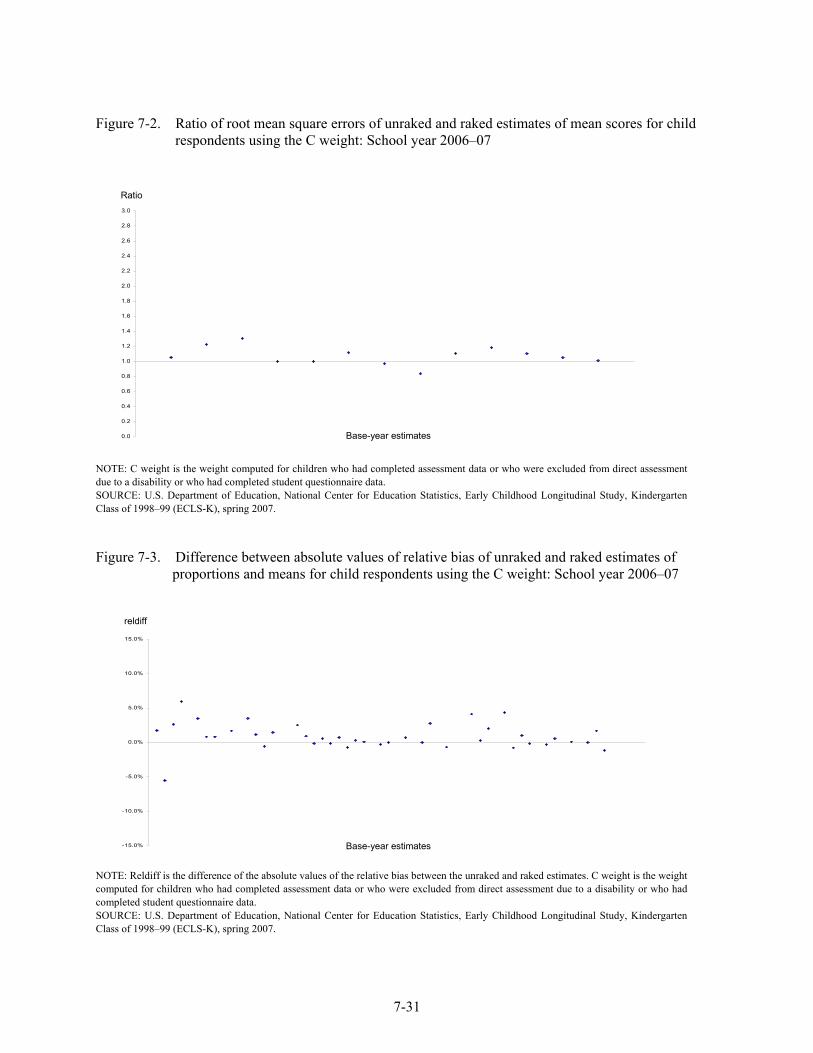
7-31
Figure 7-2. Ratio of root mean square errors of unraked and raked estimates of mean scores for child respondents using the C weight: School year 2006–07
0.0
0.2
0.4
0.6
0.8
1.0
1.2
1.4
1.6
1.8
2.0
2.2
2.4
2.6
2.8
3.0
NOTE: C weight is the weight computed for children who had completed assessment data or who were excluded from direct assessment due to a disability or who had completed student questionnaire data. SOURCE: U.S. Department of Education, National Center for Education Statistics, Early Childhood Longitudinal Study, Kindergarten Class of 1998–99 (ECLS-K), spring 2007. Figure 7-3. Difference between absolute values of relative bias of unraked and raked estimates of
proportions and means for child respondents using the C weight: School year 2006–07
-15.0%
-10.0%
-5.0%
0.0%
5.0%
10.0%
15.0%
NOTE: Reldiff is the difference of the absolute values of the relative bias between the unraked and raked estimates. C weight is the weight computed for children who had completed assessment data or who were excluded from direct assessment due to a disability or who had completed student questionnaire data. SOURCE: U.S. Department of Education, National Center for Education Statistics, Early Childhood Longitudinal Study, Kindergarten Class of 1998–99 (ECLS-K), spring 2007.
Base-year estimates
Ratio
reldiff
Base-year estimates
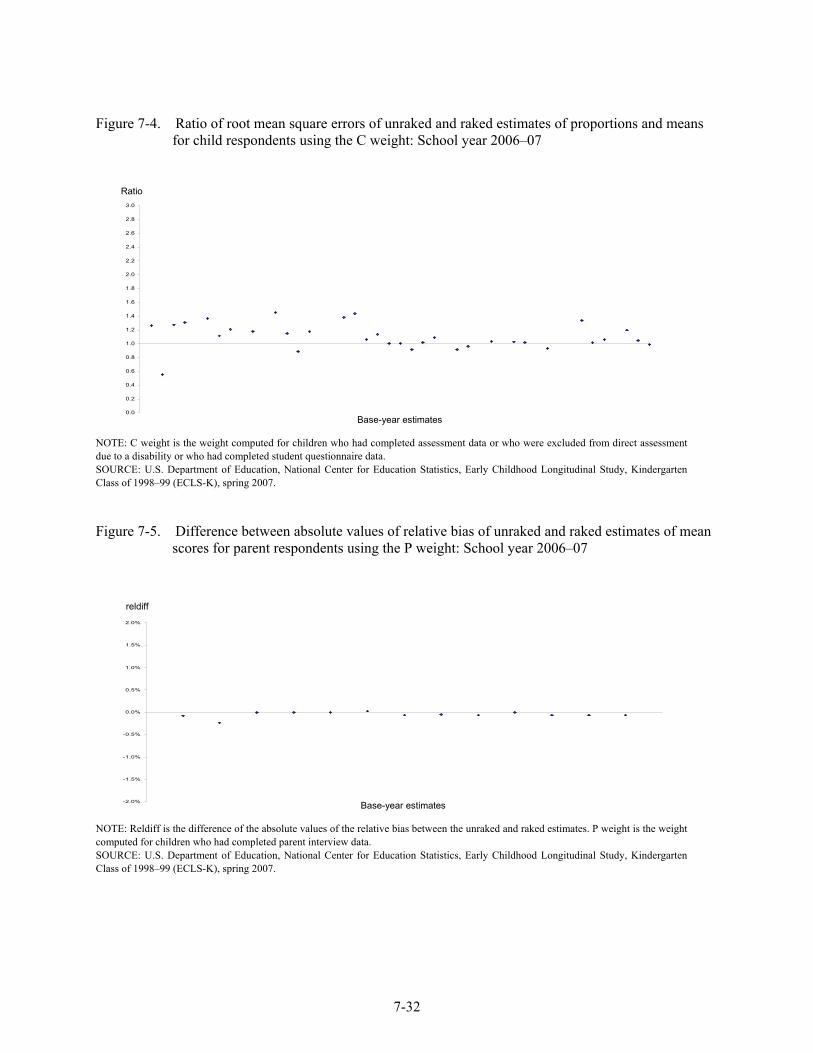
7-32
Figure 7-4. Ratio of root mean square errors of unraked and raked estimates of proportions and means for child respondents using the C weight: School year 2006–07
0.0
0.2
0.4
0.6
0.8
1.0
1.2
1.4
1.6
1.8
2.0
2.2
2.4
2.6
2.8
3.0
NOTE: C weight is the weight computed for children who had completed assessment data or who were excluded from direct assessment due to a disability or who had completed student questionnaire data. SOURCE: U.S. Department of Education, National Center for Education Statistics, Early Childhood Longitudinal Study, Kindergarten Class of 1998–99 (ECLS-K), spring 2007. Figure 7-5. Difference between absolute values of relative bias of unraked and raked estimates of mean
scores for parent respondents using the P weight: School year 2006–07
-2.0%
-1.5%
-1.0%
-0.5%
0.0%
0.5%
1.0%
1.5%
2.0%
NOTE: Reldiff is the difference of the absolute values of the relative bias between the unraked and raked estimates. P weight is the weight computed for children who had completed parent interview data. SOURCE: U.S. Department of Education, National Center for Education Statistics, Early Childhood Longitudinal Study, Kindergarten Class of 1998–99 (ECLS-K), spring 2007.
Base-year estimates
Base-year estimates
Ratio
reldiff
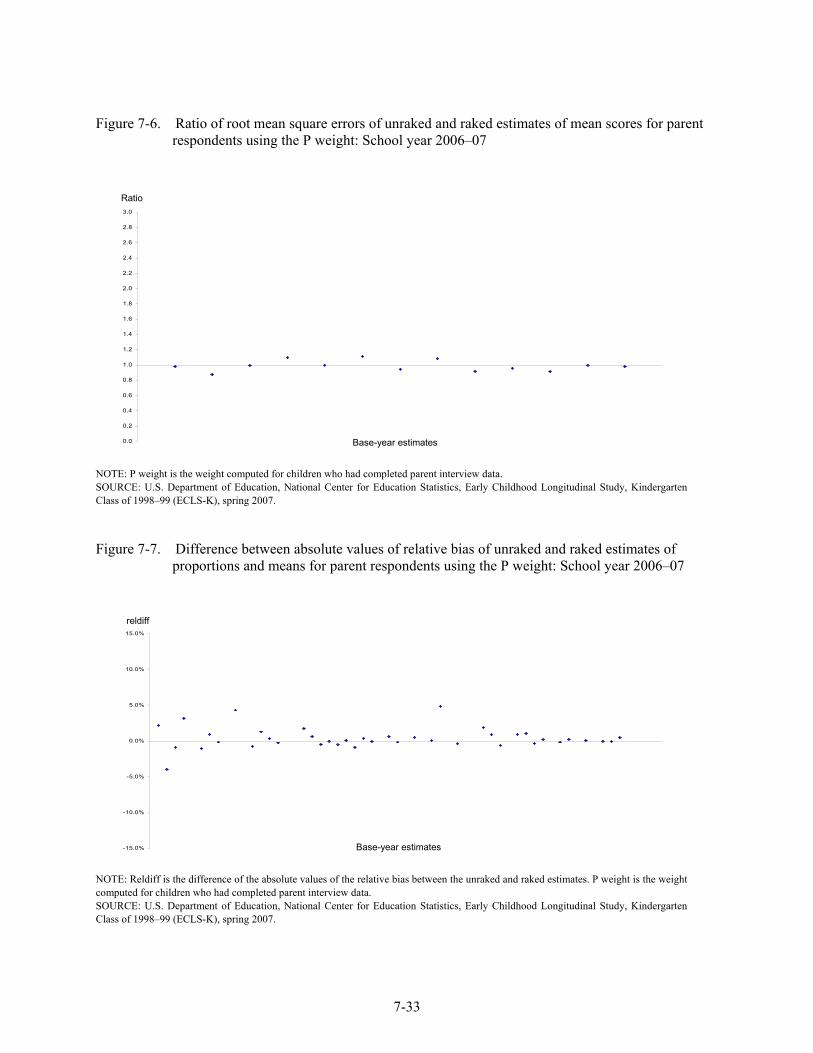
7-33
Figure 7-6. Ratio of root mean square errors of unraked and raked estimates of mean scores for parent respondents using the P weight: School year 2006–07
0.0
0.2
0.4
0.6
0.8
1.0
1.2
1.4
1.6
1.8
2.0
2.2
2.4
2.6
2.8
3.0
NOTE: P weight is the weight computed for children who had completed parent interview data. SOURCE: U.S. Department of Education, National Center for Education Statistics, Early Childhood Longitudinal Study, Kindergarten Class of 1998–99 (ECLS-K), spring 2007. Figure 7-7. Difference between absolute values of relative bias of unraked and raked estimates of
proportions and means for parent respondents using the P weight: School year 2006–07
-15.0%
-10.0%
-5.0%
0.0%
5.0%
10.0%
15.0%
NOTE: Reldiff is the difference of the absolute values of the relative bias between the unraked and raked estimates. P weight is the weight computed for children who had completed parent interview data. SOURCE: U.S. Department of Education, National Center for Education Statistics, Early Childhood Longitudinal Study, Kindergarten Class of 1998–99 (ECLS-K), spring 2007.
Ratio
reldiff
Base-year estimates
Base-year estimates
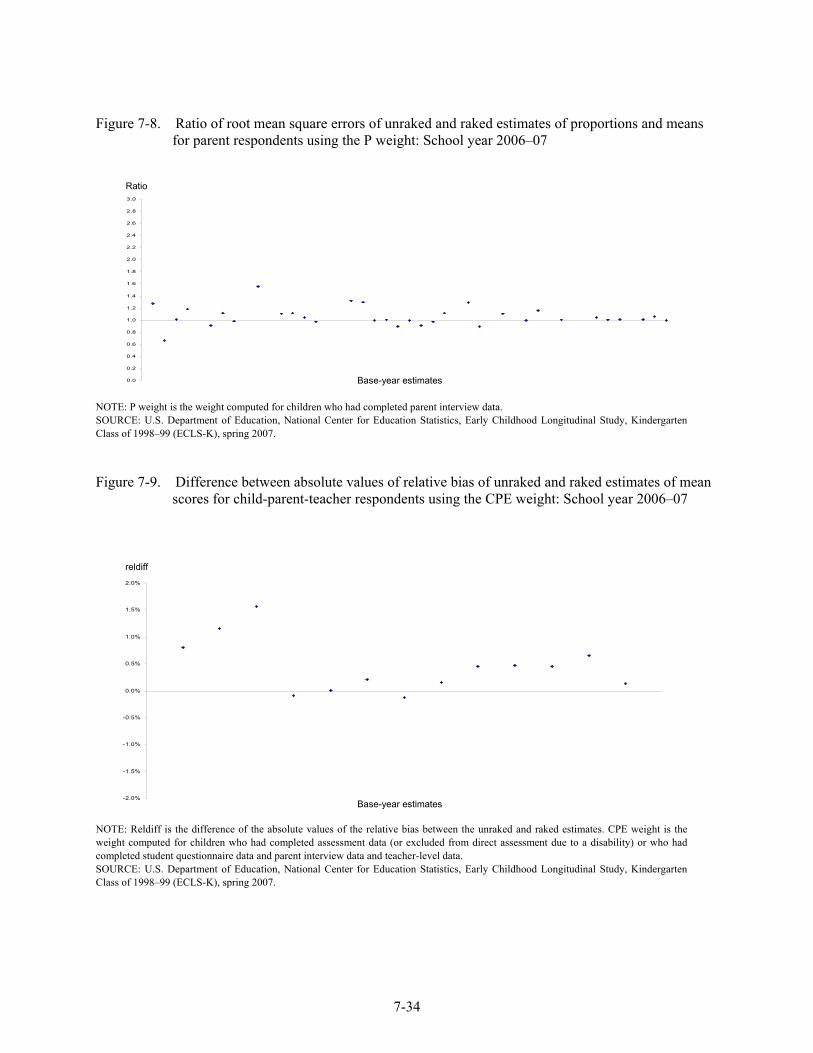
7-34
Figure 7-8. Ratio of root mean square errors of unraked and raked estimates of proportions and means for parent respondents using the P weight: School year 2006–07
0.0
0.2
0.4
0.6
0.8
1.0
1.2
1.4
1.6
1.8
2.0
2.2
2.4
2.6
2.8
3.0
NOTE: P weight is the weight computed for children who had completed parent interview data. SOURCE: U.S. Department of Education, National Center for Education Statistics, Early Childhood Longitudinal Study, Kindergarten Class of 1998–99 (ECLS-K), spring 2007. Figure 7-9. Difference between absolute values of relative bias of unraked and raked estimates of mean
scores for child-parent-teacher respondents using the CPE weight: School year 2006–07
-2.0%
-1.5%
-1.0%
-0.5%
0.0%
0.5%
1.0%
1.5%
2.0%
NOTE: Reldiff is the difference of the absolute values of the relative bias between the unraked and raked estimates. CPE weight is the weight computed for children who had completed assessment data (or excluded from direct assessment due to a disability) or who had completed student questionnaire data and parent interview data and teacher-level data. SOURCE: U.S. Department of Education, National Center for Education Statistics, Early Childhood Longitudinal Study, Kindergarten Class of 1998–99 (ECLS-K), spring 2007.
Ratio
reldiff
Base-year estimates
Base-year estimates
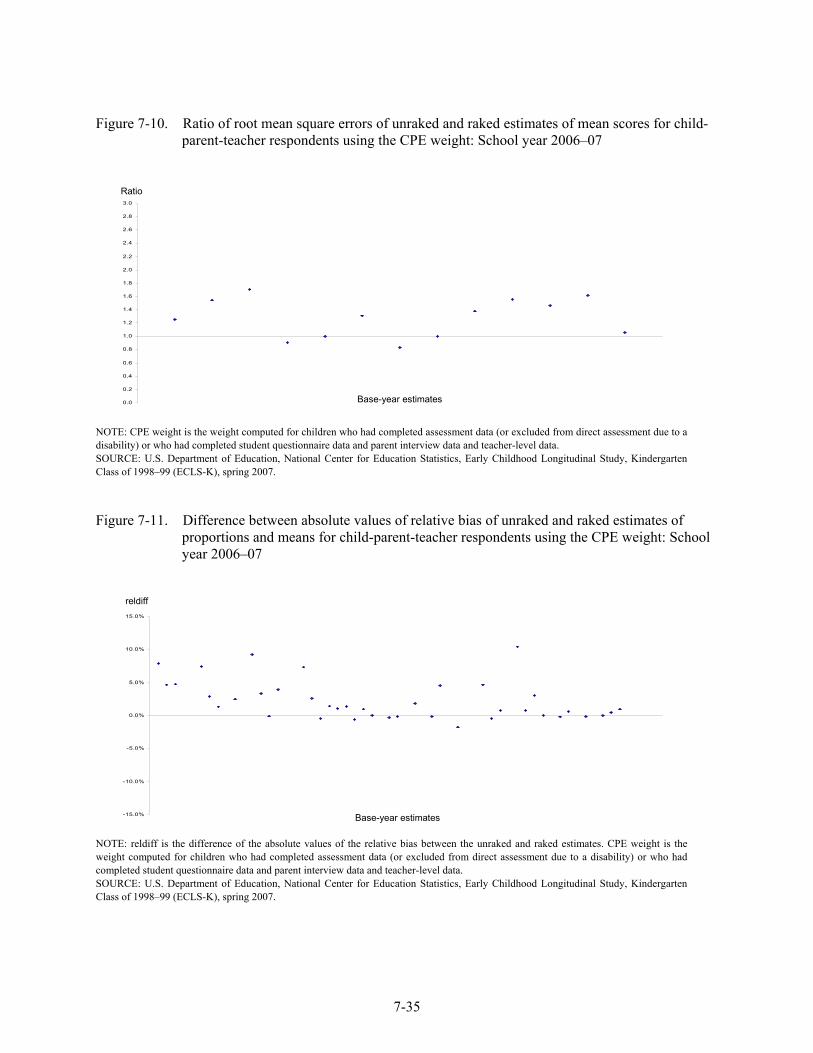
7-35
Figure 7-10. Ratio of root mean square errors of unraked and raked estimates of mean scores for child-parent-teacher respondents using the CPE weight: School year 2006–07
0.0
0.2
0.4
0.6
0.8
1.0
1.2
1.4
1.6
1.8
2.0
2.2
2.4
2.6
2.8
3.0
NOTE: CPE weight is the weight computed for children who had completed assessment data (or excluded from direct assessment due to a disability) or who had completed student questionnaire data and parent interview data and teacher-level data. SOURCE: U.S. Department of Education, National Center for Education Statistics, Early Childhood Longitudinal Study, Kindergarten Class of 1998–99 (ECLS-K), spring 2007. Figure 7-11. Difference between absolute values of relative bias of unraked and raked estimates of
proportions and means for child-parent-teacher respondents using the CPE weight: School year 2006–07
-15.0%
-10.0%
-5.0%
0.0%
5.0%
10.0%
15.0%
NOTE: reldiff is the difference of the absolute values of the relative bias between the unraked and raked estimates. CPE weight is the weight computed for children who had completed assessment data (or excluded from direct assessment due to a disability) or who had completed student questionnaire data and parent interview data and teacher-level data. SOURCE: U.S. Department of Education, National Center for Education Statistics, Early Childhood Longitudinal Study, Kindergarten Class of 1998–99 (ECLS-K), spring 2007.
Base-year estimates
Base-year estimates
Ratio
reldiff
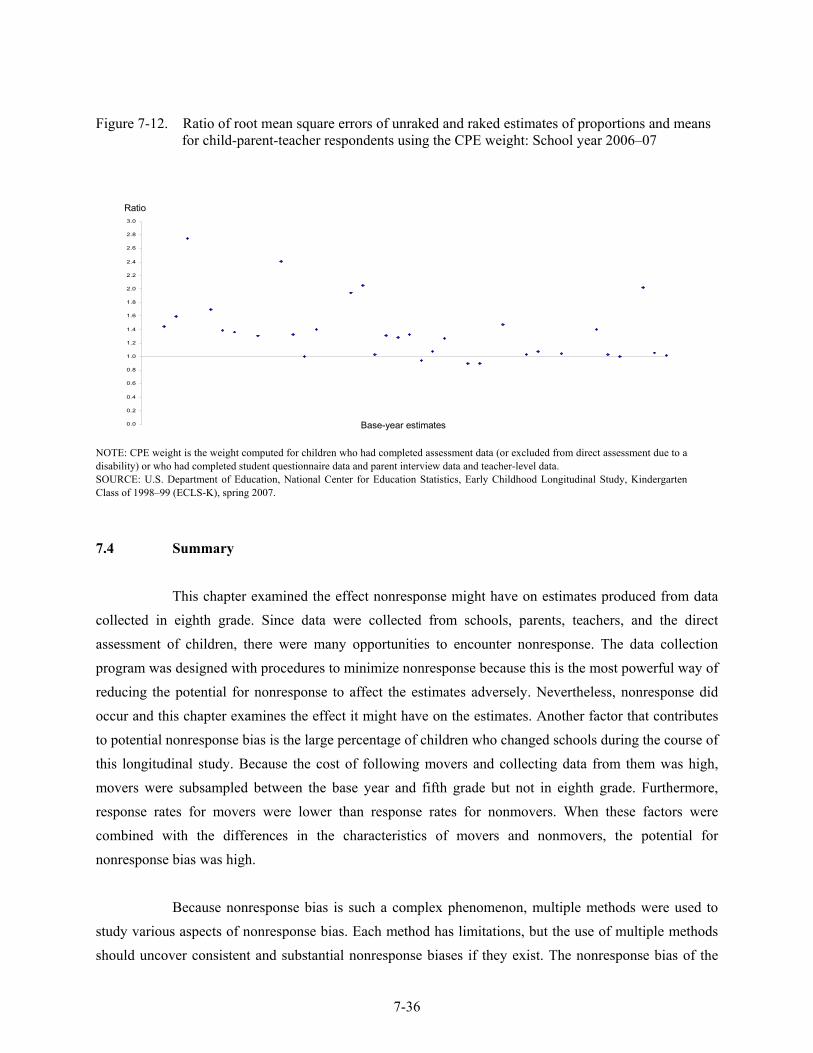
7-36
Figure 7-12. Ratio of root mean square errors of unraked and raked estimates of proportions and means for child-parent-teacher respondents using the CPE weight: School year 2006–07
0.0
0.2
0.4
0.6
0.8
1.0
1.2
1.4
1.6
1.8
2.0
2.2
2.4
2.6
2.8
3.0
NOTE: CPE weight is the weight computed for children who had completed assessment data (or excluded from direct assessment due to a disability) or who had completed student questionnaire data and parent interview data and teacher-level data. SOURCE: U.S. Department of Education, National Center for Education Statistics, Early Childhood Longitudinal Study, Kindergarten Class of 1998–99 (ECLS-K), spring 2007.
7.4 Summary
This chapter examined the effect nonresponse might have on estimates produced from data collected in eighth grade. Since data were collected from schools, parents, teachers, and the direct assessment of children, there were many opportunities to encounter nonresponse. The data collection program was designed with procedures to minimize nonresponse because this is the most powerful way of reducing the potential for nonresponse to affect the estimates adversely. Nevertheless, nonresponse did occur and this chapter examines the effect it might have on the estimates. Another factor that contributes to potential nonresponse bias is the large percentage of children who changed schools during the course of this longitudinal study. Because the cost of following movers and collecting data from them was high, movers were subsampled between the base year and fifth grade but not in eighth grade. Furthermore, response rates for movers were lower than response rates for nonmovers. When these factors were combined with the differences in the characteristics of movers and nonmovers, the potential for nonresponse bias was high.
Because nonresponse bias is such a complex phenomenon, multiple methods were used to
study various aspects of nonresponse bias. Each method has limitations, but the use of multiple methods should uncover consistent and substantial nonresponse biases if they exist. The nonresponse bias of the
Base-year estimates
Ratio
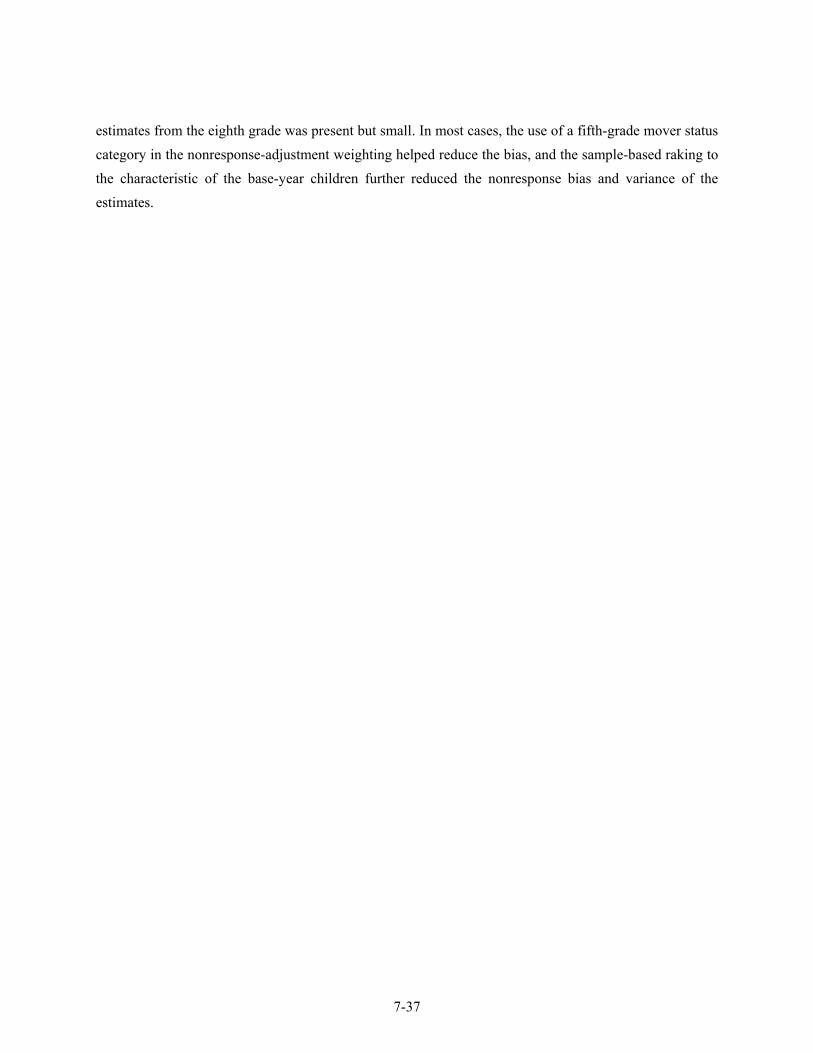
7-37
estimates from the eighth grade was present but small. In most cases, the use of a fifth-grade mover status category in the nonresponse-adjustment weighting helped reduce the bias, and the sample-based raking to the characteristic of the base-year children further reduced the nonresponse bias and variance of the estimates.
8-1
8. WEIGHTING AND VARIANCE ESTIMATION
The ECLS-K data were weighted to compensate for differential probabilities of selection at each sampling stage and to adjust for the effects of nonresponse. In the ECLS-K base year, weights were computed at the child, school, and teacher levels. Estimates using the base-year weights are representative of all kindergarten children, all schools with kindergarten programs, and all kindergarten teachers. After the base year, only child-level weights were computed. The use of these weights is essential to produce estimates that are representative of the cohort of children who were in kindergarten in 1998–99 or in first grade in 1999–2000.
In first grade, the sample was freshened with first-graders who had not been sampled in
kindergarten or first grade. Freshening was not done in third grade, fifth grade, or eighth grade. Estimates from the ECLS-K third-, fifth-, and eighth-grade data are representative of the population cohort rather than of all third-graders in 2001–02, all fifth-graders in 2003–04, or all eighth-graders in 2006–07. The estimated number of third-graders from the third-grade ECLS-K data collection is approximately 86 percent of all third-graders. From the fifth-grade data collection, the estimated number of fifth-graders is approximately 83 percent of all fifth-graders. From the eighth-grade data collection, the estimated number of eighth-graders is approximately 80 percent of all eighth-graders While the vast majority of children in third grade in the 2001–02 school year, in fifth grade in the 2003–04 school year, and in the eighth grade in the 2006–07 school year are members of the cohort, the following groups of children are not covered: children in earlier cohorts who skipped a grade and thus would have caught up to the current cohort, children who were held back from earlier cohorts and recent immigrants. Data were collected from teachers and schools to provide important contextual information about the school environment for the sampled children. Similarly, home environment data were collected from parents. Data from these sources are not representative of all third-grade teachers and schools in 2001–02, of fifth-grade teachers and schools in 2003–04, or of eighth-grade teachers and schools in 2006–07. For this reason, the weights produced from the study are child-level weights for making statements about children, including statements about the parents, teachers, and schools of those children.
The different types of weights are discussed in section 8.1, followed by a detailed
description of the computation of the weights in section 8.2. Section 8.3 describes the variance estimation methods suitable for the ECLS-K.
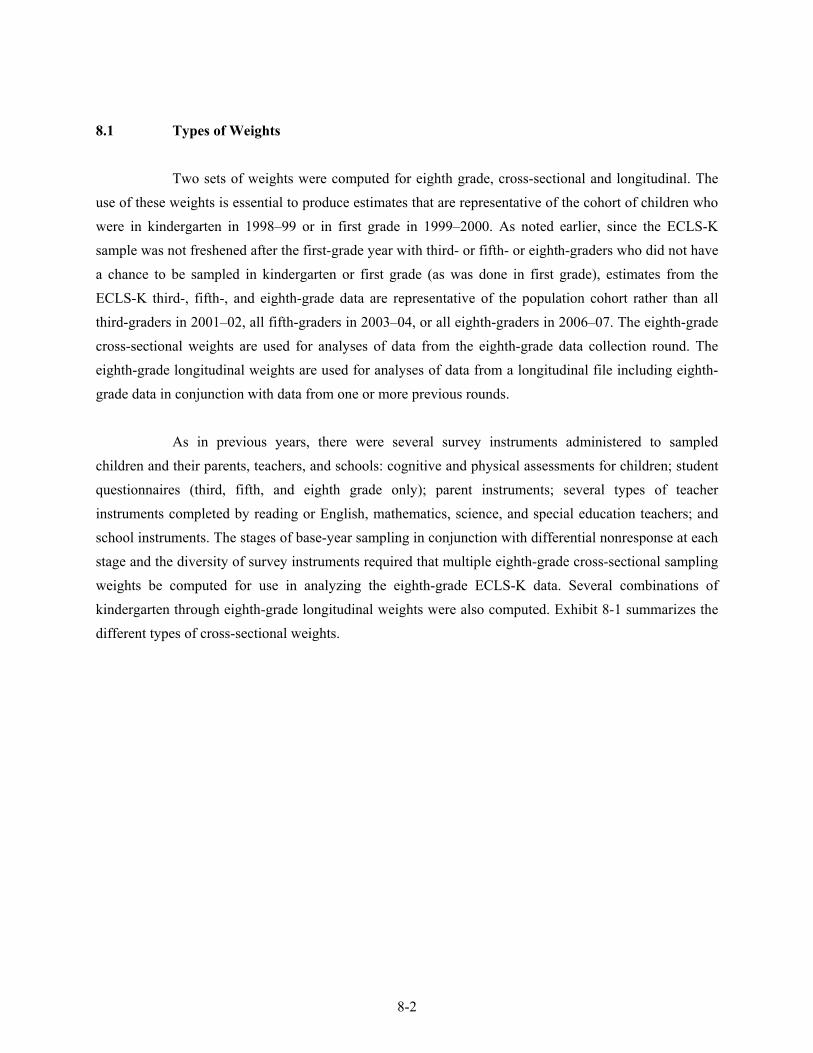
8-2
8.1 Types of Weights
Two sets of weights were computed for eighth grade, cross-sectional and longitudinal. The use of these weights is essential to produce estimates that are representative of the cohort of children who were in kindergarten in 1998–99 or in first grade in 1999–2000. As noted earlier, since the ECLS-K sample was not freshened after the first-grade year with third- or fifth- or eighth-graders who did not have a chance to be sampled in kindergarten or first grade (as was done in first grade), estimates from the ECLS-K third-, fifth-, and eighth-grade data are representative of the population cohort rather than all third-graders in 2001–02, all fifth-graders in 2003–04, or all eighth-graders in 2006–07. The eighth-grade cross-sectional weights are used for analyses of data from the eighth-grade data collection round. The eighth-grade longitudinal weights are used for analyses of data from a longitudinal file including eighth-grade data in conjunction with data from one or more previous rounds.
As in previous years, there were several survey instruments administered to sampled
children and their parents, teachers, and schools: cognitive and physical assessments for children; student questionnaires (third, fifth, and eighth grade only); parent instruments; several types of teacher instruments completed by reading or English, mathematics, science, and special education teachers; and school instruments. The stages of base-year sampling in conjunction with differential nonresponse at each stage and the diversity of survey instruments required that multiple eighth-grade cross-sectional sampling weights be computed for use in analyzing the eighth-grade ECLS-K data. Several combinations of kindergarten through eighth-grade longitudinal weights were also computed. Exhibit 8-1 summarizes the different types of cross-sectional weights.
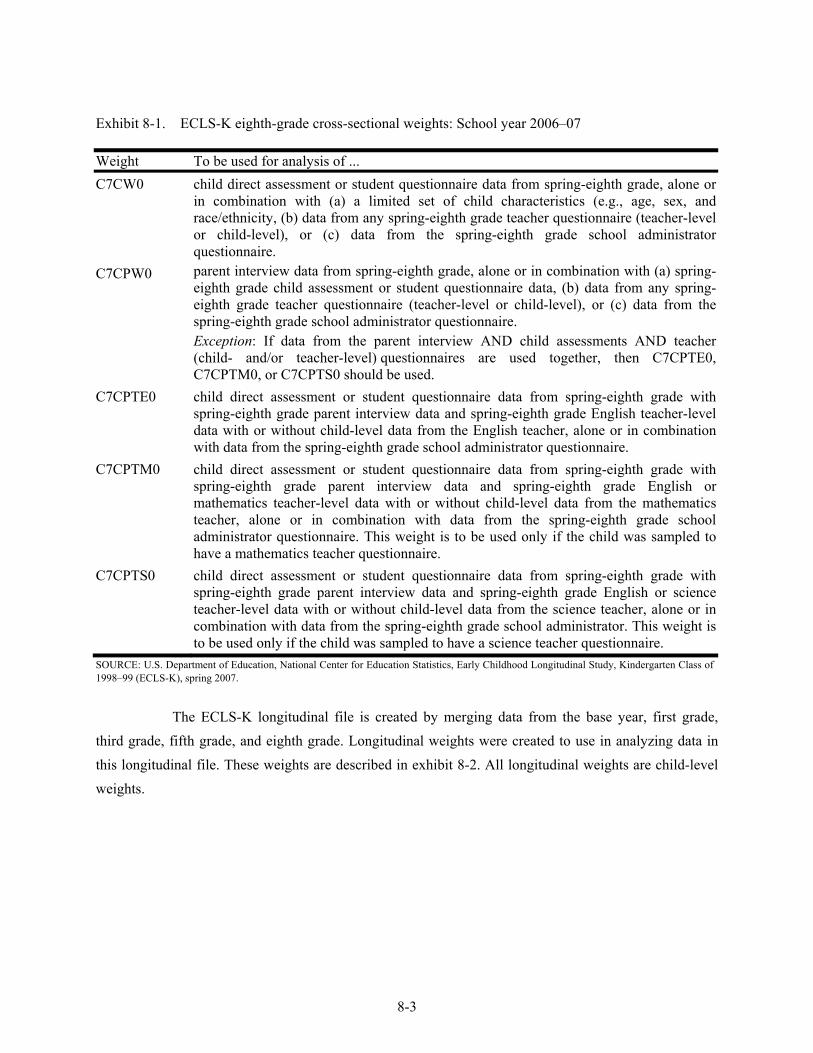
8-3
Exhibit 8-1. ECLS-K eighth-grade cross-sectional weights: School year 2006–07 Weight To be used for analysis of ... C7CW0 child direct assessment or student questionnaire data from spring-eighth grade, alone or
in combination with (a) a limited set of child characteristics (e.g., age, sex, and race/ethnicity, (b) data from any spring-eighth grade teacher questionnaire (teacher-level or child-level), or (c) data from the spring-eighth grade school administrator questionnaire.
C7CPW0 parent interview data from spring-eighth grade, alone or in combination with (a) spring-eighth grade child assessment or student questionnaire data, (b) data from any spring-eighth grade teacher questionnaire (teacher-level or child-level), or (c) data from the spring-eighth grade school administrator questionnaire. Exception: If data from the parent interview AND child assessments AND teacher (child- and/or teacher-level) questionnaires are used together, then C7CPTE0, C7CPTM0, or C7CPTS0 should be used.
C7CPTE0 child direct assessment or student questionnaire data from spring-eighth grade with spring-eighth grade parent interview data and spring-eighth grade English teacher-level data with or without child-level data from the English teacher, alone or in combination with data from the spring-eighth grade school administrator questionnaire.
C7CPTM0 child direct assessment or student questionnaire data from spring-eighth grade with spring-eighth grade parent interview data and spring-eighth grade English or mathematics teacher-level data with or without child-level data from the mathematics teacher, alone or in combination with data from the spring-eighth grade school administrator questionnaire. This weight is to be used only if the child was sampled to have a mathematics teacher questionnaire.
C7CPTS0 child direct assessment or student questionnaire data from spring-eighth grade with spring-eighth grade parent interview data and spring-eighth grade English or science teacher-level data with or without child-level data from the science teacher, alone or in combination with data from the spring-eighth grade school administrator. This weight is to be used only if the child was sampled to have a science teacher questionnaire.
SOURCE: U.S. Department of Education, National Center for Education Statistics, Early Childhood Longitudinal Study, Kindergarten Class of 1998–99 (ECLS-K), spring 2007.
The ECLS-K longitudinal file is created by merging data from the base year, first grade, third grade, fifth grade, and eighth grade. Longitudinal weights were created to use in analyzing data in this longitudinal file. These weights are described in exhibit 8-2. All longitudinal weights are child-level weights.
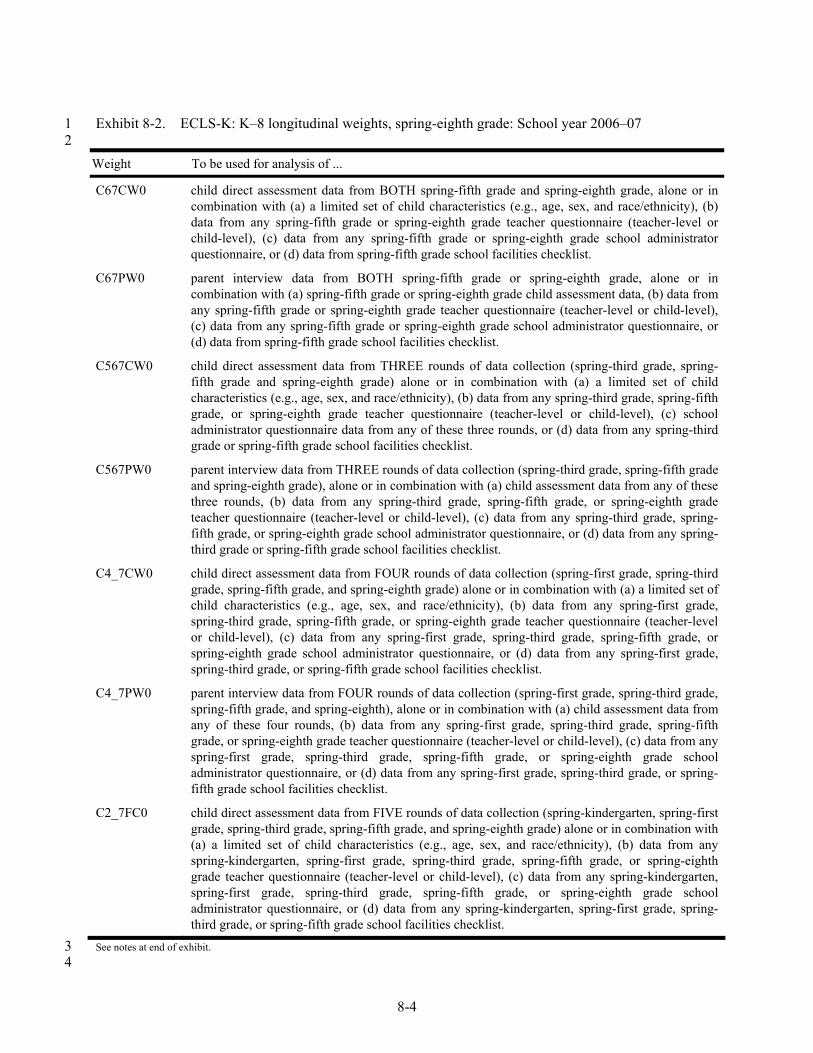
8-4
Exhibit 8-2. ECLS-K: K–8 longitudinal weights, spring-eighth grade: School year 2006–07 1 2
Weight To be used for analysis of ...
C67CW0 child direct assessment data from BOTH spring-fifth grade and spring-eighth grade, alone or in combination with (a) a limited set of child characteristics (e.g., age, sex, and race/ethnicity), (b) data from any spring-fifth grade or spring-eighth grade teacher questionnaire (teacher-level or child-level), (c) data from any spring-fifth grade or spring-eighth grade school administrator questionnaire, or (d) data from spring-fifth grade school facilities checklist.
C67PW0 parent interview data from BOTH spring-fifth grade or spring-eighth grade, alone or in combination with (a) spring-fifth grade or spring-eighth grade child assessment data, (b) data from any spring-fifth grade or spring-eighth grade teacher questionnaire (teacher-level or child-level), (c) data from any spring-fifth grade or spring-eighth grade school administrator questionnaire, or (d) data from spring-fifth grade school facilities checklist.
C567CW0 child direct assessment data from THREE rounds of data collection (spring-third grade, spring-fifth grade and spring-eighth grade) alone or in combination with (a) a limited set of child characteristics (e.g., age, sex, and race/ethnicity), (b) data from any spring-third grade, spring-fifth grade, or spring-eighth grade teacher questionnaire (teacher-level or child-level), (c) school administrator questionnaire data from any of these three rounds, or (d) data from any spring-third grade or spring-fifth grade school facilities checklist.
C567PW0 parent interview data from THREE rounds of data collection (spring-third grade, spring-fifth grade and spring-eighth grade), alone or in combination with (a) child assessment data from any of these three rounds, (b) data from any spring-third grade, spring-fifth grade, or spring-eighth grade teacher questionnaire (teacher-level or child-level), (c) data from any spring-third grade, spring-fifth grade, or spring-eighth grade school administrator questionnaire, or (d) data from any spring-third grade or spring-fifth grade school facilities checklist.
C4_7CW0 child direct assessment data from FOUR rounds of data collection (spring-first grade, spring-third grade, spring-fifth grade, and spring-eighth grade) alone or in combination with (a) a limited set of child characteristics (e.g., age, sex, and race/ethnicity), (b) data from any spring-first grade, spring-third grade, spring-fifth grade, or spring-eighth grade teacher questionnaire (teacher-level or child-level), (c) data from any spring-first grade, spring-third grade, spring-fifth grade, or spring-eighth grade school administrator questionnaire, or (d) data from any spring-first grade, spring-third grade, or spring-fifth grade school facilities checklist.
C4_7PW0 parent interview data from FOUR rounds of data collection (spring-first grade, spring-third grade, spring-fifth grade, and spring-eighth), alone or in combination with (a) child assessment data from any of these four rounds, (b) data from any spring-first grade, spring-third grade, spring-fifth grade, or spring-eighth grade teacher questionnaire (teacher-level or child-level), (c) data from any spring-first grade, spring-third grade, spring-fifth grade, or spring-eighth grade school administrator questionnaire, or (d) data from any spring-first grade, spring-third grade, or spring-fifth grade school facilities checklist.
C2_7FC0 child direct assessment data from FIVE rounds of data collection (spring-kindergarten, spring-first grade, spring-third grade, spring-fifth grade, and spring-eighth grade) alone or in combination with (a) a limited set of child characteristics (e.g., age, sex, and race/ethnicity), (b) data from any spring-kindergarten, spring-first grade, spring-third grade, spring-fifth grade, or spring-eighth grade teacher questionnaire (teacher-level or child-level), (c) data from any spring-kindergarten, spring-first grade, spring-third grade, spring-fifth grade, or spring-eighth grade school administrator questionnaire, or (d) data from any spring-kindergarten, spring-first grade, spring-third grade, or spring-fifth grade school facilities checklist.
See notes at end of exhibit. 3 4
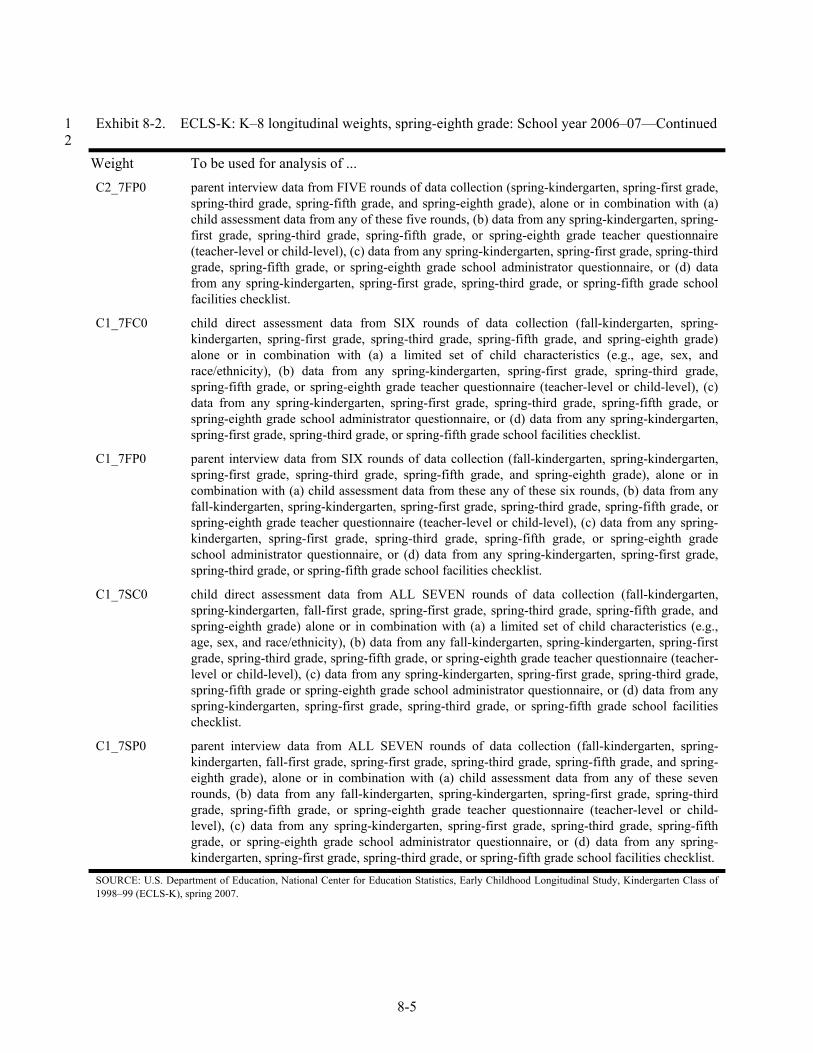
8-5
Exhibit 8-2. ECLS-K: K–8 longitudinal weights, spring-eighth grade: School year 2006–07—Continued 1 2
Weight To be used for analysis of ... C2_7FP0 parent interview data from FIVE rounds of data collection (spring-kindergarten, spring-first grade,
spring-third grade, spring-fifth grade, and spring-eighth grade), alone or in combination with (a) child assessment data from any of these five rounds, (b) data from any spring-kindergarten, spring-first grade, spring-third grade, spring-fifth grade, or spring-eighth grade teacher questionnaire (teacher-level or child-level), (c) data from any spring-kindergarten, spring-first grade, spring-third grade, spring-fifth grade, or spring-eighth grade school administrator questionnaire, or (d) data from any spring-kindergarten, spring-first grade, spring-third grade, or spring-fifth grade school facilities checklist.
C1_7FC0 child direct assessment data from SIX rounds of data collection (fall-kindergarten, spring-kindergarten, spring-first grade, spring-third grade, spring-fifth grade, and spring-eighth grade) alone or in combination with (a) a limited set of child characteristics (e.g., age, sex, and race/ethnicity), (b) data from any spring-kindergarten, spring-first grade, spring-third grade, spring-fifth grade, or spring-eighth grade teacher questionnaire (teacher-level or child-level), (c) data from any spring-kindergarten, spring-first grade, spring-third grade, spring-fifth grade, or spring-eighth grade school administrator questionnaire, or (d) data from any spring-kindergarten, spring-first grade, spring-third grade, or spring-fifth grade school facilities checklist.
C1_7FP0 parent interview data from SIX rounds of data collection (fall-kindergarten, spring-kindergarten, spring-first grade, spring-third grade, spring-fifth grade, and spring-eighth grade), alone or in combination with (a) child assessment data from these any of these six rounds, (b) data from any fall-kindergarten, spring-kindergarten, spring-first grade, spring-third grade, spring-fifth grade, or spring-eighth grade teacher questionnaire (teacher-level or child-level), (c) data from any spring-kindergarten, spring-first grade, spring-third grade, spring-fifth grade, or spring-eighth grade school administrator questionnaire, or (d) data from any spring-kindergarten, spring-first grade, spring-third grade, or spring-fifth grade school facilities checklist.
C1_7SC0 child direct assessment data from ALL SEVEN rounds of data collection (fall-kindergarten, spring-kindergarten, fall-first grade, spring-first grade, spring-third grade, spring-fifth grade, and spring-eighth grade) alone or in combination with (a) a limited set of child characteristics (e.g., age, sex, and race/ethnicity), (b) data from any fall-kindergarten, spring-kindergarten, spring-first grade, spring-third grade, spring-fifth grade, or spring-eighth grade teacher questionnaire (teacher-level or child-level), (c) data from any spring-kindergarten, spring-first grade, spring-third grade, spring-fifth grade or spring-eighth grade school administrator questionnaire, or (d) data from any spring-kindergarten, spring-first grade, spring-third grade, or spring-fifth grade school facilities checklist.
C1_7SP0 parent interview data from ALL SEVEN rounds of data collection (fall-kindergarten, spring-kindergarten, fall-first grade, spring-first grade, spring-third grade, spring-fifth grade, and spring-eighth grade), alone or in combination with (a) child assessment data from any of these seven rounds, (b) data from any fall-kindergarten, spring-kindergarten, spring-first grade, spring-third grade, spring-fifth grade, or spring-eighth grade teacher questionnaire (teacher-level or child-level), (c) data from any spring-kindergarten, spring-first grade, spring-third grade, spring-fifth grade, or spring-eighth grade school administrator questionnaire, or (d) data from any spring-kindergarten, spring-first grade, spring-third grade, or spring-fifth grade school facilities checklist.
SOURCE: U.S. Department of Education, National Center for Education Statistics, Early Childhood Longitudinal Study, Kindergarten Class of 1998–99 (ECLS-K), spring 2007.
8-6
As mentioned in the introduction, teachers and schools are not representative of eighth-grade teachers and schools in 2006–07. For this reason, there are no cross-sectional weights computed to provide estimates at the school or teacher level. Consequently, there are no longitudinal weights computed at the school or teacher level.
Each set of weights created to be used with the ECLS-K data consists of a full sample weight
that is used in computing survey estimates and replicate weights that are used in variance estimation with a jackknife replication method. First-stage stratum and primary sampling unit (PSU) identifiers are also created so that variance estimation using the Taylor series approximation method can be produced using the full sample weights. See section 8.2.7 for a description of how replicate weights were created. Section 8.3 discusses variance estimation methods.
The data file includes the final full sample weight (described in section 8.2.5) and the final
replicate weights (described in section 8.2.7) but not the intermediate weights leading to the final weights. The names of the full sample weights in the file are as described in exhibits 8-1 and 8-2 (e.g., C7CW0). The names of the replicate weights have the same prefix as the full sample weights with the last digit indicating the replicate (e.g., C7CW1 to C7CW90 are the 90 replicate weights to be used with the full sample weight C7CW0).
8.2 Computation of the Eighth-Grade Weights
All 12,129 children eligible after fifth grade (regardless of their fifth-grade response status) were eligible for the eighth-grade data collection. There was no subsampling of movers for follow-up as in previous rounds since the vast majority of children were not in the same school from kindergarten to eighth grade (having moved out of elementary schools into middle schools). This was explained in section 3.7. The subsampling of children for the administration of the mathematics or science questionnaires in fifth grade was retained in eighth grade as discussed in section 3.7.
In the weighting procedures, children excluded from the eighth-grade data collection are considered ineligible if they became ineligible in fifth grade (because they had died or moved out of the country, they were movers who were not subsampled for follow-up in fifth grade, they were hard refusal cases, or they had neither first-grade nor third-grade data). Excluded children are properly adjusted for in the weighting procedures.
8-7
The weighting procedures for both cross-sectional and longitudinal weights were divided into three main stages. These procedures were followed for creating each weight shown in exhibit 8-1 and exhibit 8-2. The change in the procedures pertains only to the change in the eligibility of children for whom the weight applies. For example, weight C7CW0 pertains to children with completed assessment data or student questionnaire data; weight C67PW0 pertains to children with completed parent interview in both fifth grade and eighth grade. In the base year, children who were not assessed because of a disability or because they were language minority children had positive C1CW0 and C2CW0 weights because they had data such as age, sex, race/ethnicity, height and weight, and characteristics of parents, teachers, and classrooms. In subsequent rounds of data collection, they continued to be treated the same. Weights that include any fall-first grade data (such as C1_7C0, which is the weight for children for whom child assessments were obtained in all seven rounds) were computed using the same procedures, but the cells for the weighting adjustments were more restricted because only the fall-first grade subsample was included. The replication scheme for data that include the fall-first grade panel is also different as described in section 8.2.7.
The first stage of weighting was to compute an initial child weight that reflects the
following:
adjustment of the school base weight for base-year school-level nonresponse;
adjustment of the child weights for base-year child-level nonresponse;
adjustment of the base-year child weight for subsampling of schools for freshening in first grade (for children sampled in first-grade only);
adjustment for fifth-grade mover subsampling (which includes adjustment for third-grade mover subsampling); and
adjustment for fifth-grade unknown eligibility status.
The procedures used in the first three steps of the first stage are the same as in all rounds of data collection after the base year because the same sample of children (base-year respondents and children sampled in first grade) is eligible for subsequent rounds of data collection. Although there was no subsampling of movers in eighth grade, the fifth-grade mover subsampling is relevant to the computation of the eighth-grade weight since children who were subsampled out in fifth grade because they moved were excluded from the eighth-grade data collection. Since fifth-graders of unknown eligibility status were also excluded from the eighth-grade data collection, the adjustment for fifth-grade unknown eligibility status was necessary.
8-8
The second stage of weighting was to adjust the initial child weight computed in the first stage for the following:
eighth-grade unknown eligibility status; and
eighth-grade child-level nonresponse.
For the mathematics and science child-parent-teacher weights, an additional adjustment was necessary (before the second-stage adjustment for unknown eligibility status and nonresponse) to adjust for the subsampling of children for whom mathematics or science teacher data questionnaires were administered. This adjustment is described in section 8.2.6.
The third and last stage was to rake the weights adjusted in the second stage to sample-based
control totals. Raking is a multivariate poststratification of the weights, explained in section 8.2.5. In general, in each adjustment to the weight, the adjustment factor is multiplied by the
weight in the prior step to get the adjusted weight. This fact is not repeated in the discussions of the weight adjustments in the following sections; only the computation of the adjustment factor is discussed.
8.2.1 Initial Child Weights
As mentioned earlier, the first stage of weighting was to compute an initial child weight that reflects: (1) the adjustment of the school base weight for base-year school-level nonresponse (school-level weights), (2) the adjustment of the child weights for base-year child-level nonresponse (child-level weights), (3) the adjustment of the base-year child weight for subsampling of schools for freshening in first grade (child-level weights, for children sampled in first grade only), (4) the adjustment for fifth-grade mover subsampling, and (5) the adjustment for fifth-grade unknown eligibility status. These weights were already computed for spring-fifth grade. For completeness, they are described below, in section 8.2.1.1 for the school-level weights, and in section 8.2.1.2 for the child-level weights.
8-9
8.2.1.1 Base-Year Nonresponse-Adjusted School Weights
The school base weight1 iSCHLBW is the same as that computed for previous rounds of data
collection. Only schools sampled in the base year have base weights. The school base weight is the inverse of the probability of selection of the school from a stratified probability proportional to size (PPS) design. See section 3.2.2 for a discussion of the selection of the school sample. The school base weight was computed as follows:
,POSPOS
SCHLBWiSCHLjPSU
i11
×=
where jPSUPOS is the probability of selection of the PSU j, and
iSCHLPOS is the probability of selection of school i within the PSU j, where the probability of selection of the PSU j, jPSUPOS , was defined as
⎪⎩
⎪⎨
⎧
⎟⎟⎠
⎞⎜⎜⎝
⎛=
h
jjPSU
MMPOS 2
1
if PSU j is a self-representing (SR) PSU, if PSU j is a non-self-representing (NSR) PSU,
where
jM is the measure of size (MOS) of jPSU (i.e., count of 5-year-old children in the PSU as described in section 3.2.1), and
hM is the total MOS in stratum h, hPSU j ∈ , and the probability of selection of school i within jPSU , iSCHLPOS , was defined as
,m
mnPOS
kjii
ikjiSCHL ∑
∈
×=
where jkn is the target number of schools in stratum k in PSU j,
im is the MOS of the school i in stratum k in PSU j; and the denominator is the sum of the measures of size of all schools in stratum k in PSU i.
1 Only schools sampled in the base year have base weights. Transfer schools do not have base weights, but children in transfer schools carry with them the base weights of the original sampled schools.
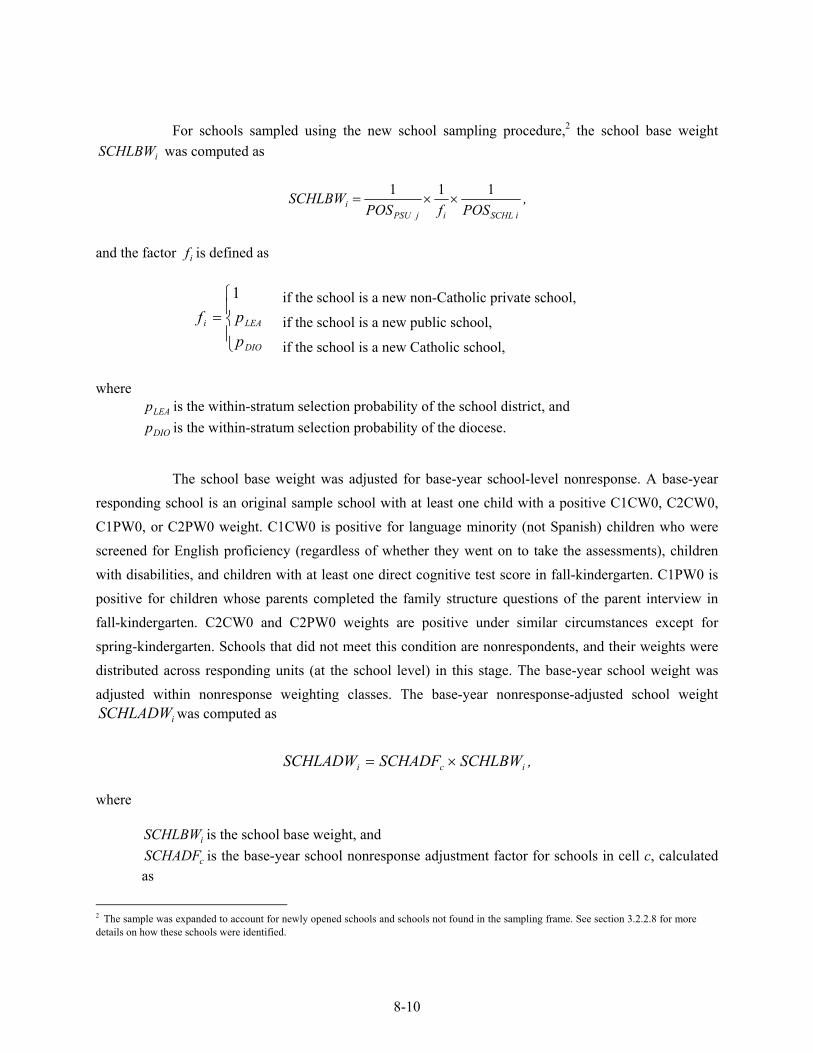
8-10
For schools sampled using the new school sampling procedure,2 the school base weight
iSCHLBW was computed as
,POSfPOS
SCHLBWiSCHLijPSU
i111
××=
and the factor if is defined as
⎪⎩
⎪⎨
⎧=
DIO
LEAi
ppf1
if the school is a new non-Catholic private school,
if the school is a new public school,
if the school is a new Catholic school, where
LEAp is the within-stratum selection probability of the school district, and
DIOp is the within-stratum selection probability of the diocese.
The school base weight was adjusted for base-year school-level nonresponse. A base-year
responding school is an original sample school with at least one child with a positive C1CW0, C2CW0, C1PW0, or C2PW0 weight. C1CW0 is positive for language minority (not Spanish) children who were screened for English proficiency (regardless of whether they went on to take the assessments), children with disabilities, and children with at least one direct cognitive test score in fall-kindergarten. C1PW0 is positive for children whose parents completed the family structure questions of the parent interview in fall-kindergarten. C2CW0 and C2PW0 weights are positive under similar circumstances except for spring-kindergarten. Schools that did not meet this condition are nonrespondents, and their weights were distributed across responding units (at the school level) in this stage. The base-year school weight was adjusted within nonresponse weighting classes. The base-year nonresponse-adjusted school weight
iSCHLADW was computed as
,SCHLBWSCHADFSCHLADW ici ×=
where
iSCHLBW is the school base weight, and
cSCHADF is the base-year school nonresponse adjustment factor for schools in cell c, calculated as
2 The sample was expanded to account for newly opened schools and schools not found in the sampling frame. See section 3.2.2.8 for more details on how these schools were identified.
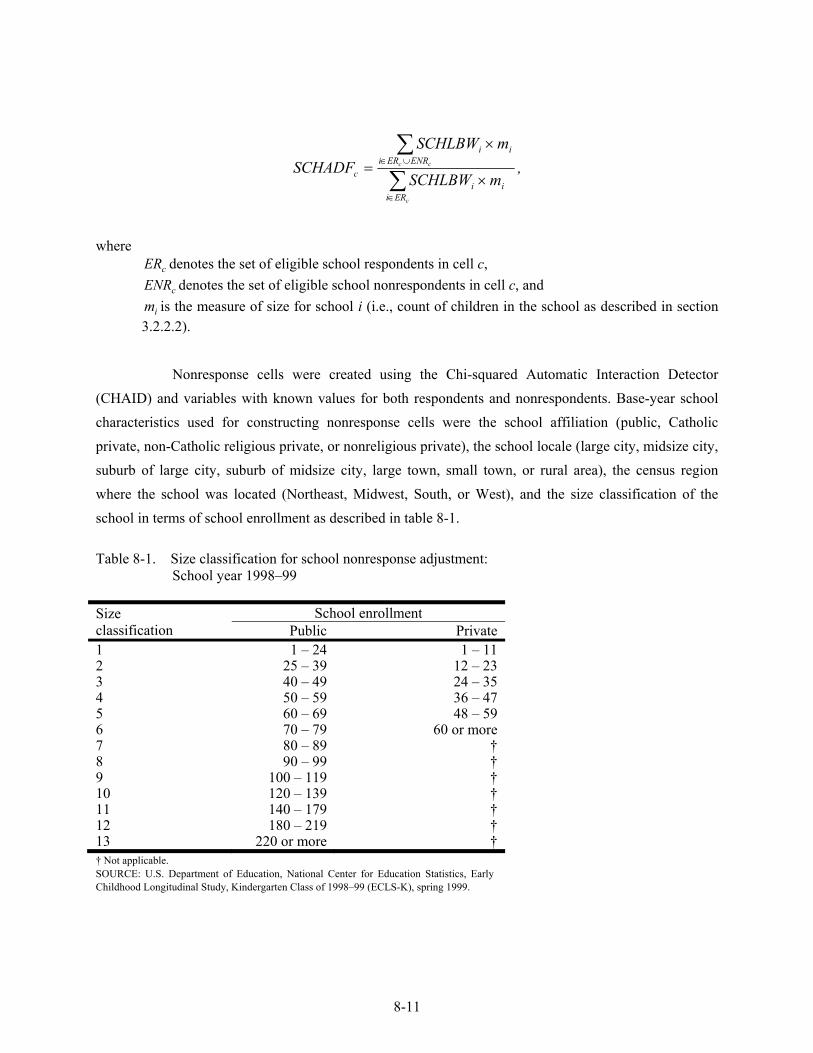
8-11
,mSCHLBW
mSCHLBWSCHADF
c
cc
ERiii
ENRERiii
c ∑∑
∈
∪∈
×
×=
where
cER denotes the set of eligible school respondents in cell c,
cENR denotes the set of eligible school nonrespondents in cell c, and
im is the measure of size for school i (i.e., count of children in the school as described in section 3.2.2.2).
Nonresponse cells were created using the Chi-squared Automatic Interaction Detector
(CHAID) and variables with known values for both respondents and nonrespondents. Base-year school characteristics used for constructing nonresponse cells were the school affiliation (public, Catholic private, non-Catholic religious private, or nonreligious private), the school locale (large city, midsize city, suburb of large city, suburb of midsize city, large town, small town, or rural area), the census region where the school was located (Northeast, Midwest, South, or West), and the size classification of the school in terms of school enrollment as described in table 8-1.
Table 8-1. Size classification for school nonresponse adjustment:
School year 1998–99 Size classification
School enrollment Public Private
1 1 – 24 1 – 112 25 – 39 12 – 233 40 – 49 24 – 354 50 – 59 36 – 475 60 – 69 48 – 596 70 – 79 60 or more7 80 – 89 †8 90 – 99 †9 100 – 119 †10 120 – 139 †11 140 – 179 †12 180 – 219 †13 220 or more †† Not applicable. SOURCE: U.S. Department of Education, National Center for Education Statistics, Early Childhood Longitudinal Study, Kindergarten Class of 1998–99 (ECLS-K), spring 1999.
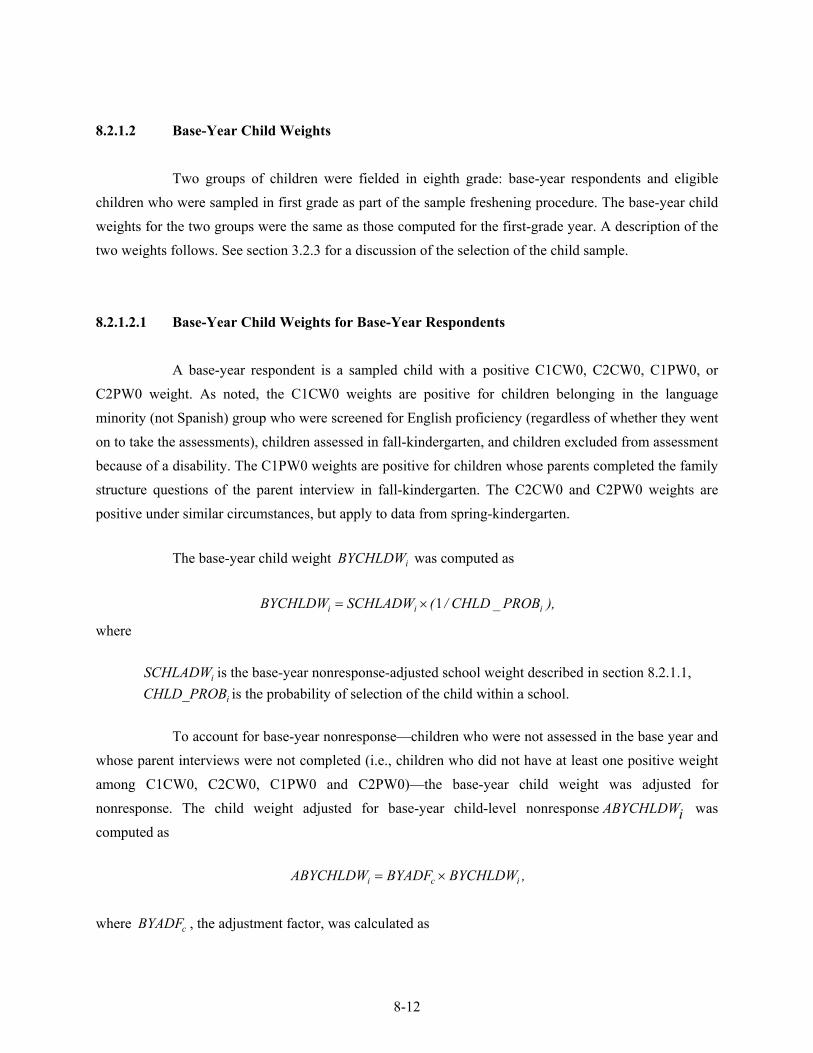
8-12
8.2.1.2 Base-Year Child Weights
Two groups of children were fielded in eighth grade: base-year respondents and eligible children who were sampled in first grade as part of the sample freshening procedure. The base-year child weights for the two groups were the same as those computed for the first-grade year. A description of the two weights follows. See section 3.2.3 for a discussion of the selection of the child sample.
8.2.1.2.1 Base-Year Child Weights for Base-Year Respondents
A base-year respondent is a sampled child with a positive C1CW0, C2CW0, C1PW0, or C2PW0 weight. As noted, the C1CW0 weights are positive for children belonging in the language minority (not Spanish) group who were screened for English proficiency (regardless of whether they went on to take the assessments), children assessed in fall-kindergarten, and children excluded from assessment because of a disability. The C1PW0 weights are positive for children whose parents completed the family structure questions of the parent interview in fall-kindergarten. The C2CW0 and C2PW0 weights are positive under similar circumstances, but apply to data from spring-kindergarten.
The base-year child weight iBYCHLDW was computed as
),PROB_CHLD/(SCHLADWBYCHLDW iii 1×=
where
iSCHLADW is the base-year nonresponse-adjusted school weight described in section 8.2.1.1,
iCHLD_PROB is the probability of selection of the child within a school.
To account for base-year nonresponse—children who were not assessed in the base year and whose parent interviews were not completed (i.e., children who did not have at least one positive weight among C1CW0, C2CW0, C1PW0 and C2PW0)—the base-year child weight was adjusted for nonresponse. The child weight adjusted for base-year child-level nonresponse iABYCHLDW was computed as
,BYCHLDWBYADFABYCHLDW ici ×=
where cBYADF , the adjustment factor, was calculated as
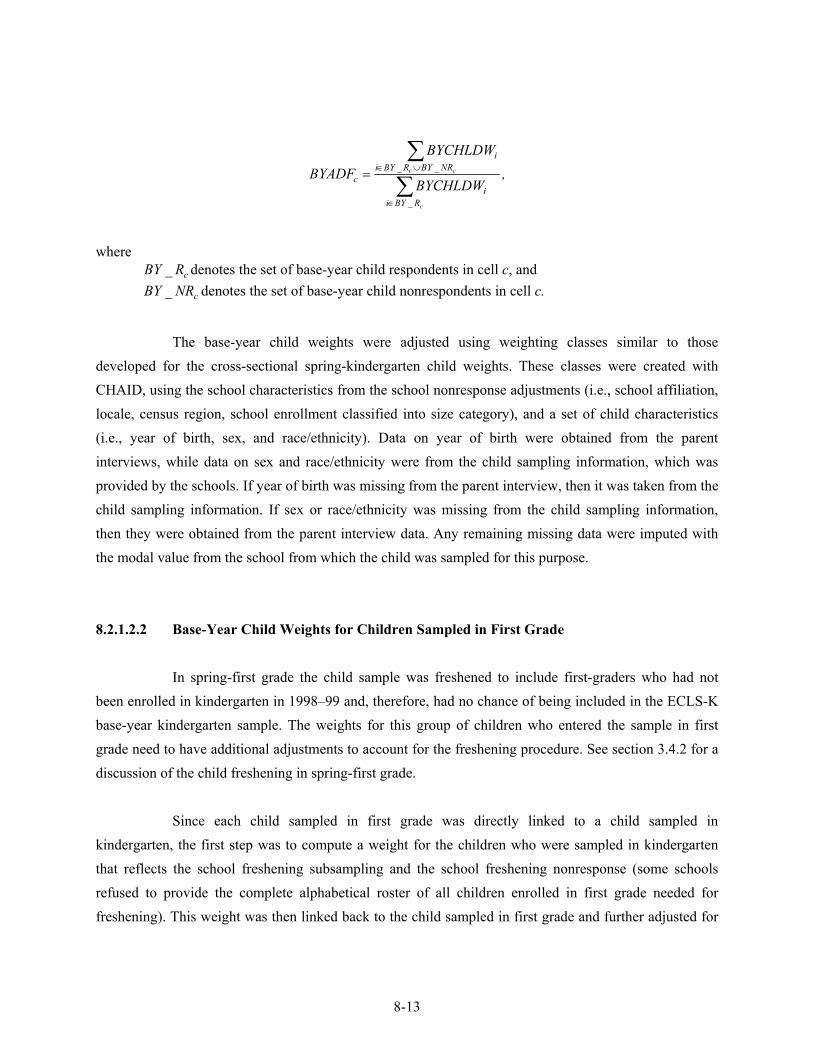
8-13
,BYCHLDW
BYCHLDWBYADF
c
cc
R_BYii
NR_BYR_BYii
c ∑∑
∈
∪∈=
where
cR_BY denotes the set of base-year child respondents in cell c, and
cNR_BY denotes the set of base-year child nonrespondents in cell c.
The base-year child weights were adjusted using weighting classes similar to those
developed for the cross-sectional spring-kindergarten child weights. These classes were created with CHAID, using the school characteristics from the school nonresponse adjustments (i.e., school affiliation, locale, census region, school enrollment classified into size category), and a set of child characteristics (i.e., year of birth, sex, and race/ethnicity). Data on year of birth were obtained from the parent interviews, while data on sex and race/ethnicity were from the child sampling information, which was provided by the schools. If year of birth was missing from the parent interview, then it was taken from the child sampling information. If sex or race/ethnicity was missing from the child sampling information, then they were obtained from the parent interview data. Any remaining missing data were imputed with the modal value from the school from which the child was sampled for this purpose.
8.2.1.2.2 Base-Year Child Weights for Children Sampled in First Grade
In spring-first grade the child sample was freshened to include first-graders who had not been enrolled in kindergarten in 1998–99 and, therefore, had no chance of being included in the ECLS-K base-year kindergarten sample. The weights for this group of children who entered the sample in first grade need to have additional adjustments to account for the freshening procedure. See section 3.4.2 for a discussion of the child freshening in spring-first grade.
Since each child sampled in first grade was directly linked to a child sampled in
kindergarten, the first step was to compute a weight for the children who were sampled in kindergarten that reflects the school freshening subsampling and the school freshening nonresponse (some schools refused to provide the complete alphabetical roster of all children enrolled in first grade needed for freshening). This weight was then linked back to the child sampled in first grade and further adjusted for
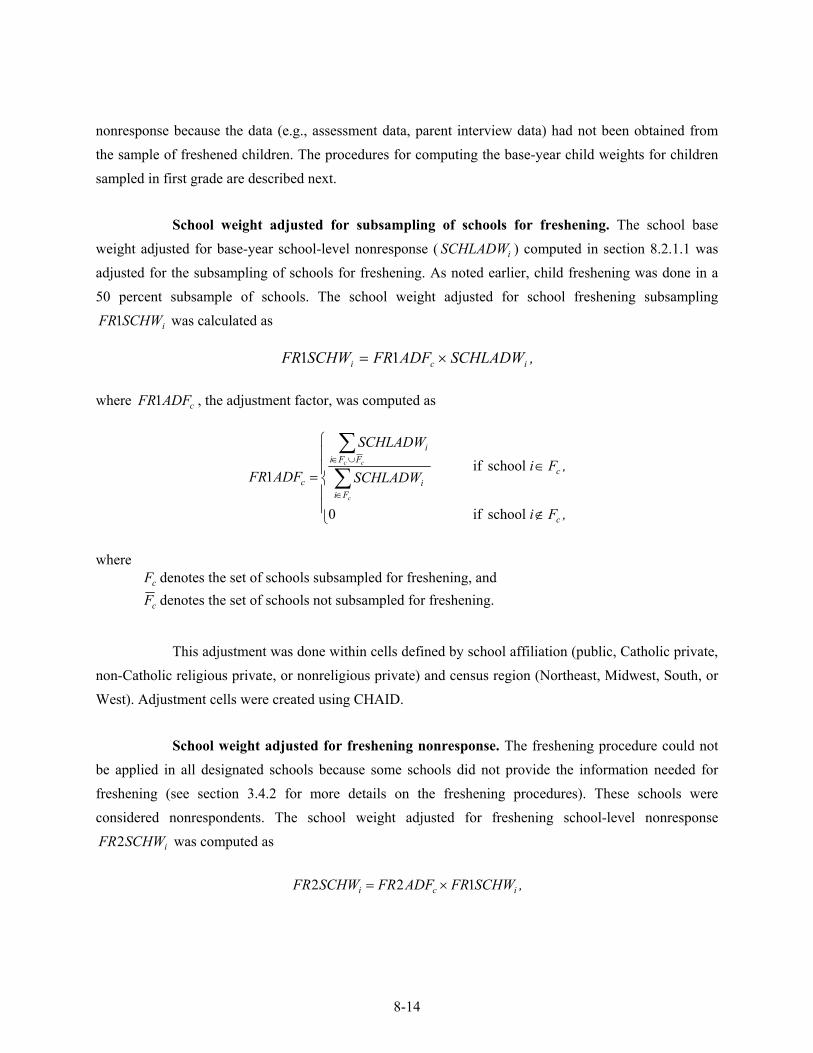
8-14
nonresponse because the data (e.g., assessment data, parent interview data) had not been obtained from the sample of freshened children. The procedures for computing the base-year child weights for children sampled in first grade are described next.
School weight adjusted for subsampling of schools for freshening. The school base
weight adjusted for base-year school-level nonresponse ( iSCHLADW ) computed in section 8.2.1.1 was adjusted for the subsampling of schools for freshening. As noted earlier, child freshening was done in a 50 percent subsample of schools. The school weight adjusted for school freshening subsampling
iSCHWFR1 was calculated as
,SCHLADWADFFRSCHWFR ici ×= 11 where cADFFR1 , the adjustment factor, was computed as
⎪⎪
⎩
⎪⎪
⎨
⎧
∉
∈= ∑
∑
∈
∪∈
,Fi
,FiSCHLADW
SCHLADW
ADFFR
c
c
Fii
FFii
cc
cc
schoolif0
schoolif1
where cF denotes the set of schools subsampled for freshening, and
cF denotes the set of schools not subsampled for freshening.
This adjustment was done within cells defined by school affiliation (public, Catholic private,
non-Catholic religious private, or nonreligious private) and census region (Northeast, Midwest, South, or West). Adjustment cells were created using CHAID.
School weight adjusted for freshening nonresponse. The freshening procedure could not
be applied in all designated schools because some schools did not provide the information needed for freshening (see section 3.4.2 for more details on the freshening procedures). These schools were considered nonrespondents. The school weight adjusted for freshening school-level nonresponse
iSCHWFR2 was computed as
,SCHWFRADFFRSCHWFR ici 122 ×=
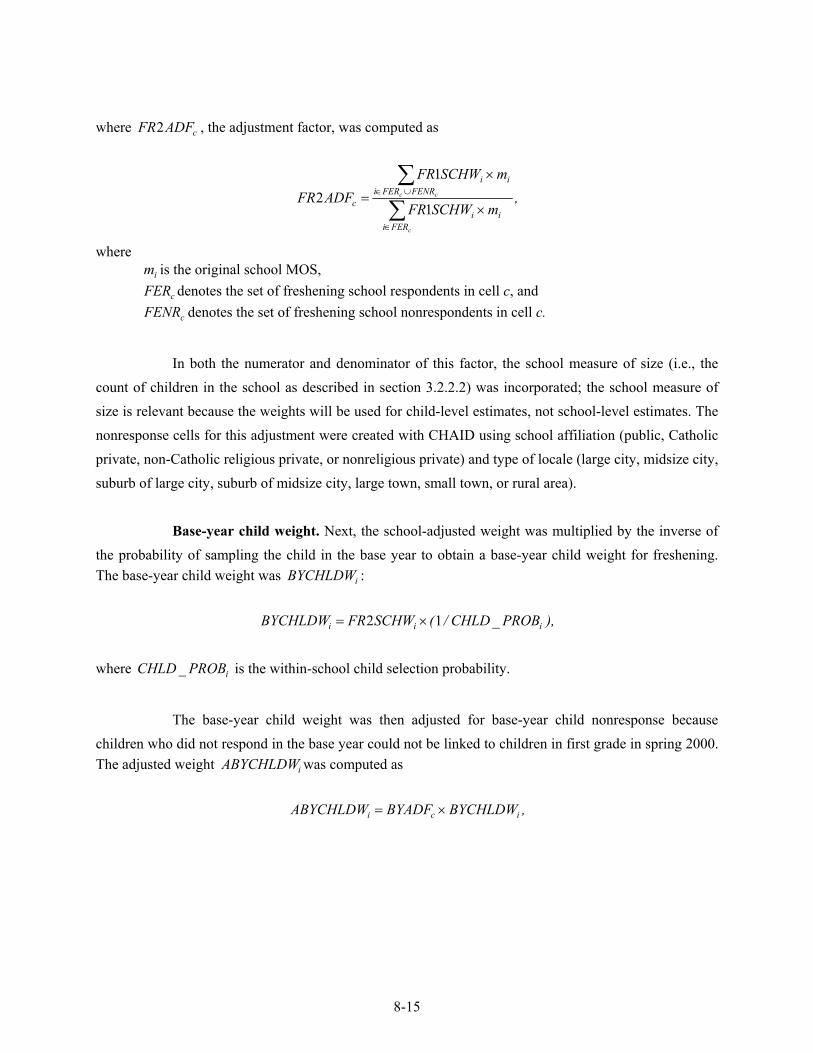
8-15
where cADFFR2 , the adjustment factor, was computed as
,mSCHWFR
mSCHWFRADFFR
c
cc
FERiii
FENRFERiii
c ∑∑
∈
∪∈
×
×
=1
12
where im is the original school MOS,
cFER denotes the set of freshening school respondents in cell c, and
cFENR denotes the set of freshening school nonrespondents in cell c.
In both the numerator and denominator of this factor, the school measure of size (i.e., the
count of children in the school as described in section 3.2.2.2) was incorporated; the school measure of size is relevant because the weights will be used for child-level estimates, not school-level estimates. The nonresponse cells for this adjustment were created with CHAID using school affiliation (public, Catholic private, non-Catholic religious private, or nonreligious private) and type of locale (large city, midsize city, suburb of large city, suburb of midsize city, large town, small town, or rural area).
Base-year child weight. Next, the school-adjusted weight was multiplied by the inverse of
the probability of sampling the child in the base year to obtain a base-year child weight for freshening. The base-year child weight was iBYCHLDW :
),PROB_CHLD/(SCHWFRBYCHLDW iii 12 ×=
where iPROB_CHLD is the within-school child selection probability.
The base-year child weight was then adjusted for base-year child nonresponse because
children who did not respond in the base year could not be linked to children in first grade in spring 2000. The adjusted weight iABYCHLDW was computed as
,BYCHLDWBYADFABYCHLDW ici ×=
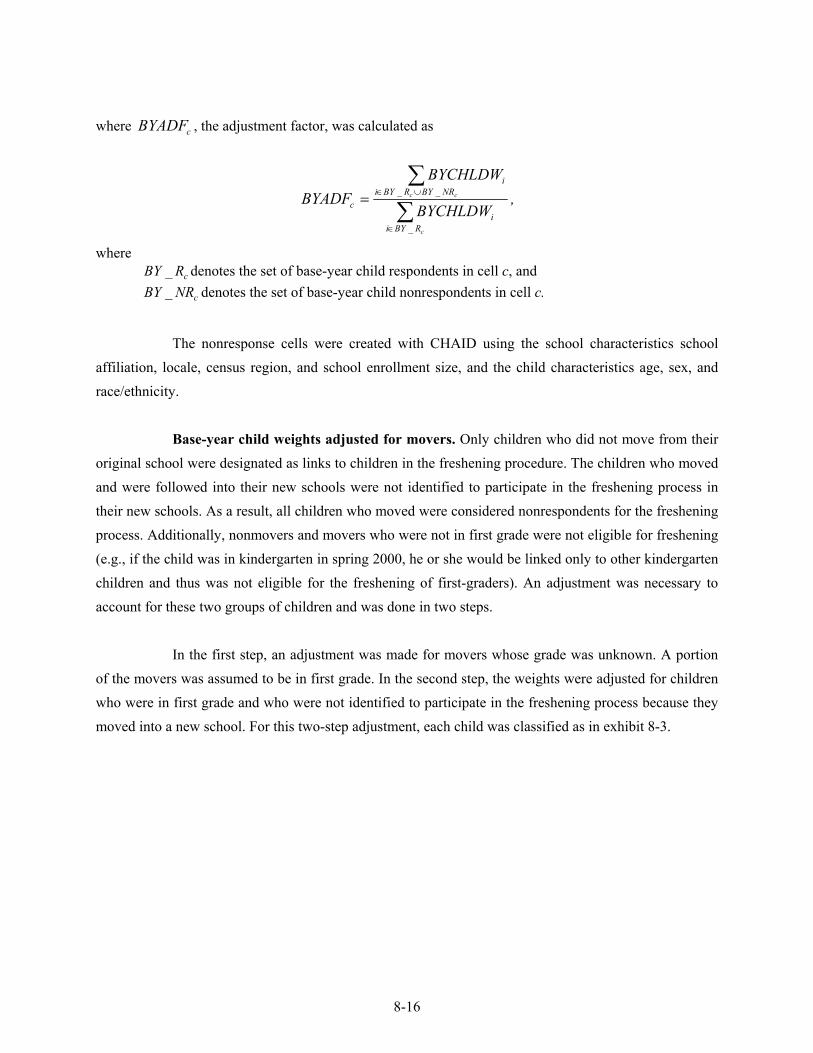
8-16
where cBYADF , the adjustment factor, was calculated as
,BYCHLDW
BYCHLDWBYADF
c
cc
R_BYii
NR_BYR_BYii
c ∑∑
∈
∪∈=
where cR_BY denotes the set of base-year child respondents in cell c, and
cNR_BY denotes the set of base-year child nonrespondents in cell c.
The nonresponse cells were created with CHAID using the school characteristics school
affiliation, locale, census region, and school enrollment size, and the child characteristics age, sex, and race/ethnicity.
Base-year child weights adjusted for movers. Only children who did not move from their
original school were designated as links to children in the freshening procedure. The children who moved and were followed into their new schools were not identified to participate in the freshening process in their new schools. As a result, all children who moved were considered nonrespondents for the freshening process. Additionally, nonmovers and movers who were not in first grade were not eligible for freshening (e.g., if the child was in kindergarten in spring 2000, he or she would be linked only to other kindergarten children and thus was not eligible for the freshening of first-graders). An adjustment was necessary to account for these two groups of children and was done in two steps.
In the first step, an adjustment was made for movers whose grade was unknown. A portion
of the movers was assumed to be in first grade. In the second step, the weights were adjusted for children who were in first grade and who were not identified to participate in the freshening process because they moved into a new school. For this two-step adjustment, each child was classified as in exhibit 8-3.
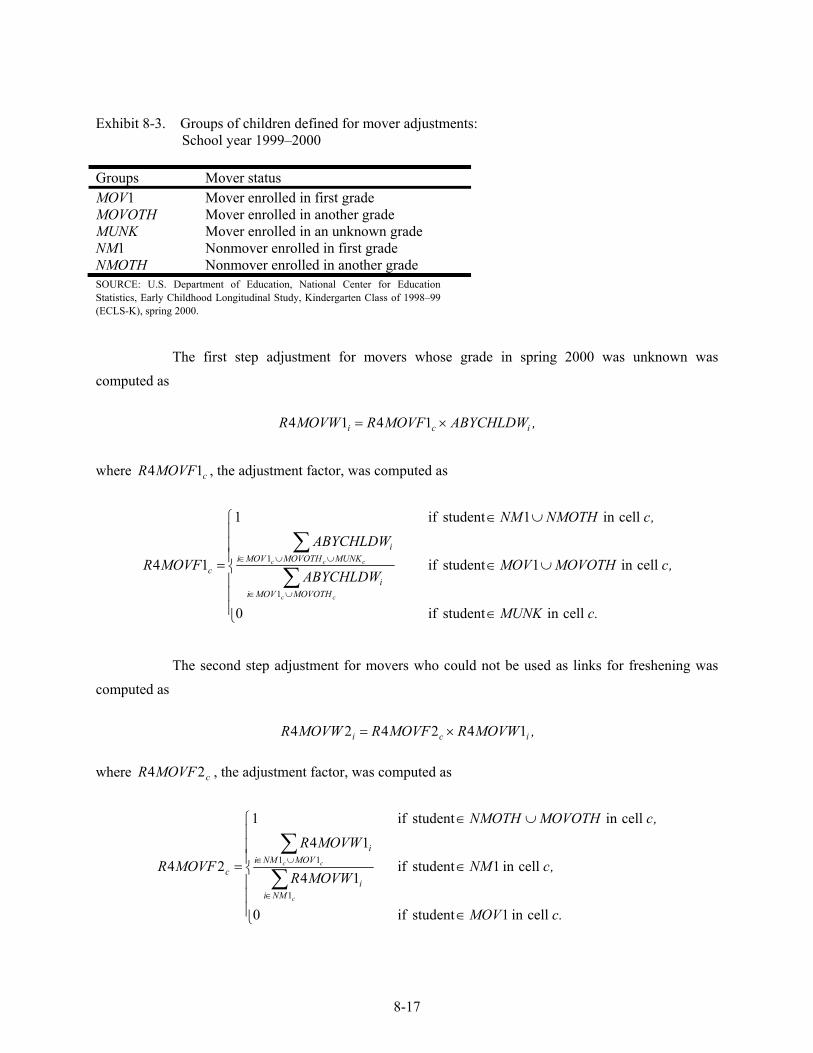
8-17
Exhibit 8-3. Groups of children defined for mover adjustments: School year 1999–2000
Groups Mover status MOV1 Mover enrolled in first grade MOVOTH Mover enrolled in another grade MUNK Mover enrolled in an unknown grade NM1 Nonmover enrolled in first grade NMOTH Nonmover enrolled in another grade SOURCE: U.S. Department of Education, National Center for Education Statistics, Early Childhood Longitudinal Study, Kindergarten Class of 1998–99 (ECLS-K), spring 2000.
The first step adjustment for movers whose grade in spring 2000 was unknown was
computed as
,ABYCHLDWMOVFRMOVWR ici ×= 1414
where cMOVFR 14 , the adjustment factor, was computed as
⎪⎪⎪
⎩
⎪⎪⎪
⎨
⎧
∈
∪∈
∪∈
=∑∑
∪∈
∪∪∈
.cMUNK
,cMOVOTHMOVABYCHLDW
ABYCHLDW
,cNMOTHNM
MOVFR
cc
ccc
MOVOTHMOVii
MUNKMOVOTHMOVii
c
cellinstudentif0
cellin1studentif
cellin1studentif1
14
1
1
The second step adjustment for movers who could not be used as links for freshening was
computed as
,MOVWRMOVFRMOVWR ici 142424 ×= where cMOVFR 24 , the adjustment factor, was computed as
⎪⎪⎪
⎩
⎪⎪⎪
⎨
⎧
∈
∈
∪∈
=∑∑
∈
∪∈
.cMOV
,cNMMOVWR
MOVWR
,cMOVOTHNMOTH
MOVFR
c
cc
NMii
MOVNMii
c
cellin1studentif0
cellin1studentif14
14
cellinstudentif1
24
1
11
8-18
This two-step adjustment was done within cells defined by school affiliation and census region.
The weights thus created for children sampled in kindergarten were then linked to the
children that they brought into the sample in first grade through sample freshening. In other words, the weight of the child sampled in first grade was defined at this point to be the weight computed for the child sampled in kindergarten that was responsible for bringing the first-grader into the sample.
For the next step in the computation of the fifth-grade child weights, the two groups of
children—base-year respondents and children sampled in first grade through sample freshening—were put together, and a common variable and label were used to designate the initial child weight. This is the base-year child weight as computed above for each group of children:
⎩⎨⎧
=grade.firstinsampledif24
,respondentyearbaseif
i
ii MOVWR
ABYCHLDWICHLDW
The initial child weights iICHLDW were adjusted for movers between the base year and fifth
grade and for nonresponse in fifth grade, and raked to sampled-based control totals to obtain the final fifth-grade child weights. These adjustments and raking procedures are described below.
8.2.2 Adjustment for Movers Between the Base Year and Fifth Grade
First, the initial child weights were adjusted to reflect the subsampling of movers. In the ECLS-K, a child could move more than once and at different times. For example, a child could move out of his original sample school because the school did not have grades higher than kindergarten. Then he or she could move again between first and third grade, first and fifth grade, or third and fifth grade. Once a child was identified as a mover, he or she stayed a mover unless he or she moved back to the original sample school. For example, a child who moved between kindergarten and third grade, but stayed in that same school in fourth and fifth grade, was considered a mover for the fifth grade.
Each mover in the fifth grade had a flag indicating whether he or she was followed into the new school (FOLLOW_F). These flags were set according to the mover subsampling plan described in section 3.6.1. Children who were excluded from the fifth-grade data collection because they had moved
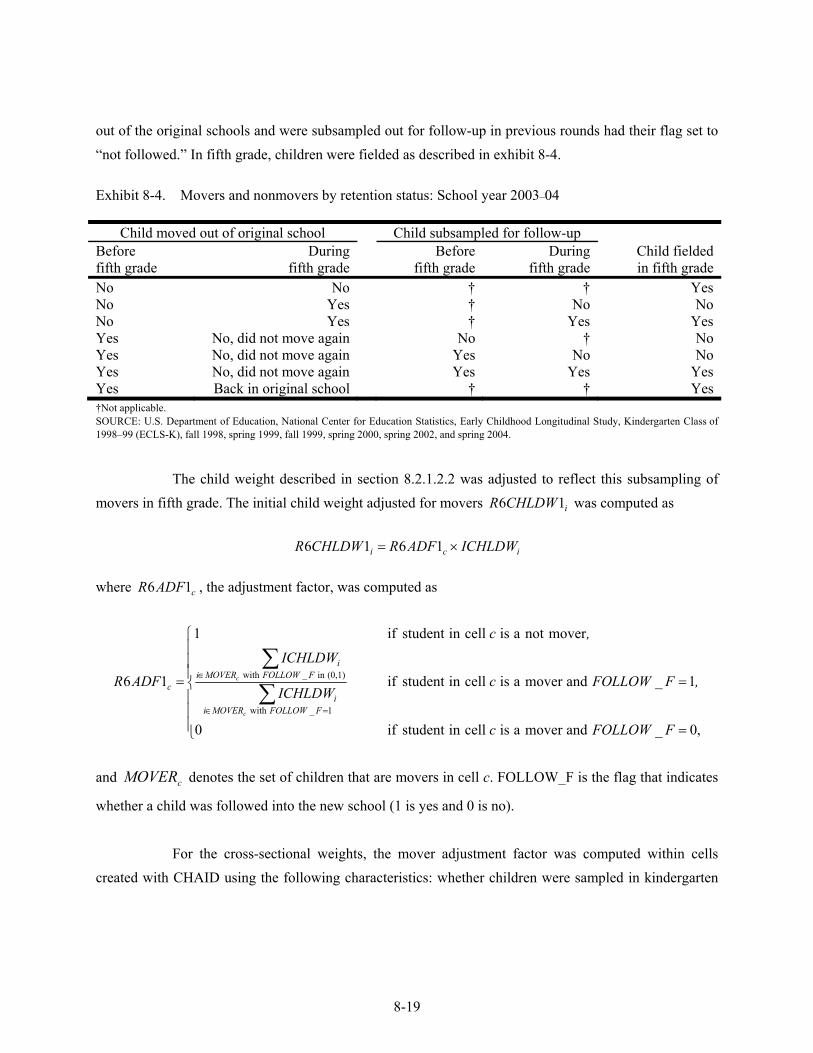
8-19
out of the original schools and were subsampled out for follow-up in previous rounds had their flag set to “not followed.” In fifth grade, children were fielded as described in exhibit 8-4.
Exhibit 8-4. Movers and nonmovers by retention status: School year 2003–04
Child moved out of original school Child subsampled for follow-up Child fieldedin fifth grade
Before fifth grade
Duringfifth grade
Beforefifth grade
During fifth grade
No No † † Yes No Yes † No No No Yes † Yes Yes Yes No, did not move again No † No Yes No, did not move again Yes No No Yes No, did not move again Yes Yes Yes Yes Back in original school † † Yes †Not applicable. SOURCE: U.S. Department of Education, National Center for Education Statistics, Early Childhood Longitudinal Study, Kindergarten Class of 1998–99 (ECLS-K), fall 1998, spring 1999, fall 1999, spring 2000, spring 2002, and spring 2004.
The child weight described in section 8.2.1.2.2 was adjusted to reflect this subsampling of
movers in fifth grade. The initial child weight adjusted for movers iCHLDWR 16 was computed as
ici ICHLDWADFRCHLDWR ×= 1616 where cADFR 16 , the adjustment factor, was computed as
⎪⎪⎪
⎩
⎪⎪⎪
⎨
⎧
=
==∑∑
=∈
∈
,0andmoveraiscellinstudentif0
1andmoveraiscellinstudentif
movernotaiscellinstudentif1
16
1with
(0,1)inwith
F_FOLLOWc
,F_FOLLOWcICHLDW
ICHLDW
,c
ADFR
F_FOLLOWMOVERii
F_FOLLOWMOVERii
c
c
c
and cMOVER denotes the set of children that are movers in cell c. FOLLOW_F is the flag that indicates
whether a child was followed into the new school (1 is yes and 0 is no).
For the cross-sectional weights, the mover adjustment factor was computed within cells created with CHAID using the following characteristics: whether children were sampled in kindergarten
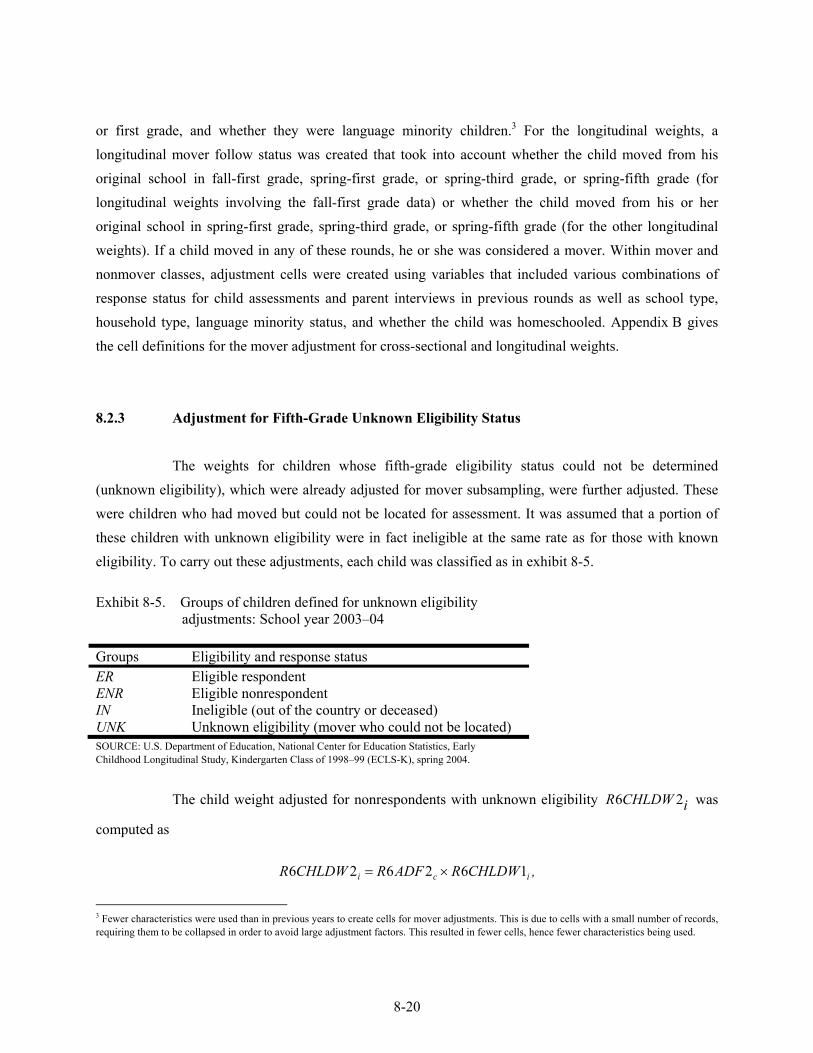
8-20
or first grade, and whether they were language minority children.3 For the longitudinal weights, a longitudinal mover follow status was created that took into account whether the child moved from his original school in fall-first grade, spring-first grade, or spring-third grade, or spring-fifth grade (for longitudinal weights involving the fall-first grade data) or whether the child moved from his or her original school in spring-first grade, spring-third grade, or spring-fifth grade (for the other longitudinal weights). If a child moved in any of these rounds, he or she was considered a mover. Within mover and nonmover classes, adjustment cells were created using variables that included various combinations of response status for child assessments and parent interviews in previous rounds as well as school type, household type, language minority status, and whether the child was homeschooled. Appendix B gives the cell definitions for the mover adjustment for cross-sectional and longitudinal weights.
8.2.3 Adjustment for Fifth-Grade Unknown Eligibility Status
The weights for children whose fifth-grade eligibility status could not be determined (unknown eligibility), which were already adjusted for mover subsampling, were further adjusted. These were children who had moved but could not be located for assessment. It was assumed that a portion of these children with unknown eligibility were in fact ineligible at the same rate as for those with known eligibility. To carry out these adjustments, each child was classified as in exhibit 8-5.
Exhibit 8-5. Groups of children defined for unknown eligibility
adjustments: School year 2003–04 Groups Eligibility and response status ER Eligible respondent ENR Eligible nonrespondent IN Ineligible (out of the country or deceased) UNK Unknown eligibility (mover who could not be located) SOURCE: U.S. Department of Education, National Center for Education Statistics, Early Childhood Longitudinal Study, Kindergarten Class of 1998–99 (ECLS-K), spring 2004.
The child weight adjusted for nonrespondents with unknown eligibility iCHLDWR 26 was
computed as
,CHLDWRADFRCHLDWR ici 162626 ×=
3 Fewer characteristics were used than in previous years to create cells for mover adjustments. This is due to cells with a small number of records, requiring them to be collapsed in order to avoid large adjustment factors. This resulted in fewer cells, hence fewer characteristics being used.
8-21
where cADFR 26 , the adjustment factor, was computed as
⎪⎪
⎩
⎪⎪
⎨
⎧
∈
∪∪∈= ∑
∑
∪∪∈
∪∪∪∈
.cUNK
,cINENRERCHLDWR
CHLDWR
ADFRccc
cccc
INENRERii
UNKINENRERii
c
cellinstudentif0
cellinstudentif16
16
26
After this step and prior to the adjustments for eighth-grade unknown eligibility and nonresponse adjustments, the large weights assigned to a dozen children were trimmed by approximately half in order to reduce the design effect due to large variation in the weights. The excess weights from these children were distributed to the remaining children in the sample so that the sum of the initial weights before trimming was equal to the sum of the initial weights after trimming.
8.2.4 Eighth-Grade Unknown Eligibility and Nonresponse Adjustment
The weight described in section 8.2.3 was adjusted for eighth-grade unknown eligibility status and nonresponse. In the first step, the adjustment was for children whose eighth grade eligibility could not be determined (unknown eligibility). These are children who were not located for assessment. As in fifth grade, a portion of these children with unknown eligibility was assumed to be ineligible at the same rate as for those with known eligibility. In the second step, the adjustment was for eligible nonrespondents. To carry out these adjustments, each child was classified as in exhibit 8-5, but using eighth-grade status.
The eighth-grade child weight adjusted for nonrespondents with unknown eligibility
iCHLDWR 17 was computed as
,CHLDWRADFRCHLDWR ici 261717 ×=
where cADFR 17 , the adjustment factor, was computed as
⎪⎪
⎩
⎪⎪
⎨
⎧
∈
∪∪∈= ∑
∑
∪∪∈
∪∪∪∈
.cUNK
,cINENRERCHLDWR
CHLDWR
ADFRccc
cccc
INENRERii
UNKINENRERii
c
cellinstudentif0
cellinstudentif26
26
17
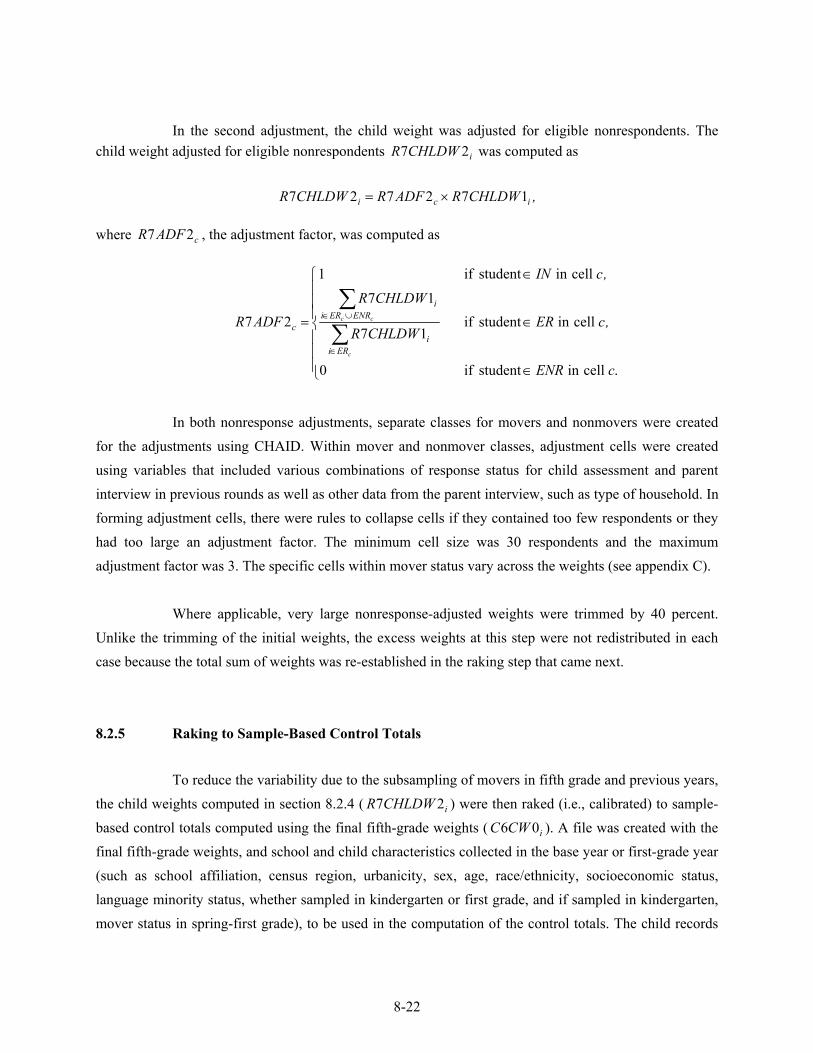
8-22
In the second adjustment, the child weight was adjusted for eligible nonrespondents. The child weight adjusted for eligible nonrespondents iCHLDWR 27 was computed as
,CHLDWRADFRCHLDWR ici 172727 ×=
where cADFR 27 , the adjustment factor, was computed as
⎪⎪⎪
⎩
⎪⎪⎪
⎨
⎧
∈
∈
∈
=∑∑
∈
∪∈
.cellinstudentif0
cellinstudentif17
17
cellinstudentif1
27
cENR
,cERCHLDWR
CHLDWR
,cIN
ADFR
c
cc
ERii
ENRERii
c
In both nonresponse adjustments, separate classes for movers and nonmovers were created
for the adjustments using CHAID. Within mover and nonmover classes, adjustment cells were created using variables that included various combinations of response status for child assessment and parent interview in previous rounds as well as other data from the parent interview, such as type of household. In forming adjustment cells, there were rules to collapse cells if they contained too few respondents or they had too large an adjustment factor. The minimum cell size was 30 respondents and the maximum adjustment factor was 3. The specific cells within mover status vary across the weights (see appendix C).
Where applicable, very large nonresponse-adjusted weights were trimmed by 40 percent.
Unlike the trimming of the initial weights, the excess weights at this step were not redistributed in each case because the total sum of weights was re-established in the raking step that came next.
8.2.5 Raking to Sample-Based Control Totals
To reduce the variability due to the subsampling of movers in fifth grade and previous years, the child weights computed in section 8.2.4 ( iCHLDWR 27 ) were then raked (i.e., calibrated) to sample-based control totals computed using the final fifth-grade weights ( iCWC 06 ). A file was created with the final fifth-grade weights, and school and child characteristics collected in the base year or first-grade year (such as school affiliation, census region, urbanicity, sex, age, race/ethnicity, socioeconomic status, language minority status, whether sampled in kindergarten or first grade, and if sampled in kindergarten, mover status in spring-first grade), to be used in the computation of the control totals. The child records
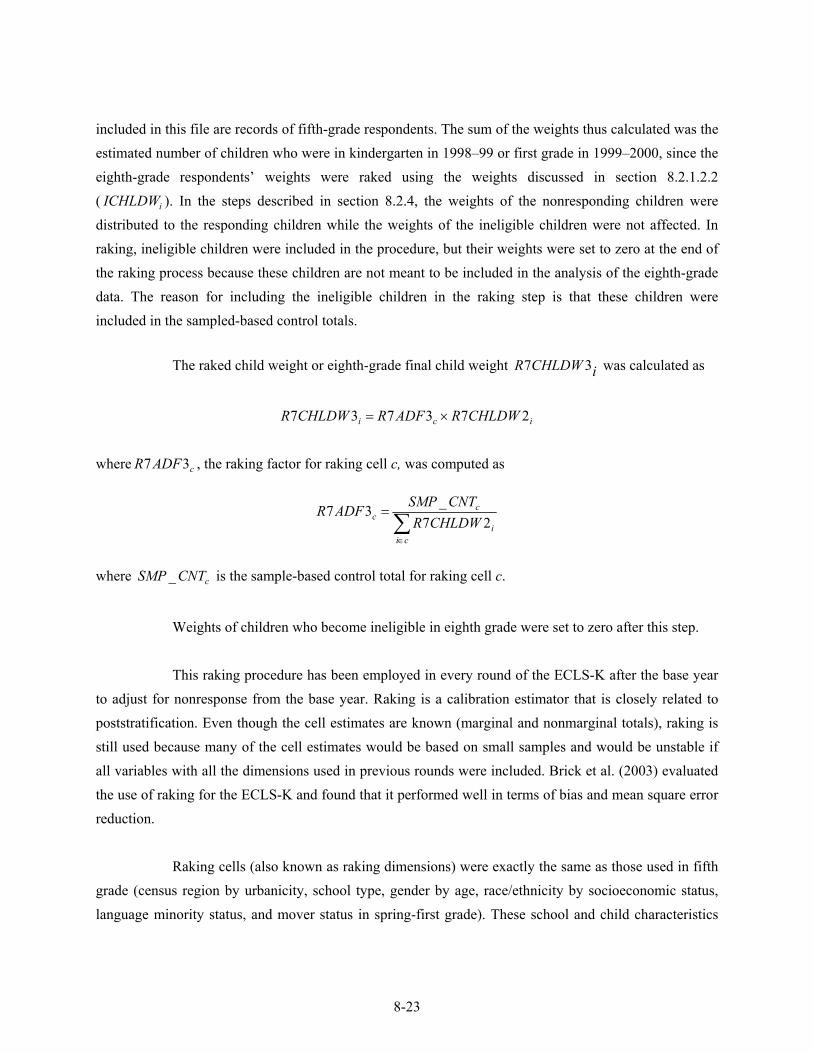
8-23
included in this file are records of fifth-grade respondents. The sum of the weights thus calculated was the estimated number of children who were in kindergarten in 1998–99 or first grade in 1999–2000, since the eighth-grade respondents’ weights were raked using the weights discussed in section 8.2.1.2.2 ( iICHLDW ). In the steps described in section 8.2.4, the weights of the nonresponding children were distributed to the responding children while the weights of the ineligible children were not affected. In raking, ineligible children were included in the procedure, but their weights were set to zero at the end of the raking process because these children are not meant to be included in the analysis of the eighth-grade data. The reason for including the ineligible children in the raking step is that these children were included in the sampled-based control totals.
The raked child weight or eighth-grade final child weight iCHLDWR 37 was calculated as
ici CHLDWRADFRCHLDWR 273737 ×=
where cADFR 37 , the raking factor for raking cell c, was computed as
∑∈
=
cii
cc CHLDWR
CNT_SMPADFR27
37
where cCNT_SMP is the sample-based control total for raking cell c.
Weights of children who become ineligible in eighth grade were set to zero after this step. This raking procedure has been employed in every round of the ECLS-K after the base year
to adjust for nonresponse from the base year. Raking is a calibration estimator that is closely related to poststratification. Even though the cell estimates are known (marginal and nonmarginal totals), raking is still used because many of the cell estimates would be based on small samples and would be unstable if all variables with all the dimensions used in previous rounds were included. Brick et al. (2003) evaluated the use of raking for the ECLS-K and found that it performed well in terms of bias and mean square error reduction.
Raking cells (also known as raking dimensions) were exactly the same as those used in fifth
grade (census region by urbanicity, school type, gender by age, race/ethnicity by socioeconomic status, language minority status, and mover status in spring-first grade). These school and child characteristics
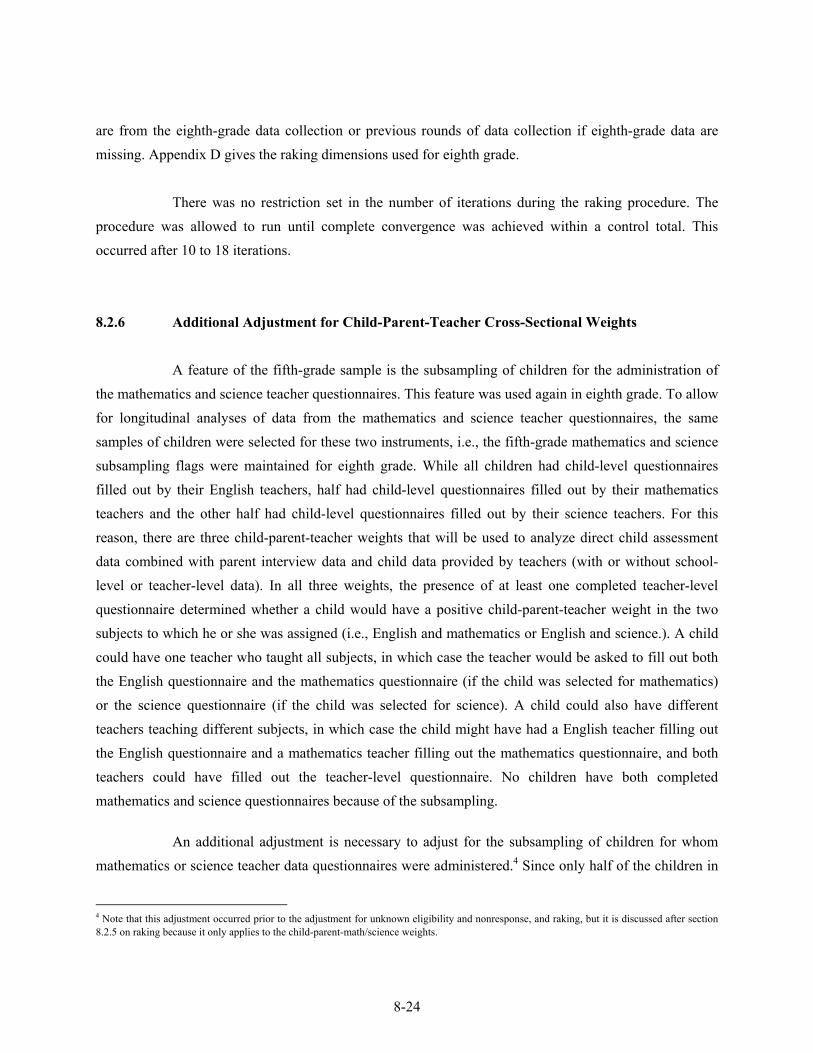
8-24
are from the eighth-grade data collection or previous rounds of data collection if eighth-grade data are missing. Appendix D gives the raking dimensions used for eighth grade.
There was no restriction set in the number of iterations during the raking procedure. The
procedure was allowed to run until complete convergence was achieved within a control total. This occurred after 10 to 18 iterations.
8.2.6 Additional Adjustment for Child-Parent-Teacher Cross-Sectional Weights
A feature of the fifth-grade sample is the subsampling of children for the administration of the mathematics and science teacher questionnaires. This feature was used again in eighth grade. To allow for longitudinal analyses of data from the mathematics and science teacher questionnaires, the same samples of children were selected for these two instruments, i.e., the fifth-grade mathematics and science subsampling flags were maintained for eighth grade. While all children had child-level questionnaires filled out by their English teachers, half had child-level questionnaires filled out by their mathematics teachers and the other half had child-level questionnaires filled out by their science teachers. For this reason, there are three child-parent-teacher weights that will be used to analyze direct child assessment data combined with parent interview data and child data provided by teachers (with or without school-level or teacher-level data). In all three weights, the presence of at least one completed teacher-level questionnaire determined whether a child would have a positive child-parent-teacher weight in the two subjects to which he or she was assigned (i.e., English and mathematics or English and science.). A child could have one teacher who taught all subjects, in which case the teacher would be asked to fill out both the English questionnaire and the mathematics questionnaire (if the child was selected for mathematics) or the science questionnaire (if the child was selected for science). A child could also have different teachers teaching different subjects, in which case the child might have had a English teacher filling out the English questionnaire and a mathematics teacher filling out the mathematics questionnaire, and both teachers could have filled out the teacher-level questionnaire. No children have both completed mathematics and science questionnaires because of the subsampling.
An additional adjustment is necessary to adjust for the subsampling of children for whom mathematics or science teacher data questionnaires were administered.4 Since only half of the children in
4 Note that this adjustment occurred prior to the adjustment for unknown eligibility and nonresponse, and raking, but it is discussed after section 8.2.5 on raking because it only applies to the child-parent-math/science weights.
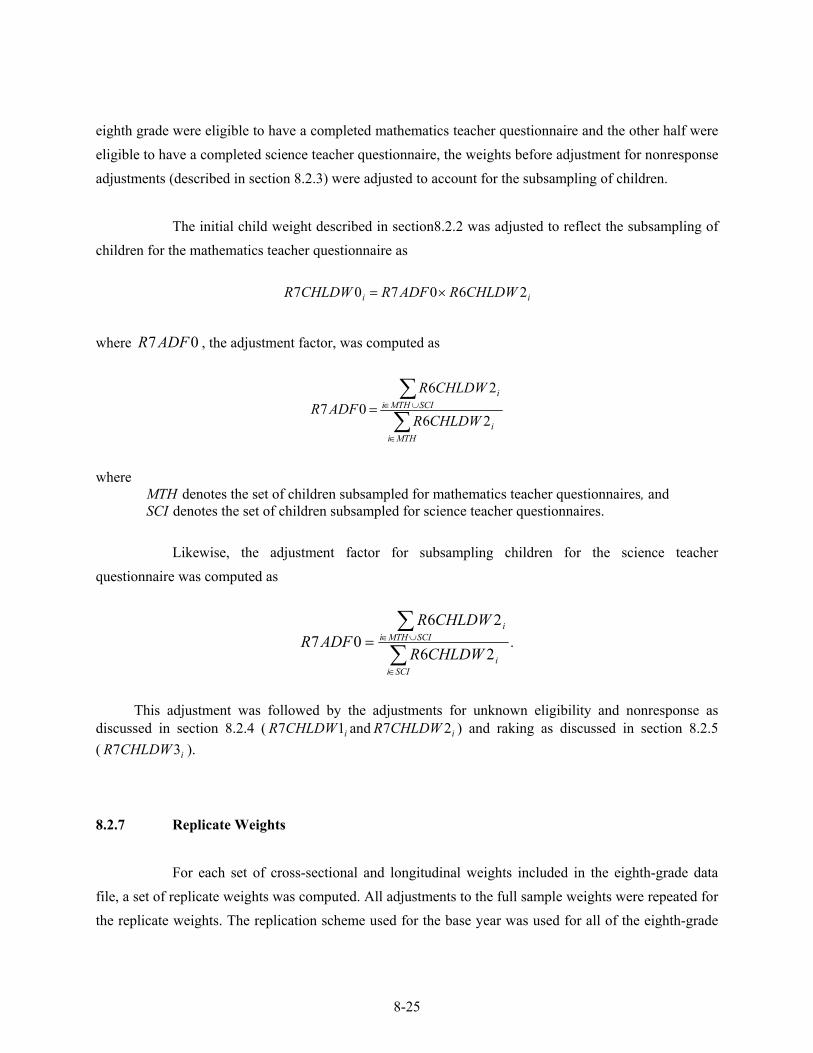
8-25
eighth grade were eligible to have a completed mathematics teacher questionnaire and the other half were eligible to have a completed science teacher questionnaire, the weights before adjustment for nonresponse adjustments (described in section 8.2.3) were adjusted to account for the subsampling of children.
The initial child weight described in section8.2.2 was adjusted to reflect the subsampling of
children for the mathematics teacher questionnaire as
ii CHLDWRADFRCHLDWR 260707 ×=
where 07ADFR , the adjustment factor, was computed as
∑∑
∈
∪∈=
MTHii
SCIMTHii
CHLDWR
CHLDWRADFR
26
2607
where MTH denotes the set of children subsampled for mathematics teacher questionnaires, and SCI denotes the set of children subsampled for science teacher questionnaires.
Likewise, the adjustment factor for subsampling children for the science teacher questionnaire was computed as
.CHLDWR
CHLDWRADFR
SCIii
SCIMTHii
∑∑
∈
∪∈=26
2607
This adjustment was followed by the adjustments for unknown eligibility and nonresponse as
discussed in section 8.2.4 ( iCHLDWR 17 and iCHLDWR 27 ) and raking as discussed in section 8.2.5 ( iCHLDWR 37 ).
8.2.7 Replicate Weights
For each set of cross-sectional and longitudinal weights included in the eighth-grade data file, a set of replicate weights was computed. All adjustments to the full sample weights were repeated for the replicate weights. The replication scheme used for the base year was used for all of the eighth-grade
8-26
weights that did not contain any fall-first grade component. If a fall-first grade component was included in the definition of the respondents for the weight, then the replication scheme used for fall-first grade estimates was used.
Replicate weights are needed to estimate the standard errors of survey estimates. A total of
90 replicate weights were computed using the paired jackknife method (denoted as JK2) for the eighth-grade weights if no fall-first grade component was included. These replicates take into account the Durbin method of PSU selection (Durbin 1967). A total of 40 replicates using the paired jackknife method were created for the weights that contain a fall-first grade component. The number of replicates is smaller because only 30 percent of the full sample of schools was included in the fall-first grade subsample. Only one of the two sampled PSUs in the non-self-representing strata was kept in the sample. Consequently, the fall-first grade weights do not account for the Durbin PSU sampling method, which required two PSUs per stratum.
The procedures used to compute the replicate weights took into account each step of the
weighting process. One feature that is somewhat uncommon in practice is the use of sample-based raking as described in section 8.2.5. The control totals ( cCNT_SMP ) used for raking are estimates calculated using the final fifth-grade child weights ( iCWC 06 ). When population-based raking is used, these totals are assumed to be numbers that are known and without sampling error. To reflect the variability of the control totals in the sample-based raking, a set of replicate control totals was calculated rather than having a constant set of totals. Each replicate weight was then raked to the corresponding replicate-based control total. The result of this process was that each replicate retained the variability associated with the original sample estimates of the control totals. As with the full sample weight, the raking procedure was allowed to run until complete convergence. For eighth grade, full convergence was achieved after 10 to 18 iterations for each replicate weight.
8.2.7.1 Replicate Weights for Samples Not Involving Fall-First Grade
For the original ECLS-K design in the base year, replicate weights were created taking into account the Durbin method of PSU selection. The Durbin method selects two first-stage units per stratum without replacement, with probability proportional to size and a known joint probability of inclusion.
8-27
In the ECLS-K PSU sample design, there were 24 self-representing strata and 38 non-self-representing strata. Among the 38 non-self-representing strata, 11 strata were identified as Durbin strata and were treated as self-representing strata for variance estimation. The purpose of the Durbin strata is to allow variances to be estimated as if the first-stage units were selected with replacement. This brings the number of self-representing PSUs to 46 (24 original self-representing PSUs and 22 Durbin PSUs from the 11 Durbin strata). The remaining 54 non-self-representing PSUs are in 27 non-self-representing strata; thus 27 replicates were formed, each corresponding to one non-self-representing stratum. For the self-representing strata, 63 replicates were formed. The 90 replicates will yield about 76 degrees of freedom for calculating confidence intervals for many survey estimates.
As stated earlier, the sample of PSUs was divided into 90 replicates or variance strata. The
27 non-self-representing strata formed 27 variance strata of two PSUs each; each PSU formed a variance unit within a variance stratum. All schools within a non-self-representing PSU were assigned to the same variance unit and variance stratum. Sampled schools in the 46 self-representing PSUs were grouped into 63 variance strata. In the self-representing PSUs, schools were directly sampled and constituted variance PSUs. Public schools were sampled from within each sample PSU while private schools were pooled into one sampling stratum and selected systematically (except in the self-representing PSUs identified through the Durbin method where private schools were treated as if they were sampled from within each sample PSU). Schools were sorted by sampling stratum, type of school (from the original sample or newly selected as part of freshening), type of frame (for new schools only), and their original order of selection (within stratum). From this sorted list, they were grouped into pairs within each sampling stratum; the last pair in the stratum may be a triplet if the number of schools in the stratum is odd. This operation resulted in a number of ordered preliminary variance strata of two or three units each. The first ordered 63 strata were then numbered sequentially from 1 to 63; the next ordered 63 strata were also numbered sequentially from 1 to 63, and so on until the list was exhausted, thus forming the desired 63 variance strata.
In strata with two units, a unit being a PSU in the case of non-self-representing PSUs and a
school in the case of self-representing PSUs, the base weight of the first unit was doubled to form the replicate weight, while the base weight of the second unit was multiplied by zero. In strata with three units, two variance strata were created: in the first variance stratum, the base weight of two of the three units was multiplied by 1.5 to form the replicate weight, and the base weight of the last unit was multiplied by zero; in the second variance stratum, the base weight of a different group of two units was multiplied by 1.5, and the base weight of the third unit was multiplied by zero. Multiplying the base weight in a unit by zero is equivalent to dropping one unit as required by the jackknife method. All
8-28
adjustments to the full sample weights were repeated for the replicate weights. For each full sample weight, there are 90 replicate weights with the same weight prefix.
A child sampled in first grade through the freshening process was assigned to the same
replicate as the originally sampled child to whom the child was linked. When the child sampled in first grade was assigned a full sample weight, he or she was assigned the replicate weights in the same manner.
8.2.7.2 Replicate Weights for Samples Involving Fall-First Grade
For the two longitudinal weights involving fall-first grade (C1_7SC0 and C1_7SP0), there are 40 replicate weights. The reason for the smaller number of replicates is that only a subsample of schools was included in the fall-first grade sample. The weights associated with the fall-first grade data do not account for the Durbin method of selecting PSUs, since it no longer applied. Rather, they reflect the fact that only one of the two sampled PSUs in the non-self-representing strata was kept in the subsample. To account for this feature, pairs of similar non-self-representing PSUs were collapsed into 19 variance strata. The self-representing PSUs account for the remaining 21 variance strata. The 40 replicates will yield about 40 degrees of freedom for calculating confidence intervals for many survey estimates.
8.3 Variance Estimation
8.3.1 Jackknife Method
The final full sample and the adjusted replicate weights can be used to compute estimates of variance for survey estimates using WesVar, AM, SUDAAN, or other software that handles replicate weights. The estimate of variance is the sum of the squared deviations of the replicate estimates from the full-sample estimate:
,)ˆˆ()ˆ(vG
g)g(∑
=
−=1
2θθθ
8-29
where θ is the population statistic of interest, θ is the estimate of θ based on the full sample, G is the number of replicates, and )g(θ is the gth replicate estimate of θ based on the observations included in the gth replicate.
8.3.2 Taylor Series Method
Variance stratum and variance unit (first-stage sample unit) identifiers were also created to be used in statistical software that computes variance estimates based on the Taylor series method (e.g., SUDAAN, Stata, SAS, SPSS Complex Samples Module, and AM). In this method, a linear approximation to a statistic is formed and then substituted into the formula for calculating the variance of a linear estimate appropriate for the sample design.
If ( )'pY,...,YY 1= denotes a p-dimensional vector of population parameters, ( )'pY,...,YY 1= is
the corresponding vector of estimators based on a sample s of size n(s), ( )Yg=θ is the population parameter of interest, and ( )Ygˆ =θ is an estimator of θ , then
( )( )jj
p
j jYY
yYgˆ −
∂∂
=− ∑=1
&θθ
and
( ) ( ) ( ) ( ) ( ) { }.Y,YCovyYg
yYgYY
yYgvˆv ij
i
p
j
p
i j
p
jjj
i ∂∂
∂∂
=⎟⎟⎠
⎞⎜⎜⎝
⎛−
∂∂
= ∑∑∑= == 1 11
&θ
The Taylor series method relies on a simplified procedure for estimating the variance for a
linear statistic even with a complex sample design and is valid in large samples in which the first stage units are sampled with replacement. For the ECLS-K, this simplified method does not capture the variance related to the Durbin sampling method, the effects of the adjustments of the weights for nonresponse, or the sample-based raking procedures. These effects are not captured in the Taylor series variance estimates mainly because each adjustment corresponds to a different estimator that the variance estimation software does not support. In some cases these adjustments may have only a minor effect on the variance estimates, but in other cases the effects could be more substantial.
8-30
For software that uses the Taylor series method, the variance strata and PSUs must be defined. For the eighth-grade ECLS-K, the Taylor variance strata were assigned by sequentially numbering the sampling strata and collapsing any stratum with one PSU with an adjacent stratum. In theory, any variance stratum with fewer than two responding units would be combined with an adjacent stratum, but this did not happen in the ECLS-K. The variance units were assigned by sequentially numbering the first-stage sampling units within sampling strata. For example, for C7CW0, Taylor variance strata were numbered sequentially from 1 to 90. Within each Taylor stratum, Taylor units were numbered sequentially from 1 to the total number of units in the stratum. This procedure was done separately for each cross-sectional and longitudinal weight.
APPENDIX A
ECLS-K SPRING 2006 FIELD TEST REPORT
NOTE: Please note that the appendixes to the ECLS-K Spring 2006 Field Test Report are not included in this appendix.
A-1
A-2
This page is intentionally left blank.
Early Childhood Longitudinal Study, Kindergarten Class of 1998–99 (ECLS-K)
Spring 2006 Field Test Report
February 2007
U.S. Department of Education Institute of Education Sciences
Prepared by
Westat
Educational Testing Service
PLEASE NOTE THAT THE APPENDIXES TO THE ECLS-K 2006 SPRING FIELD TEST REPORT ARE NOT INCLUDED.

NOTICE OF COPYRIGHT AND PERMISSIONS
“The Fish” from THE COMPLETE POEMS 1927-1979 by Elizabeth Bishop Copyright © 1979, 1983 by Alice Helen Methfessel appears on pages 13-15 of Spring 2006 Grade 8 Assessment Form 1 (appendix A-1) and is reprinted by permission of Farrar, Straus and Giroux, LLC.
“Finding a Lucky Number” from New and Selected Poems by Gary Soto, Copyright © 1995, published by Chronicle Books, San Francisco appears on pages 14-15 of Spring 2006 Grade 8 Assessment Form 2 (appendix A-2) and is reprinted by permission of Literary Cavalcade, © 1990. Website http://www.chroniclebooks.com.
An excerpt from Ellis Island: Doorway to America, by Bill Walter, appears on pages 18-20 of Spring 2006 Grade 8 Assessment Form 2 (appendix A-2). It was published in JUNIOR SCHOLASTIC April 6, 1990, © Scholastic, Inc. and is used by permission.
An excerpt from “Stones, Bones, and Petroglyphs,” by Susan Goodman, copyright ©1998, appears on pages 8-9 of Spring 2006 Grade 8 Assessment Form 3 (appendix A-3). Reprinted with permission of Atheneum Books for Young readers, an imprint of Simon and Schuster Children’s Publishing Division.
“The Sharebots” by Carl Zimmer copyright © 1995 The Walt Disney Co. appears on pages 15-17 of Spring 2006 Grade 8 Assessment Form 4 (appendix A-4). Reprinted with permission of Discover Magazine.
“The Fish” from THE COMPLETE POEMS 1927-1979 by Elizabeth Bishop Copyright © 1979, 1983 by Alice Helen Methfessel appears on pages 5-7 of Spring 2006 Grade 10 Assessment Form 1 (appendix A-5) and is reprinted by permission of Farrar, Straus and Giroux, LLC.
“Finding a Lucky Number” from New and Selected Poems by Gary Soto, Copyright © 1995, published by Chronicle Books, San Francisco appears on pages 5-6 of Spring 2006 Grade 10 Assessment Form 2 (appendix A-6) and is reprinted by permission of Literary Cavalcade, © 1990. Website http://www.chroniclebooks.com.
An excerpt from Ellis Island: Doorway to America, by Bill Walter, appears on page 9-11 of Spring 2006 Grade 10 Assessment Form 2 (appendix A-6). It was published in JUNIOR SCHOLASTIC April 6, 1990, © Scholastic, Inc. and is used by permission.
“The Sharebots” by Carl Zimmer copyright © 1995 The Walt Disney Co. appears on pages 8-10 of Spring 2006 Grade 10 Assessment Form 4 (appendix A-8). Reprinted with permission of Discover Magazine.
“About Yourself” appears on pages 12-14 of the Spring 2006 Grade 8 Student Questionnaire (appendix A-9) and is adapted with permission from Self Description Questionnaire-II, H.W. Marsh, San Antonio, TX: The Psychological Corporation, 1990.
A-ii
TABLE OF CONTENTS
Chapter Page
NOTICE OF COPYRIGHTS AND PERMISSIONS ...................................... A-ii
1 INTRODUCTION AND BACKGROUND .................................................... A-1-1
1.1 Study Overview and Purpose of Spring 2006 Field Test.................... A-1-1
1.1.1 Study Overview................................................................... A-1-11.1.2 Purpose of the Spring 2006 Field Test ................................ A-1-3
1.2 Field Test Schedule............................................................................. A-1-41.3 Instrument Design and Development.................................................. A-1-5
1.3.1 Direct Assessments ............................................................. A-1-51.3.2 Indirect Assessments ........................................................... A-1-81.3.3 Student Questionnaires........................................................ A-1-81.3.4 Teacher Questionnaires ....................................................... A-1-9
1.4 Purposive Sample of Schools ............................................................. A-1-9
1.4.1 Characteristics of Participating Schools.............................. A-1-111.4.2 Characteristics of Participating Children ............................ A-1-131.4.3 Comparison of Field Test Sample to National Sample ....... A-1-14
2 TRAINING ...................................................................................................... A-2-1
2.1 School Recruiters and Test Administrators Training.......................... A-2-1
2.1.1 District and School Recruiter Training ............................... A-2-12.1.2 Test Administrator Training................................................ A-2-2
2.2 Confidentiality .................................................................................... A-2-4
3 FIELD TEST DATA COLLECTION ............................................................. A-3-1
3.1 Data Collection Period and Field Organization .................................. A-3-13.2 Parent Recruitment ............................................................................. A-3-13.3 School Recruitment............................................................................. A-3-1
3.3.1 The School Coordinator ...................................................... A-3-33.3.2 Assessment Logistics .......................................................... A-3-43.3.3 Child and Teacher Identification......................................... A-3-53.3.4 Parent Notification .............................................................. A-3-5
A-iii
TABLE OF CONTENTS (continued)
Chapter Page
3.4 Outreach Materials and Incentives...................................................... A-3-6
3.4.1 Outreach Materials .............................................................. A-3-63.4.2 Incentives ............................................................................ A-3-6
3.5 Data Collection Procedures ................................................................ A-3-6
3.5.1 Direct Assessments ............................................................. A-3-63.5.2 Collecting Height and Weight............................................. A-3-73.5.3 Student and Teacher Questionnaires ................................... A-3-8
3.6 Field Staff Communication................................................................. A-3-83.7 Optical Scanning of Forms and Paper and Pencil Questionnaires...... A-3-8
4 FEEDBACK FROM FIELD STAFF AND RESPONDENTS ........................ A-4-1
4.1 Summary of Field Staff Diaries .......................................................... A-4-1
4.1.1 Height and Weight .............................................................. A-4-14.1.2 Experiences During the Assessment Sessions .................... A-4-24.1.3 Suggestions for the National Training ................................ A-4-2
4.2 Student and Teacher Debriefing Questionnaires ................................ A-4-3
4.2.1 Web Versus Paper Questionnaires ...................................... A-4-34.2.2 Monetary Incentives............................................................ A-4-54.2.3 Advance Materials .............................................................. A-4-54.2.4 Collection of Height and Weight ........................................ A-4-6
5 FIELD TEST ANALYSIS AND DEVELOPMENT OF THE EIGHTH-GRADE DIRECT COGNITIVE ASSESSMENTS......................... A-5-1
5.1 Field Test Design and Item Pools ....................................................... A-5-1
5.1.1 Reading ............................................................................... A-5-35.1.2 Mathematics ........................................................................ A-5-35.1.3 Science ................................................................................ A-5-4
5.2 Field Test Psychometric Analysis....................................................... A-5-4
A-iv
TABLE OF CONTENTS (continued)
Chapter Page
5.2.1 Methodology ....................................................................... A-5-45.2.2 Analysis Results .................................................................. A-5-9
5.3 Design of the Eighth-Grade Tests....................................................... A-5-13
5.3.1 Reading ............................................................................... A-5-185.3.2 Mathematics ........................................................................ A-5-285.3.3 Science ................................................................................ A-5-30
5.4 Proposed Eighth-fth-Grade Assessment Forms .................................. A-5-33
5.4.1 Assessment Forms............................................................... A-5-335.4.2 Expert Review of Eighth-Grade Assessments .................... A-5-375.4.3 Sensitivity Review .............................................................. A-5-38
6 ANALYSES TO DEVELOP EIGHTH-GRADE INDIRECT COGNITIVE ASSESSMENTS AND SOCIOEMOTIONAL MEASURES ......................... A-6-1
6.1 Review of Selected Scales in the Field-Tested Student Questionnaire ...................................................................................... A-6-1
6.1.1 Reliability Analysis............................................................. A-6-36.1.2 Factor Analysis.................................................................... A-6-46.1.3 Mean Scores by Subgroups................................................. A-6-66.1.4 Accuracy of Child Report of Books Read and Teacher
Report of Textbooks Used .................................................. A-6-96.1.5 Recommendations for Spring 2007 National Eighth-Grade
Data Collection.................................................................... A-6-11
7 SUMMARY AND RECOMMENDATIONS.................................................. A-7-1
7.1 Direct Cognitive Assessments ............................................................ A-7-1
7.1.1 Reading, Mathematics, and Science Assessments .............. A-7-17.1.2 Self-Description Questionnaire ........................................... A-7-6
7.2 Web Experiment for Student and Teacher Questionnaires ................. A-7-87.3 Collecting Child Height and Weight Using Security Screen.............. A-7-97.4 Child Reactions to Student Newsletter ............................................... A-7-107.5 Respondent Reactions to Incentives Offered ...................................... A-7-117.6 Optical Scanning of Forms and Paper and Pencil Questionnaires...... A-7-11
REFERENCES ................................................................................................ A-R-1
A-v
TABLE OF CONTENTS (continued)
List of Appendixes
Appendix
A DIRECT ASSESSMENTS, STUDENT QUESTIONNAIRE, HEIGHT AND WEIGHT RECORDING FORMS, TEACHER QUESTIONNAIRES, AND EXIT INTERVIEWS
A-1 SPRING 2006 GRADE 8 ASSESSMENT FORM 1
A-2 SPRING 2006 GRADE 8 ASSESSMENT FORM 2
A-3 SPRING 2006 GRADE 8 ASSESSMENT FORM 3
A-4 SPRING 2006 GRADE 8 ASSESSMENT FORM 4
A-5 SPRING 2006 GRADE 10 ASSESSMENT FORM 1
A-6 SPRING 2006 GRADE 10 ASSESSMENT FORM 2
A-7 SPRING 2006 GRADE 10 ASSESSMENT FORM 3
A-8 SPRING 2006 GRADE 10 ASSESSMENT FORM 4
A-9 SPRING 2006 GRADE 8 STUDENT QUESTIONNAIRE
A-10 HEIGHT AND WEIGHT RECORDING FORM
A-11 SPRING 2006 HEIGHT AND WEIGHT EXIT SURVEY
A-12 SPRING 2006 STUDENT EXIT SURVEY—PAPER QUESTIONNAIRE
A-13 SPRING 2006 STUDENT EXIT SURVEY—WEB QUESTIONNAIRE
A-14 SPRING 2006 GRADE 8 ENGLISH TEACHER QUESTIONNAIRE
A-15 SPRING 2006 GRADE 8 MATH TEACHER QUESTIONNAIRE
A-16 SPRING 2006 GRADE 8 SCIENCE TEACHER QUESTIONNAIRE
A-17 SPRING 2006 TEACHER BACKGROUND QUESTIONNAIRE
A-18 SPRING 2006 TEACHER EXIT SURVEY
A-vi

TABLE OF CONTENTS (continued)
List of Appendixes (continued)
Appendix
B SCHOOL AND TEACHER SUMMARY SHEET, PARENT NEWSLETTER, AND STUDENT NEWSLETTER
B-1 SCHOOL AND TEACHER SUMMARY SHEET
B-2 PARENT NEWSLETTER
B-3 STUDENT NEWSLETTER
C READING PASSAGES, ITEM NAMES, AND NUMBER OF RESPONSES
D MATHEMATICS ITEM NAMES AND NUMBER OF RESPONSES
E SCIENCE ITEM NAMES AND NUMBER OF RESPONSES
F READING ITEM ANALYSES
G MATHEMATICS ITEM ANALYSES
H SCIENCE ITEM ANALYSES
I READING ITEM RESPONSE THEORY PLOTS
J MATHEMATICS ITEM RESPONSE THEORY PLOTS
K MATHEMATICS ITEM RESPONSE THEORY PLOTS
L DIFFERENTIAL ITEM FUNCTIONING RESULTS FOR READING
M DIFFERENTIAL ITEM FUNCTIONING RESULTS FOR MATHEMATICS
N DIFFERENTIAL ITEM FUNCTIONING RESULTS FOR SCIENCE
O ITEM STATISTICS WORKBOOKS FOR READING
P ITEM STATISTICS WORKBOOKS FOR MATHEMATICS
Q ITEM STATISTICS WORKBOOKS FOR SCIENCE
R SUMMARY OF WHOLE NUMBER SCORES FOR READING, MATHEMATICS, AND SCIENCE (WORKBOOK)
A-vii
TABLE OF CONTENTS (continued)
List of Tables
Table Page
1-1 Eighth-Grade Field Test school characteristics: 2006 ..................................... A-1-12
1-2 Type of consent, by school sector of the Eighth-Grade Field Test schools: 2006 ................................................................................................... A-1-13
1-3 Characteristics of participating children in Eighth-Grade Field Test: 2006 .... A-1-14
1-4 Comparison of participating eighth-grade children in 2006 Eighth-Grade Field Test with eighth-grade children in 2005 National Household Education Survey, in percent ............................................................................................ A-1-15
4-1 Number of completed student questionnaires by method of completion: Spring 2006...................................................................................................... A-4-4
4-2 Number of completed teacher questionnaires by method of completion: Spring 2006...................................................................................................... A-4-4
5-1 Organization of booklets: 2006........................................................................ A-5-2
5-2 Example of item analysis tables, Field Test: 2006........................................... A-5-5
5-3 Average ability estimates (IRT theta) for the field test sample: 2006 ............. A-5-14
5-4 Counts and percentages of test takers by grade for the ECLS-K grade 5 round ................................................................................................................ A-5-15
5-5 Estimated percentages of test takers by grade for the ECLS-K grade 8 round ................................................................................................................ A-5-15
5-6 ECLS-K proficiency levels in reading, through fifth grade............................. A-5-16
5-7 ECLS-K proficiency levels in mathematics, through fifth grade..................... A-5-16
5-8 Comparison of framework percentages with proposed item pool, reading ..... A-5-25
5-9 Number of reading passages and test items for final eighth-grade forms, reading ............................................................................................................. A-5-27
A-viii
TABLE OF CONTENTS (continued)
List of Tables (continued)
Table Page
5-10 Comparison of framework percentages with proposed item pool, mathematics ..................................................................................................... A-5-29
5-11 Number of test items in the final eighth-grade forms, mathematics ................ A-5-30
5-12 Comparison of framework percentages with proposed item pool, science...... A-5-31
5-13 Number of test items in the final eighth-grade forms, science ........................ A-5-32
5-14 Sheet name and corresponding contents for item statistics appendixes O, P, and Q................................................................................................................ A-5-33
5-15 Average growth in ability in standard deviation units ..................................... A-5-34
5-16 Cut-scores for the ECLS-K grade 8 assessments by subject ........................... A-5-36
6-1 Cronbach’s coefficient alpha for scores of the SDQ scales, Spring 2006 Field Test. ........................................................................................................ A-6-4
6-2 Cronbach’s coefficient alpha for scores of the Self-Concept and the Locus of Control scales, Spring 2006 Field Test........................................................ A-6-4
6-3 Eigenvalues and proportion of variance accounted for by the three factors extracted in principal components factor analysis with Spring 2006 Field Test SDQ data. ................................................................................................. A-6-5
6-4 Eigenvalues and proportion of variance accounted for by the two factors extracted in principal components factor analysis with Spring 2006 Field Test Self-Concept and Locus of Control data. ................................................. A-6-5
6-5 Varimax rotated factor patterns for the two factors extracted in principal components factor analysis with Spring 2006 Field Test Self-Concept and Locus of Control data ...................................................................................... A-6-6
6-6 Score breakdown, Self-Concept and Locus of Control by eighth-grade population subgroup: Spring 2006 Field Test.................................................. A-6-7
6-7 Score breakdown, Perceived Interest and Competence in Math, Internalizing Behavior, and Perceived Interest and Competence in English by eighth-grade population subgroup: Spring 2006 Field Test.................................................. A-6-8
A-ix
A-x
TABLE OF CONTENTS (continued)
List of Tables (continued)
Table Page
6-8 Accuracy of child report of books read (n = 857): Spring 2006 Field Test .................................................................................................................. A-6-9
6-9 Accuracy of teacher report of primary and secondary textbooks (frequency count) ............................................................................................................... A-6-11
6-10 Accuracy of teacher report of primary and secondary textbook (percent)....... A-6-11
7-1 Counts and percentages of test takers by grade for the ECLS-K grade 5 round ................................................................................................................ A-7-2
7-2 Estimated percentages of test takers by grade for the ECLS-K grade 8 round ................................................................................................................ A-7-3
7-3 Completion rates by mode of data collection: Spring 2006............................. A-7-8
List of Exhibits
Exhibit
1-1 Instruments to be used in the ECLS-K Spring 2006 Field Test and those planned for the ECLS-K national data collection ............................................ A-1-4
1-2 Spring 2006 Field Test activities and schedule: 2006...................................... A-1-5
1-3 Components of the Eighth-Grade Field Test assessment blocks: 2006 ........... A-1-7
2-1 Spring 2006 test administrator training agenda, March 9-10, 2006................. A-2-3
2-2 NCES Affidavit of Nondisclosure ................................................................... A-2-5
2-3 Code of Conduct and Assurance of Confidentiality ........................................ A-2-6
5-1 Examples of IRT plots, ECLS-K Spring 2006 Field Test................................ A-5-7
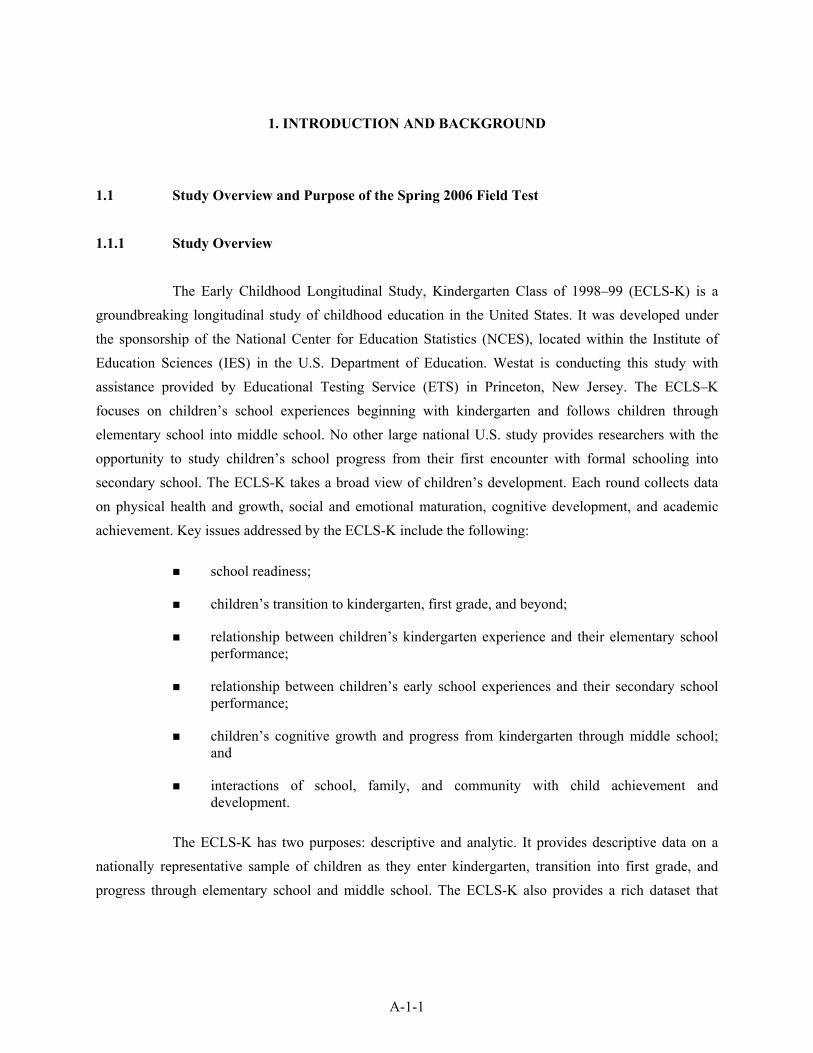
1. INTRODUCTION AND BACKGROUND
1.1 Study Overview and Purpose of the Spring 2006 Field Test
1.1.1 Study Overview
The Early Childhood Longitudinal Study, Kindergarten Class of 1998–99 (ECLS-K) is a groundbreaking longitudinal study of childhood education in the United States. It was developed under the sponsorship of the National Center for Education Statistics (NCES), located within the Institute of Education Sciences (IES) in the U.S. Department of Education. Westat is conducting this study with assistance provided by Educational Testing Service (ETS) in Princeton, New Jersey. The ECLS–K focuses on children’s school experiences beginning with kindergarten and follows children through elementary school into middle school. No other large national U.S. study provides researchers with the opportunity to study children’s school progress from their first encounter with formal schooling into secondary school. The ECLS-K takes a broad view of children’s development. Each round collects data on physical health and growth, social and emotional maturation, cognitive development, and academic achievement. Key issues addressed by the ECLS-K include the following:
school readiness;
children’s transition to kindergarten, first grade, and beyond;
relationship between children’s kindergarten experience and their elementary school performance;
relationship between children’s early school experiences and their secondary school performance;
children’s cognitive growth and progress from kindergarten through middle school; and
interactions of school, family, and community with child achievement and development.
The ECLS-K has two purposes: descriptive and analytic. It provides descriptive data on a nationally representative sample of children as they enter kindergarten, transition into first grade, and progress through elementary school and middle school. The ECLS-K also provides a rich dataset that
A-1-1
enables researchers to analyze how a wide range of family, school, community, and individual variables affect success in school.
A basic principle of the ECLS-K approach to assessment is to capture information from multiple sources. Information about children’s competencies in reading, mathematics, and other areas is obtained through two basic approaches—direct assessment of the child and reports obtained from the child’s teacher. Information about children’s social skills and problem behaviors was obtained indirectly in kindergarten and first grade, with reports obtained from the child’s parents and teacher; starting in third grade, socioemotional development is assessed through a scale administered to the child.
The ECLS-K study design includes data collections in the fall and spring of the kindergarten year, the fall1 and spring of first grade, the spring of third grade, and the spring of fifth grade. Data collection will also be conducted in the spring of eighth grade. More than 1,000 schools and 21,000 children throughout the nation have participated in the study. In each round, trained representatives assessed the study’s sample of children in their schools. To form as complete a picture as possible, information about children’s families, schools, communities, and classrooms was also collected from parents (by telephone) and from teachers and school administrators (using paper questionnaires). Similar procedures will be followed for the eighth-grade year (spring 2007). The results from this landmark study will provide comprehensive and reliable data that can be used to inform public discussion and policies related to early and middle childhood education.
As part of the process of developing the eighth-grade assessment battery, a field test was conducted in the spring of 2006 that included the direct assessments, student questionnaires, and the teacher portion of the indirect assessments. This report describes the conduct and results of that field test. The field test was designed to develop direct assessments to measure the performance of eighth-graders, test indirect cognitive and socioemotional measures, conduct an experiment of web versus paper student and teacher questionnaires, determine the ability of children to report the titles of books read, and test other field procedures.
1 The fall first-grade collection was a design enhancement to enable researchers to study summer learning gains and losses and the factors that contribute to summer learning gains and losses. The collection was limited to a 30 percent subsample of the ECLS-K schools. Approximately 27 percent of the base-year children attended the subsampled schools.
A-1-2
1.1.2 Purpose of the Spring 2006 Field Test
The primary purpose of the Spring 2006 Field Test, also referred to as the Eighth-Grade Field Test, was to evaluate the psychometric properties of the new item pools that will be used to assess children’s cognitive development in the areas of reading, mathematics, and science, as well as their socioemotional development, in eighth grade. Instruments used in the field test included the potential items for the eighth-grade cognitive assessments, selected items from the ECLS-K fifth-grade direct cognitive assessments, and selected subscales from the Self Description Questionnaire (SDQ) II (Marsh 1990). The results of the statistical analysis of the field test items will be used to produce a final two-stage2 individually administered cognitive assessment battery for eighth grade.
The Spring 2006 Field Test was designed to complete the development of the assessment battery for the cognitive and socioemotional areas. In particular, the Spring 2006 Field Test served as the primary vehicle for the following:
estimating the psychometric parameters of all items that could be used in the battery of instruments designed to assess children’s cognitive development (in reading, mathematics, and science) in the eighth grade;
evaluating the content validity of the direct assessment reading, science, and mathematics area items; and
producing psychometrically sound and valid direct and indirect cognitive and socioemotional assessment instruments.
In addition to the primary goal of evaluating the psychometric properties of the cognitive assessment item pools, the field test had several other goals, as follows:
evaluating procedures for collecting height and weight from eighth-grade children;
evaluating the effectiveness of web-based versus paper questionnaires for eighth-grade children and teachers;
obtaining estimates of the length of time it took children and teachers to complete the questionnaires;
2 The ECLS-K cognitive battery uses a two-stage assessment approach, in which the first stage in each domain contains a routing test that determines a child’s approximate skills. According to the child’s performance on the routing test, the child is administered the appropriate skill-level assessment for that domain (the second stage). The field test did not use this approach; rather, the potential items were administered in the manner described in this report.
A-1-3
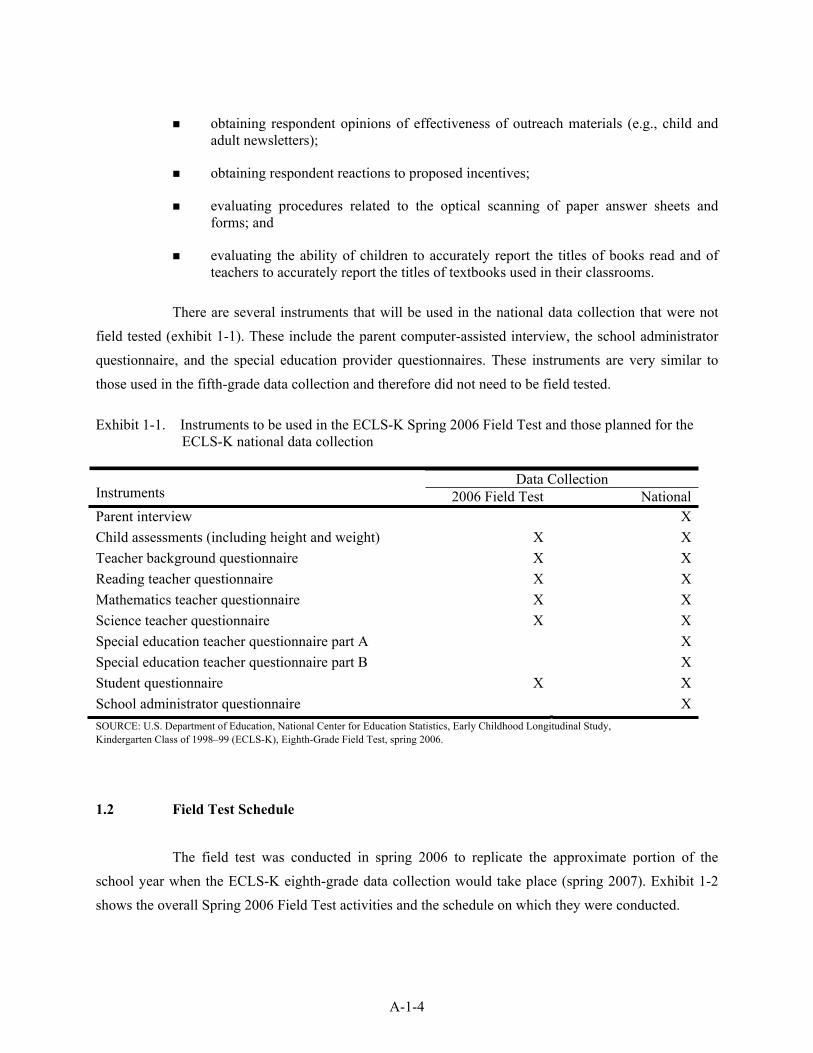
obtaining respondent opinions of effectiveness of outreach materials (e.g., child and adult newsletters);
obtaining respondent reactions to proposed incentives;
evaluating procedures related to the optical scanning of paper answer sheets and forms; and
evaluating the ability of children to accurately report the titles of books read and of teachers to accurately report the titles of textbooks used in their classrooms.
There are several instruments that will be used in the national data collection that were not field tested (exhibit 1-1). These include the parent computer-assisted interview, the school administrator questionnaire, and the special education provider questionnaires. These instruments are very similar to those used in the fifth-grade data collection and therefore did not need to be field tested.
Exhibit 1-1. Instruments to be used in the ECLS-K Spring 2006 Field Test and those planned for the ECLS-K national data collection
Data Collection Instruments 2006 Field Test NationalParent interview XChild assessments (including height and weight) X XTeacher background questionnaire X XReading teacher questionnaire X XMathematics teacher questionnaire X XScience teacher questionnaire X XSpecial education teacher questionnaire part A XSpecial education teacher questionnaire part B XStudent questionnaire X XSchool administrator questionnaire XSOURCE: U.S. Department of Education, National Center for Education Statistics, Early Childhood Longitudinal Study, Kindergarten Class of 1998–99 (ECLS-K), Eighth-Grade Field Test, spring 2006.
1.2 Field Test Schedule
The field test was conducted in spring 2006 to replicate the approximate portion of the school year when the ECLS-K eighth-grade data collection would take place (spring 2007). Exhibit 1-2 shows the overall Spring 2006 Field Test activities and the schedule on which they were conducted.
A-1-4
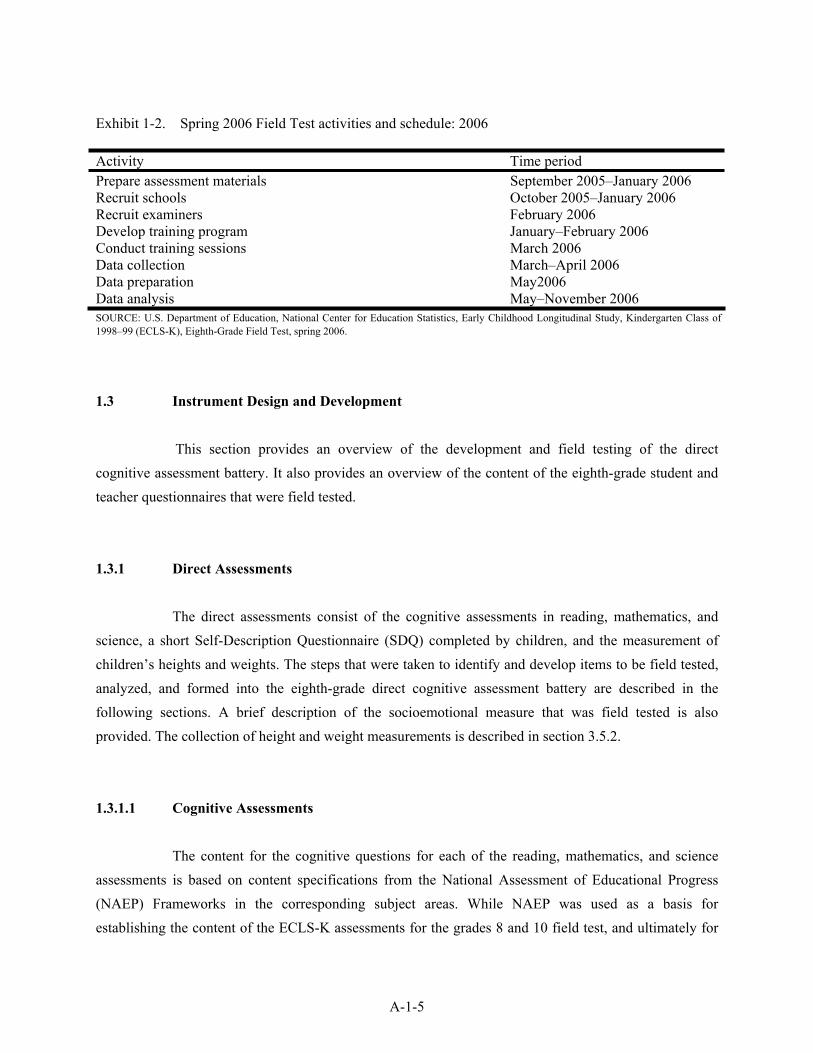
Exhibit 1-2. Spring 2006 Field Test activities and schedule: 2006
Activity Time periodPrepare assessment materials September 2005–January 2006 Recruit schools October 2005–January 2006 Recruit examiners February 2006 Develop training program January–February 2006 Conduct training sessions March 2006 Data collection March–April 2006 Data preparation May2006 Data analysis May–November 2006 SOURCE: U.S. Department of Education, National Center for Education Statistics, Early Childhood Longitudinal Study, Kindergarten Class of 1998–99 (ECLS-K), Eighth-Grade Field Test, spring 2006.
1.3 Instrument Design and Development
This section provides an overview of the development and field testing of the direct cognitive assessment battery. It also provides an overview of the content of the eighth-grade student and teacher questionnaires that were field tested.
1.3.1 Direct Assessments
The direct assessments consist of the cognitive assessments in reading, mathematics, and science, a short Self-Description Questionnaire (SDQ) completed by children, and the measurement of children’s heights and weights. The steps that were taken to identify and develop items to be field tested, analyzed, and formed into the eighth-grade direct cognitive assessment battery are described in the following sections. A brief description of the socioemotional measure that was field tested is also provided. The collection of height and weight measurements is described in section 3.5.2.
1.3.1.1 Cognitive Assessments
The content for the cognitive questions for each of the reading, mathematics, and science assessments is based on content specifications from the National Assessment of Educational Progress (NAEP) Frameworks in the corresponding subject areas. While NAEP was used as a basis for establishing the content of the ECLS-K assessments for the grades 8 and 10 field test, and ultimately for
A-1-5
the grade 8 national assessment, there are distinct differences in the numbers of items between the ECLS-K and NAEP. The total testing time required to respond to all cognitive questions in a subject at one grade level in NAEP is over 4 hours. For practical reasons, the time available for the ECLS-K is much less. In assembling the questions into field test forms for the ECLS-K, two important goals were carefully balanced. One was the need to gather data from children on as many questions as possible within the available administration time, and the second goal was to include questions that span a range of difficulty, keeping in mind that the more difficult questions require more time to answer.
Once draft assessments in the three cognitive areas were created, measurement specialists and content area specialists (i.e., science experts, reading experts, and mathematics experts) reviewed the items. The assessments were revised, as needed, and field tested during the Spring 2006 Field Test.
1.3.1.2 Components of the Assessment Blocks
The field test items for each cognitive domain included items with a range of difficulty that would help to identify those children who are just beginning to develop skills in that domain, those who have solid skills, and those who are highly proficient or advanced in that domain. The items for each cognitive domain include some items that only about 5 percent of the children should be able to answer and some items that about 95 percent of the children should be able to answer. In each subject area, a percentage of the questions were common with questions that appeared at the next adjacent grade level. That is, at grade 8, some questions also appeared on the ECLS-K grade 5 national assessment forms and others on the concurrent ECLS-K grade 10 field test forms. The inclusion of a percentage of cross-grade questions at each grade level helps to contribute to stabilize the item calibration, as well as estimate performance of items presented off their intended grade level.
Because the total number of items to be field tested was too large to be administered to any single child, a block and spiral design was used. That is, the items were first split in each domain into subsets of roughly equivalent difficulty. For each grade, reading was subset into four sets while mathematics and science were each subset into two sets—yielding 16 subsets of items. Next the subsets were arranged into blocks that contained one subset for each of two domains, as depicted in exhibit 1-3. Each child received a single block.
A-1-6
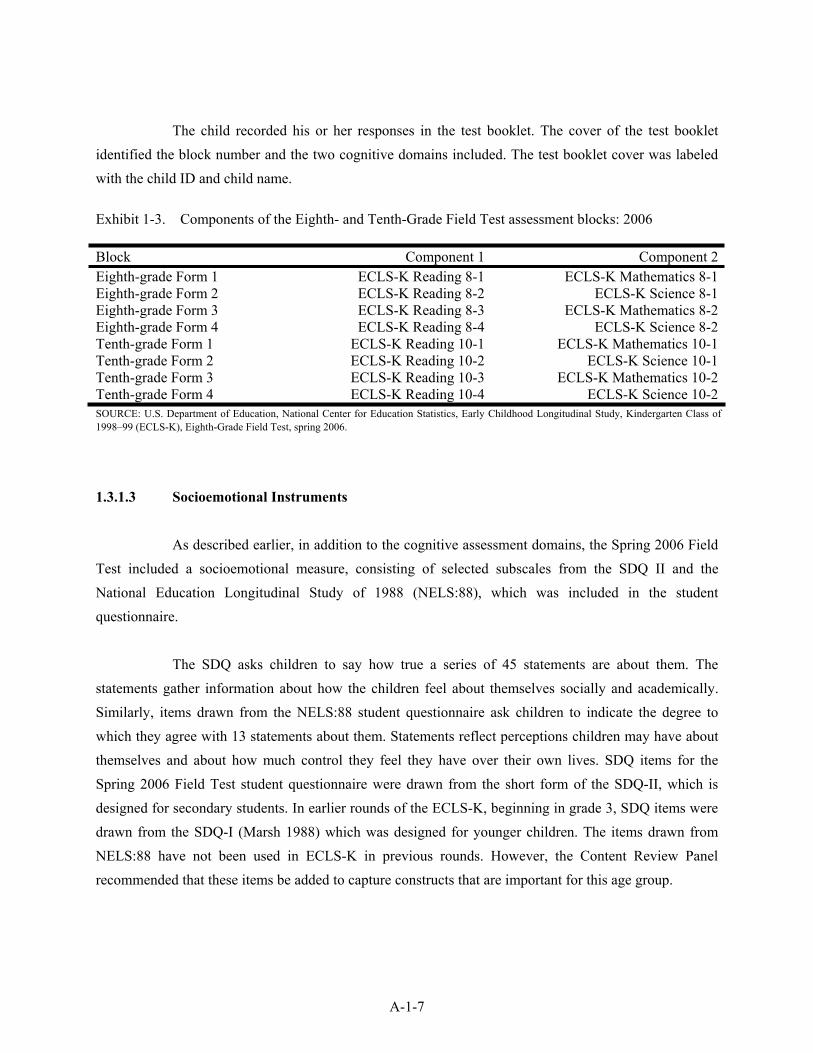
The child recorded his or her responses in the test booklet. The cover of the test booklet identified the block number and the two cognitive domains included. The test booklet cover was labeled with the child ID and child name.
Exhibit 1-3. Components of the Eighth- and Tenth-Grade Field Test assessment blocks: 2006
Block Component 1 Component 2Eighth-grade Form 1 ECLS-K Reading 8-1 ECLS-K Mathematics 8-1Eighth-grade Form 2 ECLS-K Reading 8-2 ECLS-K Science 8-1Eighth-grade Form 3 ECLS-K Reading 8-3 ECLS-K Mathematics 8-2Eighth-grade Form 4 ECLS-K Reading 8-4 ECLS-K Science 8-2Tenth-grade Form 1 ECLS-K Reading 10-1 ECLS-K Mathematics 10-1Tenth-grade Form 2 ECLS-K Reading 10-2 ECLS-K Science 10-1Tenth-grade Form 3 ECLS-K Reading 10-3 ECLS-K Mathematics 10-2Tenth-grade Form 4 ECLS-K Reading 10-4 ECLS-K Science 10-2SOURCE: U.S. Department of Education, National Center for Education Statistics, Early Childhood Longitudinal Study, Kindergarten Class of 1998–99 (ECLS-K), Eighth-Grade Field Test, spring 2006.
1.3.1.3 Socioemotional Instruments
As described earlier, in addition to the cognitive assessment domains, the Spring 2006 Field Test included a socioemotional measure, consisting of selected subscales from the SDQ II and the National Education Longitudinal Study of 1988 (NELS:88), which was included in the student questionnaire.
The SDQ asks children to say how true a series of 45 statements are about them. The statements gather information about how the children feel about themselves socially and academically. Similarly, items drawn from the NELS:88 student questionnaire ask children to indicate the degree to which they agree with 13 statements about them. Statements reflect perceptions children may have about themselves and about how much control they feel they have over their own lives. SDQ items for the Spring 2006 Field Test student questionnaire were drawn from the short form of the SDQ-II, which is designed for secondary students. In earlier rounds of the ECLS-K, beginning in grade 3, SDQ items were drawn from the SDQ-I (Marsh 1988) which was designed for younger children. The items drawn from NELS:88 have not been used in ECLS-K in previous rounds. However, the Content Review Panel recommended that these items be added to capture constructs that are important for this age group.
A-1-7
1.3.2 Indirect Assessments
The indirect assessments completed by teachers included a rating of the child’s academic effort, social behaviors, and communication skills. Items for the scale were field tested in spring 2006 to assess their applicability for children in eighth grade. To complete the scale, each teacher was asked to think about a child in a class he or she currently teaches and to evaluate that child’s academic effort, social behaviors, and communication skills. The constructs tapped by the Spring 2006 Field Test Teacher Questionnaires are similar to those tapped by the teacher questionnaires from previous rounds of the ECLS-K. Some items, such as those assessing children’s academic skills, were modified to reflect skills and activities that are typical for eighth and tenth grade children.
1.3.3 Student Questionnaires
The child-level questionnaire collected information on the children’s school experiences and extracurricular activities, family and peer relationships, general health and health behaviors, civic attitudes, and expectations for the future. In addition, the U. S. Department of Agriculture (USDA) is interested in continuing to collect data on children’s food purchasing and consumption habits in school and at home. Major sources of the items include two Centers for Disease Control and Prevention/Division of Adolescent and School Health Surveys, the Youth Risk Behavior Surveillance Survey and the School Health Programs and Policies Survey, as well as the California Children’s Healthy Eating and Exercise Practices Survey. The instrument was developed by USDA for use with the fifth-grade data collections and is appropriate for use with eighth-graders.
The child-level food purchasing and consumption questionnaire includes items on the purchase of various food and drinks at school (e.g., snack foods, soda) that adolescents can buy at school and the types food and drinks (e.g., fruits/vegetables, milk) consumed at home, at school, at restaurants, and in other places in the last week.
A copy of the student questionnaire used during the field test is contained in appendix A.
A-1-8
1.3.4 Teacher Questionnaires
Two teacher questionnaires were used in the field test. The first gathers background information about the teachers including their gender, year born, race/ethnicity, highest education completed, educational training in subject area they teach, number of years they have taught school, number of years they have taught at their current school, teaching areas in which they are certified, and attitudes about teaching, their school, and the children in the school.
The second teacher questionnaire is given to the teacher most knowledgeable of the adolescent’s performance in each of the core academic subjects (i.e., language arts, mathematics and science), and provides the information relevant to each child’s classroom environment, instruction in the core academic subjects, and the professional background of the core academic teacher. For example, the mathematics teacher completes a questionnaire with items specific to the mathematics instruction that the adolescent received during the school year while the language arts teacher completes a questionnaire with items specific to the language arts instruction. For the field test, no attempt was made to link teachers to field test children. Instead, as noted above, teachers were asked to think about a particular child in their class and to complete the questionnaires about that child.
The subject-specific teacher questionnaires also includes ratings scales with items about the children’s skills in areas of reading, mathematics, and science, the children’s social skills and behaviors; and information about placements and special services that each child may receive. In addition, the teacher questionnaire also gathered information describing the children’s classrooms. These data can be used to supplement the direct assessments administered to the sampled eighth-graders. In doing so, a picture of children’s skills over time will begin to develop and tentative conclusions can be drawn about children’s progression in school.
Copies of the teacher questionnaires used during the field test are included in appendix A.
1.4 Purposive Sample of Schools
The Spring 2006 Field Test design called for a purposive sample of 100 schools (50 middle or junior high schools and 50 high schools) representing different levels of urbanicity and areas of the country to obtain approximately 2,400 direct assessments of 1,200 eighth-graders and 1,200 tenth-graders,
A-1-9
and approximately 175 completed teacher questionnaires. The field test was conducted in five states: Ohio, Pennsylvania, Maryland, North Carolina, and Virginia. To identify the 100 schools to participate, 50 public school districts and Catholic dioceses cooperating in the ECLS-K were contacted by trained staff. Counties participating in the main ECLS-K sample were excluded from the field test sample. A sample of 172 schools within the 50 cooperating public school districts and Catholic dioceses was drawn. Of these schools, 166 were contacted, and 51 agreed to participate in the field test for a cooperation rate of 0.31.
Schools, children, and teachers were recruited throughout the field period with the intent of reaching the required number of schools and completed assessments. With a relatively short period of time to recruit field test schools, the Spring 2006 Field Test ultimately included 51 schools—23 schools with grades 8 or below, 20 high schools with grades 9-12, and 8 schools that included both eighth and tenth grades. The characteristics of the field test schools are described in section 1.4.1.
Because entire classrooms were sampled, more than the 1,200 eighth- and 1,200 tenth-graders were assessed: A sample of approximately 3,900 children (1,800 eighth-grade children and 2,100 tenth-grade children) was selected to participate in the field test. Characteristics of the children in the field test sample are described in section 1.4.2. A comparison of selected characteristics of children in the field test sample and those in a nationally representative sample of eighth-grade children is presented in section 1.4.3. While the field test sample was selected to include high- as well as low-performing schools and children, it must be remembered that it was not designed to be a systematic, representative, weighted sample of the population. Proportions of eighth-graders who will be routed to low and high forms in the national test may not turn out to be the predicted percentage split 50-50. It is not important that the predicted routing percentages turn out as expected: what is important is that each child receive a second-stage form that is appropriately matched to his or her level of ability. A discussion of the design of the direct assessments is contained in section 5.3.
Data collection consisted of administering assessments to eighth- and tenth-grade children in participating schools. During the Spring 2006 Field Test, child assessment data were collected from 1,525 eighth-grade children and 1,838 tenth-grade children (about 15 percent and 14 percent, respectively, of the field test participants were not assessed because they were either absent on the assessment day or did not have parent consent).
A-1-10
In addition, eighth-grade children and teachers were mailed advance packages containing a letter describing the study, a newsletter with results from earlier rounds, and either information on how to access web-based questionnaires or paper questionnaires. Additional information on data collection procedures and results is in chapter 3.
The Spring 2006 Field Test data collection staff selected to conduct the field test in these schools consisted of one field director and 13 test administrators. Training materials were developed, and training sessions were conducted for the test administrators. Additional information on Spring 2006 Field Test training is presented in chapter 2.
1.4.1 Characteristics of Participating Schools
As noted above, a total of 51 public, Catholic, and other private schools agreed to participate in the Spring 2006 Field Test. Schools that refused to participate generally cited the lateness in the school year and the study burden as the two main reasons for refusal. Participating schools were paid a $200 honorarium for participating. Table 1-1 presents the characteristics of the 51 participating Spring 2006 Field Test schools.
A-1-11
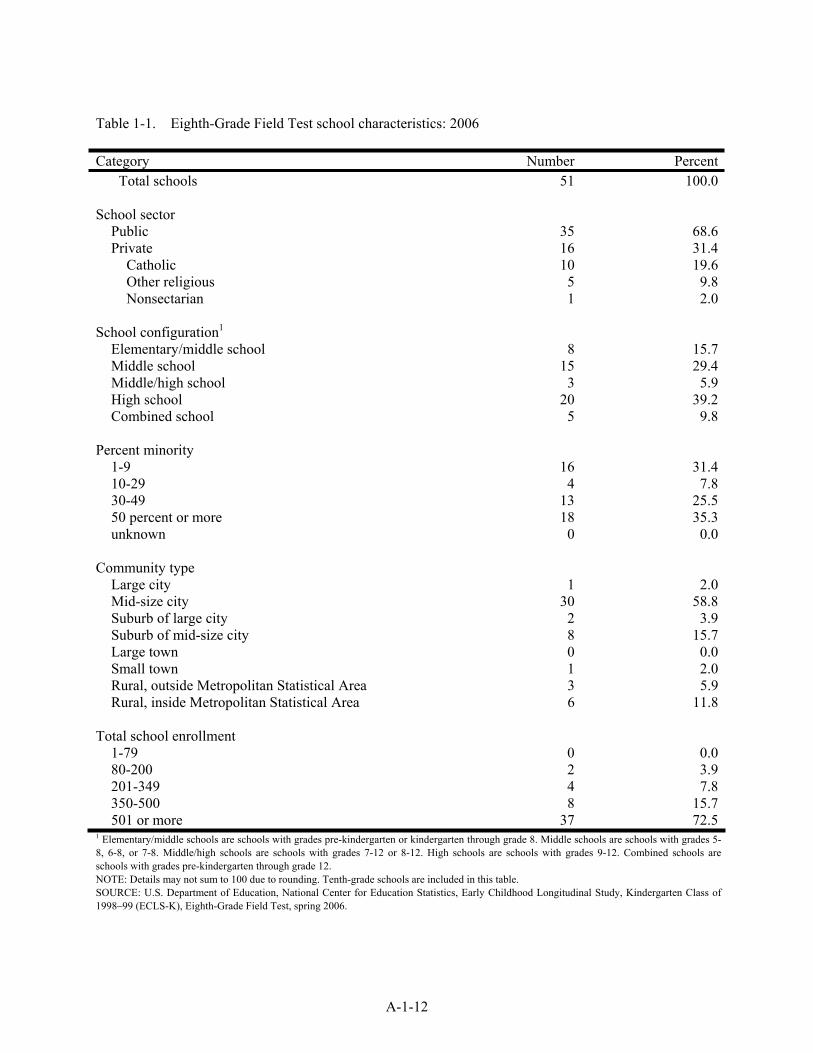
Table 1-1. Eighth-Grade Field Test school characteristics: 2006
Category Number PercentTotal schools 51 100.0
School sector Public 35 68.6Private 16 31.4
Catholic 10 19.6Other religious 5 9.8Nonsectarian 1 2.0
School configuration1
Elementary/middle school 8 15.7Middle school 15 29.4Middle/high school 3 5.9High school 20 39.2Combined school 5 9.8
Percent minority 1-9 16 31.410-29 4 7.830-49 13 25.550 percent or more 18 35.3unknown 0 0.0
Community type Large city 1 2.0Mid-size city 30 58.8Suburb of large city 2 3.9Suburb of mid-size city 8 15.7Large town 0 0.0Small town 1 2.0Rural, outside Metropolitan Statistical Area 3 5.9Rural, inside Metropolitan Statistical Area 6 11.8
Total school enrollment 1-79 0 0.080-200 2 3.9201-349 4 7.8350-500 8 15.7501 or more 37 72.5
1 Elementary/middle schools are schools with grades pre-kindergarten or kindergarten through grade 8. Middle schools are schools with grades 5-8, 6-8, or 7-8. Middle/high schools are schools with grades 7-12 or 8-12. High schools are schools with grades 9-12. Combined schools are schools with grades pre-kindergarten through grade 12. NOTE: Details may not sum to 100 due to rounding. Tenth-grade schools are included in this table. SOURCE: U.S. Department of Education, National Center for Education Statistics, Early Childhood Longitudinal Study, Kindergarten Class of 1998–99 (ECLS-K), Eighth-Grade Field Test, spring 2006.
A-1-12
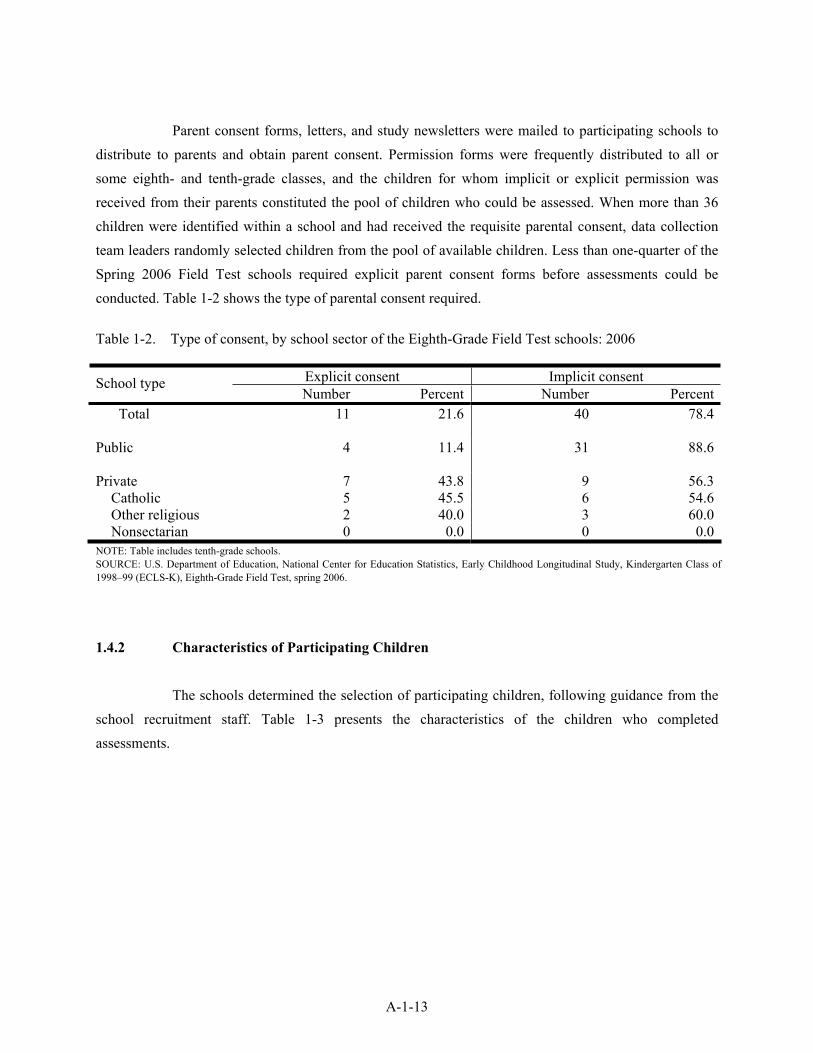
Parent consent forms, letters, and study newsletters were mailed to participating schools to distribute to parents and obtain parent consent. Permission forms were frequently distributed to all or some eighth- and tenth-grade classes, and the children for whom implicit or explicit permission was received from their parents constituted the pool of children who could be assessed. When more than 36 children were identified within a school and had received the requisite parental consent, data collection team leaders randomly selected children from the pool of available children. Less than one-quarter of the Spring 2006 Field Test schools required explicit parent consent forms before assessments could be conducted. Table 1-2 shows the type of parental consent required.
Table 1-2. Type of consent, by school sector of the Eighth-Grade Field Test schools: 2006
Explicit consent Implicit consent School type Number Percent Number Percent
Total 11 21.6 40 78.4
Public 4 11.4 31 88.6
Private 7 43.8 9 56.3Catholic 5 45.5 6 54.6Other religious 2 40.0 3 60.0Nonsectarian 0 0.0 0 0.0
NOTE: Table includes tenth-grade schools. SOURCE: U.S. Department of Education, National Center for Education Statistics, Early Childhood Longitudinal Study, Kindergarten Class of 1998–99 (ECLS-K), Eighth-Grade Field Test, spring 2006.
1.4.2 Characteristics of Participating Children
The schools determined the selection of participating children, following guidance from the school recruitment staff. Table 1-3 presents the characteristics of the children who completed assessments.
A-1-13
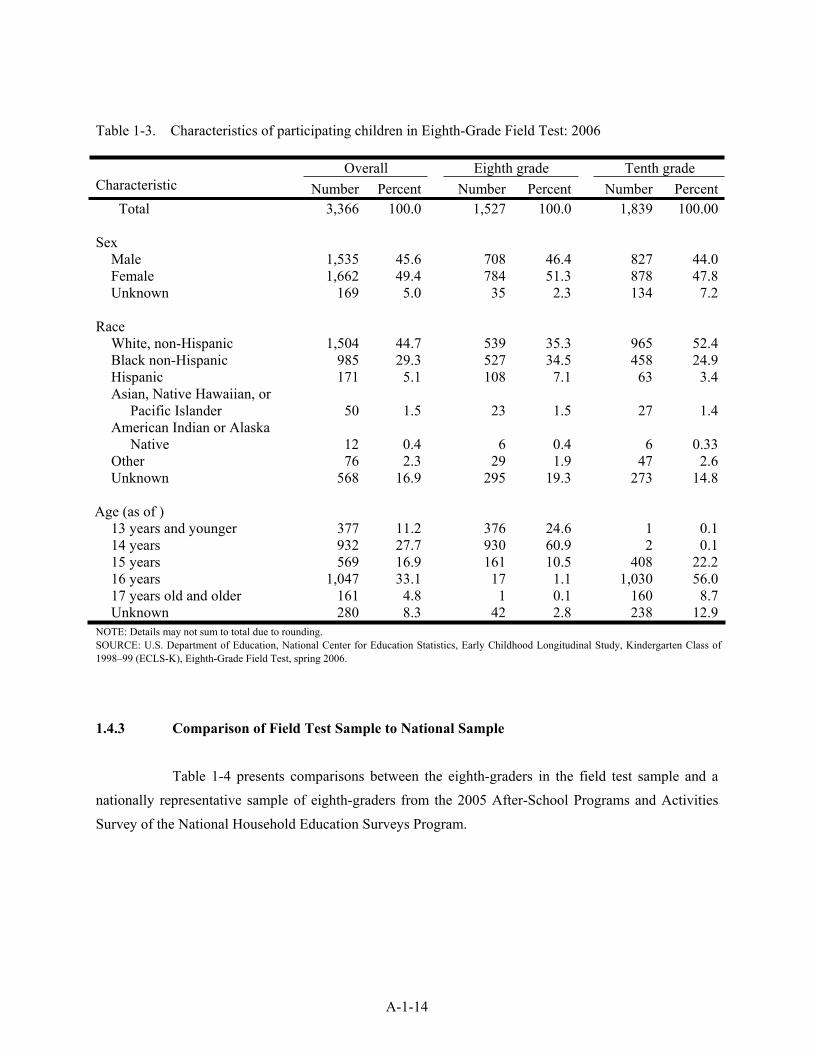
Table 1-3. Characteristics of participating children in Eighth-Grade Field Test: 2006
Overall Eighth grade Tenth gradeCharacteristic Number Percent Number Percent Number Percent
Total 3,366 100.0 1,527 100.0 1,839 100.00
SexMale 1,535 45.6 708 46.4 827 44.0Female 1,662 49.4 784 51.3 878 47.8Unknown 169 5.0 35 2.3 134 7.2
RaceWhite, non-Hispanic 1,504 44.7 539 35.3 965 52.4Black non-Hispanic 985 29.3 527 34.5 458 24.9Hispanic 171 5.1 108 7.1 63 3.4Asian, Native Hawaiian, or
Pacific Islander 50 1.5 23 1.5 27 1.4American Indian or Alaska
Native 12 0.4 6 0.4 6 0.33Other 76 2.3 29 1.9 47 2.6Unknown 568 16.9 295 19.3 273 14.8
Age (as of ) 13 years and younger 377 11.2 376 24.6 1 0.114 years 932 27.7 930 60.9 2 0.115 years 569 16.9 161 10.5 408 22.216 years 1,047 33.1 17 1.1 1,030 56.017 years old and older 161 4.8 1 0.1 160 8.7Unknown 280 8.3 42 2.8 238 12.9
NOTE: Details may not sum to total due to rounding. SOURCE: U.S. Department of Education, National Center for Education Statistics, Early Childhood Longitudinal Study, Kindergarten Class of 1998–99 (ECLS-K), Eighth-Grade Field Test, spring 2006.
1.4.3 Comparison of Field Test Sample to National Sample
Table 1-4 presents comparisons between the eighth-graders in the field test sample and a nationally representative sample of eighth-graders from the 2005 After-School Programs and Activities Survey of the National Household Education Surveys Program.
A-1-14
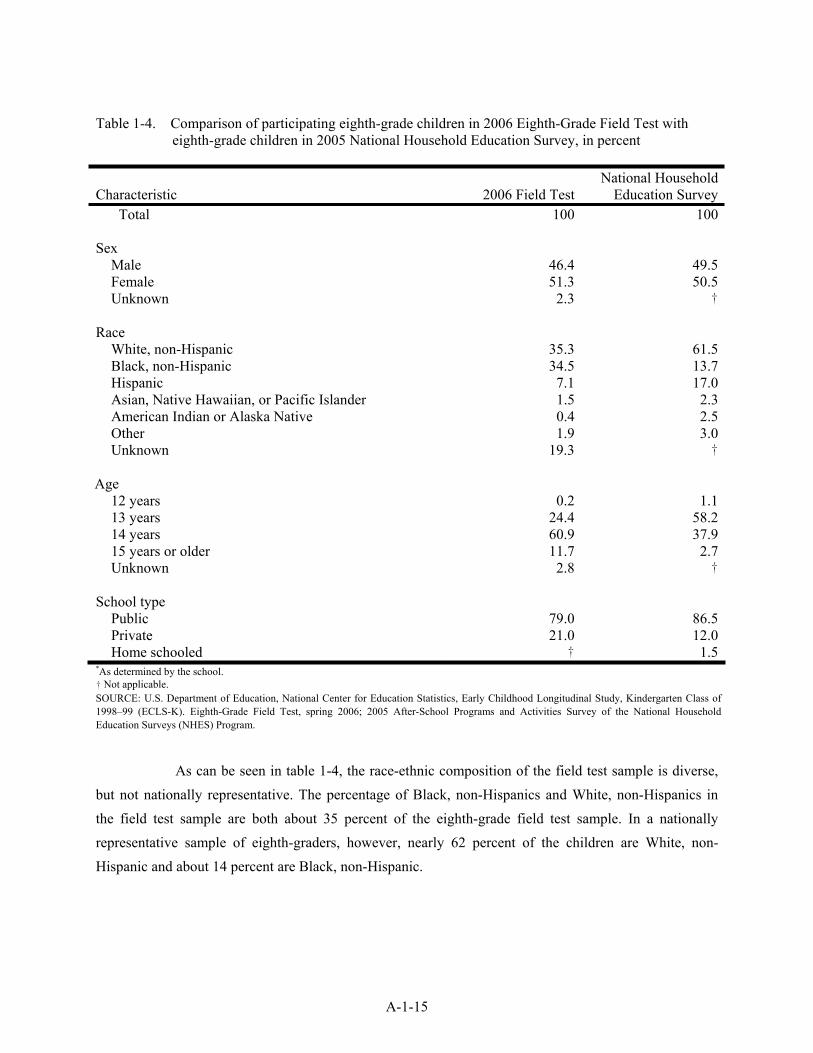
Table 1-4. Comparison of participating eighth-grade children in 2006 Eighth-Grade Field Test with eighth-grade children in 2005 National Household Education Survey, in percent
Characteristic 2006 Field Test National Household
Education SurveyTotal 100 100
SexMale 46.4 49.5Female 51.3 50.5Unknown 2.3 †
RaceWhite, non-Hispanic 35.3 61.5Black, non-Hispanic 34.5 13.7Hispanic 7.1 17.0Asian, Native Hawaiian, or Pacific Islander 1.5 2.3American Indian or Alaska Native 0.4 2.5Other 1.9 3.0Unknown 19.3 †
Age12 years 0.2 1.113 years 24.4 58.214 years 60.9 37.915 years or older 11.7 2.7Unknown 2.8 †
School type Public 79.0 86.5Private 21.0 12.0Home schooled † 1.5
*As determined by the school. † Not applicable. SOURCE: U.S. Department of Education, National Center for Education Statistics, Early Childhood Longitudinal Study, Kindergarten Class of 1998–99 (ECLS-K). Eighth-Grade Field Test, spring 2006; 2005 After-School Programs and Activities Survey of the National Household Education Surveys (NHES) Program.
As can be seen in table 1-4, the race-ethnic composition of the field test sample is diverse, but not nationally representative. The percentage of Black, non-Hispanics and White, non-Hispanics in the field test sample are both about 35 percent of the eighth-grade field test sample. In a nationally representative sample of eighth-graders, however, nearly 62 percent of the children are White, non-Hispanic and about 14 percent are Black, non-Hispanic.
A-1-15
A-1-16
The ECLS-K field test children are older than children in the NHES sample. Some of the age differences between the two samples are due to differences in the reference periods of the two samples. The NHES asks for children ages as of December 31. The Eighth-Grade Field Test data, on the other hand, asks for current age at the time of the spring data collection. Thus, children in the ECLS-K field test should be somewhat older than those in the NHES. The differences in reference periods should not affect the race/ethnicity or gender comparisons.
2. TRAINING
2.1 School Recruiters and Test Administrators Training
To lay the groundwork for the 2006 Spring Field Test, advance contact was made with the schools in the fall by trained school recruiters. This contact allowed the ECLS-K to get on the school calendar for the spring assessment and reduced burden on the schools in the spring by acquainting them with the study’s procedures to allow time to resolve any issues with scheduling the assessment and obtaining parent and child consent. The field period for the fall school contact was November 2005 through January 2006. Each school recruiter was expected to contact approximately 10 to 18 schools during the field period. To accomplish all the necessary activities in preparation for the field test, two separate trainings were held: one in the fall to train district and school recruiters and one in the spring to train test administrators. These two trainings are described in this chapter.
2.1.1 District and School Recruiter Training
Eleven staff were trained to contact districts and schools to recruit them for the field test in three sessions on November 1, 4, and 14, 2005 and began contacting schools immediately after training.
Each training was one day in length. Prior to the training, the trainees were sent a manual that they were instructed to read in preparation for the training. The manual contained all the information that would be presented at training including a description of the ECLS-K and the purpose of recruiting schools in the fall.
The training day was broken into a combination of lectures and role plays to familiarize recruiters with their duties. The first session provided trainees with an overview of the ECLS-K study and the objectives for the spring-eighth grade collection. This information was designed to provide recruiters with the information they needed to be able to readily respond to questions that districts and schools might ask. This session also described the schedule for the field test data collection and described the school coordinator role and responsibilities in the ECLS-K study.
A-2-1
Trainees were then instructed about their responsibilities on the project, including calling public school districts and Catholic archdioceses to gain permission to contact the sampled schools; calling schools to gain their cooperation for the study; and collecting information that would be helpful in the Spring 2006 Field Test. In particular, recruiters were to gather the name and contact information for the school coordinator, identify appropriate eighth- and/or tenth-grade teachers and classrooms, schedule the assessment, and obtain directions to the school, including information on where to park.
Progress getting districts and schools to cooperate was slow enough to cause concern. A decision was made to select a supplemental sample of schools and hire Westat field supervisors to contact them to ensure a sufficient sample. Four Westat field supervisors with experience on NAEP and the ECLS-K were hired and trained using the same training. The Westat supervisors began contacting supplemental sample districts on November 22, 2005 to recruit them for the field test.
2.1.2 Test Administrator Training
A 2-day training of test administrators was conducted on March 9-10, 2006, at Westat. Thirteen field staff were trained over the 2 days. The training days included a variety of activities, such as interactive lectures, small group activities, and role plays to familiarize test administrators with their tasks. Trainees were given the opportunity to practice critical aspects of their tasks while being observed by trainers so immediate feedback could be provided. Exhibit 2-1 displays the training agenda for that training.
The first day of training included an overview of the ECLS-K study and the objectives for the spring-eighth grade collection. This information was designed to provide test administrators with the information they needed to be able to readily respond to questions that districts and schools might ask during the school visit. This session also described the schedule for the field test data collection and described the school coordinator role and responsibilities in the ECLS-K study. Trainees were then instructed about their responsibilities on the project, including preparing for the assessment and conducting the assessment. Preassessment activities included contacting the school coordinator to schedule the assessment session, reviewing all assessment materials, ensuring that there were an adequate number of assessment forms, and preparing the assessment forms. Assessment activities included
A-2-2
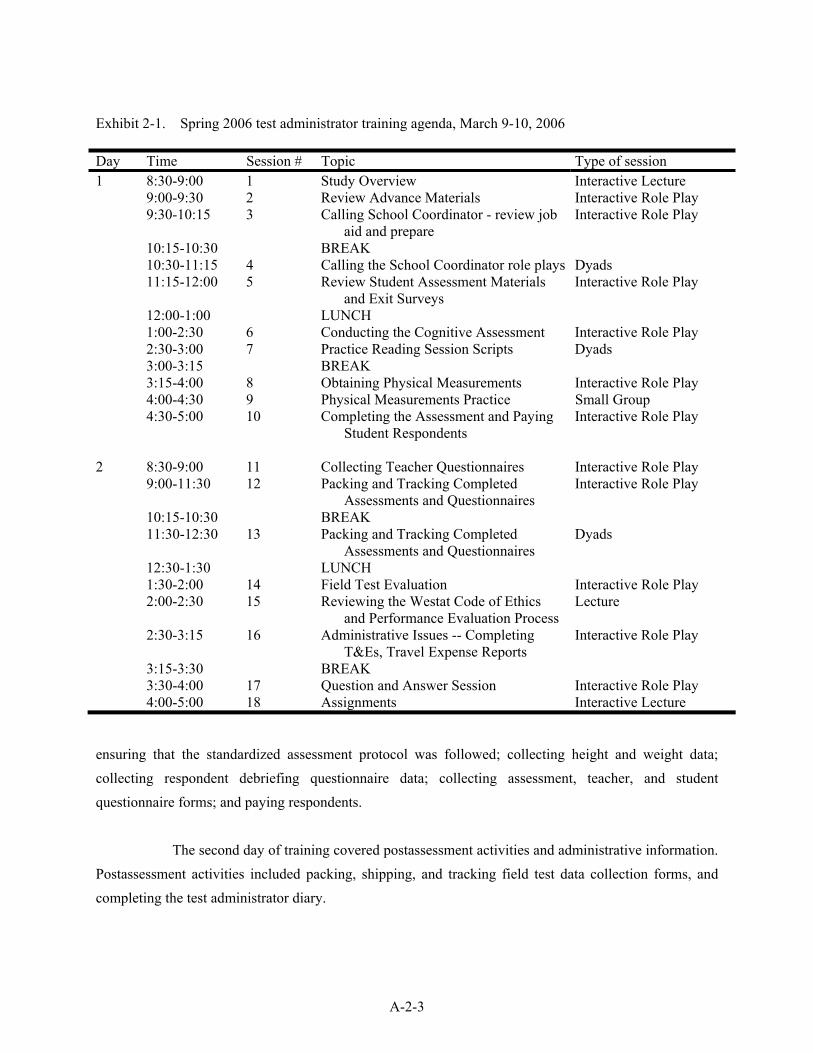
Exhibit 2-1. Spring 2006 test administrator training agenda, March 9-10, 2006
Day Time Session # Topic Type of session 1 8:30-9:00 1 Study Overview Interactive Lecture
9:00-9:30 2 Review Advance Materials Interactive Role Play 9:30-10:15 3 Calling School Coordinator - review job
aid and prepare Interactive Role Play
10:15-10:30 BREAK10:30-11:15 4 Calling the School Coordinator role plays Dyads 11:15-12:00 5 Review Student Assessment Materials
and Exit Surveys Interactive Role Play
12:00-1:00 LUNCH1:00-2:30 6 Conducting the Cognitive Assessment Interactive Role Play 2:30-3:00 7 Practice Reading Session Scripts Dyads 3:00-3:15 BREAK3:15-4:00 8 Obtaining Physical Measurements Interactive Role Play 4:00-4:30 9 Physical Measurements Practice Small Group 4:30-5:00 10 Completing the Assessment and Paying
Student Respondents Interactive Role Play
2 8:30-9:00 11 Collecting Teacher Questionnaires Interactive Role Play 9:00-11:30 12 Packing and Tracking Completed
Assessments and Questionnaires Interactive Role Play
10:15-10:30 BREAK11:30-12:30 13 Packing and Tracking Completed
Assessments and Questionnaires Dyads
12:30-1:30 LUNCH1:30-2:00 14 Field Test Evaluation Interactive Role Play 2:00-2:30 15 Reviewing the Westat Code of Ethics
and Performance Evaluation Process Lecture
2:30-3:15 16 Administrative Issues -- Completing T&Es, Travel Expense Reports
Interactive Role Play
3:15-3:30 BREAK3:30-4:00 17 Question and Answer Session Interactive Role Play 4:00-5:00 18 Assignments Interactive Lecture
ensuring that the standardized assessment protocol was followed; collecting height and weight data; collecting respondent debriefing questionnaire data; collecting assessment, teacher, and student questionnaire forms; and paying respondents.
The second day of training covered postassessment activities and administrative information. Postassessment activities included packing, shipping, and tracking field test data collection forms, and completing the test administrator diary.
A-2-3
2.2 Confidentiality
School recruiters and test administrators were instructed about the importance of the confidentiality of all information collected. All ECLS-K staff were required to sign an Affidavit of Nondisclosure (exhibit 2-2). These affidavits were notarized and kept on file in Westat’s home office. Each field staff member received a copy of this signed statement to carry to all schools at which she or he was working. They were also required to abide by Westat’s Data Collector Code of Conduct and Assurance of Confidentiality (exhibit 2-3).
A-2-4

Exhibit 2-2. NCES Affidavit of Nondisclosure
AFFIDAVIT OF NONDISCLOSURE
(Job Title) (Date of Assignment to NCES Project)
(Organizations, State or local agency or instrumentality)
(NCES Database or File Containing Individually Identifiable Information)
(Address)
I, ____________________________________, do solemnly swear (or affirm) that when given access to the subject NCES database or file, I will not
(i) use or reveal any individually identifiable information furnished, acquired, retrieved or assembled by me or others, under the provisions of Section 406 of the General Education Provisions Act (20 U.S.C. 1221e-1) for any purpose other than statistical purposes specified in the NCES survey, project or contract;
(ii) make any disclosure or publication whereby a sample unit or survey respondent could be identified or the date furnished by or related to any particular person under this section can be identified; or
(iii) permit anyone other than the individuals authorized by the Commissioner of the National Center for Education Statistics to examine the individual reports.
(Signature)
(The penalty for unlawful disclosure is a fine of not more than $250,000 (under 18 U.S.C. 3559 and 3571) or imprisonment for not more than 5 years, or both. The word “swear” should be stricken out wherever it appears when a person elects to affirm the affidavit rather than to swear to it.)
State of ____________________ County of ____________________________________
Sworn and subscribed to me before a Notary Public in and for the aforementioned County and State this _____________________________________ day of _____________________________________ 2006.
__________________________________ (Notary Public)
A-2-5
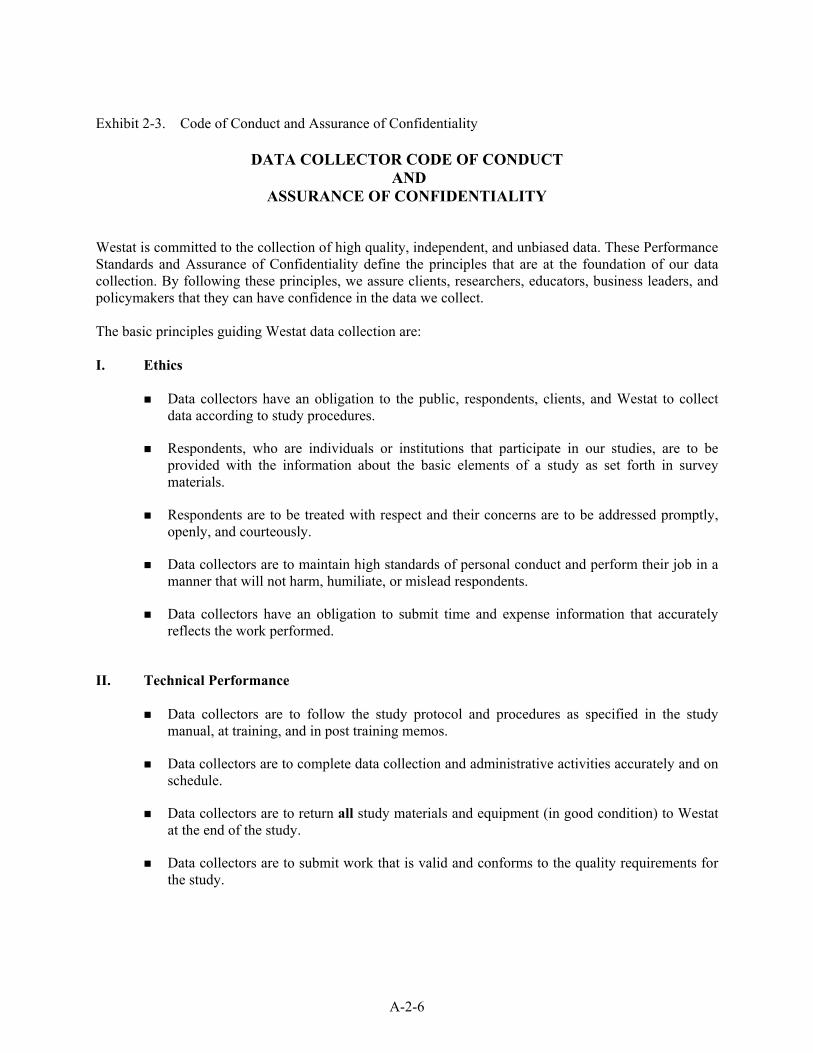
Exhibit 2-3. Code of Conduct and Assurance of Confidentiality
DATA COLLECTOR CODE OF CONDUCT AND
ASSURANCE OF CONFIDENTIALITY
Westat is committed to the collection of high quality, independent, and unbiased data. These Performance Standards and Assurance of Confidentiality define the principles that are at the foundation of our data collection. By following these principles, we assure clients, researchers, educators, business leaders, and policymakers that they can have confidence in the data we collect.
The basic principles guiding Westat data collection are:
I. Ethics
Data collectors have an obligation to the public, respondents, clients, and Westat to collect data according to study procedures.
Respondents, who are individuals or institutions that participate in our studies, are to be provided with the information about the basic elements of a study as set forth in survey materials.
Respondents are to be treated with respect and their concerns are to be addressed promptly, openly, and courteously.
Data collectors are to maintain high standards of personal conduct and perform their job in a manner that will not harm, humiliate, or mislead respondents.
Data collectors have an obligation to submit time and expense information that accurately reflects the work performed.
II. Technical Performance
Data collectors are to follow the study protocol and procedures as specified in the study manual, at training, and in post training memos.
Data collectors are to complete data collection and administrative activities accurately and on schedule.
Data collectors are to return all study materials and equipment (in good condition) to Westat at the end of the study.
Data collectors are to submit work that is valid and conforms to the quality requirements for the study.
A-2-6

III. Work Style
Data collectors are to perform their work as effectively as possible and in such a way as to meet the goals set for the study.
Data collectors are to accept responsibility for the quality of the data they collect and the work they complete.
Data collectors are to demonstrate commitment, initiative, consistency, and organization in their approach to work.
Data collectors are to display a professional attitude and appearance during the conduct of their work.
Data collectors are to communicate professionally and effectively with clients, respondents, and other employees.
Data collectors are to work effectively with the project team.
IV. Confidentiality
A. Policy on Confidentiality of Survey Data
Westat is firmly committed to the principle that the privacy of respondents and the confidentiality of individual data obtained through Westat surveys must be protected. This principle holds whether or not any specific guarantee of confidentiality was given at time of data collection, or whether or not there are specific contractual obligations to the client. When guarantees have been given or contractual obligations regarding confidentiality have been entered into, they may impose additional requirements, which are to be adhered to strictly.
B. Protecting the Privacy and Rights of Survey Participants
Successful survey research depends upon the cooperation of respondents. Data collectors are expected to gain cooperation using the methods described at training sessions or by their supervisor. For example, data collectors should explain the survey carefully and accommodate respondent time preferences wherever practical.
Data collectors are also to respect the privacy and property of respondents. They must not engage in any selling or promotion of products or services or in any other activity unrelated to the survey. If the data collector or the respondent suffers damage or injury to person or property in the course of the data collector’s activities, Westat must be notified promptly.
A-2-7

A-2-8
C. Procedures for Maintaining Confidentiality
All Westat employees and data collectors shall sign this agreement of confidentiality. This agreement may be superseded by another agreement for a particular project.
Data collectors shall keep completely confidential the names and addresses of respondents, all information or opinions collected in the course of interviews, and any information learned incidentally about individual respondents, responding organizations, or the places and organization where respondents work and live. Data collectors shall exercise care to prevent access by others to survey data in their possession.
Unless specifically instructed otherwise for a particular project, an employee or data collector, upon encountering a respondent or information pertaining to a respondent that s/he knows personally, shall immediately terminate the activity and contact her/his supervisor for instructions.
As a data collector on The Early Childhood Longitudinal Study, Kindergarten Class 1998-99 (ECLS-K), I agree to follow the principles and guidelines listed above. I understand that my performance will be evaluated using these criteria, as well as project-specific requirements detailed in the study manual, at training, in posttraining memos or as otherwise directed by my supervisor or Westat generally.
I give my personal pledge that I shall abide by all policies on privacy and confidentiality. I will keep completely confidential all information arising from surveys concerning individual respondents to which I gain access. I will not discuss, disclose, disseminate, or provide access to survey data and identifiers except as authorized by Westat for a particular contract. I will devote my best efforts to ensure that there is compliance with the required procedures by personnel whom I supervise.
I understand that violation of this pledge will result in disciplinary action, up to and including dismissal. I also understand that violation of the privacy rights of individuals through unauthorized discussion, disclosure, dissemination, or access may make me subject to criminal or civil penalties. A copy of this document has been provided to me.
Signature _______________________________ Date ____________________________
3. FIELD TEST DATA COLLECTION
3.1 Data Collection Period and Field Organization
The ECLS-K field period began March 13, 2006 and concluded June 8, 2006. As noted previously, the staff consisted of one field manager and 13 test administrators.
3.2 Parent Recruitment
The 2006 field test did not include a parent interview. Thus no parents were recruited for the field test. Parents, however, were notified by the schools that their children were participating in the field test. It was left up to the individual schools to determine the appropriate method for notifying parents (see section 3.3.4).
3.3 School Recruitment
The recruitment process began in November 2005 by sending a letter to the chief state school officer in the field test states informing them of the continuation of the ECLS-K. Letters were sent to state superintendents notifying them of the ECLS-K project and indicating that the ECLS-K was continuing into eighth and, possibly, tenth grade. Information packets that included a list of the districts and sampled schools within the state were then sent to the state test directors. Districts were then contacted by mail by sending a package that included the following:
a letter addressed to the district superintendent printed on ECLS-K letterhead introducing the study, describing the field test data collection, and alerting the superintendent of the followup telephone call;
a School and Teacher Summary Sheet—a two-page document providing a brief overview of the study and the field test data collection activities;
an ECLS-K Newsletter—a summary of findings about children from the previous rounds of data collection; and
a list of the names of the field test schools selected from the district.
A-3-1
Recruiters followed up by telephone with the district superintendent to answer any questions about the study and to secure permission to contact field test schools. After securing permission, recruiters called the sampled schools.
Once district superintendents gave permission to contact field test schools, advance packages were sent via FedEx to the field test schools in the district. The school advance package included the following materials:
a letter printed on ECLS-K letterhead introducing school staff to the study, describing the field test data collection activities;
a School and Teacher Summary Sheet—a two-page document providing a brief overview of the study and the eighth-grade data collection activities; and
an ECLS-K Newsletter—a summary of findings about children from the previous rounds of data collection.
Again, recruiters followed up by telephone to secure school participation in the spring field test assessment. Participating schools were asked to
choose a staff member to act as a school coordinator for the study;
select a teacher and three of her English classes (this could have been an eighth-grade teacher or a tenth-grade teacher or both) whose children were asked to participate;
notify selected children, teachers, and parents of the study;
identify the most efficient way to obtain parent consent and keep track of consent received;
set a date and time for the spring 2006 assessment and identify a space in which to conduct it; and
in eighth grade, identify eighth-grade English, mathematics, and science teachers who would be willing to participate in the study by completing a teacher questionnaire, and distribute and collect those questionnaires.
This advance school contact in the fall allowed the study to set a date and time on the school calendar for the spring assessment and collect information that was helpful in conducting the Spring 2006 Field Test data collection. This advance effort also reduced burden on the schools in the spring by acquainting them with the study’s procedures to allow time to resolve any issues with scheduling the appointment and obtaining parent and child consent.
A-3-2

3.3.1 The School Coordinator
The school coordinator plays a significant role in the smooth functioning and successful completion of the ECLS-K child assessments in each cooperating school. He or she knows the personality of the school, the most opportune times to schedule the assessments, the available locations where the assessments can be conducted (if not in the classroom), and the best way to notify children, their parents, and their teachers of the assessment.
The coordinator was asked to assist the ECLS-K in five ways:
inform selected children, their teachers, and their parents of the study;
identify an efficient way to inform parents and obtain parent consent, if necessary;
arrange for suitable space for the assessment activities, if not to be done in the identified sampled class;
provide information on sampled children, such as their grade, gender, race/ethnicity and teachers’ names; and
distribute teacher questionnaires and receive completed questionnaires.
As school coordinators were identified in the fall, a welcome letter was mailed to them along with the $30 honoraria check. Before the spring field test assessment, packages were mailed to school coordinators confirming the assessment date and location, asking them to coordinate with teachers to release children from class, confirming parent consent had been obtained, and asking them to distribute child invitations to the assessment to children.
Approximately one week prior to the scheduled assessment date at a school, the team leader contacted the school coordinator to verify assessment dates, location of the assessment, arrival time, check-in procedures, how children would be identified for the assessment, status of parental consent forms received, which teachers and classrooms would be visited, and which teachers would be completing questionnaires.
On the first day of assessments at a school, the team leader met with the school coordinator to finalize assessment plans for the day and verify much of the information received in the preassessment call. School coordinators would identify teachers and classrooms from which children would be drawn and review specific procedures on how children would be identified for the assessment.
A-3-3
3.3.2 Assessment Logistics
Test administrators arrived early at the schools to prepare for the assessment. They checked in at the school’s front office and met with the school coordinator. If necessary, they reviewed plans for the assessment with the school coordinator, including how to receive the children at the beginning of the session, dismiss children at the end, handle any special or emergency situations, and identify children who should not be assessed because of parental refusal.
If arrangements were made in the preassessment call for preparing the assessment room, the test administrators went to the room and made sure that everything was in order. They had to work with the space that was available. In most schools, the test administrators conducted the assessment in the child’s classroom, but in some schools the assessment took place in the cafeteria or gymnasium.
In most schools, children were already in the classroom prior to the scheduled assessment time, so the test administrators were not able to set out booklets prior to children entering the room. However, if the test administrators had the opportunity to set out booklets prior to children entering the assessment room, they did so.
At the start of each session, the test administrators set the tone for the assessment. The test administrators had been instructed to be aware of everything that was going on in the classroom and to demonstrate their awareness. The manner in which they carried themselves, their use of direct eye contact, and their facial expressions all communicated confidence and that they intended to be taken seriously.
The test administrators distributed the booklets but informed children not to open the booklets or begin until they were instructed to do so. Once all booklets were distributed, the test administrator provided instructions to children. During the assessments, the test administrators served as monitors and timekeepers to ensure that the assessments started and ended on time.
At the end of the assessments, debriefing questionnaires were given to the children to complete. Similar debriefing questionnaires were mailed to teachers. The debriefing questionnaires were short questionnaires asking respondents their opinions of their participation in the field test, such as the quality and appropriateness of the field test materials, the effectiveness of the monetary incentives, and their opinion on the mode in which they were asked to complete the questionnaires (i.e., web or paper).
A-3-4
Eighth-grade children completing the student questionnaire were asked about the mode in which they completed the questionnaire, the time it took to complete the questionnaire, and the clarity of the items. Eighth-grade children who didn’t complete the student questionnaire were asked why they did not complete the questionnaire and what could be done to encourage them to complete it.
Before the children left the room, the test administrators distributed the thank-you letters and payment envelopes to the children. Children were asked to find their name and sign the receipt control sheet to acknowledge receipt of payment. The test administrators were responsible for all the cash distributed in thank-you letters in their assignment. They returned unused thank-you letters with cash to the home office. The test administrators indicated on the receipt control sheet which children were absent or refused and that the thank-you was enclosed.
3.3.3 Child and Teacher Identification
As noted above, the school coordinator assisted in identifying the children and teachers who would participate in the field test.
3.3.4 Parent Notification
Staff discussed with the school coordinator the most efficient way to obtain parent permission and whether the school required a signed permission form. Parents were sent a parent newsletter and a letter informing them about the study and letting them know that their child had been selected to participate in the field test. Of the schools, 11 required explicit written consent from the parents for the children to participate in the field test, and 40 required implicit consent. With implicit consent, children were allowed to participate in the field test once the parents had been notified unless the school received notification from parents that they did not want their child to participate.
A-3-5

3.4 Outreach Materials and Incentives
3.4.1 Outreach Materials
The outreach materials varied depending upon the respondent. Schools and teachers were sent a School and Teacher Summary Sheet. Parents received a parent newsletter with interesting findings from previous rounds. Children received a student newsletter with findings that might be of interest to them. All three newsletters are included in appendix B.
3.4.2 Incentives
In appreciation for their participation, schools received $200. The school coordinator, teachers, and children each received an honorarium of $30 for participating. In debriefing questionnaires, teachers and children were asked for their opinion of the incentive amounts. Children were asked whether they still would have participated if the incentive had been $15 instead of $30 (see section 4.2.2).
3.5 Data Collection Procedures
3.5.1 Direct Assessments
The assessment was expected to take about 75 minutes. The assessments were paper-and-pencil assessments administered in small group settings. A trained test administrator administered and proctored the assessment as a teacher might.
For the spring 2006 field test, there were no assessment accommodations. Accommodations will be made during the spring 2007 assessment. The accommodations offered will be modeled after those provided for children who participate in the National Assessment of Educational Progress (NAEP), such as un-timed assessments and allowing a personal aide to assist the child during the assessment. During the spring 2007 assessment, every effort will be made to offer the same accommodations that the school would provide.
A-3-6
3.5.2 Collecting Height and Weight
Unlike in previous rounds, the assessments were conducted in a small group setting. One objective of the field test was to determine whether teenagers were embarrassed about having their height and weight collected in front of others and whether a portable privacy screen might alleviate their embarrassment. It was not necessary to measure the height and weight of all children to make a determination of whether the height and weight measurement procedures were effective. For this reason, height and weight were collected in only a subset of the 51 field test schools. Nine schools were selected and entire classrooms were identified to have the children’s height and weight measured. In large classrooms, a subset of children was selected to stay within the allotted timeframe. In a height and weight school, the test administrator, while preparing the room for the assessment, set up a Height and Weight Center as described below. The Center included the use of the privacy screen for children if there was sufficient room in their testing area. As part of the child debriefing questionnaire, children were asked how they felt about having their weight measured and the use of the privacy screen (see section 4.2.4).
As in previous rounds, a Shorr Board was used to measure child height and a digital scale was used to measure child weight. The test administrators used the following procedures to set up the Height and Weight Center:
assembled the privacy screen if there was sufficient room;
assembled the Shorr Board;
set the digital scale on a level area, preferably on an uncarpeted area;
made sure the tape “X” in the center of the scale that indicates where the child should stand was secure;
placed a supply of alcohol wipes near the Shorr Board (for test administrators to wipe off the head of the Shorr Board after each child was measured);
had trashcan or bag ready for easy disposal of the alcohol wipes; and
placed a table or chair near the area for children to set their heavy coats on. (Coats had to be removed during the measuring process.)
A-3-7
3.5.3 Student and Teacher Questionnaires Experiment
The field test included experiments to test the feasibility of offering eighth-grade children and teachers the opportunity to complete their questionnaires via the Internet. If effective, a web-based approach to questionnaires would have several advantages: (1) it allows the instantaneous transmission of data to the home office; (2) it eliminates the necessity of computer-assisted data entry (CADE): (3) being a CAI application, skip paths are more easily handled; (4) children and teachers may find the approach appealing and may be more motivated to complete the questionnaire in a timely manner; and (5) children and teachers may feel more assured about the privacy of their responses. The web and paper and pencil versions of the questionnaires were identical; only the mode of collection differed. For the experiments, web versions of the student and teacher questionnaires were made available on a secure website, which children and teachers accessed using unique user names and passwords. Approximately 870 children were assigned to complete the student questionnaire on the web and 760 children were assigned to complete it on paper. The field test sample of 174 teachers was divided into thirds with one-third asked to complete the teacher questionnaires via the web (n = 58), one-third asked to complete the questionnaires via paper and pencil (n = 59), and one-third offered the choice of either web or paper and pencil (n = 57). See section 4.2.1 for a discussion of the results of the web versus paper experiments.
3.6 Field Staff Communication
The field manager held at least weekly calls with the test administrators to review the progress and often communicated more often. In addition, staff received field memos via e-mail. The field memos were a mechanism for all recruiters to receive the same information about production averages and tips for successfully recruiting schools.
3.7 Optical Scanning of Forms and Paper and Pencil Questionnaires
During the field test, the answer sheets for the direct assessments, the height and weight form, the student questionnaire, the teacher background questionnaires, and the teacher subject matter questionnaires (reading, mathematics, and science) were formatted so that they could be optically scanned. It was very cost efficient to optically scan the answer sheets, and the use of optical scanning
A-3-8
services eliminated the need for computer-assisted data entry of the information. Because optical scanning had not been used in previous rounds, it was important to test these procedures during the field test.
Once the assessments were completed, the test administrators carefully packed all the materials from the school, completed a transmittal form, and shipped the materials to the optical scanner using overnight FedEx. The optical scanner then scanned the materials and returned all the hard-copy questionnaires and forms to Westat so that Westat could ensure that no materials were missing. The optical scanner also transmitted electronic files containing the scanned data to Westat. The field test revealed that there were some problems ensuring that the correct (and complete) transmittal forms accompanied each shipment.
A-3-9
A-3-10
This page is intentionally left blank.
4. FEEDBACK FROM FIELD STAFF AND RESPONDENTS
In order to assess the conduct of the field test and to learn more about respondents’ reactions to different elements of the field test (including the advance materials, the incentives, the Web versus paper experience, the conduct of the assessments, and the collection of height and weight), test administrators, teachers, and children were asked to provide feedback on their experiences. Field staff were asked to complete diaries, while teachers and children were given debriefing questionnaires to complete. This chapter summarizes the reports received from field staff and from teachers and children.
4.1 Summary of Field Staff Diaries
Test administrators were asked to describe in their diaries difficulties encountered during the field test as well as things that worked well. Because it was hypothesized that teenagers might find the collection of their height and weight in a group setting embarrassing, test administrators were told to pay particular attention to the collection of the height and weight and the use of the privacy screens. They were also asked to observe children during the assessment and look for children who were not paying attention, were cheating, or did not understand the instructions. Finally, test administrators were asked to comment on their training and on the different procedures and systems supporting data collection (e.g., the Field Management System, e-mail, and the help desk).
4.1.1 Height and Weight
According to the test administrator diaries, several schools had the height and weight measurement station set up in a room across the hall from the assessment room. In this situation, the test administrators did not feel the use of the privacy screen was necessary. Even when the measurement station was set up in the same room, most test administrators did not see a need for the privacy screen. According to the test administrators, very few children refused to have their height and weight collected. In fact, according to the test administrators, a number of children who had not been selected to have their height and weight taken were disappointed that they were not going to be measured.
A-4-1
In many schools, a man took the height and weight measurements of boys, and a woman took it of girls. In some schools, however, both boys and girls were measured by the same person, regardless of sex. Not using a person of the same sex to collect the measurements did not appear to be uncomfortable for the children and or associated with a higher number of refusals.
A few problems did arise when large numbers of children needed to be measured in the same room where the assessments were taking place. With children getting up to be measured, there was more chatting and disruption in the classroom. Also staff were preoccupied with obtaining the measurements so that there were fewer staff monitoring the assessment.
4.1.2 Experiences During the Assessment Sessions
Test administrators indicated that for the most part the assessment sessions went very smoothly. Some difficulties were encountered if the assessment room assigned was not a classroom. For example, some schools used the cafeteria or the school library as the testing area. Larger schools were more likely to use a room other than a classroom for the assessment. In non-classroom settings, appropriate seating was not always available, and test administrators indicated that such areas made it more difficult for them to be heard while they gave the instructions and also more difficult to monitor the children during the assessments and to distribute the thank-you envelopes at the end of testing. In most schools, children were pleasant and cooperative. They were attentive while the assessment instructions were given and had no difficulty understanding the instructions. They were very appreciative of the $30 that they received for doing the assessments.
4.1.3 Suggestions for the National Training
Only a few of the field staff provided comments for the national training. Those who did indicated that they would like more time to spend on computer-related and data entry procedures, including the electronic timesheets and expense forms, and less time to spend on reading the assessment scripts and setting up the Schorr board and privacy screen. Field staff also wanted more experience with e-mail as several found working with it frustrating initially. The help desk staff received positive comments for being responsive to issues that arose.
A-4-2
Several field staff commented on the timers and the batteries. Those who commented were staff who had worked on NAEP. They had been trained to remove the batteries and turn them around until they were next needed. That procedure did not work with the timers used in the field test.
Overall, interviewers found the training successful. They said the trainers were knowledgeable and personable. Pacing was good and breaks were appropriate. They indicated, however, that there should be less duplication and distribution of pages already in the manual.
4.2 Student and Teacher Debriefing Questionnaires
As noted above, eighth-grade children and teachers participating in the field test were asked to complete short debriefing questionnaires on their opinions of their participation in the field test, including their opinion of the mode in which they were asked to complete the questionnaires (i.e., web or paper), the effectiveness of the monetary incentives, and the quality and appropriateness of the field test materials. Eighth-grade children who completed the student questionnaire were asked about the mode in which they completed the student questionnaire, the time it took to complete it, and the clarity of the items. Eighth-grade children who did not complete the student questionnaire were asked why they did not complete it and what could be done to encourage them to complete it. The content of the teacher debriefing questionnaire was very similar to that of the student debriefing questionnaire.
4.2.1 Web Versus Paper Questionnaires
Participating field test children reported that the student questionnaire took an average of 21 minutes to complete. They generally provided answers to all questionnaire items and reported that the questions were not difficult to understand.
The results of the field test suggest that the student questionnaire would yield a higher response rate if it were offered in paper form. Only 106 of the 870 (12 percent) children completed the student questionnaire over the Internet, while almost 500 of the 760 (66 percent) children completed and mailed in the paper version of the questionnaire (see table 4-1). The most frequent reasons Web-assigned children gave for failing to complete the questionnaire were computer or Internet connection problems,
A-4-3
such as computer “crashing,” loss of Internet connection, too slow Internet connection, or misplacement of user name, password, or URL address.
Table 4-1. Number of completed student questionnaires by method of completion: Spring 2006
Method of completion
Type of questionnaire
Totalquestionnaires
received/sent
Total Web questionnaires
received/sent
Total paper questionnaires
received/sentStudent 603/1,630 106/870 497/760 Completion rate 37.0 12.2 65.4SOURCE: U.S. Department of Education, National Center for Education Statistics, Early Childhood Longitudinal Study, Kindergarten Class of 1998-99 (ECLS-K), Eighth-Grade Field Test, spring 2006.
Participating field test teachers reported that the questionnaire took an average of 20 minutes to complete. They reported that the questions were appropriate for the classes they taught and were not difficult to understand.
Similar to the results found with the student questionnaire, the field test also suggested that the teacher questionnaire would yield a higher response rate if it were offered in paper form. Across the four questionnaires (background, reading, mathematics, and science), only 93 teacher questionnaires were completed over the Internet, while 189 paper teacher questionnaires were completed and mailed (see table 4-2). The completion rate for teachers who were assigned to the Web (79 percent for the teacher
Table 4-2. Number of completed teacher questionnaires by method of completion: Spring 2006
Method of completion Teacher questionnaire Total Web Paper
Total 282 93 189Background 144 50 94English 54 18 36Mathematics 46 12 34Science 38 13 25
SOURCE: U.S. Department of Education, National Center for Education Statistics, Early Childhood Longitudinal Study, Kindergarten Class of 1998-99 (ECLS-K), Eighth-Grade Field Test, spring 2006.
background questionnaire) was similar to that for teachers who were assigned to paper (81 percent for the teacher background questionnaire). However, differences were seen for the teachers who were given a
A-4-4
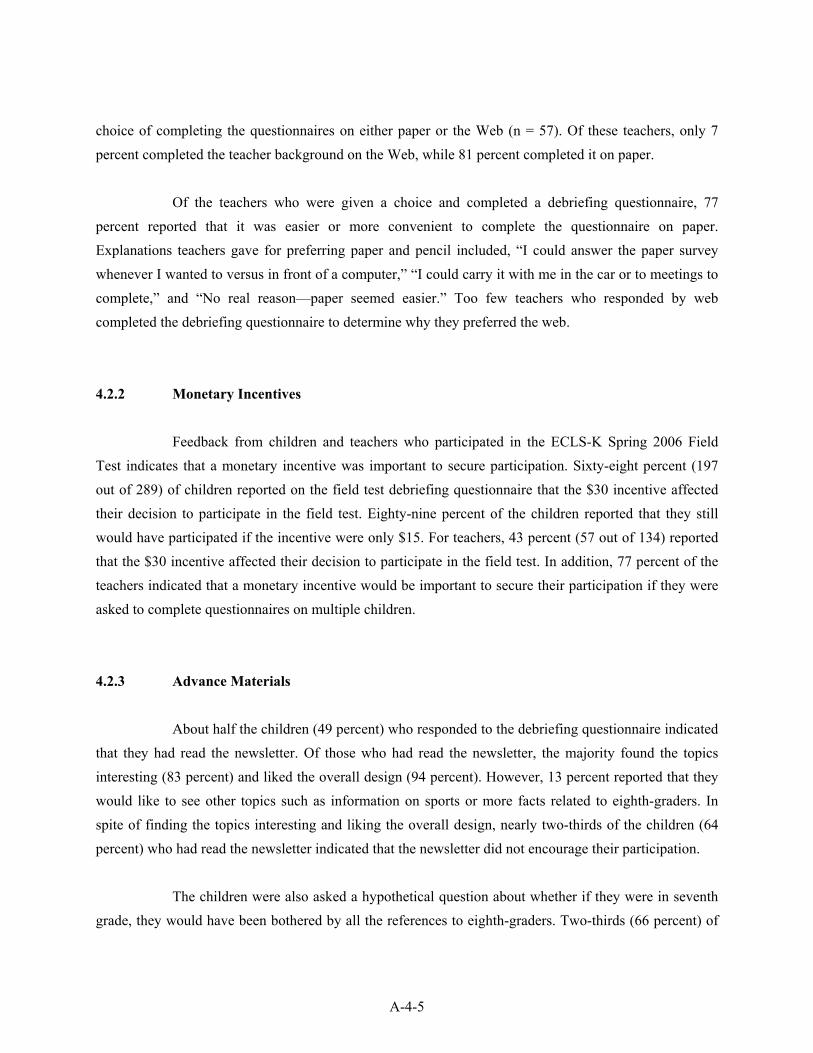
choice of completing the questionnaires on either paper or the Web (n = 57). Of these teachers, only 7 percent completed the teacher background on the Web, while 81 percent completed it on paper.
Of the teachers who were given a choice and completed a debriefing questionnaire, 77 percent reported that it was easier or more convenient to complete the questionnaire on paper. Explanations teachers gave for preferring paper and pencil included, “I could answer the paper survey whenever I wanted to versus in front of a computer,” “I could carry it with me in the car or to meetings to complete,” and “No real reason—paper seemed easier.” Too few teachers who responded by web completed the debriefing questionnaire to determine why they preferred the web.
4.2.2 Monetary Incentives
Feedback from children and teachers who participated in the ECLS-K Spring 2006 Field Test indicates that a monetary incentive was important to secure participation. Sixty-eight percent (197 out of 289) of children reported on the field test debriefing questionnaire that the $30 incentive affected their decision to participate in the field test. Eighty-nine percent of the children reported that they still would have participated if the incentive were only $15. For teachers, 43 percent (57 out of 134) reported that the $30 incentive affected their decision to participate in the field test. In addition, 77 percent of the teachers indicated that a monetary incentive would be important to secure their participation if they were asked to complete questionnaires on multiple children.
4.2.3 Advance Materials
About half the children (49 percent) who responded to the debriefing questionnaire indicated that they had read the newsletter. Of those who had read the newsletter, the majority found the topics interesting (83 percent) and liked the overall design (94 percent). However, 13 percent reported that they would like to see other topics such as information on sports or more facts related to eighth-graders. In spite of finding the topics interesting and liking the overall design, nearly two-thirds of the children (64 percent) who had read the newsletter indicated that the newsletter did not encourage their participation.
The children were also asked a hypothetical question about whether if they were in seventh grade, they would have been bothered by all the references to eighth-graders. Two-thirds (66 percent) of
A-4-5
A-4-6
the children who responded to the exit interviews said that would not have bothered them. The majority of children also reported that it would not matter to them if the newsletter were not personalized (74 percent).
4.2.4 Collection of Height and Weight
Just as the test administrators reported, most children did not object to having their height and weight collected. Of the 202 children who completed the exit questions about the height and weight measurement, 8 (4 percent) said they did not agree to have their height and weight measured. Three reported that they were shy or embarrassed, and two reported they were uncomfortable having their height and weight measured.
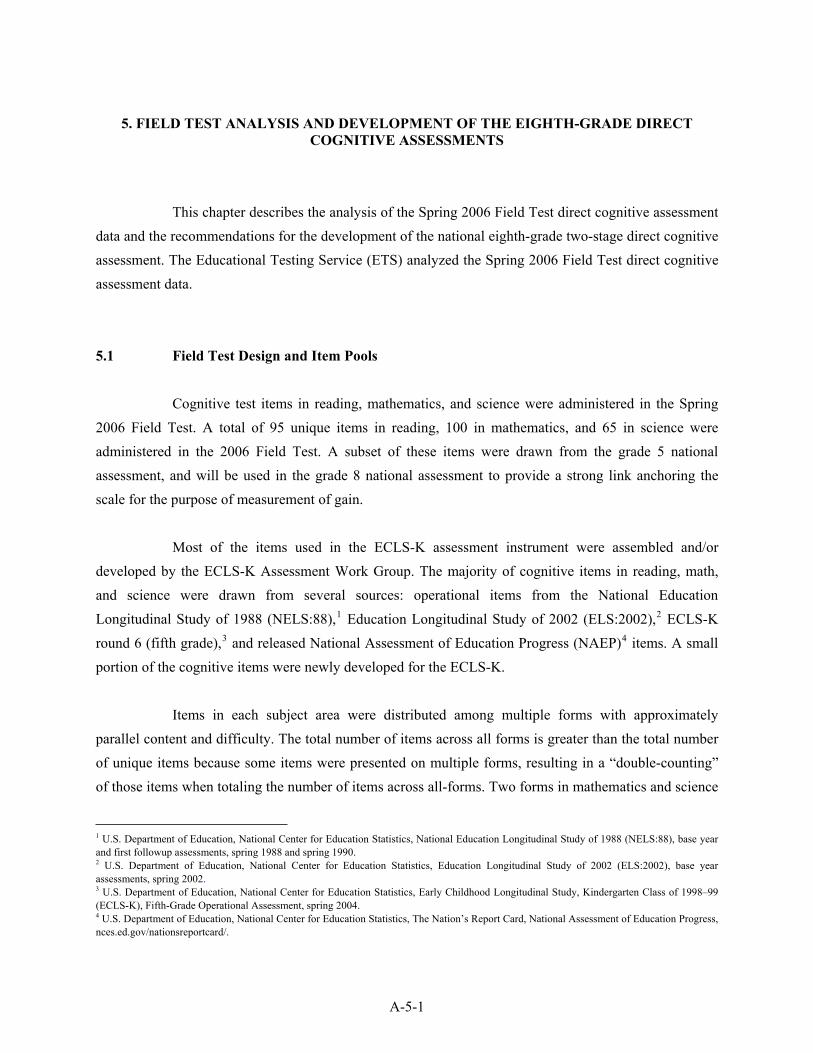
5. FIELD TEST ANALYSIS AND DEVELOPMENT OF THE EIGHTH-GRADE DIRECT COGNITIVE ASSESSMENTS
This chapter describes the analysis of the Spring 2006 Field Test direct cognitive assessment data and the recommendations for the development of the national eighth-grade two-stage direct cognitive assessment. The Educational Testing Service (ETS) analyzed the Spring 2006 Field Test direct cognitive assessment data.
5.1 Field Test Design and Item Pools
Cognitive test items in reading, mathematics, and science were administered in the Spring 2006 Field Test. A total of 95 unique items in reading, 100 in mathematics, and 65 in science were administered in the 2006 Field Test. A subset of these items were drawn from the grade 5 national assessment, and will be used in the grade 8 national assessment to provide a strong link anchoring the scale for the purpose of measurement of gain.
Most of the items used in the ECLS-K assessment instrument were assembled and/or developed by the ECLS-K Assessment Work Group. The majority of cognitive items in reading, math, and science were drawn from several sources: operational items from the National Education Longitudinal Study of 1988 (NELS:88),1 Education Longitudinal Study of 2002 (ELS:2002),2 ECLS-K round 6 (fifth grade),3 and released National Assessment of Education Progress (NAEP)4 items. A small portion of the cognitive items were newly developed for the ECLS-K.
Items in each subject area were distributed among multiple forms with approximately parallel content and difficulty. The total number of items across all forms is greater than the total number of unique items because some items were presented on multiple forms, resulting in a “double-counting” of those items when totaling the number of items across all-forms. Two forms in mathematics and science
1 U.S. Department of Education, National Center for Education Statistics, National Education Longitudinal Study of 1988 (NELS:88), base year and first followup assessments, spring 1988 and spring 1990. 2 U.S. Department of Education, National Center for Education Statistics, Education Longitudinal Study of 2002 (ELS:2002), base year assessments, spring 2002.3 U.S. Department of Education, National Center for Education Statistics, Early Childhood Longitudinal Study, Kindergarten Class of 1998–99 (ECLS-K), Fifth-Grade Operational Assessment, spring 2004. 4 U.S. Department of Education, National Center for Education Statistics, The Nation’s Report Card, National Assessment of Education Progress, nces.ed.gov/nationsreportcard/.
A-5-1
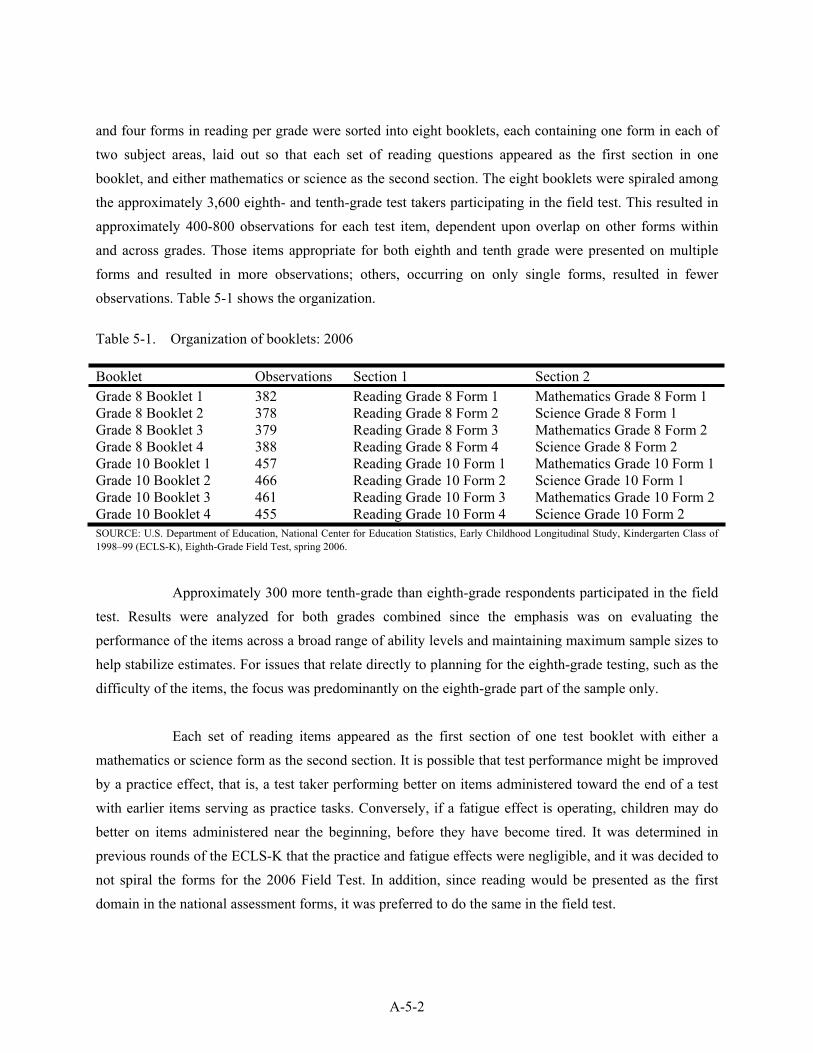
and four forms in reading per grade were sorted into eight booklets, each containing one form in each of two subject areas, laid out so that each set of reading questions appeared as the first section in one booklet, and either mathematics or science as the second section. The eight booklets were spiraled among the approximately 3,600 eighth- and tenth-grade test takers participating in the field test. This resulted in approximately 400-800 observations for each test item, dependent upon overlap on other forms within and across grades. Those items appropriate for both eighth and tenth grade were presented on multiple forms and resulted in more observations; others, occurring on only single forms, resulted in fewer observations. Table 5-1 shows the organization.
Table 5-1. Organization of booklets: 2006
Booklet Observations Section 1 Section 2 Grade 8 Booklet 1 382 Reading Grade 8 Form 1 Mathematics Grade 8 Form 1 Grade 8 Booklet 2 378 Reading Grade 8 Form 2 Science Grade 8 Form 1 Grade 8 Booklet 3 379 Reading Grade 8 Form 3 Mathematics Grade 8 Form 2 Grade 8 Booklet 4 388 Reading Grade 8 Form 4 Science Grade 8 Form 2 Grade 10 Booklet 1 457 Reading Grade 10 Form 1 Mathematics Grade 10 Form 1 Grade 10 Booklet 2 466 Reading Grade 10 Form 2 Science Grade 10 Form 1 Grade 10 Booklet 3 461 Reading Grade 10 Form 3 Mathematics Grade 10 Form 2 Grade 10 Booklet 4 455 Reading Grade 10 Form 4 Science Grade 10 Form 2 SOURCE: U.S. Department of Education, National Center for Education Statistics, Early Childhood Longitudinal Study, Kindergarten Class of 1998–99 (ECLS-K), Eighth-Grade Field Test, spring 2006.
Approximately 300 more tenth-grade than eighth-grade respondents participated in the field test. Results were analyzed for both grades combined since the emphasis was on evaluating the performance of the items across a broad range of ability levels and maintaining maximum sample sizes to help stabilize estimates. For issues that relate directly to planning for the eighth-grade testing, such as the difficulty of the items, the focus was predominantly on the eighth-grade part of the sample only.
Each set of reading items appeared as the first section of one test booklet with either a mathematics or science form as the second section. It is possible that test performance might be improved by a practice effect, that is, a test taker performing better on items administered toward the end of a test with earlier items serving as practice tasks. Conversely, if a fatigue effect is operating, children may do better on items administered near the beginning, before they have become tired. It was determined in previous rounds of the ECLS-K that the practice and fatigue effects were negligible, and it was decided to not spiral the forms for the 2006 Field Test. In addition, since reading would be presented as the first domain in the national assessment forms, it was preferred to do the same in the field test.
A-5-2
5.1.1 Reading
Each of the eight reading field test forms had approximately 20 items and four reading passages. Several passages and associated items were presented on multiple forms within and across grades. Other passages and item sets were taken from the operational grade 5 assessment. Items from the operational grade 5 assessment were included in the field test in anticipation of inclusion in the grade 8 national. The overlap of items between fifth and eighth grade will provide a strong link anchoring the scale for the purpose of measurement of gain.
The items were a mix of multiple-choice and open-ended format, with space for response below each item in the booklet. Appendix C lists the reading passages and their associated item sets, form presentation, and completion rate of each item from each passage set. Those items and passages presented in both the grade 8 and grade 10 forms, or on multiple forms within the same grade (and thus presented to more children), have higher numbers of valid responses. Valid responses exclude omitted unanswered items.
5.1.2 Mathematics
The grade 8 and 10 field test contained 125 mathematics items, divided among four forms designed to be approximately parallel within grade, with respect to the content and difficulty of the items. Each form appeared in one test booklet, paired with a reading form. Some items appeared in multiple forms within or across grades. Others were presented in the grade 5 operational assessments. As stated above, inclusion of grade 5 items was in anticipation of selecting these items for the grade 8 national assessment, for linking purposed for longitudinal measures of gain. Both multiple-choice and open-ended items were presented in each form. Appendix D lists the names, form presentation, and completion rates for each item. As with the reading, those items presented in both the grade 8 and grade 10 forms, or on multiple forms within the same grade, since presented to more children, have higher numbers of valid responses.
A-5-3
5.1.3 Science
Two grade 8 and two grade 10 field test forms each contained 20 items. Each form within grade was designed to be parallel within content and item difficulty. Similar to the mathematics, each form appeared in one test booklet, paired with a reading form. Some items appeared on multiple forms, within or across grades. Some items were also previously administered in the grade 5 operational assessments, in anticipation of scaling for longitudinal measurement.
Only multiple-choice items were presented on the field test. Response time for open-ended science items was estimated to be longer than that for the reading and mathematics items; therefore in order to maximize the number of items presented within minimal time, open-ended items were not included in the field test forms. Appendix E lists the names, form presentation, and completion rates for each item. As with the reading and mathematics assessments, those items presented in both the grade 8 and grade 10 forms, or on multiple forms within the same grade, since presented to more children, have higher numbers of valid responses.
5.2 Field Test Psychometric Analysis
This section describes the psychometric analysis methodology used for evaluating the cognitive field test items. These techniques included item analysis, Item Response Theory (IRT) calibration, and analysis of differential item functioning (DIF). The results of the psychometric analyses of field test items are presented here for each cognitive domain.
5.2.1 Methodology
Two different methodologies were used in analyzing psychometric performance of test items: traditional item analysis, which is essentially based on counts of right and wrong answers, and IRT analysis, which depends on patterns of right and wrong answers and takes into account the differential difficulty of items. Each methodology offers unique perspectives on some aspects of item performance, as well as overlapping views of item difficulty (percent correct versus IRT “b” parameter) and item discrimination (r-biserial versus IRT “a” parameter). Item analysis was carried out separately for eighth-and tenth-graders, so that differences in performance between the grades could be evaluated.
A-5-4
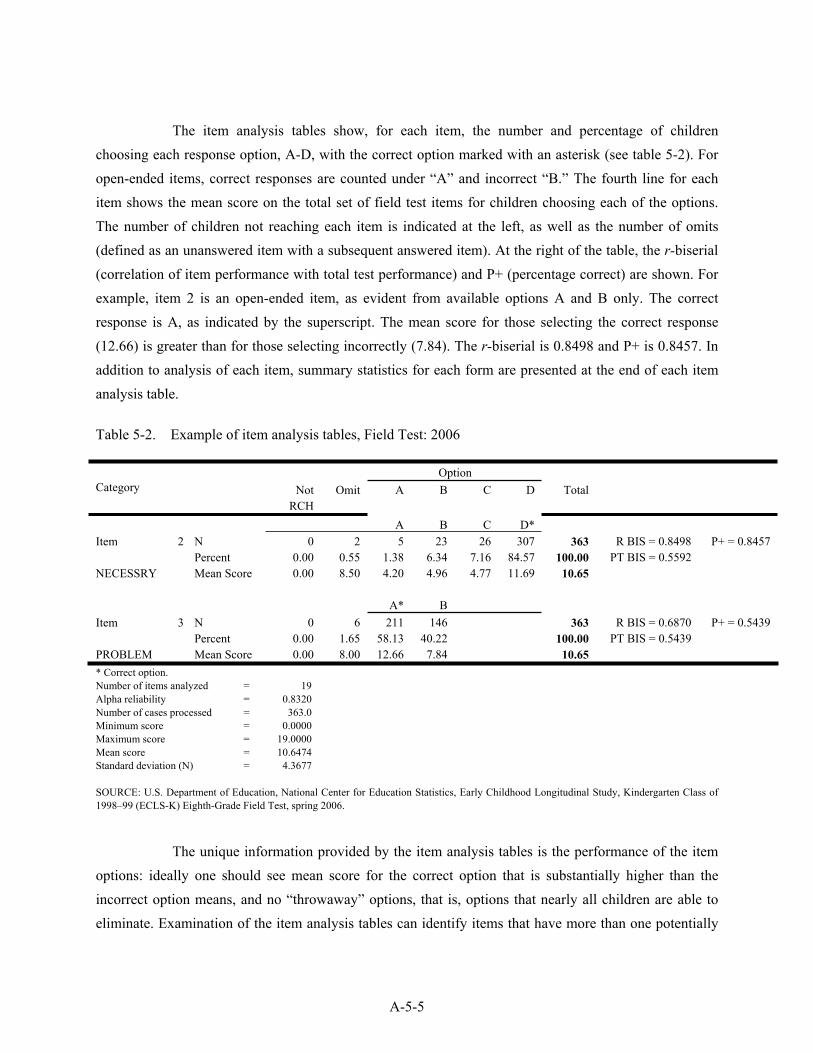
The item analysis tables show, for each item, the number and percentage of children choosing each response option, A-D, with the correct option marked with an asterisk (see table 5-2). For open-ended items, correct responses are counted under “A” and incorrect “B.” The fourth line for each item shows the mean score on the total set of field test items for children choosing each of the options. The number of children not reaching each item is indicated at the left, as well as the number of omits (defined as an unanswered item with a subsequent answered item). At the right of the table, the r-biserial (correlation of item performance with total test performance) and P+ (percentage correct) are shown. For example, item 2 is an open-ended item, as evident from available options A and B only. The correct response is A, as indicated by the superscript. The mean score for those selecting the correct response (12.66) is greater than for those selecting incorrectly (7.84). The r-biserial is 0.8498 and P+ is 0.8457. In addition to analysis of each item, summary statistics for each form are presented at the end of each item analysis table.
Table 5-2. Example of item analysis tables, Field Test: 2006
OptionCategory Not
RCHOmit A B C D Total
A B C D*Item
NECESSRY
2 NPercent Mean Score
00.000.00
20.558.50
51.384.20
236.344.96
267.164.77
30784.5711.69
363100.0010.65
R BIS = 0.8498 PT BIS = 0.5592
P+ = 0.8457
A* BItem
PROBLEM
3 NPercent Mean Score
00.000.00
61.658.00
21158.1312.66
14640.227.84
363100.0010.65
R BIS = 0.6870 PT BIS = 0.5439
P+ = 0.5439
* Correct option. Number of items analyzed = 19 Alpha reliability = 0.8320 Number of cases processed = 363.0 Minimum score = 0.0000 Maximum score = 19.0000 Mean score = 10.6474 Standard deviation (N) = 4.3677
SOURCE: U.S. Department of Education, National Center for Education Statistics, Early Childhood Longitudinal Study, Kindergarten Class of 1998–99 (ECLS-K) Eighth-Grade Field Test, spring 2006.
The unique information provided by the item analysis tables is the performance of the item options: ideally one should see mean score for the correct option that is substantially higher than the incorrect option means, and no “throwaway” options, that is, options that nearly all children are able to eliminate. Examination of the item analysis tables can identify items that have more than one potentially
A-5-5
correct answer or items that are so difficult that all children appear to be guessing at random. (Item analyses are presented in appendixes F, G, and H for the three subjects.)
The IRT plots, one graph for each test item, show performance of items across the ability range. The horizontal axis, “theta,” corresponds to the range of ability of the field test children (see exhibit 5-1). The vertical axis, “probability,” indicates the probability of answering the item correctly. The S-shaped curve plotted on the graph shows the fitted model’s estimated probability of a correct answer at each point in the ability range, with the horizontal dashed line representing the guessing parameter, that is, the probability of a very low ability test taker getting the item right. The upward and downward pointing triangles in the graphs in exhibit 5-1 show the fit of the actual data to the model, separately for grade 8 (downward triangles) and grade 10 (upward triangles). Good items have data that closely fits the curve and a relatively steep slope at the point of inflection of the “S.” The IRT “a” parameter, discrimination, is related to the slope, and is a measure of an item’s efficiency in separating lower from higher ability test takers. The first graph in exhibit 5-1 shows a successful item, with a steep curve (i.e., success on the item strongly related to overall mathematics performance) and close fit of data to the model. The second graph is the pictorial representation of a less successful item: the flat curve means that children of very different overall ability are about equally likely to answer this item correctly. (IRT plots are presented in appendixes I, J, and K for the three subjects.)
The IRT parameter estimates are less likely than item analysis statistics to be distorted by the omitted items because they are based on the patterns of responses to the items that were answered. In analyzing the field test results, IRT estimates of difficulty and discrimination were given more weight than the analogous statistics, P+ and r-biserial, from traditional item analysis. However, the traditional item analysis provides information on individual item options that cannot be observed in the IRT results, for example, items that have more than one potentially correct answer or items that are so difficult that all children appear to be guessing at random.
DIF analysis attempts to identify items that are differentially difficult for population subgroups. Field test sample sizes permitted DIF analysis for the male versus female and Black versus White comparisons for most items. There were too few Asian, Hispanic, or Native American children to compute DIF statistics for these groups. DIF analyses for all subgroups will be carried out after the eighth-grade data is collected. DIF items are characterized as C-level if they show subgroup performance differences both large and statistically significant. Any C-level DIF items identified at that time will be
A-5-6
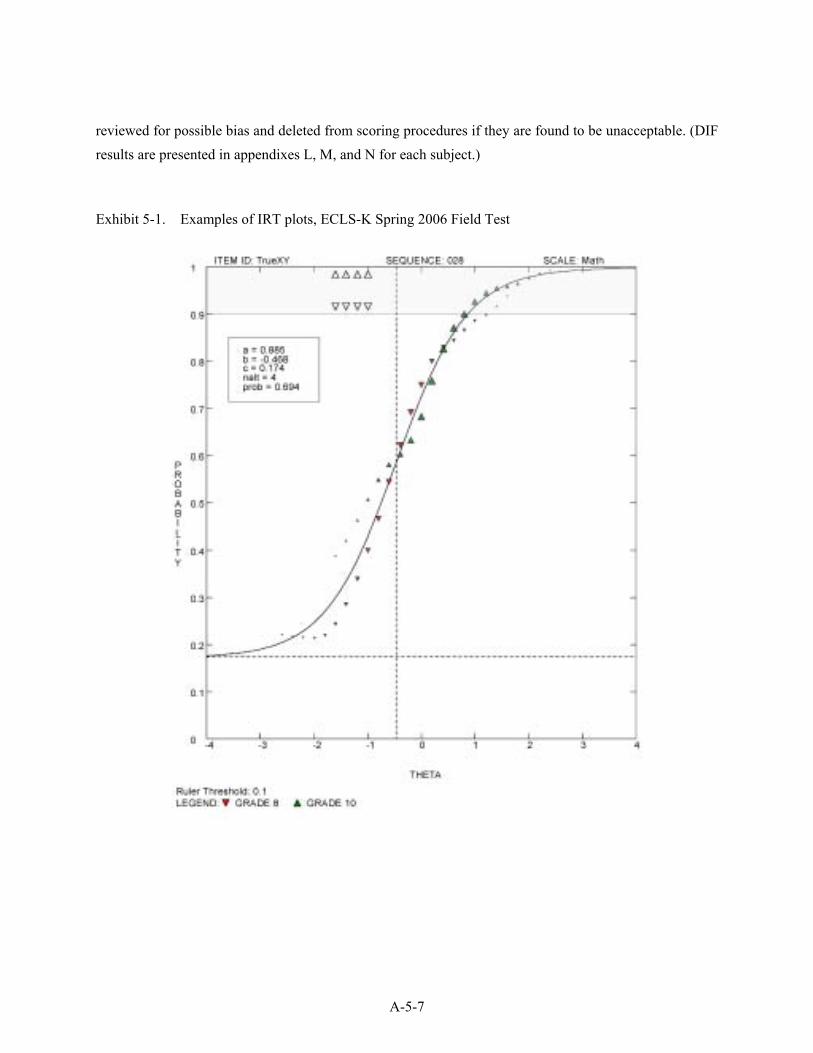
reviewed for possible bias and deleted from scoring procedures if they are found to be unacceptable. (DIF results are presented in appendixes L, M, and N for each subject.)
Exhibit 5-1. Examples of IRT plots, ECLS-K Spring 2006 Field Test
A-5-7
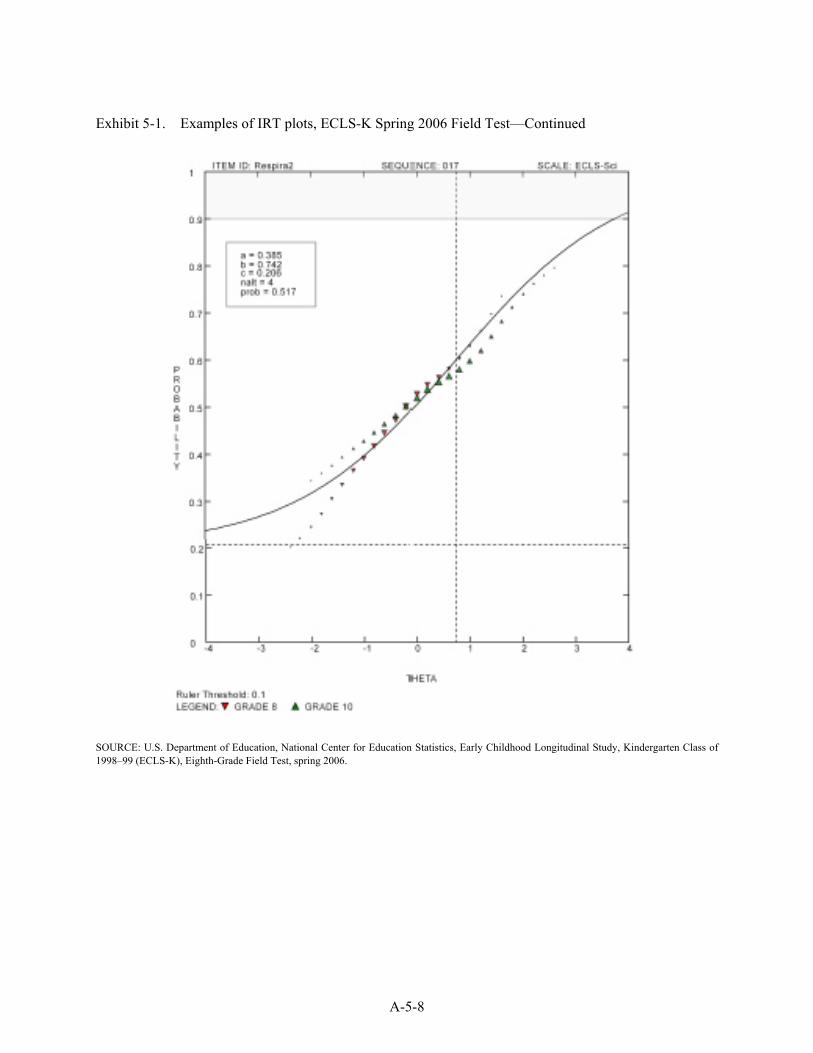
Exhibit 5-1. Examples of IRT plots, ECLS-K Spring 2006 Field Test—Continued
SOURCE: U.S. Department of Education, National Center for Education Statistics, Early Childhood Longitudinal Study, Kindergarten Class of 1998–99 (ECLS-K), Eighth-Grade Field Test, spring 2006.
A-5-8
5.2.2 Analysis Results
The following sections summarize analysis findings for the reading, mathematics, and science field test items, following a discussion of the adequacy of the field test item pool.
Adequacy of the Field Test Item Pool
The eighth- and tenth-grade items field tested in spring, 2006 were drawn from several sources: operational items from the National Education Longitudinal Study of 1988 (NELS:88),5
Education Longitudinal Study of 2002 (ELS:2002),6 ECLS-K round 6 (fifth grade),7 and released National Assessment of Education Progress (NAEP)8 items. Each of these sources has a large number of additional items available for use in ECLS-K grade 8 operational assessment.
A field test of cognitive items generally has the following objectives:
to evaluate item quality, and identify flaws in wording or response options for possible revision;
to ascertain the range of achievement that is likely to be encountered in the sample of children who will later take the operational test; and
to calibrate the field test items on scale matching the scale of child achievement, so that items of appropriate difficulty may be selected for the final forms.
The first objective, evaluation of item quality and presentation, was not one of the main objectives of the field test. Virtually all of the field test items were drawn from one of the sources named above, and have been used successfully in one or more large-scale assessments. As expected, the field test results did not show significant numbers of items that needed to be discarded or revised. In fact, for items that will be used as common items to equate to ECLS-K fifth-grade or NELS:88 scales, it is important that the items not be revised. The main goals of this field test were to determine the range of difficulty
5 U.S. Department of Education, National Center for Education Statistics, National Education Longitudinal Study of 1988 (NELS:88), base year and first followup assessments, spring 1988 and spring 1990. 6 U.S. Department of Education, National Center for Education Statistics, Education Longitudinal Study of 2002 (ELS:2002), base year assessments, spring 2002.7 U.S. Department of Education, National Center for Education Statistics, Early Childhood Longitudinal Study, Kindergarten Class of 1998–99 (ECLS-K), Fifth-Grade Operational Assessment, spring 2004. 8 U.S. Department of Education, National Center for Education Statistics, The Nation’s Report Card, National Assessment of Education Progress, nces.ed.gov/nationsreportcard/.
A-5-9
that will be required for the eighth-grade test forms, and to calibrate the difficulty of the items taken from the various sources in a common metric.
The pool of items available for assembly of the national test forms is not limited to the items in the 2006 field tests. Once difficulty parameters were calibrated in a common metric, a transformation can be estimated linking the difficulty parameters in the new metric back to the corresponding parameters in the original tests, that is, separate transformations for each of the sources. Thus virtually all items in the source tests can be considered part of the item pool for the purpose of test assembly.
Reading
Overall, the field test items for reading performed well, as expected. From the item analysis, the majority of r-biserials were well above the desired value of 0.4. One item in the item set for the J.W. Johnson’s Poetry passage exhibited a low r-biserial of 0.22. This was a new item developed for this round of the ECLS-K assessments. The item stem asks the meaning of “exemplified” in the passage. Response option C states “was typical of work produced during the Harlem Renaissance.” Those children with the highest average score selected this response. However, children whose average score was just slightly lower than those who chose this response chose alternative A instead, which states, “increased the poetic creativity of writers in Harlem.” Items such as this were not included in the proposed forms for the national assessment in order to remove any ambiguity in selection of a single correct response. All of the other items showed the expected trends in response selection; the correct response was selected by groups of children who have higher total scores. The alpha reliabilities for each of the eight test forms ranged from approximately 0.75 to 0.8, which is high for forms with only about 20 items each.
Review of the IRT plots showed good fit of item data with the estimated parameters. For those items where the fit was poor, the item was generally too easy (e.g., “fast”). Although the fit was good for most of the items, the discrimination, was not necessarily so. This generally occurs with items that are either relatively easy (e.g., “Swedish”) or hard (e.g., “notUS”). In selecting items for the national forms, items with poor fit and discrimination are avoided.
DIF analysis was carried out for males versus females and White children versus Black children, for all items for which the sample sizes were large enough. Negative C-level DIF against females was detected for two items: “hoax” (from Crop Circles) and “body” (from Throwing the Javelin).
A-5-10
The item “switched” (from Louis Armstrong) exhibited C-level DIF against Black children. C-level DIF favoring females was found for item “incident” (from Gary Soto), and favoring Black children for item “survey” (from Work Survey).
It is recommended to delete all but one of these items from the grade 8 assessment pool. The item “body” from Throwing the Javelin is proposed for the grade 8 routing form. This item was originally administered in NAEP and showed no evidence of DIF. And in the grade 8 field test, the DIF statistics for this item were borderline C-level. This is most likely the result of instability due to the small sample sizes in the field test. It is recommended that this item be retained for eighth grade because it has good statistics and a difficulty level appropriate for the routing form.
Mathematics
As with reading, the field test items for mathematics performed well, as expected. From the item analysis, the majority of r-biserials were above the desired value of 0.4. The item “HexAngle”, which is open-ended, exhibited a low r-biserial of 0.28. Only 17 percent of children answered this item correctly, but a correct answer was not strongly related to overall ability. Another difficult item, also with about 17 percent correct is “PtsOnLin,” which is multiple choice. In this case some of the incorrect response options were more attractive to higher ability children. The item “ACEq3AB” exhibited similar behavior, as did item “Y3X2Doub.” Items such as these were not included in the proposed forms for the national assessment in order to remove any ambiguity in selecting a single correct response option. All of the other items showed the expected trends in response selection; the correct response was selected by groups of children who have higher total scores. The alpha reliabilities for each of the four test forms are approximately 0.85, which is high for forms with only about 30 items each.
Review of the IRT plots showed good fit of item data with the estimated parameters for most of the items. For those items in which the fit was poor, the item was generally too hard (e.g., “HexAngle”). Although the fit was good for most of the items, the discrimination was not necessarily so. Similarly, this generally occurs with items that are relatively hard (e.g., “CardGame”). In selecting items for the national forms, items with poor fit and discrimination are avoided.
DIF analysis was carried out for males versus females and White children versus Black children, for all items for which the sample sizes were large enough. Negative C-level DIF against
A-5-11
females was detected for the item “Tile12MC.” This item was originally presented in the grade 5 assessments in open-ended format. Early on in the field test design, a few items were selected to be presented in both multiple-choice and open-ended format. Discussions after the field test was complete resulted in discarding the modified items for use in design of the national forms, so DIF for this item is not relevant. Several items exhibited C-level DIF against Black children: “Penny20,” “KayLen,” “MidPtMN,” and “ScaleBri.” These items will not be retained for the grade 8 operational forms. C-level DIF favoring females was found for items “SmithBud” and “GirlBoyM,” and favoring Black children for item “VolCyl.”
In general it is recommended to remove items showing C-level DIF against the focal group (e.g., a minority group) from any subsequent assessments. Policy regarding C-level DIF against the reference group (the comparison group, e.g. White children) is not constrained in the same manner, as is the case in the proposed mathematics forms. The item “SmithBud” is proposed for the grade 8 operational forms. It has good statistics and is a linking item from the grade 5 round. The item did not exhibit DIF in the grade 5 round, so the DIF observed in the field test is assumed to be the result of instability in the estimate due to the small sample size.
Science
Like the reading and mathematics assessments, the field test items for science performed well, as expected. From the item analysis, the majority of r-biserials were above the desired value of 0.4. The open-ended item “Bridge” exhibited a low r-biserial of 0.28. Only 25 percent of children answered this item correctly. In this case one of the incorrect response options was more attractive to higher ability children. The multiple-choice item “Pressure” also exhibited a low r-biserial of 0.19, a consequence of its difficulty, with only 28 percent of children answering correctly, just around the chance value. A negative r-biserial for item “Crust” was exhibited due to its high difficulty, probably due to correct answers selected by guessing instead of based on ability. All of the other items showed the expected trends in response selection; the correct response was selected by groups of children who have higher total scores. The alpha reliabilities for each of the four test forms are approximately 0.67-0.78. These are lower than those for the reading and mathematics forms, but are not unexpected, since the variability in item content is greater for science.
A-5-12
Review of the IRT plots showed good fit of item data with the estimated parameters for most of the items. For those items where the fit was poor, the item was generally either too easy (e.g., “Solar”), or too hard (e.g., “Bridge”). Although the fit was good for most of the items, the discrimination was not necessarily so. Similarly, this generally occurs with items that are relatively easy (e.g., “ChemSol”) or hard (e.g., “LowOrg2”). In selecting items for the national forms, items with poor fit and discrimination are avoided, unless necessary for the tails of the difficulty distribution.
DIF analysis was carried out for males versus females and White children versus Black children, for all items for which the sample sizes were large enough. Negative C-level DIF against females was detected for the item “ChemSol.” Two items exhibited C-level DIF against Black children: “Slope” and “MoonV2.” These items will not be retained for the grade 8 operational forms. C-level DIF favoring females was found for item “Sprout,” and favoring Black children for item “EnergyCV.” As with the mathematics forms, one item favoring the focal group is recommended for the grade 8 national forms. The item “Sprout” is proposed because it has good statistics and is a linking item from the grade 5 round. The item did not exhibit DIF in the grade 5 round, so the DIF exhibited in the field test is assumed to be the result of instability in the estimate due to the small sample size.
5.3 Design of the Eighth-Grade Tests
This section presents the design of the eighth-grade assessment forms. Numerous competing objectives were taken into account in selecting reading passages and reading, mathematics, and science items for the proposed eighth-grade forms, including the following:
difficulty: matching the difficulty of the test questions to the expected range of ability that will be found for the eighth-graders; choosing routing questions and second-stage forms of appropriate difficulty; avoiding floor and ceiling effects;
test specifications: matching as closely as possible the target percentages of content strands;
psychometric characteristics: selecting items that do a good job of discriminating among achievement levels; avoiding DIF items;
linking: having sufficient overlap of items carried over from the fifth-grade tests, and shared among eighth-grade forms, so that stable scales can be established for measuring status and gain;
A-5-13
proficiency level: retaining items from fifth grade that are necessary for measuring status with respect to previously established proficiency levels in reading and mathematics; and
time limits: making efficient use of testing time, to minimize burden on test takers and schools, and for budgetary reasons.
Ability Estimates of the National Grade 8 Sample
Table 5-3 shows the means and standard deviations of estimated ability for eighth- and tenth-graders in the field test sample. The ability metric corresponds to the difficulty parameter calibrated for the field test items.
Table 5-3. Average ability estimates (IRT theta) for the field test sample: 2006
Grade 8 Grade 10
Topic MeanStandarddeviation Mean
Standarddeviation
Reading -0.4128 0.8608 0.3971 0.7843Mathematics -0.4605 0.8785 0.3813 0.8241Science -0.3849 0.7798 0.3144 0.8420SOURCE: U.S. Department of Education, National Center for Education Statistics, Early Childhood Longitudinal Study, Kindergarten Class of 1998–99 (ECLS-K), Eighth-Grade Field Test, spring 2006.
As in previous rounds, a percentage of the sample to be assessed in the spring of 2007 will not be at the modal grade. Some will be above and some below eighth grade. Using the grade 8 ability mean and standard deviation from the field test results only would therefore not provide an accurate estimate of the abilities of the national sample. It was necessary to determine the percentage of children estimated to be off the modal grade in 2007. Based on the percentages from grade 5 (table 5-4), estimates of the percentages for grade 8 were established (table 5-5). The percentages off modal grade were raised slightly for the grade 8 estimate, with the assumption that over the period between grades 5 and 8, additional children may move to lower or higher grade levels. Test form difficulty ranges were designed based on these ability estimates for the national sample. Section 5.4.1 provides evidence that the forms were appropriate for all grade levels expected in the national administration.
A-5-14
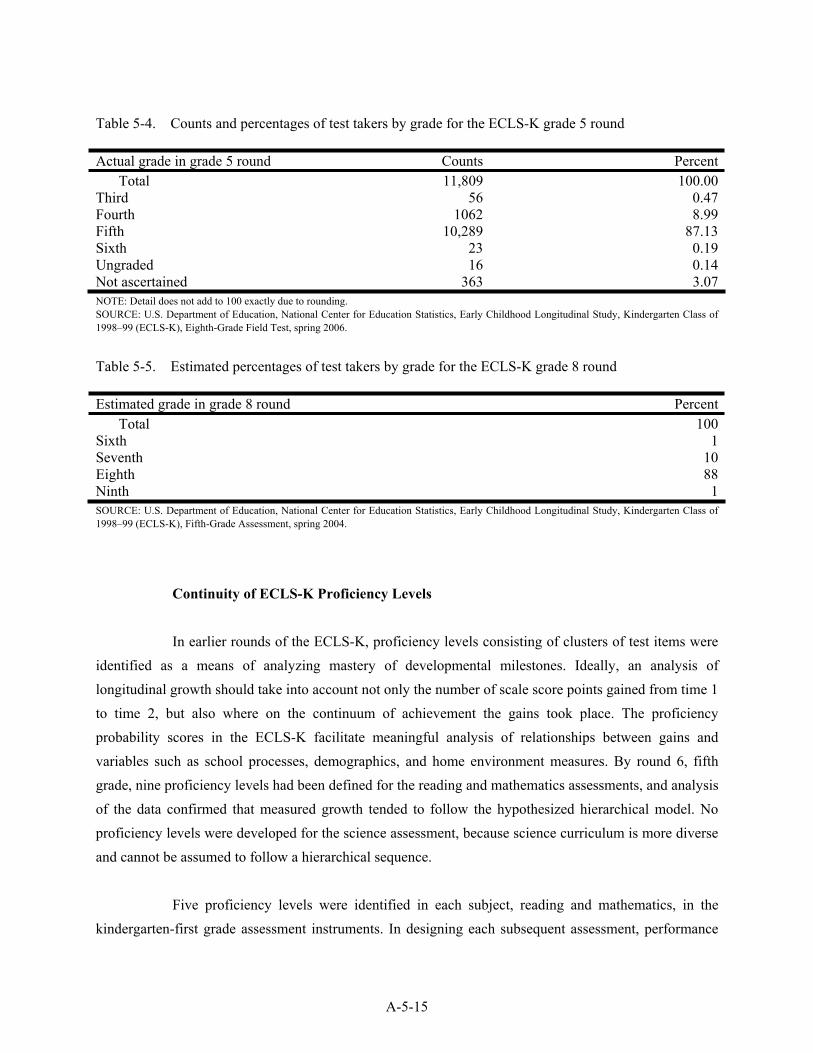
Table 5-4. Counts and percentages of test takers by grade for the ECLS-K grade 5 round
Actual grade in grade 5 round Counts PercentTotal 11,809 100.00
Third 56 0.47Fourth 1062 8.99Fifth 10,289 87.13Sixth 23 0.19Ungraded 16 0.14Not ascertained 363 3.07NOTE: Detail does not add to 100 exactly due to rounding. SOURCE: U.S. Department of Education, National Center for Education Statistics, Early Childhood Longitudinal Study, Kindergarten Class of 1998–99 (ECLS-K), Eighth-Grade Field Test, spring 2006.
Table 5-5. Estimated percentages of test takers by grade for the ECLS-K grade 8 round
Estimated grade in grade 8 round PercentTotal 100
Sixth 1Seventh 10Eighth 88Ninth 1SOURCE: U.S. Department of Education, National Center for Education Statistics, Early Childhood Longitudinal Study, Kindergarten Class of 1998–99 (ECLS-K), Fifth-Grade Assessment, spring 2004.
Continuity of ECLS-K Proficiency Levels
In earlier rounds of the ECLS-K, proficiency levels consisting of clusters of test items were identified as a means of analyzing mastery of developmental milestones. Ideally, an analysis of longitudinal growth should take into account not only the number of scale score points gained from time 1 to time 2, but also where on the continuum of achievement the gains took place. The proficiency probability scores in the ECLS-K facilitate meaningful analysis of relationships between gains and variables such as school processes, demographics, and home environment measures. By round 6, fifth grade, nine proficiency levels had been defined for the reading and mathematics assessments, and analysis of the data confirmed that measured growth tended to follow the hypothesized hierarchical model. No proficiency levels were developed for the science assessment, because science curriculum is more diverse and cannot be assumed to follow a hierarchical sequence.
Five proficiency levels were identified in each subject, reading and mathematics, in the kindergarten-first grade assessment instruments. In designing each subsequent assessment, performance
A-5-15
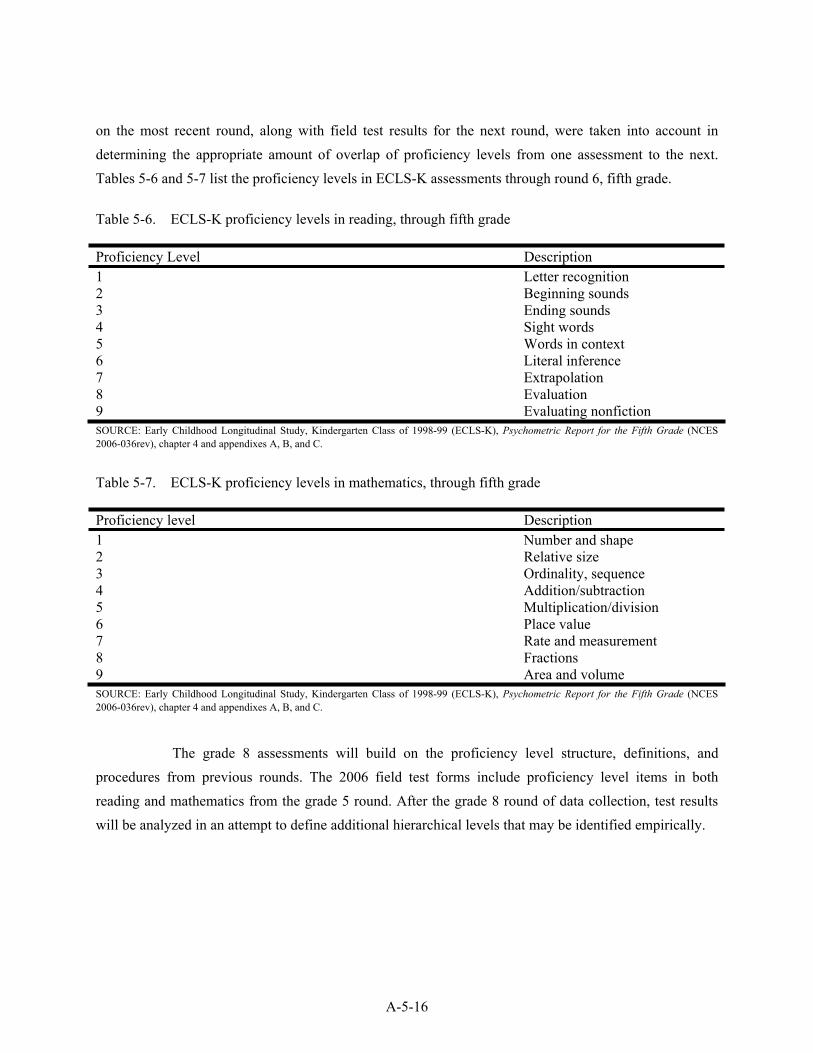
on the most recent round, along with field test results for the next round, were taken into account in determining the appropriate amount of overlap of proficiency levels from one assessment to the next. Tables 5-6 and 5-7 list the proficiency levels in ECLS-K assessments through round 6, fifth grade.
Table 5-6. ECLS-K proficiency levels in reading, through fifth grade
Proficiency Level Description1 Letter recognition2 Beginning sounds 3 Ending sounds 4 Sight words5 Words in context 6 Literal inference7 Extrapolation 8 Evaluation9 Evaluating nonfiction SOURCE: Early Childhood Longitudinal Study, Kindergarten Class of 1998-99 (ECLS-K), Psychometric Report for the Fifth Grade (NCES 2006-036rev), chapter 4 and appendixes A, B, and C.
Table 5-7. ECLS-K proficiency levels in mathematics, through fifth grade
Proficiency level Description1 Number and shape 2 Relative size3 Ordinality, sequence4 Addition/subtraction 5 Multiplication/division6 Place value7 Rate and measurement 8 Fractions9 Area and volume SOURCE: Early Childhood Longitudinal Study, Kindergarten Class of 1998-99 (ECLS-K), Psychometric Report for the Fifth Grade (NCES 2006-036rev), chapter 4 and appendixes A, B, and C.
The grade 8 assessments will build on the proficiency level structure, definitions, and procedures from previous rounds. The 2006 field test forms include proficiency level items in both reading and mathematics from the grade 5 round. After the grade 8 round of data collection, test results will be analyzed in an attempt to define additional hierarchical levels that may be identified empirically.
A-5-16
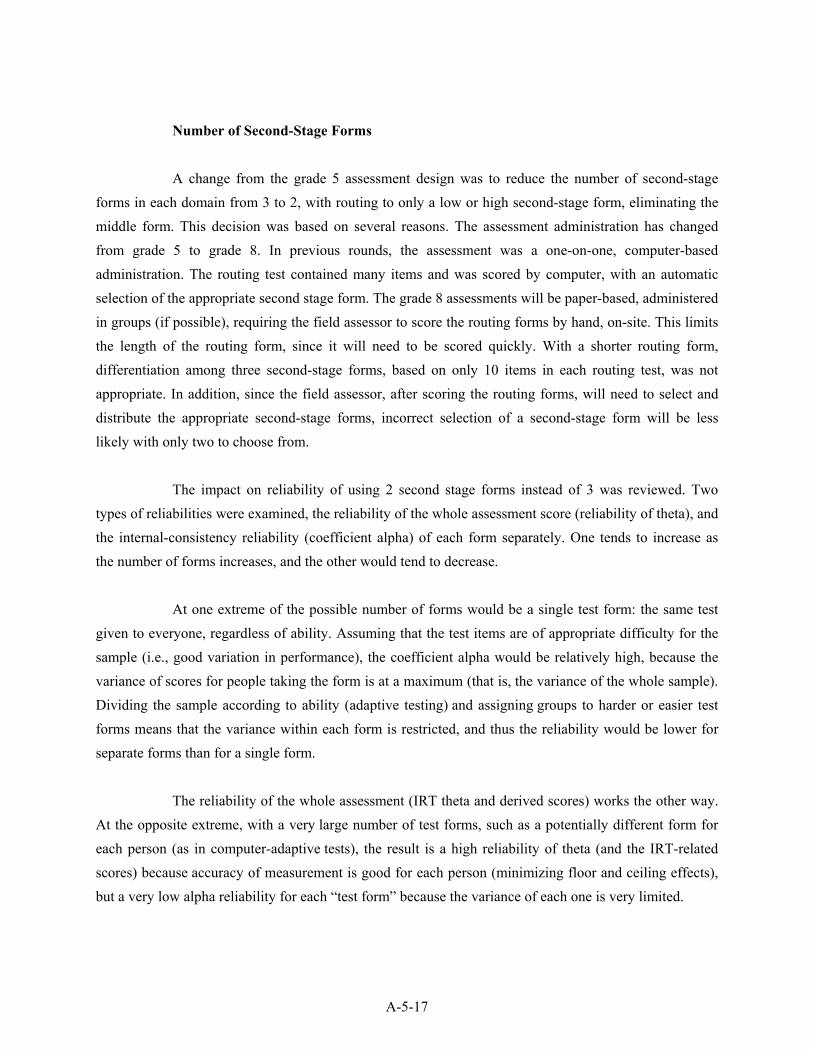
Number of Second-Stage Forms
A change from the grade 5 assessment design was to reduce the number of second-stage forms in each domain from 3 to 2, with routing to only a low or high second-stage form, eliminating the middle form. This decision was based on several reasons. The assessment administration has changed from grade 5 to grade 8. In previous rounds, the assessment was a one-on-one, computer-based administration. The routing test contained many items and was scored by computer, with an automatic selection of the appropriate second stage form. The grade 8 assessments will be paper-based, administered in groups (if possible), requiring the field assessor to score the routing forms by hand, on-site. This limits the length of the routing form, since it will need to be scored quickly. With a shorter routing form, differentiation among three second-stage forms, based on only 10 items in each routing test, was not appropriate. In addition, since the field assessor, after scoring the routing forms, will need to select and distribute the appropriate second-stage forms, incorrect selection of a second-stage form will be less likely with only two to choose from.
The impact on reliability of using 2 second stage forms instead of 3 was reviewed. Two types of reliabilities were examined, the reliability of the whole assessment score (reliability of theta), and the internal-consistency reliability (coefficient alpha) of each form separately. One tends to increase as the number of forms increases, and the other would tend to decrease.
At one extreme of the possible number of forms would be a single test form: the same test given to everyone, regardless of ability. Assuming that the test items are of appropriate difficulty for the sample (i.e., good variation in performance), the coefficient alpha would be relatively high, because the variance of scores for people taking the form is at a maximum (that is, the variance of the whole sample). Dividing the sample according to ability (adaptive testing) and assigning groups to harder or easier test forms means that the variance within each form is restricted, and thus the reliability would be lower for separate forms than for a single form.
The reliability of the whole assessment (IRT theta and derived scores) works the other way. At the opposite extreme, with a very large number of test forms, such as a potentially different form for each person (as in computer-adaptive tests), the result is a high reliability of theta (and the IRT-related scores) because accuracy of measurement is good for each person (minimizing floor and ceiling effects), but a very low alpha reliability for each “test form” because the variance of each one is very limited.
A-5-17
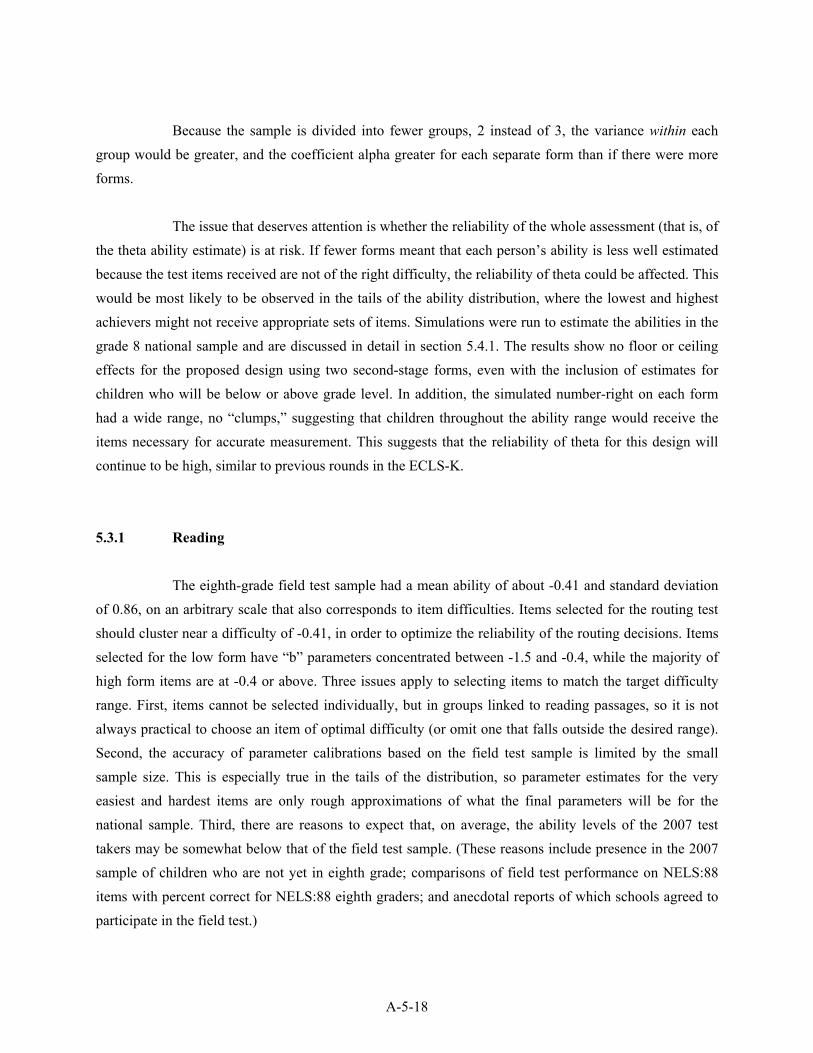
Because the sample is divided into fewer groups, 2 instead of 3, the variance within each group would be greater, and the coefficient alpha greater for each separate form than if there were more forms.
The issue that deserves attention is whether the reliability of the whole assessment (that is, of the theta ability estimate) is at risk. If fewer forms meant that each person’s ability is less well estimated because the test items received are not of the right difficulty, the reliability of theta could be affected. This would be most likely to be observed in the tails of the ability distribution, where the lowest and highest achievers might not receive appropriate sets of items. Simulations were run to estimate the abilities in the grade 8 national sample and are discussed in detail in section 5.4.1. The results show no floor or ceiling effects for the proposed design using two second-stage forms, even with the inclusion of estimates for children who will be below or above grade level. In addition, the simulated number-right on each form had a wide range, no “clumps,” suggesting that children throughout the ability range would receive the items necessary for accurate measurement. This suggests that the reliability of theta for this design will continue to be high, similar to previous rounds in the ECLS-K.
5.3.1 Reading
The eighth-grade field test sample had a mean ability of about -0.41 and standard deviation of 0.86, on an arbitrary scale that also corresponds to item difficulties. Items selected for the routing test should cluster near a difficulty of -0.41, in order to optimize the reliability of the routing decisions. Items selected for the low form have “b” parameters concentrated between -1.5 and -0.4, while the majority of high form items are at -0.4 or above. Three issues apply to selecting items to match the target difficulty range. First, items cannot be selected individually, but in groups linked to reading passages, so it is not always practical to choose an item of optimal difficulty (or omit one that falls outside the desired range). Second, the accuracy of parameter calibrations based on the field test sample is limited by the small sample size. This is especially true in the tails of the distribution, so parameter estimates for the very easiest and hardest items are only rough approximations of what the final parameters will be for the national sample. Third, there are reasons to expect that, on average, the ability levels of the 2007 test takers may be somewhat below that of the field test sample. (These reasons include presence in the 2007 sample of children who are not yet in eighth grade; comparisons of field test performance on NELS:88 items with percent correct for NELS:88 eighth graders; and anecdotal reports of which schools agreed to participate in the field test.)
A-5-18
The following is a summary of the passages, those selected for the routing, low, and high forms, and those excluded from the eighth-grade forms.
Routing Form
Passages and item sets selected for the routing form are constrained in two ways. First, the item types can only be multiple-choice, since the responses to the routing forms will be scored on-site. The complexity of scoring open-ended items with a rubric is time-consuming and operationally problematic on-site. The second constraint is that the item difficulties should be clustered near the field test mean ability level for optimal accuracy of the routing decision. The routing form consists of 10 items, with an allotted time of 15 minutes to complete. The following passages and corresponding item sets are proposed.
Louis Armstrong, 4 items, exposition:
short passage, suitable for routing test;
item difficulties spread across range with concentration at low end;
overlap with fifth grade;
two items in proficiency level 9;
removed open-ended (OE) item for routing form—MC items only on routing; and
removed vocabulary “switched” item, shows strong DIF against Black subgroup.
Flu Vaccine, 3 items, exposition:
easy read passage, suitable for routing test and
item difficulties concentrated around mean of field test ability level.
A-5-19
Throwing the Javelin, 3 items, literary:
slightly longer passage;
item difficulties concentrated around mean of field test with a higher difficulty item; and
removed OE item for routing form.
Low Form
Passages and item sets selected for the low form meet several goals. The low form items are to supplement the routing items with difficulty levels covering the lower half of the ability range. Some of the items on the low form should also be presented on the high form to permit the calibration of items on the same scale for the operational assessment, in addition to providing overlap in difficulty levels in the case where a child is routed to a form inappropriate for his or her ability level. Similarly, items from the grade 5 assessments, including proficiency level items, are included to allow for longitudinal calibration with the grade 5 assessment round.
Some items proposed for the low form were not field tested in 2006. As described in section 5.2.2, extension of the field test item pool to include items from the source assessments could be done using a transformation of parameters from the 2006 field test to the source. Items were selected from the grade 5 ECLS-K round to increase the overlap with grade 5 and increase the number of open-ended items presented on the national assessment.
The low form consists of 19 items, with an allotted time of 25 minutes to complete. The following passages and corresponding item sets are proposed.
Moving Without Jake, 5 items, literary:
very short passage;
item difficulties concentrated within 1 standard deviation above and below mean;
overlap with fifth grade;
four items in proficiency level 8; and
A-5-20
additional item from fifth-grade round (which was not in the 2006 field test) to improve overlap.
Stones, Bones and Petroglyphs, 9 items, exposition:
longer passage;
item difficulties spread across range, but concentrated at low end;
overlap with fifth grade;
two items in proficiency level 9; and
three additional items from the fifth grade (not in 2006 field test) to increase number of OE items and overlap with fifth grade.
Ellis Island, 5 items, exposition:
long passage;
item difficulties spread across entire range; and
used as overlapping set in low and high forms.
High Form
Similar goals are met for the items selected for the high form. The high form items are to supplement the routing items with difficulty levels covering the upper half of the ability range. Some items on the high form should also be presented on the low form to permit the calibration of items on the same scale for the operational assessment. Since those children routed to the high form will be of above-average ability reading levels, an additional passage and item set is proposed on the high form which will presumably be presented to the fastest readers, assuming comprehension and speed are related.
A-5-21
Like on the low form, some items are proposed for the high form that were not field tested in 2006. Two additional items from NELS:88 are proposed to add harder items to the national assessment.
Urban Transportation, 5 items, exposition:
short passage and
items spread across desired high form difficulty range, concentration between the mean and +1 standard deviation.
Sharebots, 5 items, exposition:
long passage and
items spread widely across high difficulty range.
Ellis Island, 5 items, exposition:
long passage;
item difficulties spread across entire range; and
used as overlapping set in low and high forms.
Mercy Otis Warren, 6 items, exposition:
medium-length passage;
item difficulties spread across higher end; and
two additional items from NELS:88 (not in 2006 field test) to add more difficult items.
Passages Not Used in Eighth-Grade Forms
Passages and item sets not selected for the grade 8 forms were eliminated for many reasons. Mainly these item sets exhibited very low discrimination, were in framework categories already overrepresented (see table 5-8 for description of categories), or were associated with passages that are too
A-5-22
long for the allotted time in the operational assessment. Those passages and item sets not selected for the grade 8 forms include the following:
Changing Horses, literary:
low discrimination (“a”);
easy items, but there are others in different passages at same difficulty levels with better “a” parameters; and
mostly General Understanding (GU)/Interpretation (I) items (this category already overrepresented).
Crop Circles, exposition:
some items with low “a” parameter;
other (better) items at same difficulty levels with better discrimination;
one item with DIF against females; and
mostly GU/I items.
The Fish, literary:
passage too long;
poor discrimination on several items; and
mostly I items.
Gary Soto, exposition:
passage long and
poor discrimination on most items.
Nuts!, literary:
passage long;
some items very easy, items from other passages better in same difficulty ranges; and
A-5-23
during Content Review Panel (CRP) phone calls (see section 5.4.2), panel members suggested the story would be too childish for eighth grade.
Work Survey, exposition:
passage not necessarily only reading comprehension, graph-reading task also (CRP recommendation to remove) and
most items have poor discrimination.
Wharton and Cather, exposition:
difficult items with low “a” parameters and
considered for inclusion but opted for Mercy Otis Warren (related content: female; historical) instead.
J.W. Johnson Poetry, exposition:
nice spread of difficulties, some with low “a” parameters;
better items from other passages; and
mostly GU/I items.
Voting Rights, exposition:
mediocre discrimination on most items;
better items from other passages; and
mostly I items.
Pioneer Women, exposition:
overlapping difficulties with other, better items.
SE Asia and Puerto Rico, exposition:
mostly I items and
good items, but better items on other passages at same difficulty levels.
A-5-24
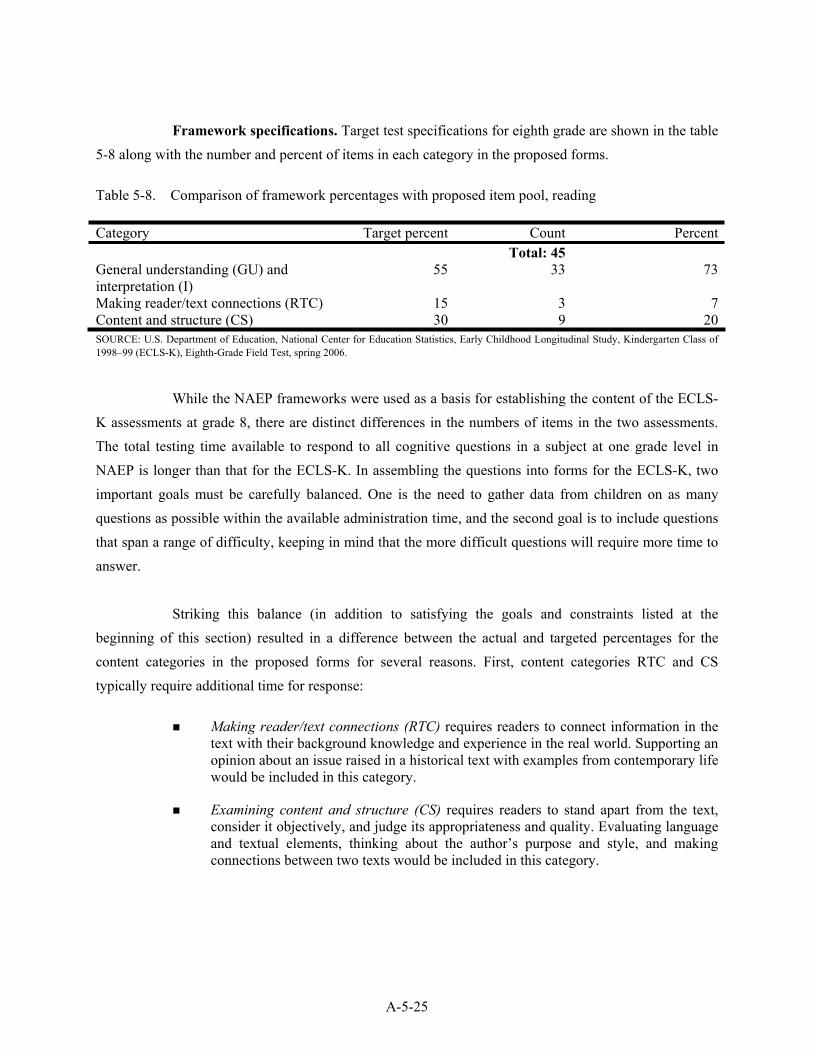
Framework specifications. Target test specifications for eighth grade are shown in the table 5-8 along with the number and percent of items in each category in the proposed forms.
Table 5-8. Comparison of framework percentages with proposed item pool, reading
Category Target percent Count PercentTotal: 45
General understanding (GU) and interpretation (I)
55 33 73
Making reader/text connections (RTC) 15 3 7Content and structure (CS) 30 9 20SOURCE: U.S. Department of Education, National Center for Education Statistics, Early Childhood Longitudinal Study, Kindergarten Class of 1998–99 (ECLS-K), Eighth-Grade Field Test, spring 2006.
While the NAEP frameworks were used as a basis for establishing the content of the ECLS-K assessments at grade 8, there are distinct differences in the numbers of items in the two assessments. The total testing time available to respond to all cognitive questions in a subject at one grade level in NAEP is longer than that for the ECLS-K. In assembling the questions into forms for the ECLS-K, two important goals must be carefully balanced. One is the need to gather data from children on as many questions as possible within the available administration time, and the second goal is to include questions that span a range of difficulty, keeping in mind that the more difficult questions will require more time to answer.
Striking this balance (in addition to satisfying the goals and constraints listed at the beginning of this section) resulted in a difference between the actual and targeted percentages for the content categories in the proposed forms for several reasons. First, content categories RTC and CS typically require additional time for response:
Making reader/text connections (RTC) requires readers to connect information in the text with their background knowledge and experience in the real world. Supporting an opinion about an issue raised in a historical text with examples from contemporary life would be included in this category.
Examining content and structure (CS) requires readers to stand apart from the text, consider it objectively, and judge its appropriateness and quality. Evaluating language and textual elements, thinking about the author’s purpose and style, and making connections between two texts would be included in this category.
A-5-25
Content categories GU and DI items do not require as much time for a response, and therefore more items can be included in a shorter period of time, resulting in greater accuracy in estimation of ability:
Forming a general understanding (GU) requires readers to consider the text as a whole and provide a global understanding of it. Explaining the purpose of an article, reflecting on the theme of a story, or identifying the topic of a passage would be included in this category.
Developing interpretation (DI) requires readers to develop a more complete understanding of what was read. It involves focusing on specific information in the text as well as linking information across parts of the text. Testing the meaning of vocabulary words in the text would be included in this category.
Difficulty in increasing the number of CS items also was due to the limited number of CS items in most passages. Passages with multiple CS items were selected for the national forms (Sharebotsand Moving Without Jake), with the exception of the Gary Soto passage, which showed items with poor discrimination in the field test. Of the nine passages selected for the national forms, five contained CS items (in addition to those above, Ellis Island, Louis Armstrong, and Throwing the Javelin), while the remaining four passages were selected for other purposes:
Flu Vaccine—item difficulties clustered around field test mean theta, good for routing;
Stones, Bones and Petroglyphs—lower difficulty items, overlap with fifth grade, proficiency items;
Urban Transportation—harder items; and
Mercy Otis Warren—harder items.
Similarly, each passage contains only a single RTC item. Three of the nine passages selected for the national forms contain RTC items (Flu Vaccine, Sharebots, Urban Transportation), while the remaining six were selected for other purposes:
Stones, Bones and Petroglyphs—lower difficulty items, overlap with fifth grade, proficiency items;
Ellis Island—item difficulties spread throughout entire theta range, good overlapping item, CS item in set;
Louis Armstrong—overlap with fifth grade, proficiency items, CS item in set;
A-5-26
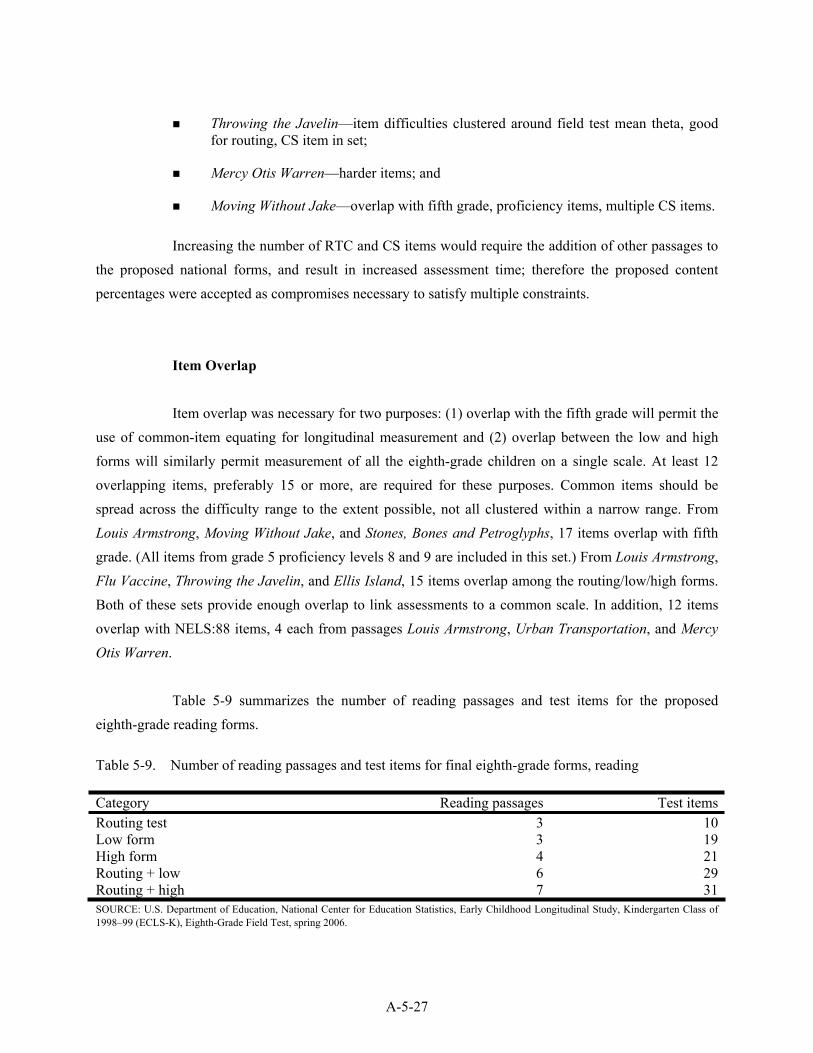
Throwing the Javelin—item difficulties clustered around field test mean theta, good for routing, CS item in set;
Mercy Otis Warren—harder items; and
Moving Without Jake—overlap with fifth grade, proficiency items, multiple CS items.
Increasing the number of RTC and CS items would require the addition of other passages to the proposed national forms, and result in increased assessment time; therefore the proposed content percentages were accepted as compromises necessary to satisfy multiple constraints.
Item Overlap
Item overlap was necessary for two purposes: (1) overlap with the fifth grade will permit the use of common-item equating for longitudinal measurement and (2) overlap between the low and high forms will similarly permit measurement of all the eighth-grade children on a single scale. At least 12 overlapping items, preferably 15 or more, are required for these purposes. Common items should be spread across the difficulty range to the extent possible, not all clustered within a narrow range. From Louis Armstrong, Moving Without Jake, and Stones, Bones and Petroglyphs, 17 items overlap with fifth grade. (All items from grade 5 proficiency levels 8 and 9 are included in this set.) From Louis Armstrong,Flu Vaccine, Throwing the Javelin, and Ellis Island, 15 items overlap among the routing/low/high forms. Both of these sets provide enough overlap to link assessments to a common scale. In addition, 12 items overlap with NELS:88 items, 4 each from passages Louis Armstrong, Urban Transportation, and Mercy Otis Warren.
Table 5-9 summarizes the number of reading passages and test items for the proposed eighth-grade reading forms.
Table 5-9. Number of reading passages and test items for final eighth-grade forms, reading
Category Reading passages Test itemsRouting test 3 10Low form 3 19High form 4 21Routing + low 6 29Routing + high 7 31SOURCE: U.S. Department of Education, National Center for Education Statistics, Early Childhood Longitudinal Study, Kindergarten Class of 1998–99 (ECLS-K), Eighth-Grade Field Test, spring 2006.
A-5-27
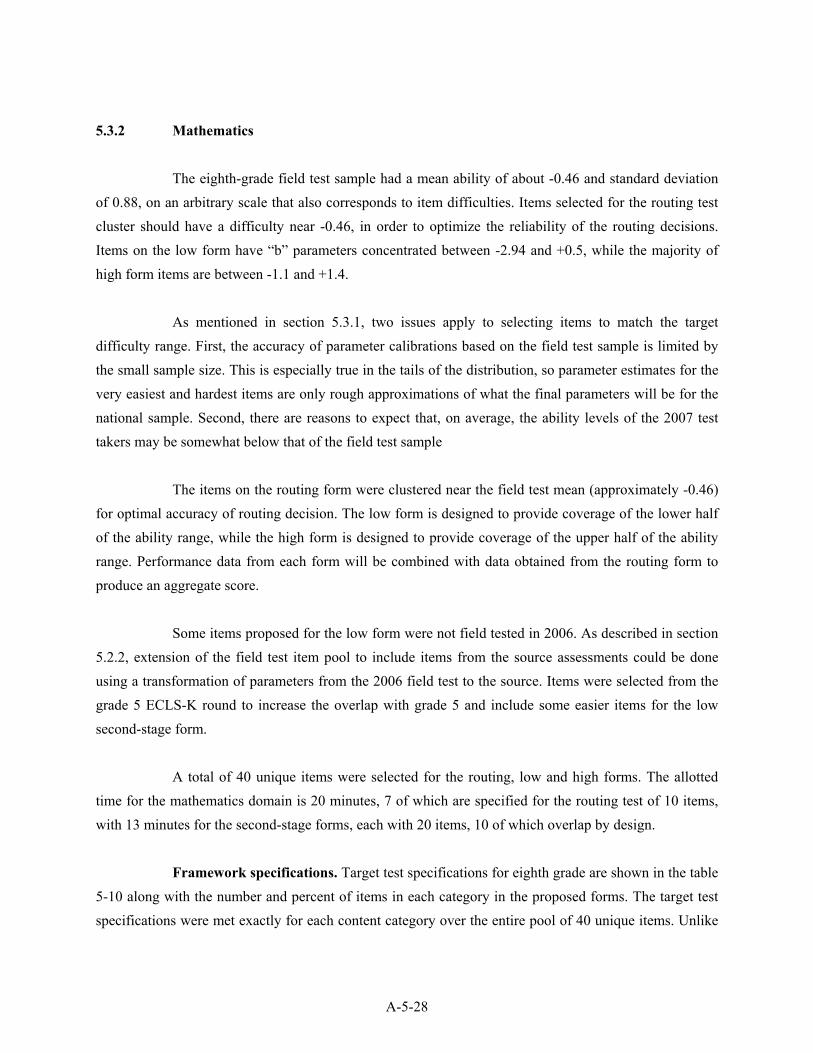
5.3.2 Mathematics
The eighth-grade field test sample had a mean ability of about -0.46 and standard deviation of 0.88, on an arbitrary scale that also corresponds to item difficulties. Items selected for the routing test cluster should have a difficulty near -0.46, in order to optimize the reliability of the routing decisions. Items on the low form have “b” parameters concentrated between -2.94 and +0.5, while the majority of high form items are between -1.1 and +1.4.
As mentioned in section 5.3.1, two issues apply to selecting items to match the target difficulty range. First, the accuracy of parameter calibrations based on the field test sample is limited by the small sample size. This is especially true in the tails of the distribution, so parameter estimates for the very easiest and hardest items are only rough approximations of what the final parameters will be for the national sample. Second, there are reasons to expect that, on average, the ability levels of the 2007 test takers may be somewhat below that of the field test sample
The items on the routing form were clustered near the field test mean (approximately -0.46) for optimal accuracy of routing decision. The low form is designed to provide coverage of the lower half of the ability range, while the high form is designed to provide coverage of the upper half of the ability range. Performance data from each form will be combined with data obtained from the routing form to produce an aggregate score.
Some items proposed for the low form were not field tested in 2006. As described in section 5.2.2, extension of the field test item pool to include items from the source assessments could be done using a transformation of parameters from the 2006 field test to the source. Items were selected from the grade 5 ECLS-K round to increase the overlap with grade 5 and include some easier items for the low second-stage form.
A total of 40 unique items were selected for the routing, low and high forms. The allotted time for the mathematics domain is 20 minutes, 7 of which are specified for the routing test of 10 items, with 13 minutes for the second-stage forms, each with 20 items, 10 of which overlap by design.
Framework specifications. Target test specifications for eighth grade are shown in the table 5-10 along with the number and percent of items in each category in the proposed forms. The target test specifications were met exactly for each content category over the entire pool of 40 unique items. Unlike
A-5-28
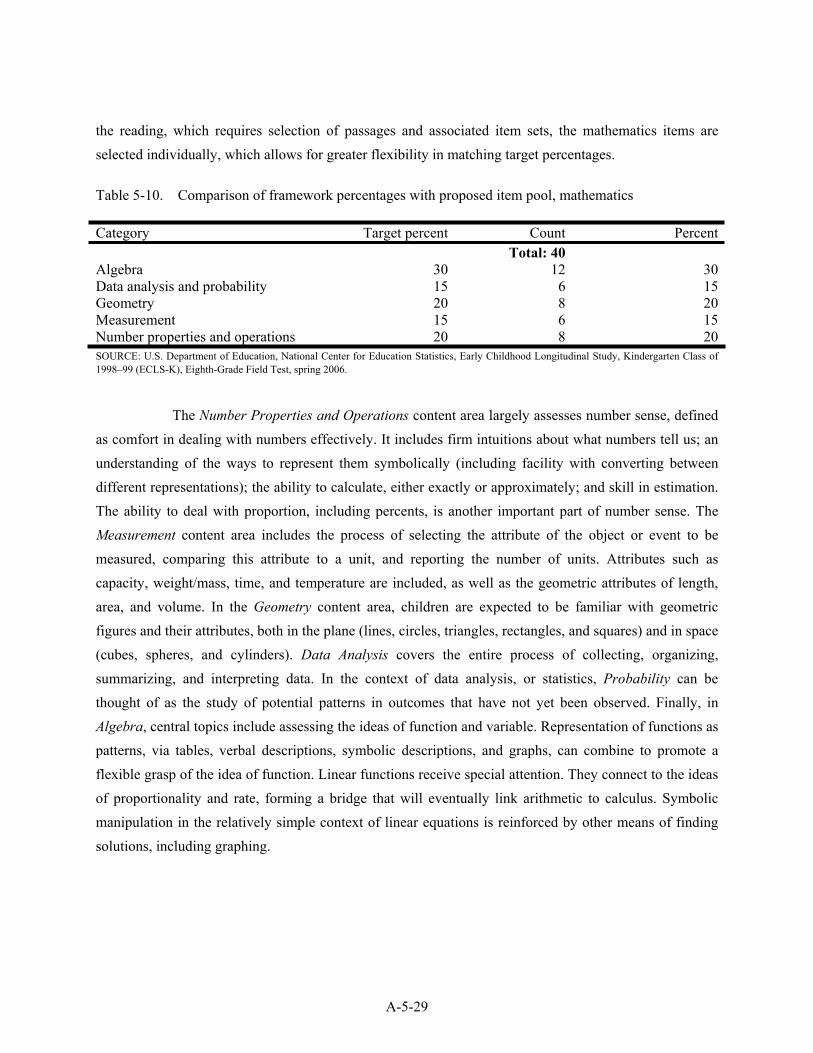
the reading, which requires selection of passages and associated item sets, the mathematics items are selected individually, which allows for greater flexibility in matching target percentages.
Table 5-10. Comparison of framework percentages with proposed item pool, mathematics
Category Target percent Count PercentTotal: 40
Algebra 30 12 30Data analysis and probability 15 6 15Geometry 20 8 20Measurement 15 6 15Number properties and operations 20 8 20SOURCE: U.S. Department of Education, National Center for Education Statistics, Early Childhood Longitudinal Study, Kindergarten Class of 1998–99 (ECLS-K), Eighth-Grade Field Test, spring 2006.
The Number Properties and Operations content area largely assesses number sense, defined as comfort in dealing with numbers effectively. It includes firm intuitions about what numbers tell us; an understanding of the ways to represent them symbolically (including facility with converting between different representations); the ability to calculate, either exactly or approximately; and skill in estimation. The ability to deal with proportion, including percents, is another important part of number sense. The Measurement content area includes the process of selecting the attribute of the object or event to be measured, comparing this attribute to a unit, and reporting the number of units. Attributes such as capacity, weight/mass, time, and temperature are included, as well as the geometric attributes of length, area, and volume. In the Geometry content area, children are expected to be familiar with geometric figures and their attributes, both in the plane (lines, circles, triangles, rectangles, and squares) and in space (cubes, spheres, and cylinders). Data Analysis covers the entire process of collecting, organizing, summarizing, and interpreting data. In the context of data analysis, or statistics, Probability can be thought of as the study of potential patterns in outcomes that have not yet been observed. Finally, in Algebra, central topics include assessing the ideas of function and variable. Representation of functions as patterns, via tables, verbal descriptions, symbolic descriptions, and graphs, can combine to promote a flexible grasp of the idea of function. Linear functions receive special attention. They connect to the ideas of proportionality and rate, forming a bridge that will eventually link arithmetic to calculus. Symbolic manipulation in the relatively simple context of linear equations is reinforced by other means of finding solutions, including graphing.
A-5-29
Item Overlap
Item overlap was considered for two purposes: (1) overlap with the fifth grade will permit the use of common-item equating for longitudinal measurement, and (2) overlap between the low and high forms will similarly permit the use of common-item equating in order to measure all of the eighth-grade children on a single scale. At least 12 overlapping items are required for these purposes, preferably 15 or more. Common items should be spread across the difficulty range to the extent possible, not all clustered within a narrow range. Twenty-four items overlap with fifth grade (including all items from proficiency levels 7, 8, and 9), and 20 overlap among the routing/low/high forms. Both of these sets provide enough overlap to utilize common-item equating. In addition, 12 items overlap with NELS:88 items.
Table 5-11 summarizes the number of items for the final eighth-grade mathematics assessment.
Table 5-11. Number of test items in the final eighth-grade forms, mathematics
Category Test itemsEighth-grade routing test 10Eighth-grade low form 20Eighth-grade high form 20Eighth-grade routing + low 30Eighth-grade routing + high 30SOURCE: U.S. Department of Education, National Center for Education Statistics, Early Childhood Longitudinal Study, Kindergarten Class of 1998–99 (ECLS-K), Eighth-Grade Field Test, spring 2006.
5.3.3 Science
The eighth-grade field test sample had a mean ability of about -0.38 and standard deviation of 0.78, on an arbitrary scale that also corresponds to item difficulties. Items selected for the routing test cluster should have a difficulty near -0.38, in order to optimize the reliability of the routing decisions. Items on the low form have “b” parameters concentrated between -2.9 and +0.3, while the majority of high form items are between -1.3 and +1.3.
The issues that apply to selecting items to match the target difficulty range are two-fold. First, the accuracy of parameter calibrations based on the field test sample is limited by the small sample
A-5-30
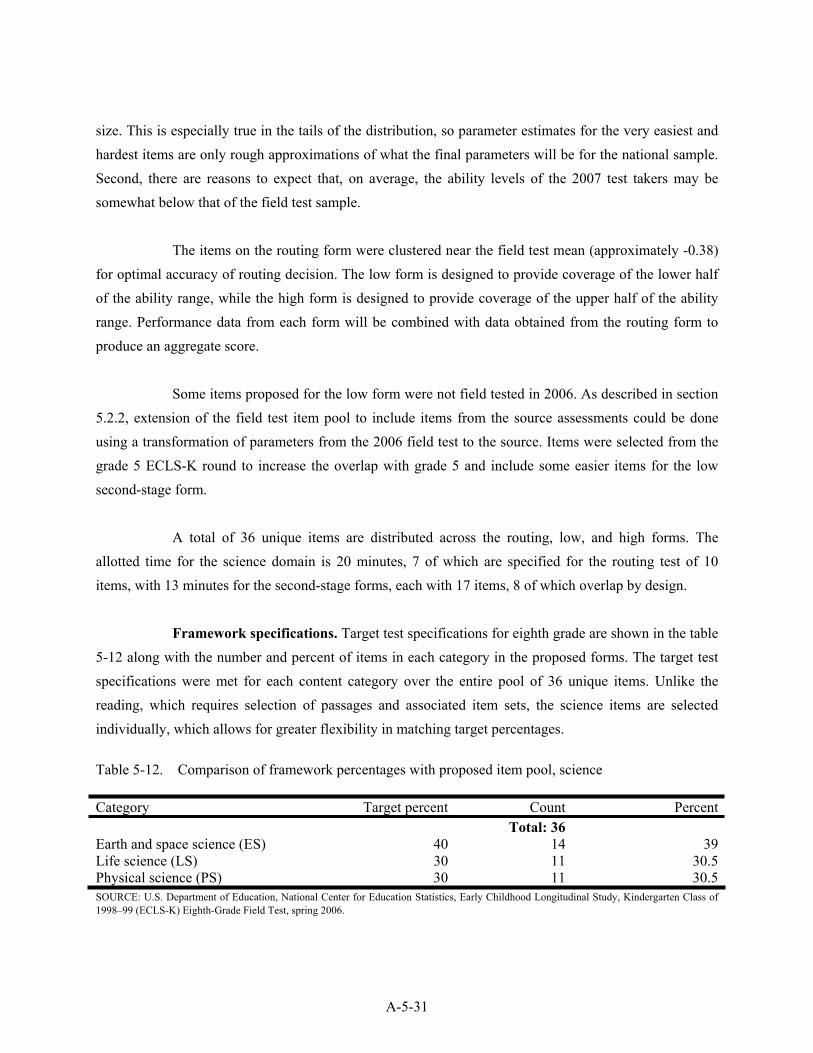
size. This is especially true in the tails of the distribution, so parameter estimates for the very easiest and hardest items are only rough approximations of what the final parameters will be for the national sample. Second, there are reasons to expect that, on average, the ability levels of the 2007 test takers may be somewhat below that of the field test sample.
The items on the routing form were clustered near the field test mean (approximately -0.38) for optimal accuracy of routing decision. The low form is designed to provide coverage of the lower half of the ability range, while the high form is designed to provide coverage of the upper half of the ability range. Performance data from each form will be combined with data obtained from the routing form to produce an aggregate score.
Some items proposed for the low form were not field tested in 2006. As described in section 5.2.2, extension of the field test item pool to include items from the source assessments could be done using a transformation of parameters from the 2006 field test to the source. Items were selected from the grade 5 ECLS-K round to increase the overlap with grade 5 and include some easier items for the low second-stage form.
A total of 36 unique items are distributed across the routing, low, and high forms. The allotted time for the science domain is 20 minutes, 7 of which are specified for the routing test of 10 items, with 13 minutes for the second-stage forms, each with 17 items, 8 of which overlap by design.
Framework specifications. Target test specifications for eighth grade are shown in the table 5-12 along with the number and percent of items in each category in the proposed forms. The target test specifications were met for each content category over the entire pool of 36 unique items. Unlike the reading, which requires selection of passages and associated item sets, the science items are selected individually, which allows for greater flexibility in matching target percentages.
Table 5-12. Comparison of framework percentages with proposed item pool, science
Category Target percent Count PercentTotal: 36
Earth and space science (ES) 40 14 39Life science (LS) 30 11 30.5Physical science (PS) 30 11 30.5SOURCE: U.S. Department of Education, National Center for Education Statistics, Early Childhood Longitudinal Study, Kindergarten Class of 1998–99 (ECLS-K) Eighth-Grade Field Test, spring 2006.
A-5-31
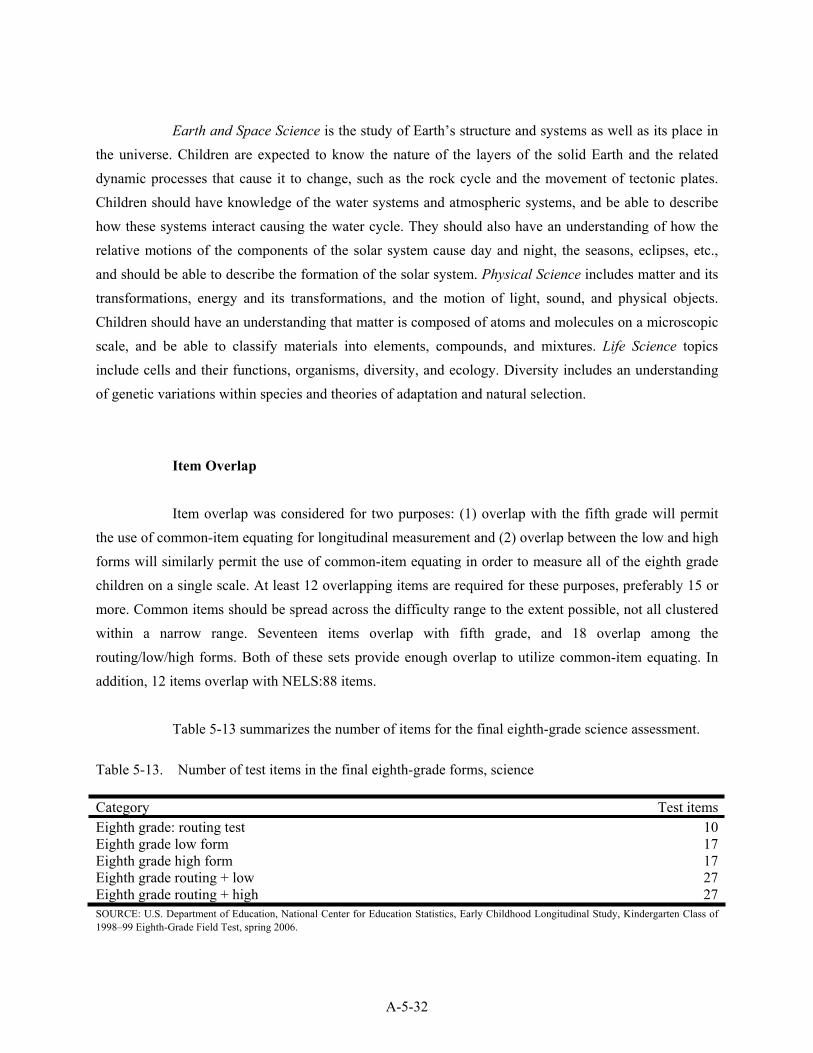
Earth and Space Science is the study of Earth’s structure and systems as well as its place in the universe. Children are expected to know the nature of the layers of the solid Earth and the related dynamic processes that cause it to change, such as the rock cycle and the movement of tectonic plates. Children should have knowledge of the water systems and atmospheric systems, and be able to describe how these systems interact causing the water cycle. They should also have an understanding of how the relative motions of the components of the solar system cause day and night, the seasons, eclipses, etc., and should be able to describe the formation of the solar system. Physical Science includes matter and its transformations, energy and its transformations, and the motion of light, sound, and physical objects. Children should have an understanding that matter is composed of atoms and molecules on a microscopic scale, and be able to classify materials into elements, compounds, and mixtures. Life Science topics include cells and their functions, organisms, diversity, and ecology. Diversity includes an understanding of genetic variations within species and theories of adaptation and natural selection.
Item Overlap
Item overlap was considered for two purposes: (1) overlap with the fifth grade will permit the use of common-item equating for longitudinal measurement and (2) overlap between the low and high forms will similarly permit the use of common-item equating in order to measure all of the eighth grade children on a single scale. At least 12 overlapping items are required for these purposes, preferably 15 or more. Common items should be spread across the difficulty range to the extent possible, not all clustered within a narrow range. Seventeen items overlap with fifth grade, and 18 overlap among the routing/low/high forms. Both of these sets provide enough overlap to utilize common-item equating. In addition, 12 items overlap with NELS:88 items.
Table 5-13 summarizes the number of items for the final eighth-grade science assessment.
Table 5-13. Number of test items in the final eighth-grade forms, science
Category Test itemsEighth grade: routing test 10Eighth grade low form 17Eighth grade high form 17Eighth grade routing + low 27Eighth grade routing + high 27SOURCE: U.S. Department of Education, National Center for Education Statistics, Early Childhood Longitudinal Study, Kindergarten Class of 1998–99 Eighth-Grade Field Test, spring 2006.
A-5-32
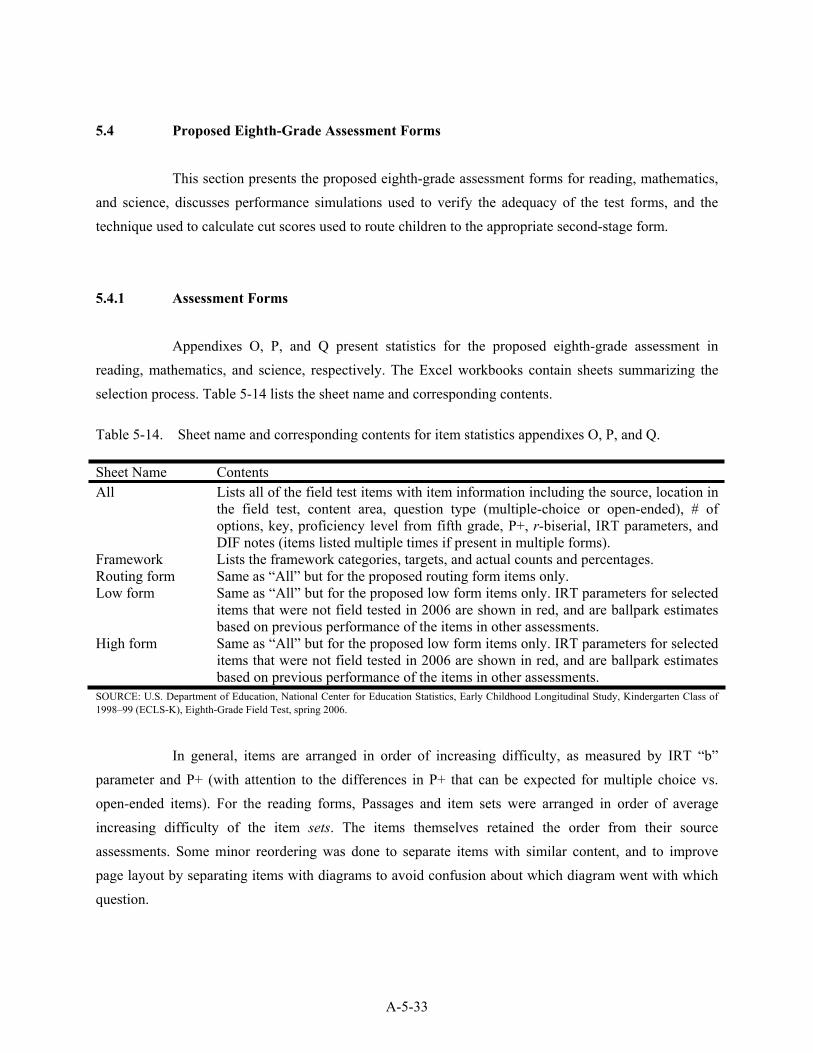
5.4 Proposed Eighth-Grade Assessment Forms
This section presents the proposed eighth-grade assessment forms for reading, mathematics, and science, discusses performance simulations used to verify the adequacy of the test forms, and the technique used to calculate cut scores used to route children to the appropriate second-stage form.
5.4.1 Assessment Forms
Appendixes O, P, and Q present statistics for the proposed eighth-grade assessment in reading, mathematics, and science, respectively. The Excel workbooks contain sheets summarizing the selection process. Table 5-14 lists the sheet name and corresponding contents.
Table 5-14. Sheet name and corresponding contents for item statistics appendixes O, P, and Q.
Sheet Name ContentsAll Lists all of the field test items with item information including the source, location in
the field test, content area, question type (multiple-choice or open-ended), # of options, key, proficiency level from fifth grade, P+, r-biserial, IRT parameters, and DIF notes (items listed multiple times if present in multiple forms).
Framework Lists the framework categories, targets, and actual counts and percentages. Routing form Same as “All” but for the proposed routing form items only. Low form Same as “All” but for the proposed low form items only. IRT parameters for selected
items that were not field tested in 2006 are shown in red, and are ballpark estimates based on previous performance of the items in other assessments.
High form Same as “All” but for the proposed low form items only. IRT parameters for selected items that were not field tested in 2006 are shown in red, and are ballpark estimates based on previous performance of the items in other assessments.
SOURCE: U.S. Department of Education, National Center for Education Statistics, Early Childhood Longitudinal Study, Kindergarten Class of 1998–99 (ECLS-K), Eighth-Grade Field Test, spring 2006.
In general, items are arranged in order of increasing difficulty, as measured by IRT “b” parameter and P+ (with attention to the differences in P+ that can be expected for multiple choice vs. open-ended items). For the reading forms, Passages and item sets were arranged in order of average increasing difficulty of the item sets. The items themselves retained the order from their source assessments. Some minor reordering was done to separate items with similar content, and to improve page layout by separating items with diagrams to avoid confusion about which diagram went with which question.
A-5-33

A-5-34
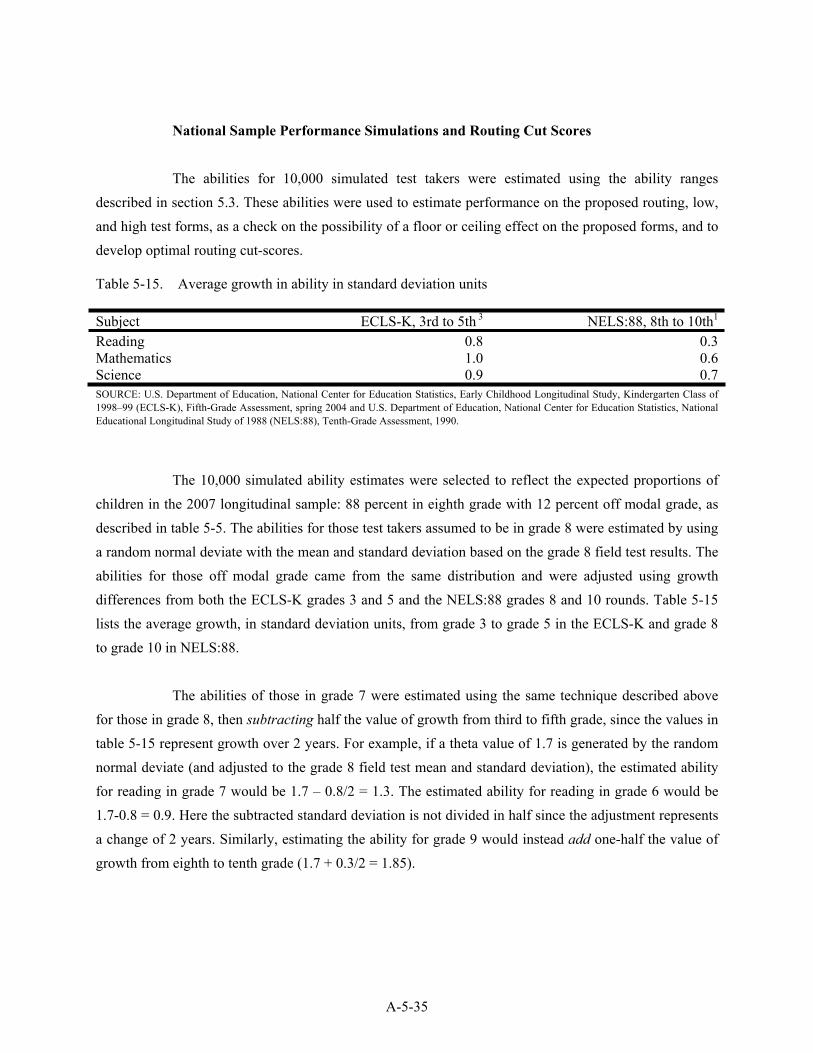
National Sample Performance Simulations and Routing Cut Scores
The abilities for 10,000 simulated test takers were estimated using the ability ranges described in section 5.3. These abilities were used to estimate performance on the proposed routing, low, and high test forms, as a check on the possibility of a floor or ceiling effect on the proposed forms, and to develop optimal routing cut-scores.
Table 5-15. Average growth in ability in standard deviation units
Subject ECLS-K, 3rd to 5th 3 NELS:88, 8th to 10th1
Reading 0.8 0.3Mathematics 1.0 0.6Science 0.9 0.7SOURCE: U.S. Department of Education, National Center for Education Statistics, Early Childhood Longitudinal Study, Kindergarten Class of 1998–99 (ECLS-K), Fifth-Grade Assessment, spring 2004 and U.S. Department of Education, National Center for Education Statistics, National Educational Longitudinal Study of 1988 (NELS:88), Tenth-Grade Assessment, 1990.
The 10,000 simulated ability estimates were selected to reflect the expected proportions of children in the 2007 longitudinal sample: 88 percent in eighth grade with 12 percent off modal grade, as described in table 5-5. The abilities for those test takers assumed to be in grade 8 were estimated by using a random normal deviate with the mean and standard deviation based on the grade 8 field test results. The abilities for those off modal grade came from the same distribution and were adjusted using growth differences from both the ECLS-K grades 3 and 5 and the NELS:88 grades 8 and 10 rounds. Table 5-15 lists the average growth, in standard deviation units, from grade 3 to grade 5 in the ECLS-K and grade 8 to grade 10 in NELS:88.
The abilities of those in grade 7 were estimated using the same technique described above for those in grade 8, then subtracting half the value of growth from third to fifth grade, since the values in table 5-15 represent growth over 2 years. For example, if a theta value of 1.7 is generated by the random normal deviate (and adjusted to the grade 8 field test mean and standard deviation), the estimated ability for reading in grade 7 would be 1.7 – 0.8/2 = 1.3. The estimated ability for reading in grade 6 would be 1.7-0.8 = 0.9. Here the subtracted standard deviation is not divided in half since the adjustment represents a change of 2 years. Similarly, estimating the ability for grade 9 would instead add one-half the value of growth from eighth to tenth grade (1.7 + 0.3/2 = 1.85).
A-5-35
Simulations of routing test and second stage test performance were computed and cross-tab distributions of routing and second-stage form number right scores were evaluated to select appropriate routing cut-scores for each second stage form. Specifically, for the 10,000 estimated thetas, the probability of a correct response was computed for each item on the routing, low and high forms, separately for each subject.9 A scale score is determined by summing the probabilities for the items on the test form. This, however, is a decimal score, and never results in a score of zero since, for the multiple choice items, the chance score is greater than zero, and therefore the sum of item probabilities is never zero if there is even a single multiple choice item.
Converting a decimal score to a dichotomous score was necessary to estimate number-right cut-scores for the routing and possible floor and ceiling effects on the overall assessments. In reality test takers will not guess exactly the pre-determined guessing proportion of multiple-choice items correctly and therefore may ultimately receive a score less than the predicted guessing chance value. The technique used was to generate a random number between 0 and 1 for each item, for each estimated theta. If the random number generated was less than or equal to the probability, the item was scored correct (=1); the item was scored incorrect (=0) if the random number was greater than the probability. For example, if the probability for an item, estimated from the item parameters and an individual theta, is 0.9 and the random number generated is 0.5, the item would be scored correct. This makes sense because if the probability to correctly answer an item is 90 percent, most times the item should be scored correctly. Conversely, if the probability is 0.1 and the random number generated is 0.5, the item should be scored incorrect. Again, since the probability is only 10 percent that this item would be answered correctly, most times the item should be scored incorrectly. Summing the zeros and ones from these calculations resulted in whole-number scores for each form for each subject. These sums were cross-tabulated, routing by second-stage form, and are summarized in the workbook in appendix R, one sheet per subject.
Note that the sheets are divided into several parts. On the left are two cross-tabs: scores of routing by low form and routing by high form. Across the top lists the routing score (0-10), while along the left the score on the second-stage form is listed and the counts are in cross-tab form. Marginals are also listed. The table on the upper right shows the floor and ceiling counts. The rule of thumb used to estimate floor effects is to total the number of simulated test takers who would score fewer than 3 correcton the combined routing and low forms. If this number is less than 3 percent of the sample, there is negligible evidence of a floor effect. Similarly, if the total number of test takers scoring fewer than 3
9 One reading item on the low form was not included in the simulation. This item from Moving Without Jake (What will help Brett the most in solving his problem?) was not field tested and the item parameters were not easily estimated for grade 8.
A-5-36
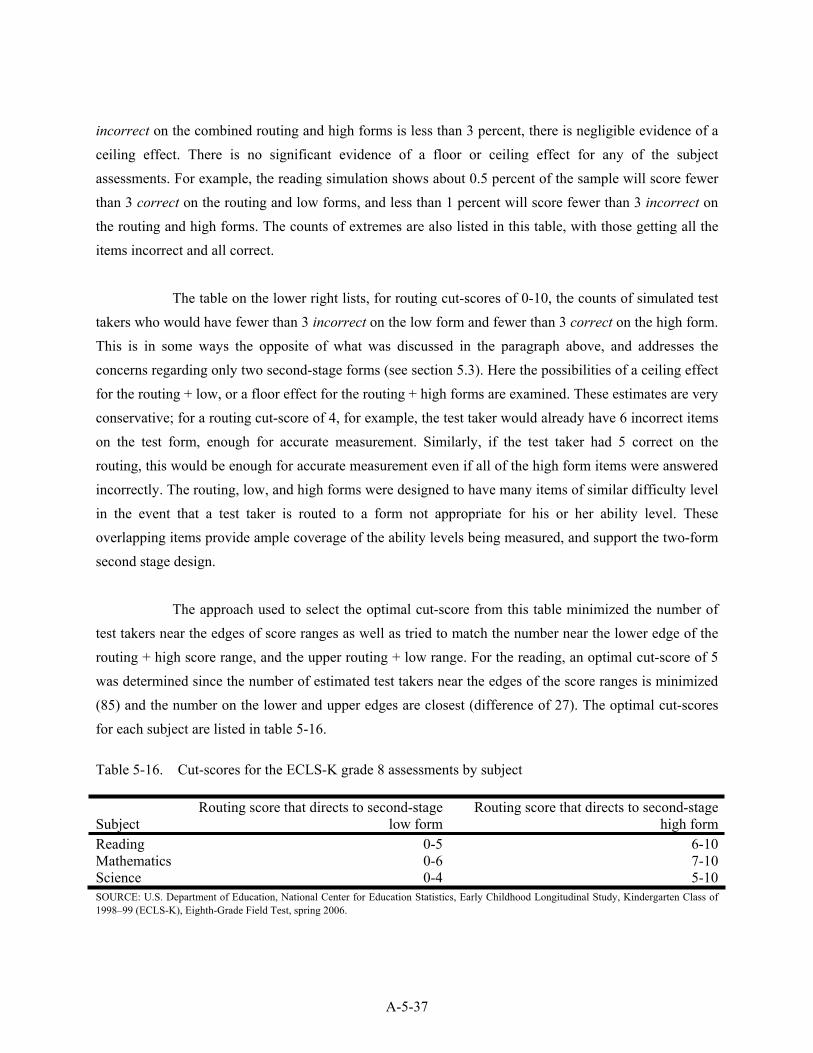
incorrect on the combined routing and high forms is less than 3 percent, there is negligible evidence of a ceiling effect. There is no significant evidence of a floor or ceiling effect for any of the subject assessments. For example, the reading simulation shows about 0.5 percent of the sample will score fewer than 3 correct on the routing and low forms, and less than 1 percent will score fewer than 3 incorrect on the routing and high forms. The counts of extremes are also listed in this table, with those getting all the items incorrect and all correct.
The table on the lower right lists, for routing cut-scores of 0-10, the counts of simulated test takers who would have fewer than 3 incorrect on the low form and fewer than 3 correct on the high form. This is in some ways the opposite of what was discussed in the paragraph above, and addresses the concerns regarding only two second-stage forms (see section 5.3). Here the possibilities of a ceiling effect for the routing + low, or a floor effect for the routing + high forms are examined. These estimates are very conservative; for a routing cut-score of 4, for example, the test taker would already have 6 incorrect items on the test form, enough for accurate measurement. Similarly, if the test taker had 5 correct on the routing, this would be enough for accurate measurement even if all of the high form items were answered incorrectly. The routing, low, and high forms were designed to have many items of similar difficulty level in the event that a test taker is routed to a form not appropriate for his or her ability level. These overlapping items provide ample coverage of the ability levels being measured, and support the two-form second stage design.
The approach used to select the optimal cut-score from this table minimized the number of test takers near the edges of score ranges as well as tried to match the number near the lower edge of the routing + high score range, and the upper routing + low range. For the reading, an optimal cut-score of 5 was determined since the number of estimated test takers near the edges of the score ranges is minimized (85) and the number on the lower and upper edges are closest (difference of 27). The optimal cut-scores for each subject are listed in table 5-16.
Table 5-16. Cut-scores for the ECLS-K grade 8 assessments by subject
SubjectRouting score that directs to second-stage
low formRouting score that directs to second-stage
high formReading 0-5 6-10Mathematics 0-6 7-10Science 0-4 5-10SOURCE: U.S. Department of Education, National Center for Education Statistics, Early Childhood Longitudinal Study, Kindergarten Class of 1998–99 (ECLS-K), Eighth-Grade Field Test, spring 2006.
A-5-37
While the field test sample was selected to include high as well as low performing schools and children, it must be remembered that it was not designed to be a systematic, representative, weighted sample of the population. Proportions of the sample who will be routed to low and high forms in each subject in the national test may not turn out to be divided equally between the two. It is not important that the routing percentages turn out equally; what is important is that each test taker receives a second-stage form that is appropriately matched to his or her level of ability.
5.4.2 Expert Review of Eighth-Grade Assessments
The proposed eighth-grade items for each cognitive domain were reviewed by content experts in each area prior to the field test. The content experts received copies of the proposed items and guidelines for their review. The content reviewer guidelines included the study background, the prior development and testing of the field test items, the objectives of the eighth-grade test, and a description of the adaptive two-stage assessment. The guidelines also included specific objectives for each cognitive domain, as well as the following general objectives:
It is important that the items be accurate: correct content, accurate presentation (language, illustrations, and charts), spelling, and grammar.
Multiple-choice questions should have a single unambiguously right answer, and all others should be unambiguously wrong.
Are the open-ended questions fairly easy to evaluate?
Incorrect options should be plausible responses to the question (i.e., options that could plausibly be selected by a test taker who does not know the answer). Ideally, a test taker who knows the material should get it correct, and one who does not should only be able to guess at random and not be able to eliminate answers that are obviously impossible.
There should be nothing about the phrasing or the context that is tricky or confusing (e.g., use of metric units in a question that is not trying to measure familiarity with the metric system may be problematic for some children and interfere with their being able to answer the question).
The question and response formats should not give hints.
Is the content of the items appropriate and important?
Are any of the items more characteristic of the typical curriculum of a different grade level?
A-5-38
A-5-39
Are there ways the presentation (context, language, illustrations, response options) need to be improved?
In addition to these general objectives, there were specific issues to consider for each cognitive domain. Content experts were asked to send their comments back in writing to Westat for adjudication prior to distribution for review by contractor staff and the NCES.
5.4.3 Sensitivity Review
The final eighth-grade items underwent a “sensitivity review” at ETS by a reviewer trained to detect objectionable material such as gender or ethnic stereotyping, inappropriate assumptions about people with disabilities, imbalance of male/female, Black/White, etc. characters in stories or test items, or any other offensive or inappropriate content. No new recommendations resulted from the sensitivity review that had not already been incorporated in the items based on reviews of earlier versions.
A-6-1
6. ANALYSES TO DEVELOP EIGHTH-GRADE INDIRECT COGNITIVE ASSESSMENTS AND SOCIOEMOTIONAL MEASURES
This chapter describes the selection and development of the Self-Description Questionnaire (SDQ)1 scales, which asked children to rate their competence and interest in school subjects, as well as behaviors that might interfere with their academic and social competence. It also describes the selection and development of two scales from the National Education Longitudinal Study of 1988 (NELS:88), which ask children about their perceptions about themselves and the amount of control they have over their own lives. In addition, information is collected on the book titles that the children are reading outside of school, as well as part of their classroom assignments, including textbooks. Analyses are presented in this chapter about the accuracy of the book titles for use in analysis of the reading levels of those texts.
6.1 Review of Selected Scales in the Field-Tested Student Questionnaire
Scales, as well as their respective subscales, were included based on recommendations from a Content Review Panel of subject matter experts in the field of assessing the social-emotional development of adolescent children. The Content Review Panel selected the following with the intention of reliably and validly assessing constructs that were particularly important for eighth-grade children while maintaining comparability with the data from previous rounds of data collection in the ECLS-K.
Self-Description Questionnaire. Beginning in the third-grade data collection in the ECLS-K, children were asked to provide self-assessments of their academic and social skills. For the eighth-grade field test, children rated their perceived competence and interest in English and mathematics. Children also reported on problem behaviors with which they might struggle. The Internalizing Problems scale included items on sadness, loneliness, and anxiety. Items for the English and mathematics scales were drawn from the SDQ-II, which was designed for secondary students. Items for the Internalizing Problems scale were drawn from the Self-Description Questionnaire used in grade 5 because the Content Review Panel felt these items better reflected the constructs that the study was intending to measure and also allowed for comparison with previous rounds of data collection.
1 The Self-Description Questionnaire items were adapted with permission from Self Description Questionnaire-II (H.W. Marsh 1990).
A-6-2
Children rated whether each item was “not at all true,” “a little bit true,” “mostly true,” or “very true.” Three scales were produced from the SDQ items. The scale scores on all SDQ scales represent the mean rating of the items included in the scale.
Children who responded to the SDQ answered virtually all of the questions, so treatment of missing data was not an issue. As with most measures of social-emotional behaviors, the distributions on these scales are skewed (negatively skewed for the positive social behavior scales, and positively skewed for the problem behavior scales).
Self-Concept and Locus of Control scale scores. The Self-Concept and Locus of Control scales were adopted from the NELS:88. These scales ask children about their perceptions about themselves and the amount of control they have over their own lives. Items were drawn from the NELS:88 student questionnaire and ask children to indicate the degree to which they agree with 13 statements about themselves. Statements reflect perceptions children may have about themselves and about how much control they feel they have over their own lives. Children rated whether they “strongly agree,” “agree,” “disagree,” or “strongly agree” with each item.
In order to be as comparable as possible to NELS:88, scale scores were calculated with the same procedures as NELS:88. Some items were positively worded, and some were negatively worded. As a result, scoring for some items was reversed to provide an appropriate score. For the Self-Concept scale, three of the seven items in the scale were reverse scored before performing computations, so that higher scores indicate more positive self- concept:
I certainly feel useless at times.
At times I think I am no good at all.
I feel I do not have much to be proud of.
The seven items in the scale were then standardized separately to a mean of zero and a standard deviation of 1. The scale score is an average of the seven standardized scores.
For the Locus of Control scale, five items were reverse scored so that higher scores indicate greater perception of control over one’s own life:
I don’t have enough control over the direction my life is taking.

A-6-3
In my life, good luck is more important than hard wok for success.
Every time I try to get ahead, something or somebody stops me.
My plans hardly every work out, so planning only makes me unhappy.
Chance and luck are very important for what happens in my life.
The six items in the scale were then standardized separately to a mean of zero and a standard deviation of 1. The scale score is an average of the six standardized scores.
Children who responded to the Self-Concept and Locus of Control items answered virtually all of the questions, so treatment of missing data was not an issue.
6.1.1 Reliability Analysis
Table 6-1 presents the internal consistency reliability estimates of the field-tested SDQ scales, as measured by Cronbach’s coefficient alpha. Previously published Cronbach’s coefficient alphas are also presented. The previously published alpha coefficients for the Perceived Interest and Competence in English and Perceived Interest and Competence in Math scales are from the authors of the SDQ-II (Ellis, Marsh, and Richards 2002). The previously published alpha coefficient for the Internalizing Behavior scale is from the ECLS-K Psychometric Report for the Fifth Grade (NCES 2006-036rev) (Pollack et al. 2005).
The Cronbach’s coefficient alpha for the Perceived Interest and Competence in Math is similar to that found by the scale’s authors. However, the coefficient for the Perceived Interest and Competence in English scale is lower than that found by the scale’s authors.
The coefficient alpha for the Internalizing Problem Behaviors is lower than what would be desired, although this is consistent with the findings from the ECLS-K grade 5 data.
A-6-4
Table 6-1. Cronbach’s coefficient alpha for scores of the SDQ scales, Spring 2006 Field Test.
Description Number of items Alpha coefficient
Published alpha coefficient of
SDQPerceived Interest and Competence in
English4 .74 .88
Perceived Interest and Competence in Math 4 .88 .89Internalizing Problems 8 .77 .79SOURCE: U.S. Department of Education, National Center for Education Statistics, Early Childhood Longitudinal Study, Kindergarten Class of 1998–99 (ECLS-K), Spring 2006 Eighth-Grade Field Test.
Table 6-2 presents the internal consistency reliability estimates of the field-tested Self-Concept and Locus of Control scales, as measured by Cronbach’s coefficient alpha, with the Spring 2006 Field Test student questionnaire data, as well as previously published Cronbach’s coefficient alphas. The previously published alpha coefficients for the Self-Concept and Locus of Control scales are from the NELS:88 Base Year: Student Component Data File User’s Manual (Ingels et al. 1990). The alpha coefficients for the Self-Concept and Locus of Control scales are similar to those reported in the NELS:88Base Year: Student Component Data File User’s Manual (Ingels et al. 1990).
Table 6-2. Cronbach’s coefficient alpha for scores of the Self-Concept and the Locus of Control scales, Spring 2006 Field Test.
Description Number of items Alpha coefficientAlpha coefficient with
NELS:88 dataSelf-Concept 7 .82 .79Locus of Control 6 .66 .68SOURCE: U.S. Department of Education, National Center for Education Statistics, Early Childhood Longitudinal Study, Kindergarten Class of 1998–99 (ECLS-K), Eighth-Grade Field Test, spring 2006.
6.1.2 Factor Analysis
To further explore the stability of the social-emotional development scales, principal components factor analyses were conducted on the field-test data for the SDQ items and the Self-Concept and Locus of Control items from the student questionnaire.
The factor analyses with the SDQ items specified the extraction of three factors. The eigenvalues and proportion of variance accounted for by each component are listed in table 6-3. These three factors account for a total of 52.6 percent of the variance.
A-6-5
Table 6-3. Eigenvalues and proportion of variance accounted for by the three factors extracted in principal components factor analysis with Spring 2006 Field Test SDQ data.
Characteristic Factor 1 Factor 2 Factor 3Eigenvalue 3.31 2.92 2.19Proportion of variance accounted for by component 20.7 18.2 13.7SOURCE: U.S. Department of Education, National Center for Education Statistics, Early Childhood Longitudinal Study, Kindergarten Class of 1998–99 (ECLS-K), Eighth-Grade Field Test, spring 2006.
The Varimax rotated factor pattern was used to examine the factor structure for each of the three factors. Variables with factor loadings of rxc > +0.5 or rxc < -0.5 were identified as loading on the factor. The resultant factor patterns of each of the three factors matched the structure of the Internalizing Problems (factor 1), Perceived Interest and Competence in Math (factor 2), and the Perceived Interest and Competence in English (factor 3) SDQ scales.2
The factor analyses with the Self-Concept and Locus of Control items specified the extraction of two factors. The eigenvalues and proportion of variance accounted for by each component are listed in table 6-4. These two factors account for a total of 46.7 percent of the variance.
Table 6-4. Eigenvalues and proportion of variance accounted for by the two factors extracted in principal components factor analysis with Spring 2006 Field Test Self-Concept and Locus of Control data.
Characteristic Factor 1 Factor 2Eigenvalue 4.47 1.60Proportion of variance accounted for by component 34.4 12.3SOURCE: U.S. Department of Education, National Center for Education Statistics, Early Childhood Longitudinal Study, Kindergarten Class of 1998–99 (ECLS-K), Eighth-Grade Field Test, spring 2006.
The Varimax rotated factor pattern was used to examine the factor structure for each of the three factors (see table 6-5). Variables with factor loadings of rxc > +0.5 or rxc < -0.5 were identified as loading on the factor. The resultant factor patterns of the two factors matched the structure of the Self-Concept (factor 1) and Locus of Control (factor 2) scales except for one variable: When I make plans, I am almost certain I can make them work. This variable was originally mapped onto the Locus of Control scale, but the results of the factor analyses with the Spring 2006 Field Test data shows this variable loading onto the Self-Concept scale. The analyses of the Cronbach’s coefficient alpha of the Locus of
2 Individual items for the SDQ-II are not listed in this report because they are copyrighted items.
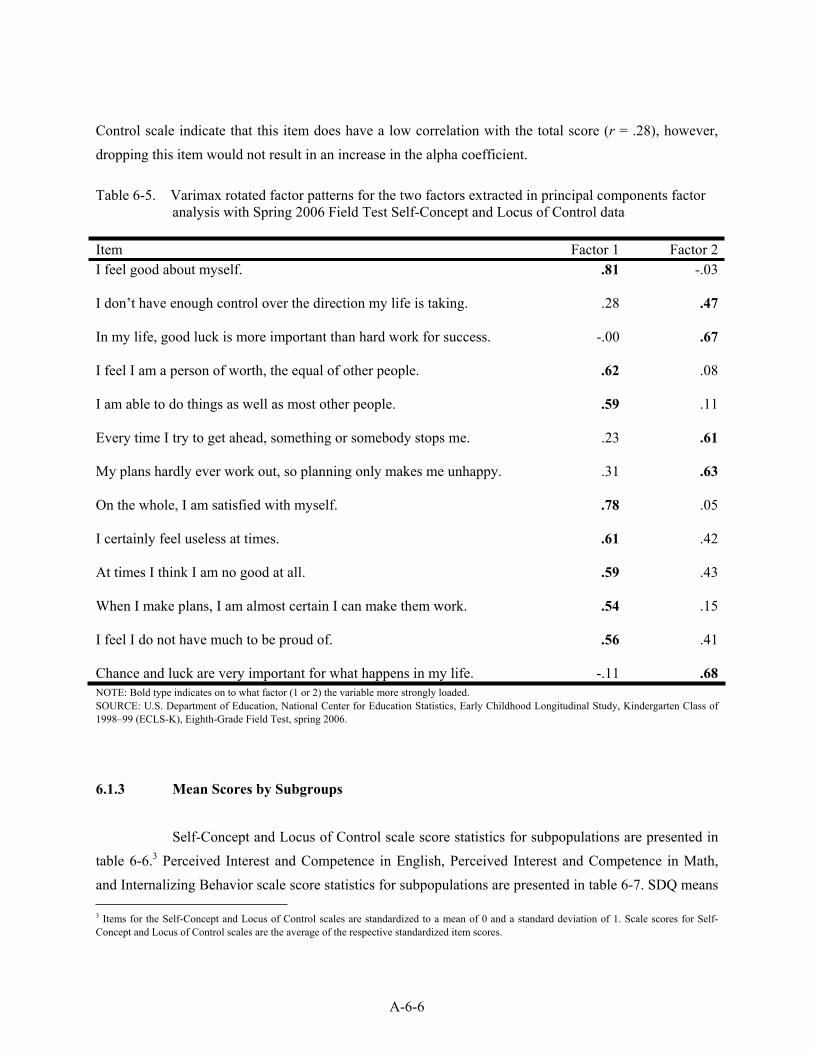
A-6-6
Control scale indicate that this item does have a low correlation with the total score (r = .28), however, dropping this item would not result in an increase in the alpha coefficient.
Table 6-5. Varimax rotated factor patterns for the two factors extracted in principal components factor analysis with Spring 2006 Field Test Self-Concept and Locus of Control data
Item Factor 1 Factor 2I feel good about myself. .81 -.03
I don’t have enough control over the direction my life is taking. .28 .47
In my life, good luck is more important than hard work for success. -.00 .67
I feel I am a person of worth, the equal of other people. .62 .08
I am able to do things as well as most other people. .59 .11
Every time I try to get ahead, something or somebody stops me. .23 .61
My plans hardly ever work out, so planning only makes me unhappy. .31 .63
On the whole, I am satisfied with myself. .78 .05
I certainly feel useless at times. .61 .42
At times I think I am no good at all. .59 .43
When I make plans, I am almost certain I can make them work. .54 .15
I feel I do not have much to be proud of. .56 .41
Chance and luck are very important for what happens in my life. -.11 .68NOTE: Bold type indicates on to what factor (1 or 2) the variable more strongly loaded. SOURCE: U.S. Department of Education, National Center for Education Statistics, Early Childhood Longitudinal Study, Kindergarten Class of 1998–99 (ECLS-K), Eighth-Grade Field Test, spring 2006.
6.1.3 Mean Scores by Subgroups
Self-Concept and Locus of Control scale score statistics for subpopulations are presented in table 6-6.3 Perceived Interest and Competence in English, Perceived Interest and Competence in Math, and Internalizing Behavior scale score statistics for subpopulations are presented in table 6-7. SDQ means 3 Items for the Self-Concept and Locus of Control scales are standardized to a mean of 0 and a standard deviation of 1. Scale scores for Self-Concept and Locus of Control scales are the average of the respective standardized item scores.
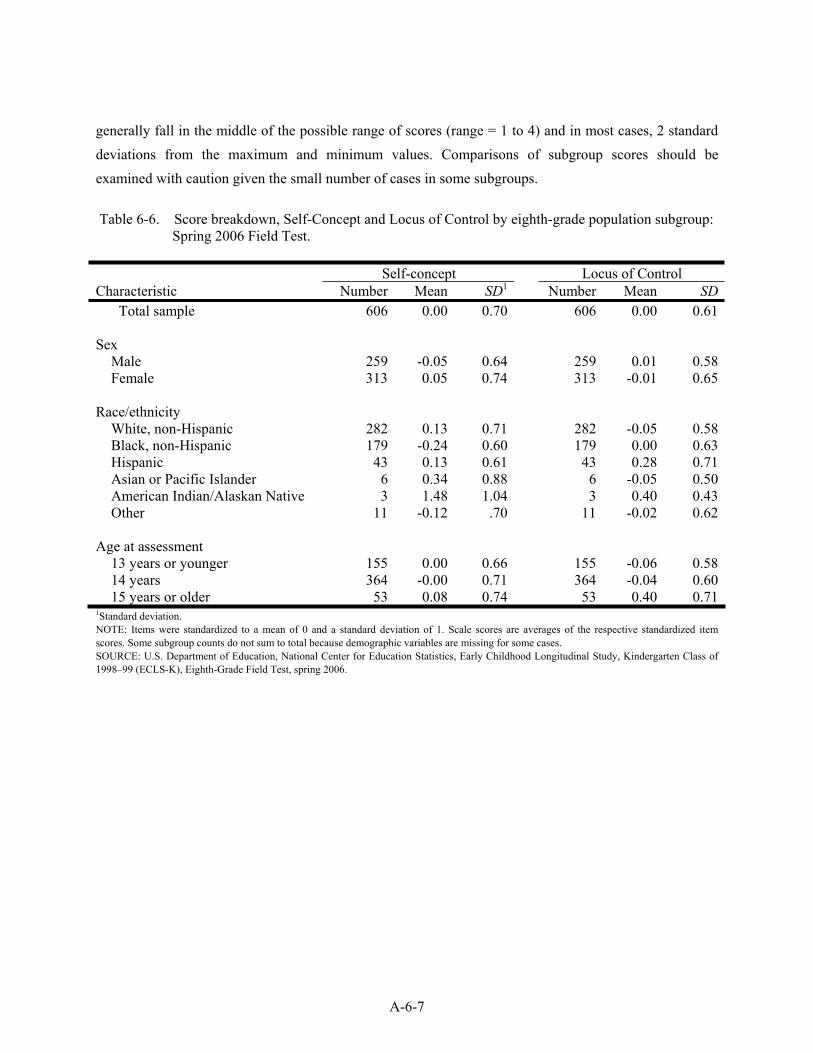
A-6-7
generally fall in the middle of the possible range of scores (range = 1 to 4) and in most cases, 2 standard deviations from the maximum and minimum values. Comparisons of subgroup scores should be examined with caution given the small number of cases in some subgroups.
Table 6-6. Score breakdown, Self-Concept and Locus of Control by eighth-grade population subgroup: Spring 2006 Field Test.
Self-concept Locus of Control Characteristic Number Mean SD1 Number Mean SD
Total sample 606 0.00 0.70 606 0.00 0.61
SexMale 259 -0.05 0.64 259 0.01 0.58Female 313 0.05 0.74 313 -0.01 0.65
Race/ethnicity White, non-Hispanic 282 0.13 0.71 282 -0.05 0.58Black, non-Hispanic 179 -0.24 0.60 179 0.00 0.63Hispanic 43 0.13 0.61 43 0.28 0.71Asian or Pacific Islander 6 0.34 0.88 6 -0.05 0.50American Indian/Alaskan Native 3 1.48 1.04 3 0.40 0.43Other 11 -0.12 .70 11 -0.02 0.62
Age at assessment 13 years or younger 155 0.00 0.66 155 -0.06 0.5814 years 364 -0.00 0.71 364 -0.04 0.6015 years or older 53 0.08 0.74 53 0.40 0.71
1Standard deviation. NOTE: Items were standardized to a mean of 0 and a standard deviation of 1. Scale scores are averages of the respective standardized item scores. Some subgroup counts do not sum to total because demographic variables are missing for some cases. SOURCE: U.S. Department of Education, National Center for Education Statistics, Early Childhood Longitudinal Study, Kindergarten Class of 1998–99 (ECLS-K), Eighth-Grade Field Test, spring 2006.
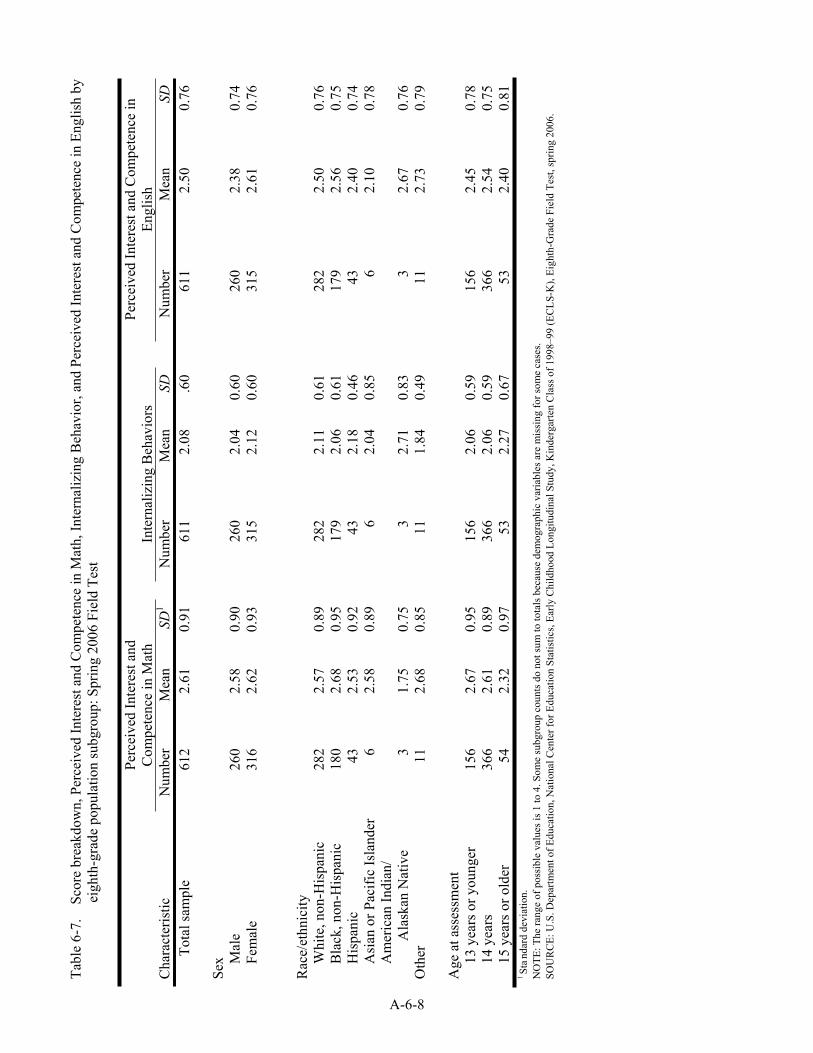
A-6-8
Tabl
e 6-
7.
Scor
e br
eakd
own,
Per
ceiv
ed In
tere
st a
nd C
ompe
tenc
e in
Mat
h, In
tern
aliz
ing
Beh
avio
r, an
d Pe
rcei
ved
Inte
rest
and
Com
pete
nce
in E
nglis
h by
ei
ghth
-gra
de p
opul
atio
n su
bgro
up: S
prin
g 20
06 F
ield
Tes
t
Perc
eive
d In
tere
st a
nd
Com
pete
nce
in M
ath
Inte
rnal
izin
g B
ehav
iors
Perc
eive
d In
tere
st a
nd C
ompe
tenc
e in
En
glis
hC
hara
cter
istic
N
umbe
r M
ean
SD1
Num
ber
Mea
n SD
Num
ber
Mea
nSD
Tota
l sam
ple
612
2.61
0.91
611
2.08
.6
061
12.
500.
76
Sex M
ale
260
2.58
0.90
260
2.04
0.60
260
2.38
0.74
Fem
ale
316
2.62
0.93
315
2.12
0.60
315
2.61
0.76
Rac
e/et
hnic
ity
W
hite
, non
-His
pani
c 28
2 2.
570.
8928
2 2.
11
0.61
282
2.50
0.76
Bla
ck, n
on-H
ispa
nic
180
2.68
0.95
179
2.06
0.
6117
92.
560.
75H
ispa
nic
43
2.53
0.92
43
2.18
0.46
432.
400.
74A
sian
or P
acifi
c Is
land
er
6 2.
580.
896
2.04
0.
856
2.10
0.78
Am
eric
an In
dian
/ A
lask
an N
ativ
e 3
1.75
0.75
32.
71
0.83
32.
670.
76O
ther
11
2.
680.
8511
1.
840.
4911
2.73
0.79
Age
at a
sses
smen
t 13
yea
rs o
r you
nger
15
6 2.
670.
9515
6 2.
06
0.59
156
2.45
0.78
14 y
ears
36
6 2.
610.
8936
6 2.
06
0.59
366
2.54
0.75
15 y
ears
or o
lder
54
2.
320.
9753
2.
27
0.67
532.
400.
811St
anda
rd d
evia
tion.
N
OTE
: The
rang
e of
pos
sibl
e va
lues
is 1
to 4
. Som
e su
bgro
up c
ount
s do
not s
um to
tota
ls b
ecau
se d
emog
raph
ic v
aria
bles
are
mis
sing
for s
ome
case
s. SO
UR
CE:
U.S
. Dep
artm
ent o
f Edu
catio
n, N
atio
nal C
ente
r for
Edu
catio
n St
atis
tics,
Early
Chi
ldho
od L
ongi
tudi
nal S
tudy
, Kin
derg
arte
n C
lass
of 1
998–
99 (E
CLS
-K),
Eigh
th-G
rade
Fie
ld T
est,
sprin
g 20
06.
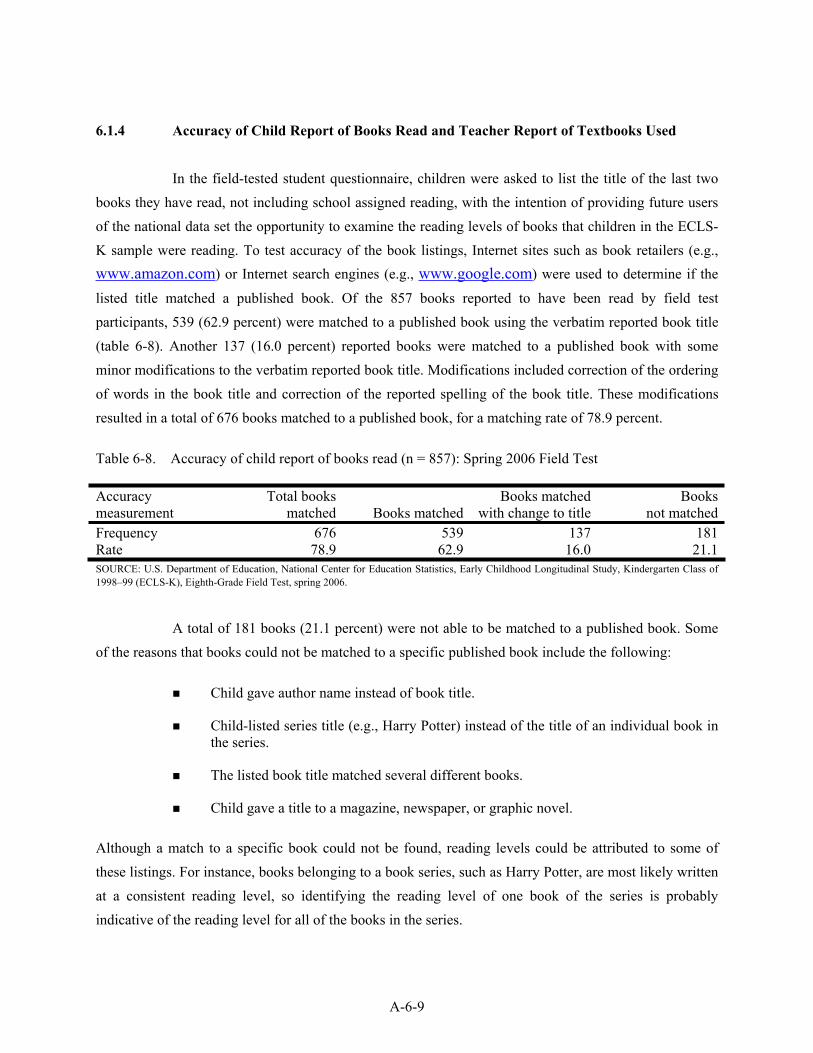
A-6-9
6.1.4 Accuracy of Child Report of Books Read and Teacher Report of Textbooks Used
In the field-tested student questionnaire, children were asked to list the title of the last two books they have read, not including school assigned reading, with the intention of providing future users of the national data set the opportunity to examine the reading levels of books that children in the ECLS-K sample were reading. To test accuracy of the book listings, Internet sites such as book retailers (e.g., www.amazon.com) or Internet search engines (e.g., www.google.com) were used to determine if the
listed title matched a published book. Of the 857 books reported to have been read by field test participants, 539 (62.9 percent) were matched to a published book using the verbatim reported book title (table 6-8). Another 137 (16.0 percent) reported books were matched to a published book with some minor modifications to the verbatim reported book title. Modifications included correction of the ordering of words in the book title and correction of the reported spelling of the book title. These modifications resulted in a total of 676 books matched to a published book, for a matching rate of 78.9 percent.
Table 6-8. Accuracy of child report of books read (n = 857): Spring 2006 Field Test
Accuracy measurement
Total books matched Books matched
Books matched with change to title
Books not matched
Frequency 676 539 137 181Rate 78.9 62.9 16.0 21.1SOURCE: U.S. Department of Education, National Center for Education Statistics, Early Childhood Longitudinal Study, Kindergarten Class of 1998–99 (ECLS-K), Eighth-Grade Field Test, spring 2006.
A total of 181 books (21.1 percent) were not able to be matched to a published book. Some of the reasons that books could not be matched to a specific published book include the following:
Child gave author name instead of book title.
Child-listed series title (e.g., Harry Potter) instead of the title of an individual book in the series.
The listed book title matched several different books.
Child gave a title to a magazine, newspaper, or graphic novel.
Although a match to a specific book could not be found, reading levels could be attributed to some of these listings. For instance, books belonging to a book series, such as Harry Potter, are most likely written at a consistent reading level, so identifying the reading level of one book of the series is probably indicative of the reading level for all of the books in the series.
A-6-10
In the field-tested teacher questionnaires, science, mathematics, and English teachers were asked to report the primary and secondary textbooks they use in the class (if any), with the intention of providing future users of the national dataset the opportunity to examine the reading levels and appropriateness of textbooks that children in the ECLS-K sample were using in their classrooms. For each textbook, the teachers were asked to list the title, author, publisher, and publication date or edition. In addition, English teachers were also asked to report on three books their class had most recently read as an assignment. To test accuracy of the book listings, Internet sites such as book retailers (e.g., www.amazon.com), Internet search engines (e.g., www.google.com), and publisher websites were used to determine if the listed title matched a published textbook. Tables 6-9 and 6-10 show the results of the accuracy test.
Of the 196 books and textbooks reported to be used by participating English teachers, 137 (70.6 percent) were matched to a published book or textbook using the verbatim reported book title. Another 56 (28.9 percent) reported books or textbooks were matched to a published book or textbook with some minor modifications to the verbatim reported textbook title. Modifications included the following:
correcting the ordering of words in the book title;
correcting the reported spelling of the book title, author/editor or publisher;
adding the author/editor;
correcting the year of publication;
correcting the identified publisher; and
correcting the edition.
These modifications resulted in a total of 193 books and textbooks matched to a published book or textbook, for a matching rate of 99.5 percent.
Of the 68 textbooks reported to be used by participating mathematics teachers, 24 (35.3 percent) were matched to a published textbook using the verbatim reported book title. Another 40 (58.8 percent) reported textbooks were matched to a published textbook with some minor modifications to the verbatim reported textbook title. These modifications resulted in a total of 64 textbooks matched to a published textbook, for a matching rate of 94.1 percent.
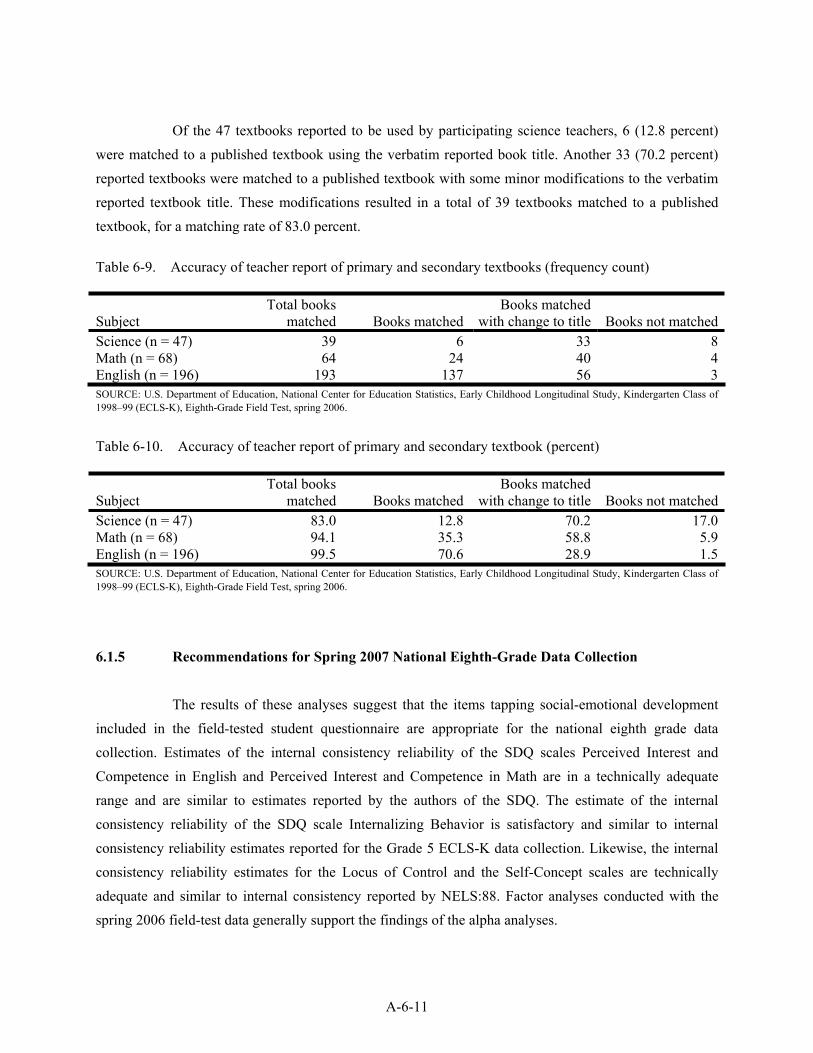
A-6-11
Of the 47 textbooks reported to be used by participating science teachers, 6 (12.8 percent) were matched to a published textbook using the verbatim reported book title. Another 33 (70.2 percent) reported textbooks were matched to a published textbook with some minor modifications to the verbatim reported textbook title. These modifications resulted in a total of 39 textbooks matched to a published textbook, for a matching rate of 83.0 percent.
Table 6-9. Accuracy of teacher report of primary and secondary textbooks (frequency count)
SubjectTotal books
matched Books matchedBooks matched
with change to title Books not matchedScience (n = 47) 39 6 33 8Math (n = 68) 64 24 40 4English (n = 196) 193 137 56 3SOURCE: U.S. Department of Education, National Center for Education Statistics, Early Childhood Longitudinal Study, Kindergarten Class of 1998–99 (ECLS-K), Eighth-Grade Field Test, spring 2006.
Table 6-10. Accuracy of teacher report of primary and secondary textbook (percent)
SubjectTotal books
matched Books matchedBooks matched
with change to title Books not matchedScience (n = 47) 83.0 12.8 70.2 17.0Math (n = 68) 94.1 35.3 58.8 5.9English (n = 196) 99.5 70.6 28.9 1.5SOURCE: U.S. Department of Education, National Center for Education Statistics, Early Childhood Longitudinal Study, Kindergarten Class of 1998–99 (ECLS-K), Eighth-Grade Field Test, spring 2006.
6.1.5 Recommendations for Spring 2007 National Eighth-Grade Data Collection
The results of these analyses suggest that the items tapping social-emotional development included in the field-tested student questionnaire are appropriate for the national eighth grade data collection. Estimates of the internal consistency reliability of the SDQ scales Perceived Interest and Competence in English and Perceived Interest and Competence in Math are in a technically adequate range and are similar to estimates reported by the authors of the SDQ. The estimate of the internal consistency reliability of the SDQ scale Internalizing Behavior is satisfactory and similar to internal consistency reliability estimates reported for the Grade 5 ECLS-K data collection. Likewise, the internal consistency reliability estimates for the Locus of Control and the Self-Concept scales are technically adequate and similar to internal consistency reported by NELS:88. Factor analyses conducted with the spring 2006 field-test data generally support the findings of the alpha analyses.
A-6-12
Analyses of the child report of the titles of books they most recently read suggest that these data are reliable for analysis of the reading levels of these books. Children were accurate in listing the titles of these books with almost 80 percent of the reported books being matched to published books. Likewise, the teacher report of textbooks used in their classrooms was reliable, with math and English teachers showing matching rates over 94 percent and science teachers showing matching rates of over 80 percent.
7. SUMMARY AND RECOMMENDATIONS
The primary objective of the ECLS-K Spring 2006 Field Test was to evaluate the psychometric properties of the new item pools that will be used to assess children’s cognitive development in the areas of reading, mathematics, and science, as well as their socioemotional development. It was also used to test the systems and procedures for the national eighth-grade data collection. Specifically, it included a web experiment for the student and teacher questionnaires to assess whether a web approach was feasible for the national data collection. It was also used to test procedures for collecting child height and weight and to obtain child reactions to the student newsletter as well as teacher and child reactions to the respondent incentives, to determine whether any modifications should be made to these elements of the study prior to the launch of the national data collection. Finally, the field test also tested the use of answer sheets for the direct assessments and questionnaires for children and teachers that could be optically scanned to eliminate the need for data entry.
7.1 Direct Cognitive Assessments
7.1.1 Reading, Mathematics, and Science Assessments
Numerous competing objectives were taken into account in recommending reading passages and reading, mathematics, and science items for the proposed eighth-grade cognitive forms, including the following:
difficulty: matching the difficulty of the test questions to the expected range of ability that will be found for the eighth-graders; choosing routing questions and second-stage forms of appropriate difficulty; avoiding floor and ceiling effects;
psychometric characteristics: selecting items that do a good job of discriminating among achievement levels; avoiding Differential Item Functioning (DIF) items;
proficiency levels: retaining items from fifth grade that are necessary for measuring status with respect to previously established proficiency levels in reading and mathematics;
test specifications: matching as closely as possible the target percentages of content strands;
A-7-1
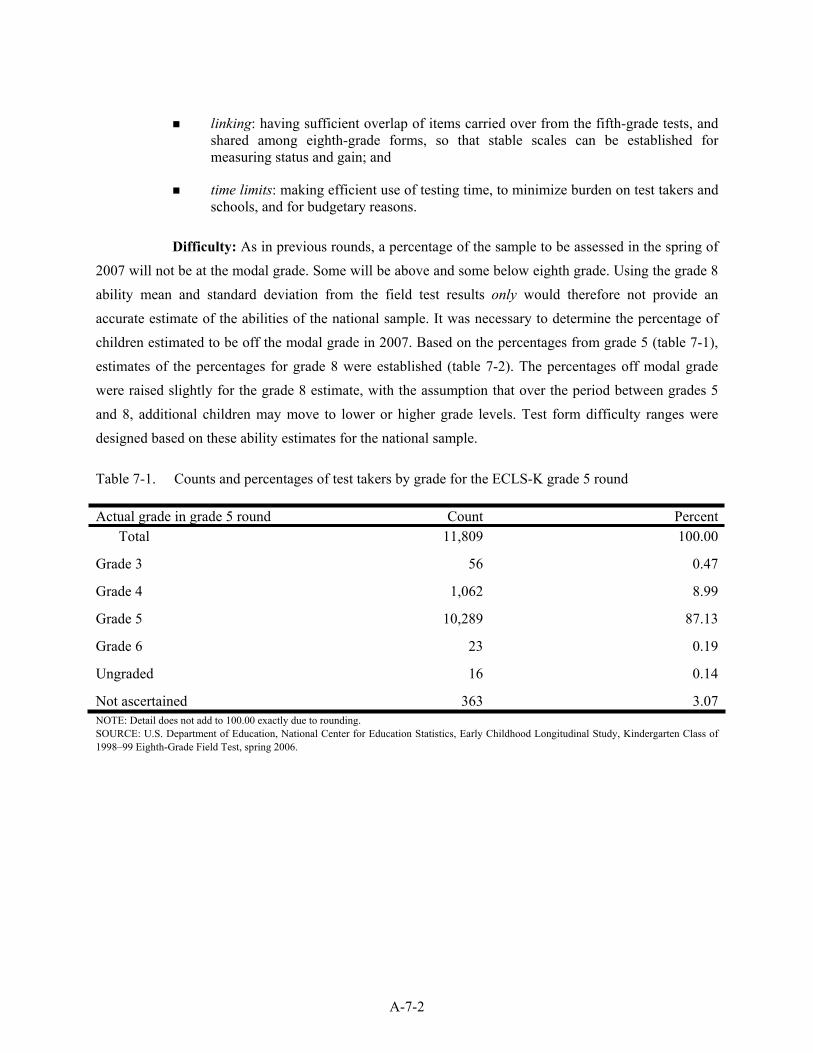
linking: having sufficient overlap of items carried over from the fifth-grade tests, and shared among eighth-grade forms, so that stable scales can be established for measuring status and gain; and
time limits: making efficient use of testing time, to minimize burden on test takers and schools, and for budgetary reasons.
Difficulty: As in previous rounds, a percentage of the sample to be assessed in the spring of 2007 will not be at the modal grade. Some will be above and some below eighth grade. Using the grade 8 ability mean and standard deviation from the field test results only would therefore not provide an accurate estimate of the abilities of the national sample. It was necessary to determine the percentage of children estimated to be off the modal grade in 2007. Based on the percentages from grade 5 (table 7-1), estimates of the percentages for grade 8 were established (table 7-2). The percentages off modal grade were raised slightly for the grade 8 estimate, with the assumption that over the period between grades 5 and 8, additional children may move to lower or higher grade levels. Test form difficulty ranges were designed based on these ability estimates for the national sample.
Table 7-1. Counts and percentages of test takers by grade for the ECLS-K grade 5 round
Actual grade in grade 5 round Count PercentTotal 11,809 100.00
Grade 3 56 0.47
Grade 4 1,062 8.99
Grade 5 10,289 87.13
Grade 6 23 0.19
Ungraded 16 0.14
Not ascertained 363 3.07NOTE: Detail does not add to 100.00 exactly due to rounding. SOURCE: U.S. Department of Education, National Center for Education Statistics, Early Childhood Longitudinal Study, Kindergarten Class of 1998–99 Eighth-Grade Field Test, spring 2006.
A-7-2
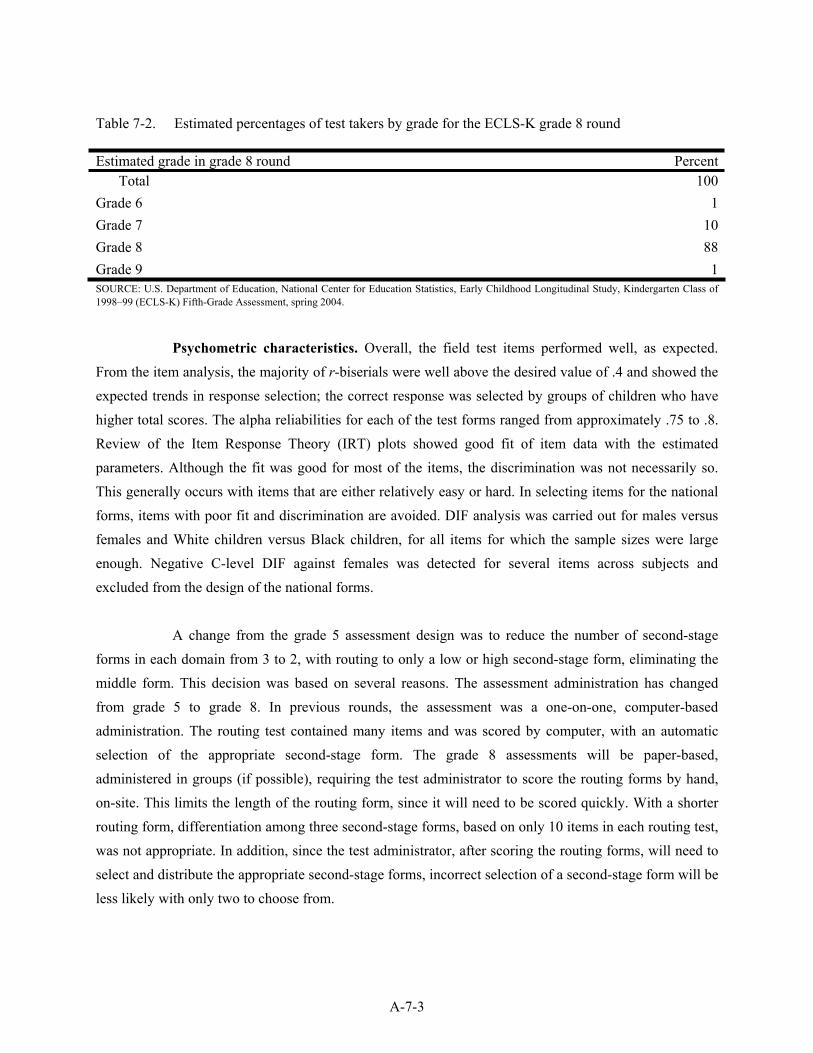
Table 7-2. Estimated percentages of test takers by grade for the ECLS-K grade 8 round
Estimated grade in grade 8 round PercentTotal 100
Grade 6 1Grade 7 10Grade 8 88Grade 9 1SOURCE: U.S. Department of Education, National Center for Education Statistics, Early Childhood Longitudinal Study, Kindergarten Class of 1998–99 (ECLS-K) Fifth-Grade Assessment, spring 2004.
Psychometric characteristics. Overall, the field test items performed well, as expected. From the item analysis, the majority of r-biserials were well above the desired value of .4 and showed the expected trends in response selection; the correct response was selected by groups of children who have higher total scores. The alpha reliabilities for each of the test forms ranged from approximately .75 to .8. Review of the Item Response Theory (IRT) plots showed good fit of item data with the estimated parameters. Although the fit was good for most of the items, the discrimination was not necessarily so. This generally occurs with items that are either relatively easy or hard. In selecting items for the national forms, items with poor fit and discrimination are avoided. DIF analysis was carried out for males versus females and White children versus Black children, for all items for which the sample sizes were large enough. Negative C-level DIF against females was detected for several items across subjects and excluded from the design of the national forms.
A change from the grade 5 assessment design was to reduce the number of second-stage forms in each domain from 3 to 2, with routing to only a low or high second-stage form, eliminating the middle form. This decision was based on several reasons. The assessment administration has changed from grade 5 to grade 8. In previous rounds, the assessment was a one-on-one, computer-based administration. The routing test contained many items and was scored by computer, with an automatic selection of the appropriate second-stage form. The grade 8 assessments will be paper-based, administered in groups (if possible), requiring the test administrator to score the routing forms by hand, on-site. This limits the length of the routing form, since it will need to be scored quickly. With a shorter routing form, differentiation among three second-stage forms, based on only 10 items in each routing test, was not appropriate. In addition, since the test administrator, after scoring the routing forms, will need to select and distribute the appropriate second-stage forms, incorrect selection of a second-stage form will be less likely with only two to choose from.
A-7-3
Passages selected for the reading and items selected for the reading, mathematics, and science routing forms were constrained in two ways. First, the item types can only be multiple choice, since the responses to the routing forms will be scored on-site. The complexity of scoring open-ended items with a rubric is time consuming and operationally problematic on-site. The second constraint is that the item difficulties should be clustered near the field test mean ability level for optimal accuracy of the routing decision.
Passages and item sets selected for the low forms met several goals. The low form items are to supplement the routing items with difficulty levels covering the lower half of the ability range. Some of the items on the low form should also be presented on the high form to permit the calibration of items on the same scale for the operational assessment, in addition to providing overlap in difficulty levels in the case in which a child is routed to a form inappropriate for his or her ability level. Similarly, items from the grade 5 assessments are included to allow for longitudinal calibration with the grade 5 assessment round.
Similar goals are met for the items selected for the high form. The high form items are to supplement the routing items with difficulty levels covering the upper half of the ability range. Some items on the high form should also be presented on the low form to permit the calibration of items on the same scale for the operational assessment. Since those children routed to the high form will be of above-average ability reading levels, an additional passage and item set is proposed on the reading high form that will presumably be presented to the fastest readers, assuming comprehension and speed are related. The number of items on the high forms in mathematics and science remain the same as on the low forms.
Some items proposed for the low and high forms were not field tested in 2006. Extension of the field test item pool to include items from the source assessments was done using a transformation of parameters from the 2006 field test to the source. Additional items were selected from the both the grade 5 ECLS-K round and NELS:88 to increase the overlap with those assessments and increase the number of open-ended items presented on the national assessment.
Proficiency levels. In earlier rounds of the ECLS-K, proficiency levels consisting of clusters of test items were identified as a means of analyzing mastery of developmental milestones. Ideally, an analysis of longitudinal growth should take into account not only the number of scale score points gained from time 1 to time 2, but also where on the continuum of achievement the gains took place. The proficiency probability scores in the ECLS-K facilitate meaningful analysis of relationships between
A-7-4
gains and variables such as school processes, demographics, and home environment measures. By round 6, fifth grade, nine proficiency levels had been defined for the reading and mathematics assessments, and analysis of the data confirmed that measured growth tended to follow the hypothesized hierarchical model. No proficiency levels were developed for the science assessment, because science curriculum is more diverse and cannot be assumed to follow a hierarchical sequence. Upon review and analysis of the grade 8 round data, possible additional proficiency levels will be examined.
Test specifications. While the NAEP frameworks were used as a basis for establishing the content of the ECLS-K assessments at grade 8, there are distinct differences in the numbers of items in the two assessments. The total testing time available to respond to all cognitive questions in a subject at one grade level in NAEP is longer than that for the ECLS-K. In assembling the questions into forms for the ECLS-K, two important goals were carefully balanced. One is the need to gather data from children on as many questions as possible within the available administration time, and the second goal is include questions that span a range of difficulty, keeping in mind that the more difficult questions will require more time to answer.
The target percentages for the mathematics and science item pools were met. However, striking the balance for the reading item pool (in addition to satisfying the goals and constraints listed at the beginning of this section) resulted in a difference between the actual and targeted percentages for the content categories in the proposed forms mainly because of the time constraints; certain content categories require extended time for response, and therefore it was not possible to include many of these item types. Other content category items do not require as much time for a response, and therefore more items can be included in a shorter period of time, resulting in greater accuracy in estimation of ability.
Linking. Item overlap for linking, or equating, was necessary for two purposes: 1) overlap with the fifth grade will permit the use of common-item equating for longitudinal measurement, and 2) overlap between the low and high forms will similarly permit measurement of all the eighth-grade children on a single scale. At least 12 overlapping items are required for these purposes, preferably 15 or more. Common items should be spread across the difficulty range to the extent possible, not all clustered within a narrow range. For reading, 17 items overlap with fifth grade, including all items from grade 5 proficiency levels 8 and 9, with 15 items overlapping among the routing/low/high forms. For mathematics, 24 items overlap with fifth grade (including all items from proficiency levels 7, 8, and 9), and 20 overlap among the routing/low/high forms. In science, 17 items overlap with fifth grade, and 18
A-7-5
overlap among the routing/low/high forms. The item sets provide enough overlap to utilize common-item equating with the grade 5 analysis. In addition, 12 items overlap with NELS:88 items in each subject.
Time limits. A change from the grade 5 assessment design was to reduce the number of second-stage forms in each domain from 3 to 2, with routing to only a low or high second-stage form, eliminating the middle form. This decision was based on several reasons. The assessment administration has changed from grade 5 to grade 8. In previous rounds, the assessment was a one-on-one, computer-based administration. The routing test contained many items and was scored by computer, with an automatic selection of the appropriate second-stage form. The grade 8 assessments will be paper-based, administered in groups (if possible), requiring the test administrator to score the routing forms by hand, on-site. This limits the length of the routing form, since it will need to be scored quickly. With a shorter routing form, differentiation among three second-stage forms, based on only 10 items in each routing test, was not appropriate. In addition, since the test administrator, after scoring the routing forms, will need to select and distribute the appropriate second-stage forms, incorrect selection of a second-stage form will be less likely with only two to choose from.
Recommendation. Based on analyses of the field test data, what is expected in the national administration, and operational constraints, two-stage adaptive tests with two second-stage forms (one low, one high) for each subject are recommended. These forms contain items with psychometric properties and difficulty levels to adequately discriminate and cover the range of expected ability levels for the grade 8 national assessment, including the expected test takers off the modal grade. Items from the grade 5 assessment, including those from the higher proficiency levels, are included in the national forms to provide adequate items for common-item equating and measurement of longitudinal gain.
7.1.2 Self-Description Questionnaire
For the eighth-grade field test, children rated their perceived competence and interest in English and mathematics, as well as internalizing problem behaviors such as sadness, loneliness, and anxiety, with items drawn from the Self-Description Questionnaire (SDQ). Items drawn from the National Education Longitudinal Study of 1988 (NELS:88) also asked children about their perceptions about themselves and the amount of control they have over their own lives. Analyses of the internal consistency reliability of these scales show that their Cronbach’s coefficient alphas are generally similar to those reported by the authors of the respective scales (only the SDQ scale: Perceived Competence and Interest
A-7-6
in English showed a lower alpha coefficient than that reported by the scale authors). Factor analyses of the respective scales generally supported the findings of the alpha analyses. Examination of the mean scores show that the mean scores fall in the middle of the possible range of scores, with little ceiling or floor effects.
In the field-tested student questionnaire, children were asked to list the title of the last two books they have read, not including school assigned reading, with the intention of providing future users of the national data set the opportunity to examine the reading levels of books that children in the ECLS-K sample were reading. To test accuracy of the book listings, Internet sites such as book retailers (e.g.,
www.amazon.com) or Internet search engines (e.g., www.google.com) were used to determine if the listed title matched a published book. Of the 857 books reported to have been read by field test participants, 78.9 percent were matched to a published book using either the verbatim reported book title or using minor modifications to the reported title.
In the field-tested teacher questionnaires, science, mathematics, and English teachers were asked to report the primary and secondary textbooks they used in the class (if any). For each textbook, the teachers were asked to list the title, author, publisher, and publication date or edition. In addition, English teachers were also asked to report on three books their class had most recently read as an assignment. The accuracy of these reports was checked in the same manner as the child-report of books described above. The field test results show that 99.5 percent of the books and textbooks reported to be used by participating English teachers were matched to a published book or textbook using the verbatim reported book title or slight modifications. For the mathematics teachers, 94.1 percent of the reported text books were matched to a published textbook using the verbatim reported book title with some or no minor modifications. For the science teachers, the matching rate was 83.0 percent with minor modifications.
Recommendations. Given that the field test results suggest that the items tapping social-emotional development included in the field-tested student questionnaire are appropriate for the national eighth-grade data collection, we recommend using the SDQ scales Perceived Interest/Competence in English, Perceived Interest/Competence in Math, and Internalizing Behavior, as well as the Locus of Control and the Self-Concept scales, in the ECLS-K eighth-grade data collection. Further, analyses of the child report of the titles of books they most recently read suggest that these data are reliable for analysis of the reading levels of these books. The teacher report of textbooks used in their classrooms was also reliable. As a result, we recommend collecting these data in the ECLS-K eighth-grade data collection.
A-7-7
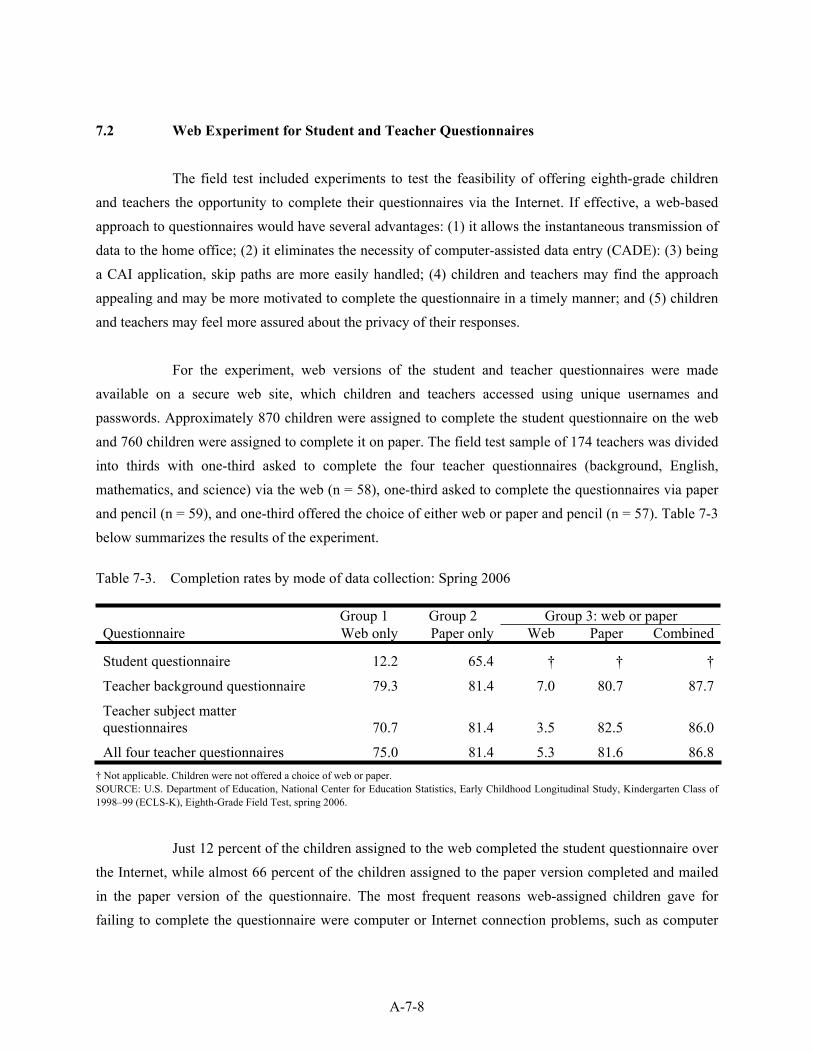
7.2 Web Experiment for Student and Teacher Questionnaires
The field test included experiments to test the feasibility of offering eighth-grade children and teachers the opportunity to complete their questionnaires via the Internet. If effective, a web-based approach to questionnaires would have several advantages: (1) it allows the instantaneous transmission of data to the home office; (2) it eliminates the necessity of computer-assisted data entry (CADE): (3) being a CAI application, skip paths are more easily handled; (4) children and teachers may find the approach appealing and may be more motivated to complete the questionnaire in a timely manner; and (5) children and teachers may feel more assured about the privacy of their responses.
For the experiment, web versions of the student and teacher questionnaires were made available on a secure web site, which children and teachers accessed using unique usernames and passwords. Approximately 870 children were assigned to complete the student questionnaire on the web and 760 children were assigned to complete it on paper. The field test sample of 174 teachers was divided into thirds with one-third asked to complete the four teacher questionnaires (background, English, mathematics, and science) via the web (n = 58), one-third asked to complete the questionnaires via paper and pencil (n = 59), and one-third offered the choice of either web or paper and pencil (n = 57). Table 7-3 below summarizes the results of the experiment.
Table 7-3. Completion rates by mode of data collection: Spring 2006
Group 1 Group 2 Group 3: web or paper Questionnaire Web only Paper only Web Paper Combined
Student questionnaire 12.2 65.4 † † †
Teacher background questionnaire 79.3 81.4 7.0 80.7 87.7
Teacher subject matter questionnaires 70.7 81.4 3.5 82.5 86.0
All four teacher questionnaires 75.0 81.4 5.3 81.6 86.8† Not applicable. Children were not offered a choice of web or paper. SOURCE: U.S. Department of Education, National Center for Education Statistics, Early Childhood Longitudinal Study, Kindergarten Class of 1998–99 (ECLS-K), Eighth-Grade Field Test, spring 2006.
Just 12 percent of the children assigned to the web completed the student questionnaire over the Internet, while almost 66 percent of the children assigned to the paper version completed and mailed in the paper version of the questionnaire. The most frequent reasons web-assigned children gave for failing to complete the questionnaire were computer or Internet connection problems, such as computer
A-7-8
“crashing,” loss of Internet connection, too slow Internet connection, or misplacement of username, password, or URL address.
Although 79.3 percent of teachers in the web-only group completed the teacher background questionnaire using the web, the percentage responding decreased to 70.7 percent for the subject matter questionnaires. For teachers offered the paper only approach, the completion rate remained 81.4 percent for the background and the subject matter questionnaires. More importantly, among teachers given the choice of web or paper questionnaires, the teachers overwhelmingly preferred the paper questionnaires with 81.6 percent selecting that mode.
Explanations teachers gave for preferring paper and pencil included “I could answer the paper survey wherever I wanted to versus in front of a computer,” “I could carry it with me in the car or to meetings to complete,” and “No real reason—paper seemed easier.” Too few teachers who responded by web completed the exit surveys to determine why they preferred the web.
Because of the low response rates for the web approach, no examination of differences in item response rates or in item answers by mode were conducted. Thus, we cannot determine, for example, whether the SDQ would have yielded the same results via the web as on paper or whether children would be more likely to answer sensitive questions on the web. Similarly, we cannot determine whether mathematics or science teachers were more likely to respond via the web than English/language arts teachers.
Recommendation: Given the clear preference of both children and teachers to complete their questionnaires using paper and pencil, we recommend that paper and pencil questionnaires be used for children and teachers during the national data collection. Although the overall completion rate for teachers was modestly higher when offered a combined approach (86.8 percent combined versus 81.4 percent paper only), the increase is not sufficiently large to warrant the cost of the web approach for the ECLS-K eighth-grade data collection.
7.3 Collecting Child Height and Weight Using Security Screen
Because both teenage girls and teenage boys may be sensitive about having their height and weight taken, the use of portable screens to provide a private screened area for the children was tested
A-7-9
during the field test. In exit interviews, children were asked about their reactions to having their height and weight measured and to the use of the security screens. The majority of children (96 percent) agreed to have their height and weight taken. Among those who refused, few stated that they were uncomfortable or embarrassed by the request.
Test administrators were asked to report on the effectiveness of the privacy screen and whether they were helpful in obtaining child cooperation. The test administrator reported that they frequently could not use the screens because the rooms provided by the schools were too small. In addition, they said that children did not appear to be concerned with privacy.
Related to child concerns about privacy, a Westat statistician has been reviewing the clustering of children within schools. It appears that for just over 80 percent of the schools in the sample, there will be 5 or fewer children being assessed at the same time. Therefore, the issue of privacy will not be a great concern during the national data collection.
Recommendation: We do not recommend using the privacy screens during national data collection for several reasons. First, the majority of children agreed to have their height and weight measured and did not express concerns about personal privacy. Second, test administrators often reported that the schools did not provide sufficient space to use the screens. And, third, for most children there will not be many other children being assessed at the same time so privacy will not be a concern.
7.4 Child Reactions to Student Newsletter
Approximately half of the children reported reading the newsletter. Of these, over 80 percent found the topics interesting (81.2 percent of children who were assigned paper questionnaires and 82.7 percent assigned web questionnaires) and 90 percent liked the overall design, including the colors used (95.7 assigned paper questionnaires and 90.7 percent assigned web questionnaires). The children had no suggestions for improvements.
Recommendation: The student newsletter was well received. We recommend that the newsletter, as designed, be used during the national data collection. The only change that needs to be made is the reference to the incentive amount from $30 to $15 to be in compliance with OMB directives on remuneration for survey respondents.
A-7-10
7.5 Respondent Reactions to Incentives Offered
Feedback from children and teachers who participated in the spring 2006 ECLS-K field test indicates that a monetary incentive is important to secure participation. Sixty-eight percent (197 out of 289) of children reported on the field test debriefing questionnaire that the $30 incentive affected their decision to participate in the field test. Eight-nine percent (257 out of 289) of children reported that they still would have participated if the incentive was only $15. For teachers, 43 percent (57 out of 134) reported that the $30 incentive affected their decision to participate in the field test. In addition, 77 percent of the teachers (101 out of 132) said that a monetary incentive would be important to secure their participation if they were asked to complete questionnaires on multiple children.
Recommendation: In light of the field test results, we recommend the following remuneration plan for the ECLS-K national data collection:
provide parents a token $2 with the advance package;
pay children $15 upon completion of the child interview and direct assessments;
include $25 in the questionnaire packages for teachers and school administrator; and
give schools a $50, $75, or $100 honorarium, depending on the number of sampled children enrolled, after all spring data collection activities are completed.
7.6 Optical Scanning of Forms and Paper and Pencil Questionnaires
During the field test, the answer sheets for the direct assessments, the height and weight form, the student questionnaire, the teacher background questionnaires, and the teacher subject matter questionnaires (reading, mathematics, and science) were formatted so that the could be optically scanned. During the field test, the test administrators shipped the materials directly to the optical scanner. The field test revealed some problems ensuring that the correct (and complete) transmittal forms accompanied each shipment with this approach.
Recommendation: The use of the optical scanning services was, overall, very successful during the field test. We recommend that this approach be used during the national data collection. However, we recommend a slight change in procedures with the test administrators shipping materials
A-7-11
A-7-12
directly to Westat rather than to the optical scanner. Thus, during the national data collection we recommend that the following procedures be used.
Once the assessments are completed, the test administrators should carefully pack all the materials from the schools and shipped them to Westat using overnight FedEx instead of to the optical scanner. Westat will then receipt all the materials, batch and repackage each shipment, and send it to the optical scanner via overnight FedEx. When the scanning is completed, the hard-copy instruments will be returned to Westat using overnight FedEx so Westat can ensure that no materials are missing. The optical scanner will also transmit to Westat an electronic file containing the scanned data. These data will then be merged with the rest of the data obtained during data collection.
REFERENCES
Ingels, S.J., Abraham, S.Y, Karr., R., Spencer, B.D., and Frankel, M.R. (1990). NELS:88 Base-Year: Student Component Data File User’s Manual. U.S. Department of Education. Washington, DC: National Center for Education Statistics.
Ellis, L. A., Marsh, H. W., and Richards, G. E. (2002). A Brief Version of the Self Description Questionnaire I. In R. G. Craven, H. W. Marsh, and K. B. Simpson (Eds.), Proceedings of the 2nd International Biennial Conference, Self-Concept Research: Driving International Research Agendas. Sydney: 2002.
Marsh, H.W. (1988). Self Description Questionnaire-I. San Antonio, TX: The Psychological Corporation.
Marsh, H.W. (1990). Self Description Questionnaire-II. San Antonio, TX: The Psychological Corporation.
Pollock, J.M., Atkins-Burnett, S., Najarian, M., and Rock, D.A. (2005). Early Childhood Longitudinal Study, Kindergarten Class of 1998-99 (ECLS-K), Psychometric Report for the Fifth Grade (NCES 2006-36rev). U.S. Department of Education. Washington, DC: National Center for Education Statistics.
A-R-1
A-R-2
This page is intentionally left blank.
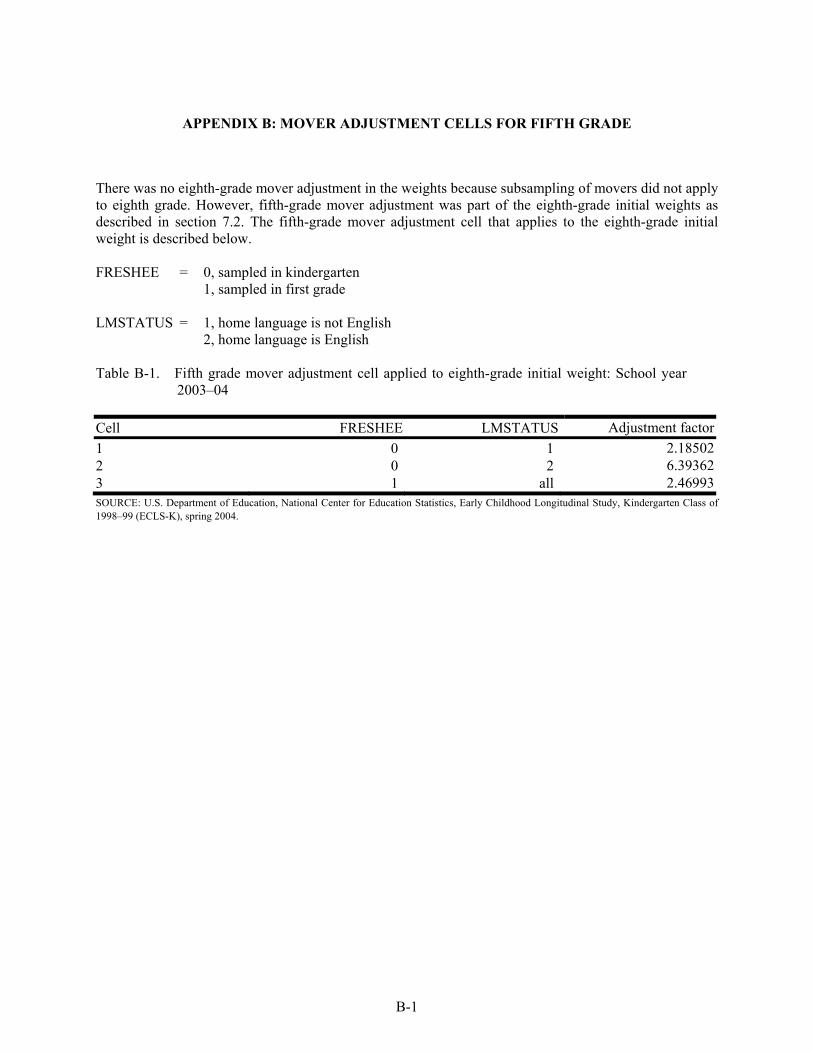
B-1
APPENDIX B: MOVER ADJUSTMENT CELLS FOR FIFTH GRADE
There was no eighth-grade mover adjustment in the weights because subsampling of movers did not apply to eighth grade. However, fifth-grade mover adjustment was part of the eighth-grade initial weights as described in section 7.2. The fifth-grade mover adjustment cell that applies to the eighth-grade initial weight is described below. FRESHEE = 0, sampled in kindergarten 1, sampled in first grade LMSTATUS = 1, home language is not English 2, home language is English Table B-1. Fifth grade mover adjustment cell applied to eighth-grade initial weight: School year
2003–04 Cell FRESHEE LMSTATUS Adjustment factor1 0 1 2.185022 0 2 6.393623 1 all 2.46993SOURCE: U.S. Department of Education, National Center for Education Statistics, Early Childhood Longitudinal Study, Kindergarten Class of 1998–99 (ECLS-K), spring 2004.

This page is intentionally left blank.
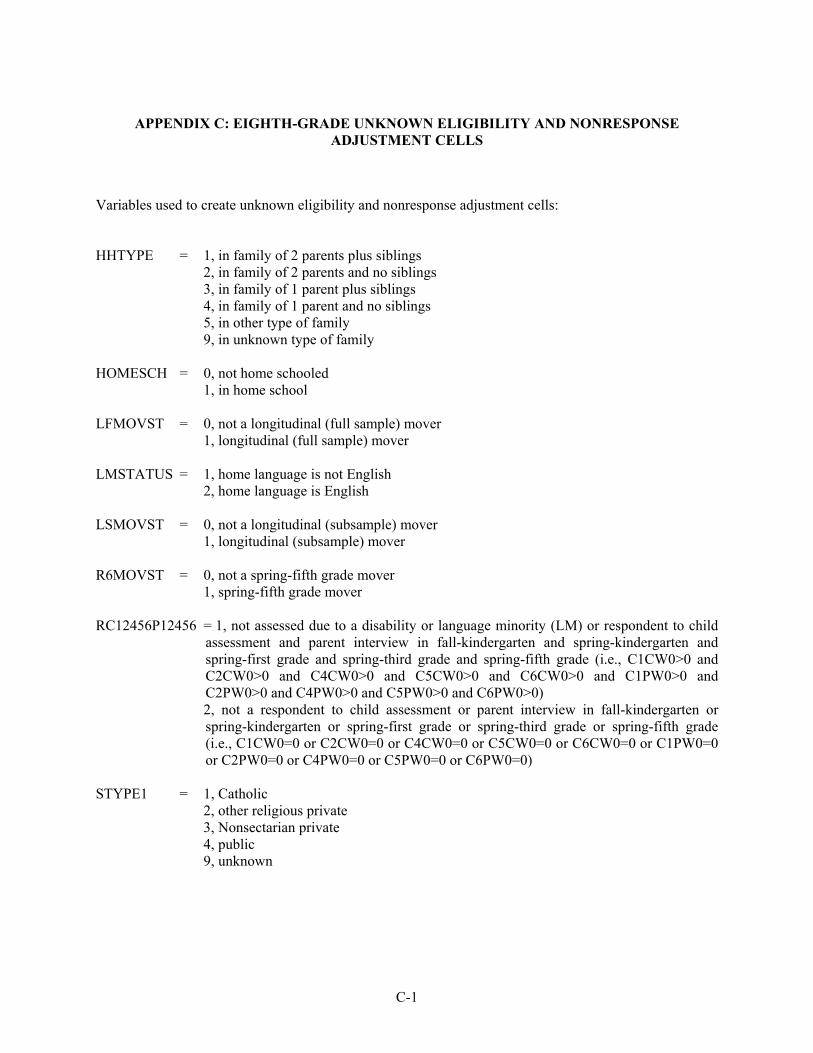
C-1
APPENDIX C: EIGHTH-GRADE UNKNOWN ELIGIBILITY AND NONRESPONSE ADJUSTMENT CELLS
Variables used to create unknown eligibility and nonresponse adjustment cells: HHTYPE = 1, in family of 2 parents plus siblings
2, in family of 2 parents and no siblings 3, in family of 1 parent plus siblings 4, in family of 1 parent and no siblings 5, in other type of family 9, in unknown type of family
HOMESCH = 0, not home schooled
1, in home school LFMOVST = 0, not a longitudinal (full sample) mover
1, longitudinal (full sample) mover LMSTATUS = 1, home language is not English
2, home language is English LSMOVST = 0, not a longitudinal (subsample) mover
1, longitudinal (subsample) mover R6MOVST = 0, not a spring-fifth grade mover
1, spring-fifth grade mover RC12456P12456 = 1, not assessed due to a disability or language minority (LM) or respondent to child
assessment and parent interview in fall-kindergarten and spring-kindergarten and spring-first grade and spring-third grade and spring-fifth grade (i.e., C1CW0>0 and C2CW0>0 and C4CW0>0 and C5CW0>0 and C6CW0>0 and C1PW0>0 and C2PW0>0 and C4PW0>0 and C5PW0>0 and C6PW0>0) 2, not a respondent to child assessment or parent interview in fall-kindergarten or spring-kindergarten or spring-first grade or spring-third grade or spring-fifth grade (i.e., C1CW0=0 or C2CW0=0 or C4CW0=0 or C5CW0=0 or C6CW0=0 or C1PW0=0 or C2PW0=0 or C4PW0=0 or C5PW0=0 or C6PW0=0)
STYPE1 = 1, Catholic
2, other religious private 3, Nonsectarian private 4, public 9, unknown
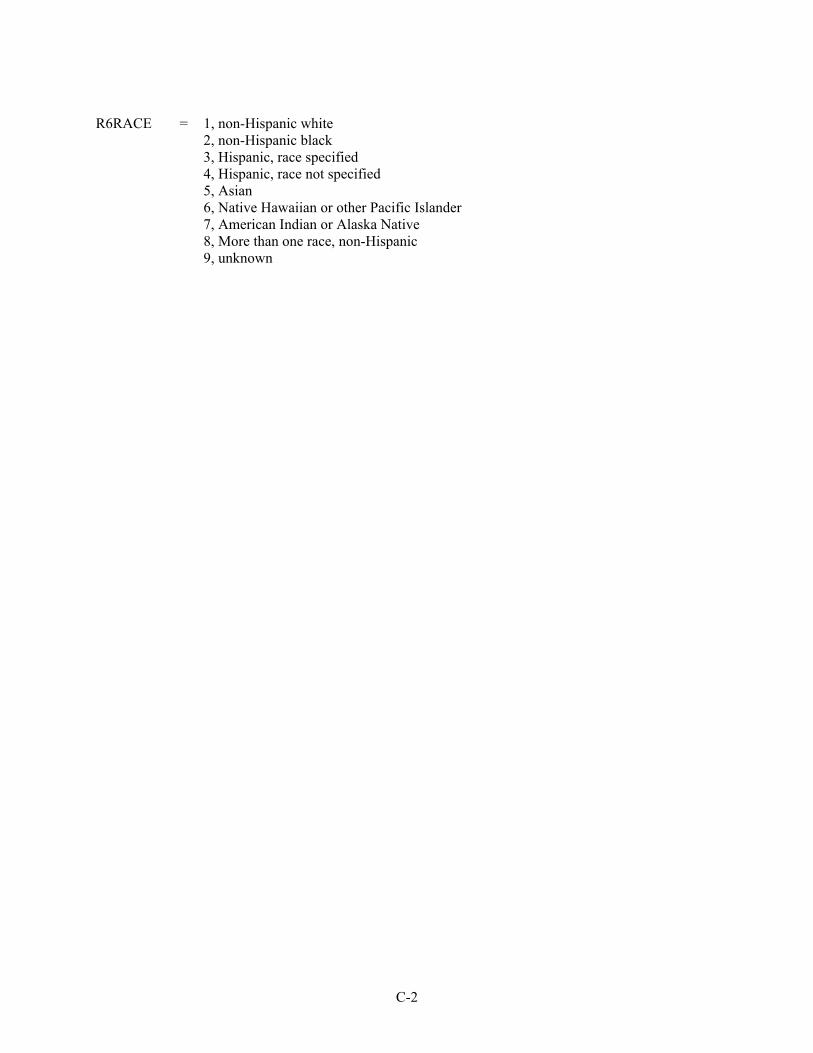
C-2
R6RACE = 1, non-Hispanic white 2, non-Hispanic black 3, Hispanic, race specified 4, Hispanic, race not specified 5, Asian 6, Native Hawaiian or other Pacific Islander 7, American Indian or Alaska Native 8, More than one race, non-Hispanic 9, unknown
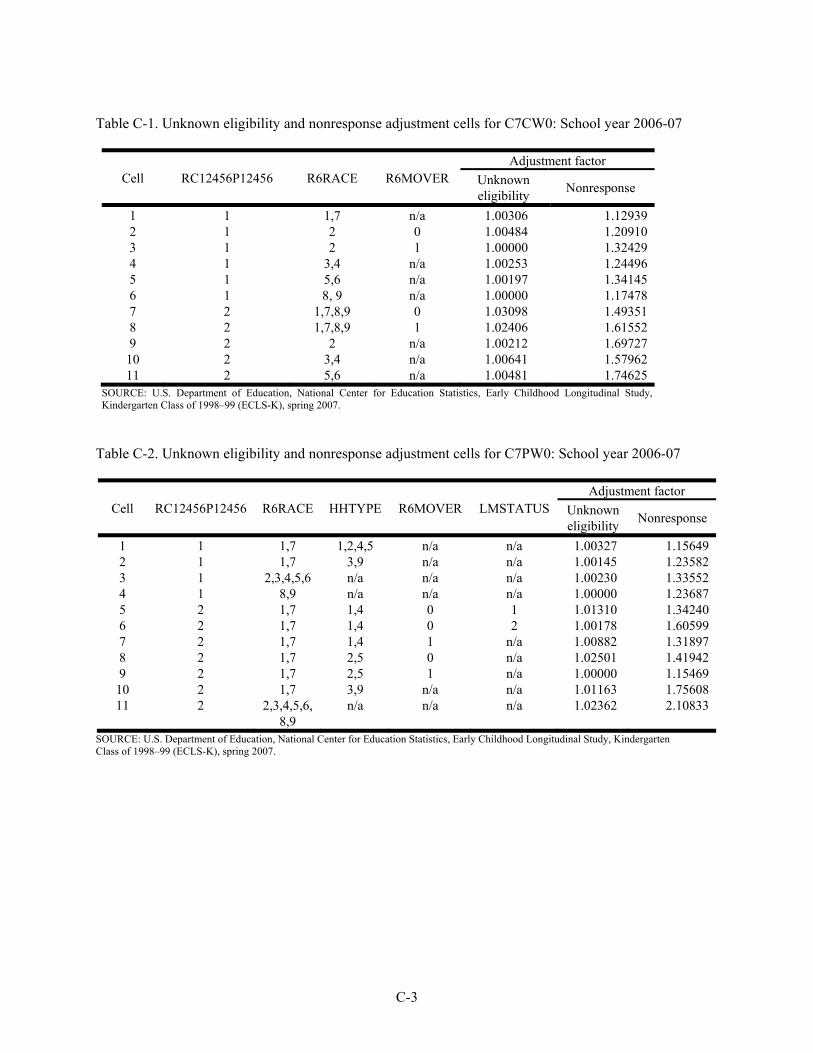
C-3
Table C-1. Unknown eligibility and nonresponse adjustment cells for C7CW0: School year 2006-07
Cell RC12456P12456 R6RACE R6MOVER Adjustment factor
Unknown eligibility Nonresponse
1 1 1,7 n/a 1.00306 1.12939 2 1 2 0 1.00484 1.20910 3 1 2 1 1.00000 1.32429 4 1 3,4 n/a 1.00253 1.24496 5 1 5,6 n/a 1.00197 1.34145 6 1 8, 9 n/a 1.00000 1.17478 7 2 1,7,8,9 0 1.03098 1.49351 8 2 1,7,8,9 1 1.02406 1.61552 9 2 2 n/a 1.00212 1.69727
10 2 3,4 n/a 1.00641 1.57962 11 2 5,6 n/a 1.00481 1.74625
SOURCE: U.S. Department of Education, National Center for Education Statistics, Early Childhood Longitudinal Study, Kindergarten Class of 1998–99 (ECLS-K), spring 2007.
Table C-2. Unknown eligibility and nonresponse adjustment cells for C7PW0: School year 2006-07
Cell RC12456P12456 R6RACE HHTYPE R6MOVER LMSTATUS Adjustment factor
Unknown eligibility Nonresponse
1 1 1,7 1,2,4,5 n/a n/a 1.00327 1.15649 2 1 1,7 3,9 n/a n/a 1.00145 1.23582 3 1 2,3,4,5,6 n/a n/a n/a 1.00230 1.33552 4 1 8,9 n/a n/a n/a 1.00000 1.23687 5 2 1,7 1,4 0 1 1.01310 1.34240 6 2 1,7 1,4 0 2 1.00178 1.60599 7 2 1,7 1,4 1 n/a 1.00882 1.31897 8 2 1,7 2,5 0 n/a 1.02501 1.41942 9 2 1,7 2,5 1 n/a 1.00000 1.15469
10 2 1,7 3,9 n/a n/a 1.01163 1.75608 11 2 2,3,4,5,6,
8,9 n/a n/a n/a 1.02362 2.10833
SOURCE: U.S. Department of Education, National Center for Education Statistics, Early Childhood Longitudinal Study, Kindergarten Class of 1998–99 (ECLS-K), spring 2007.
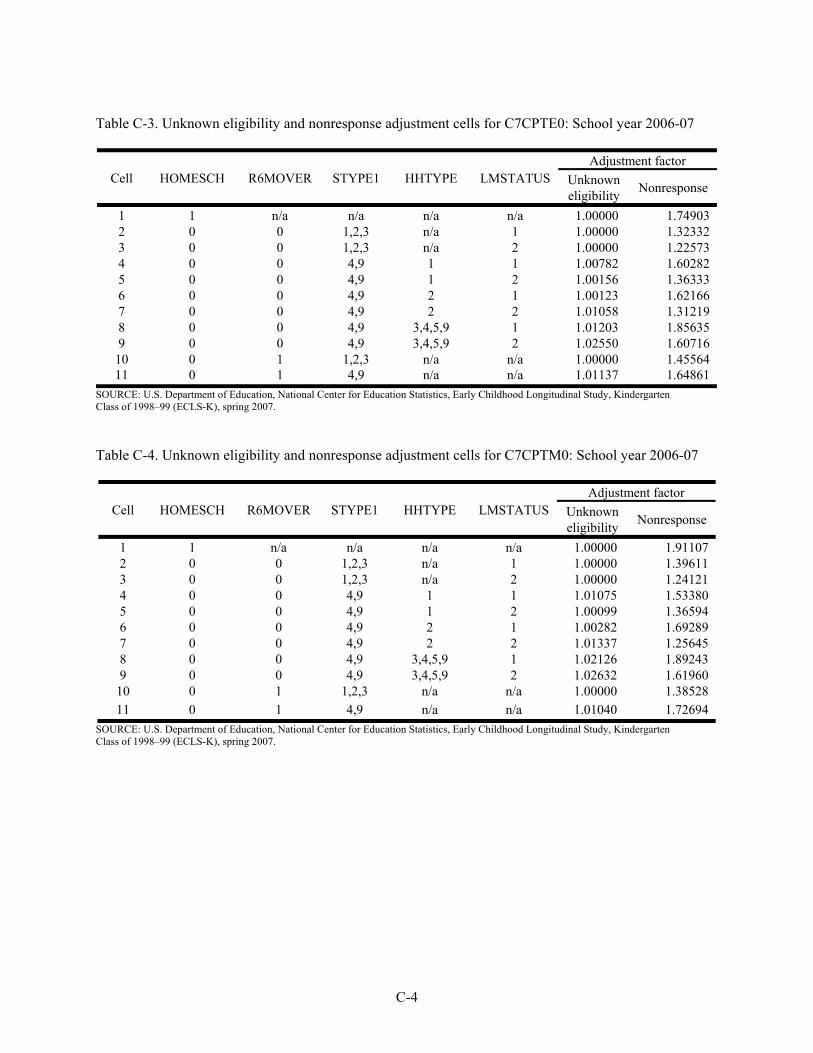
C-4
Table C-3. Unknown eligibility and nonresponse adjustment cells for C7CPTE0: School year 2006-07
Cell HOMESCH R6MOVER STYPE1 HHTYPE LMSTATUS Adjustment factor
Unknown eligibility Nonresponse
1 1 n/a n/a n/a n/a 1.00000 1.74903 2 0 0 1,2,3 n/a 1 1.00000 1.32332 3 0 0 1,2,3 n/a 2 1.00000 1.22573 4 0 0 4,9 1 1 1.00782 1.60282 5 0 0 4,9 1 2 1.00156 1.36333 6 0 0 4,9 2 1 1.00123 1.62166 7 0 0 4,9 2 2 1.01058 1.31219 8 0 0 4,9 3,4,5,9 1 1.01203 1.85635 9 0 0 4,9 3,4,5,9 2 1.02550 1.60716
10 0 1 1,2,3 n/a n/a 1.00000 1.4556411 0 1 4,9 n/a n/a 1.01137 1.64861
SOURCE: U.S. Department of Education, National Center for Education Statistics, Early Childhood Longitudinal Study, Kindergarten Class of 1998–99 (ECLS-K), spring 2007. Table C-4. Unknown eligibility and nonresponse adjustment cells for C7CPTM0: School year 2006-07
Cell HOMESCH R6MOVER STYPE1 HHTYPE LMSTATUS Adjustment factor
Unknown eligibility Nonresponse
1 1 n/a n/a n/a n/a 1.00000 1.91107 2 0 0 1,2,3 n/a 1 1.00000 1.39611 3 0 0 1,2,3 n/a 2 1.00000 1.24121 4 0 0 4,9 1 1 1.01075 1.53380 5 0 0 4,9 1 2 1.00099 1.36594 6 0 0 4,9 2 1 1.00282 1.69289 7 0 0 4,9 2 2 1.01337 1.25645 8 0 0 4,9 3,4,5,9 1 1.02126 1.89243 9 0 0 4,9 3,4,5,9 2 1.02632 1.61960
10 0 1 1,2,3 n/a n/a 1.00000 1.38528 11 0 1 4,9 n/a n/a 1.01040 1.72694
SOURCE: U.S. Department of Education, National Center for Education Statistics, Early Childhood Longitudinal Study, Kindergarten Class of 1998–99 (ECLS-K), spring 2007.
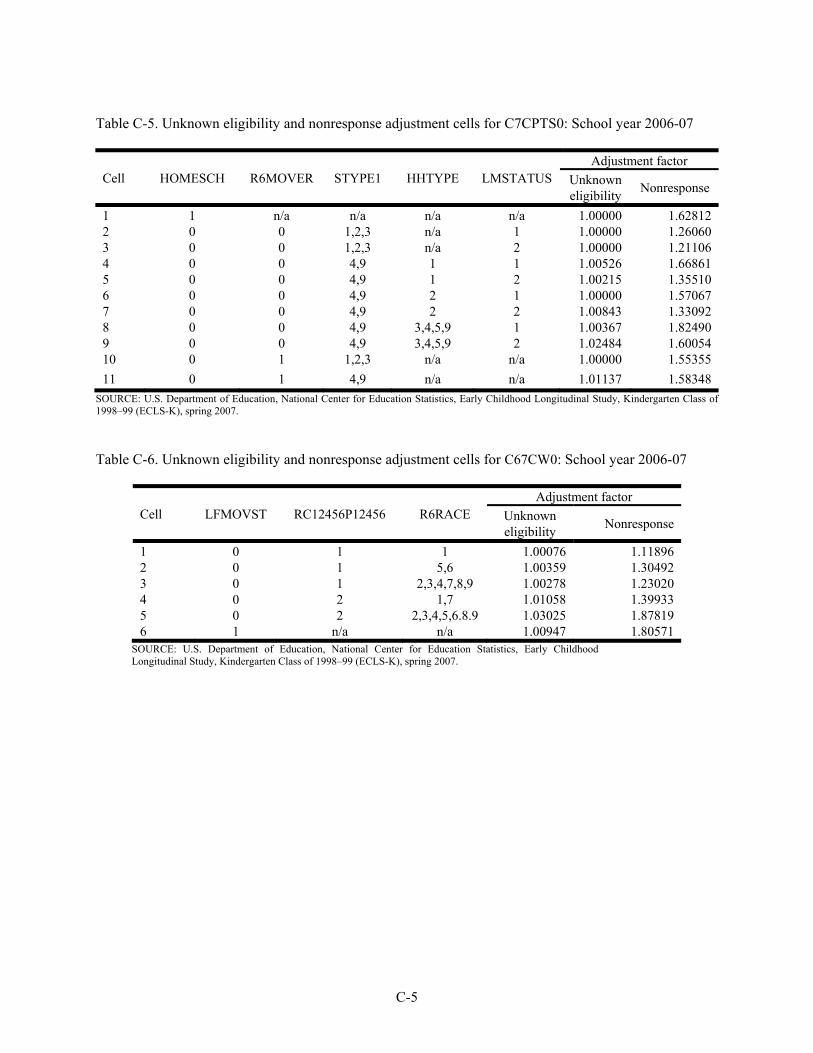
C-5
Table C-5. Unknown eligibility and nonresponse adjustment cells for C7CPTS0: School year 2006-07
Cell HOMESCH R6MOVER STYPE1 HHTYPE LMSTATUS Adjustment factor
Unknown eligibility Nonresponse
1 1 n/a n/a n/a n/a 1.00000 1.62812 2 0 0 1,2,3 n/a 1 1.00000 1.26060 3 0 0 1,2,3 n/a 2 1.00000 1.21106 4 0 0 4,9 1 1 1.00526 1.66861 5 0 0 4,9 1 2 1.00215 1.35510 6 0 0 4,9 2 1 1.00000 1.57067 7 0 0 4,9 2 2 1.00843 1.33092 8 0 0 4,9 3,4,5,9 1 1.00367 1.82490 9 0 0 4,9 3,4,5,9 2 1.02484 1.60054 10 0 1 1,2,3 n/a n/a 1.00000 1.55355 11 0 1 4,9 n/a n/a 1.01137 1.58348
SOURCE: U.S. Department of Education, National Center for Education Statistics, Early Childhood Longitudinal Study, Kindergarten Class of 1998–99 (ECLS-K), spring 2007. Table C-6. Unknown eligibility and nonresponse adjustment cells for C67CW0: School year 2006-07
Cell LFMOVST RC12456P12456 R6RACE Adjustment factor
Unknown eligibility Nonresponse
1 0 1 1 1.00076 1.11896 2 0 1 5,6 1.00359 1.30492 3 0 1 2,3,4,7,8,9 1.00278 1.23020 4 0 2 1,7 1.01058 1.39933 5 0 2 2,3,4,5,6.8.9 1.03025 1.87819 6 1 n/a n/a 1.00947 1.80571
SOURCE: U.S. Department of Education, National Center for Education Statistics, Early Childhood Longitudinal Study, Kindergarten Class of 1998–99 (ECLS-K), spring 2007.
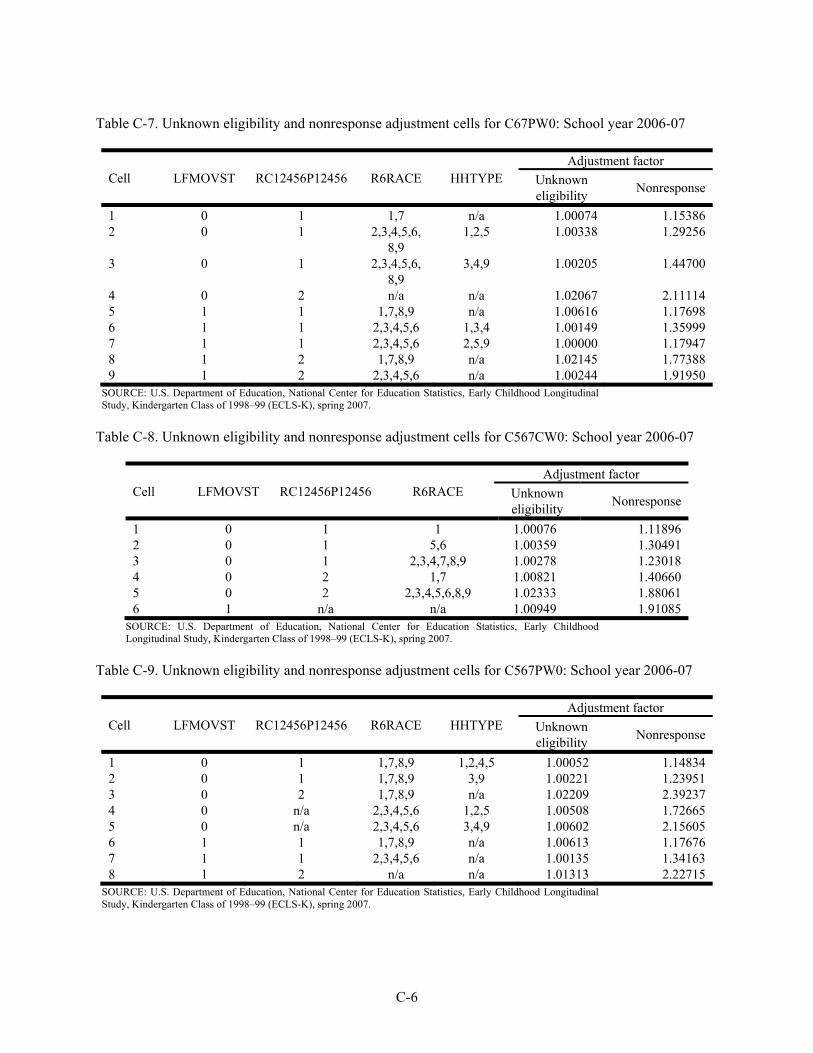
C-6
Table C-7. Unknown eligibility and nonresponse adjustment cells for C67PW0: School year 2006-07
Cell LFMOVST RC12456P12456 R6RACE HHTYPE Adjustment factor
Unknown eligibility Nonresponse
1 0 1 1,7 n/a 1.00074 1.15386 2 0 1 2,3,4,5,6,
8,9 1,2,5 1.00338 1.29256
3 0 1 2,3,4,5,6, 8,9
3,4,9 1.00205 1.44700
4 0 2 n/a n/a 1.02067 2.11114 5 1 1 1,7,8,9 n/a 1.00616 1.17698 6 1 1 2,3,4,5,6 1,3,4 1.00149 1.35999 7 1 1 2,3,4,5,6 2,5,9 1.00000 1.17947 8 1 2 1,7,8,9 n/a 1.02145 1.77388 9 1 2 2,3,4,5,6 n/a 1.00244 1.91950
SOURCE: U.S. Department of Education, National Center for Education Statistics, Early Childhood Longitudinal Study, Kindergarten Class of 1998–99 (ECLS-K), spring 2007.
Table C-8. Unknown eligibility and nonresponse adjustment cells for C567CW0: School year 2006-07
Cell LFMOVST RC12456P12456 R6RACE Adjustment factor
Unknown eligibility Nonresponse
1 0 1 1 1.00076 1.11896 2 0 1 5,6 1.00359 1.30491 3 0 1 2,3,4,7,8,9 1.00278 1.23018 4 0 2 1,7 1.00821 1.40660 5 0 2 2,3,4,5,6,8,9 1.02333 1.88061 6 1 n/a n/a 1.00949 1.91085
SOURCE: U.S. Department of Education, National Center for Education Statistics, Early Childhood Longitudinal Study, Kindergarten Class of 1998–99 (ECLS-K), spring 2007.
Table C-9. Unknown eligibility and nonresponse adjustment cells for C567PW0: School year 2006-07
Cell LFMOVST RC12456P12456 R6RACE HHTYPE Adjustment factor
Unknown eligibility Nonresponse
1 0 1 1,7,8,9 1,2,4,5 1.00052 1.14834 2 0 1 1,7,8,9 3,9 1.00221 1.23951 3 0 2 1,7,8,9 n/a 1.02209 2.39237 4 0 n/a 2,3,4,5,6 1,2,5 1.00508 1.72665 5 0 n/a 2,3,4,5,6 3,4,9 1.00602 2.15605 6 1 1 1,7,8,9 n/a 1.00613 1.17676 7 1 1 2,3,4,5,6 n/a 1.00135 1.34163 8 1 2 n/a n/a 1.01313 2.22715
SOURCE: U.S. Department of Education, National Center for Education Statistics, Early Childhood Longitudinal Study, Kindergarten Class of 1998–99 (ECLS-K), spring 2007.
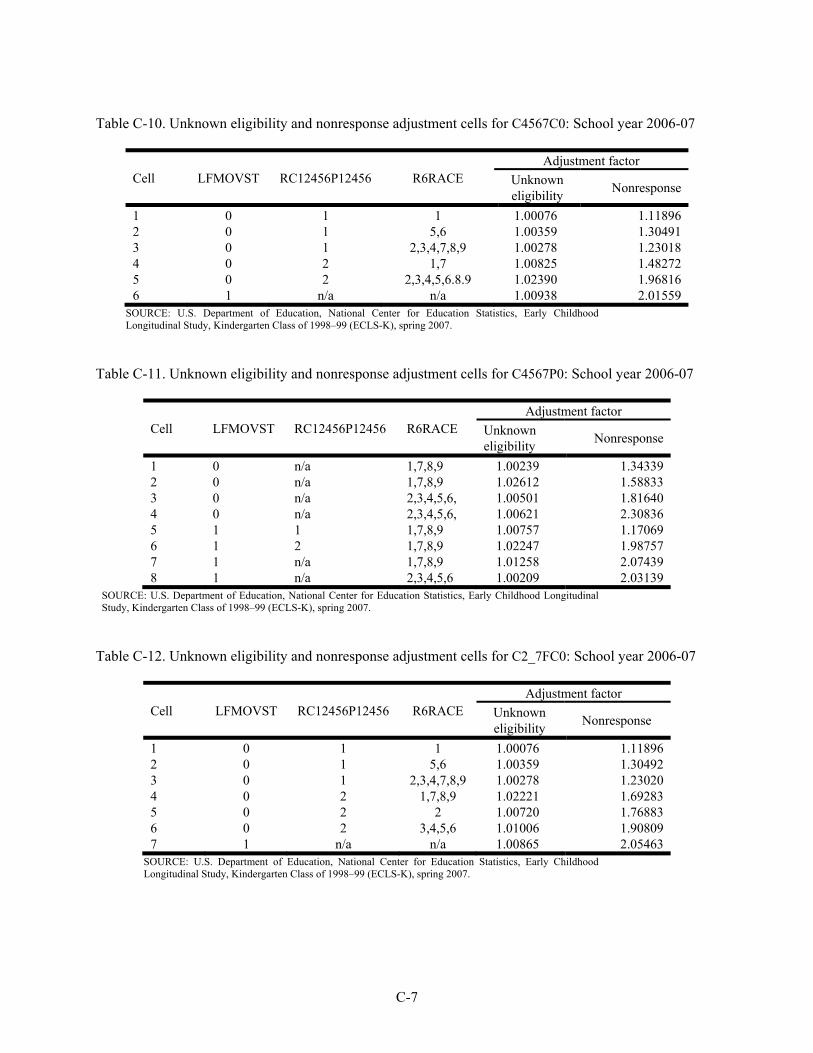
C-7
Table C-10. Unknown eligibility and nonresponse adjustment cells for C4567C0: School year 2006-07
Cell LFMOVST RC12456P12456 R6RACE Adjustment factor
Unknown eligibility Nonresponse
1 0 1 1 1.00076 1.11896 2 0 1 5,6 1.00359 1.30491 3 0 1 2,3,4,7,8,9 1.00278 1.23018 4 0 2 1,7 1.00825 1.48272 5 0 2 2,3,4,5,6.8.9 1.02390 1.96816 6 1 n/a n/a 1.00938 2.01559
SOURCE: U.S. Department of Education, National Center for Education Statistics, Early Childhood Longitudinal Study, Kindergarten Class of 1998–99 (ECLS-K), spring 2007.
Table C-11. Unknown eligibility and nonresponse adjustment cells for C4567P0: School year 2006-07
Cell LFMOVST RC12456P12456 R6RACE Adjustment factor
Unknown eligibility Nonresponse
1 0 n/a 1,7,8,9 1.00239 1.34339 2 0 n/a 1,7,8,9 1.02612 1.58833 3 0 n/a 2,3,4,5,6, 1.00501 1.81640 4 0 n/a 2,3,4,5,6, 1.00621 2.30836 5 1 1 1,7,8,9 1.00757 1.17069 6 1 2 1,7,8,9 1.02247 1.98757 7 1 n/a 1,7,8,9 1.01258 2.07439 8 1 n/a 2,3,4,5,6 1.00209 2.03139
SOURCE: U.S. Department of Education, National Center for Education Statistics, Early Childhood Longitudinal Study, Kindergarten Class of 1998–99 (ECLS-K), spring 2007.
Table C-12. Unknown eligibility and nonresponse adjustment cells for C2_7FC0: School year 2006-07
Cell LFMOVST RC12456P12456 R6RACE Adjustment factor
Unknown eligibility Nonresponse
1 0 1 1 1.00076 1.11896 2 0 1 5,6 1.00359 1.30492 3 0 1 2,3,4,7,8,9 1.00278 1.23020 4 0 2 1,7,8,9 1.02221 1.69283 5 0 2 2 1.00720 1.76883 6 0 2 3,4,5,6 1.01006 1.90809 7 1 n/a n/a 1.00865 2.05463
SOURCE: U.S. Department of Education, National Center for Education Statistics, Early Childhood Longitudinal Study, Kindergarten Class of 1998–99 (ECLS-K), spring 2007.
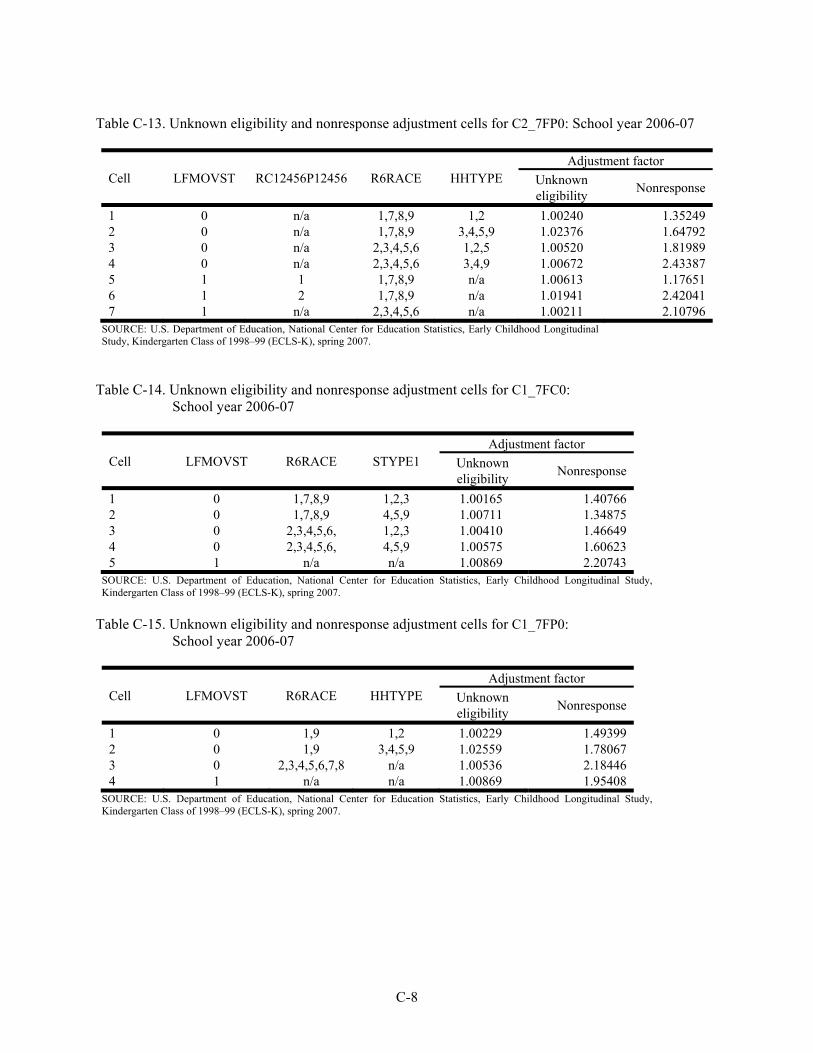
C-8
Table C-13. Unknown eligibility and nonresponse adjustment cells for C2_7FP0: School year 2006-07
Cell LFMOVST RC12456P12456 R6RACE HHTYPE Adjustment factor
Unknown eligibility Nonresponse
1 0 n/a 1,7,8,9 1,2 1.00240 1.35249 2 0 n/a 1,7,8,9 3,4,5,9 1.02376 1.64792 3 0 n/a 2,3,4,5,6 1,2,5 1.00520 1.81989 4 0 n/a 2,3,4,5,6 3,4,9 1.00672 2.43387 5 1 1 1,7,8,9 n/a 1.00613 1.17651 6 1 2 1,7,8,9 n/a 1.01941 2.42041 7 1 n/a 2,3,4,5,6 n/a 1.00211 2.10796
SOURCE: U.S. Department of Education, National Center for Education Statistics, Early Childhood Longitudinal Study, Kindergarten Class of 1998–99 (ECLS-K), spring 2007.
Table C-14. Unknown eligibility and nonresponse adjustment cells for C1_7FC0: School year 2006-07
Cell LFMOVST R6RACE STYPE1 Adjustment factor
Unknown eligibility Nonresponse
1 0 1,7,8,9 1,2,3 1.00165 1.40766 2 0 1,7,8,9 4,5,9 1.00711 1.34875 3 0 2,3,4,5,6, 1,2,3 1.00410 1.46649 4 0 2,3,4,5,6, 4,5,9 1.00575 1.60623 5 1 n/a n/a 1.00869 2.20743
SOURCE: U.S. Department of Education, National Center for Education Statistics, Early Childhood Longitudinal Study, Kindergarten Class of 1998–99 (ECLS-K), spring 2007.
Table C-15. Unknown eligibility and nonresponse adjustment cells for C1_7FP0: School year 2006-07
Cell LFMOVST R6RACE HHTYPE Adjustment factor
Unknown eligibility Nonresponse
1 0 1,9 1,2 1.00229 1.49399 2 0 1,9 3,4,5,9 1.02559 1.78067 3 0 2,3,4,5,6,7,8 n/a 1.00536 2.18446 4 1 n/a n/a 1.00869 1.95408
SOURCE: U.S. Department of Education, National Center for Education Statistics, Early Childhood Longitudinal Study, Kindergarten Class of 1998–99 (ECLS-K), spring 2007.
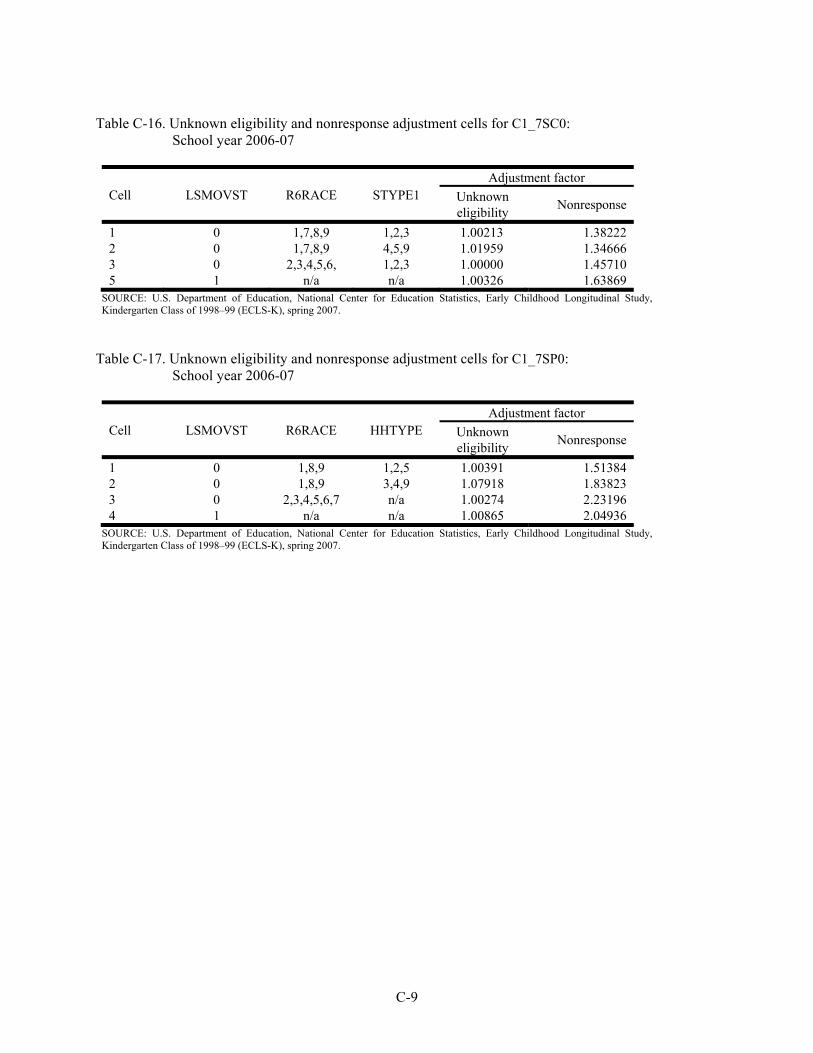
C-9
Table C-16. Unknown eligibility and nonresponse adjustment cells for C1_7SC0: School year 2006-07
Cell LSMOVST R6RACE STYPE1 Adjustment factor
Unknown eligibility Nonresponse
1 0 1,7,8,9 1,2,3 1.00213 1.38222 2 0 1,7,8,9 4,5,9 1.01959 1.34666 3 0 2,3,4,5,6, 1,2,3 1.00000 1.45710 5 1 n/a n/a 1.00326 1.63869
SOURCE: U.S. Department of Education, National Center for Education Statistics, Early Childhood Longitudinal Study, Kindergarten Class of 1998–99 (ECLS-K), spring 2007.
Table C-17. Unknown eligibility and nonresponse adjustment cells for C1_7SP0: School year 2006-07
Cell LSMOVST R6RACE HHTYPE Adjustment factor
Unknown eligibility Nonresponse
1 0 1,8,9 1,2,5 1.00391 1.51384 2 0 1,8,9 3,4,9 1.07918 1.83823 3 0 2,3,4,5,6,7 n/a 1.00274 2.23196 4 1 n/a n/a 1.00865 2.04936
SOURCE: U.S. Department of Education, National Center for Education Statistics, Early Childhood Longitudinal Study, Kindergarten Class of 1998–99 (ECLS-K), spring 2007.

This page is intentionally left blank.
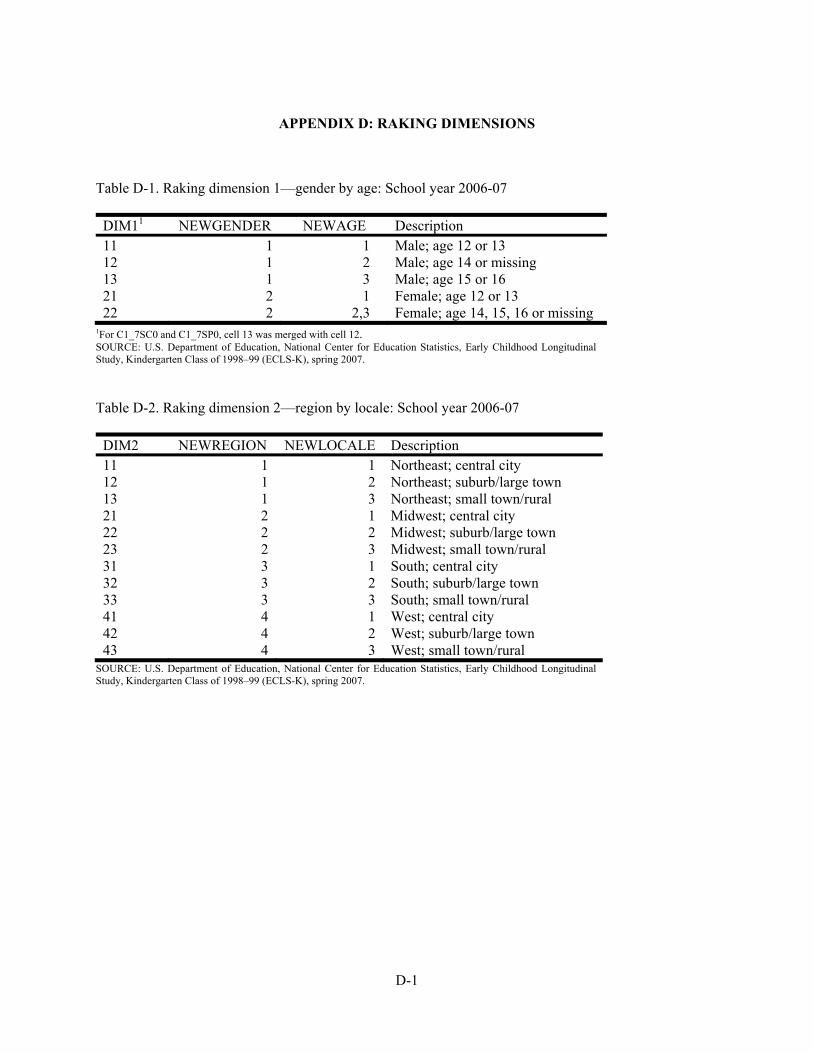
D-1
APPENDIX D: RAKING DIMENSIONS
Table D-1. Raking dimension 1—gender by age: School year 2006-07
DIM11 NEWGENDER NEWAGE Description 11 1 1 Male; age 12 or 13 12 1 2 Male; age 14 or missing 13 1 3 Male; age 15 or 16 21 2 1 Female; age 12 or 13 22 2 2,3 Female; age 14, 15, 16 or missing
1For C1_7SC0 and C1_7SP0, cell 13 was merged with cell 12. SOURCE: U.S. Department of Education, National Center for Education Statistics, Early Childhood Longitudinal Study, Kindergarten Class of 1998–99 (ECLS-K), spring 2007. Table D-2. Raking dimension 2—region by locale: School year 2006-07
DIM2 NEWREGION NEWLOCALE Description 11 1 1 Northeast; central city 12 1 2 Northeast; suburb/large town 13 1 3 Northeast; small town/rural 21 2 1 Midwest; central city 22 2 2 Midwest; suburb/large town 23 2 3 Midwest; small town/rural 31 3 1 South; central city 32 3 2 South; suburb/large town 33 3 3 South; small town/rural 41 4 1 West; central city 42 4 2 West; suburb/large town 43 4 3 West; small town/rural
SOURCE: U.S. Department of Education, National Center for Education Statistics, Early Childhood Longitudinal Study, Kindergarten Class of 1998–99 (ECLS-K), spring 2007.
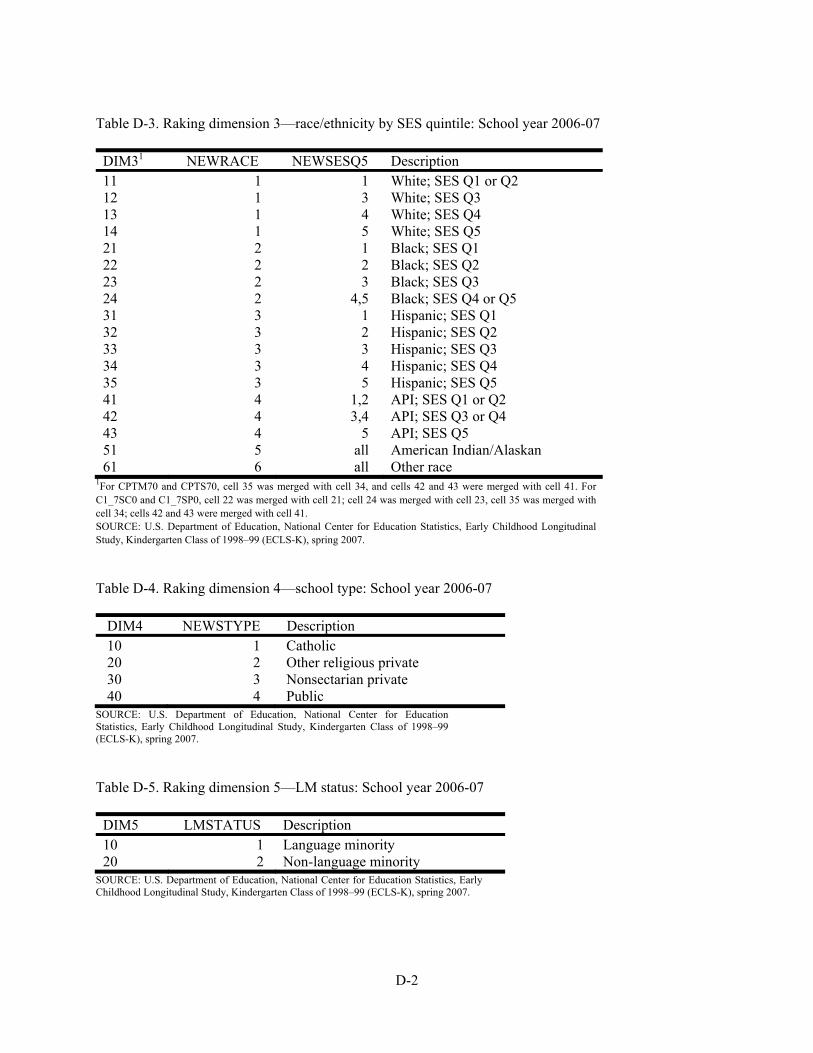
D-2
Table D-3. Raking dimension 3—race/ethnicity by SES quintile: School year 2006-07 DIM31 NEWRACE NEWSESQ5 Description 11 1 1 White; SES Q1 or Q2 12 1 3 White; SES Q3 13 1 4 White; SES Q4 14 1 5 White; SES Q5 21 2 1 Black; SES Q1 22 2 2 Black; SES Q2 23 2 3 Black; SES Q3 24 2 4,5 Black; SES Q4 or Q5 31 3 1 Hispanic; SES Q1 32 3 2 Hispanic; SES Q2 33 3 3 Hispanic; SES Q3 34 3 4 Hispanic; SES Q4 35 3 5 Hispanic; SES Q5 41 4 1,2 API; SES Q1 or Q2 42 4 3,4 API; SES Q3 or Q4 43 4 5 API; SES Q5 51 5 all American Indian/Alaskan 61 6 all Other race
1For CPTM70 and CPTS70, cell 35 was merged with cell 34, and cells 42 and 43 were merged with cell 41. For C1_7SC0 and C1_7SP0, cell 22 was merged with cell 21; cell 24 was merged with cell 23, cell 35 was merged with cell 34; cells 42 and 43 were merged with cell 41. SOURCE: U.S. Department of Education, National Center for Education Statistics, Early Childhood Longitudinal Study, Kindergarten Class of 1998–99 (ECLS-K), spring 2007. Table D-4. Raking dimension 4—school type: School year 2006-07
DIM4 NEWSTYPE Description 10 1 Catholic 20 2 Other religious private 30 3 Nonsectarian private 40 4 Public
SOURCE: U.S. Department of Education, National Center for Education Statistics, Early Childhood Longitudinal Study, Kindergarten Class of 1998–99 (ECLS-K), spring 2007.
Table D-5. Raking dimension 5—LM status: School year 2006-07
DIM5 LMSTATUS Description 10 1 Language minority 20 2 Non-language minority
SOURCE: U.S. Department of Education, National Center for Education Statistics, Early Childhood Longitudinal Study, Kindergarten Class of 1998–99 (ECLS-K), spring 2007.
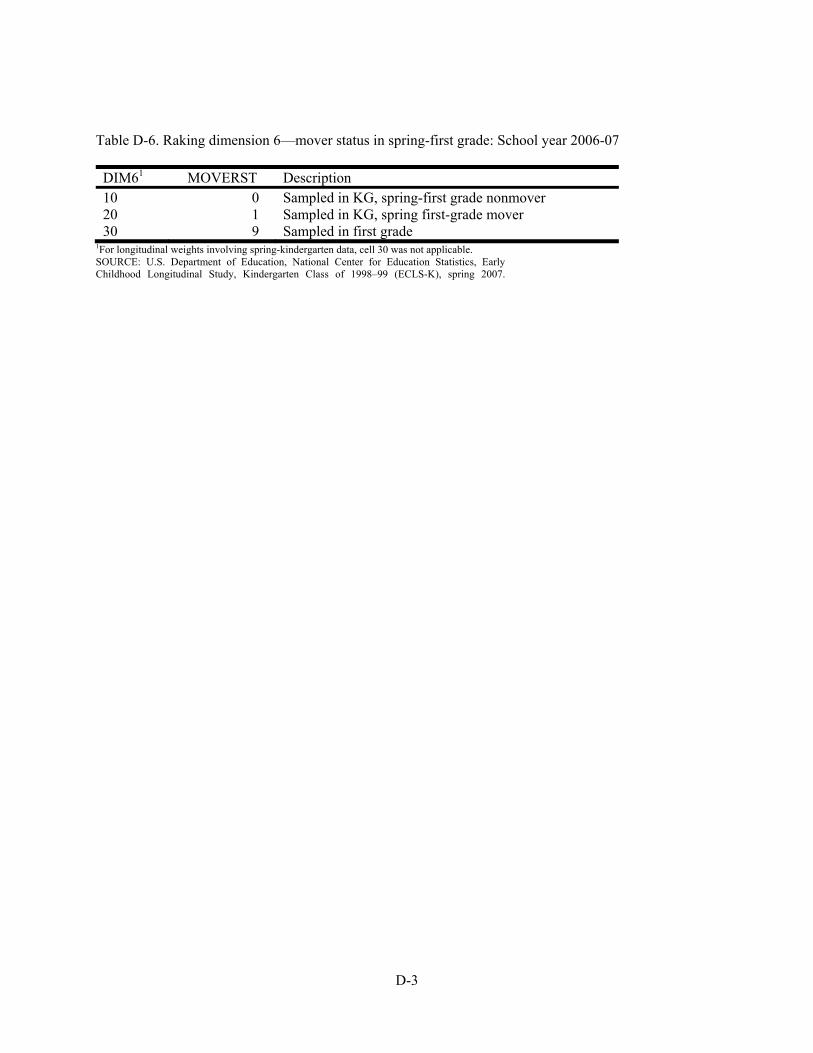
D-3
Table D-6. Raking dimension 6—mover status in spring-first grade: School year 2006-07
DIM61 MOVERST Description 10 0 Sampled in KG, spring-first grade nonmover 20 1 Sampled in KG, spring first-grade mover 30 9 Sampled in first grade
1For longitudinal weights involving spring-kindergarten data, cell 30 was not applicable. SOURCE: U.S. Department of Education, National Center for Education Statistics, Early Childhood Longitudinal Study, Kindergarten Class of 1998–99 (ECLS-K), spring 2007.

This page is intentionally left blank.