Embed Size (px)
Citation preview
School Psychology Review,2005, Volume 34, No. 2, pp. 184-201
Effects of Reading Curriculum-Based Measurement(R'CBM) Teacher Feedback in General
Education Classrooms
Suzanne Bamonto GraneyRochester Institute of Technology
Mark R. ShinnNational'Louis University
Abstract. This study examined the effects of teacher feedback from Reading Cur-riculum-Based Measurement (R-CBM) progress results for low-performing stu-dents in genera] education classrooms. Participants included 44 second-grade teach-ers and 184 students in their low reading groups. After 5 weeks of progress moni-toring, teachers in the two experimental groups were given progress results of (a)a single student in the reading group or (b) all students in the reading group. Teachersin the control group received no progress monitoring feedback. Progress feedbackdid not affect subsequent progress as hypothesized. However, students" readingprogress in all three groups improved reliably during the second half of the study,suggesting some reactive benefits of progress monitoring. The need to increasethe type and quality of teacher feedback and to support teachers to use progressmonitoring data in general education settings to make instructional changes is dis-cussed.
Curriculum-Based Measurement (CBM) for 1 mitiute. The number of words read cor-is a set of standardized procedures for collect- rectly is counted and used as the primary da-ing student data in the basic .skill areas of read- tum. Errors are also summed and can be useding, mathematics computation, spelling, and as secondary information. R-CBM has substan-written expression (e.g., Deno. 1985, 1986. tial empirical suppoti for its validity as an over-2003). Although CBM procedures can be ap- all indicator of general reading competence,plied to any ofthe basic skill areas, its reading including comprehension (e.g.. Fuchs, Fuchs,measure (R-CBM) has received the mo.st at- Hosp,& Jenkins. 2001; Fuchs. Fuch.s,&Max-tention in the research literature and the pub- well, 1988: Shinn, Good, Knutson. Tilly, &lie schools. R-CBM requires that students read Collins, 1992). Use of R-CBM originally waspassages of connected, meaningful text aloud directed at progress monitoting of students in
Author Notes. This research was supported in part by Grant No. H023B7006(). sponsored by the U.S.Department of Edncation, Office of Special Education Program.s, Student-Initiated Research competition.The views expressed within this article are not necessarily those ofthe USDE. The research described inthis article is based on the first author's doctoral dissertation.
Correspondence concerning this article should be addressed to Suzanne B. Graney, School PsychologyProgram. Rochester Institute of Technology. 18 Lomb Memorial Drive. Rochester, New York 14623; E-mail: [email protected]
Copyright 2005 by the National Association of School Psychologists, ISSN 0279-6015
184

Effects of Reading Curriculum
special education (e.g., Deno. 1985) and inproblem solving (Shinn, 2002). Increasingly.R-CBM has been of interest to general educa-tion teachers and school administrators, in part,because of its prevention focus (Shinn, Shinn,Hamilton, & Clarke, 2002) and its consistentlystrong relationship to statewide, high-stakesreading tests (e.g., Crawford, Tindal, & Steiber.2001; McGlinchey & Hixson, 2004). Given itsunique combination of efficiency, low cost, andvalidity with respect to important educationaloutcomes, R-CBM is a worthwhile indicatorfor judging the effectiveness of overall read-ing instruction and intervention support.
All CBM procedures, including R-CBM,were developed specifically for use in forma-tive evaluation, a process for evaluating theeffectiveness of instructional programs for in-dividual students (Deno, Mirkin, & Chiang.1982). After more than three decades of re-search, R-CBM continues to hold up againstestablished criteria for effective measurementsystems used in formative evaluation. The cri-teria include (a) meeting traditional psycho-metric standards for test reliability and valid-ity; (b) having the capacity to model growthover time; (c) demonstrating sensitivity to in-structional modifications over a relatively shortperiod of time; (d) independence of any spe-cific instructional program or technique; (e)providing specific information for instructionalplanning; and (0 being simple, cost-effective,and efficient enough to be implemented with-out significantly distracting teaching efforts(Fuchs & Fuchs, 1999). Most recently, R-CBMwas judged to meet the scientific standards forfrequent progress monitoring by the U.S. De-partment of Education. National Center on Stu-dent Progress Monitoring (National Center onStudent Progress Monitoring, 2005).
Formative Evaluation
Formative evaluation involves collect-ing student performance data on an ongoingbasis so that timely program changes can bemade while instruction is taking place, insteadof waiting until the end of an instructional pe-riod, such as an entire school year, to evaluatestudent learning (i.e., summative evaluation).Although summative evaluation continues to
be a predominant assessment purpose in pub-lic schools, the idea of formative evaluation,particularly in the area of basic reading devel-opment, is gaining attention at national andstate levels. Some states have passed laws re-quiring schools to provide quarterly check-upsfor all students performing below the 25"' per-centile on a group-administered achievementtest, or otherwise identified by the school asneeding additional assistance (e.g., McDaniel,1999). Often these quarterly assessments mustbe accompanied hy an individual plan outlin-ing the steps taken hy the school to increasethe rate of progress for each student. At thenational level, recipients of Reading Firstgrants must implement a comprehensive as-sessment program that includes assessment forbeginning-of-the-year screening, at least quar-terly progress monitoring for all students, di-agnosis for intervention planning with selectedstudents, and large-scale outcome data on theoverall effectiveness of the school's readingprogram (No Child Left Behind Act, 2001).
Although only recently gaining wide-spread attention, particularly in general edu-cation, formative evaluation is not a new strat-egy. Studies on formative evaluation appear inthe special education literature as early as the1970s (Jenkins, Mayhall, Peschka, &Townsend. 1974). The ideas behind these ear-lier efforts were to individualize education forstudents with disabilities hy collecting data ona continuous basis to determine whether eachstudent was benefiting from a given instruc-tional program or approach. If the student datawere showing adequate progress toward spe-cific, predefined goals, the current instructionalprogram was maintained. If student progresswas inadequate, the instructional program wasdeemed ineffective for that student and subse-quently modified. These earlier ideas, althoughdeveloped specifically for special education,remain important as formative evaluation gainspopularity in general education settings.
Formative Evaluation with R-CBM
Because formative evaluation with R-CBM was developed primarily for use in spe-cial education, the majority of research on thesubject has been conducted in special educa-
185

School Psychology Review, 2005, Volume 34, No. 2
tion settings. In this context, the componentsof formative evaluation include frequent (usu-ally weekly) measurement, individualizedprogress goals, graphic display of progressdata, summary progress statistics, and datadecision rules to determine whether to main-tain or modify tbe current instructional pro-gram (Deno & Mirkin, 1977: Shinn & Sbinn,2(X)1). Formative evaluation using R-CBM hasrepeatedly been demonstrated to increase stu-dent achievement when used by special edu-cation teachers (e.g., Fuchs. Deno, & Mirkin.1984: Fuchs & Fucbs, 1986: Wesson. 1991:Wesson, Skiba, Sevcik, King, & Deno, 1984).One mela-analysis examining tbe results of 21controlled studies on formative evaluation inspecial education determined its average ef-fect size to be .70 for increasing studentachievement (Fuchs & Fuchs. 1986).
Despite these impressive effect sizeswith special education students, the implemen-tation of a formative evaluation strategy ingeneral education cannot be accomplishedwithout a shift in focus. In special education,the emphasis is on results for individual stu-dents and law requires modifications in inter-ventions when progress is not at the expectedrate. In general education, teachers, althoughcognizant of the individual student, are moreresponsible for group outcomes (Baker &Zigmond, 1990). This difference may be animportant factor in determining tbe extent towbich general education teachers will modifytbeir programs based on information that anindividual student, particularly one identifiedas low performing, is making inadequateprogress. General education teachers may bemore likely to respond to information that agroup of students is making inadequateprogress.
Whether general education teacherswould adapt their instruction to meet individualneeds is a critical question regarding the po-tential benefits of formative evaluation in gen-eral education settings. Most of the studiesaddressing this issue are analogue in tiature,and appear in tbe literature on inclusion of stu-dents with disabilities (see Scott, Vitale. &Masten, 1998, for a review). Fewer studies ingeneral education address directly whether
teachers adapt their instruction for individualstudents, and whether the.se adaptations affectstudent achievement. A few studies usingMatb-CBM on a class-wide basis have dem-onstrated tbat general education teachers willmodify programs for tbeir entire class whengiven information on their entire class and sug-gestions for instructional modifications (Fucbs.Fuchs, Hamlett, Phillips. & Bentz, 1994). Fur-ther work in tbis area has supported the notionthat general education teachers will adaptmathematics instruction for individual studentswhen prompted to do so and provided witbextensive support (Fuchs, Fucbs, Hamlett,Phillips, & Karns. 1995).
Tbe researcb to date of R-CBM in for-mative evaluation in general education is lim-ited. Some research with students with disabili-ties whose progress was monitored in tbeirgeneral education reading groups when theywere reintegrated suggests that tbe feedbackto general education teachers on student per-formance may have cotitributed to improvedrates of reading progress (Shinn. Powell-Smith.Good, & Baker, 1997). In that study, tbeprogress of 23 reintegrated students and tbeirpeers in the low reading group was monitoredweekly using R-CBM. As a wbole, significantreading improvement was not observed formany ofthe reintegrated students or their peersduring the first 4 weeks of the study. This in-formation was shared with the teachers atWeek 4 in the form of a progress reportshowing the graphed R-CBM data of tbereintegrated student and the peers in the lowreading group. When rates of readingprogres.s were calculated 4 weeks later,progress for reintegrated students and theirpeers had improved significantly, and thistrend continued through the remainder of tbe16-week study. This increase in learning ratemay be attributable to heightened efforts byteachers to improve the unsatisfactoryprogress of their students. However, becausea control group was not used, history effects(Cook & Campbell, 1979) cannot be com-pletely ruled out as an alternative explatia-tion for tbese findings. Further re.search con-trolling for this threat to internal validity wasrequired to address whether feedback does lead
186
Effects of Reading Curriculum
to heightened instructional effort by teachersand improved student outcomes in general edu-cation.
Purpose of Study
Despite the growing popularity of for-mative evaluation in general education settings,tbese promising practices lack an etnpiricalbase to inform the field bow to enhance theirutility for decision making. In other words, weneed to know more about how information isorganized, reported, and interpreted such thatappropriate changes in instruction are facili-tated. The purpose of this study was to ex-tend the current knowledge on formativeevaluation of reading programs using R-CBM in general education settings by ex-amining different levels of feedback toteachers regarding the progress of studentsin tbeir lowest instructional reading groups.The premise was tbat general educationteachers may respond to student progressinformation when tbat information suggeststbe current instructional program is notworking for a (a) given student or (b) groupof students. Teachers wbo received feedbackon the progress of a group of students wereexpected to be more likely to improve studentperibrmance tban teachers who did not receivefeedback on tbe progress of a group. Teach-ers who received feedback regarding theprogress of an individual student were ex-pected to be more likely to improve tbe per-formance for that student only than teach-ers who did not receive feedback, but per-haps less likely to affect greater achievementfor tbe group tban teacbers who received feed-back on the entire group.
This study addressed the following re-search questions: (a) does feedback to teach-ers on the progress of tbeir lowest readinggroup affect the reading achievement for thosestudents, and (b) does feedback to teachers onthe progress of an individual student in tbe low-est reading group affect the reading achieve-ment for that student only, and/or the achieve-ment ofthe entire low reading group?
Tbe major hypothesis was that teacberswho received feedback on the progress of tbeentire group would be more likely to improve
student performance than teachers who did notreceive feedback on the progress ofthe entiregroup. Further, it was hypothesized that teach-ers wbo received feedback regarding theprogress of an individual student may be morelikely to improve tbe performance/or that.stu-dent only than teacbers wbo did not receivefeedback, but perhaps less likely to effectgreater achievement for the group than teach-ers who received feedback on the entire group.
Method
Participants
Participants were 44 second-grade gen-eral education teachers from three school dis-tricts in a Southeastern metropolitan area, and184 students receiving instruction in tbeirteacher's lowest reading group. The numberof participating students ranged from 2 to 10per classroom, with a mean of 4 students perclassroom.
Demographic Information
Teachers. The primary participants oftbis study were 44 second-grade, general edu-cation teachers. All participating teacbers werefemale. One teacher was African American,and the remaining 43 were non-HispanicWhite. Teacbers in tbis study had a mean of14.6 iSD = 8.1) years overall teacbing experi-ence and a mean of6.8(5D= 5.6) years teacb-ing second grade. No significant differencesexisted between experimental groups on over-all teacbing experience, Fi2. 42) = 1.33, p >.05, or number of years teaching second gradeF(2,42)= 1.46,/^>.O5.
Students. Student participants were 184second-grade students wbo, according to tbeirteacbers, received their primary reading in-struction in the lowest reading group in theirgeneral education classroom. The mean ageof the students in this study was 7 years, 9months ISD = 5 months). Seventeen of thestudents (10.2%) had repeated one grade.Tbe tbree experimental groups were equiva-lent on student age, F{2, 157) = 0.00. p >.05, and grade retention, ;tf'(l, n = 166) =1.28, p > .05. Of the students wbo partici-pated in this study, 59.3% were male and
187

School Psychology Review, 2005, Volume .14, No. 2
40.1% were female. No significant differencesin gender distribution were evident172)=.56,/j>.05.
Approximately 75% ofthe student par-ticipants were Caucasian, 16 % African Ameri-can. 1% Hispanic, and less tban 2% Asian,Native Atiierican, or otber. According to tbeirteachers. Engli.sb was the pritnary language forapproximately 95% ofthe students, and Span-ish was the primary language for 4% of the.students. Approxitnately 1% of tbe studentswere reported to bave a primary language otherthan English or Spanish.
A small number of student participantsIn = 19) received special education services.Fourteen received speecb/language .services, 4for reading, and 1 for mathematics.
The majority of student participants (n= 105) were reported by tbeir teachers to re-ceive supplementary reading iti.structional sup-port beyond the general education classroom.Services included pull-out instruction not cov-ered by Title I funds {n = 55), Title I services(fl = 23), tutoring (n = 7). or a combination oftutoring and small-grotip pull-out services (fl= 17). According to their teacbers, studentsreceived frotii 0 to 500 minutes of additionalservices per week, with a mean of 110 and astandard deviation of 121 minutes per week.No experimental group differences existed re-garding the number of minutes per week stu-
dents received additional services, F(2, 166)
n = =
Independent Variables
A 2 X 3 mixed-effects design was usedto examine tbe effects of feedback on readingachievement. Tbe two independent variableswere type of feedback and level of aggrega-tion.
Feedback
Tbe first independent variable, type offeedback, determined the level at which teach-ers would see the infonnation collected on theirstudents* reading progress between Weeks 2and 6. Teachers were randomly assigned to oneof three conditions: (a) group feedback, (b)individual feedback, and (c) no feedback.
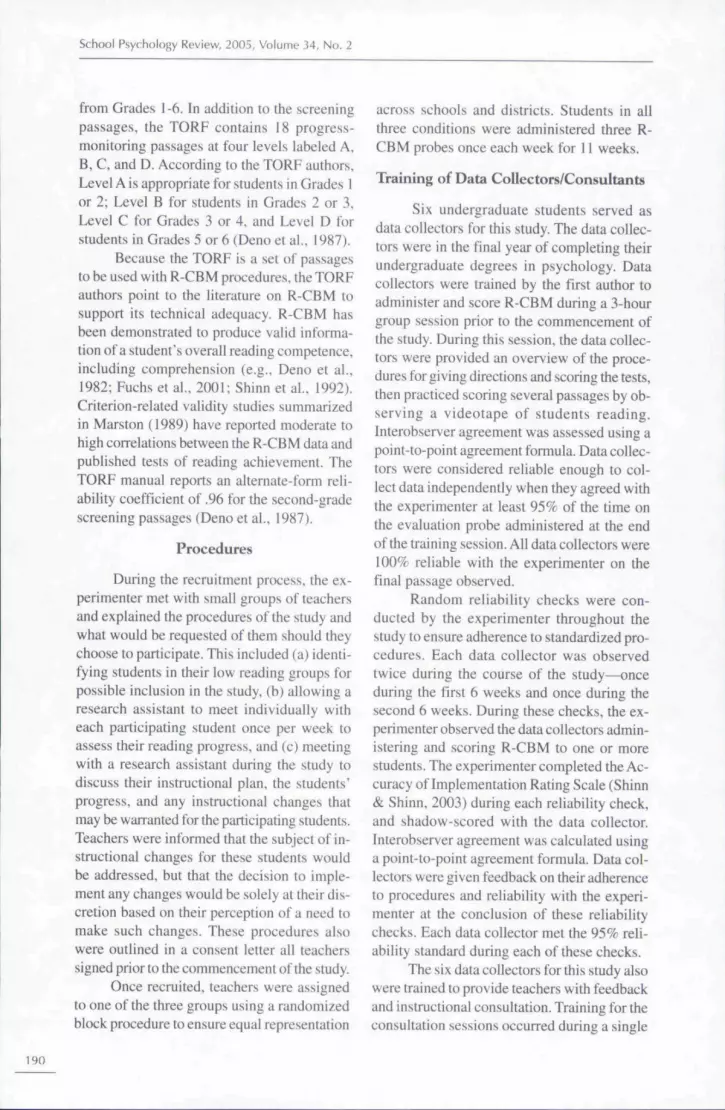
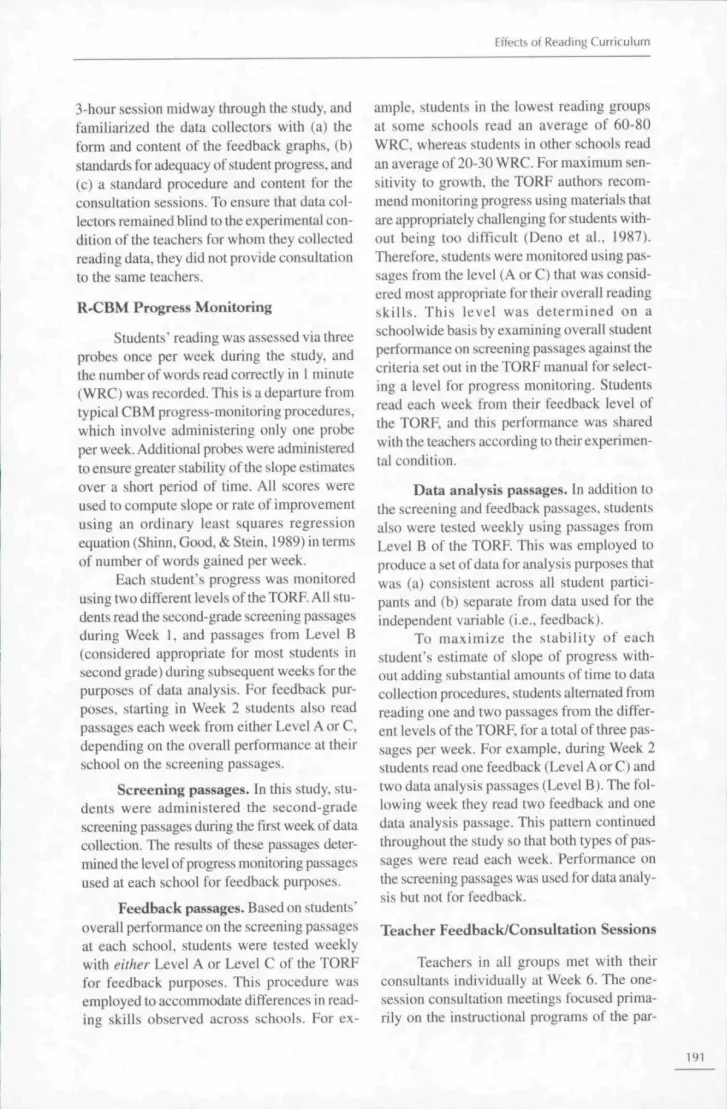
Group feedback. After 5 weeks ofprogress monitoring, teachers in the groupfeedback (GF) condition received a graphdrawn in Excel showing trend lines represent-ing the rate of progress of every student par-ticipant. Tbese slopes were based on approxi-mately nine scores per student. Tbe mean slopeof group progress was reported on the graphin terms ofthe average weekly gain in numberof words read correctly (see Figure I for anexample). Individual data points did not ap-pear on the graph for the GF condition because
180 -j-
160 -
140 -
Ms. Doe's Group Reading Progress
Group progress: Average gain of-1.5 words per week
1—I 1—I 1—I 1—I 1—I 1—I 1—I I 1
a a a a
Dates
Figure 1. Sample Group Feedback Graph.
188
Effects of Reading Curriculum
plotting the data point.s made interpretationdifficult when several students' progress wasrepresented on a single graph.
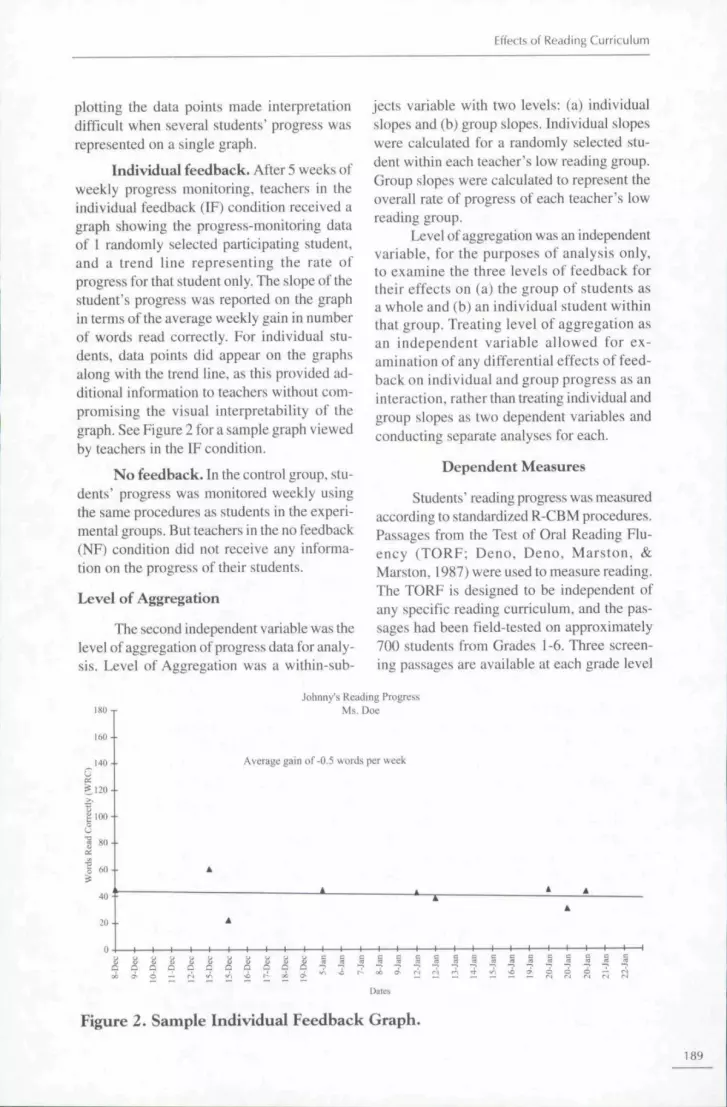
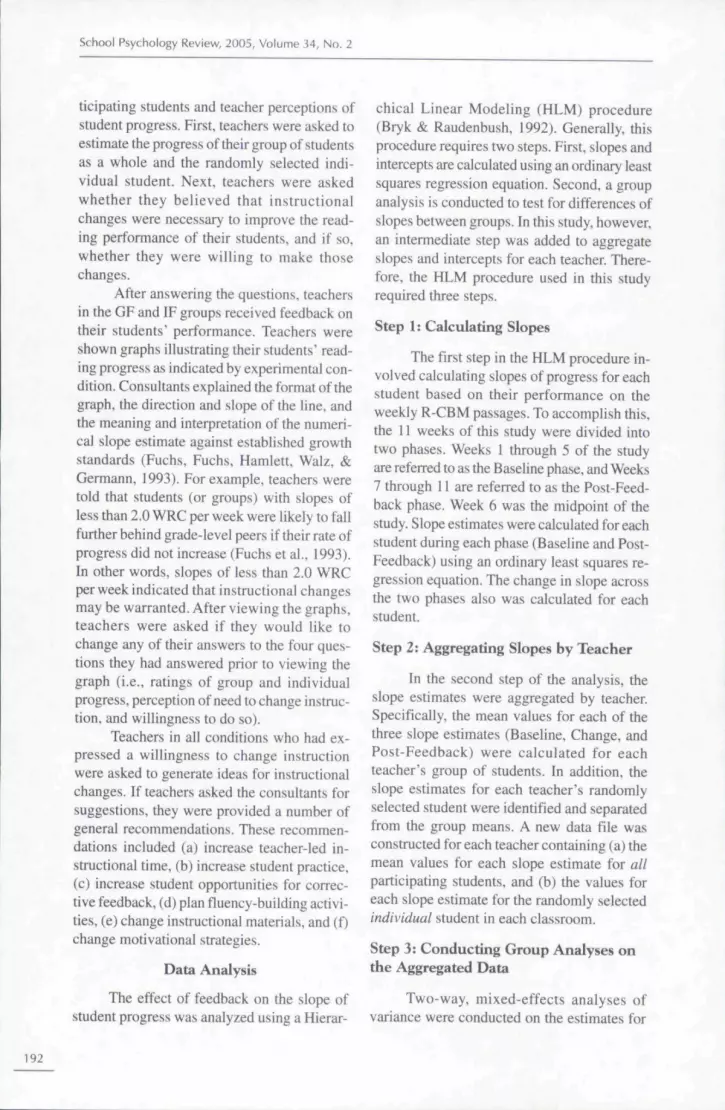
Individual feedback. After 5 weeks ofweekly progress monitoring, teachers in theindividual feedback (TF) condition received agraph showing the progress-monitoring dataof 1 randomly selected participating student,and a trend line representing the rate ofprogress for that student only. The slope of thestudent's progress was reported on the graphin terms of the average weekly gain in numberof words read correctly. For individual stu-dents, data points did appear on the graphsalong with the trend line, as this provided ad-ditional information to teachers without com-promising the visual interpretabiiity of thegraph. See Figure 2 for a sample graph viewedby teachers in the IF condition.
No feedback. In the control group, stu-dents' progress was monitored weekly usingthe same procedures as students in the experi-mental groups. But teachers in the no feedback(NF) condition did not receive any informa-tion on the progress of their students.
Level of Aggregation
The second independent variable was thelevel of aggregation of progress data for analy-sis. Level of Aggregation was a within-sub-
jects variable with two levels: (a) individualslopes and (b) group slopes. Individual slopeswere calculated for a randomly selected stu-dent within each teacher's low reading group.Group slopes were calculated to represent theoverall rate of progress of each teacher's lowreading group.
Level of aggregation was an independentvariable, for the purposes of analysis only,to examine the three levels of feedback fortheir effects on (a) the group of students asa whole and (b) an individual student withinthat group. Treating level of aggregation asan independent variable allowed for ex-amination of any differential effects of feed-back on individual and group progress as aninteraction, rather than treating individual andgroup slopes as two dependent variables andconducting separate analyses for each.
Dependent Measures
Students' reading progress was measuredaccording to standardized R-CBM procedures.Passages from the Test of Oral Reading Flu-ency (TORF; Deno, Deno, Marston. &Marston, 1987) were used to measure reading.The TORF is designed to be independent ofany specific reading curriculum, and the pas-sages had been field-tested on approximately700 students from Grades 1-6. Three screen-ing passages are available at each grade level
ISO.
160-
140-
^ 1 2 0 -
o
a:
c <>ll •
40-
^ •
0 1 1 1-
Johnny's Reading ProgressMs. Doe
Average gain of-0.5 words per week
A
i i__S
A
—1 1 1 1 1 1 1 1 1 1 1 1 1 1 1 1 1 1
A A
A
1 1 1 1 1 1 1 1
(5 a
Figure 2. Sample Individual Feedback Graph.
189
School Psychology Review, 2005, Volume 34, No. 2
from Grades 1-6. In addition to the screeningpassages, the TORF contains 18 progress-monitoring passages at tour levels labeled A,B, C. and D. According to the TORF authors.Level A is appropriate for students in Grades Ior 2; Level B for students in Grades 2 or 3,Level C for Grades 3 or 4. and Level D forstudents in Grades 5 or 6 (Deno etal., 1987).
Because the TORF is a set of passagesto be used with R-CBM procedures, the TORFauthors point to the literature on R-CBM tosupport its technical adequacy. R-CBM hasbeen demonstrated to produce valid informa-tion of a student's overall reading competence,including comprehension (e.g., Deno et al.,1982; Fuchs et al., 2001; Shinn et al.. 1992).Criterion-related validity studies summarizedin Marston (1989) have reported moderate tohigh correlations between the R-CBM data andpublished tests of reading achievement. TheTORF manual reports an alternate-form reli-ability coefficient of .96 for the second-gradescreening passages (Deno et al.. 1987).
Procedures
During the recruitment process, the ex-perimenter met with small groups of teachersand explained the procedures of the study andwhat would be requested of them should theychoose to participate. This included (a) identi-fying students in their low reading groups forpossible inclusion in the study, (b) allowing aresearch assistant to meet individually witheach participating student once per week toassess their reading progress, and (c) meetingwith a research assistant during the study todiscuss their instructional plan, the students'progress, and any instructional changes thatmay be warranted for the participating students.Teachers were informed that the subject of in-structional changes for these students wouldbe addressed, but that the decision to imple-ment any changes would be solely at their dis-cretion based on their perception of a need tomake such changes. These procedures alsowere outlined in a consent letter all teacherssigned prior to the commencement of the study.
Once recruited, teachers were assignedto one of the three groups using a randomizedblock procedure to ensure equal representation
across schools and districts. Students in allthree conditions were administered three R-CBM probes once each week for 11 weeks.
Training of Data Collectors/Consultants
Six undergraduate students served asdata collectors for this study. The data collec-tors were in the final year of completing theirundergraduate degrees in psychology. Datacollectors were trained hy the ftrst author toadminister and score R-CBM during a 3-hourgroup session prior to the commencement ofthe study. During this session, the data collec-tors were provided an overview of the proce-dures for giving directions and scoring the tests,then practiced scoring several passages by oh-serving a videotape of students reading,lnterobserver agreement was assessed using apoint-to-point agreement formula. Data collec-tors were considered reliable enough to col-lect data independently when they agreed withthe experimenter at least 95% of the time onthe evaluation probe administered at the endof the training session. All data collectors were100% reliable with the experimenter on thefinal passage observed.
Random reliability checks were con-ducted by the experimenter throughout thestudy to ensure adherence to standardized pro-cedures. Each data collector was observedtwice during the course of the study—onceduring the first 6 weeks and once during thesecond 6 weeks. During these checks, the ex-perimenter observed the data collectors admin-istering and scoring R-CBM to one or morestudents. The experimenter completed the Ac-curacy of Implementation Rating Scale (Shinn& Shinn, 2003) during each reliability check,and shadow-scored with the data collector,lnterobserver agreement was calculated usinga point-to-point agreement formula. Data col-lectors were given feedback on their adherenceto procedures and reliability with the experi-menter at the conclusion of these reliahilitychecks. Each data collector met the 95% reli-ability standard during each of these checks.
The six data collectors for this study alsowere trained to provide teachers with feedbackand instructional consultation. Training for theconsultation sessions occurred during a single
190
Effects of Reading Curriculum
3-hour session midway through the study, andfamiliarized the data collectors with (a) theform and content of the feedback graphs, (b)standards for adequacy of student progress, and(c) a standard procedure and content for theconsultation sessions. To ensure that data col-lectors remained blind to the experimental con-dition of the teachers for whom they collectedreading data, they did not provide consultationto the same teachers.
R-CBM Progress Monitoring
Students' reading was assessed via threeprohes once per week during the study, andthe number of words read correctly in 1 minute(WRC) was recorded. This is a departure fromtypical CBM progress-monitoring procedures,which involve administering only one probeper week. Additional probes were administeredto ensure greater stability of the slope estimatesover a short period of time. All scores wereused to compute slope or rate of improvementusing an ordinary least squares regressionequation (Shinn, Good, & Stein, 1989) in termsof number of words gained per week.
Each student's progress was monitoredusing twodifferent levels of the TORF. All stu-dents read the second-grade screening passagesduring Week I, and passages from Level B(considered appropriate for most students insecond grade) during subsequent weeks for thepurposes of data analysis. For feedback pur-poses, starting in Week 2 students also readpassages each week from either Level A or C,depending on the overall performance at theirschool on the screening passages.
Screening passages. In this study, stu-dents were administered the second-gradescreening passages during the first week of datacollection. The results of these passages deter-mined the level of progress monitoring passagesused at each school for feedback purposes.
Feedback passages. Based on students'overall performance on the screening passagesat each school, students were tested weeklywith either Level A or Level C of the TORFfor feedback purposes. This procedure wasemployed to accommodate differences in read-ing skills observed across schools. For ex-
ample, students in the lowest reading groupsat some schools read an average of 60-80WRC, whereas students in other schools readan average of 20-30 WRC. For maximum sen-sitivity to growth, the TORF authors recom-mend monitoring progress using materials thatare appropriately challenging for students with-out being too difficult (Deno et al., 1987).Therefore, students were monitored using pas-sages from the level (A or C) that was consid-ered most appropriate for their overall readingskills. This level was determined on aschoolwide hasis by examining overall studentperformance on screening passages against thecriteria set out in the TORF manual for select-ing a level for progress monitoring. Studentsread each week from their feedback level ofthe TORF, and this pertbrmance was sharedwith the teachers according to their experimen-tal condition.
Data analysis passages. In addition tothe screening and feedback passages, studentsalso were tested weekly using passages fromLevel B of the TORF. This was employed toproduce a set of data for analysis purposes thatwas (a) consistent across all student partici-pants and (b) separate from data used for theindependent variable (i.e., feedback).
To maximize the stability of eachstudent's estimate of slope of progress with-out adding substantial amounts of time to datacollection procedures, students alternated fromreading one and two passages from the differ-ent levels of the TORF, for a total of three pas-sages per week. For example, during Week 2students read one feedback (Level A or C) andtwo data analysis passages (Level B). The fol-lowing week they read two feedback and onedata analysis passage. This pattern continuedthroughout the study so that both types of pas-sages were read each week. Pertbrmance onthe screening passages was used for data analy-sis but not for feedback.
Teacher Feedback/Consultation Sessions
Teachers in al! groups met with theirconsultants individually at Week 6. The one-session consultation meetings focused prima-rily on the instructional programs of the par-
191
School Psyctiology Review, 2005, Volume 34, No. 2
ticipating students and teacher perceptions ofstudent progress. First, teachers were asked toestimate the progress of their group of studentsas a whole and the randomly selected indi-vidual student. Next, teachers were askedwhether they believed that instructionalchanges were necessary to improve the read-ing performance of their students, and if so,whether they were willing to make thosechanges.
After answering the questions, teachersin the GF and IF groups received feedback ontheir students' performance. Teachers wereshown graphs illustrating their students' read-ing progress as indicated by experimental con-dition. Consultants explained the format of thegraph, the direction and slope of the line, andthe meaning and interpretation of the numeri-cal slope estimate against established growthstandards (Fuchs, Fuchs. Hamlett, Walz, &Germann, 1993). For example, teachers weretold that students (or groups) with slopes ofless than 2.0 WRC per week were likely to fallfurther behind grade-level peers if their rate ofprogress did not increase (Fuchs et al.. 1993).In other words, slopes of less than 2.0 WRCperweekindicated that instructional changesmay be warranted. After viewing the graphs,teachers were asked if they would like tochange any of their answers to the four ques-tions they had answered prior to viewing thegraph (i.e., ratings of group and individualprogress, perception of need to change instruc-tion, and willingness to do so).
Teachers in ail conditions who had ex-pressed a willingness to change instructionwere asked to generate ideas for instructionalchanges. If teachers asked the consultants forsuggestions, they were provided a number ofgeneral recommendations. These recommen-dations included (a) increase teacher-led in-structional time, (b) increase student practice,(c) increase student opportunities for correc-tive feedback, (d) plan fluency-building activi-ties, (e) change instructional materials, and (f)change motivational strategies.
Data Analysis
The effect of feedback on the slope ofstudent progress was analyzed using a Hierar-
chical Linear Modeling (HLM) procedure(Bryk & Raudenbush, 1992). Generally, thisprocedure requires two steps. First, slopes andintercepts are calculated using an ordinary leastsquares regression equation. Second, a groupanalysis is conducted to test for differences ofslopes between groups. In this study, however,an intermediate step was added to aggregateslopes and intercepts for each teacher. There-fore, the HLM procedure used in this studyrequired three steps.
Step 1: Calculating Slopes
The first step in the HLM procedure in-volved calculating slopes of progress for eachstudent based on their performance on theweekly R-CBM passages. To accomplish this,the 11 weeks of this study were divided intotwo phases. Weeks 1 through 5 of the studyare referred to as the Baseline phase, and Weeks7 through 11 are referred to as the Post-Feed-back phase. Week 6 was the midpoint of thestudy. Slope estimates were calculated for eachstudent during each phase (Baseline and Post-Feedback) using an ordinary least squares re-gression equation. The change in slope acrossthe two phases also was calculated for eachstudent.
Step 2: Aggregating Slopes by Teacher
In the second step of the analysis, theslope estimates were aggregated by teacher.Specifically, the mean values for each of thethree slope estimates (Baseline, Change, andPost-Feedback) were calculated for eachteacher's group of students. In addition, theslope estimates for each teacher's randomlyselected student were identified and separatedfrom the group means. A new data file wasconstructed for each teacher containing (a) themean values for each slope estimate for allparticipating students, and (b) the values foreach slope estimate for the randomly selectedindividual student in each classroom.
Step 3: Conducting Group Analyses onthe Aggregated Data
Two-way, tnixed-effects analyses ofvariance were conducted on the estimates for
192
Effects of Reading CurrJculum
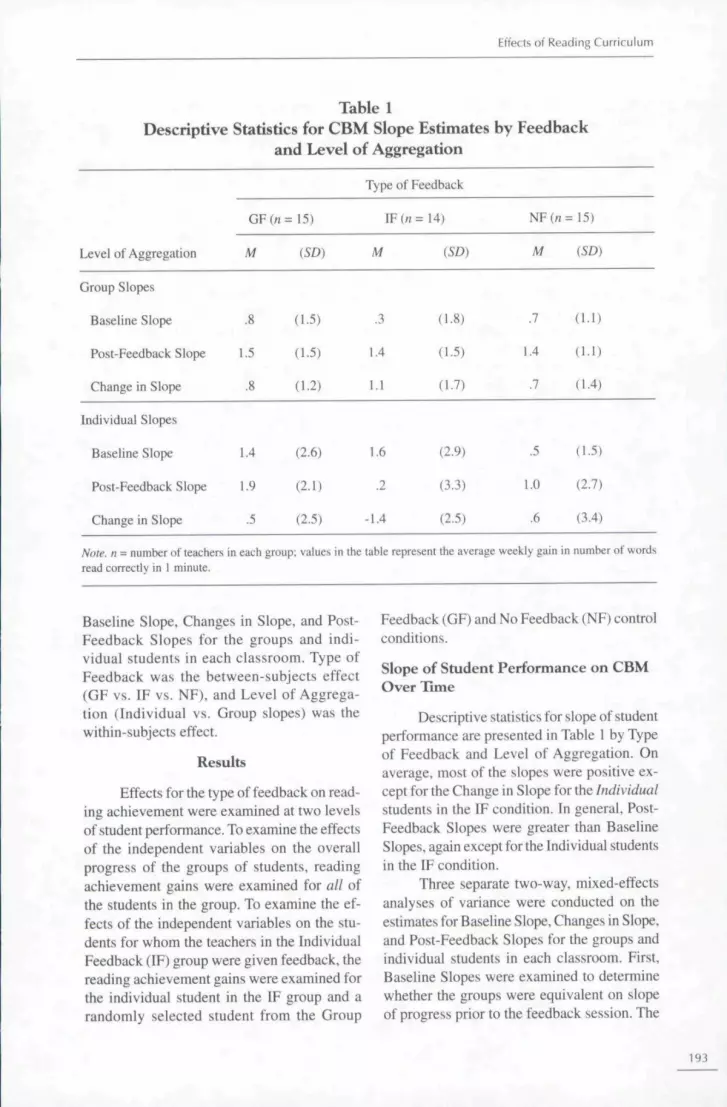
Table 1Descriptive Statistics for CBM Slope Estimates by Feedback
and Level of Aggregation
Level of Aggregation
Group Slopes
Baseline Slope
Post-Feedback Slope
Change in Slope
Individual Slopes
Baseline Slope
Post-Feedback Slope
Change in Slope
GF(n =
M
.8
1.5
.8
1.4
1.9
.5
Note, n = number of teachers in eath groupread correctly in 1 minute.
15)
(SD)
(1.5)
(1.5)
(L2)
(2.6)
(2.1)
(2.5)
Type of Feedback
IF (j
M
.3
1.4
1.1
1.6
.2
1.4
1=14)
(SD)
(L8)
(1.5)
(1.7)
(2.9)
(3.3)
(2.5)
NF(n =
M
.7
1.4
.7
.5
LO
.6
= 15)
iSD)
(1.1)
(LI )
(1.4)
(1.5)
(2.7)
(3.4)
; values in the table represent the average weekly gain in number of words
Baseline Slope, Changes in Slope, and Post-Feedback Slopes for the groups and indi-vidual students in each classroom. Type ofFeedback was the between-subjects effect(GF vs. IF vs. NF), and Level of Aggrega-tion (Individual vs. Group slopes) was thewithin-subjects effect.
Results
Effects for the type of feedback on read-ing achievement were examined at two levelsof student performance. To examine the effectsof the independent variables on the overallprogress of the groups of students, readingachievement gains were examined for all ofthe students in the group. To examine the ef-fects of the independent variables on the stu-dents for whom the teachers in the IndividualFeedback (IF) group were given feedback, thereading achievement gains were examined forthe individual student in the IF group and arandomly selected student from the Group
Feedback (GF) and No Feedback (NF) controlconditions.
Slope of Student Performance on CBMOver Time
Descriptive statistics for slope of studentperformance are presented in Table I by Typeof Feedback and Level of Aggregation. Onaverage, most of the slopes were positive ex-cept for the Change in Slope for the Individualstudents in the IF condition. In general, Post-Feedback Slopes were greater than BaselineSlopes, again except for the Individual studentsin the IF condition.
Three separate two-way, mixed-effectsanalyses of variance were conducted on theestimates for Baseline Slope, Changes in Slope,and Post-Feedback Slopes for the groups andindividual students in each classroom. First,Baseline Slopes were examined to determinewhether the groups were equivalent on slopeof progress prior to the feedback session. The
193
School Psychology Review, 2005, Volume i4, No. 2
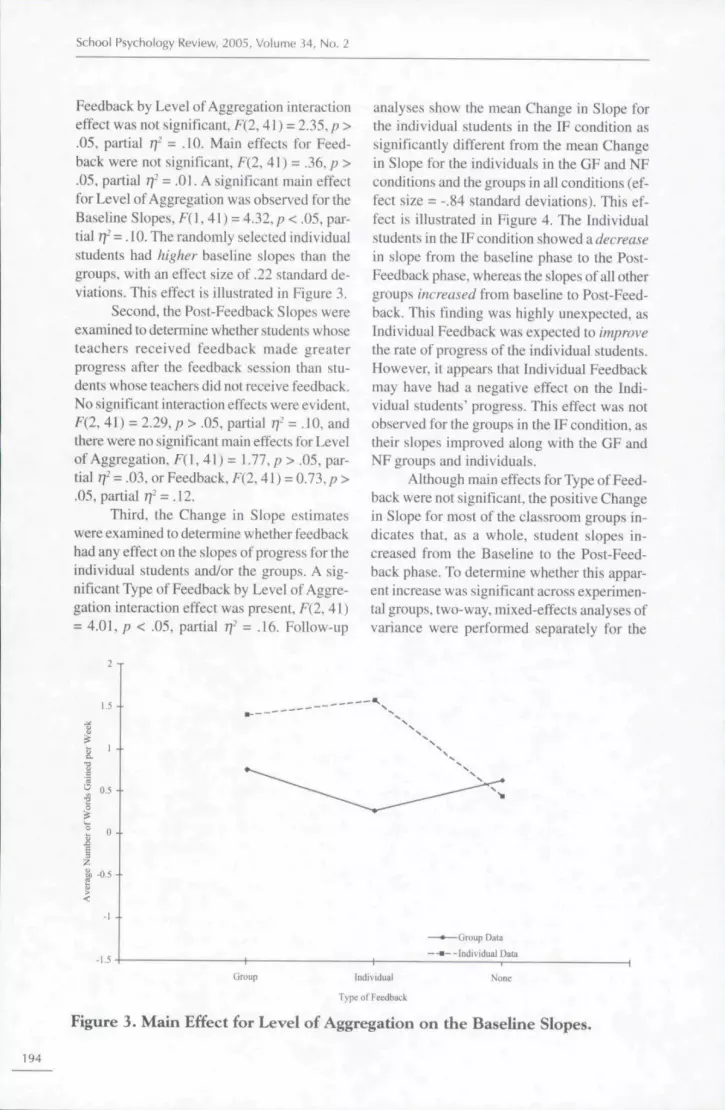
Feedback by Level ofAggregation interactioneffect was not significant. F(2.41) = 2.35. p >.05. partial f]- = .10. Main effects for Feed-back were not significant, f (2, 41 ) = .36. p >.05, partial 77- = .01. A significant main effectfor Level ofAggregation was observed for theBaseline Slopes. F( 1. 41) = 4.32. p < .05, par-tial /]- =. 10. The randomly selected individualstudents had higher baseline slopes than thegroups, with an effect size of .22 standard de-viations. This effect is illustrated in Figure 3.
Second, the Post-Feedback Slopes wereexaminedtodetermine whether students whoseteachers received feedback made greaterprogress after the feedback session than stu-dents whose teachers did not receive feedback.No significant interaction effects were evident.F(2. 41) = 2.29. p > .05, partial Y]' = .10. andthere were no significant main effects for LevelofAggregation. F(l, 41) = l.ll..p > .05, par-tial Tf = .03. or Feedback, F(2,41) = 0.73. p >.05. partial r]- = .12.
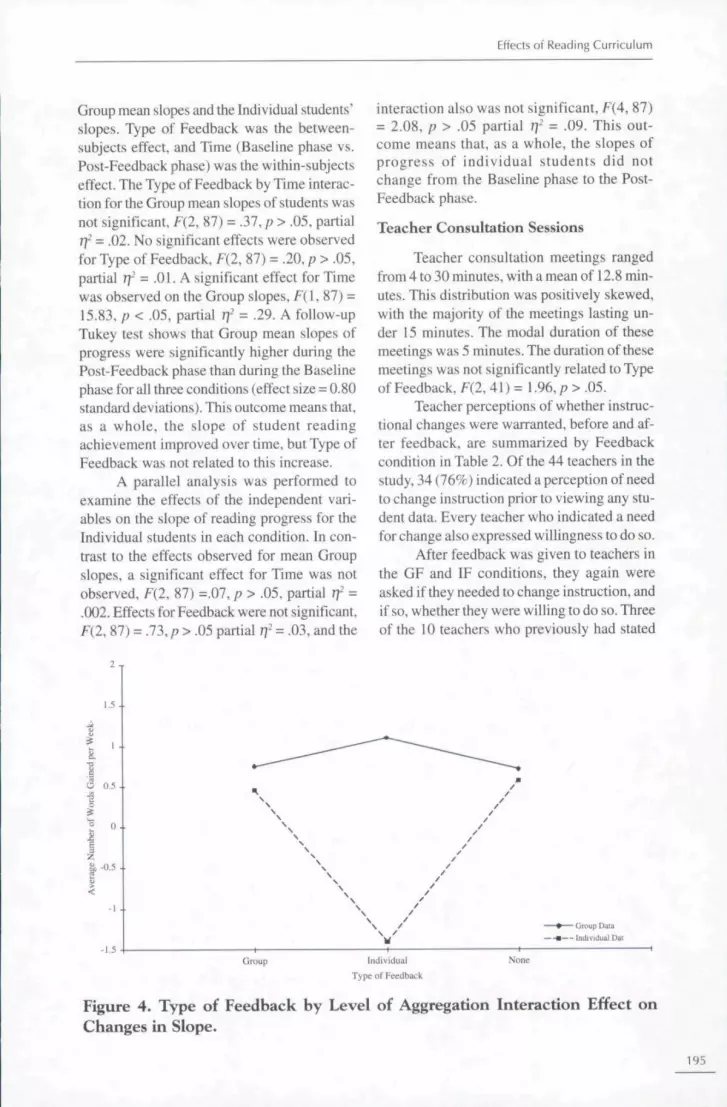
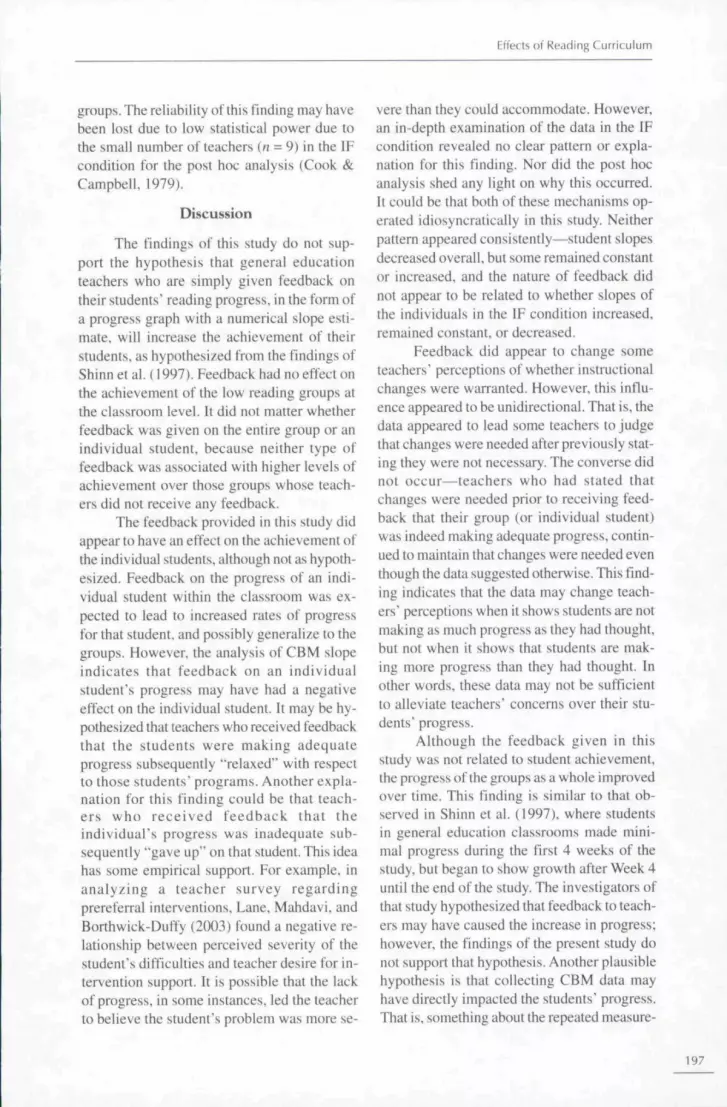
Third, the Change in Slope estimateswere examined to determine whether feedbackhad any effect on the slopes of progress for theindividual students and/or the groups. A sig-nificant Type of Feedback by Level of Aggre-gation interaction effect was present, F{2.41)= 4.01, p < .05. partial q- = .16. Foliow-up
analyses show the mean Change in Slope forthe individual students in the IF condition assignificantly different from the mean Changein Slope for the individuals in the GF and NFconditions and the groups in all conditions (ef-fect size = -.84 standard deviations). This ef-fect is illustrated in Figure 4. The Individualstudents in the IF condition showed a decreasein slope from the baseline phase to the Post-Feedback phase, whereas the slopes of all othergroups increased from baseline to Post-Feed-back. This fmding was highly unexpected, asIndividual Feedback was expected to improvethe rate of progress of the individual students.However, it appears that Individual Feedbackmay have had a negative effect on the Indi-vidual students' progress. This effect was notobserved for the groups in the IF condition, astheir slopes improved along with the GF andNF groups and individuals.
Although main effects for Type of Feed-back were not significant, the positive Changein Slope for most of the classroom groups in-dicates that, as a whole, student slopes in-creased from the Baseline to the Post-Feed-back phase. To determine whether this appar-ent increase was significant across experimen-tal groups, two-way, mixed-effects analyses ofvariance were performed separately for the
1.5..
0,5 -
-1.5
Group Data
Individual Data
Individual
Type of Feedback
Notie
Figure 3. Main Effect for Level of Aggregation on the Baseline Slopes.
194
Effects of Reading Curriculum
Group mean slopes and the Individual students'slopes. Type of Feedback was the between-subjects etfect. and Time (Baseline phase vs.Post-Feedback phase) was the within-subjectseifect. The Type of Feedback by Time interac-tion for the Group mean slopes of students wasnot significant, F(2, 87) = .37, p > .05. partialrf = .02. No significant effects were observedfor Type of Feedback, F(2, 87) = .20, p > .05,partial r)- = .0\. A significant effect for Timewas observed on the Group slopes, F{ 1. 87) =15.83, p < .05, partial r]' = -29. A follow-upTukey test shows that Group mean slopes ofprogress were significantly higher during thePost-Feedback phase than during the Baselinephase for all three conditions (effect size = 0.80standard deviations). This outcome means that,as a whole, the slope of student readingachievement improved over time, but Type ofFeedback was not related to this increase.
A parallel analysis was performed toexamine tbe effects of the independent vari-ables on the slope of reading progress for theIndividual students in eacb condition. In con-trast to tbe effects observed for mean Groupslopes, a significant effect for Time was notobserved, F(2, 87) =.07, p > .05, partial f]" =.002. Effects for Feedback were not significant.F(2, 87) = .73, p > .05 partial r)' - .03, and the
2 T
1.5 .
^ -0.5
interaction also was not significant, F{4, 87)= 2.08, p > .05 partial rj- = .09. Tbis out-come means tbat, as a whole, the slopes ofprogress of individual students did notchange from the Baseline phase to the Post-Feedback phase.
Teacher Consultation Sessions
Teacher consultation meetings rangedfrom 4 to 30 minutes, witb a mean of 12.8 min-utes. This distribution was positively skewed,with the majority of tbe meetings lasting un-der 15 minutes. The modal duration of thesemeetings was 5 minutes. Tbe duration of tbesemeetings was not significantly related to Typeof Feedback, F(2, 41) = 1.96, p > .05.
Teacher perceptions of whether instruc-tional changes were warranted, before and af-ter feedback, are summarized by Feedbackcondition in Table 2. Of the 44 teacbers in tbestudy, 34 (76%) indicated a perception of needto change instruction prior to viewing any stu-dent data. Every teacher wbo indicated a needfor change also expressed willingness to do so.
After feedback was given to teachers intbe GF and IF conditions, tbey again wereasked if they needed to change instruction, andif so, whether tbey were willing to do so. Threeof the 10 teachers who previously had stated
• — [ndiviilual Dm
Group lndlvldud]
Type of Feedback
Figure 4. Type of Feedback by Level of Aggregation Interaction Effect onChanges in Slope.
195

School Psychology Review, 2005, Volume 34, No. 2
Table 2Teacher Perceptions of Need to Change Instruction by Type of Feedback
Type of Feedback
Rating
GF IF
# % # %n Yes Yes n Yes Yes
NF
# %Yes Yes
Pre-feedback perception ofneed to change instruction
Post-feedback perception ofneed to change instruction
15 11 73% 14 11 79% 15 12 80%
15 14 93% 14 II 79% - N/A
that changes were tiot needed changed theiranswers after receiving feedback, stating theyperceived a need to change instruction. Chang-ing this perception was significantly related toType of Feedback, x' (I. " = 44) = 6.31, p <.05. All 3 teachers who changed their answerswere in the GF condition, resulting in 14 outof 15 teachers in the GF condition ultimatelystating that changes were needed. None of theteachers in the IF condition changed their per-ception; however, all 3 teachers in the IF con-dition who had stated initially that changeswere not needed viewed graphs supporting thisinitial judgment. That is. their students' slopesof progress exceeded 2.0 words gained perweek. Therefore, they did not need to changetheir perceptions based on the data. None ofthe 34 teachers who had said there was a needto change before the feedback changed theiranswers after the feedback, even if the feed-back indicated that no change was required(i.e., that the students were making adequateprogress).
Effects of Feedback That Suggested aNeed for Change
To account for differences in the natureof feedback (positive or negative) provided tothe teachers, a post hoc analysis was conductedon the slope estimates of progress on the R-CBM probes during the study. Only teacherswho received feedback that they definitelyneeded to make changes were included in thepost hoc analysis. This determination was made
upon examination of teachers' feedback slopes(i.e.. the slopes of progress reported on thegraphs for the group as a whole or the randomlyselected student). A conservative slope of lessthan 1 WRC gained per week was determinedto be indicative of a definite need for change.Teachers whose feedback graphs showedslopes greater than I WRC gained per weekwere not included in the post hoc analyses.Of the 29 teachers who received feedbackat Week 6, 21 (72%) viewed graphs show-ing slopes of less than 1 WRC gained perweek. Of these, 12 teachers (57%) were inthe GF condition and 9 teachers (43%) werein the IF condition. Three two-way, mixed-ef-fects analyses of variance were conducted onthe Baseline Slopes. Changes in Slope, andPost-Feedback Slopes of the Groups and Indi-vidual students of teachers whose feedbackindicated that changes were warranted. Nosignificant interaction or main effects forType of Feedback or Level of Aggregationwere observed for any of the three slope esti-mates.
An examination of the pattern of meansreveals that although the Type of Feedbackby Level ofAggregation interaction effectfor the Change in Slope observed with theentire sample is no longer significant, thesame basic pattern exists. That is, whenteachers in the IF condition viewed graphsshowing minimal or no progress, the slopesof progress for the individual students in theIF condition decreased and all the slopes forthe other groups increased, including tbe IF
196
Effects of Reatling CurricLjium
groups. The reliability ofthis finding may havebeen lost due to low statistical power due tothe small number of teachers (n = 9) in the IFcondition for the post hoc analysis (Cook &Campbell, 1979).
Discussion
The findings of this study do not sup-port the hypothesis that general educationteachers who are simply given feedback ontheir students' reading progress, in the form ofa progress graph with a numerical slope esti-mate, will increase the achievement of theirstudents, as hypothesized from the findings ofShinn et al. (1997). Feedback had no effect onIhe achievement of the low reading groups atthe classroom level. It did not matter whetherfeedback was given on the entire group or anindividual student, because neither type offeedback was associated with higher levels ofachievement over those groups whose teach-ers did not receive any feedback.
The feedback provided in this study didappear to have an effect on the achievement ofthe individual students, although not as hypoth-esized. Feedback on the progress of an indi-vidual student within the classroom was ex-pected to lead to increased rates of progressfor that student, and possibly generalize to thegroups. However, the analysis of CBM slopeindicates that feedback on an individualstudent's progress may have had a negativeeffect on the individual student. It may be hy-pothesized that teachers who received feedbackthat the students were making adequateprogress subsequently "relaxed" with respectto those students' programs. Another expla-nation for this finding could be that teach-ers who received feedback thai theindividual's progress was inadequate sub-sequently "gave up" on that student. This ideahas some empirical support. For example, inanalyzing a teacher survey regardingprereferral interventions. Lane. Mahdavi. andBorthwick-Duffy (2003) found a negative re-lationship between perceived severity of thestudent's difficulties and leacher desire for in-tervention support. It is possible that the lackof progress, in some instances. led the teacherto believe the student's problem was more se-
vere than they could accommodate. However,an in-depth examination of the data in the IFcondition revealed no clear pattern or expla-nation for this fmding. Nor did the post hocanalysis shed any light on why this occurred.It could be that both of these mechanisms op-erated idiosyncratically in this study. Neitherpattern appeared consistently—student slopesdecreased overall, hut some remained constantor increased, and the nature of feedback didnot appear to be related to whether slopes ofthe individuals in the IF condition increased.remained constant, or decreased.
Feedback did appear to change someteachers' perceptions of whether instructionalchanges were warranted. However, this influ-ence appeared to be unidirectional. That is. thedata appeared to lead some teachers to judgethat changes were needed after previously stat-ing they were not necessary. The converse didnot occur—teachers who had stated thatchanges were needed prior to receiving feed-hack that their group (or individual student)was indeed making adequate progress, contin-ued to maintain that changes were needed eventhough the data suggested otherwise. This find-ing indicates that the data may change teach-ers' perceptions when it shows students are notmaking as much progress as they had thought,but not when it shows that students are mak-ing mt)re progress than they had thought. Inother words, these data may not be sufficientto alleviate teachers" concerns over their stu-dents' progress.
Although the feedback given in thisstudy was not related to student achievement,the progress of the groups as a whole improvedover time. This finding is similar to that ob-served in Shinn et al. (1997). where studentsin general education ctas.srooms made mini-mal progress during the first 4 weeks of thestudy, but began to show growth after Week 4until the end of the study. The investigators ofthat study hypothesized that feedback to teach-ers may have caused the increase in progress;however, the findings of the present study donot support that hypothesis. Another plausiblehypothesis is that collecting CBM data mayhave directly impacted the students' progress.That is. something about the repeated measure-
197
School Psychology Review, 2005, Volume 34. No. 2
ment on CBM reading tests may have ac-counted for the increase in slopes other thanteachers seeing the lack of progress and in-creasing the intensity of their instruction. It ispossible that a similar phenomenon was ob-served here.
Implications for Practice
The principal implication of this study'sresults for practice is that, to use studentprogress data effectively, general educationteachers need more than feedback in the formof a graph and a numerical summary of slopeof improvement accompanied by general rec-ommendations. Although this study did notinclude specific written feedback to teachersabout whether changes were needed, the issuewas raised by consultants during the feedbackmeetings. However, knowing when to changedid not appear to be enough. The evidence sug-gests that teachers need substantial ongoingsupport in modifying their instruction. For ex-ample. Fuchs et al. (1994) found that teachersincreased their students' achievement in gen-eral education when they were provided notonly with feedback on their students' perfor-mance and specific skills analyses, but alsowith specific instructional recommendationsand ongoing consultation. In another study.teachers relied heavily on the ideas for instruc-tional changes provided by the investigators,and only a small percentage of changes imple-mented by teachers represented their own ideas(Fuchs etal , 1995).
Attempts were made in the present studyto provide prompting and instructional sup-port during the consultation session by fo-cusing teachers" attention to their instruc-tional plans and making general recommen-dations for instructional changes whenteachers asked for them. However, the lackof positive effects for group feedback andthe apparent negative effect for individualfeedback indicate that the level of supportprovided to teachers in this study was notsufficient to produce meaningful achieve-ment gains. These results reinforce the ideathat feedback needs to be (a) more descrip-tive than is achieved by providing simplenumbers, and even graphs, and (b) more pre-
scriptive with respect to what instructionalchanges are needed to improve student perfor-mance. In addition, teachers need follow-upsupport in implementing changes to their in-struction. School psychologists and other con-sultants need to be prepared to offer that sup-port when helping general education teachersincrease the achievement of their low-perform-ing students.
The second implication for practice isrelated to the fmding that individual feedbackmay have detrimental effects on the achieve-ment outcomes for low-perform ing individualstudents, especially in the absence of clear di-rections for quality interventions and ongoingsupport for teachers in implementing andevaluating those interventions. This findingmay be especially relevant considering the like-lihood that teachers implementing formativeevaluation will be aware of the progress of eachstudent individually. If individual feedback canbe detrimental to student achievement, it isimportant the data be accompanied by ongo-ing consultation to safeguard against the pos-sibility of teachers decreasing their efforts toteach individual students in response to thedata. School psychologists and other educa-tional leaders need to be aware of this possi-bility and monitor whether it occurs when for-mative evaluation is implemented in theirschools.
Limitations of Study
This study contains some limitations.First, to ensure equal representation of teach-ers within each experimental group across dis-tricts and schools, teachers within each schoolwere randomly assigned to different groups.Nine of the 14 schools involved in the studycontained at least one teacher in each Feed-back group. This procedure was used to avoidthe potentially confounding variable of schooleffects on student achievement. However, it leftthe study open to the threat of diffusion of treat-ment (Cook & Campbell, 1979). When teach-ers at a particular school received feedback thattheir students were not making adequateprogress, their colleagues in the control groupmay have assumed that their students also werenot making adequate progress.
198
Effects of Reading CLirricLilum
A second limitation of this study is thatthe majority of students participating in thestudy received additional reading support be-yond the general education classroom. Al-though the teachers had identified themselvesas primarily responsible for teaching their par-ticipating students to read, it is conceivable thatthey did not take full ownershipover their stu-dents' progress. If this were the case, the teach-ers may not have been sufficiently motivatedto make meaningful changes to their students'progress. This possibility may point to a largerissue of classroom teachers" ownership andinfluence over their lowest performing stu-dents when those students receive supple-mentary reading support from someoneother than themselves.
Finally, the teachers were not providedwith a sufficient level of support to make mean-ingful instructional changes. The consultantsused in this study were undergraduate psychol-ogy majors with limited training in the subjectof reading instruction. The consultation ses-sions were brief, several lasting only 5 min-utes, and the recommendations provided to theteachers, if any, were general (e.g., increaseinstructional time, provide more opportunitiesto respond). In addition, teachers were not pro-vided with ongoing support regarding any in-structional changes they may have agreed tomake during the consultation session. It is pos-sible that teachers would have increased theirstudents' achievement in response to the feed-back if they had more support in doing so.
Directions for Future Research
Some of the most compelling evidencefor the effects of formative evaluation in spe-cial education settings came from the studyconducted by Fuchs et al. (1984). In that study,teachers were trained to use formative evalua-tion with R-CBM and implemented it. withsupport from research staff, much the way itwould have been implemented if the schoolshad decided to provide the training and sup-port the teachers in using formative evaluation.A similar study, where general education teach-ers receive training and ongoing support forusing formative evaluation with R-CBM asadapted for general education, might demon-
strate greater student achievement over stu-dents whose teachers do not use formativeevaluation of their reading programs.
Although the feedback did not affectachievement in this study, the slopes ofprogress for the majority of the students didincrease over time. This finding is similar tothat observed in Shinn et al. (1997). suggest-ing that monitoring alone may have some posi-tive effects for students. However, history andtesting effects were not controlled for in eitherstudy. These questions may be addressedthrough further investigations of ongoing datacollection that include a no-monitoring con-trol group.
Future research also is needed to addressthe possible negative effects of individual feed-back observed in this study. One way of doingthis might be to replicate this study focusingon a single student for each teacher, while pro-viding more support to the teachers in modi-lying instruction for their individual student.Another possibility is to conduct descriptiveresearch examining the relation betweenteacher perceptions of individual studentprogress and actual progress made by the stu-dents. If indeed the negative effect of individualfeedback seen in this study generalizes to thepopulation of general education teachers andlow-performing students, a clearer understand-ing of the mechanisms behind this phenom-enon might help educators to curtail it whileimplementing formative evaluation strategiesin their general education classrooms.
References
Baker. J. M.. & Zigniond. N. (1990). Are regular educa-litin classes equipped lo accommodate siudents withlearning disabililies? Exceptional Children. 56. 315-526.
Bryk. A. S.. & Raudenbush. S. W. (1992). Hifrurchiiallinear inDdfh. Newhury Piirk: Sage Puhlications.
Cook.T. D.. & Campbell. D. T. (1979). Qiiu.si-experimen-tiitiim: Design and eimilysi.s issues for field .settings.Chit-ago: Rand McNally.
Crawford. L.. Tindal. G-. & Steiber. S. (2001). Using read-ing rate lo predicl slutleni pertormance on statewidereading tests. Educational Assessment. 7. 303-323.
Deiio, S. L. (1985). CBM: The emerging alternative. Ex-ceptionai CtuUlren. 52, 219-232.
Deno, S. L. (1986). Formative evaluation ot" individualstudent programs: A new role tor school psythologisls.Sihool Psychology Review. 15. 358-374.
199
Sctiool Psychology Review, 2005, Volume 34, No. 2
Deno, S. L. (2003). Developments in Curriculum-BasedMeasucement. Journal of Special Education, 37. 184-192.
Deno. S. L.. Deno. D., Marsion, D.. & Marston D. (1987).Test of Oral Reading Fluency. Minneapolis: Ctiildren'sEducational Ser\ices.
Deno. S. L.. & Mirkin. P. K. (1977). Data-based programmodification: A manual. Reston, VA: Council tor Ex-ceptional Children.
Deno, S. L., Mirkin. P. K.. & Chiang. B. (1982). Identify-ing valid measures of reading. Exceptional Children.49, 36-45.
Fuchs, L. S., Deno, S. L., & Mirkin, P. K. (1984). Theeffects of frequent Curriculum-Based Measurementand evaluation on pedagogy, student achievement, andstudent awareness of learning. American EducationalResearch Journal. 21. 449-460.
Fuchs, L. S.. & Fuchs, D. (1986). Effects of systematicformative evaluation: A meta-analysis. ExceptionalChildren, 53. 199-208.
Fuchs, L. S., & Fuchs. D. (1999). Monitoring studentprogress toward the development of reading compe-tence: A review of three forms of classroom-based as-sessment. School Psychology Review. 28, 659-671.
Fuchs, L. S.. Fuchs, D., Hamlett, C. L.. Phillips, N. B., &Bentz, J. (1994). Ciasswide Curriculum-Based Mea-surement: Helping general educators meet the chal-lenge of student diversity. E.xceptional Children. 60.518-537.
Fuchs, L. S.. Fuchs. D.. Hamlett. C. L., Phillips, N. B., &Karns, K. (1995). General educators" specialized ad-aptation for students wiih learning disabilities. Excep-tional Children, 61. 440-459.
Fuchs, L. S.. Fuchs, D.. Hamlett, C. L.. Walz. L.. &Gennann, G. (1993). Fotmative evaluation of academicprogress: How much growth can we expect? SchoolPsychology Review. 22. 27-48.
Fuchs, L. S., Fuchs, D., Hosp, M. K., & Jenkins, J. R.(2001). Oral reading fluency as an indicator of read-ing competence: A theoretical, empirical, and histori-cal analysis. Scientific Studies of Reading, 5(3). 239-256.
Fuchs, L. S., Fuchs. D., & Maxwell, L. (1988). The valid-ity of informal reading comprehension measures. Re-medial and Special Education. 9. 20-28.
Jenkins. J. R., Mayhall, W. F., Peschka, C, & Townsend,V. (1974). Using direct and daily measures to increaselearning. Journal af Learning Disabilities. 7(10), 14-17.
Lane, K. L., Mahdavi, J. N., & Borthwick-Duffy, S. (2003).Teacher perceptions of the prereferral intervention pro-cess; Acall for assistance with school-based interven-tions. Preventing School Failure, 47{4). 148-155.
Marston, D. B. (1989). A CBM approach to assessing aca-demic performance: What it is and why do it. In M. R.ShinniEi^.).Curriculum-Based Measurement: Assess-ing special children. New York: Guilford.
McDaniel. T. R. (1999). School accountability. ClearingHouse. 720). 132-133.
McGlinchey, M. T, & Hixson, M. D. (2004). Using Cur-riculum-Based Measurement to predict performanceon state assessments in reading. School PsychologyReview. 33, 193-203.
National Center on Student Progress Monitoring. (2005).Review of progress monitoring tools.
No Child Left Behind Act of 2001. Reading First stategrants. Title I, Section 1003(g). Retrieved February28, 2005 from http://www.studentprogress.org
Scott, B. J., Vitale, M. R., & Masten, W. J. (1998). Imple-menting instructional adaptations for students withdisabilities in inclusiveclassrooms: A literature review.Remedial and Special Education, 19. 106-118.
Shinn. M. R. (2002). Best practices in curriculum-basedmeasurement and its use in a problem-solving model.In A. Thomas & J. Grimes (Eds.), Best practices inschool psychology IV (pp. 671-698). Bethesda, MD:National Association of School Psychologists.
Shinn, M. R., Good, R. H., Knutson, N., Tilly, D., &Collins. V. (1992). Cuniculum-based measurement oforal reading tluency: A confirmatory analysis of itsrelation to reading. School Psychology Review. 21.459-479.
Shinn. M. R.. Good, R. H., & Stein, S. (1989). Summariz-ing trend in student achievement: A comparison ofmethods. School Psychology Review, 18. 356-370.
Shinn, M. R., Powell-Smith, K. A., Good. R. H.. & Baker,S. (1997). The effects of reintegration into general edu-cation reading instruction for students with mild dis-abilities. Exceptional Children. 64, 59-79.
Shinn. M. R., & Shinn, M. M. (2001). Curriculum-BasedMeasurement: Cheaper, faster, and better assessmentof students with learning disabilities. In L. Denti & P.Tefft-Cousin (Eds.), New ways of looking at learningdisabilities: Connections to classroom practice (pp. 85-109). Denver: Love Publishing Company.
Shinn, M. R., & Shinn. M. M. (2003). Aimsweb™ train-ing workbook administration and scoring of ReadingCurriculum-Based Measurement (R-CBM) for use ingenera! outcome measurement. Eden Prairie. MN:Edtbrmation, Inc.
Shinn, M. R., Shinn. M. M.. Hamilton. C . & Clarke, B.(2002). Using cuiricuium-based measurement to pro-mote achievement in general education classrooms. InM. R. Shinn, G. Stoner, & H. M. Walker (Eds.), Inter-ventions for academic and behavior problems: Pre-ventive and remedial approaches (pp. 113-142).Bethesda, MD: National Assocation of School Psy-chologists.
Wesson.C.L. (1991). Curriculum-based measurement andtwo models of follow-up consultation. ExceptionalChildren. 57. 246-256.
Wesson, C. L., Skiba. R.. Sevcik. B.. King. R. P., & Deno.S. (1984). The effects of technically adequate instruc-tional data on achievement. Remedial and SpecialEducation. 5, 17-22.
200
Effects of Reading Curriculum
Suzanne B. Graney earned her PhD in School Psychology from the University of Oregonin 1999. She is currently an Assistant Professor in School Psychology at Rochester Insti-tute of Technology in Rochester, NY. Prior to joining the faculty at RIT. she worked as aschooi psychologist for the School Dislrict of Indian River County in Vero Beach. Florida,and participated on the Florida State CBM workgroup. Her primary research interests arein the areas of academic and behavioral interventions in general education settings andalternative models of eligihility determination.
Mark Shinn is currently a Professor of School Psychology at National-Louis Universityand a consultant to schools and state departments of education. From 1984-2003, he wasProfessor of School Psychology and Special Education at the University of Oregon. He isthe recipient of the APA Division 16 2003 Jack Bardon Distinguished Service Award andwas recently appointed to the Review Panel for the Office of Special Education ProgramsProgress Monitoring Technical Assistance Center. His interests remain progress monitor-ing and use of CBM in a needs-based problem-solving service delivery system.
201