Embed Size (px)
Citation preview
© Institute for Applied Psychometrics (IAP) llc 1-30-03
A Lesson from Forrest A Lesson from Forrest GumpGumpRegarding Appropriate Expectations for Regarding Appropriate Expectations for
Students with Cognitive DisabilitiesStudents with Cognitive Disabilities
Kevin S. McGrew, PhDKevin S. McGrew, PhD
DirectorDirectorInstitute for Applied Institute for Applied
Psychometrics (IAP) Psychometrics (IAP) llcllc
Visiting ProfessorVisiting ProfessorEducational PsychologyEducational PsychologyUniversity of MinnesotaUniversity of Minnesota
www.iapsych.comwww.iapsych.com
Intelligence and School AchievementIntelligence and School Achievement
© Institute for Applied Psychometrics (IAP) llc 1-30-03
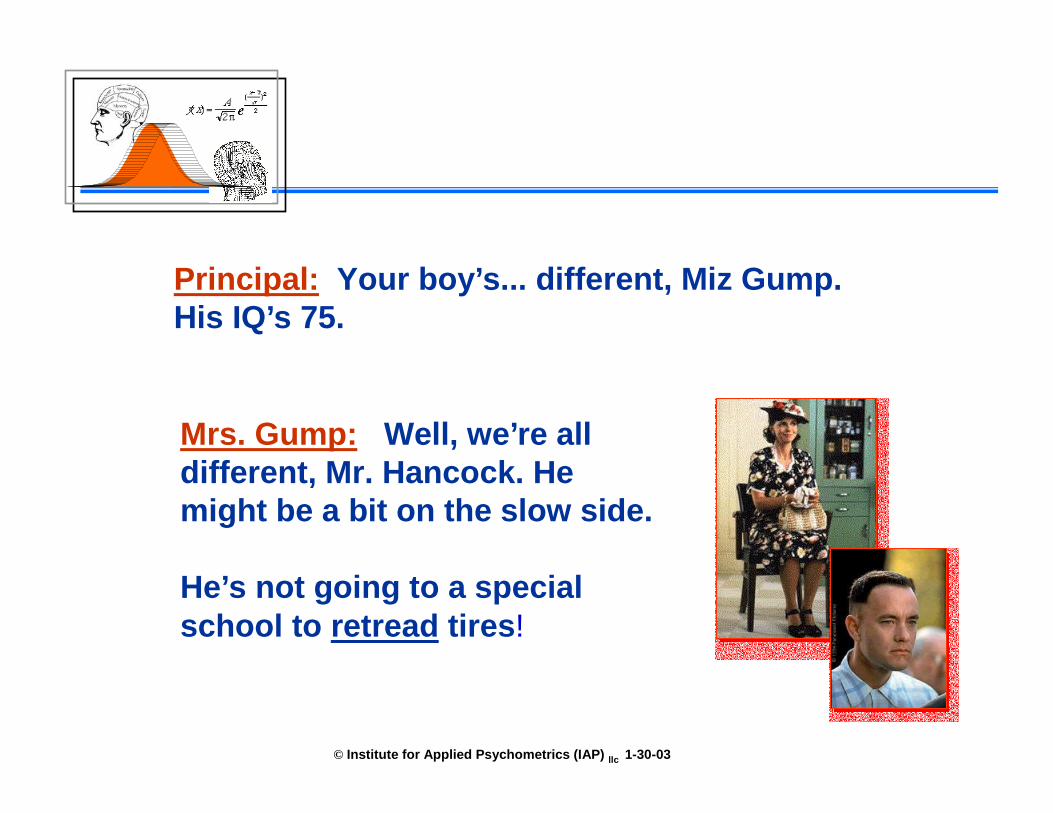
Principal: Your boy’s... different, Miz Gump. His IQ’s 75.
Mrs. Gump: Well, we’re all different, Mr. Hancock. He might be a bit on the slow side.
He’s not going to a special school to retread tires!
© Institute for Applied Psychometrics (IAP) llc 1-30-03
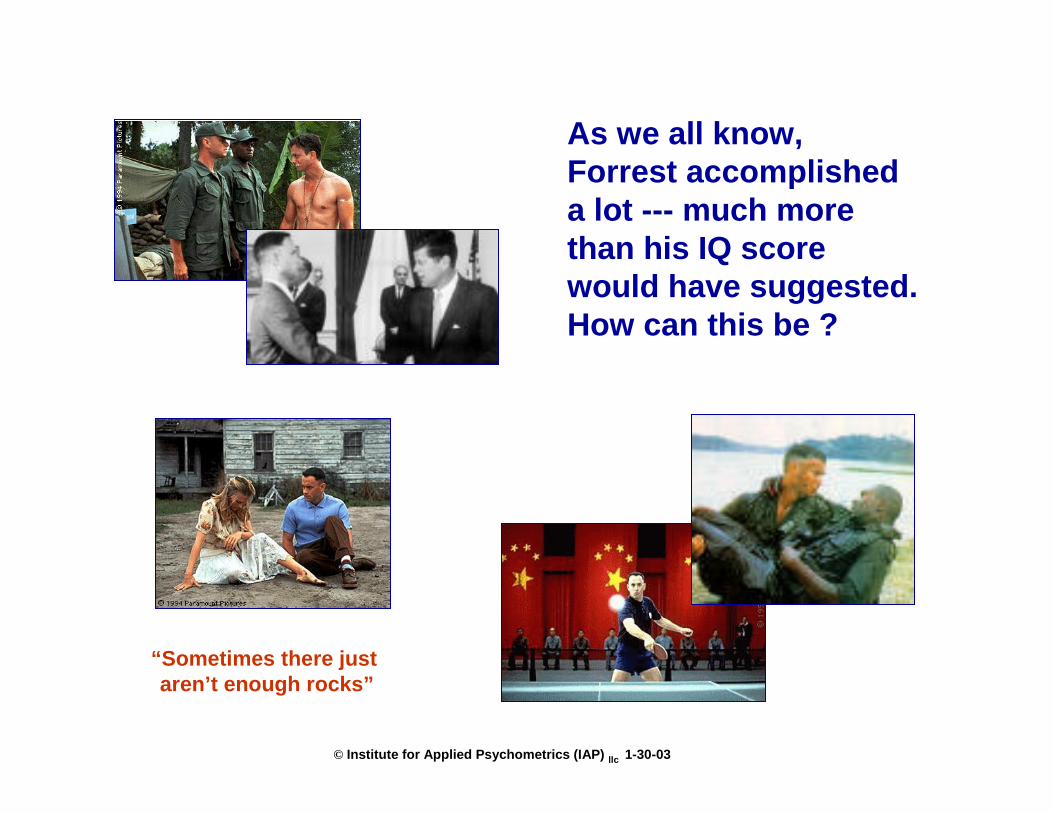
As we all know, Forrest accomplished a lot --- much more than his IQ score would have suggested. How can this be ?
“Sometimes there just aren’t enough rocks”

© Institute for Applied Psychometrics (IAP) llc 1-30-03
40 50 60 70 80 90 100 110 120 130 140 150 160
IQ=75 + 5SEM produces this
confidence band for Forrest Gump’s
IQ score
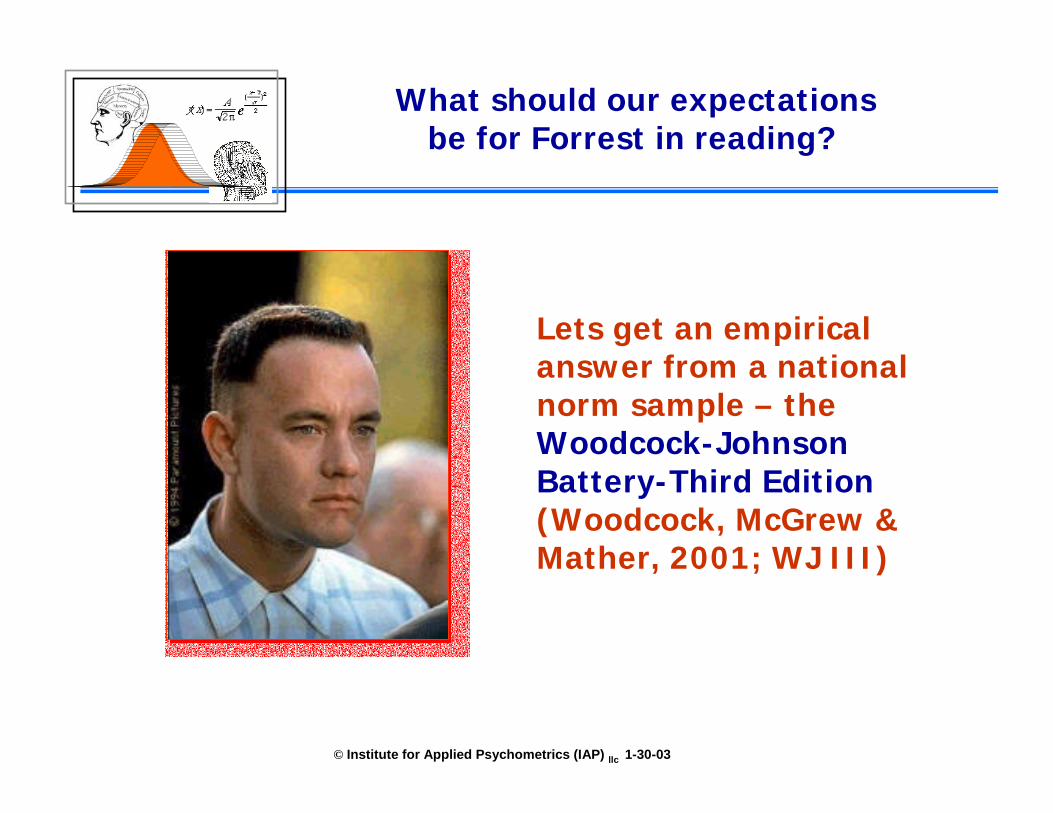
What should our expectationsbe for Forrest in reading?
© Institute for Applied Psychometrics (IAP) llc 1-30-03
Lets get an empirical answer from a national norm sample – the Woodcock-Johnson Battery-Third Edition(Woodcock, McGrew & Mather, 2001; WJ I I I )
What should our expectationsbe for Forrest in reading?
© Institute for Applied Psychometrics (IAP) llc 1-30-03
100
115
130
85
70
100
115
130
85
70
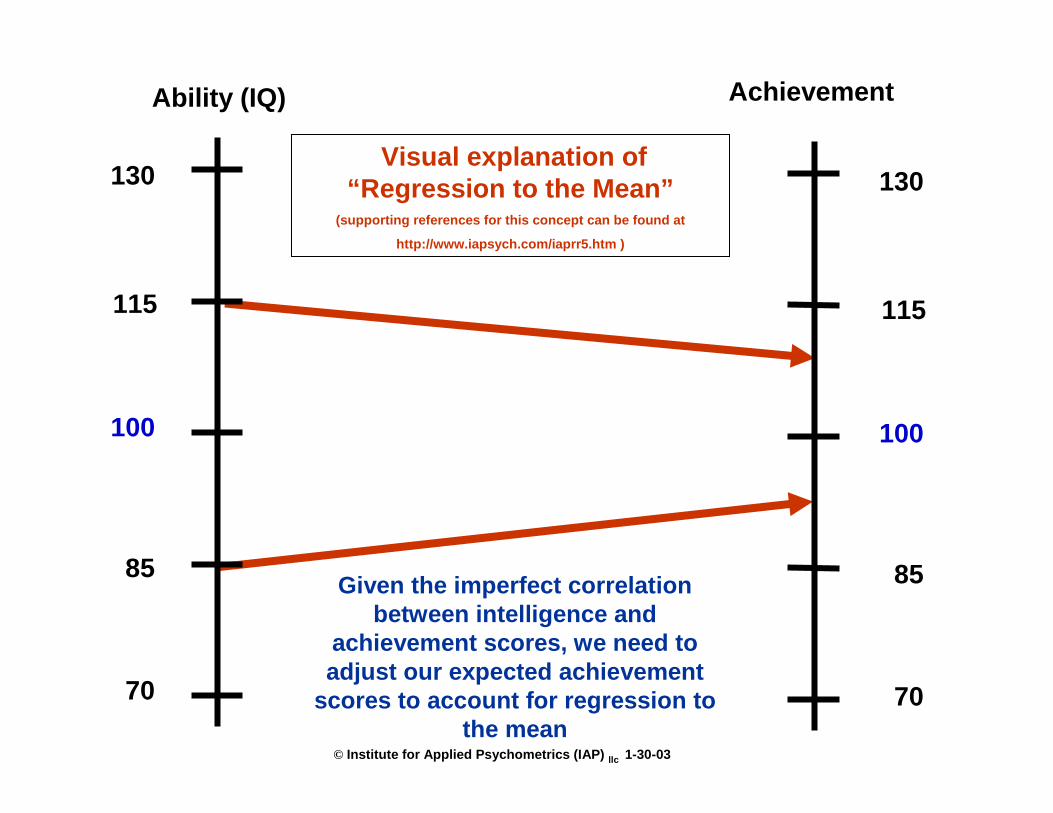
Visual explanation of “Regression to the Mean”
(supporting references for this concept can be found at
http://www.iapsych.com/iaprr5.htm )
Given the imperfect correlation between intelligence and
achievement scores, we need to adjust our expected achievement
scores to account for regression to the mean
Ability (IQ) Achievement
© Institute for Applied Psychometrics (IAP) llc 1-30-03
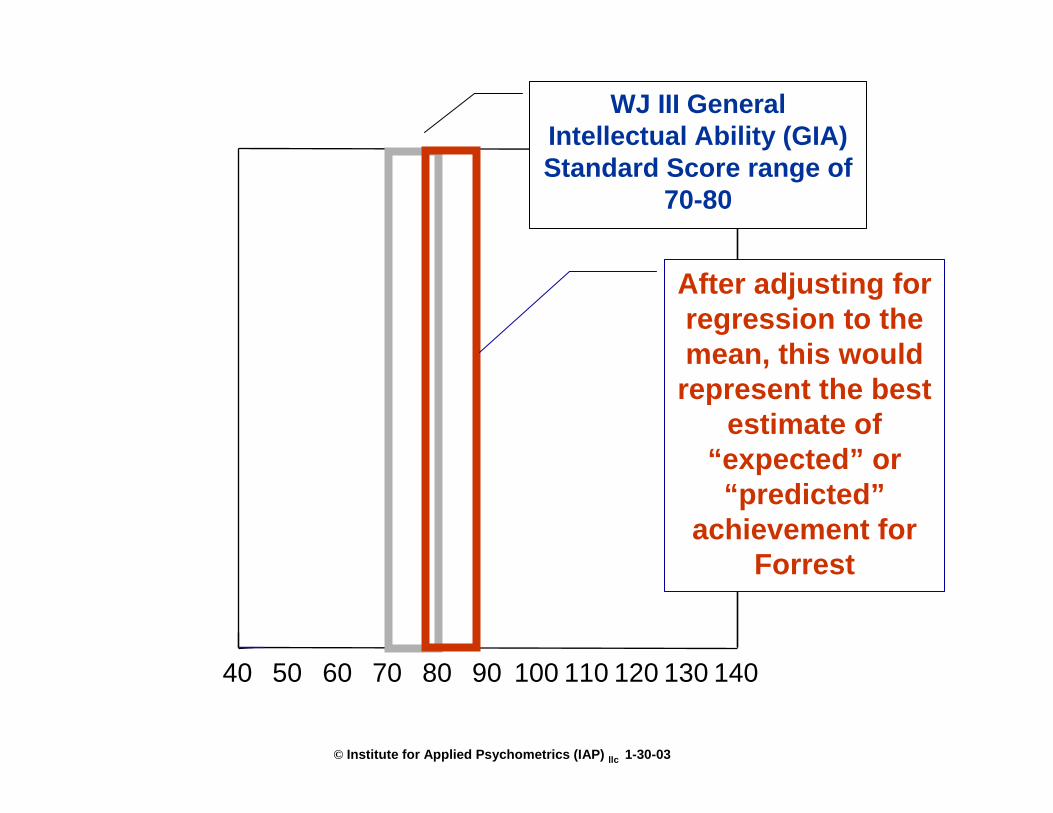
90 100 110 120 130 14040 50 60 70 80
WJ III General Intellectual Ability (GIA) Standard Score range of
70-80
After adjusting for regression to the mean, this would
represent the best estimate of
“expected” or “predicted”
achievement for Forrest

© Institute for Applied Psychometrics (IAP) llc 1-30-03
Regression-based
expected score
The histogram below represents the WJ III Basic Reading Skills achievement scores for all WJ III norm subjects with a
GIA score of 70-80.

© Institute for Applied Psychometrics (IAP) llc 1-30-03
Lets take the histogram and plot a smoothed density plot around the same data. Below is the distribution of actual WJ III Basic
Reading Skills scores for all WJ III norm subjects with a GIA score of 70-80
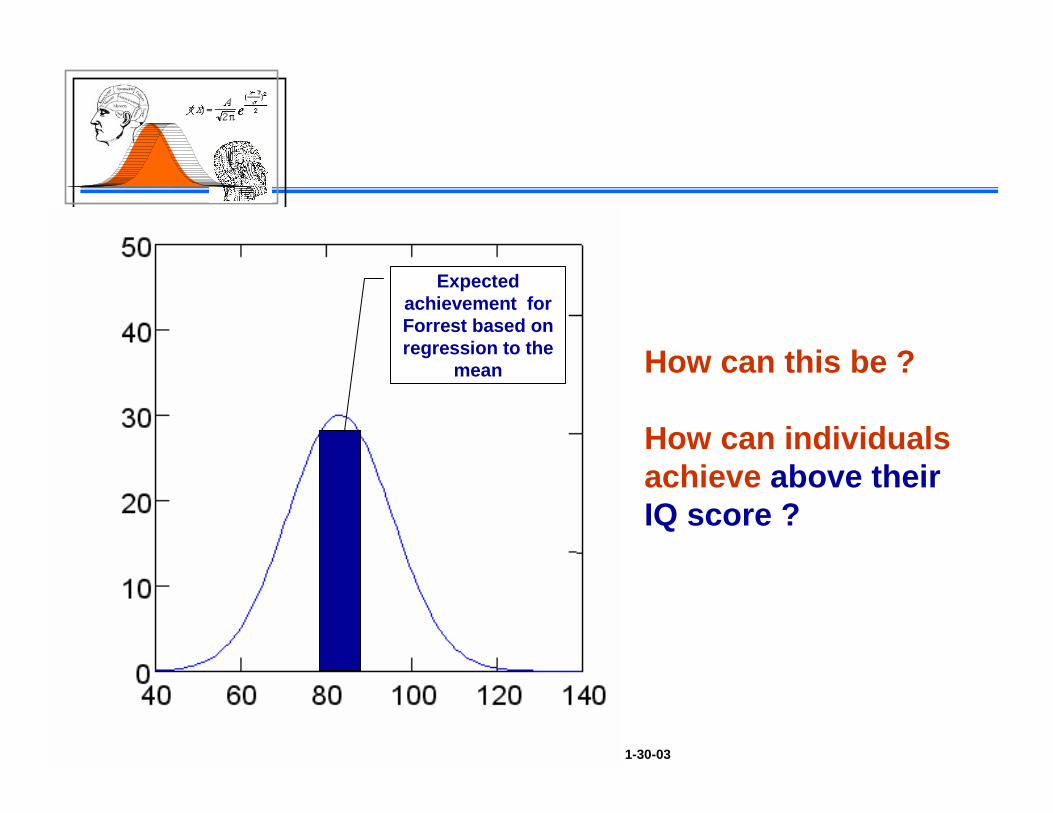
Expected achievement for Forrest based on regression to the
mean
Major observation:
The histogram has the shape of a normal distribution, with half of the population with IQs from 70-80 being above, and the other half being below, the average "expected" or “predicted” level of achievement
© Institute for Applied Psychometrics (IAP) llc 1-30-03
Expected achievement for Forrest based on regression to the
mean How can this be ?
How can individuals achieve above their IQ score ?
© Institute for Applied Psychometrics (IAP) llc 1-30-03
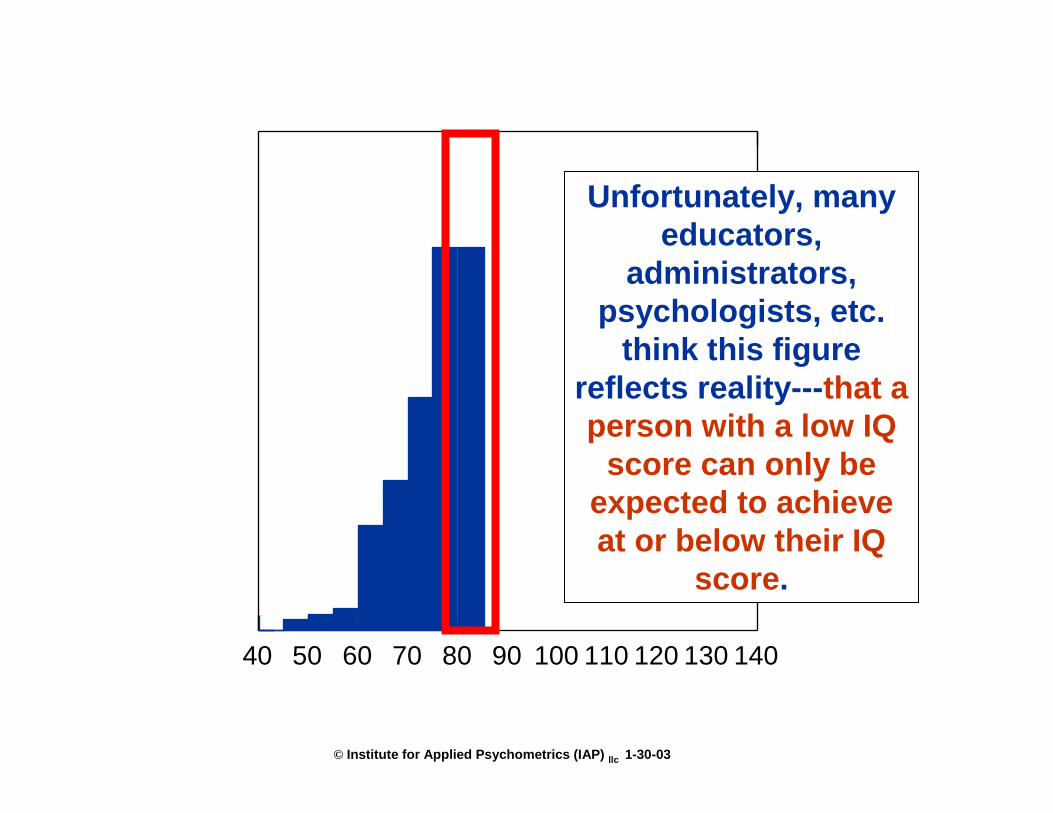
90 100 110 120 130 140
BRS40 50 60 70 80
Unfortunately, many educators,
administrators, psychologists, etc.
think this figure reflects reality---that a person with a low IQ
score can only be expected to achieve at or below their IQ
score.
© Institute for Applied Psychometrics (IAP) llc 1-30-03
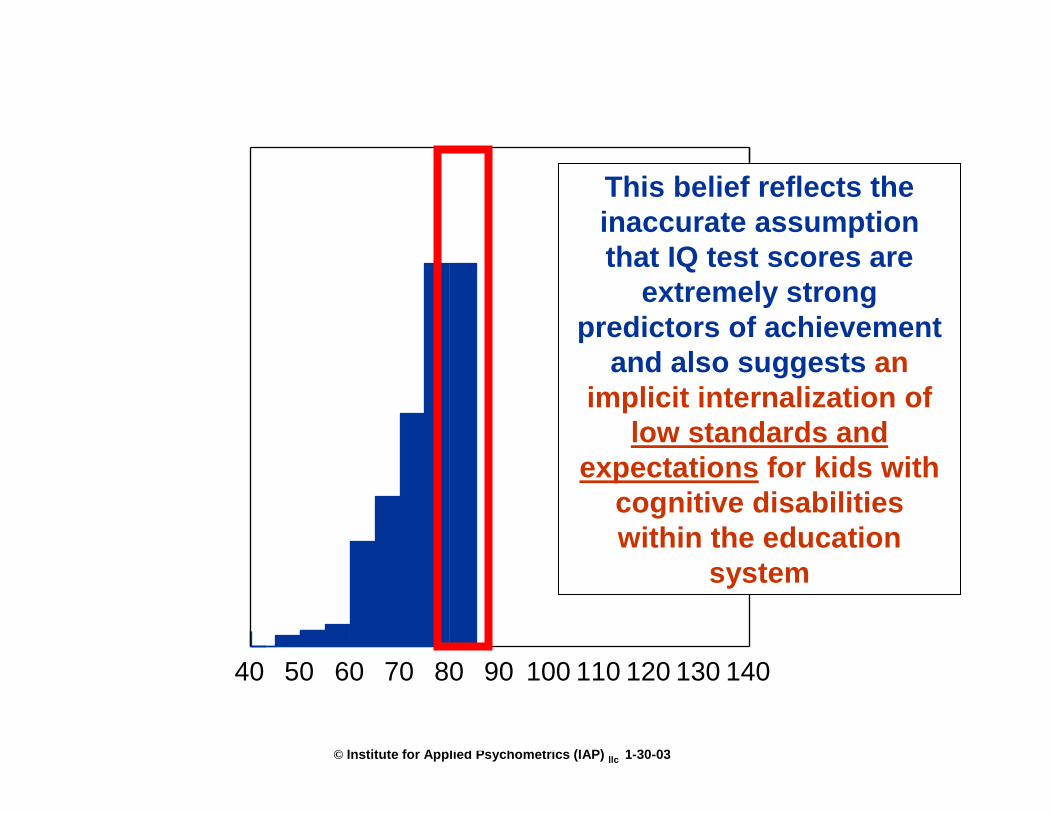
90 100 110 120 130 140
BRS40 50 60 70 80
This belief reflects the inaccurate assumption that IQ test scores are
extremely strong predictors of achievement
and also suggests an implicit internalization of
low standards and expectations for kids with
cognitive disabilities within the education
system

© Institute for Applied Psychometrics (IAP) llc 1-30-03
Our intelligence tests are fallible predictors of current and future achievement
Typical IQ-Ach correlations are in the .60
to .70 range
I Q ACH
Our IQ tests can only
account for 40 to 50 % of
school achievement
© Institute for Applied Psychometrics (IAP) llc 1-30-03
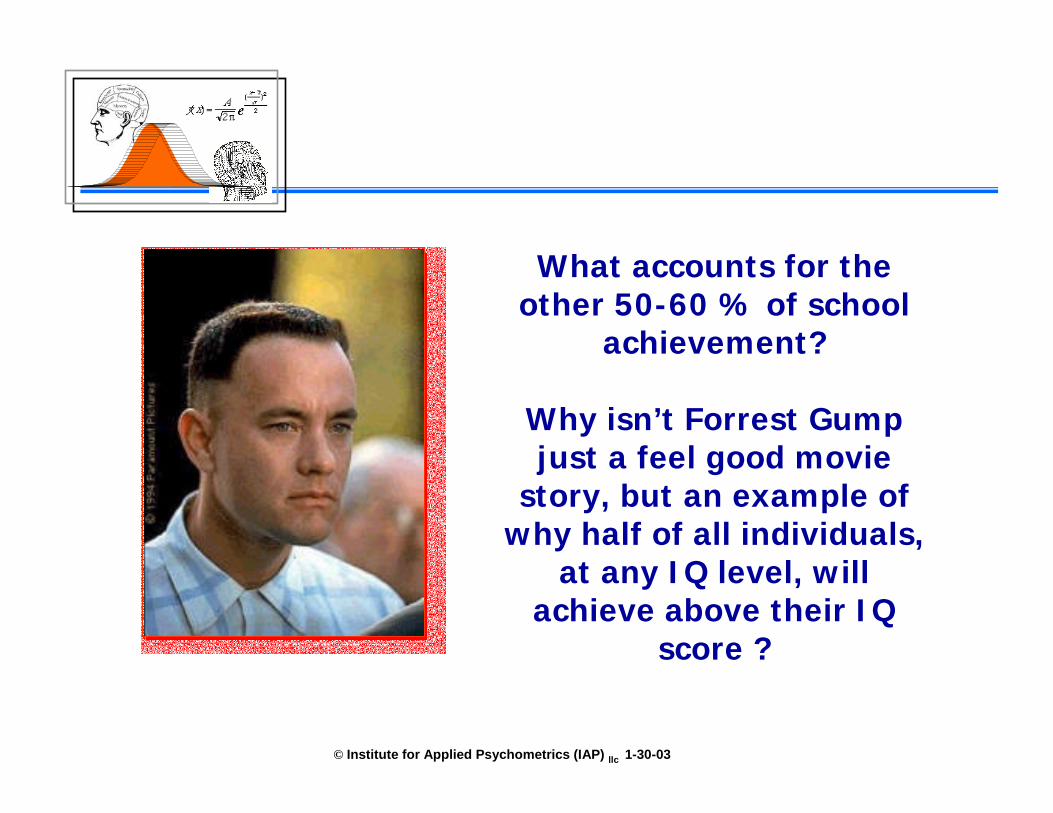
What accounts for the other 50-60 % of school
achievement?
Why isn’t Forrest Gumpjust a feel good movie
story, but an example of why half of all individuals,
at any I Q level, will achieve above their I Q
score ?
© Institute for Applied Psychometrics (IAP) llc 1-30-03
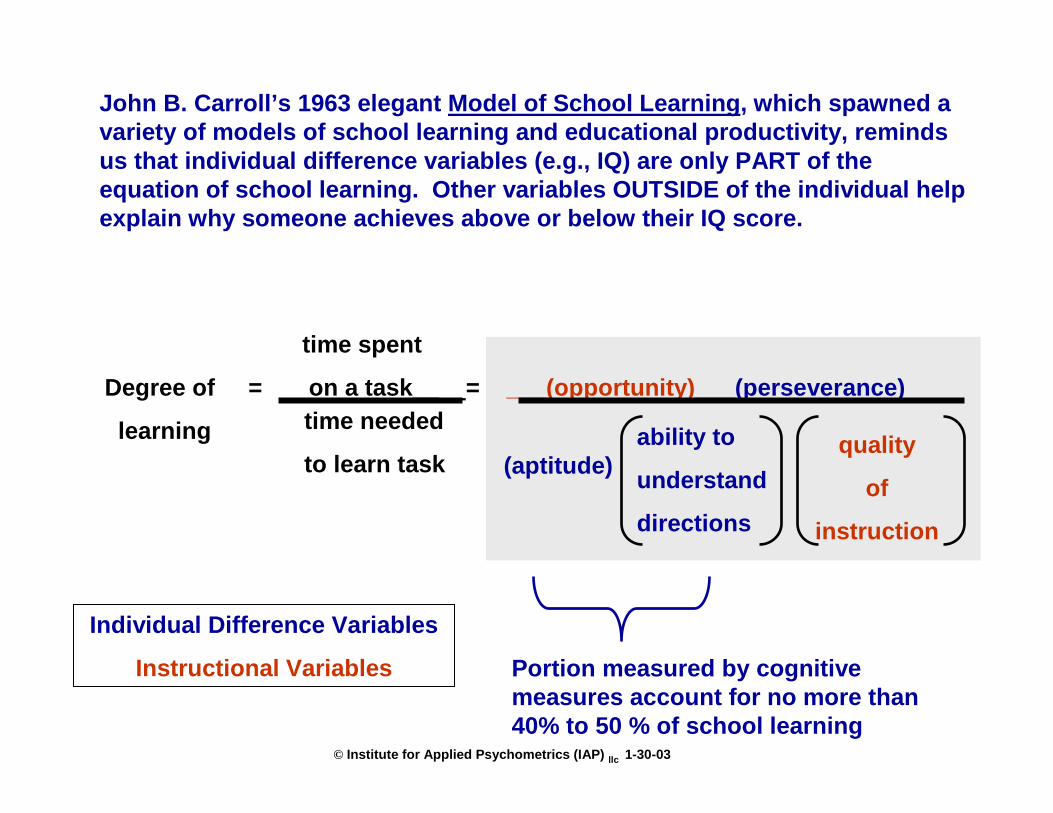
John B. Carroll’s 1963 elegant Model of School Learning, which spawned a variety of models of school learning and educational productivity, reminds us that individual difference variables (e.g., IQ) are only PART of the equation of school learning. Other variables OUTSIDE of the individual help explain why someone achieves above or below their IQ score.
Individual Difference Variables
Instructional Variables
time spent
Degree of = on a task__ = ___(opportunity)___(perseverance)__
learning(aptitude)
ability to
understand
directions
quality
of
instruction
time needed
to learn task
Portion measured by cognitive measures account for no more than 40% to 50 % of school learning
© Institute for Applied Psychometrics (IAP) llc 1-30-03
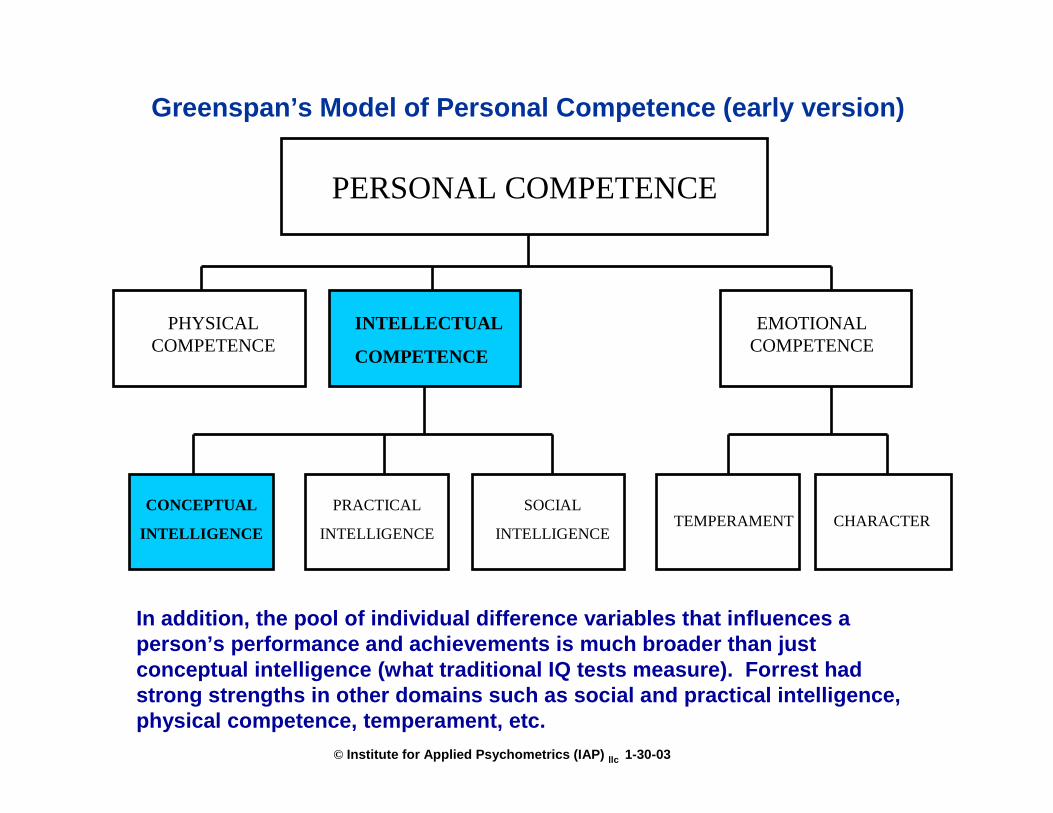
PERSONAL COMPETENCE
PHYSICAL COMPETENCE
INTELLECTUAL
COMPETENCE
EMOTIONAL COMPETENCE
CONCEPTUAL
INTELLIGENCE
PRACTICAL
INTELLIGENCE
SOCIAL
INTELLIGENCETEMPERAMENT CHARACTER
Greenspan’s Model of Personal Competence (early version)
In addition, the pool of individual difference variables that influences a person’s performance and achievements is much broader than just conceptual intelligence (what traditional IQ tests measure). Forrest had strong strengths in other domains such as social and practical intelligence, physical competence, temperament, etc.

© Institute for Applied Psychometrics (IAP) llc 1-30-03
PhysicalAbilities
ConceptualAbilities
PracticalAbilities
SocialAbilities
Emotions& Motivation
PersonalCompetence
Also, our current tests only “sample” certain cognitive & achievement abilities within the conceptual ability domain. White space =
there is much we are NOT measuring
At best, these type of tests can only account for approximately ½ of a person’s school achievement
© Institute for Applied Psychometrics (IAP) llc 1-30-03
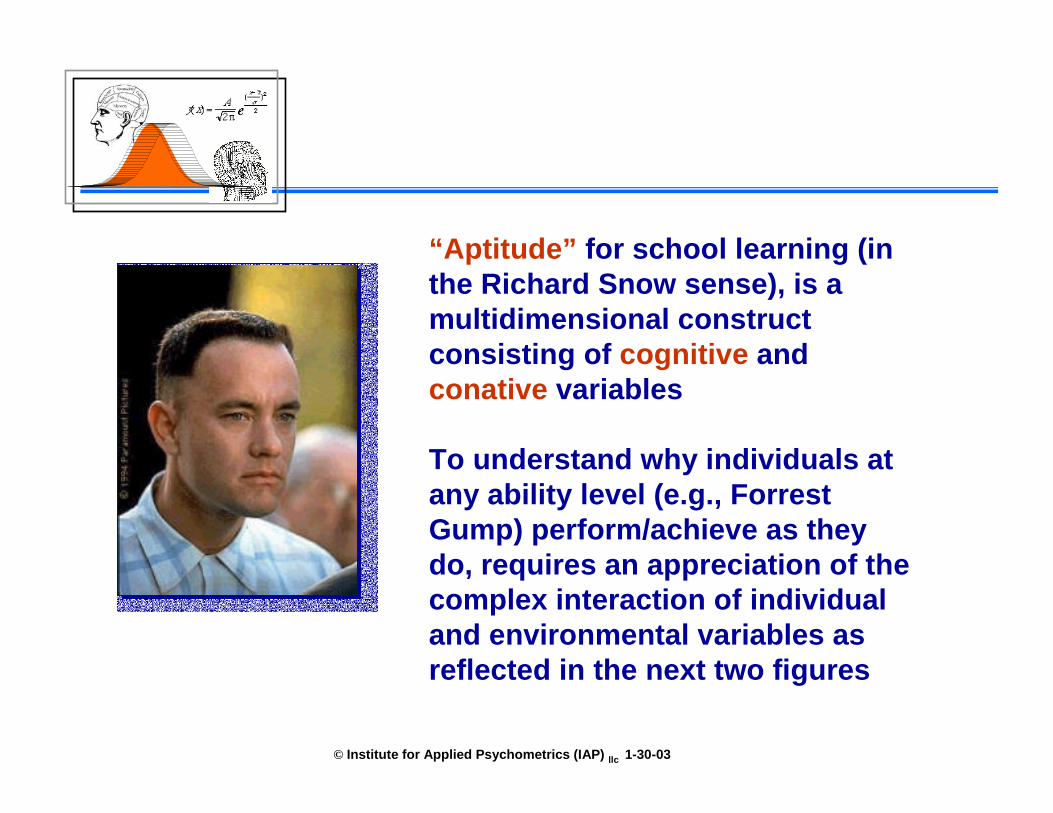
“Aptitude” for school learning (in the Richard Snow sense), is a multidimensional construct consisting of cognitive and conative variables
To understand why individuals at any ability level (e.g., Forrest Gump) perform/achieve as they do, requires an appreciation of the complex interaction of individual and environmental variables as reflected in the next two figures

© Institute for Applied Psychometrics (IAP) llc 1-30-03

© Institute for Applied Psychometrics (IAP) llc 1-30-03
© Institute for Applied Psychometrics (IAP) llc 1-30-03
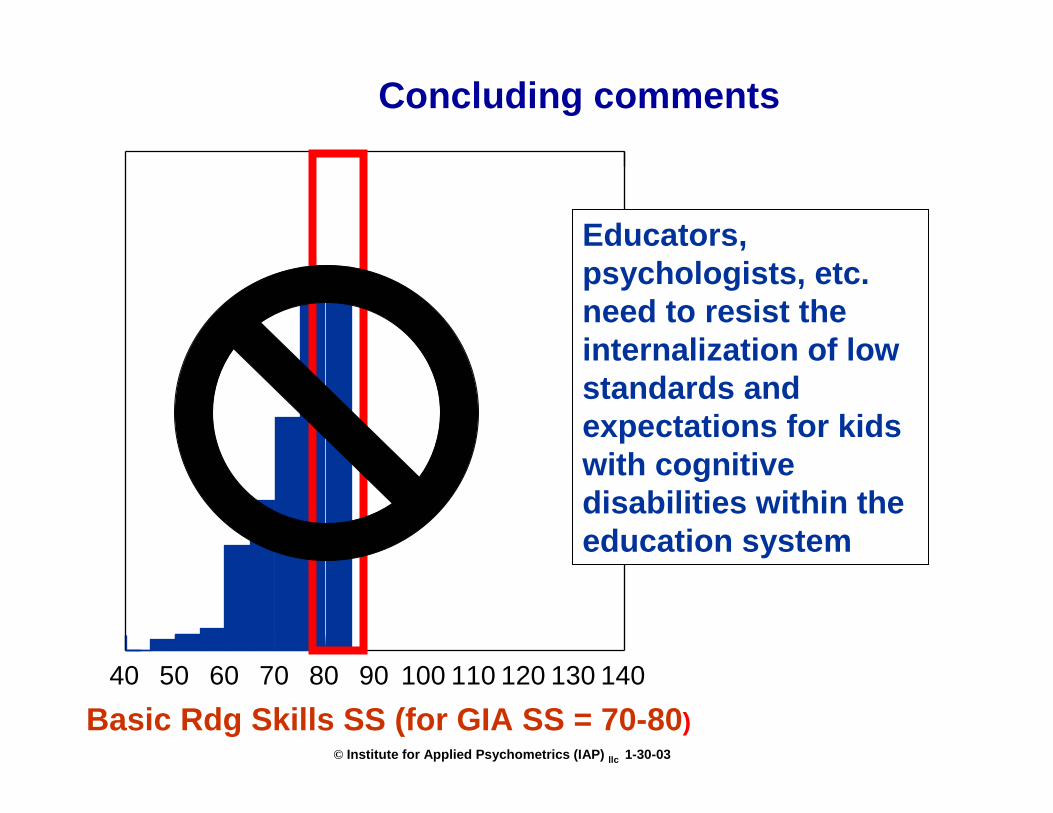
90 100 110 120 130 140
BRS40 50 60 70 80
Basic Rdg Skills SS (for GIA SS = 70-80)
Educators, psychologists, etc. need to resist the internalization of low standards and expectations for kids with cognitive disabilities within the education system
Concluding comments

© Institute for Applied Psychometrics (IAP) llc 1-30-03
Current research and assessment technology does not allow us to accurately predict which children will be in the top half of the achievement distribution at any given level of general intelligence
Concluding comments
© Institute for Applied Psychometrics (IAP) llc 1-30-03
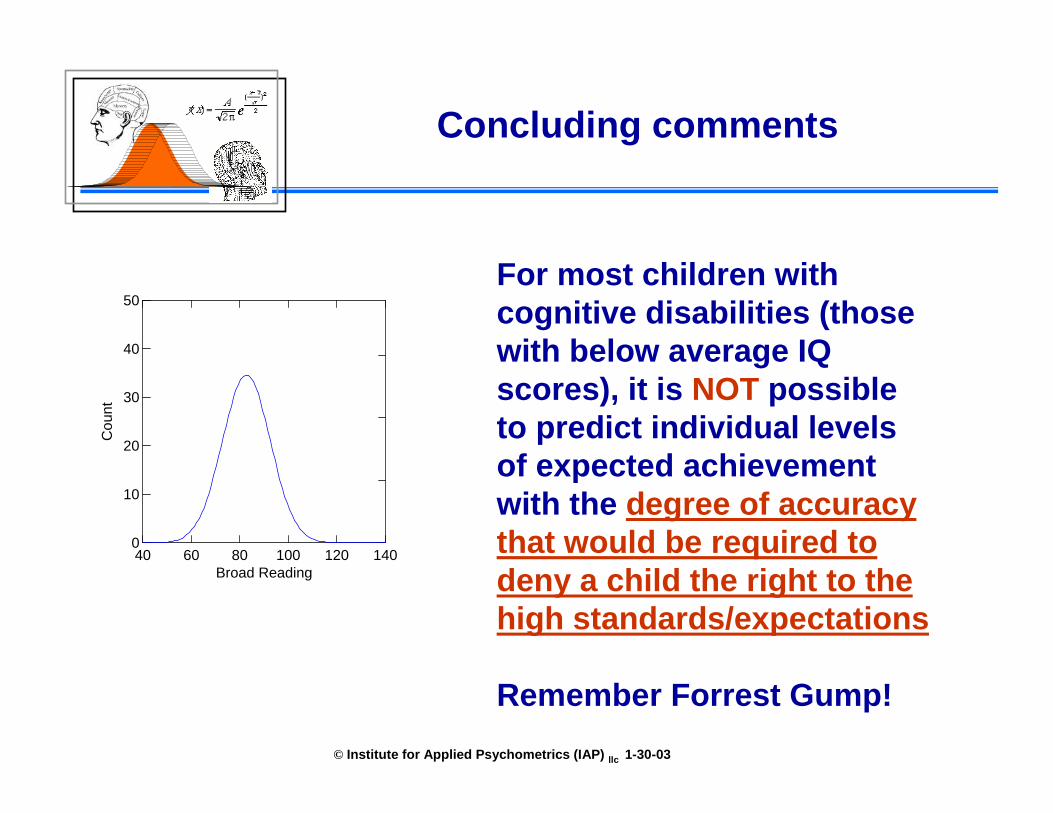
40 60 80 100 120 140Broad Reading
0
10
20
30
40
50
Cou
nt
For most children with cognitive disabilities (those with below average IQ scores), it is NOT possible to predict individual levels of expected achievement with the degree of accuracy that would be required to deny a child the right to the high standards/expectations
Remember Forrest Gump!
Concluding comments


