Embed Size (px)
Citation preview
DOCUMENT RESUME
ED 441 329 EF 005 712
AUTHOR Earthman, Glen I.TITLE The Impact of School Building Condition and Student
Achievement, and Behavior.PUB DATE 1998-11-00NOTE 26p.; Paper presented at the European Investment
Bank/Organization for Economic Coordination and DevelopmentInternational Conference, (Luxembourg, November 16-17,1998) .
PUB TYPE Information Analyses (070) Speeches/Meeting Papers (150)EDRS PRICE MF01/PCO2 Plus Postage.DESCRIPTORS *Academic Achievement; *Educational Environment;
*Educational Facilities Improvement; Elementary SecondaryEducation; Parent School Relationship; Public Schools;*Student Behavior
ABSTRACTThis paper examines study findings on the relationship
between the educational facility and the student variables of academicachievement and student behavior, revealing the extent that thermalenvironment, proper illumination, space, and equipment and furnishings haveon students. Additionally discussed is the relationship between parentalinvolvement, school building conditions, and student achievement. In almostall cases, the better the built environment is, the more positive the impacton students' test scores is: test scores between students in substandardbuildings compared to students in better school environments differed by 5 to17 percentile points. Also, in cases where there was greater parentalinvolvement in fundraising for school purposes, the school buildings were inbetter condition. The conclusion is that money spent on school buildingimprovement is money well spent. While it is known that better preparedgraduates of the local school system are more productive citizens, the degreeof influence the school environment has on later life remains unknown. (GR)
Reproductions supplied by EDRS are the best that can be madefrom the original document.
THE IMPACT OF SCHOOL BUILDING CONDITION ANDSTUDENT ACHIEVEMENT, AND BEHAVIOR
Glen I. EarthmanVirginia Polytechnic Institute 8,6 State University
Blacksburg, Virginia 24061-0302U.S.A.
(540) 231-9715(540) [email protected]
Presented at the International ConferenceThe Appraisal of Educational Investment
European Investment Bank/ Organization for EconomicCoordination and Development
Luxembourg16-17 November 1998
U.S. DEPARTMENT OF EDUCATIONOffice of Educational Research and Improvement
EDUCATIONAL RESOURCES INFORMATIONCENTER (ERIC)
ikThis document has been reproduced asreceived from the person or organizationoriginating it.
Minor changes have been made toimprove reproduction quality.
Points of view or opinions stated in thisdocument do not necessarily representofficial OERI position or policy.
1
PERMISSION TO REPRODUCE ANDDISSEMINATE THIS MATERIAL HAS
BEEN GRANTED BY
Glen I. Earthman
TO THE EDUCATIONAL RESOURCESINFORMATION CENTER (ERIC)
2
BEST COPY PALA E

Introduction
One of the most provocative and compelling questions regarding school
buildings is the influence the built environment has upon the performance of
students and teachers. Common belief held by educators and architects is that
the building does indeed have an influence upon how well students and
teachers perform. The big question, however, is the degree of influence and
how can that be accurately measured.
Over the past sixty years, considerable research has taken place in the
United States to assess the possible relationship between student performance
and built environment. Researchers have mounted studies to investigate the
influence of various building components such as wall color, building
configuration, the presence or absence of windows in classrooms, air-
conditioning, space allocation per pupil, use of carpeting on the floor, noise
levels, thermal conditions, and furniture types upon student performance in an
effort to discover a relationship. For the most part, these research efforts have
proven very valuable to the designers of new school buildings. Most new
school buildings in the United States incorporate the best features in the abovelist because of the research efforts.
From that body of research findings, considerable improvement in the
type of new school buildings have resulted. Students and teachers obviously
have benefited from this infusion of research findings in new buildings. Yet the
majority of students in the United States are not housed in new school
buildings. The vast majority of students are in older buildings, many of which
are approaching 50 years of age. These buildings do not, for the most part,
have the essential components that have been found to be necessary for a good
learning environment. As a result of this situation, research exploring the
relationship between building condition and student performance is important.
A problem that is inherent in this research is the lack of predictability onresults. In the hard sciences, predictability resulting from scientific
investigation is almost a given; yet in the social sciences, predictability is very
3
difficult at best to demonstrate. The research discussed in this paper in no
way can result in predictability. There is, however, benefit that can be derived
from examination and use of the research findings in these studies. One major
deficiency in research on school facilities has been the lack of replication of
sound studies. The studies presented here show the beginning of a
progression of studies using the same methodology, but with different
populations. These studies may be the start of discovering some generalities
regarding the impact of buildings on student performance.
In recent years, there have been some research studies completed that
have shown a promising avenue of investigation. These studies have
demonstrated a positive relationship between student achievement and
behavior and the design and condition of school buildings. There have not
been sufficient numbers of such studies; however, to present a strong
relationship from which generalizations can be made. Even the individual
studies that are in existence show a low to medium level of relationship
between these variables. Nevertheless, there is a high degree of interest in this
area of research to justify a more intense effort to gather whatever data are
available on this relationship. People want to know if the built environment
has an effect upon user performance, especially upon students in school
buildings. Some researchers state that the building has such insignificant
influence upon the user that whatever influence may be found to exist, is
simply that of chance. Other researchers, however, state that the built
environment does have a discernible influence upon the process of teaching
and learning. These individuals state the users are influenced both positively
and negatively by how the built environment either permits them to function or
inhibits the process of teaching and learning, yet systematic analysis of this
question on a scale large enough to generalize or predict has not been
undertaken.The main emphasis of investigation in this paper is the relationship
between the built environment and at least two student variables. The first
3
4
variable is student achievement as measured by some form of standardized or
normed test or examination administered to all students in the schools. The
other variable is student behavior that can include a specific level of student
activity or school climate that is a more general term. These two variables
relate directly to students themselves. There is a common belief among
educators that the behavior of students influences their academic achievement.
The reverse of this relationship is also believed to be true.
Building Age and Achievement
Conventional wisdom in the area of educational facility planning and
design seems to indicate that the physical environment does indeed have an
effect upon the behavior and performance of the students and teachers who
occupy these spaces. So often, however, a significant relationship is difficult to
statistically demonstrate. To explore this possible relationship, Bowers and
Burkett investigated the differences in student achievement, health,
attendance, and behavior between two groups of students in different physical
environments (1988). Two elementary school buildings, containing students
between the ages of 5 to 13 years, in the same school jurisdiction in rural
Tennessee were used to differentiate physical environments for thiscomparison. One school was recently opened and was a modern building in all
respects. The other building was constructed in 1939 and had very little
improvement to the physical structure. The researchers reasoned that the
students and faculty in both buildings were essentially the same. Theeducational program and teacher competency was exactly equal. Students in
the fourth and sixth grades were tested to determine the degree of academic
achievement. Students in the new school building significantly out performed
the students in the older building in reading, listening, language, andarithmetic. Further, faculty in the new building reported fewer disciplinary
incidents and health conditions than faculty in the old building. Attendancelikewise was better with those students in the new building than in the old
school. Bowers and Burkett concluded that a relationship did exist between
54

the physical environment and student achievement, health, attendance, and
behavior.
In a very recent replication of the above study, Phillips (1997) found
significant differences in the reading and arithmetic scores between students in
new buildings than those students in old buildings. He found a definite
relationship between the age of the school facility and student reading
achievement scores as measured by the Iowa Test of Basic Skills and a strong
relationship between student mathematics achievement scores and building
age. The mean mathematics scores for the treatment group (those students in
new buildings) increased 7.63 percentile ranks after moving into the new
facility. He did not find any significant differences in attendance patterns
between the students enrolled in the old or new buildings.
Building Condition and Parental Involvement
Edwards investigated the relationship between parental involvement,
school building condition, and student achievement in the schools in
Washington, D.C. (1992). She hypothesized that the condition of public school
buildings is affected by parental involvement and that the condition of the
school building further affects student achievement. She analyzed these
relationships by evaluating the condition of school buildings, determining the
extent of parental involvement and the amount of funds parents raised for the
local school, and compared the results with student achievement scores.
She used data from a self-evaluation of school facilities completed by a
group of volunteers in each community to determine the condition of the
building. The sample buildings were classified into three categories: poor, fair,
or excellent condition as a result of the evaluation. The classification of the
buildings in the various categories was based upon the presence or absence of
physical conditions. For instance, buildings that had roofs that leaked,classrooms with peeling paint, lacked air-conditioning, were not clean, and
needed repairs were grouped into the poor category.
6 5

For parent involvement, Edwards used membership in the Parent-
Teachers Association (PTA) on a per student basis plus the PTA budget at the
school on a per student basis. Student achievement was measured by using
average school scores on the Comprehensive Test of Basic Skills (CTBS) which
was administered to all three levels of schools by the Washington, D.C. Public
Schools. The average CTBS score of students in each school was obtained
through standard published reports (p. 13).
For the first part of her hypothesis dealing with parental involvement,
Edwards found that in those schools where large numbers of parents were
involved through membership in the PTA and who raised considerable funds
for school purposes, the buildings were in better condition than those buildings
where parents were less involved in school activities and who raised less money
for school purposes. For every dollar increase in the PTA budget of the school,
the building was seen to improve on the scale of building condition. In this
model of analysis, she found four variables that had significant results in
predicting the changes in building condition. These were: types of school
(elementary, junior, senior high), age of building, student enrollment, and
mean income of the community in which the school is located. The first three
of these variables have significant results in predicting the changes in building
condition. Although the mean income factor was not significant, the parameter
estimate was positive, which indicates that as the mean income of the area
increases, the building condition improves.The second part of the hypothesis dealing with building condition and
student achievement, the analysis of data supported the hypothesis. Building
condition did have an affect upon student achievement scores. The analysis
indicates that as a school moves from one category to another, the achievement
scores can be expected to increase by 5.455 percentage points. If the school
moves two categories, such as from poor to excellent, the achievement scores
would be expected to increase by 10.9 percentage points in the averageachievement scores. Conversely, based upon the analysis, "the signs of the
7
estimated building condition coefficients are negative, meaning that from our
base of excellent schools, a building condition of fair or poor [school buildings]
\vill reduce the average student achievement score" (p. 24).
Building Condition and Achievement
In a similar study, Cash investigated the relationship between certain
school building conditions, student achievement, and student behavior in rural
high schools in Virginia (1993). Basically, the same hypothesis that Edwards
employed was used in conducting this study. The condition of the building in
this study, however, was the independent variable and student achievement
and behavior served as dependent variables.
The condition of the school building was determined through evaluation
by local school system personnel. Cash developed a building evaluation
instrument to be used by local school personnel to determine the classification
of the building. This instrument was based upon existing research studies that
addressed certain building conditions. Each item on the instrument wasderived from previous studies that had been completed and which showed a
positive relationship between a particular building condition and student
achievement and behavior. The items in the Commonwealth Assessment of
Physical Environment (CAPE) addressed such conditions as: air conditioning,
classroom illumination, temperature control, classroom color, graffiti, science
equipment and utilities, paint schedules, roof adequacy, classroom windows,
floor type, building age, supporting facilities, condition of school grounds, and
furniture condition. Each of these conditions has been shown by previousresearch to be related to student achievement and behavior. The presence orabsence of these factors determined the overall condition of the building.
Buildings were classified as substandard, standard, and above standardthrough the local self-evaluation.
In addition to these evaluative condition classifications, the 27 items on
the CAPE were divided into two categories: structural factors and cosmetic
factors. Thus, some items related to the structure of the building such as
7

classroom lighting, air conditioning, thermal environment and roof integrity.
Other items such as painting schedules, color of the walls, cleanliness of the
building, and presence of graffiti related to the cosmetic condition of the
building. These two major categories were used to analyze different sections of
the CAPE with student achievement scores; however, student achievement
scores were compared to the combined 27 items on the instrument to produce
an overall building condition category. Thus, three comparisons were made
with student achievement scores: overall, cosmetic, and structural. Figure 1
lists the items in the two categories.
STRUCTURAL AND COSMETIC CATEGORIESON THE BUILDING APPRAISAL INSTRUMENT
STRUCTURAL BUILDING ITEMSBuilding AgeWindows in ClassroomsType of FlooringType of Classroom HeatingAir ConditioningRoof LeaksAdjacent FacilitiesLocker ConditionsCeiling MaterialScience Lab EquipmentScience Lab AgeClassroom LightingWall ColorExterior NoiseStudent DensitySite Acreage
Figure 1
COSMETIC BUILDING ITEMSClassroom PaintInterior Paint CycleExterior Wall PaintExterior Paint CycleFloors SweptFloors MoppedPresence of GraffitiGraffiti RemovalClassroom FurnitureSchool GroundsLandscaping
Within these categories, the evaluative classification of the building was
used for comparison purposes. Inter-rater reliability for building evaluation
was established through a comparison of the ratings of buildings completed by
school system personnel and the results of an evaluation of a sample of the
buildings contained in the study by the researcher.
9 8

Student achievement was measured by use of scaled scores of students
taking the Test of Academic Proficiency (TAP) which was administered to all
11th grade students in Virginia. The average school score for these high
schools was used in the study. The scaled scores can be used to compare
success on different sub-tests of the TAP. In addition, the ratio of students
receiving free and reduced lunches was used to control for socio-economic
status (SES) of the school attendance area. In addition, Cash used the Virginia
Composite Index, which is a measure of local fiscal capacity, to control for the
wealth of the school jurisdiction.Student behavior was measured by the disciplinary incidents reported to
the Virginia Department of Education and the number of suspensions and
expulsions of students by local school administrators for the year. Thedisciplinary incidents, suspensions, and expulsions were converted to a per
student ratio for comparison purposes. These data were used to test the
hypothesis that building condition effects student behavior.The analysis of data was done by means of comparison of
achievement score means among building condition ratings using analysis of
covariance to adjust the means. The percentage of students who did not
qualify for free or reduced lunch was the covariant. This factor served to adjust
the means for socio-economic status to reflect the status of the students. The
adjusted mean scale scores in achievement and the behavior ratios for each
building were compared across the three levels of building condition and
between the three levels of overall, cosmetic, and structural categories.
The results of this comparison indicated there were differences between
the achievement test scores of students in below standard and above standard
buildings. These differences were displayed in table form showing the school
mean score on each sub-test and the appropriate percentile ranking of thatscore. Thus, if the mean score for all of the students for example in below
standard schools were 185, the percentile rank for this score would be 47. For
all students in the above standard school buildings, the mean for the same
109

sub-test would be 188. This mean score would fall into the 51st percentile
rank. A simple comparison between the two percentile ranks would indicate a
difference of 4 points in favor of the students in above standard buildings. The
interpretation of this would be that students in sub-standard buildings
performed less well than the other students.All of the sub-tests in the achievement test were similarly displayed so
that a comparison between the percentile ranks could be made for both groups.
This resulted in a more simplistic, but dramatic comparison between the test
results of the two student groups. Table 1 presents data regarding thecomparison of percentile ranks and shows how the differences in the ranks
were achieved.
As can be seen in the table for the composite of the scores, the students
in below standard buildings had a mean score of 187 that fell into the 47th
percentile ranking. Conversely, the mean score for students in above standard
buildings was 190 that were in the 52nd percentile rank. This difference is
then reported in Table 1 to describe the scores between each group of students.
The analysis of differences in percentile rank follow this pattern in that
difference between each group of students is compared.
11 10

Table 1
Comparison of Achievement Scale Score Means and Percentile Ranks on theSub-tests of the TAP* and Building Condition
OVERALL BUILDING CONDITION
Achievement Subtest
Substandard Above Standard
Means PR** Means PR Difference
Reading 185 47 188 51 +4Mathematics 179 43 181 47 +4Written Expression 191 57 193 59 +2Sources of information 189 48 193 52 +4Basic Composite 186 49 189 53 +4Social Studies 190 48 192 51 +3Science 190 50 193 55 +5Complete Composite 187 47 190 52 +5
Test of Academic ProficientlyPercentile Rank
Note: Scale Score means have been adjusted for socioeconomic status.Percentile ranks have been derived from scale score means that have beenadjusted for socioeconomic status.
The results of the analysis indicated a positive relationship between
building condition and achievement of students. In all of the subtests of the
TAP, academic performance was positively related to the condition of the school
building. Cash found that student achievement was higher in those buildingswith higher quality ratings. The difference in percentile rankings on the
composite test score was as much as 5 percent in all three categories. The
comparison between the overall building category and achievement had higher
levels of achievement in the sub-tests than when the cosmetic and structural
building category was compared with achievement. Student achievement in
the science section of the TAP was higher in those buildings with better quality
science equipment than in those buildings with lower quality science facilities.
The difference between low and high rated schools was five percentile rank
1211
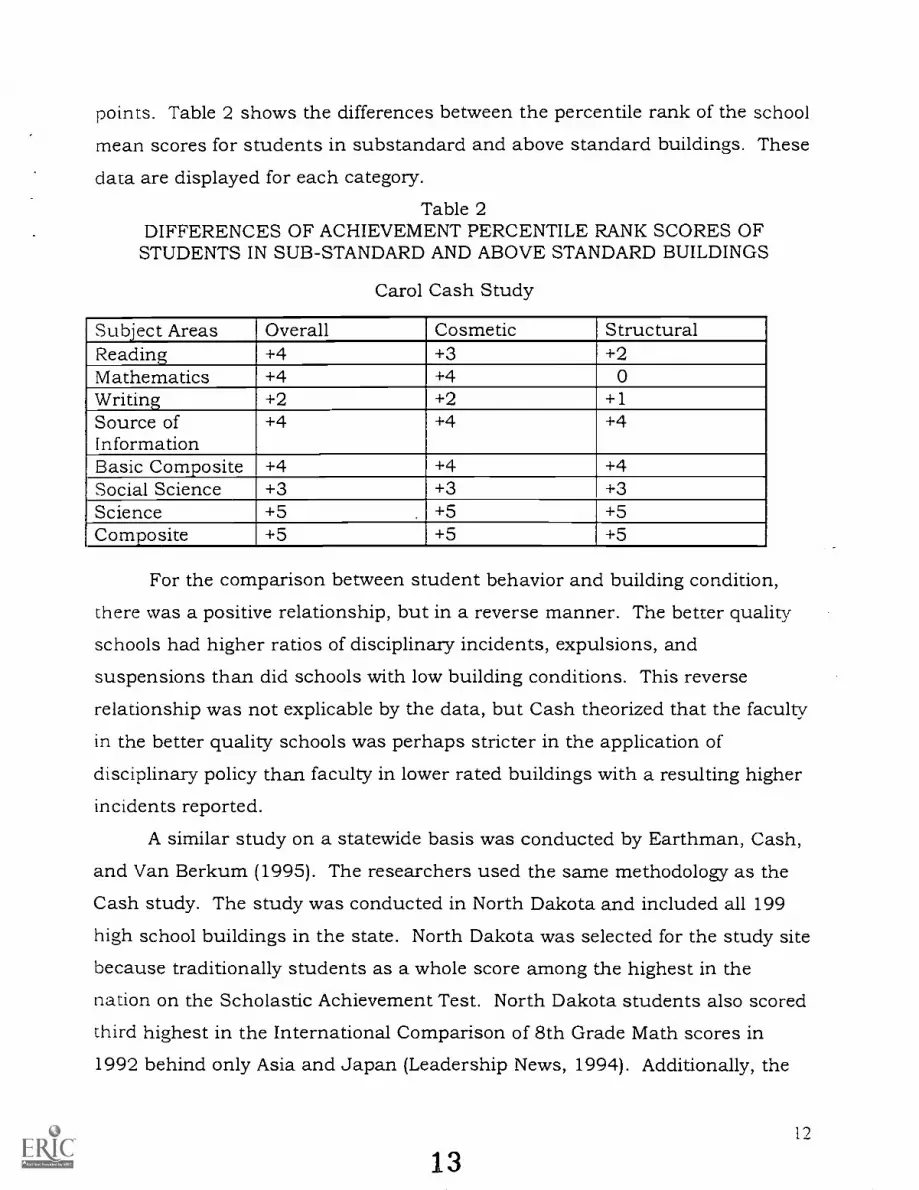
points. Table 2 shows the differences between the percentile rank of the school
mean scores for students in substandard and above standard buildings. These
data are displayed for each category.
Table 2DIFFERENCES OF ACHIEVEMENT PERCENTILE RANK SCORES OF
STUDENTS IN SUB-STANDARD AND ABOVE STANDARD BUILDINGS
Carol Cash Study
Subject Areas Overall Cosmetic StructuralReading +4 +3 +2Mathematics +4 +4 0Writing +2 +2 +1Source ofInformation
+4 +4 +4
Basic Composite +4 +4 +4Social Science +3 +3 +3Science +5 . +5 +5Composite +5 +5 +5
For the comparison between student behavior and building condition,
there was a positive relationship, but in a reverse manner. The better quality
schools had higher ratios of disciplinary incidents, expulsions, and
suspensions than did schools with low building conditions. This reverse
relationship was not explicable by the data, but Cash theorized that the faculty
in the better quality schools was perhaps stricter in the application of
disciplinary policy than faculty in lower rated buildings with a resulting higher
incidents reported.
A similar study on a statewide basis was conducted by Earthman, Cash,
and Van Berkum (1995). The researchers used the same methodology as the
Cash study. The study was conducted in North Dakota and included all 199
high school buildings in the state. North Dakota was selected for the study site
because traditionally students as a whole score among the highest in the
nation on the Scholastic Achievement Test. North Dakota students also scored
third highest in the International Comparison of 8th Grade Math scores in
1992 behind only Asia and Japan (Leadership News, 1994). Additionally, the
12
13
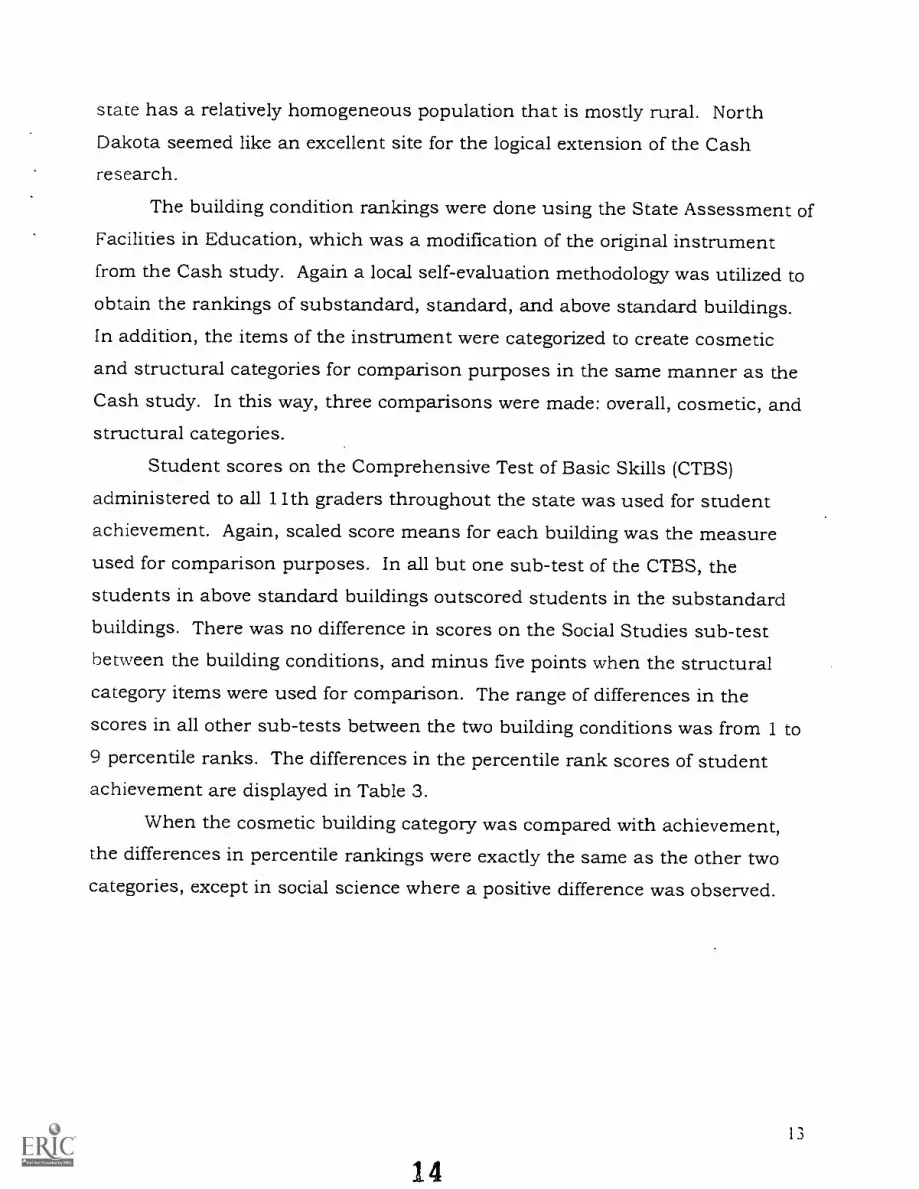
state has a relatively homogeneous population that is mostly rural. NorthDakota seemed like an excellent site for the logical extension of the Cash
research.
The building condition rankings were done using the State Assessment of
Facilities in Education, which was a modification of the original instrument
from the Cash study. Again a local self-evaluation methodology was utilized toobtain the rankings of substandard, standard, and above standard buildings.
In addition, the items of the instrument were categorized to create cosmetic
and structural categories for comparison purposes in the same manner as theCash study. In this way, three comparisons were made: overall, cosmetic, andstructural categories.
Student scores on the Comprehensive Test of Basic Skills (CTBS)
administered to all 11th graders throughout the state was used for studentachievement. Again, scaled score means for each building was the measureused for comparison purposes. In all but one sub-test of the CTBS, the
students in above standard buildings outscored students in the substandardbuildings. There was no difference in scores on the Social Studies sub-test
between the building conditions, and minus five points when the structural
category items were used for comparison. The range of differences in the
scores in all other sub-tests between the two building conditions was from 1 to
9 percentile ranks. The differences in the percentile rank scores of studentachievement are displayed in Table 3.
When the cosmetic building category was compared with achievement,the differences in percentile rankings were exactly the same as the other twocategories, except in social science where a positive difference was observed.
13
14

Table 3
Differences Between Percentile Rank Scores of Students in Substandard andAbove Standard Buildings
Earthman et al Study
Subject Area Overall Cosmetic StructuralReadingVocabulary
+7 +7 +7
Reading Comp +1 +1 +1Math Concepts +1 +1 +1MathApplication
+3 +3 +3
Language +4 +4 +4Spelling +9 +9 +9Social Science 0 +4 -5Science +7 +7 +7Composite Score +5 +5 +5
Although the differences in the composite score were exactly the same as
the Cash study, there are some notable differences. The CTBS has additional
sub-tests the TAP does not have such as reading vocabulary, mathematics
concepts, and spelling. The differences in reading vocabulary and spelling are
rather high, considering the differences in other sub-tests. The North Dakota
study does support the findings of both the Edwards and Cash studies. Both
of these researchers found at least a 5 percent difference in composite
achievement scores in their population. The North Dakota study resulted in a
similar difference of percentile rankings in student achievement scores.
A comparison of student behavior and the three rankings of the building
were made to explore a possible relationship between these variables. The total
number of disciplinary incidents per school was very small in all schools
throughout the state. As a result, the comparison figures are extremely smalland in some cases meaningless. Nevertheless, students in the above standard
buildings recorded fewer disciplinary incidents than those students in the
substandard buildings when comparisons were made on the overall and
15 14
cosmetic conditions of the building. When the structural building condition
was used as a measure of comparison, however, the results were somewhat
different. Students in above standard buildings had more disciplinaryincidents than students in below standard buildings. This latter finding is
exactly the same as what Cash found in her study. The first two comparisons,
however, are directly opposite of her findings.
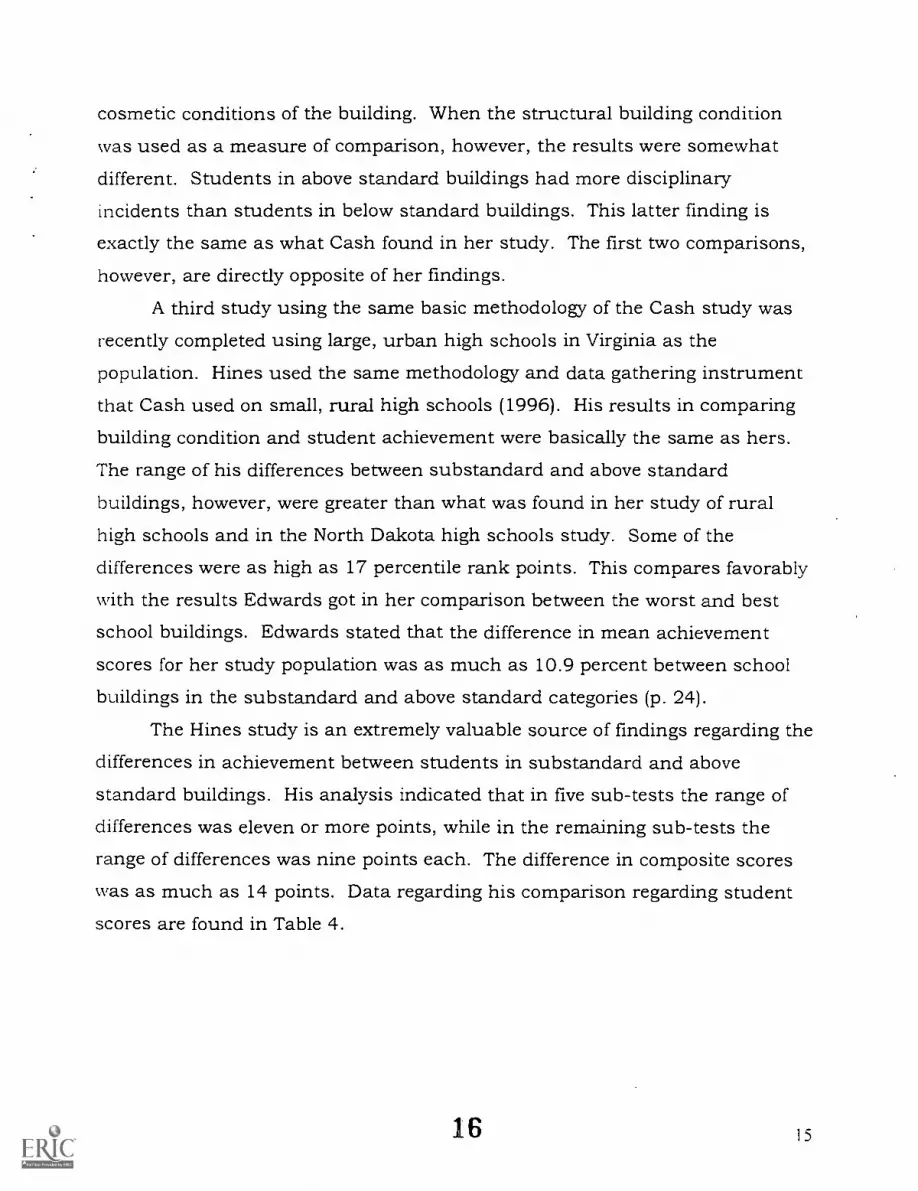
A third study using the same basic methodology of the Cash study was
recently completed using large, urban high schools in Virginia as the
population. Hines used the same methodology and data gathering instrument
that Cash used on small, rural high schools (1996). His results in comparing
building condition and student achievement were basically the same as hers.
The range of his differences between substandard and above standard
buildings, however, were greater than what was found in her study of rural
high schools and in the North Dakota high schools study. Some of the
differences were as high as 17 percentile rank points. This compares favorably
with the results Edwards got in her comparison between the worst and best
school buildings. Edwards stated that the difference in mean achievement
scores for her study population was as much as 10.9 percent between school
buildings in the substandard and above standard categories (p. 24).
The Hines study is an extremely valuable source of findings regarding the
differences in achievement between students in substandard and above
standard buildings. His analysis indicated that in five sub-tests the range of
differences was eleven or more points, while in the remaining sub-tests the
range of differences was nine points each. The difference in composite scores
was as much as 14 points. Data regarding his comparison regarding student
scores are found in Table 4.
16 15
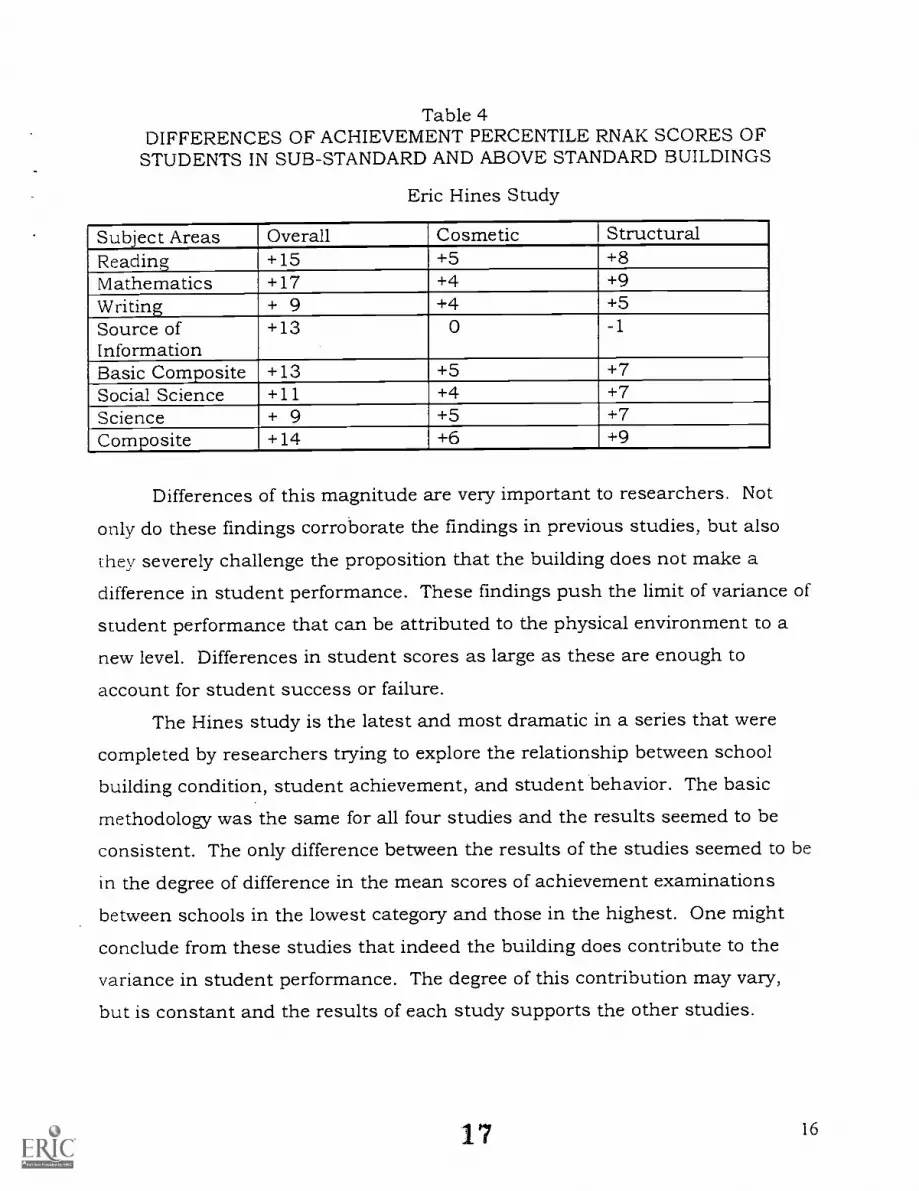
Table 4DIFFERENCES OF ACHIEVEMENT PERCENTILE RNAK SCORES OF
STUDENTS IN SUB-STANDARD AND ABOVE STANDARD BUILDINGS
Eric Hines Study
Subject Areas Overall Cosmetic StructuralReading +15
_
+8Mathematics +17 +4 +9
Writing + 9 +4 +5Source ofInformation
+13 0 -1
Basic Composite +13 +5 +7
Social Science +11 +4 +7Science + 9 +5 +7Composite +14 +6 +9
Differences of this magnitude are very important to researchers. Not
only do these findings corroborate the findings in previous studies, but also
they severely challenge the proposition that the building does not make a
difference in student performance. These findings push the limit of variance of
student performance that can be attributed to the physical environment to a
new level. Differences in student scores as large as these are enough to
account for student success or failure.The Hines study is the latest and most dramatic in a series that were
completed by researchers trying to explore the relationship between school
building condition, student achievement, and student behavior. The basic
methodology was the same for all four studies and the results seemed to be
consistent. The only difference between the results of the studies seemed to be
in the degree of difference in the mean scores of achievement examinations
between schools in the lowest category and those in the highest. One might
conclude from these studies that indeed the building does contribute to the
variance in student performance. The degree of this contribution may vary,
but is constant and the results of each study supports the other studies.
17 16
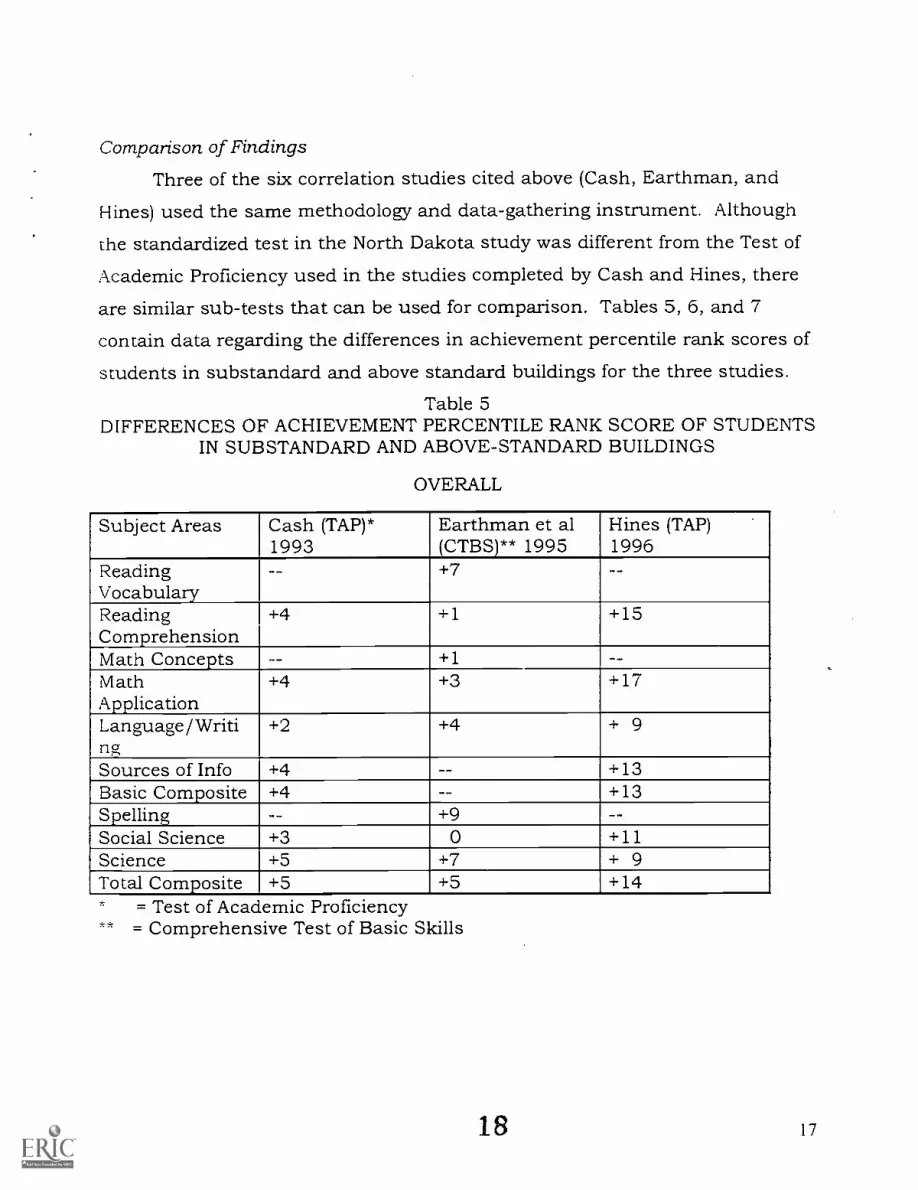
Comparison of Findings
Three of the six correlation studies cited above (Cash, Earthman, and
Hines) used the same methodology and data-gathering instrument. Althoughthe standardized test in the North Dakota study was different from the Test of
Academic Proficiency used in the studies completed by Cash and Hines, there
are similar sub-tests that can be used for comparison. Tables 5, 6, and 7contain data regarding the differences in achievement percentile rank scores of
students in substandard and above standard buildings for the three studies.Table 5
DIFFERENCES OF ACHIEVEMENT PERCENTILE RANK SCORE OF STUDENTSIN SUBSTANDARD AND ABOVE-STANDARD BUILDINGS
OVERALL
Subject Areas Cash (TAP)*1993
Earthman et al(CTBS)** 1995
Hines (TAP)1996
ReadingVocabulary
+7
ReadingComprehension
+4 +1 +15
Math Concepts +1MathApplication
+4 +3 +17
Language/Writing
+2 +4 + 9
Sources of Info +4 +13Basic Composite +4 +13Spelling +9Social Science +3 0 +11Science +5 +7 + 9Total Composite +5 +5 +14
= Test of Academic Proficiency= Comprehensive Test of Basic Skills
18 17
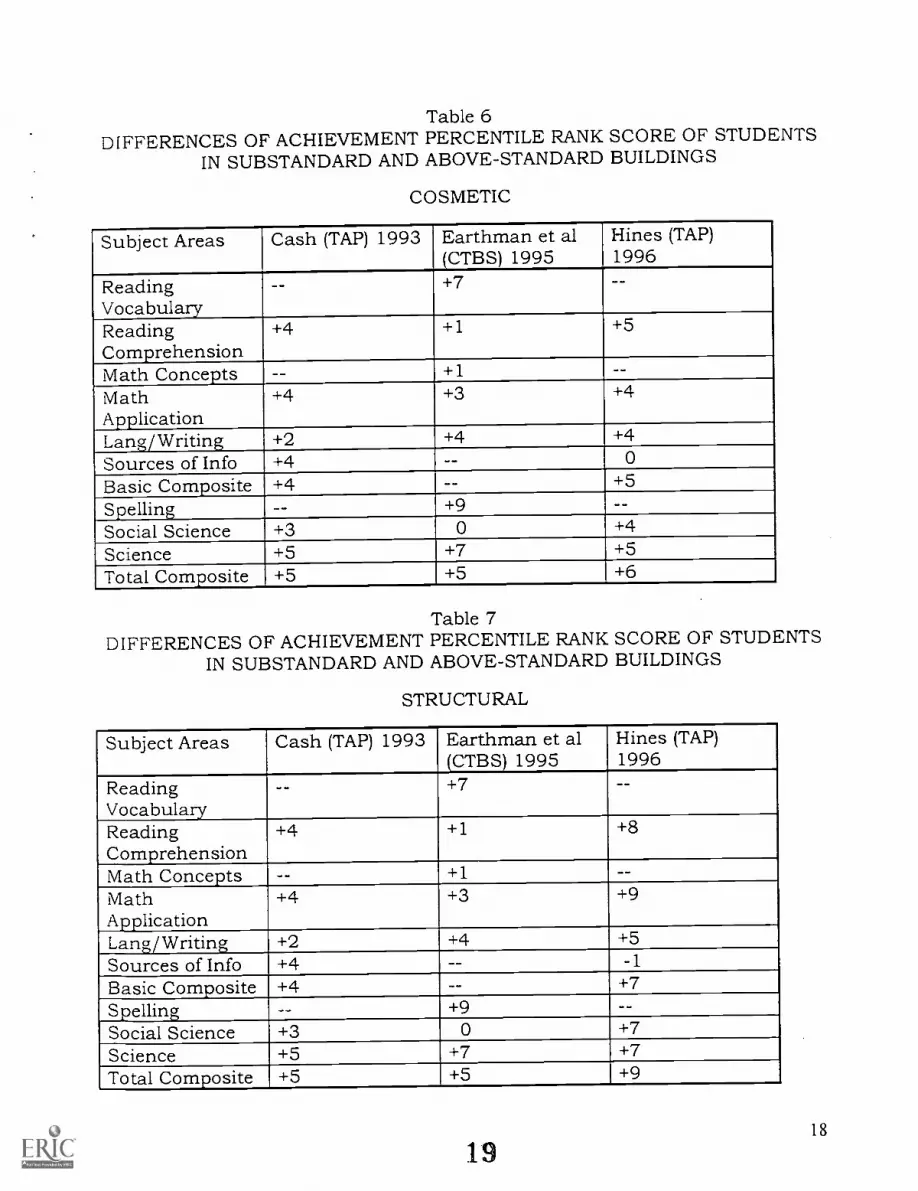
Table 6DIFFERENCES OF ACHIEVEMENT PERCENTILE RANK SCORE OF STUDENTS
IN SUBSTANDARD AND ABOVE-STANDARD BUILDINGS
COSMETIC
Subject Areas Cash (TAP) 1993 Earthman et al(CTBS) 1995
Hines (TAP)1996
ReadingVocabulary
+7 --
ReadingComprehension
+4 +1 +5
Math Concepts -- +1
MathApplication
+4 +3 +4
Lang/ Writing +2 +4 +4
Sources of Info +4 0
Basic Composite +4 +5
Spelling -- +9
Social Science +3 0 +4
Science +5 +7 +5
Total Composite +5 +5 +6
Table 7DIFFERENCES OF ACHIEVEMENT PERCENTILE RANK SCORE OF STUDENTS
IN SUBSTANDARD AND ABOVE-STANDARD BUILDINGS
STRUCTURAL
Subject Areas Cash (TAP) 1993 Earthman et al(CTBS) 1995
Hines (TAP)1996
ReadingVocabulary
-- +7
ReadingComprehension
+4 +1 +8
Math Concepts +1 --
MathApplication
+4 +3 +9
Lang/Writing +2 +4 +5
Sources of Info +4 -1
Basic Composite +4 -- +7
Spelling +9Social Science +3 0 +7
Science +5 +7 +7Total Composite +5 +5 +9
18
19

Analyses of these data would indicate first of all that all three studies
found a difference in the percentile rank scores of students in the various
buildings. In each case the differences were positive. Further the findings inthese studies corroborate the findings in previous studies. Specifically, thefindings indicate that in four main subjects of the curriculum of the publicschools, reading, mathematics, language/writing, and science, there is adifference in student performance.
All of the three studies cited above used a factor of building condition toclassify school buildings for analysis purposes. The building condition factorwas used to classify buildings into sub-standard, standard, or above standard
categories depending upon how the building was evaluated. In all of thestudies, the building factor was made up of responses to questions relating tocertain attributes or conditions in the building.
Every question in the evaluative instrument was about buildingattributes and conditions that were individually identified in previous researchstudies to be directly related to either student achievement or studentbehavior. For instance, studies were completed using such separate buildingfactors as air conditioning, level of illumination, presence of windows inclassrooms, availability of modern science equipment, floor material, or wallcolor as a variable with which to compare student achievement. The nextlogical and higher level step in this research was to incorporate the importantbuilding conditions into a single building condition factor. Thus, the buildingcondition classification stood for or represented a number of conditions that aschool building in good condition possessed or would possess. This factor wasthen used to compare student achievement and behavior with the condition ofthe school building. The building condition factor seems to be an importantconcept used in more recent research on the relationship between schoolbuilding and student achievement and behavior.
2 0BEST COPY AVAILABLE
19
Summary
All of the studies cited above have demonstrated a relationship betweenstudent performance, both achievement and behavior, and the condition of the
built environment. The depth of the relationship has varied, but the most
recent study completed demonstrates a much stronger degree of relationshipthan previously thought existed.
Some of the most important building factors that influence learning arethose that relate to control of the thermal environment, proper illumination,
adequate space, availability of equipment and furnishings, especially in thesubject area of science.
The range of difference in each of these four studies between the test
scores of students in substandard and above standard school buildings was
between 1 and 17 percentile points, but nevertheless, in almost all cases therewas a positive difference for students in the better buildings. These findings
are of particular importance because of the large number of school buildings
across the United States that are in substandard condition. The factors whichdetermined the condition of buildings in these studies are usually incorporatedin a new structure, but the vast majority of the existing school buildings do nothave the benefit of these conditions, as witness the General Accounting Office
study which documented the poor state of condition of the public schools inthe United States (1995).
The results of these all studies cited in this paper can be played out inpossible actions of school authorities and governing board members to improve
the educational opportunities of students. If, as the studies strongly indicate,the test scores of students in above standard school buildings are above thescores of students in substandard building by as much as 5-17 percentilepoints, then there are ways of increasing student performance and subsequent
Lest scores by improving the condition of the building. Spending funds to
improve the built environment might produce greater student performanceresults than funds spent on instructional materials, textbooks, and even
21
teachers. The results of these studies at least strongly suggest thisproposition.
There are limitations to research in the effect buildings have uponstudents, and of course, the major limitation on this type of research isdetermining the degree to which school facilities can be the actual cause ofstudent behavior and achievement. When one realizes the many variables thatinfluence how much students can and do learn and how students behave, it isevident the built environment perhaps has a very limited role to play.
Obviously, the most important variables that influences how students learn
come from the genes their parents impart to them and the home environmentthey create for their children. Then in descending order are variables such ascommunity surroundings and conditions beginning from the day of birth to thevery day the student enters the school building that subsequently influence the
activities of students. Only then can the school building play any part in howstudents learn. Depending upon what expert in learning theory is read, theamount of variance the built environment plays in influencing learning and
behaving is either non-existent or at best is limited. Even if the variance thebuilt environment can account for is slight, the important fact to remember isthat a portion of the variance can then be controlled through efforts of schoolauthorities and design professionals.
The condition of the school building is something over which schoolauthorities have some degree of control. They can insure that buildings are ingood condition and present the best possible learning environment. Or theschool authorities can let the condition of the buildings deteriorate to the pointof influencing the educational opportunities of students under their charge.That is a very heavy responsibility to bear, yet the resultant condition of schoolbuildings speak very loudly.
A confounding dimension to these studies, however, is the long-terminfluence a poor building may have upon students. The longitudinal influenceof the physical environment could be a very important consideration. If
22

students are housed in poor buildings for a number of years, will the effect on
achievement be multiplied? Moreover, will the aesthetic values of the students
be impaired? After long exposure to poor or marginal buildings, will students
believe such conditions are normal? It is very difficult to conduct longitudinal
research studies on the influence of a building. As a result, we can not with
any degree of certainty describe the results of this phenomenon. But the
research cited here is simply a photograph of conditions and relationships in
one period of time, not over successive periods of time. There may indeed be a
cumulative effect upon this disparity in student test scores between poor and
good school buildings that continue during the time the student is in school.
There is also the matter of equity of educational opportunity when
certain students attend school in buildings of lesser quality than other
students. If students in poor buildings perform 5-17 percentile rank points
less than other students, they certainly are at a disadvantage. This isespecially true when future education relies so heavily upon past performance.
Students in poor buildings will not have the same opportunity as other
students in better school buildings.
It has been demonstrated time and again that better prepared graduates
of the local school system are more productive citizens. Better-prepared
graduates have more productive jobs throughout their lives and in turn are
happier. Of course, the corollary to this is that more productive citizens add to
the prosperity of the state and support it more evenly through taxes.
Consequently, anything that can be done to positively raise the level of
achievement of students who will be future citizens, will greatly influence the
economy over time.
The discussion in this paper leads one to the knowledge that the school
building does have an influence upon how a student performs. Few individuals
actually question this statement. There may, however, be questions as to the
degree of influence. The correlation studies cited here seem to give a glimmer
23 ?')
into the possibilities of further studies to investigate this important relationship
between school buildings and student achievement and behavior.
There seems to be five major premises that should be kept in mind
regarding the findings of these studies.
1. School buildings may account for as much as 5 to 17 percentile rank
points in student achievement scores and these differences are very
dramatic.
2. There may be a cumulative effect to the disparity in student achievement
scores between students in above standard and below standard
buildings. This is an imponderable that may have severe repercussions
on the learning of students
3. Within many school districts and throughout the state, there may be an
equity issue if some students are housed in poor buildings and other
students are located in above standard buildings. Students in poorbuildings may be disadvantages so long as they are in such buildings.
4. There is a definite economic value attached to improving school buildings
if building conditions influence the level of student achievement.
The condition of the building is something over which school authorities
can have some control to improve.
These premises alone are sufficient for decision-makers to improve school
buildings to provide better educational opportunities for students. The local
school jurisdictions in the United States are not constructing as many new
school buildings as they did in previous decades. In spite of the fact there is a
recent surge of new students that will increase the need for new schools, the
vast majority of students still attend school in old buildings that are not safe,
functional, or efficient. These buildings were constructed many years ago and
now are in poor condition. We have a large investment in the current building
inventory in every state. This inventory of investment needs to be preserved
and improved. Many other countries throughout the world are in similar
situations concerning their school building inventory. It is incumbent upon
24 '23
school authorities and governing boards in every jurisdiction to heed the
results of research to make certain all students under their charge are in
physical surroundings that provide them with the best opportunity to achieve a
good education. In this manner schools can positively contribute to the
preparation of productive citizens and the consequential strengthening of the
economy of the country.
25
BIBLIOGRAPHY
Bowers, J. Howard and Burkett, Charles W. (August 1988). "PhysicalEnvironment Influences Related to Student Achievement, Health,Attendance, and Behavior." CEFPI Journal, Vol. 26, No. 4. PP. 33-34.
Cash, Carol. (1993). A Study of the Relationship Between School BuildingCondition and Student Achievement and Behavior. Blacksburg, VA:Unpublished Doctoral Dissertation, Virginia Polytechnic Institute and StateUniversity. PP 1-124.
Edwards, Maureen M. (1992). Building Conditions, Parental Involvement andStudent Achievement in the D.C. Public School System. UnpublishedMaster Degree Thesis, Georgetown University, Washington, D.C. (ED 264285).
Earthman, Glen I., Cash, Carol S., Van Berkum, Denny. (1995). "A StatewideStudy of Student Achievement and Behavior and School BuildingCondition." Presentation at annual meeting Council of Educational FacilityPlaners, International, Dallas, Texas, September 19, 1995.
Hines, Eric. (1996). "Building Condition and Student Achievement andBehavior." Blacksburg, VA: Unpublished Doctoral Dissertation, VirginiaPolytechnic Institute and State University. PP. 1-123.
Leadership News. (August 15, 1994). "Performance-Based Funds to FinanceReform." P.4.
Phillips, Ransel W. (1997). Educational Facility Age and the AcademicAchievement and Attendance of Upper Elementary School Students.Unpublished Doctoral Dissertation, University of Georgia, Athens, PP. 1-128.
United States General Accounting Office. (February, 1995). School Facilities:Condition of America's Schools. Washington, DC: GAO/HEHS-95-61, PP 1-103.
26
25
U.S. Department of EducationOffice of Educational Research and Improvement (OERI)
National Library of Education (NLE)Educational Resources Information Center (ERIC)
REPRODUCTION RELEASE(Specific Document)
I. DOCUMENT IDENTIFICATION:
Title: The Impact of School Building Condition and Student Achievement, and Behavior
Author(s): Earthman, Glen I.
Corporate Source: Luxembourg,OCDE Conference "The Appraisal of Educational Investment"
Publication Date:November 1998
II. REPRODUCTION RELEASE:In order to disseminate as widely as possible timely and significant materials of interest to the educational community, documents announced in the
monthly abstract journal of the ERIC system, Resources in Education (RIE), are usually made available to users in microfiche, reproduced paper copy,and electronic media, and sold through the ERIC Document Reproduction Service (EDRS). Credit is given to the source of each document, and, ifreproduction release is granted, one of the following notices is affixed to the document.
If permission is granted to reproduce and disseminate the identified document, please CHECK ONE of the following three options and sign at the bottomof the page.
The sample sticker shown below will beaffixed to all Level 1 documents
PERMISSION TO REPRODUCE ANDDISSEMINATE THIS MATERIAL HAS
BEEN GRANTED BY
\Q)
TO THE EDUCATIONAL RESOURCESINFORMATION CENTER (ERIC)
Level 1
Check here for Level 1 release, permittingreproduction and dissemination In microfiche or other
ERIC archival media (e.g., electronic) and papercopy.
Signhere,-'please
The sample sticker shown below will beaffixed to all Level 2A documents
PERMISSION TO REPRODUCE ANDDISSEMINATE THIS MATERIAL IN
MICROFICHE, AND IN ELECTRONIC MEDIAFOR ERIC COLLECTION SUBSCRIBERS ONLY,
HAS BEEN GRANTED BY
2A
C?TO THE EDUCATIONAL RESOURCES
INFORMATION CENTER (ERIC)
Level 2A
Check here for Level 2A release, permittingreproduction and dissemination in microfiche and In
electronic media for ERIC archival collectionsubscribers only
The sample sticker shown below will beaffixed to all Level 2B documents
PERMISSION TO REPRODUCE ANDDISSEMINATE THIS MATERIAL IN
MICROFICHE ONLY HAS BEEN GRANTED BY
2B
C?TO THE EDUCATIONAL RESOURCES
INFORMATION CENTER (ERIC)
Level 2B
Check here for Level 2B release, permittingreproduction and dissemination in microfiche only
Documents will be processed as indicated provided reproduction quality permits.If permission to reproduce is granted, but no box Is checked, documents will be processed at Level 1.
I hereby grant to the Educational Resources Information Center (ERIC) nonexclusive permission to reproduce and disseminate this documentas indicated above. Reproduction from the ERIC microfiche or electronic media by persons other than ERIC employees and its systemcontractors requires permission from the copyright holder. Exception is made for non-profit reproduction by libraries and other service agenciesto satisfy information needs of educators in response to discrete inquiries.
Signature:
Organ on/A ress:
6'61 1.4 V5//t/d/ /u/V( e f sistre
Printed Name/Position/Title:
6-i FArThook- afester t:"111PetTelephone: Ts.1,0 23/-E ail Address:
ai^ r rtri ct.li CD vroickUir^S /rfr
Date: rzt, A
(over)

III. DOCUMENT AVAILABILITY INFORMATION (FROM NON-ERIC SOURCE):
If permission to reproduce is not granted to ERIC, or, if you wish ERIC to cite the availability of the document from another source, pleaseprovide the following information regarding the availability of the document. (ERIC will not announce a document unless it is publiclyavailable, and a dependable source can be specified. Contributors should also be aware that ERIC selection criteria are significantly morestringent for documents that cannot be made available through EDRS.)
Publisher/Distributor:
Address:
Price:
IV. REFERRAL OF ERIC TO COPYRIGHT/REPRODUCTION RIGHTS HOLDER:
If the right to grant this reproduction release is held by someone other than the addressee, please provide the appropriate name andaddress:
Name:
Address:
V. WHERE TO SEND THIS FORM:
Send this form to the following ERIC Clearinghouse: National Clearinghouse for educational FacilitiesNational Institute of Building Sciences
1090 Vermont Ave., N.W., Suite 700Washington, DC 200054905
However, if solicited by the ERIC Facility, or if making an unsolicited contribution to ERIC, return this form (and the document beingcontributed) to:
ERIC Processing and Reference Facility1100 West Street, 2nd Floor
Laurel, Maryland 20707-3598
Telephone: 301-4974080Toll Free: 800-799-3742
FAX: 301-953-0263e-mail: [email protected]
WWW: http://ericfac.piccard.csc.comEFF-088 (Rev. 9/97)


