Embed Size (px)
Citation preview
Education Policy Analysis Archives/Archivos
Analíticos de Políticas Educativas
ISSN: 1068-2341
Arizona State University
Estados Unidos
Nichols, Sharon L.; Glass, Gene V.; Berliner, David C.
High-Stakes Testing and Student Achievement: Does Accountability Pressure Increase Student
Learning?
Education Policy Analysis Archives/Archivos Analíticos de Políticas Educativas, vol. 14, 2006, pp. 1-
175
Arizona State University
Arizona, Estados Unidos
Available in: http://www.redalyc.org/articulo.oa?id=275020543001
How to cite
Complete issue
More information about this article
Journal's homepage in redalyc.org
Scientific Information System
Network of Scientific Journals from Latin America, the Caribbean, Spain and Portugal
Non-profit academic project, developed under the open access initiative
Readers are free to copy, display, and distribute this article, as long as the work is attributed to the author(s) and Education Policy Analysis Archives, it is distributed for non-commercial purposes only, and no alteration or transformation is made in the work. More details of this Creative Commons license are available at http://creativecommons.org/licenses/by-nc-nd/2.5/. All other uses must be approved by the author(s) or EPAA. EPAA is published jointly by the Colleges of Education at Arizona State University and the University of South Florida. Articles are indexed by H.W. Wilson & Co. Send commentary to Casey Cobb ([email protected]) and errata notes to Sherman Dorn ([email protected]).
EDUCATION POLICY ANALYSIS ARCHIVES A peer-reviewed scholarly journal
Editor: Sherman Dorn College of Education
University of South Florida
Volume 14 Number 1 January 4, 2006 ISSN 1068–2341
High-Stakes Testing and Student Achievement: Does Accountability
Pressure Increase Student Learning?1
Sharon L. Nichols University of Texas at San Antonio
Gene V Glass
David C. Berliner Arizona State University
Citation: Nichols, S. L., Glass, G. V, & Berliner, D. C. (2006). High-stakes testing and student achievement: Does accountability pressure increase student learning? Education Policy Analysis Archives, 14(1). Retrieved [date] from http://epaa.asu.edu/epaa/v14n1/.
Abstract This study examined the relationship between high-stakes testing pressure and student achievement across 25 states. Standardized portfolios were created for each study state. Each portfolio contained a range of documents that told the “story” of accountability implementation and impact in that state. Using the “law of comparative judgments,” over 300 graduate-level education students reviewed one pair of portfolios and made independent evaluations as to which of the two states’ portfolios reflected a greater degree of accountability pressure. Participants’ judgments yielded a matrix that was converted into a single rating system that arranged all 25 states on a continuum of accountability “pressure” from high to low. Using this accountability pressure rating we conducted a series of regression and correlation analyses. We found no relationship between earlier pressure and later cohort achievement for math at the fourth- and eighth-grade levels on the National Assessment of Educational Progress tests. Further, no relationship was
1 This work was supported by a grant from the Great Lakes Center for Education Research and
Practice, Williamstown, Michigan to the Education Policy Studies Laboratory, Arizona State University.
Education Policy Analysis Archives Vol. 14 No. 1 2
found between testing pressure and reading achievement on the National Assessment of Education Progress tests at any grade level or for any ethnic student subgroup. Data do suggest, however, that a case could be made for a causal relationship between high-stakes testing pressure and subsequent achievement on the national assessment tests—but only for fourth grade, non-cohort achievement and for some ethnic subgroups. Implications and directions for future studies are discussed. Keywords: high-stakes testing; educational policy; No Child Left Behind.
Introduction
Supporters of high-stakes testing believe that the quality of American education can be vastly improved by introducing a system of rewards and sanctions that are triggered by students’ standardized test performance (Raymond & Hanushek, 2003). The theory of action undergirding this approach is that educators and their students will work harder and more effectively to enhance student learning when faced with large incentives and threatening punishments. But educators and researchers argue that serious problems accompany the introduction of high-stakes testing. Measurement specialists oppose high-stakes testing because using a single indicator of competence to make important decisions about individuals or schools violates the professional standards of the measurement community (AERA, 1999). Other critics worry that the unintended effects of high-stakes testing not only threaten the validity of test scores, but also lead to “perverse” (Ryan, 2004) and “corrupt” educational practice (Jones, Jones, & Hargrove, 2003; Nichols & Berliner, 2005). And others worry that the pressure of doing well on a test seriously compromises instructional practice (Pedulla et al., 2003) and keeps teachers from caring for students’ needs that are separate from how well they score on tests (e.g., Noddings, 2001, 2002). In short, high-stakes tests cannot meet all the demands made on them (Linn, 2000; Messick, 1995a, b). In spite of these increasing worries, the current landscape of education prominently features high-stakes testing. But is it working? Does it increase student learning?
Although the literature on the mostly deleterious and unintended effects of high-stakes testing is growing rapidly (Jones, Jones, & Hargrove, 2003; Neill et al., 2004; Nichols & Berliner, 2005; Orfield & Kornhaber, 2001; Valenzuela, 2005) existing research on the relationship between high-stakes testing and its intended impact on achievement is mixed and inconclusive. Some studies find no evidence that high-stakes testing impacts achievement (Amrein & Berliner, 2002a, b). Others argue that the data for or against are not sufficiently robust to reject outright the use of high-stakes testing for increasing achievement (Braun, 2004). And others report mixed effects, finding high-stakes testing to be beneficial for certain student groups but not others (Carnoy & Loeb, 2002).
One potential explanation for these mixed conclusions may be found in the different designs researchers adopt. Some researchers study the issue using a two-group comparison—comparing achievement trends in states with high-stakes testing policies against those without (Amrein & Berliner, 2002a; Braun, 2004). Others have studied the issue by rating states along some kind of policy or accountability continuum. Another reason for mixed conclusions may be the result of measurement differences in the characterization of what it means to be a “high” or “low” stake state (i.e., in which is the consequential threat real and in which is it an unfulfilled promise?). The passage of NCLB has eliminated the relevancy of between-groups designs (all states now use some form of high-stakes testing) and have made it possible to measure accountability effects more uniformly.
This study adds to the literature in two important ways. First, we describe our methods for measuring state level high-stakes testing pressure with the state-level Accountability Pressure Rating
High-Stakes Testing and Student Achievement 3
(APR). To date, this system encapsulates the best representation of state-level testing pressure. Second, using this newly created rating system, we conducted a series of analyses to examine whether the pressure of high-stakes testing increases achievement. We addressed this in two ways. First we replicated analyses by Carnoy and Loeb (2002) (substituting our index for theirs) to examine the merits of their conclusion that high-stakes testing is related to math achievement gains, specifically for minority students and for eighth graders. Second, we conducted a series of correlations to investigate the relationship between high-stakes testing implementation and achievement trends over time.
Review of Relevant Literature
Why High-Stakes Testing?
Standardized testing has played a prominent role in American education for over a century (Giordano, 2005). But the most recent trend of using standardized test scores to make significant, often life-altering decisions about people, can be traced to the 1983 publication of A Nation at Risk (National Commission for Excellence in Education, 1983). As the report noted, it was believed that if public education system did not receive a major overhaul, our economic security would be severely compromised. American culture has internalized this claim to such a degree that questions about how to solve this “crisis” continue to be at the top of many policy makers’ agendas. Although our education system is not as bad off as some would have the public believe (Berliner & Biddle, 1995; Tyack & Cuban, 1996), the rhetoric of a failing education system has led to a series of initiatives that have transformed the role and function of American public schools. High-stakes testing holds a prominent place in this transformation.
The earliest and most common form of high-stakes testing was the practice of attaching consequences to high school graduation exams (i.e., students had to pass a test to receive a high school diploma). New York’s Regents examinations served this purpose for over 100 years2 and states such as Florida, Alabama, Nevada, and Virginia had instituted high-stakes graduation exams at least as far back as the early to mid 1980s (See Table 1 in Amrein & Berliner, 2002a). But in the years since A Nation at Risk, the rhetoric of high expectations, accountability, and ensuring that all students—especially those from disadvantaged backgrounds—have an equal opportunity to receive quality education has been accompanied by a series of federal initiatives (e.g., Clinton’s 1994 re-authorization of the 1965 Elementary and Secondary School Act, subsequent education “policy summits,” and George H. W. Bush’s Goals 2000) aimed at ameliorating these “problems.” In combination, these initiatives have progressively increased the demands on teachers and their students and have laid the groundwork for what was to come next—an unprecedented federal and monolithic mandate (Sunderman & Kim, 2004a, b) that directs all states toward a single goal (i.e., 100 percent of students reaching “proficiency”) via a single system of implementation (i.e., standards-based assessment and accountability).
2 The form and function of New York’s Regents tests have changed over time. Previously, New York
had a two-tiered diploma system where students received a “regular” diploma if they did not take/pass the Regents tests. By contrast, students who did pass the tests would receive a more prestigious diploma. More recently, however, students have to pass the Regents exam in order to receive any diploma.
Education Policy Analysis Archives Vol. 14 No. 1 4
No Child Left Behind: Changing the Landscape of Accountability
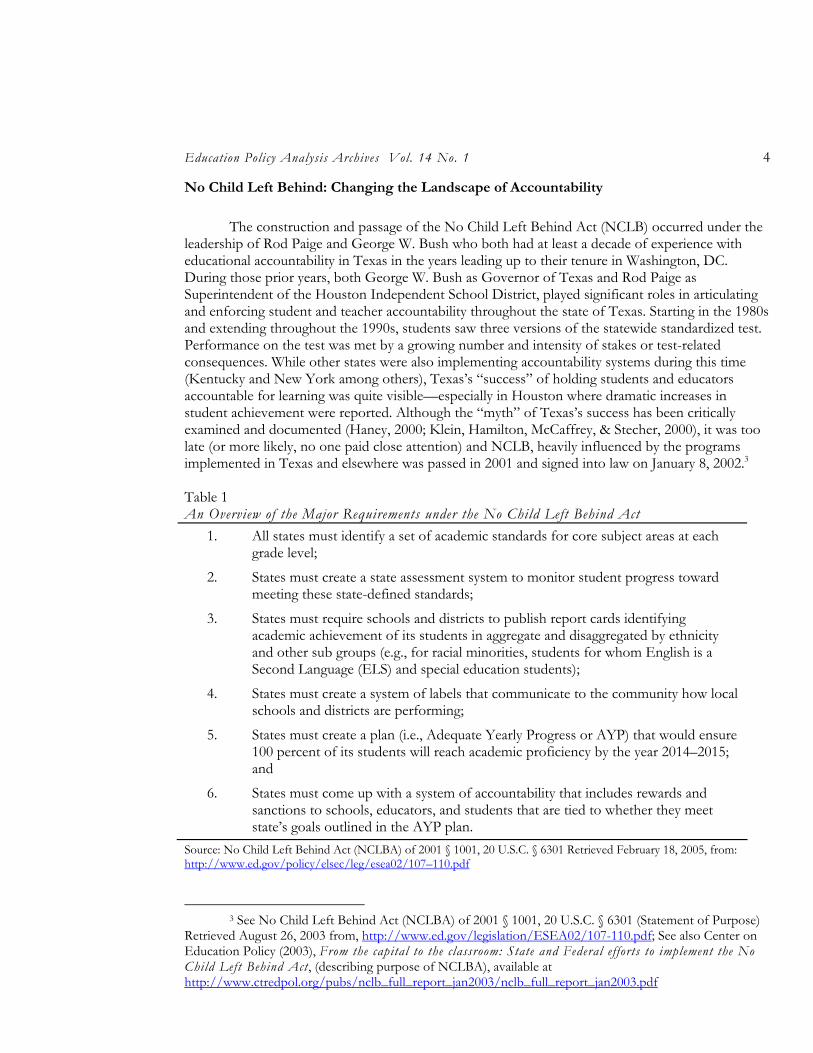
The construction and passage of the No Child Left Behind Act (NCLB) occurred under the leadership of Rod Paige and George W. Bush who both had at least a decade of experience with educational accountability in Texas in the years leading up to their tenure in Washington, DC. During those prior years, both George W. Bush as Governor of Texas and Rod Paige as Superintendent of the Houston Independent School District, played significant roles in articulating and enforcing student and teacher accountability throughout the state of Texas. Starting in the 1980s and extending throughout the 1990s, students saw three versions of the statewide standardized test. Performance on the test was met by a growing number and intensity of stakes or test-related consequences. While other states were also implementing accountability systems during this time (Kentucky and New York among others), Texas’s “success” of holding students and educators accountable for learning was quite visible—especially in Houston where dramatic increases in student achievement were reported. Although the “myth” of Texas’s success has been critically examined and documented (Haney, 2000; Klein, Hamilton, McCaffrey, & Stecher, 2000), it was too late (or more likely, no one paid close attention) and NCLB, heavily influenced by the programs implemented in Texas and elsewhere was passed in 2001 and signed into law on January 8, 2002.3
Table 1 An Overview of the Major Requirements under the No Child Left Behind Act
1. All states must identify a set of academic standards for core subject areas at each grade level;
2. States must create a state assessment system to monitor student progress toward meeting these state-defined standards;
3. States must require schools and districts to publish report cards identifying academic achievement of its students in aggregate and disaggregated by ethnicity and other sub groups (e.g., for racial minorities, students for whom English is a Second Language (ELS) and special education students);
4. States must create a system of labels that communicate to the community how local schools and districts are performing;
5. States must create a plan (i.e., Adequate Yearly Progress or AYP) that would ensure 100 percent of its students will reach academic proficiency by the year 2014–2015; and
6. States must come up with a system of accountability that includes rewards and sanctions to schools, educators, and students that are tied to whether they meet state’s goals outlined in the AYP plan.
Source: No Child Left Behind Act (NCLBA) of 2001 § 1001, 20 U.S.C. § 6301 Retrieved February 18, 2005, from: http://www.ed.gov/policy/elsec/leg/esea02/107–110.pdf
3 See No Child Left Behind Act (NCLBA) of 2001 § 1001, 20 U.S.C. § 6301 (Statement of Purpose)
Retrieved August 26, 2003 from, http://www.ed.gov/legislation/ESEA02/107-110.pdf; See also Center on Education Policy (2003), From the capital to the classroom: State and Federal efforts to implement the No Child Left Behind Act, (describing purpose of NCLBA), available at http://www.ctredpol.org/pubs/nclb_full_report_jan2003/nclb_full_report_jan2003.pdf
High-Stakes Testing and Student Achievement 5
The goal of NCLB is ambitious—to bring all students up to a level of academic “proficiency” within a 15-year period through a system of accountability defined by sanctions and rewards that would be applied to schools, teachers, and students in the event they did not meet pre-defined achievement goals. States that did not comply with the law were threatened by the loss of billions in Title I funding (see Table 1 for an overview of the law’s major mandates).
High-Stakes Testing and Achievement
In a lively exchange, Amrein and Berliner (2002a, b), Rosenshine (2003), and Braun (2004) debated the merits of high-stakes testing for improving achievement. Amrein and Berliner (2002a) used time trend analysis to study the effectiveness of high-stakes testing on achievement at both the K–8 and high school levels. They analyzed achievement trends across time in high-stakes testing states against a national average. Their extensive and descriptive set of results are organized by state for which they noted whether there was “strong” or “weak” evidence to support “increases” or “decreases” in fourth- and eighth- grade NAEP scores in math and reading as a function of the introduction of high-stakes testing policies. They concluded that “no consistent effects across states were noted. Scores seemed to go up or down in random pattern after high-stakes tests are introduced, indicating no consistent state effects as a function of high-stakes testing policy” (Amrein & Berliner, 2002a, p. 57).
In a reanalysis of the data addressing what were viewed as flaws in Amrein and Berliner’s method and design—namely a lack of control group—Rosenshine (2003) found that average NAEP increases were greater in states with high-stakes testing polices than those in a control group of states without. Still, when he disaggregated the results by state, Rosenshine (2003, p. 4) concluded that “although attaching accountability to statewide tests worked well in some high-stakes states it was not an effective policy in all states.” Again, no consistent effect was found.
In a follow-up response to Rosenshine (2003), Amrein-Beardsley and Berliner (2003) adopted his research method using a control group to examine NAEP trends over time, but they also included in their analysis NAEP exclusion rates.4 They concluded that although states with high-stakes tests seemed to outperform those without high-stakes tests on the fourth-grade math NAEP exams, this difference disappears when they controlled for NAEP exclusion rates. As Amrein-Beardsley and Berliner (2003) argued, high-stakes testing does not lead to learning increases, but to greater incentives to exclude low performing students from testing.
Braun (2004) also critiqued Amrein and Berliner (2002a) on methodological grounds. In his analysis of fourth- and eighth-grade math achievement (he did not look at reading) across the early 1990s, he found that when standard error estimates are included in the analyses, NAEP gains were greater in states with high-stakes testing for eighth-grade math than in those without in spite of exclusion rate differences. He concludes, “The strength of the association between states’ gains and
4 Exclusion rates are defined as those students excluded from the assessment because “school officials believed that either they could not participate meaningfully in the assessment or that they could not participate without assessment accommodations that the program did not, at the time, make available. These students fall into the general categories of students with disabilities (SD) and limited-English proficient students (LEP). Some identified fall within both of these categories.” From Pitoniak, M. J., & Mead, N. A. (2003, June). Statistical methods to account for excluded students in NAEP. Educational Testing Service, Princeton, NJ. Prepared for U.S. Department of Education; Institute of Education Sciences, and National Center for Education Statistics; p. 1. Retrieved February 14, 2005 from http://nces.ed.gov/nationsreportcard/pdf/main2002/statmeth.pdf
Education Policy Analysis Archives Vol. 14 No. 1 6
a measure of the general accountability efforts in the states is greater in the eighth grade than in the fourth” (Braun, 2004, p.33). However, in a separate analysis following cohorts of students (1992 fourth-grade math and 1996 eighth-grade math; 1996 fourth-grade math and 2000 eighth-grade math), he found that high-stakes testing effects largely disappeared. As students progress through school, there is no difference in achievement trends between states with high-stakes testing and those without. In spite of his conflicting results, Braun stops short of fully abandoning the usefulness of high-stakes testing as a widespread policy. “With the data available, there is no basis for rejecting the inference that the introduction of high-stakes testing for accountability is associated with gains in NAEP mathematics achievement through the 1990s” (Braun, 2004, p. 33).
Carnoy and Loeb (2003) provide yet another set of analyses to describe the impact of high-stakes testing using a completely different approach for measuring accountability and focusing on effects by student ethnicity. In contrast to others who adopted Amrein and Berliner’s initial categorization (i.e., using the two group method—identifying states with and those without any form of testing stakes), Carnoy and Loeb (2003) operationalized “high-stakes testing” in terms of a 0–5-point rating scale that ordered states in terms of the “strength” of their accountability system. Through a series of regression analyses, they concluded that accountability strength is significantly related to math achievement gains among eighth graders, especially for African American and Hispanic students.
Carnoy and Loeb also found that students’ grade-to-grade progression rates were unrelated to strength of accountability. This finding contrasts with what many others have found: that high-stakes testing is negatively related to progression rates but positively related to drop out rates (relationships that are particularly strong among disadvantaged and minority youth—e.g., Heubert, & Hauser, 1999; Orfield, Losen, Wald, & Swanson, 2004; Reardon, & Galindo, 2002; and Clarke, Haney, & Madaus, 2000).
Conclusions From the Research
To date there is no consistent evidence that high-stakes testing works to increase achievement. Although data suggest the possibility that high-stakes testing affects math achievement—especially among eighth graders and for some sub-groups of students—the findings simply are not sufficiently consistent to make the stronger claim that math learning is benefited by high-stakes testing pressure. Part of the concern is that it cannot be determined definitively whether achievement gains on state assessments are real or whether they are the outcome of increased practice and teaching to the test. That is why NAEP or other measures of student learning are needed. Thus, in spite of the claims of some (e.g., Raymond & Hanushek, 2003) who argue that the benefits of high-stakes testing are well established, it appears that more empirical studies are needed to determine whether high-stakes testing has the intended effect of increasing student learning.
Measuring High-Stakes Testing Pressure
In this section, we describe our approach to measuring high-stakes testing—or accountability—pressure. We begin with a brief overview of existing systems followed by a detailed overview of our methods for measuring pressure across our study states.
High-Stakes Testing and Student Achievement 7
Existing Systems
Amrein and Berliner (2002a) studied high-stakes testing impact by first identifying the timing and nature of each state’s high-stakes testing policies (what stakes existed and what years were they first enacted) and comparing those states’ achievement trends against a national average. Others, adopting Amrein and Berliner’s categorization of what states were considered high-stakes states and what were considered to be “no” stakes states, conducted “cleaner” two group comparisons to study achievement patterns in high-stakes testing states versus those without any high-stakes testing systems (Braun, 2004; Rosenshine, 2003). But, the rapidly increasing number of states joining the list of those with high-stakes testing—and the implementation of No Child Left Behind (NCLB)—has made a two-group design impossible to use.
Others have characterized accountability implementation and impact using a rating scale –rating states along a continuum that is defined by some aspect of accountability. Swanson and Stevenson (2002) crafted an index of “policy activism” that measured the degree to which states were implementing any one of 22 possible state policy activities related to standards-based assessment and accountability. These 22 activities were organized into four categories: (a) content standards, (b) performance standards, (c) aligned assessments, and (d) professional standards. States received one of three scores across all 22 possible policy activities (0=does not have a policy, 1=developing one, and 2=has enacted such a policy as of 1996) yielding a state-level index of overall “policy activism” (scale ranged from -1.61 to 2.46). Swanson and Stevenson’s index measures the relative amount of standards-based reform activity as of 2001.
Carnoy and Loeb (2002) created an index-like system, but one that measured each state’s accountability “strength.” Their “0–5 scale captures degrees of state external pressure on schools to improve student achievement according to state-defined performance criteria.” (Carnoy & Loeb, 2002, p. 311). Thus, their index was crafted to represent a hypothetical degree of “pressure” on teachers and students to perform well on state tests. They defined this pressure in terms of (a) how often students were tested (e.g., in which grades), (b) school accountability, (c) repercussions for schools, (d) strength of repercussions for schools, (e) if there is a high school exit test (in 2000), and if so, the grade at which first high school test is given, and (f) the first class that had to pass the test to get their diploma (all information based on data as of 1999–2000) (see Carnoy & Loeb, 2002). Although they provide a general description of what each index value represents, their descriptions are sometimes vague. For example, to receive the highest strength of accountability score they note, “States receiving a 5 had to have students tested in several different grades, schools sanctioned or rewarded based on student test scores, and a high school minimum competency test required for graduation. Other states had some of these elements, but not others” (Carnoy & Loeb, 2002, p. 14). Carnoy and Loeb provide very limited information on to how they differentiated a 5 score from a 4 score and so on. More important, their index, as a measure of existing laws, did not account for law enforcement or implementation.
Finally, researchers from Boston College developed a three by three matrix of accountability where one dimension is defined by the severity of the consequences to students (high, moderate, low) and the other by the severity of consequences to teachers, schools and districts (again, high, moderate, or low) (Clarke et al., 2003; Pedulla, et al., 2003). Each state receives one of nine possible characterizations to describe overall amount of pressure as it relates to adults versus students (H/H, L/L, etc.).
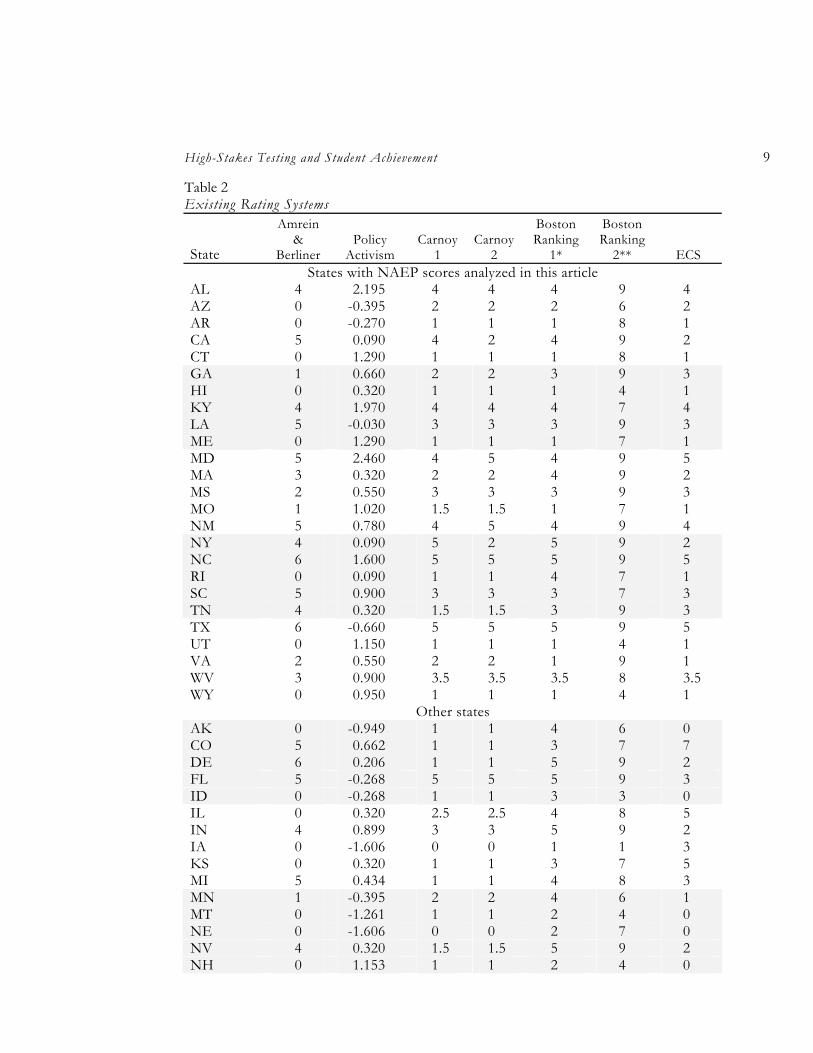
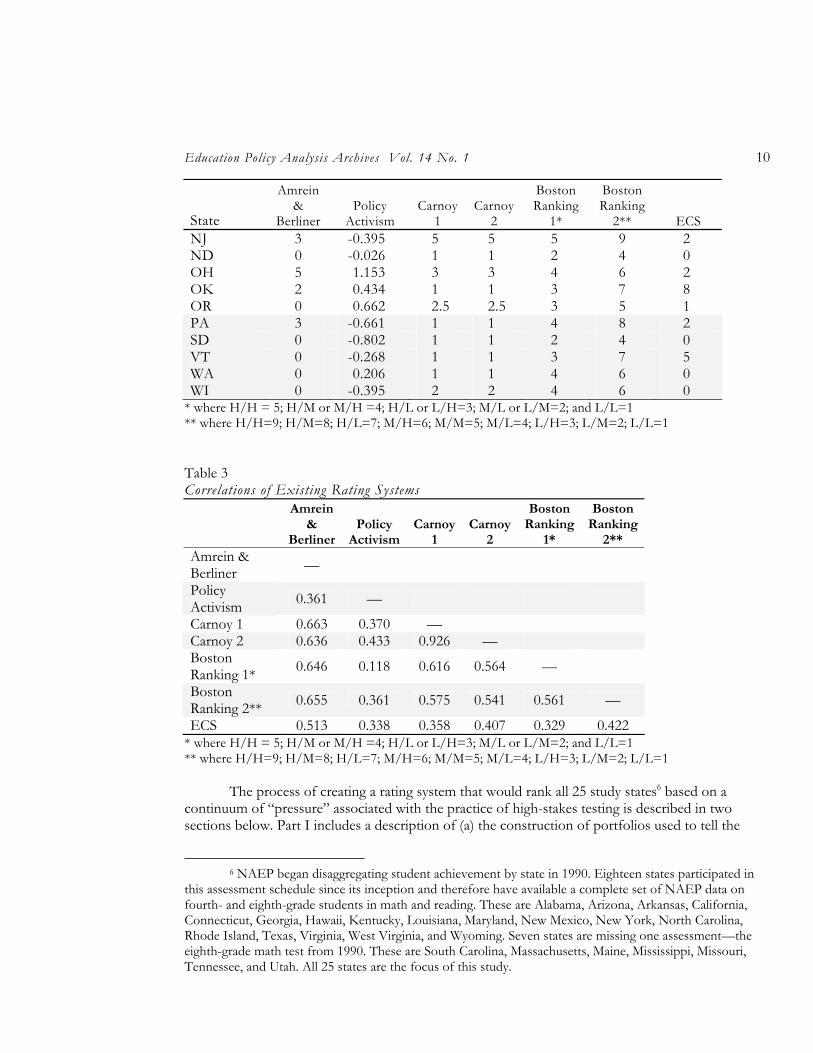
High-stakes testing categorization systems of Amrein and Berliner, Swanson and Stevenson, Pedulla et al., and Carnoy and Loeb are listed in Table 2 followed by a table of their intercorrelations in Table 3. Note that Amrein and Berliner’s rating was based on the number of stakes identified in
Education Policy Analysis Archives Vol. 14 No. 1 8
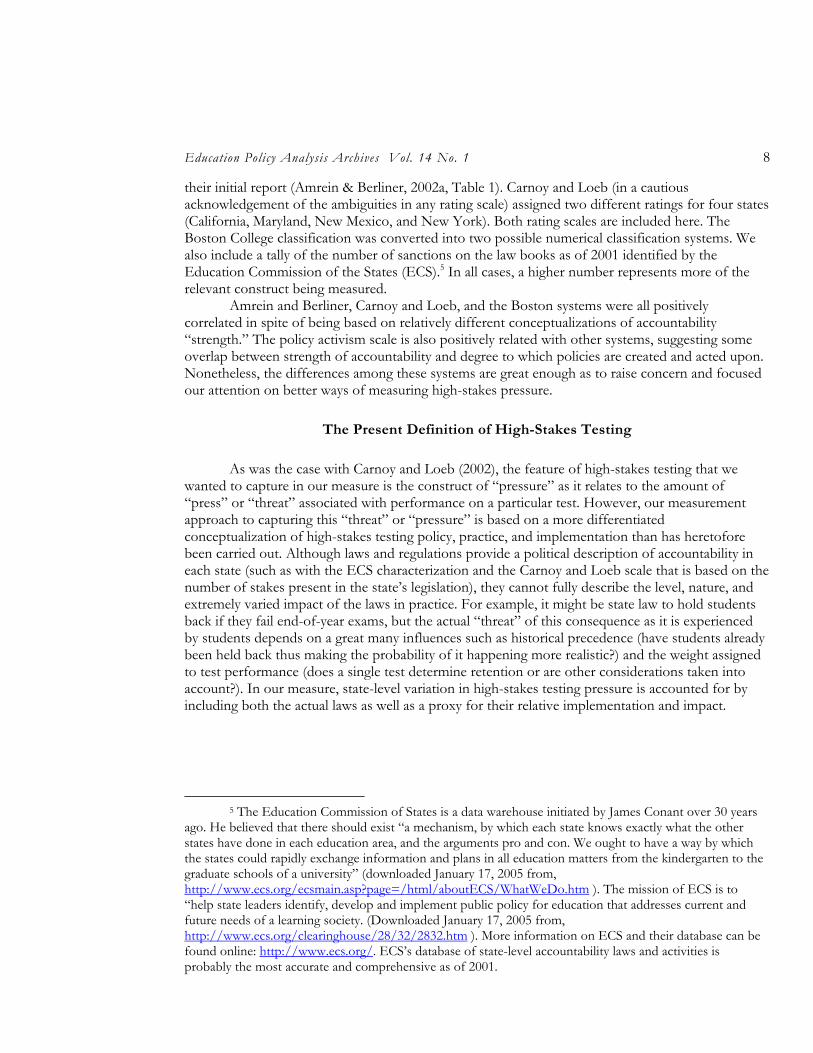
their initial report (Amrein & Berliner, 2002a, Table 1). Carnoy and Loeb (in a cautious acknowledgement of the ambiguities in any rating scale) assigned two different ratings for four states (California, Maryland, New Mexico, and New York). Both rating scales are included here. The Boston College classification was converted into two possible numerical classification systems. We also include a tally of the number of sanctions on the law books as of 2001 identified by the Education Commission of the States (ECS).5 In all cases, a higher number represents more of the relevant construct being measured.
Amrein and Berliner, Carnoy and Loeb, and the Boston systems were all positively correlated in spite of being based on relatively different conceptualizations of accountability “strength.” The policy activism scale is also positively related with other systems, suggesting some overlap between strength of accountability and degree to which policies are created and acted upon. Nonetheless, the differences among these systems are great enough as to raise concern and focused our attention on better ways of measuring high-stakes pressure.
The Present Definition of High-Stakes Testing
As was the case with Carnoy and Loeb (2002), the feature of high-stakes testing that we wanted to capture in our measure is the construct of “pressure” as it relates to the amount of “press” or “threat” associated with performance on a particular test. However, our measurement approach to capturing this “threat” or “pressure” is based on a more differentiated conceptualization of high-stakes testing policy, practice, and implementation than has heretofore been carried out. Although laws and regulations provide a political description of accountability in each state (such as with the ECS characterization and the Carnoy and Loeb scale that is based on the number of stakes present in the state’s legislation), they cannot fully describe the level, nature, and extremely varied impact of the laws in practice. For example, it might be state law to hold students back if they fail end-of-year exams, but the actual “threat” of this consequence as it is experienced by students depends on a great many influences such as historical precedence (have students already been held back thus making the probability of it happening more realistic?) and the weight assigned to test performance (does a single test determine retention or are other considerations taken into account?). In our measure, state-level variation in high-stakes testing pressure is accounted for by including both the actual laws as well as a proxy for their relative implementation and impact.
5 The Education Commission of States is a data warehouse initiated by James Conant over 30 years
ago. He believed that there should exist “a mechanism, by which each state knows exactly what the other states have done in each education area, and the arguments pro and con. We ought to have a way by which the states could rapidly exchange information and plans in all education matters from the kindergarten to the graduate schools of a university” (downloaded January 17, 2005 from, http://www.ecs.org/ecsmain.asp?page=/html/aboutECS/WhatWeDo.htm ). The mission of ECS is to “help state leaders identify, develop and implement public policy for education that addresses current and future needs of a learning society. (Downloaded January 17, 2005 from, http://www.ecs.org/clearinghouse/28/32/2832.htm ). More information on ECS and their database can be found online: http://www.ecs.org/. ECS’s database of state-level accountability laws and activities is probably the most accurate and comprehensive as of 2001.
High-Stakes Testing and Student Achievement 9
Table 2 Existing Rating Systems
State
Amrein &
Berliner Policy
Activism Carnoy
1 Carnoy
2
Boston Ranking
1*
Boston Ranking
2** ECS States with NAEP scores analyzed in this article
AL 4 2.195 4 4 4 9 4 AZ 0 -0.395 2 2 2 6 2 AR 0 -0.270 1 1 1 8 1 CA 5 0.090 4 2 4 9 2 CT 0 1.290 1 1 1 8 1 GA 1 0.660 2 2 3 9 3 HI 0 0.320 1 1 1 4 1 KY 4 1.970 4 4 4 7 4 LA 5 -0.030 3 3 3 9 3 ME 0 1.290 1 1 1 7 1 MD 5 2.460 4 5 4 9 5 MA 3 0.320 2 2 4 9 2 MS 2 0.550 3 3 3 9 3 MO 1 1.020 1.5 1.5 1 7 1 NM 5 0.780 4 5 4 9 4 NY 4 0.090 5 2 5 9 2 NC 6 1.600 5 5 5 9 5 RI 0 0.090 1 1 4 7 1 SC 5 0.900 3 3 3 7 3 TN 4 0.320 1.5 1.5 3 9 3 TX 6 -0.660 5 5 5 9 5 UT 0 1.150 1 1 1 4 1 VA 2 0.550 2 2 1 9 1 WV 3 0.900 3.5 3.5 3.5 8 3.5 WY 0 0.950 1 1 1 4 1
Other states AK 0 -0.949 1 1 4 6 0 CO 5 0.662 1 1 3 7 7 DE 6 0.206 1 1 5 9 2 FL 5 -0.268 5 5 5 9 3 ID 0 -0.268 1 1 3 3 0 IL 0 0.320 2.5 2.5 4 8 5 IN 4 0.899 3 3 5 9 2 IA 0 -1.606 0 0 1 1 3 KS 0 0.320 1 1 3 7 5 MI 5 0.434 1 1 4 8 3 MN 1 -0.395 2 2 4 6 1 MT 0 -1.261 1 1 2 4 0 NE 0 -1.606 0 0 2 7 0 NV 4 0.320 1.5 1.5 5 9 2 NH 0 1.153 1 1 2 4 0
Education Policy Analysis Archives Vol. 14 No. 1 10
State
Amrein &
Berliner Policy
Activism Carnoy
1 Carnoy
2
Boston Ranking
1*
Boston Ranking
2** ECS NJ 3 -0.395 5 5 5 9 2 ND 0 -0.026 1 1 2 4 0 OH 5 1.153 3 3 4 6 2 OK 2 0.434 1 1 3 7 8 OR 0 0.662 2.5 2.5 3 5 1 PA 3 -0.661 1 1 4 8 2 SD 0 -0.802 1 1 2 4 0 VT 0 -0.268 1 1 3 7 5 WA 0 0.206 1 1 4 6 0 WI 0 -0.395 2 2 4 6 0
* where H/H = 5; H/M or M/H =4; H/L or L/H=3; M/L or L/M=2; and L/L=1 ** where H/H=9; H/M=8; H/L=7; M/H=6; M/M=5; M/L=4; L/H=3; L/M=2; L/L=1 Table 3 Correlations of Existing Rating Systems
Amrein &
Berliner Policy
Activism Carnoy
1 Carnoy
2
Boston Ranking
1*
Boston Ranking
2** Amrein & Berliner —
Policy Activism 0.361 —
Carnoy 1 0.663 0.370 — Carnoy 2 0.636 0.433 0.926 — Boston Ranking 1* 0.646 0.118 0.616 0.564 —
Boston Ranking 2** 0.655 0.361 0.575 0.541 0.561 —
ECS 0.513 0.338 0.358 0.407 0.329 0.422 * where H/H = 5; H/M or M/H =4; H/L or L/H=3; M/L or L/M=2; and L/L=1 ** where H/H=9; H/M=8; H/L=7; M/H=6; M/M=5; M/L=4; L/H=3; L/M=2; L/L=1
The process of creating a rating system that would rank all 25 study states6 based on a
continuum of “pressure” associated with the practice of high-stakes testing is described in two sections below. Part I includes a description of (a) the construction of portfolios used to tell the
6 NAEP began disaggregating student achievement by state in 1990. Eighteen states participated in
this assessment schedule since its inception and therefore have available a complete set of NAEP data on fourth- and eighth-grade students in math and reading. These are Alabama, Arizona, Arkansas, California, Connecticut, Georgia, Hawaii, Kentucky, Louisiana, Maryland, New Mexico, New York, North Carolina, Rhode Island, Texas, Virginia, West Virginia, and Wyoming. Seven states are missing one assessment—the eighth-grade math test from 1990. These are South Carolina, Massachusetts, Maine, Mississippi, Missouri, Tennessee, and Utah. All 25 states are the focus of this study.
High-Stakes Testing and Student Achievement 11
story of state-level accountability, (b) the procedures used to convert the portfolios into an Accountability Pressure Rating (APR), and (c) the validity analysis associated with the rating system. In part II, we describe the procedures used to create an APR for each state across time (1985–2004).
Measurement Part I: Creating an Accountability Pressure Rating
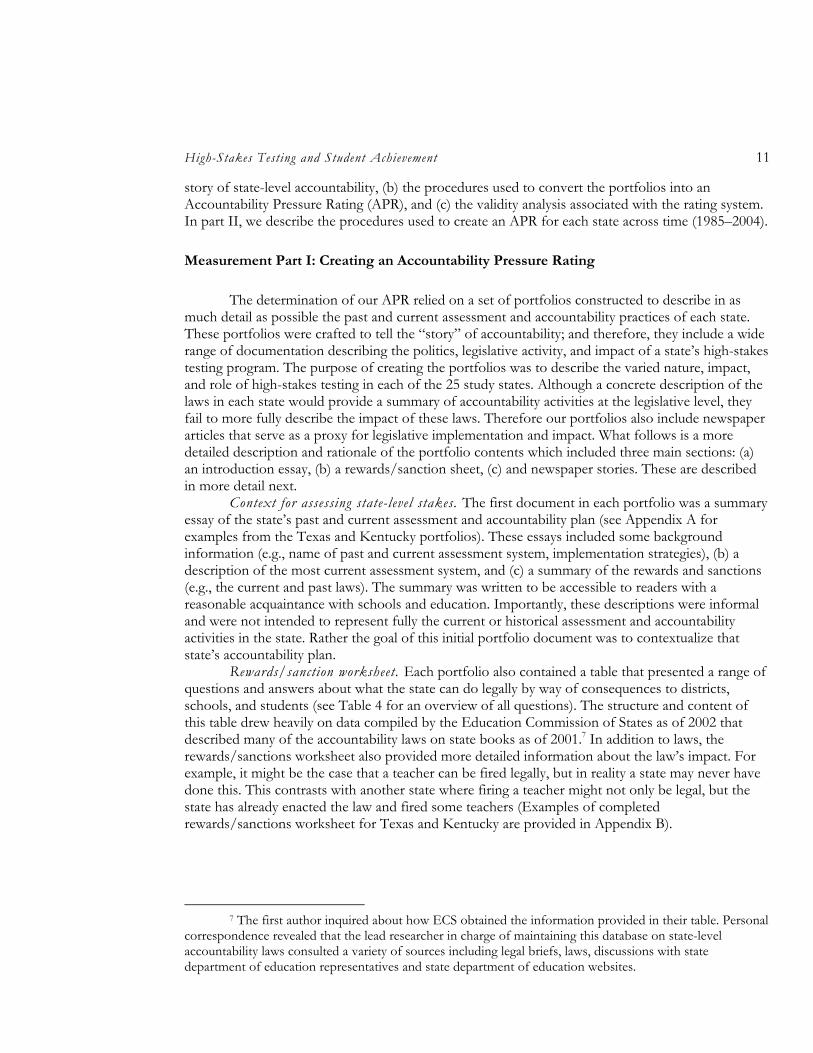
The determination of our APR relied on a set of portfolios constructed to describe in as much detail as possible the past and current assessment and accountability practices of each state. These portfolios were crafted to tell the “story” of accountability; and therefore, they include a wide range of documentation describing the politics, legislative activity, and impact of a state’s high-stakes testing program. The purpose of creating the portfolios was to describe the varied nature, impact, and role of high-stakes testing in each of the 25 study states. Although a concrete description of the laws in each state would provide a summary of accountability activities at the legislative level, they fail to more fully describe the impact of these laws. Therefore our portfolios also include newspaper articles that serve as a proxy for legislative implementation and impact. What follows is a more detailed description and rationale of the portfolio contents which included three main sections: (a) an introduction essay, (b) a rewards/sanction sheet, (c) and newspaper stories. These are described in more detail next.
Context for assessing state-level stakes. The first document in each portfolio was a summary essay of the state’s past and current assessment and accountability plan (see Appendix A for examples from the Texas and Kentucky portfolios). These essays included some background information (e.g., name of past and current assessment system, implementation strategies), (b) a description of the most current assessment system, and (c) a summary of the rewards and sanctions (e.g., the current and past laws). The summary was written to be accessible to readers with a reasonable acquaintance with schools and education. Importantly, these descriptions were informal and were not intended to represent fully the current or historical assessment and accountability activities in the state. Rather the goal of this initial portfolio document was to contextualize that state’s accountability plan.
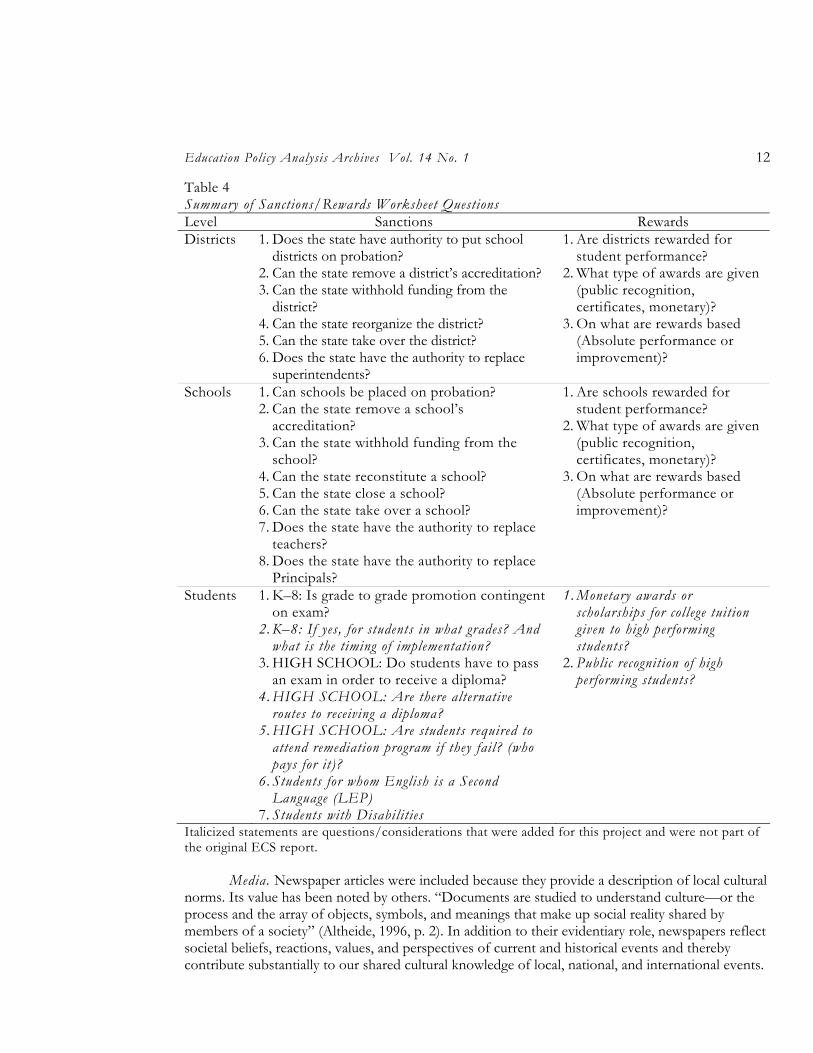
Rewards/sanction worksheet. Each portfolio also contained a table that presented a range of questions and answers about what the state can do legally by way of consequences to districts, schools, and students (see Table 4 for an overview of all questions). The structure and content of this table drew heavily on data compiled by the Education Commission of States as of 2002 that described many of the accountability laws on state books as of 2001.7 In addition to laws, the rewards/sanctions worksheet also provided more detailed information about the law’s impact. For example, it might be the case that a teacher can be fired legally, but in reality a state may never have done this. This contrasts with another state where firing a teacher might not only be legal, but the state has already enacted the law and fired some teachers (Examples of completed rewards/sanctions worksheet for Texas and Kentucky are provided in Appendix B).
7 The first author inquired about how ECS obtained the information provided in their table. Personal
correspondence revealed that the lead researcher in charge of maintaining this database on state-level accountability laws consulted a variety of sources including legal briefs, laws, discussions with state department of education representatives and state department of education websites.
Education Policy Analysis Archives Vol. 14 No. 1 12
Table 4 Summary of Sanctions/Rewards Worksheet Questions Level Sanctions Rewards Districts 1. Does the state have authority to put school
districts on probation? 2. Can the state remove a district’s accreditation? 3. Can the state withhold funding from the
district? 4. Can the state reorganize the district? 5. Can the state take over the district? 6. Does the state have the authority to replace
superintendents?
1. Are districts rewarded for student performance?
2. What type of awards are given (public recognition, certificates, monetary)?
3. On what are rewards based (Absolute performance or improvement)?
Schools 1. Can schools be placed on probation? 2. Can the state remove a school’s
accreditation? 3. Can the state withhold funding from the
school? 4. Can the state reconstitute a school? 5. Can the state close a school? 6. Can the state take over a school? 7. Does the state have the authority to replace
teachers? 8. Does the state have the authority to replace
Principals?
1. Are schools rewarded for student performance?
2. What type of awards are given (public recognition, certificates, monetary)?
3. On what are rewards based (Absolute performance or improvement)?
Students 1. K–8: Is grade to grade promotion contingent on exam?
2. K–8: If yes, for students in what grades? And what is the timing of implementation?
3. HIGH SCHOOL: Do students have to pass an exam in order to receive a diploma?
4. HIGH SCHOOL: Are there alternative routes to receiving a diploma?
5. HIGH SCHOOL: Are students required to attend remediation program if they fail? (who pays for it)?
6. Students for whom English is a Second Language (LEP)
7. Students with Disabilities
1. Monetary awards or scholarships for college tuition given to high performing students?
2. Public recognition of high performing students?
Italicized statements are questions/considerations that were added for this project and were not part of the original ECS report.
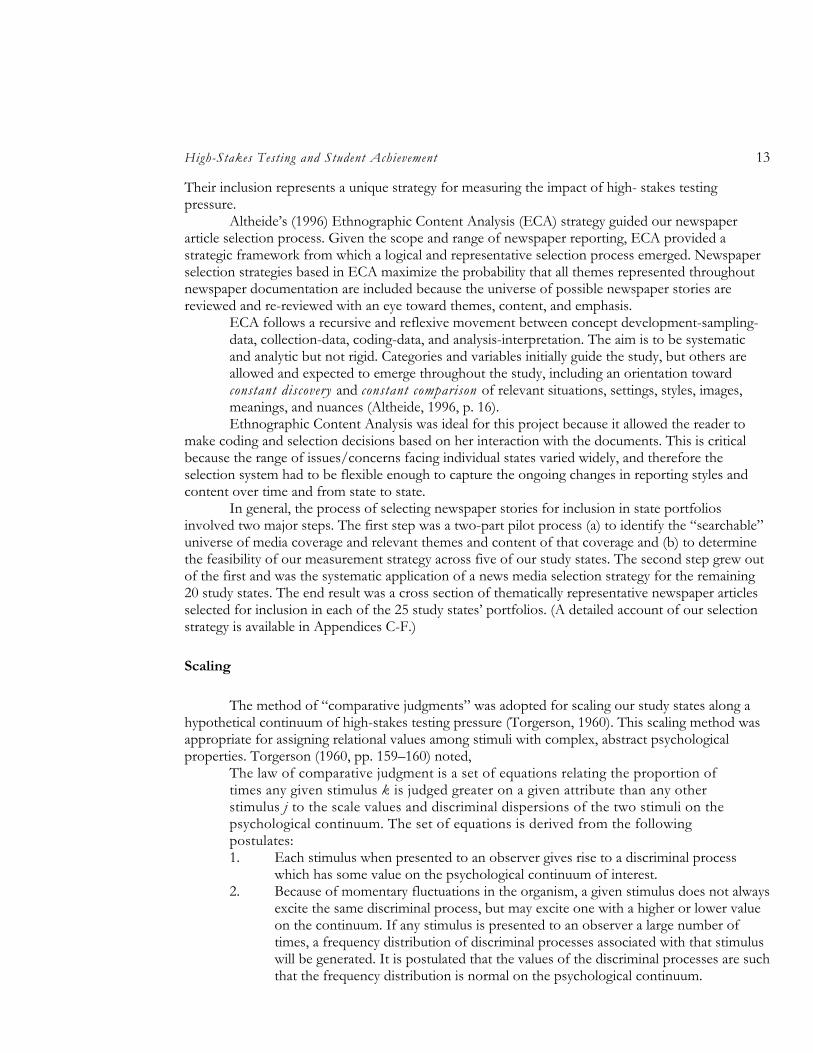
Media. Newspaper articles were included because they provide a description of local cultural
norms. Its value has been noted by others. “Documents are studied to understand culture—or the process and the array of objects, symbols, and meanings that make up social reality shared by members of a society” (Altheide, 1996, p. 2). In addition to their evidentiary role, newspapers reflect societal beliefs, reactions, values, and perspectives of current and historical events and thereby contribute substantially to our shared cultural knowledge of local, national, and international events.
High-Stakes Testing and Student Achievement 13
Their inclusion represents a unique strategy for measuring the impact of high- stakes testing pressure.
Altheide’s (1996) Ethnographic Content Analysis (ECA) strategy guided our newspaper article selection process. Given the scope and range of newspaper reporting, ECA provided a strategic framework from which a logical and representative selection process emerged. Newspaper selection strategies based in ECA maximize the probability that all themes represented throughout newspaper documentation are included because the universe of possible newspaper stories are reviewed and re-reviewed with an eye toward themes, content, and emphasis.
ECA follows a recursive and reflexive movement between concept development-sampling-data, collection-data, coding-data, and analysis-interpretation. The aim is to be systematic and analytic but not rigid. Categories and variables initially guide the study, but others are allowed and expected to emerge throughout the study, including an orientation toward constant discovery and constant comparison of relevant situations, settings, styles, images, meanings, and nuances (Altheide, 1996, p. 16). Ethnographic Content Analysis was ideal for this project because it allowed the reader to
make coding and selection decisions based on her interaction with the documents. This is critical because the range of issues/concerns facing individual states varied widely, and therefore the selection system had to be flexible enough to capture the ongoing changes in reporting styles and content over time and from state to state.
In general, the process of selecting newspaper stories for inclusion in state portfolios involved two major steps. The first step was a two-part pilot process (a) to identify the “searchable” universe of media coverage and relevant themes and content of that coverage and (b) to determine the feasibility of our measurement strategy across five of our study states. The second step grew out of the first and was the systematic application of a news media selection strategy for the remaining 20 study states. The end result was a cross section of thematically representative newspaper articles selected for inclusion in each of the 25 study states’ portfolios. (A detailed account of our selection strategy is available in Appendices C-F.)
Scaling
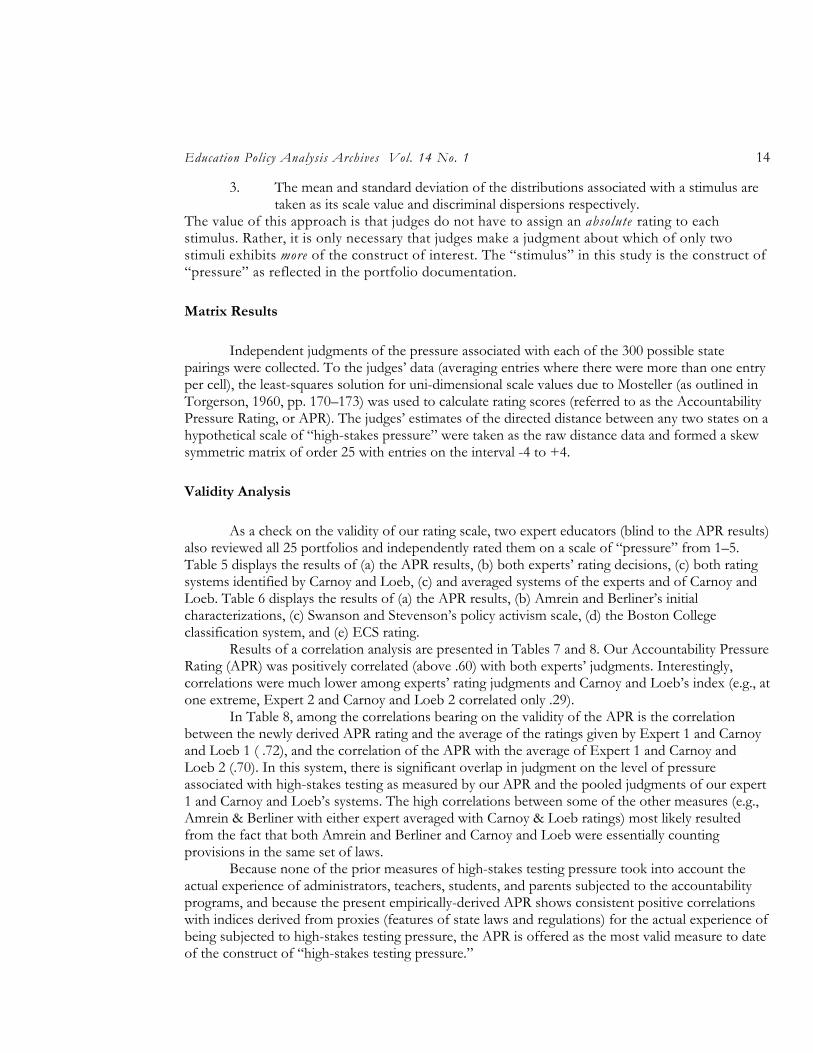
The method of “comparative judgments” was adopted for scaling our study states along a hypothetical continuum of high-stakes testing pressure (Torgerson, 1960). This scaling method was appropriate for assigning relational values among stimuli with complex, abstract psychological properties. Torgerson (1960, pp. 159–160) noted,
The law of comparative judgment is a set of equations relating the proportion of times any given stimulus k is judged greater on a given attribute than any other stimulus j to the scale values and discriminal dispersions of the two stimuli on the psychological continuum. The set of equations is derived from the following postulates: 1. Each stimulus when presented to an observer gives rise to a discriminal process
which has some value on the psychological continuum of interest. 2. Because of momentary fluctuations in the organism, a given stimulus does not always
excite the same discriminal process, but may excite one with a higher or lower value on the continuum. If any stimulus is presented to an observer a large number of times, a frequency distribution of discriminal processes associated with that stimulus will be generated. It is postulated that the values of the discriminal processes are such that the frequency distribution is normal on the psychological continuum.
Education Policy Analysis Archives Vol. 14 No. 1 14
3. The mean and standard deviation of the distributions associated with a stimulus are taken as its scale value and discriminal dispersions respectively.
The value of this approach is that judges do not have to assign an absolute rating to each stimulus. Rather, it is only necessary that judges make a judgment about which of only two stimuli exhibits more of the construct of interest. The “stimulus” in this study is the construct of “pressure” as reflected in the portfolio documentation.
Matrix Results
Independent judgments of the pressure associated with each of the 300 possible state pairings were collected. To the judges’ data (averaging entries where there were more than one entry per cell), the least-squares solution for uni-dimensional scale values due to Mosteller (as outlined in Torgerson, 1960, pp. 170–173) was used to calculate rating scores (referred to as the Accountability Pressure Rating, or APR). The judges’ estimates of the directed distance between any two states on a hypothetical scale of “high-stakes pressure” were taken as the raw distance data and formed a skew symmetric matrix of order 25 with entries on the interval -4 to +4.
Validity Analysis
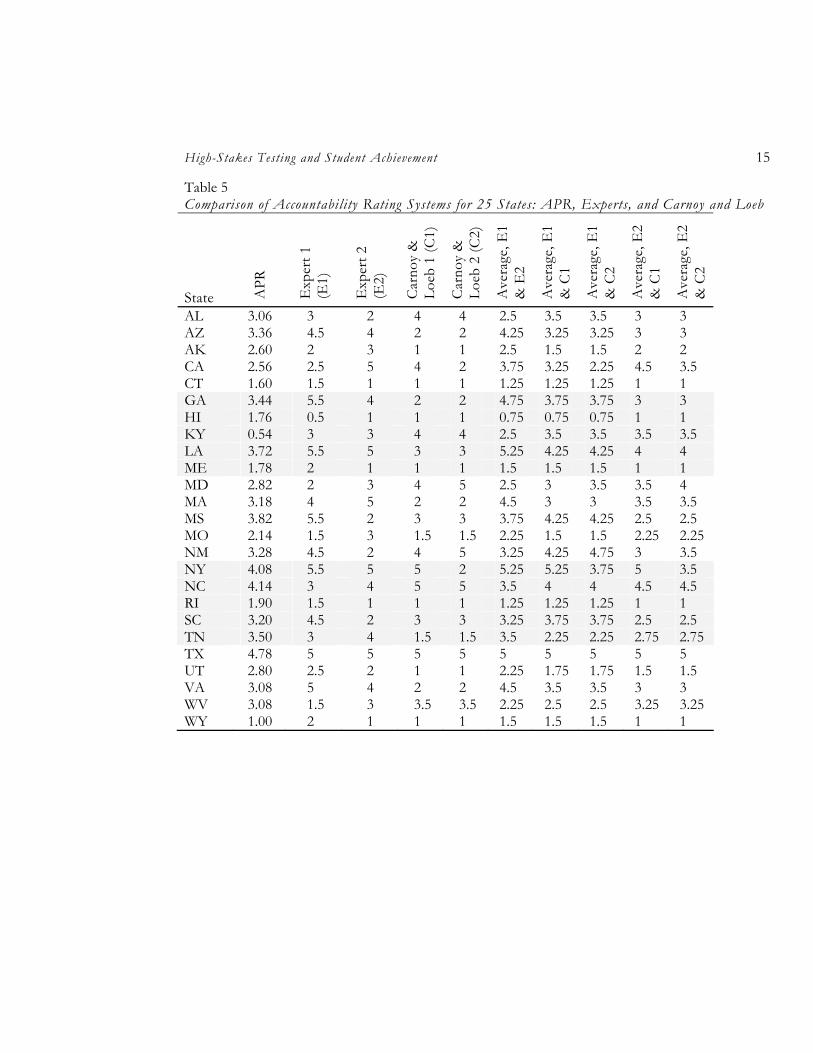
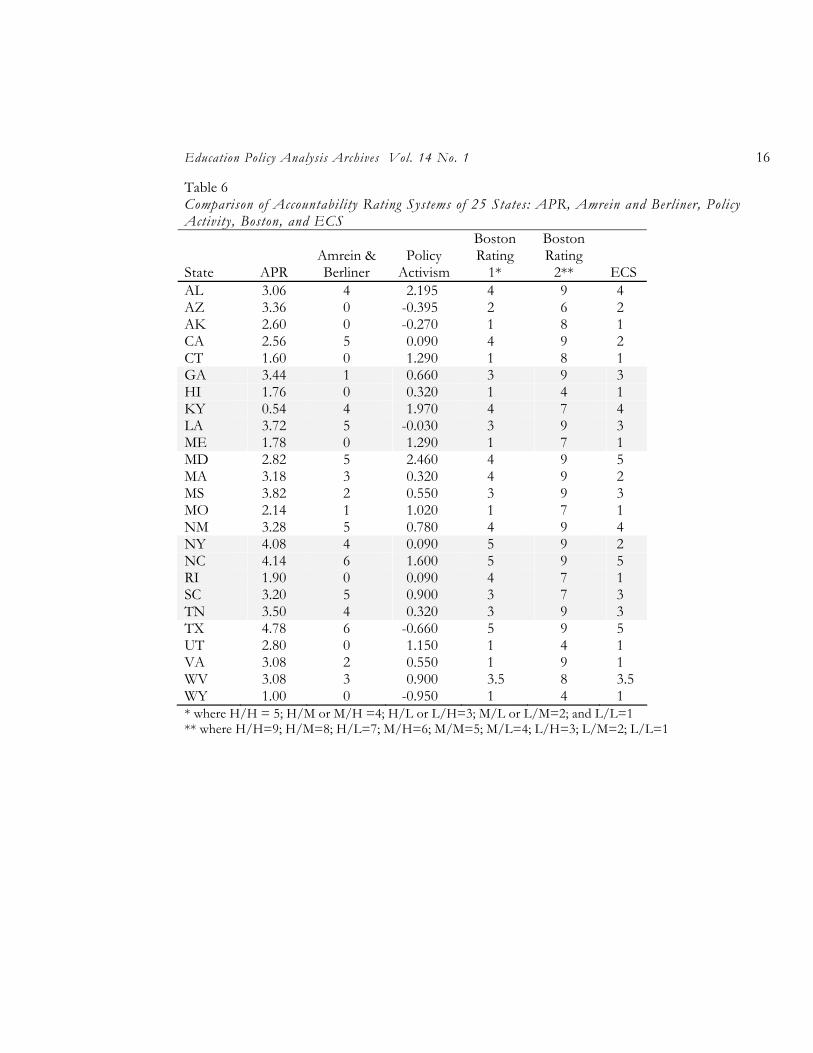
As a check on the validity of our rating scale, two expert educators (blind to the APR results) also reviewed all 25 portfolios and independently rated them on a scale of “pressure” from 1–5. Table 5 displays the results of (a) the APR results, (b) both experts’ rating decisions, (c) both rating systems identified by Carnoy and Loeb, (c) and averaged systems of the experts and of Carnoy and Loeb. Table 6 displays the results of (a) the APR results, (b) Amrein and Berliner’s initial characterizations, (c) Swanson and Stevenson’s policy activism scale, (d) the Boston College classification system, and (e) ECS rating.
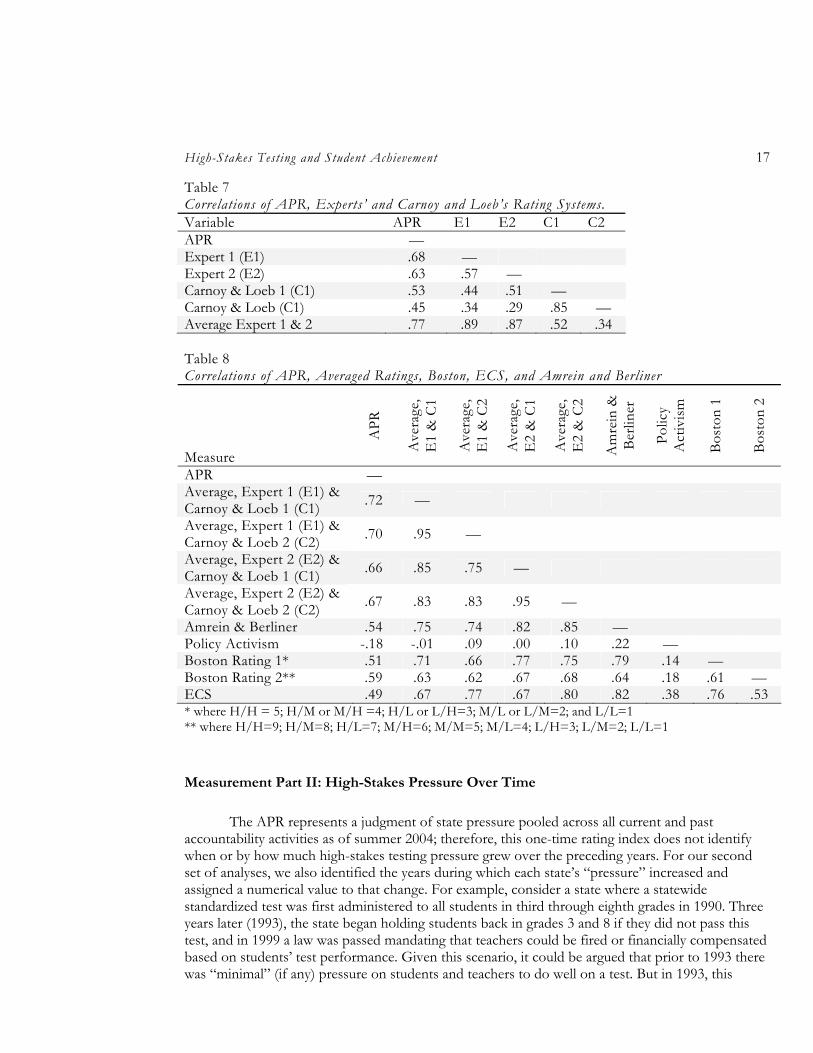
Results of a correlation analysis are presented in Tables 7 and 8. Our Accountability Pressure Rating (APR) was positively correlated (above .60) with both experts’ judgments. Interestingly, correlations were much lower among experts’ rating judgments and Carnoy and Loeb’s index (e.g., at one extreme, Expert 2 and Carnoy and Loeb 2 correlated only .29).
In Table 8, among the correlations bearing on the validity of the APR is the correlation between the newly derived APR rating and the average of the ratings given by Expert 1 and Carnoy and Loeb 1 ( .72), and the correlation of the APR with the average of Expert 1 and Carnoy and Loeb 2 (.70). In this system, there is significant overlap in judgment on the level of pressure associated with high-stakes testing as measured by our APR and the pooled judgments of our expert 1 and Carnoy and Loeb’s systems. The high correlations between some of the other measures (e.g., Amrein & Berliner with either expert averaged with Carnoy & Loeb ratings) most likely resulted from the fact that both Amrein and Berliner and Carnoy and Loeb were essentially counting provisions in the same set of laws.
Because none of the prior measures of high-stakes testing pressure took into account the actual experience of administrators, teachers, students, and parents subjected to the accountability programs, and because the present empirically-derived APR shows consistent positive correlations with indices derived from proxies (features of state laws and regulations) for the actual experience of being subjected to high-stakes testing pressure, the APR is offered as the most valid measure to date of the construct of “high-stakes testing pressure.”
High-Stakes Testing and Student Achievement 15
Table 5 Comparison of Accountability Rating Systems for 25 States: APR, Experts, and Carnoy and Loeb
State APR
Exp
ert 1
(E
1)
Exp
ert 2
(E
2)
Car
noy
&
Loeb
1 (C
1)
Car
noy
&
Loeb
2 (C
2)
Ave
rage
, E1
& E
2
Ave
rage
, E1
& C
1
Ave
rage
, E1
& C
2
Ave
rage
, E2
& C
1
Ave
rage
, E2
& C
2
AL 3.06 3 2 4 4 2.5 3.5 3.5 3 3 AZ 3.36 4.5 4 2 2 4.25 3.25 3.25 3 3 AK 2.60 2 3 1 1 2.5 1.5 1.5 2 2 CA 2.56 2.5 5 4 2 3.75 3.25 2.25 4.5 3.5 CT 1.60 1.5 1 1 1 1.25 1.25 1.25 1 1 GA 3.44 5.5 4 2 2 4.75 3.75 3.75 3 3 HI 1.76 0.5 1 1 1 0.75 0.75 0.75 1 1 KY 0.54 3 3 4 4 2.5 3.5 3.5 3.5 3.5 LA 3.72 5.5 5 3 3 5.25 4.25 4.25 4 4 ME 1.78 2 1 1 1 1.5 1.5 1.5 1 1 MD 2.82 2 3 4 5 2.5 3 3.5 3.5 4 MA 3.18 4 5 2 2 4.5 3 3 3.5 3.5 MS 3.82 5.5 2 3 3 3.75 4.25 4.25 2.5 2.5 MO 2.14 1.5 3 1.5 1.5 2.25 1.5 1.5 2.25 2.25 NM 3.28 4.5 2 4 5 3.25 4.25 4.75 3 3.5 NY 4.08 5.5 5 5 2 5.25 5.25 3.75 5 3.5 NC 4.14 3 4 5 5 3.5 4 4 4.5 4.5 RI 1.90 1.5 1 1 1 1.25 1.25 1.25 1 1 SC 3.20 4.5 2 3 3 3.25 3.75 3.75 2.5 2.5 TN 3.50 3 4 1.5 1.5 3.5 2.25 2.25 2.75 2.75 TX 4.78 5 5 5 5 5 5 5 5 5 UT 2.80 2.5 2 1 1 2.25 1.75 1.75 1.5 1.5 VA 3.08 5 4 2 2 4.5 3.5 3.5 3 3 WV 3.08 1.5 3 3.5 3.5 2.25 2.5 2.5 3.25 3.25 WY 1.00 2 1 1 1 1.5 1.5 1.5 1 1
Education Policy Analysis Archives Vol. 14 No. 1 16
Table 6 Comparison of Accountability Rating Systems of 25 States: APR, Amrein and Berliner, Policy Activity, Boston, and ECS
State APR Amrein & Berliner
Policy Activism
Boston Rating
1*
Boston Rating
2** ECS AL 3.06 4 2.195 4 9 4 AZ 3.36 0 -0.395 2 6 2 AK 2.60 0 -0.270 1 8 1 CA 2.56 5 0.090 4 9 2 CT 1.60 0 1.290 1 8 1 GA 3.44 1 0.660 3 9 3 HI 1.76 0 0.320 1 4 1 KY 0.54 4 1.970 4 7 4 LA 3.72 5 -0.030 3 9 3 ME 1.78 0 1.290 1 7 1 MD 2.82 5 2.460 4 9 5 MA 3.18 3 0.320 4 9 2 MS 3.82 2 0.550 3 9 3 MO 2.14 1 1.020 1 7 1 NM 3.28 5 0.780 4 9 4 NY 4.08 4 0.090 5 9 2 NC 4.14 6 1.600 5 9 5 RI 1.90 0 0.090 4 7 1 SC 3.20 5 0.900 3 7 3 TN 3.50 4 0.320 3 9 3 TX 4.78 6 -0.660 5 9 5 UT 2.80 0 1.150 1 4 1 VA 3.08 2 0.550 1 9 1 WV 3.08 3 0.900 3.5 8 3.5 WY 1.00 0 -0.950 1 4 1 * where H/H = 5; H/M or M/H =4; H/L or L/H=3; M/L or L/M=2; and L/L=1 ** where H/H=9; H/M=8; H/L=7; M/H=6; M/M=5; M/L=4; L/H=3; L/M=2; L/L=1
High-Stakes Testing and Student Achievement 17
Table 7 Correlations of APR, Experts’ and Carnoy and Loeb’s Rating Systems. Variable APR E1 E2 C1 C2 APR — Expert 1 (E1) .68 — Expert 2 (E2) .63 .57 — Carnoy & Loeb 1 (C1) .53 .44 .51 — Carnoy & Loeb (C1) .45 .34 .29 .85 — Average Expert 1 & 2 .77 .89 .87 .52 .34 Table 8 Correlations of APR, Averaged Ratings, Boston, ECS, and Amrein and Berliner
Measure
APR
Ave
rage
, E
1 &
C1
Ave
rage
, E
1 &
C2
Ave
rage
, E
2 &
C1
Ave
rage
, E
2 &
C2
Am
rein
&
Berli
ner
Polic
y A
ctiv
ism
Bost
on 1
Bost
on 2
APR — Average, Expert 1 (E1) & Carnoy & Loeb 1 (C1) .72 —
Average, Expert 1 (E1) & Carnoy & Loeb 2 (C2) .70 .95 —
Average, Expert 2 (E2) & Carnoy & Loeb 1 (C1) .66 .85 .75 —
Average, Expert 2 (E2) & Carnoy & Loeb 2 (C2) .67 .83 .83 .95 —
Amrein & Berliner .54 .75 .74 .82 .85 — Policy Activism -.18 -.01 .09 .00 .10 .22 — Boston Rating 1* .51 .71 .66 .77 .75 .79 .14 — Boston Rating 2** .59 .63 .62 .67 .68 .64 .18 .61 — ECS .49 .67 .77 .67 .80 .82 .38 .76 .53 * where H/H = 5; H/M or M/H =4; H/L or L/H=3; M/L or L/M=2; and L/L=1 ** where H/H=9; H/M=8; H/L=7; M/H=6; M/M=5; M/L=4; L/H=3; L/M=2; L/L=1
Measurement Part II: High-Stakes Pressure Over Time
The APR represents a judgment of state pressure pooled across all current and past accountability activities as of summer 2004; therefore, this one-time rating index does not identify when or by how much high-stakes testing pressure grew over the preceding years. For our second set of analyses, we also identified the years during which each state’s “pressure” increased and assigned a numerical value to that change. For example, consider a state where a statewide standardized test was first administered to all students in third through eighth grades in 1990. Three years later (1993), the state began holding students back in grades 3 and 8 if they did not pass this test, and in 1999 a law was passed mandating that teachers could be fired or financially compensated based on students’ test performance. Given this scenario, it could be argued that prior to 1993 there was “minimal” (if any) pressure on students and teachers to do well on a test. But in 1993, this
Education Policy Analysis Archives Vol. 14 No. 1 18
pressure increased somewhat (most specifically for third and eighth graders and their teachers), and by 1999, the pressure increased again, this time for all teachers. This change in pressure could be depicted the following way:
Year 1990 1992 1993 1994 1995 1996 1997 1998 1999 Pressure 1 1 2 2 2 2 2 2 3
Of course, these hypothetical increases are not sensitive to the differential changes in
pressure to individual schools, districts, administrators, teachers, and students. Instead, they reflect, as the APR does, a pooled increase in the amount of pressure as it exists across the entire state.
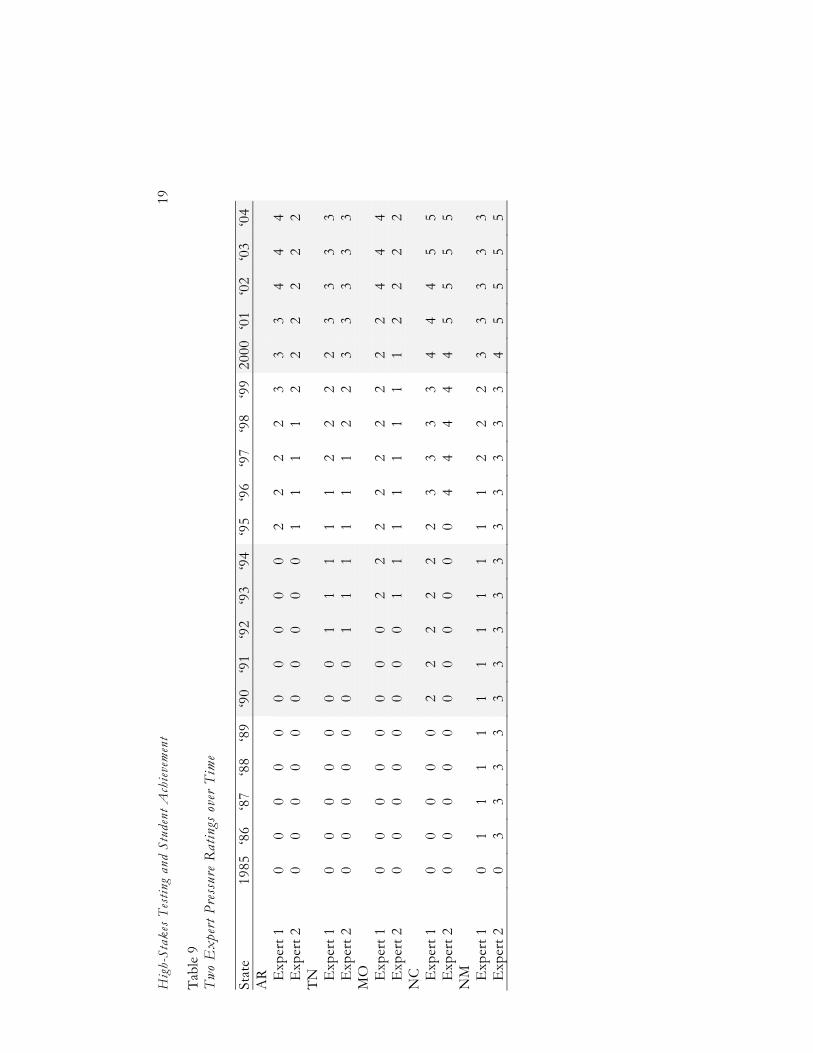
Assigning values to the timing of accountability implementation across all 25 states was a two-step process. First, one of our education experts (Expert 1) read through all 25 portfolios and made a series of judgments about the timing of high-stakes testing increases in each state. Expert 1 assigned a value for the level of threat for each state and for each year from 1985–2004. As a check, the first author followed the same procedure for a random selection of five portfolios. The results of both readers’ judgments on these five states are presented in Table 9.
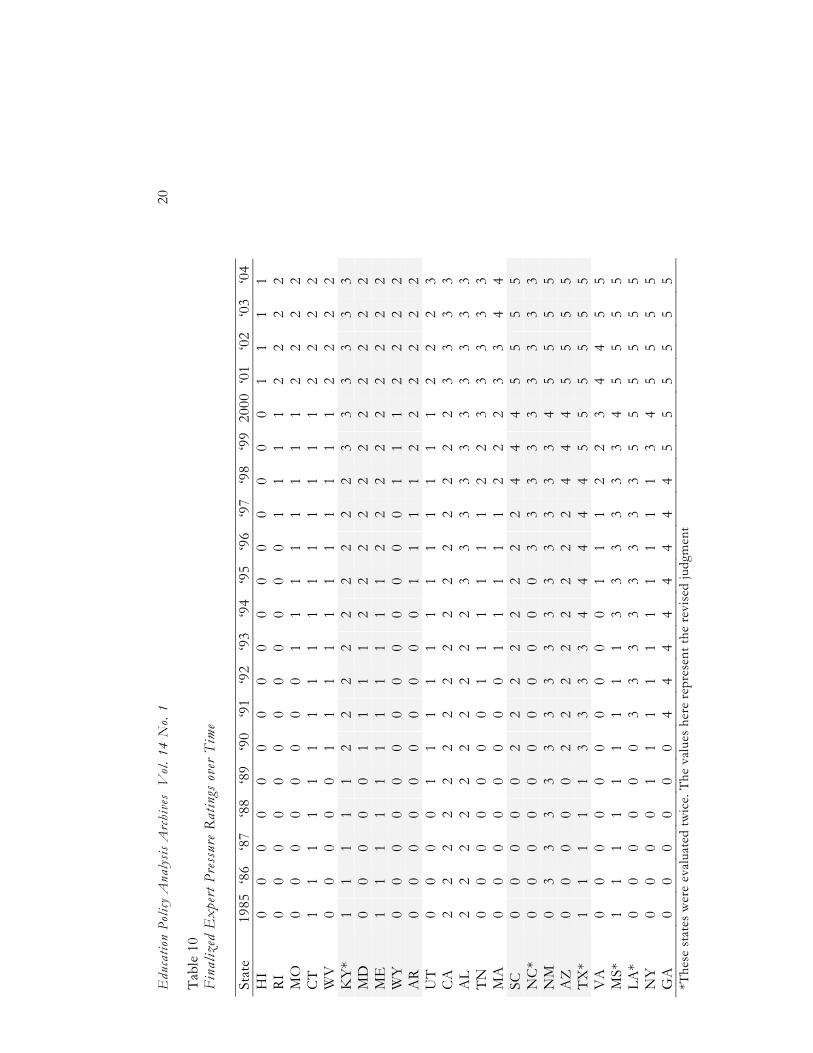
Although experts’ judgments did not reach an especially high degree of agreement on the intervening years during which pressure escalated, experts’ level of agreement on the year during which stakes were first attached to testing was relatively high. Further, experts’ level of agreement across the entire time span and the relative amount of “jump” in pressure gain overall were relatively consistent. That is, both experts’ ratings showed that pressure scores doubled for Arkansas and Missouri and ended at the same absolute level of pressure for Tennessee and North Carolina. But, perhaps more importantly, a second look at Table 7 shows that that Expert 1 had the highest correlation with APR (r = .68). Expert 2 was only slightly lower in agreement with the APR (r = .63) and the Carnoy and Loeb indices were well below both experts (r = .53 and .45). Given the impracticality of asking hundreds of judges to rate high-stakes pressure for every year from 1985 to 2003 and for every state, it was decided to let Expert 1 provide all judgments of pressure increase between the years 1985 and 2004 (Table 10). Expert 1 serves as the best available surrogate for the many judges who gave us a robust (albeit a static) measure of high-stakes testing pressure, our APR. (All subsequent analyses utilizing these ratings will be referred to as Expert Pressure Ratings or EPR.)
Hig
h-St
akes
Tes
ting
and
Stud
ent A
chiev
emen
t 19
Tabl
e 9
Two
Exp
ert P
ress
ure
Rat
ings
ove
r Ti
me
Stat
e
1985
‘8
6 ‘8
7 ‘8
8‘8
9‘9
0‘9
1‘9
2‘9
3‘9
4‘9
5‘9
6 ‘9
7‘9
8‘9
920
00‘0
1‘0
2‘0
3‘0
4A
R
E
xper
t 1
0 0
0 0
0 0
0 0
0 0
2 2
2 2
3 3
3 4
4 4
Exp
ert 2
0
0 0
0 0
0 0
0 0
0 1
1 1
1 2
2 2
2 2
2 TN
E
xper
t 1
0 0
0 0
0 0
0 1
1 1
1 1
2 2
2 2
3 3
3 3
Exp
ert 2
0
0 0
0 0
0 0
1 1
1 1
1 1
2 2
3 3
3 3
3 M
O
Exp
ert 1
0
0 0
0 0
0 0
0 2
2 2
2 2
2 2
2 2
4 4
4 E
xper
t 2
0 0
0 0
0 0
0 0
1 1
1 1
1 1
1 1
2 2
2 2
NC
E
xper
t 1
0 0
0 0
0 2
2 2
2 2
2 3
3 3
3 4
4 4
5 5
Exp
ert 2
0
0 0
0 0
0 0
0 0
0 0
4 4
4 4
4 5
5 5
5 N
M
Exp
ert 1
0
1 1
1 1
1 1
1 1
1 1
1 2
2 2
3 3
3 3
3 E
xper
t 2
0 3
3 3
3 3
3 3
3 3
3 3
3 3
3 4
5 5
5 5
Edu
catio
n Po
licy
Ana
lysis
Arc
hive
s V
ol. 1
4 N
o. 1
20
Tabl
e 10
Fi
naliz
ed E
xper
t Pre
ssur
e R
atin
gs o
ver
Tim
e St
ate
1985
‘86
‘8
7 ‘8
8 ‘8
9‘9
0‘9
1‘9
2‘9
3‘9
4‘9
5‘9
6‘9
7 ‘9
8 ‘9
920
00‘0
1‘0
2‘0
3‘0
4H
I 0
0 0
0 0
0 0
0 0
0 0
0 0
0 0
0 1
1 1
1 RI
0
0 0
0 0
0 0
0 0
0 0
0 1
1 1
1 2
2 2
2 M
O
0 0
0 0
0 0
0 0
1 1
1 1
1 1
1 1
2 2
2 2
CT
1 1
1 1
1 1
1 1
1 1
1 1
1 1
1 1
2 2
2 2
WV
0
0 0
0 0
1 1
1 1
1 1
1 1
1 1
1 2
2 2
2 K
Y*
1 1
1 1
1 2
2 2
2 2
2 2
2 2
3 3
3 3
3 3
MD
0
0 0
0 0
1 1
1 1
2 2
2 2
2 2
2 2
2 2
2 M
E
1 1
1 1
1 1
1 1
1 1
1 2
2 2
2 2
2 2
2 2
WY
0
0 0
0 0
0 0
0 0
0 0
0 0
1 1
1 2
2 2
2 A
R 0
0 0
0 0
0 0
0 0
0 1
1 1
1 2
2 2
2 2
2 U
T 0
0 0
0 1
1 1
1 1
1 1
1 1
1 1
1 2
2 2
3 C
A
2 2
2 2
2 2
2 2
2 2
2 2
2 2
2 2
3 3
3 3
AL
2 2
2 2
2 2
2 2
2 2
3 3
3 3
3 3
3 3
3 3
TN
0 0
0 0
0 0
0 1
1 1
1 1
1 2
2 3
3 3
3 3
MA
0
0 0
0 0
0 0
0 1
1 1
1 1
2 2
2 3
3 4
4 SC
0
0 0
0 0
2 2
2 2
2 2
2 2
4 4
4 5
5 5
5 N
C*
0 0
0 0
0 0
0 0
0 0
0 3
3 3
3 3
3 3
3 3
NM
0
3 3
3 3
3 3
3 3
3 3
3 3
3 3
4 5
5 5
5 A
Z
0 0
0 0
0 2
2 2
2 2
2 2
2 4
4 4
5 5
5 5
TX*
1 1
1 1
1 3
3 3
3 4
4 4
4 4
5 5
5 5
5 5
VA
0
0 0
0 0
0 0
0 0
0 1
1 1
2 2
3 4
4 5
5 M
S*
1 1
1 1
1 1
1 1
1 3
3 3
3 3
3 4
5 5
5 5
LA*
0 0
0 0
0 0
3 3
3 3
3 3
3 3
5 5
5 5
5 5
NY
0
0 0
0 1
1 1
1 1
1 1
1 1
1 3
4 5
5 5
5 G
A
0 0
0 0
0 0
4 4
4 4
4 4
4 4
5 5
5 5
5 5
*The
se s
tate
s w
ere
eval
uate
d tw
ice.
The
val
ues
here
repr
esen
t the
revi
sed
judg
men
t
High-Stakes Testing and Student Achievement 21
Method
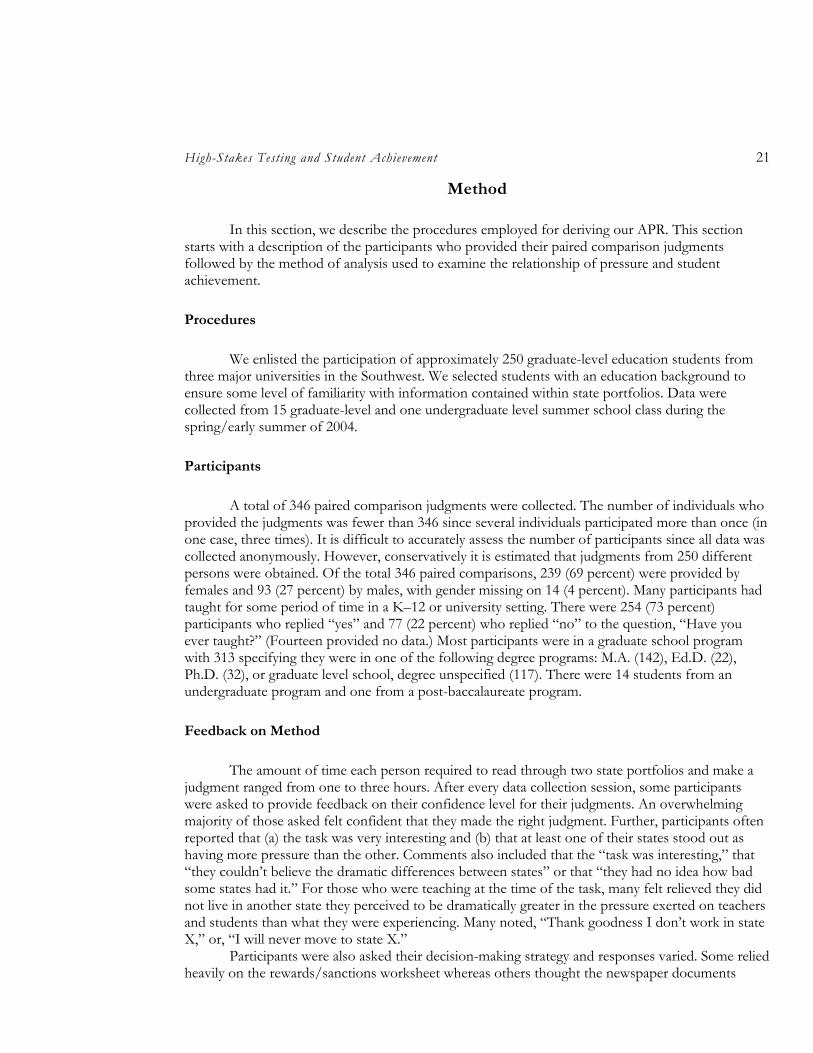
In this section, we describe the procedures employed for deriving our APR. This section starts with a description of the participants who provided their paired comparison judgments followed by the method of analysis used to examine the relationship of pressure and student achievement.
Procedures
We enlisted the participation of approximately 250 graduate-level education students from three major universities in the Southwest. We selected students with an education background to ensure some level of familiarity with information contained within state portfolios. Data were collected from 15 graduate-level and one undergraduate level summer school class during the spring/early summer of 2004.
Participants
A total of 346 paired comparison judgments were collected. The number of individuals who provided the judgments was fewer than 346 since several individuals participated more than once (in one case, three times). It is difficult to accurately assess the number of participants since all data was collected anonymously. However, conservatively it is estimated that judgments from 250 different persons were obtained. Of the total 346 paired comparisons, 239 (69 percent) were provided by females and 93 (27 percent) by males, with gender missing on 14 (4 percent). Many participants had taught for some period of time in a K–12 or university setting. There were 254 (73 percent) participants who replied “yes” and 77 (22 percent) who replied “no” to the question, “Have you ever taught?” (Fourteen provided no data.) Most participants were in a graduate school program with 313 specifying they were in one of the following degree programs: M.A. (142), Ed.D. (22), Ph.D. (32), or graduate level school, degree unspecified (117). There were 14 students from an undergraduate program and one from a post-baccalaureate program.
Feedback on Method
The amount of time each person required to read through two state portfolios and make a judgment ranged from one to three hours. After every data collection session, some participants were asked to provide feedback on their confidence level for their judgments. An overwhelming majority of those asked felt confident that they made the right judgment. Further, participants often reported that (a) the task was very interesting and (b) that at least one of their states stood out as having more pressure than the other. Comments also included that the “task was interesting,” that “they couldn’t believe the dramatic differences between states” or that “they had no idea how bad some states had it.” For those who were teaching at the time of the task, many felt relieved they did not live in another state they perceived to be dramatically greater in the pressure exerted on teachers and students than what they were experiencing. Many noted, “Thank goodness I don’t work in state X,” or, “I will never move to state X.”
Participants were also asked their decision-making strategy and responses varied. Some relied heavily on the rewards/sanctions worksheet whereas others thought the newspaper documents
Education Policy Analysis Archives Vol. 14 No. 1 22
helped them more. Some used the comparison sheets we provided as a starting point and went back and forth between portfolios on each specific document, whereas others would go through one portfolio before looking at the second one.
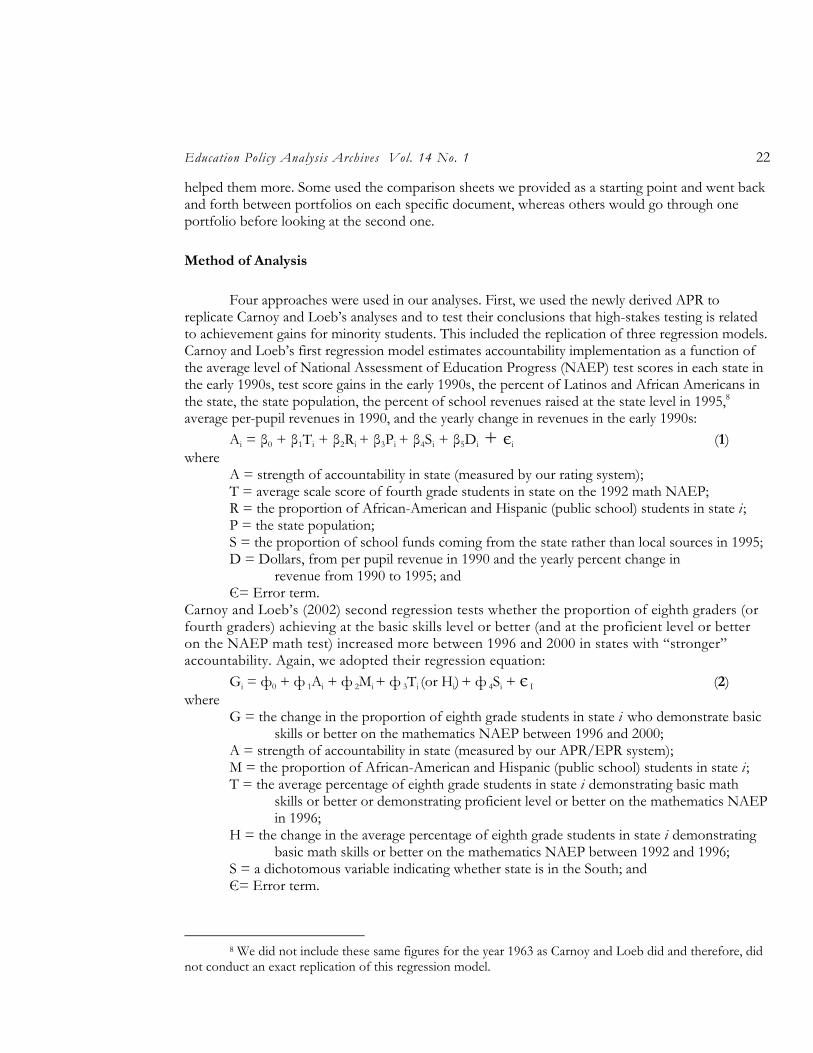
Method of Analysis
Four approaches were used in our analyses. First, we used the newly derived APR to replicate Carnoy and Loeb’s analyses and to test their conclusions that high-stakes testing is related to achievement gains for minority students. This included the replication of three regression models. Carnoy and Loeb’s first regression model estimates accountability implementation as a function of the average level of National Assessment of Education Progress (NAEP) test scores in each state in the early 1990s, test score gains in the early 1990s, the percent of Latinos and African Americans in the state, the state population, the percent of school revenues raised at the state level in 1995,8 average per-pupil revenues in 1990, and the yearly change in revenues in the early 1990s:
Ai = β0 + β1Ti + β2Ri + β3Pi + β4Si + β5Di + єi (1) where
A = strength of accountability in state (measured by our rating system); T = average scale score of fourth grade students in state on the 1992 math NAEP; R = the proportion of African-American and Hispanic (public school) students in state i; P = the state population; S = the proportion of school funds coming from the state rather than local sources in 1995; D = Dollars, from per pupil revenue in 1990 and the yearly percent change in revenue from 1990 to 1995; and Є= Error term.
Carnoy and Loeb’s (2002) second regression tests whether the proportion of eighth graders (or fourth graders) achieving at the basic skills level or better (and at the proficient level or better on the NAEP math test) increased more between 1996 and 2000 in states with “stronger” accountability. Again, we adopted their regression equation:
Gi = ф0 + ф 1Ai + ф 2Mi + ф 3Ti (or Hi) + ф 4Si + є I (2) where
G = the change in the proportion of eighth grade students in state i who demonstrate basic skills or better on the mathematics NAEP between 1996 and 2000;
A = strength of accountability in state (measured by our APR/EPR system); M = the proportion of African-American and Hispanic (public school) students in state i; T = the average percentage of eighth grade students in state i demonstrating basic math
skills or better or demonstrating proficient level or better on the mathematics NAEP in 1996;
H = the change in the average percentage of eighth grade students in state i demonstrating basic math skills or better on the mathematics NAEP between 1992 and 1996;
S = a dichotomous variable indicating whether state is in the South; and Є= Error term.
8 We did not include these same figures for the year 1963 as Carnoy and Loeb did and therefore, did
not conduct an exact replication of this regression model.
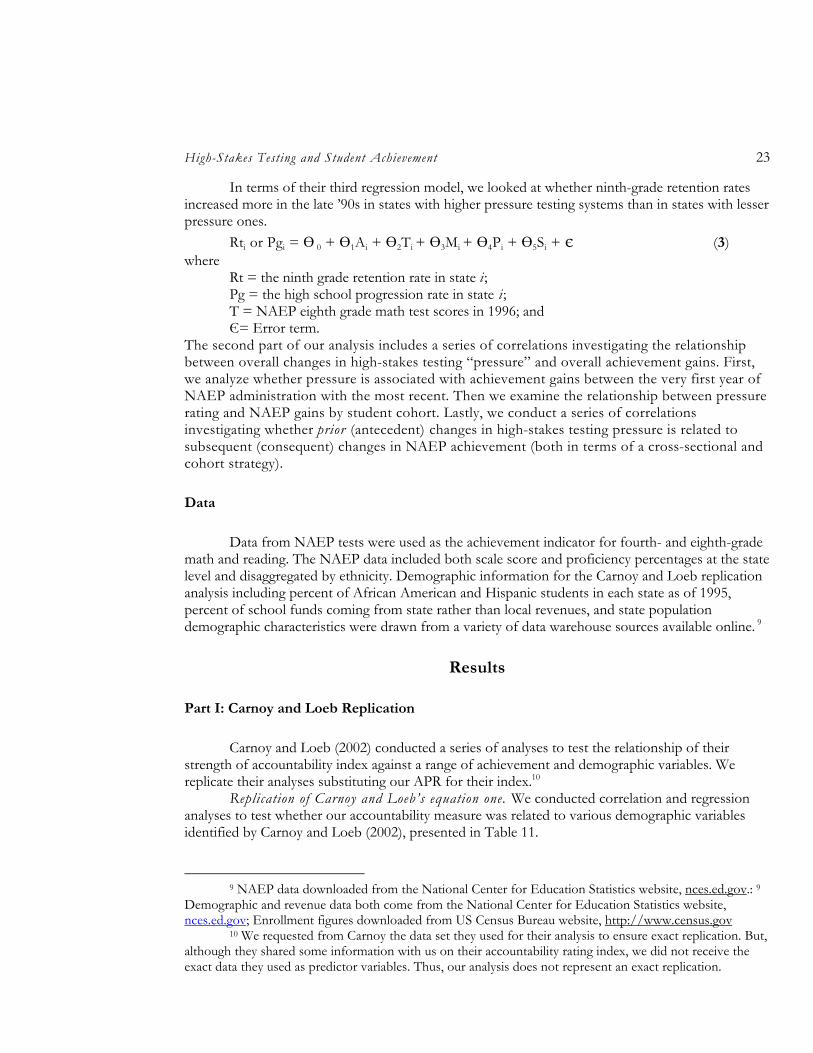
High-Stakes Testing and Student Achievement 23
In terms of their third regression model, we looked at whether ninth-grade retention rates increased more in the late ’90s in states with higher pressure testing systems than in states with lesser pressure ones.
Rti or Pgi = Ө 0 + Ө1Ai + Ө2Ti + Ө3Mi + Ө4Pi + Ө5Si + є (3) where
Rt = the ninth grade retention rate in state i; Pg = the high school progression rate in state i; T = NAEP eighth grade math test scores in 1996; and Є= Error term.
The second part of our analysis includes a series of correlations investigating the relationship between overall changes in high-stakes testing “pressure” and overall achievement gains. First, we analyze whether pressure is associated with achievement gains between the very first year of NAEP administration with the most recent. Then we examine the relationship between pressure rating and NAEP gains by student cohort. Lastly, we conduct a series of correlations investigating whether prior (antecedent) changes in high-stakes testing pressure is related to subsequent (consequent) changes in NAEP achievement (both in terms of a cross-sectional and cohort strategy).
Data
Data from NAEP tests were used as the achievement indicator for fourth- and eighth-grade math and reading. The NAEP data included both scale score and proficiency percentages at the state level and disaggregated by ethnicity. Demographic information for the Carnoy and Loeb replication analysis including percent of African American and Hispanic students in each state as of 1995, percent of school funds coming from state rather than local revenues, and state population demographic characteristics were drawn from a variety of data warehouse sources available online. 9
Results
Part I: Carnoy and Loeb Replication
Carnoy and Loeb (2002) conducted a series of analyses to test the relationship of their strength of accountability index against a range of achievement and demographic variables. We replicate their analyses substituting our APR for their index.10
Replication of Carnoy and Loeb’s equation one. We conducted correlation and regression analyses to test whether our accountability measure was related to various demographic variables identified by Carnoy and Loeb (2002), presented in Table 11.
9 NAEP data downloaded from the National Center for Education Statistics website, nces.ed.gov.: 9
Demographic and revenue data both come from the National Center for Education Statistics website, nces.ed.gov; Enrollment figures downloaded from US Census Bureau website, http://www.census.gov
10 We requested from Carnoy the data set they used for their analysis to ensure exact replication. But, although they shared some information with us on their accountability rating index, we did not receive the exact data they used as predictor variables. Thus, our analysis does not represent an exact replication.

Edu
catio
n Po
licy
Ana
lysis
Arc
hive
s V
ol. 1
4 N
o. 1
24
Tabl
e 11
C
orre
latio
ns o
f APR
, Dem
ogra
phic,
and
Ach
ievem
ent V
aria
bles
: Fou
rth-
Gra
de M
ath
and
Rea
ding
NA
EP
Var
iabl
e
APR
Population
% African American / Hispanic
1992 White math
1992 African American math
1992 White reading
1992 AA reading
92–94 change, White reading
92–94 change, AA reading
90–95 annual revenue change
% state support
APR
—
19
95 P
opul
atio
n es
timat
e .3
57
—
19
95 %
Afr
ican
Am
eric
an/H
ispan
ic.6
75
.519
—
19
92 N
AE
P m
ath
4th
grad
e W
hite
sc
ale
scor
e -.1
14
.035
-.0
97
—
1992
NA
EP
mat
h 4t
h gr
ade
Afr
ican
A
mer
ican
sco
re
.364
.2
37
.526
-.1
09
—
1992
NA
EP
4th
grad
e re
adin
g W
hite
, %
Bas
ic+
-.1
09
-.004
-.1
64
.657
-.3
06
—
1992
NA
EP
4th
read
ing,
Afr
ican
A
mer
ican
, % B
asic
+
.106
-.0
93
-.135
-.3
41
-.136
-.2
55
—
1992
–199
4 ch
ange
in N
AE
P 4t
h gr
ade
read
ing
Whi
te
.045
-.2
92
-.144
-.1
15
.105
-.0
01
.141
—
1992
–199
4 ch
ange
in N
AE
P 4t
h gr
ade
read
ing
Afr
ican
Am
eric
an
-.403
-.2
08
-.473
-.1
25
-.353
-.0
32
.344
.2
25
—
Yea
rly p
erce
nt re
venu
e ch
ange
199
0–19
95
.019
-.2
74
-.210
-.3
27
-.053
-.3
96
.482
.1
11
.429
—
% o
f rev
enue
s co
min
g fr
om s
tate
(n
ot lo
cal o
r fed
eral
) -.1
46
-.242
-.1
61
-.501
.0
46
-.641
.4
95
.117
.2
52
.312
—
Ave
rage
per
pup
il re
venu
e 19
90–9
1 -.1
91
.143
-.1
26
.308
.0
77
.584
-.2
21
.248
-.0
56
-.554
-.4
11
High-Stakes Testing and Student Achievement 25
Table 12 Regression Model: Predicting Accountability from Achievement and Demographic Variables
Variable B S.E. t p
Lower 95%
bound
Upper 95%
bound Intercept 2.48 5.94 0.42 .68 -10.3 15.3 1995 Population estimate 0.00 0.00 0.70 .50 0.0 0.0 1995 % African American/Hispanic 2.87 1.79 1.61 .13 -1.0 6.7
1992 NAEP math 4th grade White scale score -0.01 0.03 -0.37 .72 -0.1 0.0
1992 NAEP math 4thgrade African American score 0.00 0.00 0.36 .73 -0.0 0.0
1992 NAEP 4th grade reading White, % Basic+ 3.32 6.10 0.55 .60 -9.9 16.5
1992 NAEP 4th reading, African American, % Basic+
2.43 2.05 1.19 .26 -2.0 6.9
1992–1994 change in NAEP 4th grade reading White 0.09 0.07 1.27 .23 -0.1 0.2
1992–1994 change in NAEP 4th grade reading African American
-0.05 0.04 -1.19 .26 -0.1 0.0
Yearly percent revenue change 1990–1995 3.99 25.16 0.16 .88 -50.4 58.4
% of revenues coming from state (not local or federal) -1.60 2.15 -0.74 .47 -6.3 3.1
Average per pupil revenue 1990–91 0.00 0.00 -1.04 .32 -0.0 0.0
Regression Statistics Multiple R .791 R2 .626 Adjusted R2 .310 Standard Error .838 Observations 25 ANOVA Partition df SS MS F p Regression 11 15.285 1.390 1.980 0.121 Residual 13 9.122 0.702 Total 24 24.407
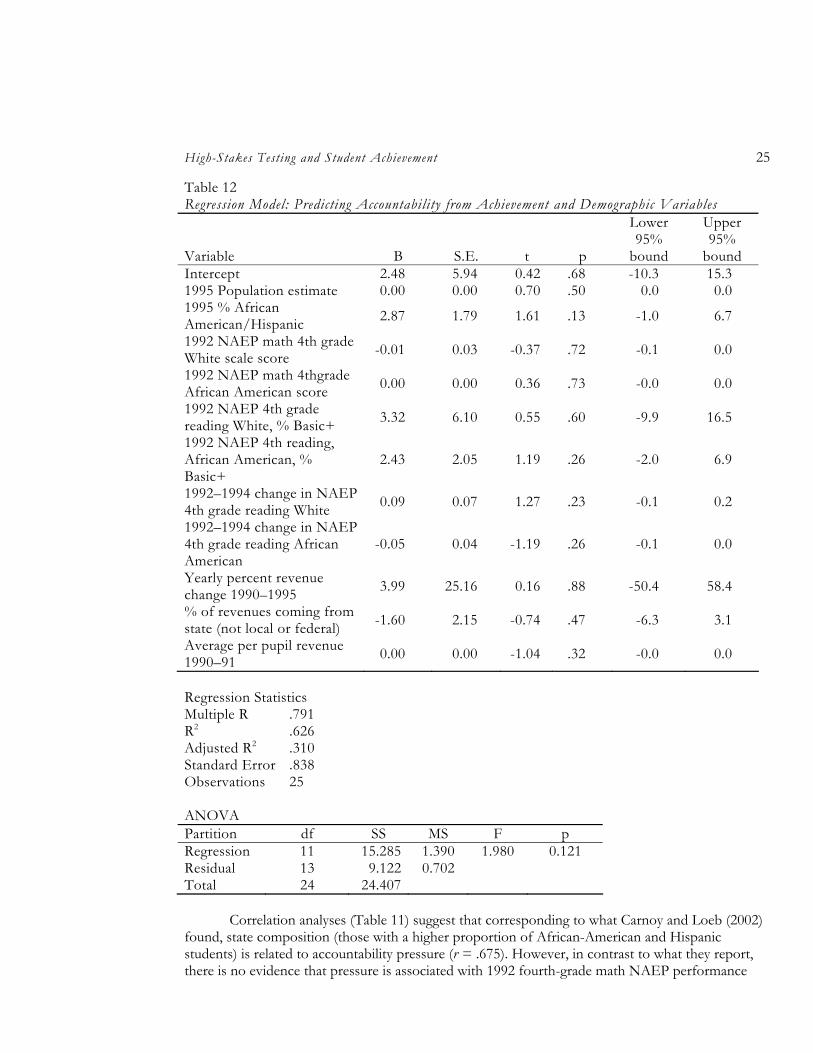
Correlation analyses (Table 11) suggest that corresponding to what Carnoy and Loeb (2002)
found, state composition (those with a higher proportion of African-American and Hispanic students) is related to accountability pressure (r = .675). However, in contrast to what they report, there is no evidence that pressure is associated with 1992 fourth-grade math NAEP performance
Education Policy Analysis Archives Vol. 14 No. 1 26
among white students (r = -.114). Instead, our results indicated that pressure is positively related to fourth-grade math achievement for African American students in 1992 (r = .364) but negatively correlated to the change in fourth-grade reading scale scores (1992–1994) for African American students (r = -.403). Our regression model was not significant (See Table 12).
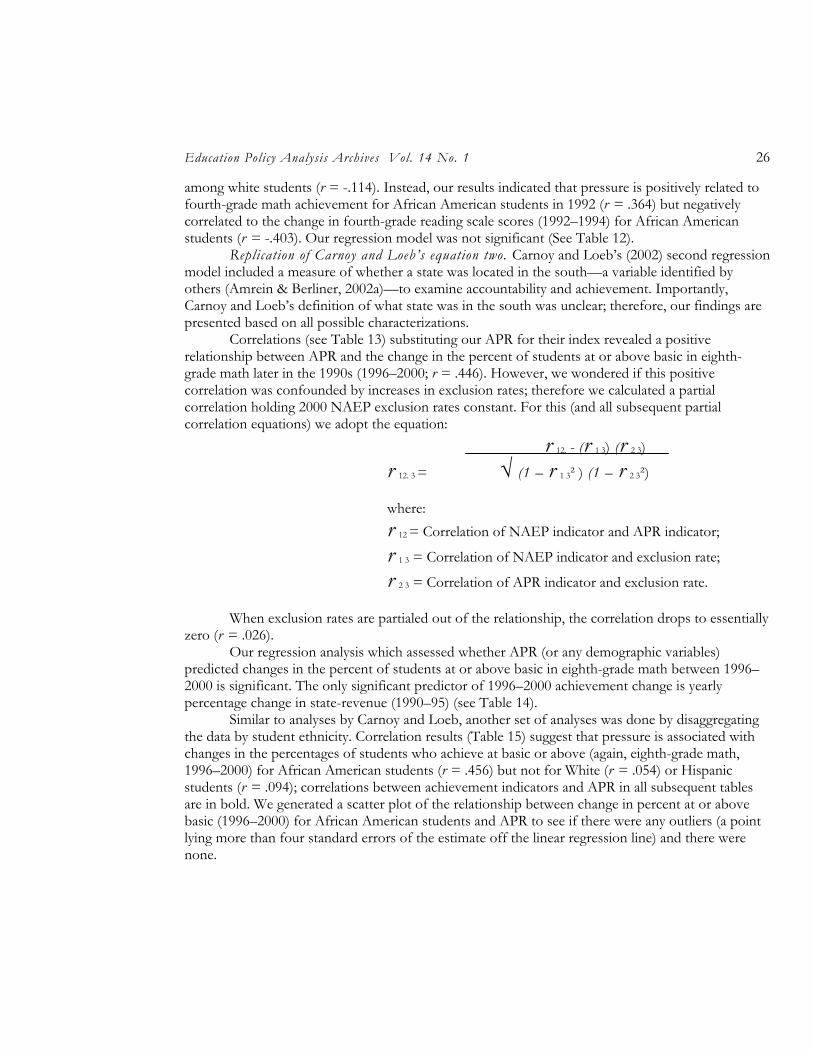
Replication of Carnoy and Loeb’s equation two. Carnoy and Loeb’s (2002) second regression model included a measure of whether a state was located in the south—a variable identified by others (Amrein & Berliner, 2002a)—to examine accountability and achievement. Importantly, Carnoy and Loeb’s definition of what state was in the south was unclear; therefore, our findings are presented based on all possible characterizations.
Correlations (see Table 13) substituting our APR for their index revealed a positive relationship between APR and the change in the percent of students at or above basic in eighth-grade math later in the 1990s (1996–2000; r = .446). However, we wondered if this positive correlation was confounded by increases in exclusion rates; therefore we calculated a partial correlation holding 2000 NAEP exclusion rates constant. For this (and all subsequent partial correlation equations) we adopt the equation:
r 12. - (r 1 3) (r 2 3)
r 12. 3 = √ (1 – r 1 3² ) (1 – r 2 3²) where: r 12 = Correlation of NAEP indicator and APR indicator;
r 1 3 = Correlation of NAEP indicator and exclusion rate;
r 2 3 = Correlation of APR indicator and exclusion rate.
When exclusion rates are partialed out of the relationship, the correlation drops to essentially zero (r = .026).
Our regression analysis which assessed whether APR (or any demographic variables) predicted changes in the percent of students at or above basic in eighth-grade math between 1996–2000 is significant. The only significant predictor of 1996–2000 achievement change is yearly percentage change in state-revenue (1990–95) (see Table 14).
Similar to analyses by Carnoy and Loeb, another set of analyses was done by disaggregating the data by student ethnicity. Correlation results (Table 15) suggest that pressure is associated with changes in the percentages of students who achieve at basic or above (again, eighth-grade math, 1996–2000) for African American students (r = .456) but not for White (r = .054) or Hispanic students (r = .094); correlations between achievement indicators and APR in all subsequent tables are in bold. We generated a scatter plot of the relationship between change in percent at or above basic (1996–2000) for African American students and APR to see if there were any outliers (a point lying more than four standard errors of the estimate off the linear regression line) and there were none.

Hig
h-St
akes
Tes
ting
and
Stud
ent A
chiev
emen
t 27
Tabl
e 13
C
orre
latio
ns o
f APR
with
Pro
port
ion
of S
tude
nts A
chiev
ing
At o
r A
bove
Bas
ic: E
ight
h-G
rade
Mat
h (1
996–
2000
)
Var
iabl
e APR
1996–2000 Math change Basic+
1995 % AA/H
1996 8th math Basic+
1996 8th math Proficient+
1992–96 Math change Basic+
South 1
South 2
APR
—
1996
–200
0 ch
ange
, NA
EP
8th-
grad
e m
ath
%
Basic
+
.446
—
1995
% A
fric
an A
mer
ican
/Hisp
anic
.6
76
.394
—
1996
NA
EP
8th-
grad
e m
ath
% B
asic
+
-.404
-.4
46
-.591
—
19
96 N
AE
P 8t
h-gr
ade
mat
h %
Pro
ficie
nt+
-.3
01
-.306
-.4
08
.937
—
1992
–96
chan
ge, N
AE
P 8t
h-gr
ade
mat
h =
%
Basic
+
.092
.0
45
-.253
.1
24
.111
—
In S
outh
1 (A
Z, N
M, T
X in
Sou
th)
.466
.4
75
.426
-.6
44
-.686
.1
58
—
In
Sou
th 2
(TX
in S
outh
, AZ
and
NM
out
) .3
87
.613
.2
74
-.599
-.6
14
.258
.8
52
—
In S
outh
3 (A
Z, N
M, T
X o
ut o
f Sou
th)
.232
.5
11
.153
-.6
24
-.649
.1
89
.786
.9
23
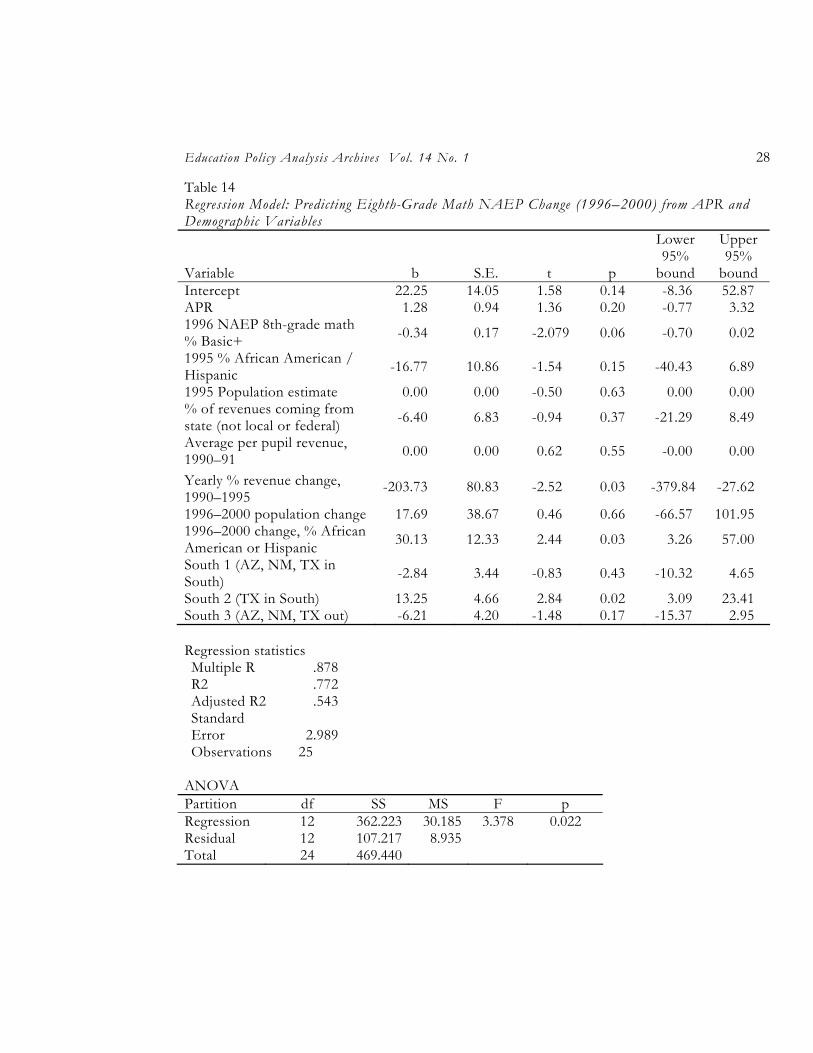
Education Policy Analysis Archives Vol. 14 No. 1 28
Table 14 Regression Model: Predicting Eighth-Grade Math NAEP Change (1996–2000) from APR and Demographic Variables
Variable b S.E. t p
Lower 95%
bound
Upper 95%
bound Intercept 22.25 14.05 1.58 0.14 -8.36 52.87 APR 1.28 0.94 1.36 0.20 -0.77 3.32 1996 NAEP 8th-grade math % Basic+ -0.34 0.17 -2.079 0.06 -0.70 0.02
1995 % African American / Hispanic -16.77 10.86 -1.54 0.15 -40.43 6.89
1995 Population estimate 0.00 0.00 -0.50 0.63 0.00 0.00 % of revenues coming from state (not local or federal) -6.40 6.83 -0.94 0.37 -21.29 8.49
Average per pupil revenue, 1990–91 0.00 0.00 0.62 0.55 -0.00 0.00
Yearly % revenue change, 1990–1995
-203.73 80.83 -2.52 0.03 -379.84 -27.62
1996–2000 population change 17.69 38.67 0.46 0.66 -66.57 101.95 1996–2000 change, % African American or Hispanic 30.13 12.33 2.44 0.03 3.26 57.00
South 1 (AZ, NM, TX in South) -2.84 3.44 -0.83 0.43 -10.32 4.65
South 2 (TX in South) 13.25 4.66 2.84 0.02 3.09 23.41 South 3 (AZ, NM, TX out) -6.21 4.20 -1.48 0.17 -15.37 2.95 Regression statistics Multiple R .878 R2 .772 Adjusted R2 .543 Standard Error 2.989 Observations 25
ANOVA Partition df SS MS F p Regression 12 362.223 30.185 3.378 0.022 Residual 12 107.217 8.935 Total 24 469.440
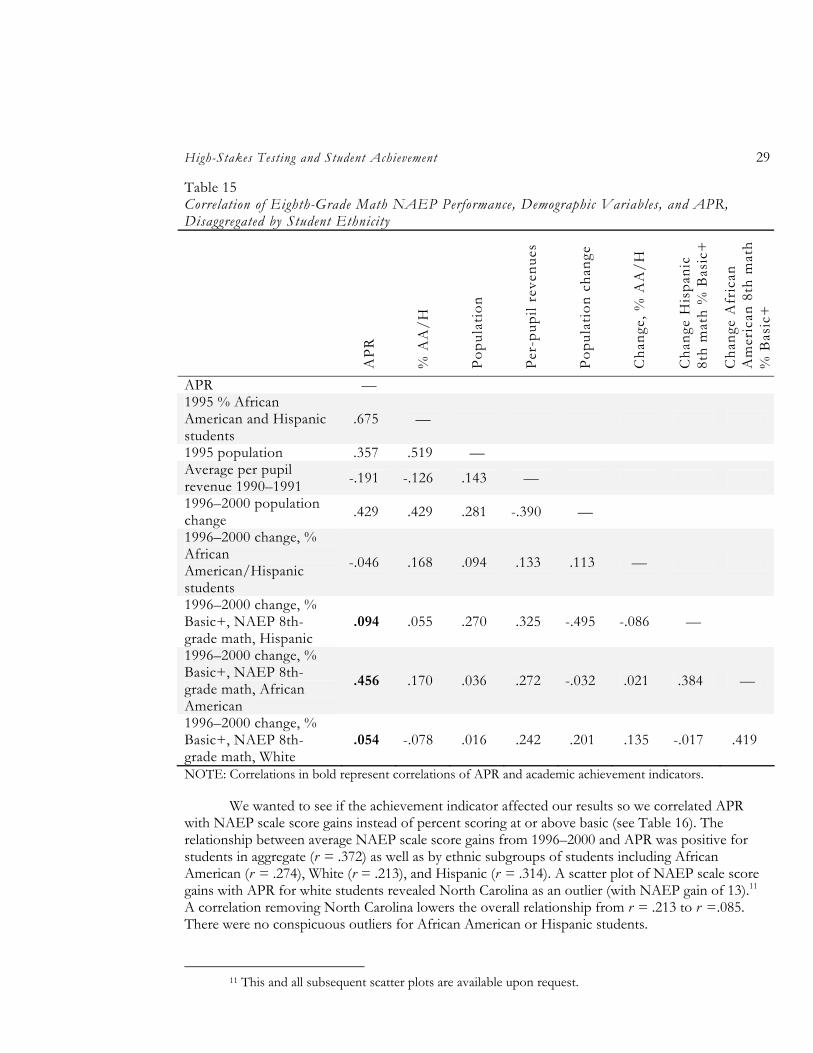
High-Stakes Testing and Student Achievement 29
Table 15 Correlation of Eighth-Grade Math NAEP Performance, Demographic Variables, and APR, Disaggregated by Student Ethnicity
APR
% A
A/H
Popu
latio
n
Per-
pupi
l rev
enue
s
Popu
latio
n ch
ange
Cha
nge,
% A
A/H
Cha
nge
His
pani
c 8t
h m
ath
% B
asic
+
Cha
nge
Afr
ican
A
mer
ican
8th
mat
h %
Bas
ic+
APR — 1995 % African American and Hispanic students
.675 —
1995 population .357 .519 — Average per pupil revenue 1990–1991 -.191 -.126 .143 —
1996–2000 population change .429 .429 .281 -.390 —
1996–2000 change, % African American/Hispanic students
-.046 .168 .094 .133 .113 —
1996–2000 change, % Basic+, NAEP 8th-grade math, Hispanic
.094 .055 .270 .325 -.495 -.086 —
1996–2000 change, % Basic+, NAEP 8th-grade math, African American
.456 .170 .036 .272 -.032 .021 .384 —
1996–2000 change, % Basic+, NAEP 8th-grade math, White
.054 -.078 .016 .242 .201 .135 -.017 .419
NOTE: Correlations in bold represent correlations of APR and academic achievement indicators.
We wanted to see if the achievement indicator affected our results so we correlated APR with NAEP scale score gains instead of percent scoring at or above basic (see Table 16). The relationship between average NAEP scale score gains from 1996–2000 and APR was positive for students in aggregate (r = .372) as well as by ethnic subgroups of students including African American (r = .274), White (r = .213), and Hispanic (r = .314). A scatter plot of NAEP scale score gains with APR for white students revealed North Carolina as an outlier (with NAEP gain of 13).11 A correlation removing North Carolina lowers the overall relationship from r = .213 to r =.085. There were no conspicuous outliers for African American or Hispanic students.
11 This and all subsequent scatter plots are available upon request.

Edu
catio
n Po
licy
Ana
lysis
Arc
hive
s V
ol. 1
4 N
o. 1
30
Tabl
e 16
C
orre
latio
n of
Eig
hth-
Gra
de M
ath
NA
EP
Ave
rage
Sca
le Sc
ore
Gai
ns, A
PR, a
nd S
tate
Dem
ogra
phic
Var
iabl
es, D
isagg
rega
ted
by
Stud
ent E
thni
city
APR
% AA / H
Population
Per-pupil revenues
Population change
Change, % AA / H
NAEP gain
NAEP gain, White
NAEP gain, AA
APR
—
19
95 %
Afr
ican
Am
eric
an /
H
ispan
ic
.675
—
1995
pop
ulat
ion
.357
.5
19
—
Ave
rage
per
pup
il Re
venu
e 19
90–9
1 -.1
91
-.126
.1
43
—
1996
–200
0 po
pula
tion
chan
ge
.429
.4
29
.281
-.3
90
—
1996
–200
0 ch
ange
, % A
fric
an
Am
eric
an /
Hisp
anic
-.0
46
.168
.0
94
.133
.1
13
—
1996
–200
0 N
AE
P sc
ale
scor
e ga
in
.372
*.2
27
.044
.2
34
-.009
.2
11
—
1996
–200
0 N
AE
P ga
in, W
hite
.2
13
.112
-.0
68
.284
.0
15
.272
.8
72
—
19
96–2
000
NA
EP
gain
,,Afr
ican
Am
eric
an
.274
.1
19
.056
.3
96
-.259
.0
19
.715
.5
12
—
1996
–200
0 N
AE
P ga
in,,H
ispan
ic
.314
.2
28
.370
.5
66
-.116
.0
57
.358
.2
77
.322
* Pa
rtia
l cor
rela
tion
hold
ing
2000
exc
lusio
n ra
tes
cons
tant
is .3
20
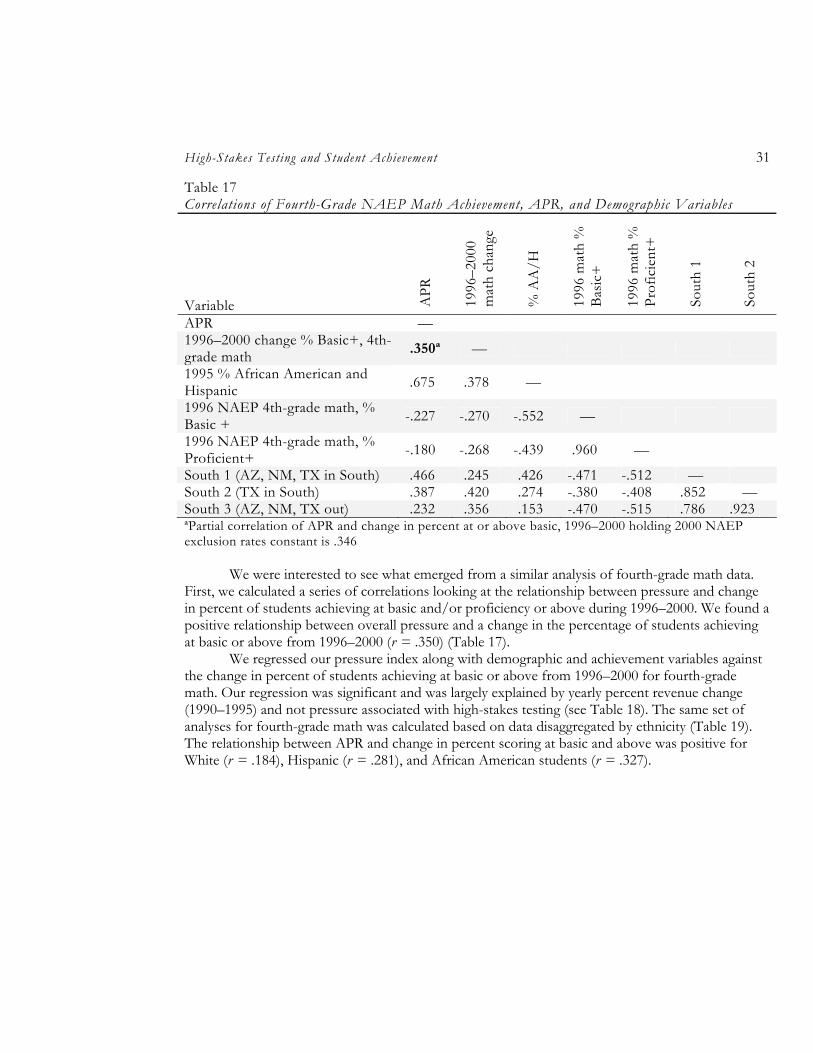
High-Stakes Testing and Student Achievement 31
Table 17 Correlations of Fourth-Grade NAEP Math Achievement, APR, and Demographic Variables
Variable APR
1996
–200
0 m
ath
chan
ge
% A
A/H
1996
mat
h %
Ba
sic+
1996
mat
h %
Pr
ofic
ient
+
Sout
h 1
Sout
h 2
APR — 1996–2000 change % Basic+, 4th-grade math .350ª —
1995 % African American and Hispanic .675 .378 —
1996 NAEP 4th-grade math, % Basic + -.227 -.270 -.552 —
1996 NAEP 4th-grade math, % Proficient+ -.180 -.268 -.439 .960 —
South 1 (AZ, NM, TX in South) .466 .245 .426 -.471 -.512 — South 2 (TX in South) .387 .420 .274 -.380 -.408 .852 — South 3 (AZ, NM, TX out) .232 .356 .153 -.470 -.515 .786 .923 ªPartial correlation of APR and change in percent at or above basic, 1996–2000 holding 2000 NAEP exclusion rates constant is .346
We were interested to see what emerged from a similar analysis of fourth-grade math data.
First, we calculated a series of correlations looking at the relationship between pressure and change in percent of students achieving at basic and/or proficiency or above during 1996–2000. We found a positive relationship between overall pressure and a change in the percentage of students achieving at basic or above from 1996–2000 (r = .350) (Table 17).
We regressed our pressure index along with demographic and achievement variables against the change in percent of students achieving at basic or above from 1996–2000 for fourth-grade math. Our regression was significant and was largely explained by yearly percent revenue change (1990–1995) and not pressure associated with high-stakes testing (see Table 18). The same set of analyses for fourth-grade math was calculated based on data disaggregated by ethnicity (Table 19). The relationship between APR and change in percent scoring at basic and above was positive for White (r = .184), Hispanic (r = .281), and African American students (r = .327).
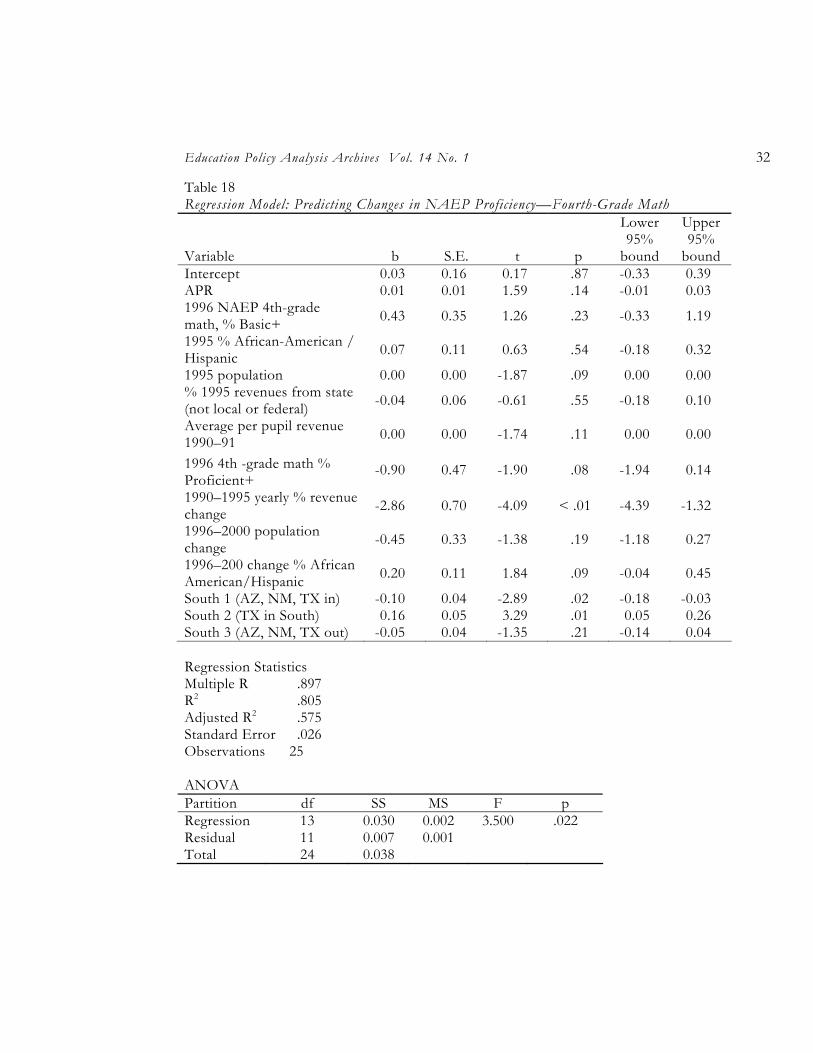
Education Policy Analysis Archives Vol. 14 No. 1 32
Table 18 Regression Model: Predicting Changes in NAEP Proficiency—Fourth-Grade Math
Variable b S.E. t p
Lower 95%
bound
Upper 95%
bound Intercept 0.03 0.16 0.17 .87 -0.33 0.39 APR 0.01 0.01 1.59 .14 -0.01 0.03 1996 NAEP 4th-grade math, % Basic+ 0.43 0.35 1.26 .23 -0.33 1.19
1995 % African-American / Hispanic 0.07 0.11 0.63 .54 -0.18 0.32
1995 population 0.00 0.00 -1.87 .09 0.00 0.00 % 1995 revenues from state (not local or federal) -0.04 0.06 -0.61 .55 -0.18 0.10
Average per pupil revenue 1990–91 0.00 0.00 -1.74 .11 0.00 0.00
1996 4th -grade math % Proficient+
-0.90 0.47 -1.90 .08 -1.94 0.14
1990–1995 yearly % revenue change -2.86 0.70 -4.09 < .01 -4.39 -1.32
1996–2000 population change -0.45 0.33 -1.38 .19 -1.18 0.27
1996–200 change % African American/Hispanic 0.20 0.11 1.84 .09 -0.04 0.45
South 1 (AZ, NM, TX in) -0.10 0.04 -2.89 .02 -0.18 -0.03 South 2 (TX in South) 0.16 0.05 3.29 .01 0.05 0.26 South 3 (AZ, NM, TX out) -0.05 0.04 -1.35 .21 -0.14 0.04 Regression Statistics Multiple R .897 R2 .805 Adjusted R2 .575 Standard Error .026 Observations 25 ANOVA Partition df SS MS F p Regression 13 0.030 0.002 3.500 .022 Residual 11 0.007 0.001 Total 24 0.038

Hig
h-St
akes
Tes
ting
and
Stud
ent A
chiev
emen
t 33
Tabl
e 19
C
orre
latio
ns o
f Fou
rth-
Gra
de M
ath
Cha
nges
in P
erce
nt P
rofic
iency
(199
6–20
00) a
nd D
isagg
rega
ted
by E
thni
city
Var
iabl
e APR
% AA/H
Population
Per-pupil revenue
% revenues from state
Change, % AA/H
Change, % Basic+, White
Change, % Basic+, Hispanic
Change, % Basic+, African American
APR
—
19
95 %
Afr
ican
Am
eric
an a
nd H
ispan
ic s
tude
nts
0.
675
—
19
95 p
opul
atio
n 0.
357
0.51
9 —
A
vera
ge p
er p
upil
reve
nue,
199
0–91
-0
.191
-0.1
260.
143
—
Pr
opor
tion
of 1
995
reve
nues
com
ing
from
sta
te
(not
loca
l or f
eder
al)
-0.1
46-0
.161
-0.2
42-0
.411
—
1996
–200
0 ch
ange
, %A
fric
an A
mer
ican
/Hisp
anic
-0
.046
0.16
8 0.
094
0.13
3 -0
.071
—
19
96–2
000
chan
ge, 4
th-g
rade
mat
h %
Bas
ic +
, W
hite
0.
184
0.32
2 0.
134
-0.0
13
-0.3
400.
042
—
1996
–200
0 ch
ange
, 4th
-gra
de m
ath
% B
asic
+,
Hisp
anic
0.
281
0.49
7 0.
187
-0.0
46
0.05
5 0.
141
0.51
2 —
1996
–200
0 ch
ange
, 4th
-gra
de m
ath
% B
asic
+,
Afr
ican
Am
eric
an
0.32
70.
117
0.27
3 0.
105
-0.4
670.
075
0.43
0 0.
167
—
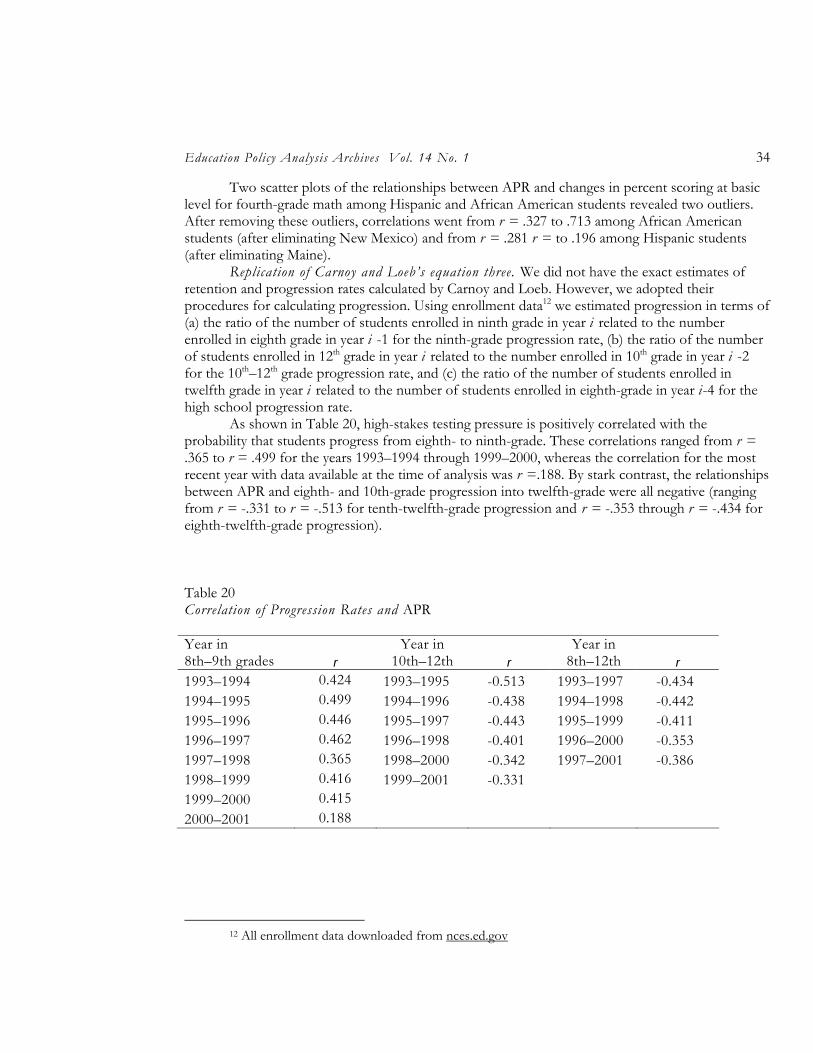
Education Policy Analysis Archives Vol. 14 No. 1 34
Two scatter plots of the relationships between APR and changes in percent scoring at basic level for fourth-grade math among Hispanic and African American students revealed two outliers. After removing these outliers, correlations went from r = .327 to .713 among African American students (after eliminating New Mexico) and from r = .281 r = to .196 among Hispanic students (after eliminating Maine).
Replication of Carnoy and Loeb’s equation three. We did not have the exact estimates of retention and progression rates calculated by Carnoy and Loeb. However, we adopted their procedures for calculating progression. Using enrollment data12 we estimated progression in terms of (a) the ratio of the number of students enrolled in ninth grade in year i related to the number enrolled in eighth grade in year i -1 for the ninth-grade progression rate, (b) the ratio of the number of students enrolled in 12th grade in year i related to the number enrolled in 10th grade in year i -2 for the 10th–12th grade progression rate, and (c) the ratio of the number of students enrolled in twelfth grade in year i related to the number of students enrolled in eighth-grade in year i-4 for the high school progression rate.
As shown in Table 20, high-stakes testing pressure is positively correlated with the probability that students progress from eighth- to ninth-grade. These correlations ranged from r = .365 to r = .499 for the years 1993–1994 through 1999–2000, whereas the correlation for the most recent year with data available at the time of analysis was r =.188. By stark contrast, the relationships between APR and eighth- and 10th-grade progression into twelfth-grade were all negative (ranging from r = -.331 to r = -.513 for tenth-twelfth-grade progression and r = -.353 through r = -.434 for eighth-twelfth-grade progression).
Table 20 Correlation of Progression Rates and APR
Year in 8th–9th grades r
Year in 10th–12th r
Year in 8th–12th r
1993–1994 0.424 1993–1995 -0.513 1993–1997 -0.434 1994–1995 0.499 1994–1996 -0.438 1994–1998 -0.442 1995–1996 0.446 1995–1997 -0.443 1995–1999 -0.411 1996–1997 0.462 1996–1998 -0.401 1996–2000 -0.353 1997–1998 0.365 1998–2000 -0.342 1997–2001 -0.386 1998–1999 0.416 1999–2001 -0.331 1999–2000 0.415 2000–2001 0.188
12 All enrollment data downloaded from nces.ed.gov
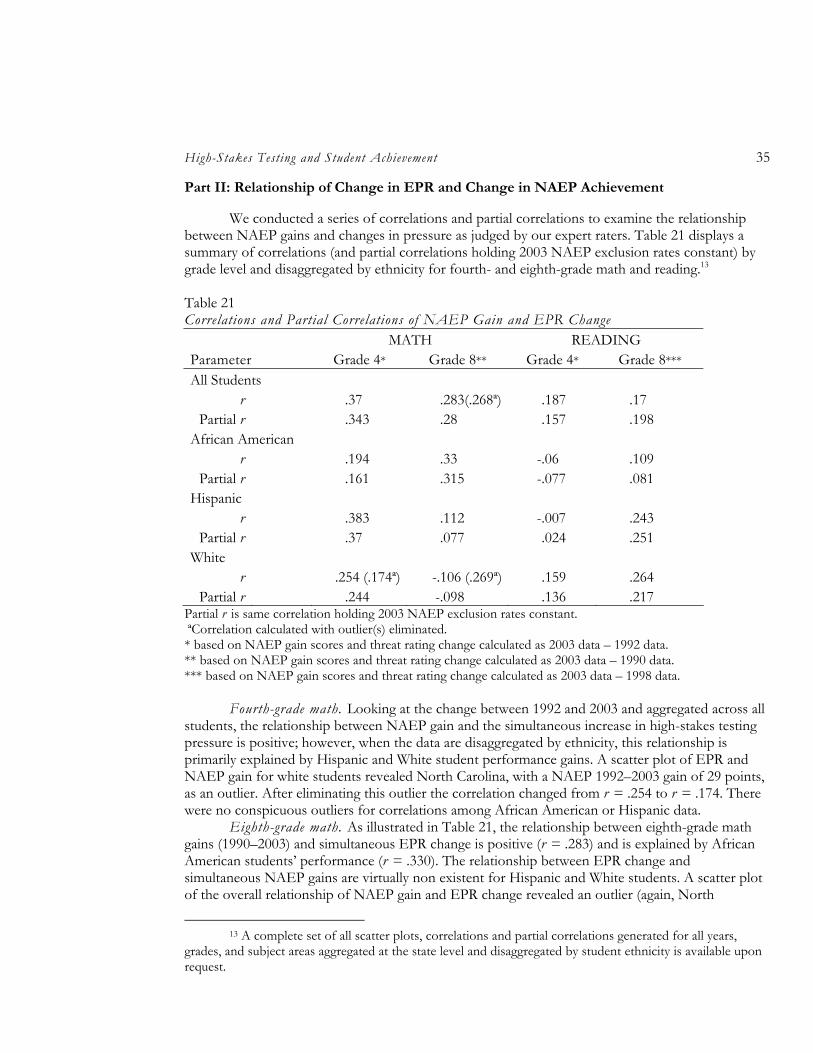
High-Stakes Testing and Student Achievement 35
Part II: Relationship of Change in EPR and Change in NAEP Achievement
We conducted a series of correlations and partial correlations to examine the relationship between NAEP gains and changes in pressure as judged by our expert raters. Table 21 displays a summary of correlations (and partial correlations holding 2003 NAEP exclusion rates constant) by grade level and disaggregated by ethnicity for fourth- and eighth-grade math and reading.13
Table 21 Correlations and Partial Correlations of NAEP Gain and EPR Change MATH READING Parameter Grade 4* Grade 8** Grade 4* Grade 8*** All Students
r .37 .283(.268ª) .187 .17 Partial r .343 .28 .157 .198
African American r .194 .33 -.06 .109
Partial r .161 .315 -.077 .081 Hispanic
r .383 .112 -.007 .243 Partial r .37 .077 .024 .251
White r .254 (.174ª) -.106 (.269ª) .159 .264
Partial r .244 -.098 .136 .217 Partial r is same correlation holding 2003 NAEP exclusion rates constant. ªCorrelation calculated with outlier(s) eliminated. * based on NAEP gain scores and threat rating change calculated as 2003 data – 1992 data. ** based on NAEP gain scores and threat rating change calculated as 2003 data – 1990 data. *** based on NAEP gain scores and threat rating change calculated as 2003 data – 1998 data.
Fourth-grade math. Looking at the change between 1992 and 2003 and aggregated across all
students, the relationship between NAEP gain and the simultaneous increase in high-stakes testing pressure is positive; however, when the data are disaggregated by ethnicity, this relationship is primarily explained by Hispanic and White student performance gains. A scatter plot of EPR and NAEP gain for white students revealed North Carolina, with a NAEP 1992–2003 gain of 29 points, as an outlier. After eliminating this outlier the correlation changed from r = .254 to r = .174. There were no conspicuous outliers for correlations among African American or Hispanic data.
Eighth-grade math. As illustrated in Table 21, the relationship between eighth-grade math gains (1990–2003) and simultaneous EPR change is positive (r = .283) and is explained by African American students’ performance (r = .330). The relationship between EPR change and simultaneous NAEP gains are virtually non existent for Hispanic and White students. A scatter plot of the overall relationship of NAEP gain and EPR change revealed an outlier (again, North
13 A complete set of all scatter plots, correlations and partial correlations generated for all years,
grades, and subject areas aggregated at the state level and disaggregated by student ethnicity is available upon request.
Education Policy Analysis Archives Vol. 14 No. 1 36
Carolina). A follow-up correlation eliminating North Carolina from the equation changed the relationship only slightly (from r = .283 to r = .268). A scatter plot of the correlation between EPR and NAEP gain among white students also revealed two outliers. A correlation eliminating these two outliers (Hawaii and Missouri) changed the relationship from r = -.106 to r = .269. There were no conspicuous outliers for the Hispanic or African American student data.
Reading, Correlations between NAEP gain and change in pressure for fourth- and eighth-grade reading are all low (see Table 21). A series of scatter plots representing these data were created but they revealed no obvious outliers.
Part III: Relationship of Change in EPR and Change in NAEP Achievement for “Cohorts” of Students
We wanted to see if changes in high-stakes testing pressure were related to changes in achievement among cohorts of students (i.e., “cohort” analyses follows the achievement trends of students as they progress from fourth to eighth grade14). For these, and all subsequent cohort analyses, cohort NAEP gains are calculated as: [eighth-grade achievement year i] – [fourth-grade achievement year (i - 4)]. Correlations between EPR change and simultaneous cohort gains in math (r = .131 for 1992–1996 cohort, r = -.028 for 1996–2000 cohort) and reading (r = -.152 for 1994–1998 cohort, r = .184 for the 1998–2002 cohort) were low.
Part IV: Antecedent-Consequent Relationships Between Change in EPR and Change in NAEP Achievement
In our last set of analyses, we attempt to move closer to warranted conclusions about any causal relationship between high-stakes testing pressure and academic achievement. In these analyses we adopt a design that involves the correlation of prior EPR changes with subsequent NAEP scale score achievement changes. Since causes must precede their effects, the lack of any correlation of prior EPR change with later NAEP change would significantly weaken any claim of a causal link. Moreover, any form of regression analysis that ignores changes in putative causal variables and ignores time sequences of putative causes and effects is vulnerable to alternative explanations. For example, high pressure states may also be poor in ways not accounted for by the other variables entered into the regression equation. However, correlations with changes in pressure are far less confounded by unaccounted for “third variables.” The combination of correlating the differences in measures of the putative causes and effect and staggering these differenced variables so that the cause is measured before the effect has a tradition in the literature of econometrics, where it is related to what is known as “Granger causality”—after Clive W. J. Granger (see pp. 620 ff, Gujaratim, 1995) who was awarded the Nobel Prize in Economics in 2003—and has been applied with some success in the study of alcohol consumption and death caused by cirrhosis of the liver (Lynch, Glass, & Tran, 1988) and the study of the economy and deaths by suicide (Webb, Glass, Metha, & Cobb, 2002).
First, we present a series of correlations between antecedent EPR change and subsequent NAEP scale score gains (non-cohort, across fourth- and eighth-grade math and reading overall, and
14 A “cohort” is not a true cohort in the sense that we follow the same students from fourth to eighth grade. Rather, it is a proxy of a true cohort—following the achievement trends of two different random samples of students as they progress through the intermediary grades from fourth to eighth grade.
High-Stakes Testing and Student Achievement 37
disaggregated by student ethnicity). Second, we examine the same patterns but using cohort NAEP score gains. To illustrate our strategy, we focus on fourth-grade math. We began by identifying NAEP years of administration (for fourth-grade math they are 1992, 1996, 2000, and 2003). NAEP non-cohort gains are then calculated for the following years: 1992–1996 (calculated as the difference of 1996 NAEP scale score and 1992 NAEP scale score), 1996–2000 and 2000–2003. Once these gain years were identified, we calculated corresponding antecedent EPR changes. For example, for NAEP gains of 1992–1996, EPR change was calculated across the previous four years of 1988–1992. Similarly, for NAEP gains of 1996–2000, we calculated the corresponding EPR change for the previous four years of 1992–1996. Lastly, for the NAEP gain of 2000–2003 we calculated the corresponding antecedent EPR change of the previous three years of 1997–2000.15
Cross-sectional causal analyses. Our first set of causal analyses for fourth-grade math is presented in Table 22. All correlations between antecedent EPR change with subsequent NAEP gains are virtually nonexistent. A series of partial correlations holding constant NAEP exclusion rates from the post testing administration (also shown in Table 22) does not change the nature of this outcome. Thus, for fourth-grade math achievement, the relationship between increases in antecedent pressure and later NAEP achievement change is nonexistent.
Analyses disaggregating the data by student ethnicity are also calculated (see Table 23). As can be seen, earlier pressure changes are not related to achievement changes for African American, Hispanic or White students earlier in the 1990s. However, as the decade progresses, the relationship between antecedent pressure and later achievement gains strengthens. Specifically, for all subgroups, pressure change in the later half of the 1990s is strongly associated with most recent 2000–2003 NAEP gains.
In our next set of analyses, we examine the relationship between antecedent pressure change and subsequent NAEP gains for eighth-grade math achievement. As can be seen in Table 24, there is a positive but varied relationship between earlier pressure change and later NAEP gain for the years 1990–1992 (r = .223), 1996–2000 (r = .411), and 2000–2003 (r = .195). By contrast, there is a negative relationship between pressure change and NAEP gain for the 1992–1996 year (r = -.297). Corresponding partial correlations do not change this outcome significantly.
A series of correlations between pressure change and eighth-grade math gains by student ethnicity are presented in Table 25. Across all years, there is no relationship between antecedent pressure and African American student NAEP score gains. Among Hispanic students, pressure has no bearing on subsequent achievement for 1990–1992 or in the most recent round of NAEP testing (2000–2003). By contrast, there is a moderate but positive relationship between pressure and NAEP gains for the years 1992–1996 (r = .245) and 1996–2000 (r = .314). Among White students pressure and NAEP change is inconsistently related for all years of 1990–1992 (r =.300), 1992–1996 (r = -.176), 1996–2000 (r = .334), and 2000–2003 (r = -.154).
15 We conducted the same set of analyses keeping the four-year intervals among APR change
constant. That is, we correlated NAEP gain of 2000-2003 with APR change 1997-2000 and with APR change 1996-2000. There were no important differences in any of these corresponding analyses. Therefore, for consistency we kept the number of change years for both APR and NAEP consistent.
Edu
catio
n Po
licy
Ana
lysis
Arc
hive
s V
ol. 1
4 N
o. 1
38
Tabl
e 22
C
orre
latio
ns o
f Ant
eced
ent E
PR C
hang
e an
d C
onse
quen
t NA
EP
Gai
ns a
cros
s 19
92–2
003:
Fou
rth-
Gra
de M
ath—
Non
-Coh
ort
Var
iabl
es
1988
–92
EPR
C
hang
e
1992
–96
NA
EP
Gai
n 19
96 %
ex
clud
ed
1992
–96
EPR
C
hang
e
1996
–200
0 N
AE
P G
ain
2000
%
excl
uded
19
96–2
000
EPR
Cha
nge
2000
-03
NA
EP
Gai
n
1988
–92
EPR
Cha
nge
—
1992
–96
NA
EP
Gai
n
-.06
6*
—
1996
%
excl
uded
.0
98
.047
—
1992
–96
EPR
Cha
nge
-.3
28
.565
-.0
48
—
1996
–200
0 N
AE
P G
ain
.2
47
.038
-.0
19
.159
**
—
2000
%
excl
uded
.0
53
.319
.6
02
.160
.1
49
—
1996
–200
0 E
PR C
hang
e
.325
.1
90
.098
-.1
51
.112
.1
37
—
2000
-03
NA
EP
Gai
n
.063
-.2
97
.081
.0
60
.124
-.2
74
.142
***
—
2003
%
excl
uded
.2
12
.336
.2
37
.150
.0
92
.463
.2
46
.028
Part
ial c
orre
latio
n re
sults
: * -.
072;
**
.138
; ***
.140
C
orre
latio
ns in
bol
dfac
e hi
ghlig
ht th
e re
latio
nshi
p of
ach
ieve
men
t and
hig
h-st
akes
test
ing
pres
sure
.
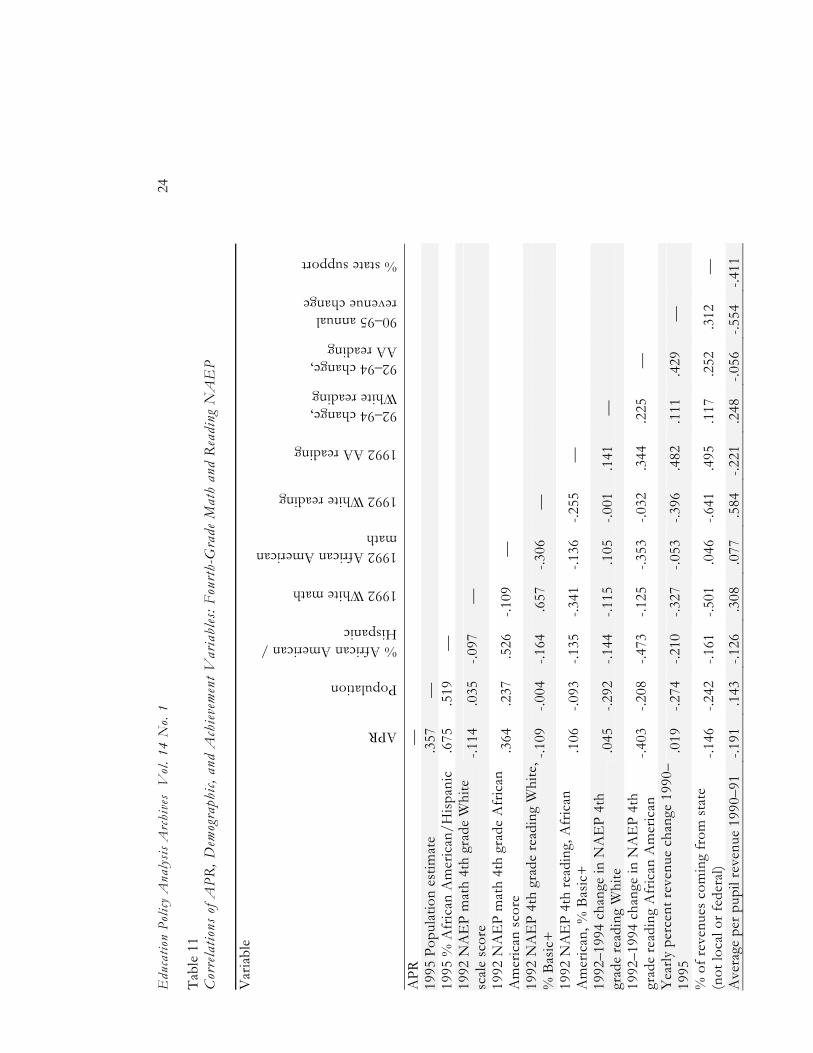
Edu
catio
n Po
licy
Ana
lysis
Arc
hive
s V
ol. 1
4 N
o. 1
24
Tabl
e 11
C
orre
latio
ns o
f APR
, Dem
ogra
phic,
and
Ach
ievem
ent V
aria
bles
: Fou
rth-
Gra
de M
ath
and
Rea
ding
NA
EP
Var
iabl
e
APR
Population
% African American / Hispanic
1992 White math
1992 African American math
1992 White reading
1992 AA reading
92–94 change, White reading
92–94 change, AA reading
90–95 annual revenue change
% state support
APR
—
19
95 P
opul
atio
n es
timat
e .3
57
—
19
95 %
Afr
ican
Am
eric
an/H
ispan
ic.6
75
.519
—
19
92 N
AE
P m
ath
4th
grad
e W
hite
sc
ale
scor
e -.1
14
.035
-.0
97
—
1992
NA
EP
mat
h 4t
h gr
ade
Afr
ican
A
mer
ican
sco
re
.364
.2
37
.526
-.1
09
—
1992
NA
EP
4th
grad
e re
adin
g W
hite
, %
Bas
ic+
-.1
09
-.004
-.1
64
.657
-.3
06
—
1992
NA
EP
4th
read
ing,
Afr
ican
A
mer
ican
, % B
asic
+
.106
-.0
93
-.135
-.3
41
-.136
-.2
55
—
1992
–199
4 ch
ange
in N
AE
P 4t
h gr
ade
read
ing
Whi
te
.045
-.2
92
-.144
-.1
15
.105
-.0
01
.141
—
1992
–199
4 ch
ange
in N
AE
P 4t
h gr
ade
read
ing
Afr
ican
Am
eric
an
-.403
-.2
08
-.473
-.1
25
-.353
-.0
32
.344
.2
25
—
Yea
rly p
erce
nt re
venu
e ch
ange
199
0–19
95
.019
-.2
74
-.210
-.3
27
-.053
-.3
96
.482
.1
11
.429
—
% o
f rev
enue
s co
min
g fr
om s
tate
(n
ot lo
cal o
r fed
eral
) -.1
46
-.242
-.1
61
-.501
.0
46
-.641
.4
95
.117
.2
52
.312
—
Ave
rage
per
pup
il re
venu
e 19
90–9
1 -.1
91
.143
-.1
26
.308
.0
77
.584
-.2
21
.248
-.0
56
-.554
-.4
11
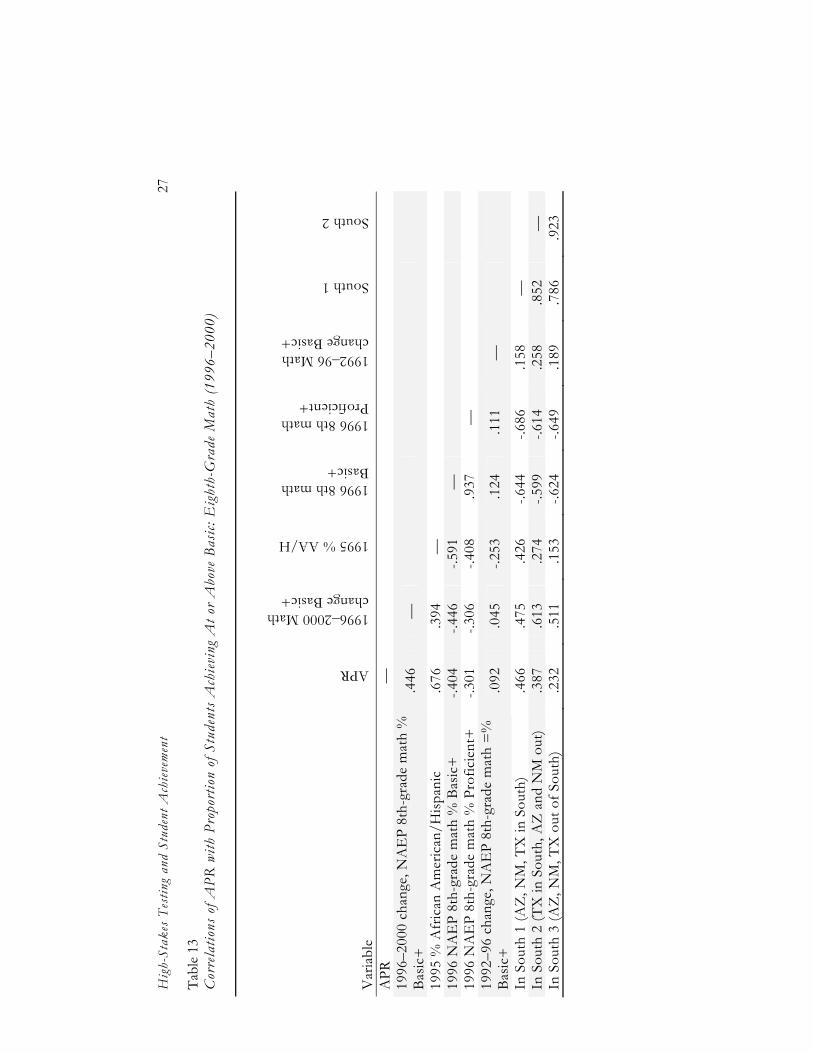
Hig
h-St
akes
Tes
ting
and
Stud
ent A
chiev
emen
t 27
Tabl
e 13
C
orre
latio
ns o
f APR
with
Pro
port
ion
of S
tude
nts A
chiev
ing
At o
r A
bove
Bas
ic: E
ight
h-G
rade
Mat
h (1
996–
2000
)
Var
iabl
e APR
1996–2000 Math change Basic+
1995 % AA/H
1996 8th math Basic+
1996 8th math Proficient+
1992–96 Math change Basic+
South 1
South 2
APR
—
1996
–200
0 ch
ange
, NA
EP
8th-
grad
e m
ath
%
Basic
+
.446
—
1995
% A
fric
an A
mer
ican
/Hisp
anic
.6
76
.394
—
1996
NA
EP
8th-
grad
e m
ath
% B
asic
+
-.404
-.4
46
-.591
—
19
96 N
AE
P 8t
h-gr
ade
mat
h %
Pro
ficie
nt+
-.3
01
-.306
-.4
08
.937
—
1992
–96
chan
ge, N
AE
P 8t
h-gr
ade
mat
h =
%
Basic
+
.092
.0
45
-.253
.1
24
.111
—
In S
outh
1 (A
Z, N
M, T
X in
Sou
th)
.466
.4
75
.426
-.6
44
-.686
.1
58
—
In
Sou
th 2
(TX
in S
outh
, AZ
and
NM
out
) .3
87
.613
.2
74
-.599
-.6
14
.258
.8
52
—
In S
outh
3 (A
Z, N
M, T
X o
ut o
f Sou
th)
.232
.5
11
.153
-.6
24
-.649
.1
89
.786
.9
23
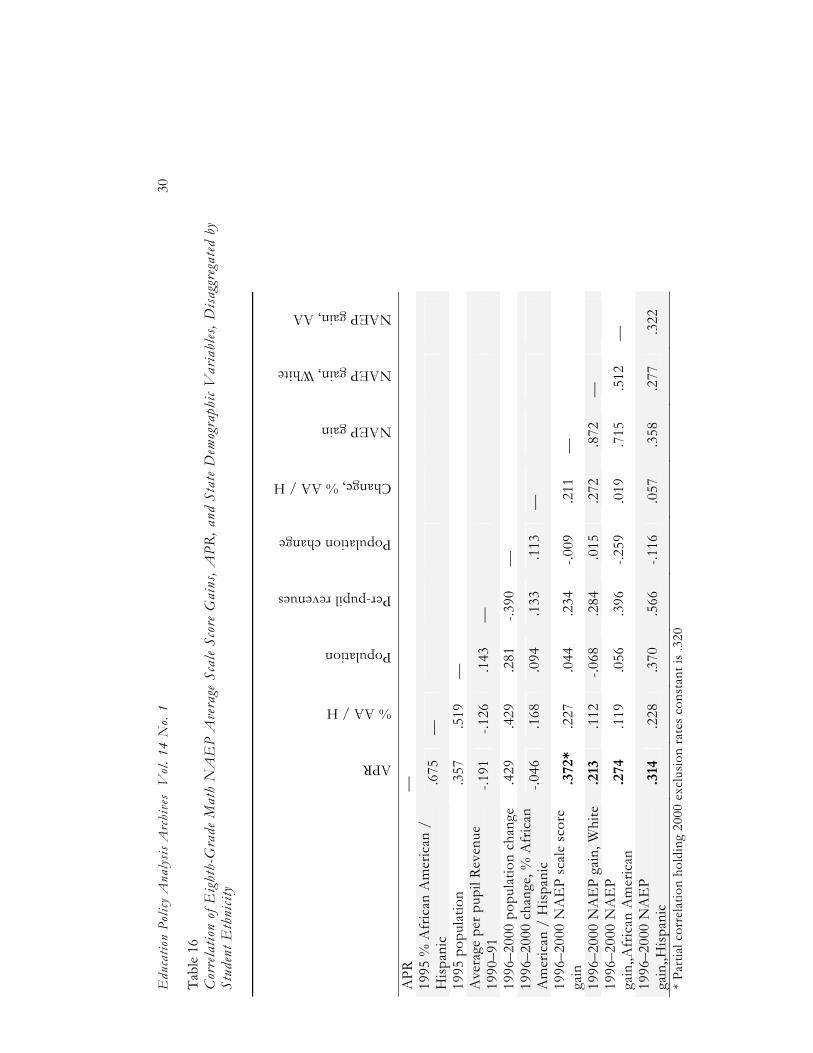
Edu
catio
n Po
licy
Ana
lysis
Arc
hive
s V
ol. 1
4 N
o. 1
30
Tabl
e 16
C
orre
latio
n of
Eig
hth-
Gra
de M
ath
NA
EP
Ave
rage
Sca
le Sc
ore
Gai
ns, A
PR, a
nd S
tate
Dem
ogra
phic
Var
iabl
es, D
isagg
rega
ted
by
Stud
ent E
thni
city
APR
% AA / H
Population
Per-pupil revenues
Population change
Change, % AA / H
NAEP gain
NAEP gain, White
NAEP gain, AA
APR
—
19
95 %
Afr
ican
Am
eric
an /
H
ispan
ic
.675
—
1995
pop
ulat
ion
.357
.5
19
—
Ave
rage
per
pup
il Re
venu
e 19
90–9
1 -.1
91
-.126
.1
43
—
1996
–200
0 po
pula
tion
chan
ge
.429
.4
29
.281
-.3
90
—
1996
–200
0 ch
ange
, % A
fric
an
Am
eric
an /
Hisp
anic
-.0
46
.168
.0
94
.133
.1
13
—
1996
–200
0 N
AE
P sc
ale
scor
e ga
in
.372
*.2
27
.044
.2
34
-.009
.2
11
—
1996
–200
0 N
AE
P ga
in, W
hite
.2
13
.112
-.0
68
.284
.0
15
.272
.8
72
—
19
96–2
000
NA
EP
gain
,,Afr
ican
Am
eric
an
.274
.1
19
.056
.3
96
-.259
.0
19
.715
.5
12
—
1996
–200
0 N
AE
P ga
in,,H
ispan
ic
.314
.2
28
.370
.5
66
-.116
.0
57
.358
.2
77
.322
* Pa
rtia
l cor
rela
tion
hold
ing
2000
exc
lusio
n ra
tes
cons
tant
is .3
20
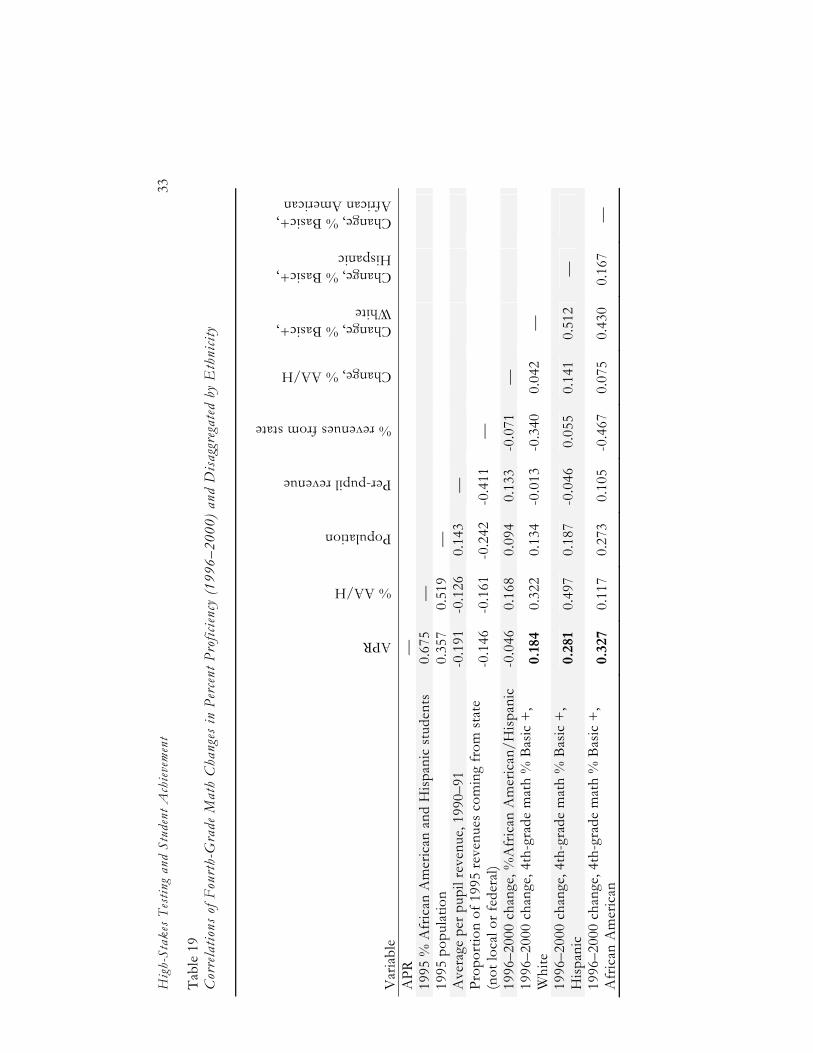
Hig
h-St
akes
Tes
ting
and
Stud
ent A
chiev
emen
t 33
Tabl
e 19
C
orre
latio
ns o
f Fou
rth-
Gra
de M
ath
Cha
nges
in P
erce
nt P
rofic
iency
(199
6–20
00) a
nd D
isagg
rega
ted
by E
thni
city
Var
iabl
e APR
% AA/H
Population
Per-pupil revenue
% revenues from state
Change, % AA/H
Change, % Basic+, White
Change, % Basic+, Hispanic
Change, % Basic+, African American
APR
—
19
95 %
Afr
ican
Am
eric
an a
nd H
ispan
ic s
tude
nts
0.
675
—
19
95 p
opul
atio
n 0.
357
0.51
9 —
A
vera
ge p
er p
upil
reve
nue,
199
0–91
-0
.191
-0.1
260.
143
—
Pr
opor
tion
of 1
995
reve
nues
com
ing
from
sta
te
(not
loca
l or f
eder
al)
-0.1
46-0
.161
-0.2
42-0
.411
—
1996
–200
0 ch
ange
, %A
fric
an A
mer
ican
/Hisp
anic
-0
.046
0.16
8 0.
094
0.13
3 -0
.071
—
19
96–2
000
chan
ge, 4
th-g
rade
mat
h %
Bas
ic +
, W
hite
0.
184
0.32
2 0.
134
-0.0
13
-0.3
400.
042
—
1996
–200
0 ch
ange
, 4th
-gra
de m
ath
% B
asic
+,
Hisp
anic
0.
281
0.49
7 0.
187
-0.0
46
0.05
5 0.
141
0.51
2 —
1996
–200
0 ch
ange
, 4th
-gra
de m
ath
% B
asic
+,
Afr
ican
Am
eric
an
0.32
70.
117
0.27
3 0.
105
-0.4
670.
075
0.43
0 0.
167
—

Edu
catio
n Po
licy
Ana
lysis
Arc
hive
s V
ol. 1
4 N
o. 1
38
Tabl
e 22
C
orre
latio
ns o
f Ant
eced
ent E
PR C
hang
e an
d C
onse
quen
t NA
EP
Gai
ns a
cros
s 19
92–2
003:
Fou
rth-
Gra
de M
ath—
Non
-Coh
ort
Var
iabl
es
1988
–92
EPR
C
hang
e
1992
–96
NA
EP
Gai
n 19
96 %
ex
clud
ed
1992
–96
EPR
C
hang
e
1996
–200
0 N
AE
P G
ain
2000
%
excl
uded
19
96–2
000
EPR
Cha
nge
2000
-03
NA
EP
Gai
n
1988
–92
EPR
Cha
nge
—
1992
–96
NA
EP
Gai
n
-.06
6*
—
1996
%
excl
uded
.0
98
.047
—
1992
–96
EPR
Cha
nge
-.3
28
.565
-.0
48
—
1996
–200
0 N
AE
P G
ain
.2
47
.038
-.0
19
.159
**
—
2000
%
excl
uded
.0
53
.319
.6
02
.160
.1
49
—
1996
–200
0 E
PR C
hang
e
.325
.1
90
.098
-.1
51
.112
.1
37
—
2000
-03
NA
EP
Gai
n
.063
-.2
97
.081
.0
60
.124
-.2
74
.142
***
—
2003
%
excl
uded
.2
12
.336
.2
37
.150
.0
92
.463
.2
46
.028
Part
ial c
orre
latio
n re
sults
: * -.
072;
**
.138
; ***
.140
C
orre
latio
ns in
bol
dfac
e hi
ghlig
ht th
e re
latio
nshi
p of
ach
ieve
men
t and
hig
h-st
akes
test
ing
pres
sure
.
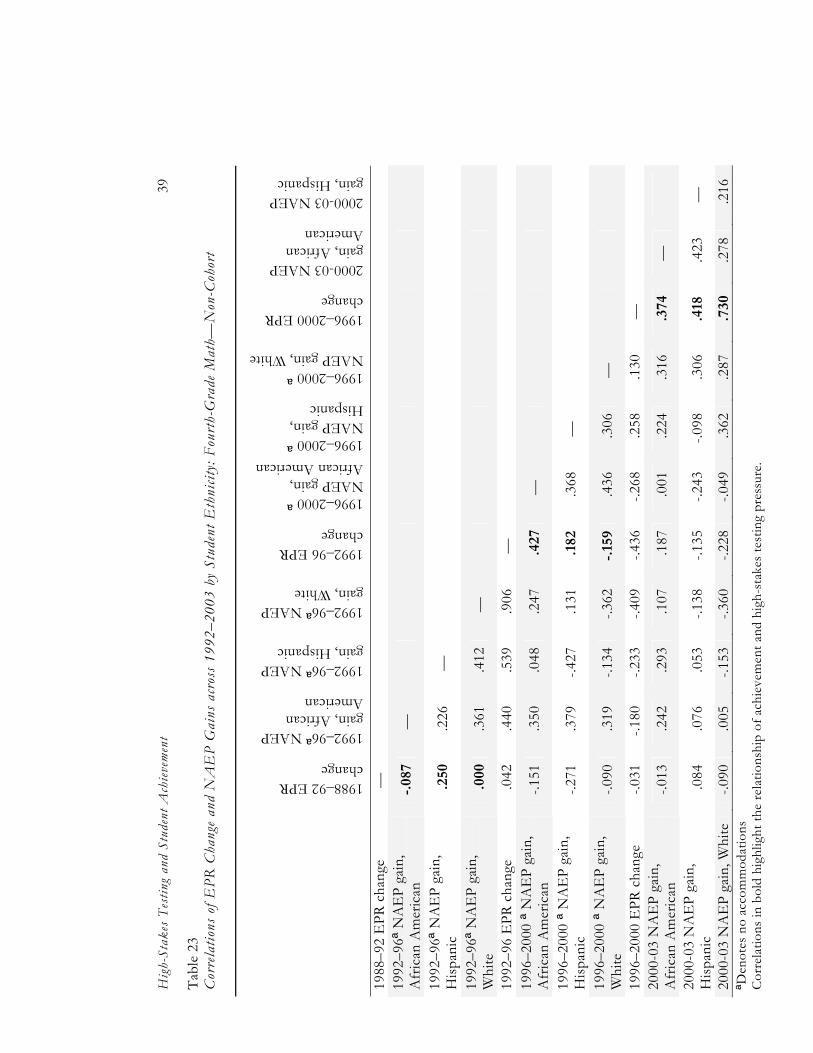
Hig
h-St
akes
Tes
ting
and
Stud
ent A
chiev
emen
t 39
Tabl
e 23
C
orre
latio
ns o
f EPR
Cha
nge
and
NA
EP
Gai
ns a
cros
s 19
92–2
003
by S
tude
nt E
thni
city:
Fou
rth-
Gra
de M
ath—
Non
-Coh
ort
1988–92 EPR change
1992–96ª NAEP gain, African American
1992–96ª NAEP gain, Hispanic
1992–96ª NAEP gain, White
1992–96 EPR change
1996–2000 ª NAEP gain, African American 1996–2000 ª NAEP gain, Hispanic
1996–2000 ª NAEP gain, White
1996–2000 EPR change
2000-03 NAEP gain, African American
2000-03 NAEP gain, Hispanic
1988
–92
EPR
cha
nge
—
19
92–9
6ª N
AE
P ga
in,
Afr
ican
Am
eric
an
-.08
7 —
1992
–96ª
NA
EP
gain
, H
ispan
ic
.250
.2
26
—
1992
–96ª
NA
EP
gain
, W
hite
.0
00
.361
.4
12
—
1992
–96
EPR
cha
nge
.0
42
.440
.5
39
.906
—
19
96–2
000
ª NA
EP
gain
, A
fric
an A
mer
ican
-.1
51
.350
.0
48
.247
.4
27
—
1996
–200
0 ª N
AE
P ga
in,
Hisp
anic
-.2
71
.379
-.4
27
.131
.1
82
.368
—
1996
–200
0 ª N
AE
P ga
in,
Whi
te
-.090
.3
19
-.134
-.3
62
-.15
9 .4
36
.306
—
1996
–200
0 E
PR c
hang
e -.0
31
-.180
-.2
33
-.409
-.4
36
-.268
.2
58
.130
—
20
00-0
3 N
AE
P ga
in,
Afr
ican
Am
eric
an
-.013
.2
42
.293
.1
07
.187
.0
01
.224
.3
16
.374
—
2000
-03
NA
EP
gain
, H
ispan
ic
.084
.0
76
.053
-.1
38
-.135
-.2
43
-.098
.3
06
.418
.4
23
—
2000
-03
NA
EP
gain
, Whi
te
-.090
.0
05
-.153
-.3
60
-.228
-.0
49
.362
.2
87
.730
.2
78
.216
ªD
enot
es n
o ac
com
mod
atio
ns
Cor
rela
tions
in b
old
high
light
the
rela
tions
hip
of a
chie
vem
ent a
nd h
igh-
stak
es te
stin
g pr
essu
re.
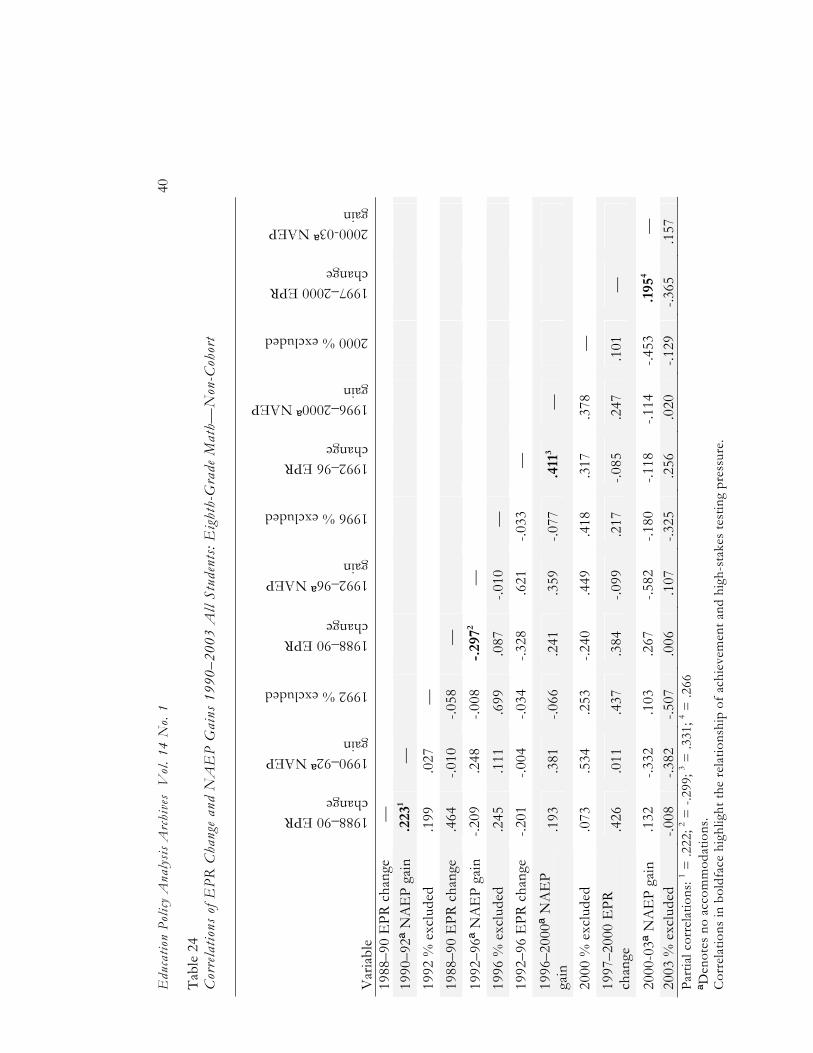
Edu
catio
n Po
licy
Ana
lysis
Arc
hive
s V
ol. 1
4 N
o. 1
40
Tabl
e 24
C
orre
latio
ns o
f EPR
Cha
nge
and
NA
EP
Gai
ns 1
990–
2003
All
Stud
ents
: Eig
hth-
Gra
de M
ath—
Non
-Coh
ort
Var
iabl
e
1988–90 EPR change
1990–92ª NAEP gain
1992 % excluded
1988–90 EPR change
1992–96ª NAEP gain
1996 % excluded
1992–96 EPR change
1996–2000ª NAEP gain
2000 % excluded
1997–2000 EPR change
2000-03ª NAEP gain
1988
–90
EPR
cha
nge
—
19
90–9
2ª N
AE
P ga
in
.223
1 —
1992
% e
xclu
ded
.1
99
.027
—
19
88–9
0 E
PR c
hang
e
.464
-.0
10
-.058
—
1992
–96ª
NA
EP
gain
-.2
09
.248
-.0
08
-.29
72 —
19
96 %
exc
lude
d .2
45
.111
.6
99
.087
-.0
10
—
19
92–9
6 E
PR c
hang
e
-.201
-.0
04
-.034
-.3
28
.621
-.0
33
—
1996
–200
0ª N
AE
P ga
in
.193
.3
81
-.066
.2
41
.359
-.0
77
.411
3 —
2000
% e
xclu
ded
.073
.5
34
.253
-.2
40
.449
.4
18
.317
.3
78
—
1997
–200
0 E
PR
chan
ge
.426
.0
11
.437
.3
84
-.099
.2
17
-.085
.2
47
.101
—
2000
-03ª
NA
EP
gain
.1
32
-.332
.1
03
.267
-.5
82
-.180
-.1
18
-.114
-.4
53
.195
4 —
20
03 %
exc
lude
d -.0
08
-.382
-.5
07
.006
.1
07
-.325
.2
56
.020
-.1
29
-.365
.1
57
Part
ial c
orre
latio
ns: 1 =
.222
; 2 = -.
299;
3 = .3
31; 4 =
.266
ªD
enot
es n
o ac
com
mod
atio
ns.
Cor
rela
tions
in b
oldf
ace
high
light
the
rela
tions
hip
of a
chie
vem
ent a
nd h
igh-
stak
es te
stin
g pr
essu
re.
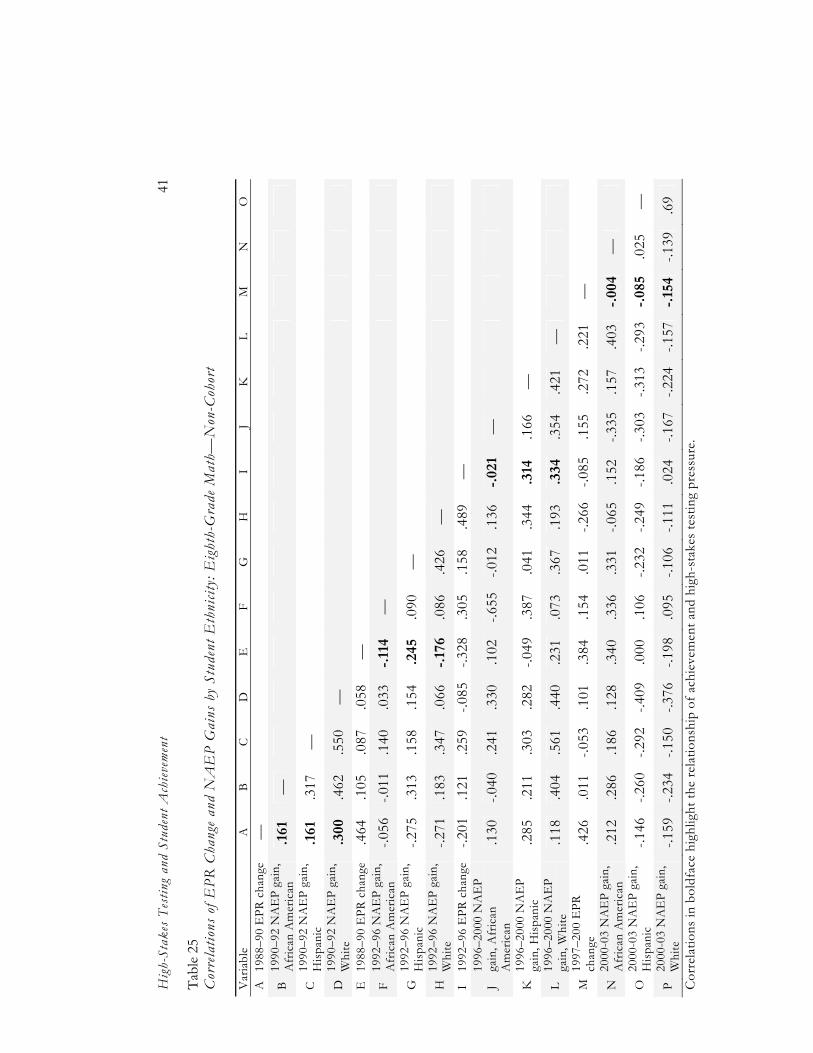
Hig
h-St
akes
Tes
ting
and
Stud
ent A
chiev
emen
t 41
Tabl
e 25
C
orre
latio
ns o
f EPR
Cha
nge
and
NA
EP
Gai
ns b
y St
uden
t Eth
nicit
y: E
ight
h-G
rade
Mat
h—N
on-C
ohor
t V
aria
ble
A
B C
D
E
F
G
H
I J
K
L M
N
O
A
19
88–9
0 E
PR c
hang
e —
B
1990
–92
NA
EP
gain
, A
fric
an A
mer
ican
.1
61
—
C
1990
–92
NA
EP
gain
, H
ispan
ic
.161
.3
17
—
D
1990
–92
NA
EP
gain
, W
hite
.3
00
.462
.5
50—
E
1988
–90
EPR
cha
nge
.464
.1
05
.087
.058
—
F 19
92–9
6 N
AE
P ga
in,
Afr
ican
Am
eric
an
-.056
-.0
11
.140
.033
-.11
4—
G
1992
–96
NA
EP
gain
, H
ispan
ic
-.275
.3
13
.158
.154
.245
.090
—
H
1992
–96
NA
EP
gain
, W
hite
-.2
71
.183
.3
47.0
66-.
176
.086
.426
—
I
1992
–96
EPR
cha
nge
-.201
.1
21
.259
-.085
-.328
.305
.158
.489
—
J 19
96–2
000
NA
EP
gain
, Afr
ican
A
mer
ican
.1
30
-.040
.2
41.3
30.1
02-.6
55-.0
12.1
36
-.02
1—
K
1996
–200
0 N
AE
P ga
in, H
ispan
ic
.285
.2
11
.303
.282
-.049
.387
.041
.344
.3
14
.166
—
L 19
96–2
000
NA
EP
gain
, Whi
te
.118
.4
04
.561
.440
.231
.073
.367
.193
.3
34.3
54.4
21—
M 19
97–2
00 E
PR
chan
ge
.426
.0
11
-.053
.101
.384
.154
.011
-.266
-.0
85.1
55.2
72.2
21—
N
2000
-03
NA
EP
gain
, A
fric
an A
mer
ican
.2
12
.286
.1
86.1
28.3
40.3
36.3
31-.0
65
.152
-.335
.157
.403
-.00
4—
O 20
00-0
3 N
AE
P ga
in,
Hisp
anic
-.1
46
-.260
-.2
92-.4
09.0
00.1
06-.2
32-.2
49
-.186
-.303
-.313
-.293
-.08
5.0
25—
P 20
00-0
3 N
AE
P ga
in,
Whi
te
-.159
-.2
34
-.150
-.376
-.198
.095
-.106
-.111
.0
24-.1
67-.2
24-.1
57-.
154
-.139
.69
Cor
rela
tions
in b
oldf
ace
high
light
the
rela
tions
hip
of a
chie
vem
ent a
nd h
igh-
stak
es te
stin
g pr
essu
re.
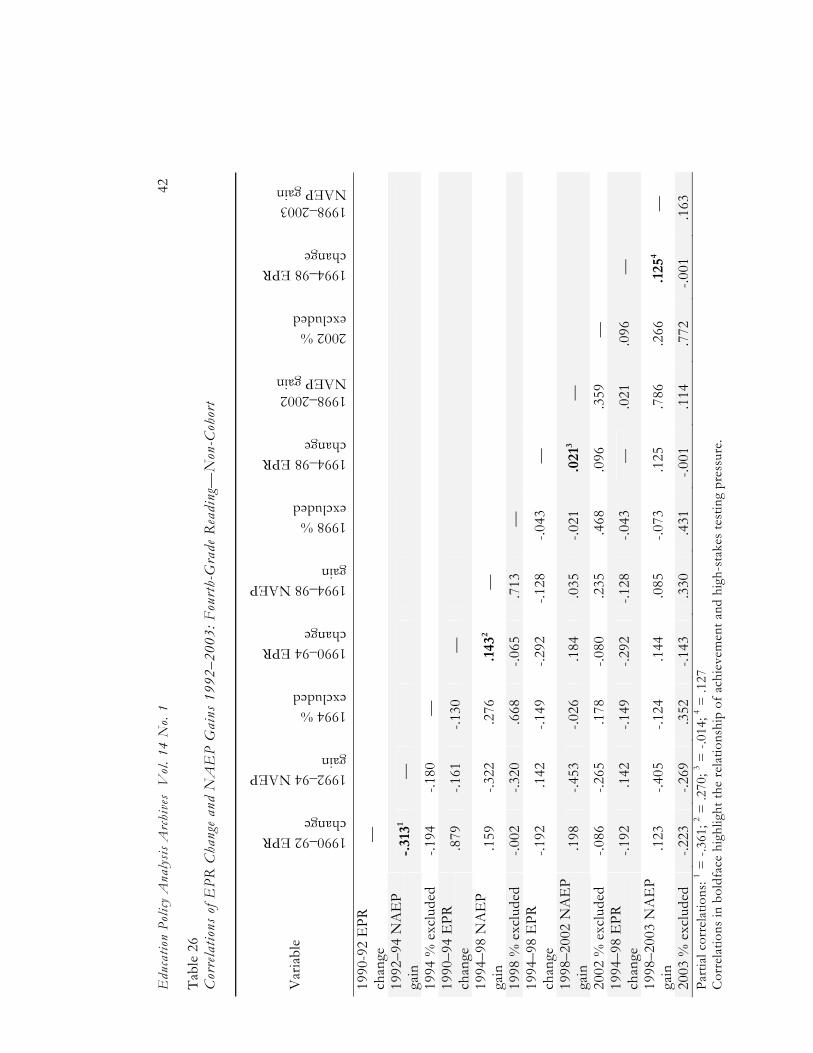
Edu
catio
n Po
licy
Ana
lysis
Arc
hive
s V
ol. 1
4 N
o. 1
42
Tabl
e 26
C
orre
latio
ns o
f EPR
Cha
nge
and
NA
EP
Gai
ns 1
992–
2003
: Fou
rth-
Gra
de R
eadi
ng—
Non
-Coh
ort
Var
iabl
e
1990–92 EPR change
1992–94 NAEP gain
1994 % excluded
1990–94 EPR change
1994–98 NAEP gain
1998 % excluded
1994–98 EPR change
1998–2002 NAEP gain
2002 % excluded
1994–98 EPR change
1998–2003 NAEP gain
1990
-92
EPR
ch
ange
—
1992
–94
NA
EP
gain
-.
3131
—
1994
% e
xclu
ded
-.194
-.1
80
—
1990
–94
EPR
ch
ange
.8
79
-.161
-.1
30
—
1994
–98
NA
EP
gain
.1
59
-.322
.2
76
.143
2 —
1998
% e
xclu
ded
-.002
-.3
20
.668
-.0
65
.713
—
1994
–98
EPR
ch
ange
-.1
92
.142
-.1
49
-.292
-.1
28
-.043
—
1998
–200
2 N
AE
P ga
in
.198
-.4
53
-.026
.1
84
.035
-.0
21
.021
3 —
2002
% e
xclu
ded
-.086
-.2
65
.178
-.0
80
.235
.4
68
.096
.3
59
—
1994
–98
EPR
ch
ange
-.1
92
.142
-.1
49
-.292
-.1
28
-.043
—
.0
21
.096
—
1998
–200
3 N
AE
P ga
in
.123
-.4
05
-.124
.1
44
.085
-.0
73
.125
.7
86
.266
.1
254
—
2003
% e
xclu
ded
-.223
-.2
69
.352
-.1
43
.330
.4
31
-.001
.1
14
.772
-.0
01
.163
Pa
rtia
l cor
rela
tions
: 1 = -.
361;
2 = .2
70; 3 =
-.01
4; 4 =
.127
C
orre
latio
ns in
bol
dfac
e hi
ghlig
ht th
e re
latio
nshi
p of
ach
ieve
men
t and
hig
h-st
akes
test
ing
pres
sure
.
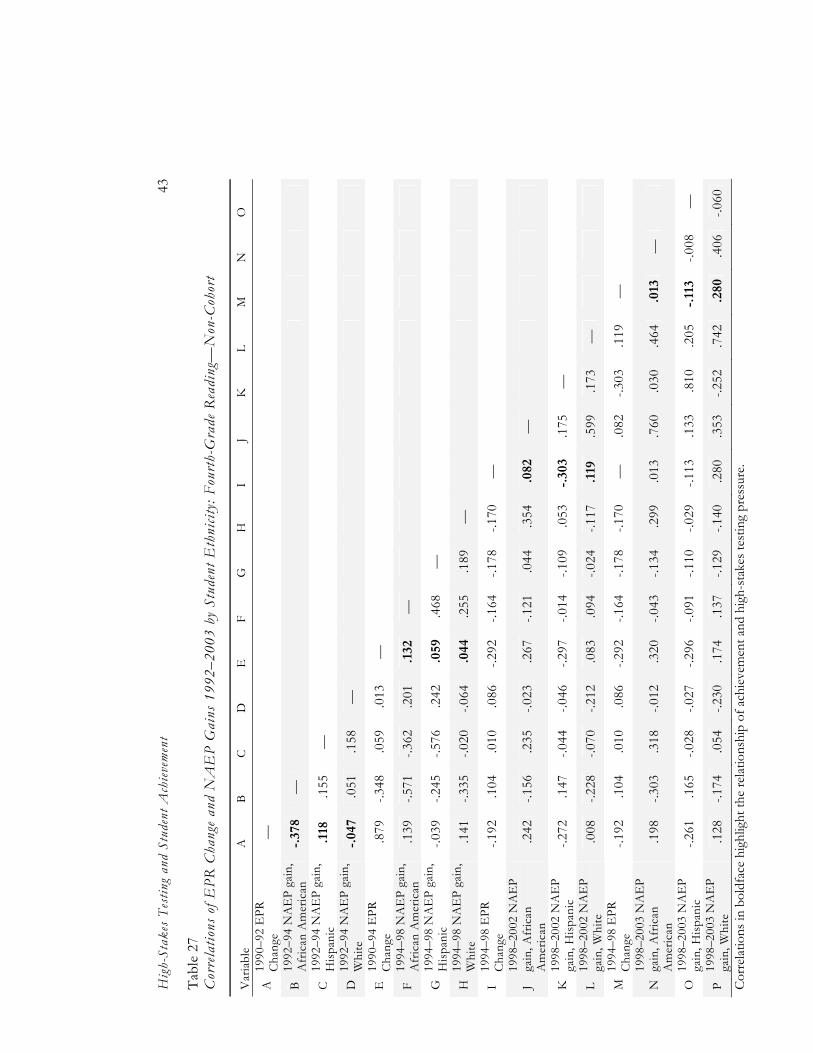
Hig
h-St
akes
Tes
ting
and
Stud
ent A
chiev
emen
t 43
Tabl
e 27
C
orre
latio
ns o
f EPR
Cha
nge
and
NA
EP
Gai
ns 1
992–
2003
by
Stud
ent E
thni
city:
Fou
rth-
Gra
de R
eadi
ng—
Non
-Coh
ort
Var
iabl
e A
B
C
D
E
F G
H
I
J K
L
M
N
O
A
1990
–92
EPR
C
hang
e —
B 19
92–9
4 N
AE
P ga
in,
Afr
ican
Am
eric
an
-.37
8 —
C
1992
–94
NA
EP
gain
, H
ispan
ic
.118
.1
55
—
D
1992
–94
NA
EP
gain
, W
hite
-.
047
.051
.1
58
—
E
1990
–94
EPR
C
hang
e .8
79
-.348
.0
59
.013
—
F 19
94–9
8 N
AE
P ga
in,
Afr
ican
Am
eric
an
.139
-.5
71
-.362
.2
01
.132
—
G
1994
–98
NA
EP
gain
, H
ispan
ic
-.039
-.2
45
-.576
.2
42
.059
.4
68
—
H
1994
–98
NA
EP
gain
, W
hite
.1
41
-.335
-.0
20
-.064
.0
44
.255
.1
89
—
I 19
94–9
8 E
PR
Cha
nge
-.192
.1
04
.010
.0
86
-.292
-.1
64
-.178
-.1
70
—
J 19
98–2
002
NA
EP
gain
, Afr
ican
A
mer
ican
.2
42
-.156
.2
35
-.023
.2
67
-.121
.0
44
.354
.0
82
—
K
1998
–200
2 N
AE
P ga
in, H
ispan
ic
-.272
.1
47
-.044
-.0
46
-.297
-.0
14
-.109
.0
53
-.30
3.1
75
—
L 19
98–2
002
NA
EP
gain
, Whi
te
.008
-.2
28
-.070
-.2
12
.083
.0
94
-.024
-.1
17
.119
.5
99
.173
—
M 19
94–9
8 E
PR
Cha
nge
-.192
.1
04
.010
.0
86
-.292
-.1
64
-.178
-.1
70
—
.082
-.3
03
.119
—
N
1998
–200
3 N
AE
P ga
in, A
fric
an
Am
eric
an
.198
-.3
03
.318
-.0
12
.320
-.0
43
-.134
.2
99
.013
.7
60
.030
.4
64
.013
—
O 19
98–2
003
NA
EP
gain
, Hisp
anic
-.2
61
.165
-.0
28
-.027
-.2
96
-.091
-.1
10
-.029
-.1
13
.133
.8
10
.205
-.
113
-.008
—
P 19
98–2
003
NA
EP
gain
, Whi
te
.128
-.1
74
.054
-.2
30
.174
.1
37
-.129
-.1
40
.280
.3
53
-.252
.7
42
.280
.4
06
-.060
Corr
elatio
ns in
bol
dfac
e hi
ghlig
ht th
e re
latio
nshi
p of
ach
ievem
ent a
nd h
igh-
stak
es te
stin
g pr
essu
re.
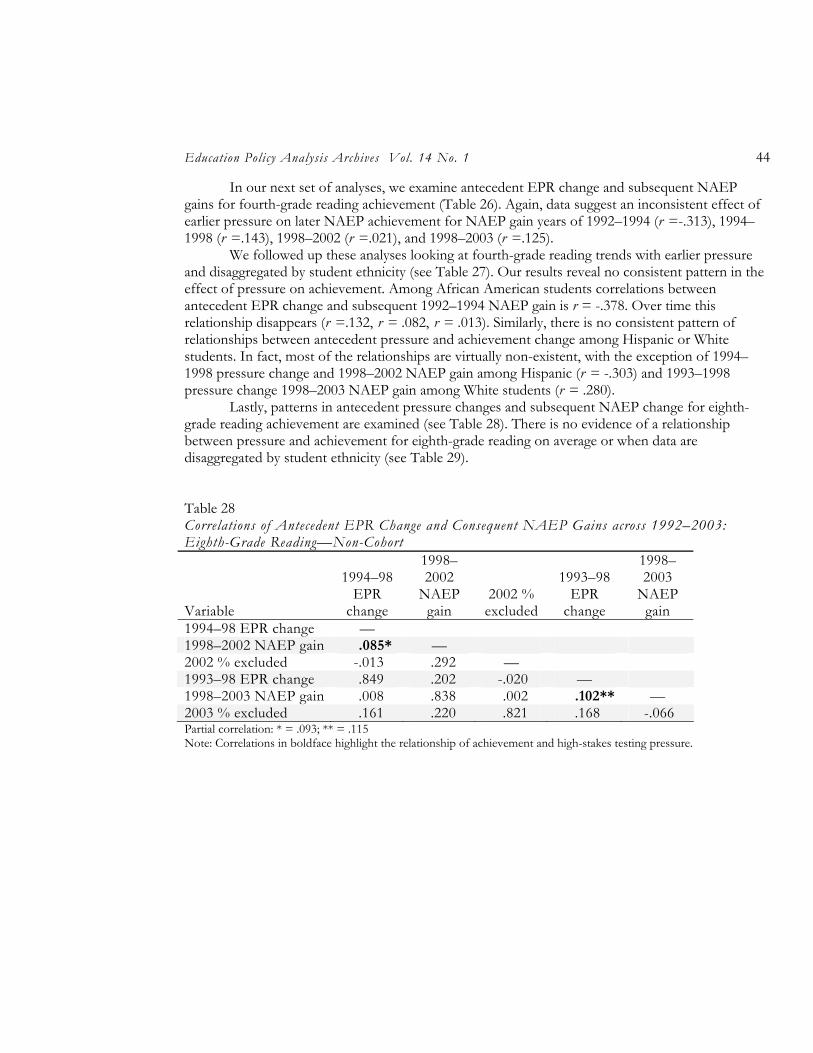
Education Policy Analysis Archives Vol. 14 No. 1 44
In our next set of analyses, we examine antecedent EPR change and subsequent NAEP gains for fourth-grade reading achievement (Table 26). Again, data suggest an inconsistent effect of earlier pressure on later NAEP achievement for NAEP gain years of 1992–1994 (r =-.313), 1994–1998 (r =.143), 1998–2002 (r =.021), and 1998–2003 (r =.125).
We followed up these analyses looking at fourth-grade reading trends with earlier pressure and disaggregated by student ethnicity (see Table 27). Our results reveal no consistent pattern in the effect of pressure on achievement. Among African American students correlations between antecedent EPR change and subsequent 1992–1994 NAEP gain is r = -.378. Over time this relationship disappears (r =.132, r = .082, r = .013). Similarly, there is no consistent pattern of relationships between antecedent pressure and achievement change among Hispanic or White students. In fact, most of the relationships are virtually non-existent, with the exception of 1994–1998 pressure change and 1998–2002 NAEP gain among Hispanic (r = -.303) and 1993–1998 pressure change 1998–2003 NAEP gain among White students (r = .280).
Lastly, patterns in antecedent pressure changes and subsequent NAEP change for eighth-grade reading achievement are examined (see Table 28). There is no evidence of a relationship between pressure and achievement for eighth-grade reading on average or when data are disaggregated by student ethnicity (see Table 29).
Table 28 Correlations of Antecedent EPR Change and Consequent NAEP Gains across 1992–2003: Eighth-Grade Reading—Non-Cohort
Variable
1994–98 EPR
change
1998–2002
NAEP gain
2002 % excluded
1993–98 EPR
change
1998–2003
NAEP gain
1994–98 EPR change — 1998–2002 NAEP gain .085* — 2002 % excluded -.013 .292 — 1993–98 EPR change .849 .202 -.020 — 1998–2003 NAEP gain .008 .838 .002 .102** — 2003 % excluded .161 .220 .821 .168 -.066 Partial correlation: * = .093; ** = .115 Note: Correlations in boldface highlight the relationship of achievement and high-stakes testing pressure.
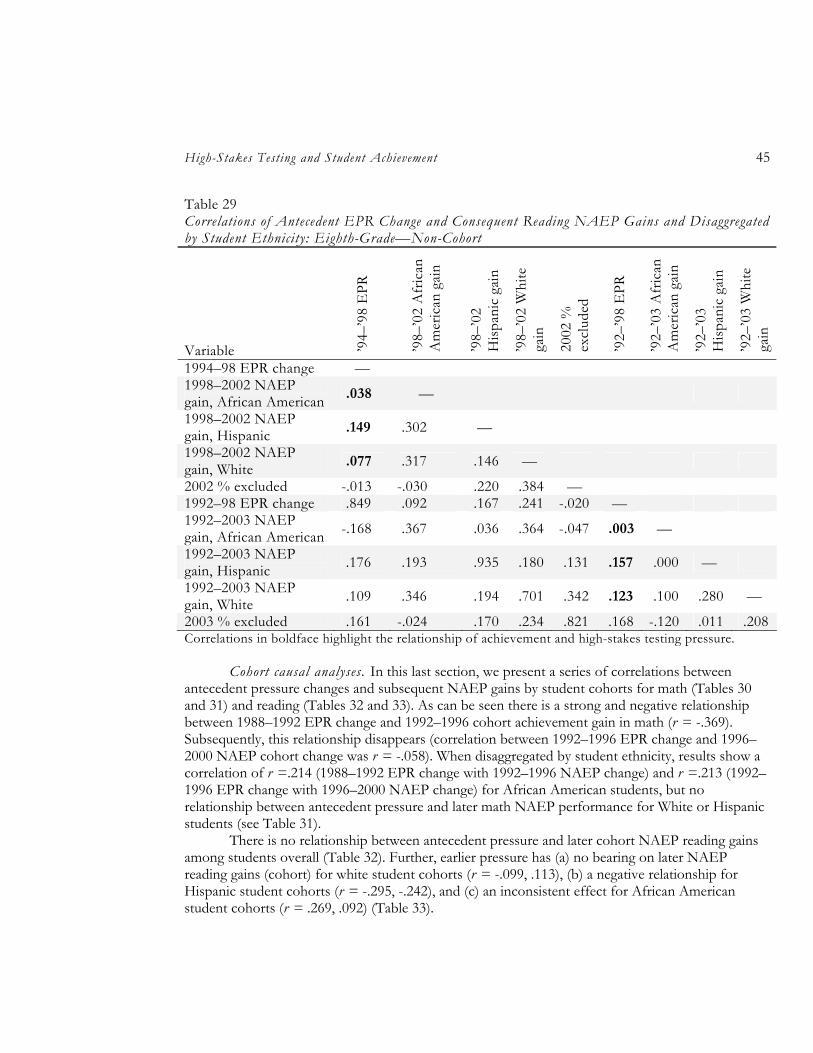
High-Stakes Testing and Student Achievement 45
Table 29 Correlations of Antecedent EPR Change and Consequent Reading NAEP Gains and Disaggregated by Student Ethnicity: Eighth-Grade—Non-Cohort
Variable ’94–
’98
EPR
’98–
’02
Afr
ican
A
mer
ican
gai
n
’98–
’02
Hisp
anic
gai
n
’98–
’02
Whi
te
gain
2002
%
excl
uded
’92–
’98
EPR
’92–
’03
Afr
ican
A
mer
ican
gai
n
’92–
’03
Hisp
anic
gai
n
’92–
’03
Whi
te
gain
1994–98 EPR change — 1998–2002 NAEP gain, African American .038 —
1998–2002 NAEP gain, Hispanic .149 .302 —
1998–2002 NAEP gain, White .077 .317 .146 —
2002 % excluded -.013 -.030 .220 .384 — 1992–98 EPR change .849 .092 .167 .241 -.020 — 1992–2003 NAEP gain, African American -.168 .367 .036 .364 -.047 .003 —
1992–2003 NAEP gain, Hispanic .176 .193 .935 .180 .131 .157 .000 —
1992–2003 NAEP gain, White .109 .346 .194 .701 .342 .123 .100 .280 —
2003 % excluded .161 -.024 .170 .234 .821 .168 -.120 .011 .208Correlations in boldface highlight the relationship of achievement and high-stakes testing pressure.
Cohort causal analyses. In this last section, we present a series of correlations between
antecedent pressure changes and subsequent NAEP gains by student cohorts for math (Tables 30 and 31) and reading (Tables 32 and 33). As can be seen there is a strong and negative relationship between 1988–1992 EPR change and 1992–1996 cohort achievement gain in math (r = -.369). Subsequently, this relationship disappears (correlation between 1992–1996 EPR change and 1996–2000 NAEP cohort change was r = -.058). When disaggregated by student ethnicity, results show a correlation of r =.214 (1988–1992 EPR change with 1992–1996 NAEP change) and r =.213 (1992–1996 EPR change with 1996–2000 NAEP change) for African American students, but no relationship between antecedent pressure and later math NAEP performance for White or Hispanic students (see Table 31).
There is no relationship between antecedent pressure and later cohort NAEP reading gains among students overall (Table 32). Further, earlier pressure has (a) no bearing on later NAEP reading gains (cohort) for white student cohorts (r = -.099, .113), (b) a negative relationship for Hispanic student cohorts (r = -.295, -.242), and (c) an inconsistent effect for African American student cohorts (r = .269, .092) (Table 33).
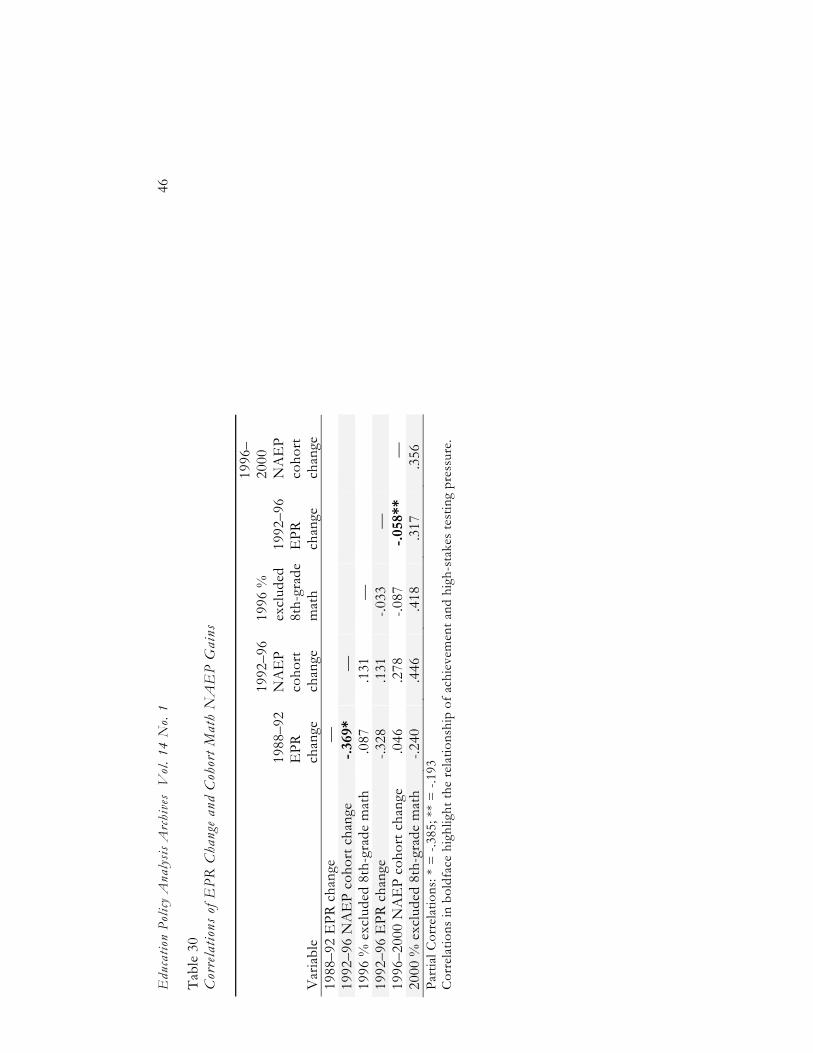
Edu
catio
n Po
licy
Ana
lysis
Arc
hive
s V
ol. 1
4 N
o. 1
46
Tabl
e 30
C
orre
latio
ns o
f EPR
Cha
nge
and
Coh
ort M
ath
NA
EP
Gai
ns
Var
iabl
e
1988
–92
EPR
ch
ange
1992
–96
NA
EP
coho
rt
chan
ge
1996
%
excl
uded
8t
h-gr
ade
mat
h
1992
–96
EPR
ch
ange
1996
–20
00
NA
EP
coho
rt
chan
ge
1988
–92
EPR
cha
nge
—
1992
–96
NA
EP
coho
rt c
hang
e -.
369*
—
1996
% e
xclu
ded
8th-
grad
e m
ath
.087
.1
31
—
1992
–96
EPR
cha
nge
-.328
.1
31
-.033
—
1996
–200
0 N
AE
P co
hort
cha
nge
.046
.2
78
-.087
-.
058*
* —
20
00 %
exc
lude
d 8t
h-gr
ade
mat
h
-.240
.4
46
.418
.3
17
.356
Pa
rtia
l Cor
rela
tions
: * =
-.38
5; *
* =
-.19
3 C
orre
latio
ns in
bol
dfac
e hi
ghlig
ht th
e re
latio
nshi
p of
ach
ieve
men
t and
hig
h-st
akes
test
ing
pres
sure
.
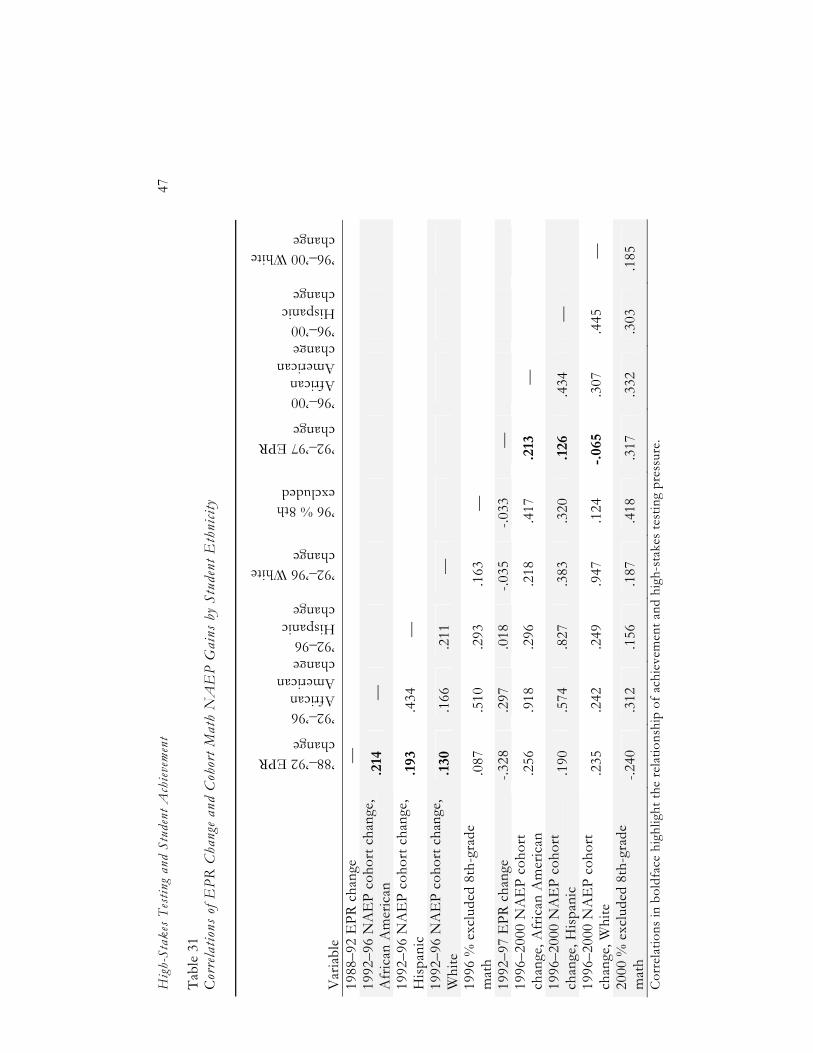
Hig
h-St
akes
Tes
ting
and
Stud
ent A
chiev
emen
t 47
Tabl
e 31
C
orre
latio
ns o
f EPR
Cha
nge
and
Coh
ort M
ath
NA
EP
Gai
ns b
y St
uden
t Eth
nicit
y
Var
iabl
e
’88–’92 EPR change
’92–’96 African American change ’92–96 Hispanic change
’92–’96 White change
’96 % 8th excluded
’92–’97 EPR change
’96–’00 African American change ’96–’00 Hispanic change
’96–’00 White change
1988
–92
EPR
cha
nge
—
1992
–96
NA
EP
coho
rt c
hang
e,
Afr
ican
Am
eric
an
.214
—
1992
–96
NA
EP
coho
rt c
hang
e,
Hisp
anic
.1
93
.434
—
1992
–96
NA
EP
coho
rt c
hang
e,
Whi
te
.130
.1
66
.211
—
1996
% e
xclu
ded
8th-
grad
e m
ath
.087
.5
10
.293
.1
63
—
1992
–97
EPR
cha
nge
-.328
.2
97
.018
-.0
35
-.033
—
1996
–200
0 N
AE
P co
hort
ch
ange
, Afr
ican
Am
eric
an
.256
.9
18
.296
.2
18
.417
.2
13
—
1996
–200
0 N
AE
P co
hort
ch
ange
, Hisp
anic
.1
90
.574
.8
27
.383
.3
20
.126
.4
34
—
1996
–200
0 N
AE
P co
hort
ch
ange
, Whi
te
.235
.2
42
.249
.9
47
.124
-.
065
.307
.4
45
—
2000
% e
xclu
ded
8th-
grad
e m
ath
-.2
40
.312
.1
56
.187
.4
18
.317
.3
32
.303
.1
85
Cor
rela
tions
in b
oldf
ace
high
light
the
rela
tions
hip
of a
chie
vem
ent a
nd h
igh-
stak
es te
stin
g pr
essu
re.
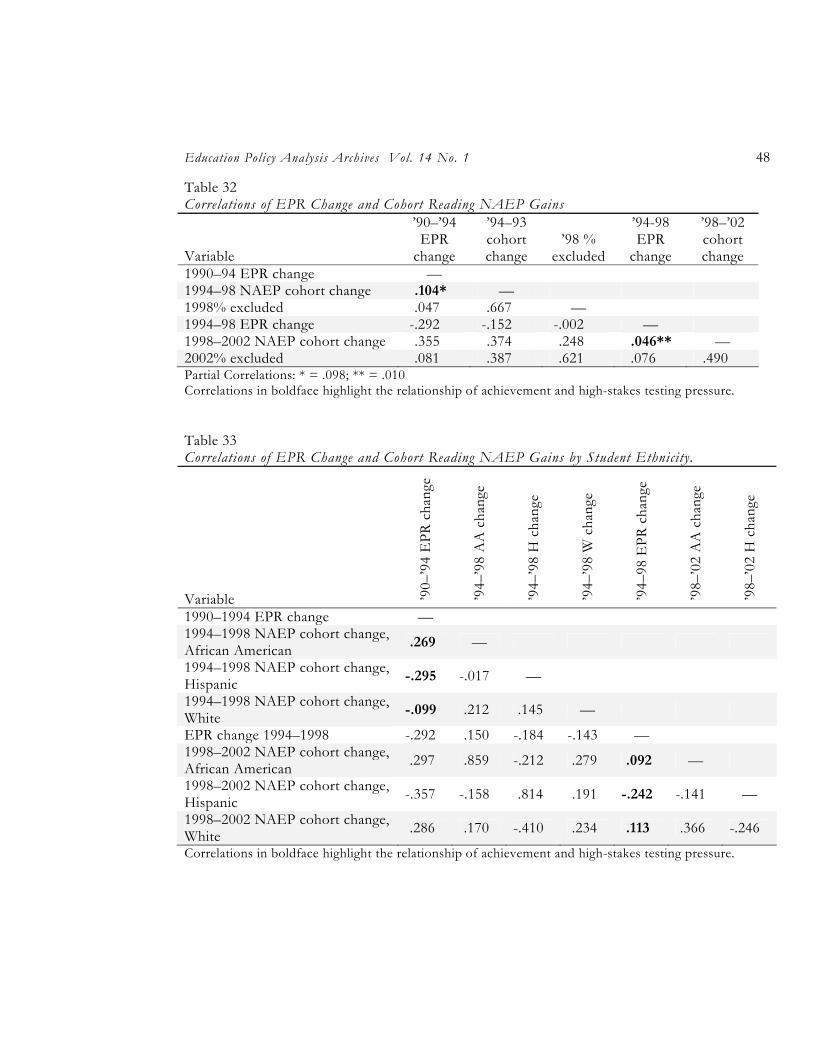
Education Policy Analysis Archives Vol. 14 No. 1 48
Table 32 Correlations of EPR Change and Cohort Reading NAEP Gains
Variable
’90–’94 EPR
change
’94–93 cohort change
’98 % excluded
’94-98 EPR
change
’98–’02 cohort change
1990–94 EPR change — 1994–98 NAEP cohort change .104* — 1998% excluded .047 .667 — 1994–98 EPR change -.292 -.152 -.002 — 1998–2002 NAEP cohort change .355 .374 .248 .046** — 2002% excluded .081 .387 .621 .076 .490 Partial Correlations: * = .098; ** = .010 Correlations in boldface highlight the relationship of achievement and high-stakes testing pressure.
Table 33 Correlations of EPR Change and Cohort Reading NAEP Gains by Student Ethnicity.
Variable ’90–
’94
EPR
cha
nge
’94–
’98
AA
cha
nge
’94–
’98
H c
hang
e
’94–
’98
W c
hang
e
’94–
98 E
PR c
hang
e
’98–
’02
AA
cha
nge
’98–
’02
H c
hang
e
1990–1994 EPR change — 1994–1998 NAEP cohort change, African American .269 —
1994–1998 NAEP cohort change, Hispanic -.295 -.017 —
1994–1998 NAEP cohort change, White -.099 .212 .145 —
EPR change 1994–1998 -.292 .150 -.184 -.143 — 1998–2002 NAEP cohort change, African American .297 .859 -.212 .279 .092 —
1998–2002 NAEP cohort change, Hispanic -.357 -.158 .814 .191 -.242 -.141 —
1998–2002 NAEP cohort change, White .286 .170 -.410 .234 .113 .366 -.246
Correlations in boldface highlight the relationship of achievement and high-stakes testing pressure.
High-Stakes Testing and Student Achievement 49
Discussion
Replication of Carnoy and Loeb
Some of our findings replicate those reported by Carnoy and Loeb (2002). For example, when our rating system was substituted for theirs, there was a strong association between state composition and population, and pressure associated with accountability. It seems relatively clear that larger states and those with a greater proportion of minority students tend to implement accountability systems that exert a greater level of pressure. But, when Carnoy and Loeb (2002) examined the relationship of students’ National Assessment of Education Progress (NAEP) test performance from the early 1990s with the strength of accountability implementation later, their only significant finding was the negative association between fourth-grade White students’ math performance and later accountability implementation. By contrast, our analysis revealed a positive relationship between earlier African American student math achievement and pressure but a negative one between the change in the percent at or above basic in fourth-grade reading (1992–1994) and pressure.
In their second regression model, Carnoy and Loeb found that math gains were significantly associated with accountability strength—especially among eighth graders. Using our Accountability Pressure Rating (APR), there was a positive relationship between eighth-grade NAEP gains and APR; however, the strength of that relationship depended on the NAEP indicator (% proficiency or average scale score) and whether exclusion rates were partialed out of the correlation. When the change in the percent of students achieving at or above basic and among all students (1996–2000) was the indicator, the correlation with APR was significant and positive at .446. However, a partial correlation holding NAEP 2000 exclusion rates constant reduced this relationship to essentially zero: .026. By contrast, when NAEP scale scores were used, the relationship between achievement gains (again among all students, 1996–2000) and our index of pressure was also positive, but slightly lower at .372 (with a partial correlation of .351). When disaggregated by ethnicity, the change in the percent of students at or above basic (1996–2000) and APR is significant (.456) for African American students, but non-existent for White (.054) or Hispanic (.094) students. Thus, among eighth graders and for math, and especially among African American eighth-graders, pressure seems to be positively related to increases in achievement. Among fourth graders, there was a positive relationship between change in percent at or above basic (1996–2000) math achievement and APR among all students and when the data are disaggregated by ethnicity. But, the strength of those relationships was lower than what was found for eighth grade (ranging from .184 to .327).
These findings replicate what Carnoy and Loeb and others have found (Braun, 2004; Rosenshine, 2003)—that accountability pressure is related to increases in math NAEP performance later in the 1990s. This finding emerges more strongly for eighth-grade math performance than it does for fourth-grade performance and for African American students more than any other ethnic subgroup. However, there is evidence that students are excluded from NAEP at higher rates during post testing which raises questions for any researcher about the validity of these academic “gain” scores.
Progression
We were surprised to find a positive correlation between our index of pressure and eighth-ninth-grade progression. We would have predicted, as Carnoy and Loeb found, that pressure and
Education Policy Analysis Archives Vol. 14 No. 1 50
eighth-ninth grade progression were unrelated. Still, it was not surprising that consistent with what others have found (Haney et al., 2004), pressure is negatively associated with the likelihood that students will progress into 12th grade. Thus, it may be that increasing pressure leads to greater numbers of students dropping out or being held back in school. However, this conclusion is drawn with caution because, as others have noted (Heubert & Hauser, 1999; Haney et al., 2004), the use of enrollment figures as a proxy for grade progression does not account for enrollment changes due to migration or movement from school to school.
EPR Change and NAEP Gains
In our second set of analyses, a series of correlations were calculated to examine the pattern of relationships among NAEP gains and pressure change, both over the same time period and based on an antecedent-consequent design. Our correlations of NAEP gains and EPR change across the same time period (1990–2003) across fourth- and eighth-grade levels and for both math and reading in aggregate and disaggregated by student ethnicity (Table 21) revealed mostly positive but weak correlations (the largest positive correlation was .383). But all correlations (among aggregated achievement scores) decreased when NAEP exclusion rates were held constant. This set of analyses suggests that between the first administration of NAEP (state level) and the most recent, the corresponding change in pressure was only slightly related to math achievement gains and only for certain subgroups (e.g., fourth-grade Hispanic and eighth-grade African American student achievement). Standing in dramatic contrast to the math results is the fact that accountability pressure increases were unrelated to reading gains at the fourth- or eighth-grade levels overall, as well as for all ethnic student subgroups.
Table 34 Averaged Antecedent—Consequent Relationships Between EPR Changes and NAEP Gains by Subject, Grade, Ethnicity and Design (Non-Cohort vs Cohort) Non-Cohort Analysis Cohort Analysis (G4-G8) Ethnicity and Grade Reading Math Reading Math African American
G4 .04 .24 .18 .21 G8 .02 .00
Hispanic G4 -.06 .30 -.27 .16 G8 .15 .16
White G4 .10 .19 .07 .03 G8 .10 .08
Our strongest findings rest in the antecedent-consequent analyses. The data summarized in
Table 34 represent averaged instances of correlating antecedent EPR changes with subsequent NAEP scale score changes for both cohort and non-cohort analyses disaggregated by student ethnicity. These averaged correlations suggest that previous increases in pressure do not cause later increases in achievement. However, a review of the underlying constituent correlations represented in this table unmasks a subtle, but important, pattern. On the next page, we list all the antecedent-consequent correlations that we presented in previous tables (i.e., Tables 23, 25, 27, and 29) for each student ethnic subgroup. These correlations are listed in order from lowest to highest.
High-Stakes Testing and Student Achievement 51
-.38 -.30 -.18 -.16 -.15 -.11 -.11 -.09 -.09 -.05 -.02 .00 .00 .00 .01 .04 .04 .06 .08 .08 .12 .12 .12 .13 .15 .16 .16 .16 .18 .25 .25 .28 .30 .31 .33 .37 .42 .43 .73
Of particular note in this list is the fact that for the four largest, positive correlations
obtained in all the antecedent-consequent analyses (see entries in boldface along the bottom row), all four are for fourth-grade math, non-cohort analyses. Moreover, three of these four correlations (.73, .42, .37) emanated from EPR changes that occurred during the last half of the 1990s. If the four largest correlation coefficients are removed, the remaining 35 coefficients average 0.05 and are fairly evenly distributed around zero with a standard deviation of 0.17, which is not far off of the standard error of correlations based on an n of 25 when the population value is zero.
The pattern of these correlations speaks to the validity of the conclusion that we have indeed uncovered a causal link between high-stakes testing pressure and student achievement but only with respect to fourth-grade math, non-cohort trends. It is significant that the strongest relationships were observed under these circumstances and not others (e.g., fourth- or eighth-grade reading, or even cohort analyses for fourth- or eighth-grade math). The difference between a NAEP gain score for a cohort analysis vs. a non-cohort analysis is that in the former case, the achievement of students is tracked from grade 4 to grade 8 across intermediate grades math curricula. In the latter case—non-cohort analysis—the achievement of one year’s grade 4 students is compared to a subsequent year’s grade 4 achievement on grade 4 math curriculum (or more likely, grades 1–4 math curricula). The math curriculum in the Primary grades (1–4) is more standardized across the nation than the math curriculum in the intermediate and middle school grades (5–8). Consequently, math achievement at these levels is more likely to be affected by drill and practice or teaching to a test because of the more “predictable” content.
These findings, in combination with our replication analyses and what others have found (Braun 2004; Carnoy & Loeb, 2002), suggest that there is something about high-stakes testing that is related to math achievement—especially among fourth graders and particularly as accountability policies were enacted and enforced in the latter part of the 1990s and early 2000s. But, it is just as notable that high-stakes pressure has no relation to reading achievement at either the fourth- or eighth-grade levels or for any student subgroup. In the end, our findings (and lack of findings) lead us to the conclusion that high-stakes testing pressure might produce effects only at the simplest level of the school curriculum: Primary school arithmetic where achievement is most susceptible to being increased by drill and practice and teaching to the test.
Limitations and Future Directions
We recognize that our measurement of pressure, while innovative and comprehensive, and an improvement over attempts made in previous research, is not without its limitations. For example, the use of newspaper documentation for describing cultural events (as represented in our portfolio system) raises many questions of potential selectivity bias. In spite of our best efforts to minimize bias through a systematic news search and sampling process, the potential of news stories to assume a negative slant and to exaggerate stories they cover must be acknowledged. Still, by systematizing the sampling procedures for identifying stories to include in all portfolios, we hoped to eliminate, or at least dramatically reduce, between state differences in newspaper orientation (i.e.,
Education Policy Analysis Archives Vol. 14 No. 1 52
liberal versus conservative) and availability (Massachusetts had significantly more types of media covering educational accountability than a state such as Maine, for example). Further, recognizing that newspapers tend to favor negative accounts, we made a concerted effort to include any positive coverage that existed in the corpus.
Our procedures for identifying state-level pressure over time, and therefore the threat rating difference estimates (i.e., EPR change), should be augmented by the judgments of a greater number of experts. Although two judges conducted independent evaluations of a random selection of portfolios and compared their year-to-year pressure rating judgments, their rates of agreement across all years and all changes in pressure were moderate. Nonetheless, the primary consequence of unreliable ratings was not observed, i.e., some non-zero correlations of EPR changes with NAEP gains were observed which would not have been the case had the EPR ratings over time by the two judges been of very low reliability. In future studies, more work must be done to ensure agreement across all pressure ratings by state and year.
This study represents a significant contribution to the measurement of high-stakes testing pressure. Future studies could draw upon our characterizations to investigate the effects of pressure on other teacher/student outcomes. For example, is pressure associated with increases in students’ antisocial behavior or teacher turnover rates? Students and teachers under increased pressure might be induced to vent their anxiety and frustration in undesirable ways. This study represents a solid framework from which future scholars can examine the effects of pressure across a range of academic and social outcomes.
In light of the rapidly growing body of evidence of the deleterious unintended effects of high-stakes testing, and the fact that our study finds no dependable or compelling evidence that the pressure associated with high-stakes testing leads to increased achievement, there is no reason to continue the practice of high-stakes testing. Further, given a) the unprofessional treatment of the educators who work in high-stakes testing situations, b) the inevitable corruption of the indicators used in accountability systems where- high-stakes testing is featured (Ryan, 2004; Nichols & Berliner, 2005), c) data from this and other studies that seriously question whether the intended effects of high-stakes testing- actually occur (Amrein & Berliner, 2002a, b), and d) the acknowledged impossibility of reaching the achievement goals set by the- NCLB act in a reasonable time frame, there is every reason to ask for a moratorium on accountability systems that require high-stakes testing.
High-Stakes Testing and Student Achievement 53
References
Altheide, D. L. (1996). Qualitative media analysis. Quantitative Research Methods, Volume 38. Thousand Oaks, CA: SAGE Publications.
American Educational Research Association (1999). Standards for educational and psychological testing. Washington, DC: Author.
Amrein, A.L. & Berliner, D.C. (2002a). The impact of high-stakes tests on student academic performance: An analysis of NAEP results in states with high-stakes tests and ACT, SAT, and AP Test results in states with high school graduation exams. Tempe, AZ: Education Policy Studies Laboratory, Arizona State University. Retrieved January 7, 2004 from http://www.asu.edu/educ/epsl/EPRU/documents/EPSL-0211–126-EPRU.pdf
Amrein, A.L. & Berliner, D.C. (2002b). High-Stakes testing, uncertainty, and student learning Education Policy Analysis Archives, 10(18). Retrieved January 7, 2004, from http://epaa.asu.edu/epaa/v10n18/
Amrein-Beardsley, A., & Berliner, D. (2003, August). Re-analysis of NAEP math and reading scores in states with and without high-stakes tests: Response to Rosenshine. Education Policy Analysis Archives, 11(25). Retrieved February 5, 2005, from http://epaa.asu.edu/epaa/v11n25/
Berliner, D. C. & Biddle, B.J. (1995). The manufactured crisis: Myths, fraud, and the attack on America's public schools. Reading, MA: Addison-Wesley Publishing.
Braun, H. (2004, January). Reconsidering the impact of high-stakes testing. Education Policy Analysis Archives, 12(1). Retrieved February 5, 2005, from http://epaa.asu.edu/epaa/v12n1/
Carnoy, M., & Loeb, S. (2002, Winter). Does external accountability affect student outcomes? A Cross-State Analysis. Educational Evaluation and Policy Analysis, 24 (4), 305–331.
Clarke, M., Haney, W., & Madaus, G. (2000). High stakes testing and high school completion. Boston, MA: Boston College, Lynch School of Education, National Board on Educational Testing and Public Policy.
Clarke, M., Shore, A., Rhoades, K., Abrams, L., Miao, J., & Li, J. (2003, January). Perceived effects of state-mandated testing programs on teaching and learning: Findings from interviews with educators in low-, medium-, and high-stakes states. Boston, MA: Boston College, National Board on Educational Testing and Public Policy. Retrieved January 7, 2004, from http://www.bc.edu/research/nbetpp/statements/nbr1.pdf
Education Commission of the States (2002, March). No state left behind: The challenges and opportunities of ESEA 2001, Author. Retrieved February 6, 2005, from http://www.ecs.org/clearinghouse/32/37/3237.pdf.
Education Policy Analysis Archives Vol. 14 No. 1 54
Erpenbach, W. J., Forte-Fast, E., & Potts, A. (2003, July). Statewide educational accountability under NCLB: Central issues arising from an examination of state accountability workbooks and U.S. Department of Education reviews under the No Child Left Behind Act of 2001. Washington, DC: Council of Chief State School Officers.
Giordano, G. (2005). How testing came to dominate American schools: The history of educational assessment. New York: Peter Lang.
Gujaratim D. N., (1995)(3rd ed.), Basic econometrics. New York: McGraw Hill.
Haney, W. (2000, August). The Texas miracle in education. Education Policy Analysis Archives, 8(41). Retrieved February 5, 2005, from http://epaa.asu.edu/epaa/v8n41/
Haney, W., Madaus, G., Abrams, L., Wheelock, A., Miao, J., & Gruia, I (2004, January). The education pipeline in the United States 1970–2000. National Board on Educational Testing and Public Policy. Chestnut Hill, MA: Boston College.
Heubert, J. P. & Hauser, R. M., Eds. (1999). High stakes: Testing for tracking, promotion, and graduation. Washington, DC: National Academy Press
Jones, M. G., Jones, B. D., and Hargrove, T. (2003). The unintended consequences of high-stakes testing. Lanham, MD: Rowman & Littlefield.
Klein, S. P., Hamilton, L. S., McCaffrey, D. F., & Stecher, B. M. (2000, October). What do test scores in Texas tell us? Education Policy Analysis Archives, 8(49). Retrieved February 22, 2005, from http://epaa.asu.edu/epaa/v8n49/
Linn, R. L. (2000). Assessments and accountability. Education Researcher, 29 (2), 4–15.
Lynch, W., Glass, G.V., & Tran, Z.V. (1988). Diet, tobacco, alcohol and stress as causes of coronary heart disease: A longitudinal causal analysis. Yale Journal of Biology and Medicine, 61, 413–426.
McCaslin, M., & Good, T. (1996). The informal curriculum. In D. Berliner & R. Calfee (Eds.), Handbook of educational psychology (pp. 622–673). New York: Macmillan.
Messick, S. L. (1995a). Standards of validity and the validity of standards in performance assessment. Educational Measurement: Issues and Practice, 14(4), 5–8.
Messick, S. L. (1995b). Validity of psychological assessment: Validation of inferences from person's responses and performances as scientific inquiry into score meaning. American Psychologist, 50(9), 741–749.
National Commission for Excellence in Education. (1983, April). A nation at risk: The imperatives for educational reform. Washington, DC: U.S. Department of Education, National Commission for Excellence in Education.
High-Stakes Testing and Student Achievement 55
Neill, M., Guisbond, L and Schaeffer, B., with Madison, J. & Legeros, L. (2004). Failing our children: How "No Child Left Behind" undermines quality and equity in education and an accountability model that supports school improvement. Cambridge, MA: Fairtest.
Nichols, S. & Berliner, D. C. (2005, March). The inevitable corruption of indicators and educators through high-stakes testing. EPSL-0503–101-EPRU. Retrieved March 23, 2005 from, http://www.greatlakescenter.org/pdf/EPSL-0503–101-EPRU.pdf
Noddings, N. (2001). Care and coercion in school reform. Journal of Educational Change, 2, 35–43.
Noddings, N. (2002). High-stakes testing and the distortion of care. In J. L. Paul, C. D. Lavely, A. Cranston-Gringas & E. L. Taylor (Eds.), Rethinking professional issues in special education (pp. 69–82). Westport, CT: Ablex Publishing Corporation.
Orfield, G. & Kornhaber, M.L. (2001) (Eds.). Raising standards or raising barriers? Inequality and high-stakes testing in public education. New York: The Century Foundation Press.
Orfield, G., Losen, D., Wald, J., & Swanson, C. B. (2004). Losing our future: How minority youth are being left behind by the graduation rate crisis. Cambridge, MA: The Civil Rights Project at Harvard University.
Pedulla, J. J., Abrams, L. M., Madaus, G. F., Russell, M. K., Ramos, M. A., & Miao, J. (2003, March). Perceived effects of state-mandated testing programs on teaching and learning: Findings from a national survey of teachers. Boston, MA: Boston College, National Board on Educational Testing and Public Policy. Retrieved January 7, 2004 from http://www.bc.edu/research/nbetpp/statements/nbr2.pdf
Raymond, M. E., & Hanushek, E. A. (2003, Summer). High-stakes research. Education Next, pp. 48–55. Retrieved from http://www.educationnext.org/
Reardon, S. F., & Galindo, C. (2002, April). Do high-stakes tests affect students’ decisions to drop out of school? Evidence from NELS. Paper presented at the Annual Meetings of the American Educational Research Association, New Orleans.
Rosenshine, B. (2003, August 4). High-stakes testing: Another analysis. Education Policy Analysis Archives, 11(24). Retrieved January 7, 2004 from http://epaa.asu.edu/epaa/v11n24/
Ryan, J. E. (2004). The perverse incentives of the No Child Left Behind Act. New York University Law Review, 79, 932–989.
Sunderman, G. L., & Kim, J. (2004a, February). Inspiring vision, disappointing results: Four studies on implementing the No Child Left Behind Act . Cambridge, MA: The Civil Rights Project at Harvard University.
Sunderman, G. L., & Kim, J. (2004b, February). Expansion of federal power in American education: Federal-state relationships under No Child Left Behind Act, Year One. Cambridge, MA: The Civil Rights Project at Harvard University.
Education Policy Analysis Archives Vol. 14 No. 1 56
Swanson, C. B., & Stevenson, D. L (2002). Standards-based reform in practice: Evidence on state policy and classroom instruction from the NAEP state assessments. Educational Evaluation and Policy Analysis, 24(1), 1–27.
Torgerson, W. S., (1960). Theory and methods of scaling. New York: John Wiley.
Tyack, D. B., & Cuban, L. (1996). Tinkering toward utopia: A century of public school reform. Cambridge, MA: Harvard University Press.
Valenzuela, A. (2005) (Ed.). Leaving children behind: How “Texas-style” accountability fails Latino youth. Albany, NY: State University of New York Press.
Webb, L.D., Glass, G.V, Metha, A. and Cobb, C. (2002). Economic correlates of suicide in the United States (1929–1992): A time series analysis. Archives of Suicide Research, 6(2), 93–101.
High-Stakes Testing and Student Achievement 57
About the Authors
Sharon L. Nichols University of Texas at San Antonio E-mail: [email protected] Sharon L. Nichols is currently an assistant professor at the University of Texas at San Antonio. She got her Ph.D. from University of Arizona where she studied student belongingness, adolescent development, and motivation. She is the co-author (with Tom Good) of America’s Teenagers—Myths and Realities: Media Images, Schooling, and the Social Costs of Indifference (Mahwah, NJ: Erlbaum, 2004). Her current research interests include educational policy, student motivation, and teacher effectiveness. Gene V Glass Arizona State University E-mail: [email protected] Gene V Glass, a Regents' Professor of Education Policy Studies and Psychology in Education at the Arizona State University College of Education, earned his B.A. from the University of Nebraska (1962) and his PhD from the University of Wisconsin (1965). He has been a faculty member of the University of Illinois (1965–67) and the University of Colorado (1967–86). Glass has been a Visiting Scholar at the Max-Planck Institute for Psychiatry (Munich) and the Center for the Study of Evaluation (UCLA). Trained originally in statistics, his interests now include evaluation methodology and policy analysis. In 1975, he was elected President of the American Educational Research Association. He served as Editor of the Review of Educational Research (1968–70), Editor for Methodology of the Psychological Bulletin (1978–80), and Co-Editor of the American Educational Research Journal (1983–86). He was twice (1968, 1970) honored with the Palmer O. Johnson award of AERA; in 1984, he received the Lazarsfeld Award of the American Evaluation Association. He is a member of the National Academy of Education. Currently he serves as editor of Education Review and is Executive Editor of the International Journal of Education & the Arts. David C. Berliner Arizona State University E-mail: [email protected] David C. Berliner is Regents’ Professor of Education at Arizona State University. He has also taught at the Universities of Arizona, Massachusetts, Oregon, and at Stanford University, as well as in Australia, Israel, Spain and the Netherlands. Dr. Berliner is a member of the National Academy of Education, a Fellow of the Center for Advanced Study in the Behavioral Sciences, and is a past president of both the American Educational
Education Policy Analysis Archives Vol. 14 No. 1 58
Research Association (AERA) and the Division of Educational Psychology of the American Psychological Association (APA). He is the recipient of awards for distinguished contributions from APA, AERA, and the National Education Association (NEA). He is co-author (with B. J. Biddle) of the best seller The Manufactured Crisis, co-author (with Ursula Casanova) of Putting Research to Work, and co-author (with N. L. Gage) of the textbook Educational Psychology, now in its 6th edition. He is co-editor of the Handbook of Educational Psychology and the books Talks to Teachers, and Perspectives on Instructional Time. He has authored almost 200 published articles, technical reports, and book chapters.
High-Stakes Testing and Student Achievement 59
Appendix A: Examples of Context For Assessing State-Level Stakes Sheet
Texas
As required by state statute, Texas has assessed minimum basic skills in reading, writing, and math with the Texas Assessment of Basic Skills tests (TABS) (1980–1984). The TABS was an assessment of minimum competency skills. This assessment changed in 1985 to become the Texas Educational Assessment of Minimum Skills (TEAMS) (1985–1989). As the standards movement took hold, a new law in 1990 required students to be tested on a criterion-referenced assessment. It was then when the Texas Assessment of Academic Skills (TAAS™) was born. The TAAS™ shifted the state’s educational focus from minimum skills to a more comprehensive assessment of the state-mandated curriculum. Texas’ first test was mandated in 1979, but it wasn’t made a graduation requirement until 1985. In 1990, the 10th-grade version of the Texas Assessment of Academic Skills, or TAAS™, was mandated, and it became the primary measure of students and their high schools.
The TAAS™ was first administered to students in grades 3, 5, 7, 9, and 11 in the falls of 1990 and 1991. These tests were considered “exit level” examinations—a measure of the minimum competency skills students were expected to have by the end of their respective grade level.
Beginning in the spring of 1993 TAAS™ tested grades 3–8 and 10. In the summer of 1993 a first attempt at assigning accountability ratings was made. The system was reworked and 1994 was the first year of the accountability system (largely based on TAAS™ performance) that went through 2002. 2002-03 was a transition year with no ratings. We will assign ratings in 2004 for TAKS™ performance (and Completion Rates, Dropout Rates, and SDAA performance).
In 1995, another law was passed stipulating that end-of-course tests be administered to students completing Algebra I, Biology, English II and U.S. History. And, in the spring of 1996 a Spanish version of TAAS™ for grades 3 and 4 in reading and mathematics were benchmarked. (The same was done for grades 5 and 6 in the spring of 1997 and grade 4 writing). In 1999, the testing program was expanded and the Texas Assessment of Knowledge and Skills (TAKS™) was born. The TAKS™ replaced the TAAS™ during the 2002–2003 academic year. It tests grades 3–11, and added science in elementary (English and Spanish).
Students
In 1999, the legislature passed Senate Bill 103 mandating the exit level test be moved from Grade 10 to Grade 11. Thus, to be able to earn a diploma from a Texas public high school, students must pass tests in all four subject areas in English Language Arts, Mathematics, Science, and Social Studies.
TAKS
The Texas Assessment of Knowledge and Skills (TAKS™) is a completely reconceived testing program. It includes more of the Texas Essential Knowledge and Skills (TEKS) than the Texas Assessment of Academic Skills (TAAS™) did and attempts to ask questions in more authentic ways. TAKS™ has been developed to better reflect good instructional practice and more accurately measure student learning. The state hopes that every teacher will be able to see the connection between what will be tested on this new state assessment and what our students should know and be able to do to be academically successful.
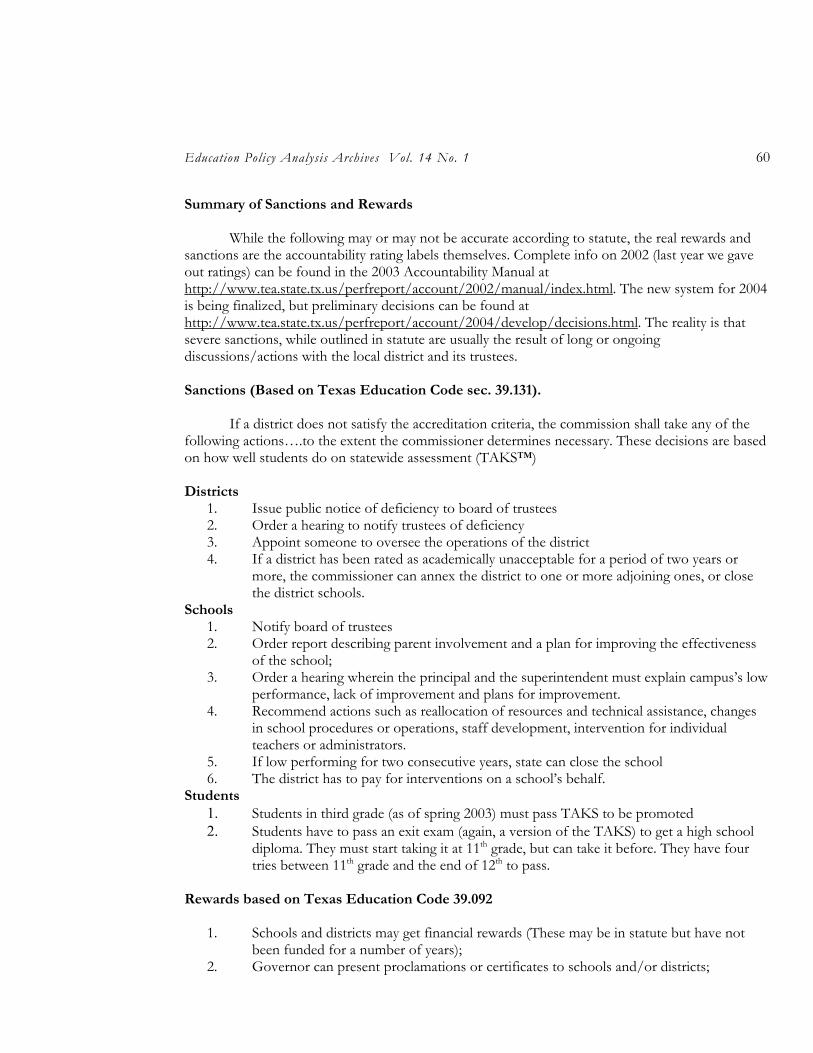
Education Policy Analysis Archives Vol. 14 No. 1 60
Summary of Sanctions and Rewards
While the following may or may not be accurate according to statute, the real rewards and
sanctions are the accountability rating labels themselves. Complete info on 2002 (last year we gave out ratings) can be found in the 2003 Accountability Manual at http://www.tea.state.tx.us/perfreport/account/2002/manual/index.html. The new system for 2004 is being finalized, but preliminary decisions can be found at http://www.tea.state.tx.us/perfreport/account/2004/develop/decisions.html. The reality is that severe sanctions, while outlined in statute are usually the result of long or ongoing discussions/actions with the local district and its trustees. Sanctions (Based on Texas Education Code sec. 39.131).
If a district does not satisfy the accreditation criteria, the commission shall take any of the
following actions….to the extent the commissioner determines necessary. These decisions are based on how well students do on statewide assessment (TAKS™)
Districts
1. Issue public notice of deficiency to board of trustees 2. Order a hearing to notify trustees of deficiency 3. Appoint someone to oversee the operations of the district 4. If a district has been rated as academically unacceptable for a period of two years or
more, the commissioner can annex the district to one or more adjoining ones, or close the district schools.
Schools 1. Notify board of trustees 2. Order report describing parent involvement and a plan for improving the effectiveness
of the school; 3. Order a hearing wherein the principal and the superintendent must explain campus’s low
performance, lack of improvement and plans for improvement. 4. Recommend actions such as reallocation of resources and technical assistance, changes
in school procedures or operations, staff development, intervention for individual teachers or administrators.
5. If low performing for two consecutive years, state can close the school 6. The district has to pay for interventions on a school’s behalf.
Students 1. Students in third grade (as of spring 2003) must pass TAKS to be promoted 2. Students have to pass an exit exam (again, a version of the TAKS) to get a high school
diploma. They must start taking it at 11th grade, but can take it before. They have four tries between 11th grade and the end of 12th to pass.
Rewards based on Texas Education Code 39.092
1. Schools and districts may get financial rewards (These may be in statute but have not been funded for a number of years);
2. Governor can present proclamations or certificates to schools and/or districts;
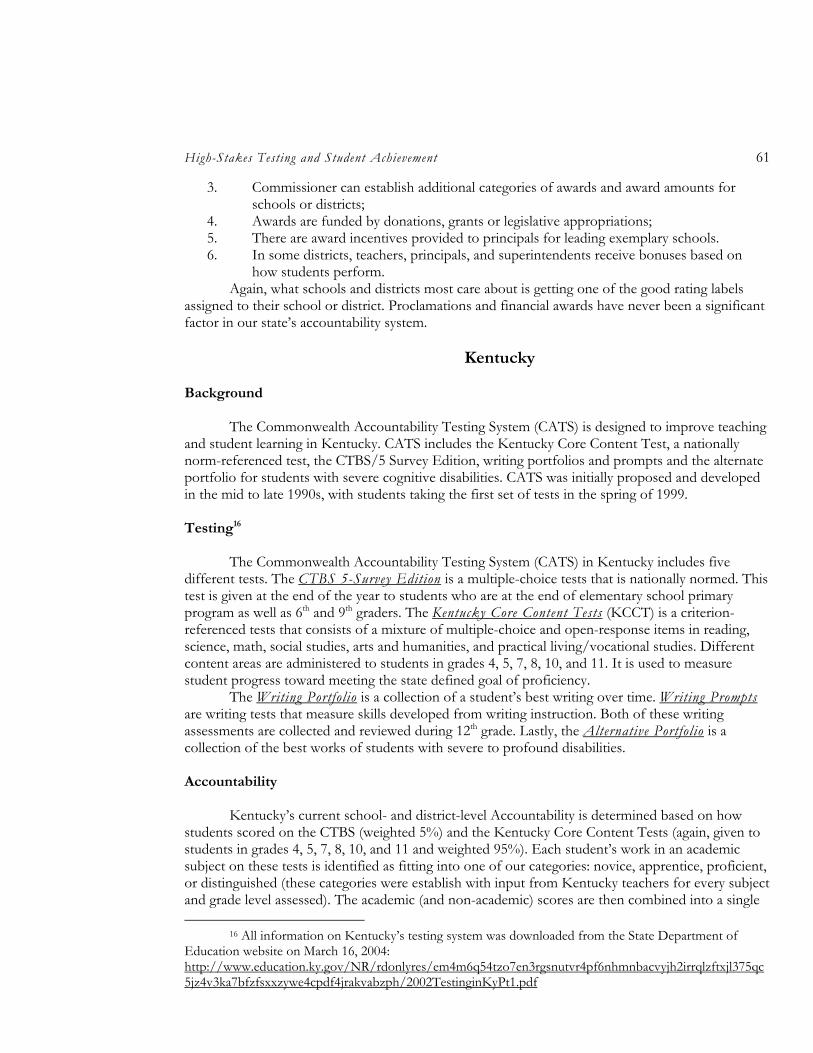
High-Stakes Testing and Student Achievement 61
3. Commissioner can establish additional categories of awards and award amounts for schools or districts;
4. Awards are funded by donations, grants or legislative appropriations; 5. There are award incentives provided to principals for leading exemplary schools. 6. In some districts, teachers, principals, and superintendents receive bonuses based on
how students perform. Again, what schools and districts most care about is getting one of the good rating labels
assigned to their school or district. Proclamations and financial awards have never been a significant factor in our state’s accountability system.
Kentucky
Background
The Commonwealth Accountability Testing System (CATS) is designed to improve teaching and student learning in Kentucky. CATS includes the Kentucky Core Content Test, a nationally norm-referenced test, the CTBS/5 Survey Edition, writing portfolios and prompts and the alternate portfolio for students with severe cognitive disabilities. CATS was initially proposed and developed in the mid to late 1990s, with students taking the first set of tests in the spring of 1999. Testing16
The Commonwealth Accountability Testing System (CATS) in Kentucky includes five different tests. The CTBS 5-Survey Edition is a multiple-choice tests that is nationally normed. This test is given at the end of the year to students who are at the end of elementary school primary program as well as 6th and 9th graders. The Kentucky Core Content Tests (KCCT) is a criterion-referenced tests that consists of a mixture of multiple-choice and open-response items in reading, science, math, social studies, arts and humanities, and practical living/vocational studies. Different content areas are administered to students in grades 4, 5, 7, 8, 10, and 11. It is used to measure student progress toward meeting the state defined goal of proficiency.
The Writing Portfolio is a collection of a student’s best writing over time. Writing Prompts are writing tests that measure skills developed from writing instruction. Both of these writing assessments are collected and reviewed during 12th grade. Lastly, the Alternative Portfolio is a collection of the best works of students with severe to profound disabilities. Accountability
Kentucky’s current school- and district-level Accountability is determined based on how students scored on the CTBS (weighted 5%) and the Kentucky Core Content Tests (again, given to students in grades 4, 5, 7, 8, 10, and 11 and weighted 95%). Each student’s work in an academic subject on these tests is identified as fitting into one of our categories: novice, apprentice, proficient, or distinguished (these categories were establish with input from Kentucky teachers for every subject and grade level assessed). The academic (and non-academic) scores are then combined into a single
16 All information on Kentucky’s testing system was downloaded from the State Department of Education website on March 16, 2004: http://www.education.ky.gov/NR/rdonlyres/em4m6q54tzo7en3rgsnutvr4pf6nhmnbacvyjh2irrqlzftxjl375qc5jz4v3ka7bfzfsxxzywe4cpdf4jrakvabzph/2002TestinginKyPt1.pdf
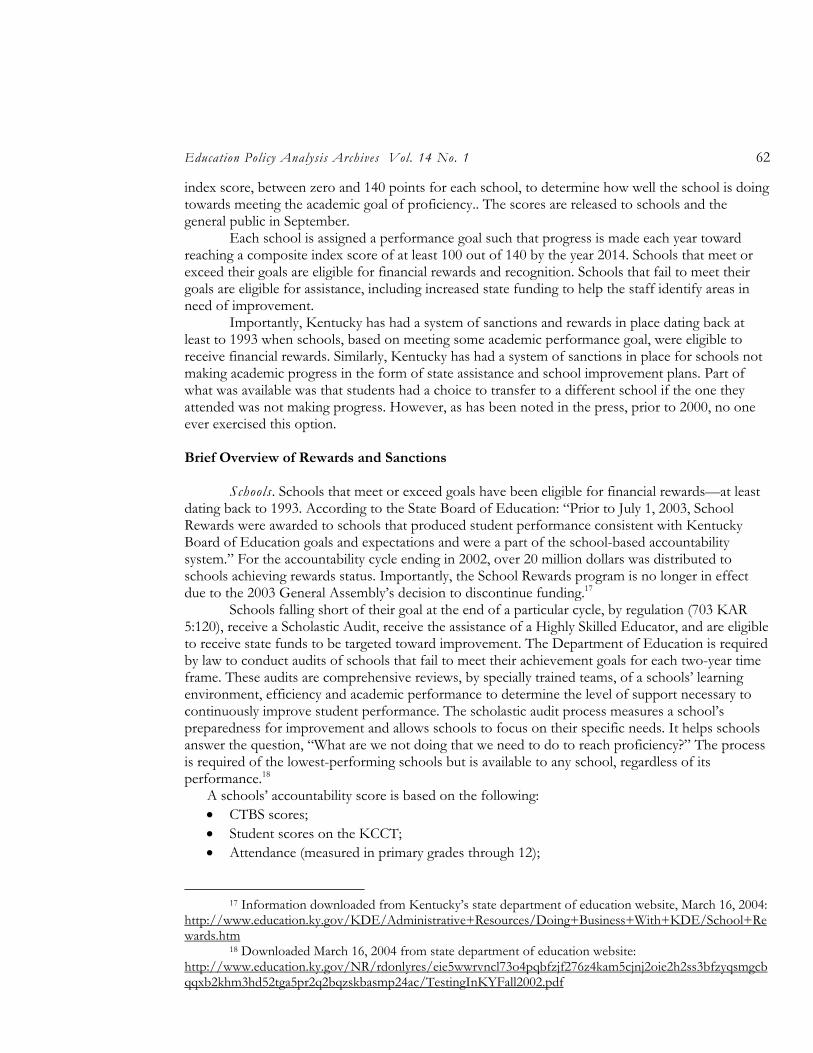
Education Policy Analysis Archives Vol. 14 No. 1 62
index score, between zero and 140 points for each school, to determine how well the school is doing towards meeting the academic goal of proficiency.. The scores are released to schools and the general public in September.
Each school is assigned a performance goal such that progress is made each year toward reaching a composite index score of at least 100 out of 140 by the year 2014. Schools that meet or exceed their goals are eligible for financial rewards and recognition. Schools that fail to meet their goals are eligible for assistance, including increased state funding to help the staff identify areas in need of improvement.
Importantly, Kentucky has had a system of sanctions and rewards in place dating back at least to 1993 when schools, based on meeting some academic performance goal, were eligible to receive financial rewards. Similarly, Kentucky has had a system of sanctions in place for schools not making academic progress in the form of state assistance and school improvement plans. Part of what was available was that students had a choice to transfer to a different school if the one they attended was not making progress. However, as has been noted in the press, prior to 2000, no one ever exercised this option. Brief Overview of Rewards and Sanctions
Schools. Schools that meet or exceed goals have been eligible for financial rewards—at least
dating back to 1993. According to the State Board of Education: “Prior to July 1, 2003, School Rewards were awarded to schools that produced student performance consistent with Kentucky Board of Education goals and expectations and were a part of the school-based accountability system.” For the accountability cycle ending in 2002, over 20 million dollars was distributed to schools achieving rewards status. Importantly, the School Rewards program is no longer in effect due to the 2003 General Assembly’s decision to discontinue funding.17
Schools falling short of their goal at the end of a particular cycle, by regulation (703 KAR 5:120), receive a Scholastic Audit, receive the assistance of a Highly Skilled Educator, and are eligible to receive state funds to be targeted toward improvement. The Department of Education is required by law to conduct audits of schools that fail to meet their achievement goals for each two-year time frame. These audits are comprehensive reviews, by specially trained teams, of a schools’ learning environment, efficiency and academic performance to determine the level of support necessary to continuously improve student performance. The scholastic audit process measures a school’s preparedness for improvement and allows schools to focus on their specific needs. It helps schools answer the question, “What are we not doing that we need to do to reach proficiency?” The process is required of the lowest-performing schools but is available to any school, regardless of its performance.18
A schools’ accountability score is based on the following: • CTBS scores; • Student scores on the KCCT; • Attendance (measured in primary grades through 12);
17 Information downloaded from Kentucky’s state department of education website, March 16, 2004:
http://www.education.ky.gov/KDE/Administrative+Resources/Doing+Business+With+KDE/School+Rewards.htm
18 Downloaded March 16, 2004 from state department of education website: http://www.education.ky.gov/NR/rdonlyres/eie5wwrvncl73o4pqbfzjf276z4kam5cjnj2oie2h2ss3bfzyqsmgcbqqxb2khm3hd52tga5pr2q2bqzskbasmp24ac/TestingInKYFall2002.pdf
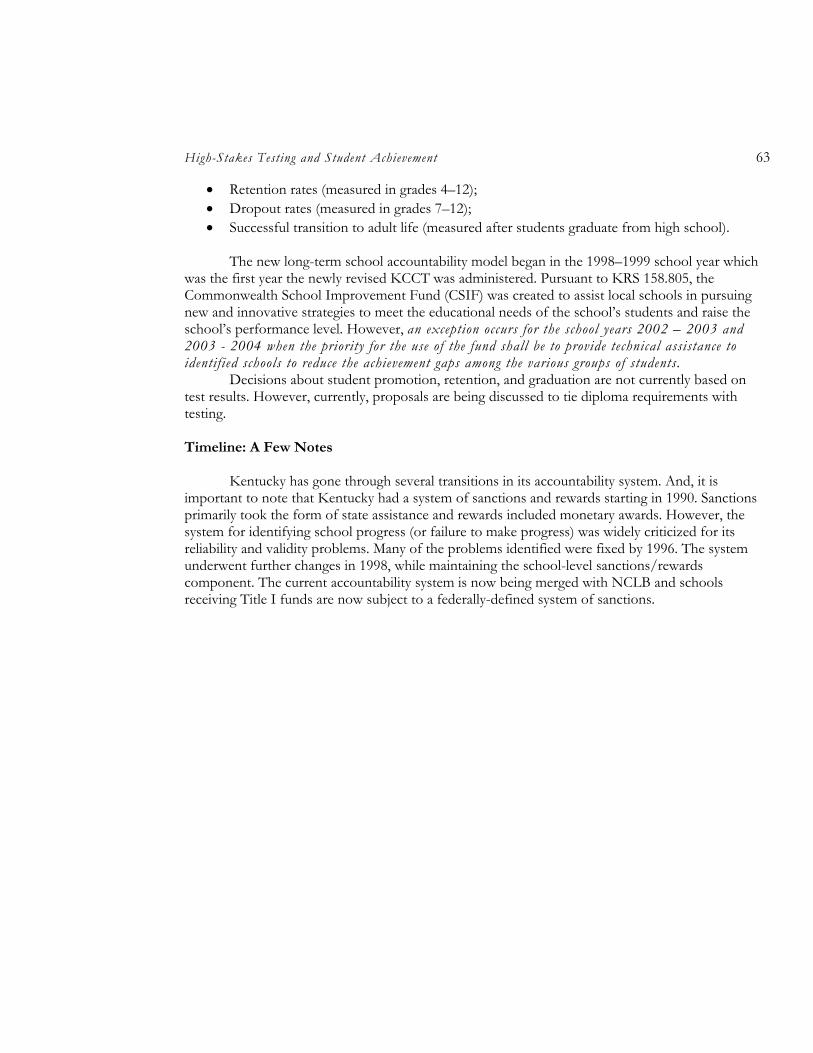
High-Stakes Testing and Student Achievement 63
• Retention rates (measured in grades 4–12); • Dropout rates (measured in grades 7–12); • Successful transition to adult life (measured after students graduate from high school).
The new long-term school accountability model began in the 1998–1999 school year which
was the first year the newly revised KCCT was administered. Pursuant to KRS 158.805, the Commonwealth School Improvement Fund (CSIF) was created to assist local schools in pursuing new and innovative strategies to meet the educational needs of the school’s students and raise the school’s performance level. However, an exception occurs for the school years 2002 – 2003 and 2003 - 2004 when the priority for the use of the fund shall be to provide technical assistance to identified schools to reduce the achievement gaps among the various groups of students.
Decisions about student promotion, retention, and graduation are not currently based on test results. However, currently, proposals are being discussed to tie diploma requirements with testing. Timeline: A Few Notes
Kentucky has gone through several transitions in its accountability system. And, it is important to note that Kentucky had a system of sanctions and rewards starting in 1990. Sanctions primarily took the form of state assistance and rewards included monetary awards. However, the system for identifying school progress (or failure to make progress) was widely criticized for its reliability and validity problems. Many of the problems identified were fixed by 1996. The system underwent further changes in 1998, while maintaining the school-level sanctions/rewards component. The current accountability system is now being merged with NCLB and schools receiving Title I funds are now subject to a federally-defined system of sanctions.
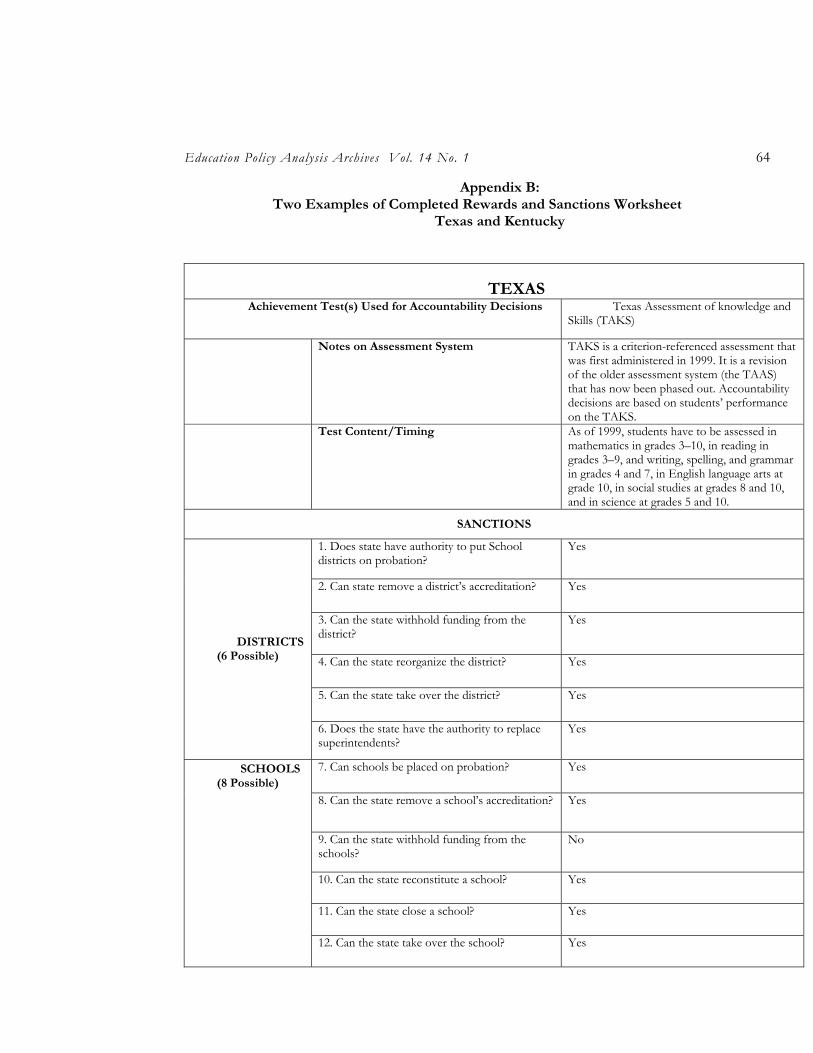
Education Policy Analysis Archives Vol. 14 No. 1 64
Appendix B: Two Examples of Completed Rewards and Sanctions Worksheet
Texas and Kentucky
TEXAS Achievement Test(s) Used for Accountability Decisions Texas Assessment of knowledge and
Skills (TAKS)
Notes on Assessment System TAKS is a criterion-referenced assessment that was first administered in 1999. It is a revision of the older assessment system (the TAAS) that has now been phased out. Accountability decisions are based on students’ performance on the TAKS.
Test Content/Timing As of 1999, students have to be assessed in mathematics in grades 3–10, in reading in grades 3–9, and writing, spelling, and grammar in grades 4 and 7, in English language arts at grade 10, in social studies at grades 8 and 10, and in science at grades 5 and 10.
SANCTIONS
1. Does state have authority to put School districts on probation?
Yes
2. Can state remove a district’s accreditation? Yes
3. Can the state withhold funding from the district?
Yes
4. Can the state reorganize the district? Yes
5. Can the state take over the district? Yes
DISTRICTS (6 Possible)
6. Does the state have the authority to replace superintendents?
Yes
7. Can schools be placed on probation? Yes
8. Can the state remove a school’s accreditation? Yes
9. Can the state withhold funding from the schools?
No
10. Can the state reconstitute a school? Yes
11. Can the state close a school? Yes
SCHOOLS (8 Possible)
12. Can the state take over the school? Yes
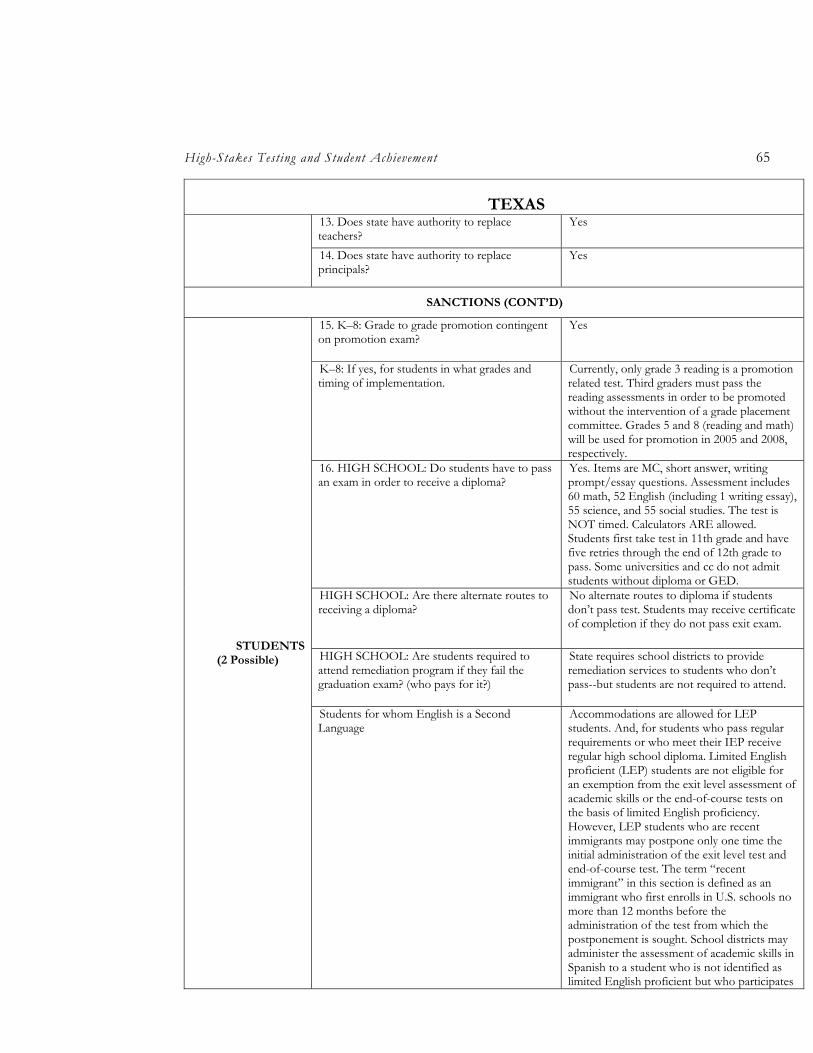
High-Stakes Testing and Student Achievement 65
TEXAS 13. Does state have authority to replace teachers?
Yes
14. Does state have authority to replace principals?
Yes
SANCTIONS (CONT’D)
15. K–8: Grade to grade promotion contingent on promotion exam?
Yes
K–8: If yes, for students in what grades and timing of implementation.
Currently, only grade 3 reading is a promotion related test. Third graders must pass the reading assessments in order to be promoted without the intervention of a grade placement committee. Grades 5 and 8 (reading and math) will be used for promotion in 2005 and 2008, respectively.
16. HIGH SCHOOL: Do students have to pass an exam in order to receive a diploma?
Yes. Items are MC, short answer, writing prompt/essay questions. Assessment includes 60 math, 52 English (including 1 writing essay), 55 science, and 55 social studies. The test is NOT timed. Calculators ARE allowed. Students first take test in 11th grade and have five retries through the end of 12th grade to pass. Some universities and cc do not admit students without diploma or GED.
HIGH SCHOOL: Are there alternate routes to receiving a diploma?
No alternate routes to diploma if students don’t pass test. Students may receive certificate of completion if they do not pass exit exam.
HIGH SCHOOL: Are students required to attend remediation program if they fail the graduation exam? (who pays for it?)
State requires school districts to provide remediation services to students who don’t pass--but students are not required to attend.
STUDENTS (2 Possible)
Students for whom English is a Second Language
Accommodations are allowed for LEP students. And, for students who pass regular requirements or who meet their IEP receive regular high school diploma. Limited English proficient (LEP) students are not eligible for an exemption from the exit level assessment of academic skills or the end-of-course tests on the basis of limited English proficiency. However, LEP students who are recent immigrants may postpone only one time the initial administration of the exit level test and end-of-course test. The term “recent immigrant” in this section is defined as an immigrant who first enrolls in U.S. schools no more than 12 months before the administration of the test from which the postponement is sought. School districts may administer the assessment of academic skills in Spanish to a student who is not identified as limited English proficient but who participates
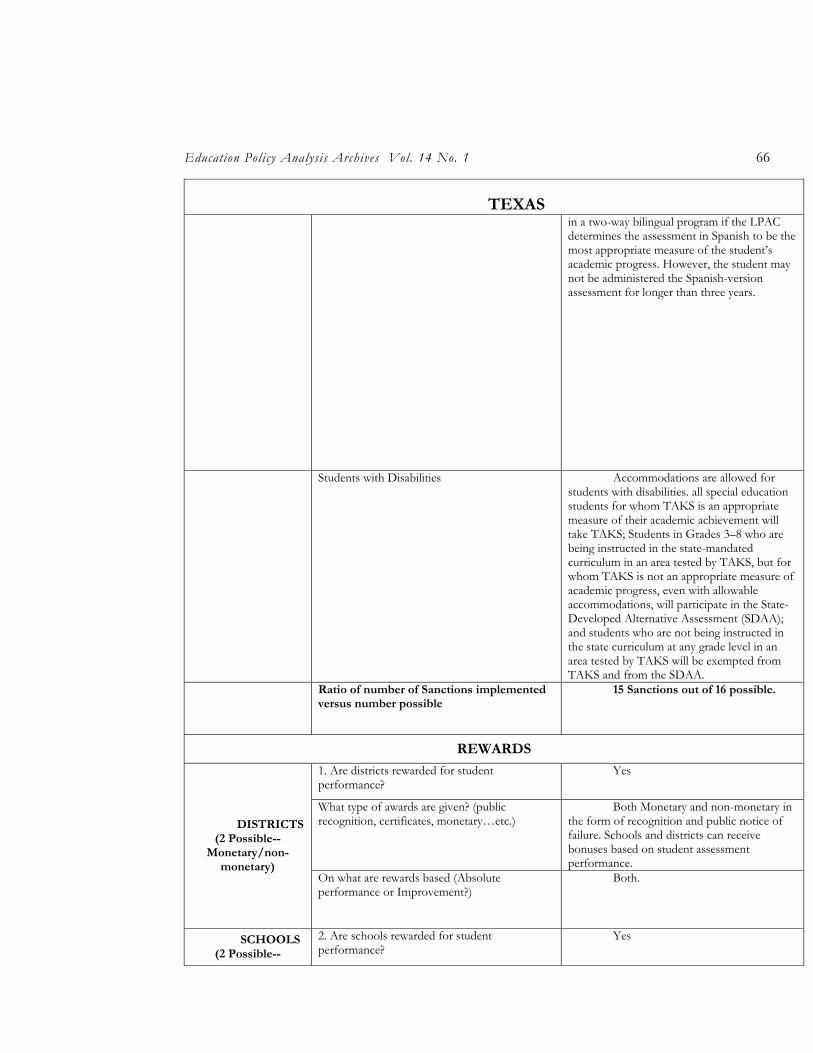
Education Policy Analysis Archives Vol. 14 No. 1 66
TEXAS in a two-way bilingual program if the LPAC determines the assessment in Spanish to be the most appropriate measure of the student’s academic progress. However, the student may not be administered the Spanish-version assessment for longer than three years.
Students with Disabilities Accommodations are allowed for students with disabilities. all special education students for whom TAKS is an appropriate measure of their academic achievement will take TAKS; Students in Grades 3–8 who are being instructed in the state-mandated curriculum in an area tested by TAKS, but for whom TAKS is not an appropriate measure of academic progress, even with allowable accommodations, will participate in the State-Developed Alternative Assessment (SDAA); and students who are not being instructed in the state curriculum at any grade level in an area tested by TAKS will be exempted from TAKS and from the SDAA.
Ratio of number of Sanctions implemented versus number possible
15 Sanctions out of 16 possible.
REWARDS
1. Are districts rewarded for student performance?
Yes
What type of awards are given? (public recognition, certificates, monetary…etc.)
Both Monetary and non-monetary in the form of recognition and public notice of failure. Schools and districts can receive bonuses based on student assessment performance.
DISTRICTS (2 Possible--
Monetary/non-monetary)
On what are rewards based (Absolute performance or Improvement?)
Both.
SCHOOLS (2 Possible--
2. Are schools rewarded for student performance?
Yes
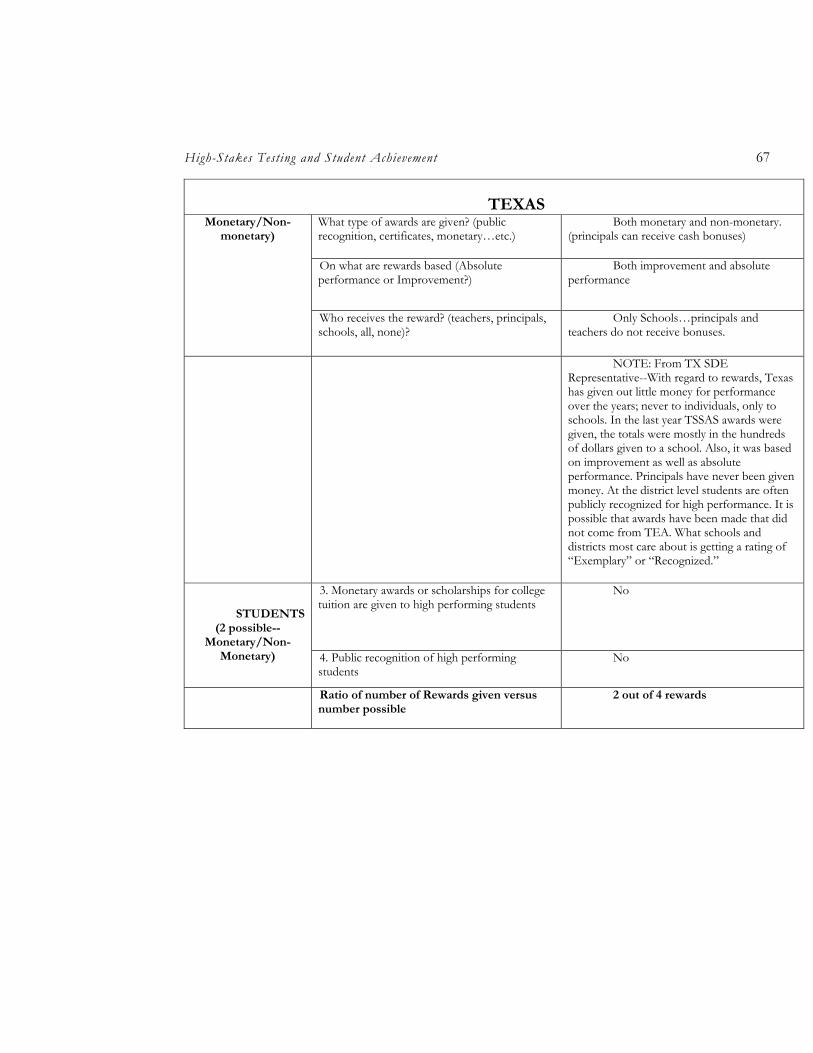
High-Stakes Testing and Student Achievement 67
TEXAS What type of awards are given? (public recognition, certificates, monetary…etc.)
Both monetary and non-monetary. (principals can receive cash bonuses)
On what are rewards based (Absolute performance or Improvement?)
Both improvement and absolute performance
Monetary/Non-monetary)
Who receives the reward? (teachers, principals, schools, all, none)?
Only Schools…principals and teachers do not receive bonuses.
NOTE: From TX SDE Representative--With regard to rewards, Texas has given out little money for performance over the years; never to individuals, only to schools. In the last year TSSAS awards were given, the totals were mostly in the hundreds of dollars given to a school. Also, it was based on improvement as well as absolute performance. Principals have never been given money. At the district level students are often publicly recognized for high performance. It is possible that awards have been made that did not come from TEA. What schools and districts most care about is getting a rating of “Exemplary” or “Recognized.”
3. Monetary awards or scholarships for college tuition are given to high performing students
No
STUDENTS (2 possible--
Monetary/Non-Monetary) 4. Public recognition of high performing
students No
Ratio of number of Rewards given versus number possible
2 out of 4 rewards
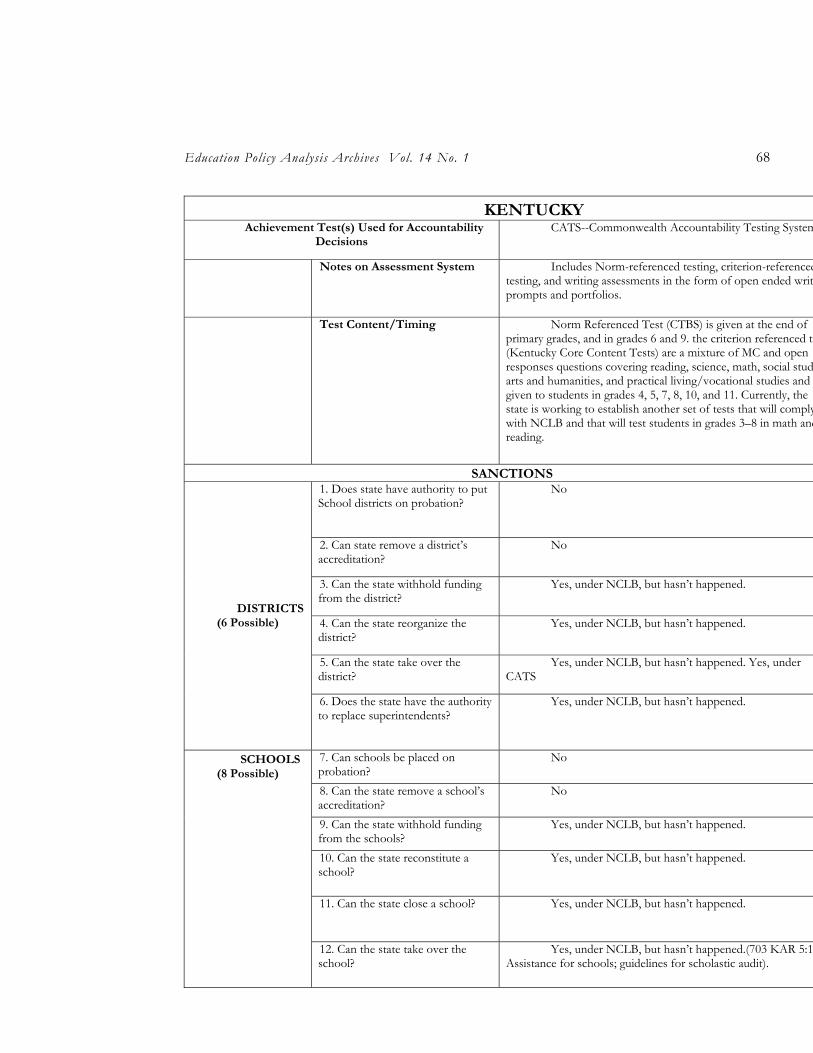
Education Policy Analysis Archives Vol. 14 No. 1 68
KENTUCKY Achievement Test(s) Used for Accountability
Decisions CATS--Commonwealth Accountability Testing System
Notes on Assessment System Includes Norm-referenced testing, criterion-referenced testing, and writing assessments in the form of open ended writing prompts and portfolios.
Test Content/Timing Norm Referenced Test (CTBS) is given at the end of primary grades, and in grades 6 and 9. the criterion referenced test (Kentucky Core Content Tests) are a mixture of MC and open responses questions covering reading, science, math, social studies, arts and humanities, and practical living/vocational studies and given to students in grades 4, 5, 7, 8, 10, and 11. Currently, the state is working to establish another set of tests that will comply with NCLB and that will test students in grades 3–8 in math and reading.
SANCTIONS 1. Does state have authority to put School districts on probation?
No
2. Can state remove a district’s accreditation?
No
3. Can the state withhold funding from the district?
Yes, under NCLB, but hasn’t happened.
4. Can the state reorganize the district?
Yes, under NCLB, but hasn’t happened.
5. Can the state take over the district?
Yes, under NCLB, but hasn’t happened. Yes, under CATS
DISTRICTS (6 Possible)
6. Does the state have the authority to replace superintendents?
Yes, under NCLB, but hasn’t happened.
7. Can schools be placed on probation?
No
8. Can the state remove a school’s accreditation?
No
9. Can the state withhold funding from the schools?
Yes, under NCLB, but hasn’t happened.
10. Can the state reconstitute a school?
Yes, under NCLB, but hasn’t happened.
11. Can the state close a school? Yes, under NCLB, but hasn’t happened.
SCHOOLS (8 Possible)
12. Can the state take over the school?
Yes, under NCLB, but hasn’t happened.(703 KAR 5:120. Assistance for schools; guidelines for scholastic audit).
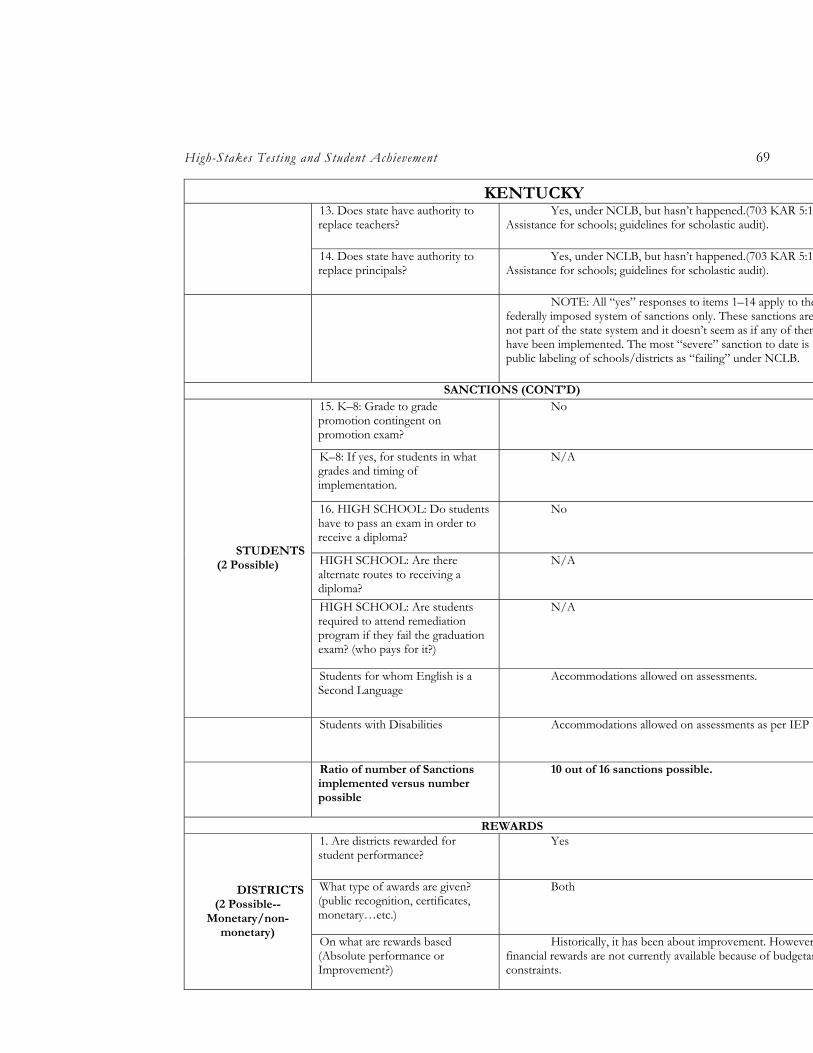
High-Stakes Testing and Student Achievement 69
KENTUCKY 13. Does state have authority to replace teachers?
Yes, under NCLB, but hasn’t happened.(703 KAR 5:120. Assistance for schools; guidelines for scholastic audit).
14. Does state have authority to replace principals?
Yes, under NCLB, but hasn’t happened.(703 KAR 5:120. Assistance for schools; guidelines for scholastic audit).
NOTE: All “yes” responses to items 1–14 apply to the federally imposed system of sanctions only. These sanctions are not part of the state system and it doesn’t seem as if any of them have been implemented. The most “severe” sanction to date is public labeling of schools/districts as “failing” under NCLB.
SANCTIONS (CONT’D) 15. K–8: Grade to grade promotion contingent on promotion exam?
No
K–8: If yes, for students in what grades and timing of implementation.
N/A
16. HIGH SCHOOL: Do students have to pass an exam in order to receive a diploma?
No
HIGH SCHOOL: Are there alternate routes to receiving a diploma?
N/A
HIGH SCHOOL: Are students required to attend remediation program if they fail the graduation exam? (who pays for it?)
N/A
STUDENTS (2 Possible)
Students for whom English is a Second Language
Accommodations allowed on assessments.
Students with Disabilities Accommodations allowed on assessments as per IEP
Ratio of number of Sanctions implemented versus number possible
10 out of 16 sanctions possible.
REWARDS 1. Are districts rewarded for student performance?
Yes
What type of awards are given? (public recognition, certificates, monetary…etc.)
Both DISTRICTS (2 Possible--
Monetary/non-monetary)
On what are rewards based (Absolute performance or Improvement?)
Historically, it has been about improvement. However, financial rewards are not currently available because of budgetary constraints.
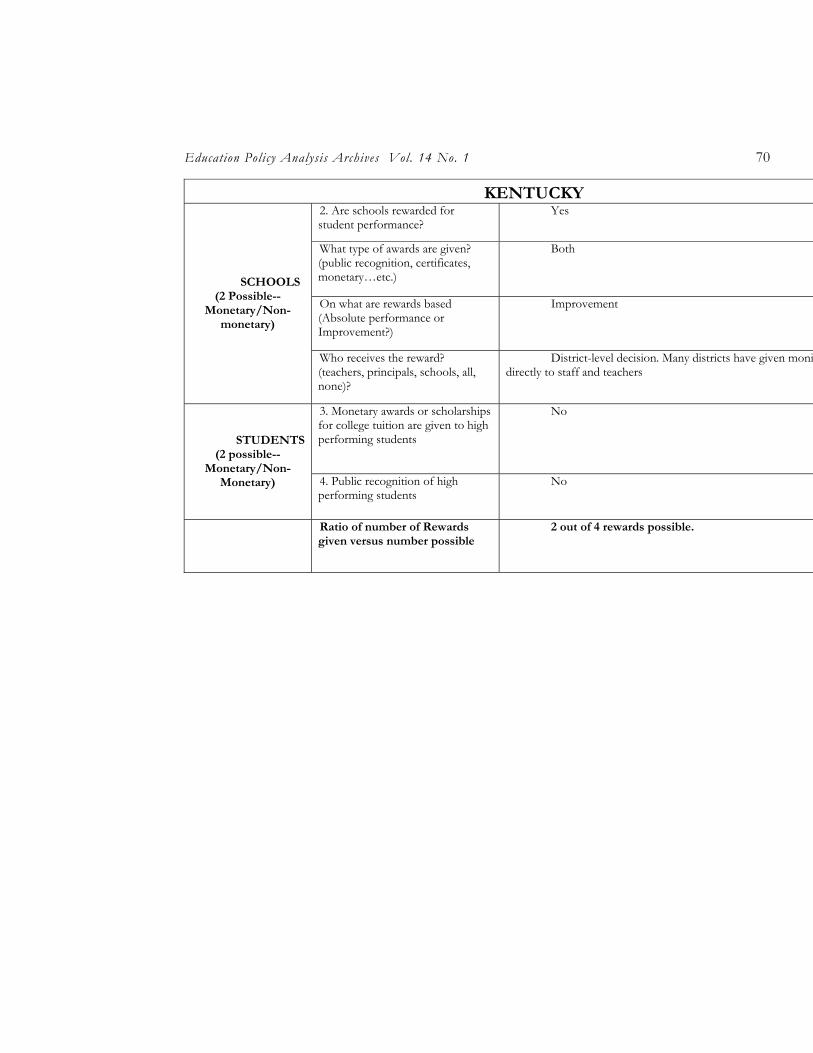
Education Policy Analysis Archives Vol. 14 No. 1 70
KENTUCKY 2. Are schools rewarded for student performance?
Yes
What type of awards are given? (public recognition, certificates, monetary…etc.)
Both
On what are rewards based (Absolute performance or Improvement?)
Improvement
SCHOOLS (2 Possible--
Monetary/Non-monetary)
Who receives the reward? (teachers, principals, schools, all, none)?
District-level decision. Many districts have given monies directly to staff and teachers
3. Monetary awards or scholarships for college tuition are given to high performing students
No
STUDENTS (2 possible--
Monetary/Non-Monetary) 4. Public recognition of high
performing students No
Ratio of number of Rewards given versus number possible
2 out of 4 rewards possible.
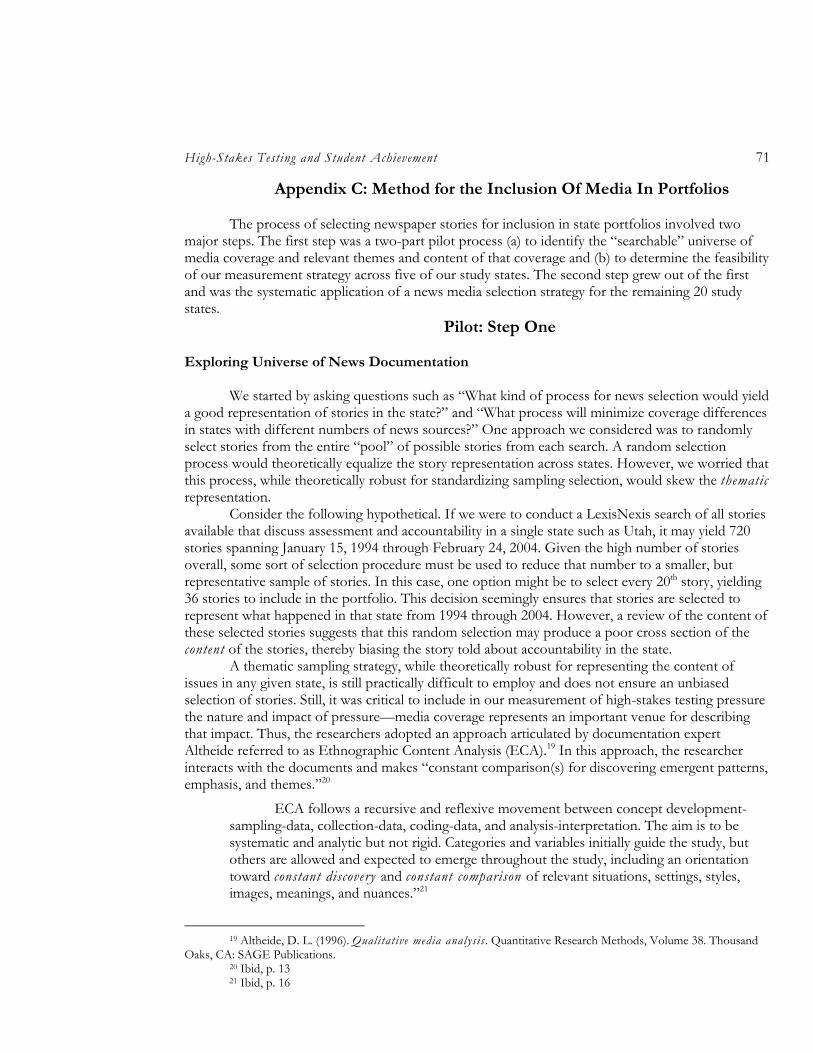
High-Stakes Testing and Student Achievement 71
Appendix C: Method for the Inclusion Of Media In Portfolios
The process of selecting newspaper stories for inclusion in state portfolios involved two major steps. The first step was a two-part pilot process (a) to identify the “searchable” universe of media coverage and relevant themes and content of that coverage and (b) to determine the feasibility of our measurement strategy across five of our study states. The second step grew out of the first and was the systematic application of a news media selection strategy for the remaining 20 study states.
Pilot: Step One Exploring Universe of News Documentation
We started by asking questions such as “What kind of process for news selection would yield a good representation of stories in the state?” and “What process will minimize coverage differences in states with different numbers of news sources?” One approach we considered was to randomly select stories from the entire “pool” of possible stories from each search. A random selection process would theoretically equalize the story representation across states. However, we worried that this process, while theoretically robust for standardizing sampling selection, would skew the thematic representation.
Consider the following hypothetical. If we were to conduct a LexisNexis search of all stories available that discuss assessment and accountability in a single state such as Utah, it may yield 720 stories spanning January 15, 1994 through February 24, 2004. Given the high number of stories overall, some sort of selection procedure must be used to reduce that number to a smaller, but representative sample of stories. In this case, one option might be to select every 20th story, yielding 36 stories to include in the portfolio. This decision seemingly ensures that stories are selected to represent what happened in that state from 1994 through 2004. However, a review of the content of these selected stories suggests that this random selection may produce a poor cross section of the content of the stories, thereby biasing the story told about accountability in the state.
A thematic sampling strategy, while theoretically robust for representing the content of issues in any given state, is still practically difficult to employ and does not ensure an unbiased selection of stories. Still, it was critical to include in our measurement of high-stakes testing pressure the nature and impact of pressure—media coverage represents an important venue for describing that impact. Thus, the researchers adopted an approach articulated by documentation expert Altheide referred to as Ethnographic Content Analysis (ECA).19 In this approach, the researcher interacts with the documents and makes “constant comparison(s) for discovering emergent patterns, emphasis, and themes.”20
ECA follows a recursive and reflexive movement between concept development-sampling-data, collection-data, coding-data, and analysis-interpretation. The aim is to be systematic and analytic but not rigid. Categories and variables initially guide the study, but others are allowed and expected to emerge throughout the study, including an orientation toward constant discovery and constant comparison of relevant situations, settings, styles, images, meanings, and nuances.”21
19 Altheide, D. L. (1996). Qualitative media analysis . Quantitative Research Methods, Volume 38. Thousand
Oaks, CA: SAGE Publications. 20 Ibid, p. 13 21 Ibid, p. 16
Education Policy Analysis Archives Vol. 14 No. 1 72
Ethnographic Content Analysis was ideal for this project because it allows the reader to make coding and selection decisions based on her interaction with the documents. This is critical because the range of issues/concerns facing individual states varied widely, and therefore the selection system had to be flexible enough to capture the ongoing changes in reporting styles and content over time and from state to state. This qualitative approach “relies on the researcher’s interaction and involvement with documents selected for their relevance to a research topic.”22
To identify the range of possible themes we would encounter throughout media coverage on accountability practice, researchers executed a trial search of stories on assessment and accountability in Massachusetts. This search led to a few conclusions. First, the sheer volume of possible stories was vast, making the prospect of creating a reasonable sampling approach daunting. The search also revealed that story content clusters in identifiable ways, making the process of selecting a thematically-relevant sample of stories possible. The limits of the database used to search for stories (i.e., LexisNexis23) was realized and it seemed appropriate to supplement all searches with an additional one using a separate database (i.e., Google24). Lastly, researchers supplemented all general searches with one that focused specifically on consequences to students, teachers, administrators, and schools. Since the study relied on the measure of “pressure” associated with stakes attached to test performance, it seemed reasonable to perform a search that directly looks for coverage on this issue. (A description of how stories were selected for the Massachusetts portfolio is available in Appendix G.)
Pilot: Step Two
Armed with a selection rationale and a general idea of what researchers faced in their
searches, a more “systematic” pilot process was developed to explore the range of news coverage of five states (AZ, AL, ME, MD, and NC). This pilot had two goals. First, to test the comparative judgment process, it was necessary to build portfolios using some kind of newspaper selection process in order to test the feasibility of the overall approach to the measure of “pressure.”25 In doing so, a few portfolio pairs were shared with voluntary participants to see (a) if it was even possible to make a judgment between two states and (b) to see how long it would take a reader to go through each portfolio. We selected two state pairs to pilot—one that was “close” (e.g., North Carolina and Arizona) and one that was “far” (e.g., Maine and North Carolina) in their hypothesized levels of pressure. Our goal for the “far” pair was to see if an independent reader would judge the pressure difference in a predictable way, and the answer was yes. In the case of the “close” pairing, we wanted to know whether it was even possible to make a decision—was one state higher in pressure when their policies looked relatively similar? Again, the answer was yes—readers were able to make a decision. We also found out that it took an average of two hours to read through both portfolios. The results of this pilot were encouraging and prompted us to move forward with the creation of the remaining portfolios.
A second goal of this pilot was to refine the sampling procedure for including news stories in each portfolio. Prior to putting together any portfolios, it was impossible to understand the range
22 Ibid, p. 24 23 Our association with the funding agency gave us a subscription to the LexisNexis universe that is broader
than the typical “Academic universe” subscribed to by most university libraries. 24 Google news media search engine has a wider range of sources to search from, but coverage is only available
for the day of and 30 days immediately prior to the search day. 25 Before spending hundreds of hours developing a systematic newspaper selection process, it was vital that we
determine whether and if the process of comparative judgments (based on our portfolios) was even possible.
High-Stakes Testing and Student Achievement 73
of issues that might emerge or how to select from among them. Therefore, the search procedure—guided by ECA—was “piloted” in these three states, out of which grew a more systematic strategy for identifying, coding, and selecting stories for portfolio inclusion.
Getting Started
A search of each state’s news documentation was approached with special attention to the timing and overall number of stories produced by each search. Initially, it was believed that each search could be standardized—that is, we would use the same “search string” term to scan for relevant articles in each state.26 For example, in this study, it was important to find any story containing keywords such as “assessment” “accountability” and “high-stakes testing.” Thus, searches using the string: “assessment and test and high stakes” would yield any story drawn from the pool of news sources containing these three words. It was impossible to use the exact same search string for every state for two reasons. First, each state had its own vernacular around assessment and accountability. Some states had specific acronyms for their state (e.g., Massachusetts had the MCAS, Maryland had the MSPAP), whereas others had no acronym, but discusses it in terms of “testing” or “assessment.” Thus, it was necessary to play around with varying search string combinations to yield, at least initially, the widest pool of stories available. Second, some states simply had coverage that was too extensive. For example, a broad search in Massachusetts initially yielded over 1,000 documents. Thus, each search was unique to each state.
Once a reasonable number of stories were produced (e.g., no more than 600), the headlines were reviewed for topic relevance and irrelevant stories were immediately discarded. For example, many times, stories gleaned from searches incorporating the search term “test” were about testimonies in recent trials. Similarly, in reviewing the initial pool of documents, often there are multiple stories covering a single event. For example, when SAT scores were released, a search of stories in a state such as Massachusetts (where many newspapers are included in LexisNexis) would produce upwards of 20 stories reporting the same SAT results. Repetitive stories that failed to add any new information were also discarded.
Two main goals of the searches with these first five states were (a) to gain more experience interacting with this type of coverage and (b) to begin to conceptualize overarching themes that might capture the range of ideas presented in them. As a result, the selection process for the remaining states was further refined. Specific procedures used for these five states and how sample selections were made for portfolio inclusion are described in Appendix H.
Method for Newspaper Inclusion: Finalized Selection System
The final procedure used for compiling newspaper documents for all remaining portfolios
included the following steps. First, researchers reviewed all of the available documents on the state’s department of education website. Typically, state websites contain detailed information on the accountability laws and the timing of when they were passed. This information provided the appropriate search terms that would yield a substantial pool of stories from which to review and select. Second, relevant search string terms were used to search for a pool of news stories. Once identified, the larger pool was then reviewed for topic content and relevance out of which a shorter, more manageable list of stories were downloaded for more careful review, coding, and possible selection for portfolio inclusion.27 A description of the rationale used to search and select news
26 A “Search String” is a term or phrase used to scan for articles. 27 All stories that were downloaded and reviewed for possible inclusion are available to the reader upon request.
Education Policy Analysis Archives Vol. 14 No. 1 74
stories for each of the remaining states is described in Appendix I. A review the categories that guided this sampling procedure follow.
These searches, which focused on the past 15 years, produced hundreds of stories through which identifiable themes emerged. For the remaining states, we drew on these themes were used to guide the sampling process. Themes are characterized by four main foci: legislative (L), reporting/documentation (R), opinion/reaction (O), and personal interest (PI). In addition to the primary themes, most stories could also be qualified in one or two ways. First, articles generally had a specific affective “tone” that could be positive, negative, or neutral. Second, articles had a general “voice” (i.e., statewide, localized, or both). A more detailed discussion of these and the broader categories are described next.
Legislative
Stories with a “legislative” categorization include any articles that discuss legislative activities. Researchers came come across three primary “legislative” themes in the news, including “voting/decisions (v),” “legal/debates (l),” and “proposals/initiatives (p).” “Legislative” stories are subcategorized as including votes or decisions (L/v) when they report on legislative or some governing panel’s voting patterns. For example, in 1995 in Rhode Island, a local school committee voted to hold principals accountable for students’ reading scores. In 1995 in Virginia, the state school board adopted a plan to raise student achievement. Among its many goals were to increase students’ average SAT scores and to make schools more cost efficient. In Hawaii, in 2000, the state legislature voted to approve a new accountability bill:
The bill requires a system of statewide performance standards for students, an annual assessment in core subjects for each grade level and continuous professional growth on the part of teachers and administrators.28
A second “legislative” theme is one that articulates legislative proposals (L/p). Many newspaper articles, especially prior to stories documenting voting patterns, reported on the proposals or initiatives that set up the vote. For example, in 1992, a pay-for-performance proposal was up for a vote in one California school district.
A unique contract that links teacher pay increases to improved student performance is up for approval tonight before the Redwood City Elementary School District board.
The proposal, already approved in concept by the teachers union, will take force only if voters back a new $ 4.5 million annual parcel tax that is expected to be put on the ballot next year.29
In Virginia, a debate was sparked when a national proposal was discussed and how it might affect students in Virginia.
Rep. Robert C. Scott said he will introduce legislation barring states and school systems that get federal funds from requiring students to pass standardized tests to graduate.
If it is passed, the bill could drastically change Virginia’s Standards of Learning system. Starting with the graduating class of 2004, students will have to pass at least six of
28 Dunford, B. (2000, April 25). House and Senate conferees agree on education accountability bill. Honolulu,
HI: Associated Press . 29 McLeod, R. G. (1992, April 8). Unusual teacher pact comes up for a vote: Redwood city ties raises to
performance. The San Francisco Chronicle , p. A14.
High-Stakes Testing and Student Achievement 75
the 11 high school [Standards of Learning] SOL tests to receive their diplomas. They will be able to take the exams an unlimited number of times. 30
A third “legislative” theme is broadly defined as legal concerns/debates (L/l). These types of stories present a legal issue that might or might not be officially proposed for a vote, but do articulate both sides of the debate. For example, in 1993, there was an article in California outlining Proposition 174—a voucher initiative. In this example, the story recounts both sides of the debate as well as the voting time line. However, it does not, by virtue of timing, report on the voting outcome. These types of stories are important to categorize and include as they often present both sides of an important accountability-related issue—even if they are not officially voted into practice.
Importantly, stories under the broader “legislative” category (and under any subcategory of voting, legal, or proposal) can also be characterized by affect or tone (positive, negative, or neutral) and voice, audience, and/or geographic focus (local, state, or both). These sub-categorizations are included in the coding scheme so that decisions to include “legislative” stories represent a wider range of reporting. Thus, stories were selected that represent both positive and negative viewpoints as well as those that speak to larger and smaller audiences (e.g., does the proposal/debate concern all students in the state, or is it isolated to a local community in which the newspaper is distributed?). Decisions to include “legislative” stories in each state’s portfolio were made to represent the cross section of these secondary categorizations.
Reporting
A large number of stories were “reporting” in nature—e.g., how students did on recent statewide assessments. In these stories, reporters provided results of student performance by way of percentages of students passing/failing or percentages of students scoring at various levels of proficiency. Stories with a “reporting” theme were further identified as “research (r),” “scores/performance levels (s),” or “policy (p).”
Stories identified as “reporting” and further identified as “research” (R/r) included any stories that reported the results of national or local research. For example, most states had at least one story dedicated to Ed Week’s31 analysis of each state’s accountability system. Other kinds of “reporting” on research included instances where local educational researchers published studies relevant to the area. For example, many researchers have published studies investigating the dropout issue in Texas and the Texas Miracle. These kinds of stories would be labeled as “reporting” on research results (R/r).
Reporting stories also focus on student scores or school performance levels (R/s). For example, every state had a barrage of stories that reported on how students did on the latest round of assessments. In November of 2003, Virginia reported, “Va. Students Improve Performance On SOLs/ 23 Of Richmond’s 55 Schools Are Now Fully Accredited, Up From 10.”32 In Connecticut in February 2004, it was reported, “Officials Cheer As Students Stand Out Among Peers In State.”33 Not only are reports on how students fared included in this category, but also how schools
30 Scott to propose ban on standardized test requirement (2000, April 10). Norfolk, VA: Associated Press . 31 Ed Week is a weekly newspaper dedicated to educational policy and events around the country. There is a
hard copy as well as an online version (www.edweek.org). 32 SOL is Virginia’s statewide standardized assessment system, and it stands for, “Standards of Learning.” See: Wermers, J. (2003, November 11). VA. Students improve performance on SOLS/ 23 of Richmond’s 55
schools are now fully accredited, up from 10. Richmond Times Dispatch , p. A1. 33 Hall, L. (2004, January 26). Officials cheer as students stand out among peers in state. Hartford Courant , p.
B3.
Education Policy Analysis Archives Vol. 14 No. 1 76
performed on the state’s accountability system. For example, in October 2002 in California, it was reported, “Two San Bernardino schools are among 11 chosen for academic audits by the state because they failed to meet Academic Performance Index goals four years in a row.”34 Importantly, based on the headlines above, these stories can be further characterized by tone (positive or negative) and audience (state versus local).
A final “reporting” category is indicated by a “policy” viewpoint (R/p). This category was loosely defined as those stories that did not fit in any of the categories defined above or those under the “legislative” category but which document varying viewpoints in the state. For example, in Hawaii in April 2002, there was a story that discussed the administration of Hawaii’s standardized test. This article is important to include because it provides some details on the nature of the state’s assessment system.
The test being given to 55,000 students, the first of its kind, is a key element in the state’s school reform movement.
The test will provide a baseline score to judge how well Hawaii students and campuses are performing in reading, writing and math. Two of the seven sections come from the national Stanford Achievement Test.35
As well as why students had not taken the test the previous year.
Hawaii public school students in grades 3, 5, 8 and 10 this month are taking a new Hawaii-based standardized test that was postponed from last year because of the statewide teachers’ strike.36
In New York, a series of “reporting” stories identified as “reporting on policy” discussed the merits of certain kinds of policies, but the series does not officially document a legislative proposal or vote or decision. For example, in 1999, one story discussed New York’s state commissioner’s disappointment with how the state’s curriculum was being administered.
When Richard P. Mills came to New York as its Education Commissioner three and a half years ago, the state had just drafted a detailed set of blueprints, contained in thick bound volumes, for how to teach nine subjects from English to science in every grade from pre-kindergarten through high school.
But as he visited schools from the South Bronx to Buffalo, Mr. Mills was dismayed to find that the plans, called “curriculum frameworks,” had made almost no impact in the trenches.37
Another 1999 article predicts high numbers of student failures on an upcoming Regents exam.
With just a year to go before high school students must pass a tough new English Regents test to graduate, New York State education officials released test results yesterday showing that more than a quarter of all seniors – and more than a third of those in New York City – would have failed if the requirement had been in place last year.38
34 Orloff, K. (2002, October 2). Schools appeal state academic audit: Two campuses are among those chosen
for scrutiny for failure to meet goals. Press Enterprise , p. B01. 35 Students taking new standardized test. (2002, April 5). Honolulu, HI: Associated Press . 36 Students taking new standardized test. (2002, April 5). Honolulu, HI: Associated Press . 37 Hartocollis, A. (1999, April 1). The man behind the exams: New York’s education chief pushes agenda of
change. New York Times , p. B1. 38 Archibald, R. C. (1999, March 16). Many seniors face failure in new test. New York Times , p. B1.
High-Stakes Testing and Student Achievement 77
The purpose of this category is to describe those stories that are related to accountability policies and that might discuss aspects of the laws, or specific viewpoints, not found in stories that are better characterized by the above categories.
Opinion/Reaction
Another primary category assigned to stories was identified as opinion- or reaction-oriented (O). These stories reported on individuals’ or groups of individuals’ perspectives on accountability practices in the state. These kinds of stories included editorial commentaries put forth by the newspaper, write-in opinion pieces (instances where citizens wrote in to the newspaper to provide their perspective on an accountability-related practice), or “reaction-oriented” articles (opinion-laden viewpoints from the perspective of individual staff writers).
Personal Interest
Personal interest was a category created to fit any type of story that focused on individual experiences and which didn’t fit into any of the above categories.
Education Policy Analysis Archives Vol. 14 No. 1 78
Appendix D: Summary News Search: Massachusetts
Because of the sheer volume of stories appearing in the Massachusetts press over the previous 10 years covering anything related to educational policy, it was necessary to conduct searches restricted to shorter time frames in order to yield a more manageable number of stories from which to review. Thus, “logical” decisions were made about the time frames based on an overall description of how educational policy evolved in Massachusetts. In this approach, the thematic events occurring over time informed subsequent decisions on how to make the search more manageable.
The search started with general searches over the course of the past 10 years to get a “feel” for the ebb and flow of educational coverage—specifically as it relates to the state’s assessment and accountability policies. Out of this cursory overview emerged a multi-step search strategy to cover story content and range. What follows is a description of the searches separated by time, each containing a “logical” rationale for the decisions that were made for including articles in this specific portfolio.
Search One
Massachusetts’s school reform act was passed in 1993. This initial act was subsequently
revamped and updated in 1999. An initial search between January 1, 1990 and December 31, 1996 (looking for any articles that talked about tests, school reform, and education) yielded 177 hits. Many of these 177 stories were irrelevant to education (e.g., there were many stories on the music industry—the “MCA” label specifically) and were therefore discarded, leaving 14 stories for more careful review. Of these 14, one story was included in the portfolio that represented the range of issues during this time period. This story outlined the provisions of the initial education reform bill that was subsequently passed by both the house and the senate and then signed into law by the governor. Thus, this story sets up the initial educational reform policy in Massachusetts for the reader.
Search Two
Stories on the statewide assessment system, the Massachusetts Comprehensive Assessment
System (MCAS), began to appear in 1997. Therefore, a second search included the timeframe of the first administration of the MCAS (which was first given in the spring of 1998). Thus, the second search looked for any article including the acronym MCAS as well as any other terms such as test, accountability, or high stake.39 During this search, the main goal was to analyze the timing and progression of stories relevant to the MCAS since its inception. This search was confined to the time period of January 1, 1997 (searches for MCAS prior to this date produced no results) to January 1, 1999. Choosing this time frame was important because it covered the time period during which the first administration of MCAS was given and it includes the reporting phase of these initial results.
39 We specifically used the search string: (ALLCAPS (MCAS) and test! or account! or high-stake!) which looked
for any article containing MCAS and any form of the words test (e.g., testing, tested) or account (including accountable, accountability) or high stake (high stake or high stakes).
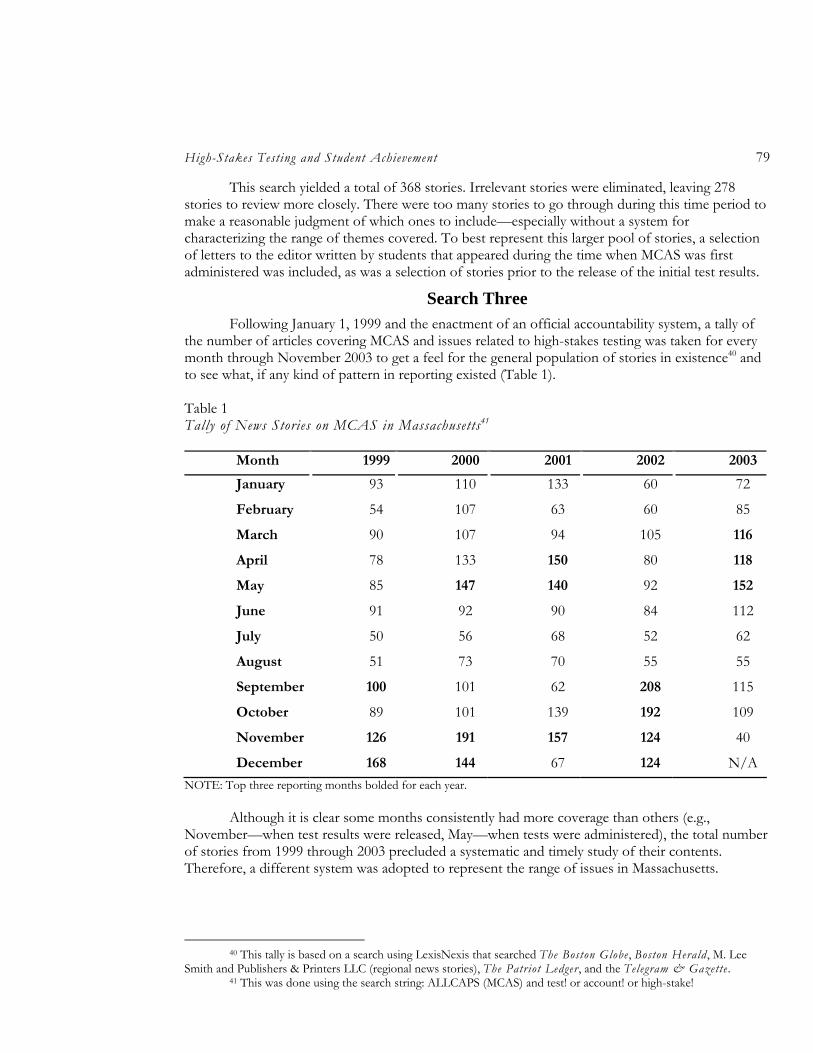
High-Stakes Testing and Student Achievement 79
This search yielded a total of 368 stories. Irrelevant stories were eliminated, leaving 278 stories to review more closely. There were too many stories to go through during this time period to make a reasonable judgment of which ones to include—especially without a system for characterizing the range of themes covered. To best represent this larger pool of stories, a selection of letters to the editor written by students that appeared during the time when MCAS was first administered was included, as was a selection of stories prior to the release of the initial test results.
Search Three Following January 1, 1999 and the enactment of an official accountability system, a tally of
the number of articles covering MCAS and issues related to high-stakes testing was taken for every month through November 2003 to get a feel for the general population of stories in existence40 and to see what, if any kind of pattern in reporting existed (Table 1).
Table 1 Tally of News Stories on MCAS in Massachusetts41
Month 1999 2000 2001 2002 2003
January 93 110 133 60 72
February 54 107 63 60 85
March 90 107 94 105 116
April 78 133 150 80 118
May 85 147 140 92 152
June 91 92 90 84 112
July 50 56 68 52 62
August 51 73 70 55 55
September 100 101 62 208 115
October 89 101 139 192 109
November 126 191 157 124 40
December 168 144 67 124 N/ANOTE: Top three reporting months bolded for each year.
Although it is clear some months consistently had more coverage than others (e.g.,
November—when test results were released, May—when tests were administered), the total number of stories from 1999 through 2003 precluded a systematic and timely study of their contents. Therefore, a different system was adopted to represent the range of issues in Massachusetts.
40 This tally is based on a search using LexisNexis that searched The Boston Globe , Boston Herald , M. Lee
Smith and Publishers & Printers LLC (regional news stories), The Patriot Ledger , and the Telegram & Gazette . 41 This was done using the search string: ALLCAPS (MCAS) and test! or account! or high-stake!
Education Policy Analysis Archives Vol. 14 No. 1 80
Tone of Testing In Massachusetts 2000–2003
Instead of coming up with a system to catalogue such a large number of stories, summaries of weekly stories compiled by a researcher in Massachusetts were used for this portfolio. Anne Wheelock catalogued and summarized news stories that discussed education reform and MCAS sporadically from May 2000 to July 2003. Her summaries include an anecdotal summary of the week’s news events as well as cut and paste snapshots of these stories. What is represented in the portfolio is a selection of these stories and her summaries during this time period.
Supplemental Search: Google
To represent the most recent “tone” in Massachusetts, a Google search was conducted for all newspapers and wires in Massachusetts for the previous 30 days. These newspapers were scanned and those that discussed consequences associated with MCAS during this time frame were included in the portfolio.
Supplemental Search: LexisNexis
The researchers conducted a LexisNexis search over the previous year to look specifically for stories related to the implementation of consequences to teachers and schools in Massachusetts. Specifically, they looked for stories where the state “took over” a school or district as well as a search of rewards (financial, public recognition) being given to teachers, schools, or districts. A search of state takeovers yielded 51 stories—a selection of these was included in the portfolio. A search over the previous year for stories related to teacher or administrator bonuses, rewards, or incentive pay yielded 290 stories. However, most of these stories were not about public recognition or rewards, but rather about teacher contract negotiations and business relationships. Therefore, none were included in the portfolio.
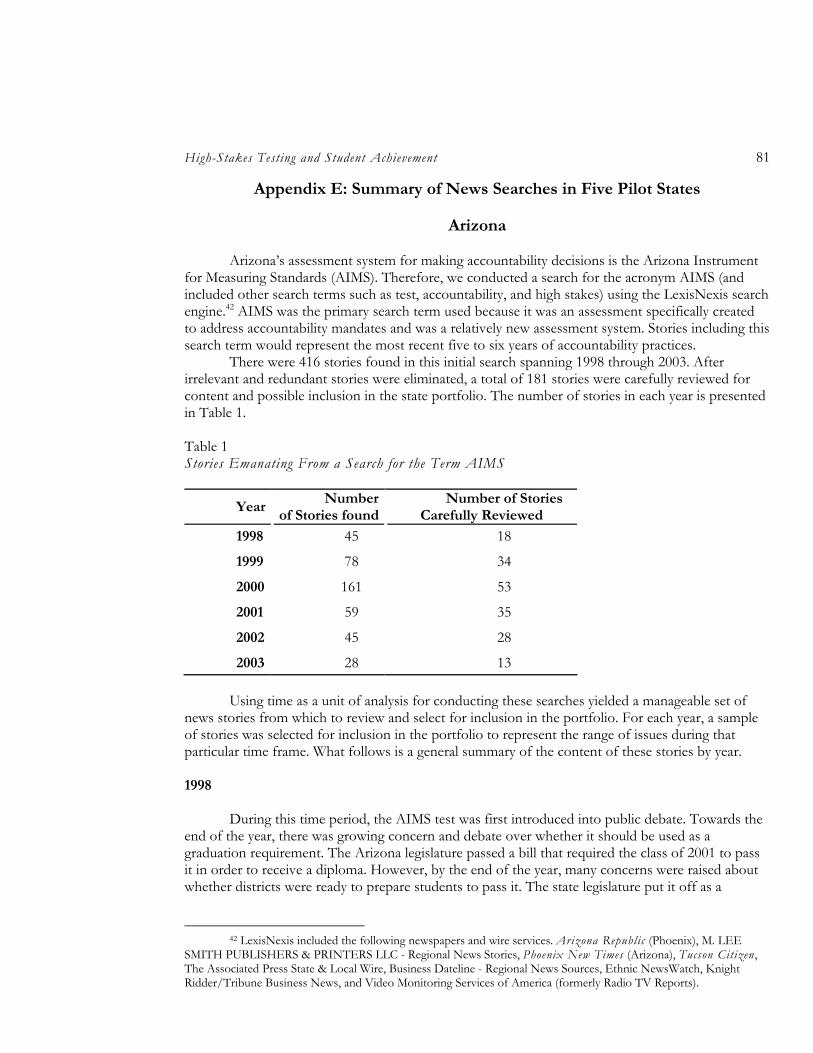
High-Stakes Testing and Student Achievement 81
Appendix E: Summary of News Searches in Five Pilot States
Arizona Arizona’s assessment system for making accountability decisions is the Arizona Instrument
for Measuring Standards (AIMS). Therefore, we conducted a search for the acronym AIMS (and included other search terms such as test, accountability, and high stakes) using the LexisNexis search engine.42 AIMS was the primary search term used because it was an assessment specifically created to address accountability mandates and was a relatively new assessment system. Stories including this search term would represent the most recent five to six years of accountability practices.
There were 416 stories found in this initial search spanning 1998 through 2003. After irrelevant and redundant stories were eliminated, a total of 181 stories were carefully reviewed for content and possible inclusion in the state portfolio. The number of stories in each year is presented in Table 1.
Table 1 Stories Emanating From a Search for the Term AIMS
Year Number
of Stories found Number of Stories
Carefully Reviewed
1998 45 18
1999 78 34
2000 161 53
2001 59 35
2002 45 28
2003 28 13 Using time as a unit of analysis for conducting these searches yielded a manageable set of
news stories from which to review and select for inclusion in the portfolio. For each year, a sample of stories was selected for inclusion in the portfolio to represent the range of issues during that particular time frame. What follows is a general summary of the content of these stories by year. 1998
During this time period, the AIMS test was first introduced into public debate. Towards the
end of the year, there was growing concern and debate over whether it should be used as a graduation requirement. The Arizona legislature passed a bill that required the class of 2001 to pass it in order to receive a diploma. However, by the end of the year, many concerns were raised about whether districts were ready to prepare students to pass it. The state legislature put it off as a
42 LexisNexis included the following newspapers and wire services. Arizona Republic (Phoenix), M. LEE
SMITH PUBLISHERS & PRINTERS LLC - Regional News Stories, Phoenix New Times (Arizona), Tucson Citizen , The Associated Press State & Local Wire, Business Dateline - Regional News Sources, Ethnic NewsWatch, Knight Ridder/Tribune Business News, and Video Monitoring Services of America (formerly Radio TV Reports).
Education Policy Analysis Archives Vol. 14 No. 1 82
requirement for one year. Initially, it was required for the class of 2001, but by the end of 1998, it was required for the class of 2002. 1999
The state superintendent of instruction (Lisa Graham Keegan) wanted the school year
extended to offset the time needed for students to take the new AIMS test. The issue of social promotion was also in the news, but it never passed a legislative vote. In a story published on May 4, 1999, the house and senate could not agree on a bill requiring third- and eighth-graders to pass AIMS in order to be promoted to the next grade. However, an earlier version of the bill that was passed a week earlier provided more latitude to students. In this bill, the requirement was for third graders only and was to be delayed another year. Further, promotion decisions were not tied to AIMS performance only—districts and schools could make promotion/retention decisions on any assessment of their choice. Both of these resolutions died in the legislature.
The results from the first administration of AIMS were released (on Monday, November 15, 1999) to widespread concern. Only 11 percent of students who were sophomores in 1998 when they took the exam passed the math portion on the first of five tries. When results were disaggregated, they showed that only 3 percent of African American, Hispanic, and American Indian students passed the math portion in comparison to 14 percent of Whites and 18 percent of Asians. As a result of these poor passing rates in math, there was public concern over whether the bar was raised too high in math—were we setting students up to fail? 2000
A judge rejected an argument that AIMS discriminates against minority students. A bill was
passed that students’ best AIMS scores must be published on their transcripts. In May 2000, Keegan proposed another delay for AIMS as a graduation requirement. She wanted to postpone it from 2002 to 2004—but just the math portion. The class of 2002 and 2003 would still have to pass the reading and writing portions. This proposal was never voted on. Keegan eventually left her position in Arizona and this decision was passed to her successor, Jaime Molera. 2001–2002
In August 2001, AIMS was officially postponed as a graduation requirement for the class of
2006. Two bills were passed in 2002. The first allows the state to assign contractors to poor performing schools. According to this report, prior to this resolution, the only “real sanction now in the state law would be a possible loss of state funding” if schools continued to fail. This new bill allowed the state to assign new management to the school. Another bill defined how districts could distribute prop 301 monies—this bill would “bar districts from basing performance-pay increases funded by voter-approved sales tax increase on a single measurement and require that plans within three years include incentives for individual teachers based on student performance.”43 The house and senate also approved a measure that allows the state to engage in a school takeover policy if schools are labeled as “under performing” for two or more years.
43 Davenport, P. (2002, May 8). Senate OKs school accountability bill allowing state intervention. Phoenix, AZ:
Associated Press .
High-Stakes Testing and Student Achievement 83
2003
New standards were adopted. Parents were urged to ignore “take your son/daughter to work day” in order to keep students in school to prepare for AIMS. New laws were discussed that empower the state to take over a school if it is underperforming for two or more years.
AIMS results from 2002 were released (September 2, 2003) to continued concerns that too many students were failing the math portion. And the superintendent of instruction publicly predicted that the public should expect 10 percent of the graduating class of 2006 to fail the AIMS test (this will be the first class who must pass it to get a diploma). Lastly, the legislature approved a bill to combine AIMS and Stanford 9 testing to minimize testing overlap to students. However, the lawmakers were not clear on how this would be accomplished. Supplemental Search: Google
A search of news archives located on Google was conducted on December 10 (searching all
news from the previous 30 days—November 10, 2003 to December 10, 2003). This search (using the search terms AIMS and test) yielded 29 stories. A selection of these was included in the portfolio. Supplemental Search: LexisNexis
A search was conducted using LexisNexis over the previous year (2003) looking for stories
of state-imposed consequences. This included a search of stories of rewards (teacher bonuses, pay for performance, any story highlighting school- or teacher-level successes) as well as sanctions (state takeover or state reorganization of a school). A selection of these was included in the portfolio.
Alabama
A search using LexisNexis44 search engine was conducted to look for high-stakes stories in
Alabama.45 This search yielded 539 hits spanning from March 2, 1999 through February 12, 2004. These 539 stories were reviewed for content and relevance. Duplicate and irrelevant stories were eliminated from consideration. Some highlights from stories that were carefully reviewed:
• Several earlier stories had to do with plans to implement a new teacher testing program;
• The first school intervention was in 1999; • In January 2000, there were debates about the strength of Alabama’s overall
accountability system, reports on survey studies showing how Alabama’s standards and accountability system rates against other states’, and a public debate over the merits of exit exams;
• There was also a public debate about pay for performance. Tying accountability measures, such as teacher pay, to student performance;
44 LexisNexis universe of coverage includes: Associated Press State & Local Wire, M. Lee Smith publishers &
Printers (Regional News Sources), and The Montgomery Advisor. 45 This search was done using the string: “(assess! or test!) and (high-stakes or accountab!) and not (sport)” and
looking over the past five years. Importantly, a review of the last 10 years yielded more than 1,000 documents and therefore, was limited to the previous five years.
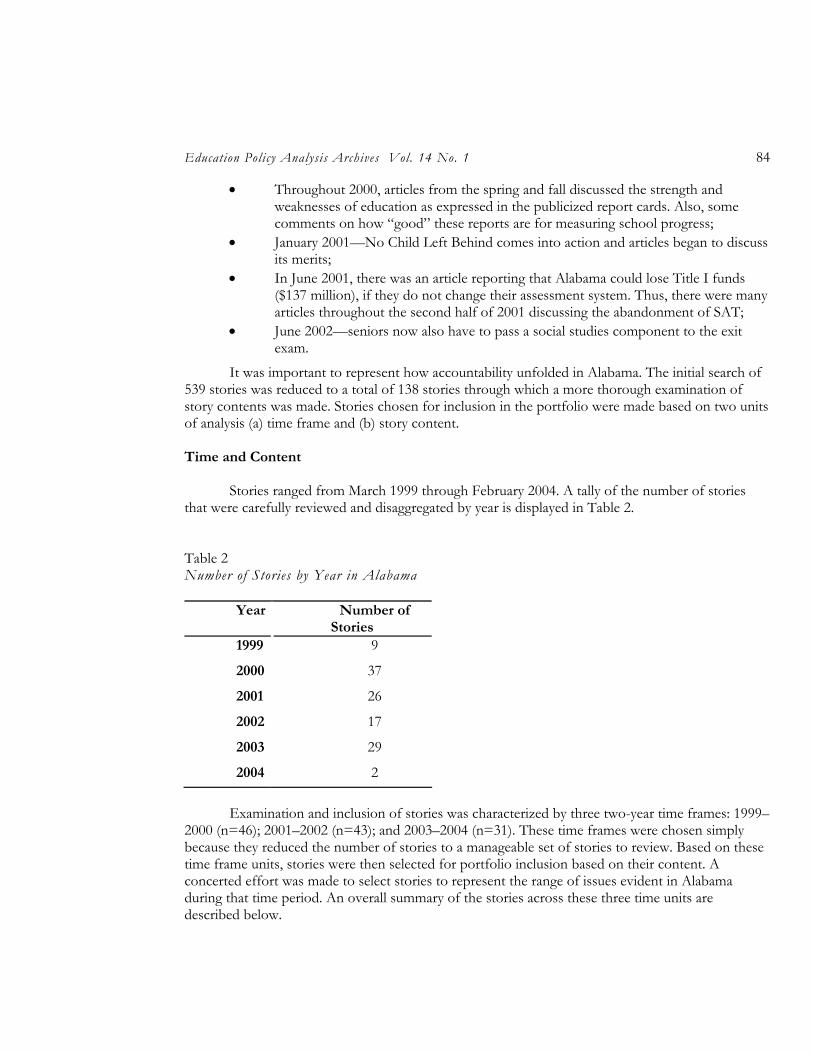
Education Policy Analysis Archives Vol. 14 No. 1 84
• Throughout 2000, articles from the spring and fall discussed the strength and weaknesses of education as expressed in the publicized report cards. Also, some comments on how “good” these reports are for measuring school progress;
• January 2001—No Child Left Behind comes into action and articles began to discuss its merits;
• In June 2001, there was an article reporting that Alabama could lose Title I funds ($137 million), if they do not change their assessment system. Thus, there were many articles throughout the second half of 2001 discussing the abandonment of SAT;
• June 2002—seniors now also have to pass a social studies component to the exit exam.
It was important to represent how accountability unfolded in Alabama. The initial search of 539 stories was reduced to a total of 138 stories through which a more thorough examination of story contents was made. Stories chosen for inclusion in the portfolio were made based on two units of analysis (a) time frame and (b) story content. Time and Content
Stories ranged from March 1999 through February 2004. A tally of the number of stories that were carefully reviewed and disaggregated by year is displayed in Table 2.
Table 2 Number of Stories by Year in Alabama
Year Number of Stories
1999 9
2000 37
2001 26
2002 17
2003 29
2004 2 Examination and inclusion of stories was characterized by three two-year time frames: 1999–
2000 (n=46); 2001–2002 (n=43); and 2003–2004 (n=31). These time frames were chosen simply because they reduced the number of stories to a manageable set of stories to review. Based on these time frame units, stories were then selected for portfolio inclusion based on their content. A concerted effort was made to select stories to represent the range of issues evident in Alabama during that time period. An overall summary of the stories across these three time units are described below.
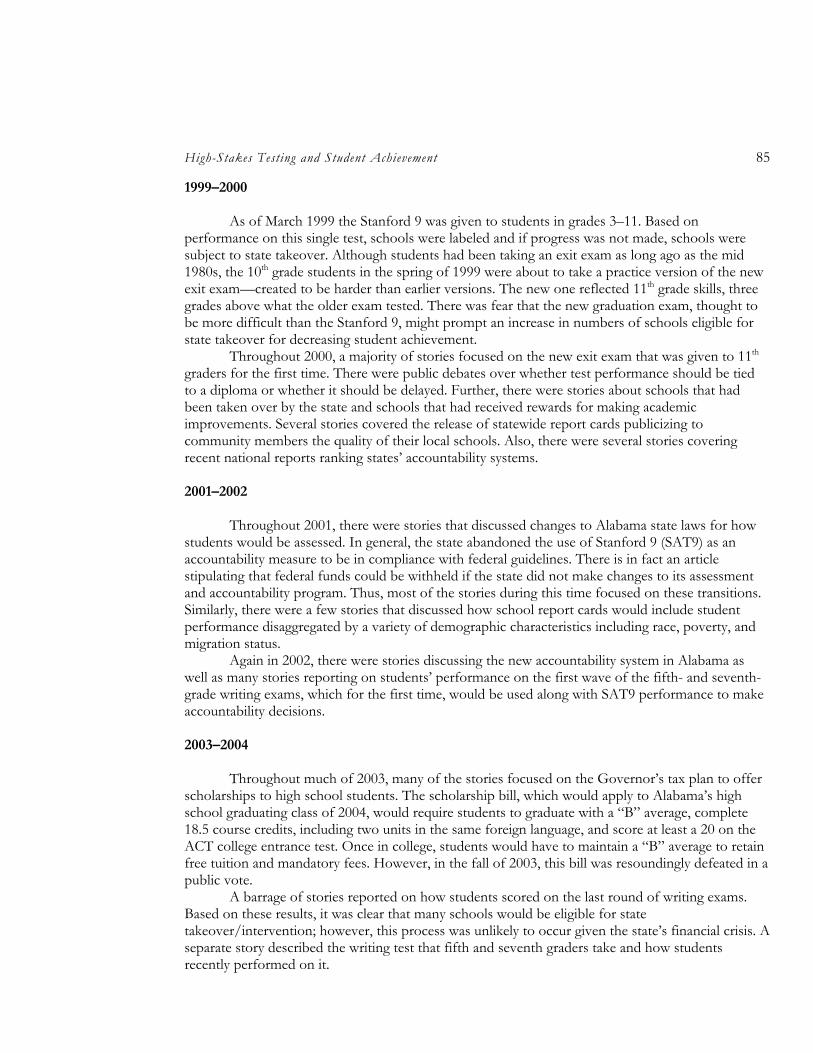
High-Stakes Testing and Student Achievement 85
1999–2000 As of March 1999 the Stanford 9 was given to students in grades 3–11. Based on
performance on this single test, schools were labeled and if progress was not made, schools were subject to state takeover. Although students had been taking an exit exam as long ago as the mid 1980s, the 10th grade students in the spring of 1999 were about to take a practice version of the new exit exam—created to be harder than earlier versions. The new one reflected 11th grade skills, three grades above what the older exam tested. There was fear that the new graduation exam, thought to be more difficult than the Stanford 9, might prompt an increase in numbers of schools eligible for state takeover for decreasing student achievement.
Throughout 2000, a majority of stories focused on the new exit exam that was given to 11th graders for the first time. There were public debates over whether test performance should be tied to a diploma or whether it should be delayed. Further, there were stories about schools that had been taken over by the state and schools that had received rewards for making academic improvements. Several stories covered the release of statewide report cards publicizing to community members the quality of their local schools. Also, there were several stories covering recent national reports ranking states’ accountability systems. 2001–2002
Throughout 2001, there were stories that discussed changes to Alabama state laws for how
students would be assessed. In general, the state abandoned the use of Stanford 9 (SAT9) as an accountability measure to be in compliance with federal guidelines. There is in fact an article stipulating that federal funds could be withheld if the state did not make changes to its assessment and accountability program. Thus, most of the stories during this time focused on these transitions. Similarly, there were a few stories that discussed how school report cards would include student performance disaggregated by a variety of demographic characteristics including race, poverty, and migration status.
Again in 2002, there were stories discussing the new accountability system in Alabama as well as many stories reporting on students’ performance on the first wave of the fifth- and seventh-grade writing exams, which for the first time, would be used along with SAT9 performance to make accountability decisions. 2003–2004
Throughout much of 2003, many of the stories focused on the Governor’s tax plan to offer
scholarships to high school students. The scholarship bill, which would apply to Alabama’s high school graduating class of 2004, would require students to graduate with a “B” average, complete 18.5 course credits, including two units in the same foreign language, and score at least a 20 on the ACT college entrance test. Once in college, students would have to maintain a “B” average to retain free tuition and mandatory fees. However, in the fall of 2003, this bill was resoundingly defeated in a public vote.
A barrage of stories reported on how students scored on the last round of writing exams. Based on these results, it was clear that many schools would be eligible for state takeover/intervention; however, this process was unlikely to occur given the state’s financial crisis. A separate story described the writing test that fifth and seventh graders take and how students recently performed on it.
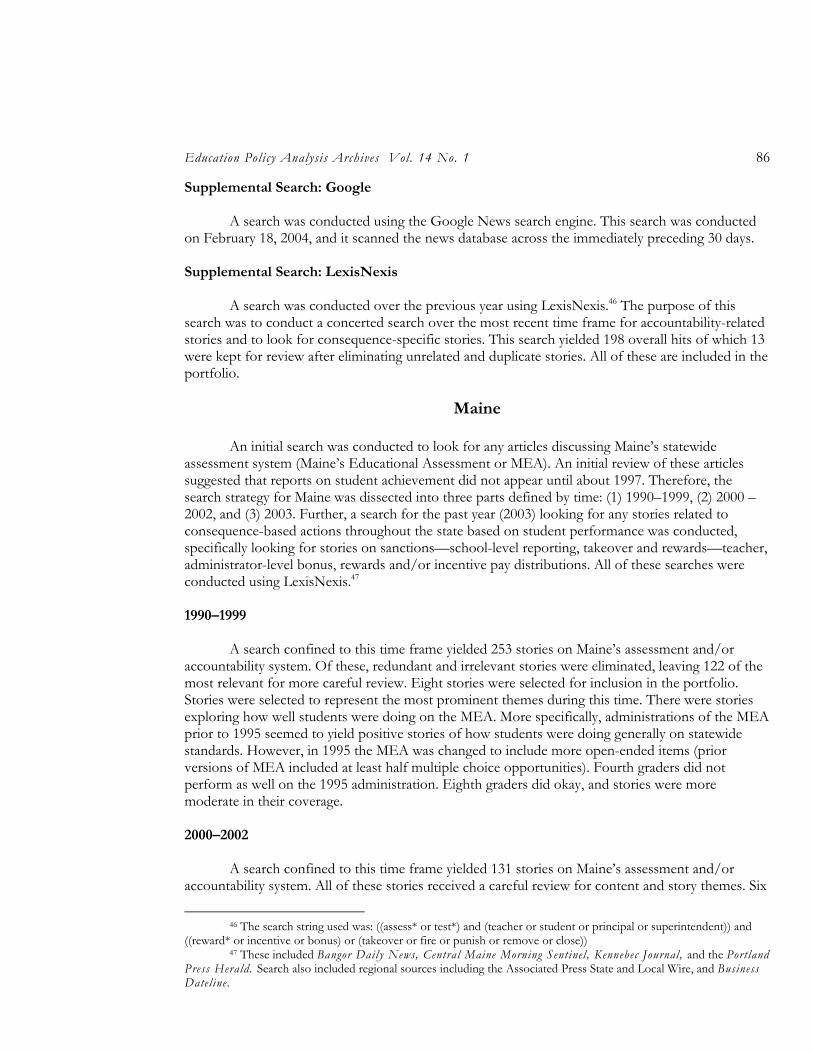
Education Policy Analysis Archives Vol. 14 No. 1 86
Supplemental Search: Google A search was conducted using the Google News search engine. This search was conducted
on February 18, 2004, and it scanned the news database across the immediately preceding 30 days. Supplemental Search: LexisNexis
A search was conducted over the previous year using LexisNexis.46 The purpose of this
search was to conduct a concerted search over the most recent time frame for accountability-related stories and to look for consequence-specific stories. This search yielded 198 overall hits of which 13 were kept for review after eliminating unrelated and duplicate stories. All of these are included in the portfolio.
Maine
An initial search was conducted to look for any articles discussing Maine’s statewide
assessment system (Maine’s Educational Assessment or MEA). An initial review of these articles suggested that reports on student achievement did not appear until about 1997. Therefore, the search strategy for Maine was dissected into three parts defined by time: (1) 1990–1999, (2) 2000 – 2002, and (3) 2003. Further, a search for the past year (2003) looking for any stories related to consequence-based actions throughout the state based on student performance was conducted, specifically looking for stories on sanctions—school-level reporting, takeover and rewards—teacher, administrator-level bonus, rewards and/or incentive pay distributions. All of these searches were conducted using LexisNexis.47 1990–1999
A search confined to this time frame yielded 253 stories on Maine’s assessment and/or
accountability system. Of these, redundant and irrelevant stories were eliminated, leaving 122 of the most relevant for more careful review. Eight stories were selected for inclusion in the portfolio. Stories were selected to represent the most prominent themes during this time. There were stories exploring how well students were doing on the MEA. More specifically, administrations of the MEA prior to 1995 seemed to yield positive stories of how students were doing generally on statewide standards. However, in 1995 the MEA was changed to include more open-ended items (prior versions of MEA included at least half multiple choice opportunities). Fourth graders did not perform as well on the 1995 administration. Eighth graders did okay, and stories were more moderate in their coverage. 2000–2002
A search confined to this time frame yielded 131 stories on Maine’s assessment and/or
accountability system. All of these stories received a careful review for content and story themes. Six
46 The search string used was: ((assess* or test*) and (teacher or student or principal or superintendent)) and
((reward* or incentive or bonus) or (takeover or fire or punish or remove or close)) 47 These included Bangor Daily News, Central Maine Morning Sentinel, Kennebec Journal, and the Portland
Press Herald. Search also included regional sources including the Associated Press State and Local Wire, and Business Dateline.
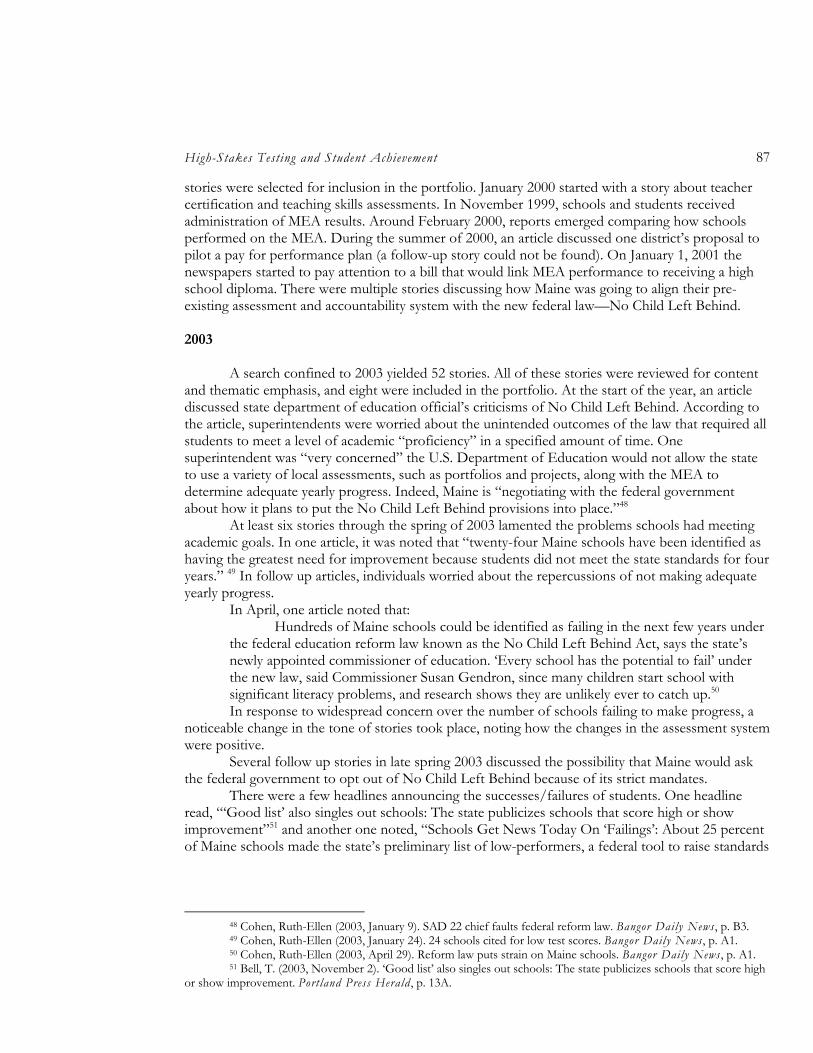
High-Stakes Testing and Student Achievement 87
stories were selected for inclusion in the portfolio. January 2000 started with a story about teacher certification and teaching skills assessments. In November 1999, schools and students received administration of MEA results. Around February 2000, reports emerged comparing how schools performed on the MEA. During the summer of 2000, an article discussed one district’s proposal to pilot a pay for performance plan (a follow-up story could not be found). On January 1, 2001 the newspapers started to pay attention to a bill that would link MEA performance to receiving a high school diploma. There were multiple stories discussing how Maine was going to align their pre-existing assessment and accountability system with the new federal law—No Child Left Behind. 2003
A search confined to 2003 yielded 52 stories. All of these stories were reviewed for content
and thematic emphasis, and eight were included in the portfolio. At the start of the year, an article discussed state department of education official’s criticisms of No Child Left Behind. According to the article, superintendents were worried about the unintended outcomes of the law that required all students to meet a level of academic “proficiency” in a specified amount of time. One superintendent was “very concerned” the U.S. Department of Education would not allow the state to use a variety of local assessments, such as portfolios and projects, along with the MEA to determine adequate yearly progress. Indeed, Maine is “negotiating with the federal government about how it plans to put the No Child Left Behind provisions into place.”48
At least six stories through the spring of 2003 lamented the problems schools had meeting academic goals. In one article, it was noted that “twenty-four Maine schools have been identified as having the greatest need for improvement because students did not meet the state standards for four years.” 49 In follow up articles, individuals worried about the repercussions of not making adequate yearly progress.
In April, one article noted that: Hundreds of Maine schools could be identified as failing in the next few years under
the federal education reform law known as the No Child Left Behind Act, says the state’s newly appointed commissioner of education. ‘Every school has the potential to fail’ under the new law, said Commissioner Susan Gendron, since many children start school with significant literacy problems, and research shows they are unlikely ever to catch up.50 In response to widespread concern over the number of schools failing to make progress, a
noticeable change in the tone of stories took place, noting how the changes in the assessment system were positive.
Several follow up stories in late spring 2003 discussed the possibility that Maine would ask the federal government to opt out of No Child Left Behind because of its strict mandates.
There were a few headlines announcing the successes/failures of students. One headline read, “‘Good list’ also singles out schools: The state publicizes schools that score high or show improvement”51 and another one noted, “Schools Get News Today On ‘Failings’: About 25 percent of Maine schools made the state’s preliminary list of low-performers, a federal tool to raise standards
48 Cohen, Ruth-Ellen (2003, January 9). SAD 22 chief faults federal reform law. Bangor Daily News , p. B3. 49 Cohen, Ruth-Ellen (2003, January 24). 24 schools cited for low test scores. Bangor Daily News , p. A1. 50 Cohen, Ruth-Ellen (2003, April 29). Reform law puts strain on Maine schools. Bangor Daily News , p. A1. 51 Bell, T. (2003, November 2). ‘Good list’ also singles out schools: The state publicizes schools that score high
or show improvement. Portland Press Herald , p. 13A.
Education Policy Analysis Archives Vol. 14 No. 1 88
and improve accountability.” 52 A selection of these stories that represent the range of positive and negative reporting as well as the scope of issues Maine faces is included in the portfolio. Supplemental Search: Google
A search using Google was conducted December 8, 2003 (and covering the news period of
November 8, 2003 through December 8, 2003) in an effort to find stories throughout major and regional news sources for anything related to MEA and student assessment. This search yielded a few stories related to assessment and accountability in the state (these are included in the portfolio). Supplemental Search: LexisNexis
A search was conducted to look for stories of the state-imposed consequences to schools,
teachers, and/or students based on statewide assessment performance. A search looking for rewards or bonuses (or incentives) tied to student performance yielded no relevant stories. A search for school takeover or reorganization yielded six hits, all of which covered a story of reorganizing a school district that was undergoing major constructive renovations—not relevant to student performance.
Maryland
The most logical place to start searching for articles on educational accountability in
Maryland was to look for any news on the Maryland School Performance Assessment Program (MSPAP)—the first set of assessments in the state during the 1990s. Looking over the entire LexisNexis universe, a search of MSPAP yielded 359 documents spanning February 1994 through November 2003. All articles that were unrelated to educational accountability and those that were redundant were eliminated, reducing the pool down to 93. These stories were reviewed carefully for inclusion in the portfolio. These 93 stories were further disaggregated by year and were included in the portfolio to represent the major themes of each year. The primary themes are summarized below. 1994
There were six stories related to the MSPAP. Not surprisingly, all of them had to do with
how students did on the first round of testing with the new set of assessments. Overall, the reports were dismal—many students had failed. 1995
There were four stories related to the MSPAP. Again, following a second wave of testing,
most of the reports were about how various schools had improved over the previous year’s showing (3). The fourth story had to do with the high school assessment and whether it should be counted as a graduation requirement.
52 Bell, T. (2003, October 24). Schools get news today on ‘failings’: About 25 percent of Maine schools made
the state’s preliminary list of low-performers. Portland Press Herald, p. 1A.
High-Stakes Testing and Student Achievement 89
1996 There were six stories related to the MSPAP. Story 1 was about how decreasing class sizes
were related to score drops in one school; Story 2 argued how the MSPAP tests are biased against minority students; Story 3 discussed that art and music might be dropped from a school’s curriculum in order to increase efforts on math and reading and to raise test scores; Story 4 was about how a couple of schools lost Title I funding for failing to make academic progress; and the last two stories centered on teachers and (a) how they are responsible for test score gains and (b) their agitation at being left out of the accountability decision-making process. 1997
There were 10 stories from this year, but one story was deleted due to insufficient
information, leaving a total of nine. Six of these nine stories were reports of the poor achievement of schools and students, two were letters to the editor written by parents lamenting the fact they do not have access to MSPAP scores, and one was a story about the recognition and rewards a school received for increased student achievement. The portfolio has (a) the story on the reward (given it is the only positive story), (b) one editorial (randomly selected), and (c) two stories on student’s declining achievement (randomly chosen). 1998
There were 13 stories from this year. Of these 13, five centered on how students performed
on the last round of testing, four were on the problems with MPSAP, and four were stories about what schools were doing to try to improve their students’ test performance. One from each of these categories is included in the portfolio. 1999
There were 12 stories from this year. Stories ranged from reporting on how schools
performed on previous waves of assessments, to several on rewards and sanctions schools had received as a result of improved/declining performance. There were also some policy-oriented articles discussing how to assess students with limited English proficiency as well as whether to tie test performance to graduation requirements. Two stories are included from this time period—one on the positive consequences schools received and one on the negative ones. 2000
There were only seven relevant stories from this year—six of which reported on the good
news of increased student performance on the most recent wave of testing. The only negative story was about how some parents, fearing the impending consequences to schools and to their children based on how well they did on the exam, kept their children home on test days. This story was included along with a random selection of one of the positive stories. 2001
Seven stories from this time period showed up in the search, including a mix of positive and
negative views on MSPAP testing. Some schools had done well and were praising the use of
Education Policy Analysis Archives Vol. 14 No. 1 90
MSPAP, whereas others, like one elementary school, was holding a “rally” of sorts where the principal was trying to keep the morale of her staff upbeat in light of receiving very low test scores. 2002
None of the nine stories from this year appeared in the portfolio. The majority of them
repeat the debate over whether MPSAP should be abandoned and how it will be replaced. 2003
Eleven stories from this year referenced MSPAP. During the summer of 2003, several stories
reported on how students performed on the new set of assessments (one story included in the portfolio). The remaining stories discussed the merits of the new assessment system (one story included). Supplemental Search: Google
A search of the most recent consequences dolled out to educators and students in Maryland
was conducted using Google. Two of these stories are included in the portfolio. Supplemental Search: LexisNexis
A search was conducted to target consequences dolled out to schools, districts, students,
teachers, and administrators based on student performance and over the immediately preceding year.53 A total of 31 stories resulted from this search, a selection of which is included in the portfolio.
53 Using the search string: (ALLCAPS (MSA) or ALLCAPS (MSPAP) and (students or teachers or schools or
districts or superintendents or principals) and (reward or incentive or bonus) or (label! or fail or punish!)
High-Stakes Testing and Student Achievement 91
North Carolina
An initial search using LexisNexis for stories in North Carolina54 on the accountability system was conducted for the time period 1990–1995. This period was chosen to cover the range of dates leading up to and including when the ABC55 assessment system began (1994). One of the first articles gleaned from this search56 was produced in 1994 and discusses the state’s fourth annual release of school report cards. A follow-up search based on this information and looking for any comment on school report cards prior to this time yielded no additional stories. Thus, it is possible that even though schools received a “report card” indicating how they were doing, prior to 1994, they were not publicly presented. A selection of stories based on this initial search for the 1990–1995 time period is included in the portfolio.
1996–1999
Confining the search to this time frame yielded 471 stories. After redundant and irrelevant
stories were discarded, a total of 57 of the most relevant stories were carefully reviewed. Of these, 14 are included in the portfolio, chosen to represent the range of themes during this period. During 1996 there were a few stories describing a proposal to offer rewards/incentive pay to teachers for student performance. Further, there were debates about the merits of giving (or striping) teachers of tenure based on student performance. During 1997, there was an increase in the number of stories as the ABC assessment plan had begun. There were stories describing student performance from the 1995–1996 assessment and stories describing the ABC assessment system in general to the public. Further, there were stories about North Carolina adding higher stakes to their accountability measures—holding teachers, schools and students accountable for how they perform on standardized tests. In August 1997, there were numerous stories describing how schools across the state had performed on the most recent wave of statewide assessments. Throughout 1998, there continued to be stories recounting how schools and students had done on previous year’s standardized tests. One particular area (Guildford) was getting a lot of attention. A selection of stories from this time period is in the portfolio. 2000–2002
Confining the search to this time frame yielded 297 stories. After redundant and irrelevant
stories were discarded, a total of 53 stories were chosen for a closer review. Of these, ten are included in the portfolio. They were chosen to represent the range of themes during this period. In general, stories ranged from general reporting (reporting how students in various districts did on statewide exams), to opinion-based editorial either decrying or supporting the accountability system in North Carolina. During 2002, there were many stories describing the flaws of the statewide writing assessment and debates over whether and how to release the results. Further, journalists commented on the merits of a writing test with so many flaws. A selection of these stories from these years is included in the portfolio.
54 This search scanned the following newspapers: Asheville Citizen-Times, The Charlotte Observer , The News
and Observer, News & Record (Greensboro), Star-News (Wilmington), Winston-Salem Journal , and regional news sources.
55 North Carolina dubbed its assessment and accountability system as the ABC’s of learning. 56 Using the search term: (ALLCAPS (ABC) or assessment or test!) and (accountabl! or (high stake!))
Education Policy Analysis Archives Vol. 14 No. 1 92
2003 Confining the search to this time frame yielded 104 stories. After redundant and irrelevant
stories were discarded, a total of 17 of the most relevant stories were selected for careful review. Of these, five are included in the portfolio. At the beginning of the year, stories focused on the state legislature’s plan to pull back on testing demands made on students in the primary grades. School report cards were released in the Fall of 2003 and numerous reports documented the plight of schools that were labeled “under performing.” Supplemental Search: Google
A search was conducted on December 16, 2003, using Google to look for any articles related
to North Carolina’s accountability program during the time period of November 16, 2003, through December 16, 2003. This search yielded stories that represented the most recent information on accountability at the time. Supplemental Search: LexisNexis
A search using LexisNexis was conducted in an effort to find any stories from 2003 that
reported on any consequences being dolled out to students, schools and/or teachers. A variety of search terms were used to include a wide range of possible consequences. A selection of these stories (which include both sanctions and rewards-based consequences) is included in the portfolio.
High-Stakes Testing and Student Achievement 93
Appendix F: Summary of New Search Rationale—Finalized System
Arkansas
A review of the state department of education documents revealed some of the language used by Arkansas to denote the states’ accountability and assessment system. A variety of these terms were used to yield a large number of relevant stories from LexisNexis.57 The first search using the search string [(assess! or test!) and (high-stakes or accountab!) and not (sport)] yielded more than 1,000 documents, forcing narrower search criteria. A second search using the string [(assess! or test!) and (high-stakes or accountab!) and (school or district or student or teacher) and not (sport)] also yielded more than 1,000 hits. The term “test!” was eliminated from the search string since often its inclusion added stories on “testimonies” (trial related). This search using the string [(assess!) and (high-stakes or accountab!) and (school) and (student or teacher) and not (sport)] yielded 427 stories that spanned January 16, 1985, through February 10, 2004.
Twelve stories were eliminated outright since they appeared prior to 1990. Given that NAEP data was only first collected in 1990, stories prior to that time were irrelevant and therefore not included. A cursory review of the remaining stories led to the deletion of almost 300 stories due to redundancy or irrelevancy of the story contents. A total of 68 stories were chosen for careful review, coding, and selection for inclusion in the portfolio. A breakdown of the number of stories reviewed based on year and major category is displayed in Table 1.
57 The complete file on LexisNexis included the Arkansas Democrat-Gazette . However, selected documents
are also included on the search engine including: ASAPII Publications - Regional News Sources; The Associated Press State & Local Wire; and Business Dateline - Regional News Sources
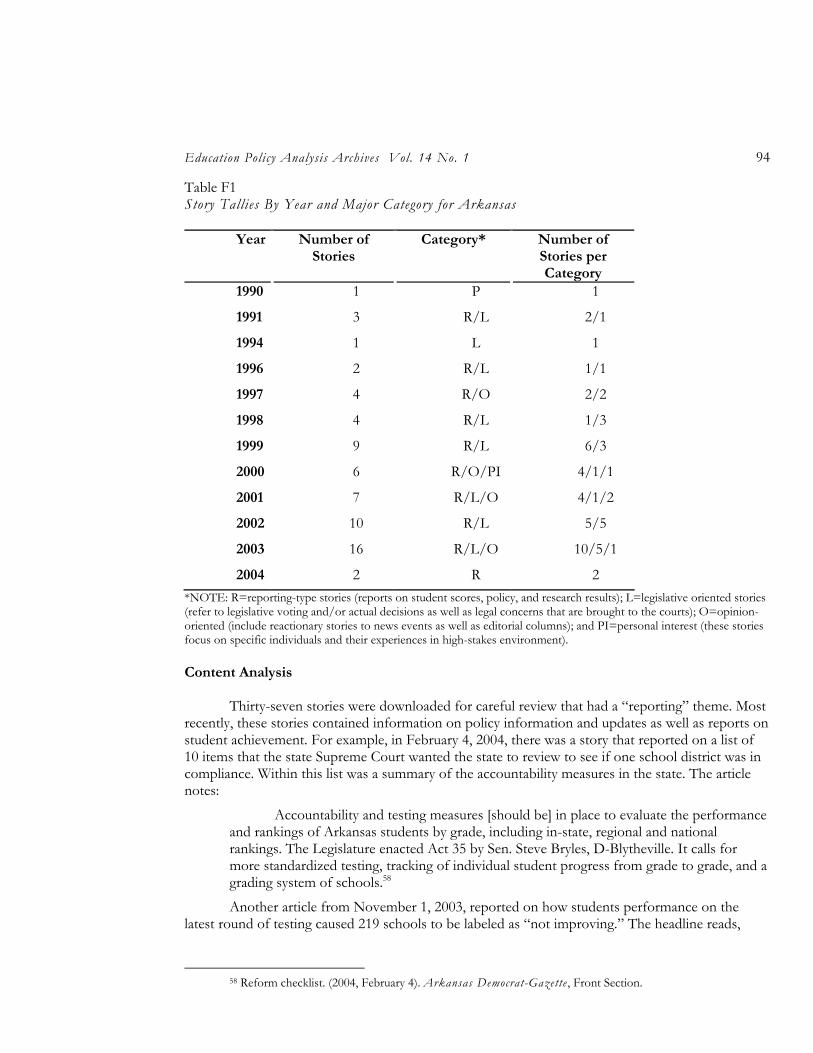
Education Policy Analysis Archives Vol. 14 No. 1 94
Table F1 Story Tallies By Year and Major Category for Arkansas
Year Number of Stories
Category* Number of Stories per Category
1990 1 P 1
1991 3 R/L 2/1
1994 1 L 1
1996 2 R/L 1/1
1997 4 R/O 2/2
1998 4 R/L 1/3
1999 9 R/L 6/3
2000 6 R/O/PI 4/1/1
2001 7 R/L/O 4/1/2
2002 10 R/L 5/5
2003 16 R/L/O 10/5/1
2004 2 R 2 *NOTE: R=reporting-type stories (reports on student scores, policy, and research results); L=legislative oriented stories (refer to legislative voting and/or actual decisions as well as legal concerns that are brought to the courts); O=opinion-oriented (include reactionary stories to news events as well as editorial columns); and PI=personal interest (these stories focus on specific individuals and their experiences in high-stakes environment). Content Analysis
Thirty-seven stories were downloaded for careful review that had a “reporting” theme. Most recently, these stories contained information on policy information and updates as well as reports on student achievement. For example, in February 4, 2004, there was a story that reported on a list of 10 items that the state Supreme Court wanted the state to review to see if one school district was in compliance. Within this list was a summary of the accountability measures in the state. The article notes:
Accountability and testing measures [should be] in place to evaluate the performance and rankings of Arkansas students by grade, including in-state, regional and national rankings. The Legislature enacted Act 35 by Sen. Steve Bryles, D-Blytheville. It calls for more standardized testing, tracking of individual student progress from grade to grade, and a grading system of schools.58
Another article from November 1, 2003, reported on how students performance on the latest round of testing caused 219 schools to be labeled as “not improving.” The headline reads,
58 Reform checklist. (2004, February 4). Arkansas Democrat-Gazette , Front Section.
High-Stakes Testing and Student Achievement 95
“Low test scores put 219 schools on troubled list State now has 342 that must offer pupil transfers, tutoring.”59
Nineteen stories had a “legislative” theme. Some of the more recent stories of 2003 with this theme included a report of the state Board of Education’s decisions about the contents of the new school accreditation rules:
The board’s action on accreditation standards put the proposed new rules out for 30 days of public comment.
Currently, the state requires schools to offer all 38 courses that make up the core curriculum, but does not require them to be taught each year.
Smart Core, the proposal that Simon has called “the answer to inefficient, ineffective high schools,” could imperil some small schools that might have difficulty affording instructors to teach the core every year. Reducing the number of high schools to better enable the state to afford education reforms is a key element in Gov. Mike Huckabee’s plan to address court-ordered public school improvements.
The academic distress designation authorizes the state Department of Education to provide special assistance to districts to improve student performance. It also triggers provisions of a new law authorizing the state board to act years sooner to address chronic academic or fiscal distress. If the percentage of students below math proficiency does not fall below 75 percent within two years, the state has a range of options, up to and including annexation or consolidation.60
This story includes some details of the accountability laws when schools are given an “academic distress” designation.
Another “legislative” story appeared on September 7, 2003, in the Arkansas Democrat-Gazette (based in Little Rock), and reported on the ongoing legislative debates about how to impose standardized testing across the state. The story presents information on decisions made by the state Board of Education regarding the use of criterion-referenced tests for measuring academic progress—a measure that meets criticism from local businesses who prefer norm-referenced tests as a way of judging student performance in their local areas.
The state Board of Education added to the dispute Aug. 11 by voting to reduce the state’s use of a test that makes it possible to compare Arkansas students with a sample of students from other states. In testing circles, this is called a “norm-referenced” test. The board decided that, starting this school year, the test would be given only in grades five and nine. Previously, it also was used with students in grade 10. At the recommendation of Education Department Director Ray Simon, the board preferred the state’s Benchmark Exam, which measures students’ knowledge of subjects the state has said they should learn. This is called a “criterion-referenced” test. The board’s rationale was that the state needs to comply with the federal No Child Left Behind law’s requirement that states test their students every year on the students’ mastery of the state’s curriculum.
The Arkansas State Chamber of Commerce/Associated Industries of Arkansas and many business leaders who say using norm-referenced tests helps the state recruit business and industry to Arkansas criticized the board’s decision. The board agreed to pay for school
59 Howell, C., & Dishongh, K. (2003, November 1). Low test scores put 219 schools on troubled list: State now
has 342 that must offer pupil transfers, tutoring. Arkansas Democrat-Gazette , p. 1. 60 Jefferson, J. (2003, October 13). School accreditation rules revised to include new curriculum standards.
Education Policy Analysis Archives Vol. 14 No. 1 96
districts to give the norm-referenced tests in more than two grades, provided the Legislature appropriates more money for this purpose. 61
Lastly, there were very few opinion/reactionary oriented stories. In fact across the entire 13-year time span there were only six stories downloaded for careful review and consideration. Of these six, all of them were editorials commenting on the pros and/or cons of the state’s evolving accountability system. A selection of these editorials, representing both sides of the issue, are included in the portfolio.
Supplemental Search: Google
A search was conducted using Google News Search on February 20, 2004 (covering the time period of January 20, 2004 through February 20, 2004) that yielded about 40 stories—most of which were unrelated or repeated the same story of the new bill that was signed into law that stipulates the state’s accountability system. Two of these stories are included in the portfolio to outline this newly approved accountability program.
Supplemental Search: LexisNexis
Additional searches were conducted to look for consequence-oriented actions in the state of Arkansas that span the most recent time frame available. Across the previous year, LexisNexis62 was used to look for stories that reported on specific actions taken to reward or sanction schools, students, teachers, and/or administrators. There were 55 hits from this initial search. A review of the stories led to the elimination of several due to redundancy or irrelevancy, leaving eight stories—each of which was included in the portfolio.
California
The first search was conducted using a search string to yield the widest number of stories possible covering the LexisNexis universe of California news sources.63 Several searches yielded more than 1,000 documents; therefore, adjustments in search string terms and time frames had to be made. The first search64 yielding a manageable set of stories was confined to the time frame of
61 Rowett, M. (2003, August 7). Educators, others split over best way to test. Arkansas Democrat-Gazette , p.
1. 62 Based on the search string: (assess! and accountab! and school and not college sport) and (reward or
incentive or bonus) or (label! or fail or punish! or takeover) 63 Alameda Times-Star (Alameda, CA); The Argus (Fremont, CA); The Business Press / California; California
Construction Link; California Journal ; The Californian (Salinas, CA); California Supreme Court Service; Cal-OSHA Reporter; City News Service; Contra Costa Newspapers; The Daily News of Los Angeles ; The Daily Review (Hayward, CA); East Bay Express (California); The Fresno Bee ; Inland Valley Daily ; Bulletin (Ontario, CA); Long Beach Press-Telegram (Long Beach, CA); Los Angeles Times; LRP Publications - Regional News Stories; Marin Independent Journal (Marin, CA); Metropolitan News Enterprise; M. LEE SMITH PUBLISHERS & PRINTERS LLC - Regional News Stories; Monterey County Herald; New Times Los Angeles (California); The Orange County Register; Pasadena Star-News (Pasadena, CA); The Press Enterprise ; The Recorder; Sacramento Bee; San Bernardino Sun (San Bernardino, CA); San Diego Union-Tribune ; The San Francisco Chronicle ; San Francisco Examiner ; San Gabriel Valley Tribune (San Gabriel Valley, CA); San Jose Mercury News ; San Mateo County Times (San Mateo, CA); SF Weekly (California); Tri-Valley Herald (Pleasanton, CA); Tulare Advance-Register (Tulare, CA); Ventura County Star (Ventura County, Ca.); Visalia Times-Delta (Visalia, CA).
64 Using the search string: (assess! or test!) and (high-stakes or accountab!) and (school or student or teacher) and not (sport or court)
High-Stakes Testing and Student Achievement 97
January 1, 1990, through December 31, 1995, and yielded 238 stories. These were reviewed for content and 61 were downloaded for more careful review and content coding.
A search confined to the next five year time span returned over 1,000 documents. Indeed, even confining the search to a year-by-year search produced anywhere from 300–900 stories. Thus, a more restrictive search string was used to make the task more manageable and to capture stories from 1996 through the present. By eliminating the word “test” from the search string,65 many stories were eliminated from consideration, thus making the review more manageable. A search looking over the time period of January 1, 1996, through December 31, 1999, using this new search string yielded 348 stories. After redundant and irrelevant stories were removed, 69 were downloaded for consideration.
Eliminating the word “test” from the 1996–1999 search string dramatically reduced the number of search “hits” to a more manageable number. However, for the next search across the next time period, the term “test” was reintroduced into the search string. It seemed important to continue to see how vast the number of hits would be when broadening the search terms. The next search was confined to the time frame of January 1, 2000, through December 31, 2001. This search66 yielded 358 hits, 70 were downloaded for careful review. Lastly, a search covering the most recent time span of January 1, 2002, through February 24, 2004, returned 495 hits of which 34 were downloaded for more careful review. Content Analysis
A total of 234 stories were carefully reviewed for consideration to be included in the
portfolio. A summary of these stories disaggregated by year and primary content theme is presented in Table 2.
65 Using the search string: (assess!) and (high-stakes or accountab!) and (school or student or teacher) and not
(sport or court) 66 Using the search string: (assess! or test!) and (high-stakes or accountab!) and (school or student or teacher)
and not (sport or court)
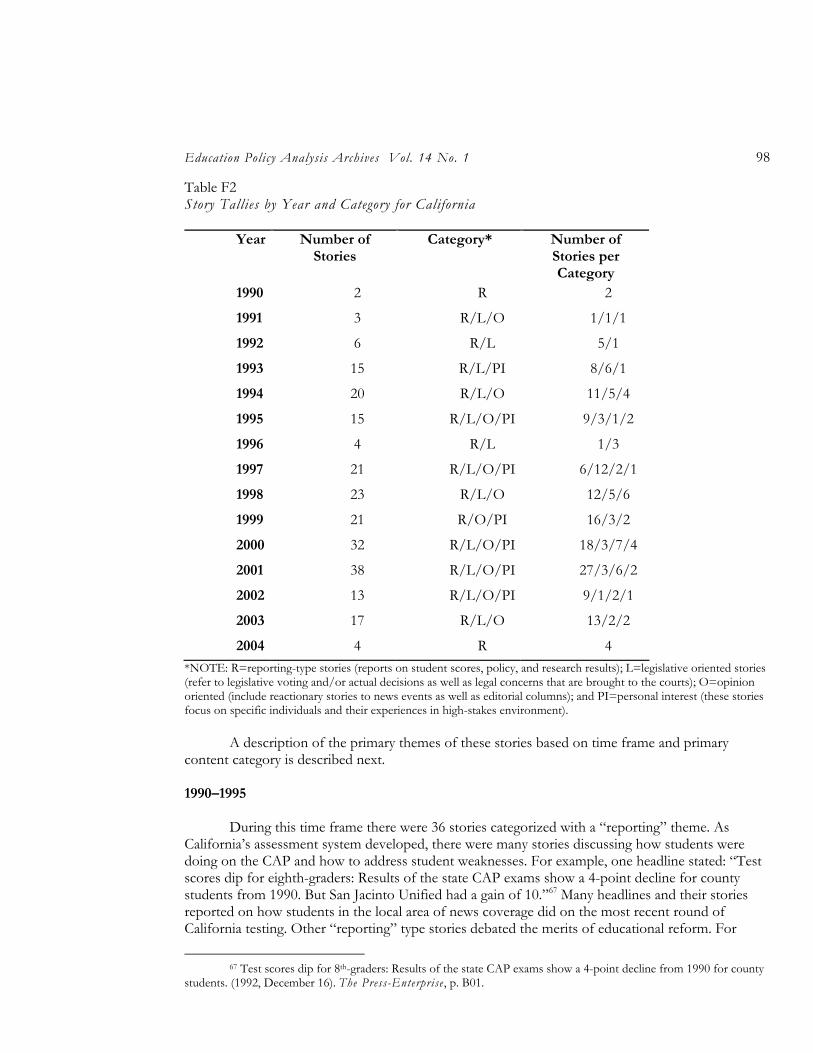
Education Policy Analysis Archives Vol. 14 No. 1 98
Table F2 Story Tallies by Year and Category for California
Year Number of Stories
Category* Number of Stories per Category
1990 2 R 2
1991 3 R/L/O 1/1/1
1992 6 R/L 5/1
1993 15 R/L/PI 8/6/1
1994 20 R/L/O 11/5/4
1995 15 R/L/O/PI 9/3/1/2
1996 4 R/L 1/3
1997 21 R/L/O/PI 6/12/2/1
1998 23 R/L/O 12/5/6
1999 21 R/O/PI 16/3/2
2000 32 R/L/O/PI 18/3/7/4
2001 38 R/L/O/PI 27/3/6/2
2002 13 R/L/O/PI 9/1/2/1
2003 17 R/L/O 13/2/2
2004 4 R 4 *NOTE: R=reporting-type stories (reports on student scores, policy, and research results); L=legislative oriented stories (refer to legislative voting and/or actual decisions as well as legal concerns that are brought to the courts); O=opinion oriented (include reactionary stories to news events as well as editorial columns); and PI=personal interest (these stories focus on specific individuals and their experiences in high-stakes environment).
A description of the primary themes of these stories based on time frame and primary
content category is described next. 1990–1995
During this time frame there were 36 stories categorized with a “reporting” theme. As
California’s assessment system developed, there were many stories discussing how students were doing on the CAP and how to address student weaknesses. For example, one headline stated: “Test scores dip for eighth-graders: Results of the state CAP exams show a 4-point decline for county students from 1990. But San Jacinto Unified had a gain of 10.”67 Many headlines and their stories reported on how students in the local area of news coverage did on the most recent round of California testing. Other “reporting” type stories debated the merits of educational reform. For
67 Test scores dip for 8th-graders: Results of the state CAP exams show a 4-point decline from 1990 for county
students. (1992, December 16). The Press-Enterprise , p. B01.
High-Stakes Testing and Student Achievement 99
example, one story talked about whether the CAP needed to change and another reported on the new statewide test that would replace the CAP. One article reported:
Test taking for California students no longer means reams of multiple-choice questions and filling in tiny bubbles with No. 2 pencils. A new series of achievement tests, dubbed California Learning Assessment System, is making its debut in fourth-, eighth- and 10th-grade classrooms across the state this month, replacing the multiple choice - or multiple guess - type of exams that has been a rite of spring since the 1920s.68
During this time period, there were also a few legislative stories, documenting current voting patterns by the legislature. For example, in 1994, the legislature voted to approve the new testing system.
Lastly, there was also a selection of editorial/opinion-oriented stories commenting largely on whether it was a good idea to base decisions on a single test score. One editorial writer argues,
But written tests don’t tell the whole story. Before state officials start issuing grades, they should drop by a Modesto City Schools classroom where a dozen different languages are spoken. They should sail into Lou Winter’s classroom in Salida when he’s passing out “Winter bucks” to give learning handicapped kids incentive to achieve.
Or, I have an idea. They should visit Mary Jane Tucker’s third-grade class at Stockard Coffee Elementary School in Modesto at 8:05 a.m. She’ll be sitting at her desk, braiding the long wispy hair of a little girl whose mother is too sick with cancer to do it herself.69
1996–1999
During this time period, 35 stories were coded under the “reporting” theme. California was
in a transitional period and therefore many of the “reporting” stories centered on keeping the public updated on California accountability policy. For example, one article discussed how charter schools would meet accountability provisions. Another reported on the financial awards given to a few local schools for making academic gains. By the end of this time period, there was a surge in “reporting stories”—stories that gave the public data on how students were doing on the new STAR test that had been implemented in 1998.
In 1997, there were many legislative stories commenting on the proposals being made and argued with respect to the new assessment system. Lastly, there were a few editorial/opinion stories that centered on government control and arguing the merits of giving the state central control over schools. Many believed that local control is best; however, both sides were presented. 2000–2001
During this time period, there were many stories documenting school’s API rankings. These
kinds of stories emerged in communities throughout California with some decrying the problems with API and others stating how well their schools are doing. There were also public debates on how to use API to close the achievement gap as well as a few editorials lamenting the problems with hanging so much on a single test score.
68 Peoples, R., & Petix, M. (1993, April 26). New achievement tests start in state. The Press-Enterprise . 69 Nelson, D. (1994, March 12). Tests measure only so much. Modesto Bee, p. B1.
Education Policy Analysis Archives Vol. 14 No. 1 100
2002 – February 2004 The most recent sets of stories fit under the category of reporting—many stories were
focused on most recent API calculations—and some communities celebrated improvements while others worried about potential state sanctions. A few stories argued against tests, claiming that students had to take too many tests—this viewpoint was expressed by students and parents. Other issues in the news concerned how to accommodate students with disabilities and students whose second language is English when they are forced to take tests.
A selection of stories from each time period represented a cross section of the issues discussed above, and was included in the portfolio. Supplemental Search: Google
A search covering the preceding 30 days was conducted on February 24, 2004 (thus covering
the range of dates January 24, 2004 through that date). The few available were relevant to educational accountability. Supplemental Search: LexisNexis
A search of stories from February 2003 through February 2004 was conducted looking for
specific articles on consequences dolled out to students and/or school personnel in the form of rewards (incentives, bonuses) and sanctions (retention, school takeover). The first search provided over 1,000 documents70 so, searches were disaggregated into two categories based on type of consequence (reward versus sanction). The first of these two searches again eliminated the word “test” from the search string and only looked for rewards. 71 This search yielded 53 hits, six of which were downloaded for more careful review. A second search looked for sanction-oriented stories. This search72 returned 121 stories, of which 44 were downloaded for more careful review. A selection of stories representing the major issues from these two searches was included.
Connecticut
A search was conducted across the entire LexisNexis universe of news media available in
Connecticut.73 This search74 yielded 133 stories, of which 48 were reviewed more carefully for possible portfolio inclusion. Interestingly, in spite of knowing that Connecticut had instituted a statewide exam as far back as 1985, none of the stories emanating from this original search yielded stories before 1998. Therefore, a second set of searches was conducted specifically confined to the time period prior to 1998 to see if there was any coverage of assessment and accountability in the
70 Using the search string: ((assess* or test*) and (teacher or student or principal or superintendent)) and
((reward* or incentive or bonus) or (takeover or fire or punish or remove or close or retention or retain)) 71 Using the search string: ((assess*) and (teacher or student or principal or superintendent)) and (reward* or
incentive or bonus or scholarship) 72 Using the search string: ALLCAPS (API or AYP or NCLB) and (takeover or fail or (school close) or (student
retention) 73 Complete File: Connecticut Law Tribune , Connecticut Post (Bridgeport, CT), The Hartford Courant , M.
LEE SMITH PUBLISHERS & PRINTERS LLC - Regional News Stories. Selected Documents: The Associated Press State & Local Wire, Business Dateline - Regional News Sources, Knight Ridder/Tribune Business News, Knight Ridder/Tribune Business News - Current News, Video Monitoring Services of America (formerly Radio TV Reports)
74 Using the search string: (ALLCAPS (CMT)) or (ALLCAPS (CAPT))
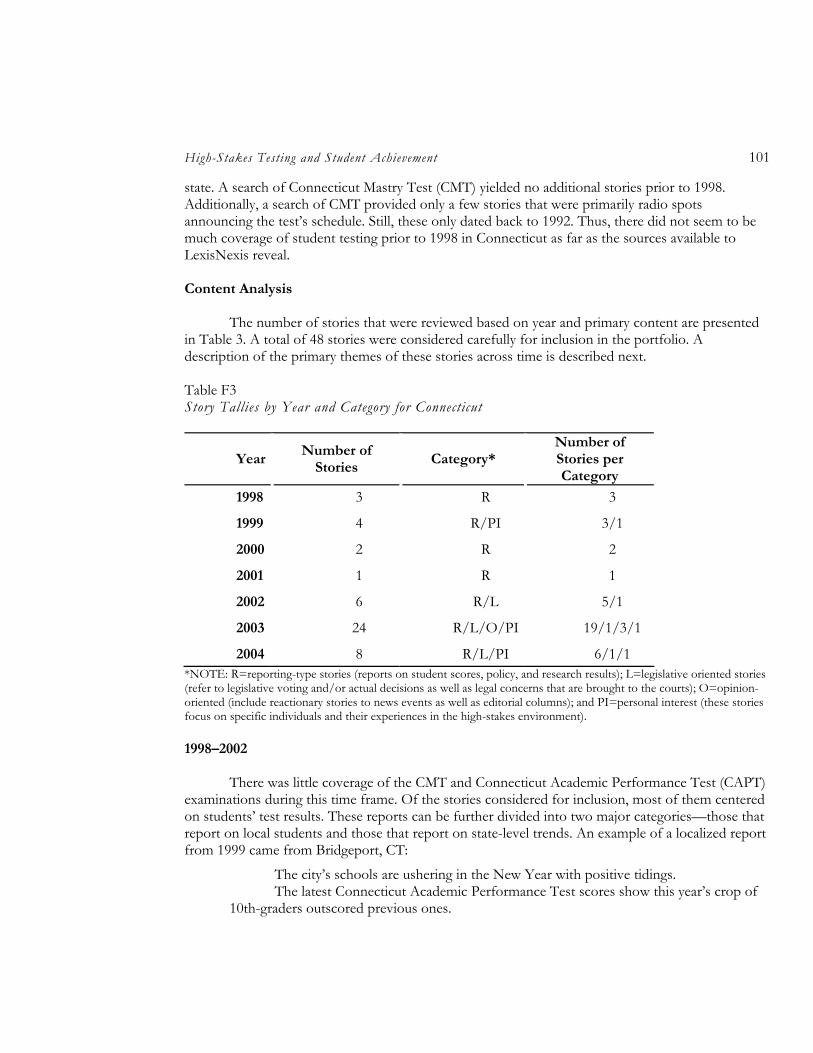
High-Stakes Testing and Student Achievement 101
state. A search of Connecticut Mastry Test (CMT) yielded no additional stories prior to 1998. Additionally, a search of CMT provided only a few stories that were primarily radio spots announcing the test’s schedule. Still, these only dated back to 1992. Thus, there did not seem to be much coverage of student testing prior to 1998 in Connecticut as far as the sources available to LexisNexis reveal. Content Analysis
The number of stories that were reviewed based on year and primary content are presented in Table 3. A total of 48 stories were considered carefully for inclusion in the portfolio. A description of the primary themes of these stories across time is described next. Table F3 Story Tallies by Year and Category for Connecticut
Year Number of
Stories Category*
Number of Stories per Category
1998 3 R 3
1999 4 R/PI 3/1
2000 2 R 2
2001 1 R 1
2002 6 R/L 5/1
2003 24 R/L/O/PI 19/1/3/1
2004 8 R/L/PI 6/1/1 *NOTE: R=reporting-type stories (reports on student scores, policy, and research results); L=legislative oriented stories (refer to legislative voting and/or actual decisions as well as legal concerns that are brought to the courts); O=opinion-oriented (include reactionary stories to news events as well as editorial columns); and PI=personal interest (these stories focus on specific individuals and their experiences in the high-stakes environment).
1998–2002
There was little coverage of the CMT and Connecticut Academic Performance Test (CAPT)
examinations during this time frame. Of the stories considered for inclusion, most of them centered on students’ test results. These reports can be further divided into two major categories—those that report on local students and those that report on state-level trends. An example of a localized report from 1999 came from Bridgeport, CT:
The city’s schools are ushering in the New Year with positive tidings. The latest Connecticut Academic Performance Test scores show this year’s crop of
10th-graders outscored previous ones.
Education Policy Analysis Archives Vol. 14 No. 1 102
Milford’s 10th-graders also outperformed other communities in the city’s economic reference group and ranked ahead of the state average. The state Department of Education released the results Monday.75
Some stories also commented on statewide results. For example, in 1999 one article talked about the mixed successes of students on the most recent CAPT testing.
Statewide scores on the Connecticut Academic Performance Test have changed little, although there were small improvements in math and the interdisciplinary section of the test. Results released Monday indicate while there were some improvements in two sections of the test, the percentage of 10th-graders meeting goals in science and language arts dipped slightly. “As a state we probably haven’t made as much progress as we would have liked, but we know were moving in the right direction,” state Education Commissioner Theodore Sergi said.76
There were also policy-oriented stories such as the one appearing in 1999 discussing the pros and cons of abandoning the practice of social promotion. This issue was prevalent in Hartford:
City school officials will move ahead with plans to end social promotion of students, but they will move a bit slower than first expected. For the first time, city students could repeat a grade for having low scores on the Connecticut Mastery Tests, however the standards are far looser than new Superintendent Anthony S. Amato had indicated in recent weeks. The state policy that discourages promoting failing students just so they can keep up with their age group does not take effect until the next school year. 77
2003–2004
During these two years, more stories emerged discussing the merits of No Child Left Behind
and students’ progress toward meeting state and federally defined academic goals. For example, in 2003, several local news reports show how students performed on the most recent CAPT testing. Many schools were seeing improvements, while a selection of schools continued to face disappointing test results. By far, the largest number of stories were “reporting” how students did on the most recent round of testing.
The most recent selection of stories from 2004 discussed the state’s problems with the testing company that was in charge of grading the CMT. Indeed, CMT scores were delayed because of large errors in scoring amassed by the testing company. Supplemental Search: Google
Several search terms were used to probe for the widest selection of stories for the period of
February 3, 2004 through March 3, 2004. Supplemental Search: LexisNexis
A search confined to the immediately preceding year was conducted looking for specific
articles on consequences dolled out to students and/or school personnel in the form of rewards
75 Spinelli, A. (2002, January 2). Students outshine prior test-takers. Connecticut Post . 76 Associated Press (2000, November 7). Test scores show small improvements for 10th graders. Author. 77 Associated Press (1999, June 14). Hartford will go a bit slower in ending social promotions. Author.
High-Stakes Testing and Student Achievement 103
(incentives, bonuses) and sanctions (retention, school takeover). The search returned 16 stories,78 only two of which were relevant and not redundant from the previous searches.
Georgia
A search was conducted across the entire LexisNexis universe of news media available in
Georgia.79 This search80 yielded over 1,000 stories. Therefore, subsequent searches81 confined to shorter timelines were conducted in an attempt to reduce the number of stories to review. The first search across January 1, 1990, through December 31, 1996, yielded 250 stories of which 41 were downloaded for more careful review. A second search was conducted across a second time frame of January 1, 1997, through December 31, 2001. However, it still yielded too many stories to review (more than 1,000). Therefore, a different search string was used to reduce this larger pool down to a more manageable set of stories. Using a slightly altered search string [(assess!) and (accountab!) and (school or student or teacher) and not (sport or court)] still yielded upwards of 900 stories; therefore, the search string was altered again in another attempt to limit the number of stories. This final search string [(test!) and (accountab!) and (high stakes) and (school or student or teacher) and not (sport or court)] and covering the period of January 1, 1997, through the present yielded a dramatically fewer number of stories (94) all of which were downloaded for careful review.82
In spite of the dramatically reduced number of stories found by limiting the search string, it was reasoned that the resultant selection of stories would represent the most relevant aspects of accountability in the state. Thus, although there were fewer stories to review, the content of these stories probably accounted for a reasonably representative range of issues that would have been found across a broader range of news coverage. Additionally, by reducing the overall number to 94 versus 200 or 300, it allowed for a more careful review and analysis. Content Analysis
The number of stories that were reviewed based on year and primary content are presented in Table 4. A description of the primary themes of these stories across time is described next.
78 Using the search string: ((assess* or test*) and (teacher or student or principal or superintendent)) and
((reward* or incentive or bonus) or (takeover or fire or punish or remove or close or retention or retain)) 79 Complete File: The Atlanta Journal and Constitution; The Augusta Chronicle; Fulton County Daily
Report; Georgia Trend ; M. LEE SMITH PUBLISHERS & PRINTERS LLC - Regional News Stories; The Times Gainesvil le (GA). Selected Documents: ABI/INFORM Selected Documents - Regional News; The Associated Press State & Local Wire; Business Dateline Database; Ethnic NewsWatch; Knight Ridder/Tribune Business News; Knight Ridder/Tribune Business News - Current News; Video Monitoring Services of America (formerly Radio TV Reports).
80 Using the search string: (assess! or test!) and (high-stakes or accountab!) and (school or student or teacher) and not (sport or court)
81 Again, using the search string: (assess! or test!) and (high-stakes or accountab!) and (school or student or teacher) and not (sport or court)
82 Although 94 were closely reviewed, additional stories were eliminated because of redundancy or irrelevancy
(e.g., some of the Atlanta stories actually covered events in neighboring states) leaving 66 stories from which a cross section were selected for portfolio inclusion.
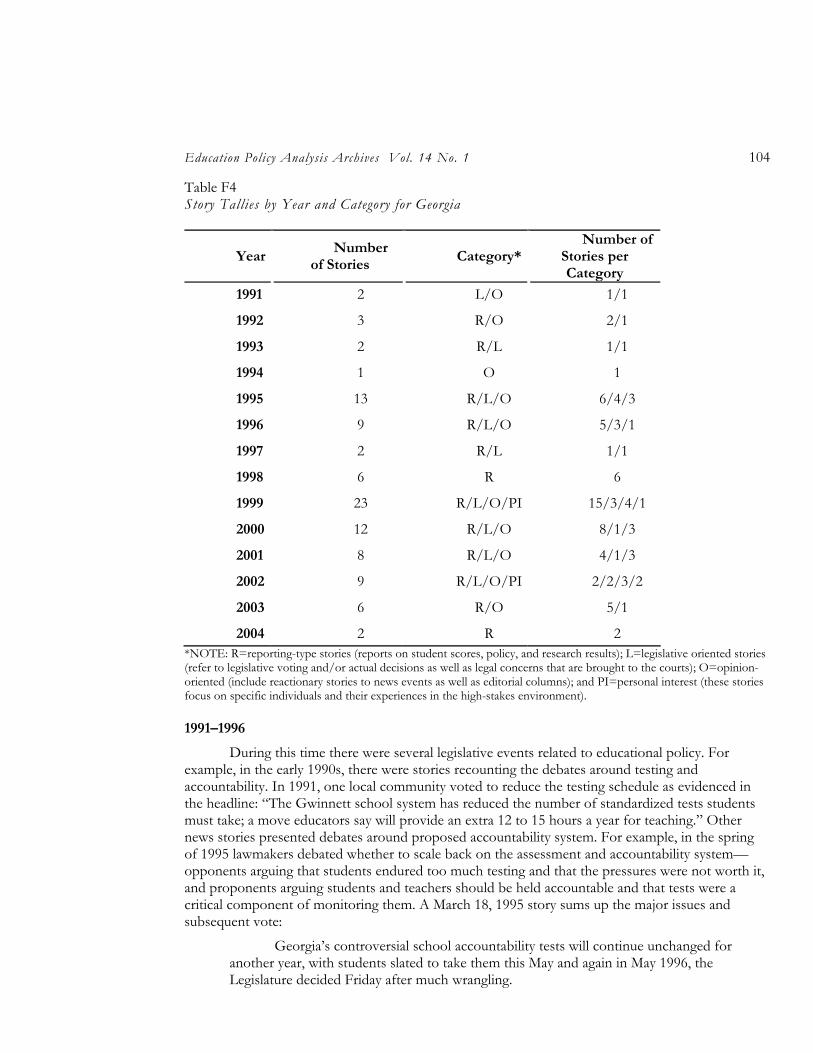
Education Policy Analysis Archives Vol. 14 No. 1 104
Table F4 Story Tallies by Year and Category for Georgia
Year Number
of Stories Category*
Number of Stories per Category
1991 2 L/O 1/1
1992 3 R/O 2/1
1993 2 R/L 1/1
1994 1 O 1
1995 13 R/L/O 6/4/3
1996 9 R/L/O 5/3/1
1997 2 R/L 1/1
1998 6 R 6
1999 23 R/L/O/PI 15/3/4/1
2000 12 R/L/O 8/1/3
2001 8 R/L/O 4/1/3
2002 9 R/L/O/PI 2/2/3/2
2003 6 R/O 5/1
2004 2 R 2 *NOTE: R=reporting-type stories (reports on student scores, policy, and research results); L=legislative oriented stories (refer to legislative voting and/or actual decisions as well as legal concerns that are brought to the courts); O=opinion-oriented (include reactionary stories to news events as well as editorial columns); and PI=personal interest (these stories focus on specific individuals and their experiences in the high-stakes environment).
1991–1996
During this time there were several legislative events related to educational policy. For example, in the early 1990s, there were stories recounting the debates around testing and accountability. In 1991, one local community voted to reduce the testing schedule as evidenced in the headline: “The Gwinnett school system has reduced the number of standardized tests students must take; a move educators say will provide an extra 12 to 15 hours a year for teaching.” Other news stories presented debates around proposed accountability system. For example, in the spring of 1995 lawmakers debated whether to scale back on the assessment and accountability system—opponents arguing that students endured too much testing and that the pressures were not worth it, and proponents arguing students and teachers should be held accountable and that tests were a critical component of monitoring them. A March 18, 1995 story sums up the major issues and subsequent vote:
Georgia’s controversial school accountability tests will continue unchanged for another year, with students slated to take them this May and again in May 1996, the Legislature decided Friday after much wrangling.
High-Stakes Testing and Student Achievement 105
But principals, curriculum directors and other school administrators hired after this spring will not get permanent job guarantees that have been standard-issue for two decades - a decision that business leaders said will prompt a needed shake-up in the way some Georgia schools are run.
Testing and tenure both went down to the wire. After a series of House-Senate stalemates, state Superintendent Linda Schrenko OK’d a compromise that spared the tests in order to assure that school administrators could readily be demoted.
Once the deal was sealed, the Senate voted unanimously to end tenure for administrators, and the House followed, 95–67.
But Shrenko pledged to revisit the tests in time to seek a change in the law next year and revise testing for the 1996–97 school year. State-mandated tests must provide more helpful feedback to teachers and parents, she said.
The Curriculum-Based Assessments, or CBAs, have been given since 1992 to measure how well Georgia schools teach reading, math, science and social studies. They ended up on the chopping block late in the session.
Schrenko and one of the state’s two major teacher groups said the CBAs should be scrapped because they don’t yield results for individual students or classrooms in most cases - only for entire schools - and they cost more than commercial national tests.
But the state school board and the other major teacher group said ending the CBAs might lower educational standards. They urged a one-year delay until complicated questions could be resolved - and they won.
School boards and the Georgia Chamber of Commerce cheered the end of tenure for administrators.
“The passage of this bill is the most significant reform, apart from funding, passed since the Quality Basic Education Act” in 1985, said chamber President Charlie Harman. “It gives elected school boards and their appointed superintendents the right to assemble their own team.”
But educators groups said allowing administrators to be demoted without hearings to show they deserve it could create civil rights violations and won’t solve the state’s education woes.83
During this time period, there were also many opinion pieces that wrangled with issues of accountability. In 1996, one editorial writer discussed the complexities of school reform in Georgia arguing that the testing system had to be overhauled.
A sound educational testing program achieves three goals: evaluation of student performance, feedback on curriculum and instruction and appraisal of teacher competency. Georgia’s student testing program does not measure up. It needs to be revised.
The state tests too much in some grades, not enough in others, and fails to glean the most helpful data from the time devoted to testing, according to a student assessment report by the state Council for School Performance.84
Lastly, a few “reporting” stories described various state policies as well as performance results of students on latest rounds of testing. For example, in 1996, reports emerged on grades schools were assigned based on how well they were doing in reaching academic performance goals.
83 White, B. (1995, March 18). State testing program spared. The Atlanta Journa- Constitution , p. 4C. 84 Editorial (1995, December 11). Student testing needs comprehensive reform. The Atlanta Journal-
Constitution, p. 10A.
Education Policy Analysis Archives Vol. 14 No. 1 106
One headline read: “Schools Graded B And C: State Report Finds Areas That Need Improvement In Richmond And Columbia Counties’ Systems.”85 1997 – 2004
There were several prominent reporting themes that emerged during this time frame. First,
from 1997 to 1999, there were several stories best characterized as “reporting” that presented both political issues and debates (R/p) as well as recent performance results (R/s). Policy debates during this time period included the pros and cons of the new state assessment system, local decisions to end social promotion, and a discussion of the policy of forcing students to pass an exit exam to receive a diploma. Several articles reported on how students performed on recent exams. For example, in 1998 a report indicated that high schoolers who took a practice version of the science portion of the exit exam failed. One headline read: “Exit exam cuts graduation rate: New science portion squeezes out some.”86
Throughout 1999 there were several stories on one large school district’s achievement and debates around social promotion. Gwinnett County School District was the first district in the state to end social promotion for third graders and many articles appeared discussing the problems and concerns with such a policy—both there and for Atlanta area schools. For example, the following story appeared on October 9, 1999:
The Gateway is Gwinnett educators’ version of a “high stakes test” --- a type of standardized test students must pass before moving on to the next grade. Such tests are gaining popularity nationwide as a response to the increasing demand for greater academic standards and accountability. In administering the Gateway, the Gwinnett district --- Georgia’s largest with about 104,000 students --- becomes the first in the state to use a high stakes test.
Starting this school year, Christine’s academic fate and that of thousands of other Gwinnett County public school students will hinge on a single factor: whether they pass the Gateway test.
County school officials will require all fourth-, seventh- and 10th-grade students take the exam in April in an attempt to raise the academic bar.
Critics of high stakes tests question whether the tests, including Gateway, are the best way to gauge student learning. Among their concerns: Is the exam too tough for students? Can teachers cover all the material on the test before it’s administered each year? Should it be the sole criterion for promotion and graduation? Does it truly result in better teaching and learning?
After three years of research and development of the Gateway, Gwinnett County officials think they’ve answered those questions.
They say the test is needed to end social promotion --- the practice of moving students to a higher grade even if they haven’t mastered the material - -- and to ensure against grade inflation --- when teachers boost student grades even if they haven’t earned it. County school officials also say that the test will stress to teachers and students the importance of mastering class work.87
85 Schrade, B. (1996, January 25). Schools graded B and C. The Augusta Chronicle , p. A1. 86 Cumming, D. (1998, June 4). Exit exam cuts graduation rate. The Atlanta Journal- Constitution, p. 01c. 87 Jones, S. L. (1999, October 10). New test raises stakes in Gwinnett. The Atlanta Journal-Constitution, p.
1G.
High-Stakes Testing and Student Achievement 107
The most recent round of stories (2000–2004) focused on the evolution of Georgia’s accountability system and include a cross section of reporting (on statewide tests, school labels), legislative (e.g., passing legislation to end social promotion for third graders in 2001), and opinion (writers expressing mostly concern and resistance to the use of tests as a measure of students, teachers, and schools). Supplemental Search: Google
Several search terms were used to probe for the widest selection of stories for the time
period of February 12, 2004 through March 12, 2004. A selection of the resultant stories is included in the portfolio. Supplemental Search: LexisNexis
A search confined to the immediately preceding year was conducted looking for specific
articles on consequences dolled out to students and/or school personnel in the form of rewards (incentives, bonuses) and sanctions (retention, school takeover). This search88 returned 294 stories, of which 29 were downloaded for review. A selection of these stories was included in the portfolio.
Hawaii
A search89 was conducted across the entire LexisNexis universe of news media available in
Hawaii.90 This search yielded 49 stories dating back to 1998, of which 19 were reviewed more carefully for possible portfolio inclusion. Content Analysis
The number of stories that were reviewed based on year and primary content are presented
in Table 5. There were a total of 19 stories that were considered carefully for inclusion in the portfolio. A description of the primary themes of these stories across time is described next.
88 Using the search string: ((assess* or test*) and (teacher or student or principal or superintendent)) and
((reward* or incentive or bonus) or (takeover or fire or punish or remove or close or retention or retain)) and not (candidate or court or health or charter)
89 Using the search string: (assess! or test!) and (high-stakes or accountab!) and (school or student or teacher) and not (sport or court)
90 Complete File: The Honolulu Advertiser; Selected Documents: The Associated Press State & Local Wire; Business Dateline - Regional News Sources.
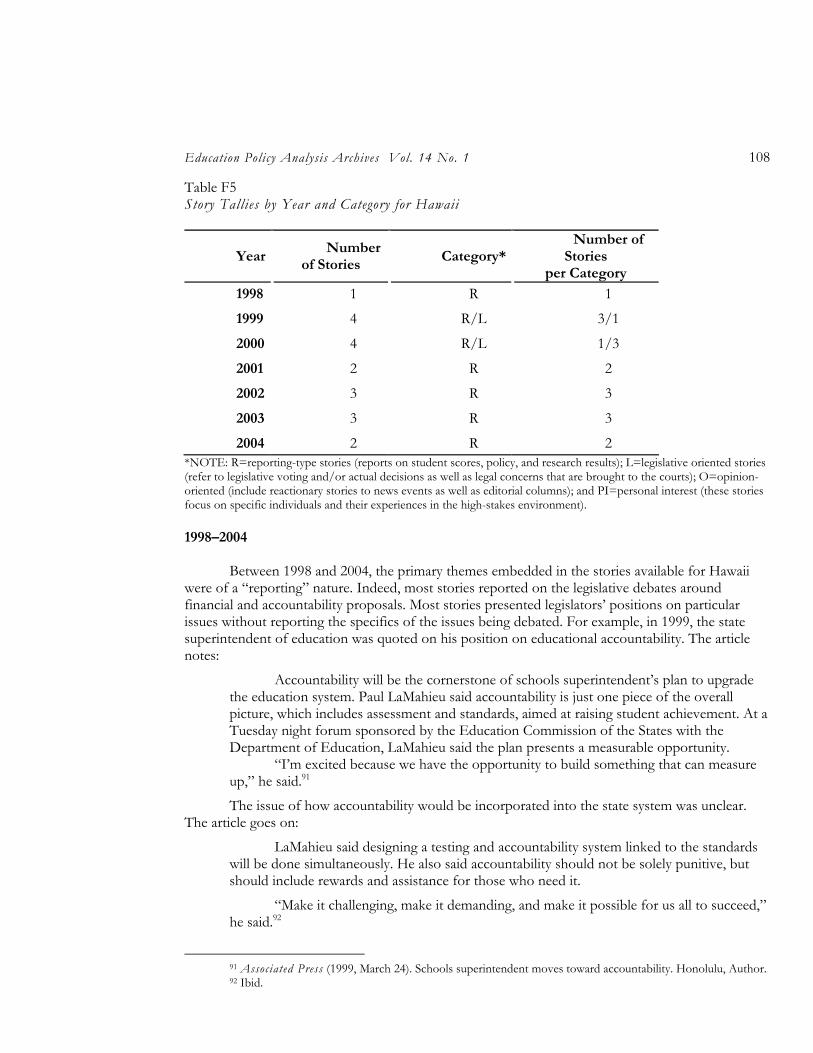
Education Policy Analysis Archives Vol. 14 No. 1 108
Table F5 Story Tallies by Year and Category for Hawaii
Year Number
of Stories Category*
Number of Stories
per Category
1998 1 R 1
1999 4 R/L 3/1
2000 4 R/L 1/3
2001 2 R 2
2002 3 R 3
2003 3 R 3
2004 2 R 2 *NOTE: R=reporting-type stories (reports on student scores, policy, and research results); L=legislative oriented stories (refer to legislative voting and/or actual decisions as well as legal concerns that are brought to the courts); O=opinion-oriented (include reactionary stories to news events as well as editorial columns); and PI=personal interest (these stories focus on specific individuals and their experiences in the high-stakes environment).
1998–2004
Between 1998 and 2004, the primary themes embedded in the stories available for Hawaii
were of a “reporting” nature. Indeed, most stories reported on the legislative debates around financial and accountability proposals. Most stories presented legislators’ positions on particular issues without reporting the specifics of the issues being debated. For example, in 1999, the state superintendent of education was quoted on his position on educational accountability. The article notes:
Accountability will be the cornerstone of schools superintendent’s plan to upgrade the education system. Paul LaMahieu said accountability is just one piece of the overall picture, which includes assessment and standards, aimed at raising student achievement. At a Tuesday night forum sponsored by the Education Commission of the States with the Department of Education, LaMahieu said the plan presents a measurable opportunity.
“I’m excited because we have the opportunity to build something that can measure up,” he said.91
The issue of how accountability would be incorporated into the state system was unclear. The article goes on:
LaMahieu said designing a testing and accountability system linked to the standards will be done simultaneously. He also said accountability should not be solely punitive, but should include rewards and assistance for those who need it.
“Make it challenging, make it demanding, and make it possible for us all to succeed,” he said.92
91 Associated Press (1999, March 24). Schools superintendent moves toward accountability. Honolulu, Author. 92 Ibid.
High-Stakes Testing and Student Achievement 109
More recent articles had similar perspectives. That is, legislators were quoted and issues were debated, but specifics on how accountability would be implemented were not provided. The most recent article found in 2004 discussed what measures would be up for a vote in November, but again, it is not clear what the specific nature of these issues are or where the state’s constituency stands on it. Part of the issue is that the state is in a transitional period where many issues are being debated, but will not be clearly defined until it is put to a vote. In this article, some of the issues are raised:
Gov. Linda Lingle has made it her mantra on the issue of education reform: Let the people decide. But decide what? Seven local school boards or 17 elected members of the state Board of Education? Veto power or voting power? Autonomy?
By the end of the week, Hawaii voters should have some idea of what measure - or measures - they will get to decide next fall as lawmakers go about trying to reform the state’s oft-criticized public education system. The choice may not be as simple as just choosing whether to set up seven locally elected school boards, Lingle proposes.
Lawmakers considered as many as five constitutional amendments related to education that they conceivably could ask voters to decide in November. Putting all five measures on the ballot is not likely, but lawmakers say they want to give themselves ample time to study all possible ways of raising student achievement in the public schools.93
Many of the stories are included in the portfolio to represent the range of issues being debated over time. Supplemental Search: Google
A search covering the immediately preceding 30 days was conducted on March 3, 2004 (thus
covering the range of dates February 3, 2004, through that date). Several search terms were used to probe for the widest selection of stories. A search using just the term “assessment” yielded 60 stories, of which only two were relevant and are included in the portfolio. Supplemental Search: LexisNexis
A search confined to the immediately preceding year was conducted looking for specific
articles on consequences dolled out to students and/or school personnel in the form of rewards (incentives, bonuses) and sanctions (retention, school takeover). The search94 provided 12 stories, of which none were relevant. Follow-up searches were conducted looking more pointedly for rewards and sanctions throughout the state and based on the previous year. The first search, using the string (assess* or test*) and teacher (reward or bonus or incentive), yielded no stories. A second search using the string (assess* or test*) and school award, returned no stories. A few searches looking for sanctions were subsequently conducted. The first, using the string (assess* or test*) and school closure, yielded no stories. Similarly, a second search, using the search string: (assess* or test*) and school reform, also provided no stories. Another two searches, using the search strings (assess* or test*) and fire, and (assess* or test*) and school takeover, also yielded no stories. A final attempt was made looking for stories on consequences to students. A search, using the search string: (assess* or test*) and student (promotion or retention or scholarship or graduation), yielded two stories—both
93 Reyes, B. J. (2004, February 15). Come November, choice for voters may be many. Honolulu., HI: Associated Press .
94 Using the search string: ((assess* or test*) and (teacher or student or principal or superintendent)) and ((reward* or incentive or bonus) or (takeover or fire or punish or remove or close or retention or retain))
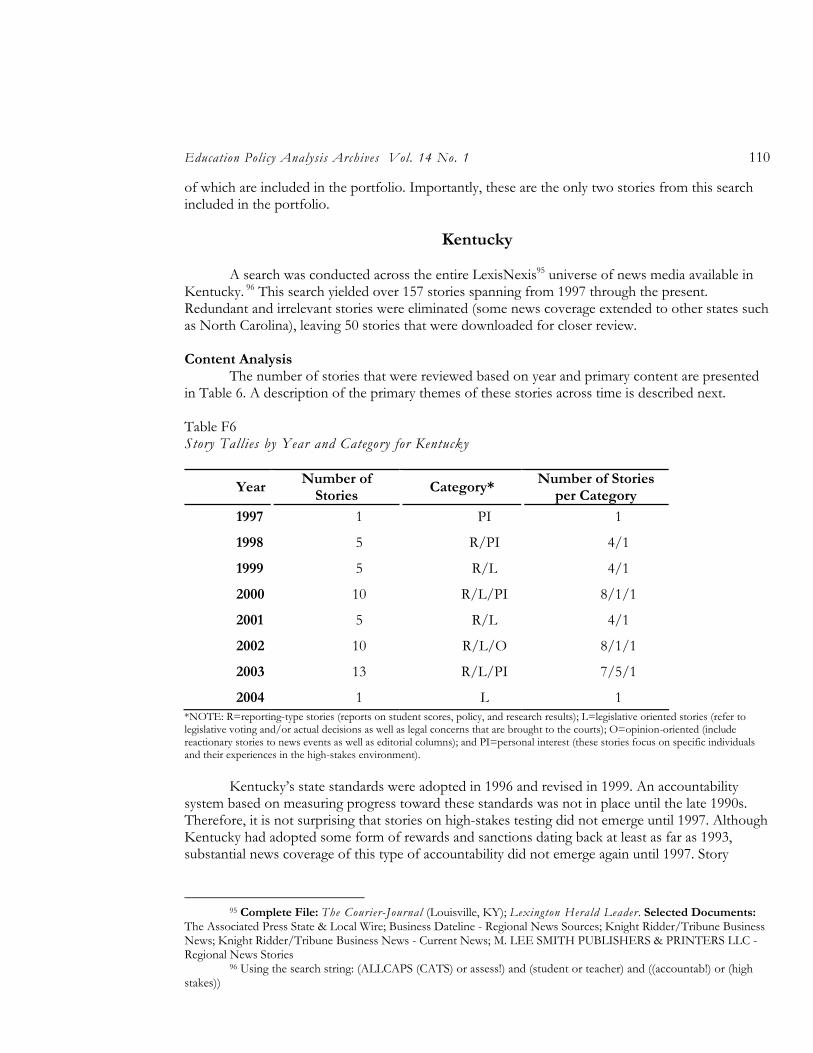
Education Policy Analysis Archives Vol. 14 No. 1 110
of which are included in the portfolio. Importantly, these are the only two stories from this search included in the portfolio.
Kentucky
A search was conducted across the entire LexisNexis95 universe of news media available in
Kentucky. 96 This search yielded over 157 stories spanning from 1997 through the present. Redundant and irrelevant stories were eliminated (some news coverage extended to other states such as North Carolina), leaving 50 stories that were downloaded for closer review. Content Analysis
The number of stories that were reviewed based on year and primary content are presented in Table 6. A description of the primary themes of these stories across time is described next. Table F6 Story Tallies by Year and Category for Kentucky
Year Number of
Stories Category*
Number of Stories per Category
1997 1 PI 1
1998 5 R/PI 4/1
1999 5 R/L 4/1
2000 10 R/L/PI 8/1/1
2001 5 R/L 4/1
2002 10 R/L/O 8/1/1
2003 13 R/L/PI 7/5/1
2004 1 L 1 *NOTE: R=reporting-type stories (reports on student scores, policy, and research results); L=legislative oriented stories (refer to legislative voting and/or actual decisions as well as legal concerns that are brought to the courts); O=opinion-oriented (include reactionary stories to news events as well as editorial columns); and PI=personal interest (these stories focus on specific individuals and their experiences in the high-stakes environment).
Kentucky’s state standards were adopted in 1996 and revised in 1999. An accountability
system based on measuring progress toward these standards was not in place until the late 1990s. Therefore, it is not surprising that stories on high-stakes testing did not emerge until 1997. Although Kentucky had adopted some form of rewards and sanctions dating back at least as far as 1993, substantial news coverage of this type of accountability did not emerge again until 1997. Story
95 Complete File: The Courier-Journal (Louisville, KY); Lexington Herald Leader. Selected Documents:
The Associated Press State & Local Wire; Business Dateline - Regional News Sources; Knight Ridder/Tribune Business News; Knight Ridder/Tribune Business News - Current News; M. LEE SMITH PUBLISHERS & PRINTERS LLC - Regional News Stories
96 Using the search string: (ALLCAPS (CATS) or assess!) and (student or teacher) and ((accountab!) or (high stakes))
High-Stakes Testing and Student Achievement 111
selection for the portfolio is based on how accountability and assessment, legislative proposals, adoptions, and implementation were covered from 1997 through the present.
From 1997 through 1998, there was little coverage on Kentucky’s statewide testing and accountability system (at least as defined by what is covered on LexisNexis and using the search string previously defined). During that time the new accountability system was being introduced and school-level testing results were revealed. One October 1998 story written by the Associated Press summarized the current accountability issues:
The state’s philosophy about accountability for public schools has shifted - significantly, some say.
Since an education reform movement began in 1990, the Kentucky Board of Education has required schools to be judged by whether their students mastered the subjects deemed necessary in meeting high academic standards.
How students individually compared with one another, or with students in other states, was not paramount. Besides other states did not have high-stakes accountability like Kentucky, with cash rewards for success and sanctions for failure.
Individual comparisons still are not paramount, board members said Tuesday. But they decided that schools’ overall accountability ratings should include, in small part, scores of standardized tests designed to show how individual students stack up against their peers.97
Interestingly, Kentucky’s initial accountability system was defined by how students mastered subjects. However, in 1998, the state board of education adopted a new set of norm-referenced tests to hold students and schools accountable. This change yielded confusion in how schools were subsequently labeled—and therefore affecting rewards and sanctions. In December of 1998, it was reported:
The numbers say 58 Kentucky schools declined drastically in two years. Education Commissioner Bill Cody said he does not necessarily believe it.
“I don’t think the classifications were very sound,” Cody said as the latest round of public school test scores became public Thursday.
Nine schools were classified “in crisis” in 1996, the end of the previous testing cycle of Kentucky’s system for assessing student progress and holding schools accountable for the results.
The sudden increase to 58 “is an artifact of a flawed accountability formula,” Cody said. “I don’t think that number 58 represents a fact that there are 58 schools in crisis.”
Schools are no longer labeled “in crisis.” They now are classified as “decline/parent notification,” meaning parents can have their children sent elsewhere. The effect is the same. Some schools’ classifications have always seemed anomalous.
A school can be among the highest scoring in the state, yet be in decline because it competes against its own past performance, not against other schools.98
By 1999, a new accountability system was adopted:
The Kentucky Board of Education is poised to give schools - literally - a graphic illustration.
97 Wolfe, C. (1998, October 6). Standardized test will count for school accountability. Frankfort, KY:
Associated Press . 98 Wolfe, C. (1998, December 3). Cody: School accountability formula ‘flawed.’ Frankfort, KY: Associated
Press .
Education Policy Analysis Archives Vol. 14 No. 1 112
Under a plan that could be approved today, every public school in Kentucky would have a common target to shoot for and the same deadline for hitting it.
A school’s progress could be plotted on a graph. There would be a starting point, an ending point and a straight line connecting them. A school’s performance, ideally, would follow that “line of expected growth.”
That is the essence of a 14-year measuring rod - a model for tracking school improvement, or lack of it, from 2000 through 2014. The new Commonwealth Accountability Testing System - CATS - was mandated by the 1998 General Assembly.99
Through 2000 and up to the present, stories mostly reported on current policy debates (R/p) and student performance levels (R/s). For example, throughout 2000, there was a series of stories describing how the state was going about the adoption of the new, and more rigorous, state performance standards. And, as the new state testing system was put into place to measure these standards (and appearing through 2000 and 2001), stories documented how students performed with the state releasing third graders’ CATS scores and fourth graders’ writing scores (among others).
By 2002 and 2003, many stories were dedicated to the debates around how Kentucky’s accountability system, already in progress, would adapt to No Child Left Behind (NCLB) mandates. Some, it was reported, were especially critical of NCLB demands and fought to waive many of their requirements. Other stories described which schools had “failed” to make adequate yearly progress (AYP) under NCLB. For example, in September of 2002, one headline reported, “Kentucky Registers 28 Public Schools on Federal ‘Failing’ List.”100 Schools that failed to make AYP were listed in this article. Similarly, legislative concerns were reviewed—including how Kentucky would introduce more testing to comply with NCLB (an issue met with concern and criticism later in the press).
A cross section of the primary themes, issues, and trends in Kentucky are represented in the selection of stories included in the portfolio. Supplemental Search: Google
A search was conducted on March 16, 2004 for the 30 days preceding it (thus covering the
range of dates February 16, 2004 through that date). Several search terms were used to probe for the widest selection of stories. A selection of these stories is included in the portfolio. Supplemental Search: LexisNexis
A supplemental search101 was conducted seeking out stories specifically addressing
consequences to schools, districts, teachers, and/or students. This search was conducted over the previous year and returned 47 stories, most were irrelevant. Also, many of these stories simply repeated the themes that are included in the main thematic analysis. Still, three stories were included in the portfolio that discussed three issues relevant to the effects of sanctions and rewards in the state of Kentucky.
99 Wolfe, C. (1999, April 12). Board poised to adopt straight-line accountability model. Louisville, KY:
Associated Press . 100 Kentucky registers 28 public schools on federal ‘failing’ list. (2002, September 21). Lexington Herald-
Leader. 101 Using the search string: ((ALLCAPS (CAT)) or assess!) and (teacher or student or principal or
superintendent)) and ((reward* or incentive or bonus) or (takeover or fire or punish or remove or close or retention or retain))
High-Stakes Testing and Student Achievement 113
Louisiana
A search was conducted across the entire LexisNexis102 universe of news media available in
Louisiana for the time period of January 1, 1990, through December 31, 1999, using a search string including the acronyms Louisiana Educational Assessment Program (LEAP) and Graduation Exit Examination (GEE). 103 This search yielded over 200 stories of which 57 were downloaded for review. A second search was conducted for the time period of January 1, 2000, to February 12, 2004, using the same search string; however this yielded more than 1,000 documents. Therefore, subsequent searches confined to shorter time periods were conducted in an attempt to reduce the number of stories to review.
The first follow-up search used a different search string104 and was confined to only the most prominent Louisiana Newspaper (The Times-Picayune) and covering the time period of January 1, 2000, through December 31, 2002. This search yielded 398 stories, of which 102 were downloaded. A second follow-up search was conducted across the time frame of January 1, 2003 through March 13, 2004, yielding 194 stories, of which 65 were downloaded for review. Content Analysis
The number of stories that were reviewed based on year and primary content are presented
in Table 7. A description of the primary themes of these stories across time is described next. Table F7 Story Tallies by Year and Category for Louisiana
Year Number of Stories
Category* Number of Stories per Category
1994 1 R 1
1995 0 None 0
1996 2 R/L 1/1
1997 10 R/L 5/5
1998 4 R/L/PI 2/1/1
1999 40 R/L/O/PI 26/8/3/2 (+1 misc.)
2000 57 R/L/O/PI 30/16/5/6
2001 25 R/O/PI 19/3/3
102 Complete File: The Advocate (Baton Rouge, LA); CityBusiness North Shore Report (New Orleans, LA);
Daily Advertiser (Lafayette, LA); Daily Town Talk (Alexandria, LA); M. LEE SMITH PUBLISHERS & PRINTERS LLC - Regional News Stories; New Orleans CityBusiness (New Orleans, LA); The News Star (Monroe, LA); The Times-Picayune; The Times (Shreveport, LA). Selected Documents: The Associated Press State & Local Wire; Business Dateline - Regional News Sources; Video Monitoring Services of America (formerly Radio TV Reports).
103 Using the search string: (ALLCAPS (LEAP or GEE)) and (student or teacher) and ((accountab!) or (high stakes))
104 (ALLCAPS (LEAP or GEE)) and (student or teacher) and ((accountab!) or (high stakes)) and not court or health or sport!
Education Policy Analysis Archives Vol. 14 No. 1 114
2002 19 R/L/O/PI 14/1/2/2
2003 56 R/L/O/PI 30/10/13/2 (+1 misc)
2004 9 R/L/O/PI 6/1/1/1 *NOTE: R=reporting-type stories (reports on student scores, policy, and research results); L=legislative oriented stories (refer to legislative voting and/or actual decisions as well as legal concerns that are brought to the courts); O=opinion-oriented (include reactionary stories to news events as well as editorial columns); and PI=personal interest (these stories focus on specific individuals and their experiences in the high-stakes environment).
1990–1999
Although the search during this time frame included 1990–1993, stories containing the terms
LEAP or GEE did not first appear until 1994. Between 1994 and 1999, a large majority of stories were “reporting” in nature. Of these, many included “policy” related discussions (R/p) that described the ongoing issues, events, and debates around the state’s accountability system. For example, in 1996 a July article discussed the plight of several schools targeted for school improvement:
Ten of Louisiana’s worst schools will be targeted this fall for intensive improvement in a test run of the state’s planned school accountability program. The schools will be chosen by the Department of Education based on standardized test scores, tempered by “uncontrollable variables” such as poverty. The schools will be asked to write or revive improvement plans, and the department will offer training or other help to implement them.105
Similarly, in an article in March of 1999, a news writer described how the upcoming and new testing system adopted by the state was affecting students. The writer also described for readers what the new assessment system was and how it was going to be implemented and used:
Children in grades 3, 5 and 7 will take the Iowa Test of Basic Skills. Children in fourth and eighth grades will take a revised version of the Louisiana Educational Assessment Program, called LEAP 21. The LEAP 21 will count for 60 percent of a school’s rating on a scale created by the state Board of Elementary and Secondary Education. The Iowa test is weighted 30 percent. Attendance will make up 10 percent of the rating for kindergarten through sixth grade. For grades 7 through 12, attendance is worth 5 percent and the dropout rate is worth 5 percent. The state board will use this year’s results to set goals for schools. Schools that exceed their goals every two years will be rewarded with praise and extra money. A school “in decline,” one with a flat or falling score, will face increased oversight and direction from Baton Rouge. It’s all part of Louisiana’s school accountability program, and it has educators alternately anxious and excited.106
Another prominent type of story appearing during this time frame was “legislative” in theme. Within this category stories were further differentiated into “legal concerns and debates (L/l) and “voting/decisions” (L/v). Many stories emanating from 1996 – 1998 described the ongoing debates among state school board members in adopting a new accountability program. For example, in December 1997 it was revealed that one school board member found a flaw in the new
105 Shipley, S. (1996, July 27). State plan to target 10 schools. Times-Picayune, p. A2. 106 Waller, M. (1999, March 12). Schools prep for state tests: Some students say buildup makes anxiety even
worse. Times-Picayune , p. B3.
High-Stakes Testing and Student Achievement 115
accountability system. This article brings to light some of the issues the state school board was wrangling with in creating a fair accountability system:
A member of the state’s top school board unveiled statistics Thursday that she said demonstrate a major flaw in the new school accountability effort. Board of Elementary and Secondary Education member Donna Contois said she found a major problem with requiring school districts to identify the 20 percent of their schools that perform the worst. Contois said she favors the state’s accountability effort, but added it’s unfair to wrongly label schools in high-achieving districts as being low performing when they really aren’t. By the same token, Contois said, it isn’t a good idea to limit some poorer-performing districts to naming and helping only 20 percent of their schools if more need assistance.107
Another example of this sort of coverage came in 1998 when an article appeared describing the debates around creating a passing cut-off score on the LEAP.
Plans for new “high-stakes” tests for Louisiana’s public school students, with harsh consequences for poor results, could be unpopular with the public, state education officials said Tuesday. But members of the Board of Elementary and Secondary Education haven’t decided what the stakes will be. The Legislature passed a bill last year requiring public schools to give fourth- and eighth-graders standardized tests beginning in the spring of 2000 that will determine whether students can move to the next grade. At a BESE committee meeting Tuesday, members questioned the state education department’s recommendations on how to treat the test results. Possible scores on the test, called “LEAP for the 21st Century,” are: “unsatisfactory,” “approaching basic,” “basic,” “proficient” and “advanced.”108
In 1999, a large number of stories appeared from our search as it was a significant year in Louisiana’s accountability evolution. There were several stories that fit into the Legislative/voting category that described the decisions of the state board of education regarding cut off scores, accountability decisions, and labeling systems. There were many “reporting” stories that described how the state debated the LEAP. For example, in February of 1999, it was reported that the LEAP had been revamped to make it more difficult. The article reported on this legislative change and presented debates on it.
LEAP 21, as the revamped Louisiana Educational Assessment Program has been dubbed by education officials, will require students to work through a more complicated, higher-order thinking process to arrive at correct answers. For example, students might be asked to find a number that is even and a multiple of both five and seven, given options such as 35, 49, 50 and 70. Eighth-graders also can expect to confront difficult questions along the lines of “Davey wears a shoe that is 6 inches long. By carefully putting one foot in front of the other, he can measure a room. How many steps will Davey take to measure the length of a room that is 24 feet long?”
Some parents voiced concern that consistent grading of such a test will be difficult. Contois said graders will be trained to identify the required components of essay answers. The tests were developed by experts in each subject and have been assessed for validity and reliability. Parents also expressed interest in developing programs for young students to address individual needs and better prepare them for the tests, and also for those who fail the LEAP exam more than once but might succeed in alternative learning environments.
107 Myers, D. (1997, December 5). Accountability law is flawed, official says. The Advocate , p. 1A. 108 Weiss, J. (1998, April 22). BESE debates consequences of failing new tests. Times-Picayune , p. A2.
Education Policy Analysis Archives Vol. 14 No. 1 116
Educators said the new tests, and the accountability program as a whole, has been designed to meet the needs of both groups of students.109
Later in the year, several reports emerged documenting student performance on the latest Iowa Test of Basic Skills (ITBS) and LEAP tests. One story reported on the successes of a local school.
West Feliciana Parish students did well on the nationally standardized tests given in Louisiana earlier this year, and the parish’s third-graders just missed leading the entire state, according to figures released last month. Only St. Tammany Parish - by one percentage point - topped West Feliciana’s third-graders on the Iowa Tests of Basic Skills, an achievement test used to compare student performance locally with that of students tested in a national sample.110
Others didn’t do as well:
At least one fourth- or eighth-grader at every New Orleans public school, including the magnet schools, failed a critical portion of a statewide standardized test they took in the spring, according to school-by-school test results released Wednesday.111
There were a large number of stories covering the issue of social promotion and summer school. Students in Louisiana in grades 4 and 8 have to pass LEAP in order to be promoted. 1999 was the last year before this policy was to go into effect. How students performed on this year’s tests indicated what schools/districts had to look forward to in subsequent years when the policy goes into effect. Some schools instituted a volunteer, but highly recommended summer school program to prepare students for next year’s test.
A five-week session of summer school ended Friday for 7,354 Orleans Parish fourth- and eighth-graders who will be taking the new statewide “high-stakes” tests next spring. If the children fail the math or English section of the Louisiana Educational Assessment Program test, they will not be automatically promoted to the next grade.
Based on predictions that 60 to 80 percent of children could fail the test, the district made free summer-school classes available to all rising fourth- and eighth-graders, not just those who needed remedial courses. Sixty-nine percent of the district’s fourth-graders and 63 percent of the eighth-graders attended, said Gertrude Ivory, interim director of summer school.112
2000–2002 The primary events and themes from 2000–2002 centered on how the accountability system
evolved in Louisiana—i.e., in terms of state law as well as how the state planned to comply with the newly adopted NCLB act. Most reporting activities during this time period occurred in 2000 during which several main events happened. First, there were vehement debates in the press over the policy to end social promotion. Parents had formed a group to protest the policy of holding students back based on test scores. On January 13, 2000 it was reported:
109 MacGlashan, S. (1999, February 26). Tests taking LEAP forward in difficulty. Times-Picayune , p. B1. 110 Minton, J. (1999, June 27). W. Feliciana students among top in LA on test. Capital City Press , p. B1. 111 Minton, J. (1999, June 27). W. Feliciana students among top in LA on test. Capital City Press , p. B1. 112 Gray, C. (1999, July 17). School’s out for students preparing for LEAP test. Times-Picayune , p. B3.
High-Stakes Testing and Student Achievement 117
A group of parents of public school students are organizing to stop the state Department of Education from failing fourth- and eighth-grade students who cannot pass a portion of the Louisiana Educational Assessment Program test.
The group, calling itself Parents for Educational Justice, will meet tonight at 6 at St. Mark’s United Methodist Church, 1130 N. Rampart St.
C.C. Campbell-Rock and her husband, Raymond Rock III, formed the group after seeing the toll that intensive LEAP tutoring was taking on their daughter.
Although the fourth-grader gets A’s and B’s at Dibert Elementary School in New Orleans, she worries about failing the test in March and being held back from fifth grade, Campbell-Rock said. Her daughter also worries that some of her friends would transfer to private schools if they failed the LEAP test, she said.
Rock said she wonders how students held back because of LEAP will regain academic motivation or momentum.113
Subsequently, a flurry of stories emerged that reflected the public debate over the pros and cons of ending social promotion, culminating in local school boards adopting their own policies around social promotion. For example, New Orleans school district voted that students should not be held back because of performance on LEAP because they had not been adequately prepared:
In a resolution passed 4–3 Monday night, the School Board said that students have not been adequately prepared for the exam and that it should not be used as the main criteria for determining promotion.114
However, in spite of the local vote, state department of education officials refused to bend:
State Superintendent of Education Cecil Picard said he was “disappointed” that the state’s largest school system followed the New Orleans City Council in taking a symbolic stance against the Louisiana Educational Assessment Program test. And he said he doubted the state Board of Elementary and Secondary Education would change the exam’s intent.115
A similar policy was confirmed in December 2000 for eighth graders:
The state Board of Elementary and Secondary Education on Tuesday made more tweaks to the evolving eighth-grade testing policy, making it marginally easier for students who fail the LEAP test to advance to high school.
The changes were endorsed unanimously in committee Tuesday and are expected to receive final approval Thursday. They would leave the policy tougher than other recent proposals.
Under the new policy, eighth-graders would move to ninth grade only if: • They pass both the English and math parts of the LEAP, either in the
spring or on a summer retest. • Or, after repeating eight grade, they pass at least one part of the LEAP
test, take summer classes and take a ninth-grade remedial class in the subject they failed. The original proposal would have let students move to ninth grade even if they failed the entire test twice.
Now, schools can move eighth graders who fail LEAP to “8.5” grades on high school campuses, where they take some ninth-grade classes but also must take remedial
113 Gray, C. (2000, January 13). Pupils pay for schools’ failure, parents say. Times-Picayune , p. B1. 114 Gray, C. (2000, March 1). N.O. board’s protest of LEAP rejected. Times-Picayune, p. A01. 115 Gray, C. (2000, March 1). N.O. board’s protest of LEAP rejected. Times-Picayune, p. A01.
Education Policy Analysis Archives Vol. 14 No. 1 118
classes in each LEAP subject they failed. Students must take summer classes to be eligible for that option.116
Other types of prominent “reporting” themes included general policy implementation around testing (e.g., upcoming test schedules, how schools were preparing for tests such as holding pep rallies, educators’ and parents’ worries about upcoming tests and stakes attached to them) and how students fared on tests (e.g., what percentage of students statewide and locally passed the recent LEAP or GEE tests). A cross section of this type of reporting was included in the portfolio. As part of this type of reporting, stories emerged discussing Louisiana’s system of labeling schools. Based on test scores from 1999 and 2000, 2001 was the first year in which these kinds of stories appeared discussing how schools were faring (e.g., public documentation of specific schools and school districts that were succeeding and those that were failing according to student performance on tests). Similarly, many stories documented the system of sanctions and rewards schools did (or could) receive based on how their students fared on the statewide tests.
For example, in 2001, a story on the most recent round of testing and school improvement revealed that one district had schools that had made improvements earning them rewards:
All but eight of Jefferson Parish’s public elementary and middle schools improved their academic scores enough during the past two years to avoid state-mandated reform measures, a new report shows. Fifty-seven of the 72 Jefferson schools even improved enough to earn cash rewards from the state, which could total about $750,000 for instructional enhancements, based on a state formula. The eight schools that fell short of goals set by the state will be placed on a track for reform.
As part of its school accountability effort, the state first assigned ratings to schools in 1999 based mostly on standardized test scores with partial consideration for attendance and drop-out rates. Those ratings were the basis for two-year improvement goals set for each school. The schools achieving “exemplary” and “recognized” growth will get money from the state, awarded on a per-pupil basis from a $10 million pot. Exemplary schools, which exceeded their growth targets, will receive $26.25 per student. Recognized schools, which met their targets, will receive $17.50. Individual schools will decide how to spend the money, subject to state regulations. But some schools that failed to reach their targets will begin “corrective actions,” which include help from a school district team of educators and the required writing of an improvement plan. When comparing just 1999 scores to just 2001 scores, the school in Jefferson that showed the most improvement was Westwego Elementary. Its 40.3-point increase earned it a label of “exemplary academic growth.”117
Finally, there were several “editorials” during this time. Some supporting the institution of Louisiana’s “tough” accountability laws:
Yes, LEAP testing is fair to the children of Louisiana. Yes, it is appropriate to hold everyone accountable for the success of our children, including parents, teachers school officials and most importantly our students. We need to start with our children. They are the foundation for our future. If you were building a house, you wouldn’t start with the roof. You’d start with the foundation. If children don’t learn to read and write at appropriate grade levels, they’ll never graduate anyway.
116 Thevenot, B. (2000, December 13). LEAP policy tweaked by panel. Times-Picayune , p. 5. 117 Waller, M. (2001, November 7). Most Jefferson Parish schools get passing mark for academic growth.
Times-Picayune , p. 1.
High-Stakes Testing and Student Achievement 119
It’s not going to improve our children’s self-concept if we continue to pass them along even though they have not learned what they need to be successful at the next grade level.118
And some opposing it:
The rhetoric of calling for “tougher standards” and the mania of high-stakes testing are doing harm to young people here and across the nation.
Teachers are being reduced to test-prep technicians and students are bored out of their skulls with constant drilling and test practice.
The real tragedy is that students aren’t learning and are in fact dropping out. What do the tests measure anyway? Speed, recall and test-taking skills. What the tests do not measure are curiosity, initiative, empathy, improvement,
honesty, diligence and creativity. BESE should end reliance on the LEAP as the sole criterion on which to base
decisions that have such a large impact on the lives of young people.119
2003–2004 Because the search of this time period was conducted in March of 2004, it consisted
primarily of coverage of 2003 events; many stories documented events before, during, and after the spring 2003 administration of LEAP. During the spring of 2003, many stories documented how schools were preparing students for the LEAP. These are evidenced in several headlines: “Pep rally last stop before LEAP test,” “Rally to psych LEAP students: It’s a chance to let off steam before big test,” “Algiers fourth-graders prep for LEAP with feast: Teachers try to calm youngsters’ nerves,” and “Schools, churches help kids with LEAP: High-stakes testing planned for March.”
In April 2003, a detailed article showed the most recent district-level ratings and how they were calculated:
In results released Thursday, school districts throughout Louisiana were rated on their academic achievement. The district wide rankings are based on District Performance Scores, which are developed from:
• Fourth- and eighth-grade scores in spring 2002 on the Louisiana Educational Assessment Program for the 21st Century, known as LEAP 21.
• Third-, fifth-, sixth- and seventh-grade scores on the Iowa Test of Basic Skills last year.
• Tenth- and 11th-grade scores on the Graduate Exit Exam for the 21st Century, or GEE 21, taken last spring.
• Attendance and dropout figures from the 2000-01 school year.120
Several editorials appeared arguing the pros and cons of Louisiana’s accountability system. For example, one writer argued against the use of tests to determine whether students receive a diploma:
Surely it’s easy enough to settle the big row over the alleged unfairness of preventing high school seniors who fail the exit exam from walking across the stage on graduation day.
118 Traina, M. (2000, September 3). LEAP is good for children. Times-Picayune , p. 06. 119 Quirk, M. (2001, March 18). Mania for testing is doing harm to students. Times-Picayune , p. 8. 120 School district accountability: Rankings and reactions (2003, April 11). Capital City Press .
Education Policy Analysis Archives Vol. 14 No. 1 120
Let those who fail do the grad walk with everyone else. Just make them wear large conical hats emblazoned with a D.
That way everybody would be happy and we’d really be getting back to basics.121
Another provided a more positive view, arguing that the use of LEAP was not racist:
Claude Steele, a psychologist at Stanford University, has written about the phenomenon he calls “stereotype threat.” He says people generally have a more difficult time performing if they fear their failure will be used to confirm a negative stereotype of their group.
Those who protest that the LEAP is designed to hurt African American students, those who make comparisons to poll taxes and weapons of mass destruction, may think they’re helping, but if Steele’s study is any guide, they’re really making it more difficult for African American students.
African American students can do well on this test. I know they can. But they need to believe that the LEAP isn’t a white supremacist plot. They need to know that the African American people who love them want them to take it and do well on it, too.122
Later in 2003, stories emerged discussing the issue of increasing the LEAP passing standards for fourth and eighth grade students to progress to the next grade. Some believed the state should definitely increase the standards as written about in The Advocate published in Baton Rouge:
If Louisiana is serious about school accountability, then the state Board of Elementary and Secondary Education ought to insist that standards for promotion on the LEAP tests be as rigorous as possible.
We don’t believe it is in the interests of students -or the political viability of the accountability program - to delay imposing the same standard for eighth-graders as for fourth-graders. Students should be pushed by the program, as school districts should feel pressure to do better in preparing middle-school students for high school.123
Ultimately, the state board of education passed a resolution, increasing the standards for passing for fourth and eighth graders in 2004.
Another political issue of some prominence was whether the state should have the authority to take over chronically failing schools. One public group supported this idea, “State takeover of foundering schools and a limited use of vouchers are two controversial steps that have won support from a New Orleans civic group that issued a report Tuesday on public education.”124 The measure was ultimately passed, after which stories appeared describing the fallout, including stories about the pressure some schools felt as a result of this “threat.” For example, one school hired a new principal: “Prescott Middle School, a school trying to stave off state takeover, has an unusually distinguished faculty this year, thanks to the recent hiring of Michael Comeau.”125
In the fall of 2003, after the most recent school-level labels were released, it was reported that several schools faced state assistant and intervention for not making academic progress:
121 Gill, J. (2003, May 30). Students need diplomas. Times-Picayune , p. 7, Editorial. 122 DeBerry, J. (2003, June 6). No, LEAP testing is not a racist plot. Times-Picayune, p. 7, Editorial. 123 A Compromise for LEAP testing (2003, August 21). The Advocate . 124 Pope, J. (2003, May 7). State takeover of schools has group’s OK. Times-Picayune, p. 1. 125 Lussier, C. (2003, November 3). Educator takes on challenge. The Advocate .
High-Stakes Testing and Student Achievement 121
The assistance could include a forced redirection of some school district money to buy extra supplies and to cover the cost of tutorial services and other types of remediation. Schools also receive help from teams of educators using special state funds.
In the most poorly performing schools, the state could step in to force the schools to completely reorganize and possibly bring in entirely new staffs to run the schools. Parents also could choose to send their children to better-performing public schools. Eventually, the schools could be forced to shut down. Seventeen schools, all but one in New Orleans, are eligible for BESE takeover in the 2004-05 school year under the guidelines of the constitutional amendment approved by voters last month, according to Jacobs.126
Supplemental Search: Google
A search covering the immediately preceding 30 days was conducted on March 14, 2004
(thus covering the range of dates February 14, 2004, through March 14, 2004). Several search terms were used to probe for the widest selection of stories. A selection of these stories is included in the portfolio. Supplemental Search: LexisNexis
A supplemental search was conducted seeking out stories specifically addressing
consequences to schools, districts, teachers, and/or students. This search127 was conducted over the previous year and yielded 110 stories, of which 19 were downloaded for further consideration and review.
Mississippi
A search128 was conducted across the entire LexisNexis universe of news media available in
Mississippi.129 This initial search, extending across the entire universe of news articles yielded 207 stories dating back to July 1998, of which 57 were downloaded for further review.
Content Analysis
The number of stories that were reviewed based on year and primary content are presented in Table 8. A description of the primary themes of these stories across time is described next.
126 Deslatte, M. (2003, November 20). Less than a third of public schools meet targeted growth. Baton Rouge,
LA: Associated Press . 127 Using the search string: (ALLCAPS (LEAP or GEE) and (teacher or student or principal or
superintendent)) and ((reward* or incentive or bonus) or (takeover or fire or punish or remove or close or retention or retain))
128 Using the search string: (assess! or test!) and (high-stakes or accountab! or reform) and not (sport or court or health)
129 Complete File: The Clarion-Ledger (Jackson, MS); Hattiesburg American (Hattiesburg, MS); M. LEE SMITH PUBLISHERS & PRINTERS LLC - Regional News Stories The Sun Herald (Biloxi, MS); Selected Documents: The Associated Press State & Local Wire; Business Dateline - Regional News Sources; Knight Ridder/Tribune Business News; Knight Ridder/Tribune Business News - Current News
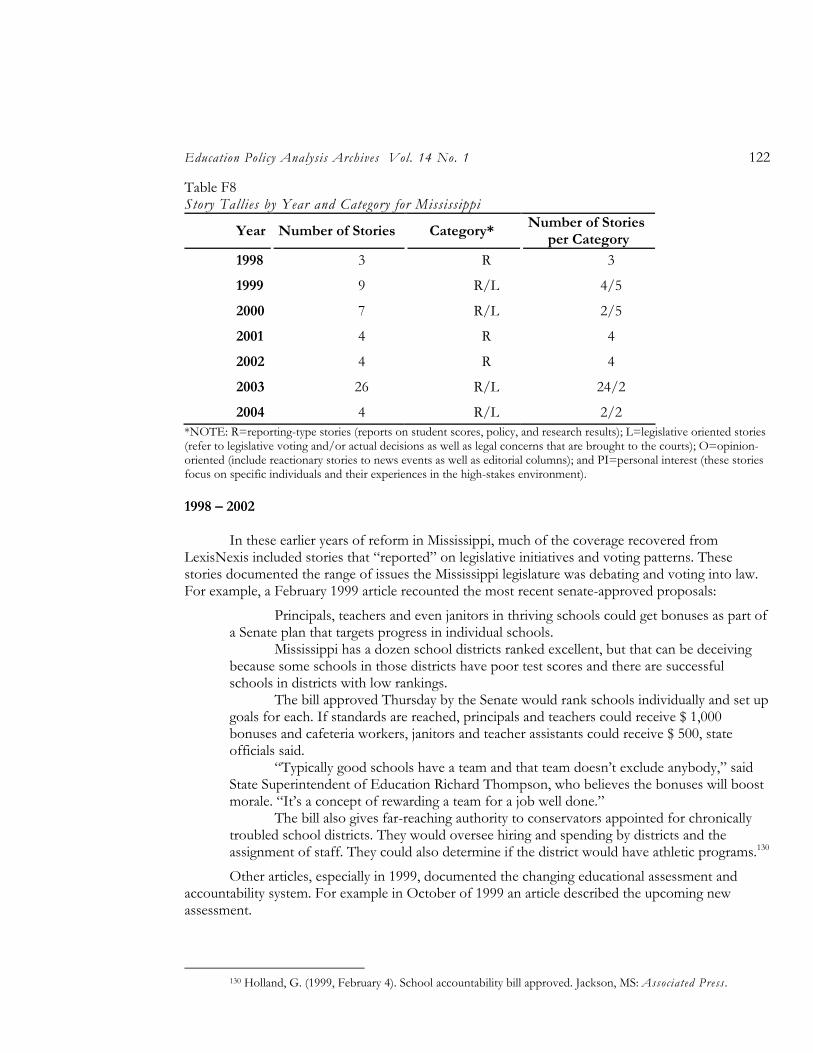
Education Policy Analysis Archives Vol. 14 No. 1 122
Table F8 Story Tallies by Year and Category for Mississippi
Year Number of Stories Category* Number of Stories
per Category
1998 3 R 3
1999 9 R/L 4/5
2000 7 R/L 2/5
2001 4 R 4
2002 4 R 4
2003 26 R/L 24/2
2004 4 R/L 2/2 *NOTE: R=reporting-type stories (reports on student scores, policy, and research results); L=legislative oriented stories (refer to legislative voting and/or actual decisions as well as legal concerns that are brought to the courts); O=opinion-oriented (include reactionary stories to news events as well as editorial columns); and PI=personal interest (these stories focus on specific individuals and their experiences in the high-stakes environment).
1998 – 2002
In these earlier years of reform in Mississippi, much of the coverage recovered from
LexisNexis included stories that “reported” on legislative initiatives and voting patterns. These stories documented the range of issues the Mississippi legislature was debating and voting into law. For example, a February 1999 article recounted the most recent senate-approved proposals:
Principals, teachers and even janitors in thriving schools could get bonuses as part of a Senate plan that targets progress in individual schools.
Mississippi has a dozen school districts ranked excellent, but that can be deceiving because some schools in those districts have poor test scores and there are successful schools in districts with low rankings.
The bill approved Thursday by the Senate would rank schools individually and set up goals for each. If standards are reached, principals and teachers could receive $ 1,000 bonuses and cafeteria workers, janitors and teacher assistants could receive $ 500, state officials said.
“Typically good schools have a team and that team doesn’t exclude anybody,” said State Superintendent of Education Richard Thompson, who believes the bonuses will boost morale. “It’s a concept of rewarding a team for a job well done.”
The bill also gives far-reaching authority to conservators appointed for chronically troubled school districts. They would oversee hiring and spending by districts and the assignment of staff. They could also determine if the district would have athletic programs.130
Other articles, especially in 1999, documented the changing educational assessment and accountability system. For example in October of 1999 an article described the upcoming new assessment.
130 Holland, G. (1999, February 4). School accountability bill approved. Jackson, MS: Associated Press .
High-Stakes Testing and Student Achievement 123
Results from tests designed to measure student progress in public school grades 2–8 will be fed into a revamped accreditation system in 2001, according to State Superintendent of Education Richard Thompson.
The system is designed to identify how well school districts and individual schools are teaching students, and if they are doing a better job from year to year, he said.
The tests will be administered during the first week of May. About 280,000 of the state’s 500,000 public school students will take the exams,
which use mostly multiple-choice questions in math, language arts and reading.131
Between 2000 and 2002, a variety of issues were covered in the press. In 2000, several articles discussed the debates of merit pay (tying teacher bonuses to student achievement), the new accountability legislation that continued to evolve, and policies around how (or whether) to incorporate out of state transfer students’ scores into the state accountability system. Further, as the new assessment system was implemented, several stories described state and local student performance. In 2002, one article described how fewer schools were labeled as “low performing” because students’ test scores were going up:
Mississippi saw a dramatic decrease in the number of schools falling below state academic standards.
There were 122 Mississippi schools that did not meet statewide testing targets during the 2000–2001 school year. That number dropped to 11 in 2001–2002.
“We are very pleased that the number of schools in need of improvement has been substantially reduced,” state Superintendent of Education Henry L. Johnson said Tuesday in a written release. “We will do everything in our power to help those schools in need of assistance.”132
2003 - 2004
Throughout 2003, there seemed to be increased coverage on school and district-level
consequences that were tied to student performance. In 2003, the federal- and state-mandated system of sanctions were described:
Federal sanctions for schools not meeting adequate yearly progress under No Child Left Behind for two consecutive years.
• Year 1 - Offer option to move to other schools within the district. • Year 2 - Offer choice and supplemental services. • Year 3 - Offer choice and supplemental services and at least one other
corrective action. • Year 4 - Offer choice and supplemental services and plan for alternative
governance. • Year 5 - Implement alternative governance. Mississippi sanctions for priority, low-performing schools.
Year 1:
131 New tests set for 2–8 grades. (1999, October 29). Jackson MS: Associated Press . 132 Brown, T. R. (2002, August 6). Mississippi sees decrease in low-performing schools. Jackson, MS:
Associated Press .
Education Policy Analysis Archives Vol. 14 No. 1 124
• Site based assessment of the school by trained evaluation team. • Report presented to community at an advertised meeting. • Development of school improvement plan through an established
parent/citizen advisory council. • Individual professional development plans developed for personnel
identified as needing improvement. Year 2:
• A teacher who fails to perform after re-evaluation will be recommended for dismissal.
• A principal, who has been at the school for three or more years, will be recommended for dismissal.
• A cap can be placed on the superintendent’s salary. Year 3: • A superintendent can be dismissed or subject to recall. • School board members can be dismissed or subject to recall.133
Most stories then recounted school and or district progress toward meeting both state and federal achievement goals. For example, in August of 2003 it was reported:
Three public schools got some good news Friday when the state Department of Education removed them from a finalized list of schools that need improvement under a new federal law.134
Similarly, in another August 2003 story, it was reported:
Ray Brooks School Principal Barbara Akon started this year on a positive note - her school is no longer ranked among the state’s lowest performing.
The 300 students at the pre-kindergarten through 12th grade school in Benoit are now performing better, along with their teachers, Akon said.
In just one year, the school managed to raise itself from Level 1 to Level 3 in its recommended ranking, Akon said. Five is the highest level in the state’s new accountability system.135
A selection of stories covering the range of issues described above are included in the portfolio. Supplemental Search: Google
A search covering the immediately preceding 30 days was conducted on April 1, 2004 (thus
covering the range of dates March 1, 2004 through April 1, 2004). Several search terms were used to probe for the widest selection of stories. A selection of these stories is included in the portfolio. Supplemental Search: LexisNexis
133 Sanctions for not meeting federal, state standards (2003, August 1). Associated Press. 134 Bulkeley, D. (2003, August 30). Three Mississippi schools off state list of possible federal sanctions. Jackson,
MS: Associated Press . 135 Bulkeley, D. (2003, August 31). Teams ready to help priority school raise the bar. Jackson, MS: Associated
Press .
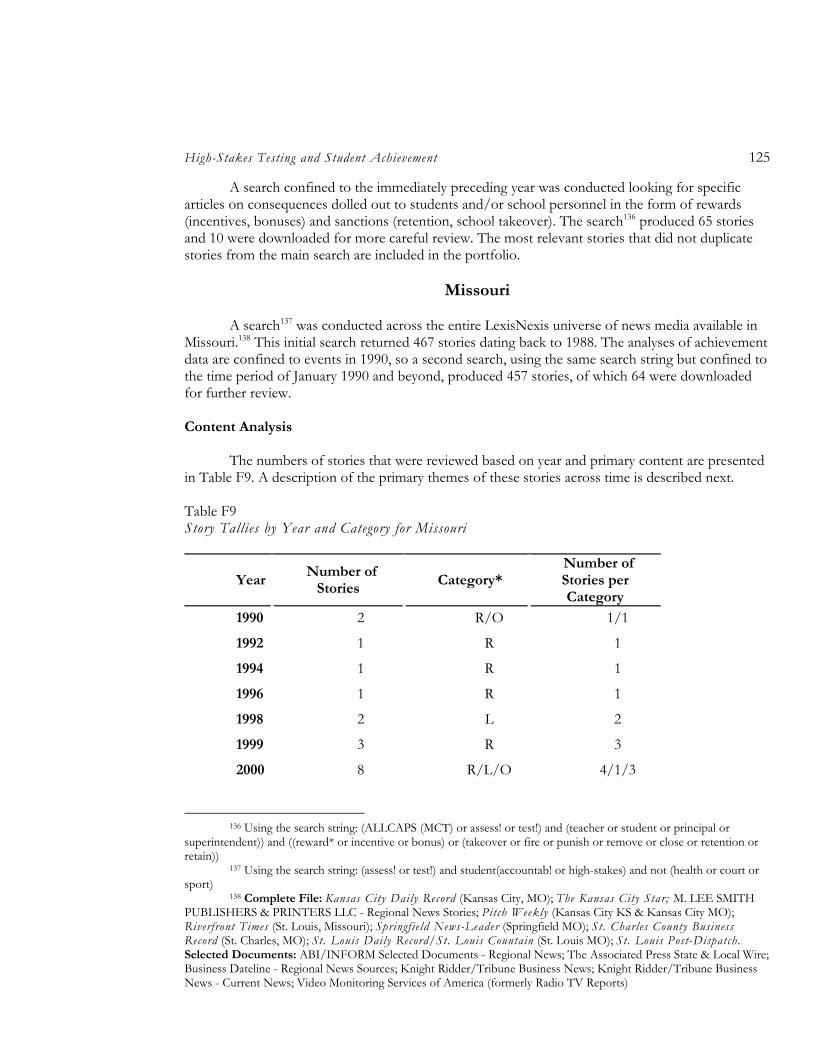
High-Stakes Testing and Student Achievement 125
A search confined to the immediately preceding year was conducted looking for specific articles on consequences dolled out to students and/or school personnel in the form of rewards (incentives, bonuses) and sanctions (retention, school takeover). The search136 produced 65 stories and 10 were downloaded for more careful review. The most relevant stories that did not duplicate stories from the main search are included in the portfolio.
Missouri
A search137 was conducted across the entire LexisNexis universe of news media available in
Missouri.138 This initial search returned 467 stories dating back to 1988. The analyses of achievement data are confined to events in 1990, so a second search, using the same search string but confined to the time period of January 1990 and beyond, produced 457 stories, of which 64 were downloaded for further review.
Content Analysis
The numbers of stories that were reviewed based on year and primary content are presented in Table F9. A description of the primary themes of these stories across time is described next.
Table F9 Story Tallies by Year and Category for Missouri
Year Number of
Stories Category*
Number of Stories per Category
1990 2 R/O 1/1
1992 1 R 1
1994 1 R 1
1996 1 R 1
1998 2 L 2
1999 3 R 3
2000 8 R/L/O 4/1/3
136 Using the search string: (ALLCAPS (MCT) or assess! or test!) and (teacher or student or principal or
superintendent)) and ((reward* or incentive or bonus) or (takeover or fire or punish or remove or close or retention or retain))
137 Using the search string: (assess! or test!) and student(accountab! or high-stakes) and not (health or court or sport)
138 Complete File: Kansas City Daily Record (Kansas City, MO); The Kansas City Star; M. LEE SMITH PUBLISHERS & PRINTERS LLC - Regional News Stories; Pitch Weekly (Kansas City KS & Kansas City MO); Riverfront Times (St. Louis, Missouri); Springfield News-Leader (Springfield MO); St. Charles County Business Record (St. Charles, MO); St. Louis Daily Record/St. Louis Countain (St. Louis MO); St. Louis Post-Dispatch. Selected Documents: ABI/INFORM Selected Documents - Regional News; The Associated Press State & Local Wire; Business Dateline - Regional News Sources; Knight Ridder/Tribune Business News; Knight Ridder/Tribune Business News - Current News; Video Monitoring Services of America (formerly Radio TV Reports)
Education Policy Analysis Archives Vol. 14 No. 1 126
2001 11 R/L/O 4/1/6
2002 10 R/L/O 6/2/2
2003 12 R/O 10/2
2004 7 R/O 5/2 *NOTE: R=reporting-type stories (reports on student scores, policy, and research results); L=legislative oriented stories (refer to legislative voting and/or actual decisions as well as legal concerns that are brought to the courts); O=opinion-oriented (include reactionary stories to news events as well as editorial columns); and PI=personal interest (these stories focus on specific individuals and their experiences in the high-stakes environment).
1990 – 1999
There were very few stories relating to high stakes testing or educational accountability
during 1990 – 1999. Still, those that did emerge primarily covered the evolving standards, assessment, and accountability policies that were being considered for adoption. For example, in 1994, the media outlined the new standards that were being considered:
Within three years, public school students in Missouri could be checking off fewer multiple-choice questions and writing more essays on their statewide achievement tests. They could even be doing experiments to show what they know.
This is all part of a three-step state drive to reform public education. A group of 150 teachers from across the state has just taken the first step by drafting 41 academic standards by which all students might be measured.
The proposed standards, released last month, have already drawn fire from two people who helped to review them.139
And, in 1996, with the release of the first statewide report cards, an article described the most current policies around public reporting:
Are students learning? And how much are they learning compared with other students?
What the public might have wanted to know most is hard to tell from the first yearly “report cards” Missouri public school districts issued earlier this month.
As the state Department of Elementary and Secondary Education decreed, the reports include students’ achievement test scores along with reams of data on such matters as finances, staffs, courses of instruction and extracurricular activities.
But the department didn’t require a particular test or format for reporting scores. So different districts reported different scores from different tests in different ways.
Some printed charts; others, columns of numbers. Few cited averages or other statistical benchmarks or offered interpretations of the numbers and pictures.140
By 1999, schools were labeled according to student achievement:
St. Louis Public Schools officials have ordered 40 schools to make significant improvement in test scores -- or face staffing changes.
139 Little, J. (1994, June 13). New standards for graduates spark debate: Do they signify reform or a dumbing-
down? St. Louis Post-Dispatch , p. 1B. 140 Thomson, S. C. (1996, October 30). Student testing far from standard. St. Louis Post-Dispatch , p. 1B.
High-Stakes Testing and Student Achievement 127
The schools will be required to adopt new instructional programs and to improve test scores, attendance rates and dropout rates. Twenty-nine of the schools are new to the list as of Tuesday. Eleven others were chosen in January 1998.
Unless the schools improve, their principals could be fired and some or all of the teachers transferred to other schools. That process is called reconstitution, and three of the 11 schools named last year are expected to undergo that process this summer, said Larry Hutchins, the school system’s director for accountability.
All of the city’s nonmagnet high schools are now on the list. Roosevelt and Beaumont were added Tuesday to join Vashon. Sumner High is not on the list but is being converted over the summer to a magnet program. Magnet schools offer special programs that draw students outside the regular attendance boundaries and from St. Louis County.
Ten middle schools and 17 elementary schools also were placed on the list Tuesday.
And the public was informed as to how Missouri students performed on the latest round of standardized achievement testing:
Missouri’s public school students scored slightly higher at most grade levels on this year’s state standardized tests than students scored on last year’s tests.
But roughly two-thirds or more of students failed to meet state standards on this year’s Missouri Assessment Program tests in math, science, reading and writing. In math and science, more than 80 percent of students in middle school and high school scored below state standards.
The best performance in all grades came on tests for reading and writing. Across the nation, officials have raised the stakes for standardized tests, using them
to hold schools and teachers accountable, to decide whether a student advances to the next grade or graduates, and even to help determine a student’s grade.
In Missouri, state officials will use the test results to help decide whether to accredit school districts. Accreditation for districts such as St. Louis and Kansas City is pending now.141
2000 – 2004
By 2000, the state’s vision for accountability was becoming more streamlined—and more
“editorials” appeared either supporting or protesting the movement. In 2000, one writer expressed the problems with really knowing how a local school ranks against other schools in the state. She suggests that instead of just looking at test scores, community members should adopt the following strategy:
I suggest that parents ask their elementary child’s school what percentage of its students are reading within two grade levels of where they are supposed to be. In the 1999 session, the Legislature passed an amendment I had sponsored, prohibiting the social promotion of students who are more than two years behind in reading. This standard does not apply to students in special education. Every school in this state has now had almost 18 months to identify those students not meeting the standard and to provide them with whatever additional assistance was necessary. If your school can assure you that all their
141 Bower, C. (1999, September 15). Missouri students improve slightly on standardized tests. St. Louis Post-
Dispatch , p. A1.
Education Policy Analysis Archives Vol. 14 No. 1 128
students are reading, we can assume that their students also will be learning. If we cannot teach every student to read, we will never have “world-class” schools.142
In 2001, there were more editorials, primarily lamenting the problems of high stakes testing. For example, one writer argued that for students who experience life-altering trauma, a test score does not adequately represent what they know and can do—especially if they are tested on days when they are feeling bad. Similarly, another writer complained that a one-size-fits-all policy is undermining our children’s educational experiences:
How did we get here? In 1983 a single federal report claimed that we were “A Nation At Risk” and said the state of public education in America was horrendous. Every school in America was lumped together. Governors, legislators and corporations all jumped into the fray with reform agendas and “silver bullets.” Instead of dealing with our archaic factory model of education, they assumed that all school districts were alike, that students were widgets to be produced and that testing was the answer. Instead of respecting the uniqueness of our learners, the inclusive nature of public schools, and new knowledge about learning and technology, reformers advocated one-size-fits-all strategies.143
In 2002, a variety of issues were described and debated, including a proposal for tying achievement results to district-level bonuses, the problems of grade inflation, and the new accountability law that was passed. This article outlined the new and updated legislative mandates for educational accountability. Included among them:
• Schools with high student achievement will be classified as “performance schools” and freed from some state rules.
• Schools with poor student achievement will be classified as “priority schools” and subject to more state requirements. The classification includes unaccredited or provisionally accredited districts as well as individual schools where students fare poorly on state standardized tests.
New Requirements:
• Poor performing schools must come up with general improvement plans and develop individualized plans for poor performing students.
• School plans must include at least one of the following: smaller class sizes or learning groups; full-day kindergarten or preschool; after-school tutoring; home visits by teachers; employment of nationally certified or regional resource teachers.
• Teachers and administrators in poor performing schools must participate in a mentoring program, work toward national certification or become certified as a scorer for the state’s standardized tests, unless they already have met similar standards.144
Over the course of 2003–2004, there were a variety of issues expressed in the media. A cross section of these issues are presented in the portfolio. Supplemental Search: Google
142 Ehlmann, S. E. (2000, September 13). How do you know if your school is doing well? St. Louis Post-
Dispatch , p. B7, Editorial. 143 Hochman, J. I. (2001, June 26). Educating widgets: Like other states, Missouri risks letting the federal
government take away students’ individuality with annual testing. St. Louis Post-Dispatch , p. B7, Editorial commentary column.
144 A look at Missouri’s new school accountability law (2002, June 19). Associated Press .
High-Stakes Testing and Student Achievement 129
A search covering the immediately preceding 30 days was conducted on March 4, 2004 (thus
covering the range of dates February 4, 2004 through March 4, 2004) Several search terms were used to probe for the widest selection of stories. A selection of these stories is included in the portfolio. Supplemental Search: LexisNexis
A search of March 2003 through March 2004 was conducted looking for specific articles on
consequences dolled out to students and/or school personnel in the form of rewards (incentives, bonuses) and sanctions (retention, school takeover). The search145 yielded 96 stories, of which nine were downloaded for more careful review.
New Mexico
A search was conducted across the entire LexisNexis146 universe of news media available in
New Mexico. 147 This search returned over 331 stories dating back to 1995. Redundant and irrelevant stories were eliminated (some news coverage extended to other
states such as North Carolina), leaving 84 stories that were downloaded for closer review. Content Analysis
The numbers of stories that were reviewed based on year and primary content are presented in Table 10. A description of the primary themes of these stories across time is described next.
145 Using the search string: (ALLCAPS (MAP) and (teacher or student or principal or superintendent)) and
((reward* or incentive or bonus) or (takeover or fire or punish or remove or close or retention or retain)) 146 Complete File: The Albuquerque Journal; The Albuquerque Tribune ; M. LEE SMITH PUBLISHERS &
PRINTERS LLC - Regional News Stories; The Santa Fe New Mexican . Selected Documents: The Associated Press State & Local Wire; Business Dateline - Regional News Sources; Knight Ridder/Tribune Business News; Knight Ridder/Tribune Business News - Current News.
147 Using the search string: (assess!) and (student or teacher) and ((accountab!) or (high stakes)) and not sport
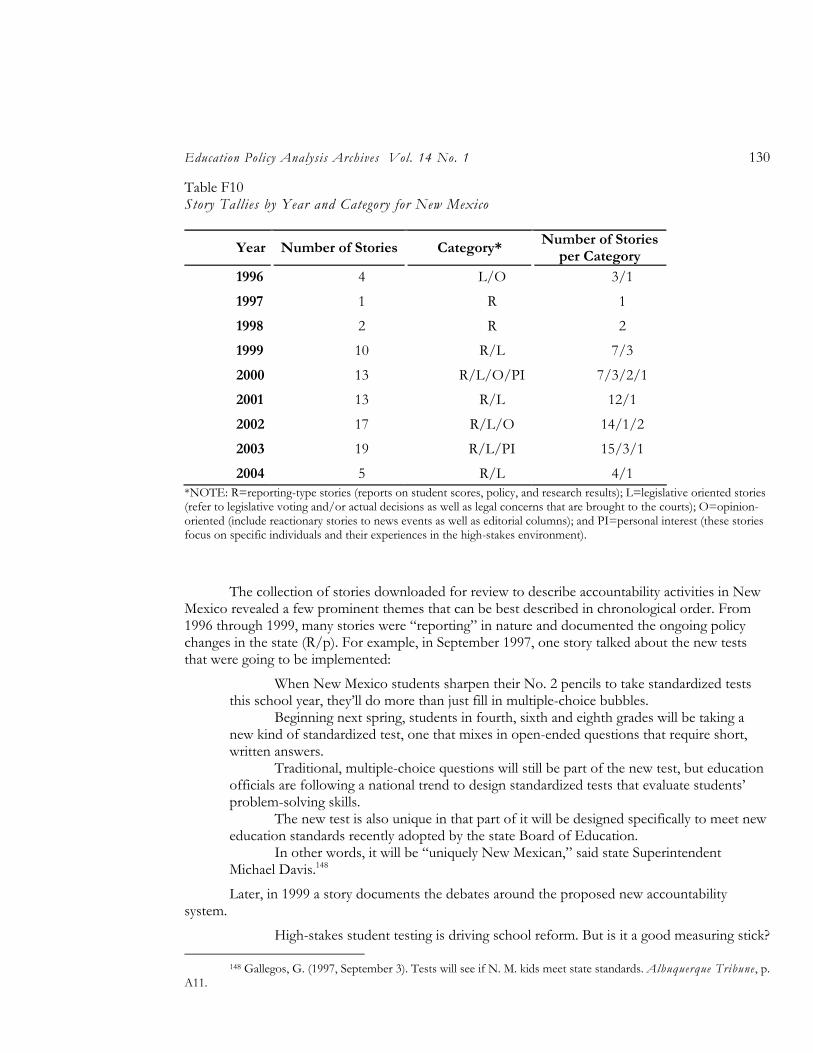
Education Policy Analysis Archives Vol. 14 No. 1 130
Table F10 Story Tallies by Year and Category for New Mexico
Year Number of Stories Category* Number of Stories
per Category
1996 4 L/O 3/1
1997 1 R 1
1998 2 R 2
1999 10 R/L 7/3
2000 13 R/L/O/PI 7/3/2/1
2001 13 R/L 12/1
2002 17 R/L/O 14/1/2
2003 19 R/L/PI 15/3/1
2004 5 R/L 4/1 *NOTE: R=reporting-type stories (reports on student scores, policy, and research results); L=legislative oriented stories (refer to legislative voting and/or actual decisions as well as legal concerns that are brought to the courts); O=opinion-oriented (include reactionary stories to news events as well as editorial columns); and PI=personal interest (these stories focus on specific individuals and their experiences in the high-stakes environment).
The collection of stories downloaded for review to describe accountability activities in New
Mexico revealed a few prominent themes that can be best described in chronological order. From 1996 through 1999, many stories were “reporting” in nature and documented the ongoing policy changes in the state (R/p). For example, in September 1997, one story talked about the new tests that were going to be implemented:
When New Mexico students sharpen their No. 2 pencils to take standardized tests this school year, they’ll do more than just fill in multiple-choice bubbles.
Beginning next spring, students in fourth, sixth and eighth grades will be taking a new kind of standardized test, one that mixes in open-ended questions that require short, written answers.
Traditional, multiple-choice questions will still be part of the new test, but education officials are following a national trend to design standardized tests that evaluate students’ problem-solving skills.
The new test is also unique in that part of it will be designed specifically to meet new education standards recently adopted by the state Board of Education.
In other words, it will be “uniquely New Mexican,” said state Superintendent Michael Davis.148
Later, in 1999 a story documents the debates around the proposed new accountability system.
High-stakes student testing is driving school reform. But is it a good measuring stick?
148 Gallegos, G. (1997, September 3). Tests will see if N. M. kids meet state standards. Albuquerque Tribune , p. A11.
High-Stakes Testing and Student Achievement 131
Sharpen your No. 2 pencil, take a deep breath and open your test booklet. Now prepare for your school, your teacher and your fellow students to be judged by how well you do on this test.
Standardized testing has been a tool for schools for decades. Now they’re being used nationwide, not only to measure, but to rank schools and
hold educators accountable for improving student learning. The trend arrived in New Mexico two years ago, and many educators question the
fairness of relying so heavily on testing. Supporters of testing say it is the bedrock of accountability.
While that debate plays out, high-stakes testing is here. And Armijo Principal Christine Lopez said the pressure is on administrators, teachers and students to improve the school’s scores.
Simple things like incorporating test-taking skills into everyday lesson plans, combined with individual tutoring for kids who struggle on the tests, is working, she said.149
This sets the stage for what kind of tests students take during the course of the next few years and how they perform.
Many reports appearing throughout 2000 and 2001 described implementation of the new accountability system and presented debates arguing for and against the use of tests for measuring schools and students. For example, one story gave the perspective of one administrator who argued that holding schools accountable based on the statewide TerraNova test results was a bad idea because tests can be flawed.
State Needs Own Exam, Official Says The Bernalillo Public Schools superintendent is proposing that New Mexico come
up with its own method of testing students, saying the current test has a flaw that will always guarantee failure.
“I believe that this flaw is so serious, however, that no matter how hard many of us try we will never be able to demonstrate enough success to remove us from a negative list,” Gary Dwyer told school administrators attending a state data and accountability conference Thursday in Albuquerque.
He said the state needs to create its own criterion-referenced test, such as the Texas Assessment of Academic Skills. Such tests are drawn up based on the state’s own personalized set of standards.
While New Mexico has a state standards portion included in its annual test, the CTB-McGraw Hill Terra Nova exam, Dwyer said it isn’t enough.150
Another prominent theme found throughout the news was “reporting” in the sense that student scores or school-level labels were released. In 2000, a news story showed that schools were improving accounting to the current accountability system.
New Mexico’s new school accountability ratings have been released, and they show that more schools across the state meet or exceed national standards than fall below them.
The ratings, reported Friday at the state Board of Education meeting in Gallup, cover 651 public schools around New Mexico. Nearly three-fourths of them met or exceeded standards, but 172 were listed as probationary.
149 Gallegos, G. (1999, December 18). Ready…set…test. Albuquerque Tribune , p. A1. 150 Schoellkopf, A. (2000, August 11). Test of students called flawed. Albuquerque Tribune , p. 1.
Education Policy Analysis Archives Vol. 14 No. 1 132
Of the 479 schools that met standards statewide, 37 were rated exemplary and 52 exceeded standards.
New Mexico has rated public schools in the past. But the board approved a new accountability system in June. The new ratings are based primarily on student performance on a national standardized tests but also take into account attendance figures and dropout rates.151
Later, a 2001 report documented the wide disparity in rankings across the state, highlighting the dramatic differences in two districts:
Local school districts’ rankings among the state’s 89 districts on proficiency tests scores ranged from Rio Rancho with overall high marks to Bernalillo’s lower but somewhat improved marks.
The state’s annual accountability report, released Friday, compares the state’s 89 districts in areas such as standardized testing, graduation rates and dropout rates. This year, the state also included the percentage of special-education students who drop out.
Rio Rancho outperformed Albuquerque and Bernalillo in most areas. 152
Supplemental Search: Google
A search was conducted on March 16, 2004 for the preceding 30 days (thus covering the range of dates February 16, 2004, through March 16, 2004). Several search terms were used to probe for the widest selection of stories. A selection of these stories is included in the portfolio.
Supplemental Search: LexisNexis
A supplemental search153 was conducted seeking out stories specifically addressing consequences to schools, districts, teachers, and/or students. This search of March 2003 through March 2004 returned 37 stories, of which most were irrelevant. Still, 10 were downloaded for careful review. A selection of the most relevant stories (and those that do not repeat stories already included in the portfolio) is included in the portfolio.
151 Holmes, S. M. (2000, August 26). School accountability ratings released. Associated Press. 152 Schoellkopf, A. (2001, January 23). Rio Rancho district ranks high in state accountability report.
Albuquerque Journal , p.1. 153 Using the search string: ((assess!) and (teacher or student or principal or superintendent)) and ((reward* or
incentive or bonus) or (takeover or fire or punish or remove or close or retention or retain))and not (sport or health or court or college or university)
High-Stakes Testing and Student Achievement 133
New York
A LexisNexis154 search of stories circulated throughout New York State was conducted in three time segments. The first search, confined to the time frame of January 1, 1990, to December 31, 1997,155 produced 86 hits, of which 18 were downloaded for more careful review. However, upon reading each story more closely, several more were eliminated from consideration because of irrelevancy or because they simply occurred too long ago, leaving eight stories from this time frame for possible inclusion in the portfolio. A second search conducted over January 1, 1998, to December, 31, 2000,156 yielded 235 hits, of which 84 were downloaded for more careful review. Many of these stories were deleted due to repetitiveness or irrelevancy—leaving 35 for portfolio consideration.
A last search conducted over the time period of January 1, 2001, to February 24, 2004,157 yielded 298, of which 71 were downloaded for more careful review. Again, after careful review, many of these 71 stories were eliminated from consideration because of redundancy, leaving 44 for portfolio consideration. Content Analysis
The numbers of stories that were reviewed based on year and primary content are presented in Table F11. A description of the primary themes of these stories based on time frame and primary content category is described next.
154 Complete File: The Buffalo News, Columbia Journalism Review, Crain's New York Business, Daily
News (New York), The Daily Record of Rochester (Rochester, NY), The Ithaca Journal (Ithaca, NY), The Journal News (Westchester County, NY), Long Island Business News (Long Island, NY), M. LEE SMITH PUBLISHERS & PRINTERS LLC - Regional News Stories, Newsday (New York, NY), The News-Press (Fort Myers, FL), New York Employment Law & Practice, The New Yorker, New York Family Law Monthly, New York Law Journal, New York Observer, The New York Post, New York Sun, The New York Times, Observer-Dispatch (Utica, NY), The Post-Standard (Syracuse, NY), Poughkeepsie Journal (Poughkeepsie, NY), Press & Sun-Bulletin (Binghamton, NY), Rochester Democrat and Chronicle, Star-Gazette (Elmira, NY), St. Charles County Business Record (St. Charles, MO), The Times Union (Albany, NY), The Village Voice . Selected Documents: ABI/INFORM Selected Documents - Regional News, The Associated Press State & Local Wire, Business Dateline - Regional News Sources, Ethnic NewsWatch, Knight Ridder/Tribune Business News, Knight Ridder/Tribune Business News - Current News, Video Monitoring Services of America (formerly Radio TV Reports)
155 Using the search string: (assess* or test*) and ((high stakes) or accountab*) and (school or teacher or student)
156 Using the search string: (assess* or test*) and ((high stakes) or accountab*) and (school or teacher or student)
157 Using the search string: (assess* or test*) and ((high stakes) or accountab*) and (school or teacher or student)
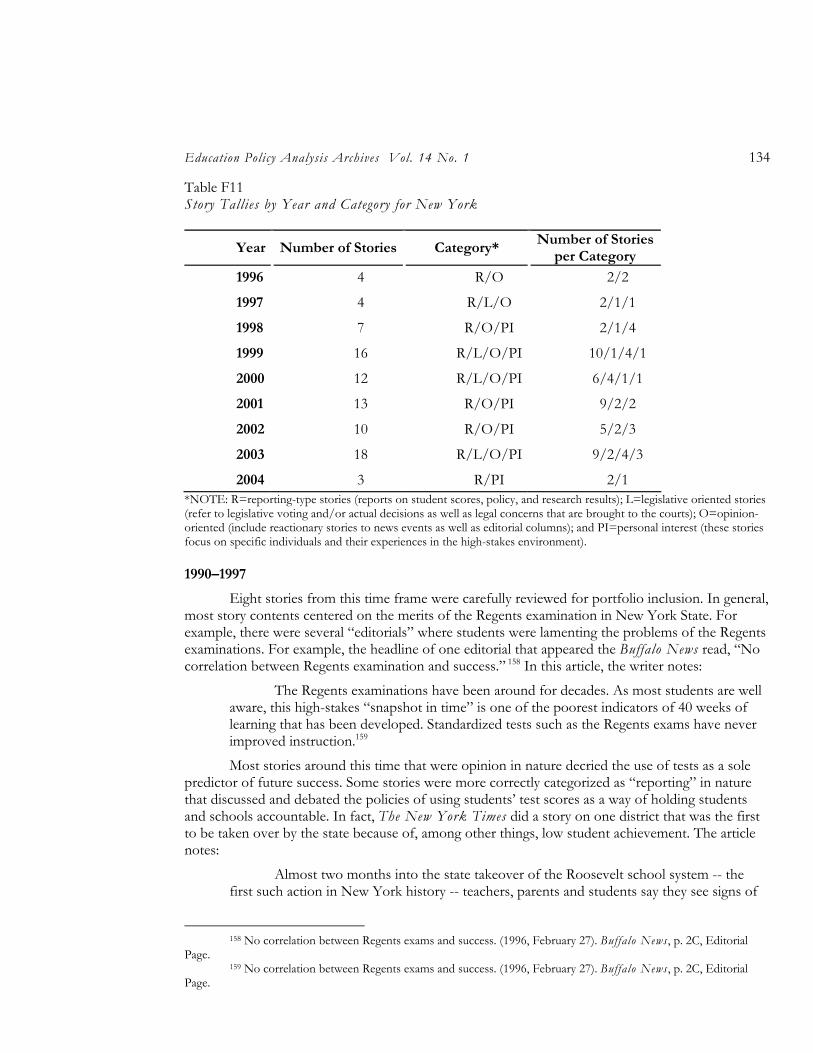
Education Policy Analysis Archives Vol. 14 No. 1 134
Table F11 Story Tallies by Year and Category for New York
Year Number of Stories Category* Number of Stories
per Category
1996 4 R/O 2/2
1997 4 R/L/O 2/1/1
1998 7 R/O/PI 2/1/4
1999 16 R/L/O/PI 10/1/4/1
2000 12 R/L/O/PI 6/4/1/1
2001 13 R/O/PI 9/2/2
2002 10 R/O/PI 5/2/3
2003 18 R/L/O/PI 9/2/4/3
2004 3 R/PI 2/1 *NOTE: R=reporting-type stories (reports on student scores, policy, and research results); L=legislative oriented stories (refer to legislative voting and/or actual decisions as well as legal concerns that are brought to the courts); O=opinion-oriented (include reactionary stories to news events as well as editorial columns); and PI=personal interest (these stories focus on specific individuals and their experiences in the high-stakes environment).
1990–1997
Eight stories from this time frame were carefully reviewed for portfolio inclusion. In general, most story contents centered on the merits of the Regents examination in New York State. For example, there were several “editorials” where students were lamenting the problems of the Regents examinations. For example, the headline of one editorial that appeared the Buffalo News read, “No correlation between Regents examination and success.” 158 In this article, the writer notes:
The Regents examinations have been around for decades. As most students are well aware, this high-stakes “snapshot in time” is one of the poorest indicators of 40 weeks of learning that has been developed. Standardized tests such as the Regents exams have never improved instruction.159
Most stories around this time that were opinion in nature decried the use of tests as a sole predictor of future success. Some stories were more correctly categorized as “reporting” in nature that discussed and debated the policies of using students’ test scores as a way of holding students and schools accountable. In fact, The New York Times did a story on one district that was the first to be taken over by the state because of, among other things, low student achievement. The article notes:
Almost two months into the state takeover of the Roosevelt school system -- the first such action in New York history -- teachers, parents and students say they see signs of
158 No correlation between Regents exams and success. (1996, February 27). Buffalo News , p. 2C, Editorial
Page. 159 No correlation between Regents exams and success. (1996, February 27). Buffalo News , p. 2C, Editorial
Page.
High-Stakes Testing and Student Achievement 135
improvement in a district long plagued by low student achievement, rock-bottom morale and a sense of defeat.
“There is more hope than doubt,” said David Carroll, a high school teacher and president of the Roosevelt Teachers’ Union.
Under special legislation passed last year, the state was given unusual powers to intervene in Roosevelt, and the Board of Regents appointed a panel to oversee a recovery plan for the district. Last month, with panel members asserting that the local school board had resisted the plan and was guilty of flagrant mismanagement, the Regents ousted the Roosevelt board, authorizing the panel to run the district until new school board elections on May 21.160
Lastly, there are also a few stories reporting on students’ scores on the latest round of Regents testing. A selection of stories is included in the portfolio to represent the range of issues. 1998–2000
During this time period, stories emerged representing the legislative changes in the state for
promoting greater academic accountability. A large number of stories were coded as “reporting” (18) with many of them reporting on the changing accountability and assessment policies. For example, in 1998 there were many stories discussing how the pressures of testing were affecting fourth graders. In 1998, the Associated Press released a story discussing the new era of testing for New York students:
January [1999] begins a series of challenging tests in New York schools - challenging for schools as well as students.
On Jan. 11, fourth-graders will begin a new, three-day reading and writing test that some educators fear will be beyond their ability. Two weeks later, many 11th-graders will take an English Regents test that they’ll have to pass at some point in order to graduate from high school.
Welcome to one of the toughest eras New York schools have yet faced.161
In 1999, many stories debated the merits of the Regents examination schedule and pressures on young students. One New York Times editorial argued that testing was putting too much pressure on students. The headline read: “New Tests Are a Stressful Measure.” In June of 1999, several “reporting” articles appeared discussing the newest round of testing and the possible effects on students and schools that do not fare well on them. The New York Daily News reported:
With the dismal results of the state’s new fourth-grade English exams still fresh in the minds of the city’s disappointed educators and parents, students began another round of high-stakes tests yesterday.
About 64,000 eighth-graders returning from a long holiday weekend tackled the first day of a grueling week of state exams in English and math. And 75,000 fourth-graders today will begin a three-day math test that for the first time will require them to explain how they arrived at answers.
State Education Commissioner Richard Mills has vowed to use the scores to identify failing schools for state takeover.162
160 Kershaw, S. (1996, March 4). Management lessons for Roosevelt schools. New York Times , p. B5. 161 New York schools face new tests beginning in January. (1998, December 29). Syracuse, NY: Associated
Press .
Education Policy Analysis Archives Vol. 14 No. 1 136
In 2000 a series of articles, both reporting- and opinion-oriented stories detailed how students performed on the most recent Regents examination. In October of 2000, the New York Times reported that “more than three-quarters of New York City’s eighth graders failed to reach acceptable levels on a statewide mathematics test last spring, raising serious questions about whether they will be able to pass a newly required Regents math exam before they graduate from high school in 2004.”163 Stories emerged talking about how these tests are biased against some student groups. An editorial in the Albany paper argued, “Tests are biased against minorities and the poor.”164 2001–2004
In the most recent group of stories, there were many articles discussing the merits of high-
stakes testing. Article writers questioned the use of “high stakes” testing as a measure of schools and students, and again, there were those who argued that exams were putting too much pressure on young people. In Albany, one article writer argued, “A rebellion is brewing among some parents and educators who believe elementary school children are being subjected to what one researcher called an almost inhumane amount of ‘high-stakes’ standardized tests.”165
Throughout 2002, dissention against high-stakes testing grew. One editorial writer complained it stifled creativity and there were several stories of local communities and parents who were boycotting the Regents exam. This occurred in Buffalo and in Syracuse.
There were also policy-related articles that documented policy makers’ discussions around merit-pay, considerations to principals for increased achievement, and an article documenting the accommodation changes for student test takers with disabilities.
Throughout 2003, the dominant theme was centered on the problems with the Regents math exam. Many high school students failed the exam causing the public to question its validity and fairness. Consequently, the exam was rescored and ultimately, policy makers decided to throw out the exam as a requirement for graduation. The major fallout of this incident was the controversy over what the graduation requirements would be. Some argued it should be raised—making it harder to get a diploma, whereas others wanted it to stay the same. Arguments on both sides were presented and are selected for inclusion. Supplemental Search: Google
A search was conducted on March 3, 2004, 2004, covering the range of dates February 3,
2004, through March 3, 2004. Several search terms were used to probe for the widest selection of stories. During this time many stories centered on the issues of schools having to close due to weather and how the testing schedule would be revamped. Stories most relevant to current accountability issues were included. Supplemental Search: LexisNexis
A search of March 2003 through March 2004 was conducted looking for specific articles on
consequences dolled out to students and/or school personnel in the form of rewards (incentives, 162 Gendar, A., & Shin, P. H. B. (1999, June 2). Grades 4, 8 feel pressure of new exams: School takeover at
stake. Daily News , p. 23. 163 Goodnough, A. (2000, October 13). Most eighth graders fail state math test. New York Times , p. B3. 164 Ross, E. W. (2000, October 22). Tests are biased against minorities and the poor. Times Union , p. B4,
Perspective. 165 Gormley, M. (2001, May 6). Standard testing creates pressure. Times Union , p. A4.
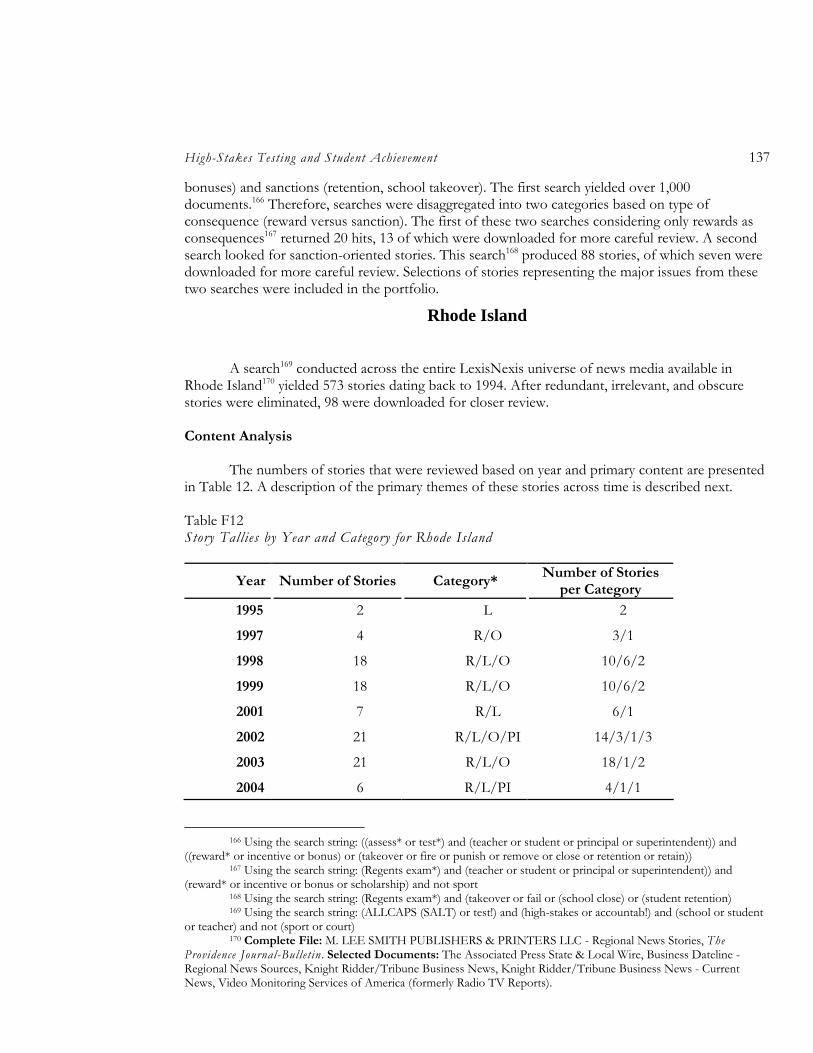
High-Stakes Testing and Student Achievement 137
bonuses) and sanctions (retention, school takeover). The first search yielded over 1,000 documents.166 Therefore, searches were disaggregated into two categories based on type of consequence (reward versus sanction). The first of these two searches considering only rewards as consequences167 returned 20 hits, 13 of which were downloaded for more careful review. A second search looked for sanction-oriented stories. This search168 produced 88 stories, of which seven were downloaded for more careful review. Selections of stories representing the major issues from these two searches were included in the portfolio.
Rhode Island
A search169 conducted across the entire LexisNexis universe of news media available in Rhode Island170 yielded 573 stories dating back to 1994. After redundant, irrelevant, and obscure stories were eliminated, 98 were downloaded for closer review. Content Analysis
The numbers of stories that were reviewed based on year and primary content are presented in Table 12. A description of the primary themes of these stories across time is described next.
Table F12 Story Tallies by Year and Category for Rhode Island
Year Number of Stories Category* Number of Stories
per Category
1995 2 L 2
1997 4 R/O 3/1
1998 18 R/L/O 10/6/2
1999 18 R/L/O 10/6/2
2001 7 R/L 6/1
2002 21 R/L/O/PI 14/3/1/3
2003 21 R/L/O 18/1/2
2004 6 R/L/PI 4/1/1
166 Using the search string: ((assess* or test*) and (teacher or student or principal or superintendent)) and
((reward* or incentive or bonus) or (takeover or fire or punish or remove or close or retention or retain)) 167 Using the search string: (Regents exam*) and (teacher or student or principal or superintendent)) and
(reward* or incentive or bonus or scholarship) and not sport 168 Using the search string: (Regents exam*) and (takeover or fail or (school close) or (student retention) 169 Using the search string: (ALLCAPS (SALT) or test!) and (high-stakes or accountab!) and (school or student
or teacher) and not (sport or court) 170 Complete File: M. LEE SMITH PUBLISHERS & PRINTERS LLC - Regional News Stories, The
Providence Journal-Bulletin . Selected Documents: The Associated Press State & Local Wire, Business Dateline - Regional News Sources, Knight Ridder/Tribune Business News, Knight Ridder/Tribune Business News - Current News, Video Monitoring Services of America (formerly Radio TV Reports).
Education Policy Analysis Archives Vol. 14 No. 1 138
*NOTE: R=reporting-type stories (reports on student scores, policy, and research results); L=legislative oriented stories (refer to legislative voting and/or actual decisions as well as legal concerns that are brought to the courts); O=opinion-oriented (include reactionary stories to news events as well as editorial columns); and PI=personal interest (these stories focus on specific individuals and their experiences in the high-stakes environment).
From 1995 to present, stories were primarily categorized as “reporting.” The range of these
stories, however, varied over time as the policies changed. From 1995 through 1999, many of the “reporting” stories were political in nature—stories with themes recounting the current policies. For example, in 1997 a story documented the new practice of publicizing school-level report cards. The article notes:
Parents, educators and taxpayers take notice: accountability in public education is coming to Rhode Island. It will start with report cards, to be issued annually for every elementary and secondary school in the state. They will chronicle student and teacher attendance rates, class sizes, how schools spend their money and how students perform on a newly designed statewide test.
The new test, given to fourth-, eighth- and 10th-graders last spring, sets the bar considerably higher than the Metropolitan Achievement Test, which has been the measure of student performance in Rhode Island for years.171
Subsequently, many of the stories in 1998 discussed the legislative debates around the new accountability system that was transitioning in. For example, early in 1998, a new school-level survey was being instituted to gauge student and school personnel’s perspectives on their school. In January of 1998, this plan was announced:
The School Committee last night officially welcomed the statewide SALT data survey into schools as a way of improving education.
The survey, known formally as School Accountability for Learning and Teaching, will examine the thoughts and opinions of students, teachers and administrators, according to Robert Felner, chairman of the Department of Education at the University of Rhode Island. The resulting data can be used to overhaul or fine-tune ways in which students are taught by allowing schools to make planning decisions based on knowledge.172
Following this announcement came a flurry of criticisms and debates arguing the merits of the policy. Some believed the SALT survey was too intrusive, others viewed it as necessary for understanding Rhode Island’s accountability process.
Another primary issue in 1998 was the introduction of the new state academic standards and policy makers’ reactions to them. One headline revealed that a state school board member was unhappy with new “critical thinking” skills embedded in the state standards: “School board head impugns new state education standards: Glenn Brewer favors a curriculum that teaches a set of facts in the subject areas, rather than one emphasizing ‘critical thinking’ skills.”173
Throughout 2001–2002, there was a flurry of news stories reporting on students’ academic achievement on statewide tests. These stories addressed state trends as well as how students in local communities fared. Additionally, a number of stories from this year reported on the SALT review
171 McVicar, D. M. (1997, July 27). R. I. schools to be graded on how well they perform. Providence Journal-
Bulletin, p. 1A. 172 Morgan, T. J. (1998, January 6). Opinion survey coming to school. Providence Journal-Bulletin, p. 1C. 173 Poon, C. (1998, May 26). School board head impugns new state education standards: Glenn Brewer favors a
curriculum that teaches a set of facts in the subject areas, rather than one emphasizing “critical thinking” skills. Providence Journal-Bulletin, p. 1C.
High-Stakes Testing and Student Achievement 139
process whereby a team of educators visit a school labeled as under performing and make evaluative recommendations. Examples of both positive and negative reviews follow.
Education Policy Analysis Archives Vol. 14 No. 1 140
Positive On November 21, positive outcomes were reported in Bristol:
Describing Byfield School as a monument to local history on the right track for the future, a group of state evaluators encouraged administrators to preserve the school’s unique educational qualities for future generations.
The report is the result of a four-day visit, Oct. 30 to Nov. 2, by a five-member evaluation team under the state initiative called School Accountability for Learning and Teaching (SALT). The evaluation team sat in on classes and followed students. Members interviewed students, teachers and staff and reviewed students’ work, school policies and professional development, among other things.
The unique opportunities of a small learning environment are exemplified at Byfield, the SALT team concluded. Its warmth, school pride and spirit and orderliness were recognized at the outset.
In addition, parents, the team found, are a growing group of active partners in the academic and social development of their children.174
Similarly, North Kingston received a positive review on December 7, 2001: Wickford Middle School is doing a good job of teaching its students, but there is
some room for improvement, according to a School Accountability for Learning and Teaching report recently released for the school.
A group of educators from around the state spent five days at the school in October. The 11-member team observed 187 classes, spending a total of 140 hours in direct classroom observation. Every classroom was visited at least once and almost every teacher was observed more than once.
The goal of SALT visits is to help public schools improve learning and teaching. The Wickford team produced a 19-page report which included eight commendations and 13 recommendations for the school.
Principal Tyler Page says the group did a good job evaluating the school.175
Negative
On May 2, 2002, a mixed review came from one school in Burrillville:
The principal, teachers and staff at the Steere Farm Elementary School are doing a good job, according to a recent survey, but there is a disconnect between the school and the district’s administration. The findings are part of the School Accountability for Learning and Teaching (SALT) program sponsored by the state Department of Elementary and Secondary Education, which dispatches teams of educators to evaluate schools across the state.
A team visited Steere Farm from March 11 through March 15 although the report was not made public on a state Internet Web site until recently.
Kenneth Rassler, who became the school’s principal last year, said he was pleased with the report. I think it’s very fair and accurate, he said.
Earlier this year, the state issued its school performance ratings based on students’ scores on the New Standards examinations. The state labeled schools high performing if at
174 Rasmussen, K. (2001, November 28). SALT team finds a lot that’s good at Byfield school. Providence
Journal-Bulletin , p. C01. 175 Emlock, E. (2001, December 7). Survey: Middle school students, teachers “connect.” Providence Journal-
Bulletin, p. C01.
High-Stakes Testing and Student Achievement 141
least 50 percent of its students had proficient scores. Steere Farm was the only school in Burrillville that made the cut. While the SALT team that visited Steere Farm issued a primarily complimentary report, it also issued some criticism.
A disconnect exists in effective communication between the teachers at Steere Farm Elementary School and district-level staff, the report reads. The faculty reports that it feels neither supported nor appreciated by the district administration. This atmosphere could pose a significant obstacle for the successful implementation of district reform plans.176
Similarly, in Cranston, on February 19, 2003, a school received a markedly negative review: An evaluation team that visited Park View Middle School last fall as part of the
state’s School Accountability for Learning and Teaching (SALT) initiative found a lot of areas that need improving, according to its recently released report.
The SALT team concluded that Park View does not challenge its students enough, lacks a collegial atmosphere among its teachers and has an administration that is perceived as distant from the faculty.
“The students are capable of so much more than is asked of them,” states the report drafted by the team of teachers, administrators, state education officials and at least one parent. “Low expectations, a lack of academic rigor and inconsistent expectations for their behavior hold many students back.”
Cranston school administrators said that they did not necessarily agree with everything that was in the report but were addressing the issues raised.
“Our job is to look at what’s in the report, determine what is accurate and then fix it,” said Park View principal Gary Spremullo. “There is work to be done in the best of the schools, and we’re ready to do the work. That’s our job.”
Supt. Catherine Ciarlo said, “I accept this report as a challenge.”177
Although a majority of stories centered on the SALT process and the SALT survey, several “editorials” debated the pros and cons of the SALT accountability system. A cross section of stories reflecting these major themes and viewpoints are included in the portfolio. Supplemental Search: Google
A search was conducted on March 5, 2004, covering the range of February 5, 2004, through
March 5, 2004). Several search terms were used to probe for the widest selection of stories. A selection of these stories is included in the portfolio. Supplemental Search: LexisNexis
A search confined to the immediately preceding year was conducted looking for specific
articles on consequences dolled out to students and/or school personnel in the form of rewards (incentives, bonuses) and sanctions (retention, school takeover). The search178 yielded 14 stories that were reviewed and two are included in the portfolio. Several additional searches using a variety of search strings were subsequently conducted to search out instances where consequences were dolled
176 Steinke, D. (2002, May 31). SALT report finds friction at Steere Farm. Providence Journal-Bulletin, p. C01. 177 Polichetti, B. (2003, February 18). Rating team gives Park View Middle School dismal review. Providence
Journal-Bulletin , p. C01. 178 Using the search string: (ALLCAPS (SALT) and (teacher or student or principal or superintendent)) and
((reward* or incentive or bonus) or (takeover or fire or punish or remove or close or retention or retain))
Education Policy Analysis Archives Vol. 14 No. 1 142
out to schools/district personnel and/or students. Relevant stories discussing rewards and/or sanctions to students (scholarships, retentions) were nonexistent. A few stories reported on school-level rewards/recognition, using the search string: ALLCAPS (SALT) and school reward or recognition or success. Similarly, there was one story on a school’s failure to make progress (found using the search string: ALLCAPS (SALT) and school reform). All of those stories found under these additional searches are included in the portfolio.
South Carolina
A search179 was conducted across the entire LexisNexis universe of news media available in
South Carolina.180 This initial search, extending across the entire universe of news articles returned more than 1,000 stories, and thus, adjustments had to be made in order to reduce the number of stories to a manageable set. A second search using a more restrictive search string181 was conducted and produced 245 stories dating back to 1998, of which 79 were downloaded for more careful review and analysis. A review of these stories revealed that none of them were from the most recent three months. Thus, another search was conducted confined to the previous 90 days (January 2, 2004 – April 2, 2004),182 yielding 37 stories, of which 8 were downloaded. A final search183 looking for articles between January 1, 1990, and December 31, 1997, was conducted yielding 154 stories, of which 28 were downloaded for careful review. Content Analysis
The numbers of stories that were reviewed based on year and primary content are presented
in Table 13. A description of the primary themes of these stories across time is described next.
179 Using the search string: (ALLCAPS (PACT) or (HASP) or assess! or test!) and (high-stakes or accountab!)
and (school or student or teacher) and not (sport or court) 180 Complete File: The Greenville News (Greenville, SC); The Herald (Rock Hill, S.C.); M. LEE SMITH
PUBLISHERS & PRINTERS LLC - Regional News Stories; The Post and Courier (Charleston, SC); The State (Columbia, S.C.). Selected Documents: The Associated Press State & Local Wire; Business Dateline - Regional News Sources; Knight Ridder/Tribune Business News; Knight Ridder/Tribune Business News - Current News.
181 By eliminating the words “test” and “assessment” it made the pool of stories from which to review more manageable. The search string used was: (ALLCAPS (PACT) or (HASP)) and (high-stakes or accountab!) and (school or student or teacher) and not (sport or court)
182 Using the search string: (ALLCAPS (PACT) or test! or assess!) and (high stakes) or (accountab!) and not (court or health)
183 Using the search string: (ALLCAPS (PACT) or (HASP) or assess! or test!) and (high-stakes or accountab!) and (school or student or teacher) and not (sport or court)
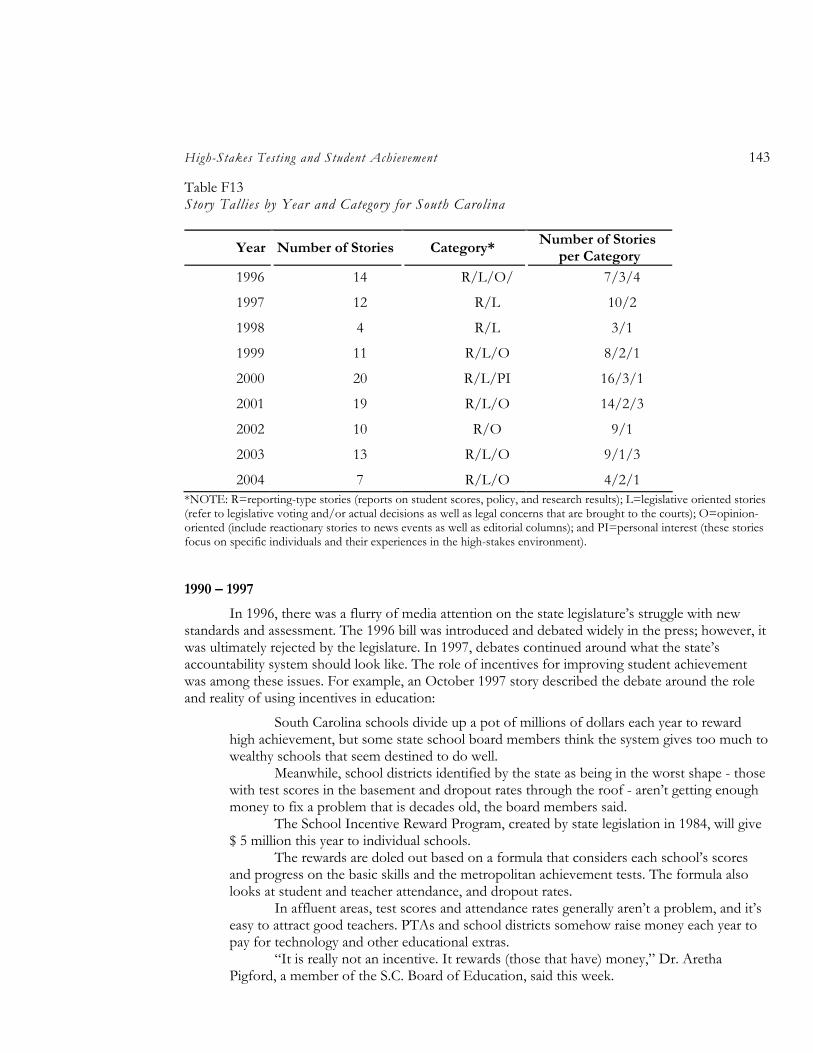
High-Stakes Testing and Student Achievement 143
Table F13 Story Tallies by Year and Category for South Carolina
Year Number of Stories Category* Number of Stories
per Category
1996 14 R/L/O/ 7/3/4
1997 12 R/L 10/2
1998 4 R/L 3/1
1999 11 R/L/O 8/2/1
2000 20 R/L/PI 16/3/1
2001 19 R/L/O 14/2/3
2002 10 R/O 9/1
2003 13 R/L/O 9/1/3
2004 7 R/L/O 4/2/1 *NOTE: R=reporting-type stories (reports on student scores, policy, and research results); L=legislative oriented stories (refer to legislative voting and/or actual decisions as well as legal concerns that are brought to the courts); O=opinion-oriented (include reactionary stories to news events as well as editorial columns); and PI=personal interest (these stories focus on specific individuals and their experiences in the high-stakes environment).
1990 – 1997
In 1996, there was a flurry of media attention on the state legislature’s struggle with new standards and assessment. The 1996 bill was introduced and debated widely in the press; however, it was ultimately rejected by the legislature. In 1997, debates continued around what the state’s accountability system should look like. The role of incentives for improving student achievement was among these issues. For example, an October 1997 story described the debate around the role and reality of using incentives in education:
South Carolina schools divide up a pot of millions of dollars each year to reward high achievement, but some state school board members think the system gives too much to wealthy schools that seem destined to do well.
Meanwhile, school districts identified by the state as being in the worst shape - those with test scores in the basement and dropout rates through the roof - aren’t getting enough money to fix a problem that is decades old, the board members said.
The School Incentive Reward Program, created by state legislation in 1984, will give $ 5 million this year to individual schools.
The rewards are doled out based on a formula that considers each school’s scores and progress on the basic skills and the metropolitan achievement tests. The formula also looks at student and teacher attendance, and dropout rates.
In affluent areas, test scores and attendance rates generally aren’t a problem, and it’s easy to attract good teachers. PTAs and school districts somehow raise money each year to pay for technology and other educational extras.
“It is really not an incentive. It rewards (those that have) money,” Dr. Aretha Pigford, a member of the S.C. Board of Education, said this week.
Education Policy Analysis Archives Vol. 14 No. 1 144
“Given the fact that we have so little money, and we know where the problems are, why not put the money where the needs are?” Pigford asked.
It’s not that simple, however. “Right now, we have to deal with the legislation as it’s written,” said board chairman
J. Alex Stanton IV. The Education Improvement Act of 1984 designed the Incentive Reward Program to give money to schools that are working well or showing improvement.184
By the end of 1997, a commission appointed by the State Board of Education compiled and presented a set of 10 recommendations for the legislature to consider when creating the new accountability system. The Board preliminarily adopted some of the recommendations in 1997:
Academic standards are considered a key part of the PASS Commission’s recent 233-page report, which offers 10 recommendations to state legislators who will soon draft school accountability bills.
The board’s preliminary approval of English/language arts, mathematics and science standards - developed through a blending of PASS Commission suggestions and curriculum frameworks from the state Department of Education - is the first step in what will likely be a busy 1998.
The PASS Commission report calls for testing of all students at the end of every year in each core subject, while also testing them on national achievement tests.
It recommends the adoption of specific standards that spell out what children need to know at each grade level. For schools that aren’t performing, the PASS Commission says the state should intervene.185
1998 – 2003
In April of 1998, a story reported on the debates between the legislature and members of the
State Board of Education over the wording of the new educational standards.
A disagreement over how education standards should be worded could render obsolete the new statewide exams students started field-testing last week.
State Superintendent Barbara Nielsen said Monday that a bill sponsored by Rep. Ronny Townsend would render useless years of work by the Department of Education to develop standards and a test to measure them.
Frustrated that those expectations were written in language for educators, the Anderson Republican wants a House education panel today to endorse standards in everyday language.186
From 1999 to 2003, stories assumed one of three major themes: (a) Reporting on the educational policies in the state—stories that presented the debates and pros and cons of various accountability laws, (b) reporting on scores (R/s)—stories that documented the achievement performance of students on recent statewide assessments such as the PACT—and (c) Legislative stories that report on voting decisions of the state governing body (L/v).
184 Guerard, M. B. (1997, October 17). State board rethinks school incentive fund. The Post and Courier , p.
A1. 185 Torres, K. (1997, December 11). State Board of Education endorses stronger standards. The Post and
Courier , p. B6. 186 Robinson, B. (1998, April 21). Disagreement on wording could make obsolete South Carolina-wide student
exams. The State .
High-Stakes Testing and Student Achievement 145
When students’ PACT achievement scores were released the first time, many stories commented on how the scores should be used for accountability purposes. For example, some stories in documenting passing/failing rates discussed the pros and cons of retaining students if they failed the exam. In October of 1999 it was reported:
South Carolina students soon will be held accountable for their scores on the Palmetto Achievement Challenge Test. If they don’t pass the new, more rigorous test on state standards, they could be held back a grade.
“Now is the time for students, parents and educators to work together to focus on having every student master the standards,” state Education Superintendent Inez Tenenbaum said Wednesday as she released the first round of PACT scores.
About a third of the 330,000 public school students in grades three through eight who took the test last spring did not meet the state’s basic math standards and almost half did not meet the English standards.
The Education Accountability Act of 1998 says classroom grades, teacher judgment and PACT scores should be used to help make retention decisions. Local school boards determine the specific standards students must meet to pass.187
Throughout 2000, there were several stories reporting on students’ updated PACT performance as well as recounting the type of consequences schools/districts and/or students faced as a result. In November of 2000, it was reported:
The failures of grade schoolers may test the mettle of lawmakers to stand by the Education Accountability Act standards they have set.
Up to a quarter of the state’s fifth- through eighth-graders could be held back next year after failing at least one section of the Palmetto Achievement Challenge Test for the third time this spring, state officials estimate.
Failure’s price tag is high. The accountability act puts a financial burden on the state to help schools and students meet the standards. The state and local districts face the prospect of coming up with an extra $425 million to pay for more than 75,000 students to repeat a grade. In 1998, South Carolina schools retained 12,467 students. 188
Another story in The Herald of Rock Hill South Carolina recounted how local students generally performed on the PACT:
Local students generally scored higher on the Palmetto Achievement Challenge Test this year than they did in 1999, the first year the state standardized test was given.
PACT results, released Tuesday, show that school districts in York, Chester and Lancaster counties improved in virtually all categories.
PACT was first given to third- through eighth-graders in 1999, replacing the Basic Skills Assessment Battery with a more challenging test to see whether students were performing at grade level.
While some of the increases can be attributed to students and teachers being more familiar with the test, local districts hope to see students steadily improve on the test.189
187 Holland, J. (1999, October 21). Students face PACT accountability, many don’t pass first test. Columbia, SC:
Associated Press . 188 High failure rates on PACT scores may test lawmaker resolve, state budget. (2000, November 15).
Greenville, SC: Associated Press . 189 Bruce, A. (2000, November 1). Area districts see increase in test scores. The Herald , p. 1A.
Education Policy Analysis Archives Vol. 14 No. 1 146
As time progressed, the stakes associated with PACT performance increased and numerous stories discussed how schools, parents, teachers, and students were preparing for the test and what they were doing to combat the anxiety and fear associated with the prospect of not passing the test. For example, in the spring of 2001, one story provided tips to parents for how to ready their child for PACT:
The message from South Carolina educators as PACT week approaches is clear - get your children to bed early and feed him or her a good breakfast before sending them to class.
As more than 300,000 third through eighth-graders take the Palmetto Achievement Challenge Test next week, anxious educators throughout the state have pressed the age-old advice in letters to parents.
The test scores will grade individual schools from excellent to unsatisfactory when the first report card is released in November.
“There is a good reason why teachers are so nervous,” said Patricia Burns, Lancaster County School district associate superintendent for instruction. “That single indicator carrying so much weight is what makes teachers so nervous.”190
Similarly, with the passage of time, schools and districts amassed enough data to report trends in student performance. The state accountability system mandated that schools/districts be labeled according to absolute performance as well as improvement over time—labels which trigged any number of consequences including financial rewards for improvement, and school improvement status for schools/districts that continually failed to make progress.
In 2002, a story discussed the problems the state was having with the testing company responsible for scoring PACT. The state complained that the testing company was releasing data with errors, and they were taking too long to release data. 2004
The primary story that emerged from a search of this time frame focused on high school
graduation requirements and the testing standards that are set for high school seniors. Supplemental Search: Google
A search was conducted on March 4, 2004, 2004, covering the range of February 4, 2004
through March 4, 2004. Several search terms were used to probe for the widest selection of stories. A selection of these stories is included in the portfolio. Supplemental Search: LexisNexis
A search of March 2003 through March 2004 was conducted looking for specific articles on
consequences dolled out to students and/or school personnel in the form of rewards (incentives, bonuses) and sanctions (retention, school takeover). The search191 yielded 34 stories, of which nine were downloaded for more careful review. Another search was conducted specifically looking for
190 Holland, J. (2001, April 27). Students, teachers anxious for PACT time. Columbia, SC: Associated Press. 191 Using the search string: (ALLCAPS (PACT) or (HASP) and (teacher or student or principal or
superintendent)) and ((reward* or incentive or bonus) or (takeover or fire or punish or remove or close or retention or retain))
High-Stakes Testing and Student Achievement 147
stories covering the LIFE scholarship.192 Forty articles were found on this topic across the previous year and a selection of these stories was included in the portfolio.
Tennessee
A search193 was conducted across the entire LexisNexis universe of news media available in
Tennessee.194 This initial search returned more than 1,000 stories, and thus, adjustments were made to the search criteria. A second search was conducted using a search string that eliminated the words “test” and “assess,” and only stories containing the acronym TCAP—referring to Tennessee’s testing program entitled Tennessee Comprehensive Assessment Program195—were selected. This produced 156 stories dating back to 1994, of which 69 were downloaded for further review and consideration.
A follow up search was conducted looking for stories prior to 1994 and containing the words “test” and “assess”—the TCAP program was instituted in the late 1990s.196 This search yielded 29 articles, of which only four were remotely related to the issues of high-stakes testing and accountability. These four were downloaded for further consideration. Content Analysis
The number of stories that were reviewed based on year and primary content are presented
in Table 14. A description of the primary themes of these stories across time is described next.
192 Using the search string: ALLCAPS (LIFE) and student and scholarship 193 Using the search string: (assess! or test!) and (high-stakes or accountab!) and (school or student or teacher)
and not (sport or court) 194 Complete File: Chattanooga Times Free Press ; The Commercial Appeal (Memphis); Knoxville News-
Sentinel (Knoxville, TN); The Leaf-Chronicle (Clarksville, TN); M. LEE SMITH PUBLISHERS & PRINTERS LLC - Regional News Stories; The Tennessean (Nashville); Tennessee Employment Law Letter. Selected Documents: The Associated Press State & Local Wire; Business Dateline - Regional News Sources; Knight Ridder/Tribune Business News; Knight Ridder/Tribune Business News - Current News.
195 Using the search string: (ALLCAPS (TCAP)) and (high-stakes or accountab!) and (school or student or teacher) and not (sport or court)
196 Using the search string: (assess! or test!) and (high-stakes or accountab!) and (school or student or teacher) and not (sport or court)
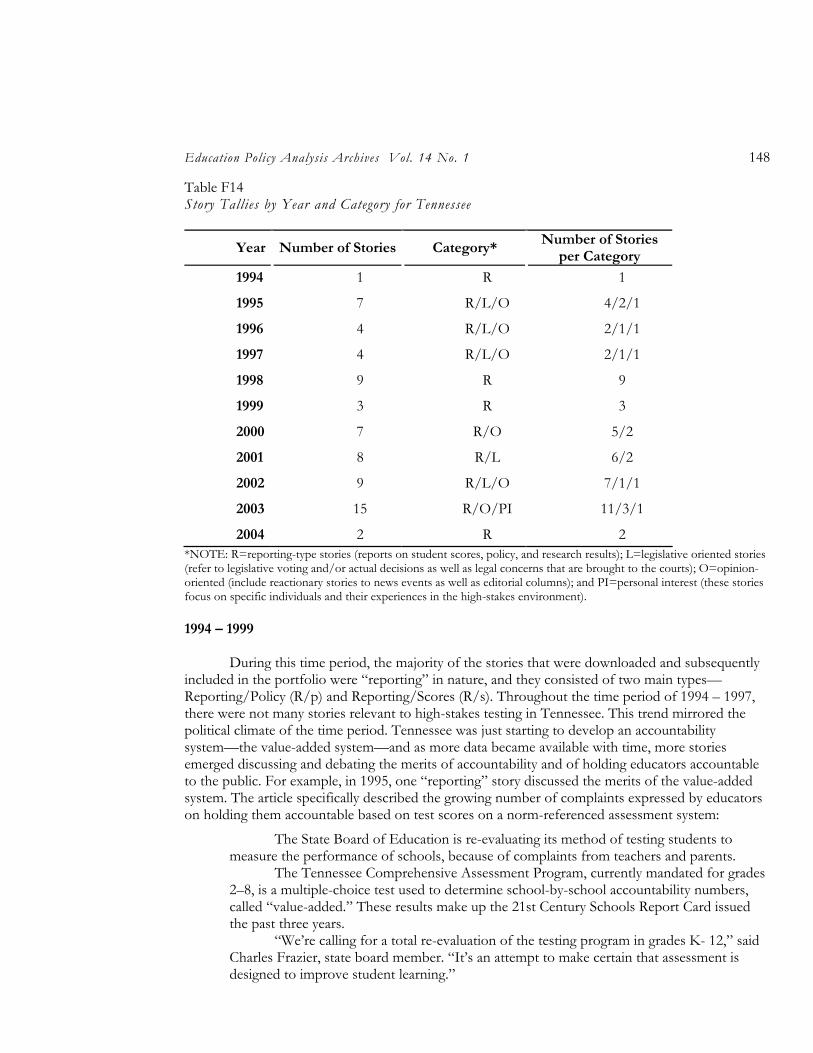
Education Policy Analysis Archives Vol. 14 No. 1 148
Table F14 Story Tallies by Year and Category for Tennessee
Year Number of Stories Category* Number of Stories
per Category
1994 1 R 1
1995 7 R/L/O 4/2/1
1996 4 R/L/O 2/1/1
1997 4 R/L/O 2/1/1
1998 9 R 9
1999 3 R 3
2000 7 R/O 5/2
2001 8 R/L 6/2
2002 9 R/L/O 7/1/1
2003 15 R/O/PI 11/3/1
2004 2 R 2 *NOTE: R=reporting-type stories (reports on student scores, policy, and research results); L=legislative oriented stories (refer to legislative voting and/or actual decisions as well as legal concerns that are brought to the courts); O=opinion-oriented (include reactionary stories to news events as well as editorial columns); and PI=personal interest (these stories focus on specific individuals and their experiences in the high-stakes environment).
1994 – 1999
During this time period, the majority of the stories that were downloaded and subsequently included in the portfolio were “reporting” in nature, and they consisted of two main types—Reporting/Policy (R/p) and Reporting/Scores (R/s). Throughout the time period of 1994 – 1997, there were not many stories relevant to high-stakes testing in Tennessee. This trend mirrored the political climate of the time period. Tennessee was just starting to develop an accountability system—the value-added system—and as more data became available with time, more stories emerged discussing and debating the merits of accountability and of holding educators accountable to the public. For example, in 1995, one “reporting” story discussed the merits of the value-added system. The article specifically described the growing number of complaints expressed by educators on holding them accountable based on test scores on a norm-referenced assessment system:
The State Board of Education is re-evaluating its method of testing students to measure the performance of schools, because of complaints from teachers and parents.
The Tennessee Comprehensive Assessment Program, currently mandated for grades 2–8, is a multiple-choice test used to determine school-by-school accountability numbers, called “value-added.” These results make up the 21st Century Schools Report Card issued the past three years.
“We’re calling for a total re-evaluation of the testing program in grades K- 12,” said Charles Frazier, state board member. “It’s an attempt to make certain that assessment is designed to improve student learning.”
High-Stakes Testing and Student Achievement 149
Since it was started in 1990, a growing number of teachers have complained that TCAP tested their students on topics they weren’t required to teach.197
Subsequently, Tennessee education policies were challenged—there were two editorials that argued for and against the TCAP as a tool for holding schools accountable:
Efforts to weaken Tennessee’s testing program in public schools appear to be picking up more opposition than support, at least among legislators in this area. That is good.
Senate Republican Leader Ben Atchley of Knoxville said last week he is bothered by reports that some lawmakers intend to propose changes in the program, called the value-added assessment system, which was designed by University of Tennessee statistician Dr. William Sanders.
The testing program is a complex statistical system designed to measure the extent of student progress from year to year in five subjects: reading, language arts, math, science and social studies. It is based on the results of Tennessee Comprehensive Assessment Program (TCAP) tests administered each year in the second through eighth grades.198
By 1999, several stories had emerged that presented student test result data. For example, in 1998, the media presented the public with the most recent round of school labels:
Report cards are out, and four Hamilton County schools have straight A’s. Calvin Donaldson Elementary, McConnell Elementary, Ooltewah Intermediate and
the 21st Century Preparatory School topped the list this year of county schools improving their academic performance faster than the national average, according to a comprehensive assessment of education in Tennessee that was released Monday.
A number of other schools have made the A-B honor roll, and show signs of improving.
“I’m not disappointed in these results,” Superintendent Jesse Register said when state Department of Education officials released the report cards Monday afternoon.199
And in 1999 the media presented specific grade-level TCAP performance results:
Hamilton County Schools’ student scores on 1998–’99 standardized tests may be “OK,” but students in other parts of Tennessee did a little better.
County students in grades 3–8 met or exceeded the national norm, 50 on a scale of 1–100, 68 percent of the time in the seven major test categories, including math and language arts.
However, students in other parts of the state met or exceeded the norm 90 percent of time in those categories, according to state records.
Schools testing director Kirk Kelly called the county’s current scores “OK.” School officials said $8,000 worth of new, test-analyzing computer software will
transform local students’ scores into a detailed profile of student skills so teachers and administrators can address student weaknesses.
197 State re-evaluating its method of testing students, schools. (1995, December 11). Chattanooga Free Press ,
Author. 198 A time for testing: Weakening state program would also erode schools’ accountability (1996, December 4).
Knoxville News-Sentinel , Comment, p. A14. 199 Wiatrowski, K. (1998, November 10). Grading our schools: 4 schools make straight A’s on state’s
assessment report. The Chattanooga Times , p. A1.
Education Policy Analysis Archives Vol. 14 No. 1 150
The TCAP (Tennessee Comprehensive Assessment Program) achievement test is now called the TerraNova test by school officials. This new version of TCAP is in its second year of use in the county, Dr. Kelly said.200
2000 - 2004
The first set of publicly released school-level report cards were released in 2000. Some
articles predicted their local school’s report card would be negative as evidenced in this July 2000 Commercial Appeal headline: “City Schools Expect Poor Report Card: State To Issue Warning List On 48 Worst Performers.”201 This was followed by several stories commenting on report card results. In late July, it was proclaimed: “More than Half of Tennessee’s Troubled Schools in Memphis: State Requires 26 ‘Failures’ to Improve Substantially.”202 In November, it was announced that the state was going to release their first-ever school-by-school report cards:
For the first time, the Tennessee Department of Education has released performance data for all 1,611 schools in the state.
The Report Card 2000 is a broad look at how well students scored on Tennessee Comprehensive Assessment Program (TCAP) standardized tests, and how much they learned over the course of the previous year.
While the department has released report cards on school systems for the last seven years, this is the first to grade individual schools.203
And, in 2001, several stories commenting on local school successes and failures emerged, like the one appearing on March 11, 2001, in the Chattanooga Times Free Press with the headline: “Hamilton schools in top 20 ranking,”204 and the one appearing on September 22, 2001, in the Commercial Appeal announcing: “6 city schools rejoice at ‘movin’ on up’ from state risk list.”205
In 2002, a series of stories covered the debate over the exit examination. Specifically, questions emerged discussing when the new exit exam should be instituted and whether it is prudent to base graduation decisions on a test. And, in 2003, many of the stories commented on a scandal involving teachers who allegedly helped students “too much” on their standardized test. Perhaps as a result of this incident, editorials and personal interest stories converged on the topic of whether the pressures of TCAP were too much. For example, a personal-interest story appearing in September of 2003 describes how a veteran teacher feels too much pressure to focus on testing:
Cathy Branan’s third-grade class doesn’t begin with hugs and story time. It begins with “morning meeting” - a 15-minute session where children put their
ponytailed and cornrowed heads together to focus on the day’s TCAP objectives.
200 Sutton, L. (1999, August 13). Test scores for county called OK: System results lag behind state in all areas,
grades. Chattanooga Free Press , p. A1. 201 Edmondson, A., & Anderson, M. (2000, July 21). City schools expect poor report card: State to issue
warning list on 48 worst performers. The Commercial Appeal , p. A1. 202 Locker, R. (2000, July 22). More than half of Tennessee’s troubled schools in Memphis: State requires 26
“failures” to improve substantially. The Commercial Appeal , p. A1. 203 Sharp, T. (2000, November 16). State releases first school-by-school “report card.” Nashville, TN:
Associated Press. 204 Sutton, L. (2001, March 11). Hamilton schools in top 20 ranking. Chattanooga Times Free Press , p. A1. 205 Erskine, M. (2001, September 22). 6 schools rejoice at “movin’ on up” from state risk list. The Commercial
Appeal , p. A1.
High-Stakes Testing and Student Achievement 151
If that sounds like a somber way to begin the day for 8-and 9-year-olds, consider this - the fate of their school hinges on these kids’ performance on the Tennessee Comprehensive Assessment Program (TCAP).
Teaching has changed in the 34 years Branan’s been in the profession. Decades ago, when she started out, she was master of her lesson plans. Now, TCAP objectives drive what she teaches in class. “It’s not right. It’s not fair. But it’s all down to test scores,” Branan, 54, says. What she calls her teaching “bible” includes binders that map out what kinds of
questions have appeared on the TCAP over the last three years and how frequently each question has appeared.
These binders prescribe her focus in class. For example, since identifying subject and predicate in sentences has appeared four times on recent TCAPs, Branan will spend a week covering it. On the other hand, she may spend only a day covering combining sentences, since recent tests have had only one question, or none at all, in that area.
Slowly and steadily the stress of high-stakes testing is getting to her, even though she’s among the most experienced and celebrated teachers in Memphis City Schools.206
Supplemental Search: Google
A search was conducted on March 4, 2004, covering the range of dates February 4, 2004, through March 4, 2004. Several search terms were used to probe for the widest selection of stories. A selection of these stories is included in the portfolio. Supplemental Search: LexisNexis
A search of stories from March 2003 through March 2004 was conducted. This search focused on specific articles that described consequences dolled out to students and/or school personnel in the form of rewards (incentives, bonuses) and sanctions (retention, school takeover). The search207 yielded 33 stories, of which eight were downloaded for more careful review.
Texas
Two searches208 using LexisNexis209 were conducted to look for high-stakes stories in the
state of Texas. These two searches were conducted in an effort to look for stories related to the two main assessment systems that were used in Texas. The first, major assessment system was the
206 Banerji, R. (2003, September 23). TCAP Challenges spirit: Dire stakes directing her class now, a veteran
sighs. The Commercial Appeal , p. A1. 207 Using the search string: (ALLCAPS (TCAP) and (teacher or student or principal or superintendent)) and
((reward* or incentive or bonus) or (takeover or fire or punish or remove or close or retention or retain)) and not court or health
208 Because the assessment system in Texas changed over time, two searches were conducted looking for stories that contained the acronyms relevant to these two systems. The first search string used was: [(ALLCAPS (TAAS)) and (high stake) and accountab!]. The second search string replaced TAAS with TAKS, the new acronym: [(ALLCAPS (TAKS)) and (high stake) and accountab!].
209 The complete file on LexisNexis includes: The Austin American-Statesman, Austin Business Journal , Corpus Christi Caller-Times , The Dallas Morning News, Dallas Observer (Texas), El Paso Times (El Paso, TX), Fort Worth Star-Telegram, The Houston Chronicle, Houston Press (Texas), M. LEE SMITH PUBLISHERS & PRINTERS LLC - Regional News Stories, San Antonio Express-News , The Texas Lawyer , .
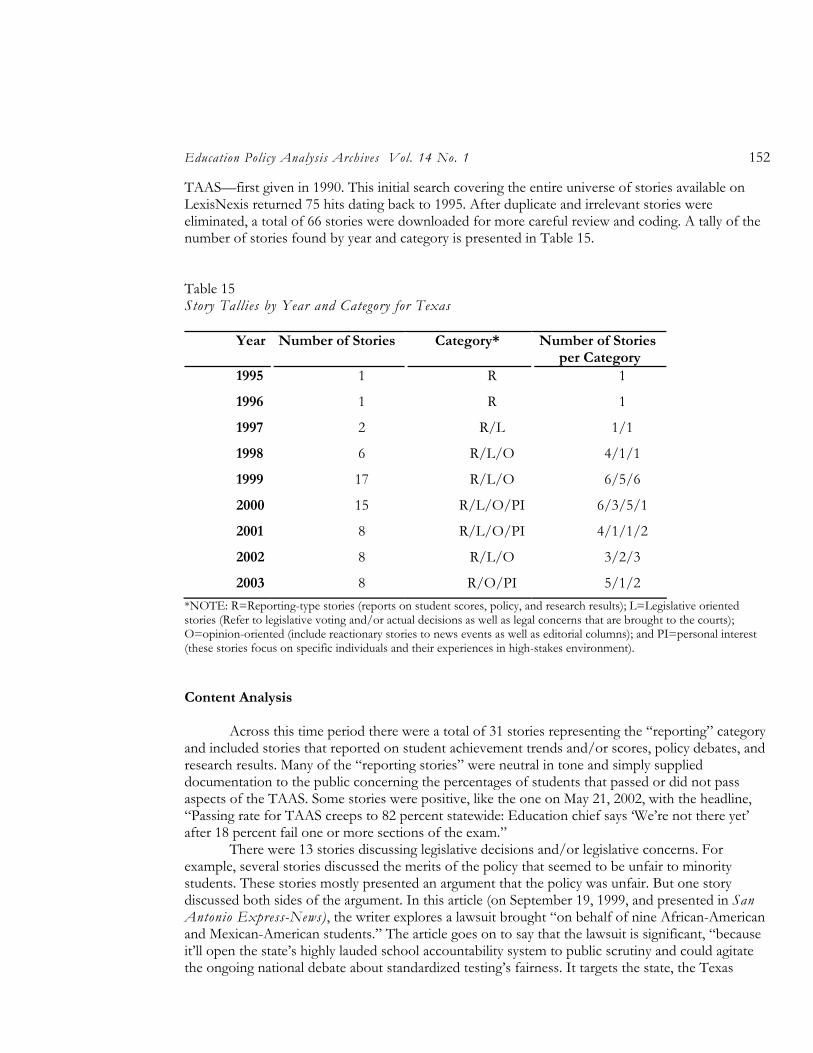
Education Policy Analysis Archives Vol. 14 No. 1 152
TAAS—first given in 1990. This initial search covering the entire universe of stories available on LexisNexis returned 75 hits dating back to 1995. After duplicate and irrelevant stories were eliminated, a total of 66 stories were downloaded for more careful review and coding. A tally of the number of stories found by year and category is presented in Table 15. Table 15 Story Tallies by Year and Category for Texas
Year Number of Stories Category* Number of Stories per Category
1995 1 R 1
1996 1 R 1
1997 2 R/L 1/1
1998 6 R/L/O 4/1/1
1999 17 R/L/O 6/5/6
2000 15 R/L/O/PI 6/3/5/1
2001 8 R/L/O/PI 4/1/1/2
2002 8 R/L/O 3/2/3
2003 8 R/O/PI 5/1/2 *NOTE: R=Reporting-type stories (reports on student scores, policy, and research results); L=Legislative oriented stories (Refer to legislative voting and/or actual decisions as well as legal concerns that are brought to the courts); O=opinion-oriented (include reactionary stories to news events as well as editorial columns); and PI=personal interest (these stories focus on specific individuals and their experiences in high-stakes environment).
Content Analysis
Across this time period there were a total of 31 stories representing the “reporting” category and included stories that reported on student achievement trends and/or scores, policy debates, and research results. Many of the “reporting stories” were neutral in tone and simply supplied documentation to the public concerning the percentages of students that passed or did not pass aspects of the TAAS. Some stories were positive, like the one on May 21, 2002, with the headline, “Passing rate for TAAS creeps to 82 percent statewide: Education chief says ‘We’re not there yet’ after 18 percent fail one or more sections of the exam.”
There were 13 stories discussing legislative decisions and/or legislative concerns. For example, several stories discussed the merits of the policy that seemed to be unfair to minority students. These stories mostly presented an argument that the policy was unfair. But one story discussed both sides of the argument. In this article (on September 19, 1999, and presented in San Antonio Express-News), the writer explores a lawsuit brought “on behalf of nine African-American and Mexican-American students.” The article goes on to say that the lawsuit is significant, “because it’ll open the state’s highly lauded school accountability system to public scrutiny and could agitate the ongoing national debate about standardized testing’s fairness. It targets the state, the Texas
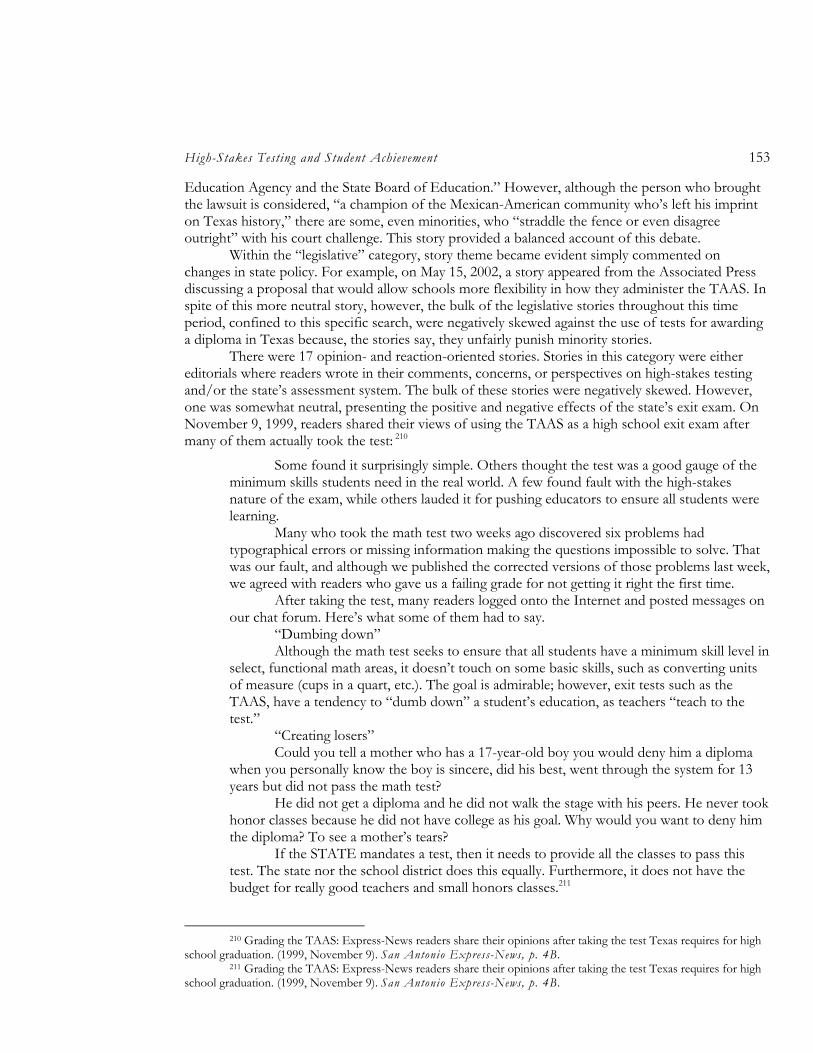
High-Stakes Testing and Student Achievement 153
Education Agency and the State Board of Education.” However, although the person who brought the lawsuit is considered, “a champion of the Mexican-American community who’s left his imprint on Texas history,” there are some, even minorities, who “straddle the fence or even disagree outright” with his court challenge. This story provided a balanced account of this debate.
Within the “legislative” category, story theme became evident simply commented on changes in state policy. For example, on May 15, 2002, a story appeared from the Associated Press discussing a proposal that would allow schools more flexibility in how they administer the TAAS. In spite of this more neutral story, however, the bulk of the legislative stories throughout this time period, confined to this specific search, were negatively skewed against the use of tests for awarding a diploma in Texas because, the stories say, they unfairly punish minority stories.
There were 17 opinion- and reaction-oriented stories. Stories in this category were either editorials where readers wrote in their comments, concerns, or perspectives on high-stakes testing and/or the state’s assessment system. The bulk of these stories were negatively skewed. However, one was somewhat neutral, presenting the positive and negative effects of the state’s exit exam. On November 9, 1999, readers shared their views of using the TAAS as a high school exit exam after many of them actually took the test: 210
Some found it surprisingly simple. Others thought the test was a good gauge of the minimum skills students need in the real world. A few found fault with the high-stakes nature of the exam, while others lauded it for pushing educators to ensure all students were learning.
Many who took the math test two weeks ago discovered six problems had typographical errors or missing information making the questions impossible to solve. That was our fault, and although we published the corrected versions of those problems last week, we agreed with readers who gave us a failing grade for not getting it right the first time.
After taking the test, many readers logged onto the Internet and posted messages on our chat forum. Here’s what some of them had to say.
“Dumbing down” Although the math test seeks to ensure that all students have a minimum skill level in
select, functional math areas, it doesn’t touch on some basic skills, such as converting units of measure (cups in a quart, etc.). The goal is admirable; however, exit tests such as the TAAS, have a tendency to “dumb down” a student’s education, as teachers “teach to the test.”
“Creating losers” Could you tell a mother who has a 17-year-old boy you would deny him a diploma
when you personally know the boy is sincere, did his best, went through the system for 13 years but did not pass the math test?
He did not get a diploma and he did not walk the stage with his peers. He never took honor classes because he did not have college as his goal. Why would you want to deny him the diploma? To see a mother’s tears?
If the STATE mandates a test, then it needs to provide all the classes to pass this test. The state nor the school district does this equally. Furthermore, it does not have the budget for really good teachers and small honors classes.211
210 Grading the TAAS: Express-News readers share their opinions after taking the test Texas requires for high
school graduation. (1999, November 9). San Antonio Express-News, p. 4B. 211 Grading the TAAS: Express-News readers share their opinions after taking the test Texas requires for high
school graduation. (1999, November 9). San Antonio Express-News, p. 4B.
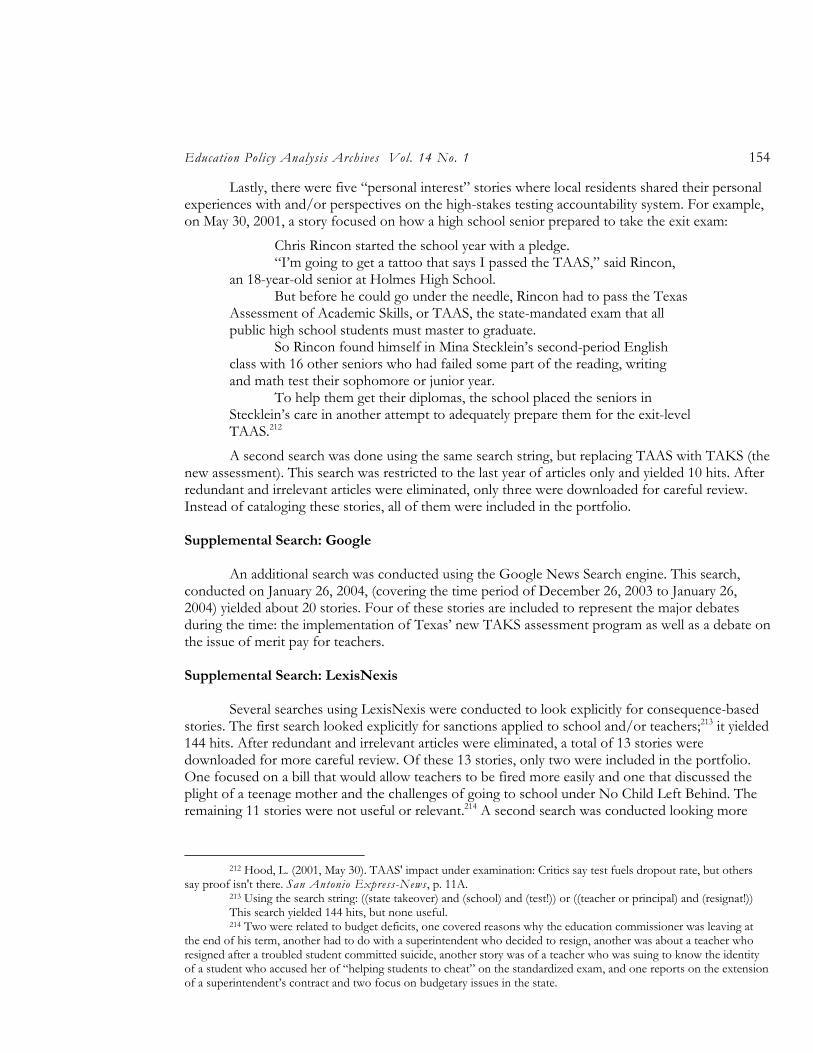
Education Policy Analysis Archives Vol. 14 No. 1 154
Lastly, there were five “personal interest” stories where local residents shared their personal experiences with and/or perspectives on the high-stakes testing accountability system. For example, on May 30, 2001, a story focused on how a high school senior prepared to take the exit exam:
Chris Rincon started the school year with a pledge. “I’m going to get a tattoo that says I passed the TAAS,” said Rincon,
an 18-year-old senior at Holmes High School. But before he could go under the needle, Rincon had to pass the Texas
Assessment of Academic Skills, or TAAS, the state-mandated exam that all public high school students must master to graduate.
So Rincon found himself in Mina Stecklein’s second-period English class with 16 other seniors who had failed some part of the reading, writing and math test their sophomore or junior year.
To help them get their diplomas, the school placed the seniors in Stecklein’s care in another attempt to adequately prepare them for the exit-level TAAS.212
A second search was done using the same search string, but replacing TAAS with TAKS (the new assessment). This search was restricted to the last year of articles only and yielded 10 hits. After redundant and irrelevant articles were eliminated, only three were downloaded for careful review. Instead of cataloging these stories, all of them were included in the portfolio. Supplemental Search: Google
An additional search was conducted using the Google News Search engine. This search,
conducted on January 26, 2004, (covering the time period of December 26, 2003 to January 26, 2004) yielded about 20 stories. Four of these stories are included to represent the major debates during the time: the implementation of Texas’ new TAKS assessment program as well as a debate on the issue of merit pay for teachers. Supplemental Search: LexisNexis
Several searches using LexisNexis were conducted to look explicitly for consequence-based
stories. The first search looked explicitly for sanctions applied to school and/or teachers;213 it yielded 144 hits. After redundant and irrelevant articles were eliminated, a total of 13 stories were downloaded for more careful review. Of these 13 stories, only two were included in the portfolio. One focused on a bill that would allow teachers to be fired more easily and one that discussed the plight of a teenage mother and the challenges of going to school under No Child Left Behind. The remaining 11 stories were not useful or relevant.214 A second search was conducted looking more
212 Hood, L. (2001, May 30). TAAS' impact under examination: Critics say test fuels dropout rate, but others
say proof isn't there. San Antonio Express-News , p. 11A. 213 Using the search string: ((state takeover) and (school) and (test!)) or ((teacher or principal) and (resignat!)) This search yielded 144 hits, but none useful. 214 Two were related to budget deficits, one covered reasons why the education commissioner was leaving at
the end of his term, another had to do with a superintendent who decided to resign, another was about a teacher who resigned after a troubled student committed suicide, another story was of a teacher who was suing to know the identity of a student who accused her of “helping students to cheat” on the standardized exam, and one reports on the extension of a superintendent’s contract and two focus on budgetary issues in the state.
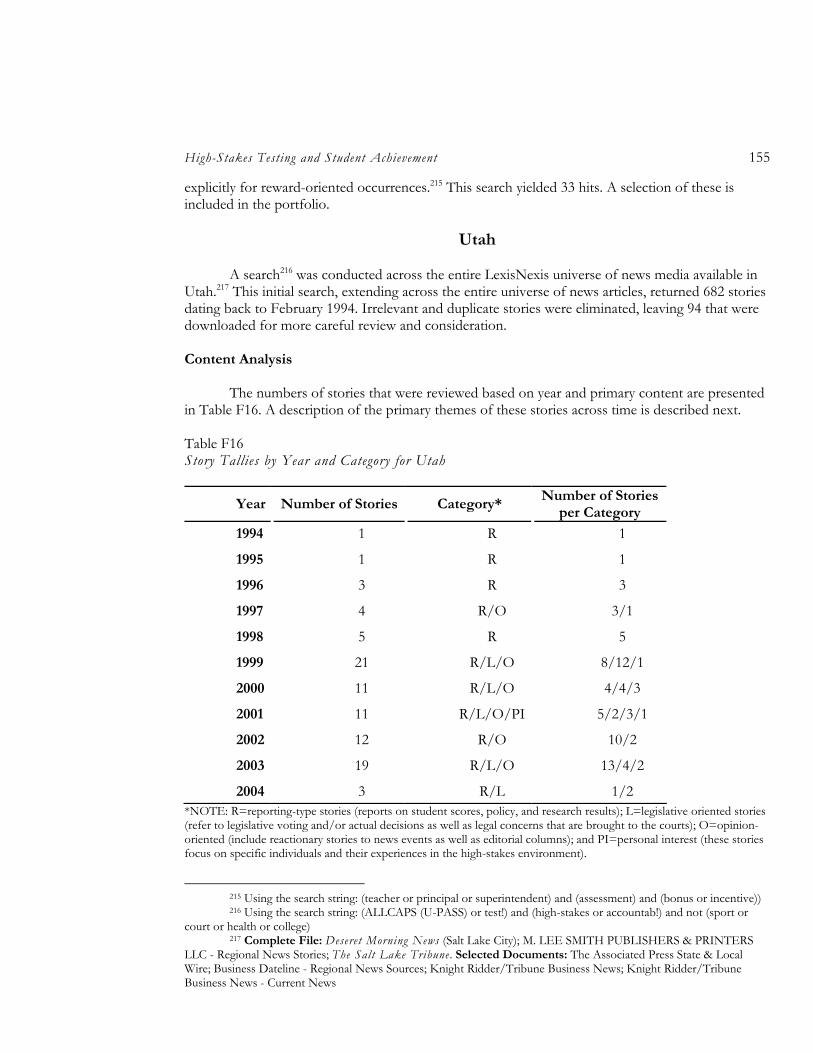
High-Stakes Testing and Student Achievement 155
explicitly for reward-oriented occurrences.215 This search yielded 33 hits. A selection of these is included in the portfolio.
Utah
A search216 was conducted across the entire LexisNexis universe of news media available in
Utah.217 This initial search, extending across the entire universe of news articles, returned 682 stories dating back to February 1994. Irrelevant and duplicate stories were eliminated, leaving 94 that were downloaded for more careful review and consideration. Content Analysis
The numbers of stories that were reviewed based on year and primary content are presented in Table F16. A description of the primary themes of these stories across time is described next. Table F16 Story Tallies by Year and Category for Utah
Year Number of Stories Category* Number of Stories
per Category
1994 1 R 1
1995 1 R 1
1996 3 R 3
1997 4 R/O 3/1
1998 5 R 5
1999 21 R/L/O 8/12/1
2000 11 R/L/O 4/4/3
2001 11 R/L/O/PI 5/2/3/1
2002 12 R/O 10/2
2003 19 R/L/O 13/4/2
2004 3 R/L 1/2 *NOTE: R=reporting-type stories (reports on student scores, policy, and research results); L=legislative oriented stories (refer to legislative voting and/or actual decisions as well as legal concerns that are brought to the courts); O=opinion-oriented (include reactionary stories to news events as well as editorial columns); and PI=personal interest (these stories focus on specific individuals and their experiences in the high-stakes environment).
215 Using the search string: (teacher or principal or superintendent) and (assessment) and (bonus or incentive)) 216 Using the search string: (ALLCAPS (U-PASS) or test!) and (high-stakes or accountab!) and not (sport or
court or health or college) 217 Complete File: Deseret Morning News (Salt Lake City); M. LEE SMITH PUBLISHERS & PRINTERS
LLC - Regional News Stories; The Salt Lake Tribune . Selected Documents: The Associated Press State & Local Wire; Business Dateline - Regional News Sources; Knight Ridder/Tribune Business News; Knight Ridder/Tribune Business News - Current News
Education Policy Analysis Archives Vol. 14 No. 1 156
1994 – 1999
The first article downloaded and appearing in 1994 laid the groundwork for the sets of issues that would be discussed in Utah. In 1994, the Salt Lake Tribune reported on the most recent round of test scores while describing the current state laws around academic assessment.
Another drop in the fifth-grade reading score is the dark cloud hanging over an otherwise positive showing by students in Utah’s 1994 statewide testing program.
It is the second time in four years that the reading score at the fifth-grade level has declined. The long-term ramifications of the trend has educators worried.
State law requires students in grades five, eight and 11 to take a norm-referenced test each fall as a way of making schools more accountable. In the next few weeks, test results for all 40 districts and individual schools will be reported to the public.
In 1994, the fifth year the statewide test has been given, some 98,880 students in the three grades participated. Students were tested in late September and early October in all major subjects, including math, reading, English, science, social science and a total basic battery.218
Importantly, as is stated in this article, state law has required students in grades 5, 8, and 11 to take a norm referenced test since 1989.
There were few articles throughout the next few years that added anything substantive to Utah’s accountability system. Importantly, those that were most relevant included an article outlining a candidate for governor’s position on a variety of topics, including education, and other reports documenting trends in student achievement. In 1999 there was a surge of media documentation on what was going on in Utah with respect to educational accountability. For example, a story reported in the Deseret News (A Salt Lake City publication) in January of 1999 discussed research reported on by a local professor—arguing that for Utah’s students to become more competitive nationally, Utah would need to establish a meaningful accountability measure:
Utah’s schools are hindered by the lack of a statewide accountability plan outlining consequences for failing to meet specific academic standards, according to a recent report by a University of Utah education professor.
John Bennion, clinical professor at the U.’s graduate school of education, says in a policy brief for the school’s Utah Education Policy Center that officials need to see the importance of setting high standards and aligning core curriculum to a year-end assessment of what students have learned.
Steps to help low-scoring schools -- and consequences for continued poor performances -- also need to be established for educators, he said.
“Until those elements are in place, no meaningful accountability will exist in Utah schools and new and existing programs will continue to operate without a clear vision of the desired learning goals to be achieved,” said Bennion, a former Salt Lake City School District superintendent.219
After this report, but not necessarily in response to the report, a series of articles emerged across varying publications arguing the need for increased accountability in Utah. Many believed that
218 Kapos, K. (1994, December 8). 5th-grade scores mar Utah’s reading tests reading: Utah scores mostly
positive. Sal Lake Tribune, p. A1. 219 Haney, J. P., & Toomer-Cook, J. (1999, January 25). School accountability urged. Deseret News, p. B01.
High-Stakes Testing and Student Achievement 157
teachers should be held accountable. One story recounted the most recent round of legislative proposals that were being debated by policy makers:
In the wake of slipping reading test scores, the Utah Legislature debated a handful of bills to hold teachers accountable for test results.
A bill by Rep. Sheryl Allen, R-Bountiful, considered a big victory by the State Office of Education, aims to tighten teacher licensure standards and includes provisions for testing teachers’ skills before they enter the classroom.
“This isn’t teacher bashing,” said Rep. Keele Johnson, R-Blanding, whose bill hashing out rules of proposed teacher testing never made it out of Senate rules.
Allen’s bill also creates national board certification as a top licensure goal, but tests cost $2,000 apiece.220
And, at least one editorial writer argued support for this type of accountability:
Accountability is a vital part of education. Homework, tests and various other measuring sticks provide it for students.
But what about those who instruct the students -- the teachers? Shouldn’t they also be accountable? Absolutely.
How to have teachers demonstrate that accountability has proven to be a philosophical beach ball -- it keeps getting batted around but never seems to land.
That may be changing in Utah, thanks in part to a bill unanimously endorsed by the House Education Standing Committee. The goal of the measure -- sponsored by Rep. Keele Johnson, R-Blanding and endorsed by both the State Office of Education and the Utah Education Association -- is to ensure a qualified professional in every classroom.221
Throughout 1999, Utah batted around a series of legislative ideas and the press recounted the surrounding debates. Importantly, different groups of individuals had a different perspective on the variety of legislative proposals that were being considered. For example, one proposal was to hold schools accountable for increasing student test scores—in this case, accountability meant public grading of each school based on how they performed (e.g., on a scale of A to F). Some educators vehemently opposed such an idea as was reported in October of 1999:
Educators give an “A” to setting high standards and being held accountable.
But rating schools on how well kids do on a battery of standardized tests receives an “F.”
That’s the report card heard Wednesday from 50 people addressing the State Task Force on Learning Standards and Accountability, who agreed that money for a massive accountability model would be better spent on programs, supplies or teacher salaries. They want parents, students and the Legislature to be held accountable, too.
“You need to quit threatening us,” said Deanna Johnson, a Jordan District educator. “I would never tell a doctor or lawyer how to run his practice. You need to come spend more time in the classroom.”
220 School bills aimed at accountability (1999, March 4). Deseret News , p. A16. 221 Teachers and accountability (1999, February 14). Teachers and accountability. Deseret News, Opinion, p.
AA1.
Education Policy Analysis Archives Vol. 14 No. 1 158
Speakers in the audience of 200 or more, mostly educators from Murray, Jordan, Granite and Uintah school districts, seemed to drive home their point with a hammer.222
2000 – 2002
Debates around accountability continued, and articles and editorials that discussed both sides of the issues continued to appear. For example, some were supportive of holding educators accountable for test performance:
Sadly, the idea of rewarding and punishing employees for performance is resisted at every turn in the public school system. In private business it is a bedrock principle that keeps corporations competitive. But educators believe it is too risky to hold people accountable for the way others perform. It may be OK for coaches to be expected to win even though their success depends on others, but not teachers or administrators. That is why programs like those sponsored by Eccles/Annenberg, although effective, aren’t likely to lead to any long-term results after the money is gone.223
In another opinion piece, one writer in September 2000 also supported the idea of grading schools based on how well they are teaching their students:
If a school is doing well, the public has a right to know that and to specifically understand if it is performing at an “A”, “B” or other level, using a scale that is easily understandable and comparable. More importantly, the public needs to know which schools fail to teach adequately, and these should be labeled as such. Obviously, schools with poor grades or rankings would suffer some embarrassment, but they would then take steps to improve, as failing schools have in other states with grading scales. How schools perform is something that should be measurable on a yearly basis and put in terms easy to interpret. Grading, as opposed to listing results in confusing categories, would allow the public to track a school’s progress.224
All of these debates were in reaction to a house accountability bill that was passed in the spring of 2000. The Bill was described in the Deseret News in March of 2000:
The Legislature approved a bill laying the groundwork for greater school accountability but not before slashing the proposal’s funding in half.
HB177, sponsored by Tammy Rowan, R-Orem, creates the Utah Performance Assessment System for Students (U-PASS).
U-PASS will include new writing exams for sixth- and ninth-graders and short-answer tests, plus the Stanford Achievement Test, core curriculum test and upcoming 10th-grade basic skills test already in state law. All will be phased in by the 2004-05 school year.
The bill also directs an accountability task force, which has met since May to come up with the bill, to determine what other data might be publicly reported as accountability measures. The aim is to identify struggling schools needing additional resources or reward others for excellence.225
222 Toomer-Cook, J. (1999, October 21). Educators flay standardized tests. Deseret News , p. B01. 223 Schools should demand success (2000, July 6). Deseret News , Opinion, p. A14. 224 Grading schools: Why not? (2000, September 4). Deseret News , Opinion, p. A12. 225 Toomer-Cook, J. (2000, March 2). Measure on school testing is approved. Deseret News , p. A13.
High-Stakes Testing and Student Achievement 159
Throughout 2001 and 2002 stories on accountability, the pros and cons, continued. However, more stories appeared discussing how students were doing on the new assessment system. Similarly, many stories discussed how Utah’s pre-existing accountability system would mesh with NCLB. A cross section of these stories and issues is included in the portfolio. 2003 – 2004
Throughout 2003, the main theme appearing in the news had to do with the exit test. Some questioned whether it was a good measure of student knowledge. Others argued that special population students were having difficulties on the test. And still others believed that Utah gave simply too many tests. The exit test was piloted in the spring of 2003:
Utah high school students this week will either put their feet up -- or into the fire. Tuesday through Thursday, sophomores will pilot a controversial graduation test that
soon will determine whether students receive a high school diploma. The test doesn’t count for them. But school bosses say there’s a big reason to take the Utah Basic Skills Competency
Test seriously. And some even are having juniors and seniors leave early or start later on those days to create a serious, highly supervised testing atmosphere for the sophomores.
“It’s mainly to make sure we’re focusing on the test and make sure there are no distractions,” Davis District director of research and assessment Chris Wahlquist said. “We think it’s important.”226
Controversy was ever present following the first administration of the exit test primarily because educators complained students simply had not been exposed to the standards-based curriculum (on which the test was based) long enough. In June of 2003, the Deseret Morning News reported on this issue:
The UBSCT is required for students to earn a full diploma, with those failing the test receiving alternative diplomas. Its purpose is to give a high school diploma more substance. The class of 2006 was to be the first to be tested.
The UBSCT is being considered for elimination because proposed standards-based graduation requirements would accomplish UBSCT’s goals, said state Testing Coordinator Louise Moulding.
The proposed graduation requirements are in response to SB154 and complaints from the governor’s Employers Education Coalition that high school graduates are ill-prepared for the work force and lack basic knowledge.227
A follow-up article in February of 2004 extended on these initial concerns when the test was given for the first time and passing it was a requirement for graduation:
Ask high school sophomores about this week’s basic skills exam and they shrug it off as one more in a series of standardized tests to suffer through -- and an unnecessary one at that.
“It’s kind of stupid because we’re being tested in all our other classes, and if we’re passing those tests, obviously we know how to do it,” said Rachel Evans, a sophomore at Viewmont High in Bountiful. “If our teachers pass us, and we pass all our classes, we should be able to get our diploma rather than it being based on one test.”
226 Toomer-Cook, J. (2003, February 3). High school test takers in hot seat. Deseret News , p. B05. 227 Hayes, E. (2003, June 18). State’s skills test may get ax. Deseret Morning News , p. A01.
Education Policy Analysis Archives Vol. 14 No. 1 160
Therein lies the difference between this and other exams. For the first time in its three-year history, the Utah Basic Skills Competency Test
counts toward graduation. It measures students’ grasp of core curriculum standards through 10th grade. Students in the class of 2006 and beyond must pass the exam to earn a high school diploma, even if they satisfy all other graduation requirements.
So not everyone understands the stakes attached to the test, affectionately known as “U-biscuit.”
The test was given on a pilot basis the past two years, so it didn’t count for the students who took it. In addition, funding shortfalls and priority shifts at the Legislature put the exam in an on-again-off-again mode, which has left some students and parents in the dark about its current status.228
Supplemental Search: Google
A search was conducted on April 6, 2004, covering the range of dates March 6, 2004 through April 6, 2004. Several search terms were used to probe for the widest selection of stories. A selection of these stories is included in the portfolio. Supplemental Search: LexisNexis
A search of April 2003 through April 2004 was conducted, looking for specific articles on consequences dolled out to students and/or school personnel in the form of rewards (incentives, bonuses)229 and sanctions (retention, school takeover).230 The search for positive consequences yielded four stories and the search for negative consequences yielded ten stories. A cross section from both of these searches was downloaded and selected for portfolio inclusion.
Virginia
A search231 was conducted across the entire LexisNexis universe of news media available in
Virginia.232 This initial search, extending across the entire universe of news articles returned more than 1,000 stories, and thus, adjustments had to be made in order to reduce the number of stories to a manageable set. A second search was conducted and confined to the time period of January 1, 1994, to December 31, 1996 (there were no stories prior to 1994). This search yielded 314 stories, of
228 Lynn, R. (2004, February 1). Skills exam is no longer just a test: This year’s sophomore students required to
pass test. Salt Lake Tribune , p. B1. 229Using two types of search strings: (ALLCAPS (U-PASS) and (student or teacher) and (reward* or incentive or bonus or scholarship) and not
(sport or court or health or college) (test!) and school and (reward or bonus or award) and not (sport or court or health or college) 230 Using the search string: (ALLCAPS (U-PASS) and (student or teacher or school) and (takeover or reform)
and not (sport or court or health or college). 231 Using the search string: (assess! or test!) and (high-stakes or accountab!) and (school or student or teacher)
and not (sport or court) 232 Complete File: The Daily News Leader (Staunton, VA), Daily Press (Newport News), Dolan’s Virginia
Business Observer (Norfolk, VA), M. LEE SMITH PUBLISHERS & PRINTERS LLC - Regional News Stories, Richmond Times Dispatch , Roanoke Times & World News, The Virginian-Pilot (Norfolk, VA). Selected Documents: The Associated Press State & Local Wire, Business Dateline - Regional News Sources, Knight Ridder/Tribune Business News, Knight Ridder/Tribune Business News - Current News, Video Monitoring Services of America (formerly Radio TV Reports)
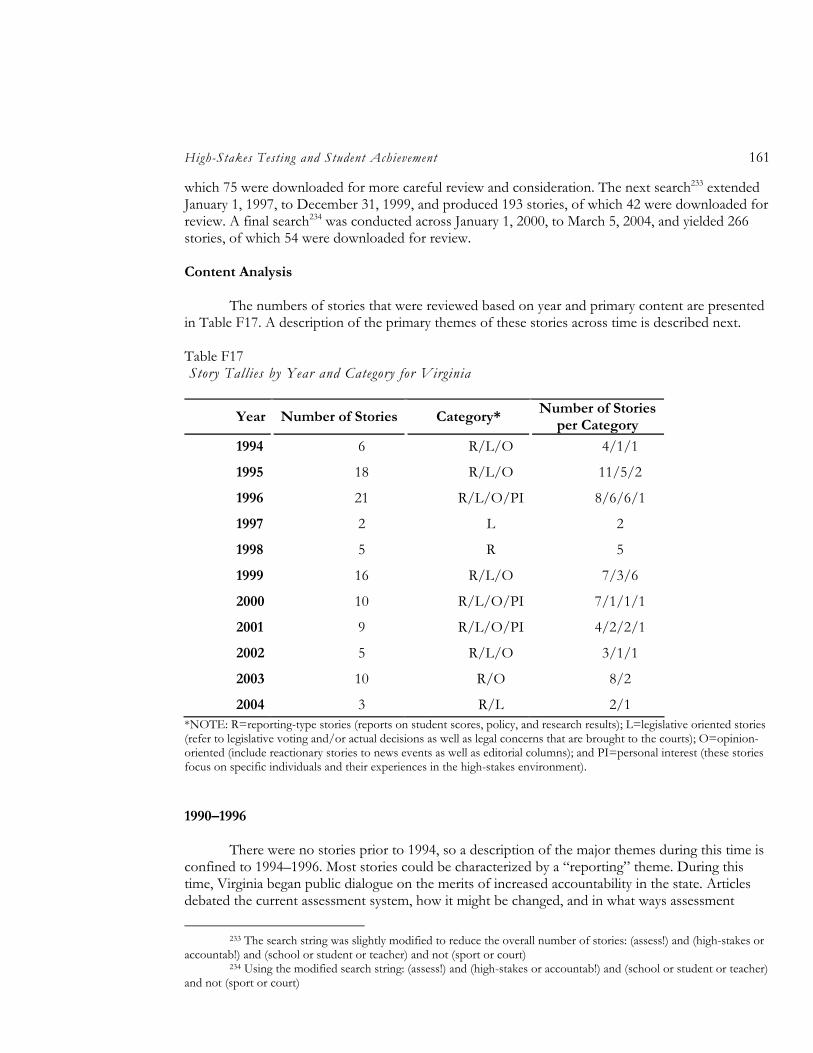
High-Stakes Testing and Student Achievement 161
which 75 were downloaded for more careful review and consideration. The next search233 extended January 1, 1997, to December 31, 1999, and produced 193 stories, of which 42 were downloaded for review. A final search234 was conducted across January 1, 2000, to March 5, 2004, and yielded 266 stories, of which 54 were downloaded for review. Content Analysis
The numbers of stories that were reviewed based on year and primary content are presented
in Table F17. A description of the primary themes of these stories across time is described next. Table F17 Story Tallies by Year and Category for Virginia
Year Number of Stories Category* Number of Stories
per Category
1994 6 R/L/O 4/1/1
1995 18 R/L/O 11/5/2
1996 21 R/L/O/PI 8/6/6/1
1997 2 L 2
1998 5 R 5
1999 16 R/L/O 7/3/6
2000 10 R/L/O/PI 7/1/1/1
2001 9 R/L/O/PI 4/2/2/1
2002 5 R/L/O 3/1/1
2003 10 R/O 8/2
2004 3 R/L 2/1 *NOTE: R=reporting-type stories (reports on student scores, policy, and research results); L=legislative oriented stories (refer to legislative voting and/or actual decisions as well as legal concerns that are brought to the courts); O=opinion-oriented (include reactionary stories to news events as well as editorial columns); and PI=personal interest (these stories focus on specific individuals and their experiences in the high-stakes environment).
1990–1996
There were no stories prior to 1994, so a description of the major themes during this time is confined to 1994–1996. Most stories could be characterized by a “reporting” theme. During this time, Virginia began public dialogue on the merits of increased accountability in the state. Articles debated the current assessment system, how it might be changed, and in what ways assessment
233 The search string was slightly modified to reduce the overall number of stories: (assess!) and (high-stakes or
accountab!) and (school or student or teacher) and not (sport or court) 234 Using the modified search string: (assess!) and (high-stakes or accountab!) and (school or student or teacher)
and not (sport or court)
Education Policy Analysis Archives Vol. 14 No. 1 162
results would be used to hold schools accountability. For example, in 1995 there was a story discussing the need for increasing the state’s academic standards for improving student performance.
The academic performance of Virginia’s public school students has grown stagnant, making it clear that the state needs improved standards of learning, state schools Superintendent William C. Bosher Jr. said Wednesday.
“We need to give kids better academic targets to shoot for,” Bosher said at a news conference after releasing results of the 1993–94 “report card” of the state’s schools.235
Stories emerged following this call for higher standards debating the merits of the administration’s proposal, highlighting the advantages and disadvantages embedded in such a proposal.
A yearlong push by the Allen administration to create new academic standards for Virginia’s public schools is creating high anxiety among the state’s education community and many parents.
Fundamental differences exist over proposed changes that, in some cases, would radically alter what children are taught in four essential subjects - social studies, language arts, math and science.
Today, the state Board of Education, which has the final stamp of approval, begins a statewide series of open hearings on the proposal at 7 p.m. at Maury High School in Norfolk. The board can expect an earful.
Some worry that the state is trying to move too fast on a plan that will have long-lasting effects. Others contend that the effort is more reflective of a narrow political agenda than sound teaching practices. And many fear that in the rush for higher standards, the state may be creating unrealistic expectations that will set up some children for failure.236
It was during this time period that the notion of attaching consequences to student performance was introduced into public debate.
Over time there were a growing number of opinion pieces speaking to the merits of instituting a new statewide testing program to measure the increased standards. Many of these appeared in 1996. These articles commented on both sides of the debate. One writer took a stance against testing because the writer feared it would be under funded and teachers would become the scapegoats:
Our leaders are willing to fund one area of the standards: testing for them. They will supply no materials or textbooks, but want to test the students’ learning and hold teachers and schools accountable. Isn’t this putting the cart before the horse?
Yes, give teachers the bad rap for not wanting to change. I’d rather take that than accept bad decisions forced upon us and our students. Why don’t leaders help us to teach children rather than hindering us?237
Another was for the testing proposals:
235 Glass, J. (1995, March 23). Schools must aim higher, official says. The Virginia-Pilot , p. A11. 236 Glass, J. (1995, March 27). New standards for schools: Are these changes the right ones? The Virginia-
Pilot , p. A1. 237 Bull, D. L. (1996, February 11). Teaching is being hindered. Roanoke Times & World News , Editorial, p.
F2.
High-Stakes Testing and Student Achievement 163
Although Governor Allen’s proposal to test Virginia schoolchildren’s achievement in basic academic subjects continues to meet resistance, its critics have yet to present a defensible argument -- perhaps because none exists. Why shouldn’t Virginians know whether students are learning what they are supposedly being taught? As the Governor pointed out recently, testing is nothing more than a consumer protection plan: Taxpayers and parents have a right to know if their money is serving its purpose.238
Other stories during this time were “legislative” in theme and reported the legislative proposals and voting patterns around the proposed standards increase.
1997–1999
During this time frame, articles focused on the new testing system, the Standards of Learning (SOL). “Reporting” themed articles debated the use of SOL for holding schools and students accountable. For example, one article appearing in 1999 presented both sides of the debate:
Furor over Virginia’s new Standards of Learning seems not to have diminished with the approaching end of another school year. In public hearings around the state, critics worry that standardized tests are sucking flexibility and creativity out of classrooms. Advocates counter that the only way to improve quality is to set a baseline and test to see if progress is being made. In truth, merit and misguided thinking inhabit both sides of the debate. Prospects for real reform will require understanding that the SOL tests are both necessary and not enough.
Minimum learning standards are needed, among other reasons, to help protect children from inferior schools and teachers, of which Virginia has multitudes. An overemphasis on test-taking, however, promotes dullness and rigidity. Pity students trapped in schools more intent on transmitting test answers than on encouraging the thirst for learning.
Conversely, “flexibility” in the classroom is fuel for inspired innovation and creative learning. Yet a lack of clear expectations or accountability for results can become, particularly in the wrong hands, a license for mediocrity or worse. It has become so too often in Virginia, especially in schools serving economically disadvantaged communities.239
There were also “legislative” themed articles that documented the legislative initiatives and voting patterns in the state such as an article from 1999 where the governor proposed a pay-for-performance plan.
The governor balked Monday at approving a General Assembly bill that would grant up to $ 30,000 over 10 years to teachers who gain national certification from the National Board for Professional Teaching Standards.
Instead, he amended the law to instruct Virginia’s Board of Education to additionally tie the bonuses to producing “improvement in student academic achievement outcomes.’’ He suggested using scores on the state’s new Standards of Learning tests, improvements in those scores, and ‘‘successful remediation” of students who fail the tests. The General Assembly must rule on the changes by April 7.240
238 Yes to testing (1996, January 26). Richmond Times Dispatch , Editorial, p. A14. 239 Standards of learning: Stay the course. (1999, June 2). The Virginian-Pilot , p. B10. 240 Bowers, M. (1999, April 3). Educators say tying bonuses to student tests is unfair: Other factors can affect
achievement, teachers say. The Virginian-Pilot , p. B1.
Education Policy Analysis Archives Vol. 14 No. 1 164
2000–2004
Most of the stories encountered during this time frame were categorized as “reporting.” One
theme common across all years were debates and decisions around what the graduation requirements would be for high school students. These debates often sparked opinion pieces of individuals arguing whether using SOL scores are a good way to decide whether students should receive a diploma. There were several stories reporting on how to address special student populations such as students with disabilities and students for whom English is a second language.
A selection of stories is included in the portfolio that represents the range of issues across all of these time frames and categories. Supplemental Search: Google
A search was conducted on March 4, 2004, covering the range of February 4, 2004 through
March 4, 2004. Several search terms were used to probe for the widest selection of stories. A selection of these stories is included in the portfolio. Supplemental Search: LexisNexis
A search confined to March 2003 through March 2004 was conducted looking for specific
articles on consequences dolled out to students and/or school personnel in the form of rewards (incentives, bonuses) and sanctions (retention, school takeover). The search241 yielded 122 stories, of which 20 were downloaded for more careful review.
West Virginia
A search was conducted across the entire LexisNexis242 universe of news media available in
West Virginia.243 This search returned 566 stories dating back to 1994. After redundant and irrelevant stories were eliminated, 74 were downloaded for closer review and possible selection for portfolio inclusion. Content Analysis
The numbers of stories that were reviewed based on year and primary content are presented in Table 18. A description of the primary themes of these stories across time is described next.
241 (ALLCAPS (SOL) and (teacher or student or principal or superintendent)) and ((reward* or incentive or
bonus) or (takeover or fire or punish or remove or close or retention or retain)) 242 Complete File: Charleston Daily Mail ; The Charleston Gazette ; Herald-Dispatch (Huntington, WV); M.
LEE SMITH PUBLISHERS & PRINTERS LLC - Regional News Stories. Selected Documents: The Associated Press State & Local Wire; Business Dateline - Regional News Sources; Knight Ridder/Tribune Business News; Knight Ridder/Tribune Business News - Current News.
243 Using the search string: (ALLCAPS (WESTEST) or assess! or test!) and (accountab! or (high stakes)) and not (court or sport or health)
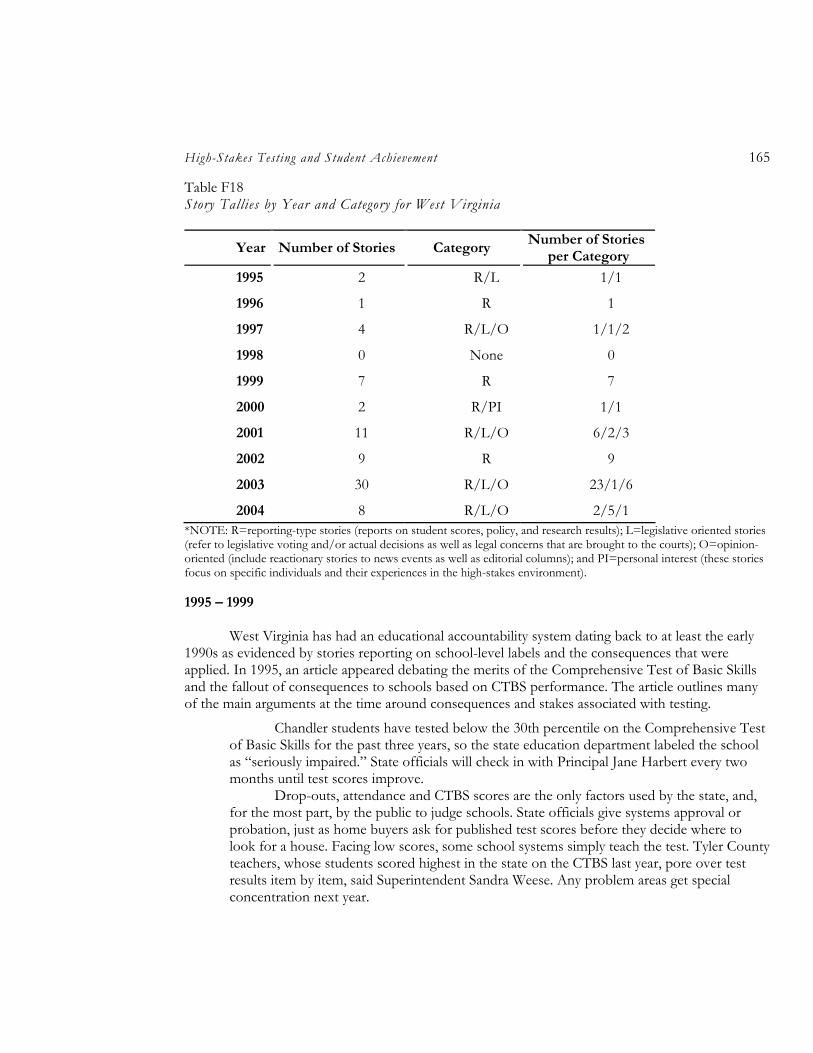
High-Stakes Testing and Student Achievement 165
Table F18 Story Tallies by Year and Category for West Virginia
Year Number of Stories Category Number of Stories
per Category
1995 2 R/L 1/1
1996 1 R 1
1997 4 R/L/O 1/1/2
1998 0 None 0
1999 7 R 7
2000 2 R/PI 1/1
2001 11 R/L/O 6/2/3
2002 9 R 9
2003 30 R/L/O 23/1/6
2004 8 R/L/O 2/5/1 *NOTE: R=reporting-type stories (reports on student scores, policy, and research results); L=legislative oriented stories (refer to legislative voting and/or actual decisions as well as legal concerns that are brought to the courts); O=opinion-oriented (include reactionary stories to news events as well as editorial columns); and PI=personal interest (these stories focus on specific individuals and their experiences in the high-stakes environment).
1995 – 1999
West Virginia has had an educational accountability system dating back to at least the early 1990s as evidenced by stories reporting on school-level labels and the consequences that were applied. In 1995, an article appeared debating the merits of the Comprehensive Test of Basic Skills and the fallout of consequences to schools based on CTBS performance. The article outlines many of the main arguments at the time around consequences and stakes associated with testing.
Chandler students have tested below the 30th percentile on the Comprehensive Test of Basic Skills for the past three years, so the state education department labeled the school as “seriously impaired.” State officials will check in with Principal Jane Harbert every two months until test scores improve.
Drop-outs, attendance and CTBS scores are the only factors used by the state, and, for the most part, by the public to judge schools. State officials give systems approval or probation, just as home buyers ask for published test scores before they decide where to look for a house. Facing low scores, some school systems simply teach the test. Tyler County teachers, whose students scored highest in the state on the CTBS last year, pore over test results item by item, said Superintendent Sandra Weese. Any problem areas get special concentration next year.
Education Policy Analysis Archives Vol. 14 No. 1 166
By comparison, the state put Kanawha County on probation after 18 of its schools tested below the 50th percentile. Administrators reluctantly told teachers to start aligning their curriculums to CTBS items as well.244
As West Virginia’s accountability system evolved, so did its standards and assessment. In 1996 the CTBS was abandoned for the SAT9. However, overtime, the SAT9 also encountered some controversy and many believed that it was unfair to make judgments about schools based on a test that did not necessarily cover what was being taught in the classroom. Gradually, the state adopted a set of state standards and eventually created a test to measure progress toward meeting the standards.
1999–2001
Many articles throughout 1999 – 2001 recounted some of the ongoing debates around how best to assess student achievement and reward/sanction based on it. For example, in January of 2001, a “pro” testing editorial appeared in the Charleston Daily Mail:
Testing is necessary and appropriate. The state has to know if its public schools are giving children the basic skills needed to function in the world. Parents need to know that. Students need to know that.
Schools can’t fix what they don’t diagnose. Teachers can’t either. West Virginia must maintain comparability. Its achievement tests must allow it to
compare its results with results in other states. We need to know whether our children comprehend what they read as well as their
cousins in North Carolina. We need to know if they have conquered the same basic math skills. They will have to compete in the same working world.
But testing should not eat up weeks of an already skimpy school calendar. And certainly the state should be cautious not to micromanage the curriculum to the point that it discourages good teaching.
West Virginia must test to see if its children are learning to read and write and calculate and understand. Devoting more class time to it and suspending the thought processes of good teachers does not further that cause.245
As accountability associated with testing continued, however, reports emerged recounting the pressures teachers and students were feeling. For example, a story in December 2002 said:
As 16 third-graders discussed what they had just read, their teacher asked them to name times they had been as afraid as a character in the story.
“When I had to get stitches in my chin,” one said. “When my grandma got two tumors in her head,” said another. “When I was in the hospital to see if my mom was dead or alive,” said a third.
Then a boy said, “When we had the SAT 9 test.” Heads around the room bobbed in agreement.
244 African Americanford, L. B. (1995, July 30). The testing dilemma: Should students be coached for a
standardized test? Charleston Gazette , p. 1B. 245 Our views: Testing schools must be held accountability with as little disruption as possible. (2001, January
31). Charleston Daily Mail , Editorial, p. 4A.
High-Stakes Testing and Student Achievement 167
Peterstown Elementary students who took the Stanford Achievement Test Ninth Edition (SAT–9) last spring were under tremendous pressure to prove their school was not “seriously impaired,” as state officials had labeled it.
Such pressures are only going to increase as the state launches a host of new tests next year and the federal No Child Left Behind act holds the nation’s schools more accountable for results.246
2002–2004
Throughout 2003 and 2004, the debate on accountability continued in West Virginia, as did reporting on how the assessment system was going to change. Accounts emerged as the accountability pressure was perceived to be increasing. According to one April 2003 story:
Just about everything that means anything in West Virginia public schools depends on what happens next week.
It’s standardized testing time - the week thousands of third- through 11th-graders are expected to show everything they’ve ever learned by bubbling in tiny circles with a No. 2 pencil.
And if they don’t know enough, schools can be placed on probation, penalized by the county, taken over by the state. Even lower property values in schools’ neighborhoods can be a result.
But this year, the stakes are even higher. This year, the new No Child Left Behind act takes effect. “Believe me, we are feeling the pressure,” said John Handley, principal of Weimer
Elementary in St. Albans. “Even our students know how important this is.” Under the sweeping education reform law passed last year by Congress, schools face
even tougher sanctions if all groups of students - based on gender, race, family income, English proficiency, disability and migrant status - don’t meet high standards.
Schools could have to pay for students to transfer to a better school, hire outside tutoring services, have entire staff replaced or even be taken over by a private company.
The new law has caused tensions to run high in nearly every classroom across the state, as students gear up to take the SAT–9, the test that much of the implementation of the law will be based on.247
Further, policy reporting emerged discussing how the assessment system was going to change in the state. Instead of relying on students’ SAT 9 performance, students would be taking the new criterion-referenced WESTEST examination results of which will be used to continue the school-labeling system.
Another issue was how NCLB and West Virginia’s state accountability laws helped or hindered students from special populations such as those with disabilities. As this issue emerged on the national scene, two editorials appeared in West Virginia arguing both sides of the debate. One argued that requiring students with disabilities to take the test (such as what is required in NCLB) is
246 Bundy, J. (2002, December 8). Test-time pressure likely to increase state adjusting its tests to ensure it meets
federal No Child Left Behind guides. Charleston Gazette , p. 2B. 247 Smith, C. (2003, April 4). School officials see stakes in testing: Reform means schools may face tougher
sanctions. Charleston Daily Mail , p. 8A.
Education Policy Analysis Archives Vol. 14 No. 1 168
a positive step toward helping those students feel “normal” and requiring teachers to hold higher expectations for them.
Why aren’t children with disabilities learning basic skills? From my vantage point as an advocate for children with disabilities, I have seen time and time again that school systems simply ignore the fact that children in segregated special-education classrooms are not learning to read or do math. Minuscule progress is cited to “pat everyone on the back,” and then baby-sitting continues until the child becomes so bored and frustrated that he or she no longer wants to attend school. Then, when the child is made to attend, under pain of truancy, the child becomes a “behavior problem.”
These “behavior problems” are, in fact, usually directly related to feeling “dumb” and “out of it” because the child can’t read well enough to keep up. This is a very convenient time for the system to “blame the child.”
No Child Left Behind will short-circuit all of the excuses and explanations. School systems that do a good job with children with disabilities will show their progress, and those that fail to do a good job will have their ineffectiveness exposed. Then parents and voters can make informed decisions about how to get the underachievers on track.248
In contrast, another editorial writer complained that NCLB was too restrictive and damaging:
Public education is at a crossroads. Despite the uplifting title of the No Child Left Behind Act of 2001, the law has created significant obstacles to helping students learn, which ultimately weakens our public schools. It imposes mandates without providing the necessary funding. It punishes schools identified as low-performing, rather than provide the resources they require to become more effective. It fails to recognize schools that are improving but fall a few points short of mandated goals.
NCLB simply measures our schools by holding educators and school districts accountable for student achievement.
West Virginia’s public schools have always been accountable to the public, and our public schools are among the best in the nation. Parental involvement and community support, two key factors in a great public school, however, are absent from the NCLB assessment equation. Parents and communities must nurture their children, so that they come to school with a clear understanding and interest in the importance of learning.
It is hard to argue with the premise of NCLB. On the other hand, it is not as simple as passing legislation and making it happen. One-size-fits-all legislation, such as NCLB, is not the solution to creating great public schools. Proclaiming that all students will perform at the proficient level by 2013–2014 without fully funding the necessary resources to reach that goal is shortchanging the very students the law was supposed to protect.249
Supplemental Search: Google
A search was conducted on March 18, 2004, covering the range of February 18, 2004, through March 18, 2004. Several search terms were used to probe for the widest selection of stories. A selection of these stories is included in the portfolio.
248 Byrne, B. (2003, October 5). Why I like this law. Charleston Gazette , Editorial, p. 1C. 249 Lange, T. (2003, November 24). No Child Left Behind Act: Cookie-cutter regulations treat schoolchildren
unfairly. Charleston Gazette, Editorial, p. 5A.
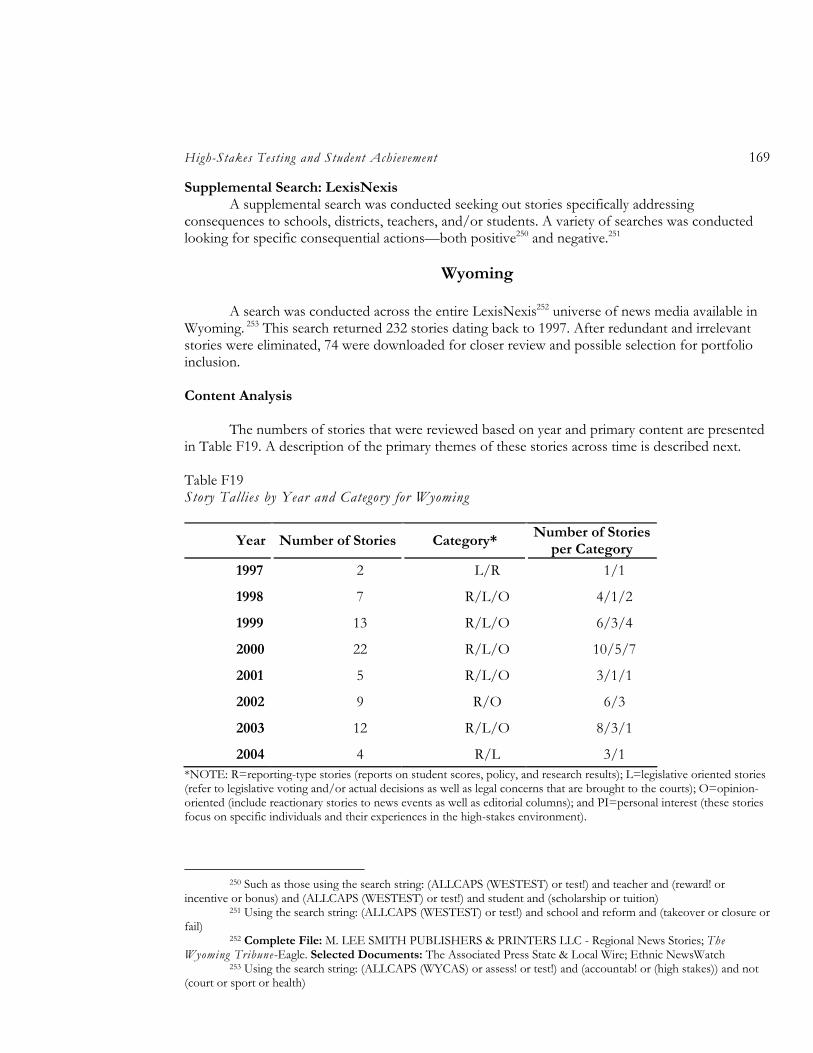
High-Stakes Testing and Student Achievement 169
Supplemental Search: LexisNexis A supplemental search was conducted seeking out stories specifically addressing
consequences to schools, districts, teachers, and/or students. A variety of searches was conducted looking for specific consequential actions—both positive250 and negative.251
Wyoming
A search was conducted across the entire LexisNexis252 universe of news media available in
Wyoming. 253 This search returned 232 stories dating back to 1997. After redundant and irrelevant stories were eliminated, 74 were downloaded for closer review and possible selection for portfolio inclusion. Content Analysis
The numbers of stories that were reviewed based on year and primary content are presented
in Table F19. A description of the primary themes of these stories across time is described next.
Table F19 Story Tallies by Year and Category for Wyoming
Year Number of Stories Category* Number of Stories
per Category
1997 2 L/R 1/1
1998 7 R/L/O 4/1/2
1999 13 R/L/O 6/3/4
2000 22 R/L/O 10/5/7
2001 5 R/L/O 3/1/1
2002 9 R/O 6/3
2003 12 R/L/O 8/3/1
2004 4 R/L 3/1 *NOTE: R=reporting-type stories (reports on student scores, policy, and research results); L=legislative oriented stories (refer to legislative voting and/or actual decisions as well as legal concerns that are brought to the courts); O=opinion-oriented (include reactionary stories to news events as well as editorial columns); and PI=personal interest (these stories focus on specific individuals and their experiences in the high-stakes environment).
250 Such as those using the search string: (ALLCAPS (WESTEST) or test!) and teacher and (reward! or
incentive or bonus) and (ALLCAPS (WESTEST) or test!) and student and (scholarship or tuition) 251 Using the search string: (ALLCAPS (WESTEST) or test!) and school and reform and (takeover or closure or
fail) 252 Complete File: M. LEE SMITH PUBLISHERS & PRINTERS LLC - Regional News Stories; The
Wyoming Tribune-Eagle. Selected Documents: The Associated Press State & Local Wire; Ethnic NewsWatch 253 Using the search string: (ALLCAPS (WYCAS) or assess! or test!) and (accountab! or (high stakes)) and not
(court or sport or health)
Education Policy Analysis Archives Vol. 14 No. 1 170
A major theme introduced in 1998 and appearing throughout 1999 and 2000 was how the state would approach graduation requirements. Initially and when Wyoming Comprehensive Assessment System (WyCAS) was first administered, the policy was to hold students accountable—a part of the decision to award a student a diploma would be contingent on how he/she did on this test. However, the state never considered using the test as the sole criterion to award a student a diploma—it always included a compilation of information including report card grades, coursework, and teacher evaluations. However, in 2000, a proposal was raised to delay the new graduation requirements that linked WyCAS performance partly to graduation. The main issues were that the WyCAS still needed work, and to hinge a student’s diploma—even partially—on an imperfect measure would be wrong. One article in September of 2000 noted:
Mike Klopfenstein, assistant superintendent of instruction for Laramie County School District 1, said he thinks the district will be ready for the language arts and math requirements in 2003.
“Whether that’s fair to those kids is another question,” he said. Klopfenstein said he hoped the board would wait to hold students accountable until 2005. “Unless we make sure we’re not hurting kids in the process, we need to take a real hard look at it,” he said.
Klopfenstein said he would like to have a few years to test the system. “We don’t want to put any kids at risk in the process,” Klopfenstein said. Kirkbride said he believes that in the long run, the requirements will benefit the state and strengthen the value of a Wyoming high school diploma.254
Some of the main themes in 1999 were “reporting” and “opinion” in nature. Several reporting stories included documenting how students had scored on recent state examinations, whereas others focused on the continuous political debates such as one that appeared in November of 1999.
The Wyoming School Boards Association will discuss two proposals dealing with the state’s new standards and testing for students when it meets next week to consider its priorities for next year’s state Legislature.
One proposal would have local school boards, instead of the state, determine minimum academic standards for students to meet. The other seeks to have the state stop testing eleventh graders.255
Most of the opinion articles during 1999 centered on the controversy of merit pay for teachers. Specifically, a proposal for awarding teachers bonuses based on student performance on WyCAS in Laramie, Wyoming was considered. Should teachers receive financial bonuses and incentives if their students’ test scores increase? A selection of opinion pieces, arguing both sides of the debate is included in the portfolio. One of the main arguments against the policy, expressed by both teachers and students, is that it would encourage teaching to the test—an approach that goes against sound educational practice.
In 2000, one article described a state senator’s decision to publicly rank school districts based on the percentages of students who attained proficiency on the latest round of WyCAS testing. This action was met with criticism—some believing that publicly ranking districts is humiliating and goes against the intended purpose of testing students, which is to determine what is and is not working in
254 Milner, K. (2000, September 21). Wyoming education association seeks delay on graduation requirements.
Wyoming Tribune-Eagle , p. A1. 255 School boards looking at changing who sets state standards (1999, November 11). Cheyenne, WY:
Associated Press .
High-Stakes Testing and Student Achievement 171
schools. This story is included because it represents some of the views on public ranking and some of the dialogue around the purposes of the WyCAS test.
In 2001 and beyond, most stories were “reporting” and documented several main themes. For example, several stories emerged around WyCAS—some were “political” (i.e., R/p) and simply reported on how districts, teachers, and students were readying for the upcoming assessment. In spite of the test not being “high stakes” for students, teachers commented on activities they did to calm students down or to provide incentives for them to show up and take the test seriously.
Another major theme discussed miscellaneous issues related to the accountability policies. One writer lamented the “unfairness” of testing Native American students with WyCAS as it was culturally biased. Another talked about a proposal to create all day kindergarten as a way to start preparing students for testing early.
Another theme of stories centered on the range of political activities in the state as legislators wrangled with NCLB and how to incorporate it into their state philosophy. For example, in 2003, several stories emerged lamenting the mandates in NCLB. In October 2003, one writer complained that NCLB disadvantages students with disabilities and those for whom English is a second language.
Not surprisingly, Triumph High Principal Gary Datus said he and his staff are focused on helping students succeed. “We want kids to stay in school and graduate,” he said, defining the alternative school’s goal.
Students there have to meet the same requirement to graduate as those at the city’s other two high schools. He said it is not a watered-down curriculum. But Datus said he is concerned about the effects the federal No Child Left Behind Act will have on his school. He’s especially worried about the school meeting a performance target called adequate yearly progress. There are benefits and drawbacks to No Child Left Behind as it relates to these students, Riedel said.
The good part is that schools really have to pay attention to these students [LEP], Riedel said. That’s because they are counted as part of the requirements to meet adequate yearly progress. But the law’s expectations are unrealistic, she said. Research shows it takes one or two years to master basic English survival skills and five to seven years to reach proficiency in speaking and writing, she added. There is a concern that the assessments will not test what they know in subjects, but how much English they know, Bridwell said. Some tests are written in Spanish, however.256
In December, a journalist reported on citizens’ reactions to NCLB.
CHEYENNE -- Other states can envy Wyoming because of the number of its schools that meet achievement targets for a new federal law, education officials said Monday.
While that was the good news about the No Child Left Behind Act, many in the audience at Monday’s town hall meeting showed frustration and anxiety over the law.
Some said it sets unfair expectations for certain students, most notably those in special education and students who speak little if any English.257
Supplemental Search: Google
256 Orr, B. (2003, October 12). “No Child” could leave alternative students behind. Cheyenne, WY: Associated
Press . 257 Orr, B. (2003, December 2). “No Child” raises anxiety, frustration. Wyoming Tribune-Eagle , p. A1.
Education Policy Analysis Archives Vol. 14 No. 1 172
A search was conducted on March 18, 2004, covering the range of dates February 18, 2004 through that date). Several search terms were used to probe for the widest selection of stories. A selection of these stories is included in the portfolio.
Supplemental Search: LexisNexis
A supplemental search was conducted seeking out stories specifically addressing consequences to schools, districts, teachers, and/or students. This search258 was conducted for the previous year (February 2003 – February 2004) and produced 115 stories, of which 16 were downloaded for further consideration and review.
258 Using the search string: (ALLCAPS (WYCAS) or assess! or test!) and (teacher or student or principal or
superintendent)) and ((reward* or incentive or bonus) or (takeover or fire or punish or remove or close or retention or retain))
High-Stakes Testing and Student Achievement 173
EDUCATION POLICY ANALYSIS ARCHIVES
http://epaa.asu.edu
Editor: Sherman Dorn, University of South Florida
Production Assistant: Chris Murrell, Arizona State University General questions about appropriateness of topics or particular articles may be addressed to the Editor, Sherman Dorn, [email protected].
Editorial Board
Michael W. Apple University of Wisconsin
David C. Berliner Arizona State University
Robert Bickel Marshall University
Greg Camilli Rutgers University
Casey Cobb University of Connecticut
Linda Darling-Hammond Stanford University
Mark E. Fetler California Commission on Teacher Credentialing
Gustavo E. Fischman Arizona State Univeristy
Richard Garlikov Birmingham, Alabama
Gene V Glass Arizona State University
Thomas F. Green Syracuse University
Aimee Howley Ohio University
Craig B. Howley Appalachia Educational Laboratory
William Hunter University of Ontario Institute of Technology
Patricia Fey Jarvis Seattle, Washington
Daniel Kallós Umeå University
Benjamin Levin University of Manitoba
Thomas Mauhs-Pugh Green Mountain College
Les McLean University of Toronto
Heinrich Mintrop University of California, Berkeley
Michele Moses Arizona State University
Education Policy Analysis Archives Vol. 14 No. 1 174
Anthony G. Rud Jr. Purdue University
Michael Scriven Western Michigan University
Terrence G. Wiley Arizona State University
John Willinsky University of British Columbia
EDUCATION POLICY ANALYSIS ARCHIVES English-language Graduate-Student Editorial Board
Noga Admon New York University
Jessica Allen University of Colorado
Cheryl Aman University of British Columbia
Anne Black University of Connecticut
Marisa Cannata Michigan State University
Chad d’Entremont Teachers College Columbia University
Carol Da Silva Harvard University
Tara Donahue Michigan State University
Camille Farrington University of Illinois Chicago
Chris Frey Indiana University
Amy Garrett Dikkers University of Minnesota
Misty Ginicola Yale University
Jake Gross Indiana University
Hee Kyung Hong Loyola University Chicago
Jennifer Lloyd University of British Columbia
Heather Lord Yale University
Shereeza Mohammed Florida Atlantic University
Ben Superfine University of Michigan
John Weathers University of Pennsylvania
Kyo Yamashiro University of California Los Angeles
High-Stakes Testing and Student Achievement 175
Archivos Analíticos de Políticas Educativas
Associate Editors Gustavo E. Fischman & Pablo Gentili
Arizona State University & Universidade do Estado do Rio de Janeiro
Founding Associate Editor for Spanish Language (1998—2003) Roberto Rodríguez Gómez
Editorial Board
Hugo Aboites Universidad Autónoma Metropolitana-Xochimilco
Adrián Acosta Universidad de Guadalajara México
Claudio Almonacid Avila Universidad Metropolitana de Ciencias de la Educación, Chile
Dalila Andrade de Oliveira Universidade Federal de Minas Gerais, Belo Horizonte, Brasil
Alejandra Birgin Ministerio de Educación, Argentina
Teresa Bracho Centro de Investigación y Docencia Económica-CIDE
Alejandro Canales Universidad Nacional Autónoma de México
Ursula Casanova Arizona State University, Tempe, Arizona
Sigfredo Chiroque Instituto de Pedagogía Popular, Perú
Erwin Epstein Loyola University, Chicago, Illinois
Mariano Fernández Enguita Universidad de Salamanca. España
Gaudêncio Frigotto Universidade Estadual do Rio de Janeiro, Brasil
Rollin Kent Universidad Autónoma de Puebla. Puebla, México
Walter Kohan Universidade Estadual do Rio de Janeiro, Brasil
Roberto Leher Universidade Estadual do Rio de Janeiro, Brasil
Daniel C. Levy University at Albany, SUNY, Albany, New York
Nilma Limo Gomes Universidade Federal de Minas Gerais, Belo Horizonte
Pia Lindquist Wong California State University, Sacramento, California
María Loreto Egaña Programa Interdisciplinario de Investigación en Educación
Mariano Narodowski Universidad Torcuato Di Tella, Argentina
Iolanda de Oliveira Universidade Federal Fluminense, Brasil
Grover Pango Foro Latinoamericano de Políticas Educativas, Perú
Vanilda Paiva Universidade Estadual Do Rio De Janeiro, Brasil
Miguel Pereira Catedratico Universidad de Granada, España
Angel Ignacio Pérez Gómez Universidad de Málaga
Mónica Pini Universidad Nacional de San Martin, Argentina
Romualdo Portella do Oliveira Universidade de São Paulo
Diana Rhoten Social Science Research Council, New York, New York
José Gimeno Sacristán Universidad de Valencia, España
Daniel Schugurensky Ontario Institute for Studies in Education, Canada
Susan Street Centro de Investigaciones y Estudios Superiores en Antropologia Social Occidente, Guadalajara, México
Nelly P. Stromquist University of Southern California, Los Angeles, California
Daniel Suarez Laboratorio de Politicas Publicas-Universidad de Buenos Aires, Argentina
Antonio Teodoro Universidade Lusófona Lisboa,
Carlos A. Torres UCLA
Jurjo Torres Santomé Universidad de la Coruña, España


