Embed Size (px)
Citation preview

EFFECT OF SEWAGE NUTRIENTS ON ALGAL PRODUCTION, BIOMASS
AND PIGMENTS IN TROPICAL TIDAL CREEKS
Burford, M.A.1, Revill, A.T.
2, Smith, J.
3, Clementson, L.
2
1Australian Rivers Institute, Griffith University, Kessels Rd, Nathan QLD 4111,
Australia
2CSIRO Marine and Atmospheric Research, GPO Box 1538, Hobart, TAS 7001,
Australia
3 Geoscience Australia, GPO Box 378, Canberra, ACT 2601, Australia
Corresponding author:
Email: [email protected]
Keywords: phytoplankton, benthic microalgae, microphytobenthos, sewage markers,
coprostanol, nitrogen
2
Abstract
Microalgal blooms can result from anthropogenic nutrient loadings in coastal
ecosystems. However, differentiating sources of nutrients remains a challenge. The
response of phytoplankton and benthic microalgae (BMA) to nutrient loads was
compared across tropical tidal creeks with and without secondary treated sewage.
Primary productivity in the water column was limited by nitrogen availability in
absence of sewage, with nitrogen saturation in the presence of sewage. Phytoplankton
primary productivity rates and chlorophyll a concentrations increased in response to
sewage, and there was a greater response than for BMA. There was no change in algal
pigment proportions within the phytoplankton or BMA communities. Concentrations
of the sewage marker, coprostanol, were higher near sewage discharge points
decreasing downstream, correlating with a decline in nutrient concentrations. This
suggests that sewage was the main source of nitrogen and phosphorus. This study
highlights the scale and type of response of algal communities to sewage nutrients.
3
Introduction
Anthropogenic nutrient loading of coastal waters is considered a major pollution
problem globally (Vitousek et al., 1997; Howarth et al., 2002; Halpern et al., 2008). In
heavily populated areas, sewage can contribute a substantial proportion of the nutrient
inputs to coastal waters and is typically in forms conducive to stimulating primary
production. Current projections are that the world’s human population will continue to
increase by 1 to 2% y-1
(Cohen, 2003), thus the enrichment of coastal waters with
nutrients will likely continue to escalate in years to come. The impact of
anthropogenic nutrients on coastal waters is expected to be greater in the tropics than
at higher latitudes (Downing et al., 1999; Halpern et al., 2008) since higher year-
round water temperatures fuel higher rates of biogeochemical processes. Additionally,
many developing countries are in the tropics, with large human populations and little
or no treatment of sewage.
Coastal waters are typically nitrogen limited (Ryther and Dunstan, 1971). Therefore
excessive nitrogen loads can stimulate excessive rates of primary production and a
higher incidence of harmful algal blooms (Beman et al., 2005; Anderson et al., 2008;
Bauman et al. 2010). This has flow-on effects to a range of biogeochemical processes
and food webs (Mackenzie et al., 2002; Jennerjahn et al., 2004; Smith et al., 2012).
The scale of the effect of sewage nutrient loadings is affected by the hydrodynamics
of the receiving waters. Typically longer water residence times lead to more
symptoms of eutrophication, due to less dilution and a resulting reduction in nutrient
concentrations and phytoplankton biomass (e.g. Cloern, 2001).
Determining the response of aquatic systems to sewage inputs is often confounded by
simultaneous and periodic inputs of non-point sources of nutrients, such as runoff
from urban and agricultural land. Use of sewage-specific markers is one mechanism
for differentiating the effect of sewage on ecosystem responses compared with other
sources. Stable nitrogen isotopes in macroalgal bioassays have been used as a sewage
marker in an Australian coastal bay (Costanzo et al., 2001, 2005). Additionally, the
sterol, coprostanol (5β(H)-cholestan-3β-ol) has proven to be a successful indicator of

4
faecal pollution, e.g. sewage, in many coastal environmental studies (e.g. Goodfellow
et al., 1977, Leeming and Nichols, 1996; Peng et al., 2002).
A recent study by Smith et al. (2012) examined the effect of sewage nutrients on a
range of biogeochemical processes in tidal creeks in a tropical harbour. They found
that sediment nutrient fluxes increased and denitrification efficiency decreased in
response to increased nutrient loads in creeks receiving sewage. The effect in these
processes was greater than for a suite of other biogeochemical processes. Our study
will compare these same creeks for the effect of sewage nutrients on algal measures.
Specifically, we tested the hypothesis that sewage nutrients would differentially affect
the phytoplankton and BMA communities, in terms of primary productivity, biomass
and species composition.
Methods
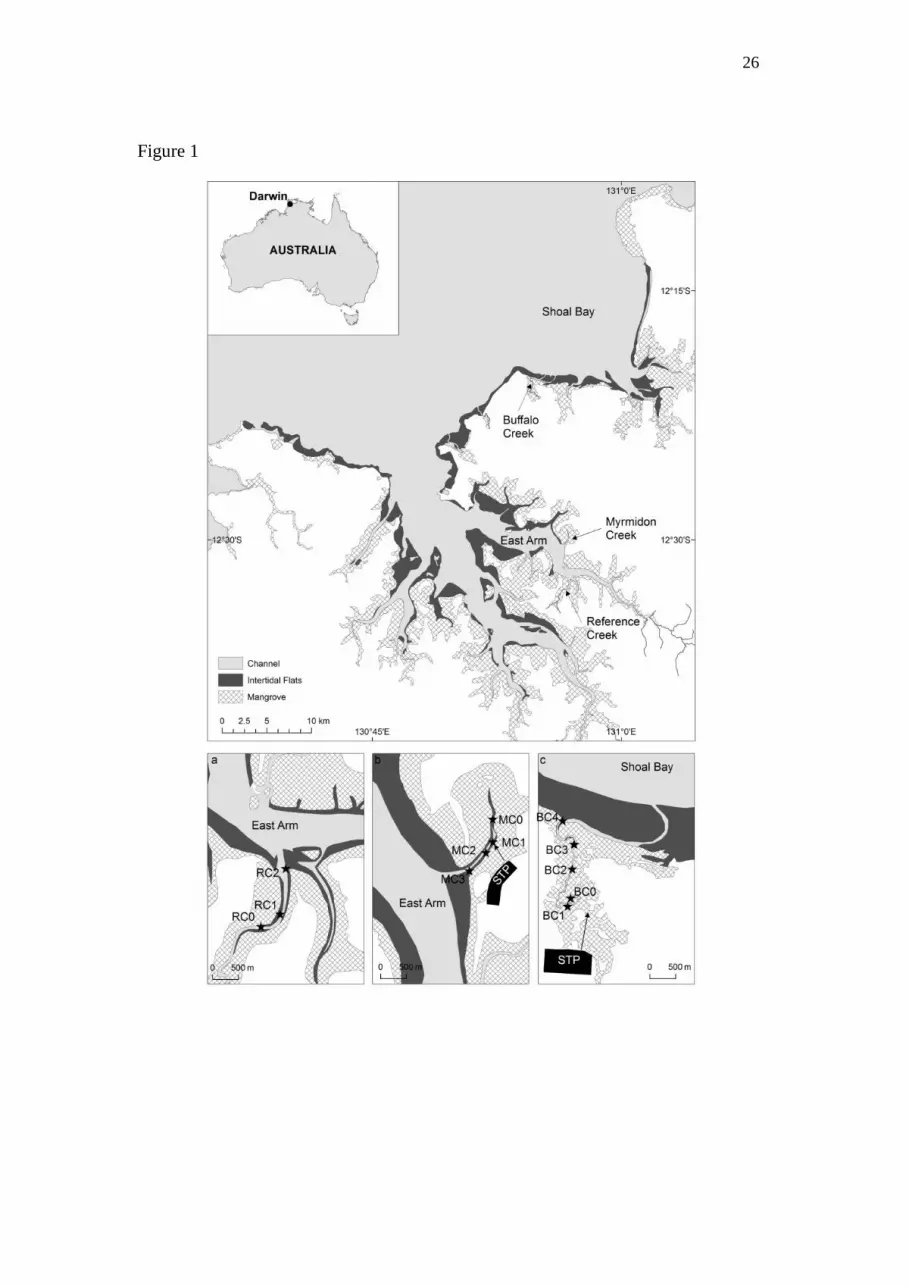
Study Area
The study was undertaken in three tidal creeks in Darwin Harbour, northern Australia
(Fig. 1). Two of the creeks received secondary-treated sewage inputs from sewage
treatment plants (Myrmidon Creek (MC) in East Arm of Darwin Harbour, and Buffalo
Creek (BC) in Shoal Bay). There was also one unnamed creek with no sewage inputs
(herein referred to as Reference Creek, RC). Darwin Harbour is in the wet tropics,
with a hot wet season (December to April) and a cooler dry season (May to
November). The mean annual rainfall is 1719 mm with 64% of this falling between
January and March, and mean monthly maximum water temperatures are similar
throughout the year ranging from 30 to 33ºC (McKinnon et al., 2006). The harbour is
macro-tidal (maximum tidal range of 7.8 m) and strong currents of up to 2 m s-1
. The
harbour is fringed by dense mangroves and during low tide, extensive intertidal
mudflats are exposed.
Sediment and water column sampling was carried out at a range of sites in the three
tidal creeks on the ebb tide. RC and MC have a similar geomorphology with
predominantly straight channels, widening downstream (Fig. 1a, b). At low tide,
intertidal mudflats, several metres wide, are exposed along the length of the creeks.

5
BC consists of a long, narrow channel with large meander bends at the downstream
end (Fig. 1c). A large intertidal sand bar across the mouth inhibits tidal movement.
RC was considered to be near-pristine, based on studies by Smith et al. (2012), and
had a flushing time ranging between 0.3 and 0.6 d for spring and neap tides
respectively. MC and BC received sewage effluent from sewage treatment plants
(STP) which used waste stabilization ponds to remove organic matter and particulate
nutrients. MC received 69 t total nitrogen (TN) y-1
and 18 t total phosphorus (TP) y-1
and during the study the treated sewage effluent was being discharged into the
mangroves close to site MC1 (Fig. 1b). MC had flushing times of between 0.3 and 0.6
d for spring and neap tides respectively. BC received 79 t TN y-1
and 43 t TP y-1
and
the treated sewage effluent was discharged into dense mangroves at the upstream end
of the creek (Fig. 1c). The flushing times in BC near the sewage discharge site ranged
between 1.6 and 4.8 d (Smith et al., 2012). The sewage discharge was gravity-fed, i.e.
at high tide there was no flow, and at low tide there was maximum flow.
This study was conducted during 2007-8 over three sampling periods. Each sampling
period lasted 5 to 6 days in between spring and neap tides during the 2-week tidal
cycle. RC and MC were sampled in October 2007 and March 2008, and BC was
sampled in December 2008.
Water and sediment sampling
Profiles of temperature, salinity, dissolved oxygen (DO) were measured at each site
with a calibrated datalogger (YSI Sonde 6000XLM). Photosynthetically active
radiation (PAR) was measured using a light meter with a 4π quantum underwater
sensor (LI-COR LI-192). Surface water samples were also collected. Total suspended
solids (TSS) was determined by filtering water samples using pre-weighed membrane
filters (0.45 µm, Millipore), drying at 60oC and re-weighing. Samples for particulate
stable nitrogen isotopes were collected by filtering water through pre-combusted GF/F
glass fibre filters (Whatman). Filters were wrapped in pre-combusted aluminium foil
and stored frozen.
For ammonium (NH4+), nitrate plus nitrite (NO2
- + NO3
-), phosphate (PO4
3-) and
silicate (SiO4) analyses, subsamples were filtered (0.45 µm, Bonnet) into tubes and
6
frozen. Samples for chlorophyll a (chl a) and algal pigment analyses were collected
by filtering water from just below the surface through GF/F filters (Whatman). The
filters were stored in liquid nitrogen until analyzed.
For chl a and algal pigments in the BMA, and coprostanol values, sediment cores
(6 cm dia.) were collected at each site using a push corer. Surface sediment (to 1 cm
depth) from each core was transferred into glass jars and homogenized. Samples for
coprostanol were frozen, while samples for chl a and algal pigments were stored in
liquid nitrogen until analyzed.
Porewater nutrients (NH4+, NO2
- + NO3
-, or PO4
3-) were determined from sediment
cores (7.3 cm dia.) collected from two sites in each creek using a push corer, and the
corers sealed. Cores were stored in the dark at ambient temperature. Within a few
hours of core retrieval, sediment from 1 cm depth intervals was extruded and
subsampled for porewater extraction and porosity. Porewater was extracted by
centrifugation (18,000 g, 10 min) and supernatant water was filtered (0.45 µm
membrane filter) and frozen until analyzed. Porosity was determined on a subsample
by weight difference between wet and dry sediment following freeze-drying.
Porewater nutrient concentrations per volume of wet sediment were calculated for
each 2 cm depth interval in a core by accounting for the porosity. The porewater
inventories for each nutrient were then calculated for a 10 cm sediment depth.
Analytical Methods
Dissolved inorganic nutrients (NH4+, NO2
- + NO3
-, PO4
3- and SiO4) from the filtered
surface water and porewater samples were analyzed by automated flow injection
analysis (Lachat) using standard colorimetric methods. Chl a and algal pigments were
extracted from pre-weighed sediment and water column filters prior to analysis by
high performance liquid chromatography following the procedures outlined in Cook
et al. (2004) and Haese et al. (2007), respectively.
Sediment samples for sterol (coprostanol) analysis were extracted quantitatively by a
modified one-phase dichloromethane-methanol method of Bligh and Dyer (1959).
After phase separation, the lipids were recovered in the lower CH2Cl2 layer (solvents

7
were removed in vacuo) and were made up to a known volume and stored sealed
under nitrogen at -20oC. The total sterol fraction was obtained following alkaline
saponification of an aliquot of the total lipids and were converted to their
corresponding O-TMSi ethers by treatment with bis(trimethylsilyl)trifluoroacetamide
(100 L, 60oC, 60 min).
Gas chromatography (GC, Varian 3800) was run interfaced with chromatography
software (Galaxy). The gas chromatograph was equipped with a 50 m x 0.32 mm i.d.
cross-linked 5% phenyl-methyl silicone (HP5) fused-silica capillary column;
hydrogen was the carrier gas. Sterol fractions were analyzed using a flame ionisation
detector (GC-FID), with 5(H)-cholan-24-ol (Chiron AS) as the internal standard.
Peak identifications were based on retention times relative to authentic and laboratory
standards and subsequent GC-mass spectrometry (MS) analysis.
Verification of the identity of individual sterols by GC-MS analyses was performed
on a bench top mass spectrometer (Thermoquest GCQ-Plus) fitted with a direct
capillary inlet and a split/splitless injector. Data were acquired in scan acquisition or
selective ion monitoring and processed using software supplied with the instrument
(Xcalibur). The nonpolar column (HP5) and operating conditions were similar to that
described above for GC-FID analyses, but helium was used as the carrier gas.
Water column and sediment primary productivity
Water column primary production was measured using 13
C-uptake incubations as per
Burford et al. (2011). Triplicate water samples were incubated at 0, 5, 14, 25, 50 and
100% of surface light using shade bags of the appropriate light attenuation. 13
C-
sodium bicarbonate (13
C 99%, Cambridge Isotope Laboratories) was added to bottles
to give a final enrichment of between 3 and 5% of the total bicarbonate concentration.
The bottles were incubated with flowing water at ambient water temperature around
midday for 2 to 3 h. Known volumes of water from the bottles were filtered onto
precombusted glass fibre (Whatman GF/F) filters, and the filters were frozen.

8
Sediment cores (4.5 cm dia.) were collected at each site for measurement of 13
C-
uptake by BMA. Capped cores were transported with overlying water from the study
site were used. Triplicate cores at each site were incubated at 100% of surface light.
13C-sodium bicarbonate was added to bottles to give a final enrichment of between 40
and 50% of the total bicarbonate concentration to the overlying water. Incubation
conditions were the same as for the water column samples. The top 2 cm was sliced
off each core and frozen until analyzed.
Filters from the 13
C-uptake incubations were dried at 60ºC for 24 h before being
analyzed for 13
C/12
C ratio and % carbon on a MS (GV Isoprime). Areal primary
productivity rates were determined using the methods of Burford et al. (2011).
Sediment cores from benthic 13
C-uptake incubations were processed in the same way
following treatment with 6N hydrochloric acid to remove carbonates. For BMA, only
maximum primary productivity (Pmax) was calculated.
Algal nutrient bioassays
Surface water samples were also collected for algal nutrient bioassays using the
methods of Burford et al. (2011). The assays involved pouring water into
polycarbonate bottles with four treatments: control, nitrogen, phosphorus and nitrogen
+ phosphorus addition. There were three replicate bottles of each treatment.
Ammonium chloride was added as the nitrogen treatment; potassium dihydrogen
phosphate was added as the P treatment. The ambient NH4+ concentration was
assumed to be 1 mol L-1
and the ambient PO43-
concentration was assumed to be 0.2
mol L-1
, and nutrients were added at ten times the assumed ambient concentrations.
Bottles were incubated with in a tub with flow-through water under 50% shadecloth in
ambient light for 24 h. Bottles were then stored in the dark for at least 20 min prior to
reading the photosynthetic yield response (Fv/Fm) using a PHYTOPAM (Heinz Walz
GmbH, Effeltrich, Germany) (Ganf and Rea, 2007). Two readings were taken from
each bottle.
Statistical methods
The algal data (water column and sediment chlorophyll a and degradation pigments,
sediment Pmax, depth integrated primary productivity) violated the assumptions of
normality. Data were therefore analyzed using a non-parametric Kruskall-Wallis test
9
(SAS software) to compare creeks. For the algal nutrient bioassays, data were tested
for normality, then treatments were compared with an unpaired t-test (SAS software).
Algal marker pigments were compared between sampling occasions and creeks using
Principal Component Analysis (PCA) graphs (PRIMER).
Results
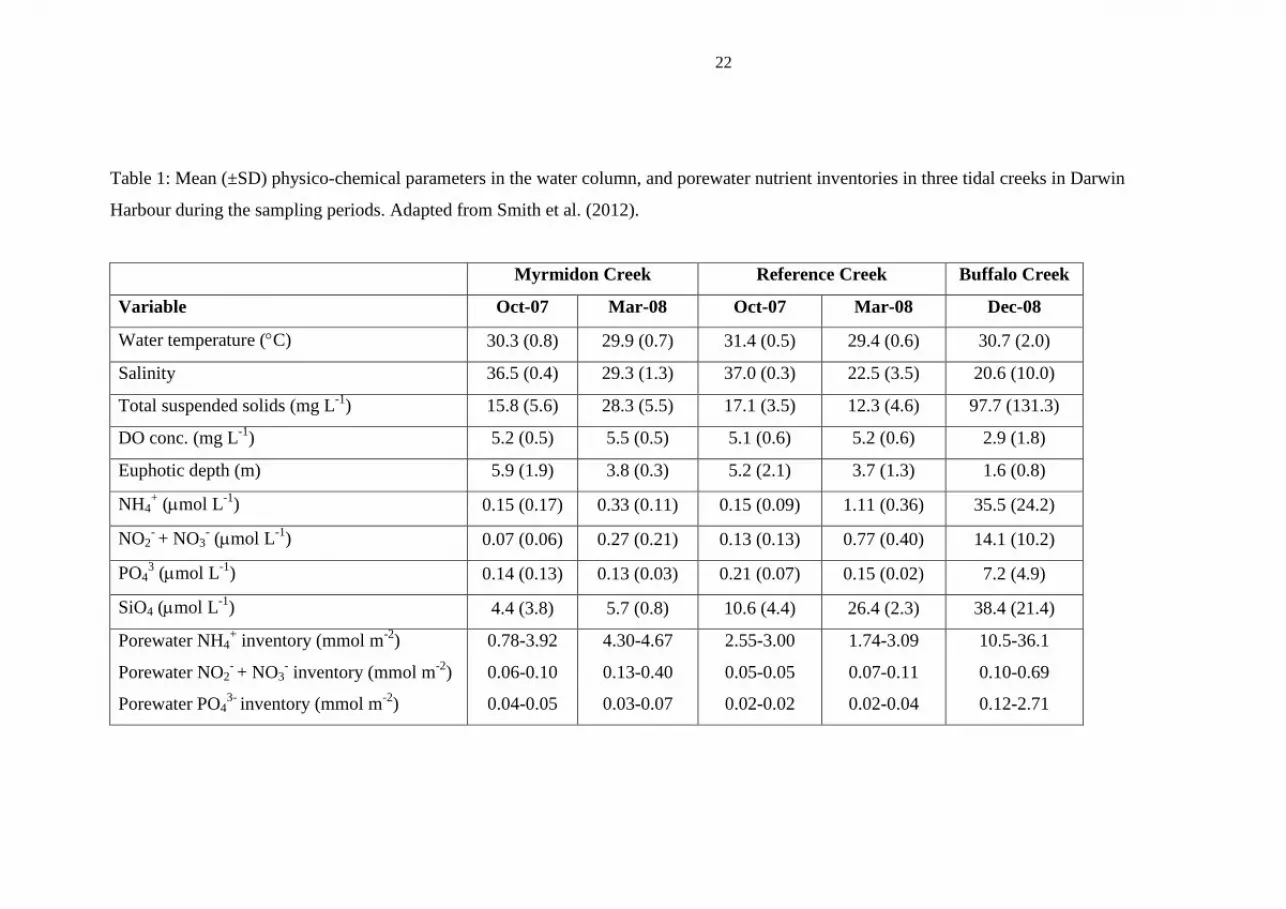
Mean water temperatures across all three creeks ranged from 29.4 to 31.4C across
the study (Table 1). Mean salinities ranged from brackish (20.6) in the wet season to
hypersaline (37.0) in the dry season. In BC, mean euphotic depths and DO
concentrations were 1.6 m and 2.9 mg L-1
respectively, while in the other two creeks,
mean euphotic depth was 4.6 m, and mean DO concentration was 5.2 mg L-1
. Mean
NH4+ concentrations in MC and RC were 0.24 and 0.63 mol L
-1 respectively while in
BC, the mean concentration was 35.5 mol L-1
(Table 1). Similarly, mean NO2- +
NO3- concentrations in MC and RC were 0.17 and 0.45 mol L
-1 respectively, while
in BC, the mean concentration was 14.1 mol L-1
. For PO43-
concentrations in MC
and RC, mean values were 0.14 and 0.18 mol L-1
respectively while in BC, the mean
concentration was 7.2 mol L-1
. Mean SiO2 concentrations were 5.0, 18.5 and 38.4
mol L-1
in MC, RC, and BC respectively.
Mean chl a concentrations in the water column in MC and RC were 2.68 and
2.83 mg m-3
respectively and statistically lower (P<0.005) than mean values in BC
(90.0 mg m-3
, Fig. 2a, Table 2). There was also a statistically higher concentration of
degradation pigments in BC compared with MC and RC. The mean sediment
chlorophyll concentrations in MC and RC were 2.74 and 2.76 g g-1
ww respectively
with a high proportion of the total chlorophyll, i.e. 22-64%, being degradation
pigments (Fig. 2b). Sediment chlorophyll a concentrations were statistically higher in
BC than MC and RC (Table 2). The highest concentrations were at the sewage outfall
site, i.e. 41.0 g g-1
ww. There were statistically higher concentrations of degradation
pigments in BC.
The porewater NH4, NO2- + NO3
- and PO4 inventories in the top 10 cm of sediment
across MC and RC ranged from 0.78 to 4.67, 0.05 to 0.40, and 0.02 to 0.07 mmol m-2
respectively (Table 1). In contrast, in BC, porewater NH4, NO2- + NO3
- and PO4

10
inventories in the top 10 cm of sediment were typically higher, ranging from 10.5 to
36.1, 0.10 to 0.69 and 0.12 to 2.71 mmol m-2
respectively.
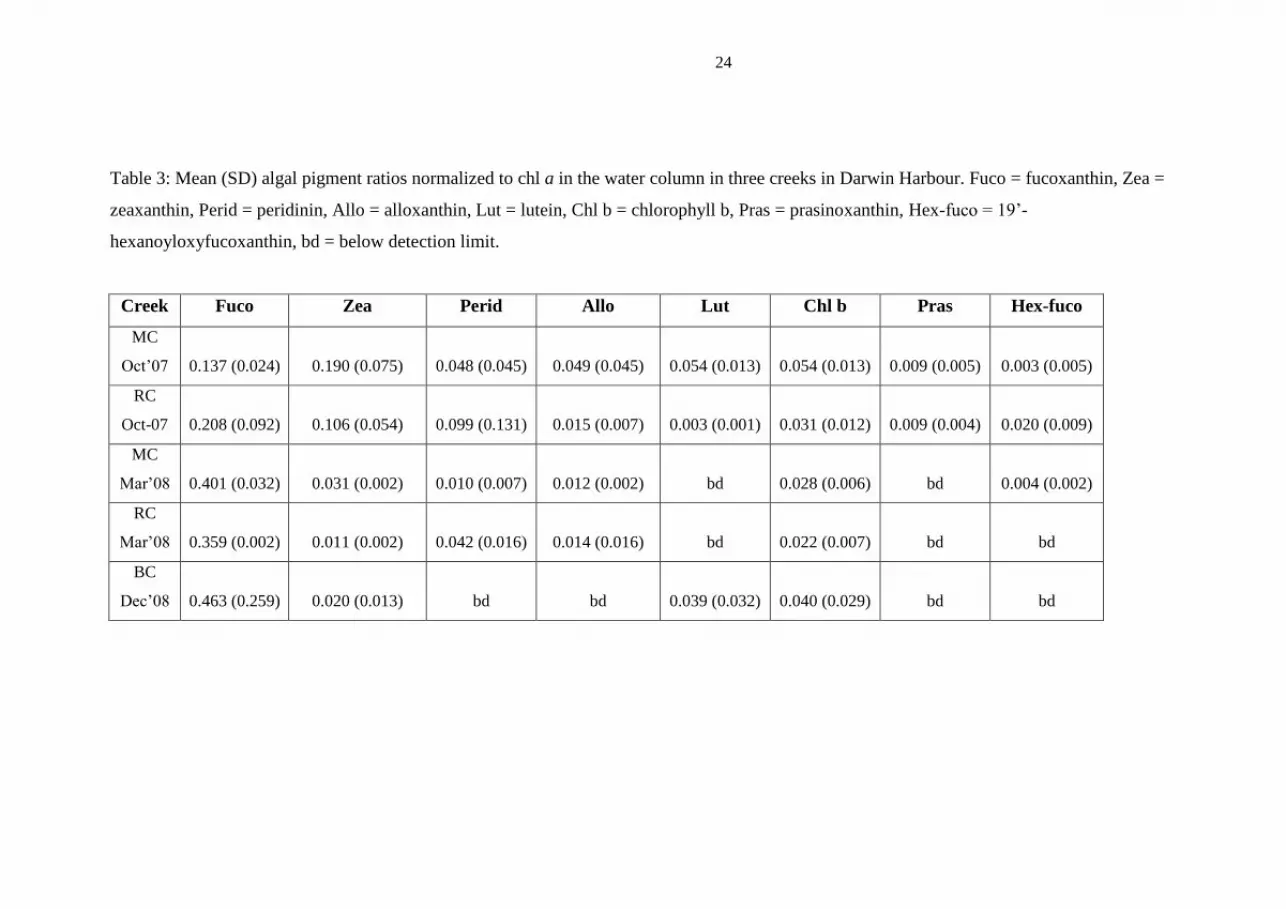
Algal pigments in the water column in RC and MC in October 2007 were dominated
by zeaxanthin (cyanobacterial marker) and fucoxanthin (diatom/golden brown
flagellate marker) while in March 2008 they were only dominated by fucoxanthin
(Table 3). BC was also dominated by fucoxanthin. The Principal Component Analysis
(PCA) poorly separated the creeks with the exception of MC and RC in October 2007
(Fig. 3a). The first axis of the PC1, largely driven by fucoxanthin, explained 81% of
the variation in the proportion of algal pigments across creeks and sites within creeks.
In the sediment, fucoxanthin also dominated the pigments in RC and MC on both
sampling occasions (Table 4). The first axis, PC1, again largely driven by
fucoxanthin, explained 77% of the variation (Fig. 3b).
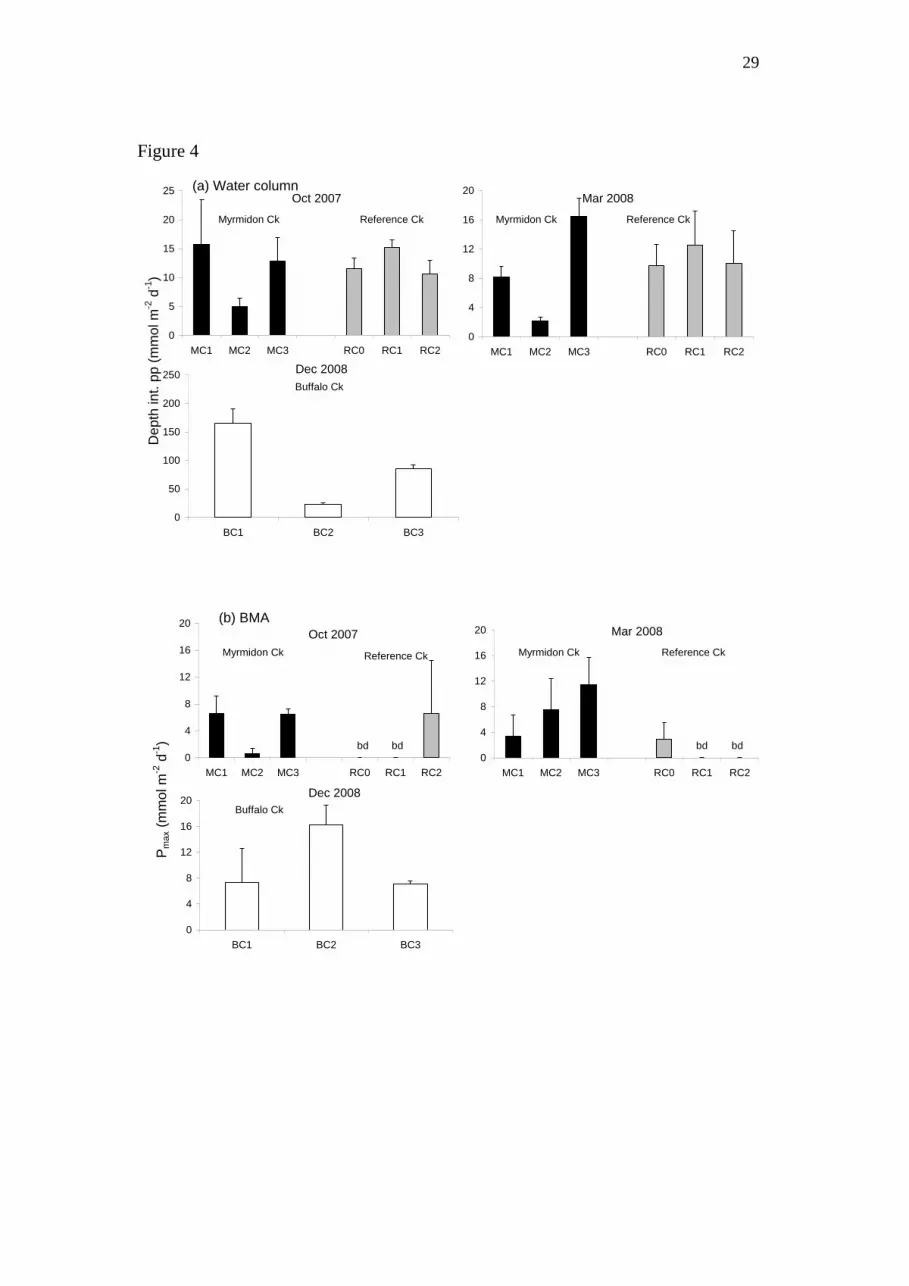
Depth-integrated primary productivity rates in the water column were statistically
higher in Buffalo Creek than the other two creeks (Table 2, Fig. 4a). Mean rates were
10.09 and 11.62 mmol m-2
d-1
in MC and RC respectively, and 91.22 mmol m-2
d-1
in
BC. However, maximum rates of primary productivity (Pmax) per unit chlorophyll a
were lower in BC than the other two creeks. Mean Pmax values in the BMA in RC,
MC, and BC were 1.58, 3.38 and 10.23 mmol m-2
d-1
respectively (Fig. 4b). There
was a statistical difference between RC and BC, and BC and MC, but not between
MC and RC (Table 2).
In RC, the photosynthetic yield (Fv/Fm) of phytoplankton increased with nitrogen,
and nitrogen plus phosphorus additions in nutrient bioassays at all sites and both
sampling occasions (Fig. 5a). There was a response to nitrogen, and nitrogen plus
phosphorus at the downstream sites at MC. However there was no yield response to
nutrients at the site nearest the sewage outfall site in October 2007 while in March
2008, there was a response to nitrogen plus phosphorus. At Buffalo Creek, data was
only available for one site nearest the outfall but there was no yield response to
nitrogen and/or phosphorus. In the case of BMA bioassays, there was no yield
response to nitrogen and/or phosphorus addition in any creek with the exception of a
response to nitrogen plus phosphorus at RC1 in March 2008 (Fig. 5b).

11
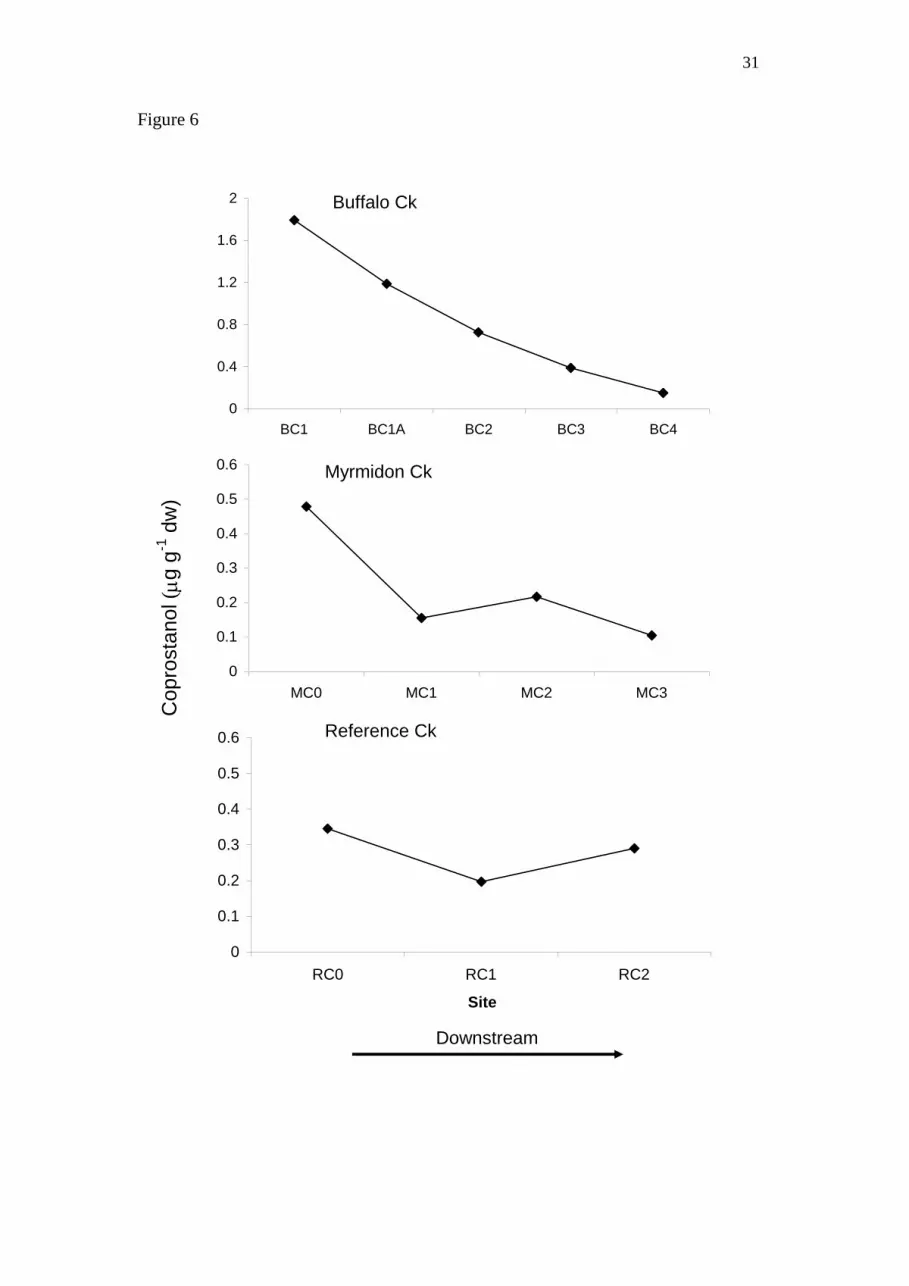
The sewage marker, coprostanol, was at a higher range of concentrations in BC
compared with RC and MC. It was highest in BC at the sewage outfall site, decreasing
linearly with distance from the outfall (Fig. 6). In MC, concentrations were highest
just upstream of the outfall site, decreasing to a background concentration by MC1. In
RC concentrations were comparable with the downstream concentrations in MC.
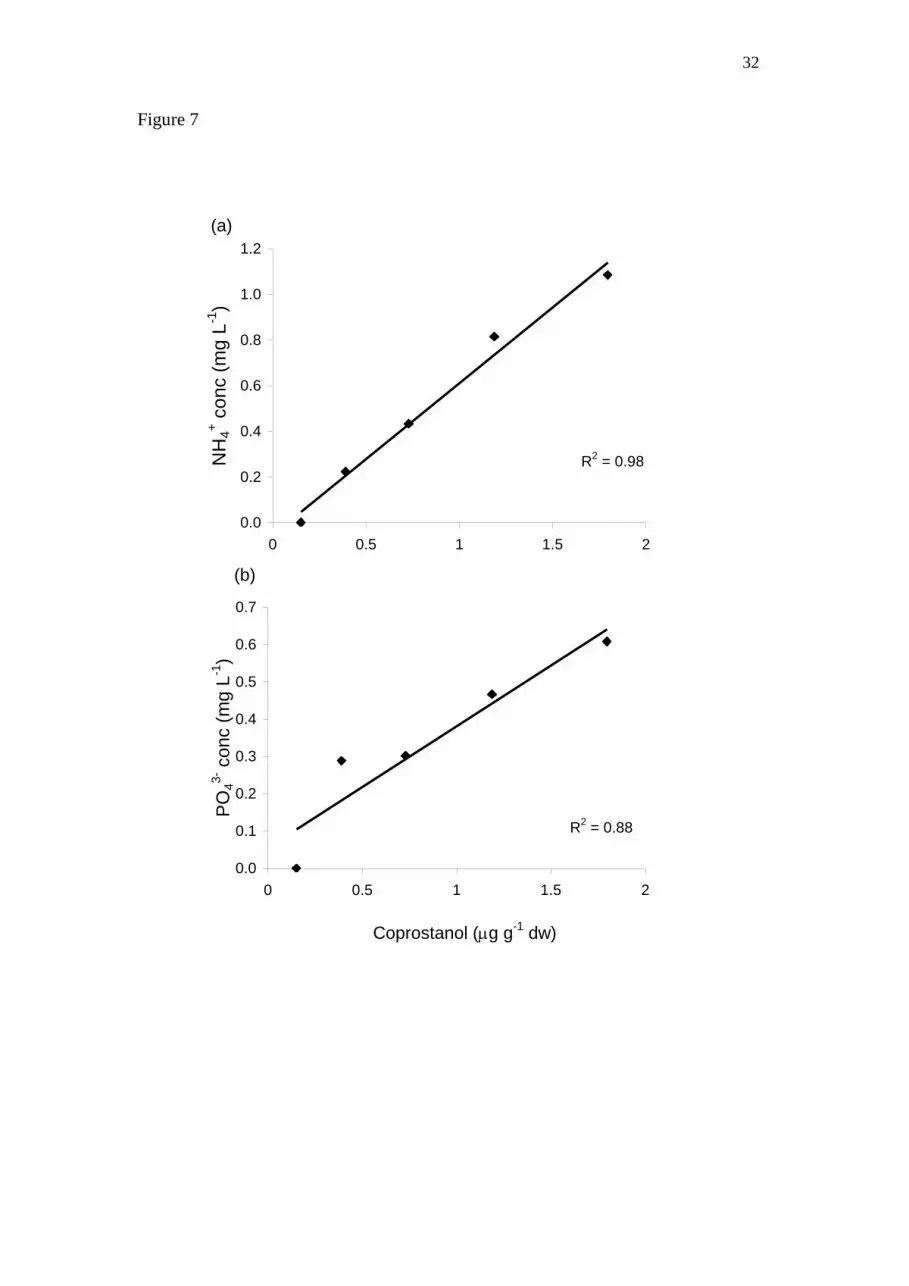
Coprostanol concentrations were highly correlated with NH4+ (Fig. 7a) and PO4
3- (Fig
7b) concentrations in BC (R2 = 0.98 and 0.88 respectively). There was a weaker
correlation between coprostanol and both NO2- + NO3
- and chlorophyll a (R
2 = 0.53
and 0.35 respectively).
Discussion
This study found that higher nutrient concentrations in the tropical tidal creeks were
the result of sewage loading. The tidal creek with sewage outfall discharging 79 and
43 t TN and TP y-1
(BC) had higher concentrations of a sewage marker, coprostanol,
than a creek with no sewage inputs. These concentrations decreased linearly
downstream. In contrast, a tidal creek receiving comparable loads of TN but with
flushing rates 1.5 to 2 times higher (MC), only had higher coprostanol concentrations
near the discharge site. Coprostanol has been used in a range of studies to track
sewage in aquatic systems (e.g. McCalley et al., 1980, Leeming and Nichols 1996,
Peng et al., 2002). Additionally, it has been proposed that linking algal blooms with
coprostanol concentrations provides a means of differentiating nutrient source effects
(Nichols et al., 1996).
Consistent with many other studies in coastal systems, our study found that nitrogen
was a limiting nutrient for phytoplankton (Ryther and Dunstan, 1971). This was based
on a positive photosynthetic yield response in short-term bioassays. This method has
proven useful in identifying nutrient limitation in previous studies (Ganf and Rea
2007; Burford et al. 2011). A previous study in Darwin Harbour has also shown that
the harbour as a whole was nitrogen limited (Burford et al., 2008). Therefore our
results were as expected, i.e. nitrogen additions stimulated photosynthetic yield
responses where sewage nitrogen was undetectable, while reverse was true at sites
where sewage nitrogen was detectable. In contrast, BMA did not respond to nitrogen
12
additions (or phosphorus), suggesting that nutrient reserves in the sediment were
sufficient for growth and that other factors play a more important role.
Sewage nutrients increased primary productivity rates by phytoplankton, but not
BMA. Phytoplankton productivity rates were high in the creek receiving the highest
sewage loading and having the lowest tidal flushing (BC) compared with the harbour
as a whole (Burford et al., 2008). Rates were comparable with those in eutrophied
tidal creeks and estuaries in other areas of the world (Rivera-Monroy et al., 1998;
Trott et al., 2004). The creek without sewage nutrients (RC) had primary productivity
rates lower than both the harbour as a whole (Burford et al., 2008), and other tropical
coastal waters (Ram et al., 2003; McKinnon et al., 2010). The creek with a similar
flushing rate to RC, but receiving sewage inputs (MC), also had similar rates of
primary productivity to RC, even near the site of discharge. This demonstrates that
tidal flushing plays an important role in minimizing the effect of algal growth.
Another study on the tidal creeks on our study found that sewage nutrients
substantially increased sediment nutrient fluxes and decreased sediment
denitrification efficiency (Smith et al., 2012). The combination of these two processes
provided a feedback loop stimulating phytoplankton productivity, i.e. high
phytoplankton productivity as a result of sewage nutrient inputs resulted in a higher
detrital load on sediments, creating anoxia and nutrient remineralization which further
stimulated phytoplankton growth. Reduced denitrification efficiency meant that
nitrogen is conserved within the creek for a longer period, compounding the effects
(Smith et al., 2012). The response to eutrophication measured in BC is consistent with
broadly accepted models of eutrophication, e.g. Nixon (1995), Cloern (2001).
Despite the lack of increase in primary productivity in the BMA in response to
sewage nutrients, chlorophyll a concentrations were higher for both BMA and
phytoplankton. However, this was only the case in BC which had the lowest tidal
flushing rates. The contrasting effect of sewage nutrients on primary productivity
versus chlorophyll a concentrations may be because the high BMA biomass resulted
in self shading, therefore reducing light availability for primary production. A study in
an estuary in North Carolina, USA also showed an increase in BMA biomass in
response to nitrogen and phosphorus, with a greater response to nitrogen loading

13
(Piehler et al. 2010). Conversely, a study of primary productivity responses of BMA
to sewage nutrients in eutrophic estuaries in Alabama, USA, which found that
increased nutrient concentrations had little effect on primary production (Stutes et al.
2006).
Our study found no differences in phytoplankton group dominance, as measured by
HPLC pigments, between creeks with and without sewage nutrients. Consistent with
many tropical coastal waters around the world, diatom/golden brown flagellate
pigments dominated with silicate concentrations sufficiently high to support diatom
growth (e.g. Burford et al., 2005, Madhu et al., 2010). This contrasts with Hu et al.
(2008) who found a historical increase in coprostanol concentrations in sedimentary
records offshore from Hong Kong, as a result of human sewage inputs, which
coincided with increased incidences of red tides, i.e. blooms of dinoflagellates, which
contain the pigment, peridinin. An increase in red tides as a result of anthropogenic
nutrients has been observed in a number of countries (Chen et al., 2010; Bauman et
al., 2010; Glibert et al., 2012). Despite the lack of effect of sewage nutrients on
phytoplankton dominance in our study, we found some evidence of a broader group of
algal classes dominating in the BMA in the sewage creek (BC) compared with the
other creeks.
Our study found that the scale of effect of sewage nutrients on algal measures appears
to be affected by the water residence time in the tidal creeks. The two creeks received
comparable nitrogen loads but the flushing rate in MC was 1.5 to 2 times higher in
comparison to BC. There was localized detection of the sewage marker, coprostanol
and changes in a range of algal measures, only near the point of discharge in the creek
with the highest flushing rates (MC). In contrast, coprostanol and algal measures were
higher throughout the creek with a longer residence time (BC). Other studies have
found that longer water residence times lead to more symptoms of eutrophication (e.g.
Cloern, 2001). However, our study provides a link between the scale of nutrient
loading and water residence times, and the scale of algal response.
It is acknowledged that our sampling design only included one sampling trip to BC in
the wet season, compared with two trips to the other creeks (one in the wet, one in the
dry). A study by Smith et al. (2012) compared the rates of biogeochemical processes
14
and water quality between the wet and dry seasons in these two creeks and found no
statistical differences in most parameters, with salinity being a key exception. This
suggests that the comparison of BC with the other two creeks, despite the differences
in sampling design, is valid. Additionally, RC had higher nutrients and lower salinity
than MC in the wet season trip, suggesting a greater catchment influence on water
quality in RC. However, this did not result in statistically higher primary productivity
or chlorophyll a concentrations. The exception was a higher Pmax in the BMA.
In conclusion, this study differentiated sewage nutrient effects in a study of tidal
creeks in the tropics. We also found that sewage nutrients stimulated algal growth but
had a greater effect on phytoplankton than BMA, with the scale of the nutrient inputs
and water dilution rates affecting the scale of response. In contrast, there was little
evidence of sewage nutrients affecting algal group dominance.

15
Acknowledgements
We wish to thank: the staff from the Aquatic Health Unit at the Northern Territory
Department of Natural Resources, Environment, The Arts and Sport for assistance
with boats and logistics; Emily Saeck, Dominic Valdez, Ralf Haese, Matt Carey and
Craig Smith for assistance with field work and laboratory analyses; Ed Czobik (NSW
DECC) and Frank Krikowa (UC) for nutrient analyses; Rene Diocares (GU) and
Rebecca Esmay (CMAR) for isotope analysis; Rhys Leeming (CMAR) helped with
coprostanol analysis; and Peter Rothlisberg, Barbara Robson and Emmanuel Grojean
provided useful comments on the manuscript. This project was conducted as part of
the Tropical Rivers and Coastal Knowledge (TRaCK) program. TRaCK received
major funding for its research through the Australian Government’s Commonwealth
Environment Research Facilities initiative; the Australian Government’s Raising
National Water Standards Program; Land and Water Australia; the Fisheries Research
and Development Corporation and the Queensland Government’s Smart State
Innovation Fund. This paper is published with the permission of the CEO, Geoscience
Australia.

16
References
Anderson, D.M., Burkholder, J.M., Cochlan, W.P., Glibert, P.M., Gobler, C.J., Heil,
C.A., Kudela, R.M., Parsons, M.L. Rensel, J.E.J., Townsend, D.W., Trainer,
V.L., Vargo, G.A. 2008. Harmful algal blooms and eutrophication: Examining
linkages from selected coastal regions of the United States. Harmful Algae 8:
39-53.
Bauman, A.G., Burt, J.A., Feary, D.A., Marquis, E., Usseglio, P. 2010. Tropical
harmful algal blooms: An emerging threat to coral reef communities? Marine
Pollution Bulletin 60: 2117-2122.
Beman, J.M., Arrigo, K.R., Matson, P.A., 2005. Agricultural runoff fuels large
phytoplankton blooms in vulnerable areas of the ocean. Nature 434: 211-214.
Bligh, E.G., Dyer, W.J. 1959. A rapid method of total lipid extraction and
purification. Canadian Journal of Biochemistry and Physiology 37: 911-917.
Burford, M.A., Rothlisberg, P.C., Wang, Y. 1995. Spatial and temporal distribution
of tropical phytoplankton species and biomass in Albatross Bay, Gulf of
Carpentaria, Australia. Marine Ecology Progress Series 118: 255-266.
Burford, M.A., Alongi, D.M., McKinnon, A.D., Trott, L.J. 2008. Primary production
and nutrients in a tropical macrotidal estuary, Darwin Harbour, Australia.
Estuarine, Coastal and Shelf Science, 79: 440-448.
Burford, M. A., Revill, A.T. Palmer, D.W. Clementson, L., Robson, B.J., Webster,
I.T. 2011. River regulation alters drivers of primary productivity along a
tropical river-estuary system. Marine and Freshwater Research, 62: 141-151.
Chen, B., Xu, Z., Xhou, Q., Chen, C.P., Gao, Y.H., Yang, S.Y., Ji, W.D. 2010. Long-
term changes of phytoplankton community in Xiagu waters of Xiamen, China.
Acta Oceanologica Sinica 29: 104-114.
Cloern, J.E. 2001. Our evolving conceptual model of the coastal eutrophication
problem. Marine Ecology Progress Series 210: 233–253.
Cohen, J.E. 2003. The next half century. Science 302: 1172-1175.
17
Cook, P.L.M., Revill, A.T., Clementson, L.A., Volkman, J.K. 2004. Carbon and
nitrogen cycling on intertidal mudflats of a temperate Australian estuary III.
Sources of organic matter. Marine Ecology Progress Series 280: 55–72
Costanzo, S.D., O’Donohue, S.D., Dennison, W.C., Loneragan, N.R., Thomas, M.
2001. A new approach for detecting and mapping sewage impacts. Marine
Pollution Bulletin 42: 149-156.
Costanzo, S.D., Udy, J., Longstaff, B., Jones, A. 2005. Using nitrogen stable isotope
ratios (delta N-15) of macroalgae to determine the effectiveness of sewage
upgrades: changes in the extent of sewage plumes over four years in Moreton
Bay, Australia. Marine Pollution Bulletin 515: 212-217.
Downing, J.A., McClain, M., Twilley, R., Melack, J.M., Elser, J., Rabalais, N.N.,
Lewis, W.M., Turner, R.E., Corredor, J., Soto, D., Yanez-Arancibia, A.,
Kopaska, J.A., Howarth, R.W. 1999. The impact of accelerating land-use
change on the N-cycle of tropical aquatic ecosystems: current conditions and
projected changes. Biogeochemistry 46: 109–148.
Ganf, G.G., Rea N. 2007. Potential for algal blooms in tropical rivers of the Northern
Territory, Australia. Marine and Freshwater Research 58: 315-326.
Glibert, P.M., Burkholder, J.M., Kana, K.M. 2012. Recent insights about the
relationships between nutrient availability, forms and stoichiometry, and the
distribution, ecophysiology, and food web effects of pelagic and benthic
Prorocentrum species. Harmful Algae 14: 231-259.
Haese, R.R., Murray, E.J., Smith, C.S., Smith, J., Clementson, L., Heggie, D.T. 2007.
Diatoms control nutrient cycles in a temperate, wave-dominated estuary
(southeast Australia). Limnology and Oceanography 52: 2686–2711.
Halpern, B.S., Walbridge, S., Selkoe, K.A., Kappel, C.V., Micheli, F., Kappel, C.V.,
Micheli, F., D’Agrosa, C., Bruno, J.F., Casey, K.S., Ebert, C., Fox, H.E., Fujita,
R., Heinemann, D., Lenihan, H.S., Madin, E.M.P., Perry, M.T., Selig, E.R.,
Spalding, M., Steneck, R., Watson, R. 2008. A global map of human impact on
marine ecosystems. Science 319: 948-952.

18
Howarth, R., Sharpley, A., Walker, D. 2002. Sources of nutrient pollution to coastal
waters in the United States: implications for achieving coastal water quality
goals. Estuaries and Coasts 25: 656–676
Hu, J., Zhang, G., Kechang, L., Peng, P., Chivas, A.R. 2008. Increased eutrophication
offshore Hong Kong, China during the past 75 years: Evidence from high-
resolution sedimentary records. Marine Chemistry 110, 7-17.
Jennerjahn, T.C., Ittekkot, V., Klopper, S., Adi, S., Purwo Nugroho, S., Sudiana, N.,
Yusmal, A., Prihartanto, Gaye-Haake, B. 2004. Biogeochemistry of a tropical
river affected by human activities in its catchment: Brantas River estuary and
coastal waters of Madura Strait, Java, Indonesia. Estuarine, Coastal and Shelf
Science 60: 503-514
Leeming, R., Nichols, P.D. 1996. Concentrations of coprostanol that correspond to
existing bacterial indicator guideline limits. Water Research 30: 2997-3006.
Madhu, N.V., Balachandran, K.K., Martin, G.D., Jyothibabu, R., Thottathil, S.D.,
Maheswari Nair, T. Joseph, K.K. Kusum. 2010. Short-term variability in water
quality and its implications for phytoplankton production in a tropical estuary
(Cochin backwaters – India). Environmental Monitoring and Assessment 170:
287-300.
Mackenzie, F.T., Ver, L.M., Lerman, A. 2002. Century-scale nitrogen and phosphorus
controls of the carbon cycle. Chemical Geology 190: 13-32
McCalley, C.V., Cooke, M., Nickless, G. 1980. Coprostanol in Severn estuary
sediments. Bulletin of Environmental Contaminants and Toxicology 25: 374-
381.
McKinnon, A.D., Smit, N., Townsend, S., Duggan, S. 2006. Darwin Harbour: Water
quality and ecosystem structure in a tropical harbour in the early stages of
development. In: E. Wolanski (Editor), The Environment in Asia Pacific
Harbours. Springer, Dordrecht, pp. 433-459.
McKinnon, A.D., Trott, L.A., Brinkman, R., Duggan, S., Castine, S., O’Leary, R.A.,
Alongi, D.M. 2010. Seacage aquaculture in a World Heritage Area: the
environmental footprint of a Barramundi farm in tropical Australia. Marine
Pollution Bulletin 60: 1489–1501

19
Nichols, P.D., Leeming, R., Rayner, M.S., Latham. V. 1996. Use of capillary gas
chromatography for measuring fecal-derived sterols. Application to
stormewater, the sea-surface microlayer, beach greases, regional studies, and
distinguishing algal blooms and human and non-human sources of sewage
pollution. Journal of Chromatography A 733: 497-509.
Nixon, S.W. 1995. Coastal marine eutrophication: a definition, social causes, and
future concerns. Ophelia 41: 199-219
Peng, X., Zhang, G., Mai, B., Min, Y., Wang, Z. 2002. Spatial and temporal trend of
sewage pollution indicated by coprostanol in Macao Estuary, southern China.
Marine Pollution Bulletin 45: 295-299.
Piehler, M.F., Currin, C.A., Hall, N.S. 2010. Estuarine intertidal sandflat benthic
microalgal reponses to in situ and mesocosm nitrogen additions. Journal of
experimental Marine Biology and Ecology 390: 99-105.
Ram, A.S.P., Nair, S., Chandramohan, D. 2003. Seasonal shift in net ecosystem
production in a tropical estuary. Limnology and Oceanography 48: 1601–1607.
Rivera-Monroy, V., Madden, C., Day, J., Twilley, R., Vera-Herrera, F., Alvarez-
Guillén, H. 1998. Seasonal coupling of a tropical mangrove forest and an
estuarine water column: enhancement of aquatic primary productivity.
Hydrobiologia 379: 41–53
Ryther, J.H., Dunstan, W.M. 1971. Nitrogen, P, and eutrophication in the coastal
marine environment. Science 171: 1008-1013.
Smith, J., Burford, M.A., Revill, A.T., Haese, R.R., Fortune, J. 2012. Effect of
nutrient loading on biogeochemical processes in tropical tidal creeks.
Biogeochemistry, 108: 359- 380.
Stutes, A.L., Cebrian, J., Corcoran, A.A. 2006. Effects of nutrient enrichment and
shading on sediment primary production and metabolism in eutrophic estuaries.
Marine Ecology Progress Series 312: 29-43.
Trott, L.A., McKinnon, A.D., Alongi, D.M., Davidson, A., Burford, M.A. 2004.
Carbon and nitrogen processes in a mangrove creek receiving shrimp farm
effluent. Estuarine, Coastal and Shelf Science, 59: 197-207.
Vitousek, P.M. 1997. Human domination of Earth's ecosystems. Science 278: 21.

20
Figure Captions
Figure 1: Map of Darwin Harbour, Australia showing the sites of the (a) Reference
Creek, (b) Myrmidon Creek, (c) Buffalo Creek in three tidal creeks in the study, and
maps showing expanded details of the creeks including sampling sites. STP = sewage
treatment plant.
Figure 2: Chl a and chlorophyll degradation product concentrations in the (a) water
column (mg m-3
) and (b) sediment (g g-1
ww) in sites in the three creeks for the three
sampling occasions. Black = chlorophyll a in Myrmidon Ck, dotted = degradation
products in Myrmidon Ck, grey = chlorophyll a in Reference Ck, vertical stripes =
degradation products in Myrmidon Ck, white = chlorophyll a in Buffalo Ck, oblique
stripes = degradation products in Buffalo Ck.
Figure 3: PCA plot showing algal pigment ratios in the (a) water column and (b)
sediment at sites in each creek on each sampling occasion.
Figure 4: Primary productivity in the (a) water column (depth-integrated productivity,
mmol C m-2
d-1
) and (b) sediment (Pmax, mmol C m-2
d-1
) at the sites in the three creeks
on three sampling occasions. bd = below detection.
Figure 5: Photosynthetic yield (Fv/Fm) to nutrient addition compared with a control in
the (a) water column and (b) sediment at sites in the three creeks on three sampling
occasions. A, B and C refer to statistical differences (P < 0.05) between treatments.
MC1a and MC1b refers to experiments conducted at this site on two consecutive
days.
Figure 6: Coprostanol concentrations (g g-1
) in the sediment at sites down each creek
RC and MC were sampled in October 2007 and BC in December 2008.
Figure 7: Coprostanol concentrations versus (a) NH4+, and (b) PO4
3- concentrations
across multiple sites and creeks.

21
22
Table 1: Mean (±SD) physico-chemical parameters in the water column, and porewater nutrient inventories in three tidal creeks in Darwin
Harbour during the sampling periods. Adapted from Smith et al. (2012).
Myrmidon Creek Reference Creek Buffalo Creek
Variable Oct-07 Mar-08 Oct-07 Mar-08 Dec-08
Water temperature (C) 30.3 (0.8) 29.9 (0.7) 31.4 (0.5) 29.4 (0.6) 30.7 (2.0)
Salinity 36.5 (0.4) 29.3 (1.3) 37.0 (0.3) 22.5 (3.5) 20.6 (10.0)
Total suspended solids (mg L-1
) 15.8 (5.6) 28.3 (5.5) 17.1 (3.5) 12.3 (4.6) 97.7 (131.3)
DO conc. (mg L-1
) 5.2 (0.5) 5.5 (0.5) 5.1 (0.6) 5.2 (0.6) 2.9 (1.8)
Euphotic depth (m) 5.9 (1.9) 3.8 (0.3) 5.2 (2.1) 3.7 (1.3) 1.6 (0.8)
NH4+ (mol L
-1) 0.15 (0.17) 0.33 (0.11) 0.15 (0.09) 1.11 (0.36) 35.5 (24.2)
NO2- + NO3
- (mol L
-1) 0.07 (0.06) 0.27 (0.21) 0.13 (0.13) 0.77 (0.40) 14.1 (10.2)
PO43 (mol L
-1) 0.14 (0.13) 0.13 (0.03) 0.21 (0.07) 0.15 (0.02) 7.2 (4.9)
SiO4 (mol L-1
) 4.4 (3.8) 5.7 (0.8) 10.6 (4.4) 26.4 (2.3) 38.4 (21.4)
Porewater NH4+ inventory (mmol m
-2)
Porewater NO2- + NO3
- inventory (mmol m
-2)
Porewater PO43-
inventory (mmol m-2
)
0.78-3.92
0.06-0.10
0.04-0.05
4.30-4.67
0.13-0.40
0.03-0.07
2.55-3.00
0.05-0.05
0.02-0.02
1.74-3.09
0.07-0.11
0.02-0.04
10.5-36.1
0.10-0.69
0.12-2.71

23
Table 2: P values from comparisons of algal variables in the water column and
sediment in three creeks: Myrmidon (MC), Buffalo (BC) and Reference (RC) using a
non-parametric one-way ANOVA. Statistically significant p-values in bold. w/c =
water column.
Water column
or Sediment
Variable RC vs. MC
P value
RC vs. BC
P value
MC vs. BC
P value
w/c Chl a 0.796 0.006 0.003
Algal degradation
pigments
0.052 0.003 0.003
Depth integrated
prim. prod.
0.873 0.020 0.020
Pmax/chl a 0.200 0.020 0.020
Sediment Chl a 0.897 0.006 0.003
BMA degradation
pigments
0.519 0.006 0.003
BMA Pmax 0.027 0.015 0.197
24
Table 3: Mean (SD) algal pigment ratios normalized to chl a in the water column in three creeks in Darwin Harbour. Fuco = fucoxanthin, Zea =
zeaxanthin, Perid = peridinin, Allo = alloxanthin, Lut = lutein, Chl b = chlorophyll b, Pras = prasinoxanthin, Hex-fuco = 19’-
hexanoyloxyfucoxanthin, bd = below detection limit.
Creek Fuco Zea Perid Allo Lut Chl b Pras Hex-fuco
MC
Oct’07 0.137 (0.024) 0.190 (0.075) 0.048 (0.045) 0.049 (0.045) 0.054 (0.013) 0.054 (0.013) 0.009 (0.005) 0.003 (0.005)
RC
Oct-07 0.208 (0.092) 0.106 (0.054) 0.099 (0.131) 0.015 (0.007) 0.003 (0.001) 0.031 (0.012) 0.009 (0.004) 0.020 (0.009)
MC
Mar’08 0.401 (0.032) 0.031 (0.002) 0.010 (0.007) 0.012 (0.002) bd 0.028 (0.006) bd 0.004 (0.002)
RC
Mar’08 0.359 (0.002) 0.011 (0.002) 0.042 (0.016) 0.014 (0.016) bd 0.022 (0.007) bd bd
BC
Dec’08 0.463 (0.259) 0.020 (0.013) bd bd 0.039 (0.032) 0.040 (0.029) bd bd

25
Table 4: Mean (SD) BMA pigment ratios normalized to chl a in three creeks in Darwin Harbour. Fuco = fucoxanthin, Zea = zeaxanthin, Lut =
lutein, Chl b = chlorophyll b, But = 19’-butanoyloxyfucoxanthin, Allo = alloxanthin, Hex-fuco = 19’-hexanoyloxyfucoxanthin, bd = below
detection limit.
Creek Fuco Zea Lut Chl b But Allo Hex
MC
Oct’07 0.245 (0.025) 0.079 (0.020) 0.039 (0.026) bd 0.015 (0.006) bd bd
RC
Oct’07 0.290 (0.036) 0.095 (0.028) 0.011 (0.009) bd 0.037 (0.023) bd bd
MC
Mar’08 0.249 (0.051) 0.076 (0.016) 0.032 (0.016) 0.057 (0.034) bd 0.013 (0.003) bd
RC
Mar’08 0.367 (0.021) 0.043 (0.011) 0.015 (0.006) 0.036 (0.009) bd 0.014 (0.003) bd
BC
Dec’08 0.152 (0.071) 0.068 (0.032) 0.068 (0.038) 0.113 (0.066) 0.014 (0.008) bd 0.009 (0.006)
26
Figure 1

27
Figure 2
0
1
2
3
4
5
6
7
MC0 MC1 MC2 MC3 RC0 RC1 RC2
0
1
2
3
4
5
6
7
MC0 MC1 MC2 MC3 RC0 RC1 RC2
0
50
100
150
200
250
BC0 BC1a BC1b BC2 BC3 BC4
Chl a,
phaeopig
ments
(m
g m
-3)
Oct 2007 Mar 2008
Dec 2008
Myrmidon Ck Reference Ck Myrmidon Ck Reference Ck
Buffalo Ck
(a) Water column
0
2
4
6
8
10
MC0 MC1 MC2 MC3 RC0 RC1 RC2
0
2
4
6
8
10
MC0 MC1 MC2 MC3 RC0 RC1 RC2
0
20
40
60
80
100
BC1 BC1a BC2 BC3 BC4
Chl a
, p
ha
eo
pig
me
nts
(m
g g
-1 w
w)
Oct 2007 Mar 2008
Dec 2008
Myrmidon Ck Reference CkMyrmidon Ck Reference Ck
Buffalo Ck
(b) BMA

28
Figure 3
b)
a)
29
Figure 4
0
5
10
15
20
25
MC1 MC2 MC3 RC0 RC1 RC2
0
4
8
12
16
20
MC1 MC2 MC3 RC0 RC1 RC2
0
50
100
150
200
250
BC1 BC2 BC3
Depth
int. p
p (
mm
ol m
-2 d
-1)
Oct 2007 Mar 2008
Dec 2008
Myrmidon Ck Reference Ck Myrmidon Ck Reference Ck
Buffalo Ck
(a) Water column
0
4
8
12
16
20
MC1 MC2 MC3 RC0 RC1 RC2
0
4
8
12
16
20
MC1 MC2 MC3 RC0 RC1 RC2
0
4
8
12
16
20
BC1 BC2 BC3
Myrmidon Ck Reference Ck Myrmidon Ck Reference Ck
Buffalo Ck
Pm
ax (
mm
ol m
-2 d
-1)
(b) BMAOct 2007 Mar 2008
Dec 2008
bd bd bd bd

30
Figure 5
0
0.2
0.4
0.6
0.8
MC1 MC2 MC3 RC0 RC1 RC2
Ph
oto
sy
nth
eti
c y
ield
(F
v/F
m)
Control
P
N
N+P
Oct 2007
0
0.1
0.2
0.3
0.4
0.5
0.6
0.7Mar 2008
0
0.2
0.4
0.6
0.8
MC1a MC1b MC3MC2 RC0 RC1 RC2
BC1
Dec 2008
A
A
AB
A A A
A B
A
B
BB B
B BB
B
A A A
AA A
ABAB B
A
B
A
A BC CAB
(a) Water column
0
0.2
0.4
0.6
0.8
MC1 RC0
C
P
N
N+P
0
0.2
0.4
0.6
0.8
MC1 MC3 RC0 RC2
0
0.2
0.4
0.6
0.8
BC1 BC3
*
Ph
oto
syn
theti
c y
ield
(F
v/F
m)
(b) BMAOct 2007 Mar 2008
Dec 2008
31
Figure 6
0
0.4
0.8
1.2
1.6
2
BC1 BC1A BC2 BC3 BC4
0
0.1
0.2
0.3
0.4
0.5
0.6
MC0 MC1 MC2 MC3
0
0.1
0.2
0.3
0.4
0.5
0.6
RC0 RC1 RC2
Site
Co
pro
sta
no
l (
g g
-1 d
w)
Buffalo Ck
Myrmidon Ck
Reference Ck
Downstream
32
Figure 7
R2 = 0.98
0.0
0.2
0.4
0.6
0.8
1.0
1.2
0 0.5 1 1.5 2
NH
4+ c
on
c (
mg
L-1
)
R2 = 0.88
0.0
0.1
0.2
0.3
0.4
0.5
0.6
0.7
0 0.5 1 1.5 2
PO
43
- conc (
mg L
-1)
Coprostanol (g g-1
dw)
(a)
(b)