Embed Size (px)
Citation preview
applied sciences
Article
Effect of Formwork Removal Time Reduction onConstruction Productivity Improvement by MixDesign of Early Strength Concrete
Taegyu Lee 1,† , Jaehyun Lee 2,†, Jinsung Kim 3, Hyeonggil Choi 3,* and Dong-Eun Lee 3
1 Department of Fire and Disaster Prevention, Semyung University, 65 Semyung-ro, Jecheon-si,Chungbuk 27136, Korea; [email protected]
2 Department of Safety Engineering, Seoul National University of Science and Technology, 232 Gongneung-ro,Nowon-gu, Seoul 01811, Korea; [email protected]
3 School of Architecture, Civil, Environment, and Energy Engineering, Kyungpook National University,80 Daehakro, Bukgu, Daegu 41566, Korea; [email protected] (J.K.); [email protected] (D.-E.L.)
* Correspondence: [email protected]; Tel.: +82-53-950-5596† These authors contributed equally to this work.
Received: 4 September 2020; Accepted: 6 October 2020; Published: 11 October 2020�����������������
Abstract: In this study, we examined the effects of cement fineness, SO3 content, an accelerating agent,and chemical admixtures mixed with unit weights of cement on concrete early strength using concretemixtures. C24 (characteristic value of concrete, 24 MPa) was used in the experiment conducted.Ordinary Portland cement (OPC), high fineness and SO3 OPC (HFS_OPC), and Early Portland cement(EPC) were selected as the study materials. The unit weights of cement were set to OPC 330, 350,and 380. Further, a concrete mixture was prepared with a triethanolamine (TEA)-based chemicaladmixture to HFS. A raw material analysis was conducted, and the compressive strength, temperaturehistory, and maturity (D·h) were examined. Then, the vertical formwork removal time was evaluatedaccording to the criterion of each country. Finally, the time required to develop concrete strengthof 5 MPa was estimated. Results showed that the early strength of concrete mixed with HFS andEPC was greater than that exhibited by concrete with an increased unit weight of cement with OPC.In addition, when HFS was used with EPC, its strength developed early, similar to the trend exhibitedby EPC, even at low temperatures.
Keywords: early strength of concrete; cement fineness; SO3 content; accelerating agent; maturity;Ordinary Portland cement
1. Introduction
Early strength concrete is used as an elemental technology for reducing construction time byrealizing early formwork removal at construction sites [1,2]. Early strength concrete can be investigatedvia two methods: (1) Appropriate management of the proportions of materials mixed in the concrete,and (2) acceleration of cement hydration by varying the curing temperature [3,4]. It is possible todecrease the setting time of concrete and increase the curing speed by reducing the water to cement(W/C) [5]. For mixtures used in the field, a reduction in the W/C ratio increases the design strength byincreasing the unit weight of cement. This method can improve the strength of concrete in a certainrange when applied to the mixture design of a site. However, the method does not consider economicefficiency and cannot be used to improve concrete mixture design [6].
Ordinary Portland cement (OPC) is commonly used in concrete mixtures owing to its chemicalstability. However, it exhibits limitations in terms of developing early strength in concrete [7]. Earlystrength in concrete can be developed using early strength cement, which increases the C3S content and
Appl. Sci. 2020, 10, 7046; doi:10.3390/app10207046 www.mdpi.com/journal/applsci
Appl. Sci. 2020, 10, 7046 2 of 15
fineness and decreases the C2S content; thus, for early strength development, early strength cement isbetter than OPC [8]. Despite the excellent early strength development, the early strength cement hasnot been commonly used because it is difficult to develop a stable long-term strength, hence reducingthe economic efficiency.
Bentz et al. [9–13] reported that a higher W/C ratio may have a greater influence on the earlystrength development and cement with a higher fineness can reduce the formwork removal time underthe curing conditions at actual construction sites.
It is possible to develop the early strength of cement for which the fineness of OPC is increasedto 380 m2/kg, and the SO3 content is increased to 3.1% in the scope of the 13–20 ◦C temperaturerange [14,15]. Rixon et al. [16–18] conducted research on the early strength development of OPCby reducing the setting time using triethanolamine (TEA). Further, according to the research resultsreported by Aggoun et al. [19], rapid curing occurred when the TEA accelerating agent was used in largequantities. A retarder was also used to control the rapid curing. However, the chemical decompositionof the accelerating agent and retarder was also reported in some cases. These studies have lowreproducibility for the actual production of concrete, and they also have limitations in determiningeconomical mixtures by fully considering the climate conditions of local areas. In particular, when thetemperature of a local area is irregular and the curing temperature is less than 15 ◦C, accurate strengthprediction for determining the formwork removal time [20–24] is difficult.
In this study, we examined the influence of unit weight of cement in concrete that uses OPC onearly strength development by considering the conditions of construction sites and referring to theconcrete mixture of C24 (characteristic value of concrete, 24 MPa). In addition, high fineness and SO3
OPC (HFS_OPC) and early Portland cement (EPC) were selected, for which the fineness and SO3
content were varied considering the economic efficiency of mixture design. Further, the effect of theaddition of a polycarboxylic (PC) superplasticizer mixed with an accelerating agent on the accelerationof early strength was analyzed. This study aims to examine the influencing factors of cement forearly strength development by curing temperature and to develop the optimal mixture with economicefficiency. In addition, the formwork removal time was predicted, and its influence on the constructionproductivity was examined.
In conclusion, this study aims to contribute toward enhancing the utilization of construction sitesby investigating the effects of various concrete material factors, amount of cement, type of cement,chemical admixture, and SO3 on the early strength.
2. Materials and Methods
2.1. Materials
Table 1 summarizes the chemical composition of the binders by X-ray fluorescence (XRF) analysis.OPC (ASTM type I), HFS_OPC, and EPC (ASTM type III) were used as the concrete binders. For OPC,the density and fineness were 3150 kg/m3 and 330 m2/kg; for HFS, they were 3130 kg/m3 and 380m2/kg; and for EPC, they were 3160 kg/m3 and 488 m2/kg, respectively.
Table 1. Chemical composition of the used binders by X-ray fluorescence (XRF) analysis.
MaterialsChemical Composition (%)
L.O.I. (4)
CaO Al2O3 SiO2 MgO Fe2O3 SO3 K2O Others
OPC (1) 60.34 4.85 19.82 3.83 3.30 2.90 1.08 0.86 3.02HFS (2) 61.00 4.51 19.22 4.14 3.35 3.13 1.04 0.79 2.82EPC (3) 61.44 4.72 20.33 2.95 3.42 3.73 0.95 0.79 1.67
(1) OPC: Ordinary Portland cement; (2) HFS: High Fineness and SO3 ordinary Portland cement; (3) EPC: EarlyPortland cement; (4) L.O.I.: Loss on ignition.
Appl. Sci. 2020, 10, 7046 3 of 15
Figure 1 shows the results of the sieve analysis curves on the aggregates. Washed sea sand andcrushed sand were used as the fine aggregates. Further, the fineness modulus of the fine aggregateswas 2.84.
Appl. Sci. 2020, 10, x FOR PEER REVIEW 3 of 15
For washed sea sand, the fineness, density, and absorption were 2.01, 2600 kg/m3, and 0.79%,
respectively. For crushed sand, the fineness, absorption, and density were 3.29, 0.87%, and 2570
kg/m3, respectively. Crushed coarse aggregate with a size of 25 mm, absorption of 0.76%, and density
of 2600 kg/m3 was used as the coarse aggregate. For the chemical admixture, a PC superplasticizer
and a TEA-based PC superplasticizer were used.
(a) (b)
Figure 1. Gradation sieve analysis test result for the aggregates: (a) Fine aggregates and (b) coarse
aggregates.
2.2. Experimental Plan and Mix Proportions
Table 2 shows the experimental plan. For the concrete strength, the concrete of C24 was
referenced, which is most commonly used at construction sites. For C24 (330 P) that used OPC, the
W/C was set to 0.50 and the unit weight of cement was set to 330 kg/m2. In general, the unit weight
of cement is increased to secure the early strength of concrete at construction sites. In this study, C27
(characteristic value of concrete = 27 MPa) and C30 (characteristic value of concrete = 30 MPa) were
selected, which increased the unit weight of cement. The unit weight of cement of C27 (350P) and
C30 (380P) was 350 and 380 kg/m2, respectively.
In addition, HFS_OPC and EPC, which increased the fineness and SO3 content of cement, were
additionally selected and examined to improve concrete strength considering the economic efficiency
of concrete mixtures. For such concrete mixtures, the unit weight of cement was set as 330 kg/m2,
similar to that of C24. HFS (330P) increased the fineness and SO3 content of OPC, and it is effective in
developing the early strength [14,15]. However, as it has limitations in developing the early strength
of concrete, ePC (early polycarboxylic superplasticizer with TEA) was added to HFS [23].
Table 2. Experimental plan.
Series Mix
ID. W/C
Cement
Type
Unit
Weight
of Cement
(kg/m3)
Chemical
Admixture
Curing
Temperature
(°C)
Evaluation Item
Ⅰ
330P 0.50 OPC 330
PC Chamber (13 °C)
▪ Slump (mm)
350P 0.47 350 ▪ Air contents (%)
380P 0.43 380 ▪ Compressive strength (MPa)
Ⅱ
330P
0.50
OPC 330 PC (1)
Room Temp. (20
°C)
- Cylinder Mold (Ø 100 × 200)
330HFS HFS 330 PC - 18, 24, and 72 h
330HFS_ePC HFS 330 ePC (2) ▪ Temperature history (°C)
330EP EPC 330 PC and Maturity (D∙h)
(1) PC: Polycarboxylic superplasticizer-based type admixture. (2) ePC: early Polycarboxylic
superplasticizer with triethanolamine (TEA).
Figure 1. Gradation sieve analysis test result for the aggregates: (a) Fine aggregates and (b)coarse aggregates.
For washed sea sand, the fineness, density, and absorption were 2.01, 2600 kg/m3, and 0.79%,respectively. For crushed sand, the fineness, absorption, and density were 3.29, 0.87%, and 2570 kg/m3,respectively. Crushed coarse aggregate with a size of 25 mm, absorption of 0.76%, and density of2600 kg/m3 was used as the coarse aggregate. For the chemical admixture, a PC superplasticizer and aTEA-based PC superplasticizer were used.
2.2. Experimental Plan and Mix Proportions
Table 2 shows the experimental plan. For the concrete strength, the concrete of C24 was referenced,which is most commonly used at construction sites. For C24 (330 P) that used OPC, the W/C was setto 0.50 and the unit weight of cement was set to 330 kg/m2. In general, the unit weight of cement isincreased to secure the early strength of concrete at construction sites. In this study, C27 (characteristicvalue of concrete = 27 MPa) and C30 (characteristic value of concrete = 30 MPa) were selected, whichincreased the unit weight of cement. The unit weight of cement of C27 (350P) and C30 (380P) was 350and 380 kg/m2, respectively.
Table 2. Experimental plan.
Series MixID. W/C Cement
Type
Unit Weightof Cement
(kg/m3)
ChemicalAdmixture
CuringTemperature
(◦C)Evaluation Item
I330P 0.50 OPC 330
PCChamber
(13 ◦C)
� Slump (mm)350P 0.47 350 � Air contents (%)380P 0.43 380 � Compressive strength (MPa)
II
330P
0.50
OPC 330 PC (1)
Room Temp.(20 ◦C)
- Cylinder Mold (∅100 × 200)330HFS HFS 330 PC - 18, 24, and 72 h
330HFS_ePC HFS 330 ePC (2) � Temperature history (◦C)330EP EPC 330 PC and Maturity (D·h)
(1) PC: Polycarboxylic superplasticizer-based type admixture. (2) ePC: early Polycarboxylic superplasticizer withtriethanolamine (TEA).
In addition, HFS_OPC and EPC, which increased the fineness and SO3 content of cement, wereadditionally selected and examined to improve concrete strength considering the economic efficiencyof concrete mixtures. For such concrete mixtures, the unit weight of cement was set as 330 kg/m2,
Appl. Sci. 2020, 10, 7046 4 of 15
similar to that of C24. HFS (330P) increased the fineness and SO3 content of OPC, and it is effective indeveloping the early strength [14,15]. However, as it has limitations in developing the early strength ofconcrete, ePC (early polycarboxylic superplasticizer with TEA) was added to HFS [23].
To identify the effect of the curing temperature on concrete strength, chamber (13 ◦C) and watercuring (20 ◦C) were examined.
The slump (mm) and air content (%) of concrete were evaluated to ensure that they could be usedonsite. As for hardened properties, a cylindrical mold (∅100 mm × 200 mm) was fabricated, and itsconcrete strength was measured at 18 h, 24 h, and 72 h. In addition, the temperature history (◦C) wasmeasured, and the maturity (D·h) was calculated based on the temperature history. The time requiredto remove the vertical formwork on concrete was estimated at the curing temperature by examiningthe correlation between the concrete strength and maturity.
The formwork removal time on concrete is specified in each country’s regulations. However, itsdecision criteria differ. This study referred to the Asian (including South Korea and Japan) criteria thatpresent a detailed demolding strength value [24,25]. The strength criterion for the formwork removalof concrete was set as 5 MPa.
Table 3 shows the mixing proportions on concrete. For the mixing proportions on concrete, theircorresponding practical values were used as reference, and the unit weight of water was 165 kg/m2.
Table 3. Mixing proportions on concrete.
Series MixID.
W/C(1)
S/a (2)
(%)
Unit Weight (kg/m3) PC(B×%)
ePC(B×%)W (3) C (4) HFS (5) EPC (6) S (7) G (8)
I330P 0.50 48.5 165 330 885 891 0.8350P 0.47 48.5 165 350 876 883 0.8380P 0.43 48.5 165 380 864 870 0.8
II
330P 0.50 48.5 165 330 885 891 0.8330HFS 0.50 48.5 165 330 884 890 0.8
330HFS_ePC 0.50 48.5 165 330 884 890 0.8330EP 0.50 48.5 165 330 885 891 0.8
(1) W/C: Water/Cement; (2) S/a: Sand/aggregates; (3) W: Water; (4) Cement; (5) High fineness and SO3 ordinaryPortland cement (6) Early Portland cement; (7) Sea sand + Crushed sand; (8) G: Gravel.
For the fine aggregates, crushed sand and washed sea sand were mixed at a volume ratio of 6:4.For the fresh properties on concrete, the slump was set to 180 ± 25 mm and air content was 4.5 ± 1.5%,respectively, to apply workability in the construction site.
The concretes were mixed using a commercial machine (mixing speed: 5–50 rpm, mixing capacity:180 L double-axial spiral mixing type, Woojin, Korea). The fine aggregate was added and mixed for 30s. Then, the binder, water, and coarse aggregate were added and mixed for 30 s. To ensure sufficientworkability, a superplasticizer was added and mixed for 30 s. The concrete mix was prepared in 150 s.
2.3. Test Methods
2.3.1. Properties of Raw Materials and Concrete
Table 4 shows the test methods for properties of the raw materials and concrete. This studyattempted to examine the effects of the unit weight of cement and factors related to the cement typeson concrete strength development of concrete. The raw material analysis of cement was conducted toinvestigate the physicochemical properties of cement. Experiments were performed in accordancewith ASTM C204 [26] for the particle size distribution of cement, ASTM C114 [27] for XRF, and ASTMC1702 [28] for the heat of hydration.
Appl. Sci. 2020, 10, 7046 5 of 15
Table 4. Test methods for engineering properties of raw materials and concrete.
Series Test Item Test Method
Raw materials(Cement)
Particle size distribution (%) ASTM C204X-ray fluorescence ASTM C114Heat of Hydration ASTM C1702
Mechanical properties analysis(Concrete)
Compressive strength (MPa) ASTM C873ASTM C39
Maturity (D·h) ASTM C1074
The slump of fresh concrete was evaluated according to ASTM C143/C143M [29], and the aircontent test method was evaluated according to ASTM C231/C231M-17a [30]. To secure the workabilityof concrete that arrived at the site, the fresh properties of concrete were evaluated after 60 min.Specimens for compressive strength test were fabricated with dimensions of ∅100 mm × 200 mm. Thespecimens were cured at 13 ◦C and 20 ◦C using a constant temperature and humidity chamber.
The compressive strength of the concrete was calculated after measuring the maximum load usinga 300-ton class universal test machine in accordance with ASTM C873 [31] and ASTM C39/C39M [32]at the ages of 18 h, 24 h, and 72 h.
2.3.2. Temperature History and Maturity on Concrete
To obtain the temperature history of concrete, the hydration history was measured by embeddingK-type thermocouples at the center of concrete specimen. The maturity was calculated as follows inaccordance with ASTM C1074 [33]:
M(t) =∑
(Ta − T0)∆t, (1)
where M(t) = the temperature-time factor at age t (degree-days or degree-h), ∆t = time interval (days orh), Ta = average concrete temperature during time interval (∆t, ◦C), and T0 = datum temperature (◦C).
3. Results and Discussion
3.1. Fresh and Hardened Properties on Concrete
Table 5 shows the fresh properties on concrete. When all the concrete mixtures were evaluated,the slump could meet the target range of 180 ± 25 mm both at the beginning and after 60 min. The aircontent of concrete met range of 4.5 ± 1.5% for all the mixtures, and its reduction was not significanteven after 60 min.
Table 5. Fresh properties on concrete.
Mix ID.Slump (mm) Air Content (%)
Initial After 60 min. Initial After 60 min.
330P 190 175 5.4 5.0350P 195 185 4.8 4.4380P 195 180 4.3 3.9
330HFS 200 185 4.4 4.0330HFS_ePC 205 190 5.8 5.4
330EP 195 175 5.5 5.0
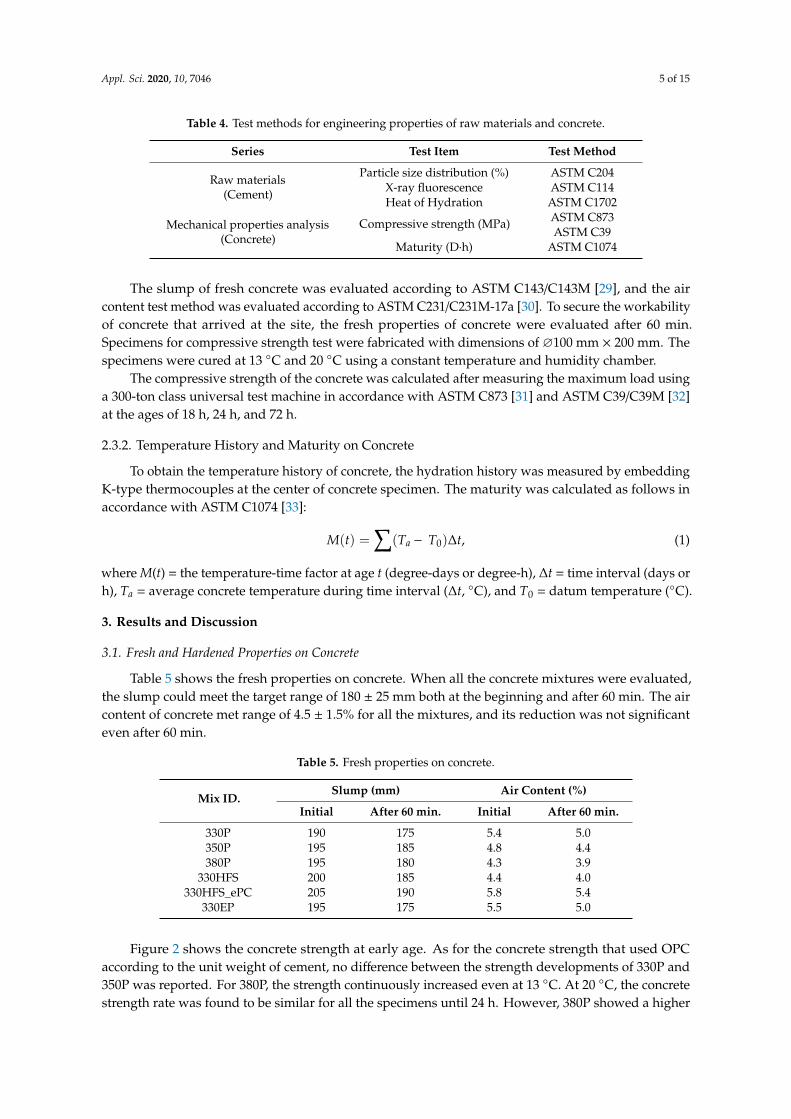
Figure 2 shows the concrete strength at early age. As for the concrete strength that used OPCaccording to the unit weight of cement, no difference between the strength developments of 330P and350P was reported. For 380P, the strength continuously increased even at 13 ◦C. At 20 ◦C, the concretestrength rate was found to be similar for all the specimens until 24 h. However, 380P showed a higher
Appl. Sci. 2020, 10, 7046 6 of 15
strength development after 72 h. In addition, for the concrete mixtures that used OPC, a compressivestrength of 5 MPa was developed after 24 h and 72 h in the case of 20 ◦C and 13 ◦C, especially.
Appl. Sci. 2020, 10, x FOR PEER REVIEW 6 of 15
strength rate was found to be similar for all the specimens until 24 h. However, 380P showed a higher
strength development after 72 h. In addition, for the concrete mixtures that used OPC, a compressive
strength of 5 MPa was developed after 24 h and 72 h in the case of 20 °C and 13 °C, especially.
(a) (b)
Figure 2. Concrete strength development at early age: (a) Cement amount and (b) cement type and
chemical admixture.
For 330HFS, the concrete strength was slightly higher compared to OPC until 24 h. However, it
significantly increased and exceeded 10 MPa at 72 h under the curing condition at 13 °C. For
330HFS_EPC, the compressive strength was 2.7 MPa at 18 h and close to 5 MPa at 24 h. It increased
with a slope similar to that of 330HFS at 72 h, thereby exhibiting very high strength development
compared to 330P. 330EP exhibited a difference in strength development of less than 1 MPa compared
to 330HFS_ePC, but showed a significantly higher compressive strength increase rate at 72 h.
At the 20 °C curing temperature, concrete exhibited a higher strength development rate than
that at 13 °C. For 330EP and 330HFS_ePC, the compressive strength reached 5 MPa within 18 h, and
this value was reached within 24 h for 330HFS and in the 24–72 h range for 330P. 330P_ePC reached
5 MPa within 24 h at 13 °C, and the effect was significantly increased at a higher curing temperature.
3.2. Temperature History and Maturity on Concrete
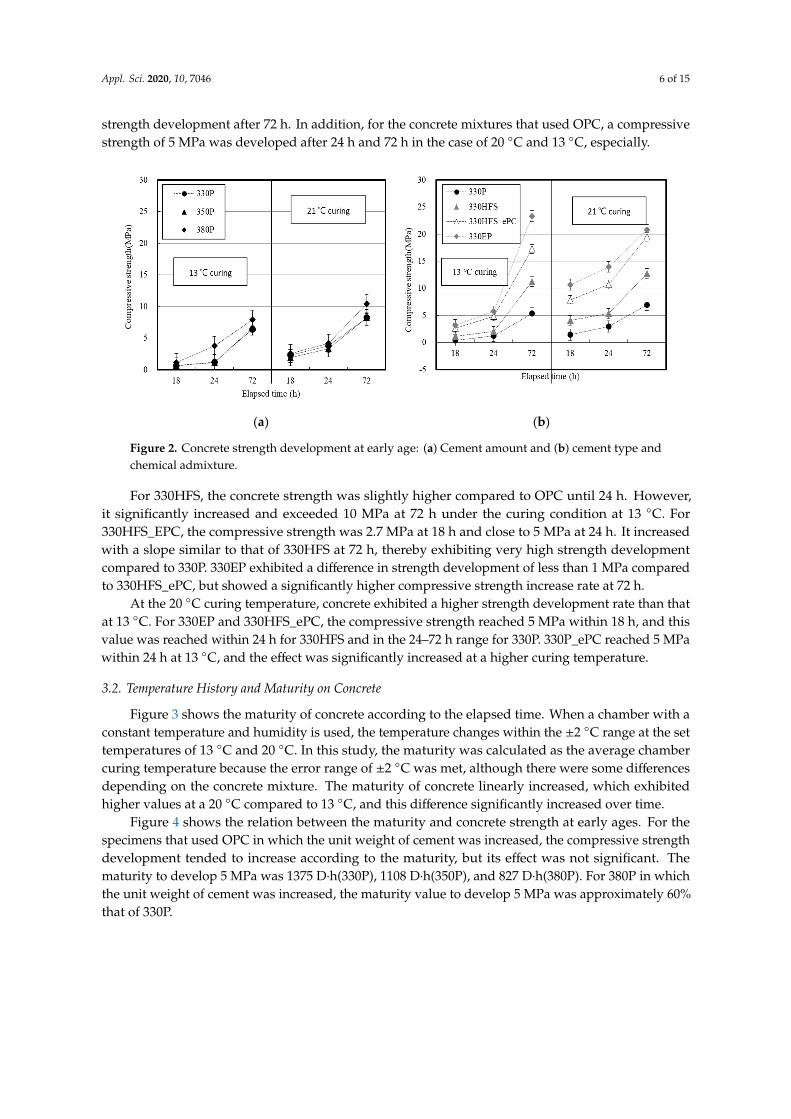
Figure 3 shows the maturity of concrete according to the elapsed time. When a chamber with a
constant temperature and humidity is used, the temperature changes within the ±2 °C range at the
set temperatures of 13 °C and 20 °C. In this study, the maturity was calculated as the average chamber
curing temperature because the error range of ±2 °C was met, although there were some differences
depending on the concrete mixture. The maturity of concrete linearly increased, which exhibited
higher values at a 20 °C compared to 13 °C, and this difference significantly increased over time.
Figure 2. Concrete strength development at early age: (a) Cement amount and (b) cement type andchemical admixture.
For 330HFS, the concrete strength was slightly higher compared to OPC until 24 h. However,it significantly increased and exceeded 10 MPa at 72 h under the curing condition at 13 ◦C. For330HFS_EPC, the compressive strength was 2.7 MPa at 18 h and close to 5 MPa at 24 h. It increasedwith a slope similar to that of 330HFS at 72 h, thereby exhibiting very high strength developmentcompared to 330P. 330EP exhibited a difference in strength development of less than 1 MPa comparedto 330HFS_ePC, but showed a significantly higher compressive strength increase rate at 72 h.
At the 20 ◦C curing temperature, concrete exhibited a higher strength development rate than thatat 13 ◦C. For 330EP and 330HFS_ePC, the compressive strength reached 5 MPa within 18 h, and thisvalue was reached within 24 h for 330HFS and in the 24–72 h range for 330P. 330P_ePC reached 5 MPawithin 24 h at 13 ◦C, and the effect was significantly increased at a higher curing temperature.
3.2. Temperature History and Maturity on Concrete
Figure 3 shows the maturity of concrete according to the elapsed time. When a chamber with aconstant temperature and humidity is used, the temperature changes within the ±2 ◦C range at the settemperatures of 13 ◦C and 20 ◦C. In this study, the maturity was calculated as the average chambercuring temperature because the error range of ±2 ◦C was met, although there were some differencesdepending on the concrete mixture. The maturity of concrete linearly increased, which exhibitedhigher values at a 20 ◦C compared to 13 ◦C, and this difference significantly increased over time.
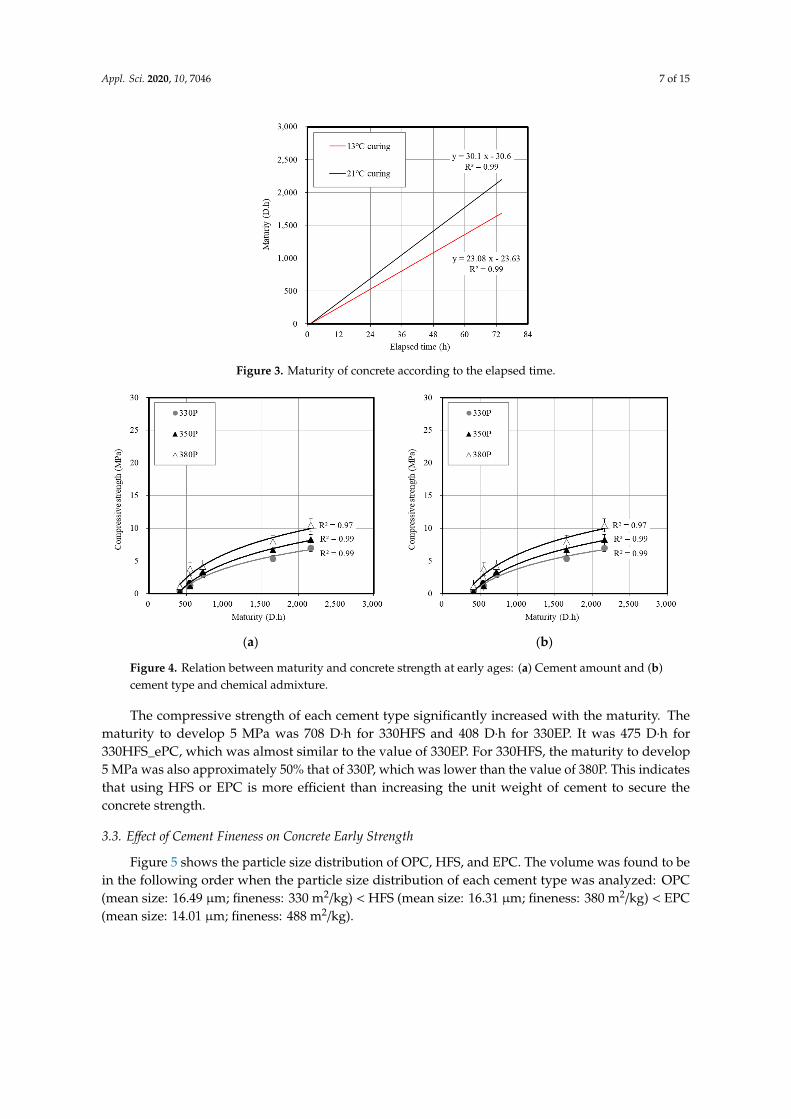
Figure 4 shows the relation between the maturity and concrete strength at early ages. For thespecimens that used OPC in which the unit weight of cement was increased, the compressive strengthdevelopment tended to increase according to the maturity, but its effect was not significant. Thematurity to develop 5 MPa was 1375 D·h(330P), 1108 D·h(350P), and 827 D·h(380P). For 380P in whichthe unit weight of cement was increased, the maturity value to develop 5 MPa was approximately 60%that of 330P.
Appl. Sci. 2020, 10, 7046 7 of 15
Appl. Sci. 2020, 10, x FOR PEER REVIEW 7 of 15
Figure 3. Maturity of concrete according to the elapsed time.
Figure 4 shows the relation between the maturity and concrete strength at early ages. For the
specimens that used OPC in which the unit weight of cement was increased, the compressive strength
development tended to increase according to the maturity, but its effect was not significant. The
maturity to develop 5 MPa was 1375 D∙h(330P), 1108 D∙h(350P), and 827 D∙h(380P). For 380P in which
the unit weight of cement was increased, the maturity value to develop 5 MPa was approximately
60% that of 330P.
(a) (b)
Figure 4. Relation between maturity and concrete strength at early ages: (a) Cement amount and (b)
cement type and chemical admixture.
The compressive strength of each cement type significantly increased with the maturity. The
maturity to develop 5 MPa was 708 D∙h for 330HFS and 408 D∙h for 330EP. It was 475 D∙h for
330HFS_ePC, which was almost similar to the value of 330EP. For 330HFS, the maturity to develop 5
MPa was also approximately 50% that of 330P, which was lower than the value of 380P. This indicates
that using HFS or EPC is more efficient than increasing the unit weight of cement to secure the
concrete strength.
3.3. Effect of Cement Fineness on Concrete Early Strength
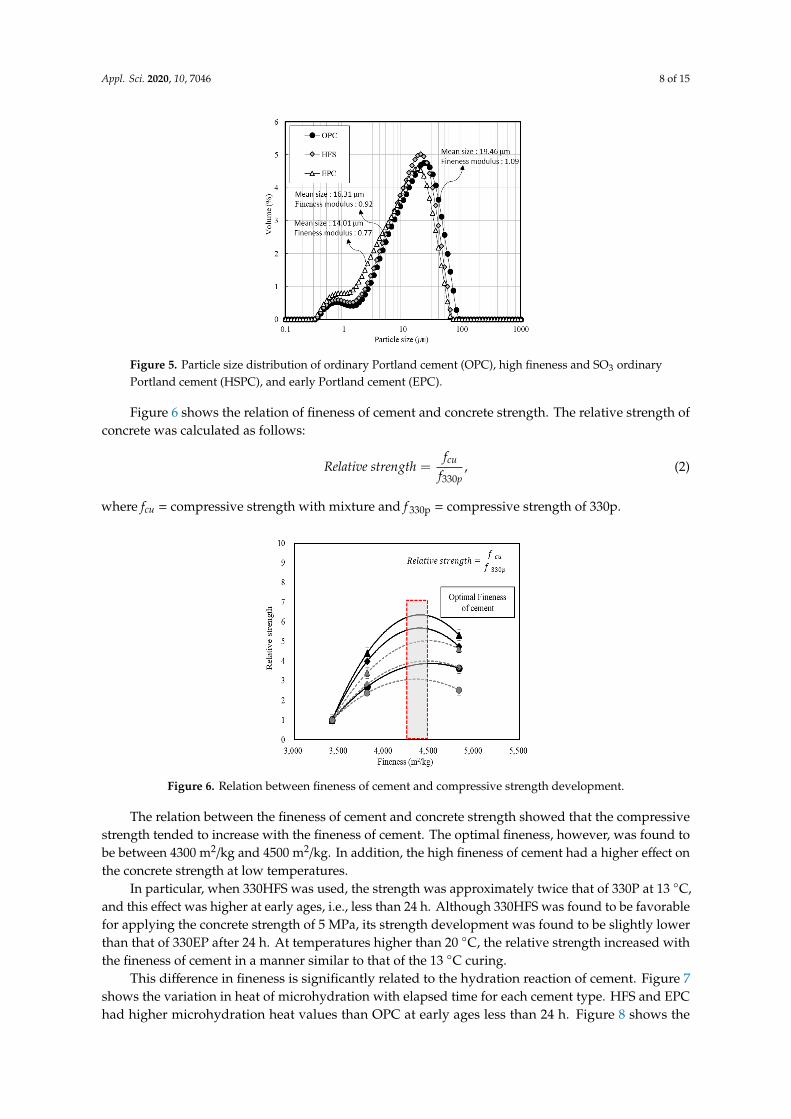
Figure 5 shows the particle size distribution of OPC, HFS, and EPC. The volume was found to
be in the following order when the particle size distribution of each cement type was analyzed: OPC
Figure 3. Maturity of concrete according to the elapsed time.
Appl. Sci. 2020, 10, x FOR PEER REVIEW 7 of 15
Figure 3. Maturity of concrete according to the elapsed time.
Figure 4 shows the relation between the maturity and concrete strength at early ages. For the
specimens that used OPC in which the unit weight of cement was increased, the compressive strength
development tended to increase according to the maturity, but its effect was not significant. The
maturity to develop 5 MPa was 1375 D∙h(330P), 1108 D∙h(350P), and 827 D∙h(380P). For 380P in which
the unit weight of cement was increased, the maturity value to develop 5 MPa was approximately
60% that of 330P.
(a) (b)
Figure 4. Relation between maturity and concrete strength at early ages: (a) Cement amount and (b)
cement type and chemical admixture.
The compressive strength of each cement type significantly increased with the maturity. The
maturity to develop 5 MPa was 708 D∙h for 330HFS and 408 D∙h for 330EP. It was 475 D∙h for
330HFS_ePC, which was almost similar to the value of 330EP. For 330HFS, the maturity to develop 5
MPa was also approximately 50% that of 330P, which was lower than the value of 380P. This indicates
that using HFS or EPC is more efficient than increasing the unit weight of cement to secure the
concrete strength.
3.3. Effect of Cement Fineness on Concrete Early Strength
Figure 5 shows the particle size distribution of OPC, HFS, and EPC. The volume was found to
be in the following order when the particle size distribution of each cement type was analyzed: OPC
Figure 4. Relation between maturity and concrete strength at early ages: (a) Cement amount and (b)cement type and chemical admixture.
The compressive strength of each cement type significantly increased with the maturity. Thematurity to develop 5 MPa was 708 D·h for 330HFS and 408 D·h for 330EP. It was 475 D·h for330HFS_ePC, which was almost similar to the value of 330EP. For 330HFS, the maturity to develop5 MPa was also approximately 50% that of 330P, which was lower than the value of 380P. This indicatesthat using HFS or EPC is more efficient than increasing the unit weight of cement to secure theconcrete strength.
3.3. Effect of Cement Fineness on Concrete Early Strength
Figure 5 shows the particle size distribution of OPC, HFS, and EPC. The volume was found to bein the following order when the particle size distribution of each cement type was analyzed: OPC(mean size: 16.49 µm; fineness: 330 m2/kg) < HFS (mean size: 16.31 µm; fineness: 380 m2/kg) < EPC(mean size: 14.01 µm; fineness: 488 m2/kg).
Appl. Sci. 2020, 10, 7046 8 of 15
Appl. Sci. 2020, 10, x FOR PEER REVIEW 8 of 15
(mean size: 16.49 µm; fineness: 330 m2/kg) < HFS (mean size: 16.31 µm; fineness: 380 m2/kg) < EPC
(mean size: 14.01 µm; fineness: 488 m2/kg).
Figure 5. Particle size distribution of ordinary Portland cement (OPC), high fineness and SO3
ordinary Portland cement (HSPC), and early Portland cement (EPC).
Figure 6 shows the relation of fineness of cement and concrete strength. The relative strength of
concrete was calculated as follows:
𝑅𝑒𝑙𝑎𝑡𝑖𝑣𝑒 𝑠𝑡𝑟𝑒𝑛𝑔𝑡ℎ =𝑓𝑐𝑢
𝑓330𝑝
, (2)
where fcu = compressive strength with mixture and f330p = compressive strength of 330p.
The relation between the fineness of cement and concrete strength showed that the compressive
strength tended to increase with the fineness of cement. The optimal fineness, however, was found
to be between 4300 m2/kg and 4500 m2/kg. In addition, the high fineness of cement had a higher effect
on the concrete strength at low temperatures.
Figure 6. Relation between fineness of cement and compressive strength development.
In particular, when 330HFS was used, the strength was approximately twice that of 330P at 13
°C, and this effect was higher at early ages, i.e., less than 24 h. Although 330HFS was found to be
favorable for applying the concrete strength of 5 MPa, its strength development was found to be
slightly lower than that of 330EP after 24 h. At temperatures higher than 20 °C, the relative strength
increased with the fineness of cement in a manner similar to that of the 13 °C curing.
Figure 5. Particle size distribution of ordinary Portland cement (OPC), high fineness and SO3 ordinaryPortland cement (HSPC), and early Portland cement (EPC).
Figure 6 shows the relation of fineness of cement and concrete strength. The relative strength ofconcrete was calculated as follows:
Relative strength =fcu
f330p, (2)
where fcu = compressive strength with mixture and f 330p = compressive strength of 330p.
Appl. Sci. 2020, 10, x FOR PEER REVIEW 8 of 15
(mean size: 16.49 µm; fineness: 330 m2/kg) < HFS (mean size: 16.31 µm; fineness: 380 m2/kg) < EPC
(mean size: 14.01 µm; fineness: 488 m2/kg).
Figure 5. Particle size distribution of ordinary Portland cement (OPC), high fineness and SO3
ordinary Portland cement (HSPC), and early Portland cement (EPC).
Figure 6 shows the relation of fineness of cement and concrete strength. The relative strength of
concrete was calculated as follows:
𝑅𝑒𝑙𝑎𝑡𝑖𝑣𝑒 𝑠𝑡𝑟𝑒𝑛𝑔𝑡ℎ =𝑓𝑐𝑢
𝑓330𝑝
, (2)
where fcu = compressive strength with mixture and f330p = compressive strength of 330p.
The relation between the fineness of cement and concrete strength showed that the compressive
strength tended to increase with the fineness of cement. The optimal fineness, however, was found
to be between 4300 m2/kg and 4500 m2/kg. In addition, the high fineness of cement had a higher effect
on the concrete strength at low temperatures.
Figure 6. Relation between fineness of cement and compressive strength development.
In particular, when 330HFS was used, the strength was approximately twice that of 330P at 13
°C, and this effect was higher at early ages, i.e., less than 24 h. Although 330HFS was found to be
favorable for applying the concrete strength of 5 MPa, its strength development was found to be
slightly lower than that of 330EP after 24 h. At temperatures higher than 20 °C, the relative strength
increased with the fineness of cement in a manner similar to that of the 13 °C curing.
Figure 6. Relation between fineness of cement and compressive strength development.
The relation between the fineness of cement and concrete strength showed that the compressivestrength tended to increase with the fineness of cement. The optimal fineness, however, was found tobe between 4300 m2/kg and 4500 m2/kg. In addition, the high fineness of cement had a higher effect onthe concrete strength at low temperatures.
In particular, when 330HFS was used, the strength was approximately twice that of 330P at 13 ◦C,and this effect was higher at early ages, i.e., less than 24 h. Although 330HFS was found to be favorablefor applying the concrete strength of 5 MPa, its strength development was found to be slightly lowerthan that of 330EP after 24 h. At temperatures higher than 20 ◦C, the relative strength increased withthe fineness of cement in a manner similar to that of the 13 ◦C curing.
This difference in fineness is significantly related to the hydration reaction of cement. Figure 7shows the variation in heat of microhydration with elapsed time for each cement type. HFS and EPChad higher microhydration heat values than OPC at early ages less than 24 h. Figure 8 shows the
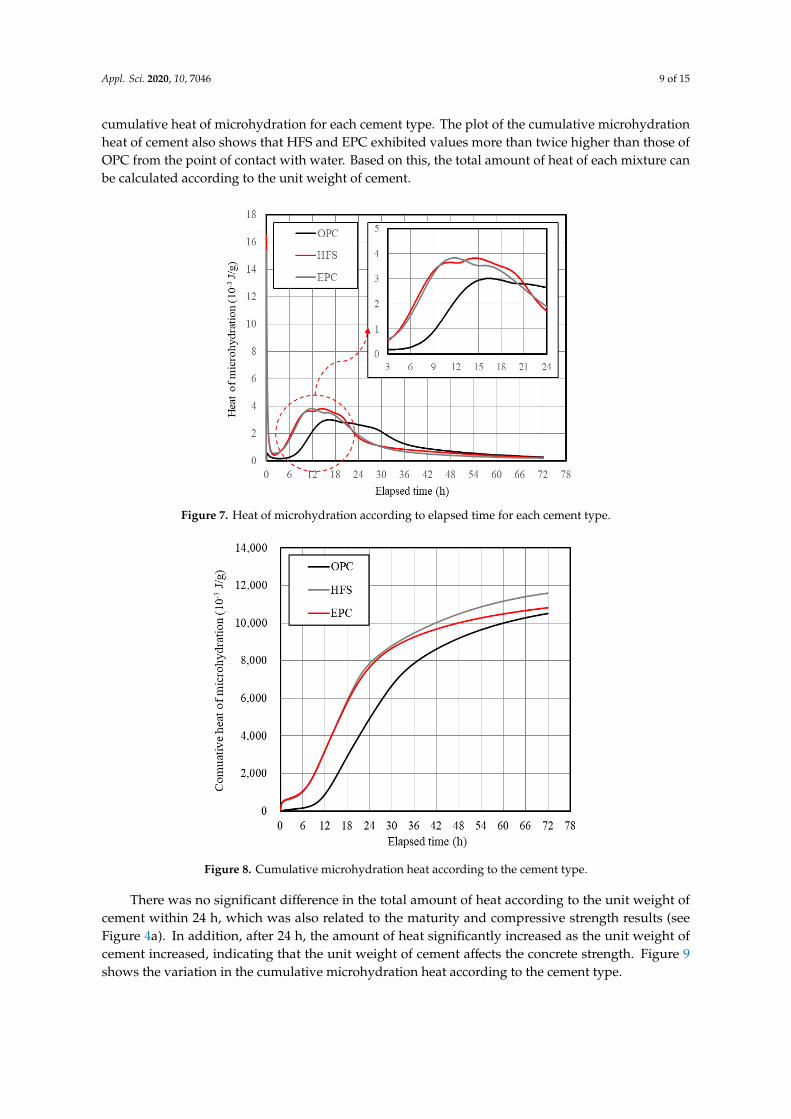
Appl. Sci. 2020, 10, 7046 9 of 15
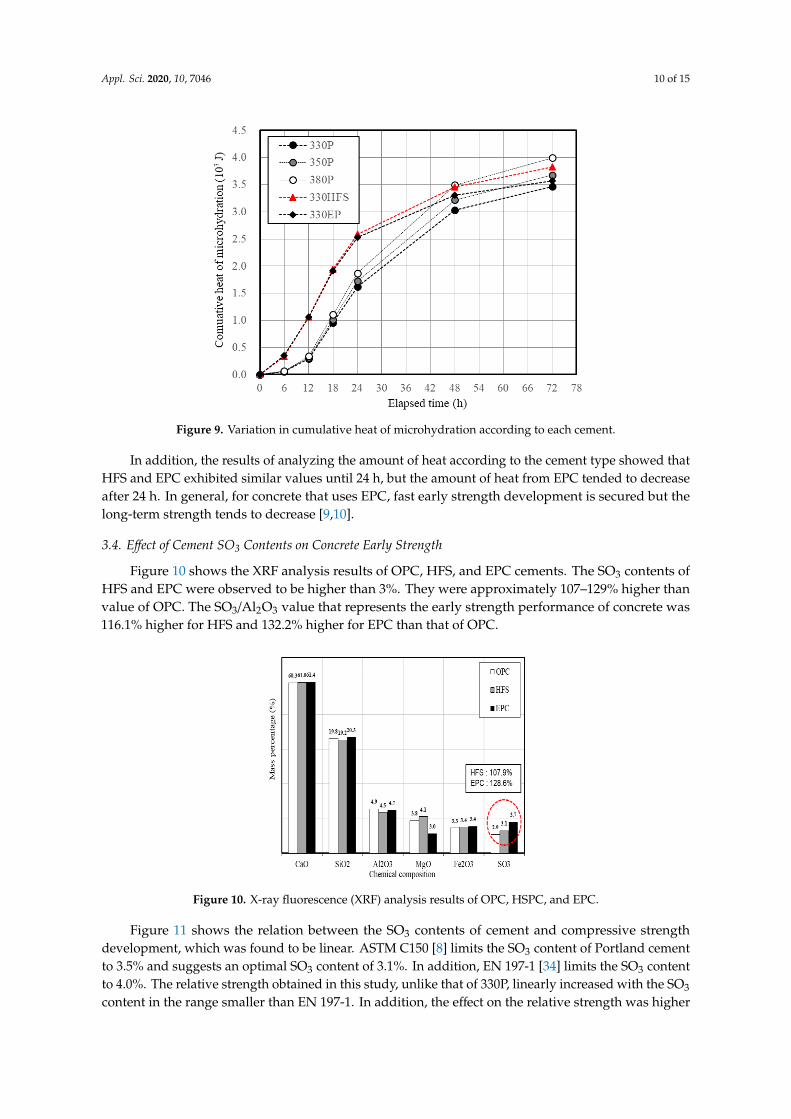
cumulative heat of microhydration for each cement type. The plot of the cumulative microhydrationheat of cement also shows that HFS and EPC exhibited values more than twice higher than those ofOPC from the point of contact with water. Based on this, the total amount of heat of each mixture canbe calculated according to the unit weight of cement.
Appl. Sci. 2020, 10, x FOR PEER REVIEW 9 of 15
This difference in fineness is significantly related to the hydration reaction of cement. Figure 7
shows the variation in heat of microhydration with elapsed time for each cement type. HFS and EPC
had higher microhydration heat values than OPC at early ages less than 24 h. Figure 8 shows the
cumulative heat of microhydration for each cement type. The plot of the cumulative microhydration
heat of cement also shows that HFS and EPC exhibited values more than twice higher than those of
OPC from the point of contact with water. Based on this, the total amount of heat of each mixture can
be calculated according to the unit weight of cement.
Figure 7. Heat of microhydration according to elapsed time for each cement type.
Figure 8. Cumulative microhydration heat according to the cement type.
There was no significant difference in the total amount of heat according to the unit weight of
cement within 24 h, which was also related to the maturity and compressive strength results (see
Figure 4a). In addition, after 24 h, the amount of heat significantly increased as the unit weight of
cement increased, indicating that the unit weight of cement affects the concrete strength. Figure 9
shows the variation in the cumulative microhydration heat according to the cement type.
Figure 7. Heat of microhydration according to elapsed time for each cement type.
Appl. Sci. 2020, 10, x FOR PEER REVIEW 9 of 15
This difference in fineness is significantly related to the hydration reaction of cement. Figure 7
shows the variation in heat of microhydration with elapsed time for each cement type. HFS and EPC
had higher microhydration heat values than OPC at early ages less than 24 h. Figure 8 shows the
cumulative heat of microhydration for each cement type. The plot of the cumulative microhydration
heat of cement also shows that HFS and EPC exhibited values more than twice higher than those of
OPC from the point of contact with water. Based on this, the total amount of heat of each mixture can
be calculated according to the unit weight of cement.
Figure 7. Heat of microhydration according to elapsed time for each cement type.
Figure 8. Cumulative microhydration heat according to the cement type.
There was no significant difference in the total amount of heat according to the unit weight of
cement within 24 h, which was also related to the maturity and compressive strength results (see
Figure 4a). In addition, after 24 h, the amount of heat significantly increased as the unit weight of
cement increased, indicating that the unit weight of cement affects the concrete strength. Figure 9
shows the variation in the cumulative microhydration heat according to the cement type.
Figure 8. Cumulative microhydration heat according to the cement type.
There was no significant difference in the total amount of heat according to the unit weight ofcement within 24 h, which was also related to the maturity and compressive strength results (seeFigure 4a). In addition, after 24 h, the amount of heat significantly increased as the unit weight ofcement increased, indicating that the unit weight of cement affects the concrete strength. Figure 9shows the variation in the cumulative microhydration heat according to the cement type.
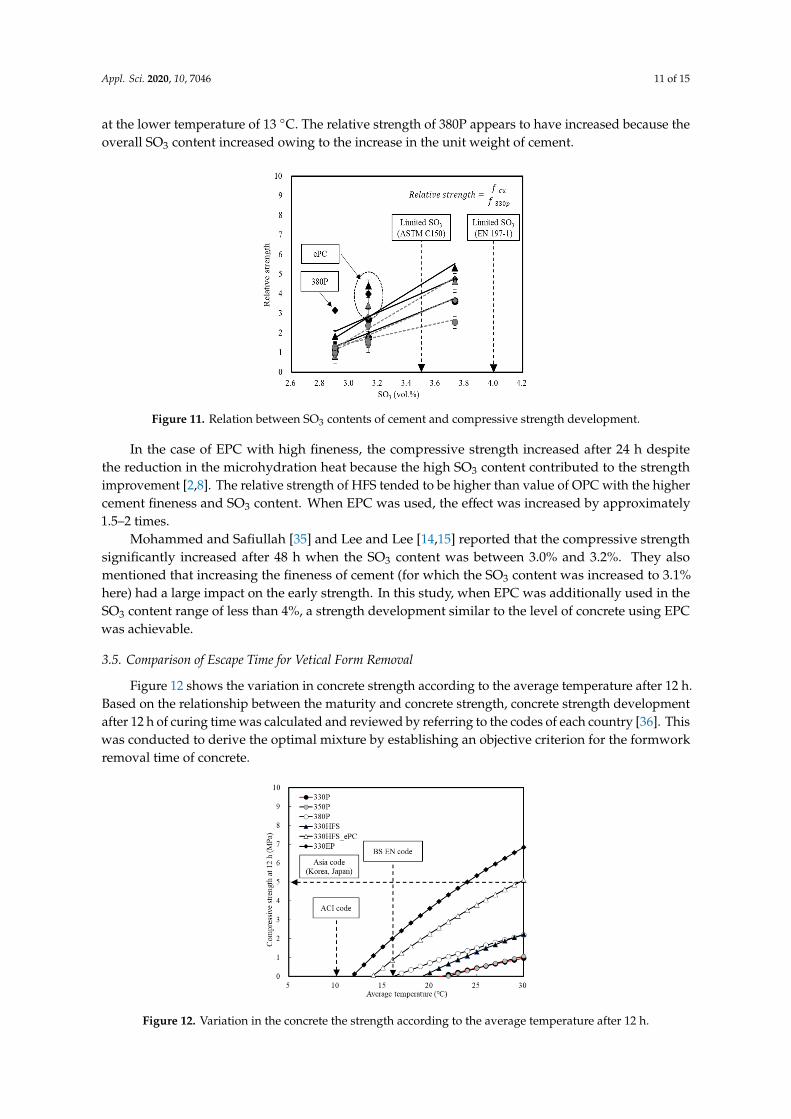
Appl. Sci. 2020, 10, 7046 10 of 15Appl. Sci. 2020, 10, x FOR PEER REVIEW 10 of 15
Figure 9. Variation in cumulative heat of microhydration according to each cement.
In addition, the results of analyzing the amount of heat according to the cement type showed
that HFS and EPC exhibited similar values until 24 h, but the amount of heat from EPC tended to
decrease after 24 h. In general, for concrete that uses EPC, fast early strength development is secured
but the long-term strength tends to decrease [9,10].
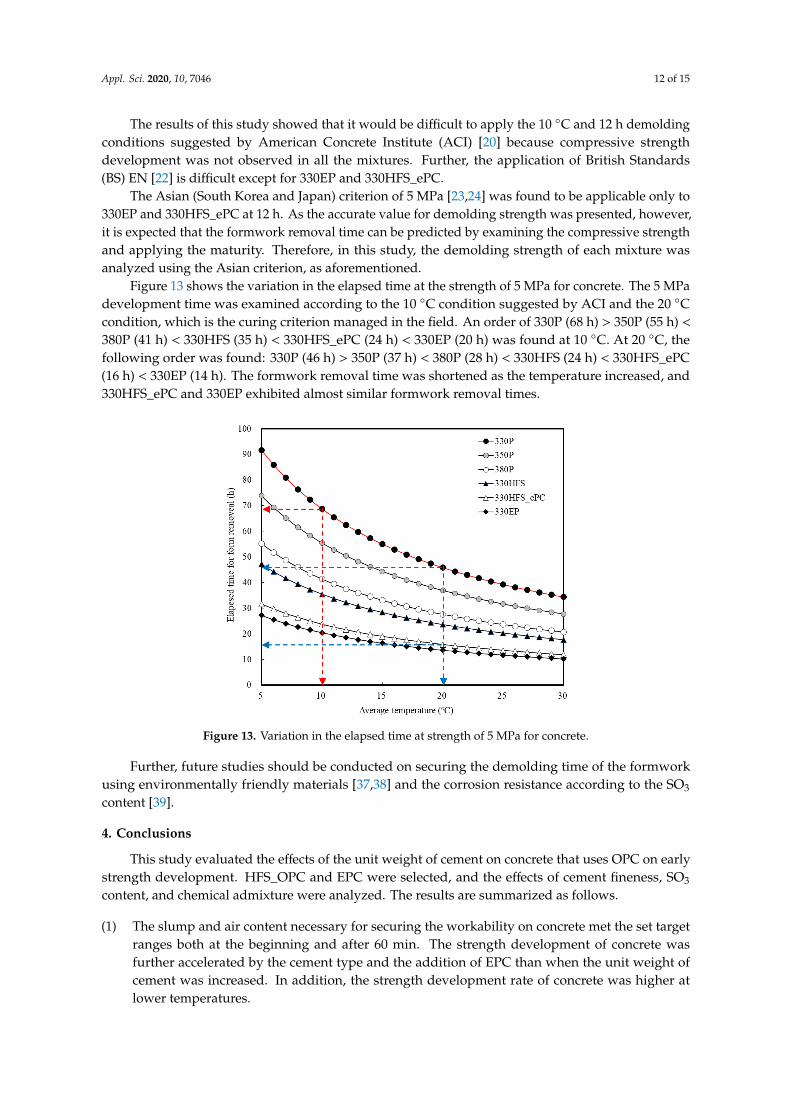
3.4. Effect of Cement SO3 Contents on Concrete Early Strength
Figure 10 shows the XRF analysis results of OPC, HFS, and EPC cements. The SO3 contents of
HFS and EPC were observed to be higher than 3%. They were approximately 107–129% higher than
value of OPC. The SO3/Al2O3 value that represents the early strength performance of concrete was
116.1% higher for HFS and 132.2% higher for EPC than that of OPC.
Figure 10. X-ray fluorescence (XRF) analysis results of OPC, HSPC, and EPC.
Figure 11 shows the relation between the SO3 contents of cement and compressive strength
development, which was found to be linear. ASTM C150 [8] limits the SO3 content of Portland cement
to 3.5% and suggests an optimal SO3 content of 3.1%. In addition, EN 197-1 [34] limits the SO3 content
to 4.0%. The relative strength obtained in this study, unlike that of 330P, linearly increased with the
SO3 content in the range smaller than EN 197-1. In addition, the effect on the relative strength was
Figure 9. Variation in cumulative heat of microhydration according to each cement.
In addition, the results of analyzing the amount of heat according to the cement type showed thatHFS and EPC exhibited similar values until 24 h, but the amount of heat from EPC tended to decreaseafter 24 h. In general, for concrete that uses EPC, fast early strength development is secured but thelong-term strength tends to decrease [9,10].
3.4. Effect of Cement SO3 Contents on Concrete Early Strength
Figure 10 shows the XRF analysis results of OPC, HFS, and EPC cements. The SO3 contents ofHFS and EPC were observed to be higher than 3%. They were approximately 107–129% higher thanvalue of OPC. The SO3/Al2O3 value that represents the early strength performance of concrete was116.1% higher for HFS and 132.2% higher for EPC than that of OPC.
Appl. Sci. 2020, 10, x FOR PEER REVIEW 10 of 15
Figure 9. Variation in cumulative heat of microhydration according to each cement.
In addition, the results of analyzing the amount of heat according to the cement type showed
that HFS and EPC exhibited similar values until 24 h, but the amount of heat from EPC tended to
decrease after 24 h. In general, for concrete that uses EPC, fast early strength development is secured
but the long-term strength tends to decrease [9,10].
3.4. Effect of Cement SO3 Contents on Concrete Early Strength
Figure 10 shows the XRF analysis results of OPC, HFS, and EPC cements. The SO3 contents of
HFS and EPC were observed to be higher than 3%. They were approximately 107–129% higher than
value of OPC. The SO3/Al2O3 value that represents the early strength performance of concrete was
116.1% higher for HFS and 132.2% higher for EPC than that of OPC.
Figure 10. X-ray fluorescence (XRF) analysis results of OPC, HSPC, and EPC.
Figure 11 shows the relation between the SO3 contents of cement and compressive strength
development, which was found to be linear. ASTM C150 [8] limits the SO3 content of Portland cement
to 3.5% and suggests an optimal SO3 content of 3.1%. In addition, EN 197-1 [34] limits the SO3 content
to 4.0%. The relative strength obtained in this study, unlike that of 330P, linearly increased with the
SO3 content in the range smaller than EN 197-1. In addition, the effect on the relative strength was
Figure 10. X-ray fluorescence (XRF) analysis results of OPC, HSPC, and EPC.
Figure 11 shows the relation between the SO3 contents of cement and compressive strengthdevelopment, which was found to be linear. ASTM C150 [8] limits the SO3 content of Portland cementto 3.5% and suggests an optimal SO3 content of 3.1%. In addition, EN 197-1 [34] limits the SO3 contentto 4.0%. The relative strength obtained in this study, unlike that of 330P, linearly increased with the SO3
content in the range smaller than EN 197-1. In addition, the effect on the relative strength was higher
Appl. Sci. 2020, 10, 7046 11 of 15
at the lower temperature of 13 ◦C. The relative strength of 380P appears to have increased because theoverall SO3 content increased owing to the increase in the unit weight of cement.
Appl. Sci. 2020, 10, x FOR PEER REVIEW 11 of 15
higher at the lower temperature of 13 °C. The relative strength of 380P appears to have increased
because the overall SO3 content increased owing to the increase in the unit weight of cement.
Figure 11. Relation between SO3 contents of cement and compressive strength development.
In the case of EPC with high fineness, the compressive strength increased after 24 h despite the
reduction in the microhydration heat because the high SO3 content contributed to the strength
improvement [2,8]. The relative strength of HFS tended to be higher than value of OPC with the
higher cement fineness and SO3 content. When EPC was used, the effect was increased by
approximately 1.5–2 times.
Mohammed and Safiullah [35] and Lee and Lee [14,15] reported that the compressive strength
significantly increased after 48 h when the SO3 content was between 3.0% and 3.2%. They also
mentioned that increasing the fineness of cement (for which the SO3 content was increased to 3.1%
here) had a large impact on the early strength. In this study, when EPC was additionally used in the
SO3 content range of less than 4%, a strength development similar to the level of concrete using EPC
was achievable.
3.5. Comparison of Escape Time for Vetical Form Removal
Figure 12 shows the variation in concrete strength according to the average temperature after 12
h. Based on the relationship between the maturity and concrete strength, concrete strength
development after 12 h of curing time was calculated and reviewed by referring to the codes of each
country [36]. This was conducted to derive the optimal mixture by establishing an objective criterion
for the formwork removal time of concrete.
Figure 12. Variation in the concrete the strength according to the average temperature after 12 h.
Figure 11. Relation between SO3 contents of cement and compressive strength development.
In the case of EPC with high fineness, the compressive strength increased after 24 h despitethe reduction in the microhydration heat because the high SO3 content contributed to the strengthimprovement [2,8]. The relative strength of HFS tended to be higher than value of OPC with the highercement fineness and SO3 content. When EPC was used, the effect was increased by approximately1.5–2 times.
Mohammed and Safiullah [35] and Lee and Lee [14,15] reported that the compressive strengthsignificantly increased after 48 h when the SO3 content was between 3.0% and 3.2%. They alsomentioned that increasing the fineness of cement (for which the SO3 content was increased to 3.1%here) had a large impact on the early strength. In this study, when EPC was additionally used in theSO3 content range of less than 4%, a strength development similar to the level of concrete using EPCwas achievable.
3.5. Comparison of Escape Time for Vetical Form Removal
Figure 12 shows the variation in concrete strength according to the average temperature after 12 h.Based on the relationship between the maturity and concrete strength, concrete strength developmentafter 12 h of curing time was calculated and reviewed by referring to the codes of each country [36]. Thiswas conducted to derive the optimal mixture by establishing an objective criterion for the formworkremoval time of concrete.
Appl. Sci. 2020, 10, x FOR PEER REVIEW 11 of 15
higher at the lower temperature of 13 °C. The relative strength of 380P appears to have increased
because the overall SO3 content increased owing to the increase in the unit weight of cement.
Figure 11. Relation between SO3 contents of cement and compressive strength development.
In the case of EPC with high fineness, the compressive strength increased after 24 h despite the
reduction in the microhydration heat because the high SO3 content contributed to the strength
improvement [2,8]. The relative strength of HFS tended to be higher than value of OPC with the
higher cement fineness and SO3 content. When EPC was used, the effect was increased by
approximately 1.5–2 times.
Mohammed and Safiullah [35] and Lee and Lee [14,15] reported that the compressive strength
significantly increased after 48 h when the SO3 content was between 3.0% and 3.2%. They also
mentioned that increasing the fineness of cement (for which the SO3 content was increased to 3.1%
here) had a large impact on the early strength. In this study, when EPC was additionally used in the
SO3 content range of less than 4%, a strength development similar to the level of concrete using EPC
was achievable.
3.5. Comparison of Escape Time for Vetical Form Removal
Figure 12 shows the variation in concrete strength according to the average temperature after 12
h. Based on the relationship between the maturity and concrete strength, concrete strength
development after 12 h of curing time was calculated and reviewed by referring to the codes of each
country [36]. This was conducted to derive the optimal mixture by establishing an objective criterion
for the formwork removal time of concrete.
Figure 12. Variation in the concrete the strength according to the average temperature after 12 h. Figure 12. Variation in the concrete the strength according to the average temperature after 12 h.
Appl. Sci. 2020, 10, 7046 12 of 15
The results of this study showed that it would be difficult to apply the 10 ◦C and 12 h demoldingconditions suggested by American Concrete Institute (ACI) [20] because compressive strengthdevelopment was not observed in all the mixtures. Further, the application of British Standards(BS) EN [22] is difficult except for 330EP and 330HFS_ePC.
The Asian (South Korea and Japan) criterion of 5 MPa [23,24] was found to be applicable only to330EP and 330HFS_ePC at 12 h. As the accurate value for demolding strength was presented, however,it is expected that the formwork removal time can be predicted by examining the compressive strengthand applying the maturity. Therefore, in this study, the demolding strength of each mixture wasanalyzed using the Asian criterion, as aforementioned.
Figure 13 shows the variation in the elapsed time at the strength of 5 MPa for concrete. The 5 MPadevelopment time was examined according to the 10 ◦C condition suggested by ACI and the 20 ◦Ccondition, which is the curing criterion managed in the field. An order of 330P (68 h) > 350P (55 h) <
380P (41 h) < 330HFS (35 h) < 330HFS_ePC (24 h) < 330EP (20 h) was found at 10 ◦C. At 20 ◦C, thefollowing order was found: 330P (46 h) > 350P (37 h) < 380P (28 h) < 330HFS (24 h) < 330HFS_ePC(16 h) < 330EP (14 h). The formwork removal time was shortened as the temperature increased, and330HFS_ePC and 330EP exhibited almost similar formwork removal times.
Appl. Sci. 2020, 10, x FOR PEER REVIEW 12 of 15
The results of this study showed that it would be difficult to apply the 10 °C and 12 h demolding
conditions suggested by American Concrete Institute (ACI) [20] because compressive strength
development was not observed in all the mixtures. Further, the application of British Standards (BS)
EN [22] is difficult except for 330EP and 330HFS_ePC.
The Asian (South Korea and Japan) criterion of 5 MPa [23,24] was found to be applicable only to
330EP and 330HFS_ePC at 12 h. As the accurate value for demolding strength was presented,
however, it is expected that the formwork removal time can be predicted by examining the
compressive strength and applying the maturity. Therefore, in this study, the demolding strength of
each mixture was analyzed using the Asian criterion, as aforementioned.
Figure 13 shows the variation in the elapsed time at the strength of 5 MPa for concrete. The 5
MPa development time was examined according to the 10 °C condition suggested by ACI and the
20° C condition, which is the curing criterion managed in the field. An order of 330P (68 h) > 350P (55
h) < 380P (41 h) < 330HFS (35 h) < 330HFS_ePC (24 h) < 330EP (20 h) was found at 10 °C. At 20 °C, the
following order was found: 330P (46 h) > 350P (37 h) < 380P (28 h) < 330HFS (24 h) < 330HFS_ePC (16
h) < 330EP (14 h). The formwork removal time was shortened as the temperature increased, and
330HFS_ePC and 330EP exhibited almost similar formwork removal times.
Figure 13. Variation in the elapsed time at strength of 5 MPa for concrete.
Further, future studies should be conducted on securing the demolding time of the formwork
using environmentally friendly materials [37,38] and the corrosion resistance according to the SO3
content [39].
4. Conclusions
This study evaluated the effects of the unit weight of cement on concrete that uses OPC on early
strength development. HFS_OPC and EPC were selected, and the effects of cement fineness, SO3
content, and chemical admixture were analyzed. The results are summarized as follows.
(1) The slump and air content necessary for securing the workability on concrete met the set target
ranges both at the beginning and after 60 min. The strength development of concrete was further
accelerated by the cement type and the addition of EPC than when the unit weight of cement
was increased. In addition, the strength development rate of concrete was higher at lower
temperatures.
Figure 13. Variation in the elapsed time at strength of 5 MPa for concrete.
Further, future studies should be conducted on securing the demolding time of the formworkusing environmentally friendly materials [37,38] and the corrosion resistance according to the SO3
content [39].
4. Conclusions
This study evaluated the effects of the unit weight of cement on concrete that uses OPC on earlystrength development. HFS_OPC and EPC were selected, and the effects of cement fineness, SO3
content, and chemical admixture were analyzed. The results are summarized as follows.
(1) The slump and air content necessary for securing the workability on concrete met the set targetranges both at the beginning and after 60 min. The strength development of concrete wasfurther accelerated by the cement type and the addition of EPC than when the unit weight ofcement was increased. In addition, the strength development rate of concrete was higher atlower temperatures.
Appl. Sci. 2020, 10, 7046 13 of 15
(2) For the maturity of concrete, the strength development tended to increase according to thematurity. This is because the unit weight of cement increased for the concrete mixtures that usedOPC. The effect, however, was not significant when the HFS_OPC and EPC were used.
(3) When the amount of heat of each mixture was calculated based on the microhydration heatresults of cement, no significant differences were found in the total amount of heat within 24 hdepending on the unit weight of cement. In addition, analyzing the results of the amount of heatfor each cement type showed that HFS and EPC exhibited significantly high values compared toOPC until 24 h, indicating that they are favorable for the development of early strength.
(4) The relation between concrete strength and the cement fineness showed that the compressivestrength tended to increase with the fineness of cement, and an optimal fineness between4300 m2/kg and 4500 m2/kg was obtained. The microhydration heat was found to be higherwhen the fineness of cement was high than when the unit weight of cement was increased. Theresults of analyzing the amount of heat for each cement type showed that HFS and EPC exhibitedsignificantly higher values compared with OPC up to 24 h. Thus, they are expected to be favorablefor early strength development.
(5) A linear relationship was observed between the SO3 content and relative strength of cement whenSO3 content was less than 4%. In addition, when the unit weight of cement was increased, theearly strength was slightly increased owing to the increase in overall SO3 content.
(6) The criterion of each country for the formwork removal time on concrete were examined andapplying the Asian criterion was judged to be effective, which presents a clear compressivestrength of 5 MPa. The use of EPC and HFS_ePC can shorten the formwork removal time by20–24 h at 10 ◦C and by 14–16 h at 20 ◦C.
Author Contributions: Conceptualization, T.L., J.L., and H.C.; methodology, T.L., J.L., and H.C.; investigation,T.L., J.L., J.K., H.C. and D.-E.L.; resources, T.L. and J.L.; writing—original draft preparation, T.L. and J.L.;writing—review and editing, T.L., J.L., J.K., H.C and D.-E.L. All authors have read and agreed to the publishedversion of the manuscript.
Funding: This research was supported by the National Research Foundation of Korea (NRF) grant funded by theKorea government (MSIT), grant number NRF-2018R1A5A1025137.
Conflicts of Interest: The authors declare no conflict of interest.
References
1. Barnes, P.; Bensted, J. Structure and Performance of Cements, 2nd ed.; CRC Press: London, UK, 2002. [CrossRef]2. Mehta, P.; Monteiro, P. Concrete: Microstructure, Properties, and Materials, 3rd ed.; McGraw-Hill: New York,
NY, USA, 2006.3. Scrivener, K.L.; Nonat, A. Hydration of cementitious materials, present and future. Cem. Concr. Res. 2011, 41,
651–665. [CrossRef]4. Juilland, K.; Monteiro, P. Advances in understanding hydration of Portland cement. Cem. Concr. Res. 2015,
78, 38–56. [CrossRef]5. Abrams, D. Design of Concrete Mixtures, Structural Materials Research Laboratory; Bulletin No. 1, PCA LS001;
Lewis Institute: Chicago, IL, USA, 1919.6. Cheung, J.; Jeknavorian, A.; Roberts, L.; Silva, D. Impact of admixtures on the hydration kinetics of Portland
cement. Cem. Concr. Res. 2011, 41, 1289–1309. [CrossRef]7. Bentz, D.P.; Peltz, M.; Winpigler, J. Early-age properties of cement-based materials: II. Influence of
water-to-cement ratio. ASCE J. Mat. Civ. Eng. 2009, 1–14. [CrossRef]8. ASTM C150. Standard specification for Portland cement. In American Society of Testing and Materials; ASTM:
West Conshohocken, PA, USA, 2019; pp. 1–10.9. Bentz, D.P. Blending different fineness cements to engineer the properties of cement-based materials. Mag.
Concr. Res. 2010, 62, 327–338. [CrossRef]10. Bentz, D.P.; Haecker, C.J. An argument for using coarse cements in high-performance concretes. Cem. Concr.
Res. 1999, 29, 615–618. [CrossRef]
Appl. Sci. 2020, 10, 7046 14 of 15
11. Bentz, D.P.; Garboczi, E.J.; Haecker, C.J.; Jensen, O.M. Effects of cement particle size distribution onperformance properties of Portland cement-based materials. Cem. Concr. Res. 1999, 29, 1663–1671. [CrossRef]
12. Frigione, G.; Marra, S. Relationship between particle size distribution and compressive strength in Portlandcement. Cem. Concr. Res. 1976, 6, 113–127. [CrossRef]
13. Osbaeck, B.; Johansen, V. Particle size distribution and rate of strength development of Portland cement. J.Am. Ceram. Soc. 1989, 72, 197–201. [CrossRef]
14. Lee, J.; Lee, T. Influences of chemical composition and fineness on the development of concrete strength bycuring conditions. Materials 2019, 12, 4061. [CrossRef] [PubMed]
15. Lee, J.; Lee, T. Effects of high CaO fly ash and sulfate activator as a finer binder for cementless groutingmaterial. Materials 2019, 12, 3664. [CrossRef] [PubMed]
16. Rixon, R.; Mailvaganam, N. Chemical Admixtures for Concrete, 3rd ed.; E & FN Spon: London, UK, 1999.[CrossRef]
17. Heren, Z.; Ölmez, H. The influence of ethanolamines on the hydration and mechanical properties of Portlandcement. Cem. Concr. Res. 1996, 26, 701–705. [CrossRef]
18. Aiad, I.; Mohammed, A.A.; Abo-El-Enein, S.A. Rheological properties of cement pastes admixed with somealkanolamines. Cem. Concr. Res. 2003, 33, 9–13. [CrossRef]
19. Aggoun, S.; Cheikh-Zouaoui, M.; Chikh, N.; Duval, R. Effect of some admixtures on the setting time andstrength evolution of cement pastes at early ages. Constr. Build. Mater. 2008, 22, 106–110. [CrossRef]
20. ACI 347-04. Guide to Formwork for Concrete; ACI 347; ACI Committee: Farmington Hills, MI, USA, 2005.21. Ceb-Fip Model code 1990, 1993: Design Code; Telford: London, UK, 1993. [CrossRef]22. BS EN 13670:2009. Execution of Concrete Structures; BSI: London, UK, 2010.23. KASS 5. Korea Architectural Standard Specification Reinforced Concrete Work; Architectural Institute of Korea:
Seoul, Korea, 2009.24. JASS 5. Japanese Architectural Standard Specification Reinforced Concrete Work; Architectural Institute of Japan:
Tokyo, Japan, 2009.25. Lee, T.; Lee, J.; Kim, Y. Effects of admixtures and accelerators on the development of concrete strength for
horizontal form removal upon curing at 10 ◦C. Constr. Build. Mater. 2020, 37, 1–7. [CrossRef]26. ASTM C204. Standard test methods for fineness of hydraulic cement by air-permeability apparatus. In
American Society of Testing and Materials; ASTM: West Conshohocken, PA, USA, 2018; pp. 1–11.27. ASTM C114-18. Standard test methods for chemical analysis of hydraulic cement. In American Society of
Testing and Materials; ASTM: West Conshohocken, PA, USA, 2018; pp. 1–33.28. ASTM C1702. Standard test method for measurement of heat of hydration of hydraulic cementitious
materials using isothermal conduction calorimetry. In American Society of Testing and Materials; ASTM: WestConshohocken, PA, USA, 2015; pp. 1–9. [CrossRef]
29. ASTM C143/C143M REV A. Standard test method for slump of hydraulic-cement concrete. In AmericanSociety of Testing and Materials; ASTM: West Conshohocken, PA, USA, 2015; pp. 1–4.
30. ASTM C231/C231M-17a. Standard test method for air content of freshly mixed concrete by the pressuremethod. In American Society of Testing and Materials; ASTM: West Conshohocken, PA, USA, 2017; pp. 1–10.
31. ASTM C873/C873M. Standard test method for compressive strength of concrete cylinders cast in place incylindrical molds. In American Society of Testing and Materials; ASTM: West Conshohocken, PA, USA, 2015;pp. 1–4. [CrossRef]
32. ASTM C39/C39M. Standard test method for compressive strength of cylindrical concrete specimens. InAmerican Society of Testing and Materials; ASTM: West Conshohocken, PA, USA, 2018; pp. 1–8.
33. ASTM C1074. Standard practice for estimating concrete strength by the maturity method. In American Societyof Testing and Materials; ASTM: West Conshohocken, PA, USA, 2019; pp. 1–10.
34. BS EN 197-1. Cement Part 1: Composition, Specifications and Conformity Criteria for Common; BSI: London,UK, 2011.
35. Mohammed, S.; Safiullah, O. Optimization of the SO3 content of an Algerian Portland cement: Study onthe effect of various amounts of gypsum on cement properties. Constr. Build. Mater. 2018, 164, 362–370.[CrossRef]
36. Benaicha, M.; Burtschell, Y.; Alaoui, A. Prediction of compressive strength at early age ofconcrete—Application of maturity. J. Build. Eng. 2016, 6, 119–125. [CrossRef]

Appl. Sci. 2020, 10, 7046 15 of 15
37. Pomares, J.C.; Gonzalez, A.; Saura, P. Simple and Resistant Construction Built with Concrete Voussoirs forDeveloping Countries. J. Constr. Eng. Manag. 2018, 144. [CrossRef]
38. Bautista, A.; Pomares, J.C.; González, M.N.; Velasco, F. Influence of the microstructure of TMT reinforcingbars on their corrosion behavior in concrete with chlorides. Constr. Build. Mater. 2019, 229, 116899. [CrossRef]
39. Małek, M.; Jackowski, M.; Łasica, W.; Kadela, M. Characteristics of Recycled Polypropylene Fibers as anAddition to Concrete Fabrication Based on Portland Cement. Materials 2020, 13, 1827. [CrossRef] [PubMed]
© 2020 by the authors. Licensee MDPI, Basel, Switzerland. This article is an open accessarticle distributed under the terms and conditions of the Creative Commons Attribution(CC BY) license (http://creativecommons.org/licenses/by/4.0/).