Embed Size (px)
Citation preview

Materialia 14 (2020) 100854
Contents lists available at ScienceDirect
Materialia
journal homepage: www.elsevier.com/locate/mtla
Full Length Article
Effect of cold rolling on phase separation in 2202 lean duplex stainless steel
S. Cazottes a , ∗ , V. Massardier a , R. Danoix
c , D. Rolland
a , S. Cisséb , F. Danoix
c
a Univ Lyon, CNRS, INSA-Lyon, MATEIS UMR5510, F-69621 Villeurbanne, France b INDUSTEEL, 56 rue Clémenceau Le Creusot, 72100, France c Normandie University, UNIROUEN, INSA Rouen, CNRS, Groupe de Physique des Matériaux, F-76000 Rouen, France
a r t i c l e i n f o
Keywords:
Lean duplex stainless steels Ferrite decomposition Cold rolling Atom probe tomography Thermoelectric power
a b s t r a c t
The effect of plastic deformation (cold rolling) on the thermal aging of a lean 2202 duplex stainless steel at intermediate temperatures (280 °C–450 °C) was studied using a combination of atom probe tomography and thermoelectric power measurements. In the undeformed condition, spinodal decomposition of ferrite was shown to be the prime aging process with an activation energy of 206 kJ/mol. Plastic deformation enhanced the aging and the austenite partly transformed into martensite. When no precipitation or phase transformation was observed in austenite, both ferrite and martensite decomposed. The spinodal decomposition kinetics of ferrite increased with increasing deformation rate. The FeCr-rich martensite also decomposed at 450 °C, via a nucleation and growth process, owing to a decrease of the Cr content in the matrix. Chromium nitrides, G-Phase, and Cu-rich precipitates were observed in the decomposed martensite.
1
t
s
a
g
s
r
a
t
[
t
p
a
t
i
n
s
m
i
w
ai
e
a
m
p
a
i
p
t
t
b
c
C
o
t
o
4
7
s
m
o
t
t
hRA2
. Introduction
Lean duplex stainless steels (DSSs) were developed in the late 1990so have a cheaper option of materials with similar mechanical corro-ion properties to counterpart standard austenitic stainless steels (suchs AISI 304 or 316) [ 1 , 2 ]. So, lean grades can often replace common 30xrades of the austenitic stainless steel family while the higher-alloyedtandard grade of duplex stainless steel, namely 2205, was designed toeplace grade 316 austenitic stainless steel. They contain lower Ni, Mo,nd Cr contents than the 2205 standard DSS but higher Mn and N con-ents to maintain a ferrite/austenite ratio close to one.
The ferritic phase in lean DSSs contains approximately 24 at% Cr3] and undergoes ferrite decomposition for aging temperatures be-ween room temperature (RT) and 500 °C [4] . This well-documentedhenomenon [5–10] is responsible for the embrittlement observed inged Fe–Cr and stainless steels that contain ferrite and martensite in thisemperature range . The initially homogeneous ferrite 1 decomposes intoron-rich alpha ( 𝛼) and chromium-rich alpha prime ( 𝛼’) domains at theanometric scale. Two mechanisms for this phase separation are pos-ible: a continuous mechanism (spinodal decomposition) or a discreteechanism (nucleation and growth, of 𝛼’ precipitates) [11] . To discrim-
nate between these mechanisms, the time evolution of the Cr contentavelength and amplitude must be tracked as a function of time in the
∗ Corresponding author. E-mail address: [email protected] (S. Cazottes).
1 In DSSs, the ferrite is called either delta or alpha ferrite. In this paper we use lpha as we are interested in intermediate temperature ageing, for which alpha s the commonly used terminology.
t
a
p
a
ttps://doi.org/10.1016/j.mtla.2020.100854 eceived 29 May 2020; Accepted 27 July 2020 vailable online 11 August 2020 589-1529/© 2020 Acta Materialia Inc. Published by Elsevier B.V. All rights reserve
arly stages, with spinodal decomposition showing t 0.15–0.20 behaviornd nucleation and growth showing t 0.33 behavior. However, from aicrostructural viewpoint, for most Cr contents, the spinodal decom-osition leads to an interconnected (or sponge-like) structure, forming continuous network of 𝛼’ zones whose Cr content increases with ag-ng time until reaching the equilibrium composition predicted by thehase diagram. The nucleation and growth mechanism occurs throughhe development of isolated particles of the same 𝛼’ phase, which isheoretically predicted to reach the equilibrium composition from theeginning. These morphological differences are commonly used to dis-riminate between the SD and NG mechanisms. However, even for lowr content, de-percolation of the 𝛼’ network can occur, and the morphol-gy of the spinodally decomposed domains can be visually very similaro that formed by the NG mechanism. For 2205 and 2003 DSSs, a spin-dal mechanism was reported for temperatures ranging from 250 °C to50 °C [ 4 , 12 , 13 ].
The decomposition rate in Fe–Cr alloys is well documented [ 5– , 9 , 10 ] and is affected by both the aging temperature and alloy compo-ition. Applied elastic stress is also known to affect the decompositionechanism [14] . Phase-field simulation has shown that the morphology
f the decomposed phases is dependent on the load direction relative tohe crystal direction [15] . Indeed, under applied stress, the 𝛼’ domainsend to align along elastic soft directions; therefore, the morphology ofhe decomposed structure is greatly affected by the amount of stressnd the strain orientation. Recent atom probe tomography (APT) ex-eriments revealed an increase in the kinetics of phase separation withpplied load in a 15–5 PH martensitic stainless steel aged at 450 °C
d.
S. Cazottes, V. Massardier and R. Danoix et al. Materialia 14 (2020) 100854
Table 1
Chemical composition of the studied duplex stainless steel.
Fe C Cr Ni Mn Mo N
wt% Bal. < 0.03 22–23.8 2–2.8 < 2 < 0.45 0.16–0.26
at% Bal. < 0.11 23–25 1.8–2.6 < 2 < 0.26 0.63–1.01
[
M
e
o
e
i
c
i
t
t
i
o
i
p
i
u
a
o
t
a
m
s
b
[
a
w
p
t
d
i
a
a
o
2
2
U
i
a
2
k
v
n
w
u
w
0
d
w
o
s
1
B
s
u
r
i
s
t
a
t
c
t
m
a
a
t
o
f
t
k
3
a
s
t
i
a
d
a
t
M
t
𝛼
t
t
p
c
c
t
a
t
t
p
2
o
n
0
3
3
D
o
4
s
t
r
b
s
a
a
16] . In that case, the phase separation occurred via a NG mechanism.oreover, the decomposition kinetics appeared to be affected by the ori-
ntation of the load relative to the crystal orientation; however, no clearrientation or elongation of the Cr-rich precipitates was observed. Zhout al. also reported an effect of strain on the phase separation kineticsn DSS welds [17] .
The phase separation observed in the Fe–Cr system leads to a signifi-ant loss of ductility and increase in hardness and yield strength, result-ng in embrittlement of the steel [18–21] . It is thus essential to charac-erize the decomposition kinetics of the ferrite to predict the evolution ofhe material properties under service conditions. The phase separationn DSSs has been shown to be faster than that in Fe–Cr binary systemsf the same Cr content [6] and therefore requires systematic character-zation [9] . In particular, the effect of the deformation on the decom-osition kinetics is not yet well documented for DSSs steels. Moreover,t is well known that in DSS steels, austenite transforms into martensitepon deformation [22] . This martensite contains around 15 wt% of Crnd is also prone to phase separation.
The aim of this paper is to study the effect of plastic deformationn the phase separation kinetics of ferrite in lean DSSs at intermediateemperature. First, the phase separation kinetics of a 2202 commerciallloy was followed using a global technique; thermoelectric power (TEP)easurements. Indeed, this global measurement technique is very sen-
itive to microstructural evolution in metallic material [23–25] and cane used to determine the activation energies responsible for demixion 4 , 26 ]. As this method requires data from three different temperatures,nd in order to cover the temperature range for which phase separationas observed, the samples were aged at 280 °C, 350 °C and 480 °C. Thehase separation products were then characterized using APT.
Secondly, the same alloy was then cold rolled to different deforma-ion levels (0, 30% and 50%) and subsequently aged at 450 °C. Largeifferences in deformation levels and a high temperature were chosenn order to maximize the phase separation phenomenon for a limitedgeing time. The kinetics of phase separation was also followed by TEP,nd the decomposition products were characterized by APT. The effectsf plastic deformation on the 𝛼–𝛼’ phase separation is discussed.
. Material and methods
.1. Material and thermal treatments
The as-received material was a 12-mm-thick hot-rolled sheet ofR2202 (S32202 × 2XrNiN22-2) lean DSS. The composition of the steel
s shown in Table 1 . The ferrite to austenite ratio of this commerciallloy in the as-received state was close to 1.
.2. Experimental procedure
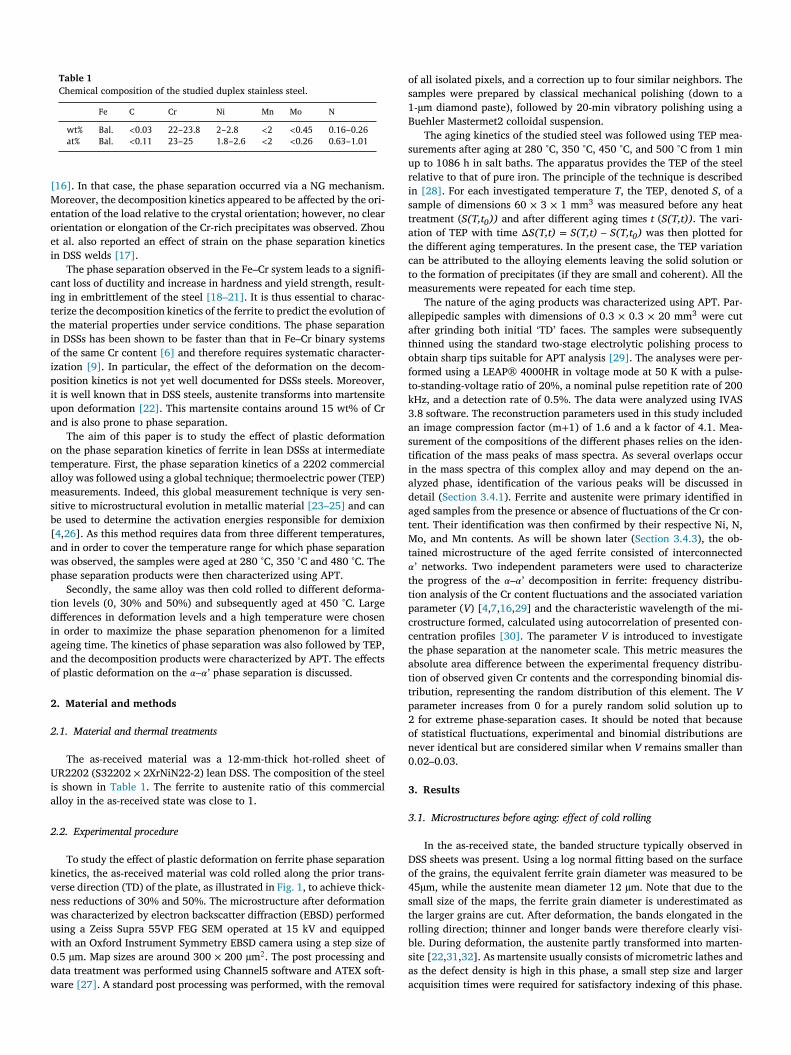
To study the effect of plastic deformation on ferrite phase separationinetics, the as-received material was cold rolled along the prior trans-erse direction (TD) of the plate, as illustrated in Fig. 1 , to achieve thick-ess reductions of 30% and 50%. The microstructure after deformationas characterized by electron backscatter diffraction (EBSD) performedsing a Zeiss Supra 55VP FEG SEM operated at 15 kV and equippedith an Oxford Instrument Symmetry EBSD camera using a step size of.5 μm. Map sizes are around 300 × 200 μm
2 . The post processing andata treatment was performed using Channel5 software and ATEX soft-are [27] . A standard post processing was performed, with the removal
f all isolated pixels, and a correction up to four similar neighbors. Theamples were prepared by classical mechanical polishing (down to a-μm diamond paste), followed by 20-min vibratory polishing using auehler Mastermet2 colloidal suspension.
The aging kinetics of the studied steel was followed using TEP mea-urements after aging at 280 °C, 350 °C, 450 °C, and 500 °C from 1 minp to 1086 h in salt baths. The apparatus provides the TEP of the steelelative to that of pure iron. The principle of the technique is describedn [28] . For each investigated temperature T , the TEP, denoted S , of aample of dimensions 60 × 3 × 1 mm
3 was measured before any heatreatment ( S(T,t 0 )) and after different aging times t ( S(T,t)) . The vari-tion of TEP with time ΔS(T,t) = S(T,t) – S(T,t 0 ) was then plotted forhe different aging temperatures. In the present case, the TEP variationan be attributed to the alloying elements leaving the solid solution oro the formation of precipitates (if they are small and coherent). All theeasurements were repeated for each time step.
The nature of the aging products was characterized using APT. Par-llepipedic samples with dimensions of 0.3 × 0.3 × 20 mm
3 were cutfter grinding both initial ‘TD’ faces. The samples were subsequentlyhinned using the standard two-stage electrolytic polishing process tobtain sharp tips suitable for APT analysis [29] . The analyses were per-ormed using a LEAP® 4000HR in voltage mode at 50 K with a pulse-o-standing-voltage ratio of 20%, a nominal pulse repetition rate of 200Hz, and a detection rate of 0.5%. The data were analyzed using IVAS.8 software. The reconstruction parameters used in this study includedn image compression factor (m + 1) of 1.6 and a k factor of 4.1. Mea-urement of the compositions of the different phases relies on the iden-ification of the mass peaks of mass spectra. As several overlaps occurn the mass spectra of this complex alloy and may depend on the an-lyzed phase, identification of the various peaks will be discussed inetail ( Section 3.4.1 ). Ferrite and austenite were primary identified inged samples from the presence or absence of fluctuations of the Cr con-ent. Their identification was then confirmed by their respective Ni, N,o, and Mn contents. As will be shown later ( Section 3.4.3 ), the ob-
ained microstructure of the aged ferrite consisted of interconnected’ networks. Two independent parameters were used to characterizehe progress of the 𝛼–𝛼’ decomposition in ferrite: frequency distribu-ion analysis of the Cr content fluctuations and the associated variationarameter ( V ) [ 4 , 7 , 16 , 29 ] and the characteristic wavelength of the mi-rostructure formed, calculated using autocorrelation of presented con-entration profiles [30] . The parameter V is introduced to investigatehe phase separation at the nanometer scale. This metric measures thebsolute area difference between the experimental frequency distribu-ion of observed given Cr contents and the corresponding binomial dis-ribution, representing the random distribution of this element. The Varameter increases from 0 for a purely random solid solution up to for extreme phase-separation cases. It should be noted that becausef statistical fluctuations, experimental and binomial distributions areever identical but are considered similar when V remains smaller than.02–0.03.
. Results
.1. Microstructures before aging: effect of cold rolling
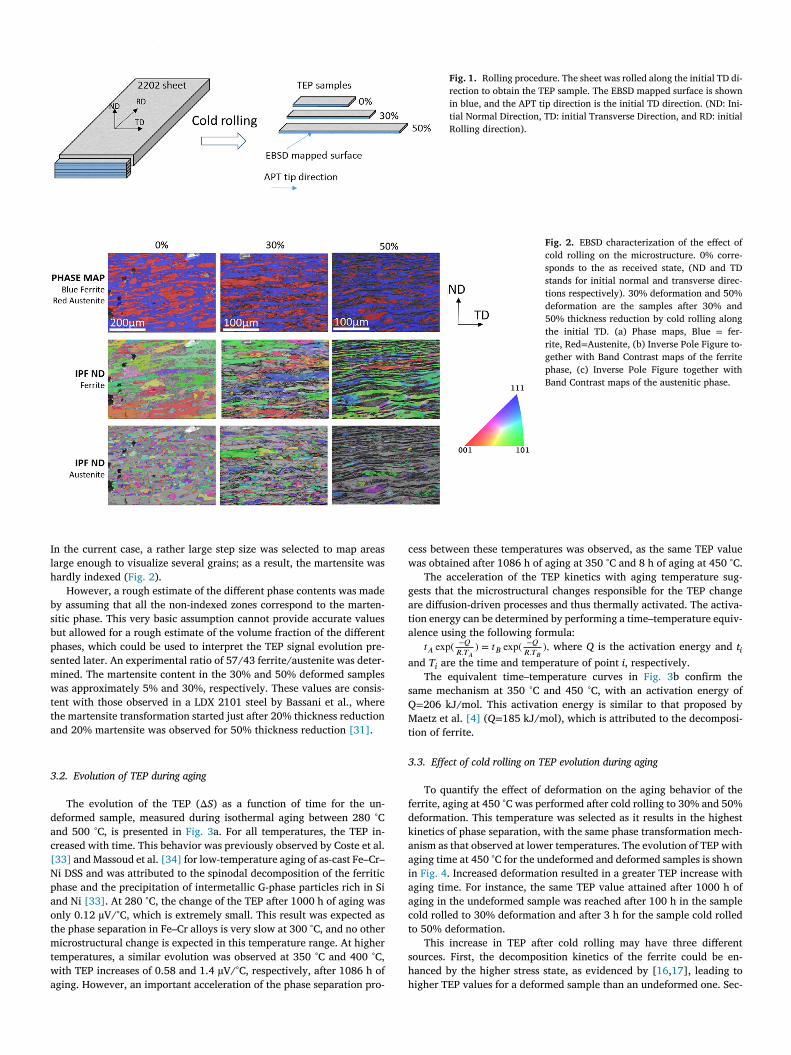
In the as-received state, the banded structure typically observed inSS sheets was present. Using a log normal fitting based on the surfacef the grains, the equivalent ferrite grain diameter was measured to be5μm, while the austenite mean diameter 12 μm. Note that due to themall size of the maps, the ferrite grain diameter is underestimated ashe larger grains are cut. After deformation, the bands elongated in theolling direction; thinner and longer bands were therefore clearly visi-le. During deformation, the austenite partly transformed into marten-ite [ 22 , 31 , 32 ]. As martensite usually consists of micrometric lathes ands the defect density is high in this phase, a small step size and largercquisition times were required for satisfactory indexing of this phase.
S. Cazottes, V. Massardier and R. Danoix et al. Materialia 14 (2020) 100854
Fig. 1. Rolling procedure. The sheet was rolled along the initial TD di- rection to obtain the TEP sample. The EBSD mapped surface is shown in blue, and the APT tip direction is the initial TD direction. (ND: Ini- tial Normal Direction, TD: initial Transverse Direction, and RD: initial Rolling direction).
Fig. 2. EBSD characterization of the effect of cold rolling on the microstructure. 0% corre- sponds to the as received state, (ND and TD
stands for initial normal and transverse direc- tions respectively). 30% deformation and 50%
deformation are the samples after 30% and 50% thickness reduction by cold rolling along the initial TD. (a) Phase maps, Blue = fer- rite, Red = Austenite, (b) Inverse Pole Figure to- gether with Band Contrast maps of the ferrite phase, (c) Inverse Pole Figure together with Band Contrast maps of the austenitic phase.
I
l
h
b
s
b
p
s
m
w
t
t
a
3
d
a
c
[N
p
a
o
t
m
t
w
a
c
w
g
a
t
a
a
s
Q
M
t
3
f
d
k
a
a
i
a
a
c
t
s
h
h
n the current case, a rather large step size was selected to map areasarge enough to visualize several grains; as a result, the martensite wasardly indexed ( Fig. 2 ).
However, a rough estimate of the different phase contents was madey assuming that all the non-indexed zones correspond to the marten-itic phase. This very basic assumption cannot provide accurate valuesut allowed for a rough estimate of the volume fraction of the differenthases, which could be used to interpret the TEP signal evolution pre-ented later. An experimental ratio of 57/43 ferrite/austenite was deter-ined. The martensite content in the 30% and 50% deformed samplesas approximately 5% and 30%, respectively. These values are consis-
ent with those observed in a LDX 2101 steel by Bassani et al., wherehe martensite transformation started just after 20% thickness reductionnd 20% martensite was observed for 50% thickness reduction [31] .
.2. Evolution of TEP during aging
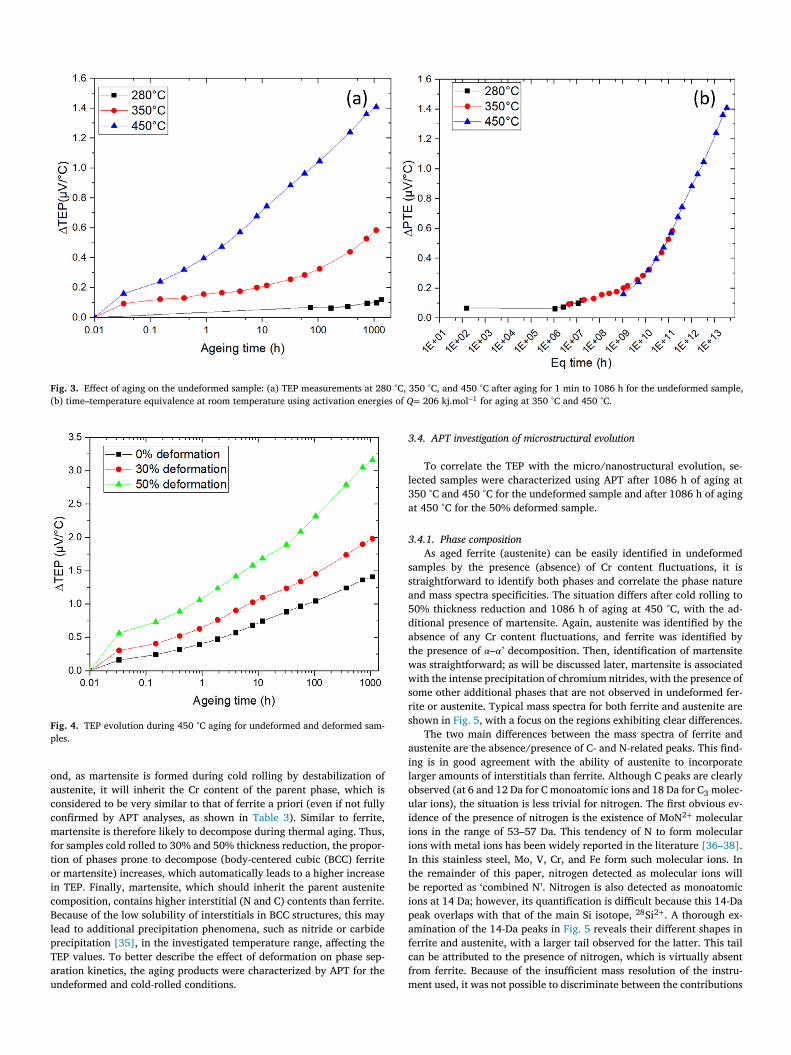
The evolution of the TEP ( ΔS ) as a function of time for the un-eformed sample, measured during isothermal aging between 280 °Cnd 500 °C, is presented in Fig. 3 a. For all temperatures, the TEP in-reased with time. This behavior was previously observed by Coste et al.33] and Massoud et al. [34] for low-temperature aging of as-cast Fe–Cr–i DSS and was attributed to the spinodal decomposition of the ferritichase and the precipitation of intermetallic G-phase particles rich in Sind Ni [33] . At 280 °C, the change of the TEP after 1000 h of aging wasnly 0.12 μV/°C, which is extremely small. This result was expected ashe phase separation in Fe–Cr alloys is very slow at 300 °C, and no othericrostructural change is expected in this temperature range. At higher
emperatures, a similar evolution was observed at 350 °C and 400 °C,ith TEP increases of 0.58 and 1.4 μV/°C, respectively, after 1086 h ofging. However, an important acceleration of the phase separation pro-
ess between these temperatures was observed, as the same TEP valueas obtained after 1086 h of aging at 350 °C and 8 h of aging at 450 °C.
The acceleration of the TEP kinetics with aging temperature sug-ests that the microstructural changes responsible for the TEP changere diffusion-driven processes and thus thermally activated. The activa-ion energy can be determined by performing a time–temperature equiv-lence using the following formula: 𝑡 𝐴 exp (
− 𝑄 𝑅. 𝑇 𝐴
) = 𝑡 𝐵 exp ( − 𝑄 𝑅. 𝑇 𝐵
) , where Q is the activation energy and t i nd T i are the time and temperature of point i , respectively.
The equivalent time–temperature curves in Fig. 3 b confirm theame mechanism at 350 °C and 450 °C, with an activation energy of = 206 kJ/mol. This activation energy is similar to that proposed byaetz et al. [4] ( Q = 185 kJ/mol), which is attributed to the decomposi-
ion of ferrite.
.3. Effect of cold rolling on TEP evolution during aging
To quantify the effect of deformation on the aging behavior of theerrite, aging at 450 °C was performed after cold rolling to 30% and 50%eformation. This temperature was selected as it results in the highestinetics of phase separation, with the same phase transformation mech-nism as that observed at lower temperatures. The evolution of TEP withging time at 450 °C for the undeformed and deformed samples is shownn Fig. 4 . Increased deformation resulted in a greater TEP increase withging time. For instance, the same TEP value attained after 1000 h ofging in the undeformed sample was reached after 100 h in the sampleold rolled to 30% deformation and after 3 h for the sample cold rolledo 50% deformation.
This increase in TEP after cold rolling may have three differentources. First, the decomposition kinetics of the ferrite could be en-anced by the higher stress state, as evidenced by [ 16 , 17 ], leading toigher TEP values for a deformed sample than an undeformed one. Sec-
S. Cazottes, V. Massardier and R. Danoix et al. Materialia 14 (2020) 100854
Fig. 3. Effect of aging on the undeformed sample: (a) TEP measurements at 280 °C, 350 °C, and 450 °C after aging for 1 min to 1086 h for the undeformed sample, (b) time–temperature equivalence at room temperature using activation energies of Q = 206 kj.mol − 1 for aging at 350 °C and 450 °C.
Fig. 4. TEP evolution during 450 °C aging for undeformed and deformed sam- ples.
o
a
c
c
m
f
t
o
i
c
B
l
p
T
a
u
3
l
3
a
3
s
s
a
5
d
a
t
w
w
s
r
s
a
i
l
o
u
i
i
i
I
t
b
i
p
a
f
c
f
m
nd, as martensite is formed during cold rolling by destabilization ofustenite, it will inherit the Cr content of the parent phase, which isonsidered to be very similar to that of ferrite a priori (even if not fullyonfirmed by APT analyses, as shown in Table 3 ). Similar to ferrite,artensite is therefore likely to decompose during thermal aging. Thus,
or samples cold rolled to 30% and 50% thickness reduction, the propor-ion of phases prone to decompose (body-centered cubic (BCC) ferriter martensite) increases, which automatically leads to a higher increasen TEP. Finally, martensite, which should inherit the parent austeniteomposition, contains higher interstitial (N and C) contents than ferrite.ecause of the low solubility of interstitials in BCC structures, this may
ead to additional precipitation phenomena, such as nitride or carbiderecipitation [35] , in the investigated temperature range, affecting theEP values. To better describe the effect of deformation on phase sep-ration kinetics, the aging products were characterized by APT for thendeformed and cold-rolled conditions.
.4. APT investigation of microstructural evolution
To correlate the TEP with the micro/nanostructural evolution, se-ected samples were characterized using APT after 1086 h of aging at50 °C and 450 °C for the undeformed sample and after 1086 h of agingt 450 °C for the 50% deformed sample.
.4.1. Phase composition
As aged ferrite (austenite) can be easily identified in undeformedamples by the presence (absence) of Cr content fluctuations, it istraightforward to identify both phases and correlate the phase naturend mass spectra specificities. The situation differs after cold rolling to0% thickness reduction and 1086 h of aging at 450 °C, with the ad-itional presence of martensite. Again, austenite was identified by thebsence of any Cr content fluctuations, and ferrite was identified byhe presence of 𝛼–𝛼’ decomposition. Then, identification of martensiteas straightforward; as will be discussed later, martensite is associatedith the intense precipitation of chromium nitrides, with the presence of
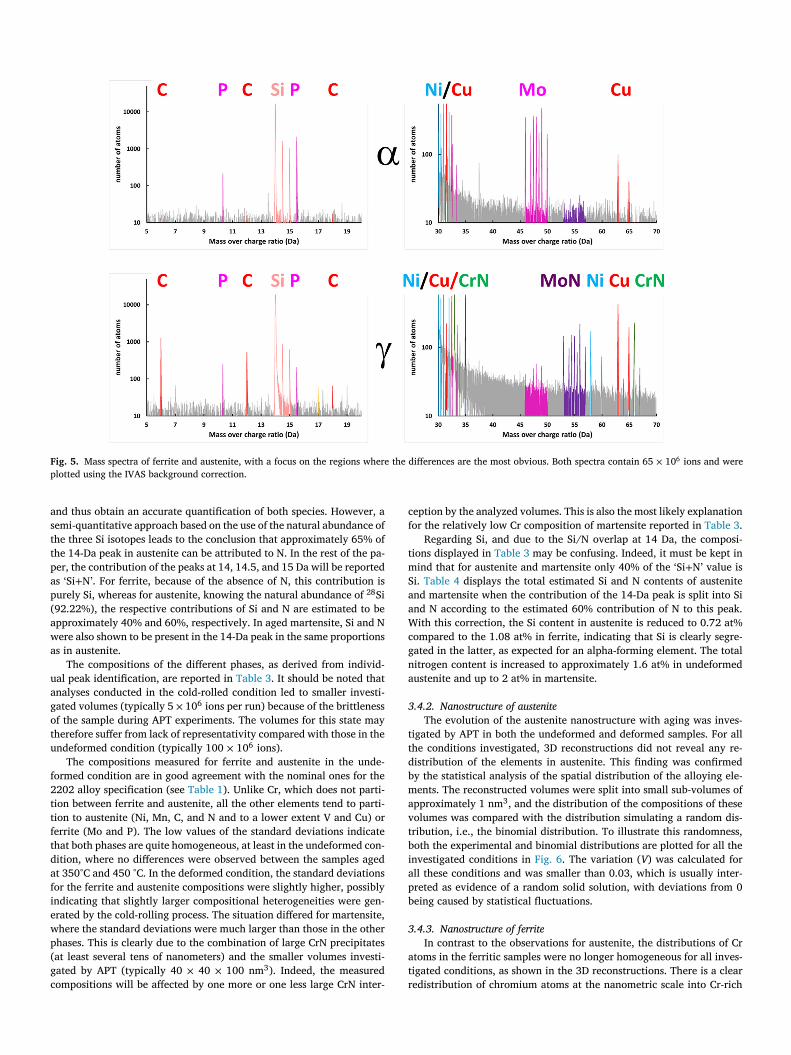
ome other additional phases that are not observed in undeformed fer-ite or austenite. Typical mass spectra for both ferrite and austenite arehown in Fig. 5 , with a focus on the regions exhibiting clear differences.
The two main differences between the mass spectra of ferrite andustenite are the absence/presence of C- and N-related peaks. This find-ng is in good agreement with the ability of austenite to incorporatearger amounts of interstitials than ferrite. Although C peaks are clearlybserved (at 6 and 12 Da for C monoatomic ions and 18 Da for C 3 molec-lar ions), the situation is less trivial for nitrogen. The first obvious ev-dence of the presence of nitrogen is the existence of MoN
2 + molecularons in the range of 53–57 Da. This tendency of N to form molecularons with metal ions has been widely reported in the literature [36–38] .n this stainless steel, Mo, V, Cr, and Fe form such molecular ions. Inhe remainder of this paper, nitrogen detected as molecular ions wille reported as ‘combined N’. Nitrogen is also detected as monoatomicons at 14 Da; however, its quantification is difficult because this 14-Daeak overlaps with that of the main Si isotope, 28 Si 2 + . A thorough ex-mination of the 14-Da peaks in Fig. 5 reveals their different shapes inerrite and austenite, with a larger tail observed for the latter. This tailan be attributed to the presence of nitrogen, which is virtually absentrom ferrite. Because of the insufficient mass resolution of the instru-ent used, it was not possible to discriminate between the contributions
S. Cazottes, V. Massardier and R. Danoix et al. Materialia 14 (2020) 100854
Fig. 5. Mass spectra of ferrite and austenite, with a focus on the regions where the differences are the most obvious. Both spectra contain 65 × 10 6 ions and were plotted using the IVAS background correction.
a
s
t
t
p
a
p
(
a
w
a
u
a
g
o
t
u
f
2
t
t
f
t
d
a
f
i
e
w
p
(
g
c
c
f
t
m
S
a
a
W
c
g
n
a
3
t
t
d
b
m
a
v
t
b
i
a
p
b
3
a
t
r
nd thus obtain an accurate quantification of both species. However, aemi-quantitative approach based on the use of the natural abundance ofhe three Si isotopes leads to the conclusion that approximately 65% ofhe 14-Da peak in austenite can be attributed to N. In the rest of the pa-er, the contribution of the peaks at 14, 14.5, and 15 Da will be reporteds ‘Si + N’. For ferrite, because of the absence of N, this contribution isurely Si, whereas for austenite, knowing the natural abundance of 28 Si92.22%), the respective contributions of Si and N are estimated to bepproximately 40% and 60%, respectively. In aged martensite, Si and Nere also shown to be present in the 14-Da peak in the same proportionss in austenite.
The compositions of the different phases, as derived from individ-al peak identification, are reported in Table 3 . It should be noted thatnalyses conducted in the cold-rolled condition led to smaller investi-ated volumes (typically 5 × 10 6 ions per run) because of the brittlenessf the sample during APT experiments. The volumes for this state mayherefore suffer from lack of representativity compared with those in thendeformed condition (typically 100 × 10 6 ions).
The compositions measured for ferrite and austenite in the unde-ormed condition are in good agreement with the nominal ones for the202 alloy specification (see Table 1 ). Unlike Cr, which does not parti-ion between ferrite and austenite, all the other elements tend to parti-ion to austenite (Ni, Mn, C, and N and to a lower extent V and Cu) orerrite (Mo and P). The low values of the standard deviations indicatehat both phases are quite homogeneous, at least in the undeformed con-ition, where no differences were observed between the samples agedt 350°C and 450 °C. In the deformed condition, the standard deviationsor the ferrite and austenite compositions were slightly higher, possiblyndicating that slightly larger compositional heterogeneities were gen-rated by the cold-rolling process. The situation differed for martensite,here the standard deviations were much larger than those in the otherhases. This is clearly due to the combination of large CrN precipitatesat least several tens of nanometers) and the smaller volumes investi-ated by APT (typically 40 × 40 × 100 nm
3 ). Indeed, the measuredompositions will be affected by one more or one less large CrN inter-
eption by the analyzed volumes. This is also the most likely explanationor the relatively low Cr composition of martensite reported in Table 3 .
Regarding Si, and due to the Si/N overlap at 14 Da, the composi-ions displayed in Table 3 may be confusing. Indeed, it must be kept inind that for austenite and martensite only 40% of the ‘Si + N’ value is
i. Table 4 displays the total estimated Si and N contents of austenitend martensite when the contribution of the 14-Da peak is split into Sind N according to the estimated 60% contribution of N to this peak.ith this correction, the Si content in austenite is reduced to 0.72 at%
ompared to the 1.08 at% in ferrite, indicating that Si is clearly segre-ated in the latter, as expected for an alpha-forming element. The totalitrogen content is increased to approximately 1.6 at% in undeformedustenite and up to 2 at% in martensite.
.4.2. Nanostructure of austenite
The evolution of the austenite nanostructure with aging was inves-igated by APT in both the undeformed and deformed samples. For allhe conditions investigated, 3D reconstructions did not reveal any re-istribution of the elements in austenite. This finding was confirmedy the statistical analysis of the spatial distribution of the alloying ele-ents. The reconstructed volumes were split into small sub-volumes of
pproximately 1 nm
3 , and the distribution of the compositions of theseolumes was compared with the distribution simulating a random dis-ribution, i.e., the binomial distribution. To illustrate this randomness,oth the experimental and binomial distributions are plotted for all thenvestigated conditions in Fig. 6 . The variation ( V ) was calculated forll these conditions and was smaller than 0.03, which is usually inter-reted as evidence of a random solid solution, with deviations from 0eing caused by statistical fluctuations.
.4.3. Nanostructure of ferrite
In contrast to the observations for austenite, the distributions of Crtoms in the ferritic samples were no longer homogeneous for all inves-igated conditions, as shown in the 3D reconstructions. There is a clearedistribution of chromium atoms at the nanometric scale into Cr-rich
S. Cazottes, V. Massardier and R. Danoix et al. Materialia 14 (2020) 100854
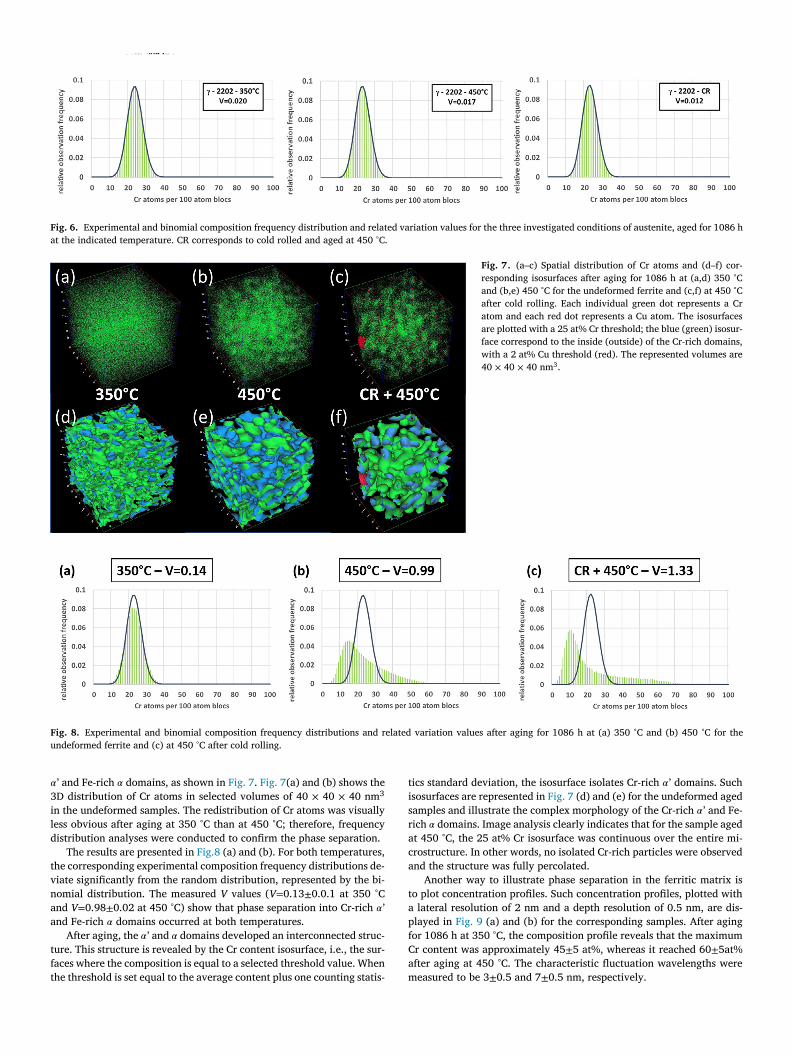
Fig. 6. Experimental and binomial composition frequency distribution and related variation values for the three investigated conditions of austenite, aged for 1086 h at the indicated temperature. CR corresponds to cold rolled and aged at 450 °C.
Fig. 7. (a–c) Spatial distribution of Cr atoms and (d–f) cor- responding isosurfaces after aging for 1086 h at (a,d) 350 °C and (b,e) 450 °C for the undeformed ferrite and (c,f) at 450 °C after cold rolling. Each individual green dot represents a Cr atom and each red dot represents a Cu atom. The isosurfaces are plotted with a 25 at% Cr threshold; the blue (green) isosur- face correspond to the inside (outside) of the Cr-rich domains, with a 2 at% Cu threshold (red). The represented volumes are 40 × 40 × 40 nm
3 .
Fig. 8. Experimental and binomial composition frequency distributions and related variation values after aging for 1086 h at (a) 350 °C and (b) 450 °C for the undeformed ferrite and (c) at 450 °C after cold rolling.
𝛼
3i
l
d
t
v
n
a
a
t
f
t
t
i
s
r
a
c
a
t
a
p
f
C
a
m
’ and Fe-rich 𝛼 domains, as shown in Fig. 7 . Fig. 7 (a) and (b) shows theD distribution of Cr atoms in selected volumes of 40 × 40 × 40 nm
3
n the undeformed samples. The redistribution of Cr atoms was visuallyess obvious after aging at 350 °C than at 450 °C; therefore, frequencyistribution analyses were conducted to confirm the phase separation.
The results are presented in Fig.8 (a) and (b). For both temperatures,he corresponding experimental composition frequency distributions de-iate significantly from the random distribution, represented by the bi-omial distribution. The measured V values ( V = 0.13 ± 0.0.1 at 350 °Cnd V = 0.98 ± 0.02 at 450 °C) show that phase separation into Cr-rich 𝛼’nd Fe-rich 𝛼 domains occurred at both temperatures.
After aging, the 𝛼’ and 𝛼 domains developed an interconnected struc-ure. This structure is revealed by the Cr content isosurface, i.e., the sur-aces where the composition is equal to a selected threshold value. Whenhe threshold is set equal to the average content plus one counting statis-
ics standard deviation, the isosurface isolates Cr-rich 𝛼’ domains. Suchsosurfaces are represented in Fig. 7 (d) and (e) for the undeformed agedamples and illustrate the complex morphology of the Cr-rich 𝛼’ and Fe-ich 𝛼 domains. Image analysis clearly indicates that for the sample agedt 450 °C, the 25 at% Cr isosurface was continuous over the entire mi-rostructure. In other words, no isolated Cr-rich particles were observednd the structure was fully percolated.
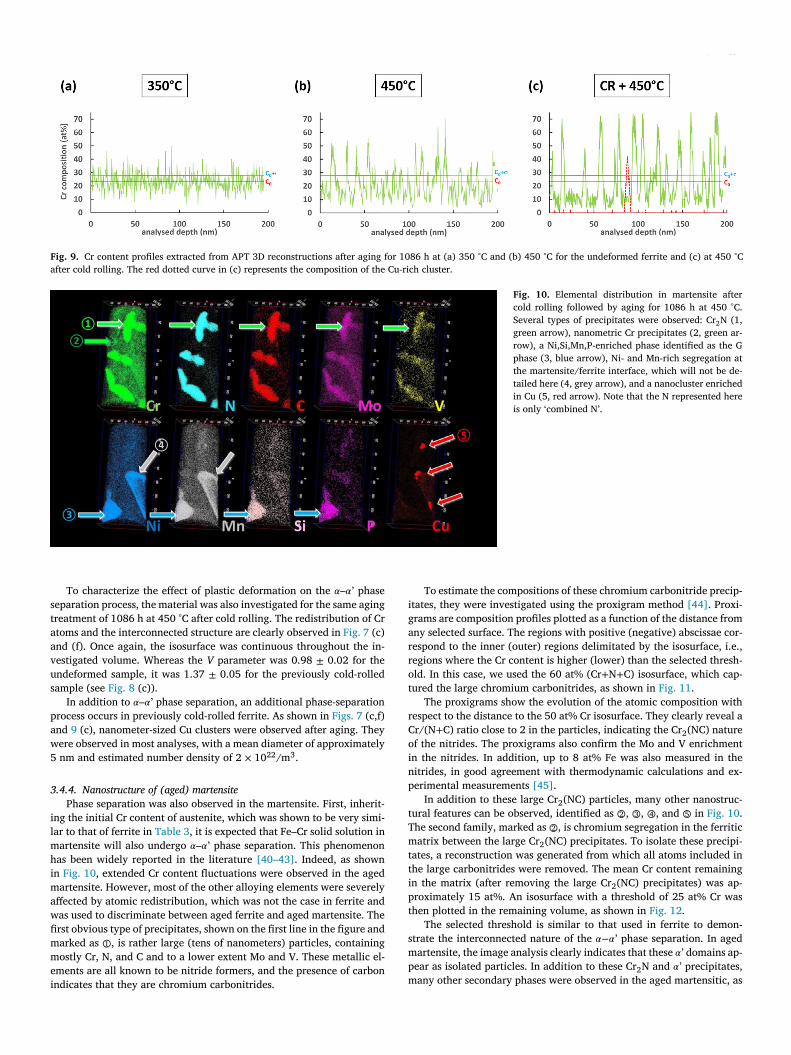
Another way to illustrate phase separation in the ferritic matrix iso plot concentration profiles. Such concentration profiles, plotted with lateral resolution of 2 nm and a depth resolution of 0.5 nm, are dis-layed in Fig. 9 (a) and (b) for the corresponding samples. After agingor 1086 h at 350 °C, the composition profile reveals that the maximumr content was approximately 45 ± 5 at%, whereas it reached 60 ± 5at%fter aging at 450 °C. The characteristic fluctuation wavelengths wereeasured to be 3 ± 0.5 and 7 ± 0.5 nm, respectively.
S. Cazottes, V. Massardier and R. Danoix et al. Materialia 14 (2020) 100854
Fig. 9. Cr content profiles extracted from APT 3D reconstructions after aging for 1086 h at (a) 350 °C and (b) 450 °C for the undeformed ferrite and (c) at 450 °C after cold rolling. The red dotted curve in (c) represents the composition of the Cu-rich cluster.
Fig. 10. Elemental distribution in martensite after cold rolling followed by aging for 1086 h at 450 °C. Several types of precipitates were observed: Cr 2 N (1, green arrow), nanometric Cr precipitates (2, green ar- row), a Ni,Si,Mn,P-enriched phase identified as the G
phase (3, blue arrow), Ni- and Mn-rich segregation at the martensite/ferrite interface, which will not be de- tailed here (4, grey arrow), and a nanocluster enriched in Cu (5, red arrow). Note that the N represented here is only ‘combined N’.
s
t
a
a
v
u
s
p
a
w
5
3
i
l
m
h
i
m
a
w
fi
m
m
e
i
i
g
a
r
r
o
t
r
C
o
i
n
p
t
T
m
t
t
i
p
t
s
m
p
m
To characterize the effect of plastic deformation on the 𝛼–𝛼’ phaseeparation process, the material was also investigated for the same agingreatment of 1086 h at 450 °C after cold rolling. The redistribution of Crtoms and the interconnected structure are clearly observed in Fig. 7 (c)nd (f). Once again, the isosurface was continuous throughout the in-estigated volume. Whereas the V parameter was 0.98 ± 0.02 for thendeformed sample, it was 1.37 ± 0.05 for the previously cold-rolledample (see Fig. 8 (c)).
In addition to 𝛼–𝛼’ phase separation, an additional phase-separationrocess occurs in previously cold-rolled ferrite. As shown in Figs. 7 (c,f)nd 9 (c), nanometer-sized Cu clusters were observed after aging. Theyere observed in most analyses, with a mean diameter of approximately nm and estimated number density of 2 × 10 22 /m
3 .
.4.4. Nanostructure of (aged) martensite
Phase separation was also observed in the martensite. First, inherit-ng the initial Cr content of austenite, which was shown to be very simi-ar to that of ferrite in Table 3 , it is expected that Fe–Cr solid solution inartensite will also undergo 𝛼–𝛼’ phase separation. This phenomenonas been widely reported in the literature [40–43] . Indeed, as shownn Fig. 10 , extended Cr content fluctuations were observed in the agedartensite. However, most of the other alloying elements were severely
ffected by atomic redistribution, which was not the case in ferrite andas used to discriminate between aged ferrite and aged martensite. Therst obvious type of precipitates, shown on the first line in the figure andarked as 1 ○, is rather large (tens of nanometers) particles, containingostly Cr, N, and C and to a lower extent Mo and V. These metallic el-
ments are all known to be nitride formers, and the presence of carbonndicates that they are chromium carbonitrides.
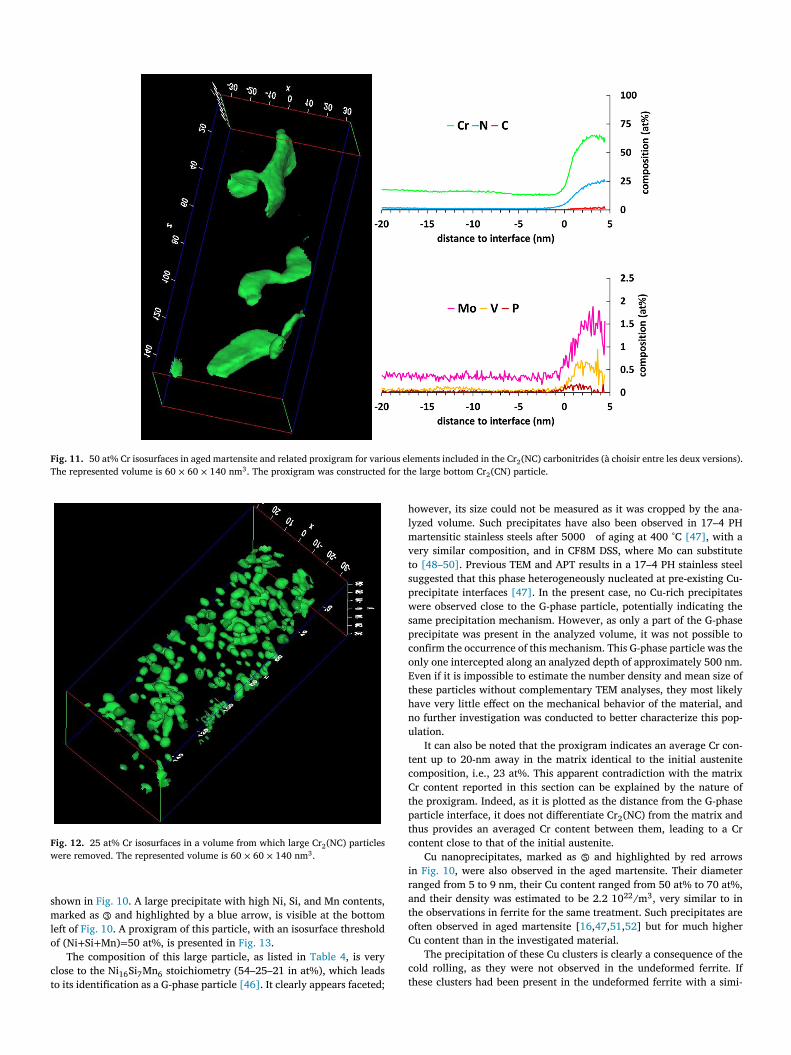
To estimate the compositions of these chromium carbonitride precip-tates, they were investigated using the proxigram method [44] . Proxi-rams are composition profiles plotted as a function of the distance fromny selected surface. The regions with positive (negative) abscissae cor-espond to the inner (outer) regions delimitated by the isosurface, i.e.,egions where the Cr content is higher (lower) than the selected thresh-ld. In this case, we used the 60 at% (Cr + N + C) isosurface, which cap-ured the large chromium carbonitrides, as shown in Fig. 11 .
The proxigrams show the evolution of the atomic composition withespect to the distance to the 50 at% Cr isosurface. They clearly reveal ar/(N + C) ratio close to 2 in the particles, indicating the Cr 2 (NC) naturef the nitrides. The proxigrams also confirm the Mo and V enrichmentn the nitrides. In addition, up to 8 at% Fe was also measured in theitrides, in good agreement with thermodynamic calculations and ex-erimental measurements [45] .
In addition to these large Cr 2 (NC) particles, many other nanostruc-ural features can be observed, identified as 2 ○, 3 ○, 4 ○, and 5 ○ in Fig. 10 .he second family, marked as 2 ○, is chromium segregation in the ferriticatrix between the large Cr 2 (NC) precipitates. To isolate these precipi-
ates, a reconstruction was generated from which all atoms included inhe large carbonitrides were removed. The mean Cr content remainingn the matrix (after removing the large Cr 2 (NC) precipitates) was ap-roximately 15 at%. An isosurface with a threshold of 25 at% Cr washen plotted in the remaining volume, as shown in Fig. 12 .
The selected threshold is similar to that used in ferrite to demon-trate the interconnected nature of the 𝛼− 𝛼’ phase separation. In agedartensite, the image analysis clearly indicates that these 𝛼’ domains ap-ear as isolated particles. In addition to these Cr 2 N and 𝛼’ precipitates,any other secondary phases were observed in the aged martensitic, as
S. Cazottes, V. Massardier and R. Danoix et al. Materialia 14 (2020) 100854
Fig. 11. 50 at% Cr isosurfaces in aged martensite and related proxigram for various elements included in the Cr 2 (NC) carbonitrides (à choisir entre les deux versions). The represented volume is 60 × 60 × 140 nm
3 . The proxigram was constructed for the large bottom Cr 2 (CN) particle.
Fig. 12. 25 at% Cr isosurfaces in a volume from which large Cr 2 (NC) particles were removed. The represented volume is 60 × 60 × 140 nm
3 .
s
m
l
o
c
t
h
l
m
v
t
s
p
w
s
p
c
o
E
t
h
n
u
t
c
C
t
p
t
c
i
r
a
t
o
C
c
t
hown in Fig. 10 . A large precipitate with high Ni, Si, and Mn contents,arked as 3 ○ and highlighted by a blue arrow, is visible at the bottom
eft of Fig. 10 . A proxigram of this particle, with an isosurface thresholdf (Ni + Si + Mn) = 50 at%, is presented in Fig. 13 .
The composition of this large particle, as listed in Table 4 , is verylose to the Ni 16 Si 7 Mn 6 stoichiometry (54–25–21 in at%), which leadso its identification as a G-phase particle [46] . It clearly appears faceted;
owever, its size could not be measured as it was cropped by the ana-yzed volume. Such precipitates have also been observed in 17–4 PHartensitic stainless steels after 5000 of aging at 400 °C [47] , with a
ery similar composition, and in CF8M DSS, where Mo can substituteo [48–50] . Previous TEM and APT results in a 17–4 PH stainless steeluggested that this phase heterogeneously nucleated at pre-existing Cu-recipitate interfaces [47] . In the present case, no Cu-rich precipitatesere observed close to the G-phase particle, potentially indicating the
ame precipitation mechanism. However, as only a part of the G-phaserecipitate was present in the analyzed volume, it was not possible toonfirm the occurrence of this mechanism. This G-phase particle was thenly one intercepted along an analyzed depth of approximately 500 nm.ven if it is impossible to estimate the number density and mean size ofhese particles without complementary TEM analyses, they most likelyave very little effect on the mechanical behavior of the material, ando further investigation was conducted to better characterize this pop-lation.
It can also be noted that the proxigram indicates an average Cr con-ent up to 20-nm away in the matrix identical to the initial austeniteomposition, i.e., 23 at%. This apparent contradiction with the matrixr content reported in this section can be explained by the nature ofhe proxigram. Indeed, as it is plotted as the distance from the G-phasearticle interface, it does not differentiate Cr 2 (NC) from the matrix andhus provides an averaged Cr content between them, leading to a Crontent close to that of the initial austenite.
Cu nanoprecipitates, marked as 5 ○ and highlighted by red arrowsn Fig. 10 , were also observed in the aged martensite. Their diameteranged from 5 to 9 nm, their Cu content ranged from 50 at% to 70 at%,nd their density was estimated to be 2.2 10 22 /m
3 , very similar to inhe observations in ferrite for the same treatment. Such precipitates areften observed in aged martensite [ 16 , 47 , 51 , 52 ] but for much higheru content than in the investigated material.
The precipitation of these Cu clusters is clearly a consequence of theold rolling, as they were not observed in the undeformed ferrite. Ifhese clusters had been present in the undeformed ferrite with a simi-

S. Cazottes, V. Massardier and R. Danoix et al. Materialia 14 (2020) 100854
Fig. 13. isoconcentration (Ni + Si + Mn) = 50 at% and corresponding proxigram illustrating the presence of a large cropped G-phase par- ticle.
l
a
r
d
i
s
d
p
n
a
w
i
v
r
s
C
i
t
d
b
a
4
4
s
s
c
(
C
m
r
c
m
a
a
c
t
h
b
a
s
c
o
f
i
T
p
c
Table 2
Phase fractions estimated from EBSD for the three different rolling parameters.
Ferrite Austenite Martensite
Rolling 0% 57 ± 5 43 ± 5 0
Rolling 30% thickness reduction 57 ± 5 36 ± 5 6 ± 5 Rolling 50% thickness reduction 57 ± 5 13 ± 5 30 ± 5
c
g
i
h
s
w
T
l
i
i
l
p
s
o
T
t
t
s
a
N
s
l
t
o
d
p
s
c
c
C
d
s
m
4
m
v
t
ar number density, they would have inevitably been observed. Indeed,s approximately 2 × 10 6 nm
3 was analyzed in the undeformed fer-ite aged for 1086 h at 450 °C and considering their estimated numberensity in martensite, approximately 40 Cu particles should have beenntercepted, whereas not a single particle was intercepted. It can be as-umed that plastic deformation generates a significant linear density ofislocations, which likely favors heterogeneous nucleation of these Cuarticles (known to be more energetically favorable than homogeneousucleation in the absence of dislocations). In addition, cold rolling plays major role in the precipitation of Cu particles. As no Cu precipitatesere detected in the ferrite, it can be concluded that the solubility of Cu
n this phase at 450 °C is higher than the measured 0.09 at%. This loweralue is slightly higher but not so different from the value of 0.08 at%eported by Miller et al. [53] The Cu enrichment measured in marten-ite (0.11 at%, as indicated in Table 3 ) could potentially explain theu precipitation but not the depletion observed in ferrite (0.05 at%, as
ndicated in Table 3 ). For the latter, the Cu content was clearly lowerhan the solubility limit; however, precipitation occurred. The thermo-ynamic reasons for Cu precipitation are not understood in this contextut are clearly related to cold rolling and most likely to the presence ofn increased density of dislocations.
. Discussion
.1. Composition measurements
As shown in Tables 3 and 4 , the distributions of C and N wereeverely affected by cold rolling and subsequent aging and showed atrong tendency to segregate in aged martensite. Indeed, the austeniteontained very little C compared to that in the undeformed condition181 atppm after deformation and 1134 atppm without deformation).arbon was mostly concentrated in the martensite (1114 atppm) and,ore surprisingly, in ferrite to a lesser extent (126 atppm in the cold-
olled condition vs. 28 atppm in the undeformed one). The higher Content in the deformed ferrite can be explained by the presence of nu-erous lattice defects resulting from plastic deformation, which acted
s potential sites for carbon trapping. In addition, the standard devi-tion for the C content of ferrite was very high (compared with the Content), indicating that some regions were C depleted while others con-ained more than 200 atppm C. This heterogeneity can be related to theeterogeneity in plastic deformation leading to heterogeneities in car-on segregation between the highly deformed regions (where defectsccumulate) and the less deformed ones. A heterogeneously deformedtate can result either in local plastic heterogeneity within grains (be-ause of deformation localization) or to a deformation difference fromne grain to another (because of the orientation dependence of the de-ormation). The different grains of the 50% deformed sample are shownn Fig. 14 a, and the misorientation distribution is plotted in Fig. 14 b.he deformation was quite localized, and some deformation bands ap-eared (indicated by the white dotted lines). This phenomenon is quiteommon for ferrite of cold-rolled DSS, where localized strain and dislo-
ation slip bands are developed. However, there is no clear effect of therain orientation on the deformation state. Therefore, the heterogene-ty of the phase separation kinetics is more likely related to the localeterogeneity of deformation.
The N content in ferrite remained very low (44 atppm) and fairly con-tant (small standard deviation). The N content in cold-rolled austeniteas slightly reduced compared with that in the undeformed one (seeable 4 ) but clearly increased in martensite, owing to the presence of
arge chromium nitrides. The martensitic matrix (as defined by exclud-ng large chromium nitrides) exhibited a very low N content of approx-mately 600 atppm, exclusively observed as ‘combined’ MoN
2 + molecu-ar ions. As only aged cold-rolled samples were investigated, it was notossible to determine whether the redistribution of interstitials resultedolely from the cold rolling or subsequent aging or from a combinationf cold rolling introducing a high density of defects and aging at 450°C.his combined mechanism can clearly be evoked for interstitial elementshat diffuse rapidly at 450°C. Complementary investigations are plannedo investigate this specific point of carbon and nitrogen redistribution.
Similar to the observations for the undeformed samples, P and Moegregated to ferrite, whereas Cu, Mn, and Ni segregated to austenitend martensite. The V content remained rather similar in all the phases.i, Mn ( Table 3 ), and Si ( Table 4 ) were also less present in marten-
ite than their original contents in austenite would suggest. This is mostikely due to their strong heterogeneous distribution, associated in par-icular with large G-phase particles. In addition, if one calculates theverall composition of the alloy in the undeformed and cold-rolled con-itions (assuming the phase compositions in Tables 3 and 4 and thehase fractions derived from EBSD measurements in Table 2 ), all theubstitutional elements were observed to be depleted in the cold-rolledondition. As all these elements are involved in the precipitation ofoarse precipitates in martensite (chromium nitrides, G-phase particles,u precipitates, unidentified Ni–Mn phase), which have sizes on the or-er of the analyzed volumes, it is clearly suspected that our APT analy-es do not capture their actual volume fractions. Additional analyses ofartensite are necessary to clarify this point.
.2. Spinodal decomposition in ferrite and effect of cold rolling
As shown in Fig. 7 d and e, the morphologies of the 𝛼 and 𝛼’ do-ains were fully interconnected and percolated. The nature of the de-
eloped microstructure strongly suggests that phase separation proceedshrough a spinodal decomposition mechanism at this temperature [54] .

S. Cazottes, V. Massardier and R. Danoix et al. Materialia 14 (2020) 100854
Fig. 14. (a) Grain detection in the ferritic phase after 50% thickness reduction; the grains are colorized as a function of their size, with the smallest colored black and the largest colored red. (b) Corresponding misorientation map, showing a large heterogeneity in the deformation of ferrite.
Table 3
Average APT-measured composition of ferrite and austenite after aging for 1086 h at 350 °C and 450 °C for the undeformed sample and after aging for 1086 h at 450 °C for the deformed sample. The standard deviations were calculated over the composition of individual analyses (at least five analyses per phase, except for martensite (three analyses)), and do not consider counting statistics, [39] which are several orders of magnitude lower than the 𝜎 given in the table.
CR level Phase Cr Ni Si + N Mo Mn V Cu C Combined N P B at% at% at% at% at% ppm ppm ppm ppm Ppm ppm
0%
ferrite 23.2 2.17 1.08 0.25 1.05 700 893 28 170 849 20
𝜎 0.2 0.03 0.03 0.01 0.02 13 30 26 166 114 20
austenite 23.6 3.34 1.80 0.19 1.35 754 1106 1134 0.50 at% 168 64
𝜎 0.5 0.19 0.15 0.01 0.03 28 84 339 0.10 at% 15 6
ferrite 23.0 2.00 1.09 0.24 0.99 543 502 126 44 758 28
𝜎 0.6 0.21 0.03 0.02 0.07 101 230 135 58 246 24
50% austenite 22.9 3.51 1.67 0.17 1.41 736 995 181 0.39 at% 198 108
𝜎 0.2 0.23 0.11 0.01 0.09 31 85 86 0.12 at% 52 39
martensite 19.9 2.52 1.42 0.14 1.00 519 1113 1114 1.17 at% 203 68
𝜎 1.5 1.1 0.44 0.03 0.32 196 842 361 0.53 at% 127 29
Table 4
Estimated Si and N contents of austenite and martensite, considering the 14-Da overlap.
Phase Undeformed austenite Deformed austenite Martensite Element Si N Si N Si N
Measured (at%) 1.80 0.50 1.67 0.39 1.42 1.17
Corrected (at%) 0.72 1.58 0.67 1.39 0.57 2.02
T
t
C
t
t
c
p
a
p
s
i
t
f
a
a
his speculation was confirmed by the Cr content profiles, in particularhat for aging at 450 °C in Fig. 9 b. It can be clearly observed that ther content of the 𝛼’ domains does not reach 85 at%, which, accordingTable 5
Experimental composition of precipitates in martensite.
at % Fe Cr Si Ni Mn M
Cr 2 (NC) 9.1 64.6 – 1.0 0.95 0
G phase 0.37 0.38 23.4 52.4 21.6 0
Ni-rich phase 69.0 22.1 1.43 4.55 1.5 0
o the phase diagram, is the expected equilibrium composition at thisemperature. This finding indicates that phase separation does not pro-eed through the nucleation and growth of equilibrium composition 𝛼’recipitates. In addition, a clear evolution is observed between 350 °Cnd 450 °C aging, characterized by an increase in the 𝛼’ domain com-osition and characteristic distances between them. All these elementsupport a spinodal mechanism being active at 450 °C (and below), evenf only a kinetic study (not conducted here) could prove this specula-ion. This conclusion is fully consistent with previous investigations oferritic stainless steels containing approximately 20 at% Cr [54] . From thermodynamical viewpoint, if SD is active at 450 °C, it must also bective at any lower temperature, including 350 °C.
o V Cu N C P B
.78 0.54 0.01 21.3 1.5 0.02 0.02
.23 0.01 0.16 0.12 0.05 1.15 –
.48 0.05 0.2 0.43 0.04 0.03

S. Cazottes, V. Massardier and R. Danoix et al. Materialia 14 (2020) 100854
Fig. 15. Fe–Cr phase diagram showing the phase transformation mechanism of the a–a’ decomposition process as a function of Cr con- tent and temperature. The dark solid symbols refer to literature data, and the empty green symbols represent the data for the current study. The black dashed line schematically represents the spinodal line, and the solid red line represents the limit of the miscibility gap as proposed by Bonny for ferritic Fe–Cr alloys [57] . Note that the Ni content was not considered.
𝛼
s
a
F
t
t
v
p
fl
u
w
d
t
t
i
b
k
a
r
t
n
p
e
l
4
p
a
o
t
c
t
t
t
w
o
p
a
F
d
s
t
C
w
a
a
(
n
d
a
h
p
i
t
f
a
g
r
t
r
m
4
e
s
a
p
w
T
d
w
m
s
t
b
s
o
i
a
a
2
t
3
5
fi
r
s
o
c
Regarding the cold-rolled samples, the interconnected nature of the–𝛼’ microstructure indicates that SD is most likely active, with the ab-ence of isolated 𝛼’ precipitates ruling out a possible NG process. From kinetic viewpoint, both the frequency distribution analysis (shown inig. 8 c) and related composition profile (shown in Fig. 9 c) confirm thathe phase separation is more advanced for the cold-rolled specimens af-er the same aging treatment of 1086 h at 450 °C. The respective mean Values were 1.37 ± 0.05 vs. 0.97 ± 0.03, the maximum Cr content was ap-roximately 70 ± 5 at% vs. 60 ± 5 at%, and the characteristic compositionuctuation wavelengths were 12 ± 0.5 nm vs. 7 ± 0.5 nm. These resultsnambiguously confirm that the previously cold-rolled samples under-ent a faster phase separation than the undeformed samples, providingirect evidence that plastic deformation enhances SD in the ferritic ma-rix of this Fe–Cr alloy. The most likely reason for this enhancement ishe presence of point defects, in particular vacancies, as revealed by thencrease in carbon content in the cold-rolled ferrite. The higher num-er of vacancies naturally accelerates atomic diffusion and thus the SDinetics. It should also be noticed that the standard deviation of the vari-tion values V is larger for the cold-rolled samples (0.05 vs. 0.02). Thisesult indicates a certain level of heterogeneity in 𝛼–𝛼’ phase separationhat was not observed in the undeformed samples. As for the heteroge-eous distribution of C in ferrite, this can be analyzed in light of thelastic strain deformation heterogeneity observed in the ferritic matrix,ven if no direct correlation was observed between the V values andocal C content.
.3. Decomposition of martensite: Cr behavior
After deformation and subsequent aging at 450 °C for 1086 h, decom-osition of both the ferritic and martensitic phases occurred. Whereasn interconnected structure, attributed to a spinodal mechanism, wasbserved in ferrite, individual particles were observed in martensite forhe same isoconcentration threshold. This change in morphology is asso-iated with a change in the phase-separation process from SD in ferriteo NG in martensite. This change in the decomposition process is relatedo the matrix composition difference between the two phases. Indeed,he composition of the martensitic matrix was measured to be 15 at%,hereas it was approximately 23 at% in ferrite. Several investigationsf 𝛼− 𝛼’ decomposition in martensite have been conducted, where thehase-separation process was identified as a function of temperaturend Cr content. These results were compiled and are presented in ae–Cr phase diagram in Fig. 15 . These investigations were mostly con-ucted on 15–5 PH, 17–4 PH, and a model 15–5 martensitic stainlessteel (where the first and second numbers refer to the Cr and Ni con-ents, respectively). NG is clearly the active mechanism for the 15 at%r from 500 °C to 425 °C [ 16 , 51 ] and for the 17 at% Cr one at 480°C [55] ,hereas SD is clearly the active mechanism for the 17 at%Cr at 400 °Cnd below [47] ; the situation was less clear for the 17 at% Cr at 450°C
ccording to [56] . It can be concluded that the location of the spinodalor bimodal) line, represented by the black dashed line, separating theucleation and growth domain (top left) and spinodal decompositionomain (bottom right), lies at approximately 450 °C for a Cr content ofpproximately 17 at%, and at increasing (decreasing) temperature forigher (lower) Cr contents. Note that the position of the spinodal line islotted for illustrative purposes; its slope is purely hypothetical.
The point representing our martensitic alloy at 450 °C (green starn Fig. 15 ) clearly lies on the left side of the spinodal line, indicatinghat it should undergo NG of 𝛼’ rather than the SD observed for theerritic phase. Assuming that the phase diagram is similar for ferriticnd martensitic alloys, the ferrite phase of the investigated alloy (emptyreen flag) lies deeply in the spinodal decomposition domain. All theseesults are in perfect agreement with our experimental data, and it canherefore be concluded that the Cr depletion of the martensitic matrixesults in a shift from SD (as observed in ferrite) to NG of 𝛼’ particles inartensite aged at 450 °C.
.4. Interpretation of TEP measurements concerning microstructural
volution
For the undeformed samples, only ferrite phase separation was ob-erved during aging in the APT characterization. This finding is in goodgreement with TEP measurements that show a similar trend for all sam-les aged between 280 °C and 450 °C, with one mechanism involved,ith an activation energy corresponding to ferrite phase separation [4] .his result highlights the efficiency of TEP measurements for the fastetection of decomposition kinetics in metals. Indeed, the TEP increaseas significant even at relatively low temperatures and fast heat treat-ents (such as Δ𝑇 𝐸𝑃 = 0 . 1 𝜇𝑉 ∕ ◦C after 1 h at 350 °C), where the phase
eparation process must give rise to very small composition variationshat are difficult to detect even with powerful techniques such as APTut that can be detected with much more time-consuming techniques,uch as Mössbauer spectrometry [8] .
For the deformed samples, APT characterization revealed that notnly ferrite phase separation but also complex precipitation and demix-ng occurred in martensite during aging. A time–temperature equiv-lence analysis was performed for the deformed samples after agingt 450 °C. For the three samples, the activation energy was set to06 kJ/mol, which corresponds to the ferrite phase separation, andhe temperature of the undeformed sample was set to 450 °C. For the0% and 50% deformed samples, selecting temperatures of 500 °C and70 °C, respectively, enabled the three curves to be superimposed. Thisnding highlights the fact that all three samples were subjected to fer-ite phase separation. The fictive temperature increase of the deformedamples confirms the acceleration in kinetics observed by APT. More-ver, one can see that for an equivalent time of 1.10 25 h, the curveorresponding to the 50% deformed sample starts to diverge from the

S. Cazottes, V. Massardier and R. Danoix et al. Materialia 14 (2020) 100854
Fig. 16. Pseudo time–temperature equivalence plotted for the de- formed samples using an activation energy of 206 kJ/mol. The tem- perature of the undeformed sample was set to 450 °C, with equivalent temperatures of 500 °C and 570 °C for the 30% and 50% deformed ones, respectively, resulting in the three curves being superimposed.
o
4
l
(
5
m
l
f
s
r
c
2
w
w
i
f
m
a
i
i
p
t
p
p
d
i
t
m
t
r
D
D
i
t
A
S
R
A
e
R
[
[
[
[
[
ther two. This result corresponds to approximately 10 h of aging at50 °C and could be a sign of the start of the other microstructural evo-utions observed from APT: precipitation and martensite decomposition Fig. 16 ).
. Conclusion
In this study, the effect of cold rolling on the aging response at inter-ediate temperatures (lower than 450 °C) of a lean 2202 duplex stain-
ess steel was investigated by comparing the thermal response of unde-ormed and cold-rolled samples.
In the undeformed samples, no elemental redistribution was ob-erved in austenite was by thermal aging up to 450 °C, whereas fer-ite decomposed into 𝛼-Fe rich and 𝛼’-Cr rich domains via spinodal de-omposition. The activation energy of this process was measured to be06 kJ/ml.
Cold rolling led to the transformation of austenite into martensite,hereas the fraction of ferrite remained unaffected. Interstitial elementsere redistributed between the three phases, with a strong enrichment
n carbon and nitrogen of martensite. Cold-rolling enhances enhances ferrite decomposition, which still
ollowed a 𝛼–𝛼’ spinodal decomposition mechanism and developed 𝛼–𝛼’icrostructure in terms of composition fluctuation amplitudes and char-
cteristic wavelength. Second, martensite, which formed during austen-te deformation, was also shown to be a site for phase transformations,ncluding 𝛼–𝛼’ decomposition and precipitation of large Cr 2 (NC), G-hase, and Cu-rich particles. 𝛼–𝛼’ decomposition of the martensitic ma-rix follows a nucleation and growth process. This change in 𝛼–𝛼’ decom-osition is due to Cr depletion in the matrix, resulting from the intenserecipitation of Cr 2 (NC), consistent with the most recent Fe–Cr phaseiagrams.
This study has demonstrated the complementarity of TEP and APT innvestigating aging in DSSs, combining the overall response of the ma-erial to TEP with the ability of APT to quantitatively characterize theicrostructure of selected samples at the nanometer scale. The combina-
ion of these techniques provides a detailed understanding of the agingesponse to cold rolling in DSSs.
ata availability
The raw/processed data will be made available on request.
eclaration of Competing Interest
The authors declare that they have no known competing financialnterests or personal relationships that could have appeared to influencehe work reported in this paper.
cknowledgments
This work was partly performed using the experimental GENE-IS platform, supported by the Region Haute-Normandie, Metropoleouen Normandie, CNRS via LABEX EMC, and French National Researchgency as part of the program “Investissements d’avenir ” under refer-nce ANR-11-EQPX-0020 .
eferences
[1] J.-O. Andersson, E. Alfonsson, C. Canderyd, Development and Properties of NewDuplex Stainless Steels, (2010) 23.
[2] M. Liljas , P. Johansson , H.-P. Liu , C.-O.A. Olsson , Development of a lean duplexstainless steel, Steel Res. Int. 79 (2008) 466–473 .
[3] J.-Y. Maetz , S. Cazottes , C. Verdu , X. Kleber , Precipitation and phase transformationsin 2101 lean duplex stainless steel during isothermal aging, Metall. Mater. Trans. A47 (2016) 239–253 .
[4] J.-Y. Maetz , S. Cazottes , C. Verdu , F. Danoix , X. Kléber , Microstructural evolutionin 2101 lean duplex stainless steel during low-and intermediate-temperature aging,Microsc. Microanal. 22 (2016) 463–473 .
[5] S.S. Brenner , M.K. Miller , W.A. Soffa , Spinodal decomposition of iron-32 at.%chromium at 470°C, Scr. Metall. 16 (1982) 831–836 .
[6] J.E. Brown , G.D.W. Smith , Atom probe studies of spinodal processes in duplex stain-less steels and single- and dual-phase Fe-Cr-Ni alloys, Surf. Sci. 246 (1991) 285–291 .
[7] F. Danoix , P. Auger , Atom probe studies of the Fe–Cr system and stainless steels agedat intermediate temperature: a review, Mater. Charact. 44 (2000) 177–201 .
[8] C. Lemoine , A. Fnidiki , J. Teillet , M. Hédin , F. Danoix , Mössbauer study of the ferritedecomposition in unaged duplex stainless steels, Scr. Mater. 39 (1998) 61–66 .
[9] M.K. Miller , J.M. Hyde , A. Cerezo , G.D.W. Smith , Comparison of low temperaturedecomposition in Fe Cr and duplex stainless steels, Appl. Surf. Sci. 87–88 (1995)323–328 .
10] M.K. Miller , K.F. Russell , Comparison of the rate of decomposition in Fe 45%Cr, Fe45%Cr 5%Ni and duplex stainless steels, Appl. Surf. Sci. 94–95 (1996) 398–402 .
11] D.A. Porter , K.E. Easterling , Phase Transformations in Metals and Alloys, Chapman& Hall, 1993 .
12] D.A. Garfinkel , J.D. Poplawsky , W. Guo , G.A. Young , J.D. Tucker , Phase separationin lean-grade duplex stainless steel 2101, JOM 67 (2015) 2216–2222 .
13] J.D. Tucker , M.K. Miller , G.A. Young , Assessment of thermal embrittlement in duplexstainless steels 2003 and 2205 for nuclear power applications, Acta Mater. 87 (2015)15–24 .
14] A. Dahlstrom , Influence of a Mechanical Load on the Ageing of Fe-Cr Alloys, Uni-versité de Rouen, 2019 .
S. Cazottes, V. Massardier and R. Danoix et al. Materialia 14 (2020) 100854
[
[
[
[
[
[
[
[
[
[
[
[
[
[
[
[
[
[
[
[
[
[
[
[
[
[
[
[
[
[
[
[
[
[
[
[
[
[
[
[
[
[
[
15] Y.-S. Li , H. Zhu , L. Zhang , X.-L. Cheng , Phase decomposition and morphology charac-teristic in thermal aging Fe–Cr alloys under applied strain: a phase-field simulation,J. Nucl. Mater. 429 (2012) 13–18 .
16] F Danoix , et al. , Effect of external stress on the Fe–Cr phase separation in 15-5 PHand Fe–15Cr–5Ni alloys, Ultramicroscopy 132 (2013) 193–198 .
17] J. Zhou , J. Odqvist , M. Thuvander , S. Hertzman , P. Hedström , Concurrent phaseseparation and clustering in the ferrite phase during low temperature stress aging ofduplex stainless steel weldments, Acta Mater. 60 (2012) 5818–5827 .
18] J.K. Sahu , U. Krupp , R.N. Ghosh , H.-J. Christ , Effect of 475°C embrittlement on themechanical properties of duplex stainless steel, Mater. Sci. Eng. A 508 (2009) 1–14 .
19] C. Örnek , M.G. Burke , T. Hashimoto , D.L. Engelberg , 748 K (475 °C) Embrittle-ment of duplex stainless steel: effect on microstructure and fracture behavior, Metall.Mater. Trans. A 48 (2017) 1653–1665 .
20] M. Hättestrand , P. Larsson , G. Chai , J.-O. Nilsson , J. Odqvist , Study of decompositionof ferrite in a duplex stainless steel cold worked and aged at 450–500°C, Mater. Sci.Eng. A 499 (2009) 489–492 .
21] F. Iacoviello , F. Casari , S. Gialanella , Effect of “475 °C embrittlement ” on duplexstainless steels localized corrosion resistance, Corros. Sci. 47 (2005) 909–922 .
22] V. Seetharaman , R. Krishnan , Influence of the martensitic transformation on thedeformation behaviour of an AISI 316 stainless steel at low temperatures, J. Mater.Sci. 16 (1981) 523–530 .
23] M. Perez , V. Massardier , X Kleber , Thermoelectric power applied to metallurgy: prin-ciple and recent applications, Int. J. Mater. Res. 100 (2009) 1461–1465 .
24] N. Lavaire , V. Massardier , J. Merlin , Quantitative evaluation of the interstitial con-tent (C and/or N) in solid solution in extra-mild steels by thermoelectric power mea-surements, Scr. Mater. 50 (2004) 131–135 .
25] J.M Pelletier , et al. , Precipitation effects on thermopower in Al-Cu alloys, Acta Met-all. 32 (1984) 1069–1078 .
26] A. Lamontagne, X. Kleber, V. Massardier, D. Mari, Application of ThermoelectricPower Technique to Study The Static Strain Ageing of Heavily Cold Drawn Steel.(2013).
27] B. Beausir , J.-J. Fundenberger , Analysis Tools for Electron and X-ray Diffraction,ATEX - Software, Université de Lorraine - Metz, 2017 www.atex-software.eu .
28] M Labonne , et al. , Precipitation kinetics in a Nb-stabilized ferritic stainless steel,Metall. Mater. Trans. A 48 (2017) 3655–3664 .
29] B. Gault , M.P. Moody , J.M. Cairney , S.P. Ringer , Atom Probe Microscopy, 160,Springer, New York, NY, 2012 .
30] L. Vonalvensleben , R. Grune , A. Hutten , M. Oehring , Statistical analysis of atomprobe data, J. Phys. 47 (1986) 489–494 .
31] P Bassani , et al. , Characterization of a cold-rolled 2101 lean duplex stainless steel,Microsc. Microanal. 19 (2013) 988–995 .
32] S.S.M. Tavares , Pardal , J.M. Silva , M.R. da & Oliveira , C.A.S. de , Martensitic trans-formation induced by cold deformation of lean duplex stainless steel UNS S32304,Mater. Res. 17 (2013) 381–385 .
33] J.F. Coste et al. Application of Thermoelectricity to NDE of Thermally
Aged Cast Duplex Stainless Steels and Neutron Irradiated Ferritic Steels . 16,https://inis.iaea.org/collection/NCLCollectionStore/_Public/30/001/30001866. pdf?r = 1&r = 1 (1997).
34] J.-P Massoud , et al. , Thermal aging of PWR duplex stainless steel components devel-opment of a thermoelectrical technique as a non-destructive evaluation method ofaging, in: Proceedings of the 7th International Conference on Nuclear Engineering,ICONE-7243, 1999 .
35] P. Jessner , R. Danoix , B. Hannoyer , F. Danoix , Investigations of the nitrided subsur-face layers of an Fe–Cr-model alloy, Ultramicroscopy 109 (2009) 530–534 .
36] H.-O. Andrén , U. Rolander , G. Wahlberg , Molybdenum-nitrogen and molybdenum–carbon complex formation in steels, J. Phys. Colloq. 49 (1988) C6-305-C6-310 .
37] S.S. Brenner , S.R. Goodman , FIM-atom probe analysis of thin nitride platelets in Fe-3at.% Mo, Scr. Metall. 5 (1971) 865–869 .
38] A Deschamps , et al. , Low temperature precipitation kinetics of niobium nitrideplatelets in Fe, Mater. Lett. 65 (2011) 2265–2268 .
39] F. Danoix , G. Grancher , A. Bostel , D. Blavette , Standard deviations of compositionmeasurements in atom probe analyses —Part II: 3D atom probe, Ultramicroscopy 107(2007) 739–743 .
40] D Delagnes , et al. , Cementite-free martensitic steels: A new route to develop highstrength/high toughness grades by modifying the conventional precipitation se-quence during tempering, Acta Mater. 60 (2012) 5877–5888 .
41] T.J. Kinkus , G.B. Olson , Microanalytical evaluation of a prototype stainless bearingsteel, Surf. Sci. 266 (1992) 391–396 .
42] K. Stiller , F. Danoix , M. Hättestrand , Mo precipitation in a 12Cr–9Ni–4Mo–2Cumaraging steel, Mater. Sci. Eng. A 250 (1998) 22–26 .
43] M. Thuvander , M. Andersson , K. Stiller , Precipitation process of martensitic PH stain-less steel Nanoflex, Mater. Sci. Technol. 28 (2012) 695–701 .
44] O.C. Hellman , J.A. Vandenbroucke , J. Rüsing , D. Isheim , D.N. Seidman , Analysis ofthree-dimensional atom-probe data by the proximity histogram, Microsc. Microanal.6 (2000) 437–444 .
45] H Van Landeghem , et al. , Contribution of local analysis techniques for the character-ization of iron and alloying elements in nitrides: consequences on the precipitationprocess in Fe–Si and Fe–Cr nitrided alloys, Materials 11 (2018) 1409 .
46] H.J. Beattie , F.L. VerSnyder , A new complex phase in a high-temperature alloy, Na-ture 178 (1956) 208–209 .
47] M. Murayama , K. Hono , Y. Katayama , Microstructural evolution in a 17-4 PH stain-less steel after aging at 400 °C, Metall. Mater. Trans. A 30 (1999) 345–353 .
48] F. Danoix , P. Auger , S. Chambreland , D. Blavette , A 3D study of G-phase precipitationin spinodally decomposed 𝛼-ferrite by tomographic atom-probe analysis, Microsc.Microanal. Microstruct. 5 (1994) 121–132 .
49] T.R. Leax , S.S. Brenner , J.A. Spitznagel , Atom probe examination of thermally agesCF8M cast stainless steel, Metall. Trans. A 23 (1992) 2725–2736 .
50] M.K. Miller , J. Bentley , APFIM and AEM investigation of CF8 and CF8M primarycoolant pipe steels, Mater. Sci. Technol. 6 (1990) 285–292 .
51] L. Couturier , F. De Geuser , A. Deschamps , Direct comparison of Fe-Cr unmixing char-acterization by atom probe tomography and small angle scattering, Mater. Charact.121 (2016) 61–67 .
52] Habibi Bajguirani , H. R. , The effect of ageing upon the microstructure and mechani-cal properties of type 15-5 PH stainless steel, Mater. Sci. Eng. A 338 (2002) 142–159 .
53] M.K. Miller , K.F. Russell , P. Pareige , M.J. Starink , R.C. Thomson , Low temperaturecopper solubilities in Fe–Cu–Ni, Mater. Sci. Eng. A 250 (1998) 49–54 .
54] J. Zhou , J. Odqvist , M. Thuvander , P. Hedström , Quantitative evaluation of spinodaldecomposition in Fe-Cr by atom probe tomography and radial distribution functionanalysis, Microsc. Microanal. 19 (2013) 665–675 .
55] G Yeli , et al. , Sequential nucleation of phases in a 17-4PH steel: microstructuralcharacterisation and mechanical properties, Acta Mater. 125 (2017) 38–49 .
56] J. Wang , H. Zou , C. Li , S. Qiu , B. Shen , The spinodal decomposition in 17-4PH stain-less steel subjected to long-term aging at 350 °C, Mater. Charact. 59 (2008) 587–591 .
57] G. Bonny , D. Terentyev , L. Malerba , On the 𝛼–𝛼′ miscibility gap of Fe–Cr alloys, Scr.Mater. 59 (2008) 1193–1196 .


