Embed Size (px)
Citation preview
Ecotoxicological Classification of Sediments using
Fuzzy Logic
S. Keiter1, T. Braunbeck2, S. Heise3, S. Pudenz4, W. Manz5, H. Hollert1
1Institute for Environmental Research (Biology V), RWTH Aachen University2Aquatic Ecology and Toxicology, University of Heidelberg3Department of Life Sciences, Hamburg University of Applied Sciences4Westlakes Scientific Consulting Ltd., Department of Environmental Science5Institute of integrated natural sciences, University of Koblenz-Landau

212.10.2011 – Rio Claro, Brazil
Index
1. Background
2. What is Fuzzy Logic?
3. The application of Fuzzy‐Logic
− Data selection
− Fuzzification
− Rule base
− Inference
− Defuzzification
4. Ecological relevance
5. Results
6. Conclusions

3
Ehingen: grayling catch and stocking
Stoc
king
(fis
hes/
a)
0
500
1000
1500
2000
2500
3000
3500
stocking
1980 1985 1990 1995 2000
Cat
ch (f
ishe
s/a)
0
100
200
300
400
500
600
catch
Negative trend of the fish catch since 1980
Background
Fish decline in the upper Danube River
12.10.2011 – Rio Claro, Brazil

4
Positive development of the water quality since 1968
Background
Fish decline in the upper Danube River
1968 1974 1981 1986 1991 1998 2004
Sigmaringen ‐ III ‐ IV II ‐ III II III II ‐ III II – III
Lauchert II II II II II II II
Schwarzach ‐ III ‐ IV II ‐ III II ‐ III II ‐ III II ‐ III II
Riedlingen ‐ III ‐ IV II ‐ II ‐ III II II
Rottenacker ‐ III II II II II II
Ehingen III ‐ IV III ‐ IV II ‐ III II II II II
Öpfingen ‐ ‐ II ‐ III II ‐ III II ‐ III II II
12.10.2011 – Rio Claro, Brazil

5
Background
Fish decline in the upper Danube River
Water qua
lity
Fish catchReasons?
12.10.2011 – Rio Claro, Brazil

6
Background
Test strategy
Field Studies:
Macrozoobenthos
Chemical analysis:
Heavy metals, PAHs, PCBs, PCDD/Fs, limnological
parameters
In situ parameters:
Histopathology of the liver, micronucleus test using
erythrocytes
Effect‐directed‐analysis (EDA):
Separation of non‐persistent and persistent pollutants
In vitro biotests:
Cytotoxicity, mutagenicity, genotoxicity, embryotoxicity, dioxin‐like activity, toxicity
towards bacteria
Weight‐of‐EvidenceStudy
12.10.2011 – Rio Claro, Brazil
7
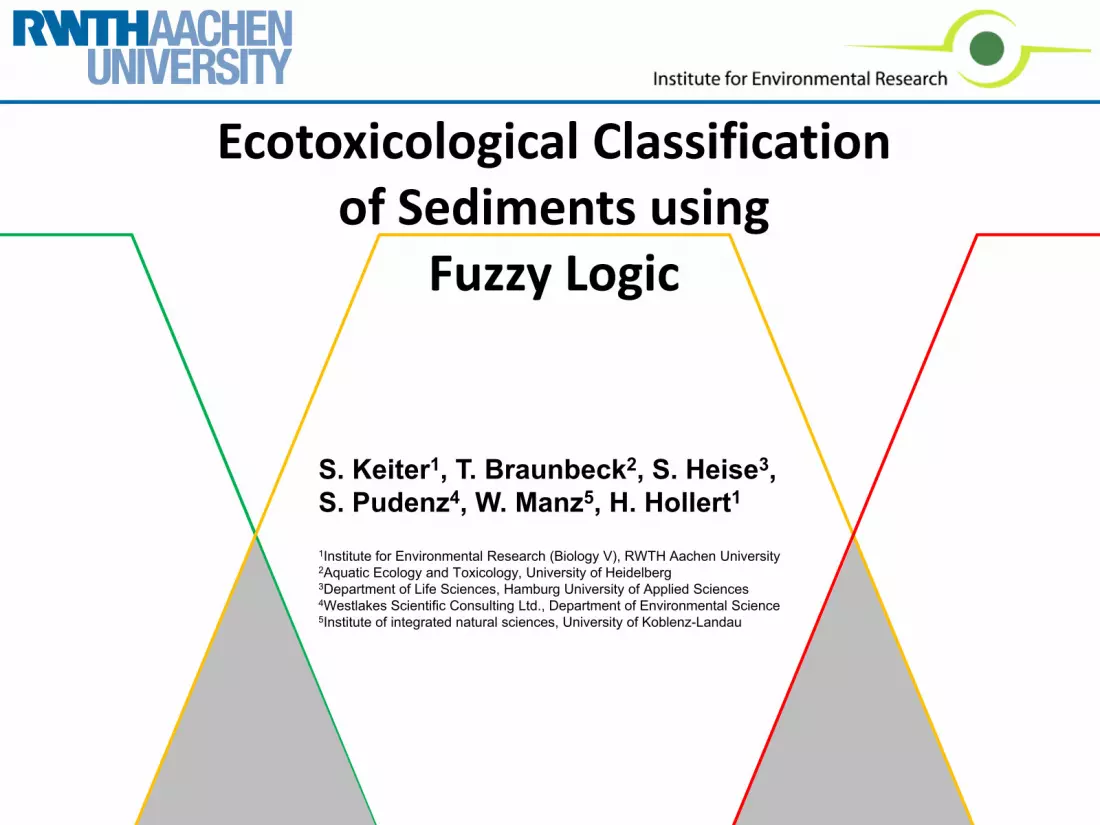
Sediments
Dioxins Heavy metals
PesticidesPAHs
PCBs
Sediments are a sink and source for many pollutants
sediment
Why sediments?
12.10.2011 – Rio Claro, Brazil
8
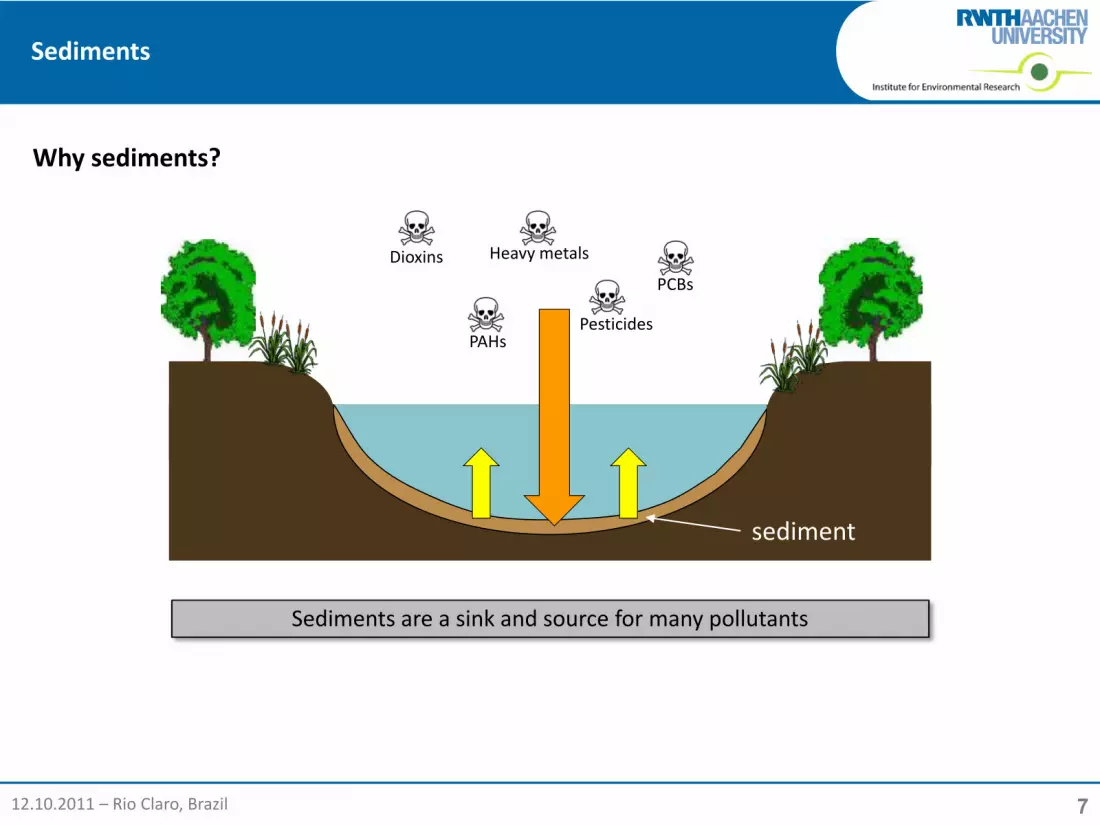
Exposure
Bioavailable hazard potential
Native
Freeze dried
Sediment contact tests:
• Comet assay
• Fish Embryo Toxicity Test
(FET)
• EROD assay
• …
Exposure scenarios
Overall hazard potential
Specific biotests:
• Comet assay
• Fish Embryo Toxicity Test
(FET)
• EROD assay
• …
Extraction
12.10.2011 – Rio Claro, Brazil

9
Background
Ecotoxicoligical assessment of sediments based on results of bioassays
12.10.2011 – Rio Claro, Brazil

10
Background
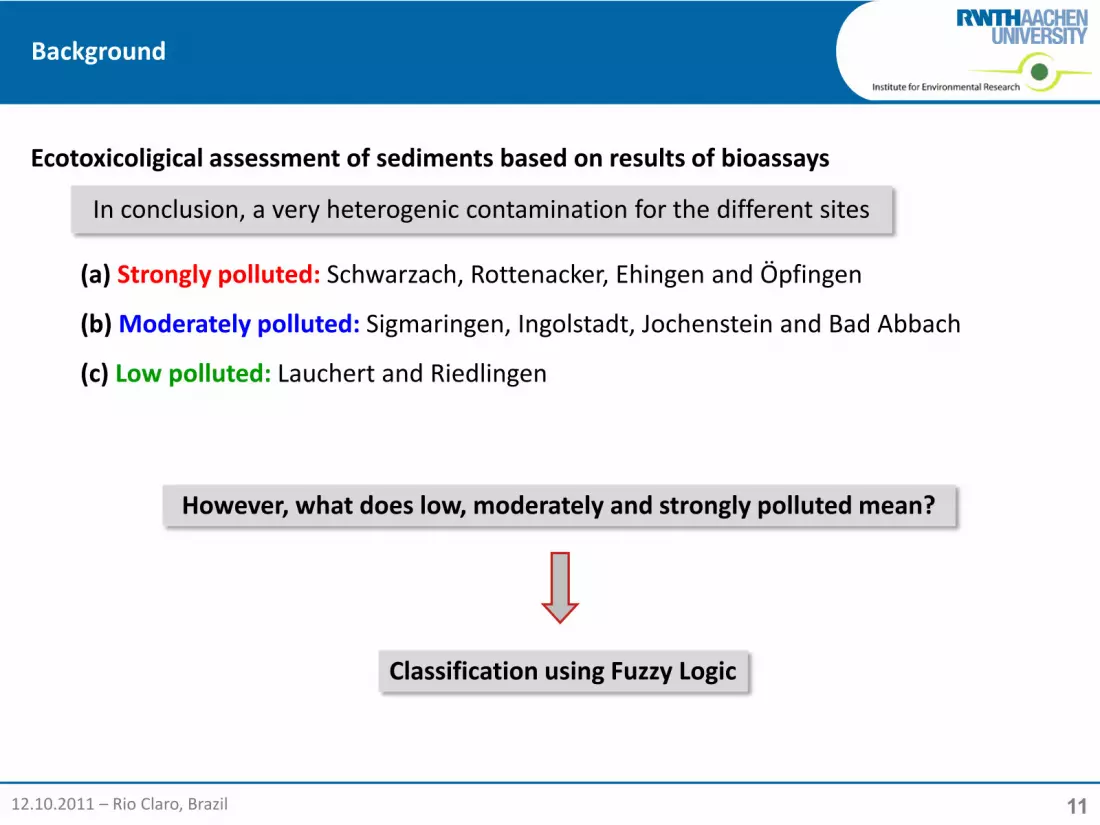
(a) Strongly polluted: Schwarzach, Rottenacker, Ehingen and Öpfingen
(b) Moderately polluted: Sigmaringen, Ingolstadt, Jochenstein and Bad Abbach
(c) Low polluted: Lauchert and Riedlingen
In conclusion, a very heterogenic contamination for the different sites
Ecotoxicoligical assessment of sediments based on results of bioassays
12.10.2011 – Rio Claro, Brazil
11
Background
Classification using Fuzzy Logic
However, what does low, moderately and strongly polluted mean?
Ecotoxicoligical assessment of sediments based on results of bioassays
12.10.2011 – Rio Claro, Brazil
(a) Strongly polluted: Schwarzach, Rottenacker, Ehingen and Öpfingen
(b) Moderately polluted: Sigmaringen, Ingolstadt, Jochenstein and Bad Abbach
(c) Low polluted: Lauchert and Riedlingen
In conclusion, a very heterogenic contamination for the different sites

12
Index
12.10.2011 – Rio Claro, Brazil
1. Background
2. What is Fuzzy Logic?
3. The application of Fuzzy‐Logic
− Data selection
− Fuzzification
− Rule base
− Inference
− Defuzzification
4. Ecological relevance
5. Results
6. Conclusions

13
What is Fuzzy Logic?
Fuzzy Logic (Fuzzy‐Set Theory)
Developed by L. Zadeh in 1965
Fuzzy Logic serves the possibility to perform a mathematical modeling of the uncertainties of imprecise words/descriptions (linguistic uncertainties)
Example from a technical application:
Imprecise terms like “slightly dirty” or “really dirty" are by Fuzzy Logic translated into the right amount of water and/or washing powder.
12.10.2011 – Rio Claro, Brazil
14
What is Fuzzy Logic?
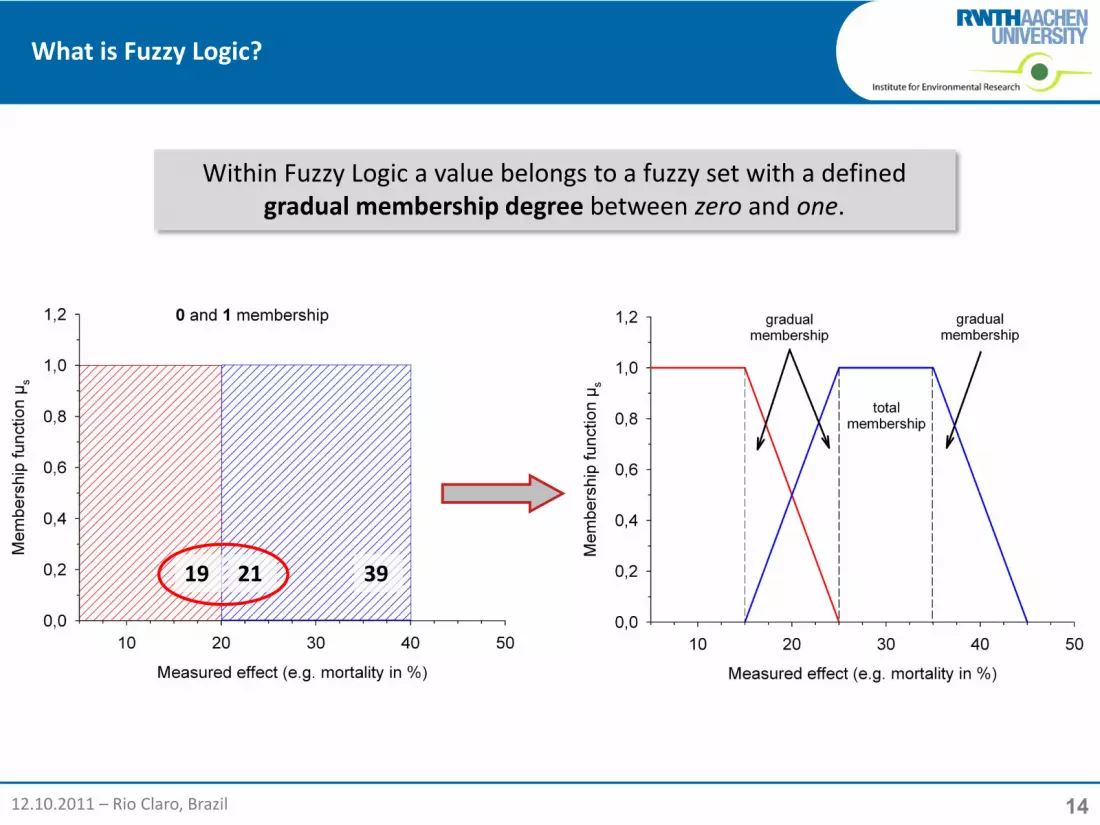
392119
Within Fuzzy Logic a value belongs to a fuzzy set with a defined gradual membership degree between zero and one.
12.10.2011 – Rio Claro, Brazil
15
What is Fuzzy Logic?
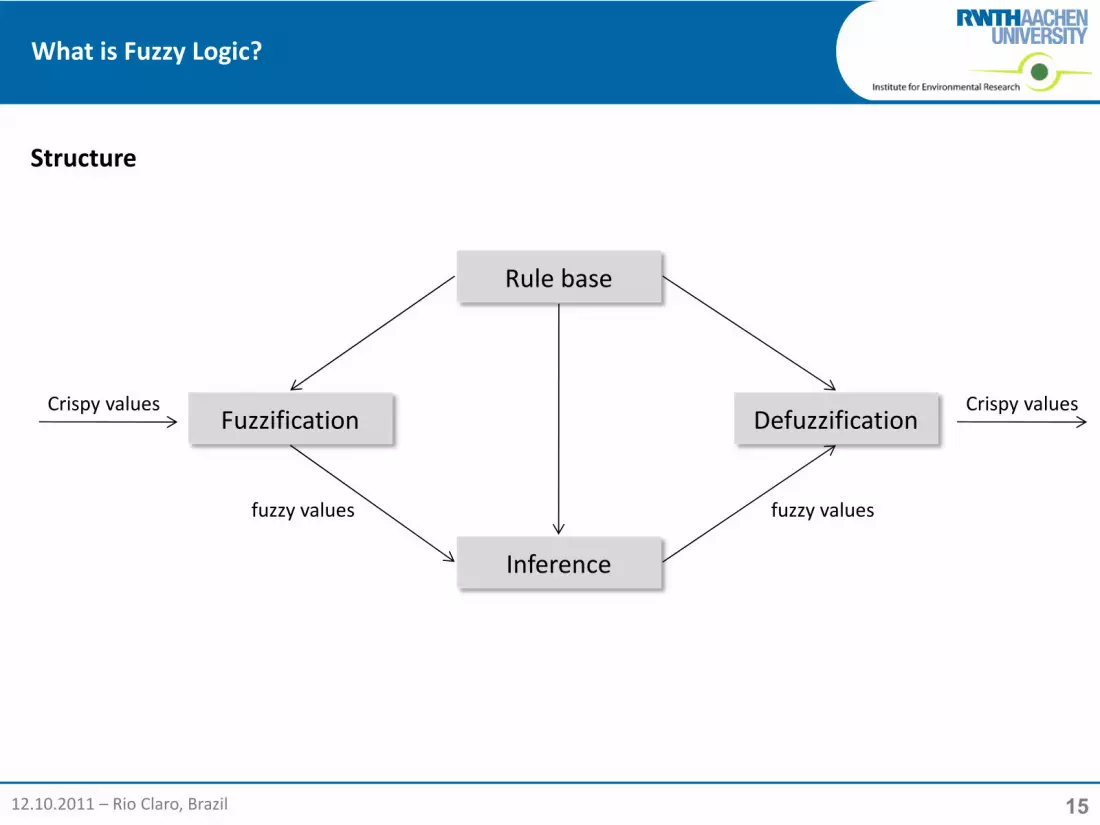
Structure
Fuzzification
Rule base
Defuzzification
Inference
Crispy valuesCrispy values
fuzzy values fuzzy values
12.10.2011 – Rio Claro, Brazil

16
Index
12.10.2011 – Rio Claro, Brazil
1. Background
2. What is Fuzzy Logic?
3. The application of Fuzzy‐Logic
− Data selection
− Fuzzification
− Rule base
− Inference
− Defuzzification
4. Ecological relevance
5. Results
6. Conclusions

17
Data selection
No redundant information
Fish egg test Comet assayEROD assay Neutral red assay
Correlation analysis
For statistical reasons as much data as possible should be selected
Neutral red assay EROD assay FET (native) FET (extracts)
Comet assay 0.43 0.37 0.62 0.16
Neutral red assay ‐ 0.52 0.28 0.07
EROD assay ‐ ‐ 0.26 ‐0.25
FET (native) ‐ ‐ ‐ ‐0.16
12.10.2011 – Rio Claro, Brazil
18
Fuzzification
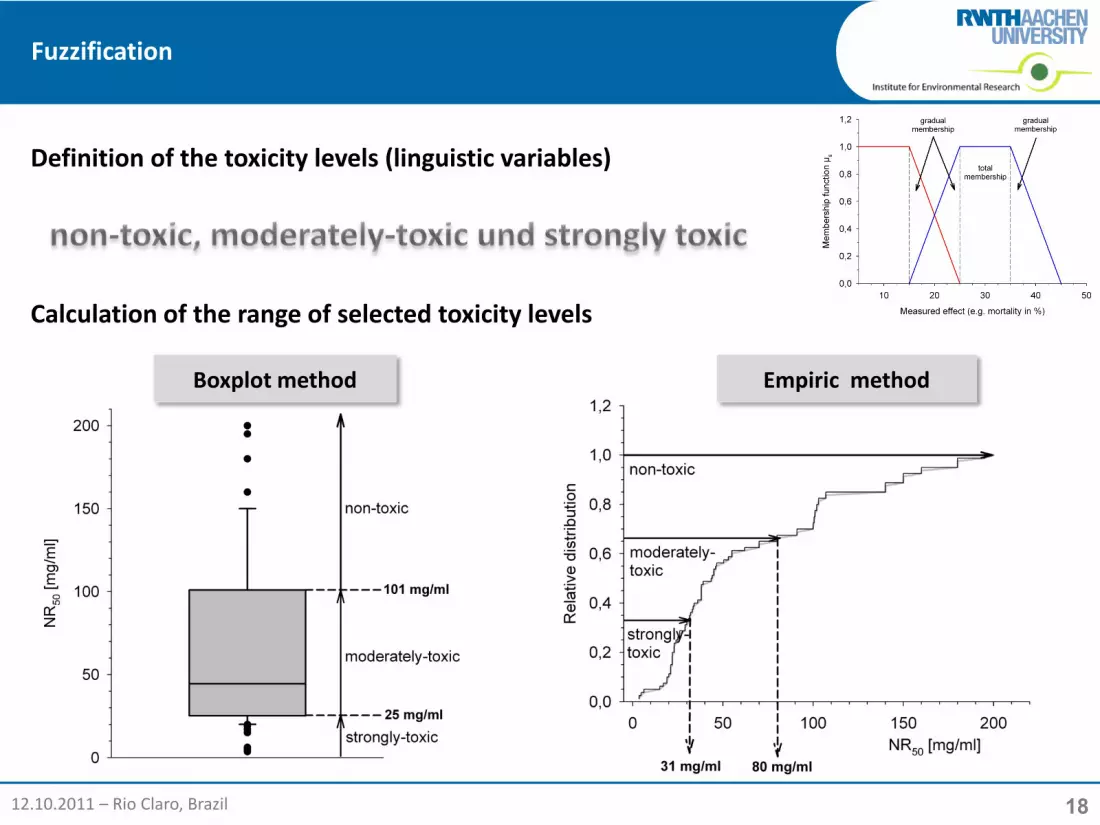
Boxplot method Empiric method
Definition of the toxicity levels (linguistic variables)
Calculation of the range of selected toxicity levels
12.10.2011 – Rio Claro, Brazil

19
Fuzzification
Example: Neutral red assay
Variability is:± 20 % (α < 0.05)
Variability of the negativ‐ and/or positiv control of each biotest.
Calculation of the gradual membership range
12.10.2011 – Rio Claro, Brazil

20
Fuzzification
Membership function of the Neutral red assay
A sample with an EC50 of 25 mg/L, shows membership values of: µ (strongly toxic) = 0.3µ (moderately toxic) = 0.7
12.10.2011 – Rio Claro, Brazil
21
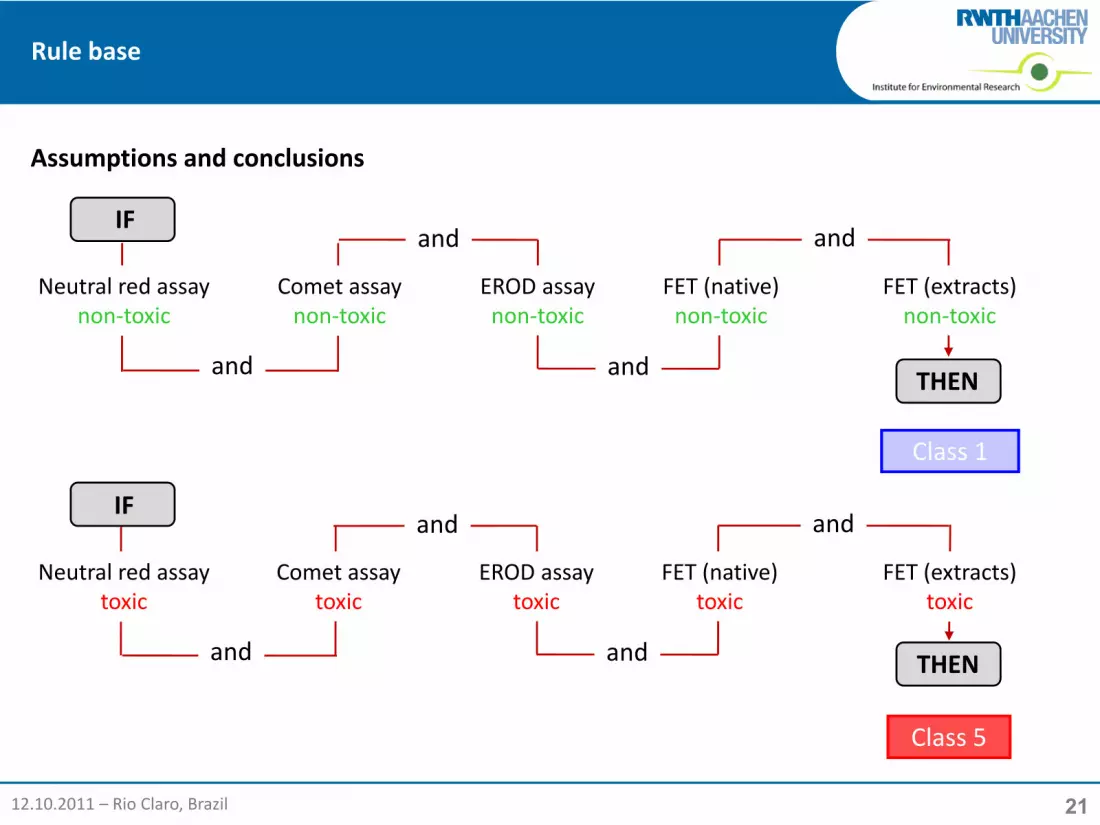
Rule base
IF
and
FET (native)non‐toxic
EROD assaynon‐toxic
Comet assaynon‐toxic
and
and
and
Class 1
THEN
Neutral red assaynon‐toxic
FET (extracts)non‐toxic
IF
and
FET (extracts)toxic
FET (native)toxic
EROD assaytoxic
Comet assaytoxic
and
and
and
Class 5
THEN
Neutral red assaytoxic
Assumptions and conclusions
12.10.2011 – Rio Claro, Brazil

22
Rule‐base
Toxicity leveles
non‐toxicmoderatly‐
toxicstrongly‐toxic
Class 15 ‐ ‐
4 1 ‐
4 ‐ 1
Class 23 1 1
3 2 ‐
2 3 ‐
Class 3
3 ‐ 2
2 ‐ 3
1 3 1
2 2 1
2 1 2
1 2 2
1 4 ‐
‐ 4 1
‐ 5 ‐
Class 4‐ 3 2
1 1 3
‐ 2 3
Class 51 ‐ 4
‐ 1 4
‐ ‐ 5
243 combinations
12.10.2011 – Rio Claro, Brazil

23
Inference
In order to come to the right conclusion (class), for all found membership values the related rules will be determined.
Test Unit Value nt mt t
Comet assay CDI 0.21 0.5 0.5 0
EROD assay BioTEQ [pg/g] 618 0.75 0.25 0
Neutralrot NR50 [mg/ml] 46.3 0.01 0.99 0
FET Test (native) LC50 [mg/ml] 214 1.0 0 0
FET Test (extract) LC50 [mg/ml] 169 1.0 0 0
More than one rule is true!
12.10.2011 – Rio Claro, Brazil
24
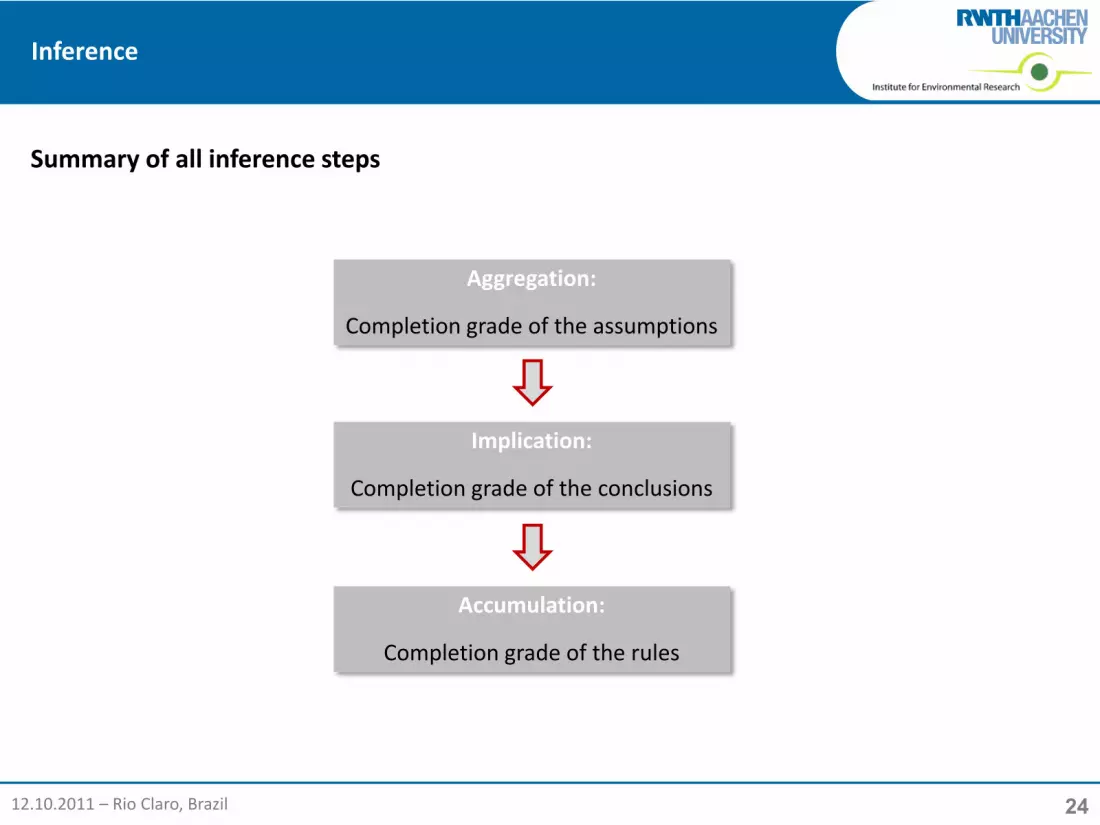
Inference
Aggregation:
Completion grade of the assumptions
Summary of all inference steps
Accumulation:
Completion grade of the rules
Implication:
Completion grade of the conclusions
12.10.2011 – Rio Claro, Brazil

25
Inference
Result of the inference
12.10.2011 – Rio Claro, Brazil
Class 1Class 2Class 3Class 4Class 5

26
Defuzzification
Very often the result of the inference step needs to be transfered into clear/chrispy value or to concret policy rules.
∫
∫= b
aout
b
aout
dxxµ
dxxxµx
)(
)(
∑=
=n
iix
nx
1
max1Mean of maxima
Center of gravity
12.10.2011 – Rio Claro, Brazil
Membership
Membership
Center of gravity

27
Index
12.10.2011 – Rio Claro, Brazil
1. Background
2. What is Fuzzy Logic?
3. The application of Fuzzy‐Logic
− Data selection
− Fuzzification
− Rule base
− Inference
− Defuzzification
4. Ecological relevance
5. Results
6. Conclusions
28
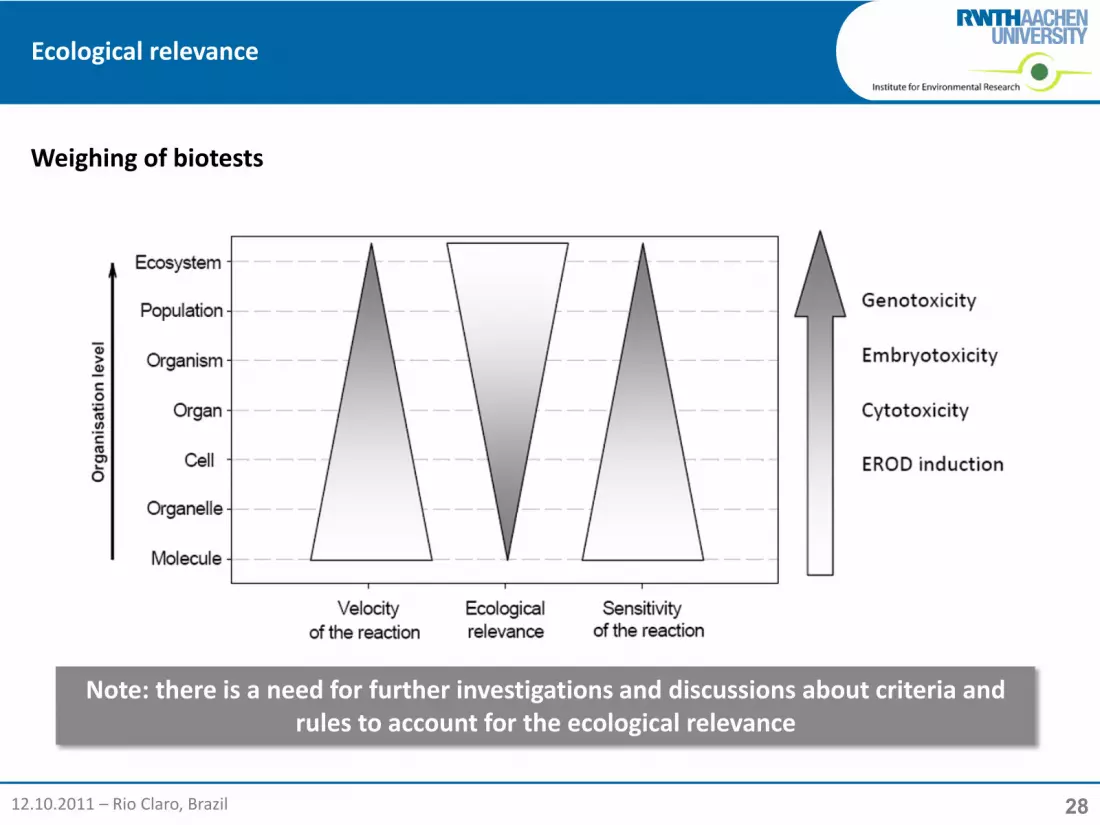
Ecological relevance
Note: there is a need for further investigations and discussions about criteria and rules to account for the ecological relevance
Weighing of biotests
12.10.2011 – Rio Claro, Brazil
29
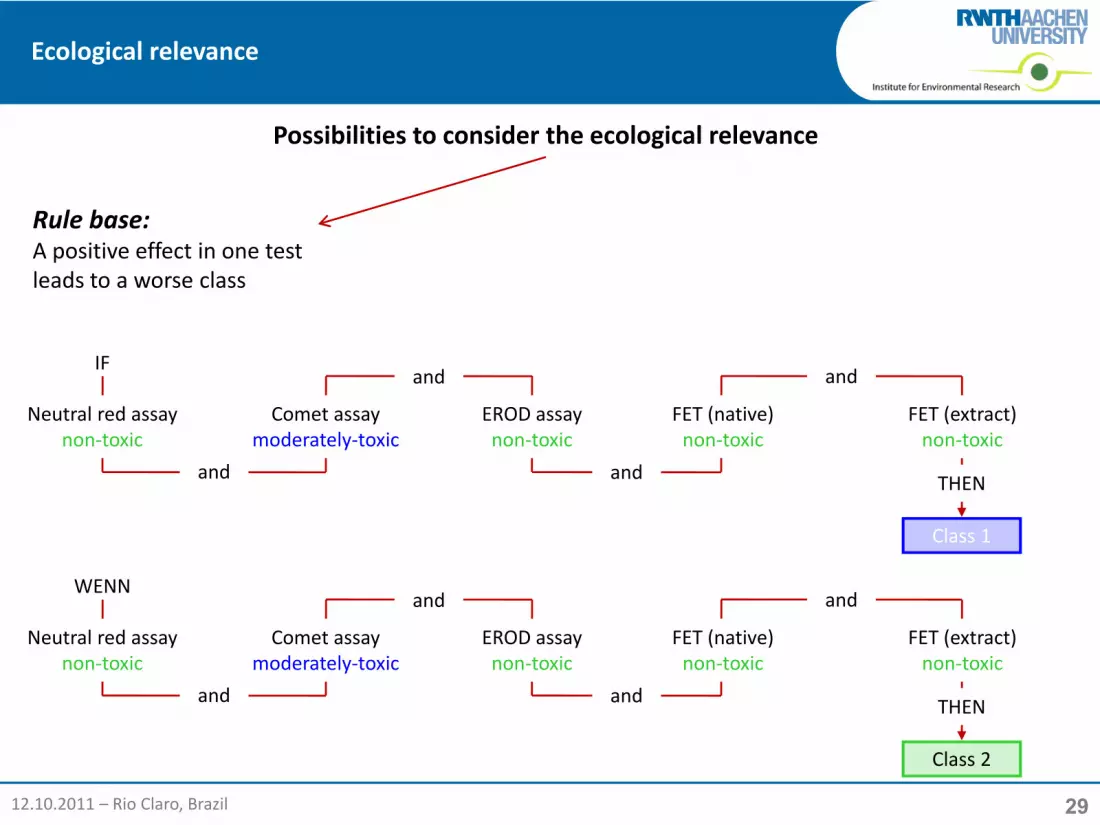
Ecological relevance
Possibilities to consider the ecological relevance
Rule base:A positive effect in one test leads to a worse class
IF
and
FET (native)non‐toxic
EROD assaynon‐toxic
Comet assaymoderately‐toxic
and
and
and
Class 1
THEN
Neutral red assaynon‐toxic
FET (extract)non‐toxic
WENN
and
FET (native)non‐toxic
EROD assaynon‐toxic
Comet assaymoderately‐toxic
and
and
and
Class 2
THEN
Neutral red assaynon‐toxic
FET (extract)non‐toxic
12.10.2011 – Rio Claro, Brazil
30
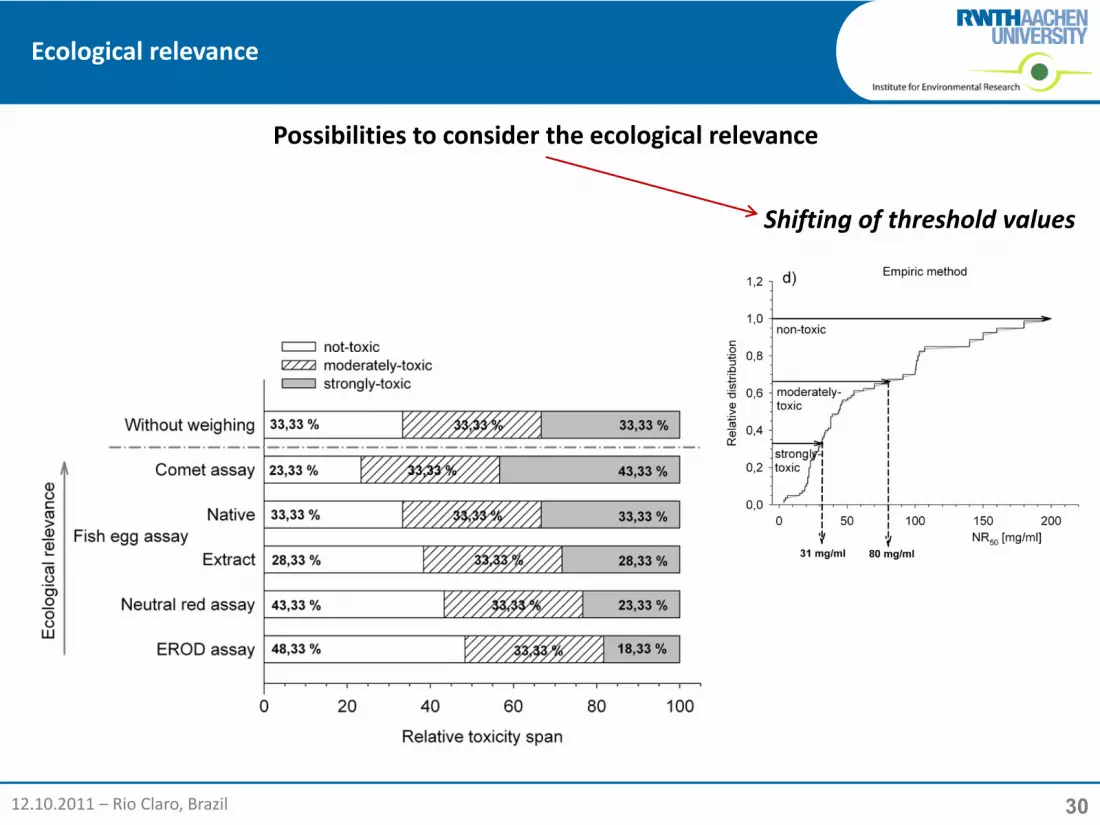
Ecological relevance
Shifting of threshold values
Possibilities to consider the ecological relevance
12.10.2011 – Rio Claro, Brazil
31
Index
12.10.2011 – Rio Claro, Brazil
1. Background
2. What is Fuzzy Logic?
3. The application of Fuzzy‐Logic
− Data selection
− Fuzzification
− Rule base
− Inference
− Defuzzification
4. Ecological relevance
5. Results
6. Conclusions

32
Results
Sediments of the rivers Rhine and Danube
12.10.2011 – Rio Claro, Brazil

33
Results
Comet assay
Neutral red assay
EROD assay
FET (native)
FET (extract)
Mean
Boxplot method (wo. weighing) 0.66 0.75 0.69 0.48 0.03 0.52
Empiric method (wo. weighing) 0.75 0.79 0.66 0.53 0.21 0.59
Empiric method (with weighing) 0.76 0.69 0.77 0.51 0.14 0.57
Correlation between classes and biotest results
12.10.2011 – Rio Claro, Brazil

34
Index
12.10.2011 – Rio Claro, Brazil
1. Background
2. What is Fuzzy Logic?
3. The application of Fuzzy‐Logic
− Data selection
− Fuzzification
− Rule base
− Inference
− Defuzzification
4. Ecological relevance
5. Results
6. Conclusions

35
Conclusions
Consideration of the range from biotest responses.
Creation of gradual memberships by the variability of the used test systems.
Consideration of the ecological relevance by shifting the threshold values.
Fuzzy Logic classification models serves the possibility to consider the uncertainties of biological effect data and their ecological relevance.
Integration of expert‐knowledge from mechanism‐specific effects.
12.10.2011 – Rio Claro, Brazil
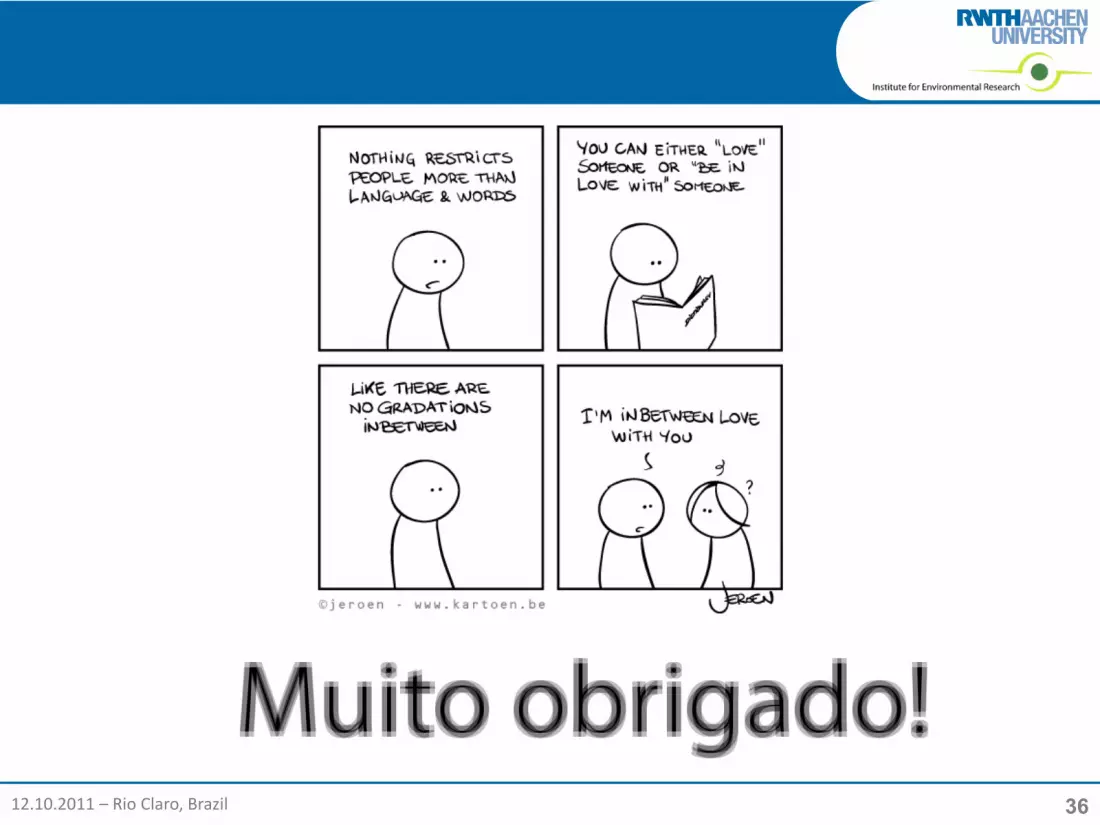
3612.10.2011 – Rio Claro, Brazil

37
Inferenz
1. Aggregation:
Hier werden die Erfülltheitsgrade der einzelnen Prämissen ausdrücke jeder Regel zu einem Erfülltheitsgrad der Gesamtprämisse zusammengefasst.
Die Auswertung jeder zutreffenden Regel (Inferenzschritt) besteht aus drei Schritten
Zugehörigkeit Auto1 Auto2 Auto3 Auto4 Auto5 Auto6
A. Leistung (PS) 0,1 0,6 0,0 0,9 1,0 0,0
B. Alter 0,8 0,2 0,9 0,4 0,3 1,0
C. Preis 0,4 0,8 0,3 0,6 0,7 0,4
D. Image 0,3 0,4 0,0 0,7 0,8 0,8
Operatoren Auto1 Auto2 Auto3 Auto4 Auto5 Auto6
Arith. Mittel 0,400 0,500 0,300 0,650 0,700 0,550
Minimum 0,100 0,200 0,000 0,400 0,300 0,000
Algeb. Produkt 0,0096 0,0384 0,0000 0,1512 0,1680 0,0000
Minimum: min [µA(x), µB(x), µC(x), µD(x)]Algeb. Produkt: µA(x) × µB(x) × µC(x) × µD(x)
Prämissen
Aggregations‐operatoren
12.10.2011 – Rio Claro, Brazil

38
Inferenz
2. Implikation:
Bei der Implikation wird ‐ aufbauend auf dem zuvor errechneten Erfülltheitsgrad der Prämisse ‐der Erfülltheitsgrad der zugehörigen Konklusion ermittelt. Dieser Schritt bildet den logischen Schluss "WENN A DANN B" ab.
Die Auswertung jeder zutreffenden Regel (Inferenzschritt) besteht aus drei Schritten
Minimum: min [µA(x), µB(x), µC(x), µD(x)]Algeb. Produkt: µA(x) × µB(x) × µC(x) × µD(x)
Aggregations‐operatoren
12.10.2011 – Rio Claro, Brazil

39
Inferenz
3. Akkumulation:
Es existieren oft mehrere Regeln mit derselben Konklusion (z.B. „Klasse 1"), aber mit unterschiedlichen Erfülltheitsgrad. Daher müssen die verschiedenen Erfülltheitsgrade der Regeln zu einem Gesamterfülltheitsgrad zusammengefasst werden.
Die Auswertung jeder zutreffenden Regel (Inferenzschritt) besteht aus drei Schritten
Maximum: max [µA(x), µB(x), µC(x), µD(x)]Algeb. Summe: [µA(x) + µB(x) + µC(x) + µD(x)] - µA(x) × µB(x) × µC(x) × µD(x)
Akkumulations‐operatoren
12.10.2011 – Rio Claro, Brazil