Embed Size (px)
Citation preview
Published and distributed by:
The Victorian Women’s TrustLevel 1, 388 Bourke StMelbourne VIC 3000 Australia
Telephone: (03) 9642 0422Outside Melbourne: 1300 739 756Facsimile: (03) 9642 0016 Email: [email protected]
www.vwt.org.au
www.watermarkaustralia.org.au
© Victorian Women’s Trust 2007
10 9 8 7 6 5 4 3 2 1
This document has been produced as a not-for-profit community resource. Reproduction for the purposes of study and discussion is permitted, however the source must be acknowledged. No financial gain should be made from the distribution of this document by any individual or organisation.
ISBN 978-0-646-47561-5
Graphic Design: Jacquie Moon [email protected]
Printed by: Print Bound [email protected]
This document has been printed by Print Bound, a commercial printing company based in Blackburn, Victoria. Company Director Mark Tomasini and Managing Director Mauro Mattarucco embarked on a significant project to improve the environmental sustainability of their printing business. Their aim was to create a culture of environmental awareness amongst employees, clients and suppliers, to improve the reputation of the print industry for poor environmental practices by educating and supporting all consumers of paper and print, and to aim to be a leader in the print industry by ensuring all staff adopted 100 per cent commitment to this project.
The business uses the most modern and effective technology available to reduce carbon emissions, eliminate the release of toxins and pollutants, significantly reduce water and energy usage and use sustainable energy sources. Since developing this programme, dedicated to reducing its environmental impact, Print Bound has cut its energy consumption by 40 per cent, replaced 80 per cent of ink tins with recyclable cartons, and cut the use of air pollutants from 12 per cent to five per cent.
Three human lifetimes – about 214 years – is simply not long enough to become truly adapted to Australia’s unique conditions, for the process of co-evolving with the land is slow and uncertain. Yet it has begun, and the transformation must be completed, for if we continue to live as strangers in this land – failing to understand it or live by its ecological dictums – we will forfeit our long-term future here by destroying the ability of Australia to support us.
Tim Flannery, 2002 Australia Day Address
While many individuals and organisations have supported the inception and progress of the Watermark Australia Project, the responsibility for the contents and conclusions of this document rests entirely with the Victorian Women’s Trust.
In this document, many of the illustrations and examples depict the situation in Victoria. However, most of the data are national and all of the proposed actions have national relevance and focus on national opportunities.
Web research played an important role in compiling this document. We have cited the addresses as accurately as possible. We recognise, however, that information may be removed as these websites are revised and updated. If this is the case, we suggest that readers contact the relevant organisation.

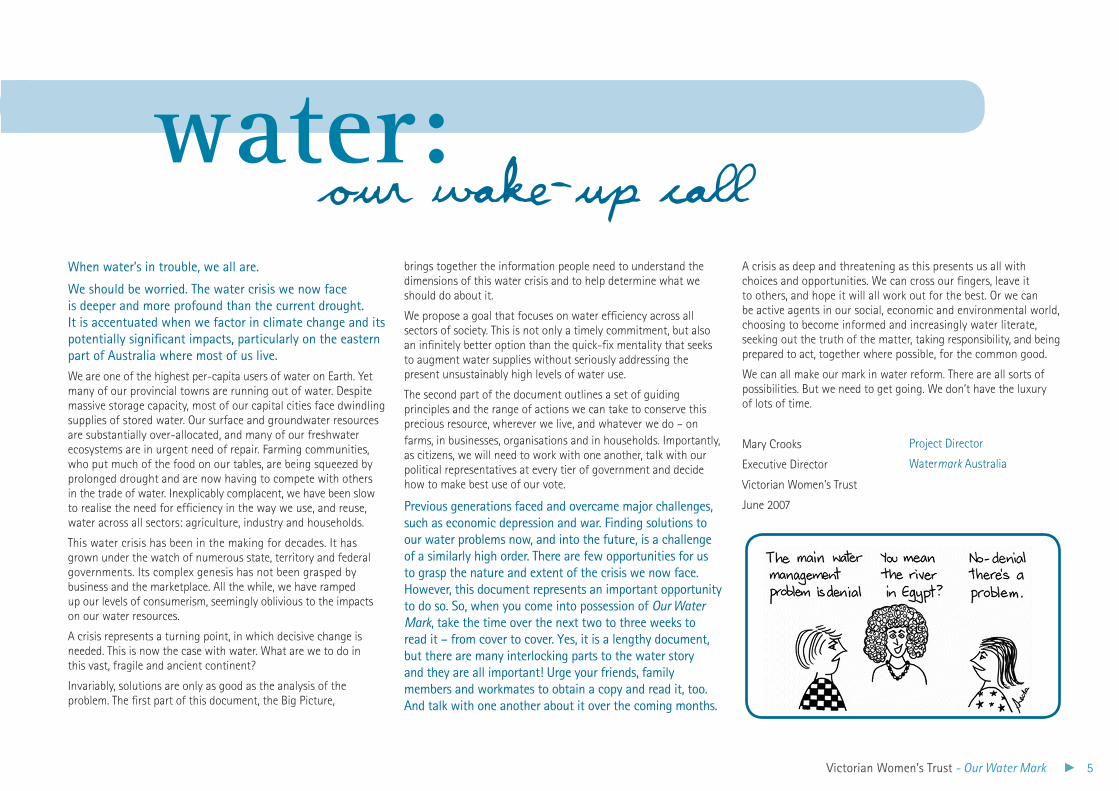
When water’s in trouble, we all are.
We should be worried. The water crisis we now face is deeper and more profound than the current drought. It is accentuated when we factor in climate change and its potentially significant impacts, particularly on the eastern part of Australia where most of us live. We are one of the highest per-capita users of water on Earth. Yet many of our provincial towns are running out of water. Despite massive storage capacity, most of our capital cities face dwindling supplies of stored water. Our surface and groundwater resources are substantially over-allocated, and many of our freshwater ecosystems are in urgent need of repair. Farming communities, who put much of the food on our tables, are being squeezed by prolonged drought and are now having to compete with others in the trade of water. Inexplicably complacent, we have been slow to realise the need for efficiency in the way we use, and reuse, water across all sectors: agriculture, industry and households.
This water crisis has been in the making for decades. It has grown under the watch of numerous state, territory and federal governments. Its complex genesis has not been grasped by business and the marketplace. All the while, we have ramped up our levels of consumerism, seemingly oblivious to the impacts on our water resources.
A crisis represents a turning point, in which decisive change is needed. This is now the case with water. What are we to do in this vast, fragile and ancient continent?
Invariably, solutions are only as good as the analysis of the problem. The first part of this document, the Big Picture,
brings together the information people need to understand the dimensions of this water crisis and to help determine what we should do about it.
We propose a goal that focuses on water efficiency across all sectors of society. This is not only a timely commitment, but also an infinitely better option than the quick-fix mentality that seeks to augment water supplies without seriously addressing the present unsustainably high levels of water use.
The second part of the document outlines a set of guiding principles and the range of actions we can take to conserve this precious resource, wherever we live, and whatever we do – on farms, in businesses, organisations and in households. Importantly, as citizens, we will need to work with one another, talk with our political representatives at every tier of government and decide how to make best use of our vote.
Previous generations faced and overcame major challenges, such as economic depression and war. Finding solutions to our water problems now, and into the future, is a challenge of a similarly high order. There are few opportunities for us to grasp the nature and extent of the crisis we now face. However, this document represents an important opportunity to do so. So, when you come into possession of Our Water Mark, take the time over the next two to three weeks to read it – from cover to cover. Yes, it is a lengthy document, but there are many interlocking parts to the water story and they are all important! Urge your friends, family members and workmates to obtain a copy and read it, too. And talk with one another about it over the coming months.
A crisis as deep and threatening as this presents us all with choices and opportunities. We can cross our fingers, leave it to others, and hope it will all work out for the best. Or we can be active agents in our social, economic and environmental world, choosing to become informed and increasingly water literate, seeking out the truth of the matter, taking responsibility, and being prepared to act, together where possible, for the common good.
We can all make our mark in water reform. There are all sorts of possibilities. But we need to get going. We don’t have the luxury of lots of time.
Mary Crooks
Executive Director
Victorian Women’s Trust
June 2007
our wake-up callwater:
Project Director
Watermark Australia
Victorian Women’s Trust - Our Water Mark 5
2 Victorian Women’s Trust - Our Water Mark
Victorian Women’s Trust - Our Water Mark 7
******renumber*******contentsWater: Our Wake-up Call 3Introduction 8Part One The Big Picture 11 The Water Cycle 12
Global Fresh Water 14
The Water Cycle in Australia 17
Variability 19
Rainfall 21
Surface Water 27
Groundwater 33
Forests & Fires 37
Severe Drought 41
Water & the Environment 45
Our Footprint 50
Agriculture 56
Households 60
Business & Industry 63
Waste(d) Water 65
Stormwater 68
Climate Change 70
Population & Economy 73
Water as a Common Good 77
Problems with Management 87
The Motivation to Act 92
Part Two The Way Forward 95 A National Goal 95 20 Principles Guiding Water Reform 96
Part Three Becoming Super-Efficient Water Users 101 What People in Business & Organisations Can Do 103
What People on the Land Can Do 115
Irrigators 116
Dryland Farmers 122
Rural Lifestyle Landholders 127
What People in Households Can Do 133
What People & Government Can Do 143
Part Four Building Community Momentum 152
Part Five Glossary 153
Acknowledgements 157
Appendix One A Closing Reflection 160
Appendix Two Postcodes of Watermark Australia Project groups 162
8 Victorian Women’s Trust - Our Water Mark
At last water is on everyone’s lips! In late 2006 the tide suddenly turned. Political debate took on a new edge and now the Federal and state governments are at pains to demonstrate their attention to the issue. Talkback radio is inundated with callers concerned about water, newspapers report on the water issue almost daily and water is the topic of conversation around the dinner table, in workplaces and on the streets. The prolonged dry spell that country people have been aware of for years starts to worry city people.
Intuitively, we know that we are everything with water and nothing without it. What we understand less well are the myriad ways we rely on water for every aspect of our lives: our health and wellbeing; our economy; the food we eat; the health of our ecosystems; and the livability of our cities.
WATEr lITErACy hOlDS ThE kEyOur society places great importance on literacy. It holds the key to the way we create, and make the most of, the challenges and opportunities we face in our lives. In much the same way, raising the level of water literacy is crucial to bringing about effective water reform.
Widespread attitudinal and behavioural change will become much more likely when people learn first hand the nature and extent of our water crisis. Once equipped with this knowledge, they can then direct their good intentions towards positive action.
We need to come to grips with the state of our water resources and what has been happening to them over time. We need to move beyond a superficial knowledge of water – such as knowing the water levels in our dams, or which towns are on what level of water restrictions – to understanding the big picture of water in this country. But how do we construct the bigger picture? We can’t simply rely on government-provided information (which tends to be treated with suspicion, in any case). And governments have not generally done a good job of informing us – apparently assuming that block ads on television are sufficient.
In piecing together the big picture, we need to look at the true extent of water use in this country, as well as the relationship between population growth and the competing demands for water. We need to appreciate the extent to which we have degraded our freshwater ecosystems, our rivers and streams, and depleted and degraded our groundwater supplies. We need to know the amount of water required to feed us and produce our exports, and how much water is embodied in our consumption of material goods and our urban-centred lifestyles.
We should all be aware that policy parameters have been set at national and state levels that will significantly shape the course of things to come. We especially need to understand the changes now being brought about by permanent water trading and the creation of a national market for water. In the face of these changes, we should be asking ourselves questions such as:
How will social equity fare in a national water market?•
Will environmental stewardship be promoted? •
Will true water efficiency be achieved? •
Can we be confident that the introduction of permanent •water trading is an appropriate arrangement as we head into an uncertain water future?
our water mark
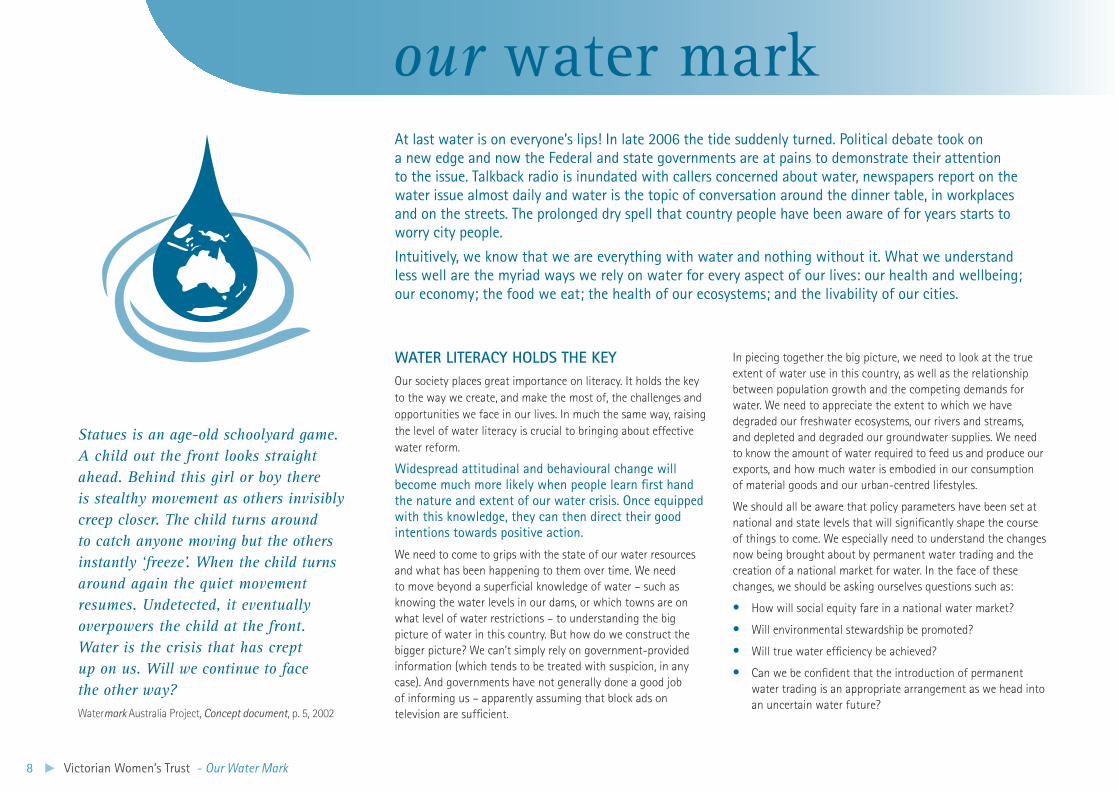
Statues is an age-old schoolyard game. A child out the front looks straight ahead. Behind this girl or boy there is stealthy movement as others invisibly creep closer. The child turns around to catch anyone moving but the others instantly ‘freeze’. When the child turns around again the quiet movement resumes. Undetected, it eventually overpowers the child at the front. Water is the crisis that has crept up on us. Will we continue to face the other way?Watermark Australia Project, Concept document, p. 5, 2002
Victorian Women’s Trust - Our Water Mark 9
Understanding this bigger picture better places us to scope the things we can all do. It helps us to identify the important principles we ought to work by and it helps us find points of entry into debates about water. It prompts us to initiate actions to make a real difference in our households, local communities and institutions, and on our farms. On another level, we can play a stronger role in shaping how our political institutions respond to this crisis.
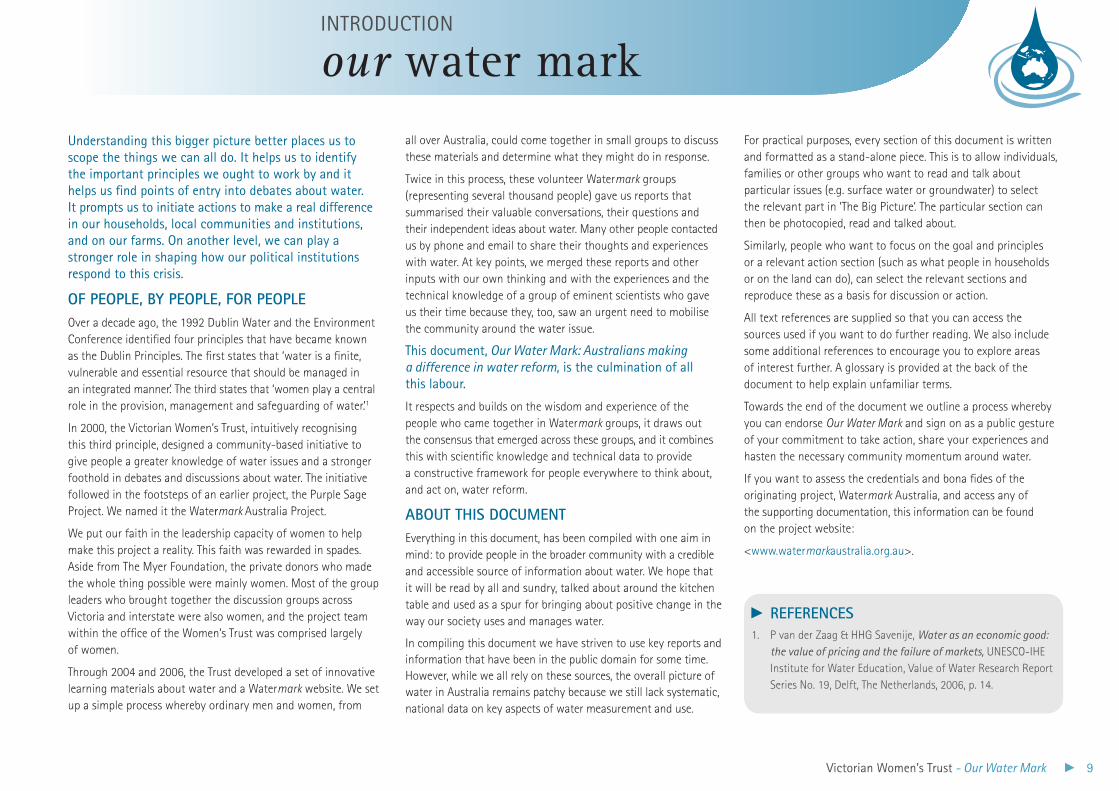
OF PEOPlE, By PEOPlE, FOr PEOPlEOver a decade ago, the 1992 Dublin Water and the Environment Conference identified four principles that have became known as the Dublin Principles. The first states that ‘water is a finite, vulnerable and essential resource that should be managed in an integrated manner.’ The third states that ‘women play a central role in the provision, management and safeguarding of water.’1
In 2000, the Victorian Women’s Trust, intuitively recognising this third principle, designed a community-based initiative to give people a greater knowledge of water issues and a stronger foothold in debates and discussions about water. The initiative followed in the footsteps of an earlier project, the Purple Sage Project. We named it the Watermark Australia Project.
We put our faith in the leadership capacity of women to help make this project a reality. This faith was rewarded in spades. Aside from The Myer Foundation, the private donors who made the whole thing possible were mainly women. Most of the group leaders who brought together the discussion groups across Victoria and interstate were also women, and the project team within the office of the Women’s Trust was comprised largely of women.
Through 2004 and 2006, the Trust developed a set of innovative learning materials about water and a Watermark website. We set up a simple process whereby ordinary men and women, from
all over Australia, could come together in small groups to discuss these materials and determine what they might do in response.
Twice in this process, these volunteer Watermark groups (representing several thousand people) gave us reports that summarised their valuable conversations, their questions and their independent ideas about water. Many other people contacted us by phone and email to share their thoughts and experiences with water. At key points, we merged these reports and other inputs with our own thinking and with the experiences and the technical knowledge of a group of eminent scientists who gave us their time because they, too, saw an urgent need to mobilise the community around the water issue.
This document, Our Water Mark: Australians making a difference in water reform, is the culmination of all this labour.
It respects and builds on the wisdom and experience of the people who came together in Watermark groups, it draws out the consensus that emerged across these groups, and it combines this with scientific knowledge and technical data to provide a constructive framework for people everywhere to think about, and act on, water reform.
ABOUT ThIS DOCUMENTEverything in this document, has been compiled with one aim in mind: to provide people in the broader community with a credible and accessible source of information about water. We hope that it will be read by all and sundry, talked about around the kitchen table and used as a spur for bringing about positive change in the way our society uses and manages water.
In compiling this document we have striven to use key reports and information that have been in the public domain for some time. However, while we all rely on these sources, the overall picture of water in Australia remains patchy because we still lack systematic, national data on key aspects of water measurement and use.
our water markINTRODUCTION
For practical purposes, every section of this document is written and formatted as a stand-alone piece. This is to allow individuals, families or other groups who want to read and talk about particular issues (e.g. surface water or groundwater) to select the relevant part in ‘The Big Picture’. The particular section can then be photocopied, read and talked about.
Similarly, people who want to focus on the goal and principles or a relevant action section (such as what people in households or on the land can do), can select the relevant sections and reproduce these as a basis for discussion or action.
All text references are supplied so that you can access the sources used if you want to do further reading. We also include some additional references to encourage you to explore areas of interest further. A glossary is provided at the back of the document to help explain unfamiliar terms.
Towards the end of the document we outline a process whereby you can endorse Our Water Mark and sign on as a public gesture of your commitment to take action, share your experiences and hasten the necessary community momentum around water.
If you want to assess the credentials and bona fides of the originating project, Watermark Australia, and access any of the supporting documentation, this information can be found on the project website:
<www.watermarkaustralia.org.au>.
rEFErENCESP van der Zaag & HHG Savenije, 1. Water as an economic good: the value of pricing and the failure of markets, UNESCO-IHE Institute for Water Education, Value of Water Research Report Series No. 19, Delft, The Netherlands, 2006, p. 14.

Victorian Women’s Trust - Our Water Mark 11
No problem can be solved from the same consciousness that created it. Albert Einstein
Many people have opinions on the water issue, but uninformed opinions are not a good basis for action. Actions should stem from real knowledge of the state of our water resources. Such knowledge helps make sense of many of the things we may have noticed or heard about water, and it provides a stronger framework for thinking about the issues and deciding what we might do in response.
We can glean some of this knowledge from our daily sources of news and information. But accessing key sources of information is problematic because key reports and data remain scattered and unintegrated. We are unlikely to have the time to hunt these down – let alone pore over them in our spare time.
Our first task in creating this document has been to assemble a coherent and integrated account of what has been happening to our water resources. Clearly, however, much more could be said about the issues touched on here.
We have tried to present a workable essence rather than a complete picture. Each of the 20 or so parts of the ‘Big Picture’ is identified with a single jigsaw piece. They are a part of a larger picture – part of the water puzzle.
In each of these parts, you will notice in the banner at the top of the page an introductory comment within inverted commas. This is us – the authors – talking. It’s our way of presenting a thematic commentary on the section as a whole.
We have arranged the parts in a logical sequence. Each treatment follows a formula of insightful quotes, key text, important diagrams and tables, text references and suggested further reading. Although we have deliberately refrained from interspersing the text with diagrams and tables, we do present key statistics within the body of the text.
PART ONE
big picturethe
We believe that educating at a grass-roots level, to give everybody an understanding of the water crisis, is essential if we are to change attitudes to individual, family, community, industrial and agricultural water use.East Melbourne Watermark Australia group
12 Victorian Women’s Trust - Our Water Mark
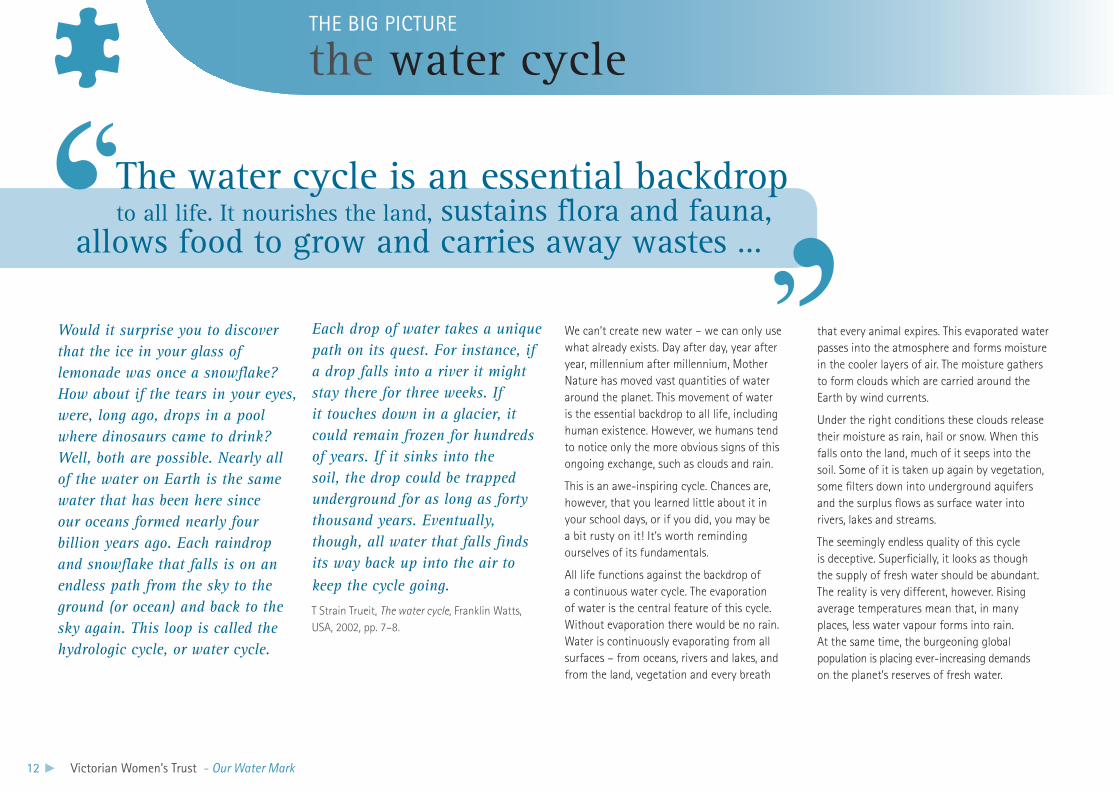
The water cycle is an essential backdrop to all life. It nourishes the land, sustains flora and fauna,
allows food to grow and carries away wastes …
Would it surprise you to discover that the ice in your glass of lemonade was once a snowflake? How about if the tears in your eyes, were, long ago, drops in a pool where dinosaurs came to drink? Well, both are possible. Nearly all of the water on Earth is the same water that has been here since our oceans formed nearly four billion years ago. Each raindrop and snowflake that falls is on an endless path from the sky to the ground (or ocean) and back to the sky again. This loop is called the hydrologic cycle, or water cycle.
Each drop of water takes a unique path on its quest. For instance, if a drop falls into a river it might stay there for three weeks. If it touches down in a glacier, it could remain frozen for hundreds of years. If it sinks into the soil, the drop could be trapped underground for as long as forty thousand years. Eventually, though, all water that falls finds its way back up into the air to keep the cycle going.
T Strain Trueit, The water cycle, Franklin Watts, USA, 2002, pp. 7–8.
We can’t create new water – we can only use what already exists. Day after day, year after year, millennium after millennium, Mother Nature has moved vast quantities of water around the planet. This movement of water is the essential backdrop to all life, including human existence. However, we humans tend to notice only the more obvious signs of this ongoing exchange, such as clouds and rain.
This is an awe-inspiring cycle. Chances are, however, that you learned little about it in your school days, or if you did, you may be a bit rusty on it! It’s worth reminding ourselves of its fundamentals.
All life functions against the backdrop of a continuous water cycle. The evaporation of water is the central feature of this cycle. Without evaporation there would be no rain. Water is continuously evaporating from all surfaces – from oceans, rivers and lakes, and from the land, vegetation and every breath
that every animal expires. This evaporated water passes into the atmosphere and forms moisture in the cooler layers of air. The moisture gathers to form clouds which are carried around the Earth by wind currents.
Under the right conditions these clouds release their moisture as rain, hail or snow. When this falls onto the land, much of it seeps into the soil. Some of it is taken up again by vegetation, some filters down into underground aquifers and the surplus flows as surface water into rivers, lakes and streams.
The seemingly endless quality of this cycle is deceptive. Superficially, it looks as though the supply of fresh water should be abundant. The reality is very different, however. Rising average temperatures mean that, in many places, less water vapour forms into rain. At the same time, the burgeoning global population is placing ever-increasing demands on the planet’s reserves of fresh water.
the water cycleTHe BIg PICTURe
Victorian Women’s Trust - Our Water Mark 13
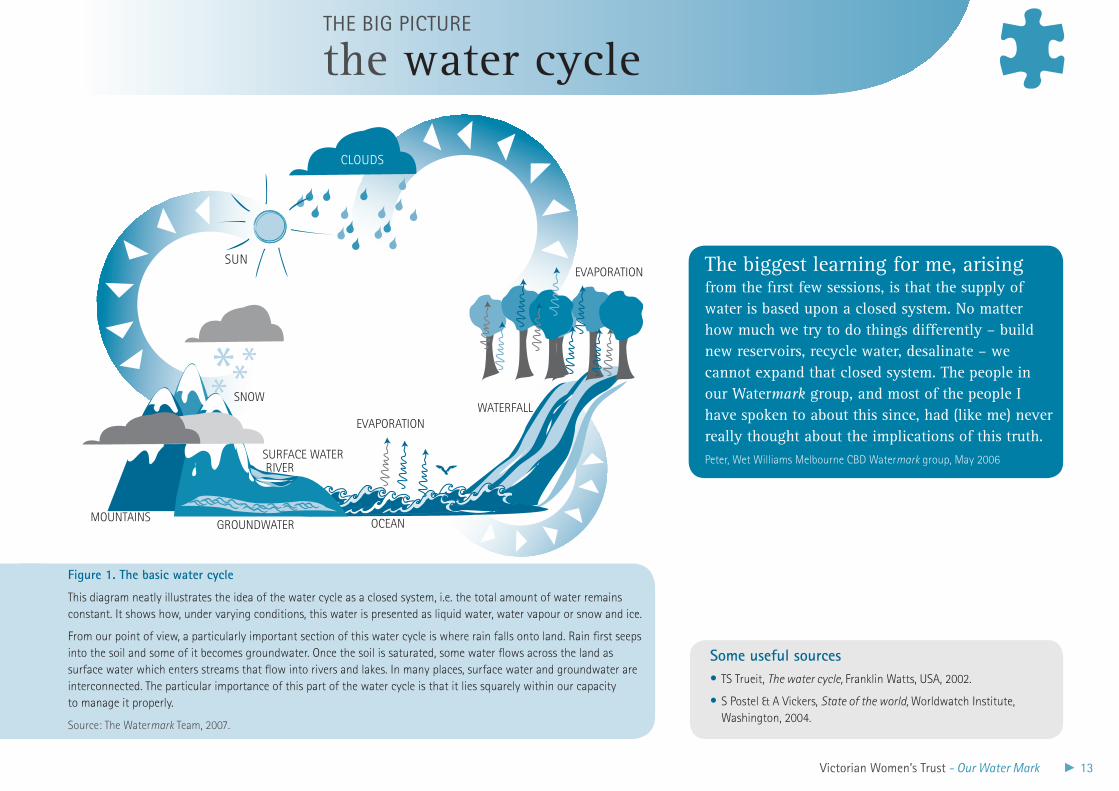
Figure 1. The basic water cycle
This diagram neatly illustrates the idea of the water cycle as a closed system, i.e. the total amount of water remains constant. It shows how, under varying conditions, this water is presented as liquid water, water vapour or snow and ice.
From our point of view, a particularly important section of this water cycle is where rain falls onto land. Rain first seeps into the soil and some of it becomes groundwater. Once the soil is saturated, some water flows across the land as surface water which enters streams that flow into rivers and lakes. In many places, surface water and groundwater are interconnected. The particular importance of this part of the water cycle is that it lies squarely within our capacity to manage it properly.
Source: The Watermark Team, 2007.
Some useful sourcesTS Trueit, • The water cycle, Franklin Watts, USA, 2002.
S Postel & A Vickers, • State of the world, Worldwatch Institute, Washington, 2004.
The biggest learning for me, arising from the first few sessions, is that the supply of water is based upon a closed system. No matter how much we try to do things differently – build new reservoirs, recycle water, desalinate – we cannot expand that closed system. The people in our Watermark group, and most of the people I have spoken to about this since, had (like me) never really thought about the implications of this truth.Peter, Wet Williams Melbourne CBD Watermark group, May 2006
the water cycleTHe BIg PICTURe
CLOUDS
SUN
EVAPORATION
SURFACE WATER
GROUNDWATER
EVAPORATION
WATERFALLSNOW
MOUNTAINS OCEAN
RIVER
14 Victorian Women’s Trust - Our Water Mark
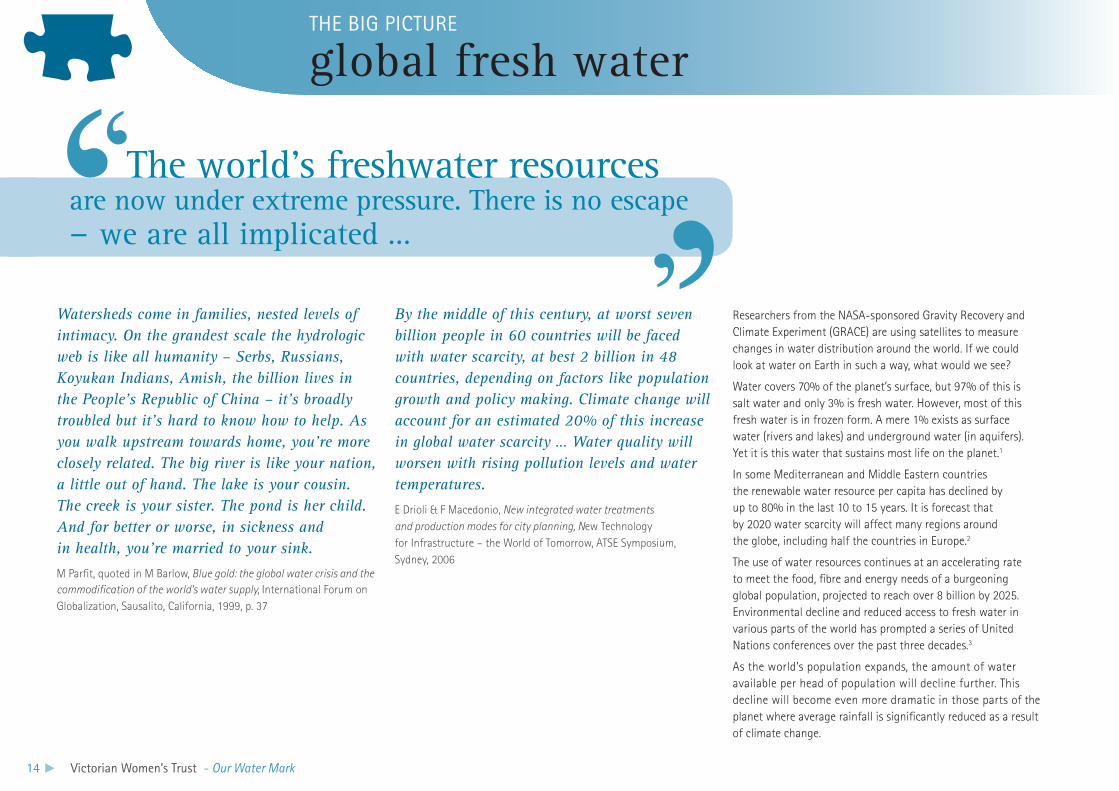
The world’s freshwater resources
are now under extreme pressure. There is no escape – we are all implicated …
Watersheds come in families, nested levels of intimacy. On the grandest scale the hydrologic web is like all humanity – Serbs, Russians, Koyukan Indians, Amish, the billion lives in the People’s Republic of China – it’s broadly troubled but it’s hard to know how to help. As you walk upstream towards home, you’re more closely related. The big river is like your nation, a little out of hand. The lake is your cousin. The creek is your sister. The pond is her child. And for better or worse, in sickness and in health, you’re married to your sink.
M Parfit, quoted in M Barlow, Blue gold: the global water crisis and the commodification of the world’s water supply, International Forum on Globalization, Sausalito, California, 1999, p. 37
By the middle of this century, at worst seven billion people in 60 countries will be faced with water scarcity, at best 2 billion in 48 countries, depending on factors like population growth and policy making. Climate change will account for an estimated 20% of this increase in global water scarcity … Water quality will worsen with rising pollution levels and water temperatures.
E Drioli & F Macedonio, New integrated water treatments and production modes for city planning, New Technology for Infrastructure – the World of Tomorrow, ATSE Symposium, Sydney, 2006
Researchers from the NASA-sponsored Gravity Recovery and Climate Experiment (GRACE) are using satellites to measure changes in water distribution around the world. If we could look at water on Earth in such a way, what would we see?
Water covers 70% of the planet’s surface, but 97% of this is salt water and only 3% is fresh water. However, most of this fresh water is in frozen form. A mere 1% exists as surface water (rivers and lakes) and underground water (in aquifers). Yet it is this water that sustains most life on the planet.1
In some Mediterranean and Middle Eastern countries the renewable water resource per capita has declined by up to 80% in the last 10 to 15 years. It is forecast that by 2020 water scarcity will affect many regions around the globe, including half the countries in Europe.2
The use of water resources continues at an accelerating rate to meet the food, fibre and energy needs of a burgeoning global population, projected to reach over 8 billion by 2025. Environmental decline and reduced access to fresh water in various parts of the world has prompted a series of United Nations conferences over the past three decades.3
As the world’s population expands, the amount of water available per head of population will decline further. This decline will become even more dramatic in those parts of the planet where average rainfall is significantly reduced as a result of climate change.
global fresh waterTHe BIg PICTURe
Victorian Women’s Trust - Our Water Mark 15
The situation is somewhat different in the developed world, where industrial products and wastes, such as mercury, cadmium, insecticides and solvents, contaminate both surface water and groundwater reserves.
In Canada, despite past regulatory controls, Lake Ontario continues to be contaminated by toxic pollutants.6 In the USA in 2001–02, 31 waterborne disease outbreaks were reported across 19 states, causing seven deaths and illness in 1020 people.7 On the Australian mainland we have problems with saline, nitrate and pesticide contamination of groundwater.
But scarcity is not the only issue. There are major problems with water quality, too. Fresh water in many parts of the world is contaminated. In developing countries, significant numbers of people die from waterborne bacterial illnesses each year.4 Of the estimated 13 million people who die from such infections, 2 million are children. In Bangladesh, 28 to 35 million people drink water containing elevated levels of arsenic. Our nearest neighbour, East Timor, has high infant and under-five mortality rates brought about by diarrhoea and respiratory infections caused by contaminated water.5
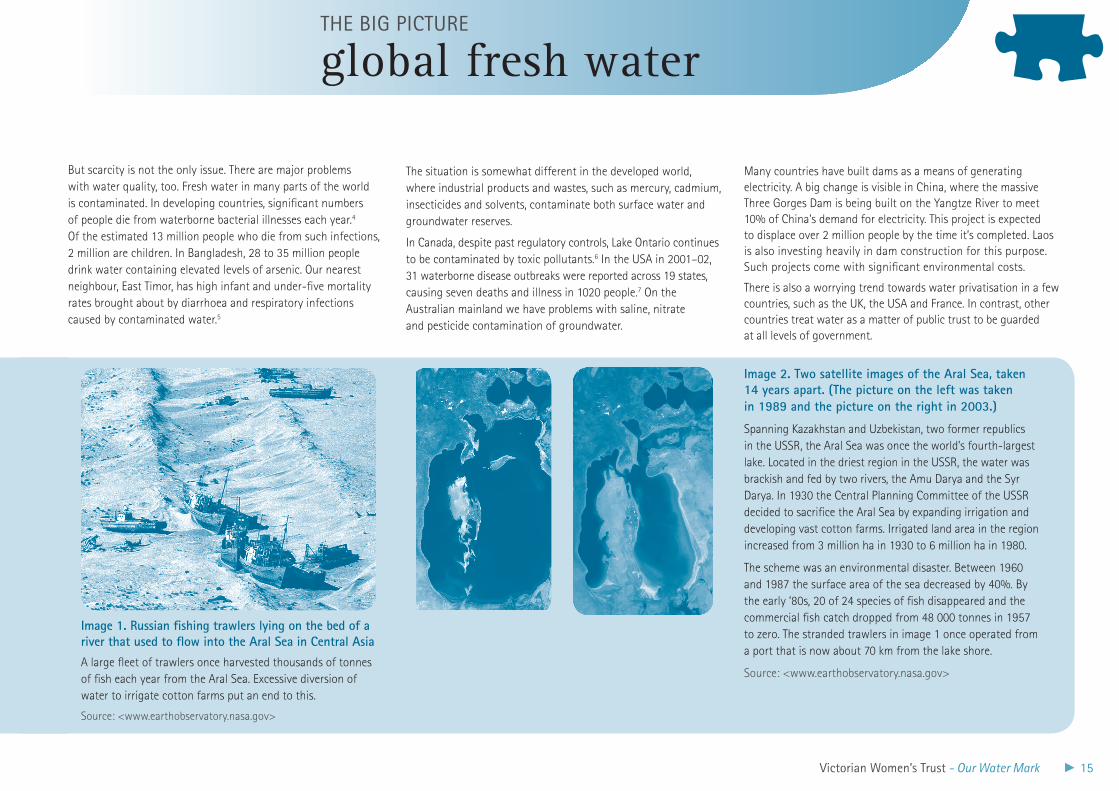
Image 1. russian fishing trawlers lying on the bed of a river that used to flow into the Aral Sea in Central AsiaA large fleet of trawlers once harvested thousands of tonnes of fish each year from the Aral Sea. Excessive diversion of water to irrigate cotton farms put an end to this.
Source: <www.earthobservatory.nasa.gov>
Image 2. Two satellite images of the Aral Sea, taken 14 years apart. (The picture on the left was taken in 1989 and the picture on the right in 2003.)
Spanning Kazakhstan and Uzbekistan, two former republics in the USSR, the Aral Sea was once the world’s fourth-largest lake. Located in the driest region in the USSR, the water was brackish and fed by two rivers, the Amu Darya and the Syr Darya. In 1930 the Central Planning Committee of the USSR decided to sacrifice the Aral Sea by expanding irrigation and developing vast cotton farms. Irrigated land area in the region increased from 3 million ha in 1930 to 6 million ha in 1980.
The scheme was an environmental disaster. Between 1960 and 1987 the surface area of the sea decreased by 40%. By the early ‘80s, 20 of 24 species of fish disappeared and the commercial fish catch dropped from 48 000 tonnes in 1957 to zero. The stranded trawlers in image 1 once operated from a port that is now about 70 km from the lake shore.
Source: <www.earthobservatory.nasa.gov>
Many countries have built dams as a means of generating electricity. A big change is visible in China, where the massive Three Gorges Dam is being built on the Yangtze River to meet 10% of China’s demand for electricity. This project is expected to displace over 2 million people by the time it’s completed. Laos is also investing heavily in dam construction for this purpose. Such projects come with significant environmental costs.
There is also a worrying trend towards water privatisation in a few countries, such as the UK, the USA and France. In contrast, other countries treat water as a matter of public trust to be guarded at all levels of government.
global fresh waterTHe BIg PICTURe
16 Victorian Women’s Trust - Our Water Mark
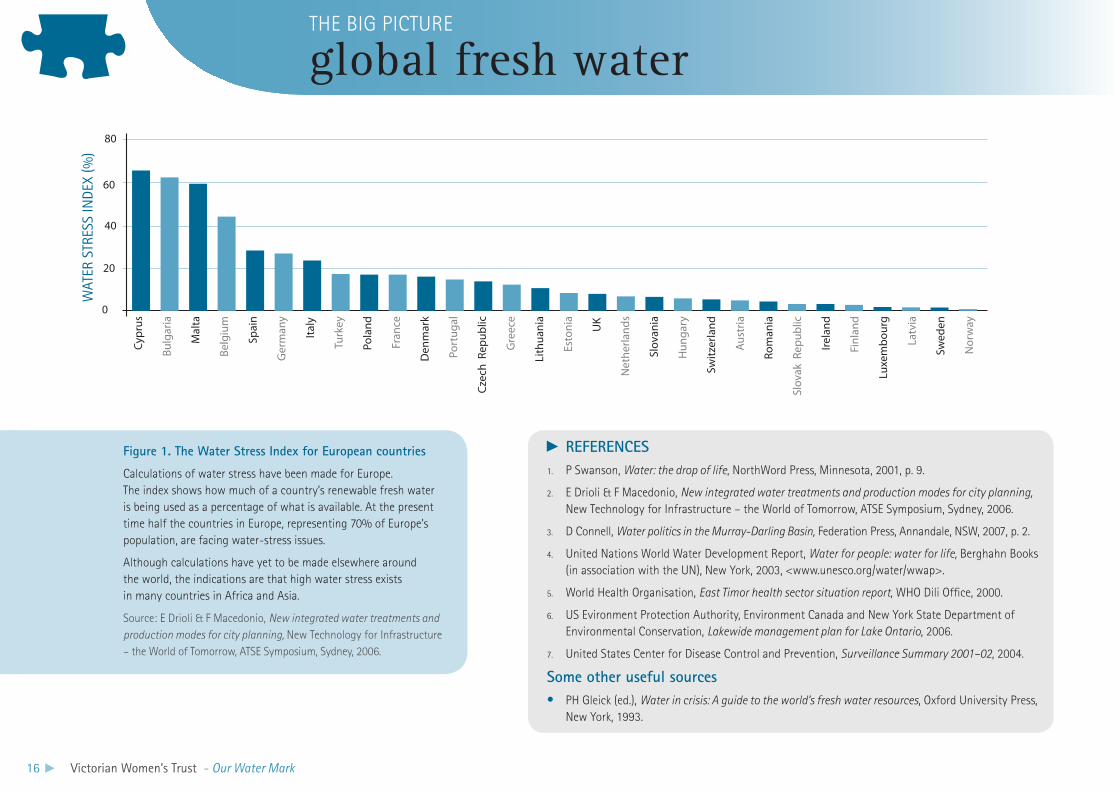
Figure 1. The Water Stress Index for European countries
Calculations of water stress have been made for Europe. The index shows how much of a country’s renewable fresh water is being used as a percentage of what is available. At the present time half the countries in Europe, representing 70% of Europe’s population, are facing water-stress issues.
Although calculations have yet to be made elsewhere around the world, the indications are that high water stress exists in many countries in Africa and Asia.
Source: E Drioli & F Macedonio, New integrated water treatments and production modes for city planning, New Technology for Infrastructure – the World of Tomorrow, ATSE Symposium, Sydney, 2006.
rEFErENCESP Swanson, 1. Water: the drop of life, NorthWord Press, Minnesota, 2001, p. 9.
E Drioli & F Macedonio, 2. New integrated water treatments and production modes for city planning, New Technology for Infrastructure – the World of Tomorrow, ATSE Symposium, Sydney, 2006.
D Connell, 3. Water politics in the Murray-Darling Basin, Federation Press, Annandale, NSW, 2007, p. 2.
United Nations World Water Development Report, 4. Water for people: water for life, Berghahn Books (in association with the UN), New York, 2003, <www.unesco.org/water/wwap>.
World Health Organisation, 5. East Timor health sector situation report, WHO Dili Office, 2000.
US Evironment Protection Authority, Environment Canada and New York State Department of 6.
Environmental Conservation, Lakewide management plan for Lake Ontario, 2006.
United States Center for Disease Control and Prevention, 7. Surveillance Summary 2001–02, 2004.
Some other useful sourcesPH Gleick (ed.), • Water in crisis: A guide to the world’s fresh water resources, Oxford University Press, New York, 1993.
global fresh waterTHE BIG PICTURE
Wat
er S
tres
s In
dex
(%)
0
20
40
60
80Cy
prus
Bulg
aria
Fran
ce
Den
mar
k
Port
ugal
Czec
h R
epub
lic
Gre
ece
Lith
uani
a
Switz
erla
nd
Hun
gary
Slov
ania
Net
herla
nds
UK
Esto
nia
Luxe
mbo
urg
Latv
ia
Nor
way
Swed
en
Finl
and
Irela
nd
Slov
ak R
epub
lic
Rom
ania
Aust
ria
Mal
ta
Belg
ium
Spai
n
Ger
man
y
Italy
Turk
ey
Pola
nd
WAT
eR S
TReS
S IN
DeX
(%)
Victorian Women’s Trust - Our Water Mark 17
This global water cycle affects countries in different ways. Such is the vastness of the Australian land mass, that we can experience the monsoons of Asia, the deserts of North Africa – and everything in between …
the water cycle in Australia
This part of it that we saw is all low even Land, with sandy banks against the Sea, only the points are rocky, and so are some of the islands in this Bay. The Land is of a dry sandy soil and destitute of Water, except you make wells.
William Dampier, A new voyage around the world, 1689
We live on the world’s driest and flattest inhabited continent with the lowest percentage of rainfall reaching our rivers as runoff, the lowest amount of water found in our rivers and the smallest surface area of permanent wetlands.
Australia is the largest continental land mass in the southern hemisphere, spanning several climatic zones. A tropical region extends across the top of the continent, from the tip of Cape York as far south as Mackay in Queensland, while on the west coast it extends south from Cape Londonderry to Broome. This tropical region features monsoonal rainfall and cyclonic storms.
Below this, on the east coast, a subtropical zone extends as far south as Coffs Harbour in NSW. The zone extends about 400 km inland and sub-tropical storms occur but no cyclonic
activity. On the west coast, the subtropical zone extends south to Carnarvon in Western Australia and east to around Roma in Queensland. However, this region is very dry.
South of the subtropical zone is a warm-temperate climate zone. This extends to the southern tip of Tasmania and features the widest annual temperature range, with frosts and snowfalls occurring in some areas. On the west coast the warm-temperate zone extends south to Esperance.1
Much of inland Australia is either arid or desert. Arid lands are classified as those receiving less than 200 mm of precipitation annually. Over 50% of Australia receives less than 500 mm. Over 80% receives less than 600 mm (about 20 inches in the old language).2
I love a sunburnt country, A land of sweeping plains, Of ragged mountain ranges, Of droughts and flooding rains. I love her far horizons, I love her jewel-sea, Her beauty and her terror – The wide brown land for me!
Dorothea McKellar, My country, 1904
THE BIG PICTURE
18 Victorian Women’s Trust - Our Water Mark
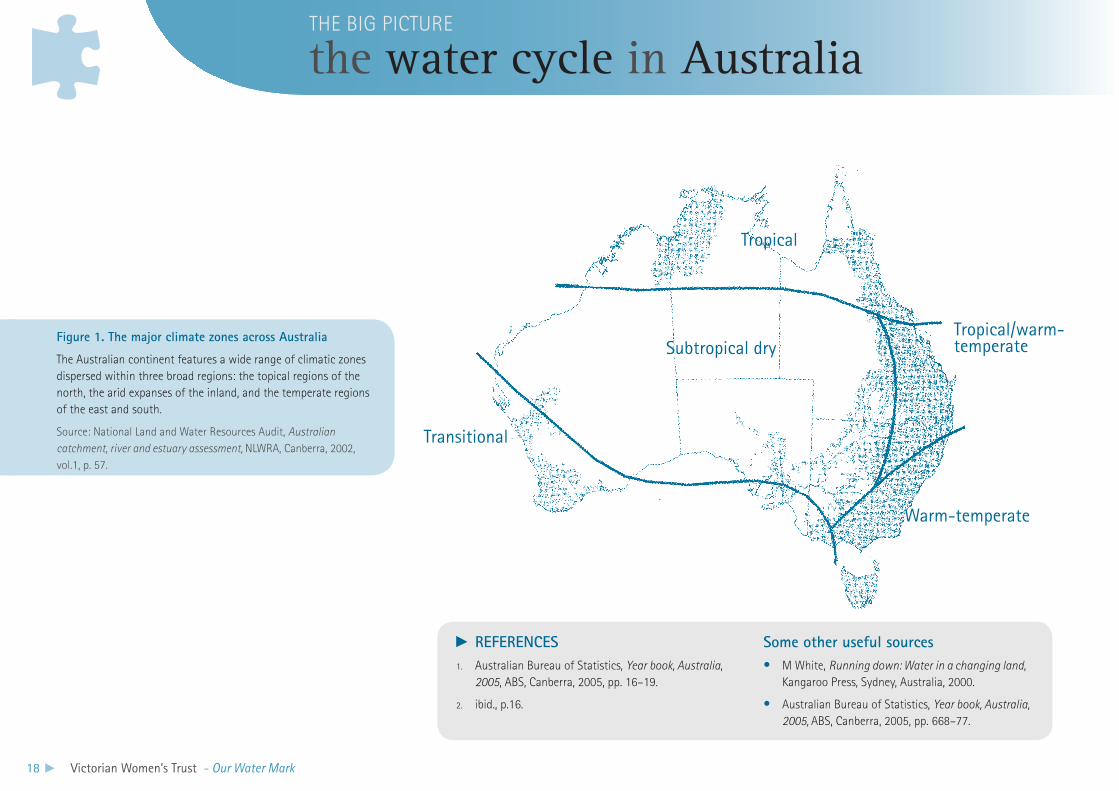
Figure 1. The major climate zones across Australia
The Australian continent features a wide range of climatic zones dispersed within three broad regions: the topical regions of the north, the arid expanses of the inland, and the temperate regions of the east and south.
Source: National Land and Water Resources Audit, Australian catchment, river and estuary assessment, NLWRA, Canberra, 2002, vol.1, p. 57.
rEFErENCESAustralian Bureau of Statistics, 1. Year book, Australia, 2005, ABS, Canberra, 2005, pp. 16–19.
ibid., p.16.2.
Some other useful sourcesM White, • Running down: Water in a changing land, Kangaroo Press, Sydney, Australia, 2000.
Australian Bureau of Statistics, • Year book, Australia, 2005, ABS, Canberra, 2005, pp. 668–77.
the water cycle in AustraliaTHE BIG PICTURE
Warm-temperate
Tropical
Tropical/warm- temperateSubtropical dry
Transitional
Victorian Women’s Trust - Our Water Mark 19
Our rainfall and stream flows are highly variable. This variability will increase with predicted climate change …
This climatic unpredictability is something that no-one can change and with which we must learn to co-operate. To have any hope of succeeding we have to have a wide vision, see the ‘big picture’ and understand the co-evolution of this continent, its water resources and its biota through geological time.Mary White, Running down: Water in a changing land, Kangaroo Press, Australia, 2000, p. 1.
Australia has the greatest rainfall variability of any country in the world. We are captive to this variability. Indigenous Australians have known for thousands of years that Australia’s rainfall is highly variable. Yet from European settlement onwards, this variability has confronted and bewildered us. Understanding this variability is the key to understanding how we have managed our water resources.
Australia’s climatic variability is captured in its extremes: from monsoonal patterns in its tropical north to desert areas where no real rain falls for years (and yet where flash floods periodically
occur, miraculously bringing these arid areas to life). There are places in our warm-temperate zone where summer temperatures soar over 40°C, while winter temperatures fall below freezing.
Early European settlers were struck by the variability of our rainfall. Australian rivers and streams could be raging torrents bursting their banks in the spring yet slow to a trickle by summer. The iconic Murray River is a good illustration of this natural variability in flow. The long-term, average runoff reaching the river is 11 259 GL (gigalitres*), but this can vary from 1670 GL in a very dry year to 30 000 GL in one very wet year.1 The Ord River in Western Australia has a long-term average flow of 3980 GL. This can be as low as 1000 GL and as high as 12 000 GL.2
These kinds of extremes are in stark contrast to rivers such as the Thames, the Nile, the Mississippi and the Danube, which have appreciable flow throughout the entire year.
This high variability defies prediction. Yet it’s important for us to understand the ways in which this climatic variability both dominates and constrains our use of land and water. It has played a huge role in the past and will continue to do so into the future.
*A gigalitre is a thousand megalitres or one billion litres. The volume of water in Sydney Harbour is approximately 500 gigalitres.
ThE BEST-lAID PlANS …In 1931–32, the NSW Government funded the construction of a new crossing over the Snowy River at McKellar Crossing. The concrete-and-steel bridge was 50 m high and 250 m long. Just a few days before the official opening, a major storm, accompanied by a cloudburst, occurred in the upper catchment. This is how the impact was captured:
‘The ensuing flash flood, thick with uprooted trees and rocks, swept out of the tributary just above the new bridge, shot across the Snowy River and smashed against the far bank, then swung downstream. The water level was 4 m higher than any flood previously recorded. The force tore the bridge’s steel trusses from its pylons. The tangled wreckage came to rest a few hundred metres downstream. The construction foreman, Edward ‘Ted’ Kay, contacted Orbost on his short-wave radio to advise that the opening should be cancelled.’3
variabilityTHE BIG PICTURE
20 Victorian Women’s Trust - Our Water Mark
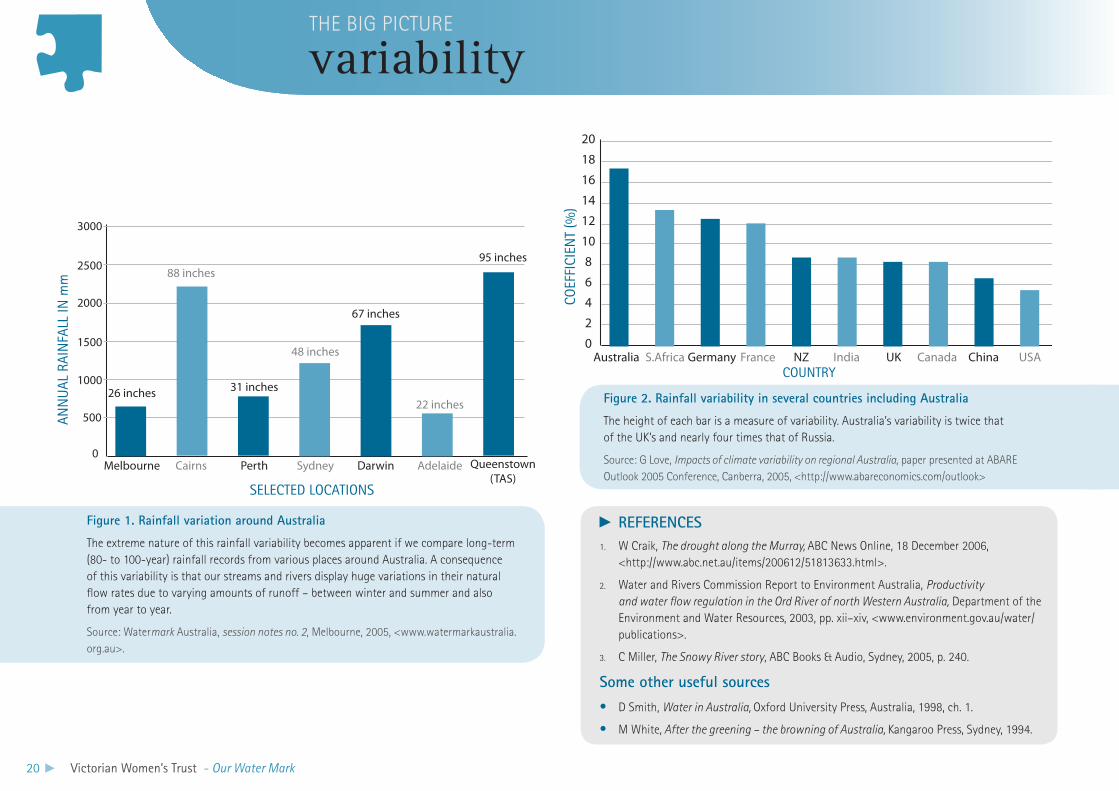
Figure 1. rainfall variation around Australia
The extreme nature of this rainfall variability becomes apparent if we compare long-term (80- to 100-year) rainfall records from various places around Australia. A consequence of this variability is that our streams and rivers display huge variations in their natural flow rates due to varying amounts of runoff – between winter and summer and also from year to year.
Source: Watermark Australia, session notes no. 2, Melbourne, 2005, <www.watermarkaustralia.org.au>.
rEFErENCESW Craik, 1. The drought along the Murray, ABC News Online, 18 December 2006, <http://www.abc.net.au/items/200612/51813633.html>.
Water and Rivers Commission Report to Environment Australia, 2. Productivity and water flow regulation in the Ord River of north Western Australia, Department of the Environment and Water Resources, 2003, pp. xii–xiv, <www.environment.gov.au/water/publications>.
C Miller, 3. The Snowy River story, ABC Books & Audio, Sydney, 2005, p. 240.
Some other useful sourcesD Smith, • Water in Australia, Oxford University Press, Australia, 1998, ch. 1.
M White,• After the greening – the browning of Australia, Kangaroo Press, Sydney, 1994.
variabilityTHE BIG PICTURE
Figure 2. rainfall variability in several countries including Australia
The height of each bar is a measure of variability. Australia’s variability is twice that of the UK’s and nearly four times that of Russia.
Source: G Love, Impacts of climate variability on regional Australia, paper presented at ABARE Outlook 2005 Conference, Canberra, 2005, <http://www.abareconomics.com/outlook>
Australia
20
18
16
14
12
10
8
6
4
2
0S.Africa Germany France NZ India RussiaUK USAChinaCanada
COeF
FICI
eNT
(%)
0
500
1000
1500
2000
2500
3000
Melbourne
26 inches
88 inches
31 inches
48 inches
67 inches
22 inches
95 inches
Cairns Perth Sydney Darwin Adelaide Queenstown(TAS)
ANN
UAL
RAI
NFA
LL IN
mm
SeLeCTeD LOCATIONS
COUNTRY
Victorian Women’s Trust - Our Water Mark 21
Most of Australia’s rainfall occurs in the north. However, most of our stored surface water is found on the eastern side of the continent – on the same side that is currently experiencing significant rainfall reduction …
But slowly they are routed out, to seek a diminishing water spout
And men will die of thirst before, the oceans rise to mount the shore.
Then lands will crack and rend anew
You think it strange … it will come true.Mother Shipton, Elder of the Anasazi Indian Nation
Rainfall is a key component in any weather system. Australia is a very dry land and rainfall is highly variable between years and across locations. Only now and again do we witness major floods with large areas inundated for weeks and sometimes months.
Official rainfall records from weather stations go back as far as 1885. When these are sorted, so as to include only those stations with a continuous data set covering at least 60 years, the analysis shows that, up to 1980, we have experienced three pronounced rainfall shifts.1 How much these shifts are due to natural climatic variation and how much they reflect the influence of greenhouse-induced global warming is debatable.
Whatever the case, these rainfall records reveal that, while the extent of year-to-year variation has not changed much, the volume of rainwater falling in various regions has been declining steadily, particularly during the last 40 to 50 years.
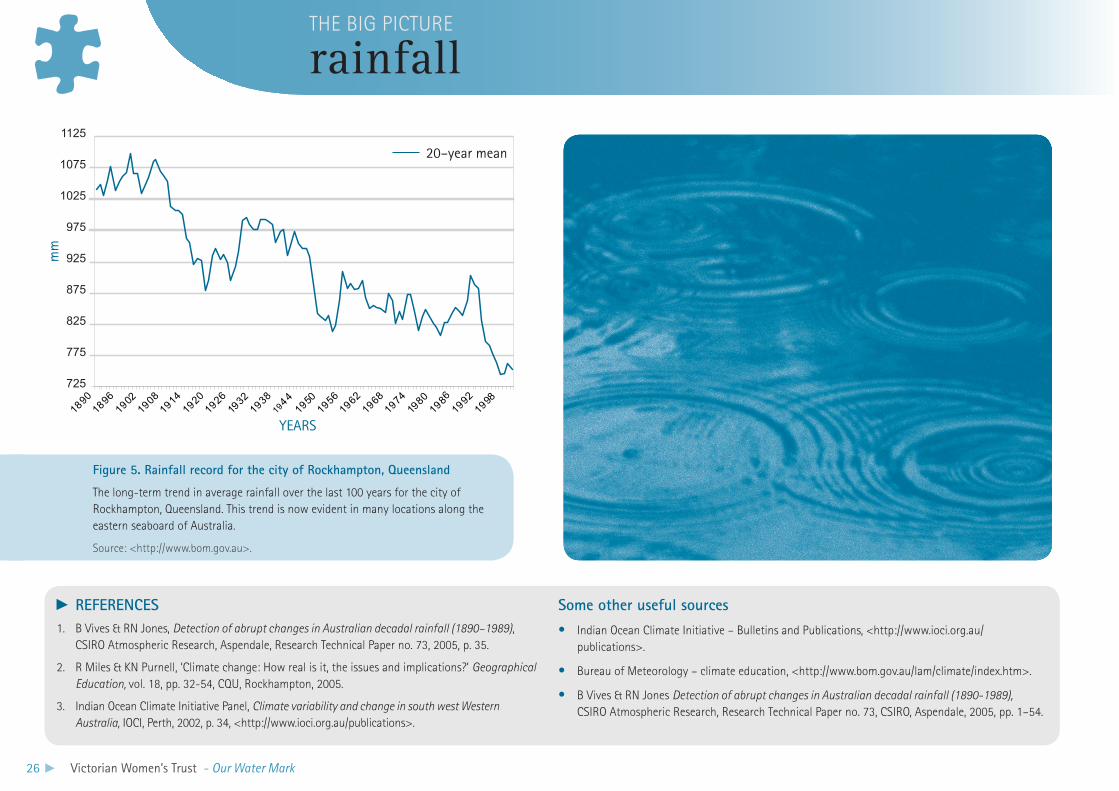
The 20-year rainfall trend shown for Rockhampton in Figure 5, is now evident in many locations along the eastern seaboard of Australia.2
Analysis of rainfall records since 1900 for the whole country puts all of this into perspective. It’s clear that large parts of the continent are drying out.
In some places the change in rainfall has been very sudden. For example, during the past 30 years Perth has experienced a decline in average annual rainfall, resulting in an average that is 15% lower than that recorded for the preceding 100 years. This decrease may not seem all that significant. However, because vegetation and soil take up the falling rain first, and what remains flows into rivers and streams, the 15% rainfall decrease resulted in a 50% fall in average flows into the city’s water storages.3
As shown in Figure 4, when the same sort of analysis is carried out for a number of locations in Victoria, a similar pattern emerges.
rainfallTHE BIG PICTURE
Lucid and compelling, 70 years ago …With what adoration should we contemplate rain and our cities’ watersheds. They give us our life. We should take off our shoes as we pass by them, for the place whereon we tread is holy ground.AO Barrett, Australia’s entail, reviewed in the Teachers’ Journal, 20 September 1937, p. 393.
22 Victorian Women’s Trust - Our Water Mark
50.040.030.020.015.010.05.00.0
-5.0-10.0-15.0-20.0-30.0-40.0-50.0
50.040.030.020.015.010.05.00.0
-5.0-10.0-15.0-20.0-30.0-40.0-50.0
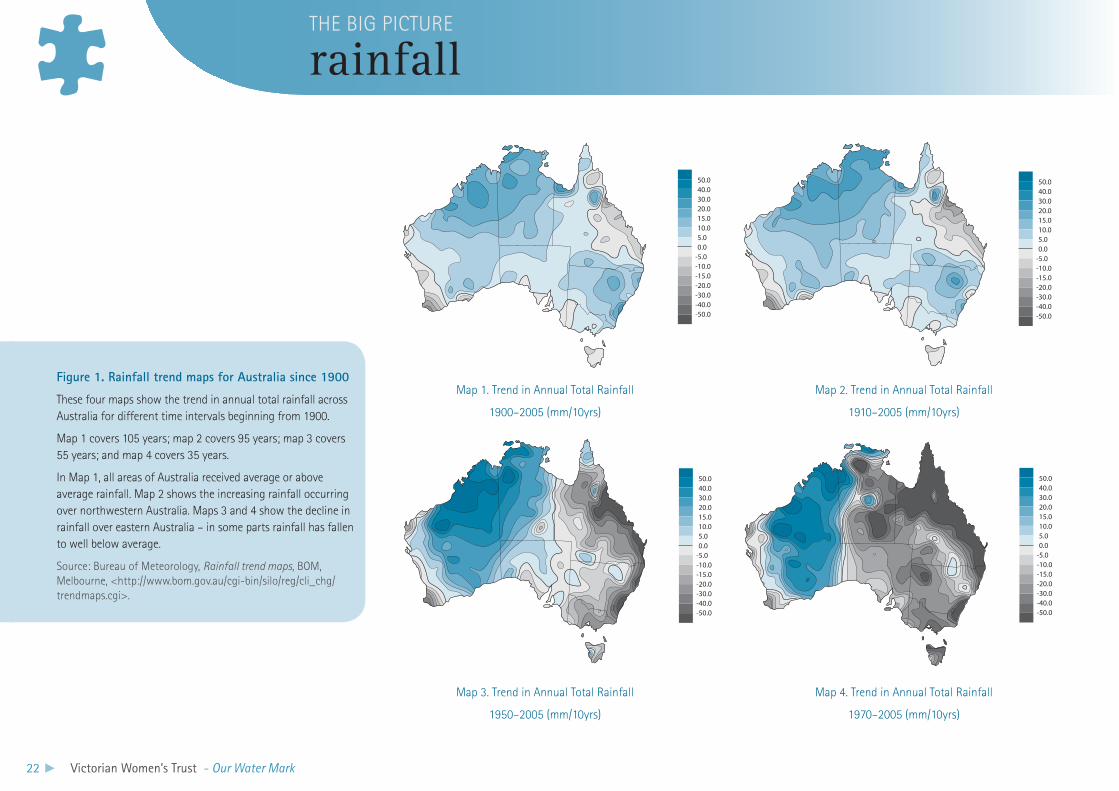
Figure 1. rainfall trend maps for Australia since 1900
These four maps show the trend in annual total rainfall across Australia for different time intervals beginning from 1900.
Map 1 covers 105 years; map 2 covers 95 years; map 3 covers 55 years; and map 4 covers 35 years.
In Map 1, all areas of Australia received average or above average rainfall. Map 2 shows the increasing rainfall occurring over northwestern Australia. Maps 3 and 4 show the decline in rainfall over eastern Australia – in some parts rainfall has fallen to well below average.
Source: Bureau of Meteorology, Rainfall trend maps, BOM, Melbourne, <http://www.bom.gov.au/cgi-bin/silo/reg/cli_chg/trendmaps.cgi>.
rainfallTHE BIG PICTURE
Map 1. Trend in Annual Total Rainfall
1900–2005 (mm/10yrs)
Map 2. Trend in Annual Total Rainfall
1910–2005 (mm/10yrs)
Map 4. Trend in Annual Total Rainfall
1970–2005 (mm/10yrs)
50.040.030.020.015.010.05.00.0
-5.0-10.0-15.0-20.0-30.0-40.0-50.0
50.040.030.020.015.010.05.00.0
-5.0-10.0-15.0-20.0-30.0-40.0-50.0
Map 3. Trend in Annual Total Rainfall
1950–2005 (mm/10yrs)
Victorian Women’s Trust - Our Water Mark 23
rainfallTHE BIG PICTURE
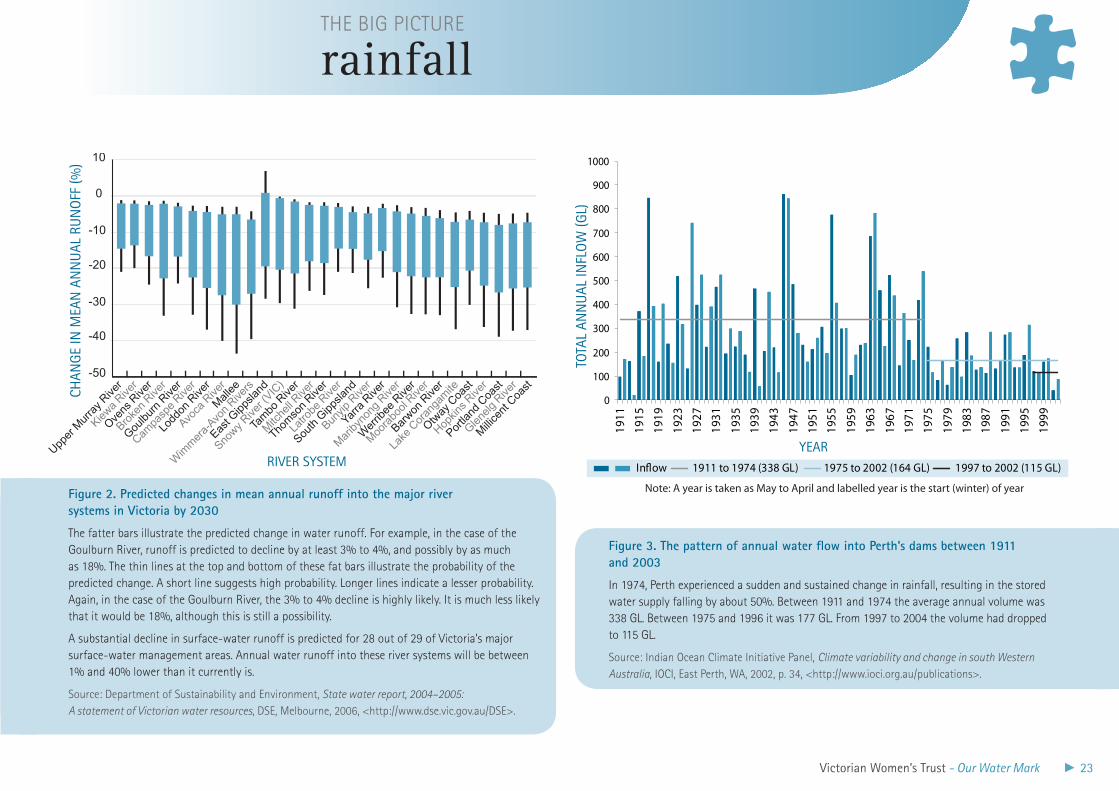
Figure 2. Predicted changes in mean annual runoff into the major river systems in Victoria by 2030
The fatter bars illustrate the predicted change in water runoff. For example, in the case of the Goulburn River, runoff is predicted to decline by at least 3% to 4%, and possibly by as much as 18%. The thin lines at the top and bottom of these fat bars illustrate the probability of the predicted change. A short line suggests high probability. Longer lines indicate a lesser probability. Again, in the case of the Goulburn River, the 3% to 4% decline is highly likely. It is much less likely that it would be 18%, although this is still a possibility.
A substantial decline in surface-water runoff is predicted for 28 out of 29 of Victoria’s major surface-water management areas. Annual water runoff into these river systems will be between 1% and 40% lower than it currently is.
Source: Department of Sustainability and Environment, State water report, 2004–2005: A statement of Victorian water resources, DSE, Melbourne, 2006, <http://www.dse.vic.gov.au/DSE>.
0
100
200
300
400
500
600
700
800
900
1000
1911
1915
1919
1923
1927
1931
1935
1939
1943
1947
1951
1955
1959
1963
1967
1971
1975
1979
1983
1987
1991
1995
1999
In�ow 1911 to 1974 (338 GL) 1975 to 2002 (164 GL) 1997 to 2002 (115 GL)
Note: A year is taken as May to April and labelled year is the start (winter) of year
Figure 3. The pattern of annual water flow into Perth’s dams between 1911 and 2003
In 1974, Perth experienced a sudden and sustained change in rainfall, resulting in the stored water supply falling by about 50%. Between 1911 and 1974 the average annual volume was 338 GL. Between 1975 and 1996 it was 177 GL. From 1997 to 2004 the volume had dropped to 115 GL.
Source: Indian Ocean Climate Initiative Panel, Climate variability and change in south Western Australia, IOCI, East Perth, WA, 2002, p. 34, <http://www.ioci.org.au/publications>.
Cha
nge
in m
ean
annu
al r
unof
f (%
)
10
-10
-20
0
-30
-40
-50
Upper
Mur
ray R
iver
Kiewa
River
Ovens
Rive
r
Broke
n Rive
r
Goulbu
rn R
iver
Campa
spe
River
Lodd
on R
iver
Avoca
Rive
r
Mall
ee
Wim
mer
a-Avo
n Rive
rs
East G
ippsla
nd
Snowy R
iver (
VIC)
Tam
bo R
iver
Mitc
hell R
iver
Thom
son
River
Latro
be R
iver
South
Gipp
sland
Bunyip
Rive
r
Yarra
Rive
r
Mar
ibyno
ng R
iver
Wer
ribee
Rive
r
Moo
rabo
ol Rive
r
Barwon
Rive
r
Lake
Cor
anga
mite
Otway
Coa
st
Hopkin
s Rive
r
Portla
nd C
oast
Glenelg
Rive
r
Milli
cent
Coa
stCHAN
ge
IN M
eAN
AN
NU
AL R
UN
OFF
(%)
TOTA
L AN
NU
AL IN
FLO
W (g
L)
RIVeR SYSTeMYeAR
24 Victorian Women’s Trust - Our Water Mark
rainfallTHE BIG PICTURE
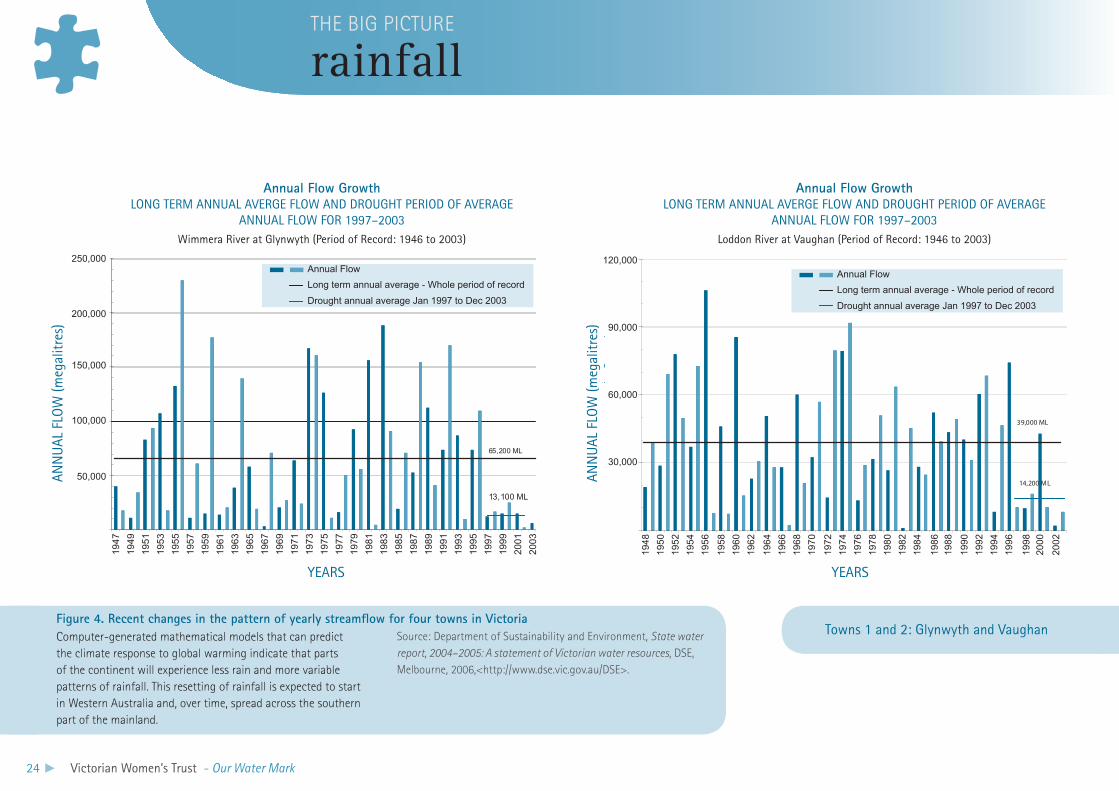
Computer-generated mathematical models that can predict the climate response to global warming indicate that parts of the continent will experience less rain and more variable patterns of rainfall. This resetting of rainfall is expected to start in Western Australia and, over time, spread across the southern part of the mainland.
Source: Department of Sustainability and Environment, State water report, 2004–2005: A statement of Victorian water resources, DSE, Melbourne, 2006,<http://www.dse.vic.gov.au/DSE>.
65,200 ML
13,100 ML
YEARS
AN
NU
AL
FLO
W (
meg
alitr
es)
250,000
200,000
150,000
100,000
50,000
Annual Flow
Long term annual average - Whole period of record
Drought annual average Jan 1997 to Dec 2003
1949
1947
1951
1953
1955
1957
1959
1961
1963
1965
1967
1969
1971
1973
1975
1977
1979
1981
1983
1985
1987
1989
1991
1993
1995
1997
1999
2001
2003
YEARS
AN
NU
AL
FLO
W (
meg
alitr
es)
30,000
60,000
90,000
120,000
Annual Flow
Long term annual average - Whole period of record
Drought annual average Jan 1997 to Dec 2003
1950
1948
1952
1954
1956
1958
1960
1962
1964
1966
1968
1970
1972
1974
1976
1978
1980
1982
1984
1986
1988
1990
1992
1994
1996
1998
2000
2002
39,000 ML
14,200 ML
Annual Flow GrowthLONg TeRM ANNUAL AVeRge FLOW AND DROUgHT PeRIOD OF AVeRAge
ANNUAL FLOW FOR 1997–2003Wimmera River at glynwyth (Period of Record: 1946 to 2003)
Annual Flow GrowthLONg TeRM ANNUAL AVeRge FLOW AND DROUgHT PeRIOD OF AVeRAge
ANNUAL FLOW FOR 1997–2003Loddon River at Vaughan (Period of Record: 1946 to 2003)
YeARS YeARS
Towns 1 and 2: glynwyth and Vaughan
ANN
UAL
FLO
W (m
egal
itres
)
ANN
UAL
FLO
W (m
egal
itres
)
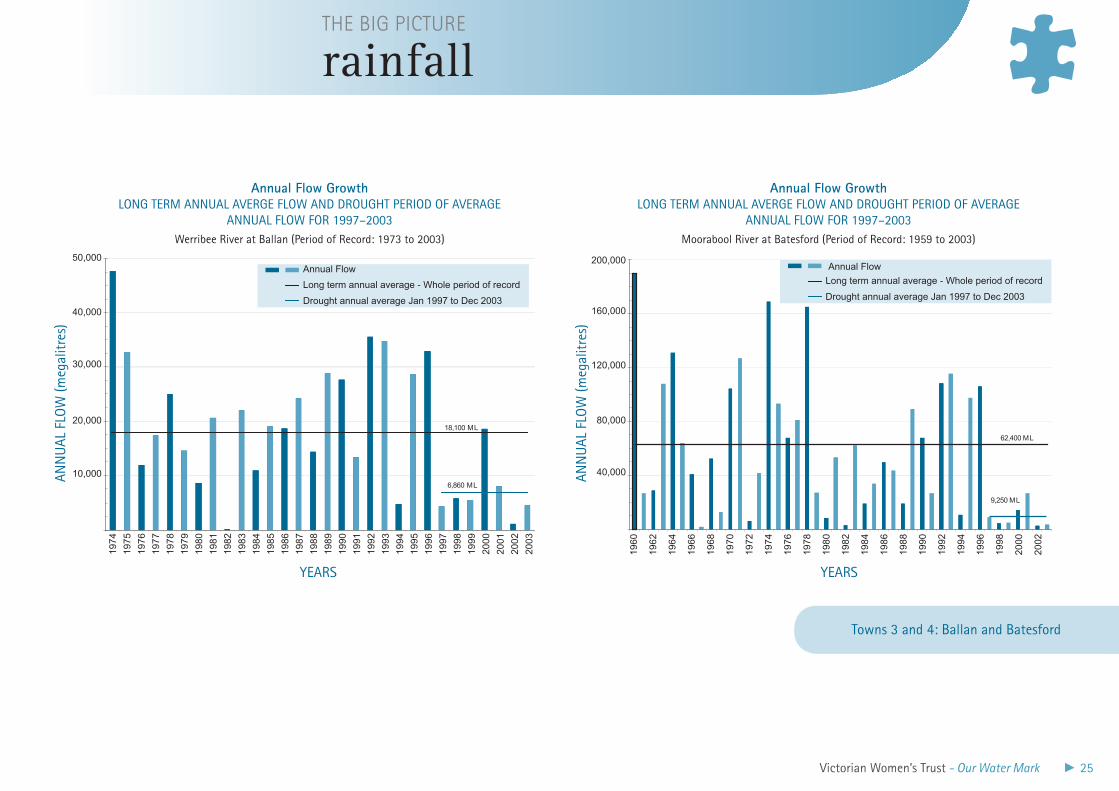
Figure 4. recent changes in the pattern of yearly streamflow for four towns in Victoria
Victorian Women’s Trust - Our Water Mark 25
rainfallTHE BIG PICTURE
50,000
40,000
30,000
20,000
10,000
Annual Flow
Long term annual average - Whole period of record
Drought annual average Jan 1997 to Dec 2003
1975
1974
1976
1977
1978
1979
1980
1981
1982
1983
1984
1985
1986
1987
1988
1989
1990
1991
1992
1993
1994
1995
1996
1997
1998
1999
2000
2002
2001
2003
18,100 ML
6,860 ML
AN
NU
AL
FLO
W (
meg
alitr
es)
1960
1962
1964
1966
1968
1970
1972
1974
1976
1978
1980
1982
1984
1986
1988
1990
1992
1994
1996
1998
2000
2002
62,400 ML
9,250 ML
YEARS
Long term annual average - Whole period of record
Drought annual average Jan 1997 to Dec 2003
200,000
160,000
120,000
80,000
40,000
Annual Flow
Annual Flow GrowthLONg TeRM ANNUAL AVeRge FLOW AND DROUgHT PeRIOD OF AVeRAge
ANNUAL FLOW FOR 1997–2003Werribee River at Ballan (Period of Record: 1973 to 2003)
Annual Flow GrowthLONg TeRM ANNUAL AVeRge FLOW AND DROUgHT PeRIOD OF AVeRAge
ANNUAL FLOW FOR 1997–2003Moorabool River at Batesford (Period of Record: 1959 to 2003)
YeARS YeARS
ANN
UAL
FLO
W (m
egal
itres
)
ANN
UAL
FLO
W (m
egal
itres
)
Towns 3 and 4: Ballan and Batesford
26 Victorian Women’s Trust - Our Water Mark
rEFErENCESB Vives & RN Jones, 1. Detection of abrupt changes in Australian decadal rainfall (1890–1989), CSIRO Atmospheric Research, Aspendale, Research Technical Paper no. 73, 2005, p. 35.
R Miles & KN Purnell, ‘Climate change: How real is it, the issues and implications?’ 2. Geographical Education, vol. 18, pp. 32-54, CQU, Rockhampton, 2005.
Indian Ocean Climate Initiative Panel, 3. Climate variability and change in south west Western Australia, IOCI, Perth, 2002, p. 34, <http://www.ioci.org.au/publications>.
Some other useful sourcesIndian Ocean Climate Initiative – Bulletins and Publications, <http://www.ioci.org.au/•publications>.
Bureau of Meteorology – climate education, <http://www.bom.gov.au/lam/climate/index.htm>.•
B Vives & RN Jones • Detection of abrupt changes in Australian decadal rainfall (1890-1989), CSIRO Atmospheric Research, Research Technical Paper no. 73, CSIRO, Aspendale, 2005, pp. 1–54.
Figure 5. rainfall record for the city of rockhampton, Queensland
The long-term trend in average rainfall over the last 100 years for the city of Rockhampton, Queensland. This trend is now evident in many locations along the eastern seaboard of Australia.
Source: <http://www.bom.gov.au>.
18901896
19021908
19141920
192619
321938
1944
19501956
19621968
197419
801986
19921998
1125
1075
1025
975
925
875
825
775
725
20 year meanYeARS
mm
rainfallTHE BIG PICTURE
20–year mean
Victorian Women’s Trust - Our Water Mark 27
For most of Australia, our main source of fresh water is surface water and this is found in large dams and weirs. Right now, these supplies are under great pressure. Future supply is predicted to decline …
Do you know in the past 20 years we have doubled the amount of water we have pulled out of our rivers, our surface water, for irrigation, and trebled the amount we’ve pulled out of the ground for irrigation? So it’s a bit like the old 6 o’clock swill when the pubs closed at 6 o’clock, and just as the minute hand was getting to the 12 everyone would order more rounds of drinks because they wanted to belt them down before the publican said ‘Time gentlemen please’. Malcolm Turnbull, speech to the Sydney Institute, 28 August 2006
Australia is the lowest continent in the world with an average height of only 330 m above sea level. This flatness means that after rain falls its passage into rivers and streams is very slow, and all the while it is evaporating.
The majority of Australia’s rainfall is returned to the atmosphere through evaporation, leaving only about 12% as surface runoff.1 Our main sources of fresh water are surface water (from rivers and lakes) and groundwater. About 73% of the fresh water used across Australia (approximately 24 000 GL) is supplied by rivers. In 1996–97, this amounted to a total of 19 109 GL. Surface water is the major source of fresh water in all jurisdictions except Western Australia and the Northern Territory.2
In an average year, a lot of rain falls on Australia – in fact more than 3 million billion litres!3 But much of it falls in places where it can’t run into rivers and most of it evaporates. Some makes its way into vast natural underground storages called aquifers.
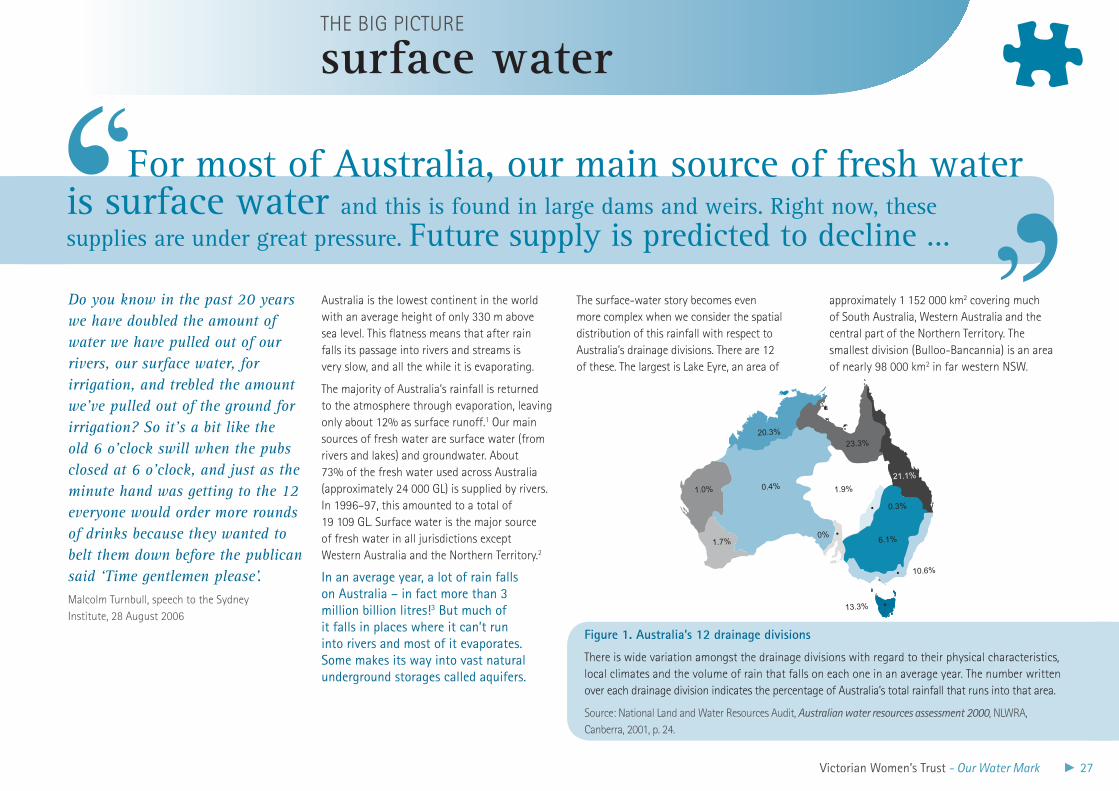
The surface-water story becomes even more complex when we consider the spatial distribution of this rainfall with respect to Australia’s drainage divisions. There are 12 of these. The largest is Lake Eyre, an area of
approximately 1 152 000 km2 covering much of South Australia, Western Australia and the central part of the Northern Territory. The smallest division (Bulloo-Bancannia) is an area of nearly 98 000 km2 in far western NSW.
surface waterTHE BIG PICTURE
1.0% 0.4%
1.7%
20.3%
23.3%
1.9%
21.1%
10.6%
0%
13.3%
6.1%
0.3%
Figure 1. Australia’s 12 drainage divisions
There is wide variation amongst the drainage divisions with regard to their physical characteristics, local climates and the volume of rain that falls on each one in an average year. The number written over each drainage division indicates the percentage of Australia’s total rainfall that runs into that area.
Source: National Land and Water Resources Audit, Australian water resources assessment 2000, NLWRA, Canberra, 2001, p. 24.
28 Victorian Women’s Trust - Our Water Mark
Five of the 11 mainland drainage divisions have runoff rates of less than 2%.4 Surface water runoff exceeds 20% in only two monsoonal drainage systems adjacent to the Timor Sea and the Gulf of Carpentaria.
lArGE-CAPACITy WATEr STOrAGESFor the past 100 or so years, water management practices in this country have tried to address the consequences of our rainfall variability by capturing and storing surface water in almost 500 large dams.5
A consequence of the construction of this large water-storage capacity is that many of Australia’s major river systems are now regulated, i.e. the natural seasonal flow patterns have been reversed.
These water storages have been strategically placed in high-yield catchments to minimise the cost of moving water to users. For instance, when full, the Hume Dam on the Murray River at Albury stores a volume of water six times that of Sydney Harbour.6 Throughout the Murray-Darling Basin, which produces 41% of Australia’s total farm output, 28 major dams and weirs have been built.
In Victoria alone, dam capacity increased from 1 million ML in the 1920s to nearly 12 million ML today, representing a twelve-fold increase over 80 years.7
It’s worth noting that the extraordinary period of economic and population growth that took place after WW II occurred during decades in which
rainfall was generally higher than the long-term average. (This was in contrast to the decades from 1900 to 1940, which were relatively dry.) Today’s water allocations, and our current expectations of water availability, are based upon the post-WW II rainfall pattterns.
It’s possible that we’re now entering another prolonged dry period as we experience the effects of climate change. It’s imperative that we take account of predictions of reduced rainfall and position ourselves accordingly.
Our water storage capacity is put to the test during prolonged dry periods. As we are probably all aware by now, the current declared drought has resulted in a significant decline in surface water runoff across most of mainland Australia during the past six to 10 years. As water levels have dropped in the major water storages supplying our cities, water restrictions have been introduced, and progressively increased.
At the end of December 2006, water restrictions applied in 28 out of 32 cities across Australia with a population of greater than 50 000 people. A total of 15 602 000 people were on Stage 3 or Stage 4 restrictions. This represents 71% of the Australian population.
Rainfall predictions suggest the current declared drought will break. There may yet be enough rainfall to refill these dams. However, rainfall predictions do not take account of the climate change that now seems to be underway. If lower average rainfall as a result of climate change comes about as predicted, the rate at which these
dams fill will be slower. There are two important unknowns here. How many years will pass before these dams fill again (indeed, if they ever completely do)? And what happens if another period of drought occurs in the short term?
SMAll FArM DAMSIn addition to these major water storages, there are millions of small dams across Australia (many on ‘hobby farms’) which together hold an estimated 9% of all stored surface water.8 For example, in the Gellibrand Catchment, west of Melbourne, it is estimated there are some 56 000 small dams.9
Small farm dams have two major impacts upon the hydrology of a catchment area. They trap an appreciable amount of water that would otherwise enter major waterways and, because of their relative shallowness, evaporation rates are usually high. With evaporation, water which could be used on land goes back as vapour into the atmosphere. When evaporation is high, more water is lost from the land surface.
Evaporation is measured by leaving a calibrated tray or pan exposed and measuring how much the water level falls over, for example, a week. This loss is the ‘pan evaporation’ rate and this rate varies from place to place. Evaporation rates across Australia are shown in Figure 4 on page 30. The evaporation rate from small farm dams is often almost the same as the pan evaporation rate because the relative shallowness of small farm dams means that the surface water warms up more quickly than water in major storages. In the Mallee region of Victoria, a 20 m2 dam can
lose 500 000 L to evaporation in a single year. A 50 m2 dam can lose 3 million L over the same period.10
In the past, farmers were encouraged to build small dams to ‘drought-proof’ their properties. However, because small dams actually reduce the amount of surface water reaching rivers and streams, many municipalities now require landowners to apply for a planning permit before establishing a dam. In the future, in some catchments farm dams may have to be decommissioned so that downstream users can obtain water.11
OUr WATEr DEMAND INCrEASESDespite the fact that our large storages are now under extreme pressure, our use of surface water has increased across all sectors: in agriculture, in industry and in cities and towns.
Between 1983 and 1984 and 1995 and 1996, surface-water use increased from 12 008 gL to 19 109 gL – an increase of 59%. Water extracted for irrigation in this period increased by 76%, while urban and industrial use increased by 55%.12
In NSW, Victoria and South Australia, surface-water extraction is either close to, or exceeds, extraction limits. In other words, more licences have been issued or allocated than there is water to supply based on the calculation of surface water runoff in average rainfall years.13
surface waterTHE BIG PICTURE
Victorian Women’s Trust - Our Water Mark 29
surface waterTHE BIG PICTURE
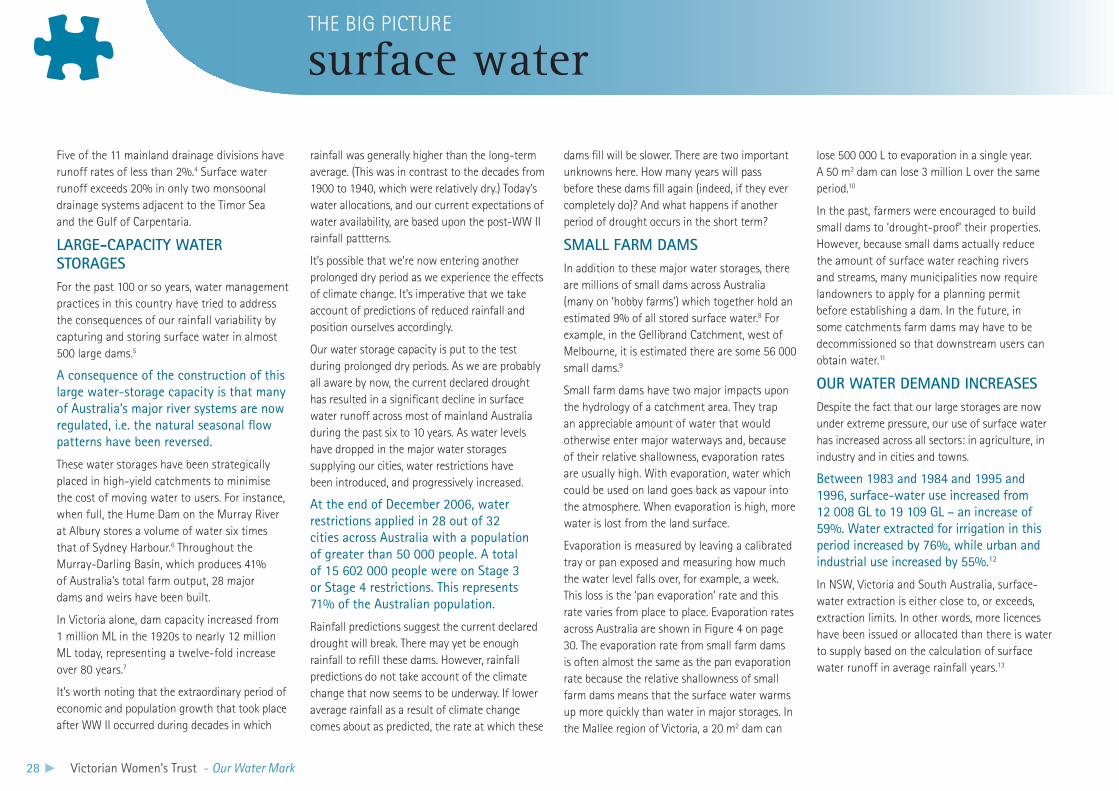
In Victoria, most of the rivers north of the Great Dividing Range which flow to the Murray River are fully allocated. The volumes of water being removed from the rivers in the Queensland portion of the Murray-Darling Basin and the rivers north of the Basin, from Charleville to Townsville as well as those to the northeast of Adelaide, are allocated at up to at least 70% of sustainable yields.
With such high allocations and extended periods of very dry conditions, natural flows can drop so low that the rivers and streams struggle to sustain aquatic ecosystems.
Water in rivers is managed on the basis of surface-water management areas. Approximately a quarter (26%) of Australia’s surface-water management areas are either close to, or exceed, the sustainable flow regime. Most of the rivers in the NSW portion of the Murray-Darling Basin, the rivers in the west of Victoria and on the eastern side of St Vincent Gulf in South Australia are over-allocated; the total volume of water that has been approved for removal exceeds the average annual flow of these rivers.
Figure 2. The status of surface-water use across Australia in 2000
The shading on the map indicates the extent of allocation.
Over developed, greater than 100%
Fully developed, 100%
High, 70–100%
Medium, 32–70%
Low, less than 32%
Note: While figure 2 provides a useful snapshot of surface-water use, some caution is needed. It would appear that allocations for Queensland are grossly underestimated. The rivers around Brisbane, in the Condamine area, are all either fully allocated or over-allocated.
Source: Australian Academy of Technological Sciences and Engineering, Water recycling in Australia, special report, ATSE, Melbourne, 2004, ch. 1, p. 3.
30 Victorian Women’s Trust - Our Water Mark
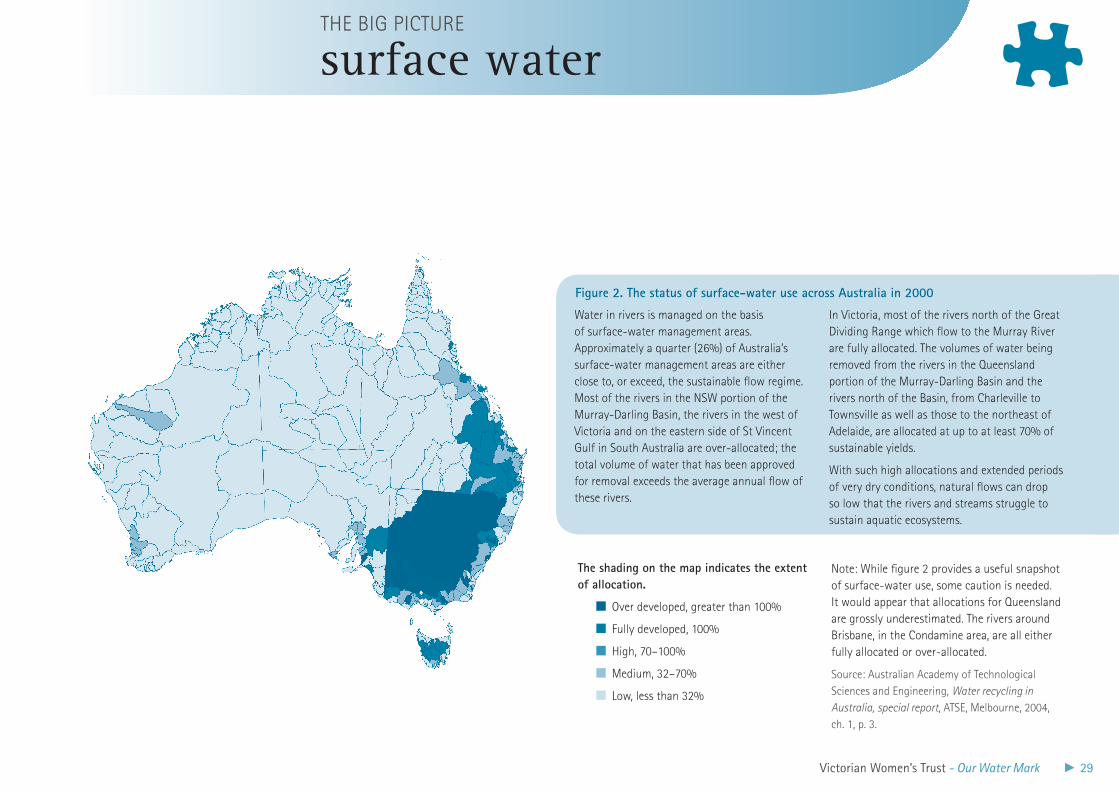
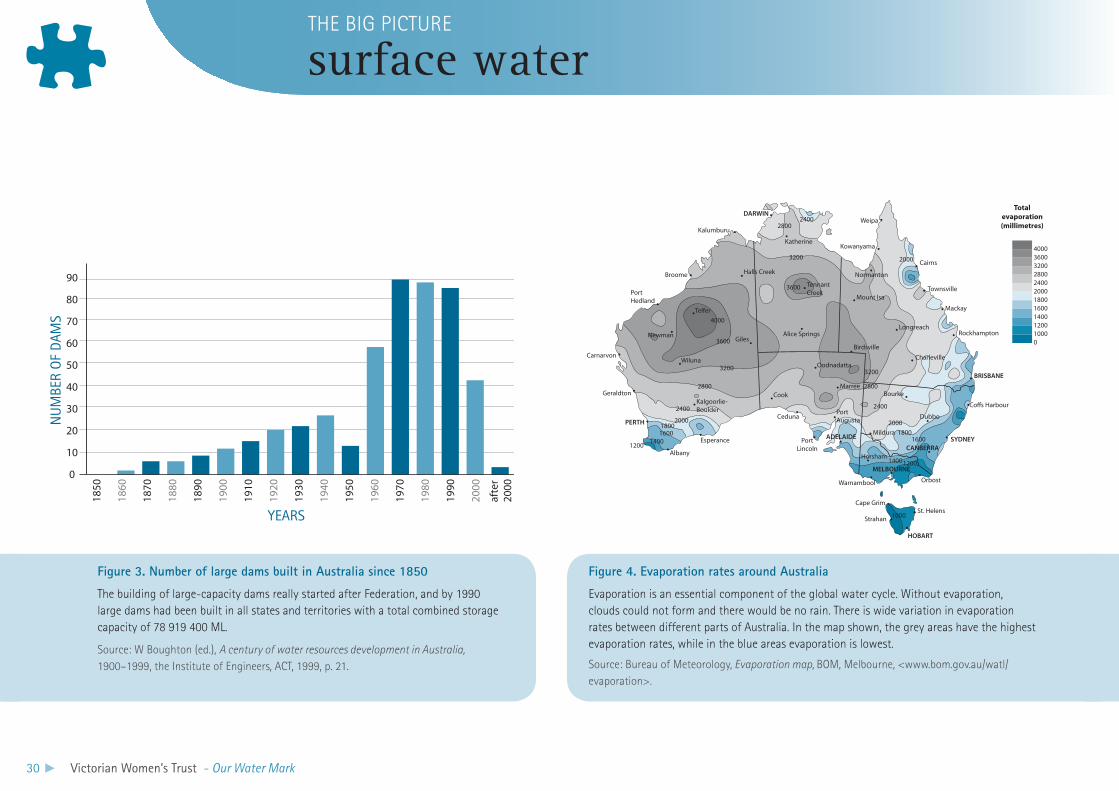
Figure 3. Number of large dams built in Australia since 1850
The building of large-capacity dams really started after Federation, and by 1990 large dams had been built in all states and territories with a total combined storage capacity of 78 919 400 ML.
Source: W Boughton (ed.), A century of water resources development in Australia, 1900–1999, the Institute of Engineers, ACT, 1999, p. 21.
Figure 4. Evaporation rates around Australia
Evaporation is an essential component of the global water cycle. Without evaporation, clouds could not form and there would be no rain. There is wide variation in evaporation rates between different parts of Australia. In the map shown, the grey areas have the highest evaporation rates, while in the blue areas evaporation is lowest.
Source: Bureau of Meteorology, Evaporation map, BOM, Melbourne, <www.bom.gov.au/watl/evaporation>.
surface waterTHE BIG PICTURE
0
10
20
30
40
50
60
70
80
90
1850
1860
1870
1880
1890
1900
1910
1920
1930
1940
1950
1960
1970
1980
1990
2000
afte
r20
00YeARS
NU
MBe
R O
F DA
MS
Orbost
SYDNEY
BRISBANE
Charleville
Rockhampton
Mackay
Townsville
Longreach
Birdsville
Mount Isa
Cairns
400036003200280024002000180016001400120010000
Normanton
Kowanyama
Weipa
Alice Springs
TennantCreek
Katherine
Halls Creek
DARWIN
Kalumburu
Broome
Telfer
GilesNewman
Wiluna
Port Hedland
Carnarvon
Geraldton
PERTH
1200 140016001800
2000
2400
2800
3200
3600
4000
3600
3200
28002400
2000
3200
2800
2400
20001800
1600
14001200
1000
Albany
Esperance
Cook
Oodnadatta
Marree
Ceduna
Totalevaporation(millimetres)
ADELAIDE
PortAugusta
PortLincoln
Kalgoorlie-Boulder
CANBERRA
MELBOURNE
HOBART
St. HelensCape Grim
Strahan
Warnambool
Horsham
Mildura
Dubbo
Bourke
200
Projection: Lambert conformal withstandard parrallels 10oS, 40oS
2000 400 600 800 km
Victorian Women’s Trust - Our Water Mark 31
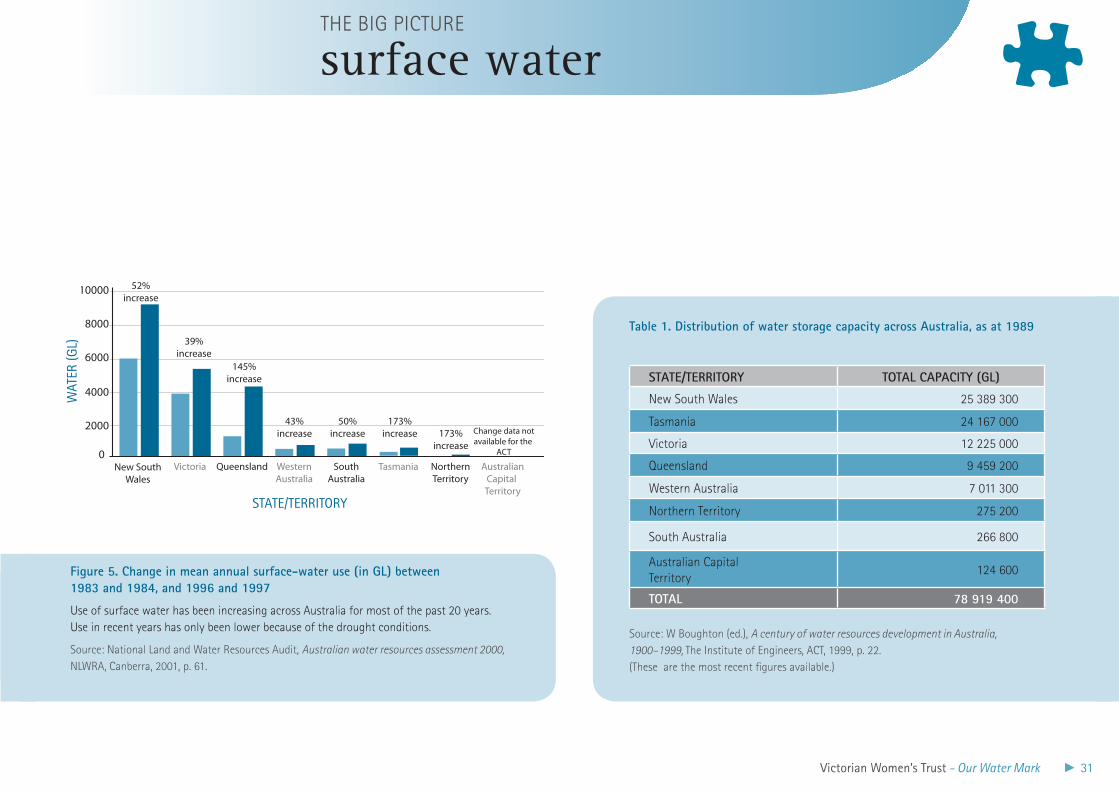
STATE/TErrITOry TOTAl CAPACITy (Gl)
New South Wales 25 389 300
Tasmania 24 167 000
Victoria 12 225 000
Queensland 9 459 200
Western Australia 7 011 300
Northern Territory 275 200
South Australia 266 800
Australian Capital Territory
124 600
TOTAl 78 919 400
Table 1. Distribution of water storage capacity across Australia, as at 1989
Source: W Boughton (ed.), A century of water resources development in Australia, 1900–1999, The Institute of Engineers, ACT, 1999, p. 22. (These are the most recent figures available.)
surface waterTHE BIG PICTURE
Figure 5. Change in mean annual surface-water use (in Gl) between 1983 and 1984, and 1996 and 1997
Use of surface water has been increasing across Australia for most of the past 20 years. Use in recent years has only been lower because of the drought conditions.
Source: National Land and Water Resources Audit, Australian water resources assessment 2000, NLWRA, Canberra, 2001, p. 61.
States and Territories
(GL)
0
2000
4000
6000
8000
10000 52%increase
39%increase
145%increase
43%increase
50%increase
173%increase 173%
increaseChange data notavailable for the
ACT
New SouthWales
Victoria Queensland WesternAustralia
SouthAustralia
Tasmania NorthernTerritory
AustralianCapital Territory
STATe/TeRRITORY
WAT
eR (g
L)
32 Victorian Women’s Trust - Our Water Mark
rEFErENCESNational Land and Water Resources Audit, 1.
Australian water resources assessment 2000, NLWRA, Canberra, 2001, p. 24.
ibid., p. 55. 2.
B Foran & F Poldy,3. Future dilemmas – options to 2050 for Australia’s population, technology, resources and environment, CSIRO Resources Futures Working Paper 02/01, CSIRO Sustainable Ecosystems, CSIRO, Canberra, 2002.
DI Smith, 4. Water in Australia: resources and management, Oxford University Press, Melbourne, 1998.
W Boughton (ed.), 5. A century of water resources development in Australia, 1900–1999, Institute of Engineers, ACT, 1999, pp.1–170.
Murray-Darling Basin Commission, 6. River Murray water – design and operation of the Hume Dam, MDBC, Canberra, 2007, <www.mdbc.gov.au/river_murray_system/hume_reservoir>.
W Boughton (ed.), 7. A century of water resources development in Australia, 1900–1999, Institute of Engineers, ACT, 1999, app. 3, p. 78.
National Land and Water Resources Audit, 8.
op. cit., p. 27.
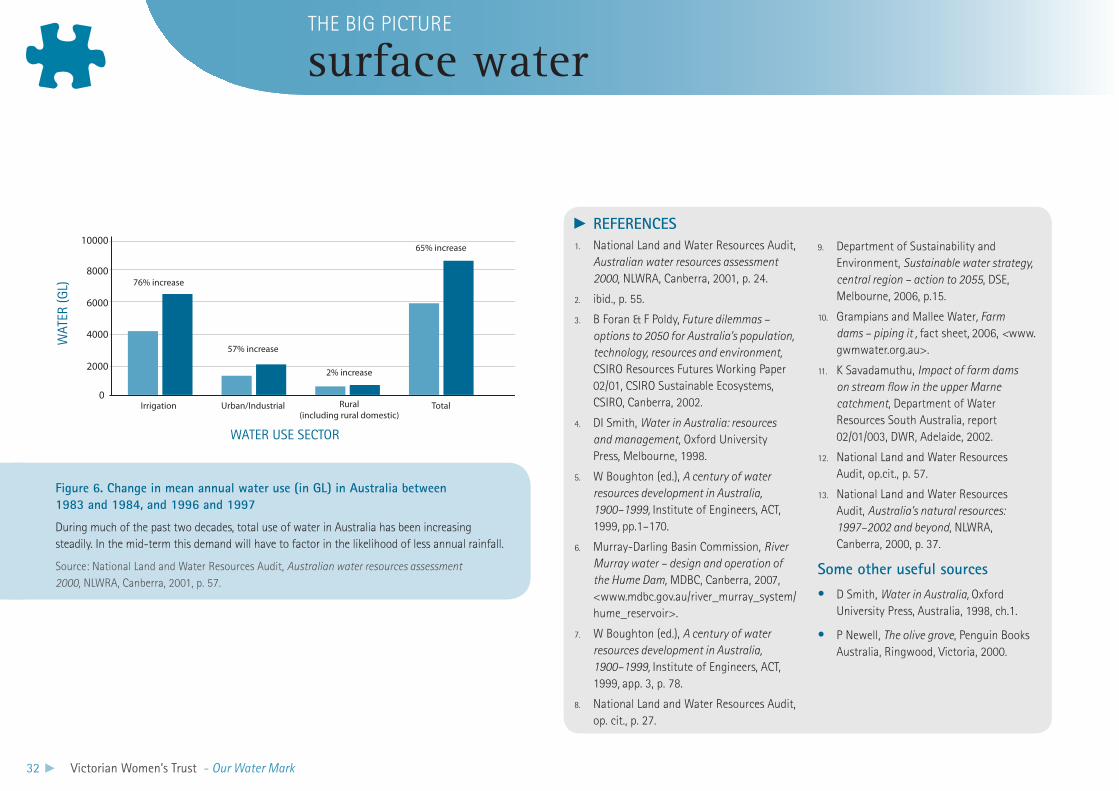
Figure 6. Change in mean annual water use (in Gl) in Australia between 1983 and 1984, and 1996 and 1997
During much of the past two decades, total use of water in Australia has been increasing steadily. In the mid-term this demand will have to factor in the likelihood of less annual rainfall.
Source: National Land and Water Resources Audit, Australian water resources assessment 2000, NLWRA, Canberra, 2001, p. 57.
76% increase
57% increase
2% increase
65% increase
(GL)
0
2000
4000
6000
8000
10000
Irrigation Urban/Industrial Rural(including rural domestic)
Total
WATeR USe SeCTOR
WAT
eR (g
L)
Department of Sustainability and 9.
Environment, Sustainable water strategy, central region – action to 2055, DSE, Melbourne, 2006, p.15.
Grampians and Mallee Water10. , Farm dams – piping it , fact sheet, 2006, <www.gwmwater.org.au>.
K Savadamuthu, 11. Impact of farm dams on stream flow in the upper Marne catchment, Department of Water Resources South Australia, report 02/01/003, DWR, Adelaide, 2002.
National Land and Water Resources 12.
Audit, op.cit., p. 57.
National Land and Water Resources 13.
Audit, Australia’s natural resources: 1997–2002 and beyond, NLWRA, Canberra, 2000, p. 37.
Some other useful sourcesD Smith, • Water in Australia, Oxford University Press, Australia, 1998, ch.1.
P Newell, • The olive grove, Penguin Books Australia, Ringwood, Victoria, 2000.
surface waterTHE BIG PICTURE
Victorian Women’s Trust - Our Water Mark 33
Groundwater is an important source of our fresh water. Right now, in many parts of Australia, groundwater
use is either above or near the capacity of the resource to renew itself …
Australia has been and still is ‘mining’ its renewable resources (of groundwater) as if they were mined minerals. That is, they are being exploited at rates faster than their renewal rates, with the result that they are declining.
Jarred Diamond, Collapse, Viking Press, 2005,
p. 378
Although it’s less visible than surface water, there is also a large groundwater resource lying under vast areas of Australia. In the drier and/or more inland parts of the continent, this is the major source of fresh water used in agriculture, mining and all domestic activities apart from human consumption. Approximately 21% of the fresh water we use is groundwater.1
Groundwater is accessed by drilling holes and installing pipes (commonly known as bores) down into underground strata which contain or enclose water. The water then comes to the surface either by pumping or by natural pressure.
The link between surface water and groundwater is crucial. When a new bore is sunk, the water drawn up is the base flow of the nearest river. every time we look at surface water – in a lake, stream or river – we are actually looking at a ‘window’ into the underlying groundwater.
The flatness of our continent assists water to seep into aquifers, and Australia has vast underground reserves of such water. When rain falls onto the land it penetrates the soil. If enough falls, the water seeps down to a saturated layer called the water table. In different parts of the country, the water table is found at varying depths below the surface. Essentially, this water is held within layers of porous soils and rock.
We have many small aquifers and some very large ones. For example, the Great Artesian Basin is one of the largest aquifers in the world. Formed at least 200 million years ago, this multi-layered aquifer extends from the Gulf of Carpentaria to approximately 600 km north of Adelaide. Although the average depth is about 500 m, in some places water is contained to depths of 3000 m and it is estimated to contain 8700 GL.2
Water in some aquifers is very old, having entered the underground system hundreds, and even thousands, of years ago. Water in an aquifer can also be relatively new, entering by a process called aquifer recharge, where water leaks through geological flaws in the beds of rivers, lakes and the land surface. A lot of recharge occurs during prolonged and extensive flooding. Thus, while large amounts of water evaporate following a flood, much also seeps down through soil and rock formations to enter aquifers.
In some parts of the Basin, groundwater levels are rising at alarming rates, and salinisation and the displacement of salt loads to the river systems are occurring. It is predicted that these processes will continue to severely degrade the usefulness of water resources in the Basin, in terms of the maintenance of healthy ecosystems and the provision of water of a suitable quality for irrigation and potable use.
D Ife & K Skelt, Murray-Darling Basin groundwater status: summary report, Murray-Darling Basin Commission, Canberra, 2004, p.10
groundwaterTHE BIG PICTURE
34 Victorian Women’s Trust - Our Water Mark
A large part of rural and remote Australia is dependent on the supply of water from aquifers. The cities of Perth and Adelaide are also partly dependent. Each aquifer being used to supply water is divided into a number of groundwater management units. A unit can supply several hundred farming enterprises, a small town or even a mine.
Across Australia there are currently 535 such operational units supplying thousands of users. Each of these users is licensed to pump a specified amount of water during a prescribed time of year.3 Only 14% of these operational units have some or all of their water use metered.4
For decades people were allowed to sink bores into these major aquifers and leave them flowing continuously. This has resulted in a significant drop in water pressure and, consequently, flow rates. For instance, across the Great Artesian Basin initial flow rates were more than 10 ML per day. These days, flow rates are in the range of 0.01–6 ML per day.5
There is now a national program underway to cap these bores so that water is released only on demand. Funding to complete this program has been included in Prime Minister Howard’s recently released A national plan for water security.6
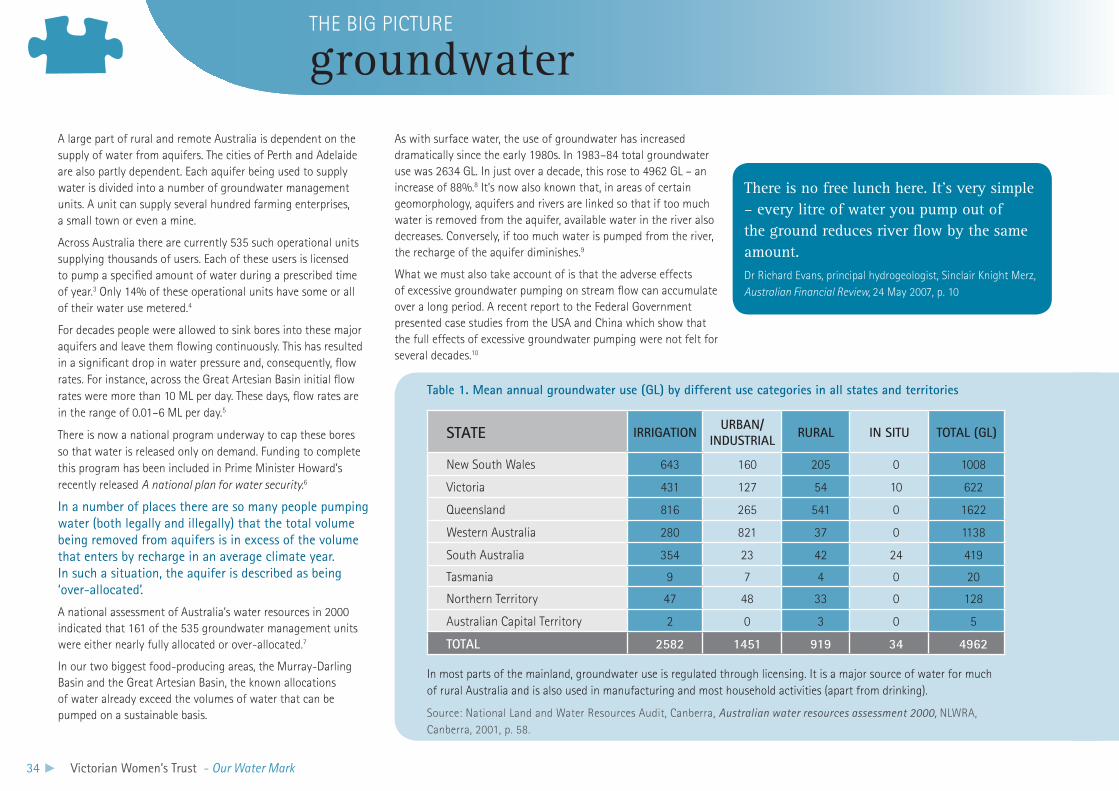
In a number of places there are so many people pumping water (both legally and illegally) that the total volume being removed from aquifers is in excess of the volume that enters by recharge in an average climate year. In such a situation, the aquifer is described as being ‘over-allocated’.
A national assessment of Australia’s water resources in 2000 indicated that 161 of the 535 groundwater management units were either nearly fully allocated or over-allocated.7
In our two biggest food-producing areas, the Murray-Darling Basin and the Great Artesian Basin, the known allocations of water already exceed the volumes of water that can be pumped on a sustainable basis.
As with surface water, the use of groundwater has increased dramatically since the early 1980s. In 1983–84 total groundwater use was 2634 GL. In just over a decade, this rose to 4962 GL – an increase of 88%.8 It’s now also known that, in areas of certain geomorphology, aquifers and rivers are linked so that if too much water is removed from the aquifer, available water in the river also decreases. Conversely, if too much water is pumped from the river, the recharge of the aquifer diminishes.9
What we must also take account of is that the adverse effects of excessive groundwater pumping on stream flow can accumulate over a long period. A recent report to the Federal Government presented case studies from the USA and China which show that the full effects of excessive groundwater pumping were not felt for several decades.10
groundwaterTHE BIG PICTURE
STATE IrrIGATION UrBAN/ INDUSTrIAl rUrAl IN SITU TOTAl (Gl)
New South Wales 643 160 205 0 1008
Victoria 431 127 54 10 622
Queensland 816 265 541 0 1622
Western Australia 280 821 37 0 1138
South Australia 354 23 42 24 419
Tasmania 9 7 4 0 20
Northern Territory 47 48 33 0 128
Australian Capital Territory 2 0 3 0 5
TOTAl 2582 1451 919 34 4962
Table 1. Mean annual groundwater use (Gl) by different use categories in all states and territories
There is no free lunch here. It’s very simple – every litre of water you pump out of the ground reduces river flow by the same amount.Dr Richard Evans, principal hydrogeologist, Sinclair Knight Merz, Australian Financial Review, 24 May 2007, p. 10
In most parts of the mainland, groundwater use is regulated through licensing. It is a major source of water for much of rural Australia and is also used in manufacturing and most household activities (apart from drinking).
Source: National Land and Water Resources Audit, Canberra, Australian water resources assessment 2000, NLWRA, Canberra, 2001, p. 58.
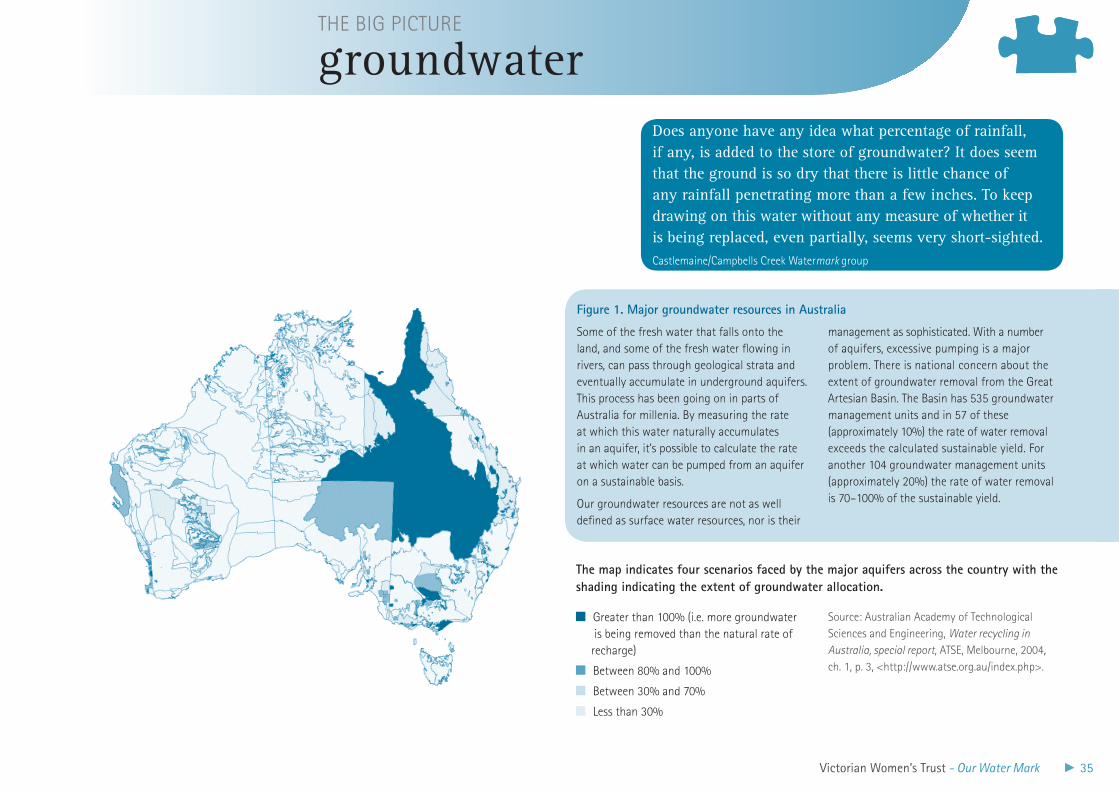
Victorian Women’s Trust - Our Water Mark 35
Figure 1. Major groundwater resources in Australia
Some of the fresh water that falls onto the land, and some of the fresh water flowing in rivers, can pass through geological strata and eventually accumulate in underground aquifers. This process has been going on in parts of Australia for millenia. By measuring the rate at which this water naturally accumulates in an aquifer, it’s possible to calculate the rate at which water can be pumped from an aquifer on a sustainable basis.
Our groundwater resources are not as well defined as surface water resources, nor is their
management as sophisticated. With a number of aquifers, excessive pumping is a major problem. There is national concern about the extent of groundwater removal from the Great Artesian Basin. The Basin has 535 groundwater management units and in 57 of these (approximately 10%) the rate of water removal exceeds the calculated sustainable yield. For another 104 groundwater management units (approximately 20%) the rate of water removal is 70–100% of the sustainable yield.
groundwaterTHE BIG PICTURE
Greater than 100% (i.e. more groundwater is being removed than the natural rate of recharge)
Between 80% and 100%
Between 30% and 70%
Less than 30%
Source: Australian Academy of Technological Sciences and Engineering, Water recycling in Australia, special report, ATSE, Melbourne, 2004, ch. 1, p. 3, <http://www.atse.org.au/index.php>.
The map indicates four scenarios faced by the major aquifers across the country with the shading indicating the extent of groundwater allocation.
Does anyone have any idea what percentage of rainfall, if any, is added to the store of groundwater? It does seem that the ground is so dry that there is little chance of any rainfall penetrating more than a few inches. To keep drawing on this water without any measure of whether it is being replaced, even partially, seems very short-sighted.Castlemaine/Campbells Creek Watermark group
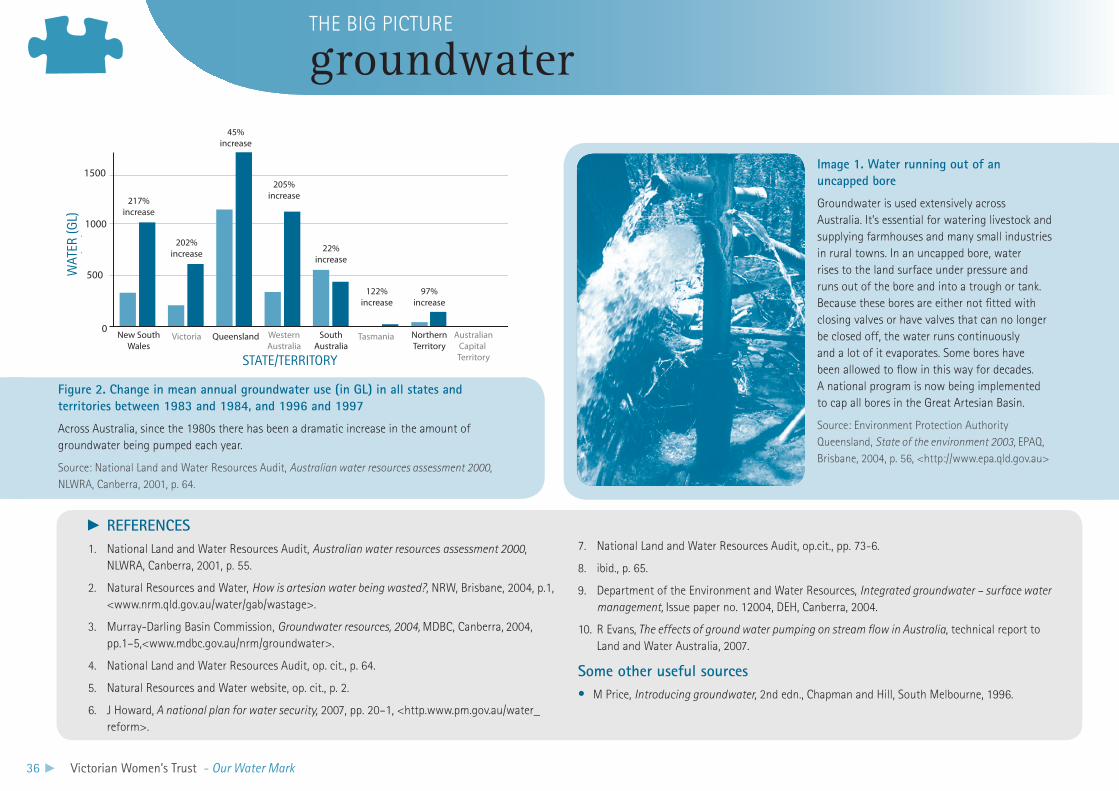
36 Victorian Women’s Trust - Our Water Mark
Image 1. Water running out of an uncapped bore
Groundwater is used extensively across Australia. It’s essential for watering livestock and supplying farmhouses and many small industries in rural towns. In an uncapped bore, water rises to the land surface under pressure and runs out of the bore and into a trough or tank. Because these bores are either not fitted with closing valves or have valves that can no longer be closed off, the water runs continuously and a lot of it evaporates. Some bores have been allowed to flow in this way for decades. A national program is now being implemented to cap all bores in the Great Artesian Basin.
Source: Environment Protection Authority Queensland, State of the environment 2003, EPAQ, Brisbane, 2004, p. 56, <http://www.epa.qld.gov.au>
rEFErENCESNational Land and Water Resources Audit, 1. Australian water resources assessment 2000, NLWRA, Canberra, 2001, p. 55.
Natural Resources and Water, 2. How is artesian water being wasted?, NRW, Brisbane, 2004, p.1, <www.nrm.qld.gov.au/water/gab/wastage>.
Murray-Darling Basin Commission, 3. Groundwater resources, 2004, MDBC, Canberra, 2004, pp.1–5,<www.mdbc.gov.au/nrm/groundwater>.
National Land and Water Resources Audit, op. cit., p. 64.4.
Natural Resources and Water website, op. cit., p. 2. 5.
J Howard,6. A national plan for water security, 2007, pp. 20–1, <http.www.pm.gov.au/water_reform>.
National Land and Water Resources Audit, op.cit., pp. 73-6.7.
ibid., p. 65.8.
Department of the Environment and Water Resources, 9. Integrated groundwater – surface water management, Issue paper no. 12004, DEH, Canberra, 2004.
R Evans,10. The effects of ground water pumping on stream flow in Australia, technical report to Land and Water Australia, 2007.
Some other useful sourcesM Price, • Introducing groundwater, 2nd edn., Chapman and Hill, South Melbourne, 1996.
groundwaterTHE BIG PICTURE
Figure 2. Change in mean annual groundwater use (in Gl) in all states and territories between 1983 and 1984, and 1996 and 1997
Across Australia, since the 1980s there has been a dramatic increase in the amount of groundwater being pumped each year.
Source: National Land and Water Resources Audit, Australian water resources assessment 2000, NLWRA, Canberra, 2001, p. 64.
(GL)
0
500
1000
1500
217%increase
202%increase
45%increase
205%increase
22%increase
122%increase
97%increase
New SouthWales
Victoria Queensland WesternAustralia
SouthAustralia
Tasmania NorthernTerritory
AustralianCapital TerritorySTATe/TeRRITORY
WAT
eR (g
L)
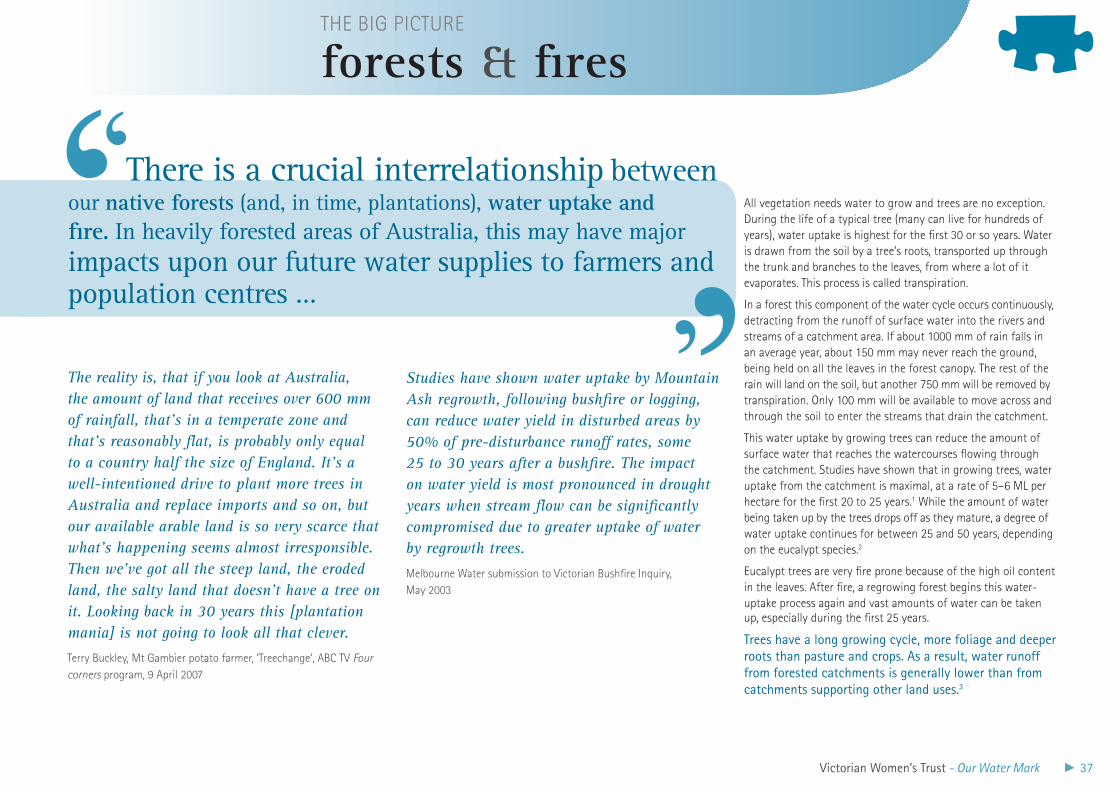
Victorian Women’s Trust - Our Water Mark 37
There is a crucial interrelationship between our native forests (and, in time, plantations), water uptake and fire. In heavily forested areas of Australia, this may have major impacts upon our future water supplies to farmers and population centres …
Studies have shown water uptake by Mountain Ash regrowth, following bushfire or logging, can reduce water yield in disturbed areas by 50% of pre-disturbance runoff rates, some 25 to 30 years after a bushfire. The impact on water yield is most pronounced in drought years when stream flow can be significantly compromised due to greater uptake of water by regrowth trees.
Melbourne Water submission to Victorian Bushfire Inquiry, May 2003
All vegetation needs water to grow and trees are no exception. During the life of a typical tree (many can live for hundreds of years), water uptake is highest for the first 30 or so years. Water is drawn from the soil by a tree’s roots, transported up through the trunk and branches to the leaves, from where a lot of it evaporates. This process is called transpiration.
In a forest this component of the water cycle occurs continuously, detracting from the runoff of surface water into the rivers and streams of a catchment area. If about 1000 mm of rain falls in an average year, about 150 mm may never reach the ground, being held on all the leaves in the forest canopy. The rest of the rain will land on the soil, but another 750 mm will be removed by transpiration. Only 100 mm will be available to move across and through the soil to enter the streams that drain the catchment.
This water uptake by growing trees can reduce the amount of surface water that reaches the watercourses flowing through the catchment. Studies have shown that in growing trees, water uptake from the catchment is maximal, at a rate of 5–6 ML per hectare for the first 20 to 25 years.1 While the amount of water being taken up by the trees drops off as they mature, a degree of water uptake continues for between 25 and 50 years, depending on the eucalypt species.2
Eucalypt trees are very fire prone because of the high oil content in the leaves. After fire, a regrowing forest begins this water-uptake process again and vast amounts of water can be taken up, especially during the first 25 years.
Trees have a long growing cycle, more foliage and deeper roots than pasture and crops. As a result, water runoff from forested catchments is generally lower than from catchments supporting other land uses.3
The reality is, that if you look at Australia, the amount of land that receives over 600 mm of rainfall, that’s in a temperate zone and that’s reasonably flat, is probably only equal to a country half the size of England. It’s a well-intentioned drive to plant more trees in Australia and replace imports and so on, but our available arable land is so very scarce that what’s happening seems almost irresponsible. Then we’ve got all the steep land, the eroded land, the salty land that doesn’t have a tree on it. Looking back in 30 years this [plantation mania] is not going to look all that clever.
Terry Buckley, Mt Gambier potato farmer, ‘Treechange’, ABC TV Four corners program, 9 April 2007
forests & firesTHE BIG PICTURE
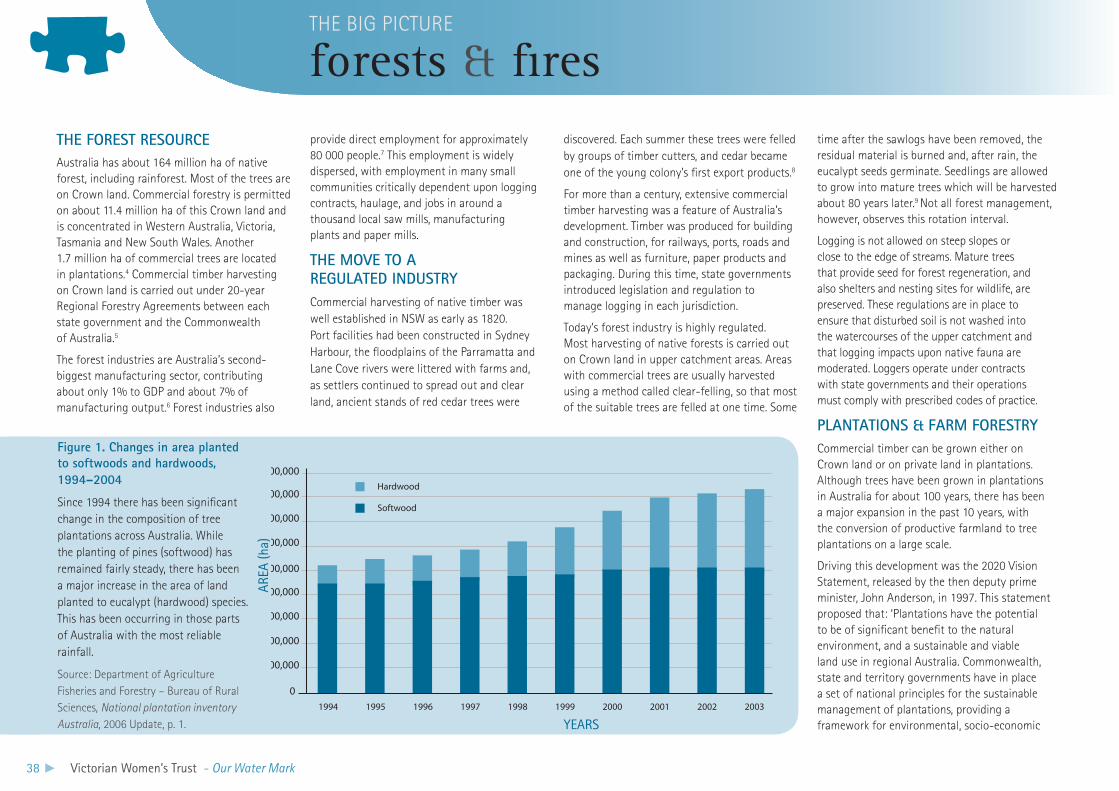
38 Victorian Women’s Trust - Our Water Mark
ThE FOrEST rESOUrCEAustralia has about 164 million ha of native forest, including rainforest. Most of the trees are on Crown land. Commercial forestry is permitted on about 11.4 million ha of this Crown land and is concentrated in Western Australia, Victoria, Tasmania and New South Wales. Another 1.7 million ha of commercial trees are located in plantations.4 Commercial timber harvesting on Crown land is carried out under 20-year Regional Forestry Agreements between each state government and the Commonwealth of Australia.5
The forest industries are Australia’s second-biggest manufacturing sector, contributing about only 1% to GDP and about 7% of manufacturing output.6 Forest industries also
provide direct employment for approximately 80 000 people.7 This employment is widely dispersed, with employment in many small communities critically dependent upon logging contracts, haulage, and jobs in around a thousand local saw mills, manufacturing plants and paper mills.
ThE MOVE TO A rEGUlATED INDUSTryCommercial harvesting of native timber was well established in NSW as early as 1820. Port facilities had been constructed in Sydney Harbour, the floodplains of the Parramatta and Lane Cove rivers were littered with farms and, as settlers continued to spread out and clear land, ancient stands of red cedar trees were
discovered. Each summer these trees were felled by groups of timber cutters, and cedar became one of the young colony’s first export products.8
For more than a century, extensive commercial timber harvesting was a feature of Australia’s development. Timber was produced for building and construction, for railways, ports, roads and mines as well as furniture, paper products and packaging. During this time, state governments introduced legislation and regulation to manage logging in each jurisdiction.
Today’s forest industry is highly regulated. Most harvesting of native forests is carried out on Crown land in upper catchment areas. Areas with commercial trees are usually harvested using a method called clear-felling, so that most of the suitable trees are felled at one time. Some
time after the sawlogs have been removed, the residual material is burned and, after rain, the eucalypt seeds germinate. Seedlings are allowed to grow into mature trees which will be harvested about 80 years later.9 Not all forest management, however, observes this rotation interval.
Logging is not allowed on steep slopes or close to the edge of streams. Mature trees that provide seed for forest regeneration, and also shelters and nesting sites for wildlife, are preserved. These regulations are in place to ensure that disturbed soil is not washed into the watercourses of the upper catchment and that logging impacts upon native fauna are moderated. Loggers operate under contracts with state governments and their operations must comply with prescribed codes of practice.
PlANTATIONS & FArM FOrESTryCommercial timber can be grown either on Crown land or on private land in plantations. Although trees have been grown in plantations in Australia for about 100 years, there has been a major expansion in the past 10 years, with the conversion of productive farmland to tree plantations on a large scale.
Driving this development was the 2020 Vision Statement, released by the then deputy prime minister, John Anderson, in 1997. This statement proposed that: ‘Plantations have the potential to be of significant benefit to the natural environment, and a sustainable and viable land use in regional Australia. Commonwealth, state and territory governments have in place a set of national principles for the sustainable management of plantations, providing a framework for environmental, socio-economic
Figure 1. Changes in area planted to softwoods and hardwoods, 1994–2004
Since 1994 there has been significant change in the composition of tree plantations across Australia. While the planting of pines (softwood) has remained fairly steady, there has been a major increase in the area of land planted to eucalypt (hardwood) species. This has been occurring in those parts of Australia with the most reliable rainfall.
Source: Department of Agriculture Fisheries and Forestry – Bureau of Rural Sciences, National plantation inventory Australia, 2006 Update, p. 1.
forests & firesTHE BIG PICTURE
0
200,000
400,000
600,000
800,000
1,000,000
1,200,000
1,400,000
1,600,000
1,800,000
1994 1995 1996
Hardwood
Softwood
1997 1998 1999 2000 2001 2002 2003
YeARS
AReA
(ha)
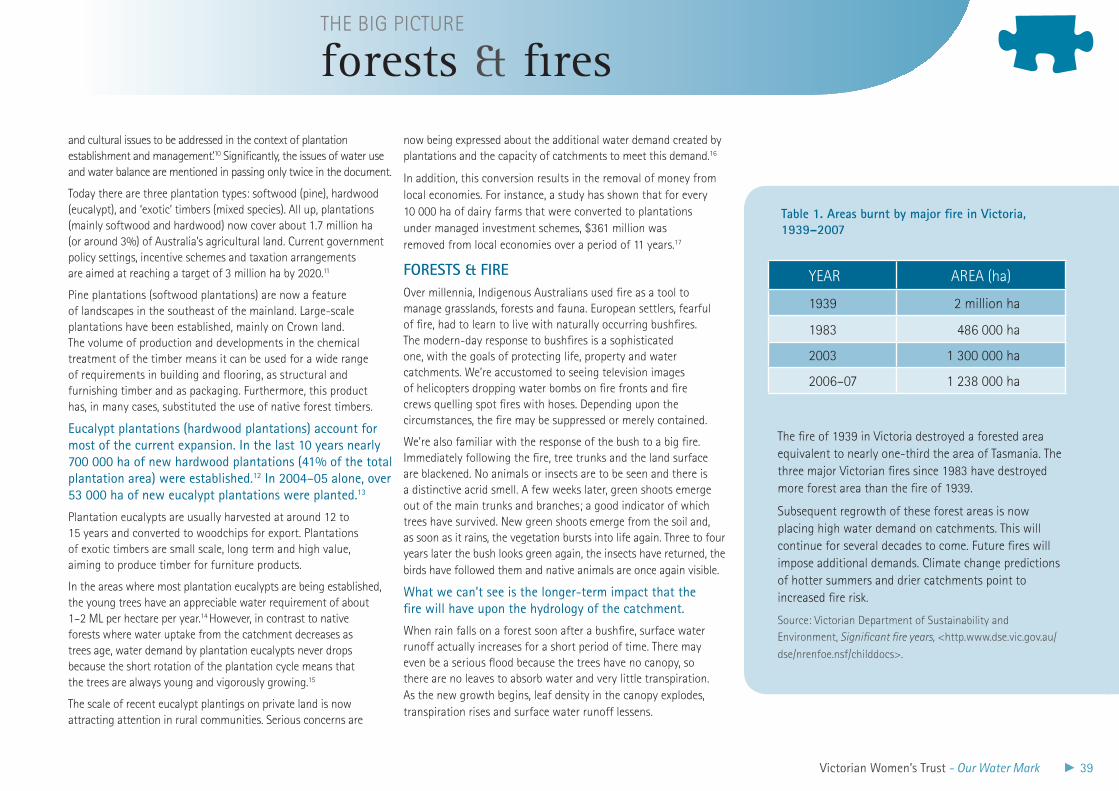
Victorian Women’s Trust - Our Water Mark 39
and cultural issues to be addressed in the context of plantation establishment and management.’10 Significantly, the issues of water use and water balance are mentioned in passing only twice in the document.
Today there are three plantation types: softwood (pine), hardwood (eucalypt), and ‘exotic’ timbers (mixed species). All up, plantations (mainly softwood and hardwood) now cover about 1.7 million ha (or around 3%) of Australia’s agricultural land. Current government policy settings, incentive schemes and taxation arrangements are aimed at reaching a target of 3 million ha by 2020.11
Pine plantations (softwood plantations) are now a feature of landscapes in the southeast of the mainland. Large-scale plantations have been established, mainly on Crown land. The volume of production and developments in the chemical treatment of the timber means it can be used for a wide range of requirements in building and flooring, as structural and furnishing timber and as packaging. Furthermore, this product has, in many cases, substituted the use of native forest timbers.
eucalypt plantations (hardwood plantations) account for most of the current expansion. In the last 10 years nearly 700 000 ha of new hardwood plantations (41% of the total plantation area) were established.12 In 2004–05 alone, over 53 000 ha of new eucalypt plantations were planted.13
Plantation eucalypts are usually harvested at around 12 to 15 years and converted to woodchips for export. Plantations of exotic timbers are small scale, long term and high value, aiming to produce timber for furniture products.
In the areas where most plantation eucalypts are being established, the young trees have an appreciable water requirement of about 1–2 ML per hectare per year.14 However, in contrast to native forests where water uptake from the catchment decreases as trees age, water demand by plantation eucalypts never drops because the short rotation of the plantation cycle means that the trees are always young and vigorously growing.15
The scale of recent eucalypt plantings on private land is now attracting attention in rural communities. Serious concerns are
now being expressed about the additional water demand created by plantations and the capacity of catchments to meet this demand.16
In addition, this conversion results in the removal of money from local economies. For instance, a study has shown that for every 10 000 ha of dairy farms that were converted to plantations under managed investment schemes, $361 million was removed from local economies over a period of 11 years.17
FOrESTS & FIrEOver millennia, Indigenous Australians used fire as a tool to manage grasslands, forests and fauna. European settlers, fearful of fire, had to learn to live with naturally occurring bushfires. The modern-day response to bushfires is a sophisticated one, with the goals of protecting life, property and water catchments. We’re accustomed to seeing television images of helicopters dropping water bombs on fire fronts and fire crews quelling spot fires with hoses. Depending upon the circumstances, the fire may be suppressed or merely contained.
We’re also familiar with the response of the bush to a big fire. Immediately following the fire, tree trunks and the land surface are blackened. No animals or insects are to be seen and there is a distinctive acrid smell. A few weeks later, green shoots emerge out of the main trunks and branches; a good indicator of which trees have survived. New green shoots emerge from the soil and, as soon as it rains, the vegetation bursts into life again. Three to four years later the bush looks green again, the insects have returned, the birds have followed them and native animals are once again visible.
What we can’t see is the longer-term impact that the fire will have upon the hydrology of the catchment.
When rain falls on a forest soon after a bushfire, surface water runoff actually increases for a short period of time. There may even be a serious flood because the trees have no canopy, so there are no leaves to absorb water and very little transpiration. As the new growth begins, leaf density in the canopy explodes, transpiration rises and surface water runoff lessens.
YEAR AREA (ha)
1939 2 million ha
1983 486 000 ha
2003 1 300 000 ha
2006–07 1 238 000 ha
Table 1. Areas burnt by major fire in Victoria, 1939–2007
The fire of 1939 in Victoria destroyed a forested area equivalent to nearly one-third the area of Tasmania. The three major Victorian fires since 1983 have destroyed more forest area than the fire of 1939.
Subsequent regrowth of these forest areas is now placing high water demand on catchments. This will continue for several decades to come. Future fires will impose additional demands. Climate change predictions of hotter summers and drier catchments point to increased fire risk.
Source: Victorian Department of Sustainability and Environment, Significant fire years, <http.www.dse.vic.gov.au/
dse/nrenfoe.nsf/childdocs>.
forests & firesTHE BIG PICTURE
40 Victorian Women’s Trust - Our Water Mark
POST-FIrE EFFECTSThe water-demand effect often peaks 30 years after the fire, although it can sometimes last for up to 70 years. The long-term effects upon water supply can be huge, especially when a very large area of forest is destroyed.
For example, the 1939 fires in Victoria resulted in the destruction of nearly 2 million ha of forests. The water required for the natural regeneration and regrowth of these forests meant that less surface water was available for agriculture and industries in rural areas. Apart from the reduction in surface water to support these activities, Melbourne’s water supply was also affected.
Some of the forests in Melbourne’s water catchments were also destroyed by the 1939 fires. The authorities were able to quantify the resultant shortfall in surface-water runoff into Melbourne’s water storages. This shortfall was a staggering 6 000 000 L per year for every hectare of forest. This deficit was experienced every year for the next 30 years.
On 25 December, 2001, lightning strikes sparked a series of fires in several of Sydney’s water catchments. These fires burned for several weeks and 225 000 ha of forested areas were blackened. Water supply from the Nattai Catchment has subsequently been reduced by 50%.18
Predictions of the impact of global warming upon southern Australia include a rise in average daily temperatures, more hotter days and drier catchments. If this eventuates, we will experience more frequent fires and larger areas within catchments will be burned. This will result in water runoff in these catchments declining further. In addition, rainfall over many of these catchments is also predicted to decline. The shortfall in surface-water runoff due to fire effects and subsequent revegetation will become an even greater constraint on the overall availability of water.
ibid., pp. 1-24.11.
M Parson, M Gavran & A Gerrand, 12. National plantation inventory – 2004 update, DAFF, Canberra, 2006, p. 2, <www.brs.gov.au/plantations>.
M Parson, M Gavran & A Gerrand, 13. National plantation inventory – 2005 update, DAFF, Canberra, 2006, p. 3, <www.brs.gov.au/plantations>.
op. cit., p. 4, <www.brs.gov.au/plantations>.14.
RJ Keenan, A Gerrand & M Parsons, 15. Science for decision makers: Plantations and water - plantation impacts on streamflow, Bureau of Rural Sciences, Barton, ACT, 2006, p. 1, <www.daff.gov.au/brs>.
The Wilderness Society, 16. Forest practices are threatening Launceston’s water supply, TWS, Hobart, 2004, pp. 1–4, <www.wilderness.org.au/campaigns>.
D Cornish, MS&A submission to Treasury Inquiry, 17. Proposed taxation arrangements for investment in forestry managed investment schemes (MIS), 2005, pp. 14-15.
C Chafers, 18. Wildfire, catchment health and water quality: a review of knowledge derived from research undertaken in Sydney’s water supply catchments 2002–2007, ewater Cooperative Research Centre, Canberra, 2007. <www.ewatercrc.com.au/newbushfire>
Some other useful sourcesB Lyons, • All Gunns blazing: J and T Gunn and the development of Launceston 1871–1997, 1990.
rEFErENCESG Kuczera, ‘Prediction of water yield reductions following 1.
a bushfire in ash-mixed species eucalypt forest’, Journal of Hydrology, vol. 94, 1985, pp. 215–36.
National Groundwater Committee, 2. Impacts of land use change on groundwater resources, Issues paper no. 3, DEH, 2004, pp. 1–4.
RJ Keenan, A Gerrand & M Parsons, 3. Science for decision makers: plantations and water - plantation impacts on streamflow, Bureau of Rural Sciences, Barton, ACT, 2006, p. 1, <www.daffa.gov.au/brs>.
Department of Agriculture, Fisheries and Forestry, 4. How does Australia’s forest management compare with the rest of the world?, fact sheet, DAFF, Canberra, 2006, <www.daff.gov.au/forestry>.
Department of Agriculture, Fisheries and Forestry, 5. Regional forest agreements, fact sheet, DAFF, Canberra, 2007, <www.daff.gov.au/forestry>.
Department of Agriculture, Fisheries and Forestry, 6. Australian forest industries, fact sheet, DAFF, Canberra, 2006, p. 1, <www.daff.gov.au/forestry>.
ibid., p. 1.7.
A Harris, 1847, reprinted in 8. Settlers and convicts, Melbourne University Press, 1995, ch. 5.
Department of Sustainability and Environment, 9. Leadbeater’s possum, DSE Melbourne, 2006, pp. 2–3.
Private Forestry Consultative Committee 1997, 10. Plantations for Australia: the 2020 vision, p. 3.
forests & firesTHE BIG PICTURE
Victorian Women’s Trust - Our Water Mark 41
Our current experience of very dry conditions for many years now, and over so much of eastern Australia, may be another drought – or it may be something more ominous …
As the drought continued, prayer was abandoned and more devilish steps adopted. Finally soldiers with rifles marched to the tops of the hills and began shooting at passing clouds.
Laurie Lee, Cider with Rosie, Longman’s Publishing Group, London and New York, 1959
parts of eastern and southern Australia, with rainfall deficits remaining widespread over Tasmania, Victoria, South Australia, NSW and southern Queensland. It was the driest year on record (since 1900) across parts of the south, most notably in northern and eastern Tasmania, northeast Victoria and adjacent parts of southern NSW and the ACT.2 While some areas are now experiencing their fourth or fifth year of drought conditions, people on the land are aware that dry conditions have prevailed for up to nine years in some places.
As drought conditions extend across a region, farmers defer sowing crops. They substantially reduce livestock numbers by either selling animals for slaughter or sending them to agistment. Animals that do remain on drought-affected properties have to be hand fed, either with feed that has been stored in good years or with purchased feed. This is a very expensive way for farmers to operate.
ThE SErIOUS IMPACTS OF DrOUGhTProlonged drought can lead to social and local industry decline and it can damage aquatic ecosystems. The depth of these direct impacts is not always felt in the big cities. Indeed our large
city populations are almost totally disconnected from the drought experiences of rural people – those on farms, living in small towns and owning or working in businesses in provincial centres.
Drought effects do show up in the national accounts. The 1982–83 drought was the most severe one experienced in the 20th century. It cost nearly $5 billion in reduced production and insurance claims with a 40% drop in cereal grain, cotton and sugar production, the destruction of millions of livestock and thousands of tonnes of topsoil blown away in dust storms.3 Overall, gross domestic product (GDP) was reduced by 0.75%, with a 9% reduction in rural exports.4
In provincial cities and rural townships, the effects of drought are immediate and endure for several years after a drought has broken with good seasonal rainfall.
A recent business and industry survey reported that, overall, 59% of respondents considered that the drought was having a negative impact upon their business. The overwhelming impact was a decline in revenues for 77% of businesses.5
Periodic droughts are an enduring feature of life in Australia. Over the 100 years between 1895 and 1995 we have experienced nine periods of serious drought. These periods have lasted from two to eight years. In each case drought was experienced in at least two states and on one occasion (1918–20) all states experienced drought conditions. Overall, serious drought has been experienced somewhere in Australia in 39 of these 100 years.1
Because of the regular cyclical occurrence of drought, Australian farming practices have evolved so that, in good years, farmers try to make provision for drought by storing surplus fodder, silage and grain feeds. Security of water supply is a critical buffer to the immediate impacts of drought. During the last century, all Australian governments carried out major infrastructure projects aimed at ’drought-proofing’ both rural areas and capital cities through the construction, and strategic siting, of large water storages across the mainland.
At the present time a significant proportion of Australia is experiencing a prolonged dry period and the Federal Government has officially declared this period a drought.
December rainfall totals for 2006 were generally well below average across the drought-affected
severe droughtTHE BIG PICTURE
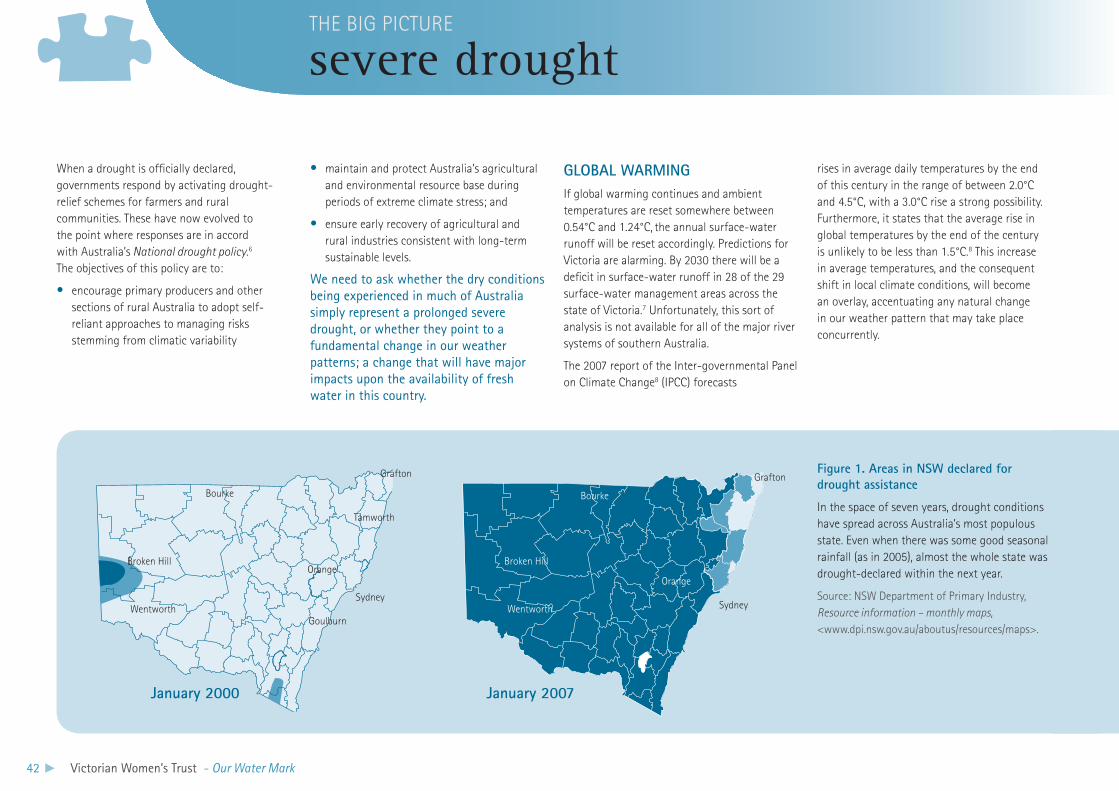
42 Victorian Women’s Trust - Our Water Mark
When a drought is officially declared, governments respond by activating drought-relief schemes for farmers and rural communities. These have now evolved to the point where responses are in accord with Australia’s National drought policy.6 The objectives of this policy are to:
encourage primary producers and other •sections of rural Australia to adopt self-reliant approaches to managing risks stemming from climatic variability
maintain and protect Australia’s agricultural •and environmental resource base during periods of extreme climate stress; and
ensure early recovery of agricultural and •rural industries consistent with long-term sustainable levels.
We need to ask whether the dry conditions being experienced in much of Australia simply represent a prolonged severe drought, or whether they point to a fundamental change in our weather patterns; a change that will have major impacts upon the availability of fresh water in this country.
severe droughtTHE BIG PICTURE
Broken Hill
WentworthGoulburn
Sydney
Tamworth
Bourke
Orange
Grafton Figure 1. Areas in NSW declared for drought assistance
In the space of seven years, drought conditions have spread across Australia’s most populous state. Even when there was some good seasonal rainfall (as in 2005), almost the whole state was drought-declared within the next year.
Source: NSW Department of Primary Industry, Resource information – monthly maps, <www.dpi.nsw.gov.au/aboutus/resources/maps>.
GlOBAl WArMINGIf global warming continues and ambient temperatures are reset somewhere between 0.54°C and 1.24°C, the annual surface-water runoff will be reset accordingly. Predictions for Victoria are alarming. By 2030 there will be a deficit in surface-water runoff in 28 of the 29 surface-water management areas across the state of Victoria.7 Unfortunately, this sort of analysis is not available for all of the major river systems of southern Australia.
The 2007 report of the Inter-governmental Panel on Climate Change8 (IPCC) forecasts
rises in average daily temperatures by the end of this century in the range of between 2.0°C and 4.5°C, with a 3.0°C rise a strong possibility. Furthermore, it states that the average rise in global temperatures by the end of the century is unlikely to be less than 1.5°C.8 This increase in average temperatures, and the consequent shift in local climate conditions, will become an overlay, accentuating any natural change in our weather pattern that may take place concurrently.
Sydney
Bourke
Grafton
Orange
Broken Hill
Wentworth
January 2000 January 2007
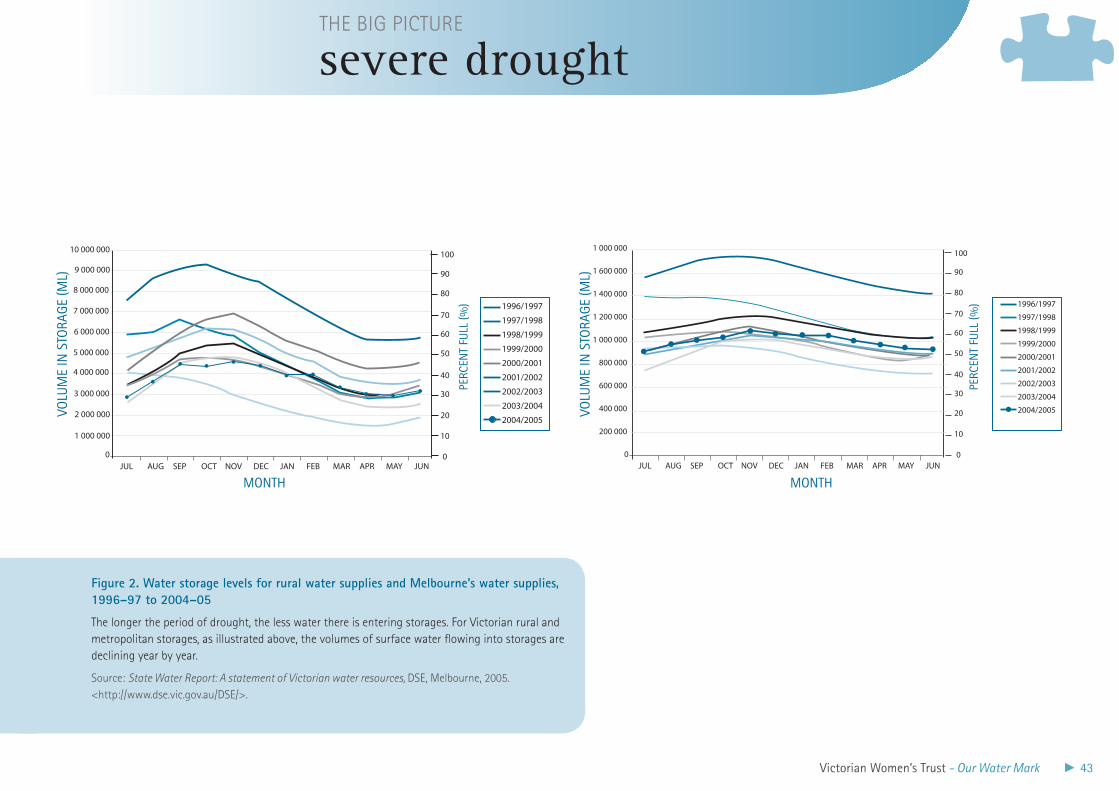
Victorian Women’s Trust - Our Water Mark 43
severe droughtTHE BIG PICTURE
Figure 2. Water storage levels for rural water supplies and Melbourne’s water supplies, 1996–97 to 2004–05
The longer the period of drought, the less water there is entering storages. For Victorian rural and metropolitan storages, as illustrated above, the volumes of surface water flowing into storages are declining year by year.
Source: State Water Report: A statement of Victorian water resources, DSE, Melbourne, 2005. <http://www.dse.vic.gov.au/DSE/>.
200 000
400 000
600 000
800 000
1 000 000
1 600 000
1 400 000
1 200 000
1 000 000
1996/1997
1997/1998
1998/1999
1999/2000
2000/2001
2001/2002
2002/2003
2003/2004
2004/2005
JUL0
AUG SEP OCT NOV DEC JAN FEB MAR APR MAY JUN0
10
20
30
40
50
60
70
80
90
100
200 000
400 000
600 000
800 000
1 000 000
1 600 000
1 400 000
1 200 000
1 000 000
1996/1997
1997/1998
1998/1999
1999/2000
2000/2001
2001/2002
2002/2003
2003/2004
2004/2005
JUL0
AUG SEP OCT NOV DEC JAN FEB MAR APR MAY JUN0
10
20
30
40
50
60
70
80
90
100
JUL
1 000 000
0 0
10
20
30
40
50
60
70
80
90
100
1996/1997
1997/1998
1998/1999
1999/2000
2000/2001
2001/2002
2002/2003
2003/2004
2004/20052 000 000
3 000 000
4 000 000
5 000 000
6 000 000
7 000 000
8 000 000
9 000 000
10 000 000
AUG SEP OCT NOV DEC JAN FEB MAR APR MAY JUNJUL
1 000 000
0 0
10
20
30
40
50
60
70
80
90
100
1996/1997
1997/1998
1998/1999
1999/2000
2000/2001
2001/2002
2002/2003
2003/2004
2004/20052 000 000
3 000 000
4 000 000
5 000 000
6 000 000
7 000 000
8 000 000
9 000 000
10 000 000
AUG SEP OCT NOV DEC JAN FEB MAR APR MAY JUN
MONTHMONTH
VOLU
Me
IN S
TORA
ge
(ML)
VOLU
Me
IN S
TORA
ge
(ML)
PeRC
eNT
FULL
(%)
PeRC
eNT
FULL
(%)
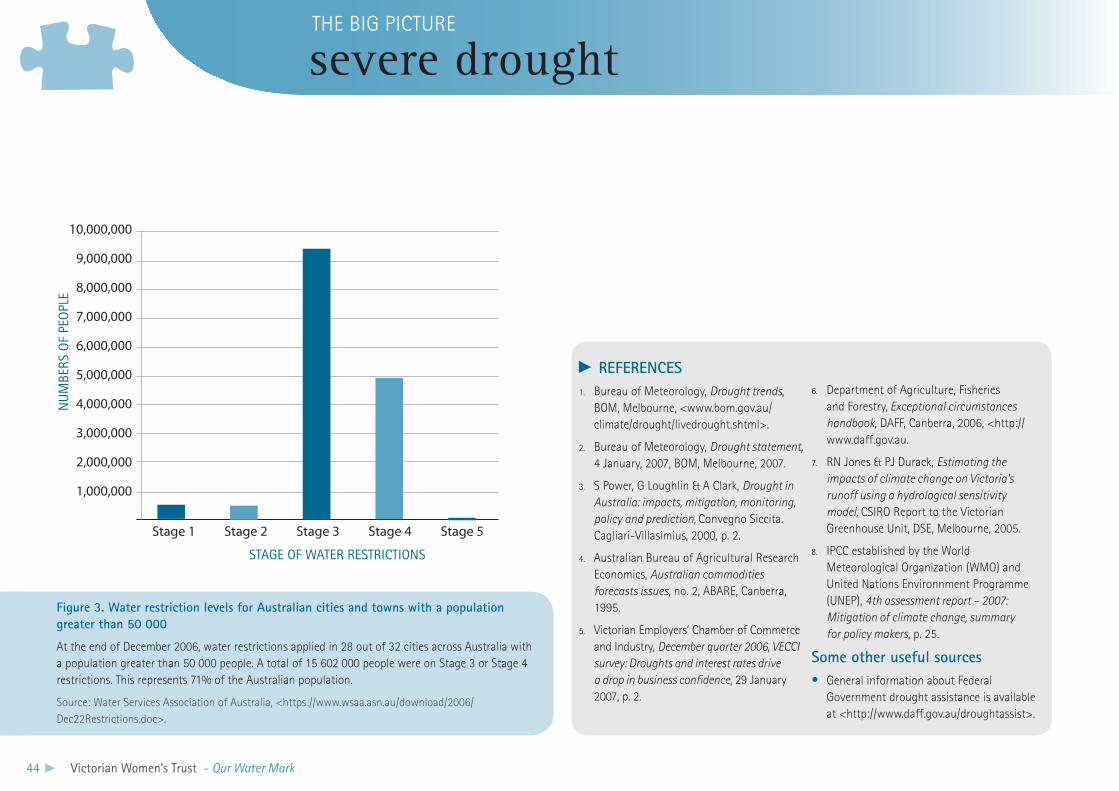
44 Victorian Women’s Trust - Our Water Mark
severe droughtTHE BIG PICTURE
Figure 3. Water restriction levels for Australian cities and towns with a population greater than 50 000
At the end of December 2006, water restrictions applied in 28 out of 32 cities across Australia with a population greater than 50 000 people. A total of 15 602 000 people were on Stage 3 or Stage 4 restrictions. This represents 71% of the Australian population.
Source: Water Services Association of Australia, <https://www.wsaa.asn.au/download/2006/ Dec22Restrictions.doc>.
Department of Agriculture, Fisheries 6.
and Forestry, Exceptional circumstances handbook, DAFF, Canberra, 2006, <http://www.daff.gov.au.
RN Jones & PJ Durack, 7. Estimating the impacts of climate change on Victoria’s runoff using a hydrological sensitivity model, CSIRO Report to the Victorian Greenhouse Unit, DSE, Melbourne, 2005.
IPCC established by the World 8.
Meteorological Organization (WMO) and United Nations Environnment Programme (UNEP), 4th assessment report – 2007: Mitigation of climate change, summary for policy makers, p. 25.
Some other useful sourcesGeneral information about Federal •Government drought assistance is available at <http://www.daff.gov.au/droughtassist>.
rEFErENCESBureau of Meteorology, 1. Drought trends, BOM, Melbourne, <www.bom.gov.au/climate/drought/livedrought.shtml>.
Bureau of Meteorology, 2. Drought statement, 4 January, 2007, BOM, Melbourne, 2007.
S Power, G Loughlin & A Clark, 3. Drought in Australia: impacts, mitigation, monitoring, policy and prediction, Convegno Siccita. Cagliari-Villasimius, 2000, p. 2.
Australian Bureau of Agricultural Research 4.
Economics, Australian commodities forecasts issues, no. 2, ABARE, Canberra, 1995.
Victorian Employers’ Chamber of Commerce 5.
and Industry, December quarter 2006, VECCI survey: Droughts and interest rates drive a drop in business confidence, 29 January 2007, p. 2.
1,000,000
2,000,000
3,000,000
4,000,000
5,000,000
6,000,000
8,000,000
7,000,000
9,000,000
10,000,000
Stage 1 Stage 2 Stage 3 Stage 4 Stage 5
STAge OF WATeR ReSTRICTIONS
NU
MBe
RS O
F Pe
OPL
e
Victorian Women’s Trust - Our Water Mark 45
We have extensively degraded many of our freshwater ecosystems. Some of this damage is beyond repair. Yet our very future rests not only on repairing as much as we can, but on adapting to the impacts of climate change …
Historical legacies of land-use change together with growing demands for water resources from agricultural, industrial and urban sectors have extensively degraded many of the freshwater ecosystems of Australia. Recent and rapid declines in the condition of these ecosystems indicate that current patterns of water consumption are ecologically unsustainable, particularly in agricultural landscapes.PS Lake & NR Bond, ‘Australian futures: Freshwater ecosystems and human water usage’, Futures, vol. 39, 2007, pp. 288–305
aware, for example, of the vast quantities of salts in our soils or that the replacement of deep-rooted native vegetation with shallow-rooted crop species set the scene for major long-term changes in the hydrology of our catchments.
We have now, in Australia, a three-dimensional environmental problem.
We have to stabilise and repair ecosystems that have been extensively degraded and damaged by past inappropriate land-use practices. At the same time, we have to ensure that current developments and forms of land use don’t repeat past ecological mistakes. Into the immediate and long-term future, we will also have to address the negative impacts of predicted climate change.
DEGrADATION OF AQUATIC ECOSySTEMSThere is insufficient water being left in many of our rivers, streams and lakes to maintain them as healthy ecosystems and habitats. The extent of degradation of our aquatic environments is evidenced by the following:
An assessment of 18 000 km of major rivers •and tributaries in Victoria shows that only 27% are in good or excellent condition.1
Surface water is over-allocated for most •rivers in the NSW section of the Murray-Darling Basin (MDB), the rivers in western Victoria and on the eastern side of St Vincent Gulf in South Australia. 2.
In Victoria, most rivers north of the Great •Divide and running into the Murray are fully allocated. Volumes of water being removed from the Queensland portion of the MDB are already at 70% of the sustainable yield. This situation is similar for rivers north of the basin, from Charleville to Townsville in Queensland; as it is for rivers northeast of Adelaide. With such high allocations and extended periods of very dry conditions, natural flows can become so low that the rivers and streams struggle to sustain aquatic ecosystems.
River health, measured by the presence •of aquatic invertebrates (such as worms, yabbies, beetles and countless others) is poor. A national assessment reveals a substantial reduction in river health along 22 000 km of river length. In NSW the loss is evident along 50% of river length. In the ACT and Western Australia, it is evident along 35% of river length, while for the remaining states and the Northern Territory, the loss is between 12% and 24%.3
The aquatic environment is much more important than many of us realise. A composite of rivers, streams, wetlands, estuaries, billabongs and bogs, it maintains a vast array of flora and fauna, as well as supporting all other life – ours included.
A sufficient quantity of fresh water of the right quality guarantees our food supply, the quality of life in our cities and towns and our public health and leisure activities. We are constantly extracting this water from our aquatic environments, yet we are not maintaining the health of those environments. In the past, we have used our waterways to dispose of waste and pollutants. We have also drained a large percentage of our wetlands to provide more land for farming.
There is no case for laying blame here. While the indigenous inhabitants understood this land, European arrivals did not. For most of us, this remains the case today. While early settlers soon realised that this was a very different climate and the soils were very different, inappropriate attitudes and practices have persisted to the present day. We were not
water & the environmentTHE BIG PICTURE
46 Victorian Women’s Trust - Our Water Mark
Riparian vegetation (the grasses, bushes and •trees growing alongside rivers and streams) is substantially degraded along 85% of these same rivers.4
Australia’s wetlands have been seriously •affected by urban development and the expansion of agriculture. Vast areas of wetland, seen as swamps that could be completely drained, have been eliminated to make more land available for cultivation or housing developments. More recently, despite a better understanding of the importance of wetlands as ecosystems, wetland degradation continues.5
With the exception of the top end of the •Northern Territory and the north of Western Australia, most of Australia’s large wetland systems are seriously degraded. Over 90% of the wetlands in the Murray-Darling Basin and 95% of the Gwydir Wetlands are gone. The Narran Lakes only receive 32% of their natural flow and the Macquarie Marshes and the Condamine-Balone systems are collapsing. Bird counts on these large wetlands have dropped by as much as 80%. Over-allocation of water for irrigation is a major cause of the current decline and, if these systems are to recover, they must urgently receive adequate volumes of environmental water.6
Across Australia, approximately 85% of •river length is in catchments whose natural condition has been altered, mainly by recent land clearing, changes in land use and broad-acre agriculture.7
Each year, some 19 000 tonnes of phosphorus •(from fertilisers) are transported by our rivers to be discharged into our estuaries. Over 80% of river length carries suspended sediment loads (i.e. the particles that make water cloudy) that are 10 to 200 times greater than normal.8
Approximately 28% of Australia’s estuaries •have been significantly modified by pollutants, dam building, dredging, wetland drainage and other effects of human settlement.9
Dryland salinity has a direct effect on reducing •agricultural productivity and it can have off-site effects, too. The most significant of these is salinisation of freshwater rivers. On current trends in land-use practices, land clearing and the spread of dryland salinity, it is predicted that by 2050 the length of rivers and streams with salinised water will double in Western Australia and treble in Victoria. Little further agricultural development will be possible on the Lower Eyre Peninsula in South Australia and salt concentrations in the Murray River may rise significantly.10
rEPAIrING DAMAGED ENVIrONMENTSIn the past 25 years a number of innovative programs have been initiated to stabilise, and then reverse, the environmental damage of the last 200 years of land use. They include the National Landcare Program, the Living Murray Initiative of the Murray-Darling Basin Commission; and the programs and services provided by catchment management
authorities such as WaterKeepers, Healthy Rivers Campaigns and Coastcare. Commonly, these programs are government supported, community focused and ongoing.
Within these programs, community activities are usually directed towards changing land-use practices, stabilising affected areas, intercepting and reversing degradation processes, and improving local ecosystems and habitats. These approaches have been successful in many parts of Australia and should continue to be so.
However, there are questions about whether these well-intentioned programs can bring about positive change quickly enough, given the scale of the problems and the rate of decline of these ecosystems.
Two critical actions would lead to major changes in the overall health of our waterways and adjoining land areas. These are the re-establishment of adequate riparian vegetation and environmental flow regimes.Riparian vegetation along rivers and streams has come under extreme pressure from human activities, to the extent that a great deal has been removed or degraded. Yet this band of vegetation represents an important micro-habitat. It contributes to improved water quality, aquatic and terrestrial biodiversity and the stabilisation of banks.
The second major action is the need to re-establish environmental flow regimes.11 This is crucial to reversing some of the key processes involved in aquatic ecosystem degradation. With this agenda in mind, the
1994 Council of Australian Governments (COAG), made up of the prime minister, state premiers and territory chief ministers, agreed to implement a strategic framework to reform the Australian water industry. The framework established, for the first time in Australia, a legal recognition that water should be allocated for the benefit of the natural environment.12
To date, however, there has very been limited success in achieving agreement between competing users about the volumes of water required, and then actually finding the water to release. These quandaries are best illustrated by the slow rate of progress in releasing environmental flows into two of our iconic rivers: the Snowy River and the Murray.
ThE SNOWy rIVErOn 6 October 2000, the Victorian, NSW and Commonwealth governments announced a $375 million agreement to breathe life back into the Snowy River and preserve a national icon for future generations. A long-term target was set to re-establish 28% of the river’s natural flow, while protecting other river systems and water users. The subsequent agreement established a target flow rate of 21% to be returned to the Snowy River over a 10-year period. The remaining 7% should be achieved through new infrastructure projects involving the private sector.13
To date, the highest flow reached in the Snowy River (in 2005–06) was a mere 4.3% of the mean annual natural flow.14 With only three years to go, it seems unlikely that the legal obligations agreed to will be met within the prescribed time frame.
water & the environmentTHE BIG PICTURE
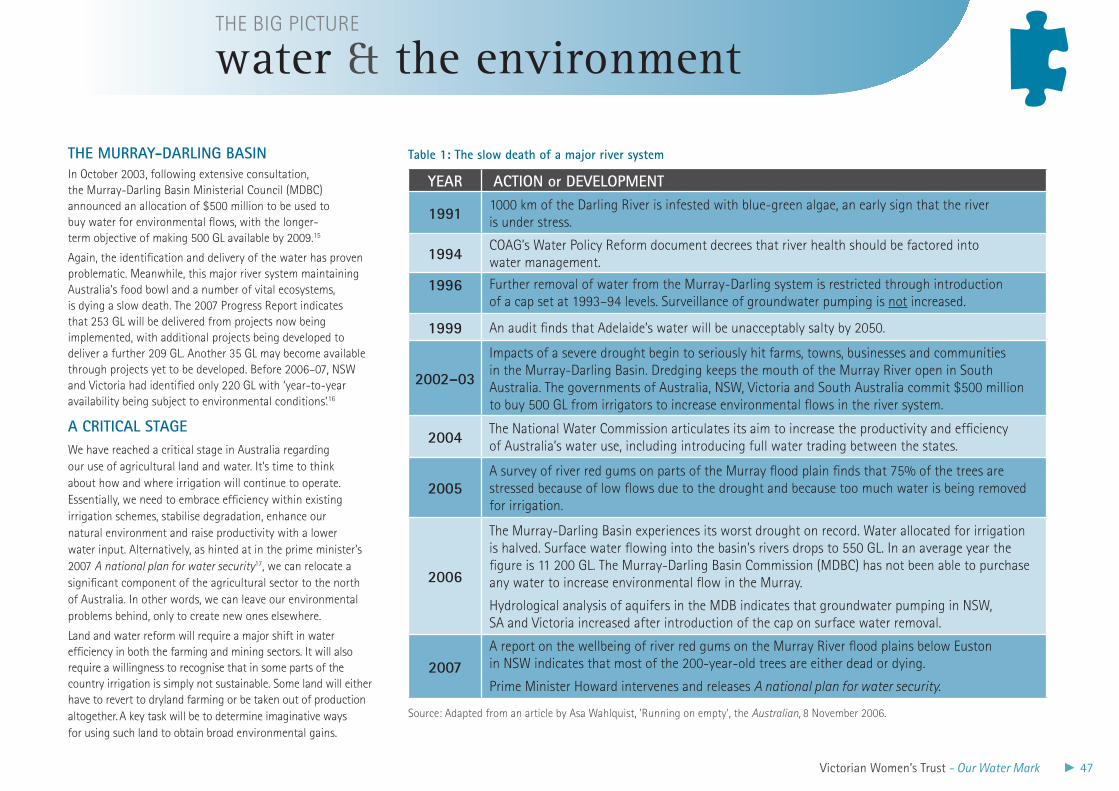
Victorian Women’s Trust - Our Water Mark 47
ThE MUrrAy-DArlING BASINIn October 2003, following extensive consultation, the Murray-Darling Basin Ministerial Council (MDBC) announced an allocation of $500 million to be used to buy water for environmental flows, with the longer-term objective of making 500 GL available by 2009.15
Again, the identification and delivery of the water has proven problematic. Meanwhile, this major river system maintaining Australia’s food bowl and a number of vital ecosystems, is dying a slow death. The 2007 Progress Report indicates that 253 GL will be delivered from projects now being implemented, with additional projects being developed to deliver a further 209 GL. Another 35 GL may become available through projects yet to be developed. Before 2006–07, NSW and Victoria had identified only 220 GL with ‘year-to-year availability being subject to environmental conditions’.16
A CrITICAl STAGEWe have reached a critical stage in Australia regarding our use of agricultural land and water. It’s time to think about how and where irrigation will continue to operate. Essentially, we need to embrace efficiency within existing irrigation schemes, stabilise degradation, enhance our natural environment and raise productivity with a lower water input. Alternatively, as hinted at in the prime minister’s 2007 A national plan for water security17, we can relocate a significant component of the agricultural sector to the north of Australia. In other words, we can leave our environmental problems behind, only to create new ones elsewhere.
Land and water reform will require a major shift in water efficiency in both the farming and mining sectors. It will also require a willingness to recognise that in some parts of the country irrigation is simply not sustainable. Some land will either have to revert to dryland farming or be taken out of production altogether. A key task will be to determine imaginative ways for using such land to obtain broad environmental gains.
water & the environmentTHE BIG PICTURE
yEAr ACTION or DEVElOPMENT
1991 1000 km of the Darling River is infested with blue-green algae, an early sign that the river is under stress.
1994 COAG’s Water Policy Reform document decrees that river health should be factored into water management.
1996 Further removal of water from the Murray-Darling system is restricted through introduction of a cap set at 1993–94 levels. Surveillance of groundwater pumping is not increased.
1999 An audit finds that Adelaide’s water will be unacceptably salty by 2050.
2002–03
Impacts of a severe drought begin to seriously hit farms, towns, businesses and communities in the Murray-Darling Basin. Dredging keeps the mouth of the Murray River open in South Australia. The governments of Australia, NSW, Victoria and South Australia commit $500 million to buy 500 GL from irrigators to increase environmental flows in the river system.
2004 The National Water Commission articulates its aim to increase the productivity and efficiency of Australia’s water use, including introducing full water trading between the states.
2005A survey of river red gums on parts of the Murray flood plain finds that 75% of the trees are stressed because of low flows due to the drought and because too much water is being removed for irrigation.
2006
The Murray-Darling Basin experiences its worst drought on record. Water allocated for irrigation is halved. Surface water flowing into the basin’s rivers drops to 550 GL. In an average year the figure is 11 200 GL. The Murray-Darling Basin Commission (MDBC) has not been able to purchase any water to increase environmental flow in the Murray.
Hydrological analysis of aquifers in the MDB indicates that groundwater pumping in NSW, SA and Victoria increased after introduction of the cap on surface water removal.
2007A report on the wellbeing of river red gums on the Murray River flood plains below Euston in NSW indicates that most of the 200-year-old trees are either dead or dying.
Prime Minister Howard intervenes and releases A national plan for water security.
Table 1: The slow death of a major river system
Source: Adapted from an article by Asa Wahlquist, 'Running on empty', the Australian, 8 November 2006.
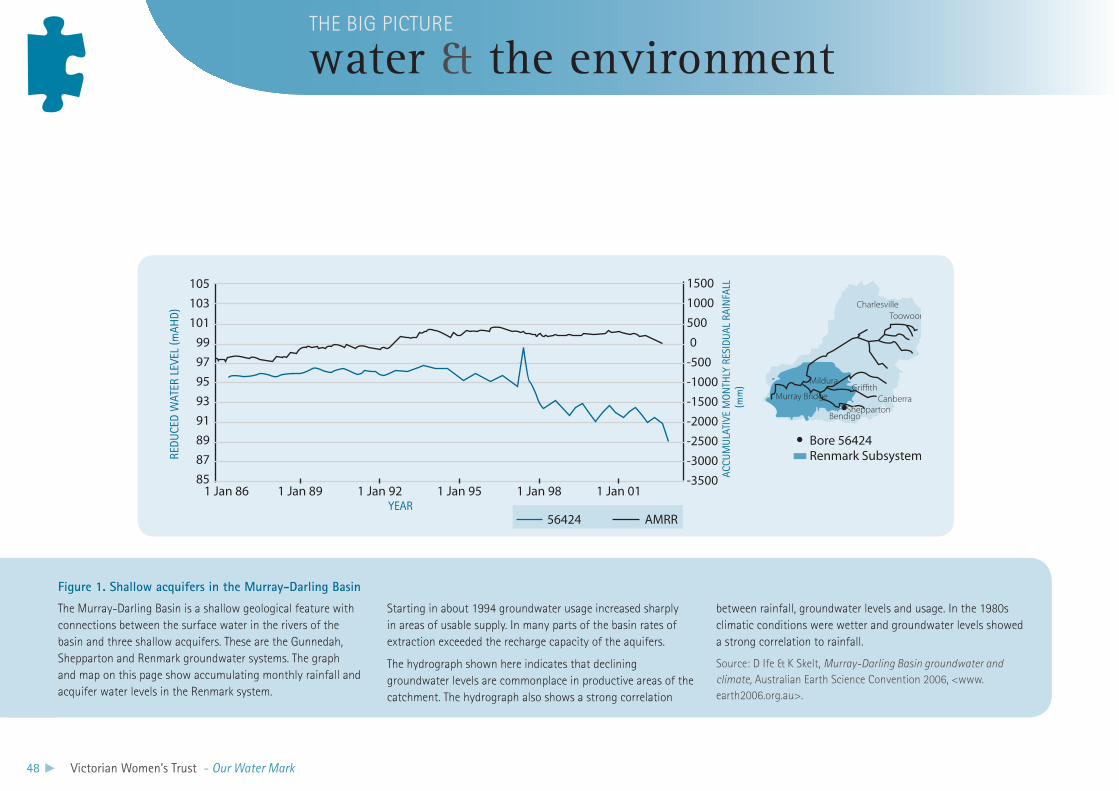
48 Victorian Women’s Trust - Our Water Mark
water & the environmentTHE BIG PICTURE
The Murray-Darling Basin is a shallow geological feature with connections between the surface water in the rivers of the basin and three shallow acquifers. These are the Gunnedah, Shepparton and Renmark groundwater systems. The graph and map on this page show accumulating monthly rainfall and acquifer water levels in the Renmark system.
Starting in about 1994 groundwater usage increased sharply in areas of usable supply. In many parts of the basin rates of extraction exceeded the recharge capacity of the aquifers.
The hydrograph shown here indicates that declining groundwater levels are commonplace in productive areas of the catchment. The hydrograph also shows a strong correlation
between rainfall, groundwater levels and usage. In the 1980s climatic conditions were wetter and groundwater levels showed a strong correlation to rainfall.
Source: D Ife & K Skelt, Murray-Darling Basin groundwater and climate, Australian Earth Science Convention 2006, <www.earth2006.org.au>.
105103101
9997959391898785
1 Jan 86 1 Jan 89 1 Jan 92 1 Jan 95 1 Jan 98 1 Jan 01
150010005000
-500-1000-1500-2000-2500-3000-3500
56424 AMRR
Renmark SubsystemBore 56424
MDBC Groundwater Status Report
CanberraShepparton
Gri�thMurray Bridge
Mildura
Bendigo
ToowoombaCharlesville
YeAR
ReDU
CeD
WAT
eR L
eVeL
(mAH
D)
ACCU
MU
LATI
Ve M
ON
THLY
ReS
IDU
AL R
AIN
FALL
(mm
)
Figure 1. Shallow acquifers in the Murray-Darling Basin
Victorian Women’s Trust - Our Water Mark 49
rEFErENCESDepartment of Sustainability and Environment, 1. Healthy rivers, healthy communities and regional growth, Draft Victorian River Health Strategy, DSE, Melbourne, 2002, p. 33.
National Land and Water Resources Audit, 2. Australian water resources assessment 2000, NLWRA, Canberra, 2001, p. 70.
National Land and Water Resources Audit, 3. Australian catchment, river and estuary assessment, vol. 1, NLWRA, Canberra, 2002, p. 79.
op. cit., p. 81.4.
Inland Rivers Network, ‘The plight of our Basin’, 5. Inland Rivers Network NSW News, vol. 11, 2006, pp. 1–12.
op. cit., pp. 1–12.6.
National Land and Water Resources Audit, 7. Australian catchment, river and estuary assessment, NLWRA, Canberra, vol. 1, 2002, p. 83.
National Land and Water Resources Audit, 8. Australian agricultural assessment, NLWRA, Canberra, 2001, p. 96.
ibid, pp. 131–3.9.
National Land and Water Resources Audit, 10. Australians and natural resource management., NLRA, Canberra, 2002, pp. 142–3.
Native Fish Australia,11. Fisheries Management Policy, NFA, Melbourne, 1993,<http://www.nativefish.asn.au>.
water & the environmentTHE BIG PICTURE
National Competition Council, 12. Assessment of governments’ progress in implementing National Competition Policy and related reforms, NCC, Melbourne, 2001, p. 81.
New South Wales, Legislative Council 2000, 13. Snowy River Agreement, hansard extract, pp. 11 678–11 686, <www.parliament.nsw.gov.au/prod/PARLMENT>
L Crisp, 14. Snowy River environmental flows – How successful so far?, Snowy Strategic Weekend Workshop, Dalgety, NSW, 2006.
Murray-Darling Basin Ministerial Council,15. The living Murray – a discussion paper on restoring the health of the River Murray, MDBC, 2002, p. ii.
Murray-Darling Basin Commission, 16. The living Murray – Progress report (water recovery), MDBC, Canberra, 2007, p. 1.
J Howard, 17. A national plan for water security, 2007, pp. 20-1, <www.pm.gov.au/water_reform>.
Some other useful sourcesMurray-Darling Basin Ministerial Council,• The living Murray initiative, 1999, <www.mdbc.gov.au/livingmurray>.
Murray-Darling Basin Ministerial Council,• The salinity audit – a 100-year perspective, MDBC, Canberra, 1999, <www.mdbc.gov.au/salinity/salinity-audit>.
C Miller,• Snowy River story, ABC Books & Audio, Sydney, 2007.
J Howard, • A national plan for water security, <www.pm.gov.au/water_reform>.
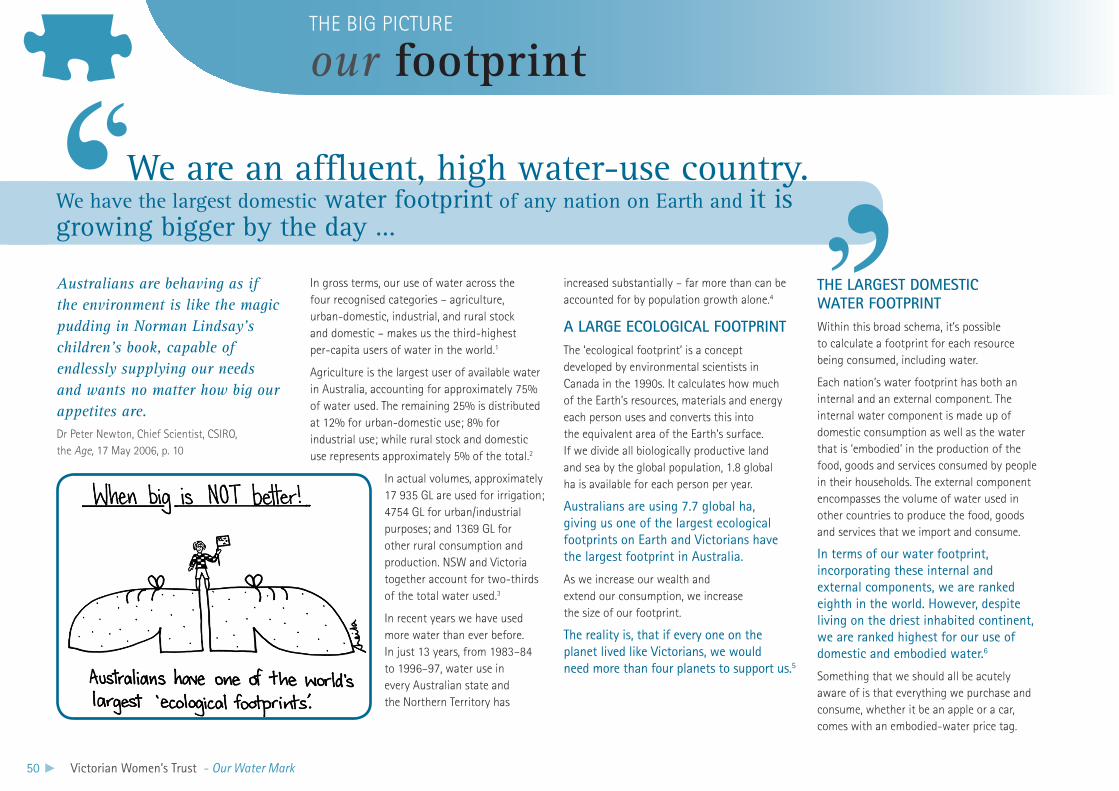
50 Victorian Women’s Trust - Our Water Mark
We are an affluent, high water-use country. We have the largest domestic water footprint of any nation on Earth and it is growing bigger by the day …
Australians are behaving as if the environment is like the magic pudding in Norman Lindsay’s children’s book, capable of endlessly supplying our needs and wants no matter how big our appetites are.Dr Peter Newton, Chief Scientist, CSIRO, the Age, 17 May 2006, p. 10
In gross terms, our use of water across the four recognised categories – agriculture, urban-domestic, industrial, and rural stock and domestic – makes us the third-highest per-capita users of water in the world.1
Agriculture is the largest user of available water in Australia, accounting for approximately 75% of water used. The remaining 25% is distributed at 12% for urban-domestic use; 8% for industrial use; while rural stock and domestic use represents approximately 5% of the total.2
In actual volumes, approximately 17 935 GL are used for irrigation; 4754 GL for urban/industrial purposes; and 1369 GL for other rural consumption and production. NSW and Victoria together account for two-thirds of the total water used.3
In recent years we have used more water than ever before. In just 13 years, from 1983–84 to 1996–97, water use in every Australian state and the Northern Territory has
increased substantially – far more than can be accounted for by population growth alone.4
A lArGE ECOlOGICAl FOOTPrINTThe ‘ecological footprint’ is a concept developed by environmental scientists in Canada in the 1990s. It calculates how much of the Earth’s resources, materials and energy each person uses and converts this into the equivalent area of the Earth’s surface. If we divide all biologically productive land and sea by the global population, 1.8 global ha is available for each person per year.
Australians are using 7.7 global ha, giving us one of the largest ecological footprints on earth and Victorians have the largest footprint in Australia.
As we increase our wealth and extend our consumption, we increase the size of our footprint.
The reality is, that if every one on the planet lived like Victorians, we would need more than four planets to support us.5
ThE lArGEST DOMESTIC WATEr FOOTPrINTWithin this broad schema, it’s possible to calculate a footprint for each resource being consumed, including water.
Each nation’s water footprint has both an internal and an external component. The internal water component is made up of domestic consumption as well as the water that is ‘embodied’ in the production of the food, goods and services consumed by people in their households. The external component encompasses the volume of water used in other countries to produce the food, goods and services that we import and consume.
In terms of our water footprint, incorporating these internal and external components, we are ranked eighth in the world. However, despite living on the driest inhabited continent, we are ranked highest for our use of domestic and embodied water.6
Something that we should all be acutely aware of is that everything we purchase and consume, whether it be an apple or a car, comes with an embodied-water price tag.
our footprintTHE BIG PICTURE
Victorian Women’s Trust - Our Water Mark 51
ThE WATEr PrICE TAGThe amount of embodied water in food items, consumer goods and services is illustrated in the following examples. It takes:
70 L of water to produce one glass of wine• 7
4660 L to produce a large steak• 8
2000 L to produce a cotton T-shirt• 9
47 600 L to produce a one-tonne vehicle• 10
23 400 L to produce a tonne of paper• 11
500 L for a large potato• 12
50 L for an orange• 13
140 L for a cup of coffee• 14
1400 L to produce a kilo of rice• 15
For persons in the lowest 20% of the income range, their weekly electricity usage accounts for 18 L of water. For persons in the top 20%, their electricity usage per week accounts for 36 L of water.16 When we leave lights on unnecessarily, we are wasting water. This is because there are inherent inefficiencies with respect to the water used in coal-fired electricity generation. When we waste food and other goods, we waste water. A 2003 survey by the Australian Food and Grocery Council revealed that Australians
waste about 2.2 million tonnes of food a year. This food contains sufficient embodied water to supply all households in Sydney and Melbourne with enough water for a year.17
Another recent report estimates that Australians spent more than $10.5 billion in 2004 on wasteful consumption. Food accounts for the largest proportion of this spending. Each year we waste $2.9 billion on fresh food, $630 million on uneaten takeaway, $876 million on leftovers, $596 million on unfinished drinks and $241 million on frozen food – a total of $5.3 billion on all forms of food.18
INCrEASING AFFlUENCE & CONSUMPTIONIn the past 50 years the average new house size in Australia has almost doubled from 115 m2 in 1955 to 221 m2 in 2000. In the same period the number of people living in households has decreased, with occupancy rates dropping from 3.6 to 2.6 persons per house.19
Household size, however, does not accurately predict water use. The determining factor is income levels. Bigger houses mean more space to fill with furniture, spa baths, curtains, lighting, carpets, appliances, paved areas,
gardens, heating and air-conditioning. More widely, Australians take up new technologies (e.g. computers, mobile phones, plasma TVs) at rapid rates. When we extend our consumption of material goods there is an invisible water price tag.
Buying these goods requires large amounts of money. Over the past 25 years, average weekly earnings have grown four-fold, from $268 to $1043.20 We earn more but save less. The household savings ratio has decreased over this period, to the point where it is now ‘negative’, in that household consumption exceeds disposable household income.21
Our spending capacity over this same period has been massively augmented by personal borrowing for consumer goods. In 1985 Australians incurred $571 million on credit cards. In the past 20 years this has grown more than 50-fold to over $26.5 billion.22
Consumer goods represent significant amounts of embodied water. A 1998–99 analysis of the ABS Household Expenditure Survey, showed that the total water budget of an average Sydney household was about 3 million L.
Because our group is made up of people from our mothers’ group, a lot of discussion centred around how we can bring up our children with a respect for water. Little things like how we can teach them through waterplay but also to incorporate an understanding of how precious water is as a resource.Mothers Watermark Australia group, Box Hill North
About half of this household water budget was the water embodied in food; only 11% was water being directly consumed in showers, watering gardens and cleaning.
Furthermore, the analysis showed that a 100% increase in household expenditure should result in a 70% average increase in water use.23
Governments have been busy mounting extensive water conservation campaigns of late, particularly as the levels in the water storages supplying our cities continue to drop. Rightly, these send messages about ways to reduce our direct consumption of water.
But these water conservation campaigns do not yet address total water demand. This would not only entail acknowledging the extraordinary amount of water that’s built into our consumption patterns and lifestyles, but a preparedness to establish in people’s minds the obvious link between affluence, resource depletion and scarcity.
Mindsets do take changing. Despite our already large water footprint, there is an established view that if only we got on with augmenting
our footprintTHE BIG PICTURE
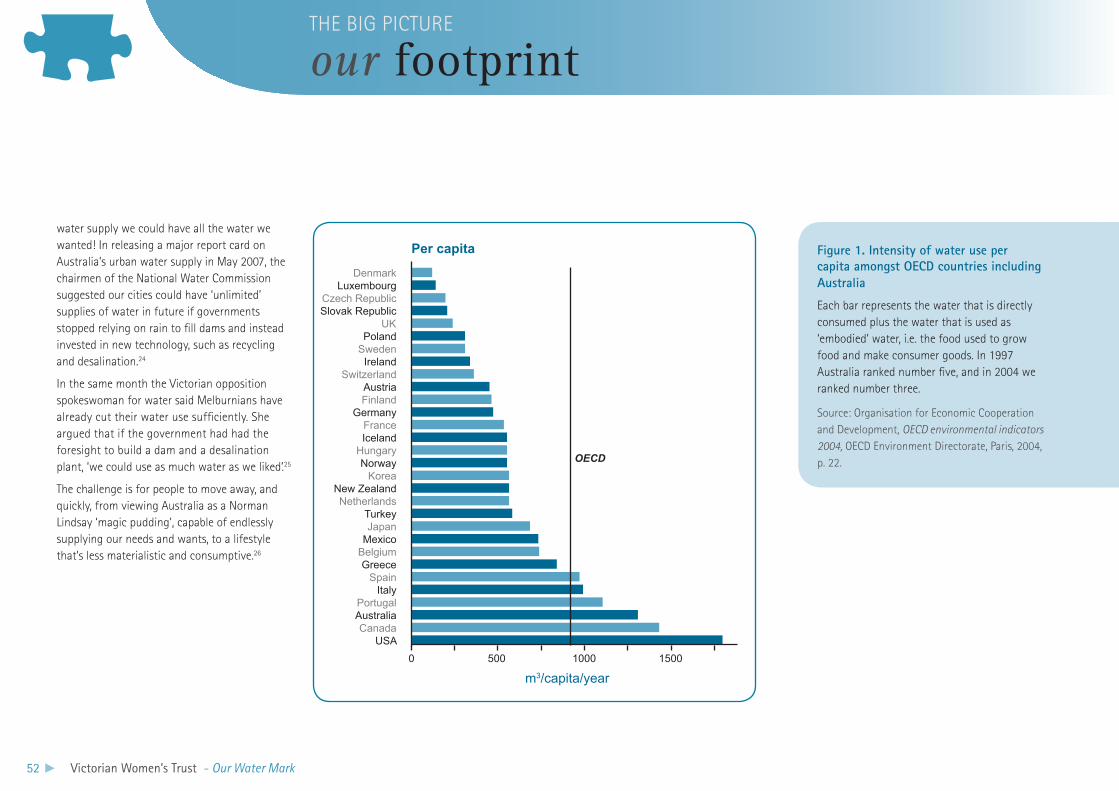
52 Victorian Women’s Trust - Our Water Mark
water supply we could have all the water we wanted! In releasing a major report card on Australia’s urban water supply in May 2007, the chairmen of the National Water Commission suggested our cities could have ‘unlimited’ supplies of water in future if governments stopped relying on rain to fill dams and instead invested in new technology, such as recycling and desalination.24
In the same month the Victorian opposition spokeswoman for water said Melburnians have already cut their water use sufficiently. She argued that if the government had had the foresight to build a dam and a desalination plant, ‘we could use as much water as we liked’.25
The challenge is for people to move away, and quickly, from viewing Australia as a Norman Lindsay ‘magic pudding’, capable of endlessly supplying our needs and wants, to a lifestyle that’s less materialistic and consumptive.26
our footprintTHE BIG PICTURE
Figure 1. Intensity of water use per capita amongst OECD countries including Australia
Each bar represents the water that is directly consumed plus the water that is used as ‘embodied’ water, i.e. the food used to grow food and make consumer goods. In 1997 Australia ranked number five, and in 2004 we ranked number three.
Source: Organisation for Economic Cooperation and Development, OECD environmental indicators 2004, OECD Environment Directorate, Paris, 2004, p. 22.
USA
0 1500
OECD
Per capita
m3/capita/year
1000500
CanadaAustraliaPortugal
ItalySpain
GreeceBelgiumMexicoJapan
TurkeyNetherlands
New ZealandKorea
NorwayHungaryIcelandFrance
GermanyFinlandAustria
SwitzerlandIreland
SwedenPoland
UKSlovak RepublicCzech Republic
LuxembourgDenmark
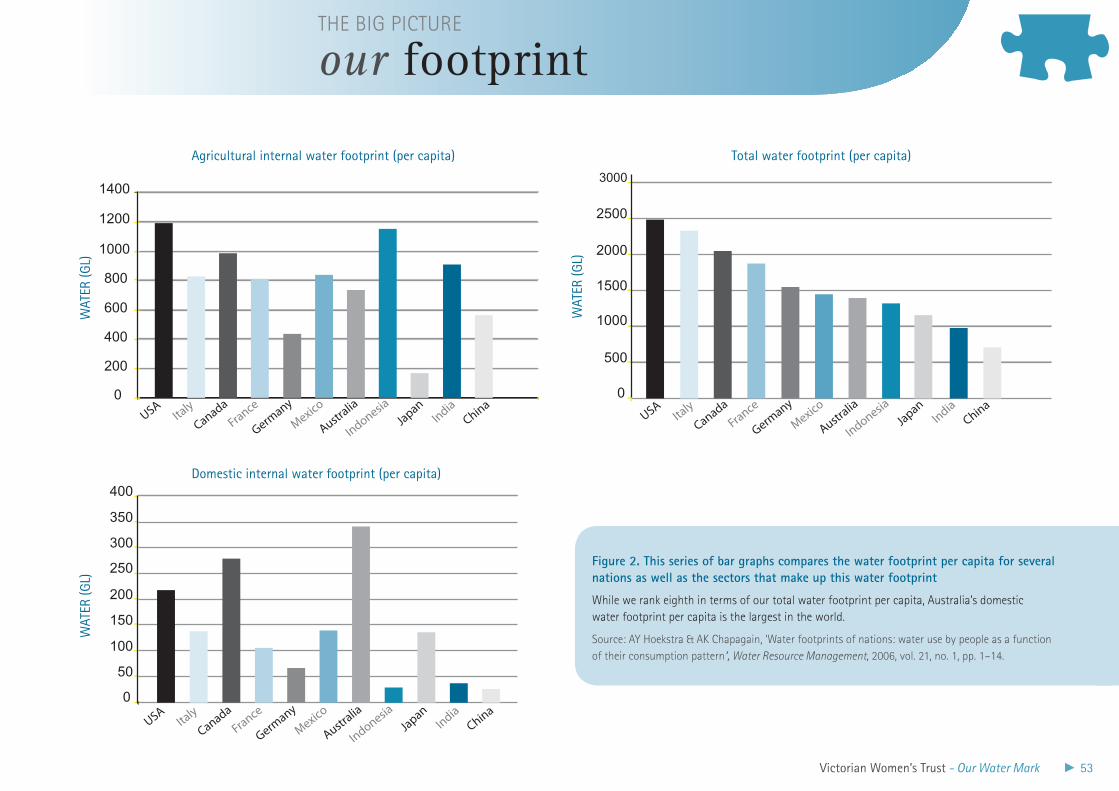
Victorian Women’s Trust - Our Water Mark 53
0
200
400
600
800
1000
1200
1400
USAIta
ly
CanadaFrance
Germany
Mexico
Australia
IndonesiaJapan
IndiaChina
Figure 2. This series of bar graphs compares the water footprint per capita for several nations as well as the sectors that make up this water footprint
While we rank eighth in terms of our total water footprint per capita, Australia’s domestic water footprint per capita is the largest in the world.
Source: AY Hoekstra & AK Chapagain, ‘Water footprints of nations: water use by people as a function of their consumption pattern’, Water Resource Management, 2006, vol. 21, no. 1, pp. 1–14.
our footprintTHE BIG PICTURE
0
500
1000
1500
2000
2500
3000
Litres/year
USAIta
ly
CanadaFrance
Germany
Mexico
Australia
IndonesiaJapan
IndiaChina
0
50
100
150
200
250
300
350
400
Litres/year
USAIta
ly
CanadaFrance
Germany
Mexico
Australia
IndonesiaJapan
IndiaChina
WAT
eR (g
L)W
ATeR
(gL)
WAT
eR (g
L)
Total water footprint (per capita)Agricultural internal water footprint (per capita)
Domestic internal water footprint (per capita)
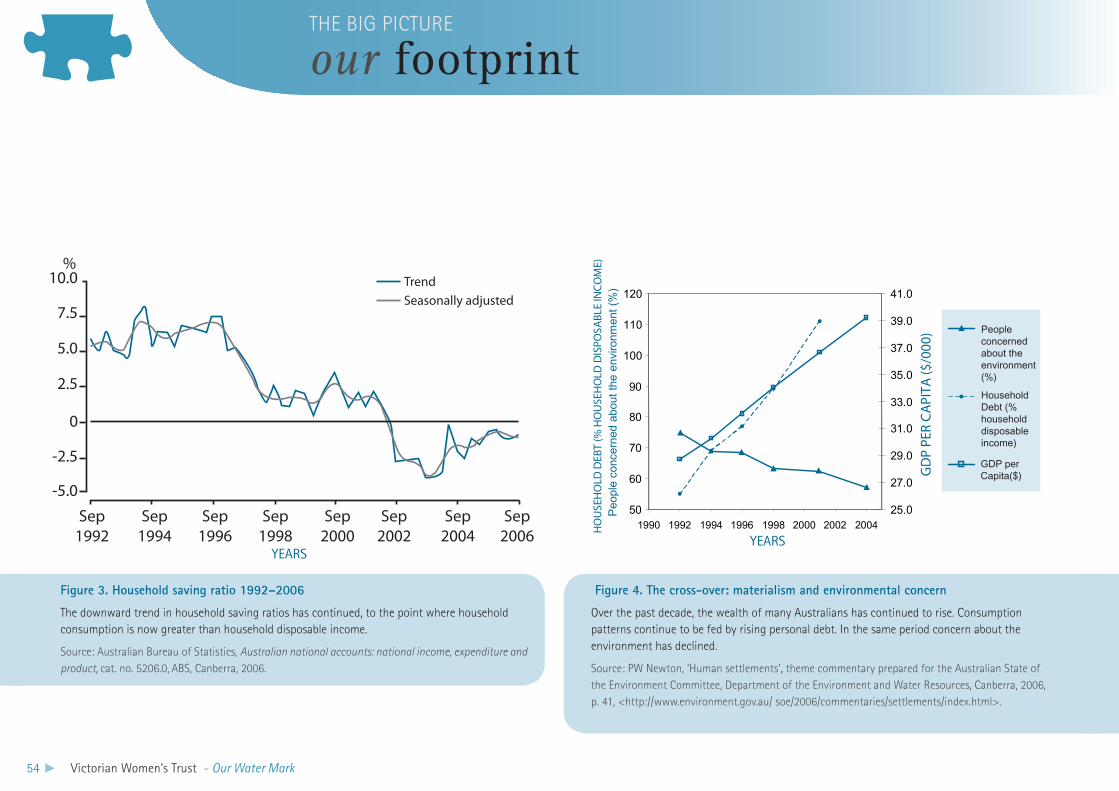
54 Victorian Women’s Trust - Our Water Mark
Sep1992
Sep1994
Sep1996
Sep1998
Sep2000
Sep2002
Sep2004
Sep2006
10.0
7.5
5.0
2.5
0
-2.5
-5.0
%TrendSeasonally adjusted
Figure 3. household saving ratio 1992–2006
The downward trend in household saving ratios has continued, to the point where household consumption is now greater than household disposable income.
Source: Australian Bureau of Statistics, Australian national accounts: national income, expenditure and product, cat. no. 5206.0, ABS, Canberra, 2006.
our footprintTHE BIG PICTURE
Figure 4. The cross-over: materialism and environmental concern
Over the past decade, the wealth of many Australians has continued to rise. Consumption patterns continue to be fed by rising personal debt. In the same period concern about the environment has declined.
Source: PW Newton, ‘Human settlements’, theme commentary prepared for the Australian State of the Environment Committee, Department of the Environment and Water Resources, Canberra, 2006, p. 41, <http://www.environment.gov.au/ soe/2006/commentaries/settlements/index.html>.
50
60
70
80
90
100
110
120
1990 1992 1994 1996 1998 2000 2002 2004HO
USE
HO
LD D
EBT
(% H
OU
SEH
OLD
DIS
POSA
BLE
INCO
ME)
P
eopl
e co
ncer
ned
abou
t the
env
ironm
ent
(%)
25.0
27.0
29.0
31.0
33.0
35.0
37.0
39.0
41.0
GD
P PE
R CA
PITA
($/0
00) People
concerned about the environment(%)
HouseholdDebt (% householddisposableincome)
GDP perCapita($)
YeARSYeARS
Victorian Women’s Trust - Our Water Mark 55
Organisation for Economic Cooperation and 1.
Development, OECD environmental indicators 2004, OECD Environment Directorate, Paris, 2004, p. 22.
National Land and Water Resources Audit, 2.
Australian water resources assessment 2000, NLWRA, Canberra, 2001, p. 55.
ibid., p. 55.3.
ibid., p. 58.4.
Environment Protection Authority Victoria5. , Victoria’s ecological footprint, no. 975, EPAV, Melbourne, 2005, p. 1.
AY Hoekstra & AK Chapagain, ‘Water 6.
footprints of nations: water use by people as a function of their consumption pattern’, Water Resource Management, 2006, vol. 1, no. 1, p. 8.
J Williams7. , Wealth from water: a national perspective, presentation to the Wealth from Water Conference, Wagga Wagga, 2003, p. 3.
op. cit., p. 3.8.
AY Hoekstra & AK Chapagain, op. cit., p. 8.9.
B Foran & F Poldy10. , Future dilemmas – options to 2050 for Australia’s population, technology, resources and environment., CSIRO Resources Futures Working Paper 02/01, CSIRO Sustainable Ecosystems, Canberra, 2002, p. 195.
op. cit., p. 191.11.
AK Chapagain & AY Hoekstra, ‘Value of water12. ’, UNESCO Institute for Water Education – Research report series, no. 16, 2004, pp. 41–2.
ibid., p. 41.13.
ibid., p. 42.14.
World Water Council, 15. Virtual water trade – conscious choices, Synthesis of the 4th World Water Forum, 2004, p. 4.
B Foran & F Poldy16. , Future dilemmas – options to 2050 for Australia’s population, technology, resources and environment., CSIRO Resources Futures Working Paper 02/01, CSIRO Sustainable Ecosystems, Canberra, 2002, p. 176, p. 193.
Australian Food and Grocery Council, 17.
Environment report, AFGC, Canberra, 2003, p. 5.
C Hamilton, R Denniss & D Baker, 18. Wasteful consumption in Australia, Australia Institute Discussion Paper No. 77, AI, 2005.
C Hamilton & R Denniss,19. Affluenza, Allen and Unwin, Sydney, NSW, pp. 20–1.
Reserve Bank of Australia, <http://www.rba.20.
gov.au/Statistics/AlphaListing/alpha_listing_e.html>.
Australian Bureau of Statistics, 21. Australian national accounts: national income, expenditure and product, cat. no. 5206.0, ABS, Canberra, 2006.
Reserve Bank of Australia, <http://www.rba.22.
gov.au/Statistics/AlphaListing/alpha_listing_c.html>.
M Lenzen, ‘The influence of lifestyles on 23.
environmental pressure’, in Australian Bureau of Statistics, Year book, Australia, cat. no. 1301.0, no. 84, ABS, Canberra, 2002.
B Doherty, 24. ‘Unlimited water on tap with new technology’, the Age, 18 May 2007, p. 1.
P Kerr, ‘Thwaites holds off on personal water 25.
targets’, the Age, 10 May 2007.
PW Newton, ‘Human settlements’, theme 26.
commentary prepared for the Australian State of the Environment Committee, Department of the Environment and Water Resources, Canberra, 2006, p. 41.
Some other useful sourcesFor more information on the ecological •footprint, go to: <http.www.footprintnetwork.org>.
World Wildlife Fund, • Living planet report 2006, <http://www.wwf.org.au/publications/living-planet-report-2006/>.
our footprintTHE BIG PICTURE
REFERENCEs

56 Victorian Women’s Trust - Our Water Mark
We use most of our available water to produce what we eat, as well as some exports. Despite significant
salinity problems, irrigation agriculture continues to expand and use more water …
In fact, in most of Australia’s farmlands the rainfall is sufficient to raise crops to maturity in only a fraction of all years: not more than half of all years at most locations, and in some agricultural areas only in two out of 10 years.Jarred Diamond, Collapse, Viking Press, p. 384, 2006
The arrival of aboriginal people in the continent, possibly as long ago as 140 000 years, and the impact of their ‘fire stick farming’ on an ice-age affected land was profound, altering the nature of vegetation over much of the continent. The impact of European settlement on this unique land in the past 200 years has been devastating.Mary White, After the greening – the browning of Australia, Kangaroo Press, Australia,1994
Agriculture produces food for the nation as well as a diverse range of export products. It contributes $17.6 billion to export earnings annually and provides employment for nearly 400 000 people.1 Overall, agriculture contributes about 2.7% to Australia’s GDP.
Agricultural production is Australia’s biggest water user, requiring around 19 000 GL annually. This is approximately 70% of available fresh water.2 The Australian dilemma is that while our agricultural sector can be justifiably proud of its contribution to domestic and export food production, this has come at great environmental cost. Australian farming and land-management practices have brought about major changes in catchment hydrology3 with many negative impacts upon the natural environment.
IMPACTS OF IrrIGATIONThese impacts are represented in the steadily declining health of many rivers and streams, the absence and decline of natural riparian vegetation, extensive loss of wetlands, loss
of tree cover, elevated water tables, substantial reductions in biodiversity, invasion by weeds and exotic plants, lowered water quality, high turbidity, bank erosion and siltation of river beds, elevated heavy-metal and nutrient levels in soils, toxic chemicals, pesticides and herbicides in soils and water, acid soils and the salinisation of extensive areas of land.4, 5
ArEA IrrIGATEDThere are two major types of farming in Australia: dryland farming and irrigation agriculture. Dryland farming takes up most agricultural land, producing sheep/wool, beef cattle, grains and legumes. Such farming relies mainly on seasonal rain, as well as some additional water from bores, rivers and streams.
In contrast, irrigation agriculture uses little land (about 1%, or 2 million ha of available agricultural land) but most of the available fresh water (mainly surface water and some groundwater). In total, this amounts to approximately 18 000 GL in an average year.6 Furthermore, irrigation agriculture is highly concentrated with 1 472 241 ha in the Murray-Darling Basin (total area: 1 058 800 km2) being used for irrigation.7
rElIANCE ON IrrIGATION AGrICUlTUrEThe history of this irrigation dependency is instructive. Soon after European settlement, it became evident that the farm practices of the home countries were not suitable in this ‘new’
agricultureTHE BIG PICTURE
Victorian Women’s Trust - Our Water Mark 57
land, with its dramatically different physical features and highly variable rainfall. Securing food production for a growing Australian population, as well as developing export products, would mean developing new farming practices using different types of grains and, ultimately, the application of extensive irrigation.
Water for irrigation goes to three main forms of agricultural output: pastures and fodder crops; broad-acre crops such as cotton, rice and soy beans; and intensive horticulture including vegetables, nuts and tree fruits.
The most intensive part of the irrigation industry in Australia is set up within designated areas, e.g. the Murrumbidgee Irrigation Area. Within this area, surface water is pumped from the major rivers and delivered to hundreds of farming units, usually of about 1000–1500 ha each. After passing through these properties, the residual water drains back into the system. Each farm unit contributes to the maintenance and running of the irrigation system and each holds an entitlement to a certain volume of water.
About two-thirds of Australia’s production from irrigation takes place within the Murray-Darling Basin, which is known as Australia’s ‘food bowl’, and produces rice, cotton, cereals, soy beans and fruit and vegetable crops.8 This productivity is linked directly to the fact that the basin contains Australia’s three longest rivers: the Darling, the Murray and the Murrumbidgee. Outside the basin, irrigation is used mainly for dairy pastures, seed crops, fodder, horticultural crops and sugar cane.9
There are striking differences in the volumes of water used and the dollar value of agricultural
commodities produced from irrigation. Rice is the most water-costly crop, using 7458 L per dollar of output, compared with vegetables and fruit which are least water costly, using 379 L per dollar of output.10
The big increase in the use of irrigated land has occurred only in the last 40 years,11 with major growth in irrigated horticulture, and the irrigation of sugar cane, rice and especially cotton. Within the last 20 years alone, land dedicated to irrigated cotton increased from 50 000 ha in 1980 to 375 000 ha in 1999. This expansion has contributed to the present problem of over-allocated water licences. Australia is now the third-largest exporter of raw cotton.12
In regard to irrigated horticulture, there has been a significant recent shift into ‘high-value’ products. For example, the value of the almond crop in Australia rose from $7 million to $29 million between 2000–01 and 2004–05, a four-fold increase. By comparison, the value of the relatively low-value orange crop fell by 20% in the same period.13 High-value crops, such as almonds, tend to be water hungry and productivity can be significantly increased if more water is used strategically within a growing cycle. In overall terms, between 1983–84 and 1996–97, water used in irrigated agriculture increased by around 76%.14
ThE SCOPE FOr WATEr EFFICIENCyWe enjoy plentiful, high-quality yet low-cost food in Australia. Our strong dependence on irrigated agriculture to produce the food we eat, as well as our export produce, is likely to continue.
At present, there are 73 irrigation systems throughout the country which are operated by 38 businesses. Irrigation employs 370 000 people and has a gross value of $39 billion.15
Much of the infrastructure associated with this intensive irrigation is now quite old, with approximately 31 000 km of channels, pipes and waterways.16 Losses of water from evaporation and leakage can be as high as 30%. At the same time, climate change, lower volumes of available surface water and overuse of groundwater mean that our irrigation industries will need to embrace substantial water-efficiency measures – and as soon as possible.
AChIEVING BEST PrACTICEWhile there are legitimate claims that parts of irrigated agriculture are already water efficient, there is still enormous scope for further substantial savings. Calculations for the Murray-Darling Basin alone, show that if half of the existing enterprises adopted best practice, the water savings would be in the order of 900 GL per year. Significant savings can also be achieved by improving delivery systems. In an average year some 6800 GL of water travels through irrigation delivery systems. About 23% of this is lost through leakage and evaporation. Reducing this loss to 20% would save 300 GL. Reducing this loss to 15% would save almost 600 GL annually.17
The move from current levels of efficiency to super efficiency on a national scale will require irrigation farming improvements in four key areas:
major improvements in farm management •with widespread adoption of best-practice measures that require low on-farm investment
high on-farm investment coupled with •this best practice, including the installation of modern water-measuring technology, adoption of new plant types and different water and fertiliser regimes
major off-farm, water-use efficiency gains, •including refurbishing and lining of channels to reduce leakage, covering channels to reduce evaporation and installing modern metering/monitoring systems
major structural changes in both policies and •practices for irrigated agriculture, including water pricing, access to rural finance, support of environmentally appropriate rural enterprise and regulation of inappropriate forms of farming.
It is estimated that adoption of best practice, the refurbishing of irrigation systems and getting the right policy framework in place could result in water savings of at least 3000 GL per year over 10 years.18
agricultureTHE BIG PICTURE
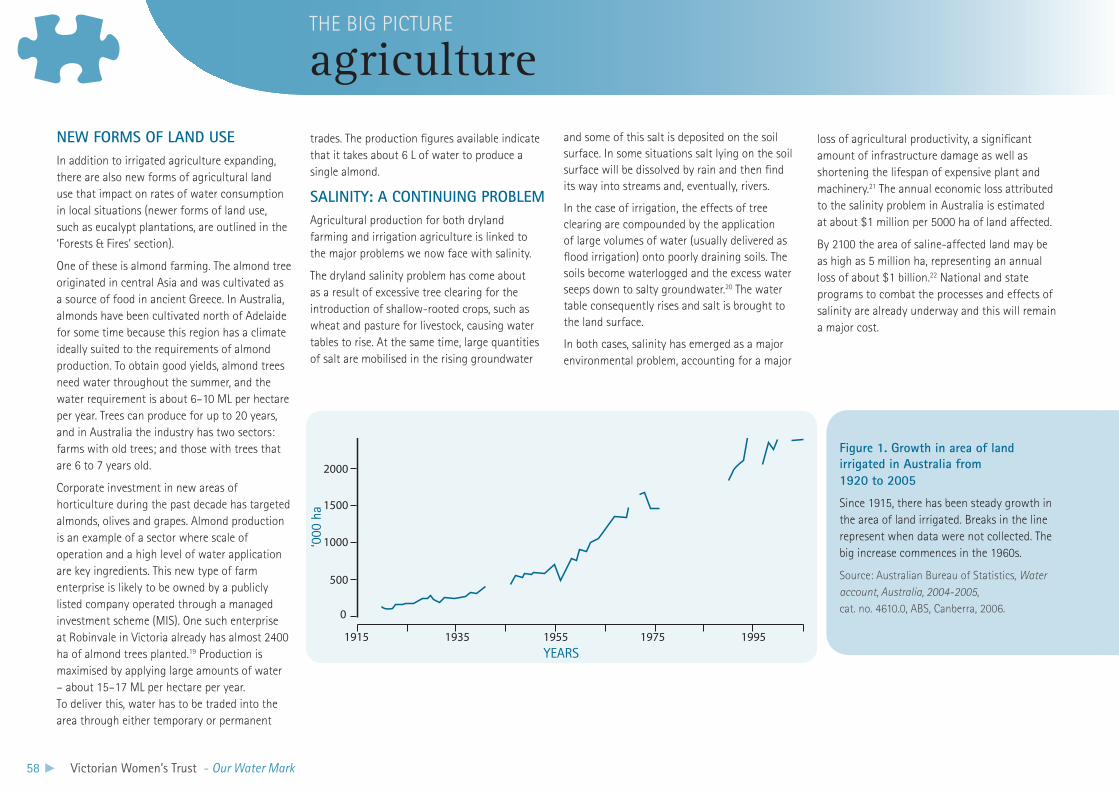
58 Victorian Women’s Trust - Our Water Mark
NEW FOrMS OF lAND USEIn addition to irrigated agriculture expanding, there are also new forms of agricultural land use that impact on rates of water consumption in local situations (newer forms of land use, such as eucalypt plantations, are outlined in the ‘Forests & Fires’ section).
One of these is almond farming. The almond tree originated in central Asia and was cultivated as a source of food in ancient Greece. In Australia, almonds have been cultivated north of Adelaide for some time because this region has a climate ideally suited to the requirements of almond production. To obtain good yields, almond trees need water throughout the summer, and the water requirement is about 6–10 ML per hectare per year. Trees can produce for up to 20 years, and in Australia the industry has two sectors: farms with old trees; and those with trees that are 6 to 7 years old.
Corporate investment in new areas of horticulture during the past decade has targeted almonds, olives and grapes. Almond production is an example of a sector where scale of operation and a high level of water application are key ingredients. This new type of farm enterprise is likely to be owned by a publicly listed company operated through a managed investment scheme (MIS). One such enterprise at Robinvale in Victoria already has almost 2400 ha of almond trees planted.19 Production is maximised by applying large amounts of water – about 15–17 ML per hectare per year. To deliver this, water has to be traded into the area through either temporary or permanent
trades. The production figures available indicate that it takes about 6 L of water to produce a single almond.
SAlINITy: A CONTINUING PrOBlEMAgricultural production for both dryland farming and irrigation agriculture is linked to the major problems we now face with salinity.
The dryland salinity problem has come about as a result of excessive tree clearing for the introduction of shallow-rooted crops, such as wheat and pasture for livestock, causing water tables to rise. At the same time, large quantities of salt are mobilised in the rising groundwater
and some of this salt is deposited on the soil surface. In some situations salt lying on the soil surface will be dissolved by rain and then find its way into streams and, eventually, rivers.
In the case of irrigation, the effects of tree clearing are compounded by the application of large volumes of water (usually delivered as flood irrigation) onto poorly draining soils. The soils become waterlogged and the excess water seeps down to salty groundwater.20 The water table consequently rises and salt is brought to the land surface.
In both cases, salinity has emerged as a major environmental problem, accounting for a major
loss of agricultural productivity, a significant amount of infrastructure damage as well as shortening the lifespan of expensive plant and machinery.21 The annual economic loss attributed to the salinity problem in Australia is estimated at about $1 million per 5000 ha of land affected.
By 2100 the area of saline-affected land may be as high as 5 million ha, representing an annual loss of about $1 billion.22 National and state programs to combat the processes and effects of salinity are already underway and this will remain a major cost.
agricultureTHE BIG PICTURE
Figure 1. Growth in area of land irrigated in Australia from 1920 to 2005
Since 1915, there has been steady growth in the area of land irrigated. Breaks in the line represent when data were not collected. The big increase commences in the 1960s.
Source: Australian Bureau of Statistics, Water account, Australia, 2004-2005, cat. no. 4610.0, ABS, Canberra, 2006.
2500‘000 ha
2000
1500
1000
500
19951975195519351915
0
YeARS
‘000
ha
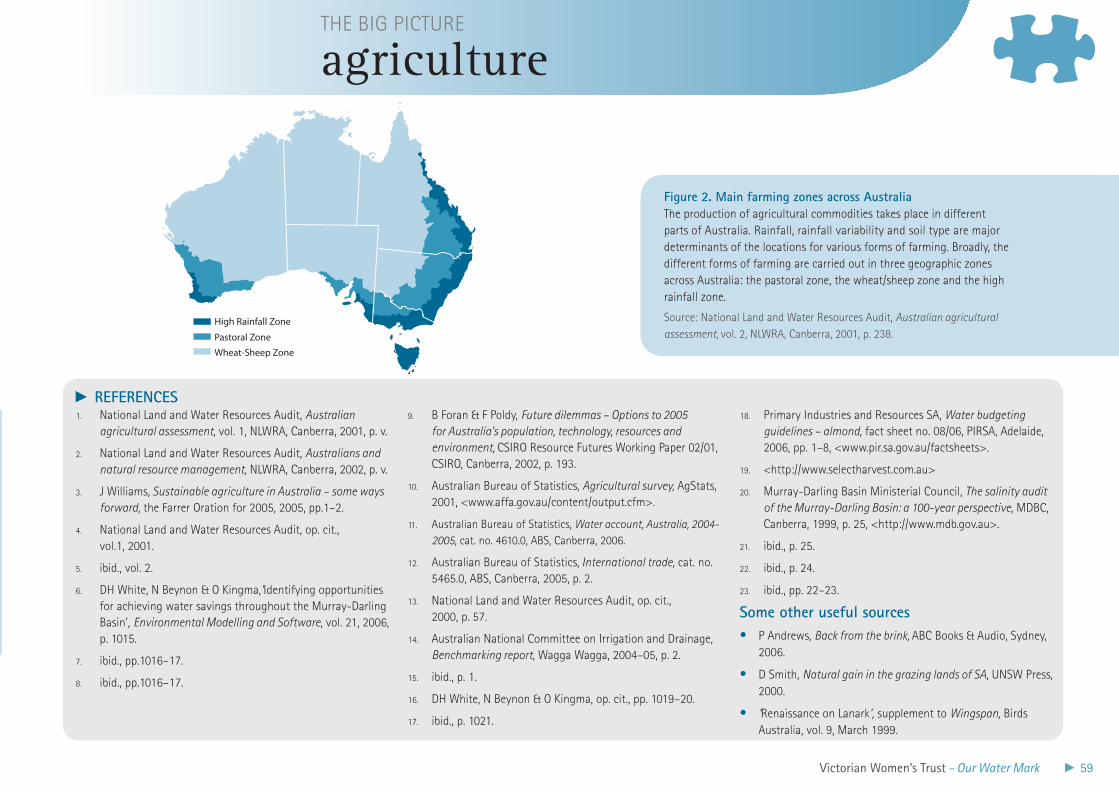
Victorian Women’s Trust - Our Water Mark 59
National Land and Water Resources Audit, 1. Australian agricultural assessment, vol. 1, NLWRA, Canberra, 2001, p. v.
National Land and Water Resources Audit, 2. Australians and natural resource management, NLWRA, Canberra, 2002, p. v.
J Williams3. , Sustainable agriculture in Australia – some ways forward, the Farrer Oration for 2005, 2005, pp.1–2.
National Land and Water Resources Audit, op. cit., 4.
vol.1, 2001.
ibid., vol. 2.5.
DH White, N Beynon & O Kingma,6. ’Identifying opportunities for achieving water savings throughout the Murray-Darling Basin’, Environmental Modelling and Software, vol. 21, 2006, p. 1015.
ibid., pp.1016–17.7.
ibid., pp.1016–17.8.
B Foran & F Poldy, 9. Future dilemmas – Options to 2005 for Australia’s population, technology, resources and environment, CSIRO Resource Futures Working Paper 02/01, CSIRO, Canberra, 2002, p. 193.
Australian Bureau of Statistics, 10. Agricultural survey, AgStats, 2001, <www.affa.gov.au/content/output.cfm>.
Australian Bureau of Statistics, 11. Water account, Australia, 2004-2005, cat. no. 4610.0, ABS, Canberra, 2006.
Australian Bureau of Statistics,12. International trade, cat. no. 5465.0, ABS, Canberra, 2005, p. 2.
National Land and Water Resources Audit, op. cit., 13.
2000, p. 57.
Australian National Committee on Irrigation and Drainage, 14.
Benchmarking report, Wagga Wagga, 2004–05, p. 2.
ibid., p. 1.15.
DH White, N Beynon & O Kingma, op. cit., pp. 1019–20. 16.
ibid., p. 1021. 17.
Primary Industries and Resources SA, 18. Water budgeting guidelines – almond, fact sheet no. 08/06, PIRSA, Adelaide, 2006, pp. 1–8, <www.pir.sa.gov.au/factsheets>.
<http://www.selectharvest.com.au>19.
Murray-Darling Basin Ministerial Council, 20. The salinity audit of the Murray-Darling Basin: a 100-year perspective, MDBC, Canberra, 1999, p. 25, <http://www.mdb.gov.au>.
ibid., p. 25.21.
ibid., p. 24.22.
ibid., pp. 22–23.23.
Some other useful sourcesP Andrews, • Back from the brink, ABC Books & Audio, Sydney, 2006.
D Smith, • Natural gain in the grazing lands of SA, UNSW Press, 2000.
‘• Renaissance on Lanark’, supplement to Wingspan, Birds Australia, vol. 9, March 1999.
agricultureTHE BIG PICTURE
Figure 2. Main farming zones across Australia The production of agricultural commodities takes place in different parts of Australia. Rainfall, rainfall variability and soil type are major determinants of the locations for various forms of farming. Broadly, the different forms of farming are carried out in three geographic zones across Australia: the pastoral zone, the wheat/sheep zone and the high rainfall zone.
Source: National Land and Water Resources Audit, Australian agricultural assessment, vol. 2, NLWRA, Canberra, 2001, p. 238.
High Rainfall Zone
Pastoral Zone
Wheat-Sheep Zone Projection: Albers Equal AreaKilometres0 500
rEFErENCES
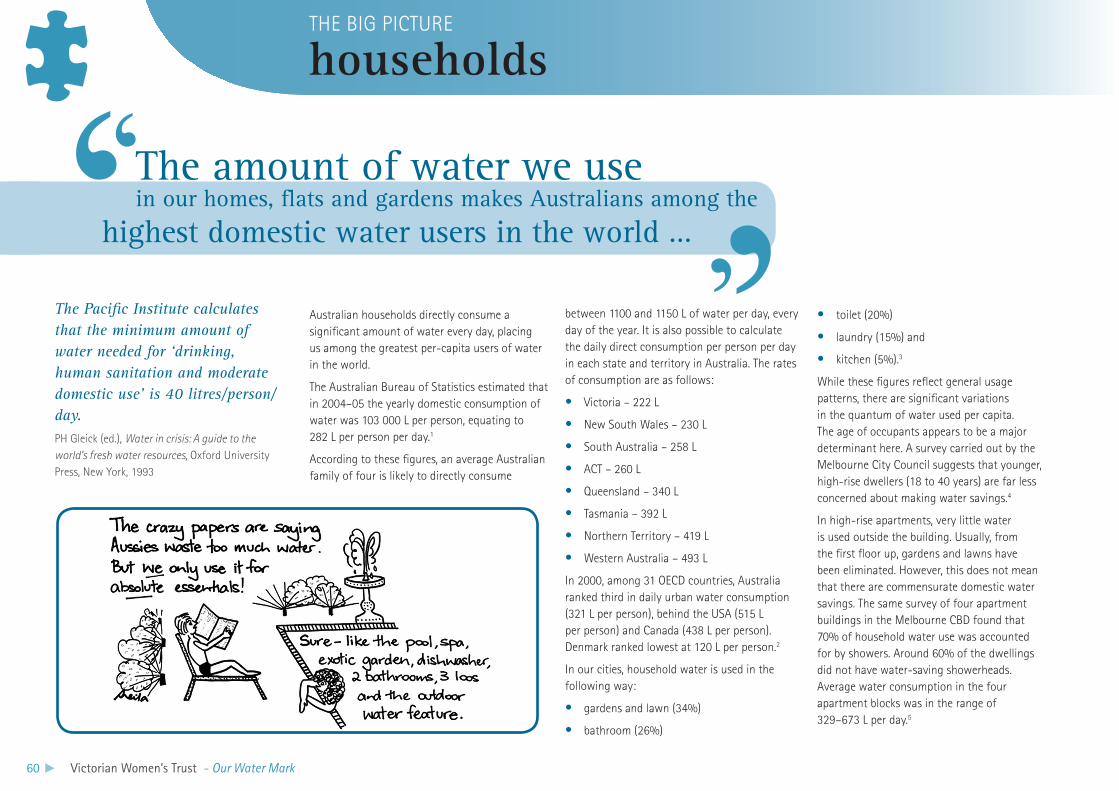
60 Victorian Women’s Trust - Our Water Mark
The amount of water we use in our homes, flats and gardens makes Australians among the
highest domestic water users in the world …
The Pacific Institute calculates that the minimum amount of water needed for ‘drinking, human sanitation and moderate domestic use’ is 40 litres/person/day. PH Gleick (ed.), Water in crisis: A guide to the world’s fresh water resources, Oxford University Press, New York, 1993
Australian households directly consume a significant amount of water every day, placing us among the greatest per-capita users of water in the world.
The Australian Bureau of Statistics estimated that in 2004–05 the yearly domestic consumption of water was 103 000 L per person, equating to 282 L per person per day.1
According to these figures, an average Australian family of four is likely to directly consume
between 1100 and 1150 L of water per day, every day of the year. It is also possible to calculate the daily direct consumption per person per day in each state and territory in Australia. The rates of consumption are as follows:
Victoria – 222 L •
New South Wales – 230 L•
South Australia – 258 L•
ACT – 260 L•
Queensland – 340 L•
Tasmania – 392 L•
Northern Territory – 419 L•
Western Australia – 493 L•
In 2000, among 31 OECD countries, Australia ranked third in daily urban water consumption (321 L per person), behind the USA (515 L per person) and Canada (438 L per person). Denmark ranked lowest at 120 L per person.2
In our cities, household water is used in the following way:
gardens and lawn (34%)•
bathroom (26%)•
toilet (20%) •
laundry (15%) and•
kitchen (5%).• 3
While these figures reflect general usage patterns, there are significant variations in the quantum of water used per capita. The age of occupants appears to be a major determinant here. A survey carried out by the Melbourne City Council suggests that younger, high-rise dwellers (18 to 40 years) are far less concerned about making water savings.4
In high-rise apartments, very little water is used outside the building. Usually, from the first floor up, gardens and lawns have been eliminated. However, this does not mean that there are commensurate domestic water savings. The same survey of four apartment buildings in the Melbourne CBD found that 70% of household water use was accounted for by showers. Around 60% of the dwellings did not have water-saving showerheads. Average water consumption in the four apartment blocks was in the range of 329–673 L per day.5
householdsTHE BIG PICTURE
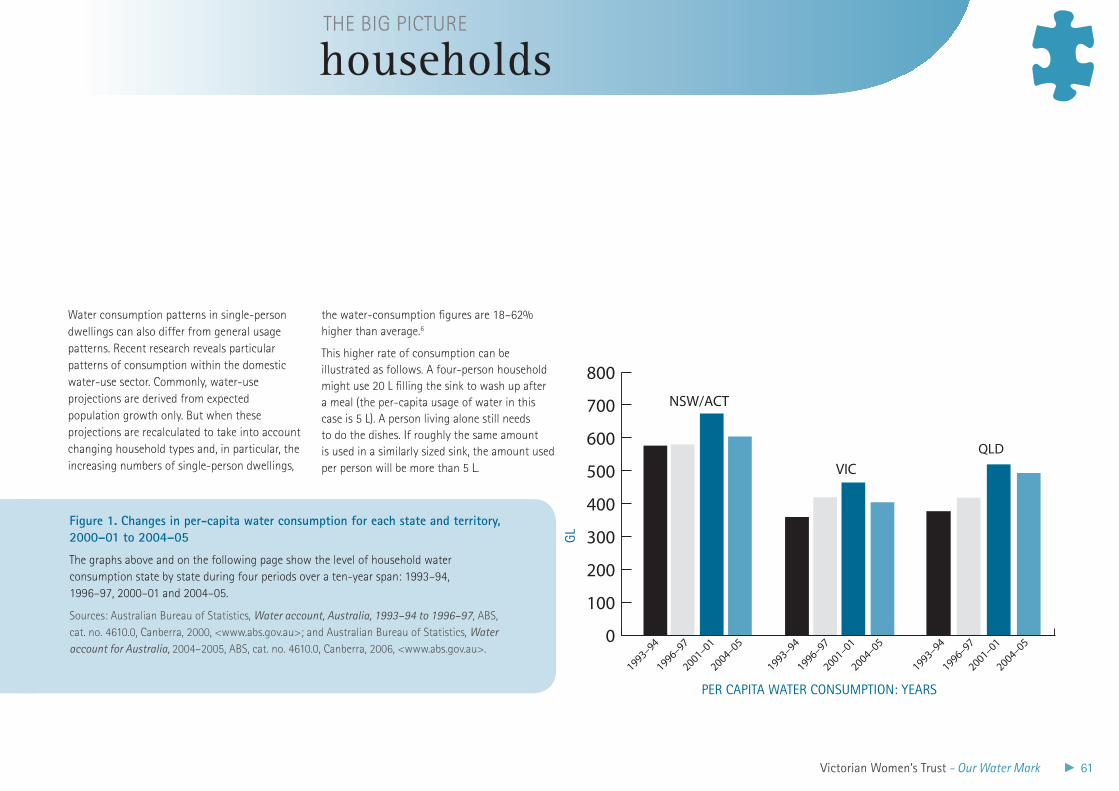
Victorian Women’s Trust - Our Water Mark 61
Water consumption patterns in single-person dwellings can also differ from general usage patterns. Recent research reveals particular patterns of consumption within the domestic water-use sector. Commonly, water-use projections are derived from expected population growth only. But when these projections are recalculated to take into account changing household types and, in particular, the increasing numbers of single-person dwellings,
the water-consumption figures are 18–62% higher than average.6
This higher rate of consumption can be illustrated as follows. A four-person household might use 20 L filling the sink to wash up after a meal (the per-capita usage of water in this case is 5 L). A person living alone still needs to do the dishes. If roughly the same amount is used in a similarly sized sink, the amount used per person will be more than 5 L.
householdsTHE BIG PICTURE
0
100
200
300
400
500
600
700
800
NSW/ACT
VIC
QLD
1993–94
1996–97
2001–01
2004–05
1993–94
1996–97
2001–01
2004–05
1993–94
1996–97
2001–01
2004–05
Figure 1. Changes in per-capita water consumption for each state and territory, 2000–01 to 2004–05
The graphs above and on the following page show the level of household water consumption state by state during four periods over a ten-year span: 1993–94, 1996–97, 2000–01 and 2004–05.
Sources: Australian Bureau of Statistics, Water account, Australia, 1993–94 to 1996–97, ABS, cat. no. 4610.0, Canberra, 2000, <www.abs.gov.au>; and Australian Bureau of Statistics, Water account for Australia, 2004–2005, ABS, cat. no. 4610.0, Canberra, 2006, <www.abs.gov.au>.
PeR CAPITA WATeR CONSUMPTION: YeARS
gL
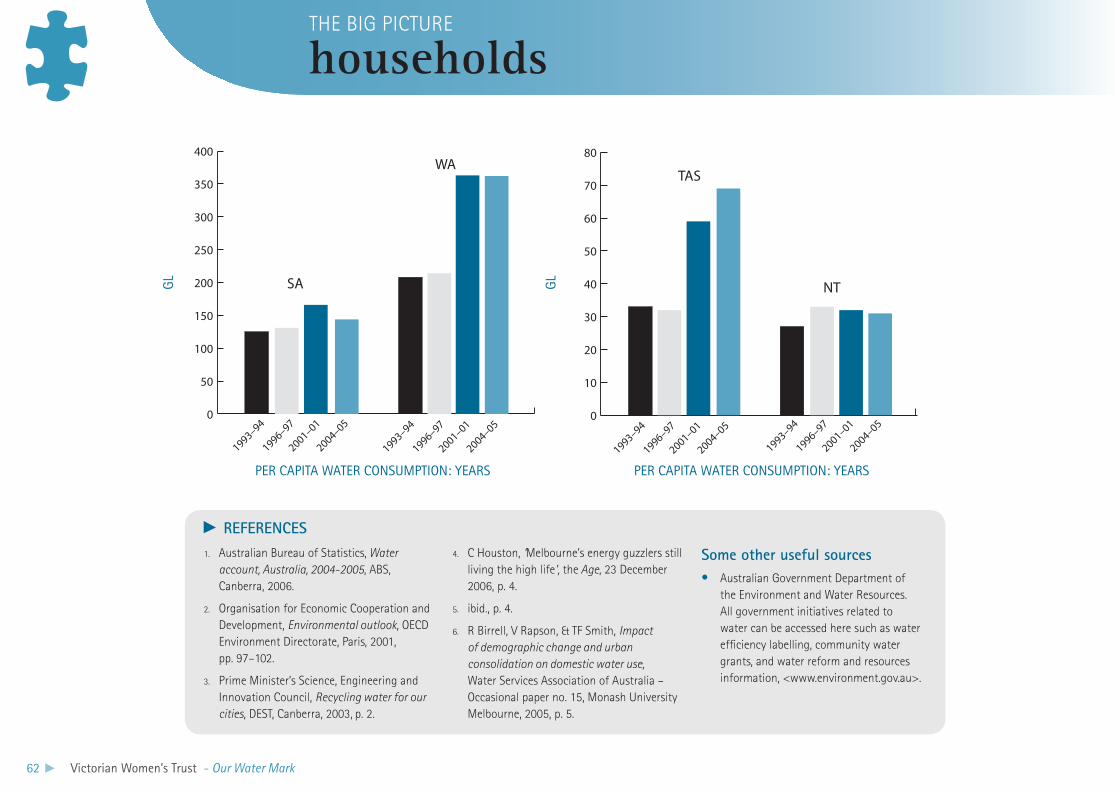
62 Victorian Women’s Trust - Our Water Mark
0
10
20
30
40
50
60
70
80
TAS
NT
1993–94
1996–97
2001–01
2004–05
1993–94
1996–97
2001–01
2004–050
50
100
150
200
250
300
350
400
SA
WA
1993–94
1996–97
2001–01
2004–05
1993–94
1996–97
2001–01
2004–05
Australian Bureau of Statistics,1. Water account, Australia, 2004-2005, ABS, Canberra, 2006.
Organisation for Economic Cooperation and 2.
Development, Environmental outlook, OECD Environment Directorate, Paris, 2001, pp. 97–102.
Prime Minister’s Science, Engineering and 3.
Innovation Council, Recycling water for our cities, DEST, Canberra, 2003, p. 2.
C Houston, 4. ‘Melbourne’s energy guzzlers still living the high life’, the Age, 23 December 2006, p. 4.
ibid., p. 4.5.
R Birrell, V Rapson, & TF Smith, 6. Impact of demographic change and urban consolidation on domestic water use, Water Services Association of Australia – Occasional paper no. 15, Monash University Melbourne, 2005, p. 5.
Some other useful sourcesAustralian Government Department of •the Environment and Water Resources. All government initiatives related to water can be accessed here such as water efficiency labelling, community water grants, and water reform and resources information, <www.environment.gov.au>.
rEFErENCES
gL
gL
householdsTHE BIG PICTURE
PeR CAPITA WATeR CONSUMPTION: YeARS PeR CAPITA WATeR CONSUMPTION: YeARS
Victorian Women’s Trust - Our Water Mark 63
Business and industry in Australia use a significant amount of water. Our mining sector and service industries are set to expand. Their continued growth will require ever-increasing amounts of water …
Over the past 16 years, the fastest growing categories of exports in real terms have been manufactured exports and exports of services … Even with export diversification occurring, we are still going to be a country with a high proportion of our exports coming from the resource sector.John Macfarlane, former governor, Reserve Bank of Australia, The Australian economy: past, present and future, speech to the National Press Club, April 2002
Business and industry are major sectors in our economy. They provide millions of Australians with employment and many of the goods and services that we need and use in our daily lives, and they earn a large part of the nation’s export income.
Manufacturing industries contribute approximately 13.5% to GDP1 and this has consistently been the case for the past few years. The total trading profit for the manufacturing sector in 2004–05 was $93.2 billion2 and approximately 1 057 600 people were employed in this sector.3
Service industries (such as commercial and domestic cleaning, banking, personnel agencies, health programs and care and support agencies) in 2005–06 contributed nearly 13% to GDP4 and gross value was just under $100 billion. The industries employ approximately 6 million people.5
There are 1.2 million small businesses across Australia – 400 000 of these are
in manufacturing and 780 000 in service industries.6
Like farms and households, all businesses require water inputs. But some sectors within business and industry require significantly greater inputs than others. Service industries are emerging as major water users. In 2004–05, they accounted for 1041 GL. In the same year mining and minerals processing used 397 GL, and manufacturing industries used 541 GL.7
In terms of national figures for water use, the requirements of mining do not seem all that great. However, many mining operations are situated in remote arid areas, so providing adequate water supplies and solving water-pollution problems near mine sites is vital.8
Activity in both these sectors is strongly influenced by the performance of the domestic economy and cyclical global settings. Strategic decisions will be required to meet the water needs of these sectors during periods of high activity and output.
We are experiencing a mining boom and this is reflected in water-use figures. In the past four years, water used in mining has grown from 452 gL to 608 gL – an increase of 35%. 9 Most of this increased consumption has occurred in Western Australia (an increase of 81%), followed by Queensland, NSW and Victoria.
Most water used in the mining industry is pumped groundwater. To date there is virtually no reuse of this water, with only 1.2% being reused in 2004–05.10
Manufacturing, on the other hand, uses both groundwater and delivered surface water. In the past four years water used by manufacturing has grown from 548 GL to 600 GL, an increase of 9%.11 There is marginally greater water reuse (2.2%) by manufacturing.12 Reflective of the mining boom, metals manufacturing consumed approximately 60 GL in 2001 and just over 90 GL in 2004–05.13
business & industryTHE BIG PICTURE
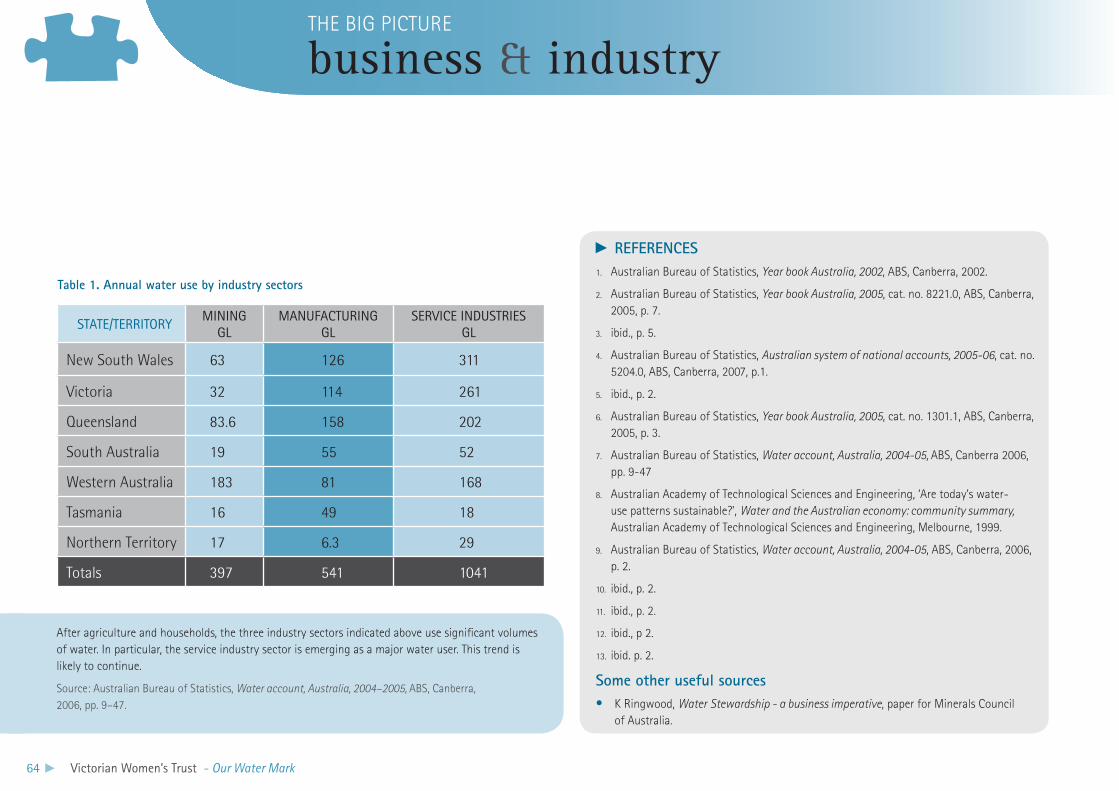
64 Victorian Women’s Trust - Our Water Mark
STATe/TeRRITORYMININg
gLMANUFACTURINg
gLSeRVICe INDUSTRIeS
gL
New South Wales 63 126 311
Victoria 32 114 261
Queensland 83.6 158 202
South Australia 19 55 52
Western Australia 183 81 168
Tasmania 16 49 18
Northern Territory 17 6.3 29
Totals 397 541 1041
Table 1. Annual water use by industry sectors
After agriculture and households, the three industry sectors indicated above use significant volumes of water. In particular, the service industry sector is emerging as a major water user. This trend is likely to continue.
Source: Australian Bureau of Statistics, Water account, Australia, 2004–2005, ABS, Canberra, 2006, pp. 9–47.
rEFErENCESAustralian Bureau of Statistics, 1. Year book Australia, 2002, ABS, Canberra, 2002.
Australian Bureau of Statistics, 2. Year book Australia, 2005, cat. no. 8221.0, ABS, Canberra, 2005, p. 7.
ibid., p. 5.3.
Australian Bureau of Statistics, 4. Australian system of national accounts, 2005-06, cat. no. 5204.0, ABS, Canberra, 2007, p.1.
ibid., p. 2.5.
Australian Bureau of Statistics, 6. Year book Australia, 2005, cat. no. 1301.1, ABS, Canberra, 2005, p. 3.
Australian Bureau of Statistics, 7. Water account, Australia, 2004-05, ABS, Canberra 2006, pp. 9-47
Australian Academy of Technological Sciences and Engineering, ‘Are today’s water-8.
use patterns sustainable?’, Water and the Australian economy: community summary, Australian Academy of Technological Sciences and Engineering, Melbourne, 1999.
Australian Bureau of Statistics, 9. Water account, Australia, 2004-05, ABS, Canberra, 2006, p. 2.
ibid., p. 2.10.
ibid., p. 2.11.
ibid., p 2.12.
ibid. p. 2.13.
Some other useful sourcesK Ringwood, • Water Stewardship - a business imperative, paper for Minerals Council of Australia.
business & industryTHE BIG PICTURE
Victorian Women’s Trust - Our Water Mark 65
For a dry continent, it is puzzling that we have for decades dragged the chain on any large-scale water
recycling. Despite a looming water crisis, there is still inertia …
The Israelis assume that nobody in their right mind would ever dispose of raw sewage. I had to bite my tongue at that point. Malcolm Turnbull, Watermark Australia session notes, no. 5
Recycling processes in Europe are sophisticated and commonplace. Most importantly, attitudes to water in Europe are completely different.Kate Shaw, ‘Just another case of being a wally’, the Age, 15 September 2006, p. 17
Every day millions of litres of used water are carried away from homes, factories, businesses and farms. This is water that has been used in day-to-day human activities. It can contain a wide range of contaminants, including human and industrial wastes, household products, food wastes, cleaning chemicals, fats, oils etc. Once generated, this water is usually moved to more remote locations for treatment before being discharged.
It’s symptomatic that Australians use the term ‘waste water’ rather than ‘wasted water’!
The technology now exists to treat this ‘waste’ water to varying standards, right up to making it fit for human consumption. We could substitute much of our potable water if we treated and used what we now call waste water.
This is not news for many countries around the world. Israel recycles, after treatment, 70% of its
waste water of urban and industrial origin for reuse in agriculture. Singapore uses state-of-the-art technology to recycle water and the use of recycled water has become a way of life. California has been recycling water for over 50 years. It has over 300 water-recycling plants in operation.1
In Europe, water recycling and reuse through surface and groundwater bodies is common practice. Denmark, for example, treats something like 87% of its waste water mechanically, chemically or biologically.2
In Australia, however, the driest inhabited continent, 97% of our city runoff and 86% of effluent water is unproductive.3 Sydney alone pumps 450 billion L of barely treated sewage into the ocean every year. In 2002–03, 360 billion L of waste water was discharged into Bass Strait and Port Phillip Bay, from Melbourne, after treatment.4
SlOW GOVErNMENT rESPONSEAs with harnessing stormwater, Australia has been very slow to move towards treating and recycling the water we use in our day-to-day activities. Foremost among the reasons why is the lack of active leadership from governments across our federal system.
Around 30 years ago, the Federal Government received recommendations from a major review of wastewater use. The review recommended that we should initiate:5
a national program of research, •demonstration and education
an integrated approach to water supply, •sewerage and solid-waste disposal as an integral part of one planning process
waste(d) waterTHE BIG PICTURE
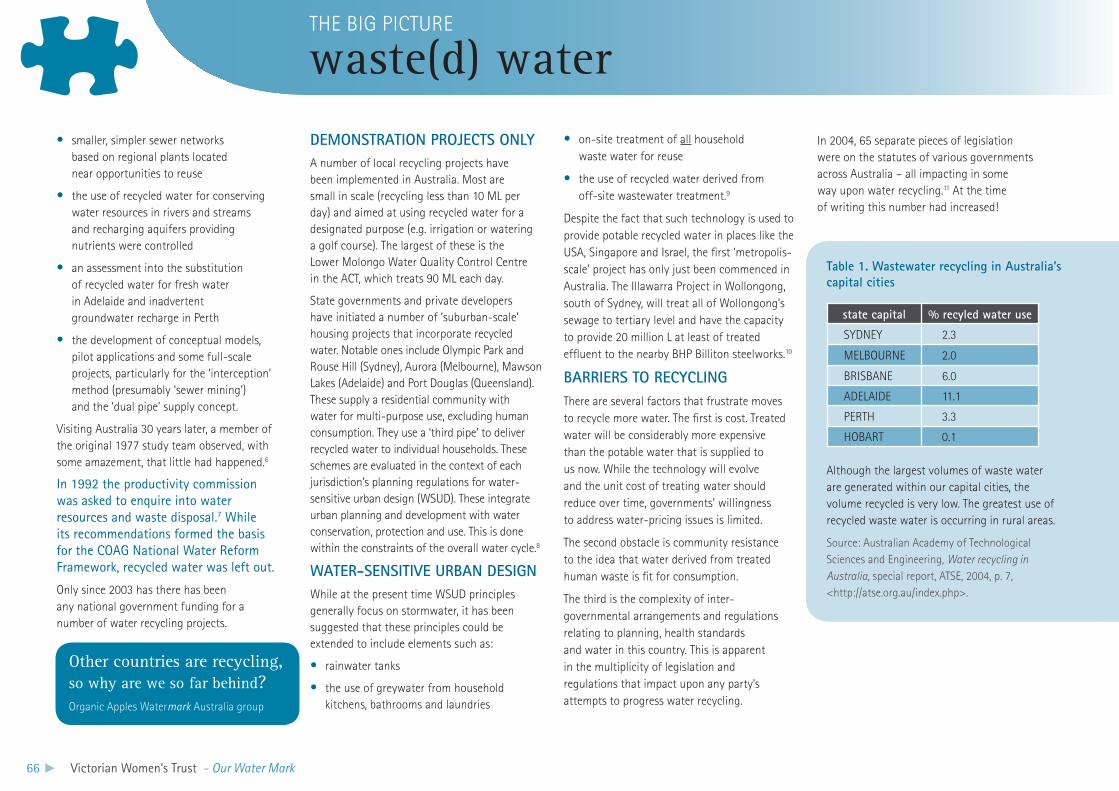
66 Victorian Women’s Trust - Our Water Mark
DEMONSTrATION PrOJECTS ONlyA number of local recycling projects have been implemented in Australia. Most are small in scale (recycling less than 10 ML per day) and aimed at using recycled water for a designated purpose (e.g. irrigation or watering a golf course). The largest of these is the Lower Molongo Water Quality Control Centre in the ACT, which treats 90 ML each day.
State governments and private developers have initiated a number of ‘suburban-scale’ housing projects that incorporate recycled water. Notable ones include Olympic Park and Rouse Hill (Sydney), Aurora (Melbourne), Mawson Lakes (Adelaide) and Port Douglas (Queensland). These supply a residential community with water for multi-purpose use, excluding human consumption. They use a ‘third pipe’ to deliver recycled water to individual households. These schemes are evaluated in the context of each jurisdiction’s planning regulations for water-sensitive urban design (WSUD). These integrate urban planning and development with water conservation, protection and use. This is done within the constraints of the overall water cycle.8
WATEr-SENSITIVE UrBAN DESIGNWhile at the present time WSUD principles generally focus on stormwater, it has been suggested that these principles could be extended to include elements such as:
rainwater tanks•
the use of greywater from household •kitchens, bathrooms and laundries
on-site treatment of • all household waste water for reuse
the use of recycled water derived from •off-site wastewater treatment.9
Despite the fact that such technology is used to provide potable recycled water in places like the USA, Singapore and Israel, the first ‘metropolis-scale’ project has only just been commenced in Australia. The Illawarra Project in Wollongong, south of Sydney, will treat all of Wollongong’s sewage to tertiary level and have the capacity to provide 20 million L at least of treated effluent to the nearby BHP Billiton steelworks.10
BArrIErS TO rECyClINGThere are several factors that frustrate moves to recycle more water. The first is cost. Treated water will be considerably more expensive than the potable water that is supplied to us now. While the technology will evolve and the unit cost of treating water should reduce over time, governments’ willingness to address water-pricing issues is limited.
The second obstacle is community resistance to the idea that water derived from treated human waste is fit for consumption.
The third is the complexity of inter-governmental arrangements and regulations relating to planning, health standards and water in this country. This is apparent in the multiplicity of legislation and regulations that impact upon any party’s attempts to progress water recycling.
In 2004, 65 separate pieces of legislation were on the statutes of various governments across Australia – all impacting in some way upon water recycling.11 At the time of writing this number had increased!
Other countries are recycling, so why are we so far behind?Organic Apples Watermark Australia group
smaller, simpler sewer networks •based on regional plants located near opportunities to reuse
the use of recycled water for conserving •water resources in rivers and streams and recharging aquifers providing nutrients were controlled
an assessment into the substitution •of recycled water for fresh water in Adelaide and inadvertent groundwater recharge in Perth
the development of conceptual models, •pilot applications and some full-scale projects, particularly for the ‘interception’ method (presumably ‘sewer mining’) and the ‘dual pipe’ supply concept.
Visiting Australia 30 years later, a member of the original 1977 study team observed, with some amazement, that little had happened.6
In 1992 the productivity commission was asked to enquire into water resources and waste disposal.7 While its recommendations formed the basis for the COAg National Water Reform Framework, recycled water was left out.
Only since 2003 has there has been any national government funding for a number of water recycling projects.
waste(d) waterTHE BIG PICTURE
Although the largest volumes of waste water are generated within our capital cities, the volume recycled is very low. The greatest use of recycled waste water is occurring in rural areas.
Source: Australian Academy of Technological Sciences and Engineering, Water recycling in Australia, special report, ATSE, 2004, p. 7, <http://atse.org.au/index.php>.
state capital % recyled water use
SYDNEY 2.3
MELBOURNE 2.0
BRISBANE 6.0
ADELAIDE 11.1
PERTH 3.3
HOBART 0.1
Table 1. Wastewater recycling in Australia’s capital cities
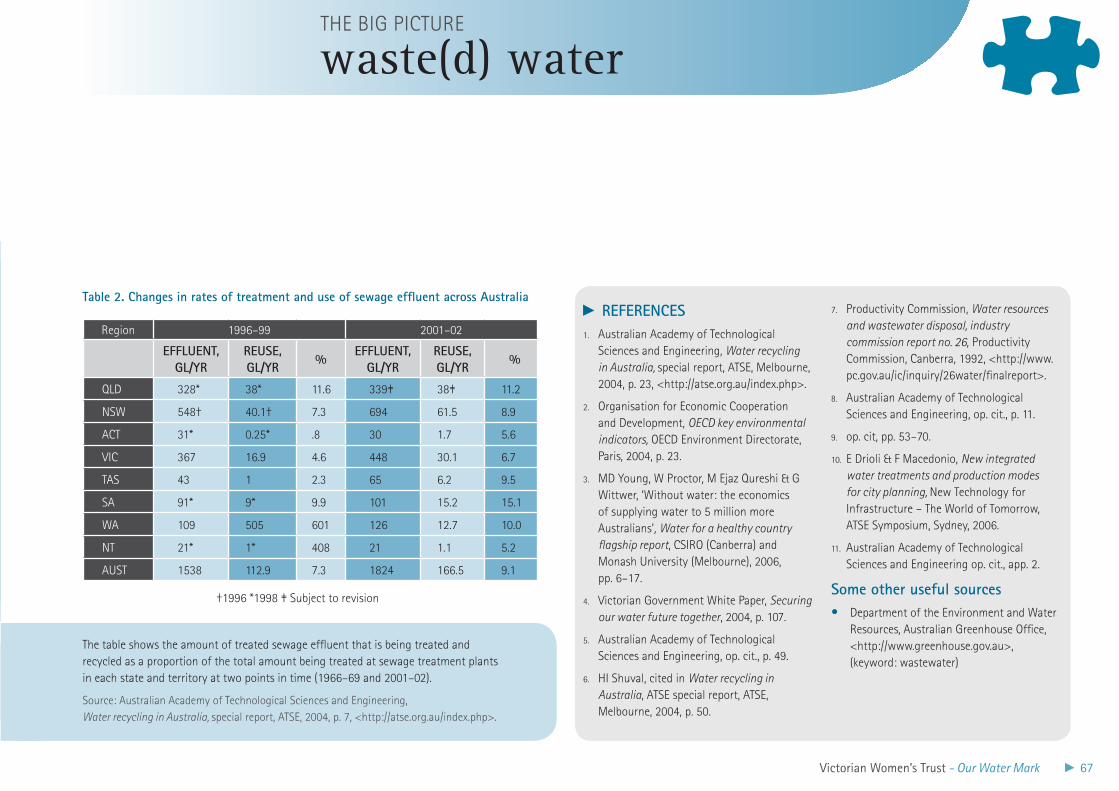
Victorian Women’s Trust - Our Water Mark 67
Region 1996–99 2001–02
EFFlUENT, Gl/yr
rEUSE, Gl/yr
%EFFlUENT,
Gl/yrrEUSE, Gl/yr
%
QLD 328* 38* 11.6 339‡ 38‡ 11.2
NSW 548† 40.1† 7.3 694 61.5 8.9
ACT 31* 0.25* .8 30 1.7 5.6
VIC 367 16.9 4.6 448 30.1 6.7
TAS 43 1 2.3 65 6.2 9.5
SA 91* 9* 9.9 101 15.2 15.1
WA 109 505 601 126 12.7 10.0
NT 21* 1* 408 21 1.1 5.2
AUST 1538 112.9 7.3 1824 166.5 9.1
Table 2. Changes in rates of treatment and use of sewage effluent across AustraliarEFErENCES
Australian Academy of Technological 1.
Sciences and Engineering, Water recycling in Australia, special report, ATSE, Melbourne, 2004, p. 23, <http://atse.org.au/index.php>.
Organisation for Economic Cooperation 2.
and Development, OECD key environmental indicators, OECD Environment Directorate, Paris, 2004, p. 23.
MD Young, W Proctor, M Ejaz Qureshi & G 3.
Wittwer, ‘Without water: the economics of supplying water to 5 million more Australians’, Water for a healthy country flagship report, CSIRO (Canberra) and Monash University (Melbourne), 2006, pp. 6–17.
Victorian Government White Paper, 4. Securing our water future together, 2004, p. 107.
Australian Academy of Technological 5.
Sciences and Engineering, op. cit., p. 49.
HI Shuval, cited in 6. Water recycling in Australia, ATSE special report, ATSE, Melbourne, 2004, p. 50.
Productivity Commission, 7. Water resources and wastewater disposal, industry commission report no. 26, Productivity Commission, Canberra, 1992, <http://www.pc.gov.au/ic/inquiry/26water/finalreport>.
Australian Academy of Technological 8.
Sciences and Engineering, op. cit., p. 11.
op. cit, pp. 53–70.9.
E Drioli & F Macedonio, 10. New integrated water treatments and production modes for city planning, New Technology for Infrastructure – The World of Tomorrow, ATSE Symposium, Sydney, 2006.
Australian Academy of Technological 11.
Sciences and Engineering op. cit., app. 2.
Some other useful sourcesDepartment of the Environment and Water •Resources, Australian Greenhouse Office, <http://www.greenhouse.gov.au>, (keyword: wastewater)
†1996 *1998 ‡ Subject to revision
waste(d) waterTHE BIG PICTURE
The table shows the amount of treated sewage effluent that is being treated and recycled as a proportion of the total amount being treated at sewage treatment plants in each state and territory at two points in time (1966–69 and 2001–02).
Source: Australian Academy of Technological Sciences and Engineering, Water recycling in Australia, special report, ATSE, 2004, p. 7, <http://atse.org.au/index.php>.
68 Victorian Women’s Trust - Our Water Mark
Although stormwater is a significant potential supplementary water resource, which is usually of much higher quality than industrial discharge, we have been very slow to capture and use it in our modern cities …
Till taught by painMen really know notWhat good water’s worthLord Byron, Don Juan, 1810
Community engagement for water recycling should be based on two premises: the community has good capability to reach sound conclusions if given the correct information from a trusted source; and, in general, the community has poor information and often doesn’t trust the sources.
Prime minister’s Science, Technology and Innovation Council, 2003
We built our cities either in proximity to the coast or alongside major rivers, so that we could access adequate freshwater supplies and discharge our household and industrial wastes. We developed reticulated water-supply systems that could be connected to every building.
We constructed sealed roads and pathways, acres of roofed houses and city buildings, car parks, airports and wharves, so that enormous surface areas were sealed and waterproofed. To prevent these areas from flooding during periods of high or extended rainfall, they were drained so that stormwater now gravity-feeds through the drainage system and eventually flows into local rivers or estuaries or directly into the sea.
In this modern urban landscape there was no place for the household rainwater tank. Indeed, for several decades householders were discouraged, and even prevented, from using water tanks by public health legislation and council regulations.
And so, stormwater disappeared from public recognition as a significant source of fresh water to complement surface-water reserves.
rENEWING INTErEST IN STOrMWATErThe increased pressure on our water resources, particularly the supply to cities and the predicted impacts of climate change on rainfall, are now forcing various authorities and professional organisations to rethink the potential for supplementing water supplies by capturing, treating and distributing urban stormwater.
In 2004 a major review by the Australian Academy of Technological Sciences and Engineering reported on water-recycling practices, policy, regulation and legislation and considered all potential water sources, including stormwater. According to this review, the potential benefits of stormwater recycling include:3
While the size of Australian cities has steadily increased, the use of stormwater has been essentially overlooked. Yet the volume of urban stormwater runoff from our cities in an average year is only slightly less than the total volume of water consumed by households.
Our cities cover a lot of ground! Brisbane, for example, has a total metropolitan area of 98.9 km2, while Melbourne covers 36.5 km2 and Sydney 27.8 km2. These three capital cities on the east coast have extensive areas of impervious surfaces. This results in large volumes of stormwater running off into nearby waterways and/or into sewerage systems. The total annual estimated volume of stormwater for these cities is 1285 GL.1, 2
lITTlE UrBAN STOrMWATEr CAPTUrEHarvesting stormwater into rainwater tanks was a common practice among our forebears, but the concentration of ever-growing numbers of people in our modern cities changed all that.
stormwaterTHE BIG PICTURE
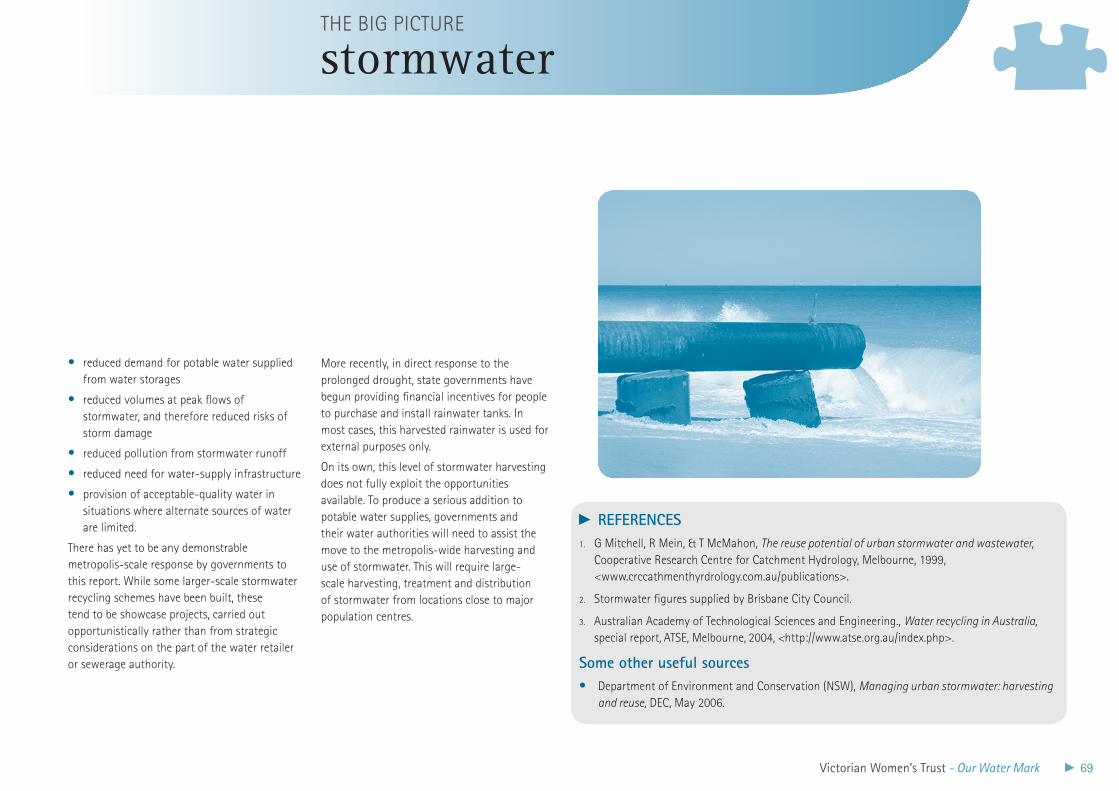
Victorian Women’s Trust - Our Water Mark 69
reduced demand for potable water supplied •from water storages
reduced volumes at peak flows of •stormwater, and therefore reduced risks of storm damage
reduced pollution from stormwater runoff•
reduced need for water-supply infrastructure•
provision of acceptable-quality water in •situations where alternate sources of water are limited.
There has yet to be any demonstrable metropolis-scale response by governments to this report. While some larger-scale stormwater recycling schemes have been built, these tend to be showcase projects, carried out opportunistically rather than from strategic considerations on the part of the water retailer or sewerage authority.
More recently, in direct response to the prolonged drought, state governments have begun providing financial incentives for people to purchase and install rainwater tanks. In most cases, this harvested rainwater is used for external purposes only.
On its own, this level of stormwater harvesting does not fully exploit the opportunities available. To produce a serious addition to potable water supplies, governments and their water authorities will need to assist the move to the metropolis-wide harvesting and use of stormwater. This will require large-scale harvesting, treatment and distribution of stormwater from locations close to major population centres.
rEFErENCESG Mitchell, R Mein, & T McMahon, 1. The reuse potential of urban stormwater and wastewater, Cooperative Research Centre for Catchment Hydrology, Melbourne, 1999, <www.crccathmenthyrdrology.com.au/publications>.
Stormwater figures supplied by Brisbane City Council.2.
Australian Academy of Technological Sciences and Engineering., 3. Water recycling in Australia, special report, ATSE, Melbourne, 2004, <http://www.atse.org.au/index.php>.
Some other useful sourcesDepartment of Environment and Conservation (NSW), • Managing urban stormwater: harvesting and reuse, DEC, May 2006.
stormwaterTHE BIG PICTURE
70 Victorian Women’s Trust - Our Water Mark
Australia’s climate is becoming hotter and average yearly rainfall is declining along the entire eastern seaboard – where most of us live …
Australia is suffering its worst drought in 100 years. Now, I realise we can’t take just one year in one city, or even in one continent as proof that something unusual is happening. And I am no scientist, but I do know how to assess a risk – and this one is clear. Climate change poses clear, catastrophic threats. We may not agree on the extent, but we certainly can’t afford the risk of inaction.
Rupert Murdoch, speech delivered to the employees of News Corporation, New York, 9 May 2007
previous 100 years’.1 If this trend continues, we can expect generally hotter and drier weather patterns in Australia. Our tropical rainfall system will move further south in Queensland and Western Australia, but there will be less annual rainfall in the southern half of the mainland and more extreme weather events around the country.2
In the Murray-Darling Basin, annual temperatures are projected to increase by up to 2°C by 2030, and up to 6°C by 2070.3
There is now strong evidence that global temperatures are rising. While the debate continues in some quarters as to whether this is a natural event or is induced, at least in part, by human greenhouse-gas producing activities, there is a striking parallel between this temperature rise and the accumulation of carbon dioxide in the atmosphere. Irrespective of the causes, a sustained rise in global temperatures will be mirrored by rises in the temperatures of the world’s oceans. These
temperature increases will directly affect climate systems, causing even more variability and greater extremes.
COMPUTED ClIMATE PrEDICTIONSAccess to supercomputers during the last 20 or so years has made it possible to develop and refine mathematical models of our climate systems. These models also describe the ways in which the anticipated changes in rainfall patterns will unfold across the southern half of the Australian mainland.
According to these models, a new rainfall pattern will first become evident on the western side of the continent and will slowly work its way west to become the dominant pattern over a large part of the eastern seaboard. While most people are aware of the expected hotter summers and warmer winters, they probably don’t appreciate that, with a medium rise in average daily temperatures (of about 0.85°C), annual rainfall across southern Australia is predicted to decline
Like every other country, Australia is influenced by global climate and ocean-current systems. Against this backdrop, a characteristic feature of our climate is its variability (for more on this, see the Variability section on pages 19–20).
While this climatic variability can be influenced by several factors, we now know that a major indicator is what we call the Southern Oscillation Index (SOI). When sea-surface temperatures in the eastern Pacific (near South America) are low relative to temperatures in the western Pacific (near Australia), Australia experiences ‘La Nina-type’ conditions and rainfall is generally above average. When this temperature difference narrows because of warming in the western Pacific, Australia experiences ‘El Nino-type’ conditions and rainfall is usually below average. Each set of conditions can remain dominant for several years at a time.
The IPCC concludes that ‘El Nino events have become more frequent, persistent and drying over the last 20 to 30 years compared to the
climate changeTHE BIG PICTURE
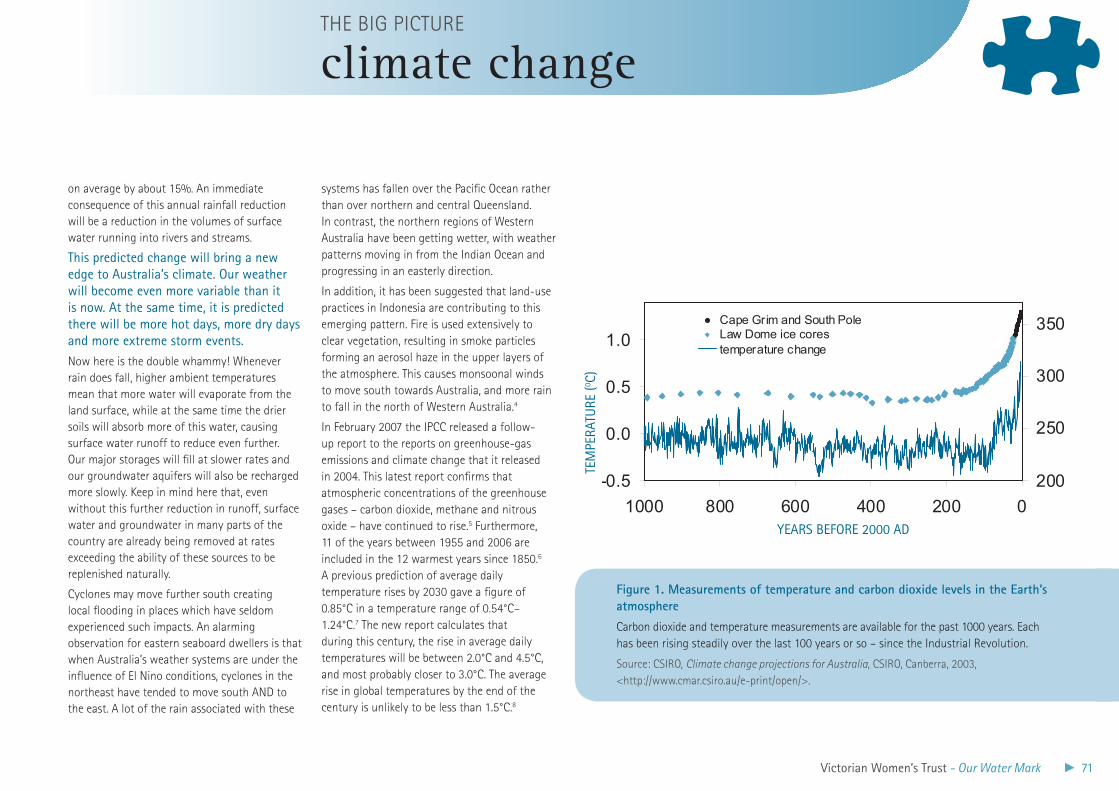
Victorian Women’s Trust - Our Water Mark 71
on average by about 15%. An immediate consequence of this annual rainfall reduction will be a reduction in the volumes of surface water running into rivers and streams.
This predicted change will bring a new edge to Australia’s climate. Our weather will become even more variable than it is now. At the same time, it is predicted there will be more hot days, more dry days and more extreme storm events. Now here is the double whammy! Whenever rain does fall, higher ambient temperatures mean that more water will evaporate from the land surface, while at the same time the drier soils will absorb more of this water, causing surface water runoff to reduce even further. Our major storages will fill at slower rates and our groundwater aquifers will also be recharged more slowly. Keep in mind here that, even without this further reduction in runoff, surface water and groundwater in many parts of the country are already being removed at rates exceeding the ability of these sources to be replenished naturally.
Cyclones may move further south creating local flooding in places which have seldom experienced such impacts. An alarming observation for eastern seaboard dwellers is that when Australia’s weather systems are under the influence of El Nino conditions, cyclones in the northeast have tended to move south AND to the east. A lot of the rain associated with these
systems has fallen over the Pacific Ocean rather than over northern and central Queensland. In contrast, the northern regions of Western Australia have been getting wetter, with weather patterns moving in from the Indian Ocean and progressing in an easterly direction.
In addition, it has been suggested that land-use practices in Indonesia are contributing to this emerging pattern. Fire is used extensively to clear vegetation, resulting in smoke particles forming an aerosol haze in the upper layers of the atmosphere. This causes monsoonal winds to move south towards Australia, and more rain to fall in the north of Western Australia.4
In February 2007 the IPCC released a follow-up report to the reports on greenhouse-gas emissions and climate change that it released in 2004. This latest report confirms that atmospheric concentrations of the greenhouse gases – carbon dioxide, methane and nitrous oxide – have continued to rise.5 Furthermore, 11 of the years between 1955 and 2006 are included in the 12 warmest years since 1850.6 A previous prediction of average daily temperature rises by 2030 gave a figure of 0.85°C in a temperature range of 0.54°C–1.24°C.7 The new report calculates that during this century, the rise in average daily temperatures will be between 2.0°C and 4.5°C, and most probably closer to 3.0°C. The average rise in global temperatures by the end of the century is unlikely to be less than 1.5°C.8
Figure 1. Measurements of temperature and carbon dioxide levels in the Earth’s atmosphere Carbon dioxide and temperature measurements are available for the past 1000 years. Each has been rising steadily over the last 100 years or so – since the Industrial Revolution.
Source: CSIRO, Climate change projections for Australia, CSIRO, Canberra, 2003, <http://www.cmar.csiro.au/e-print/open/>.
Carbon dioxide and temperature last 1000 years
200
250
300
350
02004006008001000years before 2000 AD
CO
2 (p
pm
)
-0.5
0.0
0.5
1.0
tem
per
atu
re (
o C)
Cape Grim and South PoleLaw Dome ice corestemperature change
climate changeTHE BIG PICTURE
YeARS BeFORe 2000 AD
TeM
PeRA
TURe
(0 C)
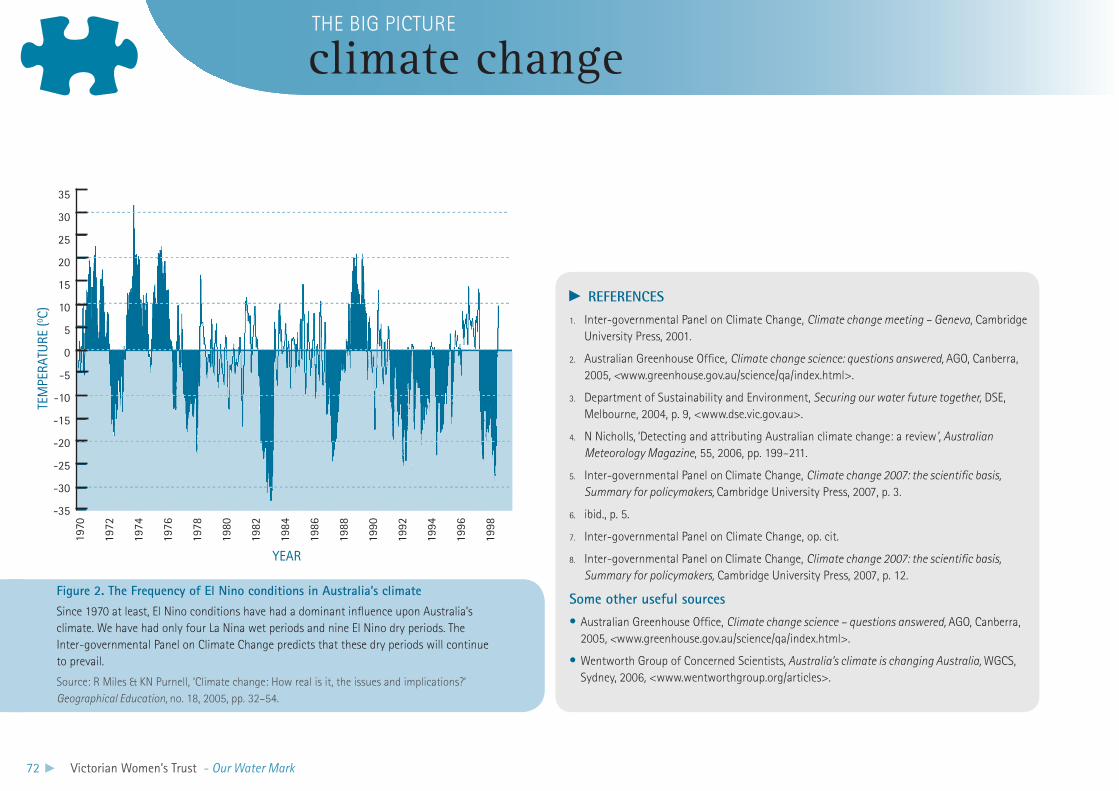
72 Victorian Women’s Trust - Our Water Mark
Figure 2. The Frequency of El Nino conditions in Australia’s climateSince 1970 at least, El Nino conditions have had a dominant influence upon Australia’s climate. We have had only four La Nina wet periods and nine El Nino dry periods. The Inter-governmental Panel on Climate Change predicts that these dry periods will continue to prevail.
Source: R Miles & KN Purnell, ‘Climate change: How real is it, the issues and implications?’ Geographical Education, no. 18, 2005, pp. 32–54.
climate changeTHE BIG PICTURE
REFERENCEs
Inter-governmental Panel on Climate Change, 1. Climate change meeting – Geneva, Cambridge University Press, 2001.
Australian Greenhouse Office, 2. Climate change science: questions answered, AGO, Canberra, 2005, <www.greenhouse.gov.au/science/qa/index.html>.
Department of Sustainability and Environment, 3. Securing our water future together, DSE, Melbourne, 2004, p. 9, <www.dse.vic.gov.au>.
N Nicholls,4. ‘Detecting and attributing Australian climate change: a review’, Australian Meteorology Magazine, 55, 2006, pp. 199–211.
Inter-governmental Panel on5. Climate Change, Climate change 2007: the scientific basis, Summary for policymakers, Cambridge University Press, 2007, p. 3.
ibid., p. 5.6.
Inter-governmental Panel on Climate Change, op. cit.7.
Inter-governmental Panel on8. Climate Change, Climate change 2007: the scientific basis, Summary for policymakers, Cambridge University Press, 2007, p. 12.
Some other useful sourcesAustralian Greenhouse Office, • Climate change science – questions answered, AGO, Canberra, 2005, <www.greenhouse.gov.au/science/qa/index.html>.
Wentworth Group of Concerned Scientists,• Australia’s climate is changing Australia, WGCS, Sydney, 2006, <www.wentworthgroup.org/articles>.
YeAR
TeM
PeRA
TURe
(0 C)
35
30
25
20
15
10
5
0
-5
-10
-15
-20
-25
-30
-35
1970
1972
1974
1976
1978
1980
1982
1984
1986
1988
1990
1992
1994
1996
1998

Victorian Women’s Trust - Our Water Mark 73
Australia’s population growth, urban expansion and steady economic growth reflect assumptions that water will always be available, and in whatever quantities required …
A nation with a long-term strategic view would know the extent to which water, precious to its people, its industries and its environmental integrity, is embodied in each good, service and product that it produces for domestic consumption, for export or that it imports. B Foran & F Poldy, Future dilemmas – options to 2050 for Australia’s population, technology, resources and environment, CSIRO Resources Futures Working Paper 02/01, CSIRO Sustainable Ecosystems, Canberra, 2002, p. 213
In the economic growth scenario, pressures for expansion (particularly in agriculture) will occur at such a level that achieving any form of ecological sustainability in future will be impossible.PS Lake & NR Bond, ‘Australian futures: freshwater ecosystems and human water useage’, Futures, vol. 39, 2007, p. 303
The arrival of the First Fleet in 1788 added 859 people to the estimated 750 000 Aboriginal and Torres Strait Islander people already present. Since that time the main component of our population growth has been natural increase, contributing about two-thirds of the total growth since the beginning of the 20th century. Natural increase rose sharply in the mid- to late 1940s as a result of the post WWII baby boom, and the immigration of many young people who then had children in Australia. As of June 2005, Australia’s population stood at 20.3 million people.1
PrOJECTED POPUlATIONDuring the last 80 years, Australia’s population has trebled.2 According to ABS projections, given the current trends in life expectancy, total fertility rates, overseas migration and current immigration policy, our population will increase to between 24 and 28 million by 2050. Much of this projected increase will occur in our capital cities.3
The dynamics of our population growth are now in a different phase. Over the past
50 or so years, life expectancy at birth has increased while the total fertility rate has fallen. Under such conditions, the setting of net immigration targets can become an important determinant of population trends. Because immigration levels over coming decades have yet to be set, predictions about our future population levels cover a wide range. This makes it difficult to accurately predict future water demand and consequently formulate appropriate water policy.
WATEr UNDErPINS ECONOMIC TrANSFOrMATIONSIn the fledgling colony, the focus was on the farming of small holdings with the aim of increasing production of staples to meet the colony’s needs. Agriculture slowly expanded beyond subsistence levels, as native grasslands were settled and grazing developed. Timber was also harvested for local use and select timbers were shipped back to England. By 1821, wool was being shipped back to England. Thus the first Australian economy was essentially an agrarian one.
population & economyTHE BIG PICTURE
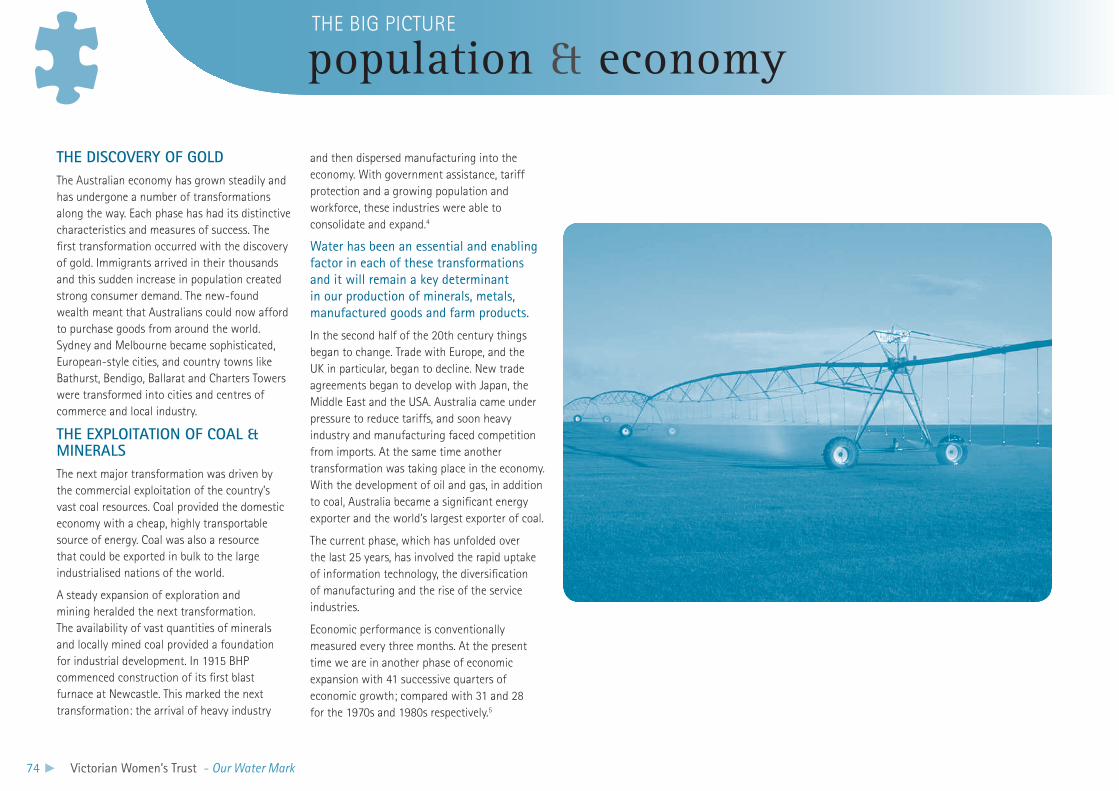
74 Victorian Women’s Trust - Our Water Mark
ThE DISCOVEry OF GOlDThe Australian economy has grown steadily and has undergone a number of transformations along the way. Each phase has had its distinctive characteristics and measures of success. The first transformation occurred with the discovery of gold. Immigrants arrived in their thousands and this sudden increase in population created strong consumer demand. The new-found wealth meant that Australians could now afford to purchase goods from around the world. Sydney and Melbourne became sophisticated, European-style cities, and country towns like Bathurst, Bendigo, Ballarat and Charters Towers were transformed into cities and centres of commerce and local industry.
ThE ExPlOITATION OF COAl & MINErAlSThe next major transformation was driven by the commercial exploitation of the country’s vast coal resources. Coal provided the domestic economy with a cheap, highly transportable source of energy. Coal was also a resource that could be exported in bulk to the large industrialised nations of the world.
A steady expansion of exploration and mining heralded the next transformation. The availability of vast quantities of minerals and locally mined coal provided a foundation for industrial development. In 1915 BHP commenced construction of its first blast furnace at Newcastle. This marked the next transformation: the arrival of heavy industry
and then dispersed manufacturing into the economy. With government assistance, tariff protection and a growing population and workforce, these industries were able to consolidate and expand.4
Water has been an essential and enabling factor in each of these transformations and it will remain a key determinant in our production of minerals, metals, manufactured goods and farm products.
In the second half of the 20th century things began to change. Trade with Europe, and the UK in particular, began to decline. New trade agreements began to develop with Japan, the Middle East and the USA. Australia came under pressure to reduce tariffs, and soon heavy industry and manufacturing faced competition from imports. At the same time another transformation was taking place in the economy. With the development of oil and gas, in addition to coal, Australia became a significant energy exporter and the world’s largest exporter of coal.
The current phase, which has unfolded over the last 25 years, has involved the rapid uptake of information technology, the diversification of manufacturing and the rise of the service industries.
Economic performance is conventionally measured every three months. At the present time we are in another phase of economic expansion with 41 successive quarters of economic growth; compared with 31 and 28 for the 1970s and 1980s respectively.5
population & economyTHE BIG PICTURE
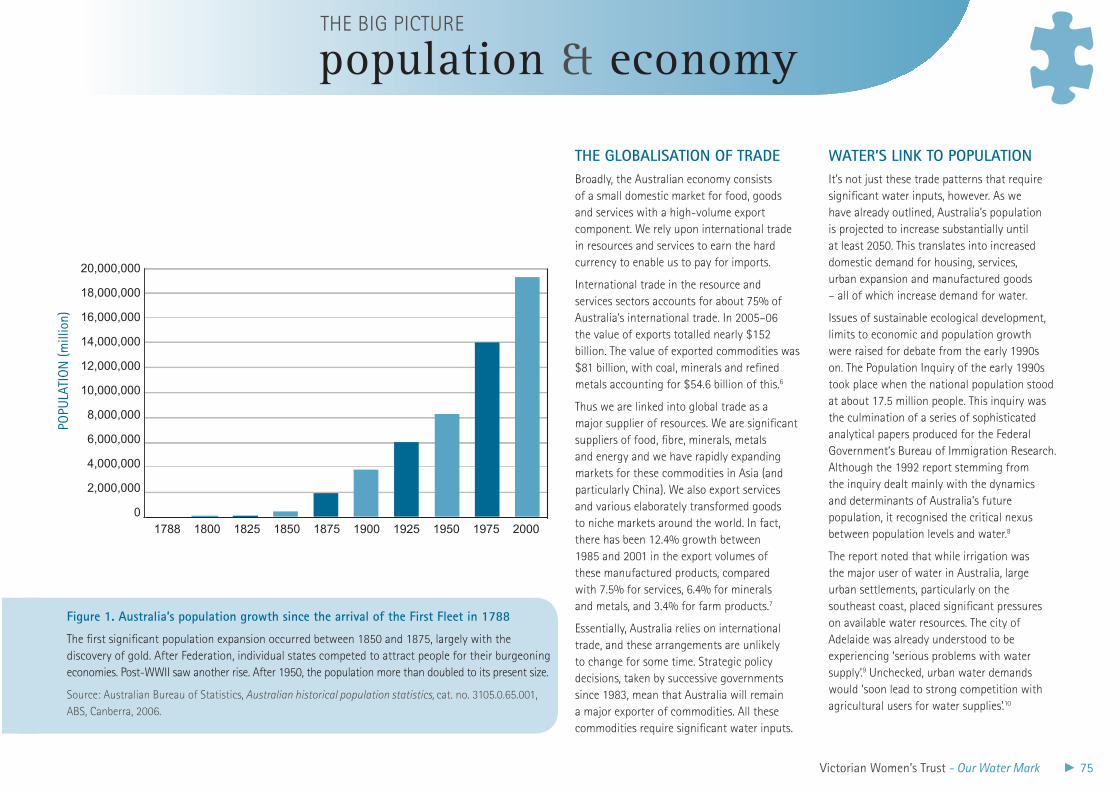
Victorian Women’s Trust - Our Water Mark 75
ThE GlOBAlISATION OF TrADEBroadly, the Australian economy consists of a small domestic market for food, goods and services with a high-volume export component. We rely upon international trade in resources and services to earn the hard currency to enable us to pay for imports.
International trade in the resource and services sectors accounts for about 75% of Australia’s international trade. In 2005–06 the value of exports totalled nearly $152 billion. The value of exported commodities was $81 billion, with coal, minerals and refined metals accounting for $54.6 billion of this.6
Thus we are linked into global trade as a major supplier of resources. We are significant suppliers of food, fibre, minerals, metals and energy and we have rapidly expanding markets for these commodities in Asia (and particularly China). We also export services and various elaborately transformed goods to niche markets around the world. In fact, there has been 12.4% growth between 1985 and 2001 in the export volumes of these manufactured products, compared with 7.5% for services, 6.4% for minerals and metals, and 3.4% for farm products.7
Essentially, Australia relies on international trade, and these arrangements are unlikely to change for some time. Strategic policy decisions, taken by successive governments since 1983, mean that Australia will remain a major exporter of commodities. All these commodities require significant water inputs.
WATEr’S lINk TO POPUlATIONIt’s not just these trade patterns that require significant water inputs, however. As we have already outlined, Australia’s population is projected to increase substantially until at least 2050. This translates into increased domestic demand for housing, services, urban expansion and manufactured goods – all of which increase demand for water.
Issues of sustainable ecological development, limits to economic and population growth were raised for debate from the early 1990s on. The Population Inquiry of the early 1990s took place when the national population stood at about 17.5 million people. This inquiry was the culmination of a series of sophisticated analytical papers produced for the Federal Government’s Bureau of Immigration Research. Although the 1992 report stemming from the inquiry dealt mainly with the dynamics and determinants of Australia’s future population, it recognised the critical nexus between population levels and water.8
The report noted that while irrigation was the major user of water in Australia, large urban settlements, particularly on the southeast coast, placed significant pressures on available water resources. The city of Adelaide was already understood to be experiencing ‘serious problems with water supply’.9 Unchecked, urban water demands would ‘soon lead to strong competition with agricultural users for water supplies’.10
population & economyTHE BIG PICTURE
20,000,000
18,000,000
14,000,000
12,000,000
10,000,000
8,000,000
6,000,000
4,000,000
2,000,000
1788 1800 1925 1950 1975 20001900187518501825
0
16,000,000
Figure 1. Australia’s population growth since the arrival of the First Fleet in 1788
The first significant population expansion occurred between 1850 and 1875, largely with the discovery of gold. After Federation, individual states competed to attract people for their burgeoning economies. Post-WWII saw another rise. After 1950, the population more than doubled to its present size.
Source: Australian Bureau of Statistics, Australian historical population statistics, cat. no. 3105.0.65.001, ABS, Canberra, 2006.
POPU
LATI
ON
(mill
ion)
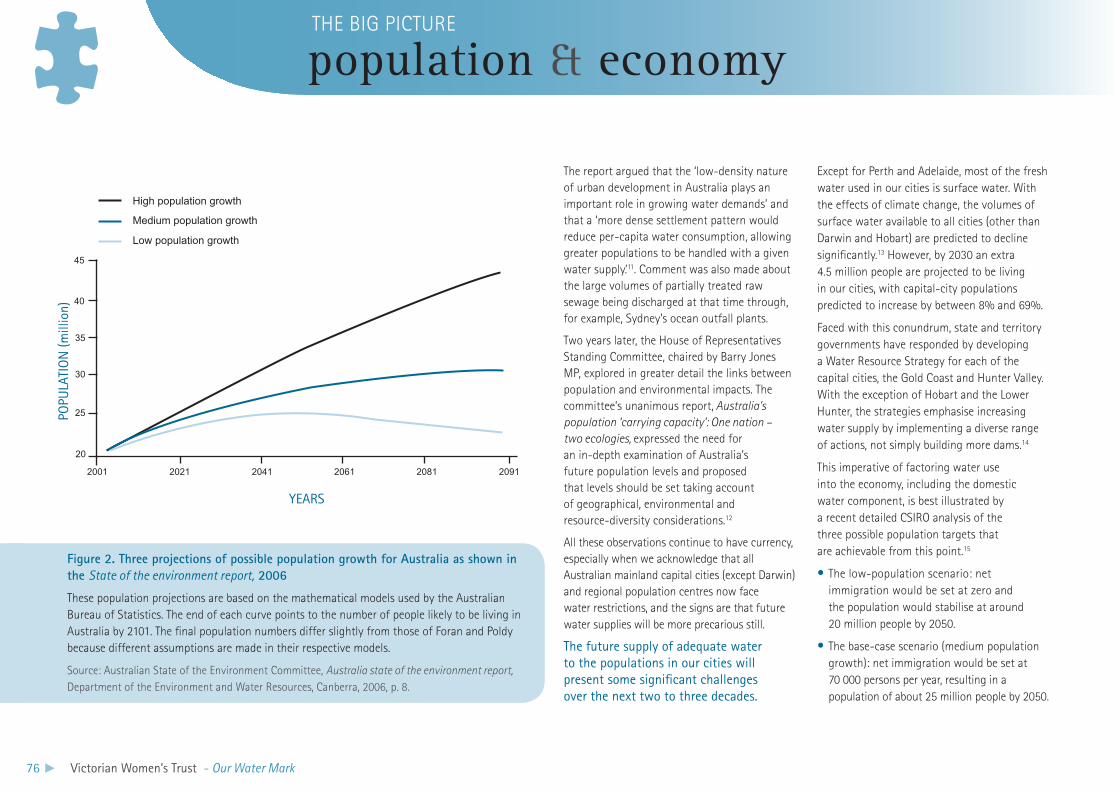
76 Victorian Women’s Trust - Our Water Mark
Figure 2. Three projections of possible population growth for Australia as shown in the State of the environment report, 2006
These population projections are based on the mathematical models used by the Australian Bureau of Statistics. The end of each curve points to the number of people likely to be living in Australia by 2101. The final population numbers differ slightly from those of Foran and Poldy because different assumptions are made in their respective models.
Source: Australian State of the Environment Committee, Australia state of the environment report, Department of the Environment and Water Resources, Canberra, 2006, p. 8.
The report argued that the ‘low-density nature of urban development in Australia plays an important role in growing water demands’ and that a ‘more dense settlement pattern would reduce per-capita water consumption, allowing greater populations to be handled with a given water supply.’11. Comment was also made about the large volumes of partially treated raw sewage being discharged at that time through, for example, Sydney’s ocean outfall plants.
Two years later, the House of Representatives Standing Committee, chaired by Barry Jones MP, explored in greater detail the links between population and environmental impacts. The committee’s unanimous report, Australia’s population ‘carrying capacity’: One nation – two ecologies, expressed the need for an in-depth examination of Australia’s future population levels and proposed that levels should be set taking account of geographical, environmental and resource-diversity considerations.12
All these observations continue to have currency, especially when we acknowledge that all Australian mainland capital cities (except Darwin) and regional population centres now face water restrictions, and the signs are that future water supplies will be more precarious still.
The future supply of adequate water to the populations in our cities will present some significant challenges over the next two to three decades.
Except for Perth and Adelaide, most of the fresh water used in our cities is surface water. With the effects of climate change, the volumes of surface water available to all cities (other than Darwin and Hobart) are predicted to decline significantly.13 However, by 2030 an extra 4.5 million people are projected to be living in our cities, with capital-city populations predicted to increase by between 8% and 69%.
Faced with this conundrum, state and territory governments have responded by developing a Water Resource Strategy for each of the capital cities, the Gold Coast and Hunter Valley. With the exception of Hobart and the Lower Hunter, the strategies emphasise increasing water supply by implementing a diverse range of actions, not simply building more dams.14
This imperative of factoring water use into the economy, including the domestic water component, is best illustrated by a recent detailed CSIRO analysis of the three possible population targets that are achievable from this point.15
The low-population scenario: net •immigration would be set at zero and the population would stabilise at around 20 million people by 2050.
The base-case scenario (medium population •growth): net immigration would be set at 70 000 persons per year, resulting in a population of about 25 million people by 2050.
population & economyTHE BIG PICTURE
High population growth
Pop
ulat
ion
(mill
ion)
At 30 June
Medium population growth
Low population growth
45
40
35
30
25
20
2001 2021 2041 2061 2081 2091
YeARS
POPU
LATI
ON
(mill
ion)
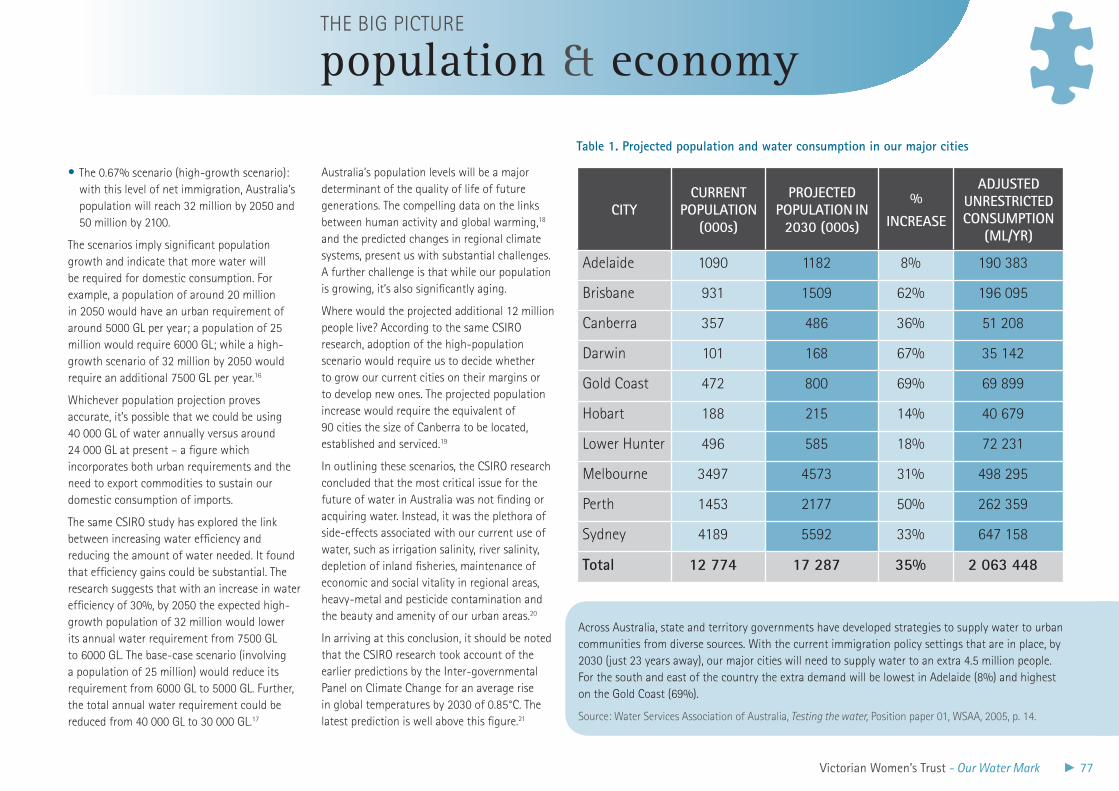
Victorian Women’s Trust - Our Water Mark 77
CITyCUrrENT
POPUlATION (000s)
PrOJECTED POPUlATION IN
2030 (000s)
%
INCrEASE
ADJUSTED UNrESTrICTED CONSUMPTION
(Ml/yr)
Adelaide 1090 1182 8% 190 383
Brisbane 931 1509 62% 196 095
Canberra 357 486 36% 51 208
Darwin 101 168 67% 35 142
Gold Coast 472 800 69% 69 899
Hobart 188 215 14% 40 679
Lower Hunter 496 585 18% 72 231
Melbourne 3497 4573 31% 498 295
Perth 1453 2177 50% 262 359
Sydney 4189 5592 33% 647 158
Total 12 774 17 287 35% 2 063 448
Table 1. Projected population and water consumption in our major cities
population & economyTHE BIG PICTURE
The 0.67% scenario (high-growth scenario): •with this level of net immigration, Australia’s population will reach 32 million by 2050 and 50 million by 2100.
The scenarios imply significant population growth and indicate that more water will be required for domestic consumption. For example, a population of around 20 million in 2050 would have an urban requirement of around 5000 GL per year; a population of 25 million would require 6000 GL; while a high-growth scenario of 32 million by 2050 would require an additional 7500 GL per year.16
Whichever population projection proves accurate, it’s possible that we could be using 40 000 GL of water annually versus around 24 000 GL at present – a figure which incorporates both urban requirements and the need to export commodities to sustain our domestic consumption of imports.
The same CSIRO study has explored the link between increasing water efficiency and reducing the amount of water needed. It found that efficiency gains could be substantial. The research suggests that with an increase in water efficiency of 30%, by 2050 the expected high-growth population of 32 million would lower its annual water requirement from 7500 GL to 6000 GL. The base-case scenario (involving a population of 25 million) would reduce its requirement from 6000 GL to 5000 GL. Further, the total annual water requirement could be reduced from 40 000 GL to 30 000 GL.17
Australia’s population levels will be a major determinant of the quality of life of future generations. The compelling data on the links between human activity and global warming,18 and the predicted changes in regional climate systems, present us with substantial challenges. A further challenge is that while our population is growing, it’s also significantly aging.
Where would the projected additional 12 million people live? According to the same CSIRO research, adoption of the high-population scenario would require us to decide whether to grow our current cities on their margins or to develop new ones. The projected population increase would require the equivalent of 90 cities the size of Canberra to be located, established and serviced.19
In outlining these scenarios, the CSIRO research concluded that the most critical issue for the future of water in Australia was not finding or acquiring water. Instead, it was the plethora of side-effects associated with our current use of water, such as irrigation salinity, river salinity, depletion of inland fisheries, maintenance of economic and social vitality in regional areas, heavy-metal and pesticide contamination and the beauty and amenity of our urban areas.20
In arriving at this conclusion, it should be noted that the CSIRO research took account of the earlier predictions by the Inter-governmental Panel on Climate Change for an average rise in global temperatures by 2030 of 0.85°C. The latest prediction is well above this figure.21
Across Australia, state and territory governments have developed strategies to supply water to urban communities from diverse sources. With the current immigration policy settings that are in place, by 2030 (just 23 years away), our major cities will need to supply water to an extra 4.5 million people. For the south and east of the country the extra demand will be lowest in Adelaide (8%) and highest on the Gold Coast (69%).
Source: Water Services Association of Australia, Testing the water, Position paper 01, WSAA, 2005, p. 14.
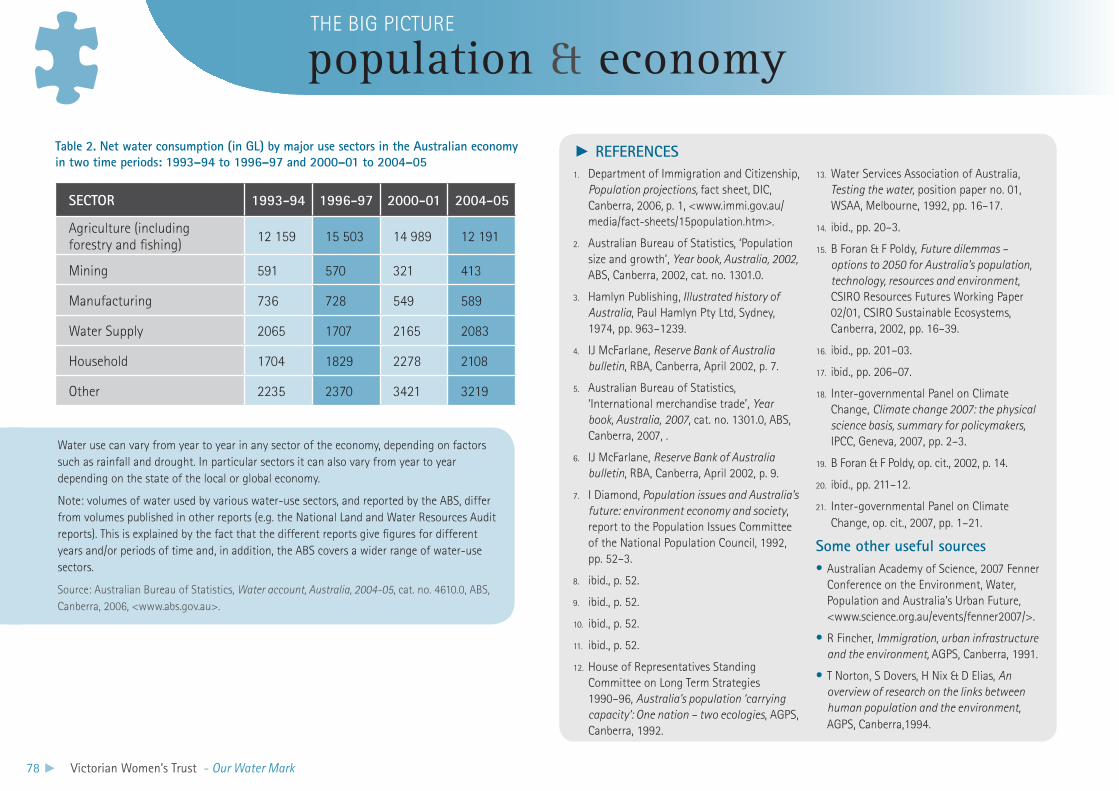
78 Victorian Women’s Trust - Our Water Mark
SECTOr 1993-94 1996-97 2000-01 2004-05
Agriculture (including forestry and fishing) 12 159 15 503 14 989 12 191
Mining 591 570 321 413
Manufacturing 736 728 549 589
Water Supply 2065 1707 2165 2083
Household 1704 1829 2278 2108
Other 2235 2370 3421 3219
Water use can vary from year to year in any sector of the economy, depending on factors such as rainfall and drought. In particular sectors it can also vary from year to year depending on the state of the local or global economy.
Note: volumes of water used by various water-use sectors, and reported by the ABS, differ from volumes published in other reports (e.g. the National Land and Water Resources Audit reports). This is explained by the fact that the different reports give figures for different years and/or periods of time and, in addition, the ABS covers a wider range of water-use sectors.
Source: Australian Bureau of Statistics, Water account, Australia, 2004-05, cat. no. 4610.0, ABS, Canberra, 2006, <www.abs.gov.au>.
Table 2. Net water consumption (in Gl) by major use sectors in the Australian economy in two time periods: 1993–94 to 1996–97 and 2000–01 to 2004–05
population & economyTHE BIG PICTURE
Department of Immigration and Citizenship, 1.
Population projections, fact sheet, DIC, Canberra, 2006, p. 1, <www.immi.gov.au/media/fact-sheets/15population.htm>.
Australian Bureau of Statistics, ‘Population 2.
size and growth’, Year book, Australia, 2002, ABS, Canberra, 2002, cat. no. 1301.0.
Hamlyn Publishing,3. Illustrated history of Australia, Paul Hamlyn Pty Ltd, Sydney, 1974, pp. 963–1239.
IJ McFarlane, 4. Reserve Bank of Australia bulletin, RBA, Canberra, April 2002, p. 7.
Australian Bureau of Statistics, 5.
‘International merchandise trade’, Year book, Australia, 2007, cat. no. 1301.0, ABS, Canberra, 2007, .
IJ McFarlane, 6. Reserve Bank of Australia bulletin, RBA, Canberra, April 2002, p. 9.
I Diamond,7. Population issues and Australia’s future: environment economy and society, report to the Population Issues Committee of the National Population Council, 1992, pp. 52–3.
ibid., p. 52.8.
ibid., p. 52.9.
ibid., p. 52.10.
ibid., p. 52.11.
House of Representatives Standing 12.
Committee on Long Term Strategies 1990–96, Australia’s population ‘carrying capacity’: One nation – two ecologies, AGPS, Canberra, 1992.
Water Services Association of Australia, 13.
Testing the water, position paper no. 01, WSAA, Melbourne, 1992, pp. 16–17.
ibid., pp. 20–3.14.
B Foran & F Poldy, 15. Future dilemmas – options to 2050 for Australia’s population, technology, resources and environment, CSIRO Resources Futures Working Paper 02/01, CSIRO Sustainable Ecosystems, Canberra, 2002, pp. 16–39.
ibid., pp. 201–03.16.
ibid., pp. 206–07.17.
Inter-governmental Panel on Climate 18.
Change, Climate change 2007: the physical science basis, summary for policymakers, IPCC, Geneva, 2007, pp. 2–3.
B Foran & F Poldy, op. cit., 2002, p. 14. 19.
ibid., pp. 211–12.20.
Inter-governmental Panel on Climate 21.
Change, op. cit., 2007, pp. 1–21.
Some other useful sourcesAustralian Academy of Science, 2007 Fenner •Conference on the Environment, Water, Population and Australia’s Urban Future, <www.science.org.au/events/fenner2007/>.
R Fincher, • Immigration, urban infrastructure and the environment, AGPS, Canberra, 1991.
T Norton, S Dovers, H Nix & D Elias, • An overview of research on the links between human population and the environment, AGPS, Canberra,1994.
rEFErENCES

Victorian Women’s Trust - Our Water Mark 79
In many parts of the world water is privately owned. This has not been the Australian experience – but changes now underway apply free-market principles and practice to water entitlements and water allocation. In the face of these changes, and our uncertain water future, we need to be sure that we have legislative and regulatory frameworks in place that not only respect, but also secure, the concept of water as a common good.
Our concern is that the market will be taken up by those who can afford to get into water speculation, e.g. banks, big business, who have no real stake in how water is allocated. Their motivation is simply making money.Kaniva Watermark Australia group
Don’t it always seem to go that you don’t know what you’ve got til it’s gone …Joni Mitchell, part of the lyrics to Big yellow taxi, 1970
Water has long been managed in Australia as a common good; belonging to all and able to be shared. However, the 1994 COAG adoption of a water-reform framework set in train a number of important developments which have changed the nature and allocation of water entitlements and removed restrictions on water trading, including where trading can occur.
From 1 July 2007 each landholder’s water entitlement will be separated from the land title (a process called ‘unbundling’). In addition, for the first time in Australia, it will be possible for anyone to permanently acquire a water entitlement (or entitlements) without owning any farmland. The water entitlement itself can now be held in perpetuity. It can be leased, used as collateral, and it can be bequeathed or permanently traded. Water entitlements will now also need to be registered.
These arrangements bestow a new status upon water – making it a commodity that can be bought and sold in the marketplace.
In order to grasp the magnitude and implications of this shift, we need to step back
in time and trace the deep and long-standing attachment Australia has to the concept of managing water as a common good.
MANAGING WATEr AS A COMMON GOODDuring at least 40 000 years of habitation, water was woven into the traditions of Australia’s indigenous peoples. It was a shared resource. Billabongs and streams were used as gathering places, for spiritual and recreational activity and as sources of abundant food. Rivers provided a reliable way of navigating from inland areas to the coast.
Soon after the arrival of the First Fleet at Sydney Cove, land became private property, but water remained a common good. In December 1803, a notice appeared in the Sydney Gazette:
‘If any person whatever is detected in throwing any filth into the stream of fresh water, cleaning fish, washing, erecting pig sties near it, or taking water out of the tanks, on conviction before a magistrate, their home will be taken down and forfeit five pounds for each offence to the Orphan Fund.’1
Governor Phillip’s proclamation clearly defined the colonial administration’s stewardship role over water. For the first three decades in the colony, everyone had free access to fresh water, though there were penalties for polluting the resource. As people spread out from Sydney Town, the need for an overall governance structure was identified. The eventual response was the 1886 Royal Commission which established that ‘government had a right to divert and control water.’2
This recommendation paved the way for the states to take control over water, on behalf of their people. By Federation, each had a Water Act on its statutes. These legal arrangements meant that when the Constitution was drawn up in 1900, water remained the responsibility of state governments, to be managed for the common good.
Water entitlementsEarly attempts by government to regulate water use came in the form of licences issued to control groundwater pumping for irrigation experiments. The next significant raft of water-
water as a common goodTHE BIG PICTURE
80 Victorian Women’s Trust - Our Water Mark
water as a common goodTHE BIG PICTURE
related legislation facilitated the setting up of irrigation schemes by government, to be managed under statutory arrangements. Thus, the NSW Irrigation Act of 1912 established the NSW Water Conservation and Irrigation Commission, which immediately embarked on the development of the Murrumbidgee Irrigation Scheme.3
State governments set about securing the water necessary to support the growth of towns and cities, agriculture and mining. This approach to water management continued for several decades. Throughout this time, farmers held water entitlements which gave them special access to, as distinct from ownership of, water as common property. These water entitlements were attached to farmland – linked to the property title. When land was traded or bequeathed, the water entitlement went with it as an integral part of the transaction. Within this system, some farmers were able to obtain additional water (at a negotiated price) from others, to assist in times of need. Such arrangements were described as ‘water sharing’. This was possible because part of a water entitlement could be leased. However, this temporary trading in water was restricted. For example, water could not be moved out of an irrigation district.
ThE 1970S: A ShIFT BEGINSThe mid-’70s represented a turning point in water policy. The globalisation of trade brought changes in economic thinking. Competition in a global marketplace dictated actions with respect to trade barriers, financial deregulation, the role
and size of government and the operation of state-owned monopolies.
Free-market principles were extolled with ever-greater force. The message was that government bureaucracies were self-serving, slow to respond, insulated from commercial realities and wasteful. Markets can, and will always, do it better.
A water market & water tradingThis self-confident mantra began to be articulated with respect to water use and management. Water was seen as a commodity that could be bought and sold in an open marketplace. As a secure investment and a tradeable entity, water would become more valuable; and this would in turn promote greater efficiency in its use and management. Instead of its use being geographically restricted, water could be directed to its highest value: water could be moved out of irrigation districts, across state borders, and between rural and urban communities. Other perceived benefits included the removal of barriers to private investment in new water infrastructure, and the breaking of state monopolies over water, thereby introducing healthy competition into the supply of rural and urban water.4
A water market came to be seen as an important tool in facilitating structural adjustment within irrigation farming and to assist the orderly transition of agriculture.5 Farmers could buy additional water entitlements to improve reliability of supply and expand their farm production. With the help of other policy instruments, such as full cost recovery, water
could be reallocated away from inefficient low-value irrigators on unsuitable soils, to efficient high-value irrigators on productive soils.6 Such reallocations would create more viable farm businesses, increase economic output from the limited resource, provide farm employment and boost local processing and service industries, helping to reinvigorate rural communities and generate environmental benefits.7 Farmers would also be free to sell their water rights, retire debt and make dignified exits from the land.
In this schema, permanent trading in entitlements is seen as having advantages over temporary trading. Permanent trades can facilitate long-term structural change because farmers are more likely to make significant financial investments in irrigation infrastructure when they have long-term security and control of the water.8
Some argue that water trading can also bring with it environmental benefits. It can relocate the extraction and application of water away from environmentally sensitive areas – such as badly salinised soils, either in the locality or further afield.9 Indeed, some agencies with a commitment to environmental sustainability are already identifying and designing initiatives on the assumption that permanent water trading presents a valuable opportunity to address land-degradation issues. Degraded and/or abandoned land can be purchased, rehabilitated, the water infrastructure refurbished, and some native habitat re-established. In this way, the usefulness of the land is enhanced, turning it into a viable and valuable farming enterprise, as well as bringing returns on investment.10
Water trading is also seen as a way of opening up options for trade between water-using sectors. For example, urban water utilities could obtain new sources of water at significantly lower cost than alternative options.11 This view assumes that the vast amounts of water currently used for relatively low-value irrigated agriculture could be transferred to inland urban centres.12
In this context, permanent water trading becomes the vehicle for opening up major private-sector investment in infrastructure development, particularly in eastern Australia. The purchase and delivery of rural water to our expanding cities, for example, would require major investment in piping, pumping and water-treatment infrastructure.
The recent paper of the Business Council of Australia provides an important clue as to what various private-sector and think-tank organisations now seek with regard to water trading and the development of a marketplace for urban water. The council calls for an expansion of the National Water Initiative (NWI) to cover urban water issues in the ‘same depth as rural ones’, and the replacement of physical water restrictions ‘with properly functioning urban water markets’. It advocates for allowing ‘greater private ownership of disaggregated water utilities’; removing the ‘various impediments to water recycling’; and conducting a ‘national review of water pricing in cities and towns’.13
Victorian Women’s Trust - Our Water Mark 81
water as a common goodTHE BIG PICTURE
Speeding up market arrangementsThe 1994 COAG created an agreed Water Reform Framework that obliged state governments to reform their water management practices, separate water-access entitlements from land titles, separate water-delivery from water-regulation functions and make explicit provision for environmental water. States could be (and have been) financially penalised for failing to comply and meet milestones and for failing to deliver fully on proposed reforms.14
A decade later, the COAG meeting of June 2004 reached agreement on the National Water Initiative, recognising the ‘continuing national imperative to increase the productivity and efficiency of Australia’s water use, the need to service rural and urban communities and to ensure the health of river and groundwater
systems by establishing clear pathways to return all systems to environmentally sustainable levels of extraction’.15
Of the eight key elements in the initiative, the first two dealt with water-access entitlements and a planning framework, and water markets and water trading. To establish uniformity across states, the NWI reinforced the concept of permanent water trading, arguing that the ‘consumptive use of water will require a water-access entitlement, separate from the land, to be described as a perpetual or open-ended share of the consumptive pool of a specified water resource, as determined by the relevant water plan’.16
The now-separated water entitlement will be exclusive, able to be traded, given, bequeathed or leased, subdivided or amalgamated. They will be ‘mortgageable’ (and in this respect have similar status to freehold land when used as collateral for accessing finance). The parties holding these now-separated entitlements will be ‘recorded in publicly accessible reliable water registers that foster public confidence and state unambiguously who owns the entitlement, and the nature of any encumbrances on it’.17
The NWI stressed that these water-access entitlements had to operate within a statutory water-planning framework. At the state and territory level, water plans will provide for ‘secure ecological outcomes by describing the environmental and other public benefit outcomes for water systems and defining the
appropriate water management arrangements to achieve those outcomes; and resource security outcomes by determining the shares in the consumptive pool and the rules to allocate water during the life of the plan’.18
The recent sharpened sense of a water crisis has stepped up pressure on governments to work out these market arrangements within the agreed time frame. In November 2006 a hastily convened meeting of heads of government resolved that trading, temporary or permanent, could begin across state borders as early as January 2007; and as recently as March 2007, the federal minister for the environment and water resources announced $5.6 million to accelerate the development of water trading in Australia.19
legislating for a national water marketRunning in parallel with this national reform agenda, and in order to facilitate the creation of a water market and permanent trading, individual states made significant amendments to their Water Acts and regulations. Reforms in Victoria serve as a good example of this change in direction. Here are the key legislative developments within the last two decades:
In 1987 amendments to the Victorian •Water Act (1958) were made legalising the temporary transfer of water rights.
Two years later, a new • Victorian Water Act (1989) was passed in the Victorian Parliament. Temporary trading remained in place. It also provided for the permanent
transfer of water rights and licences. Trade was only allowed for gravity irrigation districts, and only within them.
In 1994 an amendment to the • Water Act (1989) enabled water rights to be traded from within an irrigation district, to any land.
In December 1997, further amendments •to the Water Act (1989) allowed permanent interstate trade in water rights and licences.20
As a result of these legislated changes, from 1994 onwards, temporary and permanent water trading took off in Victoria. In the ensuing six years, the volume of water in temporary trades ranged between 3% and 8% of total water use. In the 10 years to 2000–01, a volume of water equal to 6% of the total entitlement to farmers was permanently traded.21
Increased activity in both temporary and permanent water trading is reflected nationally. In 2004–05, across Australia, there were 223 556 water-access entitlements that accounted for 29 832 GL. Approximately a third of these were entitlements to surface water. The rest were entitlements to groundwater. There were 13 456 temporary water trades (representing 1053 GL) and 1802 permanent water trades (representing 248 GL).22
NOT EVEryONE IS CONVINCEDThere is strong support for the development of a water market and permanent water trading in certain quarters of government and the private sector, and among land/
Those buying the water rights include managed investment schemes fuelled by city investors taking advantage of tax laws. At a time when growers worry desperately about the water shortage, MIS operators are gobbling up water rights before the tax loophole that spawned them is wound up in a year.Dan Silkstone and Orietta Guerrera, ‘Beneath dry blue skies, growers fear the worst …’, the Age, 21 April 2007, p. 7.
82 Victorian Women’s Trust - Our Water Mark
water as a common goodTHE BIG PICTURE
water specialists and various interest groups. But the policy framework behind the NWI and the introduction of permanent water trading are not universally welcomed and have come under sustained attack from parts of the irrigation and agricultural sector. Limited national media coverage means that the degree of anger and hostility to these changes is not readily apparent.
At the time of writing, a formal resolution is being forwarded to the Water Resources Committee of the Victorian Farmers’ Federation calling for the process of ‘unbundling’ to be immediately terminated, and for a complete halt to permanent water trading between different districts and states until a 100% water allocation is restored throughout the state. A resolution of this nature suggests the issue is causing unease and real angst in farming communities.23
lack of fairnessThe overriding concern is that water-market mechanisms, on their own, are not fair or acceptable processes for allocating and reallocating water. There is a strong sense that unregulated water trading will price farmers out of business, causing huge write-downs of farm assets.24
If irrigation water is lost to other uses, the shortage of water in a tight market will substantially force up the price of irrigation water. There is also great concern that the trading of water and departures from farms will leave stranded assets – dams
and diversion works, major channels and diversion infrastructure, local channel and delivery works, on-farm delivery systems, and other on-farm infrastructure assets associated with irrigation delivery.25
A central concern rests with big non-land holders getting in on the act. With the separation of water entitlements from land ownership, parties can now acquire substantial rights to water, causing price spikes that will be difficult for many farmers to contend with.
The fear is that an open water market will allow ‘water barons’ to buy water and manipulate supply in a tight market – pushing prices to high levels, particularly in times of drought. In an open water market, city water retailers will always be able to outbid farmers, as urban authorities can spread their costs over businesses and across households.26
Flawed economic models The economic modelling that underpins water trading and predicts its impacts is perceived as far too narrow. It is seen as ignoring important economic, social and environmental dimensions to farming, and the dynamics that build economic and social cohesion in rural communities. At issue is whether permanent water trading will damage rural communities. One early estimate is that the loss of 150 000 ML of irrigation water from northern Victoria has resulted in farm-gate losses of $150 million annually, the loss of $600 million from the regional communities annually, and a total write-down of $210 million in farm assets.27
Those who challenge permanent water trading also argue that the concept of ‘low-value use’ versus ‘high-value use’ is fundamentally flawed. They say that the value of a farm product is not measured by the farm-gate price alone. Important economic and social objectives are served by ‘low-value’ irrigated agriculture. These include the provision of reliable, safe, low-cost food and fibre for both domestic enjoyment and export earnings. There is also the employment generated in rural Australia in the handling, transport, processing, manufacturing and marketing of these products.
The flaw in judgements about ‘low-value’ versus ‘high-value’ products is that valuations can change rapidly. Take grapes, for example. Substantial amounts of water have been traded to corporate wine-grape farms financed by large managed investment schemes, yielding substantial tax breaks to investors. This has led to a significant oversupply of a number of wine-grape varieties, with prices falling from $600 to $800 per tonne, to $150 to $200 per tonne in 2006.28 This outcome not only affected corporate grape growers – it affected all grape growers.
When permanent water trading is simply described in terms of ‘high-value’ use and profitability, it ignores the issue of public accountability.
In a managed irrigation district, the water authority is accountable to the parties it supplies. If, for example, loss rates are judged to be high, the parties can demand that the authority respond and fix the infrastructure
to reduce these losses. In contrast, when water is permanently traded out of a district, and stored on the corporate farm, no-one else knows what is actually happening to the water. The new owners of the entitlement are accountable only to their shareholders. Provided they stick to their licence agreement, there is little oversight and limited opportunities for public scrutiny.
Finally, the anger over permanent water trading spills over to the policy makers. They are seen as having neglected important issues, including the amount of water lost in transmission when traded over long distances, the benefits to farm areas gaining water and the costs to farm areas losing water, the full cost to farmers and water-supply authorities resulting from the stranding of assets, and the economic losses and gains when water is traded from one region to another.29
Negative impacts of managed investment schemesThose opposed to permanent water trading have special concerns about the local impacts of managed investment schemes (MISs). They see that permanent water trading is open to capture by the MIS, with consequential distortions of rural investment, agricultural markets and water allocations.30
In this regard, it’s worth noting that most water trade in agriculture has been directed to MISs. According to an investigation conducted by the Age newspaper, in 2005, MISs were responsible for 85% of the secure water traded out of Victoria’s largest water authority – Goulburn-Murray Water. In 2006 water brokers estimated
Victorian Women’s Trust - Our Water Mark 83
that 75% of the Goulburn-Murray water sold out of the catchments, and up to 100% of Lower Murray water, has been traded to just three MISs: Timbercorp, SAI Teys McMahon and Macquarie Agribusiness.31
These investments are perceived as responding to government-sponsored tax breaks rather than being driven by market forces. In a snowballing effect, the purchase of multiple water entitlements in an area can lead farmers to exit the industry. Their irrigation channels then become uneconomic, causing the stranding of water-infrastructure assets and the assets of other farmers. In turn, other farmers go out of business.32
TrOUBlED WATErSIt’s hard to argue against the provision of opportunities to move water from different parts of agricultural production to others. After all, it makes sense to secure additional water to cover shortfalls, adverse seasonal situations and to expand production. All of this can be achieved with the temporary trades in water that have been occurring between irrigators in Australia for many years.
A key feature of this approach was that the water being temporarily traded always remained available as part of the pool.
Some would argue that it is too late to reverse institutional changes now underway. We note that there appears to have been no specific democratic mandate, either sought or granted, to introduce permanent water trading, though it dramatically changes the nature of water
entitlements, the distribution of rural water and the relationship between water sectors. There is a strong case, therefore, for bringing to light a number of troubling issues, so that debate can take place that might inform future developments regarding the operation of a water market – both rural and urban.
Water & the environment Across the country there is compelling evidence that too much water has already been removed from the natural environment. Reversal of damage to our freshwater ecosystems will require us to replenish our rivers and streams, provide seasonal flooding of wetlands and provide a mechanism for aquatic species to migrate along waterways. In addition, if water leaves districts permanently, land without water has little value and can
be left in a state of serious disrepair. This will compound existing problems of land degradation and the costs of restoration.
Water for the environment was accorded legal recognition by COAg in 1994. Yet, despite this advance, little additional water has been allocated for environmental flows – in part due to the protracted drought.
Our earlier section on surface water showed flow predictions for Victoria’s river systems. All but one are predicted to have reduced flows. In a later section of this document, we outline a fundamental principle regarding river health: that to maintain our rivers and streams as living entities, they need the first drink.
If permanent water trading continues to expand, the broader community will need to be confident that the environment can compete, in respect of environmental flows and land repair, with the interests of for-profit shareholders and individuals who trade in water.
Potentially adverse economic outcomes for the community The rhetoric accompanying the introduction of permanent water trading, and the development of a national water market, is that water can be moved and put to its highest-value use. In this context, high-value use is an economic construct to do with productivity and profitability. Such a concept does not intrinsically reflect other values, such as environmental and ecological integrity, social equity, the welfare of rural communities,
and social cohesion between rural and urban dwellers. Indeed, it’s usually because of the inability of the marketplace to account for such values that, from time to time, and in various circumstances, market failure occurs.
Australians need to feel confident that the push to create a national marketplace for rural, and possibly urban, water does not further impact negatively on freshwater ecosystems or the welfare and water-security of rural Australians. This is especially so if, and when, there is market failure.
As detailed earlier, from 1 July 2007 state governments, in their pursuit of the COAG ‘water reform’ agenda, will amend water legislation so that any party or person will be able to purchase water entitlements or ‘water shares’. When water can be bought and sold in an open marketplace, those with a financial and institutional capacity to pay have an intrinsic advantage.
Water is an appreciating ‘asset’, a fact illustrated in a recent promotion (dated 16 April 2007) by Macquarie Private Wealth/Macquarie Equities Ltd (a member of the Macquarie Banking Group). Potential investors are being encouraged to purchase units in ‘the Credit Suisse PL100 World Water Trust’.33
Water trading sounds complicated and, no pun intended, dry. Country people perceive themselves as facing the problem alone, and they don’t like it. They believe they are slowly being strangled. They want the attention of urban Australians.Dan Silkstone and Orietta Guerrera, ‘Beneath dry blue skies, growers fear the worst …’, the Age, 21 April 2007, p. 6.
We are glad the Snowy is in public hands and not, as far as we know, having profit wrung out of it for private investors.Ivanhoe Watermark Australia group
water as a common goodTHe BIg PICTURe
84 Victorian Women’s Trust - Our Water Mark
water as a common goodTHE BIG PICTURE
The promotion draws on evidence from the United Nations predicting that, if present rates of water consumption are maintained, by 2025 5 billion of the world’s 7.9 billion people will live in areas where safe water supply is uncertain (including areas of eastern Australia and most of China and India). In the US alone, water demand has tripled over the last 30 years but the population has grown by only 50%.
The promotion suggests that with ‘demand for water increasing globally, PL100 World Water may present an attractive investment opportunity.’ Some of the key benefits include ‘exposure to a basket of international water stocks,’ ‘investment loans … available to approved applicants’, ‘Australian dollar returns’ and ‘5-year terms’. Macquarie Private Wealth is clearly a canny investment outfit. They rightly appreciate the dire water circumstances facing eastern Australia, as noted in the UN appraisal. As if to underline this uncertainty, just four days after the mail-out to potential investors, the Australian prime minister and the minister for the environment and water urged Australians to ‘pray for rain’.34
In order to prevent too much water from leaving a particular irrigation district, caps have been placed on the amount that can be permanently traded in any year.
Even allowing for the application of these caps on the amounts of water traded, water trading provisions now open the door for private parties, and especially those with substantial financial resources at their disposal, to acquire
significant volumes of water over time. While we appreciate that an asset such as water will only realise its value if used to create income, there will need to be anticipatory and effective regulation that prevents water hoarding and market manipulations that hurt genuine farming enterprises.
In addition, these caps and constraints reflect the policy imperatives of the times. Incremental creep is not restricted to tax brackets. Interest groups often lobby hard to promote their interests and, as we know, governments come and go with great regularity. There can be significant policy changes every time there is a change of personnel on the parliamentary front benches. We note that up until July 2006, the cap in Victoria was set at 2%. A year later, this was increased to 4%. In this context, people in the broader community need to feel confident that these caps will not be detrimentally raised at regular intervals, by different parties in power, responding to different constituencies.
When large investments are made, they are made with an eye to security and satisfactory returns on capital. One of the key issues various water interests want to progress with governments is the question of financial compensation. There are two major aspects here. The first concerns the possible failure of the owner of the water share to receive the full volume of water purchased because of general water scarcity. The second is what happens if a government is forced to take some of the private entitlements to water to meet a community need or crisis.
Once trading is permitted, it may be harder to reduce water users’ rights without compensation when rivers are subsequently found to need greater flows.35 Taxpayers could potentially be exposed to a significant risk of paying out large sums by way of compensation to owners of water shares who will argue their entitlement is secure.
Water & energyWater and energy are inextricably linked. This link is even more critical as we face the problem of increased greenhouse-gas emissions. From now on, when we look at different options for augmenting supply we are going to have to very carefully consider the energy implications.
Huge amounts of water are used to generate hydroelectric power, particularly at times of peak demand. With private parties able to accumulate significant amounts of water, the stage is set for power companies to purchase water and use it to meet peak demand. Into the future, more of these peak periods will occur during summer months. Hotter daily temperatures will cause people to use more power (and embodied water) for cooling homes and workplaces – unless, that is, we redesign our housing and reassess our consumer and lifestyle preferences.
At the present time, our patterns of energy use and levels of demand work against the provision of adequate water for environmental flows.
Part of the reason why the Snowy River hasn’t received anywhere near the agreed 28% of
environmental flow promised it, is because water is being held to generate power rather than being released to restore it to health.
risking the common goodAustralia is at a critical juncture with respect to its water future. There are some very difficult issues before us as a nation, including the significant readjustments that will need to made in parts of the irrigation sector, achieving substantial increases in water efficiency in all water-use sectors (including industry and households), and determining what population targets are feasible in an era of water scarcity and climate change.
The creation of a national water market, and in particular permanent water trading, may well meet many of the stated objectives regarding structural adjustment in irrigation and efficiency in the allocation of water among competing users. At the same time, however, there are also risks that go way beyond those defined in capital markets and free-trade thinking.
The central one is to do with the concept of water being managed as a common good – belonging to us all and shared by us all. We need to be confident that the new water trading arrangements don’t seriously compromise or threaten the management of water as a common good.
With land and water now disassociated into independent assets, it’s possible for parties to

Victorian Women’s Trust - Our Water Mark 85
buy and sell water entitlements. Technically, they do not own the water. So, in this sense, water itself is not privatised.
However, when water is permanently allocated from the broader consumptive pool; when its use is controlled by private parties with limited transparency, oversight and public scrutiny; when the benefits of its use are confined largely to private parties for their own gain, and where there are no attendant social and environmental responsibilities; it could be argued that water trading privileges private users, rather than serving community interests. Under these circumstances, the common good is effectively denied.
There are further ambiguities and dilemmas pending which may impinge on, and perhaps alter significantly, the management of water as a common good. As it stands now, the ownership of water remains with the people. The Crown (i.e. each state government) has the title to water which it manages within its territorial boundaries for the good of the people. However, existing Water Acts focus primarily on water flowing in rivers, rather than on the water stored below the ground. The ownership of water below the ground appears to be less certain, and may well be contested over coming years.
For example, feasibility studies are being conducted into the storage of suitably treated stormwater and/or wasted water into existing, shallow aquifers. If private parties are allowed
to do this, will they then own the water in the aquifer and be able to sell it in the marketplace?
Another potential uncertainty concerns the treatment of effluent. Our eastern seabord cities will have to respond to the predicted decline in surface-water availability by significantly expanding the capture, treatment and use of wasted water. No doubt private sector interests will want to play a part – perhaps in the building and operation of facilities to treat effluent. The treating of effluent turns something of little value into a product of real value. In this case, are private operators simply providing a contracted service? Or can they claim that because they have cleaned the water, it now belongs to them and can be sold back into the marketplace?
As we move into a less certain water future, we need to have in place legislative and regulatory frameworks that not only respect, but also secure, the concept of water as a common good. It may well be that this pivotal question will need to be further clarified under constitutional law.
water as a common goodTHe BIg PICTURe
We all have to recognise that water is not a public good …Macolm Turnbull, in a speech to the Australian Water Association Symposium on Recycling, 22 March 2006
Figure 1. Growth in water trading in Victoria 1990–01 to 2000–01
With permanent water trading, the volume of water that is becoming privately owned is accumulating year by year. Temporary trading is usually only an annual transfer of the water.
Source: Department of Natural Resources and Environment, The value of water – A guide to water trading in Victoria, DNRE, 2001, p. 12.
Permanent
Temporary
Includes auction
1,00
0 m
egal
itres
1990/1
250
200
150
100
50
0
1992/3 1994/5 1996/7 1998/9 2000/1
YeARS1,
000
Meg
ALIT
ReS
86 Victorian Women’s Trust - Our Water Mark
water as a common goodTHE BIG PICTURE
rEFErENCES 1. Sydney Gazette, 18 December 1803.
Government of New South Wales, first report of the Royal 2.
Commission on the Conservation of Water, 1886.
K Jeffcoat, 3. More precious than gold – an illustrated history of water in New South Wales, Kangaroo Press, Sydney, 1988.
Independent Committee of Inquiry, 4. National Competition Policy Review (Hilmer Report), August 1993.
H Bjornlund, ‘The socio-economic structure of irrigation 5.
communities – water markets and the structural adjustment process’, Journal of Rural Society, 12 (2), pp. 123–145.
Department of Natural Resources and Environment, 6. The value of water – A guide to water trading in Victoria, DNRE, Melbourne, 2001, p. 17.
H Bjornlund, op. cit., p.197.
ibid., p. 3.8.
Department of Natural Resources and Environment, op.cit., 9.
p. 21.
There are a number of superannuation agencies already either 10.
initiating or exploring investment programs of this nature.
Allen Consulting Group, 11. Saying goodbye to permanent water restrictions in Australia’s cities, report commissioned by Infrastructure Partnerships Australia, May 2007, pp. 1–2.
ibid., p. 2.12.
See, for example, Business Council of Australia, 13. Water under pressure: Australia’s man-made water scarcity and how to fix it, BCA, Melbourne, September 2006.
National Competition Council, ‘Payment recommendations 14.
approved’, press release, 21 December 2004; National Competition Council, ‘NSW and the NCP – the facts’, press release, 17 February 2004.
Intergovernmental Agreement on a National Water Initiative 15.
between the Commonwealth of Australia and the Governments of New South Wales, Victoria, Queensland, South Australia, The Australian Capital Territory and the Northern Territory, 25 June 2004.
ibid., pp. 6-7.16.
ibid., p. 6.17.
ibid., p. 7.18.
Minister for Water and the Environment, ‘Government invests 19.
millions to further develop water trade.’, media release, 7 March 2007
Department of Natural Resources and Environment, op. cit., p. 20.
99.
ibid., p.12.21.
Australian Bureau of Statistics, 22. Water account Australia, 2004–05, cat. no. 4610.0, ABS, Canberra, 2006, ch. 8, p. 105.
Jim Belbin, Vice-President Sunraysia Branch, Victorian Farmers’ 23.
Federation, personal communication, 7 June 2007.
P Byrne, J O’Brien, Eagle & D McDonald, 24. High and dry: how free trade in water will cripple Australian agriculture, Freedom Publishing, North Melbourne, 2006, p. 51.
ibid., p. 46.25.
ibid., p. 45.26.
ibid., p. 47.27.
ibid., p. 57.28.
ibid., p. 34.29.
ibid., p. 55.30.
C Egan, ‘Water wheels and deals leave anxious farmers dry’, 31.
the Age, 17 September 2006, pp. 1–2.
P Byrne, J O’Brien, Eagle & D McDonald, 32.
op. cit., p. 70.
Macquarie Equities Ltd, promotional letter to potential investor, 33.
dated 16 April 2007.
34. Herald Sun, 19 April 2007, p. 1; and ABC Television, Insiders, 22 April 2007.
Department of Natural Resources and Environment, op. cit., 35.
p. 21.
Some other useful sourcesT Fullerton, • Watershed - Deciding our water future, juggling the interests of farmers, politicians, big business, ordinary people - and nature, ABC Books, Sydney, 2001.
G Hardin, ‘The tragedy of the Commons’, • Science, 162, pp. 1243–48, 1968.
Productivity Commission, • Rural water use and the environment: the role of market mechanisms, research report, Productivity Commission, Melbourne, August 2006.
D Smith, • Water in Australia, Oxford University Press, Australia, 1998, ch. 4.
Victorian Women’s Trust - Our Water Mark 87
We need to lift our game in the way we manage water. Major environmental restoration is required. High demand for water can be expected yet less water will be available …
Fifty years is a lot of water (recycled or otherwise) under the bridge. Who knows what Australia’s climate will be by 2057? … The advantage of having the state and the nation largely onside is an opportunity to be grasped. At stake is an environmental future that demands, and should receive, an ecumenical approach.Editorial, the Age, 13 February 2007
Numerous examples can be found to demonstrate that, on some fronts, we are already managing water at best-practice levels in this country. At the same time, however, we do have significant institutional problems that need to be squarely addressed if we are to restore and maintain our freshwater ecosystems, achieve widespread water efficiency, and continue to provide water for our population’s needs and to produce exports.
ThINkING NATIONAlly ABOUT WATErWe have a long tradition of not thinking nationally about water! The constitutional arrangements for water were established at Federation. Under the Commonwealth of Australia constitution act (1900), section 100, all the power was vested in the States:
‘The Commonwealth shall not, by any law or regulation of trade or commerce, abridge the right of a State or of the residents therein to the reasonable use of the waters of rivers for conservation or irrigation.’1
In the time since, successive state governments approached the management of their water resources with a view to underwriting state development: the growth of cities, agriculture, manufacturing, mining and, more recently, service industries, such as tourism. Water was never seen as a limiting factor. There was more recognition of public health issues than the environmental degradation that went with water extraction and diversion.
Yet, over at least the past four decades, the pressure on our water resources has grown considerably; our rivers and streams have been seriously over-allocated and degraded.
In 2004-05 there were some 76 000 surface-water access entitlements across Australia, representing a combined total body of water of almost 23 000 GL. However, total water consumption in agriculture was just over half the total volume of these surface-water entitlements. In
other words, there is a substantial over-allocation of surface-water entitlements.2
In addition, our groundwater supplies have been over-allocated, salinised and contaminated with nitrates. Vegetation has been cleared from thousands of kilometres of river banks. Tree clearing on a massive scale has resulted in rising water tables and increasing dryland salinity.
Despite a hundred years of major dam construction, water supply to all mainland capital cities (except Darwin) is now at troublingly low levels. From the early 1980s the CSIRO predictions of greenhouse impacts on our climate have gone unheeded.
The Commonwealth taxation system has been exploited by water-hungry arrangements such as managed investment schemes covering plantations and, more recently, farm enterprises. There is little formal regulation across Australia requiring large-scale recycling in industry and in our cities. If ever there was a need to think nationally about how to manage our water into the future, that time is clearly now.
problems with managementTHE BIG PICTURE
88 Victorian Women’s Trust - Our Water Mark
STrATEGIC ThINkING FOr ThE lONGEr TErMLong-term issues will not be solved by short-term thinking. Unfortunately, regular changes in government do no promote strategic thinking for the longer term. In the course of the five decades in which water availability and use started to become seriously problematic, Australia has been governed by 10 federal governments, formed under new prime ministers, and more than 70 state governments. At the federal level, one in every three elections has seen a change of the party in power.
Over the last two decades at least, Australian governments have been urged to consider the mounting evidence that Australia’s climate will be adversely affected by global warming. Since 1991 we have had federal governments unwilling to acknowledge this evidence. Local and international reports were dismissed, inquiry processes were stalled and international agreements, such as the Kyoto Protocol, were actively avoided.
Australia has not been willing to accept the need to change its internal policy settings so as to reach agreed emissions targets. The standard response, illustrated by the prime minister as recently as March 2007, is that measures which threaten domestic jobs or our international trading position will not be countenanced.3 There seems to be little, if any, recognition that the position in 20 years’ time – without change and adjustment now – may result in huge job losses and adverse economic
impacts. Meanwhile, other OECD countries are positioning themselves for the future by developing new, low-emission technologies that may well leave us stranded with vast reserves of coal largely unwanted by the marketplace.
Yet another example of short-term thinking putting at risk long-term environmental imperatives is what has recently happened to the Snowy River. The Snowy River Hydroelectric Scheme operates under a management arrangement involving the Federal Government and the state governments of NSW and Victoria.
In 2002 the parties agreed to restore an environmental flow of at least 28% to the Snowy River.4 This was the lowest estimate deemed acceptable by an independent scientific panel appointed to assess the river’s failing health. Four years later, in 2006, the NSW Government (being the major shareholder) proposed that the Snowy River Hydroelectric Scheme be sold. Victoria and the Commonwealth felt they had no option but to go along with the proposed sale. However, intense public protest and political pressure led to the plan being shelved. (Incidentally, the NSW Government’s motivation for the sale was to use the proceeds to retire debt before the anticipated state election in 2007.)
BIPArTISANShIP ON MAJOr ISSUES SUCh AS WATErOn big issues, such as water, a culture of bickering and adversarial partisan politics is seen by the electorate as both disappointing and unproductive.
In January 2007, the prime minister released A national plan for water security.5 The states along the Murray-Darling system were asked to respond to this $10 billion proposal and, specifically, to refer their powers to the Commonwealth.
One of the first requirements of effective collaboration is appropriate consultation between the major parties. This did not occur. Instead, following the announcement, the various heads of government traded cheap shots, almost daily, for weeks. The states aired suspicions about a constitutional takeover by stealth. The South Australian premier’s insistence on an independent national authority was derided by the Commonwealth. The Victorian Government refused to refer powers as requested. The NSW premier agreed to the referral of powers almost immediately – no doubt in line with his expectations that NSW would receive most of the available money. Federally, National Party ministers in the coalition government expressed opposition to a key provision in the plan: the proposed Commonwealth purchase of water entitlements.
TIMEly, STrATEGIC & INTEGrATED PlANNINGWhen the clock is ticking, as it is now with respect to the state of our environment and water supplies, we can ill afford inertia and poor planning by governments and their agencies.
In an example of poor planning and inertia, Sydney Water Board officials were told over 25 years ago that the city would run out of water by 2000 unless urgent action was taken. In 1979 the Snowy Mountains Engineering Corporation completed a report for the then Water Board, concluding, ‘It can be seen that by the year 2000, the demand could be … greatly in excess of the present (1978) capacity of the system.’ Recently, a former midddle manager at Sydney Water stated, ‘We knew the climate was changing, we knew we had problems with over-consumption, we knew we had to recycle’.6
The earlier prediction was almost on the mark. Sydney in 2007 has a disturbingly low level of supply and, throughout this period, no major initiatives were implemented to recycle water.
Take another example. In 1977, Gutteridge, Haskin and Davey made recommendations
With such political and point-scoring behaviour, we are not likely to arrive at what is best for the country as a whole, and certainly there will not be any equality across the population’s individual needs.Castlemaine/Campbells Creek Watermark Australia group
problems with managementTHe BIg PICTURe
Victorian Women’s Trust - Our Water Mark 89
to the Federal Government about a national program for widespread water recycling.7 Yet, 30 years later, according to a member of the original consultancy team, nothing has been done.8 In November 2003, the prime minister’s Science Engineering and Innovation Council delivered its report on water recycling for Australia’s cities.9 And then, in November 2004, the Australian Academy of Technological Sciences and Engineering produced its report on water recycling. Despite all this, we still have only draft national guidelines for recycled water.10
VIGIlANCE & TrANSPArENCy rEGArDING DUE PrOCESSThere have been demonstrable failures in our planning processes, such that we can justifiably
ask – albeit when it’s almost too late – how could this have been allowed to happen?
A prime example of such a failure is Cubbie Station in southwestern Queensland, which has 14 000 ha under cotton production. The property has constructed a vast system of weirs and levees with a holding capacity of 480 billion L. Whenever rain falls over the Condamine-Balonne River System in the Darling Basin, all of the water is trapped on Cubbie Station. No water flows downstream to other farmers in Queensland and New South Wales. In addition, the country along the Culgoa floodplain no longer experiences periodic flooding. All of this was allowed to come about when the Borbidge National Party government in Queensland
granted water licences to the largest irrigated cotton farm in Australia – without first requiring an environmental impact study!11
A further example of failure, this time on a even grander scale, is the situation with small farm dams on agricultural enterprises and hobby farms across Australia. These are estimated to have a capacity to hold 9% of surface water in an average year. Yet, there is no inspection regime to ensure compliance with permits, or even to check whether the total volume of water held in these dams fits with catchment management plans. Regulation is limited to the siting and construction of dams and does not extend to such issues as to how to minimise evaporation.12
NATIONAl INVESTMENT IN WATEr EFFICIENCyAgainst the backdrop of ever-increasing water use, water scarcity in major parts of Australia and the impacts of predicted climate change, we have seriously under-invested in measures directed towards water efficiency, let alone in measures directed at super efficiency.
Our irrigation systems are aging, mostly uncovered and leaking. Only now, after 10 years of drought and witnessing hundreds of rural communities stretched to the limit, have governments begun the construction of key pipeline systems that will enable movement of water in different parts of rural Australia.
Water-inefficient washing machines are still manufactured and sold, even though the most
efficient of these uses more than twice the volume of water of the least-efficient front-loading machine.13 It’s also estimated that nearly 3 million Australian households are not fitted with dual-flush toilets, and only 17% of households have rainwater tanks.14 Timer or squirt taps in gymnasiums and leisure centres are almost non-existent.
There is no formal requirement for industry to undertake water audits and develop water-efficiency plans. Our building codes do not mandate any capture of stormwater, either. We have yet to do anything significant to save water in our cities (beyond a few demonstration projects linked to urban-sensitive water design principles). We continue to operate sewage-treatment plants that discharge huge volumes of treated waste into our oceans.
Instead of state governments embarking on long-term investment programs to address such deficiences, money has been taken, year after year, from water retailers and spent on activities unrelated to water. In the two years from 2005 to 2006, State Governments across Australia took almost $1 billion in dividends from their publicly owned water bodies.15
‘Water efficiency’ is a term in common use in the water sector and government quarters. Narrowly defined, it tends to focus only on ways of reducing direct water consumption, such as cutting down shower times or not hosing driveways. It suggests that we become water efficient when we use less water in everyday activities.
The meeting of scientists, economists, sociologists, lawyers, engineers and political scientists had been sitting in Canberra for two days, debating the future of the Murray-Darling River Basin, when Jack Larkin finally had enough. Lumbering to his feet, the big farmer looked around the room in frustration: ‘When can we get some action? We’ve got the people here who know about the problem and we have been talking for two days. But what sort of things can we farmers do about it?’
More than 20 years have passed since that meeting in 1984, when Larkin’s despair was reported in the Age under the telling headline, ‘Basin full of strife’. Sadly, a generation on, the basic story – too much talk, not enough action – has hardly changed.6Liz Minchin, ‘Basin at boiling point’, the Age, 24 April 2006
problems with managementTHe BIg PICTURe
90 Victorian Women’s Trust - Our Water Mark
However, real water efficiency is reached only when we significantly reduce the volumes of potable water used in our everyday activities, and when we use all available water, again and again, before we finally discharge it as waste water. At the same time, we have to reduce our use of ‘embodied water’ in the food we eat and the goods and services that we manufacture and consume.
The scope for greater efficiency is real and compelling. Significant improvements in water efficiency can be made in the irrigation sector which translate into major reductions in water demand. For the Murray-Darling Basin alone, water savings of at least 3000 GL are attainable.15
Our cities and regional population centres and many more of our non-farm industries can become much more water efficient. By simply retrofitting households with existing water-saving technologies, it’s conceivable to reduce per-capita water consumption by around 50%.
By adopting as national goals moves towards efficiency and super efficiency, we will be able to maintain, and even improve, agricultural and industrial output with a lower water input. We can also bring about major behavioural change in our urban communities. Ultimately, these major developments and changes will result in more water being available for the needs of our natural environment.
COMMUNITy ENGAGEMENT ON WATErAustralians are not being encouraged to participate in discussions and debates about our water future. With a resource as critical as water, we might expect that our governments would have sophisticated consultative processes in place; that all Australians would be encouraged to become water literate, and that we would be encouraged to work towards agreed national goals. After all, water is essential to sustain every one of us. It is essential for our health and wellbeing. It is essential to sustain the healthy environments that we depend on, it is essential for the production of the food we eat, the goods and services we consume, and for many of our recreational pursuits.
Governments and the community are beginning to realise that we are entering a period of greater climatic variability, with less rainfall expected and less surface water available. Despite this, present water-reform initiatives fail to achieve basic standards of community engagement.
While the states have mapped out strategic directions for our water future, the depth of community consultation varies greatly. At the same time, political expediency remains an undercurrent, with significant differences between the major parties about implementation. Competing policies – about the use of desalination technology versus new dam construction, or the transport of water from northern Australia – illustrate this. At the Commonwealth level, the government interface with water is essentially through the
Murray-Darling Basin Commission and the National Water Initiative. While the Commission has operated a broadly based community consultative committee, the National Water Initiative consults with only a narrow stakeholder group.16
In addition, there is regular staging of water conferences and summits within the water industry. These high-cost, sponsored events shift around the country. Full registration fees are usually set in the thousands of dollars and, effectively, the community is excluded.
The most serious failure in community engagement relates to the steady move towards the establishment of a national water market for water used in agriculture by 2014. Very few Australians know about this, understand how it is being achieved or what the implications of it are. Some organisations and individuals, such as government departments, farmers, the finance industry, land and property developers, policy think-tanks, the timber and electricity industries and local governments in rural Australia know about it. But, by and large, the average person in our capital cities does not.
The fact that water is being purchased and permanently traded will come as a surprise to many. Over the past decade a series of pivotal changes have been ushered in by state governments and the Federal Government, particularly regarding the nature of water entitlements and where trading can occur. Yet there was no specific democratic reference for this agenda, even though it poses real challenges to the fundamental idea of water as a common good. Instead, we are assured that
the marketplace will effectively regulate future water problems.
rhETOrIC & rEAlITyThere are often huge gaps between the rhetoric and reality of water reform. The rebuilding of Melbourne’s Spencer Street railway station (renamed Southern Cross railway station) was a major infrastructure project in the second term of the Bracks government. In 2003, the premier wrote in the government’s Green Paper, Securing our water future, of the need to ‘build an ethic throughout the community of water conservation. We need to cut our water use wherever we can, recycle and reuse wherever possible … This will require some hard decisions, strong leadership and community support’.17
Despite the brand-new railway station having the largest roof area in the central business district, no water-harvesting provisions were incorporated into its design and construction. It has been estimated that in an average rainfall year, approximately 18 million L of water would be available for collection from the station’s roof. The station was reopened in early 2006. One year later, the premier announced that an extra $1.2 million would be spent on retrofitting the building for rainwater harvesting.18 A key water-efficiency initiative on a showcase project was thus presented as an afterthought.
Gaps between rhetoric and reality are not confined to government. The Business Council of Australia (BCA) released a document in 2006 called Water under pressure: Australia’s man-made water sarcity and how to fix it. The paper argues that fundamental water reform
problems with managementTHe BIg PICTURe
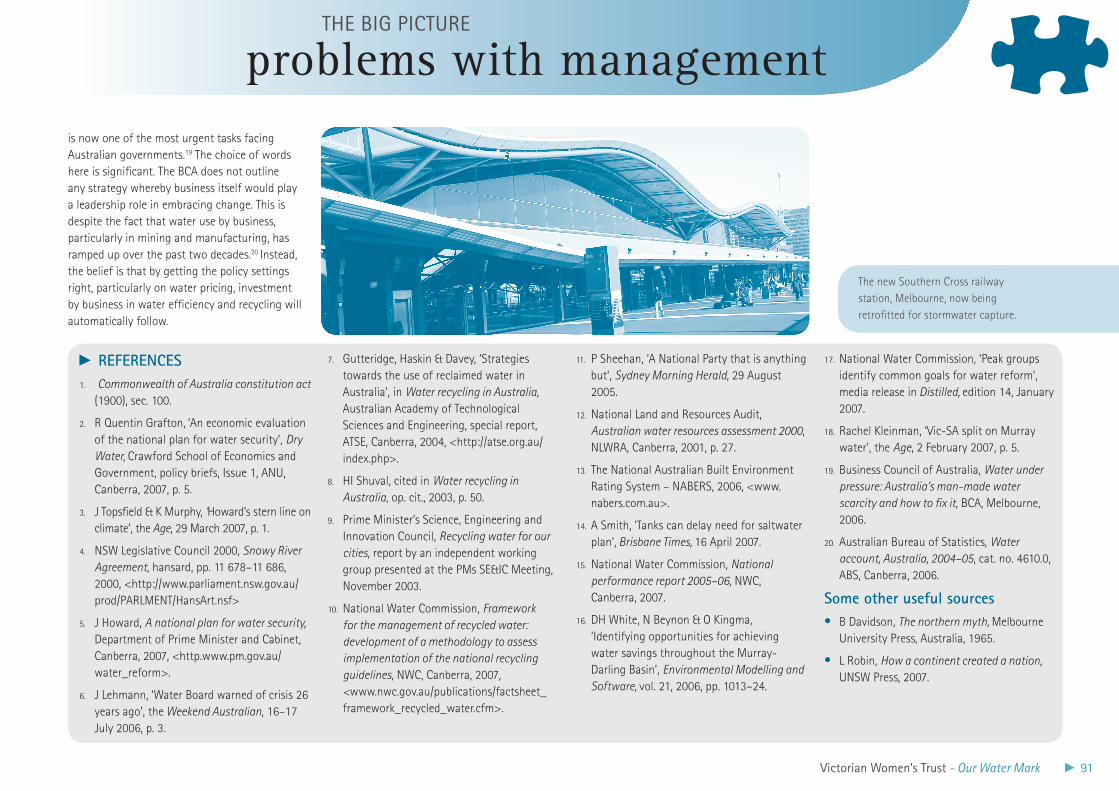
Victorian Women’s Trust - Our Water Mark 91
is now one of the most urgent tasks facing Australian governments.19 The choice of words here is significant. The BCA does not outline any strategy whereby business itself would play a leadership role in embracing change. This is despite the fact that water use by business, particularly in mining and manufacturing, has ramped up over the past two decades.20 Instead, the belief is that by getting the policy settings right, particularly on water pricing, investment by business in water efficiency and recycling will automatically follow.
problems with managementTHe BIg PICTURe
rEFErENCES 1. Commonwealth of Australia constitution act (1900), sec. 100.
R Quentin Grafton,2. ‘An economic evaluation of the national plan for water security’, Dry Water, Crawford School of Economics and Government, policy briefs, Issue 1, ANU, Canberra, 2007, p. 5.
J Topsfield & K Murphy, 3. ‘Howard’s stern line on climate’, the Age, 29 March 2007, p. 1.
NSW Legislative Council 2000, 4. Snowy River Agreement, hansard, pp. 11 678–11 686, 2000, <http://www.parliament.nsw.gov.au/prod/PARLMENT/HansArt.nsf>
J Howard, 5. A national plan for water security, Department of Prime Minister and Cabinet, Canberra, 2007, <http.www.pm.gov.au/water_reform>.
J Lehmann, ‘Water Board warned of crisis 26 6.
years ago’, the Weekend Australian, 16–17 July 2006, p. 3.
Gutteridge, Haskin & Davey, ‘Strategies 7.
towards the use of reclaimed water in Australia’, in Water recycling in Australia, Australian Academy of Technological Sciences and Engineering, special report, ATSE, Canberra, 2004, <http://atse.org.au/index.php>.
HI Shuval, cited in 8. Water recycling in Australia, op. cit., 2003, p. 50.
Prime Minister’s Science, Engineering and 9.
Innovation Council, Recycling water for our cities, report by an independent working group presented at the PMs SE&IC Meeting, November 2003.
National Water Commission, 10. Framework for the management of recycled water: development of a methodology to assess implementation of the national recycling guidelines, NWC, Canberra, 2007, <www.nwc.gov.au/publications/factsheet_framework_recycled_water.cfm>.
P Sheehan, ‘A National Party that is anything 11.
but’, Sydney Morning Herald, 29 August 2005.
National Land and Resources Audit, 12.
Australian water resources assessment 2000, NLWRA, Canberra, 2001, p. 27.
The National Australian Built Environment 13.
Rating System – NABERS, 2006, <www.nabers.com.au>.
A Smith, ‘Tanks can delay need for saltwater 14.
plan’, Brisbane Times, 16 April 2007.
National Water Commission, 15. National performance report 2005–06, NWC, Canberra, 2007.
DH White, N Beynon & O Kingma, 16.
‘Identifying opportunities for achieving water savings throughout the Murray-Darling Basin’, Environmental Modelling and Software, vol. 21, 2006, pp. 1013–24.
National Water Commission, ‘Peak groups 17.
identify common goals for water reform’, media release in Distilled, edition 14, January 2007.
Rachel Kleinman, ‘Vic-SA split on Murray 18.
water’, the Age, 2 February 2007, p. 5.
Business Council of Australia, 19. Water under pressure: Australia’s man-made water scarcity and how to fix it, BCA, Melbourne, 2006.
Australian Bureau of Statistics, 20. Water account, Australia, 2004–05, cat. no. 4610.0, ABS, Canberra, 2006.
Some other useful sourcesB Davidson, • The northern myth, Melbourne University Press, Australia, 1965.
L Robin, • How a continent created a nation, UNSW Press, 2007.
The new Southern Cross railway station, Melbourne, now being retrofitted for stormwater capture.
92 Victorian Women’s Trust - Our Water Mark
REFERENCEs
PS Lake & NR Bond, ‘Australian Futures: Freshwater Ecosystems and Human Water Useage’, Futures, vol. 39, 2007, pp. 288–305.
In our everyday lives, a flashing amber light usually puts us in alert mode. If ever we needed a signal to become more involved in water and take actions to secure our water future, then surely this is it …
But in order to move through the danger to seize the opportunity, we have first to recognize that we are in fact facing a crisis. So why is it that our leaders seem not to hear such clarion warnings? Are they resisting the truth because they know that the moment they acknowledge it, they will face a moral imperative to act? Is it simply more convenient to ignore the warnings?
Perhaps, but inconvenient truths do not go away just because they are not seen. Indeed, when they are not responded to, their significance doesn’t diminish, it grows. Al Gore, Vanity Fair, May 2006, p. 107
respect to climate change. This will require us, as a matter of urgency, to initiate major improvements in water efficiency in every aspect of life in our society and set in train processes for environmental repair.
Now is the time when we need to see articulated a national goal for water reform, to which all Australians can aspire, as well as clear pathways for taking action on water that will help secure our future in this country. The sections that follow are devoted to precisely this task.
The current water crisis in Australia is very serious. It’s not just serious for farmers, but for all of us. Sam Lake and Nick Bond cogently outlined three possible water scenarios in their recent paper ‘Australian futures: freshwater ecosystems and human water useage’.1
A ‘business-as usual’ scenario is where we continue our present farming practices, mining and manufacturing processes and urban domestic consumption patterns. We wait for the drought to break, ignore the environmental damage to our land and water and simply treat and restore a few iconic sites. In truth, this is a recipe for disaster.
Equally problematic is the ‘Bathhouse, anyone?’ scenario (see box on this page) in which we attempt to accelerate economic growth, ramp up water extraction and give away any chance of carrying out the necessary repair and restoration of our land and water systems.
Our best chance is to embrace a sustainability scenario: not simply to cope with existing pressures but to position ourselves with
We find it almost impossible to imagine the End of Us. But then so did the Mayans, one imagines. Or even the Romans, with their milder catastrophe. Perhaps in the midst of the decline there were speeches in the Forum about what great shape the franchise was in. A little unrest with the Christians, a bit of bother with the barbarians, but nothing the empire couldn’t deal with by ‘growing the business.’ Bathhouse, anyone?F Souter, ‘Buy now pay later’, the Age Good Weekend ,10 June 2006, pp. 40–1
the motivation to actTHe BIg PICTURe
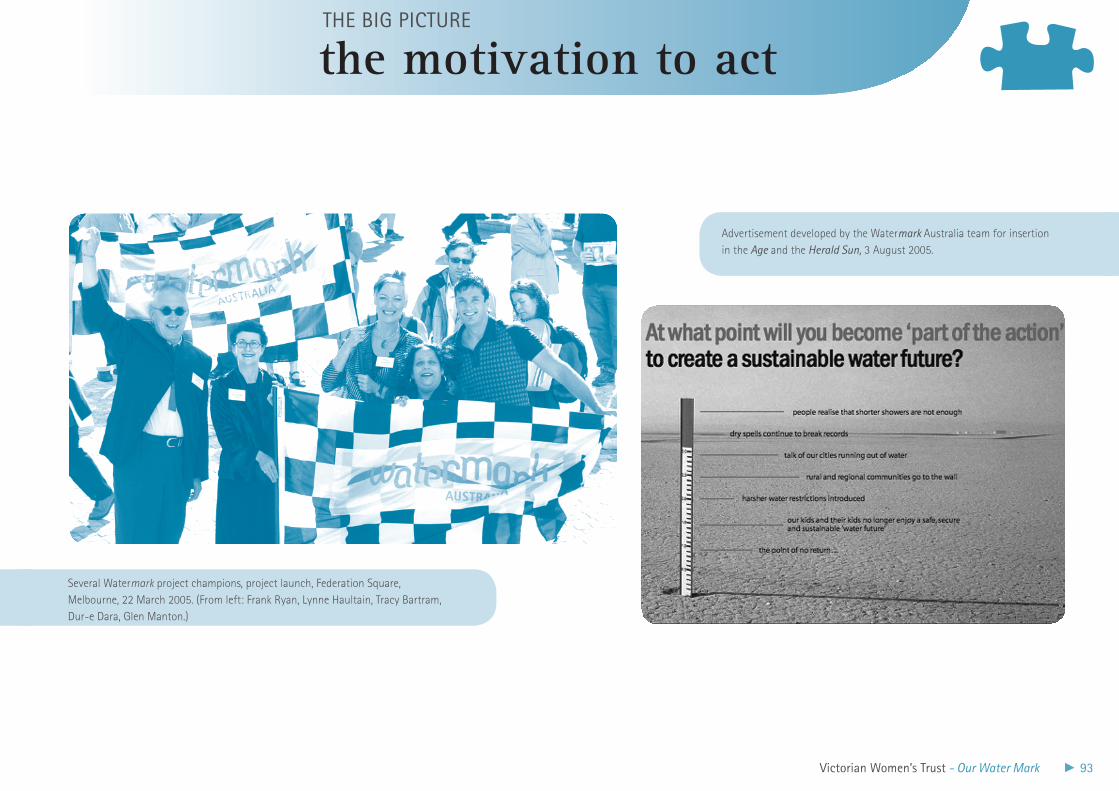
Victorian Women’s Trust - Our Water Mark 93
the motivation to actTHe BIg PICTURe
Several Watermark project champions, project launch, Federation Square, Melbourne, 22 March 2005. (From left: Frank Ryan, Lynne Haultain, Tracy Bartram, Dur-e Dara, Glen Manton.)
Advertisement developed by the Watermark Australia team for insertion in the Age and the Herald Sun, 3 August 2005.

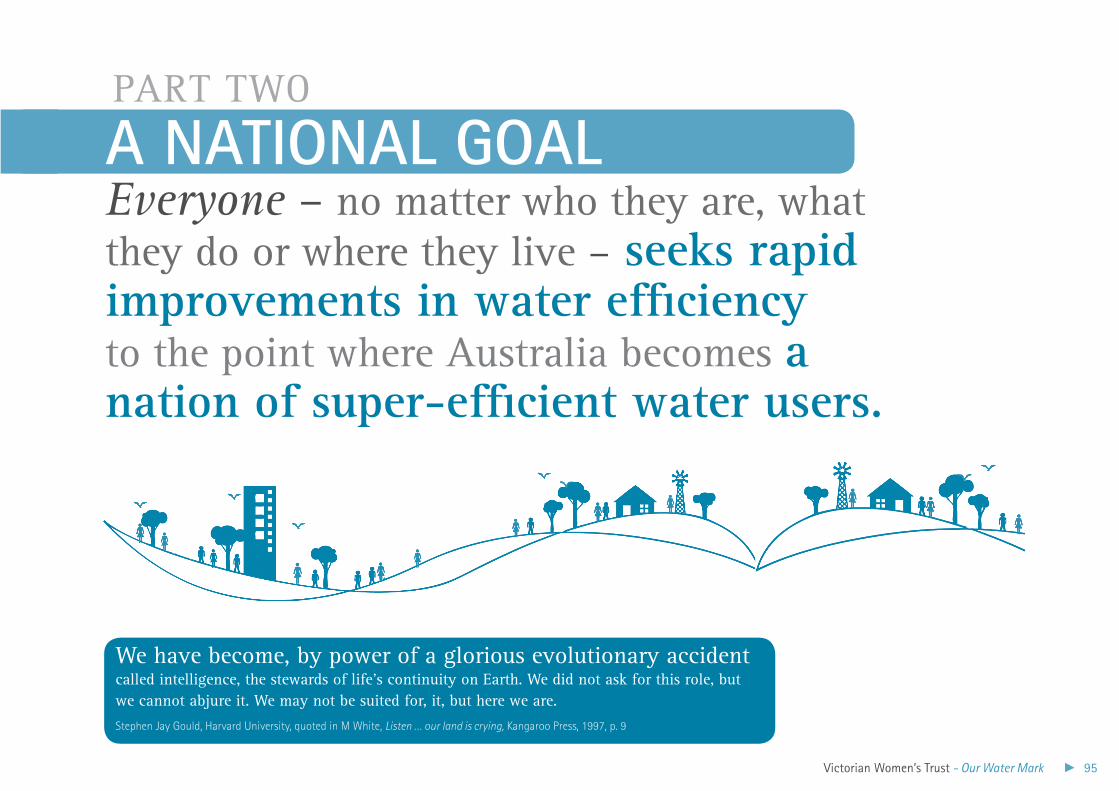
Victorian Women’s Trust - Our Water Mark 95
A NATIONAl GOAlEveryone – no matter who they are, what they do or where they live – seeks rapid improvements in water efficiency to the point where Australia becomes a nation of super-efficient water users.
We have become, by power of a glorious evolutionary accident called intelligence, the stewards of life’s continuity on Earth. We did not ask for this role, but we cannot abjure it. We may not be suited for, it, but here we are.
Stephen Jay Gould, Harvard University, quoted in M White, Listen … our land is crying, Kangaroo Press, 1997, p. 9
PART TWO
96 Victorian Women’s Trust - Our Water Mark
THE FUNDAMENTALSWorldwide, the availability of clean fresh water is diminishing while the global population grows and the earth appears to be entering a period of significant climate change. We are everything with water – and nothing without it. Water is not a resource for the privileged few. Nor should it cause social division. We need to accord a special status to water which is maintained across generations.
Access to clean fresh water is a fundamental human right.
Water has an intrinsic value to humanity and all living things irrespective of commercial considerations.This fundamental value must be safeguarded by our political, social and economic institutions.
Our fresh water is a common good, shared by all, and held in public trust by governments.
The following 20 principles will help us meet our serious water challenges by securing agreement on actions, ranking priorities, and working for the common good. These principles were derived by the Watermark Australia team using as a basis the discussions and reports from all the Watermark groups, as well as a specific workshop with several of the scientists who gave their time to the project. We also drew on a statement of community principles contained in the Purple Sage Project, led by the Victorian Women’s Trust.
guiding water reform
Creating the conditions that ensure access to water to meet the essential needs of every person,
every community and all living things is an obligation on society as a whole.
In meeting these essential needs, public health must always be protected; and
social cohesion, rather than polarity, should be nurtured and maintained.
PART TWO the way forward
20 principles
23
4
5
Victorian Women’s Trust - Our Water Mark 97
6
7
8
9
KNOWLEDGE TO GUIDE ACTION Modern societies have created new and special pressures on Earth’s finite water resources. Their future depends on achieving sustainable water use. Such recognition needs to occur at all levels of government and their agencies, in businesses and across wider communities. Responses need to be inclusive of people and based on sound knowledge and accurate information.
The decisions that need to be made about water have to be taken right
now by us, at this moment in time, and not left to some future generation.
All people should have the opportunity to participate in the debates and decisions
about water that will affect their lives and livelihoods.
Rural and urban Australians are tightly connected by the water that is used to produce our food and fibre. The
responsibility for reaching sustainable water use, and the investment that will be required, is a shared one.
We should seek to understand the land in which we live and appreciate its variability, limits, ecological processes and their timelines.
Improving and extending our water literacy is an essential step towards achieving a sustainable water future.
guiding water reform
the way forward
20 principles
98 Victorian Women’s Trust - Our Water Mark
With European settlement, many of our cities and towns were located along waterways. Water was supplied easily to these emerging population centres, as well as servicing the needs of agriculture and industry. At the same time, these waterways were used to dispose of our domestic and agricultural waste. Other towns and farming regions, however, grew by drawing on our groundwater resources, originally thought to be limitless.
Steadily, there has been a shift in the community perception of waterways, from what we might call a utilitarian view, to one that is more holistic – seeing waterways as natural living systems, essential for healthy catchments, and supporting a range of flora and fauna. We now know that waterways and aquifer systems are linked, and that groundwater resources, accumulated over millennia, are not inexhaustible. In many locations groundwater is being used at rates in excess of the natural recharge.
10
11
12
To remain living things, our rivers and streams need to get the first
drink. Once this need is satisified, water can be allocated for other purposes.
We should always respect the linkages between surface water and groundwater, ensuring that neither is wasted or contaminated.
We should seek to reuse water as many times as possible. At the same time, we should aim to
minimise adverse environmental impacts and maximise the social and economic gains from its use.
guiding water reform
the way forward
20 principles
Victorian Women’s Trust - Our Water Mark 99
Governments have a responsibility to measure, monitor and report regularly on how water is being
consumed and by whom, how the environment is being provided for and how communities are moving towards the sustainable use of water.
National and state government programs on water reform must be underpinned by appropriate public inquiry and consultation
as well as being transparent, technically sound and socially and economically responsible.
GOVERNMENTS’ ROLE
governments have a central role in guiding the economy, mediating competing interests and enhancing society in relation to water management. Decisions about water are likely to affect everyone to a varying degree. These decisions and proposed actions must be informed, considerate of the common good and of intergenerational impacts.
Governments have a particular and enduring responsibility to provide wise stewardship of the nation’s water resources.
Governments in a market economy have an enduring responsibility to act as a balance to market forces in the management of our water resources.
Governments should act as committed and independent regulators of water use, taking into account urgency, social impact, fairness and community expectations.
15
16
17
1314
guiding water reform
the way forward
20 principles
100 Victorian Women’s Trust - Our Water Mark
WHAT IT WILL TAKE
Australia’s dire water situation requires concerted, long-term national responses. We should understand and accept the need for significant investment and expenditure, to be shared equitably. There will be individual costs as well. These investments should be seen as a stake in our future, to ensure a quality of life that is shared, safe, secure and aesthetically pleasing. Rapid uptake of existing and new technologies will be central to many of these actions. 20
We need to accept and share the significant medium-term financial costs that will be required to achieve wise and efficient water use.
All sectors of society should be prepared to rapidly adopt appropriate, proven, water-saving technologies and actively support further innovation.
Each of us has a responsibility to leave society and our environment in better shape than we found it.
guiding water reform
the way forward
20 principles
1819
Victorian Women’s Trust - Our Water Mark 101
everyone can do something to bring about significant improvements in water efficiency, and, ultimately, reach super efficiency. Some will want to do more than others. So much the better. We need to aim for major advances across the whole community over the next few years. These are the steps we recommend to achieve these vital aims.
STEP 1: rECOGNISE OUr POWErWe have more power than we realise. This is played out on several different levels.
Our power as individuals Word of mouth. Word and deed. Remember that word of mouth is possibly the most potent source of information in our society! Try talking with everyone you know to raise community consciousness about water, and show the way by your own actions.
Our power in a small groupWhen we join forces with others, we share wisdom as well as the load. As individuals we usually wear different hats: as family members, parents, friends, employees, employers, small business people, volunteers or neighbours. There is enormous scope for change in coming together in small clusters of people to do important work. We know this already through such hugely successful initiatives as the Landcare groups, now dotted all over Australia.
All it might take is for a couple of parents to urge their school council to apply for a Community Water Grant to do a water audit, install rainwater tanks or other water-efficiency measures. It might involve patrons urging the manager of the local gym to start a similar process, or ratepayers talking with their local council, or staff in their workplace taking action, or volunteers in a not-for profit agency.
Our power in a communityMost of us connect in some way with organisations and networks that can help spread information, take initiatives and broadcast achievements. These could be employer groups, unions, sports clubs and associations, shareholders, faith communities, arts and recreation bodies, and so on.
Our power as votersWhen we elect people to represent us in local councils or in state and federal governments we effectively give them our power as citizens to use responsibly on our behalf. We trust them to use this power wisely.
We need to talk with our representatives about water, water efficiency and super efficiency, making suggestions and requests, commending them on important achievements and holding them to account for inadequate responses or non-responses.
Our power as global citizensWe need to look after water in our own patch as well as do what we can to help manage freshwater resources around the world.There are plenty of established forums for taking action on water outside the political arena. Start by supporting an international not-for-profit organisation such as WaterAid, which is dedicated to the provision of safe domestic water, sanitation and hygiene education to the world’s poorest.
water users
PART THREE
super-efficientbecoming
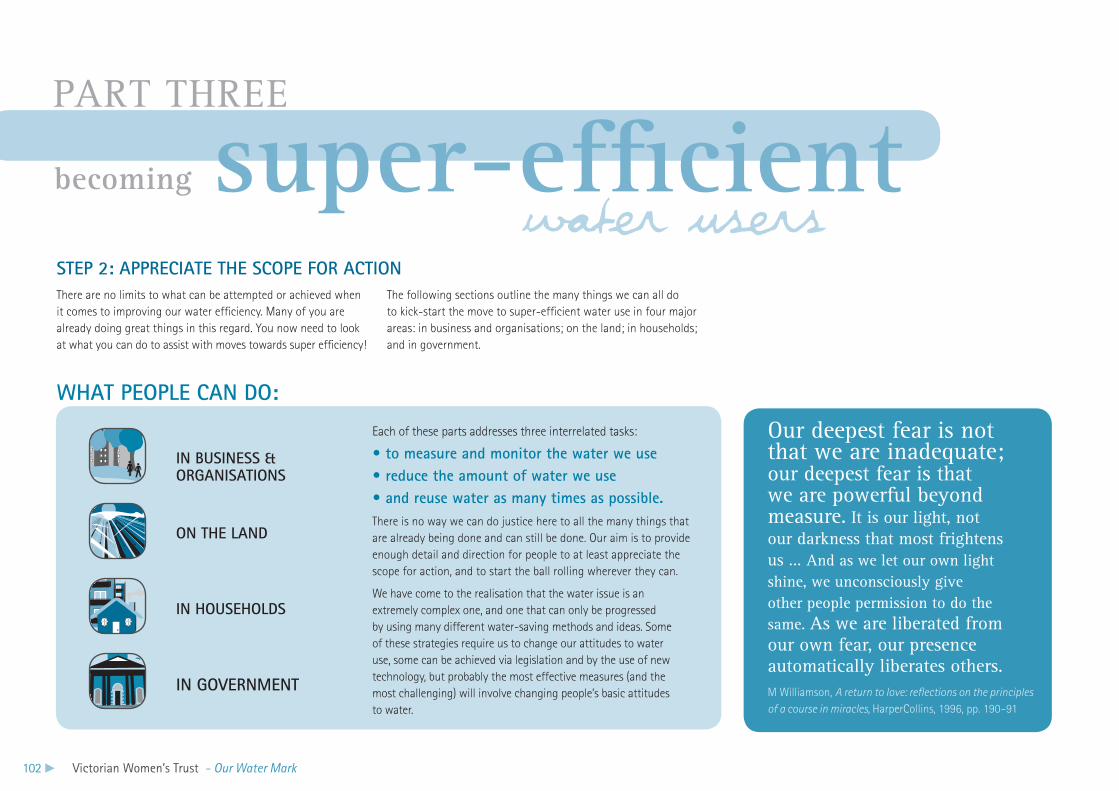
102 Victorian Women’s Trust - Our Water Mark
STEP 2: APPrECIATE ThE SCOPE FOr ACTION
IN BUSINESS & OrGANISATIONS
ON ThE lAND
IN hOUSEhOlDS
IN GOVErNMENT
Each of these parts addresses three interrelated tasks:
• to measure and monitor the water we use • reduce the amount of water we use • and reuse water as many times as possible.There is no way we can do justice here to all the many things that are already being done and can still be done. Our aim is to provide enough detail and direction for people to at least appreciate the scope for action, and to start the ball rolling wherever they can.
We have come to the realisation that the water issue is an extremely complex one, and one that can only be progressed by using many different water-saving methods and ideas. Some of these strategies require us to change our attitudes to water use, some can be achieved via legislation and by the use of new technology, but probably the most effective measures (and the most challenging) will involve changing people’s basic attitudes to water.
WhAT PEOPlE CAN DO:
Our deepest fear is not that we are inadequate; our deepest fear is that we are powerful beyond measure. It is our light, not our darkness that most frightens us … And as we let our own light shine, we unconsciously give other people permission to do the same. As we are liberated from our own fear, our presence automatically liberates others.M Williamson, A return to love: reflections on the principles of a course in miracles, HarperCollins, 1996, pp. 190–91
water users
PART THREE
super-efficientbecoming
There are no limits to what can be attempted or achieved when it comes to improving our water efficiency. Many of you are already doing great things in this regard. You now need to look at what you can do to assist with moves towards super efficiency!
The following sections outline the many things we can all do to kick-start the move to super-efficient water use in four major areas: in business and organisations; on the land; in households; and in government.
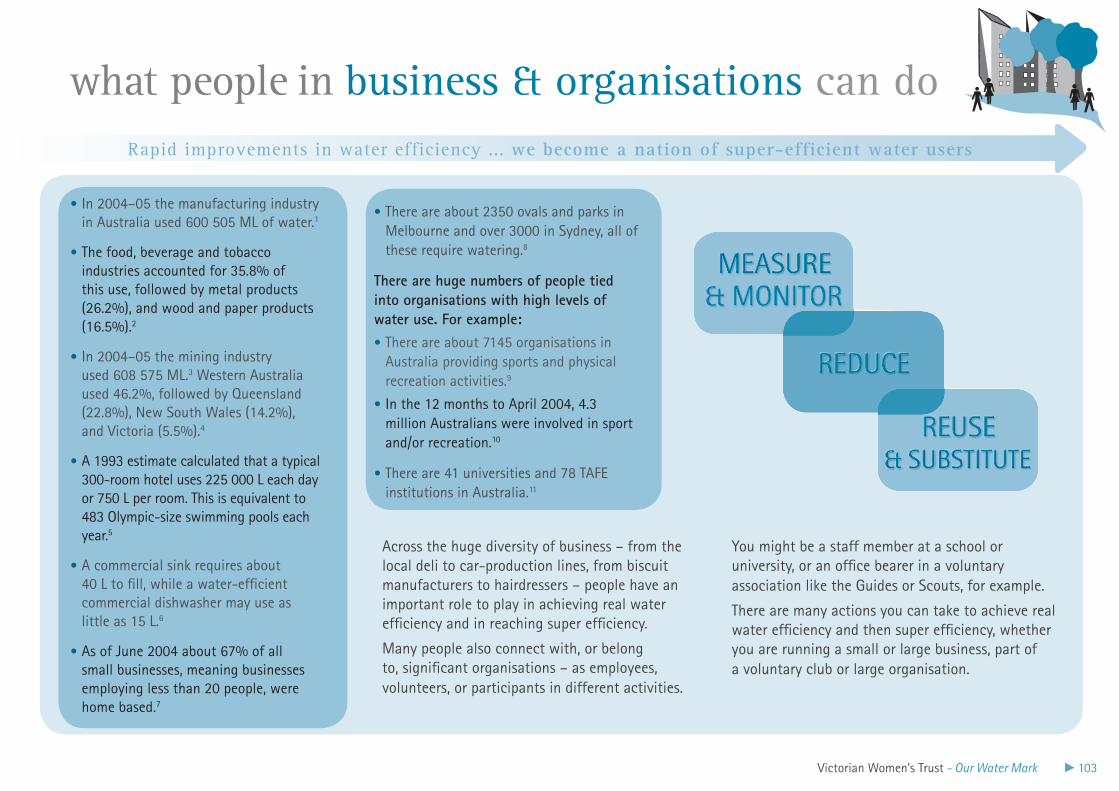
Victorian Women’s Trust - Our Water Mark 103
In 2004–05 the manufacturing industry •in Australia used 600 505 ML of water.1
The food, beverage and tobacco •industries accounted for 35.8% of this use, followed by metal products (26.2%), and wood and paper products (16.5%).2
In 2004–05 the mining industry •used 608 575 ML.3 Western Australia used 46.2%, followed by Queensland (22.8%), New South Wales (14.2%), and Victoria (5.5%).4
A 1993 estimate calculated that a typical •300-room hotel uses 225 000 L each day or 750 L per room. This is equivalent to 483 Olympic-size swimming pools each year.5
A commercial sink requires about •40 L to fill, while a water-efficient commercial dishwasher may use as little as 15 L.6
As of June 2004 about 67% of all •small businesses, meaning businesses employing less than 20 people, were home based.7
Across the huge diversity of business – from the local deli to car-production lines, from biscuit manufacturers to hairdressers – people have an important role to play in achieving real water efficiency and in reaching super efficiency.
Many people also connect with, or belong to, significant organisations – as employees, volunteers, or participants in different activities.
what people in business & organisations can do
There are about 2350 ovals and parks in •Melbourne and over 3000 in Sydney, all of these require watering.8
There are huge numbers of people tied into organisations with high levels of water use. For example:
There are about 7145 organisations in •Australia providing sports and physical recreation activities.9
In the 12 months to April 2004, 4.3 •million Australians were involved in sport and/or recreation.10
There are 41 universities and 78 TAFe •institutions in Australia.11
You might be a staff member at a school or university, or an office bearer in a voluntary association like the guides or Scouts, for example.
There are many actions you can take to achieve real water efficiency and then super efficiency, whether you are running a small or large business, part of a voluntary club or large organisation.
Rapid improvements in water efficiency ... we become a nation of super-efficient water users
Rapid improvements in water efficiency ... we become a nation of super-efficient water users
104 Victorian Women’s Trust - Our Water Mark
IDENTIFy yOUr WATEr USETo identify opportunities for increasing the water efficiency of your business you will need to do a water audit. For instance, the ways in which your organisation uses water may include:
domestic-use drinking water, washing, flushing •toilets and watering gardens and ovals
cleaning for hygiene reasons, product quality •and product changeover
cooling, removing heat from machinery, and •condensing vapours
processing, diluting, mixing, heating and •cooling or separating materials
rinsing, diluting and dispersing spills and leaks, •avoiding contamination between processes
steam-raising for process heating.•
MEASUrE WATEr USEOnce you have identified and quantified all the ways in which water is used by your organisation, you can begin to identify ways in which water use can be monitored and managed on a regular basis.
Develop a standard reporting procedure for water issues. This should include:
total water use over a defined period (week, •month or quarter)
a comparison to previous water-use patterns •and identified goals
issues that need addressing (such as leaks)•
responsibilities for action.•
Read your meter daily to monitor usage, or install an automatic monitoring system. Consider installing sub-meters to monitor specific areas of use, for instance sub-meters could be used to monitor cold-water supply, hot-water supply, kitchens, cooling towers, buildings, public amenities, laundries and outdoor areas.
IDENTIFy WhErE yOUr WATEr COMES FrOMIn some businesses, water may come from various sources. Include these various sources in your audit. Sources may include:
mains water•
bore water•
extraction from local surface water•
harvested water.•
Investigate opportunities to improve stormwater management on site. This will present opportunities for using the stormwater, thus offsetting water you are paying for, as well as reducing the risk of unwanted discharges from the site.
Food processing consumes 28% •
of the total water used in the manufacturing sector. Water use ranges from 1 L per kilogram of production for bakery products to 9 L per kilogram for meat products.12
In hospitality, most water is used •
in guests rooms (38%) followed by: kitchens (21%), lockers/public toilets (16%), laundries (12%), cold rooms (6%), steam generation (4%), pools (2%) and air-conditioning (1%).13
In 2007 the Victorian government •
identified 17 hospitals as being among the top-200 water users in the state.14
Many sporting organisations •
are significant users of water – particularly those playing outdoor sports on grass surfaces.
Consider if there will be any impacts on other users, upstream or downstream, or ecological impacts with changes in water use.
VErIFy SUPPly SySTEMSSet up a database with a user-friendly •interface so that meter readings can be manually or automatically fed into the software.
Include reporting information in annual •reports and environmental reports.
INVOlVE STAFF & CONSUMErSBrainstorm possible solutions and encourage staff to form a water conservation team. The findings and recommendations from the water audit are a good place to start adressing your water use.
COMPIlE A WATEr-MANAGEMENT PlANDevelop a structured change-management process to smoothly and effectively implement action items arising from your water
DOING MOrE WITh lESSThe Australian Food and Grocery Council was one of the first industry groups to sign an Eco-efficiency Agreement with Environment Australia in 2000. Eco-efficiency is based on the idea of ‘doing more with less’, and efficient water use is an important factor in achieving this.15
measure & monitor water useBUSINeSS & ORgANISATIONS
Rapid improvements in water efficiency ... we become a nation of super-efficient water users
Victorian Women’s Trust - Our Water Mark 105
management plan. When compiling a water management plan it’s important to:
ensure all staff are totally commited and •involved
document your investigations of all water– •efficiency opportunities
identify items that need action•
prioritise actions according to their costs, •benefits and implementation timelines
form a clear policy on water conservation •and waste minimisation, in accordance with existing environmental standards and practices
establish a results-driven but realistic timeline •for implementation and review.
CONSIDEr hArVESTED WATErMost water that falls on roofs and sealed surfaces, such as car parks, is not collected for further use. Investigate the practicality of capturing and storing this water for irrigation, flushing toilets or other uses. Do this by:
calculating the sealed surface area available for •potential harvesting
factoring in inhibitors to harvesting water •from these sites – possible inhibitors include pollutants, particularly from vehicles
checking your local Environment Protection •Authority (or equivalent) for guidelines on the safe reuse of water and relevant regulations.
measure & monitor water useBUSINeSS & ORgANISATIONS
E-lAUNDry AND Dry-ClEANING SErVICES, VICTOrIAE-Laundry operates a niche laundry service that offers a guaranteed turnaround time of less than 24 hours, in an industry that typically offers turnaround times of 48 hours.
E-Laundry relocated to a site in East Brunswick with the intention of increasing their capacity by 60%. Its upgrade included installing an Ecolab Aquamiser Filtration system to recycle approximately half of the facility’s waste water that would otherwise be discharged into the sewer. E-Laundry can expect to recycle over 15 ML per annum of water (the equivalent of 15 Olympic-size swimming pools), resulting in significant reductions in both potable water use and water discharged into the sewer.
E-Laundry highlights the capacity for this technology to be replicated in hospitals, large hotels, small food processors and by the food manufacturing sector.19
In an average year in a temperate •
climate zone, a standard sports oval requires around 70 000– 80 000 L of water per application. About three applications (subject to weather) are needed per week, requiring a water input of 210 000–240 000 L per week to keep the oval in a healthy and playable condition.16
A standard soccer pitch requires •
approximately 50 000 L of water per application. Again, three applications are required per week (150 000 L per week).17
A bowling green requires •
15 000–30 000 L of water per week to keep the turf alive.18 TOWArDS A ClEANEr CrEEk
The City of Whitehorse is assisting residents to monitor the health of one of their creeks: Gardiners Creek. A gross pollutant trap has been installed, estimated to prevent 25 tonnes of pollution entering the creek. By installing clear signs on a number of drain outlets along the creek with a unique drain identification number and phone numbers for a pollution hotline, those who live nearby can report spillages and leaks quickly and easily.
Source: City of Whitehorse <www.whitehorse.vic.gov.au>.
Rapid improvements in water efficiency ... we become a nation of super-efficient water users
106 Victorian Women’s Trust - Our Water Mark
COOlING TOWErS & PrOCESS WATEr COOlINGTypically, cooling towers used for air-conditioning consume about 10–25% of a commercial building’s total water use.24 To minimise this:
ensure that your evaporative cooling system or •chiller cooling tower is serviced regularly
avoid overflowing and ensure the float valve •and seal of the make-up supply is set correctly
eliminate water lost via wind drift by using •baffles and drift eliminators
ensure blowdown water use is controlled •properly
regularly check seals in the cooling system• .
WAShING & ClEANING Most commercial washer-extractors can be retrofitted with a tank to save the final rinse water, which can then be reused as a pre-wash in the next load. You can also save water by:
using a bucket to wash and rinse where •possible, instead of running the tap or hose
agitating rinse baths with air or mechanically, •to increase rinse-water life and efficiency
replacing standard taps with ceramic-seal taps •(the seals last longer than washers and are less likely to leak)
cleaning plant areas and paths with brooms •rather than water
ensuring all hoses are fitted with trigger-•operated guns
using process water from other areas for •equipment that needs to be cleaned regularly
using alternative methods of cleaning, such as •high-pressure air jets
washing items in water baths rather than •under sprinklers where possible
using scrapers and brooms to remove residual •build-up in plant machinery
regularly checking that spray nozzles are aimed •correctly
installing lever or mixer taps (with a single •lever or knob), as these let you find the right water temperature quickly
using reusable microfibre cleaning products •which can reduce water use and the use of chemical cleaning products.
EDUCATING STAFFSaving water at your business means everyone needs to be involved in the process and encouraged to take ownership of it. Even little things like reporting leaks can help. You should also:
set goals for reduced water use and inform •employees
consider incentives for staff to save water•
form teams that compete for a monthly •reduction target and offer a small reward to the team with the biggest reduction
review water conservation plans and progress •in staff meetings
• Overall water use across Australia for 2004–05 was 18 767 gL – a reduction from 2000–01 when it was 21 702 gL. This is accounted for by the impact of the prolonged drought.20
Despite this, water consumption •increased in the same period in the mining and manufacturing sectors.21
Across most councils, the most •water is used by playing fields (37%), followed by open spaces (22%). Swimming pools and recreation centres consume approximately 18% of water.22
use communication tools such as bulletins, •newsletters and emails to send staff water-saving ideas, announcements, progress reports and news of special achievements
include water conservation policies and •procedures in staff training programs
establish an ideas box to encourage employees •to suggest new ways to save water
erect signs informing customers and visitors of •restrictions and ask for their co-operation in reducing water use.
ON ThE PrODUCTION lINETo reduce water use on production lines:
adjust flow rates to the minimum required for •the operation
ensure water sprayers and jets turn off when •the production line halts or ceases – use timers or motion sensors to do this
install high-pressure, water-efficient spray jets•
install flow restrictors and regulators where •appropriate
use pedals and timers to deliver water only •when needed
use fogging nozzles to cool products•
inspect nozzles for clogging on a regular basis•
instead of using water for dust-suppression •consider using drought-tolerant plants to bind soil and screen dusty areas – material such as paper mulch can be used to cover areas
reduce water useBUSINeSS & ORgANISATIONS
lEAkS Checking for leaks in taps, pipes and hoses is an easy way to reduce water wastage. Remember, one leaking tap can waste more than 2000 L per month.23 In order to prevent leaks:
replace worn seals on water pipes•
repair leaking pipes, valves or other equipment•
monitor wash tanks and storage tanks to •ensure they do not overflow
ensure all taps are turned off when not in use.•
Rapid improvements in water efficiency ... we become a nation of super-efficient water users
Victorian Women’s Trust - Our Water Mark 107
with manufacturers’ specifications to see if the flow can be reduced
install automatic monitoring and control devices •in key sites to lower production costs.
PlANT Or SITE GArDENSIn plant or site gardens:
group plants with similar water needs as this •helps to ensure they all receive the correct amount of water
select indigenous and other water-wise plants •and lawns. In addition to requiring less water they also generally require less maintenance
create a rain garden by directing surface runoff •and water from gutters to landscaped areas instead of stormwater drains
mulch around plants•
use water crystals or other wetting agents, •particularly to reduce transplant shock to plants
don’t water automatically – check weather and •soil conditions first
check for leaks outdoors, including in sprinkler •systems and taps
STAFF BAThrOOMSOld-style toilets can use up to 11 L of water a flush compared to 2 L for an individual urinal. Waterless urinals are now also available. To increase water efficiency in bathrooms:
install reduced-flow showerheads•
install pressure-reduction valves in ablution •areas
install and use water-efficient urinals rather •than toilets
replace timer-controlled urinals with •movement sensors or manual controls
install auto shut-off taps•
install auto sensors on urinal flushes •
insulate hot water pipes to avoid wasting •water and power while waiting for hot water to flow through.
STAFF kITChENSEncourage staff to wait until they have a full load in the dishwasher before using it. This saves water and energy, and reduces the amount of detergent entering the sewer system. Also:
avoid rinsing dishes before loading them into •your dishwasher. Use the rinse/hold setting instead
wash fruit and vegetables in a half-filled sink •instead of under running water.
COMMErCIAl kITChENSDishwashingTo reduce water use when washing dishes:
wash full loads only•
turn off dishwashers when they are not in use•
scrape, rather than rinse, dishes and utensils •before loading into dishwashers, or
pre-soak utensils and other items in sinks •rather than rinsing with running water before loading into dishwasher
install spray rinsers for pot washing and •reduce flow of spray rinsers for prewash
ensure water pressure and flows to dishwasher •are set at minimum required settings
replace spray nozzles with water-efficient types•
install electric eye sensors for conveyer •dishwashers
install new water- and energy-efficient •dishwashers when renovating.
Ice machinesTo obtain maximum water efficiency:
adjust ice machines to produce only the •required amount of ice
consider a closed circuit cooling system if •your ice machine is currently cooled via ‘once through’ cooling water
consider buying ice from commercial vendors.•
Food preparation and serviceReduce water use by:
not using running water to thaw foods – •defrost frozen goods in the refrigerator
washing fruits and vegetables in a filled basin, •not under running water
purchasing fruits, vegetables and salad •ingredients in ‘ready-to-serve’ form to avoid washing and preparation
reduce water useBUSINeSS & ORgANISATIONS
The Victorian government’s Schools •Water efficiency Program (SWeP) estimates there are potential water savings of between 5% and 30%, an estimated billion litres or more to be saved in schools across the state.25
In May 2005 the Australian National •University bought 46 vacuum pumps to replace the existing water used aspirators in laboratories. The vacuum pumps should save around 50 000 KL of water and $62 000 each year. This is probably the largest single water conservation initiative ever undertaken at the university.26
susceptible to erosion (the mulch can be easily removed as required)27
use high-pressure, low-volume sprayers •to remove waste material. Waste should be removed in dry mode first to prevent chemicals and pollutants from entering the sewer system28
consider pipe pigs, air or inert gas pulses for •pipelines that carry manufactured product and need periodic cleaning29
conduct trials to determine the optimum flow •for the equipment, or compare the flow rate
Rapid improvements in water efficiency ... we become a nation of super-efficient water users
108 Victorian Women’s Trust - Our Water Mark
insulate hot water pipes so heat loss is •minimised and guests don’t need to wait to get hot water to the tap
minimise the distance between hot water •cylinders and taps
establish a system whereby guests can elect •to keep their towels and bed linen for stays of more than one night and save water in the laundering
review water use by cleaners to check whether •it can be reduced.
CONSTrUCTION SITESTo economise water on construction sites:
reduce evaporation by retaining as much •vegetation as possible during construction
protect water quality by minimising •disturbance of waterways, floodplains and vegetation and soil and install and maintain erosion and sediment control and cover or filter stormwater inlets and drains
use a broom rather than a hose to clean paths •and gutters
use buckets of water to clean tools instead •of running water
capture surface water runoff to supplement •supply where possible
minimise use of watering for dust suppression •and wash down
use pipes rather than open drains where •possible.
IN GUEST rOOMS & TOIlETSTo save significant amounts of water:
consider installing infra-red urinal flush controls •which generally use less than 20% of the water used by a normal ‘fill and flush’ system
install plumbing fixtures such as water-•efficient showerheads and taps, or insert flow-control devices into existing ones
install fixtures that deliver the highest water •efficiency rating, e.g. 4.5/3 L dual-flush toilets
purchasing drinks in ready-to-use form •(canned or bottled) to reduce water used in drink preparation
serving water from jugs to prevent half-empty •bottles or carafes of water being discarded
turning off continuous flow to wash drain •trays of drink machines; clean trays as needed.
Cleaning upTo become more water efficient at clean-up time:
eliminate nightly hosing in kitchen areas where •mopping will provide adequate sanitation
send laundry to commercial facilities•
use squeegees or brooms to remove surface •and floor debris before washing with water.
COMMErCIAl lAUNDrIESFor efficiency gains in commercial laundries:
consider using high-pressure steam boilers •during laundry hours and a low-pressure one when the laundry is closed
only use washing machines for full loads•
check that temperature settings in heating •and cooling settings are stable
ensure equipment such as boilers, pumps, •chillers and water heaters are used according to actual loads
ensure equipment is properly maintained •to prevent water loss due to leaks, steam or condensation
install a timer to turn off equipment when •it’s not in use.
reduce water useBUSINeSS & ORgANISATIONS
IN POOlS In a 10x15 m uncovered pool, 7 cm of surface water will evaporate each week. This amounts to 10 500 L of water in a week or 546 000 L in a year.30 To minimise water losses:
install pool and spa covers to reduce •evaporation
equip pools with recirculating pumps•
check pool infrastructure regularly to avoid •leaks or other problems
FOSTErS yATAlA BrEWEry, QUEENSlANDA $14 million water management project, undertaken by multi-beverage company Fosters Australia as part of an expansion at its Yatala brewery, has achieved massive water savings, as well as reductions in energy consumption, greenhouse gas emissions, salt-discharge levels and consumption of cleaning chemicals. At the heart of the project is an advanced wastewater treatment system for on-site recycling of process water.
This brewery, south of Brisbane, produces a quarter of all the beer consumed by Australians and is the largest water user on the Gold Coast. Fosters is now producing beer with 2.5 L of water for every litre of beer produced.
The company is saving about $1.5–2 million a year by recovering industrial waste water, which is returned to the plant in pristine condition.31
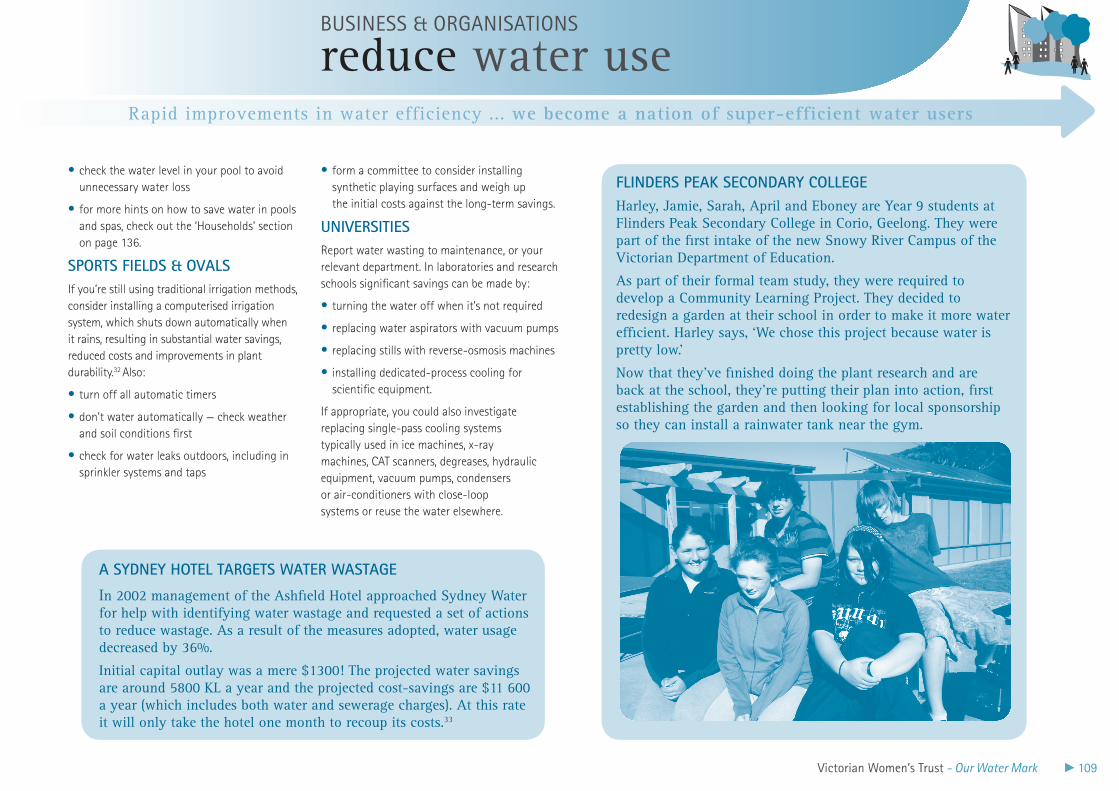
Rapid improvements in water efficiency ... we become a nation of super-efficient water users
Victorian Women’s Trust - Our Water Mark 109
form a committee to consider installing •synthetic playing surfaces and weigh up the initial costs against the long-term savings.
UNIVErSITIESReport water wasting to maintenance, or your relevant department. In laboratories and research schools significant savings can be made by:
turning the water off when it’s not required •
replacing water aspirators with vacuum pumps •
replacing stills with reverse-osmosis machines •
installing dedicated-process cooling for •scientific equipment.
If appropriate, you could also investigate replacing single-pass cooling systems typically used in ice machines, x-ray machines, CAT scanners, degreases, hydraulic equipment, vacuum pumps, condensers or air-conditioners with close-loop systems or reuse the water elsewhere.
check the water level in your pool to avoid •unnecessary water loss
for more hints on how to save water in pools •and spas, check out the ‘Households’ section on page 136.
SPOrTS FIElDS & OVAlSIf you’re still using traditional irrigation methods, consider installing a computerised irrigation system, which shuts down automatically when it rains, resulting in substantial water savings, reduced costs and improvements in plant durability.32 Also:
turn off all automatic timers•
don’t water automatically — check weather •and soil conditions first
check for water leaks outdoors, including in •sprinkler systems and taps
A SyDNEy hOTEl TArGETS WATEr WASTAGE
In 2002 management of the Ashfield Hotel approached Sydney Water for help with identifying water wastage and requested a set of actions to reduce wastage. As a result of the measures adopted, water usage decreased by 36%.
Initial capital outlay was a mere $1300! The projected water savings are around 5800 KL a year and the projected cost-savings are $11 600 a year (which includes both water and sewerage charges). At this rate it will only take the hotel one month to recoup its costs.33
reduce water useBUSINeSS & ORgANISATIONS
FlINDErS PEAk SECONDAry COllEGEHarley, Jamie, Sarah, April and Eboney are Year 9 students at Flinders Peak Secondary College in Corio, Geelong. They were part of the first intake of the new Snowy River Campus of the Victorian Department of Education.
As part of their formal team study, they were required to develop a Community Learning Project. They decided to redesign a garden at their school in order to make it more water efficient. Harley says, ‘We chose this project because water is pretty low.’
Now that they’ve finished doing the plant research and are back at the school, they’re putting their plan into action, first establishing the garden and then looking for local sponsorship so they can install a rainwater tank near the gym.
Rapid improvements in water efficiency ... we become a nation of super-efficient water users
110 Victorian Women’s Trust - Our Water Mark
CAPTUrING rAINWATErRainwater can be captured or harvested from many sources on site. These include sealed surfaces such as pavements, car parks and roofs.Potential uses for rainwater include, but are not limited to:
toilet flushing•
laundry use•
garden watering and farm irrigation•
use as top-up water for lakes and ponds.•
WATEr rECyClINGIdentify processes whereby discharged water can be reused. Reusable water includes water from equipment cleaning, filtered backwash water, final cooling and cleaning water, and water used for transport.
Consider other options for keeping waste water that can potentially add value to the organisation’s use of water on site. Waste water often contains high levels of nutrients and other by-products. If treated appropriately, these by-products can be reused or sold as products such as mulch.
Recyclable water may also originate from:
cooling towers•
industrial processes•
equipment cooling and cleaning•
garden irrigation.•
It may also be possible to:
consider waste-treatment processes such as •wetlands, composting and worm farms
recycle cooling water through a cooling tower •rather than operating a single pass through to the sewer system
recycle steam condensation and non-contact •cooling water from sterilisers to top up water in cooling towers or boilers
recycle brine from reverse osmosis or filter •backwash for cooling39
continuously assess water use in chilled •system operation
implement water recycling by capturing used •water and recycling it to coolers
use rainwater recycling for toilet flushing and •garden irrigation.
IN PlANT & SITE GArDENSTo save water in this context you can:
maximise water infiltration to recharge •groundwater
install rainwater collectors and covers •for pools to collect water and minimise evaporation
install a water-reuse system to divert waste •water to gardens for irrigation
redirect surface runoff and gutters to •landscaped areas instead of stormwater drains.
ON MINE SITESWater use can be minimised on mine sites by:
reclaiming water from tailings dams•
capturing surface runoff to supplement •supply
recycling water from vehicle wash-down bays•
appropriately treating and reinjecting water •into aquifers.
IN CONSTrUCTIONIn order to save water on construction sites:
collect rainwater for storage and reuse in •tanks, ponds, dams, swimming pools or underground tanks
use recycled water, if available, for cleaning •wherever possible.
reuse & substituteBUSINeSS & ORgANISATIONS
Reuse of water in manufacturing •
doubled to reach 2% from 2000–01 to 2004–05.34
Within manufacturing, the •
petroleum, coal, chemical and associated products industries had the highest rate of reuse of water, at 58.6%.35
The mining industry increased water •
reuse by 34% in the three years up to 2004–05.36
On average, Australian cities •
recycled about 8% of waste water in 2004–05.37
The Austin Hospital in northeast •
Melbourne was identified in 2007 as having reduced its water consumption by 11% by reusing waste water and through rainwater harvesting.38
PArrAMATTA COUNCIlParramatta Council has reduced water use in many of its facilities and public spaces. Council currently reuses groundwater collected from flooded industrial pits to water its extensive playing fields. Groundwater is used in the irrigation system installed at Doyle Ground, North Parramatta, watering the entire playing area. Based on seasonal use, the council will be able to reuse approximately 48 000 000 L per year for irrigation, cutting $14 000 a year from its water bill. 40
Rapid improvements in water efficiency ... we become a nation of super-efficient water users
Victorian Women’s Trust - Our Water Mark 111
some wider actionsBUSINeSS & ORgANISATIONS
PlAN AhEADThere are many things your business can do to achieve real water efficiency, on the way to becoming super efficient. Many actions leading to water efficiency will also result in greater energy efficiency, as the two are often linked.
Smart businesses need to anticipate the effects of climate change and look at what they can invest in now to avoid much greater costs in the future. If your business finds a leading edge in sustainability, other businesses may follow your lead.
Planning ahead is vital to maximising savings in your business. Current climate change predictions of rising temperatures and decreased rainfall will impact on all people and organisations in some way; be it increased air-conditioner use or more competition for water, which will trigger price increases.
IN yOUr BUSINESSInstall facilities to trap and store water on a scale appropriate to your business. This may be a rainwater tank or, for a large business, it could
mean constructing a dam, the use of bladders or industrial-sized tanks.
WIThIN BUSINESSES & INDUSTrIESThere are some key things you can do within your business or in combination with other businesses to promote the water-efficiency agenda. You could:
create a forum for discussion with other •manufacturers to share ideas and experiences directed at saving water
contact your local small business council or •traders association and instigate a forum, inviting a representative from your local water authority to speak about ways of saving water
liaise closely with peak industry bodies to •create a standard for water management
use your success in saving water to promote •your company to environmentally aware customers
use existing awards to recognise achievements •in water-use efficiency – there may be scope to
initiate awards under government auspices, as was the case with the Golden Gecko Award
consider calculating the total amount of water •taken to produce an item, the embodied water rate.
BETWEEN yOUr BUSINESS & lOCAl WATEr AUThOrITyYou should contact your local water authority and find out what kind of support is available for businesses. They may be able to assist your business in either a technical or an advisory capacity.
BETWEEN yOUr BUSINESS & GOVErNMENT Businesses and government can work together to promote water efficiency. Your business could:
investigate incentives for the adoption of •water-efficiency equipment – including rebates, tax concessions and vouchers
apply for a federal government Smart Water •Grant
establish a business/government forum to •research, and prepare guidelines on, the cost-effectiveness of water use
lobby government to continue to support •research into efficient use of water in key businesses
prepare formal guidelines and protocols on the •reporting of water information.
ON MINING & CONSTrUCTION SITESDevelop a groundwater resource code, similar to the Joint Ore Reserve Committee Code for mineral deposits. This would better define the risks for a water resource of meeting the requirements of a mining project.
Business cannot ignore the turbulent environment being created by growing sustainability concerns. Business must take all possibilities into account in strategic planning by engaging in the sustainability debate, embracing foresight methodologies such as ‘wild card’ identification and analysis and getting more creative.
Stephen McGrail, ‘Urgency turns into emergency,’ the Age, 19 February 2007.
PENrITh CITy COUNCIlPenrith City Council is one of Sydney’s largest local councils. When they signed up for Sydney Water’s ‘Every Drop Counts’ program in April 2002, they anticipated water savings of just 10%. But trial audits of six of the council’s high-water-use properties proved them wrong by identifying potential savings of between 15% and 56%.
In the event, Penrith City Council reduced water consumption by 56%. Better still, savings of $17 805 per year were achieved by investing just $17 830.41
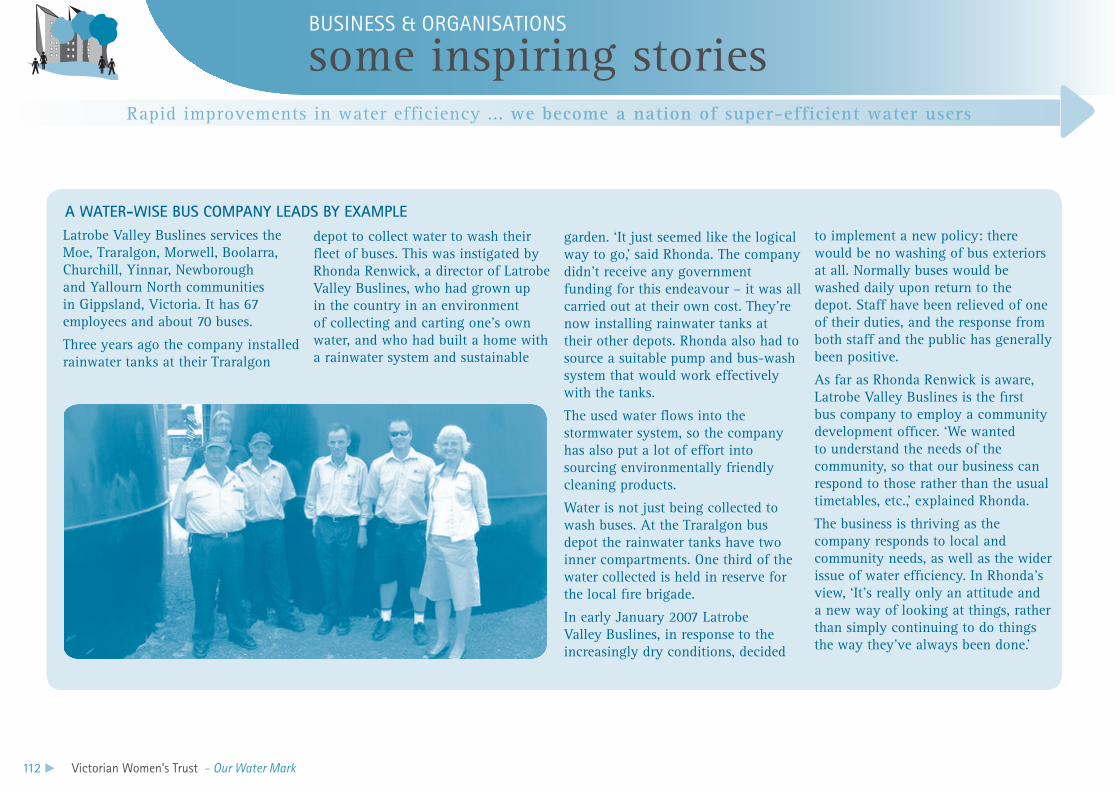
Rapid improvements in water efficiency ... we become a nation of super-efficient water users
112 Victorian Women’s Trust - Our Water Mark
Latrobe Valley Buslines services the Moe, Traralgon, Morwell, Boolarra, Churchill, Yinnar, Newborough and Yallourn North communities in Gippsland, Victoria. It has 67 employees and about 70 buses.
Three years ago the company installed rainwater tanks at their Traralgon
depot to collect water to wash their fleet of buses. This was instigated by Rhonda Renwick, a director of Latrobe Valley Buslines, who had grown up in the country in an environment of collecting and carting one’s own water, and who had built a home with a rainwater system and sustainable
garden. ‘It just seemed like the logical way to go,’ said Rhonda. The company didn’t receive any government funding for this endeavour – it was all carried out at their own cost. They’re now installing rainwater tanks at their other depots. Rhonda also had to source a suitable pump and bus-wash system that would work effectively with the tanks.
The used water flows into the stormwater system, so the company has also put a lot of effort into sourcing environmentally friendly cleaning products.
Water is not just being collected to wash buses. At the Traralgon bus depot the rainwater tanks have two inner compartments. One third of the water collected is held in reserve for the local fire brigade.
In early January 2007 Latrobe Valley Buslines, in response to the increasingly dry conditions, decided
to implement a new policy: there would be no washing of bus exteriors at all. Normally buses would be washed daily upon return to the depot. Staff have been relieved of one of their duties, and the response from both staff and the public has generally been positive.
As far as Rhonda Renwick is aware, Latrobe Valley Buslines is the first bus company to employ a community development officer. ‘We wanted to understand the needs of the community, so that our business can respond to those rather than the usual timetables, etc.,’ explained Rhonda.
The business is thriving as the company responds to local and community needs, as well as the wider issue of water efficiency. In Rhonda’s view, ‘It’s really only an attitude and a new way of looking at things, rather than simply continuing to do things the way they’ve always been done.’
some inspiring storiesBUSINeSS & ORgANISATIONS
A WATEr-WISE BUS COMPANy lEADS By ExAMPlE
Rapid improvements in water efficiency ... we become a nation of super-efficient water users
Victorian Women’s Trust - Our Water Mark 113
general referenceBUSINeSS & ORgANISATIONS
Australian Bureau of Statistics, 1. Water account, Australia, 2004–05, cat. no. 4610.0, ABS, Canberra, 2005, p. 80.
ibid., p. 80.2.
ibid., p. 79.3.
ibid., p. 79.4.
Savewater! Alliance, 5. Why save water in hospitality?, viewed 22 March 2007, <www.savewater.com.au>.
ibid. 6.
Australian Bureau of Statistics, 7. Characteristics of small business, Australia, (reissue), ABS, Canberra, 2004, p. 70.
Greater Melbourne Street Directory8. , Melways, Mt Waverley, 2007; Sydney Street Directory, Sydways, 2007.
Australian Bureau of Statistics, 9. Year book, Australia, 2006, cat. no. 1301.1, 2006, pp. 381–2.
ibid., p. 385.10.
ibid., p. 295.11.
Savewater! Alliance, viewed 22 March 2007, <www.savewater.12.
com.au>.
Savewater! Alliance, 13. Why save water in hospitality?, viewed 22 March 2007, <www.savewater.com.au>.
John Thwaites (acting premier), 14. Government ‘top 200’ sites save water, media release, 23 January 2007.
Department of the Environment and Water Resources, viewed 15.
4 April 2007, <www.environment.gov.au>.
City of Greater Geelong, Australia, 16. Water restrictions and sports grounds: frequently asked questions, viewed 22 March 2007, <www.geelongaustralia.com.au>.
ibid.17.
ibid.18.
Sustainability Victoria, 19. The sustainable laundry, viewed 22 March 2007, <www.sv.sustainability.vic.gov.au/manufacturing/sustainable_manufacturing>.
University of Queensland, Gatton Campus, 2004, 20. Water management plan, <www.pf.uq.edu.au>.
Australian Bureau of Statistics, 21. Water account, Australia, 2004–05, cat. no. 4610.0, ABS, Canberra, 2005, p. 9.
ibid., p. 9.22.
NSW Department of Energy, Utilities and Sustainability, 23.
viewed 4 April 2007, <www.deus.nsw.gov.au/water>.
Sydney Water, 24. Fact sheet: cooling towers, 2001, viewed 22 March 2007, <www.sydneywater.com.au/Publications/FactSheets/SavingWaterCoolingTowers.pdf>.
Victorian Government, 25. Our water our future – Schools Water Efficiency Program , viewed 22 March 2007, <www.ourwater.vic.gov.au/swep>.
Australian National University, viewed 22 March 2007, 26. Water conservation at the ANU, 2005, <www.anu.edu.au/facilities/anugreen.water/index.html>.
Environment Protection Authority Queensland, 27. Save water in the workplace, ecoBiz Queensland, <www.epa.qld.gov.au/publications>.
ibid.28.
ibid. 29.
Savewater! Alliance, 30. Why Save Water in Hospitality?, viewed 22 March 2007, <www.savewater.com.au>.
‘31. Water worries’, transcript of ABC Television Stateline program, 7 October 2005, viewed 27 March 2007, <www.abc.net.au/stateline/qld>. (Reporter: Margie Smithurst.)
Department for Victorian Communities, 32. Sustainable water practices for sport and recreation, PowerPoint presentation, p. 25, <www.sport.vic.gov.au>.
Sydney Water, 33. Case study, Ashfield Hotel, 2002, viewed 22 March 2007, <ww.sydneywater.com.au/Publications/CaseStudies>.
Australian Bureau of Statistics, 34. Water account, Australia, 2004-05, cat. no. 4610.0, ABS, Canberra, 2005, p. 86.
ibid, p. 86.35.
Australian Bureau of Statistics, 36. Water account, Australia, 2004-05, cat. no. 4610.0, ABS, Canberra, 2005, pp. 82–3.
Department of the Prime Minister and Cabinet, 37. Securing Australia’s urban water supplies: opportunities and impediments, Marsden Jacob Associates, November 2006, p. 29.
John Thwaites (acting premier), 38. Government ‘top 200’ sites save water, media release, 23 January 2007.
Centre of Excellence in Cleaner Production, Curtin University of 39.
Technology, Cleaning and disinfection fact sheet, 2003, viewed 22 March 2007, <www.cleanerproduction.curtin.edu.au>.
NSW Government, Water for Life, 40. Water smart government fact sheet, <www.waterforlife.nsw.gov.au/education_and_resources/resource_centre>
Sydney Water, 41. The Conserver – every drop counts business bulletin, issue 3, 2003, <www.sydneywater.com.au/Publications/CaseStudies>
Toyota Australia, <www.toyota.com.au/environment/articles>.42.
rEFErENCES
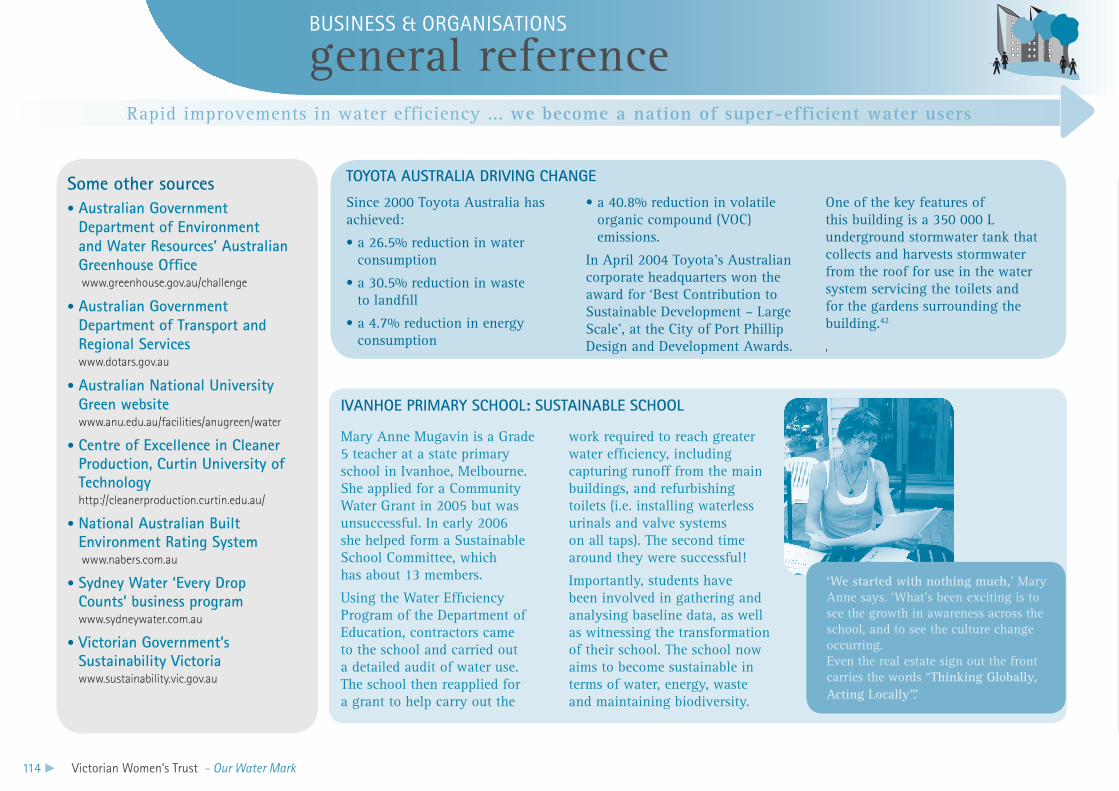
Rapid improvements in water efficiency ... we become a nation of super-efficient water users
114 Victorian Women’s Trust - Our Water Mark
general referenceBUSINeSS & ORgANISATIONS
Australian Government •Department of Environment and Water resources’ Australian Greenhouse Office www.greenhouse.gov.au/challenge
Australian Government •Department of Transport and regional Services www.dotars.gov.au
Australian National University •Green website www.anu.edu.au/facilities/anugreen/water
Centre of Excellence in Cleaner •Production, Curtin University of Technology http://cleanerproduction.curtin.edu.au/
National Australian Built •Environment rating System www.nabers.com.au
Sydney Water ‘Every Drop •Counts’ business program www.sydneywater.com.au
Victorian Government’s •Sustainability Victoria www.sustainability.vic.gov.au
Some other sources
Mary Anne Mugavin is a Grade 5 teacher at a state primary school in Ivanhoe, Melbourne. She applied for a Community Water Grant in 2005 but was unsuccessful. In early 2006 she helped form a Sustainable School Committee, which has about 13 members.
Using the Water Efficiency Program of the Department of Education, contractors came to the school and carried out a detailed audit of water use. The school then reapplied for a grant to help carry out the
work required to reach greater water efficiency, including capturing runoff from the main buildings, and refurbishing toilets (i.e. installing waterless urinals and valve systems on all taps). The second time around they were successful!
Importantly, students have been involved in gathering and analysing baseline data, as well as witnessing the transformation of their school. The school now aims to become sustainable in terms of water, energy, waste and maintaining biodiversity.
IVANhOE PrIMAry SChOOl: SUSTAINABlE SChOOl
Since 2000 Toyota Australia has achieved:
a 26.5% reduction in water •consumption
a 30.5% reduction in waste •to landfill
a 4.7% reduction in energy •consumption
a 40.8% reduction in volatile •organic compound (VOC) emissions.
In April 2004 Toyota’s Australian corporate headquarters won the award for ‘Best Contribution to Sustainable Development – Large Scale’, at the City of Port Phillip Design and Development Awards.
One of the key features of this building is a 350 000 L underground stormwater tank that collects and harvests stormwater from the roof for use in the water system servicing the toilets and for the gardens surrounding the building.42
,
TOyOTA AUSTrAlIA DrIVING ChANGE
‘We started with nothing much,’ Mary Anne says. ‘What’s been exciting is to see the growth in awareness across the school, and to see the culture change occurring. Even the real estate sign out the front carries the words “Thinking Globally, Acting Locally”.’

Victorian Women’s Trust - Our Water Mark 115
Initially I was embarrassed because I thought, ‘Here’s me promoting conservative stocking rates and I’m now running more livestock per hectare than I was 20 years ago.’ But, in actual fact, it’s exactly what I want to be saying. If you focus on the welfare of the land first, then in the long run you may actually be able to increase your stocking rates, whereas if you focus on the stocking rates ahead of the welfare of the land, then in the long term you go backwards.John Weatherstone, ‘Lyndfield Park’, Gunning, NSW
across some of the country’s prime agricultural land and perhaps more to come – the situation becomes critical. Sustainable farming involving a reduction in water use is already being practised by leading farmers across the country. education, the sharing of knowledge and the tireless pursuit of real efficiency are all key to turning the situation around. To ensure that gains are made on a broad front, we also need to get behind sustainable agricultural enterprises by buying their products and investing money in them.
This section is divided into three parts: what irrigators can do; what farmers on dryland properties can do (i.e. farmers managing with seasonal rainfall); and what rural lifestyle landholders can do.
Most of the nation’s available water is used on agricultural land. For over 200 years farmers have provided all of us with cheap, safe, high-quality food, fibre and other farm products.
We now realise, however, that this has come at a cost to our natural environment. Our farming practices, combined with the demands of a highly urbanised population, have altered the hydrology of the landscape with devastating consequences. In some places there is no turning back. Acidification and salinisation of our soils is costing us billions of dollars, and salinity problems are set to dramatically increase.
When these effects are combined with the harsh realities of farming in Australia today – 10 dry years
We use most of our water in agricultural •production – 65% of water consumed during 2004–05 was for this purpose.1
This was a 23% decrease from 2000–01, •attributable mainly to drier conditions.2
Livestock, pasture, grains and other •agricultural commodities had the highest consumption rates – collectively 36%.3
This was followed by cotton (15%) •and sugar (10%).4
what people on the land can doRapid improvements in water efficiency ... we become a nation of super-efficient water users
Rapid improvements in water efficiency ... we become a nation of super-efficient water users
116 Victorian Women’s Trust - Our Water Mark
To move toward real efficiency, irrigators need to measure and monitor the weather, water use, soil moisture and crop and/or pasture needs. They need to assess how much water their crops or pastures actually need and when it is needed.
Highly productive and efficient irrigators know a great deal about the soil on their property and its water-holding capacities.
WhOlE FArM PlANNINGWhole farm planning is a series of measures aimed at precision farming. Whole farm planning makes use of surveys to identify where salts are stored in the soils and determines the optimum layout for drains, on-farm channels and storages. It also covers paddock irrigation design, cropping and pasture planting, as well as providing information on where to undertake remediation methods to restore soil fertility.
rEVIEW ON-FArM WATEr USETo gain an accurate picture of on-farm water use:
explore all options to help you do the most •accurate measuring and monitoring, such as online technology and support, professional advice from agricultural advisers (if available) and educational materials and courses
Talk to your local member about the kinds of •information and services you need and use
your own and other irrigators’ influence to get support for these services and information sources
compare estimated annual crop water •requirements with the total water applied
review total on-farm water use. This might •included water use in sheds and yards (in the form of recycle cooling water and for yard wash down), stock and domestic consumption, drainage/effluent, and irrigation use
review the security and best use of water •rights (water-allocation policies permitting)
concentrate inputs (such as water) on the most •productive areas of the property
monitor the quality of irrigation and drainage •water.
WEAThEr INFOrMATIONThe following products and techniques can help irrigators attain greater water efficiency:
There are many types of water •users in Australia’s main irrigation areas: cotton growers with large off-river storages, rice growers and growers of other cash crops, dairy farmers, and irrigators of horticultural crops such as vines, fruit trees and vegetables.
Surface irrigation (often known •as flood irrigation) is the most common irrigation method used in Australia.1
Surface irrigation accounted for •60.2% of the total area irrigated in 2004–05.2
Only 22% of Australian irrigators •used a form of soil moisture-monitoring product in 2003.3
weather data and water-use estimates. •Daily weather information is vital to better managing irrigation. Weather stations can be connected to a range of soil water-measurement devices to provide data that can inform irrigation decisions
daily evaporation-rate statistics collated •through the Bureau of Meteorology also provide valuable data
climate analysis and decision-support packages• (software packages containing monthly and daily rainfall and streamflow records).
MOISTUrE MONITOrINGAccurate soil water-monitoring is crucial to moving towards greater eficiency. This is possible through the use of linked software systems which allow irrigators to continuously monitor changes in water content through analysing soil profiles.
It is not the quantity of water applied to a crop, it is the quantity of intelligence applied which determines the result – there is more due to intelligence than water in every case.Alfred Deakin, 1890
measure & monitor water useON THe LAND
iRRigatoRs
Rapid improvements in water efficiency ... we become a nation of super-efficient water users
Victorian Women’s Trust - Our Water Mark 117
Around • 90% of all water used for agriculture in 2004–05, was used to irrigate crops and pastures.4
The actual area irrigated •in Australia has increased dramatically in the past 50 years, from about 500 000 ha in 1955 to 2.4 million ha today.5
Nationally, almost one-third of •irrigating establishments irrigated pasture for grazing.6
Irrigation of cotton increased •significantly during 2004–05, with both the area irrigated and volume used increasing by 46% compared to the previous year.7
Rice required the highest •application rate of irrigation water (12.1 ML per hectare), followed by cotton (6.5 ML per hectare).8
APPly WATEr EFFICIENTlyKey actions to ensure efficient application include:
understanding the water storage (holding) •capacity of soil in the root zone of plants
knowing how long to irrigate for.• Match the application rate (or the discharge and duration for flood irrigation) to the rate at which water is absorbed
knowing how often to irrigate.• Understand when to schedule irrigation by measuring soil moisture or analysing weather (e.g. comparing evaporation and rainfall) and/or plant requirements
applying water evenly with an irrigation •system designed to match soil types and using well-maintained irrigation equipment.
MINIMISE WATEr lOSSES Or WASTAGEMinimise losses and wastage by:
incorporating weather forecasts into irrigation •decisions
establishing surface drains to collect runoff •and/or subsurface drains to prevent excess infiltration
establishing and managing a drainage-water •reuse system (especially for flood irrigation).
lAND MANAGEMENTTo improve land-management practices:
recognise soil-condition problems and their •potential to be remedied
monitor soil nutrients, pH, salinity and •groundwater levels
be familiar with any regional or catchment •management strategies.
Some of the following suggested actions for applying preventive and remediation measures are very expensive to implement. Look for existing government-funded programs that will assist you financially, e.g. with fencing riparian areas. Talk with local government representatives about funds or support to enable you to undertake the other actions (e.g. funding to educate irrigators about recent technological advances).
A BUNDABErG IrrIGATION STOryBundaberg cane grower Tom Loeskow is building the soil fertility on his farm for the next generation. Recent soil tests confirm the success of his farming methods — primarily a return to green-manure cropping. He is currently trialing a mix of field pea and turnip as a winter green-manure crop.
Mr Loeskow’s irrigation decisions are based on likely return on investment. As water is a limited resource, he concentrates on blocks most likely to produce the greatest return. Different soils receive different treatments. The red soils receive favoured treatment, due to their inherent productivity, with the installation of trickle tape. Some soils respond to deep ripping of the inter-row space because compaction of the inter-row reduces the water-infiltration and water-holding capacity of the soil.
Mr Loeskow has also developed a business plan to maximise potential savings. Sourced from Australian Canegrower, 11 July 2005
reduce & reuseON THe LAND: IRRIgATORS
iRRigatoRs
Rapid improvements in water efficiency ... we become a nation of super-efficient water users
118 Victorian Women’s Trust - Our Water Mark
APPly WATEr EFFICIENTly ON PASTUrES FOr GrAZINGThe National Land and Water Resources Audit (2002) produced a guide for dairy farmers using irrigated water, entitled Best management principles for the dairy industry. These principles are reprinted on the following two pages – they are an excellent starting point.
AcidityTo control acidity:
test and record surface soil (0–10 cm) pH at •least every three years (more frequently if intensively irrigated and fertilised)
ensure subsurface (10–60 cm) acidity does not •increase
apply fine lime when soils become too acidic•
consider sowing deep-rooted pastures with •legumes to ‘mop up’ excess nitrogen and get
advice on pasture species that might also lower the water table
return manure and feed refusals to the •paddock
minimise nitrogen leaching (e.g. by using •small, repeated nitrogen applications, not over-irrigating, keeping healthy pastures that use the available nitrogen and rotating night paddocks).
Dryland salinityTo manage dryland salinity problems:
concentrate production on the lowest •salinity soils
do not fallow during wet seasons•
fence off and vegetate recharge and •discharge areas
plant salt-tolerant pastures•
establish deep-rooted pastures or revegetate •with suitable species
install surface and/or subsurface drains or •groundwater bores and manage drainage waters
use and manage groundwater in conjunction •with surface water.
Irrigation-induced salinityTo reduce irrigation-induced salinity:
maximise irrigation efficiency to avoid over-•irrigation (particularly with saline water)
ensure sufficient irrigation water infiltrates •soil to prevent salt accumulation by capillary action
carefully manage the use of saline effluent•
plant salt-tolerant pastures•
install surface and/or subsurface drains or •groundwater bores and manage drainage waters
use, monitor and manage groundwater in •conjunction with surface water.
ErosionTo minimise soil erosion:
adopt conservation tillage methods •(oversowing, minimum or zero tillage and cultivate across slopes)
avoid cultivating during high-rainfall seasons•
reduce runoff and its velocity (e.g. maintain •groundcover such as permanent pastures and/or construct contour banks or diversion structures)
fence off and revegetate degraded areas•
fence off and manage stock access to water •frontages
farm land according to its capability•
design and locate laneways to avoid runoff-•induced erosion.
Acid sulfate soilsTo manage acid sulfate soils:
avoid drying out (oxidation) of acid sulfate •layers (e.g. use laser levelling instead of drainage and avoid new drainage or excavation)
adopt shallow cultivation to avoid acid sulfate •layers unless wet
after cleaning drains, water lime into soil, and •hold water back for 5 to 7 days.
Soil structureTo preserve soil structure:
adopt conservation tillage methods•
apply gypsum to soils where necessary•
increase the organic matter content of soils •through pastures and/or manures
‘Previously, I couldn’t find a drip system that would increase my production while also reducing water use, but the open hydroponics system has done both. In our second season using the system, we increased our navel orange production by 40%. Every tree is getting the same amount of water and nutrients – their health is much improved and they’re consistently producing good fruit.’Citrus grower Dean Morris, NSW
reduce & reuseON THe LAND: IRRIgATORS
iRRigatoRs
Rapid improvements in water efficiency ... we become a nation of super-efficient water users
Victorian Women’s Trust - Our Water Mark 119
Just 2% of water consumed •by agriculture in 2004–05 was reused water. This was calculated through regional reuse schemes, such as councils providing treated effluent to irrigators, but does not include on-farm reuse or recycling. This is lower than 2000–01 when water reuse was 3% of total water consumption.9
The highest use of reused water •within agriculture in 2004-05 was by livestock, pasture, grains and other industries, followed by dairy farming, vegetables and rice.10
Wet soil pluggingTo minimise wet soil plugging:
adopt special grazing measures when wet (e.g. •selective grazing, on–off grazing, loafing pads or lower stock numbers)
establish multiple entry/exit points for stock•
adopt suitable surface drainage practices (e.g. •spoon drains, ‘hump and hollow’ or plough affected areas in lanes)
install and manage subsurface drainage where •appropriate
fence off extremely vulnerable areas•
select locally suited pasture species and •manage their recovery from grazing to maintain adequate cover.
Nutrients from fertilisersFertiliser applications need to be balanced with plant/feed/production requirements: To do this:
test the nutrient levels of soils (at the same •location) every 1 to 2 years and adjust fertiliser applications accordingly
prepare nutrient budgets (at the paddock or •farm level) to monitor nutrient losses through milk, crops and stock and nutrient gains through legume pastures, fertilisers, feeds and manure
apply phosphorus at the beginning of pasture •growth periods
apply nitrogen in small quantities, to meet •pasture needs, periodically during the growing season.
Minimise nutrient lossTo reduce nutrient runoff:
reduce phosphorus loss by controlling soil •erosion in cultivated lands
reduce nitrogen loss by minimising leaching •
avoid applying fertiliser before heavy rainfall, •on sloping ground or within 20 m of streams.
When flood irrigating:
do not over-water and minimise runoff•
laser level to reduce runoff and nutrient losses•
do not irrigate for at least four days after •applying phosphorus fertiliser
ensure there is no runoff for two irrigations •after fertilising
reuse irrigation runoff•
apply nitrogen soon after an irrigation.•
reduce concentration of effluent on impervious surfacesEffluent runoff can be reduced by:
designing dairies and managing herds so cows •spend only a short holding period in yards
using water-efficient cleaning systems•
ChAllENGING TIMESAn irrigator contemplates the worst-case scenario of a zero water allocation: ‘I would start off by just heavily pruning – cutting the vines right back to the absolutely bare essentials. To sit back and do nothing would be unthinkable. So, we need to be proactive in order to conserve as much water as possible and to reduce the amount of evaporation. And if we do everything that we possibly can, and we’re still on zero, then at least we can say, “Well, we tried”.’
Grape grower Reg Brook, Barmera, SA
reduce & reuseON THe LAND: IRRIgATORS
iRRigatoRsminimising effluent loss and runoff from •laneways and feedpads
locating dairies to minimise the time cows •defecate on roadways.
reclaim effluentTo reclaim effluent:
collect effluent where possible (e.g. from •the shed and yards, feed pads, calving pads, laneways, roadsides, silage and wet food storages)
treat collected effluent (e.g. in a pond system)•
avoid compacting soils by not overgrazing or •cultivating when wet and by keeping traffic to designated laneways
deep rip or aerate compacted soils.•
Rapid improvements in water efficiency ... we become a nation of super-efficient water users
120 Victorian Women’s Trust - Our Water Mark
accommodate wet weather, herd size and soil •types in pond design or effluent-management practices.
recycle effluentWhen recycling effluent, spread it over a sufficient area to avoid concentrating nutrients and water.
Prevent off-farm movement of effluent and wastesTo keep effluent and wastes on farm:
fence off and manage access by stock to •waterways
use vegetated ‘filter strips’ (that include ground •cover) adjacent to streams, particularly in very high rainfall areas, to reduce the physical transport of manure to streams and only ‘crash graze’ these areas
manage stormwater (including stormwater •from roadsides) to reduce the prospect of manure being discharged to streams.
Beyond these measures aimed at the sound management of irrigating pastures for grazing, there are a range of other land-management practices with broad environmental benefits. These are outlined herer.
MANAGE ExISTING NATUrAl ArEASTo ensure that exisiting natural areas are maintained in a healthy state:
fence remnant vegetation to manage its use •and regeneration
control rabbits and hares and eradicate weeds•
fence waterways to manage access and grazing•
manage remnant wetlands to maintain natural •wetting and drying cycles. Retain natural snags, and eradicate introduced fish.
BrIGhTON COUNCIl (TASMANIA) ChAMPIONS WATEr rEUSEBrighton Council (Tasmania) discussed their effluent reuse project with broad-acre farmers at the outset to ensure that they had clients for the recycled water. The farmers also had to agree to install the infrastructure to store the water and irrigate with it.
‘The farmers saw it as an amazing resource,’ said a senior project engineer at Brighton Council. ‘I think people in the wider community are realising that water has more than a zero value. Brighton has installed water meters on residential, commercial and farming properties and, after installation, the demand for water dropped by 20%.’
There are seven farms involved in the Brighton reuse scheme, with the recycled water being pumped directly to farm dams for storage before being used for irrigation. It has reduced the load on the Derwent by 30 tonnes of nitrogen and 7 tonnes of phosphates at least.
Reusing the runoff means that we use every bit of water that comes on farm, but with accurate irrigation timings the runoff is dramatically reduced. Dairy farmer, northern Victoria
reduce & reuseON THe LAND: IRRIgATORS
rEVEGETATE lANDSCAPES
To assist in the revegetation of landscapes:
use windbreaks or shade plantings to link •waterways and patches of remnant native vegetation or as part of a district, catchment or roadside program
use a range of local native species (and local •provenances if possible)
establish groundcover and understorey plants •as well as trees
adopt direct seeding techniques or other •locally proven revegetation methods
design plantings to minimise potential local •pest- and weed-control problems.
MANAGE WIlDlIFETo manage wildlife:
maintain tree hollows and other natural •habitat
provide nesting boxes in revegetation •plantations
control cats, foxes and other vermin•
monitor, evaluate and manage wildlife •populations and their impacts.
iRRigatoRs
Rapid improvements in water efficiency ... we become a nation of super-efficient water users
Victorian Women’s Trust - Our Water Mark 121
ChANGES TO WATEr rIGhTS The changes to water rights on irrigation properties are significant and may have important implications. On 1 July 2007 water rights on irrigation properties in northern Victoria will be treated as a separate entity from land titles as part of the Victorian Government’s water reforms. Take the time to talk with your local water authority and relevant advisers to find out as much as you can about how these changes will affect you, particularly in relation to implementing strategies for your locality and your particular situation.
USE OF TrEATED EFFlUENT What is the likelihood and what are the practicalities of linking in with your local council to receive treated effluent? While some councils have been using small amounts of treated effluent for many years, there are also council and irrigator partnerships operating across Australia whereby councils treat effluent from urban areas and deliver it to local irrigation establishments. Dubbo City Council’s Greengrove Effluent Irrigation Facility is a good example of such a program. The council has achieved 100% beneficial reuse of the city effluent. The Brighton Council effluent reuse plan in Tasmania (see the box on the opposite page) is also a good example.
Bundaberg melon growers Mick and Ron Martens recently discovered the benefits of having two forms of moisture monitoring equipment installed to assist them with irrigation scheduling.
After purchasing a diviner three years ago, the Martens brothers set out to gain greater insights into the watering requirements of the melon and pumpkin crops they grow in rotation on their 80 ha sugar cane property.
With assistance from the Water for Profit team they used three sets of jet-fill tensiometers to double check the moisture levels recorded by the diviner. While the diviner readings were proved accurate, they decided to retain the tensiometers as a
continuing check process. This was a wise decision that helped them resolve a problem later in the season.
Readings from the diviner showed everything was normal, but Mick and Ron had noticed a lack of vigour and spread in the foliage of a particular melon crop. The tensiometers installed in that block showed a significantly different picture from the diviner. Investigation led to the discovery that a hole in the trickle tape was causing excess water to be applied to the area directly around the diviner tube which was affecting readings. The hole was fixed and the diviner moved: problem solved at an early stage.
Sourced from Fruit & Vegetable News, January 2007, p. 24
some wider actionsON THe LAND: IRRIgATORS
iRRigatoRs
WATEr-SMArT IrrIGATION
Rapid improvements in water efficiency ... we become a nation of super-efficient water users
122 Victorian Women’s Trust - Our Water Mark
In the current dry times being experienced in Australia, it’s more crucial than ever to know as much as possible about water – not only within and upon the land, but also to understand weather patterns, and how to best use this knowledge to farm sustainably, water efficiently and profitably.
The water considerations and management of water on farms will vary depending on whether the farm is used for cropping, intensive farming systems, or livestock farming. For all types of farming, as all farmers know, water is the key element.
MEASUrE & MONITOr WATEr AVAIlABIlITyTo measure and monitor the availability of water you’ll need to ascertain how much water is available on the property for stock. You’ll need to assess how long dam water will last in an extended dry period and, if pumping water from a stream or bore, you’ll need to know how much is going to be available. To gain an accurate picture you’ll need to:
calculate how much water stock are drinking on a weekly basis. •This can be done through the many resources available through the Department of Primary Industries in each state (calculations are based on depth of dam, evaporation rates and numbers of stock)
tap into local knowledge – this is crucial on every farm. For •example, in relation to groundwater you’ll need to find out such things as the depth of the groundwater, what the levels are, what the likelihood is of bores drying up, what the direction of groundwater flow is, and whether salt stores are likely to carried into streams.
For the 12-month period from March 2006 •to February 2007, serious to severe rainfall deficits affected southern and eastern Australia.1 The area affected extended, in a broad arc, across southern South Australia, most of Victoria, much of NSW west of the great Divide (apart from far western areas), and a large part of southeast Queensland roughly centred on Dalby. Northern and eastern Tasmania were also affected, as was Western Australia west of a line from exmouth to Bremer Bay. Record low falls occurred in a strip from Melbourne to central NSW, between Dalby and goondiwindi in southern Queensland, along Tasmania’s north coast and much of Western Australia’s west coast.2
The nation’s wheat, barley and canola •production is expected to fall by over 60% in 2006–07 due to the current drought.3
Agricultural income is forecast to fall to •$2.6 billion in 2006–07 – a fall of 72.4% from the 2005–06 figure of $9.3 billion. This is the lowest level of agricultural income since 1994–95.4
This kind of knowledge is not obvious on all farms. In some parts of Australia, agricultural and scientific government departments are working with farmers to gather this information and combine it to produce catchment scenarios. If your state’s department of agriculture offers advisory services, seek them out and talk to your local agricultural advisers to find out how to access the information needed.
In this part of the world there’s enormous concern about what’s happening to our regular seasons. They’ve changed and it’s pretty scary … I think that we’re all slow to change because you tend to think that next year it will rain in the autumn, but invariably it doesn’t. If it continues we’ve got to look at our stock management, because we like to lamb when we’ve got feed! So I’m actually thinking of changing from a May/June lambing to an August/September lambing next year … I don’t think anyone knows what’s going to happen, but we’re in it now, I’m sure we are. As far as we’re concerned, loss of grass in autumn and winter is the biggest problem.
Tom Porter, sheep and cattle farmer, Hay, NSW
measure & monitor water useON THe LAND: DrylAND FArMErS
DRYLaND FaRMERs
Rapid improvements in water efficiency ... we become a nation of super-efficient water users
Victorian Women’s Trust - Our Water Mark 123
Salinity estimates made available by the CSIRO in 2003 give the following staggering statistics:
The current cost of lost agricultural production •due to salinity is $130 million annually.
Salt-affected infrastructure (such as roads, •pipes and buildings) needs constant replacement, at a cost of $100 million annually.
There is an annual cost of at least $40 million •in the loss of environmental assets. All of these costs are rising.
Around 2 million ha on about 20 000 farms •across Australia showed some signs of salinisation in 2002.5
About 800 000 ha are unusable for agricultural •production as a result of salinity.6
Salinity causes $9 million damage annually •to roads and highways in southwest NSW.7
The area of salt-affected land in Western •Australia is increasing at a rate of one football field an hour.8
MEASUrE & MONITOr SOIl hEAlThBuild up a picture of soil health. A well-managed pasture that’s adapted to the soil, climate and livestock systems is more likely to survive long periods of low rainfall than a pasture that’s poorly matched to the environment, is inappropriately managed, and is already under stress before dry conditions set in. To assess and improve soil health:
measure economic returns from each paddock and identify •poorly performing areas
identify areas prone to deep drainage and look at potential •revegetation systems to capture and hold the water
access available resources and link into local initiatives. Find out •what funds and resources are available in your area to manage drought, dryland-salinity, and soil-erosion problems. Contact your local catchment management authority, local agricultural advisers and farmers’ groups
adopt local solutions. Groups, such as Southern Farming Systems •in Victoria, provide local knowledge, research, field days and much more. These types of groups, organised by farmers and based on their landscape knowledge, real-life experience and scientific support are found across the country.
MEASUrE & MONITOr ThE WEAThErThere are many technologies available to help predict weather as well as other services and sources of information. You should aim to:
build up an understanding of local weather patterns – Bureau •of Meteorology scientists run climate workshops for farmers in some areas
use climate-predicting software (e.g. Rainman)•
find out what expertise is available locally•
closely monitor short-term forecasts and computer models, •in order to enable you to respond quickly and opportunistically to actual weather conditions.
I see farming that works within conservation bounds as being a recipe that must be grasped, and very quickly, if the structure of the nation as we know it is to be held together. It is clear that we cannot rely on formal nature reserves alone.
I believe the present high-input high-return farm-management system is not sustainable in the comparatively short term – let alone the long term. It’s non-sustainable for the distinctly Australian fragile base resources – soil and water – but also for the few farmers left battling the elements in such a large land.
Retired farmer John Fenton, ‘Lanark’, near Hamilton, Western Victoria
measure & monitor water useON THe LAND: DRYLAND FARMeRS
DRYLaND FaRMERs
Rapid improvements in water efficiency ... we become a nation of super-efficient water users
124 Victorian Women’s Trust - Our Water Mark
hOlDING ONTO WATEr: NATUrAl SEQUENCE FArMINGNatural Sequence Farming looks at how to retain water and nutrients in the landscape to help revegetate land back to its natural state.
Farmer Peter Andrews has become well known across the country for developing this concept, and for producing impressive results in converting degraded, salt-ravaged properties into fertile, drought-resistant pastures.13
Field days for farmers and agriculturalists are regularly held on properties where Peter Andrews‘ results are evident. The key principles of his approach are:
•working in partnership with the natural processes of the Australian environment
undertaking relatively simple environmental •sculpting to restore or mimic the original sustainable processes developed over thousands of years to reunite waterways with their floodplains
slowing and directing water flow through •local floodplains, thus creating a freshwater ‘lens’ perched in the soil just below the surface. This feeds the roots of vegetation and keeps down salt. Organic matter and sediment from upstream then have a chance to accumulate and form soil, rather than being whisked away down deeply eroded creek channels
managing livestock in harmony with the •Australian landscape to spread fertility from the floodplain to the hillsides to rejuvenate the whole farm landscape.
STOrING WATErIn order to reduce water usage on dryland properties and maintain water quality and efficiency:
springs, soaks and dams should always be fenced•
ensure that farm dams are protected from •possible erosion – maintain vegetation filter strips
pipe water to troughs to prevent •contamination and bogging
pump water from shallow dams to a central •one to reduce evaporation losses.
We look at the varieties we choose and the timing of the planting. For example, last season (2003–04) we had 49 cold-shock days for the cotton – the average for the area is 24. Right on top of that, we then had 42 heat-shock days, which is also unusual.
We have to get rid of the old attitude of ‘let’s plant on the first of October’, and instead really monitor the weather trends leading up to planting. It’s getting more complex.John Hamparsum, primary producer (irrigated and dryland), Breeza, NSW
build drains from road catchments or other •hard surfaces to catch water from summer thunderstorms and channel it to dams
in extended dry periods, de-sludge empty dams•
store water carted (from community bores •or standpipes) in a tank rather than a dam to reduce seepage and evaporation losses
find out about bladders for storing water, like •those used by the Australian Armed Services
use circular above-ground swimming pools as •a cheap form of temporary water storage
consider bulk cartage of water by contractors – •it could well be cheaper than the do-it-yourself option.
choose the pump and pipe that best •matches your requirements in order to reduce pumping costs
reduce & reuseON THe LAND: DRYLAND FARMeRS
About 30% of land in Western •Australia’s southwest is considered to be at risk of becoming saline by 2050.9
If salinity is not effectively •managed within 20 years, the salt content in Adelaide’s drinking water may exceed World Health Organisation standards for drinking water in two of every five days.10
Around 50 million ha of Australian •agricultural land are affected by surface soil acidification.11 Of 73 river basins assessed in •2000 across Australia, two-thirds showed major water-quality problems, including salinity (saltiness), turbidity (dirtiness), and nutrient excesses (which can result in choked waterways).12
DRYLaND FaRMERs
Rapid improvements in water efficiency ... we become a nation of super-efficient water users
Victorian Women’s Trust - Our Water Mark 125
check streams and bores for salinity•
clean troughs and uncovered tanks each week •when using saline water
site new troughs and tanks to suit future needs.•
PASTUrE PrODUCTIONSowing well-adapted pasture species and managing pastures to enhance production and persistence are key factors to reducing water requirements. This will improve pasture production for each millimetre of rain, and will allow pastures to carry feed further into a dry period and to recover faster. Find out what resources are available to assist you with planting well-adapted persistent perennial pastures.
NATIVE VEGETATIONMeasures necessary to preserve native vegetation include:
reducing the rate of clearing of native •vegetation. Whatever natural habitat areas exist on your land should be kept and protected. This is particularly important during dry times if stock are eating ‘scrub’. Trees and shrubs should be only lightly pruned, and stock should not be allowed to access new growth
seeking advice from local agricultural advisers •about resources available for maintaining native vegetation, especially in dry times (e.g. fencing assistance).
OThEr MEASUrESDryland farmers can adapt to drier conditions by adopting a range of measures. For example, they can:
reallocate resources, such as fertilisers, from •areas of the farm that are performing poorly to more responsive areas
reduce intensive farming practices (e.g. adopt •minimum tillage)
adjust stocking rates to allow soil to •regenerate (lock up paddocks if they are overgrazed)
consider opportunity cropping• (if suited to local conditions), which involves sowing a crop whenever soil-water reserves are adequate. By doing this you ensure that more water is used for productive purposes where it accumulates and less water escapes below the root zone into groundwater
consider phase farming• (alternating a series of crops with a few years of perennial species). This practice helps to control recharge in cropping areas
consider companion farming, in which annual •cereals are oversown into a perennial pasture system. This system is being trialled by some northern NSW farmers who are planting native grasslands with success
explore the potential of agroforestry• for your farm (but be aware of the wider catchment impacts). Agroforestry integrates tree crops onto your land to produce forest products. It can benefit farm productivity and sustainability. Seek professional advice as to the suitability of your land for this purpose
enter the carbon emission trading market. •New opportunities and income streams are emerging from planting small tree lots. Find out about Landcare initiatives in this direction
explore options to retire some of your land if it is •degraded and has limited production potential.
It’s very fragile country where we are – shallow sandstone soil. In the 1982 drought we kept our cattle alive, but only by further degrading the already degraded land. Had we done that again in the 1986 drought, I would’ve ended up a basket case, so I changed my philosophy. I reduced our herd by one-third, with the aim of bringing it back up to the original number at the end of the drought. But when it finally rained, I was surprised by how quickly the country improved with the lower number of stock, so I decided never to increase the herd again.
The controversial result of this was that, because of the improved quality of our soil and pasture, the fertility of our cows increased by about 15% and our productivity actually marginally rose with one-third less cattle on the site. (I say controversial because I live in an area where we were always told that it was impossible to be green and productive at the same time.)Hugo Spooner, ‘Avocet’, Central Queensland
You may be able to receive assistance to plant native vegetation and fence it to promote natural regeneration and ecological succession. The emerging carbon emissions trading market is also relevant here. Remember also to:
become adaptable. Look for opportunities to •diversify, and work with what promises to be profitable and sustainable in the long term
make informed decisions based on as much •data as you can gather, rather than counting on unrealistically optimistic future scenarios.
reduce & reuseON THe LAND: DRYLAND FARMeRS
DRYLaND FaRMERs
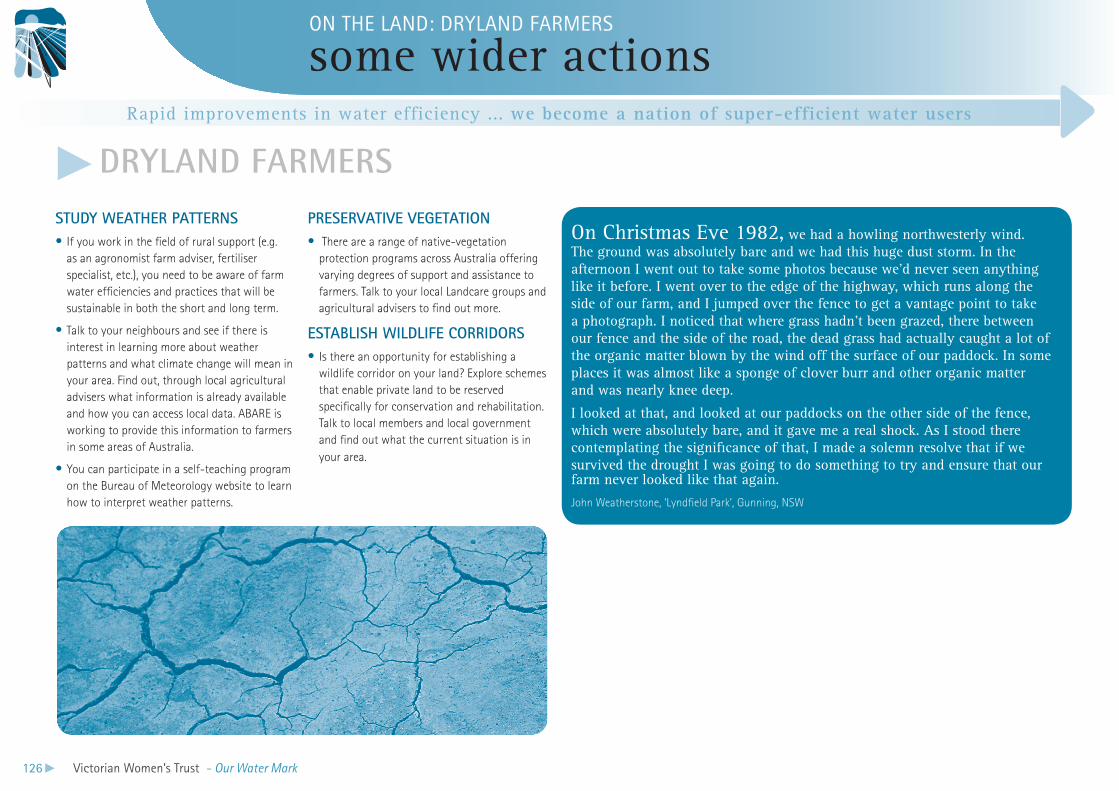
Rapid improvements in water efficiency ... we become a nation of super-efficient water users
126 Victorian Women’s Trust - Our Water Mark
STUDy WEAThEr PATTErNSIf you work in the field of rural support (e.g. •as an agronomist farm adviser, fertiliser specialist, etc.), you need to be aware of farm water efficiencies and practices that will be sustainable in both the short and long term.
Talk to your neighbours and see if there is •interest in learning more about weather patterns and what climate change will mean in your area. Find out, through local agricultural advisers what information is already available and how you can access local data. ABARE is working to provide this information to farmers in some areas of Australia.
You can participate in a self-teaching program •on the Bureau of Meteorology website to learn how to interpret weather patterns.
PrESErVATIVE VEGETATION There are a range of native-vegetation •protection programs across Australia offering varying degrees of support and assistance to farmers. Talk to your local Landcare groups and agricultural advisers to find out more.
ESTABlISh WIlDlIFE COrrIDOrSIs there an opportunity for establishing a •wildlife corridor on your land? Explore schemes that enable private land to be reserved specifically for conservation and rehabilitation. Talk to local members and local government and find out what the current situation is in your area.
On Christmas Eve 1982, we had a howling northwesterly wind. The ground was absolutely bare and we had this huge dust storm. In the afternoon I went out to take some photos because we’d never seen anything like it before. I went over to the edge of the highway, which runs along the side of our farm, and I jumped over the fence to get a vantage point to take a photograph. I noticed that where grass hadn’t been grazed, there between our fence and the side of the road, the dead grass had actually caught a lot of the organic matter blown by the wind off the surface of our paddock. In some places it was almost like a sponge of clover burr and other organic matter and was nearly knee deep.
I looked at that, and looked at our paddocks on the other side of the fence, which were absolutely bare, and it gave me a real shock. As I stood there contemplating the significance of that, I made a solemn resolve that if we survived the drought I was going to do something to try and ensure that our farm never looked like that again.
John Weatherstone, ‘Lyndfield Park’, Gunning, NSW
some wider actionsON THe LAND: DRYLAND FARMeRS
DRYLaND FaRMERs
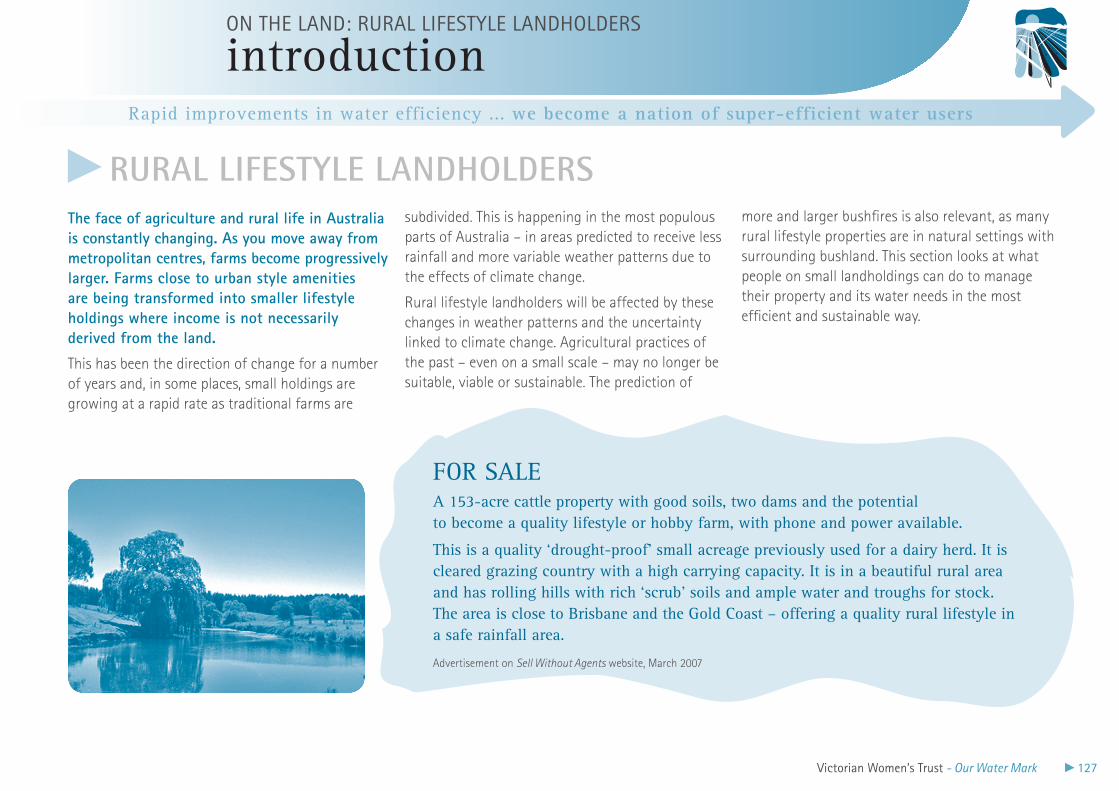
Rapid improvements in water efficiency ... we become a nation of super-efficient water users
Victorian Women’s Trust - Our Water Mark 127
FOR SALEA 153-acre cattle property with good soils, two dams and the potential to become a quality lifestyle or hobby farm, with phone and power available.
This is a quality ‘drought-proof’ small acreage previously used for a dairy herd. It is cleared grazing country with a high carrying capacity. It is in a beautiful rural area and has rolling hills with rich ‘scrub’ soils and ample water and troughs for stock. The area is close to Brisbane and the Gold Coast – offering a quality rural lifestyle in a safe rainfall area.
Advertisement on Sell Without Agents website, March 2007
subdivided. This is happening in the most populous parts of Australia – in areas predicted to receive less rainfall and more variable weather patterns due to the effects of climate change.
Rural lifestyle landholders will be affected by these changes in weather patterns and the uncertainty linked to climate change. Agricultural practices of the past – even on a small scale – may no longer be suitable, viable or sustainable. The prediction of
more and larger bushfires is also relevant, as many rural lifestyle properties are in natural settings with surrounding bushland. This section looks at what people on small landholdings can do to manage their property and its water needs in the most efficient and sustainable way.
introductionON THe LAND: RURAL LIFeSTYLe LANDHOLDeRS
RURaL LiFEstYLE LaNDHoLDERsThe face of agriculture and rural life in Australia is constantly changing. As you move away from metropolitan centres, farms become progressively larger. Farms close to urban style amenities are being transformed into smaller lifestyle holdings where income is not necessarily derived from the land.
This has been the direction of change for a number of years and, in some places, small holdings are growing at a rapid rate as traditional farms are
Rapid improvements in water efficiency ... we become a nation of super-efficient water users
128 Victorian Women’s Trust - Our Water Mark
ASSESS WATEr AVAIlABIlITy & QUAlITyIn order to assess water availability and quality:
determine the uses to which the water is to be •put, e.g. stock, home, garden, domestic, crop or irrigation use
determine how much water is needed for each •proposed use, and in which seasons it will be most needed
determine what options are available to •provide the required supplies at the level and timing wanted (i.e. does the property have a river, creek, stream, dam or water right?)
gather as much information as possible on the •weather patterns and flow regimes affecting the property
regularly measure and monitor your •household water use (see the Household section on page 134 for information on how to do this). Decide whether or not you have enough domestic water-storage capacity for unpredictably dry times.
Almost 16.6 million ha of Australian •land is managed by sub-commercial farmers who typically derive most of their income from nonfarming activities.1
In Western Australia in 2005 there •were about 40 000 landholders with properties between 1 ha and 100 ha.2
Of more than 4000 land sales •annually in Victoria, more than 56% are of plots less than 20 ha.3
In the Sydney Basin, an area subject •to the demand for rural lifestyle land, the agricultural land return is $5500 per hectare compared to the NSW average of $136 per hectare.4
Small lifestyle landholders are •attracted to areas of natural beauty. There are high proportions of the small landholder sector in areas identified as having threatened ecosystems. And the subdivision rate in these areas is increasing.5
lIVESTOCkDrinking-water requirements for stock vary according to the weather, the quality and nature of feed, water quality, animal age, the condition of animals and even social behaviour. Summer use will usually be about 125% of the average daily requirement. Winter use is usually 75% of average daily requirements. To ensure that you have adequate water and feed for stock:
calculate your stock water needs using guides •available through all state government primary industry departments. Landcare has also produced excellent guides
calculate the fire fighting reserves needed on •the property. Contact your local agricultural adviser or primary industry department to get a guide as to how much water should be held in reserve
check pasture availability regularly. In dry times •stock can graze plants that are not usually part of their diet and which may be toxic
calculate the cost and time involved in feeding •stock if your water supplies are not going to be adequate. Decide early (before stock lose condition) if you’re going to feed through dry spells or remove stock by sale or agistment.
ASSESS lAND hEAlThYou need to determine the overall health of the property and assess whether the land is under stress. Measures to help you do this include:
finding out what funds and resources are •available to measure soil health on the property
contacting your local catchment management •authority and local agricultural advisers to find out if soil tests have been done on the property recently
talking to neighbours to see what they have •done in this regard
finding out how neighbouring properties •are using their land to see if this has any implications for your property in terms of water use, runoff or possible contamination. There are many different intensive farming practices employed on small properties.
measure & monitor water useON THe LAND: RURAL LIFeSTYLe LANDHOLDeRS
RURaL LiFEstYLE LaNDHoLDERs
Rapid improvements in water efficiency ... we become a nation of super-efficient water users
Victorian Women’s Trust - Our Water Mark 129
DAMS In regard to dams on rural lifestyle landholdings, you should:
minimise evaporation losses.• There are excellent resources available through the National Program for Sustainable Irrigation to measure the potential losses through evaporation of dams and the estimated costs of mitigating evaporation. Find out about these tools and how to apply them to the dam or dams on your property
explore what kind of dam is appropriate to •your particular location. Many people, upon purchasing a rural block, decide to build a small (or not-so-small) dam. However, remember that dams have a catchment-wide impact. Each farm dam lessens the amount of surface water entering the rivers and streams in a catchment
plant out the edges of dams with the most •appropriate shrubs and bushes for your area and soil. This will reduce evaporation and provide a haven for birds.
lAND MANAGEMENTA healthy landscape will use whatever water is available far more efficiently and effectively than degraded and eroded land.
To maintain land health and enhance biodiversity on your holding:
reduce the removal of native vegetation and •protect whatever natural habitat areas remain on your land as this has the added benefit of preventing soil erosion and improving soil condition
secure the remnant vegetation on your •property. Find out through local agricultural advisers what resources are available to fence the remnant vegetation and protect these areas from weeds. Remember that revegetated riparian strips are a simple way to improve water quality, aquatic habitats and provide wildlife corridors
enhance the habitat value of native vegetation.•Control weeds, undertake direct seeding with the appropriate seed mix or plant tubestock where the soil seed bank has been exhausted. Contact local Landcare groups as a starting point for assistance.
try and link remnant vegetation. This provides •opportunities for species to move and mix and restores biodiversity. Talk to your neighbours and see how you can work together in this endeavour. Find out what resources are available to help by contacting local agricultural advisers, Landcare coordinators and other related organisations (such as the local catchment management authority)
seek advice about the most appropriate •pastures and grasses for your property. There are programs available to support the growth of perennial grasses and native grasses
seek professional advice before undertaking •any significant landscaping. Areas stripped bare of covering for any length of time can experience significant erosion and runoff
adjust stocking rates to allow soil to •regenerate. Look for signs of overgrazing, especially in extended dry periods. You may need to fence off severely overgrazed or eroded areas
fence off stream areas from livestock. There •are numerous programs in all states to assist property owners to do this
if you are exploring the potential of •agroforestry for your farm, be aware of the wider catchment impacts. Agroforestry is the integration of tree crops into your land to produce forest products. It can benefit farm productivity and sustainability. Seek professional advice about the suitability of your land for this purpose.
It’s sort of just got bigger, but the basis of it is still the same. It’s still education based – that’s the most important thing. We need to keep that going because there’s still a hunger for knowledge. There’s people coming to live in this district who want to know things, there’s people who live here and right around that want to know, I mean there’s 350 lectures over two days and we don’t want to lose the education base.
James Loneragen, Mudgee Small Farms Field Day committee member, 2004
reduce & reuseON THe LAND: RURAL LIFeSTYLe LANDHOLDeRS
Rural lifestyle landholders are •attracted to areas of natural beauty. There are high proportions of small landholders in areas identified as having threatened ecosystems, and the subdivision rate in these areas is increasing.5
RURaL LiFEstYLE LaNDHoLDERs
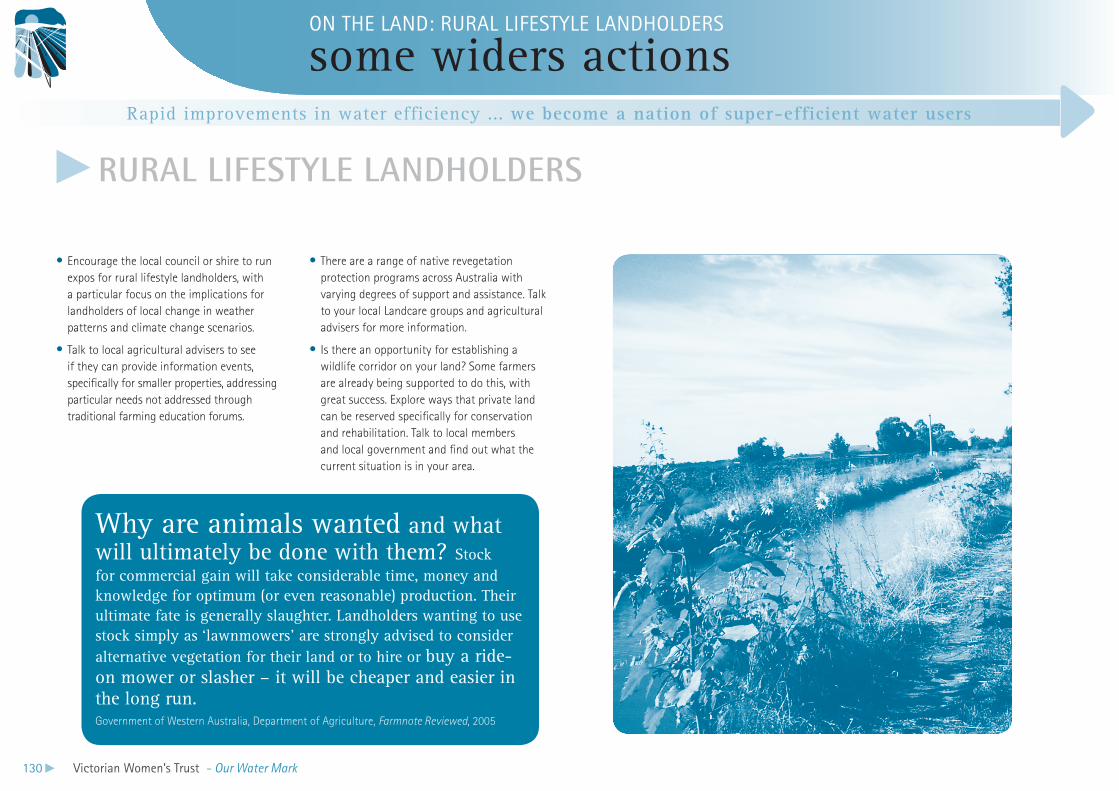
Rapid improvements in water efficiency ... we become a nation of super-efficient water users
130 Victorian Women’s Trust - Our Water Mark
Encourage the local council or shire to run •expos for rural lifestyle landholders, with a particular focus on the implications for landholders of local change in weather patterns and climate change scenarios.
Talk to local agricultural advisers to see •if they can provide information events, specifically for smaller properties, addressing particular needs not addressed through traditional farming education forums.
There are a range of native revegetation •protection programs across Australia with varying degrees of support and assistance. Talk to your local Landcare groups and agricultural advisers for more information.
Is there an opportunity for establishing a •wildlife corridor on your land? Some farmers are already being supported to do this, with great success. Explore ways that private land can be reserved specifically for conservation and rehabilitation. Talk to local members and local government and find out what the current situation is in your area.
Why are animals wanted and what will ultimately be done with them? Stock for commercial gain will take considerable time, money and knowledge for optimum (or even reasonable) production. Their ultimate fate is generally slaughter. Landholders wanting to use stock simply as ‘lawnmowers’ are strongly advised to consider alternative vegetation for their land or to hire or buy a ride-on mower or slasher – it will be cheaper and easier in the long run.Government of Western Australia, Department of Agriculture, Farmnote Reviewed, 2005
some widers actionsON THe LAND: RURAL LIFeSTYLe LANDHOLDeRS
RURaL LiFEstYLE LaNDHoLDERs
Rapid improvements in water efficiency ... we become a nation of super-efficient water users
Victorian Women’s Trust - Our Water Mark 131
general referenceWHAT PeOPLe ON THe LAND CAN DO
Introduction1 Australian Bureau of Statistics, Water account, Australia, 2004–05, cat. no. 4610.0, ABS, Canberra, 2005, p. 68. 2 ibid. 3 ibid.4 ibid.
IrrigationAustralian Bureau of Statistics, 1. Water use on Australian farms 2004–05, cat. no. 46180.0, ABS, Canberra, 2006, p. 3.
ibid.2.
ibid., p. 16.3.
ibid., p. 1.4.
ibid., p. 2.5.
ibid., p. 2.6.
ibid., p. 2.7.
ibid., p. 3.8.
Australian Bureau of Statistics, 9. Water account, Australia 2004–05, cat. no. 4610.0, ABS, Canberra, 2005, p. 71.
ibid., p. 71. 10.
Additional resourcesC Creighton, W Meyer & S Khan, • Farming and land stewardship, Case study – Australia’s innovations in sustainable irrigation, proceedings of the 4th International Crop Science Congress, Brisbane, 2004.
National Land and Water Resources Audit• , Australians and natural resource management 2002, app. 4, ‘Best Practice Management Principles for the Dairy Industry’, NLWRA, Canberra, 2002.
Dryland farmers1. Bureau of Meteorology, Definition of terms
used to describe rainfall. Serious deficiency: rainfall in the lowest 10% of historical totals, but not in the lowest 5%
2. Severe deficiency: rainfall in the lowest 5% of historical totals.
3. Bureau of Meteorology, Drought statement, BOM, Melbourne, 2007.
4. Australian Bureau of Statistics, ‘Impact of the drought on agricultural production in 2006–07,’ in Australian national accounts: national income, expenditure and product, cat. no. 5206.0, ABS, Canberra, 2007.
5. ibid.
6. Australian Bureau of Statistics, Salinity on Australian farms 2002, cat. no. 4615.0, ABS, Canberra, 2002, p. 8.
7. ibid., p. 2.
8. National Action Plan For Salinity and Water Quality, fact sheet, 2001, <www.napswq.gov.au/publications/factsheets>.
9. ibid.
10. R Beeton, K Buckley, G Jones D Morgan, R Reichelt & D Trewin, (2006 Australian State of the Environment Committee), State of the environment 2006, Independent report to the Minister for the Environment and Heritage, DEH, Canberra, 2006, ch. 8.
11. National Action Plan for Salinity and Water Quality, fact sheet, 2001,<www.napswq.gov.au/publications/factsheets>..
12. National Land and Water Resource Audit, Australian agricultural assessment, summary chapter, NLWRA, Canberra, 2001.
13. P Andrews, Back from the brink - how Australia’s landscape can be saved, ABC Books & Audio, Sydney, 2006.
Additional resourcesJohn Weatherstone’s booklet • Lyndfield Park: looking backward, moving forward, (for a free copy contact CanPrint 1800776 616, Product Code PK030494).
rural lifestyle landholders1. C Hollier, J Francis & M Reid, ‘Shrinking
extension to fit a growing small farm sector’, Extending extension: beyond traditional boundaries, methods and ways of thinkng, program and abstracts, Australasia Pacific Extension Network, Hobart, 2004, p. 2.
2. H Conkey & H Aslin, ‘Sea changers, tree changers, lifestylers and downshifters in rural Australia: implications for policy’, proceedings of Department of Agriculture, Fisheries and Forestry, BRS Seminar Series, June 2006.
3. ibid.
4. ibid.
5. C Hollier, J Francis & M Reid, op. cit., p. 3.
rEFErENCES
Rapid improvements in water efficiency ... we become a nation of super-efficient water users
132 Victorian Women’s Trust - Our Water Mark
SOME OThEr USEFUl SOUrCESIrrigation
• National Program for Sustainable Irrigation Ph: (03) 9563 3214, (02) 6263 6030
• State Departments for Primary Industries, Natural resource Management and Water
• Irrigation Association of Australia Ltd www.irrigation.org.au Provides information about the irrigation industry and standard practices.
• Aglinks – The Australian Agricultural Directory www.aglinks.com.au/Resources/Irrigation_and_Water/index.html Bodies and organisations involved in irrigation and water-resource management.
• Landcare www.landcare.com.au A community, government and business partnership to care for the landscape. More than 4000 volunteer community Landcare groups operate across Australia and in other parts of the world.
• Waterwatch www.waterwatch.org.au A national community water-monitoring program.
Dryland farmers & rural lifestyle landholders
• Departments of primary industries in each state – contact your local, state or territory government.
• Bureau of Meteorology www.bom.gov.au Daily graphs and archives of the Southern Oscillation Index (SOI). (The Southern Oscillation Index is calculated from the monthly or seasonal fluctuations in the air pressure difference between Tahiti and Darwin.)
• Industry-based Extension Programs Bestwool: www.dpi.vic.gov.au/bestwool/ Top Crop: www.topcrop.grdc.com.au Contact local agricultural advisers to find out about other relevant programs.
Saltwatch • www.saltwatch.org.au A national community salt-monitoring program.
New programs in sustainable farming• www.crcsalinity.com.au
National program for sustainable irrigation • www.npi.gov.au For information on dams and evaporation
• Local agricultural advisers provide a wealth of information and resources. Contact your local municipality for information on all rural programs, initiatives and personnel in your local area.
• Bushcare www.nht.gov.au An initiative of the Natural Heritage Trust. Supports groups to conserve and restore native habitat.
• Natural Sequence Farming www.naturalsequencefarming.com
• Publications for sustainable farming available in newsagents
Grass Roots Magazine Grass Roots Publishing Pty Ltd
Earth Garden www.earthgarden.com.au
general referenceWHAT PeOPLe ON THe LAND CAN DO
Victorian Women’s Trust - Our Water Mark 133
Australians are one of the greatest •per-capita users of water in the world.1
If we combine water we use directly and •the water embodied in the food, goods and services we consume, Australians have the largest domestic water footprint on the planet.2
Most water used in Australian households •is for outdoor purposes, such as gardens, swimming pools and outdoor water features.3
In 2004 Australians consumed, on average, •282 L of water in and around the home each day.4
In 2003 people in Denmark used •approximately 125 L per person per day.5
Between 1993 and 2003 Denmark’s •household water consumption fell by one-quarter. This took place in tandem with a 150% increase in the price of water, which included a household water tax.6
In many developing countries, people use •much less than 50 L of water per person per day.7
I organised a visit from a plumber recommended by a local environment shop. We now have flow-control valves on every single tap in the house, our rainwater tank has been plumbed into the toilet, we’ve got a hose for greywater attached to the laundry, low-flow showerheads and buckets in the showers. All up, it’s cut our household water use by almost 200 L a day!!!Watermark Australia group participant, Fairfield, Vic.
Most of us either rent a home, own a home, live alone, share households with friends or family, live in high-rise buildings, units or individual properties with gardens of varying size, or with no gardens at all.We can all do a great deal at the household level to become more water efficient, to the point of being super efficient.This section suggests ways you can improve water efficiency. It also puts forward suggestions for achieving further efficiencies by working with your neighbours, with clubs, your council, local developers and businesses and your local water authority.
Rapid improvements in water efficiency ... we become a nation of super-efficient water users
what people in households can do
Rapid improvements in water efficiency ... we become a nation of super-efficient water users
134 Victorian Women’s Trust - Our Water Mark
The most important first move in cutting down water use is to find out how much water your household is using. There are three important steps in this process.
STEP 1Eliminate the possibility of leaks. For all households on mains water, you can check for leaks by reading your water meter late at night and then again early the next morning, during which time no water should have been used. If you are unsure how to do this, check the website www.savewater.com.au for its instructional videos to assist you around the house.
STEP 2 Work out how many litres your household uses each day. Unfortunately, billing systems and styles vary across Australia. Some bills will tell you your daily usage and give you information on past usage as well. Locate as many of your old water bills as you can or start collecting them.
STEP 3Work out in more detail how you use the water in your household. The best way to do this is to conduct a water audit of your home. You can do this yourself or you can engage a qualified plumber. The Green Plumbers website has an excellent 50-point Environmental Household Inspection Report which you can do yourself. This helps you calculate the amount of water you’re using in each part of the home and in the garden. A water audit by an accredited Green Plumber will give you the opportunity to discuss various water-saving technologies: ranging from minimal-cost measures to water conservation and reuse measures that cost as much as you’re willing (or able) to pay.
There are about 500 000 •swimming pools in Australia – or one for every 12 homes.8
Around 70% of household pools •and spas in Western Australia don’t have a pool or spa cover.9
Most Australians underestimate •their daily water consumption.10
Most apartment dwellers have no •way of calculating their household water use because apartments are not individually metered.
SUPPOrTING MEASUrESYou should also let your water authority know each and every time you have a problem with your water bill. Your feedback will help them to continuously improve their bills in terms of readability and in the standardisation of reporting structure and design. Make sure you also keep your water bills to measure your progress.
If we could somehow measure our use of water, perhaps we could start using less. For example, having some sort of meter or gauge directly in the central area of the kitchen, somehow connected to the mains water meter, so you can actually see how much water is being used per day. It could tick over like a petrol bowser.St Monica’s Book Club Watermark Australia group, Essendon
measure & monitor water useHOUSeHOLDS
Rapid improvements in water efficiency ... we become a nation of super-efficient water users
Victorian Women’s Trust - Our Water Mark 135
Most fresh water used by •Australian households is for outdoor purposes: nationally 44%.11
Around 84% of Australian •households flush clean drinking water down toilets daily.12
IN ThE GArDEN
This is where Australians use most domestic mains water. It’s still possible to have a beautiful garden with minimal water use. Indeed, there are examples all over the country of thriving water-efficient gardens.
Water-efficient gardens are sometimes referred to as ‘xeriscape gardens’ (xeros meaning ‘dry’, scape meaning ‘land’). Xeriscape gardens target seven basic areas: planning; soil care; selection of plants; lawn care; irrigation; mulching; and maintenance. When applied together, these techniques reduce water consumption dramatically. However each technique on its own will have a significant impact, too.
There are several key ways to ensure efficient use of water in your garden. You should:
learn what kinds of plants are appropriate to •your local conditions and how much water they really need. Find out what drought-tolerant plants are available and suitable
use a soil moisture meter so you know when •water is really needed (ask for one at garden and DIY centres)
get the soil right. Good soil retains moisture •better and allows plants to resist dry conditions. If the soil is lacking, build it up with organic matter, such as compost
use appropriate water-storing granules and •wetting agents
always mulch your garden. Mulching reduces •evaporation from garden beds, blankets out weeds and keeps soil cooler in hot conditions. Your local council is a good place to ask about mulch as they may have discounted offers of mulch and compost to households
leave your lawn long (not less than 3 cm) and •don’t cut grass by more than a third of its length at any one time
not allow the water to run off the soil – •make a small dam from mulch and soil to concentrate water where you want it
water the plant’s roots, not its leaves.• Make sure water is being delivered on or below the ground, close to the root zone, not higher up or farther away, where it can be blown off or evaporate
monitor how your plants are going in summer •so you can make changes in autumn.
IN ThE kITChEN
Although less water is used in the kitchen than outdoors, you can still make significant savings in water use by observing a few simple rules.
DishwashersSave water when using your dishwasher by:
running the dishwasher only when you have a •full load
using the rinse/hold setting on the dishwasher, •if it has one, rather than rinsing dishes under the tap.
TapsTo minimise wastage with taps:
never leave a tap running continuously when •you’re not actively using it
install flow-controlled aerators. These are •inexpensive and can reduce water flow by 50%.
where convenient and appropriate, try to •capture ‘warm-up’ water for use on plants, rinsing dishes, washing fruit and vegetables or other cleaning tasks
insulate hot water pipes. This avoids wasting •water while waiting for hot water to flow through (and saves energy)
make sure your hot water system thermostat •is not set too high. Adding cold water to cool very hot water is wasteful.
IN ThE lAUNDryBe aware that a top-loading washing machine uses much more water than a front-loading machine. One of the best ways to considerably reduce water consumption in your laundry is to bring forward the replacement date of your top-loading washing machine. To further save water:
adjust the water level to suit the size of the •wash load – some new water-efficient models will even do this for you
reduce water useHOUSeHOLDS
There are countless ways to reduce water use in your home. Advice on how to save water within the home is freely available. If you haven’t already swung into action – along with the thousands of others who already have – now is the time to get going! You can cut down on water for washing dishes, for example, by wiping greasy plates beforehand with a paper towel (a renewable resource). You can cut down on the number of times per week you use the washing machine. You can use rinse water to give pot plants a drink. And all of this without installing a thing! Human ingenuity being what it is, new water-saving ideas are continually being developed and brought to the market!
There are many excellent websites providing advice on reducing water use at the household level. Some of these are listed at the end of this section. A particularly useful one worth highlighting is the Savewater! Alliance website (www.savewater.com.au) which provides an extremely comprehensive list of water-efficiency measures. Much of the following information has been sourced from this website. We’ll now look at how to save water in different areas of the home.
Rapid improvements in water efficiency ... we become a nation of super-efficient water users
136 Victorian Women’s Trust - Our Water Mark
wait until you have a full load before washing •and you’ll save 10 L of water for every wash (and cut your electricity costs as well)
use the sud-saver option, if your old machine •has one, when you have several loads to wash
educate everyone in the household, especially •children, to sort out which clothes actually need washing.
IN ThE BAThrOOMIn a couple of decades we’ve become a shower-obsessed society!! People survive all over the world without a daily shower, and most Australians managed without daily showers for decades yet avoided public health problems! Have a think about whether you really need to
shower daily. Of all water consumed in the home, approximately 40% is used in the bathroom and toilet (about 20% each).
ShowersTo economise on water used in the shower:
install a water-efficient showerhead. •It won’t stop you having a great shower, but it could save you $100 in water and energy costs a year. A standard showerhead may use up to 25 L of water per minute. A water-efficient showerhead might use as little as 7 L per minute. There are models featuring shut-off levers and other mechanisms that let you reduce water flow to a trickle while you soap or shampoo yourself, then turn back on without having to readjust the temperature, saving yet more water
consider an instantaneous water heater if •your water has a long way to travel from the water heater to the bathroom. But talk to a plumber before you do so to make sure it will work adequately with your water-efficient showerhead
use a bucket to collect water while waiting for •it to warm up
look for information about the water •efficiency of any product when making a purchase. However, also check to see if the marketing claims are independently verified or substantiated
use a shower timer. There are a range of •manual and electronic timers, ranging from
simple four-minute egg timers to more sophisticated electronic timers that either attach to the shower wall or showerhead or are wired into the wall during construction. These measure volume of water used, or time, and usually provide an audible ‘time-up’ tone.
ToiletsTo cut down on toilet water use:
check for leaks by putting a few drops of food •dye into the cistern. (Toilet cisterns can develop slow leaks which can waste litres of water each day.) If you have a leak, coloured water will appear in the bowl before the toilet has been flushed
install a four-star rated toilet. These use just •4.5 L for a full flush and 3 L for a half flush. Four-star rated toilets can save the average home up to 35 000 L per year
consider a composting toilet. They have come •a long way, don’t smell, and are increasingly used in urban areas outside Australia.
IN POOlS & SPASThere are about 500 000 pools in Australia, or one for every 12 homes. Most use sand filters which can use over 10 000 L a year to clean through backwashing. To conserve water in pools and spas:
install covers to reduce evaporation and •keep water cleaner (reducing the need to add chemicals)
consider installing a cartridge filter rather •than a sand filter, as these only require a quick hose-down to clean. Cartridges are finer filters leaving your pool clearer
install decking around the pool as pool decking •loses less water to evaporation than the same area covered with grass
cover your pool on windy days, as evaporation •levels increase with wind strength.
IN ThE GArAGE & DrIVEWAyWe tend to be lavish water consumers when it comes to washing cars, trucks and boats. In many cases, commercial car-washing facilities save water by providing a specialised site with water-recycling technologies and they also minimise the use of detergents released into the drainage system. To save water when washing vehicles:
wash cars, boats and other vehicles on the •lawn (if practical) with a bucket, not a running hose. Use a trigger nozzle or a positive shut-off nozzle infrequently for occasional rinsing sprays
use a commercial car wash that recycles its •wash water (but only if you don’t have to drive too far to reach one)
water-free car washing products are appearing •on the market. Check out what’s available via the Savewater! Alliance website, www.savewater.com.au.
HOUSeHOLDS
reduce water use
Waterless toilets have been •commercially available since the early 1990s, but are not used to any great extent in Australia. The Federal government encourages the use of waterless toilets, but it’s not mandated. In Victoria, the State government is trialling the use of waterless urinals in selected public buildings with 100 or more staff.13
In 2006, 43% of Australian •households have a reduced-flow showerhead. In 1994 it was 21.8%.14
Rapid improvements in water efficiency ... we become a nation of super-efficient water users
Victorian Women’s Trust - Our Water Mark 137
reduce water use
drip irrigation. The dripper lines need to have adequate cover. A thick layer of mulch on the garden will assist.
A screen or filter will be needed to avoid •clogging the irrigation system by lint and hairs. Front loading washing machines are most suitable as they produce less lint (and also use less water than top loading machines).
The system used to collect greywater from •the house and divert it to the garden must be fail-safe, so that greywater is automatically diverted to the sewer if a blockage or other system malfunction occurs. This will prevent greywater running over the ground into stormwater drains.
rEUSE WATErThe ideal approach to rapidly improving your water efficiency is obviously to use less – if you reduce your household water use then you generate less waste water. However, your household will always generate some waste water.
The most basic and popular household greywater system is the humble bucket. Bucketing water onto the garden in dry times has been occurring in Australia since the first domestic gardens were established. However, today’s household greywater contains many foreign (and potentially harmful) substances, such as laundry detergents, dishwashing detergents, bleach, carpet cleaners, medicines, herbicides, pesticides, paints, motor oil and pool chemicals, to name a few.
The most important thing to consider when reusing water in your home or garden is to know how to use it safely and sustainably. The Victorian Environmental Protection Agency (EPA) has produced an information bulletin on reuse options for household waste water. It identifies acceptable and unacceptable household wastewater reuse practices, outlines approvals required for acceptable options, identifies risks inevitably associated with reusing household water and suggests measures to minimise these risks.
The Savewater! Alliance also provides a very useful section on greywater on its website. The following tips on the humble bucket system and basic DIY greywater hose diversions come from this resource:
Water diversion systems are best restricted to •low-risk sources such as the bath, shower and laundry rinse water.
Kitchen water should not be reused as it is •heavily contaminated with fats, greases and solids.
It’s not advisable to reuse laundry wash water •due to high detergent concentrations.
Only divert in hot, dry conditions, in quantities •that can be taken up by plants.
Don’t apply greywater to vegetable gardens if •the vegetables are eaten raw or lightly cooked.
If you plan to install a proper greywater diversion system you will need to use a licensed plumber. They should observe the following measures:
To reduce the risk of spreading disease, •greywater should be distributed around the garden by a below-ground system, such as
In 2004, 16% of Australian •households recycled and reused some water in and around their homes.15
The delivery of recycled water •to Australian households is only just starting to happen. There are now a number of residential areas using a ‘third pipe’ system. For instance, Rouse Hill in Sydney, NSW, supplies around 12 000 households in Sydney’s northwest. There are similar schemes developing in all states.16
Denmark has invested extensively •in wastewater treatment over the last 25 years. Currently, most of the waste water from Danish households is directed through advanced treatment systems before being discharged into the sea or watercourses.17
It is important to remember that the construction of efficient, physically separate water supply and wastewater collection systems in our cities was responsible for great improvements in public and environmental health. New systems designed to recycle greywater must be well managed in order to protect our health and that of our environment.Savewater! Alliance
reuse & substitute HOUSeHOLDS
Rapid improvements in water efficiency ... we become a nation of super-efficient water users
138 Victorian Women’s Trust - Our Water Mark
SUBSTITUTE WATErWhen we use the term substitute, we are referring to the substitution of potable water with some other form of water e.g. recycled or stormwater. Every reuse and substitution action takes the pressure off the primary source – water from the environment.
harvesting & using rainwaterTo harvest and use rainwater you can install a simple rainwater diverter which is fitted to your downpipe allowing rainwater to be diverted to any area of your garden by simply attaching a garden hose. This diverter is available at hardware stores for very little cost.
For a much more significant investment you can install a rainwater tank. If it’s plumbed into your laundry, kitchen, bathroom and toilet system (as is the case in many rural dwellings), you will maximise your water savings.
Tank installation tipsThe following are some things to keep in mind when installing rainwater tanks:.
If your tank is large, consult a builder or •engineer as it may require structural support. Larger tanks may also require a building permit from the local council.
Have the tank installed by a plumber or the •tank manufacturer. This will ensure the system operates efficiently and is easy to maintain.
•In2004about17%ofAustralianhouseholds had a rainwater tank. In South Australia, the figure was much higher with almost half the households (48%) having a rainwater tank. However, most tanks were small and used mainly for drinking.18
•Allstatesandterritorieshaverecorded an increase in the number of rainwater tanks since 2001.19
Lead-based paint and flashing, or the tar-•based coatings found on some roofs affect water quality. Make sure your roof material is non-toxic.
A U-shaped gutter traps leaves and twigs. •If possible, choose water-friendly gutters or cover existing gutters with mesh.
Try to make all pipes ‘dry’. This means having a •continuous fall so water can’t accumulate in them between flushes.
Cover all openings with a mosquito-proof mesh.•
Install a first-flush diverter on the downpipe. •This is especially important in areas of high pesticide use or atmospheric pollution.
A sump box between the downpipe and the •tank can slow the water flow, sieving out any sediment not previously diverted.
Make sure the tank overflow outlet is •connected back into the stormwater pipe or irrigation system.
Clean the inside of the tank every few years •as sediment will accumulate.
You may need to install a pump to provide •adequate water pressure for some appliances. Consider appliances that can operate at less than mains pressure.
The greywater system must have a valve or •some other means to allow greywater to be diverted to the sewer when the garden is too wet to absorb it.
The plumber should use pipes of a different •colour to the mains system.
Households with diversion systems should:
indicate where greywater is being used with •signage
take care when choosing detergents and other •household cleaning products. Using non-phosphorus containing detergents (these have
an ‘NP’ symbol on the pack) is advised.
A MElBOUrNE FAMIly COllECTS EVEry PrECIOUS DrOP
We wanted to ensure that we achieved the maximum water savings possible while being an ordinary family on an average income. We installed four 2250-L rainwater tanks down the side of our house. The tanks were sited on land that was unusable for other purposes (such as vegetable gardens) and they were set below the fence line, as required by regulation.
Because we have a two-storey home, we have a reduced ability to capture rainwater. To increase roof area, we covered the pergola to the rear of the house and attached guttering to it. We negotiated with our next-door neighbours to divert their roof water to our tanks. We also negotiated with the neighbour to the rear of our property to divert water from his garage roof into a small tank to boost our capacity to water our garden.
Graham and Janet Steele, City of Whitehorse Sustainability Home Award Winners, 2006
HOUSeHOLDS
reuse & substitute

Victorian Women’s Trust - Our Water Mark 139
HOUSeHOLDS
reuse & substitute
Rapid improvements in water efficiency … we become a nation of super-efficient water users
NEIGhBOUrSThere are ways in which you can join forces with friends and neighbours to save water. You could:
entice some of your neighbours to join you in •brokering a group discount with a local Green Plumber to have your homes audited
there is an excellent state government and •council funded initiative called Sustainable Homes in Victoria which runs across three councils in Northern Melbourne. The program focuses on five key environmental themes: Energy, Water, Biodiversity and Sustainable Gardening, Waste and Travel. It consists of workshops, self audits and commitments, and free Sustainability Starter Kits and will run for three years 2006 – 2008. Find out if your council could qualify or be part of such an initiative.
begin discussions in your neighbourhood about •collective water storage for households. Talk to the appropriate person in council and your local water authority. Think about what it would take to initiate a pilot project in your area
let your friends and neighbours know about •free or discount offers for water-saving products and services as you become aware of them. You will help them to save money and energy, as well as water
look for opportunities to join forces with •neighbours and like-minded people in your local area. Find out about the Sustainability Street movement and think about forming your own group
talk to your body corporate (if applicable) •about installing individual water meters in place of a collective meter. You would need to talk this through with your local water authority. They will maintain all meters that are installed. There are obvious financial incentives to individually metering apartments (tenants are charged for actual water use, encouraging efficiency).
NEW hOUSING DEVElOPMENTSBe proactive in finding out information if you’re intending to buy a home in a new housing development. Ask about the sustainability measures planned for the home you’re interested in. Developers are required by law to implement sustainability measures in the construction of new homes. The level of environmental standards imposed depends on which state you live in. There are many progressive developments already happening in new housing developments, such as individual water meters inside the home itself.
Use your considerable influence as a prospective buyer by showing your preference for environmentally sustainable designs.
Find out about government-supported sustainable housing developments. These are being developed in most states. Some are up and running already, such as Rouse Hill in Sydney. Aurora, a planned sustainable community of 8000 in Epping North, Victoria, is in the developmental stages and due for completion over the next few years. Each home in the development will have a third pipe returning recycled water to gardens and toilets and for other outdoor uses. It will also use recycled water to irrigate the development.
NOrThCOTE UNITEDA group of Northcote residents in suburban Melbourne decided to take action locally. They formed their own local sustainability group. They persuaded 42 households to jointly undertake household water audits and negotiated reduced rates for the audits. The group plans to implement all the water-efficiency recommendations arising from the water audits through fundraising and their own contributions.
IN yOUr NEIGhBOUrhOOD & lOCAl COMMUNITy
HOUSeHOLDS
some wider actions
Northcote residents. Photo: John Donegan, (courtesy of the Age)

140 Victorian Women’s Trust - Our Water Mark
Rapid improvements in water efficiency … we become a nation of super-efficient water users
INSPIrING ENVIrONMENTAl DEVElOPMENTSIf you live in Melbourne, visit the Centre for Environmental Research and Education Strategies (CERES) in East Brunswick. This community environment park has developed an Urban Water Conservation Demonstration and Research Facility. This project demonstrates the latest technologies for water conservation, recycling and reuse in a variety of settings. Water is reused on site in the home, nursery, café, organic farm and community centre. Wander at your leisure, enjoy lunch and learn lots!
lOCAl COUNCIlSThere are actions you can take to progress water-efficiency initiatives with your council.
Enquire whether your council has a sustainable •water use plan. If not, talk to your councillors and identify who has responsibility for environmental issues. You could also approach the mayor.
Find out which council staff are responsible for •implementing water-efficiency initiatives. Ask if there is any community representation, or opportunities for local community members to have input into these initiatives.
Be vigilant in reporting any leaks or breakages •in council-owned water appliances or watering systems. It’s too easy to assume that someone else will take care of it.
We all know our local patch best. Talk to your •council about possible locations for capturing and reusing water.
Talk to your council about water-saving •programs for households, e.g. some councils in Australia are retrofitting homes with water-efficient appliances at a very reduced cost.
Ask your council if they will put together a •list of accredited plumbers for water-efficient advice and services.
Lobby for council-funded ‘water-efficient’ •display homes.
Encourage council to display prominent •‘barometer-type’ signage to measure the effect of council’s water-efficiency initiatives and to demonstrate to all the progress being made.
If your community group has received a •federal government community water grant, let council know. They could use your group as a positive example for other community groups. Encourage council to make public the amount of water saved through these grants in their municipality.
Ask your council if they can provide practical •water-reuse demonstration projects. They could set up training for council staff, local tradespeople and developers in the municipality.
Check with your local council to see if they’re •providing reduced-cost mulch and compost to
households. If not, approach the environment department of council and see if they are willing to provide this service.
lOCAl WATEr AUThOrITIESLet your water authority know that you’ve completed a water audit, especially if you have managed to encourage others to join you. See if your local water retailer can set up some kind of interactive webpage where their water customers can post water saving suggestions and actions.This could be advertised and promoted through the water authority’s regular conservation tips usually included with bills. Also lobby your relevant authority and state government for realistic water tank rebates – cost is still a big factor in delaying action for many.
lOCAl COMMUNITy GrOUPSThere are a number of government-funded programs, at both federal and state levels, aimed at assisting community organisations to undertake water-saving initiatives. The federal government’s community water grants are a good example and many small organisations (such as scout halls and community centres) have already received such grants. Make sure your local organisations – such as environment groups, service clubs, nursing homes and sports clubs – know about this initiative.
Did you know that there are sustainable fundraisers around? For example, Green Canary
(www.greencanary.com) offers a range of products your community group can use to raise funds.
lOCAl SPOrTING ClUBSAsk at your sporting club if there are any water-efficiency measures being undertaken. Automatically timed showers with water-efficient showerheads would make considerable savings, as would reduced-flow taps and pressure-controlled taps. Also talk to the club about the possibility of reusing water on grounds, courts or fairways. You can help by
TENNIS, ANyONE?Heatherdale Tennis Club in Melbourne’s east replaced their eight En Tout Cas courts with a Classic Clay surface and are saving about 3400 KL of water per year. Apart from wanting to reduce water consumption, the club was conscious that En Tout Cas particles were being washed into local waterways after the courts were hosed before and after every set.
They received a state government grant to replace the courts and are retrofitting clubroom toilets and showers so they are more water efficient.
IN yOUr NEIGhBOUrhOOD & lOCAl COMMUNITy
HOUSeHOLDS
some wider actions

Victorian Women’s Trust - Our Water Mark 141
rIPPON lEA ESTATE, MElBOUrNEIn suburban Melbourne, a stunning example of a sustainable water-efficient property has been around for more than 130 years! Rippon Lea, a late 19th-century private suburban estate, had sophisticated drainage, sanitation, recycling and watering systems in place well before Melbourne had any reticulated water-supply and sewerage systems.
Sir Frederick Thomas Sargood, who originally owned the stately Rippon Lea mansion, was a visionary. He created European-style gardens on 11 ha of uncultivated land in Elsternwick in 1868. The irrigation system he devised, using stormwater and a natural spring, enabled the gardens to flourish in Australia’s variable climate.
He also developed underground rainwater tanks for use inside the mansion, and made use of household and stable waste for fertilising his gardens. The property, which at its peak had a staff of 45, was entirely self-sufficient in water.
The original system, which over the years has been replaced by mains water supply, is being restored, and Rippon Lea will develop a Water Conservation and Education Centre to promote water efficiency to businesses, schools and the broader community
providing some directions and resources for the club to take this further. There are state and federal programs that can financially support sports groups to undertake these measures.
SChOOlS & ChIlDCArE FACIlITIESTalk to like-minded parents to see if a few of you can explore what water-saving incentives are available for your child’s school or childcare centre. There may be local incentives, applicable only to your area, as well as state and federal resources. Ask staff at your child’s school about
the Sustainable Schools Program (Victoria) or similar programs in other states.
lOCAl BUSINESSESThere are many things you can do in your small business that are quite similar to the actions appropriate to householders. Most importantly, you can advertise to your customers that you’re doing your bit to achieve water efficiency. You can do this using signs, posters or just talking with your customers – especially if you’re a hairdresser!
There are also environmental businesses developing in every state. Find out what exists in your patch and what they have to offer. The Environment Shop in Northcote, (suburban Melbourne) offers expertise to business, councils, householders and community groups as well as a considerable body of free information on their website to help you get going.
lOCAl NEWSPAPErSFind out if your local paper is willing to run a regular ‘water success story’ feature. You could
help by writing the first one, or by sourcing a suitably inspiring example via your local water authority. Local businesses, schools and residents could all feature. It could even be sponsored by your local water authority to include prizes and awards.
Rapid improvements in water efficiency … we become a nation of super-efficient water users
IN yOUr NEIGhBOUrhOOD & lOCAl COMMUNITy
HOUSeHOLDS
some wider actions
Rippon Lea house and garden Photo: Department of the Environment and Water Resources
Rapid improvements in water efficiency ... we become a nation of super-efficient water users
142 Victorian Women’s Trust - Our Water Mark
SOME OThEr USEFUl SOUrCES• The Alternative Technology Association
www.ata.org.au Ph: (03) 9639 1500 The ATA also publishes Renew Magazine - available in newsagents
• Community Water Grants www.communitywatergrants.gov.au
• CERES Community Environment Park Melbourne www.ceres.org.au Ph: (03) 9387 2609
• Sustainability Streets www.voxbandicoot.com.au Ph: (03) 9416 1066
• Green Plumbers www.greenplumbers.com.au Ph: 1300 368 519
• Water Efficiency Labelling and Standards (WElS) Scheme www.waterrating.gov.au Ph:1800 803 772
• Savewater! Alliance www.savewater.com.au
• Safe Use of Detergents: Lanfax Laboratories www.lanfaxlabs.com.au
• G Magazine Bi-monthly environment friendly Australian magazine www.gmagazine.com.au
general referenceHOUSeHOLDS
rEFErENCESOrganisation for Economic Cooperation and Development, 1. OECD environmental indicators 2004, OECD Environment Directorate, Paris, p. 23.
AY Hoekstra & AK Chapagain, ‘Water footprint of nations: water 2.
use by people as a function of their consumption pattern’, Water Resource Management, vol. 21, no. 1, 2006, table 3, p. 8.
Australian Bureau of Statistics, ‘Household water use and effects of 3.
the drought’, Australian economic indicators, cat. no 1350.0, ABS, Canberra, 2005.
Australian Bureau of Statistics, 4. Water account, Australia, 2004–05, cat. no. 4610.0, ABS, Canberra, 2005, p. 103.
Danish Water and Waste Water Association, ‘Water supply 5.
statistics’, Nature and environment 2003 – theme: water in Denmark, Miljoministeriet, Copenhagen, 2003.
ibid.6.
PH Gleick, ‘Basic water requirements for human activities: meeting 7.
basic needs’, Water International, vol. 21, no. 2, pp. 83–92, 1996.
Savewater! Alliance, <www.savewater.com.au>.8.
Australian Bureau of Statistics, 9. Domestic water use, Western Australia 2003, cat. no. 4616.5.55.001, ABS, Canberra, 2003, p. 6.
Environment and Natural Resources Committee, Parliament of 10.
Victoria, Inquiry into sustainable communities, DSE, Melbourne, 2005, p. 188.
Australian Bureau of Statistics, ‘Household water use and effects 11.
of the drought’, Australian economic indicators, cat. no. 1350.0, ABS, Canberra, 2005.
ibid., p. 101.12.
Department of the Environment and Water Resources, 13. Water efficiency guide: office and public buildings, Department of the Environment and Heritage, Canberra, 2006.
Australian Bureau of Statistics, ‘Household water use and effects 14.
of the drought’, Australian economic indicators, cat. no. 1350.0, ABS, Canberra, 2005.
Australian Bureau of Statistics, 15. Water account, Australia, 2004–05, cat. no. 4610.0, ABS, Canberra, 2005, p. 102.
ibid., p. 101.16.
Danish Water and Waste Water Association, ‘Water supply 17.
statistics’, Nature and environment 2003 – theme: water in Denmark, Miljoministeriet, Copenhagen, 2003.
Australian Bureau of Statistics, 18. Water account, Australia, 2004–05, cat. no. 4610.0, ABS, Canberra, 2005, p. 101.
ibid.19.

Victorian Women’s Trust - Our Water Mark 143
There are 151 federal electorates across •Australia.1
There are 595 state parliamentarians •in Australia.2
In June 2006 there were 13 081 539 •enrolled voters in Australia.3
There are 722 local governments in •Australia. Of these, 579 cover regional and rural areas.4
what people & government can do
Ideally, the relationship between elected representatives and the people is reciprocal. The representative’s role is to serve the people, and the people’s role is to assist in identifying needs in the community, to track issues and policy commitments and convey their satisfaction or dissatisfaction about policy and political decisions. This relationship should be respectful and honest. In the absence of these features, the voter becomes suspicious and distrustful and the representative becomes remote and even cynical. The Purple Sage Project, From the wisdom of the people: Action for our times, p. 28, 2000.
Many individuals, communities and governments are already working to bring about important changes in water policy, programs and initiatives. We have no intention of trying to duplicate these efforts. But we do have some ideas to add which, we believe, could add to current thinking and action.This section outlines these major ideas. Some are simple while others are large in scale – but all are achievable. We urge governments around the country to consider these proposals. Likewise, we urge people to press their governments, and all elected representatives, to consider them.
Australia faces a major water crisis and we need to urgently embark upon a long-term national response. As a nation we must become water efficient and then super efficient. That is the challenge.This will take time, and the costs will be significant. Most importantly, it will require people and governments to work together in a concerted way.Our best chance is to make use of the provisions offered by our robust democracy – and to begin right now.
Rapid improvements in water efficiency … we become a nation of super-efficient water users
Rapid improvements in water efficiency ... we become a nation of super-efficient water users
144 Victorian Women’s Trust - Our Water Mark
Commission needs to be expanded to record estimated volumes of water being stored. This might mean the inclusion of aerial-survey data and volumetric estimates for small farm dams. States could then determine what measures need to be put in place to control on-farm storage.
Without such integrated detail, there can be no guarantee that water trades will deliver water to places and purposes which maximise agricultural benefits to the broader community.
SUPPOrT AND rESOUrCE WATEr lITErACyThere are programs in most states that focus on spreading the water conservation message and initiating the necessary behavioural changes in the community. While these are impressive in
ClArIFy ThE OWNErShIP STATUS OF WATEr There is an urgent need to clarify the ownership status of water. Does water in this country belong to the Australian people, or not? On one level, the move by state and commonwealth governments to create a national water market is cast as a necessary reform. Reforms are one thing, but threatening the longstanding tradition of managing water as a common good is something else again. In this regard, some crucial ambiguities and dilemmas are now apparent concerning the fundamental question of ownership. For instance, existing state Water Acts primarily focus on water flowing in rivers, but the ownership status of water below the ground is less clear. And, if waste water is to be treated by privately owned plants, will the ensuing ‘new’, higher-value product (i.e. the water) be owned by the plant operators and available for sale to the marketplace?
even though we are some way down the track towards forming a national water market, these matters demand determination, and should be tested under constitutional law. In our democratic system, there are two ways that this can be done: either a reference could be given to a full bench of the High Court; or the matter could be the subject of a referendum.
Clarification of this fundamental ownership issue is critical to the long-term security of our irrigation industries and the future supply of water to our cities. It’s particularly important that this matter be determined soon, given the COAG decision to have a national water market operating by 2014.
ESTABlISh NATIONAl WATEr ACCOUNTSIn order to better manage our water resources, it’s now recognised that a set of accurate and reliable National Water Accounts must be developed. These would track how much water is being used, where it’s being used, and for what purposes. These accounts would need to be comprehensive and transparent.
The set of National Water Accounts currently proposed by the National Water
•SomewaterretailersinAustraliaoffer a service to conduct and report on a household water audit for less that $50.5
•AsofJanuary2007allwhitegoodsare required to display a water-efficiency rating.6
•Thereiscurrentlynostatelawrequiring industry to conduct and report on water audits.
•Indenselysettledruralcatchments,hobby farms (with small dams) can make up 50% to 60% of all rural properties.7
CONSUlTATION GENErATING POSITIVE OUTCOMESIn 2003 the Victorian Environment and Natural Resources Committee was set up to inquire into matters dealing with the environment, natural resources, planning, development or protection of land. The Committee was made up of seven members of Parliament, drawn from both houses and all parties. The committee heard evidence from 135 people at hearings in metropolitan and regional centres and received 82 written submissions. Its published report contains 72 recommendations relating to water and energy efficiency, waste management, education and the role of local government.
Within three years of its establishment, many of these recommendations either have been, or are now being, implemented.
measure & monitor water usePeOPLe & gOVeRNMeNT
Rapid improvements in water efficiency ... we become a nation of super-efficient water users
Victorian Women’s Trust - Our Water Mark 145
their content and detail, the scale of the changes required, and the urgency involved, means that initiatives must extend well beyond transient TV campaigns, newspaper ads and information provided on websites.
The Watermark Australia team has engaged people in a process of local-level dialogue about water. This has significantly increased people’s understanding of the problems we face and the opportunities for action. Raising levels of water literacy needs to be an ongoing and evolving task. Generations to come should only have the experience of being super-efficient water users.
The following key factors should be considered:
A national funding program is required to develop and support wide-ranging community initiatives directed at achieving sophisticated levels of water literacy. These will help to bring about the necessary changes in all sectors of Australian society: in agriculture; business and industry; in large and small organisations; in government; and households.
Water bills can convey crucial messages about water efficiency. This information, however, must reflect a more robust notion of efficiency than what tends to be employed at present. For instance, the information on Melbourne water bills suggests that a household of four persons with a medium-sized garden can consider itself ‘water efficient’ if it uses no more than 557 L per day. (Remember that many European countries,
such as Denmark, Netherlands and Germany, have reduced their per-capita consumption to significantly lower levels than this).
A standardised water bill needs to be introduced across Australia and used as a supplementary means of educating water consumers. In a highly mobile population such as ours, this would give people the benefit of easily understandable information on their water-use patterns.
A key factor in changing behaviour lies in making clear the link between agricultural water use and the amount of water embodied in the food and fibre consumed by our urban populations. The volume of embodied water can be reduced in two main ways: by using less water to grow food and produce goods; and by our affluent society making lifestyle changes to reduce levels of consumption.
Ongoing, targeted communication strategies should be developed to help people reduce the volume of water used in their homes. The message needs to be clearly disseminated that real water efficiency is achieved when specific activities are undertaken using lower volumes of water, and when water is used over and over again.
Given the urgency of the changes required, there is a special case to be made for the re-education of licensed plumbers and increasing the number of plumbers over the next few years. Initiatives such as Green Plumbers point the way here. Plumbers are central to consumers adopting water-saving technologies with relative ease,
and the uptake of water-saving technologies should increase as a result of these initiatives.
BIPArTISAN lEADErShIP TO MAkE OUr CITIES WATEr EFFICIENT With the exception of Darwin, each of the mainland capital cities is facing a major reduction in surface-water availability over the next 30 years at least. At the same time, it’s expected that an additional 5 million people will be living in our capital cities by 2030. Much of the current focus is on increasing the supply of water, rather than driving down consumption and bringing about the behavioural change needed to reach
measure & monitor water usePeOPLe & gOVeRNMeNT
A WATEr-EFFICIENT PArlIAMENTA water audit of the NSW Parliament House was completed in 2004–05. Recommendations were implemented to retrofit the entire building with AAA showerheads, install flow restrictors in all hand basins and sensor-operated flushing units on urinals and install sub-meters on major water-using facilities and to connect these meters to the building’s management system. These changes were estimated to reduce water consumption by 8 million L a year.
NSW Government, Water for Life, Water Smart government fact sheet, viewed 22 March 2007, <www.waterforlife.nsw.gov.au, Education and Resources > Resource Centre > Downloads>.
super efficiency. In addition, state and territory governments appear reluctant to regulate or mandate water-efficient technology in the building and construction sectors.
People in the broader community feel dismayed at the adversarial nature of our political culture and at the blame-shifting and political point-scoring that accompanies important issues. Most would prefer constructive, bipartisan approaches to major problems. There is, however, important work going on behind the scenes in such processes as parliamentary committees and inquiries. We badly need to see public displays of genuine
Rapid improvements in water efficiency ... we become a nation of super-efficient water users
146 Victorian Women’s Trust - Our Water Mark
collaboration on water. After all, this is what we would expect if the nation was facing any other kind of serious threat.
The need for urgent action on water presents our political leadership with an opportunity to come together and commit to a program to create water-efficient cities and suburbs.
Within the next 12 months, each state and territory government around Australia should bring their leaders and opposition parties together at a round table to reach bipartisan agreement on an urgent program aimed at achieving water efficiency, and then super efficiency, across industries and households.
In the first instance, each round table should set and timetable targets for future household water consumption. This should be followed by a commitment to the following measures:
legislating for mandatory auditing and •reporting on water use by business and industry
developing guidelines for use by industry, •government agencies and local government that encourage and assist them to significantly expand their use of of recycled water
legislating for mandatory fitting of key water-•saving technologies in all new households and businesses - including, but not limited to: dual-flush toilets; certified water-efficient showerheads; the fitting of ‘dead space’ water-saving valves and pressure-reduction valves;
the installation of 2000–5000 L domestic water tanks, with larger-capacity tanks for industry; and local, industrial-scale water-treatment and recycling technology.
substantially expanding rebates and incentives •to assist water users to become more water efficient.
creating and resourcing the capacity for •government-owned water retailers to drive retrofitting programs.
guaranteeing appropriate financial •arrangements to assist people on low and fixed incomes to pay for retrofitting.
introducing new regulations requiring •mandatory fitting and inspection of water-saving technologies in properties coming on to the market for resale.
instituting programs to officially recognise and •commend water-efficiency achievements by households and businesses.
After detailing the possibilities, the round table would enter into a formal bipartisan agreement, which would be broadcast to the community and provide details of proposed actions and the means for reaching specific goals.
This is entirely an issue about priorities and what is in the long-term interest of citizens, communities and society generally. And should there be any doubt about the capacity to make serious investments in water-efficient cities and suburbs, the Victorian Auditor General estimated
All water authorities and water •retailers are owned by state and territory governments. each is required to pay a public dividend to its government each year. Hundreds of millions of dollars in revenue is received in this way.
Across Australia, there are more than •7.7 million residences.8
In an average year, an average •household on Sydney’s North Shore uses 2.7 million L of embodied water. Half of this is the water that has been used to grow the food that is consumed. The rest is embodied in goods such as clothing, furniture and motor vehicles.9
every day in Australia about 450 new •residences are added to the nation’s stock of housing.10 Very few are water efficient.
that the staging of the 2006 Commonwealth Games in Melbourne involved government outlays of $1.14 billion.11
IMPrOVE IrrIGATION EFFICIENCy IN ThE MUrrAy-DArlING BASIN Maintaining agricultural production in the Murray-Darling Basin is a critical issue for Australia. However, irrigation in the basin must become an environmentally sustainable activity. As outlined in the Big Picture section on agriculture, the Murray-Darling Basin Commission was advised in 2002 that four main actions are required to ensure this:12
Action 1Major changes to irrigation practices are required throughout the basin.
At least half of all irrigators need to move to current best practice. Achieving this will require significant inputs by governments, farmer organisations and private consultants into initiatives such as farmer education, TAFE courses, online education services, advisory services, mentoring, field days, farm tours, demonstration activities and research.
Action 2Training needs to be made available in the use of state-of-the-art irrigation technology.
Incentives should be offered to encourage irrigators to adopt new technologies (involving the use of things such as modern water-metering
reduce water usePeOPLe & gOVeRNMeNT
Rapid improvements in water efficiency ... we become a nation of super-efficient water users
Victorian Women’s Trust - Our Water Mark 147
Australia’s first large-scale desalination plant has now been built at a cost of $400 million. The plant itself is solar powered, although the water distribution will use conventional coal-fired power. Located at Kwinana, the plant’s operation is now being trialled but it should eventually supply Perth with 45 GL per day. A second desalination plant in Western Australia is also under consideration.
Currently, the volumes of stored water to supply Sydney, Melbourne and Brisbane are at very low levels. Governments are coming under sustained pressure on the issue of water supplies. The new buzz word is ‘desal’. Many people seem to think that desalination is the answer. The NSW government has identified a site and is evaluating a possible desalination project. The premiers of Victoria and Queensland each say that their governments will consider the desalination option.
There are three important issues to consider here. Firstly, bearing in mind that Australians are among the largest domestic water users on Earth (and our ecological footprint is also one of the largest), it’s irresponsible to perpetuate an expectation among our urban populations that water supply can, and should, be endlessly increased to satisfy our high levels of consumption. Secondly, desalination should be seen as an option of last resort. Desalination plants are very expensive to construct and require large energy inputs to operate and distribute the desalinated water. The debate
should refocus instead on a strategic approach to implementing desalination technology.
The case for desalination is best made in relation to securing Adelaide’s water future. Adelaide is already more water efficient than other capitals. Rates of recycling and domestic use of rainwater tanks are the highest in Australia. City and suburban planning regulations are very advanced in their focus on water saving and water efficiency. Despite these efforts, the city still faces serious water problems.
Adelaide gets most of its potable water from the Murray-Darling system. While the population of South Australia is only expected to grow by around 8% by 2050, the state faces declining water availability and a rise in salt concentrations which will eventually pose a health risk. In addition, the city has relatively low-volume water storages available to it.
The Commonwealth Government should provide leadership on this issue by directing significant capital to South Australia over the next 20 years to allow it to invest in desalination technology. The overall aim would be to achieve the capacity to generate 150 GL of potable water per year.
A NATIONAl rIPArIAN VEGETATION PrOGrAMThere is a very important opportunity available to make a positive contribution to the health of our rivers and streams
by setting up a national program to re-establish riparian vegetation along every river and stream in rural Australia. The goal should be to establish 100 metre-wide strips by 2050.
Across rural Australia, there are thousand of kilometres of stream and riverside frontages presently used as farmland. While most of this land is privately owned, an appreciable area is Crown land. Management of this land is the responsibility of state governments. In many cases, the Crown land is occupied under an annual licence, with the land user being required to erect and maintain fencing along the length of the frontage. Some river and streamside frontages are occupied under leases, and in most cases the width of existing riparian strips is close to 20 metres, (although a small number are wider, at up to 140 metres).
Often, the inspection of fences has been patchy and they have fallen into disrepair. Stock have been allowed to graze right to the water’s edge. As a consequence, there are now serious degradation issues concerning our freshwater aquatic ecosystems and reduced water quality in many streams, rivers and lakes.
The long-term gains resulting from a national riparian vegetation program would be considerable, including:
significant improvements in water quality•
reduce water usePeOPLe & gOVeRNMeNT
devices, moisture and salinity probes and online weather information and satellite imagery).
Action 3A basin-wide program is needed to refurbish irrigation infrastructure.
The result would be reduced water losses via leakage and evaporation.
Action 4Accelerated policy development is needed.
This is a prerequisite to consolidating gains in water efficiency. It would mean according a high priority to the proposed National Inquiry into Water Pricing and an assessment of existing water-trading rules and regulations.
STrATEGIC MOVES TOWArDS DESAlINATIONDesalination is the only technology available at present that can produce potable water using a non-freshwater source. Worldwide, there is increasing interest in the possibility of adding desalination to existing water-supply systems. Greater interest is being shown in locations where average rainfall is either very low or highly variable, and where the population is sufficiently wealthy to find the necessary capital and meet running costs. While it’s now possible to power a large plant using electricity from a renewable resource (solar energy), large amounts of energy are required to lift the water to storages because plants are located close to sea level.

Rapid improvements in water efficiency ... we become a nation of super-efficient water users
148 Victorian Women’s Trust - Our Water Mark
reduced chemical loads and salt leaching into •rivers and streams
reduced salinity risk close to many rivers and •streams
significant increases in vegetation cover across •rural Australia
creation of major wildlife corridors providing •habitat, as well as protected pathways, for native animals to move and redistribute as local climate zones are reset
major improvements in the distribution and •abundance of a wide range of terrestrial and aquatic fauna and native fauna
establishment of a major carbon sink to trap •atmospheric carbon dioxide
increases in farm property values.•
This national program would require agreement and co-operation between the states so that the required width of strip could be progressively introduced. Promotional campaigns and consultation with landholders would be a significant feature of such a program. The costs of refencing, vermin and noxious weed control and the removal of exotic trees would be shared by the program and the landowner. The program might also attract external funds from sources such as ethical investment funds. Responsibility for program management could be placed with current catchment management authorities (where these exist) and Landcare groups.
In some parts of Australia, re-establishing vegetated riparian strips could involve Crown land, as well as private land that could be brought into the scheme either through voluntary land purchase or by agreement. In Victoria, for example, leases on streamside and river frontages come up for review in 2009. Data held by the Victorian environment assessment commissioner indicates that nearly 92 000 ha is Crown land, along approximately 46 000 km of water frontage.13
As revegetation progressed, a significant increase in tree cover would result, providing major opportunities with regard to proposed carbon-dioxide emission trading.
A 50-yEAr INVESTMENT WATEr BONDA national program to increase water efficiency, and then achieve super efficiency, will require significant expenditure. It may be that expenditure in the next 20 to 25 years will need to be in the region of at least $50 billion. Substantial investment, by both government and the private sector, will clearly be required. It’s not as though we can’t afford this level of expenditure: the ANZ Bank’s chief economist, Saul Eslake, estimates that total government ‘giveaways’ in the two successive federal budgets of 2004 and 2005 amounted to $103 billion over four years!14 Perhaps the electorate could make a choice between receiving personal tax cuts or seeing the money deployed instead in programs aimed at repairing our environment and achieving water efficiency.
A number of specific initiatives could be funded, in whole or in part, through forms of ethical investment. A vehicle for this kind of investment could be a long-term water bond. Bond holders would be offered a defined return on their investment; trustees would place investments in the marketplace and the differential return would be directed towards prescribed ethical investments.
The Commonwealth Government should encourage the establishment of a 50-year investment water bond. Trustees for bond holders would manage investment projects, such as the revegetation of riparian zones or the purchase, restoration and revegetation of degraded agricultural land.
As part of the process for establishing this bond, the Commonwealth Government should encourage the finance industry to host a conference attended by government representatives, industry members and interested community organisations to examine the feasibility of the project.
A SECUrE FOOTING FOr IrrIGATION COMMUNITIESWe all depend on our irrigation industries to feed us. Yet there are now problems with water security and some forms of land use. These developments, combined with competition from imports, the operation of managed investment schemes, and the introduction of permanent water trading are placing these industries, and the people involved, under great pressure.
reduce water usePeOPLe & gOVeRNMeNT
In the past eight years, 15% of Merbein’s water rights have been sold out of the district – the second-largest percentage loss of any district in the state. As water rights leave, money and people follow. Locals estimate that about 50 farmers have left the land in that time, leaving ghost properties.
Unpicked grapes hang stunted and withered on dead vines overrun by weeds. ‘For Sale’ signs stand outside countless properties … Merbein real estate agent Roger Walder says that once a farm’s water right is traded away, the farm is next to worthless. “Nobody will buy it, it just sits there. It’s nothing but a horse paddock.” There are flow-on effects. In Merbein’s main street, half the shops are empty.Dan Silkstone and Orietta Guerrera, ‘Beneath dry blue skies, growers fear the worst …’, the Age, 21 April 2007, pp. 6–7.
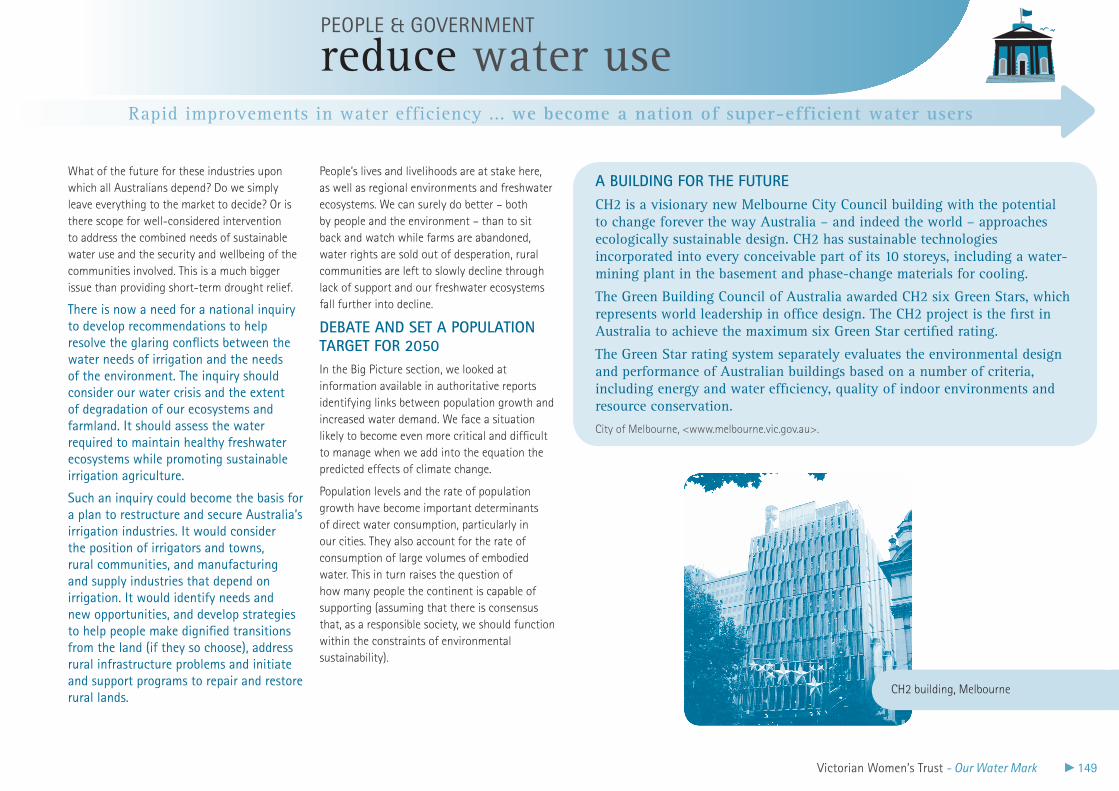
Rapid improvements in water efficiency ... we become a nation of super-efficient water users
Victorian Women’s Trust - Our Water Mark 149
People’s lives and livelihoods are at stake here, as well as regional environments and freshwater ecosystems. We can surely do better – both by people and the environment – than to sit back and watch while farms are abandoned, water rights are sold out of desperation, rural communities are left to slowly decline through lack of support and our freshwater ecosystems fall further into decline.
DEBATE AND SET A POPUlATION TArGET FOr 2050In the Big Picture section, we looked at information available in authoritative reports identifying links between population growth and increased water demand. We face a situation likely to become even more critical and difficult to manage when we add into the equation the predicted effects of climate change.
Population levels and the rate of population growth have become important determinants of direct water consumption, particularly in our cities. They also account for the rate of consumption of large volumes of embodied water. This in turn raises the question of how many people the continent is capable of supporting (assuming that there is consensus that, as a responsible society, we should function within the constraints of environmental sustainability).
reduce water usePeOPLe & gOVeRNMeNT
What of the future for these industries upon which all Australians depend? Do we simply leave everything to the market to decide? Or is there scope for well-considered intervention to address the combined needs of sustainable water use and the security and wellbeing of the communities involved. This is a much bigger issue than providing short-term drought relief.
There is now a need for a national inquiry to develop recommendations to help resolve the glaring conflicts between the water needs of irrigation and the needs of the environment. The inquiry should consider our water crisis and the extent of degradation of our ecosystems and farmland. It should assess the water required to maintain healthy freshwater ecosystems while promoting sustainable irrigation agriculture.
Such an inquiry could become the basis for a plan to restructure and secure Australia’s irrigation industries. It would consider the position of irrigators and towns, rural communities, and manufacturing and supply industries that depend on irrigation. It would identify needs and new opportunities, and develop strategies to help people make dignified transitions from the land (if they so choose), address rural infrastructure problems and initiate and support programs to repair and restore rural lands.
A BUIlDING FOr ThE FUTUrECH2 is a visionary new Melbourne City Council building with the potential to change forever the way Australia – and indeed the world – approaches ecologically sustainable design. CH2 has sustainable technologies incorporated into every conceivable part of its 10 storeys, including a water-mining plant in the basement and phase-change materials for cooling.
The Green Building Council of Australia awarded CH2 six Green Stars, which represents world leadership in office design. The CH2 project is the first in Australia to achieve the maximum six Green Star certified rating.
The Green Star rating system separately evaluates the environmental design and performance of Australian buildings based on a number of criteria, including energy and water efficiency, quality of indoor environments and resource conservation.
City of Melbourne, <www.melbourne.vic.gov.au>.
CH2 building, Melbourne
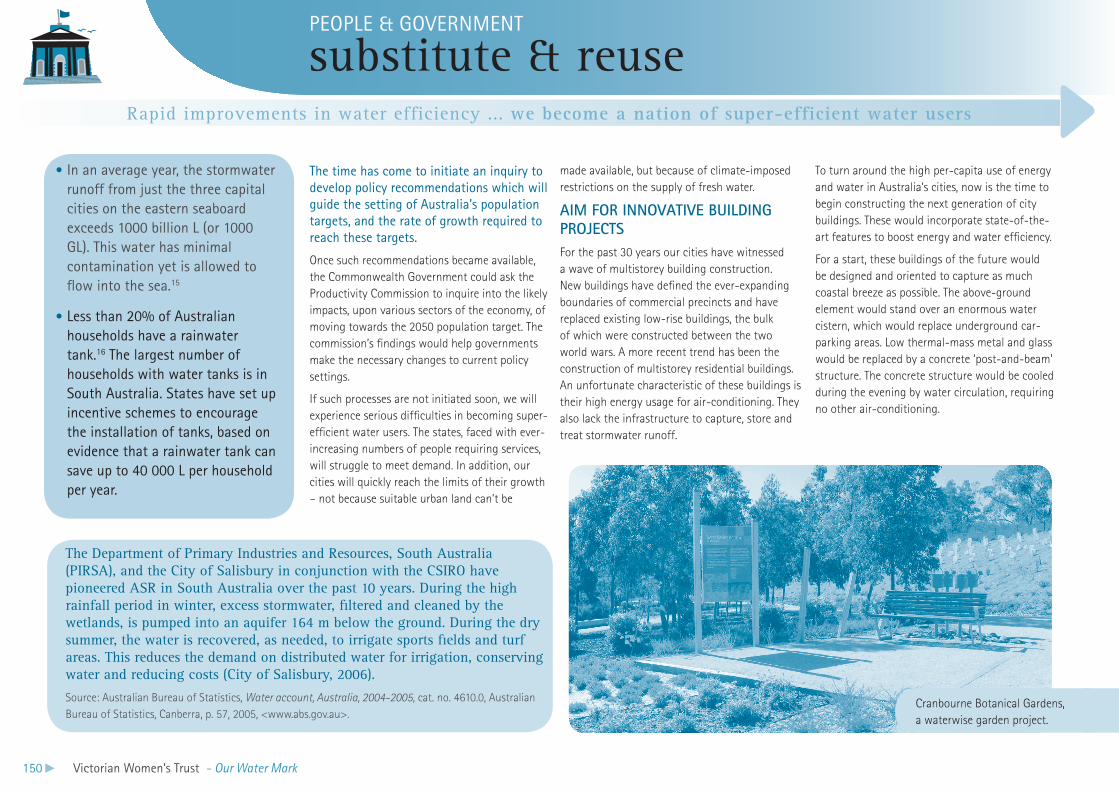
Rapid improvements in water efficiency ... we become a nation of super-efficient water users
150 Victorian Women’s Trust - Our Water Mark
The time has come to initiate an inquiry to develop policy recommendations which will guide the setting of Australia’s population targets, and the rate of growth required to reach these targets.
Once such recommendations became available, the Commonwealth Government could ask the Productivity Commission to inquire into the likely impacts, upon various sectors of the economy, of moving towards the 2050 population target. The commission’s findings would help governments make the necessary changes to current policy settings.
If such processes are not initiated soon, we will experience serious difficulties in becoming super-efficient water users. The states, faced with ever-increasing numbers of people requiring services, will struggle to meet demand. In addition, our cities will quickly reach the limits of their growth – not because suitable urban land can’t be
made available, but because of climate-imposed restrictions on the supply of fresh water.
AIM FOr INNOVATIVE BUIlDING PrOJECTS For the past 30 years our cities have witnessed a wave of multistorey building construction. New buildings have defined the ever-expanding boundaries of commercial precincts and have replaced existing low-rise buildings, the bulk of which were constructed between the two world wars. A more recent trend has been the construction of multistorey residential buildings. An unfortunate characteristic of these buildings is their high energy usage for air-conditioning. They also lack the infrastructure to capture, store and treat stormwater runoff.
In an average year, the stormwater •runoff from just the three capital cities on the eastern seaboard exceeds 1000 billion L (or 1000 gL). This water has minimal contamination yet is allowed to flow into the sea.15
Less than 20% of Australian •households have a rainwater tank.16 The largest number of households with water tanks is in South Australia. States have set up incentive schemes to encourage the installation of tanks, based on evidence that a rainwater tank can save up to 40 000 L per household per year.
To turn around the high per-capita use of energy and water in Australia’s cities, now is the time to begin constructing the next generation of city buildings. These would incorporate state-of-the-art features to boost energy and water efficiency.
For a start, these buildings of the future would be designed and oriented to capture as much coastal breeze as possible. The above-ground element would stand over an enormous water cistern, which would replace underground car-parking areas. Low thermal-mass metal and glass would be replaced by a concrete ‘post-and-beam’ structure. The concrete structure would be cooled during the evening by water circulation, requiring no other air-conditioning.
substitute & reusePeOPLe & gOVeRNMeNT
The Department of Primary Industries and Resources, South Australia (PIRSA), and the City of Salisbury in conjunction with the CSIRO have pioneered ASR in South Australia over the past 10 years. During the high rainfall period in winter, excess stormwater, filtered and cleaned by the wetlands, is pumped into an aquifer 164 m below the ground. During the dry summer, the water is recovered, as needed, to irrigate sports fields and turf areas. This reduces the demand on distributed water for irrigation, conserving water and reducing costs (City of Salisbury, 2006).
Source: Australian Bureau of Statistics, Water account, Australia, 2004-2005, cat. no. 4610.0, Australian Bureau of Statistics, Canberra, p. 57, 2005, <www.abs.gov.au>.
Cranbourne Botanical Gardens, a waterwise garden project.
Rapid improvements in water efficiency ... we become a nation of super-efficient water users
Victorian Women’s Trust - Our Water Mark 151
PeOPLe & gOVeRNMeNT
general reference
BrINDABEllA BUSINESS PArk, CANBErrAAll water used for irrigation at Brindabella Business Park (and the entire airport precinct) is either recycled or is rainwater or non-potable groundwater. Since switching to this system, Canberra International Airport has not had to draw on the ACT’s potable water supply for irrigation. In addition, a low water-use/high-efficiency system has been designed for 8 Brindabella Circuit. This consists of local drippers and in-soil wetting blankets.
Water sub-meters featuring leak-detection systems are installed on all water uses in the building, including cooling towers. In unmonitored buildings, water leakages typically account for 25% of water consumption.
The office building at 8 Brindabella Circuit saves 687 000 L of water a year compared with a standard building of similar size. That is, the water-efficient devices installed lead to a 43% reduction in water consumption.
Water-efficient devices include water-free urinals, hands-free taps, 3/6 L dual-flush toilets and 5A rated showerheads.
In addition to these water savings, the water-efficient devices employed throughout 8 Brindabella Circuit lead to a 36% reduction in emissions to the sewer.
Sources: Canberra International Airport, viewed 22 March 2007, <http://www.brindabellabusinesspark.com.au > Sustainability>.
rEFErENCESAustralian Electoral Commission website: <www.aec.gov.au>.1.
Figures calculated from state and territory government 2.
websites.
Australian Bureau of Statistics, 3. Year book Australia, 2007, cat. no. 1301.0, ABS, Canberra, 2007, p. 68.
Australian Local Governance Association, <www.alga.asn.au>.4.
Waterfix Program of Sydney Water is one example, <www.5.
sydneywater.com.au>.
Water Efficency Labelling Scheme, <www.waterrating.gov.au>.6.
C Hollier, M Reid & J Francis, Department of Sustainability and 7.
the Environment & Department of Primary Industries, Driver Research Phase, Background report no. 4, Understanding drivers of land use change associated with life style farms, , DPI, Victoria, 2004.
Australian Bureau of Statistics, 8. Year book, Australia, 2007, cat. no. 1301.0, ABS, Canberra, 2007, p. 222.
M Lenzen, ‘The influence of lifestyles on environmental 9.
pressure’, Year book, Australia, 2002, cat. no.1301.0, ABS, Canberra, 2002.
Australian Bureau of Statistics, ‘What drives housing?’ 10. Year book, Australia, 2002, cat. no. 1301.0, ABS, Canberra, 2002.
Auditor-General Victoria, ‘Melbourne 2006 Commonwealth 11.
Games – Special Purpose Financial Statements‘, Auditor General’s report on the annual financial report of the state of Victoria, 2005–06, VAGO, Melbourne, section 4.3.1.
DH White, N Beynon & O Kingma, ‘Identifying opportunities for 12.
achieving water savings throughout the Murray–Darling Basin’, Environmental Modelling and Software, vol. 21, issue 7, July 2006, pp. 1019–20.
ABC Television, ‘The Enviro Save Water System’, 13. The New Inventors, 2005, <www.enviro.net.au>.
Land Conservation Council of Victoria, 14. Statewide assessment of public land use, Land Conservation Council, Melbourne, 1988, pp. 70–80.
Saul Eslake,15. Initial assessment of the 2005-06 federal budget, 10 May 2005 ,<www.anz.com/Business/info_centre/economic_commentary/Federal_Budget/Post-Budget_2005>.
Water Services Association of Australia, 16. Testing the water, WSAA position paper 01, Water Services Association of Australia, Melbourne, October, 2006, p. 14.
Australian Bureau of Statistics, 17. Water account, Australia, 2000-01, cat no. 4610.0, ABS, Canberra, 2004.
Some other useful sourcesM Rayner, • Rooting democracy: growing the society we want, Allen & Unwin, NSW, 1997.
Cranbourne Botanical Gardens, a waterwise garden project.
152 Victorian Women’s Trust - Our Water Mark
The public release of this document, Our Water Mark, signals a new phase in the way people can engage in meaningful water reform in Australia.
People usually wear several different hats: as individuals; members of families and households; employers and employees; volunteers; sports coaches or players; members of school councils or local organisations, professional associations and so on. Given the many domains we all interact with, we have an enormous capacity to trigger change and make a difference on big issues.
Working in with others can make this even easier. The small groups of friends and acquaintances who came together during the Watermark Project found there were lots of benefits in learning and discussing together. You could start just by getting a group of friends, or family members together and working your way through this document, discussing it’s different parts and deepening your understanding of water. Maybe you could initiate such a group in your workplace. If you decide to do so, contact the Watermark Australia team and we can provide you with multiple copies and other support materials.
In another way of enabling change, from the time Our Water Mark is released, the team at the Victorian Women’s Trust will set up a simple process whereby people can be connected with others on water matters. This will make it possible to share ideas, experiences and strategies.
So, after reading Our Water Mark, if you wish to endorse its goal and principles, you can do so by registering your support for the Watermark Australia Project online. Along with this declaration of support you might decide to take a significant step – or indeed several steps – either by yourself or within your community, to achieve real water efficiency within the next year or so.
When goals are achieved, you can report this online. Remember that experience is a great teacher. By sharing our experiences with others we can learn from one another, avoid pitfalls and save valuable time and effort. Your story can inspire others to change and build vital community momentum. Together we can bring about real change!
Watermark Australia: (03) 96420422 Email: [email protected]
3 I would like to endorse the goal and principles of Our Water Mark.
3 Over the next 12 months I intend to take significant action, either by myself or within my community, that will lead to greater water efficiency and help Australia become a nation of super-efficient water users.
3 I would love to report my achievements to others to help build much-needed community momentum around water reform.
3 I intend to register with the online team at www.watermarkaustralia.org.au and be part of a wider community engagement in water reform.
momentum
PART FOUR
buildingcommunity
Never doubt that a small group of thoughtful, committed citizens can change the world. Indeed it is the only thing that ever has.Margaret Mead, US anthropologist, 1901–1978
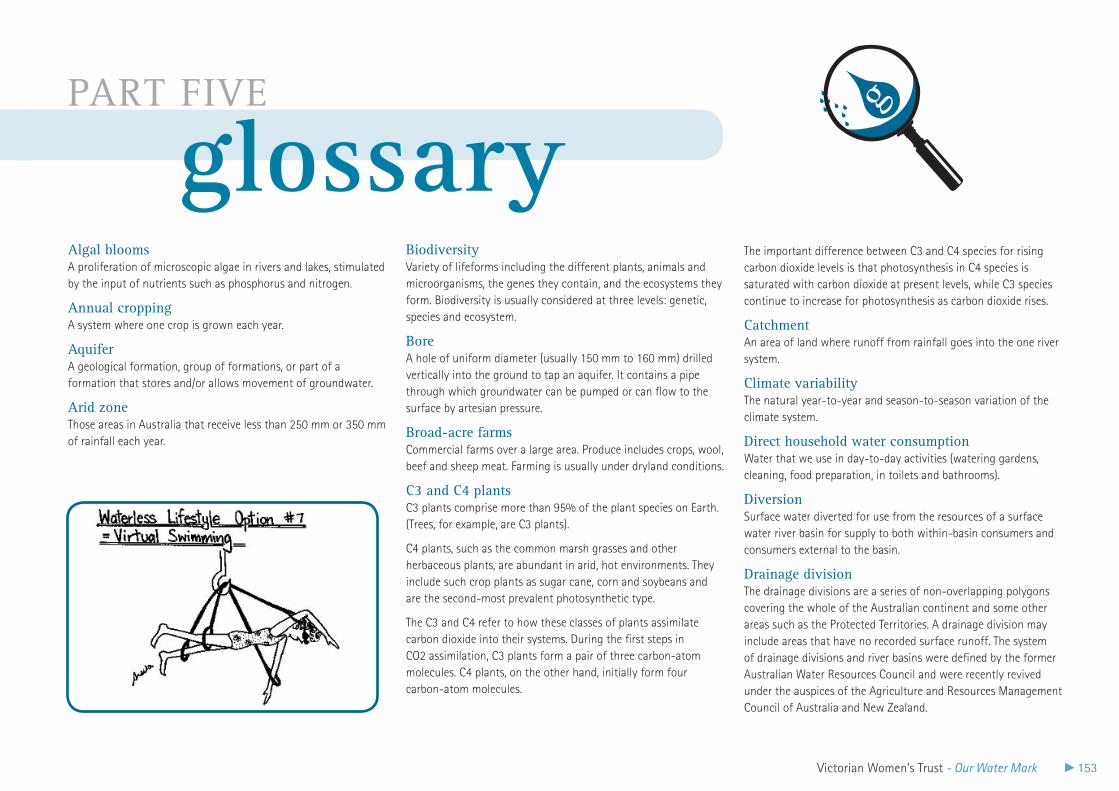
Victorian Women’s Trust - Our Water Mark 153
momentum
Algal blooms A proliferation of microscopic algae in rivers and lakes, stimulated by the input of nutrients such as phosphorus and nitrogen.
Annual cropping A system where one crop is grown each year.
Aquifer A geological formation, group of formations, or part of a formation that stores and/or allows movement of groundwater.
Arid zone Those areas in Australia that receive less than 250 mm or 350 mm of rainfall each year.
Biodiversity Variety of lifeforms including the different plants, animals and microorganisms, the genes they contain, and the ecosystems they form. Biodiversity is usually considered at three levels: genetic, species and ecosystem.
Bore A hole of uniform diameter (usually 150 mm to 160 mm) drilled vertically into the ground to tap an aquifer. It contains a pipe through which groundwater can be pumped or can flow to the surface by artesian pressure.
Broad-acre farms Commercial farms over a large area. Produce includes crops, wool, beef and sheep meat. Farming is usually under dryland conditions.
C3 and C4 plants C3 plants comprise more than 95% of the plant species on Earth. (Trees, for example, are C3 plants).
C4 plants, such as the common marsh grasses and other herbaceous plants, are abundant in arid, hot environments. They include such crop plants as sugar cane, corn and soybeans and are the second-most prevalent photosynthetic type.
The C3 and C4 refer to how these classes of plants assimilate carbon dioxide into their systems. During the first steps in CO2 assimilation, C3 plants form a pair of three carbon-atom molecules. C4 plants, on the other hand, initially form four carbon-atom molecules.
The important difference between C3 and C4 species for rising carbon dioxide levels is that photosynthesis in C4 species is saturated with carbon dioxide at present levels, while C3 species continue to increase for photosynthesis as carbon dioxide rises.
Catchment An area of land where runoff from rainfall goes into the one river system.
Climate variability The natural year-to-year and season-to-season variation of the climate system.
Direct household water consumption Water that we use in day-to-day activities (watering gardens, cleaning, food preparation, in toilets and bathrooms).
Diversion Surface water diverted for use from the resources of a surface water river basin for supply to both within-basin consumers and consumers external to the basin.
Drainage division The drainage divisions are a series of non-overlapping polygons covering the whole of the Australian continent and some other areas such as the Protected Territories. A drainage division may include areas that have no recorded surface runoff. The system of drainage divisions and river basins were defined by the former Australian Water Resources Council and were recently revived under the auspices of the Agriculture and Resources Management Council of Australia and New Zealand.
PART FIVE g
glossary
154 Victorian Women’s Trust - Our Water Mark
Dryland salinity The accumulation of salts in soils, soil water and groundwater. This can be a natural phenomenon, but it can also be caused by clearing of native vegetation. Dryland salinity differs, in origin, from wetland (irrigation) salinity.
Ecosystem A community of organisms, interacting with each other, plus the environment in which they live and with which they also interact (examples are a pond or forest).
Environmental flows River flows allocated for the maintenance of aquatic and riparian systems.
Environmental water requirements Description of the flow regimes (e.g. volume, timing, seasonality, and duration) needed to sustain the ecological values of aquatic ecosystems including their processes and biological diversity.
Evaporation The process of water changing from a liquid to a vapour.
External water footprint This is the water used in other countries to grow food and produce goods that we then import.
Gigalitre (GL) 1000 megalitres.
Greywater Water that has not been contaminated by toilet and industrial discharge. It includes water from bathtubs, dishwashing machines and clothes washing machines, as well as water from commercial laundries and carwashes.
Groundwater Water occurring below the ground surface.
Groundwater management unit A hydraulically connected groundwater system that is defined and recognised by state and territory agencies. This definition allows for management of the groundwater resource at an appropriate scale at which resource issues and intensity of use can be incorporated into local groundwater management practices.
Hydrology The scientific study of water both on and below the surface, including the geographical distributin of such water.
Internal water footprint This is made up of the individual’s direct water consumption, plus all of the water that is used in domestic activities.
Megalitre (ML) 1000 000 litres
Mean annual flow The average annual streamflow passing a specified point on a stream.
Mean annual runoff The streamflow generated as a result of direct precipitation on the area of interest.
Potable Water suitable for drinking.
Pressure In confined aquifers (those under a confining layer) the groundwater is stored under pressure. When it is intercepted (e.g. by a bore) the groundwater rises under pressure to a level above the top of the aquifer.
Recharge Rainfall that moves through the soil, beyond the roots of plants, to replenish the aquifer.
Recycled water Water derived from sewerage systems, or industry processes, that is treated to a standard that is appropriate for its intended use.
Riparian zone Vegetated corridor along streams and rivers.
Salinity The total amount of water-soluble salts present in a soil horizon.
Semi-arid zone Lands where rainfall is too low and unreliable for crops to be grown with certainty.
gPART FIVE
glossaryPART FIVE
glossary
Victorian Women’s Trust - Our Water Mark 155
Sewage Urine, faeces and other wastes disposed of in toilets into a sewerage system.
Sewerage A physical arrangement of pipes and plant for the collection, removal, treatment and disposal of liquid waste.
Siltation Deposition of sediments from water in channels, reservoirs and harbours.
Surface runoff The proportion of rainfall that is not immediately absorbed by the soil and thus flows across the surface.
Surface-water management area Areas defined by the state and territory water-management agencies for the purposes of reporting on surface-water resources. The boundaries of the reporting units commonly coincide with the Australian Water Resources Council river basins. In a number of cases the reporting units represent subdivisions of these river basins.
Third pipe systems/dual reticulation Systems used to supply recycled water for uses such as garden watering and toilet flushing.
Transpiration The process by which water absorbed by plants, usually through the roots, is evaporated into the atmosphere from the plant surface, principally from the leaves.
Turbidity In relation to water, a measure of the concentration of particulate particles.
Water cycle The cyclic sequence of events by which water moves from the land and sea to the atmosphere, then back to the Earth’s surface as precipitation, returning to the atmosphere or oceans as evapotranspiration, runoff or groundwater flow.
Water footprint A person’s water footprint is all of the water that the person requires to live and carry out activities in an average year. The water footprint has an internal and an external component.
Water Intensity Water intensity refers to the water consumed per square metre of space.
Water table The water table is the upper surface of groundwater. The soil profile is fully saturated below the water table and unsaturated above it.
Water use This refers to the water that is not directly consumed. It is the water required to grow our food and produce manufactured goods. This water is embodied in the food and goods that we purchase.
gPART FIVE
glossaryThis glossary has been sourced from
the following:
National Land and Water Resources Audit, • Australian water resources assessment 2000, NLWRA, Canberra, 2001.
Victorian Government White Paper, • Securing our water future together, 2004.
D Smith, • Water in Australia, Oxford University Press, Australia, 1998.

156 Victorian Women’s Trust - Our Water Mark
acknowledgements
This document, Our Water Mark, has been a long time coming! It has grown out of the Watermark Australia Project that has been running for the past five years.
There are many people we wish to acknowledge.
Independent fundingFunding from members of the broader community enabled us to be independent and unconstrained by government grant or corporate sponsorship.
We would not have been able to start the project without two early grants and the support of Charles Lane and Helen Morris from The Myer Foundation. For making it possible for the project to evolve into a large-scale operation, we must thank our private donors who gave generous financial donations. The fact that most of these are women is testimony to women’s understanding of the urgent need for community engagement on the water issue.
Our first donor was Helen Handbury, who died on the same day we were conducting a Watermark Australia information meeting in her home town. We also thank Jane Abercrombie,
Jo Baevski, Bindy Gross, Geoff Handbury AO, Hilary Irwin and Dame Elisabeth Murdoch AC, DBE. Two of our major donors prefer to remain private. We are as indebted to them as we are to the others.
Organisational supportSix years ago some people thought it odd for a women’s organisation to be ‘doing’ a water project, and said as much. The board of directors of the Victorian Women’s Trust and its convenor, backed the idea from the very beginning and lent great support to the project as it unfolded and made significant demands on the organisation: Dur-e Dara (convenor), Diana Batzias, Nicky Friedman, Dr Melanie Heenan, Alana Johnston, Debra Knight, Professor Marilyn Lake, Melba Marginson, Leanne Miller, Teresa Tjia.
The staff at the Victorian Women’s Trust have consistently been supportive and helpful throughout the life of the project. Particular thanks are due to Sarah Capper, Lieu Le and Wilfredo Zelada.
Individual championsWe enlisted many women and men to act as champions for the project, spreading the word and supporting us in practical ways. They were Rosanna Baini, Tracy Bartram, John Butler, Dur-e Dara, Christine Forster, Lynne Haultain, Kate Herd, Nazra Ibrahim, Natalie Jamieson, Alana Johnson, Harvey Jones, Professor Sam Lake, Glenn Manton, Kavisha Mazzella, Leanne Miller, Emeritus Professor Nancy Millis, Dr Greg Moore, Frank Ryan, Teresa Tjia, Jean Tom, Graeme Wise and Arron Wood.
Group Convenor leadershipThe process of people coming together at the local level to engage in discussions about water would not have been possible without the interest and commitment of several hundred group convenors. We thank them for their leadership, for taking initiative, for ensuring that group reports came back to the Watermark team and for enabling others to participate in this unique community process.
Special thanks to the following Watermark convenors and group participants for all their efforts in providing detailed feedback on the draft document:
Rachel Bathgate, Terry Brain, Harvey Champness, Catherine Cockayne, Joan Datsun, Jim Dolkas, Anita Hannaford, Anne Longmire, Cathy McCallum, Colleen McCombe, Jenni Mitchell, Andrew Mountford, Glenice Paulsen, Lisa Rasmussen, Rachel Sheppard, Anne Stelling, Anne Thorogood, Peter Vine, Chris and Jan Watson.
Our group of six comprised a farmer, personal assistant, community health nurse, artist/yoga instructor, retired retailer and social worker. We want to thank you for providing us with the opportunity to be involved in such a worthwhile project. At times we found that it challenged our beliefs, and at other times we found it heavy going, but it was never boring and we have learnt so much about the numerous issues that surround the care, maintenance and distribution of water and our dependence on it.
Shepparton Watermark Australia group
Victorian Women’s Trust - Our Water Mark 157
Group participant involvementAs the list of postcodes shows, we were lucky to have groups spring up all over Victoria and in other states, too. We thank the several thousand women and men who participated in these groups and gave of their wisdom and experience.
Initial project reference groupWayne Chamley
Judy Coull
Mary Crooks (chair)
Dur-e Dara
Alana Johnson
Pat Milthorpe
Jenni Mitchell
Leanne Pleash
Rose Read
Lyn Wilks
Initial project refereeProfessor Peter Cullen
Partner supportA number of organisations provided us with practical support – mostly in the form of publicising the Watermark Australia Project through their organisations and community networks. They are as follows: the Adidem Group (The Body Shop and Accessorize); the Victorian Department of Sustainability and Environment; the Victorian Local Governance Association; the Cities of Darebin, Whitehorse and Yarra, City West Water,
Coliban Water; Melbourne Water; South East Water; Western Water; Yarra Valley Water; the National Museum of Victoria; The Commission for Mission; the National Australia Bank; Green Canary; Futureye and Plan Book Travel.
Special thanks go to Sylvia Admans and the Foundation for Rural and Regional Renewal. (FRRR)
Volunteer and student supportWe were lucky to have several talented and committed people volunteer their time with the project. Thanks to Glen Evans, Colleen McCombe, Susannah Raffe, Nurul Widyaningrum, Hilary Irwin, Susan Relf, Erik Zager and Sandy Forster.
Graphic designThe writing and production of this document has occurred in a frenetic period in which we wanted to incorporate design and formatting ideas simultaneously. We are indebted to Jacquie Moon for her creativity and diligence.
EditingThe document was edited by Francesca Coles with assistance from Victoria Harrison.
Serious comic touchFrom the outset we have had the pleasure of including Sheila Hollingsworth’s cartoons, especially commissioned by the team and always delivered voluntarily as part of her passion and interest in the topic and the project.
Web design and maintenanceFor building a personalised website and database we thank Consonant Pty Ltd, Leanne Pleash and Adam Dennis. We thank
Kim Olsen from Kaos Inc for maintaining the website during the final stages of the project.
Project launchesJo Baevski
Tracey Bartram
Dur-e Dara
Dr Graham Harris
Kate Herd
Lynne Hultain
Glen Manton
Patrice Newell
Frank Ryan
Scientific and technical supportSeveral people with an enormous combined scientific experience and wisdom allowed us to call on their intellectual resources at will. They all generously made the time to speak with us, meet with us and respond to written requests for help in processing complex issues and materials: Thanks to:
Professor Sam Lake
Professor John Langford
Emeritus Professor Nancy Millis
Professor John Williams
Out of our great respect for their professional capacities we stress that any perceived deficiencies in the text are ours alone!
acknowledgements
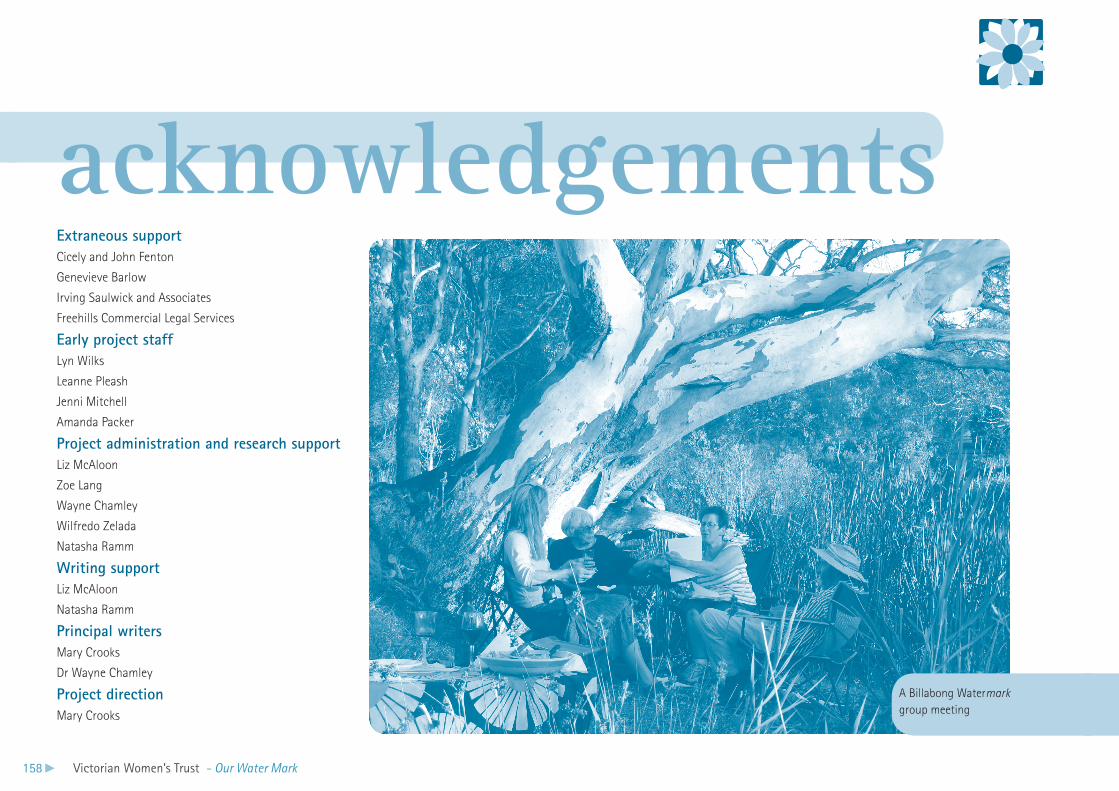
158 Victorian Women’s Trust - Our Water Mark
acknowledgementsExtraneous supportCicely and John Fenton
Genevieve Barlow
Irving Saulwick and Associates
Freehills Commercial Legal Services
Early project staffLyn Wilks
Leanne Pleash
Jenni Mitchell
Amanda Packer
Project administration and research supportLiz McAloon
Zoe Lang
Wayne Chamley
Wilfredo Zelada
Natasha Ramm
Writing supportLiz McAloon
Natasha Ramm
Principal writers Mary Crooks
Dr Wayne Chamley
Project directionMary Crooks
A Billabong Watermark group meeting
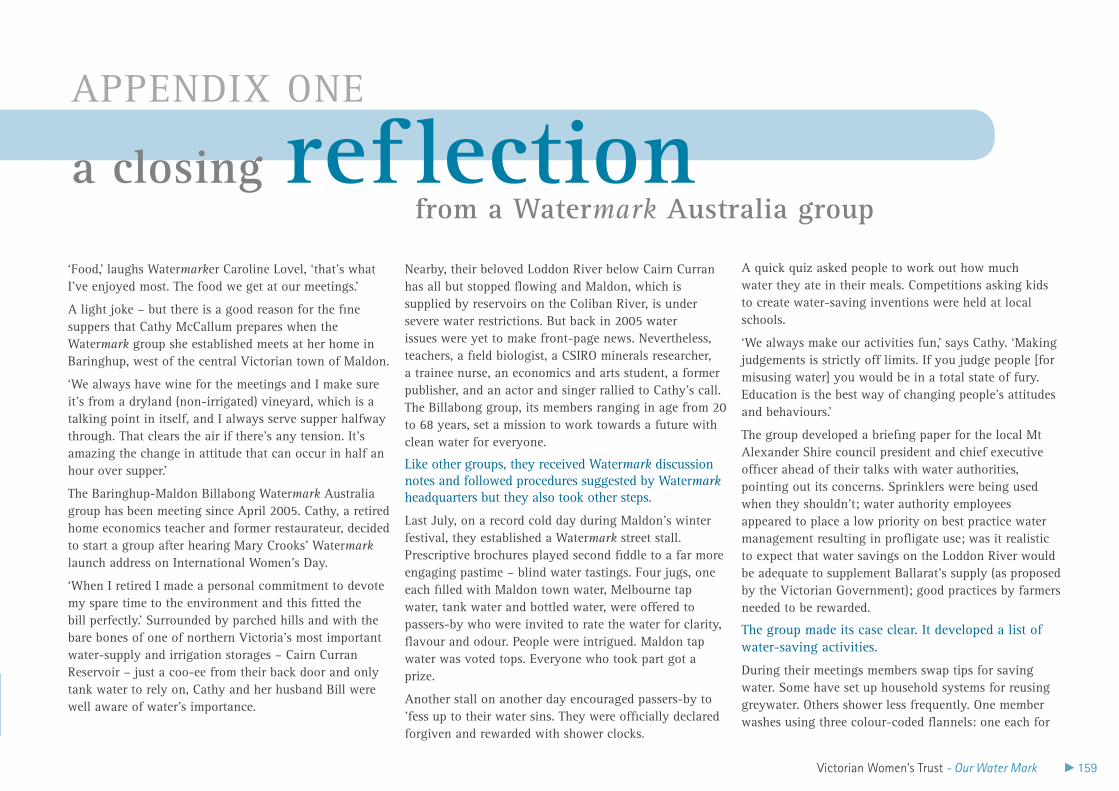
Victorian Women’s Trust - Our Water Mark 159
A Billabong Watermark group meeting
‘Food,’ laughs Watermarker Caroline Lovel, ‘that’s what I’ve enjoyed most. The food we get at our meetings.’
A light joke – but there is a good reason for the fine suppers that Cathy McCallum prepares when the Watermark group she established meets at her home in Baringhup, west of the central Victorian town of Maldon.
‘We always have wine for the meetings and I make sure it’s from a dryland (non-irrigated) vineyard, which is a talking point in itself, and I always serve supper halfway through. That clears the air if there’s any tension. It’s amazing the change in attitude that can occur in half an hour over supper.’
The Baringhup-Maldon Billabong Watermark Australia group has been meeting since April 2005. Cathy, a retired home economics teacher and former restaurateur, decided to start a group after hearing Mary Crooks’ Watermark launch address on International Women’s Day.
‘When I retired I made a personal commitment to devote my spare time to the environment and this fitted the bill perfectly.’ Surrounded by parched hills and with the bare bones of one of northern Victoria’s most important water-supply and irrigation storages – Cairn Curran Reservoir – just a coo-ee from their back door and only tank water to rely on, Cathy and her husband Bill were well aware of water’s importance.
Nearby, their beloved Loddon River below Cairn Curran has all but stopped flowing and Maldon, which is supplied by reservoirs on the Coliban River, is under severe water restrictions. But back in 2005 water issues were yet to make front-page news. Nevertheless, teachers, a field biologist, a CSIRO minerals researcher, a trainee nurse, an economics and arts student, a former publisher, and an actor and singer rallied to Cathy’s call. The Billabong group, its members ranging in age from 20 to 68 years, set a mission to work towards a future with clean water for everyone.
Like other groups, they received Watermark discussion notes and followed procedures suggested by Watermark headquarters but they also took other steps.
Last July, on a record cold day during Maldon’s winter festival, they established a Watermark street stall. Prescriptive brochures played second fiddle to a far more engaging pastime – blind water tastings. Four jugs, one each filled with Maldon town water, Melbourne tap water, tank water and bottled water, were offered to passers-by who were invited to rate the water for clarity, flavour and odour. People were intrigued. Maldon tap water was voted tops. Everyone who took part got a prize.
Another stall on another day encouraged passers-by to ’fess up to their water sins. They were officially declared forgiven and rewarded with shower clocks.
A quick quiz asked people to work out how much water they ate in their meals. Competitions asking kids to create water-saving inventions were held at local schools.
‘We always make our activities fun,’ says Cathy. ‘Making judgements is strictly off limits. If you judge people [for misusing water] you would be in a total state of fury. Education is the best way of changing people’s attitudes and behaviours.’
The group developed a briefing paper for the local Mt Alexander Shire council president and chief executive officer ahead of their talks with water authorities, pointing out its concerns. Sprinklers were being used when they shouldn’t; water authority employees appeared to place a low priority on best practice water management resulting in profligate use; was it realistic to expect that water savings on the Loddon River would be adequate to supplement Ballarat’s supply (as proposed by the Victorian Government); good practices by farmers needed to be rewarded.
The group made its case clear. It developed a list of water-saving activities.
During their meetings members swap tips for saving water. Some have set up household systems for reusing greywater. Others shower less frequently. One member washes using three colour-coded flannels: one each for
a closing ref lectionAPPENDIX ONE
from a Watermark Australia group
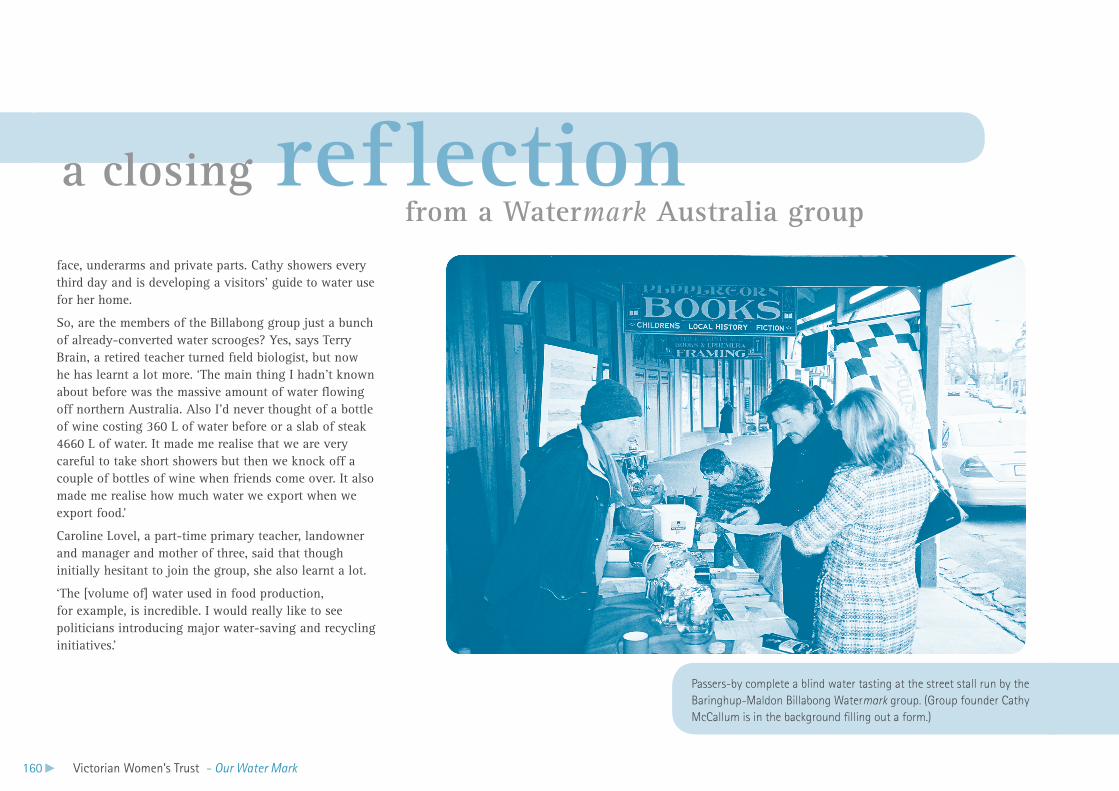
160 Victorian Women’s Trust - Our Water Mark
face, underarms and private parts. Cathy showers every third day and is developing a visitors’ guide to water use for her home.
So, are the members of the Billabong group just a bunch of already-converted water scrooges? Yes, says Terry Brain, a retired teacher turned field biologist, but now he has learnt a lot more. ‘The main thing I hadn’t known about before was the massive amount of water flowing off northern Australia. Also I’d never thought of a bottle of wine costing 360 L of water before or a slab of steak 4660 L of water. It made me realise that we are very careful to take short showers but then we knock off a couple of bottles of wine when friends come over. It also made me realise how much water we export when we export food.’
Caroline Lovel, a part-time primary teacher, landowner and manager and mother of three, said that though initially hesitant to join the group, she also learnt a lot.
‘The [volume of] water used in food production, for example, is incredible. I would really like to see politicians introducing major water-saving and recycling initiatives.’
Passers-by complete a blind water tasting at the street stall run by the Baringhup-Maldon Billabong Watermark group. (Group founder Cathy McCallum is in the background filling out a form.)
a closing ref lection from a Watermark Australia group
Victorian Women’s Trust - Our Water Mark 161
postcodesAPPENDIX TWO
Fairfield 3078
Fitzroy 3065
Fitzroy North 3068
Fitzroy North 3068
Flemington 3031
Foster 3960
Frankston 3199
French Island 3921
Glen Iris 3146
Greensborough 3088
Greensborough 3088
Hampton 3188
Hawthorn 3122
Hawthorn 3122
Heathcote 3523
Heidelberg 3084
Hepburn Springs 3461
Highlands 3660
Highlands 3660
Highton 3216
Horsham 3400
Hurstbridge 3099
Inverloch 3996
Ivanhoe 3079
ACT
Canberra 2600
Giralang 2617
Savernake 2646
NSW
Bellevue Hill 2023
Byabarra 2446
East Gardens 2036
Eschol Park 2558
Gosford 2250
Huskisson 2540
Katoomba 2780
Katoomba 2780
Kenthurst 2156
Newcastle 2300
Newcastle 2300
Orange 2800
The Entrance North 2261
Wahroonga 2076
Woollahra 2025
QLD
Campbells Creek 4625
Kallangur 4503
Kenmore 4069
Maleny 4552
Maleny 4552
Tarragindi 4121
Tiaro 4650
SA
Berri 5343
Loxton 5333
TAS
Sandy Bay 7005
VIC
Abbotsford 3067
Abbotsford 3067
Abbotsford 3067
Abbotsford 3067
Alphington 3078
Alphington 3078
Altona 3018
Altona Meadows 3028
Ashwood 3147
Ballarat 3350
Ballarat 3350
Ballarat 3350
Balwyn North 3104
Baringhup 3463
Beechworth 3747
Bena 3946
Benalla 3672
Benalla 3672
Bendigo 3500
Bendigo 3500
Bendigo 3500
Bendigo 3500
Bentleigh East 3204
Berwick 3806
Birregurra 3242
Bowmans Forest 3735
Box Hill North 3129
Box Hill North 3129
Box Hill South 3128
Bright 3741
Brighton 3186
Brighton 3186
Brunswick 3056
Brunswick 3056
Brunswick East 3056
Bundoora 3083
Burnley 3121
Burwood 3125
Camberwell 3124
Canterbury 3126
Carlton 3053
Carnegie 3163
Carnegie 3163
Castlemaine 3450
Castlemaine 3450
Castlemaine 3450
Castlemaine 3450
Chadstone 3148
Cheltenham 3192
Cheltenham 3192
Churchill 3842
Clifton Hill 3068
Colbinabbin 3559
Dandenong 3175
Eaglehawk 3556
Eaglehawk 3556
Eaglemont 3084
East Doncaster 3109
East Melbourne 3101
Elsternwick 3186
Eltham 3095
Essendon 3040
Watermark Australia groups by postcode as of May 2006
162 Victorian Women’s Trust - Our Water Mark
postcodesAPPENDIX TWO
Watermark Australia groups by postcode as of May 2006
Ivanhoe 3079
Ivanhoe 3079
Ivanhoe 3079
Jackass Flat 3556
Jeparit 3423
Kaniva 3419
Kew 3101
Kew 3101
Kew 3101
Kirkstall 3283
Kyabram 3620
Kyabram 3620
Kyneton 3444
Langwarrin 3910
Lismore 3324
Little River 3211
Lysterfield 3156
Maldon 3463
Malvern 3144
Maryborough 3465
McCrae 3938
Melbourne 3000
Melbourne 3000
Melbourne 3000
Melbourne 3000
Melbourne 3000
Melbourne 3000
Melbourne 3000
Melbourne 3000
Melbourne 3000
Melton 3337
Metung 3904
Middle Park 3206
Mirboo North 3897
Mont Albert North 3129
Mooroopna 3629
Mt Evelyn 3796
Mt Martha 3934
Mt Waverley 3149
Neerim South 3831
Newham 3442
Nicholson 3882
Niddrie 3042
North Melbourne 3051
Northcote 3070
Northcote 3070
Northcote 3070
Northcote 3070
Northcote 3070
Northcote 3070
Northcote 3070
Northcote 3070
Northcote 3070
Northcote 3070
Northcote 3070
Officer 3809
Pakenham 3810
Parkville 3053
Patchewollock 3491
Point Cook 3030
Prahran 3181
Red Hill South 3937
Riddells Creek 3431
Ringwood 3134
Rosebud South 3939
Sale 3850
Seaford 3198
Simpson 3226
South Melbourne 3205
Springvale 3171
St Kilda 3182
St Kilda 3182
Steels Creek 3775
Sunshine 3020
Surrey Hills 3127
Surrey Hills 3127
Tallangatta 3700
Tawonga 3697
Thornbury 3071
Thornbury 3071
Thornbury 3071
Timboon 3268
Towong via Corryong 3707
Trentham 3458
Upper Beaconsfield 3808
Venus Bay 3956
Wangaratta 3677
Wantirna 3152
Warrandyte 3113
Warrandyte 3113
Warrnambool 3280
Werribee 3030
Werribee 3030
Werribee 3030
Williamstown 3016
Wooragee 3747
Woori Yallock 3139
Wycheproof 3527
Yarraville 3013
Yarra Junction 3797
Yea 3717
Yea 3717
WA
Calista 6167
Joondalup 6027
Mount Lawley 6050

Victorian Women’s Trust - Our Water Mark 163
your notes

164 Victorian Women’s Trust - Our Water Mark
your notes