Embed Size (px)
Citation preview
Seediscussions,stats,andauthorprofilesforthispublicationat:https://www.researchgate.net/publication/49764700
DNAmovessequentiallytowardsthenuclearmatrixduringDNAreplicationinvivo
ARTICLEinBMCCELLBIOLOGY·JANUARY2011
ImpactFactor:2.34·DOI:10.1186/1471-2121-12-3·Source:PubMed
CITATIONS
14
READS
40
4AUTHORS,INCLUDING:
JuanCarlosRiveraMulia
FloridaStateUniversity
8PUBLICATIONS38CITATIONS
SEEPROFILE
FedericoMartínez
UniversidadNacionalAutónomadeMéxico
60PUBLICATIONS748CITATIONS
SEEPROFILE
ArmandoAranda-Anzaldo
UniversidadAutónomadelEstadodeMéxic…
63PUBLICATIONS418CITATIONS
SEEPROFILE
Availablefrom:JuanCarlosRiveraMulia
Retrievedon:04February2016
RESEARCH ARTICLE Open Access
DNA moves sequentially towards the nuclearmatrix during DNA replication in vivoJuan Carlos Rivera-Mulia1, Rolando Hernández-Muñoz2, Federico Martínez3, Armando Aranda-Anzaldo1*
Abstract
Background: In the interphase nucleus of metazoan cells DNA is organized in supercoiled loops anchored to anuclear matrix (NM). There is varied evidence indicating that DNA replication occurs in replication factoriesorganized upon the NM and that DNA loops may correspond to the actual replicons in vivo. In normal rat liver thehepatocytes are arrested in G0 but they synchronously re-enter the cell cycle after partial-hepatectomy leading toliver regeneration in vivo. We have previously determined in quiescent rat hepatocytes that a 162 kbp genomicregion containing members of the albumin gene family is organized into five structural DNA loops.
Results: In the present work we tracked down the movement relative to the NM of DNA sequences located atdifferent points within such five structural DNA loops during the S phase and after the return to cellularquiescence during liver regeneration. Our results indicate that looped DNA moves sequentially towards the NMduring replication and then returns to its original position in newly quiescent cells, once the liver regeneration hasbeen achieved.
Conclusions: Looped DNA moves in a sequential fashion, as if reeled in, towards the NM during DNA replicationin vivo thus supporting the notion that the DNA template is pulled progressively towards the replication factorieson the NM so as to be replicated. These results provide further evidence that the structural DNA loops correspondto the actual replicons in vivo.
BackgroundIn the interphase nucleus of metazoan cells DNA is orga-nized in supercoiled loops anchored to a substructurecommonly known as the nuclear matrix (NM). The NM isobtained by extracting the cells in presence of high-salt,non-ionic detergents and DNase and its specific composi-tion is still a matter of debate as some four hundred pro-teins have been associated with such a substructure [1-4].DNA is attached to the NM by non-coding sequencesknown as matrix attachment regions or MARs. So farthere are no specific consensus sequences for a prioridefining a MAR although most well-characterized MARsare rich in A-T [5]. Very few specific MAR-binding pro-teins have been characterized so far [6] but the large num-ber of DNA loops in a given cell suggests that DNA-NMinteractions occur on a grand scale by means of so-called
indirect readouts that do not depend on interactionsbetween specific NM proteins and specific DNAsequences but more likely on the recognition of localDNA structure in 3D [7,8]. MARs have been operationallyclassified into structural-constitutive, resistant to high-saltextraction, and functional-facultative, non-resistant tohigh-salt extraction [9,10]. Therefore the resulting DNAloops can be also classified into structural and functional,and the MARs attaching the structural DNA loops to theNM are also known as loop anchorage regions or LARs[9]. For some time it has been speculated that DNA loopscorrespond to independent functional domains of chroma-tin. However, it has already been shown that a single tran-scriptional unit may be organized into several structuralDNA loops [11] and further evidence suggests there is nocorrelation between the structural DNA loops and tran-scription units [10,12-14]. On the other hand, there is var-ied evidence suggesting that the structural DNA loopsmay correspond to the actual replicons [9]. Indeed, DNAreplication occurs in mammalian cells at so-called replica-tion foci or factories occupying defined nuclear sites
* Correspondence: [email protected] de Biología Molecular, Facultad de Medicina, UniversidadAutónoma del Estado de México, Apartado Postal 428, C.P. 50000, Toluca,Edo. Méx., MéxicoFull list of author information is available at the end of the article
Rivera-Mulia et al. BMC Cell Biology 2011, 12:3http://www.biomedcentral.com/1471-2121/12/3
© 2011 Rivera-Mulia et al; licensee BioMed Central Ltd. This is an Open Access article distributed under the terms of the CreativeCommons Attribution License (http://creativecommons.org/licenses/by/2.0), which permits unrestricted use, distribution, andreproduction in any medium, provided the original work is properly cited.

at specific times during S phase [15] and there is impor-tant evidence that such replication factories are organizedupon the NM [16-19]. Moreover, theoretical implicationsresulting from considering the topology of DNA andthe actual size of the replication complexes that includeenormous polymerizing machines that dwarf the DNAtemplate, suggest that replication of mammalian DNA invivo involves fixed polymerases in replication foci thatreel in their templates as they extrude newly madeDNA [20]. This coupled to varied experimental evidencesuggests that the NM is the structural support of DNAreplication [21].The hepatocytes are cells that preserve a proliferating
capacity that is elicited in vivo after partial ablation of theliver, leading to liver regeneration in experimental ani-mals such as the rat. The previously quiescent G0 hepa-tocytes synchronously re-enter the cell cycle after partialhepatectomy [22]. Evidence obtained using this animalmodel suggested that the DNA replication sites are con-tinuously bound to the NM leading to the proposal thatDNA may replicate either by reeling through fixed repli-cation complexes on the NM or that replication proceedsby sliding of the complexes through the loops untilreaching the corresponding LARs [16]. We have pre-viously shown that specific DNA sequences located indifferent chromosomes, thus representing several terri-tories within the interphase nucleus, change their originalposition relative to the NM during liver regeneration,becoming quite proximal to the NM during the peak ofDNA synthesis at 24 h after partial hepatectomy andthen recover their original positions once the liver regen-eration has been achieved and the hepatocytes return toquiescence [10,13]. Using a topological approach, wehave determined in primary rat hepatocytes that a162 kbp region that includes several genes of the albumingene family is organized in vivo into five structural DNAloops [23]. In the present work we tracked down themovement relative to the NM of target DNA sequenceslocated at different points within such five structuralloops, during the process of liver regeneration. Ourresults suggest that looped DNA moves in a sequentialfashion, as if reeled in, towards the NM (where the repli-cation complexes are assembled) during DNA replicationin vivo and then returns to its original position in newlyquiescent cells, once the liver regeneration has beenachieved, thus providing further evidence that the struc-tural DNA loops correspond to the actual replicons invivo.
ResultsKinetics of nucleoid-DNA digestion as a function of theDNA-replicating status of primary rat hepatocytesThe high-salt resistant structural DNA loops plus the NMconstitute a nucleoid (Figure 1A). Under the conditions of
lysis employed to generate nucleoids the nuclear DNAremains essentially intact, although it lacks the nucleo-some structure because of the dissociation of histones andmost other nuclear proteins usually associated with DNA,yet the structural DNA loops remain topologically con-strained by being anchored to the NM [24,25] thus beingequivalent to closed DNA circles. Under such conditionthe DNA molecule undergoes structural stress resultingfrom two factors: the covalently linked backbones of theDNA strands are helicoidal but rigid while the low-energyhydrogen bonds between the stacked bases are quasi-statistical unions that continuously break apart and formagain, such a situation poses the risk that the nucleotidebases may gyrate away from the double helix axis andbecome exposed. DNA naturally solves this structural-stress problem by further coiling upon its own axis thusavoiding exposure of the nucleotide bases, but becomingnegatively supercoiled in a similar fashion as a pulledhouse-telephone cord [26,27]. Thus the naked DNA loopsdisplay a gradient of supercoiling that goes from lower tohigher from tip to base of the loop, save for the fact thatthe structural properties of MARs are such that they alsofunction as buffers or sinks of negative supercoiling[28,29] thus avoiding maximal supercoiling at the base ofthe loops (Figure 1B).Indeed, nucleoids are also known as nuclear halos
since exposure of such structures to DNA-intercalatingagents like ethidium bromide leads to unwinding of theDNA loops that form a DNA halo around the NM per-iphery (Figure 1C). A typical structural DNA loop canbe divided into four topological zones according to theirrelative proximity to the NM [23]. Each of these zoneswould manifest an identifiable behavior when exposedto non-specific nucleases that are sensitive to the localDNA topology such as DNase I (Figure 1B). We havepreviously shown that in nucleoid preparations the rela-tive resistance of a given loop-DNA sequence to alimited concentration of DNase I is directly proportionalto its proximity to the NM anchoring point [12,13], twomain factors determine such property: (1) Steric hin-drance resulting from the proteinaceous NM that actsas a physical barrier that relatively protects the nakedloop DNA that is closer to the NM from endonucleaseaction. (2) The local degree of loop DNA supercoilingthat is lower in the distal portions of the loop andhigher in the regions proximal to the NM. Both factorsonly confer relative but not absolute DNase I-resistanceto loop DNA. Supercoiling is a structural barrier againstthe action of non-specific endonucleases such as DNaseI, that hydrolyze the DNA backbone by a single-strandcleavage (nicking) mechanism [30]. Theoretically a sin-gle nick in a DNA loop would lead to its completeunwinding but the loss of supercoiling will not occurinstantaneously and so the actual rate of supercoiling
Rivera-Mulia et al. BMC Cell Biology 2011, 12:3http://www.biomedcentral.com/1471-2121/12/3
Page 2 of 16
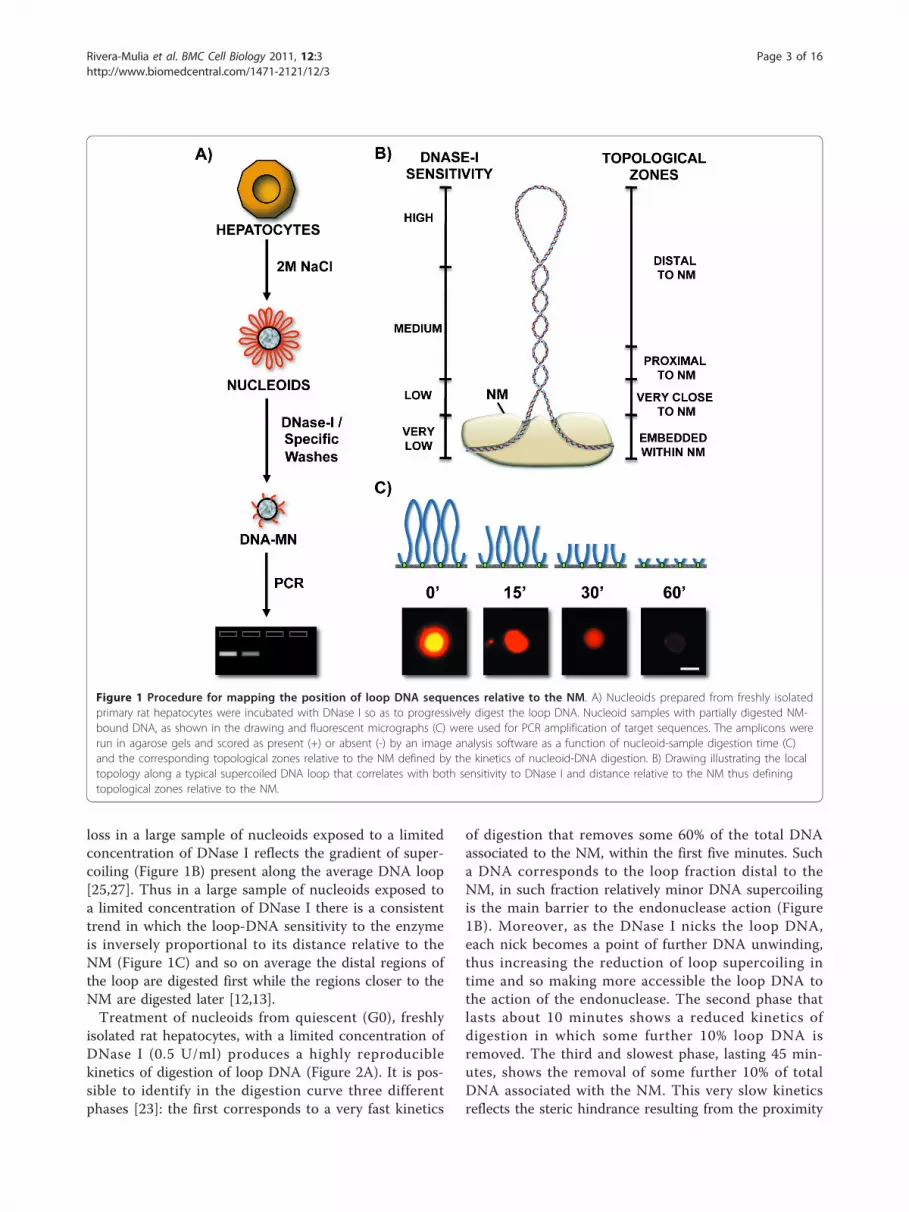
loss in a large sample of nucleoids exposed to a limitedconcentration of DNase I reflects the gradient of super-coiling (Figure 1B) present along the average DNA loop[25,27]. Thus in a large sample of nucleoids exposed toa limited concentration of DNase I there is a consistenttrend in which the loop-DNA sensitivity to the enzymeis inversely proportional to its distance relative to theNM (Figure 1C) and so on average the distal regions ofthe loop are digested first while the regions closer to theNM are digested later [12,13].Treatment of nucleoids from quiescent (G0), freshly
isolated rat hepatocytes, with a limited concentration ofDNase I (0.5 U/ml) produces a highly reproduciblekinetics of digestion of loop DNA (Figure 2A). It is pos-sible to identify in the digestion curve three differentphases [23]: the first corresponds to a very fast kinetics
of digestion that removes some 60% of the total DNAassociated to the NM, within the first five minutes. Sucha DNA corresponds to the loop fraction distal to theNM, in such fraction relatively minor DNA supercoilingis the main barrier to the endonuclease action (Figure1B). Moreover, as the DNase I nicks the loop DNA,each nick becomes a point of further DNA unwinding,thus increasing the reduction of loop supercoiling intime and so making more accessible the loop DNA tothe action of the endonuclease. The second phase thatlasts about 10 minutes shows a reduced kinetics ofdigestion in which some further 10% loop DNA isremoved. The third and slowest phase, lasting 45 min-utes, shows the removal of some further 10% of totalDNA associated with the NM. This very slow kineticsreflects the steric hindrance resulting from the proximity
Figure 1 Procedure for mapping the position of loop DNA sequences relative to the NM. A) Nucleoids prepared from freshly isolatedprimary rat hepatocytes were incubated with DNase I so as to progressively digest the loop DNA. Nucleoid samples with partially digested NM-bound DNA, as shown in the drawing and fluorescent micrographs (C) were used for PCR amplification of target sequences. The amplicons wererun in agarose gels and scored as present (+) or absent (-) by an image analysis software as a function of nucleoid-sample digestion time (C)and the corresponding topological zones relative to the NM defined by the kinetics of nucleoid-DNA digestion. B) Drawing illustrating the localtopology along a typical supercoiled DNA loop that correlates with both sensitivity to DNase I and distance relative to the NM thus definingtopological zones relative to the NM.
Rivera-Mulia et al. BMC Cell Biology 2011, 12:3http://www.biomedcentral.com/1471-2121/12/3
Page 3 of 16
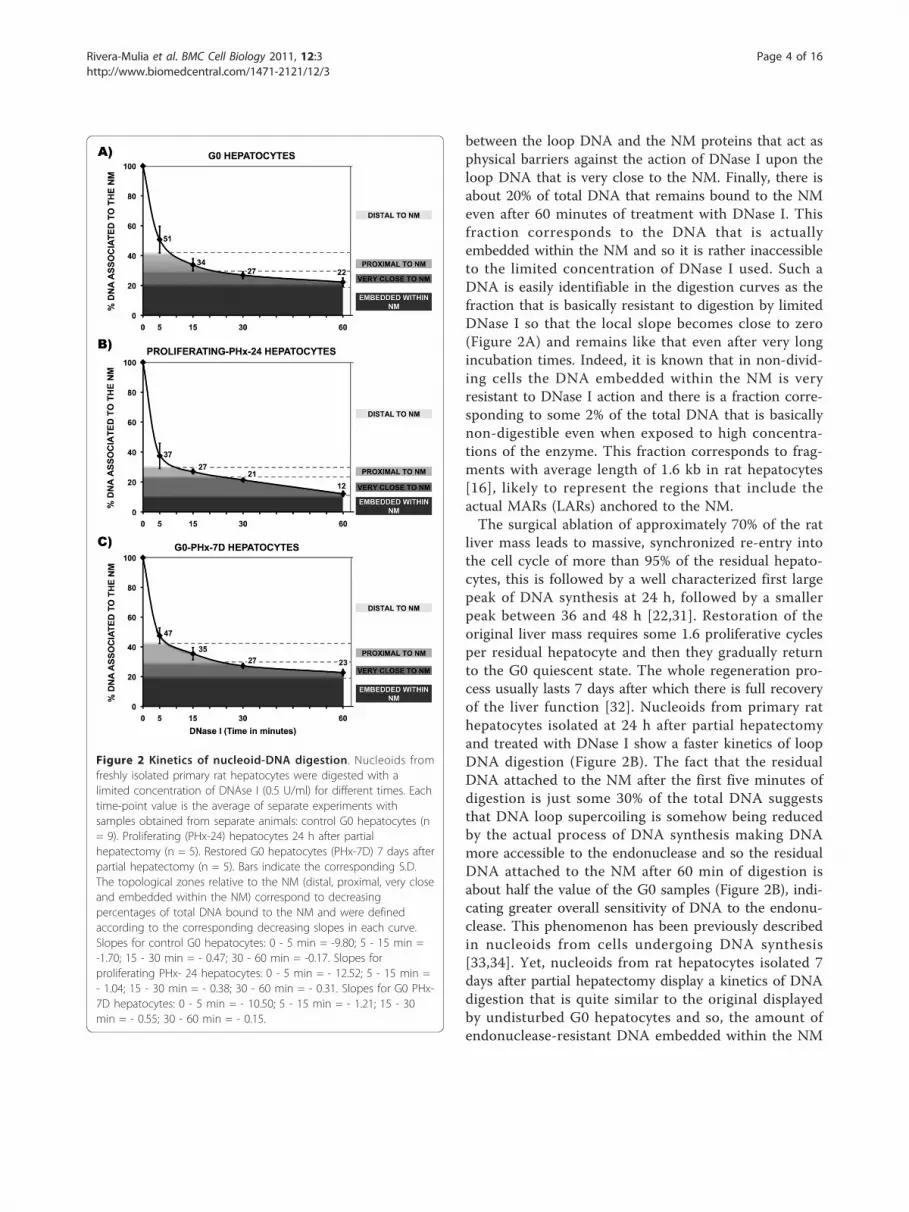
between the loop DNA and the NM proteins that act asphysical barriers against the action of DNase I upon theloop DNA that is very close to the NM. Finally, there isabout 20% of total DNA that remains bound to the NMeven after 60 minutes of treatment with DNase I. Thisfraction corresponds to the DNA that is actuallyembedded within the NM and so it is rather inaccessibleto the limited concentration of DNase I used. Such aDNA is easily identifiable in the digestion curves as thefraction that is basically resistant to digestion by limitedDNase I so that the local slope becomes close to zero(Figure 2A) and remains like that even after very longincubation times. Indeed, it is known that in non-divid-ing cells the DNA embedded within the NM is veryresistant to DNase I action and there is a fraction corre-sponding to some 2% of the total DNA that is basicallynon-digestible even when exposed to high concentra-tions of the enzyme. This fraction corresponds to frag-ments with average length of 1.6 kb in rat hepatocytes[16], likely to represent the regions that include theactual MARs (LARs) anchored to the NM.The surgical ablation of approximately 70% of the rat
liver mass leads to massive, synchronized re-entry intothe cell cycle of more than 95% of the residual hepato-cytes, this is followed by a well characterized first largepeak of DNA synthesis at 24 h, followed by a smallerpeak between 36 and 48 h [22,31]. Restoration of theoriginal liver mass requires some 1.6 proliferative cyclesper residual hepatocyte and then they gradually returnto the G0 quiescent state. The whole regeneration pro-cess usually lasts 7 days after which there is full recoveryof the liver function [32]. Nucleoids from primary rathepatocytes isolated at 24 h after partial hepatectomyand treated with DNase I show a faster kinetics of loopDNA digestion (Figure 2B). The fact that the residualDNA attached to the NM after the first five minutes ofdigestion is just some 30% of the total DNA suggeststhat DNA loop supercoiling is somehow being reducedby the actual process of DNA synthesis making DNAmore accessible to the endonuclease and so the residualDNA attached to the NM after 60 min of digestion isabout half the value of the G0 samples (Figure 2B), indi-cating greater overall sensitivity of DNA to the endonu-clease. This phenomenon has been previously describedin nucleoids from cells undergoing DNA synthesis[33,34]. Yet, nucleoids from rat hepatocytes isolated 7days after partial hepatectomy display a kinetics of DNAdigestion that is quite similar to the original displayedby undisturbed G0 hepatocytes and so, the amount ofendonuclease-resistant DNA embedded within the NM
Figure 2 Kinetics of nucleoid-DNA digestion. Nucleoids fromfreshly isolated primary rat hepatocytes were digested with alimited concentration of DNAse I (0.5 U/ml) for different times. Eachtime-point value is the average of separate experiments withsamples obtained from separate animals: control G0 hepatocytes (n= 9). Proliferating (PHx-24) hepatocytes 24 h after partialhepatectomy (n = 5). Restored G0 hepatocytes (PHx-7D) 7 days afterpartial hepatectomy (n = 5). Bars indicate the corresponding S.D.The topological zones relative to the NM (distal, proximal, very closeand embedded within the NM) correspond to decreasingpercentages of total DNA bound to the NM and were definedaccording to the corresponding decreasing slopes in each curve.Slopes for control G0 hepatocytes: 0 - 5 min = -9.80; 5 - 15 min =-1.70; 15 - 30 min = - 0.47; 30 - 60 min = -0.17. Slopes forproliferating PHx- 24 hepatocytes: 0 - 5 min = - 12.52; 5 - 15 min =- 1.04; 15 - 30 min = - 0.38; 30 - 60 min = - 0.31. Slopes for G0 PHx-7D hepatocytes: 0 - 5 min = - 10.50; 5 - 15 min = - 1.21; 15 - 30min = - 0.55; 30 - 60 min = - 0.15.
Rivera-Mulia et al. BMC Cell Biology 2011, 12:3http://www.biomedcentral.com/1471-2121/12/3
Page 4 of 16
is basically the same (Figure 2A and 2C) indicating thatthe original local topology of the corresponding struc-tural DNA loops has been fully restored in the newly-quiescent hepatocytes of the regenerated liver.
Sequential movement of loop DNA relative to the NMcorrelates with DNA replicationThe properties described in the first paragraph of theprevious section coupled to direct PCR amplification ofspecific target sequences on partially digested nucleoidpreparations allow the mapping of the relative positionto the NM of any specific loop-DNA sequence [12],according to the protocol depicted in Figure 1. Thus,templates corresponding to DNA sequences located clo-ser to the NM will consistently being amplifiable in par-tially-digested nucleoid samples corresponding to longertimes of DNase I treatment than templates correspond-ing to sequences located more distal relative to the NM.Using a slight variant of this method we were previouslyable to determine in primary rat hepatocytes the in vivostructural DNA loop organization in a 162 kbp regionencompassing several genes of the albumin gene family[23]. The region comprises five structural DNA loops[23]. We designed a set of fifteen small amplicons (<547 bp) rather evenly spaced about every 10 kb alongthe aforementioned region (Figure 3 and Table 1). Pre-vious studies have shown that the average size of thenuclear DNA fragments liberated by non-specificnucleases in rat hepatocytes is 0.8 kb [16]. Thus theDNA sequences to be mapped are ≤ 550 bp in length(Table 1) and so likely to be cut as whole units by theendonuclease instead of being progressively eroded bypartial digestions. Therefore in our mapping protocolwe score the specific templates as either present (ampli-fiable) or absent (non-amplifiable) as a function of endo-nuclease-digestion time, without considering theintensity of the amplicon signals but just whether suchsignals are detected or not by an image-analysis pro-gram (Kodak 1D Image Analysis Software 3.5), using thedefault settings. We established these criteria because inour topological-mapping approach [12,23] it is the aver-age relative position to the NM anchoring point and not
the actual template length the critical parameter thatdetermines the average sensitivity to DNase I of eachsequence mapped. Thus absence of amplified product ata given digestion time-point indicates that the relativeabundance of the target template has fallen to a non-amplifiable level within the large nucleoid populationanalyzed in each sample [10]. Using nucleoid samplesfrom primary hepatocytes obtained from: control (G0),24 h after partial hepatectomy (PHx-24) and 7 days afterpartial hepatectomy (PHx-7D) livers, we mapped theposition relative to the NM of each of such fifteenamplicons. Figure 4 shows the typical amplification pat-terns of the target sequences in DNase I-treatednucleoid samples containing residual loop DNA corre-sponding to each of the four different topological zonesrelative to the NM (Figure 1B). The specific topologicalzones for each kind of partially-digested nucleoid hepa-tocyte sample were defined according to the specifickinetics of nucleoid DNA digestion (Figure 2A for G0samples, Figure 2B for PHx-24, Figure 2C for PHx-7D).However, considering the topological zones defined by
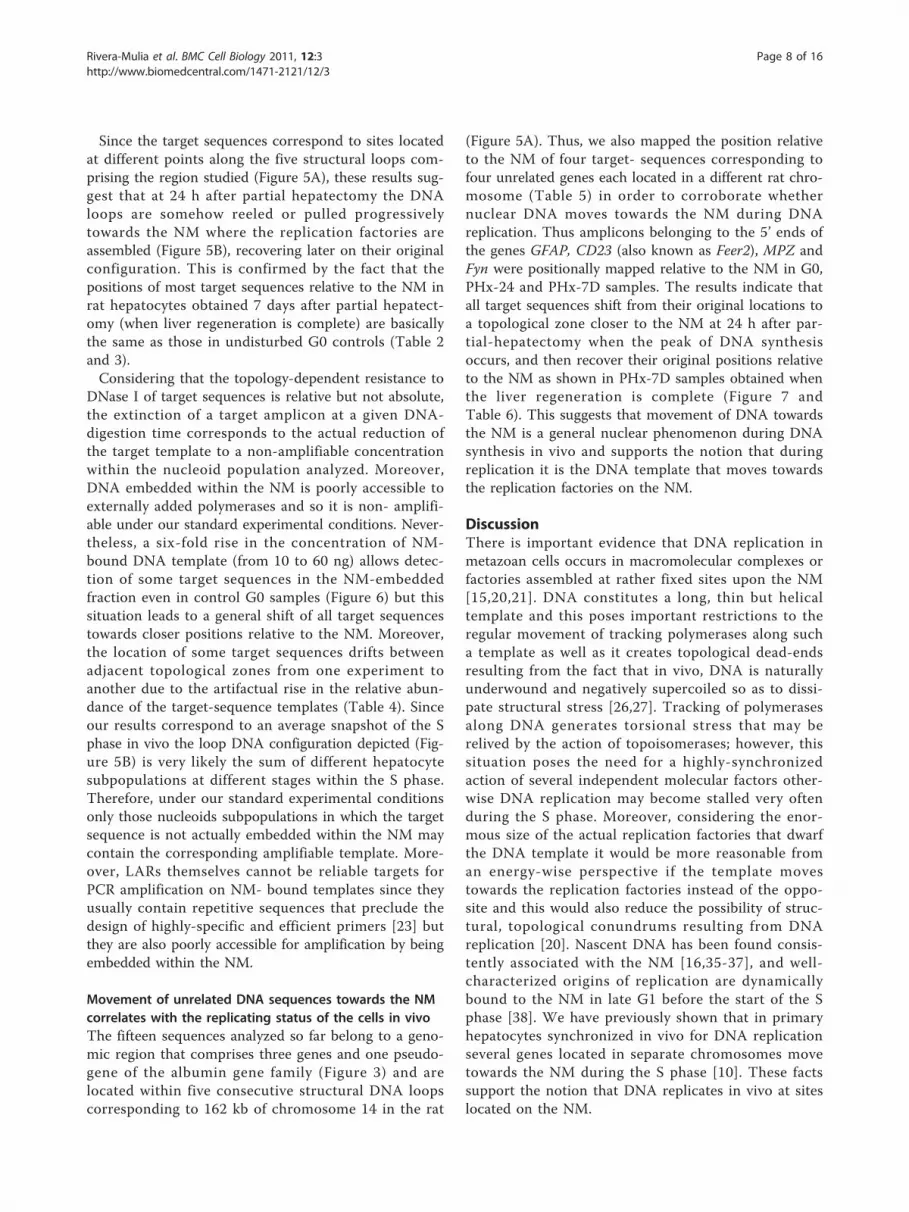
the kinetics of nucleoid DNA digestion in samples fromundisturbed G0 hepatocytes as the original referencezones and using these zones for calibrating the actualpositions relative to the NM of the target sequences inthe three kinds of hepatocyte samples (G0, PHx-24 andPHx-7D) it is possible to establish a trend for all targetsequences to become significantly closer to the NM at24 h after partial hepatectomy when there is a peak ofDNA synthesis (Table 2). On the other hand, in samplesfrom 7 days after partial hepatectomy, when liver regen-eration is basically complete, the target sequences con-sistently appear to have returned to their originalpositions relative to the NM (Table 2). Moreover, usingthe specific kinetics of nucleoid DNA digestion corre-sponding to G0, PHx-24 and PHx-7D (Figure 2) forlocating each target sequence within a topological zonerelative to the NM in each kind of nucleoid samples, itwas confirmed a general trend for most target sequencesto become closer to the NM at 24 after partial-hepatect-omy, as well as the fact that all target sequences returnto their basal positions at seven days after partial-hepa-tectomy (Table 3). Detailed analysis of data in Table 3revealed the following: sequences a and m appear toremain immobile located in the zone proximal to theNM in both control and PHx-24 samples. Sequences cand g seem to remain immobile located in the zone dis-tal to the NM in control, PHx-24 and PHx-7 samples.Eleven sequences (b, d, e, f, h, I, j, k, l, n and o) are allshifted in PHx-24 samples one further topological zonecloser to the NM from their original position in controlG0 samples, and then eight from such eleven sequencesclearly return to their original position relative to theNM in PHx- 7D samples.
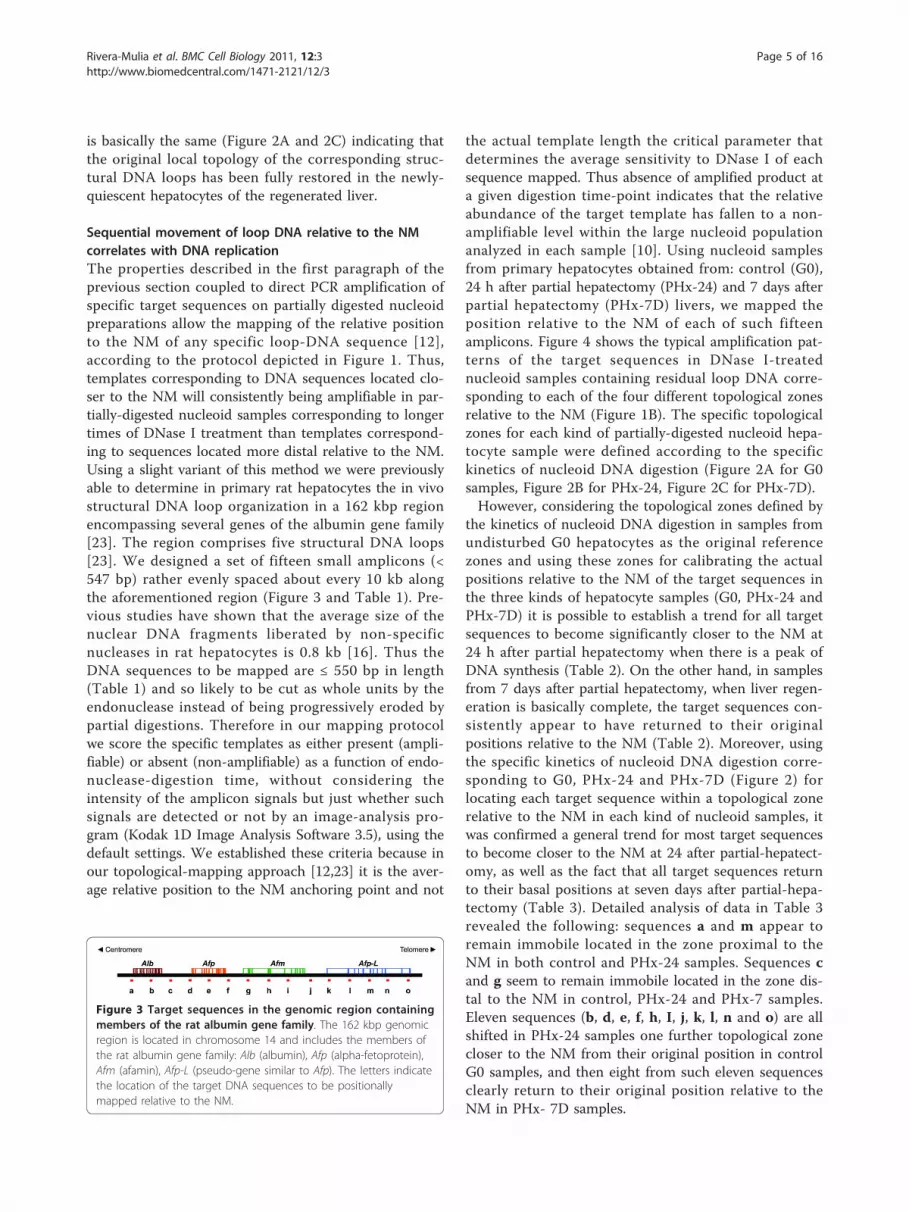
Figure 3 Target sequences in the genomic region containingmembers of the rat albumin gene family. The 162 kbp genomicregion is located in chromosome 14 and includes the members ofthe rat albumin gene family: Alb (albumin), Afp (alpha-fetoprotein),Afm (afamin), Afp-L (pseudo-gene similar to Afp). The letters indicatethe location of the target DNA sequences to be positionallymapped relative to the NM.
Rivera-Mulia et al. BMC Cell Biology 2011, 12:3http://www.biomedcentral.com/1471-2121/12/3
Page 5 of 16

Figure 4 Positional mapping relative to the NM of specific target sequences. The position relative to the NM of specific target sequencesalong the 162 kbp rat albumin gene-family genomic region was determined by PCR. Nucleoids from rat hepatocytes were treated with DNase I(0.5 U/ml) for different times (Figure 2). The residual NM-bound DNA in the partially digested samples was directly used as template for PCRamplification of the chosen target sequences (a - o). The specific amplicons were resolved in 2% agarose gels and stained with ethidiumbromide (0.5 μg/ml). C, 0’ digestion-time control. The amplicons were scored either as positive or negative as a function of endonucleasedigestion time and for each topological zone relative to the NM, depending on whether or not they were detected by a digital image-analysissystem (Kodak 1D Image Analysis Software 3.5) using the default settings. Topological zones relative to the NM: D, distal; P, proximal; VC, veryclose; E, embedded within the NM. (-) Negative control (no template); (+) positive control (pure genomic DNA as template). CT, control G0hepatocytes; PHx-24 h, hepatocytes 24 h after partial hepatectomy; PHx-7 D, hepatocytes 7 days after partial hepatectomy. The amplificationpatterns were consistently reproduced in separate experiments with samples from independent animals (n ≥ 3).
Table 1 Sets of primers and corresponding amplicon sizes of target sequences
Amplicon Forward Primer Reverse Primer Amplicon Length
A TGGCAAACATACGCAAGGGA GCGAAACACACCCCTGGAAA 275 pb
B GAGGACAGTTAGTGCTGTAGGGTTG CCTCCAACGAAGTTCCCAGAAT 547 pb
C TCCTTTGTAACCAGGCAAGTGG CCCATTTCCCAGATCCTTCACTCT 374 pb
D CCCAGGGTCAGAGTATATCAGTGC CGCTGAACGTATGTCTGAGTCA 305 pb
E TGGTAGGCAGAGATGTGAGGAAAG CCTGTTGTCCTAATGCTGGTCCTA 382 pb
F CTGATCTTCAGGCAATATGGCAGG TTGGCTGATGTCGTCTGGACA 393 pb
G AAGGATAGGTGCTTGGCTGACA GCCCTAACCCTGTGTGTGTATCTTG 504 pb
h GATCACGTAACAACCCTGTCAGCT CCTTCACAGCACCCGTCATACA 263 pb
i GGTGCTGGGAATTTGACTAAGGC TAAACTCAGGTGACAGGCTACGGC 465 pb
j AGGAACCAGGGAATCGAGTGCT AACTTGCGGGTGTTCTCTCCTT 392 pb
k TGTCAGCATGATGGTGGCTCA CTCGATTTGCCATGTCCTGTCT 252 pb
l GGGCTGGGTCCATATTGCTTGA ATGCTTTGGGCTTGCCTGAAG 373 pb
m ACGACTTCCCTTCCTATCCACAG GTAGAAAGTCGTTCTGGTTGCCAC 234 pb
n CCCTAATCTTGCTGTGGTTTGG TGAGAGCTGGGCAGACATCAA 355 pb
O GGTGACAGTTGACAGAGAGCCTTC GCTCCATGCTGACCTTGAAGTCTA 272 pb
Sets of primers and corresponding amplicon sizes defining fifteen target sequences along the 162 kbp genomic region of chromosome 14 containing membersof the rat albumin gene family.
Rivera-Mulia et al. BMC Cell Biology 2011, 12:3http://www.biomedcentral.com/1471-2121/12/3
Page 6 of 16
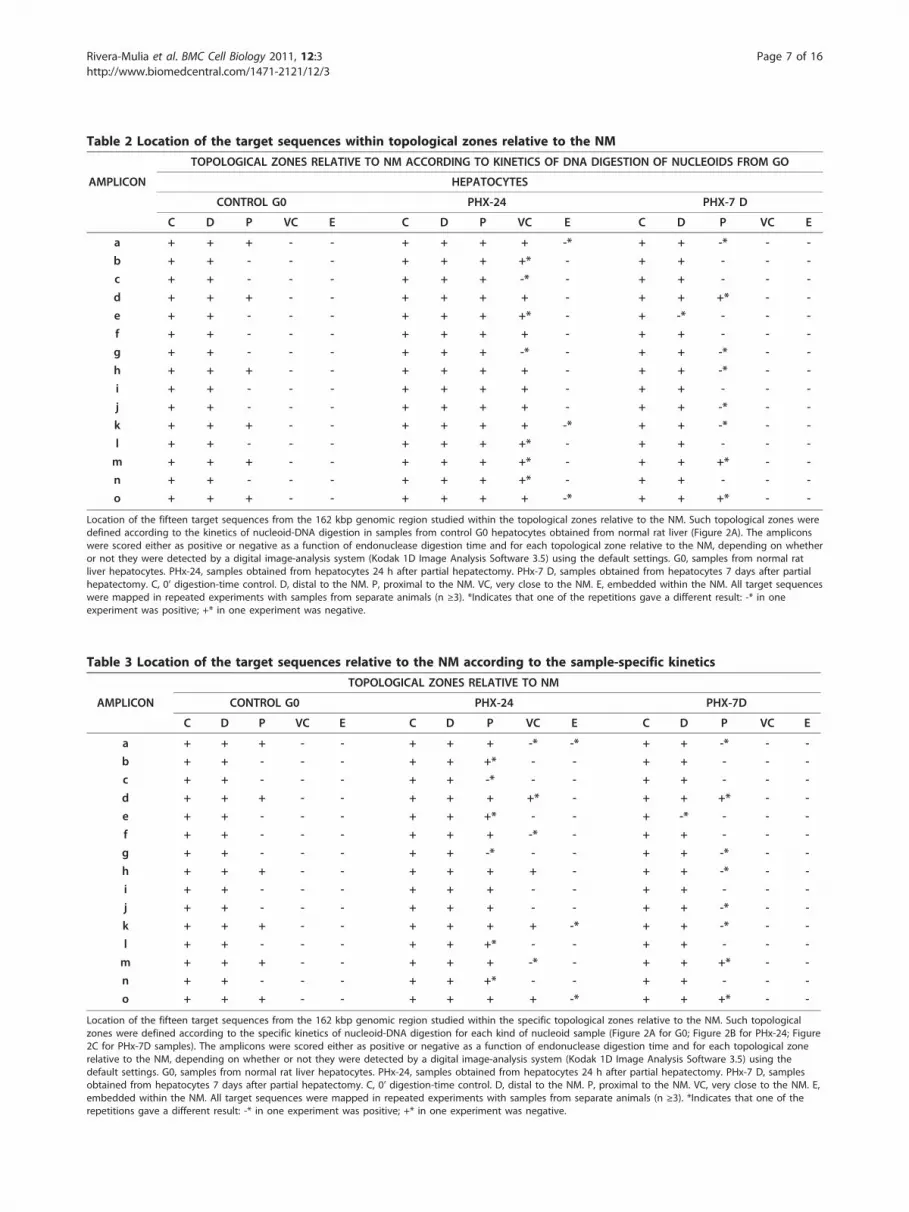
Table 2 Location of the target sequences within topological zones relative to the NM
TOPOLOGICAL ZONES RELATIVE TO NM ACCORDING TO KINETICS OF DNA DIGESTION OF NUCLEOIDS FROM GO
AMPLICON HEPATOCYTES
CONTROL G0 PHX-24 PHX-7 D
C D P VC E C D P VC E C D P VC E
a + + + - - + + + + -* + + -* - -
b + + - - - + + + +* - + + - - -
c + + - - - + + + -* - + + - - -
d + + + - - + + + + - + + +* - -
e + + - - - + + + +* - + -* - - -
f + + - - - + + + + - + + - - -
g + + - - - + + + -* - + + -* - -
h + + + - - + + + + - + + -* - -
i + + - - - + + + + - + + - - -
j + + - - - + + + + - + + -* - -
k + + + - - + + + + -* + + -* - -
l + + - - - + + + +* - + + - - -
m + + + - - + + + +* - + + +* - -
n + + - - - + + + +* - + + - - -
o + + + - - + + + + -* + + +* - -
Location of the fifteen target sequences from the 162 kbp genomic region studied within the topological zones relative to the NM. Such topological zones weredefined according to the kinetics of nucleoid-DNA digestion in samples from control G0 hepatocytes obtained from normal rat liver (Figure 2A). The ampliconswere scored either as positive or negative as a function of endonuclease digestion time and for each topological zone relative to the NM, depending on whetheror not they were detected by a digital image-analysis system (Kodak 1D Image Analysis Software 3.5) using the default settings. G0, samples from normal ratliver hepatocytes. PHx-24, samples obtained from hepatocytes 24 h after partial hepatectomy. PHx-7 D, samples obtained from hepatocytes 7 days after partialhepatectomy. C, 0’ digestion-time control. D, distal to the NM. P, proximal to the NM. VC, very close to the NM. E, embedded within the NM. All target sequenceswere mapped in repeated experiments with samples from separate animals (n ≥3). *Indicates that one of the repetitions gave a different result: -* in oneexperiment was positive; +* in one experiment was negative.
Table 3 Location of the target sequences relative to the NM according to the sample-specific kinetics
TOPOLOGICAL ZONES RELATIVE TO NM
AMPLICON CONTROL G0 PHX-24 PHX-7D
C D P VC E C D P VC E C D P VC E
a + + + - - + + + -* -* + + -* - -
b + + - - - + + +* - - + + - - -
c + + - - - + + -* - - + + - - -
d + + + - - + + + +* - + + +* - -
e + + - - - + + +* - - + -* - - -
f + + - - - + + + -* - + + - - -
g + + - - - + + -* - - + + -* - -
h + + + - - + + + + - + + -* - -
i + + - - - + + + - - + + - - -
j + + - - - + + + - - + + -* - -
k + + + - - + + + + -* + + -* - -
l + + - - - + + +* - - + + - - -
m + + + - - + + + -* - + + +* - -
n + + - - - + + +* - - + + - - -
o + + + - - + + + + -* + + +* - -
Location of the fifteen target sequences from the 162 kbp genomic region studied within the specific topological zones relative to the NM. Such topologicalzones were defined according to the specific kinetics of nucleoid-DNA digestion for each kind of nucleoid sample (Figure 2A for G0; Figure 2B for PHx-24; Figure2C for PHx-7D samples). The amplicons were scored either as positive or negative as a function of endonuclease digestion time and for each topological zonerelative to the NM, depending on whether or not they were detected by a digital image-analysis system (Kodak 1D Image Analysis Software 3.5) using thedefault settings. G0, samples from normal rat liver hepatocytes. PHx-24, samples obtained from hepatocytes 24 h after partial hepatectomy. PHx-7 D, samplesobtained from hepatocytes 7 days after partial hepatectomy. C, 0’ digestion-time control. D, distal to the NM. P, proximal to the NM. VC, very close to the NM. E,embedded within the NM. All target sequences were mapped in repeated experiments with samples from separate animals (n ≥3). *Indicates that one of therepetitions gave a different result: -* in one experiment was positive; +* in one experiment was negative.
Rivera-Mulia et al. BMC Cell Biology 2011, 12:3http://www.biomedcentral.com/1471-2121/12/3
Page 7 of 16
Since the target sequences correspond to sites locatedat different points along the five structural loops com-prising the region studied (Figure 5A), these results sug-gest that at 24 h after partial hepatectomy the DNAloops are somehow reeled or pulled progressivelytowards the NM where the replication factories areassembled (Figure 5B), recovering later on their originalconfiguration. This is confirmed by the fact that thepositions of most target sequences relative to the NM inrat hepatocytes obtained 7 days after partial hepatect-omy (when liver regeneration is complete) are basicallythe same as those in undisturbed G0 controls (Table 2and 3).Considering that the topology-dependent resistance to
DNase I of target sequences is relative but not absolute,the extinction of a target amplicon at a given DNA-digestion time corresponds to the actual reduction ofthe target template to a non-amplifiable concentrationwithin the nucleoid population analyzed. Moreover,DNA embedded within the NM is poorly accessible toexternally added polymerases and so it is non- amplifi-able under our standard experimental conditions. Never-theless, a six-fold rise in the concentration of NM-bound DNA template (from 10 to 60 ng) allows detec-tion of some target sequences in the NM-embeddedfraction even in control G0 samples (Figure 6) but thissituation leads to a general shift of all target sequencestowards closer positions relative to the NM. Moreover,the location of some target sequences drifts betweenadjacent topological zones from one experiment toanother due to the artifactual rise in the relative abun-dance of the target-sequence templates (Table 4). Sinceour results correspond to an average snapshot of the Sphase in vivo the loop DNA configuration depicted (Fig-ure 5B) is very likely the sum of different hepatocytesubpopulations at different stages within the S phase.Therefore, under our standard experimental conditionsonly those nucleoids subpopulations in which the targetsequence is not actually embedded within the NM maycontain the corresponding amplifiable template. More-over, LARs themselves cannot be reliable targets forPCR amplification on NM- bound templates since theyusually contain repetitive sequences that preclude thedesign of highly-specific and efficient primers [23] butthey are also poorly accessible for amplification by beingembedded within the NM.
Movement of unrelated DNA sequences towards the NMcorrelates with the replicating status of the cells in vivoThe fifteen sequences analyzed so far belong to a geno-mic region that comprises three genes and one pseudo-gene of the albumin gene family (Figure 3) and arelocated within five consecutive structural DNA loopscorresponding to 162 kb of chromosome 14 in the rat
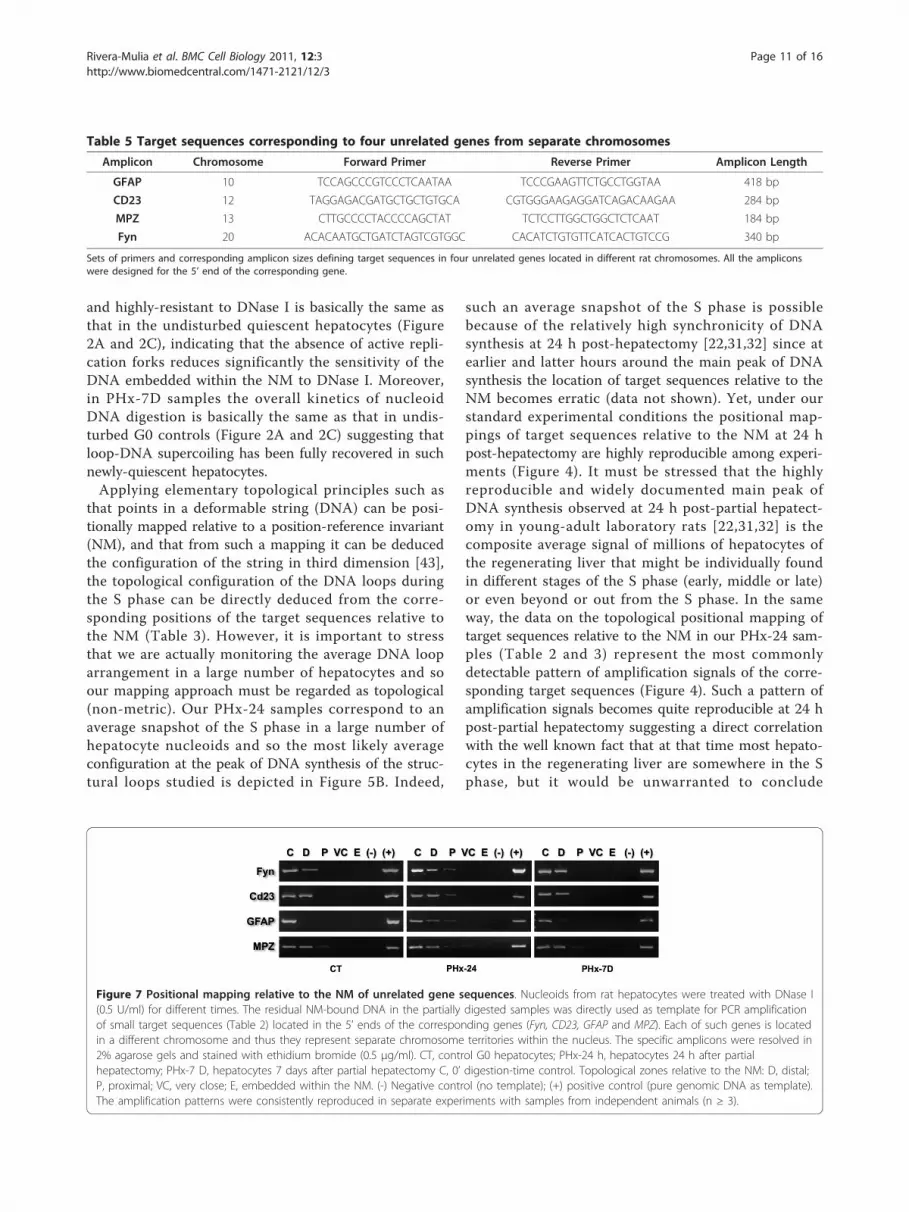
(Figure 5A). Thus, we also mapped the position relativeto the NM of four target- sequences corresponding tofour unrelated genes each located in a different rat chro-mosome (Table 5) in order to corroborate whethernuclear DNA moves towards the NM during DNAreplication. Thus amplicons belonging to the 5’ ends ofthe genes GFAP, CD23 (also known as Feer2), MPZ andFyn were positionally mapped relative to the NM in G0,PHx-24 and PHx-7D samples. The results indicate thatall target sequences shift from their original locations toa topological zone closer to the NM at 24 h after par-tial-hepatectomy when the peak of DNA synthesisoccurs, and then recover their original positions relativeto the NM as shown in PHx-7D samples obtained whenthe liver regeneration is complete (Figure 7 andTable 6). This suggests that movement of DNA towardsthe NM is a general nuclear phenomenon during DNAsynthesis in vivo and supports the notion that duringreplication it is the DNA template that moves towardsthe replication factories on the NM.
DiscussionThere is important evidence that DNA replication inmetazoan cells occurs in macromolecular complexes orfactories assembled at rather fixed sites upon the NM[15,20,21]. DNA constitutes a long, thin but helicaltemplate and this poses important restrictions to theregular movement of tracking polymerases along sucha template as well as it creates topological dead-endsresulting from the fact that in vivo, DNA is naturallyunderwound and negatively supercoiled so as to dissi-pate structural stress [26,27]. Tracking of polymerasesalong DNA generates torsional stress that may berelived by the action of topoisomerases; however, thissituation poses the need for a highly-synchronizedaction of several independent molecular factors other-wise DNA replication may become stalled very oftenduring the S phase. Moreover, considering the enor-mous size of the actual replication factories that dwarfthe DNA template it would be more reasonable froman energy-wise perspective if the template movestowards the replication factories instead of the oppo-site and this would also reduce the possibility of struc-tural, topological conundrums resulting from DNAreplication [20]. Nascent DNA has been found consis-tently associated with the NM [16,35-37], and well-characterized origins of replication are dynamicallybound to the NM in late G1 before the start of the Sphase [38]. We have previously shown that in primaryhepatocytes synchronized in vivo for DNA replicationseveral genes located in separate chromosomes movetowards the NM during the S phase [10]. These factssupport the notion that DNA replicates in vivo at siteslocated on the NM.
Rivera-Mulia et al. BMC Cell Biology 2011, 12:3http://www.biomedcentral.com/1471-2121/12/3
Page 8 of 16
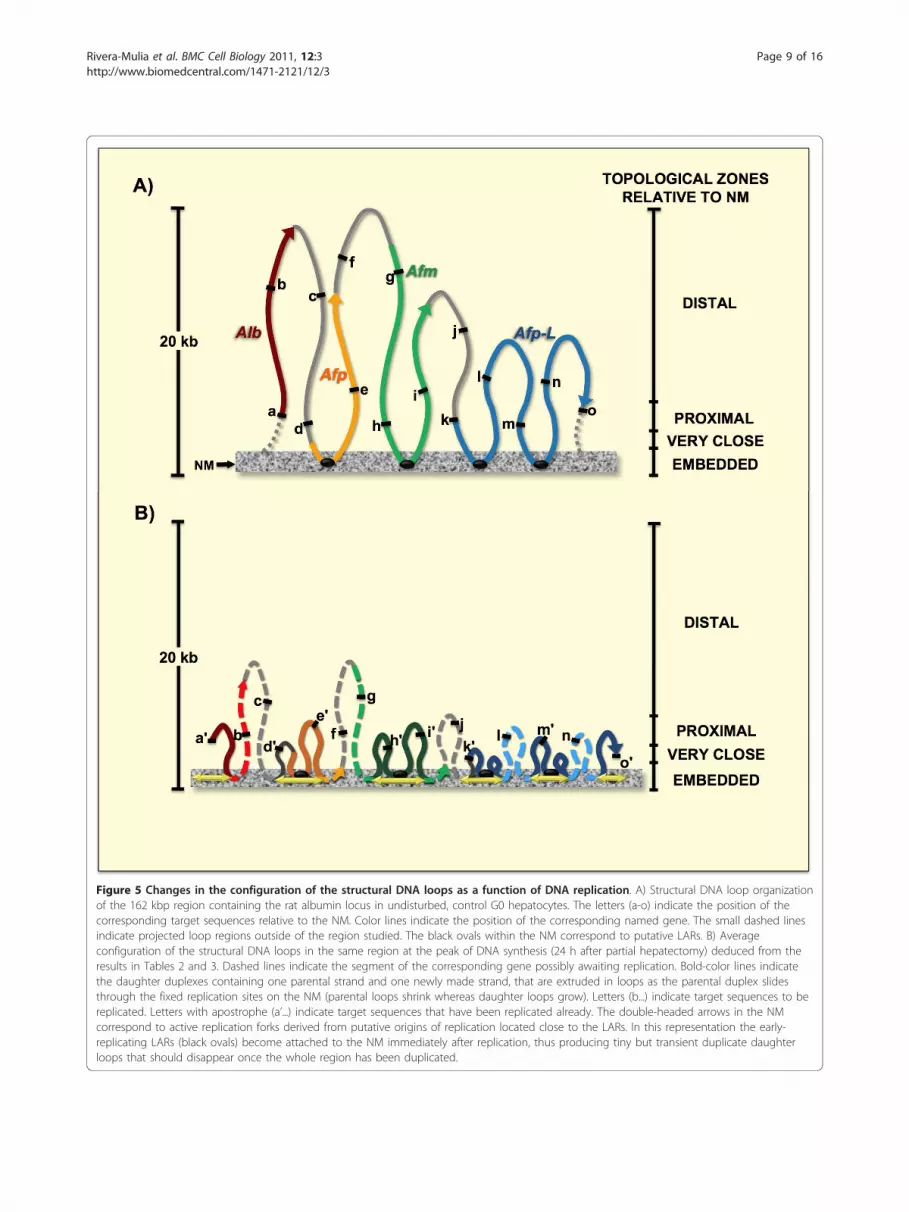
Figure 5 Changes in the configuration of the structural DNA loops as a function of DNA replication. A) Structural DNA loop organizationof the 162 kbp region containing the rat albumin locus in undisturbed, control G0 hepatocytes. The letters (a-o) indicate the position of thecorresponding target sequences relative to the NM. Color lines indicate the position of the corresponding named gene. The small dashed linesindicate projected loop regions outside of the region studied. The black ovals within the NM correspond to putative LARs. B) Averageconfiguration of the structural DNA loops in the same region at the peak of DNA synthesis (24 h after partial hepatectomy) deduced from theresults in Tables 2 and 3. Dashed lines indicate the segment of the corresponding gene possibly awaiting replication. Bold-color lines indicatethe daughter duplexes containing one parental strand and one newly made strand, that are extruded in loops as the parental duplex slidesthrough the fixed replication sites on the NM (parental loops shrink whereas daughter loops grow). Letters (b...) indicate target sequences to bereplicated. Letters with apostrophe (a’...) indicate target sequences that have been replicated already. The double-headed arrows in the NMcorrespond to active replication forks derived from putative origins of replication located close to the LARs. In this representation the early-replicating LARs (black ovals) become attached to the NM immediately after replication, thus producing tiny but transient duplicate daughterloops that should disappear once the whole region has been duplicated.
Rivera-Mulia et al. BMC Cell Biology 2011, 12:3http://www.biomedcentral.com/1471-2121/12/3
Page 9 of 16
Cells in culture, even primary cells, are prone to anumber of artifacts that may affect the process of DNAreplication, such as the fact that the elastic modulus ofthe cell culture recipient or the viscosity of the cell cul-ture substrate may dramatically alter the rate of DNAreplication [39,40], also the procedures for synchroniz-ing cells in the S phase in vitro lead to various artifacts[41]. However, the present results were obtained withsamples from freshly isolated rat hepatocytes that wereshifted from G0 to S phase in a highly synchronousfashion by the partial hepatectomy. The comparativekinetics of nucleoid DNA digestion with DNase I
between G0 and proliferating rat hepatocytes (Figure 2)is consistent with previous studies showing that replicat-ing DNA bound to the NM is very sensitive to DNase I,thus supporting the notion that DNA synthesis occursat sites located very close to the NM [16]. Indeed, theoverall faster kinetics of nucleoid DNA digestionobserved in the samples from PHx-24 hepatocytes mayresult from the action of DNA helicases necessary forDNA replication that speed-up the loss of loop DNAsupercoiling which is a topological barrier to DNase Iaction. Moreover, the amount of DNA embedded withinthe NM that is resistant to the endonuclease is alsoreduced by almost 50% in hepatocytes that are synthe-sizing DNA (Figure 2A and 2B), this phenomenon canbe accounted for by the fact that replication forks, inthe replication factories organized upon the NM, con-tain single-stranded DNA [42] that is easily cleaved byDNase I and so the actual fraction of double-strandedDNA embedded within the NM (highly-resistant toDNase I) is reduced during the S phase in vivo. Thisconclusion is supported by the observation that innucleoid samples from hepatocytes that have returnedto quiescence as the liver regeneration has been com-pleted, the amount of DNA embedded within the NM
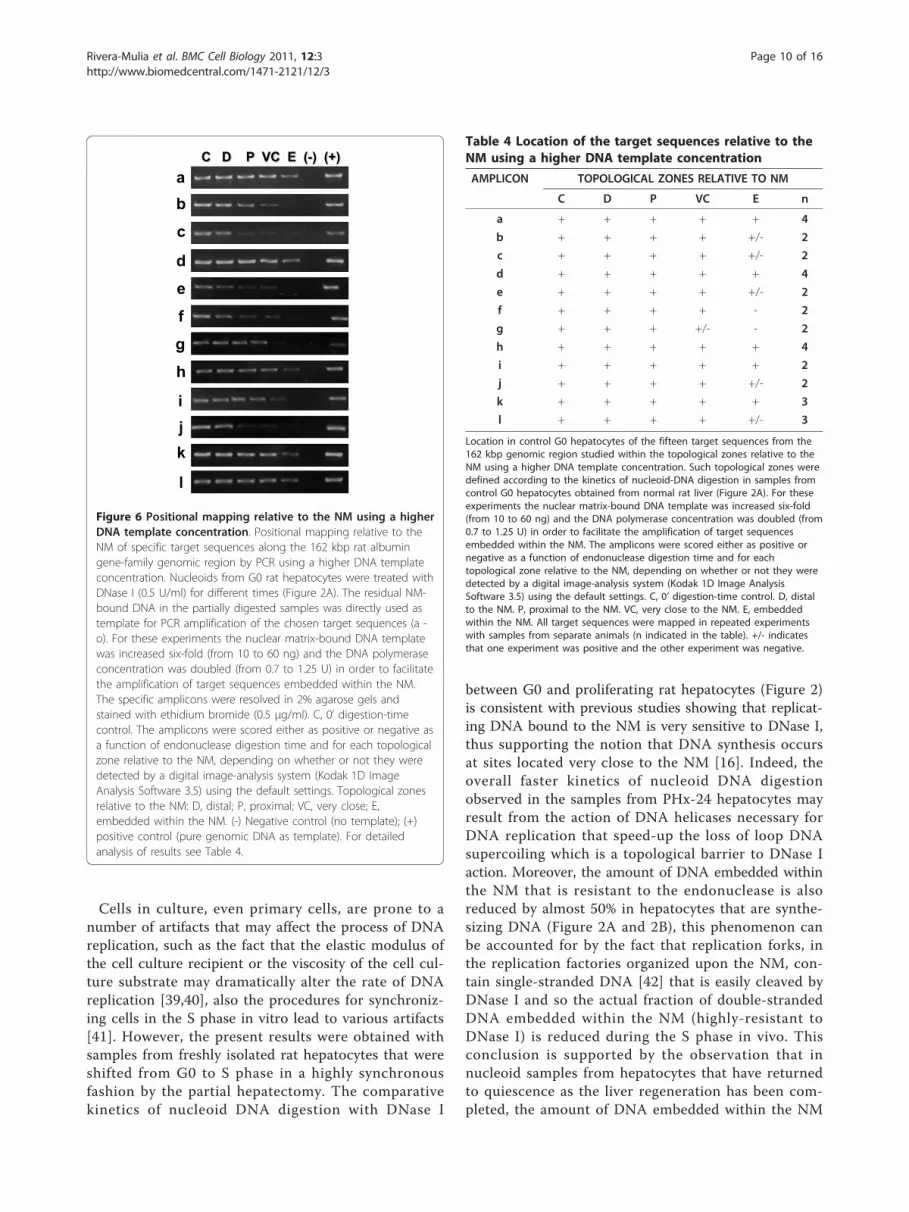
Figure 6 Positional mapping relative to the NM using a higherDNA template concentration. Positional mapping relative to theNM of specific target sequences along the 162 kbp rat albumingene-family genomic region by PCR using a higher DNA templateconcentration. Nucleoids from G0 rat hepatocytes were treated withDNase I (0.5 U/ml) for different times (Figure 2A). The residual NM-bound DNA in the partially digested samples was directly used astemplate for PCR amplification of the chosen target sequences (a -o). For these experiments the nuclear matrix-bound DNA templatewas increased six-fold (from 10 to 60 ng) and the DNA polymeraseconcentration was doubled (from 0.7 to 1.25 U) in order to facilitatethe amplification of target sequences embedded within the NM.The specific amplicons were resolved in 2% agarose gels andstained with ethidium bromide (0.5 μg/ml). C, 0’ digestion-timecontrol. The amplicons were scored either as positive or negative asa function of endonuclease digestion time and for each topologicalzone relative to the NM, depending on whether or not they weredetected by a digital image-analysis system (Kodak 1D ImageAnalysis Software 3.5) using the default settings. Topological zonesrelative to the NM: D, distal; P, proximal; VC, very close; E,embedded within the NM. (-) Negative control (no template); (+)positive control (pure genomic DNA as template). For detailedanalysis of results see Table 4.
Table 4 Location of the target sequences relative to theNM using a higher DNA template concentration
AMPLICON TOPOLOGICAL ZONES RELATIVE TO NM
C D P VC E n
a + + + + + 4
b + + + + +/- 2
c + + + + +/- 2
d + + + + + 4
e + + + + +/- 2
f + + + + - 2
g + + + +/- - 2
h + + + + + 4
i + + + + + 2
j + + + + +/- 2
k + + + + + 3
l + + + + +/- 3
Location in control G0 hepatocytes of the fifteen target sequences from the162 kbp genomic region studied within the topological zones relative to theNM using a higher DNA template concentration. Such topological zones weredefined according to the kinetics of nucleoid-DNA digestion in samples fromcontrol G0 hepatocytes obtained from normal rat liver (Figure 2A). For theseexperiments the nuclear matrix-bound DNA template was increased six-fold(from 10 to 60 ng) and the DNA polymerase concentration was doubled (from0.7 to 1.25 U) in order to facilitate the amplification of target sequencesembedded within the NM. The amplicons were scored either as positive ornegative as a function of endonuclease digestion time and for eachtopological zone relative to the NM, depending on whether or not they weredetected by a digital image-analysis system (Kodak 1D Image AnalysisSoftware 3.5) using the default settings. C, 0’ digestion-time control. D, distalto the NM. P, proximal to the NM. VC, very close to the NM. E, embeddedwithin the NM. All target sequences were mapped in repeated experimentswith samples from separate animals (n indicated in the table). +/- indicatesthat one experiment was positive and the other experiment was negative.
Rivera-Mulia et al. BMC Cell Biology 2011, 12:3http://www.biomedcentral.com/1471-2121/12/3
Page 10 of 16
and highly-resistant to DNase I is basically the same asthat in the undisturbed quiescent hepatocytes (Figure2A and 2C), indicating that the absence of active repli-cation forks reduces significantly the sensitivity of theDNA embedded within the NM to DNase I. Moreover,in PHx-7D samples the overall kinetics of nucleoidDNA digestion is basically the same as that in undis-turbed G0 controls (Figure 2A and 2C) suggesting thatloop-DNA supercoiling has been fully recovered in suchnewly-quiescent hepatocytes.Applying elementary topological principles such as
that points in a deformable string (DNA) can be posi-tionally mapped relative to a position-reference invariant(NM), and that from such a mapping it can be deducedthe configuration of the string in third dimension [43],the topological configuration of the DNA loops duringthe S phase can be directly deduced from the corre-sponding positions of the target sequences relative tothe NM (Table 3). However, it is important to stressthat we are actually monitoring the average DNA looparrangement in a large number of hepatocytes and soour mapping approach must be regarded as topological(non-metric). Our PHx-24 samples correspond to anaverage snapshot of the S phase in a large number ofhepatocyte nucleoids and so the most likely averageconfiguration at the peak of DNA synthesis of the struc-tural loops studied is depicted in Figure 5B. Indeed,
such an average snapshot of the S phase is possiblebecause of the relatively high synchronicity of DNAsynthesis at 24 h post-hepatectomy [22,31,32] since atearlier and latter hours around the main peak of DNAsynthesis the location of target sequences relative to theNM becomes erratic (data not shown). Yet, under ourstandard experimental conditions the positional map-pings of target sequences relative to the NM at 24 hpost-hepatectomy are highly reproducible among experi-ments (Figure 4). It must be stressed that the highlyreproducible and widely documented main peak ofDNA synthesis observed at 24 h post-partial hepatect-omy in young-adult laboratory rats [22,31,32] is thecomposite average signal of millions of hepatocytes ofthe regenerating liver that might be individually foundin different stages of the S phase (early, middle or late)or even beyond or out from the S phase. In the sameway, the data on the topological positional mapping oftarget sequences relative to the NM in our PHx-24 sam-ples (Table 2 and 3) represent the most commonlydetectable pattern of amplification signals of the corre-sponding target sequences (Figure 4). Such a pattern ofamplification signals becomes quite reproducible at 24 hpost-partial hepatectomy suggesting a direct correlationwith the well known fact that at that time most hepato-cytes in the regenerating liver are somewhere in the Sphase, but it would be unwarranted to conclude
Table 5 Target sequences corresponding to four unrelated genes from separate chromosomes
Amplicon Chromosome Forward Primer Reverse Primer Amplicon Length
GFAP 10 TCCAGCCCGTCCCTCAATAA TCCCGAAGTTCTGCCTGGTAA 418 bp
CD23 12 TAGGAGACGATGCTGCTGTGCA CGTGGGAAGAGGATCAGACAAGAA 284 bp
MPZ 13 CTTGCCCCTACCCCAGCTAT TCTCCTTGGCTGGCTCTCAAT 184 bp
Fyn 20 ACACAATGCTGATCTAGTCGTGGC CACATCTGTGTTCATCACTGTCCG 340 bp
Sets of primers and corresponding amplicon sizes defining target sequences in four unrelated genes located in different rat chromosomes. All the ampliconswere designed for the 5’ end of the corresponding gene.
Figure 7 Positional mapping relative to the NM of unrelated gene sequences. Nucleoids from rat hepatocytes were treated with DNase I(0.5 U/ml) for different times. The residual NM-bound DNA in the partially digested samples was directly used as template for PCR amplificationof small target sequences (Table 2) located in the 5’ ends of the corresponding genes (Fyn, CD23, GFAP and MPZ). Each of such genes is locatedin a different chromosome and thus they represent separate chromosome territories within the nucleus. The specific amplicons were resolved in2% agarose gels and stained with ethidium bromide (0.5 μg/ml). CT, control G0 hepatocytes; PHx-24 h, hepatocytes 24 h after partialhepatectomy; PHx-7 D, hepatocytes 7 days after partial hepatectomy C, 0’ digestion-time control. Topological zones relative to the NM: D, distal;P, proximal; VC, very close; E, embedded within the NM. (-) Negative control (no template); (+) positive control (pure genomic DNA as template).The amplification patterns were consistently reproduced in separate experiments with samples from independent animals (n ≥ 3).
Rivera-Mulia et al. BMC Cell Biology 2011, 12:3http://www.biomedcentral.com/1471-2121/12/3
Page 11 of 16
anything about the detailed status of the replication fac-tories, since all detailed studies on replication factoriesassembly and dynamics have been carried out in sam-ples obtained from cells in culture and so far there areno established protocols for labeling such factories inwhole animals undergoing liver regeneration. However,it has been shown that several components of the repli-cation factories are organized upon the NM [18,21].A detailed analysis of the positional changes displayed
during the S phase by the target sequences locatedalong the five DNA loops of the albumin gene familylocus shows that two target sequences (a, m) apparentlyremain fixed in a position proximal to the NM, whereasanother two target sequences (c, g) apparently remainfixed in a position distal to the NM and eleven targetsequences (b, d, e, f, g, h, i, j, k, l, n, o) display a shiftfrom their corresponding original positions towards thenext closer topological zone relative to the NM (Table3). Since our PHx-24 samples correspond to an averagesnapshot of the S phase in a large number of hepatocytenucleoids, the possible average configuration at the peakof DNA synthesis of the DNA loops studied is thatdepicted in Figure 5B.Therefore, assuming that DNA replication takes place
in factories organized upon the NM we can interpretthe resulting DNA loop arrangement in Figure 5B asfollows: the a and m target sequences are among thefirst to be replicated, given their original proximity tothe NM and to a relatively early-firing origin of
replication, thus they may have already being replicatedin most nucleoids and so daughter duplexes containingone parental strand and one newly made strand (thatinclude the copied a and m sequences) have alreadybeing extruded from the replication complexes allowingsuch a and m sequences to regain their original posi-tions relative to the NM. This situation will be detectedin our experimental system as lack of any change in thealready proximal position of the a and m sequencesrelative to the NM. However, the c and g sequencesremain distal to the NM because they are located rela-tively far away from the active replication forks and sothey have not been replicated yet in most nucleoids.This situation will be detected in our experimental sys-tem as lack of any change in the distal position relativeto the NM of sequences c and g. All other targetsequences display positions relative to the NM consis-tent to their relative proximity to putative replicationforks on the NM, thus some sequences may have beenalready replicated (d, e, h, i, k, o) while others are aboutto be replicated when they finally reach the correspond-ing active replication fork (b, f, j, l, n).The close correlation observed between DNA replicon
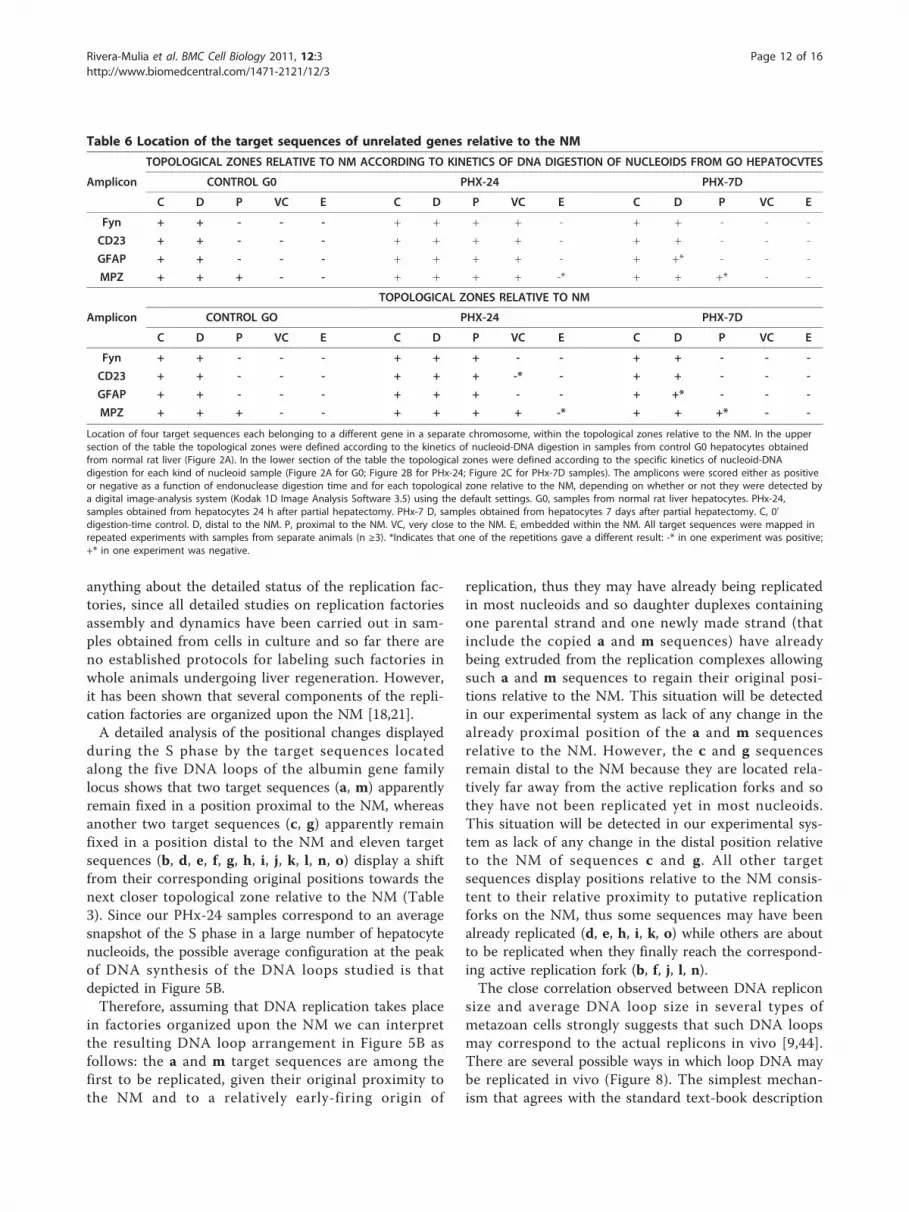
size and average DNA loop size in several types ofmetazoan cells strongly suggests that such DNA loopsmay correspond to the actual replicons in vivo [9,44].There are several possible ways in which loop DNA maybe replicated in vivo (Figure 8). The simplest mechan-ism that agrees with the standard text-book description
Table 6 Location of the target sequences of unrelated genes relative to the NM
TOPOLOGICAL ZONES RELATIVE TO NM ACCORDING TO KINETICS OF DNA DIGESTION OF NUCLEOIDS FROM GO HEPATOCVTES
Amplicon CONTROL G0 PHX-24 PHX-7D
C D P VC E C D P VC E C D P VC E
Fyn + + - - - + + + + - + + - - -
CD23 + + - - - + + + + - + + - - -
GFAP + + - - - + + + + - + +* - - -
MPZ + + + - - + + + + -* + + +* - -
TOPOLOGICAL ZONES RELATIVE TO NM
Amplicon CONTROL GO PHX-24 PHX-7D
C D P VC E C D P VC E C D P VC E
Fyn + + - - - + + + - - + + - - -
CD23 + + - - - + + + -* - + + - - -
GFAP + + - - - + + + - - + +* - - -
MPZ + + + - - + + + + -* + + +* - -
Location of four target sequences each belonging to a different gene in a separate chromosome, within the topological zones relative to the NM. In the uppersection of the table the topological zones were defined according to the kinetics of nucleoid-DNA digestion in samples from control G0 hepatocytes obtainedfrom normal rat liver (Figure 2A). In the lower section of the table the topological zones were defined according to the specific kinetics of nucleoid-DNAdigestion for each kind of nucleoid sample (Figure 2A for G0; Figure 2B for PHx-24; Figure 2C for PHx-7D samples). The amplicons were scored either as positiveor negative as a function of endonuclease digestion time and for each topological zone relative to the NM, depending on whether or not they were detected bya digital image-analysis system (Kodak 1D Image Analysis Software 3.5) using the default settings. G0, samples from normal rat liver hepatocytes. PHx-24,samples obtained from hepatocytes 24 h after partial hepatectomy. PHx-7 D, samples obtained from hepatocytes 7 days after partial hepatectomy. C, 0’digestion-time control. D, distal to the NM. P, proximal to the NM. VC, very close to the NM. E, embedded within the NM. All target sequences were mapped inrepeated experiments with samples from separate animals (n ≥3). *Indicates that one of the repetitions gave a different result: -* in one experiment was positive;+* in one experiment was negative.
Rivera-Mulia et al. BMC Cell Biology 2011, 12:3http://www.biomedcentral.com/1471-2121/12/3
Page 12 of 16
Figure 8 Possible mechanisms for replicating DNA loops in vivo. A) DNA loops are attached to the nuclear matrix (NM) by LARs sequences(black circles), the colored squares represent different sequences located along the loop DNA. B) Tracking model of DNA replication in whichthe replication complex (light blue) binds to a replication origin (purple circle) and moves along the template (blue string) while synthesizingthe nascent daughter duplexes (orange and green strings). C) Reel-in model for DNA replication in which a replication origin (purple circle)originally at the tip of the DNA loop binds to the NM in late G1 reducing the actual loop size in half. The large grey oval represents thereplication focus or factory. During the S phase the template (blue string) is pulled towards the replication complex on the NM that extrudes thenewly replicated daughter duplexes (orange and green strings) that included the early-replicated origins. The LAR sequences (black circles) willbe the last to be replicated. D) Reel-in model for DNA replication in which the origins are close to the LARs which are among the first loop DNAsequences to be duplicated. Replication begins close to the LARs but the newly-replicated LARs immediately attach to the NM as well as thenewly-replicated origins that after initially firing gave origin to the actual replication forks (light blue ovals). Thus the growing daughter duplexesextruded from the replication complex on the NM are doubled in number, resulting in tiny but transient DNA loops that disappear once theloop DNA has been fully replicated, resulting in two full-sized daughter DNA loops (E).
Rivera-Mulia et al. BMC Cell Biology 2011, 12:3http://www.biomedcentral.com/1471-2121/12/3
Page 13 of 16
of DNA synthesis is the tracking model in which thereplication complex binds to a replication origin andfrom there moves along the template while synthesizingnew DNA. In this case all loop-DNA sequences shouldmaintain their original positions relative to the NM atall times during the cell cycle (Figure 8B). Hence, ourresults do not support such a model. On the otherhand, the reel-in models for DNA replication imply thatthe replication machinery is fixed on the NM and theloop DNA is reeled through the replication complexwhile the newly synthesized DNA is extruded from thereplication factory on the NM [16,20]. The simplestmodel of this kind suggests that the replication origin islocated at the tip of the DNA loop and then it binds tothe NM late in G1 before the start of the S phase [21],and so the original DNA loop becomes suddenly dividedinto two half-sized loops (Figure 8C). This modelimplies that all loop DNA sequences would shift to clo-ser positions relative to the NM during S phase but alsothat the LARs would be the last sequences to be repli-cated. However, this model is not consistent with theevidence that so far most well-characterized origins ofreplication in metazoans are located next or very closeto LARs [5,9] and so LARs very likely correspond toearly-replicating sequences. Therefore, we may assumethat NM-embedded looped DNA regions (Figure 5A)either contain or are adjacent to the potential originsthat after firing establish the active replication forks thatremain fixed to the NM while the template is reeledtowards them. Replication factories are large enough toaccommodate several contiguous DNA loops that maybe replicated almost simultaneously [15,20]. Indeed, it isknown that adjacent origins of replication in a mamma-lian chromosome often fire simultaneously and thatreplicon clusters that share the same replication factorystably replicate at the same stage of the S phasethroughout consecutive cell cycles [15,45].
ConclusionsThe present results suggest that looped DNA moves in asequential fashion, as if reeled in, towards the NM dur-ing DNA replication in vivo and then returns to its ori-ginal position in newly quiescent cells, once the liverregeneration has been achieved, thus supporting thenotion that during replication it is the DNA templatethat is pulled towards the replication factories on theNM. The results are consistent with a reel-in model ofDNA replication in vivo in which the replication com-plexes are fixed in factories organized upon the NM[20,21] towards which the DNA template migrates in aprogressive, sequential fashion so as to be replicated(Figure 8D) thus supporting early observations, usingthe same animal model, which suggested DNA replicatesin vivo by moving through fixed replication complexes
on the NM [16]. So far we can only speculate about thedetailed molecular mechanisms involved in such a reel-in process. Nevertheless, our results provide further sup-port to the notion that the structural DNA loopsattached to the NM correspond to the actual repliconsin metazoan cells.
MethodsAnimalsMale Wistar rats weighing 200-250 g were used inaccordance with the official Mexican norm for produc-tion, care and use of laboratory animals (NOM-062-ZOO-1999).
Partial hepatectomySurgical removal of two-thirds of the liver (mechanicalpartial hepatectomy) was performed between 7 and 8am, under ether anaesthesia [10]. Rats were sacrificedusing ether anaesthesia at 24 h and 7 days after mechan-ical hepatectomy.
HepatocytesPrimary rat hepatocytes were obtained from rat livers(normal or hepatectomised), using the protocol describedpreviously [10]. Briefly, the livers were washed in situ byperfusion with PBS without Ca2+ and Mg2+ (PBS-A) at37°C for 5 min at 15 ml/min for non-hepatectomised ratsand for 2 min for hepatectomised rats. The tissue wasfurther perfused with a solution of collagenase IV, Sigma(0.025% collagenase with 0.075% of CaCl2 in HEPES buf-fer, pH 7.6) for 8 min for non-hepatectomised rats andfor 3 min for hepatectomised rats. Viable hepatocyteswere counted in a haemocytometer and used immedi-ately for preparing the nucleoids (see below).
Parameters of liver regenerationLiver regeneration progression, including main peak ofDNA synthesis and return of hepatocytes to G0 aftercompletion of liver regeneration, was estimated bydetermination of thymidine kinase activity in the cytoso-lic liver fraction using a radiometric method as we havepreviously described [46].
Preparation of nucleoidsThe DNA loops plus the nuclear substructure constitutea ‘’nucleoid’’, a very large nucleoprotein aggregate gener-ated by gentle lysis of a cell at pH 8 in non-ionic deter-gent and the presence of high salt concentration.Nucleoids were prepared as described previously [12].Briefly, freshly isolated and washed hepatocytes weresuspended in ice-cold PBS-A, aliquots of 50 μl contain-ing 3 × 10⁵ cells were gently mixed with 150 μl of alysis solution containing 2.6 M NaCl, 1.3 mM EDTA,2.6 mM Tris, 0.6% Triton-X 100 (pH 8.0). After 20 min
Rivera-Mulia et al. BMC Cell Biology 2011, 12:3http://www.biomedcentral.com/1471-2121/12/3
Page 14 of 16
at 4°C, the mixture was washed in 14 ml of PBS-A at 4°C for 4 min at 3000 rpm (1500 g). The pellet was recov-ered in a volume ranging from 200 to 300 μl.
DNase-I digestion of nucleoid samplesThe washed nucleoids were pooled for setting up theDNase I digestion curves (1.8 × 10⁶ nucleoids in 1.2 mlof PBS-A) and mixed with 5 ml of DNase I digestionbuffer (10 mM MgCl2, 0.1 mM dithiothreitol, 50 mMTris at pH 7.2). Digestions were carried out at 37°Cwith 0.5 U/ml DNase I (Sigma). Each digestion timepoint aliquot contained 3 × 10⁵ nucleoids. Digestionreactions were stopped by adding 200 μl of stop buffer(final EDTA concentration of 30 mM). The stop buffercontains 0.2 M EDTA and 10 mM Tris at pH 7.5. Afterdigestion with DNase I, the NM-bound DNA was deter-mined by spectrometry on aliquots of partially digestednucleoid samples that were washed and further handledas described previously [12]. The final nucleoid pelletwas re-suspended in 200 μl double distilled-H2O to beused directly as template for PCR.
Genomic DNA primersDistinct sets of primers were designed for establishingthe topological positions relative to the NM of fifteensmall DNA sequences located along 162 kbp of thegenomic region containing four members of the ratalbumin gene family [23]. Briefly, primer pairs weredesigned approximately each 10 kb in order to establishrather regular intervals along the region studied. All pri-mers sets were designed with a length of 20-25 bp, G-Ccontent between 50-55%, Tm of 55-60°C, and PCR pro-ducts of 250-550 bp (Table 1). Secondary structures anddimmers/duplexes were avoided. Also, primers weredesigned for small amplicons (≤ 418 bp) located in the5’ ends of four non-related genes that belong to separatechromosomes territories within the nucleus (Table 5).
PCR amplificationFor most experiments ten nanograms of nuclearmatrix-bound DNA were used as template for PCR.PCR was carried out using 0.7 U GoTaq DNA Poly-merase (Promega), 2.5 mM MgCl2, 0.2 mM of eachdNTP and 0.1 mM of each primer. Yet when indicated(Figure 6 Table 4) sixty nanograms of nuclear matrix-bound DNA template and 1.25 U GoTaq were usedinstead. Amplification was performed in an AppliedBiosystems 2720 thermocycler and the same amplifica-tion program was used for all pairs of primers: initialdenaturising step at 94°C for 5 min, denaturising stepat 94°C for 45 s, annealing at 56°C for 30 s, and exten-sion at 72°C for 1 min for 35 cycles, with a final exten-sion at 72°C for 10 min. The identity of all theamplicons was confirmed by restriction analysis with
the appropriate restriction enzymes. Amplicons wereelectrophoresed on 2% agarose gels and visualizedusing ethidium bromide staining (0.5 μg/ml), recordedand analyzed using a Kodak 1D Image Analysis Soft-ware 3.5 system. Amplicons were scored as positive ornegative on partially digested nucleoid samples,depending on whether they are detectable by the soft-ware using the default settings.
AcknowledgementsThis work was supported by CONACYT, México (grant 48477-Q-25506 to A.A-A.) and Universidad Autónoma del Estado de México, México (grant 2212/2006 to A.A-A.). While performing this work J.C. Rivera-Mulia was a CONACYTResearch Scholar within the Graduate Program in Biomedical Sciences atIFC-UNAM, México. We thank Dr. C. Rivera-Cerecedo at IFC-UNAM forsupplying the experimental animals.
Author details1Laboratorio de Biología Molecular, Facultad de Medicina, UniversidadAutónoma del Estado de México, Apartado Postal 428, C.P. 50000, Toluca,Edo. Méx., México. 2Departamento de Biología Celular, Instituto de FisiologíaCelular, UNAM, Apartado Postal 70-243, C.P. 04510, México D.F., México.3Departamento de Bioquímica, Facultad de Medicina, UNAM, ApartadoPostal 70-159, C.P. 04510, México D.F.
Authors’ contributionsJCR-M carried out the experiments and analyzed the data, RH-M and FMevaluated results and suggested experiments, AA-A designed the study,analyzed the data and wrote the manuscript. All authors read and approvedthe final manuscript.
Received: 14 June 2010 Accepted: 19 January 2011Published: 19 January 2011
References1. Nickerson J: Experimental observations of a nuclear matrix. J Cell Sci 2001,
114:463-474.2. Mika S, Rost B: NMPdb: Database of Nuclear Matrix Proteins. Nucleic Acids
Res 2005, 33:D160-163.3. Nalepa G, Harper JW: Visualization of a highly organized intranuclear
network of filaments in Living mammalian cells. Cell motil Cytoskeleton2004, 59:94-108.
4. Elcock LS, Bridger JM: Exploring the effects of a dysfunctional nuclearmatrix. Biochem Soc Trans 2008, 36:1378-1383.
5. Ottaviani D, Lever E, Takousis P, Sheer D: Anchoring the genome. GenomeBiol 2008, 9:201.
6. Tsutsui KM, Sano K, Tsutsui K: Dynamic view of the nuclear matrix. ActaMed Okayama 2005, 59:113-120.
7. Zhang Y, Xi Z, Hegde RS, Shakked Z, Crothers DM: Predicting indirectreadout effects in protein-DNA interactions. Proc Natl Acad Sci USA 2004,101:8337-8341.
8. Aranda-Anzaldo A: A structural basis for cellular senescence. Aging 2009,1:598-607.
9. Razin SV: The nuclear matrix and chromosomal DNA loops: is their anycorrelation between partitioning of the genome into loops andfunctional domains? Cell Mol Biol Lett 2001, 6:59-69.
10. Maya-Mendoza A, Hernandez-Munoz R, Gariglio P, Aranda-Anzaldo A: Genepositional changes relative to the nuclear substructure correlate withthe proliferating status of hepatocytes during liver regeneration. NucleicAcids Res 2003, 31:6168-6179.
11. Iarovaia OV, Bystritskiy A, Ravcheev D, Hancock R, Razin SV: Visualization ofindividual DNA loops and a map of loop domains in the humandystrophin gene. Nucleic Acids Res 2004, 32:2079-2086.
12. Maya-Mendoza A, Aranda-Anzaldo A: Positional mapping of specific DNAsequences relative to the nuclear substructure by direct polymerasechain reaction on nuclear matrix-bound templates. Anal Biochem 2003,313:196-207.
Rivera-Mulia et al. BMC Cell Biology 2011, 12:3http://www.biomedcentral.com/1471-2121/12/3
Page 15 of 16
13. Maya-Mendoza A, Hernandez-Munoz R, Gariglio P, Aranda-Anzaldo A: Genepositional changes relative to the nuclear substructure during carbontetrachloride-induced hepatic fibrosis in rats. J Cell Biochem 2004,93:1084-1098.
14. Maya-Mendoza A, Hernandez-Munoz R, Gariglio P, Aranda-Anzaldo A:Natural ageing in the rat liver correlates with progressive stabilisation ofDNA-nuclear matrix interactions and withdrawal of genes from thenuclear substructure. Mech Ageing Dev 2005, 126:767-782.
15. Sadoni N, Cardoso MC, Stelzer EH, Leonhardt H, Zink D: Stablechromosomal units determine the spatial and temporal organization ofDNA replication. J Cell Sci 2004, 117:5353-5365.
16. Berezney R, Buchholtz LA: Dynamic association of replicating DNAfragments with the nuclear matrix of regenerating liver. Exp Cell Res1981, 132:1-13.
17. Nakamura H, Morita T, Sato C: Structural organizations of replicondomains during DNA synthetic phase in the mammalian nucleus. ExpCell Res 1986, 165:291-297.
18. Hozak P, Hassan AB, Jackson DA, Cook PR: Visualization of replicationfactories attached to nucleoskeleton. Cell 1993, 73:361-373.
19. Wei X, Samarabandu J, Devdhar RS, Siegel AJ, Acharya R, Berezney R:Segregation of transcription and replication sites into higher orderdomains. Science 1998, 281:1502-1506.
20. Cook PR: The organization of replication and transcription. Science 1999,284:1790-1795.
21. Anachkova B, Djeliova V, Russev G: Nuclear matrix support of DNAreplication. J Cell Biochem 2005, 96:951-961.
22. Michalopoulos GK, DeFrances MC: Liver regeneration. Science 1997,276:60-66.
23. Rivera-Mulia JC, Aranda-Anzaldo A: Determination of the in vivo structuralDNA loop organization in the genomic region of the rat albumin locusby means of a topological approach. DNA Res 2010, 17:23-35.
24. Cook PR, Brazell IA, Jost E: Characterization of nuclear structurescontaining superhelical DNA. J Cell Sci 1976, 22:303-324.
25. Roti-Roti JL, Wright DM, Taylor YC: DNA loop structure and radiationresponse. Adv Radiat Biol 1993, 17:227-259.
26. Bloomfield VA, Crothers DM, Tinoco I Jr: Nucleic Acids; structure, propertiesand functions Sausalito, CA: University Science Books; 2000, 443-473.
27. Calladine CR, Drew HR, Luisi BF, Travers AA: Understanding DNA. 3 edition.Elsevier-Academic Press; 2004, 94-138.
28. Bode J, Kohwi Y, Dickinson L, Joh T, Klehr D, Mielke C, Kohwi-Shigematsu T:Biological significance of unwinding capability of nuclear matrix-associating DNAs. Science 1992, 255:195-197.
29. Benham C, Kohwi-Shigematsu T, Bode J: Stress-induced duplex DNAdestabilization in scaffold/matrix attachment regions. J Mol Biol 1997,274:181-196.
30. Lewin B: Gem Expression 2. 2 edition. New York: John Wiley and Sons; 1980,360-362.
31. Fabrikant J: The kinetics of cellular proliferation in regenerating liver. ExpCell Res 1968, 36:551-565.
32. Fausto N: Liver regeneration. J Hepatol 2000, 32:19-31.33. Aranda-Anzaldo A: Early induction of DNA single-stranded breaks in cells
infected by herpes simplex virus type 1. Arch Virol 1992, 122:317-330.34. Aranda-Anzaldo A: The normal association between newly replicated
DNA and the nuclear matrix is abolished in cells infected by herpessimplex virus type 1. Res Virol 1998, 149:195-208.
35. Pardoll DM, Vogelstein B, Coffey DS: A fixed site of DNA replication ineucaryotic cells. Cell 1980, 19:527-536.
36. McCready SJ, Godwin J, Mason DW, Brazell IA, Cook PR: DNA is replicatedat the nuclear cage. J Cell Sci 1980, 46:365-386.
37. Jackson DA, Cook PR: Replication occurs at a nucleoskeleton. EMBO J1986, 5:1403-1410.
38. Djeliova V, Russev G, Anachkova B: Dynamics of association of origins ofDNA replication with the nuclear matrix during the cell cycle. NucleicAcids Res 2001, 29:3181-3187.
39. Paszek MJ, Zahir N, Johnson KR, Lakins JN, Rozenberg GI, Gefen A, Reinhart-King CA, Margulies SS, Dembo M, Boettiger D, et al: Tensional homeostasisand the malignant phenotype. Cancer Cell 2005, 8:241-254.
40. Nelson CM, Jean RP, Tan JL, Liu WF, Sniadecki NJ, Spector AA, Chen CS:Emergent patterns of growth controlled by multicellular form andmechanics. Proc Natl AcadSci USA 2005, 102:11594-11599.
41. Conti C, Sacca B, Herrick J, Lalou C, Pommier Y, Bensimon A: Replicationfork velocities at adjacent replication origins are coordinately modifiedduring DNA replication in human cells. Mol Biol Cell 2007, 18:3059-3067.
42. Cook PR: The nucleoskeleton and the topology of replication. Cell 1991,66:627-635.
43. Flegg HG: From geometry to topology New York: Dover Publications; 2001.44. Buongiorno-Nardelli M, Micheli G, Carri MT, Marilley M: A relationship
between replicon size and supercoiled loop domains in the eukaryoticgenome. Nature 1982, 298:100-102.
45. Jackson DA, Pombo A: Replicon clusters are stable units of chromosomestructure: evidence that nuclear organization contributes to the efficientactivation and propagation of S phase in human cells. J Cell Biol 1998,140:1285-1295.
46. Morales-González JA, Gutiérrez-Salinas J, Yánez L, Villagómez-Rico C, Badillo-Romero J, Hernández-Muñoz R: Morphological and biochemical effects ofa low ethanol dose on rat liver regeneration. Dig Dis Sci 1999,44:1963-1974.
doi:10.1186/1471-2121-12-3Cite this article as: Rivera-Mulia et al.: DNA moves sequentially towardsthe nuclear matrix during DNA replication in vivo. BMC Cell Biology 201112:3.
Submit your next manuscript to BioMed Centraland take full advantage of:
• Convenient online submission
• Thorough peer review
• No space constraints or color figure charges
• Immediate publication on acceptance
• Inclusion in PubMed, CAS, Scopus and Google Scholar
• Research which is freely available for redistribution
Submit your manuscript at www.biomedcentral.com/submit
Rivera-Mulia et al. BMC Cell Biology 2011, 12:3http://www.biomedcentral.com/1471-2121/12/3
Page 16 of 16


