Embed Size (px)
Citation preview
Engineering Structures 31 (2009) 1382–1392
Contents lists available at ScienceDirect
Engineering Structures
journal homepage: www.elsevier.com/locate/engstruct
Shell elements for sequentially linear analysis: Lateral failure ofmasonry structuresMatthew J. DeJong a,∗,1, Beatrice Belletti b,1, Max A.N. Hendriks c, Jan G. Rots c,da Building Technology Program, Massachusetts Institute of Technology, 77 Massachusetts Avenue 5-418, Cambridge, Massachusetts, 02139, USAb Department of Civil and Environmental Engineering and Architecture, University of Parma, via Usberti 181/a, 43100, Parma, Italyc Faculty of Civil Engineering and Geosciences, Delft University of Technology, P.O. Box 5048, 2600 GA, Delft, The Netherlandsd Faculty of Architecture, Delft University of Technology, P.O. Box 5048, 2600 GA Delft, The Netherlands
a r t i c l e i n f o
Article history:Received 17 September 2008Received in revised form2 February 2009Accepted 3 February 2009Available online 4 March 2009
Keywords:Sequentially linear analysisFinite element analysisShell elementsFractureMasonry
a b s t r a c t
Shell elements are incorporated into the sequentially linear analysis method allowing the modelingof three-dimensional structures under non-proportional loading. The shell element implementation isfirst presented and then applied to simulate two previous experimental tests on full-scale unreinforcedmasonry structures under cyclic loading. Experimental cyclic envelopes and three-dimensional failuremechanisms are effectively predicted, providing further evidence to support sequentially linear analysisas an alternative to non-linear analysis in the finite element framework.
© 2009 Elsevier Ltd. All rights reserved.
1. Introduction
Damage tomasonry structures during earthquakes continues tothreaten public safety throughout the world. In response, severalapproaches for predicting the seismic capacity of unreinforcedmasonry buildings have been taken. The basis for these approachesranges from micromechanical modeling of failure to macro-scaleapproximation of masonry wall properties.With an emphasis on micromechanical modeling, Lourenço [1]
outlined computational strategies for unreinforced masonrystructures, starting with separate brick and mortar layers. Thisled to the development of a brick-interface model [2] and ananisotropic continuum model [3] for finite element analysis ofunreinforcedmasonry. Similarly, Gambarotta and Lagomarsino [4]proposed a brick-and-mortar damage model for seismic loading,and then applied homogenization techniques to develop acontinuummodel applicable to cyclic loading ofmasonrywalls [5].More recently, Brasile et al. [6] built upon this work, developingmore efficient iteration techniques for a similar brick-and-mortarjointmodel,making this complexmicro-scalemodelmore feasible.
∗ Corresponding author. Tel.: +1 617 253 1876; fax: +1 617 253 6152.E-mail address:[email protected] (M.J. DeJong).
1 Also research fellow at Delft University of Technology.
0141-0296/$ – see front matter© 2009 Elsevier Ltd. All rights reserved.doi:10.1016/j.engstruct.2009.02.007
At the other extreme of the analysis spectrum, simplifiedmacro-scale models are sometimes more practical for engineer-ing applications. For example, FEMA 356 [7] outlines a pier-springmodel which describes the force-deformation relationship of ma-sonry elements or components based on macro-scale properties.Moon et al. [8] proposed improvements to FEMA 356 in order toaccount for global overturning and perpendicular wall effects. Alsofrom the macro-scale perspective, simplified formulas for predict-ing rocking, shearing, and sliding capacities of wall piers have beenapplied (e.g. [9]). Finally, several researchers have approximatedmasonry walls as equivalent frames with plastic hinges in order toassess wall capacity (e.g. [10–12]).Between these two extremes, Milani et al. [13] recently
proposed a limit analysis technique based on homogenizedmicro-mechanical properties. While not capable of predictinga force-displacement response, the method is attractive forrapid assessment of collapse loads and 3D collapse mechanisms.Additionally, Yi et al. [14] applied a macro-scale interface method,where the masonry is modeled as a continuum with predefinedinterfaces at probable crack locations, and used shell finiteelements to predict the 3D response of a two-story masonrybuilding under lateral loading.In parallel with these assessment methods for masonry, the
concept of pushover analysis was developed to allow simplifiedstatic analysis to approximate the complex dynamic behavior ofstructures under the cyclic loading imposed by earthquakes [7].
M.J. DeJong et al. / Engineering Structures 31 (2009) 1382–1392 1383
This is typically done by applying a quasi-static horizontal loadderived from the critical mode shapes of the structure. Initially,pushover analysis was developed for frame-type structures typicalof steel and concrete construction. However, the technique hasalso been applied to masonry structures by modeling continuouswall elements directly or through use of the equivalent frametechnique.With the idea of pushover analysis in mind, the goal of
this work is to bridge the gap between simplified macro-scaleanalyses (e.g. linear elastic analysis, pier-springmodels, equivalentframe analysis) typically employed in engineering practice andadvanced non-linear finite element analyses being applied inacademic research. More specifically, the goal is to model the3D response of masonry structures under lateral loading, whileavoiding: (1) the discretization of walls into equivalent frames,(2) the a prioridefinition of crack locations, and (3) the convergencedifficulties which can occur during non-linear finite elementanalysis. To this end, the sequentially linear analysis (SLA) methodis extended to shell elements in this paper. Originally proposed byRots [15], SLA employs a series of linear analyses to model highlynon-linear behavior. The method has been shown to effectivelysimulate 2D fracture under non-proportional loading [16], theloading condition of interest for masonry structures under bothworking loads and lateral earthquake loads.In the following sections, the SLA framework is first reviewed,
after which the formulation of SLA for shell elements is presented.Subsequently, SLA is used to simulate experimental tests onmasonry structures by Yi et al. [17,18] and Magenes et al. [19].Experimental and numerical results are compared and discussed,and conclusions are drawn.
2. Three-dimensional SLA using shell elements
The capability of SLA is extended to three-dimensional struc-tures through the use of shell elements. While analysis with full3D solid elements is possible, shell elements provide an efficientmeans of modeling many typical structures. The general solutionprocedure is the same as in two dimensions, and is first reviewed.
2.1. General procedure for non-proportional loading
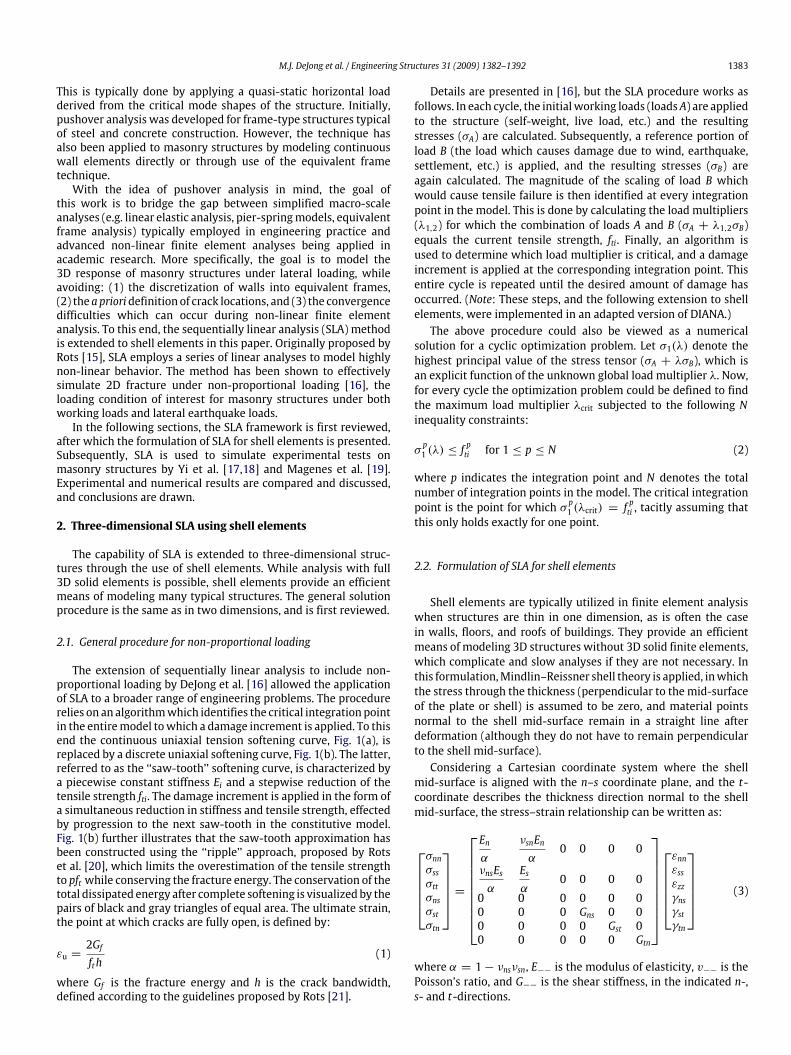
The extension of sequentially linear analysis to include non-proportional loading by DeJong et al. [16] allowed the applicationof SLA to a broader range of engineering problems. The procedurerelies on an algorithmwhich identifies the critical integration pointin the entiremodel towhich a damage increment is applied. To thisend the continuous uniaxial tension softening curve, Fig. 1(a), isreplaced by a discrete uniaxial softening curve, Fig. 1(b). The latter,referred to as the ‘‘saw-tooth’’ softening curve, is characterized bya piecewise constant stiffness Ei and a stepwise reduction of thetensile strength fti. The damage increment is applied in the form ofa simultaneous reduction in stiffness and tensile strength, effectedby progression to the next saw-tooth in the constitutive model.Fig. 1(b) further illustrates that the saw-tooth approximation hasbeen constructed using the ‘‘ripple’’ approach, proposed by Rotset al. [20], which limits the overestimation of the tensile strengthto pft while conserving the fracture energy. The conservation of thetotal dissipated energy after complete softening is visualized by thepairs of black and gray triangles of equal area. The ultimate strain,the point at which cracks are fully open, is defined by:
εu =2Gffth
(1)
where Gf is the fracture energy and h is the crack bandwidth,defined according to the guidelines proposed by Rots [21].
Details are presented in [16], but the SLA procedure works asfollows. In each cycle, the initialworking loads (loadsA) are appliedto the structure (self-weight, live load, etc.) and the resultingstresses (σA) are calculated. Subsequently, a reference portion ofload B (the load which causes damage due to wind, earthquake,settlement, etc.) is applied, and the resulting stresses (σB) areagain calculated. The magnitude of the scaling of load B whichwould cause tensile failure is then identified at every integrationpoint in the model. This is done by calculating the load multipliers(λ1,2) for which the combination of loads A and B (σA + λ1,2σB)equals the current tensile strength, fti. Finally, an algorithm isused to determine which load multiplier is critical, and a damageincrement is applied at the corresponding integration point. Thisentire cycle is repeated until the desired amount of damage hasoccurred. (Note: These steps, and the following extension to shellelements, were implemented in an adapted version of DIANA.)The above procedure could also be viewed as a numerical
solution for a cyclic optimization problem. Let σ1(λ) denote thehighest principal value of the stress tensor (σA + λσB), which isan explicit function of the unknown global load multiplier λ. Now,for every cycle the optimization problem could be defined to findthe maximum load multiplier λcrit subjected to the following Ninequality constraints:
σp1 (λ) ≤ f
pti for 1 ≤ p ≤ N (2)
where p indicates the integration point and N denotes the totalnumber of integration points in the model. The critical integrationpoint is the point for which σ p1 (λcrit) = f
pti , tacitly assuming that
this only holds exactly for one point.
2.2. Formulation of SLA for shell elements
Shell elements are typically utilized in finite element analysiswhen structures are thin in one dimension, as is often the casein walls, floors, and roofs of buildings. They provide an efficientmeans of modeling 3D structures without 3D solid finite elements,which complicate and slow analyses if they are not necessary. Inthis formulation,Mindlin–Reissner shell theory is applied, inwhichthe stress through the thickness (perpendicular to the mid-surfaceof the plate or shell) is assumed to be zero, and material pointsnormal to the shell mid-surface remain in a straight line afterdeformation (although they do not have to remain perpendicularto the shell mid-surface).Considering a Cartesian coordinate system where the shell
mid-surface is aligned with the n–s coordinate plane, and the t-coordinate describes the thickness direction normal to the shellmid-surface, the stress–strain relationship can be written as:
σnnσssσttσnsσstσtn
=
Enα
νsnEnα
0 0 0 0
νnsEsα
Esα
0 0 0 00 0 0 0 0 00 0 0 Gns 0 00 0 0 0 Gst 00 0 0 0 0 Gtn
εnnεssεzzγnsγstγtn
(3)
where α = 1− νnsνsn, E−− is the modulus of elasticity, v−− is thePoisson’s ratio, and G−− is the shear stiffness, in the indicated n-,s- and t-directions.
1384 M.J. DeJong et al. / Engineering Structures 31 (2009) 1382–1392
Fig. 1. Constitutive relation for masonry.
Initially, before any damage occurs, the material is assumed tobe isotropic, which results in:
νo = νns = νsn; Eo = En = Es;
Go = Gns = Gst = Gtn =Eo
2(1+ vo)(4)
where the subscript o refers to initial, undamaged materialproperties. Combining Eqs. (3) and (4) yields the typical shellstiffness matrix for isotropic materials [22]:σnnσssσttσnsσstσtn
= Eo1− ν2o
1 νo 0 0 0 0νo 1 0 0 0 00 0 0 0 0 00 0 0 β 0 00 0 0 0 β 00 0 0 0 0 β
εnnεssεttγnsγstγtn
(5)
where β = (1− νo)/2.Following the procedure outlined in Section 2.1 and [16], the
nonlinear behavior is modeled through application of a damageincrement at the critical integration point in the model. Whencracking is first implemented at any given integration point, thecrack direction is fixed, and the crack normal elasticity, En, isreduced. At this point, the isotropic stiffness matrix no longerapplies, and the stiffness matrix in Eq. (3) is applied. As introducedin [16], the Poisson’s ratios in the n–s plane are reduced at the samerate as the corresponding elastic modulus values:
νns = νoEnEo; νsn = νo
EsEo. (6)
However, the Poisson’s ratios in the other directions remain un-changed. Additionally, the shear modulus, which has a significanteffect on crack propagation [23], is assumed to reduce accordingto:
Gns =Emin
2(1+ voEminEo); Gst =
Es2(1+ vo EsEo )
;
Gtn =En
2(1+ vo EnEo )
(7)
where Emin = min(En, Es). These assumptions fix the crack planeto be perpendicular to the plane of the shell element.Because the above formulation was implemented through
adjusting the stiffness matrix between each linear elastic analysis,it is independent of the shell element characteristics. As a result,the typical suite of shell elements, with different numbers of nodesand integration points, are available.Essentially, the shell element formulation is similar to layered
membrane elements spaced over the thickness of the shell,introduced through a 2D mesh with additional integration pointsin the thickness direction. The number of integration points overthe thickness is related to the number of analyses required to
develop cracking through the entire shell, and should thereforebe limited if possible. When out-of-plane bending is a concern,a higher number of integration points is necessary, but when in-plane loading is of interest, the number of integration points canbe reduced.The result is a framework in which the 3D failure of
many typical buildings can be modeled. The following examplesare intended to test the ability of the procedure to predictexperimental results and to exemplify the benefits andweaknessesof the procedure through comparison with nonlinear finiteelement results. The examples herein focus onmasonry structures,but the framework is generally applicable to shell structures.As a first approach, a simple isotropic tensile failure criterion isemployed for masonry, but a more rigorous anisotropic failurecriterion which takes into account the composite behavior of thebrick and mortar could be implemented and is currently underinvestigation.
3. Simulation of the building tested by Yi et al. [18]
The first application of SLA with shell elements is to thefull-scale masonry structure tested by Yi et al. [17,18]. Inthis experiment, a two-story unreinforced masonry structure,approximately 7.5 m square by 7.1 m tall, was constructed andthen tested under cyclic loading. For details of the experimentalprocedure not explained in this text, the reader is referred to[17,18].
3.1. Testing and simulation procedure
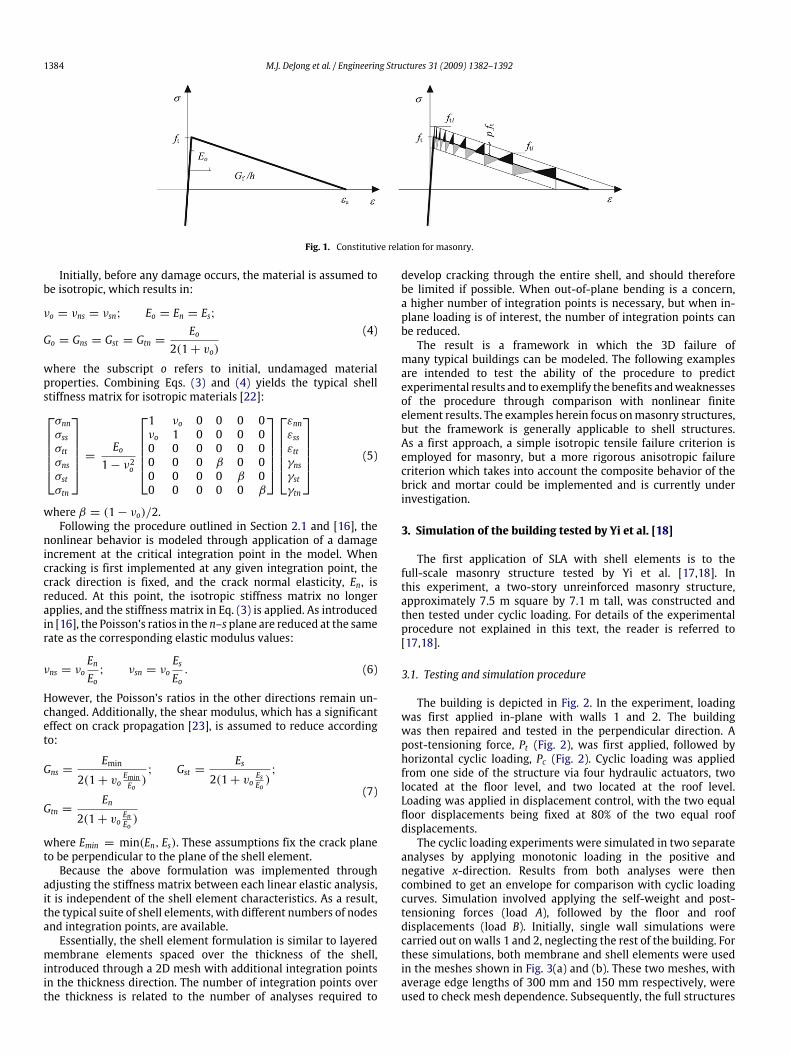
The building is depicted in Fig. 2. In the experiment, loadingwas first applied in-plane with walls 1 and 2. The buildingwas then repaired and tested in the perpendicular direction. Apost-tensioning force, Pt (Fig. 2), was first applied, followed byhorizontal cyclic loading, Pc (Fig. 2). Cyclic loading was appliedfrom one side of the structure via four hydraulic actuators, twolocated at the floor level, and two located at the roof level.Loading was applied in displacement control, with the two equalfloor displacements being fixed at 80% of the two equal roofdisplacements.The cyclic loading experiments were simulated in two separate
analyses by applying monotonic loading in the positive andnegative x-direction. Results from both analyses were thencombined to get an envelope for comparison with cyclic loadingcurves. Simulation involved applying the self-weight and post-tensioning forces (load A), followed by the floor and roofdisplacements (load B). Initially, single wall simulations werecarried out on walls 1 and 2, neglecting the rest of the building. Forthese simulations, both membrane and shell elements were usedin the meshes shown in Fig. 3(a) and (b). These two meshes, withaverage edge lengths of 300 mm and 150 mm respectively, wereused to check mesh dependence. Subsequently, the full structures
M.J. DeJong et al. / Engineering Structures 31 (2009) 1382–1392 1385
Fig. 2. Geometry and loading conditions for Yi et al. [18] test.
were simulated in three dimensions using shell elements. Themesh used for full structure analyses (Fig. 3(c)) is of the samedensity as the coarse 2Dmesh. For all analyses, four point in-planeGauss integration was used. For shell analyses, two integrationpoints were specified over the thickness.The material properties used to simulate the building response
are given in Table 1. The density, ρ, elasticity, Eo, and Poisson’sratio, vo, are the same as those used by Yi et al. [14], andwere derived from experimental results. Additionally, the wooddiaphragms at the floor and roof level were both assumed to havean elastic modulus of 0.02 MPa, also derived from experimentalresults and reasonable values for wood diaphragms [14]. Anisotropic tensile strength is clearly a simplification of compositemasonry behavior, and was particularly difficult to estimatebecause of the extremely weak mortar (Type K) used to simulatetypical pre-1950 construction. The assumed value is slightly largerthan the contact element normal tensile strength of 0.14 MPaassumed by Yi [17]. A linear softening material model was usedwith a ripple envelope defined by p = 20% and a crack bandwidthh = 424 mm for the coarse mesh and 212 mm for the fine mesh.
3.2. Simulation results
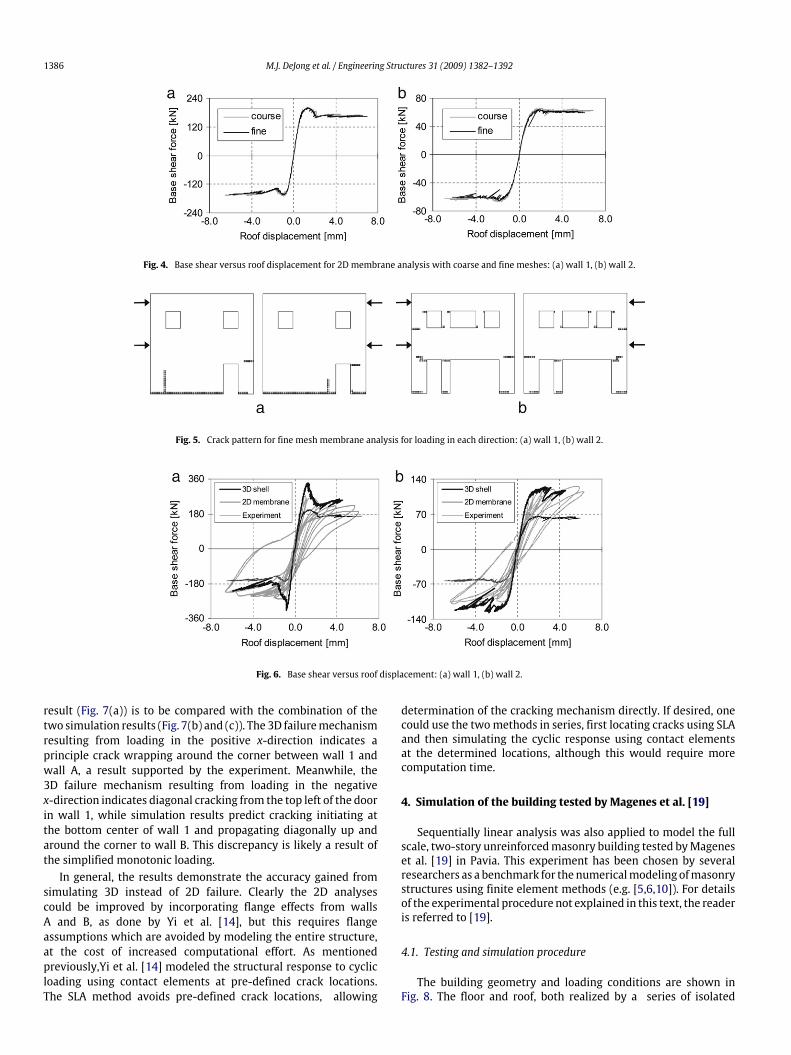
The 2D results for the coarse mesh and fine mesh are comparedin Fig. 4, and indicate no mesh density dependence. This is an
Table 1Material properties used for simulation of Yi et al. [18] test.
Material ρ (kg/m3) Eo (GPa) vo ft (MPa) Gf (N/mm)
Masonry 1920 6.9 0.25 0.2 0.05
important check, as other damage models have been observed tohave strong mesh dependence in the post-peak range [12]. Thesimilar results for the coarse and fine meshes confirm the mesh-size objectivity of SLA demonstrated by Rots and Invernizzi [24].As expected, results of shell element simulations (not shown)werethe same as 2D membrane analyses, confirming the shell elementimplementation. However, shell elements provide no benefit forthese 2D simulations, and twice asmany cycleswere necessary dueto the two integration points over the depth.The crack patterns for the fine mesh membrane analyses are
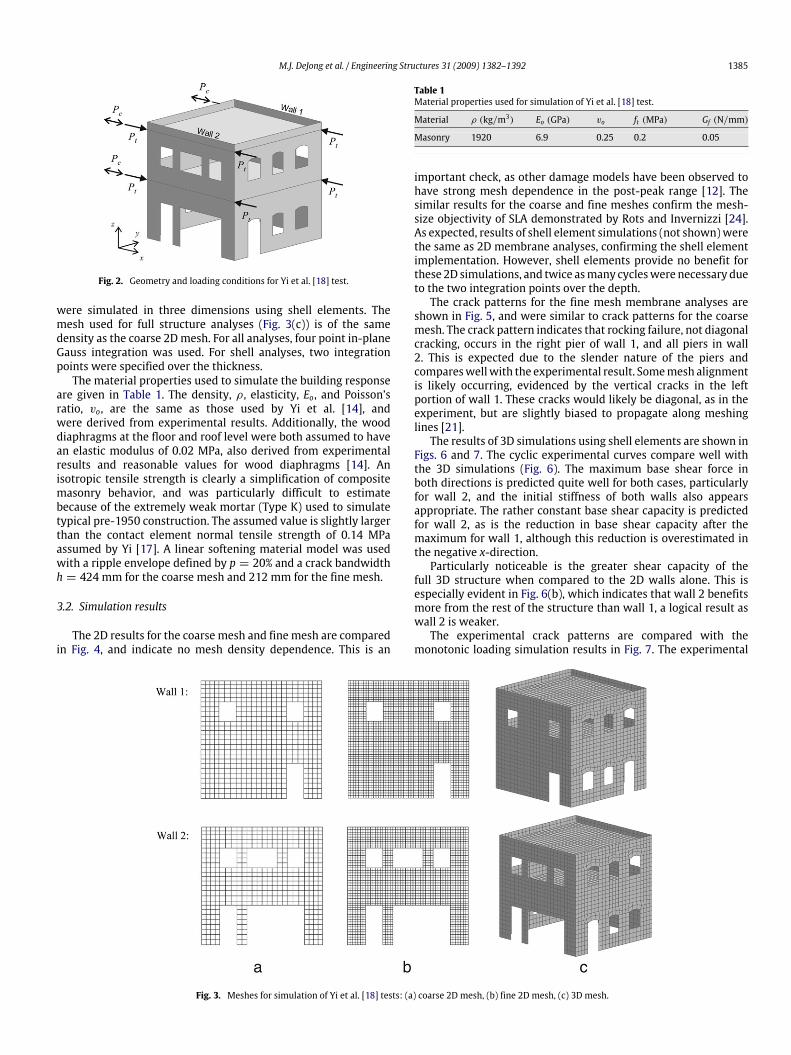
shown in Fig. 5, and were similar to crack patterns for the coarsemesh. The crack pattern indicates that rocking failure, not diagonalcracking, occurs in the right pier of wall 1, and all piers in wall2. This is expected due to the slender nature of the piers andcompareswellwith the experimental result. Somemesh alignmentis likely occurring, evidenced by the vertical cracks in the leftportion of wall 1. These cracks would likely be diagonal, as in theexperiment, but are slightly biased to propagate along meshinglines [21].The results of 3D simulations using shell elements are shown in
Figs. 6 and 7. The cyclic experimental curves compare well withthe 3D simulations (Fig. 6). The maximum base shear force inboth directions is predicted quite well for both cases, particularlyfor wall 2, and the initial stiffness of both walls also appearsappropriate. The rather constant base shear capacity is predictedfor wall 2, as is the reduction in base shear capacity after themaximum for wall 1, although this reduction is overestimated inthe negative x-direction.Particularly noticeable is the greater shear capacity of the
full 3D structure when compared to the 2D walls alone. This isespecially evident in Fig. 6(b), which indicates that wall 2 benefitsmore from the rest of the structure than wall 1, a logical result aswall 2 is weaker.The experimental crack patterns are compared with the
monotonic loading simulation results in Fig. 7. The experimental
Fig. 3. Meshes for simulation of Yi et al. [18] tests: (a) coarse 2D mesh, (b) fine 2D mesh, (c) 3D mesh.
1386 M.J. DeJong et al. / Engineering Structures 31 (2009) 1382–1392
Fig. 4. Base shear versus roof displacement for 2D membrane analysis with coarse and fine meshes: (a) wall 1, (b) wall 2.
Fig. 5. Crack pattern for fine mesh membrane analysis for loading in each direction: (a) wall 1, (b) wall 2.
Fig. 6. Base shear versus roof displacement: (a) wall 1, (b) wall 2.
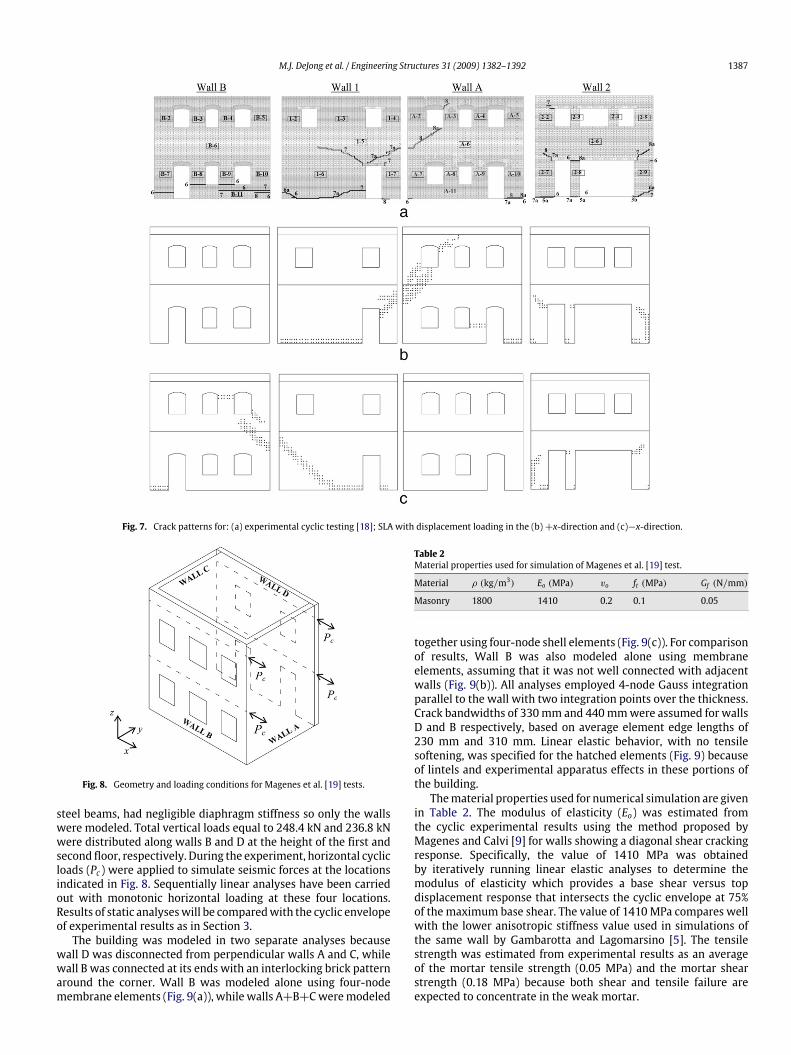
result (Fig. 7(a)) is to be compared with the combination of thetwo simulation results (Fig. 7(b) and (c)). The 3D failuremechanismresulting from loading in the positive x-direction indicates aprinciple crack wrapping around the corner between wall 1 andwall A, a result supported by the experiment. Meanwhile, the3D failure mechanism resulting from loading in the negativex-direction indicates diagonal cracking from the top left of the doorin wall 1, while simulation results predict cracking initiating atthe bottom center of wall 1 and propagating diagonally up andaround the corner to wall B. This discrepancy is likely a result ofthe simplified monotonic loading.In general, the results demonstrate the accuracy gained from
simulating 3D instead of 2D failure. Clearly the 2D analysescould be improved by incorporating flange effects from wallsA and B, as done by Yi et al. [14], but this requires flangeassumptions which are avoided by modeling the entire structure,at the cost of increased computational effort. As mentionedpreviously,Yi et al. [14] modeled the structural response to cyclicloading using contact elements at pre-defined crack locations.The SLA method avoids pre-defined crack locations, allowing
determination of the cracking mechanism directly. If desired, onecould use the twomethods in series, first locating cracks using SLAand then simulating the cyclic response using contact elementsat the determined locations, although this would require morecomputation time.
4. Simulation of the building tested by Magenes et al. [19]
Sequentially linear analysis was also applied to model the fullscale, two-story unreinforcedmasonry building tested byMageneset al. [19] in Pavia. This experiment has been chosen by severalresearchers as a benchmark for the numericalmodeling ofmasonrystructures using finite element methods (e.g. [5,6,10]). For detailsof the experimental procedure not explained in this text, the readeris referred to [19].
4.1. Testing and simulation procedure
The building geometry and loading conditions are shown inFig. 8. The floor and roof, both realized by a series of isolated
M.J. DeJong et al. / Engineering Structures 31 (2009) 1382–1392 1387
Fig. 7. Crack patterns for: (a) experimental cyclic testing [18]; SLA with displacement loading in the (b)+x-direction and (c)−x-direction.
Fig. 8. Geometry and loading conditions for Magenes et al. [19] tests.
steel beams, had negligible diaphragm stiffness so only the wallswere modeled. Total vertical loads equal to 248.4 kN and 236.8 kNwere distributed along walls B and D at the height of the first andsecond floor, respectively. During the experiment, horizontal cyclicloads (Pc) were applied to simulate seismic forces at the locationsindicated in Fig. 8. Sequentially linear analyses have been carriedout with monotonic horizontal loading at these four locations.Results of static analyseswill be comparedwith the cyclic envelopeof experimental results as in Section 3.The building was modeled in two separate analyses because
wall D was disconnected from perpendicular walls A and C, whilewall B was connected at its ends with an interlocking brick patternaround the corner. Wall B was modeled alone using four-nodemembrane elements (Fig. 9(a)), while walls A+B+Cweremodeled
Table 2Material properties used for simulation of Magenes et al. [19] test.
Material ρ (kg/m3) Eo (MPa) vo ft (MPa) Gf (N/mm)
Masonry 1800 1410 0.2 0.1 0.05
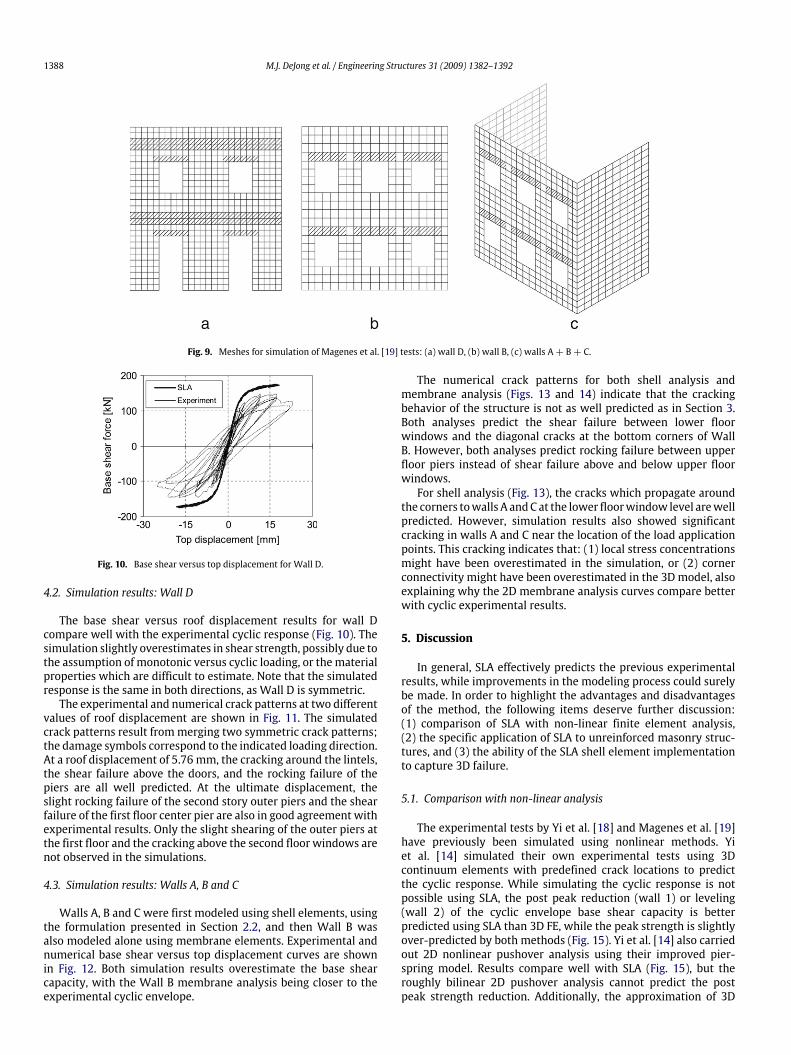
together using four-node shell elements (Fig. 9(c)). For comparisonof results, Wall B was also modeled alone using membraneelements, assuming that it was not well connected with adjacentwalls (Fig. 9(b)). All analyses employed 4-node Gauss integrationparallel to the wall with two integration points over the thickness.Crack bandwidths of 330mm and 440mmwere assumed for wallsD and B respectively, based on average element edge lengths of230 mm and 310 mm. Linear elastic behavior, with no tensilesoftening, was specified for the hatched elements (Fig. 9) becauseof lintels and experimental apparatus effects in these portions ofthe building.Thematerial properties used for numerical simulation are given
in Table 2. The modulus of elasticity (Eo) was estimated fromthe cyclic experimental results using the method proposed byMagenes and Calvi [9] for walls showing a diagonal shear crackingresponse. Specifically, the value of 1410 MPa was obtainedby iteratively running linear elastic analyses to determine themodulus of elasticity which provides a base shear versus topdisplacement response that intersects the cyclic envelope at 75%of the maximum base shear. The value of 1410MPa compares wellwith the lower anisotropic stiffness value used in simulations ofthe same wall by Gambarotta and Lagomarsino [5]. The tensilestrength was estimated from experimental results as an averageof the mortar tensile strength (0.05 MPa) and the mortar shearstrength (0.18 MPa) because both shear and tensile failure areexpected to concentrate in the weak mortar.
1388 M.J. DeJong et al. / Engineering Structures 31 (2009) 1382–1392
Fig. 9. Meshes for simulation of Magenes et al. [19] tests: (a) wall D, (b) wall B, (c) walls A+ B+ C.
Fig. 10. Base shear versus top displacement for Wall D.
4.2. Simulation results: Wall D
The base shear versus roof displacement results for wall Dcompare well with the experimental cyclic response (Fig. 10). Thesimulation slightly overestimates in shear strength, possibly due tothe assumption of monotonic versus cyclic loading, or thematerialproperties which are difficult to estimate. Note that the simulatedresponse is the same in both directions, as Wall D is symmetric.The experimental and numerical crack patterns at two different
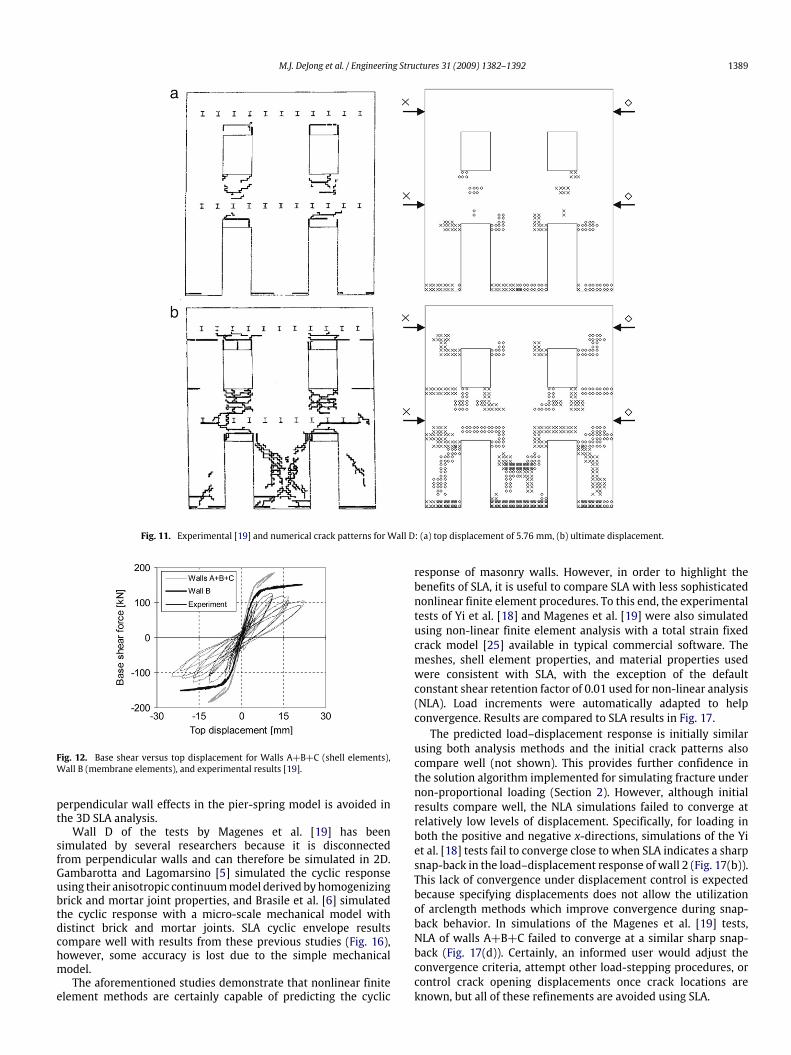
values of roof displacement are shown in Fig. 11. The simulatedcrack patterns result frommerging two symmetric crack patterns;the damage symbols correspond to the indicated loading direction.At a roof displacement of 5.76 mm, the cracking around the lintels,the shear failure above the doors, and the rocking failure of thepiers are all well predicted. At the ultimate displacement, theslight rocking failure of the second story outer piers and the shearfailure of the first floor center pier are also in good agreement withexperimental results. Only the slight shearing of the outer piers atthe first floor and the cracking above the second floor windows arenot observed in the simulations.
4.3. Simulation results: Walls A, B and C
Walls A, B and C were first modeled using shell elements, usingthe formulation presented in Section 2.2, and then Wall B wasalso modeled alone using membrane elements. Experimental andnumerical base shear versus top displacement curves are shownin Fig. 12. Both simulation results overestimate the base shearcapacity, with the Wall B membrane analysis being closer to theexperimental cyclic envelope.
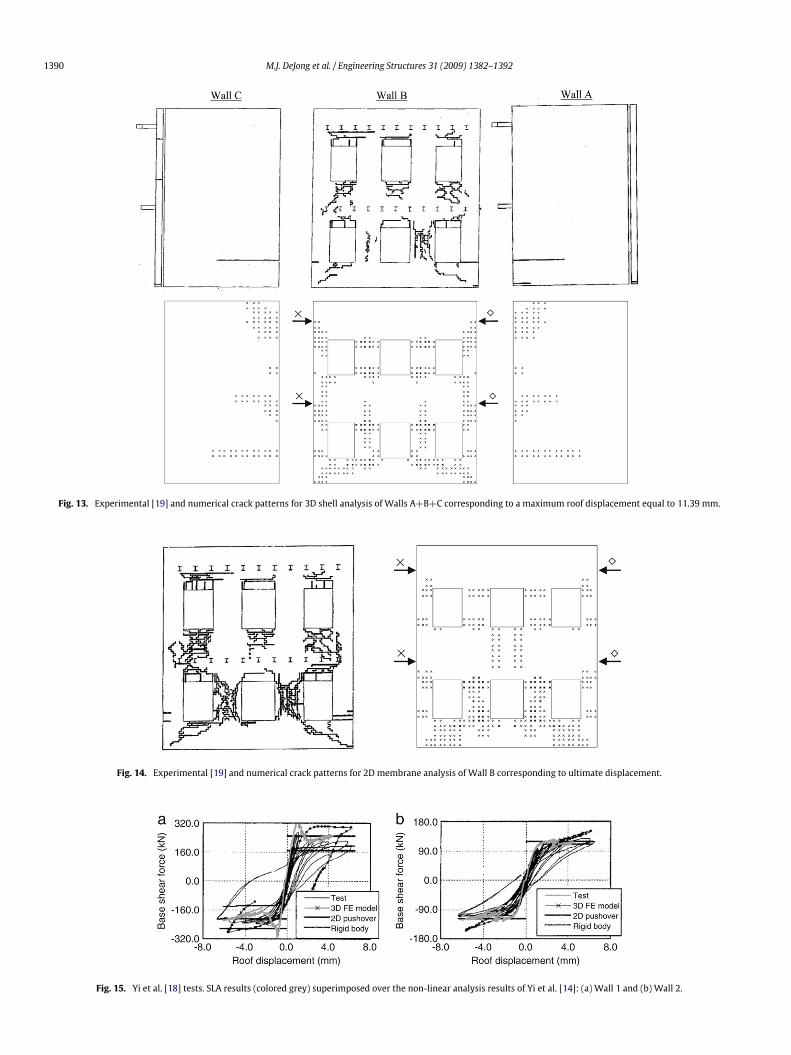
The numerical crack patterns for both shell analysis andmembrane analysis (Figs. 13 and 14) indicate that the crackingbehavior of the structure is not as well predicted as in Section 3.Both analyses predict the shear failure between lower floorwindows and the diagonal cracks at the bottom corners of WallB. However, both analyses predict rocking failure between upperfloor piers instead of shear failure above and below upper floorwindows.For shell analysis (Fig. 13), the cracks which propagate around
the corners towalls A andC at the lower floorwindow level arewellpredicted. However, simulation results also showed significantcracking in walls A and C near the location of the load applicationpoints. This cracking indicates that: (1) local stress concentrationsmight have been overestimated in the simulation, or (2) cornerconnectivity might have been overestimated in the 3Dmodel, alsoexplaining why the 2D membrane analysis curves compare betterwith cyclic experimental results.
5. Discussion
In general, SLA effectively predicts the previous experimentalresults, while improvements in the modeling process could surelybe made. In order to highlight the advantages and disadvantagesof the method, the following items deserve further discussion:(1) comparison of SLA with non-linear finite element analysis,(2) the specific application of SLA to unreinforced masonry struc-tures, and (3) the ability of the SLA shell element implementationto capture 3D failure.
5.1. Comparison with non-linear analysis
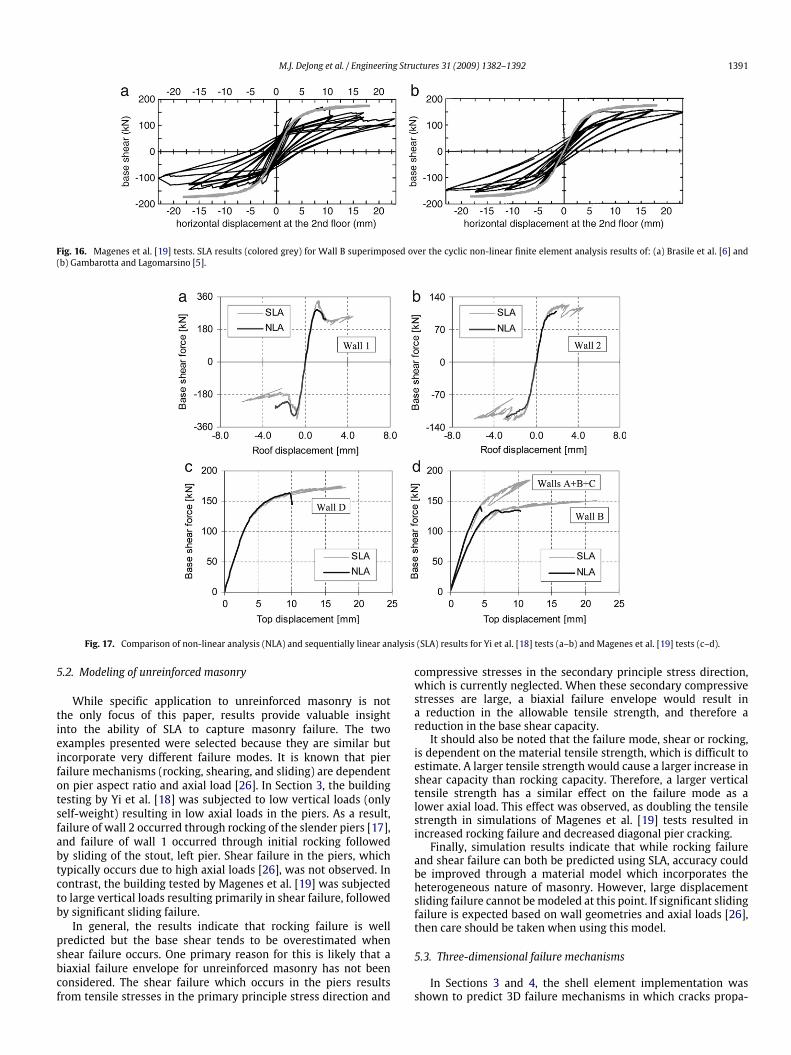
The experimental tests by Yi et al. [18] and Magenes et al. [19]have previously been simulated using nonlinear methods. Yiet al. [14] simulated their own experimental tests using 3Dcontinuum elements with predefined crack locations to predictthe cyclic response. While simulating the cyclic response is notpossible using SLA, the post peak reduction (wall 1) or leveling(wall 2) of the cyclic envelope base shear capacity is betterpredicted using SLA than 3D FE, while the peak strength is slightlyover-predicted by both methods (Fig. 15). Yi et al. [14] also carriedout 2D nonlinear pushover analysis using their improved pier-spring model. Results compare well with SLA (Fig. 15), but theroughly bilinear 2D pushover analysis cannot predict the postpeak strength reduction. Additionally, the approximation of 3D
M.J. DeJong et al. / Engineering Structures 31 (2009) 1382–1392 1389
Fig. 11. Experimental [19] and numerical crack patterns for Wall D: (a) top displacement of 5.76 mm, (b) ultimate displacement.
Fig. 12. Base shear versus top displacement for Walls A+B+C (shell elements),Wall B (membrane elements), and experimental results [19].
perpendicular wall effects in the pier-spring model is avoided inthe 3D SLA analysis.Wall D of the tests by Magenes et al. [19] has been
simulated by several researchers because it is disconnectedfrom perpendicular walls and can therefore be simulated in 2D.Gambarotta and Lagomarsino [5] simulated the cyclic responseusing their anisotropic continuummodel derived by homogenizingbrick and mortar joint properties, and Brasile et al. [6] simulatedthe cyclic response with a micro-scale mechanical model withdistinct brick and mortar joints. SLA cyclic envelope resultscompare well with results from these previous studies (Fig. 16),however, some accuracy is lost due to the simple mechanicalmodel.The aforementioned studies demonstrate that nonlinear finite
element methods are certainly capable of predicting the cyclic
response of masonry walls. However, in order to highlight thebenefits of SLA, it is useful to compare SLA with less sophisticatednonlinear finite element procedures. To this end, the experimentaltests of Yi et al. [18] and Magenes et al. [19] were also simulatedusing non-linear finite element analysis with a total strain fixedcrack model [25] available in typical commercial software. Themeshes, shell element properties, and material properties usedwere consistent with SLA, with the exception of the defaultconstant shear retention factor of 0.01 used for non-linear analysis(NLA). Load increments were automatically adapted to helpconvergence. Results are compared to SLA results in Fig. 17.The predicted load–displacement response is initially similar
using both analysis methods and the initial crack patterns alsocompare well (not shown). This provides further confidence inthe solution algorithm implemented for simulating fracture undernon-proportional loading (Section 2). However, although initialresults compare well, the NLA simulations failed to converge atrelatively low levels of displacement. Specifically, for loading inboth the positive and negative x-directions, simulations of the Yiet al. [18] tests fail to converge close to when SLA indicates a sharpsnap-back in the load–displacement response of wall 2 (Fig. 17(b)).This lack of convergence under displacement control is expectedbecause specifying displacements does not allow the utilizationof arclength methods which improve convergence during snap-back behavior. In simulations of the Magenes et al. [19] tests,NLA of walls A+B+C failed to converge at a similar sharp snap-back (Fig. 17(d)). Certainly, an informed user would adjust theconvergence criteria, attempt other load-stepping procedures, orcontrol crack opening displacements once crack locations areknown, but all of these refinements are avoided using SLA.
1390 M.J. DeJong et al. / Engineering Structures 31 (2009) 1382–1392
Fig. 13. Experimental [19] and numerical crack patterns for 3D shell analysis of Walls A+B+C corresponding to a maximum roof displacement equal to 11.39 mm.
Fig. 14. Experimental [19] and numerical crack patterns for 2D membrane analysis of Wall B corresponding to ultimate displacement.
Fig. 15. Yi et al. [18] tests. SLA results (colored grey) superimposed over the non-linear analysis results of Yi et al. [14]: (a) Wall 1 and (b) Wall 2.
M.J. DeJong et al. / Engineering Structures 31 (2009) 1382–1392 1391
Fig. 16. Magenes et al. [19] tests. SLA results (colored grey) for Wall B superimposed over the cyclic non-linear finite element analysis results of: (a) Brasile et al. [6] and(b) Gambarotta and Lagomarsino [5].
Fig. 17. Comparison of non-linear analysis (NLA) and sequentially linear analysis (SLA) results for Yi et al. [18] tests (a–b) and Magenes et al. [19] tests (c–d).
5.2. Modeling of unreinforced masonry
While specific application to unreinforced masonry is notthe only focus of this paper, results provide valuable insightinto the ability of SLA to capture masonry failure. The twoexamples presented were selected because they are similar butincorporate very different failure modes. It is known that pierfailure mechanisms (rocking, shearing, and sliding) are dependenton pier aspect ratio and axial load [26]. In Section 3, the buildingtesting by Yi et al. [18] was subjected to low vertical loads (onlyself-weight) resulting in low axial loads in the piers. As a result,failure of wall 2 occurred through rocking of the slender piers [17],and failure of wall 1 occurred through initial rocking followedby sliding of the stout, left pier. Shear failure in the piers, whichtypically occurs due to high axial loads [26], was not observed. Incontrast, the building tested by Magenes et al. [19] was subjectedto large vertical loads resulting primarily in shear failure, followedby significant sliding failure.In general, the results indicate that rocking failure is well
predicted but the base shear tends to be overestimated whenshear failure occurs. One primary reason for this is likely that abiaxial failure envelope for unreinforced masonry has not beenconsidered. The shear failure which occurs in the piers resultsfrom tensile stresses in the primary principle stress direction and
compressive stresses in the secondary principle stress direction,which is currently neglected. When these secondary compressivestresses are large, a biaxial failure envelope would result ina reduction in the allowable tensile strength, and therefore areduction in the base shear capacity.It should also be noted that the failure mode, shear or rocking,
is dependent on the material tensile strength, which is difficult toestimate. A larger tensile strength would cause a larger increase inshear capacity than rocking capacity. Therefore, a larger verticaltensile strength has a similar effect on the failure mode as alower axial load. This effect was observed, as doubling the tensilestrength in simulations of Magenes et al. [19] tests resulted inincreased rocking failure and decreased diagonal pier cracking.Finally, simulation results indicate that while rocking failure
and shear failure can both be predicted using SLA, accuracy couldbe improved through a material model which incorporates theheterogeneous nature of masonry. However, large displacementsliding failure cannot bemodeled at this point. If significant slidingfailure is expected based on wall geometries and axial loads [26],then care should be taken when using this model.
5.3. Three-dimensional failure mechanisms
In Sections 3 and 4, the shell element implementation wasshown to predict 3D failure mechanisms in which cracks propa-
1392 M.J. DeJong et al. / Engineering Structures 31 (2009) 1382–1392
gate around building corners. This contribution is significant, asprediction of the failuremechanisms is achievedwith a simplema-terial model which requires relatively fewmaterial properties andno load-stepping procedures or convergence criteria.Simulations of both structures exemplify the greater capacity
of the entire structure with respect to a single wall. Clearlysome effect of perpendicular walls must be included, and the 3Dmodels eliminate the need to estimate 3D wall corner effects.The simulated 3D capacity of the Yi et al. [18] structure isquite accurate, while the 2D membrane element models clearlyunderestimate the response (Fig. 6). Meanwhile, 2D simulationsof walls B and D of the Magenes et al. [19] tests overestimate theresponse by a similar small percentage. This is unexpected as wallD was disconnected from the rest of the structure while wall Bwas well-connected. Therefore, the effect of perpendicular wallswas reasonably predicted for Yi et al. [18] tests but overestimatedfor the Magenes et al. [19] tests. This could indicate that themethod of interconnecting wall corners was more effective in theYi et al. [18] construction. Otherwise, the absence of a diaphragmin the Magenes et al. [19] structure might cause the shell elementimplementation to overestimate the effects of perpendicularwalls. Furthermore, it could indicate that high vertical stressescaused some locking to occur when higher vertical stresses causeincreased shearing and decreased rocking around wall corners.Regardless, further verification of wall corner modeling requirescontinued research.
6. Conclusions
The primary contribution herein is a new framework bywhich shell-type structures can be effectively modeled undernon-proportional loading. Specific application to unreinforcedmasonry structures under lateral loading has led to the followingconclusions:
• Shell elements allow three-dimensional failure mechanismsto be directly predicted, eliminating the need to estimate theparticipating area of perpendicular walls when modeling intwo-dimensions.• Sequentially linear analysis allows prediction of the brittlefailure of masonry structures and requires a relatively smallnumber of modeling parameters.• Monotonic loading provides an effective means of predictingexperimental cyclic envelopes, although it can result in slightoverestimation of the maximum base shear. A safety factorshould be applied to account for the simplified loadingconditions.• The simplified tensile strength failure criteria requires a rel-atively small number of material properties, which are oftendifficult to estimate for masonry structures, while still reason-ably predicting structural response. However, implementationof more complex failure criteria which incorporate the hetero-geneity of masonry is possible within the same framework.
These conclusions give confidence in the potential of SLA as analternative to non-linear finite element analysis, and as a practicaltool for pushover analysis of masonry structures.
Acknowledgements
Financial support provided by the US Fulbright program and theTU Delft research fellowship program is gratefully acknowledged.Thanks are also extended to one reviewer whose commentssignificantly improved the paper.
References
[1] Lourenço PB. Computational strategies for masonry structures. Ph.D. disserta-tion. Delft University of Techonology; 1996.
[2] Lourenço PB, Rots JG. A multi-surface interface model for the analysis ofmasonry structures. ASCE J Eng Mech 1997;123(7):660–8.
[3] Lourenço PB, Rots JG. Continuum model for masonry: Parameter estimationand validation. ASCE J Struct Eng 1998;124(6):642–52.
[4] Gambarotta G, Lagomarsino S. Damage models for the seismic response ofbrickmasonry shear walls - Part I: Themortar jointmodel and its applications.Earthq Eng Struct Dyn 1997;26:423–39.
[5] Gambarotta G, Lagomarsino S. Damage models for the seismic response ofbrick masonry shear walls - Part II: The continuum model and its application.Earthq Eng Struct Dyn 1997;26:441–62.
[6] Brasile S, Casciaro R, Formica G. Multilevel approach for brick masonry walls -Part I: A numerical strategy for the nonlinear analysis. Comput Methods ApplMech Eng 2007;196:4934–51.
[7] American society of civil engineers. Prestandard and commentary for theseismic rehabilitation of buildings. FEMA-356. 2000.
[8] Moon FL, Yi T, Leon RT, Kahn LF. Recommendations for the seismic evaluationand retrofit of low-rise URM structures. ASCE J Struct Eng 2006;132(5):663–72.
[9] MagenesG, Calvi GM. In-plane seismic response of brickmasonrywalls. EarthqEng Struct Dyn 1997;26:1091–112.
[10] Magenes G, Della Fontana A. Simplified non-linear seismic analysis ofmasonrybuildings. Proc British Masonry Soc 1998;8:190–5.
[11] Kappos AJ, Penelis GG, Drakopoulos CG. Evaluation of simplified models forlateral load analysis of unreinforced masonry buildings. ASCE J Struct Eng2002;128(7):890–7.
[12] Salonikios T, Karakostas C, Lekidis V, Anthoine A. Comparative inelasticpushover analysis of masonry frames. Eng Struct 2003;25:1515–23.
[13] Milani G, Lourenço PB, Trallia A. 3D homogenized limit analysis of masonrybuildings under horizontal loads. Eng Struct 2007;29:3134–48.
[14] Yi T, Moon FL, Leon RT, Kahn LF. Analyses of a two-story unreinforcedmasonrybuilding. ASCE J Struct Eng 2006;132(5):653–62.
[15] Rots JG. Sequentially linear continuum model for concrete fracture. In: deBorst R,Mazars J, Pijaudier-Cabot G, vanMier JGM, editors. Fracturemechanicsof concrete structures. Lisse (The Netherlands): A.A. Balkema; 2001. p. 831–9.
[16] Dejong MJ, Hendriks MAN, Rots JG. Sequentially linear analysis of fractureunder non-proportional loading. Eng Fract Mech 2008;75:5042–56.
[17] Yi T. Large-scale testing of a two-story URM structure. Ph.D. dissertation.Georgia Institute of Technology; 2004.
[18] Yi T, Moon FL, Leon RT, Kahn LF. Lateral load tests on a two-story unreinforcedmasonry building. ASCE J Struct Eng 2006;132(5):643–52.
[19] Magenes G, Kingsley GR, Calvi GM. Seismic testing of a full-scale, two-storymasonry building: Test procedure and measured experimental response.Experimental and numerical investigation on a brick masonry buildingprototype. GNDT Rep. 3.0. Pavia (Italy); 1995.
[20] Rots JG, Belletti B, Invernizzi S. Robust modeling of RC structures with an‘‘event-by-event’’ strategy. Eng Fract Mech 2008;75:590–614.
[21] Rots JG. Computational modeling of concrete fracture. Ph.D. dissertation. DelftUniversity of Technology; 1988.
[22] Bathe KJ. Finite element procedures. Prentice Hall; 2006.[23] DejongMJ, HendriksMAN, Rots JG. Shear retention andmesh alignment during
fracture using sequentially linear analysis. In: Proc 12th int conf on fracture.2009 [accepted for publication].
[24] Rots JG, Invernizzi S. Regularized sequentially linear saw-tooth softeningmodel. Int J Numer Anal Methods Geomech 2004;28:821–56.
[25] Feenstra PH, Rots JG, Arnesen A, Teigen JG, Høiseth KV. A 3D constitutivemodel for concrete based on a co-rotational concept. In: de Borst R, et al.,editors. EURO-C 1998. Compmodeling conc struct, Rotterdam: Balkema; 1998.p. 13–22.
[26] Calvi MG, Kingsley GR, Magenes G. Testing of masonry structures for seismicassessment. Earthq Spectra 1996;12(1):145–62.


