Embed Size (px)
Citation preview

Mat. Res. Soc. Symp. Proc. Vol. 663 © 2001 Materials Research Society
Discussion on the Use of Matrix Diffusion Model after a Multidisciplinary Study of a Granitic Boulder Sample
N. Marcos1, M. Siitari-Kauppi2, J. Suksi2, K. Rasilainen3, R. Finch4 and K. -H. Hellmuth5
1 Helsinki University of Technology, Engineering Geology & Geophysics Lab, P.O. Box 6200, 02015 HUT, Finland
2 Laboratory of Radiochemistry, P.O. Box 55, 00014, Helsinki, Finland 3 VTT, Energy, P.O. Box 1604, 02044 VTT, Finland 4 Argonne National Laboratory, 9700 South Cass Ave. CMT-205, Argonne, Illinois 60439, USA 5 Finnish Centre for Radiation and Nuclear Safety, P.O. Box 14, 00881, Helsinki, Finland
ABSTRACT This paper aims to discuss the applicability of the classical matrix diffusion model against
the integrated body of new data obtained by different methodologies on several samples of three granite boulders. The matrix diffusion model was tested against observations from the upper (most weathered in contact with air) and lower (fresh in contact with the ground) part of a boulder block. A U(VI) enrichment up to nearly 300 ppm (compared to about 10 ppm background concentration) mostly as uranophane was observed in the zone between the weathered and fresh rock. U-series disequilibrium studies indicated that most of U has been accumulated recently, about 10 000 years ago [1].
High interconnected porosity (total porosity of > 1% and up to about 5.5% in altered minerals) characterizes the weathered zone (upper part), whereas the maximum porosity values in the fresh zone (lower part) of the rock are about 0.4 � 0.6%. Stable isotope studies δ18O and δ2H confirm that the mineralogical changes observed in the weathered upper part are due to old hydrothermal events. That is, the alteration is much older than uranium accumulation. Mössbauer spectroscopy showed that the Fe(III) content of the biotites from the upper to the lower part decreases from 30% in the weathered zone to 17% in the fresh rock, thus indicating possible redox control for the observed U precipitation. Fission track studies showed that secondary U(VI) also occurs within minerals grains (especially plagioclase) in the upper part.
Mathematical simulations indicate that matrix diffusion alone is not enough to reconstruct the past U accumulation. The simulated concentrations derived from U concentration in pore water multiplied by Kd are clearly too small, indicating apparent insufficiency of the Kd approach. However, even with only matrix diffusion, the simulations roughly reconstruct the observation that U levels are clearly higher in the upper part of the boulder than in the lower part.

INTRODUCTION Matrix diffusion is one of the physico-chemical retardation mechanisms affecting
radionuclide transport in groundwater. Validation of matrix diffusion modelling has been attempted through laboratory and natural analogue studies [2,3,4, and references therein]. The granitic boulder sample found on the top of a morainic hill near Hämeenlinna in southern Finland has been specifically studied as a matrix diffusion analogue. Concentration profiles of U-series nuclides were used as a reference for simulations [5]. The simulations, in turn were based on independently measured diffusion characteristics of the rock, including porosity (εp), effective diffusivity (De) and distribution coefficient (Kd). Uranium series nuclide concentrations were obtained by extractions. The physical parameters used were averages of the measured values: matrix porosity εp = 0.6 % and effective diffusivity De = 2.0E-12 m2/s. In the previous work a detailed structural and mineralogical characterization was lacking and uranophane had not been detected. The whole sample was considered to have undergone the same sorption/desorption processes and it was postulated that diffusion had taken place only across the weathered surface. As a result, the standard matrix diffusion model could roughly explain the observed pulse-like concentration distribution in the rock matrix. In this paper the previous matrix diffusion model is discussed presenting a new approach which includes matrix diffusion and takes into account the precipitation of uranophane. Figure 1 shows the outline of this paper and model development.
Figure 1. Outline of model development and discussion
EXPERIMENTAL DATA Methods Several drill core samples (φ = 25 mm, 10-16 cm length) perpendicular to the weathered
surface were taken from three boulder blocks of similar physical properties and chemical characteristics. The samples are not specified separately. For physical characterization (porosity and diffusivity) the14C-PMMA-method was applied. Radiochemical analyses were performed on slabs cut parallel to the weathered surface. The spatial distribution of uranium was studied by fission track mapping combined with image analysis techniques [6]. Scanning electron microscopy and energy dispersive X-ray spectrometry (SEM/EDS) were used for more detailed characterization of U occurrences. Information of the redox state of Fe was acquired using
Improving
Observations 1
Conceptual Model 1
Observations 2
Conceptual Model 2 Discussion
Incrementing

Mössbauer spectroscopy (WISSEL spectrometer, transmission geometry, 0.9 GBq 57Co source in Rh matrix, measurements time 48 h). U-series nuclides were separated from the ground rock material by extraction with hot aqua regia. Standard ion exchange techniques and measurements with α-spectrometry were used to analyze U-series nuclides. Also δ18O analyses of quartz, alkali feldspar within the exposed upper part of the boulders were carried out in order to discriminate between hydrothermal and low temperature alteration.
Uranium occurrence Primary uranium occurs within zircon, apatite, and monazite, common accessory minerals in
granites. These minerals are evenly distributed along the whole drill core. Secondary uranium is associated with biotite (among lamella), chlorite, epidote (around the mineral), and it occurs within altered plagioclase and K-feldspar grains. These altered minerals occur preferentially within the first 10 to 12 mm from the upper weathered surface. Most of secondary uranium occurs as uranophane distributed along the intergranular fissures at the boundaries between quartz and feldspar and quartz and plagioclase, especially at 15 to 20 mm depth.
Figure 2 shows the U concentration profile and the Th-230/U-234 activity ratio (AR) profiles across the sample. Uranium occurrence in the accumulation zone was studied in more detail using a selective extraction technique, first extracting with synthetic granite groundwater in oxidizing conditions and then with ammonium acetate. About 20% of total U was released in the synthetic groundwater and over 80% was released in the ammonium buffer solution (1M, pH 4.8).
00 .20 .40 .60 .8
11 .2
0 2 0 4 0 6 0 8 0 1 0 0 1 2 0 1 4 0 1 6 0
D istance fro m w ea the red surface (mm)
U/U
max
0
1
2
3
4
0 20 40 60 80 100 120 140 160
Distance from weathered surface (mm)
Th-2
30/U
-234
S4
S5
Figure 2. Relative U concentration and Th-230/U-234 activity ratio profiles. Umax = 275 ppm.

Porosity distribution The porosity distribution pattern, mineral phase-specific porosity and migration pathways
were characterized in drill cores of up to 15 cm length. Figure 3 shows an autoradiograph of half-sawed drill core illustrating the highly interconnected porosity in the rock matrix. The first 10 to 12 mm (left side) correspond to the most weathered zone. The porosity values of feldspars within this zone varied between 3 and 5% whereas porosity values of feldspars in the fresh zone were 0.3 to 0.5%. The porosity values of quartz grains (0.05%) remain the same in both zones. Bulk porosity varied between 0.8 and 1.2% in the weathered zone and between 0.4 and 0.6% in the fresh zone.
Figure 3. Autoradiograph of a sample impregnated with 14C-PMMA showing highly
interconnected porosity of the rock matrix. Length of sample is 80 mm.
Mössbauer spectroscopy The oxidation state of iron was studied within handpicked biotite grains. The Fe(III) content
in biotite decreased from about 25-30% within the upper 12 mm up to 17% at 17 - 31 mm depth (Figure 4).
10
15
20
25
30
35
0 5 10 15 20 25 30
D istance from the upper surface (m m )
Fe(I
II) %
Figure 4. Fe(III) content versus distance from the weathered surface.

Integration of experimental results Although the most porous mineral phases are within the weathered zone in the upper 10 to
12 mm, intergranular fissures are common through the sample. Uranophane occurrence as well as the maximum U concentration in the rock corresponds to a depth interval between 15 and 20 mm from the upper surface (Figure 5). The decrease of Fe(III) content in biotite also corresponds to a depth interval of 12 to 17 mm, thus indicating a possible link between oxygen diffusion in the matrix and the redox buffering capacity of the rock. As uranophane is a U(VI) mineral, its precipitation is not controlled by redox changes within the rock matrix. The position of uranophane at the depth where it occurs may be partly related to the differences in the physical properties (e.g., porosity) between the weathered and fresh rock.
Selective leaching experiments showed that about 20% U is loosely bound, probably corresponding to U bound within altered plagioclase and K-feldspar grains as shown by the fission track method. Most of U, however, was leached in ammonium acetate extraction indicating the existence of easily soluble secondary uranium phases as it was also shown by SEM/EDS studies revealing the existence of uranophane.
0
0 .1
0 .2
0 .3
0 .4
0 .5
0 .6
0 .7
0 .8
0 .9
1
0 2 0 4 0 6 0 8 0 1 0 0 1 2 0 1 4 0
D is tan c e f r o m w ea th er ed s u r f ac e ( m m )
Rela
tive
p o r o s ityu r an iu m
Figure 5. Uranium concentration and porosity profiles relative to their maximum values.
CONCEPTUAL MODEL AND INPUT DATA Modelling assumptions
1 Uranium in-diffusion to the rock matrix is considered to have occurred in a relatively stagnant groundwater system. The duration of in-diffusion of 100 years is based on the geological constraints of the area where the boulders were found. The matrix porosity values εp = 1⋅10-2 for the first 10 mm and εp = 6⋅10-3 from 10 to 160 mm are used for the upper part. Only one porosity value (εp = 6⋅10-3) is used for the lower part.
2 The precipitation time of uranophane obtained by the USD measurements is about 10 000 years ago [1]. The approximate value of 300 ppm U in the accumulation zone is the sum of precipitations controlled by continuous uranium in-diffusion towards the accumulation zone. That is, uranium (Table I, Figure 6) enters the rock matrix through

diffusion via the network of intergranular fissures where it precipitates as uranophane. Precipitation results in a temporary decrease in U concentration in pore water with respect to source groundwater, creating a U concentration gradient. As a result of diffusion the gradient will balance out, rising U concentration towards the accumulation zone and triggering again uranophane precipitation. After probably several precipitation events U concentration rises to the observed level.
3 Due to high land up-lift rate of the study site, U out-diffusion lasted about 50 years. During this time the investigation area was beneath the Yoldia Sea. Flushing glacial melt waters contributed to the formation of the Yoldia Sea and lead to out-diffusion processes. The uranium concentration in groundwater for FTRANS calculations is given by the relation between Kd of the sample measured in laboratory [5] and the uranium concentration measured in the outer upper surface of the sample.
4 After the study site rose up from the Yoldia sea, the only process assumed to control radionuclide concentration in the upper part of the boulders is the isolated chain decay. With respect to the lower part it is assumed to experience continuous out-leaching after land uplift at the end of Yoldia sea stage. An effective out-leaching time of about 5000 years is assumed since continuous contact with moist ground/soil is considered to last 6 month per year at Finnish latitudes. Experimentally it has been observed [7,8] that capillary force can lift water to a height of one to four cm in a drill core sample in a few hours. The values used for modelling are listed in Table I. Table II shows the subsequent
calculation steps in the multistage processes affecting U distribution in boulders. The successive in-diffusion and out-diffusion steps (Table II) are considered to be identical for both upper and lower sides of the boulder. The uranium concentration used for simulations, 10-5 M (Table I), is a value well within the stability field of uranophane in the activity diagram in Figure 6. Table III shows the thermodynamic activities for all species used to calculate the activity diagram in Figure 6.
Table I. Nuclide specific input data. Boundary conditions (BC) are the same as in [5]:
U-234/U-238 = 1.1 is a measured value within the upper part, the activity ratios Th-230/U-238 = 1.4⋅10-3 and Ra-226/U-238 = 5.7⋅10-3 are typical for water. (Note: 1 Bq/m3 ≅ 3.36⋅10-10 M)
Nuclide
IC (Bq/m3)
In-diff. (Bq/m3) (2)
BC (Bq/m3) Out-diff. (3)
Out-leach. (4) (Bq/m3)
Kd (m3/kg) In/out-diff.
Kd (m3/kg) Out-leach. (1)
U-238 0.0 2.9⋅104 7.6⋅103 2.9⋅102 1.0⋅10-2 2.0⋅10-3 U-234 0.0 3.2⋅104 8.4⋅103 3.2⋅102 1.0⋅10-2 2.0⋅10-3 Th-230 0.0 4.1⋅101 1.0⋅101 4.1⋅10-1 1.0⋅100 2.0⋅10-1 Ra-226 0.0 1.7⋅102 4.3⋅101 1.7⋅100 2.0⋅10-1 1.0⋅10-1
(1) Humic rich water => Kd for U and Th is reduced by a factor of 5, Kd for Ra is reduced by a factor of 2 (cf. Discussion in [9]).
(2) Stagnant waters buffered with atmospheric CO2, [U] = 1⋅10-5 M (see also Figure 6). (3) Value for U-238, from sorption equilibrium [5]. (4) Dilute waters, [U] = 1⋅10-7 M
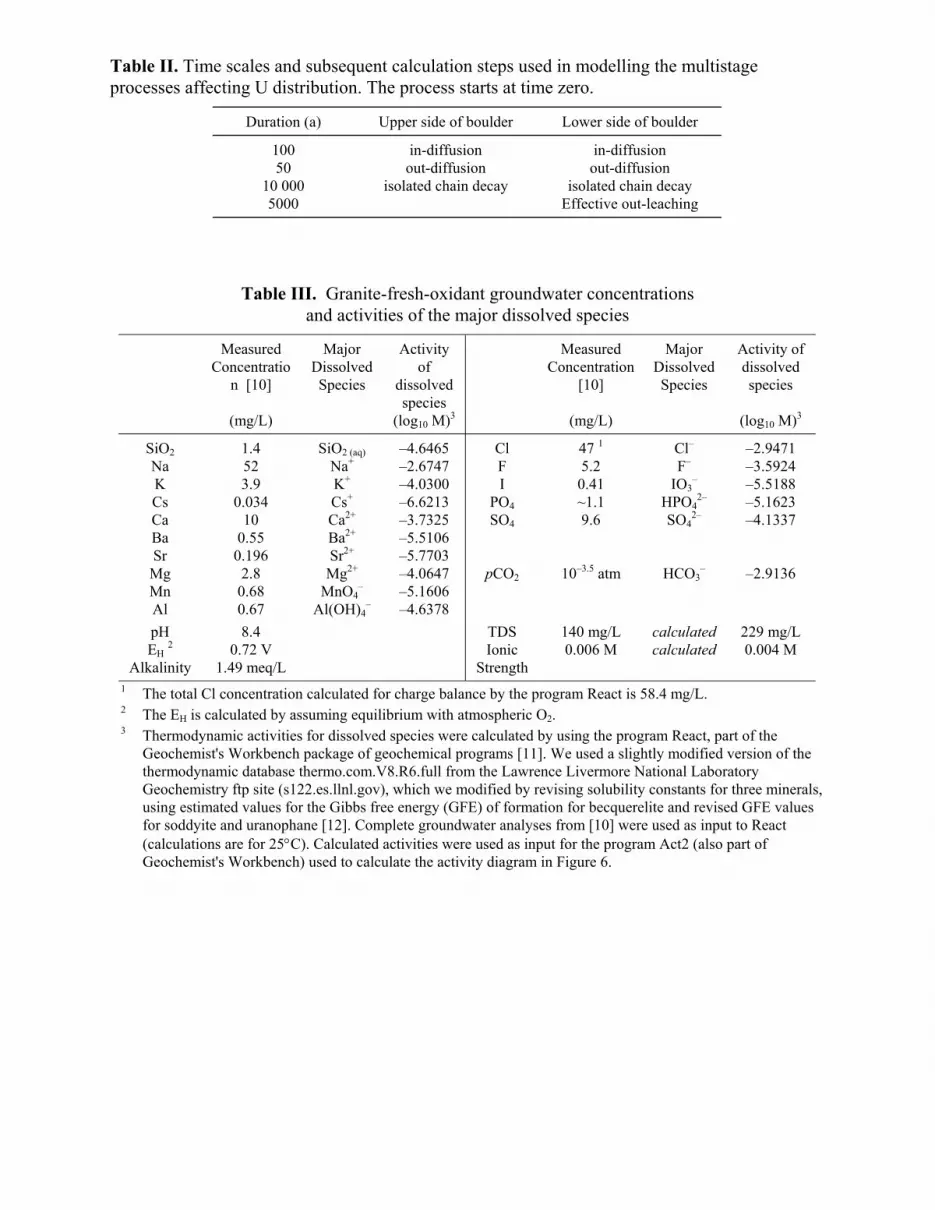
Table II. Time scales and subsequent calculation steps used in modelling the multistage processes affecting U distribution. The process starts at time zero.
Duration (a) Upper side of boulder Lower side of boulder
100 in-diffusion in-diffusion 50 out-diffusion out-diffusion
10 000 isolated chain decay isolated chain decay 5000 Effective out-leaching
Table III. Granite-fresh-oxidant groundwater concentrations and activities of the major dissolved species
Measured Concentratio
n [10]
Major Dissolved Species
Activity of
dissolved species
Measured Concentration
[10]
Major Dissolved Species
Activity of dissolved species
(mg/L) (log10 M)3 (mg/L) (log10 M)3
SiO2 1.4 SiO2 (aq) �4.6465 Cl 47 1 Cl� �2.9471 Na 52 Na+ �2.6747 F 5.2 F� �3.5924 K 3.9 K+ �4.0300 I 0.41 IO3
� �5.5188 Cs 0.034 Cs+ �6.6213 PO4 ~1.1 HPO4
2� �5.1623 Ca 10 Ca2+ �3.7325 SO4 9.6 SO4
2� �4.1337 Ba 0.55 Ba2+ �5.5106 Sr 0.196 Sr2+ �5.7703 Mg 2.8 Mg2+ �4.0647 pCO2 10�3.5 atm HCO3
� �2.9136 Mn 0.68 MnO4
� �5.1606 Al 0.67 Al(OH)4
� �4.6378 pH 8.4 TDS 140 mg/L calculated 229 mg/L EH 2 0.72 V
Alkalinity 1.49 meq/L Ionic
Strength 0.006 M calculated 0.004 M
1 The total Cl concentration calculated for charge balance by the program React is 58.4 mg/L. 2 The EH is calculated by assuming equilibrium with atmospheric O2. 3 Thermodynamic activities for dissolved species were calculated by using the program React, part of the
Geochemist's Workbench package of geochemical programs [11]. We used a slightly modified version of the thermodynamic database thermo.com.V8.R6.full from the Lawrence Livermore National Laboratory Geochemistry ftp site (s122.es.llnl.gov), which we modified by revising solubility constants for three minerals, using estimated values for the Gibbs free energy (GFE) of formation for becquerelite and revised GFE values for soddyite and uranophane [12]. Complete groundwater analyses from [10] were used as input to React (calculations are for 25°C). Calculated activities were used as input for the program Act2 (also part of Geochemist's Workbench) used to calculate the activity diagram in Figure 6.
pH
log 10a(UO2)2+ Saléeite
Becquerelite
Uranophane
(UO2)2CO3(OH)3�
UO
2 (CO
3 )2 2�
UO
2 (OH
)2 0
UO
2 PO4 �
UO
2 HPO
4 0
UO2(CO 3)34�
-6
-7
-5
-4
-3
6 7 8 9 10
pH
log 10a(UO2)2+ Saléeite
Becquerelite
Uranophane
(UO2)2CO3(OH)3�
UO
2 (CO
3 )2 2�
UO
2 (OH
)2 0
UO
2 PO4 �
UO
2 HPO
4 0
UO2(CO 3)34�
-6
-7
-5
-4
-3
6 7 8 9 10log 10a(UO2)2+ Saléeite
Becquerelite
Uranophane
(UO2)2CO3(OH)3�
UO
2 (CO
3 )2 2�
UO
2 (OH
)2 0
UO
2 PO4 �
UO
2 HPO
4 0
UO2(CO 3)34�
log 10a(UO2)2+
log 10a(UO2)2+ Saléeite
Becquerelite
Uranophane
(UO2)2CO3(OH)3�
UO
2 (CO
3 )2 2�
UO
2 (OH
)2 0
UO
2 PO4 �
UO
2 HPO
4 0
UO2(CO 3)34�
SaléeiteBecquerelite
Uranophane
(UO2)2CO3(OH)3�
UO
2 (CO
3 )2 2�
UO
2 (OH
)2 0
UO
2 PO4 �
UO
2 HPO
4 0
UO2(CO 3)34�
-6
-7
-5
-4
-3
6 7 8 9 10
-6
-7
-5
-4
-3
6 7 8 9 10
Figure 6. Activity diagram for uranium species in Granite-fresh-oxidant groundwater.
Open System (log PCO2 = -3.2) conditions at 25ºC, with the values specified in Table III.
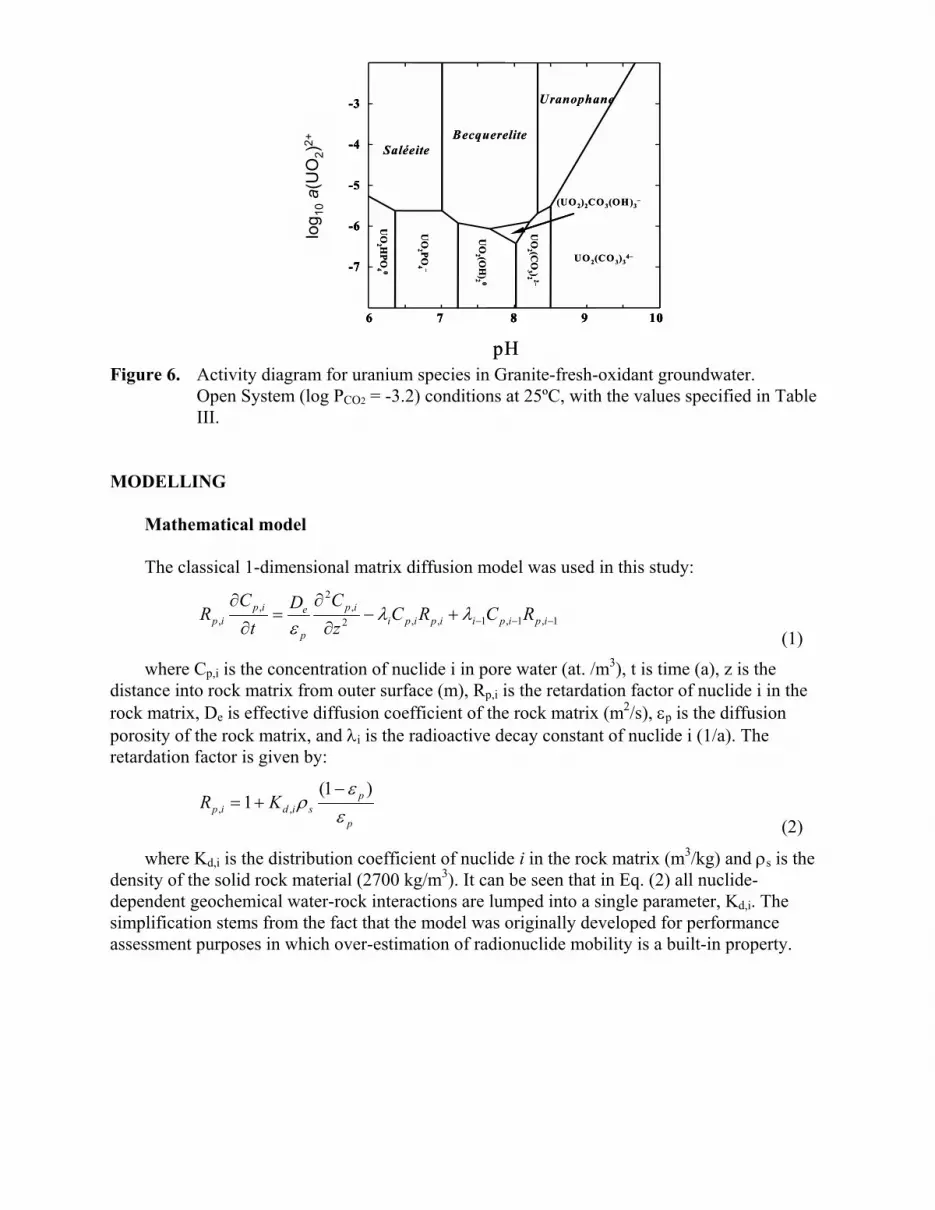
MODELLING Mathematical model The classical 1-dimensional matrix diffusion model was used in this study:
1,1,1,,2,
2,
, −−−+−∂
∂=
∂∂
ipipiipipiip
p
eipip RCRC
zCD
tC
R λλε (1)
where Cp,i is the concentration of nuclide i in pore water (at. /m3), t is time (a), z is the distance into rock matrix from outer surface (m), Rp,i is the retardation factor of nuclide i in the rock matrix, De is effective diffusion coefficient of the rock matrix (m2/s), εp is the diffusion porosity of the rock matrix, and λi is the radioactive decay constant of nuclide i (1/a). The retardation factor is given by:
p
psidip KR
εε
ρ)1(
1 ,,
−+=
(2)
where Kd,i is the distribution coefficient of nuclide i in the rock matrix (m3/kg) and ρs is the density of the solid rock material (2700 kg/m3). It can be seen that in Eq. (2) all nuclide-dependent geochemical water-rock interactions are lumped into a single parameter, Kd,i. The simplification stems from the fact that the model was originally developed for performance assessment purposes in which over-estimation of radionuclide mobility is a built-in property.
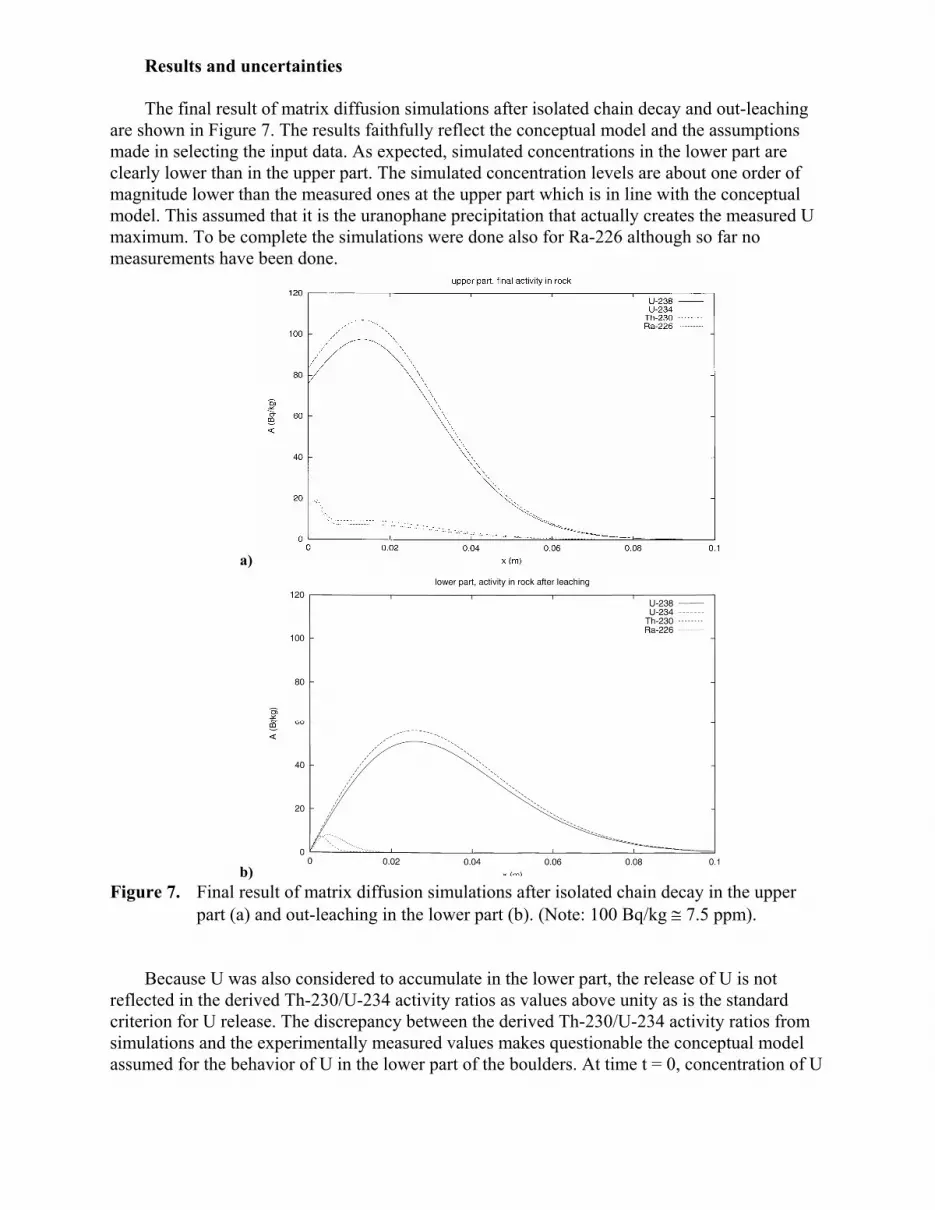
Results and uncertainties The final result of matrix diffusion simulations after isolated chain decay and out-leaching
are shown in Figure 7. The results faithfully reflect the conceptual model and the assumptions made in selecting the input data. As expected, simulated concentrations in the lower part are clearly lower than in the upper part. The simulated concentration levels are about one order of magnitude lower than the measured ones at the upper part which is in line with the conceptual model. This assumed that it is the uranophane precipitation that actually creates the measured U maximum. To be complete the simulations were done also for Ra-226 although so far no measurements have been done.
a)
b) Figure 7. Final result of matrix diffusion simulations after isolated chain decay in the upper
part (a) and out-leaching in the lower part (b). (Note: 100 Bq/kg ≅ 7.5 ppm). Because U was also considered to accumulate in the lower part, the release of U is not
reflected in the derived Th-230/U-234 activity ratios as values above unity as is the standard criterion for U release. The discrepancy between the derived Th-230/U-234 activity ratios from simulations and the experimentally measured values makes questionable the conceptual model assumed for the behavior of U in the lower part of the boulders. At time t = 0, concentration of U

within the lower part can not be 0 if after all processes the final Th-230/U-234 activity ratio varies from 1.5 to almost 4 (Figure 2).
There are unavoidable uncertainties in the input data. Rock matrix porosity (εp) and diffusivity data (De) can be considered reliable. In contrast, sorption data (Kd's) are more uncertain because the relevant waters were not available (as they do not exist anymore) for experiments in the laboratory. The Kd values used for the out-leaching stage in the lower part were a careful choice from literature, because such measurements were not done. It is suspected that the decrease in Kd values could be higher than the one applied for humic waters. In the boundary conditions (BC's), the U concentration used for the respective waters, although reliable, may suppose a major uncertainty as these affect the simulations via Kd's. For the in-diffusion period the chosen BC reflects a system with relatively stagnant waters (although buffered with atmospheric CO2; Figure 6), and for the out-diffusion period the BC was derived from measured U concentrations in rock by dividing it with Kd. This is to assume that U out-diffusion will leave a track in the form of U concentration in the rock matrix closest to the outer surface. For the out-leaching period the BC used, U concentration reflects dilute water conditions.
In spite of all the uncertainties, this case study shows that there is some consistence in the input data. The apparent diffusivity value (Da) calculated by using the simulation time given by geological constraints (100 a) and effective diffusion depth (η(t) = 20 mm) given by the experiments is 1.3⋅10-13 m2/s, as derived from [13]:
η(t) = 1.13√Dat (3)
This value is about of the same order of magnitude than the one calculated by using only rock matrix characterization values from laboratory experiments, Da = 7⋅10-14 m2/s as derived from:
Da = De/(εp ⋅ Rp) (4)
DISCUSSION AND CONCLUSIONS The classical matrix diffusion model is a simplification of reality especially concerning
geochemical processes. However it describes the physical diffusion part of the conceptual model correctly. The simulations indicate that matrix diffusion alone is not enough to reconstruct the past U accumulation. The simulated concentrations in the rock matrix (U concentration in pore water multiplied by Kd) are clearly too small. However, even with only matrix diffusion, the simulations roughly reconstruct the observation that U levels are clearly higher in the upper part of the boulder than in the lower part.
New simulations better fits the observations with respect to simulations in [5] as a result of improvement in the quality of the input data. The heterogeneity of the sample is taken into account by using two porosity values. The better characterization of the samples also is an aid in improving the conceptual model and in interpreting the results. The occurrence of uranophane is taken into account by using a reliable uranium concentration value (10-5 M, Table I and Figure 6). The role of the most altered weathered surface being older than the accumulation of uranium is the enhanced differences in the physical properties of the rock. As the conceptual model evolves with new observations, it is expected that new questions will open (see Figure 1).
Be as it may, interdisciplinary studies are a key in defining the most appropriate conceptual models to describe processes and in selecting the most appropriate input data to be applied. In

matrix diffusion modelling the major difficulty will remain in extracting unambiguous Kd values. More realistic diffusion/transport simulations integrating physical and chemical processes should be attempted in the future because the only use of the Kd approach overestimates and simplifies the mobility of radionuclides in nature.
ACKNOWLEDGEMENTS This work is part of the Public Sector�s Administrated Nuclear Waste Management
Research Programme in Finland. The assistance and contributions of V. Tukiainen, E.-L. Tullborg, E. Flitsiyan, and C. Pietzsch are gratefully acknowledged.
REFERENCES
1. L. Saarinen & J. Suksi , Report YJT-95-01, 1995. 2. W.R. Alexander, I.G. McKinley, A.B. MacKenzie & R.D. Scott, in Scientific Basis for
Nuclear Waste Management XIII, Mat. Res. Soc. Symp. Proc. 261, Pittsburg, PA, 1990, p. 567−576.
3. A.G. Latham, Nirex Report NSS/R264, 1991. 4. K. Rasilainen, VTT Publications 331, 81 p., 1997. 5. K. Rasilainen, J. Suksi, Hellmuth, K.-H. Hellmuth, A. Lindberg & S. Kulmala, in Scientific
Basis for Nuclear Waste Management XIX, edited by W.M. Murphy & D.A. Knecht, Mat. Res. Soc. Symp. Proc. 412, Pittsburg, PA, 1996, p. 855−862.
6. Κ.-H. Hellmuth, S. Lukkarinen & M. Siitari-Kauppi, Isotopenpraxis, Isotopes in Environmental and Health Studies, 30, p. 47−60, (1994).
7. Ε.Ο. Ärmänen, Lic. Thesis, Helsinki University of Technology, 1998. 8. C. Alves, M.A. Sequeira Braga & C. Hammecker, C. R., Acad. Sci. Paris, 323, p.
397−402, (1996). 9. B. Allard, F. Karlsson & I. Neretnieks, SKB Technical Report 91−50, (1991). 10. U. Vuorinen & M. Snellman, Posiva Working Report 98-14, (1998). 11. C.M. Bethke, The Geochemist's Workbench Release 3.0, A Users Guide to Rxn, Act2,
React, and Gtplot, University of Illinois, Urbana (1998) 184 pp. 12. F. Chen, R.C. Ewing & S.B. Clark, Amer. Mineral. 84 (1999) 650. 13. I. Neretnieks, Journal of Geophysical Research, 85, p. 4379−4397 (1980).