Embed Size (px)
Citation preview
Discovery of Mouse Spleen SignalingResponses to Anthrax using Label-FreeQuantitative Phosphoproteomics via MassSpectrometry*□S
Nathan P. Manes‡, Li Dong‡, Weidong Zhou§, Xiuxia Du¶, Nikitha Reghu§,Arjan C. Kool§, Dahan Choi§, Charles L. Bailey‡, Emanuel F. Petricoin III§,Lance A. Liotta§, and Serguei G. Popov‡�
Inhalational anthrax is caused by spores of the bacteriumBacillus anthracis (B. anthracis), and is an extremely dan-gerous disease that can kill unvaccinated victims within 2weeks. Modern antibiotic-based therapy can increase thesurvival rate to �50%, but only if administered presymp-tomatically (within 24–48 h of exposure). To discover hostsignaling responses to presymptomatic anthrax, label-free quantitative phosphoproteomics via liquid chroma-tography coupled to mass spectrometry was used tocompare spleens from uninfected and spore-challengedmice over a 72 h time-course. Spleen proteins were de-natured using urea, reduced using dithiothreitol, alkylatedusing iodoacetamide, and digested into peptides usingtrypsin, and the resulting phosphopeptides were enrichedusing titanium dioxide solid-phase extraction and ana-lyzed by nano-liquid chromatography-Linear Trap Qua-drupole-Orbitrap-MS(/MS). The fragment ion spectrawere processed using DeconMSn and searched usingboth Mascot and SEQUEST resulting in 252,626 confidentidentifications of 6248 phosphopeptides (correspondingto 5782 phosphorylation sites). The precursor ion spectrawere deisotoped using Decon2LS and aligned using Mul-tiAlign resulting in the confident quantitation of 3265 ofthe identified phosphopeptides. ANOVAs were used toproduce a q-value ranked list of host signaling responses.Late-stage (48–72 h postchallenge) Sterne strain (lethal)infections resulted in global alterations to the spleenphosphoproteome. In contrast, �Sterne strain (asymp-tomatic; missing the anthrax toxin) infections resulted in188 (5.8%) significantly altered (q<0.05) phosphopep-tides. Twenty-six highly tentative phosphorylation re-sponses to early-stage (24 h postchallenge) anthrax werediscovered (q<0.5), and ten of these originated from eight
proteins that have known roles in the host immune re-sponse. These tentative early-anthrax host response sig-naling events within mouse spleens may translate intopresymptomatic diagnostic biomarkers of human anthraxdetectable within circulating immune cells, and could aidin the identification of pathogenic mechanisms and ther-apeutic targets. Molecular & Cellular Proteomics 10:10.1074/mcp.M110.000927, 1–11, 2011.
Anthrax is a life-threatening infectious disease that affectshumans and many animal species, and Bacillus anthracis (B.anthracis), the causative agent of anthrax, is a Gram-positive,rod-shaped, nonmotile, endospore-forming bacterium (1, 2).During the 20th century, effective human and animal vaccinesalmost completely eradicated anthrax as a naturally occurringdisease from the industrialized world. However, anthrax re-mains a major concern because several nations stockpiledweaponized B. anthracis spores, and because B. anthracishas been used as a bioterror weapon (e.g. the 2001 anthraxletters attack in the United States) (3). As a result, B. anthracisis classified as a Category A Select Agent by the Centers forDisease Control and Prevention (some attenuated strains areexcluded).
The major routes of infection occur via inhalation, cutane-ous abrasion, and ingestion of B. anthracis spores, which cansurvive for years in the environment. Inhalational anthrax is themost severe form of the disease, and in the past it was almostinvariably lethal within �2 weeks. Fortunately, modern antibi-otic-based therapies have significantly reduced anthrax mor-tality. As a result, 55% of the inhalational anthrax victims ofthe 2001 U. S. attack survived. However, antibiotics are ef-fective only against proliferating B. anthracis, and thereforeimprove patient outcome only if administered presymptom-atically (within 24–48 h of exposure), when the level of anthraxtoxemia is low.
The major toxic factors of B. anthracis are the lethal andedema toxins encoded by the pXO1 plasmid, although otherbacterial factors might additionally play important pathogenic
From ‡The National Center for Biodefense and Infectious Diseasesand §The Center for Applied Proteomics and Molecular Medicine,George Mason University, Manassas, VA 20110-2201, and ¶The De-partment of Bioinformatics and Genomics, University of North Caro-lina at Charlotte, Charlotte, NC 28223-0001
Received May 18, 2010, and in revised form, November 24, 2010Published, MCP Papers in Press, December 28, 2010, DOI
10.1074/mcp.110.000927
Research© 2011 by The American Society for Biochemistry and Molecular Biology, Inc.This paper is available on line at http://www.mcponline.org
Molecular & Cellular Proteomics 10.3 10.1074/mcp.M110.000927–1

roles. Lethal toxin is a proteolytic inhibitor of mitogen-acti-vated protein kinase kinase, and edema toxin is a bacterialadenylate cyclase capable of increasing the levels of intracel-lular cyclic AMP. Both of these enzymatic activities have aprofound effect on cell function and viability. The antiphago-cytic capsule produced by proteins encoded by the pXO2plasmid is also an important virulence factor, but it has noinherent toxicity. Elimination of these two plasmids greatlyreduces the virulence of B. anthracis. For example, the Sternestrain (pXO1�, pXO2�) is an important vaccine strain thatcauses a mild infection in most animals, including humans. InDBA/2J mice, however, Sterne B. anthracis causes a highlylethal infection. Consequently, Sterne-challenged DBA/2Jmice have become a valuable model of human anthrax. Incontrast, the plasmidless �Sterne strain (pXO1�, pXO2�)causes an asymptomatic, abortive infection in DBA/2J mice.
The molecular events that result in the high mortality ofanthrax victims is still an active area of research, and there isno known cell model or biomarker that is predictive of patientoutcome. After the 2001 attacks, police in the USA haveinvestigated roughly 500 “white powder” hoaxes per year (4),and prophylactically prescribing powerful antibiotics can re-sult in uninfected patients developing serious adverse effects.In a large-scale anthrax hoax or in an actual attack, firstresponders and hospitals would have great difficulty distin-guishing uninfected and presymptomatic patients. Therefore,efforts in our laboratory are focused on identifying diagnostichost response biomarkers of presymptomatic anthrax, andwe recently identified candidate anthrax biomarkers in thelow-molecular-mass serum proteome of Sterne and �Sternespore-challenged DBA/2J mice using liquid chromatographycoupled to (tandem) mass spectrometry (LC-MS[/MS])1 (5).Proteomics (6–12), including phosphoproteomics (13–16),has greatly benefited from recent advances in LC-MS(/MS),though tentative biomarkers still require validation by orthog-onal experimentation.
In this investigation, host signaling responses to anthraxwere discovered using label-free quantitative phosphopro-teomics to compare spleens from uninfected and spore-chal-lenged mice. The spleen was studied because of its role in theimmune system, because it is among the first of the organs todisplay the presence of disseminating B. anthracis in themurine model, and because of the difficulty of reproduciblypreparing sufficient masses of circulating immune cells di-rectly from the blood of spore-challenged mice. Synergisti-cally with its role as a hematopoietic organ (i.e. as a site ofimmune cell maturation, activation, and proliferation), thespleen also functions as a secondary lymphoid organ both by
directly filtering the blood to capture pathogens and antigens,and by transiently concentrating phagocytes and antigen pre-senting cells (e.g. dendritic cells, granulocytes, macrophages,and monocytes) and antigen-specific B- and T-lymphocytes,resulting in an increase in the efficiency of the host im-mune response (17–20). The splenic marginated pool ofimmune cells is in dynamic equilibrium with the circulatingimmune cells, and includes 10–15% of the body’s B lympho-cytes (20, 21), 25% of the body’s T lymphocytes (20, 21),21–34% of the body’s granulocytes (22, 23), and 50% of thebody’s monocytes (24) (this reserve of monocytes can exit thespleen and differentiate to become dendritic cells and mac-rophages). The strategy of using comparative proteomics tostudy altered tissues to generate lists of candidate biomarkershas been employed previously, primarily because of the dif-ficulty of discovering biomarkers directly from the blood (25–32). Host response signaling events within mouse spleens maytranslate into presymptomatic diagnostic biomarkers of humananthrax detectable within circulating immune cells, and couldaid in the identification of pathogenic mechanisms and thera-peutic targets. In this study, thousands of mouse spleen phos-phopeptides were confidently identified and quantitated, dem-onstrating that label-free quantitative phosphoproteomics is aviable alternative to stable isotope labeling (e.g. 18O, isobarictag for relative and absolute quantification, Tandem Mass Tags,and stable isotope labeling with amino acids in cell culture).
EXPERIMENTAL PROCEDURES
Mouse Infection and Tissue Homogenization—The George MasonUniversity Institutional Animal Care and Use Committee and the Bio-con Animal Care and Use Committee/Institutional Review Board (Bio-con Inc., Rockville, MD) approved all of the animal experimentationprotocols. Using BSL-2 safety protocols at Biocon Inc., mice (Musmusculus strain DBA/2J, female, 8 weeks old, The Jackson Labora-tory, Bar Harbor, ME) were either not injected at all (five mice) or wereintraperitoneally injected with 100 �l of sterile H2O (15 mice), or 100�l �Sterne (pXO1�, pXO2�) B. anthracis spores in sterile H2O (5 � 106
spores/100 �l; 15 mice), or 100 �l 34F2 Sterne (pXO1�, pXO2�) B.anthracis spores in sterile H2O (5 � 106 spores/100 �l; 25 mice). TheB. anthracis Sterne 34F2 and �Sterne strains (33) and the sporepreparation protocol (34) have been described previously. At t � 0 h,the five uninjected mice were prepared by terminal bleed from theorbital sinus using a glass Pasteur pipette, followed by cervical dis-location and dissection of the spleen, which was then placed into a2-ml cryogenic vial and immediately snap frozen in liquid nitrogen. At24, 48, and 72 h postchallenge, five mice from each of the remainingexperimental conditions (H2O, �Sterne, and Sterne) were preparedusing the same dissection protocol. Fourteen of the Sterne-chal-lenged mice were found dead in their cages prior to 72 h postch-allenge (Sterne-infected mice have a high mortality rate at this timepoint) and were discarded, so only a single 72 h post-Sterne-challenge mouse spleen was isolated. The spleen samples wereorganized into five sample blocks by placing one biological repli-cate from each experimental condition into each block, and thenrandomizing the order of the samples within each block. The sam-ples were processed in this (random) order within these blocks toreduce any possible systematic biases (35). Each sample washomogenized by manual disruption into 600 �l of freshly preparedLysis Buffer (50 mM tris-HCl pH 8, 8 M urea), and BCA protein
1 The abbreviations used are: LC-MS(/MS), liquid chromatography-tandem MS; ACN, acetonitrile; ANOVA, analysis of variance; DHB,2,5-dihydroxybenzoic acid; FDR, false discovery rate; nc, negativecontrol; PTM, post-translational modification; SPE, solid-phase ex-traction; TFA, trifluoroacetic acid.
Discovery of Mouse Spleen Signaling Responses to Anthrax
10.1074/mcp.M110.000927–2 Molecular & Cellular Proteomics 10.3
concentration assays (Thermo Fisher Scientific Inc., Waltham, MA)were performed.
Sample Digestion and Phosphopeptide Enrichment—Two milli-grams (protein mass) of each spleen homogenate (�30–50% of amouse spleen) was diluted with Lysis Buffer to a final volume of 370�l, and 200 ng of bovine �-casein was added to each sample to serveas a phosphoprotein standard. Dithiothreitol was added to a finalconcentration of 10 mM, and the samples were incubated at 60 °C for30 min to reduce disulfide bridges. The sample proteins were alky-lated by adding iodoacetamide to a final concentration of 50 mM andincubating the samples at room temperature for 20 min in darkness.The samples were diluted with H2O and 500 mM NH4HCO3 pH 9 suchthat the final urea concentration was 1 M and the final NH4HCO3
concentration was 100 mM. The sample proteins were digested intopeptides by adding sequencing grade modified trypsin (1:100 [proteinw:w] trypsin:sample; Promega Corp., Madison, WI) and incubatingthe samples at 37 °C for 21.5 h.
The samples were acidified in preparation for C-18 solid-phaseextraction (SPE) by adding acetic acid to a final concentration of 2%v/v, and 8 pmol of phosphorylated angiotensin II was added to eachsample to serve as a phosphopeptide standard. Each sample wascentrifuged 40 min at 2000 � g at room temperature to pellet partic-ulates (to avoid clogging the SPE column), and then the supernatantsunderwent C-18 solid phase extraction using a Sep-Pak C-18 SPE 1cc 100 mg column (Waters Corp., Milford, MA). Centrifugation in aswinging-bucket rotor was used to equilibrate the Sep-Pak col-umns and to apply the samples and the wash buffer (0.1% v/vformic acid). The elution buffer (0.1% v/v formic acid, 80% v/vacetonitrile [ACN]) was applied slowly using a rubber bulb to pro-duce positive air pressure.
The Sep-Pak eluates were concentrated in a SpeedVac (no heat-ing; Thermo Fisher Scientific Inc.) to 150 �l. Next, 150 �l of freshlyprepared TiO2 Loading Buffer (5% v/v trifluoroacetic acid [TFA], 80%v/v ACN, 225 mg/ml 2,5-dihydroxybenzoic acid [DHB]) was added toeach sample, and the samples were microcentrifuged 10 min at16,000 � g at room temperature to pellet any particulates that mightclog the TiO2 SPE tip. Phosphopeptides from each supernatant wereenriched using a Titansphere PHOS-TiO 200 �l centrifuge tip con-taining 3 mg of TiO2 media (GL Sciences Inc., Torrance, CA) using aprotocol based on (36). Centrifugation was used to equilibrate thetips, apply the samples, apply the first wash buffer (freshly prepared2% v/v TFA, 80% v/v ACN, 40 mg/ml DHB), the second wash buffer(2% v/v TFA, 80% v/v ACN), the first elution buffer (5% w/v [�3M]NH4OH, to elute the phosphopeptides from the TiO2 resin), and thesecond elution buffer (2% v/v TFA, 80% v/v ACN, to elute the phos-phopeptides from the Empore C-8 bonded silica membrane belowthe TiO2 resin inside the tips). The eluates were immediately concen-trated in a SpeedVac (no heating) to 20 �l to evaporate the ACN andNH4OH, and the samples were acidified in preparation for C-18 SPEby adding 60 �l of 1% v/v acetic acid.
The samples underwent C-18 SPE using a ZipTip 10 �l pipette tip(Millipore Corp., Billerica, MA) with the Sep-Pak C-18 SPE wash andelution buffers described above. During the development of this pro-tocol, it was found that skipping the ZipTip SPE resulted in cloggingof the nano-LC-electrospray ionization (ESI) column/tip, and thatperforming this step solved this problem. Forty �l of H2O was addedto each ZipTip eluate, and then the samples were concentrated in aSpeedVac (no heating) to 10 �l to evaporate the ACN. One pmol ofangiotensin I was added to each sample to serve as a peptidestandard, and 7 �l of 1% v/v acetic acid was added to each sampleto acidify it in preparation for reversed-phase LC-MS(/MS). The sam-ples were stored at �80 °C until LC-MS(/MS).
Mass Spectrometry—Nano-LC-ESI-MS(/MS) analyses were per-formed using a Surveyor LC system coupled to an LTQ-Orbitrap mass
spectrometer (both Thermo Fisher Scientific Inc.; Buffer A: 0.1% v/vformic acid; Buffer B: 0.1% v/v formic acid, 80% v/v ACN) (37–38).Each nano-LC-ESI column/tip was prepared by laser-pulling a tip(Laser Based Micropipette Puller Model P-2000, Sutter InstrumentCo., Novato, CA) onto a 30 cm length of 100 �m I.D. coated silicacapillary tubing (Polymicro Technologies LLC, Phoenix, AZ), whichwas then packed with 15 cm of Magic C18AQ C-18 media (5 �mdiameter, 200 A pores, Michrom Bioresources Inc., Auburn, CA) (notethat this was just a single piece of capillary; there was no connectoror frit between the column and tip). One nano-LC-ESI column/tip wasused for sample blocks 1–2, and a second column/tip was used forsample blocks 3–5. Each sample was manually loaded using a pres-sure cell (Brechbuhler Inc., Houston, TX), the nano-LC-ESI column/tipwas connected to the LC system, and the postsplit flow rate wasmanually calibrated to be 350 nL/min (�70 bar, �70 �l/min presplit)using a calibrated micropipette. Note that because the sample wasmanually loaded in this manner, the phosphopeptides were neverexposed to metal or other surfaces that might have caused sampleloss (39). A 2 kV ESI voltage was applied and the ESI spray wasobserved. LC-MS(/MS) was performed using an instrument methodthat included a 120 min linear gradient (10–40% Buffer B) and a 40min 100% Buffer B column regeneration step. The LTQ-Orbitrap wasset to perform simultaneous Orbitrap-MS (400–1600 m/z, resolu-tion � 100,000) and shotgun CID LTQ-MS2 (no Electron TransferDissociation, Higher Energy Collisional Dissociation, or Pulsed QCollision Induced Dissociation was used) against the top eight mostintense ions (top six for sample block 5). Dynamic exclusion wasenabled to avoid repeatedly selecting intense ions for fragmentation(sample blocks 1 and 4 excluded from �0.1 to 1.6 m/z units about theprecursor ion for 25 s; block 2 excluded from �0.1 to 1.6 m/z for 15 s;blocks 3 and 5 excluded from �1.1 to 1.6 m/z for 60 s). Multistageactivation was performed during the analyses of sample blocks 4 and5 (Neutral Loss Mass List � �97.98, �48.99, �32.66 m/z units).These spectra are available for download as .RAW files at the Pro-teome Commons Tranche data repository at https://proteomecom-mons.org/(Tranche Hash: j7rN4iodsyEQbWjTaWAqMthHEdlfsCqJc/WeLuA5xsrD0Tiu7NOEAwQWpWxhpAwl�hRPiBRzsc�K0cTFg2Kipfp�LDEAAAAAAAA9rw��).
Phosphopeptide Identification—MS2 spectra were processed us-ing DeconMSn (v2.1.4.1, http://omics.pnl.gov/software/) (40), an im-plementation of the THRASH algorithm (41), which deisotoped theprecursor ion isotopic profiles to determine accurate precursor ionmonoisotopic masses, and then produced .dta text files of the frag-ment ion spectra. A short PERL script (dta_filt.pl) was used to deletetentative neutral-loss peaks (supplemental material), and then bothMascot (v2.2.06, Matrix Science Inc., Boston, MA) (42) and SEQUEST(v28 [rev. 12], Thermo Fisher Scientific Inc.) (43) were used to searchfor fully tryptic phosphopeptides (variable modifications: Ser, Thr, Tyrphosphorylation, Met oxidation; fixed modification: iodoacetamideCys carboxyamidomethylation; �1 missed trypsin cleavage; � 10ppm precursor ion mass tolerance; � 0.5 Da fragment ion masstolerance [Mascot]; 1 Da fragment ion mass bins [SEQUEST]).
A FASTA text file consisting of five concatenated sets of proteinsequences was used to search the spectra: (i) protein and peptidestandards, (ii) common contaminants (e.g. porcine trypsin, humankeratin), (iii) Bacillus anthracis Sterne proteins (this dataset did notinclude any plasmid proteins, retrieved July 24, 2009, ComprehensiveMicrobial Resource, J. Craig Venter Institute, http://www.jcvi.org/)(44), (iv) Bacillus anthracis Ames Ancestor plasmid proteins (only thepXO1 and pXO2 plasmid proteins, retrieved August 30, 2009, http://www.jcvi.org/) (44), and (v) mouse proteins (Mus musculus, v3.61,retrieved July 24, 2009, International Protein Index, http://www.ebi.ac.uk/IPI/IPIhelp.html) (45). Overall, there were 62,339 protein se-quences total. Protein Digestion Simulator Basic (v2.1.2991.22796,
Discovery of Mouse Spleen Signaling Responses to Anthrax
Molecular & Cellular Proteomics 10.3 10.1074/mcp.M110.000927–3

http://omics.pnl.gov/software/) was used to validate the FASTA file,to produce reversed and scrambled FASTA decoy databases fromthe normal database, and to produce tables of tryptic peptides forMicrosoft Access 2007 queries.
In addition to searching the normal protein sequence file, Mascotand SEQUEST were both used to search the two decoy databases.The decoy database searches were performed separately from thenormal searches, and the estimated false discovery rate (FDR) wascalculated using: FDR � 0.5 � (the number of reversed identifications �the number of scrambled identifications)/(the number of normal iden-tifications). It has been argued that this FDR estimate overestimatesthe true FDR, and an alternative method using concatenated (normal �decoy) databases has been proposed (46). Empirically, a highly con-fident peptide identification will result from a highly confident first hit(the “top-ranked hit”; i.e. the highest-confidence peptide sequencethat resulted from a FASTA database search against a single exper-imental fragment ion spectrum) and a much less confident second hit(the second-place hit). Although the concatenated database methodmay result in a more accurate FDR estimate, it unfortunately overes-timates the confidence of the second hits (46). Therefore, the decoydatabase searches were performed separately, which resulted inrelatively accurate second hit scores at the cost of possibly overes-timating the FDR estimates.
The resulting Mascot (.dat) and SEQUEST (.out) output files wereconverted to tab-delimited text files using Mascot Output Parser(v2003–11-13, generously provided by Dr. Matthew Monroe, PacificNorthwest National Laboratory, Richland, WA) and Peptide File Ex-tractor (console version, v1.1.3519.25650, http://omics.pnl.gov/soft-ware/). Microsoft Access 2003 was used to import each of the result-ing text files and to perform queries in an automated fashion usingmacros. Systematic precursor ion mass measurement errors weredetermined and the search-space was reduced from 20 ppm (�10ppm) to 7 ppm (�3.5 ppm about the systematic error) to reduce theFDR (supplemental Fig. 1) (a much more advanced algorithm toremove systematic precursor ion mass measurement errors has re-cently been published (47, 48)). Phosphopeptide FDR Estimator(v2009–10 � 26) (49) was used to calculate the Ambiguity Score (50)of each phosphorylation site identified by Mascot and SEQUEST, andalso to perform a discriminant analysis using the SEQUEST data(supplemental Fig. 2; the resulting q-values are included as supple-mental data but otherwise were not used to filter the data or toestimate FDRs of the filtered data). All of these steps were automatedusing Microsoft DOS command line scripting and Microsoft Access2003 macros.
For each MS2 spectrum produced by DeconMSn, only the top-ranked hit was retained (one from each of the six searches: Mascot/SEQUEST, normal/reversed/scrambled). A two-step process wasthen used to filter the resulting data to reduce the FDR. First, if Mascotand SEQUEST agreed on the phosphopeptide identification (ignoringpost-translational modification [PTM] localization), relatively mild datafiltration criteria were employed (see supplemental Table 2 for adetailed description of all of the data filtration criteria). In the rarecase that a single spectrum resulted in filter-passing Mascot andSEQUEST identifications of two different peptides, these identifica-tions were discarded (only 515 spectra resulted in this situation). Inthe second step, strict data filtration criteria were employed to filteridentifications made by only one of the two search engines (thisresulted in a relatively small number of additional filter-passing iden-tifications). FDRs of the filtered data were estimated using the decoydatabase method described above, and the data filtration criteriawere designed so that �2.5% of the phosphopeptides were wronglyidentified within each of 15 data categories (precursor ion chargestates �1 – �5; identifications made by Mascot only, SEQUEST only,or both). Overall, this resulted in 252,626 filter-passing phosphopep-
tide identifications (FDR � 0.36%; an MS2 spectrum confidentlyidentified by both Mascot and SEQUEST still counted as a singleidentification) of 6248 different phosphopeptides (FDR � 3.4%). Thiscorresponded to 5782 phosphorylation sites. If phosphopeptidesidentified by only a single spectrum were excluded (“one-hit-won-ders” are generally considered to be low-confidence), 5172 differentphosphopeptides were identified (FDR � 1.9%), and if �3 identifica-tions were required per phosphopeptide, 4652 different phosphopep-tides were identified (FDR � 1.3%). Compared with using eitherMascot or SEQUEST alone, using both search engines (i.e. “consen-sus scoring”) resulted in roughly triple the number of confidentlyidentified phosphopeptides, in agreement with previous studies(51–55).
To manually validate the phosphopeptide identifications, ReAdW(v4.3.1, Institute for Systems Biology, Seattle, WA, http://www.pro-teomecenter.org/) was used to convert the LTQ-Orbitrap output .RAWfiles to .mzXML files, MS Data File Trimmer (v1.1.2991.28041,http://omics.pnl.gov/software/) was used to produce a single file con-taining the best MS2 spectra (i.e. the spectra that resulted in thehighest-confidence identification of each phosphopeptide), andSpectrumLook (v1.5.37, http://omics.pnl.gov/software/) was used tobrowse the annotated spectra. These annotated spectra are availablefor download as a 212 MB .zip file at the Proteome CommonsTranche data repository at https://proteomecommons.org/(TrancheHash: WsVcA7Y8lkPS/nO8sWIQTueMRiq6z6Vf4ZQRPSfLyH��tSbSXEAWCjHI�gxw2usbd�7ezHNKgetev8nSCyPBln/PDcoAAAAAAAAETg��).
Phosphopeptide Quantitation and ANOVAs—The LTQ-Orbitrapoutput files were deisotoped using Decon2LS (v1.0.2964.22547,http://omics.pnl.gov/software/) (56), an implementation of theTHRASH algorithm (41). The resulting data were analyzed using Mul-tiAlign (v1.1.2994.17669, http://omics.pnl.gov/software/), an imple-mentation of the LCMSWARP (57) and AMT-tag (6–7) algorithms. TheMultiAlign data were imported into a Microsoft Access 2007 databaseand “peak-matched” to the phosphopeptide identifications deter-mined by the Mascot and SEQUEST analyses. A MultiAlign “feature”(a.k.a., a “unique mass class” or UMC) is a complete set of precursorion m/z peaks originating from a single analyte and from a singleLC-MS(/MS) analysis (i.e. a complete set of m/z peaks deconvolved ofisotopic and charge state effects and then correlated by mass andelution time across multiple MS scans within a single LC-MS[/MS]file). For each individual LC-MS(/MS) analysis, one MultiAlign featureuniquely corresponds to one analyte. During peak-matching, a Mul-tiAlign feature was matched to a Mascot/SEQUEST identification ifand only if they were both from the same LC-MS(/MS) analysis, theMultiAlign feature apex was within � 200 MS scans of the MS2
spectrum, and the MultiAlign feature mass was within � 3.5 ppm ofthe precursor ion mass. A MultiAlign “cluster” (of features) is a com-plete set of MultiAlign features from a set of multiple, aligned LC-MS(/MS) analyses (i.e. for the complete set of aligned LC-MS[/MS] anal-yses, one MultiAlign cluster uniquely corresponds to one analyte).MultiAlign clusters that peak-matched to multiple phosphopeptides[ignoring PTM localization] were discarded unless the vast majority ofthe matching phosphopeptide identifications were of only one phos-phopeptide (i.e. �fourfold the number of the second-most-numerousmatch). The vast majority of MultiAlign clusters only matched to asingle phosphopeptide because of the enormous reduction in samplecomplexity that resulted from the TiO2 SPE. MultiAlign clusters with amass range �16 ppm were discarded, “split” MultiAlign clusters(clusters confidently peak-matched to the same phosphopeptide [ig-noring PTM localization]) were joined, and phosphopeptides thatcontained a missed trypsin cleavage site were discarded. MultiAlignwas used to calculate the peak area (elution time versus intensity) ofeach feature, and each peak area was used as a relative measure of
Discovery of Mouse Spleen Signaling Responses to Anthrax
10.1074/mcp.M110.000927–4 Molecular & Cellular Proteomics 10.3

the abundance of the analyte. This resulted in 3265 confidently iden-tified and quantitated phosphopeptides (FDR � 1.81% estimated bypeak-matching the decoy database identifications). If �2 identifica-tions were required per phosphopeptide, 3006 different phosphopep-tides were confidently identified and quantitated (FDR � 1.3%), and if�3 identifications were required, 2837 different phosphopeptideswere confidently identified and quantitated (FDR � 0.97%).
To eliminate systematic abundance value biases between the sam-ples (due to, for example, slightly different sample phosphopeptidemasses), a central tendency normalization (58) was performed(supplemental Fig. 3). Specifically, one LC-MS(/MS) dataset was se-lected to be the baseline, and for each “alignee” dataset, and for eachconfidently identified and quantitated phosphopeptide, the alignee tobaseline abundance value ratio was calculated. The median of theseratios was calculated for each alignee and used as a normalizationfactor. Normalization was performed by dividing all of the aligneeabundance values by this normalization factor.
The abundance values were log10-transformed because this in-creased the normality of the distribution of their z-scores(supplemental Fig. 4). Then, to determine which phosphopeptideabundance values were significantly different between the experi-mental groups, two different types of analysis of variance (ANOVA)tests were performed for each phosphopeptide using a MATLABscript (supplemental material) (35, 59). The first ANOVA was simply aparametric one-way ANOVA (missing values were excluded). Thesecond ANOVA was a nonparametric Kruskal-Wallis one-way ANOVAby ranks (missing values were tied for the lowest rank). Each ANOVAresulted in a p value that is the probability of obtaining by randomchance data at least as disproportionate as that observed. Both typesof ANOVAs were employed because whereas the parametric ANOVAis a much more powerful test in general, it is unable to test forphosphopeptides that are present in some experimental conditionsand absent from others. Other researchers have addressed the prob-lem of missing values from proteomics datasets using data imputa-tion (60), but this strategy is controversial so it was not used in thisstudy. The resulting parametric p values were used to estimate para-metric q-values using QVALUE (v1.1, http://genomics.princeton.edu/storeylab/qvalue/index.html) (61), and the nonparametric p valueswere used to estimate nonparametric q-values in the same way. Aq-value is defined as the proportion of false positives incurred (i.e. theFDR) when a particular p value is considered significant. A single,robust q-value for each phosphopeptide could not be calculatedbecause the parametric and nonparametric p values were not inde-pendent. Consequently, for each phosphopeptide the minimum of theparametric and nonparametric q-values was calculated and was usedfor data filtration and for ranking the confidence in the phosphoryla-tion responses, and was considered an approximate estimate of theq-value of the combined ANOVAs. Unless specified otherwise, “q” or“q-value” refers to the minimum of the parametric and nonparametricq-values. To test the efficacy of the analysis strategy of the quanti-tative data, selected ion chromatograms of one of the phosphoryla-tion responses were manually inspected (supplemental Fig. 5). Hier-archical cluster analyses of the significant data were performed usingGenesis (v1.7.2, http://genome.tugraz.at/) (62) with average linkagecorrelations determined by Euclidean distance.
RESULTS
In this investigation, spleens from uninfected and spore-challenged mice were analyzed using label-free quantitativephosphoproteomics to discover host signaling responses toanthrax. A variety of organs and biofluids were retained fromeach mouse, and we ultimately focused on the spleen be-cause of its role in the immune system, and because repro-
ducibly isolating sufficient masses of circulating immune cellsfrom whole blood using BSL2 protocols was found to be verychallenging. Additionally, hemolysis was caused by the ad-vanced Sterne infections, and the resulting highly variablevolumes of blood recoverable from each mouse were ofteninsufficient for our experiments.
Initially, method development experiments were performedto design and optimize sample preparation and mass spec-trometry. Notably, several different phosphopeptide enrich-ment procedures were tested. Microcolumns prepared usinga pressure cell, frit, and capillary tubing, and packed withTitansphere 5 �m TiO2 loose media (GL Sciences Inc.) (63)worked very well (�5,000 phosphopeptide identifications per2 h LC-LTQ-Orbitrap-MS[/MS] analysis) but suffered from lowsample throughput (�1 sample/5 h), and the reproducibility ofthe protocol was never carefully determined. TopTip 200 �lTiO2 centrifuge tips (Glygen Corp., Columbia, MD) workedpoorly by comparison (�1000 phosphopeptide identificationsper 2 h LC-LTQ-Orbitrap-MS[/MS] analysis), and the TopTipsretained more nonphosphopeptides than the Titansphere me-dia. Fortunately, Titansphere PHOS-TiO 200 �l TiO2 centri-fuge tips (GL Sciences Inc.) became available recently, andthey performed just as well as the Titansphere microcolumnswhile enabling high sample throughput (�20 samples/5 h),which in turn reduced sample processing time and eliminatedthe reproducibility concern. Three alterations to the protocolwere investigated. First, using lactic acid instead of DHB (as in(64)) didn’t significantly change the number of identified phos-phopeptides per LC-LTQ-Orbitrap-MS(/MS) analysis. Sec-ond, including an insoluble component of the spleen homo-genate in the tryptic digestion resulted in clogging of theSep-Pak C-18 SPE, and therefore was excluded from consid-eration. Lastly, simplifying the TiO2 SPE procedure was foundto have no adverse effect (described in detail in the Sup-plemental Protocol).
Similarly, a data analysis strategy needed to be developedto confidently discover the phosphoprotein signaling re-sponses. To confidently identify the phosphopeptides, bothMascot and SEQUEST were used to perform databasesearching. This greatly mitigated the effect of the often poorfragmentation common to CID spectra of phosphopeptides,because both algorithms greatly complement one another. Infact, when the same FDR was required (of unique phospho-peptides), each algorithm alone resulted in roughly one-thirdof the identified phosphopeptides compared with using bothsearch engines and requiring that both identified the samephosphopeptide (ignoring PTM localization). This is not sur-prising, as the use of multiple search engines (i.e. “consensusscoring”) has been shown to significantly improve peptideidentification confidence (51–55). Additionally, a short Perlscript was written (supplemental material) to remove tentativeneutral-loss precursor ion peaks from the fragment ion spec-tra .dta files prior to the Mascot and SEQUEST analyses, andthis significantly increased the number of identified phospho-
Discovery of Mouse Spleen Signaling Responses to Anthrax
Molecular & Cellular Proteomics 10.3 10.1074/mcp.M110.000927–5
peptides at the same FDR. Also, the use of DeconMSn in-stead of extract_msn enabled operation of the LTQ-Orbitrapwith monoisotopic precursor ion selection turned off, and thisalso increased the number of identified phosphopeptides atthe same FDR.
In a preliminary comparative phosphoproteomics experi-ment using six mice (two uninfected, two 24 h Sterne-infected, and two 48 h Sterne-infected), spectrum counting(simply counting confident phosphopeptide identificationsas a rough measure of abundance) was found to be insuf-ficient to identify tentative phosphoprotein signaling re-sponses. However, reanalyzing the data using MultiAlignresulted in the discovery of 97 phosphopeptides that werealtered significantly within the 48 h Sterne samples com-pared with the other four samples (44 were more abundantand 53 were less abundant). The two phosphoproteins af-fected most dramatically (both were �30-fold more abun-dant) have known roles in the immune system: interferon-�-inducible p47 GTPase and Z-DNA binding protein (acytosolic DNA sensor).
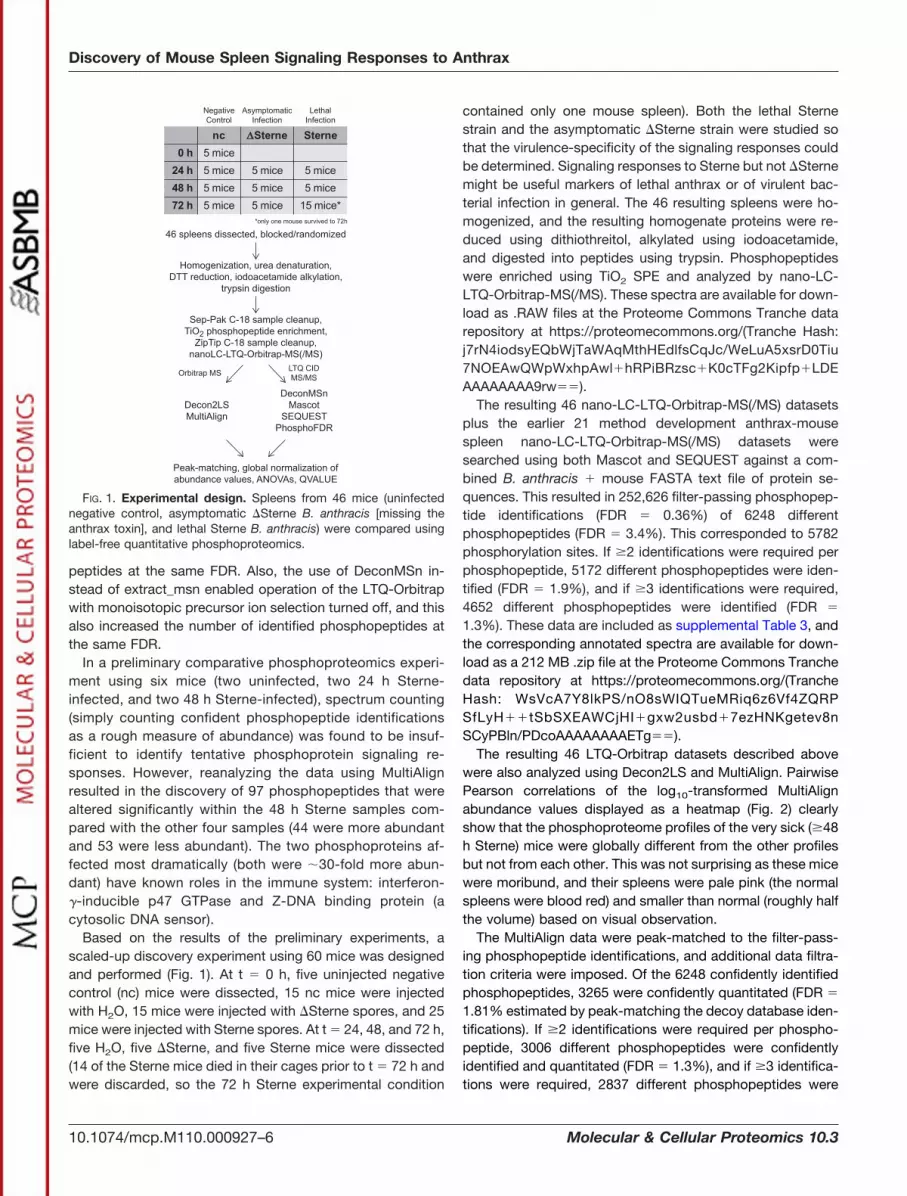
Based on the results of the preliminary experiments, ascaled-up discovery experiment using 60 mice was designedand performed (Fig. 1). At t � 0 h, five uninjected negativecontrol (nc) mice were dissected, 15 nc mice were injectedwith H2O, 15 mice were injected with �Sterne spores, and 25mice were injected with Sterne spores. At t � 24, 48, and 72 h,five H2O, five �Sterne, and five Sterne mice were dissected(14 of the Sterne mice died in their cages prior to t � 72 h andwere discarded, so the 72 h Sterne experimental condition
contained only one mouse spleen). Both the lethal Sternestrain and the asymptomatic �Sterne strain were studied sothat the virulence-specificity of the signaling responses couldbe determined. Signaling responses to Sterne but not �Sternemight be useful markers of lethal anthrax or of virulent bac-terial infection in general. The 46 resulting spleens were ho-mogenized, and the resulting homogenate proteins were re-duced using dithiothreitol, alkylated using iodoacetamide,and digested into peptides using trypsin. Phosphopeptideswere enriched using TiO2 SPE and analyzed by nano-LC-LTQ-Orbitrap-MS(/MS). These spectra are available for down-load as .RAW files at the Proteome Commons Tranche datarepository at https://proteomecommons.org/(Tranche Hash:j7rN4iodsyEQbWjTaWAqMthHEdlfsCqJc/WeLuA5xsrD0Tiu7NOEAwQWpWxhpAwl�hRPiBRzsc�K0cTFg2Kipfp�LDEAAAAAAAA9rw��).
The resulting 46 nano-LC-LTQ-Orbitrap-MS(/MS) datasetsplus the earlier 21 method development anthrax-mousespleen nano-LC-LTQ-Orbitrap-MS(/MS) datasets weresearched using both Mascot and SEQUEST against a com-bined B. anthracis � mouse FASTA text file of protein se-quences. This resulted in 252,626 filter-passing phosphopep-tide identifications (FDR � 0.36%) of 6248 differentphosphopeptides (FDR � 3.4%). This corresponded to 5782phosphorylation sites. If �2 identifications were required perphosphopeptide, 5172 different phosphopeptides were iden-tified (FDR � 1.9%), and if �3 identifications were required,4652 different phosphopeptides were identified (FDR �
1.3%). These data are included as supplemental Table 3, andthe corresponding annotated spectra are available for down-load as a 212 MB .zip file at the Proteome Commons Tranchedata repository at https://proteomecommons.org/(TrancheHash: WsVcA7Y8lkPS/nO8sWIQTueMRiq6z6Vf4ZQRPSfLyH��tSbSXEAWCjHI�gxw2usbd�7ezHNKgetev8nSCyPBln/PDcoAAAAAAAAETg��).
The resulting 46 LTQ-Orbitrap datasets described abovewere also analyzed using Decon2LS and MultiAlign. PairwisePearson correlations of the log10-transformed MultiAlignabundance values displayed as a heatmap (Fig. 2) clearlyshow that the phosphoproteome profiles of the very sick (�48h Sterne) mice were globally different from the other profilesbut not from each other. This was not surprising as these micewere moribund, and their spleens were pale pink (the normalspleens were blood red) and smaller than normal (roughly halfthe volume) based on visual observation.
The MultiAlign data were peak-matched to the filter-pass-ing phosphopeptide identifications, and additional data filtra-tion criteria were imposed. Of the 6248 confidently identifiedphosphopeptides, 3265 were confidently quantitated (FDR �
1.81% estimated by peak-matching the decoy database iden-tifications). If �2 identifications were required per phospho-peptide, 3006 different phosphopeptides were confidentlyidentified and quantitated (FDR � 1.3%), and if �3 identifica-tions were required, 2837 different phosphopeptides were
FIG. 1. Experimental design. Spleens from 46 mice (uninfectednegative control, asymptomatic �Sterne B. anthracis [missing theanthrax toxin], and lethal Sterne B. anthracis) were compared usinglabel-free quantitative phosphoproteomics.
Discovery of Mouse Spleen Signaling Responses to Anthrax
10.1074/mcp.M110.000927–6 Molecular & Cellular Proteomics 10.3

confidently identified and quantitated (FDR � 0.97%). Thesedata are included as supplemental Table 4.
A global normalization of the abundance values was per-formed to eliminate systematic biases between the samplesbecause of, for example, slightly different sample phospho-peptide masses (supplemental Fig. 3). Then log10-transforma-tion was performed because it increased the normality of thez-score distribution of the abundance values (supplemen-tal Fig. 4) indicating that the unadjusted values were approx-imately log-normal. A plot of the geometric mean (�G) versusgeometric standard deviation (�G) of the globally normalizedbut otherwise unadjusted abundance values indicated that �G
2 for most of the phosphopeptides (Fig. 3). This indicatesthat phosphorylation abundance changes of twofold uponinfection might be statistically discernable. Also, it was notedthat �G decreased as �G increased, likely because the Or-
bitrap intensity measurement is less accurate at lower precur-sor ion intensities.
Following globally normalizing and log10-transforming theabundance values, ANOVAs were used to identify phospho-peptides that were disproportionately abundant in one ormore of the experimental groups (35, 59). Of the 3265 confi-dently identified and quantitated phosphopeptides, 1173(36%) were found to be significantly altered (q 0.05). Notethat by requiring q 0.05, 5% of the data (59 phosphopep-tides) are estimated to have been wrongly considered signif-icant by the ANOVAs. The significantly altered phosphopep-tide data were analyzed using a hierarchical cluster analysisand displayed as a heatmap (Fig. 4 Top; the correspondingdata is included as supplemental Table 5). The �48 h Sternesamples were very different from the other samples, inagreement with Fig. 2. It should be noted that to justifyperforming the global normalization, it was assumed thatany abundance differences between the samples wouldaverage out. This assumption was true even for the �48 hSterne samples, as the global normalization successfullyremoved systematic biases from even these datasets(supplemental Fig. 3; note that the MultiAlign and globalnormalization baseline was the same sample, and that itwas one of the 24 h �Sterne samples).
FIG. 2. Correlation analyses of the LC-MS(/MS) datasets. Spleenphosphoproteomics samples from 46 mice were analyzed by LC-MS(/MS), and the resulting data are displayed as pairwise Pearsoncorrelations of the log10-transformed MultiAlign abundance values.Black (R2 � 0.5) and yellow (R2 � 0.9) indicate weak and strongcorrelations, respectively. The phosphoproteome profiles of the verysick (�48 h Sterne) mice were globally different from the others, butnot from each other.
FIG. 3. Variance of the phosphopeptide abundance values. TheMultiAlign phosphopeptide abundance values were globally normal-ized, and then the geometric mean (�G) and geometric standarddeviation (�G) were calculated for each analyte across the 46 spleensamples. Confidence intervals of log-normal data take the form�G�G
�n - �G�Gn (e.g. the 95% confidence interval is from �G�G
�2 to�G�G
2, or from 0.5 � �G to 2 � �G if �G � 20.5). Phosphopeptideabundances altered twofold are potentially statistically discernable.
FIG. 4. Mouse spleen signaling responses to anthrax. Top Heat-map: The MultiAlign abundance values of the confidently identifiedand quantitated phosphopeptides (n � 3265) were globally normal-ized, log10-transformed, and analyzed by ANOVAs across the sevenexperimental conditions. The significant data (q0.05, n � 1173)were z-score transformed across the 46 samples, and analyzed usinga hierarchical cluster analysis. Each row represents a confidentlyidentified phosphopeptide, each column represents a mouse spleen,and relative abundance values are indicated by color (green � rela-tively low, red � relatively high, gray � missing data). Most of thephosphopeptides were altered in the �48 h Sterne samples, corre-lating strongly with anthrax pathogenesis as the Sterne-infected micebegan to die at 48 h postchallenge and the mice infected with the�Sterne strain (missing the anthrax toxin) were asymptomatic. Bot-tom Heatmap: All of the data except for the �48 h Sterne data werereanalyzed by ANOVAs across the five remaining experimental con-ditions, and the significant data (q0.05, n � 188) were analyzedusing a hierarchical cluster analysis. The resulting heatmap depictsthe mouse spleen signal transduction cascade responding to theasymptomatic �Sterne infection.
Discovery of Mouse Spleen Signaling Responses to Anthrax
Molecular & Cellular Proteomics 10.3 10.1074/mcp.M110.000927–7
Ideally, a post hoc analysis such as the Tukey-Kramer testwould have been used to perform pairwise comparisons todetermine which phosphopeptides were significantly differentbetween specific pairs of experimental groups. Unfortunately,an algorithm to calculate the FDR of such analyses has yet tobe discovered. Therefore, to discover which phosphopep-tides were altered between the other experimental conditions(i.e. other than �48 h Sterne), the ANOVAs were recalculatedexcluding the �48 h Sterne data. This time, of the 3265confidently identified and quantitated phosphopeptides, 188(5.8%) were found to be significantly altered (q 0.05). Notethat by requiring q 0.05, 5% of the data (nine phosphopep-tides) are estimated to have been wrongly considered signif-icant by the ANOVAs. The significantly altered phosphopep-tide data were analyzed using a hierarchical cluster analysisand displayed as a heatmap (Fig. 4 Bottom; the correspond-ing data is included as supplemental Table 6). Almost all ofthese 188 phosphopeptides were disproportionately abun-dant within the �48 h �Sterne samples. Clearly these phos-phoproteins were a major component of the mouse spleenimmune response to the asymptomatic �Sterne challenge.Notably, this response was mostly absent at 24 h postchal-lenge, and it was decreased in intensity by 72 h postchal-lenge, in agreement with the abortive nature of the �Sterneinfection.
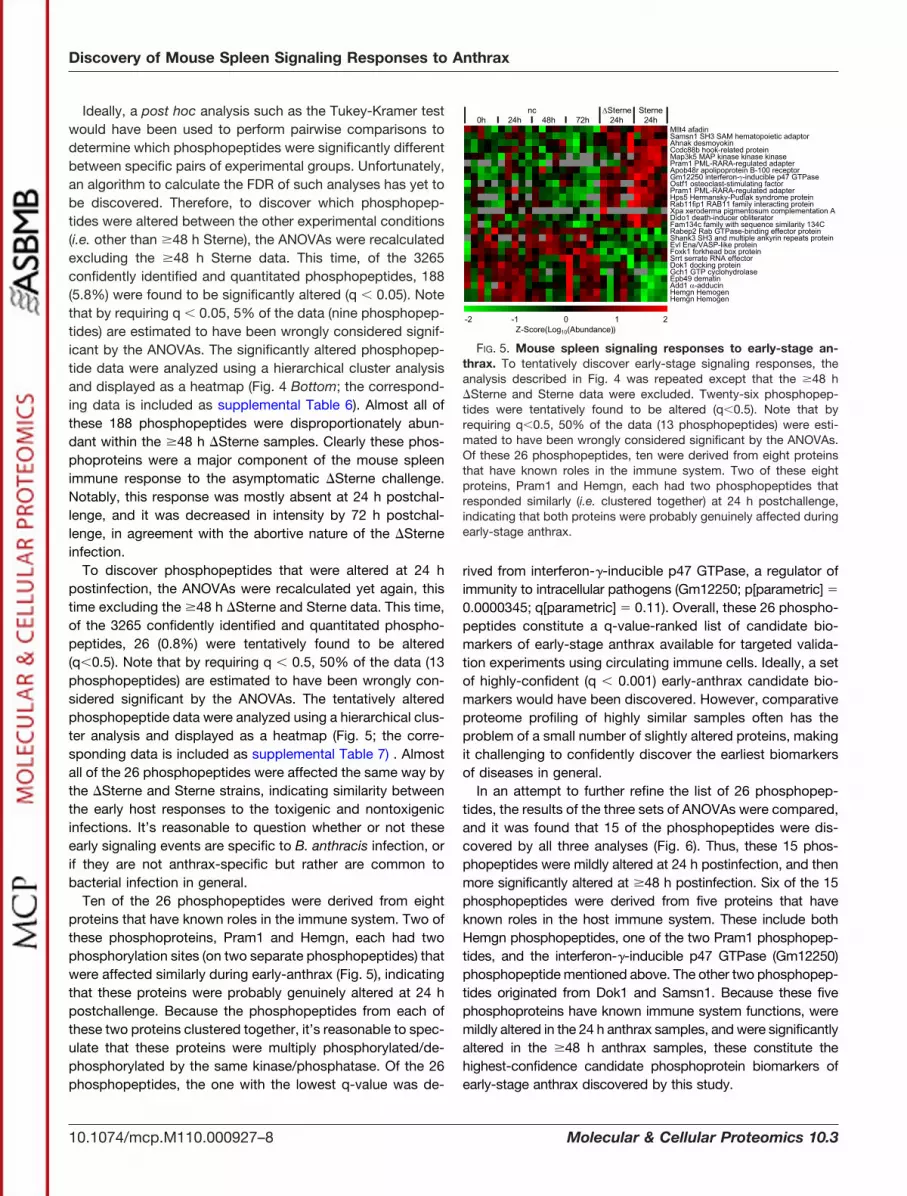
To discover phosphopeptides that were altered at 24 hpostinfection, the ANOVAs were recalculated yet again, thistime excluding the �48 h �Sterne and Sterne data. This time,of the 3265 confidently identified and quantitated phospho-peptides, 26 (0.8%) were tentatively found to be altered(q0.5). Note that by requiring q 0.5, 50% of the data (13phosphopeptides) are estimated to have been wrongly con-sidered significant by the ANOVAs. The tentatively alteredphosphopeptide data were analyzed using a hierarchical clus-ter analysis and displayed as a heatmap (Fig. 5; the corre-sponding data is included as supplemental Table 7) . Almostall of the 26 phosphopeptides were affected the same way bythe �Sterne and Sterne strains, indicating similarity betweenthe early host responses to the toxigenic and nontoxigenicinfections. It’s reasonable to question whether or not theseearly signaling events are specific to B. anthracis infection, orif they are not anthrax-specific but rather are common tobacterial infection in general.
Ten of the 26 phosphopeptides were derived from eightproteins that have known roles in the immune system. Two ofthese phosphoproteins, Pram1 and Hemgn, each had twophosphorylation sites (on two separate phosphopeptides) thatwere affected similarly during early-anthrax (Fig. 5), indicatingthat these proteins were probably genuinely altered at 24 hpostchallenge. Because the phosphopeptides from each ofthese two proteins clustered together, it’s reasonable to spec-ulate that these proteins were multiply phosphorylated/de-phosphorylated by the same kinase/phosphatase. Of the 26phosphopeptides, the one with the lowest q-value was de-
rived from interferon-�-inducible p47 GTPase, a regulator ofimmunity to intracellular pathogens (Gm12250; p[parametric] �
0.0000345; q[parametric] � 0.11). Overall, these 26 phospho-peptides constitute a q-value-ranked list of candidate bio-markers of early-stage anthrax available for targeted valida-tion experiments using circulating immune cells. Ideally, a setof highly-confident (q 0.001) early-anthrax candidate bio-markers would have been discovered. However, comparativeproteome profiling of highly similar samples often has theproblem of a small number of slightly altered proteins, makingit challenging to confidently discover the earliest biomarkersof diseases in general.
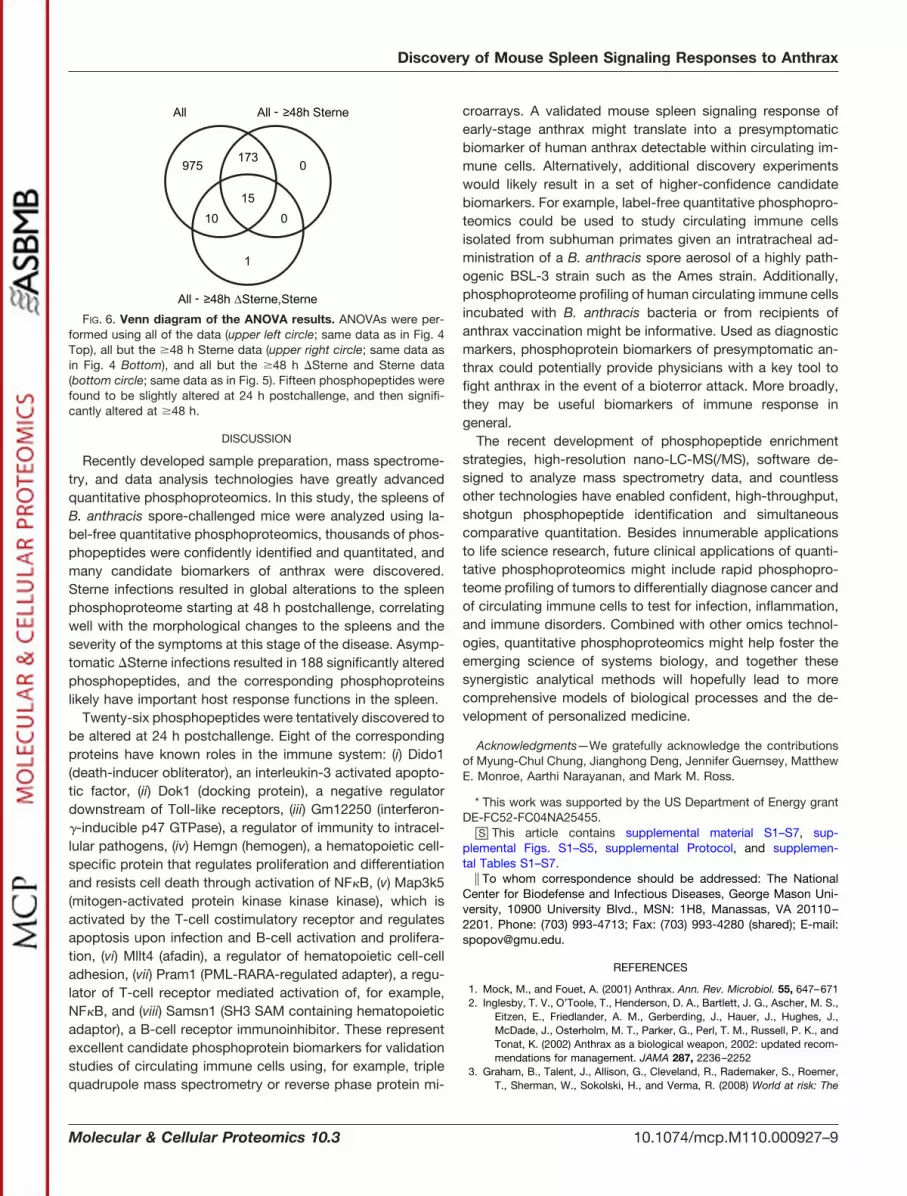
In an attempt to further refine the list of 26 phosphopep-tides, the results of the three sets of ANOVAs were compared,and it was found that 15 of the phosphopeptides were dis-covered by all three analyses (Fig. 6). Thus, these 15 phos-phopeptides were mildly altered at 24 h postinfection, and thenmore significantly altered at �48 h postinfection. Six of the 15phosphopeptides were derived from five proteins that haveknown roles in the host immune system. These include bothHemgn phosphopeptides, one of the two Pram1 phosphopep-tides, and the interferon-�-inducible p47 GTPase (Gm12250)phosphopeptide mentioned above. The other two phosphopep-tides originated from Dok1 and Samsn1. Because these fivephosphoproteins have known immune system functions, weremildly altered in the 24 h anthrax samples, and were significantlyaltered in the �48 h anthrax samples, these constitute thehighest-confidence candidate phosphoprotein biomarkers ofearly-stage anthrax discovered by this study.
FIG. 5. Mouse spleen signaling responses to early-stage an-thrax. To tentatively discover early-stage signaling responses, theanalysis described in Fig. 4 was repeated except that the �48 h�Sterne and Sterne data were excluded. Twenty-six phosphopep-tides were tentatively found to be altered (q0.5). Note that byrequiring q0.5, 50% of the data (13 phosphopeptides) were esti-mated to have been wrongly considered significant by the ANOVAs.Of these 26 phosphopeptides, ten were derived from eight proteinsthat have known roles in the immune system. Two of these eightproteins, Pram1 and Hemgn, each had two phosphopeptides thatresponded similarly (i.e. clustered together) at 24 h postchallenge,indicating that both proteins were probably genuinely affected duringearly-stage anthrax.
Discovery of Mouse Spleen Signaling Responses to Anthrax
10.1074/mcp.M110.000927–8 Molecular & Cellular Proteomics 10.3
DISCUSSION
Recently developed sample preparation, mass spectrome-try, and data analysis technologies have greatly advancedquantitative phosphoproteomics. In this study, the spleens ofB. anthracis spore-challenged mice were analyzed using la-bel-free quantitative phosphoproteomics, thousands of phos-phopeptides were confidently identified and quantitated, andmany candidate biomarkers of anthrax were discovered.Sterne infections resulted in global alterations to the spleenphosphoproteome starting at 48 h postchallenge, correlatingwell with the morphological changes to the spleens and theseverity of the symptoms at this stage of the disease. Asymp-tomatic �Sterne infections resulted in 188 significantly alteredphosphopeptides, and the corresponding phosphoproteinslikely have important host response functions in the spleen.
Twenty-six phosphopeptides were tentatively discovered tobe altered at 24 h postchallenge. Eight of the correspondingproteins have known roles in the immune system: (i) Dido1(death-inducer obliterator), an interleukin-3 activated apopto-tic factor, (ii) Dok1 (docking protein), a negative regulatordownstream of Toll-like receptors, (iii) Gm12250 (interferon-�-inducible p47 GTPase), a regulator of immunity to intracel-lular pathogens, (iv) Hemgn (hemogen), a hematopoietic cell-specific protein that regulates proliferation and differentiationand resists cell death through activation of NF�B, (v) Map3k5(mitogen-activated protein kinase kinase kinase), which isactivated by the T-cell costimulatory receptor and regulatesapoptosis upon infection and B-cell activation and prolifera-tion, (vi) Mllt4 (afadin), a regulator of hematopoietic cell-celladhesion, (vii) Pram1 (PML-RARA-regulated adapter), a regu-lator of T-cell receptor mediated activation of, for example,NF�B, and (viii) Samsn1 (SH3 SAM containing hematopoieticadaptor), a B-cell receptor immunoinhibitor. These representexcellent candidate phosphoprotein biomarkers for validationstudies of circulating immune cells using, for example, triplequadrupole mass spectrometry or reverse phase protein mi-
croarrays. A validated mouse spleen signaling response ofearly-stage anthrax might translate into a presymptomaticbiomarker of human anthrax detectable within circulating im-mune cells. Alternatively, additional discovery experimentswould likely result in a set of higher-confidence candidatebiomarkers. For example, label-free quantitative phosphopro-teomics could be used to study circulating immune cellsisolated from subhuman primates given an intratracheal ad-ministration of a B. anthracis spore aerosol of a highly path-ogenic BSL-3 strain such as the Ames strain. Additionally,phosphoproteome profiling of human circulating immune cellsincubated with B. anthracis bacteria or from recipients ofanthrax vaccination might be informative. Used as diagnosticmarkers, phosphoprotein biomarkers of presymptomatic an-thrax could potentially provide physicians with a key tool tofight anthrax in the event of a bioterror attack. More broadly,they may be useful biomarkers of immune response ingeneral.
The recent development of phosphopeptide enrichmentstrategies, high-resolution nano-LC-MS(/MS), software de-signed to analyze mass spectrometry data, and countlessother technologies have enabled confident, high-throughput,shotgun phosphopeptide identification and simultaneouscomparative quantitation. Besides innumerable applicationsto life science research, future clinical applications of quanti-tative phosphoproteomics might include rapid phosphopro-teome profiling of tumors to differentially diagnose cancer andof circulating immune cells to test for infection, inflammation,and immune disorders. Combined with other omics technol-ogies, quantitative phosphoproteomics might help foster theemerging science of systems biology, and together thesesynergistic analytical methods will hopefully lead to morecomprehensive models of biological processes and the de-velopment of personalized medicine.
Acknowledgments—We gratefully acknowledge the contributionsof Myung-Chul Chung, Jianghong Deng, Jennifer Guernsey, MatthewE. Monroe, Aarthi Narayanan, and Mark M. Ross.
* This work was supported by the US Department of Energy grantDE-FC52-FC04NA25455.
□S This article contains supplemental material S1–S7, sup-plemental Figs. S1–S5, supplemental Protocol, and supplemen-tal Tables S1–S7.
� To whom correspondence should be addressed: The NationalCenter for Biodefense and Infectious Diseases, George Mason Uni-versity, 10900 University Blvd., MSN: 1H8, Manassas, VA 20110–2201. Phone: (703) 993-4713; Fax: (703) 993-4280 (shared); E-mail:[email protected].
REFERENCES
1. Mock, M., and Fouet, A. (2001) Anthrax. Ann. Rev. Microbiol. 55, 647–6712. Inglesby, T. V., O’Toole, T., Henderson, D. A., Bartlett, J. G., Ascher, M. S.,
Eitzen, E., Friedlander, A. M., Gerberding, J., Hauer, J., Hughes, J.,McDade, J., Osterholm, M. T., Parker, G., Perl, T. M., Russell, P. K., andTonat, K. (2002) Anthrax as a biological weapon, 2002: updated recom-mendations for management. JAMA 287, 2236–2252
3. Graham, B., Talent, J., Allison, G., Cleveland, R., Rademaker, S., Roemer,T., Sherman, W., Sokolski, H., and Verma, R. (2008) World at risk: The
FIG. 6. Venn diagram of the ANOVA results. ANOVAs were per-formed using all of the data (upper left circle; same data as in Fig. 4Top), all but the �48 h Sterne data (upper right circle; same data asin Fig. 4 Bottom), and all but the �48 h �Sterne and Sterne data(bottom circle; same data as in Fig. 5). Fifteen phosphopeptides werefound to be slightly altered at 24 h postchallenge, and then signifi-cantly altered at �48 h.
Discovery of Mouse Spleen Signaling Responses to Anthrax
Molecular & Cellular Proteomics 10.3 10.1074/mcp.M110.000927–9

report of the commission on the prevention of WMD proliferation andterrorism, Random House, New York
4. Drogin, B. (Mar 8, 2009) Anthrax hoaxes pile up, as does their cost. LosAngeles Times
5. Narayanan, A., Zhou, W., Ross, M., Tang, J., Liotta, L., Petricoin, E.,Kashanchi, F., Bailey, C., and Popov, S. (2009) Discovery of InfectiousDisease Biomarkers in Murine Anthrax Model Using Mass Spectrometryof the Low-Molecular-Mass Serum Proteome. J. Proteomics Bioinform.2, 408–415
6. Zimmer, J. S., Monroe, M. E., Qian, W. J., and Smith, R. D. (2006) Advancesin proteomics data analysis and display using an accurate mass and timetag approach. Mass Spectrometry Rev. 25, 450–482
7. Liu, T., Belov, M. E., Jaitly, N., Qian, W. J., and Smith, R. D. (2007) Accuratemass measurements in proteomics. Chem. Rev. 107, 3621–3653
8. Yates, J. R., Ruse, C. I., and Nakorchevsky, A. (2009) Proteomics by massspectrometry: approaches, advances, and applications. Ann. Rev.Biomed. Eng. 11, 49–79
9. Feng, X., Liu, X., Luo, Q., and Liu, B. F. (2008) Mass spectrometry insystems biology: an overview. Mass Spectrometry Rev. 27, 635–660
10. Gstaiger, M., and Aebersold, R. (2009) Applying mass spectrometry-basedproteomics to genetics, genomics and network biology. Nat. Rev. 10,617–627
11. Nesvizhskii, A. I., Vitek, O., and Aebersold, R. (2007) Analysis and validationof proteomic data generated by tandem mass spectrometry. Nat. Meth.4, 787–797
12. Matthiesen, R. (2007) Methods, algorithms and tools in computationalproteomics: a practical point of view. Proteomics 7, 2815–2832
13. Macek, B., Mann, M., and Olsen, J. V. (2009) Global and site-specificquantitative phosphoproteomics: principles and applications. Ann. Rev.Pharmacol.Toxicol. 49, 199–221
14. Thingholm, T. E., Jensen, O. N., and Larsen, M. R. (2009) Analytical strat-egies for phosphoproteomics. Proteomics 9, 1451–1468
15. Grimsrud, P. A., Swaney, D. L., Wenger, C. D., Beauchene, N. A., and Coon,J. J. (2010) Phosphoproteomics for the masses. ACS Chem. Biol. 5,105–119
16. Nita-Lazar, A., Saito-Benz, H., and White, F. M. (2008) Quantitative phos-phoproteomics by mass spectrometry: past, present, and future. Pro-teomics 8, 4433–4443
17. Brendolan, A., Rosado, M. M., Carsetti, R., Selleri, L., and Dear, T. N. (2007)Development and function of the mammalian spleen. Bioessays 29,166–177
18. Mebius, R. E., and Kraal, G. (2005) Structure and function of the spleen.Nat. Rev. Immunol. 5, 606–616
19. Paul, W. E. (2008) Fundamental immunology, 6th Ed., pp 38–42, Lippincott,Williams and Wilkins, Philadelphia, PA
20. Cesta, M. F. (2006) Normal structure, function, and histology of the spleen.Toxicol. Pathol. 34, 455–465
21. Hoffbrand, A. V., Catovsky, D., and Tuddenham, E. (2005) PostgraduateHaematology, 5th Ed., pp 359–60, Blackwell Publishing, Oxford, UK
22. Peters, A. M., Saverymuttu, S. H., Bell, R. N., and Lavender, J. P. (1985)Quantification of the distribution of the marginating granulocyte pool inman. Scand. J. Haematol. 34, 111–120
23. Peters, A. M., Saverymuttu, S. H., Keshavarzian, A., Bell, R. N., and Lav-ender, J. P. (1985) Splenic pooling of granulocytes. Clin. Sci. 68, 283–289
24. Swirski, F. K., Nahrendorf, M., Etzrodt, M., Wildgruber, M., Cortez-Reta-mozo, V., Panizzi, P., Figueiredo, J. L., Kohler, R. H., Chudnovskiy, A.,Waterman, P., Aikawa, E., Mempel, T. R., Libby, P., Weissleder, R., andPittet, M. J. (2009) Identification of splenic reservoir monocytes and theirdeployment to inflammatory sites. Science 325, 612–616
25. Beretta, L. (2009) Comparative analysis of the liver and plasma proteomesas a novel and powerful strategy for hepatocellular carcinoma biomarkerdiscovery. Cancer Lett. 286, 134–139
26. Chen, R., Pan, S., Brentnall, T. A., and Aebersold, R. (2005) Proteomicprofiling of pancreatic cancer for biomarker discovery. Mol. Cell Pro-teomics 4, 523–533
27. Johann, D. J., Jr., Wei, B. R., Prieto, D. A., Chan, K. C., Ye, X., Valera, V. A.,Simpson, R. M., Rudnick, P. A., Xiao, Z., Issaq, H. J., Linehan, W. M.,Stein, S. E., Veenstra, T. D., and Blonder, J. (2010) Combined blood/tissue analysis for cancer biomarker discovery: application to renal cellcarcinoma. Anal. Chem. 82, 1584–1588
28. McKinney, K. Q., Lee, Y. Y., Choi, H. S., Groseclose, G., Iannitti, D. A.,
Martinie, J. B., Russo, M. W., Lundgren, D. H., Han, D. K., Bonkovsky,H. L., and Hwang, S. I. (2010) Discovery of putative pancreatic cancerbiomarkers using subcellular proteomics. J. Proteomics. 2011 Jan 1;74(1): 79–88
29. Poschmann, G., Sitek, B., Sipos, B., Hamacher, M., Vonend, O., Meyer,H. E., and Stuhler, K. (2009) Cell-based proteome analysis: the first stagein the pipeline for biomarker discovery. Biochim. Biophys. Acta 1794,1309–1316
30. Schiess, R., Wollscheid, B., and Aebersold, R. (2009) Targeted proteomicstrategy for clinical biomarker discovery. Mol. Oncol. 3, 33–44
31. Whiteaker, J. R., Zhang, H., Zhao, L., Wang, P., Kelly-Spratt, K. S., Ivey,R. G., Piening, B. D., Feng, L. C., Kasarda, E., Gurley, K. E., Eng, J. K.,Chodosh, L. A., Kemp, C. J., McIntosh, M. W., and Paulovich, A. G.(2007) Integrated pipeline for mass spectrometry-based discovery andconfirmation of biomarkers demonstrated in a mouse model of breastcancer. J. Proteome Res. 6, 3962–3975
32. Zhou, L., Cai, M., Ling, X. B., Wang, Q., Lau, K., Zhao, J. J., Schilling, J., andChen, L. (2009) Cancer biomarker discovery via targeted profiling ofmulticlass tumor tissue-derived proteomes. Clin. Proteomics 5, 163–169
33. Bradburne, C., Chung, M. C., Zong, Q., Schlauch, K., Liu, D., Popova, T.,Popova, A., Bailey, C., Soppet, D., and Popov, S. (2008) Transcriptionaland apoptotic responses of THP-1 cells to challenge with toxigenic, andnon-toxigenic Bacillus anthracis. BMC Immunol. 9, 67
34. Popov, S. G., Villasmil, R., Bernardi, J., Grene, E., Cardwell, J., Wu, A.,Alibek, D., Bailey, C., and Alibek, K. (2002) Lethal toxin of Bacillusanthracis causes apoptosis of macrophages. Biochem. Biophys. Res.Commun. 293, 349–355
35. Oberg, A. L., and Vitek, O. (2009) Statistical design of quantitative massspectrometry-based proteomic experiments. J. Proteome Res. 8,2144–2156
36. Thingholm, T. E., Jørgensen, T. J., Jensen, O. N., and Larsen, M. R. (2006)Highly selective enrichment of phosphorylated peptides using titaniumdioxide. Nat. Protoc. 1, 1929–1935
37. Scigelova, M., and Makarov, A. (2006) Orbitrap mass analyzer–overviewand applications in proteomics. Proteomics 6 Suppl 2, 16–21
38. Perry, R. H., Cooks, R. G., and Noll, R. J. (2008) Orbitrap mass spectrom-etry: instrumentation, ion motion and applications. Mass SpectrometryRev. 27, 661–699
39. Zhao, R., Ding, S. J., Shen, Y., Camp, D. G., 2nd, Livesay, E. A., Udseth, H.,and Smith, R. D. (2009) Automated metal-free multiple-column nanoLCfor improved phosphopeptide analysis sensitivity and throughput. J.Chromatogr. B Analyt. Technol. Biomed. Life Sci. 877, 663–670
40. Mayampurath, A. M., Jaitly, N., Purvine, S. O., Monroe, M. E., Auberry, K. J.,Adkins, J. N., and Smith, R. D. (2008) DeconMSn: a software tool foraccurate parent ion monoisotopic mass determination for tandem massspectra. Bioinformatics 24, 1021–1023
41. Horn, D. M., Zubarev, R. A., and McLafferty, F. W. (2000) Automatedreduction and interpretation of high resolution electrospray mass spectraof large molecules. J. Am. Soc. Mass Spectrometry 11, 320–332
42. Perkins, D. N., Pappin, D. J., Creasy, D. M., and Cottrell, J. S. (1999)Probability-based protein identification by searching sequence data-bases using mass spectrometry data. Electrophoresis 20, 3551–3567
43. Eng, J. K., McCormack, A. L., and Yates, J. R., 3rd (1994) An approach tocorrelate tandem mass spectral data of peptides with amino acid se-quences in a protein database. J. Am. Soc. Mass Spectrometry 5,976–989
44. Peterson, J. D., Umayam, L. A., Dickinson, T., Hickey, E. K., and White, O.(2001) The Comprehensive Microbial Resource. Nucleic Acids Res. 29,123–125
45. Kersey, P. J., Duarte, J., Williams, A., Karavidopoulou, Y., Birney, E., andApweiler, R. (2004) The International Protein Index: an integrated data-base for proteomics experiments. Proteomics 4, 1985–1988
46. Elias, J. E., and Gygi, S. P. (2007) Target-decoy search strategy for in-creased confidence in large-scale protein identifications by mass spec-trometry. Nat. Meth. 4, 207–214
47. Petyuk, V. A., Jaitly, N., Moore, R. J., Ding, J., Metz, T. O., Tang, K.,Monroe, M. E., Tolmachev, A. V., Adkins, J. N., Belov, M. E., Dabney,A. R., Qian, W. J., Camp, D. G., 2nd, and Smith, R. D. (2008) Eliminationof systematic mass measurement errors in liquid chromatography-massspectrometry based proteomics using regression models and a prioripartial knowledge of the sample content. Analyt. Chem. 80, 693–706
Discovery of Mouse Spleen Signaling Responses to Anthrax
10.1074/mcp.M110.000927–10 Molecular & Cellular Proteomics 10.3
48. Petyuk, V. A., Mayampurath, A. M., Monroe, M. E., Polpitiya, A. D., Purvine,S. O., Anderson, G. A., Camp, D. G., 2nd, and Smith, R. D. (2010)DtaRefinery, a software tool for elimination of systematic errors fromparent ion mass measurements in tandem mass spectra data sets. Mol.Cell Proteomics 9, 486–496
49. Du, X., Yang, F., Manes, N. P., Stenoien, D. L., Monroe, M. E., Adkins, J. N.,States, D. J., Purvine, S. O., Camp, D. G., 2nd, and Smith, R. D. (2008)Linear discriminant analysis-based estimation of the false discovery ratefor phosphopeptide identifications. J. Proteome Res. 7, 2195–2203
50. Beausoleil, S. A., Villen, J., Gerber, S. A., Rush, J., and Gygi, S. P. (2006) Aprobability-based approach for high-throughput protein phosphorylationanalysis and site localization. Nat. Biotechnol. 24, 1285–1292
51. Searle, B. C. (2010) Scaffold: a bioinformatic tool for validating MS/MS-based proteomic studies. Proteomics 10, 1265–1269
52. McHugh, L., and Arthur, J. W. (2008) Computational methods for proteinidentification from mass spectrometry data. PLoS Comput. Biol. 4, e12
53. Price, T. S., Lucitt, M. B., Wu, W., Austin, D. J., Pizarro, A., Yocum, A. K.,Blair, I. A., FitzGerald, G. A., and Grosser, T. (2007) EBP, a program forprotein identification using multiple tandem mass spectrometry datasets.Mol. Cell Proteomics 6, 527–536
54. Sultana, T., Jordan, R., and Lyons-Weiler, J. (2009) Optimization of the useof consensus methods for the detection and putative identification ofpeptides via mass spectrometry using protein standard mixtures. J.Proteomics Bioinform. 2, 262–273
55. Manes, N. P., Estep, R. D., Mottaz, H. M., Moore, R. J., Clauss, T. R.,Monroe, M. E., Du, X., Adkins, J. N., Wong, S. W., and Smith, R. D. (2008)Comparative proteomics of human monkeypox and vaccinia intracellularmature and extracellular enveloped virions. J. Proteome Res. 7, 960–968
56. Jaitly, N., Mayampurath, A., Littlefield, K., Adkins, J. N., Anderson, G. A.,
and Smith, R. D. (2009) Decon2LS: An open-source software packagefor automated processing and visualization of high resolution massspectrometry data. BMC Bioinformatics 10, 87
57. Jaitly, N., Monroe, M. E., Petyuk, V. A., Clauss, T. R., Adkins, J. N., andSmith, R. D. (2006) Robust algorithm for alignment of liquid chromatog-raphy-mass spectrometry analyses in an accurate mass and time tagdata analysis pipeline. Analyt. Chem. 78, 7397–7409
58. Callister, S. J., Barry, R. C., Adkins, J. N., Johnson, E. T., Qian, W. J.,Webb-Robertson, B. J., Smith, R. D., and Lipton, M. S. (2006) Normal-ization approaches for removing systematic biases associated with massspectrometry and label-free proteomics. J. Proteome Res. 5, 277–286
59. de la Fuente van Bentem, S., Mentzen, W. I., de la Fuente, A., and Hirt, H.(2008) Towards functional phosphoproteomics by mapping differentialphosphorylation events in signaling networks. Proteomics 8, 4453–4465
60. Polpitiya, A. D., Qian, W. J., Jaitly, N., Petyuk, V. A., Adkins, J. N., Camp,D. G., 2nd, Anderson, G. A., and Smith, R. D. (2008) DAnTE: a statisticaltool for quantitative analysis of -omics data. Bioinformatics 24,1556–1558
61. Storey, J. D., and Tibshirani, R. (2003) Statistical significance for genome-wide studies. Proc. Natl. Acad. Sci.U.S.A. 100, 9440–9445
62. Sturn, A., Quackenbush, J., and Trajanoski, Z. (2002) Genesis: clusteranalysis of microarray data. Bioinformatics 18, 207–208
63. Zhou, W., Ross, M. M., Tessitore, A., Ornstein, D., Vanmeter, A., Liotta,L. A., and Petricoin, E. F., 3rd (2009) An initial characterization of theserum phosphoproteome. J. Proteome Res. 8, 5523–5531
64. Sugiyama, N., Masuda, T., Shinoda, K., Nakamura, A., Tomita, M., andIshihama, Y. (2007) Phosphopeptide enrichment by aliphatic hydroxyacid-modified metal oxide chromatography for nano-LC-MS/MS in pro-teomics applications. Mol. Cell Proteomics 6, 1103–1109
Discovery of Mouse Spleen Signaling Responses to Anthrax
Molecular & Cellular Proteomics 10.3 10.1074/mcp.M110.000927–11


