Embed Size (px)
Citation preview
online February 5, 2014 originally publisheddoi:10.1182/blood-2013-12-546036
2014 123: e22-e36
Alexander B. Meijer, Koen Mertens and Sara ZanivanMaartje van den Biggelaar, Juan Ramon Hernández-Fernaud, Bart L. van den Eshof, Lisa J. Neilson, thrombin signaling in human endothelial cellsQuantitative phosphoproteomics unveils temporal dynamics of
http://www.bloodjournal.org/content/123/12/e22.full.htmlUpdated information and services can be found at:
(770 articles)Thrombosis and Hemostasis (133 articles)e-Blood
Articles on similar topics can be found in the following Blood collections
http://www.bloodjournal.org/site/misc/rights.xhtml#repub_requestsInformation about reproducing this article in parts or in its entirety may be found online at:
http://www.bloodjournal.org/site/misc/rights.xhtml#reprintsInformation about ordering reprints may be found online at:
http://www.bloodjournal.org/site/subscriptions/index.xhtmlInformation about subscriptions and ASH membership may be found online at:
Copyright 2011 by The American Society of Hematology; all rights reserved.of Hematology, 2021 L St, NW, Suite 900, Washington DC 20036.Blood (print ISSN 0006-4971, online ISSN 1528-0020), is published weekly by the American Society
For personal use only.on November 20, 2014. by guest www.bloodjournal.orgFrom For personal use only.on November 20, 2014. by guest www.bloodjournal.orgFrom
e-Blood
THROMBOSIS AND HEMOSTASIS
Quantitative phosphoproteomics unveils temporal dynamics of thrombinsignaling in human endothelial cellsMaartje van den Biggelaar,1 Juan Ramon Hernandez-Fernaud,2 Bart L. van den Eshof,1 Lisa J. Neilson,2
Alexander B. Meijer,1,3 Koen Mertens,1,3 and Sara Zanivan2
1Department of Plasma Proteins, Sanquin Research, Amsterdam, The Netherlands; 2Cancer Research UK Beatson Institute, Glasgow, United Kingdom;
and 3Department of Pharmaceutics, Utrecht University, Utrecht, The Netherlands
Key Points
• This is the first time-resolvedquantitative phosphoproteomicanalysis of thrombin signaling inhuman endothelial cells.
• We provide 2224 phosphositesregulated by thrombin asa unique resource for futurestudies on thrombin and PARsignaling.
Thrombin is the key serine protease of the coagulation cascade and a potent trigger of
protease-activated receptor 1 (PAR1)-mediated platelet aggregation. In recent years,
PAR1 has become an appealing target for anticoagulant therapies. However, the inhibitors
that have been developed so far increase bleeding risk in patients, likely because they
interfere with endogenous PAR1 signaling in the endothelium. Because of its complexity,
thrombin-induced signaling in endothelial cells has remained incompletely understood.
Here, we have combined stable isotope amino acids in cell culture, affinity-based phos-
phopeptide enrichment, and high-resolution mass spectrometry and performed a time-
resolvedanalysisof the thrombin-inducedsignaling inhumanprimaryendothelial cells.We
identified 2224 thrombin-regulated phosphorylation sites, the majority of which have not
beenpreviously related to thrombin.Thosesiteswere localizedonproteins thatarenovel to
thrombinsignaling,butalsoonwell-knownplayerssuchasPAR1,Rho-associatedkinase2,
phospholipaseC, andproteins related toactin cytoskeleton,cell-cell junctions, andWeibel-
Palade body release. Our study provides a unique resource of phosphoproteins and phosphorylation sites that may generate novel
insights into an intimate understanding of thrombin-mediated PAR signaling and the development of improved PAR1 antagonists that
affect platelet but not endothelial cell function. (Blood. 2014;123(12):e22-e36)
Introduction
Thrombin is a plasma protein and the key enzyme involved in thecoagulation cascade. In addition to its physiologic function in hemo-stasis, thrombin plays a role in a variety of pathologic conditions,including arterial and venous thrombosis, cancer, sepsis, dissemi-nated intravascular coagulation, angiogenesis, inflammation, andwound healing.1,2 The pleiotropic actions of thrombin are mediatedby the cleavage of protease-activated transmembrane receptors(PARs).3 The PAR family consists of 4 members called PAR1,PAR2, PAR3, and PAR4, which are expressed by a variety of celltypes, including vascular cells (endothelial cells [ECs] and smoothmuscle cells) and circulating cells (blood platelets, monocytes, andT lymphocytes).4 These receptors are irreversibly activated bycleavage of the extracellular loop which results in the formation ofa novel N terminus that serves as a tethered ligand and folds backinto the ligand-binding pocket of the receptor.3,5
In recent years, thrombin signaling has become a key target forantithrombotic therapies, and novel PAR1 inhibitors such as vorapaxarand atopaxar have been developed for anticoagulant therapies. How-ever, these inhibitors increase bleeding risks, which have been sug-gested to result from the interference of endogenous PAR1 signaling inthe endothelium.6,7 PAR1 is the predominant thrombin receptor inECs,8 and its thrombin-mediated cleavage induces conformational
changes that initiate heterotrimeric G-protein signaling, whichactivates a plethora of intracellular events,3 including cytoskeletalrearrangements, opening of the EC-cell junctions, and the releaseof storage organelles called Weibel-Palade bodies that containvarious vasoactive substances.9,10 Eventually, this results inincreased vascular permeability and release of proinflammatory,hemostatic, and vasoactive substances.11 In addition, thrombinregulates bloodvessel diameter bynitric oxide–dependent vasodilationand upregulates surface adhesion molecules that recruit neutrophilsand leukocytes.11,12 Each of these individual processes is the subject ofintensive research. However, because of the complexity of the inducedsignal transduction networks, the extent of crosstalk between theseprocesses and how thrombin-induced EC signaling events are orches-trated at the molecular level have remained undefined.
Traditionally, studies of EC signaling events havemostly focusedon single proteins or have been addressed by using unbiased ap-proaches at the gene expression level. However, protein functionsand signaling networks are regulated by rapid and reversible proteinphosphorylation.13 In recent years, mass spectrometry (MS) hasgreatly evolved and can now be used to identify thousands of phos-phorylation sites. In combination with appropriate quantitative ap-proaches, such as stable isotope labeling with amino acids in cell
Submitted December 21, 2013; accepted January 28, 2014. Prepublished
online as Blood First Edition paper, February 5, 2014; DOI 10.1182/blood-
2013-12-546036.
This article contains a data supplement.
The publication costs of this article were defrayed in part by page charge
payment. Therefore, and solely to indicate this fact, this article is hereby
marked “advertisement” in accordance with 18 USC section 1734.
© 2014 by The American Society of Hematology
e22 BLOOD, 20 MARCH 2014 x VOLUME 123, NUMBER 12
For personal use only.on November 20, 2014. by guest www.bloodjournal.orgFrom
culture (SILAC),14 phosphorylation dynamics can be assessed inan unbiased manner.15-17 Despite the fact that robust workflowshave been developed to perform quantitative MS proteomicanalysis and extensively used to study phosphorylation dynamicsin cell cultures, global phosphoproteomics has only very recentlybeen successfully applied to primary ECs.18-21 In this study, wehave performed a system-wide and time-resolved characterizationof thrombin-induced signaling in primary human blood outgrowthECs (BOECs). BOECs are ECs derived from human peripheralblood and are a bona fide EC culture model with superior expansioncapacity over traditional EC culture models.22 Furthermore, theyrepresent a promising cell model for studying EC signaling defects indifferent patient populations. Regulated phosphorylations weremeasured for a vast proportion of the BOEC phosphoproteome.Therefore, our study provides a unique resource to better understandthe complexity of thrombin signaling and opens new possibilities fordeveloping improved pharmacologic approaches for controllingthrombotic disorders.
Materials and Methods
EC culture
BOECswere isolated and SILAC-labeled as previously describedwithminormodifications.22,23 For the proteomic analysis, BOECs were starved for 2hours in SILAC endothelial basal medium 2 and stimulated with 1 U/mLhigh-activity thrombin (Sigma) for 2, 5, 10, or 30 minutes. Light, medium,and heavy SILAC cells were lysed with sodium dodecyl sulfate (SDS) lysisbuffer, 4% SDS, 100 mM dithiothreitol, 100 mM tris(hydroxymethyl)aminomethane (pH 7.4), and phosphatase and protease inhibitor cocktail(Thermo Scientific). Experiments were performed in triplicate.
Immunofluorescence
SILAC BOECs were grown to confluence, stimulated with thrombin asdescribed above, and fixed with 3.7% paraformaldehyde. Immunofluores-cence analysis was performed as previously described24 using monoclonalCLB-Rag20 (immunoglobulin G2b [IgG2b])
25 and CLB-HEC75 (IgG1)26 to
stain von Willebrand factor (VWF) and platelet/EC adhesion molecule 1(PECAM-1), respectively.
Western blots
Cells were stimulated with thrombin as described above and lysed with 23SDSpolyacrylamide gel electrophoresis buffer (0.125M tris(hydroxymethyl)aminomethane [pH 6.8], 4% SDS, 20% glycerol, 0.02% bromophenol blue)supplemented with 100 mM dithiothreitol, and phosphatase and proteaseinhibitor cocktail (Thermo Scientific). The following antibodies were used:anti–p-myosin light chain 2 (Thr18, Ser19) (Cell Signaling), anti-pERK (E-4)(Tyr204) (Santa Cruz) and anti–phospho-p38 MAP kinase (Thr180/Tyr182)(Cell Signaling). Mouse anti–a-tubulin (Sigma) was used as a loadingcontrol.
Phosphoproteome
Equal amounts of light, medium, and heavy SILAC-labeled lysatesweremixedtogether and processed as previously described.16,17 Briefly, mixed proteinswere digested by using the filter-aided sample preparation method,27 peptideswere separated with strong cation exchange chromatography, and phospho-peptides were enriched by using TiO2 beads (GL Sciences) in the presence of2,5-dihydroxybenzoic acid.28 Phosphorylated peptides were eluted with 15%ammonium hydroxide and 40% acetonitrile (ACN), loaded onto Empore-C18
StageTips,29 eluted with 80% ACN and 0.5% acetic acid, and stored at280°Cuntil MS analysis.
Secretome
The light, medium, and heavy supernatants were combined. Proteins wereisolated by using silica-based resin (J.R.H.-F.,M.v.d.B., and S.Z., manuscriptin preparation) and in-gel digested.30 Peptides were loaded onto Empore-C18
StageTips,29 elutedwith 80%ACNand0.5%acetic acid, and stored at280°Cuntil MS analysis.
MS analysis
Digested peptides were separated by nanoscale reverse chromatography(Thermo Scientific) coupled on line to a linear trap quadrupole OrbitrapElite mass spectrometer (Thermo Scientific) via a nanoelectrospray ionsource (Thermo Scientific). Full-scan MS spectra were acquired in theOrbitrap analyzer with a resolution of 120 000 at 400m/z, and a target valueof 1 000 000 charges. The 10 most intense ions were selected for highcollision dissociation fragmentation with a target value of 40 000 chargesand acquired in the Orbitrap with resolution of 15 000 at 400 m/z. All datawere acquired with Xcalibur software and were analyzed by using theMaxQuant computational platform.31
More details and a detailed description of the MS data analysis can befound in the supplemental Materials andMethods, available on the BloodWebsite.
Results
Quantitative phosphoproteomics of thrombin-stimulated ECs
To investigate the dynamics of thrombin signaling, we performeda time-resolved phosphoproteomic analysis of thrombin-stimulatedBOECs by using a three-way reverse SILAC labeling strategy(supplemental Figure 1A). First, BOECs were fully metabolicallylabeled with light, medium, or heavy arginine and lysine. SILAClabeling did not affect the cobblestone morphology and thepresence of EC markers including VWF-containing Weibel-Palade bodies and PECAM-1 (supplemental Figure 1B-D). Then,we stimulated SILAC-labeled BOECs with thrombin for 2, 5, 10,or 30 minutes, which resulted in a clear disruption of cell-celljunctions as shown by reduced PECAM-1 staining using immuno-fluorescence analysis (Figure 1A). Finally, we applied a robustworkflow that combines strong cation exchange chromatographypeptide separation, affinity-based phosphopeptide enrichment,and high-resolution Orbitrap-basedMS17 (supplemental Figure 1A).MS data were analyzed by using the MaxQuant computationalplatform,31 which identified 10 343 accurately localized (class I16)phosphorylation sites (referred to as phosphosites) (supplementalTable 1), containing 9366 serine (90.6%), 934 threonine (9%), and 43tyrosine (0.4%) residues (supplemental Table 1). Of note, a substantialnumber (17%) of those sites has not been reported previously(supplemental Table 1). For 7791 phosphosites, a SILAC ratio(calculated as phosphorylation level between stimulated andnonstimulated BOECs) was accurately measured in at least 2 of the3 replicates at each time point and used to calculate the correlationbetween experiments. This clearly indicated a high reproducibilitybetween replicates (average correlation of 0.8). Conversely, lowercorrelation was measured between time points (supplementalFigure 1E), suggesting that increasing phosphoproteomic changesoccur in BOECs stimulated with thrombin in time. This observa-tion was further emphasized by a principle component analysisof the SILAC ratios, which clearly separated the EC phosphopro-teomes according to the duration of thrombin stimulation (Figure 1B).To identify the regulated phosphosites, we required the SILACratio (log2) for at least 2 replicates of the same time point to be
BLOOD, 20 MARCH 2014 x VOLUME 123, NUMBER 12 PHOSPHOPROTEOMICS OF EC THROMBIN SIGNALING e23
For personal use only.on November 20, 2014. by guest www.bloodjournal.orgFrom
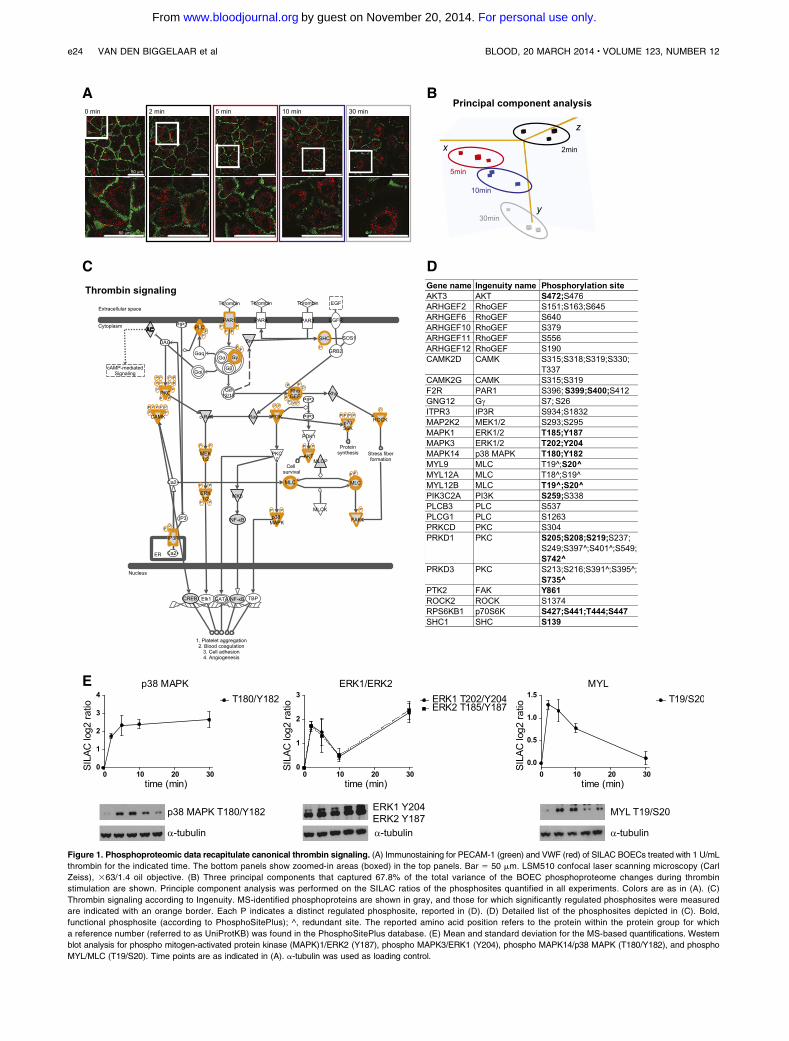
Figure 1. Phosphoproteomic data recapitulate canonical thrombin signaling. (A) Immunostaining for PECAM-1 (green) and VWF (red) of SILAC BOECs treated with 1 U/mL
thrombin for the indicated time. The bottom panels show zoomed-in areas (boxed) in the top panels. Bar 5 50 mm. LSM510 confocal laser scanning microscopy (Carl
Zeiss), 363/1.4 oil objective. (B) Three principal components that captured 67.8% of the total variance of the BOEC phosphoproteome changes during thrombin
stimulation are shown. Principle component analysis was performed on the SILAC ratios of the phosphosites quantified in all experiments. Colors are as in (A). (C)
Thrombin signaling according to Ingenuity. MS-identified phosphoproteins are shown in gray, and those for which significantly regulated phosphosites were measured
are indicated with an orange border. Each P indicates a distinct regulated phosphosite, reported in (D). (D) Detailed list of the phosphosites depicted in (C). Bold,
functional phosphosite (according to PhosphoSitePlus); ^, redundant site. The reported amino acid position refers to the protein within the protein group for which
a reference number (referred to as UniProtKB) was found in the PhosphoSitePlus database. (E) Mean and standard deviation for the MS-based quantifications. Western
blot analysis for phospho mitogen-activated protein kinase (MAPK)1/ERK2 (Y187), phospho MAPK3/ERK1 (Y204), phospho MAPK14/p38 MAPK (T180/Y182), and phospho
MYL/MLC (T19/S20). Time points are as indicated in (A). a-tubulin was used as loading control.
e24 VAN DEN BIGGELAAR et al BLOOD, 20 MARCH 2014 x VOLUME 123, NUMBER 12
For personal use only.on November 20, 2014. by guest www.bloodjournal.orgFrom
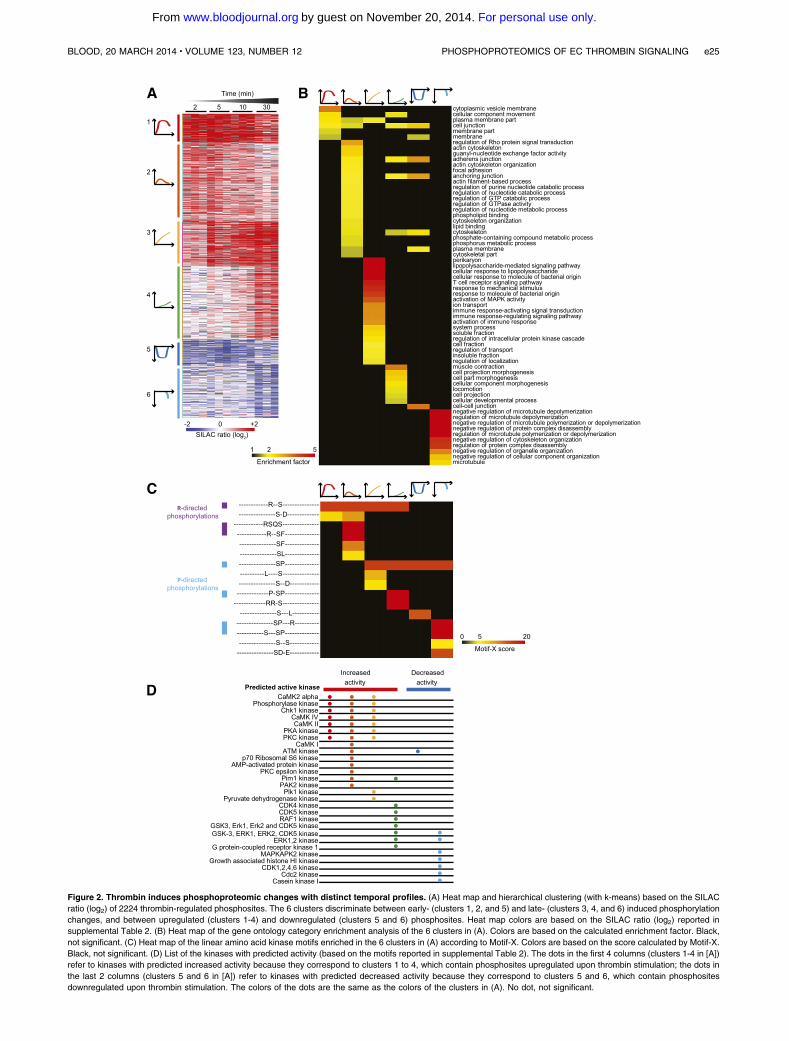
Figure 2. Thrombin induces phosphoproteomic changes with distinct temporal profiles. (A) Heat map and hierarchical clustering (with k-means) based on the SILAC
ratio (log2) of 2224 thrombin-regulated phosphosites. The 6 clusters discriminate between early- (clusters 1, 2, and 5) and late- (clusters 3, 4, and 6) induced phosphorylation
changes, and between upregulated (clusters 1-4) and downregulated (clusters 5 and 6) phosphosites. Heat map colors are based on the SILAC ratio (log2) reported in
supplemental Table 2. (B) Heat map of the gene ontology category enrichment analysis of the 6 clusters in (A). Colors are based on the calculated enrichment factor. Black,
not significant. (C) Heat map of the linear amino acid kinase motifs enriched in the 6 clusters in (A) according to Motif-X. Colors are based on the score calculated by Motif-X.
Black, not significant. (D) List of the kinases with predicted activity (based on the motifs reported in supplemental Table 2). The dots in the first 4 columns (clusters 1-4 in [A])
refer to kinases with predicted increased activity because they correspond to clusters 1 to 4, which contain phosphosites upregulated upon thrombin stimulation; the dots in
the last 2 columns (clusters 5 and 6 in [A]) refer to kinases with predicted decreased activity because they correspond to clusters 5 and 6, which contain phosphosites
downregulated upon thrombin stimulation. The colors of the dots are the same as the colors of the clusters in (A). No dot, not significant.
BLOOD, 20 MARCH 2014 x VOLUME 123, NUMBER 12 PHOSPHOPROTEOMICS OF EC THROMBIN SIGNALING e25
For personal use only.on November 20, 2014. by guest www.bloodjournal.orgFrom
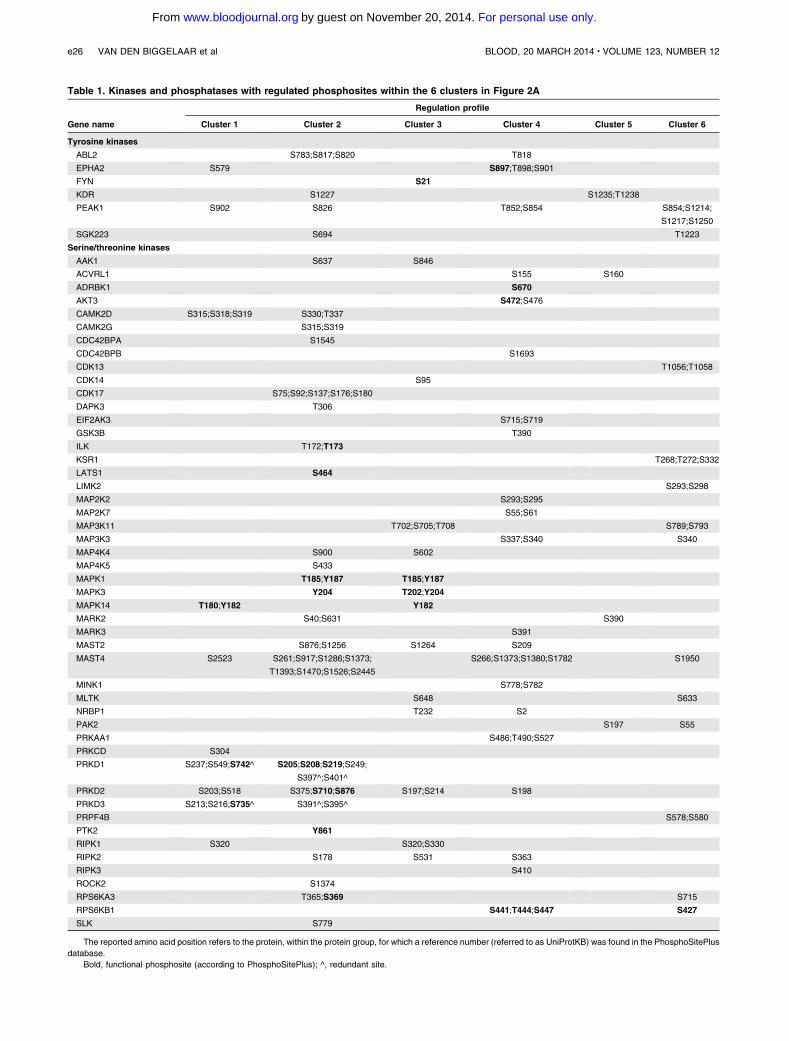
Table 1. Kinases and phosphatases with regulated phosphosites within the 6 clusters in Figure 2A
Gene name
Regulation profile
Cluster 1 Cluster 2 Cluster 3 Cluster 4 Cluster 5 Cluster 6
Tyrosine kinases
ABL2 S783;S817;S820 T818
EPHA2 S579 S897;T898;S901
FYN S21
KDR S1227 S1235;T1238
PEAK1 S902 S826 T852;S854 S854;S1214;
S1217;S1250
SGK223 S694 T1223
Serine/threonine kinases
AAK1 S637 S846
ACVRL1 S155 S160
ADRBK1 S670
AKT3 S472;S476
CAMK2D S315;S318;S319 S330;T337
CAMK2G S315;S319
CDC42BPA S1545
CDC42BPB S1693
CDK13 T1056;T1058
CDK14 S95
CDK17 S75;S92;S137;S176;S180
DAPK3 T306
EIF2AK3 S715;S719
GSK3B T390
ILK T172;T173
KSR1 T268;T272;S332
LATS1 S464
LIMK2 S293;S298
MAP2K2 S293;S295
MAP2K7 S55;S61
MAP3K11 T702;S705;T708 S789;S793
MAP3K3 S337;S340 S340
MAP4K4 S900 S602
MAP4K5 S433
MAPK1 T185;Y187 T185;Y187
MAPK3 Y204 T202;Y204
MAPK14 T180;Y182 Y182
MARK2 S40;S631 S390
MARK3 S391
MAST2 S876;S1256 S1264 S209
MAST4 S2523 S261;S917;S1286;S1373;
T1393;S1470;S1526;S2445
S266;S1373;S1380;S1782 S1950
MINK1 S778;S782
MLTK S648 S633
NRBP1 T232 S2
PAK2 S197 S55
PRKAA1 S486;T490;S527
PRKCD S304
PRKD1 S237;S549;S742^ S205;S208;S219;S249;
S397^;S401^
PRKD2 S203;S518 S375;S710;S876 S197;S214 S198
PRKD3 S213;S216;S735^ S391^;S395^
PRPF4B S578;S580
PTK2 Y861
RIPK1 S320 S320;S330
RIPK2 S178 S531 S363
RIPK3 S410
ROCK2 S1374
RPS6KA3 T365;S369 S715
RPS6KB1 S441;T444;S447 S427
SLK S779
The reported amino acid position refers to the protein, within the protein group, for which a reference number (referred to as UniProtKB) was found in the PhosphoSitePlus
database.
Bold, functional phosphosite (according to PhosphoSitePlus); ^, redundant site.
e26 VAN DEN BIGGELAAR et al BLOOD, 20 MARCH 2014 x VOLUME 123, NUMBER 12
For personal use only.on November 20, 2014. by guest www.bloodjournal.orgFrom
higher than 0.75, which approaches 1 standard deviation from themean of the measured SILAC ratios (supplemental Figure 1F).This identified 2224 phosphosites localized on 1172 proteins(supplemental Table 1). Because of the short time courseanalyzed (30 minutes), we did not expect changes in proteinlevels (eg, due to protein degradation) to have an impact on themeasurements of the phosphorylation levels. This assumptionwas supported by a standard deviation lower than 20% for theSILAC ratio measured for the proteins identified by using thenonphosphorylated peptides of the phosphoproteomic study16
(supplemental Figure 2).
Quantitative MS-based phosphoproteomics recapitulates
known thrombin signaling
PAR1 activation induces a plethora of proteins and cellular pro-cesses, including heterotrimeric G proteins, phospholipase C b,calcium mobilization, protein kinase C (PKC), calcium-regulatedkinase (CAMK), small guanosine triphosphate enzymes (GTPases),including Rho and rac, Rho-associated kinase 2 (ROCK2), focaladhesion kinase (PTK2/FAK), myosin light chain (MYL/MLC),nonreceptor tyrosine kinases of the Src family, and members ofMAPK family.3 Our quantitative MS approach identified regulatedphosphorylation levels on most of these proteins (Figure 1C-D),and western blot analysis largely confirmed the phosphorylationdynamics of MAPK1/ERK2, MAPK2/ERK1, MAPK14/p38 MAPK,and MYL/MLC (Figure 1E). A unique exception was thedephosphorylation profile of the T180/Y182 of MAPK14/p38MAPK after prolonged stimulation with thrombin. This may bea result of other posttranslational modifications on amino acidssurrounding the phosphorylated sites that may prevent thebinding of the antibody. However, altogether this suggests thepotential of our dataset as a resource of dynamically regulatedthrombin-induced phosphosites. We next performed bioinfor-matic analysis on the regulated phosphosites.
Distinct temporal phosphoproteomic profiles are identified in
thrombin-stimulated BOECs
To gain more insight into the temporal phosphoproteomic reg-ulation of BOECs stimulated with thrombin, we performed ahierarchical clustering, preprocessed with k-mean, of the 2224regulated phosphosites. This identified (1) 4 clusters of sites withincreased phosphorylation levels (1652 sites; clusters 1 to 4) and2 clusters of sites with decreased phosphorylation levels (572sites; clusters 5 and 6); (2) clusters with distinct temporalprofiles: early- (clusters 1, 2, and 5) and late- (clusters 3, 4, and 6)regulated phosphosites; and (3) clusters with different strengthsof induced signaling, in which clusters 1 and 3 showed higherchanges in phosphorylation levels compared with the otherclusters (Figure 2A). To investigate whether specific categories ofphosphoproteins belong to each cluster, we performed an en-richment analysis which identified specific sets of gene ontologybiologic processes,32 gene ontology cellular components,32
and gene ontology molecular functions33 associated with the 6clusters (Figure 2B; supplemental Table 3). These includedgeneral categories, such as membrane part and cytoskeletal part,but also specific categories, including cytoplasmic vesicle membraneand regulation of Rho protein signal transduction, which wereenriched immediately after thrombin stimulation, regulation ofmicrotubule depolymerization, and activation of MAPK activity,which were enriched only after prolonged thrombin stimulation andadherens junction. Although all these categories have already beenassociated with thrombin signaling, many of the individual proteinsand phosphosites are novel to this pathway.
We exploited our data further to predict the kinase activityresponsible for the above described phosphoproteomic regula-tion. We used two approaches based on the amino acid sequencesurrounding the regulated phosphosites: (1) Motif-X,33 whichidentifies enriched linear kinase motif (Figure 2C) and (2) en-richment analysis for predicted kinase activity (Figure 2D and
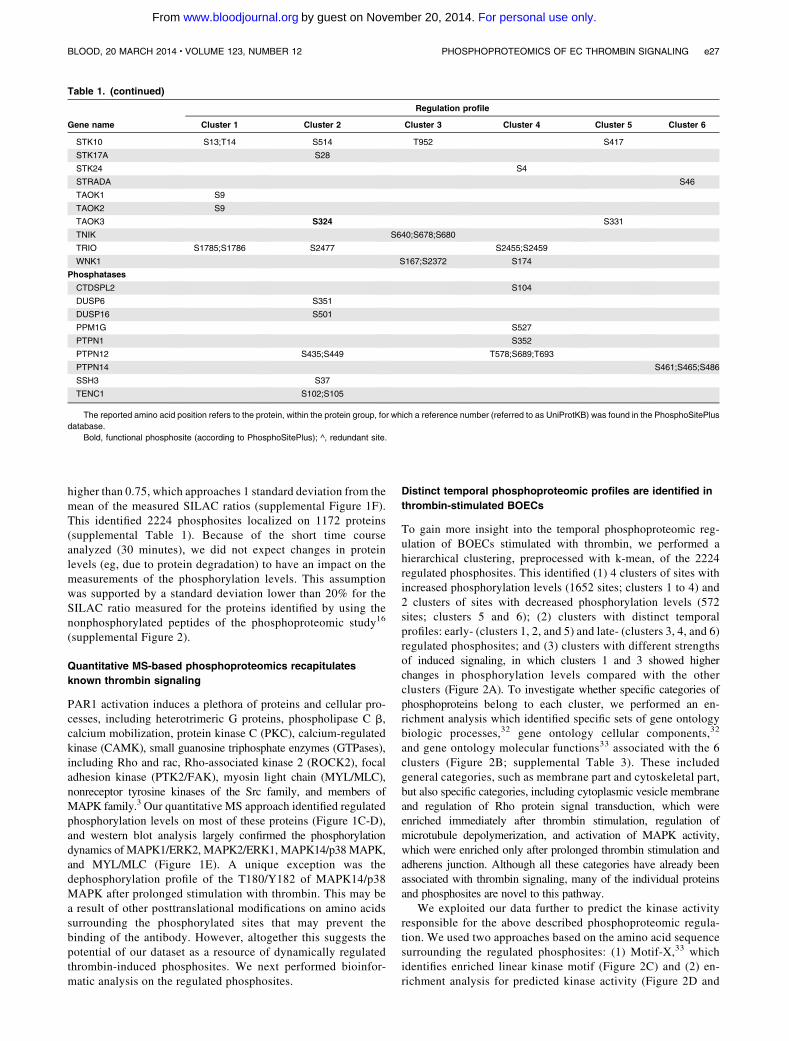
Table 1. (continued)
Gene name
Regulation profile
Cluster 1 Cluster 2 Cluster 3 Cluster 4 Cluster 5 Cluster 6
STK10 S13;T14 S514 T952 S417
STK17A S28
STK24 S4
STRADA S46
TAOK1 S9
TAOK2 S9
TAOK3 S324 S331
TNIK S640;S678;S680
TRIO S1785;S1786 S2477 S2455;S2459
WNK1 S167;S2372 S174
Phosphatases
CTDSPL2 S104
DUSP6 S351
DUSP16 S501
PPM1G S527
PTPN1 S352
PTPN12 S435;S449 T578;S689;T693
PTPN14 S461;S465;S486
SSH3 S37
TENC1 S102;S105
The reported amino acid position refers to the protein, within the protein group, for which a reference number (referred to as UniProtKB) was found in the PhosphoSitePlus
database.
Bold, functional phosphosite (according to PhosphoSitePlus); ^, redundant site.
BLOOD, 20 MARCH 2014 x VOLUME 123, NUMBER 12 PHOSPHOPROTEOMICS OF EC THROMBIN SIGNALING e27
For personal use only.on November 20, 2014. by guest www.bloodjournal.orgFrom
supplemental Table 3) in which kinases identified in clusters 1 to 4represent those with increased activity, while those in clusters 5and 6 represent those with decreased activity. The results of theseanalyses corroborated each other. Motif-X identified enrichedmotifs with an arginine at position 23 (referred to as arginine-directed) or a hydrophobic amino acid at position11 immediatelyafter thrombin activation (Figure 2C; clusters 1 and 2). Accord-ingly, the kinase activity analysis predicted early increasedactivity of the arginine-directed kinases CAMKs, PKA, PKC,RPS6KB1/p70 S6 kinase, and PAK2. Furthermore, Motif-Xidentified motifs with a proline at position 11 (referred to asproline-directed) after prolonged thrombin stimulation (Figure 2C;clusters 3 and4) and, accordingly, late regulated activitywas predictedfor the proline-directed kinases CDK1, CDK2, CDK4, and CDK6as well as MAPK3/ERK1, MAPK1/ERK2, GSK3, and CDK5(Figure 2D). Of note, the latter ones were enriched in clusterscontaining upregulated and downregulated phosphosites. ForMAPK3/ERK1, MAPK1/ERK2, RPS6KB1/p70 S6 kinase, andCDK2, the functional sites were regulated, supporting thepredicted increased or decreased activity upon thrombin stimulation.Furthermore, regulated phosphorylation levels on not yet character-ized sites were measured on kinases with predicted activity, includingPRKCD/PKC, CAMK2D, and CAMK2G, which are known to playa role in thrombin signaling, and PRKAA1/AMP-activated proteinkinase and PAK2 (Table 1).
Next, we analyzed the thrombin signaling in the context of theglobal kinome, which is composed of 518 kinases (according toManning et al34 and reported in Pfam as “pkinase”), and 224 phos-phatases (according to the DEPOD database35). Thrombin inducedphosphosite regulation on 65 kinases and 9 protein phosphatases(Table 1). For 16 of the kinases, significant regulation was mea-sured for the functional sites; of those, 8 are kinases with an estab-lished role in thrombin signaling: AKT3, MAPK1/ERK2, MAPK3/ERK1, MAPK14/p38 MAPK, PRKD1, PRKD3, PTK2/FAK, andRPS6KB1/p70 S6 kinase (Figure 1C and Table 1), and for 3 of them,our analysis predicted increased activity (Figure 2D). The other 8 arekinases for which little or no information is available related tothrombin:ADRPK1,EPHA2,FYN, ILK,LATS1,PRKD2,RPS6KA3,and TAOK3. The 48 kinases with regulated sites that have not yet beenfunctionally characterized included additional kinases known to playa role in thrombin signaling, including CAMK2D, CAMK2G,MAP2K2, PRKCD, and ROCK2 (Figure 2D).
Phosphoproteome regulation of known
thrombin-induced pathways
To integrate our phosphoproteomic data into the known thrombinsignaling pathways and make this information easily accessible,we exploited Ingenuity software and mapped the regulatedphosphosites on the following predefined pathways: actincytoskeleton signaling (Figure 3), epithelial adherence and tightjunctions signaling (Figures 4 and 5), and RhoGDI signaling(Figure 6).36 This showed the striking impact of thrombin stim-ulation on the endothelial phosphoproteome with the majority ofthe identified phosphoproteins containing regulated phosphosites.Furthermore, our data revealed a complex phosphorylation pattern atthe single protein level, whereby proteins such as CTNND1/p120and ARHGAP29 contained multiple phosphosites with differentregulation profiles. We additionally built up a literature-basedsecretorymachinery pathway (Figure 7A-B)37-41 and complementedthese data with a detailed list of proteins whose secreted levels wereregulated upon thrombin stimulation. SILAC MS proteomic analysis
quantified 1744 proteins, of which 77 showed a consistent increasedsecretion (SILAC ratio [log2] $ 1.5-fold compared with non-stimulated cells; Figure 7C-D) upon short or prolonged thrombinstimulation (supplemental Table 4). Among them was the majorcomponent of Weibel-Palade bodies, VWF. Category enrichmentanalysis (supplemental Table 5) additionally pointed out 22 proteinsbelonging to the category “extracellular region part” and 20 in thecategory “receptor activity” (Figure 7E), which includes the proteintyrosine kinase receptor Tie-1, the vascular endothelial growth factorreceptor 3 (FLT4), the hepatocyte growth factor receptor andendothelial protein C receptor (Figure 7D).
Discussion
Thrombin has rapid and profound effects on ECs, but so far, thrombin-induced signaling at the global phosphorylation level has remainedpoorly understood. Here, we report the most comprehensive phospho-proteomic study to date of thrombin signaling with 2224 dynamicallyregulated phosphosites,which clearly highlights that phosphorylationsare a substantial component of the EC response to thrombin.
Time-resolved phosphoproteomics of thrombin signaling
By combining clustering and enrichment analyses of the phospho-proteomic data, we identified 6 distinct temporal profiles and thusadded a temporal dimension to the phosphoregulation of cellularprocesses induced by thrombin. For example, our data show acomplex phosphoregulation of cell-cell junction proteins, whichwere regulated throughout the entire time course (clusters 1, 2, 4,and 5). Conversely, the actin cytoskeletal proteins were foundhighly phosphorylated early after thrombin stimulation (clusters 1and 2) and phosphoproteins related to the microtubules weregenerally dephosphorylated after prolonged thrombin stimulation,thus suggesting that thrombinmay redirect the kinase machinery tospecific subcellular components. Furthermore, similar to what haspreviously been observed upon vascular endothelial growth-factorstimulation,18 the temporal regulation of the phosphoproteomemirrored changes in the spatial distribution of the signaling withinthe cells, which started at the plasma membrane and reached thenucleus. Plasma membrane–related categories were enrichedimmediately after thrombin stimulation (cluster 1) as well as thoserelated to small GTPases (including Rho) (cluster 2), which aregenerally activated in their membrane-bound state.42 Conversely,amultitude of different processes were found regulated after longerstimulation (clusters 3 and 4). Furthermore, when we looked atproteins related to transcription factor activity (according to geneontology molecular function), a category that was not foundsignificantly enriched but is representative of the signaling in thenuclear compartment, we observed that 80% (69 of the 86phosphoproteins belonging to that category) had significantlyregulated phosphosites after prolonged stimulation (belong toclusters 3, 4, and 6) (supplemental Table 6). Fifteen of thoseproteins were phosphoregulated at functional sites, includingtranscription regulators previously related to thrombin, such asJUN/Jun-b,43 but also completely novel in the thrombin field,including the histone deacetylase (HDAC1/2) and the highmobility group protein HMG-I/HMG-Y (HMGA1) (supplementalTable 2). The measured SILAC ratio allowed distinguishing betweenproteins with high and low phosphorylation levels (clusters 1 and 2).
e28 VAN DEN BIGGELAAR et al BLOOD, 20 MARCH 2014 x VOLUME 123, NUMBER 12
For personal use only.on November 20, 2014. by guest www.bloodjournal.orgFrom
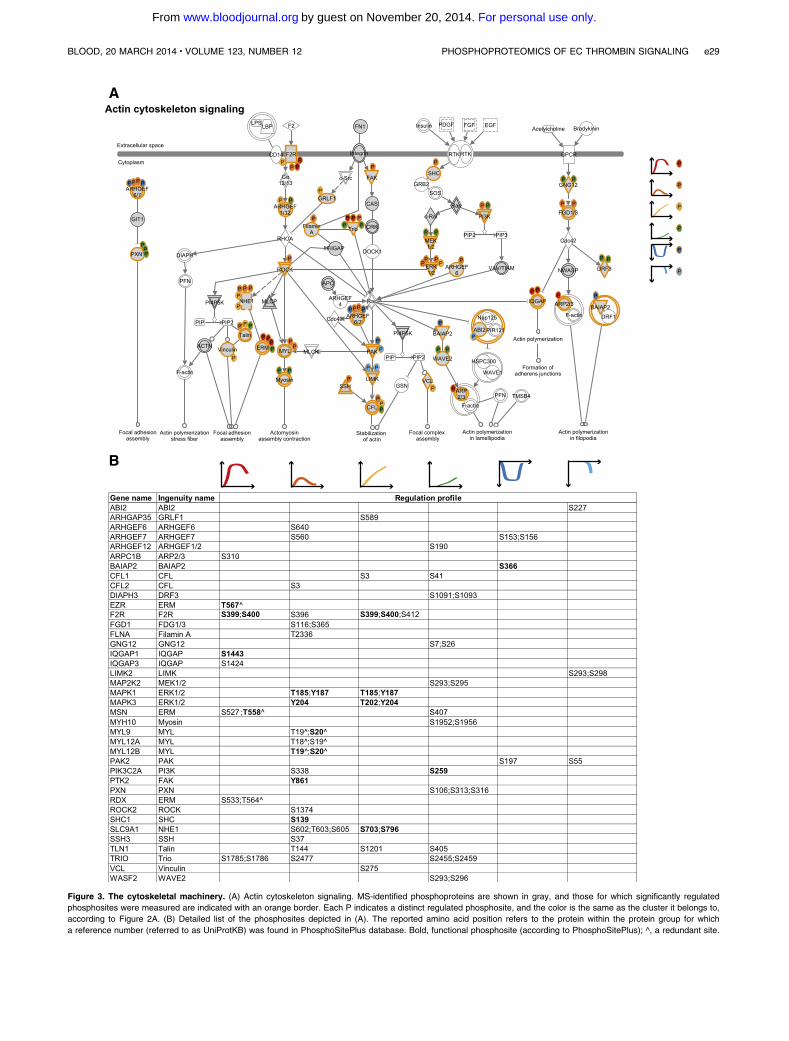
Figure 3. The cytoskeletal machinery. (A) Actin cytoskeleton signaling. MS-identified phosphoproteins are shown in gray, and those for which significantly regulated
phosphosites were measured are indicated with an orange border. Each P indicates a distinct regulated phosphosite, and the color is the same as the cluster it belongs to,
according to Figure 2A. (B) Detailed list of the phosphosites depicted in (A). The reported amino acid position refers to the protein within the protein group for which
a reference number (referred to as UniProtKB) was found in PhosphoSitePlus database. Bold, functional phosphosite (according to PhosphoSitePlus); ^, a redundant site.
BLOOD, 20 MARCH 2014 x VOLUME 123, NUMBER 12 PHOSPHOPROTEOMICS OF EC THROMBIN SIGNALING e29
For personal use only.on November 20, 2014. by guest www.bloodjournal.orgFrom
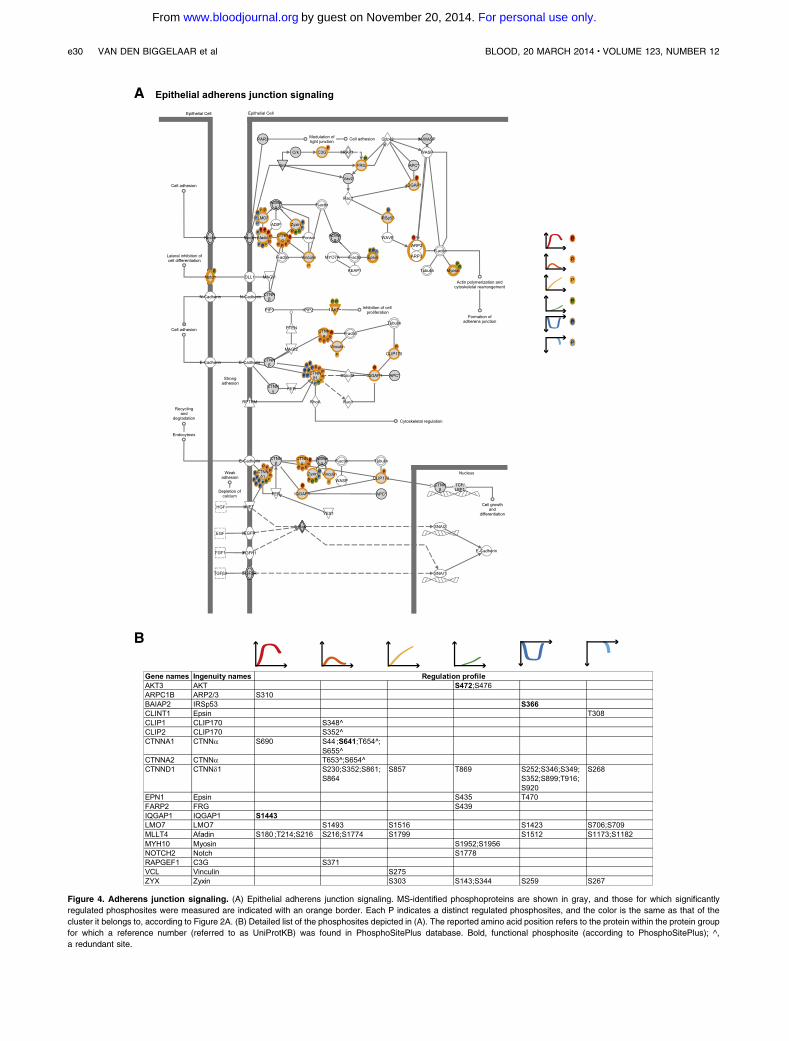
Figure 4. Adherens junction signaling. (A) Epithelial adherens junction signaling. MS-identified phosphoproteins are shown in gray, and those for which significantly
regulated phosphosites were measured are indicated with an orange border. Each P indicates a distinct regulated phosphosites, and the color is the same as that of the
cluster it belongs to, according to Figure 2A. (B) Detailed list of the phosphosites depicted in (A). The reported amino acid position refers to the protein within the protein group
for which a reference number (referred to as UniProtKB) was found in PhosphoSitePlus database. Bold, functional phosphosite (according to PhosphoSitePlus); ^,
a redundant site.
e30 VAN DEN BIGGELAAR et al BLOOD, 20 MARCH 2014 x VOLUME 123, NUMBER 12
For personal use only.on November 20, 2014. by guest www.bloodjournal.orgFrom
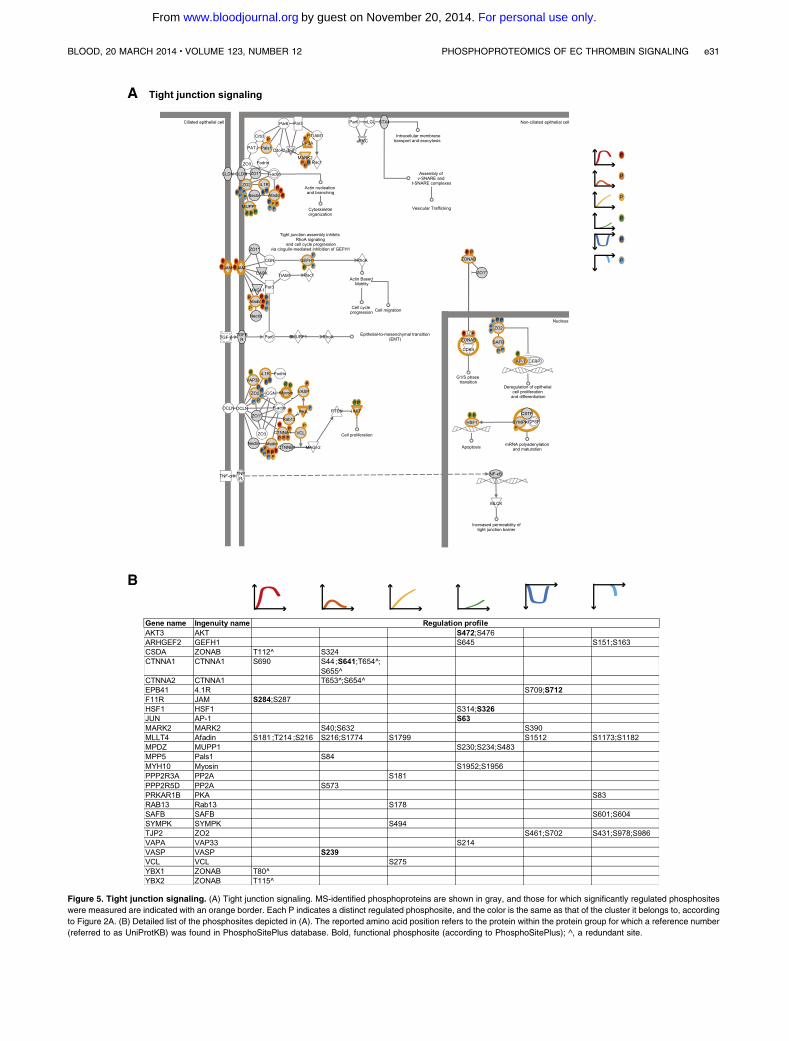
Figure 5. Tight junction signaling. (A) Tight junction signaling. MS-identified phosphoproteins are shown in gray, and those for which significantly regulated phosphosites
were measured are indicated with an orange border. Each P indicates a distinct regulated phosphosite, and the color is the same as that of the cluster it belongs to, according
to Figure 2A. (B) Detailed list of the phosphosites depicted in (A). The reported amino acid position refers to the protein within the protein group for which a reference number
(referred to as UniProtKB) was found in PhosphoSitePlus database. Bold, functional phosphosite (according to PhosphoSitePlus); ^, a redundant site.
BLOOD, 20 MARCH 2014 x VOLUME 123, NUMBER 12 PHOSPHOPROTEOMICS OF EC THROMBIN SIGNALING e31
For personal use only.on November 20, 2014. by guest www.bloodjournal.orgFrom
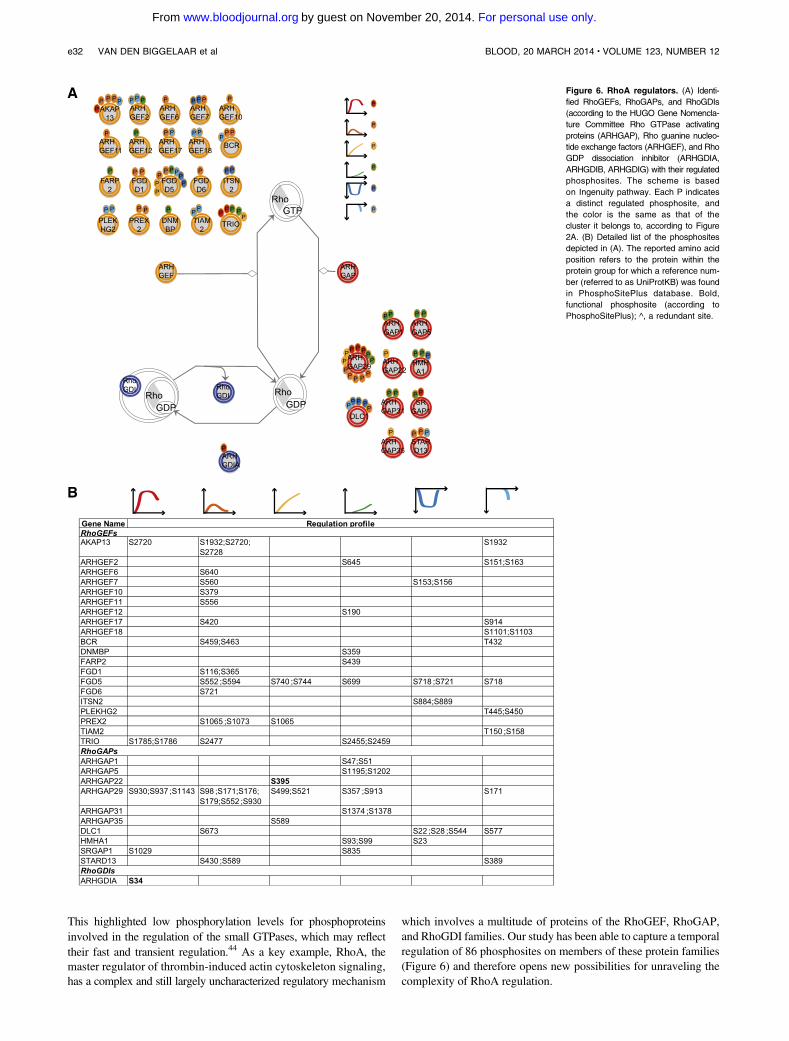
This highlighted low phosphorylation levels for phosphoproteinsinvolved in the regulation of the small GTPases, which may reflecttheir fast and transient regulation.44 As a key example, RhoA, themaster regulator of thrombin-induced actin cytoskeleton signaling,has a complex and still largely uncharacterized regulatory mechanism
which involves a multitude of proteins of the RhoGEF, RhoGAP,and RhoGDI families. Our study has been able to capture a temporalregulation of 86 phosphosites on members of these protein families(Figure 6) and therefore opens new possibilities for unraveling thecomplexity of RhoA regulation.
Figure 6. RhoA regulators. (A) Identi-
fied RhoGEFs, RhoGAPs, and RhoGDIs
(according to the HUGO Gene Nomencla-
ture Committee Rho GTPase activating
proteins (ARHGAP), Rho guanine nucleo-
tide exchange factors (ARHGEF), and Rho
GDP dissociation inhibitor (ARHGDIA,
ARHGDIB, ARHGDIG) with their regulated
phosphosites. The scheme is based
on Ingenuity pathway. Each P indicates
a distinct regulated phosphosite, and
the color is the same as that of the
cluster it belongs to, according to Figure
2A. (B) Detailed list of the phosphosites
depicted in (A). The reported amino acid
position refers to the protein within the
protein group for which a reference num-
ber (referred to as UniProtKB) was found
in PhosphoSitePlus database. Bold,
functional phosphosite (according to
PhosphoSitePlus); ^, a redundant site.
e32 VAN DEN BIGGELAAR et al BLOOD, 20 MARCH 2014 x VOLUME 123, NUMBER 12
For personal use only.on November 20, 2014. by guest www.bloodjournal.orgFrom
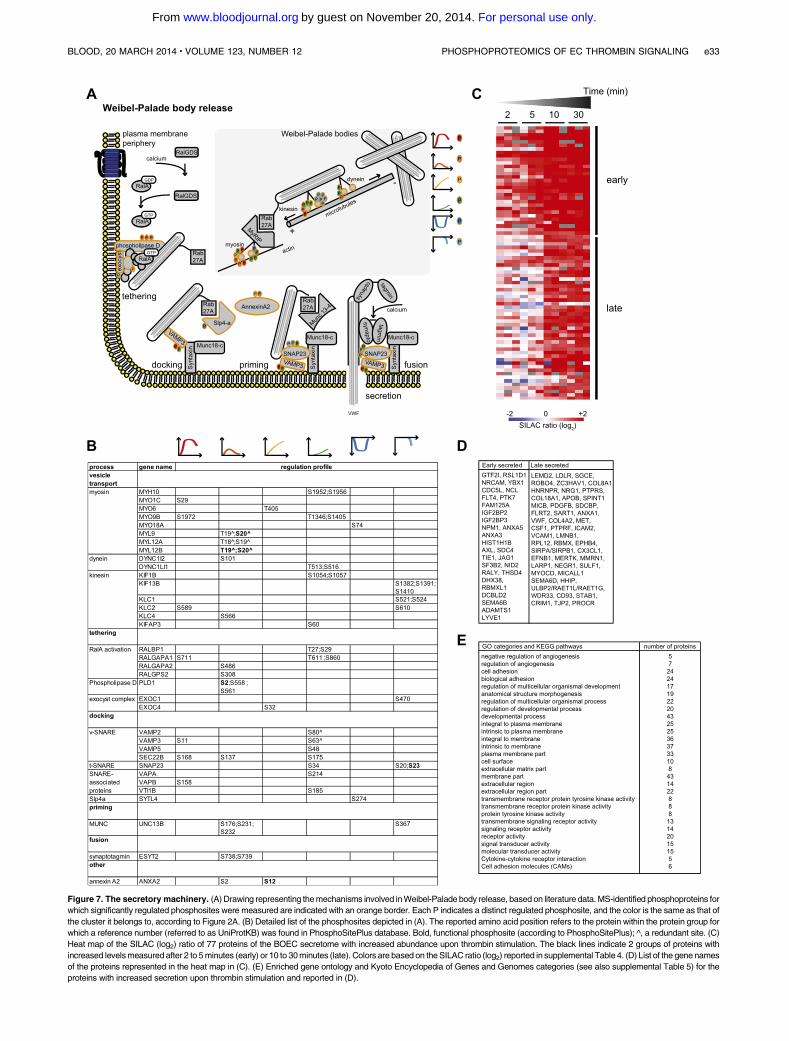
Figure 7. The secretory machinery. (A) Drawing representing themechanisms involved inWeibel-Palade body release, based on literature data.MS-identified phosphoproteins for
which significantly regulated phosphosites were measured are indicated with an orange border. Each P indicates a distinct regulated phosphosite, and the color is the same as that of
the cluster it belongs to, according to Figure 2A. (B) Detailed list of the phosphosites depicted in (A). The reported amino acid position refers to the protein within the protein group for
which a reference number (referred to as UniProtKB) was found in PhosphoSitePlus database. Bold, functional phosphosite (according to PhosphoSitePlus); ^, a redundant site. (C)
Heat map of the SILAC (log2) ratio of 77 proteins of the BOEC secretome with increased abundance upon thrombin stimulation. The black lines indicate 2 groups of proteins with
increased levelsmeasured after 2 to 5minutes (early) or 10 to 30minutes (late). Colors are based on theSILAC ratio (log2) reported in supplemental Table 4. (D) List of the gene names
of the proteins represented in the heat map in (C). (E) Enriched gene ontology and Kyoto Encyclopedia of Genes and Genomes categories (see also supplemental Table 5) for the
proteins with increased secretion upon thrombin stimulation and reported in (D).
BLOOD, 20 MARCH 2014 x VOLUME 123, NUMBER 12 PHOSPHOPROTEOMICS OF EC THROMBIN SIGNALING e33
For personal use only.on November 20, 2014. by guest www.bloodjournal.orgFrom
Thrombin-regulated kinome
Protein kinases are targets successfully exploited by the pharmaceu-tical industry to develop drugs.45 The broad regulation of the ECphosphoproteome induced by thrombin suggests that kinases mightbe appealing targets to be investigated further in the context ofthrombotic disorders, and our global phosphoproteomic data providea unique opportunity to pinpoint the regulated kinases. The combinedMS and bioinformatic analyses revealed altered phosphorylationlevels of regulatory sites and predicted activity of many of the kinaseswhich are the usual suspects in thrombin signaling, such as CAMK,PKA, and PKC, which regulate cytoskeletal protein reorganization46
and rho kinase activity.47 The kinase activity analysis also revealeda distinct temporal activation pattern, in which arginine-directedphosphorylations precede proline-directed ones. Interestingly, thelatter ones, which include MAPK3/ERK1, MAPK1/ERK2, GSK3,and CDK5, were predicted with both increased (clusters 3 and 4)and decreased activity (cluster 6). A simple explanation for thisopposite prediction is that within this group of kinases only somewere activated by thrombin while others were not. For example,we could measure increased phosphorylation of the active site ofMAPK3/ERK1 and MAPK1/ERK2, but no regulation was measuredfor the GSK3 regulatory site (Tyr216; supplemental Table 2). Analternative explanation is that, while in nonstimulated cells, thosekinases, in combination with phosphatases, maintain basal levels ofphosphorylation on a variety of substrates, upon stimulation thisbalance is differently altered for specific categories of proteins (eg,toward increased phosphorylation in actin cytoskeletal proteinsand decreased in microtubule-related proteins).
Known thrombin-regulated signaling pathways
We integrated our phosphoproteomic data into well-defined pathwaysof the Ingenuity platform (Figures 4-6), and because secretory eventsare a key feature in thrombin signaling and are the historical interest ofour laboratory, we built up a literature-based pathway of the Weibel-Palade bodies release (Figure 7). This analysis led us to the followingobservations: (1) the majority of the phosphoproteins within eachpathway have at least one phosphosite regulated upon thrombin stim-ulation, which highlights that phosphorylation is a prominentcomponent of thrombin signaling and that cellular responses to stimuliare the result of the combined effect of phosphorylations on manyproteins rather than a single phosphorylation event. For example, wereport dynamically regulated phosphosites on proteins within thedifferent layers of the cell-cell junctions48 (Figures 4 and 5) and ona large number of proteins involved in Weibel-Palade body secretion,including some involved in vesicle transport, tethering, docking, pri-ming, and fusion (Figure 7); and (2) several proteins contain multipleregulated phosphosites with distinct temporal profiles, suggesting thatit is not a single but rather a combination of phosphorylation anddephosphorylation events that regulate protein function. It is temptingto speculate that these highly regulated proteins might be key hubs ofthe thrombin-induced signaling and therefore the most promisingcandidates to be investigated further.
Novel thrombin-regulated phosphoproteins
Our phosphoproteomic data provide insights on proteins that havenot previously been associated with thrombin signaling. There areseveral interesting candidates for future studies. First, there areproteins for which we found significant changes in phosphorylationlevels on functional sites, such as the epigenetic regulatorsHDAC1/2(Ser421 HDAC1 and Ser422 HDAC2, supplemental Table 2) and
a key enzyme of the pyrimidine synthesis pathway, glutamine-dependent carbamoyl-phosphate synthase (Ser1859 and Ser1406CAD, supplemental Table 2). Second, there are protein kinases(Table 1), promising targets in a clinical context. Third, there areproteins that are very upstream in thrombin signaling (phospho-regulated soon after thrombin activation). One example isKIAA1462,for which we identified 15 upregulated phosphorylation sites imme-diately after thrombin stimulation (clusters 1 and 2) and which hasbeen associated with coronary artery disease49 and EC-cell junctions.50
In addition, our secretome analysis revealed enrichment of membraneproteins, including the tyrosine kinase receptors Tie-1, FLT4, andhepatocyte growth factor receptor and the endothelial protein Creceptor, in the supernatant of thrombin-stimulated ECs. This suggeststhat either protein ectodomain shedding or secretion of membranereceptors is a previously unrecognizedmechanism associated with thethrombin response. Alternatively, it is tempting to speculate thatthrombin itself may induce the cleavage and possibly activation oftransmembrane receptors other than PARs.
Future directions
Here, we have unveiled thrombin-induced signaling in ECs. PAR1 isthe predominant thrombin receptor in ECs,8 and EC activation usinga PAR1 agonist peptidemimics the effects of thrombin. Therefore, weexpect that the majority of the regulated phosphorylation sites thatwere identified in this study are mediated via PAR1 cleavage. How-ever, PAR1-independent phosphorylations by thrombin cannot beexcluded. It would be interesting to learn whether PAR1 accountscompletely for the observed phosphoproteomic changes. Phospho-proteomic analysis of endothelial thrombin signaling in the presenceofPAR1 inhibition may provide information about additional PARs orother receptors cleaved and activated by thrombin. In addition, similarMS-based approaches could be used to investigate the signalinginduced by different PAR1 agonists, including activated protein C51
andmatrixmetalloproteinase 1,52which can cleave PAR1 at differentpositions than thrombin and trigger differential downstreamsignaling. This is very relevant from a therapeutic perspective fordeveloping PAR1 agonists and antagonists selective for specificsignaling pathways with the ultimate goal of preventing coagulationwithout promoting bleeding.53
Acknowledgments
We thank Prof Dr J. Voorberg and Dr R. Bierings for criticalreading of the manuscript.
This work was supported by Cancer Research UK and Sanquin(PPOC11-037). The .raw MS files and search/identification files ob-tained with MaxQuant have been deposited in the ProteomeXchangeConsortium (http://proteomecentral.proteomexchange.org/cgi/GetDataset) via the PRIDE partner repository54 with the datasetidentifier PXD000597.
Authorship
Contribution: M.d.v.B., J.R.H.-F., B.L.v.d.E., and L.J.N. performedexperiments; A.B.M., K.M., M.v.d.B. and S.Z. designed theresearch; and M.v.d.B. and S.Z. analyzed results, made the figures,and wrote the paper.
e34 VAN DEN BIGGELAAR et al BLOOD, 20 MARCH 2014 x VOLUME 123, NUMBER 12
For personal use only.on November 20, 2014. by guest www.bloodjournal.orgFrom
Conflict-of-interest disclosure: The authors declare no competingfinancial interests.
Correspondence: Sara Zanivan,Vascular Proteomics Laboratory,Cancer Research UK Beatson Institute, Switchback Rd, G61 1BD,
Glasgow, United Kingdom; e-mail: [email protected];and Maartje van den Biggelaar, Department of Plasma Proteins,Sanquin Research, Plesmanlaan 125, 1066 CX, Amsterdam, TheNetherlands; e-mail: [email protected].
References
1. Siller-Matula JM, Schwameis M, Blann A,Mannhalter C, Jilma B. Thrombin as a multi-functional enzyme. Focus on in vitro and invivo effects. Thromb Haemost. 2011;106(6):1020-1033.
2. Borissoff JI, Spronk HM, Heeneman S, ten CateH. Is thrombin a key player in the ‘coagulation-atherogenesis’ maze? Cardiovasc Res. 2009;82(3):392-403.
3. Coughlin SR. Thrombin signalling and protease-activated receptors. Nature. 2000;407(6801):258-264.
4. Martorell L, Martınez-Gonzalez J, Rodrıguez C,Gentile M, Calvayrac O, Badimon L. Thrombinand protease-activated receptors (PARs) inatherothrombosis. Thromb Haemost. 2008;99(2):305-315.
5. Vu TK, Hung DT, Wheaton VI, Coughlin SR.Molecular cloning of a functional thrombinreceptor reveals a novel proteolytic mechanism ofreceptor activation. Cell. 1991;64(6):1057-1068.
6. Lee M, Saver JL, Hong KS, Wu HC, Ovbiagele B.Risk of intracranial hemorrhage with protease-activated receptor-1 antagonists. Stroke. 2012;43(12):3189-3195.
7. Ramachandran R. Developing PAR1 antagonists:minding the endothelial gap. Discov Med. 2012;13(73):425-431.
8. O’Brien PJ, Prevost N, Molino M, et al.Thrombin responses in human endothelial cells.Contributions from receptors other than PAR1include the transactivation of PAR2 by thrombin-cleaved PAR1. J Biol Chem. 2000;275(18):13502-13509.
9. Storck J, Kusters B, Zimmermann ER. Thetethered ligand receptor is the responsiblereceptor for the thrombin induced release of vonWillebrand factor from endothelial cells (HUVEC).Thromb Res. 1995;77(3):249-258.
10. Bogatcheva NV, Garcia JG, Verin AD. Molecularmechanisms of thrombin-induced endothelial cellpermeability. Biochemistry (Mosc). 2002;67(1):75-84.
11. Minami T, Sugiyama A, Wu SQ, Abid R, KodamaT, Aird WC. Thrombin and phenotypic modulationof the endothelium. Arterioscler Thromb VascBiol. 2004;24(1):41-53.
12. Hirano K. The roles of proteinase-activatedreceptors in the vascular physiology andpathophysiology. Arterioscler Thromb Vasc Biol.2007;27(1):27-36.
13. Pawson T, Scott JD. Signaling through scaffold,anchoring, and adaptor proteins. Science. 1997;278(5346):2075-2080.
14. Mann M. Functional and quantitative proteomicsusing SILAC. Nat Rev Mol Cell Biol. 2006;7(12):952-958.
15. Blagoev B, Ong SE, Kratchmarova I, Mann M.Temporal analysis of phosphotyrosine-dependentsignaling networks by quantitative proteomics.Nat Biotechnol. 2004;22(9):1139-1145.
16. Olsen JV, Blagoev B, Gnad F, et al. Global, invivo, and site-specific phosphorylation dynamicsin signaling networks. Cell. 2006;127(3):635-648.
17. Zanivan S, Meves A, Behrendt K, et al.In vivo SILAC-based proteomics revealsphosphoproteome changes during mouse skin
carcinogenesis. Cell Rep. 2013;3(2):552-566.
18. Zhuang G, Yu K, Jiang Z, et al.Phosphoproteomic analysis implicates themTORC2-FoxO1 axis in VEGF signaling andfeedback activation of receptor tyrosine kinases.Sci Signal. 2013;6(271):ra25.
19. Verano-Braga T, Schwammle V,Sylvester M, et al. Time-resolved quantitativephosphoproteomics: new insights intoAngiotensin-(1-7) signaling networks in humanendothelial cells. J Proteome Res. 2012;11(6):3370-3381.
20. Meijer LA, Zhou H, Chan OY, et al. Quantitativeglobal phosphoproteomics of human umbilicalvein endothelial cells after activation of the Rapsignaling pathway. Mol Biosyst. 2013;9(4):732-749.
21. Qiu H, Jiang JL, Liu M, Huang X, Ding SJ, WangL. Quantitative phosphoproteomics analysisreveals broad regulatory role of heparan sulfateon endothelial signaling. Mol Cell Proteomics.2013;12(8):2160-2173.
22. Martin-Ramirez J, Hofman M, van den BiggelaarM, Hebbel RP, Voorberg J. Establishment ofoutgrowth endothelial cells from peripheral blood.Nat Protoc. 2012;7(9):1709-1715.
23. Hernandez-Fernaud JR, Reid SE, Neilson LJ,Zanivan S. Quantitative mass spectrometry-based proteomics in angiogenesis. ProteomicsClin Appl. 2013;7(7-8):464-476.
24. Romani de Wit T, Rondaij MG, Hordijk PL,Voorberg J, van Mourik JA. Real-time imaging ofthe dynamics and secretory behavior of Weibel-Palade bodies. Arterioscler Thromb Vasc Biol.2003;23(5):755-761.
25. Stel HV, Sakariassen KS, Scholte BJ, et al.Characterization of 25 monoclonal antibodies tofactor VIII-von Willebrand factor: relationshipbetween ristocetin-induced platelet aggregationand platelet adherence to subendothelium. Blood.1984;63(6):1408-1415.
26. van Mourik JA, Leeksma OC, Reinders JH, deGroot PG, Zandbergen-Spaargaren J. Vascularendothelial cells synthesize a plasma membraneprotein indistinguishable from the plateletmembrane glycoprotein IIa. J Biol Chem. 1985;260(20):11300-11306.
27. Wisniewski JR, Zougman A, Nagaraj N, Mann M.Universal sample preparation method forproteome analysis. Nat Methods. 2009;6(5):359-362.
28. Larsen MR, Thingholm TE, Jensen ON,Roepstorff P, Jørgensen TJ. Highly selectiveenrichment of phosphorylated peptides frompeptide mixtures using titanium dioxidemicrocolumns. Mol Cell Proteomics. 2005;4(7):873-886.
29. Rappsilber J, Ishihama Y, Mann M. Stopand go extraction tips for matrix-assisted laserdesorption/ionization, nanoelectrospray, and LC/MS sample pretreatment in proteomics. AnalChem. 2003;75(3):663-670.
30. Shevchenko A, Tomas H, Havlis J, Olsen JV,Mann M. In-gel digestion for mass spectrometriccharacterization of proteins and proteomes. NatProtoc. 2006;1(6):2856-2860.
31. Cox J, Mann M. MaxQuant enables high peptideidentification rates, individualized p.p.b.-rangemass accuracies and proteome-wide proteinquantification. Nat Biotechnol. 2008;26(12):1367-1372.
32. Ashburner M, Ball CA, Blake JA, et al; The GeneOntology Consortium. Gene ontology: tool for theunification of biology. Nat Genet. 2000;25(1):25-29.
33. Schwartz D, Gygi SP. An iterative statisticalapproach to the identification of proteinphosphorylation motifs from large-scale data sets.Nat Biotechnol. 2005;23(11):1391-1398.
34. Manning G, Whyte DB, Martinez R, Hunter T,Sudarsanam S. The protein kinase complement ofthe human genome. Science. 2002;298(5600):1912-1934.
35. Li X, Wilmanns M, Thornton J, Kohn M.Elucidating human phosphatase-substratenetworks. Sci Signal. 2013;6(275):rs10.
36. Gray KA, Daugherty LC, Gordon SM, Seal RL,Wright MW, Bruford EA. Genenames.org: theHGNC resources in 2013. Nucleic Acids Res.2013;41(Database issue):D545-D552.
37. Jahn R, Fasshauer D. Molecular machinesgoverning exocytosis of synaptic vesicles. Nature.2012;490(7419):201-207.
38. Nightingale T, Cutler D. The secretion of vonWillebrand factor from endothelial cells; anincreasingly complicated story. J ThrombHaemost. 2013;11(Suppl 1):192-201.
39. Rondaij MG, Bierings R, van Agtmaal EL, et al.Guanine exchange factor RalGDS mediatesexocytosis of Weibel-Palade bodies fromendothelial cells. Blood. 2008;112(1):56-63.
40. Valentijn KM, Sadler JE, Valentijn JA, Voorberg J,Eikenboom J. Functional architecture of Weibel-Palade bodies. Blood. 2011;117(19):5033-5043.
41. Lowenstein CJ, Morrell CN, Yamakuchi M.Regulation of Weibel-Palade body exocytosis.Trends Cardiovasc Med. 2005;15(8):302-308.
42. Etienne-Manneville S, Hall A. Rho GTPases incell biology. Nature. 2002;420(6916):629-635.
43. Schmid DI, Schwertz H, Jiang H, et al. Translationalcontrol of JunB, an AP-1 transcription factor, inactivated human endothelial cells. J Cell Biochem.2013;114(7):1519-1528.
44. Szulcek R, Beckers CM, Hodzic J, et al. LocalizedRhoA GTPase activity regulates dynamics ofendothelial monolayer integrity. Cardiovasc Res.2013;99(3):471-482.
45. Cohen P, Alessi DR. Kinase drugdiscovery—what’s next in the field? ACS ChemBiol. 2013;8(1):96-104.
46. Borbiev T, Verin AD, Shi S, Liu F, Garcia JG.Regulation of endothelial cell barrier function bycalcium/calmodulin-dependent protein kinase II.Am J Physiol Lung Cell Mol Physiol. 2001;280(5):L983-L990.
47. Wang Z, Ginnan R, Abdullaev IF, Trebak M,Vincent PA, Singer HA. Calcium/Calmodulin-dependent protein kinase II delta 6(CaMKIIdelta6) and RhoA involvement inthrombin-induced endothelial barrier dysfunction.J Biol Chem. 2010;285(28):21303-21312.
48. Bertocchi C, Vaman Rao M, Zaidel-Bar R.Regulation of adherens junction dynamics byphosphorylation switches. J Signal Transduct.2012;2012:125295.
49. Coronary Artery Disease (C4D) GeneticsConsortium. A genome-wide association study inEuropeans and South Asians identifies five newloci for coronary artery disease. Nat Genet. 2011;43(4):339-344.
BLOOD, 20 MARCH 2014 x VOLUME 123, NUMBER 12 PHOSPHOPROTEOMICS OF EC THROMBIN SIGNALING e35
For personal use only.on November 20, 2014. by guest www.bloodjournal.orgFrom

50. Akashi M, Higashi T, Masuda S, Komori T,Furuse M. A coronary artery disease-associated gene product, JCAD/KIAA1462, isa novel component of endothelial cell-celljunctions. Biochem Biophys Res Commun.2011;413(2):224-229.
51. Mosnier LO, Sinha RK, Burnier L, Bouwens EA,Griffin JH. Biased agonism of protease-
activated receptor 1 by activatedprotein C caused by noncanonicalcleavage at Arg46. Blood. 2012;120(26):5237-5246.
52. Trivedi V, Boire A, Tchernychev B, et al.Platelet matrix metalloprotease-1 mediatesthrombogenesis by activating PAR1 at a crypticligand site. Cell. 2009;137(2):332-343.
53. Mackman N. Triggers, targets and treatmentsfor thrombosis. Nature. 2008;451(7181):914-918.
54. Vizcaıno JA, Cote RG, Csordas A, et al. ThePRoteomics IDEntifications (PRIDE) databaseand associated tools: status in 2013. NucleicAcids Res. 2013;41(Database issue):D1063-D1069.
e36 VAN DEN BIGGELAAR et al BLOOD, 20 MARCH 2014 x VOLUME 123, NUMBER 12
For personal use only.on November 20, 2014. by guest www.bloodjournal.orgFrom


