Embed Size (px)
Citation preview
Journal of Human Nutrition and Dietetics [1992], 5, 371-385
Dietary sources of energy, protein, unavailable carbohydrate and fat in 11-12-year-old English children in 1990 compared with results in 1980
A. J. Adamson, A. J. Rugg-Gum,* D. R. Appleton, T. J. Butler and A. F. Hackett Departments of Oral Biology, Child Dental Health and Medical Statistics, Medical Faculty, University of Newcastle upon Tyne, Framlington Place. Newcastle upon Tyne NE2 4BW, UK
There is little information on the food intake of adolescents or on how the intake of adolescents has changed. Yet this information is essential to assess the effect of dietary health education and is valuable in formulating future advice. This paper reports the dietary sources of energy, protein, unavailable carbohydrate and fat in the diet of 379 11- and 12-year-old schoolchildren in 1990, and compares these data with similar information collected in 1980. Each child completed two %day dietary records between January and July, and was interviewed by one dietitian to verify and enlarge upon the information recorded to obtain a quantitative measure of food intake. The children attended the same seven middle schools in south Northumberland as 375 children of the same age who recorded their diet using the same method 10 years previously (Hackett et al., 1983). Food tables were used to calculate nutrient intake.
Although the total intakes of energy, protein, unavailable carbohydrate and fat changed little over the 10-year period, there were changes in the importance of food groups as contributors to total intakes. Notably, an increase in the role played by confectionery which became the second largest contributor to total energy intake and an increase in the importance of meat and its products as a source of energy, protein and fat. The proportion of energy, protein and fat being derived from milk decreased. Chips remained the largest single source of unavailable carbohydrate, and an important energy and fat source, while the role played by ‘wholemeal’ breads in unavailable carbohydrate intake had increased.
Key words: children, food groups, food intake, total diet.
Introduction specific information exists on the food choice of this age-group.
Dietary intakes analysed and reported as mean daily intakes can be com- pared with previous similar studies to measure change, and can be compared with current recommendations to measure adequacy of the diet (Adamson et al., 1992).
371
Adolescence is a time 0fgro-h and devel- opment during which adequate nutrition is of Paramount importance, Yet little age-
* To whom correspondence should be ad- dressed.
372
It is also important, however, to report the intake of foods, as people choose foods to eat, not nutrients, and hence dietary ad- vice can be given most effectively in terms of foods.
The 10-year period 1980-90 was one of intense activity in health education with much increased interest in 'healthy eating' by the public and media. The health- education message to reduce fat and sugar intakes has been consistent and authorita- tive (National Advisory Committee on Nu- trition Education, 1983; Department of Health and Social Security, 1984; Depart- ment of Health, 198913, 1991). Particular food groups were targeted by nutritionists and dietitians, who translated expert ad- vice on nutrient intakes into practical food terms. To be effective, any dietary advice needs to be relevant to the target popula- tion, that is, based on a knowledge of present eating habits. Advice must effec- tively target the most important food groups to facilitate a reduction in fat and sugar intakes with a reciprocal increase in the intake of unrefined carbohydrate foods. Advice must also prevent, for example, a decrease in fat intake from one food group, simply resulting in its replacement from another. Dietary advice cannot focus on one aspect of the diet alone, as the compo- sition of the total diet is a result of interplay between different food groups. Dietary advice must be positive and given in food terms, that is, suggesting foods to eat more of, if health education is to be effective in achieving changes in the total diet rather than simply a change in the contribution of different food groups to the diet.
This paper presents data on the contri- bution of foods to the total energy, protein, unavailable carbohydrate and fat intakes of 11-12-year-old children living in the same"loca1ity in 1980 and 1990. It attempts to assess what effect, if any, health educa- tion messages of the 1980s had on the total diet of adolescents. Health education, how- ever, is not alone in attempting to influence food intake, it must compete with often conflicting media, advertising and socio- economic pressures.
Thus, our aims were, first, to compare
A. f. Adamson et al.
the contribution of selected food groups to the total energy, protein, unavailable car- bohydrate and fat intakes of adolescents in 1980 and 1990 and, second, to investigate the food intake of adolescents in 1990 by sex, and social group with the aim of providing information which will contri- bute to formulation of future health-edu- cation messages aimed at this age-group.
Methods
Between January and July 1990, 379 chil- dren aged 11-12 years recorded all dietary intake for 3 consecutive days on two separate occasions, the first being between January and March, and the second be- tween April and July. The children were from the same seven schools in south Northumberland, which had taken part in a similar study undertaken between 1979 and 1981 (Hackett et al., 1984). The method of collecting dietary information was the same as that used by Hackett et al. (1983), 10 years previously, when 375 children in social classes I-V were examined, although fewer days were included (6 compared with 15 days). Each child recorded, in a specially designed diary, all food and drink consumed along with an estimate of the amount, described in household measures. On the fourth day each child was inter- viewed privately by a dietitian, in order to verify and enlarge upon the information recorded in the diaries. A selection of calibrated three-dimensional food models was used along with the child's descrip- tion, to produce a quantitative estimate of intake. In addition, a series of food photo- graphs was available for each child to identify the type of milk, or spreading fat which has been used. Computerized food tables (Paul & Southgate, 1978 Tan et aI., 1985; Holland et al., 1988, 1989) with additions, were used to calculate the in- take of nutrients (Adamson et al., 1992). Unavailable carbohydrate discussed in this paper refers to all 'fibre' intake as mea- sured by the Southgate method (Wenlock et al., 1985).
As the aim of this study was to compare the contribution of selected food groups to
Sources of energy and macronutrients in children 373
the intakes of energy, protein, unavailable carbohydrate and fat, in adolescents in 1980 and 1990, it was essential that the food groupings used in 1980 (Hackett et a]., 1986) were maintained unchanged. Some subdivision of food groups was undertaken where it was considered relevant, for example, milk was subdivided into skimmed or semi-skimmed milk (‘reduced fat’) and whole milk. The food groups used largely follow the groupings given in The Composition of Foods (Paul & Southgate, 1978). The ‘meat’ group included any pas- try consumed as part of a meat item, for example, sausage rolls. ‘Confectionery’ in- cluded sweets, chocolate bars, popcorn, iced lollies, ice-cream and full-coated chocolate biscuits. ‘Soft drinks’ included carbonated and still drinks, fruit squashes and juices but excluded tea, coffee, milk- shakes and alcoholic beverages. ‘Sweet puddings’ included tinned or stewed fruit and yoghurts but excluded fresh fruit. The ‘egg’ group excluded eggs used in recipes, and the ‘cheese’ group did not include any cheese used in the cooking of composite dishes, for example, macaroni cheese. The food groups chosen in the analyses for the contribution to each nutrient varied ac- cording to their possible relevance to the nutrient being studied. For example, soft drinks were relevant to energy intake but not to protein, fat or unavailable carbohy- drate. Similarly, ‘meat’ was important to energy, protein and fat intake but provided little unavailable carbohydrate. The re- sults are given as the daily intake per child, averaged over 6 days.
The occupation of the ‘head of household’ of each child was coded as social class using the most recent publication (Regis- trar General, 1970,1980). The social classes were then grouped together as follows:
social classes I and I1 labelled ‘High’ social group (professional occupations), social class III labelled ‘Middle’ social group (skilled workers), and social classes IV and V labelled ‘Low’ social group (manual workers). The remaining children (social classes VI-IX) were not included in the social group analyses.
Because of the large number of variables involved in the analyses-two surveys, two sexes, three social groups, up to 15 food groups for each of four nutrients-sta- tistical testing of differences has not been carried out but standard errors are given to enable the reader to assess the precision of the values given in the tables.
Results
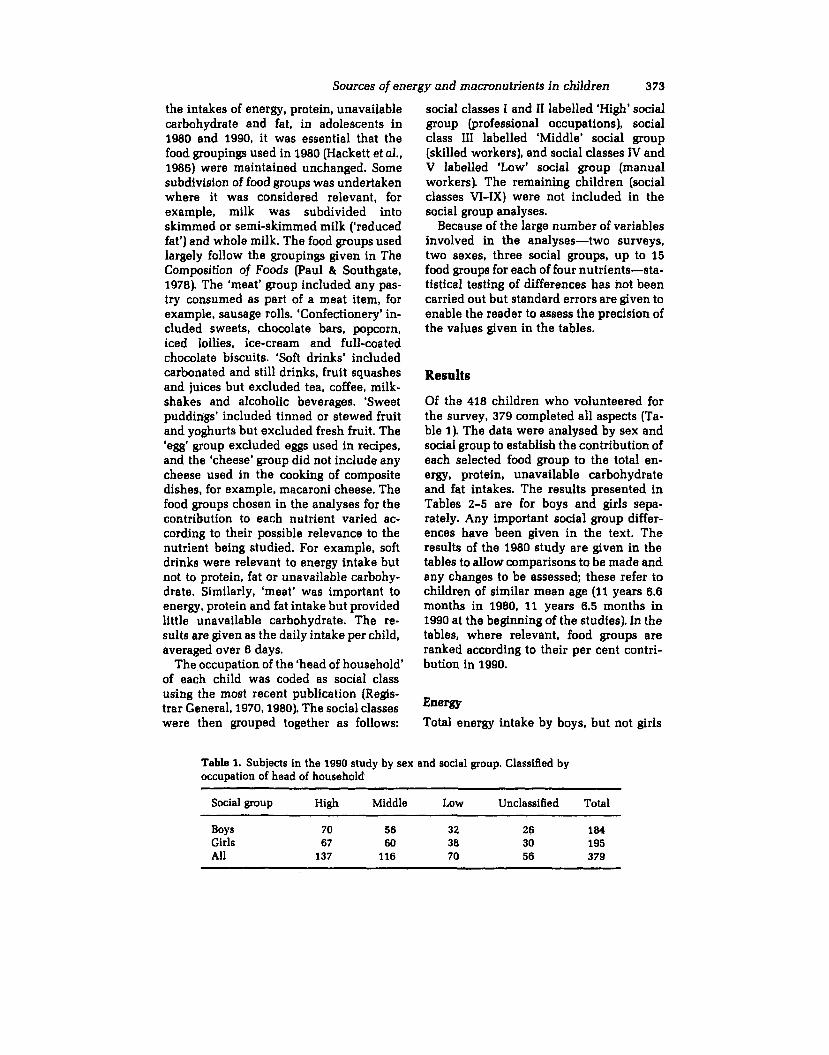
Of the 418 children who volunteered for the survey, 379 completed all aspects (Ta- ble 1). The data were analysed by sex and social group to establish the contribution of each selected food group to the total en- ergy, protein, unavailable carbohydrate and fat intakes. The results presented in Tables 2-5 are for boys and girls sepa- rately. Any important social group differ- ences have been given in the text. The results of the 1980 study are given in the tables to allow comparisons to be made and any changes to be assessed these refer to children of similar mean age (11 years 6.6 months in 1980, 11 years 6.5 months in 1990 at the beginning of the studies). In the tables, where relevant, food groups are ranked according to their per cent contri- bution in 1990.
Energy Total energy intake by boys, but not girls
Table 1. Subjects in the 1990 study by sex and social group. Classified by occupation of head of household
Social group High Middle Low Unclassified Total
Boys 70 56 32 26 184
All 137 116 70 56 3 79 Girls 67 60 30 30 195
374
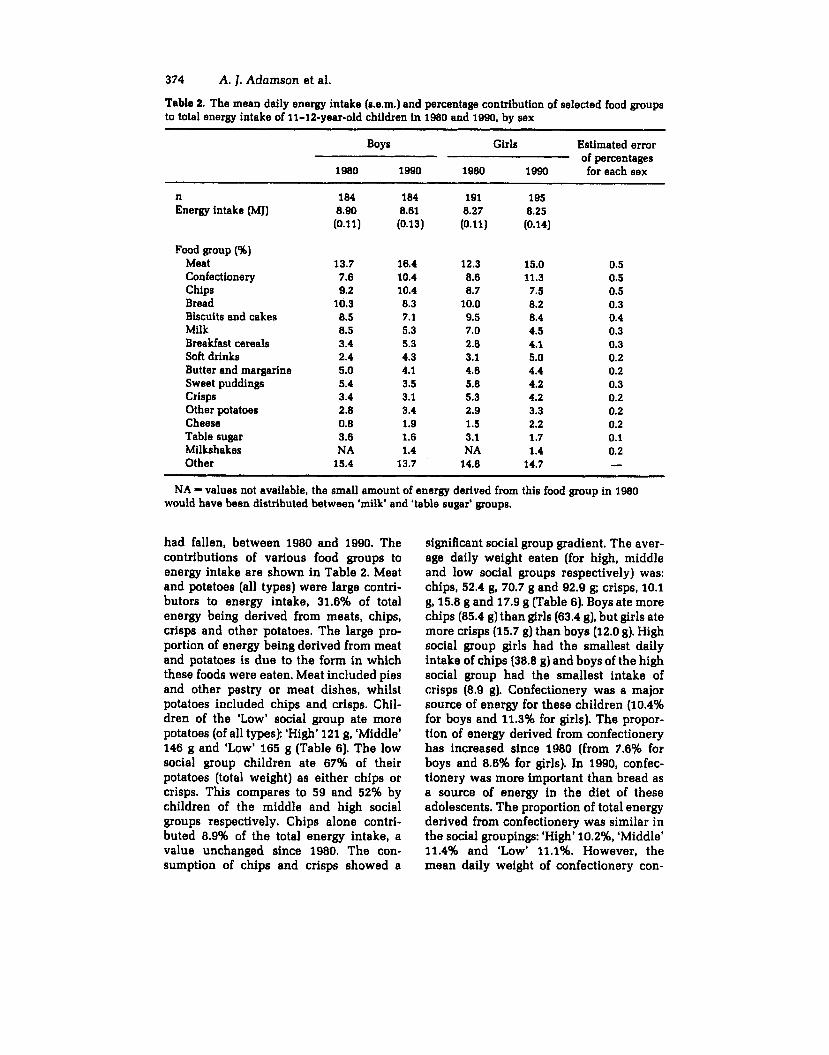
Table 2. The mean daily energy intake (s.e.m.) and percentage contribution of selected food groups to total energy intake of 11-12-year-old children in 1980 and 1990, by sex
A. 1. Adamson et al.
Boys Girls Estimated error of percentages
1980 1990 1980 1990 for each sex
n 184 184 191 195 Energy intake (MJ] 8.90 8.61 8.27 8.25
(0.11) (0.13) (0.11) (0.14)
Food group (%) Meat Confectionery Chips Bread Biscuits and cakes Milk Breakfast cereals Soft drinks Butter and margarine Sweet puddings Crisps Other potatoes Cheese Table sugar Milkshakes Other
13.7 7.6 9.2
10.3 8.5 8.5 3.4 2.4 5.0 5.4 3.4 2.8 0.8 3.6 NA
15.4
10.4 10.4 10.4 8.3 7.1 5.3 5.3 4.3 4.1 3.5 3.1 3.4 1.9 1.6 1.4
13.7
12.3 8.6 8.7
10.0 9.5 7.0 2.8 3.1 4.6 5.8 5.3 2.9 1.5 3.1 NA
14.8
15.0 11.3 7.5 8.2 8.4 4.5 4.1 5.0 4.4 4.2 4.2 3.3 2.2 1.7 1.4
14.7
0.5 0.5 0.5 0.3 0.4 0.3 0.3 0.2 0.2 0.3 0.2 0.2 0.2 0.1 0.2 -
NA - values not available, the small amount of energy derived from this food group in 1980 would have been distributed between ‘milk’ end ‘table sugar’ groups.
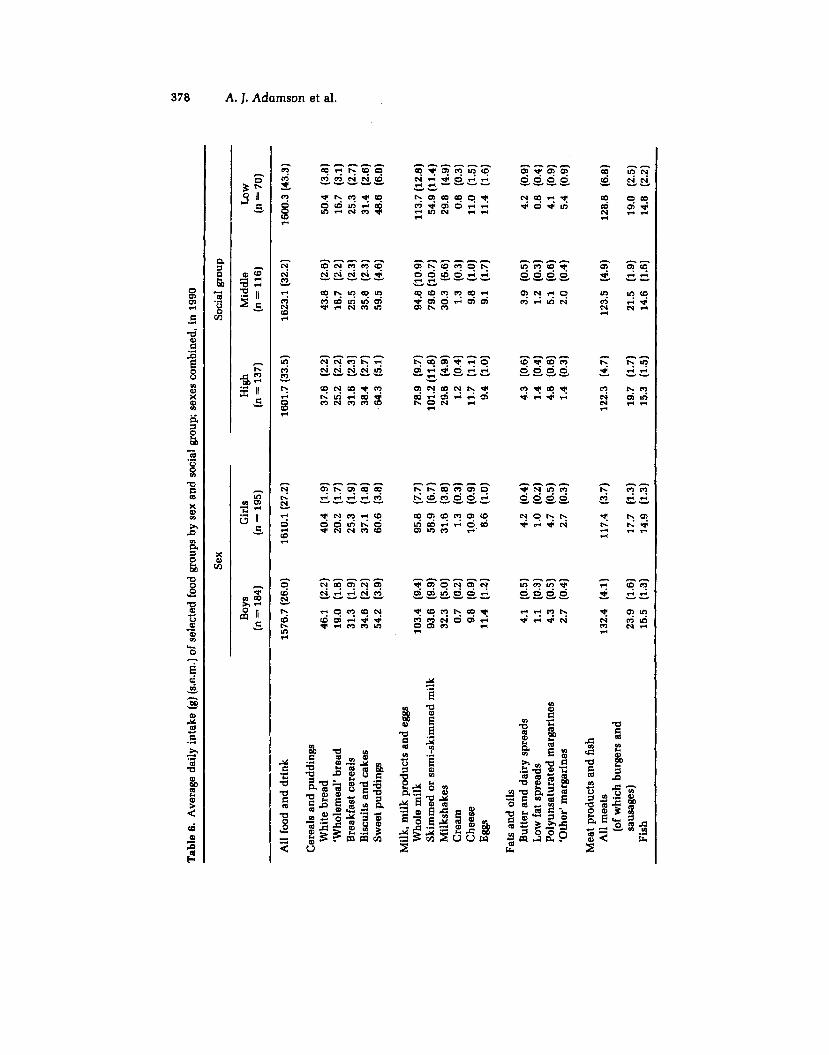
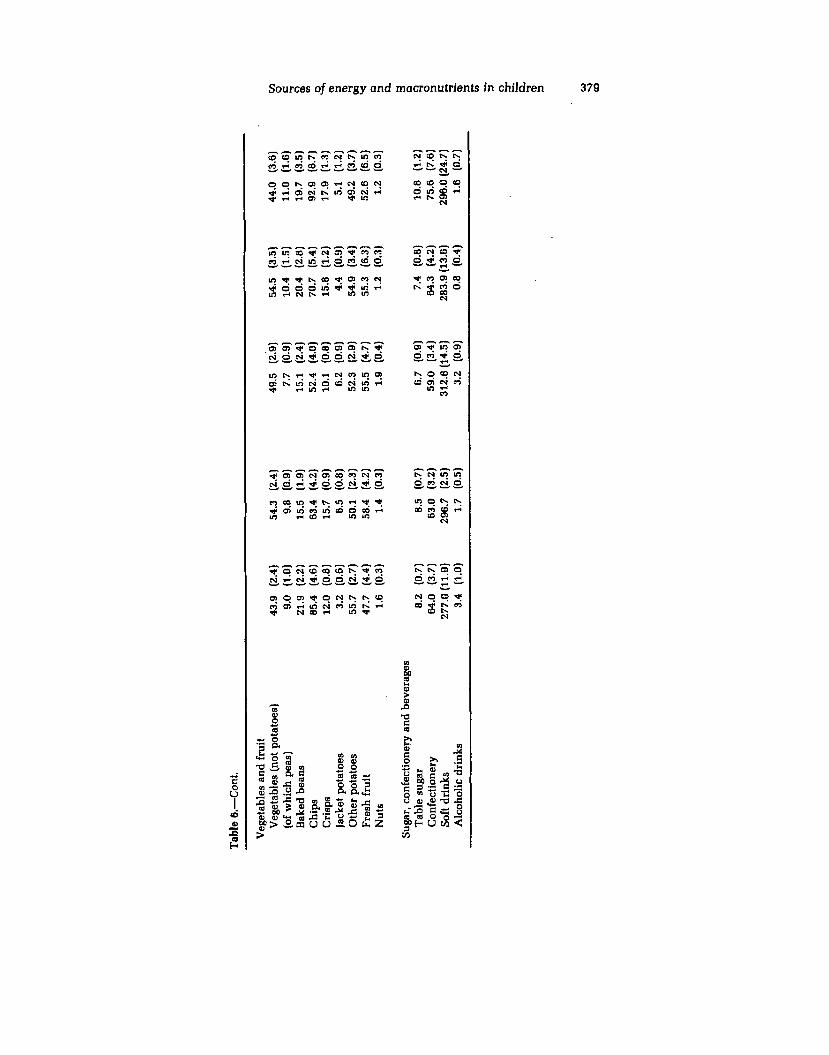
had fallen, between 1980 and 1990. The contributions of various food groups to energy intake are shown in Table 2. Meat and potatoes (all types) were large contri- butors to energy intake, 31.6% of total energy being derived from meats, chips, crisps and other potatoes. The large pro- portion of energy being derived from meat and potatoes is due to the form in which these foods were eaten. Meat included pies and other pastry or meat dishes, whilst potatoes included chips and crisps. Chil- dren of the ‘Low’ social group ate more potatoes (of all types): ‘High’ 121 g, ‘Middle’ 146 g and ‘Low’ 165 g (Table 6). The low social group children ate 67% of their potatoes (total weight) as either chips or crisps. This compares to 59 and 52% by children of the middle and high social groups respectively. Chips alone contri- buted 8.9% of the total energy intake, a value unchanged since 1980. The con- sumption of chips and crisps showed a
significant social group gradient. The aver- age daily weight eaten (for high, middle and low social groups respectively) was: chips, 52.4 g, 70.7 g and 92.9 g; crisps, 10.1 g, 15.8 g and 17.9 g (Table 6). Boys ate more chips (85.4 g) than girls (63.4 g), but girls ate more crisps (15.7 g) than boys (12.0 g). High social group girls had the smallest daily intake of chips (38.8 g) and boys of the high social group had the smallest intake of crisps (8.9 8). Confectionery was a major source of energy for these children (10.4% for boys and 11.3% for girls). The propor- tion of energy derived from confectionery has increased since 1980 (from 7.6% for boys and 8.6% for girls). In 1990, confec- tionery was more important than bread as a source of energy in the diet of these adolescents. The proportion of total energy derived from confectionery was similar in the social groupings: ‘High’ 10.2%, ‘Middle’ 11.4% and ‘Low’ 11.1%. However, the mean daily weight of confectionery con-
Sources of energy and macronutrients in children 375
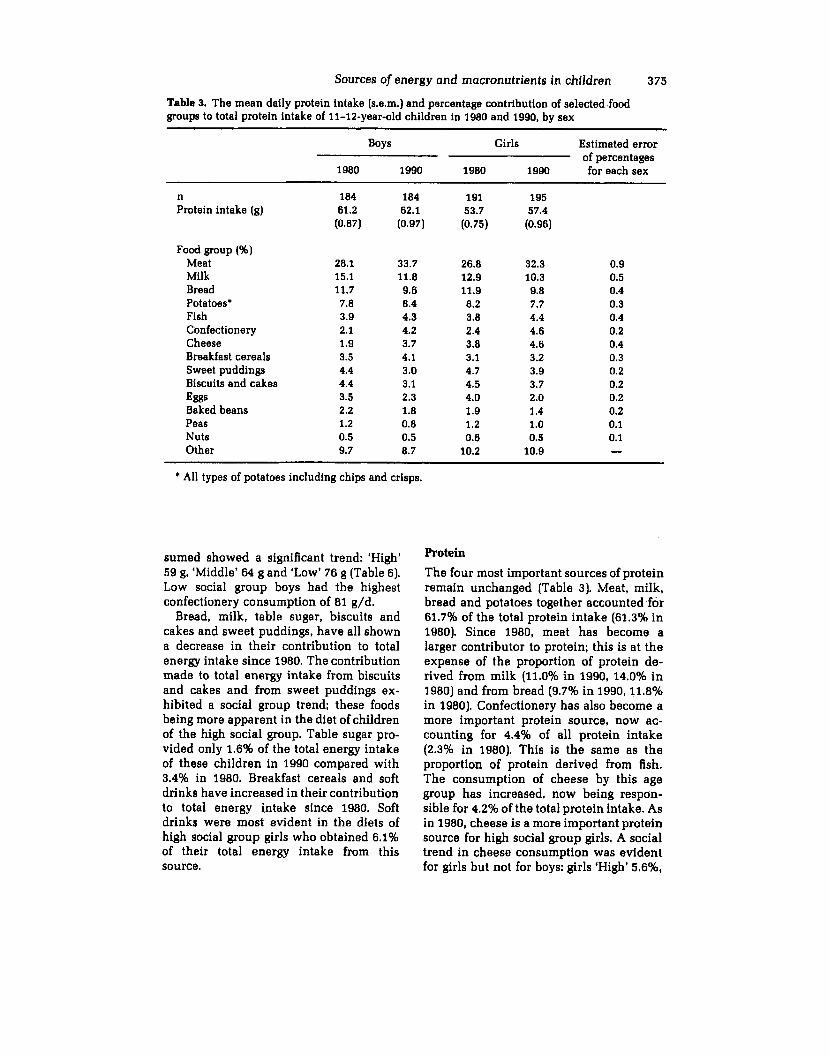
Table 3. The mean daily protein intake (s.e.m.) and percentage contribution of selected food groups to total protein intake of 11-12-year-old children in 1980 and 1990, by sex
Boys Girls Estimated error of percentages
1980 1990 1980 1990 for each sex
n 184 184 191 195 Protein intake (g) 61.2 62.1 53.7 57.4
(0.87) (0.97) (0.75) (0.96)
Food group (%) Meat Milk Bread Potatoes* Fish Confectionery Cheese Breakfast cereals Sweet puddings Biscuits and cakes Ems Baked beans Peas Nuts Other
28.1 15.1 11.7 7.8 3.9 2.1 1.9 3.5 4.4 4.4 3.5 2.2 1.2 0.5 9.7
33.7 11.8 9.6 8.4 4.3 4.2 3.7 4.1 3.0 3.1 2.3 1.8 0.8 0.5 8.7
26.8 12.9 11.9 8.2 3.8 2.4 3.8 3.1 4.7 4.5 4.0 1.9 1.2 0.6
10.2
32.3 10.3 9.8 7.7 4.4 4.6 4.6 3.2 3.9 3.7 2.0 1.4 1.0 0.5
10.9
0.9 0.5 0.4 0.3 0.4 0.2 0.4 0.3 0.2 0.2 0.2 0.2 0.1 0.1
~~
* All types of potatoes including chips and crisps.
sumed showed a significant trend ‘High’ 59 g, ‘Middle’ 64 g and ‘Low’ 76 g (Table 6). Low social group boys had the highest confectionery consumption of 81 g/d.
Bread, milk, table sugar, biscuits and cakes and sweet puddings, have all shown a decrease in their contribution to total energy intake since 1980. The contribution made to total energy intake from biscuits and cakes and from sweet puddings ex- hibited a social group trend; these foods being more apparent in the diet of children of the high social group. Table sugar pro- vided only 1.6% of the total energy intake of these children in 1990 compared with 3.4% in 1980. Breakfast cereals and soft drinks have increased in their contribution to total energy intake since 1980. Soft drinks were most evident in the diets of high social group girls who obtained 6.1% of their total energy intake from this source.
Protein The four most important sources of protein remain unchanged (Table 3). Meat, milk, bread and potatoes together accounted for 61.7% of the total protein intake (61.3% in 1980). Since 1980, meat has become a larger contributor to protein; this is at the expense of the proportion of protein de- rived from milk (11.0% in 1990, 14.0% in 1980) and from bread (9.7% in 1990, 11.8% in 1980). Confectionery has also become a more important protein source, now ac- counting for 4.4% of all protein intake (2.3% in 1980). This is the same as the proportion of protein derived from fish. The consumption of cheese by this age group has increased, now being respon- sible for 4.2% of the total protein intake. As in 1980, cheese is a more important protein source for high social group girls. A social trend in cheese consumption was evident for girls but not for boys: girls ‘High’ 5.6%,
376
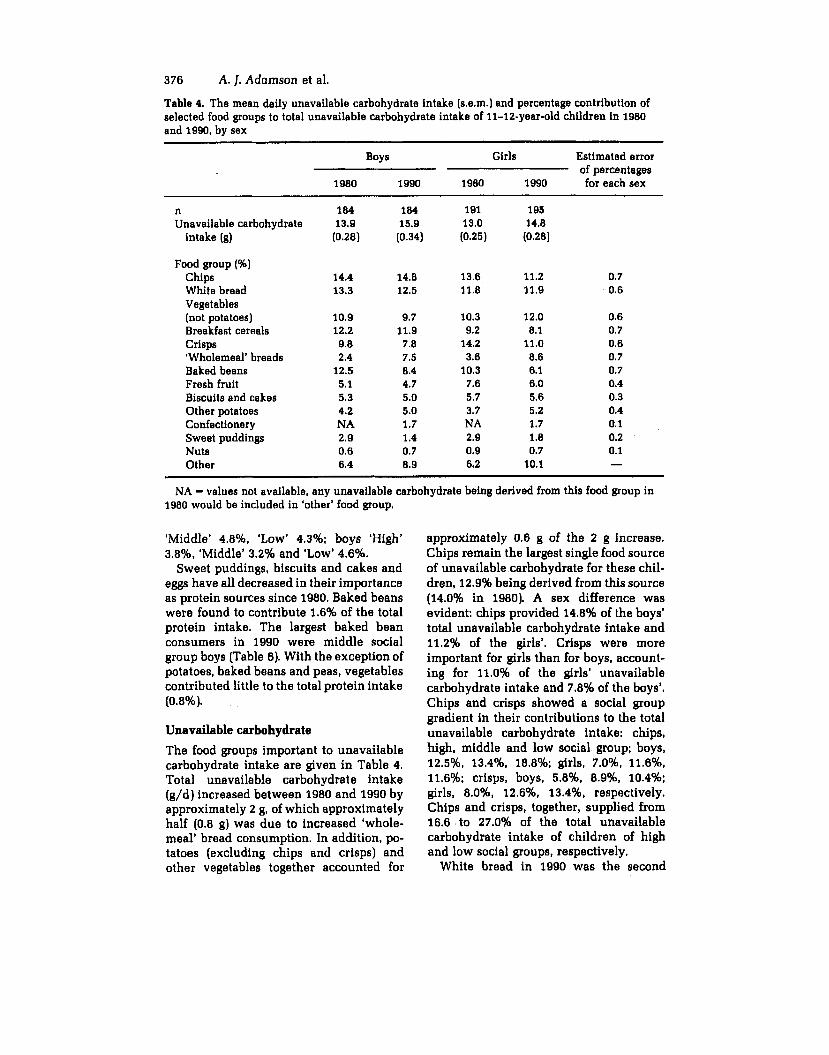
Table 4. The mean daily unavailable carbohydrate intake (s.e.m.1 and percentage contribution of selected food groups to total unavailable carbohydrate intake of 11-12-year-old children in 1980 and 1990, by sex
A. J. Adamson et al.
Boys Girls Estimated error of percentages
1980 1990 1980 1990 for each sex
n 184 184 191 195 Unavailable carbohydrate 13.9 15.9 13.0 14.8
intake (g) (0.281 (0.34) (0.25) (0.28)
Food group (%] Chips White bread Vegetables (not potatoes) Breakfast cereals Crisps ‘Wholemeal’ breads Baked beans Fresh fruit Biscuits and cakes Other potatoes Confectionery Sweet puddings Nuts Other
14.4 13.3
10.9 12.2 9.8 2.4
12.5 5.1 5.3 4.2 NA 2.9 0.6 6.4
14.8 12.5
9.7 11.9 7.8 7.5 8.4 4.7 5.0 5.0 1.7 1.4 0.7 8.9
13.6 11.8
10.3 9.2
14.2 3.6
10.3 7.6 5.7 3.7 NA 2.9 0.9 6.2
11.2 11.9
12.0 8.1
11.0 8.6 6.1 6.0 5.6 5.2 1.7 1.8 0.7
10.1
0.7 0.6
0.6 0.7 0.6 0.7 0.7 0.4 0.3 0.4 0.1 0.2 0.1 -
NA = values not available, any unavailable carbohydrate being derived from this food group in 1980 would be included in ‘other’ food group.
‘Middle’ 4.8%, ‘Low’ 4.3%; boys ‘High’ 3.8%, ‘Middle’ 3.2% and ‘Low’ 4.6%.
Sweet puddings, biscuits and cakes and eggs have all decreased in their importance as protein sources since 1980. Baked beans were found to contribute 1.6% of the total protein intake. The largest baked bean consumers in 1990 were middle social group boys (Table 6). With the exception of potatoes, baked beans and peas, vegetables contributed little to the total protein intake (0.8%).
Unavailable carbohydrate The food groups important to unavailable carbohydrate intake are given in Table 4. Total unavailable carbohydrate intake (g/d) increased between 1980 and 1990 by approximately 2 g, of which approximately half (0.8 g) was due to increased ‘whole- meal’ bread consumption. In addition, po- tatoes (excluding chips and crisps) and other vegetables together accounted for
approximately 0.6 g of the 2 g increase. Chips remain the largest single food source of unavailable carbohydrate for these chil- dren, 12.9% being derived from this source (14.0% in 1980). A sex difference was evident: chips provided 14.8% of the boys’ total unavailable carbohydrate intake and 11.2% of the girls’. Crisps were more important for girls than for boys, account- ing for 11.0% of the girls’ unavailable carbohydrate intake and 7.8% of the boys’. Chips and crisps showed a social group gradient in their contributions to the total unavailable carbohydrate intake: chips, high, middle and low social group; boys, 12.5%, 13.4%, 18.8%; girls, 7.0%, 11.6%, 11.6%; crisps, boys, 5.8%. 8.9%. 10.4%; girls, 8.0%, 12.6%, 13.4%, respectively. Chips and crisps, together, supplied from 16.6 to 27.0% of the total unavailable carbohydrate intake of children of high and low social groups, respectively.
White bread in 1990 was the second
Sources of energy and macronutrients in children 377
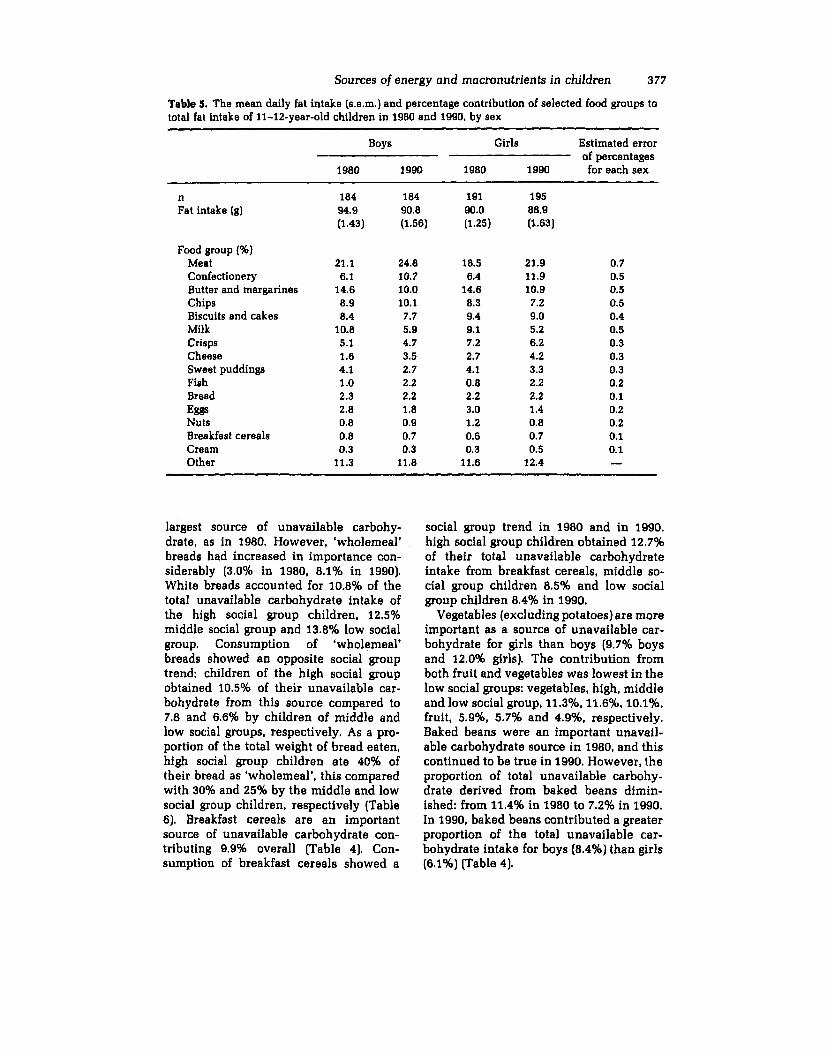
Table 5. The mean daily fat intake (s.e.m.) and percentage contribution of selected food groups to total fat intake of 11-12-year-old children in 1980 and 1990, by sex
Boys Girls Estimated error of percentages
1980 1990 1980 1990 for each sex
n Fat intake (8)
Food group 1%) Meat Confectionery Butter and margarines Chips Biscuits and cakes Milk Crisps Cheese Sweet puddings Fish Bread Em Nuts Breakfast cereals Cream Other
184 184 191 195 94.9 90.8 90.0 88.9 (1.43) (1.56) (1.25) (1.63)
21.1 6.1
14.6 8.9 8.4
10.8 5.1 1.6 4.1 1 .o 2.3 2.8 0.8 0.8 0.3
11.3
24.8 10.7 10.0 10.1 7.7 5.9 4.7 3.5 2.7 2.2 2.2 1.8 0.9 0.7 0.3
11.8
18.5 6.4
14.6 8.3 9.4 9.1 7.2 2.7 4.1 0.8 2.2 3.0 1.2 0.6 0.3
11.6
21.9 11.9 10.9 7.2 9.0 5.2 6.2 4.2 3.3 2.2 2.2 1.4 0.8 0.7 0.5
12.4
0.7 0.5 0.5 0.5 0.4 0.5 0.3 0.3 0.3 0.2 0.1 0.2 0.2 0.1 0.1 -
largest source of unavailable carbohy- drate, as in 1980. However, ‘wholemeal’ breads had increased in importance con- siderably (3.0% in 1980, 8.1% in 1990). White breads accounted for 10.8% of the total unavailable carbohydrate intake of the high social group children, 12.5% middle social group and 13.8% low social group. Consumption of ‘wholemeal’ breads showed an opposite social group trend: children of the high social group obtained 10.5% of their unavailable car- bohydrate from this source compared to 7.8 and 6.6% by children of middle and low social groups, respectively. As a pro- portion of the total weight of bread eaten, high social group children ate 40% of their bread as ‘wholemeal’, this compared with 30% and 25% by the middle and low social group children, respectively (Table 6). Breakfast cereals are an important source of unavailable carbohydrate con- tributing 9.9% overall (Table 4). Con- sumption of breakfast cereals showed a
social group trend in 1980 and in 1990. high social group children obtained 12.7% of their total unavailable carbohydrate intake from breakfast cereals, middle so- cial group children 8.5% and low social group children 8.4% in 1990.
Vegetables (excluding potatoes) are more important as a source of unavailable car- bohydrate for girls than boys (9.7% boys and 12.0% girls). The contribution from both fruit and vegetables was lowest in the low social groups: vegetables, high, middle and low social group, 11.3%, 11.6%, l O . l % , fruit, 5.9%, 5.7% and 4.9%, respectively. Baked beans were an important unavail- able carbohydrate source in 1980, and this continued to be true in 1990. However, the proportion of total unavailable carbohy- drate derived from baked beans dimin- ished from 11.4% in 1980 to 7.2% in 1990. In 1990, baked beans contributed a greater proportion of the total unavailable car- bohydrate intake for boys (8.4%) than girls (6.1%) (Table 4).
Tab
le 6
. A
vera
ge d
aily
inta
ke (8
) (s.
e.m
.) of
sel
ecte
d fo
od g
roup
s by
sex
and
soc
ial g
roup
; sex
es c
ombi
ned,
in 1
990
w
-.I
W
All
food
and
dri
nk
Cer
eals
and
pud
ding
s W
hite
bre
ad
‘Who
lem
eal’
brea
d B
reak
fast
cer
eals
B
iscu
its a
nd c
akes
Sw
eet p
uddi
ngs
Milk
, milk
pro
duct
s an
d eg
gs
Who
le m
ilk
Skim
med
or s
emi-
skim
med
milk
M
ilksh
akes
C
ream
C
hees
e E
sgs
Fats
and
oils
B
utte
r and
dai
ry s
prea
ds
Low
fat s
prea
ds
Poly
unsa
tura
ted
mar
gari
nes
‘Oth
er’ m
arga
rine
s
Mea
t pro
duct
s an
d fis
h A
ll m
eats
(o
f whi
ch b
urge
rs a
nd
saus
ages
) Fi
sh
Sex
Soci
al g
roup
Boy
s G
irls
Hig
h M
iddl
e L
OW
(n =
184
) (n
= 1
95)
(n =
137
) (n
= 1
16)
(n =
70)
1576
.7 (
26.0
) 16
10.1
(27
.2)
1601
.7 (
33.5
) 16
23.1
(32
.2)
1600
.3 (
43.3
)
50.4
(3
.8)
46.1
(2
.2)
40.4
(1
.9)
37.6
(2
.2)
43.8
(2
.6)
16.7
(3
.1)
19.0
(1
.8)
20.2
(1
.7)
25.2
(2
.2)
18.7
(2
.2)
31.3
(1
.9)
25.3
(1
.9)
31.6
(2.3)
25.5
(2
.3)
25.3
(2
.7)
34.6
(2
.2)
37.1
(1
.8)
38.4
(2
.7)
35.8
(2
.3)
31.4
(2
.6)
54.2
(3
.9)
60.6
(3
.8)
.64.
3 (5
.1)
59.5
(4
.6)
48.6
(6
.0)
103.
4 (9
.4)
95.8
(7
.7)
78.9
(9
.7)
94.8
(10
.9)
113.
7 (1
2.8)
93
.6
(9.9
) 58
.9
(6.7
) 10
1.2
(11.
8)
79.6
(10
.7)
54.9
(11
.4)
32.3
(5
.0)
31.6
(3
.8)
29.8
(4
.9)
30.3
(6
.6)
29.8
(4
.9)
0.7
(0.2
) 1.
3 (0
.3)
1.2
(0.4
) 1.
3 (0
.3)
0.8
(0.3
) 9.
8 (0
.9)
10.9
(0
.9)
11.7
(1
.1)
9.8
(1.0
) 11
.0
(1.5
) 11
.4
(1.2
) 8.
6 (1
.0)
9.4
(1.0
) 9.
1 (1
.7)
11.4
(1
.6)
4.1
(0.5
) 4.
2 (0
.4)
4.3
(0.6
) 3.
9 (0
.5)
4.2
(0.9
) 1.1
(0.3
) 1.
0 (0
.2)
1.4
(0.4
) 1.
2 (0
.3)
0.8
(0.4
) 4.
3 (0
.5)
4.7
(0.5
) 4.
8 (0
.6)
5.1
(0.6
) 4.
1 (0
.9)
2.7
(0.4
) 2.
7 (0
.3)
1.4
(0.3
) 2.
0 (0
.4)
5.4
(0.9
)
128.
8 (6
.8)
132.
4 (4
.1)
117.
4 (3
.7)
122.
3 (4
.7)
123.
5 (4
.9)
23.9
(1
.6)
17.7
(1
.3)
19.7
(1
.7)
21.5
(1
.9)
19.0
(2
.5)
14.8
(2
.2)
15.5
(1
.3)
14.9
(1
.3)
15.3
(1
.5)
14.6
(1
.6)
?
5-r
Tab
le 6
.-Con
t.
Veg
etab
les a
nd f
ruit
v)
0
Veg
etab
les (
not p
otat
oes)
43
.9
(2.4
) 54
.3
(2.4
) 49
.5
(2.9
) 54
.5
(3.5
) 44
.0
(3.6
)
Bak
ed b
eans
C
hips
85
.4
(4.6
) 63
.4
(4.2
) 52
.4
(4.0
) 70
.7
(5.4
) 92
.9
(8.7
) 17
.9
(1.3
) C
risp
s 12
.0
(0.8
) 15
.7
(0.9
) 10
.1
(0.8
) 15
.8
(1.2
)
Oth
er p
otat
oes
55.7
(2
.7)
50.1
(2
.3)
52.3
(2
.9)
54.9
(3
.4)
49.2
(3
.7)
Fres
h fr
uit
47.7
(4
.4)
58.4
(4
.2)
55.5
(4
.7)
55.3
(6
.3)
52.6
(6
.5)
(of w
hich
pea
s)
9.0
(1.0
) 9.
8 (0
.9)
7.7
(0.9
) 11
.0
(1.6
) E
21.9
(2
.2)
15.5
(1
.9)
15.1
(2
.4)
20.4
(2
.8)
19.7
(3
.5)
0 % %
Jack
et po
tato
es
3.2
(0.6
) 6.
5 (0
.8)
6.2
(0.9
) 4.
4 (0
.9)
5.1
(1.2
) 1 B
Nut
s 1.
6 (0
.3)
1.4
(0.3
) 1.
9 (0
.4)
1.2
(0.3
) 1.
2 (0
.3)
1
Suga
r, co
nfec
tione
ry a
nd b
ever
ages
2
Tab
le s
ugar
8.
2 (0
.7)
8.5
(0.7
) 6.
7 (0
.9)
7.4
(0.8
) 10
.8
(1.2
) 0
Con
fect
ione
ry
64.0
(3
.7)
63.0
(3
.2)
59.0
(3
.4)
64.3
(4
.2)
75.6
(7
.6)
i! So
ft d
rink
s 27
7.0
(11.
9)
296.
7 (2
.5)
312.
6 (1
4.5)
28
3.9
(13.
6)
296.
0 (2
4.7)
5 z.
J iT 5’ 2
10.4
(1
.5)
(0
0 e
Alc
ohol
ic d
rink
s 3.
4 (1
.0)
1.7
(0.5
) 3.
2 (0
.9)
0.8
(0.4
) 1.
6 (0
.7)
0 $ 1
380.
Fat Pata were not collected in such a way to make analysis of the fatty acid composition of the diet possible, and only total fat intake was obtained. Attempts were made, though, to investigate the nature of spread- ing fats and milk used by the children, as these two food types were considered to represent aspects of the dietary fats most readily altered in the pursuit of adherence to ‘healthy eating’ guidelines. Table 5 shows the contribution made to total fat intake by the selected food groups in 1990 and 1980. Total fat (g/d) intake was un- changed. ‘Meat’ remained the most impor- tant source of fat (23%), although this includes contributions both from fatty meats and from fats added during food processing, for example pastry. Confec- tionery has become the second largest contributor to the total fat intake of these children (11.3% in 1990, but only 6.3% in 1980). This increase reflects not only an increase in confectionery consumption but also a change in the nature of the confec- tionery eaten, an increased part being played by chocolate, chocolate-covered confectionery and ice-cream.
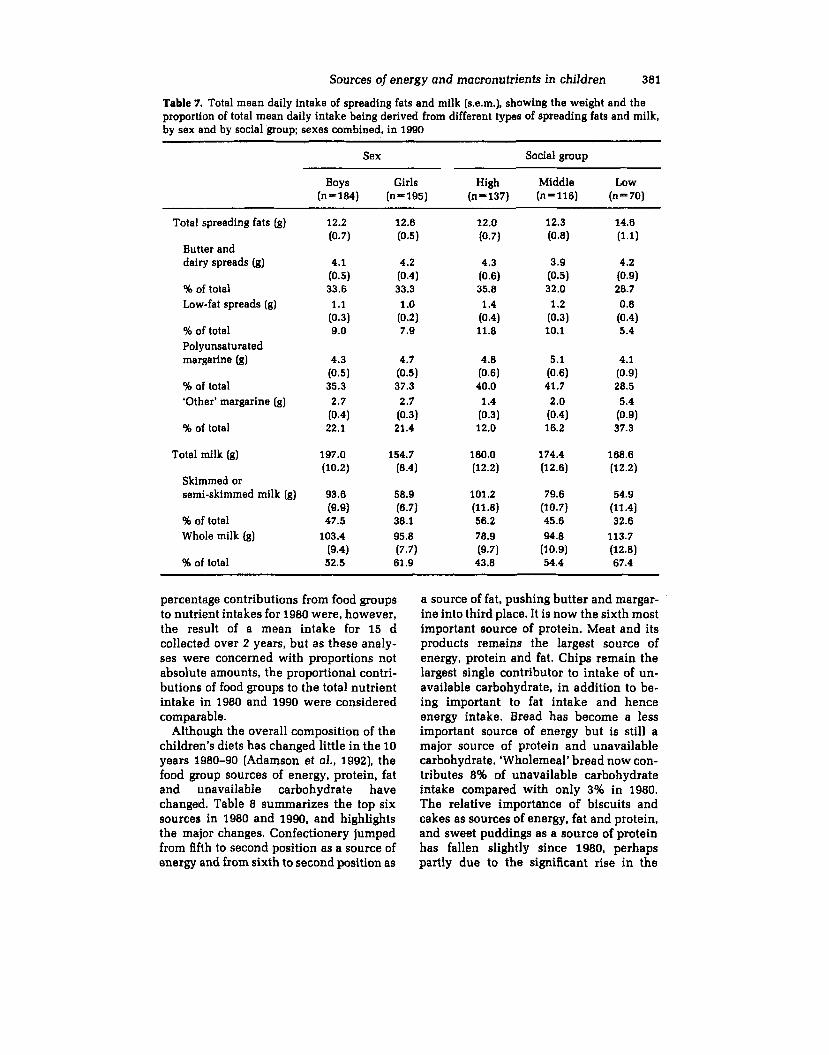
Butter and margarines accounted for 10.5% of total fat intake (14.6% in 1980). This reflects a decrease in the use of spreading fats but also a change in the type of spreading fats used by some. A social group trend in the total weight of spreading fats used was evident in 1990: ‘High’ 12.0 g, ‘Middle’ 12.3 g and ‘Low’ 14.6 g daily. This pattern was further investigated by deter- mining the nature of spreading fats used (Table 7). Low-fat spreads accounted for a small proportion of the total weight of spreading fats used by all social groups (‘High‘ 1.4 g, ‘Middle’ 1.2 g and ‘Low’ 0.8 g). The social group gradient in the proportion of total spreading fat which was a low-fat spread was more marked: ‘High’ 11.8%, ‘Middle’ 10.1% and ‘Low’ 5.4%. Polyunsat- urated margarines also showed a social group gradient: 40% of all spreading fats used by the high social group children were polyunsaturated, which fell to 28.5% for children of the low social group. The ‘other margarine’ group, being a fat spread of unspecified nature, accounted for 37.3%
A. I. Adamson et al.
(5.4 g/d) of spreading fats used by low social group children but only 12% (1.4 g/d) for children of the high social group (Table 7).
The contribution made to total fat intake by milk has fallen considerably (10.1% in 1980, 5.5% in 1990). This is due to both a decrease in milk consumption, but also a change in the nature of the product. In 1980 consumption of reduced-fat milks was negligible. Reduced-fat milks are now more widely available and are commonly used. Table 7 shows that the high social group children had a larger milk intake (180 g/d) than the low social group chil- dren (169 g/d). Of the 180 g consumed daily by children of high social group, 56% was either skimmed or semi-skimmed milk. This compares with 46% of the total milk intake of middle social group children and 33% of the low social group.
Discussion
This paper has reported the contribution of food groups to the energy, protein, fat and unavailable carbohydrate intakes of Nor- thumbrian children, attending the same schools in 1980 and 1990. So that direct comparison can be made, the composition of the food groups used in 1980 (Hackett et RL, 1986) has been adopted unchanged. The %day diary and interview method was used in both studies (Hackett et al., 1984; Adamson et al., 1992), and although a different dietitian conducted the surveys in 1980 and 1990, any possible effect of this change was minimized by duplicate exam- inations by the dietitians before the survey commenced, as described by Adamson et al. (1992). The duration of the study, and hence the number of days surveyed, was unavoidably shorter in 1990 than in 1980: the 1980 study was conducted over a 2- year period (1979-81), each child complet- ing five 3-day diaries, while the 1990 study was completed in 1 year, collecting two 3- day diaries from each child. The mean daily intakes of nutrients given in the results for both 1980 and 1990 were calcu- lated from 6 days’ intake for each child and refer to children of similar mean age. The
Sources of energy and macronutrients in children 381
Table 7. Total mean daily intake of spreading fats and milk (s.e.m.), showing the weight and the proportion of total mean daily intake being derived from different types of spreading fats and milk, by sex and by social group; sexes combined, in 1990
Sex Social group
Boys Girls Hi& Middle Low (n--184) (11-195) (11-137) (11-116) (11-70)
Total spreading fats (g)
Butter and dairy spreads (g)
% of total Low-fat spreads (g)
% of total Polyunsaturated margarine (8)
% of total ‘Other’ margarine (8)
% of total
Total milk (9)
Skimmed or semi-skimmed milk (g)
% of total Whole milk (g)
% of total
12.2 (0.7)
4.1
33.6 1.1
9.0
4.3
35.3 2.7
22.1
197.0
(0.5)
(0.3)
(0.5)
(0.4)
(10.2)
(9.9) 93.6
47.5 103.4
(9.41 52.5
12.6 (0.5)
(0.4) 4.2
33.3 1 .o
7.9
4.7
37.3 2.7
21.4
154.7 (8.4)
58.9 (6.7) 38.1 95.8
61.9
(0.2)
(0.5)
(0.3)
(7.7)
12.0 (0.7)
4.3 (0.6) 35.8 1.4
11.8
4.8 (0.61 40.0 1.4
12.0
180.0
(0.4)
(0.3)
(12.2)
101.2 (11.8) 56.2 78.9
43.8 (9.7)
12.3 (0.8)
3.9
32.0 1.2
10.1
5.1 (0.6)
41.7 2.0
16.2
174.4 (12.6)
79.6 (10.7) 45.6 94.8
54.4
(0.5)
(0.3)
(0.41
(10.9)
14.6 (1.1)
(0.9) 4.2
28.7 0.8
5.4
4.1 (0.9) 28.5 5.4
37.3
168.6
(0.4)
(0.9)
(12.2)
54.9 (11.4) 32.6
113.7 (12.8) 67.4
percentage contributions from food groups to nutrient intakes for 1980 were, however, the result of a mean intake for 15 d collected over 2 years, but as these analy- ses were concerned with proportions not absolute amounts, the proportional contri- butions of food groups to the total nutrient intake in 1980 and 1990 were considered comparable.
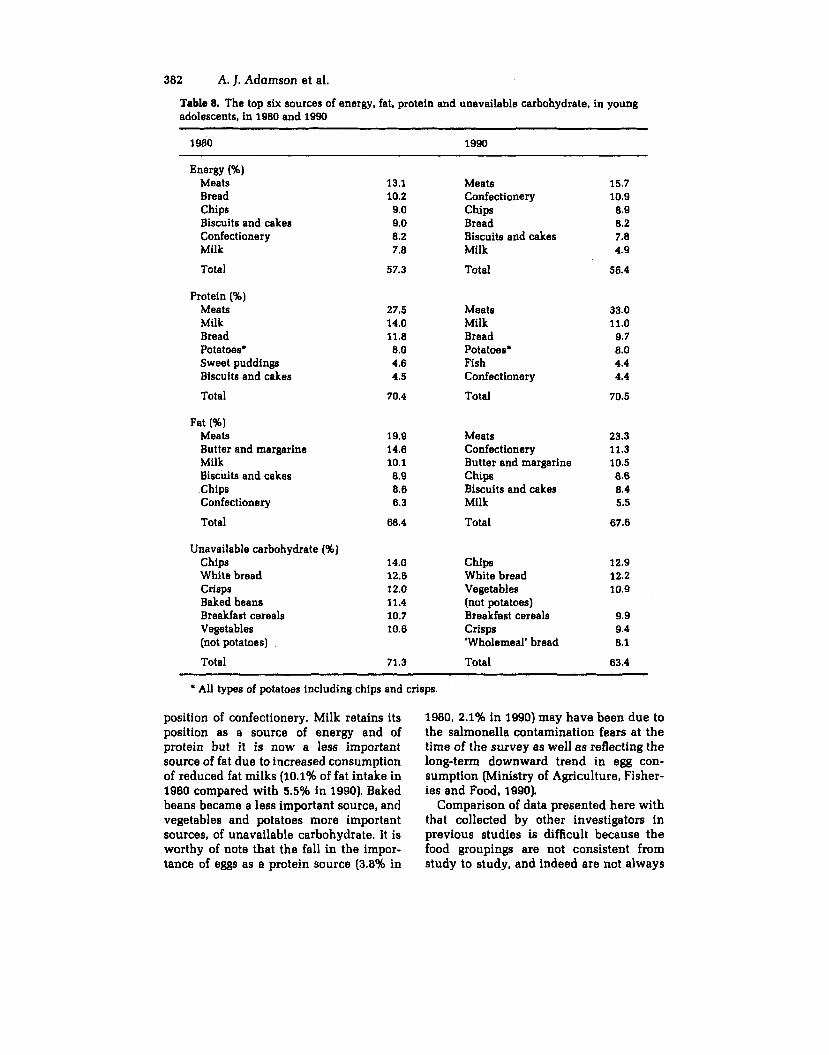
Although the overall composition of the children’s diets has changed little in the 10 years 1980-90 (Adamson et al., 1992), the food group sources of energy, protein, fat and unavailable carbohydrate have changed. Table 8 summarizes the top six sources in 1980 and 1990, and highlights the major changes. Confectionery jumped from fifth to second position as a source of energy and from sixth to second position as
a source of fat, pushing butter and margar- ine into third place. It is now the sixth most important source of protein. Meat and its products remains the largest source of energy, protein and fat. Chips remain the largest single contributor to intake of un- available carbohydrate, in addition to be- ing important to fat intake and hence energy intake. Bread has become a less important source of energy but is still a major source of protein and unavailable carbohydrate. ‘Wholemeal’ bread now con- tributes 8% of unavailable carbohydrate intake compared with only 3% in 1980. The relative importance of biscuits and cakes as sources of energy, fat and protein, and sweet puddings as a source of protein has fallen slightly since 1980, perhaps partly due to the significant rise in the
382 A. I. Adamson et al.
Table 8. The top six sources of energy, fat, protein and unavailable carbohydrate, in young adolescents, in 1980 and 1990
1980 1990
Energy (%) Meats Bread Chips Biscuits and cakes Confectionery Milk
Total
Protein (%) Meats Milk Bread Potatoes* Sweet puddings Biscuits and cakes
Total
Fat (%) Meats Butter and margarine Milk Biscuits and cakes Chips Confectionery
Total
Unavailable carbohydrate (%) Chips White bread Crisps Baked beans Breakfast cereals Vegetables (not potatoes)
Total
13.1 10.2 9.0 9.0 8.2 7.8
57.3
27.5 14.0 11.8 8.0 4.6 4.5
70.4
19.9 14.6 10.1 8.9 8.6 6.3
68.4
14.0 12.6 12.0 11.4 10.7 10.6
71.3
Meats Confectionery Chips Bread Biscuits and cakes Milk
Tot81
Meats Milk Bread Potatoes* Fish Confectionery
Total
Meats Confectionery Butter and margarine
Biscuits and cakes Milk
Total
Chips
Chips White bread Vegetables (not potatoes) Breakfast cereals Crisps ‘Wholemeal’ bread
Total
15.7 10.9 8.9 8.2 7.8 4.9
56.4
33.0 11.0 9.7 8.0 4.4 4.4
70.5
23.3 11.3 10.5 8.6 8.4 5.5
67.6
12.9 12.2 10.9
9.9 9.4 8.1
63.4
* All types of potatoes including chips and crisps.
position of confectionery, Milk retains its position as a source of energy and of protein but it is now a less important source of fat due to increased consumption of reduced fat milks (10.1% of fat intake in 1980 compared with 5.5% in 1990). Baked beans became a less important source, and vegetables and potatoes more important sources, of unavailable carbohydrate. It is worthy of note that the fall in the impor- tance of eggs as a protein source (3.8% in
1980, 2.1% in 1990) may have been due to the salmonella contamination fears at the time of the survey as well as reflecting the long-term downward trend in egg con- sumption (Ministry of Agriculture, Fisher- ies and Food, 1990).
Comparison of data presented here with that collected by other investigators in previous studies is difficult because the food groupings are not consistent from study to study, and indeed are not always
Sources of energy and macronutrients in children 383
clearly defined. The only similar study of British adolescents was completed 20 years ago. when Durnin et al. (1974) reported the percentage of the total intake of protein and energy derived from various food groups by 14-year-old Glasgow children in 1964 and 1971. Their results have previ- ously been compared with the 1980 Nor- thumberland survey (Hackett et a]., 1986), and the study presented here indicates a continuation of possible trends suggested by that comparison. For example, the con- tributions of milk to energy intake in 1964, 1971,1980 and 1990, respectively, were 14, 10, 8 and 5%. Similar data for bread were 13, 11, 10 and 8%, and for biscuits and cakes 13, 10, 9 and 8%. Percentage energy intake from potatoes had increased, pota- toes contributed 9 and 11% of the total energy intake of 14-year-old Glasgow chil- dren in 1964 and 1971, compared to 16% of energy in both 1980 and 1990, in 11-12- year-old Northumberland children. In 1964, milk contributed between 19 and 21% of the total protein intake; this had fallen to approximately 15% in 1974, and to 14 and 11% in 1980 and 1990, respectively. This would suggest both a fall in milk consumption and a change in type of milk, as both protein and fat derived from milk fell.
Exhaustive comparisons with National Food Survey committee reports of 1980 and 1989 (Ministry of Agriculture, Fisher- ies and Food, 1982, 1990) are unwarranted as these data were obtained through sur- veys of household purchasing for the whole population and are not age-specific. However, the consumption data presented here reflect some of the national trends: for example, a decrease in purchasing of bread with increased proportions of wholemeal bread. A reduction in the amount of milk purchased, with a move towards semi- skimmed milk, particularly by higher in- come group families, has been reported by the National Food Survey committee and is paralleled by the results presented in Tables 3 and 6. National figures show a fall in purchasing of both table sugar and spreading fats, which is reflected by the reduced role played by these foods in the diet of 11-12-year-old children (Table 2).
The increase in the importance of soft drinks and of breakfast cereals (Table 2) also follows the purchasing trends reported in national data. No data are available in the National Food Survey reports on con- fectionery, a large contributor to the diet of these adolescents. An increasing propor- tion of foods is now being eaten outside of the home; all of these foods are excluded from the National Food Survey.
The most recent large dietary survey of British children was conducted in 1983 and included 1723 10-11-year-old children who completed a 7-day weighed record (Department of Health, 1989a). The propor- tional contribution of food groups to en- ergy and fat were given where they ex- ceeded 5%. Curiously, protein, unavailable carbohydrate and sugars were not re- ported. Bread provided 9-10% of the total energy intake in the diet of 10-11-year-old children in 1983 (compared with 10% in 1980 and 8% in 1990 in our surveys), chips 8% (9% in both 1980 and 1990), biscuits and cakes together contributed 11% (9% in 1980 and 8% in 1990), sweet puddings 5% (6% in 1980 and 4% in 1990). Twelve per cent of all fat intake was reported to be derived from milk by 10-11-year-old chil- dren in 1983; this compares to 10% in 1980 and 6% in 1990 by the 11-12-year-old children surveyed in Northumberland. Confectionery was not included in the energy and fat results of this Department of Health (1989a) survey. This can be ex- plained as confectionery was not consi- dered as a single food group, but was subdivided into chocolate and sugar con- fectionery and the contribution to both energy and fat intakes, from each of the food groups was less than 5%.
In a recent report of conference proceed- ings, Nelson (1991) presented information on the diets of 78 boys aged 11-12 years. The mean daily energy intake recorded by Nelson (1991) using a 7-day weighed in- ventory method, was 7.74 MJ, considerably lower than the 8.61 MJ recorded for the 184 boys in our 1990 survey. Nelson (1991) reported that the per cent energy obtained from ‘foods often villified by health educa- tors’ (confectionery, biscuits, cakes, pudd- ings, ice-cream, soft drinks, table sugar,
384
chips and crisps) was 357% while in our study it was 40.4%. Confectionery pro- vided 10.9% of the total energy and 11.3% of the total fat, in the diet of our 11-12- year-old children in Northumberland, 1990. It is now an important group of foods for these children and more information on consumption is required.
Michaud et al. (1991) reported the food sources of macronutrients for French ado- lescents (aged 15-19 years), from a 1-day dietary record. Several marked differences between the French and Northumbrian studies are worthy of note. French adole- scents derived 5% of their total fat intake from potatoes (at least 14.1% in our 1990 study), 9% from cheese (3.8% in our 1990 study) and 3.8% from milk (5.5% in our 1990 study). The authors commented that the high contribution to fat intake from potatoes is due to the popularity of french fries, a popularity more than matched in our sample by English chips.
The social group gradient evident in the selection of spreading fats and milk (Table 7), suggests that health education advice to reduce fat intake and to use polyunsatu- rated fat is being acted upon, at least with respect to these foods, by the high and middle social groups to a greater extent than by low social groups. Children from high and middle social groups ate less spreading fat in total, of which a greater proportion was either polyunsaturated or low-fat brands, than children of low social groups. A social group gradient exists for both total milk and type of milk consump- tion. Children from the higher social groups took more milk in total, of which a larger proportion was of a fat-reduced type. Undoubtedly financial constraints may also play a part in food selection. However, this cannot be so in milk selection where our enquiries revealed no price differential existed at this time in the study area.
The advantage of analyses of dietary intake by food group is that the diet of the subjects is presented as foods, thereby indicating the possible target food groups for future advice. When the food sources of several nutrients are presented together it highlights the problems associated with making recommendations for one single
A. I. Adamson et el.
dietary component. The reciprocal rela- tionship between fat and sugar intakes, elaborated by COMA (Department of Health, 1989b), demonstrates this point. Some food groups, for example, confec- tionery and biscuits and cakes, are high contributors to both fat and sugar intakes. In our 1990 study, chips, crisps and confec- tionery together accounted for over 25% of the total fat intake of these young adole- scents. Crisps and confectionery are eaten almost exclusively as ‘snacks’ whilst chips may form part of a meal but are also a snack food. A reduction by half, in the fat content or the consumption of these foods alone, would result in a fall in the average contribution to energy fromifat, from 39.5% (Adamson et al., 1992) to 34.4% for these children, thereby achieving the target for total fat intake set by COMA (Department of Health and Social Security, 1984) and endorsed by COMA (Department of Health, 1991). A desirable reduction in non-milk extrinsic sugars. intake would also result. This calculation makes the assumption that the energy derived from these food sources would be replaced by foods with minimal fat and non-milk ex- trinsic sugar content. However, 24% of the energy intake of these children was also derived from chips, crisps and confection- ery and, in addition, chips and crisps account for 22% of the total unavailable carbohydrate intake. It is clear that advice fo reduce consumption of high-fat or high- sugar foods must be accompanied by ad- vice to increase alternative foods, which will compensate energy and unavailable carbohydrate intakes, without an undesir- able ‘see-saw’ increase in either non-milk extrinsic sugars or fat intake.
Those concerned with health education will be disappointed to note the increase in the importance of confectionery and soft drinks and the continued importance of chips and crisps in the diet of young adolescents, despite 10 years of intensive publicity. Although no one food can be blamed, for example, for high-fat intake, perhaps more actively discouraging the intake of these items may achieve some desirable changes. When the massive mar- keting of these items is considered, the
Sources of energy and macronutrients in children 385
prospects cannot be good. Some beneficial changes have occurred, notably in the use of spreading fat and type of milk con- sumed. Presumably this is because of the presence of acceptable alternatives that have been extensively and expensively marketed by manufacturers and pro- ducers. Alternative snacks to crisps, chips and confectionery are required as a matter of urgency if current dietary recommenda- tions and targets are to be met. Achieving these goals will need co-operation between health educators, Government, the food manufacturing and retailing industries, schools and parents.
Acknowledgments The authors gratefully acknowledge the financial support of the Medical Research Council and Newcastle Health Authority, and the kind assistance of the Northum- berland Health and Education Authorities, the schools and the families involved.
References Adamson, A., Rugg-Gunn. A., Butler, T., Apple-
ton, D. & Hackett, A. (1992) Nutritional intake, height and weight of 11- to 12-year-old Nor- thumbrian children in 1990 compared with information obtained in 1980. Br. J. Nutr. 68, (in press).
Department of Health (1989a) The Diets ofBritish Schoolchildren. Report on Health and Social Subjects no. 36. London: HMSO.
Department of Health (1989b) Dietary Sugars and Human Disease. Report on Health and Social Subjects no. 37. London: HMSO.
Department of Health (1991) Dietary Reference Valu~s for Food Energy and Nutrients for the United Kingdom. Report on Health and Social Subjects no. 41. London: HMSO.
Department of Health and Social Security (1984) Diet and Cardiovascular Disease. Report on Health and Social Subjects no. 28. London: HMSO.
Durnin, J.V.G.A.. Lonergan, M.E., Good, J. & Ewan, A. (1974) A cross sectional and anthro- pometric study, with an interval of 7 years, on 611 young adolescent schoolchildren. Br. J. Nutr. 32, 169-179.
Hackett, A.F., Rugg-Gunn, A.J. & Appleton, D.R. (1983) The use of a dietary diary and interview to estimate the food intake of children. Hum. Nutr.: Appl. Nutr. 37A. 293-300.
Hackett, A.F., Rugg-Gunn, A.J., Appleton, D.R., Eastoe, J.E. & Jenkins, G.N. (1984) A 2-year longitudinal nutritional survey of 405 Nor- thumberland children initially aged 11.5 years. Br. I. Nutr. 51, 67-75.
Hackett, A.F., Rugg-Gunn, A.J., Appleton, D.R. & Coombs, A. (1986) Dietary sources of energy, protein, fat and fibre in 375 English adole- scents. Hum. Nutr.: Appl. Nutr. MA, 176-184.
Holland, B., Unwin, I.D. & Buss, D.H. (1988) Cereals and Cereal Products. The Third Sup- plement to McCance and Widdowson’s ‘The Composition of Foods’, 4th edn London: The Royal Society of Chemistry and Ministry of Agriculture, Fisheries and Food.
Holland, B., Unwin, I.D. & Buss, D.H. (1989)Milk products and eggs. The Fourth Supplement to McConce and Widdowson’s ‘The Composition of foods’, 4th edn London: The Royal Society of Chemistry and Ministry of Agriculture, Fisheries and Food.
Michaud, C., Corniglion, J.M., Michel, F., Musse, N., Nicholas, J.P. & Mejean, L. (1991) Sources of macronutrients and energy in the diet of a group of French high-school students on school-days. J. Hum. Nutr. Diet. 4, 91-99.
Ministry of Agriculture, Fisheries and Food (1982) Household Food Consumption and Ex- penditure 1960; Annual Reports of the No- tional Food Survey Committee. London: HMSO.
Ministry of Agriculture, Fisheries and Food (1990) Household Food Consumption and Ex- penditure 1989; Annual Reports of the Notional Food Survey Committee. London: HMSO.
National Advisory Committee on Nutrition Edu- cation (1983) A Discussion Paper on Proposals for Nutritional Guidelinesfor Health Education in Britain. London: Health Education Council.
Nelson, M. (1991) Food, vitamins and IQ. Proc. Nutr. SOC. 50, 29-35.
Paul, A.A. & Southgate, D.A.T. (1978) McConce and Widdowson’s ‘The Composition of Foods’ (4th edn). London: HMSO.
Registrar General (1970) Classification of Occu- pations 1970. Office of Population Censuses and Surveys. London: HMSO.
Registrar General (1980) Classification of Occu- potions 1980. Office of Populations Censuses and Surveys. London: HMSO.
Tan, S.P., Wenlock. R.W. & Buss, D.H. (1985) Immigrant Foods. Second Supplement to McCance and Widdowson’s ‘The Composition of Foods’. London: HMSO.
Wenlock. R.W., Sivell. L.M. & Agater, LB. (1985) Dietary fibre fractions in cereal and cereal- containing products in Britain. J. Sci. Food Agric. 36, 113-121.
MS accepted August 1992