Embed Size (px)
Citation preview
REVIEW
Carbohydrate intake and obesity
RM van Dam1,2,3 and JC Seidell3
1Department of Nutrition, Harvard School of Public Health, Boston, MA, USA; 2Channing Laboratory, Department of Medicine,Brigham and Women’s Hospital, and Harvard Medical School, Boston, MA, USA and 3Institute of Health Sciences, Vrije UniversiteitAmsterdam, Amsterdam, The Netherlands
The prevalence of obesity has increased rapidly worldwide and the importance of considering the role of diet in the preventionand treatment of obesity is widely acknowledged. This paper reviews data on the effects of dietary carbohydrates on bodyfatness. Does the composition of the diet as related to carbohydrates affect the likelihood of passive over-consumption and long-term weight change? In addition, methodological limitations of both observational and experimental studies of dietarycomposition and body weight are discussed. Carbohydrates are among the macronutrients that provide energy and can thuscontribute to excess energy intake and subsequent weight gain. There is no clear evidence that altering the proportion of totalcarbohydrate in the diet is an important determinant of energy intake. However, there is evidence that sugar-sweetenedbeverages do not induce satiety to the same extent as solid forms of carbohydrate, and that increases in sugar-sweetened softdrink consumption are associated with weight gain. Findings from studies on the effect of the dietary glycemic index on bodyweight have not been consistent. Dietary fiber is associated with a lesser degree of weight gain in observational studies.Although it is difficult to establish with certainty that fiber rather than other dietary attributes are responsible, whole-graincereals, vegetables, legumes and fruits seem to be the most appropriate sources of dietary carbohydrate.European Journal of Clinical Nutrition (2007) 61 (Suppl 1), S75–S99. doi:10.1038/sj.ejcn.1602939
Keywords: obesity; diet; carbohydrate; fiber; sugar; glycemic index
General introduction
Background
The prevalence of overweight and obesity has increased
rapidly worldwide during recent decades, acquiring epidemic
proportions in children and adults and in industrialized as
well as transitional and developing countries (Popkin and
Gordon-Larsen, 2004; Ogden et al., 2006). Excess adiposity
increases risk of type 2 diabetes, arthritis, sleep apnea,
hypertension, dyslipidemia, cardiovascular diseases, various
types of cancer and premature death (Willett et al., 1999).
Therefore, the importance of prevention and treatment of
obesity is widely acknowledged. Changes in energy storage
as body fat are affected by the balance of energy intake and
energy expenditure, making diet and physical activity
obvious targets for interventions. Effects of dietary composi-
tion on both energy intake and energy expenditure (dietary
induced thermogenesis and resting energy metabolism) are
plausible, based on results from animal experiments and
metabolic studies in humans (Poppitt and Prentice, 1996;
Ludwig, 2002; Bray et al., 2004a, b; Halton and Hu, 2004;
Slavin, 2005). Although substantial short-term weight loss can
be achieved by many people, successful long-term mainte-
nance of weight loss is much more difficult and compensatory
physiological processes appear to stimulate weight regain
(Hirsch et al., 1998). Effects on body weight found in short-
term metabolic studies can therefore not be readily extra-
polated to long-term effects. This overview will present
evidence for the effects of dietary composition related to
carbohydrates on body fatness. Dietary factors that will be
discussed include the proportion of total carbohydrates in
the diet, free-sugars, sugar-sweetened beverages, the dietary
glycemic index (GI) and dietary fiber. Studies have been
identified through systematic and narrative reviews on these
topics supplemented with searches in MEDLINE (PubMed)
until July 2007. The emphasis is on longer-term studies, but
shorter-term studies are also discussed depending on the
availability of data for different exposures.
Methodological considerations for studies relating diet to body
weight
Methodological limitations have to be considered in the
interpretation of results on macronutrient composition in
Correspondence: Dr RM van Dam, Department of Nutrition, Harvard School
of Public Health, 665 Huntington Avenue, Boston, MA 02115, USA.
E-mail: [email protected]
European Journal of Clinical Nutrition (2007) 61 (Suppl 1), S75–S99& 2007 Nature Publishing Group All rights reserved 0954-3007/07 $30.00
www.nature.com/ejcn
relation to weight change or the incidence of obesity. We
will discuss these methodological limitations separately for
observational and experimental studies.
Observational studies. In these studies, individuals typically
report their food intakes by interviews or questionnaires, and
the obtained estimates are related to their body mass index
(BMI) or change in body weight. There are several metho-
dological issues that make results from observational studies
of diet and body weight difficult to interpret. First, the
possibility of an effect of perceived body weight or changes
in body weight on dietary habits (‘reverse causation’) should
be considered. In contrast to various other health outcomes,
people tend to be highly aware of their body weight and
changes therein. In addition, many people hold strong
beliefs about the relation between the composition of the
diet and body weight and have control over two of the main
determinants of body weight: energy intake and energy
expenditure through physical activity. Cross-sectional stu-
dies where diet and measures of obesity are assessed
simultaneously are therefore difficult to interpret: the
perception that their body weight is high or increasing
may lead persons to change their dietary habits (for example,
dieting). For this reason, prospective observational studies
relating dietary intakes to changes in body weight would be
preferable. However, because changes in energy balance are
likely to almost directly translate into changes in body
weight, it seems biologically most relevant to study changes
in dietary intakes in relation to changes in body weight over
the same period. Because the exposure is not assessed before
the outcome, such an analysis is not truly prospective and
associations may still reflect an effect of perceived changes in
body weight on changes in dietary habits over the same
period.
Second, selective underreporting of dietary intakes can be
correlated with the degree of overweight (Heitmann and
Lissner, 1995; Heerstrass et al., 1998). There are indications
that intakes of carbohydrates and fat are more subject to
underreporting than intakes of protein and this can bias
results of studies of macronutrient composition and body
weight.
Third, dietary intakes and reporting thereof can be
correlated to many other characteristics such as age, sex,
socioeconomic status and other health-related habits that
may affect energy balance (Braam et al., 1998). These
characteristics can confound the association between dietary
intakes and body weight. For example, individuals who are
able to adhere to a generally recommended diet for weight
management (for example, a low-fat diet) are also more
likely to be able to adhere to limited total energy intake.
Also, associations between (changes in) dietary intakes and
energy balance have to be interpreted in the context of
(changes in) energy expenditure. The latter is notoriously
difficult to assess and is also subject to reporting bias. These
methodological issues complicate the interpretation of data
on macronutrient intakes and changes therein in relation to
adiposity in observational studies.
Experimental studies. In evidence-based medicine, a stronger
weight is generally given to long-term randomized experi-
mental studies than to observational studies. In the last
several decades, many disputes have been published on the
interpretation of experimental studies that have manipu-
lated macronutrient composition of diets and evaluated
changes in body weight. The same data can be interpreted in
different ways. Some authors have argued that an increasing
proportion of energy coming from fat leads to greater weight
gain (Bray et al., 2004b), whereas others have concluded that
the proportion of energy from fat does not substantially
influence body weight (Willett, 2002). An important issue
here is that the outcomes of experimental studies seem to
be dependent on the choice of subjects (for example,
overweight versus normal weight subjects), the duration of
the experiment (short-term trials of days or weeks versus
trials that last several years) and the choice of foods that have
been used to manipulate macronutrient composition. With
respect to the latter issue, a low-fat, high-carbohydrate diet
can be a diet consisting mainly of highly refined grains and
products with added sugar, or a diet that is close to being a
traditional vegetarian diet (that is, with plenty of whole
grains, legumes, fruits and vegetables). In addition, the effect
of macronutrients on satiety and energy expenditure may
depend on the way diets are administered. Energy intake is
the outcome of the portion size� energy density� frequency
of consumption, and all the three factors can be altered
experimentally in relation to macronutrient composition.
Furthermore, experimental studies in humans rely on the
degree of successful (preferably double blinded) randomiza-
tion and on the compliance of subjects with dietary
regimens. Because both issues are problematic for long-term
trials of macronutrient intakes and weight change, the
strength of the evidence provided by randomized controlled
trials can be limited. Finally, experimental studies can be
performed by changing macronutrient intake with fixed or
ad libitum energy intakes and only the latter will provide us
with insights that are directly relevant for public health.
Effects of dietary intakes in the context of weight manage-
ment in obese persons may be different from the effects on
prevention of weight gain in leaner persons. The transition
from normal weight to obesity can result in changes in the
levels of hormones such as insulin, leptin and adiponectin,
which may alter relative substrate oxidation (fat versus
carbohydrates) and appetite control (Blaak, 2004; Schwartz
and Porte, 2005). In addition, the obese state alters basal and
24-h energy requirements as well as the sensitivity to various
hormones such as insulin and leptin. One should therefore
be cautious in the extrapolation of findings from experi-
mental studies on macronutrient composition and weight
loss in obese persons, to the role of macronutrients in the
prevention of weight gain.
Carbohydrate intake and obesityRM van Dam and JC Seidell
S76
European Journal of Clinical Nutrition
Total carbohydrate intake
Introduction
Weight gain is the result of higher energy intake than energy
expenditure. This is also known as a positive energy balance.
The total amount of energy (expressed in units of kilocalories
or kilojoules per day) ingested by food and drinks come from
four major nutrients (macronutrients).
As shown in the table above, fat contains more energy per
gram than carbohydrates. Carbohydrates, however, also
provide energy and therefore contribute to the total energy
intake per day and thus potentially to a positive energy
balance. One of the most controversial questions in human
nutrition in recent decades has been whether it matters for
energy balance what the relative contribution of macro-
nutrients is to the total energy intake. Potentially, there
could be the differences because of variations in effects on
appetite and satiety or in effects on oxidation and energy
expenditure for different macronutrients. Specifically, it has
been suggested that a higher proportion of fat in the diet can
lead to weight gain through excess energy intake, because it
is less satiating than the same amount of energy from
carbohydrates (Bray et al., 2004b). Others have suggested
that proteins are particularly satiating (Halton and Hu,
2004). The answer to this question is important because if
energy intake in the form of one macronutrient is more
likely to lead to a positive energy balance than energy intake
from other macronutrients, this would provide the basis to
emphasize the reduction of the intake of the former
macronutrient in recommendations for prevention of weight
gain or for achieving weight loss in overweight persons.
Before discussing evidence on the relation between carbohy-
drate content of the diet and body weight, we will discuss
research on energy density, because it is frequently con-
sidered to be an important mediator of effects of dietary
composition on energy balance.
Energy density
Carbohydrates and energy density. The energy density is the
amount of energy per unit of weight of foods, meals or diets
(Prentice and Jebb, 2003; Stubbs and Whybrow, 2004).
Carbohydrate provides less energy per gram than fat and is
thus less energy dense. However, few foods only contain
macronutrients, and the fiber and particularly the water
content (or conversely, the dryness) has a major effect on the
energy density of foods (Drewnowski et al., 2004). As a result,
foods with a high energy percentage of carbohydrates can
range from a low (for example, raw vegetables and fruits) to a
high (for example, sugary candy) energy density (Drewnowski
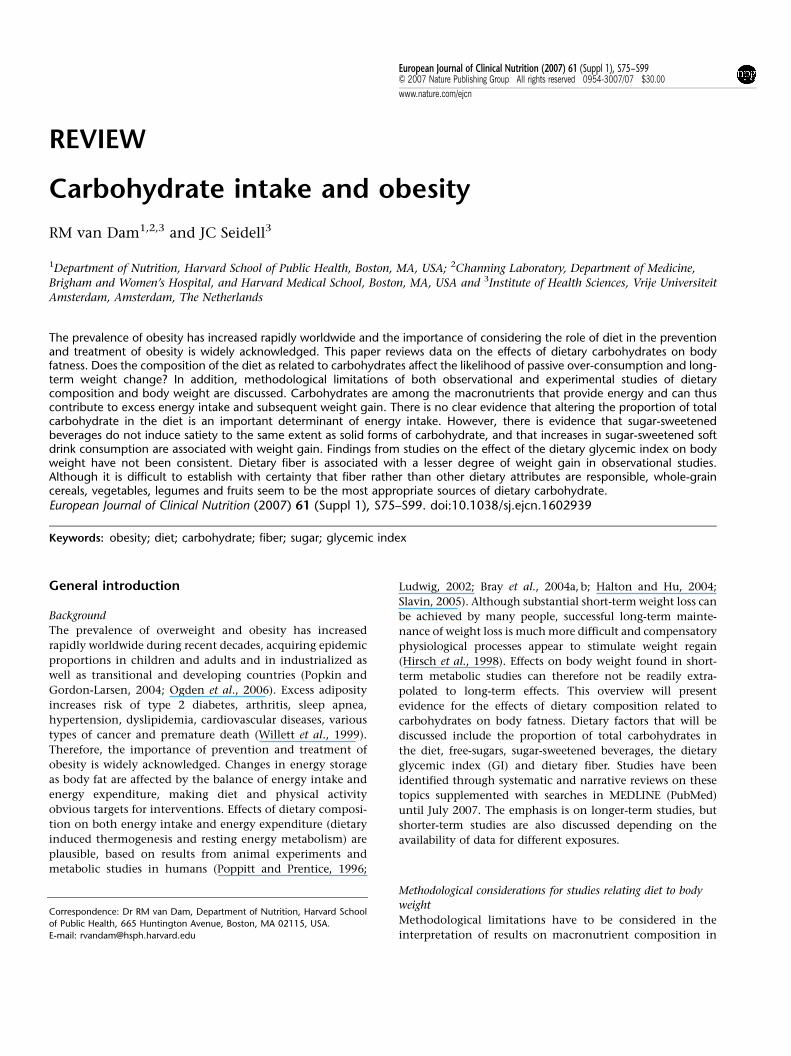
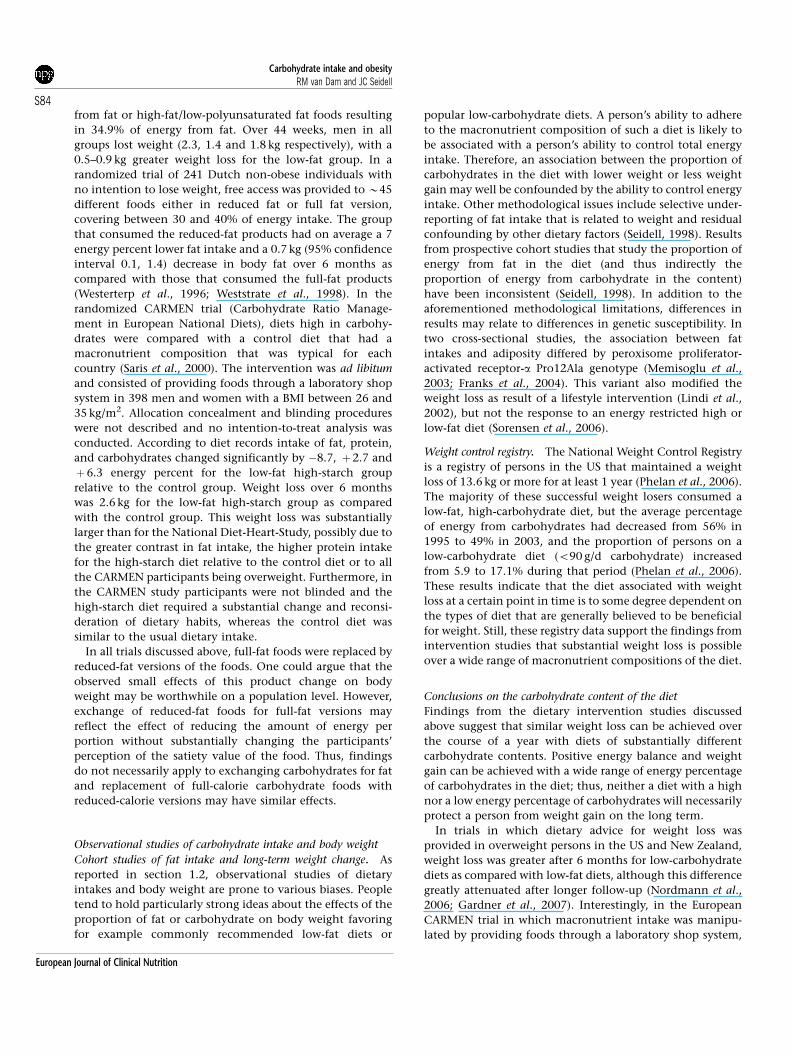
et al., 2004). Figure 1 shows the energy density of commonly
used foods, illustrating that a dry high-carbohydrate food
such as pretzels can have similar energy density as high-fat
foods such as cheese (Klein et al., 2002). The carbohydrate
content of diets tend to have a modest inverse association
with the energy density of diets, whereas a higher fat content
is generally associated with a higher energy density of diets
(Stookey, 2001; Drewnowski et al., 2004). However, whether
a diet with a moderately high energy percentage of fat has a
high or low energy density depends to a large extent on the
amount of fruits and vegetables consumed (Ledikwe et al.,
2006). Because of their high water content, beverages
generally have a lower energy density than solid foods.
However, in the interpretation of the energy density of diets
and foods it seems appropriate to consider foods and
beverages separately given indications that energy intake
from beverages is regulated differently (Mattes, 1996; Rolls
et al., 1999).
Short-term studies of energy density. Laboratory studies testing
covertly manipulated foods for a few days or less found that
under these conditions, the weight or volume of foods is the
major determinant of satiation and satiety with persons
consuming a relatively constant weight of food regardless
of energy density (Poppitt and Prentice, 1996; Stubbs and
Whybrow, 2004). Results from intervention studies lasting
up to 2 weeks suggest that the lower satiety and satiation for
fat as compared with carbohydrate intake (per unit of
energy) can be explained by the lower energy density of
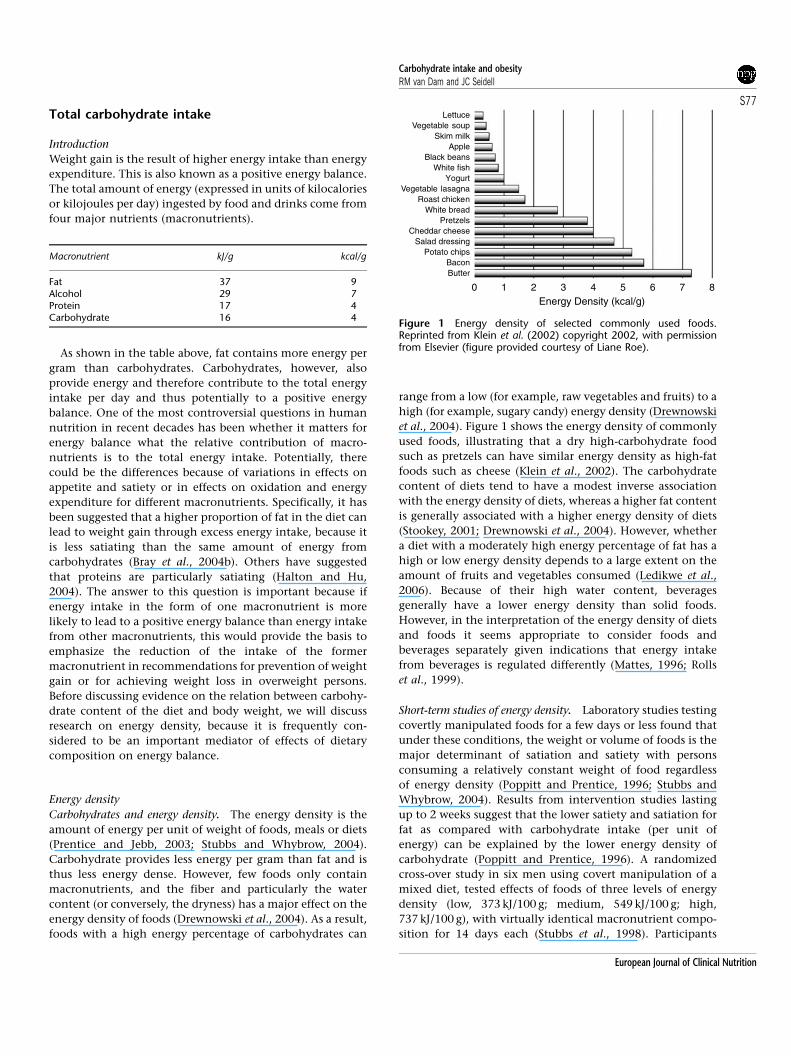
carbohydrate (Poppitt and Prentice, 1996). A randomized
cross-over study in six men using covert manipulation of a
mixed diet, tested effects of foods of three levels of energy
density (low, 373 kJ/100 g; medium, 549 kJ/100 g; high,
737 kJ/100 g), with virtually identical macronutrient compo-
sition for 14 days each (Stubbs et al., 1998). Participants
Energy Density (kcal/g)
LettuceVegetable soup
Skim milkApple
Black beansWhite fish
YogurtVegetable lasagna
Roast chickenWhite bread
PretzelsCheddar cheese
Salad dressingPotato chips
BaconButter
0 1 2 3 4 5 6 7 8
Figure 1 Energy density of selected commonly used foods.Reprinted from Klein et al. (2002) copyright 2002, with permissionfrom Elsevier (figure provided courtesy of Liane Roe).
Macronutrient kJ/g kcal/g
Fat 37 9Alcohol 29 7Protein 17 4Carbohydrate 16 4
Carbohydrate intake and obesityRM van Dam and JC Seidell
S77
European Journal of Clinical Nutrition
compensated for the energy density of diets (that is,
consuming a lower weight of foods with higher energy
density), but this compensation was incomplete resulting
in statistically significant differences in changes in body
weight: �1.20 kg for low, þ0.02 kg for medium and
þ0.95 kg for high energy density (Figure 2). In a cross-over
trial in 13 women, a contrast in the energy density of diets
was obtained by offering participants foods that contained
35–40 energy percent as fat (intervention diet) or 20–25
energy percent as fat (control diet) (Kendall et al., 1991). A
statistically significant 2.5 kg greater weight loss was found
for the low-fat diet in the first cross-over period, but in the
second cross-over period only a non-significant 0.4 kg
difference was found. Furthermore, comparison of energy
intakes for the intervention and control diet indicated that
over time, participants compensated better for the higher
energy density of the intervention diet. These observations
suggest that it is uncertain whether the effect on weight
change can be extrapolated to long-term effects on weight.
Also, compensation would probably have been more com-
plete if participants would have been able to change the type
in addition to the amount of food eaten, because there is
evidence that people compensate by choosing lower energy
density foods after consumption of higher energy density
foods (Poppitt and Prentice, 1996). In addition, when foods
differ in taste, texture and appearance, instead of being
covertly manipulated, as in many of the short-term trials
(Stubbs et al., 1998), physiological consequences of foods can
be paired to these characteristics, resulting in learning effects
and more complete compensation for energy density (Stubbs
and Whybrow, 2004; Yeomans et al., 2005). On the longer-
term, people appear to acquire a greater degree of sensory-
specific satiety for foods of a higher energy density based on
their post-ingestive effects (Stubbs and Whybrow, 2004).
Compensation for high energy density through learning
effects may, however, be less effective in an environment
with a wide availability of novel unfamiliar foods (Stubbs
and Whybrow, 2004) or in combination with large portion
sizes (Ello-Martin et al., 2005). The considerations stated
above and the difference in effects on body weight that tend
to be found for long-term as compared with short-term inter-
ventions in general warrant caution with regard to the extra-
polation of short-term effects of energy density in laboratory
studies to long-term consequences for body weight.
Longer-term studies of energy density and weight change. Few
longer-term studies have directly examined the association
between energy density and body weight. Results from cross-
sectional studies of energy density of the diet and adiposity
have been inconsistent (Drewnowski et al., 2004) and
prospective observational data are sparse. The association
between energy density and weight change was examined in
a cohort of middle-aged Danish men and women (Iqbal et al.,
2006). In the overall cohort, energy density at baseline was
not substantially associated with 5-year weight gain. In
women, energy density was positively associated with 5-year
weight gain among the obese and inversely associated with
weight gain in normal-weight women, whereas no signifi-
cant interaction with baseline weight was observed among
men. In a 1-year trial, 200 overweight and obese participants
were randomized to receive low-energy density soups or
high-energy density snacks (Rolls et al., 2005). All partici-
pants received instructions from dietitians to follow an
exchange-based energy restricted diet. Weight loss was 8.1 kg
for the control group without provided foods, 7.2 kg for the
two-soup per day group, 6.1 kg for the one-soup per day
group and 4.8 kg for the two-snack per day group. Inter-
pretation of these results is not straightforward, because the
greatest weight loss was achieved in the control group and
because the smaller weight loss for the snack group may have
related to characteristics other than energy density such as
detrimental effects of snacking in a non-hungry state (Rolls
et al., 2005). Further long-term studies of energy density and
body weight are needed.
Weight loss trials comparing diets of different carbohydrate
contents
Below, studies on the effects of weight-loss diets with
variable proportions of carbohydrate on body weight are
reviewed. This includes studies comparing energy-restricted
diets with low and high carbohydrate contents, very-low-
carbohydrate diets with low-fat energy-restricted diets, high-
protein and high-carbohydrate diets, low-fat and energy-
restricted diets and low-fat and control diets. Although all
these diets may affect body weight through reductions of
energy intake, ‘energy-restricted’ refers to explicit instruc-
tions to participants about energy restriction.
Energy-restricted diets: high versus low carbohydrate. In trials
with strictly controlled energy intakes, macronutrient
Figure 2 Mean (7standard error) change in body weight duringthree 14-day periods in which foods of different energy densitieswere provided. Reprinted by permission from Macmillan PublishersLtd: International Journal of Obesity, (Stubbs et al., 1998) copyright1998.
Carbohydrate intake and obesityRM van Dam and JC Seidell
S78
European Journal of Clinical Nutrition
composition of the diet did not substantially affect body
weight or fat mass. Golay et al. (1996) compared the effects of
diets containing 4.2 MJ per day that contained 45% (26% fat)
or 15% (53% fat) of energy as carbohydrates in 43 obese
persons. After a 6-week hospital stay during which all foods
were provided, loss of body weight and fat mass did not
differ between the two diets. However, the important
question remains whether a specific macronutrient composi-
tion of the diet can facilitate reduction of energy intake
under realistic ad libitum conditions. Table 1 shows the
characteristics and results of randomized trials that com-
pared diets that had the same explicit energy intake target,
but differed in carbohydrate content (Baron et al., 1986;
Pascale et al., 1995; Lean et al., 1997; McManus et al., 2001).
Although dietary advice included a specific target for energy
intake, the long duration of these studies and ‘free living’
conditions precluded strict control of the energy intake of
the participants. Therefore, it is of interest what carbohy-
drate composition of the diet best facilitated participants to
adhere to the advice to restrict energy intakes and to lose
weight as a result. In the study by Baron et al. (1986), no
difference in weight loss between the high- and the low-
carbohydrate diets was observed. However, the limited
3-month duration of the intervention probably reduced the
contrast in dietary composition at 12 months. The authors
reported that weight loss differed much more by weight loss
club than by macronutrient composition of the diet. Pascale
et al. (1995) compared an energy-restricted diet with the
recording of fat intake with an energy-restricted diet with
less emphasis on fat. The low-fat dietary advice resulted in a
greater weight loss in persons with type 2 diabetes, but not in
persons with only a family history of diabetes. Lean et al.
(1997) compared two diets with a 23 energy percent
difference in targets for the carbohydrate content of the
diet. No difference in weight loss between the high- and
low-carbohydrate diet was observed after 6 months. In a
subgroup of postmenopausal women who were followed for
12 months, the low-carbohydrate diet was associated with
greater weight loss than the low-fat diet. The ‘moderate-fat’
diet in the trial by McManus et al. (2001) was not particularly
low in carbohydrates, but was more liberal with regard to
unsaturated fat intake than conventional low-fat diets, and
included nuts, avocados and olive oil. The greater weight loss
and substantially lower drop-out for the ‘moderate-fat’ diet
as compared with the low-fat diet suggest that this more
liberal approach may be beneficial for long-term adherence
to diets aimed at weight loss. In summary, in trials where
participants were explicitly instructed to restrict total energy
intake, advice to consume a low-fat, high-carbo-
hydrate diet did not consistently lead to more or less weight
loss than advice to consume a lower-carbohydrate diet.
Very low-carbohydrate diet versus low-fat, energy-restricted
diet. Table 2 shows the characteristics and results of five
12-month weight loss trials that randomized participants
to very-low carbohydrate ‘Atkins’ type diets or low-fat diets
(Foster et al., 2003; Samaha et al., 2003; Stern et al., 2004;
Dansinger et al., 2005; McAuley et al., 2005, 2006; Gardner
et al., 2007). In four of the five studies, a substantially larger
weight loss was found after 6 months of the low-carbohy-
drate diet as compared with the low-fat diet (Foster et al.,
2003; Samaha et al., 2003; McAuley et al., 2005; Gardner
et al., 2007). This agrees with findings from two other (6
month) trials (Brehm et al., 2003; Yancy et al., 2004), and
results from a recent meta-analysis that reported a pooled
3.3 kg (95% confidence intervals 1.4, 5.3) greater weight loss
for the low-carbohydrate as compared with the low-fat diet
after 6 months (Nordmann et al., 2006). However, during an
additional 6 months, regain of weight diminished the
differences between the diets, resulting in lack of substantial
differences in weight after 12 months (Table 2). This was also
found in the trial with the most intensive intervention that
continued monthly meetings until the 12-month measure-
ments (Stern et al., 2004). The ketogenic effect of very-low
carbohydrate diets has been suggested to facilitate weight
loss though urinary excretion of ketones or suppression of
appetite by circulating ketones. However, the amount of
energy lost through urinary excretion of ketones is minimal
(Astrup et al., 2004). Furthermore, Foster et al. (2003) did not
observe an association between urinary ketones and weight
loss. The simplicity of the diet, the restriction of the variety
of food choices and possibly a greater satiating effect of
protein seem more plausible explanations for the greater
initial weight loss on very-low carbohydrate diets (Astrup
et al., 2004). In summary, in overweight individuals in the
US and New Zealand, instructions to consume a very-low
carbohydrate diet generally led to greater weight loss during
the first 6 months than instructions to consume low-fat
diets, but due to subsequent regain of weight this may not
result in a greater long-term weight loss.
High carbohydrate versus high protein. Effects of increasing
the proportion of carbohydrates in the diet may depend on
the macronutrient that is replaced: protein or fat. The very-
low-carbohydrate diets discussed in the previous section also
had a higher protein content than the low-fat diets: a 3–7
energy percent higher protein intake was reported at 6
months (Brehm et al., 2003; Samaha et al., 2003; Yancy et al.,
2004; McAuley et al., 2005). Other trials however, have more
specifically attempted to replace carbohydrates with protein.
A Danish group compared the effects of two ad libitum
reduced-fat (30 energy percent) diets: a diet high in
carbohydrates and a diet high in protein (Skov et al., 1999).
During the first 6 months, foods were supplied through a
laboratory shop system, followed by 6 months of consulta-
tion with a dietitian once every 2 weeks. The energy
percentage of protein in the high-protein diet (24.3%
registered in the shop at 6 months; 21.2% reported at 12
months) was substantially higher (12.5% at 6 months, 7.3%
at 12 months) than in the high-carbohydrate diet. Further-
more, regular measurement of 24-h urinary nitrogen excre-
tion agreed with these differences in protein intake. After 6
Carbohydrate intake and obesityRM van Dam and JC Seidell
S79
European Journal of Clinical Nutrition
Table 1 Long-term randomized intervention studies of hypocaloric diets: high carbohydrate (low fat) versus lower carbohydrate
Reference/country Participantsa Duration Intervention ‘High carbohydrate’ ‘Low carbohydrate’ Compliance Results
(Baron et al.,1986) UK
M/F. High carb: n¼61,age 40, BMI 28.5; lowcarb: n¼59, age 40, BMI39.5. An additional n¼8(high carb) and n¼7(low carb) were lost tofollow-up and notincluded in the analysis
12 months 3 months: participationin weekly diet clubmeetings and writtenmaterial. Target:1000–1200 kcalper day
Fat o30 g per day Carbohydrate o50 gper day
FFQ: higher fiber intake(18.4 vs 15.1 g per day),bread and potato intakefor high-carb vslow-carb diet
High carb: �1.6 kgLow carb: �2.3 kgDifference: 0.7 kg(95% CI �1.2, 2.6)
(Pascale et al.,1995) US
M/F Type 2 diabetes, age5778, BMI 36.374.7.Low fat: n¼15; higherfat: n¼16. An additionaln¼7 (low fat) and n¼6(higher fat) were lost tofollow-up and notincluded in the analysis
12 months 16 weekly group sessionsand meetings at 5, 6, 8and 10 months. Target:1000–1500 kcal per day(depending on baselineweight)
Target: 20 en% fat.Recording of bothamount of caloriesand fat of foods used
Emphasis on low energyintake. Recording ofcalories of foods used.Fat o30 en%encouraged
Diet records (12months): low-fat 26en% fat, higher fat 34en% fat
Low fat: �5.2 kg(s.d. 7.3)Higher fat: �1.0 kg(s.d. 3.9)(P¼0.06)
M/F family history ofdiabetes, age 4378, BMI35.974.7. Low fat:n¼16; higher fat: n¼13.An additional n¼7 (Lowfat) and n¼10 (higherfat) were lost to follow-up and not included inthe analysis
Diet records (12months): low-fat 26en% fat, higher fat 34en% fat
Low fat: �3.1 kg(s.d. 8.9)Higher fat: �3.2 kg(s.d. 7.2)
(Lean et al., 1997)UK
F. High carb: n¼42, age51714, BMI 32.375.5.Low carb: n¼40, age50.1714, BMI32.875.1. An additionaln¼15 (high carb) andn¼13 (low carb) lost tofollow-up at 6 monthsnot included in theanalysis
6 months;12 monthsfollow-upfor n¼46
6 months: counselingby dietitian and writtenmaterial. Target:1200 kcal per day
Target: 58 en% carb,21 en% fat, 21 en%protein
Target: 35 en% carb, 35en% fat, 30 en% protein
Not assessed 6 months: High carb:�4.2 kg.Low carb: �5.4 kg(P¼0.22). 12 months(subgroup):High carb: �3.0 kg Lowcarb: �6.5 kg (Po0.05)
(McManus et al.,2001) US
M/F. Low fat: n¼30, age44710, BMI 3373.Moderate fat: n¼31, age44710, BMI 3475. Inaddition n¼21 (highcarb) and n¼19 (lowcarb) lost to follow-up at18 months and includedin ‘last value carriedforward’ intention totreat analysis
18 months Weekly group sessionswith dietitian for wholeperiod. Target: 1200 (F)or 1500 kcal per day (M)
Target: 60–65 en%carb, 20 en% fat,15–20 en% protein
Target: 45–50 en%carb, 35 en% fat,15–20 en% protein.‘Moderate fat’
Attendance of sessions(20% for low-fat vs 54%for moderate fat,Po0.01). FFQ at 18months: low-fat 50 en%carb, 35% fat; moderate-fat 47% carb and 35% fat
Low fat: þ1.1 kgModerate-fat:�2.5 kg (P¼0.005)
Abbreviations: BMI, body mass index (kg/m2); en%, energy percent; F, female; FFQ, food frequency questionnaire; M, male; s.d., standard deviation.
All trials had a parallel design.
None of the trials reported/conducted blinding of the assessors of outcomes or allocation concealment.aValues are means7s.d.
Carbohydrateintake
andobesity
RMvan
Damand
JCSeidell
S80
EuropeanJournalofClinicalN
utrition
Table 2 Randomized intervention studies comparing very low carbohydrate diet and low-fat energy-restricted diets: results after 6 and 12 months
Reference/country
Participants Intervention ‘Low-carb’ diet ‘Low-fat’ diet Follow-up Compliance Weight loss (kg)
Low carba Low fata Difference
(Samahaet al., 2003;Stern et al.,2004) US
M/F. BMI X35,83% diabetes ormetabolicsyndrome. Lowcarb: n¼64. Low-fat: n¼68; lost tofollow-up: n¼14 at6 months, n¼6 at12 months
Group counseling:weekly sessions for4 weeks and 11monthly session;written materials
Carbohydrateintake o30 g perday
Fat o30 energy%and 500 kcal perday energy deficit
6 months 24-h recall (energy%). Low carb: C 37,F 41, P 22w.Low-fat: C 51,F 33, P 16
�5.8 (8.6) �1.9 (4.2) P¼0.002b
12 months 24-h recall(g per day).Carbohydrate: lowcarb 120; low-fat230
�5.1 (8.7) �3.1 (8.4) P¼0.20c
(Fosteret al.,2003) US
M/F. Obese (meanBMI 34). Low carb:n¼33. Low-fat:n¼30; lost tofollow-up: n¼21 at6 months, n¼26 at12 months
One consultationwith dietitian; abook/manual
Carbohydrateo20 g per dayfor 2 weeks,followed by agradual increase
Fat B25%,protein B15%,carbohydrateB60% of energy.Energy restricted
6 months Testing of urinaryketoneconcentrations.Significantdifference betweengroups up to 12weeks
�6.9 (6.4) �3.1 (5.5) P¼0.02d
12 months �4.3 (6.6) �2.5 (6.2) P¼0.26d
(Dansingeret al., 2005)US
M/F. BMI 27–42(mean 35) withmetabolic riskfactors. Low carb:n¼40. Low-fat:n¼40; lost tofollow-up: n¼19for low carb andn¼20 for low-fat
Advice during fourgroup sessions infirst 2 months;written materialsand diet book
Carbohydrateo20 g per day withgradual increase to50 g per day
Vegetarian ‘Ornish’diet with 10energy% fat
6 months Diet records(g per day):low carb: C 190 g,F 81 g; low-fat: C237 g, F 55 g
�3.2 (4.9) �3.6 (6.7) P¼0.76d
12 months Diet records (g/d):low carb: C 190 g,F 81 g; low-fat: C218 g, F 64 g
�2.1 (4.8) �3.3 (7.3) P¼0.40d
(McAuleyet al., 2005,2006)NewZealand
F. Insulin resistant,BMI427. Low carb:n¼31. Low-fat:n¼32; lost tofollow-up: n¼6 at6 months, n¼7 at12 months
Weekly counselingfor 16 weeks;written materials
Carbohydrateo20 g per dayfor 2 weeks withgradual increase
Conventionalhigh-fiber, low-fat,reduced sugardiet. No explicitenergy-restriction
6 months Diet records(energy %): lowcarb: C 26, F 47,P 24; low fat: C 45,F 28, P 21
�7.1 �4.7 Po0.05c
12 months Diet records(energy %): lowcarb: C 33, F 41,P 21; Low fat: C 45,F 29, P 22
�5.4 �4.4 P40.05c
Carbohydrateintake
andobesity
RMvan
Damand
JCSeidell
S81
EuropeanJournalofClinicalN
utrition

months, weight loss was 9.4 kg in the high-protein group
and 5.9 kg in the high-carbohydrate group (difference 3.5 kg,
P¼0.008; Skov et al., 1999). After 12 months, weight loss was
6.2 kg for the high-protein group and 4.3 kg for the high-
carbohydrate group (difference 1.9 kg, P40.05; Due et al.,
2004). Thus, despite a remaining substantial difference in
protein intake, some weight was regained and it was unclear
whether a greater long-term weight loss could be maintained
for the high-protein protein group. The reduction in waist
circumference remained statistically significantly greater
after 12 months for the high-protein as compared with the
high-carbohydrate group (Due et al., 2004). An Australian
intervention study also compared effects of a high-protein
with a high-carbohydrate diet (McAuley et al., 2005). At 6
months, the higher protein diet was associated with a 5
energy percent higher protein intake (26 versus 21%) and a
statistically significant 2.2 kg greater weight loss (6.9 versus
4.7 kg). Regain of weight in the subsequent 6 months was
0.5 kg for the high-carbohydrate and 0.9 kg for the high-
protein group (McAuley et al., 2006). After 12 months, the
energy percent of protein was identical for the two groups,
whereas a non-statistically significant 2.3 kg lower body
weight remained for the high-protein as compared with the
high-carbohydrate group. In two intervention studies by
Brinkworth and co-workers, a high-protein diet and a high-
carbohydrate diet resulted in similar weight loss after 68
weeks, but the intervention only lasted for 16 weeks and the
urinary urea/creatinine ratio indicated no difference in
protein content after the intervention (Brinkworth et al.,
2004a, b). In summary, two trials suggest that exchanging
protein for carbohydrates can facilitate weight loss over 6
months, but more research is needed to clarify whether this
beneficial effect can be maintained after 12 or more months.
Low-fat (high carbohydrate) versus energy-restricted diet. Several
long-term intervention studies compared dietary advice
focused on reducing fat intake with dietary advice focused
on restriction of total energy intake. These trials reported
worse (Harvey-Berino, 1998), similar (Jeffery et al., 1995;
Dansinger et al., 2005) and better (Toubro and Astrup, 1997)
effects on body weight for the low-fat approach, as compared
with the energy-restricted approach. These differences in the
results probably reflect differences in the energy-restricted
program (for example, a complicated color-coded system
(Toubro and Astrup, 1997) versus a simpler method of calorie
counting (Dansinger et al., 2005)) rather than effects of
differences in macronutrient composition of the diet.
Intervention studies of carbohydrate intake not primarily aimed at
weight loss
Effect of dietary advice to consume a low-fat diet on body
weight. The Women’s Health Initiative Dietary Modifica-
tion Trial tested the effect of advice to decrease fat intake and
increase consumption of fruit, vegetables and grains on
body weight for a mean follow-up of 7.5 years in 48 835Tab
le2
Conti
nued
Ref
eren
ce/
countr
yPart
icip
ants
Inte
rven
tion
‘Low
-carb
’die
t‘L
ow
-fat’
die
tFo
llow
-up
Com
plia
nce
Wei
ght
loss
(kg)
Low
carb
aLo
wfa
taD
iffe
rence
(Gard
ner
etal.,
2007)
US
F.Pre
men
op
ausa
l(2
5–50
years
),BM
I27–40.
Low
carb
:n¼
77.
Low
fat
n¼
79;
lost
tofo
llow
-up
:n¼
21
at
6m
on
ths,
n¼
27
at
12
mon
ths
Weekl
yco
un
selin
gfo
r2
mon
ths;
die
tb
ooks
Carb
oh
yd
rate
p20
gp
er
day
for
B2–3
mon
ths
follo
wed
byp
50
gp
er
day
‘LEA
RN
’p
rog
ram
:55–60%
carb
oh
yd
rate
an
do
10
en
erg
y%
satu
rate
dfa
t,ca
loric
rest
rict
ion
,exerc
ise
6m
on
ths
24-h
reca
lls(e
nerg
y%
):lo
wca
rb:
C30,
F47,
P22;
Low
fat:
C48,
F31,
P18
B�
5.8
B�
3.1
Po
0.0
5d
12
mon
ths
24-h
reca
lls(e
nerg
y%
):lo
wca
rb:
C35,
F44,
P21;
low
-fat:
C47,
F33,
P19
�4.7
(�6.3
,�
3.1
)�
2.2
(�3.6
,�
0.8
)P4
0.0
5d
Ab
bre
viati
on
s:BM
I,b
od
ym
ass
ind
ex
(kg
m�
2);
C,
carb
oh
yd
rate
s;F,
fat;
F,fe
male
;M
,m
ale
;P,
pro
tein
.
All
tria
lsh
ad
ap
ara
lleld
esi
gn
,allo
cation
con
cealm
en
tw
as
perf
orm
ed
for
all
stud
ies,
an
db
lind
ing
of
outc
om
eass
ess
ors
was
not
rep
ort
ed
.aV
alu
es
are
mean
s(s
.d.
or
95%
CI)
.bIn
ten
tion
totr
eat:
last
valu
eca
rrie
dfo
rward
.cRan
dom
coeffic
ien
tan
aly
sis.
dIn
ten
tion
totr
eat:
base
line
valu
eca
rrie
dfo
rward
.
Carbohydrate intake and obesityRM van Dam and JC Seidell
S82
European Journal of Clinical Nutrition
postmenopausal US women (Howard et al., 2006). The
intervention included 18 group sessions during the first 12
months, followed by four group sessions per year for the
duration of the trial supplemented with individual sessions.
The control group only received dietary educational materi-
als. According to self-reported data from a food frequency
questionnaire, the percentage of energy from fat decreased
by 8.8%, the percentage of energy from carbohydrates
increased by 8.2%, the number of servings of fruits and
vegetables increased by 1.4 servings per day and fiber intake
increased by 2.2 g per day in the intervention group, whereas
no substantial changes were reported by the control group.
Body weight decreased 1.9 kg after 1 year and 0.4 kg after an
average of 7.5 years for the intervention as compared with
the control group (both P-value 0.001). Trends in body
weight for the intervention and control group were similar:
an increase in women who were not overweight, little
change in those who were moderately overweight and a
decrease in those who were obese before the study (Figure 3).
Weight loss was not an aim of this study and data on dietary
change only relied on self-reports. However, the findings do
not support a substantial long-term effect of an educational
intervention aimed at reducing the proportion of fat (or
increasing the proportion of carbohydrates) in the diet on
body weight in US women. Even the small effect on body
weight may reflect changes other than fat intake as a result of
the more intensive dietary advice in the intervention as
compared with the control group.
The results of earlier smaller randomized interventions of
at least 12 months duration that tested advice to consume
low-fat diets and were not aimed at weight loss showed a
similar lack of substantial effects on body weight (Willett,
2002). A meta-analysis of intervention studies suggested a
more substantial 3.2 kg greater weight loss as a result of an ad
libitum low-fat diet as compared with the control group.
(Astrup et al., 2004) However, interpretation of the results is
limited by the inclusion of shorter term (duration was 2–12
months) and non-randomized studies. Moreover, in most
studies, only the low-fat intervention group received in-
tensive dietary advice, making it unclear whether effects
were due to changes in fat intake per se or other behavioral
changes related to the greater awareness of diet. In summary,
randomized intervention studies do not consistently show
that educational efforts aimed at reducing the percentage of
energy intake from fat (or increase the percentage of energy
from carbohydrates) without additional efforts to reduce
energy intakes have important long-term effects on body
weight.
Effect of provision of reduced fat foods on body weight. In the
double-blinded multicenter ‘First Study’ of National Diet-
Heart Study, foods of variable fat contents were provided to
approximately 1000 middle-aged US men (Anonymous,
1968). The participants were provided low-fat foods resulting
in 29.7% of energy from fat (based on diet records), high-fat/
high-polyunsaturated fat foods resulting in 34.4% of energy
Figure 3 Effects of advice to consume a low-fat diet high in fruits and vegetables on body weight: differences (from baseline) in body weight byintervention group and BMI at screening in the Women’s Health Initiative. Error bars indicate 95% confidence intervals. *Pp0.05 and 40.01wPp0.01 and 40.001 zPp0.001 for the difference between the intervention and control group. Reprinted from Howard et al. (2006) copyright(2006), American Medical Association. All rights reserved. BMI, body mass index.
Carbohydrate intake and obesityRM van Dam and JC Seidell
S83
European Journal of Clinical Nutrition
from fat or high-fat/low-polyunsaturated fat foods resulting
in 34.9% of energy from fat. Over 44 weeks, men in all
groups lost weight (2.3, 1.4 and 1.8 kg respectively), with a
0.5–0.9 kg greater weight loss for the low-fat group. In a
randomized trial of 241 Dutch non-obese individuals with
no intention to lose weight, free access was provided to B45
different foods either in reduced fat or full fat version,
covering between 30 and 40% of energy intake. The group
that consumed the reduced-fat products had on average a 7
energy percent lower fat intake and a 0.7 kg (95% confidence
interval 0.1, 1.4) decrease in body fat over 6 months as
compared with those that consumed the full-fat products
(Westerterp et al., 1996; Weststrate et al., 1998). In the
randomized CARMEN trial (Carbohydrate Ratio Manage-
ment in European National Diets), diets high in carbohy-
drates were compared with a control diet that had a
macronutrient composition that was typical for each
country (Saris et al., 2000). The intervention was ad libitum
and consisted of providing foods through a laboratory shop
system in 398 men and women with a BMI between 26 and
35 kg/m2. Allocation concealment and blinding procedures
were not described and no intention-to-treat analysis was
conducted. According to diet records intake of fat, protein,
and carbohydrates changed significantly by �8.7, þ2.7 and
þ6.3 energy percent for the low-fat high-starch group
relative to the control group. Weight loss over 6 months
was 2.6 kg for the low-fat high-starch group as compared
with the control group. This weight loss was substantially
larger than for the National Diet-Heart-Study, possibly due to
the greater contrast in fat intake, the higher protein intake
for the high-starch diet relative to the control diet or to all
the CARMEN participants being overweight. Furthermore, in
the CARMEN study participants were not blinded and the
high-starch diet required a substantial change and reconsi-
deration of dietary habits, whereas the control diet was
similar to the usual dietary intake.
In all trials discussed above, full-fat foods were replaced by
reduced-fat versions of the foods. One could argue that the
observed small effects of this product change on body
weight may be worthwhile on a population level. However,
exchange of reduced-fat foods for full-fat versions may
reflect the effect of reducing the amount of energy per
portion without substantially changing the participants’
perception of the satiety value of the food. Thus, findings
do not necessarily apply to exchanging carbohydrates for fat
and replacement of full-calorie carbohydrate foods with
reduced-calorie versions may have similar effects.
Observational studies of carbohydrate intake and body weight
Cohort studies of fat intake and long-term weight change. As
reported in section 1.2, observational studies of dietary
intakes and body weight are prone to various biases. People
tend to hold particularly strong ideas about the effects of the
proportion of fat or carbohydrate on body weight favoring
for example commonly recommended low-fat diets or
popular low-carbohydrate diets. A person’s ability to adhere
to the macronutrient composition of such a diet is likely to
be associated with a person’s ability to control total energy
intake. Therefore, an association between the proportion of
carbohydrates in the diet with lower weight or less weight
gain may well be confounded by the ability to control energy
intake. Other methodological issues include selective under-
reporting of fat intake that is related to weight and residual
confounding by other dietary factors (Seidell, 1998). Results
from prospective cohort studies that study the proportion of
energy from fat in the diet (and thus indirectly the
proportion of energy from carbohydrate in the content)
have been inconsistent (Seidell, 1998). In addition to the
aforementioned methodological limitations, differences in
results may relate to differences in genetic susceptibility. In
two cross-sectional studies, the association between fat
intakes and adiposity differed by peroxisome proliferator-
activated receptor-a Pro12Ala genotype (Memisoglu et al.,
2003; Franks et al., 2004). This variant also modified the
weight loss as result of a lifestyle intervention (Lindi et al.,
2002), but not the response to an energy restricted high or
low-fat diet (Sorensen et al., 2006).
Weight control registry. The National Weight Control Registry
is a registry of persons in the US that maintained a weight
loss of 13.6 kg or more for at least 1 year (Phelan et al., 2006).
The majority of these successful weight losers consumed a
low-fat, high-carbohydrate diet, but the average percentage
of energy from carbohydrates had decreased from 56% in
1995 to 49% in 2003, and the proportion of persons on a
low-carbohydrate diet (o90 g/d carbohydrate) increased
from 5.9 to 17.1% during that period (Phelan et al., 2006).
These results indicate that the diet associated with weight
loss at a certain point in time is to some degree dependent on
the types of diet that are generally believed to be beneficial
for weight. Still, these registry data support the findings from
intervention studies that substantial weight loss is possible
over a wide range of macronutrient compositions of the diet.
Conclusions on the carbohydrate content of the diet
Findings from the dietary intervention studies discussed
above suggest that similar weight loss can be achieved over
the course of a year with diets of substantially different
carbohydrate contents. Positive energy balance and weight
gain can be achieved with a wide range of energy percentage
of carbohydrates in the diet; thus, neither a diet with a high
nor a low energy percentage of carbohydrates will necessarily
protect a person from weight gain on the long term.
In trials in which dietary advice for weight loss was
provided in overweight persons in the US and New Zealand,
weight loss was greater after 6 months for low-carbohydrate
diets as compared with low-fat diets, although this difference
greatly attenuated after longer follow-up (Nordmann et al.,
2006; Gardner et al., 2007). Interestingly, in the European
CARMEN trial in which macronutrient intake was manipu-
lated by providing foods through a laboratory shop system,
Carbohydrate intake and obesityRM van Dam and JC Seidell
S84
European Journal of Clinical Nutrition
weight loss was greater after 6 months with a low-fat high-
carbohydrate diet as compared with a higher fat control diet
(Saris et al., 2000). There are several possible explanations for
this difference in results. First, in the trials with dietary
advice, protein intake was substantially higher for the low-
carbohydrate relative to the low-fat diet, whereas the
opposite was true for the CARMEN trial. The promising
hypothesis that a higher protein content of the diet may
contribute to weight management requires further research.
Second, the nature of the foods included in the low-fat diet
may have differed: in the CARMEN trial the low-fat diet
included many reduced-calorie versions of otherwise similar
full-fat foods, whereas diverse self-chosen high-carbohydrate
foods may have been included in the low-fat diets in the
trials with dietary advice. Third, the characteristics of the
interventions unrelated to physiological effects of macro-
nutrient composition may have played an important role. In
the trials with dietary advice, the low-carbohydrate diet was
probably the most novel, simple and restrictive diet, whereas
in the CARMEN trial the lower carbohydrate diet was a
control diet that required little change in food choice.
Long-term dietary and lifestyle interventions (X2 years)
show that consumption of a relatively high-carbohydrate
diet (B55% of energy) that includes high amounts of fiber-
rich foods can be compatible with clinically relevant weight
loss (Tuomilehto et al., 2001; Knowler et al., 2002; Esposito
et al., 2004; Mayer-Davis et al., 2004). A Mediterranean-style
moderate-fat diet with a lower carbohydrate content (B50% of
energy) was also associated with substantial weight loss after
18 months (McManus et al., 2001). Taken together, the
available data do not provide strong evidence that either
increasing or decreasing the energy percentage of carbohydrate
in the diet by itself has an important effect on body weight.
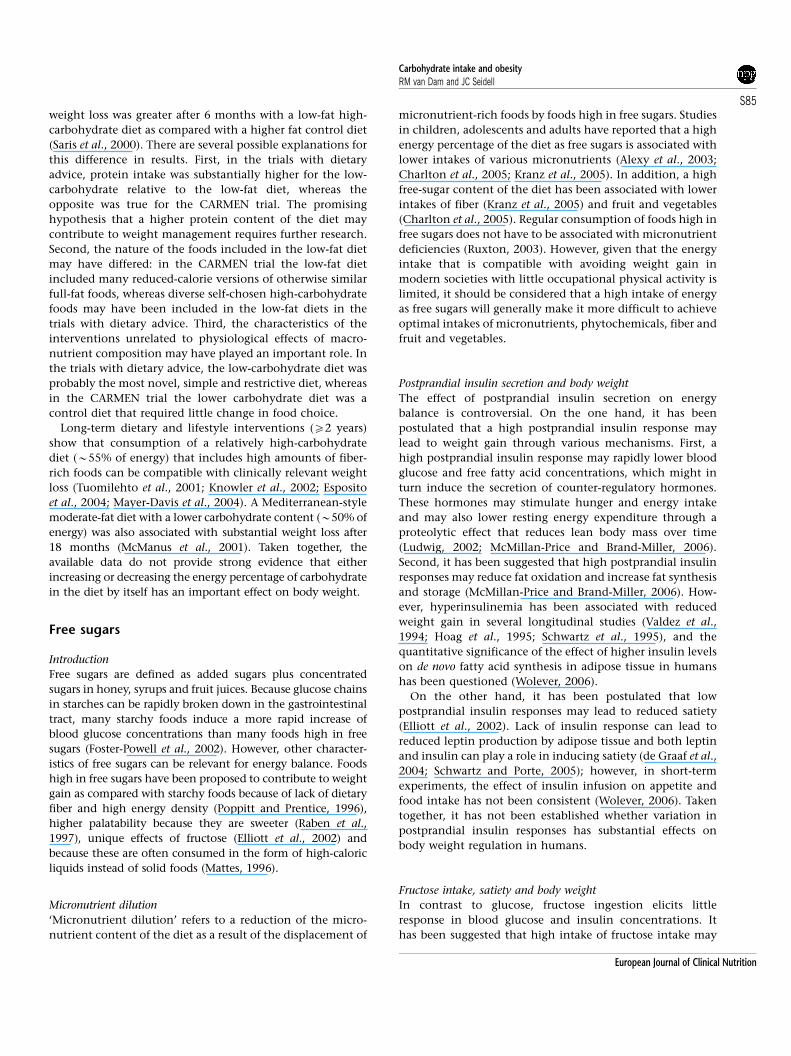
Free sugars
Introduction
Free sugars are defined as added sugars plus concentrated
sugars in honey, syrups and fruit juices. Because glucose chains
in starches can be rapidly broken down in the gastrointestinal
tract, many starchy foods induce a more rapid increase of
blood glucose concentrations than many foods high in free
sugars (Foster-Powell et al., 2002). However, other character-
istics of free sugars can be relevant for energy balance. Foods
high in free sugars have been proposed to contribute to weight
gain as compared with starchy foods because of lack of dietary
fiber and high energy density (Poppitt and Prentice, 1996),
higher palatability because they are sweeter (Raben et al.,
1997), unique effects of fructose (Elliott et al., 2002) and
because these are often consumed in the form of high-caloric
liquids instead of solid foods (Mattes, 1996).
Micronutrient dilution
‘Micronutrient dilution’ refers to a reduction of the micro-
nutrient content of the diet as a result of the displacement of
micronutrient-rich foods by foods high in free sugars. Studies
in children, adolescents and adults have reported that a high
energy percentage of the diet as free sugars is associated with
lower intakes of various micronutrients (Alexy et al., 2003;
Charlton et al., 2005; Kranz et al., 2005). In addition, a high
free-sugar content of the diet has been associated with lower
intakes of fiber (Kranz et al., 2005) and fruit and vegetables
(Charlton et al., 2005). Regular consumption of foods high in
free sugars does not have to be associated with micronutrient
deficiencies (Ruxton, 2003). However, given that the energy
intake that is compatible with avoiding weight gain in
modern societies with little occupational physical activity is
limited, it should be considered that a high intake of energy
as free sugars will generally make it more difficult to achieve
optimal intakes of micronutrients, phytochemicals, fiber and
fruit and vegetables.
Postprandial insulin secretion and body weight
The effect of postprandial insulin secretion on energy
balance is controversial. On the one hand, it has been
postulated that a high postprandial insulin response may
lead to weight gain through various mechanisms. First, a
high postprandial insulin response may rapidly lower blood
glucose and free fatty acid concentrations, which might in
turn induce the secretion of counter-regulatory hormones.
These hormones may stimulate hunger and energy intake
and may also lower resting energy expenditure through a
proteolytic effect that reduces lean body mass over time
(Ludwig, 2002; McMillan-Price and Brand-Miller, 2006).
Second, it has been suggested that high postprandial insulin
responses may reduce fat oxidation and increase fat synthesis
and storage (McMillan-Price and Brand-Miller, 2006). How-
ever, hyperinsulinemia has been associated with reduced
weight gain in several longitudinal studies (Valdez et al.,
1994; Hoag et al., 1995; Schwartz et al., 1995), and the
quantitative significance of the effect of higher insulin levels
on de novo fatty acid synthesis in adipose tissue in humans
has been questioned (Wolever, 2006).
On the other hand, it has been postulated that low
postprandial insulin responses may lead to reduced satiety
(Elliott et al., 2002). Lack of insulin response can lead to
reduced leptin production by adipose tissue and both leptin
and insulin can play a role in inducing satiety (de Graaf et al.,
2004; Schwartz and Porte, 2005); however, in short-term
experiments, the effect of insulin infusion on appetite and
food intake has not been consistent (Wolever, 2006). Taken
together, it has not been established whether variation in
postprandial insulin responses has substantial effects on
body weight regulation in humans.
Fructose intake, satiety and body weight
In contrast to glucose, fructose ingestion elicits little
response in blood glucose and insulin concentrations. It
has been suggested that high intake of fructose intake may
Carbohydrate intake and obesityRM van Dam and JC Seidell
S85
European Journal of Clinical Nutrition
lead to excess energy intake because of this lack of insulin
response as well as failure to suppress secretion of the
‘hunger hormone’ ghrelin (Elliott et al., 2002; Teff et al.,
2004). The effect of fructose intake on body weight has not
been examined in randomized trials. A diet supplemented
with 50–60 g fructose resulted in weight gain in 14 persons
with type 2 diabetes during 23 weeks, but this study did not
include a control group (Anderson et al., 1989).
Studies of mostly solid sugary foods
A cross-over study in 20 non-overweight women (mean BMI
23 kg/m2) in which all foods were provided compared 14
days of ad libitum consumption of a high-starch/high-fiber
diet with a high-sucrose diet (Raben et al., 1997). The high-
starch/high-fiber diet resulted in a 0.7 kg reduction in body
weight, whereas the sucrose diet resulted in a non-significant
0.2 kg increase in weight (Po0.05 for difference between
diets). Possibly, this difference in weight change is related to
the participants’ higher palatability ratings for the high-
sucrose diet or to the sugar-sweetened beverages in the high-
sucrose diet. In the 6-month randomized CARMEN trial, a
diet higher in mono-and disaccharides was compared with a
diet higher in starch in men and women with BMI 26–35
kg/m2 (Saris et al., 2000). The intervention was ad libitum and
consisted of providing foods through a laboratory shop
system. The diet high in mono-/disaccharides was associated
with a non-significant 0.9 kg smaller weight loss than the
high-starch diet. The same intervention in persons with the
metabolic syndrome resulted in a 4 kg greater reduction in
weight for the high-starch as compared with the high mono-
and disaccharide diet (Poppitt et al., 2002). These two diets
did not only differ in the solid foods consumed, but also in
the types of beverages used: beverages high in free sugars in
the high-mono-and disaccharide diet versus artificially
sweetened beverages in the high-starch diet (Poppitt et al.,
2002). Middle-aged male office workers who were asked to
cut out sucrose from their diet and replace it with other
foods, reduced their sucrose intake from 85 to 12 g per day
according to diet records and were reported to have lost
weight after 22 weeks (Mann et al., 1970). Similar interven-
tions showed a non-significant tendency for greater weight
loss as compared with the control group in hypertriglyceri-
demic individuals (Smith et al., 1996), whereas no difference
in weight loss was found in non-obese women (Gatenby
et al., 1997).
Sugar-sweetened beverages and body weight
Intervention studies of sugar-sweetened beverages. Several trials
have specifically examined the effects of sweetened be-
verages on body weight (Table 3). Energy consumed as
liquids may induce less satiety as compared with the same
foods in a solid form because of the rapid transit of liquids
through the stomach and intestines that may lead to reduced
stimulation of satiety signals, differences in the regulation of
thirst and hunger, and lower cognitively perceived energy
content (Mattes, 1996; DiMeglio and Mattes, 2000). Re-
ported energy intake in intervention studies of sugar-
sweetened beverages suggested a lack of compensation for
the energy provided through these liquids by reduced
subsequent energy intake (Tordoff and Alleva, 1990; DiMe-
glio and Mattes, 2000). Trials of sugar-sweetened beverage
consumption and body weight varied from blinded inter-
ventions of several weeks (Tordoff and Alleva, 1990; Raben
et al., 2002) to an education program on carbonated
beverages of 1 year (James et al., 2004; Table 3). Findings in
all trials were consistent with a detrimental effect of
consumption of sugar-sweetened beverages on body weight.
Both trials in which participants were blinded with regard to
both the aim of the study and the sweeteners in the
beverages they received found a statistically significant effect
the sugar-sweetened intervention on body weight (Tordoff
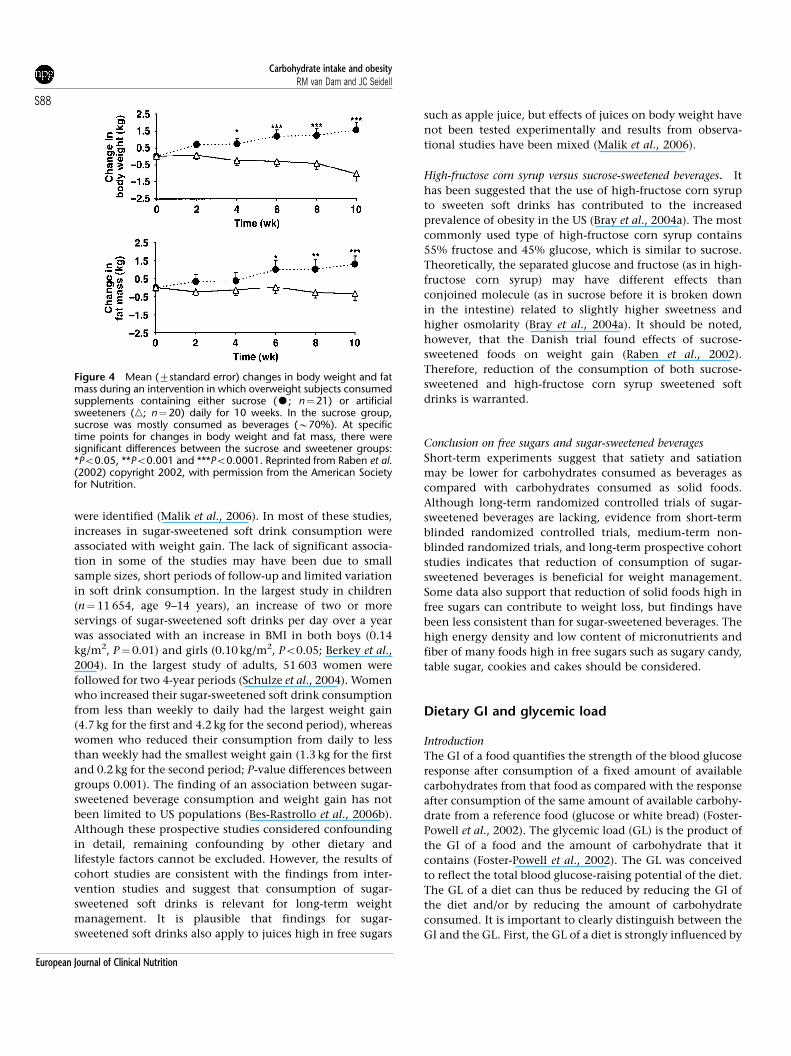
and Alleva, 1990; Raben et al., 2002). Figure 4 shows the
results of one of these blinded trials conducted by Raben
et al. (2002). A 1-year dietary educational program at schools
mainly aimed at reducing use of carbonated beverages was
associated with a reduced incidence of overweight (James
et al., 2004). However, given the very limited effect on sugar-
sweetened soft drink consumption, it is uncertain whether
the effect of the program on obesity are due to reduced
consumption of these beverages, to the apparently greater
reduction in consumption of artificially sweetened soft
drinks or to other behavioral changes. In a 25-week
intervention that mainly consisted of the free delivery of
non-caloric beverages, consumption of non-caloric bev-
erages instead of sugar-sweetened beverages was associated
with weight loss among participants with a higher baseline
BMI (Ebbeling et al., 2006). The result of this trial are also of
interest because the changed availability of beverages
resulted in a marked decrease in consumption of sugar-
sweetened beverages over 25 weeks (reported 82% decrease
in the intervention group) (Ebbeling et al., 2006). Drew-
nowski and Bellisle (2007) have pointed out that liquid meal
replacement shakes containing amounts of sugars that are
similar to the amount in sugar-sweetened beverages are
commonly used for weight loss treatment. However, in
contrast to sugar-sweetened soft drinks, liquid meal replace-
ment shakes contain substantial amounts of protein and
fiber and are used instead of meals rather than in addition to
meals (Drewnowski and Bellisle, 2007).
Cohort studies of sugar-sweetened beverages and long-term weight
change. In a real-life setting, as compared with the
described trials, additional factors may link the consumption
of sugar-sweetened beverages to excess energy intake. These
factors include huge serving sizes, free refills, massive
advertising campaigns for soft drinks and the ubiquitous
availability of soft drinks including vending machines at
schools (Bray et al., 2004a). Recently, the literature on intake
of sugar-sweetened beverages and weight gain has been
systematically reviewed and 10 prospective cohort studies
Carbohydrate intake and obesityRM van Dam and JC Seidell
S86
European Journal of Clinical Nutrition
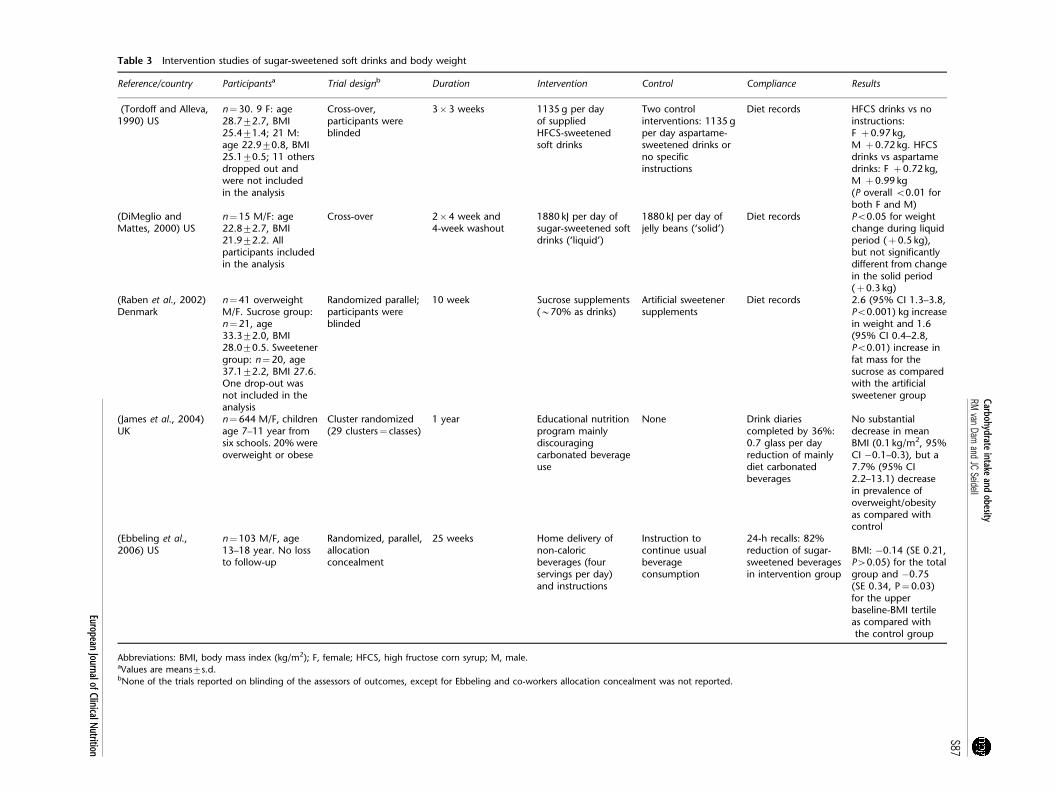
Table 3 Intervention studies of sugar-sweetened soft drinks and body weight
Reference/country Participantsa Trial designb Duration Intervention Control Compliance Results
(Tordoff and Alleva,1990) US
n¼30. 9 F: age28.772.7, BMI25.471.4; 21 M:age 22.970.8, BMI25.170.5; 11 othersdropped out andwere not includedin the analysis
Cross-over,participants wereblinded
3�3 weeks 1135 g per dayof suppliedHFCS-sweetenedsoft drinks
Two controlinterventions: 1135 gper day aspartame-sweetened drinks orno specificinstructions
Diet records HFCS drinks vs noinstructions:F þ0.97 kg,M þ0.72 kg. HFCSdrinks vs aspartamedrinks: F þ0.72 kg,M þ0.99 kg(P overall o0.01 forboth F and M)
(DiMeglio andMattes, 2000) US
n¼15 M/F: age22.872.7, BMI21.972.2. Allparticipants includedin the analysis
Cross-over 2�4 week and4-week washout
1880 kJ per day ofsugar-sweetened softdrinks (‘liquid’)
1880 kJ per day ofjelly beans (‘solid’)
Diet records Po0.05 for weightchange during liquidperiod (þ0.5 kg),but not significantlydifferent from changein the solid period(þ0.3 kg)
(Raben et al., 2002)Denmark
n¼41 overweightM/F. Sucrose group:n¼21, age33.372.0, BMI28.070.5. Sweetenergroup: n¼20, age37.172.2, BMI 27.6.One drop-out wasnot included in theanalysis
Randomized parallel;participants wereblinded
10 week Sucrose supplements(B70% as drinks)
Artificial sweetenersupplements
Diet records 2.6 (95% CI 1.3–3.8,Po0.001) kg increasein weight and 1.6(95% CI 0.4–2.8,Po0.01) increase infat mass for thesucrose as comparedwith the artificialsweetener group
(James et al., 2004)UK
n¼644 M/F, childrenage 7–11 year fromsix schools. 20% wereoverweight or obese
Cluster randomized(29 clusters¼ classes)
1 year Educational nutritionprogram mainlydiscouragingcarbonated beverageuse
None Drink diariescompleted by 36%:0.7 glass per dayreduction of mainlydiet carbonatedbeverages
No substantialdecrease in meanBMI (0.1 kg/m2, 95%CI �0.1–0.3), but a7.7% (95% CI2.2–13.1) decreasein prevalence ofoverweight/obesityas compared withcontrol
(Ebbeling et al.,2006) US
n¼103 M/F, age13–18 year. No lossto follow-up
Randomized, parallel,allocationconcealment
25 weeks Home delivery ofnon-caloricbeverages (fourservings per day)and instructions
Instruction tocontinue usualbeverageconsumption
24-h recalls: 82%reduction of sugar-sweetened beveragesin intervention group
BMI: �0.14 (SE 0.21,P40.05) for the totalgroup and �0.75(SE 0.34, P¼0.03)for the upperbaseline-BMI tertileas compared withthe control group
Abbreviations: BMI, body mass index (kg/m2); F, female; HFCS, high fructose corn syrup; M, male.aValues are means7s.d.bNone of the trials reported on blinding of the assessors of outcomes, except for Ebbeling and co-workers allocation concealment was not reported.
Carbohydrateintake
andobesity
RMvan
Damand
JCSeidell
S87
EuropeanJournalofClinicalN
utrition
were identified (Malik et al., 2006). In most of these studies,
increases in sugar-sweetened soft drink consumption were
associated with weight gain. The lack of significant associa-
tion in some of the studies may have been due to small
sample sizes, short periods of follow-up and limited variation
in soft drink consumption. In the largest study in children
(n¼ 11 654, age 9–14 years), an increase of two or more
servings of sugar-sweetened soft drinks per day over a year
was associated with an increase in BMI in both boys (0.14
kg/m2, P¼0.01) and girls (0.10 kg/m2, Po0.05; Berkey et al.,
2004). In the largest study of adults, 51 603 women were
followed for two 4-year periods (Schulze et al., 2004). Women
who increased their sugar-sweetened soft drink consumption
from less than weekly to daily had the largest weight gain
(4.7 kg for the first and 4.2 kg for the second period), whereas
women who reduced their consumption from daily to less
than weekly had the smallest weight gain (1.3 kg for the first
and 0.2 kg for the second period; P-value differences between
groups 0.001). The finding of an association between sugar-
sweetened beverage consumption and weight gain has not
been limited to US populations (Bes-Rastrollo et al., 2006b).
Although these prospective studies considered confounding
in detail, remaining confounding by other dietary and
lifestyle factors cannot be excluded. However, the results of
cohort studies are consistent with the findings from inter-
vention studies and suggest that consumption of sugar-
sweetened soft drinks is relevant for long-term weight
management. It is plausible that findings for sugar-
sweetened soft drinks also apply to juices high in free sugars
such as apple juice, but effects of juices on body weight have
not been tested experimentally and results from observa-
tional studies have been mixed (Malik et al., 2006).
High-fructose corn syrup versus sucrose-sweetened beverages. It
has been suggested that the use of high-fructose corn syrup
to sweeten soft drinks has contributed to the increased
prevalence of obesity in the US (Bray et al., 2004a). The most
commonly used type of high-fructose corn syrup contains
55% fructose and 45% glucose, which is similar to sucrose.
Theoretically, the separated glucose and fructose (as in high-
fructose corn syrup) may have different effects than
conjoined molecule (as in sucrose before it is broken down
in the intestine) related to slightly higher sweetness and
higher osmolarity (Bray et al., 2004a). It should be noted,
however, that the Danish trial found effects of sucrose-
sweetened foods on weight gain (Raben et al., 2002).
Therefore, reduction of the consumption of both sucrose-
sweetened and high-fructose corn syrup sweetened soft
drinks is warranted.
Conclusion on free sugars and sugar-sweetened beverages
Short-term experiments suggest that satiety and satiation
may be lower for carbohydrates consumed as beverages as
compared with carbohydrates consumed as solid foods.
Although long-term randomized controlled trials of sugar-
sweetened beverages are lacking, evidence from short-term
blinded randomized controlled trials, medium-term non-
blinded randomized trials, and long-term prospective cohort
studies indicates that reduction of consumption of sugar-
sweetened beverages is beneficial for weight management.
Some data also support that reduction of solid foods high in
free sugars can contribute to weight loss, but findings have
been less consistent than for sugar-sweetened beverages. The
high energy density and low content of micronutrients and
fiber of many foods high in free sugars such as sugary candy,
table sugar, cookies and cakes should be considered.
Dietary GI and glycemic load
Introduction
The GI of a food quantifies the strength of the blood glucose
response after consumption of a fixed amount of available
carbohydrates from that food as compared with the response
after consumption of the same amount of available carbohy-
drate from a reference food (glucose or white bread) (Foster-
Powell et al., 2002). The glycemic load (GL) is the product of
the GI of a food and the amount of carbohydrate that it
contains (Foster-Powell et al., 2002). The GL was conceived
to reflect the total blood glucose-raising potential of the diet.
The GL of a diet can thus be reduced by reducing the GI of
the diet and/or by reducing the amount of carbohydrate
consumed. It is important to clearly distinguish between the
GI and the GL. First, the GL of a diet is strongly influenced by
Figure 4 Mean (7standard error) changes in body weight and fatmass during an intervention in which overweight subjects consumedsupplements containing either sucrose (K; n¼21) or artificialsweeteners (n; n¼20) daily for 10 weeks. In the sucrose group,sucrose was mostly consumed as beverages (B70%). At specifictime points for changes in body weight and fat mass, there weresignificant differences between the sucrose and sweetener groups:*Po0.05, **Po0.001 and ***Po0.0001. Reprinted from Raben et al.(2002) copyright 2002, with permission from the American Societyfor Nutrition.
Carbohydrate intake and obesityRM van Dam and JC Seidell
S88
European Journal of Clinical Nutrition
its carbohydrate content, whereas a low-GI diet can be either
high or low in carbohydrates. Second, physiological effects
can be different for low-GI diets as compared with low-GL
diets (Wolever et al., 1995). For example, in a study that
evaluated four meals with different combinations of the GI
(low or high) and carbohydrate content (low or high), the
greatest contrast in effects on free fatty acid levels was found
between the low-GI/high-carbohydrate meal and the low-GI/
low-carbohydrate (that is, lowest GL) meal (Wolever et al.,
1995).
Mechanistic studies of the GI and GL and energy balance
It has been postulated that consumption of high-GI foods
can lead to excess energy intake through rapid rises and
rapid subsequent declines in blood glucose concentrations
and associated increases in levels of counter-regulatory
hormones (Ludwig, 2002). This is supported by the observa-
tion that declines in blood glucose concentrations acutely
increased voluntary food intake in time-blinded volunteers
(Melanson et al., 1999). Several studies have reported
beneficial effects of low-GI meals on self-reported hunger
and short-term energy intake (Raben, 2002; Pereira et al.,
2004), but overall findings have been mixed (Raben, 2002).
In addition, a greater reduction in resting energy expendi-
ture has been observed in 39 overweight adults after a 10%
weight reduction as result of a high-GL hypocaloric diet than
after the same weight reduction as a result of a hypocaloric
diet with a lower GL (Pereira et al., 2004). No differences in
lean or fat mass were detected and the authors suggested that
low postprandial circulating concentrations of metabolic
substrates may have caused this difference possibly through
neuroendocrinological adaptations to conserve energy
(Pereira et al., 2004). It cannot be fully excluded that other
differences between the diets including substantial differ-
ences in protein, fiber and micronutrients may have
contributed to the observed effects.
It is plausible that the effects on energy balance differ for
different types of low-GI foods. For example, it has been
reported that having some low-GI foods (for example,
spaghetti) for breakfast reduced the glycemic response to a
subsequent lunch as compared with high-GI white wheat
bread, whereas having other low-GI foods for breakfast (for
example, white wheat bread with added vinegar) did not
(Liljeberg et al., 1999). The authors suggested that the
‘second-meal effect’ for the former foods might have resulted
from the prolonged elevation of postprandial glucose
concentrations and avoidance of a between-meal fasting.
Furthermore, the effect of foods with a low-GI as a result
of slow absorption of starches in the intestines may be
different from that of foods with a low GI as a result of high
fructose content. For example, slowly absorbed starches may
reach the lower part of the ileum and stimulate the secretion
of gut satiety hormones such as glucagon-like peptide-1
(McMillan-Price and Brand-Miller, 2006).
Cohort studies of the GI and GL
The association between the dietary GI or GL and changes in
body weight has been examined in two cohort studies, and
lower values were associated reductions in body weights
(Spieth et al., 2000; Ma et al., 2005). However, the limited
control for other dietary factors (Spieth et al., 2000; Ma et al.,
2005) and substantial loss to follow-up (Spieth et al., 2000)
complicate the interpretation of these results.
Intervention studies of the GI and weight change
Table 4 presents data on intervention studies that examined
the dietary GI in relation to body weight and body fatness
(Slabber et al., 1994; Tsihlias et al., 2000; Bouche et al., 2002;
Wolever and Mehling, 2003; Sloth et al., 2004; Carels et al.,
2005; Raatz et al., 2005). These trials had a duration ranging
from 5 weeks (Bouche et al., 2002) to 12 months (Carels et al.,
2005), and included only dietary advice (Slabber et al., 1994;
Bouche et al., 2002; Carels et al., 2005; Raatz et al., 2005),
provision of key foods (Tsihlias et al., 2000; Wolever and
Mehling, 2003) or provision of foods that provided much of
the total energy intake (Sloth et al., 2004; Raatz et al., 2005).
The presented intervention studies tested effects of slowly
absorbed carbohydrates rather than fructose-rich low-GI
foods. Effects of the dietary GI on body weight may be
mediated by effects on satiety/satiation and energy intake.
Therefore, we did not include studies in which energy
intakes were fixed. In the study by Raatz et al. (2005) the
energy intake was fixed in the first phase of the study, but
not in the second ‘free-living’ phase. Although the dietary
advice in the Slabber et al. (1994) intervention had a specific
deficit in energy intake as a target, the characteristics of the
trial (no foods provided 12-week duration) implied that the
energy intake of the participants could still vary widely.
In one of the studies, the low-GI intervention resulted in a
statistically significant reduction in weight as compared with
the control intervention (Slabber et al., 1994). This study
consisted of a randomized parallel trial comparing a low-GI
diet (‘low insulin response’ diet) with a control diet
(‘balanced diet’), where about half of the participants
volunteered to subsequently switch the other diet resulting
in a cross-over study (Slabber et al., 1994). Although the same
trend was observed in the parallel study and the cross-over
study, differences in weight loss were only statistically
significant in the latter. The used cross-over study approach
may result in selection bias, because volunteering to switch
to the other diet may depend on the experience with the
previous diet. Another limitation of this study is that it is not
reported how the diets changed as a result of the provided
advice. Differences in diets other than the GI may have
occurred, for example the ‘low-insulin response’ advice also
included the instruction not to use any snacks. In a French
study, dietary advice to consume low-GI foods did not lead
to a lower body weight but resulted in a 0.5 kg lower fat mass
as compared with dietary advice to eat high-GI foods
(Bouche et al., 2002). Fiber intake also differed substantially
Carbohydrate intake and obesityRM van Dam and JC Seidell
S89
European Journal of Clinical Nutrition
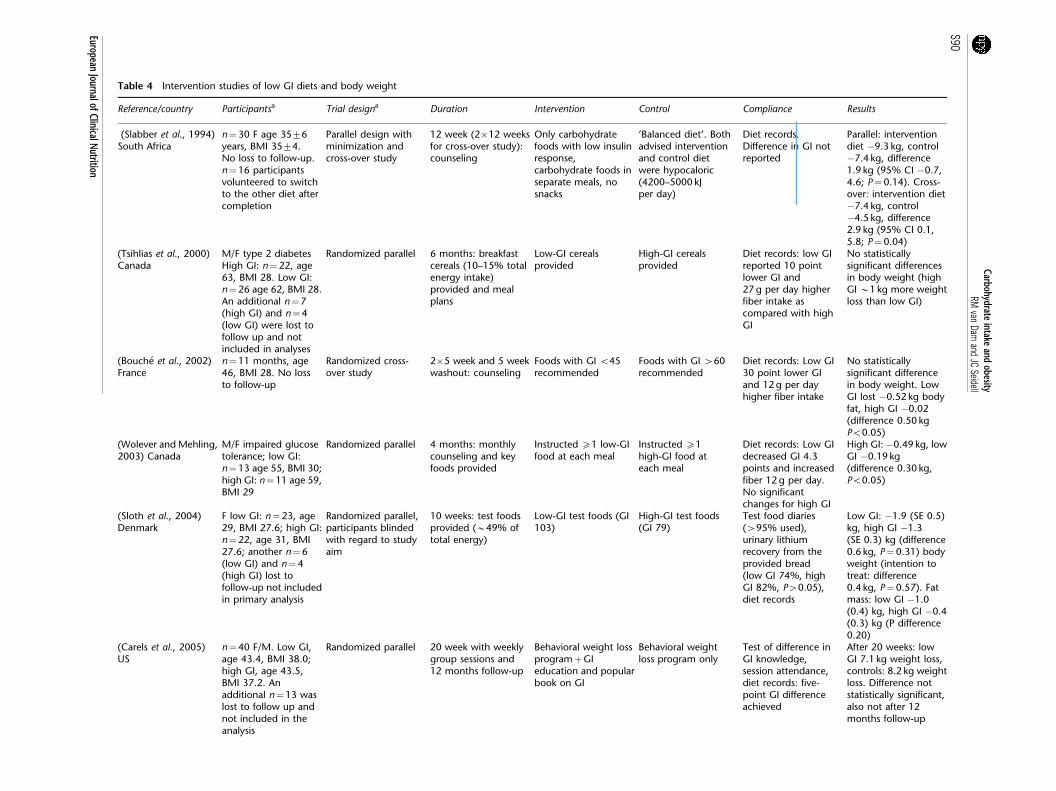
Table 4 Intervention studies of low GI diets and body weight
Reference/country Participantsa Trial designa Duration Intervention Control Compliance Results
(Slabber et al., 1994)South Africa
n¼30 F age 3576years, BMI 3574.No loss to follow-up.n¼16 participantsvolunteered to switchto the other diet aftercompletion
Parallel design withminimization andcross-over study
12 week (2�12 weeksfor cross-over study):counseling
Only carbohydratefoods with low insulinresponse,carbohydrate foods inseparate meals, nosnacks
‘Balanced diet’. Bothadvised interventionand control dietwere hypocaloric(4200–5000 kJper day)
Diet records.Difference in GI notreported
Parallel: interventiondiet �9.3 kg, control�7.4 kg, difference1.9 kg (95% CI �0.7,4.6; P¼0.14). Cross-over: intervention diet�7.4 kg, control�4.5 kg, difference2.9 kg (95% CI 0.1,5.8; P¼0.04)
(Tsihlias et al., 2000)Canada
M/F type 2 diabetesHigh GI: n¼22, age63, BMI 28. Low GI:n¼26 age 62, BMI 28.An additional n¼7(high GI) and n¼4(low GI) were lost tofollow up and notincluded in analyses
Randomized parallel 6 months: breakfastcereals (10–15% totalenergy intake)provided and mealplans
Low-GI cerealsprovided
High-GI cerealsprovided
Diet records: low GIreported 10 pointlower GI and27 g per day higherfiber intake ascompared with highGI
No statisticallysignificant differencesin body weight (highGI B1 kg more weightloss than low GI)
(Bouche et al., 2002)France
n¼11 months, age46, BMI 28. No lossto follow-up
Randomized cross-over study
2�5 week and 5 weekwashout: counseling
Foods with GI o45recommended
Foods with GI 460recommended
Diet records: Low GI30 point lower GIand 12 g per dayhigher fiber intake
No statisticallysignificant differencein body weight. LowGI lost �0.52 kg bodyfat, high GI �0.02(difference 0.50 kgPo0.05)
(Wolever and Mehling,2003) Canada
M/F impaired glucosetolerance; low GI:n¼13 age 55, BMI 30;high GI: n¼11 age 59,BMI 29
Randomized parallel 4 months: monthlycounseling and keyfoods provided
Instructed X1 low-GIfood at each meal
Instructed X1high-GI food ateach meal
Diet records: Low GIdecreased GI 4.3points and increasedfiber 12 g per day.No significantchanges for high GI
High GI: �0.49 kg, lowGI �0.19 kg(difference 0.30 kg,Po0.05)
(Sloth et al., 2004)Denmark
F low GI: n¼23, age29, BMI 27.6; high GI:n¼22, age 31, BMI27.6; another n¼6(low GI) and n¼4(high GI) lost tofollow-up not includedin primary analysis
Randomized parallel,participants blindedwith regard to studyaim
10 weeks: test foodsprovided (B49% oftotal energy)
Low-GI test foods (GI103)
High-GI test foods(GI 79)
Test food diaries(495% used),urinary lithiumrecovery from theprovided bread(low GI 74%, highGI 82%, P40.05),diet records
Low GI: �1.9 (SE 0.5)kg, high GI �1.3(SE 0.3) kg (difference0.6 kg, P¼0.31) bodyweight (intention totreat: difference0.4 kg, P¼0.57). Fatmass: low GI �1.0(0.4) kg, high GI �0.4(0.3) kg (P difference0.20)
(Carels et al., 2005)US
n¼40 F/M. Low GI,age 43.4, BMI 38.0;high GI, age 43.5,BMI 37.2. Anadditional n¼13 waslost to follow up andnot included in theanalysis
Randomized parallel 20 week with weeklygroup sessions and12 months follow-up
Behavioral weight lossprogramþGIeducation and popularbook on GI
Behavioral weightloss program only
Test of difference inGI knowledge,session attendance,diet records: five-point GI differenceachieved
After 20 weeks: lowGI 7.1 kg weight loss,controls: 8.2 kg weightloss. Difference notstatistically significant,also not after 12months follow-up
Carbohydrateintake
andobesity
RMvan
Damand
JCSeidell
S90
EuropeanJournalofClinicalN
utrition
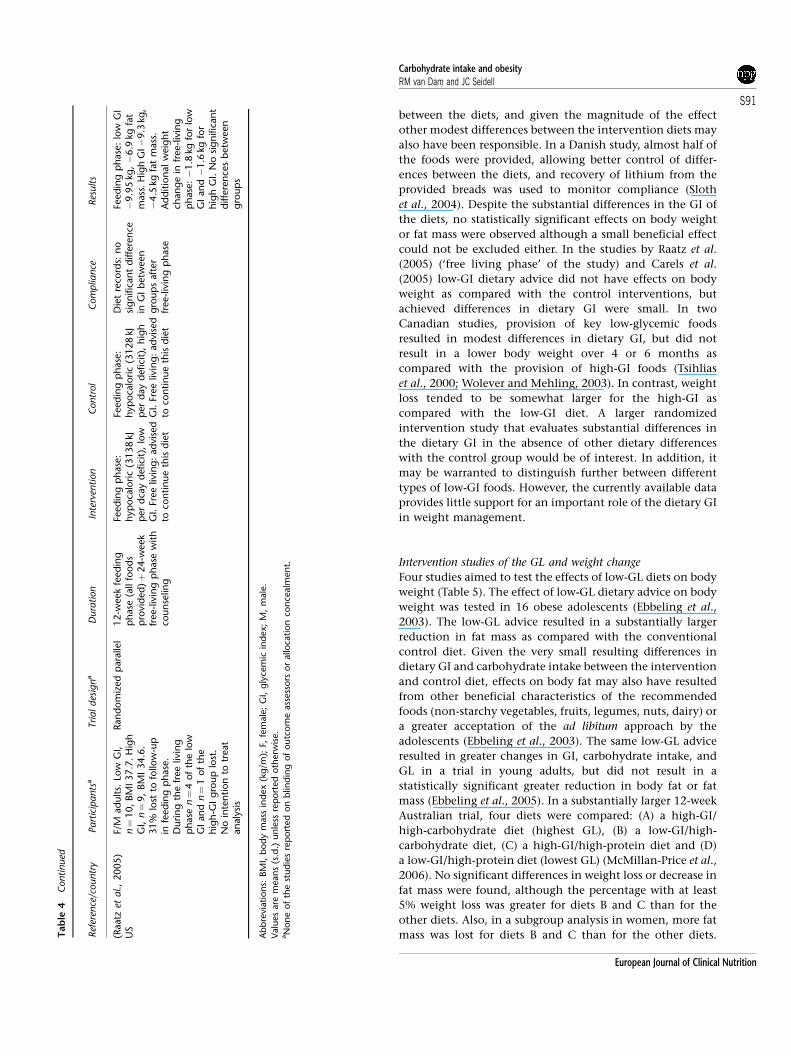
between the diets, and given the magnitude of the effect
other modest differences between the intervention diets may
also have been responsible. In a Danish study, almost half of
the foods were provided, allowing better control of differ-
ences between the diets, and recovery of lithium from the
provided breads was used to monitor compliance (Sloth
et al., 2004). Despite the substantial differences in the GI of
the diets, no statistically significant effects on body weight
or fat mass were observed although a small beneficial effect
could not be excluded either. In the studies by Raatz et al.
(2005) (‘free living phase’ of the study) and Carels et al.
(2005) low-GI dietary advice did not have effects on body
weight as compared with the control interventions, but
achieved differences in dietary GI were small. In two
Canadian studies, provision of key low-glycemic foods
resulted in modest differences in dietary GI, but did not
result in a lower body weight over 4 or 6 months as
compared with the provision of high-GI foods (Tsihlias
et al., 2000; Wolever and Mehling, 2003). In contrast, weight
loss tended to be somewhat larger for the high-GI as
compared with the low-GI diet. A larger randomized
intervention study that evaluates substantial differences in
the dietary GI in the absence of other dietary differences
with the control group would be of interest. In addition, it
may be warranted to distinguish further between different
types of low-GI foods. However, the currently available data
provides little support for an important role of the dietary GI
in weight management.
Intervention studies of the GL and weight change
Four studies aimed to test the effects of low-GL diets on body
weight (Table 5). The effect of low-GL dietary advice on body
weight was tested in 16 obese adolescents (Ebbeling et al.,
2003). The low-GL advice resulted in a substantially larger
reduction in fat mass as compared with the conventional
control diet. Given the very small resulting differences in
dietary GI and carbohydrate intake between the intervention
and control diet, effects on body fat may also have resulted
from other beneficial characteristics of the recommended
foods (non-starchy vegetables, fruits, legumes, nuts, dairy) or
a greater acceptation of the ad libitum approach by the
adolescents (Ebbeling et al., 2003). The same low-GL advice
resulted in greater changes in GI, carbohydrate intake, and
GL in a trial in young adults, but did not result in a
statistically significant greater reduction in body fat or fat
mass (Ebbeling et al., 2005). In a substantially larger 12-week
Australian trial, four diets were compared: (A) a high-GI/
high-carbohydrate diet (highest GL), (B) a low-GI/high-
carbohydrate diet, (C) a high-GI/high-protein diet and (D)
a low-GI/high-protein diet (lowest GL) (McMillan-Price et al.,
2006). No significant differences in weight loss or decrease in
fat mass were found, although the percentage with at least
5% weight loss was greater for diets B and C than for the
other diets. Also, in a subgroup analysis in women, more fat
mass was lost for diets B and C than for the other diets.(Raatz
etal.,
2005)
US
F/M
ad
ults.
Low
GI,
n¼
10,BM
I37.7
.H
igh
GI,
n¼
9,
BM
I34.6
.31%
lost
tofo
llow
-up
infe
ed
ing
ph
ase
.D
urin
gth
efr
ee
livin
gp
hase
n¼
4of
the
low
GI
an
dn¼
1of
the
hig
h-G
Ig
roup
lost
.N
oin
ten
tion
totr
eat
an
aly
sis
Ran
dom
ized
para
llel
12-w
eek
feed
ing
ph
ase
(all
food
sp
rovi
ded
)þ
24-w
eek
free-liv
ing
ph
ase
with
coun
selin
g
Feed
ing
ph
ase
:h
yp
oca
loric
(3138
kJp
er
dca
yd
efici
t),
low
GI.
Free
livin
g:
ad
vise
dto
con
tin
ue
this
die
t
Feed
ing
ph
ase
:h
yp
oca
lori
c(3
128
kJp
er
day
defici
t),
hig
hG
I.Fr
ee
livin
g:
ad
vise
dto
con
tin
ue
this
die
t
Die
tre
cord
s:n
osi
gn
ific
an
td
iffe
ren
cein
GI
betw
een
gro
up
saft
er
free-liv
ing
ph
ase
Feed
ing
ph
ase
:lo
wG
I�
9.9
5kg
,�
6.9
kgfa
tm
ass
.H
igh
GI�
9.3
kg,
�4.5
kgfa
tm
ass
.A
dd
itio
nal
weig
ht
chan
ge
infr
ee-liv
ing
ph
ase
:�
1.8
kgfo
rlo
wG
Ian
d�
1.6
kgfo
rh
igh
GI.
No
sig
nific
an
td
iffe
ren
ces
betw
een
gro
up
s
Ab
bre
viation
s:BM
I,b
od
ym
ass
ind
ex
(kg
/m);
F,fe
male
;G
I,g
lyce
mic
ind
ex;
M,
male
.
Valu
es
are
mean
s(s
.d.)
un
less
rep
ort
ed
oth
erw
ise.
aN
on
eof
the
stud
ies
rep
ort
ed
on
blin
din
gof
outc
om
eass
ess
ors
or
allo
cati
on
con
cealm
en
t.
Tab
le4
Conti
nued
Ref
eren
ce/c
ountr
yPart
icip
ants
aTri
al
des
ign
aD
ura
tion
Inte
rven
tion
Contr
ol
Com
plia
nce
Res
ult
s
Carbohydrate intake and obesityRM van Dam and JC Seidell
S91
European Journal of Clinical Nutrition
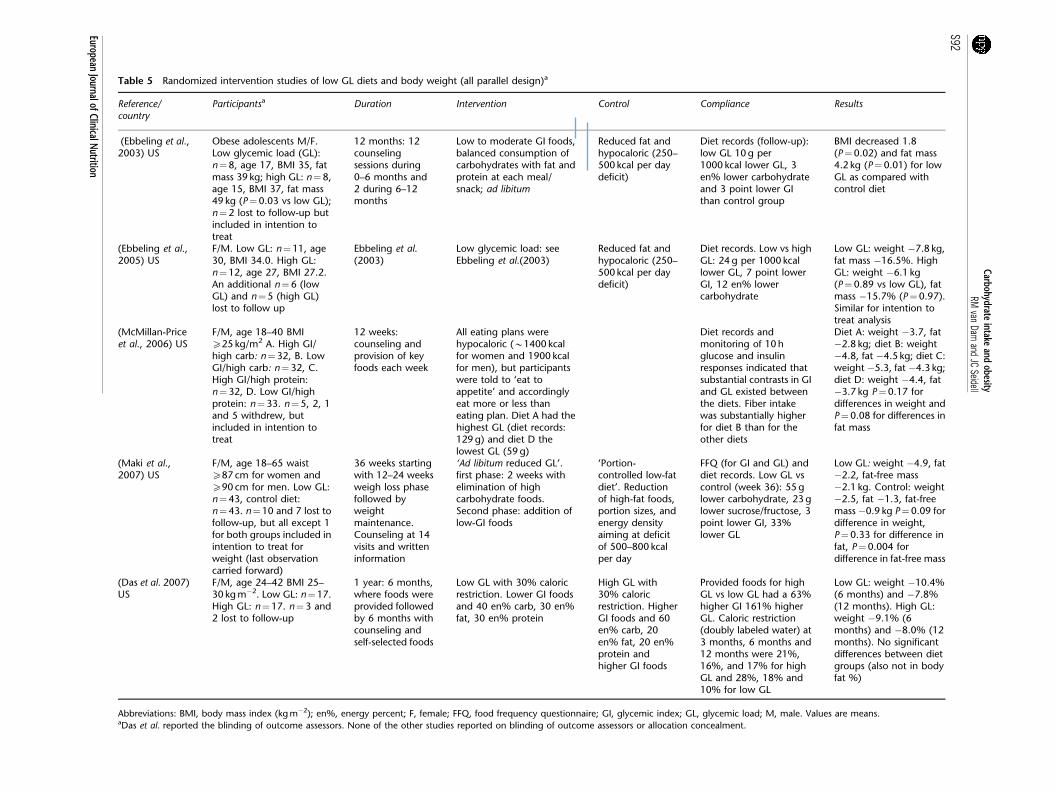
Table 5 Randomized intervention studies of low GL diets and body weight (all parallel design)a
Reference/country
Participantsa Duration Intervention Control Compliance Results
(Ebbeling et al.,2003) US
Obese adolescents M/F.Low glycemic load (GL):n¼8, age 17, BMI 35, fatmass 39 kg; high GL: n¼8,age 15, BMI 37, fat mass49 kg (P¼0.03 vs low GL);n¼2 lost to follow-up butincluded in intention totreat
12 months: 12counselingsessions during0–6 months and2 during 6–12months
Low to moderate GI foods,balanced consumption ofcarbohydrates with fat andprotein at each meal/snack; ad libitum
Reduced fat andhypocaloric (250–500 kcal per daydeficit)
Diet records (follow-up):low GL 10 g per1000 kcal lower GL, 3en% lower carbohydrateand 3 point lower GIthan control group
BMI decreased 1.8(P¼0.02) and fat mass4.2 kg (P¼0.01) for lowGL as compared withcontrol diet
(Ebbeling et al.,2005) US
F/M. Low GL: n¼11, age30, BMI 34.0. High GL:n¼12, age 27, BMI 27.2.An additional n¼6 (lowGL) and n¼5 (high GL)lost to follow up
Ebbeling et al.(2003)
Low glycemic load: seeEbbeling et al.(2003)
Reduced fat andhypocaloric (250–500 kcal per daydeficit)
Diet records. Low vs highGL: 24 g per 1000 kcallower GL, 7 point lowerGI, 12 en% lowercarbohydrate
Low GL: weight �7.8 kg,fat mass �16.5%. HighGL: weight �6.1 kg(P¼0.89 vs low GL), fatmass �15.7% (P¼0.97).Similar for intention totreat analysis
(McMillan-Priceet al., 2006) US
F/M, age 18–40 BMIX25 kg/m2 A. High GI/high carb: n¼32, B. LowGI/high carb: n¼32, C.High GI/high protein:n¼32, D. Low GI/highprotein: n¼33. n¼5, 2, 1and 5 withdrew, butincluded in intention totreat
12 weeks:counseling andprovision of keyfoods each week
All eating plans werehypocaloric (B1400 kcalfor women and 1900 kcalfor men), but participantswere told to ‘eat toappetite’ and accordinglyeat more or less thaneating plan. Diet A had thehighest GL (diet records:129 g) and diet D thelowest GL (59 g)
Diet records andmonitoring of 10 hglucose and insulinresponses indicated thatsubstantial contrasts in GIand GL existed betweenthe diets. Fiber intakewas substantially higherfor diet B than for theother diets
Diet A: weight �3.7, fat�2.8 kg; diet B: weight�4.8, fat �4.5 kg; diet C:weight �5.3, fat �4.3 kg;diet D: weight �4.4, fat�3.7 kg P¼0.17 fordifferences in weight andP¼0.08 for differences infat mass
(Maki et al.,2007) US
F/M, age 18–65 waistX87 cm for women andX90 cm for men. Low GL:n¼43, control diet:n¼43. n¼10 and 7 lost tofollow-up, but all except 1for both groups included inintention to treat forweight (last observationcarried forward)
36 weeks startingwith 12–24 weeksweigh loss phasefollowed byweightmaintenance.Counseling at 14visits and writteninformation
‘Ad libitum reduced GL’.first phase: 2 weeks withelimination of highcarbohydrate foods.Second phase: addition oflow-GI foods
‘Portion-controlled low-fatdiet’. Reductionof high-fat foods,portion sizes, andenergy densityaiming at deficitof 500–800 kcalper day
FFQ (for GI and GL) anddiet records. Low GL vscontrol (week 36): 55 glower carbohydrate, 23 glower sucrose/fructose, 3point lower GI, 33%lower GL
Low GL: weight �4.9, fat�2.2, fat-free mass�2.1 kg. Control: weight�2.5, fat �1.3, fat-freemass �0.9 kg P¼0.09 fordifference in weight,P¼0.33 for difference infat, P¼0.004 fordifference in fat-free mass
(Das et al. 2007)US
F/M, age 24–42 BMI 25–30 kg m�2. Low GL: n¼17.High GL: n¼17. n¼3 and2 lost to follow-up
1 year: 6 months,where foods wereprovided followedby 6 months withcounseling andself-selected foods
Low GL with 30% caloricrestriction. Lower GI foodsand 40 en% carb, 30 en%fat, 30 en% protein
High GL with30% caloricrestriction. HigherGI foods and 60en% carb, 20en% fat, 20 en%protein andhigher GI foods
Provided foods for highGL vs low GL had a 63%higher GI 161% higherGL. Caloric restriction(doubly labeled water) at3 months, 6 months and12 months were 21%,16%, and 17% for highGL and 28%, 18% and10% for low GL
Low GL: weight �10.4%(6 months) and �7.8%(12 months). High GL:weight �9.1% (6months) and �8.0% (12months). No significantdifferences between dietgroups (also not in bodyfat %)
Abbreviations: BMI, body mass index (kg m�2); en%, energy percent; F, female; FFQ, food frequency questionnaire; GI, glycemic index; GL, glycemic load; M, male. Values are means.aDas et al. reported the blinding of outcome assessors. None of the other studies reported on blinding of outcome assessors or allocation concealment.
Carbohydrateintake
andobesity
RMvan
Damand
JCSeidell
S92
EuropeanJournalofClinicalN
utrition

Despite a substantially lower GL for diet D as compared with
diet A, according to diet records (�54%) and 10-h incre-
mental area under the glucose (�38%) and insulin (�45%)
curve on profile days, no substantial or significant difference
in loss of fat mass was observed. Thus, although results from
this study could be seen as supportive for a low-GI /high-
carbohydrate/high-fiber diet and a high-protein diet for
weight loss, the unexpected results for the diet that
combined a low-GI and high protein intake, the sex
differences in results and the limited duration warrant a
cautious interpretation. In a US study, a reduced GL diet was
compared with a portion-controlled low-fat diet (Maki et al.,
2007). Weight loss and loss of fat mass was greater for the
low-GL diet as compared with the control diet after 12 weeks
(‘weight loss phase’), but these differences did not remain
significant after 36 weeks (‘weight maintenance phase’).
Finally, another US study in 34 participants combined a goal
of 30% caloric restriction with a low or high-GL diet (Das
et al., 2007). No significant differences in weight loss or
energy intake measured with the doubly labeled water
method were found after either the 6-month phase in which
all foods were provided or the subsequent 6-month phase
where the participants selected the foods themselves. In
summary, studies that have directly compared low- and
high-GL diets do not consistently support this hypothesis
that a low-GL diet supports weight loss.
Conclusion on GI and GL
Current evidence from studies on low-GI and low-GL diets is
too limited to warrant specific recommendation with regard
to these concepts for the prevention of obesity. Caution
with regard to the health effects of high fructose intake is
warranted, whereas other low-GI foods such as legumes that
also have other beneficial nutritional properties could be
recommended as part of a diet for weight control.
Dietary fiber
Introduction
A higher fiber content contributes to a lower energy density
of foods (Slavin, 2005). In addition, viscous fibers form a
viscous gel in contact with water and have been suggested to
reduce energy intake through increased feelings of fullness
(Pasman et al., 1997). These types of fiber may also increase
gastrointestinal transit time, slow glucose absorption and
lead to a more gradual increase in blood glucose levels (see
glycemic index section) (Slavin, 2005).
Intervention studies of ‘fiber’ supplements and body weight
Guar gum is a viscous galactomannan fiber that is
commonly used in the form of supplements in attempts to
lose weight (Pittler and Ernst, 2001). In a meta-analysis
published in 2001, the results of 11 randomized double-blind
trials of guar gum intake and body weight were pooled
(Pittler and Ernst, 2001). The results did not suggest a
difference in effect on body weight as compared with
placebo treatment (weighted mean difference �0.04 kg;
95% confidence interval �2.2 to 2.1). In a 14-month
randomized intervention study with 11 obese women,
adding 20 g of guar gum supplements per day to an ad
libitum diet after completion of a very low-calorie diet did
not reduce weight as compared with controls (Pasman et al.,
1997). Timing of the intake of fiber supplements in relation
to meals may be relevant (Pasman et al., 1997). Also, fiber
supplements may not have appreciable effects in isolation,
but rather improve adherence to hypocaloric diets. Ryttig
et al. (1989) examined the effects of a fiber supplement in
combination with a hypocaloric diet in a series of double-
blind, randomized trials of 3- to 12-month duration in
overweight persons (Rossner et al., 1987; Rigaud et al., 1990).
The addition of the fiber supplements to a hypocaloric diet
led to a statistically significant 1–2 kg greater weight loss as
compared with a placebo in combination with the hypo-
caloric diet. An effect of similar magnitude was observed for
adding viscous glucomannan fiber supplement to a hypo-
caloric diet in 5-week placebo-controlled double-blind
randomized study (Birketvedt et al., 2005). In summary,
although results for ‘fiber’ supplements on body weight have
been mixed there is some evidence that these supplements
may increase adherence to hypocaloric diets and thus lead to
a small additional weight loss. The role of different types of
fiber as well as the timing of fiber intake requires further
study in this context.
Weight loss interventions with high-fiber foods
In a randomized trial in obese men and women that received
an energy-restricted diet (target 500 kcal per day deficit) for
48 weeks additional advice to increase consumption of
vegetables, fruit and whole grains was associated with a
B10 g per day reported higher fiber intake, but not with
greater weight loss (Thompson et al., 2005). In a 2-year
randomized trial, the effect of a ‘Mediterranean-style’ diet
high in fiber-rich foods was tested in 180 persons with the
metabolic syndrome (Esposito et al., 2004). The intervention
group received individualized dietary advice from a dietician
(monthly session in the 1st year, bimonthly in the second
year) and participated in group sessions with education on
reducing calories, personal goal setting and self-monitoring.
Aims included increasing consumption of fruits, vegetables,
legumes, nuts, whole grains and olive oil combined with less
than 30% of energy from fat and 50–60% from carbohy-
drates. The control group did not receive individualized
advice, but only general recommendations based on the
same goals for macronutrient intakes. Weight loss after 2
years was 4.0 kg for the intervention and 1.2 kg for the
control group (difference 2.8 kg, 95% confidence interval
0.5–5.1). The 16 g per day greater increase in fiber intake as
well as other characteristics of the recommended foods or
Carbohydrate intake and obesityRM van Dam and JC Seidell
S93
European Journal of Clinical Nutrition
the educational program may have contributed to this
greater weight loss.
Intervention studies of high-fiber foods not primarily aimed at
weight loss
In the Women’s Health Initiative, a modest self-reported
increase in fruit, vegetable and fiber intake was observed in
the intervention group and this was not associated with a
substantial long-term effect on body weight (Howard et al.,
2006). Other trials that were not aimed at weight loss
generally did not find an effect of increased consumption of
fruits and vegetables on body weight (Rolls et al., 2004). For
example, in a 1-year trial in 201 men and women specifically
aimed at fruit and vegetable consumption, fruit (diet records
þ2.8 serving per day), vegetable (þ1.4 serving per day),
juice (þ2.5 serving per day) and fiber intake (þ 5.5 g per
day) increased substantially more in the intervention as
compared with the control group (Smith-Warner et al.,
2000). These changes were supported by increased plasma
carotenoid concentrations, but no appreciable difference in
weight change was found between the intervention
(þ0.3 kg) and control group (þ0.4 kg). It has been suggested
that concomitant increases in juice consumption, a high-
caloric beverage, may have reduced possible beneficial effects
of the fruits and vegetable interventions on body weight
(Rolls et al., 2004). An alternative explanation that is
consistent with the results from prospective cohort studies
is that effects of higher consumption of fiber-rich foods on
body weight are modest and only apparent after several
years.
Cohort studies of high-fiber foods and long-term weight change
The association between fiber intake and weight change has
been examined in several large prospective cohort studies
with detailed adjustment for potential confounders. In a
study of men, a 10 g per day increase in fiber intake was
associated with a 2.25 kg lower weight gain over 8 years after
correction for measurement error in the assessment of fiber
intake (Koh-Banerjee et al., 2004). Similar results have been
obtained in women, younger adults, and a Mediterranean
population (Ludwig et al., 1999; Liu et al., 2003; Bes-Rastrollo
et al., 2006a). Higher consumption of whole grains (Liu et al.,
2003; Koh-Banerjee et al., 2004) and fruits and vegetables (He
et al., 2004; Bes-Rastrollo et al., 2006a) was also associated
with a modestly lower long-term weight gain. These findings
may reflect a dietary pattern rather than fiber intake per se,
and the possibility that confounding by unmeasured or
imprecisely measured factors contributed to these associa-
tions cannot be excluded.
Conclusion on dietary fiber
The currently available evidence does not support a major
effect of fiber intake on weight loss, but evidence is
consistent with modest long-term effects of higher con-
sumption of fiber-rich foods on body weight gain. An
important reason to attempt weight loss is the prevention
of morbidity associated with excess adiposity including type
2 diabetes, coronary heart disease and stroke (Willett et al.,
1999). Consumption of a diet high in fruits, vegetables and
whole grains is associated with reduced risk of these diseases
(Appel et al., 1997; de Lorgeril et al., 1999; Jacobs and
Gallaher, 2004) and should therefore be included in diets for
long-term weight management. Ad libitum intervention
studies that specifically examine the effects of whole grain
consumption on body weight appear to be lacking and this
topic warrants further research.
General discussion
Although weight gain is due to an imbalance between energy
intake and energy expenditure, this equation is deceivingly
simple in the context of obesity prevention and treatment
under realistic conditions. Complex feedback mechanisms
appear to stimulate regaining lost weight (Hirsch et al., 1998)
and potent environmental influences stimulate over-con-
sumption of ubiquitously available foods and a sedentary
lifestyle (Egger and Swinburn, 1997). The optimal macro-
nutrient composition of diet for weight management may
also differ by individual characteristics. First, the response to
diets may differ by genetic susceptibility of individuals
(Memisoglu et al., 2003), although a recent study of 26
candidate genes did not identify important modifiers of the
effects of a high or low carbohydrate weight loss diet
(Sorensen et al., 2006). Second, findings from two recent
randomized intervention studies suggest that insulin sensi-
tivity or glucose-induced insulin secretion can modify the
weight loss in response to low-carbohydrate or low-GL diets
(Cornier et al., 2005; Pittas et al., 2005). Larger studies are
needed to test the hypothesis that characteristics related to a
person’s glucose homeostasis may affect the optimal macro-
nutrient composition for weight management. Finally, the
carbohydrate content of a diet that allows long-term
adherence may to a large extent depend on individual
preferences. For prevention of weight gain, individuals
should be able to maintain a dietary pattern that prevents
excess energy intake for decades and the degree of adherence
to weight loss interventions is a strong predictor of weight
loss (Heshka et al., 2003; Dansinger et al., 2005).
This overview is limited to dietary carbohydrates in
relation to obesity. However, many other factors should be
considered in the design of weight loss interventions. Self-
monitoring of diet and activity, structural approaches
providing foods, meal replacements or menus and recipes,
increased physical activity, and longer length of treatment
have been shown to contribute to greater weight loss (Perri
et al., 1989; Foster et al., 2005). Although, the achieved
weight loss of long-term interventions may appear small,
B5% loss of body weight as a result of dietary changes and
Carbohydrate intake and obesityRM van Dam and JC Seidell
S94
European Journal of Clinical Nutrition
increased physical activity has been associated with a major
decrease in incidence of type 2 diabetes and other metabolic
disturbances (Tuomilehto et al., 2001; Knowler et al., 2002).
The high prevalence of overweight and obesity indicates that
energy imbalance is a population-wide phenomenon in
many societies across the world. In addition to interventions
aimed at individuals, rigorous changes in the social and
physical environment including the food supply that reduce
stimuli to overeat and facilitate greater physical activity will
be needed to target the epidemic of obesity.
Although more randomized longer-term trials of diet and
body weight have been conducted in recent years, many
caveats exist in the current evidence and further research
efforts to address this topic that is of pivotal importance for
public health is strongly recommended.
Conclusions and recommendations
Carbohydrates are among the macronutrients that provide
energy and can thus contribute to excess energy intake and
subsequent weight gain. If energy intake is strictly con-
trolled, macronutrient composition of the diet (energy
percentages of fat and carbohydrates) does not substantially
affect body weight or fat mass (Golay et al., 1996). However,
an important issue is whether among free-living individuals,
macronutrient composition of the diet increases the like-
lihood of passive over-consumption. There is no clear
evidence that altering the proportion of total carbohydrate
in the diet is an important determinant of energy intake.
However, there is evidence that sugar-sweetened beverages
do not induce satiety to the same extent as solid forms of
carbohydrate and that increases in sugar sweetened soft
drink consumption are associated with weight gain. Thus,
there is a justification for the recommendation to restrict the
use of beverages high in free sugars in order to reduce the risk
of excessive weight gain and to treat obesity. Solid foods high
in free sugars tend to be energy dense, and there is some
evidence from intervention studies that reduction of solid
foods high in free sugars can contribute to weight loss. Thus,
the current recommendation to restrict free sugars to no
more than 10 percent of total energy is consistent with
appropriate diets for the prevention of obesity. A high
content of dietary fiber in whole-grain cereals, vegetables,
legumes and fruits is associated with relatively low energy
density, promotion of satiety, and in observational studies a
lesser degree of weight gain than among those with lower
intakes. Although it is difficult to establish with certainty
that dietary fiber rather than other dietary attributes are
responsible, it is considered appropriate to recommend that
whole grain cereals, vegetables, legumes and fruits are the
most appropriate sources of dietary carbohydrate. The
currently available evidence is considered to be insufficient
to recommend carbohydrate-containing foods likely to
reduce the risk of obesity or promote weight loss on the
basis of their GI.
Acknowledgements
We thank Dr Ahmad R Dorosty, Dr Cara Ebbeling, Professor
Philip James, Professor Simin Liu, Professor Jim Mann,
Professor Boyd Swinburn, Professor Carolyn Summerbell
and Dr Ricardo Uauy for their valuable comments on the
earlier manuscript.
Conflict of interest
During preparation and peer-review of this paper in 2006, the
authors and peer-reviewers declared the following interests.
Authors
Dr Rob M van Dam: None declared.
Professor Jaap C Seidell: None declared.
Peer-reviewers
Dr Ahmad R Dorosty: None declared.
Dr Cara Ebbeling: None declared.
Professor Philip James: None declared.
Professor Simin Liu: None declared.
Professor Jim Mann: None declared.
Professor Boyd Swinburn: None declared.
Professor Carolyn Summerbell: None declared.
Dr Ricardo Uauy: Scientific Adviser on a temporary basis
for Unilever and Wyeth; Scientific Editorial/Award Adviser
for Danone, DSM, Kelloggs, and Knowles and Bolton on an
ad hoc basis.
References
Alexy U, Sichert-Hellert W, Kersting M (2003). Associations betweenintake of added sugars and intakes of nutrients and food groups inthe diets of German children and adolescents. Br J Nutr 90, 441–447.
Anderson JW, Story LJ, Zettwoch NC, Gustafson NJ, Jefferson BS(1989). Metabolic effects of fructose supplementation in diabeticindividuals. Diabetes Care 12, 337–344.
Anonymous (1968). The National Diet-Heart Study Final Report.Circulation 37, I1–I428.
Appel LJ, Moore TJ, Obarzanek E, Vollmer WM, Svetkey LP, Sacks FMet al. (1997). A clinical trial of the effects of dietary patterns onblood pressure. DASH Collaborative Research Group. N Engl J Med336, 1117–1124.
Astrup A, Meinert Larsen T, Harper A (2004). Atkins and other low-carbohydrate diets: hoax or an effective tool for weight loss?Lancet 364, 897–899.
Baron JA, Schori A, Crow B, Carter R, Mann JI (1986). A randomizedcontrolled trial of low carbohydrate and low fat/high fiber diets forweight loss. Am J Public Health 76, 1293–1296.
Berkey CS, Rockett HR, Field AE, Gillman MW, Colditz GA (2004). Sugar-added beverages and adolescent weight change. Obes Res 12, 778–788.
Bes-Rastrollo M, Martinez-Gonzalez MA, Sanchez-Villegas A, de laFuente Arrillaga C, Martinez JA (2006a). Association of fiber intakeand fruit/vegetable consumption with weight gain in a Mediterra-nean population. Nutrition 22, 504–511.
Bes-Rastrollo M, Sanchez-Villegas A, Gomez-Gracia E, Martinez JA,Pajares RM, Martinez-Gonzalez MA (2006b). Predictors of weightgain in a Mediterranean cohort: the Seguimiento Universidad deNavarra Study 1. Am J Clin Nutr 83, 362–370;quiz 394–395.
Birketvedt GS, Shimshi M, Erling T, Florholmen J (2005). Experienceswith three different fiber supplements in weight reduction. Med SciMonit 11, PI5–PI8.
Carbohydrate intake and obesityRM van Dam and JC Seidell
S95
European Journal of Clinical Nutrition
Blaak EE (2004). Basic disturbances in skeletal muscle fatty acidmetabolism in obesity and type 2 diabetes mellitus. Proc Nutr Soc63, 323–330.
Bouche C, Rizkalla SW, Luo J, Vidal H, Veronese A, Pacher N et al.(2002). Five-week, low-glycemic index diet decreases total fat massand improves plasma lipid profile in moderately overweightnondiabetic men. Diabetes Care 25, 822–828.
Braam LA, Ocke MC, Bueno-de-Mesquita HB, Seidell JC (1998).Determinants of obesity-related underreporting of energy intake.Am J Epidemiol 147, 1081–1086.
Bray GA, Nielsen SJ, Popkin BM (2004a). Consumption of high-fructose corn syrup in beverages may play a role in the epidemic ofobesity. Am J Clin Nutr 79, 537–543.
Bray GA, Paeratakul S, Popkin BM (2004b). Dietary fat and obesity: areview of animal, clinical and epidemiological studies. PhysiolBehav 83, 549–555.
Brehm BJ, Seeley RJ, Daniels SR, D’Alessio DA (2003). A randomizedtrial comparing a very low carbohydrate diet and a calorie-restricted low fat diet on body weight and cardiovascular riskfactors in healthy women. J Clin Endocrinol Metab 88, 1617–1623.
Brinkworth GD, Noakes M, Keogh JB, Luscombe ND, Wittert GA,Clifton PM (2004a). Long-term effects of a high-protein, low-carbohydrate diet on weight control and cardiovascular riskmarkers in obese hyperinsulinemic subjects. Int J Obes Relat MetabDisord 28, 661–670.
Brinkworth GD, Noakes M, Parker B, Foster P, Clifton PM (2004b).Long-term effects of advice to consume a high-protein, low-fatdiet, rather than a conventional weight-loss diet, in obese adultswith type 2 diabetes: one-year follow-up of a randomised trial.Diabetologia 47, 1677–1686.
Carels RA, Darby LA, Douglass OM, Cacciapaglia HM, Rydin S (2005).Education on the glycemic index of foods fails to improvetreatment outcomes in a behavioral weight loss program. EatBehav 6, 145–150.
Charlton KE, Kolbe-Alexander TL, Nel JH (2005). Micronutrientdilution associated with added sugar intake in elderly black SouthAfrican women. Eur J Clin Nutr 59, 1030–1042.
Cornier MA, Donahoo WT, Pereira R, Gurevich I, Westergren R,Enerback S et al. (2005). Insulin sensitivity determines theeffectiveness of dietary macronutrient composition on weightloss in obese women. Obes Res 13, 703–709.
Dansinger ML, Gleason JA, Griffith JL, Selker HP, Schaefer EJ (2005).Comparison of the Atkins, Ornish, Weight Watchers, and Zonediets for weight loss and heart disease risk reduction: a randomizedtrial. JAMA 293, 43–53.
Das SK, Gilhooly CH, Golden JK, Pittas AG, Fuss PJ, Cheatham RAet al. (2007). Long-term effects of 2 energy-restricted diets differingin glycemic load on dietary adherence, body composition, andmetabolism in CALERIE: a 1-y randomized controlled trial. Am JClin Nutr 85, 1023–1030.
de Graaf C, Blom WA, Smeets PA, Stafleu A, Hendriks HF(2004). Biomarkers of satiation and satiety. Am J Clin Nutr 79,946–961.
de Lorgeril M, Salen P, Martin JL, Monjaud I, Delaye J, Mamelle N(1999). Mediterranean diet, traditional risk factors, and the rate ofcardiovascular complications after myocardial infarction: finalreport of the Lyon Diet Heart Study. Circulation 99, 779–785.
DiMeglio DP, Mattes RD (2000). Liquid versus solid carbohydrate:effects on food intake and body weight. Int J Obes Relat MetabDisord 24, 794–800.
Drewnowski A, Bellisle F (2007). Liquid calories, sugar, and bodyweight. Am J Clin Nutr 85, 651–661.
Drewnowski A, Almiron-Roig E, Marmonier C, Lluch A (2004).Dietary energy density and body weight: is there a relationship?Nutr Rev 62, 403–413.
Due A, Toubro S, Skov AR, Astrup A (2004). Effect of normal-fat diets,either medium or high in protein, on body weight in overweightsubjects: a randomised 1-year trial. Int J Obes Relat Metab Disord 28,1283–1290.
Ebbeling CB, Feldman HA, Osganian SK, Chomitz VR, Ellenbogen SJ,Ludwig DS (2006). Effects of decreasing sugar-sweetened beverageconsumption on body weight in adolescents: a randomized,controlled pilot study. Pediatrics 117, 673–680.
Ebbeling CB, Leidig MM, Sinclair KB, Hangen JP, Ludwig DS (2003). Areduced-glycemic load diet in the treatment of adolescent obesity.Arch Pediatr Adolesc Med 157, 773–779.
Ebbeling CB, Leidig MM, Sinclair KB, Seger-Shippee LG, Feldman HA,Ludwig DS (2005). Effects of an ad libitum low-glycemic load dieton cardiovascular disease risk factors in obese young adults. Am JClin Nutr 81, 976–982.
Egger G, Swinburn B (1997). An ‘ecological’ approach to the obesitypandemic. BMJ 315, 477–480.
Elliott SS, Keim NL, Stern JS, Teff K, Havel PJ (2002). Fructose, weightgain, and the insulin resistance syndrome. Am J Clin Nutr 76, 911–922.
Ello-Martin JA, Ledikwe JH, Rolls BJ (2005). The influence of foodportion size and energy density on energy intake: implications forweight management. Am J Clin Nutr 82, 236S–241S.
Esposito K, Marfella R, Ciotola M, Di Palo C, Giugliano F, GiuglianoG et al. (2004). Effect of a mediterranean-style diet on endothelialdysfunction and markers of vascular inflammation in the meta-bolic syndrome: a randomized trial. JAMA 292, 1440–1446.
Foster GD, Makris AP, Bailer BA (2005). Behavioral treatment ofobesity. Am J Clin Nutr 82, 230S–235S.
Foster GD, Wyatt HR, Hill JO, McGuckin BG, Brill C, Mohammed BSet al. (2003). A randomized trial of a low-carbohydrate diet forobesity. N Engl J Med 348, 2082–2090.
Foster-Powell K, Holt SH, Brand-Miller JC (2002). International tableof glycemic index and glycemic load values: 2002. Am J Clin Nutr76, 5–56.
Franks PW, Luan J, Browne PO, Harding AH, O’Rahilly S, ChatterjeeVK et al. (2004). Does peroxisome proliferator-activated receptorgamma genotype (Pro12ala) modify the association of physicalactivity and dietary fat with fasting insulin level? Metabolism 53,11–16.
Gardner CD, Kiazand A, Alhassan S, Kim S, Stafford RS, Balise RR et al.(2007). Comparison of the Atkins, Zone, Ornish, and LEARN dietsfor change in weight and related risk factors among overweightpremenopausal women: the A TO Z Weight Loss Study: arandomized trial. JAMA 297, 969–977.
Gatenby SJ, Aaron JI, Jack VA, Mela DJ (1997). Extended use of foodsmodified in fat and sugar content: nutritional implications in afree-living female population. Am J Clin Nutr 65, 1867–1873.
Golay A, Allaz AF, Morel Y, de Tonnac N, Tankova S, Reaven G (1996).Similar weight loss with low- or high-carbohydrate diets. Am J ClinNutr 63, 174–178.
Halton TL, Hu FB (2004). The effects of high protein diets onthermogenesis, satiety and weight loss: a critical review. J Am CollNutr 23, 373–385.
Harvey-Berino J (1998). The efficacy of dietary fat vs total energyrestriction for weight loss. Obes Res 6, 202–207.
He K, Hu FB, Colditz GA, Manson JE, Willett WC, Liu S (2004).Changes in intake of fruits and vegetables in relation to risk ofobesity and weight gain among middle-aged women. Int J ObesRelat Metab Disord 28, 1569–1574.
Heerstrass DW, Ocke MC, Bueno-de-Mesquita HB, Peeters PH, SeidellJC (1998). Underreporting of energy, protein and potassium intakein relation to body mass index. Int J Epidemiol 27, 186–193.
Heitmann BL, Lissner L (1995). Dietary underreporting by obeseindividuals—is it specific or non-specific? BMJ 311, 986–989.
Heshka S, Anderson JW, Atkinson RL, Greenway FL, Hill JO, PhinneySD et al. (2003). Weight loss with self-help compared with astructured commercial program: a randomized trial. JAMA 289,1792–1798.
Hirsch J, Hudgins LC, Leibel RL, Rosenbaum M (1998). Dietcomposition and energy balance in humans. Am J Clin Nutr 67,551S–555S.
Hoag S, Marshall JA, Jones RH, Hamman RF (1995). High fastinginsulin levels associated with lower rates of weight gain in persons
Carbohydrate intake and obesityRM van Dam and JC Seidell
S96
European Journal of Clinical Nutrition

with normal glucose tolerance: the San Luis Valley Diabetes Study.Int J Obes Relat Metab Disord 19, 175–180.
Howard BV, Manson JE, Stefanick ML, Beresford SA, Frank G, Jones Bet al. (2006). Low-fat dietary pattern and weight change over 7years: the Women’s Health Initiative Dietary Modification Trial.JAMA 295, 39–49.
Iqbal SI, Helge JW, Heitmann BL (2006). Do energy density anddietary fiber influence subsequent 5-year weight changes in adultmen and women? Obesity (Silver Spring) 14, 106–114.
Jacobs Jr DR, Gallaher DD (2004). Whole grain intake andcardiovascular disease: a review. Curr Atheroscler Rep 6, 415–423.
James J, Thomas P, Cavan D, Kerr D (2004). Preventing childhoodobesity by reducing consumption of carbonated drinks: clusterrandomised controlled trial. BMJ 328, 1237.
Jeffery RW, Hellerstedt WL, French SA, Baxter JE (1995). Arandomized trial of counseling for fat restriction versus calorierestriction in the treatment of obesity. Int J Obes Relat Metab Disord19, 132–137.
Kendall A, Levitsky DA, Strupp BJ, Lissner L (1991). Weight loss on alow-fat diet: consequence of the imprecision of the control of foodintake in humans. Am J Clin Nutr 53, 1124–1129.
Klein S, Wadden T, Sugerman HJ (2002). AGA technical review onobesity. Gastroenterology 123, 882–932.
Knowler WC, Barrett-Connor E, Fowler SE, Hamman RF, Lachin JM,Walker EA et al. (2002). Reduction in the incidence of type 2diabetes with lifestyle intervention or metformin. N Engl J Med346, 393–403.
Koh-Banerjee P, Franz M, Sampson L, Liu S, Jacobs Jr DR, SpiegelmanD et al. (2004). Changes in whole-grain, bran, and cereal fiberconsumption in relation to 8-y weight gain among men. Am J ClinNutr 80, 1237–1245.
Kranz S, Smiciklas-Wright H, Siega-Riz AM, Mitchell D (2005).Adverse effect of high added sugar consumption on dietary intakein American preschoolers. J Pediatr 146, 105–111.
Lean ME, Han TS, Prvan T, Richmond PR, Avenell A (1997). Weightloss with high and low carbohydrate 1200 kcal diets in free livingwomen. Eur J Clin Nutr 51, 243–248.
Ledikwe JH, Blanck HM, Kettel Khan L, Serdula MK, Seymour JD,Tohill BC et al. (2006). Dietary energy density is associated withenergy intake and weight status in US adults. Am J Clin Nutr 83,1362–1368.
Liljeberg HG, Akerberg AK, Bjorck IM (1999). Effect of the glycemicindex and content of indigestible carbohydrates of cereal-basedbreakfast meals on glucose tolerance at lunch in healthy subjects.Am J Clin Nutr 69, 647–655.
Lindi VI, Uusitupa MI, Lindstrom J, Louheranta A, Eriksson JG, ValleTT et al. (2002). Association of the Pro12Ala polymorphism in thePPAR-gamma2 gene with 3-year incidence of type 2 diabetes andbody weight change in the Finnish Diabetes Prevention Study.Diabetes 51, 2581–2586.
Liu S, Willett WC, Manson JE, Hu FB, Rosner B, Colditz G (2003).Relation between changes in intakes of dietary fiber and grainproducts and changes in weight and development of obesityamong middle-aged women. Am J Clin Nutr 78, 920–927.
Ludwig DS (2002). The glycemic index: physiological mechanismsrelating to obesity, diabetes, and cardiovascular disease. JAMA 287,2414–2423.
Ludwig DS, Pereira MA, Kroenke CH, Hilner JE, Van Horn L, SlatteryML et al. (1999). Dietary fiber, weight gain, and cardiovasculardisease risk factors in young adults. JAMA 282, 1539–1546.
Ma Y, Olendzki B, Chiriboga D, Hebert JR, Li Y, Li W et al. (2005).Association between dietary carbohydrates and body weight. Am JEpidemiol 161, 359–367.
Maki KC, Rains TM, Kaden VN, Raneri KR, Davidson MH (2007).Effects of a reduced-glycemic-load diet on body weight, bodycomposition, and cardiovascular disease risk markers in over-weight and obese adults. Am J Clin Nutr 85, 724–734.
Malik VS, Schulze MB, Hu FB (2006). Intake of sugar-sweetened beveragesand weight gain: a systematic review. Am J Clin Nutr 84, 274–288.
Mann JI, Hendricks DA, Truswell AS, Manning E (1970). Effects onserum-lipids in normal men of reducing dietary sucrose or starchfor five months. Lancet 1, 870–872.
Mattes RD (1996). Dietary compensation by humans for supple-mental energy provided as ethanol or carbohydrate in fluids.Physiol Behav 59, 179–187.
Mayer-Davis EJ, Sparks KC, Hirst K, Costacou T, Lovejoy JC,Regensteiner JG et al. (2004). Dietary intake in the diabetesprevention program cohort: baseline and 1-year post randomiza-tion. Ann Epidemiol 14, 763–772.
McAuley KA, Hopkins CM, Smith KJ, McLay RT, Williams SM, TaylorRW et al. (2005). Comparison of high-fat and high-protein dietswith a high-carbohydrate diet in insulin-resistant obese women.Diabetologia 48, 8–16.
McAuley KA, Smith KJ, Taylor RW, McLay RT, Williams SM, Mann JI(2006). Long-term effects of popular dietary approaches on weightloss and features of insulin resistance. Int J Obes (London) 30,342–349.
McManus K, Antinoro L, Sacks F (2001). A randomized controlledtrial of a moderate-fat, low-energy diet compared with a low fat,low-energy diet for weight loss in overweight adults. Int J ObesRelat Metab Disord 25, 1503–1511.
McMillan-Price J, Brand-Miller J (2006). Low-glycaemic index dietsand body weight regulation. Int J Obes (London) 30 (Suppl 3),S40–S46.
McMillan-Price J, Petocz P, Atkinson F, O’Neill K, Samman S,Steinbeck K et al. (2006). Comparison of 4 diets of varyingglycemic load on weight loss and cardiovascular risk reduction inoverweight and obese young adults: a randomized controlled trial.Arch Intern Med 166, 1466–1475.
Melanson KJ, Westerterp-Plantenga MS, Saris WH, Smith FJ,Campfield LA (1999). Blood glucose patterns and appetite intime-blinded humans: carbohydrate versus fat. Am J Physiol 277,R337–R345.
Memisoglu A, Hu FB, Hankinson SE, Manson JE, De Vivo I, WillettWC et al. (2003). Interaction between a peroxisome proliferator-activated receptor gamma gene polymorphism and dietary fatintake in relation to body mass. Hum Mol Genet 12, 2923–2929.
Nordmann AJ, Nordmann A, Briel M, Keller U, Yancy Jr WS, Brehm BJet al. (2006). Effects of low-carbohydrate vs low-fat diets on weightloss and cardiovascular risk factors: a meta-analysis of randomizedcontrolled trials. Arch Intern Med 166, 285–293.
Ogden CL, Carroll MD, Curtin LR, McDowell MA, Tabak CJ, FlegalKM (2006). Prevalence of overweight and obesity in the UnitedStates, 1999–2004. JAMA 295, 1549–1555.
Pascale RW, Wing RR, Butler BA, Mullen M, Bononi P (1995). Effectsof a behavioral weight loss program stressing calorie restrictionversus calorie plus fat restriction in obese individuals with NIDDMor a family history of diabetes. Diabetes Care 18, 1241–1248.
Pasman WJ, Westerterp-Plantenga MS, Muls E, Vansant G, van Ree J,Saris WH (1997). The effectiveness of long-term fibre supplemen-tation on weight maintenance in weight-reduced women. Int JObes Relat Metab Disord 21, 548–555.
Pereira MA, Swain J, Goldfine AB, Rifai N, Ludwig DS (2004). Effectsof a low-glycemic load diet on resting energy expenditureand heart disease risk factors during weight loss. JAMA 292,2482–2490.
Perri MG, Nezu AM, Patti ET, McCann KL (1989). Effect of length oftreatment on weight loss. J Consult Clin Psychol 57, 450–452.
Phelan S, Wyatt HR, Hill JO, Wing RR (2006). Are the eating andexercise habits of successful weight losers changing? Obesity (SilverSpring) 14, 710–716.
Pittas AG, Das SK, Hajduk CL, Golden J, Saltzman E, Stark PC et al.(2005). A low-glycemic load diet facilitates greater weight loss inoverweight adults with high insulin secretion but not in over-weight adults with low insulin secretion in the CALERIE Trial.Diabetes Care 28, 2939–2941.
Pittler MH, Ernst E (2001). Guar gum for body weight reduction:meta-analysis of randomized trials. Am J Med 110, 724–730.
Carbohydrate intake and obesityRM van Dam and JC Seidell
S97
European Journal of Clinical Nutrition

Popkin BM, Gordon-Larsen P (2004). The nutrition transition:worldwide obesity dynamics and their determinants. Int J ObesRelat Metab Disord 28 (Suppl 3), S2–S9.
Poppitt SD, Prentice AM (1996). Energy density and its role in thecontrol of food intake: evidence from metabolic and communitystudies. Appetite 26, 153–174.
Poppitt SD, Keogh GF, Prentice AM, Williams DE, Sonnemans HM,Valk EE et al. (2002). Long-term effects of ad libitum low-fat, high-carbohydrate diets on body weight and serum lipids in overweightsubjects with metabolic syndrome. Am J Clin Nutr 75, 11–20.
Prentice AM, Jebb SA (2003). Fast foods, energy density and obesity: apossible mechanistic link. Obes Rev 4, 187–194.
Raatz SK, Torkelson CJ, Redmon JB, Reck KP, Kwong CA, Swanson JEet al. (2005). Reduced glycemic index and glycemic load dietsdo not increase the effects of energy restriction on weight lossand insulin sensitivity in obese men and women. J Nutr 135,2387–2391.
Raben A (2002). Should obese patients be counselled to follow a low-glycaemic index diet? No. Obes Rev 3, 245–256.
Raben A, Macdonald I, Astrup A (1997). Replacement of dietary fat bysucrose or starch: effects on 14 d ad libitum energy intake, energyexpenditure and body weight in formerly obese and never-obesesubjects. Int J Obes Relat Metab Disord 21, 846–859.
Raben A, Vasilaras TH, Moller AC, Astrup A (2002). Sucrose comparedwith artificial sweeteners: different effects on ad libitum foodintake and body weight after 10 wk of supplementation inoverweight subjects. Am J Clin Nutr 76, 721–729.
Rigaud D, Ryttig KR, Angel LA, Apfelbaum M (1990). Overweighttreated with energy restriction and a dietary fibre supplement: a6-month randomized, double-blind, placebo-controlled trial. Int JObes 14, 763–769.
Rolls BJ, Bell EA, Thorwart ML (1999). Water incorporated into a foodbut not served with a food decreases energy intake in lean women.Am J Clin Nutr 70, 448–455.
Rolls BJ, Ello-Martin JA, Tohill BC (2004). What can interventionstudies tell us about the relationship between fruit and vegetableconsumption and weight management? Nutr Rev 62, 1–17.
Rolls BJ, Roe LS, Beach AM, Kris-Etherton PM (2005). Provision offoods differing in energy density affects long-term weight loss.Obes Res 13, 1052–1060.
Rossner S, von Zweigbergk D, Ohlin A, Ryttig K (1987). Weightreduction with dietary fibre supplements. Results of two double-blind randomized studies.. Acta Med Scand 222, 83–88.
Ruxton CH (2003). Dietary guidelines for sugar: the need forevidence. Br J Nutr 90, 245–247.
Ryttig KR, Tellnes G, Haegh L, Boe E, Fagerthun H (1989). A dietaryfibre supplement and weight maintenance after weight reduction:a randomized, double-blind, placebo-controlled long-term trial.Int J Obes 13, 165–171.
Samaha FF, Iqbal N, Seshadri P, Chicano KL, Daily DA, McGrory Jet al. (2003). A low-carbohydrate as compared with a low-fat dietin severe obesity. N Engl J Med 348, 2074–2081.
Saris WH, Astrup A, Prentice AM, Zunft HJ, Formiguera X, Verboeket-van de Venne WP et al. (2000). Randomized controlled trial ofchanges in dietary carbohydrate/fat ratio and simple vs complexcarbohydrates on body weight and blood lipids: the CARMENstudy. The Carbohydrate Ratio Management in European Nationaldiets. Int J Obes Relat Metab Disord 24, 1310–1318.
Schulze MB, Manson JE, Ludwig DS, Colditz GA, Stampfer MJ, WillettWC et al. (2004). Sugar-sweetened beverages, weight gain, andincidence of type 2 diabetes in young and middle-aged women.JAMA 292, 927–934.
Schwartz MW, Porte Jr D (2005). Diabetes, obesity, and the brain.Science 307, 375–379.
Schwartz MW, Boyko EJ, Kahn SE, Ravussin E, Bogardus C (1995).Reduced insulin secretion: an independent predictor of bodyweight gain. J Clin Endocrinol Metab 80, 1571–1576.
Seidell JC (1998). Dietary fat and obesity: an epidemiologicperspective. Am J Clin Nutr 67, 546S–550S.
Skov AR, Toubro S, Ronn B, Holm L, Astrup A (1999). Randomizedtrial on protein vs carbohydrate in ad libitum fat reduced diet forthe treatment of obesity. Int J Obes Relat Metab Disord 23, 528–536.
Slabber M, Barnard HC, Kuyl JM, Dannhauser A, Schall R (1994).Effects of a low-insulin-response, energy-restricted diet on weightloss and plasma insulin concentrations in hyperinsulinemic obesefemales. Am J Clin Nutr 60, 48–53.
Slavin JL (2005). Dietary fiber and body weight. Nutrition 21,411–418.
Sloth B, Krog-Mikkelsen I, Flint A, Tetens I, Bjorck I, Vinoy S et al.(2004). No difference in body weight decrease between a low-glycemic-index and a high-glycemic-index diet but reduced LDLcholesterol after 10-wk ad libitum intake of the low-glycemic-indexdiet. Am J Clin Nutr 80, 337–347.
Smith JB, Niven BE, Mann JI (1996). The effect of reduced extrinsicsucrose intake on plasma triglyceride levels. Eur J Clin Nutr 50,498–504.
Smith-Warner SA, Elmer PJ, Tharp TM, Fosdick L, Randall B, Gross Met al. (2000). Increasing vegetable and fruit intake: randomizedintervention and monitoring in an at-risk population. CancerEpidemiol Biomarkers Prev 9, 307–317.
Sorensen TI, Boutin P, Taylor MA, Larsen LH, Verdich C, Petersen Let al. (2006). Genetic polymorphisms and weight loss in obesity: arandomised trial of hypo-energetic high- versus low-fat diets. PLoSClin Trials 1, e12.
Spieth LE, Harnish JD, Lenders CM, Raezer LB, Pereira MA, Hangen SJet al. (2000). A low-glycemic index diet in the treatment ofpediatric obesity. Arch Pediatr Adolesc Med 154, 947–951.
Stern L, Iqbal N, Seshadri P, Chicano KL, Daily DA, McGrory J et al.(2004). The effects of low-carbohydrate versus conventionalweight loss diets in severely obese adults: one-year follow-up ofa randomized trial. Ann Intern Med 140, 778–785.
Stookey JD (2001). Energy density, energy intake and weight status ina large free-living sample of Chinese adults: exploring theunderlying roles of fat, protein, carbohydrate, fiber and waterintakes. Eur J Clin Nutr 55, 349–359.
Stubbs RJ, Whybrow S (2004). Energy density, diet composition andpalatability: influences on overall food energy intake in humans.Physiol Behav 81, 755–764.
Stubbs RJ, Johnstone AM, O’Reilly LM, Barton K, Reid C (1998). Theeffect of covertly manipulating the energy density of mixed dietson ad libitum food intake in ‘pseudo free-living’ humans. Int J ObesRelat Metab Disord 22, 980–987.
Teff KL, Elliott SS, Tschop M, Kieffer TJ, Rader D, Heiman M et al.(2004). Dietary fructose reduces circulating insulin and leptin,attenuates postprandial suppression of ghrelin, and increasestriglycerides in women. J Clin Endocrinol Metab 89, 2963–2972.
Thompson WG, Rostad Holdman N, Janzow DJ, Slezak JM, MorrisKL, Zemel MB (2005). Effect of energy-reduced diets high in dairyproducts and fiber on weight loss in obese adults. Obes Res 13,1344–1353.
Tordoff MG, Alleva AM (1990). Effect of drinking soda sweetenedwith aspartame or high-fructose corn syrup on food intake andbody weight. Am J Clin Nutr 51, 963–969.
Toubro S, Astrup A (1997). Randomised comparison of diets formaintaining obese subjects’ weight after major weight loss: ad lib,low fat, high carbohydrate diet v fixed energy intake. BMJ 314, 29–34.
Tsihlias EB, Gibbs AL, McBurney MI, Wolever TM (2000). Compar-ison of high- and low-glycemic-index breakfast cereals withmonounsaturated fat in the long-term dietary management oftype 2 diabetes. Am J Clin Nutr 72, 439–449.
Tuomilehto J, Lindstrom J, Eriksson JG, Valle TT, Hamalainen H,Ilanne-Parikka P et al. (2001). Prevention of type 2 diabetesmellitus by changes in lifestyle among subjects with impairedglucose tolerance. N Engl J Med 344, 1343–1350.
Valdez R, Mitchell BD, Haffner SM, Hazuda HP, Morales PA,Monterrosa A et al. (1994). Predictors of weight change in a bi-ethnic population. The San Antonio Heart Study. Int J Obes RelatMetab Disord 18, 85–91.
Carbohydrate intake and obesityRM van Dam and JC Seidell
S98
European Journal of Clinical Nutrition

Westerterp KR, Verboeket-van de Venne WP, Westerterp-PlantengaMS, Velthuis-te Wierik EJ, de Graaf C, Weststrate JA (1996). Dietaryfat and body fat: an intervention study. Int J Obes Relat MetabDisord 20, 1022–1026.
Weststrate JA, van het Hof KH, van den Berg H, Velthuis-te-Wierik EJ, deGraaf C, Zimmermanns NJ et al. (1998). A comparison of the effect offree access to reduced fat products or their full fat equivalents onfood intake, body weight, blood lipids and fat-soluble antioxidantslevels and haemostasis variables. Eur J Clin Nutr 52, 389–395.
Willett WC (2002). Dietary fat plays a major role in obesity: no. ObesRev 3, 59–68.
Willett WC, Dietz WH, Colditz GA (1999). Guidelines for healthyweight. N Engl J Med 341, 427–434.
Wolever TM (2006). Physiological mechanisms and observed healthimpacts related to the glycaemic index: some observations. Int JObes (London) 30 (Suppl 3), S72–S78.
Wolever TM, Mehling C (2003). Long-term effect of varying thesource or amount of dietary carbohydrate on postprandial plasmaglucose, insulin, triacylglycerol, and free fatty acid concentrationsin subjects with impaired glucose tolerance. Am J Clin Nutr 77,612–621.
Wolever TM, Bentum-Williams A, Jenkins DJ (1995). Physiologicalmodulation of plasma free fatty acid concentrations by diet.Metabolic implications in nondiabetic subjects. Diabetes Care 18,962–970.
Yancy Jr WS, Olsen MK, Guyton JR, Bakst RP, Westman EC (2004). Alow-carbohydrate, ketogenic diet versus a low-fat diet to treatobesity and hyperlipidemia: a randomized, controlled trial. AnnIntern Med 140, 769–777.
Yeomans MR, Weinberg L, James S (2005). Effects of palatability andlearned satiety on energy density influences on breakfast intake inhumans. Physiol Behav 86, 487–499.
Carbohydrate intake and obesityRM van Dam and JC Seidell
S99
European Journal of Clinical Nutrition