Embed Size (px)
Citation preview
Dn
RD
a
ARR1AA
KPMLCDER
1
lIacMs[oiwadcbsf[
0d
Colloids and Surfaces A: Physicochem. Eng. Aspects 336 (2009) 79–87
Contents lists available at ScienceDirect
Colloids and Surfaces A: Physicochemical andEngineering Aspects
journa l homepage: www.e lsev ier .com/ locate /co lsur fa
ielectric spectroscopy of hydrophilic polymers–montmorillonite clayanocomposite aqueous colloidal suspension
.J. Sengwa ∗, Shobhna Choudhary, Sonu Sankhlaielectric Research Laboratory, Department of Physics, J N V University, Jodhpur 342005, India
r t i c l e i n f o
rticle history:eceived 8 August 2008eceived in revised form2 November 2008ccepted 13 November 2008vailable online 21 November 2008
eywords:olymers
a b s t r a c t
Frequency-dependent complex dielectric function, loss tangent, electric modulus, alternating currentelectrical conductivity, and impedance spectra of poly(vinyl alcohol) (PVA), poly(vinyl pyrrolidone) (PVP),poly(ethylene glycol) (PEG), and blends of PVA–PVP and PVA–PEG, loaded with polymer grade montmo-rillonite (MMT) clay upto 5 wt% of solute (polymer + clay) in aqueous colloidal suspensions, have beeninvestigated in the frequency range 20 Hz to 1 MHz at 27 ◦C. These materials show the dielectric dispersioncorresponding to ionic conduction and electrode polarization phenomena in the experimental frequencyrange. The loss tangent peak frequency which separates the contribution of the bulk material and theelectrode polarization phenomenon was used to evaluate the electrode polarization relaxation time cor-responding to the dynamics of electric double layers. The dielectric and electrical conductivity spectra
ontmorillonite clayiquid nanocompositesolloidal suspensionielectric spectroscopylectrical conductivityelaxation time
were interpreted as a result of these material complex structures formed by constituents H-bonding inter-actions, and the clay intercalation and exfoliation that alter the conduction pathways. Results show thatthe dielectric/electrical properties of the polymer–clay nanocomposites aqueous colloidal suspensionhave good resemblance to their structural properties, which were explored from other spectroscopic andmorphological techniques. A close look on the dielectric parameters of the investigated materials provesthe suitability for the synthesis of new materials with desirable and predicted properties.
. Introduction
Organic polymers, loaded with small amount of montmoril-onite (MMT) clay result in polymer–clay nanocomposites (PCNs).n last two decades, PCNs have evoked an intense industrial andcademic research, due to their outstanding mechanical, thermal,hemical and electrical properties over pure polymers [1–8]. TheMT clay which is also called inorganic polymer has a laminar
tructure and excellent hydrophilic and cation exchange properties8]. Its sheet dimensions in the length and width can be in hundredsf nanometers but thickness is only one nanometer. The MMT clays composed of units made of two silica tetrahedral sheets centered
ith an alumina octahedral sheet, which is called 2:1 phyllosilicatend chemically it is a metal silicate. Its layers are stacked by weakipolar or van der Waals forces, and it has both surface and edgeharges. The charges on edges are easily accessible to modification,
ut they do not accomplish much improvement in interlaminareparation. These sites represent an opportunity for attachment ofunctional group of polymers during the synthesis of PCN materials8,9]. In water or polar organic solvents, the MMT clay has excel-∗ Corresponding author.E-mail address: [email protected] (R.J. Sengwa).
927-7757/$ – see front matter © 2008 Elsevier B.V. All rights reserved.oi:10.1016/j.colsurfa.2008.11.015
© 2008 Elsevier B.V. All rights reserved.
lent swelling properties owing to the intercalation (absorption) ofsolvent molecules in the clay galleries and also the adsorption ofsolvent molecules on its external surfaces of the sheets.
Three methods commonly used for the synthesis of PCNs arein situ polymerization [10], solvent intercalation [11] and polymermelt intercalation [12]. In case of hydrophilic polymers and clay,the PCNs films are frequently prepared by casting solution interca-lated nanocomposite material directly onto a glass plate. In PCNsaqueous solutions, intercalation and exfoliation are two extremesfor the clay structures. In intercalated, polymer is located in the claygalleries, expanding the clay structures but retaining some long dis-tance register between the platelets or sheets. Whereas, in case ofexfoliated, the original face-to-face structure of the clay platelets isdestroyed and single clay sheets are randomly dispersed in the poly-meric solution. Complete exfoliation of all the individual platelets isvery difficult to achieve and most PCNs solutions contain region ofboth intercalated and exfoliated structures and their ratio dependson the polymer and clay interaction in the solutions. The structuralmorphology and polymer intercalation properties of the PCNs films
are widely characterized by SEM and TEM micrographs, and XRDand FTIR spectroscopy. The characterization of dielectric proper-ties of PCNs films have their significant applications in integratedcircuits, microelectronics and insulating devices, and membranetechnology [7,13,14]. The PCNs aqueous colloidal suspension and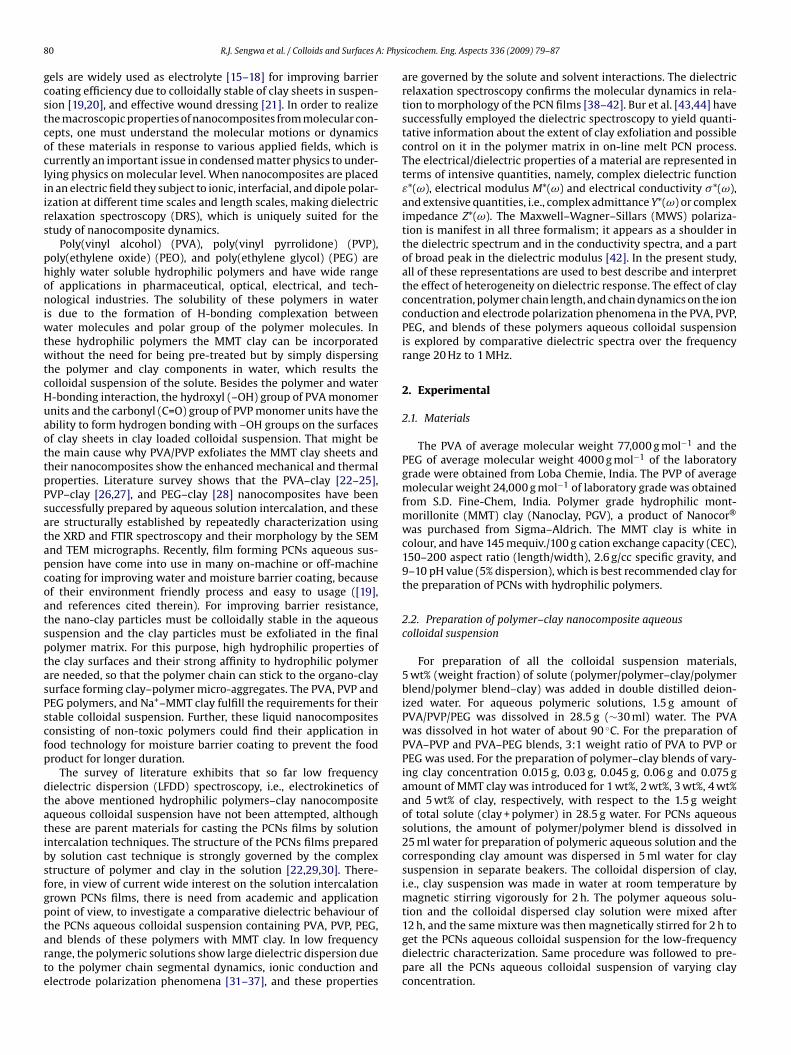
8 : Phys
gcstcocliirs
phoniwtwtcHuaottpPsatapcoatsptasPscfp
dtatibsfgptarte
0 R.J. Sengwa et al. / Colloids and Surfaces A
els are widely used as electrolyte [15–18] for improving barrieroating efficiency due to colloidally stable of clay sheets in suspen-ion [19,20], and effective wound dressing [21]. In order to realizehe macroscopic properties of nanocomposites from molecular con-epts, one must understand the molecular motions or dynamicsf these materials in response to various applied fields, which isurrently an important issue in condensed matter physics to under-ying physics on molecular level. When nanocomposites are placedn an electric field they subject to ionic, interfacial, and dipole polar-zation at different time scales and length scales, making dielectricelaxation spectroscopy (DRS), which is uniquely suited for thetudy of nanocomposite dynamics.
Poly(vinyl alcohol) (PVA), poly(vinyl pyrrolidone) (PVP),oly(ethylene oxide) (PEO), and poly(ethylene glycol) (PEG) areighly water soluble hydrophilic polymers and have wide rangef applications in pharmaceutical, optical, electrical, and tech-ological industries. The solubility of these polymers in water
s due to the formation of H-bonding complexation betweenater molecules and polar group of the polymer molecules. In
hese hydrophilic polymers the MMT clay can be incorporatedithout the need for being pre-treated but by simply dispersing
he polymer and clay components in water, which results theolloidal suspension of the solute. Besides the polymer and water-bonding interaction, the hydroxyl (–OH) group of PVA monomernits and the carbonyl (C=O) group of PVP monomer units have thebility to form hydrogen bonding with –OH groups on the surfacesf clay sheets in clay loaded colloidal suspension. That might behe main cause why PVA/PVP exfoliates the MMT clay sheets andheir nanocomposites show the enhanced mechanical and thermalroperties. Literature survey shows that the PVA–clay [22–25],VP–clay [26,27], and PEG–clay [28] nanocomposites have beenuccessfully prepared by aqueous solution intercalation, and thesere structurally established by repeatedly characterization usinghe XRD and FTIR spectroscopy and their morphology by the SEMnd TEM micrographs. Recently, film forming PCNs aqueous sus-ension have come into use in many on-machine or off-machineoating for improving water and moisture barrier coating, becausef their environment friendly process and easy to usage ([19],nd references cited therein). For improving barrier resistance,he nano-clay particles must be colloidally stable in the aqueoususpension and the clay particles must be exfoliated in the finalolymer matrix. For this purpose, high hydrophilic properties ofhe clay surfaces and their strong affinity to hydrophilic polymerre needed, so that the polymer chain can stick to the organo-clayurface forming clay–polymer micro-aggregates. The PVA, PVP andEG polymers, and Na+–MMT clay fulfill the requirements for theirtable colloidal suspension. Further, these liquid nanocompositesonsisting of non-toxic polymers could find their application inood technology for moisture barrier coating to prevent the foodroduct for longer duration.
The survey of literature exhibits that so far low frequencyielectric dispersion (LFDD) spectroscopy, i.e., electrokinetics ofhe above mentioned hydrophilic polymers–clay nanocompositequeous colloidal suspension have not been attempted, althoughhese are parent materials for casting the PCNs films by solutionntercalation techniques. The structure of the PCNs films preparedy solution cast technique is strongly governed by the complextructure of polymer and clay in the solution [22,29,30]. There-ore, in view of current wide interest on the solution intercalationrown PCNs films, there is need from academic and applicationoint of view, to investigate a comparative dielectric behaviour of
he PCNs aqueous colloidal suspension containing PVA, PVP, PEG,nd blends of these polymers with MMT clay. In low frequencyange, the polymeric solutions show large dielectric dispersion dueo the polymer chain segmental dynamics, ionic conduction andlectrode polarization phenomena [31–37], and these propertiesicochem. Eng. Aspects 336 (2009) 79–87
are governed by the solute and solvent interactions. The dielectricrelaxation spectroscopy confirms the molecular dynamics in rela-tion to morphology of the PCN films [38–42]. Bur et al. [43,44] havesuccessfully employed the dielectric spectroscopy to yield quanti-tative information about the extent of clay exfoliation and possiblecontrol on it in the polymer matrix in on-line melt PCN process.The electrical/dielectric properties of a material are represented interms of intensive quantities, namely, complex dielectric functionε*(ω), electrical modulus M*(ω) and electrical conductivity �*(ω),and extensive quantities, i.e., complex admittance Y*(ω) or compleximpedance Z*(ω). The Maxwell–Wagner–Sillars (MWS) polariza-tion is manifest in all three formalism; it appears as a shoulder inthe dielectric spectrum and in the conductivity spectra, and a partof broad peak in the dielectric modulus [42]. In the present study,all of these representations are used to best describe and interpretthe effect of heterogeneity on dielectric response. The effect of clayconcentration, polymer chain length, and chain dynamics on the ionconduction and electrode polarization phenomena in the PVA, PVP,PEG, and blends of these polymers aqueous colloidal suspensionis explored by comparative dielectric spectra over the frequencyrange 20 Hz to 1 MHz.
2. Experimental
2.1. Materials
The PVA of average molecular weight 77,000 g mol−1 and thePEG of average molecular weight 4000 g mol−1 of the laboratorygrade were obtained from Loba Chemie, India. The PVP of averagemolecular weight 24,000 g mol−1 of laboratory grade was obtainedfrom S.D. Fine-Chem, India. Polymer grade hydrophilic mont-morillonite (MMT) clay (Nanoclay, PGV), a product of Nanocor®
was purchased from Sigma–Aldrich. The MMT clay is white incolour, and have 145 mequiv./100 g cation exchange capacity (CEC),150–200 aspect ratio (length/width), 2.6 g/cc specific gravity, and9–10 pH value (5% dispersion), which is best recommended clay forthe preparation of PCNs with hydrophilic polymers.
2.2. Preparation of polymer–clay nanocomposite aqueouscolloidal suspension
For preparation of all the colloidal suspension materials,5 wt% (weight fraction) of solute (polymer/polymer–clay/polymerblend/polymer blend–clay) was added in double distilled deion-ized water. For aqueous polymeric solutions, 1.5 g amount ofPVA/PVP/PEG was dissolved in 28.5 g (∼30 ml) water. The PVAwas dissolved in hot water of about 90 ◦C. For the preparation ofPVA–PVP and PVA–PEG blends, 3:1 weight ratio of PVA to PVP orPEG was used. For the preparation of polymer–clay blends of vary-ing clay concentration 0.015 g, 0.03 g, 0.045 g, 0.06 g and 0.075 gamount of MMT clay was introduced for 1 wt%, 2 wt%, 3 wt%, 4 wt%and 5 wt% of clay, respectively, with respect to the 1.5 g weightof total solute (clay + polymer) in 28.5 g water. For PCNs aqueoussolutions, the amount of polymer/polymer blend is dissolved in25 ml water for preparation of polymeric aqueous solution and thecorresponding clay amount was dispersed in 5 ml water for claysuspension in separate beakers. The colloidal dispersion of clay,i.e., clay suspension was made in water at room temperature bymagnetic stirring vigorously for 2 h. The polymer aqueous solu-tion and the colloidal dispersed clay solution were mixed after
12 h, and the same mixture was then magnetically stirred for 2 h toget the PCNs aqueous colloidal suspension for the low-frequencydielectric characterization. Same procedure was followed to pre-pare all the PCNs aqueous colloidal suspension of varying clayconcentration.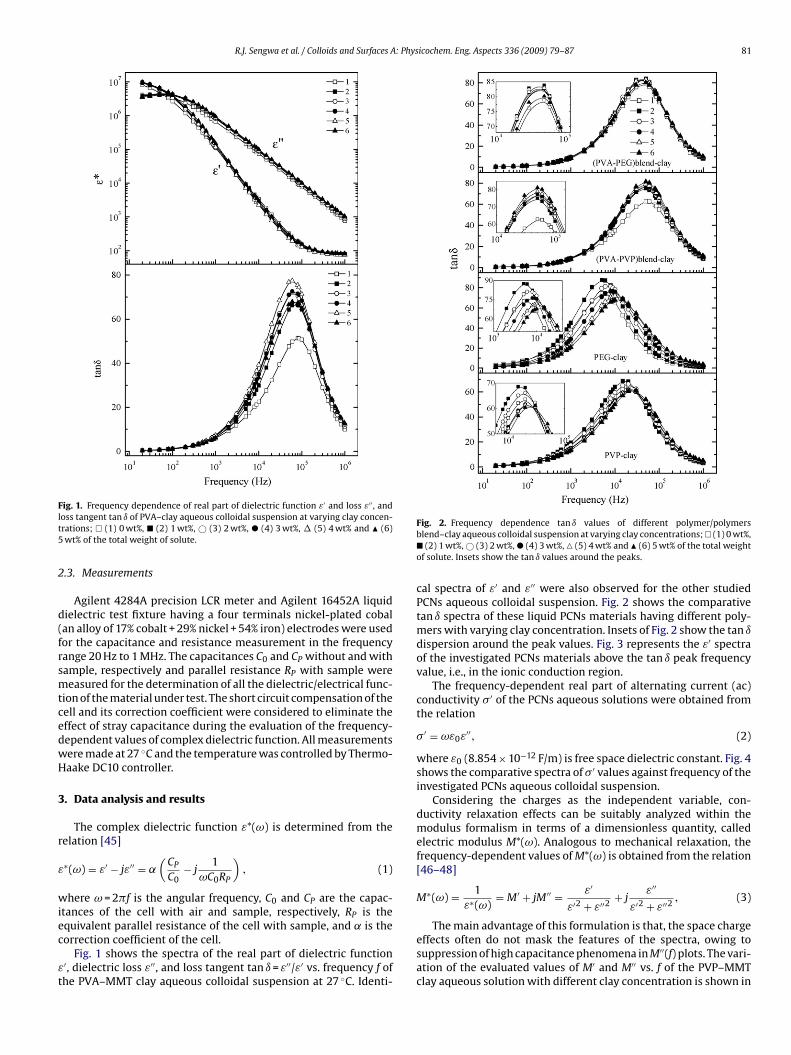
R.J. Sengwa et al. / Colloids and Surfaces A: Physicochem. Eng. Aspects 336 (2009) 79–87 81
Flt5
2
d(frsmtcedwH
3
r
ε
wiec
εt
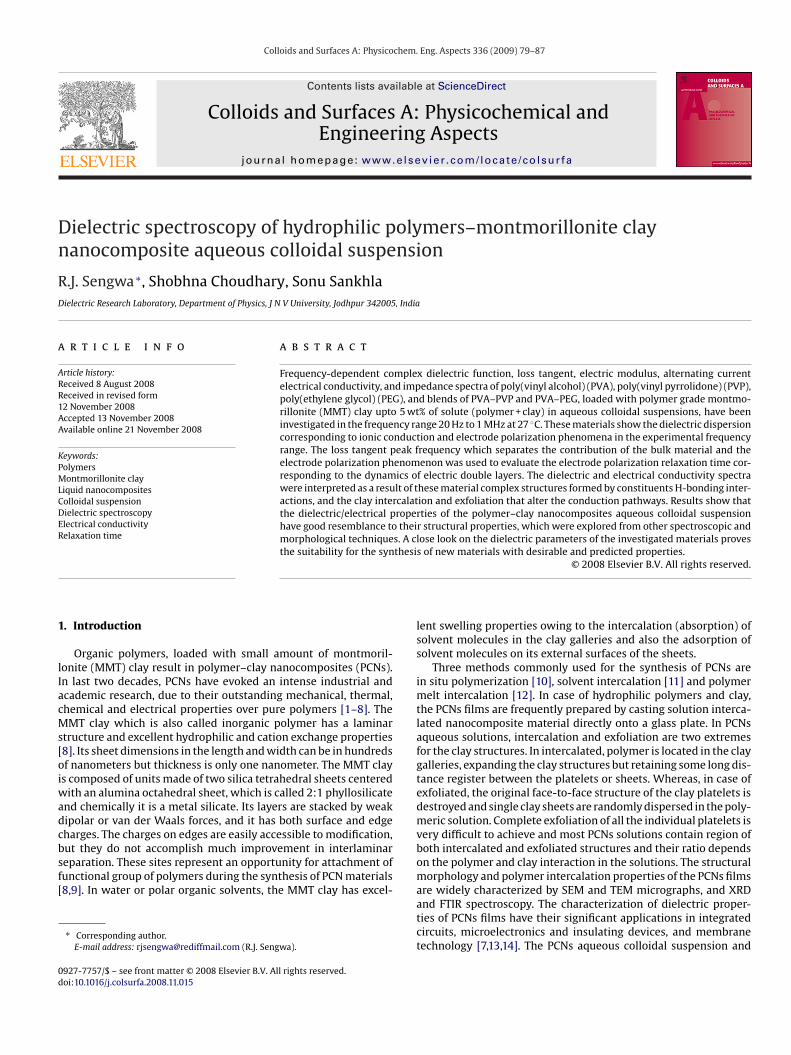
ig. 1. Frequency dependence of real part of dielectric function ε′ and loss ε′′ , andoss tangent tan ı of PVA–clay aqueous colloidal suspension at varying clay concen-rations; � (1) 0 wt%, � (2) 1 wt%, © (3) 2 wt%, � (4) 3 wt%, � (5) 4 wt% and � (6)wt% of the total weight of solute.
.3. Measurements
Agilent 4284A precision LCR meter and Agilent 16452A liquidielectric test fixture having a four terminals nickel-plated cobalan alloy of 17% cobalt + 29% nickel + 54% iron) electrodes were usedor the capacitance and resistance measurement in the frequencyange 20 Hz to 1 MHz. The capacitances C0 and CP without and withample, respectively and parallel resistance RP with sample wereeasured for the determination of all the dielectric/electrical func-
ion of the material under test. The short circuit compensation of theell and its correction coefficient were considered to eliminate theffect of stray capacitance during the evaluation of the frequency-ependent values of complex dielectric function. All measurementsere made at 27 ◦C and the temperature was controlled by Thermo-aake DC10 controller.
. Data analysis and results
The complex dielectric function ε*(ω) is determined from theelation [45]
∗(ω) = ε′ − jε′′ = ˛(
CP
C0− j
1ωC0RP
), (1)
here ω = 2�f is the angular frequency, C0 and CP are the capac-tances of the cell with air and sample, respectively, RP is the
quivalent parallel resistance of the cell with sample, and ˛ is theorrection coefficient of the cell.Fig. 1 shows the spectra of the real part of dielectric function′, dielectric loss ε′′, and loss tangent tan ı = ε′′/ε′ vs. frequency f ofhe PVA–MMT clay aqueous colloidal suspension at 27 ◦C. Identi-
Fig. 2. Frequency dependence tan ı values of different polymer/polymersblend–clay aqueous colloidal suspension at varying clay concentrations;� (1) 0 wt%,� (2) 1 wt%, © (3) 2 wt%, � (4) 3 wt%, � (5) 4 wt% and � (6) 5 wt% of the total weightof solute. Insets show the tan ı values around the peaks.
cal spectra of ε′ and ε′′ were also observed for the other studiedPCNs aqueous colloidal suspension. Fig. 2 shows the comparativetan ı spectra of these liquid PCNs materials having different poly-mers with varying clay concentration. Insets of Fig. 2 show the tan ıdispersion around the peak values. Fig. 3 represents the ε′ spectraof the investigated PCNs materials above the tan ı peak frequencyvalue, i.e., in the ionic conduction region.
The frequency-dependent real part of alternating current (ac)conductivity � ′ of the PCNs aqueous solutions were obtained fromthe relation
� ′ = ωε0ε′′, (2)
where ε0 (8.854 × 10⁻¹² F/m) is free space dielectric constant. Fig. 4shows the comparative spectra of � ′ values against frequency of theinvestigated PCNs aqueous colloidal suspension.
Considering the charges as the independent variable, con-ductivity relaxation effects can be suitably analyzed within themodulus formalism in terms of a dimensionless quantity, calledelectric modulus M*(ω). Analogous to mechanical relaxation, thefrequency-dependent values of M*(ω) is obtained from the relation[46–48]
M∗(ω) = 1ε∗(ω)
= M′ + jM′′ = ε′
ε′2 + ε′′2 + jε′′
ε′2 + ε′′2 , (3)
The main advantage of this formulation is that, the space chargeeffects often do not mask the features of the spectra, owing tosuppression of high capacitance phenomena in M′′(f) plots. The vari-ation of the evaluated values of M′ and M′′ vs. f of the PVP–MMTclay aqueous solution with different clay concentration is shown in
82 R.J. Sengwa et al. / Colloids and Surfaces A: Physicochem. Eng. Aspects 336 (2009) 79–87
Fmto
Fg
uiwfdir
Z
srrcsv
4
4r
td
Fig. 4. Frequency dependence of real part of ac conductivity � ′ of differentpolymer/polymers blend–clay aqueous colloidal suspension at varying clay concen-trations; � (1) 0 wt%, � (2) 1 wt%, © (3) 2 wt%, � (4) 3 wt%, � (5) 4 wt% and � (6)5 wt% of the total weight of solute. The continuous solid line in � ′ spectra representsthe fit of experimental data of the Jonscher power law � ′(ω) = �dc + Aωn .
ig. 3. Frequency dependence of real part of dielectric function ε′ of poly-er/polymers blend–clay aqueous colloidal suspension at varying clay concentra-
ions; � (1) 0 wt%, � (2) 1 wt%, © (3) 2 wt%, � (4) 3 wt%, � (5) 4 wt% and � (6) 5 wt%f the total weight of solute.
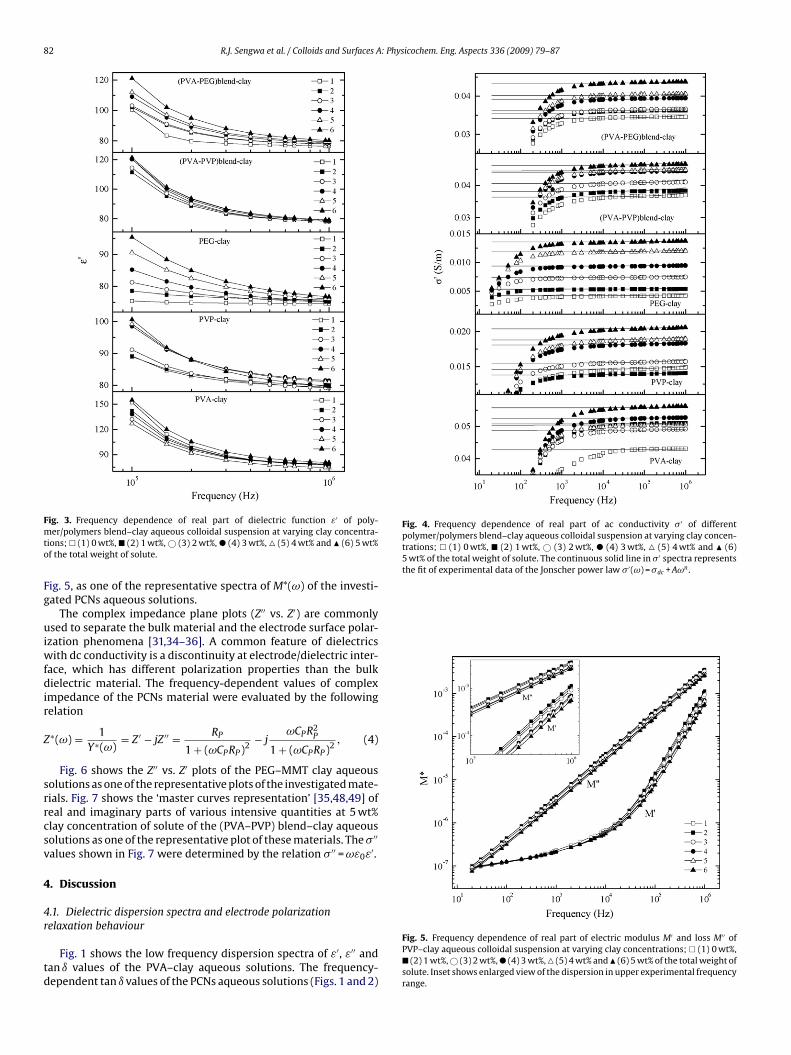
ig. 5, as one of the representative spectra of M*(ω) of the investi-ated PCNs aqueous solutions.
The complex impedance plane plots (Z′′ vs. Z′) are commonlysed to separate the bulk material and the electrode surface polar-
zation phenomena [31,34–36]. A common feature of dielectricsith dc conductivity is a discontinuity at electrode/dielectric inter-
ace, which has different polarization properties than the bulkielectric material. The frequency-dependent values of complex
mpedance of the PCNs material were evaluated by the followingelation
∗(ω) = 1Y∗(ω)
= Z ′ − jZ ′′ = RP
1 + (ωCPRP)2− j
ωCPR2P
1 + (ωCPRP)2, (4)
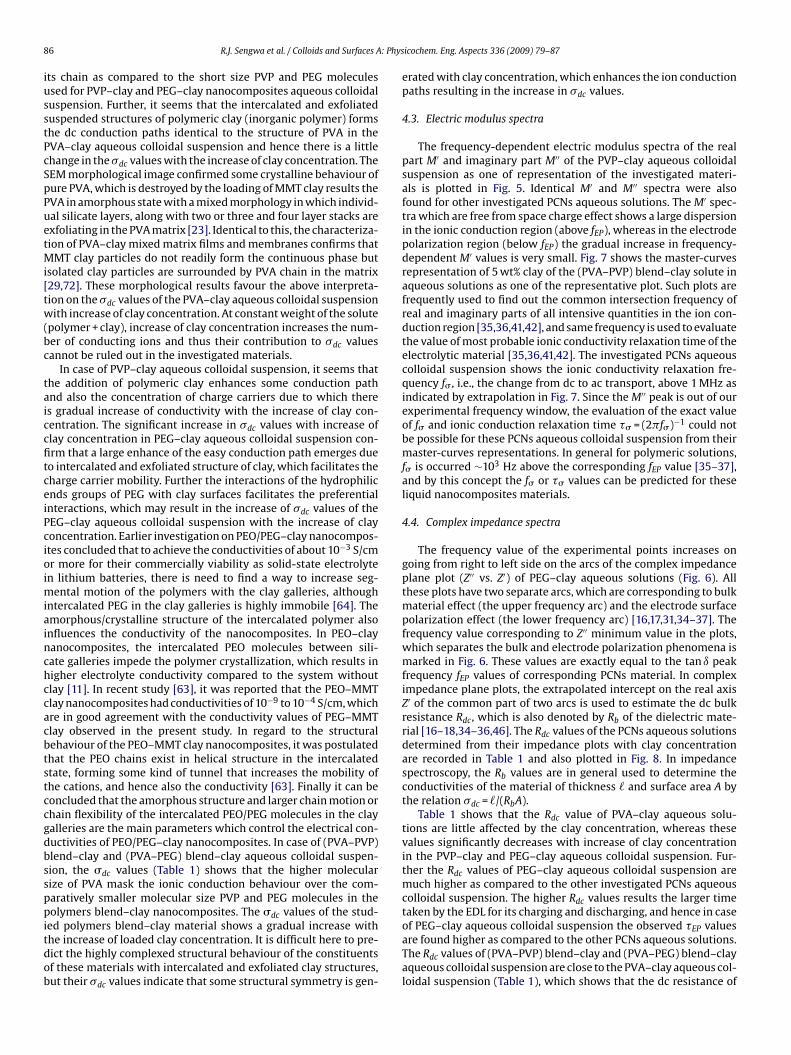
Fig. 6 shows the Z′′ vs. Z′ plots of the PEG–MMT clay aqueousolutions as one of the representative plots of the investigated mate-ials. Fig. 7 shows the ‘master curves representation’ [35,48,49] ofeal and imaginary parts of various intensive quantities at 5 wt%lay concentration of solute of the (PVA–PVP) blend–clay aqueousolutions as one of the representative plot of these materials. The � ′′
alues shown in Fig. 7 were determined by the relation � ′′ = ωε0ε′.
. Discussion
.1. Dielectric dispersion spectra and electrode polarization
elaxation behaviourFig. 1 shows the low frequency dispersion spectra of ε′, ε′′ andan ı values of the PVA–clay aqueous solutions. The frequency-ependent tan ı values of the PCNs aqueous solutions (Figs. 1 and 2)
Fig. 5. Frequency dependence of real part of electric modulus M′ and loss M′′ ofPVP–clay aqueous colloidal suspension at varying clay concentrations; � (1) 0 wt%,� (2) 1 wt%, © (3) 2 wt%, � (4) 3 wt%, � (5) 4 wt% and� (6) 5 wt% of the total weight ofsolute. Inset shows enlarged view of the dispersion in upper experimental frequencyrange.
R.J. Sengwa et al. / Colloids and Surfaces A: Physicochem. Eng. Aspects 336 (2009) 79–87 83
Fc(
satdto
Fra5
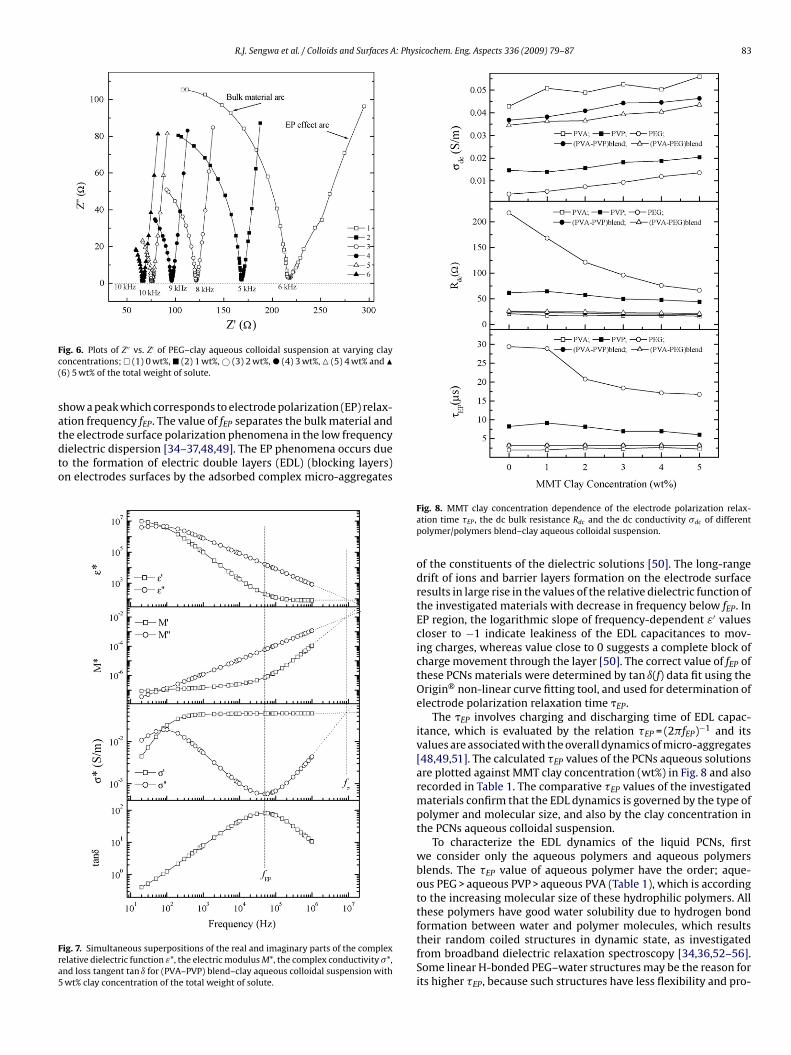
ig. 6. Plots of Z′′ vs. Z′ of PEG–clay aqueous colloidal suspension at varying clayoncentrations; � (1) 0 wt%, � (2) 1 wt%, © (3) 2 wt%, � (4) 3 wt%, � (5) 4 wt% and �6) 5 wt% of the total weight of solute.
how a peak which corresponds to electrode polarization (EP) relax-tion frequency fEP. The value of fEP separates the bulk material and
he electrode surface polarization phenomena in the low frequencyielectric dispersion [34–37,48,49]. The EP phenomena occurs dueo the formation of electric double layers (EDL) (blocking layers)n electrodes surfaces by the adsorbed complex micro-aggregatesig. 7. Simultaneous superpositions of the real and imaginary parts of the complexelative dielectric function ε*, the electric modulus M*, the complex conductivity �*,nd loss tangent tan ı for (PVA–PVP) blend–clay aqueous colloidal suspension withwt% clay concentration of the total weight of solute.
Fig. 8. MMT clay concentration dependence of the electrode polarization relax-ation time �EP , the dc bulk resistance Rdc and the dc conductivity �dc of differentpolymer/polymers blend–clay aqueous colloidal suspension.
of the constituents of the dielectric solutions [50]. The long-rangedrift of ions and barrier layers formation on the electrode surfaceresults in large rise in the values of the relative dielectric function ofthe investigated materials with decrease in frequency below fEP. InEP region, the logarithmic slope of frequency-dependent ε′ valuescloser to −1 indicate leakiness of the EDL capacitances to mov-ing charges, whereas value close to 0 suggests a complete block ofcharge movement through the layer [50]. The correct value of fEP ofthese PCNs materials were determined by tan ı(f) data fit using theOrigin® non-linear curve fitting tool, and used for determination ofelectrode polarization relaxation time �EP.
The �EP involves charging and discharging time of EDL capac-itance, which is evaluated by the relation �EP = (2�fEP)−1 and itsvalues are associated with the overall dynamics of micro-aggregates[48,49,51]. The calculated �EP values of the PCNs aqueous solutionsare plotted against MMT clay concentration (wt%) in Fig. 8 and alsorecorded in Table 1. The comparative �EP values of the investigatedmaterials confirm that the EDL dynamics is governed by the type ofpolymer and molecular size, and also by the clay concentration inthe PCNs aqueous colloidal suspension.
To characterize the EDL dynamics of the liquid PCNs, firstwe consider only the aqueous polymers and aqueous polymersblends. The �EP value of aqueous polymer have the order; aque-ous PEG > aqueous PVP > aqueous PVA (Table 1), which is accordingto the increasing molecular size of these hydrophilic polymers. Allthese polymers have good water solubility due to hydrogen bond
formation between water and polymer molecules, which resultstheir random coiled structures in dynamic state, as investigatedfrom broadband dielectric relaxation spectroscopy [34,36,52–56].Some linear H-bonded PEG–water structures may be the reason forits higher �EP, because such structures have less flexibility and pro-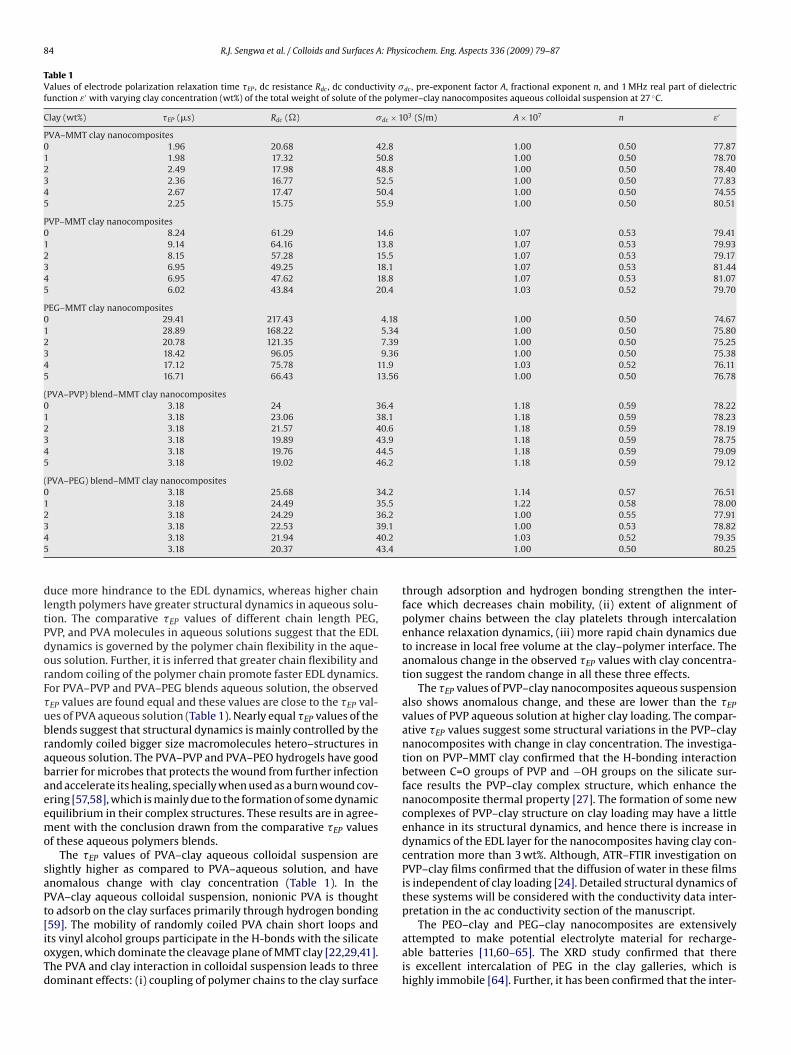
84 R.J. Sengwa et al. / Colloids and Surfaces A: Physicochem. Eng. Aspects 336 (2009) 79–87
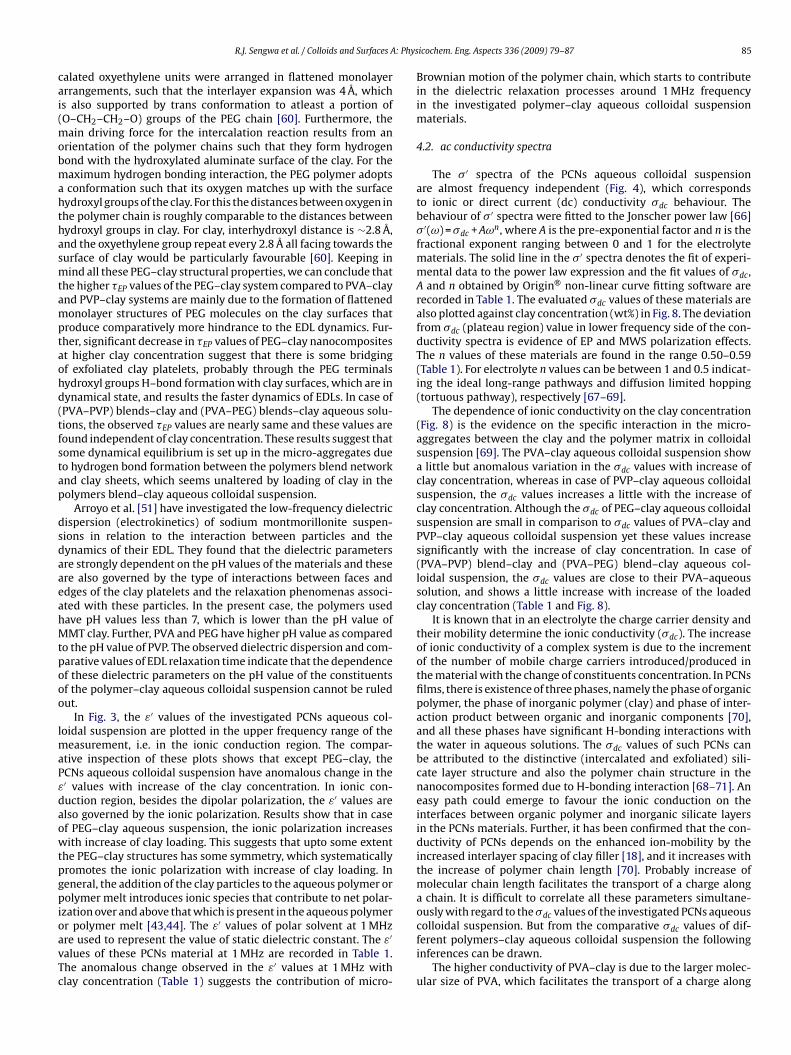
Table 1Values of electrode polarization relaxation time �EP , dc resistance Rdc , dc conductivity �dc , pre-exponent factor A, fractional exponent n, and 1 MHz real part of dielectricfunction ε′ with varying clay concentration (wt%) of the total weight of solute of the polymer–clay nanocomposites aqueous colloidal suspension at 27 ◦C.
Clay (wt%) �EP (�s) Rdc (�) �dc × 103 (S/m) A × 107 n ε′
PVA–MMT clay nanocomposites0 1.96 20.68 42.8 1.00 0.50 77.871 1.98 17.32 50.8 1.00 0.50 78.702 2.49 17.98 48.8 1.00 0.50 78.403 2.36 16.77 52.5 1.00 0.50 77.834 2.67 17.47 50.4 1.00 0.50 74.555 2.25 15.75 55.9 1.00 0.50 80.51
PVP–MMT clay nanocomposites0 8.24 61.29 14.6 1.07 0.53 79.411 9.14 64.16 13.8 1.07 0.53 79.932 8.15 57.28 15.5 1.07 0.53 79.173 6.95 49.25 18.1 1.07 0.53 81.444 6.95 47.62 18.8 1.07 0.53 81.075 6.02 43.84 20.4 1.03 0.52 79.70
PEG–MMT clay nanocomposites0 29.41 217.43 4.18 1.00 0.50 74.671 28.89 168.22 5.34 1.00 0.50 75.802 20.78 121.35 7.39 1.00 0.50 75.253 18.42 96.05 9.36 1.00 0.50 75.384 17.12 75.78 11.9 1.03 0.52 76.115 16.71 66.43 13.56 1.00 0.50 76.78
(PVA–PVP) blend–MMT clay nanocomposites0 3.18 24 36.4 1.18 0.59 78.221 3.18 23.06 38.1 1.18 0.59 78.232 3.18 21.57 40.6 1.18 0.59 78.193 3.18 19.89 43.9 1.18 0.59 78.754 3.18 19.76 44.5 1.18 0.59 79.095 3.18 19.02 46.2 1.18 0.59 79.12
(PVA–PEG) blend–MMT clay nanocomposites0 3.18 25.68 34.2 1.14 0.57 76.511 3.18 24.49 35.5 1.22 0.58 78.002 3.18 24.29 36.2 1.00 0.55 77.913 9.14 0.25 3.4
dltPdorF�ubrabaeemo
saPt[ioTd
3.18 22.53 33.18 21.94 43.18 20.37 4
uce more hindrance to the EDL dynamics, whereas higher chainength polymers have greater structural dynamics in aqueous solu-ion. The comparative �EP values of different chain length PEG,VP, and PVA molecules in aqueous solutions suggest that the EDLynamics is governed by the polymer chain flexibility in the aque-us solution. Further, it is inferred that greater chain flexibility andandom coiling of the polymer chain promote faster EDL dynamics.or PVA–PVP and PVA–PEG blends aqueous solution, the observedEP values are found equal and these values are close to the �EP val-es of PVA aqueous solution (Table 1). Nearly equal �EP values of thelends suggest that structural dynamics is mainly controlled by theandomly coiled bigger size macromolecules hetero–structures inqueous solution. The PVA–PVP and PVA–PEO hydrogels have goodarrier for microbes that protects the wound from further infectionnd accelerate its healing, specially when used as a burn wound cov-ring [57,58], which is mainly due to the formation of some dynamicquilibrium in their complex structures. These results are in agree-ent with the conclusion drawn from the comparative �EP values
f these aqueous polymers blends.The �EP values of PVA–clay aqueous colloidal suspension are
lightly higher as compared to PVA–aqueous solution, and havenomalous change with clay concentration (Table 1). In theVA–clay aqueous colloidal suspension, nonionic PVA is thoughto adsorb on the clay surfaces primarily through hydrogen bonding
59]. The mobility of randomly coiled PVA chain short loops andts vinyl alcohol groups participate in the H-bonds with the silicatexygen, which dominate the cleavage plane of MMT clay [22,29,41].he PVA and clay interaction in colloidal suspension leads to threeominant effects: (i) coupling of polymer chains to the clay surface1.00 0.53 78.821.03 0.52 79.351.00 0.50 80.25
through adsorption and hydrogen bonding strengthen the inter-face which decreases chain mobility, (ii) extent of alignment ofpolymer chains between the clay platelets through intercalationenhance relaxation dynamics, (iii) more rapid chain dynamics dueto increase in local free volume at the clay–polymer interface. Theanomalous change in the observed �EP values with clay concentra-tion suggest the random change in all these three effects.
The �EP values of PVP–clay nanocomposites aqueous suspensionalso shows anomalous change, and these are lower than the �EP
values of PVP aqueous solution at higher clay loading. The compar-ative �EP values suggest some structural variations in the PVP–claynanocomposites with change in clay concentration. The investiga-tion on PVP–MMT clay confirmed that the H-bonding interactionbetween C=O groups of PVP and −OH groups on the silicate sur-face results the PVP–clay complex structure, which enhance thenanocomposite thermal property [27]. The formation of some newcomplexes of PVP–clay structure on clay loading may have a littleenhance in its structural dynamics, and hence there is increase indynamics of the EDL layer for the nanocomposites having clay con-centration more than 3 wt%. Although, ATR–FTIR investigation onPVP–clay films confirmed that the diffusion of water in these filmsis independent of clay loading [24]. Detailed structural dynamics ofthese systems will be considered with the conductivity data inter-pretation in the ac conductivity section of the manuscript.
The PEO–clay and PEG–clay nanocomposites are extensivelyattempted to make potential electrolyte material for recharge-able batteries [11,60–65]. The XRD study confirmed that thereis excellent intercalation of PEG in the clay galleries, which ishighly immobile [64]. Further, it has been confirmed that the inter-
: Phys
cai(mobmahthasmtamptaohd(tfstap
dsdaaeahMtpooo
lmaPεdaowtpgpioavTc
R.J. Sengwa et al. / Colloids and Surfaces A
alated oxyethylene units were arranged in flattened monolayerrrangements, such that the interlayer expansion was 4 Å, whichs also supported by trans conformation to atleast a portion ofO–CH2–CH2–O) groups of the PEG chain [60]. Furthermore, the
ain driving force for the intercalation reaction results from anrientation of the polymer chains such that they form hydrogenond with the hydroxylated aluminate surface of the clay. For theaximum hydrogen bonding interaction, the PEG polymer adoptsconformation such that its oxygen matches up with the surfaceydroxyl groups of the clay. For this the distances between oxygen inhe polymer chain is roughly comparable to the distances betweenydroxyl groups in clay. For clay, interhydroxyl distance is ∼2.8 Å,nd the oxyethylene group repeat every 2.8 Å all facing towards theurface of clay would be particularly favourable [60]. Keeping inind all these PEG–clay structural properties, we can conclude that
he higher �EP values of the PEG–clay system compared to PVA–claynd PVP–clay systems are mainly due to the formation of flattenedonolayer structures of PEG molecules on the clay surfaces that
roduce comparatively more hindrance to the EDL dynamics. Fur-her, significant decrease in �EP values of PEG–clay nanocompositest higher clay concentration suggest that there is some bridgingf exfoliated clay platelets, probably through the PEG terminalsydroxyl groups H–bond formation with clay surfaces, which are inynamical state, and results the faster dynamics of EDLs. In case ofPVA–PVP) blends–clay and (PVA–PEG) blends–clay aqueous solu-ions, the observed �EP values are nearly same and these values areound independent of clay concentration. These results suggest thatome dynamical equilibrium is set up in the micro-aggregates dueo hydrogen bond formation between the polymers blend networknd clay sheets, which seems unaltered by loading of clay in theolymers blend–clay aqueous colloidal suspension.
Arroyo et al. [51] have investigated the low-frequency dielectricispersion (electrokinetics) of sodium montmorillonite suspen-ions in relation to the interaction between particles and theynamics of their EDL. They found that the dielectric parametersre strongly dependent on the pH values of the materials and thesere also governed by the type of interactions between faces anddges of the clay platelets and the relaxation phenomenas associ-ted with these particles. In the present case, the polymers usedave pH values less than 7, which is lower than the pH value ofMT clay. Further, PVA and PEG have higher pH value as compared
o the pH value of PVP. The observed dielectric dispersion and com-arative values of EDL relaxation time indicate that the dependencef these dielectric parameters on the pH value of the constituentsf the polymer–clay aqueous colloidal suspension cannot be ruledut.
In Fig. 3, the ε′ values of the investigated PCNs aqueous col-oidal suspension are plotted in the upper frequency range of the
easurement, i.e. in the ionic conduction region. The compar-tive inspection of these plots shows that except PEG–clay, theCNs aqueous colloidal suspension have anomalous change in the′ values with increase of the clay concentration. In ionic con-uction region, besides the dipolar polarization, the ε′ values arelso governed by the ionic polarization. Results show that in casef PEG–clay aqueous suspension, the ionic polarization increasesith increase of clay loading. This suggests that upto some extent
he PEG–clay structures has some symmetry, which systematicallyromotes the ionic polarization with increase of clay loading. Ineneral, the addition of the clay particles to the aqueous polymer orolymer melt introduces ionic species that contribute to net polar-
zation over and above that which is present in the aqueous polymer
r polymer melt [43,44]. The ε′ values of polar solvent at 1 MHzre used to represent the value of static dielectric constant. The ε′alues of these PCNs material at 1 MHz are recorded in Table 1.he anomalous change observed in the ε′ values at 1 MHz withlay concentration (Table 1) suggests the contribution of micro-
icochem. Eng. Aspects 336 (2009) 79–87 85
Brownian motion of the polymer chain, which starts to contributein the dielectric relaxation processes around 1 MHz frequencyin the investigated polymer–clay aqueous colloidal suspensionmaterials.
4.2. ac conductivity spectra
The � ′ spectra of the PCNs aqueous colloidal suspensionare almost frequency independent (Fig. 4), which correspondsto ionic or direct current (dc) conductivity �dc behaviour. Thebehaviour of � ′ spectra were fitted to the Jonscher power law [66]� ′(ω) = �dc + Aωn, where A is the pre-exponential factor and n is thefractional exponent ranging between 0 and 1 for the electrolytematerials. The solid line in the � ′ spectra denotes the fit of experi-mental data to the power law expression and the fit values of �dc,A and n obtained by Origin® non-linear curve fitting software arerecorded in Table 1. The evaluated �dc values of these materials arealso plotted against clay concentration (wt%) in Fig. 8. The deviationfrom �dc (plateau region) value in lower frequency side of the con-ductivity spectra is evidence of EP and MWS polarization effects.The n values of these materials are found in the range 0.50–0.59(Table 1). For electrolyte n values can be between 1 and 0.5 indicat-ing the ideal long-range pathways and diffusion limited hopping(tortuous pathway), respectively [67–69].
The dependence of ionic conductivity on the clay concentration(Fig. 8) is the evidence on the specific interaction in the micro-aggregates between the clay and the polymer matrix in colloidalsuspension [69]. The PVA–clay aqueous colloidal suspension showa little but anomalous variation in the �dc values with increase ofclay concentration, whereas in case of PVP–clay aqueous colloidalsuspension, the �dc values increases a little with the increase ofclay concentration. Although the �dc of PEG–clay aqueous colloidalsuspension are small in comparison to �dc values of PVA–clay andPVP–clay aqueous colloidal suspension yet these values increasesignificantly with the increase of clay concentration. In case of(PVA–PVP) blend–clay and (PVA–PEG) blend–clay aqueous col-loidal suspension, the �dc values are close to their PVA–aqueoussolution, and shows a little increase with increase of the loadedclay concentration (Table 1 and Fig. 8).
It is known that in an electrolyte the charge carrier density andtheir mobility determine the ionic conductivity (�dc). The increaseof ionic conductivity of a complex system is due to the incrementof the number of mobile charge carriers introduced/produced inthe material with the change of constituents concentration. In PCNsfilms, there is existence of three phases, namely the phase of organicpolymer, the phase of inorganic polymer (clay) and phase of inter-action product between organic and inorganic components [70],and all these phases have significant H-bonding interactions withthe water in aqueous solutions. The �dc values of such PCNs canbe attributed to the distinctive (intercalated and exfoliated) sili-cate layer structure and also the polymer chain structure in thenanocomposites formed due to H-bonding interaction [68–71]. Aneasy path could emerge to favour the ionic conduction on theinterfaces between organic polymer and inorganic silicate layersin the PCNs materials. Further, it has been confirmed that the con-ductivity of PCNs depends on the enhanced ion-mobility by theincreased interlayer spacing of clay filler [18], and it increases withthe increase of polymer chain length [70]. Probably increase ofmolecular chain length facilitates the transport of a charge alonga chain. It is difficult to correlate all these parameters simultane-ously with regard to the �dc values of the investigated PCNs aqueous
colloidal suspension. But from the comparative �dc values of dif-ferent polymers–clay aqueous colloidal suspension the followinginferences can be drawn.The higher conductivity of PVA–clay is due to the larger molec-ular size of PVA, which facilitates the transport of a charge along
8 : Phys
iusstPcSpPuetMi[tw(bc
taiccfitceiPcioimiainchccacbtstccgdbssppitdob
6 R.J. Sengwa et al. / Colloids and Surfaces A
ts chain as compared to the short size PVP and PEG moleculessed for PVP–clay and PEG–clay nanocomposites aqueous colloidaluspension. Further, it seems that the intercalated and exfoliateduspended structures of polymeric clay (inorganic polymer) formshe dc conduction paths identical to the structure of PVA in theVA–clay aqueous colloidal suspension and hence there is a littlehange in the �dc values with the increase of clay concentration. TheEM morphological image confirmed some crystalline behaviour ofure PVA, which is destroyed by the loading of MMT clay results theVA in amorphous state with a mixed morphology in which individ-al silicate layers, along with two or three and four layer stacks arexfoliating in the PVA matrix [23]. Identical to this, the characteriza-ion of PVA–clay mixed matrix films and membranes confirms that
MT clay particles do not readily form the continuous phase butsolated clay particles are surrounded by PVA chain in the matrix29,72]. These morphological results favour the above interpreta-ion on the �dc values of the PVA–clay aqueous colloidal suspensionith increase of clay concentration. At constant weight of the solute
polymer + clay), increase of clay concentration increases the num-er of conducting ions and thus their contribution to �dc valuesannot be ruled out in the investigated materials.
In case of PVP–clay aqueous colloidal suspension, it seems thathe addition of polymeric clay enhances some conduction pathnd also the concentration of charge carriers due to which theres gradual increase of conductivity with the increase of clay con-entration. The significant increase in �dc values with increase oflay concentration in PEG–clay aqueous colloidal suspension con-rm that a large enhance of the easy conduction path emerges dueo intercalated and exfoliated structure of clay, which facilitates theharge carrier mobility. Further the interactions of the hydrophilicnds groups of PEG with clay surfaces facilitates the preferentialnteractions, which may result in the increase of �dc values of theEG–clay aqueous colloidal suspension with the increase of clayoncentration. Earlier investigation on PEO/PEG–clay nanocompos-tes concluded that to achieve the conductivities of about 10−3 S/cmr more for their commercially viability as solid-state electrolyten lithium batteries, there is need to find a way to increase seg-
ental motion of the polymers with the clay galleries, althoughntercalated PEG in the clay galleries is highly immobile [64]. Themorphous/crystalline structure of the intercalated polymer alsonfluences the conductivity of the nanocomposites. In PEO–clayanocomposites, the intercalated PEO molecules between sili-ate galleries impede the polymer crystallization, which results inigher electrolyte conductivity compared to the system withoutlay [11]. In recent study [63], it was reported that the PEO–MMTlay nanocomposites had conductivities of 10−9 to 10−4 S/cm, whichre in good agreement with the conductivity values of PEG–MMTlay observed in the present study. In regard to the structuralehaviour of the PEO–MMT clay nanocomposites, it was postulatedhat the PEO chains exist in helical structure in the intercalatedtate, forming some kind of tunnel that increases the mobility ofhe cations, and hence also the conductivity [63]. Finally it can beoncluded that the amorphous structure and larger chain motion orhain flexibility of the intercalated PEO/PEG molecules in the clayalleries are the main parameters which control the electrical con-uctivities of PEO/PEG–clay nanocomposites. In case of (PVA–PVP)lend–clay and (PVA–PEG) blend–clay aqueous colloidal suspen-ion, the �dc values (Table 1) shows that the higher molecularize of PVA mask the ionic conduction behaviour over the com-aratively smaller molecular size PVP and PEG molecules in theolymers blend–clay nanocomposites. The �dc values of the stud-
ed polymers blend–clay material shows a gradual increase withhe increase of loaded clay concentration. It is difficult here to pre-ict the highly complexed structural behaviour of the constituentsf these materials with intercalated and exfoliated clay structures,ut their �dc values indicate that some structural symmetry is gen-
icochem. Eng. Aspects 336 (2009) 79–87
erated with clay concentration, which enhances the ion conductionpaths resulting in the increase in �dc values.
4.3. Electric modulus spectra
The frequency-dependent electric modulus spectra of the realpart M′ and imaginary part M′′ of the PVP–clay aqueous colloidalsuspension as one of representation of the investigated materi-als is plotted in Fig. 5. Identical M′ and M′′ spectra were alsofound for other investigated PCNs aqueous solutions. The M′ spec-tra which are free from space charge effect shows a large dispersionin the ionic conduction region (above fEP), whereas in the electrodepolarization region (below fEP) the gradual increase in frequency-dependent M′ values is very small. Fig. 7 shows the master-curvesrepresentation of 5 wt% clay of the (PVA–PVP) blend–clay solute inaqueous solutions as one of the representative plot. Such plots arefrequently used to find out the common intersection frequency ofreal and imaginary parts of all intensive quantities in the ion con-duction region [35,36,41,42], and same frequency is used to evaluatethe value of most probable ionic conductivity relaxation time of theelectrolytic material [35,36,41,42]. The investigated PCNs aqueouscolloidal suspension shows the ionic conductivity relaxation fre-quency f�, i.e., the change from dc to ac transport, above 1 MHz asindicated by extrapolation in Fig. 7. Since the M′′ peak is out of ourexperimental frequency window, the evaluation of the exact valueof f� and ionic conduction relaxation time �� = (2�f�)−1 could notbe possible for these PCNs aqueous colloidal suspension from theirmaster-curves representations. In general for polymeric solutions,f� is occurred ∼103 Hz above the corresponding fEP value [35–37],and by this concept the f� or �� values can be predicted for theseliquid nanocomposites materials.
4.4. Complex impedance spectra
The frequency value of the experimental points increases ongoing from right to left side on the arcs of the complex impedanceplane plot (Z′′ vs. Z′) of PEG–clay aqueous solutions (Fig. 6). Allthese plots have two separate arcs, which are corresponding to bulkmaterial effect (the upper frequency arc) and the electrode surfacepolarization effect (the lower frequency arc) [16,17,31,34–37]. Thefrequency value corresponding to Z′′ minimum value in the plots,which separates the bulk and electrode polarization phenomena ismarked in Fig. 6. These values are exactly equal to the tan ı peakfrequency fEP values of corresponding PCNs material. In compleximpedance plane plots, the extrapolated intercept on the real axisZ′ of the common part of two arcs is used to estimate the dc bulkresistance Rdc, which is also denoted by Rb of the dielectric mate-rial [16–18,34–36,46]. The Rdc values of the PCNs aqueous solutionsdetermined from their impedance plots with clay concentrationare recorded in Table 1 and also plotted in Fig. 8. In impedancespectroscopy, the Rb values are in general used to determine theconductivities of the material of thickness and surface area A bythe relation �dc = /(RbA).
Table 1 shows that the Rdc value of PVA–clay aqueous solu-tions are little affected by the clay concentration, whereas thesevalues significantly decreases with increase of clay concentrationin the PVP–clay and PEG–clay aqueous colloidal suspension. Fur-ther the Rdc values of PEG–clay aqueous colloidal suspension aremuch higher as compared to the other investigated PCNs aqueouscolloidal suspension. The higher Rdc values results the larger timetaken by the EDL for its charging and discharging, and hence in case
of PEG–clay aqueous colloidal suspension the observed �EP valuesare found higher as compared to the other PCNs aqueous solutions.The Rdc values of (PVA–PVP) blend–clay and (PVA–PEG) blend–clayaqueous colloidal suspension are close to the PVA–clay aqueous col-loidal suspension (Table 1), which shows that the dc resistance of
: Phys
ti
5
masidlaionritoptmDoclistfir
A
optR
R
[[[[
[
[[
[[
[[[[[[[
[
[[[[[[[
[[[[[
[[
[
[[[
[
[[[[
[[
[[
[[[
[
[
[
[[[[[[
[
[[
[69] R.J. Sengwa, S. Choudhary, S. Sankhla, Express Polym. Lett. 2 (2008) 800.
R.J. Sengwa et al. / Colloids and Surfaces A
hese blends are controlled by PVA and have a little decrease withncrease of clay concentration.
. Conclusion
The low frequency dielectric behaviour of the hydrophilic poly-ers namely the PVA, PVP and PEG, and blends of the PVA–PVP
nd PVA–PEG, loaded with the MMT clay in aqueous colloidaluspension is governed by ionic conduction and electrode polar-zation phenomena. The comparative analysis of the variousielectric/electrical properties of the polymer–clay aqueous col-
oidal suspension confirms that the behaviour of ionic conductionnd EDL dynamics depends on the type of hydrophilic polymer andts molecular size, and the loaded clay concentration. The formationf H–bonding interactions between the constituents of the liquidanocomposite material and clay intercalation and exfoliation wereecognized by specific signatures related to the structural featuresn the investigated dielectric properties, and their resemblanceo the results explored from other spectroscopy and morphol-gy techniques on these materials. The interesting electrokineticarameters of the liquid polymer–clay nanocomposites suggesthat the PCNs dielectric properties can be tailored in the predicted
anner with the use of suitable polymer and clay concentration.ielectric results also indicate their contribution to developmentf handy methods for reliable assessment of silicate layers inter-alation and exfoliation, and the dynamics of complex H-bondediquid organic–inorganic nanocomposite systems. Further, the works in progress on the PCNs films casted from these aqueous colloidaluspension nanocomposites to establish some correlation betweenhe dielectric properties of liquid nanocomposites and their solidlms, which may serve as model for designing new materials of theequired dielectric parameters.
cknowledgements
Authors are grateful to the Department of Science and Technol-gy, New Delhi for providing the experimental facilities throughroject No. SR/S2/CMP-09/2002. One of the authors SC is thankfulo the University Grants Commission, New Delhi for the award ofFSMS fellowship.
eferences
[1] M. Alexandre, P. Dubois, Mater. Sci. Eng. 28 (2000) 1.[2] S.S. Ray, M. Okamoto, Prog. Polym. Sci. 28 (2003) 1539.[3] S.S. Ray, M. Bousmina, Prog. Mater. Sci. 50 (2005) 962.[4] H. Fischer, Mater. Sci. Eng. C 23 (2003) 763.[5] M.V. Burmistr, K.M. Sukhyy, V.V. Shilov, P. Pissis, A. Spanoudaki, I.V. Sukha, V.I.
Tomilo, Y.P. Gomza, Polymer 46 (2005) 12226.[6] N. Fedullo, E. Sorlier, M. Sclavons, C. Bailly, J.-M. Lefebvre, J. Devaux, Prog. Inorg.
Coat. 58 (2007) 87.[7] T. Tanaka, G.C. Montanari, R. Mülhaupt, IEEE Trans. Dielect. Elect. Insul. 11 (2004)
763.[8] F. Bergaya, B.K.G. Theng, G. Lagaly, Handbook of Clay Science, Elsevier, Amster-
dam, 2006.[9] L.A. Ultracki, M. Sepehr, E. Boccaleri, Polym. Adv. Technol. 18 (2007) 1.10] A. Okada, A. Usuki, Mater. Sci. Eng. C 3 (1995) 109.11] P. Aranda, E. Ruiz-Hitzky, Appl. Clay Sci. 15 (1999) 119.12] R.A. Vaia, E.P. Giannelis, Macromolecules 30 (1997) 7990.13] H. Treichel, G. Ruhl, P. Ansmann, R. Würl, Ch. Müller, M. Dietlmeier, Microelec-
tron. Eng. 40 (1998) 1.14] Y.H. Zhang, Z.M. Dang, S.Y. Fu, J.H. Xin, J.G. Deng, J. Wu, S. Yang, L.F. Li, Q. Yan,
Chem. Phys. Lett. 401 (2005) 553.15] H.-W. Chen, F.-C. Chang, Polymer 42 (2001) 9763.16] A.K. Thakur, D.K. Pradhan, B.K. Samantaray, R.N.P. Choudhary, J. Power Sources
159 (2006) 272.
[
[[
icochem. Eng. Aspects 336 (2009) 79–87 87
17] M. Wang, S. Dong, J. Power Sources 170 (2007) 425.18] S. Kim, E.-J. Hwang, Y. Jung, M. Han, S.-J. Park, Colloids Surf. A 313/314 (2008)
216.19] Q. Sun, F.J. Schork, Y. Deng, Composite Sci. Technol. 67 (2007) 1823.20] Y.-H. Yu, J.-M. Yeh, S.-J. Liou, Y.-P. Chang, Acta Mater. 52 (2004) 475.21] M. Kokabi, M. Sirousazar, Z.M. Hassan, Eur. Polym. J. 43 (2007) 773.22] K.E. Strawhecker, E. Manias, Chem. Mater. 12 (2000) 2943.23] Y.-H. Yu, C.-Y. Lin, J.-M. Yeh, W.-H. Lin, Polymer 44 (2003) 3553.24] L.-M. Döppers, C. Breen, C. Sammon, Vib. Spectrosc. 35 (2004) 27.25] H.M. Jung, E.M. Lee, B.C. Ji, Y. Deng, J.D. Yun, J.H. Yeum, Colloid Polym. Sci. 285
(2007) 705.26] J.-M. Séquaris, A. Hild, H.D. Narres, M.J. Schwuger, J. Colloid Interf. Sci. 230
(2000) 73.27] C.M. Koo, H.T. Ham, M.H. Choi, S.O. Kim, I.J. Chung, Polymer 44 (2003) 681.28] B. Chen, J.R.G. Evans, J. Phys. Chem. B 108 (2004) 14986.29] K.E. Strawhecker, E. Manias, Macromolecules 34 (2001) 8475.30] K.E. Strawhecker, E. Manias, Chem. Mater. 15 (2003) 844.31] P. Pissis, A. Kyritsis, Solid State Ionics 97 (1997) 105.32] P. Pissis, A. Kyritsis, A.A. Konsta, D. Daoukaki, Colloids Surf. A 149 (1999) 253.33] N. Shinyashiki, R.J. Sengwa, S. Tsubotani, H. Nakamura, S. Sudo, S. Yagihara, J.
Phys. Chem. A 110 (2006) 4953.34] R.J. Sengwa, S. Sankhla, Polymer 48 (2007) 2737.35] R.J. Sengwa, S. Sankhla, Colloids Polym. Sci. 285 (2007) 1237.36] R.J. Sengwa, S. Sankhla, J. Macromol. Sci. Part B: Phys. 46 (2007) 717.37] R.J. Sengwa, S. Sankhla, J. Mol. Liq. 141 (2008) 73.38] G. Georgousis, A. Kanapitsas, P. Pissis, Yu.V. Savelyev, V.Ya. Veselov, E.G. Privalko,
Eur. Polym. J. 36 (2000) 1113.39] A. Kanapitsas, P. Pissis, R. Kotsilkova, J. Non-Cryst. Solids 305 (2002) 204.40] M. Böhning, H. Goering, A. Fritz, K.-W. Brzezinka, G. Turky, A. Schönhals, B.
Scharter, Macromolecules 38 (2005) 2764.41] V.M. Gun’ko, P. Pissis, A. Spanoudaki, V.I. Zarko, Y.M. Nychiporuk, L.S. Andriyko,
E.V. Goncharuk, R. Leboda, J. Skubiszewska-Zieba, V.D. Osovskii, Y.G. Ptushin-skii, J. Colloid Interf. Sci. 312 (2007) 201.
42] J. Mijovic, H. Lee, J. Kenny, J. Mays, Macromolecules 39 (2006) 2172.43] A.J. Bur, Yu.-H. Lee, S.C. Roth, P.R. Start, Polymer 46 (2005) 10908.44] N. Noda, Yu.-H. Lee, A.J. Bur, V.M. Prabhu, C.R. Snyder, S.C. Roth, M. McBrearty,
Polymer 46 (2005) 7201.45] Agilent 16452A Liquid Test Fixture–Operation and Service Manual, Agilent
Technologies Ltd., Japan, 2000.46] P.B. Macedo, C.T. Moynihan, R. Bose, Phys. Chem. Glasses 13 (1972) 171.47] W.C. Hasz, C.T. Moynihan, P.A. Tick, J. Non-Cryst. Solids 1363 (1994) 172.48] S. Zhang, S. Dou, R.H. Colby, J. Runt, J. Non-Cryst. Solids 351 (2005) 2825.49] R.J. Klein, S. Zhang, S. Dou, B.H. Jones, R.H. Colby, J. Runt, J. Chem. Phys. 124
(2006) 144903.50] D.Q.M. Craig, J.M. Newton, R.M. Hill, J. Mater. Sci. 28 (1993) 405.51] F.J. Arroyo, F. Carrique, M.L. Jiménez-Olivares, A.V. Delgado, J. Colloids Interf.
Sci. 229 (2000) 118.52] A. Kyritsis, P. Pissis, J. Polym. Sci. B: Polym. Phys. 35 (1997) 1545.53] N. Shinyashiki, S. Yagihara, I. Arita, S. Mashimo, J. Phys. Chem. B 102 (1998)
3249.54] R.J. Sengwa, K. Kaur, Polym. Int. 49 (2000) 1314.55] T. Sato, H. Sakai, K. Sou, R. Buchner, E. Tsuchida, J. Phys. Chem. B 111 (2007) 1393.56] N. Shinyashiki, M. Shimomura, T. Ushiyama, T. Miyagawa, S. Yagihara, J. Phys.
Chem. B 111 (2007) 10079.57] F. Yoshii, Y. Zhanshan, K. Isobe, K. Shinozaki, K. Makuuchi, Radiat. Phys. Chem.
55 (1999) 133.58] M.T. Razzak, Zainuddin, Erizal, S.P. Dewi, H. Lely, E. Taty, Sukirno, Radiat. Phys.
Chem. 55 (1999) 153.59] J.H. Chang, T.G. Jang, K.J. Ihn, W.K. Lee, G.S. Sur, J. Appl. Polym. Sci. 90 (2003)
3208.60] J.J. Tunney, C. Detellier, Chem. Mater. 8 (1996) 927.61] W. Chen, Q. Xu, R.Z. Yuan, Comp. Sci. Technol. 61 (2001) 935.62] B. Liao, M. Song, H. Liang, Y. Pang, Polymer 42 (2001) 10007.63] M.X. Reinholdt, R.J. Kirkpatrick, T.J. Pinnavaia, J. Chem. Phys. B 109 (2005) 16296.64] D.J. Chaiko, Chem. Mater. 15 (2003) 1105.65] S. Lin-Gibson, H. Kim, G. Schmidt, C.C. Han, E.K. Hobbie, J. Colloid Interf. Sci. 274
(2004) 515.66] A.K. Jonscher, Dielectric Relaxation in Solids, Chelsea Dielectric Press, London,
1983.67] A.K. Mauritz, Macromolecules 22 (1989) 4483.68] D.K. Pradhan, R.N.P. Choudhary, B.K. Samantaray, Express Polym. Lett. 2 (2008)
630.
70] Y. Mamunya, A. Kanapitsas, P. Pissis, G. Boiteux, E. Lebedev, Macromol. Symp.198 (2003) 449.
71] M. Wang, F. Zhao, Z. Guo, S. Dong, Electrochim. Acta 49 (2004) 3595.72] S.G. Adoor, M. Sairam, L.S. Manjeshwar, K.V.S.N. Raju, T.M. Aminabhavi, J.
Membr. Sci. 285 (2006) 182.


