Embed Size (px)
Citation preview

This article appeared in a journal published by Elsevier. The attachedcopy is furnished to the author for internal non-commercial researchand education use, including for instruction at the authors institution
and sharing with colleagues.
Other uses, including reproduction and distribution, or selling orlicensing copies, or posting to personal, institutional or third party
websites are prohibited.
In most cases authors are permitted to post their version of thearticle (e.g. in Word or Tex form) to their personal website orinstitutional repository. Authors requiring further information
regarding Elsevier’s archiving and manuscript policies areencouraged to visit:
http://www.elsevier.com/copyright

Author's personal copy
Note
Characterization of silver nanoparticles deposited on montmorillonite
Petr Praus a,⁎, Martina Turicová a, Vladimír Machovič b, Soňa Študentová a, Mariana Klementová c
a Department of Analytical Chemistry and Material Testing, VŠB-Technical University of Ostrava, 17. listopadu 15, 708 33 Ostrava-Poruba, Czech Republicb Central Laboratory, Institute of Chemical Technology Prague, Technická 5, 166 28 Prague, Czech Republicc Institute of Inorganic Chemistry of the AS CR, v.v.i., 250 68 Husinec-Řež 1001, Czech Republic
a b s t r a c ta r t i c l e i n f o
Article history:Received 15 February 2010Received in revised form 4 June 2010Accepted 9 June 2010Available online 17 June 2010
Keywords:Silver nanoparticlesFormaldehyde and borohydride reductionMontmorilloniteSurface enhanced Raman scattering
Silver nanoparticles were prepared by reduction of silver ions intercalated into montmorillonite (MMT) withborohydride and formaldehyde. They were deposited on the external surface of the MMT particles. Scanningelectronmicroscopy(SEM), transmissionelectronmicroscopy(TEM)andspecific surfacearea (SSA)measurementsrevealed that borohydride produced very small particleswith narrow sizedistribution (3–13 nm) evenly dispersedon theMMT surface. Silver ions reduced by formaldehyde formed both small particles and large aggregates. The Agnanoparticles were composed of cubic and hexagonal and/or amorphous silver crystals. The Raman scattering(SERS) was significantly increased by montmorillonite covered with Ag nanoparticles, especially when preparedwith borohydride.
© 2010 Elsevier B.V. All rights reserved.
1. Introduction
Silver nanoparticles found many applications during recent years.They have been used in electronics as thick film conductors, in catalysis,in medicine due to its antibacterial properties, in photonics due to itswaveguiding, optical switching, and nonlinear optical properties (Nahaland Shapoori, 2009) etc. Recently, nanosilver ink has been used forinkjet printing (Lee et al., 2005).
Problems with a stability of the produced colloidal Ag dispersionshas been solved by addition of polymers and surfactants. Suchcomplications do not occur if the nanoparticles are deposited on astable inert carrier. Silver nanoparticles have been deposited on glassfibers (Sharifi and Taghavinia, 2009), activated carbon (Sawai andOshima, 2008), alumina (Shashikala et al., 2007), glass (Li et al., 2003;Nahal and Shapoori, 2009), titanium nitride layer (Akhavan, 2009),smectites (Ayyappan et al., 1996; Patakfalvi et al., 2003; Valášková etal., 2008; Praus et al., 2009) and other inorganic solids (Kwiatkowskiand Lukehart, 2002).
In this study, silver nanoparticles were deposited onmontmorilloniteand studied by electron scanning and transmission microscopy, X-raydiffraction, specific surface areameasurements and Raman spectrometry.The Raman spectra were measured because the SERS effect of Agnanoparticles was expected (e.g. Hutter and Fendler, 2004). In addition,to our best knowledge, SERS of MMT covered by Ag nanoparticles (Ag-
MMT)hasnot beenobservedyet. Thenanoparticleswereprepared by thereduction with formaldehyde and borohydride.
2. Materials and methods
2.1. Reagents
All chemicals were of analytical reagent grade: formalin (37%),sodium hydroxide, triethanolamine (TEA), sodium hydrogen carbonate(Lachema, Czech Republic) and sodium borohydride (NaBH4) (Merck,Germany).Water used for the preparation of all solutionswas deionisedby reverse osmosis. We used Na+-rich montmorillonite SWy 2 (CrookCounty, Wyoming) with an exchange capacity of 1.2 meq g−1, deter-mined by the saturation with NH4
+ (Madejová et al., 1999) and by theanalysis of released ions (Na+, K+, Ca2+, Mg2+). The structural formulais Na0.38 K0.04(Ca0.12 Mg0.50 Fe3+0.41 Al2.90 Ti0.01 Mn0.01)(Si8) O20(OH)4as calculated from the results of X-ray fluorescence analysis. The b5 μmfraction separated by sedimentation was used.
2.2. Deposition of silver nanoparticles on MMT
Silver ions intercalated into montmorillonite were reduced byformaldehyde and borohydride as described recently (Praus et al.,2009). After the reduction, Ag-MMT was filtered with 1.2 μm glass fibrefilters and washed several times with water. Ag-MMT samples weregently dried at 50 °C and stored in dark (in desiccators). Silvernanoparticles prepared by borohydride were labelled as Ag-MMT/NaBH4 and those prepared by formaldehyde were labelled as Ag-MMT/F-NaOH, Ag-MMT/F-NaHCO3, and Ag-MMT/F-TEA depending of the usedalkaline reagents.
Applied Clay Science 49 (2010) 341–345
⁎ Corresponding author. Tel/fax: +420 59 732 3370.E-mail address: [email protected] (P. Praus).
0169-1317/$ – see front matter © 2010 Elsevier B.V. All rights reserved.doi:10.1016/j.clay.2010.06.009
Contents lists available at ScienceDirect
Applied Clay Science
j ourna l homepage: www.e lsev ie r.com/ locate /c lay
Author's personal copy
2.3. Transmission electron microscopy
Transmission electron microscopy was carried out on a JEOL JEM3010 microscope operated at 300 kV (LaB6 cathode, point resolution0.17 nm) with an EDX (Energy Dispersive X-ray) detector attached.The micrographs were recorded on a CCD camera with the resolutionof 1024×1024 pixels using the Digital Micrograph software package.
The powder samples were dispersed in ethanol and the dispersionwas treated in ultrasound for 10 min. A drop of very diluted dispersionwas placed on a holey-carbon-coated copper grid and allowed todry at the room temperature. Selected-area electron diffraction(SAED) patterns were evaluated using the Process Diffractionsoftware package.
2.4. X-ray powder diffraction
TheX-raypowderdiffraction studywasperformedusing thepowderdiffractometer INEL CPS 120 (INEL, France) equipped with a curvedposition-sensitive detector PSD 120 MB/11 (reflection mode, Ge-monochromatized, CuKα1 radiation), which allows simultaneous datacollection over 0° to 120° with steps of 0.031° in 2-theta. Diffractionpatterns were acquired in ambient atmosphere under constantconditions (2000 s, 35 kV, 20 mA).
2.5. Surface area measurements
The specific surface areas of the powder samples were measuredwith the Sorptomatic 1990 (Thermo Electron Corporation, USA) usingnitrogen and calculated by the Advance Data Processing softwareaccording to the BET isotherm (Brunauer et al., 1938) within the range
p/p0=0 to 0.3 at 77.31 K. Monolayer surface areas were calculatedafter fitting 10 points of each isotherm. The specific surface areasof micro- and mesopores were calculated by means of the HorváthKawazoe (Horváth and Kawazoe, 1983) and BJH (Barrett et al., 1951)models.
2.6. Raman spectrometry
The Raman spectra were measured by the Raman dispersionspectrometer Labram HR (Jobin Yvon, France) equipped by a confocalmicroscope (Olympus). A laser of λ=532 nm and an operationoutput of 50 mW was used as an excitation source. Powder sampleswere measured at the operation output of 5 mW and time of 30 s (anaccumulation of 30 spectra) on an air-cooled CCD camera. A grating of300 l/mm was used.
3. Results and discussion
3.1. Electron microscopy study
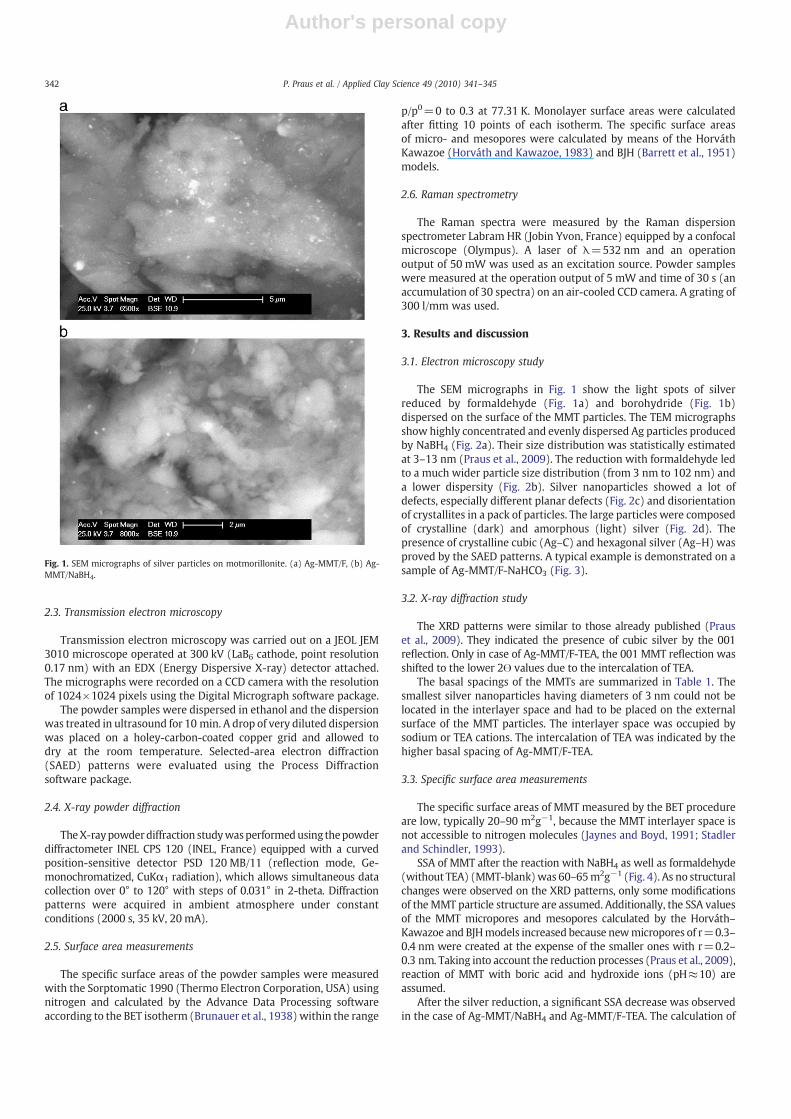
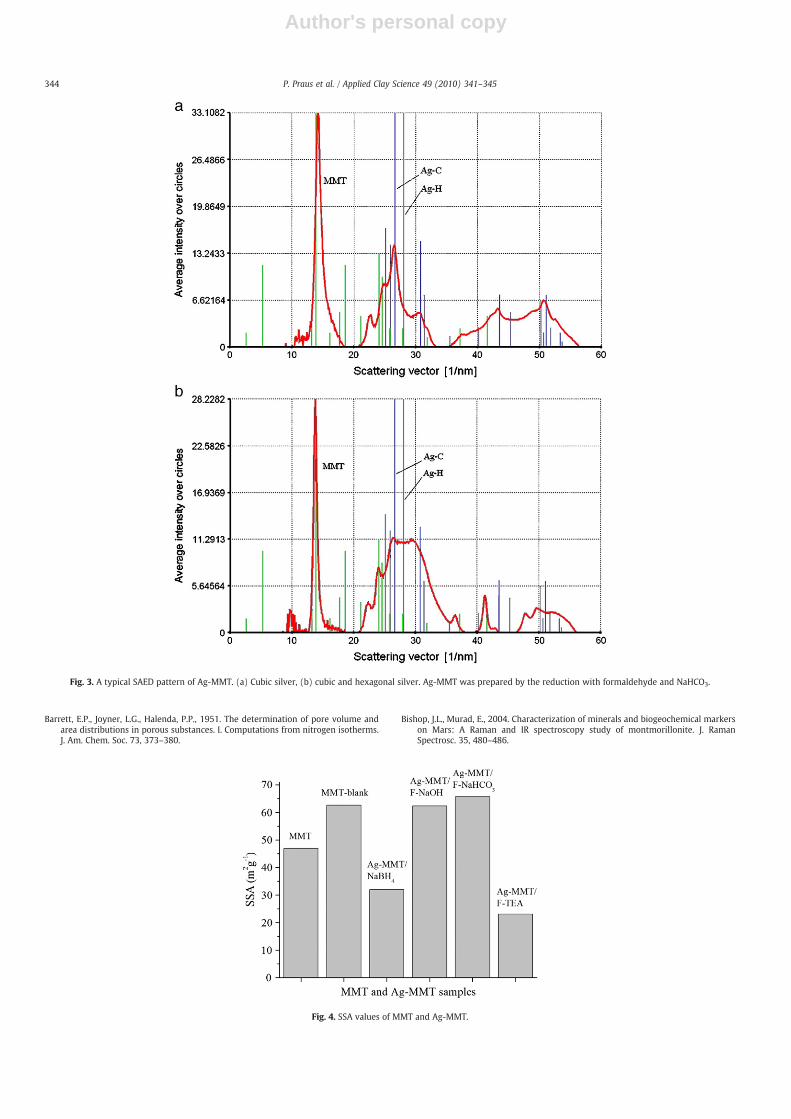
The SEM micrographs in Fig. 1 show the light spots of silverreduced by formaldehyde (Fig. 1a) and borohydride (Fig. 1b)dispersed on the surface of the MMT particles. The TEM micrographsshow highly concentrated and evenly dispersed Ag particles producedby NaBH4 (Fig. 2a). Their size distribution was statistically estimatedat 3–13 nm (Praus et al., 2009). The reduction with formaldehyde ledto a much wider particle size distribution (from 3 nm to 102 nm) anda lower dispersity (Fig. 2b). Silver nanoparticles showed a lot ofdefects, especially different planar defects (Fig. 2c) and disorientationof crystallites in a pack of particles. The large particles were composedof crystalline (dark) and amorphous (light) silver (Fig. 2d). Thepresence of crystalline cubic (Ag–C) and hexagonal silver (Ag–H) wasproved by the SAED patterns. A typical example is demonstrated on asample of Ag-MMT/F-NaHCO3 (Fig. 3).
3.2. X-ray diffraction study
The XRD patterns were similar to those already published (Prauset al., 2009). They indicated the presence of cubic silver by the 001reflection. Only in case of Ag-MMT/F-TEA, the 001 MMT reflection wasshifted to the lower 2V values due to the intercalation of TEA.
The basal spacings of the MMTs are summarized in Table 1. Thesmallest silver nanoparticles having diameters of 3 nm could not belocated in the interlayer space and had to be placed on the externalsurface of the MMT particles. The interlayer space was occupied bysodium or TEA cations. The intercalation of TEA was indicated by thehigher basal spacing of Ag-MMT/F-TEA.
3.3. Specific surface area measurements
The specific surface areas of MMT measured by the BET procedureare low, typically 20–90 m2g−1, because the MMT interlayer space isnot accessible to nitrogen molecules (Jaynes and Boyd, 1991; Stadlerand Schindler, 1993).
SSA of MMT after the reaction with NaBH4 as well as formaldehyde(without TEA) (MMT-blank)was 60–65m2g−1 (Fig. 4). As no structuralchanges were observed on the XRD patterns, only some modificationsof theMMT particle structure are assumed. Additionally, the SSA valuesof the MMT micropores and mesopores calculated by the Horváth–Kawazoe and BJHmodels increased because newmicropores of r=0.3–0.4 nm were created at the expense of the smaller ones with r=0.2–0.3 nm. Taking into account the reduction processes (Praus et al., 2009),reaction of MMT with boric acid and hydroxide ions (pH≈10) areassumed.
After the silver reduction, a significant SSA decrease was observedin the case of Ag-MMT/NaBH4 and Ag-MMT/F-TEA. The calculation of
Fig. 1. SEM micrographs of silver particles on motmorillonite. (a) Ag-MMT/F, (b) Ag-MMT/NaBH4.
342 P. Praus et al. / Applied Clay Science 49 (2010) 341–345

Author's personal copy
micro- and mesopore distributions showed that the micropores ofr=0.2–0.4 nm nearly diminished because very small Ag nanoparti-cles and TEA filled these pores. The presence of such small Ag particleson MMT was also confirmed by TEM (Fig. 2a).
3.4. Raman spectrometry
The spectrum of natural montmorillonite contained bands up to710 cm−1 that are attributed to structural lattice modes. The bandsbetween 710 cm−1 and 1000 cm−1 have been attributed to AlMgOH,AlFeOH, and Al2OH bending vibrations (Bishop and Murad, 2004).
It is obvious from Fig. 5 Ag-MMT samples provided more intensiveRaman spectra than MMT. The enhancement of the Raman signal canbe attributed to the surface-enhanced Raman scattering caused bysilver nanoparticles. In addition, the vibration bands corresponding toAg-MMT/NaBH4 were stronger than the others likely because itssurface was more densely covered by Ag nanoparticles (Fig. 2a).
On the contrary, the Raman signal of Ag-MMT/F-TEA was evenless than the signal observed for MMT. The MMT vibrations were
likely desactivated by TEA, which was intercalated and adsorbed onAg-MMT.
4. Conclusion
Ag nanoparticles were prepared by the reduction of Ag+ intercalatedinto MMT by NaBH4 and formaldehyde and deposited on the externalsurfaces of the MMT particles as confirmed by SEM, TEM and the SSAmeasurements. The TEM micrographs also revealed crystalline andamorphous silver nanoparticles. In addition, the SAED patterns revealedthe crystalline cubic and hexagonal modification of Ag.
Ag nanoparticles caused the SERS of montmorillonite. The mostsignificant SERS was observed with Ag-MMT/NaBH4, the lowest withAg-MMT/F-TEA likely due to the TEA adsorption on Ag-MMT.
Acknowledgement
The authorswould like to thank Dr. M. Valášková andMrs.M. Heliová(both fromNanotechnology Centre, VŠB-Technical University of Ostrava)for recording the XRD patterns and SEM micrographs, respectively. Thisworkwas supported by theMinistry of Education, Youth and Sport of theCzech Republic (MSM 6198910016) and by the Regional MaterialsScience and Technology Centre (CZ.1.05/2.1.00/01.0040).
References
Akhavan, O., 2009. Silver nanocube crystals on titanium nitride buffer layer. J. Phys. DAppl. Phys. 42, 105305 6 pp.
Ayyappan, S., Subbanna, G.N., Goplan, R.S., Rao, C.N.R., 1996. Nanoparticles of nickel andsilver produced by the polyol reduction of the metal salts intercalated inmontmorillonite. Solid State Ionics 84, 271–281.
Fig. 2. TEM micrographs of Ag-MMT. (a) Reduction by NaBH4, (b) reduction by formaldehyde, (c) Ag microstructure, (d) a particle composed of crystalline and amorphous silver.
Table 1Montmorillonite interlayer distances.
MMT sample Reduction d001 (nm)
MMT none 1.22Ag/MMT F-NaOH 1.26Ag/MMT F-NaHCO3 1.26Ag/MMT F-TEA 1.40Ag/MMT NaBH4 1.25
343P. Praus et al. / Applied Clay Science 49 (2010) 341–345
Author's personal copy
Barrett, E.P., Joyner, L.G., Halenda, P.P., 1951. The determination of pore volume andarea distributions in porous substances. I. Computations from nitrogen isotherms.J. Am. Chem. Soc. 73, 373–380.
Bishop, J.L., Murad, E., 2004. Characterization of minerals and biogeochemical markerson Mars: A Raman and IR spectroscopy study of montmorillonite. J. RamanSpectrosc. 35, 480–486.
Fig. 3. A typical SAED pattern of Ag-MMT. (a) Cubic silver, (b) cubic and hexagonal silver. Ag-MMT was prepared by the reduction with formaldehyde and NaHCO3.
Fig. 4. SSA values of MMT and Ag-MMT.
344 P. Praus et al. / Applied Clay Science 49 (2010) 341–345

Author's personal copy
Brunauer, S., Emmett, P.H., Teller, E., 1938. Adsorption of gases inmultimolecular layers.J. Amer. Chem. Soc. 60, 309–319.
Horváth, G., Kawazoe, K., 1983. Method for the calculation of effective pore sizedistribution in molecular sieve carbon. J. Chem. Eng. Jpn 16, 470–475.
Hutter, E., Fendler, J.H., 2004. Exploitation of Laocalized Surface Plasmon Resonance.Adv. Mater. 16, 1685–1706.
Jaynes,W.F., Boyd, S.A., 1991. Hydrophobicity of siloxane surfaces in smectites as revealedby aromatic hydrocarbon adsorption from water. Clays Clay Miner. 39, 428–436.
Kwiatkowski, K.C., Lukehart, Ch.M., 2002. NanostructuredMaterials and Technology. In:Nalwa, H.S. (Ed.), Academic Press, London.
Lee, H.H., Chou, K.S., Huang, K.Ch., 2005. Inkjet printing of nanosized silver colloids.Nanotechnology 16, 2436–2441.
Li, W., Seal, S., Megan, E., Ramsdell, J., Scammon, K., Lelong, G., Lachal, L., 2003. Physicaland optical properties of sol–gel nano-silver doped silica film on glass substrate as afunction of heat-treatment temperature. J. Appl. Phys. 93, 9553–9561.
Madejová, J., Arvaiová, B., P., Komadel, 1999. FTIR spectroscopic characterization ofthermally treated Cu2+, Cd2+, and Li+ montmorillonites. Spectrochim. Acta Part A55, 2467.
Nahal, A., Shapoori, K., 2009. Linear dichroism, produced by thermo-electric alignmentof silver nanoparticles on the surface of ion-exchanged glass. Appl. Surf. Sci. 255,7946–7950.
Patakfalvi, R., Oszkó, A., Dékány, I., 2003. Synthesis and characterization of silvernanoparticle/kaolinite composites. Colloids Surf. A 220, 45–54.
Praus, P., Turicová, M., Klementová, M., 2009. J. Brazil. Chem. Soc. 20, 1351–1357.Sawai, O., Oshima, Y., 2008. Deposition of silver nano-particles on activated carbon
using supercritical water. J. Supercrit. Fluids 47, 240–246.Sharifi, N., Taghavinia, N., 2009. Silver nano-islands on glass fibers using heat
segregation method. Mater. Chem. Phys. 113, 63–66.Shashikala, V., Kumar, V.S., Padmasri, A.H., Raju, B.D., Mohan, S.V., Sarma, P.N. Rama,
Rao, K.S., 2007. J. Mol. Catal. A 268, 95–100.Stadler, M., Schindler, P.W., 1993. Clays Clay Miner. 41, 288–296.Valášková, M., Martynková, G.S., Lešková, J., Čapková, P., Klemm, V., Rafaja, D., 2008.
Silver nanoparticles/montmorilloniet composites prepared using nitrating reagentat water and glycerol. J. Nanosci. Nanotechnol. 8, 1–9.
Fig. 5. Raman spectra of MMT and Ag-MMT.
345P. Praus et al. / Applied Clay Science 49 (2010) 341–345


