Embed Size (px)
Citation preview
Köseoğlu Yılmaz P. JOTCSA. 2019; 6(3): 271-280. RESEARCH ARTICLE
271
Optimization of Hydrophilic-Lipophilic Balance Solid-Phase Extraction
of Phthalates in Pharmaceutical Preparations
Pelin Köseoğlu Yılmaz
Department of Analytical Chemistry, Faculty of Pharmacy, Istanbul University, Istanbul, Turkey.
Abstract: Phthalates, which are used as plasticizers to soften rough polymers in the industrial processes,
possess endocrine system disrupting activities. In this study, a hydrophilic-lipophilic balance solid-phase extraction method was optimized for seven phthalates as dimethyl, dipropyl, benzyl butyl, di-n-butyl, dicyclohexyl, di-(2-ethylhexyl) and di-n-octyl phthalates in terms of the type and the volume of the
conditioning and the elution solvents. The phthalates were quantified by a validated HPLC/UV method. The
recovery values were higher than 80% for dimethyl, dipropyl, benzylbutyl, di-n-butyl and dicyclohexyl phthalates. Using optimized conditions, three types of liquid pharmaceutical preparations as an intravenous isotonic sodium chloride solution, an intravenous dextrose solution and an osmotic laxative kept in polymeric packages were analyzed with high accuracy, precision and recovery. Only the intravenous isotonic sodium chloride solution was determined to be contaminated with dipropyl phthalate at a
concentration of 13.2±0.16 μg/L.
Keywords: Hydrophilic-lipophilic balance, high performance liquid chromatography, pharmaceutical, phthalate, solid-phase extraction. Submitted: February 12, 2019. Accepted: May 22, 2019.
Cite this: Köseoğlu Yılmaz P. Optimization of Hydrophilic-Lipophilic Balance Solid-Phase Extraction of Phthalates in Pharmaceutical Preparations. JOTCSA. 2019;6(3):271–80.
DOI: https://doi.org/10.18596/jotcsa.526124. Corresponding author: E-mail: [email protected]. Phone: +902124400000-13504.
INTRODUCTION Phthalates are a class of dialkyl or alkyl aryl esters of 1,2-benzenedicarboxylic acid. They are suspected endocrine-disrupting compounds widely used to increase the flexibility of plastics
or in common household products, cosmetics, detergents, flame retardants, plastics, inks, adhesives, metal food can liners, and medical devices (1). Since phthalates are not chemically bounded to polymer matrices, they can easily migrate to foods, beverages, cosmetics, and pharmaceuticals kept in polymeric packages (2).
Some of the phthalates are thought to disrupt the endocrine system by competing with 17β-estradiol for binding to the estrogen receptors (3). Also, toxicological studies have revealed that the lower molecular weight phthalates were
irritating to eyes, nose, throat, and larger molecular weight phthalates were suspected carcinogens (1).
Considering the negative impacts of phthalates on human health, it became more of an issue to develop reliable extraction and analysis methods. Because of the low concentration levels and complex sample matrices, direct use of the analytical methods is usually limited by their
sensitivity and/or selectivity. Generally, a pre-concentration/clean-up step is necessary prior to analysis. In this purpose, solid-phase extraction (SPE) is one of the mostly used methods in determination of phthalates (4). Different types of SPE sorbents such as PLRP-S (5), C18 (6), polymeric anion exchanger (7), florisil (8), carbon
nanotubes (9), magnetic carbon nanotubes (10), magnetic graphene (11, 12) and molecularly imprinted polymers (13) have been used for the extraction of phthalates from various matrices. In a study, hydrophilic-lipophilic balance (HLB) sorbent, which is a hydrophilic modified polymeric
reversed-phase material, was used to investigate the potential migration of plasticizers, plastic components and additives from several plastic water bottles (14). Since HLB is water-wettable, it possesses high retention capability even if the
Köseoğlu Yılmaz P. JOTCSA. 2019; 6(3): 271-280. RESEARCH ARTICLE
272
sorbent runs dry. Also HLB contains both nonpolar
and polar functional groups, that provides retention of a wide range of analytes from
aqueous samples (4). One of the reasons of the exposure to phthalates for human is the contaminated pharmaceutical
preparations kept in polymeric packages. There are several studies on migration and/or determination of pharmaceutical packaging materials in the literature (15, 16). In the present study, it was aimed to determine the phthalate content of liquid pharmaceutical preparation samples in polymeric packages by an offline SPE-
HPLC/UV method. A SPE procedure was optimized for the extraction of seven phthalates as dimethyl (DMP), dipropyl (DPP), benzyl butyl (BBP), di-n-butyl (DBP), dicyclohexyl (DCHP), di-(2-ethylhexyl) (DEHP) and di-n-octyl (DOP) phthalates using HLB cartridges. The analytes
were detected by a simultaneous HPLC-UV
method. Finally, the developed SPE-HPLC/UV method was applied to 3 different types of liquid pharmaceutical preparations as an intravenous isotonic NaCl solution, an intravenous dextrose solution, and an osmotic laxative preparation kept in polymeric packages.
MATERIALS AND METHODS Materials and chemicals The analytical standards of DMP, DPP, DBP, BBP, DCHP, DEHP, DOP and formic acid (FA) were purchased from Sigma (Darmstadt, Germany).
The stock solution that contained each of the analyzed phthalates at a concentration of 10 mg/L was prepared with HPLC-grade methanol. The standard solutions in the range of 0.05–2.50
mg/L were prepared by diluting the stock solution to appropriate volumes with the mobile phase. Supel™-Select HLB SPE cartridges (200 mg/6
mL) were purchased from Sigma-Aldrich (Düren, Germany). Methanol (MeOH) (HPLC-grade), acetonitrile (ACN) (HPLC-grade), o-phosphoric acid (OPA) and potassium dihydrogen phosphate (KH2PO4) were purchased from Merck (Darmstadt, Germany). The phosphate buffer
was prepared with 0.78 g KH2PO4 and 340 μL of OPA in 1 L of ultra pure water. All of the glassware used was rinsed with n-hexane and dried at 90°C to avoid any contamination of phthalates. Also a blank analysis was carried out to check the purity of the chemicals and SPE cartridge used.
Pharmaceutical preparation samples
Intravenous isotonic NaCl solution, intravenous dextrose solution, and osmotic laxative preparation in polymeric packages were purchased from a local drugstore in Istanbul (Turkey) in 2017.
Instruments and analytical conditions The quantitative analysis of the phthalates was accomplished with a Shimadzu (Shimadzu, Kyoto, Japan) LC20A HPLC system with UV detection. Analytes were separated on a GL Sciences (GL
Sciences, Tokyo, Japan) Intersil ODS-3 column
(C18, 250×4.6 mm, i.d. 5.0 μm) and quantified by a slightly modified HPLC-UV method, which
was developed and validated in a former study (2). A gradient program with a mobile phase system consisting of 0.2 M KH2PO4 buffer (pH 2.6) and MeOH/ACN (50:50, v/v) was established for
the elution. The flow rate was 1 mL/min and the injection volume was set to 20 μL. The column temperature was adjusted to 40°C. The analyte peaks were detected at 230 nm. All of the analyses were performed in triplicate. The data obtained were analyzed by the LabSolutions software (version 1.25).
Quantification of phthalates Phthalates were identified by comparing their retention times with those of the ones in the samples and with the increase of the peak areas after spiking. Data obtained using different
wavelengths were compared. The quantification
was performed by the external standard method. The calibration curves were prepared in the concentration range of 0.05–2.50 mg/L with six replicates. The linear regression model of least-squares was used for the calibration and analysis of the results (LabSolutions, Version 1.25).
Optimization of the SPE method At first, the SPE optimization studies were performed with a standard solution containing each of the phthalates at a concentration of 0.10 mg/L. The volume and the type of the conditioning and the elution solvents were
optimized to obtain the highest recovery values. Several conditioning solvents (A: MeOH, water; B: MeOH; C: MeOH, 1% o-phosphoric acid solution; D: MeOH at pH 3.0 by o-phosphoric
acid, water; E: MeOH at pH 3.6 by phosphate buffer) were examined to get the best retention. Three different types of elution solvents
(MeOH/ACN, 50:50 v/v; ACN; ACN with 1% FA) were compared in terms of elution efficiency. The volumes of the conditioning and the elution solvents were selected following the trials performed with 3, 6 and 12 mL of each. Later, phthalates were extracted from the original and
spiked (at 0.10 mg/L) liquid pharmaceutical preparation samples using the optimized SPE procedure. The standard solutions, original and spiked samples were extracted in triplicate to check the repeatability of the method. The precision of the method was determined as the percent relative standard deviation (RSD%) of
the three replicate extractions. The recoveries
from the standard solutions were calculated using the HPLC analysis data and the real concentration of the solutions. The recovery from the pharmaceutical preparation samples were determined by the data of the original and the spiked samples.
RESULTS AND DISCUSSION In the present study, Supel™-Select HLB cartridges, which were composed of hydrophilic
Köseoğlu Yılmaz P. JOTCSA. 2019; 6(3): 271-280. RESEARCH ARTICLE
273
modified styrene polymer, were used for the
extraction of phthalates. One of the advantages of HLB sorbents for the extraction of analytes with
aromatic rings is their selectivity to these compounds by π–π interactions. In addition, HLB sorbents possess both nonpolar and polar functional groups, providing the extraction of a
wide range of polar to nonpolar and acidic to basic compounds from aqueous samples. Considering these advantages, an HLB SPE method was developed and applied for the extraction of DMP,
DPP, BBP, DBP, DCHP, DEHP and DOP (Figure 1)
from liquid pharmaceutical preparations kept in polymeric packages. The volume and type of the
conditioning and the elution solvents were optimized to obtain the highest recovery values. Phthalates were quantified by a slightly modified HPLC-UV method, which was developed and
validated by Yilmaz et al. (2). The analytical performance of the present HPLC-UV method was given in Table 1.
Figure 1. Chemical structures of the analyzed phthalates.
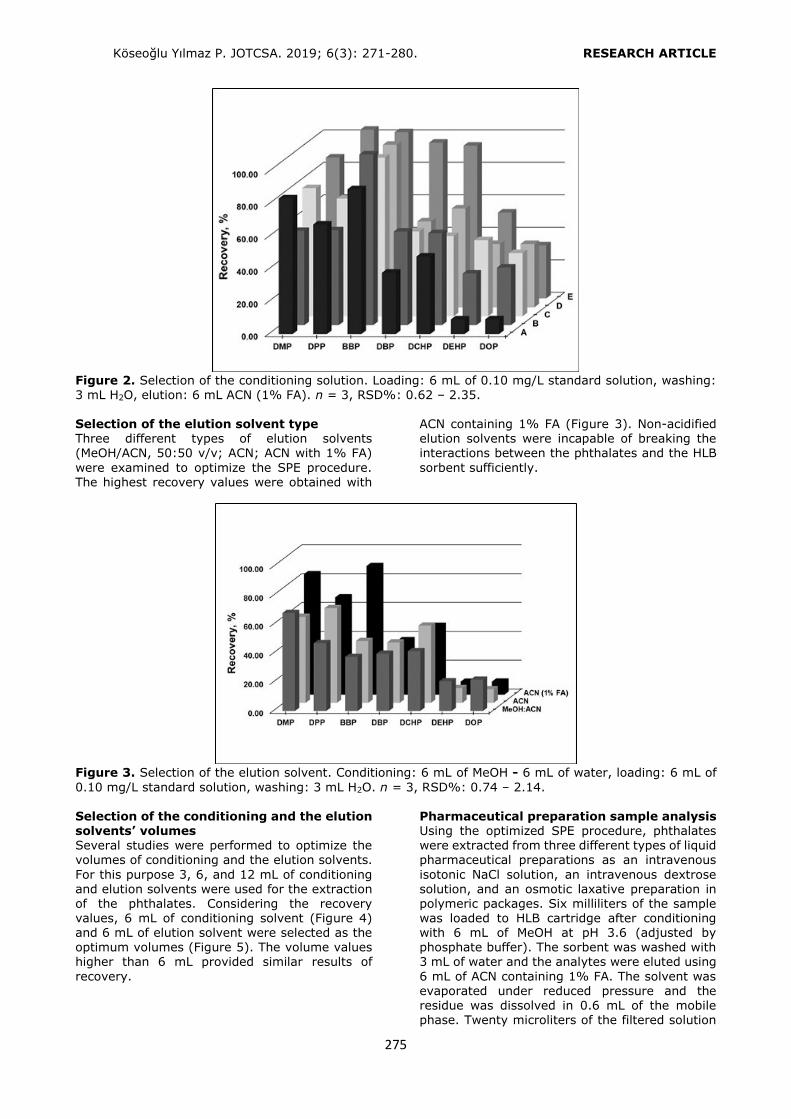
Selection of the conditioning solvent type The general conditioning procedure for an HLB cartridge includes conditioning with an organic
solvent like methanol (MeOH) or acetonitrile (ACN) followed by water or a buffer solution for aqueous samples. In the present study, several conditioning solvent types (A: MeOH, water; B: MeOH; C: MeOH, 1% o-phosphoric acid solution; D: MeOH at pH 3.0 by o-
phosphoric acid, water; E: MeOH at pH 3.6 by phosphate buffer) were examined to get the
best retention from a standard solution containing each of the phthalates at a
concentration of 0.10 mg L-1 (Figure 2). Recovery values higher than 80.00% were obtained by using conditioning solvent E. Only
DEHP and DOP had lower retention (recoveries 52.88% and 32.62%, respectively) since the polarities of these analytes were significantly lower than the others. After conditioning, 6 mL of the standard solution was loaded. The cartridge was washed with 3 mL of water to
avoid the water soluble interferences. Then the analytes were eluted with 6 mL of ACN
containing 1% FA.
Köseoğlu Yılmaz P. JOTCSA. 2019; 6(3): 271-280. RESEARCH ARTICLE
274
Table 1. Analytical performance of the HPLC/UV method (n = 6).
Analyte tR (min) Calibration range (mg/L)
Linear equation R2 LOD (mg/L)
LOQ (mg/L)
Tailing factor Resolution
DMP 4.285±0.018 0.05-2.50 y=1016567x+7258.6 0.9999 0.01 0.02 1.167±0.035 - DPP 6.589±0.035 0.05-2.50 y=504397x+4266.2 0.9999 0.01 0.02 1.145±0.049 12.018±0.162
BBP 7.589±0.095 0.05-2.50 y=632886x+4272.5 0.9999 0.01 0.02 1.137±0.085 5.704±0.055 DBP 7.897±0.033 0.05-2.50 y=290853x+3066.5 0.9999 0.01 0.03 1.141±0.063 2.057±0.063 DHCP 9.659±0.021 0.05-2.50 y=250847x+2352.1 0.9999 0.01 0.02 1.118±0.055 9.481±0.085 DEHP 13.581±0.045 0.05-2.50 y=2562203x+546.5 0.9999 0.01 0.02 1.102±0.065 17.764±0.046 DOP 14.415±0.019 0.05-2.50 y=241992x-2914.6 0.9977 0.09 0.27 1.110±0.078 2.941±0.084
Köseoğlu Yılmaz P. JOTCSA. 2019; 6(3): 271-280. RESEARCH ARTICLE
275
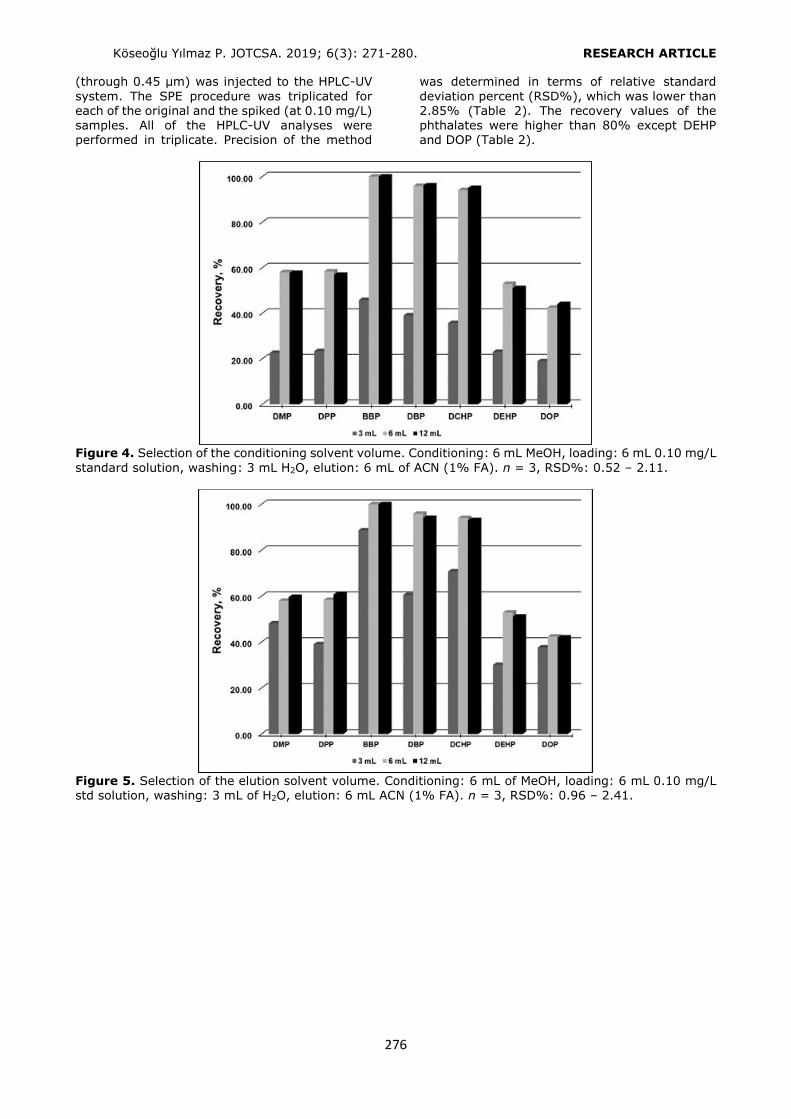
Figure 2. Selection of the conditioning solution. Loading: 6 mL of 0.10 mg/L standard solution, washing: 3 mL H2O, elution: 6 mL ACN (1% FA). n = 3, RSD%: 0.62 – 2.35. Selection of the elution solvent type Three different types of elution solvents (MeOH/ACN, 50:50 v/v; ACN; ACN with 1% FA)
were examined to optimize the SPE procedure. The highest recovery values were obtained with
ACN containing 1% FA (Figure 3). Non-acidified elution solvents were incapable of breaking the interactions between the phthalates and the HLB
sorbent sufficiently.
Figure 3. Selection of the elution solvent. Conditioning: 6 mL of MeOH - 6 mL of water, loading: 6 mL of
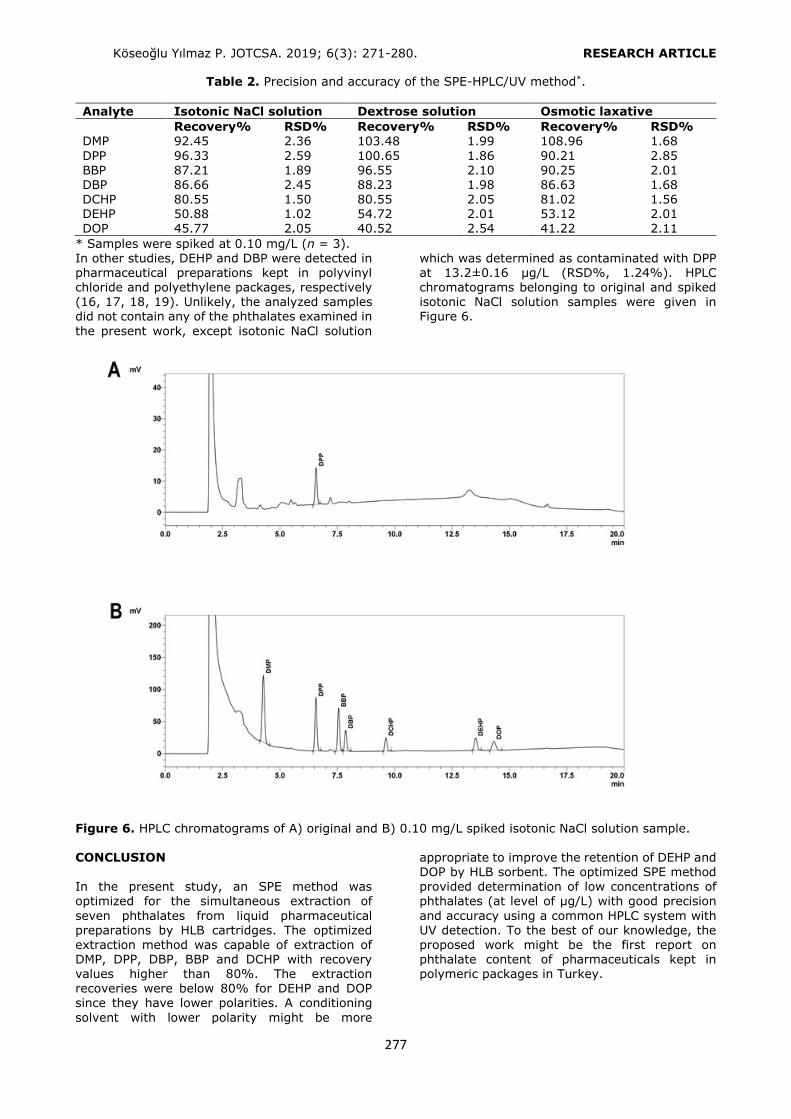
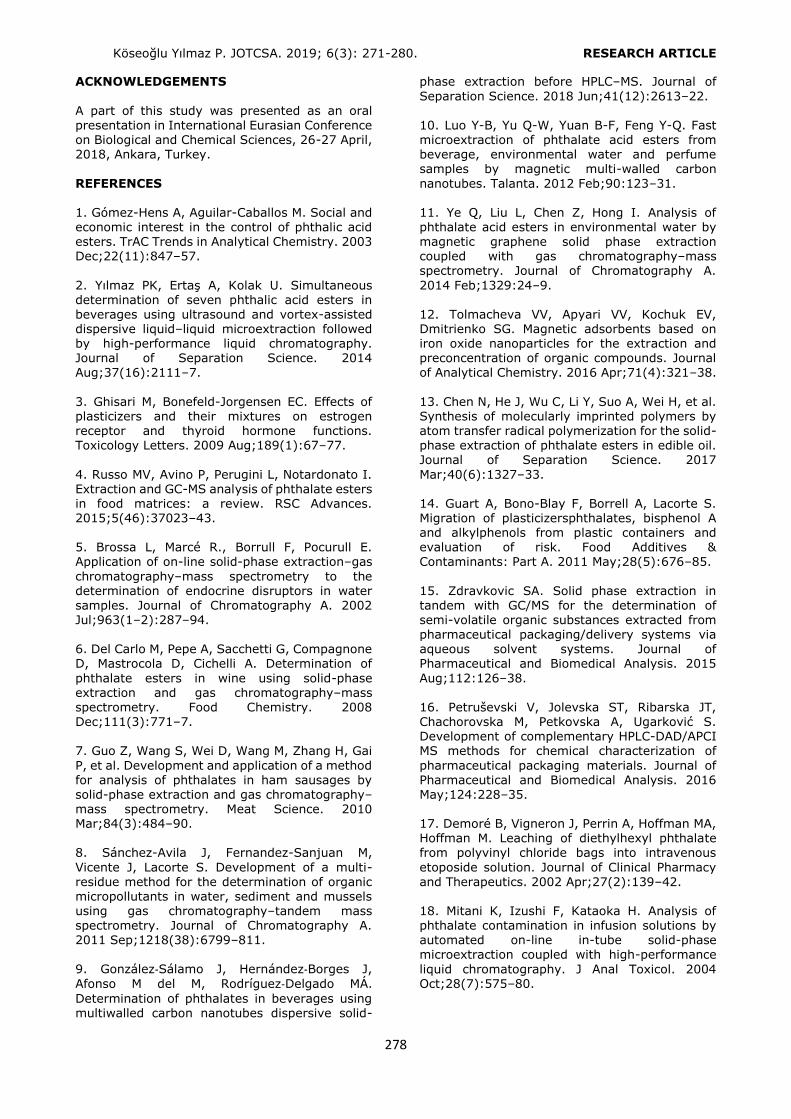
0.10 mg/L standard solution, washing: 3 mL H2O. n = 3, RSD%: 0.74 – 2.14. Selection of the conditioning and the elution solvents’ volumes Several studies were performed to optimize the volumes of conditioning and the elution solvents.
For this purpose 3, 6, and 12 mL of conditioning and elution solvents were used for the extraction of the phthalates. Considering the recovery values, 6 mL of conditioning solvent (Figure 4) and 6 mL of elution solvent were selected as the optimum volumes (Figure 5). The volume values higher than 6 mL provided similar results of
recovery.
Pharmaceutical preparation sample analysis Using the optimized SPE procedure, phthalates were extracted from three different types of liquid pharmaceutical preparations as an intravenous
isotonic NaCl solution, an intravenous dextrose solution, and an osmotic laxative preparation in polymeric packages. Six milliliters of the sample was loaded to HLB cartridge after conditioning with 6 mL of MeOH at pH 3.6 (adjusted by phosphate buffer). The sorbent was washed with 3 mL of water and the analytes were eluted using
6 mL of ACN containing 1% FA. The solvent was evaporated under reduced pressure and the residue was dissolved in 0.6 mL of the mobile phase. Twenty microliters of the filtered solution
Köseoğlu Yılmaz P. JOTCSA. 2019; 6(3): 271-280. RESEARCH ARTICLE
276
(through 0.45 μm) was injected to the HPLC-UV
system. The SPE procedure was triplicated for each of the original and the spiked (at 0.10 mg/L)
samples. All of the HPLC-UV analyses were performed in triplicate. Precision of the method
was determined in terms of relative standard
deviation percent (RSD%), which was lower than 2.85% (Table 2). The recovery values of the
phthalates were higher than 80% except DEHP and DOP (Table 2).
Figure 4. Selection of the conditioning solvent volume. Conditioning: 6 mL MeOH, loading: 6 mL 0.10 mg/L
standard solution, washing: 3 mL H2O, elution: 6 mL of ACN (1% FA). n = 3, RSD%: 0.52 – 2.11.
Figure 5. Selection of the elution solvent volume. Conditioning: 6 mL of MeOH, loading: 6 mL 0.10 mg/L std solution, washing: 3 mL of H2O, elution: 6 mL ACN (1% FA). n = 3, RSD%: 0.96 – 2.41.
Köseoğlu Yılmaz P. JOTCSA. 2019; 6(3): 271-280. RESEARCH ARTICLE
277
Table 2. Precision and accuracy of the SPE-HPLC/UV method*.
Analyte Isotonic NaCl solution Dextrose solution Osmotic laxative Recovery% RSD% Recovery% RSD% Recovery% RSD%
DMP 92.45 2.36 103.48 1.99 108.96 1.68
DPP 96.33 2.59 100.65 1.86 90.21 2.85 BBP 87.21 1.89 96.55 2.10 90.25 2.01 DBP 86.66 2.45 88.23 1.98 86.63 1.68 DCHP 80.55 1.50 80.55 2.05 81.02 1.56 DEHP 50.88 1.02 54.72 2.01 53.12 2.01 DOP 45.77 2.05 40.52 2.54 41.22 2.11
* Samples were spiked at 0.10 mg/L (n = 3). In other studies, DEHP and DBP were detected in pharmaceutical preparations kept in polyvinyl chloride and polyethylene packages, respectively (16, 17, 18, 19). Unlikely, the analyzed samples did not contain any of the phthalates examined in
the present work, except isotonic NaCl solution
which was determined as contaminated with DPP at 13.2±0.16 μg/L (RSD%, 1.24%). HPLC chromatograms belonging to original and spiked isotonic NaCl solution samples were given in Figure 6.
Figure 6. HPLC chromatograms of A) original and B) 0.10 mg/L spiked isotonic NaCl solution sample. CONCLUSION
In the present study, an SPE method was optimized for the simultaneous extraction of
seven phthalates from liquid pharmaceutical preparations by HLB cartridges. The optimized extraction method was capable of extraction of DMP, DPP, DBP, BBP and DCHP with recovery values higher than 80%. The extraction recoveries were below 80% for DEHP and DOP since they have lower polarities. A conditioning
solvent with lower polarity might be more
appropriate to improve the retention of DEHP and DOP by HLB sorbent. The optimized SPE method
provided determination of low concentrations of phthalates (at level of μg/L) with good precision
and accuracy using a common HPLC system with UV detection. To the best of our knowledge, the proposed work might be the first report on phthalate content of pharmaceuticals kept in polymeric packages in Turkey.
Köseoğlu Yılmaz P. JOTCSA. 2019; 6(3): 271-280. RESEARCH ARTICLE
278
ACKNOWLEDGEMENTS
A part of this study was presented as an oral
presentation in International Eurasian Conference on Biological and Chemical Sciences, 26-27 April, 2018, Ankara, Turkey.
REFERENCES 1. Gómez-Hens A, Aguilar-Caballos M. Social and economic interest in the control of phthalic acid esters. TrAC Trends in Analytical Chemistry. 2003 Dec;22(11):847–57.
2. Yılmaz PK, Ertaş A, Kolak U. Simultaneous determination of seven phthalic acid esters in beverages using ultrasound and vortex-assisted dispersive liquid–liquid microextraction followed by high-performance liquid chromatography. Journal of Separation Science. 2014
Aug;37(16):2111–7.
3. Ghisari M, Bonefeld-Jorgensen EC. Effects of plasticizers and their mixtures on estrogen receptor and thyroid hormone functions. Toxicology Letters. 2009 Aug;189(1):67–77.
4. Russo MV, Avino P, Perugini L, Notardonato I. Extraction and GC-MS analysis of phthalate esters in food matrices: a review. RSC Advances. 2015;5(46):37023–43. 5. Brossa L, Marcé R., Borrull F, Pocurull E. Application of on-line solid-phase extraction–gas
chromatography–mass spectrometry to the determination of endocrine disruptors in water samples. Journal of Chromatography A. 2002 Jul;963(1–2):287–94.
6. Del Carlo M, Pepe A, Sacchetti G, Compagnone D, Mastrocola D, Cichelli A. Determination of
phthalate esters in wine using solid-phase extraction and gas chromatography–mass spectrometry. Food Chemistry. 2008 Dec;111(3):771–7. 7. Guo Z, Wang S, Wei D, Wang M, Zhang H, Gai
P, et al. Development and application of a method for analysis of phthalates in ham sausages by solid-phase extraction and gas chromatography–mass spectrometry. Meat Science. 2010 Mar;84(3):484–90. 8. Sánchez-Avila J, Fernandez-Sanjuan M,
Vicente J, Lacorte S. Development of a multi-
residue method for the determination of organic micropollutants in water, sediment and mussels using gas chromatography–tandem mass spectrometry. Journal of Chromatography A. 2011 Sep;1218(38):6799–811. 9. González‐Sálamo J, Hernández‐Borges J,
Afonso M del M, Rodríguez‐Delgado MÁ.
Determination of phthalates in beverages using multiwalled carbon nanotubes dispersive solid-
phase extraction before HPLC–MS. Journal of
Separation Science. 2018 Jun;41(12):2613–22.
10. Luo Y-B, Yu Q-W, Yuan B-F, Feng Y-Q. Fast microextraction of phthalate acid esters from beverage, environmental water and perfume samples by magnetic multi-walled carbon
nanotubes. Talanta. 2012 Feb;90:123–31. 11. Ye Q, Liu L, Chen Z, Hong I. Analysis of phthalate acid esters in environmental water by magnetic graphene solid phase extraction coupled with gas chromatography–mass spectrometry. Journal of Chromatography A.
2014 Feb;1329:24–9. 12. Tolmacheva VV, Apyari VV, Kochuk EV, Dmitrienko SG. Magnetic adsorbents based on iron oxide nanoparticles for the extraction and preconcentration of organic compounds. Journal
of Analytical Chemistry. 2016 Apr;71(4):321–38.
13. Chen N, He J, Wu C, Li Y, Suo A, Wei H, et al. Synthesis of molecularly imprinted polymers by atom transfer radical polymerization for the solid-phase extraction of phthalate esters in edible oil. Journal of Separation Science. 2017
Mar;40(6):1327–33. 14. Guart A, Bono-Blay F, Borrell A, Lacorte S. Migration of plasticizersphthalates, bisphenol A and alkylphenols from plastic containers and evaluation of risk. Food Additives & Contaminants: Part A. 2011 May;28(5):676–85.
15. Zdravkovic SA. Solid phase extraction in tandem with GC/MS for the determination of semi-volatile organic substances extracted from
pharmaceutical packaging/delivery systems via aqueous solvent systems. Journal of Pharmaceutical and Biomedical Analysis. 2015
Aug;112:126–38. 16. Petruševski V, Jolevska ST, Ribarska JT, Chachorovska M, Petkovska A, Ugarković S. Development of complementary HPLC-DAD/APCI MS methods for chemical characterization of
pharmaceutical packaging materials. Journal of Pharmaceutical and Biomedical Analysis. 2016 May;124:228–35. 17. Demoré B, Vigneron J, Perrin A, Hoffman MA, Hoffman M. Leaching of diethylhexyl phthalate from polyvinyl chloride bags into intravenous
etoposide solution. Journal of Clinical Pharmacy
and Therapeutics. 2002 Apr;27(2):139–42. 18. Mitani K, Izushi F, Kataoka H. Analysis of phthalate contamination in infusion solutions by automated on-line in-tube solid-phase microextraction coupled with high-performance
liquid chromatography. J Anal Toxicol. 2004 Oct;28(7):575–80.

Köseoğlu Yılmaz P. JOTCSA. 2019; 6(3): 271-280. RESEARCH ARTICLE
279
19. Chaudhary AK, Waske SA, Yadav S, Chandrashekhar TG, Singh V. Validated reverse
phase HPLC method for the determination of
DEHP content in reconstituting diluents and in
reconstituted solutions of imipenem and cilastatin for injection. E-Journal of Chemistry.
2010;7(2):501-13.

Köseoğlu Yılmaz P. JOTCSA. 2019; 6(3): 271-280. RESEARCH ARTICLE
280
Goger F et al. JOTCSA. 2019; 6(3): 281-292. RESEARCH ARTICLE
281
Phytochemical Profiling and Evaluation of Marrubium sivasense Aytaç, Akgül & Ekici for Antioxidant Activity and Inhibition Effects
on α-Amylase, Lipoxygenase, Xanthine Oxidase and Tyrosinase Enzymes
Fatih Göger1,2,* , Gülmira Özek1, , Mehmet Tekin4, ,
Süleyman Yur1,2, , Temel Özek1,2,
1Anadolu University, Faculty of Pharmacy, Department of Pharmacognosy, 26470, Eskişehir, Turkey.
2Anadolu University, Medicinal Plant, Drug and Scientific Research Center (AUBIBAM), 26470,
Eskisehir, Turkey.
3Anadolu University, Yunus Emre Vocational School, Department of Pharmacy, Program in Pharmacy
Services, 26470, Eskişehir Turkey.
4Trakya University, Faculty of Pharmacy, Department of Pharmaceutical Botany, 58140 Edirne,
Turkey.
Abstract: In the present study, the extract of an endemic plant ourkey Marrubium sivasense Aytaç,
Akgül & Ekici was investigated for phytochemical profile, antioxidant properties and inhibition of
several enzymes. The chemical composition of the extract was investigated with LC-MS/MS
technique. Forsythoside B, verbascoside and leucoseptoside were identified as the main compounds.
The free radical scavenging activity of the extract was determined against DPPH• radicals (IC50 0.34
mg/mL) and ABTS•+ cation radicals (TEAC 2.3 mM). In the xanthine-xanthine oxidase (XO) system
and in β-carotene bleaching assay the extract demonstrated moderate activity (Inh% 16.54 and
Inh% 43±1.26, respectively). The extract demonstrated hypoglycemic activity (Inh% 49.67±1.09)
via inhibition of porcine pancreatic α-amylase. The antiinflammatory effect tested via inhibition of 5-
LOX was found as Inh% 18.71±0.74. However, no antityrosinase activity was found.
Keywords: Marrubium sivasense, extract, LC-MS/MS; antioxidant, xanthine oxidase, α-amylase,
tyrosinase.
Submitted: January 23, 2019. Accepted: May 29, 2019.
Cite this: Göger F, Özek G, Tekin M, Yur S, Özek T. Phytochemical Profiling and Evaluation of
Marrubium sivasense Aytaç, Akgül & Ekici for Antioxidant Activity and Inhibition Effects on α-
Amylase, Lipoxygenase, Xanthine Oxidase and Tyrosinase Enzymes. JOTCSA. 2009;6(3):272–82.
DOI: https://doi.org/10.18596/jotcsa.516888.
*Corresponding author. E-mail: [email protected], Tel: +90-2223350580 Extn.:3663-3707,
Fax: +90-2223306809
Goger F et al. JOTCSA. 2019; 6(3): 281-292. RESEARCH ARTICLE
282
INTRODUCTION
The genus Marrubium L. (Lamiaceae) consists
of 40 species indigenous in Europe, the
Mediterranean and Asia. In the Flora of
Turkey, the genus is represented by 21 taxa,
of which 12 are endemic (1-3). The endemism
rate (57%) shows that Turkey is an important
center of diversity for the genus (4, 5). Several
aspects on chemical and pharmacological
potent of the genus Marrubium were reported
by Meyre-Silva et al (6). A previous
phytochemical studies on Marrubium species
resulted with polyphenols (7), essential oils
(8), labdane diterpenoids and sterols (9, 10).
Biological activity investigations of Marrubium
species encompasses antibacterial (11),
antioxidant, antiproliferative (12),
antinociceptive (13), antidiabetic (14),
antihypertensive (15), hepatoprotective (16),
antiinflammatory (17), cardioprotective (18)
and cytotoxic/cytostatic (19) potentials. Some
Marrubium species are traditionally used to
treat various diseases, including asthma,
pulmonary infections, inflammation and
hypotension, as cholagogues and sedative
agents, and for pain relief. M. vulgare
(horehound) is cultivated in Lithuania (20) and
serves as raw material and source for food
flavoring and for medicinal purposes (herbal
extracts) and beverage industries (21). The
plant has also been used as a substitute for
hop in beer-breweries and as an ingredient of
pastilles, as a flavoring in stick candy, and
candy drops (22, 23). In Turkey, Marrubium
species are known as “Agor çalbasi” (in Sivas
province), “şalba” (in Antalya province) and
“kayişkiran otu” (in Kirklareli province) (24).
Marrubium sivasense Aytaç, Akgül & Ekici is
the local endemic species in Sivas province of
Turkey (1). The local name of this plant is
“kukasotu”. Taking into consideration the
previous literature data on the chemistry and
biological activities of Marrubium species as
well as lacking information about M.
sivasense, we aimed to investigate chemical
composition and biological potential of this
species. Therefore, the extract of M. sivasense
was screened for antioxidant activity using
different in vitro methods like 2,2-diphenyl-1-
picrylhydrazyl (DPPH˙) radical scavenging
test, Trolox equivalent antioxidant capacity
test and β-carotene bleaching test. The
antioxidant effect of extract on oxidative
damage was also evaluated with enzymatic
method using XO system that generated
superoxide anion radical (O2-). The test
samples which interact with XO can affect the
kinetics of xanthine oxidation to uric acid
which causes hyperuricacidemia associated
with gout (25). XO has a role in the generation
of reactive oxygen species in various
pathologies such as viral infection,
inflammation, brain tumors or the process of
ischemia/reperfusion. Thus, inhibitors of XO
are expected to be therapeutically useful for
the treatment or prophylaxis of these
diseases. Earlier, it has been supposed that
the essential oil of M. peregrinum L. may
contain compounds that would be more
effective in the treatment of gout from the
widely used allopurinol because of they can
inhibit XO as well as neutralize O2-• (26). In
literature there is no any information about
effect of Marrubium sivasense on XO enzyme.
Therefore, it was aimed to investigate
inhibitory effect of M. sivasense extract on XO
enzyme.
In the literature there is information about
antiinflammatory properties of M. vulgare and
M. allyson (27, 28). The phenylpropanoid
glycosides from M. vulgare have been reported
as the strong inhibitors of enzymes associated
with inflammation. Therefore, it was
interesting to investigate the extract of M.
sivasense against 5-lipoxygenase (5-LOX)
enzyme, which linked to inflammation
process.
Recently, the perspectives of M. vulgare as
antidiabetic natural product have been
discussed in several papers (14, 29, 30). The
investigation of M. sivasense inhibitory activity
against pancreatic α-amylase, which is known
as key enzyme in digestion of dietary
carbohydrate in organism, may give
information on antihyperglycemic potential of
the plant. The inhibitors of -amylase enzyme
may be effective in retarding carbohydrate
digestion and glucose absorption to suppress
postprandial hyperglycemia.
A literature search revealed information about
tyrosinase inhibition potent of flavonoids and
phenylethanoid glycosides isolated from M.
velutinum and M. cylleneum. (7). In the scope
of the present work, we attempted to
investigate in vitro potential of M. sivasense
against tyrosinase enzyme which is the key
Goger F et al. JOTCSA. 2019; 6(3): 281-292. RESEARCH ARTICLE
283
enzyme in production of melanin (31). The
central role of tyrosinase in dopamine
neurotoxicity as well as contribution to the
neurodegenerative Parkinson’s disease has
earlier been well documented (32). The
inhibitors of tyrosinase found application in
cosmetic products for whitening and
depigmentation after sunburn as well as for
the treatment of hyperpigmentation.
Nowadays, there is increasing demand for
naturally derived inhibitors of tyrosinase due
to diverse side effects of synthetic products.
The tyrosinase inhibitory activity of M.
velutinum and M. cylleneum was reported to
be due to flavonoid and phenylethanoid
glycosides (7). It was supposed, that
flavonoids and cinnamic acid derivatives may
contribute to antityrosinase activity of M.
vulgare extract (33). The above mentioned
reports encouraged us to investigate M.
sivasense for antityrosinase activity. The
present research work is the first contribution
into the chemistry and biological activities of
M. sivasense, endemic species from Turkey.
MATERIALS AND METHODS
Chemicals and Enzymes
3,4-Dihydroxyl-L-phenilalanine, β-carotene,
linoleic acid, Tween-20, butylated
hydroxytoluene (BHT), gallic acid, (±)-6-
hydroxy-2,5,7,8-tetramethylchromane-2-
carboxylic acid (Trolox), 2,2-diphenyl-1-
picrylhydrazyl (DPPH˙), amonium acetate,
kojic acid, acarbose, 3,4-dihydroxy-L-
phenylalanine (L-DOPA), nordihydroguaiaretic
acid (NDGA), allopurinol, α-amylase from
porcine pancreas (Type VI-B, EC 3.2.1.1),
tyrosinase from mushroom (EC 1.14.18.1),
xanthine oxidase from bovine milk (Grade IV)
and lipoxidase from Glycine max (Type I-B)
were purchased from Sigma-Aldrich (St. Louis,
MO, USA). Soluble starch extra pure, iodine
and potassium iodide were purchased from
Merck (Darmstadt, Germany). Sodium
phosphate, disodium phosphate, aluminum
chloride, water and methanol were extra pure
analytical grade. A C9–C40 n-alkane standard
solution was purchased from Fluka (Buchs,
Switzerland). All solvents were purchased
from Sigma Aldrich (Germany) and were of
analytical grade.
Equipment
Shimadzu 20A HPLC system equipped with
Applied Biosystem 3200 Q trap MS/MS
detector was used for chromatographic
analysis of the extract. Microtiter plate assay
was performed with Biotek Powerwave XS
microplate reader. Ultrapure water was
obtained from a Direct-Q Water Purification
System (Germany). Spectrophotometric
measurements were carried out with a UV-
Pharma Spec 1700 (Shimadzu)
spectrophotometer.
Plant Material
The aerial parts of M. sivasense were collected
in Sivas province, vicinity of Mancilik village of
Kangal district, on June, 2015 and dried under
the shade. Botanical identification was
performed by Dr. Mehmet Tekin (Trakya
University, Faculty of Pharmacy, Department
of Pharmaceutical Botany). The voucher
specimen is stored in the Herbarium of
Cumhuriyet University, Faculty of Science
(CUFH) under herbarium code Tekin 1686.
Preparation of the Extract
Aerial parts of M. sivasense (10.0 g) were
powdered and subjected to maceration in
methanol (200 mL) by shaking (3000 per min)
at room temperature for 24 h. The obtained
liquid extract was filtered and dried under
vacuum. The dried methanol extract was kept
at 4°C until phytochemical analysis and
biological activity tests.
Liquid-Chromatography - Mass
Spectrometry (MS/MS)
LC-MS/MS analysis was carried out using an
Absciex 3200 Q trap MS/MS detector. The
experiments were performed with a Shimadzu
20A HPLC system coupled to an Applied
Biosystems 3200 Q-Trap LC-MS/MS
instrument equipped with an ESI source
operating in negative ion mode. For the
chromatographic separation, a GL Science
Intersil ODS 250 × 4.6 mm, i.d., 5 µm particle
size, analytical column operating at 40ºC was
used. The solvent flow rate was maintained at
0.5 mL/min. The detection was carried out
with PDA and MS detectors. The elution
gradient consisted of mobile phases (A)
acetonitrile : water : formic acid (10:89:1,
Goger F et al. JOTCSA. 2019; 6(3): 281-292. RESEARCH ARTICLE
284
v/v/v) and (B) acetonitrile : water : formic acid
(89:10:1, v/v/v). The composition of B was
increased from 10% to 100% in 40 min. LC-
ESI-MS/MS data were collected and processed
by Analyst 1.6 software.
Identification of Compounds
Identification of phenolic constituents was
based on matching of mass-spectral patterns
obtained with LC-MS/MS system.
Free Radical Scavenging Activity (DPPH˙
assay)
The hydrogen atoms or electrons donation
ability of M. sivasense extract was evaluated
according to bleaching of purple colored
DPPH° stable radicals by using of the method
of Brand-Williams (34) with slight
modifications. The solution of DPPH° (0.08
mg/mL, in methanol) was freshly prepared
daily, kept in the dark at 4 oC between the
measurements. The solutions of the extract
(10 mg/mL) and gallic acid (0.1 mg/mL) were
prepared in methanol. In the experiment, 100
µL of the sample (extract/ standard) solution
and 100 µL of DPPH solution were pipetted by
multichannel automatic pipette (Eppendorf
Research® plus, Germany) into 96-flat bottom
well plate cells and allowed to stand in the dark
for 30 min. The control well contained 100 µL
methanol (instead of the sample) mixed with
100 µL of DPPH. The decrease in the
absorbance was recorded at 517 nm. Gallic
acid (standard) was used as the positive
control. The experiments were performed in
triplicate. The free radical scavenging activity
of the samples was expressed as percentage
of inhibition calculated according to Equation
1:
Inh%=(𝐴𝑏𝑠𝑐𝑜𝑛𝑡𝑟𝑜𝑙−𝐴𝑏𝑠𝑠𝑎𝑚𝑝𝑙𝑒
𝐴𝑏𝑠𝑐𝑜𝑛𝑡𝑟𝑜𝑙) × 100 (Eq. 1)
where, Abscontrol is the absorbance of the
control (containing all reagents except the test
compound), Abssample is the absorbance of
the sample with added DPPH reagent. The
IC50 values were obtained by plotting the
DPPH˙ scavenging percentage of each sample
against the sample concentration. Data were
analyzed using the SigmaPlot software
(Version 12.0).
Trolox Equivalent Antioxidant Capacity
(TEAC Assay)
The free radical scavenging activity of the
extract was tested against 2,2'-azino-bis(3-
ethylbenzothiazoline-6-sulfonic acid)
(ABTS•+) cation radicals according to the
procedure described by Re et al. (35) with
slight modifications. 7 mM ABTS and 2.5 mM
K2S2O8 dissolved in 10 mL ultrapure water
were allowed to stand in the dark for 16 h at
room temperature to create ABTS•+ cation
radicals. Prior to the assay, ABTS•+ solution
was diluted with absolute ethanol to get an
absorbance between 0.7-0.8 at 734 nm. The
solutions of the extract (5 mg/mL) and Trolox
(standard, 3.0; 2.0; 1.0; 0.5; 0.25; 0.125
mM) were prepared in methanol. In the
experiment, the sample solution (10 uL) was
mixed with 990 µL ABTS•+ solution. Ten
microliter of methanol instead of the sample
mixed with ABTS•+ solution was used as the
control. Gallic acid solution (0.1 mg/mL) was
used as the positive control. Decrease in the
absorbance after 30 minutes of incubation was
recorded at 734 nm to get linear Trolox
equation. ABTS•+ scavenging activity of the
sample was expressed as Trolox equivalent
antioxidant capacity and calculated using
linear equation obtained for Trolox
(y=33.644×x+ 2.6523, r²=0.9942).
β-Carotene/Linoleic Acid Peroxidation
Inhibition Assay
β-Carotene/linoleic acid peroxidation inhibition
assay used linoleic acid as the model lipid
substrate in an emulsified form (with Tween-
20) lies in between methods employing only
model substrates (e.g. DPPH˙) and those
using real lipids (36). Inhibition of lipid
peroxidation by M. sivasense extract was
measured according to method of Marco (37)
with slight modifications. Briefly, β-carotene
(5 mg) dissolved in chloroform (5 mL) was
added to flask containing linoleic acid (120
mg) and Tween-20 (1200 mg). The content of
flask was vigorously shaken and chloroform
was evaporated under the vacuum. After
evaporation, pure water (300 mL) was added
and shaken vigorously. BHT (1 mg/mL) was
used as the standard inhibitor. The sample
(extract/ standard) solution (10 uL) and β-
carotene emulsion (2 mL) were mixed in the
deep well plate. After that, 300 µL of the
mixture was placed by multichannel automatic
pipette (Eppendorf, Germany) into a 96-well
microplate cells and incubated at 50°C for 2 h.
Goger F et al. JOTCSA. 2019; 6(3): 281-292. RESEARCH ARTICLE
285
Control was prepared without sample or
standards according to the same procedure.
The rate of β-carotene bleaching was
monitored by measuring the absorbance at 15
min periods at 470 nm in an ELISA microplate
reader (Biotek Powerwave XS). Analyses were
run in triplicate and the results were expressed
as average of inhibition percentage values
with SEM calculated according to Equation 2:
AA% =[1 −(𝐴𝑏𝑠0𝑠𝑎𝑚𝑝𝑙𝑒− 𝐴𝑏𝑠120𝑠𝑎𝑚𝑝𝑙𝑒)
𝐴𝑏𝑠0𝑐𝑜𝑛𝑡𝑟𝑜𝑙−𝐴𝑏𝑠120𝑐𝑜𝑛𝑡𝑟𝑜𝑙] × 100 Equation (2)
where, AA is an antioxidant activity,
Abs0sample and Abs120sample are the
absorbance values of the sample at 0 min and
120 min, Abs0control and Abs120control are
the absorbance values of the control at 0 min
and 120 min.
Xanthine Oxidase (XO) Inhibition Assay
The XO inhibition assay was carried out
according to procedure reported by Chen (38)
with slight modifications. Namely, the stock
solution of the extract (5 mg/mL) prepared in
methanol was diluted with phosphate buffer
(0.1 M, pH 7.5) up to 1 mg/mL. In the
experiment, the sample solution (100 µL),
buffer (1.75 mL) and 40 µL of XO (0.33 U/mL
in sodium phosphate buffer) were pipetted in
quartz cuvette and pre-incubated for 10 min
at 25 °C. The reaction was initiated by addition
of the substrate solution (100 µL 0.5 mM
xanthine in buffer). Then, the mixture was
subjected to the second incubation for 12 min
at 25 °C. The sample blanks contained all
reaction reagents and 40 µL buffer instead of
enzyme. The control cuvette contained all the
reagents without the sample (plus equivalent
amount of the sample solvent was added).
Control incubations, representing 100%
enzyme activity were conducted in the same
manner replacing the plant extract with the
solvent used for the solution of the extract.
The standard inhibitor of XO, allopurinol (1 mM
in DMSO) was used as the positive control.
Absorbance at 295 nm was recorded with a
spectrophotometer. The percentage inhibition
was calculated according to Equation 3:
Inh% =[(𝐴𝑏𝑠𝑐𝑜𝑛𝑡𝑟𝑜𝑙−𝐴𝑏𝑠𝑐𝑜𝑛𝑡𝑟𝑜𝑙 𝑏𝑙𝑎𝑛𝑘)−(𝐴𝑏𝑠𝑠𝑎𝑚𝑝𝑙𝑒−𝐴𝑏𝑠𝑠𝑎𝑚𝑝𝑙𝑒 𝑏𝑙𝑎𝑛𝑘)
𝐴𝑏𝑠𝑐𝑜𝑛𝑡𝑟𝑜𝑙−𝐴𝑏𝑠𝑐𝑜𝑛𝑡𝑟𝑜𝑙 𝑏𝑙𝑎𝑛𝑘] × 100 (Eq. 3)
where Abscontrol and Abscontrol blank are the
absorbance values of the control and its blank,
Abssample and Abssample blank are the
absorbance values of the sample and its blank.
Tyrosinase Inhibition Assay
An inhibitory activity of M. sivasense extract
on tyrosinase was assessed using the modified
microplate method reported by Masuda (39).
The solution of the extract (1 mg/mL) was
prepared in phosphate buffer (pH 6.8) with
adding DMSO. The experiment was carried out
as follow: eight wells were used, A (three
wells, control), B (one well, blank), C (three
wells, sample), and D (one well, blank), which
contained the following reaction mixtures: A,
120 μL of phosphate buffer (0.1 M, pH 6.8)
and 40 μL of tyrosinase (33.3 U/mL) in the
buffer; B, 160 μL of the buffer; C, 80 μL of the
buffer, 40 μL of tyrosinase (33.3 U/mL) in the
buffer, 40 μL of the sample-buffer solution
containing DMSO; D, 120 μL of the buffer and
40 μL of the sample solution containing DMSO.
Pipetting was performed with multichannel
automatic pipette (Eppendorf Research® plus,
Germany). Kojic acid (0.01-0.1 mg/mL in
buffer) was used as the positive control. The
contents of each well were mixed and then
preincubated at 23°C for 10 min, before 40 µl
L-DOPA (2.5 mM) in the buffer was added.
After incubation at 23°C for 15 min, the
absorbance at 475 nm was measured using an
ELISA microplate reader (Biotek Powerwave
XS). The percentage inhibition of the
tyrosinase activity (Inh %) was calculated
according to Equation 4:
𝐼𝑛ℎ% =(𝐴𝑏𝑠𝐴−𝐴𝑏𝑠𝐵 )−(𝐴𝑏𝑠𝐶−𝐴𝑏𝑠𝐷)
(𝐴𝑏𝑠𝐴−𝐴𝑏𝑠𝐵)× 100 (Eq. 4)
α-Amylase Inhibition Assay
The inhibitory potential of the extract on
activity of α-amylase was measured using
Caraway-Somogyi iodine/potassium iodide
(I/KI) method (40) with slight modifications.
The substrate solution (0.05 %) was prepared
by dissolving soluble potato starch (10 mg) in
20 mL ultrapure water then boiling for 10 min
and cooling to room temperature before use.
As a positive control experiment, acarbose
(0.01-0.1 mg/mL in buffer) was used. The
Goger F et al. JOTCSA. 2019; 6(3): 281-292. RESEARCH ARTICLE
286
experiment was carried out as follows: 20 mM
sodium phosphate buffer (pH 6.9) was
pipetted in the 96-well flat bottom plates with
multichannel automatic pipette (Eppendorf,
Germany), then 25 µL sample solution and 50
µL α-amylase (0.8 U/mL in buffer) were added
and incubated for 10 min at 37ºC. After
incubation, 50 µL substrate solution was
added to the mixture. The mixture was
subjected to the second incubation for 10 min
at 37ºC. The reaction was stopped by addition
of 25 µL HCl (1 M). Finally, 100 µL of I/KI
reagent was added to the wells. The sample
blanks contained all reaction reagents and 50
µL buffer instead of enzyme. The control wells
contained all reaction reagents and 25 µL
solvent (instead of the sample solution). The
control incubations, representing 100%
enzyme activity were conducted in the same
manner replacing the plant extract with the
solvent used for solution of the extract. The
absorbance values were recorded for the
sample and blank at 630 nm. The percentage
inhibition of the α-amylase activity (Inh %)
was calculated according to Equation 3.
Lipoxygenase Inhibition Assay
Inhibition of 5-LOX activity was measured with
spectrophotometric method described by
Albano et al. (41). The solutions of the extract
(1 mg/mL) and NDGA (0.1 mg/mL) were
prepared in methanol. The substrate solution
(4 mM) was prepared as follows: 50 mg
linoleic acid, 50 mg Tween-20, 500 µL NaOH
(1 M) were mixed and the total volume (40
mL) was adjusted with 0.1 M phosphate buffer
(pH=8). The enzyme solution was prepared in
phosphate buffer (273000 U/mL). In the
experiment, 50 µL of the sample solution
(extract/standard), 2.5 mL phosphate buffer
and 50 µL of 5-LOX were mixed in quartz
cuvette and incubated for 10 min at 25 ºC.
Then, the reaction was initiated by adding
linoleic acid (25 µL). Increase in the
absorbance at 234 nm was recorded for 6 min.
The percentage inhibition was calculated
according to equation 3.
Statistical Analysis of Data
Data obtained from antioxidant and enzyme
inhibition experiments were expressed as
mean standard error (±SEM). IC50 values
were estimated using a nonlinear regression
algorithm.
RESULTS AND DISCUSSION
In the literature, there are a number of papers
promising about phytochemical properties and
biological activities of diverse Marrubium
species (7,11-19). However, there is no
information about phytochemistry and
biological potent of endemic species M.
sivasense. The main objective of the present
work was to evaluate chemical composition
and confirm the biological potent of non-
volatile metabolites of M. sivasense. The
extract was subjected to evaluations for free
radical scavenging, lipid peroxidation
inhibition and Trolox equivalent antioxidant
capacity. Another goal was to determine
inhibitory potential of the extract on enzymes
involved in oxidation metabolism (XO),
digestion of carbohydrates (α-amylase),
process of inflammation (5-LOX), and linked to
melanin formation and Parkinson’s disease
(tyrosinase).
Composition of Extract
In scope of the research, M. sivasense
methanol extract phenolics were determined
with LC-MS/MS technique. Phenylethanoid
glycosides: forsythoside B, verbascoside,
alyssonoside, martynoside were identified as
the main compounds. Chromatographic profile
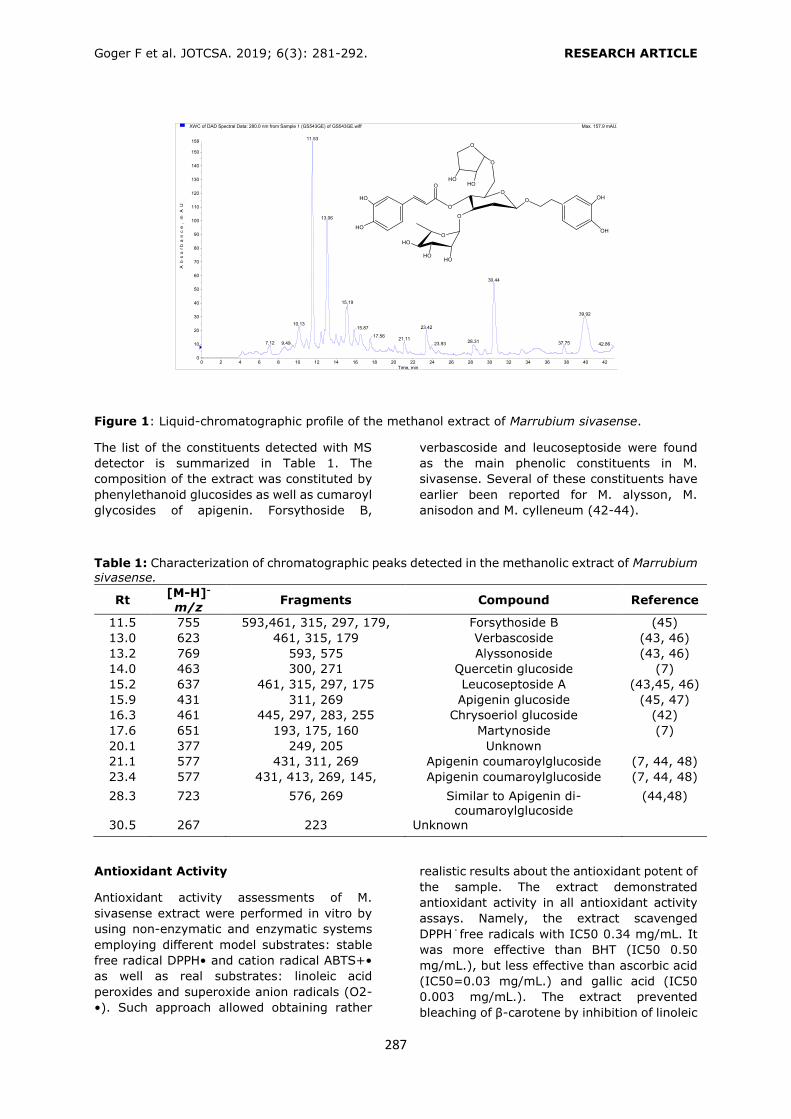
of the extract is presented on Figure 1.
Goger F et al. JOTCSA. 2019; 6(3): 281-292. RESEARCH ARTICLE
287
Figure 1: Liquid-chromatographic profile of the methanol extract of Marrubium sivasense.
The list of the constituents detected with MS
detector is summarized in Table 1. The
composition of the extract was constituted by
phenylethanoid glucosides as well as cumaroyl
glycosides of apigenin. Forsythoside B,
verbascoside and leucoseptoside were found
as the main phenolic constituents in M.
sivasense. Several of these constituents have
earlier been reported for M. alysson, M.
anisodon and M. cylleneum (42-44).
Table 1: Characterization of chromatographic peaks detected in the methanolic extract of Marrubium sivasense.
Rt [M-H]-
m/z Fragments Compound Reference
11.5 755 593,461, 315, 297, 179, Forsythoside B (45)
13.0 623 461, 315, 179 Verbascoside (43, 46)
13.2 769 593, 575 Alyssonoside (43, 46)
14.0 463 300, 271 Quercetin glucoside (7)
15.2 637 461, 315, 297, 175 Leucoseptoside A (43,45, 46)
15.9 431 311, 269 Apigenin glucoside (45, 47)
16.3 461 445, 297, 283, 255 Chrysoeriol glucoside (42)
17.6 651 193, 175, 160 Martynoside (7)
20.1 377 249, 205 Unknown
21.1 577 431, 311, 269 Apigenin coumaroylglucoside (7, 44, 48)
23.4 577 431, 413, 269, 145, Apigenin coumaroylglucoside (7, 44, 48)
28.3 723 576, 269 Similar to Apigenin di- coumaroylglucoside
(44,48)
30.5 267 223 Unknown
Antioxidant Activity
Antioxidant activity assessments of M.
sivasense extract were performed in vitro by
using non-enzymatic and enzymatic systems
employing different model substrates: stable
free radical DPPH• and cation radical ABTS+•
as well as real substrates: linoleic acid
peroxides and superoxide anion radicals (O2-
•). Such approach allowed obtaining rather
realistic results about the antioxidant potent of
the sample. The extract demonstrated
antioxidant activity in all antioxidant activity
assays. Namely, the extract scavenged
DPPH˙free radicals with IC50 0.34 mg/mL. It
was more effective than BHT (IC50 0.50
mg/mL.), but less effective than ascorbic acid
(IC50=0.03 mg/mL.) and gallic acid (IC50
0.003 mg/mL.). The extract prevented
bleaching of β-carotene by inhibition of linoleic
XWC of DAD Spectral Data: 280.0 nm from Sample 1 (GS543GE) of GS543GE.wiff Max. 157.9 mAU.
0 2 4 6 8 10 12 14 16 18 20 22 24 26 28 30 32 34 36 38 40 42Time, min
0
10
20
30
40
50
60
70
80
90
100
110
120
130
140
150
158
Ab
so
rb
an
ce
, m
AU
11.53
13.06
30.44
15.19
39.92
10.1323.4215.87
17.5621.11
28.317.12 37.759.49 23.93 42.86
Goger F et al. JOTCSA. 2019; 6(3): 281-292. RESEARCH ARTICLE
288
acid peroxidation with Inh% 43. In the TEAC
assay, the extract demonstrated noteworthy
ABTS●+ bleaching activity equivalent to 2.3
mM of Trolox. Such significant activity may be
observed due to phenolic compounds detected
in the extract as reported in Table 2. In the
xanthine/xanthine oxidase system, the extract
demonstrated moderate inhibitory effect
(16.54 %). As can be seen from the
antioxidant activity determination results
(Table 2), the extract of M. sivasense may be
considered as potential source of antioxidant
agents in prevention of oxidative damage. LC-
MS/MS analysis revealed that extract of M.
sivasense contained phenylethanoid
glucosides: forsythoside, verbascoside and
leucoseptoside. It has earlier been reported
that these compounds displayed notable
antioxidant capacity (49). In the literature,
there is increasing evidence that polyphenols
have multiple beneficial effects on preventing
of oxidative damage. The phenol content is
well known to correlate with higher antioxidant
activity in plant extracts (50). The mechanism
by which polyphenols exert their effects is not
fully clarified, but a consensus was reached
that polyphenols protect membranes,
proteins, and DNA against damage by
scavenging free radicals generated through
oxidative metabolism.
Enzyme Inhibition Assays
Inhibitory Effect of the Extract on Mushroom
Tyrosinase Activity
In scope of the research work, the inhibitory
effect of M. sivasense extract on mushroom
tyrosinase activity was evaluated. The extract
was found to be inactive when tested at a
concentration of 1 mg/mL (Table 2).
Inhibitory Effect of the Extract on Porcine
Pancreatic α-Amylase Activity
M. sivasense extract was evaluated in vitro for
hypoglycemic activity via inhibition of the
porcine pancreatic α-amylase. As can be seen
in Table 2, the extract demonstrated inhibitory
activity (Inh% 49.67). It seems to be that M.
sivasense can be considered as perspective
potential source of natural phytochemicals
with hypoglycemic effect. Earlier, antidiabetic
phytochemicals from different Marrubium
species have been proved to be effective
agents. The hypoglycemic effect of M. vulgare
extract was clinically documented in patients
with type II non-controlled diabetes mellitus
(51). It was reported, that M. radiatum extract
exerted the strongest activity against α-
amylase and α-glucosidase (52). The
evidenced-based therapeutic usage of many
plants is scarce. Nowadays, there is demand
for new effective and safe natural products
with hypoglycemic property. The efficacy of
known synthetic hypoglycemic products is
debatable. So, the plants reputed for their
antidiabetic effect should be verified either
experimentally or clinically.
Inhibitory Effect of the Extract on
Lipoxygenase Activity
Antiinflammatory effect of M. sivasense was
tested with 5-LOX enzyme inhibition system.
Actually, 5-LOX catalyzes the oxidation of
arachidonic acid, produces 5(S)-
hydroxyperoxyeicosatetraenoic acid (5-HETE)
which undergoes dehydration, resulting in the
formation of leukotriene. Enzymatic hydrolysis
of leukotriene, as well as conjugation with
other substances, leads to the formation of
inflammatory mediators.
In the present study, the extract of M.
sivasense was found to be as moderate
inhibitor of 5-LOX with Inh% 18.71 when
tested at 5 mg/mL concentration (Table 2).

Goger F et al. JOTCSA. 2019; 6(3): 281-292. RESEARCH ARTICLE
289
Table 2.The biological activity of M. sivasense extract*.
DPPH°
˙ IC50
(mg/mL)
β-
Carotenea, Inh%
TEACa
, mM
XODb,
Inh%
α-AMLc,
Inh%
LOXa,
Inh%
TYRb,
Inh%
Extract 0.34 43.04 2.3 16.54 49.67 18.71 N/A
Gallic acid 0.003 - - - - - - Ascorbic acid 0.03 - - - - - - BHTb 0.50 85.0 - - - - - Acarbosed - - - - 98.0 - - NDGAe - - - - - 86.38 - Allopurinolf - - - 81.02 - - -
Kojic acidd - - - - - - 84.0 *Activity values are presented as results of triplicate experiments n=3, p<0.01; BHT: butylated hydroxytoluene; N/A: not active; α-AML: α-amylase; LOX: lipoxygenase; TYR: tyrosinase; NDGA: nordihydroguaiaretic acid; §the deviation from the mean is <0.01 of the
mean value; Concentrations of the tested sample: a)5 mg/mL;b)1 mg/mL; c)0.5 mg/mL; d)0.3
mg/mL; e)0.1 mg/mL; f)1.0 mM.
CONCLUSION
The liquid chromatographic analysis of
Marrubium sivasense methanol extract
resulted with identification of phenolic
constituents, namely forsythoside B,
leucoseptoside A, verbascoside, alyssonoside,
martynoside, as well as glucosides of
quercetin, apigenin and chrysoeriol, and
coumaroylglucoside of apigenin. Evaluation of
the extract in different model systems
revealed that M. sivasense methanol extract is
good inhibitor of α-amylase enzyme. However,
the extract did not demonstrate noteworthy
effect on 5-LOX, XOD and tyrosinase enzymes.
The data gathered from the current study
support that M. sivasense is a good source of
flavonoid constituents and other bioactive
compounds that might be responsible for the
observed antioxidant and some enzyme
inhibitory activities. These interesting results
encourage further investigation geared
towards the isolation of potent phytochemicals
of different polarity from M. sivasense.
ACKNOWLEDGEMENTS
Authors are grateful to Anadolu University
Scientific Research Department for supporting
this research project (Grant Number
1705S171).
REFERENCES
1. Aytaç Z, Akgul G, Ekici M. A New Species of
Marrubium (Lamiaceae) from Central Anatolia,
Turkey. Turk J Bot. 2012;36:443-9.
2. Akgül G, Ketenoglu O. The new subspecies
for the Flora of Turkey: Marrubium
cephalanthum Boiss. & Noë subsp.
akdağhicum (Lamiaceae). In: Ürgüp, Turkey:
IXth National Conference on Ecology; 7-10
October;, Nevşehir: Nevşehir University
Faculty of Science; 2009.
3. Tuylu M, Büyükkartal HN, Akgül G, Kalyoncu
H. Marrubium lutescens Boiss. ve M.
cephalanthum Boiss. & Noë subsp.
akdaghicum (Lamiaceae)'un gövde ve yaprak
özelliklerinin anatomik olarak karşılaştırılması.
Süleyman Demirel Univ. J Nat Appl Sci.
2017;21(1):113‐7.
4. Firat M. Marrubium eriocephalum
(Lamiaceae); a Species New to the Flora of
Turkey, with Contributions to its Taxonomy.
PhytoKeys. 2016(58):9-20.
5. Davis PH, Mill RR, Kit T. Flora of Turkey and
the East Aegean Islands (Suppl. 1).
Edinburgh: Edinburgh University Press; 1988.
p. 202-3.

Goger F et al. JOTCSA. 2019; 6(3): 281-292. RESEARCH ARTICLE
290
6. Meyre-Silva C, Cechinel-Filho V. A Review
Of The Chemical And Pharmacological Aspects
of the Genus Marrubium. Curr Pharm Des.
2010;16(31):3503-18.
7. Karioti A, Protopappa A, Megoulas N,
Skaltsa H. Identification of Tyrosinase
Inhibitors from Marrubium velutinum and
Marrubium cylleneum. Bioorg Med Chem.
2007;15(7):2708-14.
8. Golmakani H, Rabbani Nasab H, Sharifan M,
Kamali H, Yadollahi A. The Essential Oil
Composition and Antibacterial Activity of
Marrubium duabense Murata from North
Khorassan Province, Iran. J Essent Oil Bear
Plants. 2016;19(4):963-71.
9. Masoodi M, Ali Z, Liang S, Yin H, Wang W,
Khan IA. Labdane Diterpenoids from
Marrubium vulgare. Phytochem Lett.
2015;13:275-9.
10. Piozzi F, Bruno M, Rosselli S, Maggio A. The
Diterpenoids of The Genus Marrubium
(Lamiaceae). Nat Prod Commun. 2006;7:585-
92.
11. Dehbashi Z, Mazaheri M, Saeedi S,
Sabbagh SK. Antibacterial Activity of
Marrubium vulgare L. Against Antibiotic
Resistance Klebsiella pneumoniae Strains. Adv
Herb Med. 2015;1(3):9-14.
12. Hamedeyazdan S, Sharifi S, Nazemiyeh H,
Fathiazad F. Evaluating Antiproliferative And
Antioxidant Activity of Marrubium crassidens.
Adv Pharm Bull. 2014;4(Supp1):459-64.
13. De Jesus R, Cechinel-Filho V, Oliveira A,
Schlemper V. Analysis of the Antinociceptive
Properties of Marrubiin Isolated From
Marrubium vulgare. Phytomed.
2000;7(2):111-5.
14. Boudjelal A, Henchiri C, Siracusa L, Sari M,
Ruberto G. Compositional Analysis And In Vivo
Anti-Diabetic Activity Of Wild Algerian
Marrubium vulgare L. Infusion. Fitoterapia.
2012;83(2):286-92.
15. Namjoyan F, Azemi ME, Abdollahi E,
Goudarzi N, Nikan K. Angiotensin I Converting
Enzyme Inhibitory Activities Of Hydroalcoholic
Extract of Nardostachys jatamansi, Prangos
ferulacea and Marrubium vulgare. Jundishapur
J Nat Pharm Prod. 2015;10(2):e17255.
16. Ettaya A, Dhibi S, Samout N, Elfeki A,
Hfaiedh N. Hepatoprotective Activity Of White
Horehound (Marrubium Vulgare) Extract
Against Cyclophosphamide Toxicity In Male
Rats. Can J Physiol Pharmacol.
2015;94(4):441-7.
17. Saad S, Ouafi S, Chabane D. Anti-
Inflammatory And Acute Toxicity Evaluation Of
Aqueous Infusion Extract Obtained From Aerial
Parts of Marrubium deserti de Noé growing in
Algeria. Afr J Tradit, Complement Altern Med.
2016;13(1):71-5.
18. Yousefi K, Soraya H, Fathiazad F, Khorrami
A, Hamedeyazdan S, Maleki-Dizaji N, et al.
Cardioprotective Effect Of Methanolic Extract
Of Marrubium vulgare L. on Isoproterenol-
Induced Acute Myocardial Infarction In Rats.
Ind J Exp Biol. 2013;51(8):653-60.
19. Argyropoulou A, Samara P, Tsitsilonis O,
Skaltsa H. Polar Constituents Of Marrubium
Thessalum Boiss. & Heldr.(Lamiaceae) And
Their Cytotoxic/Cytostatic Activity. Phytother
Res. 2012;26(12):1800-6.
20. Pukalskas A, Venskutonis PR, Salido S, de
Waard P, van Beek TA. Isolation, Identification
And Activity Of Natural Antioxidants From
Horehound (Marrubium Vulgare L.) Cultivated
in Lithuania. Food Chem. 2012;130(3):695-
701.
21. Letchamo W, Mukhopadhyay S. Variability
in Chromosomes, Herb Yield, Essential Oil
Goger F et al. JOTCSA. 2019; 6(3): 281-292. RESEARCH ARTICLE
291
Content And Potentials Of Horehound For
North American Commercial Production. J
Horticult Sci. 1997;72(5):741-8.
22. Weel KG, Venskutonis PR, Pukalskas A,
Gruzdiene D, Linssen JP. Antioxidant Activity
Of Horehound (Marrubium vulgare L) Grown in
Lithuania. Eur J Lipid Sci Tech.
1999;101(10):395-9.
23. Orhan IE, Belhattab R, Şenol F, Gülpinar
A, Hoşbaş S, Kartal M. Profiling of
cholinesterase inhibitory and antioxidant
activities of Artemisia absinthium, A. herba-
alba, A. fragrans, Marrubium vulgare, M.
astranicum, Origanum vulgare subsp.
glandulossum and Essential Oil Analysis Of
Two Artemisia Species. Ind Crops Prod.
2010;32(3):566-71.
24. Tuzlaci E. A Dictionary of Turkish Plants.
Melisa Matbaacilik: ALFA Press; 2006.
25. Song H-P, Zhang H, Fu Y, Mo H-y, Zhang
M, Chen J, et al. Screening for Selective
Inhibitors Of Xanthine Oxidase From Flos
Chrysanthemum Using Ultrafiltration LC–MS
Combined With Enzyme Channel Blocking. J
Chromatogr B. 2014;961:56-61.
26. Kaurinovic B, Vlaisavljevic S, Popovic M,
Vastag D, Djurendic-Brenesel M. Antioxidant
Properties Of Marrubium Peregrinum
L.(Lamiaceae) Essential Oil. Molecules.
2010;15(9):5943-55.
27. Sahpaz S, Garbacki N, Tits M, Bailleul F.
Isolation and Pharmacological Activity Of
Phenylpropanoid Esters From Marrubium
vulgare. J Ethnopharmacol. 2002;79(3):389-
92.
28. Essawy SS, Abo-Elmatty DM, Ghazy NM,
Badr JM, Sterner O. Antioxidant and Anti-
Inflammatory Effects Of Marrubium Alysson
Extracts In High Cholesterol-Fed Rabbits.
Saudi Pharm J. 2014;22(5):472-82.
29. Benkhnigue O, Ben Akka F, Salhi S, Fadli
M, Douira A, Zidane L. Catalogue Des Plantes
Médicinales Utilisées Dans Le Traitement Du
Diabète Dans La Région d’Al Haouz-Rhamna
(Maroc). J Anim Plant Sci. 2014;23(1):3539-
68.
30. Orch H, Douira A, Zidane L. Étude
Ethnobotanique Des Plantes Médicinales
Utilisées Dans Le Traitement Du Diabète, Et
Des Maladies Cardiaques Dans La Région
d’Izarène (Nord du Maroc). J Appl Biosci.
2015;86(1):7940-56.
31. Tsukamoto K, Jackson IJ, Urabe K,
Montague PM, Hearing V. A Second
Tyrosinase-Related Protein, TRP-2, Is A
Melanogenic Enzyme Termed Dopachrome
Tautomerase. EMBO J. 1992;11(2):519-26.
32. Xu Y, Stokes AH, Freeman WM, Kumer SC,
Vogt BA, Vrana KE. Tyrosine mRNA is
Expressed In Human Substantia Nigra. Mol
Brain Res. 1997;45(1):159-62.
33. Namjoyan F, Jahangiri A, Azemi ME, Arkian
E, Mousavi H. Inhibitory Effects of Physalis
alkekengi L., Alcea rosea L., Bunium persicum
B. Fedtsch. and Marrubium vulgare L. on
Mushroom Tyrosinase. Jundishapur J Nat
Pharm Prod. 2015;10(1):1-6.
34. Brand-Williams W, Cuvelier M-E, Berset C.
Use Of A Free Radical Method To Evaluate
Antioxidant Activity. LWT-Food Sci Technol.
1995;28(1):25-30.
35. Re R, Pellegrini N, Proteggente A, Pannala
A, Yang M, Rice-Evans C. Antioxidant Activity
Applying An Improved ABTS Radical Cation
Decolorization Assay. Free Rad Biol Med.
1999;26(9-10):1231-7.
36. Prior RL, Wu X, Schaich K. Standardized
Methods For The Determination Of Antioxidant
Capacity And Phenolics In Foods And Dietary
Supplements. J Agric Food Chem.
2005;53(10):4290-302.
Goger F et al. JOTCSA. 2019; 6(3): 281-292. RESEARCH ARTICLE
292
37. Marco GJ. A Rapid Method For Evaluation
Of Antioxidants. J Am Oil Chem Soc.
1968;45(9):594-8.
38. Chen C-H, Chan H-C, Chu Y-T, Ho H-Y,
Chen P-Y, Lee T-H, et al. Antioxidant Activity
Of Some Plant Extracts Towards Xanthine
Oxidase, Lipoxygenase And Tyrosinase.
Molecules. 2009;14(8):2947-58.
39. Masuda T, Yamashita D, Takeda Y,
Yonemori S. Screening For Tyrosinase
Inhibitors Among Extracts Of Seashore Plants
And Identification Of Potent Inhibitors From
Garcinia subelliptica. Biosci Biotech Biochem.
2005;69(1):197-201.
40. Yang X-W, Huang M-Z, Jin Y-S, Sun L-N,
Song Y, Chen H-S. Phenolics from Bidens
bipinnata And Their Amylase Inhibitory
Properties. Fitoterapia. 2012;83(7):1169-75.
41. Albano SM, Lima AS, Pedro MGMLG,
Barroso JG, Figueiredo AC. Antioxidant, Anti-
5-Lipoxygenase And Antiacetylcholinesterase
Activities Of Essential Oils And Decoction
Waters Of Some Aromatic Plants. Rec Nat
Prod. 2012;6(1):35.
42. Michelis F, Tiligada E, Skaltsa H, Lazari D,
Skaltsounis A-L, Delitheos A. Effects of the
Flavonoid Pilloin Isolated From Marrubium
Cylleneum On Mitogen-Induced Lymphocyte
Transformation. Pharm Biol. 2002;40(4):245-
8.
43. Çalis I, Hosny M, Khalifa T, Rüedi P.
Phenylpropanoid Glycosides From Marrubium
alysson. Phytochem. 1992;31(10):3624-6.
44. Hussain A, Perveen S, Malik A, Afza N,
Iqbal L, Tareen RB. Urease Inhibitiory Flavone
Glucosides from Marrubium anisodon. Pol J
Chem. 2009;83(7):1329-35.
45. Mitreski I, Stanoeva JP, Stefova M, Stefkov
G, Kulevanova S. Polyphenols in
Representative Teucrium Species in the Flora
of R. Macedonia: LC/DAD/ESI-MS (n) profile
and content. Nat Prod Commun.
2014;9(2):175-80.
46. Kırmızıbekmez H, Montoro P, Piacente S,
Pizza C, Dönmez A, Çalış İ. Identification by
HPLC‐PAD‐MS and Quantification by HPLC‐PAD
of Phenylethanoid Glycosides of Five Phlomis
Species. Phytochem Anal. 2005;16(1):1-6.
47. Ulubelen A, Topcu G, Kolak U. Labiatae
flavonoids and their bioactivity. In: Atta ur R,
editor. Studies in Natural Products Chemistry.
Vol. 30: Elsevier; 2005. p. 233-302.
48. Buckingham J, Munasinghe VRN.
Dictionary of Flavonoids with CD-ROM: CRC
Press; 2015.
49. Tsvetkov D, Dmitrenok A, Tsvetkov YE,
Menshov V, Yashunsky D, Yashin AY, et al.
Phenylethanoid Glycosides From Teak Wood
Knots And Their Antioxidant Activity. J Biol
Active Prod Nat. 2016;6(4):272-81.
50. Zhang H, Tsao R. Dietary Polyphenols,
Oxidative Stress And Antioxidant And Anti-
Inflammatory Effects. Curr Opin Food Sci.
2016;8:33-42.
51. Herrera-Arellano A, Aguilar-Santamaria L,
Garcia-Hernandez B, Nicasio-Torres P,
Tortoriello J. Clinical trial of Cecropia
obtusifolia and Marrubium vulgare Leaf
Extracts On Blood Glucose And Serum Lipids
In Type 2 Diabetics. Phytomed. 2004;11(7-
8):561-6.
52. Loizzo MR, Saab AM, Tundis R, Menichini
F, Bonesi M, Piccolo V, et al. In vitro Inhibitory
Activities Of Plants Used In Lebanon
Traditional Medicine Against Angiotensin
Converting Enzyme (ACE) And Digestive
Enzymes Related To Diabetes. J
Ethnopharmacol. 2008;119(1):109-16.
Salisu A, Salga MS. JOTCSA. 2019; 6(3): 293-302. RESEARCH ARTICLE
293
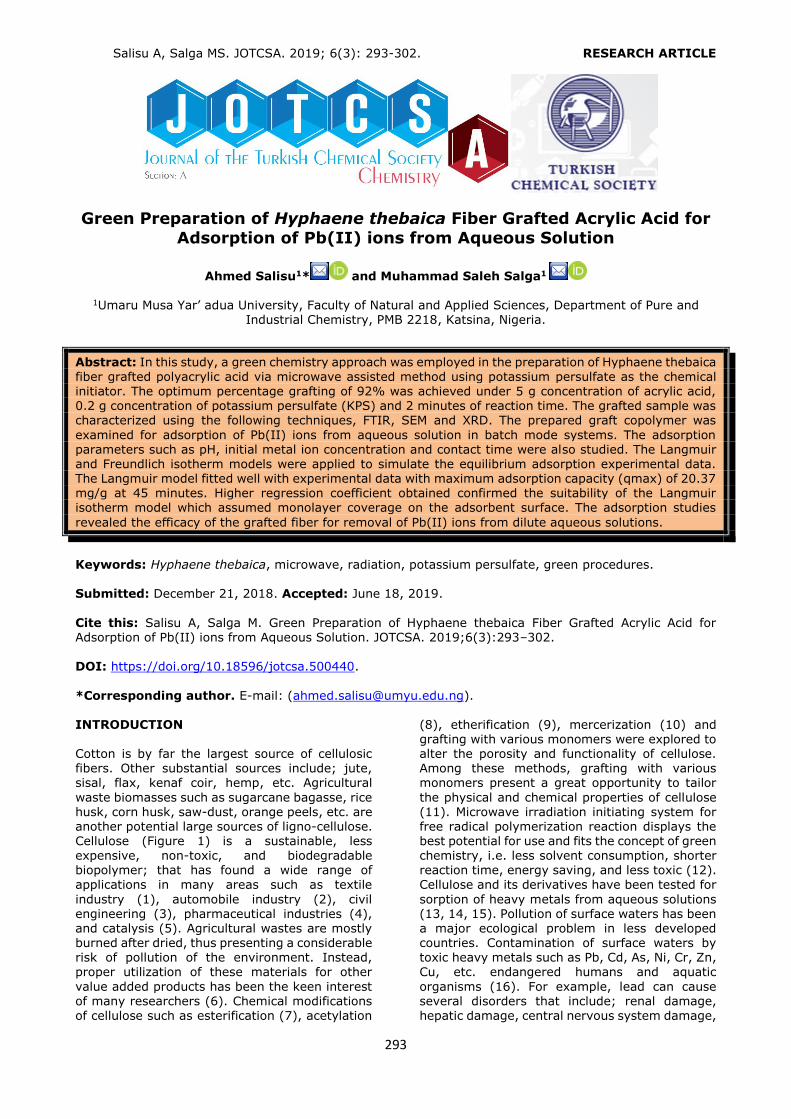
Green Preparation of Hyphaene thebaica Fiber Grafted Acrylic Acid for
Adsorption of Pb(II) ions from Aqueous Solution
Ahmed Salisu1* and Muhammad Saleh Salga1
1Umaru Musa Yar’ adua University, Faculty of Natural and Applied Sciences, Department of Pure and Industrial Chemistry, PMB 2218, Katsina, Nigeria.
Abstract: In this study, a green chemistry approach was employed in the preparation of Hyphaene thebaica
fiber grafted polyacrylic acid via microwave assisted method using potassium persulfate as the chemical initiator. The optimum percentage grafting of 92% was achieved under 5 g concentration of acrylic acid, 0.2 g concentration of potassium persulfate (KPS) and 2 minutes of reaction time. The grafted sample was characterized using the following techniques, FTIR, SEM and XRD. The prepared graft copolymer was
examined for adsorption of Pb(II) ions from aqueous solution in batch mode systems. The adsorption parameters such as pH, initial metal ion concentration and contact time were also studied. The Langmuir and Freundlich isotherm models were applied to simulate the equilibrium adsorption experimental data. The Langmuir model fitted well with experimental data with maximum adsorption capacity (qmax) of 20.37 mg/g at 45 minutes. Higher regression coefficient obtained confirmed the suitability of the Langmuir isotherm model which assumed monolayer coverage on the adsorbent surface. The adsorption studies
revealed the efficacy of the grafted fiber for removal of Pb(II) ions from dilute aqueous solutions.
Keywords: Hyphaene thebaica, microwave, radiation, potassium persulfate, green procedures. Submitted: December 21, 2018. Accepted: June 18, 2019.
Cite this: Salisu A, Salga M. Green Preparation of Hyphaene thebaica Fiber Grafted Acrylic Acid for Adsorption of Pb(II) ions from Aqueous Solution. JOTCSA. 2019;6(3):293–302. DOI: https://doi.org/10.18596/jotcsa.500440.
*Corresponding author. E-mail: ([email protected]). INTRODUCTION Cotton is by far the largest source of cellulosic fibers. Other substantial sources include; jute, sisal, flax, kenaf coir, hemp, etc. Agricultural
waste biomasses such as sugarcane bagasse, rice husk, corn husk, saw-dust, orange peels, etc. are another potential large sources of ligno-cellulose. Cellulose (Figure 1) is a sustainable, less expensive, non-toxic, and biodegradable biopolymer; that has found a wide range of
applications in many areas such as textile
industry (1), automobile industry (2), civil engineering (3), pharmaceutical industries (4), and catalysis (5). Agricultural wastes are mostly burned after dried, thus presenting a considerable risk of pollution of the environment. Instead, proper utilization of these materials for other
value added products has been the keen interest of many researchers (6). Chemical modifications of cellulose such as esterification (7), acetylation
(8), etherification (9), mercerization (10) and grafting with various monomers were explored to alter the porosity and functionality of cellulose. Among these methods, grafting with various monomers present a great opportunity to tailor
the physical and chemical properties of cellulose (11). Microwave irradiation initiating system for free radical polymerization reaction displays the best potential for use and fits the concept of green chemistry, i.e. less solvent consumption, shorter reaction time, energy saving, and less toxic (12).
Cellulose and its derivatives have been tested for
sorption of heavy metals from aqueous solutions (13, 14, 15). Pollution of surface waters has been a major ecological problem in less developed countries. Contamination of surface waters by toxic heavy metals such as Pb, Cd, As, Ni, Cr, Zn, Cu, etc. endangered humans and aquatic
organisms (16). For example, lead can cause several disorders that include; renal damage, hepatic damage, central nervous system damage,
Salisu A, Salga MS. JOTCSA. 2019; 6(3): 293-302. RESEARCH ARTICLE
294
and damage to the reproductive system (17).
Currently, the existing conventional heavy metal wastewater treatment technologies include
chemical precipitation, oxidation, evaporation, electro-deposition, chelation, ion-exchange, coagulation, membrane filtration and adsorption (18). Each of the methods has positive and
negative attributes; however, adsorption has been widely reported as cheap, effective and less technical compared to other techniques (19, 20). The focus of the present study is to modify Hyphaene thebaica fiber, a huge lingo-cellulose agricultural waste produced in tons annually in most sub-Saharan African countries, with acrylic
acid via microwave free radical graft copolymerization, characterize the graft copolymer prepared and tested for its potential for sorption of lead ions from aqueous solution.
Figure 1: Chemical repeating unit of cellulose.
MATERIALS AND METHODS
Materials Acrylic acid, acetone, methanol, and potassium persulfate (KPS) were purchased from Sigma-Aldrich (USA). Pb(NO3)2 was purchased from Loba Chemie (England). A stock solution of Pb(II) ions (1000 mg/L) was prepared by dissolving
1.599 g of Pb(NO3)2 salt in a beaker (250 mL) with deionized water. The prepared stock solution was transferred to a 1.0 liter volumetric flask, followed by the addition of 100 mL of 0.1M HNO3
and made to the mark with deionized water. Desired concentrations of the metal solutions were prepared by serial dilution of the stock
solution using deionized water. Other chemical reagents were of analytical grade and used as received. Sample Collection and Pretreatment A fresh stalk of Hyphaene thebaica was collected from the local fields near Kayauki village, along
Daura road Katsina State, Nigeria, in clean plastic containers. The stalk (300 g) was cleaned with distilled water, pulverized and soaked in distilled water at room temperature for 24 hrs. Thereafter the fibers were removed and washed thoroughly with distilled water and oven-dried at 50 °C.
Subsequently, mercerization of the fiber was
carried out with 5% (w/v) aqueous sodium hydroxide (500 mL) for 24 hours in a 1000 mL beaker at room temperature. This treatment removes lignin, wax and oil and also increases hydrophilicity (fiber wetting). The alkali treated fibers were washed thoroughly with distilled
water until the pH of wash water becomes neutral. The fibers were oven dried at 50 °C.
Graft Copolymerization of Acrylic Acid onto
Hyphaene Thebaica Fiber The graft copolymer was prepared using the
procedure described previously (21) with minor modifications. Mercerized Hyphaene thebaica fiber (0.5 g) was soaked in 50 mL distilled water in a 250 mL Bomex beaker for 24 hours before
graft copolymerization, in order to activate the reaction sites on the fibrous surface. Required amount of acrylic acid and KPS were added and stirred well. The reaction vessel was placed at the center of a rotating ceramic plate in the domestic microwave oven (Model WMO20L-MGSB, Skyrun, Nigeria). The reaction vessel was then exposed to
microwave radiation at 900 W power for desired time. Periodically, the microwave irradiation was stopped and the reaction vessel was allowed to cool by placing it in cold water. Reaction parameters such as monomer concentration, initiator concentration and microwave exposure
time were varied. Afterwards, polymeric product
was precipitated by adding excess acetone and oven-dried at 50 °C. The sample was extracted
by Soxhlet extraction with methanol for 6 hours to remove the homopolymer adhered to the fibrous surface. Thereafter, the prepared grafted fiber was oven-dried at 50 °C.
The percentage grafting was measured using equation (1).
(%) Grafting = W𝟐−W1
W1 × 100 (Eq. 1)
where W1 is the initial weight of the fiber sample, W2 is the weight of the grafted fiber after Soxhlet extraction (22).
Characterization Techniques Fourier Transform infrared analysis was performed by using a FTIR VERTEX 70/70v spectrometer (Agilent Technologies, USA). A scanning electron microscope (SEM) micrograph of the fiber and its surface morphology was
examined using PHENOM PRO X (Netherlands). Powder X-ray diffraction patterns were recorded on ARL X’TRA X-ray Diffractometer (Thermo Scientific, Switzerland) using graphite monochromatic CuKα1 (1.5406 Å) and Kα2 operated at 40 kV and 30 mA in the range of 2θ angles of 5-70o.
Batch Equilıbrium Adsorption Experiment Batch experiments were performed by varying different variables such as pH, contact time,
metal ions concentration. The experiments were carried out in 250 mL conical flasks by adding 0.1 g of the grafted fiber with 25 mL of various metal
ion solution of concentrations, 20, 40, 60, 80, 100, 120, and 140 mg/L and adjusted to desired pH at room temperature using a shaker operating at 300 rpm. At desired times, the adsorption experiments were stopped, all of the 25 mL of metal ion solutions with the grafted fiber was
filtered. The metal ion concentration was determined and the separated grafted fiber was
Salisu A, Salga MS. JOTCSA. 2019; 6(3): 293-302. RESEARCH ARTICLE
295
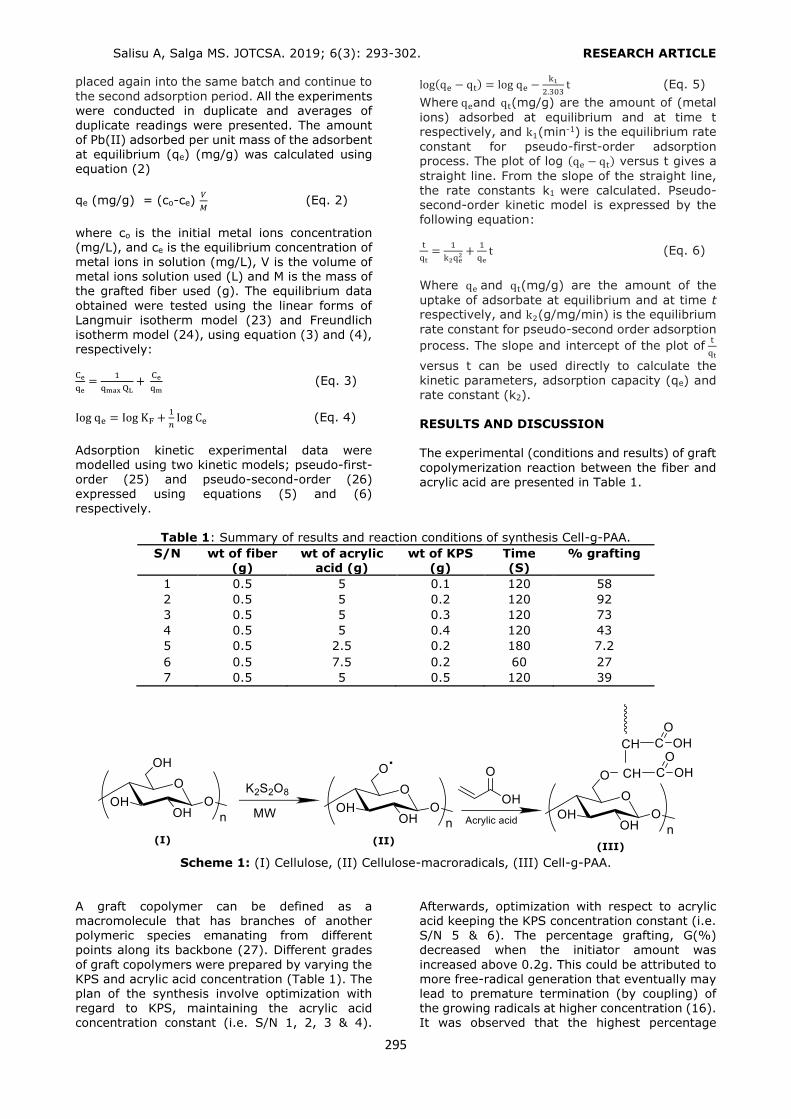
placed again into the same batch and continue to
the second adsorption period. All the experiments were conducted in duplicate and averages of
duplicate readings were presented. The amount of Pb(II) adsorbed per unit mass of the adsorbent at equilibrium (qe) (mg/g) was calculated using equation (2)
qe (mg/g) = (co-ce) 𝑉
𝑀 (Eq. 2)
where co is the initial metal ions concentration (mg/L), and ce is the equilibrium concentration of metal ions in solution (mg/L), V is the volume of metal ions solution used (L) and M is the mass of the grafted fiber used (g). The equilibrium data
obtained were tested using the linear forms of Langmuir isotherm model (23) and Freundlich isotherm model (24), using equation (3) and (4), respectively: Ce
qe=
1
qmax QL+
Ce
qm (Eq. 3)
Iog qe = Iog KF +1
𝑛Iog Ce (Eq. 4)
Adsorption kinetic experimental data were modelled using two kinetic models; pseudo-first-order (25) and pseudo-second-order (26) expressed using equations (5) and (6) respectively.
log(qe − qt) = log qe −k1
2.303t (Eq. 5)
Where qeand qt(mg/g) are the amount of (metal
ions) adsorbed at equilibrium and at time t respectively, and k1(min-1) is the equilibrium rate
constant for pseudo-first-order adsorption process. The plot of log (qe − qt) versus t gives a
straight line. From the slope of the straight line, the rate constants k1 were calculated. Pseudo-second-order kinetic model is expressed by the following equation: t
qt=
1
k2qe2 +
1
qet (Eq. 6)
Where qe and qt(mg/g) are the amount of the
uptake of adsorbate at equilibrium and at time t respectively, and k2(g/mg/min) is the equilibrium
rate constant for pseudo-second order adsorption
process. The slope and intercept of the plot of t
qt
versus t can be used directly to calculate the
kinetic parameters, adsorption capacity (qe) and rate constant (k2). RESULTS AND DISCUSSION The experimental (conditions and results) of graft
copolymerization reaction between the fiber and acrylic acid are presented in Table 1.
Table 1: Summary of results and reaction conditions of synthesis Cell-g-PAA.
S/N wt of fiber (g)
wt of acrylic acid (g)
wt of KPS (g)
Time (S)
% grafting
1 0.5 5 0.1 120 58
2 0.5 5 0.2 120 92
3 0.5 5 0.3 120 73
4 0.5 5 0.4 120 43
5 0.5 2.5 0.2 180 7.2
6 0.5 7.5 0.2 60 27
7 0.5 5 0.5 120 39
Scheme 1: (I) Cellulose, (II) Cellulose-macroradicals, (III) Cell-g-PAA.
A graft copolymer can be defined as a macromolecule that has branches of another polymeric species emanating from different points along its backbone (27). Different grades
of graft copolymers were prepared by varying the KPS and acrylic acid concentration (Table 1). The plan of the synthesis involve optimization with regard to KPS, maintaining the acrylic acid concentration constant (i.e. S/N 1, 2, 3 & 4).
Afterwards, optimization with respect to acrylic acid keeping the KPS concentration constant (i.e. S/N 5 & 6). The percentage grafting, G(%) decreased when the initiator amount was
increased above 0.2g. This could be attributed to more free-radical generation that eventually may lead to premature termination (by coupling) of the growing radicals at higher concentration (16). It was observed that the highest percentage
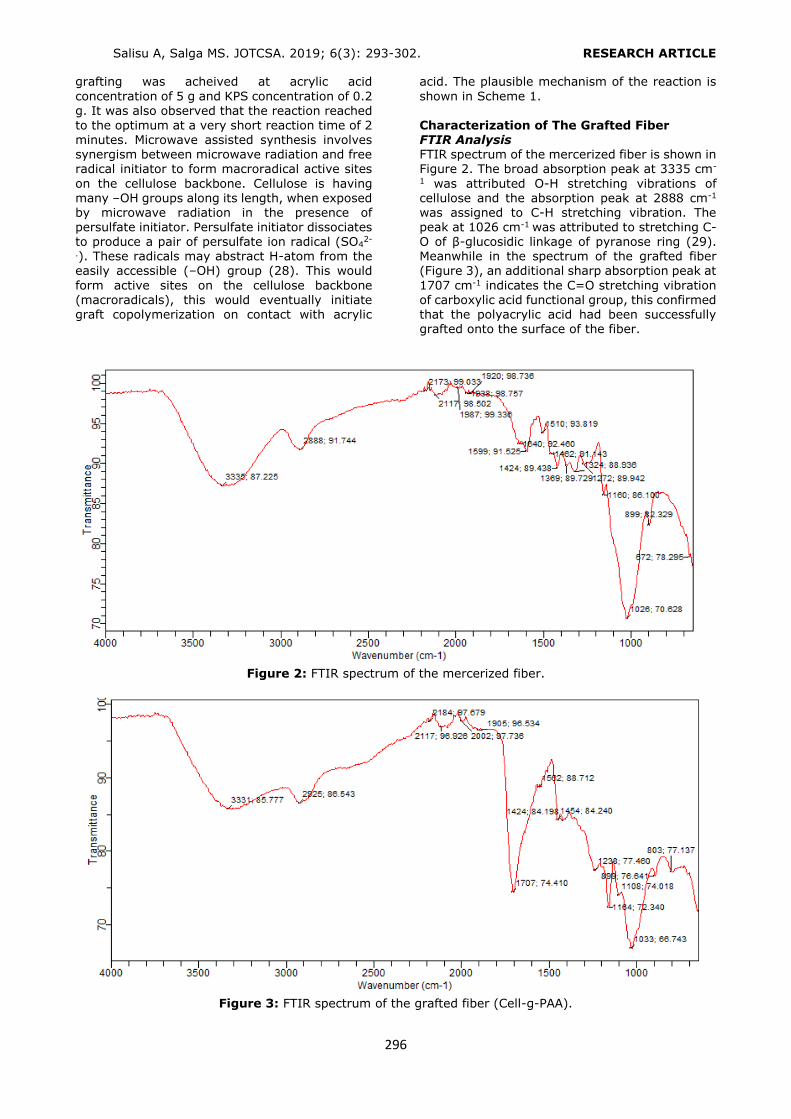
Salisu A, Salga MS. JOTCSA. 2019; 6(3): 293-302. RESEARCH ARTICLE
296
grafting was acheived at acrylic acid
concentration of 5 g and KPS concentration of 0.2 g. It was also observed that the reaction reached
to the optimum at a very short reaction time of 2 minutes. Microwave assisted synthesis involves synergism between microwave radiation and free radical initiator to form macroradical active sites
on the cellulose backbone. Cellulose is having many –OH groups along its length, when exposed by microwave radiation in the presence of persulfate initiator. Persulfate initiator dissociates to produce a pair of persulfate ion radical (SO4
2-
.). These radicals may abstract H-atom from the easily accessible (–OH) group (28). This would
form active sites on the cellulose backbone (macroradicals), this would eventually initiate graft copolymerization on contact with acrylic
acid. The plausible mechanism of the reaction is
shown in Scheme 1.
Characterization of The Grafted Fiber FTIR Analysis FTIR spectrum of the mercerized fiber is shown in Figure 2. The broad absorption peak at 3335 cm-
1 was attributed O-H stretching vibrations of cellulose and the absorption peak at 2888 cm-1 was assigned to C-H stretching vibration. The peak at 1026 cm-1 was attributed to stretching C-O of β-glucosidic linkage of pyranose ring (29). Meanwhile in the spectrum of the grafted fiber (Figure 3), an additional sharp absorption peak at
1707 cm-1 indicates the C=O stretching vibration of carboxylic acid functional group, this confirmed that the polyacrylic acid had been successfully grafted onto the surface of the fiber.
Figure 2: FTIR spectrum of the mercerized fiber.
Figure 3: FTIR spectrum of the grafted fiber (Cell-g-PAA).
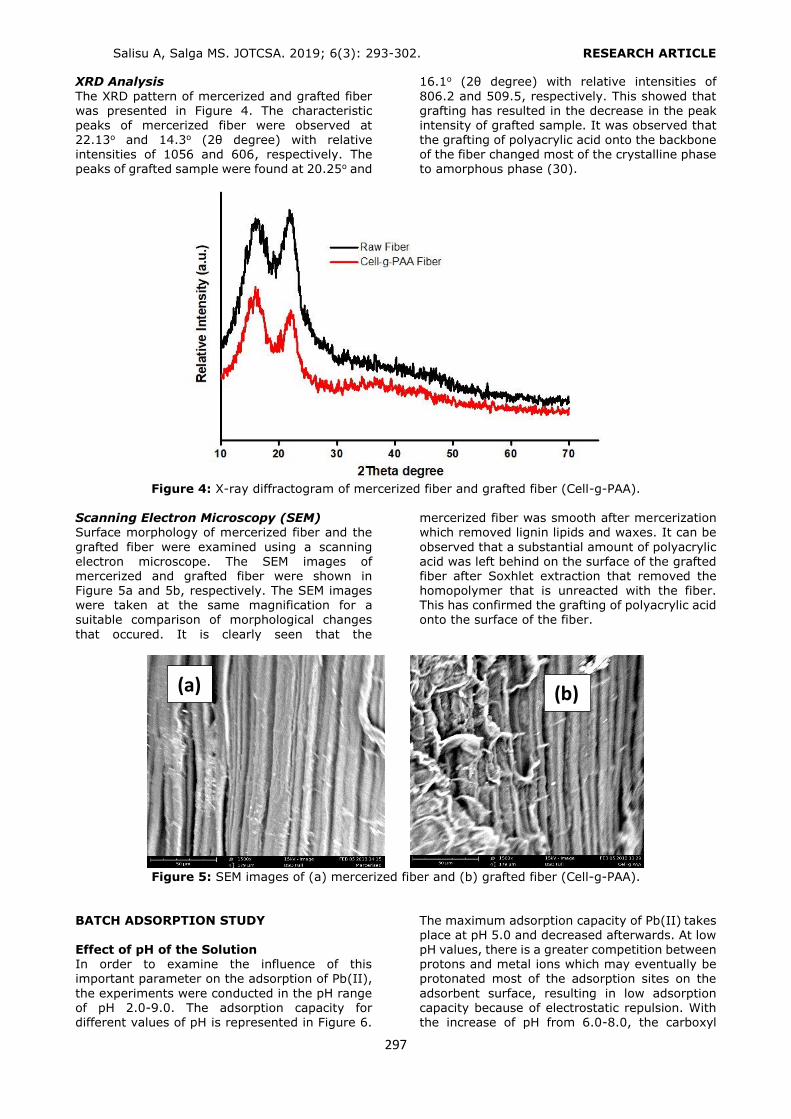
Salisu A, Salga MS. JOTCSA. 2019; 6(3): 293-302. RESEARCH ARTICLE
297
XRD Analysis
The XRD pattern of mercerized and grafted fiber was presented in Figure 4. The characteristic
peaks of mercerized fiber were observed at 22.13o and 14.3o (2θ degree) with relative intensities of 1056 and 606, respectively. The peaks of grafted sample were found at 20.25o and
16.1o (2θ degree) with relative intensities of
806.2 and 509.5, respectively. This showed that grafting has resulted in the decrease in the peak
intensity of grafted sample. It was observed that the grafting of polyacrylic acid onto the backbone of the fiber changed most of the crystalline phase to amorphous phase (30).
Figure 4: X-ray diffractogram of mercerized fiber and grafted fiber (Cell-g-PAA).
Scanning Electron Microscopy (SEM) Surface morphology of mercerized fiber and the
grafted fiber were examined using a scanning electron microscope. The SEM images of mercerized and grafted fiber were shown in Figure 5a and 5b, respectively. The SEM images were taken at the same magnification for a suitable comparison of morphological changes
that occured. It is clearly seen that the
mercerized fiber was smooth after mercerization which removed lignin lipids and waxes. It can be
observed that a substantial amount of polyacrylic acid was left behind on the surface of the grafted fiber after Soxhlet extraction that removed the homopolymer that is unreacted with the fiber. This has confirmed the grafting of polyacrylic acid onto the surface of the fiber.
Figure 5: SEM images of (a) mercerized fiber and (b) grafted fiber (Cell-g-PAA).
BATCH ADSORPTION STUDY Effect of pH of the Solution In order to examine the influence of this important parameter on the adsorption of Pb(II),
the experiments were conducted in the pH range of pH 2.0-9.0. The adsorption capacity for different values of pH is represented in Figure 6.
The maximum adsorption capacity of Pb(II) takes place at pH 5.0 and decreased afterwards. At low pH values, there is a greater competition between protons and metal ions which may eventually be protonated most of the adsorption sites on the
adsorbent surface, resulting in low adsorption capacity because of electrostatic repulsion. With the increase of pH from 6.0-8.0, the carboxyl
(a) (b)
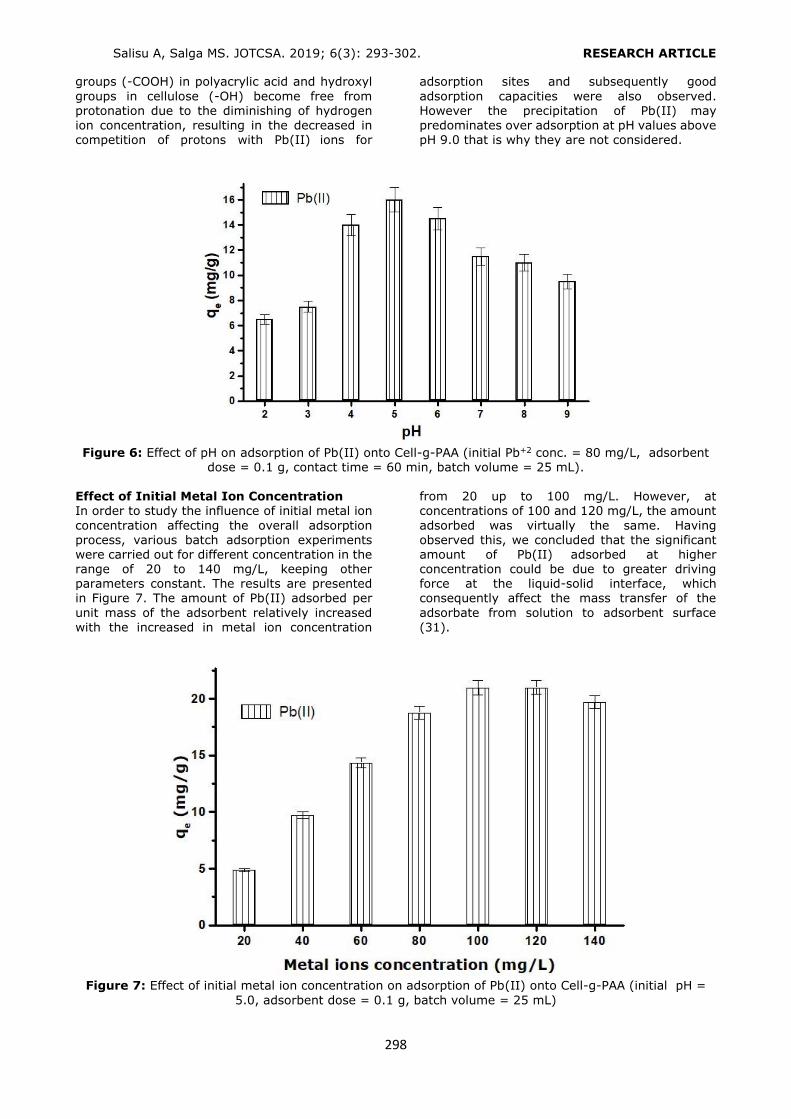
Salisu A, Salga MS. JOTCSA. 2019; 6(3): 293-302. RESEARCH ARTICLE
298
groups (-COOH) in polyacrylic acid and hydroxyl
groups in cellulose (-OH) become free from protonation due to the diminishing of hydrogen
ion concentration, resulting in the decreased in competition of protons with Pb(II) ions for
adsorption sites and subsequently good
adsorption capacities were also observed. However the precipitation of Pb(II) may
predominates over adsorption at pH values above pH 9.0 that is why they are not considered.
Figure 6: Effect of pH on adsorption of Pb(II) onto Cell-g-PAA (initial Pb+2 conc. = 80 mg/L, adsorbent
dose = 0.1 g, contact time = 60 min, batch volume = 25 mL).
Effect of Initial Metal Ion Concentration In order to study the influence of initial metal ion
concentration affecting the overall adsorption process, various batch adsorption experiments were carried out for different concentration in the range of 20 to 140 mg/L, keeping other parameters constant. The results are presented in Figure 7. The amount of Pb(II) adsorbed per
unit mass of the adsorbent relatively increased
with the increased in metal ion concentration
from 20 up to 100 mg/L. However, at concentrations of 100 and 120 mg/L, the amount
adsorbed was virtually the same. Having observed this, we concluded that the significant amount of Pb(II) adsorbed at higher concentration could be due to greater driving force at the liquid-solid interface, which consequently affect the mass transfer of the
adsorbate from solution to adsorbent surface
(31).
Figure 7: Effect of initial metal ion concentration on adsorption of Pb(II) onto Cell-g-PAA (initial pH =
5.0, adsorbent dose = 0.1 g, batch volume = 25 mL)
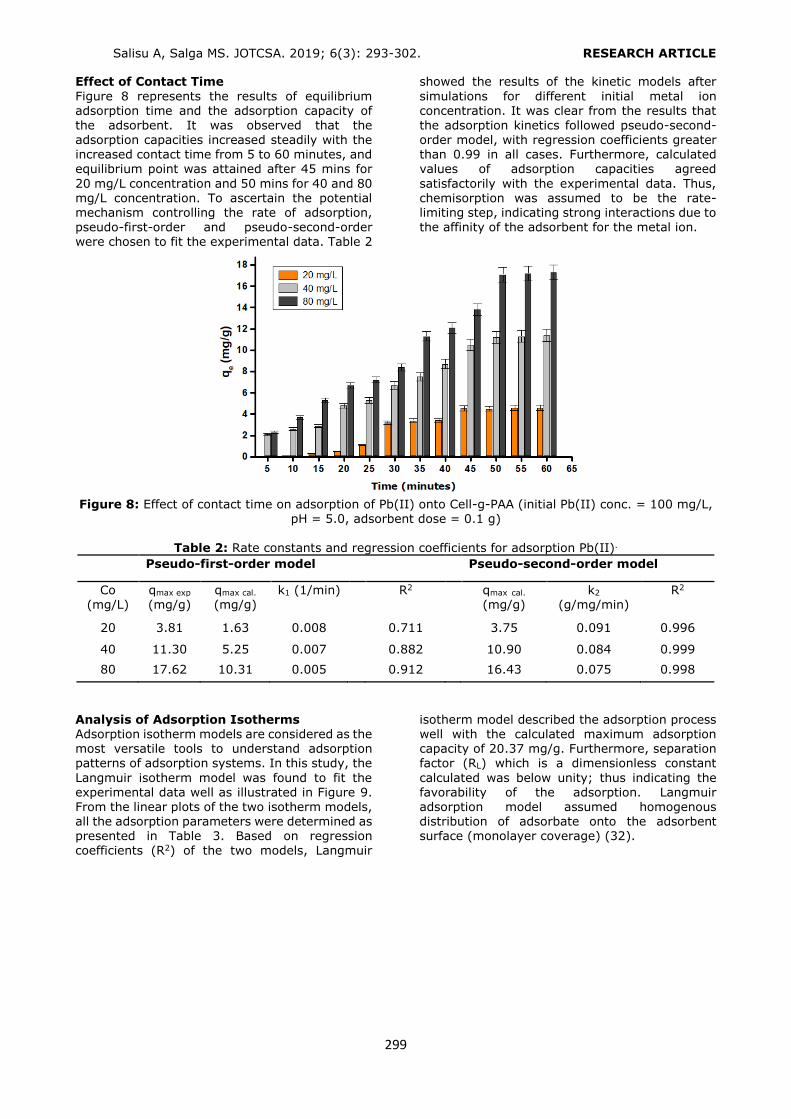
Salisu A, Salga MS. JOTCSA. 2019; 6(3): 293-302. RESEARCH ARTICLE
299
Effect of Contact Time
Figure 8 represents the results of equilibrium adsorption time and the adsorption capacity of
the adsorbent. It was observed that the adsorption capacities increased steadily with the increased contact time from 5 to 60 minutes, and equilibrium point was attained after 45 mins for
20 mg/L concentration and 50 mins for 40 and 80 mg/L concentration. To ascertain the potential mechanism controlling the rate of adsorption, pseudo-first-order and pseudo-second-order were chosen to fit the experimental data. Table 2
showed the results of the kinetic models after
simulations for different initial metal ion concentration. It was clear from the results that
the adsorption kinetics followed pseudo-second-order model, with regression coefficients greater than 0.99 in all cases. Furthermore, calculated values of adsorption capacities agreed
satisfactorily with the experimental data. Thus, chemisorption was assumed to be the rate-limiting step, indicating strong interactions due to the affinity of the adsorbent for the metal ion.
Figure 8: Effect of contact time on adsorption of Pb(II) onto Cell-g-PAA (initial Pb(II) conc. = 100 mg/L,
pH = 5.0, adsorbent dose = 0.1 g)
Table 2: Rate constants and regression coefficients for adsorption Pb(II).
Pseudo-first-order model Pseudo-second-order model
Co (mg/L)
qmax exp (mg/g)
qmax cal. (mg/g)
k1 (1/min) R2 qmax cal.
(mg/g) k2
(g/mg/min) R2
20 3.81 1.63 0.008 0.711 3.75 0.091 0.996
40 11.30 5.25 0.007 0.882 10.90 0.084 0.999
80 17.62 10.31 0.005 0.912 16.43 0.075 0.998
Analysis of Adsorption Isotherms Adsorption isotherm models are considered as the most versatile tools to understand adsorption patterns of adsorption systems. In this study, the
Langmuir isotherm model was found to fit the experimental data well as illustrated in Figure 9. From the linear plots of the two isotherm models, all the adsorption parameters were determined as presented in Table 3. Based on regression coefficients (R2) of the two models, Langmuir
isotherm model described the adsorption process well with the calculated maximum adsorption capacity of 20.37 mg/g. Furthermore, separation factor (RL) which is a dimensionless constant
calculated was below unity; thus indicating the favorability of the adsorption. Langmuir adsorption model assumed homogenous distribution of adsorbate onto the adsorbent surface (monolayer coverage) (32).
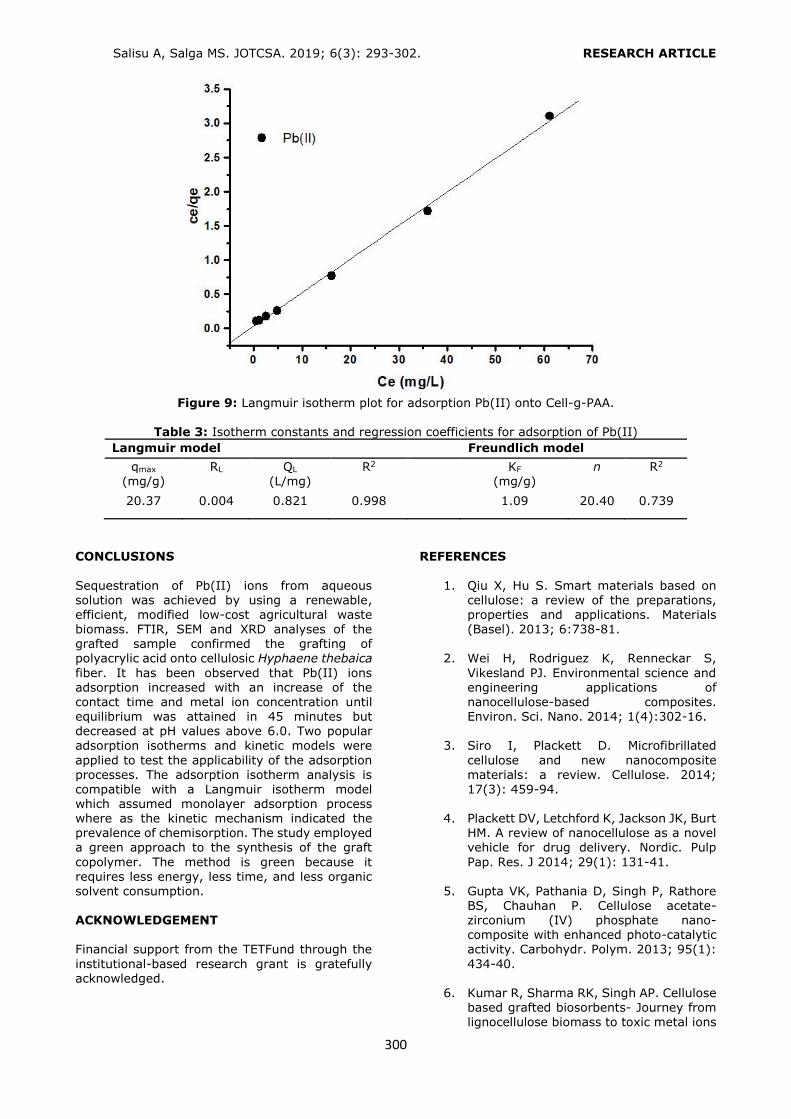
Salisu A, Salga MS. JOTCSA. 2019; 6(3): 293-302. RESEARCH ARTICLE
300
Figure 9: Langmuir isotherm plot for adsorption Pb(II) onto Cell-g-PAA.
Table 3: Isotherm constants and regression coefficients for adsorption of Pb(II)
Langmuir model Freundlich model
qmax (mg/g)
RL QL (L/mg)
R2 KF (mg/g)
n R2
20.37 0.004 0.821 0.998 1.09 20.40 0.739
CONCLUSIONS
Sequestration of Pb(II) ions from aqueous solution was achieved by using a renewable, efficient, modified low-cost agricultural waste
biomass. FTIR, SEM and XRD analyses of the grafted sample confirmed the grafting of polyacrylic acid onto cellulosic Hyphaene thebaica
fiber. It has been observed that Pb(II) ions adsorption increased with an increase of the contact time and metal ion concentration until equilibrium was attained in 45 minutes but decreased at pH values above 6.0. Two popular adsorption isotherms and kinetic models were
applied to test the applicability of the adsorption processes. The adsorption isotherm analysis is compatible with a Langmuir isotherm model which assumed monolayer adsorption process where as the kinetic mechanism indicated the prevalence of chemisorption. The study employed a green approach to the synthesis of the graft
copolymer. The method is green because it
requires less energy, less time, and less organic solvent consumption. ACKNOWLEDGEMENT Financial support from the TETFund through the
institutional-based research grant is gratefully acknowledged.
REFERENCES
1. Qiu X, Hu S. Smart materials based on
cellulose: a review of the preparations, properties and applications. Materials
(Basel). 2013; 6:738-81.
2. Wei H, Rodriguez K, Renneckar S,
Vikesland PJ. Environmental science and engineering applications of nanocellulose-based composites. Environ. Sci. Nano. 2014; 1(4):302-16.
3. Siro I, Plackett D. Microfibrillated
cellulose and new nanocomposite materials: a review. Cellulose. 2014; 17(3): 459-94.
4. Plackett DV, Letchford K, Jackson JK, Burt HM. A review of nanocellulose as a novel vehicle for drug delivery. Nordic. Pulp
Pap. Res. J 2014; 29(1): 131-41.
5. Gupta VK, Pathania D, Singh P, Rathore
BS, Chauhan P. Cellulose acetate-zirconium (IV) phosphate nano-composite with enhanced photo-catalytic activity. Carbohydr. Polym. 2013; 95(1):
434-40.
6. Kumar R, Sharma RK, Singh AP. Cellulose based grafted biosorbents- Journey from lignocellulose biomass to toxic metal ions
Salisu A, Salga MS. JOTCSA. 2019; 6(3): 293-302. RESEARCH ARTICLE
301
sorption applications- A review. Journal of
Molecular Liquids. 2017; 232: 62-93.
7. Zhang J, Wu J, Cao Y, Sang S, Zhang J, He J. Synthesis of cellulose benzoates under homogeneous conditions in an ionic liquid. Cellulose. 2009; 16(2): 299-308.
8. Wan Daud WR, Djuned FM. Cellulose
acetate from oil palm empty fruit bunch via a one step heterogeneous acetylation. Carbohydr. Polym. 2015; 132: 252-60.
9. Stein A, Klemm D, Syntheses of cellulose
derivatives via O-triorganosilyl cellulose I. Effective synthesis of organic cellulose esters by acetylation of trimethyl silyl celluloses. Die Makromolekulare Chemie Rapid Communications. 1988; 9(8): 569-73.
10. Bali G, Meng X, Deneff JI, Sun Q, Arthur JR. The effect of Alkaline pre-treatment methods on cellulose structure and Accessibility. ChemsusChem Communications. 2014; 2(3): 1-5.
11. Roy D, Semsarilar M, Guthriea JT, Perrier S. Cellulose modification by polymer grafting, A review. Chem. Soc. Rev. 2006; 38: 2046-64.
12. Mishra S, Usha GR, Sen G. Microwave initiated synthesis and application of
polyacrylic acid grafted carboxymethyl cellulose. Carbohydr. Polym. 2011; 87: 2255-62.
13. Nada AAMA, Alkady MY, Fekry HM. Synthesis and characterization of grafted cellulose for use in water and metal ions
sorption. Bioresources. 2008; 3:46-59.
14. Hajeeth T, Sudha PN, Vijayalakshmi TG. Sorption studis on Cr(VI) removal from aqueous solution using cellulose grafted with acrylonitrile monomer. Int. J. Biol.
Macromol. 2014; 66:295-301.
15. Okieimen FE, Sogbaike CE, Ebhoaye JE. Removal of cadmium and copper ions from aqueous solution with cellulose graft copolymers. Sep. Purif. Technol. 2005; 44: 85-89
16. Salisu A, Mohd MS, Ahmedy AN, Ibrahim WAW, Khairil JA. Removal of lead ions from aqueous solutions using sodium alginate-graft-poly(methyl methacrylate) beads. Desal. Water Treat. 2016; 57(33): 15353- 61.
17. Naseem R, Tahir SS. Removal of Pb(II)
from aqueous solution by using bentonite as an adsorbent. Water Res. 2001; 35: 3982-6.
18. Salisu A, Mohd MS, Ahmedy AN, Ibrahim WAW, Khairil JA. Alginate graft
polyacrylonitrile beads for the Removal of lead ions from aqueous solutions Polym Bull. 2016; 73: 519-37.
19. Raji C, Anirudhan TS. Batch Cr(VI) removal by polyacrylamide-grafted sawdust: kinetics and thermodynamics. Water Res. 1998; 32: 3772-80.
20. Sharma S, Pathania D, Singh . Preparation, characterization and Cr(VI)
adsorption behavior study of poly(acrylic acid) grafted Fiscus carica bast fiber. Adv. Mater. Lett. 2013; 4: 271-6.
21. Rani P, Sen G, Mishra S, Jha U. Microwave assisted synthesis of polyacrylamide
grafted gum ghatti and its application as
flocculant. Carbohydr. Polym. 2012; 89: 275-81.
22. Isiklan N, Kursun F, Inal M. Graft copolymerization of itaconic acid onto sodium alginate using benzoyl peroxide.
Carbohydr. Polym. 2010; 101: 665-72.
23. Langmuir I. The adsorption of gases on plane surfaces of glass, mica and platinum. J. Chem. Soc. 1918; 40: 1361-403.
24. Freundlich HMF. Uber die adsorption in losungen. Zeitschrift fur physikalische. chemie (Leipzig). 1906; 57A, 385-470.
25. Gurgel LV, Gil LF. Adsorption of Cu(II), Cd(II) and Pb(II) from aqueous single solution by succinylated twice-
mercerized sugarcane bagasse functionalized with triethylenetetraamine. Water Res. 2009; 43:4479-88.
26. Ho YS, McKay G. Pseudo-second-order
model for sorption processes. Proc. Biochem. 1999; 34: 451-465.
27. David WJ, Hudson SM. Review of vinyl graft copolymerization featuring recent advances toward controlled radical-based reactions and illustrated with
chitin/chitosan trunk polymers. Chem.
Rev. 2001; 101: 3245-73.
28. Umar A, Mohd MS, Salisu A, Ibrahim WAW, Khairil AJ, Abdul Keyon AS. Preparation and characterization of starch grafted with methaacrylamide using
ammonium persulphate initiator. Materials letters. 2016; 185: 173-6.
29. Arowona MT, Olatunji GA, Saliu OD, Adeniyi OR, Atolani O, Adisa MJ.

Salisu A, Salga MS. JOTCSA. 2019; 6(3): 293-302. RESEARCH ARTICLE
302
Thermally stable rice husk
microcrystalline cellulose as adsorbent in PTLC plates. JOTCSA. 2018; 5(3): 1177-
84.
30. Gupta VK, Agarwal S, Singh P, Pathania D. Acrylic acid grafted cellulosic Luffa
cylidrical fiber for the removal of dye and metal ions. Carbohydr. Polym. 2013; 98: 1214-21.
31. Zhou Q, Yan C, Luo W. Preparation of a
novel carboxylate-rich wheat straw
through surface graft modification for efficient separation of Ce (III) from
wastewater. Materials and Design. 2016; 97: 195-203.
32. Dang V, Doan HD, Dang-Vu AL.
Equilibrium and kinetics of biosorption of cadmium (II) ad copper (II) ions by wheat straw. Bioresource Technol. 2008; 100: 211-19.
Şenocak A. JOTCSA. 2019; 6(3): 303-310. RESEARCH ARTICLE
303
Synthesis, Characterization, and Molecular Docking Studies of Fluoro
and Chlorophenylhydrazine Schiff Bases
Ayşegül ŞENOCAK
Tokat Gaziosmanpasa University, College of Science and Arts, Department of Chemistry, 60240, Tokat,
Turkey.
Abstract: Six Schiff bases synthesized by condensation reaction of p-fluoro and chlorophenylhydrazines
with some carbonyl compounds were reported in this work. Structures of the prepared compounds were elucidated by FT-IR, 1H- and 13C-NMR spectroscopy. FT-IR spectra exhibited characteristic transitions for all compounds. Also, their structures were proved by NMR spectroscopy, especially with the imine peak which is an indicator of the formation of Schiff bases. In addition, molecular docking studies of the Schiff bases were carried out on Alzheimer’s disease. The calculated docking scores and inhibition constants pointed out the probability of the usage of 2-chloro-5-nitrobenzaldehyde Schiff bases as a new drug
candidate for Alzheimer’s disease after structural regulations.
Keywords: Schiff base, Phenylhydrazine, NMR spectroscopy, Alzheimer’s disease, Cholinesterases, Molecular docking.
Submitted: March 04, 2019. Accepted: July 08, 2019.
Cite this: Şenocak A. Synthesis, Characterization, and Molecular Docking Studies of Fluoro and Chlorophenylhydrazine Schiff Bases. JOTCSA. 2019;6(3):303–10. DOI: https://doi.org/10.18596/jotcsa.535441.
Corresponding author. E-mail: [email protected], [email protected]. Tel: +90 356 252 1616/3051, Fax: +90 356 252 1585. INTRODUCTION Schiff bases are regarded as one of the most
studied compound group because of their potential using areas ranging from pharmacology and industry to biology and chemistry. Versatility, stability, and ease of synthesis of the Schiff bases induce their broad in scope applications containing catalysts, dyes and pigments,
corrosion inhibitors, and bioactive materials (1–
8). Among those applications, bioactive materials have come to the forefront especially because of the contribution of the azomethine group to bioactivity by interacting and forming hydrogen bonding with certain sites in the cell structure (9).
For the synthesis of the Schiff bases, various amine compounds have been used. Phenylhydrazine compounds are also used for this purpose especially by converting to pyrazoles and
pyrazolones. In one of the studies about phenylhydrazines, Dayakar et al. synthesized a series of pyrazole and pyrazolone derivatives by
refluxing phenylhydrazines with ethyl-4-chloro-3-oxobutanoate (10). Besides, various pyrazole and pyrazolone compounds derived from phenylhydrazine Schiff bases were studied and reported as antimicrobial and anticancer agents by different groups (11–13). In another study,
N,O-hydrazone Schiff base ligand and its
complexes with nickel and copper were synthesized and catalytic effects of the complexes on oxidation of benzyl alcohol were studied (14). Finally, half-sandwich complexes of phenyl hydrazone Schiff base ligands prepared by Lapasam et al. exhibited good antibacterial
activity againist P. aeruginosa and B. thuringiensis (15).
Şenocak A. JOTCSA. 2019; 6(3): 303-310. RESEARCH ARTICLE
304
Alzheimer's disease (AD), one of the most
common neurodegenerative diseases, most commonly affects people in the 65-90 age range
and many studies have been carried out on its treatment. One of the target proteins intensily used in these studies is cholinesterase enzymes. Inhibition of acetylcholinesterase (AChE) and
butyrylcholinesterase (BChE) enzymes alleviates the symptoms of AD regulating the level of acetylcholine in certain regions of the brain. Therefore synchronized inhibition of these two enzymes have been promising for the treatment of AD, which may develop for many reasons (16) and there are so many studies on inhibition of
AChE and BChE in the literature (16–22). Andrade-Jorge et al. evaluated new isoindoline and dioxoisoindoline compounds for AchE inhibition. They compared the compounds to observe the effect of carbonyl group on inhibition
activity (20). A series of compounds were
prepared to evaluate their AChE and BChE inhibitory activities by Arumagum et al. Molecular docking and in vitro studies showed good
inhibitory activities for all compounds(21). In
another study, very potent cholinesterase inhibitors based on a weak cholinesterase
inhibitor called minaprine were prepared. As a result, two of the compounds exhibiting high activity were revealed for new drug active material candidates (22).
The desire to hinder waste of time and resources of scientists interesting in bioactivity studies have driven forward computer based drug design approaches over the last decades. The usage of these methods before clinic studies has been increased the efficiency drug development
process. Especially enzyme inhibition studies about the diseases like tuberculosis, cancer, diabetes, Alzheimer’s, and epilepsy have intensely appeared in the literature (23–26). In this study, six Schiff bases were prepared and
defined by FT-IR, 1H- and 13C-NMR spectroscopic
methods. Besides, molecular docking studies of the Schiff bases were carried out as AChE and BChE inhibitors against AD.
Scheme 1: The Schiff bases synthesized in this study.
EXPERIMENTAL SECTION Chemistry 1H- and 13C-NMR spectra of the imine compounds were measured using AC Bruker 400 MHz NMR spectrometer in d-methanol at ambient temperature. FT-IR spectra were recorded on a
Jasco FT-IR 4700 spectrometer in the range of 400-4000 cm-1. Elemental analyses were recorded on a Elementar Vario Micro Cube elemental analyzer. Solvents and chemicals were
used as received from commercial sources. Docking Studies
Docking calculations were made by DockingServer (http://www.dockingserver.com). In order to energy minimization of ligand molecules, the MMFF94 force field was used by DockingServer (27). Gasteiger partial charges were added to the ligand atoms. Non-polar
hydrogen atoms were combined, and rotatable bonds were defined. Docking calculations were
made on AChE (PDB ID: 2ckm) and BChE (PDB ID: 1p0i) proteins. The addition of essential hydrogen atoms, Kollman united atom type charges, and solvation parameters was carried out by AutoDock tools (28). Affinity (grid) maps of 100×100×100 Å grid points and 0.375 Å spacing were created by the aid of the Autogrid
program (28). For the calculation of the van der Waals and the electrostatic terms, AutoDock parameter set- and distance- dependent dielectric functions were used. Docking
simulations were made through the Lamarckian genetic algorithm (LGA) and the Solis & Wets local search method (29). Initial position,
orientation, and torsions of the ligand molecules were set randomly. Every docking experiment included 100 runs that were set to terminate after a maximum of 2500000 energy evaluations. The population size was adjusted to 150. During the search, a translational step of 0.2 Å, and
quaternion and torsion steps of 5 were used.
Şenocak A. JOTCSA. 2019; 6(3): 303-310. RESEARCH ARTICLE
305
Experimental Fluoro- or chlorophenylhydrazine (6 mmol) was
placed in a round-bottom flask with ethanol (30 mL). After addition of NEt3, this solution was mixed until all content was dissolved. Then, the carbonyl compound (6 mmol) was added to the
clear solution. The reaction mixture was mixed for a couple of days. During this time the solution has changed to yellow or orange. After reaction’s completion, reaction mixture was left to crystallization and the obtained precipitate was washed with ethanol and diethyl ether.
1a: Yield 55%; mp: 161 °C. FT-IR (cm-1): 3320 (N-H), 3268 (O-H), 2999 (C-H), 1596 (azomethine, C=N); 1H-NMR (CH3OH-d4, δ, ppm): 2.33 (3H, s, CH3), 6.34 (1H, s, CH), 6.38 (1H, d, CH), 7.01 (4H, dd, CH), 7.35 (1H, d, CH). 13C-NMR (CH3OH-d4, δ, ppm): 11.29, 102.74,
106.43, 112.82, 113.51, 115.05, 115.28, 127.97,
142.22, 149.30, 155.95, 158.30, 158.85, 159.34. Anal. calcd. for C14H13FN2O2 (260.27 g/mol): C, 64.61; H, 5.03; N, 10.76. Found: C, 64.47; H, 5.52; N, 11.09%. 1b: Yield 62%; mp: 198 °C (decomp.). FT-IR
(cm-1): 3056 (O-H), 2954, 2910 (C-H), 1578 (azomethine, C=N); 1H-NMR (CH3OH-d4, δ, ppm): 2.81 (3H, s, CH3), 6.53 (1H, d, CH), 6.60 (1H, dd, CH), 6.99 (2H, dd, CH), 7.35 (2H, dd, CH), 7.78 (1H, d, CH). 13C-NMR (CH3OH-d4, δ, ppm): 15.06, 102.45, 107.86, 109.57, 114.96, 115.98, 126.74, 129.02, 129.15, 133.88, 143.31,
143.72, 161.42, 165.87. Anal. calcd. for C14H13ClN2O2 (276.72 g/mol): C, 60.77; H, 4.74; N, 10.12. Found: C, 60.52; H, 5.25; N, 10.89%.
2a: Yield 43%; mp: 197 °C (decomp.). FT-IR (cm-1): 3203 (N-H), 3046 (O-H), 1564 (azomethine, C=N); 1H-NMR (CH3OH-d4, δ,
ppm): 6.76 (1H, s, CH), 6.90 (1H, d, CH), 7.05 (4H, dd, CH), 7.22 (1H, dd, CH), 8.22 (1H, s, CH). 13C-NMR (CH3OH-d4, δ, ppm): 113.61, 115.14, 115.25, 115.40, 115.48, 123.10, 123.42, 141.29, 146.05, 150.70, 159.14, 159.88. Anal. calcd. for C13H11FN2O2 (246.24 g/mol): C, 63.41; H, 4.50;
N, 11.38. Found: C, 63.79; H, 3.95; N, 11.87%. 2b: Yield 85%; mp: 194 °C (decomp.). FT-IR (cm-1): 3285 (N-H), 3063 (O-H), 1564 (azomethine, C=N); 1H-NMR (CH3OH-d4, δ, ppm): 6.89 (1H, d, CH), 7.03 (2H, dd, CH), 7.19 (1H, dd, CH), 7.25 (2H, dd, CH), 7.38 (1H, d, CH),
8.17 (1H, s, CH). 13C-NMR (CH3OH-d4, δ, ppm):
113.33, 114.35, 115.33, 116.01, 122.85, 123.88, 124.68, 128.74, 129.02, 144.02, 145.93, 149.02,
150.08. Anal. calcd. for C13H11ClN2O2 (262.69 g/mol): C, 59.44; H, 4.22; N, 10.66. Found: C, 59.08; H, 5.02; N, 11.41%.
3a: Yield 61%; mp: 176 °C. FT-IR (cm-1): 3305 (N-H), 3103,3083 (C-H), 1575 (azomethine, C=N), 1339,1295 (NO2); 1H-NMR (CH3OH-d4, δ, ppm): 7.05 (2H, dd, CH), 7.15 (2H, dd, CH), 7.62 (1H, d, CH), 8.05 (1H, dd CH), 8.15 (1H, s, CH), 8.82 (1H, s, CH). 13C-NMR (CH3OH-d4, δ, ppm): 113.35, 115.13, 115.36, 119.92, 121.91, 129.52,
130.70, 135.09, 137.14, 141.06, 147.08. Anal. calcd. for C13H9ClFN3O2 (293.68 g/mol): C, 53.17; H, 3.09; N, 14.31. Found: C, 52.83; H, 3.47; N, 14.81%. 3b: Yield 72%; mp: 188 °C. FT-IR (cm-1): 3301
(N-H), 3094, 3074 (C-H), 1575 (azomethine,
C=N), 1340,1289 (NO2); 1H-NMR (CH3OH-d4, δ, ppm): 7.13 (2H, dd, CH), 7.25 (2H, dd, CH), 7.62 (1H, d, CH), 8.05 (1H, dd, CH), 8.17 (1H, s, CH), 8.81 (1H, d, CH). 13C-NMR (CH3OH-d4, δ, ppm): 113.59, 120.02, 122.17, 124.54, 128.76, 130.45, 130.75, 135.19, 137.33, 143.37, 147.03. Anal.
calcd. for C13H9Cl2N3O2 (310.13 g/mol): C, 50.35; H, 2.93; N, 13.55. Found: C, 50.57; H, 3.37; N, 13.98%. RESULTS AND DISCUSSION The reaction of carbonyl compounds with fluoro-
or chloro-phenylhydrazines in an equimolar ratio completed in a couple of days and target compounds were obtained by crystallization from EtOAc:hexane solvent system (2:1) with
moderate to high yields. The compounds were moisture- and air-stable, and soluble in methanol and DMSO. Their structures were proved by FT-
IR, 1H- and 13C-NMR spectroscopic methods. FT-IR Spectra The important IR bands were presented in the experimental section. Besides, FT-IR spectra of 1a was shown in Figure 1. The sharp N-H band of
hydrazine compound in 1a was observed at 3320 cm-1 as overlapped with broad O-H stretching vibrations around 3268 cm-1. The band at 1596 cm-1 was indicator of the imine bond. Other Schiff bases were observed to exhibit FT-IR spectra with similar frequencies and no important changes.

Şenocak A. JOTCSA. 2019; 6(3): 303-310. RESEARCH ARTICLE
306
Figure 1: FT-IR spectrum of 1a.
NMR Spectra The 1H- and 13C-NMR spectra of all compounds confirmed the expected Schiff base structures. The 1H- and 13C-NMR spectra of 1a were shown in Figure 2. The singlet at about 2.33 ppm was
induced by the three protons of the methyl group. The other singlet was attributed to the methine proton placed between two tertiary aromatic carbon of carbonyl compound. While one of the
two doublet peaks belonging to carbonyl compound segment was observed at 6.38 ppm, the other one originating from methine proton adjacent to imine group was at 7.35 ppm. As it comes to phenylhydrazine ring protons, they
were observed as overlapped at 7.01 ppm. 13C-NMR peaks were in accordance with that of 1H-NMR peaks.
Figure 2: 1H- and 13C-NMR spectra of 1a.
Şenocak A. JOTCSA. 2019; 6(3): 303-310. RESEARCH ARTICLE
307
Molecular Docking Studies
Schiff bases were docked against AChE (PDB ID: 2CKM) and BChE (PDB ID: 1P0I) downloaded
from Protein Data Bank by using Molecular Docking Server (Figure 3). Their binding affinity
and interaction of amino acid residues near their
binding sites were also examined. Besides, pymol visual images of interacted proteins and ligands
were shown in Table 1.
Acetylcholinesterase (2CKM) Butyrylcholinesterase (1P0I)
Figure 3: PDB structure of the proteins.
The amino acid fragments predicted to form hydrogen bonds with ligands were GLU 374, GLU 455, TYR 282, TYR 121, ASN 230, SER 87, SER
235, GLN 514, ARG 515, ALA 516, VAL 453. Among six ligands, fluoro derivative had the
higher activity against butyrylcholinesterase while chloro derivative exhibited the higher binding affinity against acetylcholinesterase
(Table 2).
Table 1: Pymol visual images of ligand docked proteins.
Ligands
AChE
(2CKM)
BChE
(1P0I)
1a
1b

Şenocak A. JOTCSA. 2019; 6(3): 303-310. RESEARCH ARTICLE
308
2a
2b
3a
3b
Table 2: Calculated binding affinity values between proteins and ligands.
Ligand
2CKM 1P0I
Docking Score (kcal/mol)
Estimated Inhibition Constant
Docking Score (kcal/mol)
Estimated Inhibition Constant
1a -2.62 12 mM -3.14 5 mM
1b -2.76 9.42 mM -3.85 1.52 mM
2a -3.23 4.31 mM -3.39 3.25 mM
2b -3.61 2.26 mM -3.28 3.96 mM
3a -3.54 2.53 mM -4.14 926.18 M
3b -4.31 692.01 µM -3.60 2.28 mM
Şenocak A. JOTCSA. 2019; 6(3): 303-310. RESEARCH ARTICLE
309
Tacrine (THA) is the first cholinesterase inhibitor,
approved by the FDA and then withdrawn from the market because of its adverse effects.
Showing lower side effects in comparison with THA, 7-methoxy derivative (7-MEOTA) was observed to exhibit similar activity against cholinesterases. The Schiff base compounds 1a-
3b synthesized in this study exhibited lower docking scores in comparison with THA [-9.9 kcal/mol for AChE (2ckm) and -9.5 kcal/mol for BChE (1p0i)] and 7-MEOTA [-9.8 kcal/mol for AChE (2ckm) and -9.3 kcal/mol for BChE (1p0i)] (30).
CONCLUSIONS In conclusion, the Schiff bases composed of phenylhydrazine halogen derivatives and carbonyl compounds were synthesized and characterized by spectroscopic methods (FT-IR, 1H- and 13C-NMR). The compounds were prepared
by mixing fluoro- or chloro-phenylhydrazine with the carbonyl compounds in equimolar amount in ethanol. The results of spectroscopic methods were used to explain the structures of the compounds and verified the predicted Schiff base structures. Besides, the compounds which were
likely to exhibit inhibition activity on Alzheimer's disease were examined by molecular docking methods. The possibility of exhibiting inhibition activity of the Schiff bases on Alzheimer's disease was estimated based on similar chemical groups (phenyl ring and nitrogen atoms) included in their structure with Tacrine. All of the compounds
exhibited low to mild binding affinities against acetylcholinesterase and butyrylcholinesterase in comparison with reference compounds (THA and 7-MEOTA). Schiff bases 3a and 3b derived from
2-chloro-5-nitrobenzaldehyde showed best results for both cholinesterase proteins. According to the calculated results, especially 3a
and 3b were decided to be modified so as to use potential therapeutic agents for treating Alzheimer's disease. REFERENCES
1. Kumar R, Mani G. Exhibition of the Brønsted acid–base character of a Schiff base in palladium(II) complex formation: lithium complexation, fluxional properties and catalysis of Suzuki reactions in water. Dalt Trans. 2015;44(15):6896–908.
2. Nejati K, Rezvani Z, Massoumi B.
Syntheses and investigation of thermal properties of copper complexes with azo-containing Schiff-base dyes. Dye Pigment. 2007;75(3):653–7. 3. Ebenso EE, Isabirye DA, Eddy NO. Adsorption and Quantum Chemical Studies on the
Inhibition Potentials of Some Thiosemicarbazides for the Corrosion of Mild Steel in Acidic Medium. Int J Mol Sci [Internet]. 2010;11(6):2473–98.
4. Cinarli A, Gürbüz D, Tavman A, Birteksöz
AS. Synthesis, spectral characterizations and antimicrobial activity of some Schiff bases of 4-
chloro-2-aminophenol. Bull Chem Soc Ethiop. 2011;25(3):407–17. 5. Alshaheri AA, Tahir MIM, Rahman MBA,
Begum T, Saleh TA. Synthesis, characterisation and catalytic activity of dithiocarbazate Schiff base complexes in oxidation of cyclohexane. J Mol Liq. 2017;240:486–96. 6. Cuesta-Aluja L, Campos-Carrasco A, Castilla J, Reguero M, Masdeu-Bultó AM, Aghmiz
A. Highly active and selective Zn(II)-NN′O Schiff base catalysts for the cycloaddition of CO2to epoxides. J CO2 Util [Internet]. 2016;14:10–22. 7. Silku P, Özkinali S, Öztürk Z, Asan A, Köse DA. Synthesis of novel Schiff Bases containing
acryloyl moiety and the investigation of
spectroscopic and electrochemical properties. J Mol Struct. 2016;1116:72–83. 8. Karaer H, Gümrükçüoǧlu IE. Synthesis
and spectral characterisation of novel azo-azomethine dyes. Turkish J Chem. 1999;23(1):67–71. 9. Kajal A, Bala S, Kamboj S, Sharma N, Saini V. Schiff Bases: A Versatile Pharmacophore.
J Catal. 2013;2013:1–14. 10. Dayakar C, Jyothi D, Suman P, Raju BC. Condensation of Ortho-phenylenediamines and Phenylhydrazines with Ethyl 4-Chloro-3-oxobutanoate: A Facile Approach for the Synthesis of Substituted 1 H-Benzimidazoles,
Pyrazolones, and Pyrazoles. Synth Commun [Internet]. 2015;45(14):1642–51. 11. Anush SM, Vishalakshi B, Kalluraya B, Manju N. Synthesis of pyrazole-based Schiff bases of Chitosan: Evaluation of antimicrobial activity. Int J Biol Macromol [Internet].
2018;119:446–52. 12. Lv XH, Ren ZL, Li DD, Ruan BF, Li QS, Chu MJ, et al. Discovery of novel double pyrazole Schiff base derivatives as anti-tobacco mosaic virus (TMV) agents. Chinese Chem Lett
[Internet]. 2017;28(2):377–82. 13. Wazalwar SS, Banpurkar AR, Perdih F. Synthesis, Characterization, Molecular Docking
Studies and Anticancer Activity of Schiff Bases Derived from 3-(Substituted phenyl)-1-phenyl-1H-pyrazole-4-carbaldehyde and 2-Aminophenol.
J Chem Crystallogr [Internet]. 2018;48(4):185–99. 14. del Mar Conejo M, Cantero J, Pastor A, Álvarez E, Galindo A. Synthesis, structure and properties of nickel and copper complexes containing N,O-hydrazone Schiff base ligand.
Inorganica Chim Acta. 2018;470:113–8.

Şenocak A. JOTCSA. 2019; 6(3): 303-310. RESEARCH ARTICLE
310
15. Lapasam A, Dkhar L, Joshi N, Poluri KM, Kollipara MR. Antimicrobial selectivity of
ruthenium, rhodium, and iridium half sandwich complexes containing phenyl hydrazone Schiff base ligands towards B. thuringiensis and P. aeruginosa bacteria. Inorganica Chim Acta
[Internet]. 2019;484(August 2018):255–63. 16. Abedinifar F, Farnia SMF, Mahdavi M, Nadri H, Moradi A, Ghasemi JB, et al. Synthesis and cholinesterase inhibitory activity of new 2-benzofuran carboxamide-benzylpyridinum salts. Bioorg Chem. 2018;80:180–8.
17. Abbas-Mohammadi M, Moridi Farimani M, Salehi P, Nejad Ebrahimi S, Sonboli A, Kelso C, et al. Acetylcholinesterase-inhibitory activity of Iranian plants: Combined HPLC/bioassay-guided fractionation, molecular networking and docking
strategies for the dereplication of active
compounds. J Pharm Biomed Anal. 2018;158:471–9. 18. Makhaeva GF, Boltneva NP, Lushchekina S V., Rudakova E V., Serebryakova OG, Kulikova LN, et al. Synthesis, molecular docking, and
biological activity of 2-vinyl chromones: Toward selective butyrylcholinesterase inhibitors for potential Alzheimer’s disease therapeutics. Bioorganic Med Chem. 2018;26(16):4716–25. 19. Andrade-Jorge E, Sánchez-Labastida LA, Soriano-Ursúa MA, Guevara-Salazar JA, Trujillo-
Ferrara JG. Isoindolines/isoindoline-1,3-diones as AChE inhibitors against Alzheimer’s disease, evaluated by an improved ultra-micro assay. Med Chem Res. 2018;27(9):2187–98.
20. Larik FA, Shah MS, Saeed A, Shah HS, Channar PA, Bolte M, et al. New cholinesterase
inhibitors for Alzheimer’s disease: Structure activity relationship, kinetics and molecular docking studies of 1–butanoyl–3–arylthiourea derivatives. Int J Biol Macromol. 2018;116:144–50.
21. Arumugam N, Almansour AI, Suresh Kumar R, Altaf M, Padmanaban R, Sureshbabu P, et al. Spiropyrrolidine/spiroindolizino[6,7-b]indole heterocyclic hybrids: Stereoselective synthesis, cholinesterase inhibitory activity and their molecular docking study. Bioorg Chem. 2018;79:64–71.
22. Kilic B, Gulcan HO, Aksakal F, Ercetin T, Oruklu N, Umit Bagriacik E, et al. Design and
synthesis of some new carboxamide and
propanamide derivatives bearing phenylpyridazine as a core ring and the
investigation of their inhibitory potential on in-vitro acetylcholinesterase and butyrylcholinesterase. Bioorg Chem. 2018;79:235–49.
23. Senthil SL, Chandrasekaran R, Arjun HA, Anantharaman P. In vitro and in silico inhibition properties of fucoidan against α-amylase and α-D-glucosidase with relevance to type 2 diabetes mellitus. Carbohydr Polym. 2019;209:350–5.
24. Ghaleb A, Aouidate A, Bouachrine M, Lakhlifi T, Sbai A. Discovery of Novel 1,2,3-Triazole Analogues as Anti-Tuberculosis agents Using 3D QSAR, Molecular Docking, and In Silico ADMET Screening. Anal Bioanal Chem Res. 2019;6(1):215–29.
25. Almutairi MS, Leenaraj DR, Ghabbour HA, Joe IH, Attia MI. Spectroscopic identification, structural features, Hirshfeld surface analysis and molecular docking studies on stiripentol: An orphan antiepileptic drug. J Mol Struct. 2019;1180:110–8.
26. Chen Y, Liu J, Geng S, Liu Y, Ma H, Zheng J, et al. Lipase-catalyzed synthesis mechanism of tri-acetylated phloridzin and its antiproliferative activity against HepG2 cancer cells. Food Chem. 2019;277:186–94.
27. Halgren TA. Merck molecular force field. I. Basis, form, scope, parameterization, and performance of MMFF94. J Comput Chem. 1996;17(5–6):490–519.
28. Morris GM, Goodsell DS, Halliday RS, Huey R, Hart WE, Belew RK, et al. Automated
docking using a Lamarckian genetic algorithm and an empirical binding free energy function. J Comput Chem. 1998;19(14):1639–62. 29. Solis FJ, Wets RJ-B. Minimization by Random Search Techniques. Math Oper Res.
1981;6(1):19–30. 30. Spilovska K, Korabecny J, Kral J, Horova A, Musilek K, Soukup O, et al. 7-methoxytacrine-adamantylamine heterodimers as cholinesterase inhibitors in Alzheimer’s disease treatment - Synthesis, biological evaluation and molecular
modeling studies. Molecules. 2013;18(2):2397–
418.
Bayraktutan T. JOTCSA. 2019; 6(3): 311-318. RESEARCH ARTICLE
311
Molecular Interaction Between Cationic Polymer Polyethyleneimine and Rose Bengal Dye: A Spectroscopic Study
Tuğba BAYRAKTUTAN1*
1Department of Biochemistry, Faculty of Arts and Science, Iğdır University, Iğdır, Turkey
Abstract: The binding mechanism and polymer–fluorescence probe interactions between
polyethyleneimine (PEI) and Rose Bengal (RB) were investigated by using UV–Vis absorption, steady-state and time-resolved fluorescence spectroscopy techniques. The spectroscopic data indicated that unusual interactions and binding constant was calculated at 3.75 x 10² M-1 with high linearity for the PEI-RB system. The photophysical parameters of the dye, such as band shifts, fluorescence quantum yields, and fluorescence lifetimes, were determined. Non-radiative (knr) and radiative (kr) rate constants were
calculated and then compared.
Keywords: Polyethyleneimine, Rose Bengal, Absorption and Fluorescence Spectroscopy, Dye-Polymer Interaction Submitted: December 28, 2018. Accepted: July 10, 2019.
Cite this: Bayraktutan T. Molecular Interaction Between Cationic Polymer Polyethyleneimine and Rose Bengal Dye: A Spectroscopic Study. JOTCSA. 2019;6(3):311–8.
DOI: https://doi.org/10.18596/jotcsa.504528. *Corresponding author: E-mail: [email protected].
INTRODUCTION Among the studies on macromolecule-small molecule interactions, comprehensive studies are available on dye compounds and binding through
water-soluble synthetic or natural polymers. Many dyes were found to exhibit very different binding properties to unmodified PEI. Previous studies in this area have shown that the binding affinity of polyethyleneimine (PEI) is suitable (1, 2). Among the cationic polymers,
polyethyleneimine (PEI) is an applicable
transfection reactant derived from the polyamine group (3). It is a polymer with linear or branched forms. PEI acts as a good polymer chelating agent due to its water solubility and suitable molecular weights. It is a polymer where chelating properties are examined by using potentiometric and spectrophotometric methods (4, 5). In this
study, a branched PEI containing primary, secondary, and tertiary amino groups at approximately 1/4, 1/2 and 1/4 rates respectively, were used (6). In this study, PEI provides a change in the spectral properties for Rose Bengal (RB) dye through π -π stacking and
electrostatic interaction.
Rose Bengal (RB) is an anionic dye derived from xanthene. It is a water-soluble, xanthene -derived, an anionic dye, which has a high absorbance coefficient in the UV-visible region
and high sensitivity to light. The tendency to transfer long life radicals from the triplet excited state and intersystem crossing efficiency is high (7, 8). Since it is a dye that is highly sensitive to a micro-environment, it is much preferred in photophysical studies.
This study aims to examine the polymer-dye interactions between Polyethylenimine (PEI) and Rose Bengal (RB) by using UV-Vis absorption and fluorescence spectroscopy techniques. In this context, PEI is a good candidate because polyamine polymers have a high concentration of amine groups, which provides an effective
macromolecular environment in the aqueous solution. In this study, we will provide RB-PEI interaction, and the photophysical parameters will be discussed and an attempt presented for the polymer-dye interaction mechanism. The formation of complex and aggregation in the dye-
polymer interactions is one of the most common
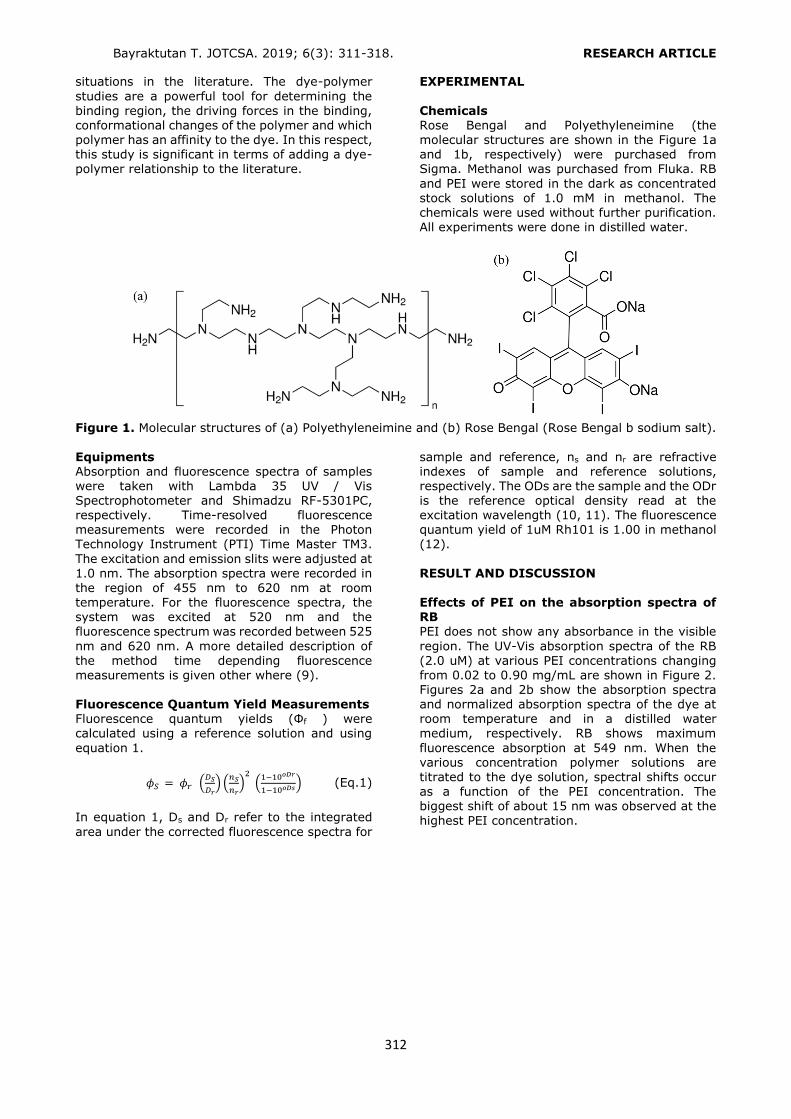
Bayraktutan T. JOTCSA. 2019; 6(3): 311-318. RESEARCH ARTICLE
312
situations in the literature. The dye-polymer
studies are a powerful tool for determining the
binding region, the driving forces in the binding, conformational changes of the polymer and which polymer has an affinity to the dye. In this respect, this study is significant in terms of adding a dye-polymer relationship to the literature.
EXPERIMENTAL
Chemicals Rose Bengal and Polyethyleneimine (the molecular structures are shown in the Figure 1a and 1b, respectively) were purchased from Sigma. Methanol was purchased from Fluka. RB
and PEI were stored in the dark as concentrated stock solutions of 1.0 mM in methanol. The chemicals were used without further purification. All experiments were done in distilled water.
Figure 1. Molecular structures of (a) Polyethyleneimine and (b) Rose Bengal (Rose Bengal b sodium salt).
Equipments Absorption and fluorescence spectra of samples were taken with Lambda 35 UV / Vis Spectrophotometer and Shimadzu RF-5301PC, respectively. Time-resolved fluorescence measurements were recorded in the Photon Technology Instrument (PTI) Time Master TM3.
The excitation and emission slits were adjusted at 1.0 nm. The absorption spectra were recorded in
the region of 455 nm to 620 nm at room temperature. For the fluorescence spectra, the system was excited at 520 nm and the fluorescence spectrum was recorded between 525
nm and 620 nm. A more detailed description of the method time depending fluorescence measurements is given other where (9). Fluorescence Quantum Yield Measurements Fluorescence quantum yields (Φf ) were calculated using a reference solution and using
equation 1.
𝜙𝑆 = 𝜙𝑟 (𝐷𝑆
𝐷𝑟) (
𝑛𝑆
𝑛𝑟)
2 (
1−10𝑜𝐷𝑟
1−10𝑜𝐷𝑠) (Eq.1)
In equation 1, Ds and Dr refer to the integrated
area under the corrected fluorescence spectra for
sample and reference, ns and nr are refractive indexes of sample and reference solutions, respectively. The ODs are the sample and the ODr is the reference optical density read at the excitation wavelength (10, 11). The fluorescence quantum yield of 1uM Rh101 is 1.00 in methanol (12).
RESULT AND DISCUSSION
Effects of PEI on the absorption spectra of RB PEI does not show any absorbance in the visible
region. The UV-Vis absorption spectra of the RB (2.0 uM) at various PEI concentrations changing from 0.02 to 0.90 mg/mL are shown in Figure 2. Figures 2a and 2b show the absorption spectra and normalized absorption spectra of the dye at room temperature and in a distilled water medium, respectively. RB shows maximum
fluorescence absorption at 549 nm. When the various concentration polymer solutions are titrated to the dye solution, spectral shifts occur as a function of the PEI concentration. The biggest shift of about 15 nm was observed at the
highest PEI concentration.
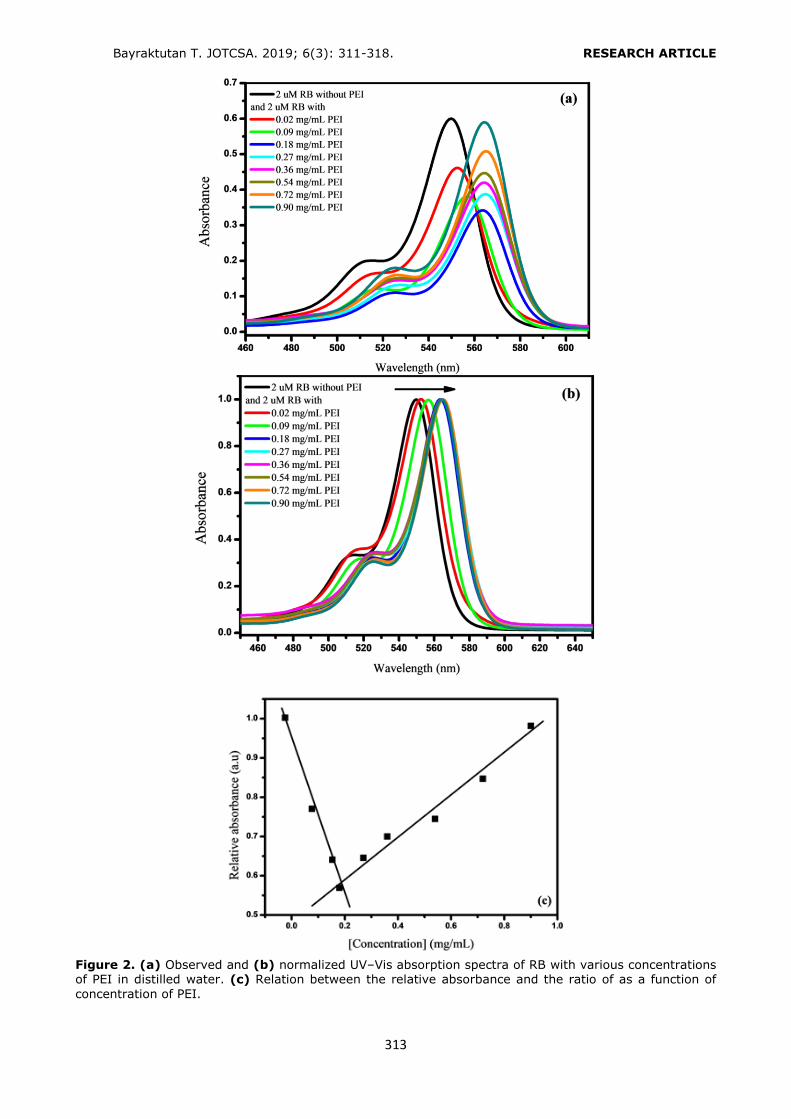
Bayraktutan T. JOTCSA. 2019; 6(3): 311-318. RESEARCH ARTICLE
313
Figure 2. (a) Observed and (b) normalized UV–Vis absorption spectra of RB with various concentrations of PEI in distilled water. (c) Relation between the relative absorbance and the ratio of as a function of
concentration of PEI.
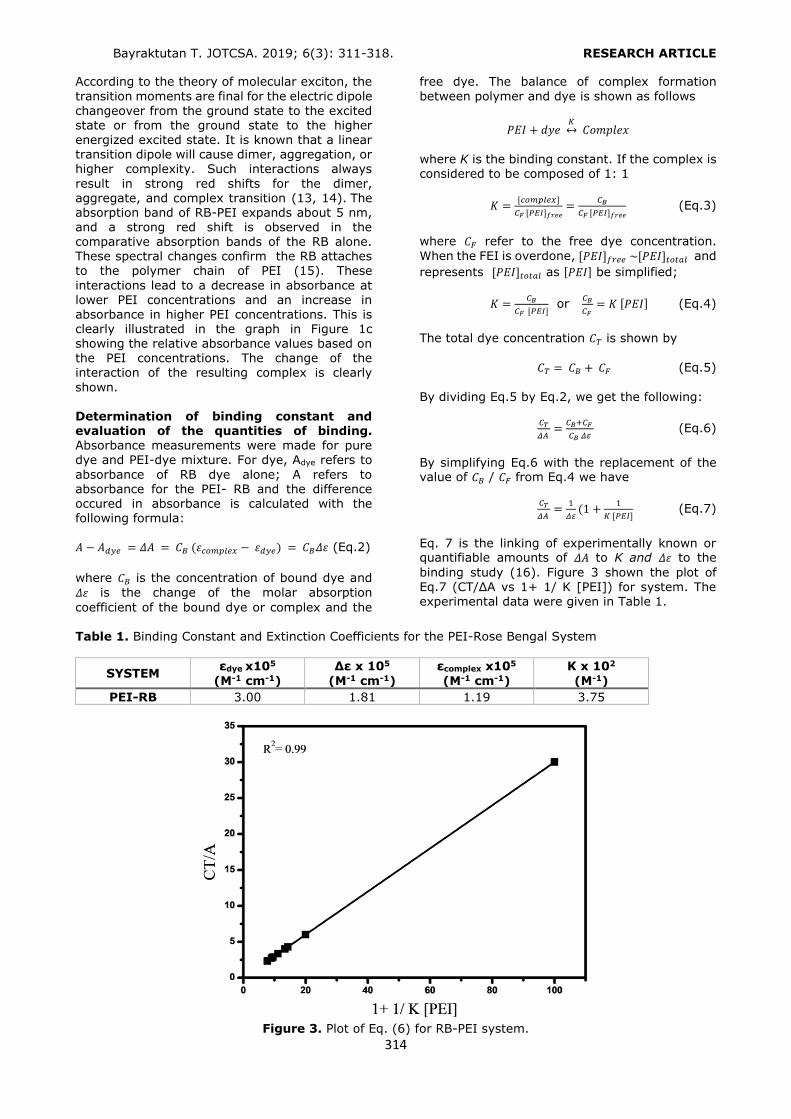
Bayraktutan T. JOTCSA. 2019; 6(3): 311-318. RESEARCH ARTICLE
314
According to the theory of molecular exciton, the
transition moments are final for the electric dipole
changeover from the ground state to the excited state or from the ground state to the higher energized excited state. It is known that a linear transition dipole will cause dimer, aggregation, or higher complexity. Such interactions always
result in strong red shifts for the dimer, aggregate, and complex transition (13, 14). The absorption band of RB-PEI expands about 5 nm, and a strong red shift is observed in the comparative absorption bands of the RB alone. These spectral changes confirm the RB attaches to the polymer chain of PEI (15). These
interactions lead to a decrease in absorbance at lower PEI concentrations and an increase in absorbance in higher PEI concentrations. This is clearly illustrated in the graph in Figure 1c
showing the relative absorbance values based on the PEI concentrations. The change of the interaction of the resulting complex is clearly
shown. Determination of binding constant and evaluation of the quantities of binding. Absorbance measurements were made for pure dye and PEI-dye mixture. For dye, Adye refers to
absorbance of RB dye alone; A refers to absorbance for the PEI- RB and the difference occured in absorbance is calculated with the following formula: 𝐴 − 𝐴𝑑𝑦𝑒 = 𝛥𝐴 = 𝐶𝐵 (𝜀𝑐𝑜𝑚𝑝𝑙𝑒𝑥 − 𝜀𝑑𝑦𝑒) = 𝐶𝐵𝛥𝜀 (Eq.2)
where 𝐶𝐵 is the concentration of bound dye and
𝛥𝜀 is the change of the molar absorption
coefficient of the bound dye or complex and the
free dye. The balance of complex formation
between polymer and dye is shown as follows
𝑃𝐸𝐼 + 𝑑𝑦𝑒 𝐾↔ 𝐶𝑜𝑚𝑝𝑙𝑒𝑥
where K is the binding constant. If the complex is considered to be composed of 1: 1
𝐾 =[𝑐𝑜𝑚𝑝𝑙𝑒𝑥]
𝐶𝐹 [𝑃𝐸𝐼]𝑓𝑟𝑒𝑒=
𝐶𝐵
𝐶𝐹 [𝑃𝐸𝐼]𝑓𝑟𝑒𝑒 (Eq.3)
where 𝐶𝐹 refer to the free dye concentration.
When the FEI is overdone, [𝑃𝐸𝐼]𝑓𝑟𝑒𝑒 ~[𝑃𝐸𝐼]𝑡𝑜𝑡𝑎𝑙 and
represents [𝑃𝐸𝐼]𝑡𝑜𝑡𝑎𝑙 as [𝑃𝐸𝐼] be simplified;
𝐾 =𝐶𝐵
𝐶𝐹 [𝑃𝐸𝐼] or
𝐶𝐵
𝐶𝐹 = 𝐾 [𝑃𝐸𝐼] (Eq.4)
The total dye concentration 𝐶𝑇 is shown by
𝐶𝑇 = 𝐶𝐵 + 𝐶𝐹 (Eq.5)
By dividing Eq.5 by Eq.2, we get the following:
𝐶𝑇
𝛥𝐴 =
𝐶𝐵+𝐶𝐹
𝐶𝐵 𝛥𝜀 (Eq.6)
By simplifying Eq.6 with the replacement of the value of 𝐶𝐵 / 𝐶𝐹 from Eq.4 we have
𝐶𝑇
𝛥𝐴 =
1
𝛥𝜀(1 +
1
𝐾 [𝑃𝐸𝐼] (Eq.7)
Eq. 7 is the linking of experimentally known or quantifiable amounts of 𝛥𝐴 to K and 𝛥𝜀 to the
binding study (16). Figure 3 shown the plot of
Eq.7 (CT/ΔA vs 1+ 1/ K [PEI]) for system. The experimental data were given in Table 1.
Table 1. Binding Constant and Extinction Coefficients for the PEI-Rose Bengal System
SYSTEM εdye x105
(M-1 cm-1)
Δε x 105
(M-1 cm-1)
εcomplex x105
(M-1 cm-1)
K x 102
(M-1)
PEI-RB 3.00 1.81 1.19 3.75
Figure 3. Plot of Eq. (6) for RB-PEI system.
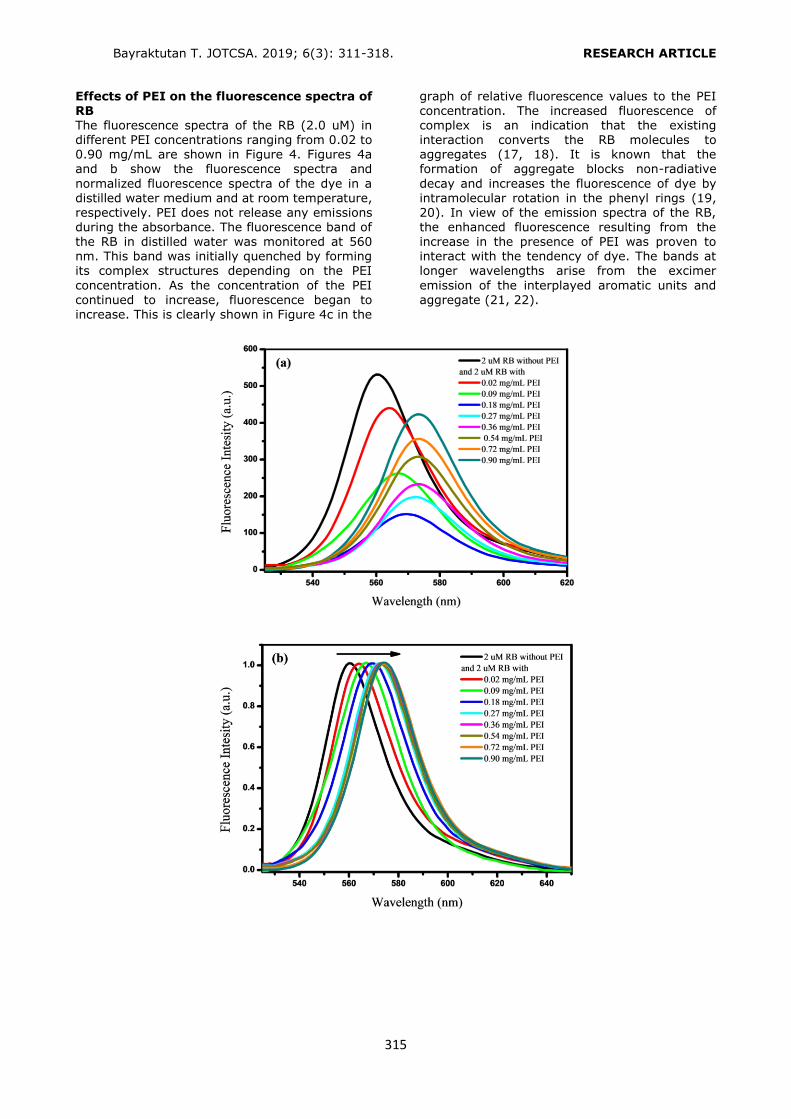
Bayraktutan T. JOTCSA. 2019; 6(3): 311-318. RESEARCH ARTICLE
315
Effects of PEI on the fluorescence spectra of
RB The fluorescence spectra of the RB (2.0 uM) in different PEI concentrations ranging from 0.02 to 0.90 mg/mL are shown in Figure 4. Figures 4a and b show the fluorescence spectra and
normalized fluorescence spectra of the dye in a distilled water medium and at room temperature, respectively. PEI does not release any emissions during the absorbance. The fluorescence band of the RB in distilled water was monitored at 560 nm. This band was initially quenched by forming its complex structures depending on the PEI
concentration. As the concentration of the PEI continued to increase, fluorescence began to increase. This is clearly shown in Figure 4c in the
graph of relative fluorescence values to the PEI
concentration. The increased fluorescence of complex is an indication that the existing interaction converts the RB molecules to aggregates (17, 18). It is known that the formation of aggregate blocks non-radiative
decay and increases the fluorescence of dye by intramolecular rotation in the phenyl rings (19, 20). In view of the emission spectra of the RB, the enhanced fluorescence resulting from the increase in the presence of PEI was proven to interact with the tendency of dye. The bands at longer wavelengths arise from the excimer
emission of the interplayed aromatic units and aggregate (21, 22).
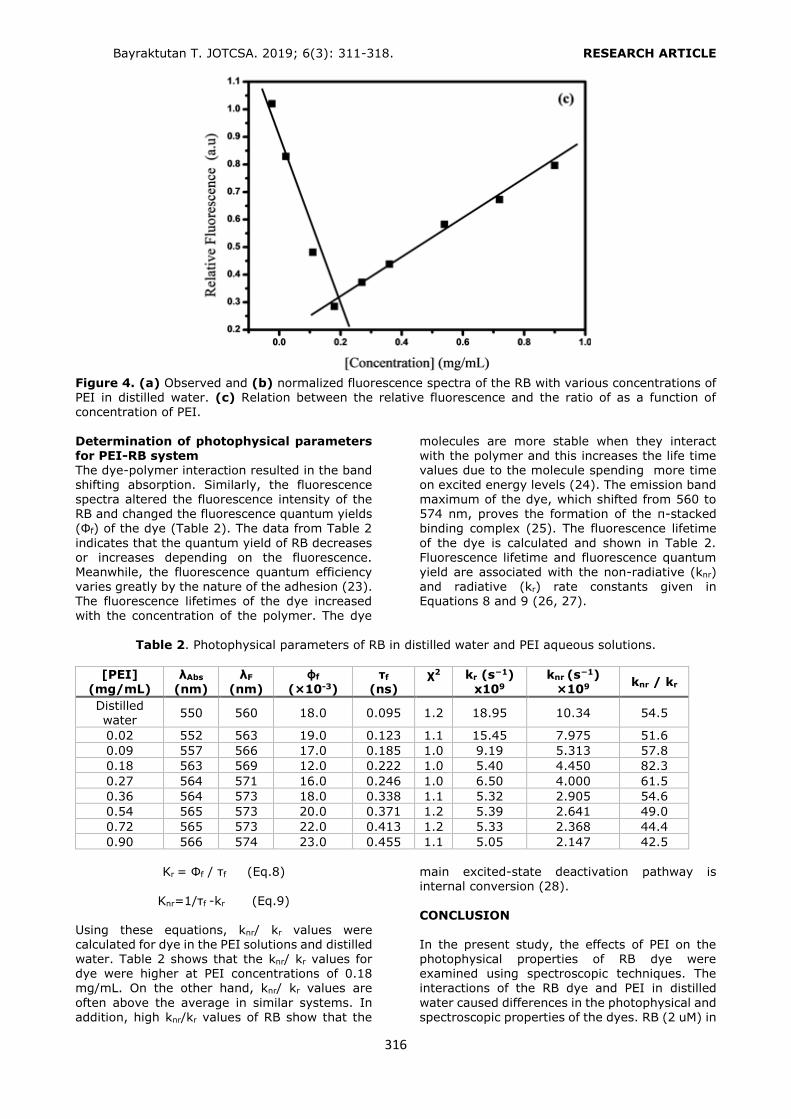
Bayraktutan T. JOTCSA. 2019; 6(3): 311-318. RESEARCH ARTICLE
316
Figure 4. (a) Observed and (b) normalized fluorescence spectra of the RB with various concentrations of PEI in distilled water. (c) Relation between the relative fluorescence and the ratio of as a function of concentration of PEI.
Determination of photophysical parameters for PEI-RB system The dye-polymer interaction resulted in the band shifting absorption. Similarly, the fluorescence spectra altered the fluorescence intensity of the RB and changed the fluorescence quantum yields (Фf) of the dye (Table 2). The data from Table 2
indicates that the quantum yield of RB decreases or increases depending on the fluorescence. Meanwhile, the fluorescence quantum efficiency
varies greatly by the nature of the adhesion (23). The fluorescence lifetimes of the dye increased with the concentration of the polymer. The dye
molecules are more stable when they interact with the polymer and this increases the life time values due to the molecule spending more time on excited energy levels (24). The emission band maximum of the dye, which shifted from 560 to 574 nm, proves the formation of the π-stacked binding complex (25). The fluorescence lifetime
of the dye is calculated and shown in Table 2. Fluorescence lifetime and fluorescence quantum yield are associated with the non-radiative (knr)
and radiative (kr) rate constants given in Equations 8 and 9 (26, 27).
Table 2. Photophysical parameters of RB in distilled water and PEI aqueous solutions.
[PEI] (mg/mL)
λAbs (nm)
λF
(nm)
ɸf
(×10-3) τf
(ns)
χ2
kr (s−1)
x109
knr (s−1) ×109
knr / kr
Distilled water
550 560 18.0 0.095 1.2 18.95 10.34 54.5
0.02 552 563 19.0 0.123 1.1 15.45 7.975 51.6
0.09 557 566 17.0 0.185 1.0 9.19 5.313 57.8
0.18 563 569 12.0 0.222 1.0 5.40 4.450 82.3
0.27 564 571 16.0 0.246 1.0 6.50 4.000 61.5
0.36 564 573 18.0 0.338 1.1 5.32 2.905 54.6
0.54 565 573 20.0 0.371 1.2 5.39 2.641 49.0
0.72 565 573 22.0 0.413 1.2 5.33 2.368 44.4
0.90 566 574 23.0 0.455 1.1 5.05 2.147 42.5
Kr = Фf / τf (Eq.8)
Knr=1/τf -kr (Eq.9) Using these equations, knr/ kr values were calculated for dye in the PEI solutions and distilled water. Table 2 shows that the knr/ kr values for dye were higher at PEI concentrations of 0.18 mg/mL. On the other hand, knr/ kr values are
often above the average in similar systems. In addition, high knr/kr values of RB show that the
main excited-state deactivation pathway is internal conversion (28).
CONCLUSION In the present study, the effects of PEI on the photophysical properties of RB dye were examined using spectroscopic techniques. The interactions of the RB dye and PEI in distilled
water caused differences in the photophysical and spectroscopic properties of the dyes. RB (2 uM) in
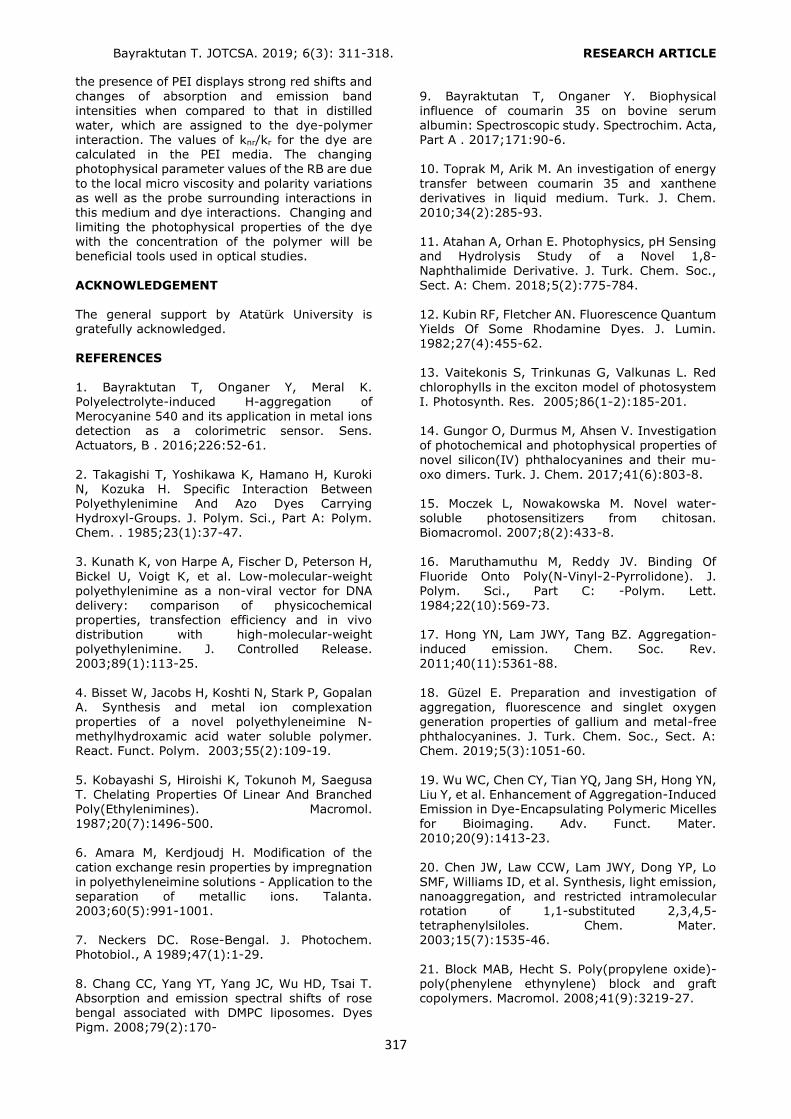
Bayraktutan T. JOTCSA. 2019; 6(3): 311-318. RESEARCH ARTICLE
317
the presence of PEI displays strong red shifts and
changes of absorption and emission band
intensities when compared to that in distilled water, which are assigned to the dye-polymer interaction. The values of knr/kr for the dye are calculated in the PEI media. The changing photophysical parameter values of the RB are due
to the local micro viscosity and polarity variations as well as the probe surrounding interactions in this medium and dye interactions. Changing and limiting the photophysical properties of the dye with the concentration of the polymer will be beneficial tools used in optical studies.
ACKNOWLEDGEMENT The general support by Atatürk University is gratefully acknowledged.
REFERENCES
1. Bayraktutan T, Onganer Y, Meral K. Polyelectrolyte-induced H-aggregation of Merocyanine 540 and its application in metal ions detection as a colorimetric sensor. Sens. Actuators, B . 2016;226:52-61.
2. Takagishi T, Yoshikawa K, Hamano H, Kuroki N, Kozuka H. Specific Interaction Between Polyethylenimine And Azo Dyes Carrying Hydroxyl-Groups. J. Polym. Sci., Part A: Polym. Chem. . 1985;23(1):37-47. 3. Kunath K, von Harpe A, Fischer D, Peterson H,
Bickel U, Voigt K, et al. Low-molecular-weight
polyethylenimine as a non-viral vector for DNA delivery: comparison of physicochemical properties, transfection efficiency and in vivo distribution with high-molecular-weight polyethylenimine. J. Controlled Release. 2003;89(1):113-25.
4. Bisset W, Jacobs H, Koshti N, Stark P, Gopalan A. Synthesis and metal ion complexation properties of a novel polyethyleneimine N-methylhydroxamic acid water soluble polymer. React. Funct. Polym. 2003;55(2):109-19.
5. Kobayashi S, Hiroishi K, Tokunoh M, Saegusa T. Chelating Properties Of Linear And Branched Poly(Ethylenimines). Macromol.
1987;20(7):1496-500. 6. Amara M, Kerdjoudj H. Modification of the
cation exchange resin properties by impregnation in polyethyleneimine solutions - Application to the separation of metallic ions. Talanta. 2003;60(5):991-1001. 7. Neckers DC. Rose-Bengal. J. Photochem. Photobiol., A 1989;47(1):1-29.
8. Chang CC, Yang YT, Yang JC, Wu HD, Tsai T. Absorption and emission spectral shifts of rose bengal associated with DMPC liposomes. Dyes Pigm. 2008;79(2):170-
9. Bayraktutan T, Onganer Y. Biophysical
influence of coumarin 35 on bovine serum albumin: Spectroscopic study. Spectrochim. Acta, Part A . 2017;171:90-6. 10. Toprak M, Arik M. An investigation of energy
transfer between coumarin 35 and xanthene derivatives in liquid medium. Turk. J. Chem. 2010;34(2):285-93. 11. Atahan A, Orhan E. Photophysics, pH Sensing and Hydrolysis Study of a Novel 1,8-Naphthalimide Derivative. J. Turk. Chem. Soc.,
Sect. A: Chem. 2018;5(2):775-784. 12. Kubin RF, Fletcher AN. Fluorescence Quantum Yields Of Some Rhodamine Dyes. J. Lumin.
1982;27(4):455-62. 13. Vaitekonis S, Trinkunas G, Valkunas L. Red
chlorophylls in the exciton model of photosystem I. Photosynth. Res. 2005;86(1-2):185-201. 14. Gungor O, Durmus M, Ahsen V. Investigation of photochemical and photophysical properties of novel silicon(IV) phthalocyanines and their mu-
oxo dimers. Turk. J. Chem. 2017;41(6):803-8. 15. Moczek L, Nowakowska M. Novel water-soluble photosensitizers from chitosan. Biomacromol. 2007;8(2):433-8. 16. Maruthamuthu M, Reddy JV. Binding Of
Fluoride Onto Poly(N-Vinyl-2-Pyrrolidone). J.
Polym. Sci., Part C: -Polym. Lett. 1984;22(10):569-73. 17. Hong YN, Lam JWY, Tang BZ. Aggregation-induced emission. Chem. Soc. Rev. 2011;40(11):5361-88.
18. Güzel E. Preparation and investigation of aggregation, fluorescence and singlet oxygen generation properties of gallium and metal-free phthalocyanines. J. Turk. Chem. Soc., Sect. A: Chem. 2019;5(3):1051-60.
19. Wu WC, Chen CY, Tian YQ, Jang SH, Hong YN, Liu Y, et al. Enhancement of Aggregation-Induced Emission in Dye-Encapsulating Polymeric Micelles
for Bioimaging. Adv. Funct. Mater. 2010;20(9):1413-23.
20. Chen JW, Law CCW, Lam JWY, Dong YP, Lo SMF, Williams ID, et al. Synthesis, light emission, nanoaggregation, and restricted intramolecular rotation of 1,1-substituted 2,3,4,5-tetraphenylsiloles. Chem. Mater. 2003;15(7):1535-46.
21. Block MAB, Hecht S. Poly(propylene oxide)-poly(phenylene ethynylene) block and graft copolymers. Macromol. 2008;41(9):3219-27.

Bayraktutan T. JOTCSA. 2019; 6(3): 311-318. RESEARCH ARTICLE
318
22. Wehry EL. Principles Of Fluorescence
Spectroscopy - Lakowicz,JR. Am. Sci.
1984;72(4):395-6. 23. Lepecq JB. Citation Classic - A Fluorescent Complex Between Ethidium-Bromide And Nucleic-Acids - Physical-Chemical Characterization.
Current Contents/Life Sci. 1984(35):16-20. 24. Datta A, Mandal D, Pal SK, Bhattacharyya K. Intramolecular charge transfer processes in confined systems. Nile red in reverse micelles. J. Phys. Chem. B. 1997;101(49):10221-5.
25. Ozcelik S, Atay NZ. Optical transition rates of a meso-substituted thiacarbocyanine in methanol-in-oil reverse micelles (vol 113, pg 1,
2005). J. Lumin. 2005;114(3-4):314-8.
26. Thomas SW, Joly GD, Swager TM. Chemical sensors based on amplifying fluorescent conjugated polymers. Chem. Rev. 2007;107(4):1339-86.
27. Gur B, Meral K. The effect of poly(vinyl alcohol) on the photophysical properties of pyronin dyes in aqueous solution: A spectroscopic study. Spectrochim. Acta, Part A. 2013;101:306-13. 28. Bayraktutan T, Meral K, Onganer Y.
Photophysical properties of pyronin dyes in reverse micelles of AOT. J. Lumin. 2014;145:925-9.
Pekbelgin Karaoğlu H, Kalkan Burat A. JOTCSA. 2019; 6(3): 319-328. RESEARCH ARTICLE
319
Synthesis and photophysical properties of a non-symmetrically
substituted phthalocyanine-pyrene conjugate
Hande Pekbelgin Karaoğlu*, Ayfer Kalkan Burat
Istanbul Technical University, Department of Chemistry, TR34469, İstanbul, Turkey.
Abstract: An unsymmetrical zinc phthalocyanine (ZnPc) (5) bearing one pyrene (Py) and six tert-
butylphenoxy units was synthesized in 3 steps. The unsymmetrical zinc phthalocyanine carrying the protecting group was synthesized in the first step. In the second stage, the protecting group was removed
and in the final stage pyrene structure was introduced with the Sonagashira coupling reaction. The new compound was characterized by using spectroscopic techniques. The photophysical measurements of the
conjugated structure were performed to determine the effect of the pyrene group on the fluorescence of Pc. It was determined that the absorption of the pyrene structure around 350 nm was overlapping with the B-band of phthalocyanine after conjugation. Fluorescence quantum yield (ΦF) and lifetime (τF) were calculated. The fluorescence quenching examinations were performed by adding the different concentration of 1,4-benzoquinone (BQ) in N,N-dimethylformamide (DMF) and the Stern-Volmer constant (Ksv) and
quenching constant (kq) values of unsymmetrical zinc phthalocyanine (5) were determined.
Keywords: Zinc, pyrene, phthalocyanine, fluorescence, characterization. Submitted: May 30, 2019. Accepted: July 16, 2019.
Cite this: Pekbelgin Karaoğlu H, Kalkan Burat A. Synthesis and photophysical properties of a non-symmetrically substituted phthalocyanine-pyrene conjugate. JOTCSA. 2019;6(3):319–28.
DOI: https://doi.org/10.18596/jotcsa.572013. *Corresponding author. E-mail: [email protected].
INTRODUCTION Phthalocyanines (Pcs) have 18 π-electron system and they are disc-like aromatic macrocycles. Due to the π–electron delocalization over the molecule, they have unique photophysical, photochemical, redox, and coordination
properties, and high chemical and thermal stability (1). The properties of Pcs depend on both the electronic properties of the central metal cations and the nature of substituents. It is advantageous to substitute the functional groups at the peripheral or non-peripheral positions of
the Pcs, since they provide solubility and it also tunes the color of the material. Substitution of functional groups also changes the electron density of the phthalocyanines and allows the use in various fields such as solar cells, sensors, liquid crystals, and nonlinear optics (2-6).
Although Pcs display good chemical and photochemical properties, their fluorescence properties are poor (7). Large central metals reduce the fluorescence by enhancement of the
intersystem crossing to the triple state, hence restricting the applications of phthalocyanines in imaging (8). The fluorescence properties of the aromatic structure may alter by the interaction of a Pc core with a fluorescent probe like pyrene group. The chemical or physical binding of the fluorescent probe to the Pc causes a shift in the
spectrum or a change in intensity (9). It is well known that pyrene (Py) has a high quantum yield of fluorescence and a relatively long lifetime of singlet excited state (10). Pyrene is one of the most popular fluorescent
chromophores used for photochemical applications. Pyrene derivatives with high quantum yields and lifetime, and are also valuable molecular probes for fluorescence spectroscopy (0.65 and 410 ns, respectively, in ethanol at 293 K) (11). In addition, pyrene and its derivatives have often been used as anchor
groups to facilitate electron transfer into the acceptor domains (12).

Pekbelgin Karaoğlu H, Kalkan Burat A. JOTCSA. 2019; 6(3): 319-328. RESEARCH ARTICLE
320
Phthalocyanine-pyrene (Pc-Py) conjugates
appear to be promising candidates for solar cells, sensors, nonlinear optical and photovoltaic
applications because of their photophysical and photochemical properties (13-16). According to the literature, the presence of pyrene groups in the structure of phthalocyanine improves the π–π
interaction between the Pc-Py and single-wall carbon nanotubes (SWCNT). Non-covalent functionalization of single-wall carbon nanotubes (SWNTs) with Pc-Py molecules were accomplished by Torres et al. to form stable hybrids (17). Durmus and coworkers synthesized hybrids of SWNT with phthalocyanines bearing
one pyrene unit and studied their sensory response to ammonia vapor (18). They reported that the pyrene units and its derivatives display a strong affinity towards sp2-nanocarbon networks (19, 20). In another study, tri-and tetra-pyrene substituted indium phthalocyanines (InPcs) with
strong triplet absorption and high triplet yields
were investigated for the third- and second-order nonlinearities by Nykong et al. (15). From the point of view, the aim of this study is to synthesize pyrenyl substituted unsymmetrical zinc phthalocyanine for the preparation of light-
harvesting antennae. Although there are symmetrically or unsymmetrically substituted phthalocyanine-pyrene conjugated structures in the literature (21-24), unsymmetrically substituted zinc phthalocyanine in which the pyrenyl group was bound to the phthalocyanine ring, was synthesized for the first time. The
photophysical properties of this new compound was investigated by fluorescence measurements. EXPERIMENTAL SECTION
Materials and methods All reported 1H- NMR spectra were recorded on an
Agilent VNMRS 500 MHz spectrometer. Fluorescence and UV-Vis spectra were obtained using Perkin-Elmer LS55 fluorescence and Scinco LabProPlus UV/Vis spectrophotometers. FTIR spectra of the compounds were recorded on a Perkin-Elmer Spectrum One FTIR spectrometer.
Mass spectra were measured on a Bruker Microflex LT MALDI-TOF MS spectrometer. The isotopic patterns for all assigned signals are in agreement with the calculated natural abundance. 4,5-Bis-(4-tert-butylphenoxy)phthalonitrile (1), 4-(3-hydroxy-3-methyl-1-butynyl)phthalonitrile (2),
2,3,9,10,16,17-hexakis(tert-butylphenoxy)-23-
(3-hydroxy-3-methyl-1-butynyl)phthalocyaninato zinc(II) (3) and 2,3,9,10,16,17-hexakis(tert-butylphenoxy)-23-(ethynyl)phthalocyaninato zinc(II) (4) were prepared according to reported procedures (25-27).
Preparation Synthesis of 2,3,9,10,16,17-Hexakis(tert-butylphenoxy)-23-(pyrenyl)phthalocyaninato
zinc(II) (5): 100 mg of compound 4 (0.07 mmol)
was dissolved in 10 mL of dry tetrahydrofuran (THF) /trimethylamine (1:1) mixture and then 40
mg of 1-bromopyrene (0.13 mmol), 3 mg of bis(triphenylphosphine)palladium(II) chloride (0.004 mmol), and a catalytic amount of copper(I) iodide (1 mmol, 0.1 mg) were added to
this solution. The reaction mixture was heated to 60 °C for 24 h under nitrogen (N2) atmosphere. Once the ethynyl derivative is consumed, monitored by TLC, the mixture was filtered over celite and the solvent was removed under vacuum. The green product was purified by column chromatography on silica gel using first
hexane/dioxane (3:1) and then dichloromethane (DCM) /methanol (MeOH) (50:1) as eluents. Solubility: Soluble in THF, CH2Cl2, DMF, and DMSO. Yield: 0.026 g, (24 %). FT-IR (υmax/cm-1): 3039 (Ar-C-H), 2957-2869 (Aliph. -C-H), 2206 (C≡C), 1506 (Ar-C=C), 1173 (Ar-O-Ar), 1087
(Ar-O-Ar). UV-Vis λmax (nm) THF: 269, 356, 683;
DMF: 267, 365, 684. 1H-NMR (500 MHz, CDCl3): δ, ppm 7.65-7.33 (42 H, m, Ar-H) 1.30 (54 H, s, CH3). Anal. Calc. for C110H96N8O6Zn (1689.68 g/mol) %: C, 78.11; H, 5.72; N, 6.63 Found: C, 78.12; H, 5.69; N, 6.56. MS (MALDI-TOF): m/z 1689.66 [M]+.
Photophysical parameters Fluorescence quantum yields and lifetimes: The comparative method was used to determine the fluorescence quantum yields (ΦF) according to the Eq. (1) below (28, 29), utilizing non-
substituted ZnPc in DMF as the standard (ΦF = 0.17) (28, 29):
∅F=∅F(Std)FAStdη2
FStdAηStd2
(Eq. 1)
where F and FStd are the areas under the fluorescence emission curves of the phthalocyanine (5) and the standard, respectively. AStd and A are the respective absorbances at the excitation of standard and 5, ηStd and η are the refractive index of solvent (ηDMF
= 1.496) used for the standard and sample. The fluorescence lifetime (τF), which is the average time of the molecule at the excited state before fluorescing, was found using the PhotochemCAD program and the Strickler-Berg equation. The fluorescence quantum yield (ΦF)
and the fluorescence lifetime (τF) value are
directly proportional. The natural radiative lifetime (τo) was calculated with Eq. (2) (28, 29):
∅F = τFτo⁄
(Eq. 2) Fluorescence quenching by 1,4-benzoquinone: Fluorescence quenching experiments were carried out in DMF with the addition of BQ
solutions ranging from 0 to 0.040 M into the ZnPc solution. With the addition of BQ, an energy
Pekbelgin Karaoğlu H, Kalkan Burat A. JOTCSA. 2019; 6(3): 319-328. RESEARCH ARTICLE
321
transfer takes place between the excited ZnPc
(fluorophore) and the BQ (quencher). The fluorescence spectra of ZnPc were recorded each
time after the addition of different concentration of BQ. Changes in fluorescence intensity due to BQ concentration were consistent with the kinetic mechanism of the Stern-Volmer (SV) equation
(Eq 3) (30):
𝐼0
𝐼= 1 + 𝐾𝑆𝑉[𝐵𝑄]
(Eq. 3) where I0 and I are the fluorescence intensities of fluorophore in the absence and presence of quencher, respectively. [BQ] is the concentration
of the quencher and KSV is the Stern-Volmer constant. KSV is the product of the bimolecular quenching constant (kq) and the τF, and is shown in Eq. (4) (31):
𝐾𝑆𝑉 = 𝑘𝑞 × 𝜏𝐹
(Eq. 4)
The ratios of I0/I were calculated and plotted
against [BQ] according to Eq. (4), and KSV is determined from the slope. RESULTS AND DISCUSSION Synthesis and spectroscopic
characterization There are three methods for the preparation of usymmetrically substituted Pcs. These include a statistical condensation of two different phthalonitriles (32-34), a polymeric support method (35, 36) and a ring-expansion of sub-
phthalocyanine (SubPc) (37, 38). Sub-Pcs undergo ring expansion when reacted with diaminoisoindoline or its analogues, resulting in the A3B type phthalocyanines. Although ring expansion reaction is highly selective and the A3B phthalocyanine is the major product, this only applies to limited phthalonitriles. It is because the
ring expansion reaction is dependent on the experimental conditions and the electronic properties of the reactants (39-42). Despite the variety of commercially available polymeric supports, phthalonitriles having a functional
group that can bind to the polymer and then be
separated under acidic or alkaline conditions is limited. Therefore, the synthesis of A3B type
phthalocyanines by the polymeric support route is restricted (43, 44). Since the starting materials used in this study do not have a functional group that can bind to the polymer, the statistical
condensation method is preferred. If the reactivities of the two phthalonitrile involved in the condensation are similar, the symmetrical A4 type Pc (33%), the asymmetrical A3B type Pc (44%) and the remaining Pcs (23%) can be obtained using a 3 : 1 (A:B) ratio. In this method, the use of phthalonitriles with different solubility
properties will facilitate purification of the targeted asymmetric phthalocyanine. Phthalonitrile 1 and phthalonitrile 2 were used as starting materials. Compound 1 was synthesized from the reaction of 4-tert-butylphenol with 4,5-
dichlorophthalonitrile in dimethyl sulfoxide
(DMSO). The reaction was completed at 90 °C for 4 hours and potassium carbonate (K2CO3) was used as the base (25). Nitrile 2 was prepared by the reaction of 2-methylbut-3-yn-2-ol with 4-iodophthalonitrile under typical Sonogashira reaction conditions (26, 45). The mixed
condensation of phthalonitrile precursors 1 and 2 with zinc chloride (ZnCl2) in 2-dimethylaminoethanol (DMAE) at 145 °C afforded the corresponding zinc phthalocyanine (3) (Scheme 1). The desired phthalocyanine (3) was purified by column chromatography. The dioxane:hexane (1:3) mixture was used as the
eluent on silica gel and the compound was obtained in moderate yield (14%) (27). The protecting group was then removed by treatment with sodium hydroxide in toluene to give the
ethynyl derivative (4) (27). The resulting crude product was purified by column chromatography on silica gel by using dioxane:hexane (1:5) as
eluent. Phthalocyanine 4 was obtained as green solid in a 69% yield. The Sonagashira coupling reaction between compound 4 and 1-bromopyrene in THF/trimethylamine with bis(triphenylphosphine)palladium(II)chloride and copper(I)iodide as catalyst at 60 °C under N2
atmosphere led to the formation of 5 in 24% yield.
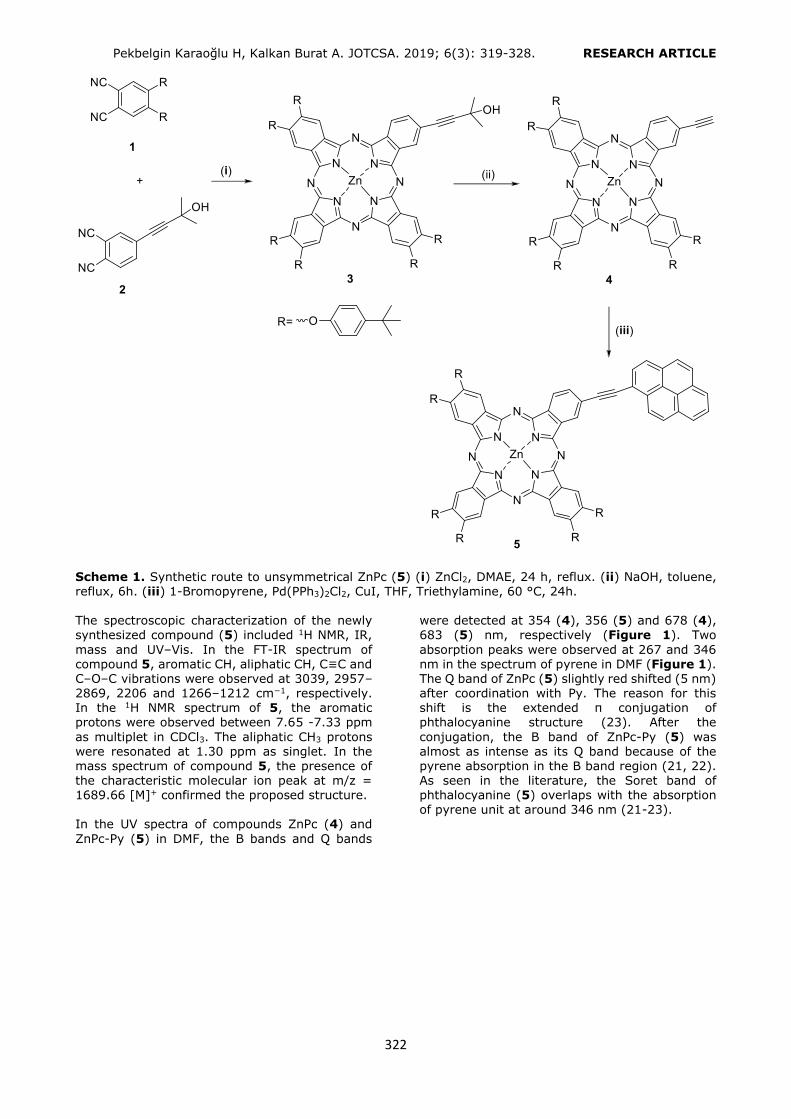
Pekbelgin Karaoğlu H, Kalkan Burat A. JOTCSA. 2019; 6(3): 319-328. RESEARCH ARTICLE
322
Scheme 1. Synthetic route to unsymmetrical ZnPc (5) (i) ZnCl2, DMAE, 24 h, reflux. (ii) NaOH, toluene, reflux, 6h. (iii) 1-Bromopyrene, Pd(PPh3)2Cl2, CuI, THF, Triethylamine, 60 °C, 24h. The spectroscopic characterization of the newly
synthesized compound (5) included 1H NMR, IR,
mass and UV–Vis. In the FT-IR spectrum of compound 5, aromatic CH, aliphatic CH, C≡C and C–O–C vibrations were observed at 3039, 2957–2869, 2206 and 1266–1212 cm−1, respectively. In the 1H NMR spectrum of 5, the aromatic protons were observed between 7.65 -7.33 ppm
as multiplet in CDCl3. The aliphatic CH3 protons were resonated at 1.30 ppm as singlet. In the mass spectrum of compound 5, the presence of the characteristic molecular ion peak at m/z = 1689.66 [M]+ confirmed the proposed structure. In the UV spectra of compounds ZnPc (4) and
ZnPc-Py (5) in DMF, the B bands and Q bands
were detected at 354 (4), 356 (5) and 678 (4),
683 (5) nm, respectively (Figure 1). Two
absorption peaks were observed at 267 and 346 nm in the spectrum of pyrene in DMF (Figure 1). The Q band of ZnPc (5) slightly red shifted (5 nm) after coordination with Py. The reason for this shift is the extended π conjugation of phthalocyanine structure (23). After the
conjugation, the B band of ZnPc-Py (5) was almost as intense as its Q band because of the pyrene absorption in the B band region (21, 22). As seen in the literature, the Soret band of phthalocyanine (5) overlaps with the absorption of pyrene unit at around 346 nm (21-23).

Pekbelgin Karaoğlu H, Kalkan Burat A. JOTCSA. 2019; 6(3): 319-328. RESEARCH ARTICLE
323
Figure 1. UV/Vis spectra of ZnPc (4), ZnPc-Py (5) and pyrene (Py) in DMF (6 × 10⁻⁵ M)
The fluoresence measurements and fluorescence quenching studies of 5 were performed in DMF upon exitation at 615 nm. The fluorescence emission, excitation, and absorption spectra of 5 were shown in Figure 2. Fluorescence emission
peak of 5 was detected at 705 nm and Stokes’ shifts was evaluated as 27 nm. The observed Stokes’ shift was within the region ∼20-30 nm as
typical for Pc complexes (46). The excitation spectrum was similar to absorption spectrum and both were mirror images of the fluorescent spectra for 5 in DMF. This shows that the nuclear configurations of the ground and excited states
are similar and not affected by excitation (28, 29).
Figure 2. Absorption (red), excitation (blue) and emission (green) spectra of 5 in DMF (4 × 10⁻⁶ M)
The fluorescence quantum yield (ΦF) of
compound 5 was calculated as 0.173 which is very close to the ΦF value of the ZnPc used as reference. According to the literature, the
insertion of a diamagnetic central metal is known to increase the fluorescence quantum yield (ΦF) (47). For standard ZnPc the ΦF value is known to
be 0.17 in DMF (28, 29). According to the literature, Özçeşmeci and coworkers synthesized phthalocyanines bearing four pyrene units and studied their photophysical properties (21). In another study performed by Sürgün et al., pyrenyl substituted phthalocyanine
synthesis and photophysical measurements were
performed (22). In these studies where the
pyrene groups were not conjugated to the phthalocyanine ring, the fluorescence quantum yields measured for ZnPc’s were close to the
value of the standard ZnPc. ZnPc-Py conjugate structure was accomplished by Ogbodu and coworkers (23). They reported that the
fluorescence quantum yield of the pyrene substituted unsymmetrical ZnPc was close to the reference yield. In this study, we extend the conjugation of the Pc by adding a pyrenyl group and the fluorescence quantum yield of 5, was found to be very close to the value in the literature.
0
0,5
1
1,5
2
2,5
250 350 450 550 650 750
Ab
sorb
ance
Wavelength (nm)
ZnPc Py ZnPc-Py
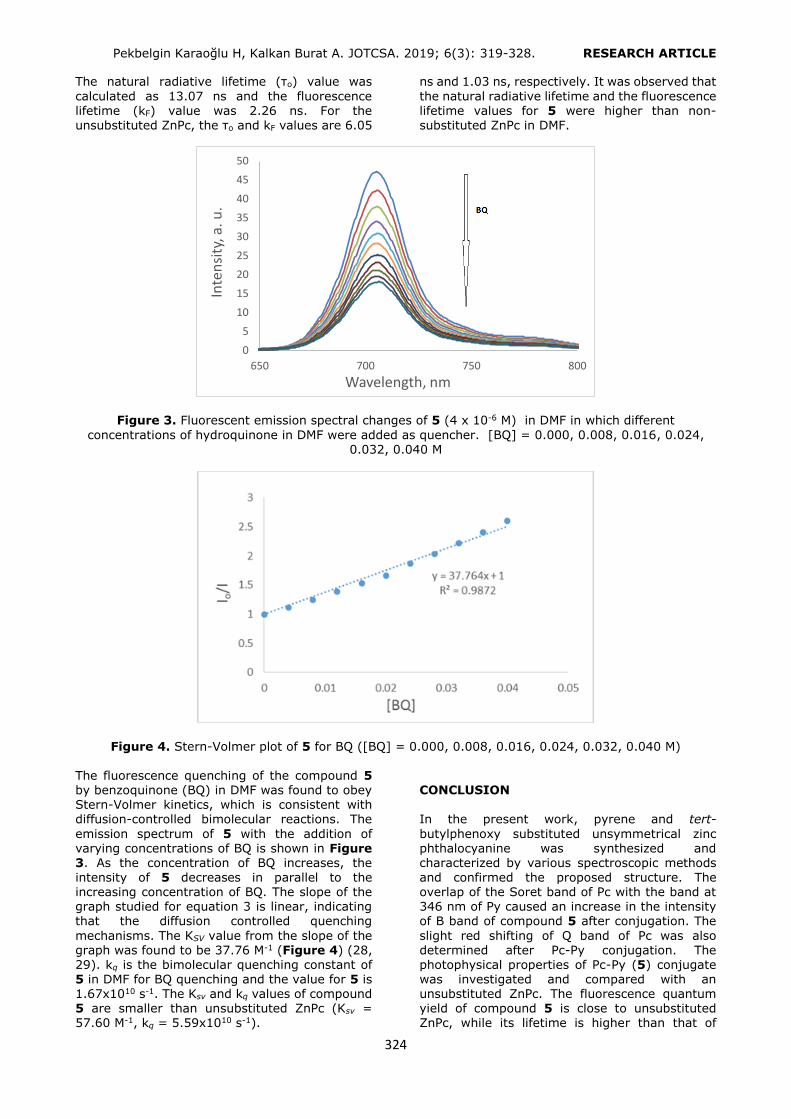
Pekbelgin Karaoğlu H, Kalkan Burat A. JOTCSA. 2019; 6(3): 319-328. RESEARCH ARTICLE
324
The natural radiative lifetime (τo) value was
calculated as 13.07 ns and the fluorescence lifetime (kF) value was 2.26 ns. For the
unsubstituted ZnPc, the τo and kF values are 6.05
ns and 1.03 ns, respectively. It was observed that
the natural radiative lifetime and the fluorescence lifetime values for 5 were higher than non-
substituted ZnPc in DMF.
Figure 3. Fluorescent emission spectral changes of 5 (4 x 10⁻⁶ M) in DMF in which different
concentrations of hydroquinone in DMF were added as quencher. [BQ] = 0.000, 0.008, 0.016, 0.024, 0.032, 0.040 M
Figure 4. Stern-Volmer plot of 5 for BQ ([BQ] = 0.000, 0.008, 0.016, 0.024, 0.032, 0.040 M)
The fluorescence quenching of the compound 5 by benzoquinone (BQ) in DMF was found to obey Stern-Volmer kinetics, which is consistent with diffusion-controlled bimolecular reactions. The
emission spectrum of 5 with the addition of varying concentrations of BQ is shown in Figure 3. As the concentration of BQ increases, the
intensity of 5 decreases in parallel to the increasing concentration of BQ. The slope of the graph studied for equation 3 is linear, indicating that the diffusion controlled quenching
mechanisms. The KSV value from the slope of the graph was found to be 37.76 M-1 (Figure 4) (28, 29). kq is the bimolecular quenching constant of 5 in DMF for BQ quenching and the value for 5 is 1.67x10¹⁰ s-1. The Ksv and kq values of compound 5 are smaller than unsubstituted ZnPc (Ksv = 57.60 M-1, kq = 5.59x10¹⁰ s-1).
CONCLUSION In the present work, pyrene and tert-
butylphenoxy substituted unsymmetrical zinc phthalocyanine was synthesized and characterized by various spectroscopic methods
and confirmed the proposed structure. The overlap of the Soret band of Pc with the band at 346 nm of Py caused an increase in the intensity of B band of compound 5 after conjugation. The
slight red shifting of Q band of Pc was also determined after Pc-Py conjugation. The photophysical properties of Pc-Py (5) conjugate was investigated and compared with an unsubstituted ZnPc. The fluorescence quantum yield of compound 5 is close to unsubstituted ZnPc, while its lifetime is higher than that of
0
5
10
15
20
25
30
35
40
45
50
650 700 750 800
Inte
nsi
ty, a
. u.
Wavelength, nm
Pekbelgin Karaoğlu H, Kalkan Burat A. JOTCSA. 2019; 6(3): 319-328. RESEARCH ARTICLE
325
unsubstituted ZnPc. In addition, the fluorescence
quantum yield of compound 5 was compared with the fluorescence quantum yield of other
tetrasubstituted ZnPc substituted with pyrene groups in the literature (21-23). The fluorescence quantum yield of 5 is in agreement with the literature values. Furthermore, the fluorescence
quenching studies were performed by benzoquinone typically. The Stern-Volmer kinetics were also investigated in DMF. In comparasion with unsubstituted zinc phthalocyanine, compound 5 showed lower Ksv and kq values.
ACKNOWLEDGEMENTS This work was supported by the Research Fund of the Istanbul Technical University. REFERENCES
1. Schmid G, Sommerauer M, Geyer M, Hanack M, Leznoff CC. A.B.P. Lever (Eds.), Phthalocyanines: Properties and Applications, vol. 4, VCH Publishers, New York, 1996, pp. 1–18. 2. Basova TV., Parkhomenko RG, Polyakov M,
Gürek AG, Atilla D, Yuksel F, et al. Effect of dispersion of gold nanoparticles on the properties and alignment of liquid crystalline copper phthalocyanine films. Dye Pigment. 2016; 125: 266–73. 3. Çimen Y, Ermiş E, Dumludağ F, Özkaya AR,
Salih B, Bekaroğlu Ö. Synthesis, characterization, electrochemistry and VOC sensing properties of novel ball-type dinuclear metallophthalocyanines. Sensors Actuators, B Chem. 2014; 202: 1137–
47. 4. Nagel S, Lener M, Keil C, Gerdes R,Lapok L,
Gorun SM, Schlettwein D. Electrochromic Switching of Evaporated Thin Films of Bulky, Electronic Deficient Metallo-Phthalocyanines. J Phys Chem C. 2011; 115: 8759-8767. 5. Maya EM, Garcia-Frutos EM, Vazquez P, Torres
T, Martin G, Rojo G, Agullo-Lopez F, Gonzalez-Jonte RH, Ferro VR, Vega JMG, Ledoux I, Zyss J. Novel Push−Pull Phthalocyanines as Targets for Second-Order Nonlinear Applications. J Phys Chem A. 2003; 107: 2110-2117. 6. Walter MG, Rudine AB, Wamser CC. Porphyrins
and phthalocyanines in solar photovoltaic cells. J
Porphyrins Phthalocyanines. 2010; 14: 759–792. 7. Liu MO, Tai CH, Teh Hu A. The fluorescent and photoelectric conversion properties of phthalocyanineeperylene tetracarboxylic complexes. J Photochem Photobiol A. 2004; 165:
193-200. 8. Nyokong T, Antunes E. in The Handbook of Porphyrin Science, ed. Kadish KM, Smith KM and
Guilard R. World Scientific. Singapore, 2010, ch.
34, vol 7.
9. Frahn MS, Abellon RD, Jager WF, Luthjens LH, Warman JM. Synthesis and characterization of a new fluorogenic probe molecule N-(1-pyrene)methacrylamide for monitoring radiation-
induced polymerization. Nucl Instrum Methods Phys Res. Sect B. 2001; 185: 241-47. 10. Lerner MG, Resczenski JM, Amin A, Johnson RR, Goldsmith JI, Johnson ATC. Toward quantifying the electrostatic transduction mechanism in carbon nanotube molecular
sensors. J Am Chem Soc. 2012; 134: 14318. 11. Valeur B. Molecular fluorescence principles and applications. Germany, Weinheim: Wiley-VCH; 2002.
12. Karabacak M, Cinar M, Kurt M,
Sundaraganesan N. Experimental and theoretical FTIR and FT-Raman spectroscopic analysis of 1-pyrenecarboxylic acid. Spectrochim Acta Part A: Mol Biomol Spectrosc. 2013; 114: 509-519. 13. Roth A, Ragoussi ME, Wibmer L, Katsukis G,
Torre G, Torres T, Guldi DM. Electron-accepting phthalocyanine–pyrene conjugates: towards liquid phase exfoliation of graphite and photoactive nanohybrid formation with graphene. Chem Sci. 2014; 5: 3432–3438. 14. Kaya EN, Tuncel S, Basova TV, Banimuslem
H, Hassan A, Gürek AG, Ahsen V, Durmuş M. Effect of pyrene substitution on the formation and sensor propertiesof phthalocyanine-single walled carbon nanotube hybrids. Sensors and Actuators
B. 2014; 199: 277-283. 15. Sanusi K, Nyokong T. Effects of pyrene on the
photophysical and two-photon absorption-based nonlinear optical properties of indium(III) phthalocyanines. Journal of Coordination Chemistry. 2014; 67: 2911-2924. 16. Kumar RS, Son YA. Synthesis, photophysical
and aggregation properties of novel phenanthrene and pyrene substituted phthalocyanines. Korean Chem Eng Res. 2018; 56(6): 792-797. 17. Bartelmess J, Ballesteros B, Torre G, Kiessling D, Campidelli S, Prato M, Torres T, Guldi DM.
Phthalocyanine-pyrene conjugates: A powerful
approach toward carbon nanotube solar cells. J Am Chem Soc. 2010; 132: 16202-16211. 18. Kaya EN, Basova TV, Polyakov M, Durmuş M, Kadem B, Hassan A. Hybrid materials of pyrene substituted phthalocyanines with single-walled
carbon nanotubes: structure and sensing properties. RSC Adv. 2015; 5: 91855-91862.

Pekbelgin Karaoğlu H, Kalkan Burat A. JOTCSA. 2019; 6(3): 319-328. RESEARCH ARTICLE
326
19. Su Q, Pang S, Alijani V, Li C, Feng X, Müllen
K. Composites of graphene with large aromatic molecules. Adv Mater. 2009; 21: 3191-3195.
20. Mann JA, Rodriguez-Lopez J, Abruna HD, Dichtel WR. Multivalent binding motifs for the noncovalent functionalization of graphene. J Am
Chem Soc. 2011; 133: 17614-17617. 21. Özçeşmeci İ, Gelir A, Gül A. Synthesis and photophysical properties phthalocyanineepyrene dyads. Dye Pigment. 2012; 92: 954-960. 22. Sürgün S, Arslanoğlu Y, Hamuryudan E.
Synthesis of non-peripherally and peripherally substituted zinc (II) phthalocyanines bearing pyrene groups via different routes and their photophysical properties. Dye Pigment. 2014; 100: 32-40.
23. Ogbodu RO, Antunes E, Nyokong T.
Physicochemical properties of a zinc phthalocyanine – pyrene conjugate adsorbed onto single walled carbon nanotubes. Dalton Trans. 2013; 42: 10769-10777. 24. Ke L, Min J, Adam M, Gasparini N, Hou Y,
Perea JD, Chen W, Zhang H, Fladischer S, Sale , Erdmann Spiecker AC, Tykwinski RR, Brabec CJ, Ameri T. A series of pyrene-substituted silicon phthalocyanines as near-ir sensitizers in organic ternary solar cells. Adv Energy Mater. 2016; 6 (1502355): 1-13.
25. Maree SE, Nyokong T. Syntheses and photochemical properties of octasubstituted phthalocyaninato zinc complexes. J Porphyrins Phthalocyanines. 2001; 5: 782–792.
26. Maya EM, Vazquez P, Torres T. Homo- and hetero-dimetallic ethynyl- and butadiynyl-
bridged bisphthalocyaninato complexes. Chem Commun. 1997; 1175-76. 27. Garcia-Iglesias M, Torres T, Gonzalez-Rodriguez D. Well-defined, persistent, chiral phthalocyanine
nanoclusters via G-quadruplex assembly. Chem Commun. 2016; 52: 9446-9449. 28. Karaoğlu HRP, Yenilmez HY, Koçak MB. Phthalocyanines formed from several precursors: synthesis, characterization, and comparative fluorescence and quinone quenching. Journal of
Coordination Chemistry. 2018; 71(15): 2340-
2357. 29. Zorlu Y, Dumoulin F, Durmuş M, Ahsen V. Comparative studies of photophysical and photochemical properties of solketal substituted platinum (II) and zinc (II) phthalocyanine sets.
Tetrahedron. 2010; 66 (17): 3248-3258. 30. Du H, Fuh RCA, Li J, Corkan LA, Lindsey JS. PhotochemCAD: A Computer-Aided Design and
Research Tool in Photochemistry. Photochem.
Photobiol. 1998; 68: 141-142.
31. Rose J. Advanced Physico-chemical Experiments, first ed., Sir Isaac Pitman & Sons Ltd., London, 1964, 257.
32. Kalkan A, Koca A, Bayır ZA. Unsymmetrical phthalocyanines with alkynyl substituents. Polyhedron. 2004; 23: 3155–3162. 33. Haas M, Liu SX, Kahnt A, Leiggener C, Guldi DM, Hauser A, Decurtins S. Photoinduced energy transfer processes within dyads of
metallophthalocyanines compactly fused to a ruthenium(II) polypyridine chromophore. J Org Chem. 2007; 72: 7533-7543. 34. Kimura T, Kanota N, Matsui K, Tanaka I, Tsuboi T, Takaguchi Y, Yomogita A, Wakahara T,
Kuwahara S, Nagatsugi F, Akasaka T. Preparation
and electrochemical and optical properties of unsymmetrically substituted phthalocyanines with one or two trithiole rings and related symmetric derivatives. Inorg Chem. 2008; 47: 3577-3583.
35. Leznoff CC, Hall TW. The synthesis of a soluble, unsymmetrical phthalocyanine on a polymer support. Tetrahedron Lett. 1982; 23: 3023-3026. 36. Erdem SS, Nesterova IV, Soper SA, Hammer RP. Solid-phase synthesis of asymmetrically
substituted “AB3-type” phthalocyanines. J Org Chem. 2008; 73: 5003-5007. 37. Kobayashi N, Kondo R, Nakajima S, Osa T.
New route to unsymmetrical phthalocyanine analogs by the use of structurally distorted subphthalocyanines. J Am Chem Soc. 1990; 112:
9640-9641. 38. Kobayashi N, Ishizaki T, Ishii K, Konami H. Synthesis, spectroscopy, and molecular orbital calculations of subazaporphyrins, subphthalocyanines, subnaphthalocyanines, and
compounds derived therefrom by ring expansion. J Am Chem Soc. 1999: 121; 9096-9110. 39. Kobayashi N, Nonomura T. First observation of the circular dichroism spectra of chiral subphthalocyanines with C3 symmetry. Tetrahedron Lett. 2002; 43: 4253–4255.
40. Meller A, Ossko A. Phthalocyaninartige Bor-Komplexe. Monatsh Chem. 1972; 103: 150-155. 41. Dabak S, Gül A, Bekaroğlu Ö. Hexakis(alkylthio)‐substituted unsymmetrical
phthalocyanines. Chem Ber. 1994; 127: 2009-
2012. 42. Bhatt MV, Kulkarni SU. Cleavage of ethers. Synthesis. 1983; 249-282.

Pekbelgin Karaoğlu H, Kalkan Burat A. JOTCSA. 2019; 6(3): 319-328. RESEARCH ARTICLE
327
43. Hirth A, Sobbi AK, Wöhrle D. Synthesis of a
monofunctional phthalocyanine on silica. J. Porphyrins Phthalocyanines. 1997; 1: 275-279.
44. De la Torre G, Claessens CG, Torres T. Phthalocyanines: The need for selective synthetic approaches. Eur J Org Chem. 2000; 16: 2821-
2830. 45. K. Sonagashira, in: F. Diederich, P.J. Stang (Eds.), Metal- catalyzed cross-coupling reactions. Wiley-V
CH, Weinheim, 1998, pp. 203–229.
46. Özçeşmeci M, Nar I, Hamuryudan E.
Synthesis and electrochemical and spectroelectrochemical characterization of chloromanganese(III) phthalocyanines. Turk. J. Chem. 2014; 38: 1064-1072.
47. McKeown NB, Li H, Helliwell M, J. Porphyr. Phthalocyanines. A non-planar, hexadeca-substituted, metal-free phthalocyanine. 2005; 9(12): 841-845.

Pekbelgin Karaoğlu H, Kalkan Burat A. JOTCSA. 2019; 6(3): 319-328. RESEARCH ARTICLE
328
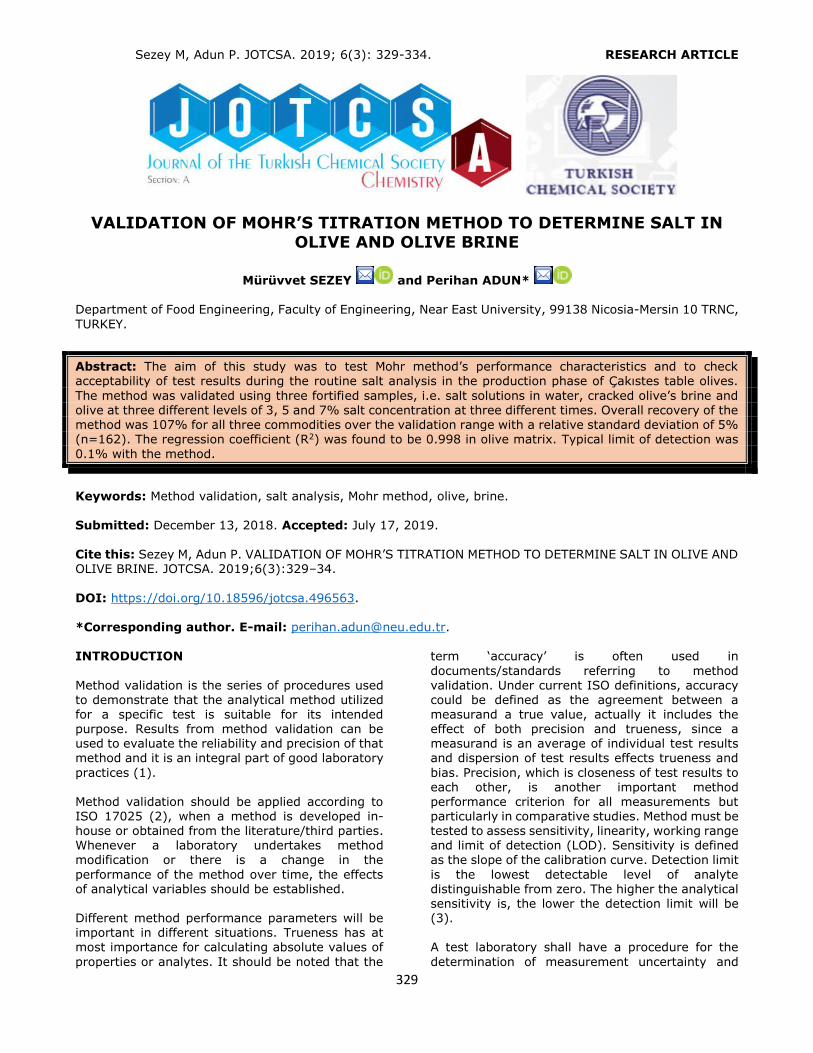
Sezey M, Adun P. JOTCSA. 2019; 6(3): 329-334. RESEARCH ARTICLE
329
VALIDATION OF MOHR’S TITRATION METHOD TO DETERMINE SALT IN OLIVE AND OLIVE BRINE
Mürüvvet SEZEY and Perihan ADUN*
Department of Food Engineering, Faculty of Engineering, Near East University, 99138 Nicosia-Mersin 10 TRNC,
TURKEY.
Abstract: The aim of this study was to test Mohr method’s performance characteristics and to check acceptability of test results during the routine salt analysis in the production phase of Çakıstes table olives.
The method was validated using three fortified samples, i.e. salt solutions in water, cracked olive’s brine and olive at three different levels of 3, 5 and 7% salt concentration at three different times. Overall recovery of the method was 107% for all three commodities over the validation range with a relative standard deviation of 5% (n=162). The regression coefficient (R2) was found to be 0.998 in olive matrix. Typical limit of detection was
0.1% with the method.
Keywords: Method validation, salt analysis, Mohr method, olive, brine. Submitted: December 13, 2018. Accepted: July 17, 2019.
Cite this: Sezey M, Adun P. VALIDATION OF MOHR’S TITRATION METHOD TO DETERMINE SALT IN OLIVE AND OLIVE BRINE. JOTCSA. 2019;6(3):329–34.
DOI: https://doi.org/10.18596/jotcsa.496563. *Corresponding author. E-mail: [email protected]. INTRODUCTION
Method validation is the series of procedures used to demonstrate that the analytical method utilized for a specific test is suitable for its intended purpose. Results from method validation can be used to evaluate the reliability and precision of that method and it is an integral part of good laboratory
practices (1).
Method validation should be applied according to ISO 17025 (2), when a method is developed in-house or obtained from the literature/third parties. Whenever a laboratory undertakes method modification or there is a change in the
performance of the method over time, the effects of analytical variables should be established.
Different method performance parameters will be important in different situations. Trueness has at most importance for calculating absolute values of
properties or analytes. It should be noted that the
term ‘accuracy’ is often used in
documents/standards referring to method validation. Under current ISO definitions, accuracy could be defined as the agreement between a measurand a true value, actually it includes the effect of both precision and trueness, since a measurand is an average of individual test results and dispersion of test results effects trueness and
bias. Precision, which is closeness of test results to each other, is another important method performance criterion for all measurements but particularly in comparative studies. Method must be tested to assess sensitivity, linearity, working range and limit of detection (LOD). Sensitivity is defined as the slope of the calibration curve. Detection limit
is the lowest detectable level of analyte distinguishable from zero. The higher the analytical sensitivity is, the lower the detection limit will be (3).
A test laboratory shall have a procedure for the
determination of measurement uncertainty and

Sezey M, Adun P. JOTCSA. 2019; 6(3): 329-334. RESEARCH ARTICLE
330
shall apply to this procedure. Uncertainty does not
assure trueness; however in an analytical point of
view, uncertainty defines the range of the values that could reasonably be attributed to an analytical result. Uncertainty arises not only from random errors in the analysis such as short-term deviations in temperature, relative humidity and power source
variations, but also from systematic errors such as wrong solvent use, changes in instrumental calibrations. When laboratories report uncertainty together with an analytical result, it gives a quantitative indication of the quality of the analytical result and allows the user to make decision. The confidence can be placed on a result
when it is compared with certain limits defined in a specification or regulation. The validation of the result and to compare analytical results from
different laboratories can be possible by using uncertainty value (4). Different approaches can be used to estimate measurement uncertainty such as Gum Approach, method validation and use of
method performance data, inter-laboratory studies, internal quality control studies and external quality assessment data (5). Çakıstes is one of the most typical table olive products of Northern Cyprus prepared by cracking
pink or green domestic olives. Domat, Memecik and Yamalak varieties are used to prepare Çakıstes. After the olives are transported to the plant, they are graded and scratched on 2 or 3 sides and put into fresh water to remove bitter taste. The water
should be changed every day to obtain the desired taste. Then, olives are transferred into brine which
is composed of 7% NaCl, 1% citric acid and 1% CaCl2, in fermentation tanks. The brine salt ratio is increased progressively keeping salt ratio constant at 7-8%. When salt ratio in olives reaches to 5-6%, Çakıstes olives are now ready for consumption and packaging. This process takes almost one month (6).
Sodium chloride (NaCl) concentration is a crucial parameter which strongly influences the storage and quality of table olives. Its level is very effective to achieve stability of the products, as salt prevents growth of pathogens and hence its spoilage. In
recent years, consumers have developed a
tendency to low sodium intake, since a diet rich in sodium leads to higher blood pressure. Therefore, scientists have focused on the viability, application and consequences of replacement of sodium with calcium or potassium in table olive fermentation (7).
Selection of a method to determine sodium chloride content of any food is an important criterion designing a quality assurance plan. There are various methods available for determining salt content of food; every single method has their own advantages and limitations. Based on method
performance criteria, analysts prefer standard
methods to determine salt content such as
refractometry, ion-selective electrodes, and titration (8). Mohr’s titration method was applied and validated in this study, since this method is widely used for salt analysis in olive, olive brine and many other food samples.
The Mohr’s method, named after Karl Friedrich Mohr, determines the chloride ion concentration of a solution by titration with silver nitrate. As the silver nitrate solution is slowly added, a precipitate of silver chloride forms. The end point of the titration occurs when all the chloride ions are
precipitated. Then additional silver ions react with the chromate ions of the indicator, potassium chromate, to form a red-brown precipitate of silver
chromate (9): Ag+
(aq) + Cl–(aq) → AgCl(s) (Ksp = 1.6 x 10⁻¹⁰)
2Ag+
(aq) + CrO42-
(aq) Ag2CrO4 (s) (Ksp = 1.1 x 10⁻¹²)
The aim of this study is to validate Mohr’s method to determine the amount of salt in olive and olive brine and to evaluate accuracy and precision of the method and to estimate measurement uncertainty. Acceptability of test results was also checked during
the Çakıstes production season by an internal quality control technique based on comparisons of duplicated test results. EXPERIMENTAL
Water, olive brine and olive samples fortified with
NaCl at three different levels i.e. 3, 5 and 7% were used as material for validation experiments.
Preparation of fortified water samples Distilled water enough for the experiments was fortified with pure sodium chloride (NaCl) at 3 different levels i.e, 3, 5 and 7%, for 6 replicates at
each level and at three different occasions.
Preparation of fortified olive brine Olives were manually picked from trees. They were at green color maturity period. Samples were taken in plastic boxes and transferred to factory. Firstly,
olives were washed in washing machine and separated according to size in sorting machine. Then they were cracked with crushing machine and put into pure water as same as in practice. Olives were kept in water for 3 days to include olive matrix components into brine water representing the conditions in practice. Olives were then separated
from water and this water was fortified with pure sodium chloride (NaCl) at 3 different levels i.e., 3, 5 and 7%, enough for 6 replicates at each level and for three different occasions.
Sezey M, Adun P. JOTCSA. 2019; 6(3): 329-334. RESEARCH ARTICLE
331
Preparation of fortified olive matrix
2 kg of olive were picked from trees. They were
transferred to the laboratory. Olives were washed and fruit flesh were chopped, then comminuted and homogenized. Homogenized olive samples were fortified with pure sodium chloride (NaCl) at 3 different levels, i.e, 3, 5 and 7%, for 6 replicates at
each level and for three different occasions. Fortified samples were kept for one day at room temperature, so that NaCl can incorporate with olive matrix. Next day, salty olive samples were filtered through filter cloth.
Preparation of internal quality control test samples Picked olives were washed in washing machine and
sorted. Then, they were cracked with crushing machine and put in polyester boxes. When the box was full with olives, brine, which contained 7% salt and 1% citric acid was added. During fermentation
period of olives, brine samples were taken from selected boxes in duplicates and analyzed in different days. Total 18 analyses were performed and the following formula was used to calculate laboratory uncertainty from differences of duplicate measurements of test samples.
𝑠 =1
√2 √
∑ 𝑑2
𝑛 = √
∑ 𝑑2
2𝑛
Where s: standard deviation of analysis from duplicate laboratory determinations
d: the difference of duplicates in one laboratory
n: the number of data pairs
Preparation of calibration curve Calibration curve was constructed to assess limit of detection, although calibration curve is not used for quantitation of NaCl amount in routine analysis. Olives were picked from trees and then transferred to the laboratory. They were washed and fruit flesh
were chopped, then comminuted and homogenized. Homogenized olive samples were fortified with pure sodium chloride (NaCl) at 7 different levels, i.e, 1, 2, 3, 4, 5, 6 and 7%. Fortified
samples were kept for one day, so that NaCl can
incorporate with olive matrix. Next day, salty olive
samples were filtered through filter cloth and then
used for the construction of calibration curve with replicate titrations. Salt analysis by using Mohr’s titration method All fortified samples and olive brine samples taken
during the olive fermentation period for internal quality control purpose were analyzed for the salt content by Mohr titration method by 6 replicates at the level of 3, 5 and 7% salt and at three different occasions. Procedure is described below:
An aliquot of 1 mL was taken from brine and put into an Erlenmeyer flask.
0.5 mL of 5% potassium chromate
(indicator) was added. The burette was filled with 0.1 N of AgNO3
until the zero point. The sample was titrated with standardized
AgNO3 solution until the first perceptible pale red-brown color.
The color should remain constant for 30 seconds.
Titration volume was recorded. The following formula was used to calculate
the amount of salt.
𝑁𝑎𝐶𝑙 𝑐𝑜𝑛𝑡𝑒𝑛𝑡 (%) = 𝑉 × 𝑁 × 𝐹 × 0.0585 × 100
𝑚
V: Consumption of 0,1 N AgNO3 in titration (mL)
N: Normality of AgNO3
F: Factor of 0,1 N AgNO3
m: mass of sample (g) RESULTS and DISCUSSION Validation results of fortified matrices Table 1 shows the recoveries and repeatability values for all fortified matrices at each occasion of
analysis. Salt recoveries from fortified pure water changed between 101% and 121%, from brine 94% to 117% and from olive solutions 100% to 119%. Repeatability values changed from 3% to 6% RSD among the replicates of three different
fortification levels at the same day.
Sezey M, Adun P. JOTCSA. 2019; 6(3): 329-334. RESEARCH ARTICLE
332
Table 1. Method validation characteristics for different matrices (n=162).
Matrix Days of Analysis Average Recovery
(%)
Precision
as Repeatability of Recoveries (RSD%, n=18)
Water 1 109 4
2 110 4 3 113 5
Olive brine 1 103 3 2 105 3 3 107 5
Olive 1 107 6 2 106 4 3 105 3
Accuracy and reproducibility of the Mohr’s
Method Table 2 summarizes the recoveries for all fortified
matrices at each fortification level. Mean recoveries for olive brine and olives were found as 105% and 106% respectively, whereas 111% for direct aqueous solutions with the relative standard deviations of 4, 4 and 5% respectively (see Figure
1). Our findings are in accordance with the similar
titrimetric method validation criteria, although not
any validation data on Mohr’s method could be found.
Finally, overall recovery, in other words, accuracy of the Mohr’s titration method was 107% with RSD of 5% (n=162) for three matrices, three levels and three different occasions.
Figure 1. Mean recoveries and RSD values of fortified water solutions, fortified olive brine and fortified olive at three different salt level (%).
Table 2. Method validation characteristics of the method at different levels independent of the matrix. Analysis uncertainty is expressed as CVA (n=162).
Fortification Level Accuracy
(Average Recovery, %)
Precision as Reproducibility of Recoveries
(RSD%, n=18)
3% 111 6
5% 105 2
7% 106 4
Overall recovery 107 5*
*coefficient of variation (CVA) for the analysis. Internal Quality Check Results Obtained from Duplicate Analysis of Olive Brine
Olive brine samples were taken during the fermentation period for the estimation of laboratory
Sezey M, Adun P. JOTCSA. 2019; 6(3): 329-334. RESEARCH ARTICLE
333
uncertainty, three sampling parties were selected
during one-month period. Three samples were
taken from each barrel with weekly intervals. Sample 1 was analyzed on the day of sampling, the 2nd sample was analyzed the next day and sample
3 was stored as a control sample. Total 18 samples
were analyzed in the same manner and laboratory
uncertainty was calculated as 3% (Table 3), which was better and in accordance with analysis uncertainty (5%).
Table 3. Results of two groups of measurements under repeatability conditions for the estimation of laboratory
uncertainty
Sample Replicate1 Replicate2 Relative difference between
duplicates
Square of relative
differences
Sum of squares
CVlab
1 4.50 4.79 -0.062 0.00390 0.01214 0.02597
2 5.82 5.55 0.047 0.00226 3 6.40 6.40 0 0.00000 4 4.38 4.38 0 0.00000 5 6.05 6.14 -0.014 0.00022
6 6.61 6.55 0.009 0.00008 7 5.50 5.90 -0.070 0.00492
8 6.31 6.14 0.027 0.00075 9 6.23 6.25 -0.003 0.00001
Linearity and Limit of Detection (LOD) Linearity and limit of detection are important method performance criteria to be determined in
method validation experiments. One simple way to estimate linearity and LOD is the use of calibration curves in matrix (10). The standard deviations of relative residuals (Srr), which is a decisive
parameter in internal quality control of linearity, should be ≤ 0.1 (11-12). This was the case in the study that correlation coefficient R2 was 0.998 and
Srr was 0.03 (Figure 2). Typical LOD value for salt calculated from the calibration curve was found to be 0.1%.
Figure 2. Calibration graph of salt analysis by using Mohr method.

Sezey M, Adun P. JOTCSA. 2019; 6(3): 329-334. RESEARCH ARTICLE
334
CONCLUSION
Mohr’s titration method for the determination of salt amount in olive and/or olive brine was successfully validated, since the accuracy and precision of the method were within the acceptable
ranges (accuracy 70-120% and RSD 5%). Laboratory uncertainty value was in accordance with method’s reproducibility value (CVA) from validation study. Mohr’s method can be used for routine analysis of salt determination by implementing quality control measures during its use.
This study was presented as an oral presentation at the Thirtieth National Chemistry Congress, 5-8
November 2018, Famagusta, Cyprus. REFERENCES
1. Huber, L. Validation of Analytical Methods and Procedures. Validation and qualification in Analytical Laboratories. 2007; 125.
2. Karaman, D., Akalın, A.S. Süt
teknolojisinde metot validasyonu ve uygulamaları. Türkiye 10. Gıda Kongresi. 2008; 749-51.
3. Method Validation Course 1125 © 2015
LGC Limited
4. EURACHEM/CITAC Guide. Quantifying Uncertainty in Analytical Measurement. Second Edition. 2000.
5. Türk Akreditasyon Kurumu (TURKAK).
R20.02, Deney/Analiz Sonuçlarındaki ölçüm belirsizliği tahmini için TURKAK
Prensipleri. 09.07.2015.
6. "Present and Future of the Mediterranean
Olive Sector". Zaragoza (Spain). 26-28 November 2012.
7. Romeo, F.V. Microbiological aspects of
table olives. The microbiological hazards
in table olives. 2012.
8. Masulli, D. Determining salt in food. 2015; Retrieved from: www.foodqualityandsafety.com/.../determining-salt-in-food
9. Yoder, L. "Adaptation of the Mohr Volumetric Method to General Determinations of Chlorine". Industrial &
Engineering Chemistry. 1919; 11 (8): 755.
10. Aysal, P., Ambrus, A., Lehotay, S.J.,
Cannavan, A. Validation of an efficient method for the determination of pesticide residues in fruits and vegetables using ethyl acetate for extraction. Journal of Environmental Science and Health Part B. 2007; 42 (5):
481 – 90.
11. Gozek, K.; Yucel, U.; Ilim, M.; Cayci-Aysal, P. & Tuncbilek, A.S. C14-dimethoate residues in olive oil during oil
processing. Isotope Aided Studies of Pesticide Residues during Food
Processing. 1995; 33-40.
12. Miller, J.N., Ambrus, A. Statistics in calibration analysis. Manual on Basic Statistics. FAO/ IAEA Training and Reference Centre for Food and Environmental Protection Section. 2000;
1-18.
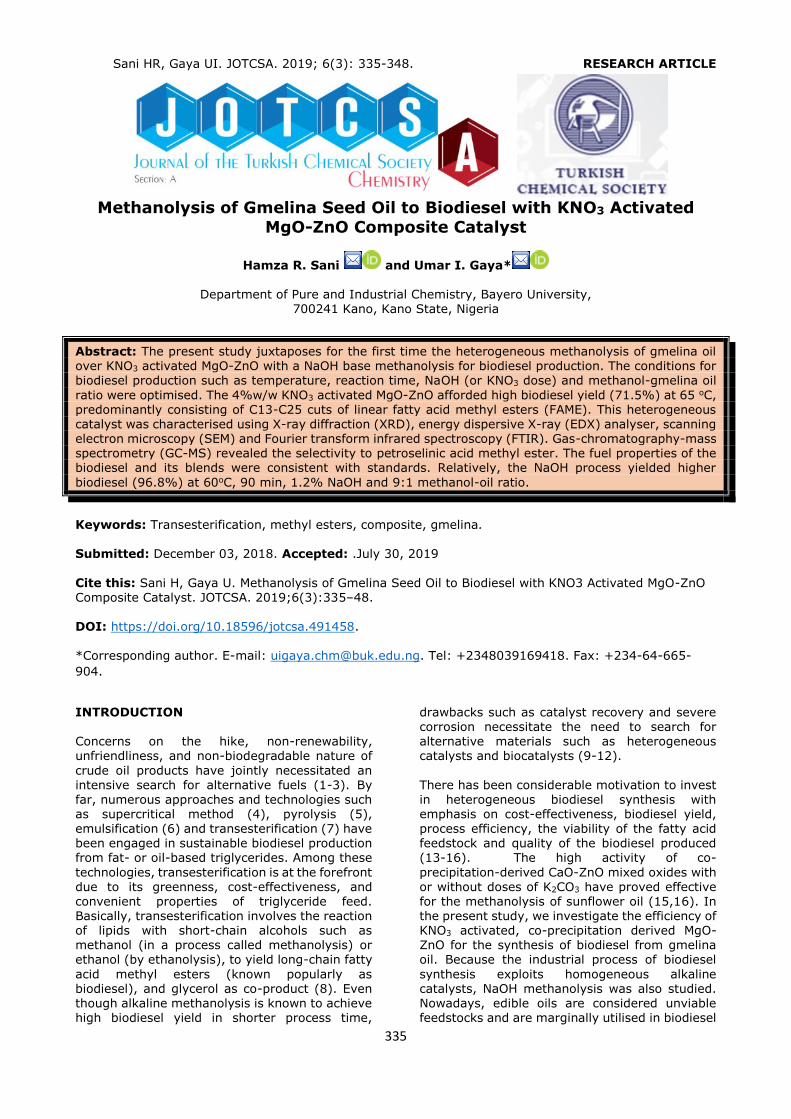
Sani HR, Gaya UI. JOTCSA. 2019; 6(3): 335-348. RESEARCH ARTICLE
335
Methanolysis of Gmelina Seed Oil to Biodiesel with KNO3 Activated
MgO-ZnO Composite Catalyst
Hamza R. Sani and Umar I. Gaya*
Department of Pure and Industrial Chemistry, Bayero University, 700241 Kano, Kano State, Nigeria
Abstract: The present study juxtaposes for the first time the heterogeneous methanolysis of gmelina oil over KNO3 activated MgO-ZnO with a NaOH base methanolysis for biodiesel production. The conditions for biodiesel production such as temperature, reaction time, NaOH (or KNO3 dose) and methanol-gmelina oil
ratio were optimised. The 4%w/w KNO3 activated MgO-ZnO afforded high biodiesel yield (71.5%) at 65 oC, predominantly consisting of C13-C25 cuts of linear fatty acid methyl esters (FAME). This heterogeneous catalyst was characterised using X-ray diffraction (XRD), energy dispersive X-ray (EDX) analyser, scanning electron microscopy (SEM) and Fourier transform infrared spectroscopy (FTIR). Gas-chromatography-mass spectrometry (GC-MS) revealed the selectivity to petroselinic acid methyl ester. The fuel properties of the biodiesel and its blends were consistent with standards. Relatively, the NaOH process yielded higher
biodiesel (96.8%) at 60oC, 90 min, 1.2% NaOH and 9:1 methanol-oil ratio.
Keywords: Transesterification, methyl esters, composite, gmelina. Submitted: December 03, 2018. Accepted: .July 30, 2019
Cite this: Sani H, Gaya U. Methanolysis of Gmelina Seed Oil to Biodiesel with KNO3 Activated MgO-ZnO
Composite Catalyst. JOTCSA. 2019;6(3):335–48. DOI: https://doi.org/10.18596/jotcsa.491458. *Corresponding author. E-mail: [email protected]. Tel: +2348039169418. Fax: +234-64-665-
904.
INTRODUCTION Concerns on the hike, non-renewability, unfriendliness, and non-biodegradable nature of
crude oil products have jointly necessitated an intensive search for alternative fuels (1-3). By far, numerous approaches and technologies such as supercritical method (4), pyrolysis (5),
emulsification (6) and transesterification (7) have been engaged in sustainable biodiesel production from fat- or oil-based triglycerides. Among these
technologies, transesterification is at the forefront due to its greenness, cost-effectiveness, and convenient properties of triglyceride feed. Basically, transesterification involves the reaction of lipids with short-chain alcohols such as methanol (in a process called methanolysis) or ethanol (by ethanolysis), to yield long-chain fatty
acid methyl esters (known popularly as biodiesel), and glycerol as co-product (8). Even though alkaline methanolysis is known to achieve high biodiesel yield in shorter process time,
drawbacks such as catalyst recovery and severe corrosion necessitate the need to search for alternative materials such as heterogeneous catalysts and biocatalysts (9-12).
There has been considerable motivation to invest in heterogeneous biodiesel synthesis with emphasis on cost-effectiveness, biodiesel yield,
process efficiency, the viability of the fatty acid feedstock and quality of the biodiesel produced (13-16). The high activity of co-
precipitation-derived CaO-ZnO mixed oxides with or without doses of K2CO3 have proved effective for the methanolysis of sunflower oil (15,16). In the present study, we investigate the efficiency of KNO3 activated, co-precipitation derived MgO-ZnO for the synthesis of biodiesel from gmelina oil. Because the industrial process of biodiesel
synthesis exploits homogeneous alkaline catalysts, NaOH methanolysis was also studied. Nowadays, edible oils are considered unviable feedstocks and are marginally utilised in biodiesel

Sani HR, Gaya UI. JOTCSA. 2019; 6(3): 335-348. RESEARCH ARTICLE
336
synthesis as opposed to vegetable and animal
oils. The choice of gmelina oil for this study is therefore governed by the fact that it is non-
edible and the source plant Gmelina arborea Linn. Roxb., is widely available in the wild of tropical countries (17).
MATERIALS AND METHODS Seed samples and chemicals The seeds of Gmelina arborea were collected from Bayero University Old Campus, Kano, in March, 2015. Methanol (99.8%, Sigma-Aldrich), Zn(NO3)2.4H2O (98%, BDH), Mg(NO3)2.4H2O
(99%, BDH), KNO3 (99%, BDH), NH4OH (Sigma Aldrich, 36%), n-hexane (98%, Sigma Aldrich) were used as received from the manufacturers. Petrodiesel standard was obtained from Kaduna Refinery and Petrochemical Company (KRPC), a
subsidiary of Nigeria National Petroleum Corporation (NNPC). De-ionised water was used
in all preparations. Oil extraction and pre-treatment Gmelina oil was extracted from the Gmelina arborea seeds in the same manner described by Kansedo and Lee (18). Seeds were cleaned and
dried in an oven at 100 oC overnight. The dry seeds were ground to fine particles using a mortar and pestle and then re-dried to remove moisture. The oil was extracted with n-hexane using soxhlet apparatus, operated at 70 oC for 4 h. Pre-treatment steps followed to remove free fatty acids from the oil were those of Šánek et al. (19).
Exactly 40.7 g of the extracted oil was mixed
thoroughly with 43.7 mL of methanol and 8.4 mL of 25% methanolic solution of tetramethylammonium hydroxide. The resultant mixture was shaken for 10 min and allowed to separate overnight in separating funnel and the phases so obtained were subsequently withdrawn
and analysed. Preparation of heterogeneous catalyst The solid catalysts used in this work were prepared by co-precipitation followed by impregnation. The method of Istadi et al. (13)
was applied, but substituting calcium for magnesium precursor. A solution of Zn(NO3)2.4H2O (2 mol/L) was co-precipitated with solution of Mg(NO3)2.4H2O (2 mol/L) in
presence of NH4OH. The gel formed was collected, washed with deionised water, and then dried in the oven overnight at 110 oC. The dry solid was
calcined at 600 oC for 3 h in a muffle furnace to obtained MgO-ZnO composite. This material was then impregnated with appropriate amounts of KNO3 and dried in an oven at 110 oC overnight to produce 1 to 6%w/w. The resulting solid catalysts were calcined in the furnace at 600 oC for 3 h.
Heterogeneous methanolysis The production of biodiesel by using the KNO3 activated MgO-ZnO catalysts was performed in a two-necked 500 mL glass reactor, and fitted with
a condenser and thermometer. The catalyst
amount was fixed at 0.8 g, but the impregnation solution was varied from 1 to 6%w/w. Prior to
methanolysis, the catalyst was first activated in methanol at 40 oC with constant stirring for 40 min. After activation of the catalyst, 40 g of oil (heated at 100 oC for 30 min prior to the reaction)
was added to the batch reactor. The system was agitated using a magnetic stirrer. In order to separate the catalyst, the resulting mixture was filtered through a Whatman filter paper (125 mm diameter, 2.5 μm pore size). The filtrate was allowed to stand for 24 h in separating funnel. Subsequently, the glycerol resident at the bottom
was separated from the biodiesel. The percentage of biodiesel yield was calculated using the following equation:
Biodiesel yield (%) =weight of biodiesel produced
weight of oil used× 100 (1)
Homogeneous methanolysis
In order to compare the rate of the heterogeneous methanolysis with the conventional NaOH base methanolysis, biodiesel was produced using a previously described method (20). Exactly 40 g of oil was measured and poured into 500 mL round bottom flask. The catalyst was weighed and 20 mL methanol was
added to it in a conical flask and stirred until the pellet dissolves, to form sodium methoxide solution. The solution was poured into the oil; the resultant mixture was refluxed at 50 to 70 oC for 90 min, in the presence of desired methanol to oil molar ratio and a known amount of NaOH. Agitation speed was 600 rpm. After completion of
the reaction, the mixture was transferred into a separating funnel and allowed to stand overnight to allow for proper settling of the glycerol. In order to remove residual by-products such as soap, residual methanol and glycerol, the
biodiesel produced was purified by several washing cycles, using de-ionized water. The biodiesel was diluted (30%), stirred for 2 min and transferred to a clean separating funnel and allowed to stand for 5 h. The top layer was pure biodiesel. The impure bottom layer was re-extracted repeatedly until no appearance of by-
products. The resulting biodiesel was then allowed to form pure biodiesel (B100) by standing for 24 h. Biodiesel blends, B20 and B50, were
prepared by mixing petroleum diesel and pure biodiesel in a ratio of 80:20 and 50:50. Gmelina oil and biodiesel characterisation
Free fatty acids (FFA) content and a saponification value of the gmelina oil were determined using the titrimetric methods described by the American Oil Chemists Society (AOAC) (21, 22). Fuel properties of the gmelina oil, biodiesel and petrodiesel such as kinematic viscosity, flash
point, cloud point and specific gravity were determined using the methods of American Society for Testing and Materials (ASTM) (23). The composition analysis of the biodiesel was
Sani HR, Gaya UI. JOTCSA. 2019; 6(3): 335-348. RESEARCH ARTICLE
337
performed with the aid of gas chromatography-
mass spectroscopy (GC-MS) using a Shimadzu QP2010 Plus GCMS. The injector of the GC was
kept at 200 oC. Injection mode was split by a ratio of 20. The column was VF-5, held at 60 oC for 2 min and ramped at the rate of 10 oC/min to 280 oC for 7 min.
Effect of reaction variables The operation parameters (methanol to oil molar ratio, KNO3 loading levels, reaction time and temperature) for the heterogeneous system were varied from 3:1 to 18:1, 1 to 6%w/w, 2 to 7 h, 45 to 65 oC by the classical one factor at a time
method at fixed agitation velocity (600 rpm), catalyst amount (0.8 g) and initial gmelina oil mass (40 g). All parameters were optimised. The potential of reuse of the solid catalyst was investigated at the optimised conditions using the
recovery method. On the other hand, the homogeneous process was investigated using 3.1
to 9:1 methanol to oil molar ratios, 0.4 to 2.0% NaOH for 30 to 90 min reaction times at 45 to 70 oC. Characterization of the solid catalyst The solid catalyst with an outstanding
performance was characterised. X-ray diffraction (XRD) analysis was performed on a Philips X’Pert Pro diffractometer, using Cu-Kα source (λ=1.56877 Å). The diffractometer was run at 30 kV and 30 mA, over a 2θ range of 10o to 120o. Scanning electron microscopy was carried out on Leica Stereoscan-440 SEM hyphenated with
Phoenix energy dispersive X-ray analyser.
Crystallite size was estimated using the Debye-Scherer formula:
D =k
cos (2)
where D is the crystalline diameter; k is the
crystallographic constant (0.9, for spherical crystals), λ is the wavelength of CuKα radiation,
0.156877 nm; β is the full width of half maximum (FWHM) while θ is the diffraction angle. As crystallite sizes depend mainly on diffraction angles, the average crystallite size of the catalyst
was calculated using equation (3).
Average crystallite size =∑( crystallite size)
Number of peaks (3)
Elemental measurements were carried out on Leica Stereoscan-440 scanning electron microscope instrument interfaced with Phoenix
Energy-dispersive X-ray spectrometer. The instrument was operated using Pd X-ray tube at 25 kV and 1.2 mA. Fourier transform infrared spectroscopy was performed on an Agilent Cary
630 diamond attenuated total reflectance Fourier transform infrared spectrometer (ATR-FTIR), within a spectral range of 1000-650 cm-1.
RESULTS AND DISCUSSION Catalyst characterization The crystalline structure of 4% w/w KNO3
activated MgO-ZnO, the best performing
composite, was characterised using XRD plot
(Figure 1). From the figure, the XRD peaks of ZnO
are clearly seen at 2θ angle of 31.8o, 34.48o,
36.3o, 47.6o, 56.6o, 62.9o, 66.47o, 69.1o, 71.8o,
76.8o, 80.7o (JCPDS card 36-1451). The
diffractogram also clearly reveals peaks of MgO at
2θ angle of 42.9o, 53.76o, 62.2o, 73.7o, 78.6o,
83.7o, 86.1o (JCPDS file 01-072-0447). It also
shows reflection peaks consistent with that of K—
O (JCPDS file 77-2176) with 2θ angles of 23.08o,
26.7o, 28.96o, 40.7o, 82.78o, 90.1o, 91.3o,
109.76o. The average crystallite size of the
catalyst was calculated using Debye-Scherer
equation to be 66.45 nm.

Sani HR, Gaya UI. JOTCSA. 2019; 6(3): 335-348. RESEARCH ARTICLE
338
Figure 1. The X-ray diffractogram of 4%w/w KNO3 activated MgO-ZnO.
The external morphology of the synthesised catalyst is displayed in Figure 2. The SEM image
shows lumps of organised grains. Section analysis informs of the dimension of the grains to be in the order of hundreds to a thousand plus nanometer.
Figure 2. Scanning electron micrograph of the heterogeneous catalyst.
The elemental composition of the 4% w/w KNO3 activated MgO-ZnO catalyst is presented in Table 1. The ratios of the EDX peak concentrations in the table revealed atomic ratios which confirm the formula of 4% w/w KNO3 activated MgO-ZnO
catalyst to be the non-stoichiometric oxide K4.08N0.73Mg0.54-ZnO2.38. The ATR-FTIR spectrum
of the prepared catalyst revealed the sharp peak between at 527 cm-1 characteristics of stretching mode of Zn-O bond (24). The incorporation of Mg2+ into the ZnO crystal structure is corroborated by the intense Mg-O peak at 474
cm-1 (25). The formation of K-O bond was confirmed by the peak at 491 cm-1.
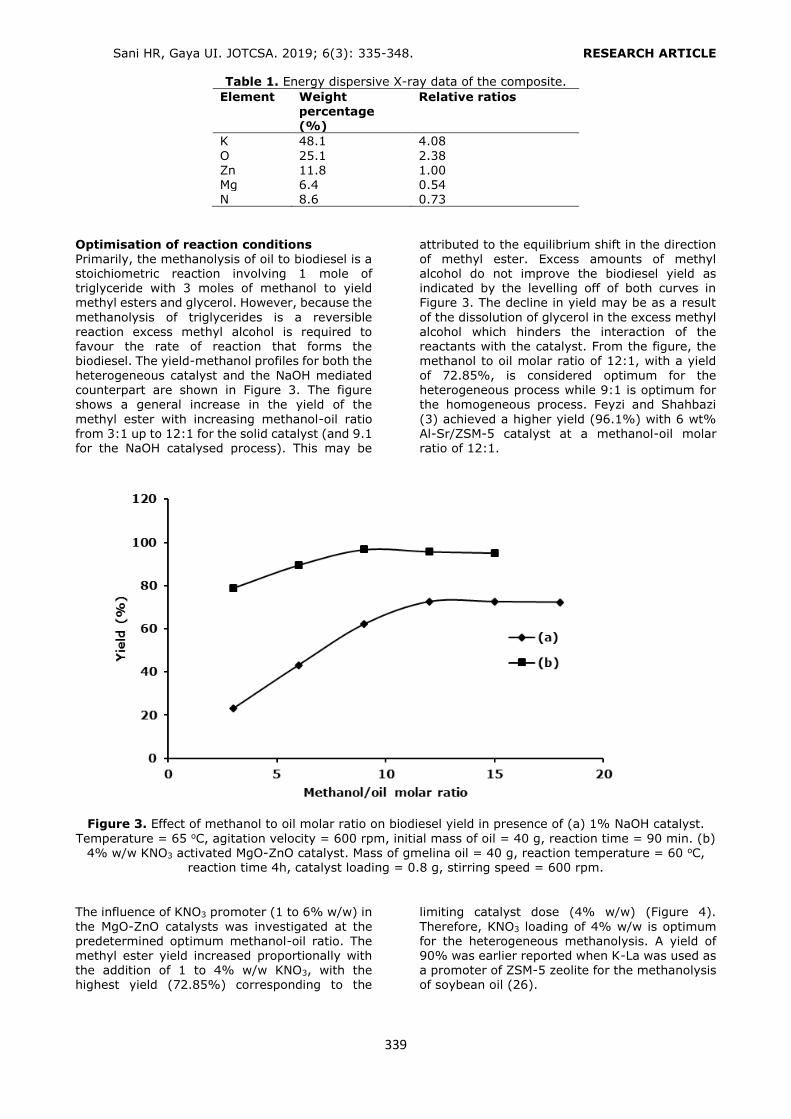
Sani HR, Gaya UI. JOTCSA. 2019; 6(3): 335-348. RESEARCH ARTICLE
339
Table 1. Energy dispersive X-ray data of the composite.
Element Weight percentage
(%)
Relative ratios
K 48.1 4.08
O 25.1 2.38 Zn 11.8 1.00 Mg 6.4 0.54 N 8.6 0.73
Optimisation of reaction conditions Primarily, the methanolysis of oil to biodiesel is a stoichiometric reaction involving 1 mole of triglyceride with 3 moles of methanol to yield methyl esters and glycerol. However, because the
methanolysis of triglycerides is a reversible reaction excess methyl alcohol is required to favour the rate of reaction that forms the biodiesel. The yield-methanol profiles for both the
heterogeneous catalyst and the NaOH mediated counterpart are shown in Figure 3. The figure shows a general increase in the yield of the
methyl ester with increasing methanol-oil ratio from 3:1 up to 12:1 for the solid catalyst (and 9.1 for the NaOH catalysed process). This may be
attributed to the equilibrium shift in the direction of methyl ester. Excess amounts of methyl alcohol do not improve the biodiesel yield as indicated by the levelling off of both curves in Figure 3. The decline in yield may be as a result
of the dissolution of glycerol in the excess methyl alcohol which hinders the interaction of the reactants with the catalyst. From the figure, the methanol to oil molar ratio of 12:1, with a yield
of 72.85%, is considered optimum for the heterogeneous process while 9:1 is optimum for the homogeneous process. Feyzi and Shahbazi
(3) achieved a higher yield (96.1%) with 6 wt% Al-Sr/ZSM-5 catalyst at a methanol-oil molar ratio of 12:1.
Figure 3. Effect of methanol to oil molar ratio on biodiesel yield in presence of (a) 1% NaOH catalyst.
Temperature = 65 oC, agitation velocity = 600 rpm, initial mass of oil = 40 g, reaction time = 90 min. (b) 4% w/w KNO3 activated MgO-ZnO catalyst. Mass of gmelina oil = 40 g, reaction temperature = 60 oC,
reaction time 4h, catalyst loading = 0.8 g, stirring speed = 600 rpm.
The influence of KNO3 promoter (1 to 6% w/w) in
the MgO-ZnO catalysts was investigated at the predetermined optimum methanol-oil ratio. The methyl ester yield increased proportionally with the addition of 1 to 4% w/w KNO3, with the highest yield (72.85%) corresponding to the
limiting catalyst dose (4% w/w) (Figure 4).
Therefore, KNO3 loading of 4% w/w is optimum for the heterogeneous methanolysis. A yield of 90% was earlier reported when K-La was used as a promoter of ZSM-5 zeolite for the methanolysis of soybean oil (26).
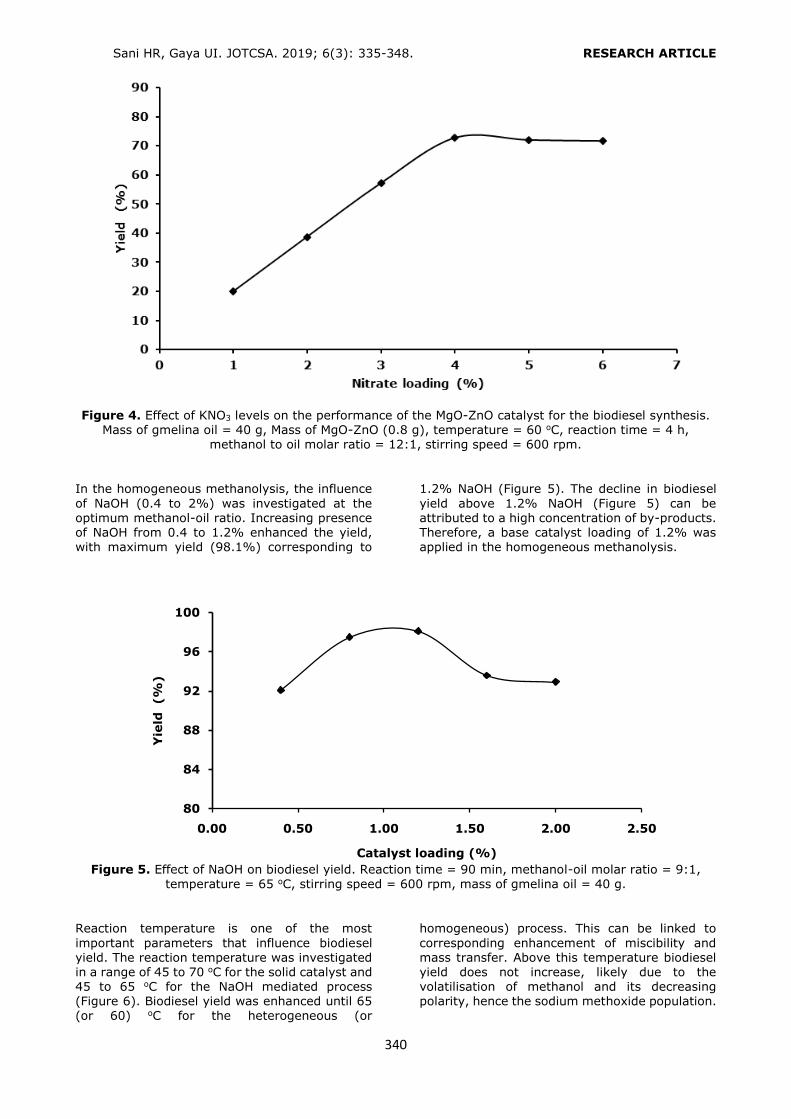
Sani HR, Gaya UI. JOTCSA. 2019; 6(3): 335-348. RESEARCH ARTICLE
340
Figure 4. Effect of KNO3 levels on the performance of the MgO-ZnO catalyst for the biodiesel synthesis.
Mass of gmelina oil = 40 g, Mass of MgO-ZnO (0.8 g), temperature = 60 oC, reaction time = 4 h, methanol to oil molar ratio = 12:1, stirring speed = 600 rpm.
In the homogeneous methanolysis, the influence
of NaOH (0.4 to 2%) was investigated at the optimum methanol-oil ratio. Increasing presence of NaOH from 0.4 to 1.2% enhanced the yield, with maximum yield (98.1%) corresponding to
1.2% NaOH (Figure 5). The decline in biodiesel
yield above 1.2% NaOH (Figure 5) can be attributed to a high concentration of by-products. Therefore, a base catalyst loading of 1.2% was applied in the homogeneous methanolysis.
Figure 5. Effect of NaOH on biodiesel yield. Reaction time = 90 min, methanol-oil molar ratio = 9:1,
temperature = 65 oC, stirring speed = 600 rpm, mass of gmelina oil = 40 g.
Reaction temperature is one of the most
important parameters that influence biodiesel yield. The reaction temperature was investigated in a range of 45 to 70 oC for the solid catalyst and 45 to 65 oC for the NaOH mediated process (Figure 6). Biodiesel yield was enhanced until 65 (or 60) oC for the heterogeneous (or
homogeneous) process. This can be linked to
corresponding enhancement of miscibility and mass transfer. Above this temperature biodiesel yield does not increase, likely due to the volatilisation of methanol and its decreasing polarity, hence the sodium methoxide population.
Figure 5. Effect of NaOH on biodiesel yield. Reaction time = 90 min, methanol-oil molar
ratio = 9:1, temperature = 65 oC, stirring speed = 600 rpm, mass of gmelina oil = 40 g.
80
84
88
92
96
100
0.00 0.50 1.00 1.50 2.00 2.50
Yie
ld (%
)
Catalyst loading (%)
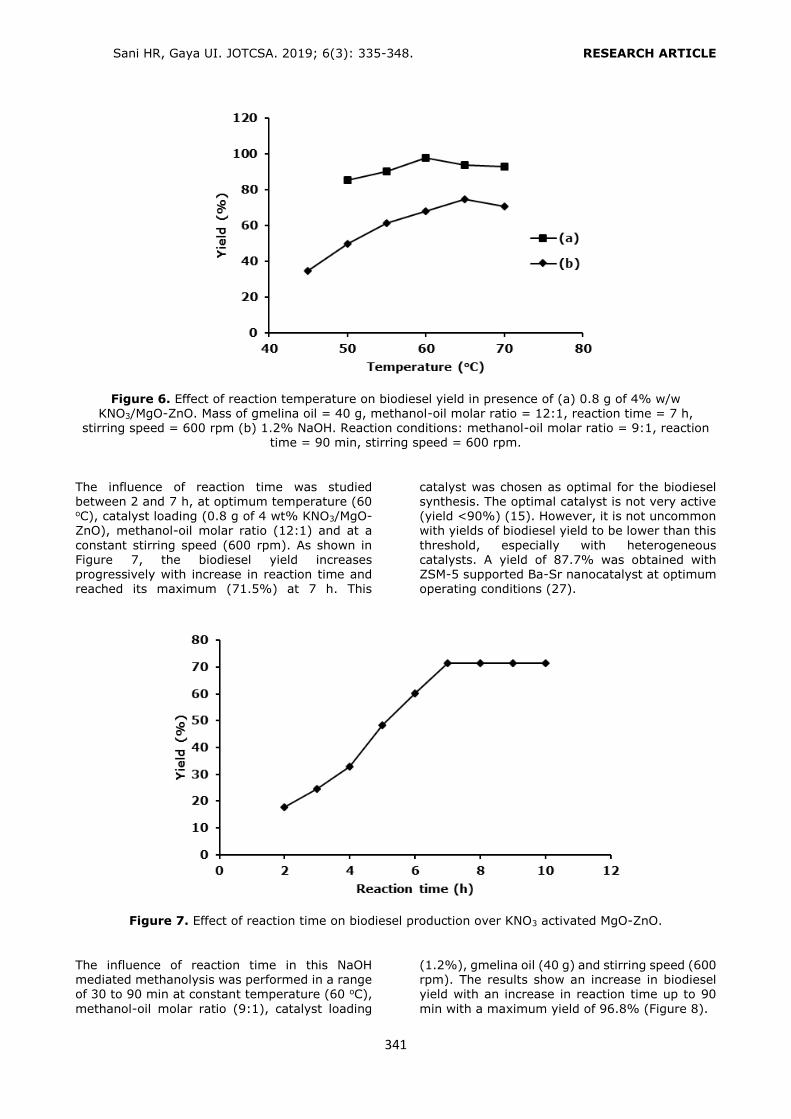
Sani HR, Gaya UI. JOTCSA. 2019; 6(3): 335-348. RESEARCH ARTICLE
341
Figure 6. Effect of reaction temperature on biodiesel yield in presence of (a) 0.8 g of 4% w/w
KNO3/MgO-ZnO. Mass of gmelina oil = 40 g, methanol-oil molar ratio = 12:1, reaction time = 7 h, stirring speed = 600 rpm (b) 1.2% NaOH. Reaction conditions: methanol-oil molar ratio = 9:1, reaction
time = 90 min, stirring speed = 600 rpm.
The influence of reaction time was studied between 2 and 7 h, at optimum temperature (60 oC), catalyst loading (0.8 g of 4 wt% KNO3/MgO-ZnO), methanol-oil molar ratio (12:1) and at a
constant stirring speed (600 rpm). As shown in Figure 7, the biodiesel yield increases progressively with increase in reaction time and reached its maximum (71.5%) at 7 h. This
catalyst was chosen as optimal for the biodiesel synthesis. The optimal catalyst is not very active (yield <90%) (15). However, it is not uncommon with yields of biodiesel yield to be lower than this
threshold, especially with heterogeneous catalysts. A yield of 87.7% was obtained with ZSM-5 supported Ba-Sr nanocatalyst at optimum operating conditions (27).
Figure 7. Effect of reaction time on biodiesel production over KNO3 activated MgO-ZnO.
The influence of reaction time in this NaOH mediated methanolysis was performed in a range of 30 to 90 min at constant temperature (60 oC),
methanol-oil molar ratio (9:1), catalyst loading
(1.2%), gmelina oil (40 g) and stirring speed (600 rpm). The results show an increase in biodiesel yield with an increase in reaction time up to 90
min with a maximum yield of 96.8% (Figure 8).
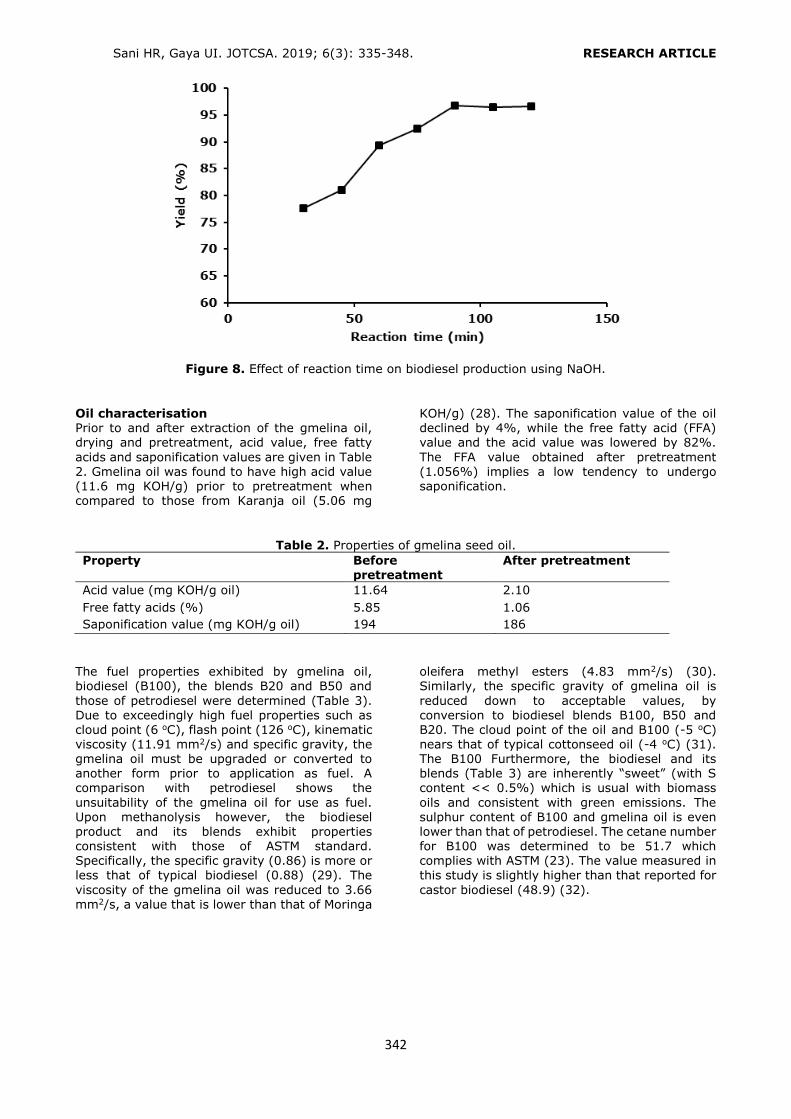
Sani HR, Gaya UI. JOTCSA. 2019; 6(3): 335-348. RESEARCH ARTICLE
342
Figure 8. Effect of reaction time on biodiesel production using NaOH.
Oil characterisation Prior to and after extraction of the gmelina oil, drying and pretreatment, acid value, free fatty
acids and saponification values are given in Table 2. Gmelina oil was found to have high acid value (11.6 mg KOH/g) prior to pretreatment when compared to those from Karanja oil (5.06 mg
KOH/g) (28). The saponification value of the oil declined by 4%, while the free fatty acid (FFA) value and the acid value was lowered by 82%.
The FFA value obtained after pretreatment (1.056%) implies a low tendency to undergo saponification.
Table 2. Properties of gmelina seed oil.
Property Before pretreatment
After pretreatment
Acid value (mg KOH/g oil) 11.64 2.10
Free fatty acids (%) 5.85 1.06
Saponification value (mg KOH/g oil) 194 186
The fuel properties exhibited by gmelina oil, biodiesel (B100), the blends B20 and B50 and
those of petrodiesel were determined (Table 3). Due to exceedingly high fuel properties such as cloud point (6 oC), flash point (126 oC), kinematic viscosity (11.91 mm2/s) and specific gravity, the gmelina oil must be upgraded or converted to another form prior to application as fuel. A comparison with petrodiesel shows the
unsuitability of the gmelina oil for use as fuel. Upon methanolysis however, the biodiesel product and its blends exhibit properties consistent with those of ASTM standard. Specifically, the specific gravity (0.86) is more or
less that of typical biodiesel (0.88) (29). The
viscosity of the gmelina oil was reduced to 3.66 mm2/s, a value that is lower than that of Moringa
oleifera methyl esters (4.83 mm2/s) (30). Similarly, the specific gravity of gmelina oil is
reduced down to acceptable values, by conversion to biodiesel blends B100, B50 and B20. The cloud point of the oil and B100 (-5 oC) nears that of typical cottonseed oil (-4 oC) (31). The B100 Furthermore, the biodiesel and its blends (Table 3) are inherently “sweet” (with S content << 0.5%) which is usual with biomass
oils and consistent with green emissions. The sulphur content of B100 and gmelina oil is even lower than that of petrodiesel. The cetane number for B100 was determined to be 51.7 which complies with ASTM (23). The value measured in
this study is slightly higher than that reported for
castor biodiesel (48.9) (32).
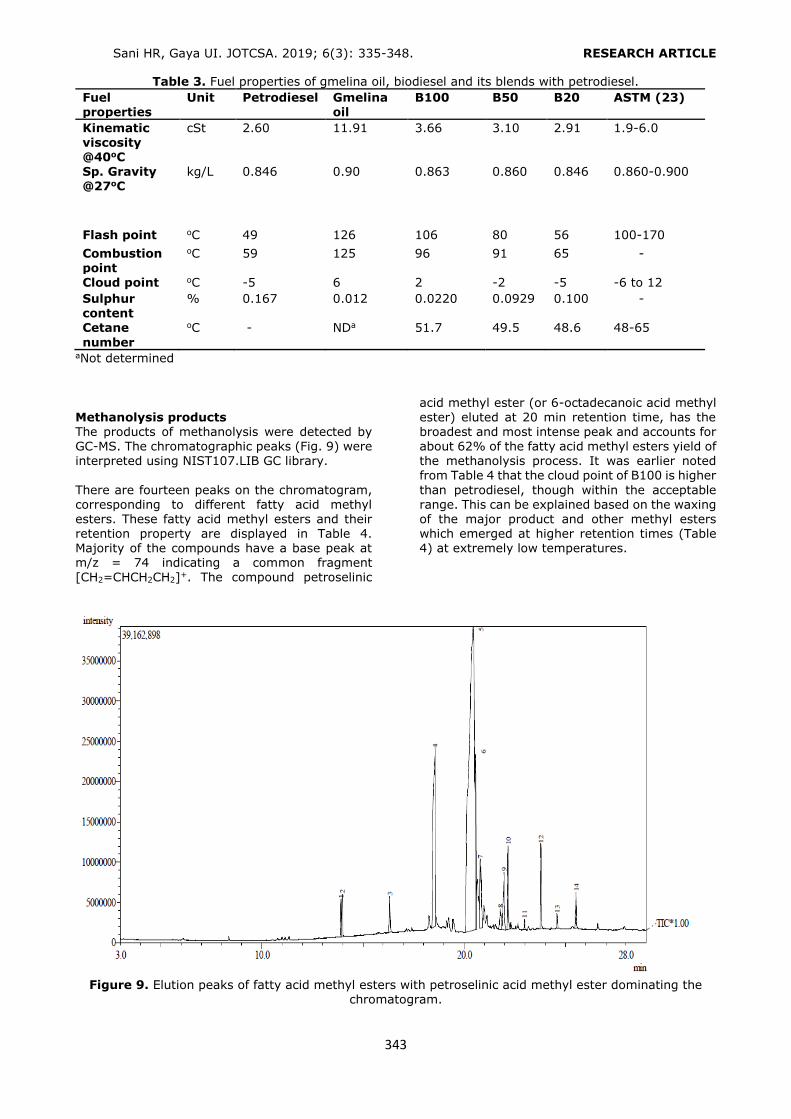
Sani HR, Gaya UI. JOTCSA. 2019; 6(3): 335-348. RESEARCH ARTICLE
343
Table 3. Fuel properties of gmelina oil, biodiesel and its blends with petrodiesel.
Fuel properties
Unit Petrodiesel Gmelina oil
B100 B50 B20 ASTM (23)
Kinematic viscosity @40oC
cSt 2.60 11.91 3.66 3.10 2.91 1.9-6.0
Sp. Gravity @27oC
kg/L 0.846 0.90 0.863 0.860 0.846 0.860-0.900
Flash point oC 49 126 106 80 56 100-170
Combustion point
oC 59 125 96 91 65 -
Cloud point oC -5 6 2 -2 -5 -6 to 12
Sulphur content
% 0.167 0.012 0.0220 0.0929 0.100 -
Cetane
number
oC - NDa 51.7 49.5 48.6 48-65
aNot determined
Methanolysis products The products of methanolysis were detected by GC-MS. The chromatographic peaks (Fig. 9) were interpreted using NIST107.LIB GC library.
There are fourteen peaks on the chromatogram, corresponding to different fatty acid methyl esters. These fatty acid methyl esters and their retention property are displayed in Table 4. Majority of the compounds have a base peak at m/z = 74 indicating a common fragment [CH2=CHCH2CH2]+. The compound petroselinic
acid methyl ester (or 6-octadecanoic acid methyl ester) eluted at 20 min retention time, has the broadest and most intense peak and accounts for about 62% of the fatty acid methyl esters yield of the methanolysis process. It was earlier noted from Table 4 that the cloud point of B100 is higher
than petrodiesel, though within the acceptable range. This can be explained based on the waxing of the major product and other methyl esters which emerged at higher retention times (Table 4) at extremely low temperatures.
Figure 9. Elution peaks of fatty acid methyl esters with petroselinic acid methyl ester dominating the
chromatogram.
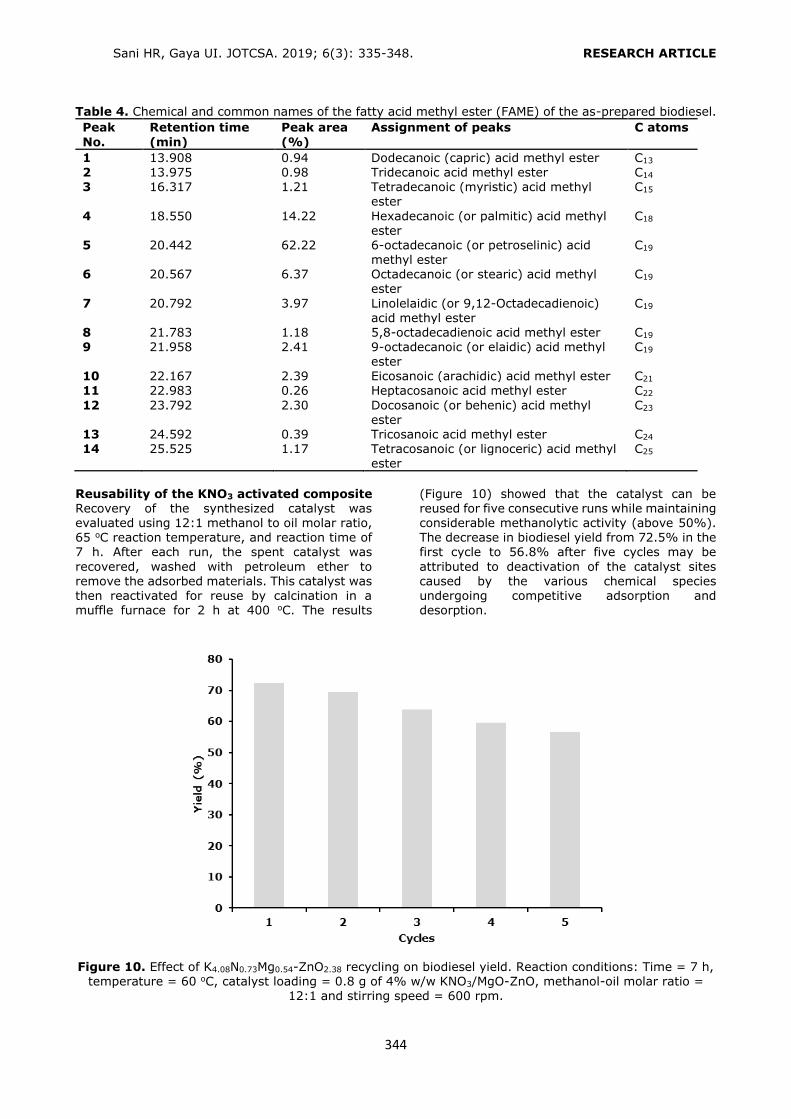
Sani HR, Gaya UI. JOTCSA. 2019; 6(3): 335-348. RESEARCH ARTICLE
344
Table 4. Chemical and common names of the fatty acid methyl ester (FAME) of the as-prepared biodiesel.
Peak
No.
Retention time
(min)
Peak area
(%)
Assignment of peaks C atoms
1 13.908 0.94 Dodecanoic (capric) acid methyl ester C13
2 13.975 0.98 Tridecanoic acid methyl ester C14
3 16.317 1.21 Tetradecanoic (myristic) acid methyl ester
C15
4 18.550 14.22 Hexadecanoic (or palmitic) acid methyl ester
C18
5 20.442 62.22 6-octadecanoic (or petroselinic) acid methyl ester
C19
6 20.567 6.37 Octadecanoic (or stearic) acid methyl ester
C19
7 20.792 3.97 Linolelaidic (or 9,12-Octadecadienoic) acid methyl ester
C19
8 21.783 1.18 5,8-octadecadienoic acid methyl ester C19 9 21.958 2.41 9-octadecanoic (or elaidic) acid methyl
ester C19
10 22.167 2.39 Eicosanoic (arachidic) acid methyl ester C21
11 22.983 0.26 Heptacosanoic acid methyl ester C22
12 23.792 2.30 Docosanoic (or behenic) acid methyl ester
C23
13 24.592 0.39 Tricosanoic acid methyl ester C24
14 25.525 1.17 Tetracosanoic (or lignoceric) acid methyl ester
C25
Reusability of the KNO3 activated composite Recovery of the synthesized catalyst was evaluated using 12:1 methanol to oil molar ratio, 65 oC reaction temperature, and reaction time of 7 h. After each run, the spent catalyst was
recovered, washed with petroleum ether to remove the adsorbed materials. This catalyst was then reactivated for reuse by calcination in a muffle furnace for 2 h at 400 oC. The results
(Figure 10) showed that the catalyst can be reused for five consecutive runs while maintaining considerable methanolytic activity (above 50%). The decrease in biodiesel yield from 72.5% in the first cycle to 56.8% after five cycles may be
attributed to deactivation of the catalyst sites caused by the various chemical species undergoing competitive adsorption and desorption.
Figure 10. Effect of K4.08N0.73Mg0.54-ZnO2.38 recycling on biodiesel yield. Reaction conditions: Time = 7 h,
temperature = 60 oC, catalyst loading = 0.8 g of 4% w/w KNO3/MgO-ZnO, methanol-oil molar ratio = 12:1 and stirring speed = 600 rpm.
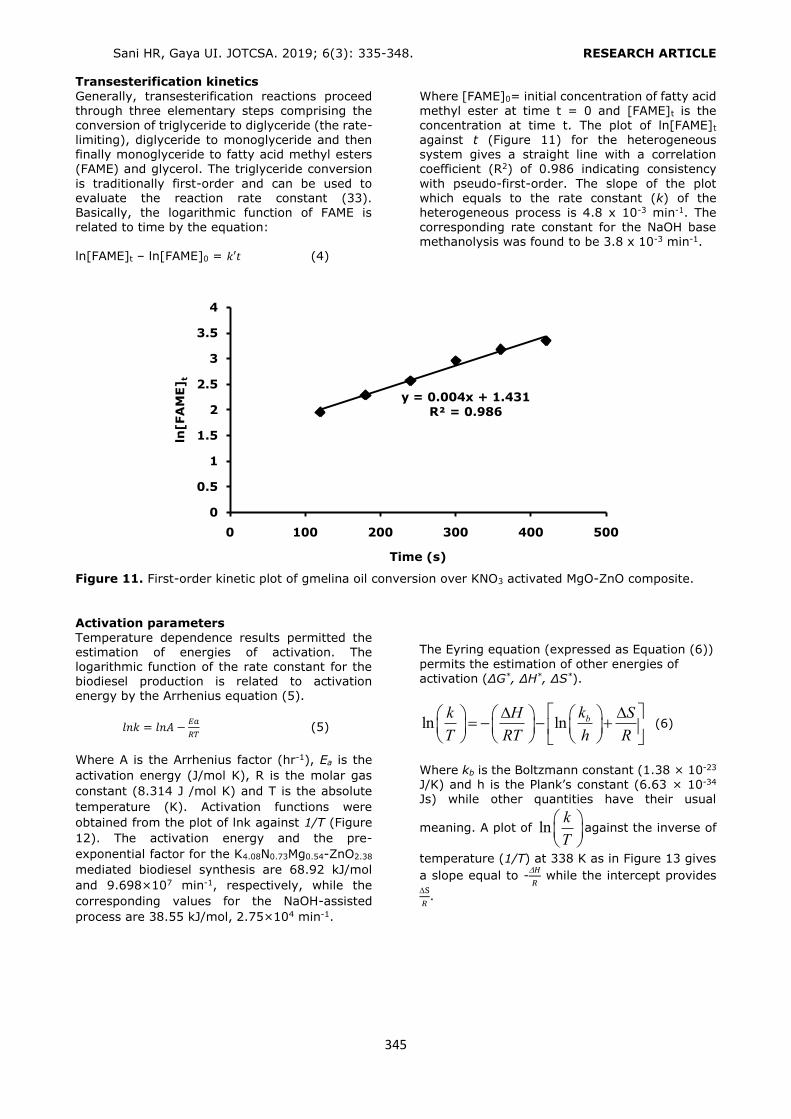
Sani HR, Gaya UI. JOTCSA. 2019; 6(3): 335-348. RESEARCH ARTICLE
345
Transesterification kinetics
Generally, transesterification reactions proceed through three elementary steps comprising the
conversion of triglyceride to diglyceride (the rate-limiting), diglyceride to monoglyceride and then finally monoglyceride to fatty acid methyl esters (FAME) and glycerol. The triglyceride conversion
is traditionally first-order and can be used to evaluate the reaction rate constant (33). Basically, the logarithmic function of FAME is related to time by the equation: ln[FAME]t – ln[FAME]0 = 𝑘′𝑡 (4)
Where [FAME]0= initial concentration of fatty acid methyl ester at time t = 0 and [FAME]t is the
concentration at time t. The plot of ln[FAME]t
against t (Figure 11) for the heterogeneous system gives a straight line with a correlation coefficient (R2) of 0.986 indicating consistency
with pseudo-first-order. The slope of the plot which equals to the rate constant (k) of the heterogeneous process is 4.8 x 10⁻³ min-1. The corresponding rate constant for the NaOH base methanolysis was found to be 3.8 x 10⁻³ min-1.
Figure 11. First-order kinetic plot of gmelina oil conversion over KNO3 activated MgO-ZnO composite.
Activation parameters
Temperature dependence results permitted the estimation of energies of activation. The logarithmic function of the rate constant for the biodiesel production is related to activation energy by the Arrhenius equation (5).
𝑙𝑛𝑘 = 𝑙𝑛𝐴 −𝐸𝑎
𝑅𝑇 (5)
Where A is the Arrhenius factor (hr-1), Ea is the
activation energy (J/mol K), R is the molar gas
constant (8.314 J /mol K) and T is the absolute
temperature (K). Activation functions were
obtained from the plot of lnk against 1/T (Figure
12). The activation energy and the pre-
exponential factor for the K4.08N0.73Mg0.54-ZnO2.38
mediated biodiesel synthesis are 68.92 kJ/mol
and 9.698×10⁷ min-1, respectively, while the
corresponding values for the NaOH-assisted
process are 38.55 kJ/mol, 2.75×10⁴ min-1.
The Eyring equation (expressed as Equation (6))
permits the estimation of other energies of activation (ΔG*, ΔH*, ΔS*).
ln ln bkk H S
T RT h R
(6)
Where kb is the Boltzmann constant (1.38 × 10⁻²³ J/K) and h is the Plank’s constant (6.63 × 10⁻³⁴ Js) while other quantities have their usual
meaning. A plot of lnk
T
against the inverse of
temperature (1/T) at 338 K as in Figure 13 gives
a slope equal to -𝐻
𝑅 while the intercept provides
S
𝑅.
Figure 11. First-order kinetic plot of gmelina oil conversion over KNO3 activated MgO-
ZnO composite.
y = 0.004x + 1.431
R² = 0.986
0
0.5
1
1.5
2
2.5
3
3.5
4
0 100 200 300 400 500
ln[FA
ME]
t
Time (s)

Sani HR, Gaya UI. JOTCSA. 2019; 6(3): 335-348. RESEARCH ARTICLE
346
Figure 12. Arrhenius plot correlating lnk with 1/T for the conversion of gmelina oil to biodiesel over KNO3
activated MgO-ZnO composite.
Figure 13. Eyring plot correlating ln(k/T) with 1/T for the conversion of gmelina oil to biodiesel over
KNO3 activated MgO-ZnO composite.
Table 5. Activation energies of gmelina methyl esters and reference values from selected literature.
Methyl esters* G (kJ/mol) H (kJ/mol) S (kJ/mol K) Reference
GME 100.50 66.004 -0.102 This work RME 105.6 139.5 -98.0 (34)
CME 96.128 36.124 -180.19 (35) SPME 92.71 16.35 -232.83 (33)
*Gmelina methyl esters (GME), rapeseed methyl esters (RME), Chlorella methyl esters (CME), Spirulina platensis methyl esters (SPME). The activation properties for gmelina biodiesel are presented in Table 5. Also in the same table for the sake of comparison are thermodynamic properties of the methyl esters of rapeseed,
Chlorella and Spirulina platensis. The Gibbs free
energy, enthalpy and entropy of the gmelina methyl esters produced by the heterogeneous catalyst are 100.50 kJ/mol, 66.00 kJ/mol and -0.102 kJ/mol K. The corresponding activation
properties of the NaOH base system are 92.14
Figure 12. Arrhenius plot correlating lnk with 1/T for the conversion of gmelina oil to
biodiesel over KNO3 activated MgO-ZnO composite.
y = -8289x + 18.39
R² = 0.998
-8
-7.5
-7
-6.5
-6
-5.5
-5
0.0029 0.00295 0.003 0.00305 0.0031 0.00315 0.0032
ln k
1/T (K-1)
Figure 13. Eyring plot correlating ln(k/T) with 1/T for the conversion of gmelina oil to
biodiesel over KNO3 activated MgO-ZnO composite.
y = -7939x + 11.52
R² = 0.997
-13.6
-13.4
-13.2
-13
-12.8
-12.6
-12.4
-12.2
-12
-11.8
-11.6
-11.4
0.0029 0.00295 0.003 0.00305 0.0031 0.00315 0.0032
ln (
k/
T)
1/T (K-1)
Sani HR, Gaya UI. JOTCSA. 2019; 6(3): 335-348. RESEARCH ARTICLE
347
kJ/mol, 34.23 kJ/mol and -0.174 kJ/mol K. The
enthalpies of activation are within the range reported in various literature. As seen from the
Table, the gmelina transesterification process is characterized by negative entropies of smaller magnitude which implies the formation or more ordered transient structures en route the
formation of methyl esters (36). CONCLUSIONS Methyl esters were successfully produced from gmelina oil via methanolysis using NaOH and for the first time compared with KNO3 activated MgO-
ZnO. At optimal reaction condition, the biodiesel yields were significant for both the heterogeneous and homogeneous processes. Petroselinate or 6-octadecanoic acid ester was the major product and its fuel properties are within ASTM limits. It still remains a challenge to achieve a combination
of high yield, low methanol-oil molar ratio and
short reaction time with heterogeneous catalysts relative to the conventional base process. ACKNOWLEDGEMENTS The authors of this paper acknowledge the
support of all of the staff of Quality Control Unit, Production, Programming and Quality Control Department, Kaduna Refinery and Petrochemical Company (KRPC), and Nigerian National Petroleum Corporation (NNPC). REFERENCES
1. Ullah Z, Bustam MA, Man Z. Biodiesel production from waste cooking oil by acidic ionic liquid as a catalyst. Renewable Energy. 2015; 77:
521-6. 2. Sun K, Lu J, Ma L, Han Y, Fu Z, Ding J. A
comparative study on the catalytic performance of different zeolites for biodiesel production. Fuel. 2015; 158: 848-54. 3. Feyzi M, Shahbazi Z. Preparation, kinetic and thermodynamic studies of Al–Sr nanocatalysts for
biodiesel production. Journal of the Taiwan Institute of Chemical Engineers. 2017; 71: 145-155. 4. Ortiz-Martínez PA, Andreo-Martínez P, García-Martínez N, Pérez de le Ríos, Hernández-Fernández FJ, Quesada-Medina J. Approach to
biodiesel production from microalgae under
supercritical conditions by the PRISMA method. Fuel Processing Technology. 2019; 191: 211-222. 5. Shahir VK, Jawahar CP, Suresh PR, Vinod V. Experimental Investigation on Performance and Emission Characteristics of a Common Rail Direct
InjectionEngine Using Animal Fat Biodiesel Blends. Energy Procedia, 2017; 117: 283-290. 6. Goh BHH, Ong HC, Cheah MY, Chen W-H, Yu KL, Mahlia TMI. Sustainability of direct biodiesel
synthesis from microalgae biomass: A critical
review. Renewable and sustainable Energy Reviews. 2019; 107: 59-74.
7. Tural S. Zinc perchlorate hexahydrate catalyzed mono- and bis-transesterification of malonic esters. Turkish Journal of Chemistry.
2008; 32: 169-79. 8. Alhassan FH, Rashid U, Taufiq-Yap YH. Biodiesel synthesis catalyzed by transition metal oxide: Ferric-manganese doped tungstated/molybdena nanoparticle catalyst. Journal of Oleo Science.2014; 10: 1-8.
9. Lam MK, Lee KT, Mohamed AR. Homogeneous, heterogeneous and enzymatic catalysis for transesterification of high free fatty acid oil (waste cooking oil) to biodiesel: A review. Biotechnology Advances. 2010; 28: 500-518.
10. Mehra T., process optimization biodiesel production from cedar wood oil (Cerdrus deodara) using response surface methodology, SAE Technical paper 2018-01-0665, 2018. 11. Raita M, Laothanachareon T, Champreda V,
Laosiripojana N. Biocatalytic esterification of palm oil fatty acids for biodiesel production using glycine-based cross-linked protein coated microcrystalline lipase. Journal of Molecular Catalysis. B: Enzymatic. 2011; 73: 74-9. 12. Ramachandran K, Suganya T, Nagendra GN,
Renganathan S. Recent developments for biodiesel production by ultrasonic assisted transesterification using different heterogeneous catalysts: A review. Renewable & Sustainable
Energy Reviews. 2013; 22: 410-418. 13. Istadi I, Prasetyo AP, Nugroho TS.
Characterization of K2O/CaO-ZnO catalyst for transesterification of soybean oil to biodiesel. Procedia Environmental Science. 2014; 23: 394-9. 14. Abdulkareem-Alsultan G, Asikin-Mijan N, Lee
HV, Taufiq-Yap YH. A new route for the synthesis of La-Ca oxide supported on nano activated carbon via vacuum impregnation method for one pot esterification transesterification reaction. Chemical Engineering Journal. 2016; 304: 61–71. 15. Kesić Ž, Lukić I, Brkić D, Rogan J, Zdujić L,
Liu H, Skala D. Mechanochemical preparation
and characterization of CaO·ZnO used as catalyst for biodiesel synthesis. Applied Catalysis, A: General. 2012; 427: 58– 65. 16. Kesić Ž, Lukić I, Zdujić L, Liu H, Skala D. Mechanochemical synthesis of CaO·ZnO.K2CO3
catalyst:Characterization and activity for methanolysis of sunflower oil. Chemical Industry and Chemical Engineering Quarterly. 2015; 21(1): 1−12.
Sani HR, Gaya UI. JOTCSA. 2019; 6(3): 335-348. RESEARCH ARTICLE
348
17. Fuwape JA, Onyekwelu JC, Adekunle, VAJ.
Biomass equations and estimation for Gmelina arborea and Nauclea diderrichii stands in Akure
forest reserve. Biomass & Bioenergy. 2001; 21: 401-5. 18. Kansedo J, Lee KT. Process optimization and
kinetic study for biodiesel production from nonedible sea mango (Cerbera odollam) oil using response surface methodology. Chemical Engineering Journal. 2013; 214: 157-64. 19. Šánek L, Pecha J, Kolomaznik K, Bařinová M. Biodiesel production from tannery fleshings:
Feedstock pretreatment and process modeling. Fuel. 2015; 148: 16-24. 20. Okoro LN, Fadila IS, Mukhtar L, Clifford N. Thermodynamic and viscometric evaluation of biodiesel and blends from olive oil and cashew nut
oil. Research Journal of Chemical Sciences. 2011;
1(4): 90-7. 21. AOCS Methods Ca 5a-40, Official methods and recommended practices of the American Oil Chemists’ Society. American Oil Chemists Society, Champaign IL, USA; 2000a.
22. AOCS Method Cd 3b-76, Official methods and recommended practices of the American Oil Chemists’ Society, 5th Ed., American Oil Chemists Society, Champaign IL, USA; 2000b. 23. ASTM Method D6751-02 “Standard
specification for biodiesel fuel (B100) blend stock for distillate fuels” ASTM International, West Conshohocken, PA, Pennsylvania, United States of America; 2002.
24. Das S, Khushalani D. Nonhydrolytic route for synthesis of ZnO and its use as a recyclable
photocatalyst. Journal of Physical Chemistry C. 2010; 114: 2544–50. 25. Etacheri V, Roshan R, Kumar V. Mg-doped ZnO nanoparticles for efficient sunlight-driven photocatalysis. ACS Applied Materials &
Interfaces. 2012; 4: 2717-25.
26. Feyzi M, Zinatizdeh AAL, Nouri P, Jafari F.
Catalytic performance and characterization of promoted K-La/ZSM-5 nanocatalyst for biodiesel
production. Iranian Journal of Chemistry and Chemical Engineering. 2018; 37(2): 33-44. 27. Feyzi M, Khajavi G. Investigation of biodiesel
production using modified strontium nanocatalysts supported on the ZSM-5 zeolite. Industrial Crops and Products. 2014; 58: 298–304. 28. Meher LC, Naik SN, Das LM. Methanolysis of Pongamia pinnata (Karanja) oil for production of
biodiesel, Journal of Scientific and Industrial Research. 2004; 63: 913-8. 29. Hoekman SK, Broch A, Robbins C, Ceniceros E, Natarajan M. Review of biodiesel composition, properties, and specifications. Renewable and
Sustainable Energy Reviews. 2012; 16: 143– 69.
30. Rashid U, Anwar F, Moser BR, Knothe G. Moringa oleifera oil: A possible source of biodiesel. Bioresource Technology. 2008; 99: 8175–9.
31. Knothe G. “Designer” Biodiesel: Optimizing fatty ester composition to improve fuel properties. Energy Fuels. 2008; 22: 1358–64. 32. Berman P, Nizri S, Wiesman Z. Castor oil biodiesel and its blends as alternative fuel, Biomass & Bioenergy. 2011; 35: 2861-6.
33. Nautiyal P, Subramanian KA, Dastidar MG. Kinetic and thermodynamic studies on biodiesel production from Spirulina platensis algae biomass
using single stage extraction-transesterifcation process. Fuel. 2014; 135: 228-34.
34. Astria DF, Ilvania CV, Fraderico AL, Heiddy MA, Vitor HM. Thermodynamic analysis of the kinetics reaction of the production of FAME and FAEE using Novazyme-435 as catalyst. Fuel Processing Technololgy. 2011; 92: 1007-11.
35. Ahmad AL, Mat Yasin NH, Derek CJC, Lim JK. Kinetic studies and thermodynamics of oil extraction and transesterification of Chlorella sp. for biodiesel production. Environmental Technology. 2014; 35: 881-7. 36. Engel T, Reid P. Physical chemistry. Pearson
Education, San Fransisco; 2006.

Bahammou I et al., JOTCSA. 2019; 6(3): 349-354. RESEARCH ARTICLE
349
A Green and Efficient Process for the Synthesis of Benzothiazinones using Phosphate Fertilizers MAP, DAP and TSP as Heterogeneous
Catalysts
Imane Bahammou , Badr Malek , Tourya Ghailane , Rachida Ghailane ,
Said Boukhris , Abdelaziz Souizi*
Laboratory of Organic, Organometallic and Theoretical Chemistry, University Ibn Tofail, B.P.
Abstract: The aim of this work is to demonstrate the efficiency of the phosphate fertilizers mono-
ammonium phosphate (MAP), di-ammonium phosphate (DAP), and triple-super phosphate (TSP) as a “green” heterogeneous catalyst for the synthesis of 2-aryl-2H-benzo[b][1,4]thiazin-3(4H)-ones via the C-S and C-N coupling process of gem-dicyano epoxide with α-aminothiophenol. To optimize the reaction conditions, the synthesis was conducted with a range of solvents, catalyst amounts, and particle sizes of
the catalyst. Also, the recyclability potential of the catalysts was confirmed by using the recycled catalyst.
Keywords: Heterogeneous catalyst, phosphate fertilizer, MAP, DAP, TSP, Benzothiazinone. Submitted: May 10, 2019. Accepted: August 09, 2019. Cite this: Bahammou I, Malek B, Ghailane T, Ghailane R, Boukhris S, Souizi A. A Green and Efficient
Process for the Synthesis of Benzothiazinones using Phosphate Fertilizers MAP, DAP and TSP as Heterogeneous Catalysts. JOTCSA. 2019;6(3):349–54.
DOI: https://doi.org/10.18596/jotcsa.563093. *Corresponding author. E-mail: [email protected]. Tel: +212661183260.
INTRODUCTION To date, benzothiazinone (BTZ) skeleton have been extensively used as pharmacophore group for the construction of numerous biologically active compounds such as anti-tubercular (1),
antimicrobial (2), allosteric modulator (3), inhibitor of glycogen synthase kinase 3β (3), monoamine oxidase B inhibitors (4), adenosine A2A receptor antagonists (4), antioxidant (5), anti-candida (6) and antitumor agents (7). Currently, BTZ compounds were identified as a
possible new class of acetylcholinesterase inhibitors for curing the symptoms of Alzheimer’s disease (8). In continuation of evaluation of BTZ’s properties, Ghailane et al. (9) were able to classify some BTZ derivatives as anticorrosive agents for mild steel
in 1M HCl based on quantum chemical studies and electrochemical measurements.
Given the importance of BTZ heterocyclic systems, they have been the object of several synthetic studies. For example, BTZ derivatives were successfully synthesized by the condensation of α-aminothiophenol with aryltrichlorocarbinol (10), or
dibromonitroacrylates (11), from methyl 2-iodobenzoate and cyclic thiourea (12) or 2-mercaptoacetate and substituted 2-iodoanilines (13) via the Cu-catalyzed coupling processes. In attempts to establish a green approach to elaborate new derivatives of BTZ, Sharifi et al. (14) developed a green synthesis of various
benzothiazinones via the condensation of 2-bromoalkanoates with α-aminothiophenol using ball milling and KF-Al2O3 support. Recently, new, facile, and regio-controlled methods to obtain BTZ derivatives by reacting α-aminothiophenol with different electron acceptor epoxides were reported (15). Therefore, the improvement of
these methods in terms of reaction time, product purity and yield is highly desirable given environmental considerations.

Bahammou I et al., JOTCSA. 2019; 6(3): 349-354. RESEARCH ARTICLE
350
MAP, DAP, and TSP are ones of the most
important and popular members of phosphate fertilizers family due to their composition rich in
nitrogen (from NH4+ (MAP, DAP)), phosphorus
(from PO43- (MAP, DAP, TSP)) and calcium (from
Ca (TSP)). Nowadays, they prove to be eco-friendly, economically and highly active
heterogeneous catalysts for Knoevenagel condensation (16), 2,3-dihydroquinazolin-4(1H)-one synthesis (17) and synthesis of 1-(benzothiazolylamino) methyl-2-naphthol derivatives (18). As part of our previous efforts to valorize
phosphate fertilizers (16) we describe herein a ‘green’ optimization of the one-pot synthesis of BTZ derivatives from gem-dicyano epoxide 1 as described by Ghailane et al. (15) using MAP, DAP and TSP fertilizers as novel heterogeneous and reusable catalysts.
EXPERIMENTAL Chemicals and instruments Chemicals were purchased from Fluka or Aldrich Companies. Catalysts MAP, DAP and TSP, were purchased from OCP group. They are marked as
mention in our previous work (16). Mono-Ammonium Phosphate: MAP 11-52-00 - Binary Fertilizer, complex granule with Nitrogen: 11% N and Phosphorus: 52% P2O5. Di-Ammonium Phosphate: DAP 18-46-00 - Binary Fertilizer, complex granule with Nitrogen: 18% N and Phosphorus: 46% P2O5.Triple Super Phosphate:
TSP 00-46-00 - Simple granule Fertilizer with Phosphorus: 46% P2O5. All known compounds were identified by
comparing their melting points with literature data. Melting points were recorded on a Wagner & Munz HEIZBANK Kofler bench.
Separation of catalyst’s particles according to their size The catalyst was crushed and sieved on a mechanical sieve shaker to provide different size of catalyst particles. Three different powders of
catalysts MAP, DAP and TSP were tested in this
work. The first (designated F1) comprised catalyst
powder in size range of 36-71 µm. The second (designated F2) was of the size range between 71
and 90 µm. The last powder tested (designated F3) comprised between 91 and 120 µm. General experimental procedure for the
phosphate fertilizers MAP, DAP and TSP catalyzed the one-pot synthesis of 2-(p-tolyl)-2H-benzo[b][1,4]thiazin-3(4H)-one, 3a Into a 25 mL round-bottomed flask equipped with a reflux condenser and mechanical stirrer were placed 2 mmoles of epoxide 1, 2 mmoles of α-
aminothiophenol 2 dissolved in 3 mL of acetonitrile. 10 mol% of catalyst was then added to the mixture. The latter was stirred for an appropriate time. The progress of the reaction was monitored by TLC, eluted with chloroform/petroleum ether (2:1). After
completion of the reaction, the mixture was
filtered to separate the catalyst. Then, the solvent of the filtrate was removed under vacuum, and the oily residue obtained was triturated with a mixture of diethyl ether and petroleum ether (9:1) to give 2-arylbenzothiazin-3-one as a solid which was collected and crystallized from ethanol.
Recyclability studies on the catalysts The catalyst separated from the mixture was rinsed with EtOH (2×5 mL), dried at 70 °C for 6 hours and reused for subsequent catalytic reactions.
RESULTS AND DISCUSSION Catalytic synthesis of BTZ To obtain the optimal reaction conditions, one-pot
synthesis of BTZ was carried out using MAP, DAP and TSP as heterogeneous catalysts. The reaction of epoxide 1a with α-aminothiophenol was
selected as a model reaction to produce 2-(p-tolyl)-2H-benzo[b][1,4]thiazin-3(4H)-one (3a). In the preliminary studies, the reaction was conducted following the conventional synthesis conditions earlier described (12) in the presence of 10 mol% of catalyst from fraction 1 (F1)
(Scheme 1).
Scheme 1: Synthesis of compounds 3a in the presence of MAP, DAP or TSP catalysts.
Table 1: Catalytic test runs.
Entry Catalyst Time Yield (%)
1 Neat 22 h 80 2 MAP 1 h 20 87 3 DAP 1 h 85 4 TSP 2 h 82
Bahammou I et al., JOTCSA. 2019; 6(3): 349-354. RESEARCH ARTICLE
351
Influence of reaction parameters
Effects of reaction solvent After screening the potential activity of phosphate
fertilizers MAP, DAP, and TSP, an optimized procedure for the preparation of 2-(p-tolyl)-2H-benzo[b]1,4]thiazin-3(4H)-one (3a) over these heterogeneous catalysts were therefore
developed. Initially, the reaction was carried out in several solvents including MeCN, EtOH, AcOEt, CHCl3 using 10 mol% of catalyst (F1) (Table 2). As shown, the three catalysts tested were highly active and gave the desired BTZ 3a in high yields within short reaction time in EtOH (Table 2, entries 4, 5 and 6). These results can be
explained by the fact that EtOH contains polar molecules and an acidic hydrogen atom which is liable to establish a hydrogen bond with the oxygen atom of epoxide to facilitate the bi-nucleophilic attack of α-aminothiophenol.
Effects of catalysts’ amount
The catalytic activities were then tested with a range of catalyst amounts (F1), from 10
mol% up to 40 mol%, to determine the optimal catalyst loading for each catalyst. The reaction was conducted under otherwise identical reaction conditions in the presence of EtOH as a solvent.
As can be seen, MAP, DAP and TSP catalysts exhibited high activities under a catalyst loading of 10 mol% and afforded the desired product within 40, 35, and 55 minutes, respectively, in high yields (Table 3, entries 1, 5 and 9). A further increase in the catalysts’ amounts up to 40 mol% resulted in an extension of the reaction time with
a slight decrease in the product yield, indicating the catalyst amount of 10 mol% to be optimal. This observation established the excellent catalytic activity of the recently developed catalysts.
Table 2: Optimization of the reaction solvent using MAP, DAP and TSP catalysts.
Entry Catalyst (10 mol %) Solvent (3 mL) Time Yield (%)
1 MAP MeCN 1 h 20 87 2 DAP MeCN 1h 85
3 TSP MeCN 2h 82 4 MAP EtOH 40 min 92 5 DAP EtOH 35 min 89 6 TSP EtOH 55 min 90 7 MAP AcOEt 3 h 30 75 8 DAP AcOEt 3 h 73 9 TSP AcOEt 2h 50 65
10 MAP CHCl3 3 h 10 63 11 DAP CHCl3 3 h 40 60 12 TSP CHCl3 4 h 55
Table 3: Optimization of the catalysts amount for the synthesis of 2-(p-tolyl)-2H-benzo[b][1,4]thiazin-3(4H)-one 3a.
Entry Catalyst Catalyst loading (%) Time Yield (%)
1 MAP 10 40 min 92 2 MAP 20 55 min 91
3 MAP 30 1 h 10 85 4 MAP 40 1 h 25 82 5 DAP 10 35 min 89 6 DAP 20 45 min 88 7 DAP 30 1 h 85 8 DAP 40 1 h 15 83
9 TSP 10 55 min 90 10 TSP 20 1 h 05 85 11 TSP 30 1 h 20 83 12 TSP 40 1 h 35 79
Effects of catalysts’ particle size
In the current study, we also focused on
determining the effect of the catalysts’ particle size in an attempt to compare the results with those obtained in our previous work (18). No remarkable influence of the catalyst particle size
on the catalysts activities was observed. The
results prove our previous findings that the three
phosphate fertilizers MAP, DAP and TSP can constantly show high catalytic activities even when their particle size increases.
Bahammou I et al., JOTCSA. 2019; 6(3): 349-354. RESEARCH ARTICLE
352
Table 4: Screening of the effects of catalyst particle size on the catalytic activities of MAP, DAP and TSP
for the synthesis of 2-(p-tolyl)-2H-benzo[b][1,4]thiazin-3(4H)-one 3a.
Entry Catalyst (10 mol%) Particle size range Time (min) Yield (%)
1 MAP 36-71 µm 40 92 2 MAP 71-90 µm 40 93
3 MAP 90-120 µm 40 91 4 DAP 36-71 µm 35 89 5 DAP 71-90 µm 35 89 6 DAP 90-120 µm 40 88 7 TSP 36-71 µm 55 90 8 TSP 71-90 µm 55 88 9 TSP 90-120 µm 55 91
Control of the generality of the catalysts To further screen the scope and the generality of our new catalysts, the reaction of α-aminothiophenol with various substituted
epoxides for the synthesis of BTZ derivatives was studied under the optimized conditions using catalyst from fraction 1 (F1). As shown in Table 5,
almost all of the epoxide substrates with either
electron-withdrawing or electron-donating substitution furnished the corresponding adducts in high yields. It is noteworthy that the reaction time was extended to 45 min for MAP, 50 min for
DAP and 1h for TSP when the epoxide was substituted with the nitro group (Table 5, Entries 7, 8 and 9).
Table 5. Synthesis of BTZ derivatives over phosphate fertilizers MAP, DAP and TSP under the optimized conditions.
Entry R 1 Catalyst Product Time (min) Mp (°C) Yield (%)
1 CH3 1a MAP 3a 40 198-199 92 2 CH3 1a DAP 3a 35 198-199 89 3 CH3 1a TSP 3a 55 198-199 90
4 Cl 1b MAP 3b 25 186-187 96 5 Cl 1b DAP 3b 30 186-187 93 6 Cl 1b TSP 3b 40 186-187 94 7 NO2 1c MAP 3c 45 202-203 92 8 NO2 1c DAP 3c 50 202-203 85 9 NO2 1c TSP 3c 60 202-203 90
Recyclability studies on the catalysts
In another study, the reaction of epoxide 1a and α-aminothiophenol 2 was tested in the presence of recovered MAP, DAP and TSP to establish the reusability of the three catalysts developed for
the synthesis of 2-(p-tolyl)-2H-
benzo[b][1,4]thiazin-3(4H)-one 3a, the results are displayed in Table 6. To our delight, MAP, DAP and TSP catalysts were found to be reusable with consistency in activity up to four times.
Table 6. Recyclability of MAP, DAP and TSP catalysts.
Entry Catalyst Run number Time(min) Yield (%)
1 MAP 1 40 92 2 MAP 2 40 92
3 MAP 3 40 91 4 MAP 4 40 90 5 DAP 1 35 89 6 DAP 2 35 88 7 DAP 3 35 88 8 DAP 4 35 87 9 TSP 1 55 90
10 TSP 2 55 88
11 TSP 3 55 88 12 TSP 4 55 87
CONCLUSIONS
Through this study, we demonstrated the catalytic efficiency of the phosphate fertilizers MAP, DAP and TSP for the C-S and C-N coupling reactions. A “green” optimized procedure was therefore designed for the synthesis of 2-aryl-2H-
benzo[b][1,4]thiazin-3(4H)-ones from α-
aminothiophenol and gem-dicyano epoxide. ACKNOWLEDGEMENT This study was financially supported by the Research Excellence Award Program of the
Bahammou I et al., JOTCSA. 2019; 6(3): 349-354. RESEARCH ARTICLE
353
National Center for Scientific and Technical
Research (CNRST-Rabat, Morocco).
REFERENCES 1. Xiong L, Gao C, Shi YJ, Tao X, Rong J, Liu KL, Peng CT, Wang NY, Lei Q, Zhang YW, Yu LT,
Wei YQ. Identification of a new series of benzothiazinone derivatives with excellent antitubercular activity and improved pharmacokinetic profiles. RSC Adv. 2018; 8:11163–76. 2. Armenise D, Muraglia M, Florio MA, De
Laurentis N, Rosato A, Carrieri A, Corbo F, Franchini C. 4H-1, 4-Benzothiazine, Dihydro-1, 4-benzothiazinones and 2-Amino-5-fluorobenzenethiol Derivatives: Design, Synthesis and in vitro Antimicrobial Screening. Arch Pharm. 2012; 345:407–16.
3. Zhang P, Li S, Gao Y, Lu W, Huang K, Ye D, Li X, Chu Y. Novel benzothiazinones (BTOs) as allosteric modulator or substrate competitive inhibitor of glycogen synthase kinase 3β (GSK-3β) with cellular activity of promoting glucose uptake. Bioorg Med Chem Lett. 2014; 24:5639–
43. 4. Stoßel A, Schlenk M, Hinz S, Küppers P, Heer J, Gütschow M, Müller CE. Dual targeting of adenosine A2A receptors and monoamine oxidase B by 4 H-3, 1-benzothiazin-4-ones. J Med Chem. 2013; 56:4580–96.
5. Kumar M, Sharma K, Samarth RM, Kumar A. Synthesis and antioxidant activity of quinolinobenzothiazinones. Eur J Med Chem.
2010; 45:4467–72. 6. Borate HB, Maujan SR, Sawargave SP,
Chandavarkar MA, Vaiude SR, Joshi VA, Wakharkar RD, Iyer R, Kelkar RG, Chavan SP, Kunte SS. Fluconazole analogues containing 2H-1, 4-benzothiazin-3 (4H)-one or 2H-1, 4-benzoxazin-3 (4H)-one moieties, a novel class of anti-Candida agents. Bioorg Med Chem Lett.
2010; 20:722–5. 7. Kamel MM, Ali HI, Anwar MM, Mohamed NA, Soliman AM. Synthesis, antitumor activity and molecular docking study of novel Sulfonamide-Schiff’s bases, thiazolidinones, benzothiazinones and their C-nucleoside
derivatives. Eur J Med Chem. 2010; 45:572–80.
8. Berwaldt GA, Gouvêa DP, da Silva DS, das Neves AM, Soares MS, Azambuja JH, Spanevello RM, Cunico W. Synthesis and biological evaluation of benzothiazin-4-ones: a possible new class of acetylcholinesterase inhibitors. J Enzyme Inhib
Med Chem. 2019; 34:197–203. 9. Ghailane T, Balkhmima RA, Ghailane R, Souizi A, Touir R, Touhami ME, Marrakchi K, Komiha N. Experimental and theoretical studies
for mild steel corrosion inhibition in 1 M HCl by
two new benzothiazine derivatives. Corros Sci. 2013; 76:317–24.
10. Willardsen JA, Dudley DA, Cody WL, Chi L, McClanahan TB, Mertz TE, Potoczak RE, Narasimhan LS, Holland DR, Rapundalo ST,
Edmunds JJ, Design, synthesis, and biological activity of potent and selective inhibitors of blood coagulation factor Xa. J Med Chem. 2004; 47:4089–99. 11. Makarenko SV, Kovalenko KS, Vershinina YS, Berestovitskaya VM. One-pot synthesis of
substituted 1,3-benzothiazole and 1,4-benzothiazinone from dibromonitroacrylates. Russ J Org Chem. 2014; 50:83–6. 12. Chen D, Wu J, Yang J, Huang L, Xiang Y, Bao W. Cascade syntheses of aza[2,1-b][1,3]-
benzothiazinone heteropolycyclic compounds
from cyclic thiourea catalyzed by Cu(I). Tetrahedron Lett. 2012; 53:7104–7. 13. Huang W-S, Xu R, Dodd R, Shakespeare WC. Facile synthesis of 1, 4-benzothiazin-3-ones
from Cu-catalyzed coupling of 2-iodoanilines and 2-mercaptoacetate. Tetrahedron Lett. 2013; 54:5214–6. 14. Sharifi A, Ansari M, Darabi HR, Abaee MS. Synergistic promoting effect of ball milling and KF–alumina support for the green synthesis of
benzothiazinones. Tetrahedron Lett. 2016; 57: 529–32. 15. Ghailane T, Saadouni M, Boukhris S,
Habbadi N, Hassikou A, Kerbal A, Garrigues B, Souizi A. Regio-controlled synthesis of 1,4-benzothiazinones. Heterocycles. 2011; 83:357–
63. 16. Bahammou I, Esaady A, Boukhris S, Ghailane R, Habbadi N, Hassikou A, Souizi A. Direct use of mineral fertilizers MAP, DAP, and TSP as heterogeneous catalysts in organic
reactions. Mediterr J Chem. 2016; 5:615–23. 17. Merroun Y, Chehab S, Ghailane T, Boukhris S, Ghailane R, Habbadi N, Hassikou A, Lakhrissi B, Souizi A. An effective method to synthesize 2,3-dihydroquinazolin-4(1H)-One using phosphate fertilizers (MAP, DAP and TSP)
as green heterogeneous catalysts. J Turk Chem
Soc Sect A Chem. 2018; 5:303–16. 18. Zimou O, Malek B, Elhallaoui A, Ghailane T, Ghailane R, Boukhris S, Habbadi N, Hassikou A, Souizi A. Valorization of the Phosphate Fertilizers Catalytic Activity in 1-
(Benzothiazolylamino) Methy l-2-Naphthol Derivatives Synthesis. Bull Chem React Eng Catal. 2019; 14:238-46.

Bahammou I et al., JOTCSA. 2019; 6(3): 349-354. RESEARCH ARTICLE
354
Doğan Çalhan S, Gündoğan M. JOTCSA. 2019; 6(3): 355-364. RESEARCH ARTICLE
Evaluation of Changes in the Biological Activity of Onosma SericeumWilld (Boraginaceae) Based on Collection Time and Extraction Solvent,
and Determination of Its Mineral and Trace Element Composition
Selda Doğan Çalhan1* , Mustafa Gündoğan2
1Mersin University, Faculty of Pharmacy, Department of Pharmaceutical Biotechnology, 33169 Mersin,Turkey.2Mersin University, Faculty of Pharmacy, Department of Pharmaceutical Technology, 33169 Mersin,Turkey.
Abstract: In this study, total phenol, flavonoid, and free radical scavenging activity of Onosma SericeumWilld (Boraginaceae), a plant grown in Turkey and traditionally used for wound healing, were determinedby using spectrophotometric methods. Its cytotoxic effect on breast cancer cells (MCF-7) wasinvestigated. Furthermore, mineral and trace element composition of the plant roots, collected indifferent times, was determined by using inductively coupled plasma mass spectroscopy (ICP-MS).Onosma Sericeum Willd, which was collected in Besni region, Adıyaman in May, June and July and driedproperly, was extracted by using different solvents in the study. Total phenol content of the extracts wascalculated by using the Folin-Ciocalteu method in gallic acid equivalent as 58.42±0.13–93.34±0.68 mg(GAE)/g. The flavonoid content was calculated as 21.79±1.3–60.33±0.36 mg (KUE)/g in quercetinequivalent by using the aluminum chloride method. Free radical scavenging activity was measuredspectrophotometrically by using the 2,2-diphenyl-1- picrylhydrazyl (DPPH) assay. DPPH radicalscavenging activity rates were found to be in the range of 60.27±0.06-78.60±0.21% in the form of %inhibition. It was observed that extracts which were prepared by using ethanol produced the cytotoxiceffect on the MCF-7 cancer cells depending on the dosage. It was concluded that the rates of phenol,flavonoid, free radical scavenging activity, and cytotoxic effect differed based on the solvent used forextraction and the time of plant collection. Moreover, trace element and mineral composition of the plantsamples, collected in different times, were determined.
Keywords: Boraginaceae, phenolic species, antioxidant activity, wound healing, element composition.
Submitted: July 01, 2019. Accepted: August 25, 2019.
Cite this: Doğan Çalhan S, Gündoğan M. Evaluation of Changes in the Biological Activity of OnosmaSericeum Willd (Boraginaceae) Based on Collection Time and Extraction Solvent, and Determination of ItsMineral and Trace Element Composition. JOTCSA. 2019;6(3):355–64.
DOI: https://doi.org/10.18596/jotcsa.585036.
*Corresponding author. E-mail: [email protected] .
INTRODUCTION
Mankind has sought ways of coping withdiseases since the beginning of the world, andthis adventure is still ongoing. One of theprimary sources used by people in this process isplants. Archeological research indicates thatherbal medicine dates back to the ancient times.Increased knowledge of plants over time andpositive outcomes of the treatment of diseasesbrought along the concept of medication.Therefore, the first medications were herbaldrugs. Considering the plant diversity and
population worldwide, and the possibility offinding dozens of active substances withpharmaceutical efficacy in every plant, we cometo realize how an endless world we live in.Hence, knowledge that has been acquired andlearned for centuries has resulted in thecooperation of different disciplines in this area.
Turkey hosts a wide variety of plant species dueto its geographical location and diverse climate.One of them is the family Boraginaceae. Spreadin the tropical, subtropical and temperateregions of the world, the family is represented
355
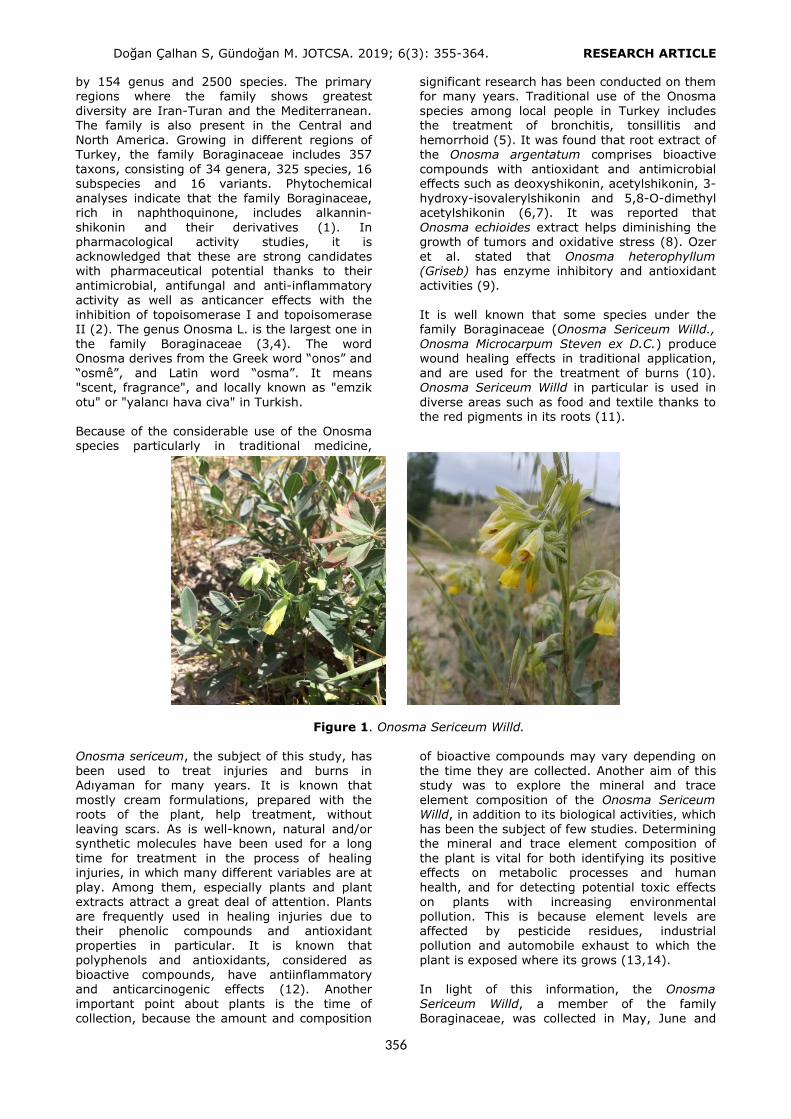
Doğan Çalhan S, Gündoğan M. JOTCSA. 2019; 6(3): 355-364. RESEARCH ARTICLE
by 154 genus and 2500 species. The primaryregions where the family shows greatestdiversity are Iran-Turan and the Mediterranean.The family is also present in the Central andNorth America. Growing in different regions ofTurkey, the family Boraginaceae includes 357taxons, consisting of 34 genera, 325 species, 16subspecies and 16 variants. Phytochemicalanalyses indicate that the family Boraginaceae,rich in naphthoquinone, includes alkannin-shikonin and their derivatives (1). Inpharmacological activity studies, it isacknowledged that these are strong candidateswith pharmaceutical potential thanks to theirantimicrobial, antifungal and anti-inflammatoryactivity as well as anticancer effects with theinhibition of topoisomerase I and topoisomeraseII (2). The genus Onosma L. is the largest one inthe family Boraginaceae (3,4). The wordOnosma derives from the Greek word “onos” and“osmê”, and Latin word “osma”. It means"scent, fragrance", and locally known as "emzikotu" or "yalancı hava civa" in Turkish.
Because of the considerable use of the Onosmaspecies particularly in traditional medicine,
significant research has been conducted on themfor many years. Traditional use of the Onosmaspecies among local people in Turkey includesthe treatment of bronchitis, tonsillitis andhemorrhoid (5). It was found that root extract ofthe Onosma argentatum comprises bioactivecompounds with antioxidant and antimicrobialeffects such as deoxyshikonin, acetylshikonin, 3-hydroxy-isovalerylshikonin and 5,8-O-dimethylacetylshikonin (6,7). It was reported thatOnosma echioides extract helps diminishing thegrowth of tumors and oxidative stress (8). Ozeret al. stated that Onosma heterophyllum(Griseb) has enzyme inhibitory and antioxidantactivities (9).
It is well known that some species under thefamily Boraginaceae (Onosma Sericeum Willd.,Onosma Microcarpum Steven ex D.C.) producewound healing effects in traditional application,and are used for the treatment of burns (10).Onosma Sericeum Willd in particular is used indiverse areas such as food and textile thanks tothe red pigments in its roots (11).
Figure 1. Onosma Sericeum Willd.
Onosma sericeum, the subject of this study, hasbeen used to treat injuries and burns inAdıyaman for many years. It is known thatmostly cream formulations, prepared with theroots of the plant, help treatment, withoutleaving scars. As is well-known, natural and/orsynthetic molecules have been used for a longtime for treatment in the process of healinginjuries, in which many different variables are atplay. Among them, especially plants and plantextracts attract a great deal of attention. Plantsare frequently used in healing injuries due totheir phenolic compounds and antioxidantproperties in particular. It is known thatpolyphenols and antioxidants, considered asbioactive compounds, have antiinflammatoryand anticarcinogenic effects (12). Anotherimportant point about plants is the time ofcollection, because the amount and composition
of bioactive compounds may vary depending onthe time they are collected. Another aim of thisstudy was to explore the mineral and traceelement composition of the Onosma SericeumWilld, in addition to its biological activities, whichhas been the subject of few studies. Determiningthe mineral and trace element composition ofthe plant is vital for both identifying its positiveeffects on metabolic processes and humanhealth, and for detecting potential toxic effectson plants with increasing environmentalpollution. This is because element levels areaffected by pesticide residues, industrialpollution and automobile exhaust to which theplant is exposed where its grows (13,14).
In light of this information, the OnosmaSericeum Willd, a member of the familyBoraginaceae, was collected in May, June and
356
Doğan Çalhan S, Gündoğan M. JOTCSA. 2019; 6(3): 355-364. RESEARCH ARTICLE
July, extracted by using different solvents, andtotal phenolic, flavonoid content and free radicalscavenging activity of the extractsweredetermined. Cytotoxic effect of differentextracts on the MCF-7 breast cancer cell wasinvestigated. Trace element and mineralcomposition of the plant which was gathered indifferent times was also identified.
MATERIALS AND METHODS
Collection and Identification of PlantMaterialSpecimens of the Onosma Sericeum Willd(Boraginaceae) used in the study were gatheredin Besni district of Adıyaman, Turkey in May,June and July 2018. The plant was identified byAssoc. Prof. Rıza Binzet from the Department ofBiology of the Faculty of Arts and Sciences,Mersin University. After properly dried, roots ofthe plant were used throughout the study.
Materials Methanol and ethanol, used as extractionsolvents in the study, were procured fromMerck. Folin-Ciocalteu phenol reagent, 2-2-diphenyl-1-picrylhydrazyl (DPPH), ascorbic acid,and gallic acid were obtained from Sigma.Sodium carbonate was procured from Tekkim.Quercetin, aluminum chloride (Fluka), sodiumnitrite (Merck) and sodium hydroxide weresupplied by Sigma. Nitric acid (65%, Merck),hydrochloric acid (37%, Merck), hydrogenperoxide (30%, Merck), and dimethyl sulfoxide(99.9%, Merck) were used in experimentalwork. Cell culture applications used fetal bovineserum (Sigma), Trypsin-EDTA solution (Sigma),Penicillin-Streptomycin solution (Sigma),Thiazolyl blue tetrazolium bromide (MTT) (98%,Sigma) and RPMI 1640 medium (Sigma). TheMCF-7 breast cancer cells were procured fromATTC (catalogue number: HTB-22). All thechemicals used in the study were of analyticalgrade, and 18.2 mΩ of distilled water neededthroughout the research was obtained throughthe Milli-Q A10 water purification system.
InstrumentsAll spectrophotometric measurements wereconducted by using a Shimadzu UV-1601spectrophotometer. Element and mineralcomposition was analyzed by using the Agilent7500ce Inductively Coupled Plasma-MassSpectrometry (ICP-MS). CEM Mars 240/50microwave system was used to digest thesamples on the ICP-MS. Thermal shaking waterbath was used for plant extraction. The studyalso used Heidolph Reaxtop vortex and HeidolphLaborota 4000 efficient evaporator.
Extraction Procedure5 g of crushed plant roots was obtained, andmixed with 25 mL of ethanol (EtOH), methanol(MeOH), and boiled water, respectively. It waskept in shaking water bath for 1 hour. Thisprocedure was repeated 3 times. Later, the
extracts were filtered withwhite filter paper andevaporated at maximum 40 oC by using a rotaryevaporator. Dried extracts were dispersed byusing solvents, and stock solutions wereprepared and filtered through 0.45 µmmembrane filters. The stock solutions werestored under suitable conditions to be used indetermining biological activity and traceelement/mineral composition. Nine differentextracts which were collected in May, June andJuly were named as May EtOH, May MeOH, Maywater, June EtOH, June MeOH, June water, JulyEtOH, July MeOH and July water.
Total Phenolic Content AnalysisTotal phenolic content of the extracts wasdetermined spectrophotometrically by using theFolin-Ciocalteu method (15). 100 μL of sample/L of sample/extract sample was mixed with 7900 µLofdistilled water and 500 μL of sample/L of Folin-Ciocalteu’sreagent in a test tube (10%, v/v in water). Themixture was vortexed and allowed to stand toincubate in the dark at room temperature for 2minutes. After that, 1.5 mL of Na2CO3 (20%)solution (w/v) was added to the mixture, and itwas vortexed again. After the mixture was keptin the dark at room temperature for 2 hours,absorbance of the resulting blue solutions wasmeasured by using the UV spectrophotometer at765 nm wavelength. Gallic acid was used asstandard. Results were expressed as average ofthe three measurements, in mg GAE/g dryweight.
Total Flavonoid Content AnalysisTotal flavonoid content of the extracts wasdetermined spectrophotometrically through thealuminum chloride/sodium nitrite method (16).After 500 μL of sample/L of extract sample, diluted to acertain extent, was placed in a test tube with 3mL of distilled water, 0.3 mL of aqueous NaNO2
solution (5%) was added, and the mixture wasvortexed. After 5 minutes, 0.3 mL of aqueousAlCl3 solution (10%) was added to the mixture.Then, by adding 2 mL of 1 M NaOH after 1minute, the final volume of the mixture wascompleted to 10 mL, with distilled water. Thisfinal mixture was vortexed again, and itsabsorbance was measured at 510 nm. Resultswere expressed as the average of the threemeasurements, in mg Quercetin/g dry weight.
DPPH.Free Radical Scavenging Activity Free radical scavenging activity of the extractswas assessed spectrophotometrically throughthe DPPH method (17). 100 μL of sample/L of the rootextract and ascorbic acid solution with differentconcentrations, used as standard, was mixedwith 2.9 mL of 80 μL of sample/M DPPH solution, freshlyprepared in methanol. The mixture was vortexedand kept in the dark for 1 hour to incubate. Afterthis procedure, absorbance of each mixture wasmeasured at 517 nm. Theresults are given asaverage of the three measurements, in %inhibition (Equation 1).
357

Doğan Çalhan S, Gündoğan M. JOTCSA. 2019; 6(3): 355-364. RESEARCH ARTICLE
% Inhibition =[(Abscontrol–Abssample)/ Abscontrol] x 100 (Eq. 1)
Cytotoxic EffectThe MTT (3-(4,5-dimethylthiazolyl-2)-2,5-diphenyltetrazolium bromide) assay, acolorimetric method, is based on the principle ofthe reduction of tetrazolium salt to coloredformazans. Cell viability is assessed by dying thecells at various levels with the MTT according totheir mitochondrial activity. After the formazancrystals are dissolved, reading is made at 570nm wavelength.The present study used themethod proposed by Turan et al. (18) with somemodification. In the present study, the MCF-7cells were seeded into 4 plates containing 96wells, with 104 cells in each well. Water wasplaced in the outermost wells of the plates toadjust moisture balance. Nine samples (MayEtOH, May MeOH, May water, June EtOH, JuneMeOH, June water, July EtOH, July MeOH, Julywater) were administered to the MCF-7 breastcancer cells in 3 different concentrations (50µg/
mL, 100 µg/mL, 200 µg/mL). The procedure wasrepeated 10 times for each concentration(n=10). After 24 hours, the extracts in the cellswere taken from the wells and mixed with theMTT solvent. The cells were kept for incubationat 37 °C, with 5% CO2. The plates were wrappedwith aluminum foil to prevent the entrance oflight. The cells were taken out after being keptin incubation for 5 hours, the medium over themwas removed, and 200 µL of dimethyl sulfoxidewas added to each well. In this way, unsolvedformazan crystals were also dissolved. Afterwaiting for 15 minutes, they were measured byusing an ELISA set at 570 nm wavelength. Outerwells which did not contain any cells wereintroduced as empty. IC50 value and cellviability was calculated by using the absorbancerates and the formula in Equation 2.
Relative cell viability (%)= OD570 of the treated sample/OD570 of the control (Eq. 2)
To count the viable cells, Cedex XS (Roche,Mannheim, Germany) was used. This devicedistinguishes between viable and non-viablecells with high precision, by providinginformation about cell concentration and viabilitybased on the trypan blue exclusion method, in asemi-automatical manner. 20 μL of sample/L of resuspendedcells were taken and added to 0.2 mL ofEppendorf tube. The cells were mixed with 20 μL of sample/Lof trypan blue solution (0.4%), diluted withdistilled water which helps to distinguishbetween viable and non-viable cells (Roche,Mannheim, Germany). After this mixture washomogenized through pipetting, 20 μL of sample/Lof it wasput in the Smart Slides chamber, special slide ofthe device (Roche, Mannheim, Germany). Later,the sample was placed on the Cedex XS cellcounter in the chamber, and the cells werecounted by using the software of the device.
Determination of Mineral and TraceElement Composition 0.5 g of the plant roots which were collected inMay, June and July was obtained, and digestedusing the heat controlled microwave system. Forthis procedure, 12 mL of nitric acid-hydrochloricacid mixture and 1 mL of hydrogen peroxidewere used. Digestion process took 30 minutes at175 °C. The system settings of the device wereoptimized to 239 PSI and 720 w. After theresulting acidic solution was diluted properly,measurements were made through the ICP-MS.Operating parameters of the ICP-MS device aregiven in Table 1.
Statistical AnalysisThe results were calculated by taking theaverage of the three measurements andstandard deviation (mean±SD). RepeatedMeasures Analysis of Variant was used for
comparing more than two dependent averages(in different times). Contrast process was usedto determine in which time intervals thedifference occurred. The statistical significancelevel was set at 0.05 in all analyses. The datawas analyzed by using SPSS 21.
Table 1. Operating Conditions of ICP MS.Parameter ValueRF power 1500 WSampling Depth 8.8mmFlow Rates of Plasma Gas 15 L/minFlow Rates of Carrier Gas 0.9 L/minFlow Rates of Auxiliary Gas 1 L/minIntegration Time 0.60 s
RESULTS AND DISCUSSION
It is known that the genus Onosma, includingthe Onosma Sericeum Willd, the subject ofthepresent study, is used in traditionaltreatment, especially in healing wounds (19,20). Studies conducted on the Onosma rootsfound alkannin/ shikonin derivatives displayingbiological activity and these structures havehealing, anti-inflammatory, anti-tumor, anti-thrombotic, and anti-microbial properties (21-23). For this reason, it is highly important andnecessary to carry out biological activityresearch on this genus. Thus, this studyinvestigated the biological activity of theOnosmaSericeum Willd species, which is not studied asmuch as the other Onosma species, dependingon collection time and extraction solvent. Thestudy also determined its element compositionwhich plays significant roles and/or has toxiceffects in biological processes.
In the study, Onosma Sericeum Willd wascollected in Besni region, Adıyaman in May, June
358
Doğan Çalhan S, Gündoğan M. JOTCSA. 2019; 6(3): 355-364. RESEARCH ARTICLE
and July 2018, and its roots were extracted byusing ethanol, methanol, and water. The totalphenol, flavonoid content and DPPH radicalscavenging activity of the extracts weredetermined. The cytotoxic effect of the extractson the MCF-7 cells was investigated through theMTT method. Trace element and mineralcomposition of the plant samples, collected indifferent periods, was determined through theICP-MS after the samples were digested usingmicrowave.
Total phenol was determined by Folin-Ciocalteureactive using the spectrophotometric method. Acalibration graphic was created by preparinggallic acid solutions in specific concentrations(used as standard)and the amount of sample inthe extract was calculated in gallic acidequivalent as 58.42±0.13-93.34±0.68mg(GAE)/g by taking into considerationy=0.001x+0.0033, R2=0.9901 regressionequation and dilution.
The total flavonoid content was determinedthrough the spectrophotometric method by usingthe aluminum chloride/sodium nitrite method. Acalibration graphic was created by preparingquercetin solutions in specific concentrations(used as standard), and the amount of sample inthe extract was calculated in quercetinequivalent as 21.79±1.3-60.33±0.36 mg(KUE)/g by taking into considerationy=0.0002x+0.0078, R2=0.9717 regressionequation and dilution.
The DPPH radical scavenging activity rates of theextracts were given in % inhibition which is usedas the indicator of antioxidant activity.Calculations were carried out based on y=-0.0038x+0.7616 regression equation andEquation 1. According to the results, it wasfound that the % inhibition rates were in therange of 60.27±0.06-78.60±0.21%.
All the results are given as the average of thethree measurements and with standarddeviation rates (Table 2).
Tablo 2.Total phenol, flavonoid, and % inhibition rates of the Onosma Sericeum Willd extract.PHENOL CONTENT*mg GAE/g
FLAVONOIDCONTENT *mgKUE/g
RADICAL SCAVENGINGACTIVITY*% Inhibition
May EtOH 93.34±0.68 60.33±0.36 60.27±0.06May MeOH 70.46±1.31 46.79±0.95 62.13±0.21May Water 62.36±0.13 24.5±1.65 78.60±0.22June EtOH 75.01±1.31 40.54±0.95 67.37±0.11June MeOH 68.19±1.31 32.21±0.95 61.09±0.27June Water
60.46±0.13 23.25±1.25 73.82±0.22
July EtOH 70.08±0.47 42.42±0.95 66.87±0.38July MeOH 59.78±0.26 31.58±1.30 60.81±0.23July Water 58.42±0.13 21.79±1.30 73.75±0.62
* The results were given based on dry weight and as the average of three measurements.
An assessment of the results indicated that therates of phenol, flavonoid, and free radicalscavenging activity differed according tocollection time and extraction solvent, and thedifference between the averages was statisticallysignificant. A statistically significant differencewas found in the phenol content between MayEtOH, June EtOH, and July EtOH (p=0.001).Accordingly, it was determined that thedifference was between May and June(p=0.001), May and July (p=0.001), and Juneand July (p=0.036) periods. It was observedthat there was a statistically significantdifference (p=0.011) in the phenol contentbetween May MeOH, June MeOH, and July MeOH(p=0.011); and this difference was between Mayand July (p=0.004), and June and July(p=0.007) periods. A statistically significantdifference (p<0.001) was also observed in thephenol content between May Water, June Water,and July Water. It was concluded that thisdifference (p=0.002) was between May and July(p<0.001), and June and July (p<0.001)periods. Moreover,a statistically significant
difference (p<0.001) was identified in theflavonoid content between May EtOH, JuneEtOH, and July EtOH, which was found to bebetween May and June (p=0.001) and May andJuly (p=0.001). There was a statisticallysignificant difference in the flavonoid contentbetween May MeOH, June MeOH, and July MeOH(p=0.004). The difference was observedbetween May and June (p=0.003) and May andJuly (p=0.006) periods. The difference in theflavonoid content between May Water, JuneWater, and July Water (p=0.011) was alsostatistically significant. Accordingly, thisdifference was between May and July (p=0.006),and June and July (p=0.020) periods. Anotherstatistically significant difference was identifiedin the radical scavenging activity rates betweenMay EtOH, June EtOH, and July EtOH (p<0.001).The difference was between May and June(p=0.001) and May and July (p<0.001) periods.There was a statistically significant difference(p=0.009) in the radical scavenging activityrates between May MeOH, June MeOH, and JulyMeOH. The difference was between May and
359
Doğan Çalhan S, Gündoğan M. JOTCSA. 2019; 6(3): 355-364. RESEARCH ARTICLE
June (p=0.015) and May and July (p=0.001)periods. Finally, a statistically significantdifference was found in the radical scavengingactivity rates between May Water, June Water,and July Water (p=0.002),which was betweenMay and July (p<0.001) periods.
In a study by Mazandarani et al. (24) in 2011,phenolic and flavonoid contents were detected indifferent extraction solvents of the OnosmaDichroanthum Boiss (ethanol, methanol,acetone). According to the results of this study,the total phenol concentration varied between4.5 ± 0.7 and 125.6 ± 3.01 mgGAE/g, andflavonoid concentration was between 9.8 ± 3and 41 ± 2.3 mgKUE/g, which is compatible withthe results of the present study.
In a biological activity study conducted as resultof the extraction of theOnosmatauricum withethyl acetate, methanol and water, the phenolicand flavonoid concentrations were determinedas 40.88 µmolGAEs/g and 7.40 µmolREs/g,respectively.This finding is also compatible withthe results of the present study (25). Thecytotoxic effect of the samples which werecollected in May, June, and July and extracted
by using ethanol, methanol, and water,respectively, on the MCF-7 cells was investigatedthrough the MTT test (3-(4,5-dimethylthiazol-2-yl)-2,5 –diphenyltetrazolium bromide), acolorimetric method. 24 hours after adding theextract, the % relative cell viability of the MCF-7cells was determined by using the Equation 2. Itwas found that the extracts prepared withmethanol and water did not have any cytotoxiceffect on the cancer cells; on the contrary, thesesamples triggered the growth of these cells(Relative cell viability>100). In addition, it wasfound there was a significant cytotoxic effect,depending on the dosage, on the samplescollected in May, June, and July and extractedwith ethanol (Figure 2-4). Cell viabilitydecreased in all concentrations compared to thecontrol group. The concentration whichdecreased the cell viability most was 50 µg/mL.The more the concentration increased, the morethe cytotoxic effect on the cancer cellsdecreased. It is considered that the plant has apositive impact on cell growth due to its woundhealing property, and it produced cytotoxiceffect on the cancer cells in low concentrationswhile it affected the growth of cancer cellspositively in high concentrations.
Conc µg/mL Relative cellviability (%)
May EtOH 50 62.13±11.33May EtOH 100 64.58±12.39May EtOH 200 83.79±11.83
Figure 2. Cell viability (%) for May EtOH 50 µg/mL, 100 µg/mL, and 200 µg/mL.
Conc µg/mL Relative cellviability (%)
June EtOH 50 40.92 ± 6.81June EtOH 100 47.47 ± 15.3June EtOH 200 89.55 ± 20.77
Figure 3. Cell viability (%) for June EtOH 50 µg/mL, 100 µg/mL, and 200 µg/mL.
360
Doğan Çalhan S, Gündoğan M. JOTCSA. 2019; 6(3): 355-364. RESEARCH ARTICLE
Conc µg/mL Relative cellviability (%)
July EtOH 50 28.76±11.31July EtOH 100 41.75±15.56July EtOH 200 72.71±17.07
Figure 4. Cell viability (%) for July EtOH 50µg/mL, 100 µg/mL, and 200 µg/mL.
In a study investigating the cytotoxic effects ofthe Alkanna, another significant species in thefamily Boraganicae (26), five different cancercell lines were used. Also using the MCF-7cancer cells, the study assessed cytotoxic effectsthrough the MTT analysis. Some of the findingsdemonstrated that the more the extractconcentration decreased, the more cytotoxiceffect increased. The study emphasized that themore the purity of biologically active substancescreating cytotoxic effect increased, the more theamount of concentration, in which it was active,decreased. These results are consistent with therates obtained in the present study. Moreover,the study reported that roots of the plantdisplayed higher cytotoxic effect than groundsurface parts.
The present study revealed that the extractproducing cytotoxic effect on the cancer cellswas prepared in ethanol for all months. It wasdetermined whether the dosage made anystatistical difference for all months. A
statistically significant difference was identifiedbetween May EtOH 50 µg/mL, June EtOH 50 µg/mL, and July EtOH 50 µg/mL (p<0.001). Thisdifference was between May and June(p<0.001), May and July (p<0.001), and Juneand July (p<0.001) periods. The differencebetween May EtOH 100 µg/mL, June EtOH 100µg/mL, and July EtOH 100 µg/mL wasstatistically significant (p=0.001). Accordingly,the difference was between May and June(p=0.003) and May and July (p=0.001) periods.However, there was no statistically significantdifference between May EtOH 200 µg/mL, JuneEtOH 200 µg/mL, and July EtOH 200 µg/mL(p=0.565).
After the Onosma Sericeum Willd, collected inMay, June and July, was digested using themicrowave, its trace element and mineralcomposition was defined. The results are givenas the average of three measurements (Table3).
Table 3. Total content of metals (ppb) in dried Onosma Sericeum Willd.May June July
B 9944±1.594 16328±4.598 2262.4±3.196Na 9600±0.002 9600±0.003 13600±0.012Mg 47200±0.013 67200±0.019 7200±0.046Al 4217.6±0.818 5449.6±1.834 9056±6.908P 42040±9.444 78200±2.244 41288±2.255K 909600±0.191 1267200±0.240 912000±0.540Ca 508000±0.043 939200±0.151 1233600±0.748Cr 1114.4±0.271 1504.8±0.623 1695.2±1.516Mn 2238.4±0.309 4124±0.965 2818.4±1.659Fe 12000±0.001 13600±0.004 15200±0.013Co nd nd ndNi 234.4±0.037 357.6±0.023 339.2±0.157Cu 1388±0.057 1807.2±0.135 1915.2±0.814Zn 3107.2±0.037 2702.4±0.085 5067.2±2.124As 395.2±0.105 356±0.132 362.4±0.322Se 661.6±0.407 278.4±0.162 195.2±0.239Cd nd nd ndSn 1549.6±0.200 1887.2±0.043 1600±0.861Ba 4338.4±0.323 10680±1.738 11392±5.653Pb nd nd nd
nd: not detected
361
Doğan Çalhan S, Gündoğan M. JOTCSA. 2019; 6(3): 355-364. RESEARCH ARTICLE
As it is seen in Table 3, the concentration valuesof toxic elements such as cobalt, cadmium andlead could not be determined as they werebelow 1ppb. Nickel, arsenic, and selenium wererelatively in low concentrations, and they wereat proximate levels in three periods when theplant was collected. Among the toxic elements,only the concentration rate of aluminum washigher compared to nickel, arsenic andselenium. It was identified that all the otherelements were essential and had higherconcentration rates than other toxic elements.
CONCLUSION
The use of plants for therapeutic purposes is asold as the human history. In fact, mostly plantand plant extracts were used for medicalpurposes until the discovery of synthetic drugs.In this process until the present day, the ideathat synthetic drugs have greater potentialharmful effects has led people to use drugs ofnatural origin. Interest in natural products hasincreased gradually with the promotion of printand visual media. One of the significantdisadvantages of this deep interest is the ideathat natural products have no harmful or sideeffects. However, it is vital that herbal productsare procured from reliable sources using propermethods, and recommended and administeredby competent persons. Otherwise, it might resultin serious mortality and morbidity. Besides, thedata on plants, particularly those with traditionaluse, must be built on a scientific foundation. Inaddition to all these, the area where the plantgrows, collection time, soil and climateconditions might change the quantity ofbioactive components and composition of theplant. Moreover, it is necessary to carry outtoxicity studies while determining the dosage tobe used.It is a fact that antioxidant activitywhich plays a significant role especially inhealing the wounds depends on the quantity ofphenolic and flavonoid species. Thus, thepresent study investigated the changes in thebiological activity of the Onosma Sericeum Willd,traditionally used and known for its therapeuticproperties among public, depending on collectiontime and extraction solvent. Its cytotoxic effecton the MCF-7 was also investigated. The highestcytotoxic effect was detected in the extractscontaining ethanol which also had high phenolic,flavonoid and radical scavenging activity rates.At the same time, the study assessed traceelement/mineral composition which plays asignificant role in understanding biologicalprocesses. The results demonstrated thatbiological activity changed depending oncollection time and extraction solvent. Althoughthe family Boraginacea has drawn the attentionof many researchers due to its bioactive species,studies on the Onosma Sericeum Willd, amember of this family, are considerably limited.In this sense, we believe that our study willmake a contribution to the relevant literature. In
continuation of this study, the researchersintend to carry out the isolation of bioactivecompounds belonging to this species,assessment of their biological activities, andassessment of possible cytotoxic effects ondifferent cells.
ACKNOWLEDGEMENTS
The authors thank Assoc. Prof. Dr. Rıza Binzetfrom the Department of Biology at the Faculty ofArts and Sciences, Mersin University for thebotanical identification of the plant. We alsothank the Department of Biostatistics andMedical Informatics, Faculty of Medicine, MersinUniversity and Specialist Asena Ayça Özdemir fortheir contributions in performing statisticalanalyses.
REFERENCES
1. Vukic MD, Vukovic NL, Djelic GT, Popovic S,Zaric MM, Baskic DD, Krstic GB, Tesevic VV,Kacaniova MM. Antibacterial and cytotoxicactivities of naphthoquinone pigments fromOnosma Visianii Clem. EXCLI Journal.2017;16:73-88.
2. Ozgen U, Ikbal M, Hacimuftuoglu A, HoughtonP.J, Gocer F, Dogan H, Coskun M. Fibroblastgrowth stimulation by extracts and compoundsof Onosma argentatum roots. J Ethnopharmacol.2006;104:100–3.
3. Binzet R,Orcan N. A New species of Onosma(Boraginaceae) from Southern Turkey. MissouriBotanical Garden Press.2007;17(1): 8-10.
4. Akçin ÖE, Aktaş T, Altıntaş MY. MyosotisAlpestris F.W.Schmidt (Boraginaceae) türününanatomik özellikleri. Ordu Univ. J. Sci. Tech.2013;3(1): 61-8.
5. Tosun A, Akkol EK, Bahadır Ö, Yesilada E.Evaluation of anti-inflammatory andantinociceptive activities of some Onosma L.Species growing in Turkey.JEthnopharmacol.2008;120:378–81.
6. Ozgen U, Coskun, M, Kazaz, C, Secen, H.Naphthoquinones from the roots of OnosmaargentatumHub.-Mor (Boraginaceae). Turk JChem. 2004;28: 451–4.
7. Ozgen U, Houghton, PJ, Ogundipe, Y, Coskun,M. The Antioxidant and antimicrobial activities ofOnosma argentatum and Rubiaperegrina.Fitoterapia. 2003;74: 682–5.
8. Sharma S,Khan, K, Sultana, S. Effect ofOnosma echiodes on DMBA/croton oil mediatedcarvcinogenic response, hyperproliferation andoxidative damage in murine skin. Life Sci.2004;75(20): 2391–410.
362
Doğan Çalhan S, Gündoğan M. JOTCSA. 2019; 6(3): 355-364. RESEARCH ARTICLE
9. Ozer MS, Kirkan B, Sarikurkcu C, Cengiz M,Ceylan O, Atılgan N, Tepe B.Onosmaheterophyllum:Phenolic composition,enzyme inhibitory and antioxidant activities. IndCrops Prod. 2018;111:179–84.
10. Sezik E, Yeşilada E, Tabata M, Honda G,Takaishi Y, Fujita T, Tanaka T, Takedau Y.Traditional medicine in Turkey VIII. Folkmedicine in East Anatolia; Erzurum, Erzincan,Ağrı, Kars, Igdır Provinces. Econ. Bot.1997;51(3):195-211.
11. Gharehmatrossian S, Popov Y, Ghorbanli M,Safaeian S, Iranbakhsh A. Phytochemical andmorphological evidences for Shikonin productionby plant cell cultures of OnosmasericeumWilld.Braz. Arch. Biol. Technol.2016; 59: 1-7.
12. Dziri S, Hassen I, Fatnassi S, Mrabet Y,Casabianca H, Hanchi B. Phenolicconstituents,antioxidant and antimicrobial activities ofrosygarlic (Alliumroseum var. odoratissimum). JFunct Foods. 2012; 4(2): 423-32.
13. Baye H, Hymete A. Lead and cadmiumaccumulation in medicinal plants collected fromenvironmentally different sites. BullEnvironContam Toxicol. 2010; 84(2): 197-201.
14. Pytlakowska K, Kita A, Janoska P, PołowniakM, Kozik V. Multi-element analysis of mineraland trace elements in medicinal herbs and theirinfusions. FoodChem. 2012; 135(2): 494-501.
15. Slinkard K. Singleton VL. Total phenolsanalysis: Automation and comparison withmanual methods.Am. J. Enol. Vitic, 1977;28: 49– 55.
16. Kim DO, Jeong SW, Lee CY. Antioxidantcapacity of phenolic phytochemicals from variouscultivars of plums, Food Chem. 2003;81(3): 321– 6.
17. Floegel A, Kim DO, Chung SJ, Koo SI, ChunOK. Comparison of ABTS/DPPH assays tomeasure antioxidant capacity in popularantioxidant-rich US foods. J Food CompostAnal.2011;24: 1043–8.
18. Turan I, Demir S, Aliyazıcıoğlu R,Aliyazıcıoğlu Y. Evaluation of antioxidant andcytotoxic properties of Primula vulgaris LeafExtract. KSU J. Nat. Sci. 2017; 20(4): 361-7.
19. Cadirci E, Suleyman H, Aksoy H, Halici Z,Ozgen U, Koc A. Effects of Onosma armeniacumroot extract on ethanol-induced oxidative stressin stomach tissue of rats. Chem Biol Interact.2007;170(1):40-8.
20. Binzet R, Akçin ÖE. The anatomicalproperties of two Onosma L. (Boraginaceae)species from Turkey.J Med Plant Res. 2012;6(17): 3288-94.
21. Papageorgiou VP, Assimopoulou AN, BallisAC. Alkannins and shikonins: a new class ofwound healing agents. Curr Med Chem.2008;15:3248-67.
22. Wang L, Li F, Liu X, Chen B, Yu K, Wang MK.Meroterpenoids and a naphthoquinone fromArnebiaeuchroma and their cytotoxic activity.Planta Med.2015;81:320-6.
23. Naz S, Ahmad S, AjazRasool S, AsadSayeedS, SiddiqIR. Antibacterial activity directedisolation of compounds from Onosma hispidum.MicrobiolRes.2006;161:43-8.
24. Mazandarani M, Moghaddam PZ, Baiat H,Zolfaghari MR, Ghaemiand EA, Hemati H.Antioxidant activity, phenol, flavonoid andanthocyanin contents in various extracts ofOnosma dichroanthum Boiss. in north of IranMasoumeh. Iran. J. Plant Physiol. 2011; 1(3):169 – 76.
25. Kirkan B, Sarikurkcu C, Ozer MS, Cengiz M,Atılgan N,Ceylan O, Tepe B. Phenolic profile,antioxidant and enzyme inhibitory potential ofOnosma tauricum var. Tauricum. Ind CropsProd.2018; 125:549–55.
26. Bıçkıcı Ş. Bazı Alkanna türlerinin biyoaktiviterehberli izolasyon yöntemi kullanılarak çeşitlikanser hücreleri üzerindeki sitotoksik etkilerininin vitro ortamda taranması [Master of ScienceThesis].[İzmir]:Ege University;2006.
363

Doğan Çalhan S, Gündoğan M. JOTCSA. 2019; 6(3): 355-364. RESEARCH ARTICLE
364
Ciftci M. JOTCSA. 2019; 6(3): 365-372. RESEARCH ARTICLE
365
Synthesis of Polysulfone Based Amphiphilic Graft Copolymers by a
‘Grafting to’ Approach
Mustafa Ciftci*
1 Bursa Technical University, Faculty of Engineering and Natural Sciences, Department of Chemistry, 16310, Bursa, Turkey.
Abstract: Synthesis of amphiphilic polysulfone graft copolymers by ‘‘Click’’ chemistry is described. First, a
commercial PSU was chloromethylated to give chloro-funtional PSU (PSU-Cl). Subsequently, chloride groups were converted into azide moieties by nucleophilic substitution. Hydrophilic poly(N,N-dimethylacrylamide) (PDMA) side chains were then attached via a “grafting to” approach by using copper-catalyzed azide–alkyne cycloaddition (CuAAC). Precursor polymer and the final amphiphilic copolymers
were characterized by proton nuclear magnetic resonance (1H NMR), fourier-transform infrared
spectroscopy (FT-IR), gel permeation chromatography (GPC) and contact angle measurements.
Keywords: Polysulfone, grafting to, graft copolymers, amphiphilic materials.
Submitted: August 19, 2019. Accepted: August 28, 2019. Cite this: Ciftci M. Synthesis of Polysulfone Based Amphiphilic Graft Copolymers by a ‘Grafting to’ Approach. JOTCSA. 2019;6(3):365–72. DOI: https://doi.org/10.18596/jotcsa.606191.
*Corresponding author. E-mail: [email protected]. INTRODUCTION Based on their outstanding properties, such as
superb thermal and chemical stability, mechanical strength, and resistance to radiation degradation (1, 2), polysulfones (PSU) have been widely employed in numerous industrial applications such as food processing, fuel cells, and electronics (3, 4). Moreover, based on their biocompatible and non-degradable nature, they
have also been used in bio-applications including bioreactors, hemodialysis, etc. (5, 6). However, their poor tracking resistance and weathering properties remains as the major challenges limit their even wider utilization (7). Not only to overcome these problems, but also to fulfill the
necessities of the application, functionalization of
suitable PSU precursors have gained growing interest recently (8). Using functional co-monomers through the polymerization or post-modification approaches are the two main approaches utilized for this purpose. However, the latter method, in which the desired
functionalities are incorporated to the PSU chains, appears to be a more powerful approach, since polymerizations may be inhibited in the direct
polymerization case as a result of limited functional-group tolerance of the polymerization procedures (9).
The post-modification concept has made a great progress by the development of “Click Chemistry” (10). Basically, click chemistry term covers the chemical approaches with several advantageous properties including high yields, tremendous orthogonality and selectivity (11). Although here
exist different type of click reactions including Diels-Alder and thiol-ene reactions, the pioneering approach, copper-catalyzed azide–alkyne cycloaddition (CuAAC) has gained broad interest and has been extensively utilized for the preparation of numerous complex
macromolecular structures (12). For instance, it
has been established that many macromolecular architectures such as graft/block and star copolymers, polymeric networks, functional polymers and hyperbranched polymers can be prepared by CuAAC click reactions (13). Moreover, CuAAC has been also demonstrated to
be a powerful tool for the modification/ functionalization of different polymeric materials (14, 15).
Ciftci M. JOTCSA. 2019; 6(3): 365-372. RESEARCH ARTICLE
366
Amphiphilic polymeric materials have been the basis of different bio-applications ranging from
drug delivery systems to membranes (16-18). As a result of their unique chemical structure, they form polymeric micelles with a hydrophobic core and hydrophilic shell where the core act as a
reservoir for hydrophobic drugs and the hydrophilic part stabilizes the core by serving as an interface between aqueous phase and the hydrophobic domain. This exceptional property makes them perfect materials for encapsulation and delivery of hydrophobic drugs (19, 20). Among the various polymers employed as
hydrophilic domains for amphiphilic polymers, poly(N,N-dimethylacrylamide) (PDMA) is one of the most widely used one due to their hydrophilic in the absence of ionic functionalities and inertness to biomolecules (21, 22).
In the current study, a “grafting to” approach is described for the synthesis of PSU-based graft copolymers through CuAAC. PDMA was purposely chosen as the side chain to obtain amphiphilic polysulfone graft copolymers. Thus, the obtained polymer scaffold is believed to be a suitable
candidate for biomedical applications and drug delivery systems. EXPERIMENTAL SECTION Materials Polysulfone (PSU, Udel® P-1700, Solvay),
paraformaldehyde (95%, Merck), tin(IV) chloride (98%, Alfa Aesar), trimethylsilyl chloride (≥ 99.0%, Aldrich), sodium azide (97%, Aldrich), N,N'-dicyclohexylcarbodiimide (DCC, 99%,
Aldrich), 4-(dimethylamino)pyridine (DMAP, 98%, Aldrich), propargyl alcohol (99%, Aldrich), copper (I) bromide (98%, Acros), N,N,N′,N′′,N′′-
pentamethyldiethylene triamine (PMDETA, 99%, Aldrich), N,N-dimethylacrylamide (99%, Aldrich), N,N-dimethylformamide (DMF, ≥ 99.8%, Merck), and methanol (100%, VWR) were used as received. Alkyne functional RAFT agent (RAFT-alkyne) was synthesized according to previous
literature (23). Characterization 1H NMR spectra were recorded on a Bruker Advance III, 300 MHz spectrometer at room temperature in CDCl3 with tetramethylsilane as an internal standard. Molecular weights and
distributions were determined by GPC using
Viscotek GPC max system including a pump module (GPC max, Viscotek, Houston, TX) and a refractive index (RI) detector (VE 3580, Viscotek). In the analyses, 1 mL/min flow rate and 50 μL injection volume were used with autosampler system. The calibration of RI
detector was done by narrow molecular weight polystyrene standards. Two columns (LT5000L, Mixed, Medium Organic 300×8 mm and LT3000L, Mixed, Ultra-Low Organic 300 × 8 mm) with a guard column (TGuard, Organic Guard Column 10
× 4.6 mm) were used for the tetrahydrofuran
eluent at 35 oC. Viscotek OmniSEC Omni01 software was used to analyze the data. Fourier
transformed infrared spectroscopy (FTIR) studies were performed by using a Perkin-Elmer Spectrum Two Spectrometer (Lambda 25, Waltham, MA) equipped with a diamond
attenuated total reflectance (ATR) device at ambient temperature. Chloromethylation of polysulfones PSU-Cl was synthesized by following a literature protocol. Briefly, PSU (10 g, 0.25 mmol) was dissolved in chloroform (300 mL) by using an
ultrasonic bath and then paraformaldehyde (29 mL, 225 mmol) and trimethylsilyl chloride (29 mL, 225 mmol) were added. After stirring for a while, tin(IV) chloride (0.26 mL, 2.25 mmol) was added and the mixture was stirred at room temperature for 72 hours. At the end of the given
time, the product was precipitated by pouring into
excess methanol. Then, the precipitate was filtered and dried in a vacuum oven at room temperature. Azidation of polysulfones PSU-Cl was synthesized by following a literature
protocol. Briefly, PSU (10 g, 0.25 mmol) was dissolved in chloroform (300 mL) by using ultrasonic bath and then paraformaldehyde (29 mL, 225 mmol) and trimethylsilyl chloride (29 mL, 225 mmol) were added. After stirring for a while, tin(IV) chloride (0.26 mL, 2.25 mmol) was added and the mixture was stirred at room
temperature for 72 hours. End of the given time, the product was precipitated into excess methanol. Then, the precipitate was filtered and dried in a vacuum oven at room temperature.
Synthesis of alkyne functional PDMA (PDMA-alkyne)
PDMA-alkyne was synthesized by reversible addition–fragmentation chain-transfer (RAFT) polymerization according to previous literature. Briefly, DMA (50 eq.), RAFT agent (1 eq.), and AIBN (0.01) were dissolved in DMSO. After deoxygenation by purging with N2, the mixture
was heated at 60 oC. After given time the reaction was terminated by cooling to 0 oC and exposed to air. The mixture was dissolved in a large excess of DCM and extracted twice by distilled water. The organic phase removed by reduce pressure, the concentrated mixture was precipitated in ten-fold excess of Et2O and dried under reduced pressure.
Click Reactions In a typical click reaction, azide functional PSU (50 mg), PDMA-alkyne (3 × 10⁻⁴ mol), catalyst (CuIBr, 3 × 10⁻⁴ mol), ligand (PMDETA, 6 × 10⁻⁴ mol), and 4 mL of toluene were placed in a Schlenk tube. The reaction mixture was degassed
by three freeze−pump−thaw cycles and stirred at room temperature for 24 h. After the click reaction, the reaction mixture was passed through a column filled with neutral alumina to
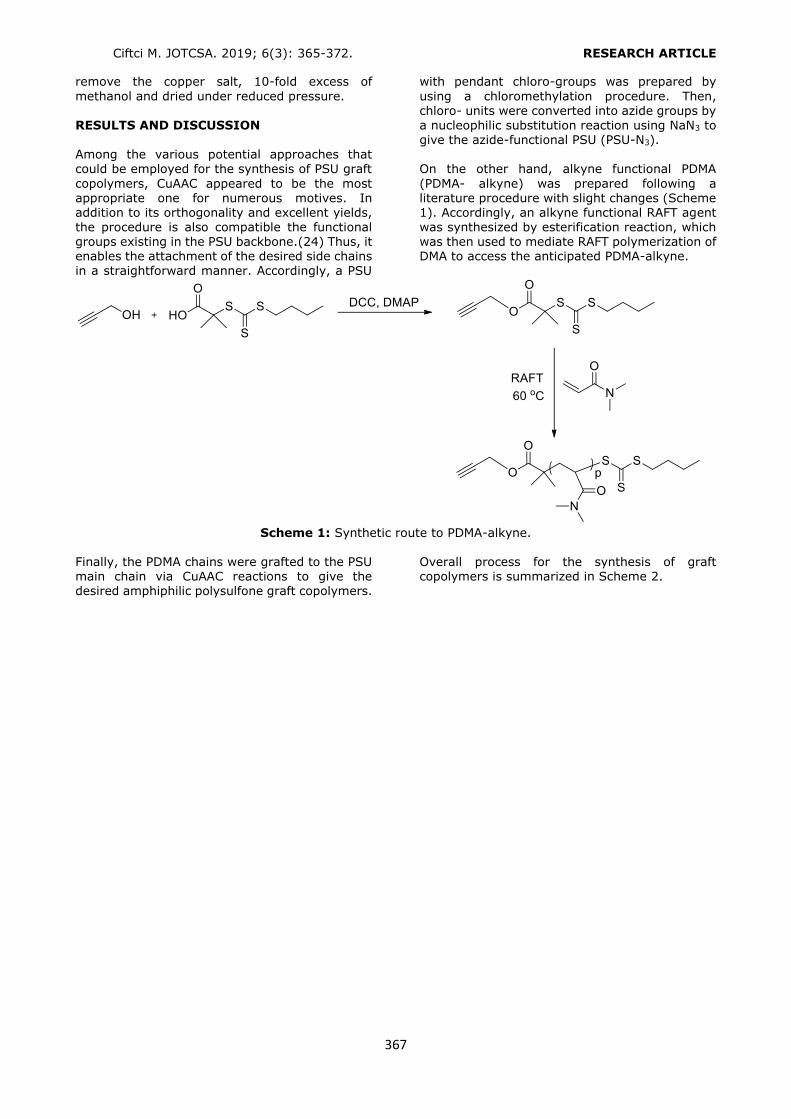
Ciftci M. JOTCSA. 2019; 6(3): 365-372. RESEARCH ARTICLE
367
remove the copper salt, 10-fold excess of
methanol and dried under reduced pressure.
RESULTS AND DISCUSSION Among the various potential approaches that could be employed for the synthesis of PSU graft
copolymers, CuAAC appeared to be the most appropriate one for numerous motives. In addition to its orthogonality and excellent yields, the procedure is also compatible the functional groups existing in the PSU backbone.(24) Thus, it enables the attachment of the desired side chains in a straightforward manner. Accordingly, a PSU
with pendant chloro-groups was prepared by
using a chloromethylation procedure. Then, chloro- units were converted into azide groups by
a nucleophilic substitution reaction using NaN3 to give the azide-functional PSU (PSU-N3). On the other hand, alkyne functional PDMA
(PDMA- alkyne) was prepared following a literature procedure with slight changes (Scheme 1). Accordingly, an alkyne functional RAFT agent was synthesized by esterification reaction, which was then used to mediate RAFT polymerization of DMA to access the anticipated PDMA-alkyne.
Scheme 1: Synthetic route to PDMA-alkyne.
Finally, the PDMA chains were grafted to the PSU main chain via CuAAC reactions to give the desired amphiphilic polysulfone graft copolymers.
Overall process for the synthesis of graft copolymers is summarized in Scheme 2.
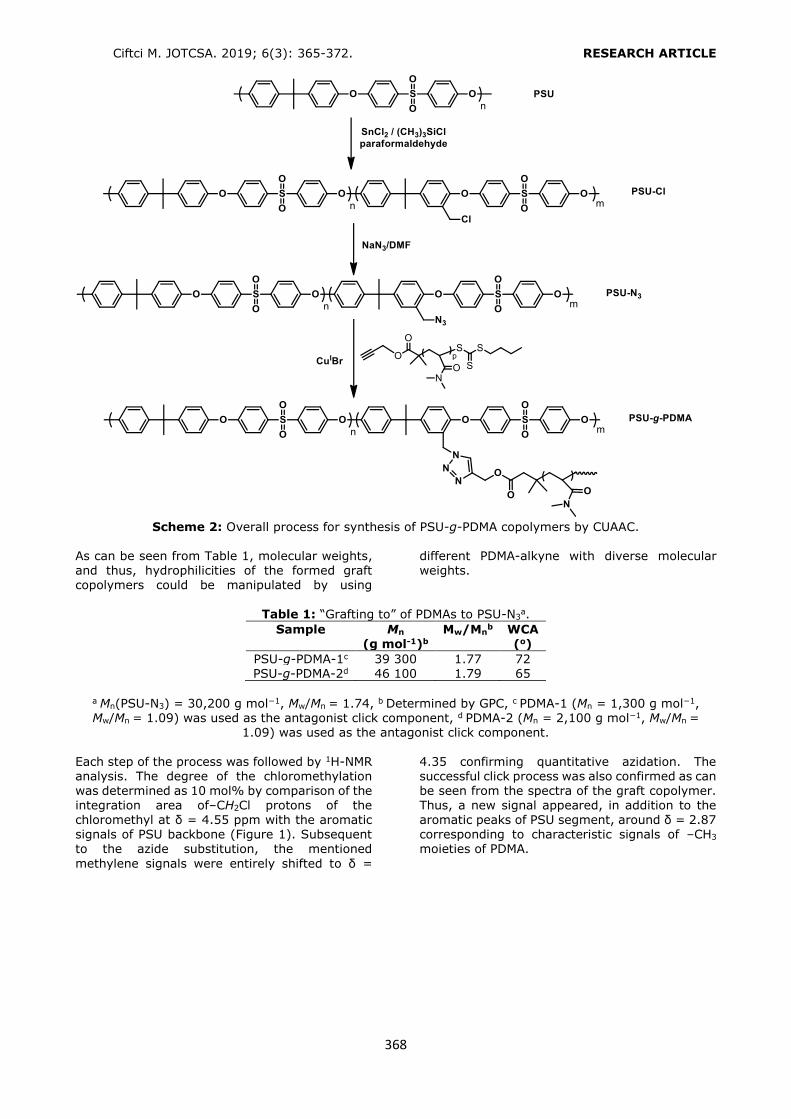
Ciftci M. JOTCSA. 2019; 6(3): 365-372. RESEARCH ARTICLE
368
Scheme 2: Overall process for synthesis of PSU-g-PDMA copolymers by CUAAC.
As can be seen from Table 1, molecular weights, and thus, hydrophilicities of the formed graft copolymers could be manipulated by using
different PDMA-alkyne with diverse molecular weights.
Table 1: “Grafting to” of PDMAs to PSU-N3a.
Sample Mn (g mol-1)b
Mw/Mnb WCA
(o)
PSU-g-PDMA-1c 39 300 1.77 72 PSU-g-PDMA-2d 46 100 1.79 65
a Mn(PSU-N3) = 30,200 g mol−1, Mw/Mn = 1.74, b Determined by GPC, c PDMA-1 (Mn = 1,300 g mol−1, Mw/Mn = 1.09) was used as the antagonist click component, d PDMA-2 (Mn = 2,100 g mol−1, Mw/Mn =
1.09) was used as the antagonist click component.
Each step of the process was followed by 1H-NMR analysis. The degree of the chloromethylation was determined as 10 mol% by comparison of the integration area of–CH2Cl protons of the chloromethyl at δ = 4.55 ppm with the aromatic signals of PSU backbone (Figure 1). Subsequent to the azide substitution, the mentioned
methylene signals were entirely shifted to δ =
4.35 confirming quantitative azidation. The successful click process was also confirmed as can be seen from the spectra of the graft copolymer. Thus, a new signal appeared, in addition to the aromatic peaks of PSU segment, around δ = 2.87 corresponding to characteristic signals of –CH3 moieties of PDMA.
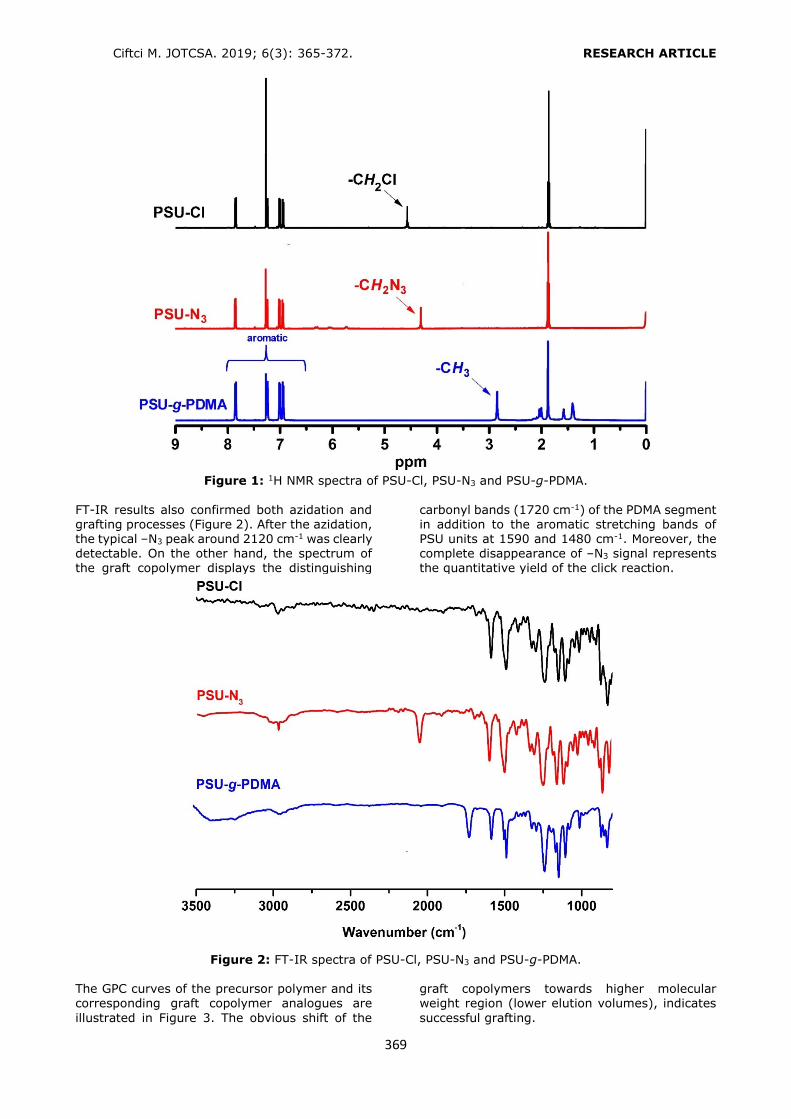
Ciftci M. JOTCSA. 2019; 6(3): 365-372. RESEARCH ARTICLE
369
Figure 1: 1H NMR spectra of PSU-Cl, PSU-N3 and PSU-g-PDMA.
FT-IR results also confirmed both azidation and grafting processes (Figure 2). After the azidation, the typical –N3 peak around 2120 cm-1 was clearly detectable. On the other hand, the spectrum of the graft copolymer displays the distinguishing
carbonyl bands (1720 cm-1) of the PDMA segment in addition to the aromatic stretching bands of PSU units at 1590 and 1480 cm-1. Moreover, the complete disappearance of –N3 signal represents the quantitative yield of the click reaction.
Figure 2: FT-IR spectra of PSU-Cl, PSU-N3 and PSU-g-PDMA.
The GPC curves of the precursor polymer and its corresponding graft copolymer analogues are
illustrated in Figure 3. The obvious shift of the
graft copolymers towards higher molecular weight region (lower elution volumes), indicates
successful grafting.

Ciftci M. JOTCSA. 2019; 6(3): 365-372. RESEARCH ARTICLE
370
Figure 3: GPC traces of PSU-N3, PSU-g-PDMA-1 and PSU-g-PDMA-2.
Hydrophilicity of the graft copolymers were investigated by demonstrated by water contact angle (WCA) measurements. The WCA results of
the pristine PSU and corresponding graft
copolymer analogues are presented in Figure 4. WCAs of graft copolymers were lower (72° and
65°) then the precursor PSU (81°) as expected. Moreover, as can deduced from the higher WCA of PSU-g-PDMA-1 that bears a shorter hydrophilic
PDMA side chain compared to PSU-g-PDMA-2, the
WCAs decreased with the increase of the PDMA side chain content in the structure.
Figure 4. Shapes of water drops on thin films of PSU-N3 (left), WCA: 83°, PSU-g-PDMA-1 (middle),
WCA: 72°and PSU-g-PDMA-2 (right), WCA: 65°. In summary, amphiphilic polysulfone graft copolymers, with different hydrophilicities were obtained. In the process, chloro-functional PSUs were synthesized from a commercial PSU then
azide groups were then incorporated to the polymer chain. Subsequently, alkyne functional PDMAs, prepared by RAFT polymerization by using functional RAFT agent, were attached via CuAAC to give the amphiphilic polysulfone-g-poly(N,N-dimethylacrylamide) (PSU-g-PDMA)
copolymers. The obtained graft copolymers
possessing hydrophobic PSU main chain and hydrophilic PDMA side chains appear as suitable candidates for various application especially biomedical applications. REFERENCES
1. Barth C, Goncalves MC, Pires ATN, Roeder J, Wolf BA. Asymmetric polysulfone and
polyethersulfone membranes: effects of thermodynamic conditions during formation on their performance. Journal of Membrane Science. 2000;169(2):287-99.
2. Watanabe S, Kobayashi A, Kakimoto M-A, Imai Y. Synthesis and characterization of new aromatic polyesters and polyethers derived from 1,2-bis(4-hydroxyphenyl)-1,2-diphenylethylene. 1994;32(5):909-15.
3. Hickner MA, Ghassemi H, Kim YS, Einsla BR, McGrath JE. Alternative Polymer Systems for Proton Exchange Membranes (PEMs). Chemical Reviews. 2004;104(10):4587-612. 4. Noshay A, Robeson LM. Sulfonated
Polysulfone. Journal of Applied Polymer Science. 1976;20(7):1885-903.
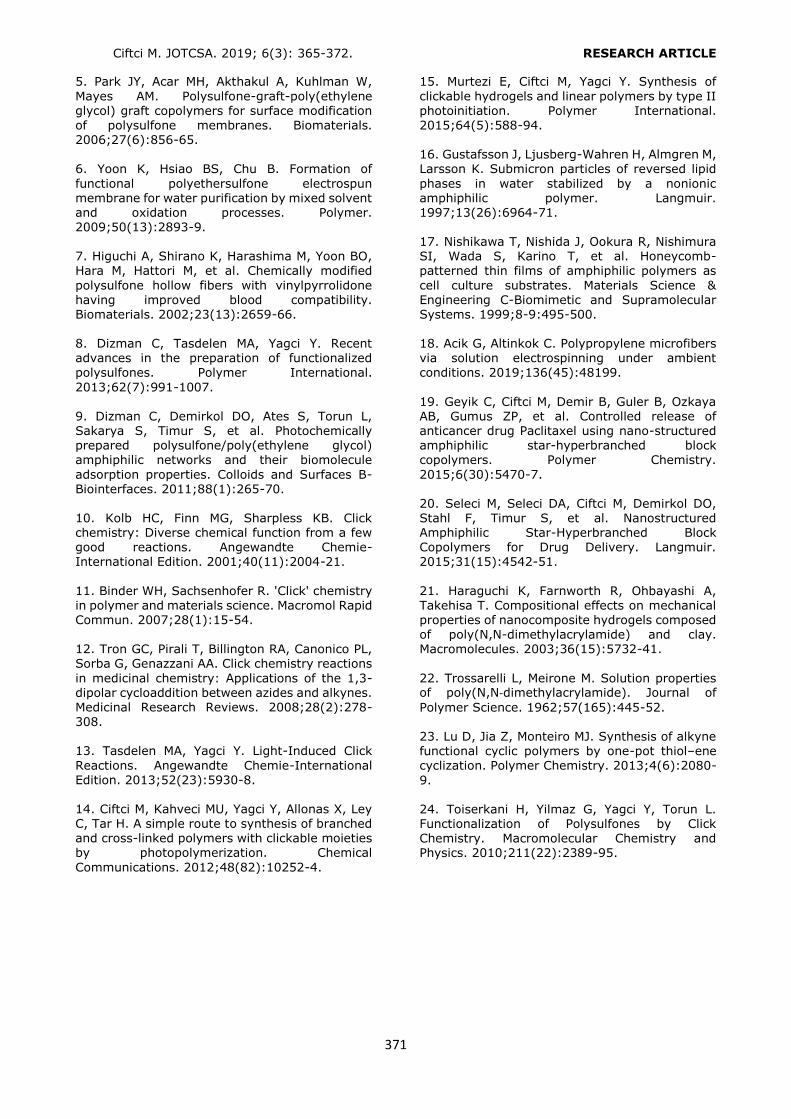
Ciftci M. JOTCSA. 2019; 6(3): 365-372. RESEARCH ARTICLE
371
5. Park JY, Acar MH, Akthakul A, Kuhlman W,
Mayes AM. Polysulfone-graft-poly(ethylene glycol) graft copolymers for surface modification
of polysulfone membranes. Biomaterials. 2006;27(6):856-65. 6. Yoon K, Hsiao BS, Chu B. Formation of
functional polyethersulfone electrospun membrane for water purification by mixed solvent and oxidation processes. Polymer. 2009;50(13):2893-9. 7. Higuchi A, Shirano K, Harashima M, Yoon BO, Hara M, Hattori M, et al. Chemically modified
polysulfone hollow fibers with vinylpyrrolidone having improved blood compatibility. Biomaterials. 2002;23(13):2659-66. 8. Dizman C, Tasdelen MA, Yagci Y. Recent advances in the preparation of functionalized
polysulfones. Polymer International.
2013;62(7):991-1007. 9. Dizman C, Demirkol DO, Ates S, Torun L, Sakarya S, Timur S, et al. Photochemically prepared polysulfone/poly(ethylene glycol) amphiphilic networks and their biomolecule
adsorption properties. Colloids and Surfaces B-Biointerfaces. 2011;88(1):265-70. 10. Kolb HC, Finn MG, Sharpless KB. Click chemistry: Diverse chemical function from a few good reactions. Angewandte Chemie-International Edition. 2001;40(11):2004-21.
11. Binder WH, Sachsenhofer R. 'Click' chemistry in polymer and materials science. Macromol Rapid Commun. 2007;28(1):15-54.
12. Tron GC, Pirali T, Billington RA, Canonico PL, Sorba G, Genazzani AA. Click chemistry reactions
in medicinal chemistry: Applications of the 1,3-dipolar cycloaddition between azides and alkynes. Medicinal Research Reviews. 2008;28(2):278-308. 13. Tasdelen MA, Yagci Y. Light-Induced Click
Reactions. Angewandte Chemie-International Edition. 2013;52(23):5930-8. 14. Ciftci M, Kahveci MU, Yagci Y, Allonas X, Ley C, Tar H. A simple route to synthesis of branched and cross-linked polymers with clickable moieties by photopolymerization. Chemical
Communications. 2012;48(82):10252-4.
15. Murtezi E, Ciftci M, Yagci Y. Synthesis of
clickable hydrogels and linear polymers by type II photoinitiation. Polymer International.
2015;64(5):588-94. 16. Gustafsson J, Ljusberg-Wahren H, Almgren M, Larsson K. Submicron particles of reversed lipid
phases in water stabilized by a nonionic amphiphilic polymer. Langmuir. 1997;13(26):6964-71. 17. Nishikawa T, Nishida J, Ookura R, Nishimura SI, Wada S, Karino T, et al. Honeycomb-patterned thin films of amphiphilic polymers as
cell culture substrates. Materials Science & Engineering C-Biomimetic and Supramolecular Systems. 1999;8-9:495-500. 18. Acik G, Altinkok C. Polypropylene microfibers via solution electrospinning under ambient
conditions. 2019;136(45):48199.
19. Geyik C, Ciftci M, Demir B, Guler B, Ozkaya AB, Gumus ZP, et al. Controlled release of anticancer drug Paclitaxel using nano-structured amphiphilic star-hyperbranched block copolymers. Polymer Chemistry.
2015;6(30):5470-7. 20. Seleci M, Seleci DA, Ciftci M, Demirkol DO, Stahl F, Timur S, et al. Nanostructured Amphiphilic Star-Hyperbranched Block Copolymers for Drug Delivery. Langmuir. 2015;31(15):4542-51.
21. Haraguchi K, Farnworth R, Ohbayashi A, Takehisa T. Compositional effects on mechanical properties of nanocomposite hydrogels composed
of poly(N,N-dimethylacrylamide) and clay. Macromolecules. 2003;36(15):5732-41.
22. Trossarelli L, Meirone M. Solution properties of poly(N,N‐dimethylacrylamide). Journal of
Polymer Science. 1962;57(165):445-52. 23. Lu D, Jia Z, Monteiro MJ. Synthesis of alkyne functional cyclic polymers by one-pot thiol–ene cyclization. Polymer Chemistry. 2013;4(6):2080-
9. 24. Toiserkani H, Yilmaz G, Yagci Y, Torun L. Functionalization of Polysulfones by Click Chemistry. Macromolecular Chemistry and Physics. 2010;211(22):2389-95.

Ciftci M. JOTCSA. 2019; 6(3): 365-372. RESEARCH ARTICLE
372
Orhan E, Kose M, Alkan D, Öztürk L. JOTCSA. 2019; 6(3): 373-382. RESEARCH ARTICLE
Synthesis and Characterization of Some New 4-Methyl-5-ImidazoleCarbaldehyde Derivatives
Ersin Orhan1* , Mahmut Kose2 , Demet Alkan2 and Leyla Öztürk2
1Department of Chemistry, Faculty of Arts and Science, Düzce University, 81620, Düzce, Turkey.2Department of Chemistry, Faculty of Arts and Science, Bülent Ecevit University, 67100, Zonguldak,
Turkey.
Abstract: Imidazole is a common and important heterocyclic fragment of many biologically importantmolecules. 5-imidazole-carbaldehydes containing mono- (N-1) methyl (or aryl) analogs are commonlyused as building blocks in medical chemistry. In this study, starting from 4-methyl-1H-imidazole-5-carbaldehyde, the N-1 atom of the imidazole ring is derived with different alkyl groups. In addition,both N atoms of the starting imidazole-carbaldehyde were methylated to give 5-carbaldehyde-1,3,4-trimethyl-3-imidazolium salt. The salt which possess quite reactive carbaldehyde group could be usedas a precursor for synthesis of other imidazolium derivatives. Furthermore, 4-methyl-5-imidazolecarbaldehyde was converted into the benzoxazole, benzothiazole and benzoimidazole by a two-stepreaction over the aldehyde group. These new compounds could display some biological activities.
Keywords: Imidazole, imidazolium derivatives, biologically active imidazole.
Submitted: January 22, 2019. Accepted: September 05, 2019.
Cite this: Orhan E, Kose M, Alkan D, Öztürk L. Synthesis and Characterization of Some New 4-Methyl-5-Imidazole Carbaldehyde Derivatives. JOTCSA. 2019;6(3):373–82.
DOI: https://doi.org/10.18596/jotcsa.530757.
*Corresponding author. E-mail: [email protected].
INTRODUCTION
Imidazole ring is one of the most basic groupsof biologically important compounds. Manybiologically active compounds containing theimidazole ring have been synthesized.Imidazole derivatives are used for thedevelopment of antifungal, antibacterial,anticancer, and antimalarial drugs. Until now,many drug and drug candidate isomers,
containing imidazole and mono-N-alkylatedimidazole rings, have been synthesized. Forexample, ipronidazole is a drug developed asan anti-protozoal agent (1). Nimorazole, aheterocyclic N-alkyl substituted compound, isan effective antimicrobial drug in parasites ofthe genus trichomonas, synthesized in 1970(2). The imidazole derivative known under thetrade name of moxnidazole is an antimicrobialdrug acting with trichomonas parasites.
373
Orhan E, Kose M, Alkan D, Öztürk L. JOTCSA. 2019; 6(3): 373-382. RESEARCH ARTICLE
Another imidazole derivative that is effectiveagainst the Trichomonas parasites isflunidazole (3-6). Imidazole derivatives alsohave been used in the development of drugsfor the treatment of ulcers. For example, theimidazole derivative known as Cimetidine is ahighly effective drug in the treatment of ulcers(7). Highly complex imidazole-based drugscontaining the imidazole group have also beendeveloped. For example, the imidazolederivative known as dazadrol, is used as ananti-depressant (8). The drug called cimicoxib,which exhibits anti-inflammatory properties, isalso an imidazole derivative (9). The imidazolederivative, Cipralisant, synthesized in recentyears, has been found to be effective inattention deficit syndrome on animal studies.This compound is probably thought to be goodfor Alzheimer's disease (10-12). Imidazoliumderivatives have begun to work in recent years.James H. Davis, Jr. et al. synthesized the firstbiologically active ionic liquid crystallineimidazolium cation starting from miconazolewhich exhibit antifungal properties (13). Azamiet al. have synthesized many 1,3-dialkylimidazolium derivatives and some of thesecompounds have antibacterial properties (14).In another study, imidazolium derivativescontaining long alkyl chains on the N atomwere synthesized and these compounds werefound to have quite good antimicrobial activityon gram-negative, gram-positive bacteria andfungi (15). Donald D. Ourth et al. isolated andelucidated its structure of 1,3-methylimidazolium derivatives which occurrednaturally; this compound showed a broad-spectrum antiviral properties for insects. Thiscompound also contemplated that can be usedin HIV-1 and HSV viruses seen in humans (16-18). Jadwiga Zabielska-Matejuk et al. havesynthesized several 1,3-dialkyimidazoliumderivatives and studied their antifungalproperties to protect wood materials. Thesynthesized imidazolium salts have been foundto inhibit the growth of fungus, in particularSclerophoma pityophila (19-27).
5-Imidazole-carbaldehyde and its mono- (N-1)alkyl or aryl analogs are often used in medicineas drug building blocks, but their dialkyl (N-1and N-3) analogs are less visible in theliterature. In this work, new imidazolederivatives were synthesized from 4-methyl-5-imidazole carbaldehyde by alkylation of N atom
or condensation of carbonyl group withappropriate reagents.
EXPERIMENTAL
GeneralThe starting chemicals were commerciallypurchased from Merck, Aldrich, Acros Organics,and ABCR.The 1H NMR spectra were recorded on Bruker400 MHz spectrometers for samples in DMSOand CDCl3. The signals are expressed as partsper million down fields from (CH3)4Si, used asan internal standard. IR spectra weremeasured using a Jasco FT-IR-300Espectrometer. Electrospray ionization massspectra were obtained in positive ion mode ona AB SCIEX LC - MS/MS spectrometer. Columnchromatographic isolation was performed onMerck Kieselgel 60 (70-230 mesh) using ethylacetate and n-hexane as the eluent. Ananalytical thin-layer chromatography wasperformed on Merck pre-coated silica gel 60GF-254 with 0.25-mm thick TLC plates.
1,4-dimethyl-imidazole-5-carbaldehyde (1)NaH (60%, 2.179 g, 0.0908 mol) in dry THF(120 mL) was added to 4-methyl-5-imidazolecarbaldehyde (5 g, 0.0454 mol) at roomtemperature for 30 min. Methyl iodide (5.65mL, 0.0908 mol) was then added and mixed atroom temperature for 20 hours. As a result ofthe reaction, the mixture had solid and liquidphases. The THF phase was isolated, then thesolid phase was washed several times withCHCl3, then the organic phases were combined.The remaining precipitate was dissolved inwater and extracted again with CHCl3. Then allthe organic phases were combined and thesolvent was evaporated. The resultingbrownish-yellow oily substance was purified bycolumn chromatography using ethyl acetateover silica gel. Isomer 1 was obtained as ayellow oily solid (3.32 g, 59%). 1H NMR (400MHz, DMSO): dH 2.46 (3H, s, CH3), 3.60 (3H, s,CH3), 7.73 (1H, s, imidazole C-H), 9.76 (1H, s,CHO).
1-Benzyl-4-methyl-imidazole-5-carbaldehyde(2)4-Methyl-5-imidazole carbaldehyde (1 g, 9.08mmol) was treated with NaH (60%, 720 mg,18.16 mmol) in dry DMF (120 mL) at roomtemperature for 5 min. Benzyl chloride (1.36
374
Orhan E, Kose M, Alkan D, Öztürk L. JOTCSA. 2019; 6(3): 373-382. RESEARCH ARTICLE
mL, 11.8 mmol) was then added and mixed atroom temperature for 20 h. After thatsaturated sodium carbonate solution (25 mL)was added to the mixture, extracted byaddition of 30 mL of water and extraction withethyl acetate (3 x 30 mL). The combinedextracts were filtered after being dried oversodium sulfate. The solvent was removed onthe rotary evaporator. The resulting brownish-yellow oily substance was purified by columnchromatography using ethyl acetate over silicagel. Yellow oily solid (0.76 g, 42%). Mixture ofisomers 2a and 2b 1H NMR (400 MHz, CDCl3):dH 2.30 (3H, s, CH3), 2.38 (3H, s, CH3), 4.41(2H, s, N-CH2), 4.67 (2H, s, N-CH2), 7.30-7.62(10H, m, Ar-H), 9.79 (1H, s, CHO), 9.83 (1H,s, CHO).
1-(2-phenylethyl)-4-methyl-imidazole-5-carbaldehyde (3)
4-Methyl-5-imidazole carbaldehyde (0.5 g, 4.5mmol) was treated with NaH (60%, 220 mg,5.5 mmol) in dry DMF (120 mL) at roomtemperature for 5 min. It was allowed to mix.2-Phenylethylbromide (0.7 mL, 5 mmol) wasthen added and mixed at room temperature for20 h. Saturated sodium carbonate solution (25mL) was then added to the mixture, extractedby addition of 25 mL of water and extractionwith ethyl acetate (2 x V). The combinedextracts were filtered after being dried oversodium sulfate. The solvent was removed onthe rotary evaporator. The resulting brownish-yellow oily substance was purified by columnchromatography eluting with ethyl acetate oversilica gel. It was seen from the 1H NMRspectrum that this compound was an isomericmixture in approximately equal proportions.Yellow oily solid (0.48 g, 49%). Mixture ofisomers 3a and 3b 1H NMR (400 MHz, CDCl3):dH 2.27 (3H, s, CH3), 2.41 (3H, s, CH3), 2.93(2x2H, t, 2xCH2),4.05 (2H, t, N-CH2), 4.40 (2H,t, N-CH2), 6.94-7.25 (10H, m, Ar-H), 9.82 (1H,s, CHO), 9.85 (1H, s, CHO). IR (ATR, ν/cm-1):3127, 2923-2852, 1662, 1610. ESI-MS: m/z =215 (M)+; Calcd. for C13H14N2O:214.11.
1-(2-Chlorobenzyl)-4-methyl-imidazole-5-carbaldehyde (4)4-Methyl-5-imidazole carbaldehyde (1 g, 9mmol) was treated with NaH (60%, 720 mg,18 mmol) in dry DMF (120 mL) at roomtemperature for 5 min. It was allowed to mix.2-chlorobenzyl bromide (1.53 mL, 10 mmol)
was then added and mixed at roomtemperature for 1 day. Saturated sodiumcarbonate solution (25 mL) was then added tothe mixture extracted by the addition of about25-30 mL of water and extraction with ethylacetate (3 x 40 mL). The combined extractswere filtered after being dried over sodiumsulfate. The solvent was removed on the rotaryevaporator. The resulting brown-yellow oilysubstance was purified by columnchromatography eluting with ethyl acetate oversilica gel. Yellow oily solid was observed as amixture of products in 1H NMR (0.82 g, 39%).Main product 4a (%85): 1H NMR (400 MHz,CDCl3): dH 2.42 (3H, s, CH3), 5.48 (2H, s, CH2),6.90-7.48 (5H, m, Ar-H), 9.73 (1H, s, CHO).By-product 4b (%15): 1H NMR (400 MHz,CDCl3): dH 2.37 (3H, s, CH3), 4.66 (2H, s, CH2),6.90-7.48 (5H, m, Ar-H), 9.85 (1H, s, CHO). IR(ATR, ν/cm-1): 3111, 2851, 1661, 1543. ESI-MS : m/z = 235(M)+; Calc. forC12H11ClN2O:234.05.
1-(3-Chlorobenzyl)-4-methyl-imidazole-5-carbaldehyde (5)4-Methyl-5-imidazole carbaldehyde (1 g, 9mmol) was treated with NaH (60%, 720 mg,18 mmol) in dry DMF (120 mL) at roomtemperature for 5 min. It was allowed to mix.3-Chlorobenzyl bromide (1.4 mL, 10 mmol)was then added and mixed at roomtemperature for 1 day. Saturated sodiumcarbonate solution (25 mL) was then added tothe mixture extracted by addition of 25 mL ofwater and extraction with ethyl acetate (3 x 40mL). The combined extracts were filtered afterbeing dried over sodium sulfate. Solvent wasremoved on the rotary evaporator. Theresulting oily substance was purified by columnchromatography eluting with ethyl acetate oversilica gel. Yellow oily solid (0.71 g, 33%). Itwas found from the 1H NMR results that thematerial was isolated as an isomeric mixture.Main product 5a (%71): 1H NMR (400 MHz, CDCl3): dH 2.43 (3H, s, CH3), 5.36 (2H, s, CH2),6.98-7.54 (5H, m, Ar-H), 9.74 (1H, s, CHO).By-product 5b (%29): 1H NMR (400 MHz,CDCl3): dH 2.34 (3H, s, CH3), 4.95 (2H, s, CH2),6.98-7.54 (5H, m, Ar-H), 9.88 (1H, s, CHO). IR(ATR, ν/cm-1): 3088, 2936, 2841, 1659, 1598.ESI-MS : m/z = 235(M)+; Calc. forC12H11ClN2O:234.05.
375
Orhan E, Kose M, Alkan D, Öztürk L. JOTCSA. 2019; 6(3): 373-382. RESEARCH ARTICLE
5-formyl-1,3,4-trimethyl-imidazoliumtetrafluoroborate (6)1,4-dimethyl-1H-imidazole-5-carbaldehyde (1g, 8.77 mmol) and trimethyloxoniumtetrafluoroborate (1.55 g, 0.0105 mol) werestirred in dry ethyl acetate (15 mL) for 2 hoursat room temperature. The solvent wasremoved on the rotary evaporator. Due to thefact that the product is highly polar, theorganic phase could not be extracted and alsocould not be purified by chromatography. Themixture was further left to rinse in a mixture ofethanol and chloroform. 1H NMR analysis wasperformed on pure white crystals and theexpected product was observed to be formed.1H NMR (400 MHz, DMSO): dH 2.59 (3H, s,CH3), 3.79 (3H, s, N-CH3), 4.00 (3H, s, N-CH3),9.14 (1H, s, imidazolium C-H), 9.94 (1H, s,CHO).
2-((4-methyl-1H-imidazole-5-yl)methyleneamino)phenol (8)4-methyl-1H-imidazole-5-carbaldehyde (1 g,9.082 mmol), 2-aminophenol (0.99 g, 9.082mmol) was refluxed in 95% EtOH for 1 day.The reaction mixture was allowed to crystallizewith EtOH. A light yellow solid 4.3.1 (0.81 g,44%) was obtained. Compound 8 was found tohave very little impurity from the 1H NMRspectrum. 1H NMR (400 MHz, DMSO): dH 2.38(3H, s, CH3), 6.8-7.07 (4H, m, Ar-H), 7.45 (1H,s, N=C-H), 7.83 (1H, s, imidazole C-H), 8.73(1H, s, Ar-OH), 12.61 (1H, broad s, N-H).
2-((4-methyl-1H-imidazole-5-yl)methyleneamino)benzenethiol (9)4-Methyl-5-imidazole carbaldehyde (1 g, 9.082mmol) and 2-aminothiophenol (1.137 g, 9.082mmol) were refluxed in EtOH (20 mL) for 1hour. The reaction was followed by TLC (50%EtOAc / n-Hexane) .The reaction was continueduntil the starting material was finished in theTLC. When the reaction mixture was allowed tocool, it was immediately observed that lightcream crystals began to form. A quantity of theobtained solid light cream matter (1.494 g)was observed to be 12 by 1 H NMR analysis 9as well as part of the material being convertedto ring closure reaction. It was detected fromthe 1H NMR spectrum that the ratio of 9 to 12was 79:21. Main product 9 (%79): 1H NMR (400 MHz,DMSO): dH 2.16 (3H, s, CH3), 3.38 (1H, s, SH),6.48-6.59 (3H, m, Ar-H), 6.61-6.97 (2H, m,
Ar-H), 7.45 (1H, s, imidazole C-H), 8.02 (1H,s, N=C-H), 11.93 (1H, broad s, N-H). By-product 12 (%21): 1H NMR (400 MHz,DMSO): dH 2.66 (3H,s, CH3), 7.34-7.48 (2H,d.t., 2xAr-H), 7.70 (1H, s, imidazole C-H),7.90- 8.04 (2H, d.d., 2xAr-H), 12.56 (1H,broad s, N-H).
2-((4-methyl-1H-imidazole-5-yl)methyleneamino)aniline (10)1-2-diaminobenzene (1.178 g, 10.9 mmol)with 4-methyl-5-imidazolecarbaldehyde (1 g,9.082 mmol) was refluxed in 20 mL EtOH for 1day. The reaction was extracted by TLC (20%EtOH, EtOAc), the product was observed to belower in TLC as it was more polar thanimidazole. The solvent was removed and theremaining mixture was purified by flash columnchromatography on silica gel using n-hexane,ethyl acetate and EtOH. (The solvent polarityfor the separation was 20% acetate-n-hexaneand the temperature was increased to 50%EtOH / EtOAc mixture). The fractions of theproduct were collected and the solvent wasremoved to give the target compound 10 as alight brown solid (1.66 g, 90%).
It was determined that there is an isomericmixture of 10 from 1H NMR spectrum. Theisomeric mixture may possibly be an E/Zmixture around -N=CH-. The isomeric ratioswere found to be 63% for the main isomer and37% for the other isomer. 1H NMR (400 MHz,DMSO): dH 2.56 (3H, s, CH3), 2.65 (3H, s,CH3), 7.10-7.59 (8H, m, Ar-H), 7.48 (1H, s,imidazole C-H), 7.71 (1H, s, imidazole C-H),7.82 (2H, s, N=C-H), 12.25 (2H, broad s, N-H).
2-(4-methyl-1H-imidazole-5-yl)benzo[d]oxazole (11)2-((4-methyl-1H-imidazol-5-yl)methyleneamino)phenol (8) (0.6 g, 2.28mmol) and lead tetraacetate (1.32 g, 2.98mmol) were dissolved in acetic acid (12 mL) at45-50 0C for 24 hours. The reaction wasmonitored by TLC (25% EtOH / EtOAc); TLCwas observed to walk faster because it is lesspolar than the starting material of the product.The reaction mixture was basified in ice bathwith about 20 mL of 10% NaOH. The organicextracts were extracted with chloroform andthe organic phase was dried over sodiumsulfate. The mixture was separated by columnchromatography on silica gel using n-hexane,
376

Orhan E, Kose M, Alkan D, Öztürk L. JOTCSA. 2019; 6(3): 373-382. RESEARCH ARTICLE
ethyl acetate, and EtOH. (The solvent polarityfor the separation was 5% ethyl acetate-n-hexane and eluted to 25% EtOH / EtOAcmixture). Compound 11 was isolated as a paleyellow solid (0.41 g, 69%). 1H NMR (400 MHz,DMSO): dH 2.63 (3H,s, CH3), 7.35 (2H, m,2xAr-H), 7.72 (2H, m, 2xAr-H), 7.83 (1H, s,imidazole C-H). IR (ATR, ν/cm-1): 3379, 1642.ESI-MS : m/z = 200(M)+; Calcd. forC11H9N3O:199.07.
2-(4-methyl-1H-imidazole-5-yl)benzo[d]thiazole (12)Compound 9 (0.6 g, 2.764 mmol) and leadtetraacetate (1.2 g, 2.764 mmol) were stirredin acetic acid (10 mL) at 45-50 °C for 1 day.After termination of the reaction, the mixturewas basified in ice bath with about 20 mL ofNaOH. The organic material was extracted withchloroform and the organic phase was driedover sodium sulfate. The solvent was removedand the residue was chromatographed on silicagel in a mixture of ethyl acetate-n-hexane (1:1). Compound 12 was obtained as a yellowsolid (0.348 g, 30%). 1H NMR (400 MHz,DMSO): dH 2.66 (3H,s, CH3), 7.33-7.48 (2H,d.t., 2xAr-H), 7.71 (1H, s, imidazole C-H),7.91- 8.05 (2H, d.d., 2xAr-H), 12.58 (1H,broad s, N-H). IR (ATR, ν/cm-1): 3054, 3015,2937-2838-2711, 1603. ESI-MS : m/z =216(M)+; Calc. for C11H9N3S:215.05.
2-(4-methyl-1H-imidazole-5-yl)-1H-benzimidazole (13)2-((4-methyl-1H-imidazole-5-yl)methyleneamino)aniline (10) (1.1281 g,5.63 mmol) and lead acetate (2.49 g, 5.63mol) in glacial acetic acid (20 mL) was addedfor 24 hours at 35-40 0C. It was basified with10% NaOH. Extraction with chloroform wasperformed. (3xV) and the organic phase wasdried over sodium sulfate. Crystallizationyielded 13 as a light yellow solid (0.66 g,59%). 1H NMR (400 MHz, DMSO): dH 2.55(3H,s, CH3), 7.14 (2H, m, 2xAr-H), 7.39 (1H,s), 7.58 (2H, m, 2xAr-H), 7.80 (1H, s,imidazole C-H), 12.45 (1H, broad s, N-H).IR (ATR, ν/cm-1): 3127, 2922, 2852, 1606.ESI-MS : 293.1(M)+; Calc. for C11H10N4:198.09.
RESULTS AND DISCUSSION
The alkylation reaction of 4-methyl-5-imidazolecarbaldehyde is shown in Figure 1. The acidicN-H hydrogen in the imidazole ring was firstionized with strong base NaH and thenconverted to the corresponding primary alkylhalides (N-alkylation) by reaction with the SN2type reaction.
dry EtOAc (4 0C)
N
N
C
Me
OH
Me
Me
R-X+NH
N
C
Me
OH
r.t
NaH / DMF
N
N
C
Me
OH
R
R = Me
(CH3)3OBF4
CH2 CH2CH2 CH2 CH2
Cl Cl
1 2a 3a 4a 5a
6
Figure 1. The alkylation reaction of 4-methyl-5-imidazole carbaldehyde.
An isomeric mixture or polyalkylation can beexpected because of the presence of two Natoms on the imidazole ring. As a result of thereaction with Me-I, very pure N-methylatedimidazole derivative was obtained. 1H-NMR
analyses showed that there was only oneisomer 1 for this compound. In the Me-Ireaction, although more than two equivalentsof Me-I was taken, multiple alkylation has notbeen detected.
377

Orhan E, Kose M, Alkan D, Öztürk L. JOTCSA. 2019; 6(3): 373-382. RESEARCH ARTICLE
N
N
C
Me
O
H
N
N
C
Me
O
H
major Product minor product
2a 2b
N
N
C
Me
O
H
N
N
C
Me
O
H
major Product minor product
3a 3b
Figure 2. Isomeric mixtures of 2a, 2b and 3a,3b.
The second reaction of this section is thereaction with benzyl chloride (PhCH2Cl). Amongthe alkyl halides used, only benzyl chloride isless reactive than the others (other alkylhalides are alkyl bromides and iodides). Fromthe benzyl chloride reaction, the product wasimpure and is also an isomeric mixture.However, when the alkylation reaction wascarried out with sterically more hindered alkylgroup, such as 2-phenylethyl bromide, isomericmixture (3a and 3b) were obtained (Figure 2).The 1H-NMR analysis showed that the isomericmixture almost in the vicinity of 50:50. Whenalkylation reactions was carried out with 2-chlorobenzyl bromide or 3-chlorobenzylbromide, which are structurally very similarwith benzyl chloride, the reaction proceededsmoothly and expected products (4a and 5a)were obtained. In all alkylation reactions,except Me-I, the product was obtained both asa low yield and as an isomeric mixture; forinstance, the alkylation reaction of 4-methyl-5-
imidazole carbaldehyde with 2-chlorobenzylbromide or 3-chlorobenzyl bromide gave about30% yield and the products were isomericmixture (4a / 4b and 5a / 5b). But from thesimilar reaction with Me-I, only one isomer withhigher yield (60%) was obtained.
The isomeric mixtures of 4a and 4b or 5a and5b, could not be separated completely bycolumn chromatography (Figure 3). 1H NMRanalysis indicated that the major isomer was4a and the minor isomer was 4b and the ratioof the two isomers was 85:15. Similar way, theH NMR spectroscopy showed that the 5a ismajor and the 5b is minor and isomer ratio is71/29. It is not surprising that, although theisomeric mixture is not observed in thereaction with MeI, the alkyl halides with a largeR group causes isomerization. This can beattributed to the steric effect of thecarbaldehyde group adjacent to the N-H group.
N
N
C
Me
O
H
N
N
C
Me
O
H
N
N
C
Me
O
H
N
N
C
Me
O
H
Cl
Cl
Cl
Cl
major Product minor product major Product minor product
5a 5b4a 4b
Figure 3. Isomeric mixtures of 4a, 4b and 5a,5b.
4-Methyl-5-imidazole carbaldehydes (N-R)were tried to convert to their imidazolium saltsusing (CH3)3O+BF4
-, from this reaction only N-
Me isomer 1 gave desired imidazolium salt 6,but other isomers (N-R) for example 5a couldnot converted to 7(figure 4).
378

Orhan E, Kose M, Alkan D, Öztürk L. JOTCSA. 2019; 6(3): 373-382. RESEARCH ARTICLE
Figure 4. Unsuccessful synthesis of compound 7.
Synthesis of benzoxazole, benzothiazoleand benzimidazole derivatives from 4-methyl-5-imidazole carbaldehydeIn the literature, benzoxazole, benzothiazoleand benzimidazole derivatives weresynthesized from less reactive carbonylcompounds with 2-aminophenol, 2-aminobenzenethiol and 1,2-diaminobenzeneetc via two step Schiff base reaction and theirantimicrobial effects were investigated (28-32).Therefore, it was thought that the basicstarting material used in this study, 4-methyl-5-imidazole carbaldehyde, could react with 2-aminophenol, 2-aminobenzenethiol, and 1,2-diaminobenzene. Thus, synthesis ofbenzoxazole, benzothiazole and benzimidazole
derivatives containing imidazole rings has beentried to synthesize by a two-step reaction asshown in Figure 5. The intermediate products(8, 9 and 10), obtained as a result of the firststep shown in Figure 5, were isolated as anisomeric mixture or with some impurities(analyzed by 1H NMR spectroscopy). Theisomerization (cis / trans isomers) may bederived from the -N=CH- double bond. Furtherreaction of the intermediates gave newbenzoxazole, benzothiazole and benzimidazoles(11, 12 and 13) as pure compounds.
In addition, compounds 1, 2, 12 and 13 weresynthesized by different methods from theliterature (33-35).
379
dry EtOAc (4 0C)
N
N
C
Me
OH
Me
N
N
C
Me
OH
(CH3)3OBF4
Cl Cl
7
X
5a

Orhan E, Kose M, Alkan D, Öztürk L. JOTCSA. 2019; 6(3): 373-382. RESEARCH ARTICLE
Figure 5. Synthesis of benzoxazole, benzothiazole and benzimidazole derivativescontainingimidazole ring.
CONCLUSIONS
In this work, the N-1 atom on the imidazolering of the starting 4-methyl-1H-imidazole-5-carbaldehyde were derivatized with differentalkyl groups. In addition, both N atoms of thestarting imidazole-carbaldehyde weremethylated to give 5-carbaldehyde-1,3,4-trimethyl-3-imidazolium salt. The salt whichpossess quite reactive carbaldehyde groupcould be used for synthesis of otherimidazolium derivatives. Furthermore, 4-methyl-5-imidazole carbaldehyde wasconverted into the benzoxazole, benzothiazoleand benzimidazoles by a two-step reaction overthe aldehyde group. These new compoundscould display some biological activities.
ACKNOWLEDGMENTS
The authors are grateful to the ZonguldakBülent Ecevit University (Grant No.: BAP 2014-72118496-06) and Düzce University (GrantNo.: 2012.05.03.097) for the financial aid ofthis study.
REFERENCES
1. Butler K, Howes HL, Lynch JE and Pirie DK.Nitroimidazole Derivatives. Relationshipbetween Structure and AntitrichomonalActivity. J. Med. Chem. 1967;10(5):891–7.
2. a) Giraldi PN, Mariotti V, Namini G, TosoliniGP, Dradi E, Logemann W, de Carnevi I, MontiG. Arzneimittelforsch. 1970; 20,52 b) Heeres J,Mostmans JH and Maes R, German Patent,1975;2:429,755.
3. Rufer C, Kessler HJ, Schroeder E.Chemotherapeutic nitroheterocycles 6.Substituted 5- aminomethyl-3-(5-nitro-2-imidazolylmethyleneamino)-2-oxazolidinones.J. Med. Chem. 1971; 14(2):94–6.
4. Arton., Netherlands Patent, 1965, 6413814;Chem. Abstr., 1965, 63, 18097b
5. Godefroi EF, Van Cutsem J, Van Der EyckenCAM, Janssen PAJ. Med. Chem. 1967;10:1160.
380
NH
N
C+
X
NH2
NHC
Me
OH
NH
N
Me
X
Reflux
Ethanol
(AcO)4Pb
Glacial AcOH r.t
Y
N
N
N
Me
H
8-10
11-13
8 (X= OH), 9 (X= SH), 10 (X= NH2)
11(Y= O), 12 (Y= S), 13 (Y= NH)

Orhan E, Kose M, Alkan D, Öztürk L. JOTCSA. 2019; 6(3): 373-382. RESEARCH ARTICLE
6. Godefroi EF, Heeres J, Van CutsemJ, Janssen PAJ. Preparation and antimycoticproperties of derivatives of 1-phenethylimidazole. J. Med.Chem. 1969;12 (5):784–91.
7. Durant GJ, Emmett JC, Ganellin CR, MilesPD, Parsons ME, Prain HD, White GR.Cyanoguanidine-thiourea equivalence in thedevelopment of the histamine H2-receptorantagonist, cimetidine. J. Med. Chem.1977;20 (7):901–6.
8. Walter LA. German Patent. 1969;1: 905,353; Chem. Abstr., 1970; 72, 317904.
9. Almansa C, Alfón J, de Arriba AF , CavalcantiFL, Escamilla I, Gómez LA, Miralles A, Soliva R,Bartrolí J, Carceller E, Merlos M, García-Rafanell J. Synthesis and Structure−ActivityRelationship of a New Series of COX-2Selective Inhibitors: 1,5-Diarylimidazoles, J.Med. Chem. 2003;46 (16):3463–75.
10. Liu H, Kerdesky FA, Black LA, Fitzgerald M,Henry R, Ebenshade TA, Hancock AA, BennaniYL. An efficient multigram synthesis of thepotent histamine H3 antagonist GT-2331 andthe reassessment of the absolute configuration.J. Org. Chem. 2004;69(1):192-4.
11. Nallan L, Bauer KD, Bendale P, RivasK, Yokoyama K, Hornéy CP, Pendyala PR, FloydD, Lombardo LJ, Williams DK, Hamilton A,Sebti S, Windsor WT, Weber PC, BucknerFS, Chakrabarti D, Gelb MH, Voorhis WCV.Protein Farnesyltransferase Inhibitors ExhibitPotent Antimalarial Activity. J. Med. Chem.2005;48(11):3704-13.
12. Berezin M, Achilefu S. Novel synthon forincorporating 1,3-dimethyl-imidazolium groupinto molecular architecture. TetrahedronLetters. 2007;48(7):1195–9.
13. Davis Jr JH, Forrester KJ, Merrigan T. Novelorganic ionic liquids (OILs) incorporatingcations derived from the antifungal drugmiconazole. Tetrahedron Letters.1998;39(49):8955-8.
14. Hu B, Malamas M, Ellingboe J, Largis E,Han S, Mulvey R, Tillett J. Newoxadiazolidinedione derivatives as potent and
selective human β3 agonists. Bioorganic &Medicinal Chemistry Letters. 2001;11(8): 981-4.
15. Demberelnyamba D, Kim K-S, Choi S, ParkS-Y, Lee H, Kim C-J, Yoo I-D. Synthesis andantimicrobial properties of imidazolium andpyrrolidinonium salts. Bioorganic & MedicinalChemistry. 2004;12(5):853–7.
16. Ourth DD. Antiviral activity against humanimmunodeficiency virus-1 in vitro bymyristoylated-peptide from Heliothis virescens.Biochemical and Biophysical ResearchCommunications. 2004;320(1):190–6.
17. Orhan E, Garci A, Tina R, Saudani M, DysonPJ, Therrien B. Cytotoxic double areneruthenium metalla-cycles that overcomecisplatin resistance. Journal of OrganometallicChemistry, 2016;803: 39-44.
18. Orhan E, Garci A, Riedel T, Dyson PJ,Therrien B. Cytotoxicity of arene rutheniummetalla-rectangles incorporating bispyridyldiimide linkers. Journal of OrganometallicChemistry, 2016; 815-816: 53-8.
19. Zabielska-Matejuk J. Antifungal propertiesof new quaternary ammonium compounds inrelation to their surface activity. Wood SciTechnol. 2005;39(3):235–43.
20. Reiter LA. Synthesis of 4(5)-acyl-, 1-substituted 5-acyl- and 1-substituted 4-acyl-1H-imidazoles from 4-aminoisoxazoles. J. Org.Chem. 1987;52(13):2714–26.
21. Koch P, Ansideri F. 2-Alkylsulfanyl-4(5)-aryl-5(4)-heteroarylimidazoles: An Overviewon synthetic Strategies and Biological Activity.Arch. Pharm. Chem. Life Sci. 2017;350(12):e1700258.
22. Beyer C, Wagenknecht H-A. Synthesis ofSpiropyrans As Building Blocks for MolecularSwitches and Dyads. J. Org. Chem.2010;75(8):2752–5.
23. Küçükbay H, Durmaz R, Orhan E, Günal S.Synthesis, antibacterial and antifungalactivities of electron-rich olefins derived
381

Orhan E, Kose M, Alkan D, Öztürk L. JOTCSA. 2019; 6(3): 373-382. RESEARCH ARTICLE
benzimidazole compounds. Il Farmaco.2003;58(6):431-7.
24. Akkurt M, Öztürk S, Küçükbay H, Orhan E,Büyükgüngör O. 1-Ethyl-3-(2-phenylethyl)benzimidazole-2-selone. Acta CrystallographicaSection E: Structure Reports Online.2004;60(7):o1263-o1265.
25. Akkurt M, Yıldırım SO, Orhan E, KüçükbayH, Büyükgüngör O. 1-Methoxyethyl-5-nitrobenzimidazole. Acta CrystallographicaSection E: Structure Reports Online.2005;61(9):o2804-5.
26. Yıldırım SO, Akkurt M, Küçükbay H, OrhanE, Büyükgüngör O. 6-Nitro-1-(2-phenylethyl)1H-benzimidazole. ActaCrystallographica Section E: Structure ReportsOnline. 2005;61(7):o2038-9.
27. Küçükbay H, Günal S, Orhan E, Durmaz R.Synthesis and Antimicrobial Activities of SomeTransition Metal Benzimidazole Complexes.Asian Journal of Chemistry. 2010;22(9):7376.
28. Abdel-Magid AF, Carson KG, Harris BD,Maryanoff CA, Shah RD. Reductive Aminationof Aldehydes and Ketones with SodiumTriacetoxyborohydride. Studies on Direct andIndirect Reductive Amination Procedures. J.Org. Chem. 1996;61(11):3849–62.
29. Gwaltney SL, O’Connor SJ, Nelson LTJ,Sullivan GM, Imade H, Wang W, Hasvold L, LiQ, Cohen J, Gu W-Z, Tahir SK, Bauch J, MarshK, Ng S-C, Frost DJ, Zhang H, Muchmore S,Jakob CG, Stoll V, Hutchins C, Rosenberg SH,Hing. Aryl tetrahydropyridine inhibitors offarnesyltransferase: bioavailable analogueswith improved cellular potency.
Bioorganic & Medicinal Chemistry Letters. 2003;13:1363– 6.
30. Pınar Ş, Akkurt M, Küçükbay H, Orhan E,Büyükgüngör O. Bis[1-(but-2-enyl)-5-nitro-1H- benzimidazole-kN3]dichlorocobalt(II), ActaCrystallographica Section E: Structure ReportsOnline. 2006;62(7):m1663-5.
31. Akkurt M, Karaca S, Küçükbay H, Orhan E,Büyükgüngör O. 1-Benzyl-3-(2-phenethyl)benzimidazolium bromidemonohydrate, Acta Crystallographica SectionE: Structure Reports Online.2005;61(8):o2452-4.
32. Akkurt M, Karaca S, Küçükbay H, Orhan E,Büyükgüngör O. Dichlorobis[1-(2-ethoxyethyl)-1H-benzimidazole-kN3]nickel(II),Acta Crystallographica Section E: StructureOnline. 2004;61(1):m41-3.
33. Hubball W, Pyman FL. Glyoxaline-4(5)-formaldehyde. Journal of the ChemicalSociety, 1928; 21-32.
34. Reiter LA. Synthesis of 4(5)-Acyl-, 1-Substituted 5-Acyl-, and 1-Substituted 4-Acyl-1H- imidazoles from 4-Aminoisoxazoles. J.Org. Chem., 1987; 52(13): 2714-26.
35. Gilbert JG, Addison AW, Palaniandavar Mand Butcher RJ. Synthesis of SomeBenzimidazole-, Benzothiazole- and PyridineDerived Chelating Agents. Journal ofHeterocyclic Chemistry, 2002;39(2):399-404.
382

Şahin S. JOTCSA. 2019; 6(3): 383-394. RESEARCH ARTICLE
Experimental and modeling study of polyphenols in Oleaeuropaea leaves through ultrasound-assisted extraction
Selin Şahin*
Istanbul University-Cerrahpaşa, Engineering Faculty, Department of Chemical Engineering,34320 Avcilar, Istanbul, Turkey.
Abstract: Olive tree (Olea europaea) leaves were extracted by ultrasound-assistedextraction (UAE). The attention was focused on the yield of extract and its polyphenols,and extraction kinetics to contribute to the application of the extraction processindustrially. Samples were extracted with water, ethanol, methanol, and their aqueoussolutions (50%, v/v) under temperature values ranging from 30 to 50 °C. Additionally,the temperature interval changed between 30 and 80 °C, when water was used as thesolvent. Backing the solvents with water enhanced the polyphenolic yield. Total phenoliccontent (TPC) from water extracts decreased after a certain temperature point, as a resultof the problems of degradation. The second-order model was followed for characterizingthe kinetic of the UAE process of TPC from olive leaves under various solvents andtemperatures. Major phenolic component was also quantified for each solvent system bymeans of High Performance Liquid Chromatography (HPLC).
Keywords: Agro-industrial by-products; mathematical model; olive leaves; polyphenolsextraction.
Submitted: January 04, 2019. Accepted: September 10, 2019.
Cite this: Şahin S. Experimental and modeling study of polyphenols in Olea europaea leavesthrough ultrasound-assisted extraction. JOTCSA. 2019;6(3):383–94.
DOI: https://doi.org/10.18596/jotcsa.508113.
Corresponding author. E-mail: [email protected] .
INTRODUCTION
Olive tree (Olea europaea) is grown toproduce table olives and olive oil, and theleaves, its abundant wastes, are traditionallyused for therapeutic purposes. Olive leaf is asubstantial by-product of tree pruning andfruit harvesting. Recent scientific studies havereported that phenolic extracts from all parts(such as fruit, leaves, pomace, and even olivetree extracts) of the olive crop haveremarkable antioxidant activity (1–5).
Olive plantation in Mediterranean countriescounts about 98% (corresponding to 8 ha) ofthe world’s cultivation. Olive leaf obtainedfrom pruning is estimated to be 25 kg perolive tree, accounting for approximately 10%of the total weight of the olives from the oliveoil industries. So, this huge amount of wasteby-product should be valorized for botheconomic and ecological points. Due to itsbeneficial effects to health, interests in thisby-product have been increasing in many
383

Şahin S. JOTCSA. 2019; 6(3): 383-394. RESEARCH ARTICLE
researchers and commercial organizations(6,7). Generally, medical properties of thisnatural material is mostly attributable tooleuropein, which is its predominant phenolicingredient (8–10). Oleuropein is a phenolic
secoiridoid compound, and has a formulasimilar to the forms of dimethyl oleuropein(sketched in ChemDraw, see Figure 1) such asligstroside, oleuroside, and verbascoside.
O
OH
O
OHHO
HO
O
O O
O
O
OH
OH
Figure 1. Molecular structure of oleuropein.
Since various biological activities of plantextracts and their phytochemical content havebeen reported, the study of higher plants withknown ethnobotanical knowledge hasattracted the attention of researchers. Due tothe transition from disease-based products toproducts that promote healthy living,phytochemicals have high commercial value inlocal and global markets. In addition, theprevalence of chronic diseases that cannot betreated with conventional drugs hastransformed the phytochemical industry intoan approaching industrial sector. However, acommon trap associated with this sector isthat the production of these phytochemicals isoften carried out by various conventionalmethods, resulting in high losses and lowyields. In order to make the phytochemicalindustries suitable and profitable, varioustransformations with appropriate processessuch as planting and harvesting, raw materialpreparation and high-added value productionare required. Furthermore, the processtechnology for successful modernization ofphytochemical processes needs to beoptimized for the purpose of extraction andproduct formulation. In this respect, themodeling of the kinetics of a process is abeneficial engineering tool for controlling the
process for industrial applications throughoptimization and simulation (11).
Ultrasound technology has not beendeveloped recently (12). Sound waves havingfrequencies greater than 20 kHz can movewithin a material and may include expansionand compression cycles during movement inthe environment. The frequency between 18and 40 kHz range was considered to be anexcellent source of energy to supportultrasound-assisted extraction (UAE). UAE ismuch more rapid than conventional extractionmethods due to the high contact surface areabetween the solid matrix and liquid solvent.High frequency sound energy can separatephytochemicals from plant materials bymeans of cavitation. The formation andcollapse of cavitation or microscopic bubblescreates a tremendous amount of energy, suchas heat, pressure, and mechanical shear.Thus, it increases mass transfer and facilitatessolvent diffusion to the cell (13, 14). In thissense, special attention has been given to theuse of UAE in the recovery of bio-activecompounds from diverse natural sources. Therelated cavitation has a great effect onextraction efficiency and its kinetics.Therefore, it enhances the penetration
384

Şahin S. JOTCSA. 2019; 6(3): 383-394. RESEARCH ARTICLE
potential of the solvent to the cell matrix andfavors mass transfer. In the UAE process,sonication can disturb walls of the bioactivecells by improving the release of targetcontent. UAE is cheaper and easier to extractfine chemicals from natural raw materialscomparing to other advanced methods suchas microwave and supercritical CO2 (15). UAEhas been suggested as an advancedseparation method with better recovery of thetarget bioactive components with less energyand solvent consumption (16, 17). In this study, olive leaves were extracted bymeans of UAE under several conditions. Thekinetic description of the UAE process wascarried out by second-order kinetic model withrespect to total phenolic content (TPC)extraction. Effect of extraction temperaturewas also investigated as well as solvent type.Finally, the most distinguished phenoliccompound of the olive leaf extract was alsoquantified by means of high performanceliquid chromatography (HPLC).
MATERIAL AND METHODS
MaterialOlive leaf samples were collected from Kaş inMediterranean area of Turkey. Leaf samplesbelong to Tavşan yüreği cultivar of olives. Thesamples collected in November (2013), wherethe leaves have the highest period in terms ofphenolic matter (18). The leaves were driedat ambient conditions in dark. After 4 days,the samples were stored at plastic bags keptin the dark until grinding for the extraction.The moisture of the leaf sample was nearly 16% of the total leaf weight.
Ethanol, methanol, acetonitrile, and formicacid were purchased from Merck (Darmstadt,Germany), while Folin-Ciocalteu, gallic acid,and sodium carbonate were procured fromSigma-Aldrich (St. Louis, MO).
Ultrasound-Assisted ExtractionExtraction process was carried out in asonicator (Protech) with 50 Hz of frequencyunder several temperature values (30, 40, 50,60, 70, and 80 °C). A specific amount of leafsamples were added into the selected solvents(water, ethanol, methanol, and their 50%aqeous solutions (v/v)), respectively. Thebeaker containing the material and thesolvent was kept in an ice bath to maintainthe temperature constant. A centrifuge (Nüve,CN 180) was used to separate theheterogeneous mixture for 15 min of time at5000 rpm. Aqueous olive leaf extracts weredried in a rotary evaporator (Buchi,Switzerland) under vacuum.
Folin-Ciocalteu MethodThe procedure developed by Malik andBradford (2006) was exploited for thequantification of total polyphenolic content ofthe extract samples (19). UV-spectrophotometry (PG Instruments,T60/Leicestershire, England) was used asdescribed in detail by Şahin and Samli (2013)(20). Results were given as gallic acidequivalence per gram of dried leaf (mg GAE/gDL).
HPLCExtracts obtained under optimum conditionsby each solvent system were also analyzed byHigh Performance Liquid Chromatography(HPLC). The gradient elution program used inthis method is shown in Table 1.
Table 1. Gradient program and analysis conditions applied in HPLC.Conditions Program
Agilent 1260 (Agilent, Waldbronn, ABD) (model) Time (sec) A (%) B (%)Agilent Eclipse Plus C18 RRHD 18 (3 mm x 5 mm; 1,8 µm) (column)
0.0 100 0
Mobile phase A: Water + 0.1% formic acid (v/v)Mobile phase B: Acetonitrile + 0.1% formic acid (v/v)
0.5 100 0
276 nm (wavelength) 7.0 60 401 mL/min (flow rate) 7.1 0 10040 °C (column temperature) 8.6 0 10020 µL (injection volume) 8.7 100 0
385

Şahin S. JOTCSA. 2019; 6(3): 383-394. RESEARCH ARTICLE
Kinetics of UAEKinetic description of olive leaf extraction bymeans of UAE was held by second-orderkinetic model as stated below (Qu et al.,2010):
2)( tet CCk
dt
dC (1)
The linearized form of the equation 1 isstated as given below:
eet C
t
kCC
t
2
1(2)
where:Ct= Concentration of TPC at time t
(mg/g)Ce= Concentration of TPC when the
equilibrium is attained (mg/g)t= Extraction time (min)k= Rate constant (g/mg·min)
When t approaches to 0, initialextraction rate can be expressed as h(mg/g·min):
(3)If h is substituted into Eq. 2, Ct can be
stated as follows:
et Cth
tC
1 (4)
Statistical analysisAnalysis of variance (ANOVA) statistical testwas utilized through Tukey’s test of InStat®software (GraphPad, San Diego, CA, USA) toanalyze the means of three replicate outputs.
Reliability of the mathematical model wasevaluated by some indicators such ascorrelation coefficient (R2/r2) and the root-mean-square deviations (rmsd):
n
CC
rmsd
n
icalii
1
2,exp, )(
(5)
n= number of the experimentsCi,exp = concentration value of experiment iCi,cal = calculated concentration value of the i
RESULTS AND DISCUSSIONS
Effect of the type of solvent Table 2 indicates the influence of solvent typeunder several temperature values on theextract yield and TPC of each olive leaf extractobtained by UAE as a function of time.
Table 2. Change of the extract yield and TPC of the olive leaf extracts as a function of timewith various solvent types under different temperatures.
Solvent(v/v)
T(°C)
Time(minute)
Extract yield*
(mg/g DL)TPC**
(mg GAE/g DL)
50 % EtOH
30
20 194.74 ± 6.50 20.78 ± 0.4530 202.55 ± 9.01 24.56 ± 1.2040 255.00 ± 9.81 25.18 ± 1.6850 254.98 ± 8.25 27.11 ± 1.8860 263.06 ± 7.51 28.71 ± 2.39
40
20 202.24 ± 9.82 28.78 ± 1.2930 220.01 ± 8.41 31.09 ± 1.4540 257.60 ± 5.21 31.54 ± 2.0050 270.71 ± 5.60 32.53 ± 2.4060 281.20 ± 6.74 32.84 ± 1.11
50
20 277.57 ± 7.71 32.43 ± 1.1130 298.09 ± 6.45 34.50 ± 3.3240 301.79 ± 9.46 36.80 ± 1.4550 320.91 ± 7.55 37.33 ± 3.0160 322.33 ± 7.01 37.38 ± 1.75
50 % MeOH 30 20 172.44 ± 5.12 26.18 ± 1.38
386

Şahin S. JOTCSA. 2019; 6(3): 383-394. RESEARCH ARTICLE
Solvent(v/v)
T(°C)
Time(minute)
Extract yield*
(mg/g DL) TPC**
(mg GAE/g DL)
30 201.98 ± 6.66 28.70 ± 0.5840 233.03 ± 8.45 31.03 ± 0.2850 234.09 ± 9.01 33.28 ± 0.7060 234.48 ± 5.01 35.20 ± 1.96
40
20 188.14 ± 4.21 38.55 ± 1.6530 229.89 ± 8.02 40.30 ± 2.2940 255.98 ± 9.78 42.72 ± 3.2550 277.31 ± 9.90 43.40 ± 1.2860 279.07 ± 4.00 43.87 ± 3.04
50
20 242.04 ± 6.12 44.11 ± 1.7630 257.57 ± 4.30 46.97 ± 2.0640 288.99 ± 6.13 49.22 ± 2.4850 303.88 ± 7.13 51.01 ± 2.8560 310.26 ± 7.50 51.78 ± 3.03
100 % EtOH
30
20 81.89 ± 3.51 9.79 ± 0.530 100.91 ± 5.06 10.99 ± 1.7540 124.07 ± 4.45 12.00 ± 2.0350 130.21 ± 5.55 13.60 ± 2.3260 132.89 ± 4.44 15.15 ± 1.00
40
20 127.56 ± 5.50 16.24 ± 1.530 131.87 ± 4.12 18.09 ± 2.8940 134.65 ± 6.77 18.97 ± 3.0150 145.00 ± 4.99 20.06 ± 2.2160 147.53 ± 5.33 20.28 ± 1.51
50
20 160.72 ± 7.50 20.99 ± 2.5030 172.90 ± 4.54 23.25 ± 1.7840 172.87 ± 4.33 23.57 ± 2.7550 173.00 ± 7.10 24.14 ± 2.7560 176.42 ± 7.44 24.46 ± 2.02
100 % MeOH
30
20 171.89 ± 5.09 26.53 ± 3.0230 188.45 ± 6.06 27.91 ± 3.3040 199.96 ± 7.06 30.00 ± 1.4550 255.98 ± 6.77 30.71 ± 2.0660 266.89 ± 6.50 31.42 ± 1.50
40
20 196.88 ± 3.64 30.87 ± 3.0230 242.22 ± 7.79 33.01 ± 3.1240 254.61 ± 7.03 36.45 ± 2.8550 274.59 ± 6.84 38.40 ± 1.9860 284.04 ± 5.51 39.89 ± 3.00
50
20 252.44 ± 6.16 38.49 ± 3.0030 277.65 ± 7.67 41.70 ± 2.4540 296.64 ± 4.55 42.36 ± 1.9950 312.98 ± 5.78 42.96 ± 2.0760 328.82 ± 7.02 43.07 ± 3.50
Water
30
20 178.65 ± 4.79 12.30 ± 2.5030 187.98 ± 8.03 14.18 ± 1.8840 192.87 ± 7.16 14.95 ± 2.7850 200.00 ± 8.01 16.01 ± 3.1460 207.15 ± 4.00 17.24 ± 2.50
40 20 201.34 ± 7.77 16.99 ± 1.78
387

Şahin S. JOTCSA. 2019; 6(3): 383-394. RESEARCH ARTICLE
Solvent(v/v)
T(°C)
Time(minute)
Extract yield*
(mg/g DL) TPC**
(mg GAE/g DL)
30 206.23 ± 8.30 18.91 ± 3.0540 211.09 ± 4.73 21.25 ± 1.8950 218.78 ± 5.79 22.01 ± 2.0160 217.04 ± 6.00 22.84 ± 2.06
50
20 200.89 ± 5.44 18.70 ± 1.5030 207.56 ± 6.78 20.95 ± 0.9840 212.37 ± 6.00 22.87 ± 0.8850 218.83 ± 7.11 24.24 ± 1.0860 220.13 ± 4.51 26.40 ± 2.01
60
20 209.35 ± 6.88 19.24 ± 2.3530 216.38 ± 6.44 22.24 ± 2.0840 228.26 ± 6.51 25.07 ± 2.1150 234.92 ± 6.42 28.01 ± 2.7160 246.40 ± 6.00 30.67 ± 3.10
70
20 226.73 ± 4.89 21.14 ± 1.3330 240.57 ± 5.00 23.02 ± 1.7740 252.34 ± 3.01 25.46 ± 1.4850 255.91 ± 5.78 25.65 ± 1.8660 254.86 ± 6.11 25.75 ± 2.50
80
20 226.59 ± 7.77 22.32 ± 2.0330 236.71 ± 5.78 23.46 ± 3.0140 255.12 ± 7.99 25.19 ± 2.1450 254.98 ± 8.78 25.86 ± 1.1360 257.91 ± 9.00 25.96 ± 3.00
* Data are expressed as the mean (n=3) ± S.D** Data are expressed as the mean (n=9) ± S.D
Both extract yield and TPC in all solventsystems rose steadily with time. Generally,after 40 minutes, the slow extraction wasfound out by a low rise in the yields. Hence,60 minute is accepted as the equilibrium timein the relevant process (Table 2). EtOH gavethe poorest extract yield, whereas MeOHshowed the greatest performance. Water didnot produce the highest yields, even though itis the most polar one among the selectedsolvents. This might be a matter of masstransfer, where water’s comparatively higherviscosity leads to lower yields. On the otherhand, the 50% MeOH treatment showed thehighest yield of TPC, due to the fact thataddition of water into the solvent gives rise toopen the pores in the plant matrix byincreasing the diffusion of the phenolics intothe solvent. On the other hand, MeOH itselfalso assists for disruption of the targetedingredients from the plant material (15, 21).Additionally, water’s high dielectric constantalso might be the another reason since that
increases the polarity of MeOH-water mixture(22).
Effect of temperature Figure 2 represents the effect of temperatureon the extract yield and TPC of each olive leafextract obtained by UAE through varioussolvents. More precisely, the figure exhibitsthe comparative extract yield and TPC ofextractions at the 60th minute (at equilibrium),respectively. Both extract yield and TPC of allsolvents increased by temperature. Rather,the same trend was observed for each solventwith respect to both extract yield and TPC.However, for water, the TPC of the extractsstarted to decrease after a certaintemperature point (60 °C) and reached theequilibrium at 70 °C. This might be explainedby degradation owing to the hydrolysis andoxidation of the antioxidant ingredients (23).This might be ascribed to the enzymepolyphenol oxidase, which degradepolyphenols in water extracts, whereas theyare not active in alcohol medium. On the
388
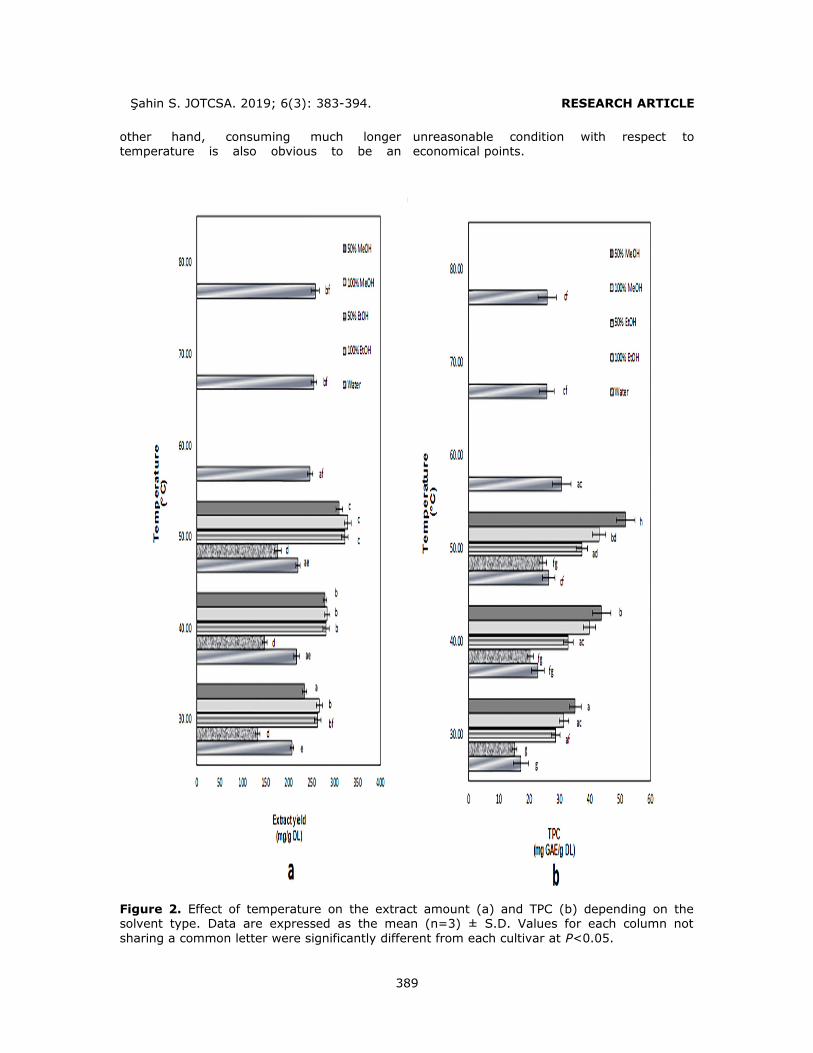
Şahin S. JOTCSA. 2019; 6(3): 383-394. RESEARCH ARTICLE
other hand, consuming much longertemperature is also obvious to be an
unreasonable condition with respect toeconomical points.
Figure 2. Effect of temperature on the extract amount (a) and TPC (b) depending on thesolvent type. Data are expressed as the mean (n=3) ± S.D. Values for each column notsharing a common letter were significantly different from each cultivar at P<0.05.
389
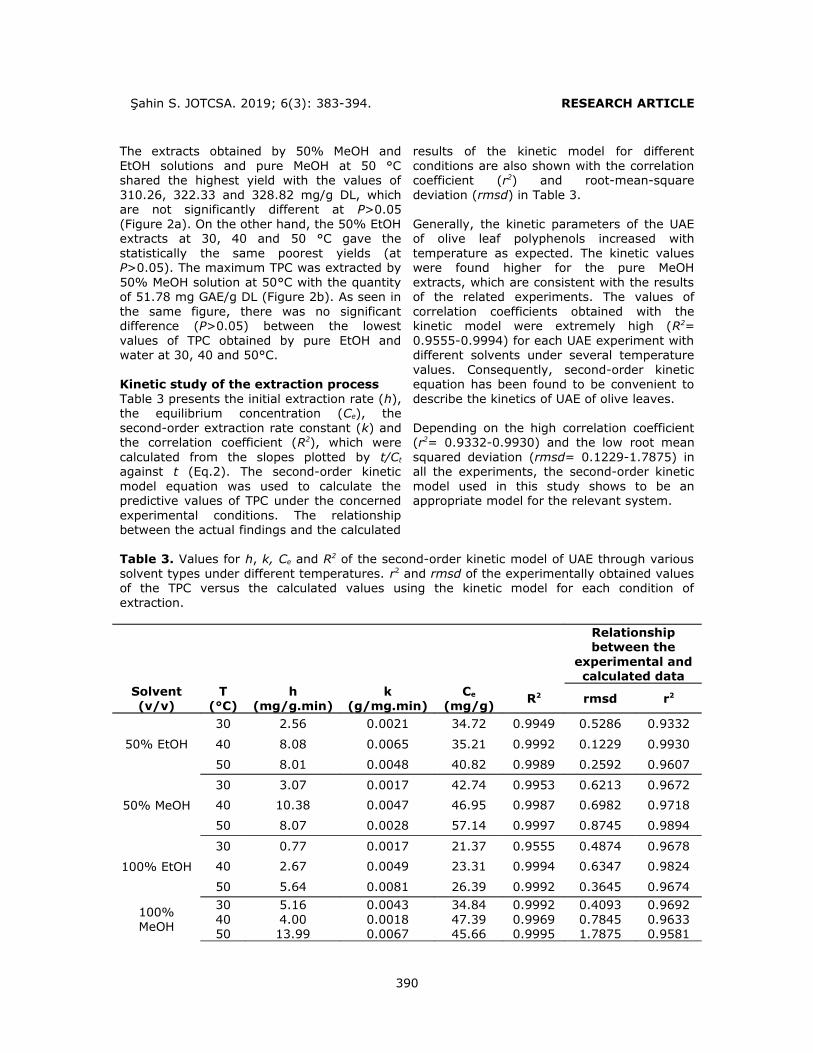
Şahin S. JOTCSA. 2019; 6(3): 383-394. RESEARCH ARTICLE
The extracts obtained by 50% MeOH andEtOH solutions and pure MeOH at 50 °Cshared the highest yield with the values of310.26, 322.33 and 328.82 mg/g DL, whichare not significantly different at P>0.05(Figure 2a). On the other hand, the 50% EtOHextracts at 30, 40 and 50 °C gave thestatistically the same poorest yields (atP>0.05). The maximum TPC was extracted by50% MeOH solution at 50°C with the quantityof 51.78 mg GAE/g DL (Figure 2b). As seen inthe same figure, there was no significantdifference (P>0.05) between the lowestvalues of TPC obtained by pure EtOH andwater at 30, 40 and 50°C.
Kinetic study of the extraction processTable 3 presents the initial extraction rate (h),the equilibrium concentration (Ce), thesecond-order extraction rate constant (k) andthe correlation coefficient (R2), which werecalculated from the slopes plotted by t/Ct
against t (Eq.2). The second-order kineticmodel equation was used to calculate thepredictive values of TPC under the concernedexperimental conditions. The relationshipbetween the actual findings and the calculated
results of the kinetic model for differentconditions are also shown with the correlationcoefficient (r2) and root-mean-squaredeviation (rmsd) in Table 3.
Generally, the kinetic parameters of the UAEof olive leaf polyphenols increased withtemperature as expected. The kinetic valueswere found higher for the pure MeOHextracts, which are consistent with the resultsof the related experiments. The values ofcorrelation coefficients obtained with thekinetic model were extremely high (R2=0.9555-0.9994) for each UAE experiment withdifferent solvents under several temperaturevalues. Consequently, second-order kineticequation has been found to be convenient todescribe the kinetics of UAE of olive leaves.
Depending on the high correlation coefficient(r2= 0.9332-0.9930) and the low root meansquared deviation (rmsd= 0.1229-1.7875) inall the experiments, the second-order kineticmodel used in this study shows to be anappropriate model for the relevant system.
Table 3. Values for h, k, Ce and R2 of the second-order kinetic model of UAE through varioussolvent types under different temperatures. r2 and rmsd of the experimentally obtained valuesof the TPC versus the calculated values using the kinetic model for each condition ofextraction.
Relationshipbetween the
experimental andcalculated data
Solvent(v/v)
T(°C)
h(mg/g.min)
k(g/mg.min)
Ce
(mg/g)R2 rmsd r2
50% EtOH
30 2.56 0.0021 34.72 0.9949 0.5286 0.9332
40 8.08 0.0065 35.21 0.9992 0.1229 0.9930
50 8.01 0.0048 40.82 0.9989 0.2592 0.9607
50% MeOH
30 3.07 0.0017 42.74 0.9953 0.6213 0.9672
40 10.38 0.0047 46.95 0.9987 0.6982 0.9718
50 8.07 0.0028 57.14 0.9997 0.8745 0.9894
100% EtOH
30 0.77 0.0017 21.37 0.9555 0.4874 0.9678
40 2.67 0.0049 23.31 0.9994 0.6347 0.9824
50 5.64 0.0081 26.39 0.9992 0.3645 0.9674
100%MeOH
30 5.16 0.0043 34.84 0.9992 0.4093 0.969240 4.00 0.0018 47.39 0.9969 0.7845 0.963350 13.99 0.0067 45.66 0.9995 1.7875 0.9581
390

Şahin S. JOTCSA. 2019; 6(3): 383-394. RESEARCH ARTICLE
Water
30 1.39 0.0031 21.19 0.9941 0.2859 0.9730
40 2.11 0.0027 27.86 0.9983 0.2571 0.9859
50 1.99 0.0018 32.89 0.9920 1.1361 0.9540
60 1.57 0.0008 44.05 0.9845 0.6680 0.9741
70 3.93 0.0046 29.33 0.9966 1.6563 0.9505
80 4.83 0.0059 28.65 0.9989 0.5339 0.9632
Major polyphenol of the extractAs seen in Figure 3, oleuropein remarkablysurpasses of all phenolic compounds in oliveleaf extract. Oleuropein has been verified to
be the major polyphenolic compound of oliveleaf. Many pharmacological effects of oliveleaf are also attributed to this component (7).
Figure 3. HPLC chromatogram of olive leaf extract obtained under optimum extractionconditions by means of 50% (v/v) methanol.
Figure 4 demonstrates the oleuropeincontents of olive leaf extracts obtained underoptimum conditions by each solvent system.
It was found to be between 8.69 and 31 mgper gram of dried leaf. This output isconsistent with the reported results (24).
391

Şahin S. JOTCSA. 2019; 6(3): 383-394. RESEARCH ARTICLE
Figure 4. Oleuropein quantity of olive leaf extracts depending on the solvent.
CONCLUSION
Addition of water to alcohol improved theextraction of bioactive ingredients. TPC fromwater extracts decreased after a certaintemperature point, as a result of degradationproblems. Second-order kinetic equation hasbeen found to be adequate to represent theexperimental outcome for the ultrasound-assisted extraction of biologically activeingredients from olive leaves.
REFERENCES
1. Brahmi F, Mechri B, Dhibi M, Hammami M. Variations in phenolic compounds and antiradical scavenging activity of Olea europaea leaves and fruits extracts collected in two different seasons. Industrial Crops and Products. 2013; 49: 256–264.
2. Salido S, Pérez-Bonilla M, Adams RP, Altarejos J. Phenolic Components and Antioxidant Activity of Wood Extracts from 10 Main Spanish Olive Cultivars. Journal of Agricultural and Food Chemistry. 2015; 63: 6493–6500.
3. Talhaoui N, Taamalli A, Gómez-Caravaca AM, Fernández-Gutiérrez A, Segura-Carretero A. Phenolic compounds in olive leaves: Analytical determination, biotic and abiotic influence, and health benefits. Food Research Interntional. 2015; 77: 92–108.
4. Elhussein EAA, Şahin S. Drying behaviour,
effective diffusivity and energy of activation ofolive leaves dried by microwave, vacuum and oven drying methods. Heat and Mass Transfer. 2018; 54: 1901–1911.
5. Şahin S, Samli R, Tan ASB, Barba FJ, Chemat F, Cravotto G, Lorenzo JM. Solvent-Free Microwave-Assisted Extraction of Polyphenols from Olive Tree Leaves: Antioxidant and Antimicrobial Properties. Molecules. 2017; 22: 1056.
6. Bouaziz M, Sayadi S. Isolation and evaluation of antioxidants from leaves of a Tunisian cultivar olive tree. European Journal of Lipid Science and Technology. 2005; 107: 497–504.
7. Şahin S, Bilgin M. Olive tree ( Olea europaea L.) leaf as a waste by-product of table olive and olive oil industry: a review. Journal of the Science of Food and Agriculture. 2018; 98: 1271–1279.
9. Şahin S, Elhussein E, Bilgin M, Lorenzo JM, Barba FJ, Roohinejad S. Effect of drying method on oleuropein, total phenolic content, flavonoid content, and antioxidant activity of olive ( Olea europaea ) leaf. Journal of Food Processing and Preservation. 2018; 42: e13604.
10. Şahin S, Sayım E, Bilgin M. Effect of olive leaf extract rich in oleuropein on the quality ofvirgin olive oil. Journal of Food Science and Technology. 2017; 54: 1721–1728.
392

Şahin S. JOTCSA. 2019; 6(3): 383-394. RESEARCH ARTICLE
11. Bilgin M, Şahin S. Effects of geographical origin and extraction methods on total phenolic yield of olive tree (Olea europaea) leaves. Journal of the Taiwan Instute of Chemical Engineers. 2013; 44: 8–12.
12. Soria AC, Villamiel M. Effect of ultrasound on the technological properties and bioactivityof food: a review. Trends in Food Science and Technology. 2010; 21: 323–331.
13. Novak I, Janeiro P, Seruga M, Oliveira-Brett AM. Ultrasound extracted flavonoids from four varieties of Portuguese red grape skins determined by reverse-phase high-performance liquid chromatography with electrochemical detection. Analaytica Chimica Acta. 2008; 630: 107-115.
14. Joana Gil-Chávez G, Villa JA, Fernando Ayala-Zavala J, Basilio Heredia J, Sepulveda D, Yahia EM, González-Aguilar GA. Technologies for Extraction and Production of Bioactive Compounds to be Used as Nutraceuticals and Food Ingredients: An Overview. Comprehensive Reviews in Food Science and Food Safety. 2013; 12: 5–23.
15. Wang L, Weller CL. Recent advances in extraction of nutra- ceuticals from plants. Trends in Food Science and Technology. 2006;17: 300–312.
16. Esclapez MD, García-Pérez JV, Mulet A, Cárcel JA. Ultrasound-Assisted Extraction of Natural Products. Food Engineering Reviews. 2011; 3: 108–120.
17. Leighton TG. What is ultrasound? Progressin biophysics and molecular biology. 2007; 93: 3–83.
18. Şahin S, Saeed N, Malik A, Perez JL, Brockington JE. Seasonal Changes of Individual Phenolic Compounds in Leaves of Twenty Olive Cultivars Grown in Texas. Journal of Agricultural Science and Technology B. 2012; 2: 242–247.
19. Malik NSA, Bradford JM. Changes in oleuropein levels during differentiation and development of floral buds in “Arbequina” olives. Scientia Horticulturae. 2006; 110: 274–278.
20. Şahin S, Şaml R. Optimization of olive leafextract obtained by ultrasound-assisted extraction with response surface methodology. Ultrasonic Sonochemistry. 2013; 20: 595–602.
21. Lang Q, Wai CM. Supercritical fluid extraction in herbal and natural product studies — a practical review. Talanta, 2001; 53: 771–782.
22. Spigno G, De Faveri DM. Microwave-assisted extraction of tea phenols: A phenomenological study. Journal of Food Engineering. 2009; 93: 210–217.
23. Co M, Zettersten C, Nyholm L, Sjöberg PJR, Turner C. Degradation effects in the extraction of antioxidants from birch bark using water at elevated temperature and pressure. Analytica Chimica Acta. 2012; 716: 40–48.
24. Alañón ME, Ivanović M, Gómez-Caravaca AM, Arráez-Román D, Segura-Carretero A. Choline chloride derivative-based deep eutectic liquids as novel green alternative solvents for extraction of phenolic compounds from olive leaf. Arabian Journal of Chemistry. 2018; in press, doi:10.1016/J.ARABJC.2018.01.003.
393

Şahin S. JOTCSA. 2019; 6(3): 383-394. RESEARCH ARTICLE
394

Karaağaç D. JOTCSA. 2019; 6(3): 395-402. RESEARCH ARTICLE
Synthesis, spectroscopic, thermal, and structural properties of cyano-bridged metal complexes containing tetracyanonickelate(II) building
blocks with 4-aminomethylpyridine
Dursun Karaağaç*
Ulubatlı Hasan Anatolian High School, 16320, Bursa, Turkey.
Abstract: New cyano-bridged metal complexes with chemical formulas [Fe(NH3)2(ampy)Ni(CN)4]n,[Co(H2O)2(ampy)Ni(CN)4]n and [Ni(NH3)2(ampy)Ni(CN)4]n (ampy = 4-aminomethylpyridine, hereafterabbreviated as Fe–Ni–ampy, Co–Ni–ampy and Ni–Ni–ampy) were obtained in the form of powdersand examined by vibrational (infrared and Raman) spectroscopy, thermal (TG, DTG and DTA), andelemental analysis techniques. The infrared and Raman spectra of the complexes were performed inthe range of 4000–400 cm-1 and 4000–250 cm-1, respectively. General information about thestructural features of synthesized complexes was obtained by considering the changes in the cyanogroup and characteristic peaks of ampy. The cleavage of the (CN) stretching bands in the infraredspectrum of the complexes shows that the terminal and bridge cyano groups are in the structure.Considering the variations in the vibrational frequencies of the cyano group and ampy ligand in thespectrum of the complexes, the Ni atom is in a square plane geometry with four cyano groups andtwo of these cyano groups are the bridge and the other two are terminal. In addition, the metalatoms [Fe(II), Co(II) or Ni(II)] are linked to the ring and amino nitrogen atoms of two symmetricampy ligands, the two ammonia (two aqua ligands for Co–Ni–ampy) ligands and the two bridgingcyano groups, and show a distorted octahedral geometry. The thermal degradation of the complexeswas also studied between 30 and 950 ºC using TG, DTG, and DTA techniques.
Keywords: Tetracyanonickelate(II), 4-aminomethylpyridine, Cyano-bridged complex, Vibration spectra,Thermal analysis.
Submitted: August 14, 2018. Accepted: September 13, 2019.
Cite this: Karaağaç D. Synthesis, spectroscopic, thermal, and structural properties of cyano-bridgedmetal complexes containing tetracyanonickelate(II) building blocks with 4-aminomethylpyridine. JOTCSA.2019;6(3):395–400.
DOI: https://doi.org/10.18596/jotcsa.453521.
*Corresponding author. E-mail: [email protected]. Tel.: +90 224 3661101; fax: +90 2243669696.
INTRODUCTION
Metal organic lattice framework structures (MOFs)are formed by binding by organic linkers of metalcenters and these formed structures can be ofone-, two-, and three-dimensional. MOFs haveextraordinary high surface areas and most of themallow the permanent porous structures to beformed (1-3). Different sizes of porous structures
can be formed with changes of metal and organiclinkers. Because of these porous structures, MOFsare the subject of many areas of work, includingapplications such as gas storage (4, 5), iodineadsorption (6), magnetic materials (7), ionexchange materials (8) and conductivity (9).
The cyano, azide and nitrile short bridge ligands arehighly preferred ligands in the binding of transition
395

Karaağaç D. JOTCSA. 2019; 6(3): 395-402. RESEARCH ARTICLE
metals. By using cyano donor atoms, the cyanoanion can either provide monodentate (C-) orbidentate (C-, N-) coordination. Cyano acts as abridging ligand by binding to metal atoms throughboth carbon and nitrogen atoms or a terminalligand by binding from carbon atoms to metalatoms. With this feature, the cyano ligand canproduce different polymeric species (7, 10, 11).
The cyano anion is used as a bridging ligandbetween metal centers and additionally differentneutral organic molecules such as 4-aminomethylpyridne, imidazole, and pyridine canbe obtained metal organic lattice frameworkstructures. In these structures, octahedral Fe, Co,or Ni, square pyramidal [Ni(CN)5]3−, square-planar[Ni(CN)4]2−, tetrahedral [Cd(CN)4]2−, trigonal[Cu(CN)3]2− and linear [Ag(CN)2]− cyanometallicsare used as main building blocking entities (12,13). Between these building blocks, the square-planar [Ni(CN)4]2− cyanometallics were intensivelystudied (14-19). The cyano groups in the[Ni(CN)4]2− may exhibit two different arrangementsin cyano-bridged metal complexes by acting asboth a bridging and terminal ligands. In this case,1D, 2D and 3D cyano-bridged complexes can beobtained.
We reported tetracyanometallate(II) complexeswith 4-aminomethylpyridine (20-24). As a part ofour continuing work on cyano-bridged metalcomplexes, cyano-bridged metal complexes of thetype [M(NH3)2(ampy)Ni(CN)4]n, and[Co(H2O)2(ampy)Ni(CN)4]n [ampy = 4-aminomethylpyridine; M = Fe(II) or Ni(II)] weresynthesized using cyano, 4-aminomethylpyridine,two ammonia (two aqua ligands for Co–Ni–ampy)ligands. Structural properties of the resultingcomplexes were illuminated by vibrational (infraredand Raman) spectroscopy, elemental and thermalanalysis methods.
EXPERIMENTAL
MaterialsIron(II) chloride tetrahydrate (FeCl2·4H2O, 99%),cobalt(II) chloride tetrahydrate (CoCl2·4H2O, 98%),nickel(II) chloride hexahydrate (NiCl26H2O, 97%),potassium cyanide (KCN, 96%) and 4-aminomethylpyridine (C6H9N2, 97%) werepurchased from commercial sources.
Syntheses of the complexesThe cyano-bridged metal complexes weresynthesized in three stages; in the 1st stageK2[Ni(CN)4]H2O, in the 2nd stage M[Ni(CN)4]H2O[M = Fe(II), Co(II) or Ni(II)] and in the final stage[M(NH3)2(ampy)Ni(CN)4]n, and[Co(H2O)2(ampy)Ni(CN)4]n [ampy = 4-aminomethylpyridine; M = Fe(II) or Ni(II)]. TheK2[Ni(CN)4]H2O complexes were prepared
according to literature (25). 1 mmol (0.259 g) oftetracyanonickelate(II) was dissolved in distilledwater, and 1 mmol of the metal(II) chloride(FeCl2·4H2O = 0.199 g, CoCl2·4H2O = 0.202 g andNiCl26H2O = 0.238 g) was dissolved in distilledwater and added to the stirringtetracyanonickelate(II) solution and then, theM[Ni(CN)4]H2O [M = Fe(II), Co(II) or Ni(II)] hasbeen obtained. The colors of Fe[Ni(CN)4]H2O,Co[Ni(CN)4]H2O and Ni[Ni(CN)4]H2O are brown,pink and pale blue, respectively. A mixture of{Fe[Ni(CN)4]H2O = 0.237 g, 1 mmol,Co[Ni(CN)4]H2O = 0.240 g, 1 mmol orNi[Ni(CN)4]H2O = 0.239 g, 1 mmol} in water (10mL), ampy (2 mmol, 0.216 g) dissolved in ethanol(10 mL) and ammonia for Fe–Ni–ampy and Ni–Ni–ampy (2 mmol, 0.034 g) was stirred at 40 °C for 4h in a temperature-controlled bath. The resultingcomplexes were filtered and washed with distilledwater and ethanol respectively, and dried in air.These complexes were analyzed for C, H, and N,and the results obtained: Anal. Found (Calcd.) (%)for brown C10H14N8FeNi (Mw = 360.81 g/mol) : C,33.45 (33.29); H, 3.68 (3.91); N, 30.76 (31.06);for pink C10H12N6O2CoNi (Mw = 365.87 g/mol) : C,33.54 (32.83); H, 3.79 (3.31); N, 21.89 (22.97);for pale blue C10H14N8Ni2 (Mw = 363.66 g/mol) : C,32.13 (33.03); H, 4.39 (3.88); N, 30.41 (30.81).
Measurements The synthesized complexes were analyzed for C, H,and N with a LECO CHN-932 analyzer at the MiddleEast Technical University Central Laboratory inAnkara, Turkey. The infrared spectra were recordedas KBr pellets between 4000 and 400 cm-1 (2 cm-1
resolution) on a Perkin Elmer 100 FT-IRspectrometer, which was calibrated usingpolystyrene and CO2 bands. Raman spectrum of thesynthesized complexes were recorded between4000 and 250 cm -1 on a Bruker SenterraDispersive Raman apparatus using 785 nm laserexcitation. Thermal analysis curves of the obtainedcomplexes were performed in a static airatmosphere at a heating rate of 10 K min-1 in thetemperature region 30-950 ºC using Perkin ElmerDiamond TG/DTA thermal analyzer instrument.
RESULTS AND DISCUSSION
Ligand vibrations The infrared spectrum of the ampy ligand is shownin Figure S1. The infrared and Raman spectra of theobtained cyano-bridged metal complexes are givenin Figures S2-S7. The infrared vibration frequenciesof the ampy (liquid) and the vibration (Infrared andRaman) frequencies of the obtained cyano-bridgedmetal complexes together with the vibrationalassignments of the ampy ligand according to (26)are presented in Table 1. Asymmetric andsymmetric stretching vibrations and deformationvibrations of the free ammonia ligand are found in
396

Karaağaç D. JOTCSA. 2019; 6(3): 395-402. RESEARCH ARTICLE
the 3400-3000 cm-1 and 1650-550 cm-1 regions,respectively (27). In the infrared spectrum of Fe–Ni–ampy and Ni–Ni–ampy, the ν(NH3) and δ(NH3)vibration frequencies are identified at 3381 cm-1
and 1661 cm-1 for Fe-Ni-ampy, at 3381 and 1672cm-1 for Ni-Ni-ampy, respectively. In general, theν(OH) and δ(HOH) vibration frequencies appear inthe 3560–3200 and 1700–1600 cm-1 regions,respectively (27, 28). The aqua ligand of Co–Ni–ampy displays a sharp peak of ν(OH) at 3544 cm-1.In the infrared spectrum of Co–Ni–ampy, theδ(HOH) bending vibration of the aqua ligand wasalso found at 1695 cm-1.
The ampy ligand has unpaired electrons on thenitrogen atom. The ampy ligand which has theseelectron pairs can coordinate as monodentate orbidentate ligand to metal atoms. When thecoordination takes place via the amino nitrogenatom of the ampy ligand, the N-H bond isweakened and the NH2 stretching frequencies arelowered. In this case, the M-N bond is stronger,whereas the N-H bond is weaker. Furthermore, ifthe NH2 group of the ampy ligand makes ahydrogen bond, the N-H stretching frequencies arefurther reduced. In addition, the out of planebending frequencies of NH2 shift to higher frequencyregion (27, 29, 30). As presented in Table 2,symmetric and asymmetric wavenumbers of theν(N–H) belonging to the NH2 group in the ampyligand are found at 3367 and 3292 cm-1. In theinfrared spectrum of the complexes, the strongvibration bands at 3346 and 3274 cm−1 for Fe-Ni-ampy, at 3346 and 3292 cm-1 for Co-Ni-ampy andat 3346 and 3274 cm-1 for Ni-Ni-ampy are identifiedas the stretching vibrations belonging to the NH2
group. The ν(N–H) belonging to the NH2 group ofthe ampy in the obtained complexes are lower thanthose of the free ampy ligand. The band identifiedat 1602 cm-1 in the infrared spectrum of the freeampy determined as the out-of-plane bendingvibration of NH2 and observed at a higher frequencyaccording to the free ampy ligand in the spectrumof the complexes. Shifts in the NH2 stretching andbending vibration frequencies are sensitive tometal. On the other hand, when the ampy ligand islinked to metal atoms from the ring nitrogen atom,there are significant shifts in the ring stretching andthe deformation vibration frequencies. Especially,the increase in ring stretching frequencies isobserved (17, 23, 31). The ring stretching modesof the free ampy ligand, ν(skeletal) assigned as thestrong and sharp bands at 1220, 1088, 1065 and994 cm-1 in the infrared spectrum of the free ampy.In the complexes, the metals are N-bonded (ring)since the ν(skeletal) of the free ligand is shifted tohigher frequencies around 3–40 cm-1. Othersignificant bands of the free ampy ligand are theν(CH) at 3070 and 2991 cm-1, the ν(CH) at 2991cm-1 and 2898 cm-1, the ν(CC) at 1560 cm-1, theδ(CH2) at 1496 and 1446 cm-1, the t(CH2) at 877
cm-1 and r(NH2) at 591 cm-1. In the complexes,these vibration bands show upward or downwardshifts in frequency according to those of the freeampy ligand. Therefore, infrared and Ramanspectra show that the ampy ligand in the obtainedcomplexes is N-bonded from both ring nitrogenatom of pyridine and NH2 group.
Vibrations (infrared and Raman) of the[Ni(CN)4]2- group The vibrational assignments and frequencies of thetetracyanonickelate(II) in the complexes areincluded in Table 1. The assignments of vibrationalbands belonging to vibrations (infrared and Raman)of the tetracyanonickelate(II) in the obtainedcomplexes are performed using that of the solidNa2[Ni(CN)4] salt presented by McCullough et al.,(32). The distinctive band in the cyano-bridgedmetal complexes is the vibration band of the cyanogroup. The ν(CN) stretching vibration band of thecyano group gives a strong and sharp peak in therange of 2200–2000 cm-1 and can be easilydetermined in the spectrum of the complexes. Theν(CN) stretching vibration frequency of free cyanoligand in ionic KCN is determined at 2080 cm-1 (27).When the cyano ligand is coordinated to a metalatom from the carbon atom, the ν(CN) stretchingvibration frequency is undergoes a blue-shift. Inthis case, the M-CN type terminal property is seenin the complexes (23, 33-35). If the cyano ligand isbound to two separate metal atoms from both thecarbon and the nitrogen atom, ν(CN) stretchingvibration occurs more blue shift and the M-CN-Mʹtype bridge forms in the complexes. Both terminaland bridge property of cyano ligand in the cyano-bridged metal complexes is intensively observed(23, 33-35). The terminal Ni-CN of obtainedcomplex K2[Ni(CN)4] H 2O exhibits a distinctive peakat 2120 cm-1 in the infrared spectra. In the infraredspectrum of the cyano-bridged metal complexes,the ν(CN) stretching vibration frequency isobserved at 2124 cm-1 (for Fe–Ni–ampy), 2123 cm-1
(for Co–Ni–ampy) and 2125 cm-1 (for Ni–Ni–ampy).The ν(CN) stretching vibration frequencies in thecomplexes M–Ni–ampy ([Fe(II), Co(II) or Ni(II)]are closer that of the terminal Ni-CN. M-CN-Mʹ typebridge in the cyano complexes can easily bedetermined with infrared spectroscopy. Accordingto this, the ν(CN) stretching vibration in obtainedcyano-bridged metal complexes were determined at2162 and 2143 cm-1 (for Fe–Ni–ampy), 2160 cm-1
(for Co–Ni–ampy), 2162 and 2143 cm-1 (for Ni–Ni–ampy). Bridge ν(CN) stretching vibrationwavenumbers in obtained cyano-bridged metalcomplexes are usually identified at higherfrequencies due to kinematic binding, which is amechanical limitation upon the bridging cyanoligand bound to the second metal (13, 17, 27). Thecleavage of the ν(CN) supports the presence ofbridges and terminal cyano groups in the cyano-bridged metal complexes. In the resulting
397

Karaağaç D. JOTCSA. 2019; 6(3): 395-402. RESEARCH ARTICLE
complexes, the A1g and B1g cyano stretching modesare observed at 2186 and 2169 cm-1 (for Fe–Ni–ampy), 2187 cm-1 (for Co–Ni–ampy), 2187, 2170and 2150 cm-1 (for Ni–Ni–ampy). This data showthat the A1g and B1g modes are observed to havehigher wavenumbers in the region of 9–27 cm-1 inobtained cyano-bridged metal complexes. Inaddition, the modes originating from ν(NiCN) and
δ(NiCN) vibrations for the obtained cyano-bridgedmetal complexes are determined between 600 and400 cm-1. In the infrared spectrum of M-Ni-ampy[M(II) = Fe(II), Co(II) or Ni(II)], the modes foundat 557 and 429 cm-1 in Fe–Ni–ampy, 557 and 438cm-1 in Co–Ni–ampy, 555 and 429 cm-1 in Ni–Ni–ampy are expressed as the ν(NiCN) and δ(NiCN)vibrations, respectively.
Table 1 The vibrational wavenumbers of the tetracyanonickelate(II) group in M-Ni-ampy (cm-1).Assignments (32) K2[Ni(CN)4]H2O Fe–Ni–ampy Co–Ni–ampy Ni–Ni–ampyA1g, ν(CN) (2160) vs (2186) s,
(2169) vs(2187) vs (2187) s,
(2170) vsB1g, ν(CN) (2137) m (2150) vs - (2150) vs
Eu, ν(CN) 2120 vs 2162 s, 2143 s, 2124 vs
2160 vs, 2126 m 2163 s, 2143 s,2125 s
ν(13CN) 2084 vw 2087 vw 2097 vw 2084 vwEu, ν(NiC) 542 w 557 w 557 w 555 mA2u, π(NiCN) 443 w 468 vw 486 w 472 vwEu, δ(NiCN) 414 vs 429 s 438 s 429 s
ν; valence, δ; in-plane, ; out-of-plane, s; strong, m; medium, w; weak, sh; shoulder, v; very. Thevibrational frequencies in the Raman spectrum are enclosed in parentheses.
As a result, the ampy ligand acts as a bridge ligandbetween metals, while the cyano ligand acts as aterminal and bridging ligand. In this case, it is
considered that the structures of the complexesaccording to the obtained spectral data are asshown in Figs. 1 and 2.
Figure 1. Representation of molecular structures of Fe–Ni–ampy and Ni–Ni–ampy.
398
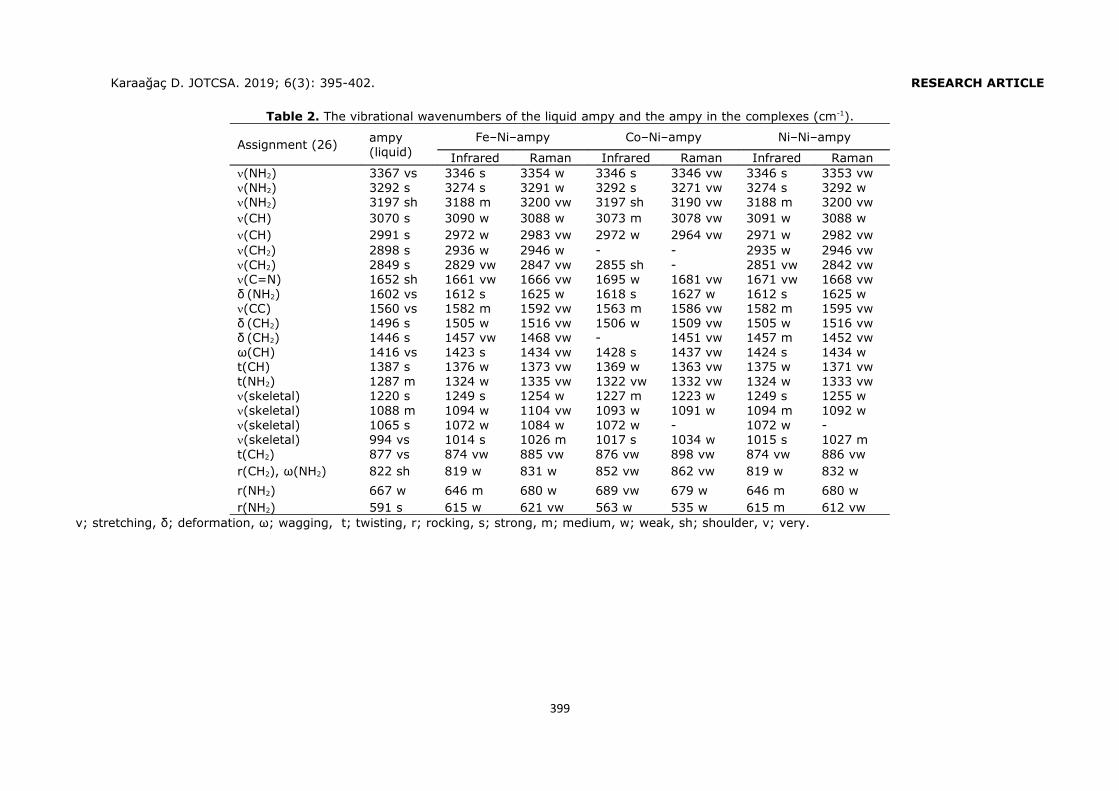
Karaağaç D. JOTCSA. 2019; 6(3): 395-402. RESEARCH ARTICLE
Table 2. The vibrational wavenumbers of the liquid ampy and the ampy in the complexes (cm-1).
Assignment (26) ampy(liquid)
Fe–Ni–ampy Co–Ni–ampy Ni–Ni–ampy
Infrared Raman Infrared Raman Infrared Raman(NH2) 3367 vs 3346 s 3354 w 3346 s 3346 vw 3346 s 3353 vw(NH2) 3292 s 3274 s 3291 w 3292 s 3271 vw 3274 s 3292 w(NH2) 3197 sh 3188 m 3200 vw 3197 sh 3190 vw 3188 m 3200 vw(CH) 3070 s 3090 w 3088 w 3073 m 3078 vw 3091 w 3088 w(CH) 2991 s 2972 w 2983 vw 2972 w 2964 vw 2971 w 2982 vw(CH2) 2898 s 2936 w 2946 w - - 2935 w 2946 vw(CH2) 2849 s 2829 vw 2847 vw 2855 sh - 2851 vw 2842 vw(C=N) 1652 sh 1661 vw 1666 vw 1695 w 1681 vw 1671 vw 1668 vwδ (NH2) 1602 vs 1612 s 1625 w 1618 s 1627 w 1612 s 1625 w(CC) 1560 vs 1582 m 1592 vw 1563 m 1586 vw 1582 m 1595 vwδ (CH2) 1496 s 1505 w 1516 vw 1506 w 1509 vw 1505 w 1516 vwδ (CH2) 1446 s 1457 vw 1468 vw - 1451 vw 1457 m 1452 vwω(CH) 1416 vs 1423 s 1434 vw 1428 s 1437 vw 1424 s 1434 wt(CH) 1387 s 1376 w 1373 vw 1369 w 1363 vw 1375 w 1371 vwt(NH2) 1287 m 1324 w 1335 vw 1322 vw 1332 vw 1324 w 1333 vw(skeletal) 1220 s 1249 s 1254 w 1227 m 1223 w 1249 s 1255 w(skeletal) 1088 m 1094 w 1104 vw 1093 w 1091 w 1094 m 1092 w(skeletal) 1065 s 1072 w 1084 w 1072 w - 1072 w -(skeletal) 994 vs 1014 s 1026 m 1017 s 1034 w 1015 s 1027 mt(CH2) 877 vs 874 vw 885 vw 876 vw 898 vw 874 vw 886 vwr(CH2), ω(NH2) 822 sh 819 w 831 w 852 vw 862 vw 819 w 832 w
r(NH2) 667 w 646 m 680 w 689 vw 679 w 646 m 680 wr(NH2) 591 s 615 w 621 vw 563 w 535 w 615 m 612 vw
ν; stretching, δ; deformation, ω; wagging, t; twisting, r; rocking, s; strong, m; medium, w; weak, sh; shoulder, v; very.
399
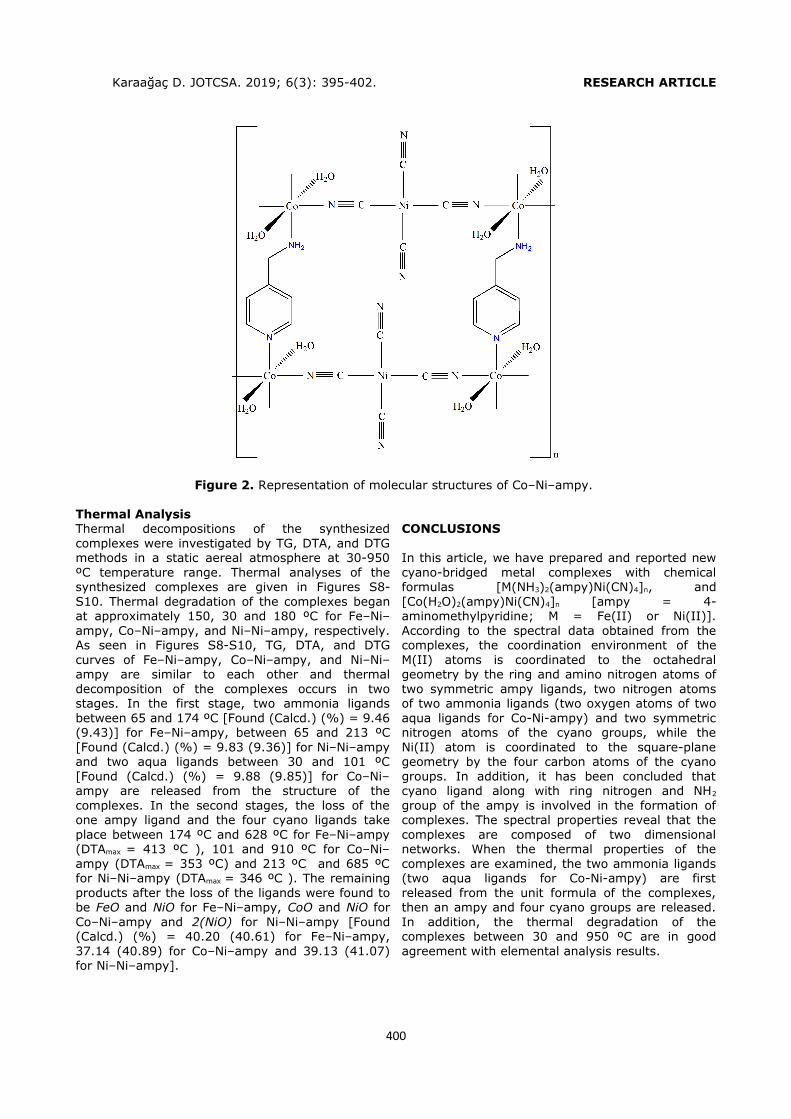
Karaağaç D. JOTCSA. 2019; 6(3): 395-402. RESEARCH ARTICLE
Figure 2. Representation of molecular structures of Co–Ni–ampy.
Thermal AnalysisThermal decompositions of the synthesizedcomplexes were investigated by TG, DTA, and DTGmethods in a static aereal atmosphere at 30-950ºC temperature range. Thermal analyses of thesynthesized complexes are given in Figures S8-S10. Thermal degradation of the complexes beganat approximately 150, 30 and 180 ºC for Fe–Ni–ampy, Co–Ni–ampy, and Ni–Ni–ampy, respectively.As seen in Figures S8-S10, TG, DTA, and DTGcurves of Fe–Ni–ampy, Co–Ni–ampy, and Ni–Ni–ampy are similar to each other and thermaldecomposition of the complexes occurs in twostages. In the first stage, two ammonia ligandsbetween 65 and 174 ºC [Found (Calcd.) (%) = 9.46(9.43)] for Fe–Ni–ampy, between 65 and 213 ºC[Found (Calcd.) (%) = 9.83 (9.36)] for Ni–Ni–ampyand two aqua ligands between 30 and 101 ºC[Found (Calcd.) (%) = 9.88 (9.85)] for Co–Ni–ampy are released from the structure of thecomplexes. In the second stages, the loss of theone ampy ligand and the four cyano ligands takeplace between 174 ºC and 628 ºC for Fe–Ni–ampy(DTAmax = 413 ºC ), 101 and 910 ºC for Co–Ni–ampy (DTAmax = 353 ºC) and 213 ºC and 685 ºCfor Ni–Ni–ampy (DTAmax = 346 ºC ). The remainingproducts after the loss of the ligands were found tobe FeO and NiO for Fe–Ni–ampy, CoO and NiO forCo–Ni–ampy and 2(NiO) for Ni–Ni–ampy [Found(Calcd.) (%) = 40.20 (40.61) for Fe–Ni–ampy,37.14 (40.89) for Co–Ni–ampy and 39.13 (41.07)for Ni–Ni–ampy].
CONCLUSIONS
In this article, we have prepared and reported newcyano-bridged metal complexes with chemicalformulas [M(NH3)2(ampy)Ni(CN)4]n, and[Co(H2O)2(ampy)Ni(CN)4]n [ampy = 4-aminomethylpyridine; M = Fe(II) or Ni(II)].According to the spectral data obtained from thecomplexes, the coordination environment of theM(II) atoms is coordinated to the octahedralgeometry by the ring and amino nitrogen atoms oftwo symmetric ampy ligands, two nitrogen atomsof two ammonia ligands (two oxygen atoms of twoaqua ligands for Co-Ni-ampy) and two symmetricnitrogen atoms of the cyano groups, while theNi(II) atom is coordinated to the square-planegeometry by the four carbon atoms of the cyanogroups. In addition, it has been concluded thatcyano ligand along with ring nitrogen and NH2
group of the ampy is involved in the formation ofcomplexes. The spectral properties reveal that thecomplexes are composed of two dimensionalnetworks. When the thermal properties of thecomplexes are examined, the two ammonia ligands(two aqua ligands for Co-Ni-ampy) are firstreleased from the unit formula of the complexes,then an ampy and four cyano groups are released.In addition, the thermal degradation of thecomplexes between 30 and 950 ºC are in goodagreement with elemental analysis results.
400
Karaağaç D. JOTCSA. 2019; 6(3): 395-402. RESEARCH ARTICLE
ACKNOWLEDGMENT
I would like to thank Prof. Dr. Güneş Süheyla Kürkçüoğlu for her support in the writing of this article.
REFERENCES
1.Wong-Ng W, Culp J, Siderius D, Chen Y.Synthesis and synchrotron X-ray characterization oftwo 2D Hoffman related compounds [Ni(p-Xylylenediamine)nNi(CN)4] and [Ni(p-tetrafluoroxylylenediamine)nNi(CN)4]. Solid StateSci. 2018;81:12-8.
2. Wong-Ng W, Williamson I, Lawson M, Siderus DW, Jeffrey T, Culp J F. Electronic structure, poresize distribution, and sorption characterization of anunusual MOF, {[Ni (dpbz)][Ni(CN)4]}n, dpbz=1,4-bis(4-pyridyl)benzene. J. Appl. Phys.2018;123(24):245105.
3.Lu W, Wei Z, Gu Z-Y, Liu T.F, Park J, Park J, TianJ, Zhang M, Zhang Q, Gentle T, Boscha M, Zhou HC. Tuning the structure and function of metal–organic frameworks via linker design. Chem. Soc.Rev. 2014;43(16):5561-93.
4.Li Y, Liu Y, Wang Y, Leng Y, Xie L, Li X. Hydrogenstorage properties of [M(Py){Ni(CN) 4}] (M=Fe, Co,Ni). Int. J. Hydrogen Energy. 2007;32(15):3411-5.
5.Culp JT, Natesakhawat S, Smith MR, Bittner E,Matranga C, Bockrath B. Hydrogen storageproperties of rigid three-dimensional hofmannclathrate derivatives: The effects of pore size. J.Phys. Chem. 2008;112(17):7079-83.
6.Massasso G, Rodríguez-Castillo M, Long J, HainesJ, Devautour-Vinot S, Maurin G, Grandjean A,Onida B, Donnadieu B, Larionova J, Guérina C,Guari Y. Molecular iodine adsorption withinHofmann-type structures M(L)[M′(CN)4](M=Ni, Co;M′=Ni, Pd, Pt): impact of their composition. DaltonTrans. 2015;44(44):19357-69.
7.Černák J, Orendáč M, Potočňák I, Chomič J,Orendáčová A, Skoršepa J, Feher A.Cyanocomplexes with one-dimensional structures:preparations, crystal structures and magneticproperties. Coord. Chem. Rev. 2002;224(1-2):51-66.
8.Kämper M, Wagner M, Weiß A. Krypton und‐Xenon Einschlußverbindungen komplexer‐Metallcyanide. Angew. Chem. 1979;91(6):517-8.
9.Gapud A, Weber A, Alexander J, Pham L, Khan A,Leatherbury R I, Reyes A P, Lumata L L, Kuhns P L,Valente E J, Sykora R E. New quasi-one-
dimensional tetracyanidoplatinate, Cs4[Pt(CN)4](CF3SO3)2: Synthesis, structure, and physicalcharacterization. J. Phys. Chem. Solids.2014;75(3):447-52.
10.Çetinkaya F, Kürkçüoğlu G S, Yeşilel O Z,Hökelek T, Dal H. One-dimensional cyano-bridgedheterometallic (Cu/Ni and Cu/Pd) complexes with1-ethylimidazole. Polyhedron 2012;47(1):126-33.
11.Potocnak I, Vavra M, Cizmar E, Tibenská K,Orendáčová A, Steinborn D, Wagner C, Dušek M,Fejfarová K, Fejfarová H, Muller C, Orendáč M,Feher A J. Low-dimensional compounds containingcyano groups. XIV. Crystal structure, spectroscopic,thermal and magnetic properties of [CuL2][Pt(CN)4]complexes (L=ethylenediamine or N,N-dimethylethylenediamine). J. Solid State Chem.2006;179:1965-76.
12.Nemec I, Herchel R, Boča R, Svoboda I,Trávníček Z, Dlháň L, Matelková K, Uess H.Heterobimetallic assemblies of Ni(II) complexeswith a tetradentate amine ligand and diamagneticcyanidometallates. Inorg. Chim. Acta.2011;366(1):366-72.
13.Ouyang L. The use of Tetracyanozincate (II) inthe preparation of supramolecular coordinationpolymers: Department of Chemistry-Simon FraserUniversity; 2007.
14.Sayın E, Kürkçüoğlu G S, Yeşilel O Z, Hökelek T.1D cyanide complexes with 2-pyridinemethanol:Synthesis, crystal structures and spectroscopicproperties. J. Mol. Struct. 2015;1101:73-81.
15.Karaağaç D, Kürkçüoğlu G S, Yeşilel O Z,Hökelek T, Dal H. Synthesis and crystal structure ofcyano-bridged three dimensional polyheteronuclearcomplex. Z. Kristallogr. 2012;227(9):639-45.
16.Karaağaç D, Kürkçüoğlu G S. Syntheses,spectroscopic and thermal analyses of thehofmann-type metal(II) tetra-cyanonickelate(II)pyridazine complexes:{[M(pdz)Ni(CN) 4]∙ H2O}n
(M=Zn(II) or Cd(II)). Bull. Chem. Soc. Ethiop.2015;29(3):415-22.
17.Kartal Z. Synthesis, spectroscopic, thermal andstructural properties of [M(3-aminopyridine)2Ni(μ-CN)2(CN)2]n (M(II)=Co and Cu) heteropolynuclearcyano-bridged complexes. Spectrochim. Acta, PartA. 2016;152:577-83.
18.Parlak C, Alver Ö, Şenyel M. Vibrationalspectroscopic study on some Hofmann typeclathrates: M(1-Phenylpiperazine)2Ni(CN)4·2G(M=Ni, Co and Cd; G=aniline). J. Mol. Struct.2009;919(1-3):41-6.
401
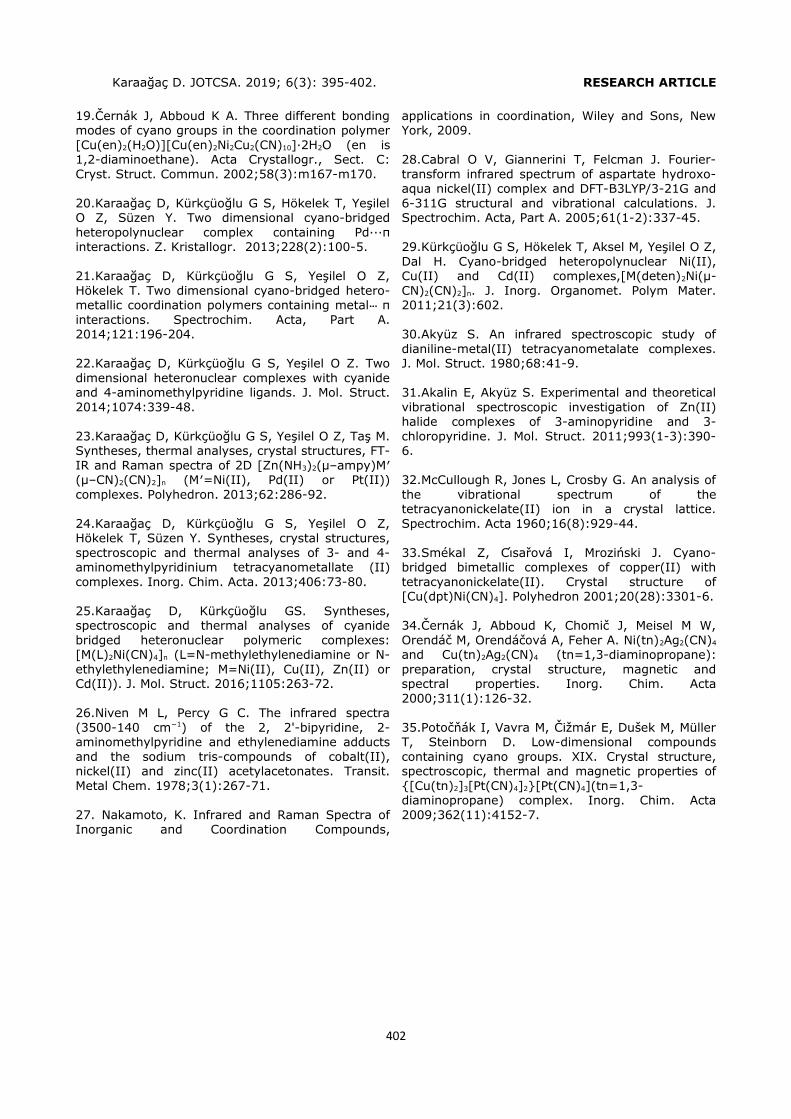
Karaağaç D. JOTCSA. 2019; 6(3): 395-402. RESEARCH ARTICLE
19.Černák J, Abboud K A. Three different bondingmodes of cyano groups in the coordination polymer[Cu(en)2(H2O)][Cu(en)2Ni2Cu2(CN)10]·2H2O (en is1,2-diaminoethane). Acta Crystallogr., Sect. C:Cryst. Struct. Commun. 2002;58(3):m167-m170.
20.Karaağaç D, Kürkçüoğlu G S, Hökelek T, YeşilelO Z, Süzen Y. Two dimensional cyano-bridgedheteropolynuclear complex containing Pd···πinteractions. Z. Kristallogr. 2013;228(2):100-5.
21.Karaağaç D, Kürkçüoğlu G S, Yeşilel O Z,Hökelek T. Two dimensional cyano-bridged hetero-metallic coordination polymers containing metal π⋅⋅⋅interactions. Spectrochim. Acta, Part A.2014;121:196-204.
22.Karaağaç D, Kürkçüoğlu G S, Yeşilel O Z. Twodimensional heteronuclear complexes with cyanideand 4-aminomethylpyridine ligands. J. Mol. Struct.2014;1074:339-48.
23.Karaağaç D, Kürkçüoğlu G S, Yeşilel O Z, Taş M.Syntheses, thermal analyses, crystal structures, FT-IR and Raman spectra of 2D [Zn(NH3)2(μ–ampy)M′(μ–CN)2(CN)2]n (M′=Ni(II), Pd(II) or Pt(II))complexes. Polyhedron. 2013;62:286-92.
24.Karaağaç D, Kürkçüoğlu G S, Yeşilel O Z,Hökelek T, Süzen Y. Syntheses, crystal structures,spectroscopic and thermal analyses of 3- and 4-aminomethylpyridinium tetracyanometallate (II)complexes. Inorg. Chim. Acta. 2013;406:73-80.
25.Karaağaç D, Kürkçüoğlu GS. Syntheses,spectroscopic and thermal analyses of cyanidebridged heteronuclear polymeric complexes:[M(L)2Ni(CN)4]n (L=N-methylethylenediamine or N-ethylethylenediamine; M=Ni(II), Cu(II), Zn(II) orCd(II)). J. Mol. Struct. 2016;1105:263-72.
26.Niven M L, Percy G C. The infrared spectra(3500-140 cm−1) of the 2, 2'-bipyridine, 2-aminomethylpyridine and ethylenediamine adductsand the sodium tris-compounds of cobalt(II),nickel(II) and zinc(II) acetylacetonates. Transit.Metal Chem. 1978;3(1):267-71.
27. Nakamoto, K. Infrared and Raman Spectra ofInorganic and Coordination Compounds,
applications in coordination, Wiley and Sons, NewYork, 2009.
28.Cabral O V, Giannerini T, Felcman J. Fourier-transform infrared spectrum of aspartate hydroxo-aqua nickel(II) complex and DFT-B3LYP/3-21G and6-311G structural and vibrational calculations. J.Spectrochim. Acta, Part A. 2005;61(1-2):337-45.
29.Kürkçüoğlu G S, Hökelek T, Aksel M, Yeşilel O Z,Dal H. Cyano-bridged heteropolynuclear Ni(II),Cu(II) and Cd(II) complexes,[M(deten)2Ni(μ-CN)2(CN)2]n. J. Inorg. Organomet. Polym Mater.2011;21(3):602.
30.Akyüz S. An infrared spectroscopic study ofdianiline-metal(II) tetracyanometalate complexes.J. Mol. Struct. 1980;68:41-9.
31.Akalin E, Akyüz S. Experimental and theoreticalvibrational spectroscopic investigation of Zn(II)halide complexes of 3-aminopyridine and 3-chloropyridine. J. Mol. Struct. 2011;993(1-3):390-6.
32.McCullough R, Jones L, Crosby G. An analysis ofthe vibrational spectrum of thetetracyanonickelate(II) ion in a crystal lattice.Spectrochim. Acta 1960;16(8):929-44.
33.Smékal Z, Cıısařová I, Mroziński J. Cyano-bridged bimetallic complexes of copper(II) withtetracyanonickelate(II). Crystal structure of[Cu(dpt)Ni(CN)4]. Polyhedron 2001;20(28):3301-6.
34.Černák J, Abboud K, Chomič J, Meisel M W,Orendáč M, Orendáčová A, Feher A. Ni(tn)2Ag2(CN)4
and Cu(tn)2Ag2(CN)4 (tn=1,3-diaminopropane):preparation, crystal structure, magnetic andspectral properties. Inorg. Chim. Acta2000;311(1):126-32.
35.Potočňák I, Vavra M, Čižmár E, Dušek M, MüllerT, Steinborn D. Low-dimensional compoundscontaining cyano groups. XIX. Crystal structure,spectroscopic, thermal and magnetic properties of{[Cu(tn)2]3[Pt(CN)4]2}[Pt(CN)4](tn=1,3-diaminopropane) complex. Inorg. Chim. Acta2009;362(11):4152-7.
402
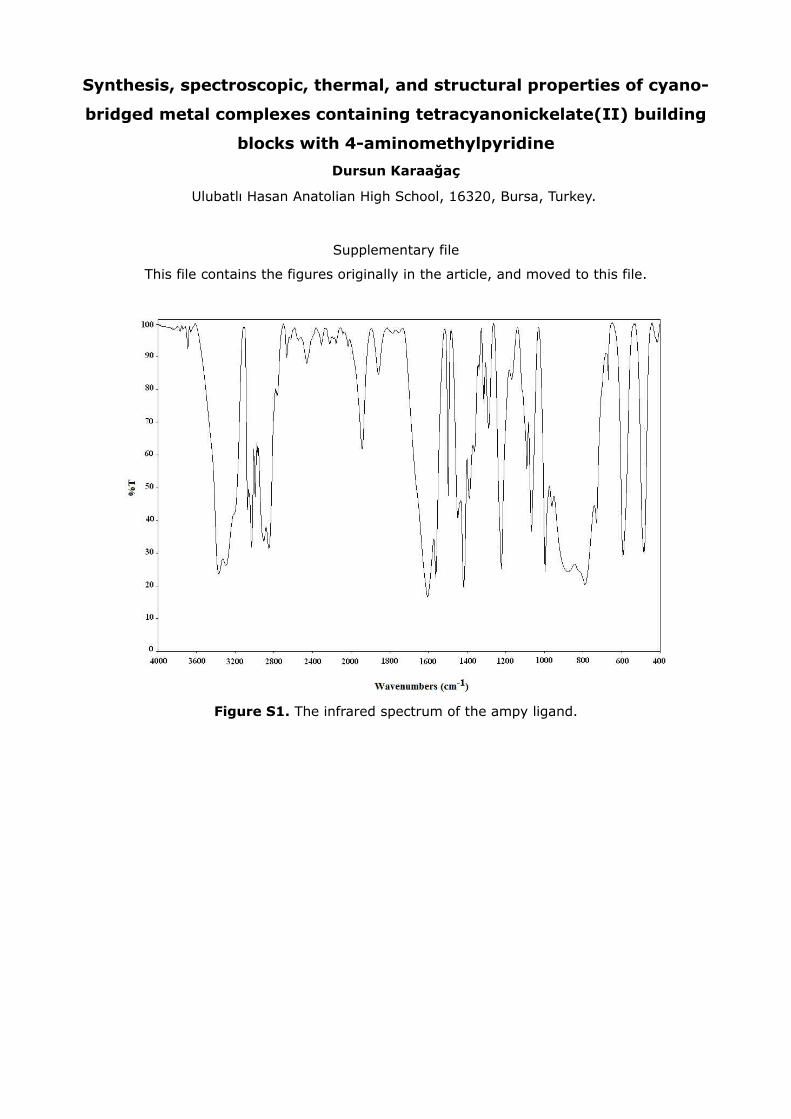
Synthesis, spectroscopic, thermal, and structural properties of cyano-
bridged metal complexes containing tetracyanonickelate(II) building
blocks with 4-aminomethylpyridine
Dursun Karaağaç
Ulubatlı Hasan Anatolian High School, 16320, Bursa, Turkey.
Supplementary file
This file contains the figures originally in the article, and moved to this file.
Figure S1. The infrared spectrum of the ampy ligand.
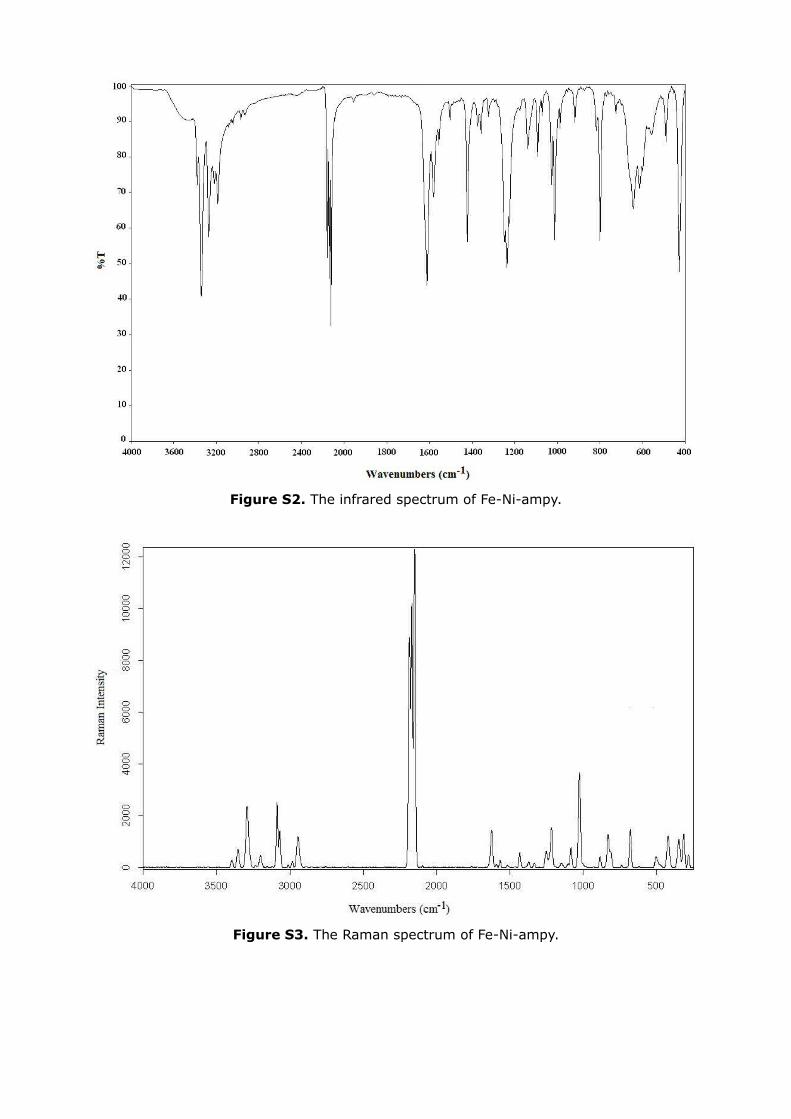
Figure S2. The infrared spectrum of Fe-Ni-ampy.
Figure S3. The Raman spectrum of Fe-Ni-ampy.
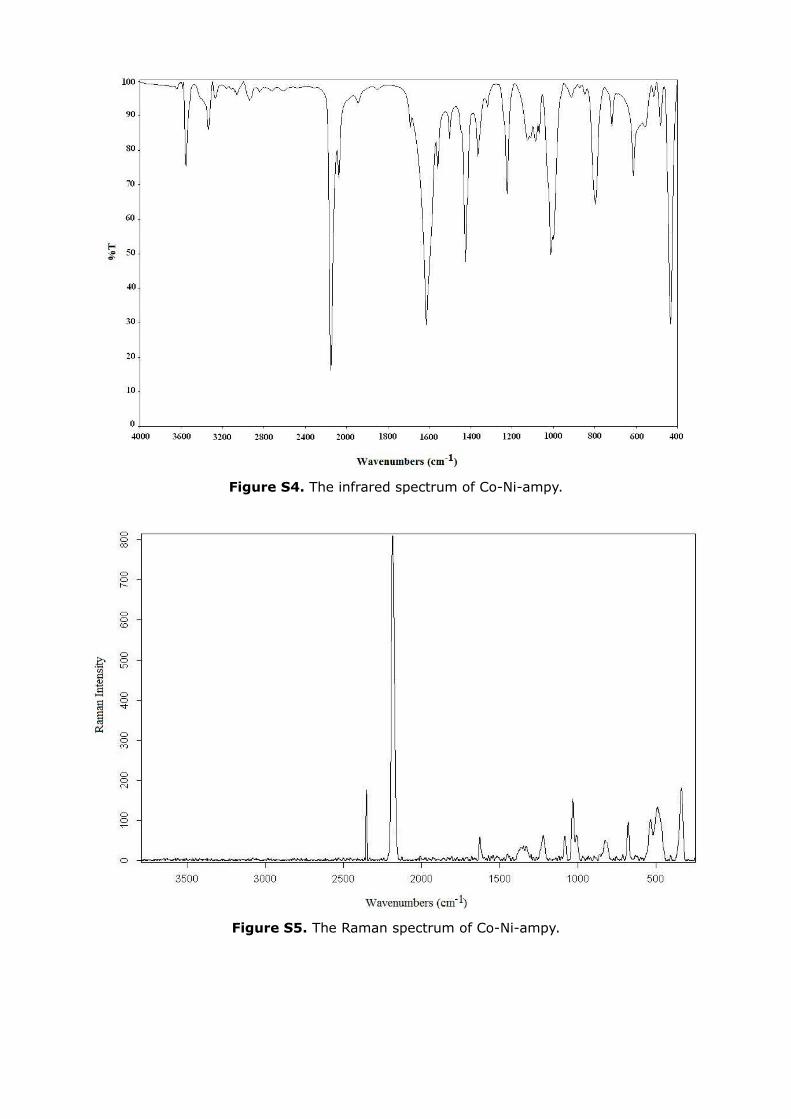
Figure S4. The infrared spectrum of Co-Ni-ampy.
Figure S5. The Raman spectrum of Co-Ni-ampy.
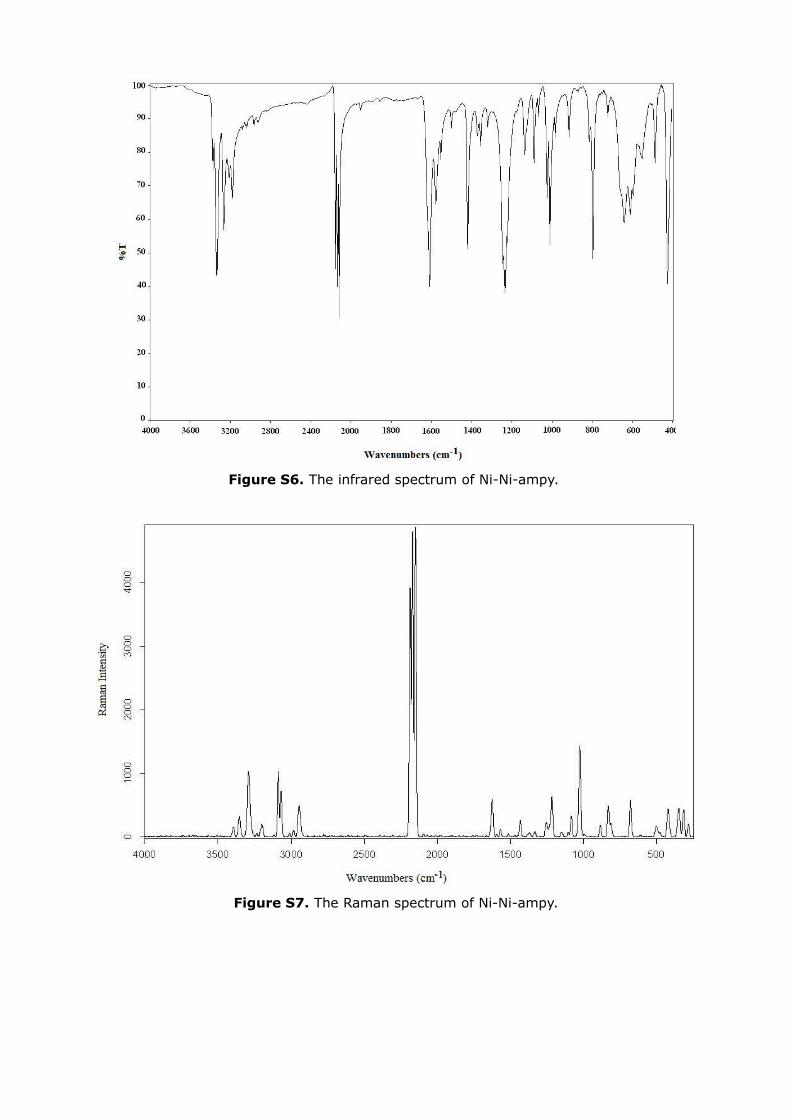
Figure S6. The infrared spectrum of Ni-Ni-ampy.
Figure S7. The Raman spectrum of Ni-Ni-ampy.
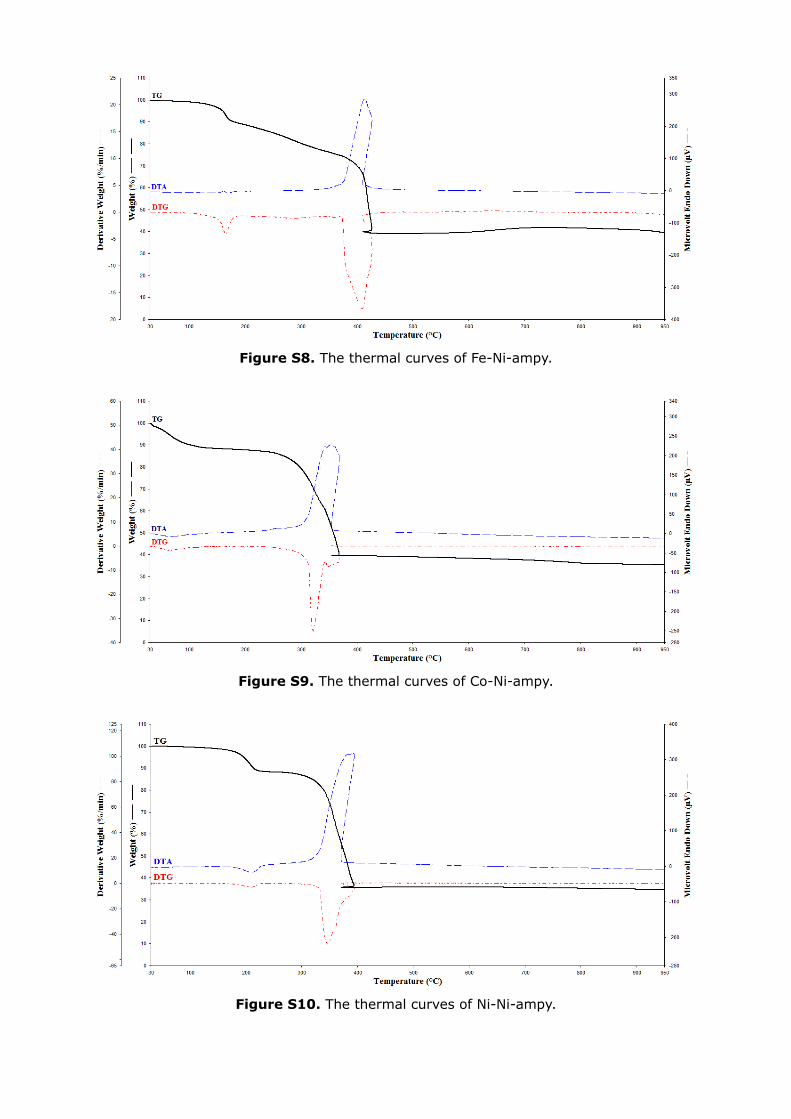
Figure S8. The thermal curves of Fe-Ni-ampy.
Figure S9. The thermal curves of Co-Ni-ampy.
Figure S10. The thermal curves of Ni-Ni-ampy.
Şahin M, Gubbuk HI. JOTCSA. 2019; 6(3): 403-410. RESEARCH ARTICLE
Green Synthesis of Antioxidant Silver and Platinum NanoparticlesUsing Ginger and Turmeric Extracts and Investigation of Their
Catalytic Activity
Muradiye SAHIN1* , Ilkay Hilal GUBBUK2
1-Graduate School of Natural Sciences, Selcuk University, 42003, Selcuklu/Konya,Turkey2- Department of Chemistry, Selcuk University, Campus, 42075, Konya, Turkey
Abstract: Antioxidant silver nanoparticles (AgNPs) and platinum nanoparticles (PtNPs) were synthesizedby using ginger and turmeric extracts with green method in this work. Thus these nanoparticlessynthesized were characterized by UV-Vis spectroscopy, SEM-EDX and FTIR. The UV-Visible spectra ofthe AgNPs revealed a characteristic surface plasmon resonance peak at 420-425 nm and the UV-Visiblespectra of the PtNPs revealed a characteristic surface plasmon resonance peak at 234-240 nm. Thesynthesized AgNPs and PtNPs acted as a catalyst to the degradation of dyes (rhodamine B, methylorange, and methylene blue) with sodium borohydride (NaBH4). Green synthesized antioxidant silvernanoparticles effectively degraded the dyes nearly 4-10 min. and green synthesized antioxidant platinumnanoparticles effectively degraded the dyes nearly 15-24 min. of exposure time.
Keywords: Platinum nanoparticles, catalysis, silver nanoparticles, antioxidants, dyes.
Submitted: December 14, 2018. Accepted: April 06, 2019.
Cite this: Şahin M, Gubbuk I. Green Synthesis of Antioxidant Silver and Platinum Nanoparticles UsingGinger and Turmeric Extracts and Investigation of Their Catalytic Activity. JOTCSA. 2019;6(3):403–10.
DOI: https://doi.org/10.18596/jotcsa. 497440 .
*Corresponding author. E-mail: [email protected] .
INTRODUCTION
Noble metal nanoparticles such as silver andplatinum have emerged as promisingantimicrobial agents and catalytic elements sohave been greatly applied in the cosmetic,medical, textile and food industries (1). Catalystsof metal nanoparticles such as silver are efficientfor various reactions. Silver have earnedsignificant caution due to their inimitableelectronic properties and high Fermi potential (2,3).
Over the last few years, herb-welded biologicallysynthesis of the nanoparticles are earnedoverage significance because of their inexpensiveand environmentally approach (4-7). Theapplications of AgNPs and PtNPs in medicine,optoelectronics, optics, and catalysis are well
known and has received great attention due tothe surface strong absorption in the visible regionwhich can be easily monitored by UV–visiblespectrophotometer (8). Moreover, these NPshave been gaining significant research interestdue to their unique shape and size-dependentoptical, antimicrobial and catalytic properties (9).
In this work, silver and platinum nanoparticlesare synthesized, for the first time, using gingerand turmeric antioxidant extracts as a reducingagent for the first time. Antioxidants limit thedeleterious effects of oxidative reactions so theycan involve scavenging free radicals followed bythe stabilization of nanoparticles.
Organic dyes are a major class environmentalpollutant in various industries, particularlytextiles. The organic dyes can cause many
403
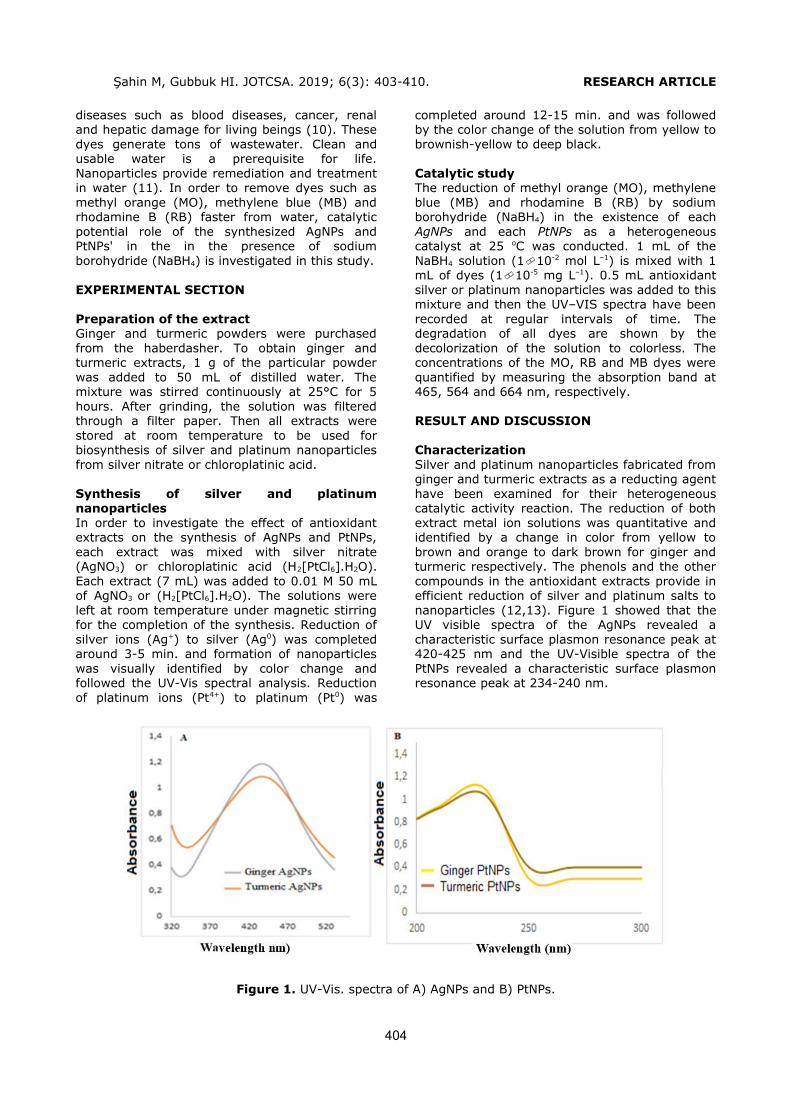
Şahin M, Gubbuk HI. JOTCSA. 2019; 6(3): 403-410. RESEARCH ARTICLE
diseases such as blood diseases, cancer, renaland hepatic damage for living beings (10). Thesedyes generate tons of wastewater. Clean andusable water is a prerequisite for life.Nanoparticles provide remediation and treatmentin water (11). In order to remove dyes such asmethyl orange (MO), methylene blue (MB) andrhodamine B (RB) faster from water, catalyticpotential role of the synthesized AgNPs andPtNPs' in the in the presence of sodiumborohydride (NaBH4) is investigated in this study.
EXPERIMENTAL SECTION
Preparation of the extractGinger and turmeric powders were purchasedfrom the haberdasher. To obtain ginger andturmeric extracts, 1 g of the particular powderwas added to 50 mL of distilled water. Themixture was stirred continuously at 25°C for 5hours. After grinding, the solution was filteredthrough a filter paper. Then all extracts werestored at room temperature to be used forbiosynthesis of silver and platinum nanoparticlesfrom silver nitrate or chloroplatinic acid.
Synthesis of silver and platinumnanoparticlesIn order to investigate the effect of antioxidantextracts on the synthesis of AgNPs and PtNPs,each extract was mixed with silver nitrate(AgNO3) or chloroplatinic acid (H2[PtCl6].H2O).Each extract (7 mL) was added to 0.01 M 50 mLof AgNO3 or (H2[PtCl6].H2O). The solutions wereleft at room temperature under magnetic stirringfor the completion of the synthesis. Reduction ofsilver ions (Ag+) to silver (Ag0) was completedaround 3-5 min. and formation of nanoparticleswas visually identified by color change andfollowed the UV-Vis spectral analysis. Reductionof platinum ions (Pt4+) to platinum (Pt0) was
completed around 12-15 min. and was followedby the color change of the solution from yellow tobrownish-yellow to deep black.
Catalytic studyThe reduction of methyl orange (MO), methyleneblue (MB) and rhodamine B (RB) by sodiumborohydride (NaBH4) in the existence of eachAgNPs and each PtNPs as a heterogeneouscatalyst at 25 oC was conducted. 1 mL of theNaBH4 solution (110-2 mol L–1) is mixed with 1mL of dyes (110-5 mg L–1). 0.5 mL antioxidantsilver or platinum nanoparticles was added to thismixture and then the UV–VIS spectra have beenrecorded at regular intervals of time. Thedegradation of all dyes are shown by thedecolorization of the solution to colorless. Theconcentrations of the MO, RB and MB dyes werequantified by measuring the absorption band at465, 564 and 664 nm, respectively.
RESULT AND DISCUSSION
CharacterizationSilver and platinum nanoparticles fabricated fromginger and turmeric extracts as a reducting agenthave been examined for their heterogeneouscatalytic activity reaction. The reduction of bothextract metal ion solutions was quantitative andidentified by a change in color from yellow tobrown and orange to dark brown for ginger andturmeric respectively. The phenols and the othercompounds in the antioxidant extracts provide inefficient reduction of silver and platinum salts tonanoparticles (12,13). Figure 1 showed that theUV visible spectra of the AgNPs revealed acharacteristic surface plasmon resonance peak at420-425 nm and the UV-Visible spectra of thePtNPs revealed a characteristic surface plasmonresonance peak at 234-240 nm.
Figure 1. UV-Vis. spectra of A) AgNPs and B) PtNPs.
404
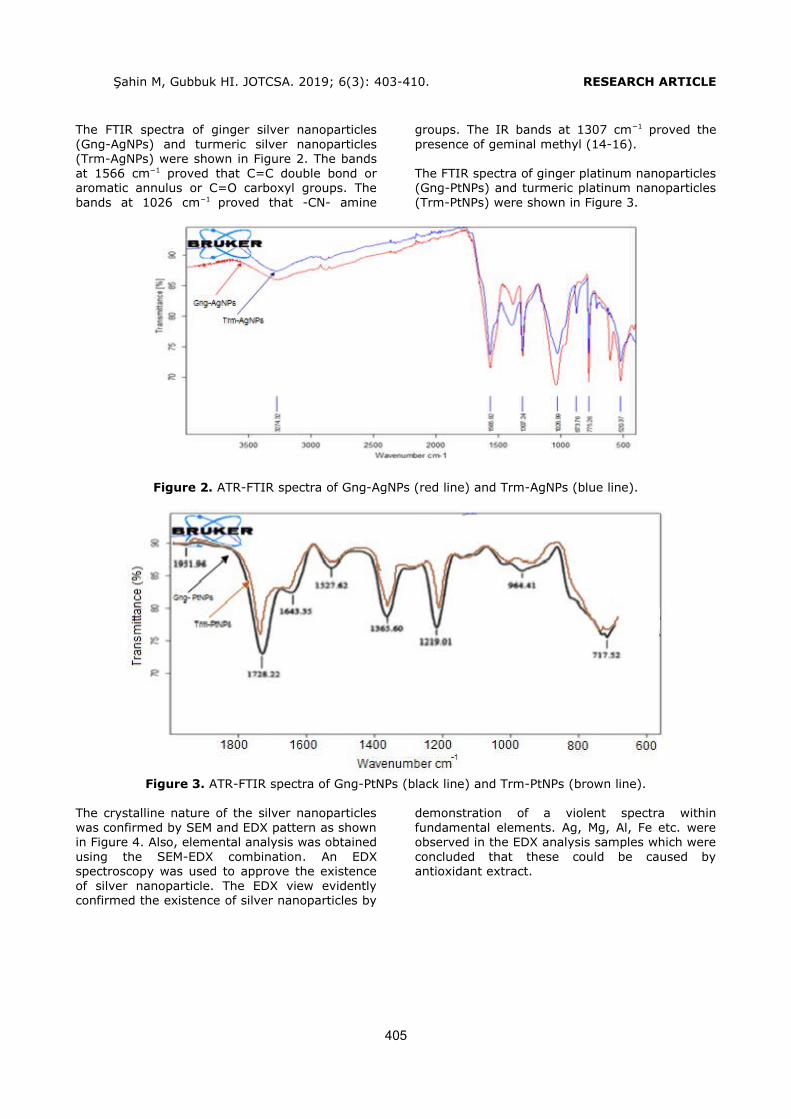
Şahin M, Gubbuk HI. JOTCSA. 2019; 6(3): 403-410. RESEARCH ARTICLE
The FTIR spectra of ginger silver nanoparticles(Gng-AgNPs) and turmeric silver nanoparticles(Trm-AgNPs) were shown in Figure 2. The bandsat 1566 cm−1 proved that C=C double bond oraromatic annulus or C=O carboxyl groups. Thebands at 1026 cm−1 proved that -CN- amine
groups. The IR bands at 1307 cm−1 proved thepresence of geminal methyl (14-16).
The FTIR spectra of ginger platinum nanoparticles(Gng-PtNPs) and turmeric platinum nanoparticles(Trm-PtNPs) were shown in Figure 3.
Figure 2. ATR-FTIR spectra of Gng-AgNPs (red line) and Trm-AgNPs (blue line).
Figure 3. ATR-FTIR spectra of Gng-PtNPs (black line) and Trm-PtNPs (brown line).
The crystalline nature of the silver nanoparticleswas confirmed by SEM and EDX pattern as shownin Figure 4. Also, elemental analysis was obtainedusing the SEM-EDX combination. An EDXspectroscopy was used to approve the existenceof silver nanoparticle. The EDX view evidentlyconfirmed the existence of silver nanoparticles by
demonstration of a violent spectra withinfundamental elements. Ag, Mg, Al, Fe etc. wereobserved in the EDX analysis samples which wereconcluded that these could be caused byantioxidant extract.
405
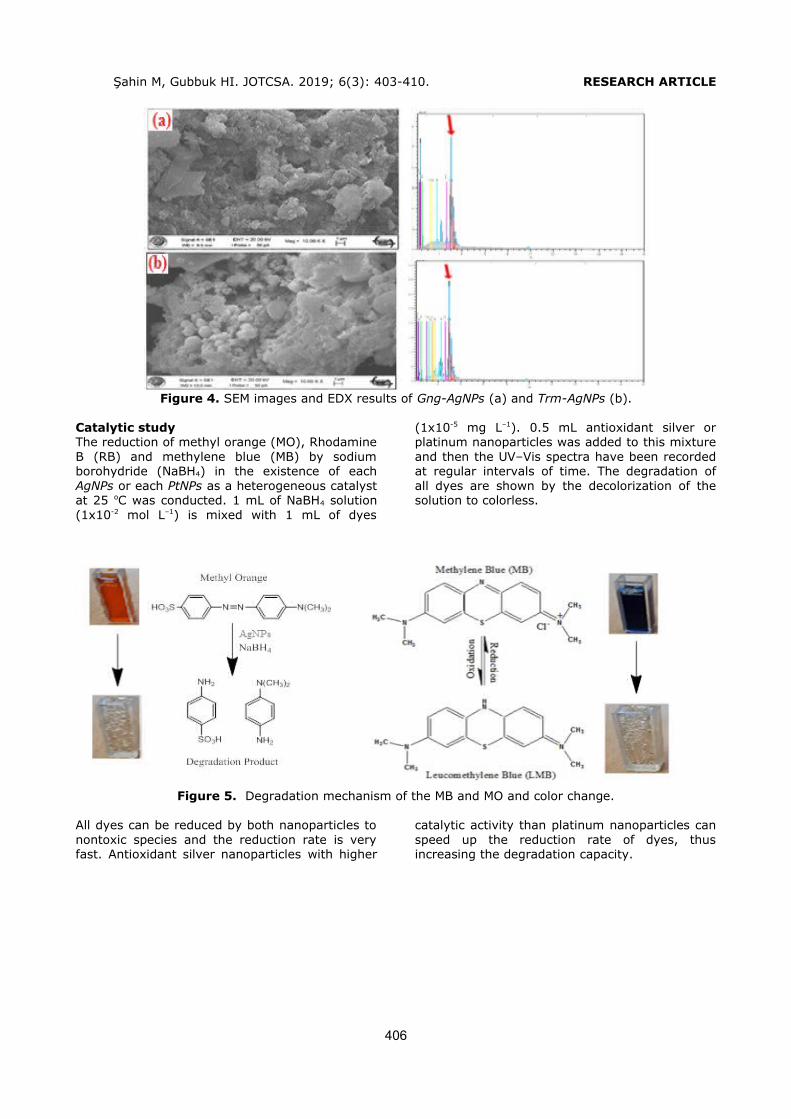
Şahin M, Gubbuk HI. JOTCSA. 2019; 6(3): 403-410. RESEARCH ARTICLE
Figure 4. SEM images and EDX results of Gng-AgNPs (a) and Trm-AgNPs (b).
Catalytic studyThe reduction of methyl orange (MO), RhodamineB (RB) and methylene blue (MB) by sodiumborohydride (NaBH4) in the existence of eachAgNPs or each PtNPs as a heterogeneous catalystat 25 oC was conducted. 1 mL of NaBH4 solution(1x10⁻² mol L–1) is mixed with 1 mL of dyes
(1x10⁻⁵ mg L–1). 0.5 mL antioxidant silver orplatinum nanoparticles was added to this mixtureand then the UV–Vis spectra have been recordedat regular intervals of time. The degradation ofall dyes are shown by the decolorization of thesolution to colorless.
Figure 5. Degradation mechanism of the MB and MO and color change.
All dyes can be reduced by both nanoparticles tonontoxic species and the reduction rate is veryfast. Antioxidant silver nanoparticles with higher
catalytic activity than platinum nanoparticles canspeed up the reduction rate of dyes, thusincreasing the degradation capacity.
406

Şahin M, Gubbuk HI. JOTCSA. 2019; 6(3): 403-410. RESEARCH ARTICLE
Figure 6. UV-Vis. spectra of the catalytic reduction of Methylene Blue.
Figure 7. UV-Vis. spectra of the catalytic reduction of Methyl Orange.
407
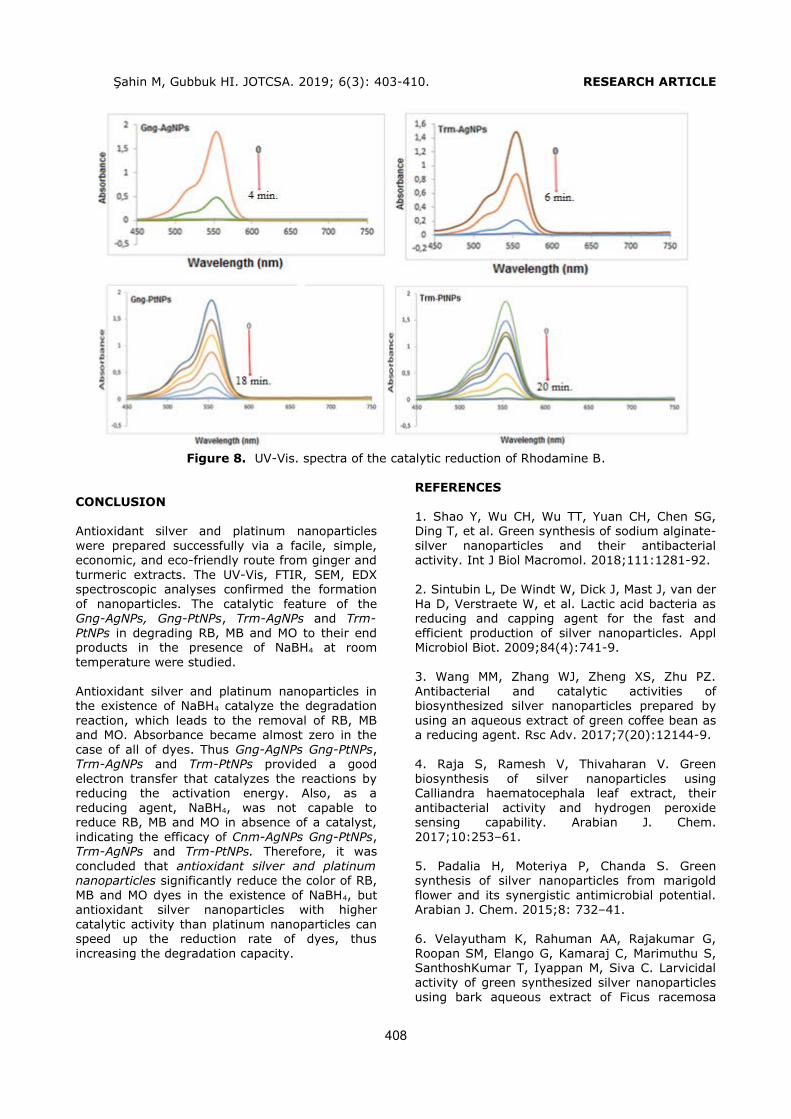
Şahin M, Gubbuk HI. JOTCSA. 2019; 6(3): 403-410. RESEARCH ARTICLE
Figure 8. UV-Vis. spectra of the catalytic reduction of Rhodamine B.
CONCLUSION
Antioxidant silver and platinum nanoparticleswere prepared successfully via a facile, simple,economic, and eco-friendly route from ginger andturmeric extracts. The UV-Vis, FTIR, SEM, EDXspectroscopic analyses confirmed the formationof nanoparticles. The catalytic feature of theGng-AgNPs, Gng-PtNPs, Trm-AgNPs and Trm-PtNPs in degrading RB, MB and MO to their endproducts in the presence of NaBH4 at roomtemperature were studied.
Antioxidant silver and platinum nanoparticles inthe existence of NaBH4 catalyze the degradationreaction, which leads to the removal of RB, MBand MO. Absorbance became almost zero in thecase of all of dyes. Thus Gng-AgNPs Gng-PtNPs,Trm-AgNPs and Trm-PtNPs provided a goodelectron transfer that catalyzes the reactions byreducing the activation energy. Also, as areducing agent, NaBH4, was not capable toreduce RB, MB and MO in absence of a catalyst,indicating the efficacy of Cnm-AgNPs Gng-PtNPs,Trm-AgNPs and Trm-PtNPs. Therefore, it wasconcluded that antioxidant silver and platinumnanoparticles significantly reduce the color of RB,MB and MO dyes in the existence of NaBH4, butantioxidant silver nanoparticles with highercatalytic activity than platinum nanoparticles canspeed up the reduction rate of dyes, thusincreasing the degradation capacity.
REFERENCES
1. Shao Y, Wu CH, Wu TT, Yuan CH, Chen SG,Ding T, et al. Green synthesis of sodium alginate-silver nanoparticles and their antibacterialactivity. Int J Biol Macromol. 2018;111:1281-92.
2. Sintubin L, De Windt W, Dick J, Mast J, van derHa D, Verstraete W, et al. Lactic acid bacteria asreducing and capping agent for the fast andefficient production of silver nanoparticles. ApplMicrobiol Biot. 2009;84(4):741-9.
3. Wang MM, Zhang WJ, Zheng XS, Zhu PZ.Antibacterial and catalytic activities ofbiosynthesized silver nanoparticles prepared byusing an aqueous extract of green coffee bean asa reducing agent. Rsc Adv. 2017;7(20):12144-9.
4. Raja S, Ramesh V, Thivaharan V. Greenbiosynthesis of silver nanoparticles usingCalliandra haematocephala leaf extract, theirantibacterial activity and hydrogen peroxidesensing capability. Arabian J. Chem.2017;10:253–61.
5. Padalia H, Moteriya P, Chanda S. Greensynthesis of silver nanoparticles from marigoldflower and its synergistic antimicrobial potential.Arabian J. Chem. 2015;8: 732–41.
6. Velayutham K, Rahuman AA, Rajakumar G,Roopan SM, Elango G, Kamaraj C, Marimuthu S,SanthoshKumar T, Iyappan M, Siva C. Larvicidalactivity of green synthesized silver nanoparticlesusing bark aqueous extract of Ficus racemosa
408
Şahin M, Gubbuk HI. JOTCSA. 2019; 6(3): 403-410. RESEARCH ARTICLE
against Culex quinquefasciatus and Culex gelidus.Asian Pac. J. Trop. Med. 2013;6:95–101.
7. Kumar DA, Palanichamy V, Roopan SM. Greensynthesis of silver nanoparticles usingAlternanthera dentata leaf extract at roomtemperature and their antimicrobial activity.Spectrochim. Acta A 2014;127:168–171.
8. Edison TJI, Sethuraman MG. Instant greensynthesis of silver nanoparticles using Terminaliachebula fruit extract and evaluation of theircatalytic activity on reduction of methylene blue.Process Biochemistry 2012;47:1351–7.
9. Baruah B, Gabriel GJ, Akbashev MJ, BooherME. Facile Synthesis of Silver NanoparticlesStabilized by Cationic Polynorbornenes and TheirCatalytic Activity in 4 Nitrophenol Reduction.Langmuir 2013;29:4225−30.
10. Veisi H, Azizi S, Mohammadi P. Greensynthesis of the silver nanoparticles mediated byThymbra spicata extract and its application as aheterogeneous and recyclable nanocatalyst forcatalytic reduction of a variety of dyes in water. JClean Prod. 2018;170:1536-43.
11. Sowmyya T, Lakshmi GV. Antimicrobial andCatalytic Potential of Soymida febrifuga Aqueous
Fruit Extract-Engineered Silver Nanoparticles.Bionanoscience. 2018;8:179-95.
12. Harborn, JB. Introduction to EcologicalBiochemistry, 3rd ed. London Academic Press.1988;356.
13. Vidhu VK, Philip D. Catalytic degradation oforganic dyes using biosynthesizedsilvernanoparticles. Micron 56. 2014;54–62.
14. Lopez-Miranda JL, Vazquez M, Fletes N,Esparza R, Rosas G. Biosynthesis of silvernanoparticles using a Tamarix gallica leaf extractand their antibacterial activity. Mater. Lett.2016;176:285–9.
15. Karimzadeh I, Aghazadeh M, Ganjali MR,Norouzi P, Shirvani-Arani S, et al. A novelmethod for preparation of bare andpoly(vinylpyrrolidone) coated superparamagneticiron oxide nanoparticles for biomedicalapplications, Mater. Lett. 2016;179:5–8.
16. Khan ZUH, Khan A, Shah A, Wan P, Chen Y,et al. Enhanced photocatalytic andelectrocatalytic applications of green synthesizedsilver nanoparticles, J. Mol. Liq. 2016;220:248–57.
409

Şahin M, Gubbuk HI. JOTCSA. 2019; 6(3): 403-410. RESEARCH ARTICLE
410

Ekalu A et al. JOTCSA. 2019; 6(3): 411-418. RESEARCH ARTICLE
Bioactivities of Phaeophytin a, α-Amyrin, and lupeol from Brachystelmatogoense Schltr
Abiche Ekalua* , Rachael Gbekele-Oluwa Ayob , James D. Habilab and Ibrahim
Hamisub
a Department of Chemistry, Nigerian Army School of Education, Ilorin, Kwara, Nigeriab Department of Chemistry, Ahmadu Bello University Zaria, Kaduna, Nigeria
Abstract: Phaeophytin a, α-amyrin and lupeol isolated from Brachystelma togoense were screened againstS. aureus, E. coli, S. pneumoniae, S. typhi, and C. albicans using Ciprofloxacin and Terbinafine as standards.The results showed that these phytochemicals displayed antimicrobial activity against the tested organismswith the zone of inhibition from 12 – 27 mm. The result of minimum inhibitory concentration (MIC) showedthat phaeophytin a was most active against C. albicans (0.09 mg/mL). The minimum bactericidalconcentration (MBC) showed that phaeophytin a and lupeol were most active against S. aureus, S.pneumoniae and S. typhi (0.37 mg/mL). The result of minimum fungicidal concentration (MFC) showed thatphaeophytin a was most active against C. albicans (0.1875 mg/mL). The activities of thesephytoconstituents in B. togoense justified ethnomedicinal uses of the plant to treat various ailments.
Keywords: Bioactivity, Phaeophytin a, α-amyrin and lupeol, Brachystelma togoense Schtlr
Submitted: May 30, 2019. Accepted: September 17, 2019.
Cite this: Ekalu A, Gbekele-Oluwa Ayo R, Habila J, Hamisu I. Bioactivities of Phaeophytin a, α-Amyrin, andlupeol from Brachystelma togoense Schltr. JOTCSA. 2019;6(3):411–8.
DOI: https://doi.org/10.18596/jotcsa. 571770 .
*Corresponding author. Address: Department of Chemistry, Nigerian Army School of Education, Ilorin,Kwara, Nigeria. E-mail: [email protected].
INTRODUCTION
Medicinal plants are used in developing countriesas alternative medical treatments andphytochemicals isolated from these plants haveshown in vitro and in vivo biological activity (1).Previously, humans have used natural products,such as plants, animals, microorganisms, andmarine organisms, in medicines to alleviate andtreat various diseases.
These natural products have a unique chemicaldiversity, which results in diversity in their
biological activities and drug-like properties (2).The use of medicinal plants for the treatment ofdiseases dates back to the history of human life, asthe use of plants was their only choice of treatment(3). The World Health Organization (WHO) definestraditional medicinal plants as natural plantmaterials which are used at least or in the absenceindustrial processing for the treatment of diseasesat a local or regional scale. Traditional herbalmedicine has been used for thousands of yearsbecause it is natural and causes relatively fewercomplications (3). There is a promising future of
411

Ekalu A et al. JOTCSA. 2019; 6(3): 411-418. RESEARCH ARTICLE
medicinal plants as many plants around the world,and most of them are not investigated yet for theirmedical activities and their hidden potential ofmedical activities could be useful in the treatmentof present and future studies (4).
Brachystelma was first described by Robert Brownin 1822. The genus Brachystelma R. Br.(Apocynaceae: Asclepiadoideae) is represented byabout 100-120 species (5). Brachystelma is chieflydistributed in South Africa, South-East Asia, andAustralasia (6). A total of 18 species are known inIndia (7) and out of them, 3 species are inMaharashtra. Brachystelma togoense is distributedon partially degraded hill slopes and open hill topsamong grasses. It is an erect perennial herb,growing up to 30 cm, recorded from Ghana toNigeria, in lowlands to montane situations. Thetuber is said to be edible raw (8). The leaves aregreen in color, opposite, decussate, sessile orsubsessile, linear to lanceolate to narrowly elliptic,3-8 x 0.4-1 cm, acute, and margin ciliate. Tubersof Brachystelma species are known to be eaten asa food supplement in rural areas when there is afood shortage. Many of the tuberous Brachystelmaare known to be used medicinally for the treatmentof headache, stomach ache, and colds in children.In China, Brachystelma edule tubers are edible andthe plant is used for the treatment of coughs andreduction of phlegm (9).
The secondary metabolites, phaeophytin a, α-amyrin, and lupeol, were previously isolated fromthe CH2Cl2 and MeOH extracts of B. togoense. Thestructures were elucidated using 1H, 13C and 2DNMR. The presence of phaeophytin a, α-amyrin,and lupeol in B. togoense justified the use of theplant for medicinal purpose in Nigeria (10). Theaim of this study is to carry out antimicrobialstudies of the phaeophytin a, α-amyrin, and lupeolisolated from the aerial parts of B. togoense.
MATERIALS AND METHODS
ChemicalsThe chemicals used for this study are CH2Cl2, MeOH,EtOH, DMSO, and EtOAc. All the chemicals were ofanalytical grade.
Material
Collection of plant
The stem bark of Brachystelma togoense wascollected in April 2018 from Benue State, Nigeria.The plant was identified by the plant taxonomistMallam Sanusi Namadi and a voucher specimen(no. 25856) is retained in the Biological ScienceDepartment, Ahmadu Bello University, Zaria-Nigeria.
Extraction and isolation
The air-dried B. togoense was manually reduced topowder using a mortar and pestle. Exactly 1000 gof the powdered plant material was extracted on ashaker (labcon sw39, 136 rpm) at roomtemperature (at 25 oC) using 100%dichloromethane (CH2Cl2) for 72 h. The extractswere concentrated using a rotary evaporator(Rotavapor R-215) at 40 oC resulting in a browngum-like texture (32.0 g). The same procedurewas used for methanol (MeOH) which yielded abrown gum-like texture (36.0 g). The CH2Cl2 andMeOH extracts were then separated by flashchromatography (Biotage SP1) over silica gel usingthree solvents. Firstly, an n-hexane/ CH2Cl2,gradient starting with 100% hexane and graduallyincreasing the polarity to 100% CH2Cl2. Secondly,CH2Cl2/ EtOH/EtOAc from a 100% CH2Cl2 to 50%EtOH/ EtOAc and to 100% EtOH/ EtOAc to yieldvarious fractions (fr. 1-100). Fr.20 was spotted onthe TLC plate using 100% CH2Cl2 and appeared apure compound 1 (51.0 mg). The same procedurewas repeated for the MeOH extract yieldingcompounds 2 (32.0 mg) and 3 (28.0 mg) whichwere spotted as pure compounds using CH2Cl2/EtOH/ EtOAc (7:3) from fr.30. The structures ofphaeophytin a (1), α-amyrin (2) and lupeol (3) areshown in Figure 1.
412

Ekalu A et al. JOTCSA. 2019; 6(3): 411-418. RESEARCH ARTICLE
N
NHN
HN
OOO
OO
3132
3221
192420
4
21
56
22
23
10
9
881
82771
11
12121
13
131
133
134
132
182 181
17
171
16
14
15
172
p1
9293
p20
p4
p5
p6p7
p8
p9
p10p12
p13
p14p15 p11
p17
p16
p18 p19
H
H
HH1
2
3 54
910
6
2324
25
2627
28
7
8
1112
15
13
16
18
17
19
22
30
2920
14
HO
H
HOH
H
H
12
43 5
6
910
7
1125
2324
8
12
13
14
2627
1528
18
19 21
22
30
29
17
16
1 23
Figure 1. Structures of phaeophytin a (1), α-amyrin (2) and lupeol (3).
Antimicrobial screening of the isolatesThe antimicrobial activities of the isolates weredetermined using some pathogenicmicroorganisms. The microorganisms wereobtained from the Department of MedicalMicrobiology, Ahmadu Bello University TeachingHospital, Zaria, Nigeria. All isolates were checkedfor purity and maintained in slants of blood agar.The antimicrobial activities of the isolates wereevaluated by the broth dilution assay as describedpreviously for the bacteria and Mueller Hinton brothassay for the fungi (11). The microorganismstested were as follows: Staphylococcus aureus,Streptococcus pneumoniae, Escherichia coli,Salmonella typhi, and Candida albicans.
Determination of Zone of Inhibition
Solutions of 6.0 mg of the compounds wereprepared using 10.0 mL dimethyl sulfoxide(DMSO). This solution was used to check theantimicrobial activity of the compound. A controlexperiment was also set up using DMSO.
The standardized inocula of the isolates wereuniformly streaked onto freshly prepared MuellerHinton agar plates with the aid of a sterile swabstick. Using a sterile cork borer (6 mm indiameter), 5 appropriately labelled wells werepunched into each agar plate. An aliquot of 0.3 mLof the appropriate isolate concentration was placedin each well and then allowed to diffuse into theagar. An extra plate was streaked with the isolateand Ciprofloxacin (10 µg/disc) was placed on it.The plates were incubated at 37 oC for 24 h. Whilefor the fungi, Sabouraud dextrose broth was usedand the incubation period was 30 oC and 48 h. Theantimicrobial activities were expressed as diameter(mm) of inhibition zones produced by the plantextracts.
Minimum Inhibition Concentration (MIC)
The minimum inhibition concentrations of theisolates were carried out on the test microbesusing the broth dilution method as outlined by theClinical and Laboratory Standards Institute (CLSI)(12). Mueller Hinton broth was prepared as follows:10.0 mL was dispensed into tubes and wassterilized at 121 oC for 15 minutes and allowed tocool. The McFarland turbidity standard scale 0.5was prepared to give turbidity of the solution.Normal saline was prepared, 10.0 mL wasdispensed into a sterile test tube and the testmicrobes were inoculated and incubated at 37 oCfor 24 hours. Dilution of the test microbes wasdone in the normal saline until the turbiditymatched that of the McFarland turbidity scale byvisual comparison at this point the test microbehas a concentration of about 1.5x10⁸ cfu/mL. Two-fold serial dilution of the extracts in the sterilizedbroth was made to obtain the concentrations of3.00 mg/mL, 1.50 mg/mL, 0.75 mg/mL, 0.37 mg/mL, 0.18 mg/mL and 0.09 mg/mL. The initialconcentration was obtained by dissolving 6.0 mg ofthe isolate in 10 mL of the sterile broth. Havingobtained the different concentrations of theextracts in the sterile broth, 0.3 mL of the standardinoculum of the test microbe in the normal salinewas then inoculated into the differentconcentrations. Incubation was made at 37 oC for24 h, after which each test tube of the broth wasobserved for turbidity (growth). The lowestconcentration of the isolate in which the brothshows no turbidity was recorded as the MinimumInhibition Concentration (MIC).
Determination of Minimum Bactericidal Concentration/Minimum Fungicidal Concentration (MBC/MFC)
This was carried out to determine whether themicroorganisms could be completely killed or theirgrowth could only be inhibited. The minimum
413

Ekalu A et al. JOTCSA. 2019; 6(3): 411-418. RESEARCH ARTICLE
bactericidal concentration of the isolates wasdetermined as outlined by the CLSI on the nutrientagar plates. Minimum bactericidal concentrationswere determined by assaying the test tubecontents of the MIC determinations. A loopful ofthe content of each tube was inoculated by
streaking on a solidified nutrient agar plate andthen incubated at 37 oC for 24 h for bacterial and30 oC for 48 h for fungi. The lowest concentrationof the subculture with no growth was considered asminimum bactericidal concentration/ minimumfungicidal concentration.
Table 1. Diameter of Zone Of Inhibition (mm) of Phaeophytin a.
Concentration (mg/mL)Microorganisms 3 1.5 0.75 0.375 Ciprofloxacin
(10x10-6) Terbinafine (30x 10-6)
S. aureus 21 19 16 14 25E. coli 20 17 14 12 33S. pneumoniae 20 17 14 12 20S. typhi 19 17 15 13 19C. albicans 27 24 21 20 33
Table 2. Diameter of Zone Of Inhibition (mm) of α-amyrin.
Concentration (mg/mL)Microorganisms 3 1.5 0.75 0.375 Ciprofloxacin
(10x10-6 ) Terbinafine (30x 10-6 )
S. aureus 18 16 15 14 25E. coli 20 18 16 13 34S. pneumoniae 18 14 13 12 20S. typhi 19 16 15 14 18C. albicans 22 19 16 14 33
Table 3. Diameter of Zone Of Inhibition (mm) of lupeol.
Concentration (mg/mL)Microorganisms 3.0 1.5 0.75 0.375 Ciprofloxacin
(10x10-6) Terbinafine (30x 10-6)
S. aureus 19 16 14 13 25E. coli 20 18 16 16 35S. pneumoniae 22 18 15 13 20S. typhi 20 18 16 15 20C. albicans 21 18 15 13 33
Table 4. Minimum Inhibitory Concentration (MIC)
Concentration(mg/mL)Microorganisms Phaeophytin a α-amyrin lupeolS. aureus 0.18 0.37 0.37E. coli 0.18 0.37 0.37S. pneumoniae 0.18 0.37 0.18S. typhi 0.18 0.37 0.18C. albicans 0.09 0.37 0.18
414

Ekalu A et al. JOTCSA. 2019; 6(3): 411-418. RESEARCH ARTICLE
Table 5. Minimum Bactericidal Concentration (MBC).
Concentration(mg/mL)Microorganisms Phaeophytin a α-amyrin lupeolS. aureus 0.37 0.75 0.75E. coli 0.75 0.75 0.75S. pneumoniae 0.75 0.75 0.37S. typhi 0.75 0.75 0.37
Table 6. Minimum Fungicidal Concentration (MFC).
Concentration(mg/mL)Microorganism Phaeophytin a α -amyrin lupeolC. albicans 0.18 0.75 0.37
00,10,20,30,40,50,60,70,8
Phaeophytin aα-amyrinlupeol
MB
C (
mg/
mL
)
Figure 2. Graphical representation of Minimum Inhibitory Concentration (MIC) of the isolates against themicrooganisms.
0
0.05
0.1
0.15
0.2
0.25
0.3
0.35
0.4
Phaeophytin aα-amyrinlupeol
MIC
(m
g/m
L)
Figure 3. Graphical representation of the Minimum Bactericidal Concentration (MBC) of the isolates againstthe microorganisms.
415

Ekalu A et al. JOTCSA. 2019; 6(3): 411-418. RESEARCH ARTICLE
Figure 4. Graphical representation of the Minimum Fungicidal Concentration (MFC) of the isolates againstthe fungus.
RESULTS AND DISCUSSION
This study was carried out to investigate the invitro antimicrobial activities of thephytoconstituents in B. togoense so as to justify itsethnomedicinal uses in the treatment of variousailments. The results of the antimicrobial studiesshowed that the compounds exhibited remarkableactivity at 3.0 mg/mL against the fivemicroorganisms tested. These phytochemicalsdisplayed antimicrobial activity against the testedorganisms with the zone of inhibition at variousconcentrations used ranging between 12 – 27 mm(Tables 1, 2 and 3). The MIC (Table 4 and Figure2) showed that Phaeophytin a inhibited the growthof the microorganisms between 0.09- 0.18 mg/mL.That of α-amyrin was observed at 0.37 mg/mLwhile lupeol showed MIC between 0.37-0.75mg/mL. The MBC (Table 5 and Figure 3) showedthat Phaeophytin a killed the microbes between0.37-0.75 mg/mL. That of α-amyrin was observedat 0.75 mg/mL while lupeol showed MBC between0.37-0.75 mg/mL against these microbes. Theresult of MFC (Table 6 and Figure 4) showed thatphaeophytin a, α-amyrin and lupeol stopped thegrowth of the microbes at 0.18 mg/mL, 0.75mg/mL and 0.37mg/mL, 0.18 mg/mL respectively.
Phaeophytin a was most potent against C. albicans(0.09 mg/mL). The MBC showed that Phaeophytina and lupeol were the most potent against S.aureus, S. pneumoniae and S. typhi (0.37 mg/mL)which confirmed the antimicrobial activity of lupeol
(13). Pheophytin had exhibited in vitroantimicrobial action against fungal and bacterialstandard strains (14). This confirmed the potencyof Phaeophytin a in this study against themicroorganisms tested. The result of MFC showedthat Phaeophytin a was most potent against C.albicans (0.1875 mg/mL) confirmed thatpheophytin a possess strong antimicrobial activityagainst C. albicans (ATCC 90028) and C. albicans(ATCC 76615) (14). Pheophytin a had alsoexhibited antimicrobial action against variousmicroorganisms tested (15). α- and β-amyrin andamyrin acetate derivatives have exhibited potentialantifungal activity against Candida spp (16). Thepentacyclic triterpenoids, α -amyrin and β -amyrin,and lupeol have showed antibacterial activityagainst S. aureus and E. coli (17). In general, α-,β-amyrin have proved to be active by reducingbacterial viability ˂ 20 % (18). α- and β-amyrinhad inhibited the growth of Bacillus subtilis,Staphylococcus aureus, Enterococcus faecium andStaphylococcus saprophyticus (19).
CONCLUSION
Phaeophytin a, α-amyrin, and lupeol isolated fromBrachystelma togoense were screened against S.aureus, E. coli, S. pneumoniae, S. typhi, and C.albicans using Ciprofloxacin and Terbinafine asstandards. The results of activity of these isolatessupported the ethnomedicinal uses of this plant inthe treatment of skin infections, abdominal
416

Ekalu A et al. JOTCSA. 2019; 6(3): 411-418. RESEARCH ARTICLE
disorders, gonorrhea, cough, cold, and typhoidfever. Though isolation and characterization ofthese compounds have been reported (10), this isthe first report of antimicrobial activity of thisgenus. The activities of these phytoconstituents inB. togoense justified ethnomedicinal uses of theplant.
ACKNOWLEDGMENTS
The authors wish to thank the Natural ProductsResearch Group, University of Surrey, UK for thebench work opportunity.
REFERENCES
1. Höfling J, Anibal PC, Obando-Pereda G, A T Peixoto I, Furletti VF, Foglio M, et al. Antimicrobial potential of some plant extracts against Candida species. Brazilian Journal of Biology [Internet]. 2010;70:1065–8. Available from: http://www.scielo.br/pdf/bjb/v70n4/a22v70n4.pdf
2. Yuan H, Ma Q, Ye L, Piao G. The Traditional Medicine and Modern Medicine from Natural Products. Molecules. 2016;21(229):1–3.
3. Jamshidi-kia F, Lorigooini Z, Amini-khoei H. Medicinal plants : Past history and future perspective. Journal of Herbmed Pharmacology. 2018;7(1):1–7.
4. Dar RA, Shahnawaz M, Qazi PH. General overview of medicinal plants : A review. The Journal of Phytopharmacology. 2017;6(6):349–51.
5. Bruyns P V. Three New Species of Brachystelma (Apocynaceae, Asclepiadoideae, Ceropegieae) fromSouth Tropical and Southern Africa. Vol. 19. SPIE; 2009. 5 p.
6. Ollerton J, Masinde S, Meve U, Picker M, Whittington A. Fly pollination in Ceropegia (Apocynaceae: Asclepiadoideae): biogeographic and phylogenetic perspectives. Annals of Botany. 2009;103(9):1501–14.
7. Britto SJ, Bruyns P V. Three new species of Brachystelma from Tamil Nadu, India. Haseltonia. 2016;(22):48–54.
8. Kew Royal Botanical Gardens. Electronic Plant Information Centre (ePIC) [Internet]. 2019 [cited 2019 Feb 7]. Available from: http://epic.kew.org/index.htm
9. Prasad K, Prasanna P V., Meve U, Rao MS, Thulasaiah T. Brachystelma annamacharyae sp. nov. (Apocynaceae) from the Seshachalam hills of Andhra Pradesh (India). Nordic Journal of Botany. 2016;34(3):360–3.
10. Ekalu A, Ayo RG, Habila JD, Hamisu I. Phaeophytin and Triterpenoids from Brachystelma togoense Schltr , a Nigerian Medicinal Herb. Asian Journal of Chemical Sciences. 2019;6(1):1–5.
11. Niaz SI, Zhang P, Shen H, Li J, Chen B, Chen S, et al. Two new isochromane derivatives penisochromanes A and B from ascidian-derived fungus Penicillium sp. 4829. Natural Product Research [Internet]. 2018;6419(May):1–7. Available from: https://doi.org/10.1080/14786419.2018.1470173
12. CLSI. Testing, Clinical and Laboratory Standards Institute,32. 27 th. 2017.
13. Gallo M, Miranda bullet, Sarachine J. Biologicalactivities of lupeol. In: International Journal of Biomedical and Pharmaceutical Sciences. 2009. p. 46–66.
14. Gomes RA, Teles YCF, Pereira F de O, Rodrigues LA de S, Lima E de O, Agra M de F, et al.Phytoconstituents from Sidastrum micranthum (A. St.-Hil.) Fryxell (Malvaceae) and antimicrobial activity of pheophytin a. Brazilian Journal of Pharmaceutical Sciences [Internet]. 2015;51:861–7. Available from: http://www.scielo.br/scielo.php?script=sci_arttext&pid=S1984-82502015000400861&nrm=iso
15. Yen KH, Nyokat N, Kutoi CJ, Hamzah AS, Lim IF. Chemical Constituents of Artocarpus odoratissimus from Sarawak. 2017;7(08):137–41.
16. Johann S, Soldi C, Lyon JP, Pizzolatti MG, Resende MA. Antifungal activity of the amyrin derivatives and in vitro inhibition of Candida albicans adhesion to human epithelial cells. 2007;45:148–53.
17. Keawsa-ard S, Liawruangrath B, KongtaweelertS. Bioactive Compounds from Mesua ferrea Stems. 2015;42(1):185–95.
18. Díaz-ruiz G, Hernández-vázquez L, Luna H, Wacher-rodarte MC, Navarro-ocaña A. Growth
417

Ekalu A et al. JOTCSA. 2019; 6(3): 411-418. RESEARCH ARTICLE
Inhibition of Streptococcus from the Oral Cavity by α-Amyrin Esters. 2012;(Figure 1):12603–11.
19. Kiplimo JJ, Koorbanally NA, Chenia H. Triterpenoids from Vernonia auriculifera Hiern exhibit antimicrobial activity. 2011;5(8):1150–6.
418

Beluli VM. JOTCSA. 2019; 6(3): 419-428. RESEARCH ARTICLE
ASSESSMENT OF GROUNDWATERS’ QUALITY WITH DEPTH of 8-60 mIN THE ARBËRIA NEIGHBOURHOOD OF GJILAN MUNICIPALITY,
KOSOVO
Valdrin M. Beluli 1*
1University of Tirana, Faculty of Natural Sciences, Department of Industrial Chemistry, Boulevard Zogu I,Tirana, Albania.
Abstract: Gjilan is one of the largest cities in the Republic of Kosovo. Groundwater samples with adepth of 8-60 m have been taken in this neighbourhood Arbëria, where the samples were taken inthree different areas. These groundwaters are used as drinking water and to ascertain that thesegroundwaters comparing with the WHO regulation. Parameters analysed are: nitrites (NO2-N), nitrates(NO3-N), ammonia (NH3-N), chlorides (Cl-), bicarbonates (HCO3
-), alkaline (A-HCl), carbonic strength(CS), NTU, pH, and conductivity in water (CW). The results of this study display the quality of thesegroundwaters based on the WHO regulation. Some groundwaters are not in accordance with WHOwater quality regulations. The groundwaters we have analysed in three areas of the Arbërianeighbourhood in Gjilan Municipality, based on the analysis confirm very well, showing that the land ofthis neighbourhood has strong layers of lime.
Keywords: Groundwater, hydrogenochemical, neighbourhood, WHO.
Submitted: December 08, 2018. Accepted: September 24, 2019.
Cite this: Beluli V. ASSESSMENT OF GROUNDWATERS’ QUALITY WITH DEPTH of 8-60 m IN THEARBËRIA NEIGHBOURHOOD OF GJILAN MUNICIPALITY, KOSOVO. JOTCSA. 2019;6(3):419–28.
DOI: https://doi.org/10.18596/jotcsa. 493909 .
*Corresponding author. E-mail: [email protected] .
INTRODUCTION
The vast majority of groundwater comes fromrains and melting of ice. Water fills the spacesbetween stones and soil forming aquifers (waterreservoirs). Groundwater can be considered asone of the hidden resources. Groundwater maycontain natural impurities or pollutants regardlessof human activity (1). Groundwater is animportant water resource and a major factor formaintaining the regional ecological environment,which plays a significant role in ensuring water,food, economic, and ecological security (2). Thechemical composition of groundwater is theproduct of the long-term interaction betweengroundwater and the surrounding environment.During the evolution of a groundwater system,different hydrogenochemical processes result in
groundwaters having different chemicalcompositions (3).
Well water quality and their suitability fordrinking were discussed through physico-chemical parameters. Well water was taken indifferent depths and analysed for pH,conductivity in water (CW), nephelometricturbidity unit (NTU), bicarbonates (HCO3-),carbonic strength (CS), alkaline (A-HCl),chlorides (Cl-), nitrites (NO2- N), nitrates (NO3-N), and ammonia (NH3-N).
pH is a very important parameter in water quality(4). Turbidity results from the scattering of lightin water by organic and inorganic particles;however, high turbidity usually is caused bysuspended inorganic particles, particularly
419

Beluli VM. JOTCSA. 2019; 6(3): 419-428. RESEARCH ARTICLE
sediments (5). Conductivity of water (CW), also,known as specific conductivity, represents theability of water to convey electricity, and isrelated to the concentration of ionised substancesin water (6).
Ammonia (NH3-N) is present in groundwater veryoften. Its presence in water describes itsformation as the result of the reduction of organicsubstances containing nitrogen, deamination ofamines, etc. The main source of nitrite ions (NO2-N), in water is the process of mineralisation oforganic matter and nitrification from bacteria.Nitrites are much more toxic than ammonia andnitrates (7). In our case, some groundwatercontains high amounts of NO2 and their valuesare not in accordance with WHO, etc.Concentration of nitrates in groundwater oftenreaches alarming values. The concentration ofNO3-N higher than 10 mg/L in water is a causefor the methemoglobinemia of children, a diseasecharacterised by cyanosis and blue skin colour.NO3-N deactivates haemoglobin by transforminginto methaemoglobin, a form that cannot makeoxygen transport. This illness hits hard babies upto three months after birth. Chlorides areinorganic anions that are most commonly foundin natural and contaminated waters and mainlycome from natural minerals and industrialpollution. In drinking waters such asgroundwater, salty taste is derived from thepresence of high amounts of Cl- (1). Waterhardness considers the amount of mineral saltsdissolved in water or water capability to form astone scale. The water hardness indicator is ofgreat importance for determining the use ofdrinking water and for industrial purposes (4).The largest number of European countries relymore on surface water than on groundwater. Inmany countries, groundwater is used as the mainsource of water for public use because suchprocessing and water supply costs are relativelylow, while water is of high quality, etc. Theparameters analysed in groundwaters are basedon WHO criteria.
EXPERIMENTAL
ChemicalsSome of the reagents used for groundwateranalysis: Nitri Ver 3 (HACH®), Nitra Ver 5(HACH®), 0.01 M HCl, K2CrO4 0.257 mol/L,AgNO3 0.01 M, methyl orange, phenolphthalein,0.1 M HCl, Ammonia Salicylate reagent (HACH®),Ammonia Cyanurate reagent (HACH®).
Physico – Chemical parameters andmethods analysisAbsorption spectrophotometry in the ultravioletand visible region is based on theelectromagnetic radiation absorption of molecules
in the UV spectra of 160–400 nm and Vis 400–780 nm range. UV-Vis radiation absorptioncauses the excitation of the electrons of chemicalbonds by passing the molecules to higher energylevels (8). The absorption of UV-Vis radiationfrom complex molecules and inorganic salts oftransitional metals, as well as of lanthanides andactinides, causes the molecule to move from itsbasal to its excited state (9). The HACH® ModelDR/2010 Spectrophotometer is a microprocessor-controlled single-beam instrument forcolorimetric testing in the laboratory or in thefield. The instrument is precalibrated for over 120different colorimetric measurements and allowsconvenient calibrations for user-entered andfuture HACH® methods (10).
The pH and CW are defined in the groundwatersampling areas so that the results are asaccurate and realistic as those waters. The pH isdetermined with a WTW 3010 type instrument,while CW is determined with WTW Cond 3110 atµS/cm. NTU results were obtained in labs shortlyafter laboratory sampling. The instrument usedwas the 2100N ISC Turbidimeter HACH® (ISOMethod 7027).
In aquatic environments, total ammonia exists intwo chemical forms, unionised ammonia andionised ammonium (NH3-N). Nowadays, there isincreasing attention and a significant number ofstudies that are focusing on nitrogen to gainmore knowledge about the factors that areinfluencing its different transformation pathways(11).
NH3-N concentration was determined using infirst step Ammonia Salicylate reagent and insecond step using Ammonia Cyanurate reagent(Nitrogen Ammonia Test 0 – 0.50 mg/L, Method8155) and the absorbance level was thenmeasured using a spectrophotometer (HACH®
DR/ 2010, USA) at λ = 655 nm.
NO2-N concentration was determined using NitriVer 3 reagent (Nitrite Test 2 - 150 mg/L, Method8153) and the absorbance level was thenmeasured using a spectrophotometer (HACH® DR900, USA). Nitrate (NO3-N) concentration wasdetermined using Nitra Ver 5 reagent (NitrateTest 0-30 mg/L, Method 8039) and theabsorbance level was then measured using aspectrophotometer (HACH® DR / 2010, USA) at λ= 500 nm.
The water sample alkalinity is the measurementof its capacity to neutralise the acids. Wateraccumulation is mainly due to weak acid salts.We took 100 mL of the analysed sample, added 4drops of phenolphthalein and if the 100 mLsolution gets purple, then water has bases as a
420

Beluli VM. JOTCSA. 2019; 6(3): 419-428. RESEARCH ARTICLE
result of pH above 8.3, and if it does not getpurple, then 2 to 3 drops of methyl orange isadded, which gives yellow colour. It is titratedwith 0.01 M HCl until the solution gets orangeand the amount of titre used is written (7).
The determination of chlorides was carried out inan Erlenmeyer flask containing 100 mL of watersample (adjust pH 7–10 if necessary). With theaddition of 1 mL of (K2CrO4 (C= 0.257 mol/L))the sample turned to a yellowish colour. Titrationwas done with silver nitrate (AgNO3 (C = 0.01mol/L)) and it stopped at the moment when thesolution gets light red colour. The value of thechlorides in the sample was calculated accordingto Eq. 1 (12):
Cl- mg/L = 35.453 · M · (V 1−V 2 )V s
(1)
where V1 is the volume of the titre for the sample(mL), V2 is the volume of the titre for blanksample (mL), M is molarity of AgNO3 0.01 M, andVs is the volume of the sample used (100 mL inour case).
Carbonate strength (CS) is defined as thealkalinity to methyl orange. A volume of 100 mLwater sample was transferred to a 500 mLErlenmeyer flask and 2–3 drops of methylenechloride were added. The titration was performedwith standard HCl solution (C = 0.01 mol/L) untilthe colour changed to orange. The analysisresults were calculated in German degrees (°dH)water hardness scale according to E. 2 (12):
CS (°dH) = 2.8 ‧ V H C l ‧ CHC l (2)
2.8 is a constant, V H C l is the consumed volume of
HCl, and the concentration of HCl is 0.1 mol/L.
RESULTS AND DISCUSSION
The location of the analysed samplesTo analyse a large-scale neighbourhood is achallenge. We have analysed 15 groundwaters inthe Arbëria neighbourhood in municipality ofGjilan, where the distance from one sample tothe other sample is about 100-200 m and thedepth of the groundwaters are 8 to 60 m. Beforesampling the waters, sampling planning has beencarried out to divide into three sampling areassuch as Area 1, Area 2 and Area 3, see Figure 1.
Figure 1. Research areas of groundwaters within the depth of 8-60 m in neighbourhood Arbëria inmunicipality of Gjilan.
Transporting samples to the laboratoryFirst, we have cleaned the glass bottles andsterilised them well in order to be in a level ofpurity, then started collecting 1000 mL watersamples and in each area were taken 5 samples
in deep wells of 8-60 m. The water samples weretransported from 15 locations to a laboratorywith a temperature of 4-5 °C. The water is takenfrom taps that have been connected withgroundwater and before the samples are taken,
421

Beluli VM. JOTCSA. 2019; 6(3): 419-428. RESEARCH ARTICLE
the water flow should be within a 15-minute timeinterval. The samples were taken according toEPA / 600 / R-94/205.
Results for the pHpH is a very important parameter ingroundwaters, surface waters, and atmosphericwaters. In our case, the pH does not express anydegradation as a parametre and is in accordancewith the WHO regulation. In area 1, pH rangesfrom 7.1-7.45 in depths of 8-60 m, see Table 1.In Area 2, pH in groundwaters with depth of 8-30m is 7.39-7.81, while in area 3 pH ingroundwaters with depth of 25-40 m is 7.2-7.8,see Table 1. pH in area 2 is slightly highercompared to Areas 1 and 3.
Results for the conductivity water (CW)Electrical conductivity in water, also known asspecific conductivity, is the ability of water toconvey electricity, and is related to theconcentration of ionised substances in water (7).If the electrical conductivity in the water is toohigh, then this indicates that in that sample thewater contains many minerals. In the CW waterchemistry is an important parameter that iscarried out at the place where the samples aretaken. CW in groundwaters where we haveobtained values in the deposits in the three areasis not presented as a problem in the three areasanalysed (Figure 1). In Area 1, where thesampling depth was 8-60 m, which CW is 867-1673 μS/cm as seen in Table 3. In a groundwaterS/cm as seen in Table 3. In a groundwaterwith a depth of 18 m, the CW is slightly high andis not in compliance with WHO allowed values.see Table 1. Groundwaters in area 2 with a depthof 8-30 m, CW value is from 471-1448 μS/cm as seen in Table 3. In a groundwaterS/cmand these groundwaters are in accordance withWHO, see Table 1, also in Area 3 wheregroundwater with depth of 25-40 m CW includedin 920-1400 μS/cm as seen in Table 3. In a groundwaterS/cm, see Table 1. Meaning thateven in Area 3 conductivity is in accordance withWHO rules. Groundwaters have always beenfound to possess a higher conductivity thansurface water (lakes, rivers etc).
Results for Nephelometric turbidity unit (NTU)Turbidity is a measurement of the influence ofsuspended solids on an aqueous solution’s abilityto transmit light (13). In the groundwaters fromthe evidence of scientific research it hasconcluded that in the groundwaters it is difficultto achieve a high turbidity, eventually if there isextreme contamination near an undergroundwater, etc. In Area 1 of groundwaters with depthof 8-60 m, the value of NTU is not high which is0.75-3.54 and is in accordance with the WHOregulation, while in area 2 (Figure 1), wheregroundwaters with depth 8-30 m, the NTU arefrom 0.44 to 0.65, these NTU values that are
analysed are in accordance with WHO. In Area 3,NTU in groundwaters with depth of 25-40 m is0.5-3.1, see Table 1. NTU values in the threeareas analysed are in accordance with WHO.
Results for chlorides (Cl-)Chlorides (Cl-) are present in both fresh and saltywater, and are essential elements of life. Highchloride concentrations in fresh water can harmaquatic organisms by interfering withosmoregulation, the biological process by whichthey maintain the proper concentration of saltand other solutes in their bodily fluids (14).Chlorides in groundwaters often are higher thansurface water because water is always in contactwith the various layers of soil which may containdifferent ions. Groundwaters in Area 1 with depthof 8-60 m, there is no high concentration ofchlorides is 26.2-55 mg/L, see Table 1. In Area 2,groundwaters with depth of 8-30 m, theconcentration of Cl- in this area is 12.6-49.4 mg/L. In Area 3, the concentration of Cl- ingroundwaters with depth of 25 -60 m is 22-60mg/L, see Table 1. In Area 3 (Figure 1) theconcentration of Cl- is higher compared to Area 2and Area 1, see Table 1. In all groundwatersamples, the concentration of Cl- is in accordancewith WHO.
Results for AlkalinityAlkalinity is determined by volume through classtitrations or potentiometric titrations (6). Thealkaline in these waters are in accordance withthe WHO regulation and this appearance apositivity in these groundwaters that we haveanalysed. In Area 1, the amount of alkalinity ingroundwaters with depth of 8-60 m is 6.39-8.57HCl/ mL, while in area 2 the amount of alkalinityis 4.2-8.6 HCl/mL in the groundwaters’ depths of8-30 m, see Table 1. In Area 3, groundwaterswith a depth of 25-40 m, the amount of alkalinityis 4.73-8.46 HCl/mL, see Table 1. In the threeareas analysed (Figure 1), all values obtained inthis groundwater are in accordance with the WHOregulation for this parameter, see Table 1.
Results for bicarbonates (HCO3-)
The amount of bicarbonate (HCO3-) oftenexpresses great concern in groundwaters,because limestone layers can be found in theinterior, etc. In Area 1, the concentration ofHCO3- in groundwaters with depth of 8 - 60 m is390.4 -523.2 mg/L, so in two groundwaters ofthis area are not in accordance with the WHOregulation. In area 2, groundwaters with a depthof 8-30 m of HCO3- is 256.2-524.6 mg/L. In Area3, groundwaters with a depth of 25-40 m ofHCO3- is within 289-516.5 mg/L, see Table 1. Theconcentration of HCO3- in those groundwatersthat is not accordance with WHO:
422

Beluli VM. JOTCSA. 2019; 6(3): 419-428. RESEARCH ARTICLE
(i). In groundwater with a depth of 8 m in Area1, the concentration of HCO3- is 523.2 mg/L. Thisconcentration indicates that it is not inaccordance with the WHO regulation because it ismore than 23.2 mg/L, see Table 1. In addition, inthis area there is another groundwater that is notin accordance with the WHO regulation, which isin depth of 9 m, where the concentration ofHCO3- is 518.5 mg/L. This indicates that theconcentration of 18.5 mg/L is more than theWHO allowed regulation, see Table 1.
(ii). In Area 2, there is only a groundwater that isnot in accordance with the WHO. The depth ofthis groundwater reaches up to 12 m where theconcentration of HCO3- is 524.6 mg/L, soaccording to this value, the concentration of 24.6mg/L is above the WHO allowed value, see Table1.
(iii). Also, in Area 3, groundwater with a depth of30 m and other groundwater with a depth of 40m are not in accordance with WHO. Ingroundwater with a depth of 30 m, theconcentration of HCO3- is 516.5 mg/L, soaccording to this concentration in thisgroundwater there are more than 16.5 mg/LHCO3-, see Table 1. In groundwater with a depthof 40 m, the concentration of HCO3- is 501.9 mg/L, see Table 1 and compare with WHO criteria forthese parametres that have been analysed inthree areas.
Results for nitrites (NO2- N) and nitrates (NO3- N)Nitrates (NO3−) and nitrites (NO2−) are frequentlypresent in plants, soils and waters; since theirchemistries are practically indissociable, onerarely is found without the other. If in excessivelevels, these ions can have an adverse impact onpublic health and ecological systems. NO3− is theforemost toxic agent, but the fairly inert nitrate iseasily reduced to nitrite by bacterial action in thesoil or within the digestive system (15). With thedevelopment of agriculture, the use of artificialfertilisers increases, which means that theconsumption of nitrates increases, while thephosphate consumption remains the same. Thereis a risk of NO3−, because approximately 10% offertilisers and pesticides are removed from thesoil surface (16). In Area 1, the concentration ofNO3-N in groundwaters with a depth of 8-60 mdoes not contain a high concentration, wherevalues are within 3-7.1 mg/L, while in Area 2 theconcentration of NO3-N is within 1.9-35 mg/L ingroundwaters with depth of 8-30 m, see Table 1.In Area 3, groundwaters with depth of 25-40 mdoes not display a high concentration of NO3-N,where values are within 1.9-8.9 mg/L. Theconcentration of NO3-N which is not inaccordance with WHO regulation:
(i). In Area 2, groundwater with a depth of 8 m(Figure 1) possesses a very high concentration ofnitrate up to 35 mg/L, see Table 1. Thisconcentration is too high for a groundwater,containing more than 25 mg/L as compared toWHO regulation. This groundwater is not inaccordance with WHO, see Table 1.
Nitrites (NO2-N) usually display manycomplications in groundwater, where thesewaters are open in the ex-agricultural land, as inour study.
The nitrites in our case in the groundwater with adepth of up to 60 m have been proved to bepresent in most groundwaters, the concentrationof NO2-N in some groundwaters is not inaccordance with WHO. In Area 1, NO2-N ingroundwaters with depth of 8 - 60 m, theconcentration of NO2-N is 0.001-0.008 mg/L, seeTable 1. In Area 2, in groundwaters with depth of8 - 30 m, the concentration of NO2-N is 0.003-0.008 mg/L, while in Area 3, the NO2-N quantityis within 0.002-0.009 mg/L, see Table 1. Theconcentration of NO2-N in groundwaters in theArbëria neighbourhood that are not in accordancewith the WHO regulation:
(i). In Area 1, groundwater with a depth of 8 m,NO2-N is 0.008 mg/L, see Table 1 and thisconcentration is high compared to WHO, seeTable 1. In this groundwater NO2-N is more than0.003 mg/L compare to the permissibility up to0.005 mg/L.
(ii). In Area 2, groundwater with a depth of 12 mdisplays an obstacle in this water because theconcentration of NO2-N is 0.008 mg/L, thisconcentration of NO2-N is not in accordance withthe WHO. So, in this groundwater theconcentration of NO2-N is more than 0.003 mg/Lcompare to the permissible concentration up to0.005 mg/L, see Table 1.
(iii). In Area 3, groundwater with depths of 30 m,32 m and 40 m, the value of NO2-N is high, seeTable 2. In groundwater with a depth of 30 m theconcentration of NO2-N is 0.007 mg/L and thisvalue display in one consistent with the WHOregulation and this indicates that it is not inaccordance, see Table 1. In groundwater with adepth of 30 m, the concentration of NO2-N is0.006 mg/L, this value is not in accordance withthe WHO because in this water is more than0.001 mg/L, while in groundwater with a depth of40 m, the concentration of NO2-N is 0.009 mg/L,this value is out of regulation or better to say it isnot in accordance with the WHO regulation,because it contains more than 0.004 mg/L, seeTable 1.
423

Beluli VM. JOTCSA. 2019; 6(3): 419-428. RESEARCH ARTICLE
Results for ammonia (NH3-N)Nowadays, there is increasing attention and asignificant number of studies that are focusing onnitrogen to gain more knowledge about thefactors that are influencing its differenttransformation pathways (7). Amount ofammonia (NH3-N) in groundwater with depth of8-60 m reaches the concentration of 0-0.09 mg/Lin Area 1, see Table 1. These concentrations arein accordance with WHO. In Area 2, ingroundwater with a depth of 8-30 m, NH3-N is 0-0.08 mg/L, this chemical parameter in this areais in accordance with the WHO, see Table 1. Area3 (Figure 1), in groundwater with depths of 25-30 m, NH3-N quantities is 0-0.03 mg/L and thesevalues do not indicate any risk, see Table 1. InArea 3, all results obtained in this groundwatersare in accordance with WHO, see Table 1. In Area1, NH3-N is present with a higher concentrationcompared to Areas 2 and 3.
Results for carbonic strengthWater hardness is considered to be adisadvantageous parameter in the use of waterfor urban purposes and factories (due to theformation of lacquer layers in the steam pipes).But it should be said that drinking water shouldhave a moderate hardness value because inthese cases the solubility of the toxic metals islower and the water represents a higher bufferingeffect on acidic compounds. In addition, medium-medium water presents a better taste as well asevidence that it is better for health in particularin reducing cases of some heart disease (6).Natural water which has a high amount of solublecalcium and magnesium salts is called strongwater (17).
The carbonic strength (CS) in the groundwaterswe have analysed in three different areas (Figure1) is a bit high, but this creates a benefit forreason that reduces heart disease, also the thirdtoxic metals. In Area 1, groundwaters with adepth of 8-60 m, the amount of CS is 21.67-40.02 °dH, see Table 1. In Area 2, the amount ofCS is 12.53-37.07 °dH in the groundwaters withdepth of 8-30 m, while in Area 3 in groundwaterswith depth of 25-40 m, the amount of CSincludes values 20.64-36.47 °dH. Carbonicstrength (CS) in groundwaters with depths of 8-60 m which are not in accordance with the WHOregulation:
(i). In Area 1, all groundwaters entered thecategory of strong water according to WHO, whilethe very high CS value in this area is at a depthof 18 m which reaches up to 40.02 °dH. Thisvalue is not in accordance with WHO, see Table1.
(ii). In Area 2, all groundwaters entered thecategory of strong water according to theGerman °dH degree. In groundwater with adepth of 30 m, the value of CS is 37.07 °dH, thisvalue is not in tune because this groundwaterentered the category of very strong water, seeTable 1.
(iii). Also, in area 3, groundwaters entered thecategory of strong waters. In groundwater with adepth of 32 m, where the value of CS is 36.47°dH, as well as in groundwater with a depth of 40m value of CS is 31.2 °dH, see Table 1. In thesetwo high groundwaters mentioned in area 3, theyentered the category of groundwater with highhardness according to the German scale and thistwo groundwaters are not in accordance withWHO, see Table 1.
If the water contains large amounts ofbicarbonate, this will determine the hardness ofthe CS rather than the general hardness (GH). Inthis case, after determining the total hardness(GH), it equals the carbonate strength.
The health side effects that may have someunderground water in the three study areasof the Arbëria neighbourhood
One current challenge in geochemistry isdetermining the genesis and particularly thegeochemical processes controlling the chemicalcompositions of mineral waters, which are oftengenerated in complex hydrogeological systems(18).
Arterial hypertension, affecting about one billionpeople worldwide, is the most prevalentmodifiable risk factor for cardiovascular diseasesand related disability (19). In many cases,groundwater has caused many health problemsdue to the scarcity of chemical knowledge. In ourcase, some groundwaters containing HCO3- thatare not in accordance with WHO and can causehealth problems (Figure 2) due to the formationof alkalosis.
Normal arterial blood pH is restricted to a verynarrow range of 7.35 to 7.45. A person who hasa blood pH below 7.35 is considered to be inacidosis (actually, “physiological acidosis,”because blood is not truly acidic until its pH dropsbelow 7), and a continuous blood pH below 7.0can prove fatal. Acidosis has several symptoms,including headache and confusion, and theindividual can become lethargic and easilyfatigued. A person who has a blood pH above7.45 is considered to be in alkalosis, and a pHabove 7.8 is fatal. Some symptoms of alkalosisinclude cognitive impairment (which can progressto unconsciousness), tingling or numbness in the
424

Beluli VM. JOTCSA. 2019; 6(3): 419-428. RESEARCH ARTICLE
extremities, muscle twitching and spasm,nausea, and vomiting. Both acidosis and alkalosiscan be caused by either metabolic or respiratorydisorders. Metabolic alkalosis is the opposite ofmetabolic acidosis. It occurs when the blood istoo alkaline (pH above 7.45) due to too muchbicarbonate (called primary bicarbonate excess),see Table 2. A transient excess of bicarbonate inthe blood can follow ingestion of excessiveamounts of bicarbonate, citrate, or antacids forconditions such as stomach acid reflux—known asheartburn. Cushing’s disease, which is thechronic hypersecretion of adrenocorticotrophichormone (ACTH) by the anterior pituitary gland,can cause chronic metabolic alkalosis. The oversecretion of ACTH results in elevated aldosteronelevels and an increased loss of potassium byurinary excretion. Other causes of metabolicalkalosis include the loss of hydrochloric acidfrom the stomach through vomiting, potassiumdepletion due to the use of diuretics forhypertension, and the excessive use of laxatives(20).
Nitrogen compounds are formed in the air bylightning or discharged into it from industrialprocesses, motor vehicles, and intensiveagriculture (21). Nitrites in the water supplysystem can also reach due to their frequent useas a corrosion inhibitor during industry water
processing. When the nitrite ions reach thestomach, the high concentration of hydrochloricacid in the stomach turns nitrite into nitrous acid(HNO2) which reacts with secondary amines fromthe digestive tract and forms N-nitrosoamine. N-nitrosoamines are known as carcinogenicsubstances (1).
Figure 2. Scientific description of chemicalproblems in groundwaters with depths of (8-60)m in Arbëria neighbourhood in municipality of
Gjilan.
425

Beluli VM. JOTCSA. 2019; 6(3): 419-428. RESEARCH ARTICLE
Table 1. Physico-chemical results of groundwaters with depth 8-60 m in the Arbëria neighbourhood inGjilan Municipality.
Are
a
Dep
th (
m) pH NTU CW
µS/cmCl-
mg/LA- mLHCl0.1
HCO3-
mg/LCS°dH
NO2-Nmg/L
NO3-Nmg/L
NH3-Nmg/L
Are
a 1
8 7.19 3.54 1400 55 8.57 523.2 23.21 0.008 7.1 0.05
9 7.45 0.75 1076 46 8.5 518.5 21.67 0.002 5.6 0.06
12 7.32 1.62 867 26.2 6.39 390.4 21.79 0.002 5.9 0.02
18 7.4 1.15 1693 55 7.1 433.1 40.02 0.004 4 0.09
60 7.1 1.66 1037 28 8.1 494.1 26.27 0.001 3 0
Are
a 2
8 7.57 0.65 920 39 5.6 341.6 23.08 0.003 5 0.04
12 7.74 4.52 1170 45.2 8.6 524.6 29.35 0.008 5 0.06
18 7.51 0.44 978 65 7.78 292 25.27 0.003 6.9 0
30 7.39 0.45 471 49.4 4.26 260.1 12.53 0.004 1.9 0.01
30 7.81 0.51 1448 12.6 4.2 256.2 37.07 0.003 3.4 0.08
Are
a 3
25 7.3 1.5 920 43 4.73 289 24.08 0.002 7.3 0.03
30 7.31 3.1 1230 29 8.46 516.5 20.64 0.007 8.7 0
30 7.12 2.99 1310 22 7.05 430.1 21.94 0.004 8.1 0
32 7.2 0.45 1295 60 6.54 399.1 36.47 0.006 1.9 0
40 7.8 0.5 1400 59 8.22 501.9 31.2 0.009 8.9 0.01
WHO reference values
7.2to 7.8
5 1500 250 10.5 250 to 500
18 to 30
0.005 10(Method8039)
0.5
Table 2. Types of Acidosis and AlkalosispH PCO2 HCO3-
Metabolic acidosis ↓ N, then ↓ ↓
Respiratory acidosis ↓ ↑ N, then ↑
Metabolic alkalosis ↑ N, then↑ ↑
Respiratory alkalosis ↑ ↓ N, then ↓
Reference values (arterial): pH: 7.35–7.45; pCO2:male: 35–48 mm Hg, female: 32–45 mm Hg; total
venous bicarbonate: 22–29 mM. N denotes normal;↑ denotes a rising or increased value; and ↓
denotes a falling or decreased value.
CONCLUSION
The quality and quantity of water for humanduring history has been a vital factor indetermining the welfare. The results obtained onthe basis of laboratory analysis conclude that inthe neighbourhood Arbëria the water is not of
good quality in some areas due to the highconcentrations of NO2-N and HCO3- ions andthese values of these ions send us in a directionthat the waters in this neighbourhood areincluded a high CS at the German °dH scale.During the analysis we have concluded that thereis a high carbonic strength (CS) in the three
426
Beluli VM. JOTCSA. 2019; 6(3): 419-428. RESEARCH ARTICLE
research areas, and this happened when thewater comes into contact with the undergroundlime layers by dissolving them. In conclusion wecan say that water quality is not very good due tothe carbon strength exceeding the alloweddrinking norm and this is dangerous for directconsumption and for use in the field of industry.The reason why these waters are not suitable forhuman organs is that these waters after use willcause problems over time in the digestivesystem, cardiovascular problems etc. NO2-N inthese groundwaters express a great concernbecause nitrites are very toxic. After receivingthe results, we immediately informed the users ofthese groundwater where their parameters werenot in accordance with the WHO regulation. Insome groundwaters of the three analysed areas itis proved that those parameters that are not inaccordance can cause major problems of normalmetabolism.
List of symbols and abbreviationsCW – conductivity water, NTU – nephelometricturbidity unit, CS – carbonic strength, EDTA –ethylenediaminetetraacetic acid, GH – generalhardness, WHO – World Health Organisation, A -Alkalinity, ACTH - adrenocorticotrophic hormone.
REFERENCES
1. Korça B, Analiza Kimike e Ujit, Universiteti i Prishtinës [Water Chemical Analysis, University of Pristina], Prishtinë . 2013: 91–92, 95, 97, 100, 105, 108.
2. Ting X, Dengming Y, Baisha W, Wuxia B,Pierre D, Fang L, Wang Y, Jun M. "TheEffect Evaluation of ComprehensiveTreatment for Groundwater Overdraft inQuzhou County, China.Water. 2018;10:1-18,https://doi.org/10.3390/w10070874
3. Liting X, Linxian H, Xinyu H, LizhiY ,Guangyao Ch, Junxiang X, HenghuaZh. Groundwater Hydrochemical Zoningin Inland Plains and its GeneticMechanisms. Water. 2018; 10: 1-18https://doi.org/10.3390/w10060752
4. Aliu M, Teknologjia e Ujit, Universiteti iMitrovicës [Water Technology, Universityof Mitrovica]. 2017: 23, 52
5. Denby S, Lloyd Jeffrey S, KoeningsJacqueline P, Laperriere D, Effects ofTurbidity in Fresh Waters of Alaska.1987; 7: 18-33https://doi.org/10.1577/1548-8659(1987)
6. Çullaj A, Kimi Mjedisi, Universiteti i Tiranës [Chemistry Environment, University of Tirana], Tiranë. 2005: 13, 171
7. Daci N.M, Daci-Ajvazi M.N, Shkenca eMjedisit, Akademia e Shkencave dhe eArteve të Kosovës [EnvironmentalScience, Academy of Sciences and Arts ofKosovo], Prishtinë. 2014: 87, 230, 249-255
8. Vasjari M, Shehu A, Baraj B, Çullaj A,Metodat Instrumentale të Analizës,Universiteti i Tiranës [InstrumentalMethods of Analysis, University ofTirana], Tiranë. 2013: 52
9. Lazo P, Çullaj A, Metoda të AnalizësInstrumentale, Universiteti i Tiranës[Instrumental Analysis Methods,University of Tirana], Tiranë. 2017: 59
10. DR/2010 Spectrophotometer instrumentmanual, general description, USA. 1999:15.
11. Leoni B, Patelli M, Soler V, Nava V,Ammonium Transformation in 14 Lakesalong a Trophic Gradient. Water. 2018;10: 1-13.https://doi.org/10.3390/w10030265
12. Beluli V.M. Influence of Urbanization andIndustries on the Pollution of Rivers ofGjilan Municipality, Kosovo. 2018; 67:517-525.https://doi.org/10.15255/KUI.2018.007
13. Arnold E, Toran L, Effects of Bank Vegetation and Incision on Erosion Rates in an Urban Stream. Water. 2018; 10: 1-16. https://doi.org/10.3390/w10040482
14. Molly H, Elizabeth H, Linda G, Chlorides in Fresh Water, The University of Rohde, Island. 2012: 1-4
15. Almeida X. MG, Serra A, Silveira CM, Moura JJ, Nitrite Biosensing via Selective Enzymes—A Long but Promising Route. Sensors. 2010; 10: 1-26, https://doi.org/10.3390/s101211530
16. Liu C-W, Sung Y, Chen B-C, Lai H-Y. Effects of Nitrogen Fertilizers on the Growth and Nitrate Content of Lettuce (Lactuca sativa L.). International Journal of Environmental Research and Public Health. 2014; 11 (4): 4427-4440.
427
Beluli VM. JOTCSA. 2019; 6(3): 419-428. RESEARCH ARTICLE
17. Rexhepi R. Nj, Mbrojtja e ambientit për jetë më të mirë [Protecting the environment for a better life], Prishtinë. 2006: 17
18. Shestakova A, Guseva N, Kopylova Y, Khvaschevskaya A, Polya DA, Tokarev I. Geothermometry and Isotope Geochemistry of CO2-Rich Thermal Waters in Choygan, East Tuva, Russia. Water. 2018; 10(6):729. https://doi.org/10.3390/w10060729
19. Tetti M, Monticone S, Burrello J, Matarazzo P, Veglio F, Pasini B, Jeunemaitre X, Mulatero P. Liddle
Syndrome: Review of the Literature and Description of a New Case. International Journal of Molecular Sciences. 2018; 19(3):812. https://doi.org/10.3390/ijms19030812
20. URL-1. https://courses.lumenlearning.com/suny-ap2/chapter/disorders-of-acid-base-balance/ (20.03.2019)
21. URL-2. https://www.who.int/water_sanitation_health/dwq/chemicals/nitratenitrite2ndadd.pdf (21.03.2019)
428
Çelik Onar H et al. JOTCSA. 2019; 6(3): 429-432. RESEARCH ARTICLE
Anticancer Activities of Even-Numbered Monoketo Eicosanoic AcidAnilides and Semicarbazones
Hülya Çelik Onar1* , Fatma Ceren Anlaş2 , Hasniye Yaşa1 ,
Fulya Üstün Alkan2 , Belma Hasdemir1 and Tülay Bakırel2
1 Istanbul University-Cerrahpaşa Engineering Faculty, Chemistry Department, Organic Chemistry Division,Avcilar/İstanbul/Turkey.2Istanbul University-Cerrahpaşa Veterinary Faculty, Pharmacology and Toxicology Department,Avcilar/İstanbul/Turkey.
Abstract : This work was carried out on the cytotoxic activity of semicarbazone and anilide derivatives ofketoeicosanoic acids on canine mammary tumor cell line (CMT-U27). Five semicarbazone compounds (1-5) and five anilide compounds (6-10) were used in this study. 8-Semicarbazone eicosanoic acid (3) wasshown to be cytotoxic. In contrast, 10-keto eicosanoic acid anilide (9) has been shown to be lesscytotoxic towards CMT-U27 cell line.
Keywords: Anilide, Semicarbazone, Fatty Acid,Canine mammary tumor, MTT Assay.
Submitted: June 28, 2019. Accepted: September 24, 2019.
Cite this: Çelik Onar H, Anlaş F, Yaşa H, Üstün Alkan F, Hasdemir B, Bakırel T. Anticancer Activities ofEven-Numbered Monoketo Eicosanoic Acid Anilides and Semicarbazones. JOTCSA. 2019;6(3):429–32.
DOI: https://doi.org/10.18596/jotcsa. 583845 .
*Corresponding author. E-mail: [email protected].
INTRODUCTION
In recent years, pharmaceutical industry hasbeen focused on the development of newinnovative drugs for cancer therapy, due tocancer represents an important health problem ata global level. Many natural and syntheticcompounds are in charge of affecting selectivelyspecific organs and tissues within a biologicalsystem. Particularly heterocyclic compounds arebeing studied as anticancer reagents. Amongsuch compounds, Schiff bases are importantfunctional groups in terms of biological activitiesas antimicrobial (1-3), anti-inflammatory (4,5),analgesic (6,7), and pesticidal agents (8,9).
Keto-fatty acids are stable compounds. Highmolecular weight keto-fatty acids constitute thestructure of plant waxes. There are manyliterature reports on the biological activity of fattyacids. For example, antibacterial effects of C12-C18
saturated and unsaturated fatty acids have beenobserved (10). As another one, it has beensuggested that surfactants prepared from fattyacids have a skin irritation-reducing effect. Theyshow good biodegradability and low toxicity, sothey are defined as environmentally friendly (11).Amides and anilides are also important inpharmaceutical, agrochemical industries, and areused as protecting groups in organic synthesis(12,13). It has been proved that some of thefatty acid amides and anilides synthesized havegood activity against gram-positive bacteria (14).The anticancer activities of vanillinsemicarbazone have been reported againstEhrlich Ascites Carcinoma (EAC) (15).
In this study, anilide and semicarbazonederivatives of (4-12) monoketo C20 fatty acidswere examined as anti-cancer agent on caninemammary tumor cell line (CMT-U27) and theeffect of the position of the keto group were also,
429
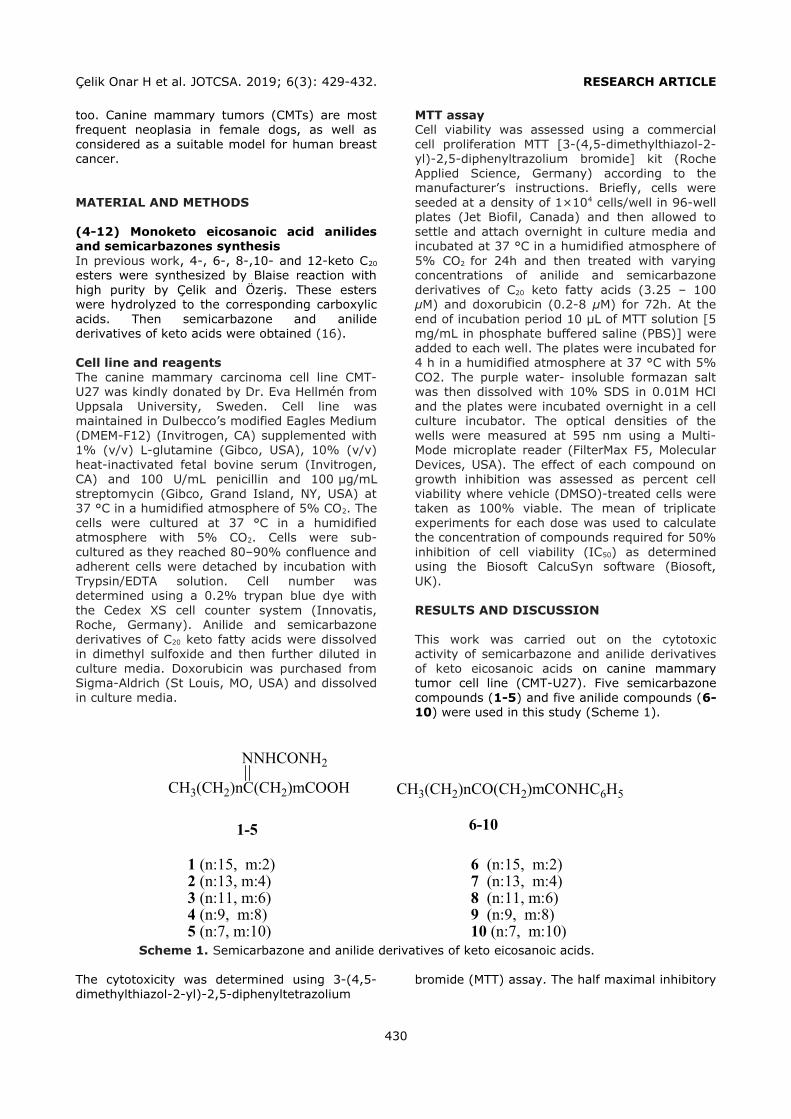
Çelik Onar H et al. JOTCSA. 2019; 6(3): 429-432. RESEARCH ARTICLE
too. Canine mammary tumors (CMTs) are mostfrequent neoplasia in female dogs, as well asconsidered as a suitable model for human breastcancer.
MATERIAL AND METHODS
(4-12) Monoketo eicosanoic acid anilidesand semicarbazones synthesisIn previous work, 4-, 6-, 8-,10- and 12-keto C20
esters were synthesized by Blaise reaction withhigh purity by Çelik and Özeriş. These esterswere hydrolyzed to the corresponding carboxylicacids. Then semicarbazone and anilidederivatives of keto acids were obtained (16).
Cell line and reagentsThe canine mammary carcinoma cell line CMT-U27 was kindly donated by Dr. Eva Hellmén fromUppsala University, Sweden. Cell line wasmaintained in Dulbecco’s modified Eagles Medium(DMEM-F12) (Invitrogen, CA) supplemented with1% (v/v) L-glutamine (Gibco, USA), 10% (v/v)heat-inactivated fetal bovine serum (Invitrogen,CA) and 100 U/mL penicillin and 100 μg/mLg/mLstreptomycin (Gibco, Grand Island, NY, USA) at37 °C in a humidified atmosphere of 5% CO2. Thecells were cultured at 37 °C in a humidifiedatmosphere with 5% CO2. Cells were sub-cultured as they reached 80–90% confluence andadherent cells were detached by incubation withTrypsin/EDTA solution. Cell number wasdetermined using a 0.2% trypan blue dye withthe Cedex XS cell counter system (Innovatis,Roche, Germany). Anilide and semicarbazonederivatives of C20 keto fatty acids were dissolvedin dimethyl sulfoxide and then further diluted inculture media. Doxorubicin was purchased fromSigma-Aldrich (St Louis, MO, USA) and dissolvedin culture media.
MTT assayCell viability was assessed using a commercialcell proliferation MTT [3-(4,5-dimethylthiazol-2-yl)-2,5-diphenyltrazolium bromide] kit (RocheApplied Science, Germany) according to themanufacturer’s instructions. Briefly, cells wereseeded at a density of 1×10⁴ cells/well in 96-wellplates (Jet Biofil, Canada) and then allowed tosettle and attach overnight in culture media andincubated at 37 °C in a humidified atmosphere of5% CO2 for 24h and then treated with varyingconcentrations of anilide and semicarbazonederivatives of C20 keto fatty acids (3.25 – 100µM) and doxorubicin (0.2-8 µM) for 72h. At theend of incubation period 10 μg/mLL of MTT solution [5mg/mL in phosphate buffered saline (PBS)] wereadded to each well. The plates were incubated for4 h in a humidified atmosphere at 37 °C with 5%CO2. The purple water- insoluble formazan saltwas then dissolved with 10% SDS in 0.01M HCland the plates were incubated overnight in a cellculture incubator. The optical densities of thewells were measured at 595 nm using a Multi-Mode microplate reader (FilterMax F5, MolecularDevices, USA). The effect of each compound ongrowth inhibition was assessed as percent cellviability where vehicle (DMSO)-treated cells weretaken as 100% viable. The mean of triplicateexperiments for each dose was used to calculatethe concentration of compounds required for 50%inhibition of cell viability (IC50) as determinedusing the Biosoft CalcuSyn software (Biosoft,UK).
RESULTS AND DISCUSSION
This work was carried out on the cytotoxicactivity of semicarbazone and anilide derivativesof keto eicosanoic acids on canine mammarytumor cell line (CMT-U27). Five semicarbazonecompounds (1-5) and five anilide compounds (6-10) were used in this study (Scheme 1).
CH3(CH2)nCO(CH2)mCONHC6H5CH3(CH2)nC(CH2)mCOOH
NNHCONH2
1-5 6-10
1 (n:15, m:2) 6 (n:15, m:2)2 (n:13, m:4) 7 (n:13, m:4)3 (n:11, m:6) 8 (n:11, m:6)4 (n:9, m:8) 9 (n:9, m:8)5 (n:7, m:10) 10 (n:7, m:10)
Scheme 1. Semicarbazone and anilide derivatives of keto eicosanoic acids.
The cytotoxicity was determined using 3-(4,5-dimethylthiazol-2-yl)-2,5-diphenyltetrazolium
bromide (MTT) assay. The half maximal inhibitory
430
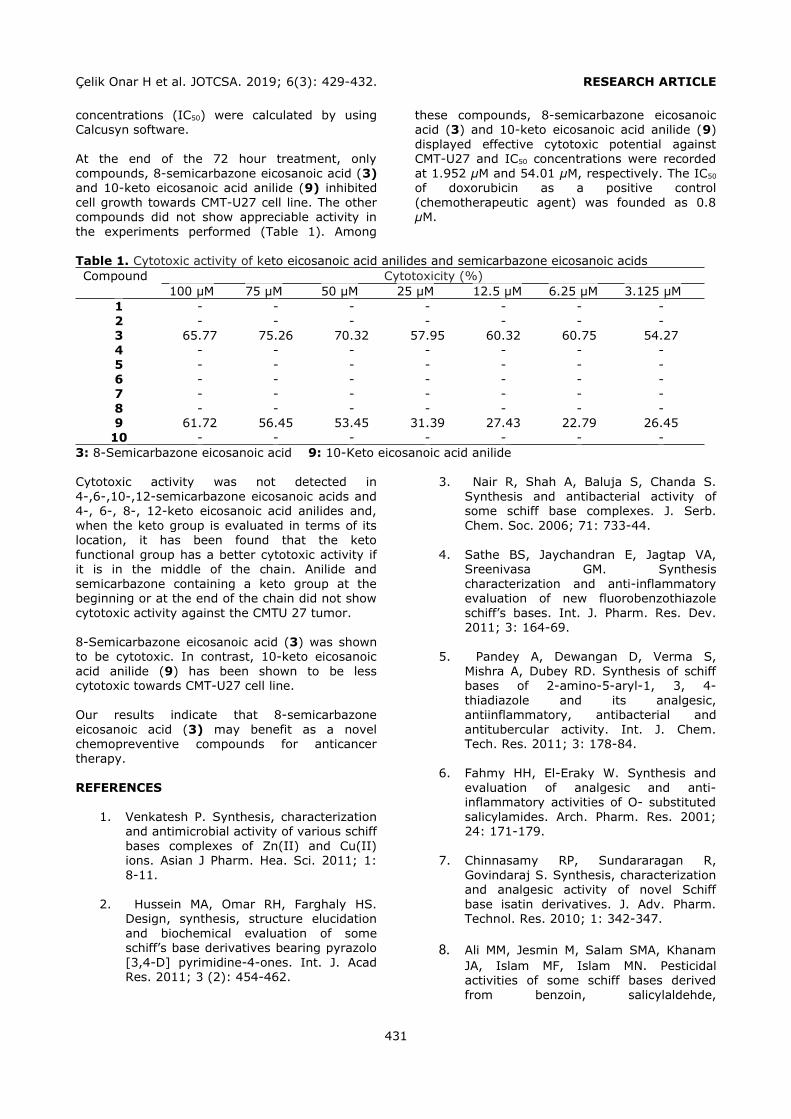
Çelik Onar H et al. JOTCSA. 2019; 6(3): 429-432. RESEARCH ARTICLE
concentrations (IC50) were calculated by usingCalcusyn software.
At the end of the 72 hour treatment, onlycompounds, 8-semicarbazone eicosanoic acid (3)and 10-keto eicosanoic acid anilide (9) inhibitedcell growth towards CMT-U27 cell line. The othercompounds did not show appreciable activity inthe experiments performed (Table 1). Among
these compounds, 8-semicarbazone eicosanoicacid (3) and 10-keto eicosanoic acid anilide (9)displayed effective cytotoxic potential againstCMT-U27 and IC50 concentrations were recordedat 1.952 µM and 54.01 µM, respectively. The IC50
of doxorubicin as a positive control(chemotherapeutic agent) was founded as 0.8µM.
Table 1. Cytotoxic activity of keto eicosanoic acid anilides and semicarbazone eicosanoic acidsCompound Cytotoxicity (%)
100 µM 75 µM 50 µM 25 µM 12.5 µM 6.25 µM 3.125 µM1 - - - - - - -2 - - - - - - -3 65.77 75.26 70.32 57.95 60.32 60.75 54.274 - - - - - - -5 - - - - - - -6 - - - - - - -7 - - - - - - -8 - - - - - - -9 61.72 56.45 53.45 31.39 27.43 22.79 26.45
10 - - - - - - -3: 8-Semicarbazone eicosanoic acid 9: 10-Keto eicosanoic acid anilide
Cytotoxic activity was not detected in4-,6-,10-,12-semicarbazone eicosanoic acids and4-, 6-, 8-, 12-keto eicosanoic acid anilides and,when the keto group is evaluated in terms of itslocation, it has been found that the ketofunctional group has a better cytotoxic activity ifit is in the middle of the chain. Anilide andsemicarbazone containing a keto group at thebeginning or at the end of the chain did not showcytotoxic activity against the CMTU 27 tumor.
8-Semicarbazone eicosanoic acid (3) was shownto be cytotoxic. In contrast, 10-keto eicosanoicacid anilide (9) has been shown to be lesscytotoxic towards CMT-U27 cell line.
Our results indicate that 8-semicarbazoneeicosanoic acid (3) may benefit as a novelchemopreventive compounds for anticancertherapy.
REFERENCES
1. Venkatesh P. Synthesis, characterizationand antimicrobial activity of various schiffbases complexes of Zn(II) and Cu(II)ions. Asian J Pharm. Hea. Sci. 2011; 1:8-11.
2. Hussein MA, Omar RH, Farghaly HS.Design, synthesis, structure elucidationand biochemical evaluation of someschiff’s base derivatives bearing pyrazolo[3,4-D] pyrimidine-4-ones. Int. J. AcadRes. 2011; 3 (2): 454-462.
3. Nair R, Shah A, Baluja S, Chanda S.Synthesis and antibacterial activity ofsome schiff base complexes. J. Serb.Chem. Soc. 2006; 71: 733-44.
4. Sathe BS, Jaychandran E, Jagtap VA,Sreenivasa GM. Synthesischaracterization and anti-inflammatoryevaluation of new fluorobenzothiazoleschiff’s bases. Int. J. Pharm. Res. Dev.2011; 3: 164-69.
5. Pandey A, Dewangan D, Verma S,Mishra A, Dubey RD. Synthesis of schiffbases of 2-amino-5-aryl-1, 3, 4-thiadiazole and its analgesic,antiinflammatory, antibacterial andantitubercular activity. Int. J. Chem.Tech. Res. 2011; 3: 178-84.
6. Fahmy HH, El-Eraky W. Synthesis andevaluation of analgesic and anti-inflammatory activities of O- substitutedsalicylamides. Arch. Pharm. Res. 2001;24: 171-179.
7. Chinnasamy RP, Sundararagan R,Govindaraj S. Synthesis, characterizationand analgesic activity of novel Schiffbase isatin derivatives. J. Adv. Pharm.Technol. Res. 2010; 1: 342-347.
8. Ali MM, Jesmin M, Salam SMA, KhanamJA, Islam MF, Islam MN. Pesticidalactivities of some schiff bases derivedfrom benzoin, salicylaldehde,
431
Çelik Onar H et al. JOTCSA. 2019; 6(3): 429-432. RESEARCH ARTICLE
aminophenol and 2, 4-dinitrophenylhydrazine. J. Sci. Res.2009; 1: 641-646.
9. Jesmin M, Ali MM, Islam MN. PesticidalActivity of some Schiff Base ComplexesDerived from some Divalent MetalAcetates, Glycine and Salicylaldehyde. J.Sci. Found. 2008; 6: 49-56.
10. Jon JK, Swieczkowski DM, AnthonyJC, Truant JP. Fatty Acids andDerivatives as Antimicrobial Agents.Antimicrob. Agents Chemother. 1972; 2(1): 23-28.
11. Maag H. Fatty acid derivatives:Important surfactants for household,cosmetic and industrial purposes. J. Am.Oil Chem. Soc. 1984; 61: 259-267.
12. Pasha MA, Nanjundaswamy HM.Reductive fission of azoarenes to
aminoarenes by aluminium/hydrazinehydrate. J. Chem. Res. 1984; 750-752.
13. Hartley D, Kidd H. The AgrochemicalsHand Book, 2nd ed.; Royal Society ofChemistry: Nottingham, 1987; p 215.
14. Maurer EW, Smith FD. Fatty acid amidesand anilides, syntheses and antimicrobialproperties. J. Am. Oil Chem. Soc. 1980;57: 98-103.
15. Shaikh MMA, Azad MAK, Jesmin M, AhsanS, Rahman MM, Kraham JA, Islam MN,Shahria SMS. In vivo anticancer activityof vanillin semicarbazone. Asian Pac. J.Trop. Biomed. 2012; 438-442.
16. Çelik H, Özeriş S. Synthesis of EvenNumbered of (2-12) MonohydroxyEicosanoic Acid Isomers. Chim. ActaTurc. 1996; 24: 23-27.
432
Yaşa H, Demir K. JOTCSA. 2019; 6(3): 433-438. RESEARCH ARTICLE
Bi(NO3)3·5H2O-catalyzed Mannich Reaction: A Potent Catalyst forSynthesis of β-Aminocarbonyl Compounds
Hasniye Yaşa1* and Kübra Demir2
1Istanbul University-Cerrahpaşa, Engineering Faculty, Chemistry Department, 34320 Avcilar, Istanbul,Turkey.2Istanbul University-Cerrahpaşa, Institute of Science, Chemistry Division, Avcilar-Istanbul,Turkey
Abstract: Biologically active compounds containing nitrogen, natural molecules and drugs are importantfor organic synthesis. Mannich reaction is one of the most common methods used for the synthesis ofthese compounds. Bi(NO3)3 was used as an efficient catalyst for the one-pot three-component Mannichreactions of ketones with different aromatic amines and aromatic aldehydes at room temperature. It is agood method to prepare β-aminocarbonyl compounds in excellent yield. The high efficiency using simplestarting materials and a catalytic amount of a reusable catalyst is especially noteworthy.
Keywords: Mannich reaction, One-pot synthesis, Bismuth(III) nitrate, β-Aminocarbonyls.
Submitted: August 16, 2019. Accepted: September 26, 2019.
Cite this: Yaşa H, Demir K. Bi(NO3)3·5H2O-catalyzed Mannich Reaction: A Potent Catalyst for Synthesisof β-Aminocarbonyl Compounds. JOTCSA. 2019;6(3):433–8.
DOI: https://doi.org/10.18596/jotcsa. 605641 .
*Corresponding author. E-mail: [email protected]. Tel: 05423831488.
INTRODUCTION
In recent years, β-amino ketones are compoundswith significant biological effects such asantibacterial, antifungal, antitumor, antidiabeticeffects (1-6). They can be easily converted intotheir derivatives and are often used in the field ofmedicine. These compounds are the mostimportant structural units used for the synthesisof 1,3-aminoalcohol and β-amino acid forms (2).Presently, β-aminocarbonyl forms are present inmany synthetic drugs available for treatment invarious medical conditions (7). β-aminocarbonylcompounds are frequently used in the synthesisof various antibiotics such as neopolyoxin andnikomycin. In the synthesis and modification ofβ-amino acids have been recorded severalmethods. Mannich reaction has an important rolein organic chemistry for obtaining bioactivecompounds and natural products. Severalmethods have been reported in the literature forthe synthesis of β-aminocarbonyl compoundsusing Brønsted acids (8), Lewis acids (9) and
organocatalysts (10). However, there are alsoproblems such as long reaction time, difficultreaction conditions, toxicity, and difficulties inseparating complex molecules. Hence there is anincreasing interest in developing environmentallybenign reactions for the synthesis of β-aminocarbonyl compounds’ syntheses.Nowadays, bismuth(III) salts (11-13) are used ascatalysts in organic synthesis because of easyhandling, low cost, and eco-friendly behavior. Wenotify a fast synthesis of β-aminocarbonylcompounds in the presence of Bi(NO3)3•5H2O(BN) for it is non-toxic, stable in air, andcheaper.
The synthesized β-aminocarbonyl compounds(4a-o) were purified by crystallization andcharacterized by elemental analysis, FT-IR, 1HNMR, 13C NMR, and MS methods. Some of thesecompounds were first synthesized in this study(4g, 4j, and 4o).
433
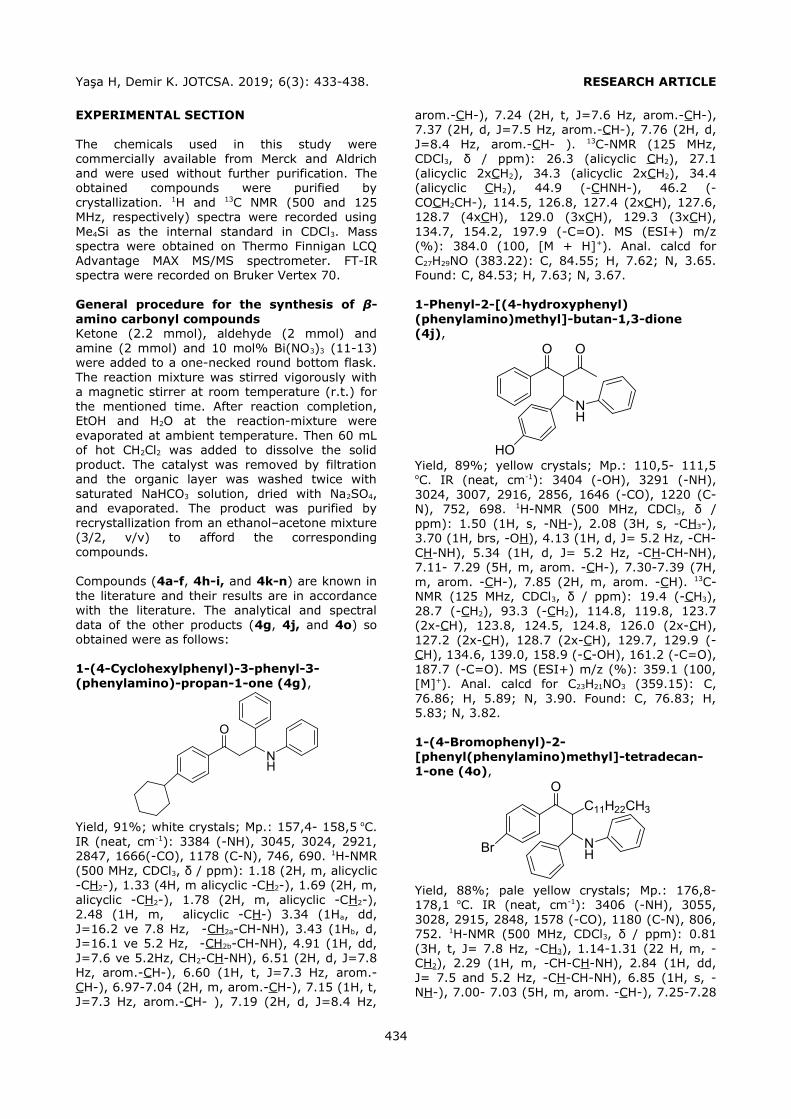
Yaşa H, Demir K. JOTCSA. 2019; 6(3): 433-438. RESEARCH ARTICLE
EXPERIMENTAL SECTION
The chemicals used in this study werecommercially available from Merck and Aldrichand were used without further purification. Theobtained compounds were purified bycrystallization. 1H and 13C NMR (500 and 125MHz, respectively) spectra were recorded usingMe4Si as the internal standard in CDCl3. Massspectra were obtained on Thermo Finnigan LCQAdvantage MAX MS/MS spectrometer. FT-IRspectra were recorded on Bruker Vertex 70.
General procedure for the synthesis of β-amino carbonyl compoundsKetone (2.2 mmol), aldehyde (2 mmol) andamine (2 mmol) and 10 mol% Bi(NO3)3 (11-13)were added to a one-necked round bottom flask.The reaction mixture was stirred vigorously witha magnetic stirrer at room temperature (r.t.) forthe mentioned time. After reaction completion,EtOH and H2O at the reaction-mixture wereevaporated at ambient temperature. Then 60 mLof hot CH2Cl2 was added to dissolve the solidproduct. The catalyst was removed by filtrationand the organic layer was washed twice withsaturated NaHCO3 solution, dried with Na2SO4,and evaporated. The product was purified byrecrystallization from an ethanol–acetone mixture(3/2, v/v) to afford the correspondingcompounds.
Compounds (4a-f, 4h-i, and 4k-n) are known inthe literature and their results are in accordancewith the literature. The analytical and spectraldata of the other products (4g, 4j, and 4o) soobtained were as follows:
1-(4-Cyclohexylphenyl)-3-phenyl-3-(phenylamino)-propan-1-one (4g),
NH
O
Yield, 91%; white crystals; Mp.: 157,4- 158,5 oC.IR (neat, cm-1): 3384 (-NH), 3045, 3024, 2921,2847, 1666(-CO), 1178 (C-N), 746, 690. 1H-NMR(500 MHz, CDCl3, δ / ppm): 1.18 (2H, m, alicyclic-CH2-), 1.33 (4H, m alicyclic -CH2-), 1.69 (2H, m,alicyclic -CH2-), 1.78 (2H, m, alicyclic -CH2-),2.48 (1H, m, alicyclic -CH-) 3.34 (1Ha, dd,J=16.2 ve 7.8 Hz, -CH2a-CH-NH), 3.43 (1Hb, d,J=16.1 ve 5.2 Hz, -CH2b-CH-NH), 4.91 (1H, dd,J=7.6 ve 5.2Hz, CH2-CH-NH), 6.51 (2H, d, J=7.8Hz, arom.-CH-), 6.60 (1H, t, J=7.3 Hz, arom.-CH-), 6.97-7.04 (2H, m, arom.-CH-), 7.15 (1H, t,J=7.3 Hz, arom.-CH- ), 7.19 (2H, d, J=8.4 Hz,
arom.-CH-), 7.24 (2H, t, J=7.6 Hz, arom.-CH-),7.37 (2H, d, J=7.5 Hz, arom.-CH-), 7.76 (2H, d,J=8.4 Hz, arom.-CH- ). 13C-NMR (125 MHz,CDCl3, δ / ppm): 26.3 (alicyclic CH2), 27.1(alicyclic 2xCH2), 34.3 (alicyclic 2xCH2), 34.4(alicyclic CH2), 44.9 (-CHNH-), 46.2 (-COCH2CH-), 114.5, 126.8, 127.4 (2xCH), 127.6,128.7 (4xCH), 129.0 (3xCH), 129.3 (3xCH),134.7, 154.2, 197.9 (-C=O). MS (ESI+) m/z(%): 384.0 (100, [M + H]+). Anal. calcd forC27H29NO (383.22): C, 84.55; H, 7.62; N, 3.65.Found: C, 84.53; H, 7.63; N, 3.67.
1-Phenyl-2-[(4-hydroxyphenyl)(phenylamino)methyl]-butan-1,3-dione(4j),
O O
NH
HOYield, 89%; yellow crystals; Mp.: 110,5- 111,5oC. IR (neat, cm-1): 3404 (-OH), 3291 (-NH),3024, 3007, 2916, 2856, 1646 (-CO), 1220 (C-N), 752, 698. 1H-NMR (500 MHz, CDCl3, δ /ppm): 1.50 (1H, s, -NH-), 2.08 (3H, s, -CH3-),3.70 (1H, brs, -OH), 4.13 (1H, d, J= 5.2 Hz, -CH-CH-NH), 5.34 (1H, d, J= 5.2 Hz, -CH-CH-NH),7.11- 7.29 (5H, m, arom. -CH-), 7.30-7.39 (7H,m, arom. -CH-), 7.85 (2H, m, arom. -CH). 13C-NMR (125 MHz, CDCl3, δ / ppm): 19.4 (-CH3),28.7 (-CH2), 93.3 (-CH2), 114.8, 119.8, 123.7(2x-CH), 123.8, 124.5, 124.8, 126.0 (2x-CH),127.2 (2x-CH), 128.7 (2x-CH), 129.7, 129.9 (-CH), 134.6, 139.0, 158.9 (-C-OH), 161.2 (-C=O),187.7 (-C=O). MS (ESI+) m/z (%): 359.1 (100,[M]+). Anal. calcd for C23H21NO3 (359.15): C,76.86; H, 5.89; N, 3.90. Found: C, 76.83; H,5.83; N, 3.82.
1-(4-Bromophenyl)-2-[phenyl(phenylamino)methyl]-tetradecan-1-one (4o),
Br
C11H22CH3
O
NH
Yield, 88%; pale yellow crystals; Mp.: 176,8-178,1 oC. IR (neat, cm-1): 3406 (-NH), 3055,3028, 2915, 2848, 1578 (-CO), 1180 (C-N), 806,752. 1H-NMR (500 MHz, CDCl3, δ / ppm): 0.81(3H, t, J= 7.8 Hz, -CH3), 1.14-1.31 (22 H, m, -CH2), 2.29 (1H, m, -CH-CH-NH), 2.84 (1H, dd,J= 7.5 and 5.2 Hz, -CH-CH-NH), 6.85 (1H, s, -NH-), 7.00- 7.03 (5H, m, arom. -CH-), 7.25-7.28
434
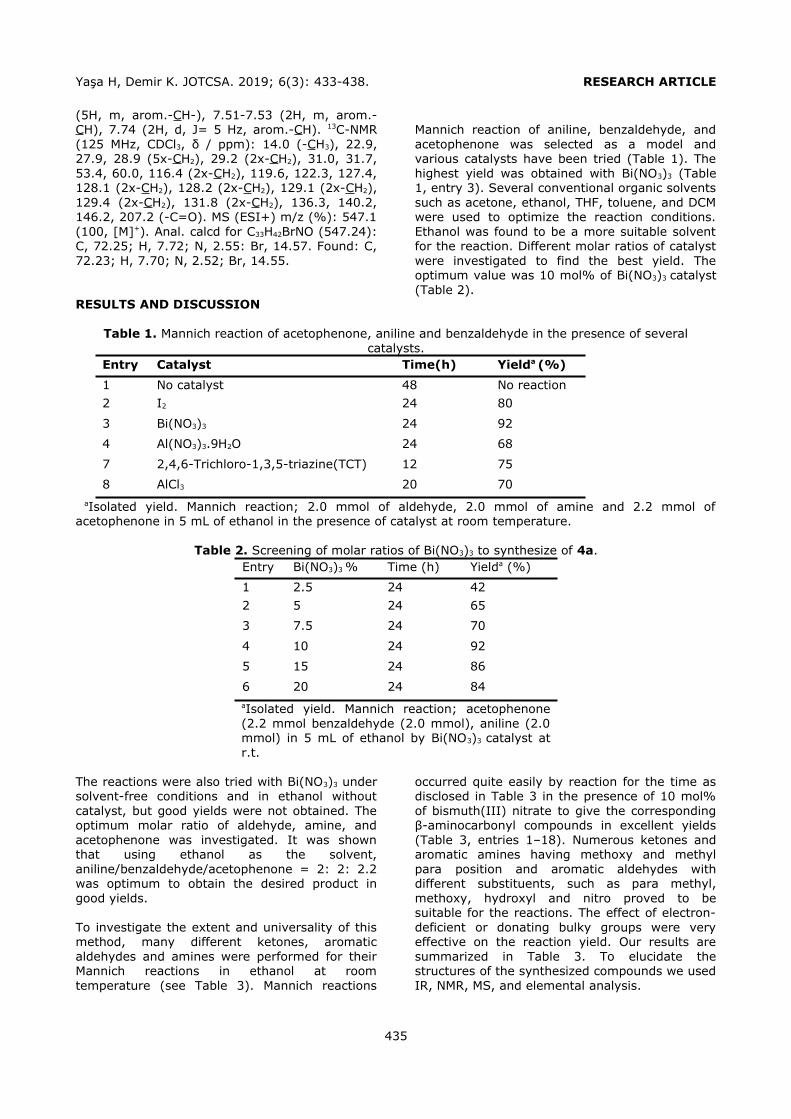
Yaşa H, Demir K. JOTCSA. 2019; 6(3): 433-438. RESEARCH ARTICLE
(5H, m, arom.-CH-), 7.51-7.53 (2H, m, arom.-CH), 7.74 (2H, d, J= 5 Hz, arom.-CH). 13C-NMR(125 MHz, CDCl3, δ / ppm): 14.0 (-CH3), 22.9,27.9, 28.9 (5x-CH2), 29.2 (2x-CH2), 31.0, 31.7,53.4, 60.0, 116.4 (2x-CH2), 119.6, 122.3, 127.4,128.1 (2x-CH2), 128.2 (2x-CH2), 129.1 (2x-CH2),129.4 (2x-CH2), 131.8 (2x-CH2), 136.3, 140.2,146.2, 207.2 (-C=O). MS (ESI+) m/z (%): 547.1(100, [M]+). Anal. calcd for C33H42BrNO (547.24):C, 72.25; H, 7.72; N, 2.55: Br, 14.57. Found: C,72.23; H, 7.70; N, 2.52; Br, 14.55.
RESULTS AND DISCUSSION
Mannich reaction of aniline, benzaldehyde, andacetophenone was selected as a model andvarious catalysts have been tried (Table 1). Thehighest yield was obtained with Bi(NO3)3 (Table1, entry 3). Several conventional organic solventssuch as acetone, ethanol, THF, toluene, and DCMwere used to optimize the reaction conditions.Ethanol was found to be a more suitable solventfor the reaction. Different molar ratios of catalystwere investigated to find the best yield. Theoptimum value was 10 mol% of Bi(NO3)3 catalyst(Table 2).
Table 1. Mannich reaction of acetophenone, aniline and benzaldehyde in the presence of severalcatalysts.
Entry Catalyst Time(h) Yielda (%)
1 No catalyst 48 No reaction
2 I2 24 80
3 Bi(NO3)3 24 92
4 Al(NO3)3.9H2O 24 68
7 2,4,6-Trichloro-1,3,5-triazine(TCT) 12 75
8 AlCl3 20 70
aIsolated yield. Mannich reaction; 2.0 mmol of aldehyde, 2.0 mmol of amine and 2.2 mmol ofacetophenone in 5 mL of ethanol in the presence of catalyst at room temperature.
Table 2. Screening of molar ratios of Bi(NO3)3 to synthesize of 4a.Entry Bi(NO3)3 % Time (h) Yielda (%)
1 2.5 24 42
2 5 24 65
3 7.5 24 70
4 10 24 92
5 15 24 86
6 20 24 84aIsolated yield. Mannich reaction; acetophenone(2.2 mmol benzaldehyde (2.0 mmol), aniline (2.0mmol) in 5 mL of ethanol by Bi(NO3)3 catalyst atr.t.
The reactions were also tried with Bi(NO3)3 undersolvent-free conditions and in ethanol withoutcatalyst, but good yields were not obtained. Theoptimum molar ratio of aldehyde, amine, andacetophenone was investigated. It was shownthat using ethanol as the solvent,aniline/benzaldehyde/acetophenone = 2: 2: 2.2was optimum to obtain the desired product ingood yields.
To investigate the extent and universality of thismethod, many different ketones, aromaticaldehydes and amines were performed for theirMannich reactions in ethanol at roomtemperature (see Table 3). Mannich reactions
occurred quite easily by reaction for the time asdisclosed in Table 3 in the presence of 10 mol%of bismuth(III) nitrate to give the correspondingβ-aminocarbonyl compounds in excellent yields(Table 3, entries 1–18). Numerous ketones andaromatic amines having methoxy and methylpara position and aromatic aldehydes withdifferent substituents, such as para methyl,methoxy, hydroxyl and nitro proved to besuitable for the reactions. The effect of electron-deficient or donating bulky groups were veryeffective on the reaction yield. Our results aresummarized in Table 3. To elucidate thestructures of the synthesized compounds we usedIR, NMR, MS, and elemental analysis.
435
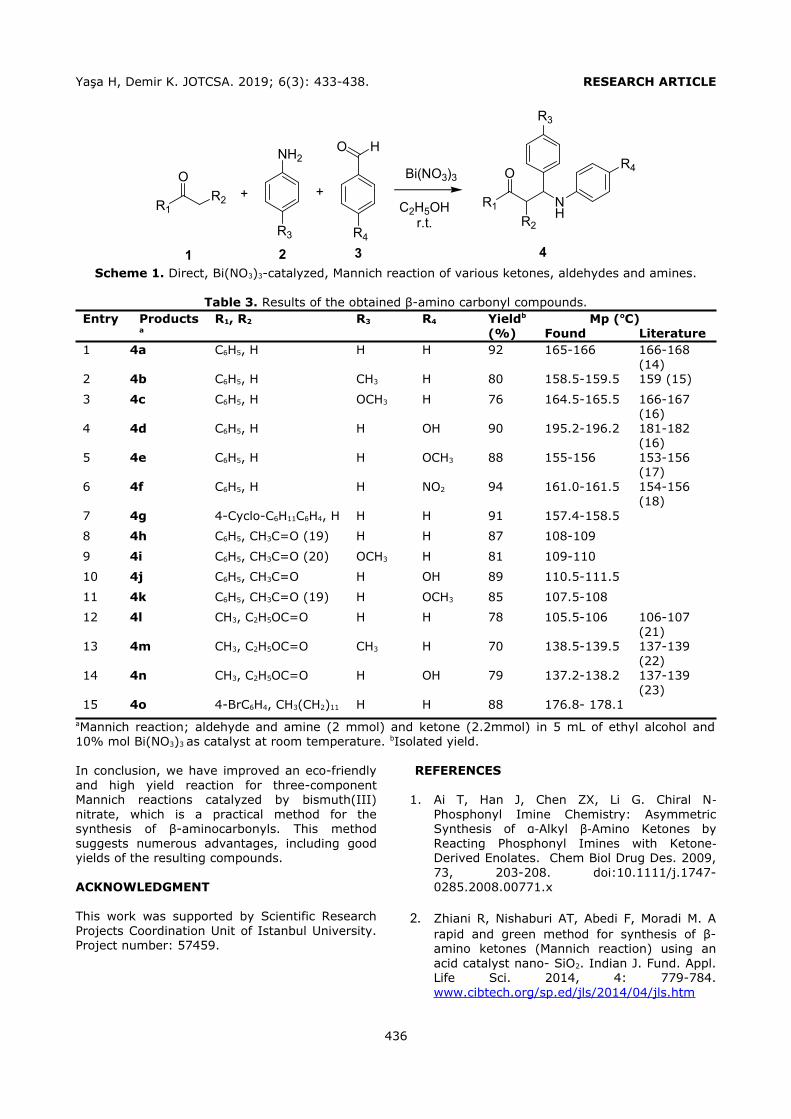
Yaşa H, Demir K. JOTCSA. 2019; 6(3): 433-438. RESEARCH ARTICLE
R1
O+
NH2
+
HO
R1 NH
O
R2
R2C2H5OHr.t.
1 2 3 4
Bi(NO3)3
R3 R4
R3
R4
Scheme 1. Direct, Bi(NO3)3-catalyzed, Mannich reaction of various ketones, aldehydes and amines.
Table 3. Results of the obtained β-amino carbonyl compounds.Entry Products
aR1, R2 R3 R4 Yieldb
(%) Mp (oC)Found Literature
1 4a C6H5, H H H 92 165-166 166-168(14)
2 4b C6H5, H CH3 H 80 158.5-159.5 159 (15)
3 4c C6H5, H OCH3 H 76 164.5-165.5 166-167(16)
4 4d C6H5, H H OH 90 195.2-196.2 181-182(16)
5 4e C6H5, H H OCH3 88 155-156 153-156(17)
6 4f C6H5, H H NO2 94 161.0-161.5 154-156(18)
7 4g 4-Cyclo-C6H11C6H4, H H H 91 157.4-158.5
8 4h C6H5, CH3C=O (19) H H 87 108-109
9 4i C6H5, CH3C=O (20) OCH3 H 81 109-110
10 4j C6H5, CH3C=O H OH 89 110.5-111.5
11 4k C6H5, CH3C=O (19) H OCH3 85 107.5-108
12 4l CH3, C2H5OC=O H H 78 105.5-106 106-107(21)
13 4m CH3, C2H5OC=O CH3 H 70 138.5-139.5 137-139(22)
14 4n CH3, C2H5OC=O H OH 79 137.2-138.2 137-139(23)
15 4o 4-BrC6H4, CH3(CH2)11 H H 88 176.8- 178.1aMannich reaction; aldehyde and amine (2 mmol) and ketone (2.2mmol) in 5 mL of ethyl alcohol and10% mol Bi(NO3)3 as catalyst at room temperature. bIsolated yield.
In conclusion, we have improved an eco-friendlyand high yield reaction for three-componentMannich reactions catalyzed by bismuth(III)nitrate, which is a practical method for thesynthesis of β-aminocarbonyls. This methodsuggests numerous advantages, including goodyields of the resulting compounds.
ACKNOWLEDGMENT
This work was supported by Scientific ResearchProjects Coordination Unit of Istanbul University.Project number: 57459.
REFERENCES
1. Ai T, Han J, Chen ZX, Li G. Chiral N‐Phosphonyl Imine Chemistry: AsymmetricSynthesis of α‐Alkyl β‐Amino Ketones byReacting Phosphonyl Imines with Ketone‐Derived Enolates. Chem Biol Drug Des. 2009,73, 203-208. doi:10.1111/j.1747-0285.2008.00771.x
2. Zhiani R, Nishaburi AT, Abedi F, Moradi M. Arapid and green method for synthesis of β-amino ketones (Mannich reaction) using anacid catalyst nano- SiO2. Indian J. Fund. Appl.Life Sci. 2014, 4: 779-784.www.cibtech.org/sp.ed/jls/2014/04/jls.htm
436
Yaşa H, Demir K. JOTCSA. 2019; 6(3): 433-438. RESEARCH ARTICLE
3. Srivastava BK, Kapadnis PB, Pandya P,Lohray VB. Novel Mannich ketones ofoxazolidinones as antibacterial agents. Eur. J.Med. Chem. 2004, 39: 989-992. doi:10.1016/j.ejmech.2004.07.007.
4. Lutz Z, Orban K, Bona A, Mark L, Maasz G,Prokai L, Seress L, Lorand T. Mannich Ketonesas Possible Antimycobacterial Agents, Arch.Pharm. Chem. Life Sci. 2017, 350: e1700102.doi:10.1002/ardp.201700102.
5. Hollosy F, Lorand T, Orfi L, Eros D, Keri G,Idei M. Relationship between lipophilicity andantitumor activity of molecule library ofMannich ketones determined by high-performance liquid chromatography, clogPcalculation and cytotoxicity test. J.Chromatogr. B. 2001, 768: 361-368.doi:10.1016/S1570-0232(02)00004-1.
6. Loranda T, Kocsis B, Sohar P, Nagy G, KispalG, Krane HG, Schmitt H, Weckert E. Synthesisand antibacterial study of unsaturatedMannich ketones. Eur. J. Med. Chem. 2001,36: 705-717. doi:10.1016/S0223-5234(01)01264-8.
7. Filho JFA, Lemos BC, Souza AS, Pinheiro S,Greco SJ. Multicomponent Mannich reactions:General aspects, methodologies andapplications, Tetrahedron. 2017, 73: 6977-7004. doi:10.1016/j.tet.2017.10.063.
8. Yi WB and Cai C. Mannich-type reactions ofaromatic aldehydes, anilines, and methylketones in fluorous biphase systems createdby rare earth (III) perfluorooctane sulfonatescatalysts in fluorous media. J. Fluorine Chem.2006, 127: 1515-1521. doi:10.1016/j.jfluchem.2006.07.009.
9. Wang R, Li BG, Huang TK, Shi L, Lu XX. NbCl5-Catalyzed one-pot Mannich-type reaction:three component synthesis of β-aminocarbonyl compounds. Tetrahedron Lett. 2007,48: 2071-2073.doi:10.1016/j.tetlet.2007.01.142.
10. Fujisawa H, Takahashi E, Mukaiyama T. Lewisbase catalyzed Mannich-type reactionsbetween trimethylsilyl enol ethers andaldimines. Chemistry. 2006, 12: 5082-5093.doi:10.1002/chem.200500821.
11. Rajput JK, Kaur G. Bi(NO3)3·5H2O: An Efficientand Green Catalyst for Synthesis of 1,5-Benzodiazepines and β-Amino CarbonylCompounds. Asian J. Chem. 2013, 25: 6545-6549. doi:10.14233/ajchem.2013.14353.
12. Ravikumar Naik TR, Bhojya Naik HS,Raghavendra M, Bindu PJ, Mahadevan KM.Synthesis of novel 1,5-benzothiazepine[7,6-b]-1, 8-naphthyridines under microwaveirradiation via Mannich condensation. J. SulfurChem. 2007, 28: 589-595. doi:10.1080/17415990701625050.
13. Sheik Mansoor S, Aswin K, Logaiya K, SudhanSPN. An efficient synthesis of β-amino ketonecompounds through one-pot three-componentMannich-type reactions using bismuth nitrateas catalyst. J. Saudi Chem. Soc. 2015, 19:379-386. doi:10.1016/j.jscs.2012.04.008.
14. Min W, Yan L, Zhigou S. Aluminium nitrate asan efficient and reusable catalyst for the threecomponents one-pot Mannich reaction:Synthesis of -amino carbonyl compoundsIndian. J. Chem., Sect. B: Org. Chem.Including Med. Chem. 2010, 49: 1653-1656. http://hdl.handle.net/123456789/10734.
15. El-Sayed Mansour ME, El-Sadany SK, KassemAA, Maksoud H. Aminolysis of para-substituted benzalacetophenones., J. Chem.And Eng. Data. 1989, 34: 368-370. doi:10.1021/je00057a030.
16. Hua L, Hang-yao Z, Hua-wu. Bismuth(III)chloride-catalyzed one-pot Mannich reaction:three-component synthesis of β-aminocarbonyl compounds. Tetrahedron Lett. 2009,50:6858-6860.doi:10.1016/j.tetlet.2009.09.131.
17. Abdghasem D, Afsaneh TN, Niloofar TH.Carbon-based Solid Acid Catalyzed One-potMannich Reaction: A Facile Synthesis of β-Amino Carbonyl Compounds. Bull. KoreanChem. Soc. 2011, 32: 635-638.doi:10.5012/bkcs.2011.32.2.635.
18. Hai-Tang L, Yu-Ru K, Hong-Yun N, Li-Ming Y.Sulfamic Acid as a Cost‐Effective andRecyclable Catalyst for β‐Amino CarbonylCompounds Synthesis. J. Chin. Chem. Soc.2009, 56: 186-195.doi:10.1002/jccs.200900027.
19. Kozlov NS, Kiseleva SA, Buzykin BI.Reaktionen Aromatischer Azomethine MitBenzoylaceton. Zh. Org. Khim. 1974, 10:1487.
20. Kozlov NS, Kiseleva SA, Buzykin B. Catalyticreaction of azomethines with benzoylactone.
Tr. Perm. Sel.-Khoz. Inst. 1971, 79: 13.
437

Yaşa H, Demir K. JOTCSA. 2019; 6(3): 433-438. RESEARCH ARTICLE
21. Neelakantan L, Hartung WH. α-Aminoalkanesulfonic Acids. J. Org. Chem.1959, 24: 1943-1948. doi:10.1021/jo01094a029.
22. Wu M, Jing H, Chang T. Synthesis of β-aminocarbonyl compounds via a Mannich reactioncatalyzed by Salen Zn complex. Catal.Commun. 2007, 8: 2217-2221.
doi:10.1016/j.catcom.2007.05.011.
23. Demirkol O, Akbaşlar D, Giray S, Barış AB.One-Pot Synthesis of Mannich Bases UnderSolvent-Free Conditions. Synth. Commun.2014, 44: 1279-1285. doi:10.1080/00397911.2013.853191.
438
1
SUPPORTING INFORMATION
Bi(NO3)3·5H2O-catalyzed Mannich Reaction: A Potent Catalyst for
Synthesis of β-Aminocarbonyl Compounds
Hasniye Yaşa1*, and Kübra Demir
1Istanbul University-Cerrahpaşa, Engineering Faculty, Chemistry Department, 34320 Avcilar,
Istanbul, Turkey
2Istanbul University-Cerrahpasa, Institute of Science, Chemistry Division, Avcilar-Istanbul,
Turkey
*Correspondence: [email protected]

2
1) Content 2
2) Experimental section and spectroscopic data
of synthesized β-amino carbonyl compounds 4g 4
3) 1H, 13C NMR, IR and GC-MS spectra of 4j 6
4) 1H, 13C NMR, IR and GC-MS spectra of 4o 8
3
2. General procedure
The chemicals used in this study were commercially available from Merck and Aldrich and were
used without further purification. The obtained compounds were purified by crystallization. 1H and
13C NMR (500 and 125 MHz, respectively) spectra were recorded using Me4Si as the internal
standard in CDCl3. Mass spectra were obtained on Thermo Finnigan LCQ Advantage MAX MS/MS
spectrometer. FT-IR spectra were recorded on Bruker Vertex 70.
General procedure for the synthesis of β-amino carbonyl compounds
Ketone (2.2 mmol), aldehyde (2 mmol) and amine (2 mmol) and 10 mol % Bi(NO3)3 [11-13] were
added to a one-necked round bottom flask. The reaction mixture was stirred vigorously with a
magnetic stirrer at room temperature (r.t.) for the mentioned time. After reaction completion,
EtOH and H2O at the reaction-mixture was evaporated at ambient temperature. Then 60 ml of hot
CH2Cl2 was added to dissolve the solid product. The catalyst was removed by filtration and the
organic layer was washed twice with saturated NaHCO3 solution, dried with Na2SO4, and
evaporated. The product was purified by recrystallization from an ethanol–acetone mixture (3/2,
v/v) to afford the corresponding compounds.
Compounds (4a-f, 4h-i, and 4k-n) are known in the literature and their results are in accordance
with the literature. The analytical and spectral data of the other products (4g, 4j, and 4o) so
obtained were as follows:
4
Spectral Data
Figure S1. 1H-NMR spectrum of compound 4g (500 MHz, CDCl3)
Figure S2. 13C-NMR spectrum of compound 4g (125 MHz, CDCl3)

5
Figure S3. IR spectrum of compound 4g
Figure S4. MS spectrum of compound 4g

6
Figure S5. 1H-NMR spectrum of compound 4j (500 MHz, CDCl3)
Figure S6. 13C-NMR spectrum of compound 4j (125 MHz, CDCl3)

7
Figure S7. IR spectrum of compound 4j
Figure S8. MS spectrum of compound 4j

8
Figure S9. 1H-NMR spectrum of compound 4o (500 MHz, CDCl3)
Figure S10. 13C-NMR spectrum of compound 4o (125 MHz, CDCl3)

9
Figure S11. IR spectrum of compound 4o
Figure S12. MS spectrum of compound 4o

Kılıç S. JOTCSA. 2019; 6(3): 439-450. RESEARCH ARTICLE
439
Effect of Temperature on Stability of Lipid Microbubbles
Sevgi Kilic*
Department of Chemical Engineering, Izmir Institute of Technology, Urla, 35430-Izmir, TURKEY
Abstract: The effect of temperature on stability of lipid microbubble shell containing polyethyleneoxide-40-
stearate (PEG40St) as emulsifier was investigated. Microbubbles at 4 °C were subjected to different temperatures up to 48 ºC (down-to-up) and it was found that both the number and the size of microbubbles
remained unchanged in the population up to a certain time, so called “onset time”. The onset time was about 6 hours at 10 °C, 2 hours at 20 °C and shorter at elevated temperatures, exhibiting an exponential decrease with increasing temperature. Once the onset time was reached, the number of microbubbles started to decrease and the average size of the population started to increase. Observation of single microbubbles on a constant temperature heating stage exhibited that each microbubble had its own onset time, with the smaller microbubbles vanishing earlier than the larger ones. The Langmuir monolayer studies showed that hydration
degree of the emulsifier PEG chains decreased with temperature, causing them go through conformational changes and subsequently destabilization of the shell. By subjecting the freshly produced microbubbles directly to the desired temperatures in up-to-down fashion, more stable microbubbles were able to be produced, with their onset time increased 40% at 10 °C to 500% at 38 °C. Overall, the results suggest that the new strategies need to be developed to control the collapse process in the microbubble shell resulting from the conformational
changes in the PEG chains of the emulsifier for the design of more stable microbubbles.
Keywords: Microbubble, ultrasound contrast agent, Langmuir monolayers, temperature, phospholipid, emulsifier, PEG conformations, stability Submitted: July 19, 2019. Accepted: October 01, 2019.
Cite this: Kilic S. Effect of Temperature on Stability of Lipid Microbubbles. JOTCSA. 2019;6(3):439–54. DOI: https://doi.org/10.18596/jotcsa.594219. *Corresponding author. E-mail: [email protected]. Phone: +90-232-750 6647; Fax:+90-232-750 6645.
INTRODUCTION
Microbubbles, micron-size gas bubbles surrounded by a lipid-based monolayer shell, are contrast agents used in ultrasound to improve the image quality.
Microbubbles are also used in targeted gene/drug delivery, metabolic gas transport, and hyperthermia
therapy (1). Attachment of therapeutic agents to microbubbles has become one of the popular strategy to achieve more effective targeting, combined with diagnosis and therapy (2). The clinical application of microbubbles with a wide range of applications is however hampered by their restricted
lifetime after their administration. Therefore, development of persistent and stable microbubbles has become one of the most promising fields in
medicine in order to enhance the therapeutic and diagnostic capabilities of ultrasound. Microbubble persistency is generally related to the dissolution of the gas core, which is associated with the shell permeation resistance (3-8). It is believed that the
Laplace driven dissolution of gas core of lipid microbubbles causes changes in the shell structure
through buckling and folding process, followed by the collapse of the shell leading to further dissolution of microbubbles (6, 9-14). However, although temperature can have important effect on the molecular orientation and arrangement of the components in a monolayer (15, 16), its effect on
the shell microstructure has not been investigated truly. The studies mostly focused on temperature dependent behavior of microbubbles. For instance,

Kılıç S. JOTCSA. 2019; 6(3): 439-450. RESEARCH ARTICLE
440
Mulvana et. al showed that commercial SonoVue®
microbubbles exhibit a size dependent dissolution
rate, with smaller size microbubbles dissolving at higher rates and increasing with increasing temperature at static and acoustically driven conditions (17). They also showed that SonoVue® microbubbles exhibit an increase in the mean bubble
diameter of the population with increasing temperature and a decrease in bubble concentration. Through their investigations on the dynamic behavior of individual SonoVue® microbubbles, they demonstrated that the majority of the microbubbles oscillated approximately spherically at room temperature, while the same size bubbles oscillated
more violently at body temperature (18). Swanson et al. monitored the change in average size of the population of oxygen microbubbles of both DSPC and DPPC with PEG40St and observed that both
microbubble type have a tendency to grow in size when stored at 4 ºC, with the DPPC coated microbubbles exhibiting smaller change in the mean
diameter (19). For the microbubbles composed of DPPC and PEG40St, Farook et al reported that while the initial sizes of the microbubbles remained unchanged for almost 2.5 hours at room temperature, the mean size of the microbubbles decreased rapidly from 6.6 µm to 1.3 µm in less than
an hour at the body temperature (20). Kwan et al monitored the dissolution behavior of a single microbubble composed of various phosphocholine lipids and PEG40St as the emulsifier, and filled with SF6 gas, in an air saturated solution and observed that the microbubbles with longer acyl chain length are more persistent at lower temperatures (5, 9).
They reported that the use of different emulsifiers, for instancemDSPE-PEG2000 versus PEG40St, did not significantly affect the dissolution behavior of the microbubbles (9). In all these studies, the less stable behavior of the microbubbles with increasing temperature was attributed simply to the changes in the physical properties of the phospholipid shell,
which are believed to be determined by the strength of attractive hydrophobic and van der Waals interactions between the hydrocarbon tails of the phospholipid molecules (9, 11, 17, 21, 22). In this respect, considerable amount of research was carried out to investigate the effect of lipid
hydrocarbon tail length on microbubble stability at different temperatures (9, 13, 14, 21). Unfortunately, the aforementioned studies still
remain insufficient to enlighten the mechanism causing destabilization of the shell under temperature and to provide a roadmap for the design of more stable microbubbles. The study investigating
the effect of cooling rate on microbubbles microstructure is very challenging, evoking that some other factors as well as hydrophobic and van der Waals interactions may be effective in the shell gas permeability (14). So far, no attention was paid to the role of temperature on emulsifier, which is the crucial component in microbubble formation and
possesses bulky polyethylene glycol (PEG) chain. In
the present study, along with monitoring the
microbubbles dissolution behavior at various
temperatures, Langmuir monolayer measurements were performed to reveal the changes in the PEG chain of the emulsifier with temperature. The results showed that the conformational changes induced by temperature in the PEG chain of the emulsifier affect
the packing density of microbubble shell and thus has important influence on destabilization of microbubbles.
MATERIALS AND METHODS
Materials
1,2-Distearoyl-sn-glycero-3-phosphocholine (DSPC) was purchased from Avanti Polar Lipids Inc (Alabaster, AL). Polyoxyethylene-40 stearate (PEG40St), propylene glycol (PG) and chloroform
were all purchased from Sigma-Aldrich (St. Louis, MO). All chemicals were used as received.
Preparation of Microbubbles A mixture of DSPC and PEG40St at a molar ratio of 9:1 was dissolved in chloroform. The solution was dried under nitrogen gas and kept in a vacuum oven at room temperature overnight to form completely dried lipid/emulsifier film. The resulting film was then
hydrated for 2 hours in phosphate buffer saline (PBS)-propylene glycol (PG) solution mixed at volume ratio of 4:1 at 60 ºC. The lipid/emulsifier mixture was first sonicated using a probe tip sonicator (Misonix, S4000, Newtown, CT) with the probe tip down in the solution to obtain well dispersed solution. The homogenous mixture was
then sonicated continuously for 30 seconds with the tip of the probe at the interface of the air-aqueous solution to form microbubbles. The resulting suspension was diluted with cold PBS at 4 ºC. After homogenization, the microbubble solution was aliquoted into 2-mL tubes. Free remaining lipids in the solution were removed via washing of
microbubble mixture with cold phosphate buffer solution (PBS) and then centrifugation operated at 2000 rpm for 2 minutes. The infranatant part of the suspension consisting of residual lipids and vesicles were discarded. The resulting cake was re-suspended in the cold PBS and centrifuged again. To
the final cake in each tube was added PBS:PG (4:1) mixture up to 1 mL volume. All tubes were combined in a large syringe to get a homogenous mixture and
then the microbubble solution was aliquoted into small vials and stored at 4 ºC. All analyses were performed on the next day following storage at 4 ºC.
Effect of Temperature on Microbubble Stability Temperature responses of a population of microbubbles were investigated at 4 ºC, 10 ºC, 20 ºC, 30 ºC, 38 ºC and 48 ºC. The microbubble solution was taken from the refrigerator at 4 ºC and measured for the concentration and size distribution by optical microscopy. The microbubbles were then
diluted to concentration of 3.5x10⁸ microbubble/ml

Kılıç S. JOTCSA. 2019; 6(3): 439-450. RESEARCH ARTICLE
441
in a 2 ml tube with temperature equilibrated PBS
buffer and then placed back into the same constant
temperature water bath. 10 µL of the samples was withdrawn from the tubes at periodic time intervals and distributed on a thoma cell counting chamber to measure the size and concentration of the microbubble population by optical microscopy.
Images of the microbubbles were captured using a digital camera attached onto an upright microscope (Olympus CH40) with a 10X objective. Image analysis was performed using ImageJ (NIH free software). In a separate study, 9:1 DSPC/PEG40St microbubbles were produced in the same manner described above. But instead of washing with PBS at
4 °C, they were washed with PBS at the temperature to be tested and submerged in the constant temperature water bath for size and concentration measurements.
The changes in the diameter of individual microbubbles were also investigated over time using
a temperature controlled hot stage at 38 ºC by observing the same frame of microscope slide without cover slip for approximately 40 minutes (Carl Zeiss Axio Imager.M2 with long working distance 63X objective). Time lapse images were acquired using a high resolution CCD camera (Carl Zeiss
AxioCam 506 mono) and analyzed by ImageJ software.
Langmuir Isotherms of Microbubble Shell Components Langmuir trough (KSV minitrough, Finland) with two movable barriers was used to investigate the phase
behavior of DSPC, PEG40St monolayers and their mixture at different temperatures. The trough was thermostated at desired temperature using a circulating bath. The system was enclosed in a box to minimize possible contamination of air-monolayer-water interface and the disturbance of the monolayer by air currents. The trough was filled
with ultrapure water with specific resistivity of 1.8x10⁷ .cm produced by a Millipore purification
system. Cleanness of the air-water interface was confirmed by closing and opening the barriers and ensuring that the surface pressure readings do not differ by more than ±0.1 mN/m. The solutions of the pure components and the mixture in chloroform were prepared in screw cap septum vials at concentrations
less than 1.0 mg/ml to avoid chloroform evaporation
and stored at 4 ºC. Prior to spreading the solution,
the sealed vial was taken from the refrigerator,
homogenized using a bath sonicator and cooled down to room temperature under continuous stirring. The solution was withdrawn via a Hamilton microsyringe from the vial sealed tightly. The surface pressure-area (-A) isotherms were obtained via
symmetric compression of monolayers by the two barriers. A compression speed of 5 mm/min was
used in all experiments. Each isotherm was repeated at least 4-5 times to make sure reproducibility of the isotherms. The same procedure was employed to monitor the relaxation behavior of the monolayers. The monolayers were compressed to the specified target pressure (30 mN/m and 40 mN/m) at constant temperature (20 °C and 38 °C) and then
the surface pressure was set to zero and the surface pressure evolution was followed with time over a
constant area of air-water interface. RESULTS AND DISCUSSION
Preparation and Characterization of Microbubbles Air-filled microbubbles were prepared by sonication method from the mixture of DSPC and emulsifier PEG40St mixed at a molar ratio of 9:1, which is the microbubble formulation commonly used in the current literature (9, 13, 14, 23, 24). Sonication
method was employed, which is the method used commonly for the production of microbubbles owing to its capability to provide fast production with low cost, but with some polydispersity (25). In this study, polydispersity of the microbubble solution
enabled us to observe the microbubbles at different sizes at the same time. Figure 1.a shows optical
microscope image of the microbubbles. Figure 1.b shows typical optical image captured under the microscope using a 10X objective and does Figure 1.c the processed micrograph created by the ImageJ program for concentration and size determination of the microbubbles. At least four images from different
field of view were taken and analyzed for size and concentration measurements. As can be seen from the figures, the microbubbles have been achieved to be distributed quite homogeneously on the stage, allowing for determination of accurate number and size distribution of the microbubbles.
Figure 1. (a) An optical image of the microbubbles captured by 10X objective (b) Microscope image analysis
microbubbles (c) image processed by ImageJ for size and concentration measurements.
10.85 mm(a) (c)(b)

Kılıç S. JOTCSA. 2019; 6(3): 439-450. RESEARCH ARTICLE
442
Effect of Temperature on Microbubble Stability
The change in the concentration of the microbubbles with time at varying temperatures is shown in Figure 2.a. The numbers of the microbubbles counted at each time was determined using optical microscopy and normalized with respect to the initial number. As
seen from the figure, while the microbubbles preserved their concentration at 4 ºC, at the other temperatures, the microbubbles maintained their concentration only up to a certain time, called ‘onset time’, exhibiting a plateau. The extent of the plateaus became shorter with increasing temperature. Once the onset time was reached, both
the number of the bubbles started to decrease (Figure 2.a) and the mean size of the population started to increase as can be seen from the
cumulative size distribution of the microbubbles at
20 °C as an example (Figure 2.b). As seen from the figure, the initial sizes of the microbubbles were less than 9 µm for the 90 % of the population and exhibited a size distribution up to 14 µm. The size distribution of the microbubbles shifted to the right
over time, indicating that the average size of the microbubbles increased in the population while the number of microbubbles decreased. The initial d50% size, which refers to the value where half of the population resides above this point, and other half resides below this point, was about 4 µm, and it increased to about 10 µm at the end of 8 hours. The
microbubbles showed similar behavior at other temperatures as well (data not shown).
Figure 2. Change of (a) microbubble concentration (normalized with respect to initial concentration) (b) cumulative size distribution at 20 °C, (c) onset time and half-life of the 9:1 DSPC/PEG40St microbubbles over time at different temperatures.
Figure 2.c summarizes the onset time as well as half-life of the microbubbles at different temperatures.
Half-life refers to the time at which the number of microbubbles dropped to the half of their initial value. The error bars correspond to the arithmetic mean of at least three independent measurements. The microbubbles kept at 4 °C were observed to remain stable for much longer than the experimental time scale. The onset time was about 6 hours at 10
°C, 2 hours at 20 °C and it was shorter than an hour at elevated temperatures. Half of the population was
lost at 14 hours at 10 °C, 6 hours at 20 °C and in shorter than an hour at elevated temperatures. Both the onset time and half-life exhibited an exponential
decrease with increasing temperature, similar to the observations seen with Sonovue® microbubbles (17) and SF6 microbubbles coated with DSPC/PEG40St and DSPC/DSPE-PEG2000 (9). To understand the fate of the microbubbles in the population under the effect of temperature, the
behavior of individual microbubbles was also investigated by observing the microbubble solution
(a)
0.0
0.1
0.2
0.3
0.4
0.5
0.6
0.7
0.8
0.9
1.0
1.1
0 2 4 6 8 10 12 14 16 18 20 22 24 26 28
Nu
mb
er (
No
rmal
ized
), #
/#0
Time (h)
4°C
10°C
20°C
30°C
38°C
48°C
(b)
(c)
0
2
4
6
8
10
12
14
16
0
2
4
6
8
10
12
14
16
0 5 10 15 20 25 30 35 40 45 50
Hal
f-Li
fe (
h)
On
set
Tim
e (h
)
Temperature (°C)
Onset Time
Half-Life
60 oC
4 oC
38 oC
30 oC
20 oC
10 oC
MicrobubbleProduction
Co
ole
d d
ow
n &
St
ore
d
Hea
tin
g Te
mp
.
48 oC
0
10
20
30
40
50
60
70
80
90
100
0 2 4 6 8 10 12 14 16 18 20
Cu
mu
lati
ve %
Diameter (µm)
t=0
t=2 h
t=4 h
t=7 h
t=8 h
T=20 C

Kılıç S. JOTCSA. 2019; 6(3): 439-450. RESEARCH ARTICLE
443
on a temperature controlled hot stage without a
coverslip at 38 °C. This allowed to monitor the
behavior of individual microbubbles with different sizes at constant saturation and temperature. As seen from Figure 3, each microbubble had a characteristic onset time proportional to its initial size, exhibiting a continuous reduction in size beyond
the onset time. The larger microbubbles maintained their initial size relatively for a longer period of time compared to the smaller ones. Evaluation of the
results for population of microbubbles and individual
microbubbles together suggest that the smaller
microbubbles vanish earlier in the population, leaving the larger ones behind in the suspension. This explains the reason behind the increase in the mean size of the population over time after the onset time. This result is in good agreement with the
Epstein-Plesset theory, suggesting that microbubble dissolution accelerates once dissolution begins and ends with a complete disappearance (26).
Figure 3. Changes in the diameter of individual 9:1 DSPC/PEG40St microbubbles with different sizes over time at 38 ºC. Microbubbles were monitored without a cover slip at constant saturation and temperature.
Langmuir Isotherms of Microbubble Shell Components Investigations of temperature on microbubble shell is very complex because it is not only the molecules orientations change, but also the gas dissolution can change. Langmuir monolayer technique stands out as the ideal technique to eliminate the gas
dissolution effect and investigate the effect of temperature only on molecules orientation at various compression states encountered during gas dissolution. Indeed, Langmuir monolayers composed of microbubble shell components are considered as a two-dimensional “skin” of the microbubble shell
(27) and therefore the technique has already been used in several studies as an experimental tool to
investigate microbubble shell characteristics (27-
29). The technique has also been used to reveal the morphological changes in the microbubble shell with compression using the Langmuir trough in combination with fluorescence microscopy (9, 13, 14). The Langmuir isotherms of DSPC/PEG40St mixture as well as the pure components were acquired at different temperatures (Figure 4). The
Langmuir isotherms of DSPC is illustrated at two different temperatures, being in a good agreement with the previously published literature (30). The isotherm for DSPC at 24 °C showed a steep rise at about 55 A2/molecule and an extended behavior at 40 °C. However, in the low compressibility region
(below ~47 A2/molecule), the isotherm at 40 °C located to the left of the one at 24 °C.
0
2
4
6
8
10
12
14
16
0 5 10 15 20 25 30 35 40 45 50
Dia
met
er (µ
m)
Time (min)
14.812.910.79.99.58.46.4
Bubble
Diameter
(mm)

Kılıç S. JOTCSA. 2019; 6(3): 439-450. RESEARCH ARTICLE
444
Figure 4. Langmuir isotherms of (a) DSPC, (b) PEG40St (c) 9:1 DSPC/PEG40St mixture at different temperatures. The numbers in figure (c) refers to the stage of the monolayer molecules orientation/organization depicted in Figure 5.
In comparison to DSPC monolayer, PEG40St molecules resulted in much larger surface pressures
in mean molecular areas larger than ~ 55 A2/molecule, exhibiting maximum surface pressures of only 33-35 mN/m depending on the temperature, known as collapse pressure (13). The isotherms
shifted to the right with increasing temperature from 4 °C to 24 °C. With further increase in temperature to 38 °C, the isotherm moved to the far left of all isotherms. Similar to PEG40St monolayer, in the high compressibility region (above 50 A2/molecule), the mixture isotherm shifted to the right with increasing
temperature, exhibiting an extended behavior. All isotherms exhibited a plateau at around 33-35 mN/m, with distinct changes at 38 °C and 48 °C, corresponding to squeeze out of the emulsifier molecules from the monolayer (13). However, in the low compressibility region where intermolecular
interactions are more dominant (below about 43
A2/molecule), the isotherms exhibited extended behavior with increasing temperature up to 30 °C and then shifted towards left with further increase in temperature. The numbers in Figure 4.c refers to the molecular organization state of the monolayer depicted in Figure 5.
The mean molecular areas of the isotherms at different temperatures were extracted from the Langmuir isotherms and plotted at different surface pressures to ease the visualization (Figure 6). In
contrast to the insignificant changes in DSPC molecules, the changes in the mean molecular area
of the pure emulsifier molecules with temperature were very prominent at all surface pressures. PEG40St monolayer exhibited a capricious behavior with temperature, increasing first and then
decreasing followed by an increase again at 48 °C at all surface pressures. Similar behavior was observed also with the mixture. A steady increase in mean molecular area with temperature was observed for the mixture at surface pressures less than about 35 mN/m, most likely because of the PEG40St molecules
not being squeezed out yet. However, above this surface pressure, the area per molecule increased with temperature up to 30 °C and then decreased again with further increase in temperature, exhibiting more distinct changes with increasing surface pressures.
In Langmuir monolayers, higher surface pressures are observed if adsorbed molecules pack more densely at the air-water interface, i.e. possessing smaller mean molecular areas. However, in this study, achievement of the same surface pressure at higher mean molecular areas with increasing temperature can be attributed to the adsorption of
increasing mass of the molecules at the interface, which can only be explained by ‘curling up’ of the PEG chain of the emulsifier towards the gas-liquid interface. The observed effect is more pronounced in
(a) (b)
(c)
0
10
20
30
40
50
60
70
20 30 40 50 60 70 80 90
Surf
ace
Pre
ssu
re (
mN
/m)
Mma (A2/molecule)
T= 4 °C
T= 10
T= 24
T= 30
T= 38
T= 48
(1)(2)
(3)
(4)
(5)
15
20
25
30
35
40
20 30 40 50 60 70 80 90 100 110
Surf
ace
Pre
ssu
re (m
N/m
)
Mma (A2/molecule)
T= 4 °CT= 10T= 24T= 38T= 48
0
10
20
30
40
50
60
70
20 30 40 50 60 70 80 90
Surf
ace
Pre
ssu
re (m
N/m
)
Mma (A2/molecule)
T=24 °C
T=40 °C

Kılıç S. JOTCSA. 2019; 6(3): 439-450. RESEARCH ARTICLE
445
pure emulsifier monolayer because the mixture
contains only 10% of the emulsifier. Migration of the
PEG chains of the emulsifier towards the gas-liquid
interface indicates temperature dependent
miscibility of PEG chains with water.
Figure 5. A cartoon depicting conformational changes and molecular organization of the microbubble shell component at various compression stages of the monolayer (as shown in Figure 4.c), mimicking the microbubble shell undergoing gas dissolution at low and high temperatures. Note that, PEG chains are more in extended into aqueous phase at lower temperatures while they curl up more towards the interface at higher temperatures.
Indeed, the interaction of ethylene oxide polymers with water occurs by means of hydrogen bonding, and the strength of the hydrogen bonds diminishes
with temperature, reducing the miscibility of the PEG chains with water (31-33). Depending on the degree of miscibility, PEG chains acquire different
conformations at the interface (30, 34), as depicted in Figure 6.b. Hence, the steady increase in the mean molecular area of the emulsifier and the mixed monolayer with increasing temperature at all surface pressures is the clear indication of decreased
miscibility of PEG chains with water, indicating migration of the PEG chains towards the interface. The further decrease in the mean molecular areas
indicates the local collapse of the monolayer to relieve the stress accumulated at the interface due to excessive accumulation of the PEG chains and
thus increased repulsive forces between them (35). The observed effect diminished with increasing surface pressure due to reduced intermolecular spacing and associated squeeze out of the emulsifier from the interface.
High Temperature Low Temperature
(1) Gas Phase(1) Gas Phase
(2) Liquid Expanded
(4) Squeeze Out
(2) Liquid Expanded
(4) Squeeze Out
(5) Solid (5) Solid
(3) Liquid Condensed (3) Liquid Condensed

Kılıç S. JOTCSA. 2019; 6(3): 439-450. RESEARCH ARTICLE
446
Figure 6. Change in the mean molecular area of (a) DSPC, (b) PEG40St, (c) 9:1 DSPC/PEG40St mixed
monolayer at different temperatures and surface pressures. The inset in figure (b) shows the conformational changes in the PEG chain of the emulsifier with temperature due to its reduced miscibility with water. The response of the Langmuir monolayer to increased lateral interactions at constant temperature can be considered similar to the
behavior of microbubble shell undergoing various degrees of compression under gas dissolution at that temperature. In order to further investigate the effects of conformational changes and increasing lateral interactions (i.e. collapse) on the microbubble shell, monolayer relaxation measurements were carried out by monitoring changes in the surface
pressure of the monolayer at constant mean molecular area with time. Monolayer relaxation occurs because of the compressed monolayer normally not being in the thermodynamic equilibrium when the surface pressure is higher than the equilibrium surface pressure (35, 36). Monolayer relaxation behavior of the mixed monolayer was
monitored at two different surface pressures (below
and above the collapse pressure of the emulsifier) and at two different temperatures (20 °C and 38 °C). The mixture isotherms showed that the surface pressure of approximately 33-35 mN/m is the collapse pressure of the emulsifier (Figure 4), in
agreement with the published literature (13). As
seen in Figure 7, at 20 °C, the monolayer compressed to 40 mN/m relaxes much more slowly than the monolayer at 30 mN/m (compare curves b
and c). Because the PEG chains acquire more extended conformation into the subphase at low temperatures, during the compression of the monolayer to higher surface pressures, some portion of the emulsifier molecules become miscible with DSPC and/or trapped within DSPC domains even if the remaining portion undergoes phase separation
and squeeze out, as depicted in Figure 5. Moreover, in contrast to the monolayers compressed to 30 mN/m, the initial fluctuations (see the inset in Figure 7) observed in the surface pressure of the monolayers compressed to 40 mN/m at both temperatures indicates the collapse (exclusion) of excessive emulsifier molecules, remaining
temporarily associated to the surface and
reinserting, but ultimately collapsing and leaving a more stable DSPC-rich monolayer behind (see Figure 5), as suggested elsewhere (36-38). The molecules in more ordered and rigid domains is known to collapse irreversibly (do not reinsert) (38).
(a) (b)
(c)
30
35
40
45
50
55
60
65
70
75
80
0 10 20 30 40 50 60
Mea
n M
ole
cula
r A
rea
(A2/m
ole
cule
)
Temperature (oC)
∏=15
∏=20
∏=25
∏=30
∏=35
∏=40
∏=45
∏=50
20
30
40
50
60
70
80
90
100
110
120
0 10 20 30 40 50 60
Mea
n M
ole
cula
r A
rea
(A
2/m
ole
cule
)
Temperature (oC)
∏=22∏=24∏=26∏=28∏=30∏=32
T
Area Area Area
30
35
40
45
50
55
60
65
70
75
80
0 10 20 30 40 50 60
Mea
n m
ole
cula
r ar
ea (
A2/m
ole
cule
)
Temperature (oC)
∏=15
∏=20
∏=25
∏=30
∏=35
∏=40
∏=45
∏=50
∏=55
Area Area Area
T

Kılıç S. JOTCSA. 2019; 6(3): 439-450. RESEARCH ARTICLE
447
Figure 7. Change in surface pressure () of 9:1 DSPC/PEG40 St mixed monolayer with time at different temperatures and target surface pressures (a) =30 mN/m and T=38 °C, (b) =40 mN/m and T=20 °C, (c)
=30 mN/m and T=20 °C, (d) =40 mN/m and T=38 °C. The inset shows the initial fluctuations during 2.5
minutes.
In contrast to the monolayer at low temperature, initial decrease in the surface pressure of the monolayers compressed to 40 mN/m is much higher at 38 ºC. This is because PEG chains become more hydrophobic, with higher portion of the PEG chains migrating to the interface and creating larger size
fluid-like domains. As a result, the steric hindrance
for accommodation of bulky PEG chains at the interface between the hydrocarbon tails of DSPC becomes much greater at higher temperatures (Figure 5). Moreover, the cohesive interactions between the hydrocarbon tails pinning the emulsifier molecules to the interface get weaker at higher
temperatures to compensate for the steric repulsions between the bulky PEG chains. As a result, created fluid-like disordered domains with larger size are more prone to collapse, resulting in decrease in surface pressure at higher rates. Equilibration of the monolayer in shorter time (about 35 min) in the case of higher temperature is also another indication for
the exclusion of the emulsifier from the monolayer at a faster rate, leaving behind a DSPC rich monolayer.
Translation of these results to microbubbles mean that during low temperature gas core dissolution,
emulsifier molecules, if not all, are trapped between DSPC molecules and some remain surface-bound upon collapse. Repetitive reinsertion of the emulsifier followed by collapse alleviates surface deformation, inhibiting gas dissolution and resulting in an onset time during microbubble dissolution. Surface deformation goes with simultaneous collapse and in-
plane reorganization of the molecules (6, 9).
Recalling that no microbubble formation is possible without the emulsifier (10, 13, 39), the microbubble shell disintegrates when the emulsifier content decreases below a ‘critical’ value in the monolayer. During high temperature dissolution however, the lateral distance at the interface decreases at much
higher rates under the combined effect of
accumulation of more PEG chains at the interface and accelerated gas core dissolution. This results in the shell to undergo collapse with the loss of PEGylated emulsifier from the interface and disintegration at much faster rate.
In a separate study, the freshly prepared microbubbles were washed with the PBS at the target temperatures and tested immediately. The onset time curve for the microbubbles cooled down directly to the target temperature located above the curve for the microbubbles exposed to elevated temperatures from 4 ºC (Figure 8). It was observed
40 % increase in the onset time of microbubbles at 10 °C, while 500% at 38 °C. This result suggests that DSPC and emulsifier molecules are initially
adsorbed around the gas bubble up to an equilibrium surface value, then upon cooling down to lower temperatures, PEG chains undergo extension into
the aqueous phase due to increased hydrophilicity with decreasing temperature while the gas bubbles go to compression at the same time. Apparently, extension of the polymer chains into the aqueous phase created the space needed for the condensation of the molecules around the gas bubble while the surface of the microbubble shell was reaching a new
equilibrium surface value. As a result, the emulsifier
-7
-6
-5
-4
-3
-2
-1
0
1
0 10 20 30 40 50 60
∆
(mN
/m)
t (min)
a
d
c
b
-2
-1.5
-1
-0.5
0
0.5
1
0 0.5 1 1.5 2 2.5
a
d
c
b

Kılıç S. JOTCSA. 2019; 6(3): 439-450. RESEARCH ARTICLE
448
molecules were retained in the microbubble shell in
extended conformation into the aqueous phase. This
argument is also in good agreement with the observed microbubble shell morphology changes with cooling rate reported elsewhere (13, 14). In those studies, formation of larger dark domains surrounded by emulsifier-rich continuous phase
(rich-in fluorophore and therefore brighter) during slow cooling process indicates entrapment of more emulsifier molecules between condensed phase
DSPC molecules (deficient in fluorophore and
therefore darker) as results of PEG chains enabling
to have enough time to extend into the aqueous phase and mix with condensed DSPC molecules, as discussed above. We also showed that conformational changes in the PEG chain of the emulsifier can be controlled by increasing the
PEG40St content in the formulation, leading to production of more stable microbubbles (40, 41).
Figure 8. Comparison of the onset time of 9:1 DSPC/PEG40St microbubbles for two cases. In the first case (open circles), the microbubbles were cooled down to 4 ºC, and then exposed to elevated temperatures. In
the second case (closed circles), the microbubbles were directly cooled down from elevated temperature to target temperature and tested immediately.
CONCLUSIONS
This study demonstrated that the conformational changes induced by temperature in the PEG chain of the emulsifier have important influence on destabilization of microbubbles. Upon their production, microbubbles are usually refrigerated and then exposed to higher temperatures for
administration and/or laboratory investigations. Langmuir isotherms and surface pressure relaxation measurements demonstrated that PEG chain of the emulsifier became predominantly hydrophobic with increasing temperature, curling up towards the air-
water interface. Accordingly, surface deformations initiates on the microbubble shell. With the initiation
of surface deformations and subsequently gas dissolution, microbubble shell undergoes compression, causing lateral distance between the shell components to decrease. At the point where the monolayer exceeds the equilibrium surface pressure value, the shell/monolayer undergoes collapse
mostly in the emulsifier rich regions, as evidenced by the reinsertions (i.e. fluctuations) in the monolayer relaxation experiments. Repetitive reinsertion of the emulsifier gives rise to the onset time, which is a
period of time during which the microbubbles
preserve their stability and then exhibit a decrease in total number by earlier disappearance of the smaller microbubbles from the population. When combined with the gas dissolution at a faster rate at higher temperatures, the more hydrophobic the PEG chains, the more the surface deformations, resulting in more destructive collapse of the monolayer and
lower stability of microbubbles. It was shown that microbubble stability can be improved by controlling the conformational changes in the PEG chain of the emulsifier by cooling down the microbubbles to desired temperature upon their production. As we
have shown before, the another way to control conformational changes in the PEG chain of the
emulsifier is to increase the PEG40St content in the formulation (40, 41). Overall, the results suggest that the effect of the conformational changes induced by temperature in the PEG chain of the emulsifier should be taken into account for the design of more stable microbubbles.
0
1
2
3
4
5
6
7
8
9
0 5 10 15 20 25 30 35 40 45 50
On
set
Tim
e (h
r)
Temperature (°C)
from 4 oC
from 60 oC60 oC
43 oC
38 oC
20 oC
10 oC
4 oC
48 oC
38 oC
20 oC
10 oC
MicrobubbleProduction
By
coo
ling
do
wn
fr
om
60
oC
By
hea
tin
g fr
om
4 o
C
30 oC
T
Area Area Area
T
Area Area Area

Kılıç S. JOTCSA. 2019; 6(3): 439-450. RESEARCH ARTICLE
449
ACKNOWLEDGEMENTS
The author would like to thank The Scientific and Technological Research Council of Turkey (TUBITAK) for the financial support through the project number of 109M494. The author also would like to thank Elif Seniz Bolukcu and Emine Aysu Sagdic for their help
in part of the experiments. REFERENCES 1. Paefgen V, Doleschel D, Kiessling F. Evolution of contrast agents for ultrasound imaging and ultrasound-mediated drug delivery. Front
Pharmacol. 2015;6. 2. Lentacker I, Geers B, Demeester J, De Smedt SC, Sanders NN. Design and Evaluation of
Doxorubicin-containing Microbubbles for Ultrasound-triggered Doxorubicin Delivery: Cytotoxicity and Mechanisms Involved. Molecular Therapy.
2010;18(1):101-8. 3. Borden MA, Longo ML. The dependence of lipid-coated microbubble dissolution behavior on acyl chain length. Biophys J. 2002;82(1):35a-a.
4. Garg S, Thomas AA, Borden MA. The effect of lipid monolayer in-plane rigidity on in vivo microbubble circulation persistence. Biomaterials. 2013;34(28):6862-70. 5. Kwan JJ, Borden MA. Lipid monolayer dilatational mechanics during microbubble gas
exchange. Soft Matter. 2012;8(17):4756-66. 6. Pu G, Borden MA, Longo ML. Collapse and shedding transitions in binary lipid monolayers coating microbubbles. Langmuir. 2006;22(7):2993-9.
7. Kabalnov A, Klein D, Pelura T, Schutt E, Weers J. Dissolution of multicomponent microbubbles in the bloodstream: 1. Theory. Ultrasound Med Biol. 1998;24(5):739-49. 8. Borden MA, Longo ML. Oxygen permeability
of fully condensed lipid monolayers. J Phys Chem B. 2004;108(19):6009-16.
9. Kwan JJ, Borden MA. Lipid monolayer collapse and microbubble stability. Advances in Colloid and Interface Science. 2012;183:82-99.
10. Shen Y, Powell RL, Longo ML. Interfacial and stability study of microbubbles coated with a mono stearin/monopalmitin-rich food emulsifier and PEG40 stearate. Journal of Colloid and Interface Science. 2008;321(1):186-94. 11. Shen YY, Powell RL, Longo ML. Influence of
the dissolution rate on the collapse and shedding
behavior of monostearin/monopalmitin-rich coated
microbubbles. Langmuir. 2008;24(18):10035-40.
12. Kwan JJ, Borden MA. Microbubble Dissolution in a Multigas Environment. Langmuir. 2010;26(9):6542-8.
13. Borden MA, Pu G, Runner GJ, Longo ML. Surface phase behavior and microstructure of lipid/PEG-emulsifier monolayer-coated microbubbles. Colloid Surface B. 2004;35(3-4):209-23. 14. Pu G, Longo ML, Borden MA. Effect of
microstructure on molecular oxygen permeation through condensed phospholipid monolayers. Journal of the American Chemical Society. 2005;127(18):6524-5.
15. Petrache HI, Dodd SW, Brown MF. Area per lipid and acyl length distributions in fluid
phosphatidylcholines determined by H-2 NMR spectroscopy. Biophys J. 2000;79(6):3172-92. 16. Kucerka N, Nieh MP, Katsaras J. Fluid phase lipid areas and bilayer thicknesses of commonly used phosphatidylcholines as a function of temperature.
Biochimica Et Biophysica Acta-Biomembranes. 2011;1808(11):2761-71. 17. Mulvana H, Stride E, Hajnal JV, Eckersley RJ. Temperature Dependent Behavior of Ultrasound Contrast Agents. Ultrasound Med Biol. 2010;36(6):925-34.
18. Mulvana H, Stride E, Tang MX, Hajnal JV, Eckersley R. Temperature-Dependent Differences in the Nonlinear Acoustic Behavior of Ultrasound Contrast Agents Revealed by High-Speed Imaging and Bulk Acoustics. Ultrasound Med Biol. 2011;37(9):1509-17.
19. Swanson EJ, Mohan V, Kheir J, Borden MA. Phospholipid-Stabilized Microbubble Foam for Injectable Oxygen Delivery. Langmuir. 2010;26(20):15726-9.
20. Farook U, Stride E, Edirisinghe MJ. Preparation of suspensions of phospholipid-coated microbubbles by coaxial electrohydrodynamic
atomization. Journal of the Royal Society Interface. 2009;6(32):271-7. 21. Borden MA, Longo ML. Dissolution behavior
of lipid monolayer-coated, air-filled microbubbles: Effect of lipid hydrophobic chain length. Langmuir. 2002;18(24):9225-33. 22. Grant CA, McKendry JE, Evans SD. Temperature dependent stiffness and visco-elastic behaviour of lipid coated microbubbles using atomic
force microscopy. Soft Matter. 2012;8(5):1321-6.
Kılıç S. JOTCSA. 2019; 6(3): 439-450. RESEARCH ARTICLE
450
23. Borden M. Nanostructural features on stable
microbubbles. Soft Matter. 2009;5(4):716-20. 24. Upadhyay A, Dalvi SV, Gupta G, Khanna N. Effect of PEGylation on performance of protein microbubbles and its comparison with lipid
microbubbles. Mat Sci Eng C-Mater. 2017;71:425-30. 25. Stride E, Edirisinghe M. Novel preparation techniques for controlling microbubble uniformity: a comparison. Medical & Biological Engineering & Computing. 2009;47(8):883-92.
26. Epstein PS, Plesset MS. On the Stability of Gas Bubbles in Liquid-Gas Solutions. J Chem Phys 1950;18(11):1505-9.
27. Wang WH, Moser CC, Wheatley MA. Langmuir trough study of surfactant mixtures used
in the production of a new ultrasound contrast agent consisting of stabilized microbubbles. J Phys Chem-Us. 1996;100(32):13815-21. 28. Abou-Saleh RH, Peyman SA, Johnson BRG, Marston G, Ingram N, Bushby R, et al. The influence
of intercalating perfluorohexane into lipid shells on nano and microbubble stability. Soft Matter. 2016;12(34):7223-30. 29. Xing ZW, Ke HT, Wang JR, Zhao B, Yue XL, Dai ZF, et al. Novel ultrasound contrast agent based on microbubbles generated from surfactant mixtures
of Span 60 and polyoxyethylene 40 stearate. Acta Biomaterialia. 2010;6(9):3542-9. 30. Chou TH, Chu IM. Thermodynamic characteristics of DSPC/DSPE-PEG(2000) mixed monolayers on the water subphase at different temperatures. Colloid Surface B. 2003;27(4):333-
44. 31. Bae YC, Lambert SM, Soane DS, Prausnitz JM. Cloud-Point Curves of Polymer-Solutions from Thermooptic Measurements. Macromolecules. 1991;24(15):4403-7.
32. Gao X, Kucerka N, Nieh MP, Katsaras J, Zhu SP, Brash JL, et al. Chain Conformation of a New
Class of PEG-Based Thermoresponsive Polymer
Brushes Grafted on Silicon as Determined by
Neutron Reflectometry. Langmuir. 2009;25(17):10271-8. 33. Tyrode E, Johnson CM, Rutland MW, Claesson PM. Structure and hydration of
poly(ethylene oxide) surfactants at the air/liquid interface. A vibrational sum frequency spectroscopy study. Journal of Physical Chemistry C. 2007;111(31):11642-52. 34. Frey SL, Lee KYC. Temperature dependence of poloxamer insertion into and squeeze-out from
lipid monolayers. Langmuir. 2007;23(5):2631-7. 35. Jebrail M, Schmidt R, DeWolf CE, Tsoukanova V. Effect of aliphatic chain length on
stability of poly(ethylene glycol)-grafted phospholipid monolayers at the air/water interface. Colloid Surface A. 2008;321(1-3):168-74.
36. Angelova A, De Coninck J, Ionov R. Equilibrium surface properties of lipid mixtures of retinal, phosphatidylcholine and fatty acid derivatives at the air/water interface. Supramol Sci. 1997;4(3-4):207-14.
37. Gopal A, Lee KYC. Morphology and collapse transitions in binary phospholipid monolayers. J Phys Chem B. 2001;105(42):10348-54. 38. Lipp MM, Lee KYC, Takamoto DY, Zasadzinski JA, Waring AJ. Coexistence of buckled
and flat monolayers. Physical Review Letters. 1998;81(8):1650-3. 39. Hristova K, Kenworthy A, Mcintosh TJ. Effect of Bilayer Composition on the Phase-Behavior of Liposomal Suspensions Containing Poly(Ethylene Glycol)-Lipids. Macromolecules. 1995;28(23):7693-
9. 40. Kilic S, Bolukcu ES. Phase behavior of DSPC/PEG(40)St mixtures at higher emulsifier contents. Colloid Surface B. 2018;171:368-76.
41. Kilic S. Quantification of PEG(40)St squeeze out from DSPC/PEG(40)St monolayers at higher molar ratios. Colloid Surface A. 2018;551:58-64.
Umar BA, Uzairu A, Shallangwa GA. JOTCSA. 2019; 6(3): 451-462. RESEARCH ARTICLE
Understanding Inhibition of Steel Corrosion by Some Potent TriazoleDerivatives of Pyrimidine through Density Functional Theory and
Molecular Dynamics Simulation Studies
Bello Abdullahi Umar* , Adamu Uzairu and Gideon Adamu Shallangwa Department of Chemistry, Ahmadu Bello University, Zaria, Nigeria
Abstract: Density Functional Theory (DFT) calculation at B3LYP level of theory and 6-31G* basis set wasapplied on some triazole derivatives of pyrimidine which led to the optimization of their structures,generation of electronic and other important Quantum chemical descriptors such as the energy of the highestoccupied molecular orbital (EHOMO), the energy of the lowest unoccupied molecular orbital (ELUMO), energy bandgap (ΔE), Dipole Moment (E), Dipole Moment (μ)), chemical hardness (η),), chemical softness (σ)), global electronegativity
σ =1η =−(
2( EHOMO −E LUMO)
)
(χ) andnumber of transferred electrons (ΔE), Dipole Moment (N) using SPARTAN’14 Software. The obtained results shows a goodcorrelation between the chemical structures of the inhibitors and their experimental inhibition efficiencies(%IEs). The ranking of these efficiencies (%IEs) nicely matched with the order of a good number of thegenerated descriptors but with a varying degree of correlation as majority of the descriptors indicates that I-4 is the best inhibitor among the data set. Furthermore, molecular dynamic (MD) simulations were carriedout to search the best adsorption configuration of the inhibitor on the steel (1 1 0) surface using MaterialStudio 8.0. The obtained results of MD simulations suggest that the interaction was as a results of thechemical adsorption on the steel surface, since the binding energy > 100 Kcalmol-1 for all the inhibitors andthe best adsorption energy was found to be -488.07 Kcalmol-1 (I-4). This observation are in good agreementwith the DFT results and the experiment findings. Thus; this study provides a valuable approach and newdirection to novel steel corrosion inhibitor discovery.
Keywords: Triazole Derivatives of pyrimidine; DFT (B3LYP/6-31G*); MD simulation.
Submitted: July 23, 2018. Accepted: October 03, 2019.
Cite this: Umar B, Uzairu A, Shallangwa G. Understanding Inhibition of Steel Corrosion by Some PotentTriazole Derivatives of Pyrimidine through Density Functional Theory and Molecular Dynamics SimulationStudies. JOTCSA. 2019;6(3):455–66.
DOI: https://doi.org/10.18596/jotcsa. 446084 .
*Corresponding author. E-mail: [email protected] .
INTRODUCTION
Corrosion of steel is a serious mechanical problemwhich affects several areas of industrial processesespecially the oil industry which always leads toenormous economic losses (1, 2). The corrosion ofsteel may cause mechanical damage of equipmentand lead to changes in the chemical properties of
processing substances. The cost of corrosionglobally reported in 2010 was about $ 2.2 Trillion,which was around 3 % of $ 73.33 Trillion (world’sentire domestic product) (3, 4). Prevention ofcorrosion exhibited a vital role for many industriesparticularly petrochemical industries that oftenmake use of steel (2). Although it is not possible to
451
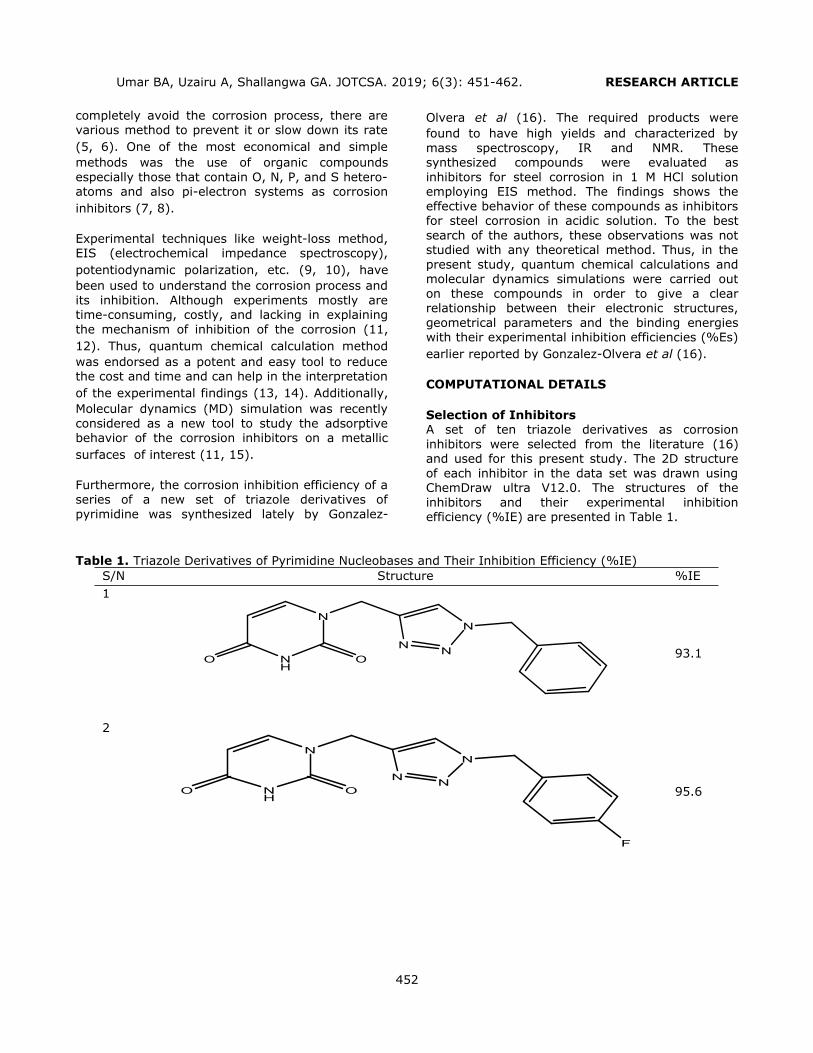
Umar BA, Uzairu A, Shallangwa GA. JOTCSA. 2019; 6(3): 451-462. RESEARCH ARTICLE
completely avoid the corrosion process, there arevarious method to prevent it or slow down its rate(5, 6). One of the most economical and simplemethods was the use of organic compoundsespecially those that contain O, N, P, and S hetero-atoms and also pi-electron systems as corrosioninhibitors (7, 8).
Experimental techniques like weight-loss method,EIS (electrochemical impedance spectroscopy),potentiodynamic polarization, etc. (9, 10), havebeen used to understand the corrosion process andits inhibition. Although experiments mostly aretime-consuming, costly, and lacking in explainingthe mechanism of inhibition of the corrosion (11,12). Thus, quantum chemical calculation methodwas endorsed as a potent and easy tool to reducethe cost and time and can help in the interpretationof the experimental findings (13, 14). Additionally,Molecular dynamics (MD) simulation was recentlyconsidered as a new tool to study the adsorptivebehavior of the corrosion inhibitors on a metallicsurfaces of interest (11, 15).
Furthermore, the corrosion inhibition efficiency of aseries of a new set of triazole derivatives ofpyrimidine was synthesized lately by Gonzalez-
Olvera et al (16). The required products werefound to have high yields and characterized bymass spectroscopy, IR and NMR. Thesesynthesized compounds were evaluated asinhibitors for steel corrosion in 1 M HCl solutionemploying EIS method. The findings shows theeffective behavior of these compounds as inhibitorsfor steel corrosion in acidic solution. To the bestsearch of the authors, these observations was notstudied with any theoretical method. Thus, in thepresent study, quantum chemical calculations andmolecular dynamics simulations were carried outon these compounds in order to give a clearrelationship between their electronic structures,geometrical parameters and the binding energieswith their experimental inhibition efficiencies (%Es)earlier reported by Gonzalez-Olvera et al (16).
COMPUTATIONAL DETAILS
Selection of InhibitorsA set of ten triazole derivatives as corrosioninhibitors were selected from the literature (16)and used for this present study. The 2D structureof each inhibitor in the data set was drawn usingChemDraw ultra V12.0. The structures of theinhibitors and their experimental inhibitionefficiency (%IE) are presented in Table 1.
Table 1. Triazole Derivatives of Pyrimidine Nucleobases and Their Inhibition Efficiency (%IE)S/N Structure %IE1
93.1
2
95.6
452
NH
N
OO
N
NN
NH
N
OO
N
NN
F
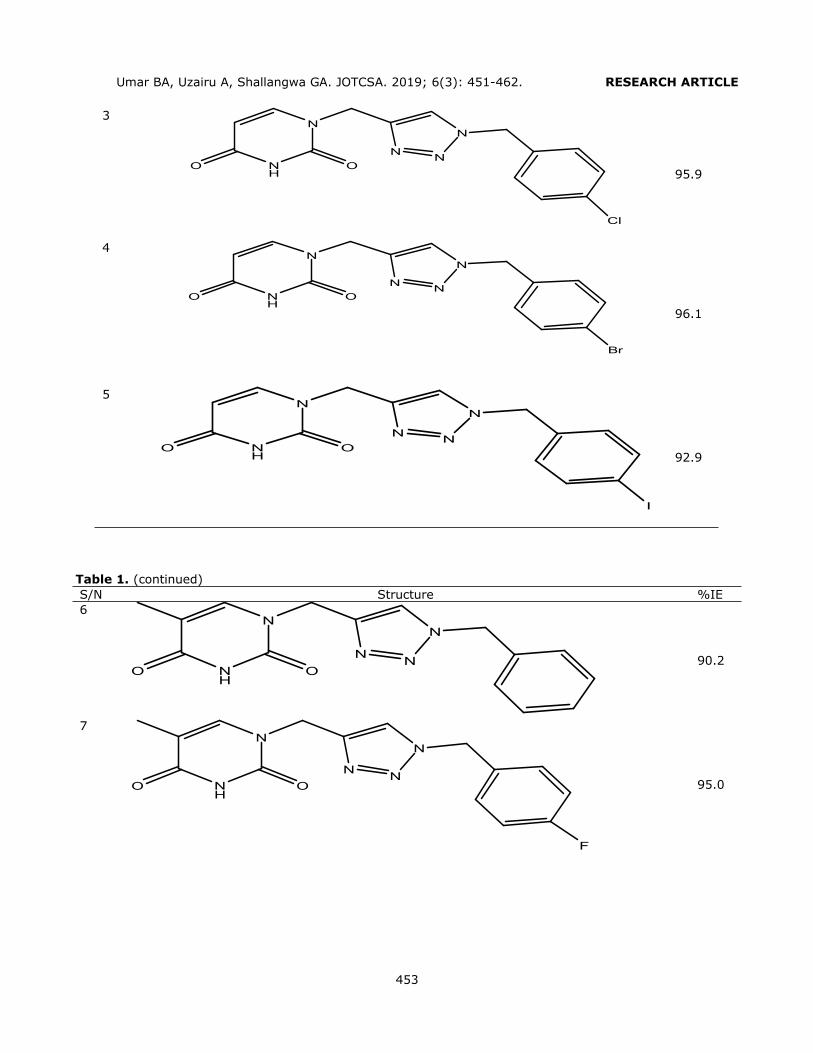
Umar BA, Uzairu A, Shallangwa GA. JOTCSA. 2019; 6(3): 451-462. RESEARCH ARTICLE
3
95.9
4
96.1
5
92.9
Table 1. (continued)S/N Structure %IE6
NH
N
OO
N
NN 90.2
7
NH
N
OO
N
NN
F
95.0
453
NH
N
OO
N
NN
Cl
NH
N
OO
N
NN
Br
NH
N
OO
N
NN
I
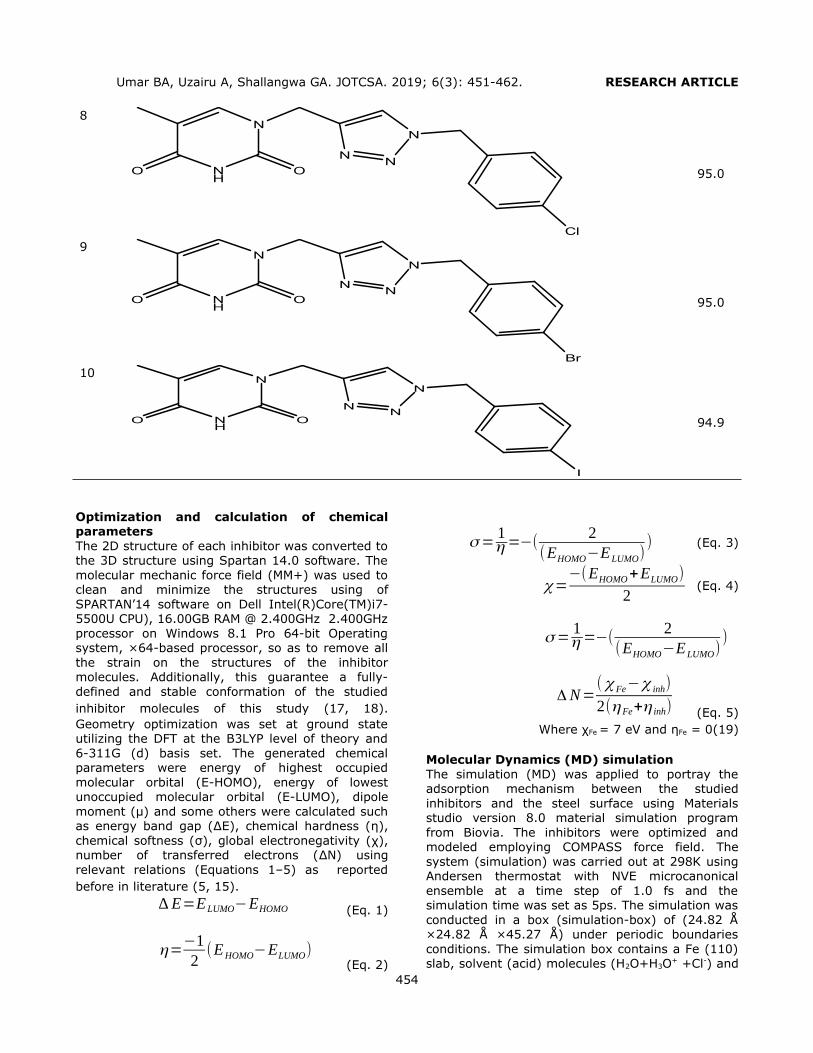
Umar BA, Uzairu A, Shallangwa GA. JOTCSA. 2019; 6(3): 451-462. RESEARCH ARTICLE
8
NH
N
OO
N
NN
Cl
95.0
9
NH
N
OO
N
NN
Br
95.0
10
NH
N
OO
N
NN
I
94.9
Optimization and calculation of chemicalparametersThe 2D structure of each inhibitor was converted tothe 3D structure using Spartan 14.0 software. Themolecular mechanic force field (MM+) was used toclean and minimize the structures using ofSPARTAN’14 software on Dell Intel(R)Core(TM)i7-5500U CPU), 16.00GB RAM @ 2.400GHz 2.400GHzprocessor on Windows 8.1 Pro 64-bit Operatingsystem, ×64-based processor, so as to remove allthe strain on the structures of the inhibitormolecules. Additionally, this guarantee a fully-defined and stable conformation of the studiedinhibitor molecules of this study (17, 18).Geometry optimization was set at ground stateutilizing the DFT at the B3LYP level of theory and6-311G (d) basis set. The generated chemicalparameters were energy of highest occupiedmolecular orbital (E-HOMO), energy of lowestunoccupied molecular orbital (E-LUMO), dipolemoment (μ)) and some others were calculated suchas energy band gap (ΔE), Dipole Moment (E), chemical hardness (η),),chemical softness (σ)), global electronegativity (χ),number of transferred electrons (ΔE), Dipole Moment (N) usingrelevant relations (Equations 1–5) as reportedbefore in literature (5, 15).
∆ E=ELUMO−EHOMO (Eq. 1)
η=−12
(EHOMO−ELUMO)(Eq. 2)
σ =1η =−(
2(EHOMO−ELUMO)
) (Eq. 3)
χ=−(EHOMO+ELUMO)
2(Eq. 4)
σ =1η =−(
2(EHOMO−ELUMO)
)
ΔN=( χ Fe−χ inh)
2(ηFe+η inh) (Eq. 5)Where χFe = 7 eV and η),Fe = 0(19)
Molecular Dynamics (MD) simulationThe simulation (MD) was applied to portray theadsorption mechanism between the studiedinhibitors and the steel surface using Materialsstudio version 8.0 material simulation programfrom Biovia. The inhibitors were optimized andmodeled employing COMPASS force field. Thesystem (simulation) was carried out at 298K usingAndersen thermostat with NVE microcanonicalensemble at a time step of 1.0 fs and thesimulation time was set as 5ps. The simulation wasconducted in a box (simulation-box) of (24.82 Å×24.82 Å ×45.27 Å) under periodic boundariesconditions. The simulation box contains a Fe (110)slab, solvent (acid) molecules (H2O+H3O+ +Cl-) and
454
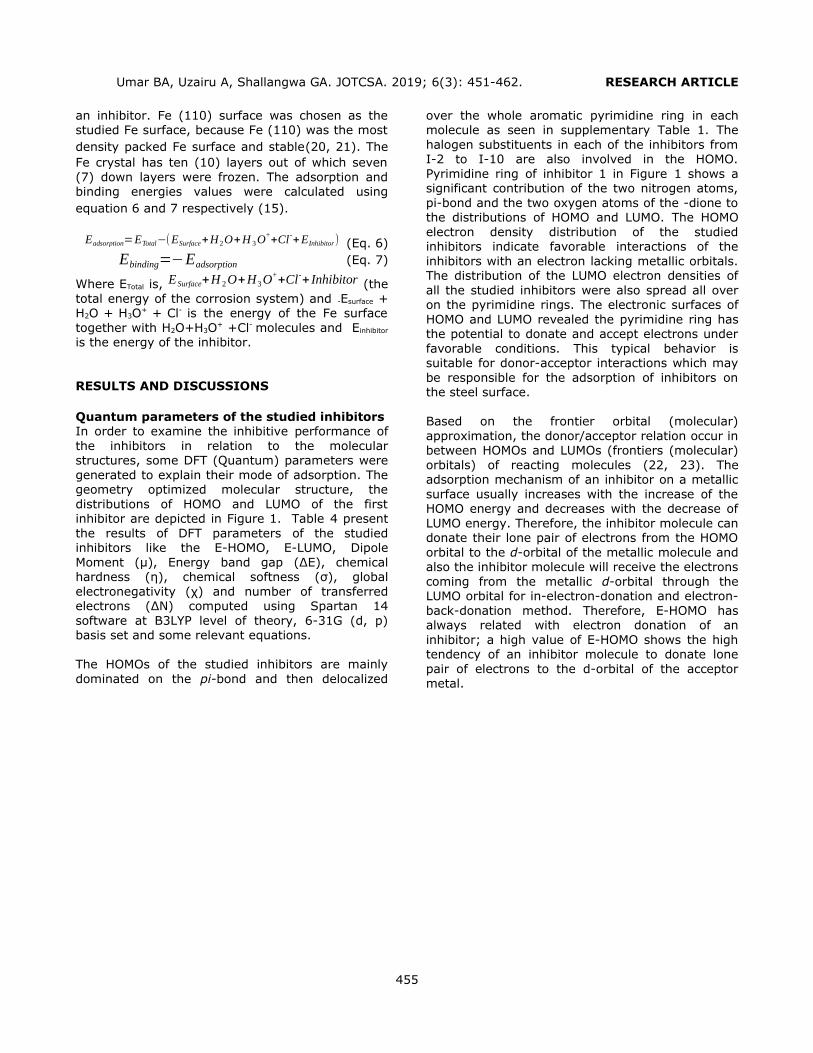
Umar BA, Uzairu A, Shallangwa GA. JOTCSA. 2019; 6(3): 451-462. RESEARCH ARTICLE
an inhibitor. Fe (110) surface was chosen as thestudied Fe surface, because Fe (110) was the mostdensity packed Fe surface and stable(20, 21). TheFe crystal has ten (10) layers out of which seven(7) down layers were frozen. The adsorption andbinding energies values were calculated usingequation 6 and 7 respectively (15). Eadsorption=ETotal−(ESurface+H2O+H 3O
++Cl -+EInhibitor) (Eq. 6)
Ebinding=−Eadsorption (Eq. 7)
Where ETotal is, E Surface+H 2O+H3O++Cl-+ Inhibitor (the
total energy of the corrosion system) and -Esurface +H2O + H3O+ + Cl- is the energy of the Fe surfacetogether with H2O+H3O+ +Cl- molecules and Einhibitor
is the energy of the inhibitor.
RESULTS AND DISCUSSIONS
Quantum parameters of the studied inhibitorsIn order to examine the inhibitive performance ofthe inhibitors in relation to the molecularstructures, some DFT (Quantum) parameters weregenerated to explain their mode of adsorption. Thegeometry optimized molecular structure, thedistributions of HOMO and LUMO of the firstinhibitor are depicted in Figure 1. Table 4 presentthe results of DFT parameters of the studiedinhibitors like the E-HOMO, E-LUMO, DipoleMoment (μ)), Energy band gap (ΔE), Dipole Moment (E), chemicalhardness (η),), chemical softness (σ)), globalelectronegativity (χ) and number of transferredelectrons (ΔE), Dipole Moment (N) computed using Spartan 14software at B3LYP level of theory, 6-31G (d, p)basis set and some relevant equations.
The HOMOs of the studied inhibitors are mainlydominated on the pi-bond and then delocalized
over the whole aromatic pyrimidine ring in eachmolecule as seen in supplementary Table 1. Thehalogen substituents in each of the inhibitors fromI-2 to I-10 are also involved in the HOMO.Pyrimidine ring of inhibitor 1 in Figure 1 shows asignificant contribution of the two nitrogen atoms,pi-bond and the two oxygen atoms of the -dione tothe distributions of HOMO and LUMO. The HOMOelectron density distribution of the studiedinhibitors indicate favorable interactions of theinhibitors with an electron lacking metallic orbitals.The distribution of the LUMO electron densities ofall the studied inhibitors were also spread all overon the pyrimidine rings. The electronic surfaces ofHOMO and LUMO revealed the pyrimidine ring hasthe potential to donate and accept electrons underfavorable conditions. This typical behavior issuitable for donor-acceptor interactions which maybe responsible for the adsorption of inhibitors onthe steel surface.
Based on the frontier orbital (molecular)approximation, the donor/acceptor relation occur inbetween HOMOs and LUMOs (frontiers (molecular)orbitals) of reacting molecules (22, 23). Theadsorption mechanism of an inhibitor on a metallicsurface usually increases with the increase of theHOMO energy and decreases with the decrease ofLUMO energy. Therefore, the inhibitor molecule candonate their lone pair of electrons from the HOMOorbital to the d-orbital of the metallic molecule andalso the inhibitor molecule will receive the electronscoming from the metallic d-orbital through theLUMO orbital for in-electron-donation and electron-back-donation method. Therefore, E-HOMO hasalways related with electron donation of aninhibitor; a high value of E-HOMO shows the hightendency of an inhibitor molecule to donate lonepair of electrons to the d-orbital of the acceptormetal.
455
Umar BA, Uzairu A, Shallangwa GA. JOTCSA. 2019; 6(3): 451-462. RESEARCH ARTICLE
Figure 1. (A) Optimized Structure (B) HOMO distribution and (C) LUMO distribution for I-1(Inh.1).
Table 2. Selected quantum chemical parameters of the studied inhibitors. S/N E-HOMO(eV) E-LUMO(eV) ΔE), Dipole Moment (E μ) (Debye) η), σ) χ ΔE), Dipole Moment (N1 -6.59 -1.04 5.55 3.38 2.775 -0.360 3.815 4.4192 -6.63 -1.07 5.56 3.85 2.780 -0.359 3.850 4.3793 -6.66 -1.10 5.56 4.04 2.780 -0.359 3.880 4.3374 -6.66 -1.09 5.57 4.03 2.785 -0.359 3.875 4.3525 -6.65 -1.08 5.57 3.79 2.785 -0.359 3.865 4.3656 -6.32 -0.90 5.42 3.99 2.710 -0.369 3.610 4.5937 -6.38 -0.95 5.43 3.13 2.715 -0.368 3.665 4.5278 -6.39 -0.96 5.43 2.01 2.715 -0.368 3.675 4.5139 -6.41 -0.98 5.43 1.92 2.715 -0.368 3.695 4.48710 -6.40 -1.09 5.31 2.06 2.655 -0.377 3.745 4.321
Energy of highest occupied molecular orbital (E-HOMO), Energy of lowestunoccupied molecular orbital (E-LUMO) Energy band gap (ΔE), dipolemoment (μ) chemical hardness () chemical hardness (η), chemical softness (σ),globalelectronegativity (χ), number of transferred electrons (ΔN).
From Table 2, the values of E-HOMO for thestudied inhibitors increases in the order I-4 > I-3 >I-5 > I-2 > I-1 > I-9 > I-10 > I-8 > I-7 > I-6respectively. The trend in the increase of theHOMO energies show some level of consistencywith the increase of the efficiencies (inhibition),Thus, I-4 with a high efficiency (96.1%) has alarger HOMO energy and I-6 with the lowestefficiency (90.2%) has a lower HOMO energy asseen in Table 2. Conversely, a low value of E-LUMOof an inhibitor molecule demonstrate the high
tendency of the inhibitor molecule to receiveelectrons coming from the metallic d-orbital duringthe back-donation process. From Table 2, the E-LUMO value in the ascending order are: I-6 > I-7 >I-8 > I-9 > I-1 > I-2 > I-5 > I-4 > I-10 > I-3.This indicates that I-3 has a stronger chances ofaccepting electrons from orbital of the metal asthey interact with the Fe surface. Therefore, I-3may strongly adsorb on the surface of the metallicand achieve better inhibition effectiveness thoughthe second highest in terms of %IE. I-6 strongly
456
Umar BA, Uzairu A, Shallangwa GA. JOTCSA. 2019; 6(3): 451-462. RESEARCH ARTICLE
agrees with EIS findings as it has the lowest %IEhaving the highest LUMO energy.
Energy band gap, ΔE), Dipole Moment (E is another crucial property asmost efficient inhibitors were characterized by asmall value of ΔE), Dipole Moment (E (24). In Table 2, the trend atwhich the energy gap decreases is not consistentwith the increase in the experimental %IEs of thestudied inhibitors. However, the reverse is the casei.e. the ΔE), Dipole Moment (E increases when the %IEs decreases.The dipole moment (μ)) is another parameter whichis commonly used for the prediction of direction ofthe inhibition process. It shows a distribution of theelectrons on the molecule, and also measure thepolarity in any given bond (25). The molecules withhigher μ) values tend to form a strong interactions(dipole-dipole) with the metallic steel surface,resulting to a strong adsorption of the inhibitor onthe metallic surface and hence resulting in thebetter IE% of an inhibitor (26). Nevertheless, thereis no established correlation between the μ) and IE% reported (21). The results shown in Table 2indicate that I-3 has the largest μ) value and I-9has the lowest μ) value. Among all the ten (10)studied inhibitors, increasing the μ) leads to anincrement of their IE% due to the increase in theintermolecular forces.
Inhibitor with the large hardness (η),) value isexpected to be weaker compared to otherinhibitors with lower values (7). Thus, as shown inTable 2, the hardness value increases as the %IEincreases. I-4 has the highest η), value hence thebest inhibitor and this agrees with the experimentalobservation reported in table 1. The larger σ) valueindicates that the inhibitor have softer nature andwill have higher chances of donating electrons tothe metallic molecule (27). The arrangementacross the inhibitors in the σ) values as presented inTable 2 decreases in the order, I-2 > I-3 > I-4 > I-5 > I-1 > I-7 > I-7 > I-8 > I-9 > I-6 > I-10. Thissuggests that I-2 has the highest and therefore themost reactive inhibitor molecule.
The electronegativity (χ) describes the electronattracting power of an inhibitor molecule. The highvalue of χ shows the strong attracting capability ofan inhibitor molecule to accept the electrons fromthe metallic (Fe) surface (11). Afterward, theinhibitors that have larger electronegativities wouldhave better interaction with Fe surface and thenwill have better IE%. From Table 2, it can beobserved that the χ values of the ten inhibitorsobey the order I-3 > I-4 > I-5 > I-2 > I-1 > I-10> I-9 > I-8 > I-7 > I-6, hence, it is confirmed thatI-3 followed by I-4 has the higher tendency ofaccepting electrons and I-6 has the least among
the studied inhibitors and these findings are ingood agreement with the experimental findings.The values of ΔE), Dipole Moment (N demonstrate the fraction ofelectrons that transfer from the inhibitor to themetallic surface. If ΔE), Dipole Moment (N > 0, then electrons wastransferred from the inhibitor molecule to the Fe-surface while if ΔE), Dipole Moment (N < 0 , then electrons weretransferred from Fe-surface to inhibitor moleculethrough electron back donation process (15). FromTable 2, it can be observed that the values of ΔE), Dipole Moment (N ofthe studied inhibitors are all greater than 0 (ΔE), Dipole Moment (N >0), this indicates that all the studied inhibitors maydonate electrons on to the Fe surface through theformation of a coordinate covalent bond.Examination of the results in Table 2 indicates thatthe values of ΔE), Dipole Moment (N of the inhibitors has a very littledifference. This further confirms the electrondonating ability of the studied inhibitors asobserved from their experimental findings.
Molecular Dynamic Simulation StudiesElectronic parameters alone are not enough todetermine the trend of the inhibitive performancesof these studied inhibitors despite its success inexplaining the mechanism of action of theinhibitors. Thus, it is essential to conduct thoroughmodelling of the direct interactions of the studiedinhibitors with the Fe surface. It is believed thatthe major mechanism of the inhibition of corrosionis through adsorption. Therefore, adsorption ofthese inhibitors on the steel (Fe) surface wassimulated to predict the nature of interactionsbetween the studied inhibitors and Fe (110) crystalsurface in 1M HCl. The first step of this simulationprocess was the geometry optimization of thestudied inhibitors, solvent (acid) molecules (H2O,H3O+, and Cl-) and Fe (110) crystal. The geometryoptimization of the corrosion system wasconducted until the total energy of the systemreached a local minimum on the potential energysurface. During the optimization process, theatomic coordinates were adjusted using COMPASSforce-field which continues unless the totalenergies of the individual structures reached to theminimum energy, after which, a box was createdfor the simulation process by importing the Fe(110) crystal, solvent molecules (H2O, H3O+ andCl-) and the inhibitor molecule. Then the MDprocess were conducted and the system attainedequilibrium when both the energy and temperatureof the system were balanced. All the otherinhibitors were studied similarly. The equilibriumconfigurations of the simulated system for the firstinhibitor are depicted in Figure 4. It could beobserved that in Figure 5 and 6 at the middle ofthe MD simulation process the system movestowards the equilibrium. After the system attainedequilibrium, the adsorption and the binding energyvalues of the inhibitors adsorbed on the Fe surface
457

Umar BA, Uzairu A, Shallangwa GA. JOTCSA. 2019; 6(3): 451-462. RESEARCH ARTICLE
was calculated according to equations (6) and (7)respectively and are presented in Table 3.
Table 3. Molecular Dynamic Simulations Results of the studied inhibitors.S/N EFe+soln.(kcalmol-1) EInh.(kcalmol-1) ETotal (kcalmol-1) EAds.(kcalmol-1) EBind.(kcalmol-1) BD(Å)1 -125832.513 -42.694 -126294.487 -419.28 419.28 2.5952 -125832.513 -40.231 -126346.164 -473.42 473.42 2.8913 -125832.513 -40.376 -126353.079 -480.19 480.19 2.3904 -125832.513 -40.323 -126360.906 -488.07 488.07 2.1605 -125832.513 -40.284 -126316.487 -443.69 443.69 3.186 -125832.513 -78.975 -126350.438 -438.95 438.95 2.9208 -125832.513 -78.997 -126377.5 -465.99 465.99 2.7839 -125832.513 -75.505 -126389.708 -481.69 481.69 2.8429 -125832.513 -72.986 -126383.419 -477.92 477.92 2.78010 -125832.513 -74.047 -126356.57 -450.01 450.01 3.050EFe+soln. (Energy of Fe + H2O+H3O+ + Cl-), EInh. (Energy of the inhibitor), ETotal (total energyof the simulation system), EAds. (Adsorption Energy), EBind. (Binding Energy), BD (BondDistance).
It can be observed from the molecularstructures of the examined inhibitors thatthese molecules contain various electrons(lone pair) on the N and O atoms and alsoπ-bonds of the aromatic systems.Therefore, these electrons (lone pair) onthe heteroatoms will be donated to anempty d orbitals of Fe metal. It could beobserved in Figure 4, that the inhibitoradsorbs almost flatly in orientation withthe Fe surface and the interaction is morethrough the pyrimidine ring. This flatorientation of the inhibitor molecule onthe Fe surface can be as a result of achemical bond formation between theinhibitor and Fe surface. This observationwas supported by the HOMO and LUMOdistributions of these inhibitors as theregion (pyrimidine ring) was found to bethe most active center of adsorption (seeFigure 1). Additionally, it could be seenfrom the results presented in Table 3 thatthe values of the adsorption energy of the
simulation systems at 298 K were largeand negative. These high negative valuesof adsorption energies may be attributedto the strong interaction which occurbetween these inhibitors and Fe surfaces.Thus, the calculated adsorption energyvalues reveal that inhibitor 4 adsorbs onthe Fe surface more spontaneously thanany other inhibitor among the series.However, the adsorption capability of aninhibitor molecule on the Fe surface mayalso be determined from the values of thebinding energy. The larger the bindingenergy is, the better will be theadsorption. Therefore, it is furtherconfirmed from the results presented inTable 3, that all the adsorption of theinhibitors on the Fe surfaces occurredthrough chemical adsorption processsince the magnitude of the bindingenergies is actually within the range ofchemisorption (>100 kcal mol−1) (28).
458
Umar BA, Uzairu A, Shallangwa GA. JOTCSA. 2019; 6(3): 451-462. RESEARCH ARTICLE
Figure 2. Equilibrium interaction configurations of the first inhibitor on Fe (1 1 0) surface.
Figure 3. Fluctuation curves of Energies obtained from MD simulation for the first inhibitor.
459
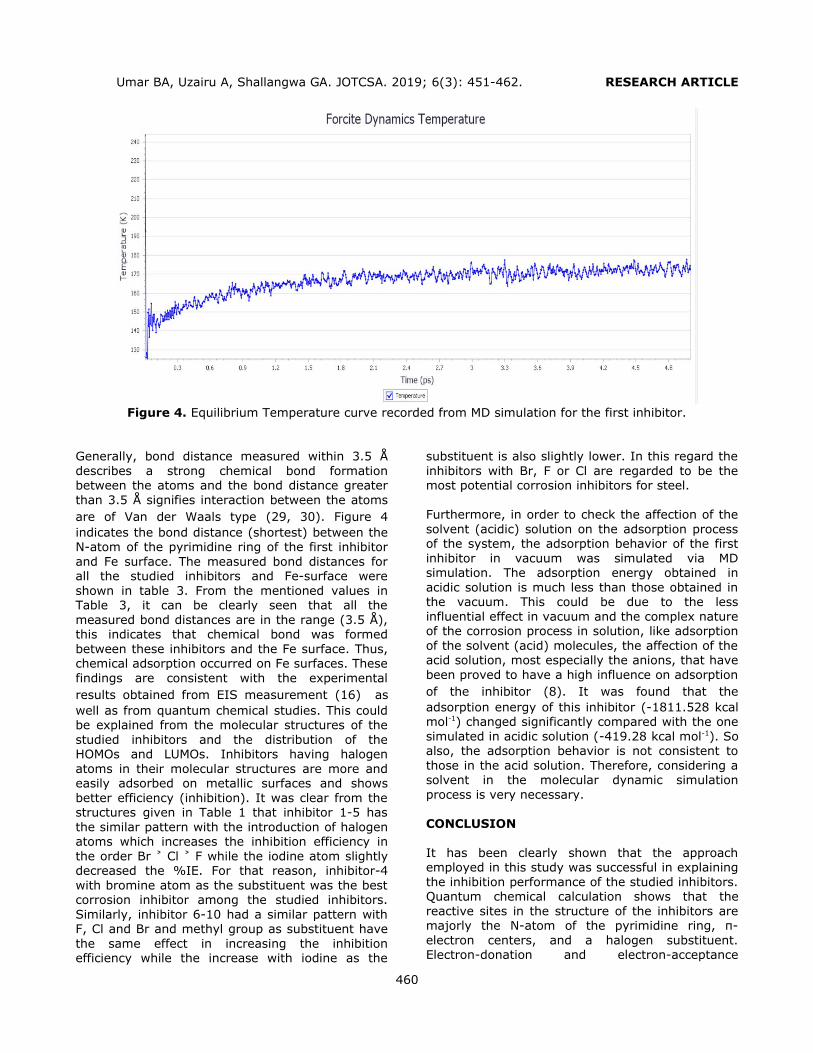
Umar BA, Uzairu A, Shallangwa GA. JOTCSA. 2019; 6(3): 451-462. RESEARCH ARTICLE
Figure 4. Equilibrium Temperature curve recorded from MD simulation for the first inhibitor.
Generally, bond distance measured within 3.5 Ådescribes a strong chemical bond formationbetween the atoms and the bond distance greaterthan 3.5 Å signifies interaction between the atomsare of Van der Waals type (29, 30). Figure 4indicates the bond distance (shortest) between theN-atom of the pyrimidine ring of the first inhibitorand Fe surface. The measured bond distances forall the studied inhibitors and Fe-surface wereshown in table 3. From the mentioned values inTable 3, it can be clearly seen that all themeasured bond distances are in the range (3.5 Å),this indicates that chemical bond was formedbetween these inhibitors and the Fe surface. Thus,chemical adsorption occurred on Fe surfaces. Thesefindings are consistent with the experimentalresults obtained from EIS measurement (16) aswell as from quantum chemical studies. This couldbe explained from the molecular structures of thestudied inhibitors and the distribution of theHOMOs and LUMOs. Inhibitors having halogenatoms in their molecular structures are more andeasily adsorbed on metallic surfaces and showsbetter efficiency (inhibition). It was clear from thestructures given in Table 1 that inhibitor 1-5 hasthe similar pattern with the introduction of halogenatoms which increases the inhibition efficiency inthe order Br ˃ Cl ˃ F while the iodine atom slightlydecreased the %IE. For that reason, inhibitor-4with bromine atom as the substituent was the bestcorrosion inhibitor among the studied inhibitors.Similarly, inhibitor 6-10 had a similar pattern withF, Cl and Br and methyl group as substituent havethe same effect in increasing the inhibitionefficiency while the increase with iodine as the
substituent is also slightly lower. In this regard theinhibitors with Br, F or Cl are regarded to be themost potential corrosion inhibitors for steel.
Furthermore, in order to check the affection of thesolvent (acidic) solution on the adsorption processof the system, the adsorption behavior of the firstinhibitor in vacuum was simulated via MDsimulation. The adsorption energy obtained inacidic solution is much less than those obtained inthe vacuum. This could be due to the lessinfluential effect in vacuum and the complex natureof the corrosion process in solution, like adsorptionof the solvent (acid) molecules, the affection of theacid solution, most especially the anions, that havebeen proved to have a high influence on adsorptionof the inhibitor (8). It was found that theadsorption energy of this inhibitor (-1811.528 kcalmol-1) changed significantly compared with the onesimulated in acidic solution (-419.28 kcal mol-1). Soalso, the adsorption behavior is not consistent tothose in the acid solution. Therefore, considering asolvent in the molecular dynamic simulationprocess is very necessary.
CONCLUSION
It has been clearly shown that the approachemployed in this study was successful in explainingthe inhibition performance of the studied inhibitors.Quantum chemical calculation shows that thereactive sites in the structure of the inhibitors aremajorly the N-atom of the pyrimidine ring, π-electron centers, and a halogen substituent.Electron-donation and electron-acceptance
460
Umar BA, Uzairu A, Shallangwa GA. JOTCSA. 2019; 6(3): 451-462. RESEARCH ARTICLE
capability of these inhibitors were consistent withthe results obtained from the EIS experiment. Theinteraction energies (Eads. and Ebind.) between theinhibitors and Fe (1 1 0) metal surface via MD-simulation were large indicating chemical bondformation and that the inhibitors can more tightlyadsorb on the iron surface. Inhibitor 4 showed highadsorption energy (-488.07 kcal mol-1) amongother co-inhibitors as observed from theexperiment. From this molecular dynamicssimulations analysis, we realized that the order ofvalues of the adsorption and binding energy werein good agreement to the experimental findingsand also the shortest bond distances measuredindicates that these inhibitors have a very stronginteractions with steel (Fe) surface. Thus, thisquantum chemical calculations and moleculardynamic simulation results correlate with eachother and suggest the directions for the design ofnew anti-corrosion molecules with better inhibitivepotential toward corrosion of steel.
ACKNOWLEDGMENTS
The authors sincerely acknowledge Ahmadu BelloUniversity, Zaria for providing the softwares usedand all the members of the group for their adviceand encouragement in the cause of this research.
REFERENCES
1. Szklarska-Smialowska Z, ZS-Smialowska.Pitting and crevice corrosion: NACE InternationalHouston, TX; 2005.
2. Singh P, Ebenso EE, Olasunkanmi LO, ObotI, Quraishi M. Electrochemical, theoretical, andsurface morphological studies of corrosioninhibition effect of green naphthyridine derivativeson mild steel in hydrochloric acid. The Journal ofPhysical Chemistry C. 2016;120(6):3408-19.
3. Obot IB. Recent advances in computationaldesign of organic materials for corrosion protectionof steel in aqueous media. Developments incorrosion protection: InTech; 2014.
4. Al Hashem A. Corrosion in the GulfCooperation Council (GCC) states: statistics andfigures. proceedings of the Corrosion UAE, AbuDhabi, UAE. 2011.
5. Nwankwo HU, Ateba CN, Olasunkanmi LO,Adekunle AS, Isabirye DA, Onwudiwe DC, et al.Synthesis, characterization, antimicrobial studiesand corrosion inhibition potential of 1, 8-dimethyl-1, 3, 6, 8, 10, 13-hexaazacyclotetradecane:experimental and quantum chemical studies.Materials. 2016;9(2):107.
6. Usmana B, MOHAMMED AS, Umarb A.QUANTUM CHEMICAL EVALUATION ONCORROSION INHIBTION PERFORMANCE OFBALANITIN-7 ON MILD STEEL IN 1MHYDROCHLORIC ACID SOLUTION. Applied Journalof Environmental Engineering Science.4(3):4-3(2018) 380-386.
7. Murulana LC, Singh AK, Shukla SK,Kabanda MM, Ebenso EE. Experimental andquantum chemical studies of some bis(trifluoromethyl-sulfonyl) imide imidazolium-basedionic liquids as corrosion inhibitors for mild steel inhydrochloric acid solution. Industrial & EngineeringChemistry Research. 2012;51(40):13282-99.
8. Zhao H, Zhang X, Ji L, Hu H, Li Q.Quantitative structure–activity relationship modelfor amino acids as corrosion inhibitors based on thesupport vector machine and molecular design.Corrosion Science. 2014;83:261-71.
9. Zhang D-Q, Cai Q-R, He X-M, Gao L-X,Zhou G-D. Inhibition effect of some amino acids oncopper corrosion in HCl solution. MaterialsChemistry and Physics. 2008;112(2):353-8.
10. Amin MA, Ibrahim MM. Corrosion andcorrosion control of mild steel in concentratedH2SO4 solutions by a newly synthesized glycinederivative. Corrosion Science. 2011;53(3):873-85.
11. Wazzan NA, Obot I, Kaya S. Theoreticalmodeling and molecular level insights into thecorrosion inhibition activity of 2-amino-1, 3, 4-thiadiazole and its 5-alkyl derivatives. Journal ofMolecular Liquids. 2016;221:579-602.
12. Usman B, Jimoh I, Umar BA. THEORETICALSTUDY OF 2-(3, 4-DIHYDROXYPHENYL) CHROMAN-3, 5, 7-TRIOL ON CORROSION INHIBITION OFMILD STEEL IN ACIDIC MEDIUM. Applied Journal ofEnvironmental Engineering Science.5(1):5-1(2019) 66-74.
13. Atalay Y, Yakuphanoglu F, Sekerci M, AvcıD, Başoğlu A. Theoretical studies of molecularstructure and vibrational spectra of 2-amino-5-phenyl-1, 3, 4-thiadiazole. Spectrochimica ActaPart A: Molecular and Biomolecular Spectroscopy.2006;64(1):68-72.
14. Ebenso EE, Arslan T, Kandemirli F, CanerN, Love I. Quantum chemical studies of somerhodanine azosulpha drugs as corrosion inhibitorsfor mild steel in acidic medium. InternationalJournal of Quantum Chemistry. 2010;110(5):1003-18.
461
Umar BA, Uzairu A, Shallangwa GA. JOTCSA. 2019; 6(3): 451-462. RESEARCH ARTICLE
15. Saha SK, Banerjee P. A theoreticalapproach to understand the inhibition mechanismof steel corrosion with two aminobenzonitrileinhibitors. RSC Advances. 2015;5(87):71120-30.
16. González-Olvera R, Espinoza-Vázquez A,Negrón-Silva GE, Palomar-Pardavé ME, Romero-Romo MA, Santillan R. Multicomponent clicksynthesis of new 1, 2, 3-triazole derivatives ofpyrimidine nucleobases: Promising acidic corrosioninhibitors for steel. Molecules. 2013;18(12):15064-79.
17. Viswanadhan VN, Ghose AK, Revankar GR,Robins RK. Atomic physicochemical parameters forthree dimensional structure directed quantitativestructure-activity relationships. 4. Additionalparameters for hydrophobic and dispersiveinteractions and their application for an automatedsuperposition of certain naturally occurringnucleoside antibiotics. Journal of chemicalinformation and computer sciences.1989;29(3):163-72.
18. Arthur DE, Uzairu A, Mamza P, Abechi E,Shallangwa G. QSAR MODELLING OF SOMEANTICANCER PGI50 ACTIVITY ON HL-60 CELLLINES. Albanian Journal of PharmaceuticalSciences. 2016;3(1):4-9.
19. Musa AY, Jalgham RT, Mohamad AB.Molecular dynamic and quantum chemicalcalculations for phthalazine derivatives as corrosioninhibitors of mild steel in 1 M HCl. CorrosionScience. 2012;56:176-83.
20. Khaled K. Molecular simulation, quantumchemical calculations and electrochemical studiesfor inhibition of mild steel by triazoles.Electrochimica Acta. 2008;53(9):3484-92.
21. Nwankwo HU, Olasunkanmi LO, Ebenso EE.Experimental, quantum chemical and moleculardynamic simulations studies on the corrosioninhibition of mild steel by some carbazolederivatives. Scientific reports. 2017;7(1):2436.
22. Bereket G, Öğretir C, Özşahin Ç. Quantumchemical studies on the inhibition efficiencies ofsome piperazine derivatives for the corrosion of
steel in acidic medium. Journal of MolecularStructure: THEOCHEM. 2003;663(1-3):39-46.
23. Bello A, Uzairu A, Shallangwa G. MOLECULARMODELLING AND DYNAMIC SIMULATION OFCORROSION INHIBITORS ON STEEL IN ACIDICMEDIUM. FUW Trends in Science & TechnologyJournal. 2018;3 (2A):365-372
24. Ebenso EE, Khaled K, Shukla SK, Singh AK,Eddy N, Saracoglu M, et al. Quantum chemicalinvestigations on quinoline derivatives as effectivecorrosion inhibitors for mild steel in acidic medium.2012.
25. Abdallah M, Atwa S, Salem M, Fouda A.Synergistic effect of some halide ions on theinhibition of zinc corrosion in hydrochloric acid bytetrahydro carbazole derivatives compounds. Int JElectrochem Sci. 2013;8:10001-21.
26. Verma C, Olasunkanmi LO, Ebenso EE,Quraishi MA, Obot IB. Adsorption behavior ofglucosamine-based, pyrimidine-fused heterocyclesas green corrosion inhibitors for mild steel:experimental and theoretical studies. The Journalof Physical Chemistry C. 2016;120(21):11598-611.
27. Wazzan NA. DFT calculations ofthiosemicarbazide, arylisothiocynates, and 1-aryl-2, 5-dithiohydrazodicarbonamides as corrosioninhibitors of copper in an aqueous chloride solution.Journal of Industrial and Engineering Chemistry.2015;26:291-308.
28. Akalezi CO, Enenebaku CK, Oguzie EE.Application of aqueous extracts of coffee senna forcontrol of mild steel corrosion in acidicenvironments. International Journal of IndustrialChemistry. 2012;3(1):13.
29. Shi W, Xia M, Lei W, Wang F. Moleculardynamics study of polyether polyamino methylenephosphonates as an inhibitor of anhydrite crystal.Desalination. 2013;322:137-43.
30. Zeng J, Zhang J, Gong X. Moleculardynamics simulation of interaction betweenbenzotriazoles and cuprous oxide crystal.Computational and Theoretical Chemistry.2011;963(1):110-4.
462


