Embed Size (px)
Citation preview
ARTICLE IN PRESS
0013-9351/$ - se
doi:10.1016/j.en
$This study
human subjects
Public Health
Nutrition in M
guidelines for t�CorrespondE-mail addr
Environmental Research 100 (2006) 371–386
www.elsevier.com/locate/envres
Deficits in cognitive function and achievement inMexican first-graders with low blood lead concentrations$
Katarzyna Kordasa,�, Richard L. Canfielda, Patricia Lopezb, Jorge L. Rosadoc,Gonzalo Garcıa Vargasd, Mariano E. Cebriane, Javier Alatorre Ricof,
Dolores Ronquilloc, Rebecca J. Stoltzfusa
aDivision of Nutritional Sciences, Cornell University, Ithaca, NY 14853, USAbDepartment of Nutritional Physiology, National Institute of Medical Sciences and Nutrition, Mexico
cSchool of Natural Sciences, University of Queretaro, MexicodSchool of Medicine; University of Juarez at Durango, Mexico
eCINVESTAV, National Polytechnic Institute, MexicofDepartment of Psychology, National Autonomous University of Mexico, Mexico
Received 14 January 2005; received in revised form 2 June 2005; accepted 28 July 2005
Available online 19 September 2005
Abstract
Elevated blood lead levels in children are associated with lower scores on tests of cognitive functioning. Recent studies have
reported inverse relations between lifetime exposure and intellectual functioning at blood lead concentrations below 10 mg/dL, theCenters for Disease Control and Prevention’s (CDC) level of concern. We report associations between blood lead and cognitive
performance for first-grade Mexican children living near a metal foundry. Using a cross-sectional design, we examined the relation
between children’s concurrent blood lead concentrations (mean (SD) 11.4 mg/dL (6.1)) and their performance on 14 tests of global or
specific cognitive functions. The blood lead–cognition relations were modeled using both linear and nonlinear methods. After
adjustment for covariates, a higher blood lead level was associated with poorer cognitive performance on several cognitive tests.
Segmented linear regressions revealed significant effects of lead but only for the segments defined by a concurrent blood lead
concentration below 10–14 mg/dL. One implication of these findings is that at the age of 7 years, even in the absence of information
on lead exposure in infancy and early childhood, a test result with blood lead o10mg/dL should not be considered safe. Together
with other recent findings, these results add to the empirical base of support available for evaluating the adequacy of current
screening guidelines and for motivating efforts at primary prevention of childhood lead exposure.
r 2005 Elsevier Inc. All rights reserved.
Keywords: Child; School age; Cognition; Cut-off; Lead exposure
1. Introduction
It is well known that lead exposure is associated withchildren’s scores on tests of academic achievement and
e front matter r 2005 Elsevier Inc. All rights reserved.
vres.2005.07.007
was approved by committees on research involving
at the Johns Hopkins University Bloomberg School of
and the National Institute of Medical Sciences and
exico. All the work was conducted in accordance with
he protection of human subjects.
ing author. Fax: +1607 255 1033.
ess: [email protected] (K. Kordas).
intelligence (Bellinger et al., 1992; Needleman andGatsonis, 1990; Stiles and Bellinger, 1993). However,little is known about the possible adverse effects at verylow blood lead concentrations (PbBs). A level of concernset by the Centers for Disease Control and Prevention(CDC) to guide screening and prevention efforts has beenrepeatedly lowered since the 1970s. The current level ofconcern is based on a series of prospective and cross-sectional assessments showing adverse effects of leadconcentrations below 25mg/dL and as low as 10mg/dL onchildren’s mental development and IQ (CDC, 1991).
ARTICLE IN PRESSK. Kordas et al. / Environmental Research 100 (2006) 371–386372
Children with blood lead o10mg/dL are not consideredlead-poisoned and are usually not given medical atten-tion. This practice is due partly to cognitive or develop-mental deficits not having been conclusivelydemonstrated at such low levels, and partly to lack ofresources and effective treatment options for childrenwith low PbBs (Barnard, 2003).
Recent studies, however, raise serious questions aboutthe safety of PbBs less than 10 mg/dL. Using data fromNHANES III, Lanphear et al. (2000) examined mea-sures of nonverbal reasoning, memory, and achievementin relation to concurrent PbBs in children aged 6–16years. When the sample was restricted to children withPbBso10 mg/dL, significant inverse associations werefound for Block Design and Digit Span from theWechsler Intelligence Scales for Children—Revised(WISC-R) and for the Arithmetic and Reading tasksfrom the Wide Range Achievement Test—Revised(WRAT). Remarkably, PbB was significantly andinversely related to Reading and Arithmetic scores evenwith the sample restricted to PbBso5 mg/dL.
A longitudinal study conducted in Rochester, NYprovided more complete information about children’sexposure history and also measured a broader range ofpotential confounders (Canfield et al., 2003). PbBs wereassessed for 172 children at seven time points from 6 to60 months of age and IQ tests were administered at ages3 and 5 years. When estimated using covariate-adjustedsemiparametric regression, an increase in lifetimeaverage PbB was associated with a decline of 7.4 pointson the Stanford–Binet intelligence test. Considering onlythose children whose peak PbB (the highest PbBmeasured at any time) was o10 mg/dL, the inverserelation between PbB and IQ remained significant.There was also a nonlinear relation between PbB andIQ, with a steeper slope at lower rather than higherPbBs. A given increment in blood lead was associatedwith a greater decline in IQ for children with peakPbBso10 mg/dL than 410 mg/dL.
The populations studied in Lanphear et al. (2000) andCanfield et al. (2003) were US-based, with exposurederived primarily from lead-based paint and contami-nated dust. In these circumstances, children’s PbBstypically peak during the first 3 years of age. Indeveloping countries, where environmental contamina-tion is a serious public health problem (Tong et al.,2000), evidence of adverse lead effects is also strong.Because studies of childhood lead exposure are necessa-rily observational in design, there is a need to provideinformation from other cultures that may exhibit uniquepatterns of exposure and confounding. Several reportshave described adverse cognitive functioning in lead-exposed children from Pristina and Mitrovica, Yugosla-via and Port Pirie, Australia (Baghurst et al., 1992; Tonget al., 1996; Wasserman et al., 1994), both with smeltersas sources of lead exposure. More recently, studies of
children from the Middle East and South Asia have alsoshown negative associations between lead exposure andcognitive performance in school children. The strengthsof the individual studies include a large, representativesample (Al-Saleh et al., 2001; Wang et al., 2002) and awide range of lead exposures with over 80% of childrenwith PbBX10 mg/dL and 20% 420 mg/dL (Rahmanet al., 2002). In a Mexican study using standardizedcognitive measures, lead exposure in children 6–9 yearsof age was not associated with concurrent PbB in therange 4–26 mg/dL (Calderon et al., 2001). However, thesmall sample size and exposure to another toxin, arsenic,may have attenuated the lead–cognition association.
Each of these studies provides unique information fora full description of the worldwide consequences ofchildhood lead exposure. However, with the exceptionof a report on performance of Saudi Arabian girls(Al-Saleh et al., 2001), which showed a significantassociation between class rank and PbBo9 mg/dL, mostof these recent studies have not specifically investigatedthe effects of very-low-level lead on cognition andachievement of school children. Documenting thepossible consequences of low-level lead exposure indeveloping countries provides the most relevant infor-mation for local policymakers. For this reason, analysesof the association between very-low lead levels andcognitive performance similar to those reported in USchildren (Canfield et al., 2003; Chiodo et al., 2004;Lanphear et al., 2000) are needed in other culturalsettings.
Age of assessment is an important factor in under-standing the relation between exposure to neurotoxinsand children’s cognitive functioning. An advantage ofstudying children of school age, as compared to youngerages, is that their cognitive systems are sufficientlydifferentiated to allow the administration of a broadrange of tasks. In addition, performance on cognitivetests in older children is substantially more reliable thanin preschool children, and more predictive of latercognitive performance and educational achievement(Sattler, 1992).
We report on associations between PbB and cognitiveperformance of Mexican first-graders exposed to leadfrom a metal foundry, allowing us to expand on findingsfrom previous studies in two important ways. First, weexamined the relation between lead and global, as wellas specific cognitive functions, such as memory, atten-tion, and visual spatial abilities. Second, based onevidence that the relation between PbB and cognition,specifically IQ, may not be linear (Canfield et al., 2003;Chiodo et al., 2004; Lanphear et al., 2000; Munoz et al.,1993), we described the nature of the lead–cognitionrelation using both linear and spline (segmented)regression methods. In spline analyses we examinedspecific PbBs at which slopes of the lead–cognitionassociation changed and characterized the nature of this

ARTICLE IN PRESSK. Kordas et al. / Environmental Research 100 (2006) 371–386 373
association below and above the cutoffs. Our popula-tion is well suited for this analysis because the largesample consists of a wide range of lead values, with 51%and 20% PbBs X10 and X15 mg/dL, respectively. Incontrast, in the Canfield et al. (2003) study, which hadthe strongest design to address this question, 55.8%of the 5-year-olds had peak PbBso10 mg/dL, andthe nature of the Pb–IQ relationship could not becharacterized at PbBs 415 mg/dL.
2. Methods
2.1. Setting and participants
The study took place in the city of Torreon, Mexico.The present analysis involves baseline data from arandomized trial of iron and zinc supplementation tolead-exposed children. The parents of all first graders(n ¼ 724) attending nine public elementary schools inthe vicinity of a metal foundry were approached forstudy participation and 602 provided written consent.The exclusion criteria were PbB445 mg/dL or hemoglo-bin (Hb) concentration o9 g/dL. No children wereexcluded based on Hb. One child with PbB 445 mg/dLwas referred for clinical treatment. The sample included46% girls; children’s ages ranged from 6.2 to 8.5 years(51% 6-year-olds, 47% 7-year-olds, 2% 8-year-olds).The study was approved by committees on humanresearch at the Johns Hopkins Bloomberg School ofPublic Health and the Institute of Medical Sciences andNutrition in Mexico City. Additional approval wasgiven by the Ministry of Education in the state ofCoahuila, where the study took place.
Most children in this study live and attend school inneighborhoods within a 3-km radius of a metal foundry.The main source of lead exposure is a depositorycontaining byproducts of the smelting process, includinglead, located on foundry premises. Lead particles areswept from the depository by winds and settle in dustaround schools and houses. Smelting also releases leadparticles into the air. Because the region is arid and rainsare infrequent, children inhale and pick up lead on theirhands while outdoors. The exposure characteristics ofchildren in this study were similar to the cohort studiedin Port Pirie, Australia. The geometric mean PbB atage 7 years was 10.2 mg/dL (range 2–43.8), similar tothe 7-year geometric mean of the Port Pirie cohort(11.6 mg/dL, range 2.1–37.7) (Tong et al., 1996). PbBwas previously measured on some of the Torreonchildren (n ¼ 116) when they were 5 years old as partof a screening campaign unrelated to our study. Thegeometric mean PbB at 5 years for these children was16.6 mg/dL (range 2–65.7), again similar to the Port Pirie5-year data. In Port Pirie the correlation between 7-yearPbB and lifetime average lead was 0.81. In Torreon the
overall correlation between PbB at 5 and 7 years of agewas 0.71 (n ¼ 116; Po0:001). Because exposure char-acteristics of the present sample resemble those in PortPirie, we expect that our 7-year PbB measure is similarlyrepresentative of children’s lifetime exposure.
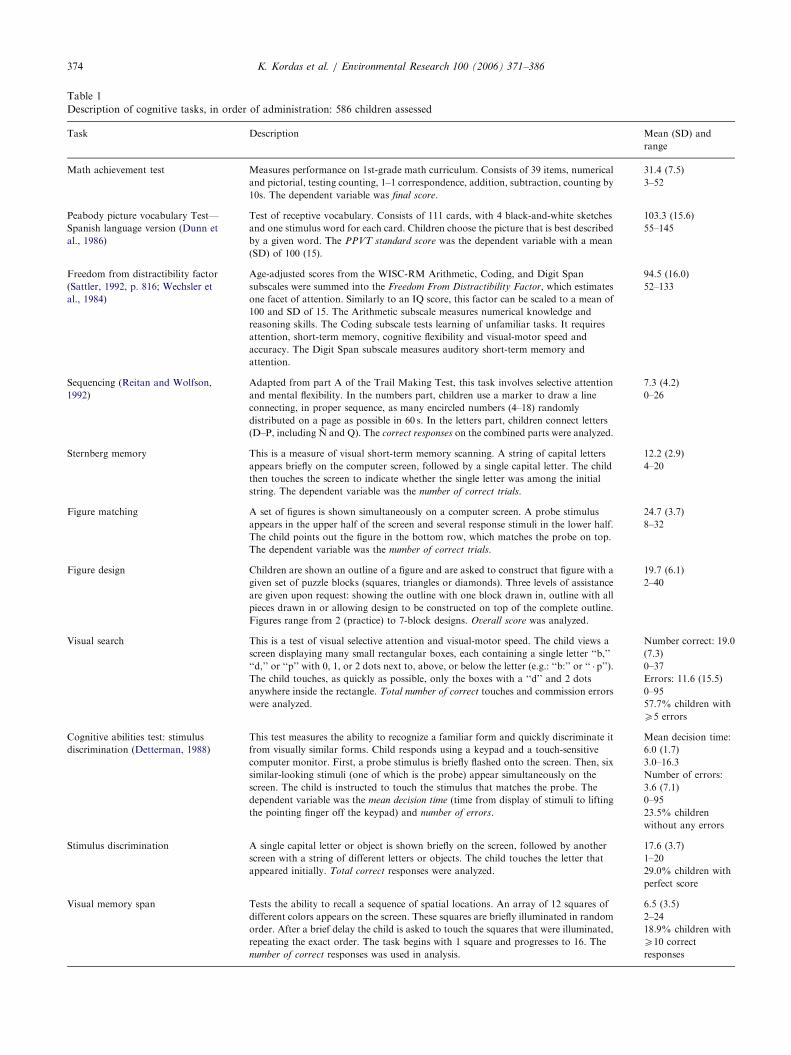
2.2. Cognitive outcomes
The testing battery consisted of 14 paper-and-pencilor computer-based tasks that assess specific and globalaspects of cognition (Table 1). The tests were dividedinto two groups and were administered, in the sameorder, on two different days by Mexican testers, all ofwhom held bachelor’s degrees in psychology and hadprevious experience testing children. The examiners wereunaware of children’s blood lead concentrations. Thetesting days typically occurred within the span of aweek. Each day’s testing lasted approximately65–70min and took place in an isolated room at eachschool.
2.3. Blood lead measurement
Fasting venous blood samples were collected at theschools between 8:30 and 10 am. Between 5 and 7mL ofvenous blood were obtained from each child by aregistered nurse using sealed sodium heparine Vacutai-ner lead-free tubes (Beckton-Dickinson, USA). In thefield samples were stored on ice in coolers andtransported on the same day to the laboratory, wherewhole blood and serum were aliquoted and stored at�70 1C until analysis. Blood lead analysis was per-formed at the National Polytechnic Institute in Mexico,using atomic absorption spectrophotometry with a2 ng/g limit of detection (Zeeman 5100, Perkin ElmerCorporation, Norwalk, CT) (Miller et al., 1987).Samples, analyzed in duplicate, were acceptable withCV o5%. Lead in bovine blood (NIST 955b) with threedifferent concentrations (5.01, 13.53, and 30.63 mg/dL)served as standard reference. Recoveries ranged from104% to 112% and the CV ranged between 3% and10%. This laboratory participates in two quality controlprograms: the Trace Element External Quality Assess-ment Scheme at University of Surrey, UK and the InterLaboratory Program of Quality Control at Zaragoza,Spain.
2.4. Measurement and selection of covariates
Covariates were chosen to include well-documentedpredictors of cognitive functioning and intellectualoutcomes in children: child’s age, gender, family socio-economic status (home ownership, possessions, andcrowding), maternal formal education, parental involve-ment in schooling, family structure, and birth order. Allinformation was obtained from teacher and parent
ARTICLE IN PRESS
Table 1
Description of cognitive tasks, in order of administration: 586 children assessed
Task Description Mean (SD) and
range
Math achievement test Measures performance on 1st-grade math curriculum. Consists of 39 items, numerical
and pictorial, testing counting, 1–1 correspondence, addition, subtraction, counting by
10s. The dependent variable was final score.
31.4 (7.5)
3–52
Peabody picture vocabulary Test—
Spanish language version (Dunn et
al., 1986)
Test of receptive vocabulary. Consists of 111 cards, with 4 black-and-white sketches
and one stimulus word for each card. Children choose the picture that is best described
by a given word. The PPVT standard score was the dependent variable with a mean
(SD) of 100 (15).
103.3 (15.6)
55–145
Freedom from distractibility factor
(Sattler, 1992, p. 816; Wechsler et
al., 1984)
Age-adjusted scores from the WISC-RM Arithmetic, Coding, and Digit Span
subscales were summed into the Freedom From Distractibility Factor, which estimates
one facet of attention. Similarly to an IQ score, this factor can be scaled to a mean of
100 and SD of 15. The Arithmetic subscale measures numerical knowledge and
reasoning skills. The Coding subscale tests learning of unfamiliar tasks. It requires
attention, short-term memory, cognitive flexibility and visual-motor speed and
accuracy. The Digit Span subscale measures auditory short-term memory and
attention.
94.5 (16.0)
52–133
Sequencing (Reitan and Wolfson,
1992)
Adapted from part A of the Trail Making Test, this task involves selective attention
and mental flexibility. In the numbers part, children use a marker to draw a line
connecting, in proper sequence, as many encircled numbers (4–18) randomly
distributed on a page as possible in 60 s. In the letters part, children connect letters
(D–P, including N and Q). The correct responses on the combined parts were analyzed.
7.3 (4.2)
0–26
Sternberg memory This is a measure of visual short-term memory scanning. A string of capital letters
appears briefly on the computer screen, followed by a single capital letter. The child
then touches the screen to indicate whether the single letter was among the initial
string. The dependent variable was the number of correct trials.
12.2 (2.9)
4–20
Figure matching A set of figures is shown simultaneously on a computer screen. A probe stimulus
appears in the upper half of the screen and several response stimuli in the lower half.
The child points out the figure in the bottom row, which matches the probe on top.
The dependent variable was the number of correct trials.
24.7 (3.7)
8–32
Figure design Children are shown an outline of a figure and are asked to construct that figure with a
given set of puzzle blocks (squares, triangles or diamonds). Three levels of assistance
are given upon request: showing the outline with one block drawn in, outline with all
pieces drawn in or allowing design to be constructed on top of the complete outline.
Figures range from 2 (practice) to 7-block designs. Overall score was analyzed.
19.7 (6.1)
2–40
Visual search This is a test of visual selective attention and visual-motor speed. The child views a
screen displaying many small rectangular boxes, each containing a single letter ‘‘b,’’
‘‘d,’’ or ‘‘p’’ with 0, 1, or 2 dots next to, above, or below the letter (e.g.: ‘‘b:’’ or ‘‘ � p’’).
The child touches, as quickly as possible, only the boxes with a ‘‘d’’ and 2 dots
anywhere inside the rectangle. Total number of correct touches and commission errors
were analyzed.
Number correct: 19.0
(7.3)
0–37
Errors: 11.6 (15.5)
0–95
57.7% children with
X5 errors
Cognitive abilities test: stimulus
discrimination (Detterman, 1988)
This test measures the ability to recognize a familiar form and quickly discriminate it
from visually similar forms. Child responds using a keypad and a touch-sensitive
computer monitor. First, a probe stimulus is briefly flashed onto the screen. Then, six
similar-looking stimuli (one of which is the probe) appear simultaneously on the
screen. The child is instructed to touch the stimulus that matches the probe. The
dependent variable was the mean decision time (time from display of stimuli to lifting
the pointing finger off the keypad) and number of errors.
Mean decision time:
6.0 (1.7)
3.0–16.3
Number of errors:
3.6 (7.1)
0–95
23.5% children
without any errors
Stimulus discrimination A single capital letter or object is shown briefly on the screen, followed by another
screen with a string of different letters or objects. The child touches the letter that
appeared initially. Total correct responses were analyzed.
17.6 (3.7)
1–20
29.0% children with
perfect score
Visual memory span Tests the ability to recall a sequence of spatial locations. An array of 12 squares of
different colors appears on the screen. These squares are briefly illuminated in random
order. After a brief delay the child is asked to touch the squares that were illuminated,
repeating the exact order. The task begins with 1 square and progresses to 16. The
number of correct responses was used in analysis.
6.5 (3.5)
2–24
18.9% children with
X10 correct
responses
K. Kordas et al. / Environmental Research 100 (2006) 371–386374
ARTICLE IN PRESSK. Kordas et al. / Environmental Research 100 (2006) 371–386 375
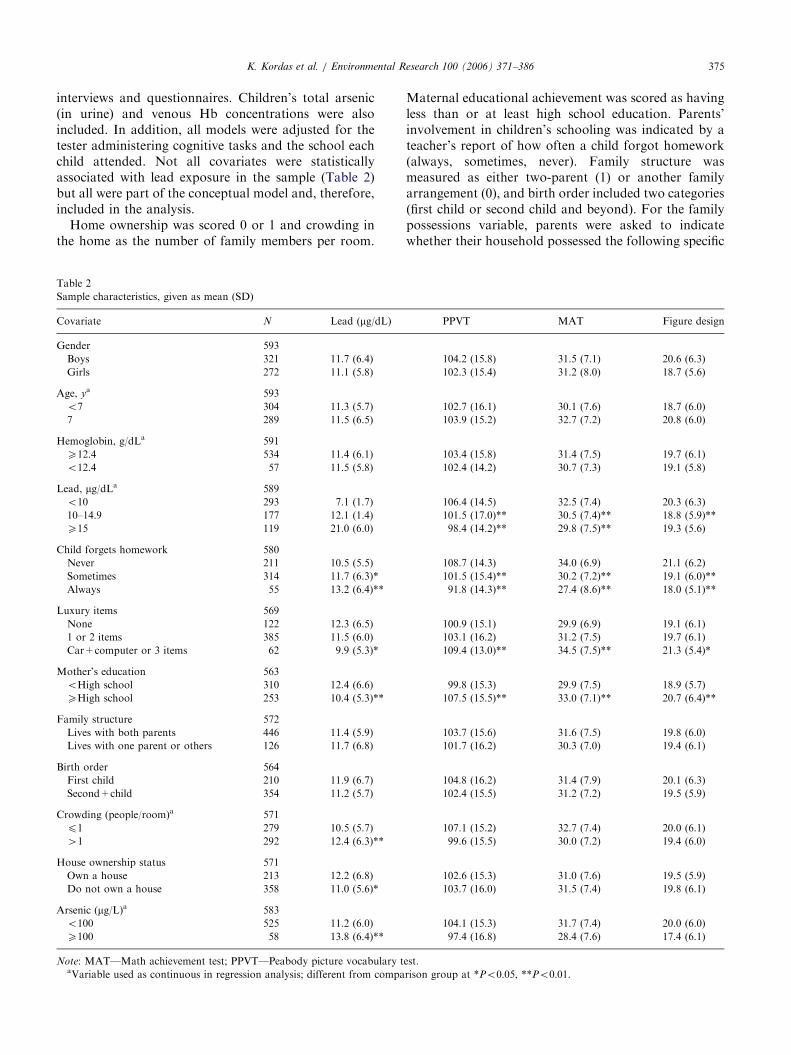
interviews and questionnaires. Children’s total arsenic(in urine) and venous Hb concentrations were alsoincluded. In addition, all models were adjusted for thetester administering cognitive tasks and the school eachchild attended. Not all covariates were statisticallyassociated with lead exposure in the sample (Table 2)but all were part of the conceptual model and, therefore,included in the analysis.
Home ownership was scored 0 or 1 and crowding inthe home as the number of family members per room.
Table 2
Sample characteristics, given as mean (SD)
Covariate N Lead (mg/dL)
Gender 593
Boys 321 11.7 (6.4)
Girls 272 11.1 (5.8)
Age, ya 593
o7 304 11.3 (5.7)
7 289 11.5 (6.5)
Hemoglobin, g/dLa 591
X12.4 534 11.4 (6.1)
o12.4 57 11.5 (5.8)
Lead, mg/dLa 589
o10 293 7.1 (1.7)
10–14.9 177 12.1 (1.4)
X15 119 21.0 (6.0)
Child forgets homework 580
Never 211 10.5 (5.5)
Sometimes 314 11.7 (6.3)*
Always 55 13.2 (6.4)**
Luxury items 569
None 122 12.3 (6.5)
1 or 2 items 385 11.5 (6.0)
Car+computer or 3 items 62 9.9 (5.3)*
Mother’s education 563
oHigh school 310 12.4 (6.6)
XHigh school 253 10.4 (5.3)**
Family structure 572
Lives with both parents 446 11.4 (5.9)
Lives with one parent or others 126 11.7 (6.8)
Birth order 564
First child 210 11.9 (6.7)
Second+child 354 11.2 (5.7)
Crowding (people/room)a 571
p1 279 10.5 (5.7)
41 292 12.4 (6.3)**
House ownership status 571
Own a house 213 12.2 (6.8)
Do not own a house 358 11.0 (5.6)*
Arsenic (mg/L)a 583
o100 525 11.2 (6.0)
X100 58 13.8 (6.4)**
Note: MAT—Math achievement test; PPVT—Peabody picture vocabulary taVariable used as continuous in regression analysis; different from compa
Maternal educational achievement was scored as havingless than or at least high school education. Parents’involvement in children’s schooling was indicated by ateacher’s report of how often a child forgot homework(always, sometimes, never). Family structure wasmeasured as either two-parent (1) or another familyarrangement (0), and birth order included two categories(first child or second child and beyond). For the familypossessions variable, parents were asked to indicatewhether their household possessed the following specific
PPVT MAT Figure design
104.2 (15.8) 31.5 (7.1) 20.6 (6.3)
102.3 (15.4) 31.2 (8.0) 18.7 (5.6)
102.7 (16.1) 30.1 (7.6) 18.7 (6.0)
103.9 (15.2) 32.7 (7.2) 20.8 (6.0)
103.4 (15.8) 31.4 (7.5) 19.7 (6.1)
102.4 (14.2) 30.7 (7.3) 19.1 (5.8)
106.4 (14.5) 32.5 (7.4) 20.3 (6.3)
101.5 (17.0)** 30.5 (7.4)** 18.8 (5.9)**
98.4 (14.2)** 29.8 (7.5)** 19.3 (5.6)
108.7 (14.3) 34.0 (6.9) 21.1 (6.2)
101.5 (15.4)** 30.2 (7.2)** 19.1 (6.0)**
91.8 (14.3)** 27.4 (8.6)** 18.0 (5.1)**
100.9 (15.1) 29.9 (6.9) 19.1 (6.1)
103.1 (16.2) 31.2 (7.5) 19.7 (6.1)
109.4 (13.0)** 34.5 (7.5)** 21.3 (5.4)*
99.8 (15.3) 29.9 (7.5) 18.9 (5.7)
107.5 (15.5)** 33.0 (7.1)** 20.7 (6.4)**
103.7 (15.6) 31.6 (7.5) 19.8 (6.0)
101.7 (16.2) 30.3 (7.0) 19.4 (6.1)
104.8 (16.2) 31.4 (7.9) 20.1 (6.3)
102.4 (15.5) 31.2 (7.2) 19.5 (5.9)
107.1 (15.2) 32.7 (7.4) 20.0 (6.1)
99.6 (15.5) 30.0 (7.2) 19.4 (6.0)
102.6 (15.3) 31.0 (7.6) 19.5 (5.9)
103.7 (16.0) 31.5 (7.4) 19.8 (6.1)
104.1 (15.3) 31.7 (7.4) 20.0 (6.0)
97.4 (16.8) 28.4 (7.6) 17.4 (6.1)
est.
rison group at *Po0:05, **Po0:01.
ARTICLE IN PRESSK. Kordas et al. / Environmental Research 100 (2006) 371–386376
appliances or amenities: car, computer, VCR, TV set,stove, refrigerator, radio, and electricity. All homes hadelectricity and very few were without a radio, TV, stove,or refrigerator, making possession of these itemsuninformative. Sufficient variability was present forownership of an automobile, computer, or VCR.Parents’ answers to questions about the three itemswere grouped in the following manner: 0 indicated noitems owned; 1 indicated ownership of one item, or twoitems for the combination video+computer orvideo+automobile. A score of 2 indicated ownershipof all three items or the combination computer+auto-mobile.
Hb was analyzed immediately following the blooddraw using the Hemocue Photometer (Hemocue AB,Angelholm, Sweden). Arsenic exposure from potablewater is a concern in this population and was measuredhere because of its potential adverse effects on cognitivefunctioning in children. Total urine arsenic was analyzedin samples (digested with nitric, sulfuric, and perchloricacids) by atomic absorption spectrophotometry(Del Razo et al., 1997). A Perkin Elmer 3100 spectro-photometer was used (Perkin Elmer Corporation,Norwalk, CT) with detection limit 1 ppb and CV of4–5%.
Parents also provided information on whether theirchildren were born prematurely, whether they werebreastfed, and for how long (months). These variableswere not included in regression models for three reasons:(1) the information was collected at a posttreatmentevaluation with many children (n ¼ 87) missing data onthese variables; (2) these variables were not significantlyassociated with cognitive outcomes in bivariate analysis;and (3) based on changes in adjusted R2, when enteredinto complete models these variables explained noadditional variability in cognitive performance.
2.5. Statistical methods
Analyses were performed using STATA 6.0 (STATACorp., College Station, TX). Only children aged lessthan 8 years were included in the analysis (n ¼ 594). Inthe Mexican public school system all children aged 6–7years are eligible to be enrolled in the first grade. Thereare no school readiness exams. It is likely that childrenolder than 8 years were held back because of pooracademic achievement or behavioral problems. There-fore, we removed all 8-year-olds from analysis (n ¼ 9).We had complete data on 532 children.
The analysis was first conducted using unadjusted andadjusted linear regressions with the cognitive measuresas dependent variables and lead as independent variable,untransformed and continuous. Quadratic terms forlead were tested and were not significant. Subsequentanalyses focusing on the nonlinearity of the PbB–cogni-tion outcome also used linear models, but they included
an interaction term between the continuous leadvariable and one of four dichotomous lead variablesthat represented four cutoffs for defining lower vs.higher exposure levels. These regressions yielded esti-mates of models with two nonintersecting lines.A significant interaction term indicated differing slopesfor the two lines. Based on previous examination ofscatter plots of lead and cognitive function with LOW-ESS smoothed lines (Hamilton, 1998), the four cutoffpoints were chosen at 8, 10, 12, and 14 mg/dL. For eachcognitive outcome, models for all four cutoff valueswere estimated first in unadjusted analyses. For some ofthe outcomes, multiple cutoffs yielded significant inter-actions. For simplicity of presentation we report onlyone model for each outcome, either because it had asignificant interaction term or because it had the highestadjusted R2 of all the models tested for that outcome.Because in our approach we first explored multiplecutoffs and reported the ‘‘best’’ cutoff, we likelyoptimized the probability of significant findings.Adjusted segmented regressions for each cognitiveoutcome were modeled using the cutoffs reported forthe unadjusted model. Regression diagnostics wereperformed on all models and did not reveal anydeviations from assumptions. We did not adjust theP-values for multiple tests on the data set.
3. Results
3.1. Linear regressions
When estimated in unadjusted linear models, 8 of 13outcomes were significantly associated with children’sPbB (Table 3). Higher PbBs were associated with worsetest performance. However, the estimated declines weresmall to modest and lead alone explained a smallportion of variability in test scores (data not shown,0.4–4.8%). Adjusting for covariates attenuated theestimates and only three outcomes (Math, PPVT, andSternberg Memory test) remained significantly asso-ciated with PbB (Po0:05). In this sample, a 10-mg/dLchange in PbB was associated in adjusted linear modelswith a mean 1.7-, 3.5-, and 0.5-point decline in Math,PPVT, and Sternberg performance, respectively. ForFigure Matching and CAT Stimulus Discriminationtask errors, the adjusted coefficients were marginallysignificant (Po0:1).
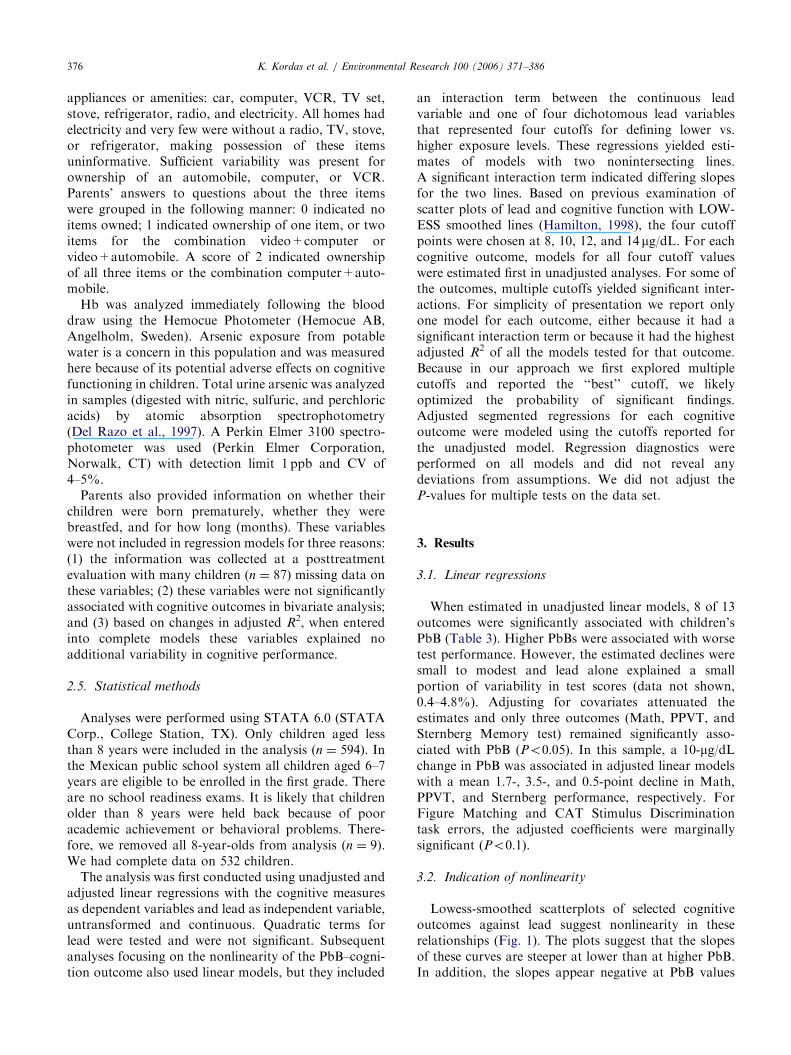
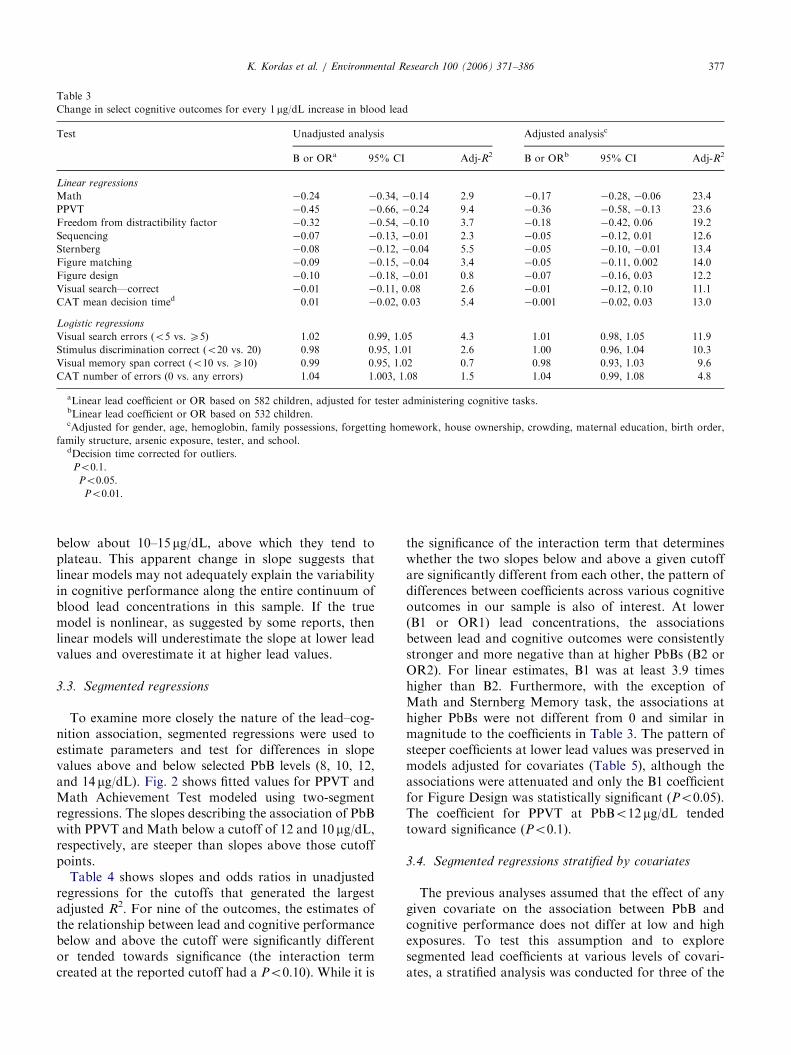
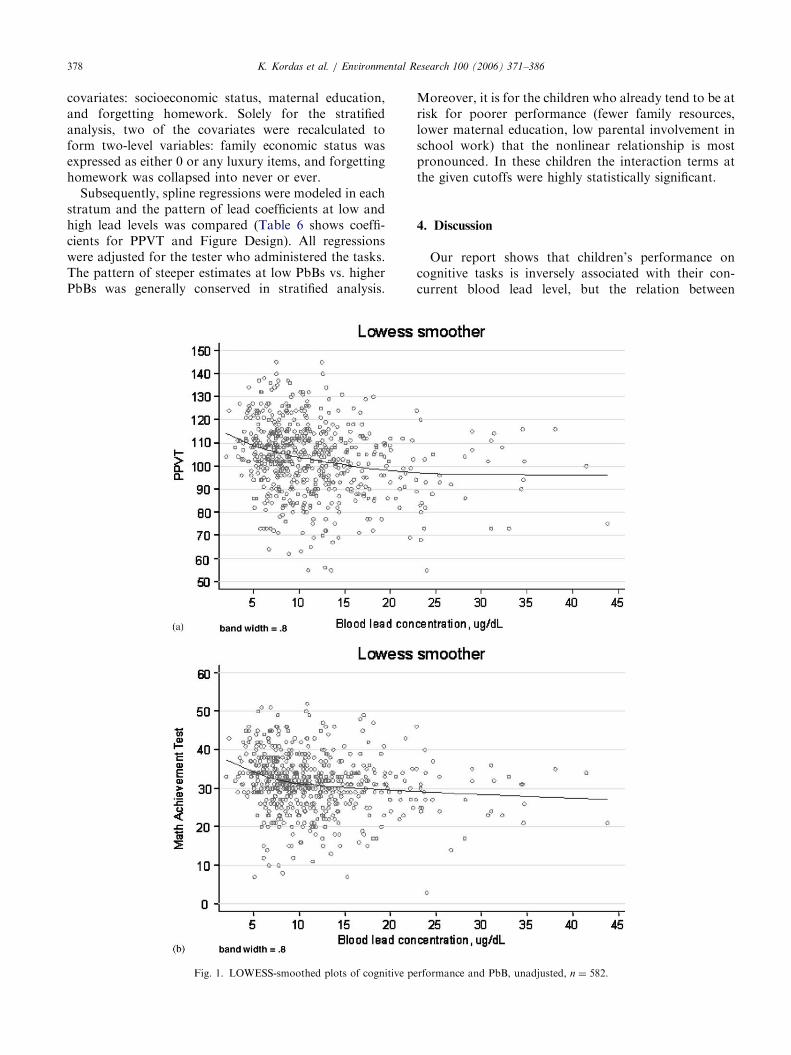
3.2. Indication of nonlinearity
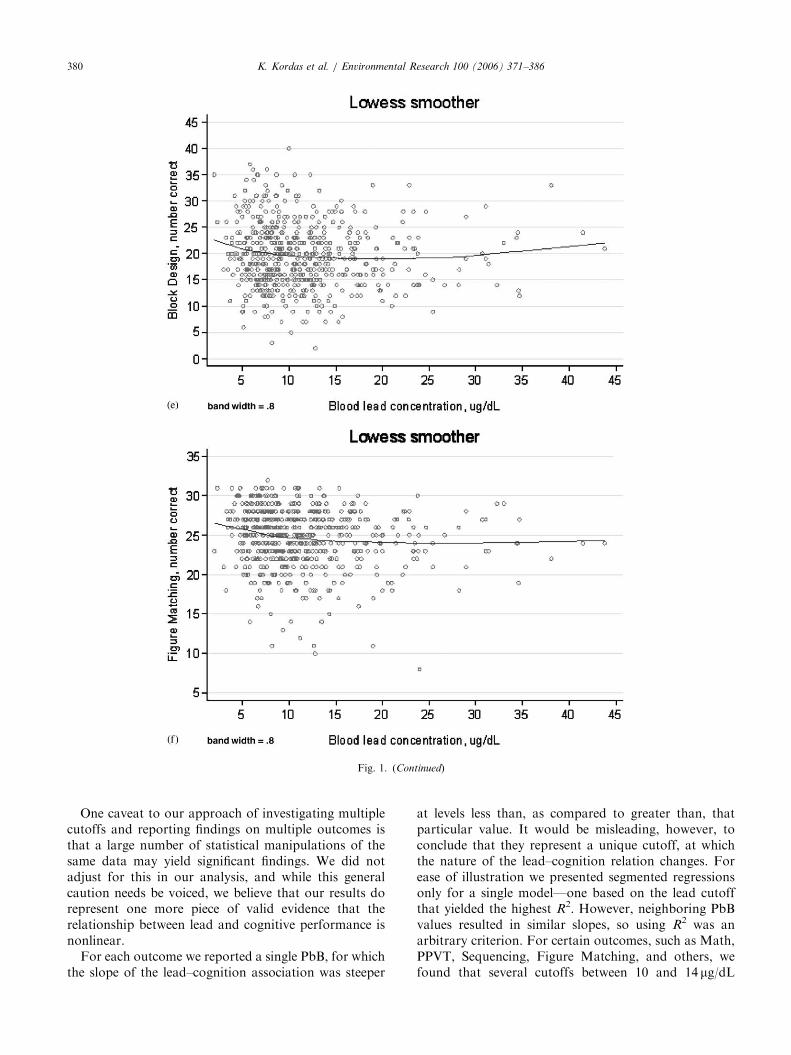
Lowess-smoothed scatterplots of selected cognitiveoutcomes against lead suggest nonlinearity in theserelationships (Fig. 1). The plots suggest that the slopesof these curves are steeper at lower than at higher PbB.In addition, the slopes appear negative at PbB values
ARTICLE IN PRESS
Table 3
Change in select cognitive outcomes for every 1 mg/dL increase in blood lead
Test Unadjusted analysis Adjusted analysisc
B or ORa 95% CI Adj-R2 B or ORb 95% CI Adj-R2
Linear regressions
Math �0.24��� �0.34, �0.14 2.9 �0.17��� �0.28, �0.06 23.4
PPVT �0.45��� �0.66, �0.24 9.4 �0.36��� �0.58, �0.13 23.6
Freedom from distractibility factor �0.32��� �0.54, �0.10 3.7 �0.18 �0.42, 0.06 19.2
Sequencing �0.07�� �0.13, �0.01 2.3 �0.05 �0.12, 0.01 12.6
Sternberg �0.08��� �0.12, �0.04 5.5 �0.05�� �0.10, �0.01 13.4
Figure matching �0.09��� �0.15, �0.04 3.4 �0.05� �0.11, 0.002 14.0
Figure design �0.10�� �0.18, �0.01 0.8 �0.07 �0.16, 0.03 12.2
Visual search—correct �0.01 �0.11, 0.08 2.6 �0.01 �0.12, 0.10 11.1
CAT mean decision timed 0.01 �0.02, 0.03 5.4 �0.001 �0.02, 0.03 13.0
Logistic regressions
Visual search errors (o5 vs. X5) 1.02 0.99, 1.05 4.3 1.01 0.98, 1.05 11.9
Stimulus discrimination correct (o20 vs. 20) 0.98 0.95, 1.01 2.6 1.00 0.96, 1.04 10.3
Visual memory span correct (o10 vs. X10) 0.99 0.95, 1.02 0.7 0.98 0.93, 1.03 9.6
CAT number of errors (0 vs. any errors) 1.04�� 1.003, 1.08 1.5 1.04� 0.99, 1.08 4.8
aLinear lead coefficient or OR based on 582 children, adjusted for tester administering cognitive tasks.bLinear lead coefficient or OR based on 532 children.cAdjusted for gender, age, hemoglobin, family possessions, forgetting homework, house ownership, crowding, maternal education, birth order,
family structure, arsenic exposure, tester, and school.dDecision time corrected for outliers.�Po0:1.��Po0:05.���Po0:01.
K. Kordas et al. / Environmental Research 100 (2006) 371–386 377
below about 10–15 mg/dL, above which they tend toplateau. This apparent change in slope suggests thatlinear models may not adequately explain the variabilityin cognitive performance along the entire continuum ofblood lead concentrations in this sample. If the truemodel is nonlinear, as suggested by some reports, thenlinear models will underestimate the slope at lower leadvalues and overestimate it at higher lead values.
3.3. Segmented regressions
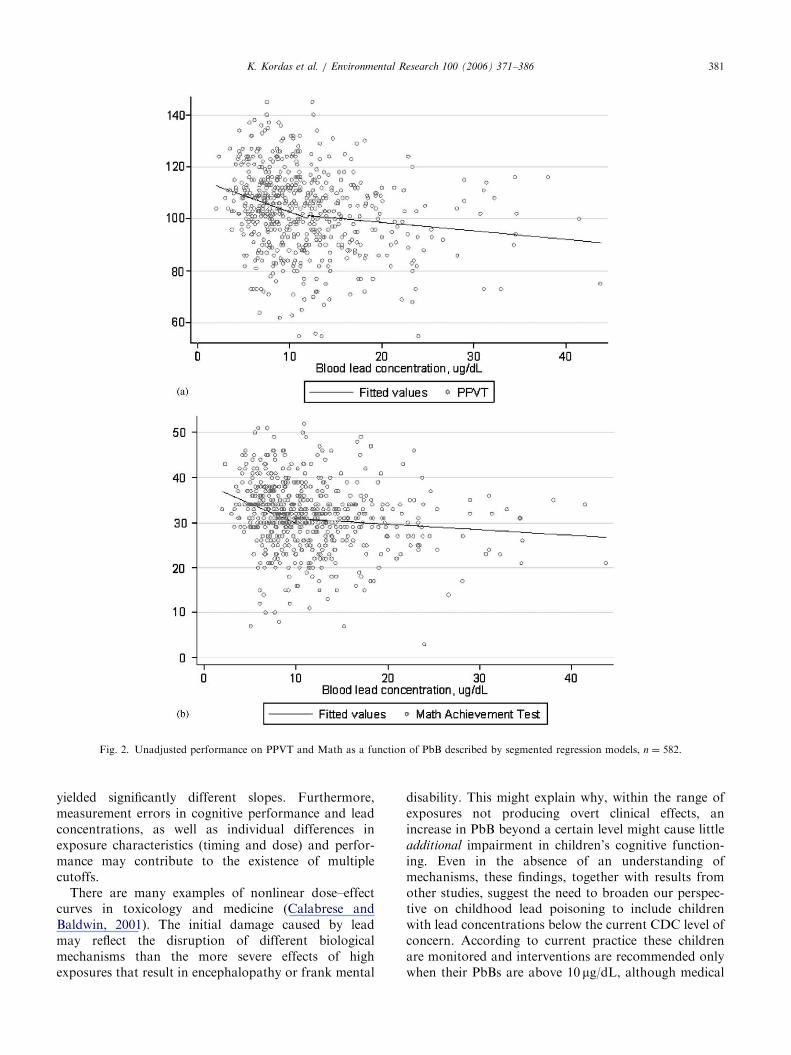
To examine more closely the nature of the lead–cog-nition association, segmented regressions were used toestimate parameters and test for differences in slopevalues above and below selected PbB levels (8, 10, 12,and 14 mg/dL). Fig. 2 shows fitted values for PPVT andMath Achievement Test modeled using two-segmentregressions. The slopes describing the association of PbBwith PPVT and Math below a cutoff of 12 and 10 mg/dL,respectively, are steeper than slopes above those cutoffpoints.
Table 4 shows slopes and odds ratios in unadjustedregressions for the cutoffs that generated the largestadjusted R2. For nine of the outcomes, the estimates ofthe relationship between lead and cognitive performancebelow and above the cutoff were significantly differentor tended towards significance (the interaction termcreated at the reported cutoff had a Po0:10). While it is
the significance of the interaction term that determineswhether the two slopes below and above a given cutoffare significantly different from each other, the pattern ofdifferences between coefficients across various cognitiveoutcomes in our sample is also of interest. At lower(B1 or OR1) lead concentrations, the associationsbetween lead and cognitive outcomes were consistentlystronger and more negative than at higher PbBs (B2 orOR2). For linear estimates, B1 was at least 3.9 timeshigher than B2. Furthermore, with the exception ofMath and Sternberg Memory task, the associations athigher PbBs were not different from 0 and similar inmagnitude to the coefficients in Table 3. The pattern ofsteeper coefficients at lower lead values was preserved inmodels adjusted for covariates (Table 5), although theassociations were attenuated and only the B1 coefficientfor Figure Design was statistically significant (Po0:05).The coefficient for PPVT at PbBo12 mg/dL tendedtoward significance (Po0:1).
3.4. Segmented regressions stratified by covariates
The previous analyses assumed that the effect of anygiven covariate on the association between PbB andcognitive performance does not differ at low and highexposures. To test this assumption and to exploresegmented lead coefficients at various levels of covari-ates, a stratified analysis was conducted for three of the
ARTICLE IN PRESSK. Kordas et al. / Environmental Research 100 (2006) 371–386378
covariates: socioeconomic status, maternal education,and forgetting homework. Solely for the stratifiedanalysis, two of the covariates were recalculated toform two-level variables: family economic status wasexpressed as either 0 or any luxury items, and forgettinghomework was collapsed into never or ever.
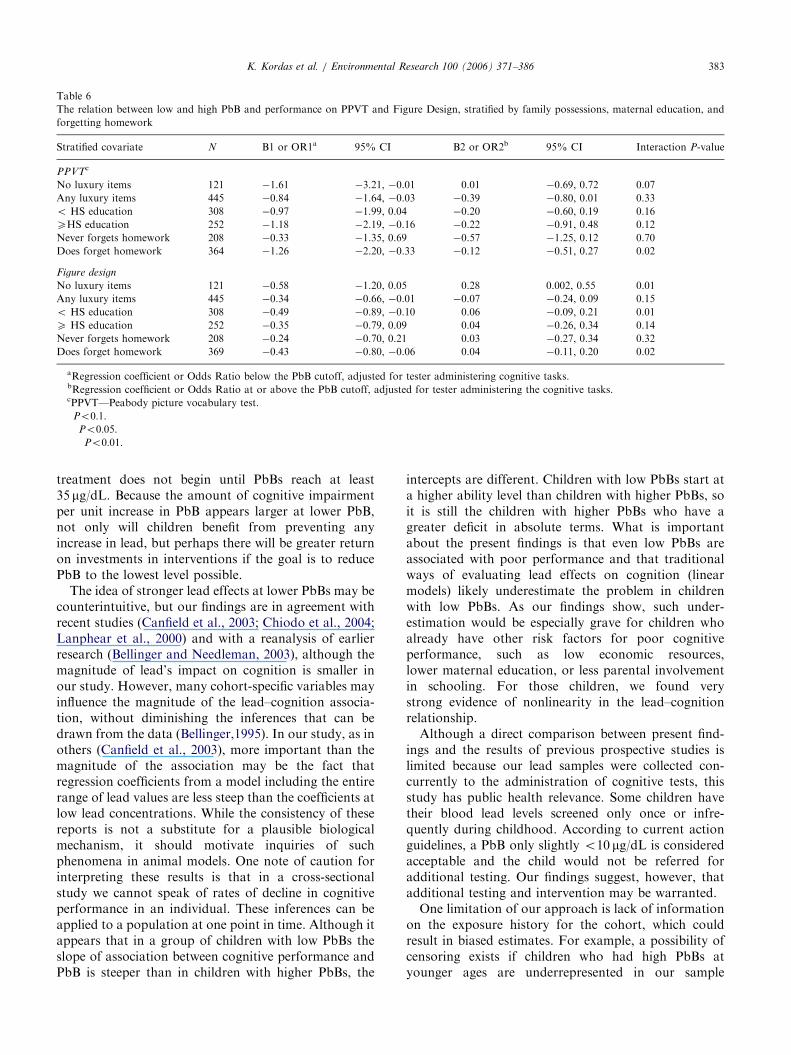
Subsequently, spline regressions were modeled in eachstratum and the pattern of lead coefficients at low andhigh lead levels was compared (Table 6 shows coeffi-cients for PPVT and Figure Design). All regressionswere adjusted for the tester who administered the tasks.The pattern of steeper estimates at low PbBs vs. higherPbBs was generally conserved in stratified analysis.
Fig. 1. LOWESS-smoothed plots of cognitive pe
Moreover, it is for the children who already tend to be atrisk for poorer performance (fewer family resources,lower maternal education, low parental involvement inschool work) that the nonlinear relationship is mostpronounced. In these children the interaction terms atthe given cutoffs were highly statistically significant.
4. Discussion
Our report shows that children’s performance oncognitive tasks is inversely associated with their con-current blood lead level, but the relation between
rformance and PbB, unadjusted, n ¼ 582.
ARTICLE IN PRESS
Fig. 1. (Continued)
K. Kordas et al. / Environmental Research 100 (2006) 371–386 379
performance and PbB is not constant across the range oflead concentrations examined here. In our sample, theassociation between lead and cognitive performance ismore accurately described using a segmented regressionmodel than a single line. The estimated cognitive deficitfor each 1 mg/dL increase in the PbB of this populationwas greater across the range of PbB o10–14 mg/dL,than above this range. Previous studies also showedassociations between lead o10 mg/dL and tests of IQ orachievement. The pattern of greater deficits at lowerPbB observed in our study for tasks ranging from visual
spatial abilities to achievement extends findings fromprevious studies and reinforces the validity of theseresults. The evidence of a nonlinear relationship betweenlead and cognitive performance was most pronouncedfor children who are already at risk for cognitive deficits.For the two outcomes we presented in stratified analysis(PPVT and Figure Design), the interaction terms for thegiven cutoffs were significant among children whosefamilies had fewer resources, whose mothers did notcomplete high school, and whose parents were lessinvolved in their children’s school work.
ARTICLE IN PRESS
Fig. 1. (Continued)
K. Kordas et al. / Environmental Research 100 (2006) 371–386380
One caveat to our approach of investigating multiplecutoffs and reporting findings on multiple outcomes isthat a large number of statistical manipulations of thesame data may yield significant findings. We did notadjust for this in our analysis, and while this generalcaution needs be voiced, we believe that our results dorepresent one more piece of valid evidence that therelationship between lead and cognitive performance isnonlinear.
For each outcome we reported a single PbB, for whichthe slope of the lead–cognition association was steeper
at levels less than, as compared to greater than, thatparticular value. It would be misleading, however, toconclude that they represent a unique cutoff, at whichthe nature of the lead–cognition relation changes. Forease of illustration we presented segmented regressionsonly for a single model—one based on the lead cutoffthat yielded the highest R2. However, neighboring PbBvalues resulted in similar slopes, so using R2 was anarbitrary criterion. For certain outcomes, such as Math,PPVT, Sequencing, Figure Matching, and others, wefound that several cutoffs between 10 and 14 mg/dL
ARTICLE IN PRESS
Fig. 2. Unadjusted performance on PPVT and Math as a function of PbB described by segmented regression models, n ¼ 582.
K. Kordas et al. / Environmental Research 100 (2006) 371–386 381
yielded significantly different slopes. Furthermore,measurement errors in cognitive performance and leadconcentrations, as well as individual differences inexposure characteristics (timing and dose) and perfor-mance may contribute to the existence of multiplecutoffs.
There are many examples of nonlinear dose–effectcurves in toxicology and medicine (Calabrese andBaldwin, 2001). The initial damage caused by leadmay reflect the disruption of different biologicalmechanisms than the more severe effects of highexposures that result in encephalopathy or frank mental
disability. This might explain why, within the range ofexposures not producing overt clinical effects, anincrease in PbB beyond a certain level might cause littleadditional impairment in children’s cognitive function-ing. Even in the absence of an understanding ofmechanisms, these findings, together with results fromother studies, suggest the need to broaden our perspec-tive on childhood lead poisoning to include childrenwith lead concentrations below the current CDC level ofconcern. According to current practice these childrenare monitored and interventions are recommended onlywhen their PbBs are above 10 mg/dL, although medical

ARTICLE IN PRESS
Table 4
Unadjusted change in cognitive performance for every 1mg/dL increase in blood lead for low and high lead exposure
Test Ca B1 or OR1b 95% CI B2 or OR2c 95% CI Adj-R2
Linear regressions
Math 10d �0.90��� �1.41, �0.38 �0.14� �0.29, 0.002 4.0
PPVT 12d �1.07��� �1.78, �0.37 �0.27 �0.62, 0.07 9.7
Freedom from distractibility factor 12e �0.95�� �1.69, �0.20 �0.24 �0.60, 0.12 3.9
Sequencing 10d �0.32�� �0.61, �0.03 �0.01 �0.09, 0.07 3.1
Sternberg 10e �0.26�� �0.46, �0.06 �0.06�� �0.12, �0.01 5.8
Figure matching 10d �0.35�� �0.60, �0.10 �0.04 �0.12, 0.03 4.2
Figure design 12d �0.42�� �0.70, �0.13 0.04 �0.10, 0.17 2.0
Visual search correct 10 �0.36 �0.86, 0.14 �0.06 �0.20, 0.08 2.8
CAT mean decision timef 10e 0.10� �0.02, 0.21 �0.01 �0.04, 0.03 5.6
Logistic regressions
Visual search errors (o5 vs. X5) 10d 1.18�� 1.02, 1.37 1.00 0.95, 1.04 5.0
Stimulus discrimination correct (o20 vs. 20) 8 0.83 0.64, 1.07 0.98 0.94, 1.02 2.9
Visual memory span correct (o10 vs. X10) 10 0.87 0.73, 1.03 1.01 0.96, 1.06 1.2
CAT number of errors (0 vs. any errors) 14 1.06 0.98, 1.15 0.98 0.91, 1.05 2.1
aCutoff point.bRegression coefficient or Odds Ratio below the PbB cutoff, adjusted for tester administering cognitive tasks.cRegression coefficient or Odds Ratio above and including the PbB cutoff, adjusted for tester administering cognitive tasks.dSlopes of lines below and above cutoff different at Po0:05.eSlopes of lines below and above cutoff different at Po0:1.fStimulus discrimination task, decision time corrected for outliers.�Po0:1.��Po0:05.���Po0:01.
Table 5
Adjusted change in cognitive performance for every 1mg/dL increase in blood lead at low and high lead exposure
Test Ca B1 or OR1b,c 95% CI B2 or OR2c,d 95% CI Adj-R2
Linear regressions
Math 10 �0.42 �0.92, 0.08 �0.11 �0.26, 0.03 23.4
PPVT 12 �0.71* �1.43, 0.02 �0.28 �0.62, 0.06 23.4
Freedom from distractibility factor 12 �0.40 �1.17, 0.37 �0.20 �0.57, 0.16 19.0
Sequencing 10 �0.20 �0.50, 0.10 �0.01 �0.10, 0.07 12.7
Sternberg 10 �0.16 �0.37, 0.05 �0.04 �0.10, 0.02 13.3
Figure matching 10 �0.20 �0.47, 0.06 �0.01 �0.09, 0.06 14.2
Figure design 12e �0.31** �0.62, �0.01 �0.01 �0.15, 0.14 12.4
Visual search correct 10 �0.01 �0.52, 0.51 �0.07 �0.22, 0.07 11.0
CAT mean decision timef 10 0.05 �0.07, 0.17 �0.01 �0.05, 0.02 13.0
Logistic regressions
Visual search errors (o5 vs. X5) 10 1.09* 0.92, 1.28 1.0 0.96, 1.05 12.0
Stimulus discrimination correct (o20 vs. 20) 8 0.85 0.63, 1.13 1.00 0.95, 1.04 10.5
Visual memory span correct (o10 vs. X10) 10 0.90 0.74, 1.10 0.98 0.92, 1.05 9.7
CAT number of errors (0 vs. any errors) 14 1.06 0.96, 1.17 0.97 0.90, 1.05 5.4
*Po0:1; **Po0:05; ***Po0:01.aCutoff point.bRegression coefficient or Odds Ratio below the PbB cutoff.cAdjusted for child’s gender, age and hemoglobin, possession of household items, home ownership, crowding, maternal education, birth order,
frequency of forgetting homework, family structure, arsenic, tester, and school.dRegression coefficient or Odds Ratio at or below the PbB cutoff.eSlopes of lines below and above cutoff different at Po0:1.fDecision time corrected for outliers.
K. Kordas et al. / Environmental Research 100 (2006) 371–386382
ARTICLE IN PRESS
Table 6
The relation between low and high PbB and performance on PPVT and Figure Design, stratified by family possessions, maternal education, and
forgetting homework
Stratified covariate N B1 or OR1a 95% CI B2 or OR2b 95% CI Interaction P-value
PPVTc
No luxury items 121 �1.61�� �3.21, �0.01 0.01 �0.69, 0.72 0.07
Any luxury items 445 �0.84�� �1.64, �0.03 �0.39� �0.80, 0.01 0.33
o HS education 308 �0.97� �1.99, 0.04 �0.20 �0.60, 0.19 0.16
XHS education 252 �1.18�� �2.19, �0.16 �0.22 �0.91, 0.48 0.12
Never forgets homework 208 �0.33 �1.35, 0.69 �0.57 �1.25, 0.12 0.70
Does forget homework 364 �1.26��� �2.20, �0.33 �0.12 �0.51, 0.27 0.02
Figure design
No luxury items 121 �0.58� �1.20, 0.05 0.28�� 0.002, 0.55 0.01
Any luxury items 445 �0.34�� �0.66, �0.01 �0.07 �0.24, 0.09 0.15
o HS education 308 �0.49�� �0.89, �0.10 0.06 �0.09, 0.21 0.01
X HS education 252 �0.35 �0.79, 0.09 0.04 �0.26, 0.34 0.14
Never forgets homework 208 �0.24 �0.70, 0.21 0.03 �0.27, 0.34 0.32
Does forget homework 369 �0.43�� �0.80, �0.06 0.04 �0.11, 0.20 0.02
aRegression coefficient or Odds Ratio below the PbB cutoff, adjusted for tester administering cognitive tasks.bRegression coefficient or Odds Ratio at or above the PbB cutoff, adjusted for tester administering the cognitive tasks.cPPVT—Peabody picture vocabulary test.�Po0:1.��Po0:05.���Po0:01.
K. Kordas et al. / Environmental Research 100 (2006) 371–386 383
treatment does not begin until PbBs reach at least35 mg/dL. Because the amount of cognitive impairmentper unit increase in PbB appears larger at lower PbB,not only will children benefit from preventing anyincrease in lead, but perhaps there will be greater returnon investments in interventions if the goal is to reducePbB to the lowest level possible.
The idea of stronger lead effects at lower PbBs may becounterintuitive, but our findings are in agreement withrecent studies (Canfield et al., 2003; Chiodo et al., 2004;Lanphear et al., 2000) and with a reanalysis of earlierresearch (Bellinger and Needleman, 2003), although themagnitude of lead’s impact on cognition is smaller inour study. However, many cohort-specific variables mayinfluence the magnitude of the lead–cognition associa-tion, without diminishing the inferences that can bedrawn from the data (Bellinger,1995). In our study, as inothers (Canfield et al., 2003), more important than themagnitude of the association may be the fact thatregression coefficients from a model including the entirerange of lead values are less steep than the coefficients atlow lead concentrations. While the consistency of thesereports is not a substitute for a plausible biologicalmechanism, it should motivate inquiries of suchphenomena in animal models. One note of caution forinterpreting these results is that in a cross-sectionalstudy we cannot speak of rates of decline in cognitiveperformance in an individual. These inferences can beapplied to a population at one point in time. Although itappears that in a group of children with low PbBs theslope of association between cognitive performance andPbB is steeper than in children with higher PbBs, the
intercepts are different. Children with low PbBs start ata higher ability level than children with higher PbBs, soit is still the children with higher PbBs who have agreater deficit in absolute terms. What is importantabout the present findings is that even low PbBs areassociated with poor performance and that traditionalways of evaluating lead effects on cognition (linearmodels) likely underestimate the problem in childrenwith low PbBs. As our findings show, such under-estimation would be especially grave for children whoalready have other risk factors for poor cognitiveperformance, such as low economic resources,lower maternal education, or less parental involvementin schooling. For those children, we found verystrong evidence of nonlinearity in the lead–cognitionrelationship.
Although a direct comparison between present find-ings and the results of previous prospective studies islimited because our lead samples were collected con-currently to the administration of cognitive tests, thisstudy has public health relevance. Some children havetheir blood lead levels screened only once or infre-quently during childhood. According to current actionguidelines, a PbB only slightly o10 mg/dL is consideredacceptable and the child would not be referred foradditional testing. Our findings suggest, however, thatadditional testing and intervention may be warranted.
One limitation of our approach is lack of informationon the exposure history for the cohort, which couldresult in biased estimates. For example, a possibility ofcensoring exists if children who had high PbBs atyounger ages are underrepresented in our sample
ARTICLE IN PRESSK. Kordas et al. / Environmental Research 100 (2006) 371–386384
because they were more likely to move away from thestudy area or because they represent such a low level ofmental abilities that they had to be enrolled in remedialclassrooms. We have information, however, that leadsus to believe that our sample represents a wide range ofboth abilities and previous exposures. In the publiceducation system in Torreon, special education schoolsor classrooms are not common; nor is school readinesstesting provided to identify children at risk. Children ofall ability levels attend the same school. To reduce thelikelihood that the present analysis included childrenretained in first grade from previous years, all childrenaged 8 years or more were excluded. Furthermore, inthis geographic area, where many adults are employedby the ailing garment industry, families are likely tomove away for financial reasons, not because of leadexposure.
Previous PbBs (taken at 5 years of age) were availablefor a subsample of our study children (n ¼ 116). Thegeometric mean PbB for this group was 16.6 mg/dL(range 2–65.7), with only 11% o10 mg/dL. Thoughincomplete, this information suggests the history ofexposure in our sample to be similar to the Port Piriecohort, where 7-year PbBs were highly correlated withaverage lifetime PbB. Similarly, we expect our 7-yearPbBs to reflect lifetime lead exposures, althoughabsolute levels were likely greater at younger ages.Thus, we can say with some degree of confidence thatthe majority, if not all, of our study subjects had PbB410 mg/dL at some point in their lives, and that theirconcurrent PbB measured at 7 years of age represents adecline from peak levels. Canfield et al. (2003) found themagnitude of the adjusted associations between Pb and5-year IQ to be similar for the concurrent and thelifetime average PbB. Finally, a recent study showedthat lead exposure concurrent to cognitive testing ofprimary school children makes a substantial andsignificant contribution to performance, independentof exposures at earlier ages (Chen et al., 2005).
Due to time and resource constraints, this study didnot include some important covariates relating tocognitive performance, such as the HOME inventoryor a maternal IQ. This study was part of a large placebo-controlled trial. The time frame of the trial and the largesample size, in addition to the wide range of cognitivetests administered to the study subjects, prevented usfrom concentrating on children’s home environment oradditional maternal measures. Although the absence ofmeasures of maternal IQ and home environment haspotentially serious implications for our findings, webelieve the results reported here are still important forthree reasons, detailed below.
First, while it is true that environmental variables arestrongly correlated with tests of intelligence andachievement, they are only moderately related toreasoning ability scores and minimally related to spatial
ability (Sattler, 1992). This suggests that adjustment formaternal IQ and home variables may be crucial for thePPVT, the Freedom from Distractibility factor andmath achievement outcomes in our study, but margin-ally so for the spatial abilities tests. That the generalpattern of performance indicative of steeper slopes atlow PbBs compared to higher PbBs is similar in tests ofachievement and spatial abilities, adds strength to ourconclusions.
Second, other considerations are important in inter-preting child cognitive performance. For example, (1)the home environment is likely not independent offamily background characteristics, (2) the SES correlatesat a level of 0.33 with child IQ scores, and (3) othercharacteristics of the home, such as parental involve-ment with their children, also explain variability inscores. In the present study, in addition to SES andparental education, we collected information from theteachers on the frequency with which children forgettheir homework. Parental involvement in schoolworkreflects an important aspect of parenting—monitoringchildren’s academic progress, which has been shown tobe a good proxy for the quality of children’s homeenvironment (Ginsburg and Bronstein, 1993). It mayalso serve as an indicator of drive for achievementparents instill in their children. We also included ascovariates information not typically included in otherlead studies: iron status, arsenic concentrations, andcrowding. Iron status is associated with children’scognitive performance independently of lead exposure(Kordas et al., 2004; Wasserman et al., 1992), whereascrowding has been related to children’s socioemotionaladjustment (Evans et al., 2002). Finally, our aim was notto present definitive data on the differential relationbetween low vs. moderate lead exposure and cognitiveperformance. Rather, we wanted to provide additionalpoints to the gathering pool of evidence and stimulateother research on this topic.
This study examined the nature of the relationbetween lead exposure and cognitive performance inschool children. It revealed a consistent pattern ofassociations, with lower PbBs associated with steeperdeclines in performance than higher PbB. This patternwas observable after controlling for a range ofcovariates known to influence cognitive performancein children, and in different strata of variables describingfamily demographics. Furthermore, in unadjusted seg-mented analyses 9 of the 13 outcomes had significant ornearly significant interaction terms, suggesting that theslopes were statistically different from each other.These findings have important implications for leadprevention and treatment policies. Currently mostpractices concentrate on providing treatment to childrenwith PbB 410 mg/dL. Perhaps a more effective ap-proach would be to concentrate on prevention of any
exposure because low-level PbBs are clearly damaging
ARTICLE IN PRESSK. Kordas et al. / Environmental Research 100 (2006) 371–386 385
for child development and learning, especially inchildren already at risk for poorer outcomes.
Acknowledgments
We thank Dr. Arturo Cebrian, Grissel Concha,Brenda Gamez, Julio Gavino, Magdalena Gutierrez,Gabriel Leon, Alicia Luna, Francisco Marentes, RosaIsela Morales, Carina Sosa, Griselda Torres andRemedios Sanchez for help in data collection, andEunice Vera for chemical analyses. This work wasfunded by the Spencer Foundation, Chicago, IL.
Appendix A. Supplementary Materials
Supplementary data associated with this article can befound in the online version at doi:10.1016/j.envres.2005.07.007.
References
Al-Saleh, I., Nester, M., DeVol, E., Shinwari, N., Munchari, L.,
Al-Shahria, S., 2001. Relationships between blood lead concentra-
tions, intelligence and academic achievement of Saudi Arabian
schoolgirls. Int. J. Hyg. Environ. Health 204, 165– 174.
Baghurst, P.A., McMichael, A.J., Wigg, N.R., Vimpani, G.V.,
Robertson, E.F., Roberts, R.J., Tong, S.L., 1992. Environmental
exposure to lead and children’s intelligence at the age of seven
years. The Port Pirie Cohort Study. N. Engl. J. Med. 327,
1279– 1284.
Barnard, S.M., 2003. Should the Centers for Disease Control and
Prevention’s childhood lead poisoning intervention level be
lowered? Am. J. Public Health 93, 1253– 1260.
Bellinger, D.C., 1995. Interpreting the literature on lead and child
development: the neglected role of the ‘‘experimental system’’.
Neurotoxicol. Teratol. 17, 201– 212.
Bellinger, D.C., Needleman, H.L., 2003. Intellectual impairment and
blood lead levels. N. Engl. J. Med. 349, 500– 502.
Bellinger, D.C., Leviton, A., Needleman, H.L., Waternaux, C.,
Rabinowitz, M., 1992. Longitudinal analyses of prenatal and
postnatal lead exposure and early cognitive development. N. Engl.
J. Med. 316, 1037– 1043.
Calabrese, E.J., Baldwin, L.A., 2001. The frequency of U-shaped dose
responses in the toxicological literature. Toxicol. Sci. 62, 330– 338.
Calderon, J., Navarro, M.E., Jimenez-Capdeville, M.E., Santos-Dıaz,
M.A., Golden, A., Rodriguez-Leyva, I., Borja-Aburto, V., Dıaz-
Barriga, F., 2001. Exposure to arsenic and lead and neuropsycho-
logical development in Mexican children. Environ. Res. 85, 69– 76.
Canfield, R.L., Henderson, C.R., Cory-Slechta, D.A., Cox, C., Jusko,
T.A., Lanphear, B.P., 2003. Intellectual impairment in children
with blood lead concentrations below 10 mg per deciliter. N. Engl.
J. Med. 348 (16), 1517– 1526.
CDC (Centers for Disease Control and Prevention), 1991. Preventing
Lead Poisoning in Young Children. CDC.
Chen, A., Dietrich, K.N., Ware, J.H., Radcliffe, J., Rogan, W.J., 2005.
IQ and blood lead from 2 to 7 years of age: are the effects in older
children the residual of high blood lead concentrations in 2-year-
olds? Environ. Health Perspect. 113, 597– 601.
Chiodo, L.M., Jacobson, S.W., Jacobson, J.L., 2004. Neurodevelop-
mental effects of postnatal lead exposure at very low levels.
Neurotoxicol. Teratol. 26, 359– 371.
Del Razo, L.M., Garcıa Vargas, G.G., Vargas, H., Albores, M.E.,
Gonsebatt, M.E., Montero, R., Ostrosky-Wegman, P., Kelsh, M.,
Cebrian, M.E., 1997. Altered profile of urinary arsenic metabolites
in adults with chronic arsenicism. A pilot study. Arch. Toxicol. 71,
211– 217.
Detterman, D.K., 1988. Cognitive Abilities Test. Case Western
University, Cleveland, OH.
Dunn, L.M., Lugo, D.E., Padilla, E.R., Dunn, L.M., 1986. Test de
Vocabulario en Imagenes Peabody. American Guidance Service,
Circle Pines, MN.
Evans, G.W., Lercher, P., Kofler, W.W., 2002. Crowding and
children’s mental health: the role of house type. J. Environ.
Psychol. 22, 221– 231.
Ginsburg, G.S., Bronstein, P., 1993. Family factors related to
children’s intrinsic/extrinsic motivational orientation and academic
performance. Child Dev. 64, 1461– 1474.
Hamilton, L.C., 1998. Statistics with STATA 5. Duxbury Press,
Albany, NY.
Kordas, K., Lopez, P., Rosado, J.L., Garcıa Vargas, G., Alatorre
Rico, J., Ronquillo, D., Cebrian, M.E., Stoltzfus, R.J., 2004. Blood
lead, anemia and short stature are independently associated with
cognitive performance in Mexican school children. J. Nutr. 134,
363– 371.
Lanphear, B.P., Dietrich, K., Auinger, P., Cox, C., 2000. Cognitive
deficits associated with blood lead concentrations o10mg/dl in US
children and adolescents. Publ. Health Rep. 115, 521– 529.
Miller, D.T., Paschal, D.C., Gunter, E.W., Stroud, P.E., D’Angelo, J.,
1987. Determination of lead in blood using electrothermal
atomisation atomic absorption spectrometry with a L’vov platform
and matrix modifier. Analyst 112, 1701– 1704.
Munoz, H., Romieu, I., Palazuelos, E., Mancilla-Sanchez, T.,
Meneses-Gonzalez, F., Hernandez-Avila, M., 1993. Blood lead
level and neurobehavioral development among children living in
Mexico City. Arch. Environ. Health 48, 132– 139.
Needleman, H.L., Gatsonis, C.A., 1990. Low-level lead exposure and
the IQ of children. A meta-analysis of modern studies. J. Am. Med.
Assoc. 263, 673– 678.
Rahman, A., Maqbool, E., Zuberi, H.S., 2002. Lead-associated deficits
in stature, mental ability and behaviour in children in Karachi.
Ann. Trop. Paediatr. 22, 301– 311.
Reitan, R.M., Wolfson, D., 1992. Neuropsychological Evaluation of
Older Children. Neuropsychology Press, Tucson, AZ.
Sattler, J.M., 1992. Assessment of Children, third ed. Jerome M.
Sattler, San Diego.
Stiles, K.M., Bellinger, D.C., 1993. Neuropsychological correlates of
low-level lead exposure in school-age children: a prospective study.
Neurotoxicol. Teratol. 15, 27– 35.
Tong, S., Baghurst, P., McMichael, A., Sawyer, M., Mudge, J., 1996.
Lifetime exposure to environmental lead and children’s intelligence
at 11– 13 years: the Port Pirie cohort study. Br. Med. J. 312,
1569– 1575.
Tong, S., von Schirnding, Y.E., Prapamontol, T., 2000. Environmental
lead exposure: a public health problem of global dimensions. Bull.
World Health Org. 78, 1068– 1077.
Wang, C.L., Chuang, H.Y., Ho, C.K., Yang, C.Y., Tsai, J.L., Wu,
T.S., Wu, T.N., 2002. Relationship between blood lead concentra-
tions and learning achievement among primary school children in
Taiwan. Environ. Res. 89, 12– 18.
Wasserman, G., Graziano, J.H., Factor-Litvak, P., Popovac, D.,
Morina, N., Musabegovic, A., Vrenzi, N., Capuni-Paracka, S.,
Lekic, V., Preteni-Redjepi, E., Hadjialjevic, S., Slavkovich, V.,

ARTICLE IN PRESSK. Kordas et al. / Environmental Research 100 (2006) 371–386386
Kline, V., Shrout, P., Stein, Z., 1992. Independent effects of lead
exposure and iron deficiency anemia on developmental outcome at
age 2 years. J. Pediatr. 121, 695– 703.
Wasserman, G., Graziano, J.H., Factor-Litvak, P., Popovac, D.,
Morina, N., Musabegovic, A., Vrenzi, N., Capuni-Pracka, S.,
Lekic, V., Preteni-Redjepi, E., Hadzialjevic, S., Slavkovich, V.,
Kline, J., Shrout, P., Stein, Z., 1994. Consequences of lead
exposure and iron supplementation on childhood development at
age 4 years. Neurotoxicol. Teratol. 16, 233– 240.
Wechsler, D., Gomez-Palacio, M., Padilla, E.R., Roll, S., 1984. Escala
de Inteligencia Para Nivel Escolar-RM. El Manual Moderno,
Mexico, DF.


