Embed Size (px)
Citation preview
Debt Financing and Risk Management ∗
Ilona BabenkoW. P. Carey School of Business
Arizona State University
Yuri TserlukevichW. P. Carey School of Business
Arizona State University
May 31, 2020
ABSTRACT
Using detailed data on derivative positions of U.S. oil and gas producers during1999-2019, we find that firms’ hedge ratios and contract maturities are strongly re-lated to debt issuance. Debt financing comes with restrictive covenants on hedgingpolicy, with 53.6% of outstanding lending agreements containing explicit minimumhedging requirements. Using adoption of capital-intensive technologies during thefracking boom as a shock to firms’ financing policies, we show that a sharp increasein debt financing results in more hedging. We rule out lender expropriation as amotive for hedging and show that firms with hedging requirements perform betterduring the COVID-19 pandemic. Overall, it appears that firms face constrainedoptimization in their hedging decisions imposed by prior financing choices.
JEL codes: G30, G32, G21
Keywords: hedging, risk management, debt, covenants, credit boom
∗Both authors are in the Department of Finance, Arizona State University, P.O. Box 873906, Tempe, AZ85287-3906; [email protected], 480-965-1036, and [email protected], 480-965-7281. We are grateful to HankBessimbinder. We thank Arditti Center for Risk Management for generous support and Fan Zhang and GoeunChoi for able research assistance.
“Our credit agreement requires that we hedge at least 75% but not more than 80% ofprojected oil production from our existing proved producing mineral interests for not less than30 months.” Exco Resources Inc.
Over several recent decades academics have developed many appealing theories of
corporate risk management (see, e.g., Stulz (1984), Smith and Stulz (1985), Bessem-
binder (1991), Froot, Scharfstein, and Stein (1993), Morellec and Smith (2007), Rampini
and Viswanathan (2010), and Bolton, Chen, and Wang (2011)), which prescribe opti-
mal hedge ratios for value-maximizing firms or utility-maximizing managers. Yet, these
theories are often unable to explain why in practice firms with similar characteristics
pursue widely different risk management policies, and the empirical evidence provides
mixed support for model predictions (e.g., Mian (1996), Nance, Smith, and Smithson
(1993), Geczy, Minton, and Schrand (1997), and Tufano (1996)). In this paper, we
posit that firms face constrained optimization in their hedging decisions imposed by
prior financing choices, which may explain observed risk management behavior.
Our argument is that a firm’s reliance on debt financing often dictates a particular
risk management policy. First, it is common for lenders to place explicit requirements on
firm risk management policy, such as limits on the amount of hedging, non-speculative
clauses, requirements of lender-approved counterparties, redetermination of the borrow-
ing base upon hedge unwinding, minimum hedge ratios, and hedge maturities. In fact,
hedging covenants are present in 85.2% of all credit and loan agreements, with 53.6% of
agreements and 43.7% of firm-years containing explicit minimum hedging requirements.
Further, even when hedging covenants are not present, firms may choose to hedge in
order to obtain more favorable terms on a loan. For example, Campello, Lin, Ma, and
Zou (2011) find that hedgers pay lower interest spreads and have fewer restrictions on
their investment policy.
To understand how debt financing shapes risk management policy, we first analyze
the relation between debt issuance and firm hedge ratios, contract maturities, and the
sophistication of the hedging portfolio. Our data set covers 2,577 firm-years for 308
U.S. oil and gas producers (SIC Code 1311) during the period 1999-2019 and provides
a near-ideal setting to study risk management: oil and gas firms face a common and
1
clear exposure to fluctuating energy prices,1 there is a well-developed market for energy
derivatives, and there is significant variation both across firms and time in adopted risk
management policies.
Our analysis reveals a strong positive relation between debt issuance and hedging,
which is robust to the inclusion of firm-fixed effects and economically important. For
example, a one standard deviation increase in debt issuance is associated with 8.2%
higher oil hedge ratio and approximately three months longer contract maturity. One
potential issue with the interpretation of these results, however, is that firms that hedge
more (for some reason) may be more appealing to prospective lenders and therefore
are able to secure larger loans. This reverse causality mechanism can bias the OLS
coefficients and we address it next.2
As a laboratory we use the shock to financing policies of oil and gas producers as-
sociated with adoption of new capital-intensive technologies. As hydraulic fracturing
and horizontal drilling techniques became commercially viable in mid- to late-2000s,
firms dramatically expanded their capital spending programs and financed this expan-
sion primarily by debt. In fact, the average annual capital expenditures in the oil and
gas industry grew from $143 million in real terms in 1999 to $1 billion in 2019. This
activity had a profound effect on debt financing—the annual long-term debt issuance
increased from $150 million to $1.1 billion over the same period.
There are at least two reasons why debt was a marginal source of financing for oil
and gas firms in mid- to late-2000s. First, this period was characterized by historically
low interest rates, particularly post the 2008 financial crisis. Second, the widespread
industry practice of Reserve Base Lending (RBL), whereby a loan is secured by a firm’s
proved oil and gas reserves, has made it easy for banks to extend credit during the period
of high energy prices (Azar (2017)). Indeed, by increasing the available collateral, shale
boom facilitated borrowing (see, e.g., Kiyotaki and Moore (1997) and Brunnermeier
1The variation in energy prices is high during our sample period. For example, the average monthly spotprice for WTI crude oil contract was $12 per barrel in 1999, whereas it reached $140 per barrel in 2008.
2Additionally, firms may strategically hedge more in order to obtain a larger loan. This mechanism is partof our explanation that debt financing drives firm hedging behavior. However, to the extent that firms withweak balance sheets are more likely to engage in strategic hedging behavior, it would cause us to underestimatethe effect of debt issuance on risk management in panel regressions.
2
and Oehmke (2013)).
Our empirical strategy leverages the fact that firms disclose in their annual reports
whether they apply new technology. Specifically, we use the frequency of terms ‘hy-
draulic fracturing’ and ‘horizontal drilling’ in firms’ annual reports as the instrument
for debt financing. The key to this strategy is that the new technology required signifi-
cant new investment, which was financed (often dollar for dollar) by new debt. Indeed,
we find that the technological shock strongly predicts debt issuance by firms, with the
instrument satisfying the first-stage criteria for strong instruments. The second-stage
estimates reveal that a one standard deviation increase in debt issuance more than dou-
bles firms’ hedge ratios for both oil and gas commodities and results in substantially
longer maturities of hedges.
The next set of tests investigates which mechanism is responsible for the link between
debt issuance and risk management. To see whether covenants in firms’ lending agree-
ments is what drives hedging policies, we separate debt issuance into two categories:
debt that comes with minimum hedging requirements and unrestricted debt. Consis-
tent with lending agreements shaping hedging policies, we find it is debt with minimum
hedging requirements that has a positive effect on firm hedge ratios and maturities,
whereas unrestricted debt has virtually no effect. These results are robust to firm- and
bank-fixed effects, indicating that time-invariant firm or bank characteristics cannot
explain this relation. Overall, our results underscore the importance of covenants and
suggest that the mechanism, whereby firms voluntarily hedge their production in order
to obtain better loan terms is unlikely to be of large importance.
The second potential mechanism is related to expropriation of existing debtholders.
Because derivatives are exempt from the automatic stay in bankruptcy, it can be ex
post optimal for a firm to hedge default risk with a derivative that is effectively senior
to existing debt (Roe (2011), Bolton and Oehmke (2015)). However, we find several
pieces of evidence inconsistent with this explanation. First, in many cases lenders do
not allow oil and gas firms to collateralize their derivative contracts when they hedge
with the third party, which strips derivatives of their seniority over debt claims. Second,
the positive effect of debt issuance on risk management is concentrated among highly
3
profitable firms that face a low probability of bankruptcy. Third, it is not unusual in
the oil and gas industry for financing and risk management to be bundled, which allows
lenders to internalize any transfers between the financing and hedging parts of their
portfolio. In fact, 54.5% of lending agreements explicitly allow and 8.8% agreements
require firms to use the original lender as a counterparty to any derivative transactions.3
We find that debt issuance generally has a greater positive effect on hedge ratios and
maturities when financing and hedging are bundled together, which is inconsistent with
the expropriation channel.
Our final set of tests examines the effectiveness of bank-imposed hedging require-
ments during the COVID-19 pandemic of 2020. The emergence of the novel coronavirus
had a dramatic effect on energy producers, with oil prices dropping from more than
$60 per barrel at the beginning of the year to less than $20 at the end of March 2020.4
Correspondingly, industry market valuations have dropped by more than 50%. Our
analysis reveals, however, that firms that had minimum hedging covenants in their loan
agreements had a significantly lower sensitivity to the daily crude oil price and the
wordwide COVID-19 case count. For example, during the month of March associated
with the largest industry decline, firms with minimum hedging requirements posted, on
average, a 9.6% higher cumulative return than firms without such requirements. These
differences were even more stark for highly levered firms, amounting to 25.8% return
differental. Further, we find that hedging requirements imposed by the banks were more
effective at mitigating the effect of pandemic on firm value than the voluntary hedging
programs, which is likely driven by firms choosing to unwind their voluntary hedges
at the beginning of 2020. Overall, our results demonstrate that firms with hedging
covenants perform better when industry is hit by a large negative shock.
The remainder of this paper is organized as follows. The next section offers a brief
review of the literature. Section II describes the technological revolution in the oil and
gas industry that came with the adoption of hydraulic fracturing and horizontal drilling
3Lender-counterparty may also receive preferential treatment. For example, derivative transactions withthe original lender can be collateralized, whereas derivative transactions with another counterparty have to beunsecured.
4In fact, the WTI crude oil price has turned negative for the first time in history on April 20, 2020.
4
methods and presents evidence on increased firms’ reliance on debt financing. Section
III describes covenants that lenders place to better control firms’ hedging policies and
presents summary statistics for the main sample. The empirical analysis linking debt
issuance and risk management policies is in Section IV. Section V examines mechanisms,
and Section VI offers results on firm performance.
I Literature Review
A vast finance literature focuses on the benefits of corporate risk management. In-
deed, by reducing the variability of cash flows, hedging can decrease the expected
costs of financial distress, increase debt capacity, minimize the corporate tax bill, de-
crease the expected costs of external financing, and increase productive investment (see,
e.g., Smith and Stulz (1985), Froot, Scharfstein, and Stein (1993), Graham and Smith
(1999), Fehle and Tsyplakov (2005), Leland (1998), Graham and Rogers (2002), and
Purnanandam (2008)). Risk management also mitigates certain market frictions. By
strengthening firm commitment to meet its obligations, hedging facilitates contracting
with firm creditors, customers, and suppliers (Bessembinder (1991)). In addition, hedg-
ing helps managers to reduce information asymmetries and better communicate their
ability to the labor market (DeMarzo and Duffie (1995)).
Another view on risk management is that risk-averse corporate executives engage
in hedging not to maximize shareholder value, but instead to increase their personal
utility, for example, by decreasing compensation risk (Stulz (1984), Smith and Stulz
(1985)). Consistent with this view, Tufano (1996) finds that hedging in gold mining
industry is related to compensation structure of firms’ executives and Knopf, Nam, and
Thornton Jr. (2002) find that firms hedge more when the sensitivity of managers’ stock
and stock option portfolios to stock price increases.
The literature pioneered by Rampini and Viswanathan (2010) focuses on hedging
by constrained firms. In particular, Rampini and Viswanathan (2010) build a dynamic
model that highlights the role of collateral constraints. Their main message is that
the opportunity cost of engaging in risk management is forgone current investment.
5
Subsequent work by Rampini, Sufi, and Viswanathan (2014) tests the predictions of
theory using a sample of 23 U.S. commercial airlines from 1996 to 2009. The authors
show that more financially constrained airlines are less likely to hedge fuel costs both
in the cross-section and within a given airline over time. Rampini, Viswanathan, and
Vuillemey (2019) provide further evidence that higher capitalization is associated with
more hedging using data on interest rate and foreign exchange risk hedging. For iden-
tification, the paper uses net worth shocks from the drop of house prices that affect
financial institutions.5
Many empirical studies show that hedging increases firm value (see, e.g., Allayannis
and Weston (2001), Graham and Rogers (2002), Adam and Fernando (2006), Mackay
and Moeller (2007), Bartram, Brown, and Conrad (2011), Ellul and Yerramilli (2013),
Cornaggia (2013), and Perez-Gonzalez and Yun (2013)). The notable exceptions are
Jin and Jorion (2006), who find no relation between hedging and market value, and
Guay and Kothari (2003), who argue that the magnitude of hedged risk exposure is too
small to have a meaningful effect on firm value.
Our paper is related to studies linking hedging policies and leverage. Using a tax-
based instrument, Campello, Lin, Ma, and Zou (2011) show that hedgers pay lower
interest spreads and are less likely to have capital expenditure restrictions in their loan
agreements, which increases firm value. The main argument in their paper is that hedg-
ing improves contracting outcomes for firms, while the focus of our paper is on hedging
covenants imposed by the bank and the relation between debt issuance and risk man-
agement. Another related paper is Haushalter (2000), who shows, among other things,
that hedging is related to firm leverage and contends that corporate risk management
alleviates financial contracting costs. There are several differences between his study
and ours. First, we focus on the relation between active debt issuance and hedging poli-
cies (hedge ratios, maturities, and form of hedging). Second, we focus on a time period
of technological revolution in industry, which allows us to use a sharper identification
strategy. Finally, by using the detailed data on hedging covenants contained in credit
5The main prediction is that financial institutions with lower net worth hedge less since the cost of foregoinglending or cutting credit lines is higher at the margin for such institutions. The authors do not discuss hedgingcovenants or specifics of credit agreements that the banks are entering into.
6
agreements, we shed light on the mechanism linking debt issuance to hedging policies.
Finally, our paper contributes to the literature on selective hedging (see, e.g., Stulz
(1996), Brown, Crabb, and Haushalter (2006), Adam and Fernando (2006), and Geczy,
Minton, and Schrand (2007)). For example, Stulz (1996) gives his view on “selective
hedging” as a way for companies to embed their expectations of future commodity
prices into firm value. We identify selective hedging not only with respect to hedged
volumes, but also with respect to hedge maturities. Further, our contribution lies in
showing that selective hedging is more pronounced for firms issuing large amounts of
debt–a finding we attribute to lenders using conservative “price decks” for unhedged
reserves and therefore encouraging locking-in the high current prices by hedging.
II Background
Hydraulic fracturing is a stimulation technique, in which rock is fractured by a highly
pressurized liquid. The first experiments involving hydraulic fracturing (“fracking”)
date back to late 1950s, but the high initial cost of technology and its relatively low
efficiency prevented early adoption by oil and gas firms. In the early- to mid-2000s,
hydraulic fracturing was successfully combined with horizontal drilling technique, which
resulted in a commercially viable application to shale rock formations. As a result, the
new technology was put to use in gas fields around 2005-2006, and the application
to longer hydrocarbon chains that make up crude oil followed several years later.6
Implementation of new technology, however, proved to be capital intensive as it required
significant investment by firms in land, mineral rights, equipment, and labor.7
Figure 1 shows the evolution of technology adoption by U.S. oil and gas compa-
nies during 1999-2019, as illustrated by mentions of hydraulic fracturing and horizontal
drilling methods in firms’ annual reports. The frequency of word ‘horizontal’ increased
from approximately one mention per annual report before 2005 to more than 11 men-
6See “The Texas well that started fracking revolution,” Wall Street Journal, June 29, 2018.7The energy report by Maugeri (2012) indicates that shale gas and tight oil operations are more capital
intensive than the application of conventional technology. In particular, hydraulically fractured wells aredepleted much faster, so that more frequent drilling of new wells is required to maintain the constant level ofproduction.
7
tions post-2011. Similarly, the word ‘hydraulic’ that was almost never used prior to
2005, appeared, on average, more than 30 times post-2011. As the bottom panels of
Figure 1 show, exploration and extraction of oil and gas increased substantially in mid-
and late-2000s.
At the same time, firm capital expenditures (adjusted for inflation to base year of
2019) grew from less than $265 million before 2005 to more than $1 billion post-2011
(see Figure 2). Large investment by oil and gas firms and dire need for financing had a
profound effect on use of debt. Syndicated bank loans and revolving lines of credit have
historically represented the marginal source of funds for these firms and have grown
tremendously with firms’ increased appetite for financing. First, the widespread use of
Reserve Base Lending (RBL) in the industry, whereby the loan is secured by the proved
oil and gas reserves, have made it easy for banks to extend credit during the period
when energy prices were relatively high and the firms’ reserves were rapidly increasing
(Azar (2017)). Indeed, a large literature argues that increasing asset values make the
firm’s collateral more valuable and facilitate borrowing (see, e.g., Kiyotaki and Moore
(1997) and Brunnermeier and Oehmke (2013)). Second, this period was characterized
by historically low interest rates, particularly post the 2008 financial crisis.
As Figure 2 shows, annual long-term debt issuance increased from less than $300
million before 2005 to approximately $800 million post-2011. Equity issuance, however,
remained fairly steady, except for a temporary spike in 2016 when low energy prices
made debt issuance secured by firms’ reserves more difficult.
The next panel illustrates the dynamics of LIBOR rates, that are often used by
lending firms as a base for determining the interest rate on a loan (e.g., LIBOR rate
+3%). Evidently, interest rates were relatively high at the beginning of our sample
period, they temporarily decreased following the recession of 2000-2001, then bounced
back, and dramatically decreased post 2008. We observe from Figure 2 that book
leverage increased from about 35% before 2004 to about 60% by 2016. The last two
panels of Figure 2 show the average spot prices for natural gas and crude oil around
the same period.
We argue that increased reliance on debt financing significantly shaped firms’ risk
8
management policies. This is not only because of the several-fold increase in debt
issuance, but also because new credit agreements reflected the enhanced requirements
of the banking industry, particularly in the post-crisis period when banks had lean
balance sheets. Many banks started to include “hedging covenants” and specified how
derivative portfolios should be treated upon covenant violations or firm bankruptcy.
Appendix A provides examples of such hedging covenants. Covenants often specify the
minimum and the maximum portion of the estimated production that must be covered
by a derivative position. In addition to hedge ratios, some credit agreements place
minimum and maximum restrictions on maturity of contracts. A non-speculation clause
is often present in credit agreements and typically states that ‘the hedge agreement is
for the principal purpose of protecting against fluctuations in commodity prices and not
for purpose of speculation.’ Finally, it is common for banks to require that all derivative
positions are reported back to the lender in a timely fashion, including hedged volumes,
type of securities used, maturities, and involved counterparties.
In Appendix B, we provide examples from credit agreements and firms’ annual
reports describing how hedging portfolio is treated upon a covenant violation or default.
Evidently, hedge contracts are frequently terminated upon default, with the proceeds
from the settlement becoming immediately payable to the lender. Moreover, lenders
often restrict the borrower’s ability to enter into new hedging contracts, either explicitly
by applying the control over the company decisions, or because the credit agreement
requires that the only counterparty for a hedge contract can be the lender or its affiliates.
III Sample Construction and Summary Statistics
A Sample of Oil and Gas Firms
We use data from U.S. oil and gas producing firms (SIC Code 1311 ‘Crude Petroleum
and Natural Gas Extraction’) that have non-missing accounting data in COMPUSTAT.
For each firm, we download the annual statements (10-K or 10-KSB) from SEC EDGAR
for the period 1999-2019. We drop observations with no reported production of oil or
natural gas and firm-years for which no corresponding annual reports are available. The
9
resulting sample consists of 308 unique firms and 2,577 firm-year observations.
We search the annual reports for the keywords related to firms’ risk management
practices: “hedg,” “swap,” “derivative,” “collar,” “risk management,” “futures,” and
“forward.” Firms typically report the type of outstanding derivatives they hold, their
maturity, hedged volume, and the relevant contract prices. A number of firms also
report the additional positions they take in basis, spread, or differential swaps. To avoid
double counting, we ignore these additional derivatives for the purposes of calculating
the hedged volume.
To calculate a firm’s hedge ratio for crude oil and natural gas, we first sum, sepa-
rately for each commodity, all notional amounts for the reported outstanding derivatives
for the fiscal year directly following the reporting year. We then divide the hedged vol-
ume by the size of the underlying exposure, which we set to the next year’s respective
production of oil or gas. Whenever the next year’s production is unavailable, we divide
the hedged volume by the current year’s production.8 While it is possible that some
firms enter into commodity derivative positions to speculate rather than to hedge (and
we certainly see cases where firms substantially “over-hedge” their next year produc-
tion), for the purposes of our analysis we treat all outstanding positions as hedging.9
We also obtain from the financial statements the stated maximum maturity of hedging
contracts, separately for oil and gas derivatives.10
Figure 3 demonstrates changes in firms’ risk management policies that took place
during the period 1999-2019. Consistent with greater firms’ reliance on debt financing,
which necessitated more hedging, we observe that the fraction of firms hedging oil price
exposure increased rather dramatically over the sample period, from approximately
39% before 2005 to more than 65% after 2011. Similar dynamics is observed for the
average fraction of next year’s oil and gas production hedged. In fact, the average oil
hedge ratio was less than 20% prior to 2005 and increased to more than 30% after 2011.
8Our results are robust to alternatively calculating the hedge ratios as the future hedged volume dividedby the current year’s production for all firm-years.
9No firms in our sample use commodity derivatives to increase their net exposure to crude oil or naturalgas price, which is consistent with the findings by Tufano (1996) for gold mining industry. Further, less than8% of firms report that they use any derivatives for trading or speculation purposes.
10We record the maximum maturity of all outstanding derivative contracts. Thus, if a firm has regular swapsfor the next 24 months and basis swaps for the next 36 months, the recorded maturity is 36 months.
10
The bottom two panels of Figure 3 present the average maturity of oil and gas hedging
contracts. Mirroring the growth in commodity hedge ratios, the maximum maturities
of oil and gas hedging contracts increased from about 5-10 months at the beginning of
our sample to 14-20 months in the second half of the sample.
Table 1 provides the description of main empirical variables, and Table 2 reports
the summary statistics for our sample. Panel A shows that 66.7% oil and gas producers
report using derivatives, with 63.6% of firms using derivatives to hedge commodity price
exposure. The fraction of firms hedging crude oil prices is 53.7% and is very similar
to the fraction of firms hedging natural gas prices (53.9%).11 We also find that 20.3%
firms use interest rate derivatives, such as floating-for-fixed interest rate swaps, and
8.4% firms report using foreign exchange (FX) derivatives, such as currency swaps.
Panel B provides summary statistics for the annual production of oil and gas and
the characteristics of firms’ outstanding hedging portfolios. On average, hedge ratio is
29.9% for crude oil production and 26.6% for natural gas production. Correspondingly,
the average maturity is 13 months for oil hedging contracts and 14 months for natural
gas contracts. We also report the average sophistication of hedging contracts, whereby
one point is assigned for use of each category of derivatives: (i) swaps/forwards/futures,
(ii) collars, and (iii) options. On average, the firm in our sample has a sophistication
measure of 1.1. For commodity hedgers, the average sophistication is 1.8, implying that
the average hedger uses more than one type of derivatives.
Finally, the last panel in Table 2 reports the statistics for firm-level characteristics.
Overall, oil and gas firms have high leverage and relatively low profitability, with the
average return on assets being negative. What is perhaps notable is that these firms
issue each year, on average, a dollar amount of long-term debt equal to 18.4% of their
book value of assets. Consistent with large reliance on debt financing, we find that in
1.3% of firm-year observations the firm is in default as of the year-end (most commonly
in Chapter 11). We also find that oil and gas producers have relatively large tax-loss
carryforwards, with the median firm having positive tax-loss carryforwards.
11In general, more firms hedge natural gas price exposure in the early part of the sample, whereas oil pricehedging is more prevalent in the late part of the sample. Firms are also more likely to hedge natural gas priceexposure when it constitutes a greater portion of their overall energy production.
11
Table 3 compares firm-characteristics for commodity hedgers and non-hedgers. Con-
sistent with prior literature and economies of scale to risk management, firms with
bigger assets and larger annual production are more likely to hedge their commodity
exposure. Hedging is negatively related to firms’ growth opportunities, measured by
market-to-book ratios, and negatively related to firm profitability.
Financing policies are also substantially different for hedgers and non-hedgers. In
particular, firms that hedge their commodity exposure have, on average, a book leverage
of 38.9%, compared to 29.6% for non-hedgers. Even more dramatic are the differences in
active debt issuance for firms that manage their commodity risk and those that do not.
Specifically, the average long-term debt issuance constitutes on average 23.1% of book
value of assets for oil hedgers, compared to only 10.1% for non-hedgers. Despite having
significantly more leverage, firms that engage in risk management are significantly less
likely to be in default by the year-end.
B Sample of Hedging Covenants
Before we proceed to the analysis of the relation between debt issuance and risk manage-
ment, we present evidence on hedging covenants that are present in firms’ outstanding
lending agreements. To obtain the sample of lending agreements, we first search firms’
annual reports for mentions of any outstanding credit agreement or loans and then ex-
tract the full text of these agreements from prior SEC filings (most commonly contained
in 8-K or 10-Q reports).12 Table 4, Panel A shows that when we are able to identify
a credit or loan agreement (1,976 firm-years), it contains hedging covenants in 85.2%
of cases. Approximately 53.6% of agreements explicitly require a minimum amount of
hedging by indicating the minimum hedge ratio, hedged volume, and maturity, and/or
by specifying that the loan commitment will be reduced if the borrower unwinds existing
hedges. Since banks are commonly worried about potential speculation with derivatives
by the firm once debt is in place,13 the common practice is to place restrictions on the
12We search the annual reports for “credit agreement,” “credit facility,” and “loan.” When multiple agree-ments are outstanding, we record the information on the most recent one.
13See, e.g., the argument in Bolton and Oehmke (2015) why the treatment of derivatives in bankruptcy andtheir effective seniority to debt claims may induce firms to over-hedge.
12
maximum allowed hedge ratios and/or maturities (69.8% of firm-years). In 54.5% of
firm-years, the lending agreements explicitly mention that the lending bank can be a
used as a counterparty to firm derivative transaction. Even more interesting is that
some agreements (8.8% firm-years) require the lender to be a counterparty for any firm
swap transactions.
Panel B presents the statistics for all firm-years in the sample, including observations
when firms do not have loans or have only indentures or notes.14 In the full sample,
hedging covenants are present in 69.8% of firm-years and contain covenants requiring
hedging in 43.7% of observations. In 25.9% of cases, there is an explicit covenant re-
quiring the firm to hedge a minimum percentage of its future production. When such
covenant is present, the minimum allowed hedge ratio is, on average, 54.1%. The re-
quirement to maintain a minimum maturity of hedging contracts is less frequent (16.2%
firm-years), and when present, it specifies the average allowed minimum maturity of
approximately 26 months. In almost half of the cases, the lending agreements require
the borrower to enter hedging contracts only with the counterparties pre-approved by
the lender or with counterparties that have a credit rating above a certain threshold.
In 44.4% of firm-years, the lending agreements explicitly allow the lending bank to be a
counterparty to firm hedging positions, and in 7.2% firm-years they require the lender
to be a counterparty.
In 59.8% of firm-years, the agreements also require timely reports of all firm’s deriva-
tive positions to the lender, including hedged volumes, involved counterparties, type
of derivatives used, strike prices for option positions, and the relevant contract ma-
turities.15 Lenders are also commonly worried about unwinding or termination of any
existing hedge and either explicitly prohibit such unwinding or state that the borrowing
base will be reduced by a certain amount conditional on hedge termination or entry into
any offsetting derivative positions. Many agreements also place restrictions on the use
14Indentures, promissory notes, and convertible notes rarely place any restrictions on firm hedging policy.15The reporting requirements vary considerably across firms, with some agreements asking only for the initial
report of outstanding hedging positions, others requiring quarterly updates, and some asking for a report eachtime there is a change in hedging position. Further, it is possible that even when the reporting requirement isnot explicitly present in the lending agreement, the banks will have access to the existing hedging positions ofthe firm and examine it before determining the terms of the loan.
13
of interest rate swaps or specify other hedging covenants, such as restrictions on post-
ing collateral for hedge contracts, requiring hedges to be unsecured, indebtedness on
hedging obligations, entering into option positions, the strike prices on these contracts,
and cross-default provisions. These other restrictions occur in 53.1% of firm-years.
The last panel of Table 4 shows that when it comes to hedging covenants there are
significant differences in bank styles. Some banks, such as Well Fargo Bank and BNP
Paribas, frequently require minimum amount of hedging as part of the loan (83.1% and
84.6%, respectively). Others, such as Bank of America and Bank One, use it seldom
(32.6% and 33.9%).
In Figure 4, we plot the fraction of oil and gas firms placing hedging covenants
over time. Overall, the propensity to place such covenants increased from 57.1% at the
beginning of the sample to 78.9% by the end. Even more dramatic was the increase
in the number of covenants requiring hedging, which we define as having a covenant
that requires a minimum hedge ratio, specifies that the borrowing base of the loan will
be reduced upon unwinding of existing hedges, or/and having a covenant that requires
a minimum maturity of hedges. The fraction of firms with such covenants increased
from 22.0% to approximately 60.6% by the end of the sample period. The figure also
shows an increased tendency of firms to add non-speculation clauses for hedging and
reporting requirements.
IV Empirical Analysis
A OLS Results: Debt Issuance and Risk Management
Next, we examine the relation between firm debt issuance and risk management policies.
Our hypothesis is that increased reliance on debt financing dictates changes in firms’
risk management policies.
Several mechanisms can give rise to a causal relation. First, as we showed in the
previous section, lenders often explicitly place specific restrictions on hedging policy
and, in particular, require minimum hedge ratios and/or minimum maturities of hedging
contracts. While one view is that covenants are not imposed on a firm and are instead
14
an outcome of a bilateral negotiation between firms and lenders, our own reading of
firms’ annual reports indicates that firms were concerned for having these covenants in
place and often had to modify their pre-existing (supposedly optimal) risk management
policies.
Second, even when no specific requirements for hedging exist in loan agreements,
firms may prefer to cater to lenders by voluntarily engaging in risk management. Such
strategy can potentially expand firm’s borrowing base, reduce interest rate paid on a
loan, and allow to relax loan covenants (e.g., covenants placed on firm investment pol-
icy). For example, a firm that plans to invest heavily during the next couple years does
not want to suddenly discover that the lenders reduced their commitment after a semi-
annual redetermination of a borrowing base simply because commodity prices declined.
This mechanism can be especially important during the period of high commodity spot
prices. According to Azar (2017), in determining the value of a firm’s collateral and
the borrowing base for the loan, banks often use highly conservative price decks for
commodities relative to their futures prices. Therefore, it may be advantageous for a
firm to enter into swap agreements that allow to lock in the current futures prices that
lenders can use in their borrowing base determination. Finally, hedgers may pay lower
interest spreads and have fewer restrictions placed by the lenders on other firm policies,
such as investment (see, e.g., Campello, Lin, Ma, and Zou (2011) for causal evidence
on hedging and the cost of loans).
Table 5 presents our main results, where the dependent variable in Panel A is the oil
hedge ratio and in Panel B the natural gas hedge ratio. The key variable of interest is
debt issuance. We control for standard determinants of risk management, such as firm
size, growth options, tax function convexity, firm profitability, incidence of firm default,
as well as the average spot commodity prices during the fiscal year and the volatility
of commodity prices. Following Nance, Smith, and Smithson (1993), we proxy for
tax convexity using the amount tax-loss carryforwards that the firm has accumulated
normalized by book value of assets. The first two specifications in each panel do not
include firm-fixed effects, and the last two specifications include them to better control
for omitted time-invariant firm-characteristics that could drive both debt issuance and
15
risk management policies. In all specifications, we cluster the standard errors by firm
to address the potential concern that risk management policies are persistent over time
within a given firm.
The estimates in Table 5 reveal a robust positive relation between active debt is-
suance and firms’ hedge ratios. This relation also appears to be economically important.
For example, based on the first specification, a one standard deviation increase in debt
issuance is associated with roughly 8.2% higher oil hedge ratios when the mean is 29.9%.
Inclusion of firm-fixed effects reduces the magnitude of the effect, but the coefficient
remains statistically significant.
Another notable result that emerges from Table 5 is that firms that are in default
(e.g., in Chapter 11) at the end of the fiscal year, have lower hedge ratios. These results
become especially pronounced when we look at within-firm estimates. For example, the
estimates in specification 3 of Panel A and Panel B suggest that firms in default reduce
their hedge ratios by 28.0% for oil and 29.7% for gas, respectively. These results are
consistent with the empirical findings by Rampini, Sufi, and Viswanathan (2014) for the
airline industry, who explain this empirical relation by the low willingness of firms to cut
their current investment in order to post collateral. However, the mechanism is likely
to be different for commodity producers as it is uncommon for these firms to post cash
collateral for derivative positions.16 Instead, the lower hedge ratios may be attributed
to termination by counterparties of derivative contracts in default (a standard contract
provision) and the inability of oil and gas firms to find new counterparties despite their
willingness to do so.
Further, we observe a positive relation between hedging and commodity spot prices.
Although several effects could be responsible for this relation, it is likely driven by firm
debt.17 The significant effect of the interaction term between firm leverage and spot
16In particular, oil and gas firms can post as collateral their proved developed reserves.17For example, as Stulz (1996) argues, the companies can sometime engage in selective hedging, when
managers attempt to lock in the higher commodity prices using their derivative portfolios. Managers may haveinformational advantage over other market participants or they may believe that they possess such advantage,when in reality they do not. Several papers (see, e.g., Brown, Crabb, and Haushalter (2006), Faulkender(2005), and Adam and Fernando (2006)) find support for the hypothesis that managerial views affect theirrisk management policies in different settings. Another potential explanation is that a high commodity priceis associated with a high firm net worth, while a low price is more likely to be associated with distress andbankruptcy. We have previously documented that low net worth or bankrupt firms tend to have much smaller
16
prices suggests that firms with debt lock in the high prices to maintain the minimum
lending base.
Table 6 reports the results that relate debt issuance to the maturity and sophisti-
cation of outstanding hedging contracts. The dependent variable in Columns 1-2 and
Columns 3-4 is, respectively, the longest maturity (in months) of a firm’s outstand-
ing crude oil and natural gas hedging contracts. The results reveal a positive relation
between debt issuance and the maturity of hedging contracts. For example, a one stan-
dard deviation in debt issuance is associated with approximately 3 months longer oil
hedge maturity when the average maturity is 13 months. As is the case for hedge ra-
tios, we also find a pronounced negative effect of firm default on maturities of hedging
positions. In particular, the within-firm estimates suggest that the contract maturities
are reduced by 12 months for oil hedges and 13 months for gas hedges.
Finally, in Columns 5-6 we use a measure of commodity hedging sophistication. The
hedging sophistication is negatively related to the firms’ state of default and positively
related to debt issuance. The latter observation is consistent with our view that the risk
management strategy, including the type of derivative used in forming the portfolios,
is often imposed by the lender.
Overall, the results in Tables 5 and 6 provide strong suggestive evidence that debt
issuance drives risk management policies. However, despite the fact that we control for
firm-fixed effects, the OLS estimates cannot be interpreted in a causal way. It is still
possible that some omitted time-varying variables drive both debt issuance and risk
management. In particular, one possibility is that firms with lean balance sheets for
which it is more difficult to obtain a large loan, hedge in order to expand debt capacity.
If this is the case, then OLS estimates will be biased downward.
In the next section, we therefore sharpen our identification strategy to better capture
the exogenous increase in the amount of debt financing that was attributed to the
adoption of new technologies.
hedge ratios.
17

B Technological Shock and the Instrumental Variables Estimation
Our hypothesis is that debt financing increased sharply in the mid- to late-2000s because
of a higher demand by oil and gas firms originating from adoption of capital-intensive
technologies. Not all firms, however, implemented the new technology at the same
time as there were substantial differences across firms in staff expertise, technological
knowledge, and geological formations of land owned.
To capture the firm-specific shocks to adoption of technologies, we therefore use
the firms’ self-reported adoption, as indicated by the use of terms ‘horizontal drilling’
and ‘hydraulic fracturing’ in firms’ annual reports. Our general view is that use of the
term ‘hydraulic fracturing’ is more indicative than the term ‘horizontal drilling’ of a
technological shock that took place and we therefore we give it more prominence in our
measure of a shock. More specifically, we construct an instrument for debt issuance as
the natural logarithm of one plus the number of times a firm’s 10-K report mentions
the term ‘hydraulic fracturing’ multiplied by one if the firm uses the term ‘horizontal
drilling’ at least once.18
The results of IV analysis with the technological shock as the instrument for debt
issuance are presented in Tables 7 and 8. We present the estimates from the first stage,
where the dependent variable is debt issuance. We find that technological shock strongly
positively predicts debt issuance. The instrument is also fairly strong as judged by the
relatively high R-squared from the first stage and the test of excluded instruments. In
particular, the F-stastistic for the test of excluded instruments of 25.1 is well above
the cutoff of 16.4 proposed by Stock and Yogo (2002), mitigating the concern for weak
instruments. However, the test for weak instruments by Stock and Yogo (2002) is de-
rived under the assumption of conditionally homoscedastic serially uncorrelated errors.
Olea and Pflueger (2013) obtain the asymptotic properties of an F-test that adjusts for
heteroscedasticity, autocorrelation, and clustering, and derive the new critical value of
23.1. Our instrument passes this more stringent criterion as well. The second-stage
18Our results are robust to using the logarithm of one plus the number of mentions of term ‘hydraulicfracturing’ as our instrument or the logarithm of one plus the sum of mentions of ‘hydraulic fracturing’ and‘horizontal drilling’.
18
estimates reveal that higher debt issuance causes higher hedge ratios for both oil and
gas, as well as longer maturities of such hedges, although the effect on maturity of
natural gas contracts is not significant. Consistent with OLS coefficients being biased
down because borrowers with weak characteristics hedge to secure a loan, we also find
larger magnitudes for the IV estimates.
V Mechanisms
A Debt Issuance and Actual Hedging Covenants
Our next set of tests aims to identify the mechanisms that give rise to a positive relation
between debt issuance and risk management. As alluded earlier, the two mechanisms
that can be responsible for such a relation are: (i) “catering to lenders” and (ii) “expro-
priating lenders”. For example, catering to lenders may involve acceptance of restrictive
covenants on hedging policy and modifying firm risk management practice as a result.
Additionally, when lenders do not place explicit covenants, catering to lenders may in-
volve voluntary changes in firm hedging policy with the goal of securing a loan on more
favorable terms. In contrast, expropriating lenders refers to firms finding it optimal,
after debt has been issued, to hedge with derivatives that are effectively senior to this
debt in bankruptcy.
To understand whether hedging covenants that became more prevalent recently
play any role in shaping firms’ hedging policies, we separate firm debt issuance into
two categories: (i) debt issuance with no minimum requirements on risk management
policy and (ii) debt issuance that is stapled with minimum hedging requirements in
firms’ credit agreements, i.e., covenants requiring minimum hedge ratios, minimum
maturities, or calling for automatic decreases in the firm’s borrowing base following
hedge unwinding or terminations.
Table 9 reports the results of the OLS regressions, where the dependent variable
is hedge ratios for oil and gas exposure (in Panel A) and hedge maturities (in Panel
B). Consistent with the lending agreements playing an important role in determining
firms’ risk management policies, we find that it is largely debt issuance stapled with the
19
minimum hedging requirements that has a profound positive effect on firm hedge ratios
and hedge maturities. For example, a one standard deviation in such debt issuance is
associated with 12.4% and 8.8% higher hedge ratios for oil and gas, respectively. Un-
restricted debt issuance does not have a significant effect on risk management policies.
Further, these results continue to hold if we use firm-fixed effects (Columns 2 and 5),
and even if we include firm- and bank-fixed effects (Columns 3 and 6). The robustness
to the inclusion of bank-fixed effects implies that hedging policy of the firm changes
when the bank that it regularly deals with decides to change the hedging covenants.19
Similarly, we observe that hedge maturities are strongly related to debt issuance
stapled with the minimum hedge requirements, but are not related to unrestricted debt
issuance. For example, a one standard deviation in debt issuance stapled with the
minimum hedge requirements is associated with approximately 4 months longer hedge
maturities for oil and gas.
B Debt Issuance and Predicted Hedging Covenants
To mitigate a potential concern that banks change their hedging covenants either be-
cause they observe or anticipate changes in firm characteristics, we employ a slightly dif-
ferent empirical strategy, whereby we identify the propensity to place hedging covenants
by the firm’s lender from other observed lending agreements by this lender in the same
year. When it comes to propensity to require minimum hedging, lenders pursue quite
different styles, with some banks (e.g., Wells Fargo) requiring it for most of their con-
tracts, and others (e.g., Bank of America) placing such covenants only occasionally.
Table 10 presents the results of our tests, where we regress firm hedge ratios and
hedge maturities on debt issuance with predicted hedging requirements, where the latter
is equal to the average rate at which the firm’s bank places hedging requirements during
this year on other firms in the industry. The results show that across all specifications,
debt issuance that is associated with a high probability of hedging requirements, has a
greater effect on firm hedging policy.
19Of course, the decision of the bank to change covenants can be endogenous as well, with the bank likelytightening the hedging covenants when the financial condition of the firm deteriorates. We will address thispossibility in the next section using a different identification strategy.
20
C Ruling Out Alternative Mechanisms
As mentioned earlier, one potential explanation why firms hedge more after issuance of
debt securities is related to expropriation of debtholders in bankruptcy. In general, this
explanation is somewhat at odds with our evidence that unrestricted debt issuance (i.e.,
without covenants requiring hedging), has almost no effect on firm risk management
choices. Nevertheless, it is still possible that covenants are less likely to be placed on
financially sound firms.
To assess expropriation of debtholders as a potential mechanism behind the positive
relation between debt issuance and use of commodity derivatives more fully, we conduct
two additional tests. First, if derivatives are issued primarily because of their effective
senior status over debt securities in case of default (Roe (2011)), we would expect
more pronounced effects of debt issuance on hedging for less profitable firms that face
a high probability of bankruptcy. Second, when the original lender provides a bundle
of financing and hedging to the firm, he should internalize any transfers between the
two parts of his portfolio, and thus we would expect smaller effect of debt issuance on
hedging in such cases.
Our results are contrary to both of these predictions (see Table 11). We find that,
if anything, debt issuance has a larger effect on hedging policies for more profitable
firms. Further, when the firm is explicitly allowed (or required) to use the lender as
a counterparty to its derivative transactions, we tend to find larger effects of debt
issuance on hedging as well. Overall, our results indicate that catering to lenders, and
in particular, satisfying hedging covenants imposed by them on the firm, is more likely
explanation why firms hedge more when they issue debt.
VI Firm Performance during the COVID-19 Pandemic
Up to this point, we have focused on the hedging requirements imposed by lenders and
the determinants of risk management policies. The analysis that follows examines the
effectiveness of hedging requirements and voluntary hedging programs at the time when
the industry is hit by a large negative shock. Specifically, we use as experiment the
21

emergence of the novel COVID-19 coronavirus that disrupted firm operations, reduced
global demand for oil, and resulted in a large decrease in energy prices.
To understand how firms with different hedging policies perform during the crisis,
we obtain daily stock returns of all US-incorporated oil and gas firms between January
1, 2020 and March 23, 2020. We end the sample in late March because by this time
the U.S. stock market had likely incorporated most of the negative news associated
with the pandemic and because the Senate passed the first stimulus package on March
25 (H.R. 748 “Coronavirus Aid, Relief, and Economic Security Act”).20 We measure
firm performance by the daily stock return and capture the evolution of the shock by
two variables: the daily WTI crude oil spot price and the global count of COVID-
19 cases.21 The summary statistics for this sample are reported in Panel A of Table
12. Not surprisingly, oil and gas firms perform poorly during the development of the
COVID-19 pandemic and post, on average, -1.66% daily stock return. Approximately
62.0% of firms have minimum hedging requirements in their lending agreements, and
the average hedge ratio as of the end of 2019 is 42.0%.
Table 12 reports our regression results. The key variable of interest is the interaction
between hedging requirements and the shock (lower oil price or higher case count). As
expected, the daily stock returns are positively correlated to crude oil price and are
negatvely correlated to the number of confirmed virus cases. Further, firms that have
hedging requirements imposed by the lenders as well as firms that choose to hedge
voluntarily, tend to do better during this time period. More important, we observe
that presence of hedging requirements and hedging programs reduces the sensitivity of
firm’s stock returns to the negative shock. Finally, in Columns 3 and 6, we examine
whether the reduced sensitivity to the negative shock is driven by voluntary hedges put
in place in 2019 or the hedging requirements imposed by the lenders, and find it is the
latter. One potential explanation for these results is that firms that voluntarily put in
place hedging programs at the end of 2019, unwound their hedges at the beginning of
20According to data from Jonh Hopkins University, the first COVID-19 case in the United States wasconfirmed on January 22, 2020, and the first death was reported on February 29, 2020. The World HealthOrganization (WHO) declared the coronavirus outbreak a global pandemic on March 11, 2020, and the nationalemergency was declared in the United States on March 13, 2020.
21Our results are very similar if instead of case count, we use the number of deaths attributed to COVID-19.
22
2020 when the energy prices started to fall. The lenders, however, did not appear to
relax the hedging covenants.
Figure 5 further illustrates the dynamics of the cumulative returns in March 2020,
which is the most sensitive time period. For reference, we use the red vertical line to
denote the date when the WHO declared the coronavirus outbreak a global pandemic.
We observe that the cumulative returns of firms with hedging requirements are ap-
proximately 9.6% higher by the end of the period. Note, however, that this magnitude
may be difficult to interpret because firms that have hedging requirements that come
with loans are more likely to have higher leverage. To mitigate this concern, in the
next panel we focus on the subsample of highly levered firms. When leverage across
firms that have hedging requirements and those that do not is more comparable, we
observe even starker differences in returns. In fact, firms with hedging requirements
earn approximately 25.8% higher return by the end of the period. Overall, our results
show that hedging requirements are effective in mitigating the exposure of oil and gas
firms to negative shocks.
VII Conclusion
In this paper, we argue that firms often face constrained optimization in determining
their risk management policies, which is shaped by their prior financing choices. Once
debt is in place, firms may have the incentive to dilute the existing creditors by en-
tering into derivative positions that are effectively senior to debt. They also have the
incentive to lock-in the current commodity prices by hedging in order to prevent the
downwards adjustments by banks of their borrowing base. Finally, the lending agree-
ments often place rigid constraints on firms’ risk management policy, leaving little room
for deviations and causing firm to solve constrained optimization problem.
Using a sample of oil and gas producing firms over 1999 to 2019, we show that
firms’ increased reliance on debt financing that came with higher capital needs during
shale gas and tight oil revolution in industry, caused higher hedge ratios, longer hedge
maturities, and increased the sophistication of hedging contracts.
23
Appendix A. Sample Hedging Covenants
Below we provide several examples of language used in credit agreements to specify
various hedging covenants.
Minimum and maximum hedge ratio requirements
1. “The Administrative Agent shall have received evidence that the Loan Parties shall
have entered into commodities Hedging Agreements with respect to its Hydrocarbon pro-
duction with one or more counterparties, each of which are rated at least BBB by Stan-
dard & Poor’s and Baa2 by Moody’s, with the aggregate notional volumes of Hydrocar-
bons covered by such commodities Hedging Agreements . . . constituting not less than
25% and not more than 75% of the aggregate amount of the Loan Parties’ estimated
Hydrocarbon production volumes on an mcf equivalent basis . . . for the succeeding six
calendar months...” (KCS Energy credit agreement, March 31, 2003)
2. “The notional quantity of gaseous and liquid hydrocarbons subject to Commodity
Hedging Agreements by the Borrower or its Subsidiaries, at the time of entering into
such Commodity Hedging Agreements, shall not be, without the prior written approval
of the Required Lenders, greater than 80% or less than 60% of the monthly production
of hydrocarbons from the Proved Developed Producing Oil and Gas Properties of the
Borrower and its Subsidiaries as determined by the Administrative Agent for the nearest
36 month period...” (Saratoga Resources credit agreement, July 14, 2008)
3. “We are required to maintain commodity price hedges with a term of not greater
than 3 years and with notional amounts greater than 25% of projected production’...’
(GMX Resources Inc., 10-K report for 2007)
4. “Under the terms of its revolving credit facility, the Company was required to
hedge at least 50%, but not more than 75%, of its daily oil production at a price not
lower than the lowest price used in the bank’s price deck, for a period between 12 and
18 months.’ (Equity Oil, 10-K report for 1999)
5. “...Borrower shall not, and shall not permit any of its Subsidiaries to, directly or
indirectly: . . . Enter into, or suffer to exist, any Hedging Agreement unless approved in
advance in writing by the Administrative Agent.” (DHS credit agreement, December
20, 2007)
24
Non-speculation clause and borrowing base redetermination
1. “...The Hydrocarbon Hedge Agreement is a Hedge Agreement entered into in the
ordinary course of business for the principal purpose of protecting against fluctuations
in commodity prices or commodity basis risk and not for purpose of speculation...” (Red
Mountain Resources, February 5, 2013)
2. “...Upon completion of (i) any early termination of any Hedge Transaction used
in determining the Borrowing Base on the immediately preceding Determination Date
..., the effect of which termination or Disposition would be a reduction in the Borrowing
Base then in effect of 7.5% or more on a pro forma basis, the Borrowing Base shall
immediately and automatically upon consummation of such transaction be reduced by
the Borrowing Base contribution of such Hedge Transaction or assets, and all Net Cash
Proceeds from the termination of such Hedge Transaction or the Disposition of such
assets shall be applied to reduce or eliminate any Borrowing Base Deficiency resulting
from such reduction.” (Sandridge Energy credit agreement, April 22, 2010)
Reporting requirement and lender counterparty
1. “...each report required to be delivered by the Borrower pursuant to Section 8.01(e),
as of the date of (or as of the date(s) otherwise set forth in) such report, sets forth, a
true and complete list of all Swap Agreements of the Borrower and each other Credit
Party, the material terms thereof (including the type, term, effective date, termination
date and notional amounts or volumes), the estimated net mark-to-market value thereof,
all credit support agreements relating thereto other than Loan Documents (including
any margin required or supplied) and the counterparty to each such agreement.” (Rice
Energy credit agreement, October 19, 2016)
2. “The Company’s Credit Facility requires that counterparties in derivative transac-
tions be limited to the Lenders, including affiliates of the Lenders.” (Meredian Resource,
10-K report for 2010)
25
Appendix B. Treatment of Hedging Contracts in Default
Termination of outstanding hedge contracts in default
1. “The Company’s Bankruptcy Petition in July 2015 represented an event of default
under Sabine’s existing derivative agreements resulting in a termination right by coun-
terparties on all derivative positions at July 15, 2015. Additionally, certain of the Com-
pany’s derivative positions were terminated prior to July 15, 2015 as a result of defaults
under Sabine’s derivative agreements that occurred prior to the filing of the Bankruptcy
Petition.” (Forest Oil Group, 10-K report for 2015, in Chapter 11 bankruptcy)
2. “On June 14, 2018, the Company’s hedging counterparty, Koch Supply & Trading
LP, terminated the only outstanding hedge contract resulting in a settlement of $0.5
million.” (PetroQuest Energy Inc., 2019, in Chapter 11 bankruptcy)
3. “The convertible note hedging transactions have since been terminated in con-
nection with our Chapter 11 proceedings.” (Stone Energy Corp. 2016-12-31, in Ch. 11
bankruptcy)
4. “In February 2010, the administrative agent under our credit facilities liquidated
all of our existing hedge contracts and applied the proceeds thereof to amounts owed
under the facilities. As a result, our production is currently unhedged.” (Saratoga
Resources Inc., 10-K report for 2010, in Chapter 11 bankruptcy)
5. “Our hedging arrangements contain standard events of default, including cross
default provisions, that, upon a default, provide for (i) the delivery of additional col-
lateral, (ii) the termination and acceleration of the hedge, (iii) the suspension of the
lenders’ obligations under the hedging arrangement” (ATP Oil and Gas, 10-K report
for 2010)
6. “The filing of the Chapter 11 Petitions triggered an event of default under each
of the agreements governing our derivative transactions (“ISDA Agreements”). . . As a
result, our counterparties were permitted to terminate, and did terminate, all outstand-
ing transactions governed by the ISDA Agreements.” (Breitburn Energy Partners, 10-K
report for 2016)
Inability to enter new hedges
1. “As substantial doubt exists that we will be able to continue as a going concern,
finding counterparties for commodity hedges has proven difficult.” (EV Energy Partners,
10-K report for 2017, in Chapter 11 bankruptcy)
2. “...potential reduced counterparty willingness to enter into new hedges with us
26

while under Chapter 11...” (Vanguard Natural Resources, 10-K report for 2018, filing
bankruptcy petition)
3. “Due to our default under the Credit Facility, the Lenders have not allowed the
Company to enter into any additional hedging agreements.” (Meredian Resource Corp.
2010, covenant violation)
4. “During the Chapter 11 proceedings, our ability to enter into new commodity
derivatives covering additional estimated future production will be dependent upon either
entering into unsecured hedges or obtaining Bankruptcy Court approval to enter into
secured hedges. As a result, we may not be able to enter into additional commodity
derivatives covering our production in future periods on favorable terms or at all.”
(Forest Oil Group, 10-K report for 2015)
27

References
Adam, Tim R., and Chitru S. Fernando, 2006, Hedging, speculation, and shareholder value, Journalof Financial Economics 81, 283–309.
Allayannis, George, and James P. Weston, 2001, The use of foreign currency derivatives and firmmarket value, Review of Financial Studies 14, 243–276.
Azar, Air, 2017, Reserve base lending and the outlook for shale oil and gas finance, Report, Center onGlobal Energy Policy.
Bartram, Sohnke M., Gregory W. Brown, and Jennifer Conrad, 2011, The effects of derivatives on firmrisk and value, Journal of Financial and Quantitative Analysis 46, 967–999.
Bessembinder, Hank, 1991, Forward contracts and firm value: Investment incentive and contractingeffects, Journal of Financial and Quantitative Analysis 26, 519–532.
Bolton, Patrick, Hui Chen, and Neng Wang, 2011, A unified theory of tobin’s q, corporate investment,financing, and risk management, Journal of Finance 66, 1545–1578.
Bolton, Patrick, and Martin Oehmke, 2015, Should derivatives be privileged in bankruptcy?, Journalof Finance 70, 2353–2394.
Brown, Gregory W., Peter R. Crabb, and David Haushalter, 2006, Are firms successful at selectivehedging?, Journal of Business 79, 2925–2949.
Brunnermeier, Markus K, and Martin Oehmke, 2013, Bubbles, financial crises, and systemic risk, inHandbook of the Economics of Financevol. 2 . pp. 1221–1288 (Elsevier).
Campello, Murillo, Chen Lin, Yue Ma, and Hong Zou, 2011, The real and financial implications ofcorporate hedging, Journal of Finance 66, 1615–1647.
Cornaggia, Jess, 2013, Does risk management matter? Evidence from the U.S. agricultural industry,Journal of Financial Economics 109, 419–440.
DeMarzo, Peter M., and Darrell Duffie, 1995, Corporate incentives for hedging and hedge accounting,Review of Financial Studies 8, 743–771.
Ellul, Andrew, and Vijay Yerramilli, 2013, Stronger risk controls, lower risk: Evidence from U.S. bankholding companies, Journal of Finance 68, 1757–1803.
Faulkender, Michael, 2005, Hedging or market timing? Selecting the interest rate exposure of corporatedebt, Journal of Finance 60, 931–962.
Fehle, Frank, and Sergey Tsyplakov, 2005, Dynamic risk management: Theory and evidence, Journalof Financial Economics 78, 3–47.
Froot, Kenneth A., David S. Scharfstein, and Jeremy C. Stein, 1993, Risk management: Coordinatingcorporate investment and financing policies, Journal of Finance 48, 1629–1658.
Geczy, Christopher, Bernadette A. Minton, and Catherine Schrand, 1997, Why firms use currencyderivatives, Journal of Finance 52, 1323–1354.
Geczy, Christopher C, Bernadette A Minton, and Catherine M Schrand, 2007, Taking a view: Corpo-rate speculation, governance, and compensation, Journal of Finance 62, 2405–2443.
28
Graham, John R., and Daniel A. Rogers, 2002, Do firms hedge in response to tax incentives?, Journalof Finance 57, 815–838.
Graham, John R., and Clifford W. Smith, 1999, Tax incentives to hedge, Journal of Finance 54,2441–2262.
Guay, Wayne R., and S.P. Kothari, 2003, How much do firms hedge with derivatives?, Journal ofFinancial Economics 70, 423–461.
Haushalter, David G., 2000, Financing policy, basis risk, and corporate hedging: Evidence from oiland gas producers, Journal of Finance 55, 107–152.
Jin, Yanbo, and Philippe Jorion, 2006, Firm value and hedging: Evidence from U.S. oil and gasproducers, Journal of Finance 61, 893–919.
Kiyotaki, Nobuhiro, and John Moore, 1997, Credit cycles, Journal of political economy 105, 211–248.
Knopf, John D., Jouahn Nam, and John H. Thornton Jr., 2002, The volatility and price sensitivitiesof managerial stock option portfolios and corporate hedging, Journal of Finance 57, 801–813.
Leland, Hayne, 1998, Agency costs, risk management, and capital structure, Journal of Finance 53,1213–1243.
Mackay, Peter, and Sara B. Moeller, 2007, The value of corporate risk management, Journal of Finance52, 1379–1419.
Maugeri, Leonardo, 2012, Oil: The next revolution, Belfer Center for Science and International AffairsDiscussion Paper.
Mian, Shehzad L., 1996, Evidence on corporate hedging policy, Journal of Financial and quantitativeAnalysis 31, 419–439.
Morellec, Erwan, and Clifford W. Smith, 2007, Agency conflicts and risk management, Review ofFinance 11, 1–23.
Nance, Deana R., Jr. Clifford W. Smith, and Charles W. Smithson, 1993, On the determinants ofcorporate hedging, Journal of Finance 48, 267–284.
Olea, Jose Luis Montiel, and Carolin Pflueger, 2013, A robust test for weak instruments, Journal ofBusiness & Economic Statistics 31, 358–369.
Perez-Gonzalez, Francisco, and Hayong Yun, 2013, Risk management and firm value: Evidence fromweather derivatives, Journal of Finance 68, 2143–2176.
Purnanandam, Amiyatosh, 2008, Financial distress and corporate risk management: Theory and evi-dence, Journal of Financial Economics 87, 706–739.
Rampini, Andriano A., Amir Sufi, and S. Viswanathan, 2014, Dynamic risk management, Journal ofFinancial Economics 111, 271–296.
Rampini, Andriano A., and S. Viswanathan, 2010, Collateral, risk management, and the distributionof debt capacity, Journal of Finance 65, 2293–2322.
, and Guillaume Vuillemey, 2019, Risk management in financial institutions, working paper,Duke University.
29
Roe, Mark J., 2011, The derivatives players’ payment priorities as financial crisis accelerator, StanfordLaw Review 63, 539–590.
Smith, Clifford W., and Rene Stulz, 1985, The determinants of firms’ hedging policies, Journal ofFinancial and Quantitative Analysis 20, 391–405.
Stock, James H., and Motohiro Yogo, 2002, Testing for weak instruments in linear iv regression, .
Stulz, Rene M, 1984, Optimal hedging policies, Journal of Financial and Quantitative analysis 19,127–140.
, 1996, Rethinking risk management, Journal of applied corporate finance 9, 8–25.
Tufano, Peter, 1996, Who manages risk? An empirical examination of risk management practices inthe gold mining industry, Journal of Finance 51, 1097–1137.
30

Table 1. Variable Definitions
Variable Definition
Firm size The logarithm of the book value of assets.Market-to-book ratio The sum of long-term and short-term debt and the market value of equity,
divided by the book value of assets.Return on assets The income before extraordinary items, divided by the book value of assets.Book leverage The sum of long-term and short-term debt, divided by the book value of
assets.Tax-loss carryforwards The amount of tax-loss carryforwards (TLCF), divided by the book value of
assets.Debt issuance The annual issuance of long-term debt (DLTIS), divided by the end-of-year
book value of assets.Oil hedge ratio, % The sum of the outstanding notional amounts of oil derivatives for the next
fiscal year, divided by the next year oil production.Gas hedge ratio, % The sum of the outstanding notional amounts of natural gas derivatives for
the next fiscal year, divided by the next year natural gas production.Oil hedge maturity The maturity of outstanding oil hedging contracts (months).Gas hedge maturity The maturity of outstanding natural gas hedging contracts (months).Hedging sophistication The score for hedging policy sophistication (0 to 3); one point is added for
using swaps, forwards, or futures, one point for use of collars, and one pointis added for use of options.
Crude oil spot price The average monthly WTI crude oil spot price per Bbl during the fiscal year.Volatility of oil price The standard deviation of monthly WTI crude oil price during the fiscal year.Natural gas spot price The average monthly Henry Hub natural gas spot price per Mcf during the
fiscal year.Volatility of gas price The standard deviation of monthly Henry Hub natural gas price during the
fiscal year per Mcf.Technological shock The logarithm of one plus the number of times the word “hydraulic” is men-
tioned in a firm’s 10-K report multiplied by one if the word “horizontal” ismentioned at least once, zero otherwise.
Firm default A dummy variable equal to one if the firm is in default on its loan or inbankruptcy (Chapter 7 or Chapter 11) as of the end of the fiscal year; zerootherwise.
Debt issuance, norequirements
Long-term debt issuance divided by the book value of assets, multiplied byone if there are no covenants requiring hedging; zero otherwise.
Debt issuance, hedgingrequirements
Long-term debt issuance divided by the book value assets, multiplied by oneif there are covenants requiring hedging; zero otherwise.
31
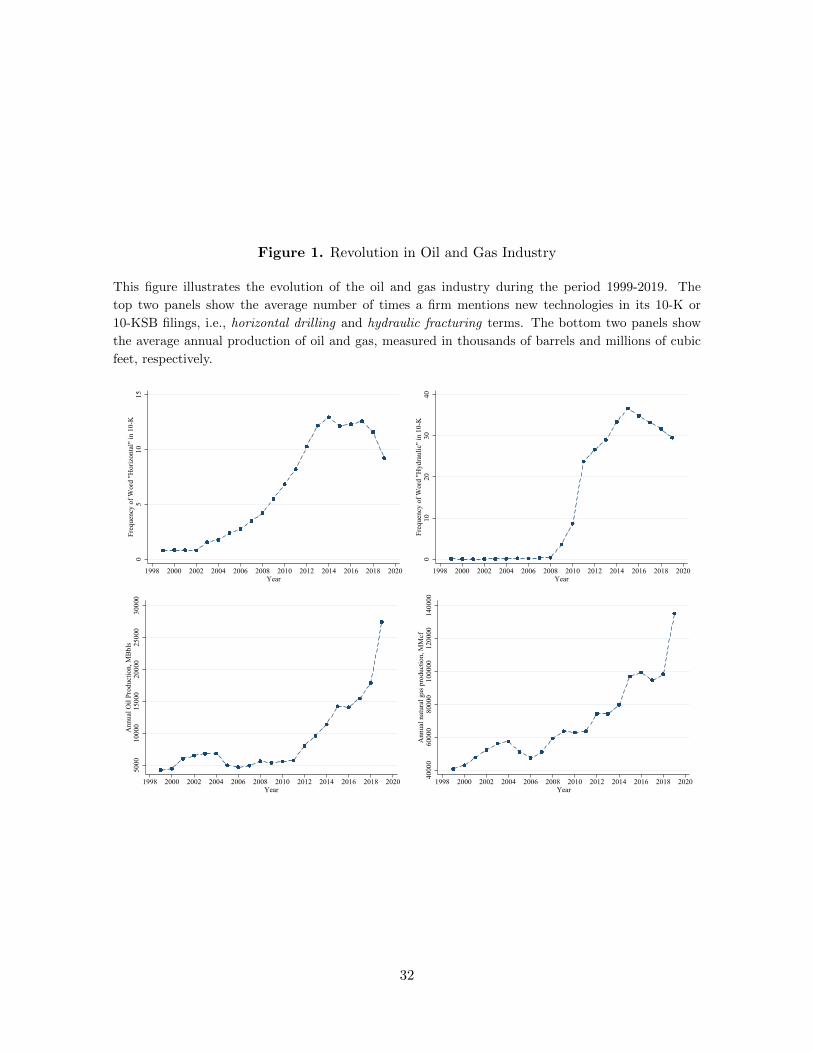
Figure 1. Revolution in Oil and Gas Industry
This figure illustrates the evolution of the oil and gas industry during the period 1999-2019. The
top two panels show the average number of times a firm mentions new technologies in its 10-K or
10-KSB filings, i.e., horizontal drilling and hydraulic fracturing terms. The bottom two panels show
the average annual production of oil and gas, measured in thousands of barrels and millions of cubic
feet, respectively.
05
1015
Freq
uenc
y of
Wor
d "H
oriz
onta
l" in
10-
K
1998 2000 2002 2004 2006 2008 2010 2012 2014 2016 2018 2020Year
010
2030
40Fr
eque
ncy
of W
ord
"Hyd
raul
ic" i
n 10
-K
1998 2000 2002 2004 2006 2008 2010 2012 2014 2016 2018 2020Year
5000
1000
015
000
2000
025
000
3000
0A
nnua
l Oil
Prod
uctio
n, M
Bbl
s
1998 2000 2002 2004 2006 2008 2010 2012 2014 2016 2018 2020Year
4000
060
000
8000
010
0000
1200
0014
0000
Ann
ual n
atur
al g
as p
rodu
ctio
n, M
Mcf
1998 2000 2002 2004 2006 2008 2010 2012 2014 2016 2018 2020Year
32
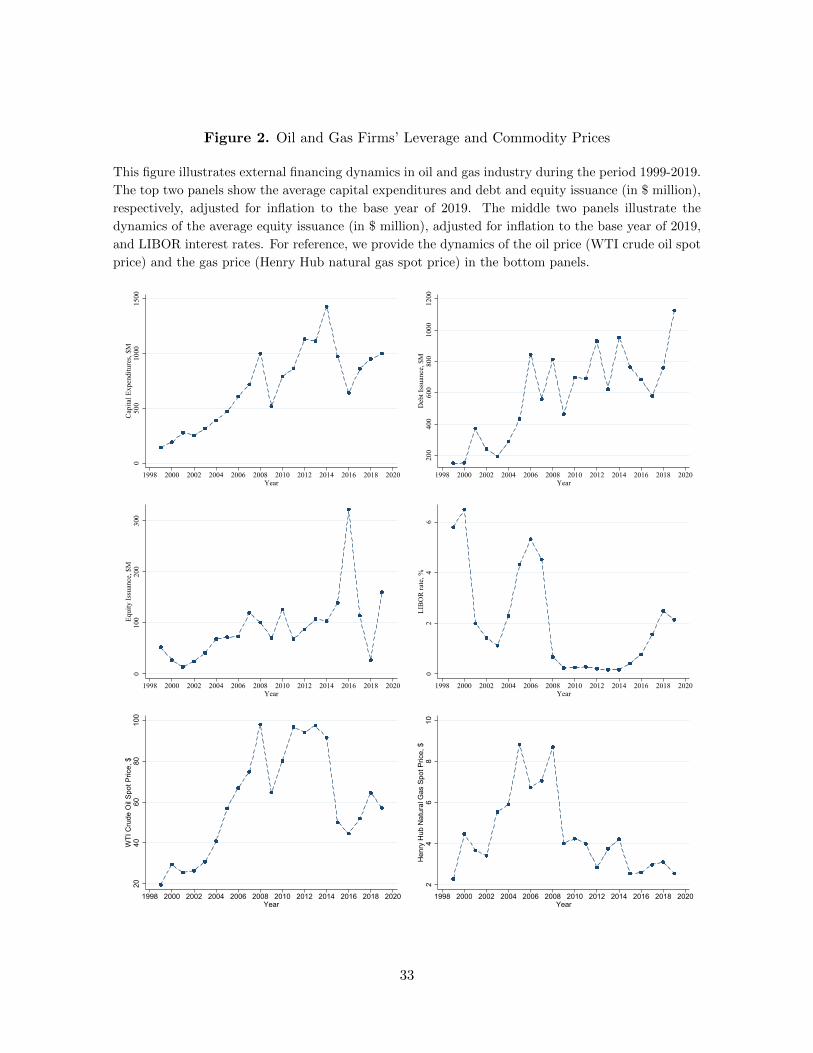
Figure 2. Oil and Gas Firms’ Leverage and Commodity Prices
This figure illustrates external financing dynamics in oil and gas industry during the period 1999-2019.
The top two panels show the average capital expenditures and debt and equity issuance (in $ million),
respectively, adjusted for inflation to the base year of 2019. The middle two panels illustrate the
dynamics of the average equity issuance (in $ million), adjusted for inflation to the base year of 2019,
and LIBOR interest rates. For reference, we provide the dynamics of the oil price (WTI crude oil spot
price) and the gas price (Henry Hub natural gas spot price) in the bottom panels.
050
010
0015
00C
apita
l Exp
endi
ture
s, $M
1998 2000 2002 2004 2006 2008 2010 2012 2014 2016 2018 2020Year
200
400
600
800
1000
1200
Deb
t Iss
uanc
e, $
M
1998 2000 2002 2004 2006 2008 2010 2012 2014 2016 2018 2020Year
010
020
030
0Eq
uity
Issu
ance
, $M
1998 2000 2002 2004 2006 2008 2010 2012 2014 2016 2018 2020Year
02
46
LIB
OR
rate
, %
1998 2000 2002 2004 2006 2008 2010 2012 2014 2016 2018 2020Year
2040
6080
100
WTI
Cru
de O
il Sp
ot P
rice,
$
1998 2000 2002 2004 2006 2008 2010 2012 2014 2016 2018 2020Year
24
68
10H
enry
Hub
Nat
ural
Gas
Spo
t Pric
e, $
1998 2000 2002 2004 2006 2008 2010 2012 2014 2016 2018 2020Year
33
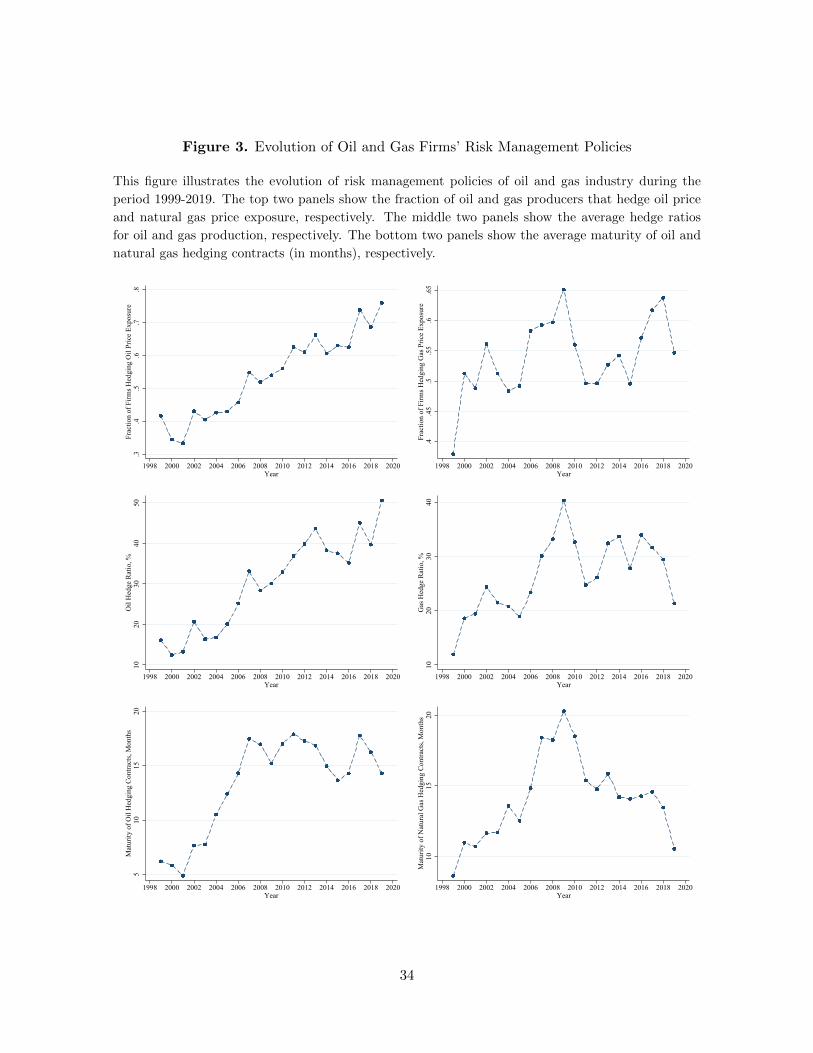
Figure 3. Evolution of Oil and Gas Firms’ Risk Management Policies
This figure illustrates the evolution of risk management policies of oil and gas industry during the
period 1999-2019. The top two panels show the fraction of oil and gas producers that hedge oil price
and natural gas price exposure, respectively. The middle two panels show the average hedge ratios
for oil and gas production, respectively. The bottom two panels show the average maturity of oil and
natural gas hedging contracts (in months), respectively.
.3.4
.5.6
.7.8
Frac
tion
of F
irms H
edgi
ng O
il Pr
ice
Expo
sure
1998 2000 2002 2004 2006 2008 2010 2012 2014 2016 2018 2020Year
.4.4
5.5
.55
.6.6
5Fr
actio
n of
Firm
s Hed
ging
Gas
Pric
e Ex
posu
re
1998 2000 2002 2004 2006 2008 2010 2012 2014 2016 2018 2020Year
1020
3040
50O
il H
edge
Rat
io, %
1998 2000 2002 2004 2006 2008 2010 2012 2014 2016 2018 2020Year
1020
3040
Gas
Hed
ge R
atio
, %
1998 2000 2002 2004 2006 2008 2010 2012 2014 2016 2018 2020Year
510
1520
Mat
urity
of O
il H
edgi
ng C
ontra
cts,
Mon
ths
1998 2000 2002 2004 2006 2008 2010 2012 2014 2016 2018 2020Year
1015
20M
atur
ity o
f Nat
ural
Gas
Hed
ging
Con
tract
s, M
onth
s
1998 2000 2002 2004 2006 2008 2010 2012 2014 2016 2018 2020Year
34
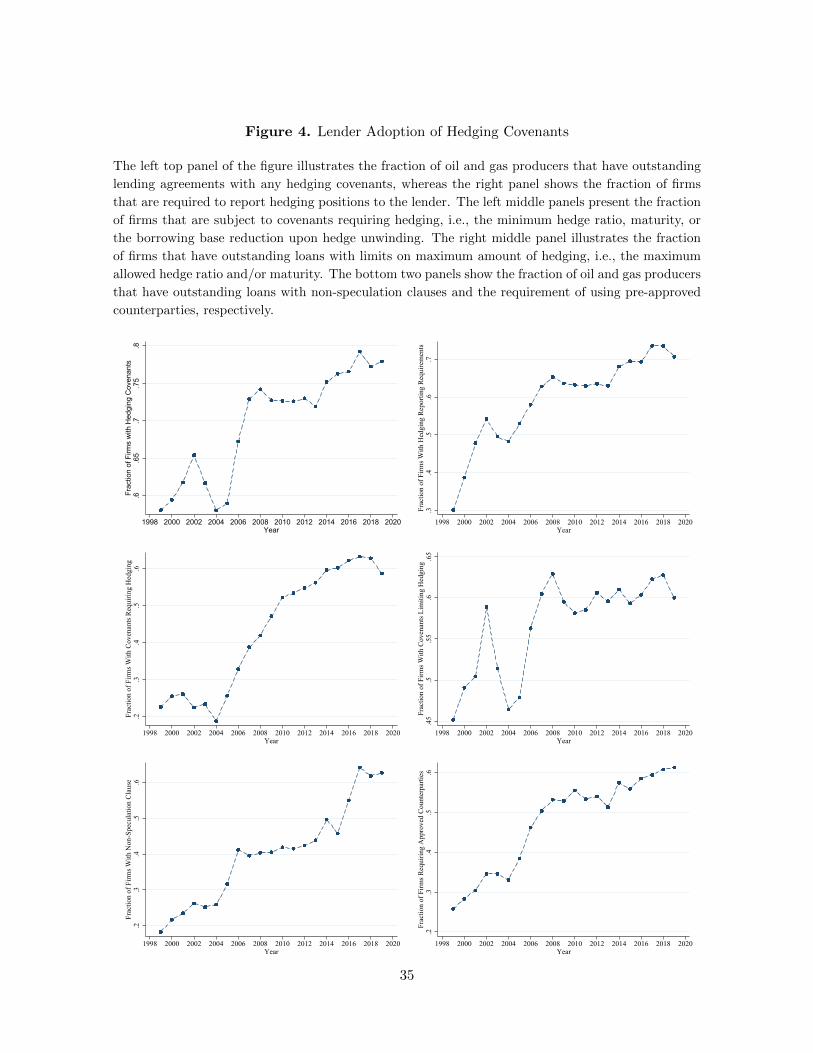
Figure 4. Lender Adoption of Hedging Covenants
The left top panel of the figure illustrates the fraction of oil and gas producers that have outstanding
lending agreements with any hedging covenants, whereas the right panel shows the fraction of firms
that are required to report hedging positions to the lender. The left middle panels present the fraction
of firms that are subject to covenants requiring hedging, i.e., the minimum hedge ratio, maturity, or
the borrowing base reduction upon hedge unwinding. The right middle panel illustrates the fraction
of firms that have outstanding loans with limits on maximum amount of hedging, i.e., the maximum
allowed hedge ratio and/or maturity. The bottom two panels show the fraction of oil and gas producers
that have outstanding loans with non-speculation clauses and the requirement of using pre-approved
counterparties, respectively.
.6.6
5.7
.75
.8Fr
actio
n of
Firm
s w
ith H
edgi
ng C
oven
ants
1998 2000 2002 2004 2006 2008 2010 2012 2014 2016 2018 2020Year
.3.4
.5.6
.7Fr
actio
n of
Firm
s With
Hed
ging
Rep
ortin
g R
equi
rem
ents
1998 2000 2002 2004 2006 2008 2010 2012 2014 2016 2018 2020Year
.2.3
.4.5
.6Fr
actio
n of
Firm
s With
Cov
enan
ts R
equi
ring
Hed
ging
1998 2000 2002 2004 2006 2008 2010 2012 2014 2016 2018 2020Year
.45
.5.5
5.6
.65
Frac
tion
of F
irms W
ith C
oven
ants
Lim
iting
Hed
ging
1998 2000 2002 2004 2006 2008 2010 2012 2014 2016 2018 2020Year
.2.3
.4.5
.6Fr
actio
n of
Firm
s With
Non
-Spe
cula
tion
Cla
use
1998 2000 2002 2004 2006 2008 2010 2012 2014 2016 2018 2020Year
.2.3
.4.5
.6Fr
actio
n of
Firm
s Req
uirin
g A
ppro
ved
Cou
nter
parti
es
1998 2000 2002 2004 2006 2008 2010 2012 2014 2016 2018 2020Year
35
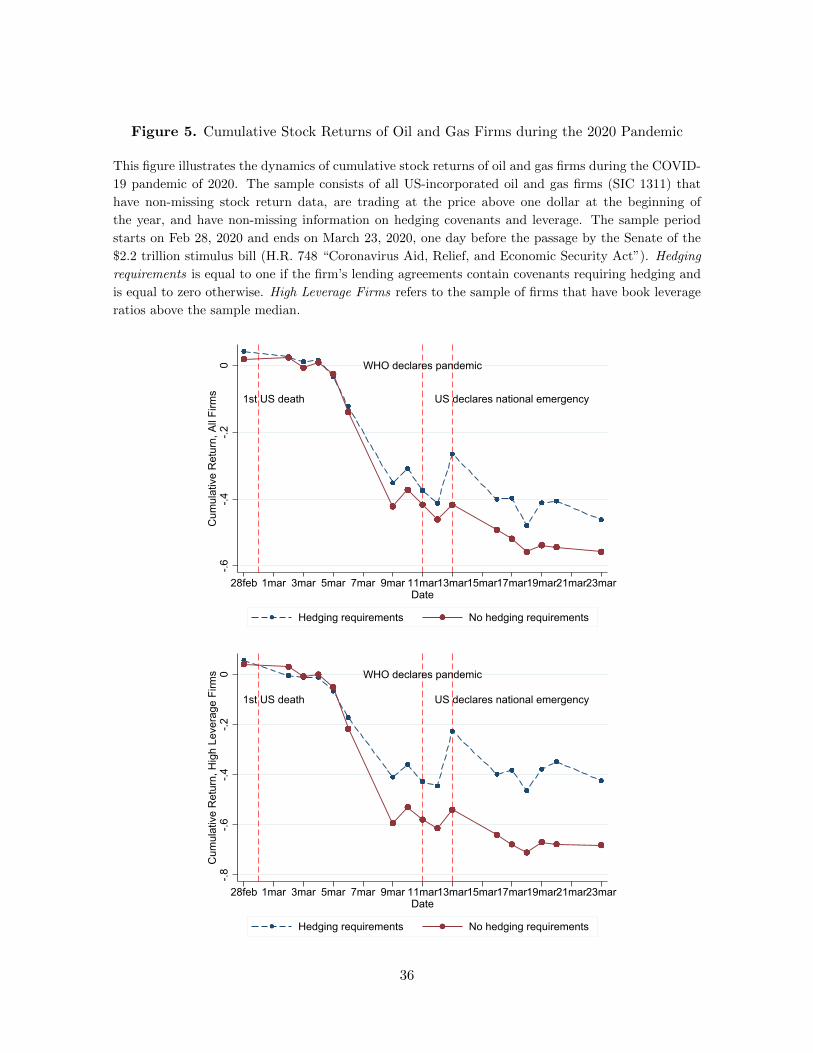
Figure 5. Cumulative Stock Returns of Oil and Gas Firms during the 2020 Pandemic
This figure illustrates the dynamics of cumulative stock returns of oil and gas firms during the COVID-
19 pandemic of 2020. The sample consists of all US-incorporated oil and gas firms (SIC 1311) that
have non-missing stock return data, are trading at the price above one dollar at the beginning of
the year, and have non-missing information on hedging covenants and leverage. The sample period
starts on Feb 28, 2020 and ends on March 23, 2020, one day before the passage by the Senate of the
$2.2 trillion stimulus bill (H.R. 748 “Coronavirus Aid, Relief, and Economic Security Act”). Hedging
requirements is equal to one if the firm’s lending agreements contain covenants requiring hedging and
is equal to zero otherwise. High Leverage Firms refers to the sample of firms that have book leverage
ratios above the sample median.
WHO declares pandemic
1st US death US declares national emergency
-.6-.4
-.20
Cum
ulat
ive
Ret
urn,
All
Firm
s
28feb 1mar 3mar 5mar 7mar 9mar 11mar13mar15mar17mar19mar21mar23marDate
Hedging requirements No hedging requirements
WHO declares pandemic
1st US death US declares national emergency
-.8-.6
-.4-.2
0C
umul
ativ
e R
etur
n, H
igh
Leve
rage
Firm
s
28feb 1mar 3mar 5mar 7mar 9mar 11mar13mar15mar17mar19mar21mar23marDate
Hedging requirements No hedging requirements
36
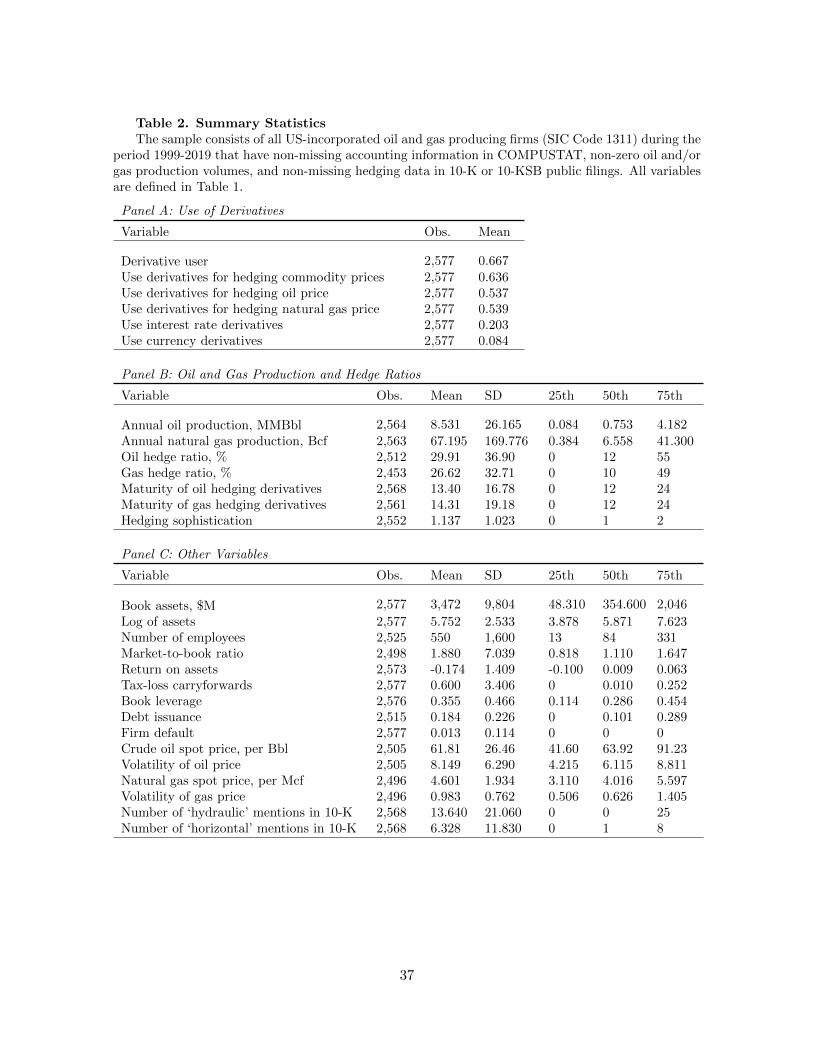
Table 2. Summary StatisticsThe sample consists of all US-incorporated oil and gas producing firms (SIC Code 1311) during the
period 1999-2019 that have non-missing accounting information in COMPUSTAT, non-zero oil and/orgas production volumes, and non-missing hedging data in 10-K or 10-KSB public filings. All variablesare defined in Table 1.
Panel A: Use of Derivatives
Variable Obs. Mean
Derivative user 2,577 0.667Use derivatives for hedging commodity prices 2,577 0.636Use derivatives for hedging oil price 2,577 0.537Use derivatives for hedging natural gas price 2,577 0.539Use interest rate derivatives 2,577 0.203Use currency derivatives 2,577 0.084
Panel B: Oil and Gas Production and Hedge Ratios
Variable Obs. Mean SD 25th 50th 75th
Annual oil production, MMBbl 2,564 8.531 26.165 0.084 0.753 4.182
Annual natural gas production, Bcf 2,563 67.195 169.776 0.384 6.558 41.300Oil hedge ratio, % 2,512 29.91 36.90 0 12 55Gas hedge ratio, % 2,453 26.62 32.71 0 10 49Maturity of oil hedging derivatives 2,568 13.40 16.78 0 12 24Maturity of gas hedging derivatives 2,561 14.31 19.18 0 12 24Hedging sophistication 2,552 1.137 1.023 0 1 2
Panel C: Other Variables
Variable Obs. Mean SD 25th 50th 75th
Book assets, $M 2,577 3,472 9,804 48.310 354.600 2,046
Log of assets 2,577 5.752 2.533 3.878 5.871 7.623Number of employees 2,525 550 1,600 13 84 331Market-to-book ratio 2,498 1.880 7.039 0.818 1.110 1.647Return on assets 2,573 -0.174 1.409 -0.100 0.009 0.063Tax-loss carryforwards 2,577 0.600 3.406 0 0.010 0.252Book leverage 2,576 0.355 0.466 0.114 0.286 0.454Debt issuance 2,515 0.184 0.226 0 0.101 0.289Firm default 2,577 0.013 0.114 0 0 0Crude oil spot price, per Bbl 2,505 61.81 26.46 41.60 63.92 91.23Volatility of oil price 2,505 8.149 6.290 4.215 6.115 8.811Natural gas spot price, per Mcf 2,496 4.601 1.934 3.110 4.016 5.597Volatility of gas price 2,496 0.983 0.762 0.506 0.626 1.405Number of ‘hydraulic’ mentions in 10-K 2,568 13.640 21.060 0 0 25Number of ‘horizontal’ mentions in 10-K 2,568 6.328 11.830 0 1 8
37

Table 3. Commodity Hedgers and Non-HedgersThe table shows the means for firm characteristics for firms that use derivatives for commodity
hedging and those that do not. The sample consists of all US-incorporated oil and gas producingfirms (SIC Code 1311) during the period 1999-2019 that have non-missing accounting information inCOMPUSTAT, non-zero oil and/or gas production volumes, and non-missing hedging data in 10-K or10-KSB public filings. All variables are defined in Table 1. The last column shows the t-test for thedifference in means; the standard errors are clustered by firm. ∗∗∗, ∗∗, and ∗ denote significance at the1%, 5%, and 10% levels, respectively.
Variable Hedger Non-Hedger Difference T-test
Annual oil production, MMBbl 12.147 2.145 10.002 4.68∗∗∗
Annual gas production, Bcf 99.290 10.147 88.838 5.45∗∗∗
Book assets, $M 4,959 879.2 4,080 4.52∗∗∗
Market-to-book ratio 1.222 3.001 -1.780 -2.32∗∗
Return on assets -0.051 -0.389 0.338 2.47∗∗
Tax-loss carryforwards 0.184 1.325 -1.142 -3.37∗∗∗
Book leverage 0.389 0.296 0.093 2.18∗∗
Debt issuance 0.231 0.101 0.130 8.88∗∗∗
Firm default 0.009 0.021 -0.013 -2.42∗∗
Crude oil spot price, per Bbl 63.65 58.67 4.99 3.17∗∗∗
Natural gas price, per Mcf 4.53 4.72 -0.19 -1.95∗
38
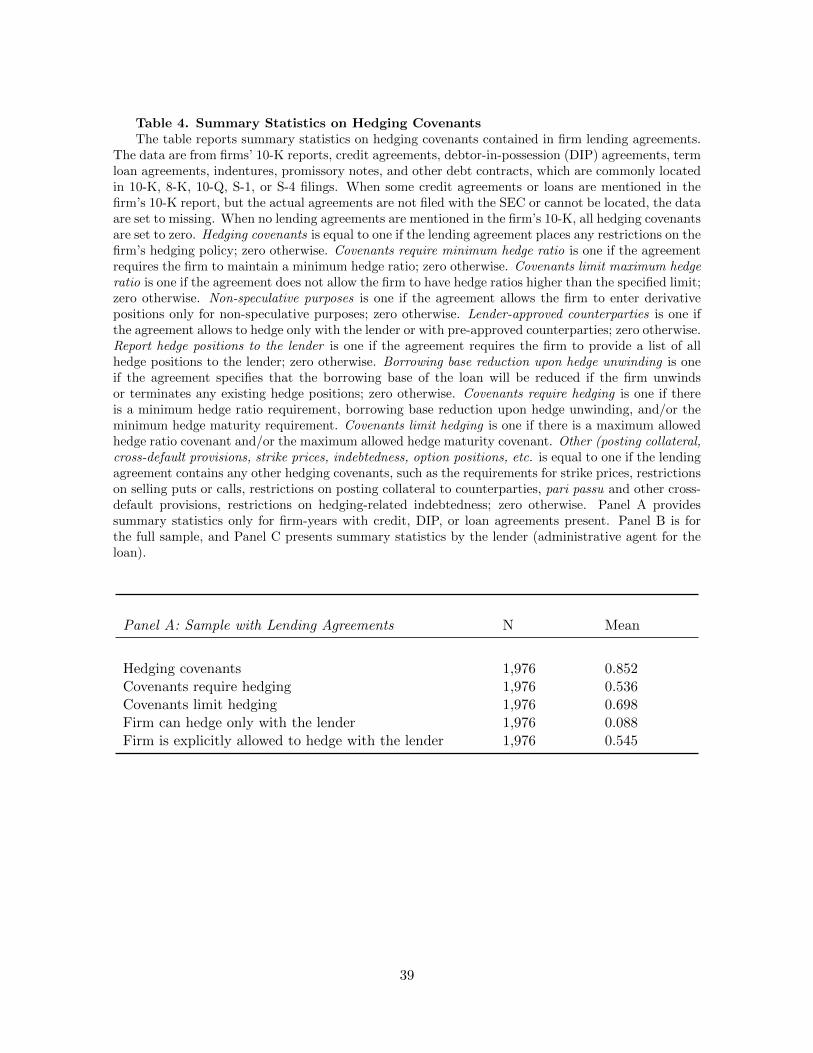
Table 4. Summary Statistics on Hedging CovenantsThe table reports summary statistics on hedging covenants contained in firm lending agreements.
The data are from firms’ 10-K reports, credit agreements, debtor-in-possession (DIP) agreements, termloan agreements, indentures, promissory notes, and other debt contracts, which are commonly locatedin 10-K, 8-K, 10-Q, S-1, or S-4 filings. When some credit agreements or loans are mentioned in thefirm’s 10-K report, but the actual agreements are not filed with the SEC or cannot be located, the dataare set to missing. When no lending agreements are mentioned in the firm’s 10-K, all hedging covenantsare set to zero. Hedging covenants is equal to one if the lending agreement places any restrictions on thefirm’s hedging policy; zero otherwise. Covenants require minimum hedge ratio is one if the agreementrequires the firm to maintain a minimum hedge ratio; zero otherwise. Covenants limit maximum hedgeratio is one if the agreement does not allow the firm to have hedge ratios higher than the specified limit;zero otherwise. Non-speculative purposes is one if the agreement allows the firm to enter derivativepositions only for non-speculative purposes; zero otherwise. Lender-approved counterparties is one ifthe agreement allows to hedge only with the lender or with pre-approved counterparties; zero otherwise.Report hedge positions to the lender is one if the agreement requires the firm to provide a list of allhedge positions to the lender; zero otherwise. Borrowing base reduction upon hedge unwinding is oneif the agreement specifies that the borrowing base of the loan will be reduced if the firm unwindsor terminates any existing hedge positions; zero otherwise. Covenants require hedging is one if thereis a minimum hedge ratio requirement, borrowing base reduction upon hedge unwinding, and/or theminimum hedge maturity requirement. Covenants limit hedging is one if there is a maximum allowedhedge ratio covenant and/or the maximum allowed hedge maturity covenant. Other (posting collateral,cross-default provisions, strike prices, indebtedness, option positions, etc. is equal to one if the lendingagreement contains any other hedging covenants, such as the requirements for strike prices, restrictionson selling puts or calls, restrictions on posting collateral to counterparties, pari passu and other cross-default provisions, restrictions on hedging-related indebtedness; zero otherwise. Panel A providessummary statistics only for firm-years with credit, DIP, or loan agreements present. Panel B is forthe full sample, and Panel C presents summary statistics by the lender (administrative agent for theloan).
Panel A: Sample with Lending Agreements N Mean
Hedging covenants 1,976 0.852Covenants require hedging 1,976 0.536Covenants limit hedging 1,976 0.698Firm can hedge only with the lender 1,976 0.088Firm is explicitly allowed to hedge with the lender 1,976 0.545
39
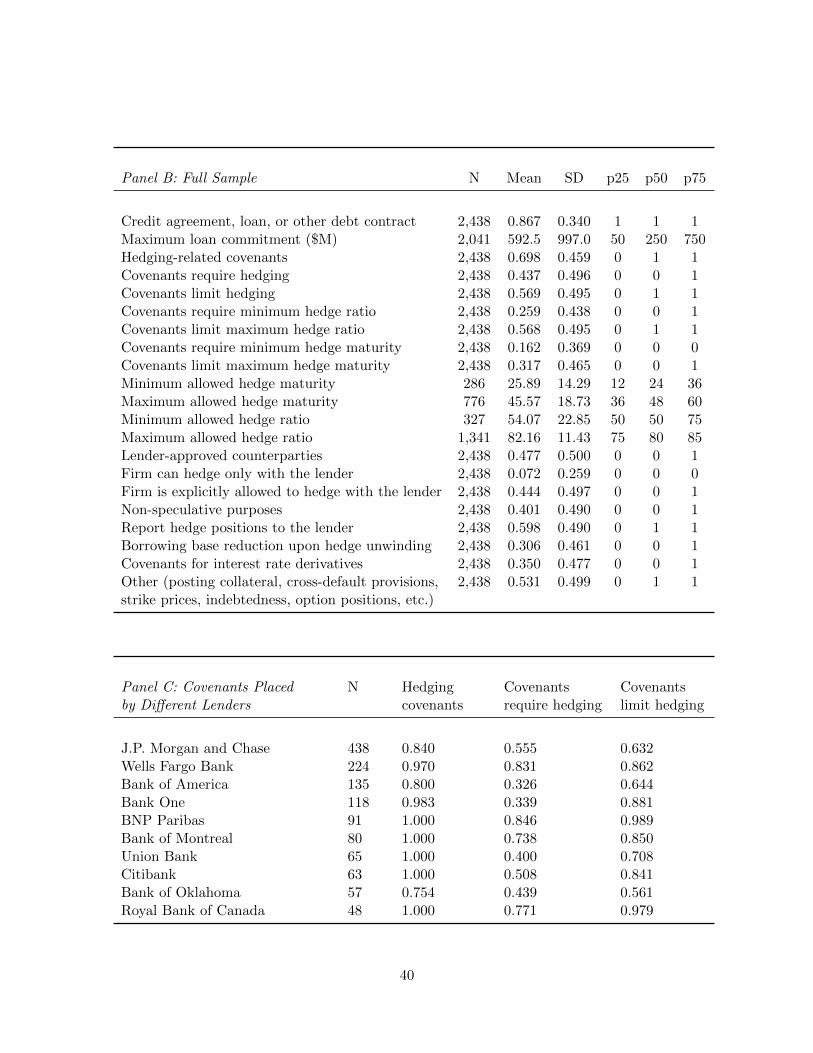
Panel B: Full Sample N Mean SD p25 p50 p75
Credit agreement, loan, or other debt contract 2,438 0.867 0.340 1 1 1Maximum loan commitment ($M) 2,041 592.5 997.0 50 250 750Hedging-related covenants 2,438 0.698 0.459 0 1 1Covenants require hedging 2,438 0.437 0.496 0 0 1Covenants limit hedging 2,438 0.569 0.495 0 1 1Covenants require minimum hedge ratio 2,438 0.259 0.438 0 0 1Covenants limit maximum hedge ratio 2,438 0.568 0.495 0 1 1Covenants require minimum hedge maturity 2,438 0.162 0.369 0 0 0Covenants limit maximum hedge maturity 2,438 0.317 0.465 0 0 1Minimum allowed hedge maturity 286 25.89 14.29 12 24 36Maximum allowed hedge maturity 776 45.57 18.73 36 48 60Minimum allowed hedge ratio 327 54.07 22.85 50 50 75Maximum allowed hedge ratio 1,341 82.16 11.43 75 80 85Lender-approved counterparties 2,438 0.477 0.500 0 0 1Firm can hedge only with the lender 2,438 0.072 0.259 0 0 0Firm is explicitly allowed to hedge with the lender 2,438 0.444 0.497 0 0 1Non-speculative purposes 2,438 0.401 0.490 0 0 1Report hedge positions to the lender 2,438 0.598 0.490 0 1 1Borrowing base reduction upon hedge unwinding 2,438 0.306 0.461 0 0 1Covenants for interest rate derivatives 2,438 0.350 0.477 0 0 1Other (posting collateral, cross-default provisions, 2,438 0.531 0.499 0 1 1strike prices, indebtedness, option positions, etc.)
Panel C: Covenants Placedby Different Lenders
N Hedgingcovenants
Covenantsrequire hedging
Covenantslimit hedging
J.P. Morgan and Chase 438 0.840 0.555 0.632Wells Fargo Bank 224 0.970 0.831 0.862Bank of America 135 0.800 0.326 0.644Bank One 118 0.983 0.339 0.881BNP Paribas 91 1.000 0.846 0.989Bank of Montreal 80 1.000 0.738 0.850Union Bank 65 1.000 0.400 0.708Citibank 63 1.000 0.508 0.841Bank of Oklahoma 57 0.754 0.439 0.561Royal Bank of Canada 48 1.000 0.771 0.979
40

Table 5. OLS Regressions for Hedge RatiosThe table reports the estimates of the OLS regressions. The dependent variable in Panel A is the
hedge ratio for crude oil (%); the dependent variable in Panel B is the hedge ratio for natural gas.The sample consists of all US-incorporated oil and gas producing firms (SIC Code 1311) during theperiod 1999-2019 that have non-missing accounting information in COMPUSTAT, non-zero oil and/orgas production volumes, and non-missing hedging data in 10-K or 10-KSB public filings. All variablesare defined in Table 1. Intercept is included in all specifications, but not shown. T-statistics based onheteroskedasticity-consistent standard errors clustered by the firm are reported in brackets. ∗∗∗, ∗∗,and ∗ denote significance at the 1%, 5%, and 10% levels, respectively.
Panel A: Oil Hedge Ratio (1) (2) (3) (4)
Debt issuance 36.302*** -2.311 9.497** 0.703[7.41] [-0.25] [2.39] [0.07]
Crude oil spot price*debt issuance 0.620*** 0.139[4.20] [0.95]
Log of assets 5.251*** 5.189*** 6.396*** 6.288***[7.88] [7.95] [5.74] [5.62]
Market-to-book ratio -0.158 -0.125 0.282 0.278[-0.70] [-0.57] [1.56] [1.56]
Return on assets 0.042 -0.070 -0.349 -0.371[0.10] [-0.17] [-0.58] [-0.62]
Firm default -9.746 -9.303 -27.977*** -27.868***[-1.59] [-1.46] [-3.98] [-3.94]
Tax-loss carryforwards 0.113 0.074 -0.153 -0.166[0.61] [0.43] [-0.43] [-0.47]
Crude oil spot price 0.337 0.250 0.256 0.235[1.34] [1.00] [1.26] [1.15]
Volatility of oil price 0.042 -0.010 0.008 -0.007[0.16] [-0.04] [0.03] [-0.03]
Observations 2,311 2,311 2,311 2,311R-squared 0.286 0.296 0.643 0.644Firm FE No No Yes YesYear FE Yes Yes Yes Yes
41
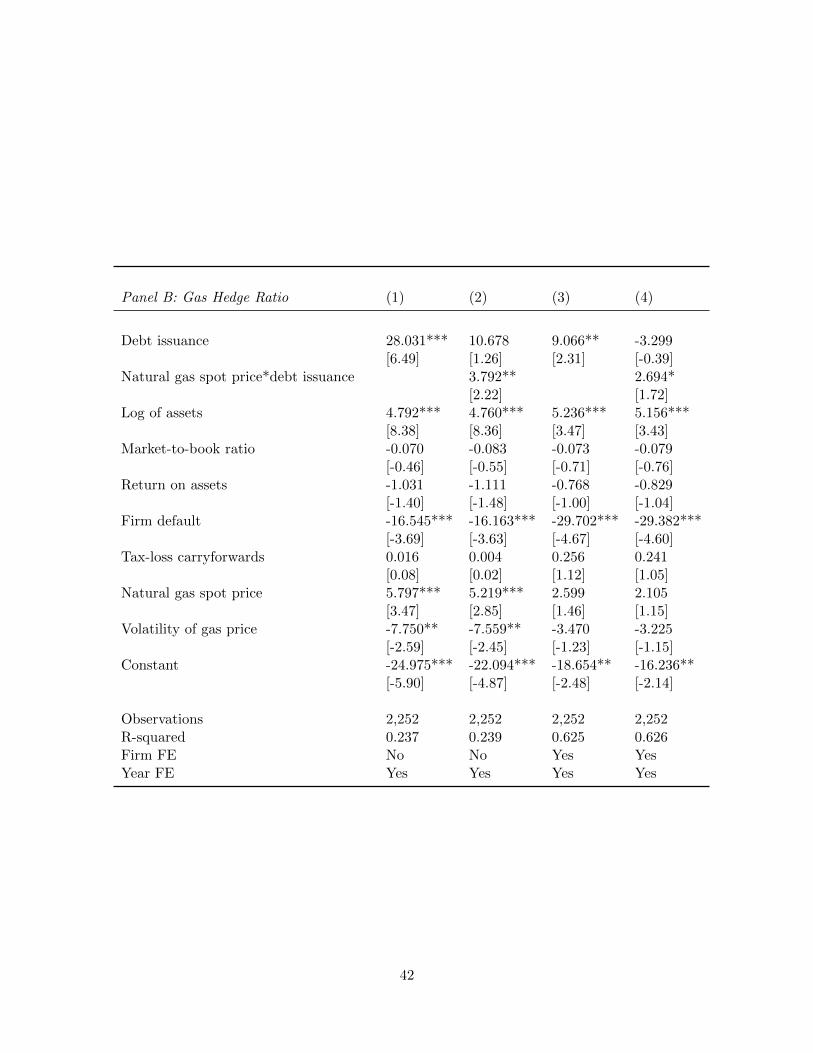
Panel B: Gas Hedge Ratio (1) (2) (3) (4)
Debt issuance 28.031*** 10.678 9.066** -3.299[6.49] [1.26] [2.31] [-0.39]
Natural gas spot price*debt issuance 3.792** 2.694*[2.22] [1.72]
Log of assets 4.792*** 4.760*** 5.236*** 5.156***[8.38] [8.36] [3.47] [3.43]
Market-to-book ratio -0.070 -0.083 -0.073 -0.079[-0.46] [-0.55] [-0.71] [-0.76]
Return on assets -1.031 -1.111 -0.768 -0.829[-1.40] [-1.48] [-1.00] [-1.04]
Firm default -16.545*** -16.163*** -29.702*** -29.382***[-3.69] [-3.63] [-4.67] [-4.60]
Tax-loss carryforwards 0.016 0.004 0.256 0.241[0.08] [0.02] [1.12] [1.05]
Natural gas spot price 5.797*** 5.219*** 2.599 2.105[3.47] [2.85] [1.46] [1.15]
Volatility of gas price -7.750** -7.559** -3.470 -3.225[-2.59] [-2.45] [-1.23] [-1.15]
Constant -24.975*** -22.094*** -18.654** -16.236**[-5.90] [-4.87] [-2.48] [-2.14]
Observations 2,252 2,252 2,252 2,252R-squared 0.237 0.239 0.625 0.626Firm FE No No Yes YesYear FE Yes Yes Yes Yes
42
Table 6. OLS Regressions for Maturity and Sophistication of Hedging ContractsThe table reports the estimates of the OLS regressions. The dependent variable in Columns 1-
2 (Columns 3-4) is the longest maturity of outstanding crude oil (natural gas) hedging contracts inmonths; the dependent variable in Columns 5-6 is a measure of hedging sophistication (0 to 3), wherebyone point is added for use of swaps, futures, or forwards, one for use of two-way or three-way collars,and one point for use of options. The sample consists of all US-incorporated oil and gas producingfirms (SIC Code 1311) during the period 1999-2019 that have non-missing accounting information inCOMPUSTAT, non-zero oil and/or gas production volumes, and non-missing hedging data in 10-K or10-KSB public filings. All variables are defined in Table 1. Intercept is included in all specifications,but not shown. T-statistics based on heteroskedasticity-consistent standard errors clustered by the firmare reported in brackets. ∗∗∗, ∗∗, and ∗ denote significance at the 1%, 5%, and 10% levels, respectively.
(1) (2) (3) (4) (5) (6)
Debt issuance 14.992*** 7.333*** 13.162*** 6.368*** 0.776*** 0.215**[6.53] [4.42] [5.77] [3.56] [6.46] [2.40]
Log of assets 2.909*** 1.951*** 3.819*** 3.337*** 0.249*** 0.194***[9.82] [3.18] [10.54] [3.98] [18.31] [6.15]
Market-to-book ratio 0.021 -0.000 -0.012 -0.061 0.002 0.002[0.51] [-0.00] [-0.25] [-1.10] [0.69] [0.83]
Return on assets 0.070 -0.015 -0.285 -0.254 -0.014 -0.012[0.35] [-0.06] [-1.51] [-0.98] [-1.62] [-1.18]
Firm default -5.176** -11.772*** -8.291*** -12.633*** -0.559*** -0.842***[-2.40] [-4.74] [-4.44] [-4.18] [-3.61] [-4.66]
Tax-loss carryforwards 0.160** 0.062 0.298*** 0.298*** 0.009* 0.000[2.00] [0.32] [3.25] [2.62] [1.93] [0.05]
Crude oil spot price 0.188* 0.237** 0.006 0.010**[1.96] [2.38] [1.10] [2.10]
Volatility of oil price -0.000 0.009 -0.004 0.002[-0.00] [0.08] [-0.62] [0.50]
Natural gas spot price 1.504* 0.904[1.69] [1.16]
Volatility of gas price -3.088*** -1.837*[-2.60] [-1.73]
Observations 2,363 2,363 2,347 2,347 2,340 2,340R-squared 0.315 0.643 0.301 0.633 0.446 0.744Firm FE No Yes No Yes No YesYear FE Yes Yes Yes Yes Yes Yes
43
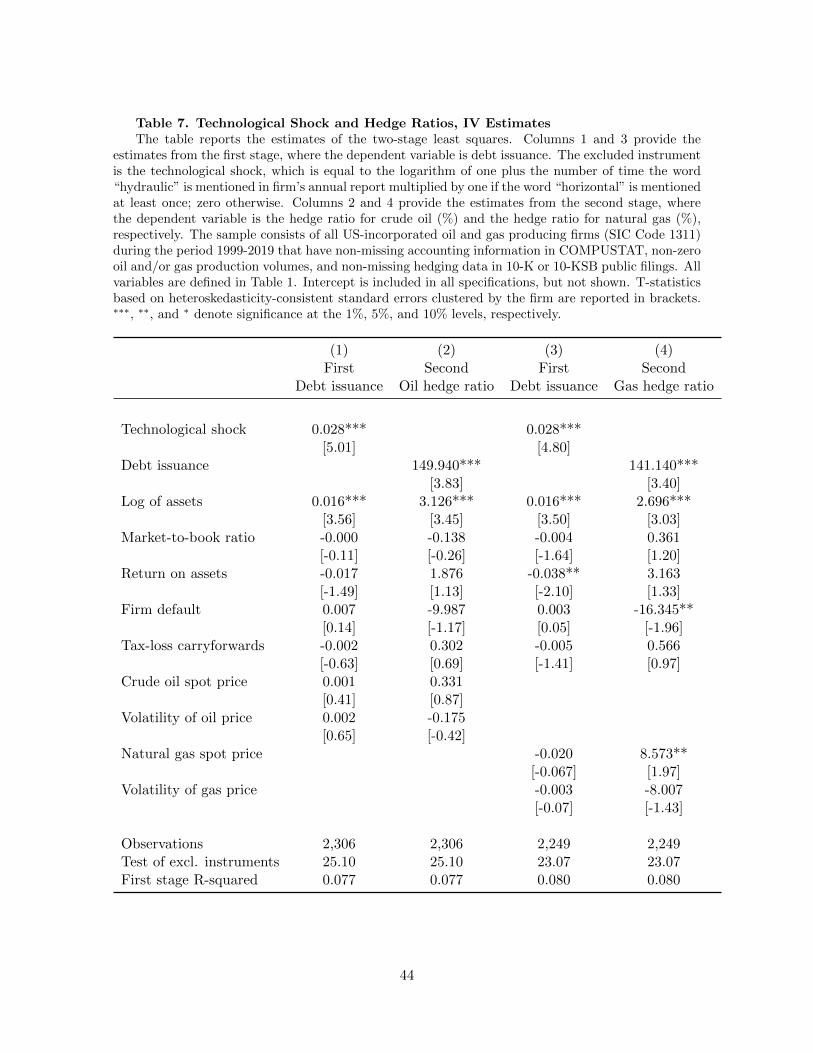
Table 7. Technological Shock and Hedge Ratios, IV EstimatesThe table reports the estimates of the two-stage least squares. Columns 1 and 3 provide the
estimates from the first stage, where the dependent variable is debt issuance. The excluded instrumentis the technological shock, which is equal to the logarithm of one plus the number of time the word“hydraulic” is mentioned in firm’s annual report multiplied by one if the word “horizontal” is mentionedat least once; zero otherwise. Columns 2 and 4 provide the estimates from the second stage, wherethe dependent variable is the hedge ratio for crude oil (%) and the hedge ratio for natural gas (%),respectively. The sample consists of all US-incorporated oil and gas producing firms (SIC Code 1311)during the period 1999-2019 that have non-missing accounting information in COMPUSTAT, non-zerooil and/or gas production volumes, and non-missing hedging data in 10-K or 10-KSB public filings. Allvariables are defined in Table 1. Intercept is included in all specifications, but not shown. T-statisticsbased on heteroskedasticity-consistent standard errors clustered by the firm are reported in brackets.∗∗∗, ∗∗, and ∗ denote significance at the 1%, 5%, and 10% levels, respectively.
(1) (2) (3) (4)First Second First Second
Debt issuance Oil hedge ratio Debt issuance Gas hedge ratio
Technological shock 0.028*** 0.028***[5.01] [4.80]
Debt issuance 149.940*** 141.140***[3.83] [3.40]
Log of assets 0.016*** 3.126*** 0.016*** 2.696***[3.56] [3.45] [3.50] [3.03]
Market-to-book ratio -0.000 -0.138 -0.004 0.361[-0.11] [-0.26] [-1.64] [1.20]
Return on assets -0.017 1.876 -0.038** 3.163[-1.49] [1.13] [-2.10] [1.33]
Firm default 0.007 -9.987 0.003 -16.345**[0.14] [-1.17] [0.05] [-1.96]
Tax-loss carryforwards -0.002 0.302 -0.005 0.566[-0.63] [0.69] [-1.41] [0.97]
Crude oil spot price 0.001 0.331[0.41] [0.87]
Volatility of oil price 0.002 -0.175[0.65] [-0.42]
Natural gas spot price -0.020 8.573**[-0.067] [1.97]
Volatility of gas price -0.003 -8.007[-0.07] [-1.43]
Observations 2,306 2,306 2,249 2,249Test of excl. instruments 25.10 25.10 23.07 23.07First stage R-squared 0.077 0.077 0.080 0.080
44
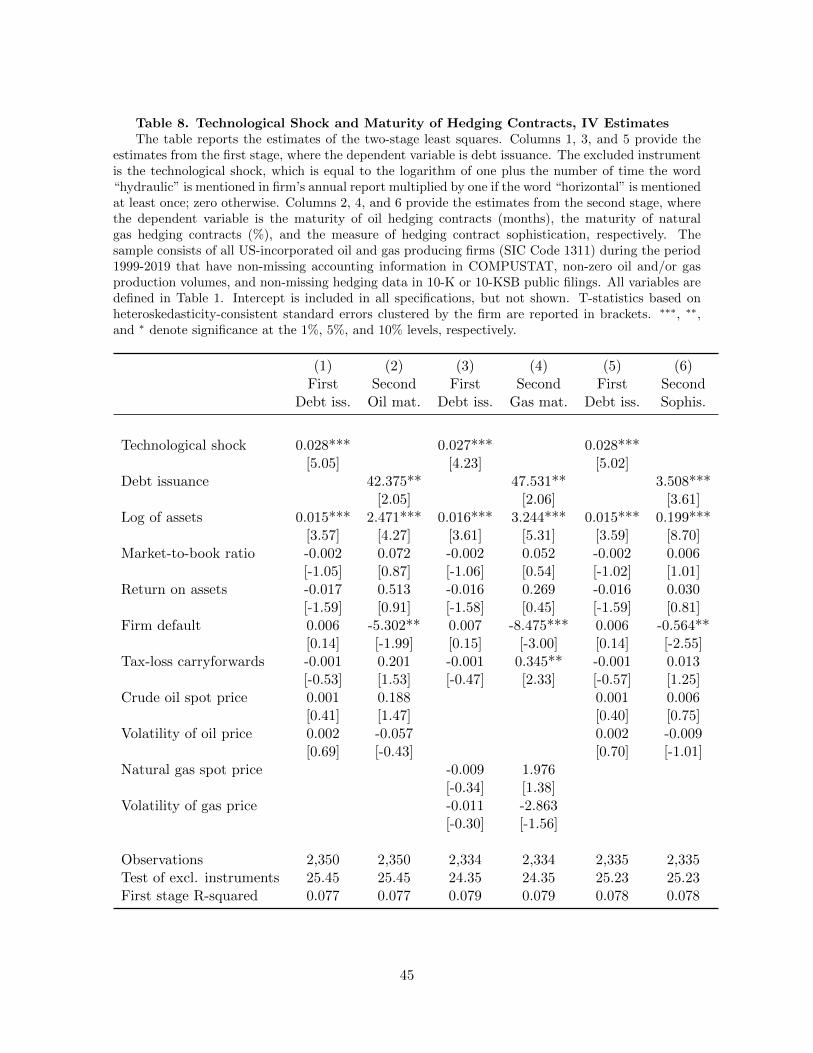
Table 8. Technological Shock and Maturity of Hedging Contracts, IV EstimatesThe table reports the estimates of the two-stage least squares. Columns 1, 3, and 5 provide the
estimates from the first stage, where the dependent variable is debt issuance. The excluded instrumentis the technological shock, which is equal to the logarithm of one plus the number of time the word“hydraulic” is mentioned in firm’s annual report multiplied by one if the word “horizontal” is mentionedat least once; zero otherwise. Columns 2, 4, and 6 provide the estimates from the second stage, wherethe dependent variable is the maturity of oil hedging contracts (months), the maturity of naturalgas hedging contracts (%), and the measure of hedging contract sophistication, respectively. Thesample consists of all US-incorporated oil and gas producing firms (SIC Code 1311) during the period1999-2019 that have non-missing accounting information in COMPUSTAT, non-zero oil and/or gasproduction volumes, and non-missing hedging data in 10-K or 10-KSB public filings. All variables aredefined in Table 1. Intercept is included in all specifications, but not shown. T-statistics based onheteroskedasticity-consistent standard errors clustered by the firm are reported in brackets. ∗∗∗, ∗∗,and ∗ denote significance at the 1%, 5%, and 10% levels, respectively.
(1) (2) (3) (4) (5) (6)First Second First Second First Second
Debt iss. Oil mat. Debt iss. Gas mat. Debt iss. Sophis.
Technological shock 0.028*** 0.027*** 0.028***[5.05] [4.23] [5.02]
Debt issuance 42.375** 47.531** 3.508***[2.05] [2.06] [3.61]
Log of assets 0.015*** 2.471*** 0.016*** 3.244*** 0.015*** 0.199***[3.57] [4.27] [3.61] [5.31] [3.59] [8.70]
Market-to-book ratio -0.002 0.072 -0.002 0.052 -0.002 0.006[-1.05] [0.87] [-1.06] [0.54] [-1.02] [1.01]
Return on assets -0.017 0.513 -0.016 0.269 -0.016 0.030[-1.59] [0.91] [-1.58] [0.45] [-1.59] [0.81]
Firm default 0.006 -5.302** 0.007 -8.475*** 0.006 -0.564**[0.14] [-1.99] [0.15] [-3.00] [0.14] [-2.55]
Tax-loss carryforwards -0.001 0.201 -0.001 0.345** -0.001 0.013[-0.53] [1.53] [-0.47] [2.33] [-0.57] [1.25]
Crude oil spot price 0.001 0.188 0.001 0.006[0.41] [1.47] [0.40] [0.75]
Volatility of oil price 0.002 -0.057 0.002 -0.009[0.69] [-0.43] [0.70] [-1.01]
Natural gas spot price -0.009 1.976[-0.34] [1.38]
Volatility of gas price -0.011 -2.863[-0.30] [-1.56]
Observations 2,350 2,350 2,334 2,334 2,335 2,335Test of excl. instruments 25.45 25.45 24.35 24.35 25.23 25.23First stage R-squared 0.077 0.077 0.079 0.079 0.078 0.078
45
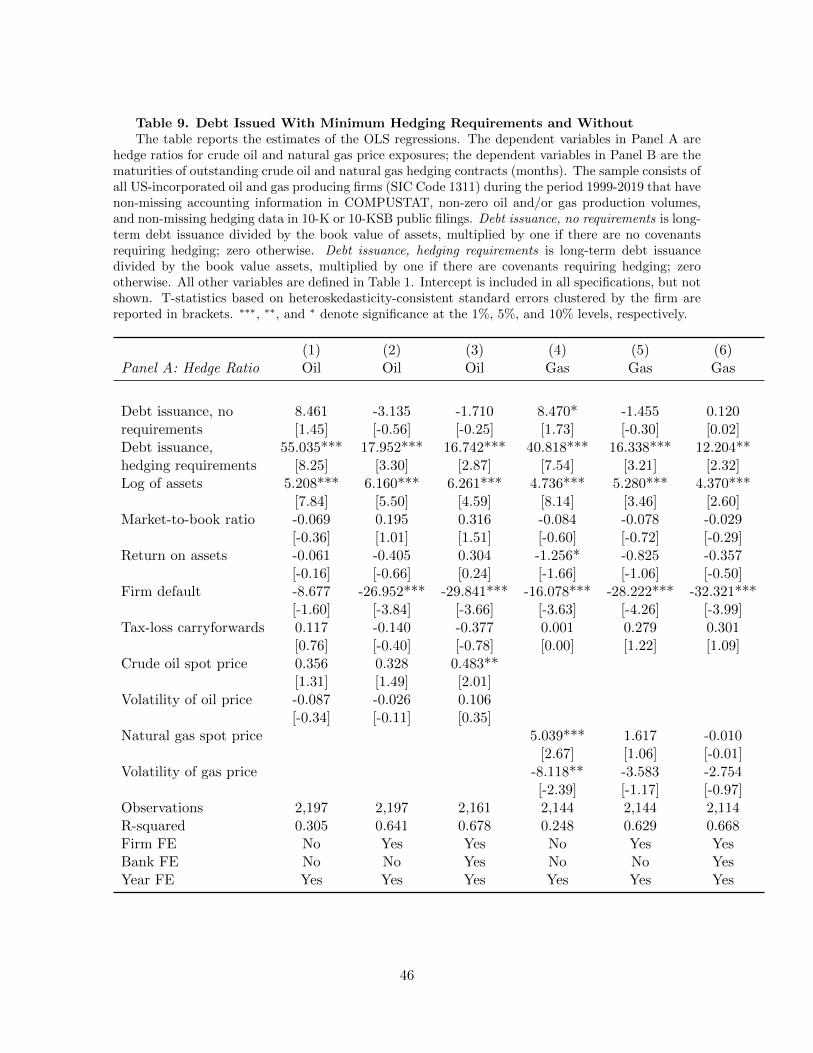
Table 9. Debt Issued With Minimum Hedging Requirements and WithoutThe table reports the estimates of the OLS regressions. The dependent variables in Panel A are
hedge ratios for crude oil and natural gas price exposures; the dependent variables in Panel B are thematurities of outstanding crude oil and natural gas hedging contracts (months). The sample consists ofall US-incorporated oil and gas producing firms (SIC Code 1311) during the period 1999-2019 that havenon-missing accounting information in COMPUSTAT, non-zero oil and/or gas production volumes,and non-missing hedging data in 10-K or 10-KSB public filings. Debt issuance, no requirements is long-term debt issuance divided by the book value of assets, multiplied by one if there are no covenantsrequiring hedging; zero otherwise. Debt issuance, hedging requirements is long-term debt issuancedivided by the book value assets, multiplied by one if there are covenants requiring hedging; zerootherwise. All other variables are defined in Table 1. Intercept is included in all specifications, but notshown. T-statistics based on heteroskedasticity-consistent standard errors clustered by the firm arereported in brackets. ∗∗∗, ∗∗, and ∗ denote significance at the 1%, 5%, and 10% levels, respectively.
(1) (2) (3) (4) (5) (6)Panel A: Hedge Ratio Oil Oil Oil Gas Gas Gas
Debt issuance, no 8.461 -3.135 -1.710 8.470* -1.455 0.120requirements [1.45] [-0.56] [-0.25] [1.73] [-0.30] [0.02]Debt issuance, 55.035*** 17.952*** 16.742*** 40.818*** 16.338*** 12.204**hedging requirements [8.25] [3.30] [2.87] [7.54] [3.21] [2.32]Log of assets 5.208*** 6.160*** 6.261*** 4.736*** 5.280*** 4.370***
[7.84] [5.50] [4.59] [8.14] [3.46] [2.60]Market-to-book ratio -0.069 0.195 0.316 -0.084 -0.078 -0.029
[-0.36] [1.01] [1.51] [-0.60] [-0.72] [-0.29]Return on assets -0.061 -0.405 0.304 -1.256* -0.825 -0.357
[-0.16] [-0.66] [0.24] [-1.66] [-1.06] [-0.50]Firm default -8.677 -26.952*** -29.841*** -16.078*** -28.222*** -32.321***
[-1.60] [-3.84] [-3.66] [-3.63] [-4.26] [-3.99]Tax-loss carryforwards 0.117 -0.140 -0.377 0.001 0.279 0.301
[0.76] [-0.40] [-0.78] [0.00] [1.22] [1.09]Crude oil spot price 0.356 0.328 0.483**
[1.31] [1.49] [2.01]Volatility of oil price -0.087 -0.026 0.106
[-0.34] [-0.11] [0.35]Natural gas spot price 5.039*** 1.617 -0.010
[2.67] [1.06] [-0.01]Volatility of gas price -8.118** -3.583 -2.754
[-2.39] [-1.17] [-0.97]Observations 2,197 2,197 2,161 2,144 2,144 2,114R-squared 0.305 0.641 0.678 0.248 0.629 0.668Firm FE No Yes Yes No Yes YesBank FE No No Yes No No YesYear FE Yes Yes Yes Yes Yes Yes
46

Panel B: Hedge (1) (2) (3) (4) (5) (6)Maturity Oil Oil Oil Gas Gas Gas
Debt issuance, no 2.322 0.352 -0.695 1.454 -3.353 -4.817requirements [1.03] [0.14] [-0.23] [0.68] [-0.72] [-0.80]Debt issuance, 23.451*** 12.343*** 11.790*** 21.181*** 13.610*** 14.100***hedging requirements [7.21] [4.61] [4.07] [6.49] [4.76] [4.35]Log of assets 2.923*** 1.796*** 2.293*** 3.811*** 3.268*** 3.633***
[9.74] [3.03] [3.41] [10.40] [4.20] [3.29]Market-to-book ratio 0.019 -0.018 0.062 -0.012 -0.073 -0.055
[0.56] [-0.31] [1.07] [-0.28] [-1.12] [-0.63]Return on assets 0.008 -0.051 0.246 -0.328* -0.302 -0.293
[0.05] [-0.21] [0.63] [-1.68] [-1.08] [-0.61]Firm default -4.817** -11.065*** -11.810*** -8.056*** -11.571*** -11.495***
[-2.49] [-4.41] [-3.71] [-4.33] [-3.57] [-2.95]Tax-loss carryforwards 0.168** 0.067 -0.070 0.305*** 0.308*** 0.263*
[2.25] [0.35] [-0.28] [3.29] [2.74] [1.74]Crude oil spot price 0.188* 0.269** 0.293**
[1.69] [2.42] [2.44]Volatility of oil price -0.080 -0.030 -0.012
[-0.76] [-0.25] [-0.10]Natural gas spot price 1.303 0.889 0.667
[1.21] [1.00] [0.70]Volatility of gas price -2.986** -1.793 -1.563
[-2.17] [-1.49] [-1.31]Observations 2,236 2,236 2,200 2,224 2,224 2,188R-squared 0.341 0.646 0.701 0.323 0.643 0.673Firm FE No Yes Yes No Yes YesBank FE No No Yes No No YesYear FE Yes Yes Yes Yes Yes Yes
47
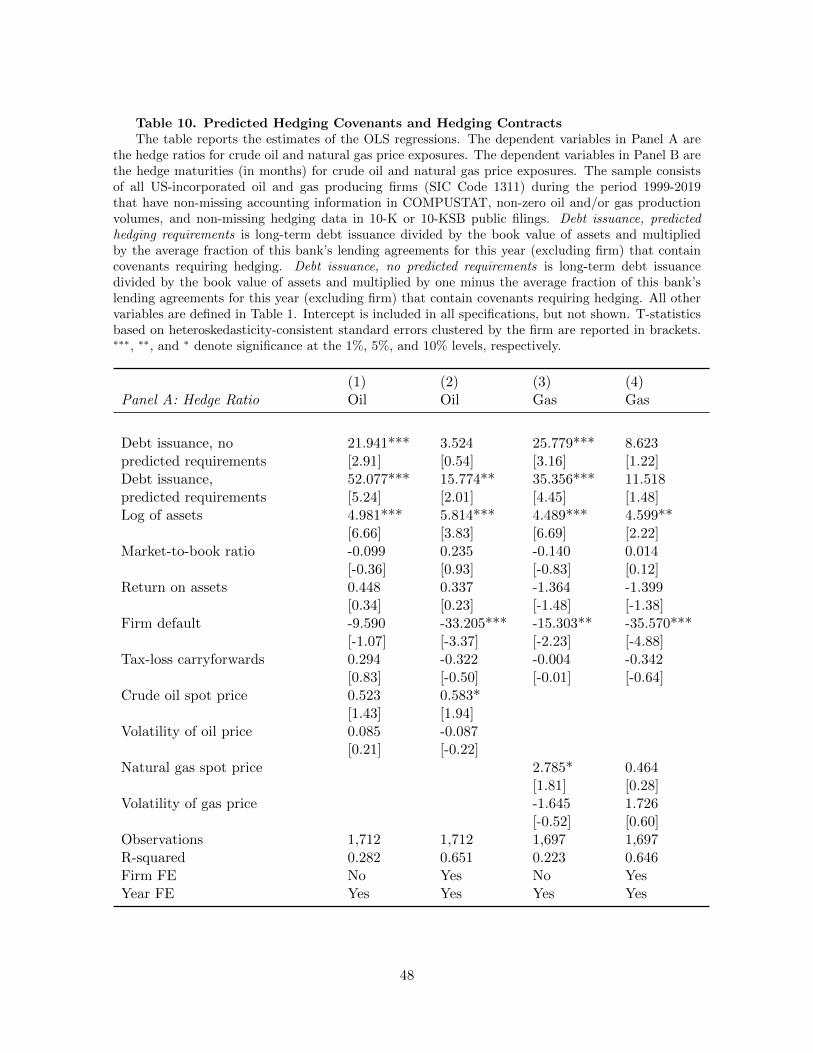
Table 10. Predicted Hedging Covenants and Hedging ContractsThe table reports the estimates of the OLS regressions. The dependent variables in Panel A are
the hedge ratios for crude oil and natural gas price exposures. The dependent variables in Panel B arethe hedge maturities (in months) for crude oil and natural gas price exposures. The sample consistsof all US-incorporated oil and gas producing firms (SIC Code 1311) during the period 1999-2019that have non-missing accounting information in COMPUSTAT, non-zero oil and/or gas productionvolumes, and non-missing hedging data in 10-K or 10-KSB public filings. Debt issuance, predictedhedging requirements is long-term debt issuance divided by the book value of assets and multipliedby the average fraction of this bank’s lending agreements for this year (excluding firm) that containcovenants requiring hedging. Debt issuance, no predicted requirements is long-term debt issuancedivided by the book value of assets and multiplied by one minus the average fraction of this bank’slending agreements for this year (excluding firm) that contain covenants requiring hedging. All othervariables are defined in Table 1. Intercept is included in all specifications, but not shown. T-statisticsbased on heteroskedasticity-consistent standard errors clustered by the firm are reported in brackets.∗∗∗, ∗∗, and ∗ denote significance at the 1%, 5%, and 10% levels, respectively.
(1) (2) (3) (4)Panel A: Hedge Ratio Oil Oil Gas Gas
Debt issuance, no 21.941*** 3.524 25.779*** 8.623predicted requirements [2.91] [0.54] [3.16] [1.22]Debt issuance, 52.077*** 15.774** 35.356*** 11.518predicted requirements [5.24] [2.01] [4.45] [1.48]Log of assets 4.981*** 5.814*** 4.489*** 4.599**
[6.66] [3.83] [6.69] [2.22]Market-to-book ratio -0.099 0.235 -0.140 0.014
[-0.36] [0.93] [-0.83] [0.12]Return on assets 0.448 0.337 -1.364 -1.399
[0.34] [0.23] [-1.48] [-1.38]Firm default -9.590 -33.205*** -15.303** -35.570***
[-1.07] [-3.37] [-2.23] [-4.88]Tax-loss carryforwards 0.294 -0.322 -0.004 -0.342
[0.83] [-0.50] [-0.01] [-0.64]Crude oil spot price 0.523 0.583*
[1.43] [1.94]Volatility of oil price 0.085 -0.087
[0.21] [-0.22]Natural gas spot price 2.785* 0.464
[1.81] [0.28]Volatility of gas price -1.645 1.726
[-0.52] [0.60]Observations 1,712 1,712 1,697 1,697R-squared 0.282 0.651 0.223 0.646Firm FE No Yes No YesYear FE Yes Yes Yes Yes
48
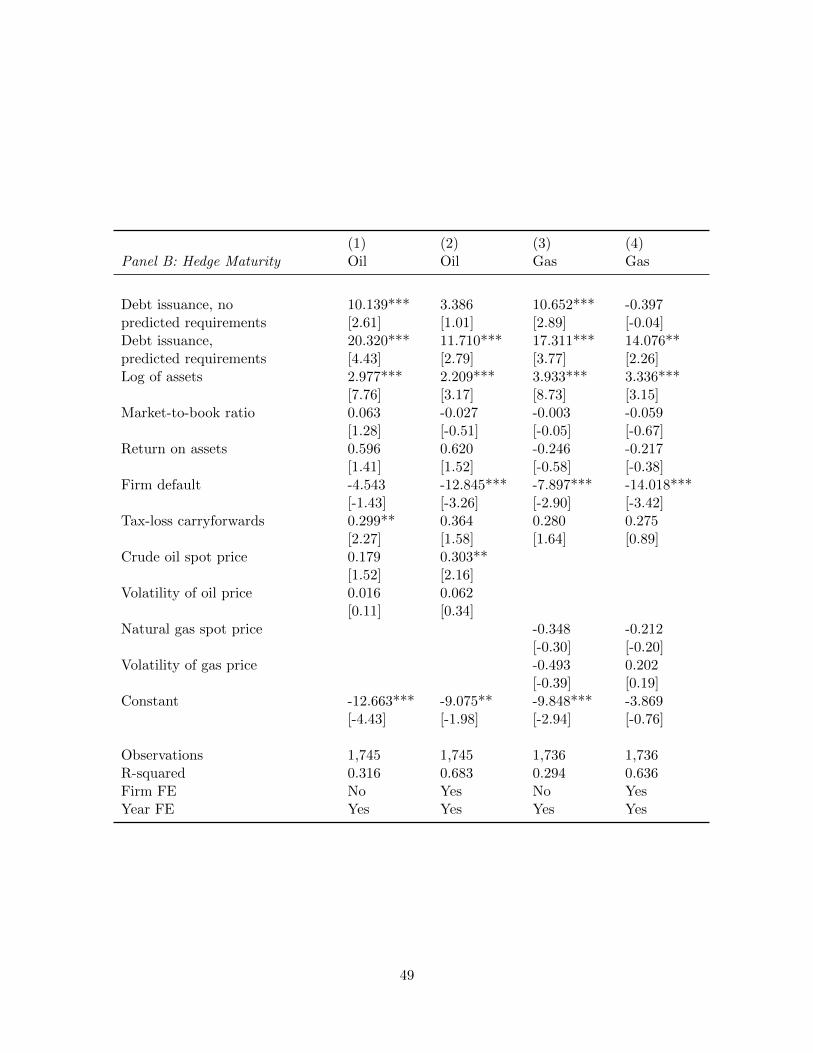
(1) (2) (3) (4)Panel B: Hedge Maturity Oil Oil Gas Gas
Debt issuance, no 10.139*** 3.386 10.652*** -0.397predicted requirements [2.61] [1.01] [2.89] [-0.04]Debt issuance, 20.320*** 11.710*** 17.311*** 14.076**predicted requirements [4.43] [2.79] [3.77] [2.26]Log of assets 2.977*** 2.209*** 3.933*** 3.336***
[7.76] [3.17] [8.73] [3.15]Market-to-book ratio 0.063 -0.027 -0.003 -0.059
[1.28] [-0.51] [-0.05] [-0.67]Return on assets 0.596 0.620 -0.246 -0.217
[1.41] [1.52] [-0.58] [-0.38]Firm default -4.543 -12.845*** -7.897*** -14.018***
[-1.43] [-3.26] [-2.90] [-3.42]Tax-loss carryforwards 0.299** 0.364 0.280 0.275
[2.27] [1.58] [1.64] [0.89]Crude oil spot price 0.179 0.303**
[1.52] [2.16]Volatility of oil price 0.016 0.062
[0.11] [0.34]Natural gas spot price -0.348 -0.212
[-0.30] [-0.20]Volatility of gas price -0.493 0.202
[-0.39] [0.19]Constant -12.663*** -9.075** -9.848*** -3.869
[-4.43] [-1.98] [-2.94] [-0.76]
Observations 1,745 1,745 1,736 1,736R-squared 0.316 0.683 0.294 0.636Firm FE No Yes No YesYear FE Yes Yes Yes Yes
49
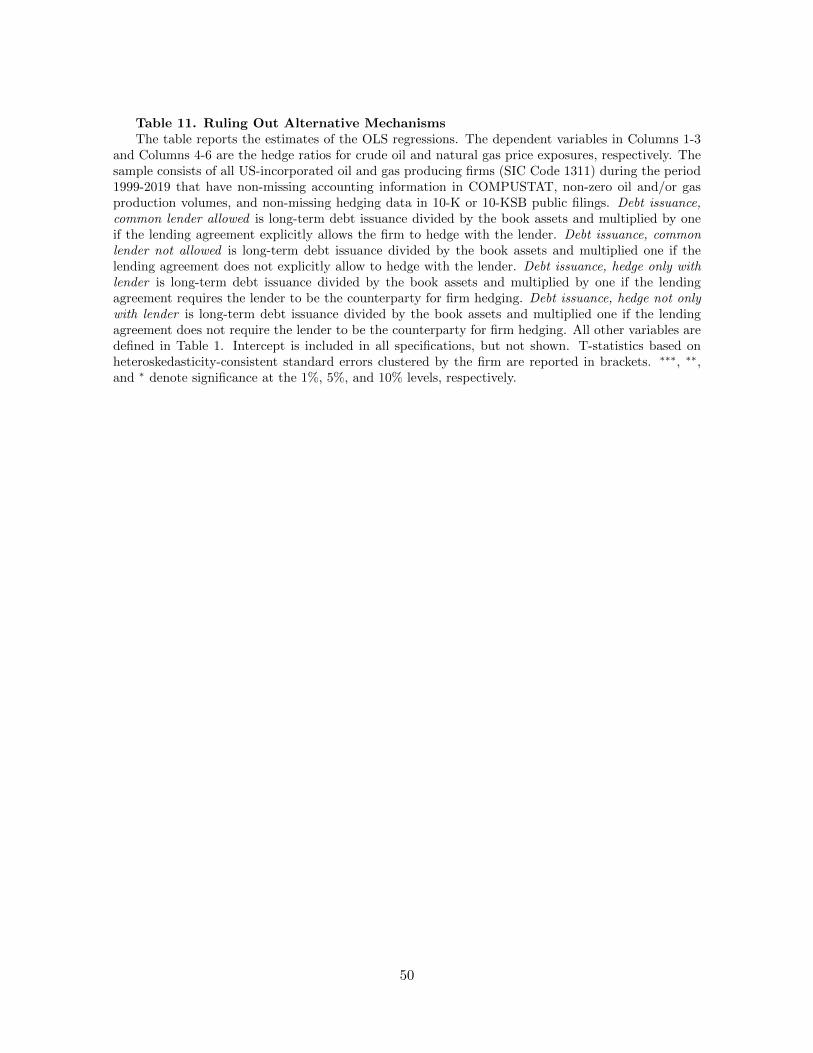
Table 11. Ruling Out Alternative MechanismsThe table reports the estimates of the OLS regressions. The dependent variables in Columns 1-3
and Columns 4-6 are the hedge ratios for crude oil and natural gas price exposures, respectively. Thesample consists of all US-incorporated oil and gas producing firms (SIC Code 1311) during the period1999-2019 that have non-missing accounting information in COMPUSTAT, non-zero oil and/or gasproduction volumes, and non-missing hedging data in 10-K or 10-KSB public filings. Debt issuance,common lender allowed is long-term debt issuance divided by the book assets and multiplied by oneif the lending agreement explicitly allows the firm to hedge with the lender. Debt issuance, commonlender not allowed is long-term debt issuance divided by the book assets and multiplied one if thelending agreement does not explicitly allow to hedge with the lender. Debt issuance, hedge only withlender is long-term debt issuance divided by the book assets and multiplied by one if the lendingagreement requires the lender to be the counterparty for firm hedging. Debt issuance, hedge not onlywith lender is long-term debt issuance divided by the book assets and multiplied one if the lendingagreement does not require the lender to be the counterparty for firm hedging. All other variables aredefined in Table 1. Intercept is included in all specifications, but not shown. T-statistics based onheteroskedasticity-consistent standard errors clustered by the firm are reported in brackets. ∗∗∗, ∗∗,and ∗ denote significance at the 1%, 5%, and 10% levels, respectively.
50
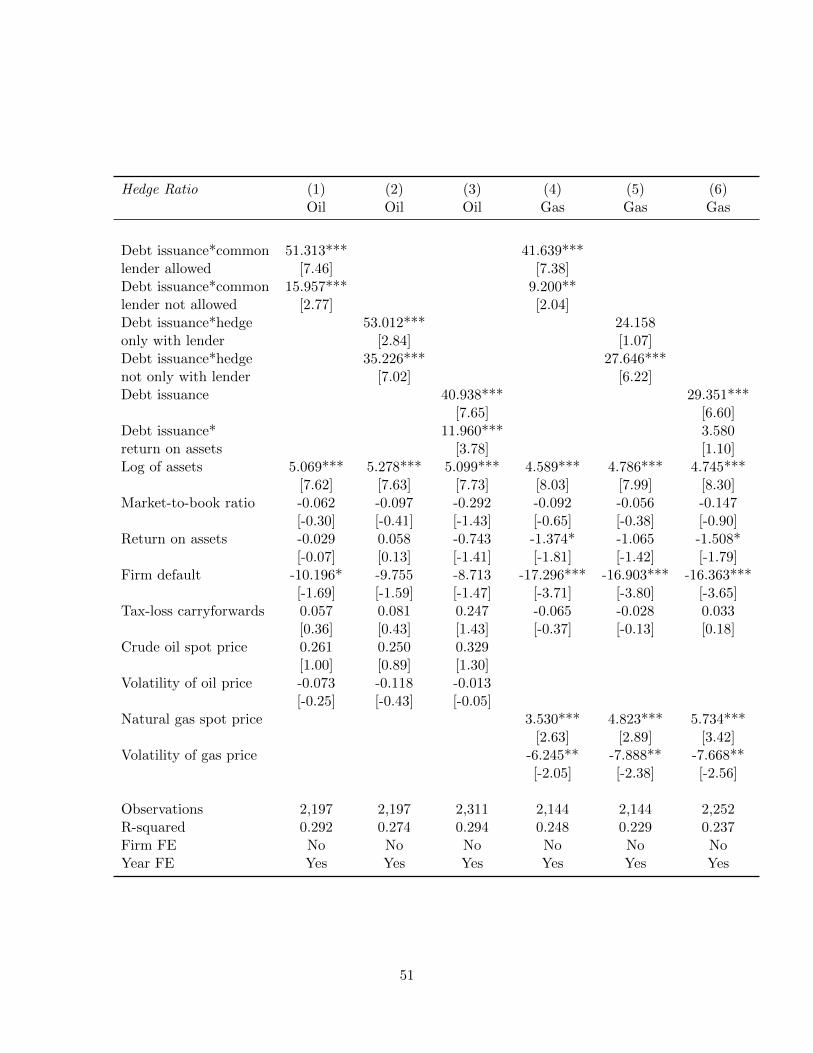
Hedge Ratio (1) (2) (3) (4) (5) (6)Oil Oil Oil Gas Gas Gas
Debt issuance*common 51.313*** 41.639***lender allowed [7.46] [7.38]Debt issuance*common 15.957*** 9.200**lender not allowed [2.77] [2.04]Debt issuance*hedge 53.012*** 24.158only with lender [2.84] [1.07]Debt issuance*hedge 35.226*** 27.646***not only with lender [7.02] [6.22]Debt issuance 40.938*** 29.351***
[7.65] [6.60]Debt issuance* 11.960*** 3.580return on assets [3.78] [1.10]Log of assets 5.069*** 5.278*** 5.099*** 4.589*** 4.786*** 4.745***
[7.62] [7.63] [7.73] [8.03] [7.99] [8.30]Market-to-book ratio -0.062 -0.097 -0.292 -0.092 -0.056 -0.147
[-0.30] [-0.41] [-1.43] [-0.65] [-0.38] [-0.90]Return on assets -0.029 0.058 -0.743 -1.374* -1.065 -1.508*
[-0.07] [0.13] [-1.41] [-1.81] [-1.42] [-1.79]Firm default -10.196* -9.755 -8.713 -17.296*** -16.903*** -16.363***
[-1.69] [-1.59] [-1.47] [-3.71] [-3.80] [-3.65]Tax-loss carryforwards 0.057 0.081 0.247 -0.065 -0.028 0.033
[0.36] [0.43] [1.43] [-0.37] [-0.13] [0.18]Crude oil spot price 0.261 0.250 0.329
[1.00] [0.89] [1.30]Volatility of oil price -0.073 -0.118 -0.013
[-0.25] [-0.43] [-0.05]Natural gas spot price 3.530*** 4.823*** 5.734***
[2.63] [2.89] [3.42]Volatility of gas price -6.245** -7.888** -7.668**
[-2.05] [-2.38] [-2.56]
Observations 2,197 2,197 2,311 2,144 2,144 2,252R-squared 0.292 0.274 0.294 0.248 0.229 0.237Firm FE No No No No No NoYear FE Yes Yes Yes Yes Yes Yes
51
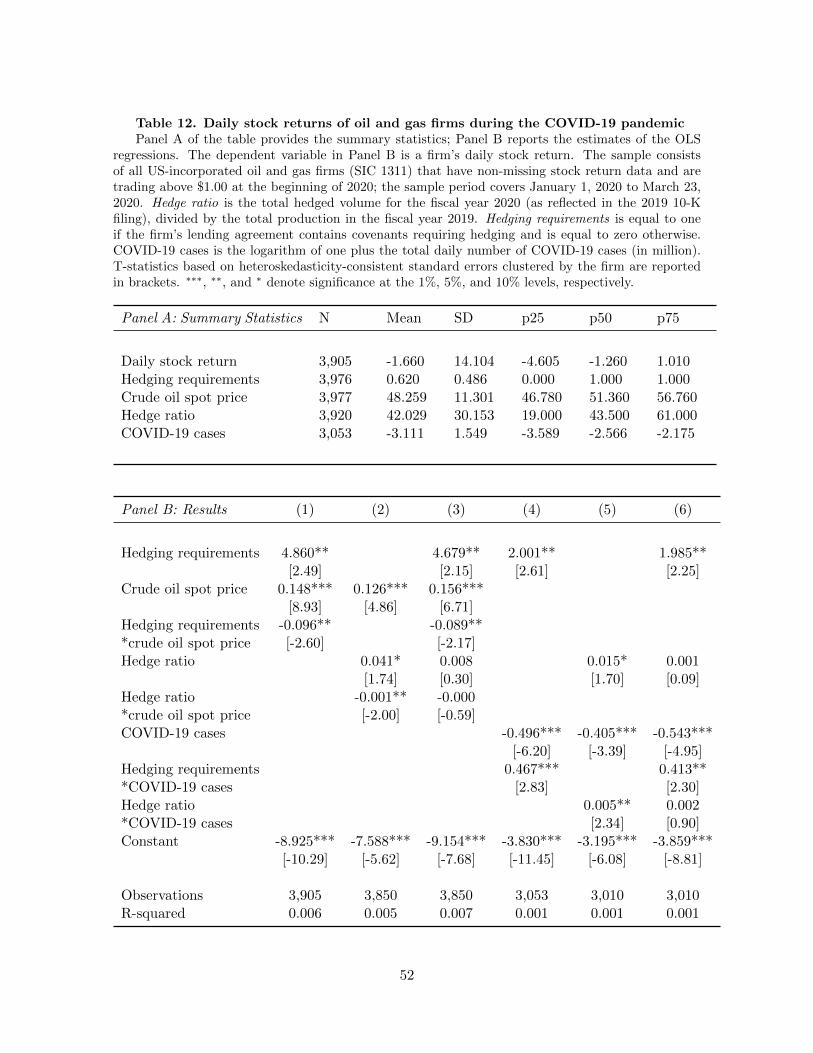
Table 12. Daily stock returns of oil and gas firms during the COVID-19 pandemicPanel A of the table provides the summary statistics; Panel B reports the estimates of the OLS
regressions. The dependent variable in Panel B is a firm’s daily stock return. The sample consistsof all US-incorporated oil and gas firms (SIC 1311) that have non-missing stock return data and aretrading above $1.00 at the beginning of 2020; the sample period covers January 1, 2020 to March 23,2020. Hedge ratio is the total hedged volume for the fiscal year 2020 (as reflected in the 2019 10-Kfiling), divided by the total production in the fiscal year 2019. Hedging requirements is equal to oneif the firm’s lending agreement contains covenants requiring hedging and is equal to zero otherwise.COVID-19 cases is the logarithm of one plus the total daily number of COVID-19 cases (in million).T-statistics based on heteroskedasticity-consistent standard errors clustered by the firm are reportedin brackets. ∗∗∗, ∗∗, and ∗ denote significance at the 1%, 5%, and 10% levels, respectively.
Panel A: Summary Statistics N Mean SD p25 p50 p75
Daily stock return 3,905 -1.660 14.104 -4.605 -1.260 1.010Hedging requirements 3,976 0.620 0.486 0.000 1.000 1.000Crude oil spot price 3,977 48.259 11.301 46.780 51.360 56.760Hedge ratio 3,920 42.029 30.153 19.000 43.500 61.000COVID-19 cases 3,053 -3.111 1.549 -3.589 -2.566 -2.175
Panel B: Results (1) (2) (3) (4) (5) (6)
Hedging requirements 4.860** 4.679** 2.001** 1.985**[2.49] [2.15] [2.61] [2.25]
Crude oil spot price 0.148*** 0.126*** 0.156***[8.93] [4.86] [6.71]
Hedging requirements -0.096** -0.089***crude oil spot price [-2.60] [-2.17]Hedge ratio 0.041* 0.008 0.015* 0.001
[1.74] [0.30] [1.70] [0.09]Hedge ratio -0.001** -0.000*crude oil spot price [-2.00] [-0.59]COVID-19 cases -0.496*** -0.405*** -0.543***
[-6.20] [-3.39] [-4.95]Hedging requirements 0.467*** 0.413***COVID-19 cases [2.83] [2.30]Hedge ratio 0.005** 0.002*COVID-19 cases [2.34] [0.90]Constant -8.925*** -7.588*** -9.154*** -3.830*** -3.195*** -3.859***
[-10.29] [-5.62] [-7.68] [-11.45] [-6.08] [-8.81]
Observations 3,905 3,850 3,850 3,053 3,010 3,010R-squared 0.006 0.005 0.007 0.001 0.001 0.001
52