Embed Size (px)
Citation preview
Date: 10 May, 2019
The Daily Viewpoint
Page 2PCG Research
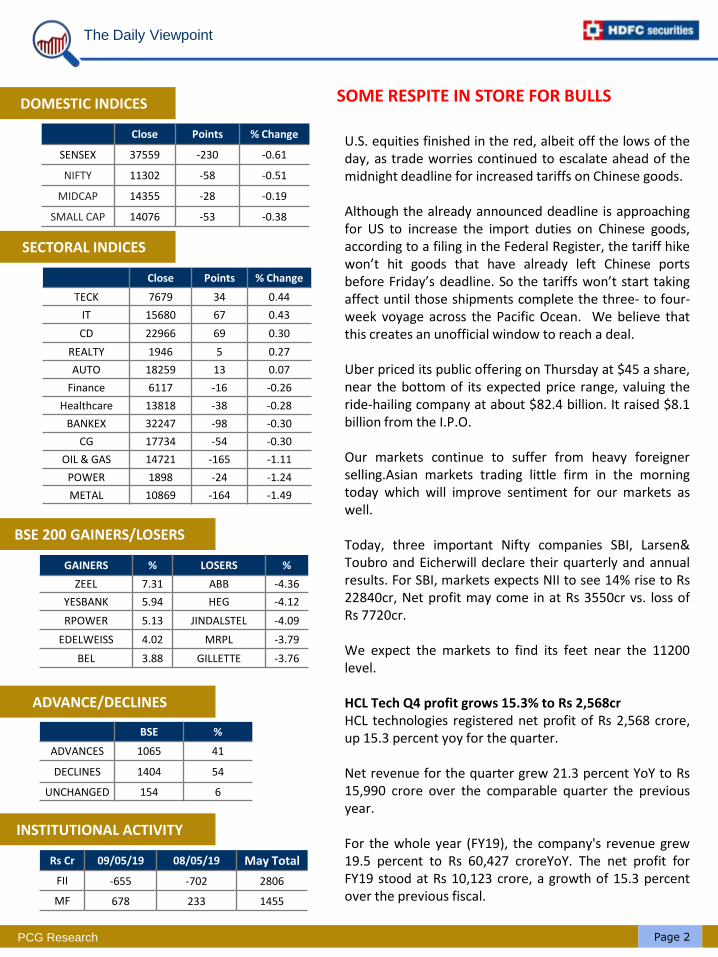
DOMESTIC INDICES
Close Points % Change
SENSEX 37559 -230 -0.61
NIFTY 11302 -58 -0.51
MIDCAP 14355 -28 -0.19
SMALL CAP 14076 -53 -0.38
SECTORAL INDICES
Close Points % Change
TECK 7679 34 0.44
IT 15680 67 0.43
CD 22966 69 0.30
REALTY 1946 5 0.27
AUTO 18259 13 0.07
Finance 6117 -16 -0.26
Healthcare 13818 -38 -0.28
BANKEX 32247 -98 -0.30
CG 17734 -54 -0.30
OIL & GAS 14721 -165 -1.11
POWER 1898 -24 -1.24
METAL 10869 -164 -1.49
BSE 200 GAINERS/LOSERS
GAINERS % LOSERS %
ZEEL 7.31 ABB -4.36
YESBANK 5.94 HEG -4.12
RPOWER 5.13 JINDALSTEL -4.09
EDELWEISS 4.02 MRPL -3.79
BEL 3.88 GILLETTE -3.76
ADVANCE/DECLINES
BSE %
ADVANCES 1065 41
DECLINES 1404 54
UNCHANGED 154 6
INSTITUTIONAL ACTIVITY
Rs Cr 09/05/19 08/05/19 May Total
FII -655 -702 2806
MF 678 233 1455
U.S. equities finished in the red, albeit off the lows of theday, as trade worries continued to escalate ahead of themidnight deadline for increased tariffs on Chinese goods.
Although the already announced deadline is approachingfor US to increase the import duties on Chinese goods,according to a filing in the Federal Register, the tariff hikewon’t hit goods that have already left Chinese portsbefore Friday’s deadline. So the tariffs won’t start takingaffect until those shipments complete the three- to four-week voyage across the Pacific Ocean. We believe thatthis creates an unofficial window to reach a deal.
Uber priced its public offering on Thursday at $45 a share,near the bottom of its expected price range, valuing theride-hailing company at about $82.4 billion. It raised $8.1billion from the I.P.O.
Our markets continue to suffer from heavy foreignerselling.Asian markets trading little firm in the morningtoday which will improve sentiment for our markets aswell.
Today, three important Nifty companies SBI, Larsen&Toubro and Eicherwill declare their quarterly and annualresults. For SBI, markets expects NII to see 14% rise to Rs22840cr, Net profit may come in at Rs 3550cr vs. loss ofRs 7720cr.
We expect the markets to find its feet near the 11200level.
HCL Tech Q4 profit grows 15.3% to Rs 2,568crHCL technologies registered net profit of Rs 2,568 crore,up 15.3 percent yoy for the quarter.
Net revenue for the quarter grew 21.3 percent YoY to Rs15,990 crore over the comparable quarter the previousyear.
For the whole year (FY19), the company's revenue grew19.5 percent to Rs 60,427 croreYoY. The net profit forFY19 stood at Rs 10,123 crore, a growth of 15.3 percentover the previous fiscal.
SOME RESPITE IN STORE FOR BULLS
The Daily Viewpoint
Page 3PCG Research
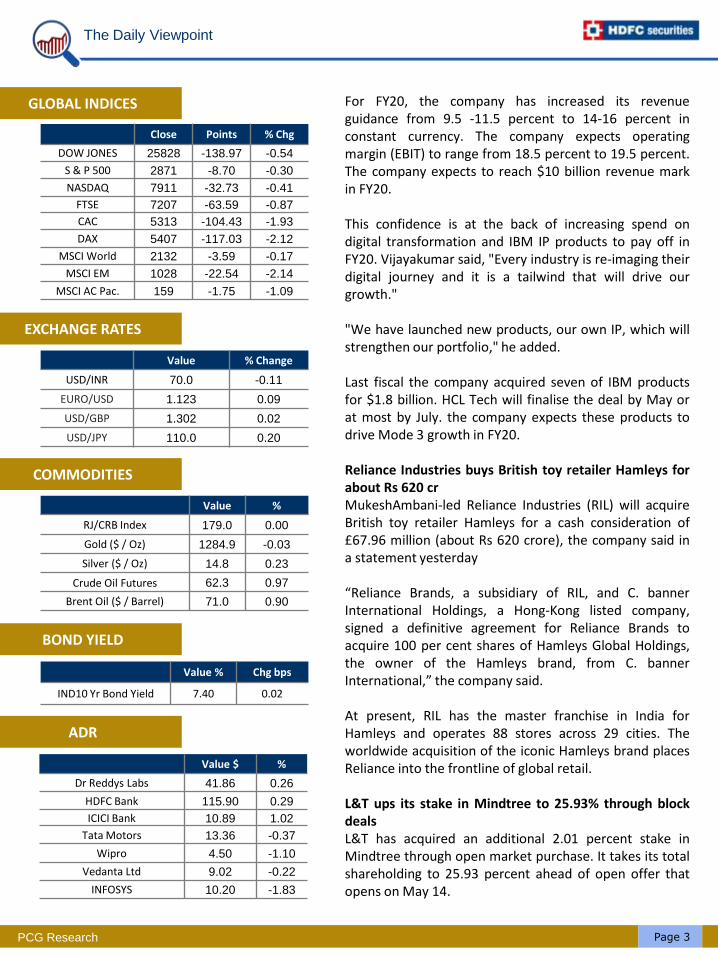
GLOBAL INDICES For FY20, the company has increased its revenueguidance from 9.5 -11.5 percent to 14-16 percent inconstant currency. The company expects operatingmargin (EBIT) to range from 18.5 percent to 19.5 percent.The company expects to reach $10 billion revenue markin FY20.
This confidence is at the back of increasing spend ondigital transformation and IBM IP products to pay off inFY20. Vijayakumar said, "Every industry is re-imaging theirdigital journey and it is a tailwind that will drive ourgrowth."
"We have launched new products, our own IP, which willstrengthen our portfolio," he added.
Last fiscal the company acquired seven of IBM productsfor $1.8 billion. HCL Tech will finalise the deal by May orat most by July. the company expects these products todrive Mode 3 growth in FY20.
Reliance Industries buys British toy retailer Hamleys forabout Rs 620 crMukeshAmbani-led Reliance Industries (RIL) will acquireBritish toy retailer Hamleys for a cash consideration of£67.96 million (about Rs 620 crore), the company said ina statement yesterday
“Reliance Brands, a subsidiary of RIL, and C. bannerInternational Holdings, a Hong-Kong listed company,signed a definitive agreement for Reliance Brands toacquire 100 per cent shares of Hamleys Global Holdings,the owner of the Hamleys brand, from C. bannerInternational,” the company said.
At present, RIL has the master franchise in India forHamleys and operates 88 stores across 29 cities. Theworldwide acquisition of the iconic Hamleys brand placesReliance into the frontline of global retail.
L&T ups its stake in Mindtree to 25.93% through blockdealsL&T has acquired an additional 2.01 percent stake inMindtree through open market purchase. It takes its totalshareholding to 25.93 percent ahead of open offer thatopens on May 14.
Close Points % Chg
DOW JONES 25828 -138.97 -0.54
S & P 500 2871 -8.70 -0.30
NASDAQ 7911 -32.73 -0.41
FTSE 7207 -63.59 -0.87
CAC 5313 -104.43 -1.93
DAX 5407 -117.03 -2.12
MSCI World 2132 -3.59 -0.17
MSCI EM 1028 -22.54 -2.14
MSCI AC Pac. 159 -1.75 -1.09
EXCHANGE RATES
Value % Change
USD/INR 70.0 -0.11
EURO/USD 1.123 0.09
USD/GBP 1.302 0.02
USD/JPY 110.0 0.20
COMMODITIES
Value %
RJ/CRB Index 179.0 0.00
Gold ($ / Oz) 1284.9 -0.03
Silver ($ / Oz) 14.8 0.23
Crude Oil Futures 62.3 0.97
Brent Oil ($ / Barrel) 71.0 0.90
BOND YIELD
Value % Chg bps
IND10 Yr Bond Yield 7.40 0.02
ADR
Value $ %
Dr Reddys Labs 41.86 0.26
HDFC Bank 115.90 0.29
ICICI Bank 10.89 1.02
Tata Motors 13.36 -0.37
Wipro 4.50 -1.10
Vedanta Ltd 9.02 -0.22
INFOSYS 10.20 -1.83
The Daily Viewpoint
Page 4PCG Research
The company purchased 3,305,775 shares in a block deal on May 9 at Rs 980 per share. Having crossed thenecessary 25 percent, an open offer is automatically triggered. L&T’s open offer starts on May 14 and willclose on May 27.
Over 25 percent stake in Mindtree means that L&T can call for a board meeting and seek a seat on theMindtree board. Recently, few sources said L&T had raised concerns about Mindtree’s governance and boardpractices and these matters would be the focus for L&T management.
In India’s first-ever hostile takeover bid, L&T signed a definitive agreement to buy 20.32 percent from VGSiddhartha and his coffee enterprise for over Rs 3,000 crore on March 18, 2019. The deal was formalised lastmonth.
The company said it will buy an additional 46 percent through the open market purchase of 15 percentshares and 31 percent through an open offer. This puts the total value of the acquisition at Rs 10,700 crore.
Voltas consolidated net falls 27% to Rs 142 cr in March quarterVoltas said that its consolidated net profit has fallen 27 percent to Rs 141.7 crore for the fourth quarter.EBITDA posted degrowth of 43% yoy to Rs 144cr. Weak operating performance, higher finance costs andlosses from associates led to 27% yoy fall in PAT.
Total income during the quarter stood at Rs 2,120.2 crore, a rise of 1.34 percent.
For FY19, Voltas net profit stood at Rs 514 crore, down 11.07 percent (Rs 577.9 crore). Voltas’ total incomerose 10.7 percent to Rs 7,310.32 crore.
Voltas said its board in a meeting has recommended a dividend of Rs 4 per share for 2018-19.
Asian Paints Q4 net dips ~2% to Rs 487 croreRevenues saw 12% rise to Rs 5018cr led by double digit volume growth in decorative segment. On the back oflower EBITDA, net profit dipped 2% to Rs 487cr.
PNB Housing Q4 PAT grew 51% to Rs 380crNet profit was up 51% at Rs 379.8 crore vs. Rs 251.6 crore, revenues increased 30.9% to Rs 2,145.2 crore.
Mahanagar Gas (MGL) posts 27% growth in PAT to Rs 133.5crRevenues grew 23% yoy to Rs 793cr. PAT increased 27% yoy to Rs 133.5cr. Other Income came in at Rs 24crvs. Rs 17.4cr yoy. For the year, revenues posted 25% yoy growth to Rs 3057cr. PAT came in at Rs 546cr, +15%yoy. Board has recommended Final Dividend of Rs. 10.5 per share for the year.
SBI Q4 PAT may surge to Rs 3550crNII may see 14% rise to Rs 22840cr. Net profit may come in at Rs 3550cr vs. loss of Rs 7720cr. Gross NPA isestimated at 8.3% vs. 10.9% yoy.
Key issues to watch for· Updates on the retail, SME and agri slippages.· Recoveries from resolution of NCLT accounts.· Outlook on power assets and macro developments on asset quality.
The Daily Viewpoint
Page 5PCG Research
Eicher Motors PAT seen down 14% yoy to Rs 553crRevenues may dip 2% yoy to Rs 2465cr. EBITDA margin is expected to contract 230bps to 29.2%. PAT is likelyto see 14% yoy dip to Rs 553cr.
L&T Q4 PAT may grow 10% yoy to Rs 3475crRevenues may increase 11% yoy to Rs 45263cr. EBITDA margin may expand 40bps to 13.7%. PAT is estimatedto see 10% increase to Rs 3475cr.
US markets: Trade spat continue to weigh on stocksU.S. equities finished in the red, albeit off the lows of the day, as trade worries continued to escalate ahead ofthe midnight deadline for increased tariffs on Chinese goods.
S&P 500 and the Nasdaq finished lower for a fourth session as trade tensions ramped up after U.S. PresidentDonald Trump threatened tariff retaliation on China, some of the fears were assuaged after Trump disclosedthat he’s received a missive from Chinese President Xi Jinping just hours before U.S. and Chinese officialswere set to resume trade talks in Washington.
The Dow Jones fell 138 points to end at 25828 after falling by as much as 450 points earlier. The S&P 500index dropped 8 points to 2870 and the Nasdaq lost 32 points to 7910.
Anxiety over the prospect of a deepening trade dispute between the U.S. and China has weighed on stockmarkets all week, after Trump voiced frustration over the pace of talks in a Sunday tweet. Those fears werecompounded Wednesday evening when the president accused the Chinese of negotiating in bad faith andreneging on commitments made in previous rounds of negotiation.
Walt Disney posted stronger-than-expected quarterly results, and Chevron withdrew its offer to acquireAnadarko Petroleum following a higher bid from Occidental Petroleum.
Uber priced its public offering on Thursday at $45 a share, near the bottom of its expected price range,valuing the ride-hailing company at about $82.4 billion. It raised $8.1 billion from the I.P.O.
Fed chatterFederal Reserve Chairman Jerome Powell discussed the “crucial” problems of stagnant middle-class incomesand economic mobility at the Fed’s community development research conference Thursday morning.
Economic dataThe Producer Price Index showed prices at the wholesale level in April rose 0.2% month-over-month,compared to the forecast of a 0.3% gain, and following March's unrevised 0.6% rise. The core rate, whichexcludes food and energy, was up 0.1%, versus expectations of a 0.2% gain, and after March's unadjusted0.3% increase.
The trade balance showed that the deficit widened to $50.0 billion in March, compared to estimates of $50.1billion. February's deficit was revised lower to $49.3 billion. Exports were up 1.0% at $212.0 billion, whileimports gained 1.1% to $262.0 billion.Weekly initial jobless claims declined 2,000 to 228,000, compared to estimates of 220,000, and versus theprior week's unrevised 230,000 level. The four-week moving average rose 7,750 to 220,250, while continuingclaims increased by 13,000 to 1,684,000, north of estimates of 1,670,000.
The Daily Viewpoint
Page 6PCG Research
Wholesale inventories were revised to a 0.1% dip in March, versus expectations to remain at the preliminaryflat reading, and compared to February's upwardly-revised 0.4% gain.
Treasuries rose, as the yield on the 2-year note fell 4 basis points to 2.26%, the yield on the 10-year notedropped 3 bps to 2.45%, and the 30-year bond rate declined 2 bps to 2.87%.
The U.S. Dollar Index also saw pressure.
The Daily Viewpoint
Page 7PCG Research
DATA & EVENTS
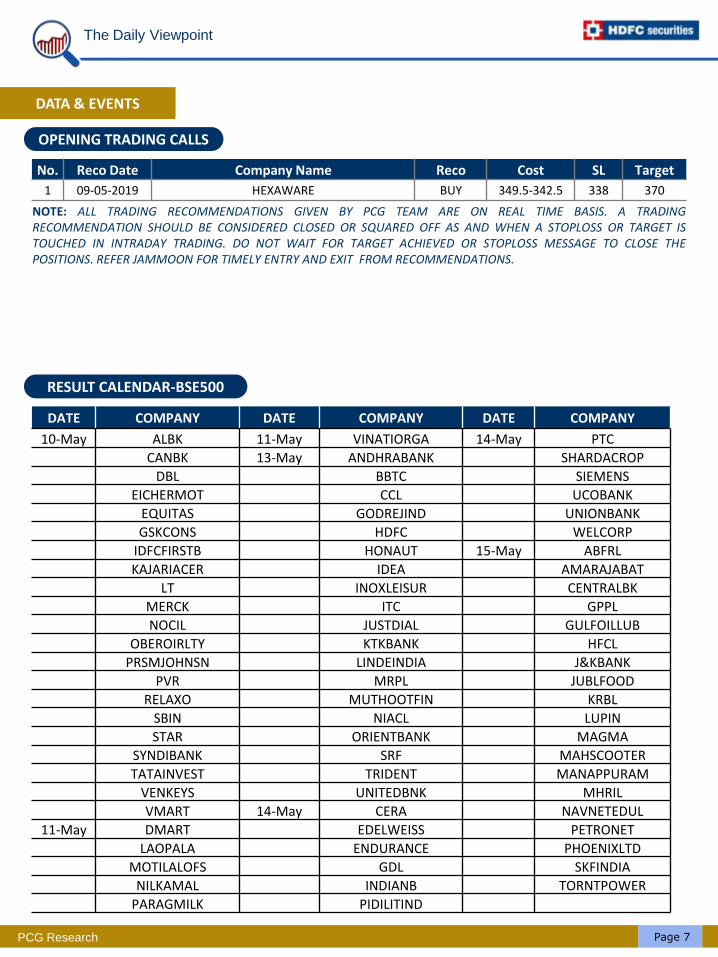
OPENING TRADING CALLS
NOTE: ALL TRADING RECOMMENDATIONS GIVEN BY PCG TEAM ARE ON REAL TIME BASIS. A TRADINGRECOMMENDATION SHOULD BE CONSIDERED CLOSED OR SQUARED OFF AS AND WHEN A STOPLOSS OR TARGET ISTOUCHED IN INTRADAY TRADING. DO NOT WAIT FOR TARGET ACHIEVED OR STOPLOSS MESSAGE TO CLOSE THEPOSITIONS. REFER JAMMOON FOR TIMELY ENTRY AND EXIT FROM RECOMMENDATIONS.
RESULT CALENDAR-BSE500
No. Reco Date Company Name Reco Cost SL Target
1 09-05-2019 HEXAWARE BUY 349.5-342.5 338 370
DATE COMPANY DATE COMPANY DATE COMPANY
10-May ALBK 11-May VINATIORGA 14-May PTC
CANBK 13-May ANDHRABANK SHARDACROP
DBL BBTC SIEMENS
EICHERMOT CCL UCOBANK
EQUITAS GODREJIND UNIONBANK
GSKCONS HDFC WELCORP
IDFCFIRSTB HONAUT 15-May ABFRL
KAJARIACER IDEA AMARAJABAT
LT INOXLEISUR CENTRALBK
MERCK ITC GPPL
NOCIL JUSTDIAL GULFOILLUB
OBEROIRLTY KTKBANK HFCL
PRSMJOHNSN LINDEINDIA J&KBANK
PVR MRPL JUBLFOOD
RELAXO MUTHOOTFIN KRBL
SBIN NIACL LUPIN
STAR ORIENTBANK MAGMA
SYNDIBANK SRF MAHSCOOTER
TATAINVEST TRIDENT MANAPPURAM
VENKEYS UNITEDBNK MHRIL
VMART 14-May CERA NAVNETEDUL
11-May DMART EDELWEISS PETRONET
LAOPALA ENDURANCE PHOENIXLTD
MOTILALOFS GDL SKFINDIA
NILKAMAL INDIANB TORNTPOWER
PARAGMILK PIDILITIND
The Daily Viewpoint
Page 8PCG Research
DATA & EVENTS
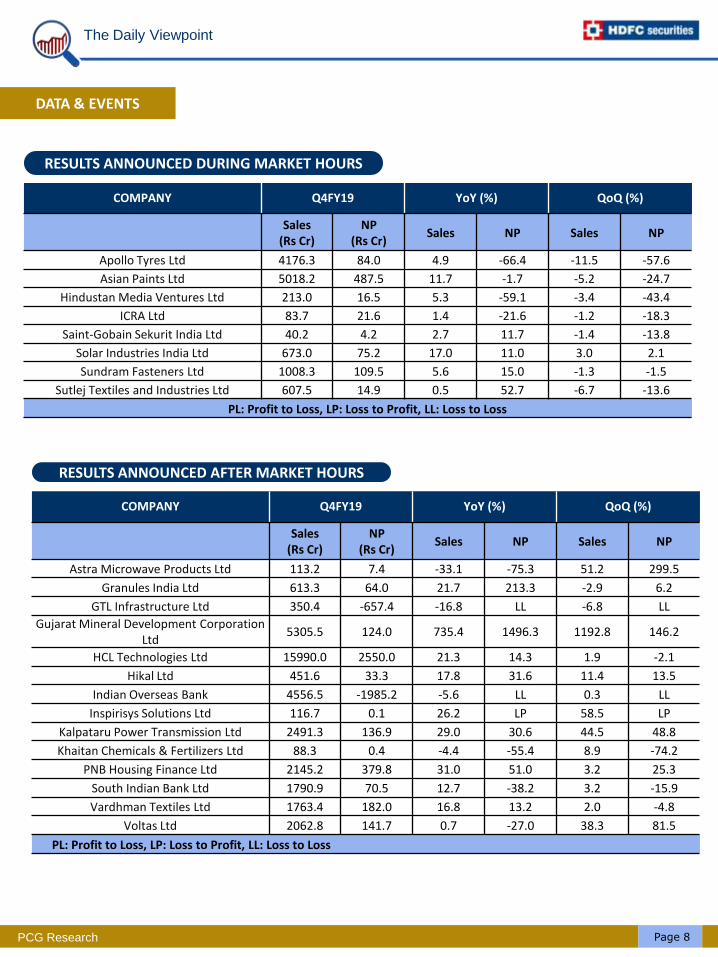
RESULTS ANNOUNCED DURING MARKET HOURS
COMPANY Q4FY19 YoY (%) QoQ (%)
Sales (Rs Cr)
NP (Rs Cr)
Sales NP Sales NP
Apollo Tyres Ltd 4176.3 84.0 4.9 -66.4 -11.5 -57.6
Asian Paints Ltd 5018.2 487.5 11.7 -1.7 -5.2 -24.7
Hindustan Media Ventures Ltd 213.0 16.5 5.3 -59.1 -3.4 -43.4
ICRA Ltd 83.7 21.6 1.4 -21.6 -1.2 -18.3
Saint-Gobain Sekurit India Ltd 40.2 4.2 2.7 11.7 -1.4 -13.8
Solar Industries India Ltd 673.0 75.2 17.0 11.0 3.0 2.1
Sundram Fasteners Ltd 1008.3 109.5 5.6 15.0 -1.3 -1.5
Sutlej Textiles and Industries Ltd 607.5 14.9 0.5 52.7 -6.7 -13.6
PL: Profit to Loss, LP: Loss to Profit, LL: Loss to Loss
RESULTS ANNOUNCED AFTER MARKET HOURS
COMPANY Q4FY19 YoY (%) QoQ (%)
Sales (Rs Cr)
NP (Rs Cr)
Sales NP Sales NP
Astra Microwave Products Ltd 113.2 7.4 -33.1 -75.3 51.2 299.5
Granules India Ltd 613.3 64.0 21.7 213.3 -2.9 6.2
GTL Infrastructure Ltd 350.4 -657.4 -16.8 LL -6.8 LL
Gujarat Mineral Development Corporation Ltd
5305.5 124.0 735.4 1496.3 1192.8 146.2
HCL Technologies Ltd 15990.0 2550.0 21.3 14.3 1.9 -2.1
Hikal Ltd 451.6 33.3 17.8 31.6 11.4 13.5
Indian Overseas Bank 4556.5 -1985.2 -5.6 LL 0.3 LL
Inspirisys Solutions Ltd 116.7 0.1 26.2 LP 58.5 LP
Kalpataru Power Transmission Ltd 2491.3 136.9 29.0 30.6 44.5 48.8
Khaitan Chemicals & Fertilizers Ltd 88.3 0.4 -4.4 -55.4 8.9 -74.2
PNB Housing Finance Ltd 2145.2 379.8 31.0 51.0 3.2 25.3
South Indian Bank Ltd 1790.9 70.5 12.7 -38.2 3.2 -15.9
Vardhman Textiles Ltd 1763.4 182.0 16.8 13.2 2.0 -4.8
Voltas Ltd 2062.8 141.7 0.7 -27.0 38.3 81.5
PL: Profit to Loss, LP: Loss to Profit, LL: Loss to Loss
The Daily Viewpoint
Page 9PCG Research
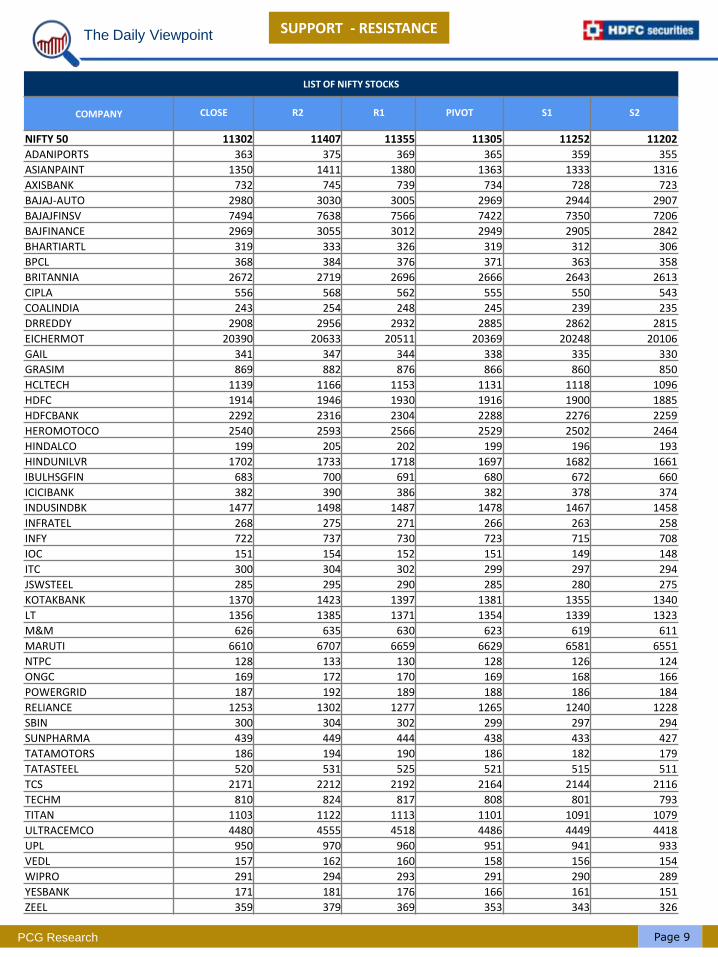
LIST OF NIFTY STOCKS
COMPANY CLOSE R2 R1 PIVOT S1 S2
NIFTY 50 11302 11407 11355 11305 11252 11202
ADANIPORTS 363 375 369 365 359 355
ASIANPAINT 1350 1411 1380 1363 1333 1316
AXISBANK 732 745 739 734 728 723
BAJAJ-AUTO 2980 3030 3005 2969 2944 2907
BAJAJFINSV 7494 7638 7566 7422 7350 7206
BAJFINANCE 2969 3055 3012 2949 2905 2842
BHARTIARTL 319 333 326 319 312 306
BPCL 368 384 376 371 363 358
BRITANNIA 2672 2719 2696 2666 2643 2613
CIPLA 556 568 562 555 550 543
COALINDIA 243 254 248 245 239 235
DRREDDY 2908 2956 2932 2885 2862 2815
EICHERMOT 20390 20633 20511 20369 20248 20106
GAIL 341 347 344 338 335 330
GRASIM 869 882 876 866 860 850
HCLTECH 1139 1166 1153 1131 1118 1096
HDFC 1914 1946 1930 1916 1900 1885
HDFCBANK 2292 2316 2304 2288 2276 2259
HEROMOTOCO 2540 2593 2566 2529 2502 2464
HINDALCO 199 205 202 199 196 193
HINDUNILVR 1702 1733 1718 1697 1682 1661
IBULHSGFIN 683 700 691 680 672 660
ICICIBANK 382 390 386 382 378 374
INDUSINDBK 1477 1498 1487 1478 1467 1458
INFRATEL 268 275 271 266 263 258
INFY 722 737 730 723 715 708
IOC 151 154 152 151 149 148
ITC 300 304 302 299 297 294
JSWSTEEL 285 295 290 285 280 275
KOTAKBANK 1370 1423 1397 1381 1355 1340
LT 1356 1385 1371 1354 1339 1323
M&M 626 635 630 623 619 611
MARUTI 6610 6707 6659 6629 6581 6551
NTPC 128 133 130 128 126 124
ONGC 169 172 170 169 168 166
POWERGRID 187 192 189 188 186 184
RELIANCE 1253 1302 1277 1265 1240 1228
SBIN 300 304 302 299 297 294
SUNPHARMA 439 449 444 438 433 427
TATAMOTORS 186 194 190 186 182 179
TATASTEEL 520 531 525 521 515 511
TCS 2171 2212 2192 2164 2144 2116
TECHM 810 824 817 808 801 793
TITAN 1103 1122 1113 1101 1091 1079
ULTRACEMCO 4480 4555 4518 4486 4449 4418
UPL 950 970 960 951 941 933
VEDL 157 162 160 158 156 154
WIPRO 291 294 293 291 290 289
YESBANK 171 181 176 166 161 151
ZEEL 359 379 369 353 343 326
SUPPORT - RESISTANCE
The Daily Viewpoint
Page 10PCG Research
PCG TEAM
Name DESIGNATION EMAIL ID
Mr. Vinod Sharma Head, PCG & Market Strategy [email protected]
Mr. Devarsh Vakil Head, Advisory [email protected]
Mr. Nandish Shah Derivative Analyst [email protected]
Mr. Vinay Rajani Technical Analyst [email protected]
Mr. Kushal Rughani Fundamental Analyst [email protected]
Ms. Kinnari Patel Junior Analyst [email protected]
Ms. Nisha Sankhala Fundamental Analyst [email protected]
Mr. Dilip Parmar Currency Analyst [email protected]
Mr. Tapan Patel Commodity Analyst [email protected]
Mr. Karan Shah Fundamental Analyst [email protected]
Disclaimer:This report has been prepared by HDFC Securities Ltd and is meant for sole use by the recipient and not for circulation. The information and opinions contained herein havebeen compiled or arrived at, based upon information obtained in good faith from sources believed to be reliable. Such information has not been independently verified andno guaranty, representation of warranty, express or implied, is made as to its accuracy, completeness or correctness. All such information and opinions are subject to changewithout notice. This document is for information purposes only. Descriptions of any company or companies or their securities mentioned herein are not intended to becomplete and this document is not, and should not be construed as an offer or solicitation of an offer, to buy or sell any securities or other financial instruments.This report is not directed to, or intended for display, downloading, printing, reproducing or for distribution to or use by, any person or entity who is a citizen or resident orlocated in any locality, state, country or other jurisdiction where such distribution, publication, reproduction, availability or use would be contrary to law or regulation or whatwould subject HSL or its affiliates to any registration or licensing requirement within such jurisdiction.If this report is inadvertently send or has reached any individual in such country, especially, USA, the same may be ignored and brought to the attention of the sender. Thisdocument may not be reproduced, distributed or published for any purposes without prior written approval of HSL.Foreign currencies denominated securities, wherever mentioned, are subject to exchange rate fluctuations, which could have an adverse effect on their value or price, or theincome derived from them. In addition, investors in securities such as ADRs, the values of which are influenced by foreign currencies effectively assume currency risk.It should not be considered to be taken as an offer to sell or a solicitation to buy any security. HSL may from time to time solicit from, or perform broking, or other servicesfor, any company mentioned in this mail and/or its attachments.HSL and its affiliated company(ies), their directors and employees may; (a) from time to time, have a long or short position in, and buy or sell the securities of thecompany(ies) mentioned herein or (b) be engaged in any other transaction involving such securities and earn brokerage or other compensation or act as a market maker inthe financial instruments of the company(ies) discussed herein or act as an advisor or lender/borrower to such company(ies) or may have any other potential conflict ofinterests with respect to any recommendation and other related information and opinions.HSL, its directors, analysts or employees do not take any responsibility, financial or otherwise, of the losses or the damages sustained due to the investments made or anyaction taken on basis of this report, including but not restricted to, fluctuation in the prices of shares and bonds, changes in the currency rates, diminution in the NAVs,reduction in the dividend or income, etc.HSL and other group companies, its directors, associates, employees may have various positions in any of the stocks, securities and financial instruments dealt in the report,or may make sell or purchase or other deals in these securities from time to time or may deal in other securities of the companies / organizations described in this report.
HSL or its associates might have managed or co-managed public offering of securities for the subject company or might have been mandated by the subject company for anyother assignment in the past twelve months.HSL or its associates might have received any compensation from the companies mentioned in the report during the period preceding twelve months from t date of thisreport for services in respect of managing or co-managing public offerings, corporate finance, investment banking or merchant banking, brokerage services or other advisoryservice in a merger or specific transaction in the normal course of business.HSL or its analysts did not receive any compensation or other benefits from the companies mentioned in the report or third party in connection with preparation of theresearch report. Accordingly, neither HSL nor Research Analysts have any material conflict of interest at the time of publication of this report. Compensation of our ResearchAnalysts is not based on any specific merchant banking, investment banking or brokerage service transactions. HSL may have issued other reports that are inconsistent withand reach different conclusion from the information presented in this report.Research entity has not been engaged in market making activity for the subject company. Research analyst has not served as an officer, director or employee of the subjectcompany. We have not received any compensation/benefits from the subject company or third party in connection with the Research Report.
HDFC securities Limited, SEBI Registration No.: INZ000186937 (NSE, BSE, MSEI, MCX) |NSE Trading Member Code: 11094 | BSE Clearing Number: 393 | MSEI TradingMember Code: 30000 | MCX Member Code: 56015 | AMFI Reg No. ARN -13549, PFRDA Reg. No - POP 04102015, IRDA Corporate Agent Licence No.-HDF2806925/HDFC000222657 , Research Analyst Reg. No. INH000002475, CIN-U67120MH2000PLC152193. Registered Address: I Think Techno Campus, Building, B, Alpha, Office Floor 8,Near Kanjurmarg Station, Kanjurmarg (East), Mumbai -400 042. Tel -022 30753400. Compliance Officer: Ms. Binkle R Oza. Ph: 022-3045 3600 Email:[email protected].
Mutual Funds Investments are subject to market risk. Please read the offer and scheme related documents carefully before investing.


