Embed Size (px)
Citation preview
ORI GIN AL PA PER
Damage to residential buildings due to floodingof New Orleans after hurricane Katrina
Aimilia K. Pistrika • Sebastiaan N. Jonkman
Received: 3 February 2009 / Accepted: 12 October 2009 / Published online: 6 November 2009� Springer Science+Business Media B.V. 2009
Abstract This article analyzes the direct damage to residential buildings caused by the
flooding of New Orleans after hurricane Katrina in the year 2005. A public dataset has been
analyzed that contains information on the economic damage levels for approximately
95,000 residential buildings in the flooded area. The relationship between the flood
characteristics and economic damage to residential buildings has been investigated. Results
of hydrodynamic flood simulations have been used that give insight in water depths and
flow velocities in the study area. In general, differences between the three polders in the
observed distributions of damage estimates are related to differences in flood conditions.
The highest damage percentages and structural damage mainly occurred in areas where
higher flow velocities occurred, especially near the breaches in the Lower 9th Ward
neighborhood. Further statistical analysis indicated that there is not any strong one-to-one
relationship between the damage percentage and the water depth or the depth–velocity
product. This suggests that there is considerable uncertainty associated with stage-damage
functions, especially when they are applied to individual structures or smaller clusters of
buildings. Based on the data, a more general approach has been proposed that could be
used to distinguish different damage zones based on water depth and flow velocity for an
area that is affected by flooding due to breaching of flood defenses. Further validation of
existing damage models with the dataset and further inclusion of information on building
type in the analysis of damage levels is recommended.
Keywords Flooding � Damage � Residential buildings � Damage function �Depth–velocity product � Hurricane Katrina � New Orleans
A. K. Pistrika (&)Centre for the Assessment of Natural Hazards and Proactive Planning,National Technical University of Athens, Athens, Greecee-mail: [email protected]
S. N. JonkmanDelft University and Royal Haskoning, Delft, The Netherlandse-mail: [email protected]
123
Nat Hazards (2010) 54:413–434DOI 10.1007/s11069-009-9476-y
1 Introduction
1.1 Background and objective
The catastrophic flooding in the United States after hurricane Katrina in late August 2005
caused enormous economic damage and human suffering in the states of Louisiana and
Mississippi. It is estimated that hurricane Katrina left more than 204,000 homes in Lou-
isiana uninhabitable, damaged, or destroyed (FEMA 2006). Especially, the city of New
Orleans was severely affected. An estimate of direct property and infrastructure damage
due to flooding was published in the ‘‘consequences’’ report of the Interagency Perfor-
mance Evaluation Team (IPET 2007a). The report conveyed that flood damage to resi-
dential property in New Orleans is estimated at US$16 billion and damage to public
structures, infrastructure, and utilities (like roads, railroads, water defenses, electricity
network, drainage etc.) at US$7 billion.
Several publications discuss other types of consequences due to hurricane Katrina, such
as the loss of life (Jonkman et al. 2009), the physical and mental health impacts (Bourque
et al. 2006; Sullivent et al. 2006), and the pollution from industrial and household
chemicals that mixed with floodwaters (Pardue et al. 2006). Several sources gave insights
in the economic damage relatively shortly after the hurricane. The Department of
Homeland Security (DHS) (2006) compiled detailed tables to assess the full extent of
housing damage due to Hurricanes Katrina, Rita, and Wilma. Brinkmann and Ragas (2006)
investigated the economic viability of the repair or replacement of the many damaged
residential properties in New Orleans. Hallegatte (2008) presented a study of the indirect
damages that occurred outside the flooded area in the Louisiana economy. These publi-
cations were mainly based on data that were available in the year after the disaster and the
application of existing models for damage prediction.
This article focuses on the direct damage to residential buildings caused by the flooding
of New Orleans after hurricane Katrina. The objective of this article is to improve the
insight in the relationship between the flood characteristics and the direct damage to
residential buildings. This is done based on a dataset that was collected in the aftermath of
the flooding. The dataset contains information on the damage for approximately 95,000
residential buildings and this data were mainly collected by means of surveys and
inspections in the field. The size of the damage dataset is exceptionally large, and the
analysis will contribute to a stronger empirical basis of flood damage analyses. The flood
conditions that developed due to hurricane Katrina are a combination of multiple sources
of flooding (e.g. rainfall, storm surge, levee breach etc.) and resulted in particularly severe
loadings on structures. Besides flood depth, the effects other flood characteristics are
examined, in particular the effects of flow velocity.
The outline of this article is as follows. The remainder of this section describes existing
concepts for damage estimation. Section 2 gives the background history of the flooding of
New Orleans due to hurricane Katrina and presents a summary of the results of hydro-
dynamic simulations of the flooding conditions. Section 3 describes the damage dataset
and its derivation. The relationship between flood depth and economic damage is examined
for the flood affected area of New Orleans in Sect. 4. Section 5 analyzes the relationship
between the combination of flood depth and flow velocity and the economic damage for the
severely damaged neighborhood Lower 9th Ward. A discussion of the findings and their
implications is included in Sect. 6. Final conclusions and recommendations are described
in Sect. 7.
414 Nat Hazards (2010) 54:413–434
123
1.2 General approach for damage estimation
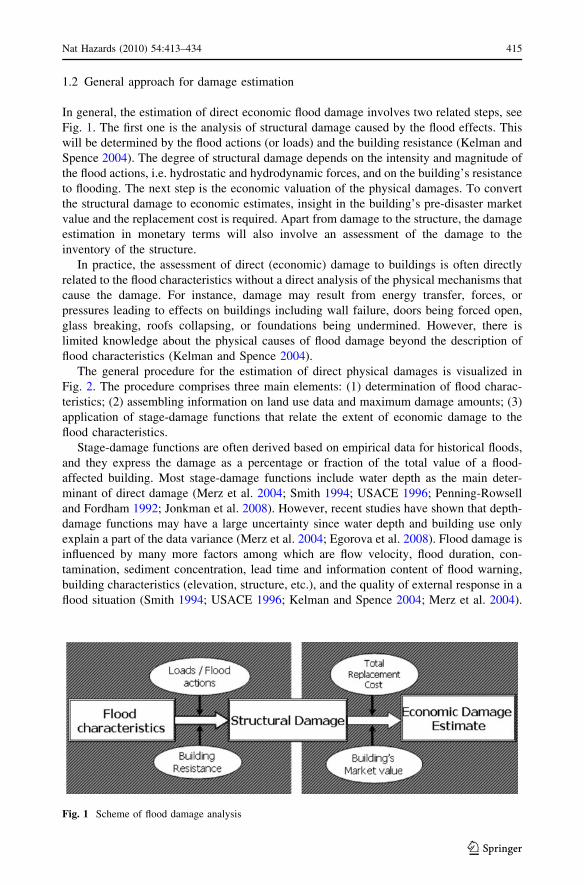
In general, the estimation of direct economic flood damage involves two related steps, see
Fig. 1. The first one is the analysis of structural damage caused by the flood effects. This
will be determined by the flood actions (or loads) and the building resistance (Kelman and
Spence 2004). The degree of structural damage depends on the intensity and magnitude of
the flood actions, i.e. hydrostatic and hydrodynamic forces, and on the building’s resistance
to flooding. The next step is the economic valuation of the physical damages. To convert
the structural damage to economic estimates, insight in the building’s pre-disaster market
value and the replacement cost is required. Apart from damage to the structure, the damage
estimation in monetary terms will also involve an assessment of the damage to the
inventory of the structure.
In practice, the assessment of direct (economic) damage to buildings is often directly
related to the flood characteristics without a direct analysis of the physical mechanisms that
cause the damage. For instance, damage may result from energy transfer, forces, or
pressures leading to effects on buildings including wall failure, doors being forced open,
glass breaking, roofs collapsing, or foundations being undermined. However, there is
limited knowledge about the physical causes of flood damage beyond the description of
flood characteristics (Kelman and Spence 2004).
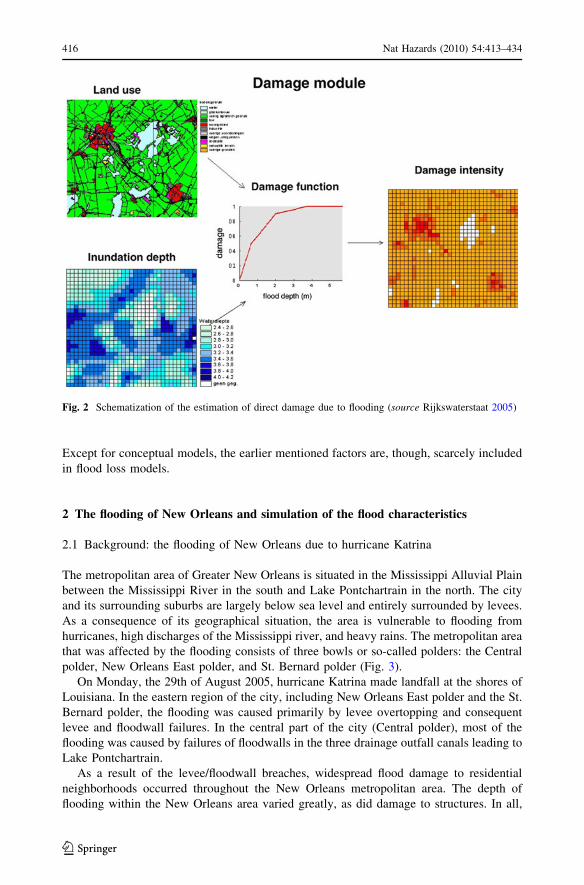
The general procedure for the estimation of direct physical damages is visualized in
Fig. 2. The procedure comprises three main elements: (1) determination of flood charac-
teristics; (2) assembling information on land use data and maximum damage amounts; (3)
application of stage-damage functions that relate the extent of economic damage to the
flood characteristics.
Stage-damage functions are often derived based on empirical data for historical floods,
and they express the damage as a percentage or fraction of the total value of a flood-
affected building. Most stage-damage functions include water depth as the main deter-
minant of direct damage (Merz et al. 2004; Smith 1994; USACE 1996; Penning-Rowsell
and Fordham 1992; Jonkman et al. 2008). However, recent studies have shown that depth-
damage functions may have a large uncertainty since water depth and building use only
explain a part of the data variance (Merz et al. 2004; Egorova et al. 2008). Flood damage is
influenced by many more factors among which are flow velocity, flood duration, con-
tamination, sediment concentration, lead time and information content of flood warning,
building characteristics (elevation, structure, etc.), and the quality of external response in a
flood situation (Smith 1994; USACE 1996; Kelman and Spence 2004; Merz et al. 2004).
Fig. 1 Scheme of flood damage analysis
Nat Hazards (2010) 54:413–434 415
123
Except for conceptual models, the earlier mentioned factors are, though, scarcely included
in flood loss models.
2 The flooding of New Orleans and simulation of the flood characteristics
2.1 Background: the flooding of New Orleans due to hurricane Katrina
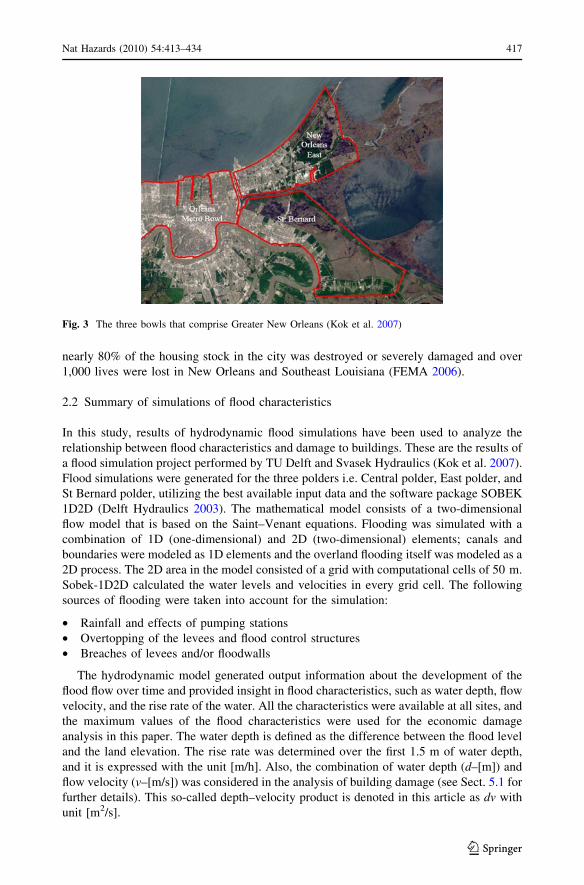
The metropolitan area of Greater New Orleans is situated in the Mississippi Alluvial Plain
between the Mississippi River in the south and Lake Pontchartrain in the north. The city
and its surrounding suburbs are largely below sea level and entirely surrounded by levees.
As a consequence of its geographical situation, the area is vulnerable to flooding from
hurricanes, high discharges of the Mississippi river, and heavy rains. The metropolitan area
that was affected by the flooding consists of three bowls or so-called polders: the Central
polder, New Orleans East polder, and St. Bernard polder (Fig. 3).
On Monday, the 29th of August 2005, hurricane Katrina made landfall at the shores of
Louisiana. In the eastern region of the city, including New Orleans East polder and the St.
Bernard polder, the flooding was caused primarily by levee overtopping and consequent
levee and floodwall failures. In the central part of the city (Central polder), most of the
flooding was caused by failures of floodwalls in the three drainage outfall canals leading to
Lake Pontchartrain.
As a result of the levee/floodwall breaches, widespread flood damage to residential
neighborhoods occurred throughout the New Orleans metropolitan area. The depth of
flooding within the New Orleans area varied greatly, as did damage to structures. In all,
Fig. 2 Schematization of the estimation of direct damage due to flooding (source Rijkswaterstaat 2005)
416 Nat Hazards (2010) 54:413–434
123
nearly 80% of the housing stock in the city was destroyed or severely damaged and over
1,000 lives were lost in New Orleans and Southeast Louisiana (FEMA 2006).
2.2 Summary of simulations of flood characteristics
In this study, results of hydrodynamic flood simulations have been used to analyze the
relationship between flood characteristics and damage to buildings. These are the results of
a flood simulation project performed by TU Delft and Svasek Hydraulics (Kok et al. 2007).
Flood simulations were generated for the three polders i.e. Central polder, East polder, and
St Bernard polder, utilizing the best available input data and the software package SOBEK
1D2D (Delft Hydraulics 2003). The mathematical model consists of a two-dimensional
flow model that is based on the Saint–Venant equations. Flooding was simulated with a
combination of 1D (one-dimensional) and 2D (two-dimensional) elements; canals and
boundaries were modeled as 1D elements and the overland flooding itself was modeled as a
2D process. The 2D area in the model consisted of a grid with computational cells of 50 m.
Sobek-1D2D calculated the water levels and velocities in every grid cell. The following
sources of flooding were taken into account for the simulation:
• Rainfall and effects of pumping stations
• Overtopping of the levees and flood control structures
• Breaches of levees and/or floodwalls
The hydrodynamic model generated output information about the development of the
flood flow over time and provided insight in flood characteristics, such as water depth, flow
velocity, and the rise rate of the water. All the characteristics were available at all sites, and
the maximum values of the flood characteristics were used for the economic damage
analysis in this paper. The water depth is defined as the difference between the flood level
and the land elevation. The rise rate was determined over the first 1.5 m of water depth,
and it is expressed with the unit [m/h]. Also, the combination of water depth (d–[m]) and
flow velocity (v–[m/s]) was considered in the analysis of building damage (see Sect. 5.1 for
further details). This so-called depth–velocity product is denoted in this article as dv with
unit [m2/s].
Fig. 3 The three bowls that comprise Greater New Orleans (Kok et al. 2007)
Nat Hazards (2010) 54:413–434 417
123
The results of flood simulations were compared with data/observations presented in
the report of the Interagency Performance Evaluation Task Force (IPET (Interagency
Performance Evaluation Task Force) 2007b) in the format of eye witness accounts,
stopped clock times, and time/date stamped digital photographs. The computed flood
hydrographs were similar to the data presented by IPET, and for the purpose of this
study, the model results were considered applicable. Kok et al. (2007) discuss further
details regarding the simulation process, the assumptions and the validation of the
simulations.
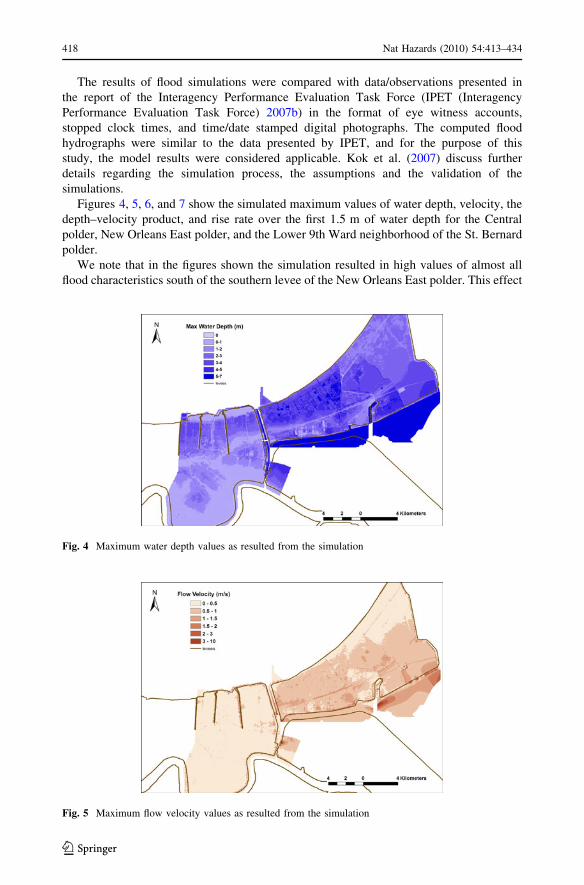
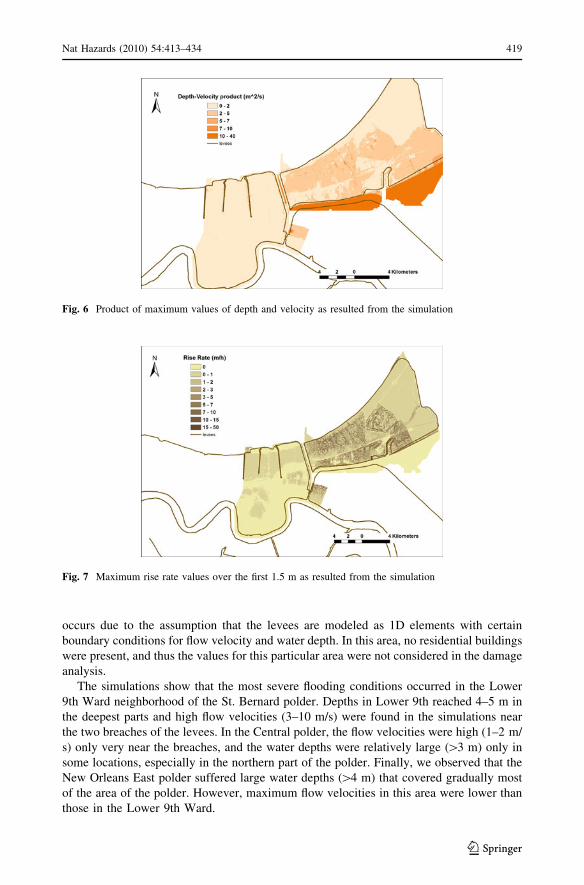
Figures 4, 5, 6, and 7 show the simulated maximum values of water depth, velocity, the
depth–velocity product, and rise rate over the first 1.5 m of water depth for the Central
polder, New Orleans East polder, and the Lower 9th Ward neighborhood of the St. Bernard
polder.
We note that in the figures shown the simulation resulted in high values of almost all
flood characteristics south of the southern levee of the New Orleans East polder. This effect
Fig. 4 Maximum water depth values as resulted from the simulation
Fig. 5 Maximum flow velocity values as resulted from the simulation
418 Nat Hazards (2010) 54:413–434
123
occurs due to the assumption that the levees are modeled as 1D elements with certain
boundary conditions for flow velocity and water depth. In this area, no residential buildings
were present, and thus the values for this particular area were not considered in the damage
analysis.
The simulations show that the most severe flooding conditions occurred in the Lower
9th Ward neighborhood of the St. Bernard polder. Depths in Lower 9th reached 4–5 m in
the deepest parts and high flow velocities (3–10 m/s) were found in the simulations near
the two breaches of the levees. In the Central polder, the flow velocities were high (1–2 m/
s) only very near the breaches, and the water depths were relatively large ([3 m) only in
some locations, especially in the northern part of the polder. Finally, we observed that the
New Orleans East polder suffered large water depths ([4 m) that covered gradually most
of the area of the polder. However, maximum flow velocities in this area were lower than
those in the Lower 9th Ward.
Fig. 6 Product of maximum values of depth and velocity as resulted from the simulation
Fig. 7 Maximum rise rate values over the first 1.5 m as resulted from the simulation
Nat Hazards (2010) 54:413–434 419
123
3 The damage dataset
3.1 Introduction
A dataset with information on damage to residential buildings was created by the city of
New Orleans in order to better serve the public and enhance the recovery process from the
damage that the hurricane Katrina caused. This information was made available at the
CNOGIS, the city of New Orleans GIS Data sharing portal (http://gisweb.cityofno.com/
cnogis/dataportal.aspx, accessed in March 2008). The data from this source was compiled
into an independent GIS dataset by using ArcView 9.1 and ArcView 9.2 geocoder with
StreetMaps USA. The damage dataset contains information for approximately 95,000
residential buildings in Orleans parish. Information for other areas and parishes in Loui-
siana that were affected by Katrina was not included.
Since the focus of the damage analysis was on single-family residential buildings, the
damage dataset includes the following information for every property: location (street
address, census block id, neighborhood, zip code, planning district, xy coordinates) and the
estimated damage percentage. In the original dataset, there is no available information on
the building or structure type for individual properties.
3.2 Overview of the dataset
In order to identify what the housing damage estimates represent and how the damage
estimates were determined, the authors reviewed available published documentation made
available by the city of New Orleans, as well as official reports from FEMA, the U.S.
Department of Homeland and Security and the city’s Department of Safety and Permits
(FEMA 2006; IPET 2007a; Skinner 2006). According to the available sources, the percent
damage estimates are defined as the percentage of pre-Katrina building’s market value that
is damaged, i.e. the ratio of the cost to repair/improve a building to the market value of the
building before the disaster:
Percentage damage value ¼ Cost of repairs
Market value of buildingð1Þ
In the remainder of this article, the percent damage value is at some locations also
indicated as damage fraction, with values between 0 and 1 (i.e. between 0 and 100%). The
damage dataset covers Orleans parish and thereby most of the residential properties within
Central polder and East polder. For the St. Bernard polder, it covers the neighborhood
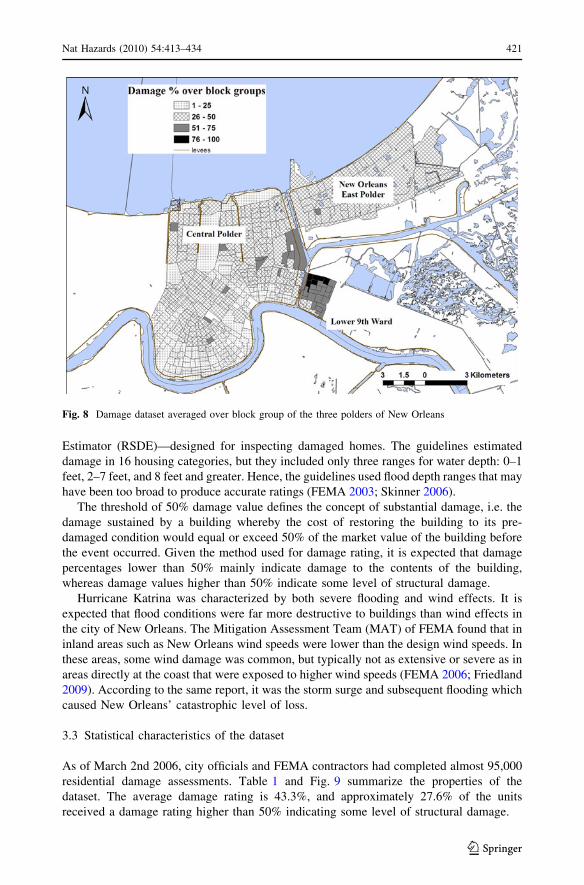
Lower 9th Ward. Figure 8 gives an overview of the three polders and the average housing
damage value by block group. Block groups are spatial units used as standard aggregation
levels for the 2000 US Census (GARM 1994). On average, block groups cover 0.07 km2
and include 400 houses.
The estimates of damage percentage in the dataset are largely based on direct inspec-
tions and surveys of individual residential properties by FEMA contract inspectors to
determine eligibility for FEMA housing assistance. For some of the properties impacted by
hurricane Katrina, the contract inspectors did not have access to the interiors of the homes,
so they conducted damage assessments based on the water lines on the homes’ exterior
(Skinner 2006). Moreover, remote sensing techniques were used, where site inspections did
not take place (Friedland 2009).
To overcome the problem of not having access to the homes, the USACE developed
standardized guidesheets from a FEMA software program—Residential Substantial Damage
420 Nat Hazards (2010) 54:413–434
123
Estimator (RSDE)—designed for inspecting damaged homes. The guidelines estimated
damage in 16 housing categories, but they included only three ranges for water depth: 0–1
feet, 2–7 feet, and 8 feet and greater. Hence, the guidelines used flood depth ranges that may
have been too broad to produce accurate ratings (FEMA 2003; Skinner 2006).
The threshold of 50% damage value defines the concept of substantial damage, i.e. the
damage sustained by a building whereby the cost of restoring the building to its pre-
damaged condition would equal or exceed 50% of the market value of the building before
the event occurred. Given the method used for damage rating, it is expected that damage
percentages lower than 50% mainly indicate damage to the contents of the building,
whereas damage values higher than 50% indicate some level of structural damage.
Hurricane Katrina was characterized by both severe flooding and wind effects. It is
expected that flood conditions were far more destructive to buildings than wind effects in
the city of New Orleans. The Mitigation Assessment Team (MAT) of FEMA found that in
inland areas such as New Orleans wind speeds were lower than the design wind speeds. In
these areas, some wind damage was common, but typically not as extensive or severe as in
areas directly at the coast that were exposed to higher wind speeds (FEMA 2006; Friedland
2009). According to the same report, it was the storm surge and subsequent flooding which
caused New Orleans’ catastrophic level of loss.
3.3 Statistical characteristics of the dataset
As of March 2nd 2006, city officials and FEMA contractors had completed almost 95,000
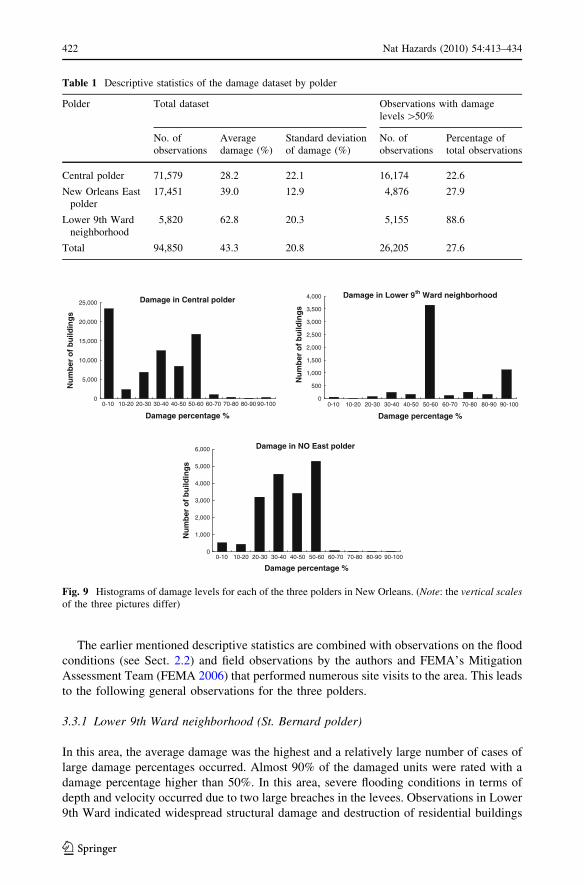
residential damage assessments. Table 1 and Fig. 9 summarize the properties of the
dataset. The average damage rating is 43.3%, and approximately 27.6% of the units
received a damage rating higher than 50% indicating some level of structural damage.
Fig. 8 Damage dataset averaged over block group of the three polders of New Orleans
Nat Hazards (2010) 54:413–434 421
123
The earlier mentioned descriptive statistics are combined with observations on the flood
conditions (see Sect. 2.2) and field observations by the authors and FEMA’s Mitigation
Assessment Team (FEMA 2006) that performed numerous site visits to the area. This leads
to the following general observations for the three polders.
3.3.1 Lower 9th Ward neighborhood (St. Bernard polder)
In this area, the average damage was the highest and a relatively large number of cases of
large damage percentages occurred. Almost 90% of the damaged units were rated with a
damage percentage higher than 50%. In this area, severe flooding conditions in terms of
depth and velocity occurred due to two large breaches in the levees. Observations in Lower
9th Ward indicated widespread structural damage and destruction of residential buildings
Table 1 Descriptive statistics of the damage dataset by polder
Polder Total dataset Observations with damagelevels [50%
No. ofobservations
Averagedamage (%)
Standard deviationof damage (%)
No. ofobservations
Percentage oftotal observations
Central polder 71,579 28.2 22.1 16,174 22.6
New Orleans Eastpolder
17,451 39.0 12.9 4,876 27.9
Lower 9th Wardneighborhood
5,820 62.8 20.3 5,155 88.6
Total 94,850 43.3 20.8 26,205 27.6
Damage in Central polder
0
5,000
10,000
15,000
20,000
25,000
0-10 10-20 20-30 30-40 40-50 50-60 60-70 70-80 80-90 90-100
Damage percentage %
Nu
mb
er o
f b
uild
ing
s
Damage in Lower 9th Ward neighborhood
0
500
1,000
1,500
2,000
2,500
3,000
3,500
4,000
0-10 10-20 20-30 30-40 40-50 50-60 60-70 70-80 80-90 90-100
Damage percentage %
Nu
mb
er o
f b
uild
ing
s
Damage in NO East polder
0
1,000
2,000
3,000
4,000
5,000
6,000
0-10 10-20 20-30 30-40 40-50 50-60 60-70 70-80 80-90 90-100
Damage percentage %
Nu
mb
er o
f b
uild
ing
s
Fig. 9 Histograms of damage levels for each of the three polders in New Orleans. (Note: the vertical scalesof the three pictures differ)
422 Nat Hazards (2010) 54:413–434
123
from high-velocity floodwaters, winds waves, and high floodwaters that knocked buildings
off their foundations, collapsed load-bearing walls, and caused other structural failures
(FEMA 2006). Very high (95–100%) damage estimates mainly covered areas near the
levee breaches (see also Sect. 5).
3.3.2 Central polder
In the Central polder, the highest values of flood depth were observed in the northern
part of the polder, and the highest values of flow velocity were calculated only to the
areas immediately behind of the breaches in the levees. The damage levels here varied
largely, and the majority of damage values were lower than 50%. A relatively large
number of houses with a low damage percentage (\10%) was found in this area. The
relatively high standard deviation in the Central polder is expected to be related to the
wide range of flooding conditions (see Figs. 4, 5) and the variation in the building
types.
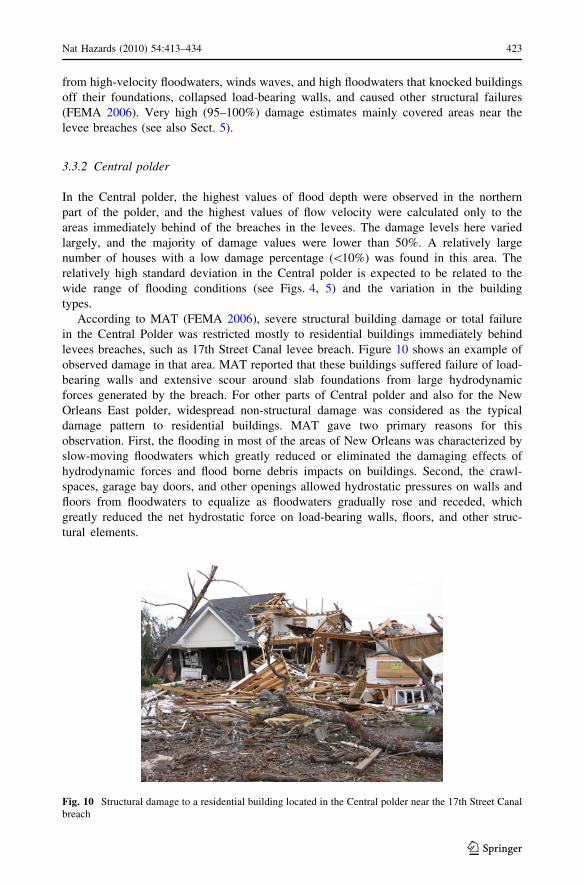
According to MAT (FEMA 2006), severe structural building damage or total failure
in the Central Polder was restricted mostly to residential buildings immediately behind
levees breaches, such as 17th Street Canal levee breach. Figure 10 shows an example of
observed damage in that area. MAT reported that these buildings suffered failure of load-
bearing walls and extensive scour around slab foundations from large hydrodynamic
forces generated by the breach. For other parts of Central polder and also for the New
Orleans East polder, widespread non-structural damage was considered as the typical
damage pattern to residential buildings. MAT gave two primary reasons for this
observation. First, the flooding in most of the areas of New Orleans was characterized by
slow-moving floodwaters which greatly reduced or eliminated the damaging effects of
hydrodynamic forces and flood borne debris impacts on buildings. Second, the crawl-
spaces, garage bay doors, and other openings allowed hydrostatic pressures on walls and
floors from floodwaters to equalize as floodwaters gradually rose and receded, which
greatly reduced the net hydrostatic force on load-bearing walls, floors, and other struc-
tural elements.
Fig. 10 Structural damage to a residential building located in the Central polder near the 17th Street Canalbreach
Nat Hazards (2010) 54:413–434 423
123
3.3.3 New Orleans East polder
In the New Orleans East polder, there are also a relatively low number of cases of very
large damage, whereas the flooding conditions involved high values of depth and rise rate.
Similar to the Central polder, the dominant observed damage pattern here (FEMA 2006)
was the widespread non-structural damage due to long duration flooding.
4 Analysis of the relationship between flood depth and economic damage
The relationship between the damage percentages and the different types of flood
characteristics (depth, velocity, rise rate) has been analyzed by using the damage dataset
and the output of the flood simulations. No clear relationship was found between the
variable of rise rate and damage levels. For example, the same range of rise rate values
was found for Central and St. Bernard polders (see also Fig. 7), but damage distributions
were different for these areas. In this section, the results of an analysis based on water
depth are presented. The effects of velocity in combination with depth are investigated in
Sect. 5.
In the analysis, the flood depth has been spatially averaged over two types of stan-
dardized spatial aggregation levels: census blocks and block groups. According to 2000 US
Census Bureau guidelines (GARM 1994), an ideal size for a block group is of 400 housing
units, with a minimum of 250, and a maximum of 550 housing units. The guidelines further
require that a block includes on average 15 housing units e.g. residential buildings. The
minimum size of a block is 0.0028 km2.
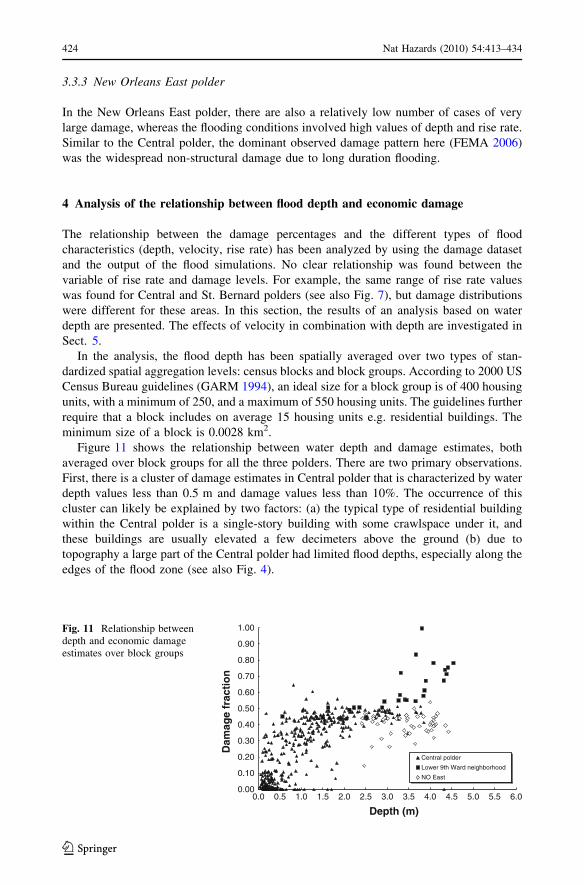
Figure 11 shows the relationship between water depth and damage estimates, both
averaged over block groups for all the three polders. There are two primary observations.
First, there is a cluster of damage estimates in Central polder that is characterized by water
depth values less than 0.5 m and damage values less than 10%. The occurrence of this
cluster can likely be explained by two factors: (a) the typical type of residential building
within the Central polder is a single-story building with some crawlspace under it, and
these buildings are usually elevated a few decimeters above the ground (b) due to
topography a large part of the Central polder had limited flood depths, especially along the
edges of the flood zone (see also Fig. 4).
0.00
0.10
0.20
0.30
0.40
0.50
0.60
0.70
0.80
0.90
1.00
0.0 0.5 1.0 1.5 2.0 2.5 3.0 3.5 4.0 4.5 5.0 5.5 6.0
Depth (m)
Dam
age
frac
tio
n
Central polder
Lower 9th Ward neighborhood
NO East
Fig. 11 Relationship betweendepth and economic damageestimates over block groups
424 Nat Hazards (2010) 54:413–434
123
A second observation for the scatter plots of Fig. 11 is that a large part of the damage
estimates was rated equal or below the 51% threshold value of substantial damage with the
exception of the damage estimates in Lower 9th Ward area. Most of the damage estimates
for the Lower 9th Ward are rated over 50% value, although the flood depth was similar to
the depth in New Orleans East. This observation leads to the expectation that flood depth
alone can not cause substantial damage unless high values of velocity are also involved.
Several statistical distributions have been examined to provide a best fit function for the
dataset, but, even for the best fitting functions (exponential and power fits), the squared
correlation coefficient (R2) remained below a value of 0.5.
5 Analysis of the relationship between the depth–velocity product and economicdamage
5.1 Background
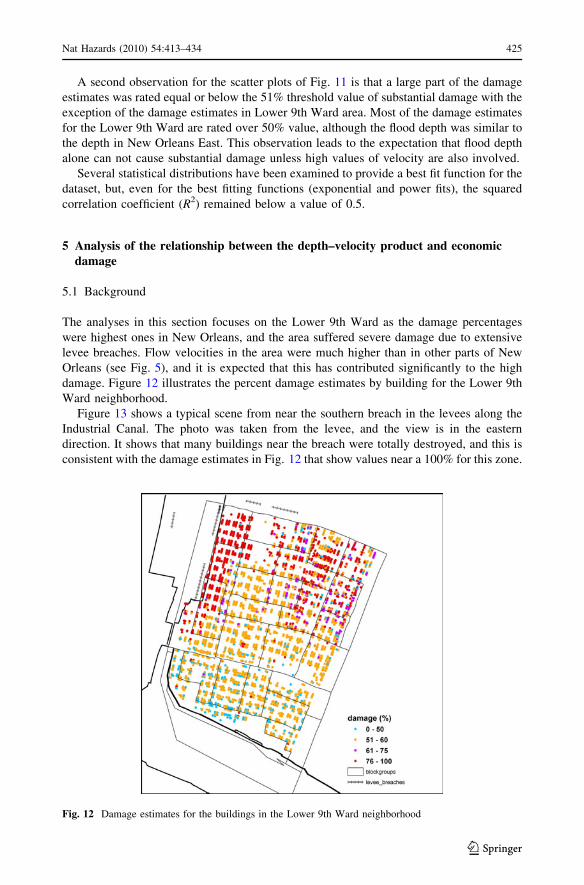
The analyses in this section focuses on the Lower 9th Ward as the damage percentages
were highest ones in New Orleans, and the area suffered severe damage due to extensive
levee breaches. Flow velocities in the area were much higher than in other parts of New
Orleans (see Fig. 5), and it is expected that this has contributed significantly to the high
damage. Figure 12 illustrates the percent damage estimates by building for the Lower 9th
Ward neighborhood.
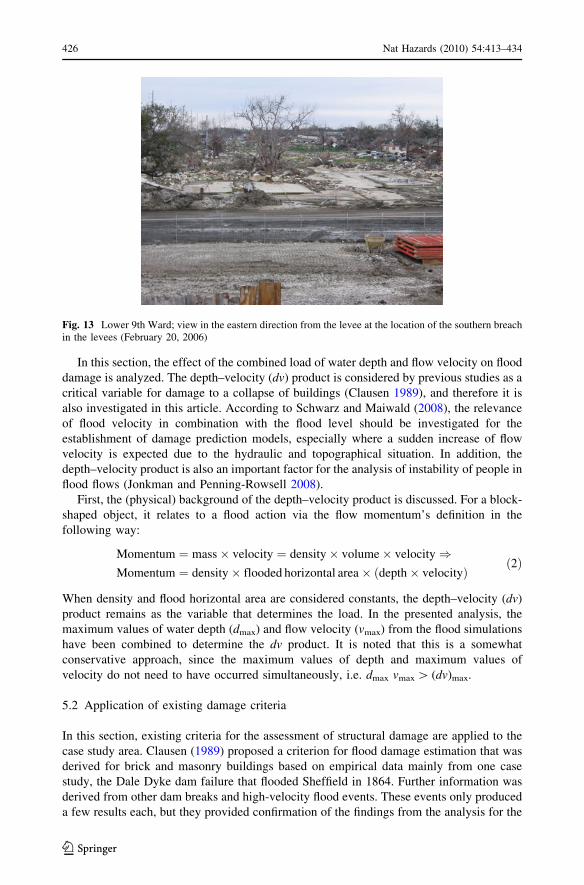
Figure 13 shows a typical scene from near the southern breach in the levees along the
Industrial Canal. The photo was taken from the levee, and the view is in the eastern
direction. It shows that many buildings near the breach were totally destroyed, and this is
consistent with the damage estimates in Fig. 12 that show values near a 100% for this zone.
Fig. 12 Damage estimates for the buildings in the Lower 9th Ward neighborhood
Nat Hazards (2010) 54:413–434 425
123
In this section, the effect of the combined load of water depth and flow velocity on flood
damage is analyzed. The depth–velocity (dv) product is considered by previous studies as a
critical variable for damage to a collapse of buildings (Clausen 1989), and therefore it is
also investigated in this article. According to Schwarz and Maiwald (2008), the relevance
of flood velocity in combination with the flood level should be investigated for the
establishment of damage prediction models, especially where a sudden increase of flow
velocity is expected due to the hydraulic and topographical situation. In addition, the
depth–velocity product is also an important factor for the analysis of instability of people in
flood flows (Jonkman and Penning-Rowsell 2008).
First, the (physical) background of the depth–velocity product is discussed. For a block-
shaped object, it relates to a flood action via the flow momentum’s definition in the
following way:
Momentum ¼ mass� velocity ¼ density� volume� velocity)Momentum ¼ density� flooded horizontal area� ðdepth� velocityÞ
ð2Þ
When density and flood horizontal area are considered constants, the depth–velocity (dv)
product remains as the variable that determines the load. In the presented analysis, the
maximum values of water depth (dmax) and flow velocity (vmax) from the flood simulations
have been combined to determine the dv product. It is noted that this is a somewhat
conservative approach, since the maximum values of depth and maximum values of
velocity do not need to have occurred simultaneously, i.e. dmax vmax [ (dv)max.
5.2 Application of existing damage criteria
In this section, existing criteria for the assessment of structural damage are applied to the
case study area. Clausen (1989) proposed a criterion for flood damage estimation that was
derived for brick and masonry buildings based on empirical data mainly from one case
study, the Dale Dyke dam failure that flooded Sheffield in 1864. Further information was
derived from other dam breaks and high-velocity flood events. These events only produced
a few results each, but they provided confirmation of the findings from the analysis for the
Fig. 13 Lower 9th Ward; view in the eastern direction from the levee at the location of the southern breachin the levees (February 20, 2006)
426 Nat Hazards (2010) 54:413–434
123
Dale Dyke catastrophe (Clausen 1989). Three damage levels were distinguished: inun-
dation damage, partial damage, and total destruction. These categories were defined in
qualitative terms and described which level of structural damage they represented. Because
these damage levels are linked to flood characteristics (discussed later) they can be used to
distinguish different flood hazard zones with different structural damage patterns. The
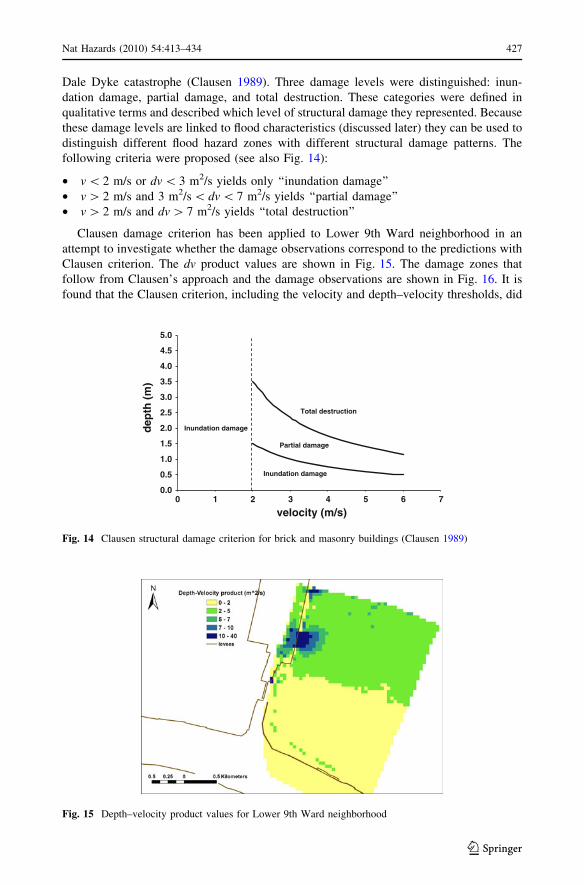
following criteria were proposed (see also Fig. 14):
• v \ 2 m/s or dv \ 3 m2/s yields only ‘‘inundation damage’’
• v [ 2 m/s and 3 m2/s \ dv \ 7 m2/s yields ‘‘partial damage’’
• v [ 2 m/s and dv [ 7 m2/s yields ‘‘total destruction’’
Clausen damage criterion has been applied to Lower 9th Ward neighborhood in an
attempt to investigate whether the damage observations correspond to the predictions with
Clausen criterion. The dv product values are shown in Fig. 15. The damage zones that
follow from Clausen’s approach and the damage observations are shown in Fig. 16. It is
found that the Clausen criterion, including the velocity and depth–velocity thresholds, did
0.0
0.5
1.0
1.5
2.0
2.5
3.0
3.5
4.0
4.5
5.0
0 1 2 3 4 5 6 7
velocity (m/s)
dep
th (
m)
Inundation damage
Partial damage
Total destruction
Inundation damage
Fig. 14 Clausen structural damage criterion for brick and masonry buildings (Clausen 1989)
Fig. 15 Depth–velocity product values for Lower 9th Ward neighborhood
Nat Hazards (2010) 54:413–434 427
123
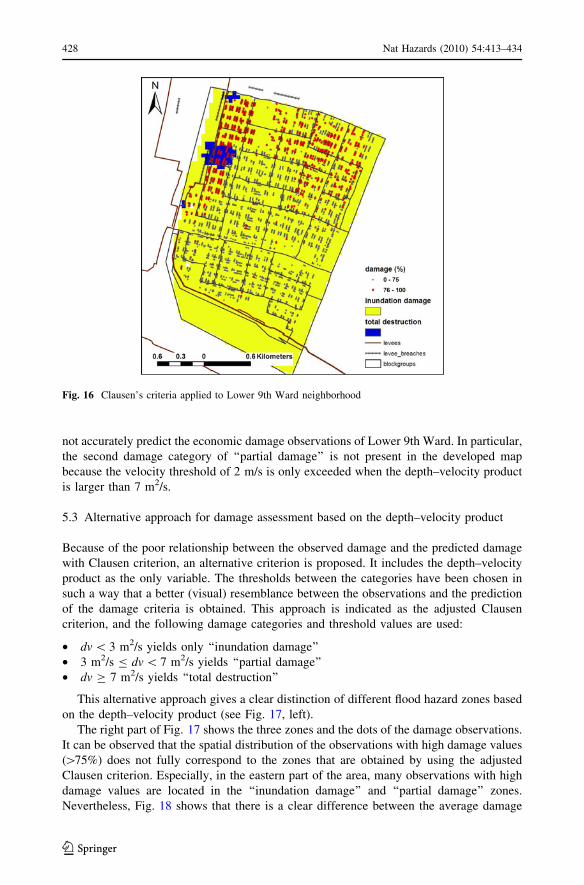
not accurately predict the economic damage observations of Lower 9th Ward. In particular,
the second damage category of ‘‘partial damage’’ is not present in the developed map
because the velocity threshold of 2 m/s is only exceeded when the depth–velocity product
is larger than 7 m2/s.
5.3 Alternative approach for damage assessment based on the depth–velocity product
Because of the poor relationship between the observed damage and the predicted damage
with Clausen criterion, an alternative criterion is proposed. It includes the depth–velocity
product as the only variable. The thresholds between the categories have been chosen in
such a way that a better (visual) resemblance between the observations and the prediction
of the damage criteria is obtained. This approach is indicated as the adjusted Clausen
criterion, and the following damage categories and threshold values are used:
• dv \ 3 m2/s yields only ‘‘inundation damage’’
• 3 m2/s B dv \ 7 m2/s yields ‘‘partial damage’’
• dv C 7 m2/s yields ‘‘total destruction’’
This alternative approach gives a clear distinction of different flood hazard zones based
on the depth–velocity product (see Fig. 17, left).
The right part of Fig. 17 shows the three zones and the dots of the damage observations.
It can be observed that the spatial distribution of the observations with high damage values
([75%) does not fully correspond to the zones that are obtained by using the adjusted
Clausen criterion. Especially, in the eastern part of the area, many observations with high
damage values are located in the ‘‘inundation damage’’ and ‘‘partial damage’’ zones.
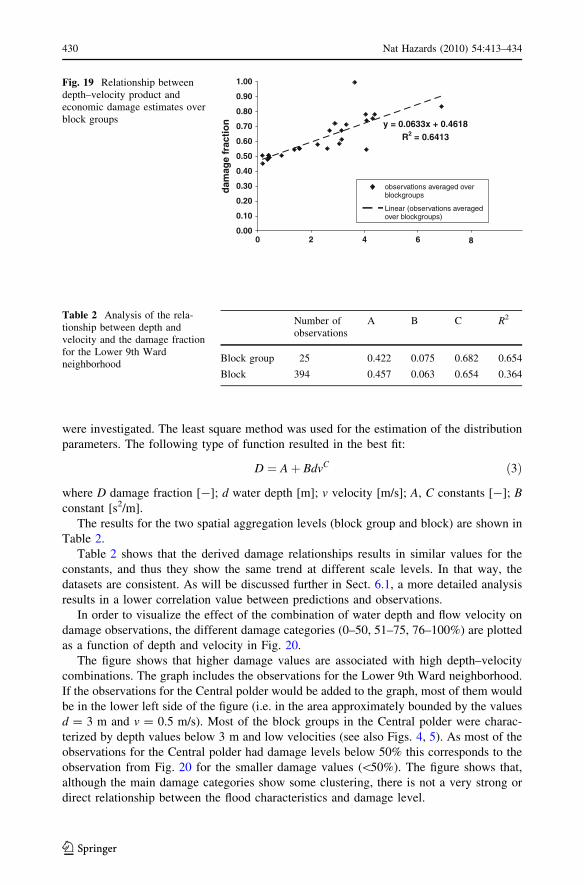
Nevertheless, Fig. 18 shows that there is a clear difference between the average damage
Fig. 16 Clausen’s criteria applied to Lower 9th Ward neighborhood
428 Nat Hazards (2010) 54:413–434
123
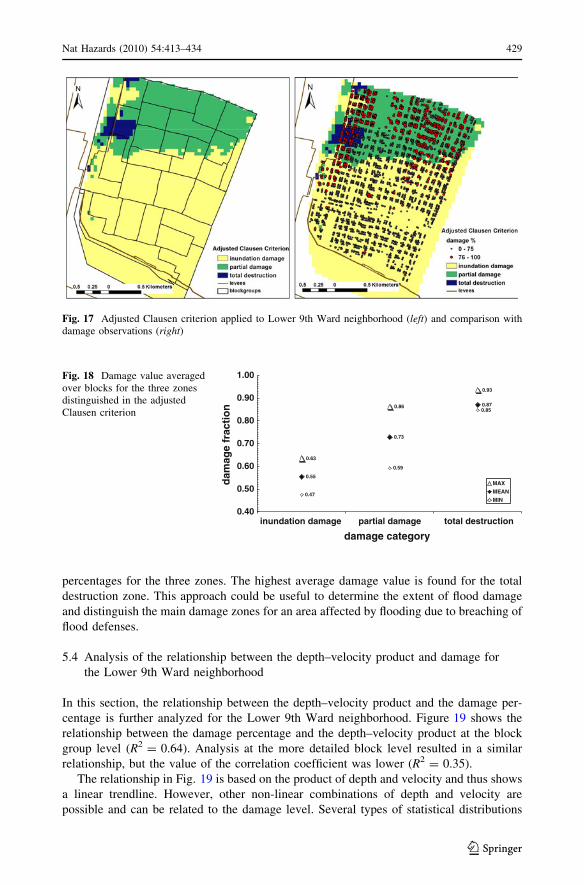
percentages for the three zones. The highest average damage value is found for the total
destruction zone. This approach could be useful to determine the extent of flood damage
and distinguish the main damage zones for an area affected by flooding due to breaching of
flood defenses.
5.4 Analysis of the relationship between the depth–velocity product and damage for
the Lower 9th Ward neighborhood
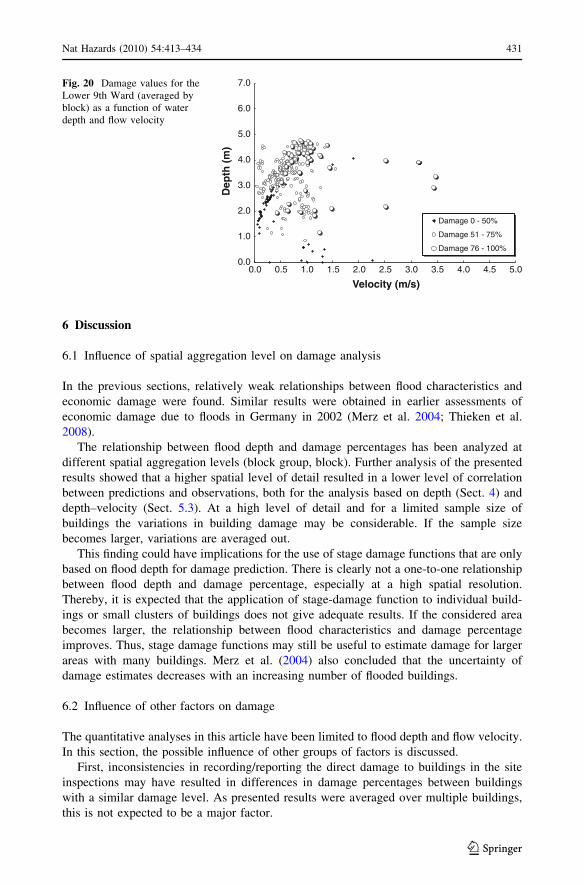
In this section, the relationship between the depth–velocity product and the damage per-
centage is further analyzed for the Lower 9th Ward neighborhood. Figure 19 shows the
relationship between the damage percentage and the depth–velocity product at the block
group level (R2 = 0.64). Analysis at the more detailed block level resulted in a similar
relationship, but the value of the correlation coefficient was lower (R2 = 0.35).
The relationship in Fig. 19 is based on the product of depth and velocity and thus shows
a linear trendline. However, other non-linear combinations of depth and velocity are
possible and can be related to the damage level. Several types of statistical distributions
Fig. 17 Adjusted Clausen criterion applied to Lower 9th Ward neighborhood (left) and comparison withdamage observations (right)
0.63
0.86
0.93
0.55
0.73
0.87
0.47
0.59
0.85
0.40
0.50
0.60
0.70
0.80
0.90
1.00
total destructionpartial damageinundation damage
damage category
dam
age
frac
tio
n
MAX
MEAN
MIN
Fig. 18 Damage value averagedover blocks for the three zonesdistinguished in the adjustedClausen criterion
Nat Hazards (2010) 54:413–434 429
123
were investigated. The least square method was used for the estimation of the distribution
parameters. The following type of function resulted in the best fit:
D ¼ Aþ BdvC ð3Þ
where D damage fraction [-]; d water depth [m]; v velocity [m/s]; A, C constants [-]; Bconstant [s2/m].
The results for the two spatial aggregation levels (block group and block) are shown in
Table 2.
Table 2 shows that the derived damage relationships results in similar values for the
constants, and thus they show the same trend at different scale levels. In that way, the
datasets are consistent. As will be discussed further in Sect. 6.1, a more detailed analysis
results in a lower correlation value between predictions and observations.
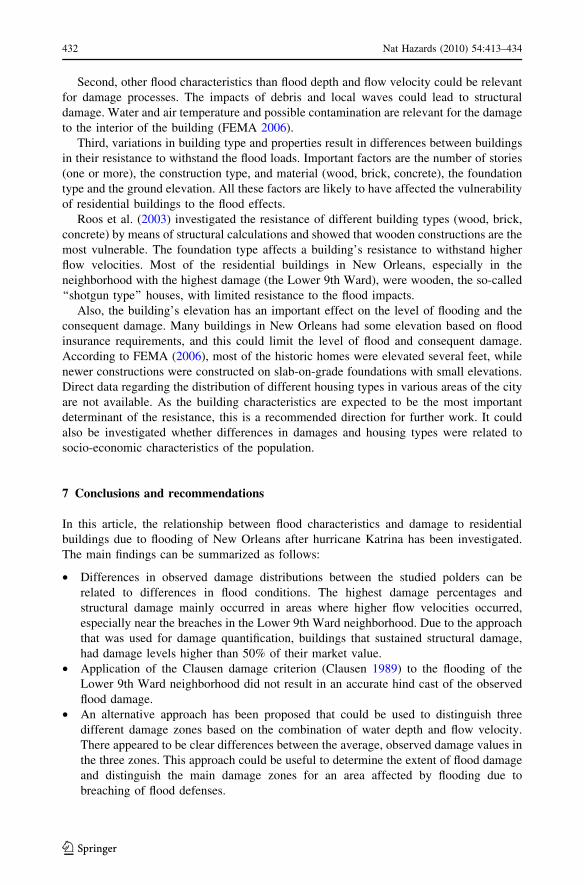
In order to visualize the effect of the combination of water depth and flow velocity on
damage observations, the different damage categories (0–50, 51–75, 76–100%) are plotted
as a function of depth and velocity in Fig. 20.
The figure shows that higher damage values are associated with high depth–velocity
combinations. The graph includes the observations for the Lower 9th Ward neighborhood.
If the observations for the Central polder would be added to the graph, most of them would
be in the lower left side of the figure (i.e. in the area approximately bounded by the values
d = 3 m and v = 0.5 m/s). Most of the block groups in the Central polder were charac-
terized by depth values below 3 m and low velocities (see also Figs. 4, 5). As most of the
observations for the Central polder had damage levels below 50% this corresponds to the
observation from Fig. 20 for the smaller damage values (\50%). The figure shows that,
although the main damage categories show some clustering, there is not a very strong or
direct relationship between the flood characteristics and damage level.
y = 0.0633x + 0.4618R2 = 0.6413
0.00
0.10
0.20
0.30
0.40
0.50
0.60
0.70
0.80
0.90
1.00
0 2 4 6 8
dam
age
frac
tio
n
observations averaged overblockgroups
Linear (observations averagedover blockgroups)
Fig. 19 Relationship betweendepth–velocity product andeconomic damage estimates overblock groups
Table 2 Analysis of the rela-tionship between depth andvelocity and the damage fractionfor the Lower 9th Wardneighborhood
Number ofobservations
A B C R2
Block group 25 0.422 0.075 0.682 0.654
Block 394 0.457 0.063 0.654 0.364
430 Nat Hazards (2010) 54:413–434
123
6 Discussion
6.1 Influence of spatial aggregation level on damage analysis
In the previous sections, relatively weak relationships between flood characteristics and
economic damage were found. Similar results were obtained in earlier assessments of
economic damage due to floods in Germany in 2002 (Merz et al. 2004; Thieken et al.
2008).
The relationship between flood depth and damage percentages has been analyzed at
different spatial aggregation levels (block group, block). Further analysis of the presented
results showed that a higher spatial level of detail resulted in a lower level of correlation
between predictions and observations, both for the analysis based on depth (Sect. 4) and
depth–velocity (Sect. 5.3). At a high level of detail and for a limited sample size of
buildings the variations in building damage may be considerable. If the sample size
becomes larger, variations are averaged out.
This finding could have implications for the use of stage damage functions that are only
based on flood depth for damage prediction. There is clearly not a one-to-one relationship
between flood depth and damage percentage, especially at a high spatial resolution.
Thereby, it is expected that the application of stage-damage function to individual build-
ings or small clusters of buildings does not give adequate results. If the considered area
becomes larger, the relationship between flood characteristics and damage percentage
improves. Thus, stage damage functions may still be useful to estimate damage for larger
areas with many buildings. Merz et al. (2004) also concluded that the uncertainty of
damage estimates decreases with an increasing number of flooded buildings.
6.2 Influence of other factors on damage
The quantitative analyses in this article have been limited to flood depth and flow velocity.
In this section, the possible influence of other groups of factors is discussed.
First, inconsistencies in recording/reporting the direct damage to buildings in the site
inspections may have resulted in differences in damage percentages between buildings
with a similar damage level. As presented results were averaged over multiple buildings,
this is not expected to be a major factor.
0.0
1.0
2.0
3.0
4.0
5.0
6.0
7.0
0.0 0.5 1.0 1.5 2.0 2.5 3.0 3.5 4.0 4.5 5.0
Velocity (m/s)
Dep
th (
m)
Damage 0 - 50%
Damage 51 - 75%
Damage 76 - 100%
Fig. 20 Damage values for theLower 9th Ward (averaged byblock) as a function of waterdepth and flow velocity
Nat Hazards (2010) 54:413–434 431
123
Second, other flood characteristics than flood depth and flow velocity could be relevant
for damage processes. The impacts of debris and local waves could lead to structural
damage. Water and air temperature and possible contamination are relevant for the damage
to the interior of the building (FEMA 2006).
Third, variations in building type and properties result in differences between buildings
in their resistance to withstand the flood loads. Important factors are the number of stories
(one or more), the construction type, and material (wood, brick, concrete), the foundation
type and the ground elevation. All these factors are likely to have affected the vulnerability
of residential buildings to the flood effects.
Roos et al. (2003) investigated the resistance of different building types (wood, brick,
concrete) by means of structural calculations and showed that wooden constructions are the
most vulnerable. The foundation type affects a building’s resistance to withstand higher
flow velocities. Most of the residential buildings in New Orleans, especially in the
neighborhood with the highest damage (the Lower 9th Ward), were wooden, the so-called
‘‘shotgun type’’ houses, with limited resistance to the flood impacts.
Also, the building’s elevation has an important effect on the level of flooding and the
consequent damage. Many buildings in New Orleans had some elevation based on flood
insurance requirements, and this could limit the level of flood and consequent damage.
According to FEMA (2006), most of the historic homes were elevated several feet, while
newer constructions were constructed on slab-on-grade foundations with small elevations.
Direct data regarding the distribution of different housing types in various areas of the city
are not available. As the building characteristics are expected to be the most important
determinant of the resistance, this is a recommended direction for further work. It could
also be investigated whether differences in damages and housing types were related to
socio-economic characteristics of the population.
7 Conclusions and recommendations
In this article, the relationship between flood characteristics and damage to residential
buildings due to flooding of New Orleans after hurricane Katrina has been investigated.
The main findings can be summarized as follows:
• Differences in observed damage distributions between the studied polders can be
related to differences in flood conditions. The highest damage percentages and
structural damage mainly occurred in areas where higher flow velocities occurred,
especially near the breaches in the Lower 9th Ward neighborhood. Due to the approach
that was used for damage quantification, buildings that sustained structural damage,
had damage levels higher than 50% of their market value.
• Application of the Clausen damage criterion (Clausen 1989) to the flooding of the
Lower 9th Ward neighborhood did not result in an accurate hind cast of the observed
flood damage.
• An alternative approach has been proposed that could be used to distinguish three
different damage zones based on the combination of water depth and flow velocity.
There appeared to be clear differences between the average, observed damage values in
the three zones. This approach could be useful to determine the extent of flood damage
and distinguish the main damage zones for an area affected by flooding due to
breaching of flood defenses.
432 Nat Hazards (2010) 54:413–434
123
• No clear one-to-one relationship between flood characteristics and the exact values of
observed damage percentages was found. This has also been concluded in earlier work
based on damage observations for other flood events (Merz et al. 2004). Thereby, it is
expected that the application of stage damage functions to individual buildings or small
clusters of buildings does not give adequate results.
• The spatial level of detail of the analysis is a determining factor for the correlation
between predictions and observations. The smaller the spatial unit of the analysis the
poorer the relationship between flood characteristics and damage. This also implies that
damage criteria that are derived on this type of data should not be used at a too high
level of spatial detail, e.g. for individual structures.
Based on this study, the following recommendations are made:
• Given the relative weakness of the observed relationship between flood characteristics
and damage percentages, it is recommended to further investigate the application of
stage-damage functions. In this context, it is also relevant to further investigate the
adequate spatial aggregation level of damage analysis in relation to the variations in the
data that were used for the derivation of the stage-damage functions.
• It is recommended to investigate the derivation and rating methodology of the damage
dataset, in order to verify the quality and reliability of the data. A review and
verification of the dataset (Skinner 2006) revealed several issues that could affect the
quality and consistency of the data.
• It is recommended to collect further information about the variation in building types,
structures, and materials. An analysis of the damage data according to the building type
and the structure may lead to better results.
• The analyzed damage estimates primarily refer to economic flood damage. In further
work, it would be interesting to investigate whether a more specific relationship
between flood characteristics and structural damage level could be found.
• It is recommended to further investigate the relationship between damage and loss of
life. The large number of fatalities near the breaches in the Lower 9th Ward
neighborhood appears to be related to the large number of collapsed buildings in the
area and the consequent loss of shelter (Jonkman et al. 2009).
• It is recommended to apply existing damage models, such as FEMA’s HAZUS model,
to provide an estimate in hindsight of the damage in New Orleans due to hurricane
Katrina. Comparison of the predicted and observed data could be used to improve the
damaged models.
Acknowledgments Bob Maaskant (HKV Consultants and Delft University) and Marinus Aalberts (DelftUniversity and Witteveen en Bos) provided the authors with the results of the flood simulation project‘‘Polder Flood Simulations for Greater New Orleans—Hurricane Katrina August 2005’’. The damage datasetwas initially edited by Ezra Boyd and then updated by Carol Friedland, both researchers at Louisiana StateUniversity Hurricane Center. The work presented in the paper was partially supported by the StateScholarship Foundation of Greece and BC Hydro (Canada).
References
Bourque LB, Siegel JM, Kano M, Wood MM (2006) Weathering the storm: the impact of hurricanes onphysical and mental health. Ann Am Acad Pol Soc Sci AAPPS 604:129–151
Brinkmann E, Ragas W (2006) An estimate of the cost of hurricane Katrina flood damage to single-familyresidential structures in Orleans parish. Mortgage Bankers Association 6 Feb 2006
Nat Hazards (2010) 54:413–434 433
123
Clausen LK (1989) Potential dam failure: estimation of consequences, and implications for planning.Unpublished Master of Philosophy thesis at the School of Geography and Planning, MiddlesexPolytechnic collaborating with Binnie and Partners. Redhill
Delft Hydraulics (2003) SOBEK 1D2D. Delft. http://www.sobek.nl. Accessed March 2008DHS (2006) Current housing unit damage estimates hurricanes Katrina, Rita and Wilma. Department of
Homeland Security. February 12, 2006Egorova R, van Noortwijk Jan M, Holterman R (2008) Uncertainty in flood damage estimation. Int J River
Basin Manag JRBM 6(2):1–10FEMA (2006) Hurricane Katrina in the Gulf Coast (FEMA 549). Federal Emergency Management Agency,
Washington DCFriedland CJ (2009) Residential building damage from hurricane storm surge: proposed methodologies to
describe, assess and model building damage. PhD thesis. Louisiana State University. May 2009GARM (Geographical Areas Reference Manual) (1994) U.S. Department of Commerce, Economics and
Statistics Administration, Bureau of Census. November 1994Hallegatte S (2008) An adaptive regional input-output model and its application to the assessment of the
economic cost of Katrina. Risk Anal 28(3):779–799IPET (Interagency Performance Evaluation Task Force) (2007a) Performance Evaluation of the New
Orleans and South East Louisiana Hurricane Protection System, vol VII, the consequences. FinalReport. 26 March 2007
IPET (Interagency Performance Evaluation Task Force) (2007b) Performance evaluation of the NewOrleans and southeast Louisiana hurricane protection system, vol V, the performance—levees andfloodwalls. Final Report. 26 March 2007
Jonkman SN, Penning-Rowsell E (2008) Human instability in flood flows. J Am Water Resour As (JAWRA)44(4):1–11
Jonkman SN, Bockarjova M, Kok M, Bernardini P (2008) Integrated hydrodynamic and economic modelingof flood damage in the Netherlands. Ecol Econ 66:77–90
Jonkman SN, Maaskant B, Boyd E, Levitan ML (2009) Loss of life caused by the flooding of New Orleansafter hurricane Katrina: analysis of the relationship between flood characteristics and mortality. RiskAnal 29(5):676–698
Kelman I, Spence R (2004) An overview of flood actions on buildings. Eng Geol 73(3–4):297–309Kok M, Aalberts M, Maaskant B, de Wit L (2007) Polder flood simulations for greater New Orleans.
Hurricane Katrina August 2005. TU Delft, The NetherlandsMerz B, Kreibich H, Thieken A, Schmidtke R (2004) Estimation uncertainty of direct monetary flood
damage to buildings. Nat Hazards Earth Syst Sci 4:153–163Pardue JH, Moe WM, Mcinnes D, Thibodeaux LJ, Valsaraj KT, Maciasz E, van Heerden I, Korevec N,
Yuan QZ (2006) Chemical and microbiological parameters in New Orleans floodwater followinghurricane Katrina. Environ Sci Technol 39(22):8591–8599
Penning-Rowsell E, Fordham M (1992) Flood hazard assessment, modeling and management: results fromthe EUROflood project. Floods across Europe. Middlesex University Press, London
Rijkswaterstaat (2005) Flood risks and safety in Netherlands-full report. DWW report 2006-014. In:Havinga F, Kok M (eds) Ministry of transport. Public Works and Water Management, Delft
Roos W, Waarts P, Vrouwenvelder A (2003) Damage to buildings. Delft ClusterSchwarz J, Maiwald H (2008) Damage and loss prediction model based on the vulnerability of building
types. 4th international symposium on flood defence: managing flood risk, reliability and vulnerability.Toronto, Ontario, Canada, Institute for Catastrophic Loss Reduction
Skinner RL (2006) Review of Hurricane Katrina activities. Department of Homeland Security, WashingtonDC
Smith DI (1994) Flood damage estimation—a review of urban stage-damage curves and loss functions.Water SA 20(3):231–238
Sullivent EE, West CA, Noe RS, Thomas KE, Wallace LJD, Leeb RT (2006) Nonfatal injuries followinghurricane Katrina—New Orleans, Louisiana, 2005. J Safety Res 37:213–217
Thieken AH, Ackermann V, Elmer F, Kreibich H, Kuhlmann B, Kunert U, Maiwald H, Merz B, Muller M,Piroth K, Schwarz J, Schwarze R, Seifert I, Seifert J (2008) Methods for the evaluation of direct andindirect flood losses. 4th international symposium on flood defense: managing flood risk, reliability andvulnerability. Toronto, Ontario, Canada, May 6–8 2008
USACE (United States Army Corps of Engineers) (1996) Risk-based analysis for flood damage reductionstudies, Engineering Manual, Technical Report EM 1110-2-1619
434 Nat Hazards (2010) 54:413–434
123


