Embed Size (px)
Citation preview

Principal Authors:
Mirya R. Holman
Chloe Schwanz Design, Promotion, and Coordination Assistance:
Anna Mahoney
Aidan Smith
Aisha Champagne
Advisory Board:
We would like to thank the members of our Advisory Board for their contributions to this report.
Caitlin Cain, President of the Women’s Professional Council
Rosalind Blanco Cook, President of the League of Women Voters
Christine Day, Ph.D., Professor of Political Science, University of New Orleans
Norah Friar, MPH, Epidemiologist - Bureau of Family Health
Councilmember Susan G. Guidry, District "A"
Karissa Haugeberg, Ph.D. Assistant Professor of History, Tulane University
Mary Claire Landry, MBA, LCSW, Executive Director of the New Orleans Family Justice Center
Cathy McRae, President of the Women’s Leadership Council
Anna Nguyen, Communications Director for Councilwoman LaToya Cantrell
Leslie G. Parr, Ph.D., Director, Center for the Study of New Orleans, Loyola University New Orleans
Joann Ricci, VP of Organizational Effectiveness, Greater New Orleans Foundation
Lisa Richardson, Ph.D., Director of Research and Evaluation, Institute of Women and Ethnic Studies
Vanessa Spinazola, Chief of Staff, District “A”
Acknowledgements:
The authors wish to acknowledge and thank the Newcomb College Institute for their generous support of the project,
Anna Mahoney for her work in coordinating, encouraging, and supervising the completion of the project, Sally Kenney,
for her support of research on women in New Orleans, the Tulane Political Science department, and the Gender and
Political Psychology writing group for feedback on the project.
A variety of sources provided key data for the reporting, including the U.S. Census Bureau, the City of New Orleans, the
New Orleans Police Department, Louisiana Pregnancy Risk Assessment Monitoring System, the Louisiana Secretary of
State, the Dartmouth Atlas of Health, the Centers for Disease Control, the U.S. Department of Housing and Urban
Development, the Agenda for Children, United States Department of Health and Human Services, the Behavioral Risk
Factor Surveillance System, the Federal Housing Finance Agency, the Louisiana Department of Health, the FBI, the
Economic Census, UNITY of New Orleans, and Jeff Asher for a methodological approach to evaluating crime data. All
errors are our own.

3
Table of Contents:
EXECUTIVE SUMMARY..................................................................................................................................................... 5
DEMOGRAPHICS ................................................................................................................................................................. 8
Population ........................................................................................................................................................................... 8
Population and race ........................................................................................................................................................... 10
Age .................................................................................................................................................................................... 12
Educational attainment ...................................................................................................................................................... 15
College enrollment ............................................................................................................................................................ 17
High school attendance and dropout rates ........................................................................................................................ 19
Birthrate ............................................................................................................................................................................ 20
Marriage and relationships ................................................................................................................................................ 21
Mobility and Foreign Born ............................................................................................................................................... 22
ECONOMIC ......................................................................................................................................................................... 25
Income and wages ............................................................................................................................................................. 25
Poverty .............................................................................................................................................................................. 28
Poverty .............................................................................................................................................................................. 31
Poverty and Government Services .................................................................................................................................... 32
Wages by occupation and sex ........................................................................................................................................... 33
Sectors of Employment ..................................................................................................................................................... 35
Women owned businesses ................................................................................................................................................ 37
Employment ...................................................................................................................................................................... 41
HEALTH............................................................................................................................................................................... 43
Basic access to health care facilities ................................................................................................................................. 43
Causes of Death and Crude Death Rate ............................................................................................................................ 44
Hospital Use by Medicare Enrollees ................................................................................................................................. 45
Female Medicare Beneficiaries ......................................................................................................................................... 46
Self-reported rates of women’s preventative care visits ................................................................................................... 47
CHILDREN .......................................................................................................................................................................... 48
Teen Birth Rates ............................................................................................................................................................... 48

4
Prenatal Care ..................................................................................................................................................................... 50
Infant mortality ................................................................................................................................................................. 52
Child care costs, assistance programs, and availability .................................................................................................... 53
CRIME & THE POLICE ...................................................................................................................................................... 55
Rape and Sexual Assault ................................................................................................................................................... 55
Domestic Violence ............................................................................................................................................................ 56
Interactions with Police by Gender and Race ................................................................................................................... 58
Inmates in Jail ................................................................................................................................................................... 60
Home ownership and renter occupancy ............................................................................................................................ 61
HOUSING............................................................................................................................................................................. 63
Housing Assistance ........................................................................................................................................................... 63
Mortgage applications ....................................................................................................................................................... 64
POLITICS ............................................................................................................................................................................. 66
Voter registration and turnout ........................................................................................................................................... 66
Women’s Representation in Office ................................................................................................................................... 67
DATA NOTES: .................................................................................................................................................................... 69

5
EXECUTIVE SUMMARY By Mirya R. Holman and Chloe Schwanz
Hurricane Katrina and the aftermath of the storm produced fundamental changes in the landscape, economy, and people
of New Orleans. Many of the changes have had a profound effect on women’s lives in the city. The following report uses a
variety of local, state, and national data sources to detail many of the changes for women in New Orleans since Katrina.
The Status of Women in New Orleans points to demographic, economic, health, housing, crime, and political changes for
women. Women in New Orleans are whiter and more educated than prior to Katrina. Many of the positive economic changes
in the city have left women behind, as women earn less than men and are not participating in many of the high-growth areas
of the local economy. Overall levels of health and access to medical care for women has increased, while access to
reproductive rights has declined. Women are not participating in the rapid growth of the property market in New Orleans,
as they are less likely to be mortgage applicants and are more likely to rent. Domestic violence calls have increased, as have
their severity. Women are the majority of local voters and are an increasing share of local representatives, while the rate of
women holding state-level and national offices has declined. Taken together, the findings presented in this report offer
opportunities to identify strengths, weaknesses, and room for policy innovation and action.
Women and Demographic Change
The female population of New Orleans and Orleans Parish has largely rebounded to pre-Katrina levels.
The population of the New Orleans MSA has rebounded to pre-Katrina levels, but the proportion of women in the
population has fallen from 52.1% to 51.5%, resulting in 40,000 fewer women in the MSA in 2014 than pre-
Katrina.
The female population is composed of more White residents than it was prior to Katrina, moving from 26%
White in 2005 prior to Katrina to 35% in 2006 immediately following Katrina to 33% White in 2014. The change
in proportions is largely due to a decline in the Black female population.
The median age for women (36.6) is very similar to the pre-Katrina median age (36.8). However, the distributions
of the population has changed, with large declines in both the number of Black girls and White female residents
65 and older.
The rate of college education among women had increased significantly since Katrina, from 23% of women
with a college education or above in 2005 to 32% in 2014. College education rates have increased among White,
Black, and Hispanic women, but with particularly strong gains among White women.
Women, particularly young women, are also enrolling in college at higher rates than prior to Katrina. High school
dropout rates for young women have declined.
Birth rates in New Orleans are increasing, particularly among women with a college education and younger
women.

6
Women and Economic Change
Among full time workers, women's median income ($36,367) is 79% of men's median income ($45,934). The
gap between men’s and women’s income has not changed – positively or negatively – since the pre-Katrina
difference.
Compared to White men’s wages, the gap is worse for Black women (50%) and Hispanic women (63%) than
for white women (79%).
The wage gap between white women and white men is much worse now (at 79%) than it was prior to Katrina
(at 92%). The gap between Black women and white men has also gotten worse, while the gap between Hispanic
women and White men has improved.
The poverty rate is much higher for women than for men in New Orleans. Almost 1 in 3 (30%) of women in
New Orleans have an income under the federal poverty rate. And the poverty rate for female-headed households
with children higher; 56% of female headed households with children have an income below the federal poverty
line.
The proportion of female owned businesses is growing in New Orleans. In 2002, 28% of firms were owned by
a woman - this has increased to 37% by 2012. However, the share of sales, receipts and values of shipments has
not grown at the same rate - female owned firms accounted for 4.4% of all sales, receipts, and shipments from
New Orleans based firms. By 2012, that rate had slipped to 3% of all sales.
The unemployment rate for women has declined since pre-Katrina (from 15.8% unemployment for women in
2005) to 9.6%. However, this is still far higher than the national average rate of 6.6% unemployment for women.
The cost of child care has increased at a rate far faster than income has increased. As a result, families are
paying a much higher proportion of their income for child care today than they were prior to Katrina.
Women’s Health
Women’s health is improving in New Orleans, with declining rates of mortality for many major diseases.
Access to general health care is improving, including the provision of obstetrician/ gynecologists. One potential
byproduct of this is that expectant mothers are getting first trimester care at higher rates, although the overall level
of early and adequate care for pregnant mothers is similar to pre-Katrina levels
At the same time, the share of older women on Medicare is declining, as is the rate that women on Medicare
are discharged from the hospital and the average number of impatient days for women on Medicare.
The teen birth rate has declined since prior to Katrina, especially among Black mothers. Infant mortality has
also declined; this decline is also focused among Black mothers.
7
Women’s Interactions with the Police
Women’s interactions with the police via stop and search actions have increased since 2010. In particular, the
rate at which women interact with the police through traffic stops has increased significantly over time.
The rate of domestic violence calls to 911 in New Orleans has increased in overall number and rate since 2010.
Since 2010, these calls are progressively less likely to be dismissed as without cause and more likely to be
marked as a priority call.
The rate of sexual assault has declined, although there are significant questions about the actual rate of sexual
assault in the city, given findings by the Inspector General that the NOPD misclassified these crimes in a
systematic manner.
The overall number of prisoners in the Orleans Parish Prison has declined, while the proportion of those prisoners
who are female has remained fairly steady over time.
Women and Housing:
Female heads of households are less likely to own their home than other household groups. This is particularly
true for female householders age 35-64. Given the lower income among this group, the rising cost of rent in New
Orleans is particularly impactful.
Women make up a smaller share of those receiving housing assistance from the U.S. Department of Housing
and Urban Development today than they did pre-Katrina. The decline is primarily in the number and proportion of
women receiving section 8 housing vouchers.
Female borrowers make up a smaller share of mortgage applicants for single family home loans in 2010 and
2014 than in 2000. Female borrowers are older than male borrowers and are more likely to be Black, although
Black borrowing rates are not representative of their share of the population.
Women and Politics:
Women have turned out to vote at higher rates than men in all elections in post-Katrina national elections. The
turnout rates are similar for men and women in local elections.
Women make up the majority of registered voters in Orleans Parish. Given their elevated turnout and
registration rates, women have made up between 55-61% of the voters in every election since 2010.
Women make up a larger share of representatives (and candidates for office) at the local level post-Katrina
than they did prior to Katrina. However, the rate of women holding state-level and national offices has declined
or plateaued.
Looking at local level activism, women’s representation in political party delegates from Orleans parish has
increased among Democrats, but not among Republicans.

8
DEMOGRAPHICS Population
The population of Orleans Parish (384,320 in 2014) has reached 88% of its pre-Katrina population
(437,186 in 2005). The male population is nearly 90% of the pre-Katrina population, the female
population is only 86%; the decline in proportion of women is also evident in the changes in the
percentage of women in the Parish. In 2005, women made up 53.4% of the parish population. In 2014,
52.4% of the population are female, which is a decline of a full percentage point. As a result, the female
population of New Orleans has largely rebounded, but is still 20,000 below pre-Katrina levels.
Figure: Female population of Orleans Parish
Looking at the larger MSA, similar patterns are evident – the overall population has largely recovered
from Katrina, but the proportion of the population that are female has declined from 52.1% to 51.5%.
Given that the overall population of the MSA is over 1.2 million, this .5% decline represents over
40,000 fewer women in the MSA in 2014 than in 2005. Even with the decline in the female population,
both Orleans Parish and the New Orleans-Metairie-Kenner MSA are more female than the United
States overall, which is (in 2014) 50.8% female.i
Data Notes and Sources:
The population data from
2005, pre-Katrina, to 2014
is from the American
Communities Survey and
represents the total
number of people, both
male and female, in
Orleans Parish and the
New Orleans-Metairie-
Kenner MSA. The New-
Orleans-Metairie-Kenner
MSA contains the cities of
New Orleans, Metairie,
and Jefferson, as well as
the parishes of Orleans,
Plaquemines, St. Bernard,
St. Charles, St. James, St.
John the Baptist, and St.
Tammany.
Metropolitan Statistical
Areas have at least one
urbanized area of 50,000
or more population, plus
adjacent territory that has
a high degree of social
and economic integration
with the core as measured
by commuting ties.
Micropolitan Statistical
Areas have at least one
urban cluster of at least
10,000 but less than
50,000 population, plus
adjacent territory that has
a high degree of social
and economic integration
with the core as measured
by commuting ties.
Source: U.S. Census
B01001: Sex By Age -
Universe: Total Population
-
50,000
100,000
150,000
200,000
250,000
2 0 0 5 2 0 0 6 2 0 0 7 2 0 0 8 2 0 0 9 2 0 1 0 2 0 1 1 2 0 1 2 2 0 1 3 2 0 1 4

9
Figure: Male and female population in the New Orleans MSA, percentage female
50.8%
51.0%
51.2%
51.4%
51.6%
51.8%
52.0%
52.2%
52.4%
52.6%
-
200,000
400,000
600,000
800,000
1,000,000
1,200,000
1,400,000
2005 2006 2007 2008 2009 2010 2011 2012 2013 2014
Per
cent
fem
ale
MS
A P
op
ula
tio
n
Male Female Percent female

10
DEMOGRAPHICS
Population and race
The population of women has declined across all three of the largest racial categories since before
Katrina. The female percentage of White residents of Orleans Parish has declined from 50.1% in 2005
(and a high of 51% in 2006) to 49.2% in 2014. Similarly, the female proportion of the Black population
declined from 55.1% in 2005 (and a peak of 56.4% in 2006) to 54.5% and the Hispanic female
population declined from 49.8% in 2005 (and 55.4% in 2006) to 46.7% in 2014. ii Taken together, this
data suggests that while a diverse group of women stayed (or could not leave) immediately following
Katrina, the population that has returned or moved to New Orleans since Katrina has been more male
than female. Some of this may be related to the jobs available following Katrina: for example, the
construction work available after Katrina is generally dominated by men (see Economic – Jobs and
Industry).
Figure: Female proportion of each race in Orleans Parish
When we break the racial composition data down by the proportion of each race in the female
population, three clear patterns emerge: first, the population changes from Katrina had a large effect
on the racial composition of the female population of Orleans Parish. Second, these changes are
primarily seen through an increase in the proportion of White females and a decrease in Black females.
Third, these changes occurred immediately after Katrina and have largely persisted since this point.
40%
42%
44%
46%
48%
50%
52%
54%
56%
58%
2005 2006 2007 2008 2009 2010 2011 2012 2013 2014
Per
cent
of
each
rac
e th
at a
re f
emal
e
White Black Hispanic
Data Notes and Sources:
The American
Communities Survey
provides the raw number
of males and females in
Orleans Parish by primary
race category.
Source: American
Communities Survey –
one year estimates
B01001: Sex By Age -
Universe: Total Population
B01001A: Sex By Age
(White Alone) - Universe:
People Who Are White
Alone
B01001B: Sex By Age
(Black Or African
American Alone) -
Universe: People Who
Are Black Or African
American Alone
B01001I: Sex By Age
(Hispanic Or Latino) -
Universe: People Who
Are Hispanic Or Latino.
Note – Data Is Not
Available In 2007.

11
Table: Proportion and raw population of females, by race
2005 2006 2007 2008 2009 2010 2011 2012 2013 2014
Total female
population
233,284 120,925 127,953 164,998 186,948 179,112 186,919 192,042 196,892 201,213
White % of female
pop
26% 35% 32% 33% 31% 31% 32% 32% 33% 33%
White female pop 61,374 41,872 40,451 54,049 57,088 55,417 59,871 61,588 64,507 65,777
Black % of female
pop
70% 61% 63% 64% 64% 62% 63% 62% 61% 62%
Black female pop 162,571 74,070 80,892 104,997 120,477 111,879 116,871 119,136 121,068 124,012
Hispanic % of
female pop
3% 4% -- 4% 4% 4% 4% 5% 5% 5%
Hispanic female
pop
6,809 5,064 -- 7,118 7,618 7,938 8,377 8,760 9,217 9,947
Indeed, from 2005 to 2006, the proportion of females who are White increased from 26% to 35% and the proportion of Blacks in the
female population decreased from 70% to 61%. Since 2006, these numbers have remained largely stable, with Whites making up 33%
and Blacks representing 62% of the female population in 2014. The growth of Hispanic females in Orleans Parish has occurred gradually
and steadily.
Figure: Racial composition of Orleans Parish, females only
26%
35%32% 33% 31% 31% 32% 32% 33% 33%
70%
61% 63% 64% 64% 62% 63% 62% 61% 62%
3% 4% 4% 4% 4% 4% 5% 5% 5%
0%
10%
20%
30%
40%
50%
60%
70%
80%
2005 2006 2007 2008 2009 2010 2011 2012 2013 2014
Po
pula
tio
n
White (%) Black (%) Hispanic (%)

12
DEMOGRAPHICS
Age
Women in New Orleans have an older median age today than they did prior to Katrina. The median
age peaked in 2006, as many families with children left the New Orleans area immediately following
Katrina.
Figure: Median age by gender over time for Orleans Parish
The changes in median age is driven by two forces: a decrease in the number of women under the age
of 20 in the city (from 28% of the
female population in 2005 to 23% of
the female population 2014), while
the proportion of the population over
the age of 65 has remained largely
stable.iii
34.6
36.8
42.141.1
39.8
37.8
35.5 3635.4
36.3 36.6
30
32
34
36
38
40
42
44
2000 2005 2006 2007 2008 2009 2010 2011 2012 2013 2014
Male Female
Data Notes and Sources:
What is this data and
where does it come from?
This data is from the
American Communities
Survey (2005-2014) and
the U.S. Census (2000)
for Orleans Parish and
provides the raw number
of individuals by age
group and gender. Median
indicates the middle point
in age, with 50% of
women (or men) older
than this point and 50%
younger.
Source: U.S. Census
Bureau, American
Communities Survey.
Median Age: Median Age
By Sex (P013: 2000;
B01002: 2005 through
2014)
Population by age group:
2000: P008: Sex By Age;
P012: Sex By Age (for
specific racial groups);
2009 and 2014: B01001I:
Sex By Age
Table: Proportion of population in age categories in
Orleans Parish
2000 2009 2014
Population under 5 Male 9% 8% 7%
Female 7% 6% 6%
Population under 20 Male 32% 26% 25%
Female 28% 24% 23%
Population over 65 Male 9% 10% 10%
Female 14% 14% 13%

13
Table: Proportion of each gender in each age category by race in Orleans Parish
Figure: Proportion of the Black population under the age of 20 in Orleans Parish
When we disaggregate by race, three patterns emerge: first, while the proportion of the population under the age of 5 has largely remained
constant from 2000 to 2014, there are large shifts in youth ages 5 to 20 and among those 65 and older.
White Black Hispanic
2000 2009 2014 2000 2009 2014 2000 2009 2014
Population under 5 Male 4% 5% 5% 9% 9% 8% 6% 9% 8%
Female 4% 5% 5% 7% 7% 6% 6% 8% 10%
Population under 20 Male 16% 15% 15% 39% 33% 31% 26% 25% 21%
Female 16% 16% 16% 33% 27% 26% 24% 26% 26%
Population over 65 Male 15% 7% 12% 7% 4% 9% 10% 5% 6%
Female 24% 20% 15% 10% 11% 12% 15% 15% 9%
Second, the proportion of girls age 5-20 has remained consistent over time for Whites and Hispanics, the proportion of Black girls has
dropped precipitously from 33% of the Black female population under the age of 20 in 2000 to 26% in 2014. A similar rate of decline
is seen among Black boys – the population has declined from 39% of the Black population in 2000 to 31% in 2014.
Third, the older population has also changed dramatically in New Orleans, particularly for White women. While the overall proportion
of the population that is 65 or older has remained consistent from 2000 (14%) to 2014 (13%), the proportion of White women that are
65 or older has declined from nearly 1 in 4 (24%) to fewer than 1 in 6 (15%). This is unique to White females – the proportion of White
males 65 and over has declined overall since prior to Katrina, but has been increasing since 2009. Hispanics 65 and older (both male
and female) have also declined as a portion of the population, while the proportion of Black residents 65 and older has increased – from
10% to 12% for Black women and from 7% to 9% for Black men.
39%
33%33%
27%
31%
26%
20%
30%
40%
50%
Male Female
Per
cent
of
Bla
ck p
op
ula
tio
n
und
er 2
0
2000 2009 2014

14
Figure: Proportion of the White population 65 and older in Orleans Parish
As a result of these changes, the median ages of White and Black women have largely converged in New Orleans, which is a substantial
change from pre-Katrina demographics, when White women had an older median age (44.1) than Black women (34.1). By 2014, White
(37.3) and Black (36.7) women have near identical median ages.
Figure: Median age for White and Black women in Orleans Parish
15%
24%
7%
20%
12%
15%
0%
5%
10%
15%
20%
25%
Male Female
Per
cent
of
whit
e p
op
ula
tio
n t
hat
is 6
5+
2000 2009 2014
44.1
46.4 46.7
36.9 37.3
34.1
41
39.6
35.3
36.7
30
32
34
36
38
40
42
44
46
48
2005 2006 2007 2008 2009 2010 2011 2012 2013 2014
White Black
15
DEMOGRAPHICS
Educational attainment
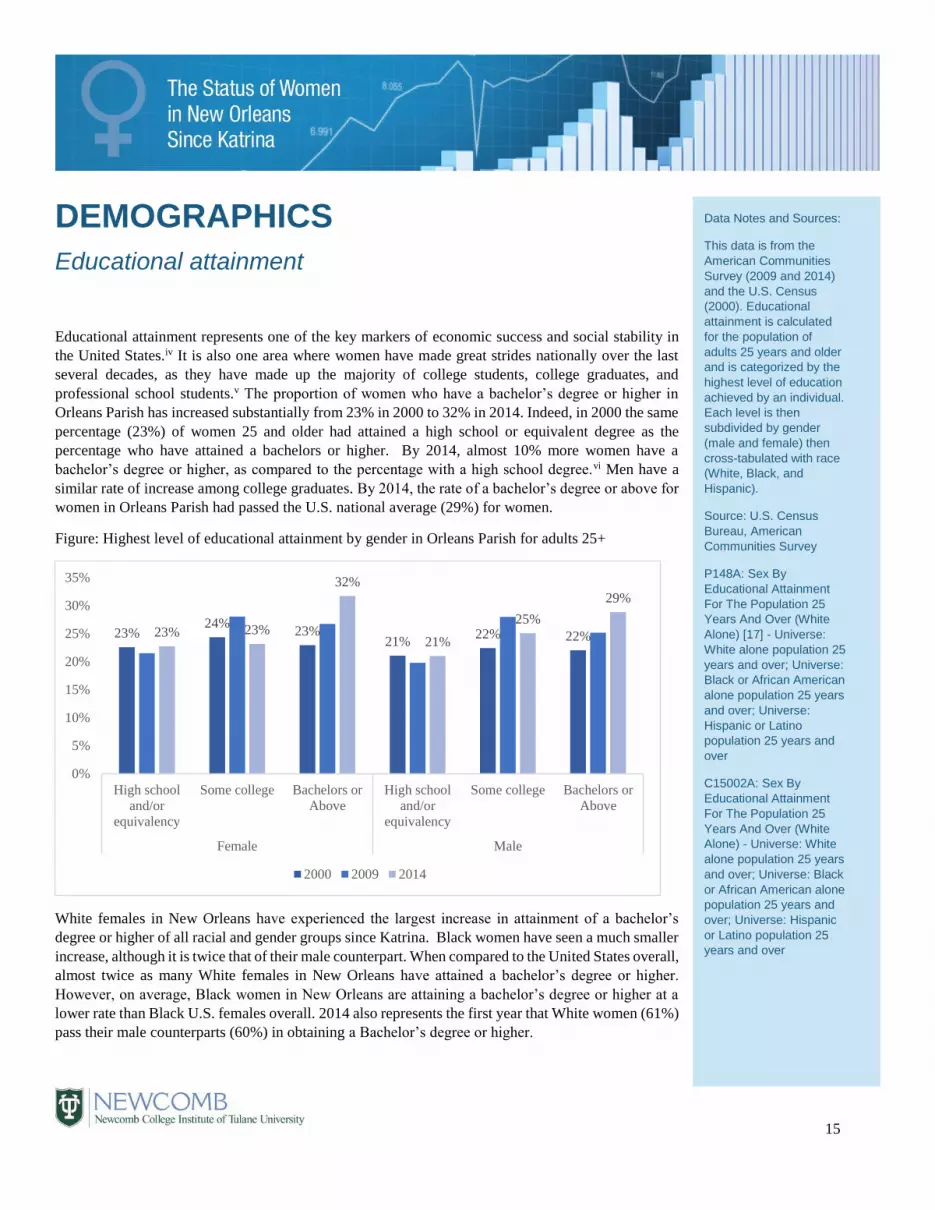
Educational attainment represents one of the key markers of economic success and social stability in
the United States.iv It is also one area where women have made great strides nationally over the last
several decades, as they have made up the majority of college students, college graduates, and
professional school students.v The proportion of women who have a bachelor’s degree or higher in
Orleans Parish has increased substantially from 23% in 2000 to 32% in 2014. Indeed, in 2000 the same
percentage (23%) of women 25 and older had attained a high school or equivalent degree as the
percentage who have attained a bachelors or higher. By 2014, almost 10% more women have a
bachelor’s degree or higher, as compared to the percentage with a high school degree.vi Men have a
similar rate of increase among college graduates. By 2014, the rate of a bachelor’s degree or above for
women in Orleans Parish had passed the U.S. national average (29%) for women.
Figure: Highest level of educational attainment by gender in Orleans Parish for adults 25+
White females in New Orleans have experienced the largest increase in attainment of a bachelor’s
degree or higher of all racial and gender groups since Katrina. Black women have seen a much smaller
increase, although it is twice that of their male counterpart. When compared to the United States overall,
almost twice as many White females in New Orleans have attained a bachelor’s degree or higher.
However, on average, Black women in New Orleans are attaining a bachelor’s degree or higher at a
lower rate than Black U.S. females overall. 2014 also represents the first year that White women (61%)
pass their male counterparts (60%) in obtaining a Bachelor’s degree or higher.
23%24%
23%21%
22% 22%23% 23%
32%
21%
25%
29%
0%
5%
10%
15%
20%
25%
30%
35%
High school
and/or
equivalency
Some college Bachelors or
Above
High school
and/or
equivalency
Some college Bachelors or
Above
Female Male
2000 2009 2014
Data Notes and Sources:
This data is from the
American Communities
Survey (2009 and 2014)
and the U.S. Census
(2000). Educational
attainment is calculated
for the population of
adults 25 years and older
and is categorized by the
highest level of education
achieved by an individual.
Each level is then
subdivided by gender
(male and female) then
cross-tabulated with race
(White, Black, and
Hispanic).
Source: U.S. Census
Bureau, American
Communities Survey
P148A: Sex By
Educational Attainment
For The Population 25
Years And Over (White
Alone) [17] - Universe:
White alone population 25
years and over; Universe:
Black or African American
alone population 25 years
and over; Universe:
Hispanic or Latino
population 25 years and
over
C15002A: Sex By
Educational Attainment
For The Population 25
Years And Over (White
Alone) - Universe: White
alone population 25 years
and over; Universe: Black
or African American alone
population 25 years and
over; Universe: Hispanic
or Latino population 25
years and over
16
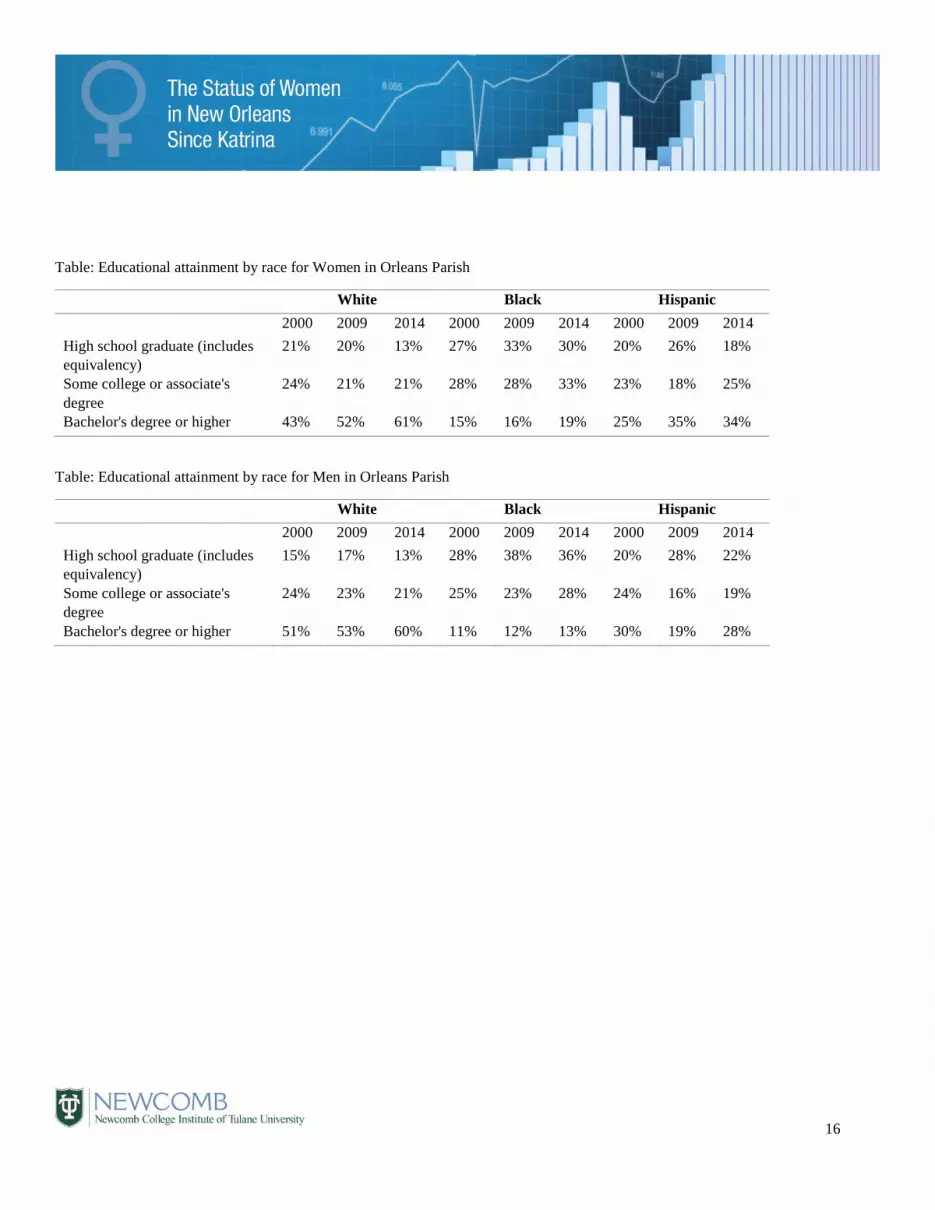
Table: Educational attainment by race for Women in Orleans Parish
White Black Hispanic
2000 2009 2014 2000 2009 2014 2000 2009 2014
High school graduate (includes
equivalency)
21% 20% 13% 27% 33% 30% 20% 26% 18%
Some college or associate's
degree
24% 21% 21% 28% 28% 33% 23% 18% 25%
Bachelor's degree or higher 43% 52% 61% 15% 16% 19% 25% 35% 34%
Table: Educational attainment by race for Men in Orleans Parish
White Black Hispanic
2000 2009 2014 2000 2009 2014 2000 2009 2014
High school graduate (includes
equivalency)
15% 17% 13% 28% 38% 36% 20% 28% 22%
Some college or associate's
degree
24% 23% 21% 25% 23% 28% 24% 16% 19%
Bachelor's degree or higher 51% 53% 60% 11% 12% 13% 30% 19% 28%

17
Figure: Percent of Orleans Parish residents enrolled in college or graduate school by gender
DEMOGRAPHICS
College enrollment
More women are enrolled in college in 2014 than were enrolled prior to Katrina. And, while more
women than men were enrolled in college prior to Katrina, the gap between women’s and men’s
enrollment has grown from 2% in 2005 to 2.3% in 2014.
Some of these changes may be due to changes in the colleges, universities and graduate and
professional schools in the area. As one example, the female population at Tulane Universityvii has
increased significantly since Katrina to today. While women have made up the majority of Tulane
students since before Katrina, their share has increased over time to 56% in the 2015-2016 school
year. Indeed, Tulane had 800 more female students in 2015-2016 than they did in 2004-2005.
Figure: Tulane’s Enrollment by Gender
8.2% 8.3%
10.6%10.3% 9.9%
13.0%
0%
2%
4%
6%
8%
10%
12%
14%
2005 2009 2014
Male Female
52%53%
57%
51%
52%
53%
54%
55%
56%
57%
(1,000)
1,000
3,000
5,000
7,000
9,000
11,000
13,000
15,000
2004-2005 2009-2010 2014-2015
Per
cent
fem
ale
Tula
ne
stud
ents
Male students Female students Percent female
Data Notes and Sources:
This data is from the
American Communities
Survey data on enrollment
in nursery, K-12, college,
and graduate school by
gender.
Source: U.S. Census,
American Communities
Survey
B14004: Sex By College
Or Graduate School
Enrollment By Type Of
School By Age For The
Population 15 Years And
Over - Universe:
Population 15 years and
over. Percentage
calculations by authors
Tulane’s enrollment
numbers from Tulane’s
Enrollment Management
Office. UNO’s enrollment
numbers are from UNO.

18
At the same time, the University of New Orleans’ student population has shrunk significantly from pre-Katrina numbers, including the
female student population. As a result of both the decline in the overall number of students at UNO and the decline in the percentage
of women at the university, UNO has 5,653 fewer female students than prior to Katrina. What accounts for the changes in the
population, given what we know about the college student populations in New Orleans over this time? One possibility is that UNO’s
student body drew from the New Orleans area, but not necessarily Orleans Parish. Another possibility is that these are many of the
Black youth that have left New Orleans following Katrina. In many ways, the changes in Tulane and UNO’s enrollments are
representative of New Orleans overall, with increases in out-of-state White women college students at Tulane and a decrease in local
Black women at UNO.
Figure: University of New Orleans’ (UNO) Enrollment by Gender
The increase in college attendance in New Orleans is concentrated among women age 18-24, which is the traditional age for college
attendance. This is a change from prior to Katrina: in 2005,
fewer than one in three (31%) of women in Orleans parish
18-24 were enrolled in college or graduate school. By 2014,
more than half (56%) of women 18-24 were enrolled in
college or graduate school.viii At the same time, the
proportion of women age 25-34 enrolled in college has
declined from 21% to 16%, suggesting that women in New
Orleans are more likely to attend school following high
school graduation.
57%
45%
50%
40%
42%
44%
46%
48%
50%
52%
54%
56%
58%
-
2,000
4,000
6,000
8,000
10,000
12,000
14,000
16,000
18,000
2004-2005 2009-2010 2014-2015
Per
cent
fem
ale
UN
O S
tud
ents
Male Female Percent female
Table: Percentage of each age group in college school
2005 2009 2014
Male Age 18-24 32% 36% 45%
Age 25-34 12% 12% 14%
Age 35 or older 3% 2% 3%
Female Age 18-24 31% 47% 56%
Age 25-34 21% 12% 16%
Age 35 or older 4% 3% 4%

19
DEMOGRAPHICS
High school enrollment and dropout rates
What does this data say about the status of women since Katrina: The rate of female school
enrollment among older youth has increased since Katrina, from 78% of female youth aged 16-19 in
school in 2005 (pre-Katrina) to 86% in 2014. In addition, the rate of female youth who are not in
school and do not have a high school diploma or equivalent has declined from 6% to 4%. At the same
time, the rate of female youth who are high school graduates and are not in school has declined from
16% to 10%. The in-school, graduation, and dropout rates suggests that older youth in New Orleans,
including girls, are staying in school longer and are less likely to drop out of high school. This,
combined with the increasing college graduation rates, suggests that New Orleans is home to a more
educated female population today than prior to Katrina.
Table: School and graduation status of youth age 16-29 in Orleans Parish
2005 2009 2014
Male In school 76% 76% 87%
Graduate: high school graduate or
equivalent
14% 12% 6%
Drop out: Not in school, not high school
graduate or equivalent
10% 12% 7%
Female In school 78% 84% 86%
Graduate: high school graduate or
equivalent
16% 9% 10%
Drop out: Not in school, not high school
graduate or equivalent
6% 7% 4%
Data Notes and Sources:
This data is from the
American Communities
Survey data on school
enrollment for youth aged
16-19 in Orleans Parish,
LA.
Source: U.S. Census,
American Communities
Survey
2005, 2009, and 2014
data. C14005: Sex By
School Enrollment By
Educational Attainment By
Employment Status For
The Population 16 To 19
Years - Universe:
Population 16 to 19 years.
High school graduate
included equivalents, such
as the G.E.D.

20
DEMOGRAPHICS
Birth rate The overall birth rate in New Orleans has increased following Katrina, moving from 33 births per
1000 women in 2005 to 52 in 2014. This trend is remarkable for several reasons. First, this trend
differs from the general trend in the United States overall, which has not increased significantly in the
prior decade.ix
Second, this trend is
very different than
urban areas in the
United States,
where the birth rate
is on the decline.
Third, the increased birth rate is concentrated among women age 20-34, while national trends have
generally only seen increases in the birth rate among women over the age of 35.x
Figure: Percentage of births by age of mother
The increased birth rate is particularly concentrated among women with a bachelor’s degree, a high
school diploma or those with less than a high school degree, while the birth rate is falling among
women with graduate degrees. However, given that the proportion of the female population with a
bachelor’s
degree is
increasing, this
shows a
positive
correlation with
the birth rate
overall.
0%
10%
20%
30%
40%
50%
60%
70%
80%
90%
15 to 19 20 to 34 35 to 50
2005
2009
2014
Data Notes and Sources:
This data is from the
American Communities
Survey and is the overall
birth rate (per 1000
women) in Orleans Parish
among women age 15 to
50, as well as the percent
of the female population
with a live birth in the
previous year.
Source: U.S. Census,
American Communities
Survey
B13002: Women 15 To 50
Years Who Had A Birth In
The Past 12 Months By
Marital Status And Age -
Universe: Women 15 to
50 years
Table: Women 15 to 50 with a live birth in past twelve months in
Orleans Parish
2005 2009 2014
Overall birth rate (per 1000) in New Orleans 33 45 52
Overall birth rate (per 1000) in United States1 54.9 57 51.6
Women who had a live birth in past year 3% 5% 4%
Table: Birth rate (per 1000) for women, age 15-50, by age and educational
attainment
2005 2009 2014
Less than high school graduate 42 57 68
High school graduate (includes equivalency) 20 59 50
Some college or associate's degree 42 34 40
Bachelor's degree 16 26 55
Graduate or professional degree 52 56 40

21
DEMOGRAPHICS
Marriage and relationships
The rate of women and men who report never being married has increased significantly in New
Orleans following Katrina. By 2014, 46% of women 15 years and older reported that they are not and
have never been married; at these levels, the rate of never married for women in New Orleans is far
higher than the national average of 29%. Additionally, the percentage of those reporting that they are
not married has been increasing for both men and women in New Orleans, as is the percentage of
women who are widowed or divorced. The rate of marriage for women in New Orleans – currently at
32% and down from 35% in 2005- is rather different than women’s national marriage rate, which has
increased slightly from 49% in 2005 to 51% in 2014.
Figure: Marital status of men and women in Orleans Parish
The rate of same-sex partnerships in New Orleans is difficult to quantify, given challenges with data,
measurement, and reporting rates. As a crude measure of same-sex partnerships, we look at the rate of
individuals who report living with a partner of their same sex on the American Communities Survey.xi
Overall, the rate of same-sex partner households has very slightly, but steadily, declined since 2000-
both nationally and in New Orleans. Although, New Orleans has consistently reported at least twice
the occupancy rate as the U.S. in same-sex male households. In same-sex female households, however,
the rate in New Orleans is similar to national reporting rates.
Table: Percent of total households with a male householder and male partner or female householder
and female partner.
New Orleans US Overall
2000 2009 2014 2000 2009 2014
Male householder and male partner 0.6% 0.6% 0.5% 0.3% 0.3% 0.2%
Female householder and female partner 0.4% 0.3% 0.3% 0.3% 0.3% 0.2%
0%
10%
20%
30%
40%
50%
60%
Men Women Men Women Men Women
Never married Now married Widowed or Divorced
2005 2009 2014
Data Notes and Sources:
American Communities
Survey self-reported
marital status and same-
sex reporting on the
households survey.
Sources: U.S. Census,
American Communities
Survey
B12001: Sex By Marital
Status For The Population
15 Years And Over -
Universe: Population 15
years and over.
Percentages calculated by
authors.
PCT014: Unmarried-
Partner Households By
Sex Of Partners [7] -
Universe: Households
B11009: Unmarried-
Partner Households By
Sex Of Partner - Universe:
Households
MS-1. Marital Status of
the Population 15 Years
Old and Over by Sex,
Race and Hispanic Origin:
1950 to Present

22
DEMOGRAPHICS
Mobility and foreign born
One major consequence of Hurricane Katrina on New Orleans was an increase in the mobility of
residents following the storm, as individuals and families moved away from – and back to – New
Orleans as the city recovered from the storm.xii In addition, much attention has been paid to
newcomers to New Orleans, particularly in the past five years.xiii As expected, a large portion of
women (20%) in New Orleans report living in another county in 2007, which is less than the percent
of men (23%) who reported moving into the county.xiv Starting in 2008, that proportion drops to 12%,
and levels out to an equilibrium of between 6% and 8% from 2010-2014. This pattern reinforces other
data (see Demographics: Population) to suggest that fewer women – as compared to men – left New
Orleans after Katrina.
Figure: Percent of each gender in Orleans Parish who did not live in same county one year ago
Where are the newcomers arriving from? We next look at those who have moved to New Orleans
from a different county and whether they relocating Louisiana residents, individuals moving from
another state in the United States, or people moving from abroad.
5%
10%
23%
11% 12%
8% 7%7% 7%
7%4%
12%
20%
12% 10%
8%8% 8%
6%
7%
3%
8%
13%
18%
23%
2005 2006 2007 2008 2009 2010 2011 2012 2013 2014
Men Women
Data Notes and Sources:
The data from the
American Communities
Survey is regarding an
individual’s place of
residence one year prior
to having been surveyed,
then categorized by
gender.
Source: U.S. Census
Bureau, American
Communities Survey.
B07003: Residence 1
Year Ago By Sex In The
United States - Universe:
Population 1 year and
over in the United States.
Percentages calculated by
authors
B05003: Sex By Age By
Citizenship Status -
Universe: Total population
23
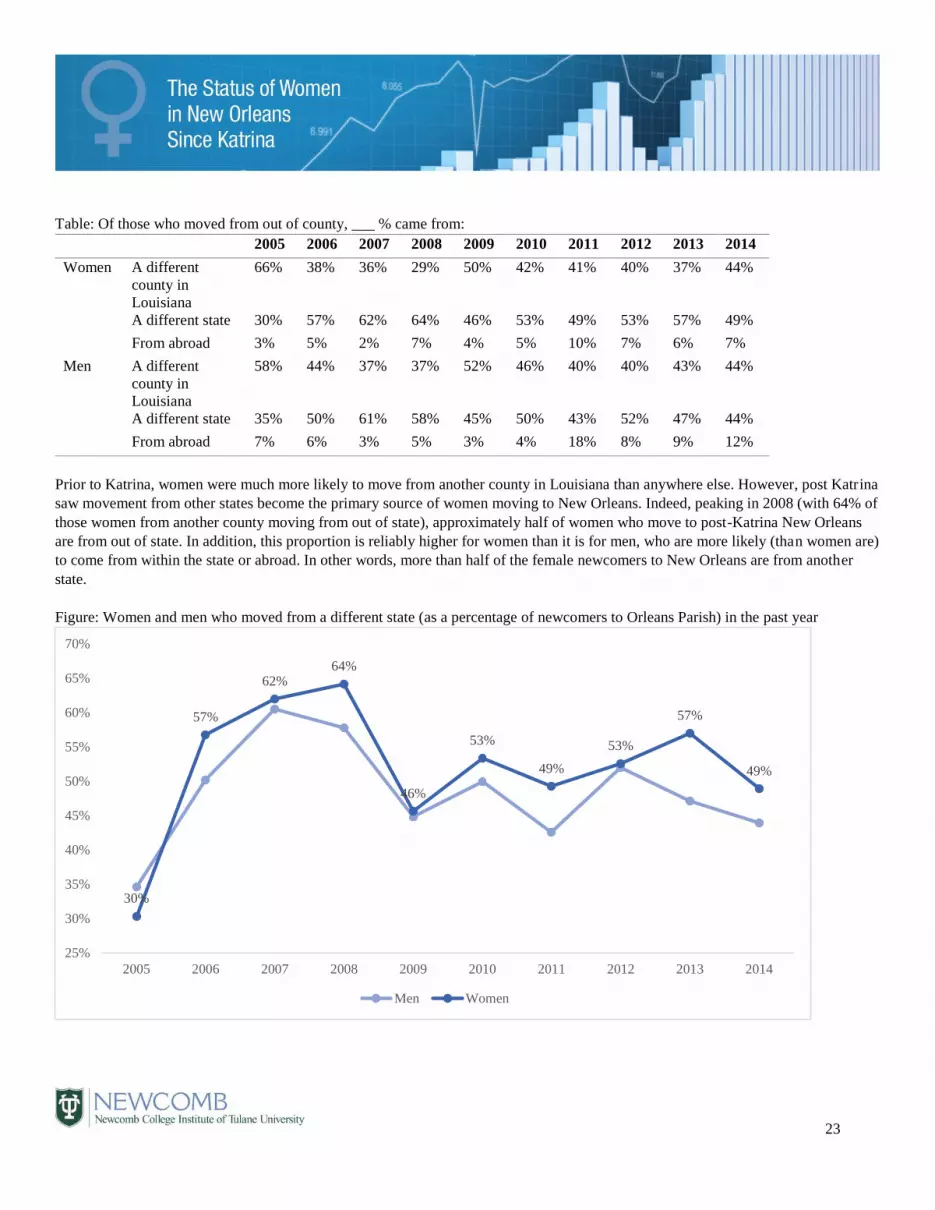
Table: Of those who moved from out of county, ___ % came from:
2005 2006 2007 2008 2009 2010 2011 2012 2013 2014
Women A different
county in
Louisiana
66% 38% 36% 29% 50% 42% 41% 40% 37% 44%
A different state 30% 57% 62% 64% 46% 53% 49% 53% 57% 49%
From abroad 3% 5% 2% 7% 4% 5% 10% 7% 6% 7%
Men A different
county in
Louisiana
58% 44% 37% 37% 52% 46% 40% 40% 43% 44%
A different state 35% 50% 61% 58% 45% 50% 43% 52% 47% 44%
From abroad 7% 6% 3% 5% 3% 4% 18% 8% 9% 12%
Prior to Katrina, women were much more likely to move from another county in Louisiana than anywhere else. However, post Katrina
saw movement from other states become the primary source of women moving to New Orleans. Indeed, peaking in 2008 (with 64% of
those women from another county moving from out of state), approximately half of women who move to post-Katrina New Orleans
are from out of state. In addition, this proportion is reliably higher for women than it is for men, who are more likely (than women are)
to come from within the state or abroad. In other words, more than half of the female newcomers to New Orleans are from another
state.
Figure: Women and men who moved from a different state (as a percentage of newcomers to Orleans Parish) in the past year
30%
57%
62%64%
46%
53%
49%
53%
57%
49%
25%
30%
35%
40%
45%
50%
55%
60%
65%
70%
2005 2006 2007 2008 2009 2010 2011 2012 2013 2014
Men Women

24
New Orleans has always been a global city that attracts people from all over the world. This continues to be true after Katrina, with an
increase in the foreign born population in the city. Indeed, the percent of newcomers moving from abroad has also increased since
Katrina, particularly among men. Prior to Katrina, 3.3% of women (and 4.2% of men) were foreign born. Following Katrina, this
percentage increased to 5.5% of women and 6.9% of men. If mobility trends remain consistent, we expect additional increases in the
foreign born population.
Figure: Percent of the population foreign born in Orleans Parish
4.2%
5.5%
6.9%
3.3%
5.2%5.5%
0%
1%
2%
3%
4%
5%
6%
7%
8%
2005 2009 2014
Male Female

25
ECONOMIC Income and wages
Women’s income in New Orleans has increased by 24% since prior to Katrina, moving from $16,377
in 2005 to $20,388 in 2014. This is lower than the U.S. median income for women in 2014 (at
$21,551) and higher than the Louisiana median income for women (at $18,569).
Examining the difference between men and women’s overall income, women make an average of
70% (or $7,541 less) of men’s income. The gap between women and men has varied over time, from
women making 58% of men’s salaries following Katrina in 2006, to women making 76% of men’s
income in 2009. The largest gap, in 2006, represents both a decline in women’s income (from
$16,377 to $15,318) and an increase in men’s income. In 2014, the most recent data available, the gap
is 73% or $7,438.
Figure: Median income in the past 12 months by sex for Orleans Parish
One possible explanation for the difference in income between women and men is that women are
more likely to work part-time jobs. This may be particularly true in New Orleans, where many sectors
of the economy are conducive to part time labor. When we look at full time workers, the gap between
men and women does shrink to an average of 77% (or $9,798) over the 2005-2014 period. As with
the gap in income for all workers, the largest gap among full time workers occurs immediately after
Katrina, where women make 60% of what men make, and the smallest gap is found in 2009, where
full time female workers made 83% of full time male worker’s income. In 2014, the gap is 79%, or
$9,567.
$23,057
$26,134
$22,496
$21,093
$23,513
$25,553$24,866
$25,468
$26,857$27,824
$16,377$15,318
$14,844$14,207
$17,978 $17,545$18,664
$17,409
$19,620$20,388
$10,000
$12,000
$14,000
$16,000
$18,000
$20,000
$22,000
$24,000
$26,000
$28,000
$30,000
2005 2006 2007 2008 2009 2010 2011 2012 2013 2014
Male Female
Data Notes and Sources:
Median income
represents a key
evaluation of the
economic status of a
group. The Census and
the American
Communities Survey
calculates the median
income for the population
overall, as well as for
specific subgroups of the
population. We present
data for households,
individuals, and families,
with a particular focus on
females and female
headed households and
families. We compare the
data to figures for the U.S.
overall. Here, median
indicates the middle point
in wages, with 50% of
workers making less than
this salary and 50%
making more.
Source: U.S. Census
Bureau, American
Communities Survey
Median Income In The
Past 12 Months (In 2011
Inflation-Adjusted Dollars)
By Sex By Work
Experience In The Past
12 Months For The
Population 15 Years And
Over With Income -
Universe: Population 15
years and over with
income in the past 12
months.
2000: Income Distribution
in 1999 of Households
and Families: 2000
2009: S1903: Median
Income in the Past 12
Months (In 2009 Inflation-
Adjusted Dollars)
2014: S1903: Median
Income in the Past 12
Months (In 2014 Inflation-
Adjusted Dollars)

26
Figure: Median income in the past 12 months for fulltime workers by sex for Orleans Parish
When we disaggregate the gender income gap by race, two patterns emerge. First, the wage gap between white woman and white men
is much worse in 2014 than it was pre-Katrina. Indeed, the gap has moved from white women making 95% of what white men make
in 2015 to 79% in 2014. Second, the gap is much worse between Black women or Hispanic women and White men than for White
women. And, for Black women, the gap is getting worse, moving from 57% in 2005 to 50% in 2014. This means that the median
income for Black women in New Orleans is half of the median income of White men. The gap between Hispanic women and White
men has gotten better, but is still alarming as the gap has moved from 51% in 2005 to 63% in 2014.
Figure: White, Black, and Hispanic women’s income (of full time workers) as a percentage of White men’s income
$36,822
$46,257
$42,889
$36,619
$39,957
$44,402
$42,412
$44,238
$46,008 $45,934
$29,883
$27,862
$30,766
$26,763
$33,232
$35,843$34,459
$36,446 $35,934 $36,367
$25,000
$30,000
$35,000
$40,000
$45,000
$50,000
2005 2006 2007 2008 2009 2010 2011 2012 2013 2014
Male Female
95%
57%
51%
92%
55%
68%
79%
50%
63%
40%
50%
60%
70%
80%
90%
100%
White women Black women Hispanic women
2005 2009 2014
27
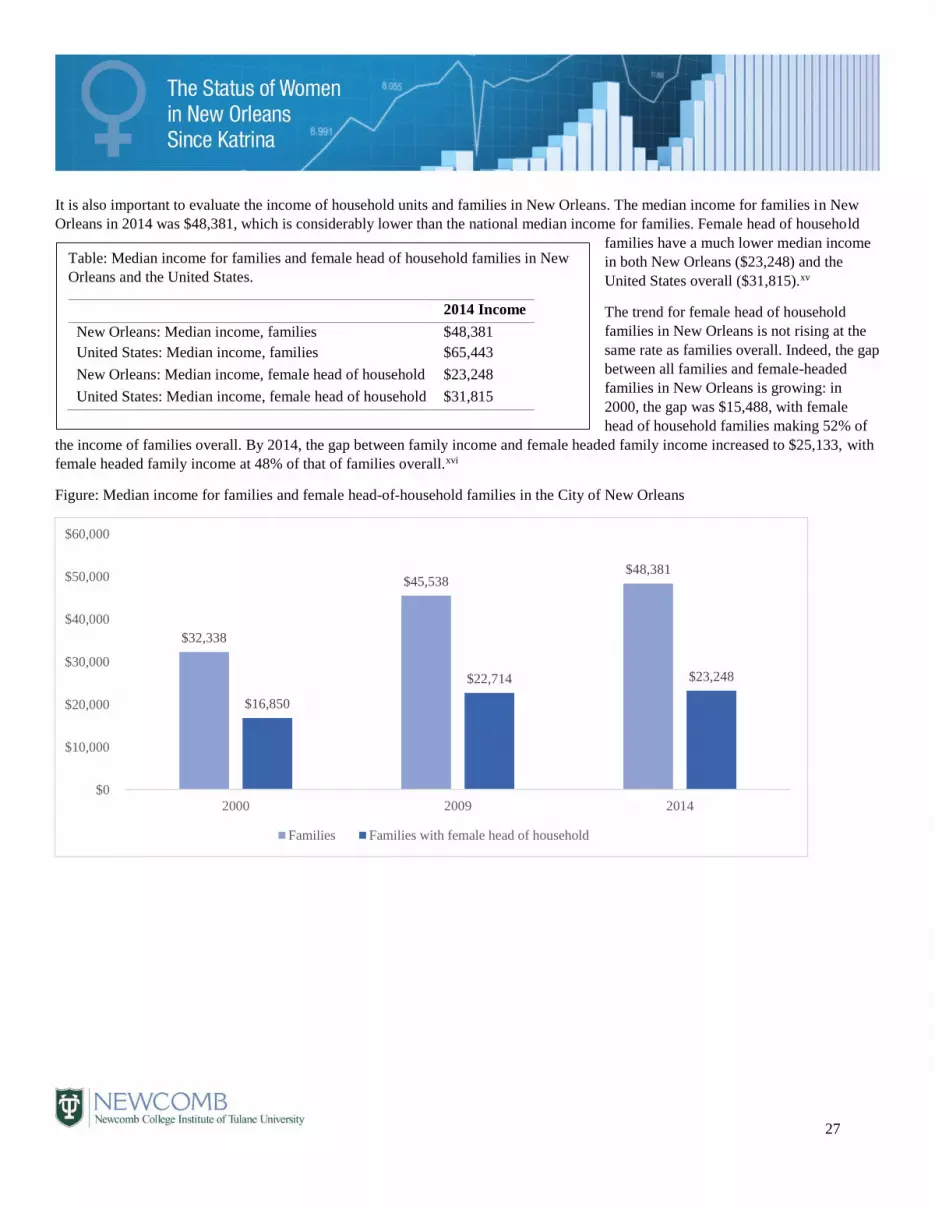
It is also important to evaluate the income of household units and families in New Orleans. The median income for families in New
Orleans in 2014 was $48,381, which is considerably lower than the national median income for families. Female head of household
families have a much lower median income
in both New Orleans ($23,248) and the
United States overall ($31,815).xv
The trend for female head of household
families in New Orleans is not rising at the
same rate as families overall. Indeed, the gap
between all families and female-headed
families in New Orleans is growing: in
2000, the gap was $15,488, with female
head of household families making 52% of
the income of families overall. By 2014, the gap between family income and female headed family income increased to $25,133, with
female headed family income at 48% of that of families overall.xvi
Figure: Median income for families and female head-of-household families in the City of New Orleans
$32,338
$45,538 $48,381
$16,850
$22,714 $23,248
$0
$10,000
$20,000
$30,000
$40,000
$50,000
$60,000
2000 2009 2014
Families Families with female head of household
Table: Median income for families and female head of household families in New
Orleans and the United States.
2014 Income
New Orleans: Median income, families $48,381
United States: Median income, families $65,443
New Orleans: Median income, female head of household $23,248
United States: Median income, female head of household $31,815

28
ECONOMIC
Poverty New Orleans has a poverty problem – the rate of poverty is much higher in the city than for the
United States or the state of Louisiana overall and this has not gotten better since Katrina.xvii New
Orleans poverty is also highly gendered. Women in New Orleans are more likely to live in poverty
now (30%) than they were prior to Katrina (27%), and, as is consistent with statewide and national
patterns, are more likely to experience poverty than are men. In addition, as compared to Louisiana or
the United States overall, women in New Orleans have a much higher poverty rate.
Figure: Poverty rate for men and women in the City of New Orleans, Louisiana, and the United States
Women living in families are not immune from these trends. The rate of families in poverty in New
Orleans in 2014 (at 23%) looks very similar to the rate of poverty prior to Katrina in the city (at 24%
in 2000). As is common in the United States, rates of poverty among families are higher in female
headed households.xviii Indeed, the poverty rate for female head of household families is 20% higher
than families overall in 2000 – and 21% in 2014. Families with children under the age of 18 are also
much more likely to have an income under the poverty line and this disparity increases with female
head of household families with children. In fact, more than half of families with a female head of
household and children under the age of 18 have an income under the federal poverty level in 2014.
22% 23%25%
18%
14%
27%25%
30%
22%
17%
2005 2009 2014 2014 2014
New Orleans Louisiana United States
Male Female
Data Notes and Sources:
Poverty rates are
conservative estimates of
the proportion of the
population living under the
Federal income threshold
for poverty. In 2014, the
federal poverty threshold
for a family of four with
two children was $24,008,
up from $17,463 in 2000.1
We present both
individual poverty
information by gender and
information on families,
including families with a
female head of
household.
Source: U.S. Census
Bureau: DP-3: Profile of
Selected Economic
Characteristics: 2000
U.S. Census Bureau,
American Communities
Survey
2005-2014: S1701:
Poverty Status in the Past
12 Months
2005-2014: S1702:
Poverty Status in the Past
12 Months of Families
Table: Families in poverty by presence of children and female head of household in the City of
New Orleans
2000 2009 2014
Percent of families below poverty level 24% 19% 23%
w/ related children under 18 34% 29% 35%
Percent of female head of household below poverty 43% 39% 44%
w/ related children under 18 61% 48% 56%

29
Unfortunately, the overall poverty rate for families overall and those headed by women, with or without children, in New Orleans are
substantially higher than that of Louisiana or the United States overall. Female head of household families are particularly
disadvantaged in New Orleans: while the poverty rate for families overall in the New Orleans (23%) is 11% higher than U.S. rate
(12%), the poverty rate for female-headed families with children is 15% higher in New Orleans (56%) than the U.S. rate (41%).
Figure: 2014 Poverty rate for families in New Orleans, Louisiana, and the United States overall
When the poverty rate for families is broken down by race and female head of household, several patterns emerge. First, the rate of
poverty for White families is far lower than that of either Black or Hispanic families. At the same time, there are few overall changes
within each group when 2014 poverty rates are
compared to pre-Katrina levels. Female head of
household families experience poverty at higher rates
than all families consistently across racial groups.
The highest rate, with nearly half of families living
under the poverty line, are Black female head of
household families in New Orleans. White female
head of household families has seen an increase in the
poverty rate from 13% of families in 2000 to 17% in
2014. However, the largest increase in the rate of
poverty belongs to Hispanic female head of household
families with a growth of 5% from 2000 (31%) to
2014 (36%).
The overall rate of education is
increasing in New Orleans (see
Education for more information), with
particularly strong growth in the rate
of women holding bachelor’s degrees
or higher. However, when looking at
poverty rates by educational
attainment, it is apparent that a degree
is not a guarantee of upward
economic mobility. As a matter of
fact, while the overall rate of poverty
among families with a bachelor’s
23%
35%
44%
56%
15%
23%
39%
48%
12%18%
31%
41%
Percent of families below
poverty level
w/ related children under 18 Percent of female head of
household below poverty
w/ related children under 18
New Orleans Louisiana United States
Table: Families in poverty by race and female head of household in
the City of New Orleans
2000 2009 2014
Percent of white families below poverty 5% 4% 6%
w/ female head of household 13% 14% 17%
Percent of black families below poverty 31% 26% 32%
w/ female head of household 47% 42% 47%
Percent of Hispanic families below poverty 17% 24% 19%
w/ female head of household 31% 38% 36%
Table: Families and female head of household families in poverty by the level of
education of the head of household in New Orleans
Total Households Female Head of Household
2005 2009 2014 2005 2009 2014
Less than high school graduate 45% 38% 43% 58% 52% 60%
High school graduate1 30% 28% 36% 49% 48% 55%
Some college, associate's degree 19% 18% 24% 39% 37% 42%
Bachelor's degree or higher 4% 3% 4% 8% 9% 13%

30
degree or higher has only increased from 3.6% in 2005 to 4.3% in 2014, the poverty rate for female-headed households with a
bachelor’s degree or higher has increased from 8.1% in 2005 to 12.6% in 2014. Thus, while the rate of education among women has
increased – particularly the proportion of the female population with a bachelor’s degree or higher – this increase may not produce the
same economic benefits that it has for women in the past or as it does for men in New Orleans.

31
ECONOMIC
Poverty The number of homeless individuals in New Orleans increased dramatically following Katrina. Since
2007, however, that number has been in decline, moving from a high point of 11,619 in 2007 to 1,221
in 2014. The proportion of women in the homeless population has ranged from 27% in 2011 to 22%
in 2012 to 39% in 2014. Part of the increase in the proportion of women in the homeless population
may be the focus of particular efforts in the city to address homelessness on populations that are more
likely to be male. For example, New Orleans has partnered with Veteran’s Affairs and the U.S.
Department of Housing and Urban Development to end veteran homelessness in New Orleans. The
city accomplished this goal in 2015.xix At the same time, the homeless veteran population in the
United States is predominantly male, so providing services specifically targeted at this population
means that female homeless may not receive that care. Organizations specifically serving homeless
women report consistently high levels of demand.xx
Figure: Number of Homeless Individuals (in or out of shelter) in New Orleans by Year, with data for
female homeless when available
-
2,000
4,000
6,000
8,000
10,000
12,000
14,000
2005 2007 2009 2011 2012 2014
Data Notes and Sources:
Unity of Greater New
Orleans conducts a point-
in-time survey of the
homeless population in
the city. These are their
counts. Prior to 2011, the
number of homeless
females is unavailable.
Source: Unity of Greater
New Orleans
Homelessness in Greater
New Orleans: A Report on
Progress toward Ending
Homelessness
http://unitygno.org/wp-
content/uploads/2012/05/
UNITY-2012-Point-In-
Time-Homeless-Count-
Report.pdf

32
ECONOMIC
Poverty and government services The Supplemental Nutrition Assistance Program (SNAP)xxi provides monthly benefits to low income
households for the purchase of food. Households must meet particularly criteria to receive benefits.
Those receiving Supplemental Security Income or other family-based benefits are eligible to apply, as
are those who fall beneath a particular income threshold. In 2015-2016, the gross monthly income for
a household of one was
$1,276 and $2,628 for a
household of four.xxii
Nationally, women,
particularly women with
children, are more likely
to participate in SNAP
than are men. This is true
in New Orleans, where
female headed
households are more
likely to receive SNAP benefits, particularly if there are children under the age of 18 in the
household. Indeed, in 2014, while 21% of all households reported receiving SNAP benefits to the
American Communities Survey, more than half – 57% – of female headed households with children
reported receiving the benefit. This rate is an increase from 2005, with 49% of female headed
households received benefits.
When we look at SNAP benefits receipt by the number of benefits allocated overall in Orleans Parish,
the rate has increased since Katrina to match pre-storm rates.xxiii
Figure: Rate of SNAP benefits receipt, by number of individuals in poverty in Orleans Parish.
10%
12%
14%
16%
18%
20%
22%
24%
26%
28%
30%
2005 2006 2007 2008 2009 2010 2011 2012 2013
Data Notes and Sources:
Number of individuals
participating in the
Supplemental Nutrition
Assistance Program
(SNAP) from the U.S.
Census.
The SNAP benefits data
represent the number of
participants in the
Supplemental Nutrition
Assistance Program for
each county divided by
the number of individuals
in poverty in the county.
Source: U.S. Census
Bureau, American
Communities Survey
B22002: Receipt Of Food
Stamps/Snap In The Past
12 Months By Presence
Of Children Under 18
Years By Household Type
For Households -
Universe: Households
U.S. Census Bureau,
Small Area Estimates
Branch
County SNAP benefits
recipients
Table: Percent of households receiving SNAP benefits in the last year
2005 2009 2014
All households 16% 19% 21%
All households with children under 18 32% 30% 36%
Female householder, no children 21% 30% 29%
Female householder with children under 18 49% 44% 57%
33
ECONOMIC
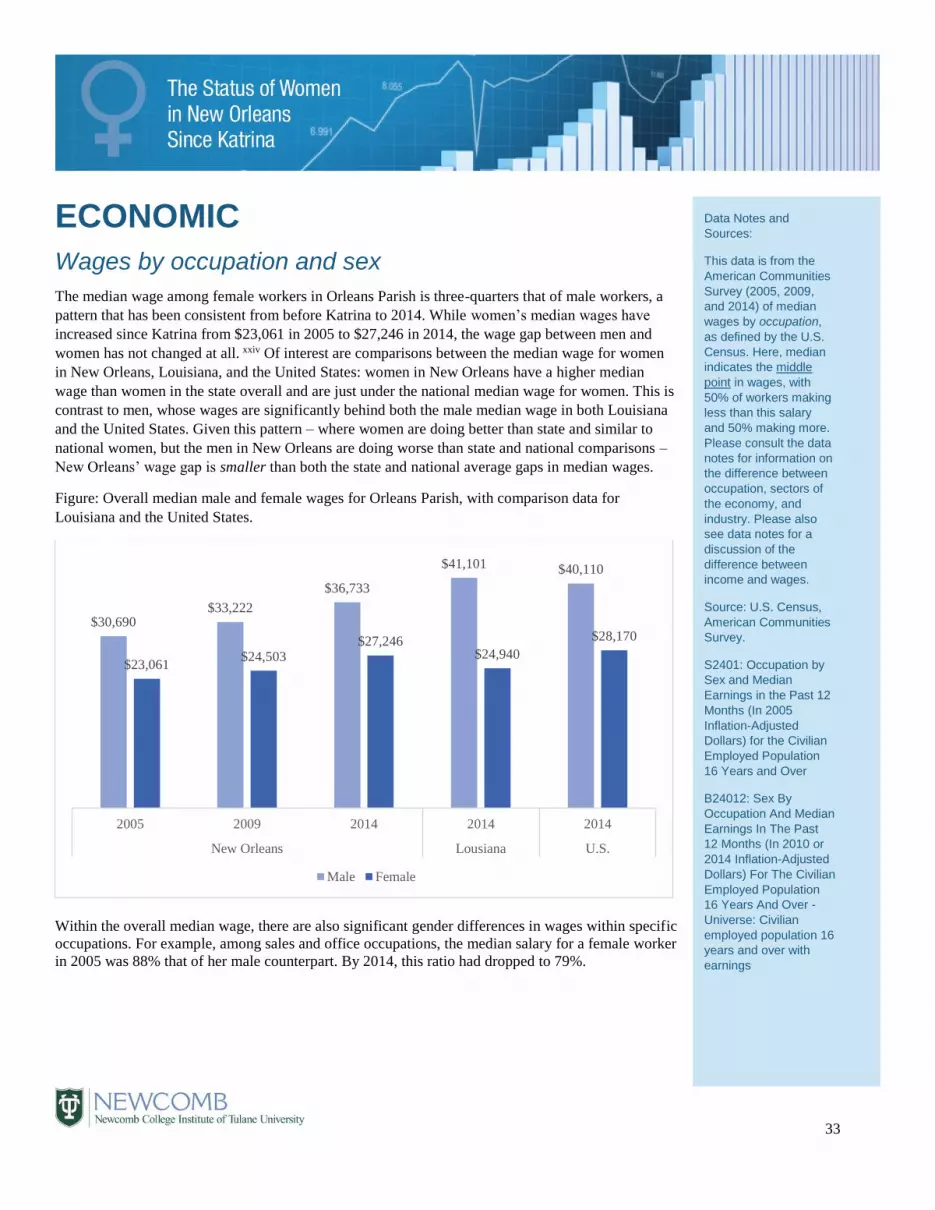
Wages by occupation and sex
The median wage among female workers in Orleans Parish is three-quarters that of male workers, a
pattern that has been consistent from before Katrina to 2014. While women’s median wages have
increased since Katrina from $23,061 in 2005 to $27,246 in 2014, the wage gap between men and
women has not changed at all. xxiv Of interest are comparisons between the median wage for women
in New Orleans, Louisiana, and the United States: women in New Orleans have a higher median
wage than women in the state overall and are just under the national median wage for women. This is
contrast to men, whose wages are significantly behind both the male median wage in both Louisiana
and the United States. Given this pattern – where women are doing better than state and similar to
national women, but the men in New Orleans are doing worse than state and national comparisons –
New Orleans’ wage gap is smaller than both the state and national average gaps in median wages.
Figure: Overall median male and female wages for Orleans Parish, with comparison data for
Louisiana and the United States.
Within the overall median wage, there are also significant gender differences in wages within specific
occupations. For example, among sales and office occupations, the median salary for a female worker
in 2005 was 88% that of her male counterpart. By 2014, this ratio had dropped to 79%.
$30,690$33,222
$36,733
$41,101 $40,110
$23,061$24,503
$27,246$24,940
$28,170
2005 2009 2014 2014 2014
New Orleans Lousiana U.S.
Male Female
Data Notes and
Sources:
This data is from the
American Communities
Survey (2005, 2009,
and 2014) of median
wages by occupation,
as defined by the U.S.
Census. Here, median
indicates the middle
point in wages, with
50% of workers making
less than this salary
and 50% making more.
Please consult the data
notes for information on
the difference between
occupation, sectors of
the economy, and
industry. Please also
see data notes for a
discussion of the
difference between
income and wages.
Source: U.S. Census,
American Communities
Survey.
S2401: Occupation by
Sex and Median
Earnings in the Past 12
Months (In 2005
Inflation-Adjusted
Dollars) for the Civilian
Employed Population
16 Years and Over
B24012: Sex By
Occupation And Median
Earnings In The Past
12 Months (In 2010 or
2014 Inflation-Adjusted
Dollars) For The Civilian
Employed Population
16 Years And Over -
Universe: Civilian
employed population 16
years and over with
earnings

34
Table: Median wage for female workers as compared to male median wage, by occupation
2005 2010 2014
Overall median wage 75% 74% 74%
Professional 78% 74% 72%
Service occupations 72% 80% 73%
Sales and office occupations 88% 71% 79%
Natural resources, construction, and maintenance occupationsxxv -- 81% 68%
Production, transportation, and material moving occupations 54% 63% 67%
When we examine the ratio of female to male wages in more detailed categories, women’s median wage is higher than men’s median
wage in management, business, and financial services, and near equal in office and administrative support. At the low end of the scale,
women’s median wage is 37% that of men in construction and related occupations, with women’s median wage a low $9,330. At the
same time, in health diagnosing and treating (i.e. doctors and specialists), women’s median wage is less than 41% of men’s wage. This
difference is particularly striking, given that the median wage for men is over $100,000, and $41,422 for women
Table: 2014 median wage and women’s representation in occupation by those occupations with 10,000 or more employees
Median
wage
Male median
wage
Female median
wage
Female % of male
wage
All employed individuals 16+ $26,233 $30,690 $23,061 75%
Management and professional $40,538 $48,807 $38,224 78%
- Management, business, and financial $42,302 $41,841 $44,536 106%
Professional and related occupations: $39,492 $52,305 $37,397 71%
- Education, training, and library $35,316 $44,135 $29,670 67%
- Health diagnosing and treating
practitioners
$47,996 $100,000+ $41,422 41% (or less)xxvi
Service occupations: $16,025 $20,997 $15,140 72%
- Food preparation and serving $12,988 $15,152 $11,635 77%
Sales and office occupations $22,314 $23,915 $21,157 88%
- Sales $20,603 $22,349 $12,477 56%
- Office and administrative support $23,131 $24,784 $22,547 91%
Construction, extraction, maintenance, and
repair
$23,843 $25,156 $9,330 37%
Production, transportation, and material
moving
$25,408 $30,811 $16,662 54%
35
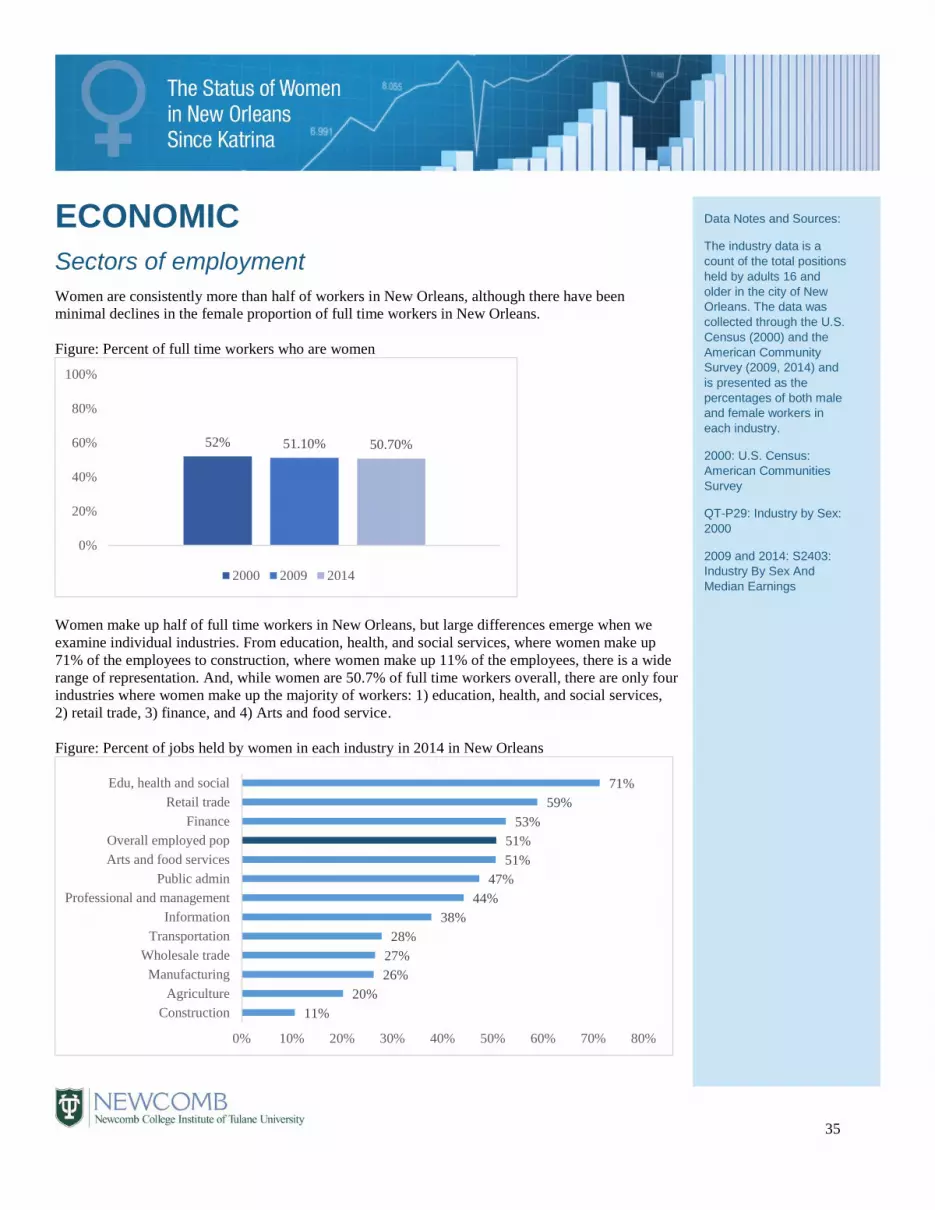
ECONOMIC
Sectors of employment Women are consistently more than half of workers in New Orleans, although there have been
minimal declines in the female proportion of full time workers in New Orleans.
Figure: Percent of full time workers who are women
Women make up half of full time workers in New Orleans, but large differences emerge when we
examine individual industries. From education, health, and social services, where women make up
71% of the employees to construction, where women make up 11% of the employees, there is a wide
range of representation. And, while women are 50.7% of full time workers overall, there are only four
industries where women make up the majority of workers: 1) education, health, and social services,
2) retail trade, 3) finance, and 4) Arts and food service.
Figure: Percent of jobs held by women in each industry in 2014 in New Orleans
52% 51.10% 50.70%
0%
20%
40%
60%
80%
100%
2000 2009 2014
11%
20%
26%
27%
28%
38%
44%
47%
51%
51%
53%
59%
71%
0% 10% 20% 30% 40% 50% 60% 70% 80%
Construction
Agriculture
Manufacturing
Wholesale trade
Transportation
Information
Professional and management
Public admin
Arts and food services
Overall employed pop
Finance
Retail trade
Edu, health and social
Data Notes and Sources:
The industry data is a
count of the total positions
held by adults 16 and
older in the city of New
Orleans. The data was
collected through the U.S.
Census (2000) and the
American Community
Survey (2009, 2014) and
is presented as the
percentages of both male
and female workers in
each industry.
2000: U.S. Census:
American Communities
Survey
QT-P29: Industry by Sex:
2000
2009 and 2014: S2403:
Industry By Sex And
Median Earnings
36
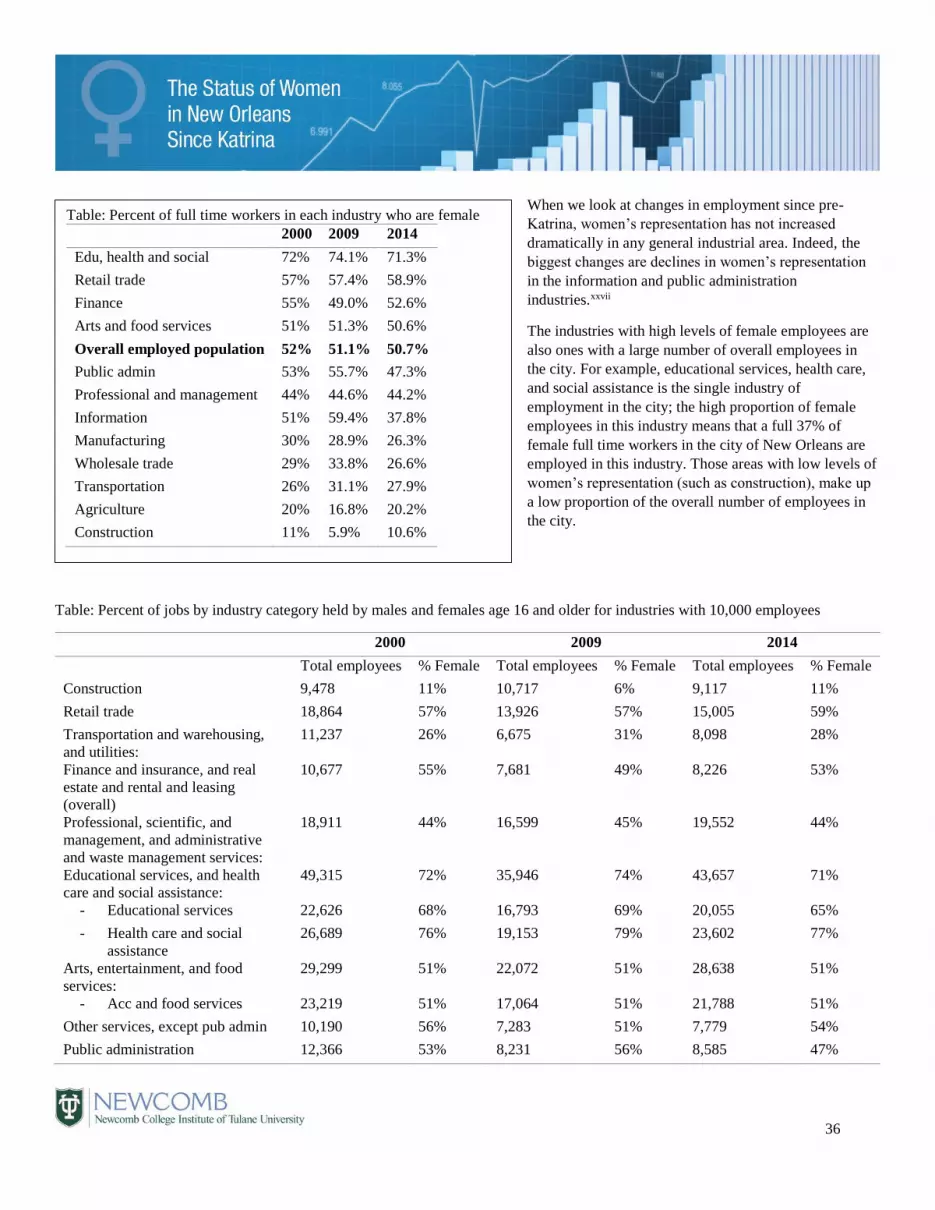
When we look at changes in employment since pre-
Katrina, women’s representation has not increased
dramatically in any general industrial area. Indeed, the
biggest changes are declines in women’s representation
in the information and public administration
industries.xxvii
The industries with high levels of female employees are
also ones with a large number of overall employees in
the city. For example, educational services, health care,
and social assistance is the single industry of
employment in the city; the high proportion of female
employees in this industry means that a full 37% of
female full time workers in the city of New Orleans are
employed in this industry. Those areas with low levels of
women’s representation (such as construction), make up
a low proportion of the overall number of employees in
the city.
Table: Percent of jobs by industry category held by males and females age 16 and older for industries with 10,000 employees
2000 2009 2014
Total employees % Female Total employees % Female Total employees % Female
Construction 9,478 11% 10,717 6% 9,117 11%
Retail trade 18,864 57% 13,926 57% 15,005 59%
Transportation and warehousing,
and utilities:
11,237 26% 6,675 31% 8,098 28%
Finance and insurance, and real
estate and rental and leasing
(overall)
10,677 55% 7,681 49% 8,226 53%
Professional, scientific, and
management, and administrative
and waste management services:
18,911 44% 16,599 45% 19,552 44%
Educational services, and health
care and social assistance:
49,315 72% 35,946 74% 43,657 71%
- Educational services 22,626 68% 16,793 69% 20,055 65%
- Health care and social
assistance
26,689 76% 19,153 79% 23,602 77%
Arts, entertainment, and food
services:
29,299 51% 22,072 51% 28,638 51%
- Acc and food services 23,219 51% 17,064 51% 21,788 51%
Other services, except pub admin 10,190 56% 7,283 51% 7,779 54%
Public administration 12,366 53% 8,231 56% 8,585 47%
Table: Percent of full time workers in each industry who are female
2000 2009 2014
Edu, health and social 72% 74.1% 71.3%
Retail trade 57% 57.4% 58.9%
Finance 55% 49.0% 52.6%
Arts and food services 51% 51.3% 50.6%
Overall employed population 52% 51.1% 50.7%
Public admin 53% 55.7% 47.3%
Professional and management 44% 44.6% 44.2%
Information 51% 59.4% 37.8%
Manufacturing 30% 28.9% 26.3%
Wholesale trade 29% 33.8% 26.6%
Transportation 26% 31.1% 27.9%
Agriculture 20% 16.8% 20.2%
Construction 11% 5.9% 10.6%
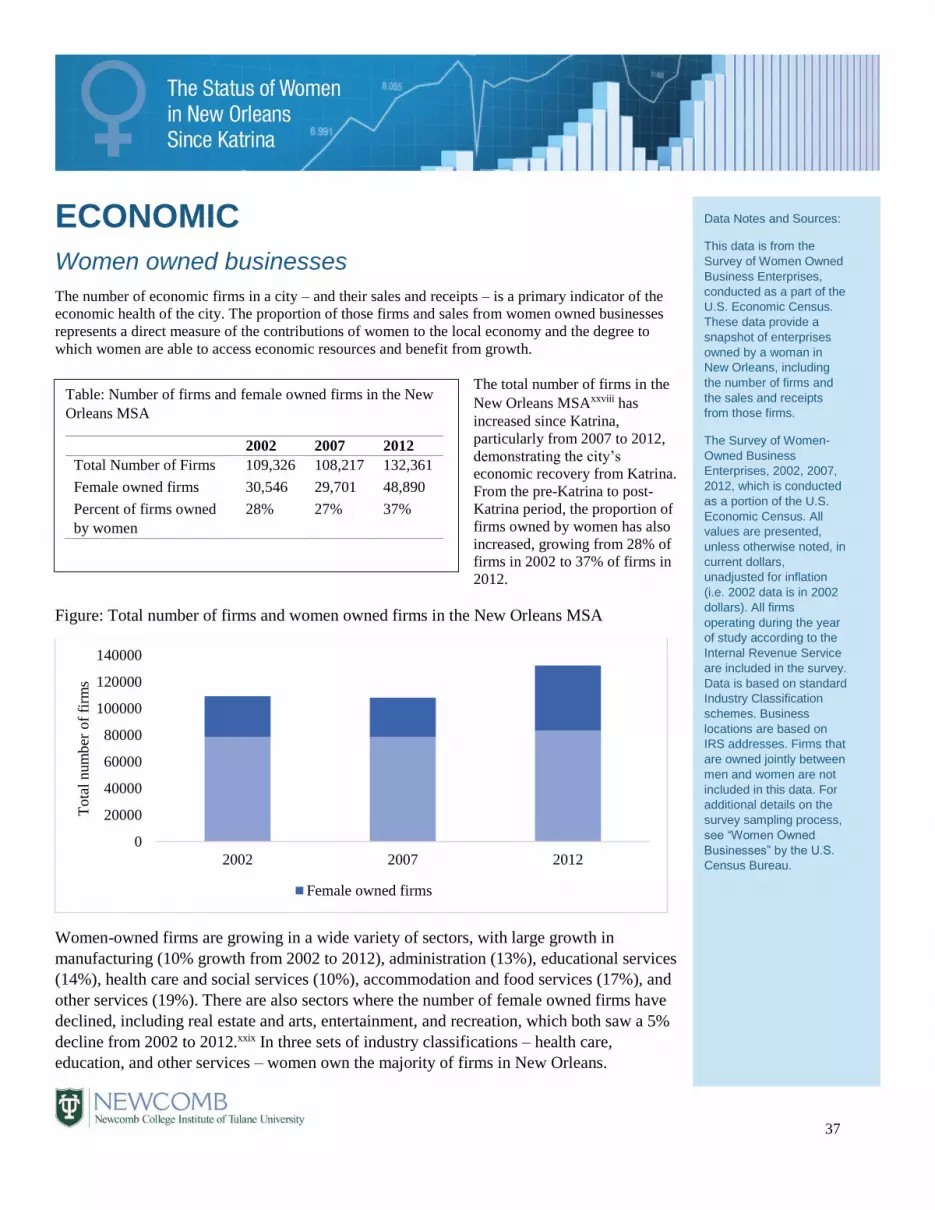
37
ECONOMIC
Women owned businesses
The number of economic firms in a city – and their sales and receipts – is a primary indicator of the
economic health of the city. The proportion of those firms and sales from women owned businesses
represents a direct measure of the contributions of women to the local economy and the degree to
which women are able to access economic resources and benefit from growth.
The total number of firms in the
New Orleans MSAxxviii has
increased since Katrina,
particularly from 2007 to 2012,
demonstrating the city’s
economic recovery from Katrina.
From the pre-Katrina to post-
Katrina period, the proportion of
firms owned by women has also
increased, growing from 28% of
firms in 2002 to 37% of firms in
2012.
Figure: Total number of firms and women owned firms in the New Orleans MSA
Women-owned firms are growing in a wide variety of sectors, with large growth in
manufacturing (10% growth from 2002 to 2012), administration (13%), educational services
(14%), health care and social services (10%), accommodation and food services (17%), and
other services (19%). There are also sectors where the number of female owned firms have
declined, including real estate and arts, entertainment, and recreation, which both saw a 5%
decline from 2002 to 2012.xxix In three sets of industry classifications – health care,
education, and other services – women own the majority of firms in New Orleans.
0
20000
40000
60000
80000
100000
120000
140000
2002 2007 2012
To
tal
num
ber
of
firm
s
Female owned firms
Data Notes and Sources:
This data is from the
Survey of Women Owned
Business Enterprises,
conducted as a part of the
U.S. Economic Census.
These data provide a
snapshot of enterprises
owned by a woman in
New Orleans, including
the number of firms and
the sales and receipts
from those firms.
The Survey of Women-
Owned Business
Enterprises, 2002, 2007,
2012, which is conducted
as a portion of the U.S.
Economic Census. All
values are presented,
unless otherwise noted, in
current dollars,
unadjusted for inflation
(i.e. 2002 data is in 2002
dollars). All firms
operating during the year
of study according to the
Internal Revenue Service
are included in the survey.
Data is based on standard
Industry Classification
schemes. Business
locations are based on
IRS addresses. Firms that
are owned jointly between
men and women are not
included in this data. For
additional details on the
survey sampling process,
see “Women Owned
Businesses” by the U.S.
Census Bureau.
Table: Number of firms and female owned firms in the New
Orleans MSA
2002 2007 2012
Total Number of Firms 109,326 108,217 132,361
Female owned firms 30,546 29,701 48,890
Percent of firms owned
by women
28% 27% 37%

38
Looking at the rate of growth of firms in particular industries, those areas with large numbers of women owned firms are also those
with high growth in the overall number of firms. For example, educational services firms have grown 47% from 2002 to 2012 – much
of this growth is in women-owned firms. Health related industries, which may be the source of economic growth in New Orleans in
the future, also have seen both an increase in the number of firms and an increase in the number of women-owned businesses. Areas
with a decline in the overall number of firms, including wholesale trade, management, and agriculture, forestry, fishing, and hunting,
have very low numbers of female-owned firms.
Table: Number of firms per sector and proportion of firms owned by women by year in the New Orleans MSA
2002 2007 2012
Number of
firms
% owned
by women
Number
of firms
% owned
by women
Number
of firms
% owned
by women
Total for all sectors 109,326 28% 108,217 27% 132,361 37%
Agriculture, forestry, fishing and
hunting
3,418 -- 2,120 9% 2,877 12%
Mining 812 8% 579 19% 832 15%
Utilities 51 12% 75 -- 106 30%
Construction 12,009 6% 16,269 10% 14,147 11%
Manufacturing 1,722 18% 1,488 19% 1,687 28%
Wholesale trade 3,330 15% 2,705 20% 2,792 20%
Retail trade 10,146 33% 8,692 32% 9,909 40%
Transportation and warehousing 5,745 13% 5,249 17% 6,011 16%
Information 1,123 24% 1,195 26% 1,618 29%
Finance and insurance 4,331 17% 3,885 16% 4,097 20%
Real estate and rental and
leasing
9,651 29% 9,304 23% 12,299 25%
Professional, scientific, and
technical services
16,274 27% 14,843 26% 16,594 32%
Management of companies and
enterprises
164 4% 124 -- 143 --
Administrative and support and
waste management and
remediation services
8,050 35% 9,651 37% 12,845 48%
Educational services 1,803 43% 1,749 44% 2,645 57%
Health care and social assistance 9,207 54% 8,293 50% 11,696 64%
Arts, entertainment, and
recreation
4,545 36% 4,697 25% 7,040 32%
Accommodation and food
services
3,848 22% 4,016 27% 5,517 39%
Other services (except public
administration)
13,437 39% 13,657 40% 19,861 59%
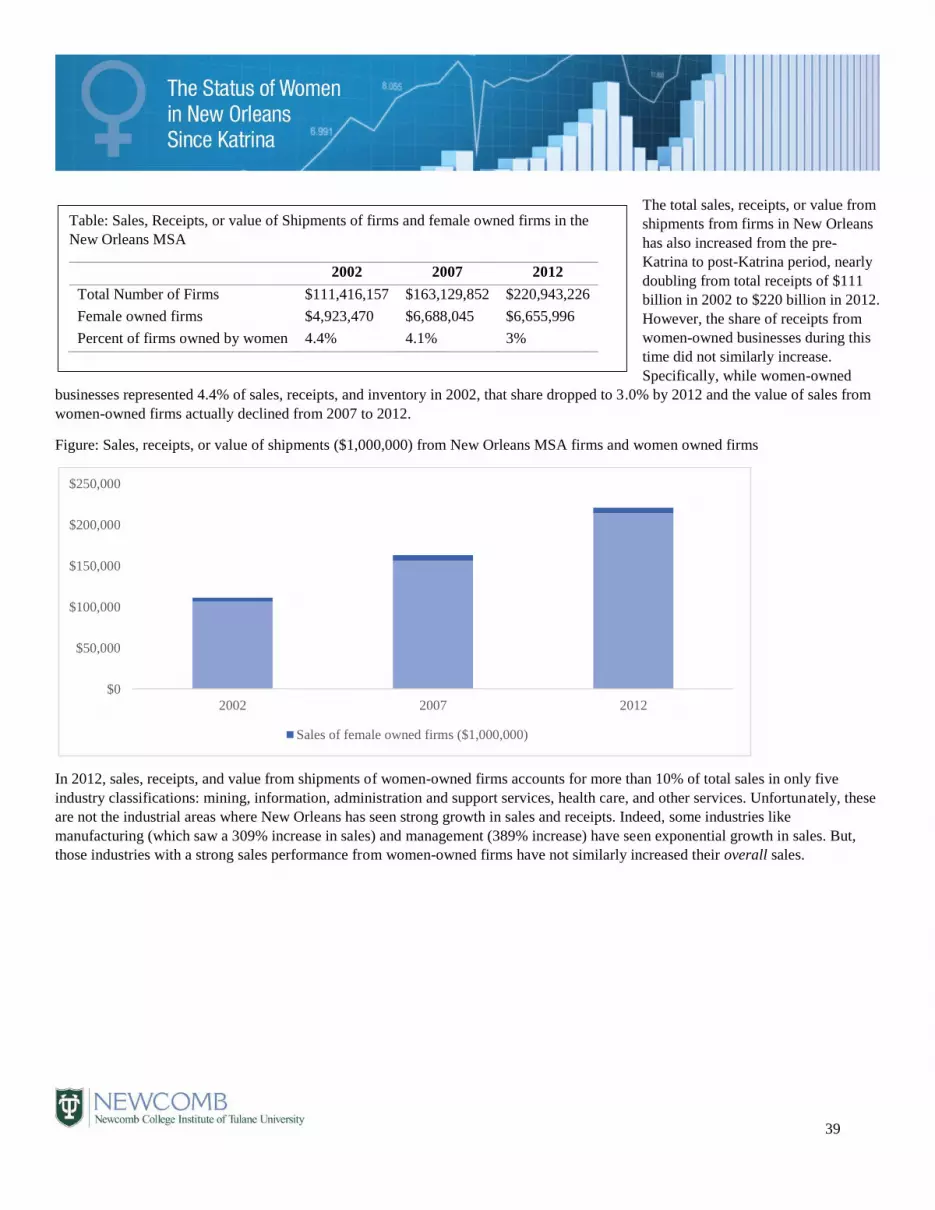
39
The total sales, receipts, or value from
shipments from firms in New Orleans
has also increased from the pre-
Katrina to post-Katrina period, nearly
doubling from total receipts of $111
billion in 2002 to $220 billion in 2012.
However, the share of receipts from
women-owned businesses during this
time did not similarly increase.
Specifically, while women-owned
businesses represented 4.4% of sales, receipts, and inventory in 2002, that share dropped to 3.0% by 2012 and the value of sales from
women-owned firms actually declined from 2007 to 2012.
Figure: Sales, receipts, or value of shipments ($1,000,000) from New Orleans MSA firms and women owned firms
In 2012, sales, receipts, and value from shipments of women-owned firms accounts for more than 10% of total sales in only five
industry classifications: mining, information, administration and support services, health care, and other services. Unfortunately, these
are not the industrial areas where New Orleans has seen strong growth in sales and receipts. Indeed, some industries like
manufacturing (which saw a 309% increase in sales) and management (389% increase) have seen exponential growth in sales. But,
those industries with a strong sales performance from women-owned firms have not similarly increased their overall sales.
$0
$50,000
$100,000
$150,000
$200,000
$250,000
2002 2007 2012
Sales of female owned firms ($1,000,000)
Table: Sales, Receipts, or value of Shipments of firms and female owned firms in the
New Orleans MSA
2002 2007 2012
Total Number of Firms $111,416,157 $163,129,852 $220,943,226
Female owned firms $4,923,470 $6,688,045 $6,655,996
Percent of firms owned by women 4.4% 4.1% 3%

40
Table: Total sales, receipts, or value of shipments by sector and proportion by women owned firmsxxx
2002 2007 2012
Total sales
($1000)
% by
women
owned
firms
Total sales
($1000)
% by
women
owned
firms
Total sales
($1000)
% by
women
owned
firms
Total for all sectors 111,416,157 4% 163,129,852 4% 220,943,226 3%
Agriculture, forestry,
fishing and hunting
132,091 -- 95,527 10% 189,574 7%
Mining 5,278,899 1% 8,870,369 -- 1,216,179 14%
Utilities 2,442,085 1% 3,515,833 -- 2,818,092 --
Construction 4,620,682 -- 7,426,929 8% 7,151,922 7%
Manufacturing 26,687,384 -- 64,247,976 0% 109,169,721 0%
Wholesale trade 24,754,019 5% 25,386,235 4% 37,695,535 3%
Retail trade 13,229,370 5% 14,744,818 5% 17,496,467 6%
Transportation and
warehousing
3,326,824 8% 4,179,158 8% 6,179,354 8%
Information 2,679,105 -- 2,178,397 8% 2,036,261 14%
Finance and insurance 6,828,597 1% 7,854,928 2% 7,491,616 1%
Real estate and rental and
leasing
2,021,067 -- 2,509,837 6% 2,802,499 8%
Professional, scientific,
and technical services
4,080,128 -- 5,203,882 8% 6,556,397 7%
Management of companies
and enterprises
182,228 -- 298,094 -- 886,364 --
Administrative and support
and waste management and
remediation services
1,998,866 -- 2,665,923 15% 2,517,196 16%
Educational services 1,200,448 -- 1,203,646 3% 1,878,656 4%
Health care and social
assistance
5,693,527 6% 6,452,239 6% 6,739,953 11%
Arts, entertainment, and
recreation
1,641,398 3% 1,325,070 3% 1,609,763 5%
Accommodation and food
services
3,382,552 0% 3,765,687 7% 4,789,969 9%
Other services (except
public administration)
1,217,604 15% 1,204,417 15% 1,715,265 19%
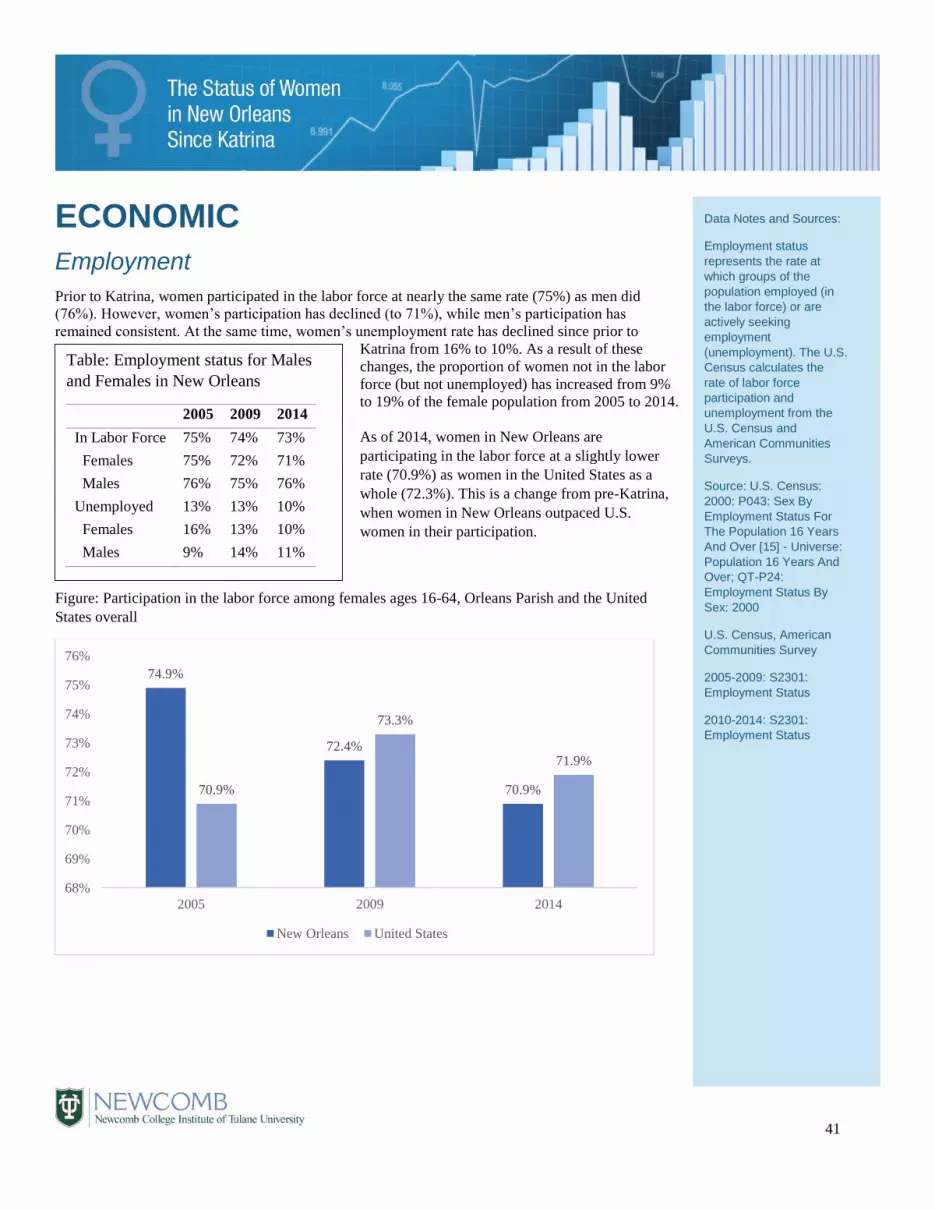
41
ECONOMIC
Employment Prior to Katrina, women participated in the labor force at nearly the same rate (75%) as men did
(76%). However, women’s participation has declined (to 71%), while men’s participation has
remained consistent. At the same time, women’s unemployment rate has declined since prior to
Katrina from 16% to 10%. As a result of these
changes, the proportion of women not in the labor
force (but not unemployed) has increased from 9%
to 19% of the female population from 2005 to 2014.
As of 2014, women in New Orleans are
participating in the labor force at a slightly lower
rate (70.9%) as women in the United States as a
whole (72.3%). This is a change from pre-Katrina,
when women in New Orleans outpaced U.S.
women in their participation.
Figure: Participation in the labor force among females ages 16-64, Orleans Parish and the United
States overall
74.9%
72.4%
70.9%70.9%
73.3%
71.9%
68%
69%
70%
71%
72%
73%
74%
75%
76%
2005 2009 2014
New Orleans United States
Data Notes and Sources:
Employment status
represents the rate at
which groups of the
population employed (in
the labor force) or are
actively seeking
employment
(unemployment). The U.S.
Census calculates the
rate of labor force
participation and
unemployment from the
U.S. Census and
American Communities
Surveys.
Source: U.S. Census:
2000: P043: Sex By
Employment Status For
The Population 16 Years
And Over [15] - Universe:
Population 16 Years And
Over; QT-P24:
Employment Status By
Sex: 2000
U.S. Census, American
Communities Survey
2005-2009: S2301:
Employment Status
2010-2014: S2301:
Employment Status
Table: Employment status for Males
and Females in New Orleans
2005 2009 2014
In Labor Force 75% 74% 73%
Females 75% 72% 71%
Males 76% 75% 76%
Unemployed 13% 13% 10%
Females 16% 13% 10%
Males 9% 14% 11%
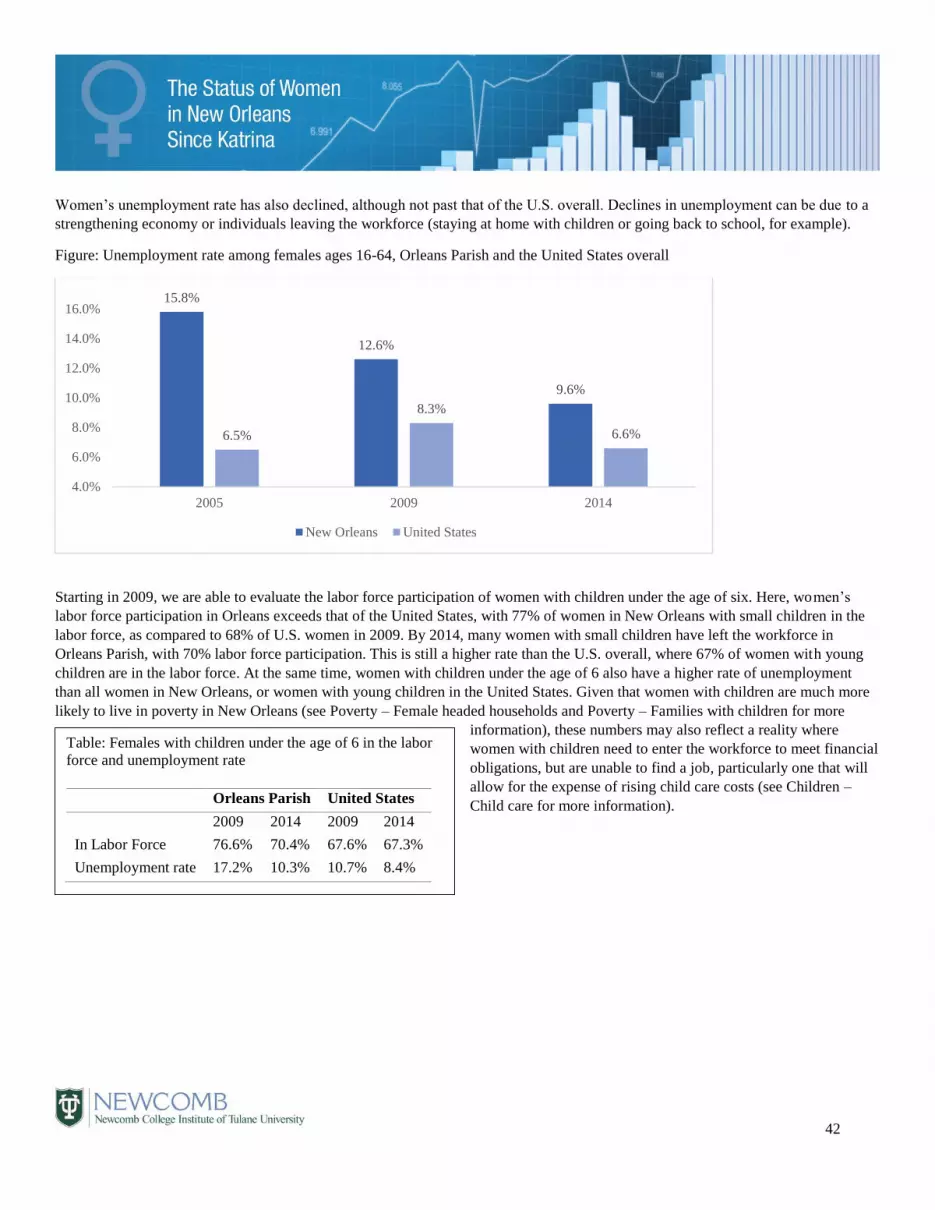
42
Women’s unemployment rate has also declined, although not past that of the U.S. overall. Declines in unemployment can be due to a
strengthening economy or individuals leaving the workforce (staying at home with children or going back to school, for example).
Figure: Unemployment rate among females ages 16-64, Orleans Parish and the United States overall
Starting in 2009, we are able to evaluate the labor force participation of women with children under the age of six. Here, women’s
labor force participation in Orleans exceeds that of the United States, with 77% of women in New Orleans with small children in the
labor force, as compared to 68% of U.S. women in 2009. By 2014, many women with small children have left the workforce in
Orleans Parish, with 70% labor force participation. This is still a higher rate than the U.S. overall, where 67% of women with young
children are in the labor force. At the same time, women with children under the age of 6 also have a higher rate of unemployment
than all women in New Orleans, or women with young children in the United States. Given that women with children are much more
likely to live in poverty in New Orleans (see Poverty – Female headed households and Poverty – Families with children for more
information), these numbers may also reflect a reality where
women with children need to enter the workforce to meet financial
obligations, but are unable to find a job, particularly one that will
allow for the expense of rising child care costs (see Children –
Child care for more information).
15.8%
12.6%
9.6%
6.5%
8.3%
6.6%
4.0%
6.0%
8.0%
10.0%
12.0%
14.0%
16.0%
2005 2009 2014
New Orleans United States
Table: Females with children under the age of 6 in the labor
force and unemployment rate
Orleans Parish United States
2009 2014 2009 2014
In Labor Force 76.6% 70.4% 67.6% 67.3%
Unemployment rate 17.2% 10.3% 10.7% 8.4%

43
HEALTH Basic access to health care facilities
The availability of health care has generally returned to pre-Katrina levels in New Orleans, with the
exception of Hospital beds, which have declined from 4.89 per 1000 residents in 1996 to 2.69 in
2012. One cause for the decline in beds is likely due to closing of Charity Hospital. The rate of
hospital beds per residents has increased since 2015, with the opening of the University Medical
Center, which is not reflected in these numbers.
The supply of physicians in New Orleans has met or exceeded pre-Katrina levels, with the rate of
total physicians, primary care physicians, family practice physicians, and obstetrician/gynecologists
all exceeding pre-Katrina levels.
Table: Availability of Health Care services per Resident for the New Orleans Hospital Service Area
1996 2006 2011/2012xxxi
Acute Care Hospital Beds per 1,000 Residents 4.89 1.63 2.69
Hospital-based Registered Nurses per 1,000 Residents 5.15 2.38 5.68
FTE Hospital Employees per 1,000 Residents 23.2 8.8 18.3
Total Physicians per 100,000 Residents 237.2 167.3 242.6
Primary Care Physicians per 100,000 Residents 64.2 50.2 72.1
Family Practice Physicians per 100,000 Residents 16.1 11.8 17.7
The rate of obstetrician/gynecologists is particularly interesting for the state of women’s health care.
Unfortunately, the pre-Katrina and
post-Katrina numbers are not
directly comparable, as the measure
changes from the rate of
obstetrician/gynecologists per
100,000 residents in 1996 to the rate
per 100,000 women age 15-44 in
2006 and 2011. While access to
specialized women’s health care
may be increasingly available, the
availability of reproductive services
is not necessarily increasing; indeed,
access to abortion services has
declined since prior to Katrina, with
a single abortion provider available
in the New Orleans area.xxxii
Data Notes and Sources:
This is the rate of hospital
beds, nurses, hospital
employees, physicians,
and specialty care
physicians per 100,000
residents in the New
Orleans Hospital Service
Area.
Hospital service
areas (HSAs) are local
health care markets for
hospital care. An HSA is a
collection of ZIP codes
whose residents receive
most of their
hospitalizations from the
hospitals in that area.
HSAs were defined by
assigning ZIP codes to
the hospital area where
the greatest proportion of
their Medicare residents
were hospitalized.
Source:
Dartmouth Atlas of Health
Care
http://www.dartmouthatlas
.org/downloads/reports/Pri
mary_care_report_09091
0.pdf
Figure: Rate of obstetrician/gynecologists in the New
Orleans Hospital Service Region
14.5
38.0
52.7
0.0
10.0
20.0
30.0
40.0
50.0
60.0
1996 2006 2011/2012
per 100,000
Residents
per 100,000 Women Age 15-
44

44
HEALTH
Causes of death and crude death rate
As is the case for the United States overall, the overall death rate has declined since Katrina in New
Orleans. This decline is seen among both men and women, whose overall crude death rate has
declined from 929 deaths per 100,000 in 2004 to 716 in 2014. In 2004, the U.S. female rate was 816;
by 2014, this rate has
declined slightly to 802.
Thus, women in New
Orleans move from a
higher-than-average to a
lower-than-average death
rate from 2004 to 2014.
Breaking the death rate
down by the principal
causes of mortality for
women in Orleans Parish,
heart disease, cancer, and
diabetes related diseases
are the leading causes of
death. All three main
causes of death are on the
decline, with both heart disease and diabetes related diseases dropping precipitously from 2004 to
2015. In all three areas, the rate of mortality in 2014 is lower than the United States overall. Indeed,
only in genital and urinary diseases and infection and parasitic diseases is New Orleans statistically
higher than the overall U.S. rate.xxxiii
Table: Death rate by principal causes for women
New Orleans United States
2004 2009 2014 2014
Heart diseasexxxiv 325.3 262 217.3 246.4
Cancerxxxv 201.4 178.6 171.4 177.8
Diabetesxxxvi 79 31.3 24.4 33.6
Respiratoryxxxvii 57.5 50.9 49.8 81.9
Nervous systemxxxviii 46.4 39 40.4 60.9
Genital and urinaryxxxix 42.2 34.9 33.4 21.4
Infectious and parasitic diseases 41 31.9 36.9 21.2
Mental and behavioral 34.9 23.7 54.8 60.1
External causesxl 30.3 39.6 41.9 41.2
Digestive systemxli 23 23.7 19.4 29.2
Otherxlii 19.9 23.1 10.5 10.8
Data Notes and Sources:
This is the crude death
rate (or the number of
deaths per year per
100,000 in the population)
and the death rate from
various causes by year
and gender from the
Centers for Disease
Control.
Source: United States
Department of Health and
Human Services (US
DHHS), Centers for
Disease Control and
Prevention (CDC),
National Center for Health
Statistics (NCHS),
Compressed Mortality File
(CMF) on CDC WONDER
Online Database.
Figure: Death Rate (per 100,000 people) in Orleans Parish by
gender
929
754 716
1122
926 916
0
200
400
600
800
1000
1200
2004 2009 2014
Female Male

45
HEALTH
Hospital use by Medicare enrollees
Coupled with information on the availability of primary care services in the New Orleans area, this
data provides a snapshot view into the overall health of women in the city and the availability of both
hospital beds in the New Orleans area (which increases the instances of hospital discharge rates) and
Medicare accepting primary care physicians (which decreases hospital discharge rates. Overall, while
the rate of Medicare hospital discharges increased substantially for women from 2000 to 2009, the
rate has now dropped below the pre-Katrina level. While men’s rate of discharge has declined from
2009, it still remains higher than it was prior to Katrina. Both women’s and men’s discharge rates
follow national patterns. Unlike many other health indicators, Orleans Parish is not substantially
worse than the national averages in hospital discharge rates.
Table: Hospital Discharges per 1,000 Medicare Enrollees and by Gender
Hospital Discharge Rate
Women Men
New Orleans Hospital Region US
Overall
New Orleans Hospital Region US
Overall
2004 335 346.4 204.5 231.5
2009 296.9 325.6 186.5 217.3
2012 255.5 294.1 180 199.9
Inpatient Days per Medicare Enrollee
Women Men
New Orleans Hospital Region US
Overall
New Orleans Hospital Region US
Overall
2004 1.95 1.84 1.81 1.84
2009 1.52 1.64 1.39 1.62
2012 1.21 1.42 1.29 1.41
Data Notes and Sources:
This is the reported rate of
hospital visits (as
measured in discharges)
of Medicare Enrollees (per
1000 Medicare Enrollees),
by gender for the years
2000, 2009, and 2012 and
the average number of
inpatient days. Generally,
a hospital discharge
represents the release of
a patient (either living or
dead) who has stayed at
least one night in the
hospital. It is also a
general measurement of
the health of the
population. Here, these
represent Medicare
enrollees who use the
hospital system. Hospital
discharge rates and
length of stays in hospitals
are two important
measures of overall
hospital activities,
including demand for
hospital services and the
ability of primary care
services to provide
treatment to avoid hospital
stays.
Dartmouth Atlas of Health
Care. 100% of Medicare
enrollees age 65-99 with
full Part A entitlement and
no HMO enrollment during
the measurement period.
Age, gender, race, and
eligibility are determined
using the Denominator
file.
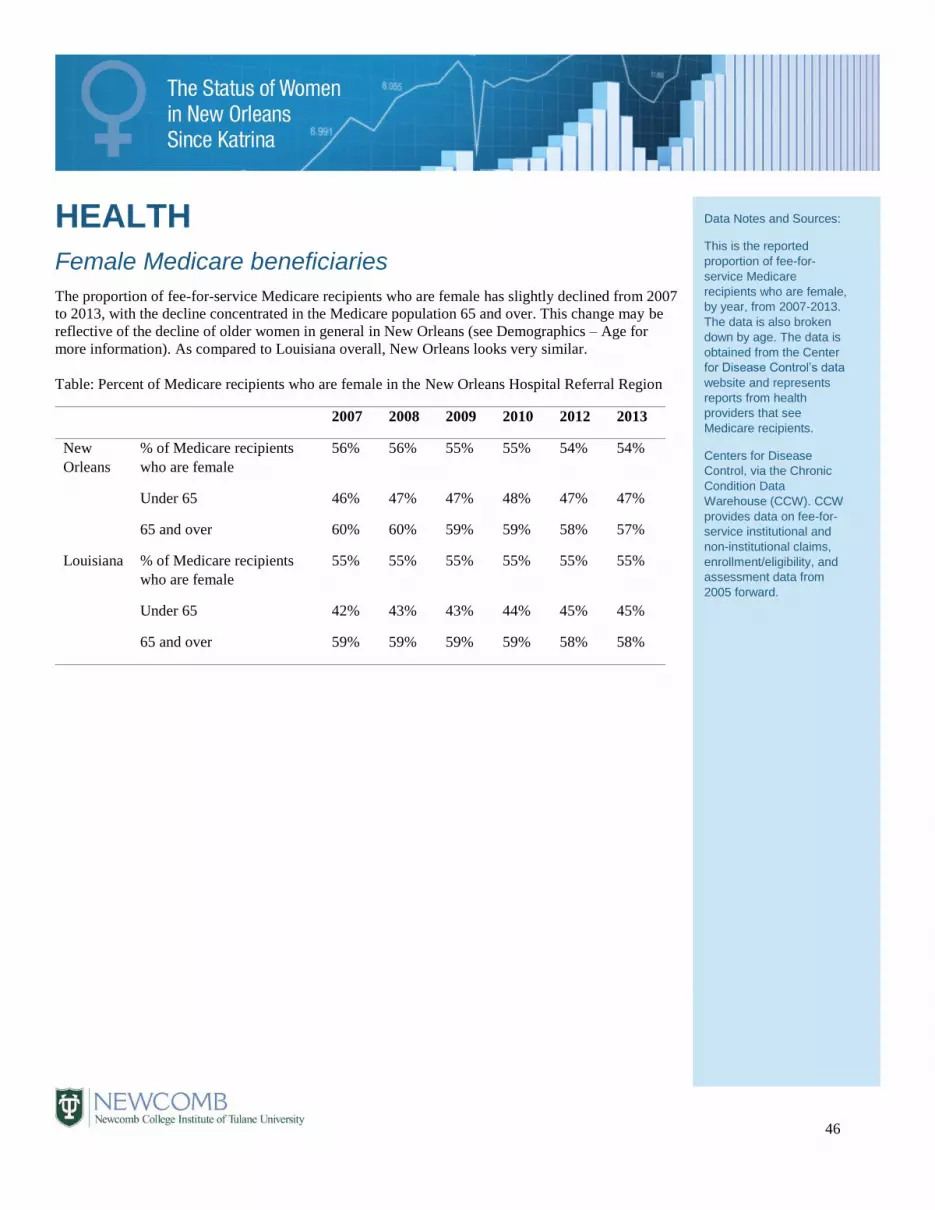
46
HEALTH
Female Medicare beneficiaries
The proportion of fee-for-service Medicare recipients who are female has slightly declined from 2007
to 2013, with the decline concentrated in the Medicare population 65 and over. This change may be
reflective of the decline of older women in general in New Orleans (see Demographics – Age for
more information). As compared to Louisiana overall, New Orleans looks very similar.
Table: Percent of Medicare recipients who are female in the New Orleans Hospital Referral Region
2007 2008 2009 2010 2012 2013
New
Orleans
% of Medicare recipients
who are female
56% 56% 55% 55% 54% 54%
Under 65 46% 47% 47% 48% 47% 47%
65 and over 60% 60% 59% 59% 58% 57%
Louisiana % of Medicare recipients
who are female
55% 55% 55% 55% 55% 55%
Under 65 42% 43% 43% 44% 45% 45%
65 and over 59% 59% 59% 59% 58% 58%
Data Notes and Sources:
This is the reported
proportion of fee-for-
service Medicare
recipients who are female,
by year, from 2007-2013.
The data is also broken
down by age. The data is
obtained from the Center
for Disease Control’s data
website and represents
reports from health
providers that see
Medicare recipients.
Centers for Disease
Control, via the Chronic
Condition Data
Warehouse (CCW). CCW
provides data on fee-for-
service institutional and
non-institutional claims,
enrollment/eligibility, and
assessment data from
2005 forward.

47
HEALTH
Self-reported rates of women’s preventative care visits
Women’s mammogram rates have remained fairly constant across the pre- and post-Katrina period.
xliii This is good news, particularly given the decline in the availability of women’s health services in
the New Orleans area and it suggests that older women are receiving the preventative care that is
recommended. Unfortunately, the decline in pap test rates suggests a different story.xliv Indeed, the
rate of women obtaining a pap test in the prior three years has declined from a high of 91% in 2002 to
a (plateaued) low of 81% in 2008, 2010, and 2012.
Figure: Self-reporting Mammogram and pap tests by residents of Orleans Parish
78%
76%
80%
78%77% 81%
91%
85%85%
81% 81%81%
70%
75%
80%
85%
90%
95%
2002 2004 2006 2008 2010 2012
Data Notes and Sources:
These are aggregated
results from the
Behavioral Risk Factor
Surveillance System,
which asks a
representative sample of
U.S. residents questions
about their health
behavior. We focus on
two primary preventative
health behaviors: the
proportion of adult women
(ages 18+) who have had
a Pap test in the prior
three years and the
proportion of women,
aged 40 or older, who
have had a mammogram
in the prior two years.
Source: Behavioral Risk
Factor Surveillance
System (BRFSS) is an
annual telephone survey
that collect data about
U.S. residents and their
health-related risk
behaviors, chronic health
conditions, and use of
preventive services.
Percentages calculated by
authors.
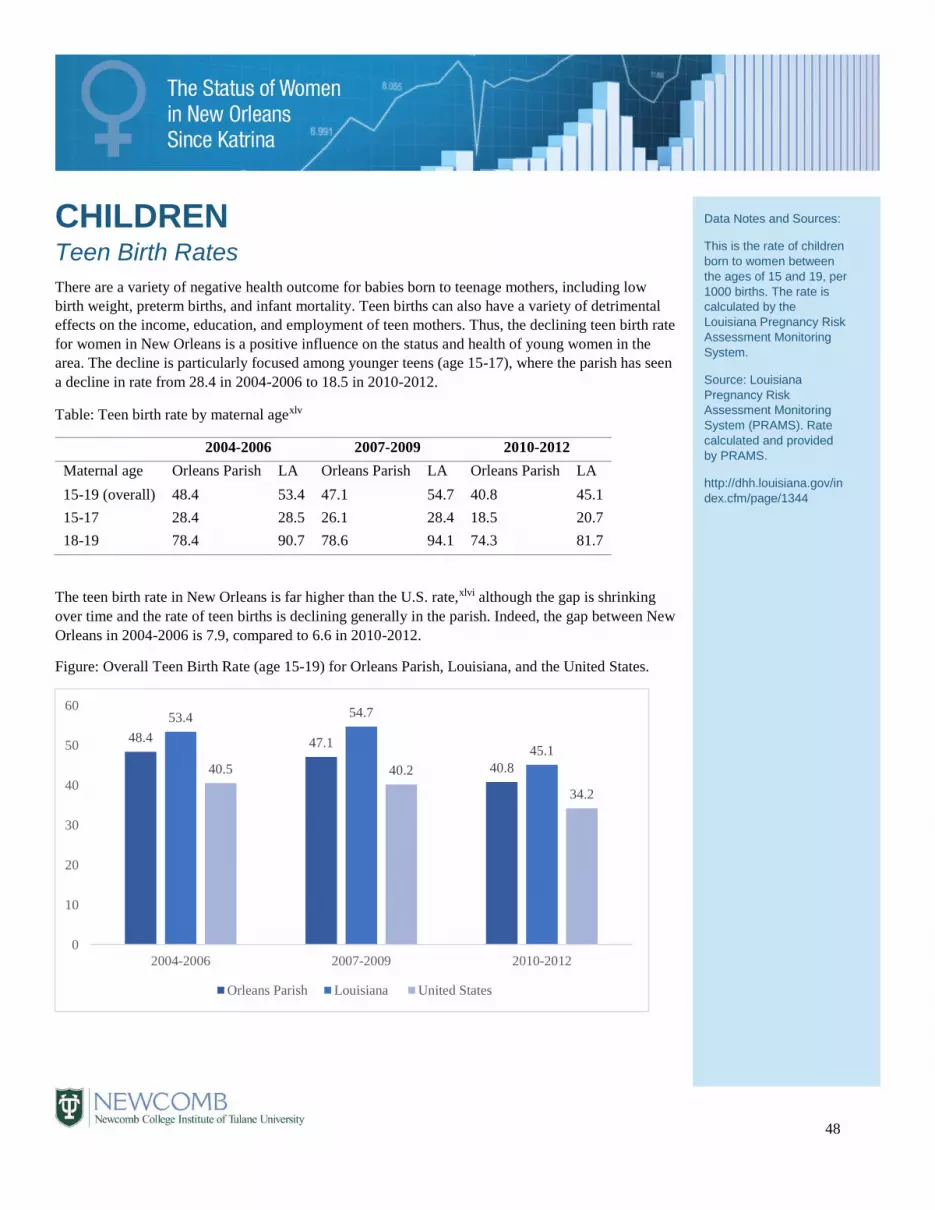
48
CHILDREN Teen Birth Rates
There are a variety of negative health outcome for babies born to teenage mothers, including low
birth weight, preterm births, and infant mortality. Teen births can also have a variety of detrimental
effects on the income, education, and employment of teen mothers. Thus, the declining teen birth rate
for women in New Orleans is a positive influence on the status and health of young women in the
area. The decline is particularly focused among younger teens (age 15-17), where the parish has seen
a decline in rate from 28.4 in 2004-2006 to 18.5 in 2010-2012.
Table: Teen birth rate by maternal agexlv
2004-2006 2007-2009 2010-2012
Maternal age Orleans Parish LA Orleans Parish LA Orleans Parish LA
15-19 (overall) 48.4 53.4 47.1 54.7 40.8 45.1
15-17 28.4 28.5 26.1 28.4 18.5 20.7
18-19 78.4 90.7 78.6 94.1 74.3 81.7
The teen birth rate in New Orleans is far higher than the U.S. rate,xlvi although the gap is shrinking
over time and the rate of teen births is declining generally in the parish. Indeed, the gap between New
Orleans in 2004-2006 is 7.9, compared to 6.6 in 2010-2012.
Figure: Overall Teen Birth Rate (age 15-19) for Orleans Parish, Louisiana, and the United States.
48.4 47.1
40.8
53.4 54.7
45.1
40.5 40.2
34.2
0
10
20
30
40
50
60
2004-2006 2007-2009 2010-2012
Orleans Parish Louisiana United States
Data Notes and Sources:
This is the rate of children
born to women between
the ages of 15 and 19, per
1000 births. The rate is
calculated by the
Louisiana Pregnancy Risk
Assessment Monitoring
System.
Source: Louisiana
Pregnancy Risk
Assessment Monitoring
System (PRAMS). Rate
calculated and provided
by PRAMS.
http://dhh.louisiana.gov/in
dex.cfm/page/1344
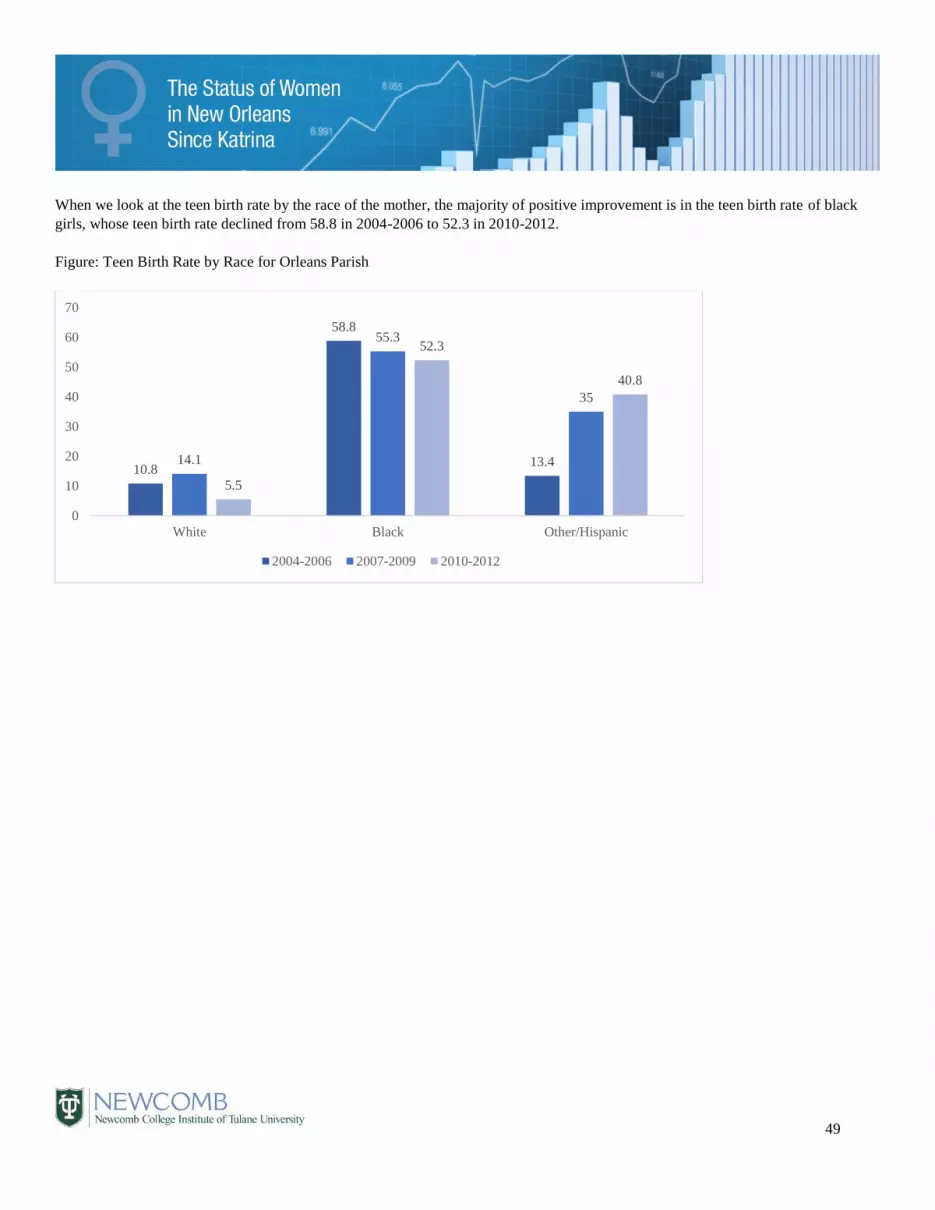
49
When we look at the teen birth rate by the race of the mother, the majority of positive improvement is in the teen birth rate of black
girls, whose teen birth rate declined from 58.8 in 2004-2006 to 52.3 in 2010-2012.
Figure: Teen Birth Rate by Race for Orleans Parish
10.8
58.8
13.414.1
55.3
35
5.5
52.3
40.8
0
10
20
30
40
50
60
70
White Black Other/Hispanic
2004-2006 2007-2009 2010-2012

50
CHILDREN
Prenatal Care
Pregnant women who do not receive appropriate prenatal care can suffer a variety of health risks,
including those that increase the possibility of adverse outcomes for the mother and baby.xlvii
Overall, expectant mothers are seeking and receiving first trimester care at increasing rates, with
more than 86% of mothers receiving care in their first trimester by 2009-2010. However, the rate of
early and adequate care is not similarly increasing. Instead, the general rate is very similar to pre-
Katrina levels.
Figure: Percent of mothers seeking care during pregnancy in Orleans Parish
When we look at the data by race, mothers of all races are increasing their access to first trimester
care, with White women more likely to receive first trimester care than Black mothers across all years
of data. At the same time, the rate of first trimester entry for Black women has increased faster than
that of White women. As a result, the racial gap is smaller in 2009-2010 than in 2004-2006.
Table: Percent with first trimester entry by race in Orleans Parish
2004-2006 2007-2009 2009-2010
Orleans Parish White 92.2 93.8 94.3
Black 77.2 80.1 82.7
Other 85.9 81.8 90.1
All races 80.9 83.4 86.1
Louisiana All races 86.5 87 88.2
80.9
83.4
86.1
83.2
78.9
82.9
2004-2006 2007-2009 2009-2010
First trimester entry (%) Early and adequate (%)
Data Notes and Sources:
This is the rate of
pregnant mothers seeking
care in the first trimester
and seeking early and
adequate prenatal care
(which is a combination of
first trimester entry and
the ratio of actual visits to
expected visits for
pregnant mothers) from
the Louisiana Pregnancy
Risk Assessment
Monitoring System.
Source: Louisiana
Pregnancy Risk
Assessment Monitoring
System (PRAMS). Rate
calculated and provided
by PRAMS.
http://dhh.louisiana.gov/in
dex.cfm/page/1344
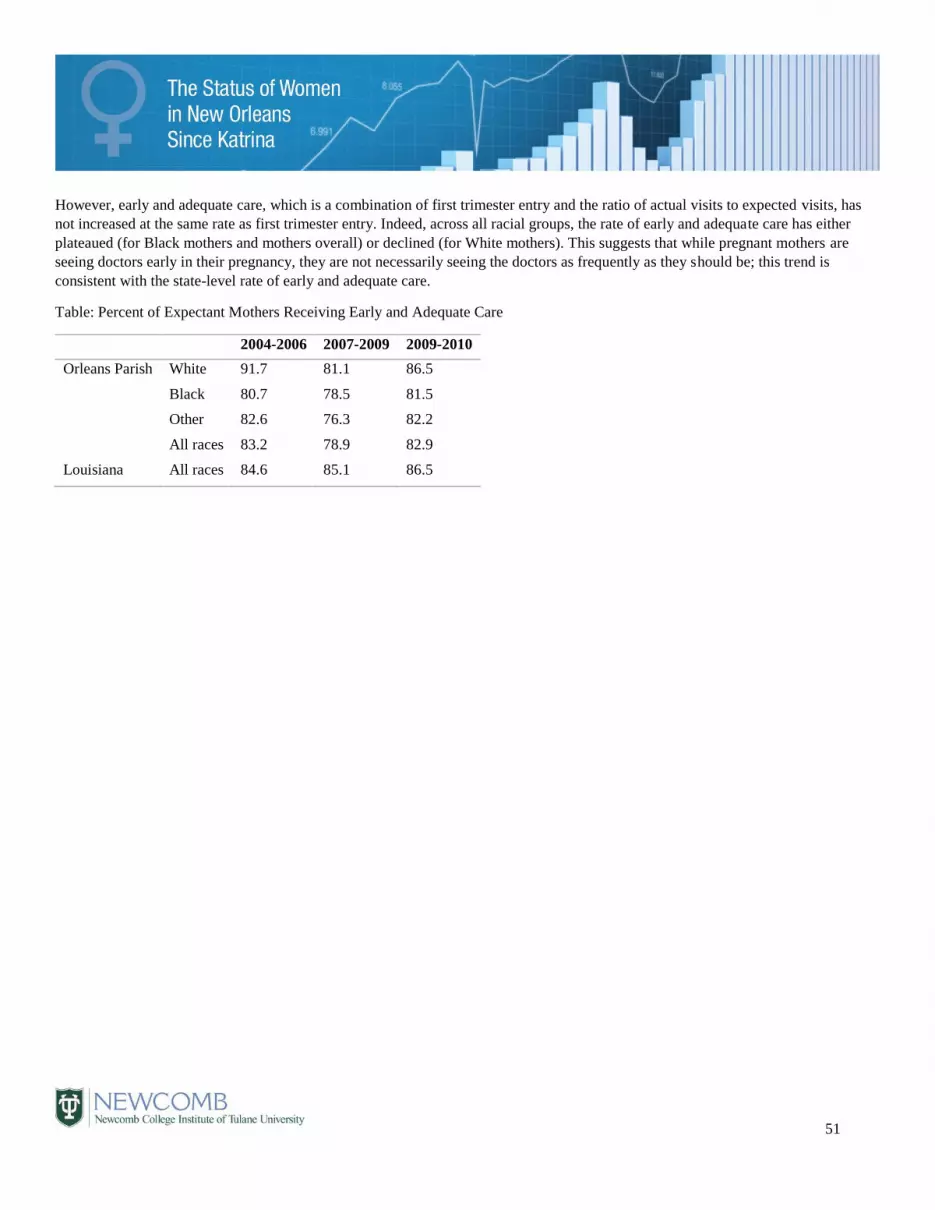
51
However, early and adequate care, which is a combination of first trimester entry and the ratio of actual visits to expected visits, has
not increased at the same rate as first trimester entry. Indeed, across all racial groups, the rate of early and adequate care has either
plateaued (for Black mothers and mothers overall) or declined (for White mothers). This suggests that while pregnant mothers are
seeing doctors early in their pregnancy, they are not necessarily seeing the doctors as frequently as they should be; this trend is
consistent with the state-level rate of early and adequate care.
Table: Percent of Expectant Mothers Receiving Early and Adequate Care
2004-2006 2007-2009 2009-2010
Orleans Parish White 91.7 81.1 86.5
Black 80.7 78.5 81.5
Other 82.6 76.3 82.2
All races 83.2 78.9 82.9
Louisiana All races 84.6 85.1 86.5

52
CHILDREN
Infant mortality
Infant mortality is an important measure of the health of child-bearing mothers and young children.
The rate of infant mortality is declining for Orleans Parish – from a rate of 10.1 deaths of children
under one year of age per 1000 live births in 2004-2006 to 6.5 in 2010-2012. At the same time,
however, Orleans Parish has not improved at the same rate as Louisiana and, since 2010-2012, has
had a higher infant mortality rate.
Figure: Infant mortality rate in Orleans Parish
If we examine infant mortality by race, the gains are particularly concentrated in non-White children.
For example, mortality rate for Black infants has declined from 11.5 (2004-2006) to 7.5 (2010-2012),
while the White infant mortality rate ranges from 4.8 in 2004-2006 to 7.2 in 2007-2009, returning to
4.4 in 2010-2012.
2004-2006 2007-2009 2010-2012
Infant mortality (all races) 10.1 8.6 6.5
White 4.8 7.2 4.4
Black 11.5 9.7 7.5
Other / Hispanic (in 2010-2012)xlviii 12 -- 6.1
Louisiana overall 10.2 9 5
10.1
8.6
6.5
10.2
9
5
2004 2007-2009 2010-2012
Orleans Parish Louisiana
Data Notes and Sources:
Infant mortality is the rate
of deaths of children
under one year of age per
1000 births in Orleans
Parish. The rate is
calculated by the
Louisiana Pregnancy Risk
Assessment Monitoring
System.
Source: PRAMS
http://dhh.louisiana.gov/in
dex.cfm/page/1344

53
CHILDREN
Child care costs, assistance programs, and availability
Child care availability and cost is a key determinant of whether women with children can work
outside the home or rejoin the workforce after childbirth. The cost of child care for an infant in New
Orleans has increased from $4,940 in 2005 to $6,500 in 2012.xlix Adjusted for inflation, the cost of
child care for an infant increased substantially after Katrina, but has remained fairly steady since
2007. The cost of day care for an infant and 3 year old also increased after Katrina and has remained
fairly steady from 2009 to 2012.
Table: Median annual cost of child care in a Class A child care center by year in Orleans Parish
2005 2007 2009 2010 2012
Infant $4,940 $5,720 $6,240 $6,500 $6,500
Infant (in 2012 dollars, adjusted for
inflation)
$5,807 $6,334 $6,678 $6,844 $6,500
Infant & 3 year old $9,360 $10,920 $11,960 $12,310 $12,740
Infant & 3 year old (in 2012 dollars,
adjusted for inflation)
$11,004 $12,092 $12,799 $12,961 $12,740
When these amounts are considered in the context of a fairly stable median income, the post-Katrina
increase in costs is particularly damaging to the prospects of working mothers. Indeed, in 2012, a
working mother making the median income would pay just under one-fifth of her income to provide
child care for an infant and more than one-third of her income to provide child care for an infant and
a 3 year old.
Figure: Child care costs in Orleans Parish as a percentage of median income
16%15%
18% 18%19%
31%29%
34% 34%
37%
2005 2007 2009 2010 2012
Infant Infant & 3 year olds
Data Notes and Sources:
Agenda for Children
conducts a survey of the
average cost of day care
per week, multiplies that
cost by 52, and calculates
the median point of yearly
child care costs.1 Agenda
for Children also provides
the capacity of child care
centers in New Orleans,
which is sourced from the
Louisiana Department of
Children and Family
Services Bureau of
Licensing
Data Source for median
costs: Agenda for
Children's analysis of data
from the “Louisiana Child
Care Market Rate Survey
2005,” “Louisiana Child
Care Market Rate Survey
2007,” “Louisiana Child
Care Market Rate Survey
2009,” “Louisiana Child
Care Market Rate Survey
2010,” and “Louisiana
Child Care Market Rate
Survey 2012,” which were
produced by Care
Solutions, Inc. and the
Louisiana Department of
Children and Family
Services. The full reports
are available from
the Care Solution's web
site.
Data source for number
and capacity of child care
centers: Louisiana
Department of Children
and Family Services,
Bureau of Licensing,
Baton Rouge, LA.
Capacity is the total
number of children that
can be legally cared for in
a particular center.

54
One potential cause of the increase in cost of child care post-Katrina is that child care centers may have closed, thus decreasing the
supply of child care services. While the number of centers did decline precipitously from 2005 (273 centers) to 2006 (74 centers), the
number of children under the age of five also declined during that time.l When the availability of child care is evaluated via seats per
child, the availability of child care has remained fairly stable over time. While child care was less available immediately following
Katrina, the capacity-to-demand has since rebounded (approximately 1 seat per every two children) to a similar rate as seen in 2004.
This suggests that child care, like many other cost-of-living indexes, has increased in value much faster than income in New Orleans.
Indeed, we see that women – and mothers – are less likely to be in the labor force (employed or unemployed) than prior to Katrina
(see Economic – Employment). One potential cause of women’s decreased engagement in the labor force is that the value received
from their labor is declining because of the increased cost of child care.
Table: Number and capacity of child care centers
2005 2006 2007 2008 2009 2010 2011 2012
Number 273 74 105 127 144 154 160 159
Capacity 16,083 5,307 7,177 8,817 9,827 10,942 10,507 10,991
Children under 5 34,101 15,414 12,434 18,711 25,549 22,263 23,809 24,371
Capacity per children under 5li 0.472 0.344 0.577 0.471 0.385 0.491 0.441 0.451
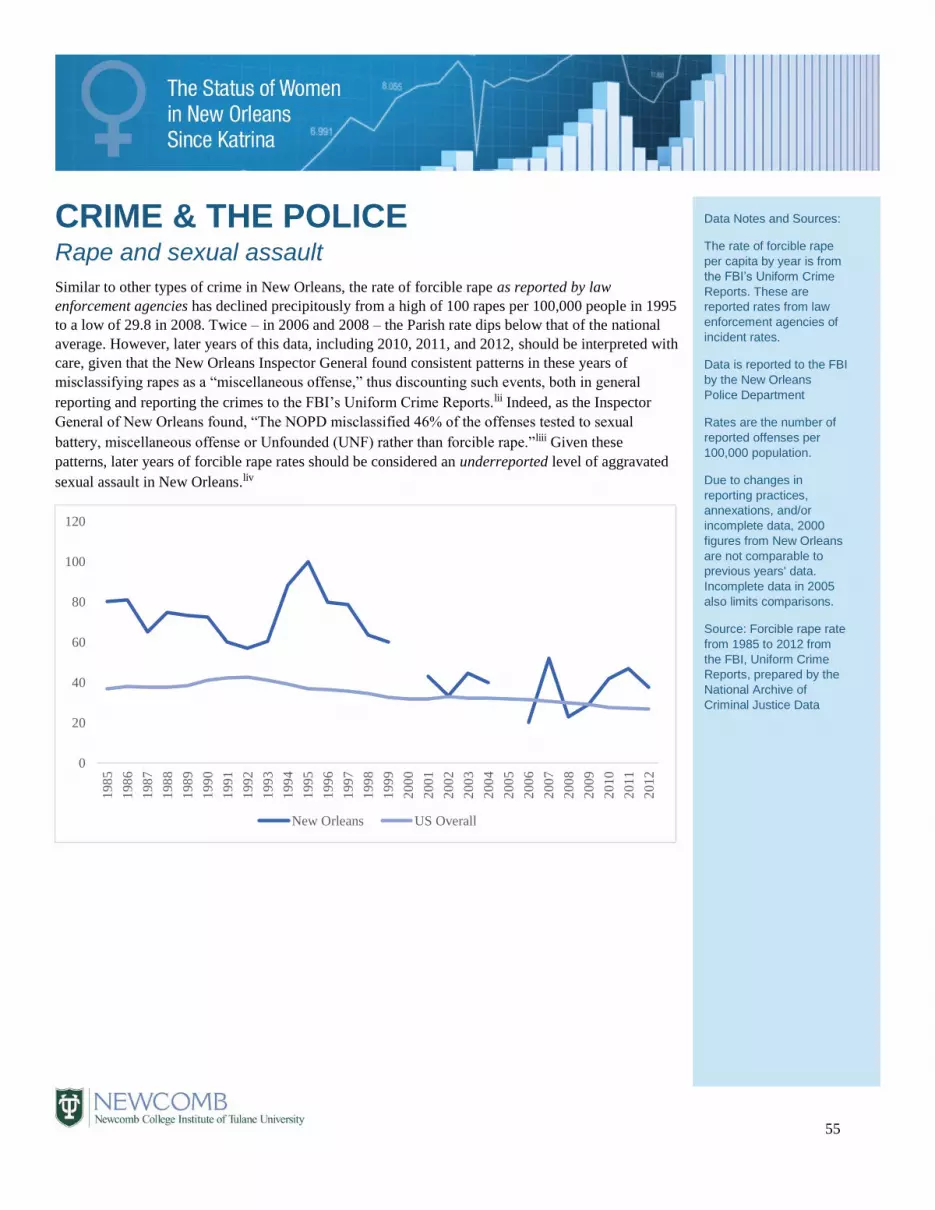
55
CRIME & THE POLICE Rape and sexual assault
Similar to other types of crime in New Orleans, the rate of forcible rape as reported by law
enforcement agencies has declined precipitously from a high of 100 rapes per 100,000 people in 1995
to a low of 29.8 in 2008. Twice – in 2006 and 2008 – the Parish rate dips below that of the national
average. However, later years of this data, including 2010, 2011, and 2012, should be interpreted with
care, given that the New Orleans Inspector General found consistent patterns in these years of
misclassifying rapes as a “miscellaneous offense,” thus discounting such events, both in general
reporting and reporting the crimes to the FBI’s Uniform Crime Reports.lii Indeed, as the Inspector
General of New Orleans found, “The NOPD misclassified 46% of the offenses tested to sexual
battery, miscellaneous offense or Unfounded (UNF) rather than forcible rape.”liii Given these
patterns, later years of forcible rape rates should be considered an underreported level of aggravated
sexual assault in New Orleans.liv
0
20
40
60
80
100
120
198
5
198
6
198
7
198
8
198
9
199
0
199
1
199
2
199
3
199
4
199
5
199
6
199
7
199
8
199
9
200
0
200
1
200
2
200
3
200
4
200
5
200
6
200
7
200
8
200
9
201
0
201
1
201
2
New Orleans US Overall
Data Notes and Sources:
The rate of forcible rape
per capita by year is from
the FBI’s Uniform Crime
Reports. These are
reported rates from law
enforcement agencies of
incident rates.
Data is reported to the FBI
by the New Orleans
Police Department
Rates are the number of
reported offenses per
100,000 population.
Due to changes in
reporting practices,
annexations, and/or
incomplete data, 2000
figures from New Orleans
are not comparable to
previous years' data.
Incomplete data in 2005
also limits comparisons.
Source: Forcible rape rate
from 1985 to 2012 from
the FBI, Uniform Crime
Reports, prepared by the
National Archive of
Criminal Justice Data

56
CRIME & THE POLICE
Domestic Violence
We look, in particular, at domestic violence because of the gendered nature of the crime – women are
overwhelming the victims of domestic violence and intimate partner violence.lv Calls to the police for
service were considered domestic violence-related if they were classified as aggravated battery
domestic, domestic disturbance, homicide domestic, simple battery domestic, simple assault
domestic, or aggravated assault domestic. The overall number of calls, as well as the proportion of all
calls associated with these police codes and the rate per 100,000 inhabitants are presented in the
figure.
Data is cleaned and analyzed in a manner consistent with other crime analysis in the City of New
Orleans, including work by Jeff Asher, whose analysis can be found at nolacrimenews.com.lvi As
Asher notes, Calls for Service is a very good indicator of official Uniform Crime Report numbers. lvii
Thus, examining crimes that women are more likely to be the victims of through Calls for Service
allows us to provide a more detailed evaluation of crime data as it relates to the status of women.
The rate of domestic violence, as measured through calls to the New Orleans Police Department, has
risen substantially from 2011 to 2015 in the raw number of domestic violence calls, increasing from
6,704 in 2011 to 13,910 in 2015. The rate of domestic violence calls has also increased as a share of
total calls, moving from 1 to 3% of all calls. Finally, the rate of domestic violence calls per 100,000
inhabitants has also increased, from to 2,085 calls per 100,000 in 2011 to 3,570 calls per 100,000 in
2015.
Figure: Domestic Violence calls in New Orleans
The outcome of domestic violence instances has also changed from 2011 to 2015. Specifically, the
percent labeled “unfounded” in the disposition report by the involved police officer is declining over
0%
1%
1%
2%
2%
3%
3%
4%
0
2000
4000
6000
8000
10000
12000
14000
16000
18000
20000
2011 2012 2013 2014 2015
Per
cent
of
call
s
Num
ber
of
do
mes
tic
vio
lence
inst
ance
s
Number of domestic violence instances Rate per 100,000 inhabitants
Percent of all police calls
Data Notes and Sources:
The data is derived from
data published by the
NOPD. The authors used
the New Orleans Police
Department’s publicly
available database of all
police actions from 2011
to 2016.
Source: New Orleans
Police Department’s
Crime data. Data is
provided by Orleans
Parish Communication
District (OPCD), the
administrative office of 9-
1-1 for the City of New
Orleans. In the OPCD
system, NOPD may
reclassify or change the
signal type for up to 36
hours after the incident is
marked up.
Population (for rate per
100,000) are from the
U.S. Census for the city of
New Orleans.

57
time, from a high of 46% unfounded in 2011 to 28% in 2015. This change suggests a change in either the types of calls to 911 about
domestic violence or a change in police perceptions of those calls when received.
Figure: Percent of all domestic violence calls labeled “Unfounded” by reporting police officer
There has also been a change in the classification of domestic violence calls. According to the NOPD Policy Manual, “Domestic
violence calls assigned a code 1A priority response may be answered by one officer,” where “All domestic violence calls assigned a
code 2 priority response will be answered with two officers and, whenever possible, a supervisor.”lviii The share of Domestic violence
calls receiving a code 2 priority response has increased from 64% to 70%, also suggesting an increase in the severity of domestic
violence in the city.
Figure: Percent of domestic violence calls classified as 1A, 1B, 2A, and 2B over time.
46%
41%
38%
33%
28%
25%
30%
35%
40%
45%
50%
2011 2012 2013 2014 2015
32% 32%29% 29% 28% 29%
64% 63%67%
70% 71% 70%
20%
30%
40%
50%
60%
70%
80%
2011 2012 2013 2014 2015 2016
Classification 1A/B Classification 2A/B
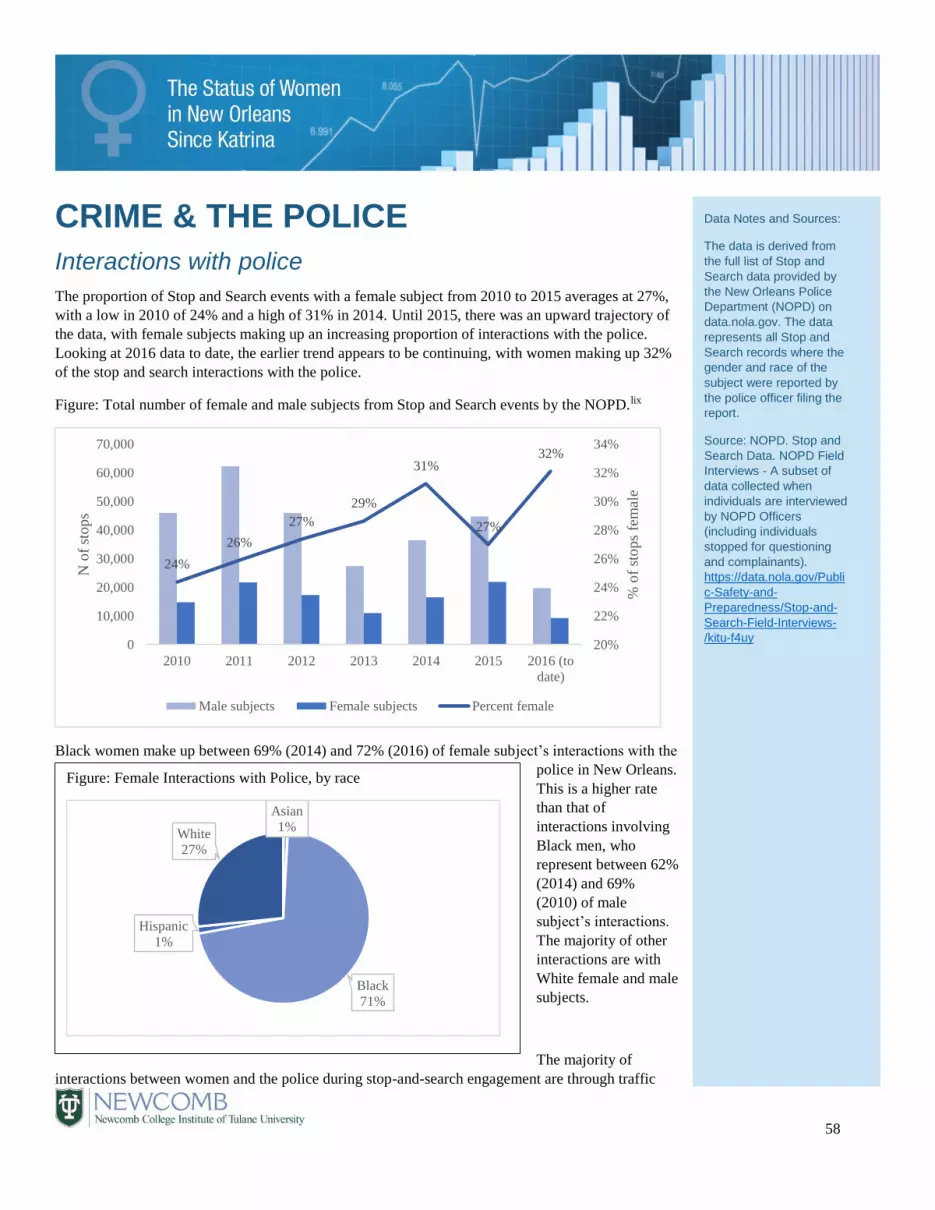
58
CRIME & THE POLICE
Interactions with police
The proportion of Stop and Search events with a female subject from 2010 to 2015 averages at 27%,
with a low in 2010 of 24% and a high of 31% in 2014. Until 2015, there was an upward trajectory of
the data, with female subjects making up an increasing proportion of interactions with the police.
Looking at 2016 data to date, the earlier trend appears to be continuing, with women making up 32%
of the stop and search interactions with the police.
Figure: Total number of female and male subjects from Stop and Search events by the NOPD.lix
Black women make up between 69% (2014) and 72% (2016) of female subject’s interactions with the
police in New Orleans.
This is a higher rate
than that of
interactions involving
Black men, who
represent between 62%
(2014) and 69%
(2010) of male
subject’s interactions.
The majority of other
interactions are with
White female and male
subjects.
The majority of
interactions between women and the police during stop-and-search engagement are through traffic
24%
26%
27%
29%
31%
27%
32%
20%
22%
24%
26%
28%
30%
32%
34%
0
10,000
20,000
30,000
40,000
50,000
60,000
70,000
2010 2011 2012 2013 2014 2015 2016 (to
date)
% o
f st
op
s fe
mal
e
N o
f st
op
s
Male subjects Female subjects Percent female
Data Notes and Sources:
The data is derived from
the full list of Stop and
Search data provided by
the New Orleans Police
Department (NOPD) on
data.nola.gov. The data
represents all Stop and
Search records where the
gender and race of the
subject were reported by
the police officer filing the
report.
Source: NOPD. Stop and
Search Data. NOPD Field
Interviews - A subset of
data collected when
individuals are interviewed
by NOPD Officers
(including individuals
stopped for questioning
and complainants).
https://data.nola.gov/Publi
c-Safety-and-
Preparedness/Stop-and-
Search-Field-Interviews-
/kitu-f4uy
Figure: Female Interactions with Police, by race
Asian
1%
Black
71%
Hispanic
1%
White
27%

59
stops. Actually, the proportion of women’s interactions with the police attributed to traffic stops has increased over time from 44% of
interactions in 2010 to 74% of interactions in 2015. The 2016 data, updated to July 2016, shows that, again, 74% of stop and search
activities involving a female subject were due to traffic stops in the current year. The share of interactions associated with traffic
violations has also increased for male subjects, from 35% of interactions in 2010 to 62% in 2015 (and 62% of interactions to date in
2016), but women are stopped for traffic violations at a statistically higher rate than are men in each year represented.
Figure: Traffic stops as proportion of interactions with police by subject gender over time
Looking again at the traffic stop numbers, both Black and White women are stopped for traffic violations more than their same-race
male counterparts. Indeed, with the exception of a dip for White women in 2013, the share of interactions attributed to traffic stops for
White and Black women are very similar, as are those for Black and White men.
Figure: Traffic stops as proportion of interactions with police by subject gender and race over time
30%
35%
40%
45%
50%
55%
60%
65%
70%
75%
80%
2010 2011 2012 2013 2014 2015 2016 (to date)
Female Male
30%
35%
40%
45%
50%
55%
60%
65%
70%
75%
2010 2011 2012 2013 2014 2015 2016
Black Women Black Men White Women White Men

60
CRIME & THE POLICE
Inmates in Jail
The overall number of prisoners in Orleans Parishlx has declined since prior to Katrina. With this
decline, we also find a reduction in the number of female prisoners. At the same time, the proportion
– with the exception of 2006 – of female prisoners has remained relatively stable, with women
making up 8% of the Orleans Parish prisoners in 2012.
Table: Gender composition and percentage of inmates in jail in Orleans Parish
2000 2004 2006 2009 2012
Number of male inmates 5524 4936 1674 3102 2537
Number of female inmates 553 510 224 350 220
Percent of inmates that are female 9% 9% 12% 10% 8%
Data Notes and Sources:
The annual survey of jails
provides data on jail
populations across the
nation. It should be
consider a “snapshot”
view of the jail population
at the time of the survey.
The gender composition
includes both adult and
juvenile inmates; this total
number is calculated by
the Bureau of Justice
Statistics.
Annual Survey of Jails:
Jurisdiction-Level Data,
2004; Principal
Investigator(s): United
States Department of
Justice. Office of Justice
Programs. Bureau of
Justice Statistics. The
annual survey of jails
provides annual data on
jail populations across the
nation. It should be
consider a “snapshot”
view of the jail population
at the time of the survey.

61
HOUSING
Home ownership and renter occupancy
Owner-occupancy rates are a measure of neighborhood stability and are a means of measuring
property ownership of a group. The measure is particularly important in New Orleans, where owner-
occupied homes suffered more damage from Katrinalxi and the value of real estate has increased
precipitously, particularly over the last five years.lxii The rate of owner-occupancy has remained fairly
steady since pre-Katrina, with 61% of households in 2014 living in homes they own. The rate of
owner-occupancy is much lower for female headed households at 40%.
Figure: % of family group who live in owner occupied housing units in Orleans Parish
The low rate of owner-occupancy for female-headed households is particularly alarming, given the
high rate of poverty in this group (see Economics – Poverty) and the increasing cost of renting in
New Orleans. The U.S. Department of Housing and Urban Development calculates fair market rents,
or a minimum cost for renting in an MSA in each year. The cost of renting in New Orleans has
increased considerably since Katrina, particularly for units with a large number of bedrooms.
59%57%
61%
76% 77% 77%
38%34%
40%
0%
10%
20%
30%
40%
50%
60%
70%
80%
90%
2005 2009 2014
Family households Married-couple family Female household, no husband
Data Notes and Sources:
This is the proportion of
households who live in
“owner-occupied” housing
in Orleans Parish. An
alternative interpretation is
that the remainder of
households in any group
are renters in the parish.
Source: U.S. Census
Bureau, American
Communities Survey
S2501: Occupancy
Characteristics.
Calculations by authors.
Source of Fair Market
Rents is the U.S.
Department of Housing
and Urban Development.
Fair Market Rents (FMRs)
are primarily used to
determine payments for
public housing units and
voucher values. The
current definition used is
the 40th percentile rent,
the dollar amount below
which 40 percent of the
standard-quality rental
housing units are rented.

62
Figure: Fair Market Rents (40% of the standard-quality rental housing cost) for a 1 and 4 bedroom rental unit in the New Orleans
MSA.
The difference in rates between married couples and female-headed households in owner-occupancy is particularly striking when we
look at it broken down by age. In particular, the steady difference of owner-occupancy rates between married couples age 35-64 (80%
in 2014) and female householders age 35-64 (40% in 2014) suggest that middle-age women are not accumulating wealth and are more
susceptible to changes in the rental market than other households.
% of family groups who live in owner occupied housing units by age of householder
2005 2009 2014
Age 15-34
Married couple 41% 56% 39%
Female householder 15% 12% 13%
Age 35-64
Married couple 81% 79% 80%
Female householder 43% 38% 40%
65 years and
older
Married couple 86% 83% 90%
Female householder 72% 69% 76%
$500
$700
$900
$1,100
$1,300
$1,500
2002 2003 2004 2005 2006* 2007 2008 2009 2010 2011 2012 2013 2014 2015 2016
1 bedroom 4 bedroom

63
HOUSING Housing assistance
The availability of housing assistance, either through units or vouchers, declined significantly
following Katrina. The decline was the result of the replacement of public housing projects with
mixed-income units through a HOPE IV grant, combined with a general destruction of the housing
stock, which resulted in an increase in demand for housing, especially affordable housing. These
changes have had a particularly negative effect on the ability of women to find affordable housing in
New Orleans.lxiii In addition, the increased use of housing vouchers within the housing assistance
program have cut the number of women receiving assistance, as this is the type of assistance that has
the lowest proportion of female recipients.lxiv
Table: Provision of public assistance for housing in the New Orleans MSA
2000 2009 2014
Number of units/vouchers 26,594 15,659 23,479
Units to female head of household 23,141 12,156 18,456
-- Units to female head of household with children 13,839 6,994 10,328
Percent female head of household 87% 78% 79%
Percent female head of household with children 52% 45% 44%
Figure: Number of individuals receiving housing assistance in the New Orleans MSA
3453 3503 5023
9302 51638128
13839
6994
10328
0
5000
10000
15000
20000
25000
30000
2000 2009 2014
Other units Female head of household Female head of household w/ children
Data Notes and Sources:
This is the number of
public housing united and
vouchers available in
Orleans Parish, as
reported by the U.S.
Department of Housing
and Urban Development.
Source: U.S. Department
of Housing and Urban
Development
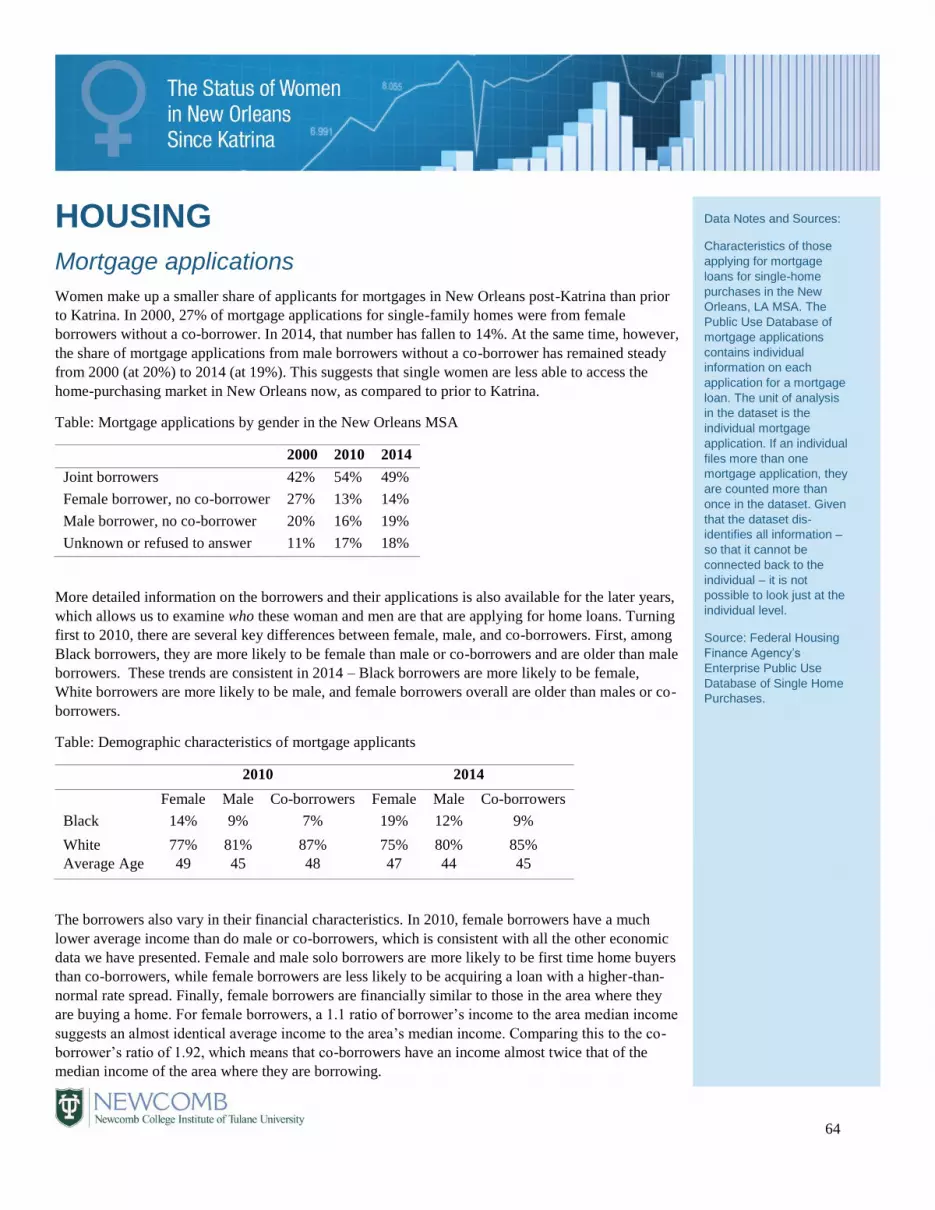
64
HOUSING
Mortgage applications
Women make up a smaller share of applicants for mortgages in New Orleans post-Katrina than prior
to Katrina. In 2000, 27% of mortgage applications for single-family homes were from female
borrowers without a co-borrower. In 2014, that number has fallen to 14%. At the same time, however,
the share of mortgage applications from male borrowers without a co-borrower has remained steady
from 2000 (at 20%) to 2014 (at 19%). This suggests that single women are less able to access the
home-purchasing market in New Orleans now, as compared to prior to Katrina.
Table: Mortgage applications by gender in the New Orleans MSA
2000 2010 2014
Joint borrowers 42% 54% 49%
Female borrower, no co-borrower 27% 13% 14%
Male borrower, no co-borrower 20% 16% 19%
Unknown or refused to answer 11% 17% 18%
More detailed information on the borrowers and their applications is also available for the later years,
which allows us to examine who these woman and men are that are applying for home loans. Turning
first to 2010, there are several key differences between female, male, and co-borrowers. First, among
Black borrowers, they are more likely to be female than male or co-borrowers and are older than male
borrowers. These trends are consistent in 2014 – Black borrowers are more likely to be female,
White borrowers are more likely to be male, and female borrowers overall are older than males or co-
borrowers.
Table: Demographic characteristics of mortgage applicants
2010 2014
Female Male Co-borrowers Female Male Co-borrowers
Black 14% 9% 7% 19% 12% 9%
White 77% 81% 87% 75% 80% 85%
Average Age 49 45 48 47 44 45
The borrowers also vary in their financial characteristics. In 2010, female borrowers have a much
lower average income than do male or co-borrowers, which is consistent with all the other economic
data we have presented. Female and male solo borrowers are more likely to be first time home buyers
than co-borrowers, while female borrowers are less likely to be acquiring a loan with a higher-than-
normal rate spread. Finally, female borrowers are financially similar to those in the area where they
are buying a home. For female borrowers, a 1.1 ratio of borrower’s income to the area median income
suggests an almost identical average income to the area’s median income. Comparing this to the co-
borrower’s ratio of 1.92, which means that co-borrowers have an income almost twice that of the
median income of the area where they are borrowing.
Data Notes and Sources:
Characteristics of those
applying for mortgage
loans for single-home
purchases in the New
Orleans, LA MSA. The
Public Use Database of
mortgage applications
contains individual
information on each
application for a mortgage
loan. The unit of analysis
in the dataset is the
individual mortgage
application. If an individual
files more than one
mortgage application, they
are counted more than
once in the dataset. Given
that the dataset dis-
identifies all information –
so that it cannot be
connected back to the
individual – it is not
possible to look just at the
individual level.
Source: Federal Housing
Finance Agency’s
Enterprise Public Use
Database of Single Home
Purchases.

65
Similar patterns are evident in 2014. Female borrowers have a lower average income than male or co-borrowers. Both female and
male solo borrowers are more likely to be first time home buyers than co-borrowers. For female borrowers, the first time home-buyer
rate has increased from 12% in 2010 to 22% in 2014. The group of home buyers who are receiving a higher-than-normal rate is similar
across borrowing groups and very low. And, again, female borrowers resemble the areas where they are purchasing homes, at least in
income. The ratio of female borrower’s income to the area’s median income is 1.21, as compared to 1.66 for the male borrowers and
1.93 for co-borrowers.
Table: Financial characteristics of mortgage applicants
2010 2014
Female Male Co-
borrowers
Female Male Co-
borrowers
Borrower’s average income $67,476 $103,114 $117,674 $71,326 $97,551 $114,135
First time home buyers 12% 12% 6.50% 22% 21% 17%
Rate spread reported 2% 4% 3% 2% 2% 1.30%
The ratio of borrower’s income to
area median income
1.1 1.68 1.92 1.21 1.66 1.93

66
POLITICS Voter registration and turnout
Women are the majority of registered voters in Orleans Parish across all elections over the 2010-2015
period. Women make up an average of 56% of qualified voters over the 22 elections over that time
period, never falling below 56% of eligible voters.
Women turn out to vote at higher rates than men do in elections across the United States. In Orleans
Parish over the past several elections, women’s rate of turnout is generally higher than men’s, but this
higher rate is largely limited to those elections with national candidates, including Presidential and
Congressional elections.
Men’s and women’s turnout by election
The difference in both the overall level of turnout and the gap between men’s and women’s turnout is
clear when the elections are aggregated by the type of election for those elections between 2010 and
2016.
Average gap between
women’s and men’s
turnout
Average
women's
turnout
National elections 4.5% 42.2%
Statewide elections 0.5% 16.9%
Local only elections 0.3% 15.5%
0%
10%
20%
30%
40%
50%
60%
70%
1-O
ct-1
0
1-J
an-1
1
1-A
pr-
11
1-J
ul-
11
1-O
ct-1
1
1-J
an-1
2
1-A
pr-
12
1-J
ul-
12
1-O
ct-1
2
1-J
an-1
3
1-A
pr-
13
1-J
ul-
13
1-O
ct-1
3
1-J
an-1
4
1-A
pr-
14
1-J
ul-
14
1-O
ct-1
4
1-J
an-1
5
1-A
pr-
15
1-J
ul-
15
1-O
ct-1
5
1-J
an-1
6
1-A
pr-
16
Male turnout Female turnout
Data Notes and Sources:
Louisiana’s Secretary of
State records the gender
and race of elected
officials. These are the
aggregate percentages of
women holding local,
state, and national offices
in Orleans Parish.
Source: State of Louisiana
Secretary of State voting
records

67
POLITICS
Women’s representation in office
Women’s representation in local office has increased since Katrina, although a woman has not held
the office of Mayor, Sheriff, Coroner, or Assessor in New Orleans / Orleans Parish. The increase in
women’s representation is in direct contrast to women’s representation in state and national office,
where women’s representation is declining. These findings are not surprising, given that Louisiana is
currently last in the nation in women’s representation in the state legislature. One potential solution to
the low – and declining – numbers of women in state level office are programs like Ready to Run,
which trains women to run for political office. The Louisiana Legislative Women’s Caucus
Foundation has recently started running these programs for women in the state. lxv
Figure: Percent of locallxvi, statelxvii, and nationallxviii offices held by women in Orleans Parish
Another potential means of measuring women’s political engagement are the number of women
running for political office. Here, we present the percent of candidates for the New Orleans city
council – whether in a primary or general election – who are women by year. The total percent of
candidates who are women in any city council election in New Orleans has increased since Katrina,
suggesting a higher rate of involvement of women in local politics after Katrina.
0%
10%
20%
30%
40%
50%
60%
Local offices State offices National offices
Data Notes and Sources:
The Louisiana Secretary
of State records the
gender and race of all
candidates for office and
elected representatives.
Source: Louisiana ‘s
Secretary of State Elected
Officials of Orleans
Parish. Percentages
calculated by authors
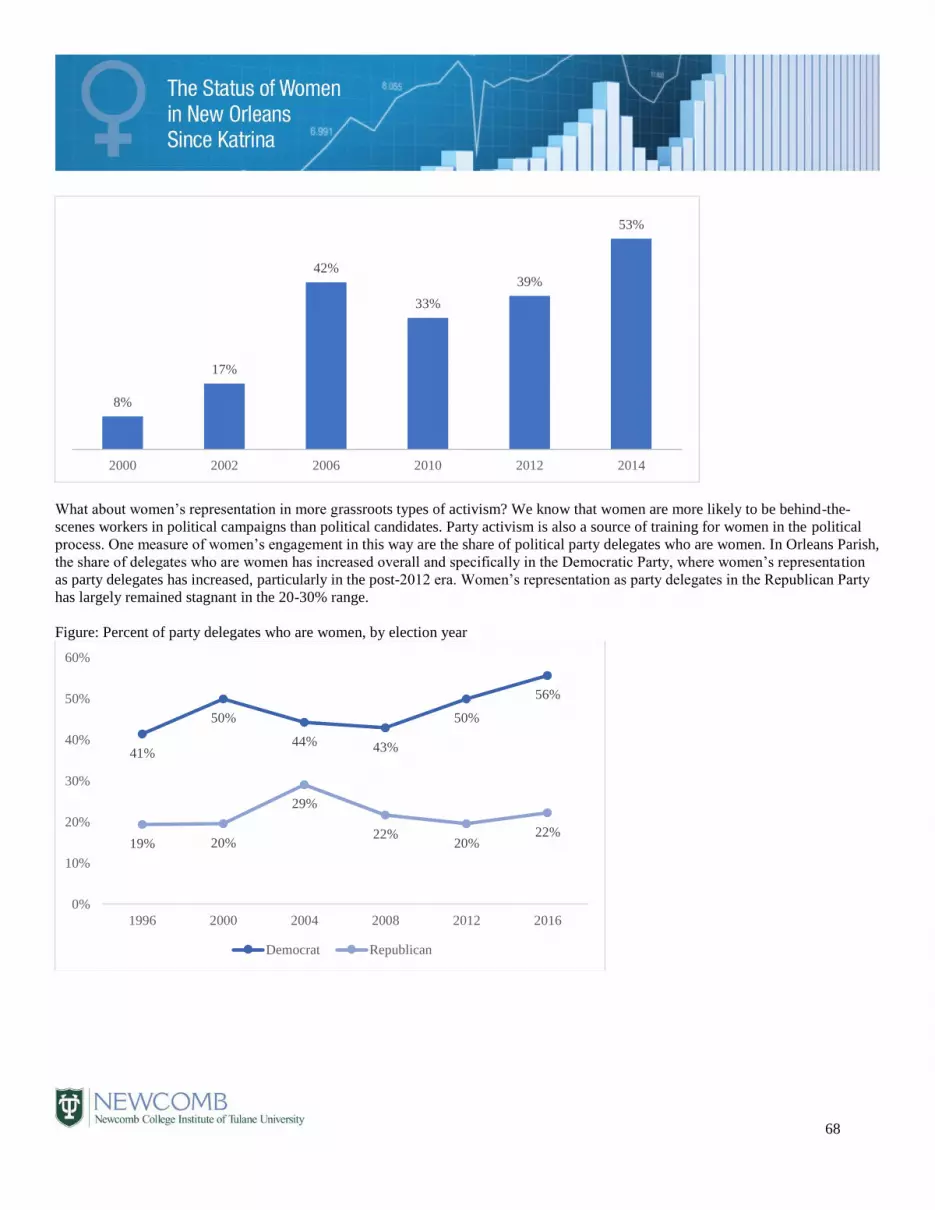
68
What about women’s representation in more grassroots types of activism? We know that women are more likely to be behind-the-
scenes workers in political campaigns than political candidates. Party activism is also a source of training for women in the political
process. One measure of women’s engagement in this way are the share of political party delegates who are women. In Orleans Parish,
the share of delegates who are women has increased overall and specifically in the Democratic Party, where women’s representation
as party delegates has increased, particularly in the post-2012 era. Women’s representation as party delegates in the Republican Party
has largely remained stagnant in the 20-30% range.
Figure: Percent of party delegates who are women, by election year
8%
17%
42%
33%
39%
53%
2000 2002 2006 2010 2012 2014
41%
50%
44% 43%
50%
56%
19% 20%
29%
22%20%
22%
0%
10%
20%
30%
40%
50%
60%
1996 2000 2004 2008 2012 2016
Democrat Republican
69
DATA NOTES:
Sex and Gender: The two are not interchangeable. Sex is a biological marker, gender is a social construction.
We use the categories provided by the organization or agency providing the data. In general, most of the data
that we provide relies on surveys and self-reporting by individuals to agencies. For example, the U.S. Census
and the American Communities Survey are surveys completed by individuals, who indicate their gender
category. Other data, such as Medicare data, may rely on assigned sex from other documents, such as the Social
Security Administration. Unfortunately, we are unable to determine preferred gender assignment for data such
as this. Thus, some error will be associated with our measures of the class of category of female and / or
women.
Race and Ethnicity: We use the term Black because it is a more inclusive term because it includes those with
African heritage that do not identify as Americans or with the history of African Americas. We use the term
Hispanic unless Latino is explicitly used by a data source. Generally, we report large categories of data; as a
result, we often do not report any racial categories other than White, Black, and Hispanic.
Geographic boundaries: We use data on several different geographic boundaries in the report, including: the
City of New Orleans, which includes all those individuals, businesses, or households within the legal boundary
around the municipal government of New Orleans, Orleans Parish, which includes all those individuals,
businesses or households within the legal boundaries of Orleans Parish, and the New Orleans MSA, which
includes all those individuals, businesses, or households within the cities of New Orleans and Metairie and
Jefferson, Orleans, Plaquemines, St. Bernard, St. Charles, St. James, St. John the Baptist, and St. Tammany
Parishes. We also occasionally use geographic markers like the New Orleans Hospital Region or Congressional
districts. The geographic area of interest is carefully identified for all data presented in the report.
Name change in the New Orleans MSA: The U.S. Census bureau changed the name of the Metropolitan
Statistical Area (MSA) in 2012 from New Orleans-Metairie-Kenner MSA to New-Orleans-Metairie MSA
because of a change in the convention of naming MSAs in 2010. The geographic boundaries of the MSA do not
with the naming change. Data from 2005-2011 is from the New Orleans-Metairie-Kenner MSA. Data from
2013-2014 is from the New Orleans-Metairie MSA.
Years of data: We try to present at least a single year of data from prior to Katrina for comparison purposes.
This is generally either 2000, 2004, or 2005, with 2005 data only presented when the data collection occurred
prior to August 2005 to ensure that Katrina did not influence the data collection process. For example, the U.S.
Census data collection process in 2005 was completed prior to July 2005. As a result, this data can be used as a
pre-Katrina measure of the population.

70
American Communities Survey and margin of errors. Unless otherwise noted, we report data from the
American Communities Survey and use whatever data is the most precise (i.e. we use the five-year estimates
when possible). This data has a margin of error associated with it that we do not generally report. This data is
available from the U.S. Census Bureau for those interested. Whenever possible, we avoid reporting findings that
would be greatly influenced by the margin of error associated with the data.
Industry, area, and occupation: We present several different sets of data relating to women’s economic
participation. Unfortunately, given that we are reliant on existing sources, we are unable to present exactly the
same economic categories across various indicators. For example, women-owned businesses are presented by
economic sector, while full-time employment data is presented by industry, and wage data is presented by
occupation. There are overlapping businesses across these various categories, but they should not be treated as
equivalent.
Income and wages: We present several different pieces of information on how much money individuals,
households, and families make in New Orleans. Income is a more inclusive earning measure, as it encompasses
wages as well as social security payments, pensions, child support, public assistance, annuities, money from
rental property, interest, and dividends. Wages are only wages and salaries from employment.

71
Authors:
Dr. Mirya R. Holman is Assistant Professor of Political Science at Tulane University. She researches and
teaches on women and politics, urban politics, and research methods. She has a Ph.D. from Claremont Graduate
University and is a graduate of the political science and history departments and the honors program at Loyola
University, New Orleans. She is the author of Women in Politics in the American City (Temple University
Press, 2015), which is a comprehensive evaluation of the effect of gender in urban politics and policy making.
She lives in Uptown with her husband, Zachary Danner.
Chloe Schwanz attends Tulane University as an undergraduate, where she anticipates earning her bachelor’s
degree in Political Science in the spring of 2017 and works as a research assistant. Chloe lives in Uptown with
her husband and two sons.
Sponsor: Newcomb College Institute’s mission is to educate undergraduate women for leadership in the 21st
century. We support women students’ research initiatives, advocate for a gender-integrated curriculum, develop
community engaged service-learning courses, promote student organizations for women, and bring women
leaders to campus. NCI carries on the legacy of Newcomb College by offering a women-centered educational
experience in a co-educational institution. To learn more about NCI and their contributions to Tulane and the
community, visit tulane.edu/newcomb.

72
Notes: i Unless otherwise noted, data represents the complete population in the New Orleans-Metairie-Kenner MSA (2005-2012) and the
New Orleans-Metairie MSA (2013-2014). See data notes for additional information on the MSA. ii Data is unavailable for Hispanics in 2007. iii See also: The Data Center, “The New Orleans Youth Index” (New Orleans, LA: The Data Center, December 2015). Percentages
indicate the percent of that gender (or race) group that falls into a particular age category. iv Eduardo Porter, September 2014, “A Simple Equation: More Education = More Income.” New York Times
http://www.nytimes.com/2014/09/11/business/economy/a-simple-equation-more-education-more-income.html v Nolan Feeney, October 2015, “Women Are Now More Likely to Have College Degree Than Men.” Time Magazine
http://time.com/4064665/women-college-degree/ vi We cannot identify whether the increase in the percentage of women in New Orleans with bachelor’s degrees or higher is due to
women in the city attending college at a higher rate or women moving to New Orleans from another place with a bachelor’s degree.
However, given that the influx of population generally only makes up 4-5% of the population of women, the increase can probably be
attributed to both long-term residents and newcomers. vii These figures include undergraduate, graduate, and professional school enrollment. viii Men age 18-24 have also seen an increase in college enrollment, but not at the rate of increase seen among women. ix Zumbrun, Josh. June 7, 2016. “Behind the Ongoing U.S. Baby Bust, in 5 Charts.”
http://blogs.wsj.com/economics/2016/06/07/behind-the-ongoing-u-s-baby-bust-in-5-charts/ Wall Street Journal. x Ibid. xi Same-sex marriage became legal in New Orleans in June 2015. Prior to that point, gay and lesbian partnerships are only identified
through the unmarried households classification on the American Communities Survey and the U.S. Census. xii U.S. Census Bureau, July 2015, “FFF: Hurricane Katrina 10th Anniversary.”
http://www.census.gov/newsroom/facts-for-features/2015/cb15-ff16.html xiii See, for example: Curbed New Orleans, “New Orleans Gentrification” http://nola.curbed.com/new-orleans-gentrification; Manuel
Roig-Franzia, August 2015, “A resilience lab.” The Washington Post http://www.washingtonpost.com/sf/national/2015/08/22/a-
resilience-lab/ xiv Unless otherwise noted, data represents the population, 1 year and over, in Orleans Parish. Data are limited to the household
population and exclude the population living in institutions, college dormitories, and other group quarters. xv The census defines these families as “female head of household – no husband present” xvi The gap is also growing between families overall and female headed families in the United States from $24,588 in 2000 to $33,628,
and moving from 50% to 48%. xvii Bill Quigley, August 2016, “Katrina Pain Index 2016: Race and Class Gap Widening.” Huffington Post
http://www.huffingtonpost.com/entry/katrina-pain-index-2016-race-and-class-gap-widening_us_57baf8e8e4b07d22cc390045 xviii Female head of household indicates a woman living “with a husband” in 2000 and a single, female head of household in 2009 and
2014. xix See (for example): U.S. Department of Housing and Urban Development. December 2015. “Ending Veteran Homelessness in New
Orleans.” https://www.hudexchange.info/resources/documents/Ending-Veteran-Homelessness-in-New-Orleans.pdf xx New Orleans Women & Children’s Shelter operates at 90% capacity. http://nowcs.org/our-response/ xxi The Supplemental Nutrition Assistance Program (SNAP) is the name for what was formerly known as the federal Food Stamp
Program, as of October 1, 2008.
xxii United States Department of Agriculture, Food and Nutrition Service, “Eligibility.”
http://www.fns.usda.gov/snap/eligibility#Income xxiii This includes SNAP benefits is to all recipients, not just women. xxiv Unless otherwise noted, data is not adjusted for inflation.
73
xxv No data is available for female median wage in this occupational category in 2005. xxvi The salary range for median salary is capped at $100,000+. As a result, the ratio of male to female salaries in this category, where
female median salaries are $41,422, may be lower than 42%, given that the male median salary may far exceed $100,000. xxvii Larger industries only. See next table for more detail. xxviii Unless otherwise noted, data represents the New Orleans-Metairie, LA Metropolitan Statistical Area (2012) or the New Orleans-
Metairie-Kenner, LA MSA (2002 and 2007). xxix Sectors are not listed unless there were at least 1000 firms in the sector in 2002. Blank cells indicate no information from the
Census, usually due to too few firms in a particular industry. xxx Blank cells indicate no information from the Census, usually due to too few firms reporting in a particular industry. xxxi 2011 data for the physician workforce, 2012 data for hospital resources xxxii Jenny Jarvie and Molly Hennessy-Fiske. February 26, 2016. One of the last abortion clinics in Louisiana: How long will it hold
on? Los Angeles Times http://www.latimes.com/nation/la-na-louisiana-abortion-20160226-story.html xxxiii The rate of mental and behavioral, external causes, and other causes are statistically similar for the United States and New
Orleans. xxxiv Diseases of the circulatory system xxxv Neoplasms xxxvi Endocrine, nutritional and metabolic diseases xxxvii Diseases of the respiratory system xxxviii Diseases of the nervous system xxxix Diseases of the genitourinary system xl External causes of morbidity and mortality xli Diseases of the digestive system xlii Symptoms, signs and abnormal clinical and laboratory findings, not elsewhere classified xliii The survey asks: “A clinical breast exam is when a doctor, nurse, or other health professional feels the breasts for lumps. Have you
ever had a clinical breast exam? How long has it been since your last breast exam?” BRFSS provides the number of 40 or older
women who answer yes and no. Later years of the survey data also provide the data for women aged 50 and older – we only present
the data on 40+ as it is the only information available for earlier years. xliv Survey respondents are asked: “A Pap test is a test for cancer of the cervix. Have you ever had a Pap test? How long has it been
since you had your last Pap test?” BRFSS then provides the number of women who respond affirmative and negative to the question. xlv PRAMS provides data in two-year ranges. The most recent data available is 2010-2012. xlvi National Vital Statistics Report. 2014. “National and State Patterns of Teen Births in the United States, 1940–2013.”
http://www.cdc.gov/nchs/data/nvsr/nvsr63/nvsr63_04.pdf xlvii Centers for Disease Control and Prevention. 2006. Safe Motherhood: Promoting Health for Women Before, During and After
Pregnancy, 2006. xlviii In earlier years, PRAMS classified this group as “Other.” In the 2010-2012 report, PRAMS changes this category to Hispanic.
This data is unavailable in 2007-2009. xlix Values are also provided in inflation-adjusted 2012 dollars. l The Louisiana Department of Children and Family Services licenses child care centers in Louisiana. Licensed facilities must meet
minimum standards regarding health and safety, program activities, staff training, environment, and child/staff ratios. Some programs
serving young children are exempt from the Louisiana DCFS licensing regulations and are thus excluded from this count. Exempt
facilities include: private or public day schools serving children in grades one and above or operating kindergartens or prekindergarten
programs, as well as certified Montessori schools, camps, and some part-day programs li This is the number of total seats available, divided by the number of children under the age of 5 (from the American Communities
Survey). lii Office of Inspector General City of New Orleans. “A Performance Audit of the New Orleans Police Department’s Uniform Crime
Reporting of Forcible Rapes A&R13PAU002.” May 14, 2014. https://assets.documentcloud.org/documents/1719903/ig-audit-of-
nopd-ucr-forcible-rape-audit.pdf liii Ibid., p. 4. liv Mustain, Jim. “Audit shows N.O. Police underreported rape.” The New Orleans Advocate May 16, 2014
http://www.theadvocate.com/new_orleans/news/article_af451530-8f95-52a1-bac0-4cd77fdd81f4.html
74
lv Emily Farris and Mirya R. Holman, 2015, “Public Officials and a “Private” Matter: Attitudes and Policies in the County Sheriff
Office Regarding Violence Against Women.” Social Science Quarterly 96(4): 1117-1135. lvi See, for example, Jeff Asher, March 2016, “Projection: New Orleans to likely see ‘relatively sizable jump’ in crime in 2016.”
https://nolacrimenews.com/2016/03/08/first-blog-post/ lvii Jeff Asher, October 2015. “New Orleans Police likely to report major crime on rise in past three months.”
http://www.theadvocate.com/new_orleans/news/crime_police/article_390250b2-311b-5967-93e1-02aa8d3ccf83.html lviii New Orleans Police Department Operations Manual. May 20, 2015. Chapter 42.4. “Domestic Violence.” Page 30. lix Unless otherwise noted, data represented is from the NOPD from department reported Stop and Search data. lx Unless otherwise noted, data represented jail data reported by Orleans Parish Sheriff for the jails he manages. lxi Karl F. Seidman, 2013, Coming Home to New Orleans, Oxford University Press. lxii Katherine Sayre, December 2015, “New Orleans metro forecast to be America's 6th hottest housing market in 2016.” Nola.com, http://www.nola.com/business/index.ssf/2015/12/new_orleans_6th-hottest_real_e.html lxiii Institute for Women’s Policy Research. 2010. “Mounting Losses: Women and Public Housing After Hurricane Katrina.” lxiv Stacy Seicshnaydre and Ryan C. Albright. New Orleans Data Center. 2015. “Expanding Choice and Opportunity in the Housing
Choice Voucher Program.” Greater New Orleans Fair Housing Action Center. 2016. “Practical Steps to End Poverty for Families in
the Housing Choice Voucher Program.” http://www.gnofairhousing.org/wp-content/uploads/2016/01/HANO-HCVP_Issue_Brief_Jan-
2016.pdf lxv http://www.llwcf.org/Ready-to-Run-Louisiana.html lxvi Includes Mayor, City Council, Sheriff, Assessor, and Coroner lxvii Includes Governor, Lt Gov., Sec of State, Attn Gen, Treasurer, State Senators (seats 1, 3, 4, 5, 7, 9), and State Representatives
(seats 91, 93, 94, 97, 98, 99, 100, 102, 103, 105). lxviii Includes U.S. Senator and U.S. Representative


