Embed Size (px)
Citation preview
16CLIMATECHANGE RESEARCHREPORTCCRR-16
Responding to
Climate Change
Through Partnership
Current and Projected Future Climatic Conditions for Ecoregions and Selected Natural Heritage Areas in Ontario
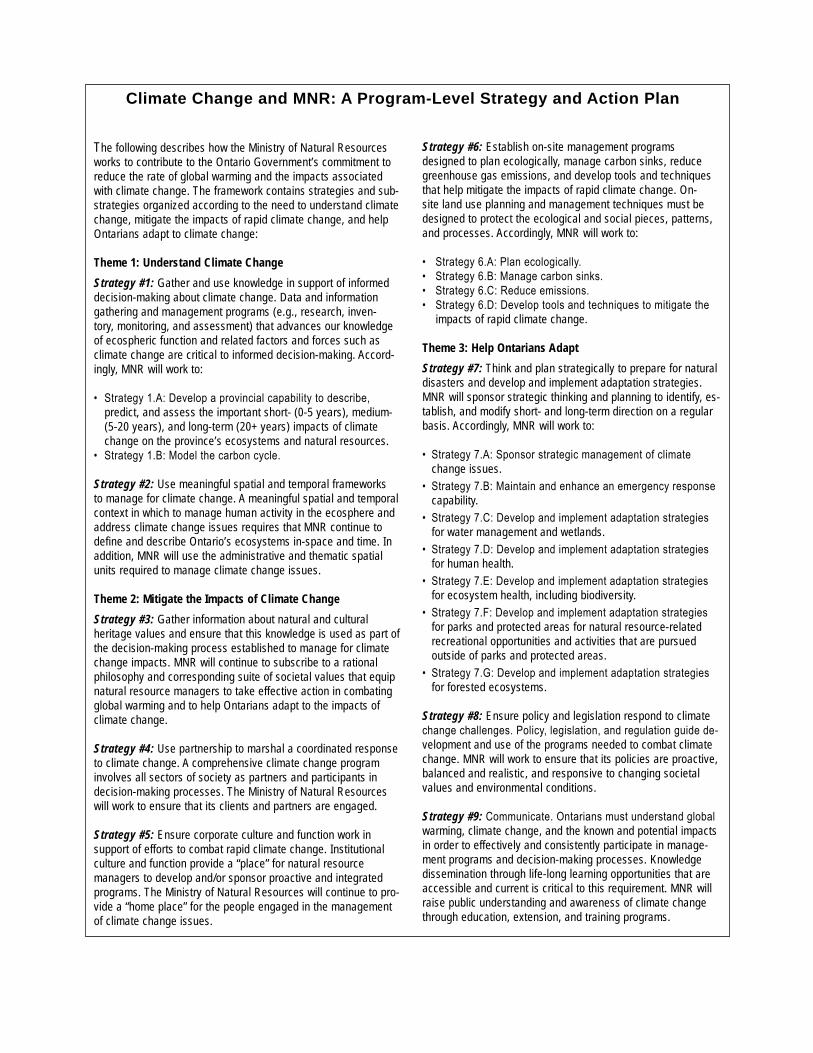
The following describes how the Ministry of Natural Resources works to contribute to the Ontario Government’s commitment to reduce the rate of global warming and the impacts associated with climate change. The framework contains strategies and sub-strategies organized according to the need to understand climate change, mitigate the impacts of rapid climate change, and help Ontarians adapt to climate change:
Theme 1: Understand Climate ChangeStrategy #1: Gather and use knowledge in support of informed decision-making about climate change. Data and information gathering and management programs (e.g., research, inven-tory, monitoring, and assessment) that advances our knowledge of ecospheric function and related factors and forces such as climate change are critical to informed decision-making. Accord-ingly, MNR will work to:
• Strategy1.A:Developaprovincialcapabilitytodescribe,predict, and assess the important short- (0-5 years), medium- (5-20 years), and long-term (20+ years) impacts of climate change on the province’s ecosystems and natural resources.
• Strategy1.B:Modelthecarboncycle.
Strategy #2: Use meaningful spatial and temporal frameworks to manage for climate change. A meaningful spatial and temporal context in which to manage human activity in the ecosphere and address climate change issues requires that MNR continue to define and describe Ontario’s ecosystems in-space and time. In addition, MNR will use the administrative and thematic spatial units required to manage climate change issues.
Theme 2: Mitigate the Impacts of Climate ChangeStrategy #3: Gather information about natural and cultural heritage values and ensure that this knowledge is used as part of the decision-making process established to manage for climate change impacts. MNR will continue to subscribe to a rational philosophy and corresponding suite of societal values that equip natural resource managers to take effective action in combating global warming and to help Ontarians adapt to the impacts of climate change.
Strategy #4: Use partnership to marshal a coordinated response to climate change. A comprehensive climate change program involves all sectors of society as partners and participants in decision-making processes. The Ministry of Natural Resources will work to ensure that its clients and partners are engaged.
Strategy #5: Ensure corporate culture and function work in support of efforts to combat rapid climate change. Institutional culture and function provide a “place” for natural resource managers to develop and/or sponsor proactive and integrated programs. The Ministry of Natural Resources will continue to pro-vide a “home place” for the people engaged in the management of climate change issues.
Strategy #6: Establish on-site management programs designed to plan ecologically, manage carbon sinks, reduce greenhouse gas emissions, and develop tools and techniques that help mitigate the impacts of rapid climate change. On-site land use planning and management techniques must be designed to protect the ecological and social pieces, patterns, and processes. Accordingly, MNR will work to:
• Strategy6.A:Planecologically.• Strategy6.B:Managecarbonsinks.• Strategy6.C:Reduceemissions.• Strategy6.D:Developtoolsandtechniquestomitigatethe impacts of rapid climate change.
Theme 3: Help Ontarians AdaptStrategy #7: Think and plan strategically to prepare for natural disasters and develop and implement adaptation strategies. MNR will sponsor strategic thinking and planning to identify, es-tablish, and modify short- and long-term direction on a regular basis. Accordingly, MNR will work to:
• Strategy7.A:Sponsorstrategicmanagementofclimatechange issues.
• Strategy7.B:Maintainandenhanceanemergencyresponse capability.• Strategy7.C:Developandimplementadaptationstrategies for water management and wetlands.• Strategy7.D:Developandimplementadaptationstrategies for human health.• Strategy7.E:Developandimplementadaptationstrategies for ecosystem health, including biodiversity.• Strategy7.F:Developandimplementadaptationstrategies
for parks and protected areas for natural resource-related recreational opportunities and activities that are pursued outside of parks and protected areas.
• Strategy7.G:Developandimplementadaptationstrategiesfor forested ecosystems.
Strategy #8: Ensure policy and legislation respond to climate changechallenges.Policy,legislation,andregulationguidede-velopment and use of the programs needed to combat climate change. MNR will work to ensure that its policies are proactive, balanced and realistic, and responsive to changing societal values and environmental conditions.
Strategy #9:Communicate.Ontariansmustunderstandglobalwarming, climate change, and the known and potential impacts in order to effectively and consistently participate in manage-ment programs and decision-making processes. Knowledge dissemination through life-long learning opportunities that are accessible and current is critical to this requirement. MNR will raise public understanding and awareness of climate change through education, extension, and training programs.
Climate Change and MNR: A Program-Level Strategy and Action Plan
Applied Research and Development Branch • Ontario Ministry of Natural Resources
2010
Current and Projected Future Climatic Conditions for Ecoregions and Selected Natural Heritage Areas in Ontario
Daniel W. McKenney, LandscapeAnalysisandApplicationsSection,NaturalResourcesCanada,CanadianForestService,GreatLakesForestryCentre,1219QueenSteetE.,SaultSte.Marie,ON,P6A2E5.Phone:(705)541-5569;Fax:(705)759-5700;Email:[email protected]
John H. Pedlar, LandscapeAnalysisandApplicationsSection,NaturalResourcesCanada,CanadianForestService,GreatLakesForestryCentre,1219QueenSteetE.,SaultSte.Marie,ON,P6A2E5.Phone:(705)541-5563;Fax:(705)759-5700;Email:[email protected]
Kevin Lawrence, LandscapeAnalysisandApplicationsSection,NaturalResourcesCanada,CanadianForestService,GreatLakesForestryCentre,1219QueenSteetE.,SaultSte.Marie,ON,P6A2E5.Phone:(705)541-5570;Fax:(705)759-5700;Email:[email protected]
Paul A. Gray, AppliedResearchandDevelopmentBranch,OntarioMinistryofNaturalResources,300WaterStreet,Peterborough,ON,K9J8M5.Phone:(705)755-1967;FAX(705)755-2802;Email:[email protected]
Stephen J. Colombo, OntarioForestResearchInstitute,OntarioMinistryofNaturalResources,1235QueenStreetEast,SaultSte.Marie,ON,P6A2E5.Phone:(807)343-4024;Email:[email protected]
William J. Crins, NaturalHeritage,LandsandProtectedSpacesBranch,OntarioMinistryofNaturalResources,300WaterSt.,Peterborough,ON,K9J8M5.Phone:(705)755-1946;Fax:(705)755-1701;Email:[email protected]
This paper contains recycled materials.
© 2010, Queen’s Printer for OntarioPrinted in Ontario, Canada
Single copies of this publicationare available from:
Applied Research and DevelopmentOntario Forest Research InstituteMinistry of Natural Resources1235 Queen Street EastSault Ste. Marie, ONCanada P6A 2E5
Telephone: (705) 946-2981Fax: (705) 946-2030E-mail: [email protected]
Cette publication hautement spécialisée Current and Projected Future Climatic Conditions for Ecoregions and Selected Natural Heritage Areas in Ontario n’est disponible qu’en Anglais en vertu du Règlement 411/97 qui en exempte l’application de la Loi sur les services en français. Pour obtenir de l’aide en français, veuillez communiquer avec le ministère de Richesses naturelles au [email protected].
Library and Archives Canada Cataloguing in Publication Data
Main entry under title: Current and projected future climate conditions for ecoregions and selected natural heritage areas in Ontario [electronic resource]
(Climate change research report ; CCRR-16)Includes bibliographical references.Electronic resource in PDF format.Issued also in printed form.ISBN 978-1-4435-2277-9
1. Climatic changes—Ontario—Forecasting. 2. Ecological regions—Ontario. 3. Natural areas—Ontario. 4. Trees—Climatic factors—Ontario. 5. Ontario—Climate. I. McKenney, Daniel W. II. Ontario. Ministry of Natural Resources. Applied Research and Development Branch. III. Series: Climate change research report (Online) ; CCRR-16.
QC903.2 O57 C87 2010 551.69713 C2010-964012-8

I
Summary
The changes in global climate that have been projected for this century have major implications for the composition, structure, and function of ecosystems in Ontario. In this report, we present four approaches that summarize projected changes in climate across Ontario’s ecosystems at two scales: for ecoregions and for selected natural heritage areas. First, the current climatic regime or “climate envelope” for each ecoregion is summarized and mapped for three future time periods (2011-2040, 2041-2070, 2071-2100); this shows where current ecoregion climatic conditions are projected to move as the century progresses. Second, climate summaries are provided for each ecoregion for the current and three future time periods to show how climate is projected to change within the currently defined ecoregion boundaries. Similarly, current and future climate summaries are provided for 29 selected natural heritage areas. Finally, to introduce the concept of climate-related movement of flora and fauna, current and future climate envelopes are generated for 12 Ontario tree species that have a range of climate and site type preferences. The extent to which these species’ climate habitats are represented across Ontario’s network of natural heritage areas is shown for current and future climate. Our findings suggest that changes are in store for Ontario, with ecoregion climate envelopes projected to shift northward, becoming increasingly smaller and more scattered, and in some cases even disappearing, as the century progresses. These changes are driven by a northward shift in temperature combined with relatively stable precipitation patterns. Clearly Ontario’s natural heritage areas will also be affected by these changes. For example, the annual mean temperature in Polar Bear Provincial Park is projected to increase from -4.5oC to nearly +2oC and the number of growing season degree days will more than double by the end of this century; this climatic shift would in principle make the park’s climate suitable for the growth of sugar maple. This type of assessment is an important first step in projecting the effects of future climate on Ontario’s ecoregions and natural heritage areas, and helps establish a basis for discussing and developing management strategies and policies to ensure the ecoregion framework remains relevant to land use planning in a rapidly changing climate. Together, these analyses provide novel perspectives on some of the challenges that resource managers are likely to face during the 21st century.
II
Résumé
Conditions climatiques actuelles et prévues des écorégions et de zones choisies du patrimoine naturel de l’Ontario
Les changements climatiques planétaires prévus pour ce siècle ont des répercussions importantes sur la composition, la structure et la fonction des écosystèmes de l’Ontario. Dans le présent rapport, nous présentons quatre approches qui résument les changements climatiques prévus dans les écosystèmes de l’Ontario à deux échelons : les écorégions et des zones choisies du patrimoine naturel. Nous résumons et cartographions d’abord le régime climatique actuel ou l’« enveloppe climatique » de chaque écorégion pour trois périodes à venir (2011 à 2040, 2041 à 2070, 2071 à 2100), ce qui révèle où on prévoit que les conditions climatiques actuelles de l’écorégion devraient se déplacer au cours du siècle. Ensuite, des résumés climatiques de chaque écorégion pour la période actuelle et les trois périodes à venir révèlent en quoi le climat devrait changer dans les limites de l’écorégion telles qu’actuellement définies. Nous présentons de même de tels résumés des conditions climatiques actuelles et futures de 29 zones choisies du patrimoine naturel. Enfin, en vue d’aborder le concept du mouvement de la flore et de la faune en lien avec le climat, nous avons généré les enveloppes climatiques actuelles et futures de 12 essences d’arbres de l’Ontario qui ont une prédilection pour certaines conditions climatiques et des préférences quant au type de site. Nous avons indiqué la représentation des habitats climatiques de ces espèces dans le réseau ontarien des zones du patrimoine naturel pour les conditions climatiques actuelles et futures. Nos résultats suggèrent que des changements se préparent pour l’Ontario : les enveloppes climatiques de l’écorégion pourraient se déplacer vers le nord, devenir de plus en plus petites et dispersées et, dans certains cas, aller jusqu’à disparaître à mesure que nous avancerons dans le siècle. Ces changements seront provoqués par un mouvement de la température vers le nord combiné à des configurations de précipitations relativement stables. Il est clair que ces changements auront une incidence sur les zones du patrimoine naturel de l’Ontario. Par exemple, on prévoit que la température annuelle moyenne du parc provincial de l’Ours polaire passera de -4,5 oC à près de +2 oC et que le nombre d’unités thermiques de croissance de la saison de végétation aura plus que doublé d’ici la fin de ce siècle. Ce changement climatique permettrait en principe la croissance de l’érable à sucre dans le parc. Ce type d’évaluation est une première étape importante dans la projection des effets des futures conditions climatiques sur les écorégions et les zones du patrimoine naturel de l’Ontario, et contribue à établir une base de discussion et d’élaboration de stratégies et politiques de gestion, afin de veiller à ce que le cadre de travail de l’écorégion demeure pertinent à la planification de l’affectation des terres dans une situation de changements climatiques rapides. Ensemble, ces analyses constituent de nouvelles perspectives sur des défis que les gestionnaires de ressources devront probablement relever au cours du 21e siècle.
III
Contents
Summary .......................................................................................................................................... I
Acknowledgements ........................................................................................................................IV
Introduction ...................................................................................................................................... 1
Methods ........................................................................................................................................... 4
Describing Ontario’s Current Climate ........................................................................................................4
Describing Ontario’s Potential Future Climates .........................................................................................5
Generating Climate Envelopes for Ecoregions, Natural Heritage Areas, and Tree Species ...................5
Results ............................................................................................................................................. 7
Climate Change in Ontario ........................................................................................................................7
Climate Change and Ecoregions ............................................................................................................12
Climate Change and Natural Heritage Areas .........................................................................................13
Climatic Suitability of Natural Heritage Areas for Selected Tree Species .............................................19
Discussion ......................................................................................................................................22
Recommendations ........................................................................................................................24
References ....................................................................................................................................25
Appendix 1. Projected change in six climate variables for each ecoregion for A2 scenario ...... 27
Appendix 2. Projected change in six climate variables for each ecoregion for B2 scenario ..... 29
Appendix 3. Current and projected future climate for natural heritage areas.............................. 31
Appendix 4. Current and future presence/absence of suitable climate for 12 tree species ....... 41

IV
Acknowledgements
Support for this project was provided by the Ontario Ministry of Natural Resources Climate Change Program and the Canadian Forest Service, Natural Resources Canada. We thank Randy Rennick and Greg Sikma of MNR’s Provincial Geomatics Service Centre for creating the maps used in this report and coordinating development of the CD-ROM map browser. We thank Jenny Gleeson and Gary Nielsen for reviewing an earlier version of the manuscript. We thank Lisa Buse for editorial assistance and Trudy Vaittinen for layout and graphic design.
CLIMATE CHANGE RESEARCH REPORT CCRR-16 1
Introduction
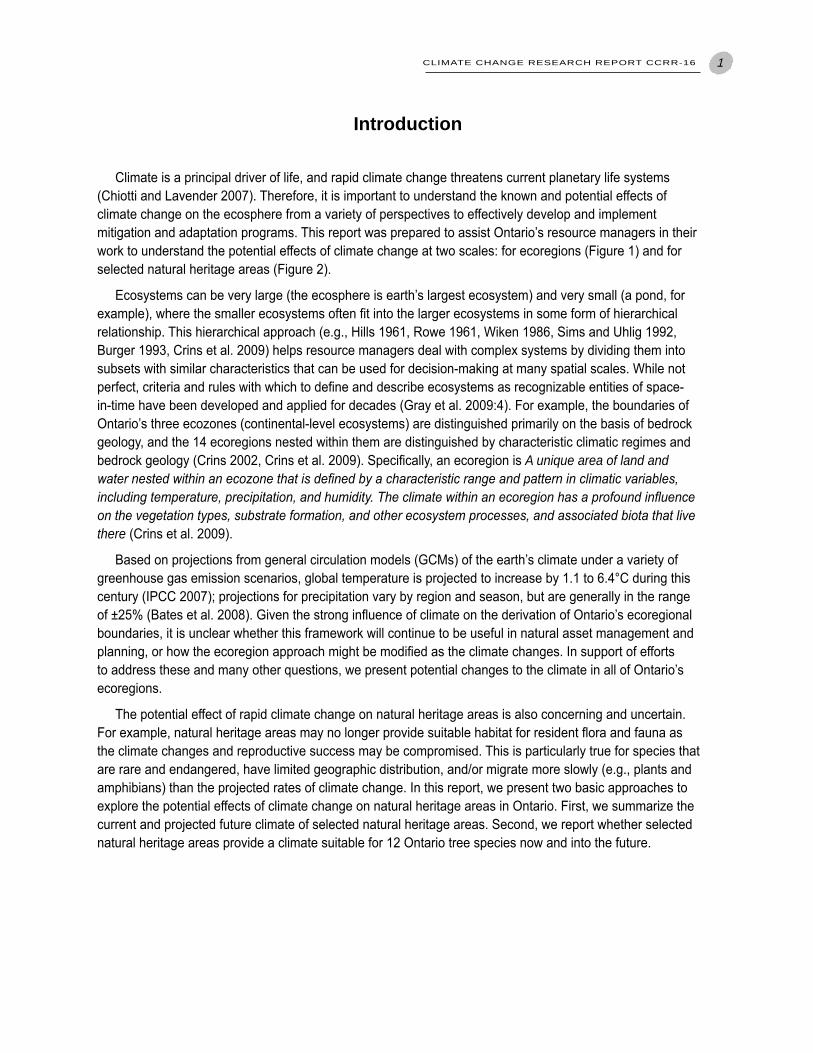
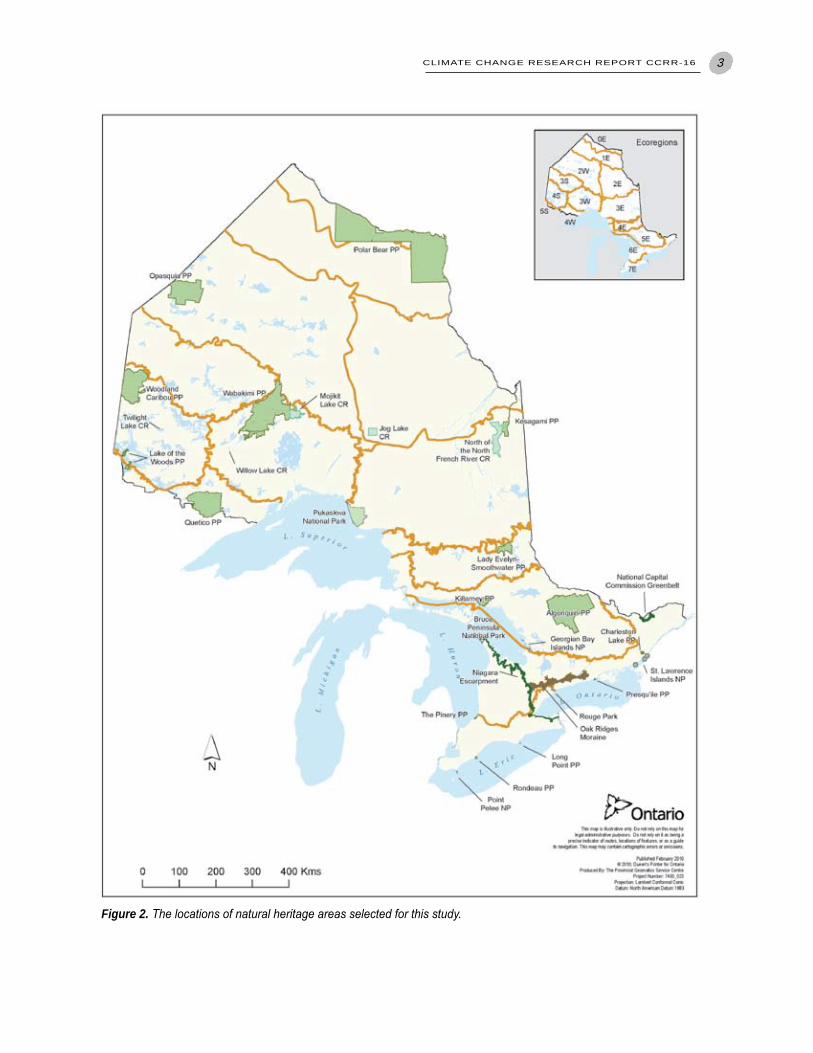
Climate is a principal driver of life, and rapid climate change threatens current planetary life systems (Chiotti and Lavender 2007). Therefore, it is important to understand the known and potential effects of climate change on the ecosphere from a variety of perspectives to effectively develop and implement mitigation and adaptation programs. This report was prepared to assist Ontario’s resource managers in their work to understand the potential effects of climate change at two scales: for ecoregions (Figure 1) and for selected natural heritage areas (Figure 2).
Ecosystems can be very large (the ecosphere is earth’s largest ecosystem) and very small (a pond, for example), where the smaller ecosystems often fit into the larger ecosystems in some form of hierarchical relationship. This hierarchical approach (e.g., Hills 1961, Rowe 1961, Wiken 1986, Sims and Uhlig 1992, Burger 1993, Crins et al. 2009) helps resource managers deal with complex systems by dividing them into subsets with similar characteristics that can be used for decision-making at many spatial scales. While not perfect, criteria and rules with which to define and describe ecosystems as recognizable entities of space-in-time have been developed and applied for decades (Gray et al. 2009:4). For example, the boundaries of Ontario’s three ecozones (continental-level ecosystems) are distinguished primarily on the basis of bedrock geology, and the 14 ecoregions nested within them are distinguished by characteristic climatic regimes and bedrock geology (Crins 2002, Crins et al. 2009). Specifically, an ecoregion is A unique area of land and water nested within an ecozone that is defined by a characteristic range and pattern in climatic variables, including temperature, precipitation, and humidity. The climate within an ecoregion has a profound influence on the vegetation types, substrate formation, and other ecosystem processes, and associated biota that live there (Crins et al. 2009).
Based on projections from general circulation models (GCMs) of the earth’s climate under a variety of greenhouse gas emission scenarios, global temperature is projected to increase by 1.1 to 6.4°C during this century (IPCC 2007); projections for precipitation vary by region and season, but are generally in the range of ±25% (Bates et al. 2008). Given the strong influence of climate on the derivation of Ontario’s ecoregional boundaries, it is unclear whether this framework will continue to be useful in natural asset management and planning, or how the ecoregion approach might be modified as the climate changes. In support of efforts to address these and many other questions, we present potential changes to the climate in all of Ontario’s ecoregions.
The potential effect of rapid climate change on natural heritage areas is also concerning and uncertain. For example, natural heritage areas may no longer provide suitable habitat for resident flora and fauna as the climate changes and reproductive success may be compromised. This is particularly true for species that are rare and endangered, have limited geographic distribution, and/or migrate more slowly (e.g., plants and amphibians) than the projected rates of climate change. In this report, we present two basic approaches to explore the potential effects of climate change on natural heritage areas in Ontario. First, we summarize the current and projected future climate of selected natural heritage areas. Second, we report whether selected natural heritage areas provide a climate suitable for 12 Ontario tree species now and into the future.
2 CLIMATE CHANGE RESEARCH REPORT CCRR-16
Figure 1. The ecozones, ecoregions and ecodistricts of Ontario (Crins 2002).
CLIMATE CHANGE RESEARCH REPORT CCRR-16 3
Figure 2. The locations of natural heritage areas selected for this study.
4 CLIMATE CHANGE RESEARCH REPORT CCRR-16
Methods
Describing Ontario’s Current ClimateThe climate data used in this study are part of a larger effort to produce spatial climate models for all of
North America (e.g., see McKenney et al. 2007a for details). Here we used standard 30-year mean monthly values (or “normals”) of minimum and maximum temperature and total precipitation for the 1971-2000 period (McKenney et al. 2006a). The climate models were generated using the thin plate smoothing spline algorithms of ANUSPLIN (Hutchinson 2001). ANUSPLIN uses climate station data to produce spatially continuous models (see Wahba 1990 for details on thin plate smoothing splines). The models of current climate developed for this study had relatively high levels of accuracy, with error levels of about half a degree Celsius for temperature variables and 10 to 20% for precipitation (McKenney et al. 2006a) and fall within the range of measurement error.
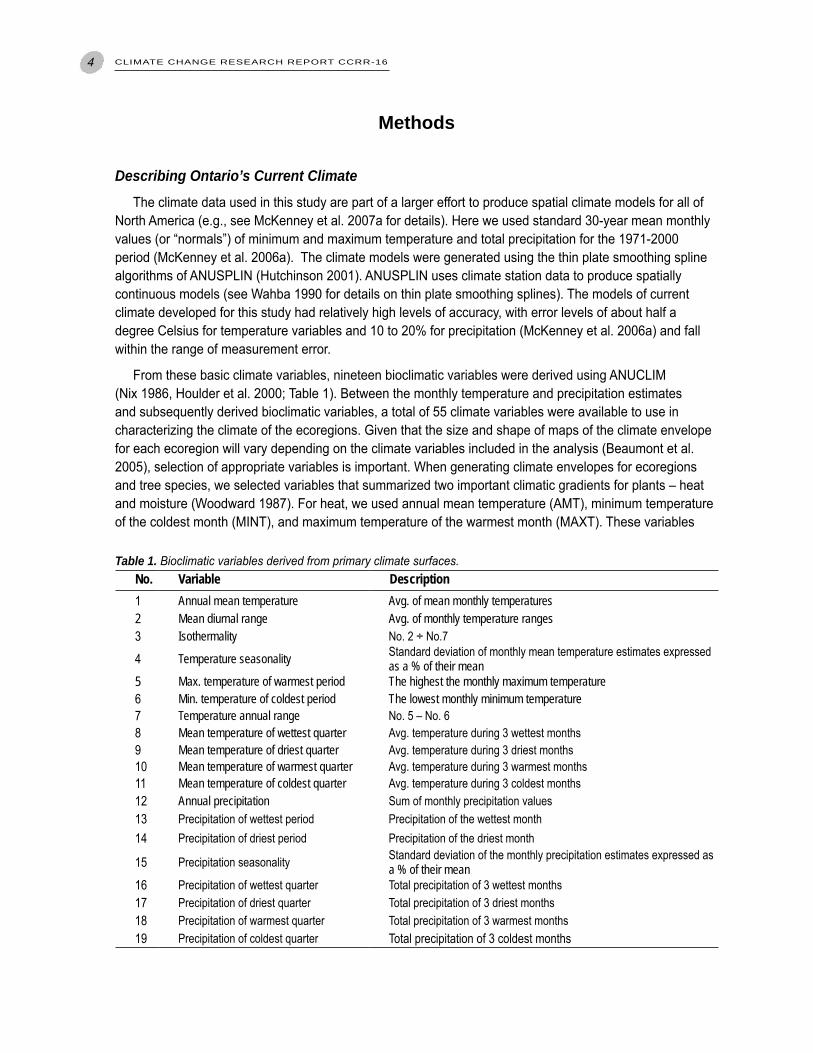
From these basic climate variables, nineteen bioclimatic variables were derived using ANUCLIM (Nix 1986, Houlder et al. 2000; Table 1). Between the monthly temperature and precipitation estimates and subsequently derived bioclimatic variables, a total of 55 climate variables were available to use in characterizing the climate of the ecoregions. Given that the size and shape of maps of the climate envelope for each ecoregion will vary depending on the climate variables included in the analysis (Beaumont et al. 2005), selection of appropriate variables is important. When generating climate envelopes for ecoregions and tree species, we selected variables that summarized two important climatic gradients for plants – heat and moisture (Woodward 1987). For heat, we used annual mean temperature (AMT), minimum temperature of the coldest month (MINT), and maximum temperature of the warmest month (MAXT). These variables
Table 1. Bioclimatic variables derived from primary climate surfaces. No. Variable Description1 Annual mean temperature Avg. of mean monthly temperatures2 Mean diurnal range Avg. of monthly temperature ranges3 Isothermality No.2÷No.7
4 Temperature seasonality Standarddeviationofmonthlymeantemperatureestimatesexpressedas a % of their mean
5 Max. temperature of warmest period The highest the monthly maximum temperature6 Min. temperature of coldest period The lowest monthly minimum temperature7 Temperature annual range No.5–No.68 Mean temperature of wettest quarter Avg.temperatureduring3wettestmonths9 Mean temperature of driest quarter Avg.temperatureduring3driestmonths10 Mean temperature of warmest quarter Avg.temperatureduring3warmestmonths11 Mean temperature of coldest quarter Avg.temperatureduring3coldestmonths12 Annual precipitation Sumofmonthlyprecipitationvalues13 Precipitationofwettestperiod Precipitationofthewettestmonth14 Precipitationofdriestperiod Precipitationofthedriestmonth
15 Precipitationseasonality Standarddeviationofthemonthlyprecipitationestimatesexpressedasa % of their mean
16 Precipitationofwettestquarter Totalprecipitationof3wettestmonths17 Precipitationofdriestquarter Totalprecipitationof3driestmonths18 Precipitationofwarmestquarter Totalprecipitationof3warmestmonths19 Precipitationofcoldestquarter Totalprecipitationof3coldestmonths
CLIMATE CHANGE RESEARCH REPORT CCRR-16 5
represent the mean and extreme values of temperature at a given location and are highly correlated (r > 0.90) with other familiar climatic controls on plant distribution, such as extreme minimum temperature, growing season length, and degree days. Moisture gradients were similarly summarized using annual precipitation (ANNP), precipitation in the warmest quarter (PRECWQ), and precipitation in the coldest quarter (PRECCQ). To summarize the current and future climate for selected natural heritage areas, we report these six variables as well as eight others of general interest: mean diurnal range, annual temperature range, growing season start date, growing season end date, growing season length, growing season degree days, growing season mean temperature, and growing season temperature range.
Describing Ontario’s Potential Future ClimatesProjections of monthly temperature and precipitation were generated for each year over the period 2011-
2100. The projections were based on the outputs from 2 emission scenarios for the following GCMs: (1) the Canadian GCM (CGCM2; Boer et al. 2000), (2) the UK-based Hadley GCM (HadCM3; Gordon et al. 2000), (3) the Australian-based Commonwealth Scientific and Industrial Research Organisation GCM (CSIRO; Gordon and O’Farrell 1997), and (4) the US-based National Center for Atmospheric Research GCM (NCAR; Collins et al. 2006). Data were obtained for the A2 and B2 emissions scenarios (see Nakicenovic and Swart 2000). They differ in that scenario A2 assumes a higher human population, less-forested land, greater pollution, and higher carbon dioxide (CO2) emissions. Scenario B2 assumes an acceleration of energy and resource conservation efforts during the early decades of this century, such that CO2 emissions will decline by mid-century. These scenarios were selected to assess plausible futures, given a range in human choices over the next few decades. For the CGCM2 output, the data were downloaded from the Canadian Centre for Climate Modelling and Analysis (http://www.cccma.bc.ec.gc.ca/data/cgcm2/cgcm2.shtml); for all other models, data were obtained from the IPCC data distribution centre (http://ipccddc.cru.uea.ac.uk).
GCM outputs are typically provided at very coarse spatial scales (e.g., 200 x 300 km grid cells), so it was necessary to interpolate them for use in regional applications (see McKenney et al. 2006b and Colombo et al. 2007 for details). First, annual change estimates were calculated between GCM outputs and a reference period (i.e., 1961-1990) for each climate variable at each GCM output location. These annual change estimates were then averaged for 3 time periods (2011-2040, 2041-2070, and 2071-2100). A model was generated for each period by interpolating the coarse-scale average change values. These change surfaces were then “resolved” at the location of climate stations across the both the United States and Canada with the predicted changes at each location being combined with the 1971-2000 average values. This provided a network of station values that included both current climate and the changes projected by the GCMs. This method of adding the model-generated anomalies to current climate values also has the advantage of eliminating bias in the control run of the GCM model (Overpeck et al. 1991). Derived bioclimatic variables were generated as outlined above. Using 30-year averages rather than single year values for the future values reduced the risk of using GCM output from an anomalous year.
Generating Climate Envelopes for Ecoregions, Natural Heritage Areas, and Tree SpeciesThe current and future surfaces for the climate variables of interest were mapped at a resolution of 300
arc seconds (approximately a 10 km grid). For the ecoregion aspect of the work, these grids were overlain with the ecoregion polygons and climatic summaries were generated for each ecoregion using ANUCLIM (Nix 1986, Houlder et al. 2000). The ANUCLIM summaries identify a climate envelope for each ecoregion (i.e., maximum and minimum values for numerous climate variables) as well as a “core range” that identifies

6 CLIMATE CHANGE RESEARCH REPORT CCRR-16
the values associated with the 5th and 95th percentile for each climate variable. The idea of the core range is to identify a smaller climate envelope that better represents the central climatic conditions of each ecoregion. These summaries were used in two ways. First, the location of the current climatic conditions in each ecoregion was mapped for each future time period, indicating where that ecoregion’s climate is predicted to migrate during this century. Second, the climatic conditions in each ecoregion were summarized for each 30-year period to show how climate is projected to change within the currently defined ecoregion boundaries.
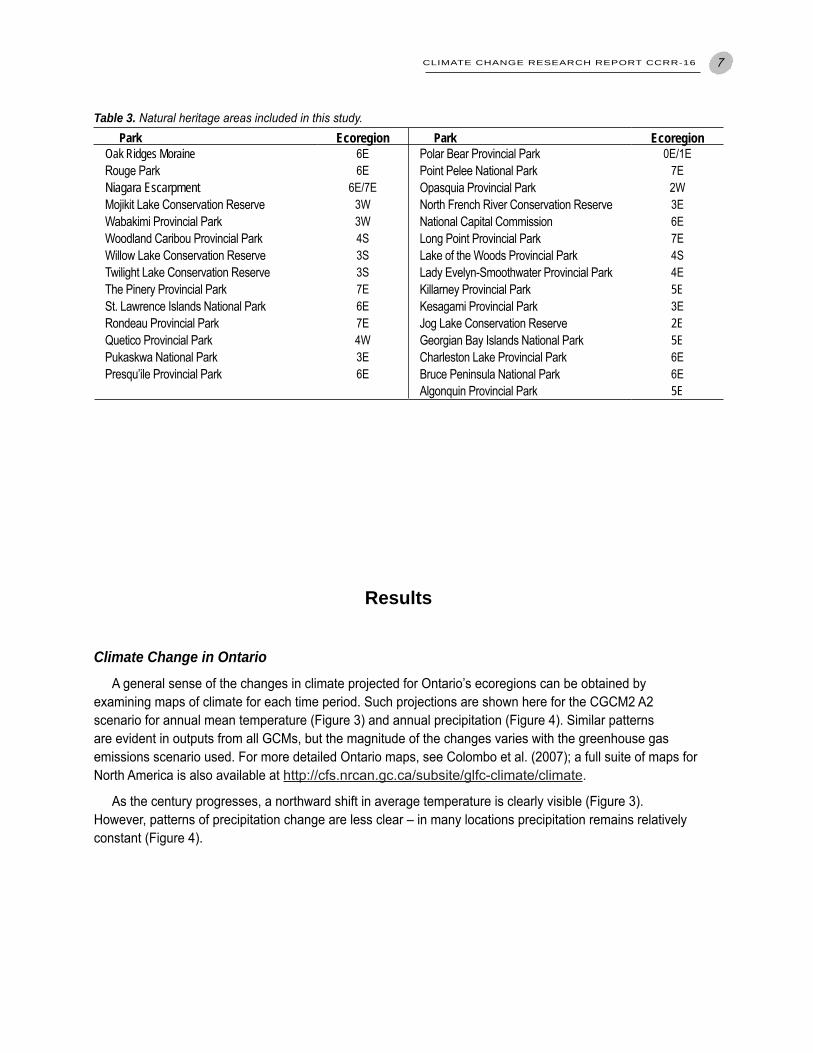
For the natural heritage areas component, we identified 12 tree species with a range of climatic and site type preferences (Table 2) and 29 natural heritage areas from across the province (Table 3). The selected natural heritage areas include National Parks, Provincial Parks, Conservation Reserves, Rouge Park, National Capital Commission Lands, the Oak Ridges Moraine, and the Niagara Escarpment. The selection criteria, management objectives, legislation, and operating principles of these and many other types of natural heritage areas are described in Gray et al. (2009). Current climate envelopes (both the full and core ranges as described above) were generated for each tree species using plant occurrence data from a plant hardiness data set (see McKenney et al. 2007b for description of the plant hardiness project and McKenney et al. 2007c for details of tree distribution and climate change study) and the six climate variables outlined above. These climatic conditions were then located on maps of expected future climate to track the movement of the climate envelope for each tree species in each of the 30-year periods. For each time period, the amount of climate habitat contained within the natural heritage network was summarized for each tree species. The presence or absence of climate habitat for each tree species in each of the 29 natural heritage areas was also tracked for each time period. Finally, the current and future climate for each of the selected natural heritage areas was summarized for the 14 climate variables outlined above.
Table 2. Tree species considered in this study.
Common Name Scientific NameBlackspruce Picea mariana(Mill.)B.S.P.Whitespruce Picea glauca (Moench) VossJackpine Pinus banksiana Lamb.Balsamfir Abies balsamea (L.) Mill.Trembling aspen Populus tremuloides Michx.Whitepine Pinus strobus L.Red pine Pinus resinosa AitonSugarmaple Acer saccharum MarshallRed oak Quercus rubra L.Tulip poplar Liriodendron tulipifera L.Blackwalnut Juglans nigra L.Shagbarkhickory Carya ovata (Mill.) K.Koch
CLIMATE CHANGE RESEARCH REPORT CCRR-16 7
Table 3. Natural heritage areas included in this study.Park Ecoregion
Oak Ridges Moraine 6ERougePark 6ENiagara Escarpment 6E/7EMojikitLakeConservationReserve 3WWabakimiProvincialPark 3WWoodlandCaribouProvincialPark 4SWillowLakeConservationReserve 3STwilightLakeConservationReserve 3SThePineryProvincialPark 7ESt.LawrenceIslandsNationalPark 6ERondeauProvincialPark 7EQueticoProvincialPark 4WPukaskwaNationalPark 3EPresqu’ileProvincialPark 6E
PolarBearProvincialPark 0E/1EPointPeleeNationalPark 7EOpasquiaProvincialPark 2WNorthFrenchRiverConservationReserve 3ENationalCapitalCommission 6ELongPointProvincialPark 7ELakeoftheWoodsProvincialPark 4SLadyEvelyn-SmoothwaterProvincialPark 4EKillarneyProvincialPark 5EKesagamiProvincialPark 3EJogLakeConservationReserve 2EGeorgianBayIslandsNationalPark 5ECharlestonLakeProvincialPark 6EBrucePeninsulaNationalPark 6EAlgonquinProvincialPark 5E
Results
Climate Change in OntarioA general sense of the changes in climate projected for Ontario’s ecoregions can be obtained by
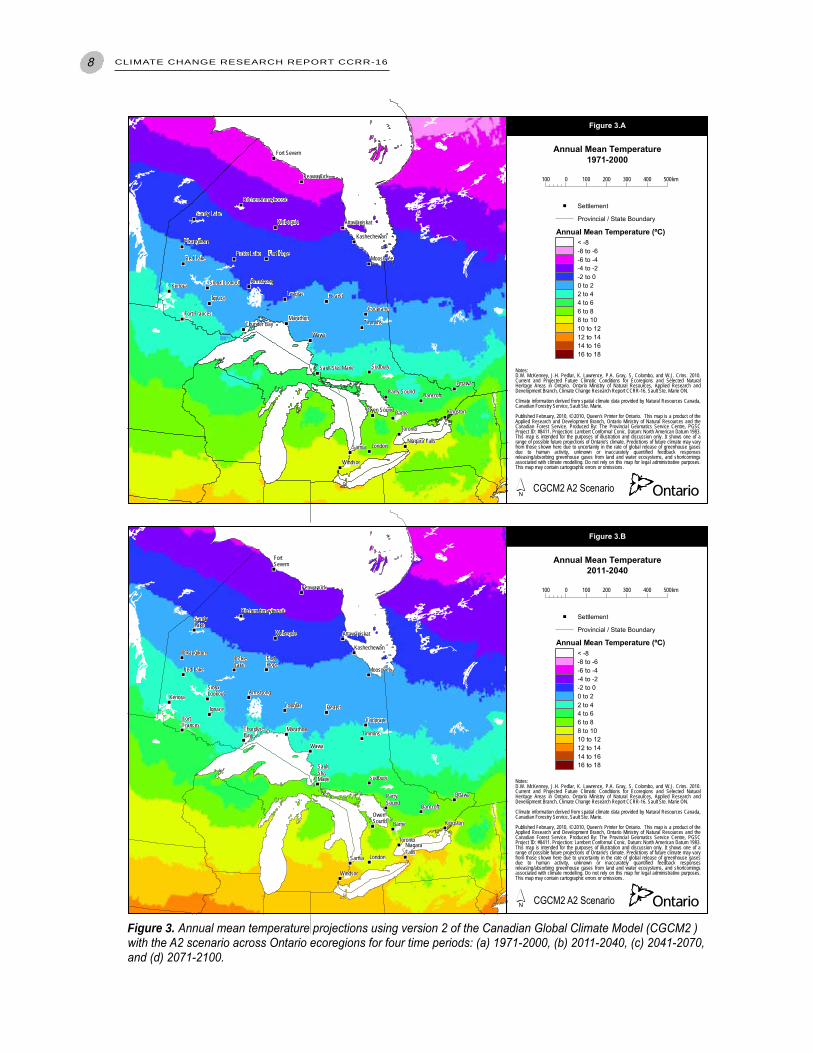
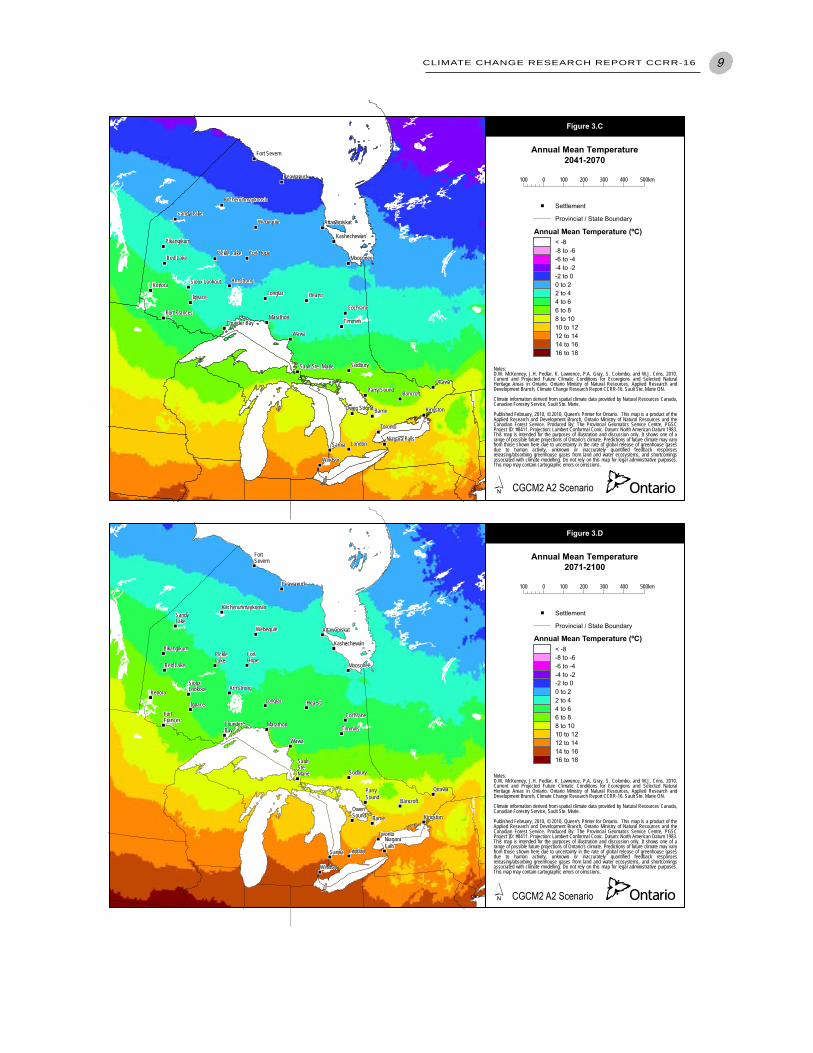
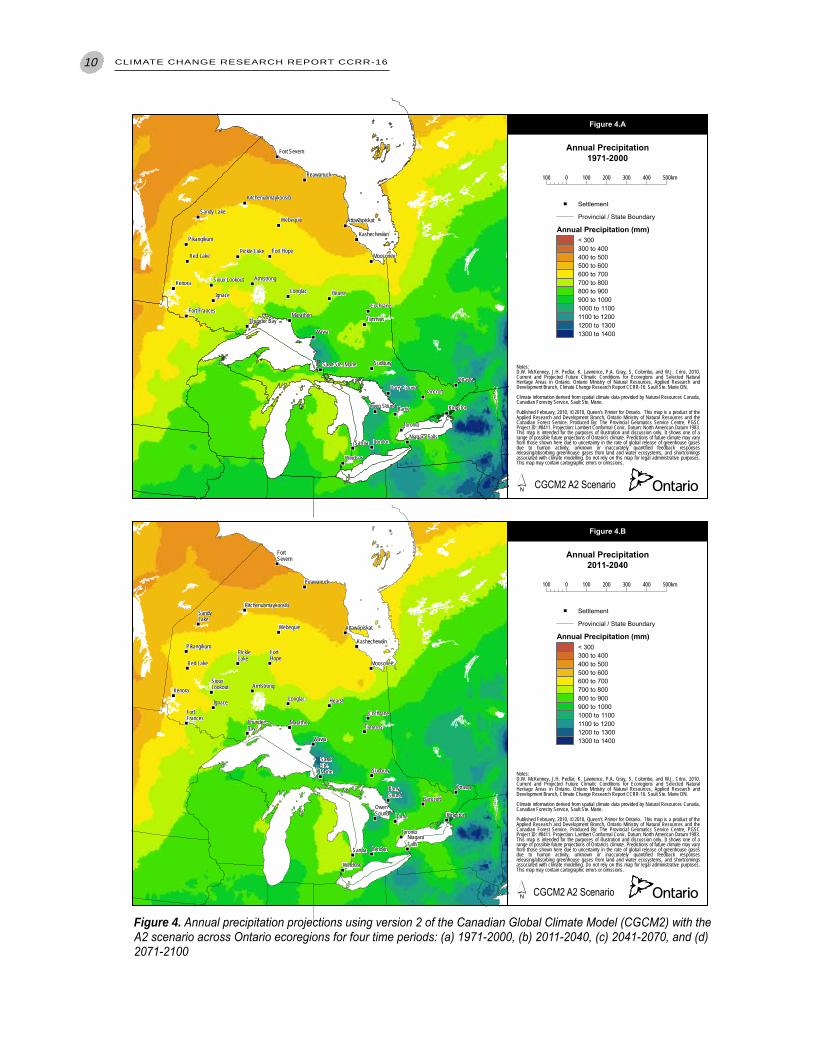
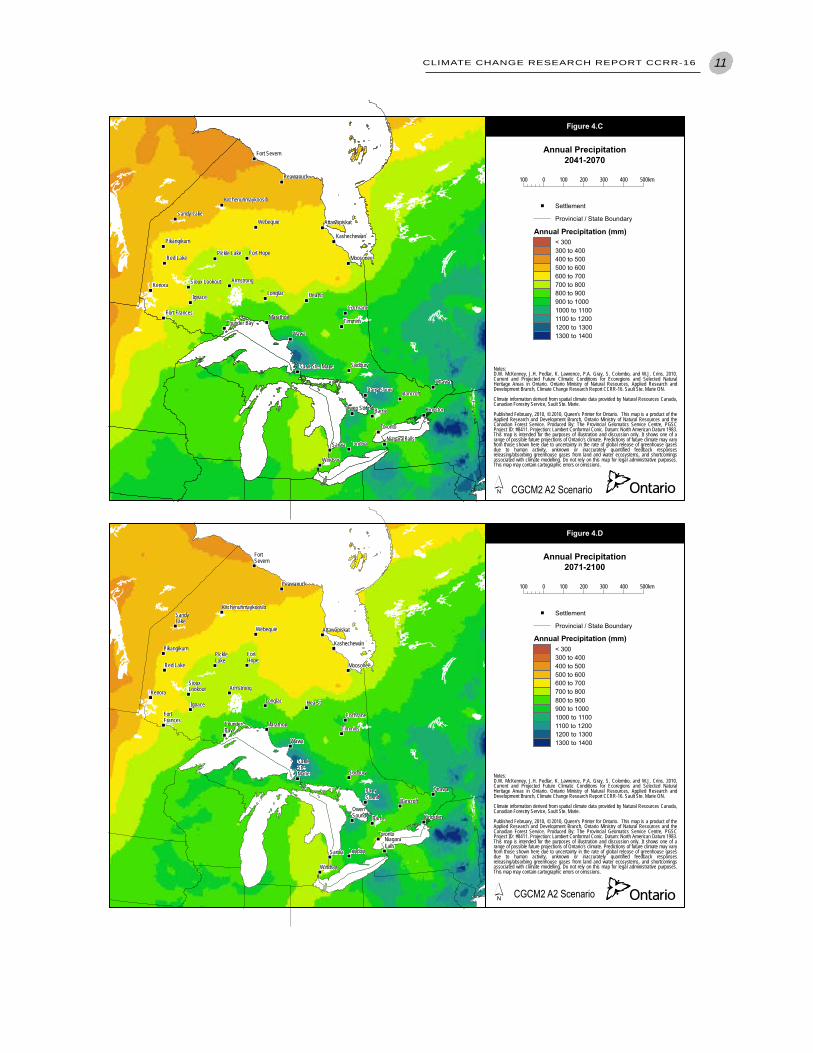
examining maps of climate for each time period. Such projections are shown here for the CGCM2 A2 scenario for annual mean temperature (Figure 3) and annual precipitation (Figure 4). Similar patterns are evident in outputs from all GCMs, but the magnitude of the changes varies with the greenhouse gas emissions scenario used. For more detailed Ontario maps, see Colombo et al. (2007); a full suite of maps for North America is also available at http://cfs.nrcan.gc.ca/subsite/glfc-climate/climate.
As the century progresses, a northward shift in average temperature is clearly visible (Figure 3). However, patterns of precipitation change are less clear – in many locations precipitation remains relatively constant (Figure 4).
Park Ecoregion
8 CLIMATE CHANGE RESEARCH REPORT CCRR-16
""
""
""
""
""
""
""
""
""
""
""""
""
""
""
""""""
""
""
""
""
""
""
""
""
""
""
""
""
""
""
""
""
""
""
""
Wawa
Hearst
LondonSarnia
Barrie
Ottawa
Kenora
Ignace
Timmins
Windsor
Toronto
Sudbury
Longlac
Bancroft
Webequie
Cochrane
Red Lake
Kingston
Marathon
Moosonee
Peawanuck
Fort Hope
Armstrong
Pikangikum
Owen Sound
Sandy Lake
Parry Sound
Pickle Lake
Fort Severn
Thunder Bay
Kashechewan
Fort Frances
Attawapiskat
Sioux Lookout
Niagara Falls
Sault Ste. Marie
Kitchenuhmaykoosib
´
100 0 100 200 300 400 500km
1971-2000
Annual Mean Temperature
"" Settlement
Provincial / State Boundary
Annual Mean Temperature (ºC)< -8-8 to -6-6 to -4-4 to -2-2 to 00 to 22 to 44 to 66 to 88 to 1010 to 1212 to 1414 to 1616 to 18
Figure 3.A
Notes:D.W. McKenney, J.H. Pedlar, K. Lawrence, P.A. Gray, S. Colombo, and W.J. Crins. 2010.Current and Projected Future Climatic Conditions for Ecoregions and Selected NaturalHeritage Areas in Ontario. Ontario Ministry of Natural Resources, Applied Research andDevelopment Branch, Climate Change Research Report CCRR-16. Sault Ste. Marie ON.
Climate information derived from spatial climate data provided by Natural Resources Canada,Canadian Forestry Service, Sault Ste. Marie.
Published February, 2010, © 2010, Queen's Printer for Ontario. This map is a product of theApplied Research and Development Branch, Ontario Ministry of Natural Resources and theCanadian Forest Service. Produced By: The Provincial Geomatics Service Centre, PGSCProject ID: #8411. Projection: Lambert Conformal Conic. Datum: North American Datum 1983.This map is intended for the purposes of illustration and discussion only. It shows one of arange of possible future projections of Ontario’s climate. Predictions of future climate may varyfrom those shown here due to uncertainty in the rate of global release of greenhouse gasesdue to human activity, unknown or inaccurately quantified feedback responsesreleasing/absorbing greenhouse gases from land and water ecosystems, and shortcomingsassociated with climate modelling. Do not rely on this map for legal administrative purposes.This map may contain cartographic errors or omissions.
""
""
""
""
""
""
""
""
""
""
""""
""
""
""
""""""
""
""
""
""
""
""
""
""
""
""
""
""
""
""
""
""
""
""
""Hearst
Bancroft
London
ParrySound
PikangikumPickleLake
FortSevern
Peawanuck
Webequie
Kitchenuhmaykoosib
FortHope
Cochrane
Timmins
SiouxLookout
Red Lake
Windsor
Sarnia
NiagaraFalls
Toronto
BarrieOwenSound Kingston
Ottawa
SaultSte.Marie
ThunderBay
Marathon
FortFrances
Kenora
Sudbury
Longlac
SandyLake
Ignace
Attawapiskat
Kashechewan
Armstrong
Wawa
Moosonee
´
100 0 100 200 300 400 500km
2011-2040
Annual Mean Temperature
"" Settlement
Provincial / State Boundary
Annual Mean Temperature (ºC)< -8-8 to -6-6 to -4-4 to -2-2 to 00 to 22 to 44 to 66 to 88 to 1010 to 1212 to 1414 to 1616 to 18
Figure 3.B
Notes:D.W. McKenney, J.H. Pedlar, K. Lawrence, P.A. Gray, S. Colombo, and W.J. Crins. 2010.Current and Projected Future Climatic Conditions for Ecoregions and Selected NaturalHeritage Areas in Ontario. Ontario Ministry of Natural Resources, Applied Research andDevelopment Branch, Climate Change Research Report CCRR-16. Sault Ste. Marie ON.
Climate information derived from spatial climate data provided by Natural Resources Canada,Canadian Forestry Service, Sault Ste. Marie.
Published February, 2010, © 2010, Queen's Printer for Ontario. This map is a product of theApplied Research and Development Branch, Ontario Ministry of Natural Resources and theCanadian Forest Service. Produced By: The Provincial Geomatics Service Centre, PGSCProject ID: #8411. Projection: Lambert Conformal Conic. Datum: North American Datum 1983.This map is intended for the purposes of illustration and discussion only. It shows one of arange of possible future projections of Ontario’s climate. Predictions of future climate may varyfrom those shown here due to uncertainty in the rate of global release of greenhouse gasesdue to human activity, unknown or inaccurately quantified feedback responsesreleasing/absorbing greenhouse gases from land and water ecosystems, and shortcomingsassociated with climate modelling. Do not rely on this map for legal administrative purposes.This map may contain cartographic errors or omissions.
Figure 3. Annual mean temperature projections using version 2 of the Canadian Global Climate Model (CGCM2 ) with the A2 scenario across Ontario ecoregions for four time periods: (a) 1971-2000, (b) 2011-2040, (c) 2041-2070, and (d) 2071-2100.
CGCM2A2Scenario
CGCM2A2Scenario
CLIMATE CHANGE RESEARCH REPORT CCRR-16 9
""
""
""
""
""
""
""
""
""
""
""""
""
""
""
""""""
""
""
""
""
""
""
""
""
""
""
""
""
""
""
""
""
""
""
""
Wawa
Hearst
LondonSarnia
Barrie
Ottawa
Kenora
Ignace
Timmins
Windsor
Toronto
Sudbury
Longlac
Bancroft
Webequie
Cochrane
Red Lake
Kingston
Marathon
Moosonee
Peawanuck
Fort Hope
Armstrong
Pikangikum
Owen Sound
Sandy Lake
Parry Sound
Pickle Lake
Fort Severn
Thunder Bay
Kashechewan
Fort Frances
Attawapiskat
Sioux Lookout
Niagara Falls
Sault Ste. Marie
Kitchenuhmaykoosib
´
100 0 100 200 300 400 500km
2041-2070
Annual Mean Temperature
"" Settlement
Provincial / State Boundary
Annual Mean Temperature (ºC)< -8-8 to -6-6 to -4-4 to -2-2 to 00 to 22 to 44 to 66 to 88 to 1010 to 1212 to 1414 to 1616 to 18
Figure 3.C
Notes:D.W. McKenney, J.H. Pedlar, K. Lawrence, P.A. Gray, S. Colombo, and W.J. Crins. 2010.Current and Projected Future Climatic Conditions for Ecoregions and Selected NaturalHeritage Areas in Ontario. Ontario Ministry of Natural Resources, Applied Research andDevelopment Branch, Climate Change Research Report CCRR-16. Sault Ste. Marie ON.
Climate information derived from spatial climate data provided by Natural Resources Canada,Canadian Forestry Service, Sault Ste. Marie.
Published February, 2010, © 2010, Queen's Printer for Ontario. This map is a product of theApplied Research and Development Branch, Ontario Ministry of Natural Resources and theCanadian Forest Service. Produced By: The Provincial Geomatics Service Centre, PGSCProject ID: #8411. Projection: Lambert Conformal Conic. Datum: North American Datum 1983.This map is intended for the purposes of illustration and discussion only. It shows one of arange of possible future projections of Ontario’s climate. Predictions of future climate may varyfrom those shown here due to uncertainty in the rate of global release of greenhouse gasesdue to human activity, unknown or inaccurately quantified feedback responsesreleasing/absorbing greenhouse gases from land and water ecosystems, and shortcomingsassociated with climate modelling. Do not rely on this map for legal administrative purposes.This map may contain cartographic errors or omissions.
""
""
""
""
""
""
""
""
""
""
""""
""
""
""
""""""
""
""
""
""
""
""
""
""
""
""
""
""
""
""
""
""
""
""
""Hearst
Bancroft
London
ParrySound
PikangikumPickleLake
FortSevern
Peawanuck
Webequie
Kitchenuhmaykoosib
FortHope
Cochrane
Timmins
SiouxLookout
Red Lake
Windsor
Sarnia
NiagaraFalls
Toronto
BarrieOwenSound Kingston
Ottawa
SaultSte.Marie
ThunderBay
Marathon
FortFrances
Kenora
Sudbury
Longlac
SandyLake
Ignace
Attawapiskat
Kashechewan
Armstrong
Wawa
Moosonee
´
100 0 100 200 300 400 500km
2071-2100
Annual Mean Temperature
"" Settlement
Provincial / State Boundary
Annual Mean Temperature (ºC)< -8-8 to -6-6 to -4-4 to -2-2 to 00 to 22 to 44 to 66 to 88 to 1010 to 1212 to 1414 to 1616 to 18
Figure 3.D
Notes:D.W. McKenney, J.H. Pedlar, K. Lawrence, P.A. Gray, S. Colombo, and W.J. Crins. 2010.Current and Projected Future Climatic Conditions for Ecoregions and Selected NaturalHeritage Areas in Ontario. Ontario Ministry of Natural Resources, Applied Research andDevelopment Branch, Climate Change Research Report CCRR-16. Sault Ste. Marie ON.
Climate information derived from spatial climate data provided by Natural Resources Canada,Canadian Forestry Service, Sault Ste. Marie.
Published February, 2010, © 2010, Queen's Printer for Ontario. This map is a product of theApplied Research and Development Branch, Ontario Ministry of Natural Resources and theCanadian Forest Service. Produced By: The Provincial Geomatics Service Centre, PGSCProject ID: #8411. Projection: Lambert Conformal Conic. Datum: North American Datum 1983.This map is intended for the purposes of illustration and discussion only. It shows one of arange of possible future projections of Ontario’s climate. Predictions of future climate may varyfrom those shown here due to uncertainty in the rate of global release of greenhouse gasesdue to human activity, unknown or inaccurately quantified feedback responsesreleasing/absorbing greenhouse gases from land and water ecosystems, and shortcomingsassociated with climate modelling. Do not rely on this map for legal administrative purposes.This map may contain cartographic errors or omissions.
CGCM2A2Scenario
CGCM2A2Scenario
10 CLIMATE CHANGE RESEARCH REPORT CCRR-16
""
""
""
""
""
""
""
""
""
""
""""
""
""
""
""""""
""
""
""
""
""
""
""
""
""
""
""
""
""
""
""
""
""
""
""
Wawa
Hearst
LondonSarnia
Barrie
Ottawa
Kenora
Ignace
Timmins
Windsor
Toronto
Sudbury
Longlac
Bancroft
Webequie
Cochrane
Red Lake
Kingston
Marathon
Moosonee
Peawanuck
Fort Hope
Armstrong
Pikangikum
Owen Sound
Sandy Lake
Parry Sound
Pickle Lake
Fort Severn
Thunder Bay
Kashechewan
Fort Frances
Attawapiskat
Sioux Lookout
Niagara Falls
Sault Ste. Marie
Kitchenuhmaykoosib
´
100 0 100 200 300 400 500km
1971-2000
Annual Precipitation
"" Settlement
Provincial / State Boundary
Annual Precipitation (mm)< 300300 to 400400 to 500500 to 600600 to 700700 to 800800 to 900900 to 10001000 to 11001100 to 12001200 to 13001300 to 1400
Figure 4.A
Notes:D.W. McKenney, J.H. Pedlar, K. Lawrence, P.A. Gray, S. Colombo, and W.J. Crins. 2010.Current and Projected Future Climatic Conditions for Ecoregions and Selected NaturalHeritage Areas in Ontario. Ontario Ministry of Natural Resources, Applied Research andDevelopment Branch, Climate Change Research Report CCRR-16. Sault Ste. Marie ON.
Climate information derived from spatial climate data provided by Natural Resources Canada,Canadian Forestry Service, Sault Ste. Marie.
Published February, 2010, © 2010, Queen's Printer for Ontario. This map is a product of theApplied Research and Development Branch, Ontario Ministry of Natural Resources and theCanadian Forest Service. Produced By: The Provincial Geomatics Service Centre, PGSCProject ID: #8411. Projection: Lambert Conformal Conic. Datum: North American Datum 1983.This map is intended for the purposes of illustration and discussion only. It shows one of arange of possible future projections of Ontario’s climate. Predictions of future climate may varyfrom those shown here due to uncertainty in the rate of global release of greenhouse gasesdue to human activity, unknown or inaccurately quantified feedback responsesreleasing/absorbing greenhouse gases from land and water ecosystems, and shortcomingsassociated with climate modelling. Do not rely on this map for legal administrative purposes.This map may contain cartographic errors or omissions.
""
""
""
""
""
""
""
""
""
""
""""
""
""
""
""""""
""
""
""
""
""
""
""
""
""
""
""
""
""
""
""
""
""
""
""Hearst
Bancroft
London
ParrySound
PikangikumPickleLake
FortSevern
Peawanuck
Webequie
Kitchenuhmaykoosib
FortHope
Cochrane
Timmins
SiouxLookout
Red Lake
Windsor
Sarnia
NiagaraFalls
Toronto
BarrieOwenSound Kingston
Ottawa
SaultSte.Marie
ThunderBay
Marathon
FortFrances
Kenora
Sudbury
Longlac
SandyLake
Ignace
Attawapiskat
Kashechewan
Armstrong
Wawa
Moosonee
´
100 0 100 200 300 400 500km
2011-2040
Annual Precipitation
"" Settlement
Provincial / State Boundary
Annual Precipitation (mm)< 300300 to 400400 to 500500 to 600600 to 700700 to 800800 to 900900 to 10001000 to 11001100 to 12001200 to 13001300 to 1400
Figure 4.B
Notes:D.W. McKenney, J.H. Pedlar, K. Lawrence, P.A. Gray, S. Colombo, and W.J. Crins. 2010.Current and Projected Future Climatic Conditions for Ecoregions and Selected NaturalHeritage Areas in Ontario. Ontario Ministry of Natural Resources, Applied Research andDevelopment Branch, Climate Change Research Report CCRR-16. Sault Ste. Marie ON.
Climate information derived from spatial climate data provided by Natural Resources Canada,Canadian Forestry Service, Sault Ste. Marie.
Published February, 2010, © 2010, Queen's Printer for Ontario. This map is a product of theApplied Research and Development Branch, Ontario Ministry of Natural Resources and theCanadian Forest Service. Produced By: The Provincial Geomatics Service Centre, PGSCProject ID: #8411. Projection: Lambert Conformal Conic. Datum: North American Datum 1983.This map is intended for the purposes of illustration and discussion only. It shows one of arange of possible future projections of Ontario’s climate. Predictions of future climate may varyfrom those shown here due to uncertainty in the rate of global release of greenhouse gasesdue to human activity, unknown or inaccurately quantified feedback responsesreleasing/absorbing greenhouse gases from land and water ecosystems, and shortcomingsassociated with climate modelling. Do not rely on this map for legal administrative purposes.This map may contain cartographic errors or omissions.
Figure 4. Annual precipitation projections using version 2 of the Canadian Global Climate Model (CGCM2) with the A2 scenario across Ontario ecoregions for four time periods: (a) 1971-2000, (b) 2011-2040, (c) 2041-2070, and (d) 2071-2100
CGCM2A2Scenario
CGCM2A2Scenario
CLIMATE CHANGE RESEARCH REPORT CCRR-16 11
""
""
""
""
""
""
""
""
""
""
""""
""
""
""
""""""
""
""
""
""
""
""
""
""
""
""
""
""
""
""
""
""
""
""
""
Wawa
Hearst
LondonSarnia
Barrie
Ottawa
Kenora
Ignace
Timmins
Windsor
Toronto
Sudbury
Longlac
Bancroft
Webequie
Cochrane
Red Lake
Kingston
Marathon
Moosonee
Peawanuck
Fort Hope
Armstrong
Pikangikum
Owen Sound
Sandy Lake
Parry Sound
Pickle Lake
Fort Severn
Thunder Bay
Kashechewan
Fort Frances
Attawapiskat
Sioux Lookout
Niagara Falls
Sault Ste. Marie
Kitchenuhmaykoosib
´
100 0 100 200 300 400 500km
2041-2070
Annual Precipitation
"" Settlement
Provincial / State Boundary
Annual Precipitation (mm)< 300300 to 400400 to 500500 to 600600 to 700700 to 800800 to 900900 to 10001000 to 11001100 to 12001200 to 13001300 to 1400
Figure 4.C
Notes:D.W. McKenney, J.H. Pedlar, K. Lawrence, P.A. Gray, S. Colombo, and W.J. Crins. 2010.Current and Projected Future Climatic Conditions for Ecoregions and Selected NaturalHeritage Areas in Ontario. Ontario Ministry of Natural Resources, Applied Research andDevelopment Branch, Climate Change Research Report CCRR-16. Sault Ste. Marie ON.
Climate information derived from spatial climate data provided by Natural Resources Canada,Canadian Forestry Service, Sault Ste. Marie.
Published February, 2010, © 2010, Queen's Printer for Ontario. This map is a product of theApplied Research and Development Branch, Ontario Ministry of Natural Resources and theCanadian Forest Service. Produced By: The Provincial Geomatics Service Centre, PGSCProject ID: #8411. Projection: Lambert Conformal Conic. Datum: North American Datum 1983.This map is intended for the purposes of illustration and discussion only. It shows one of arange of possible future projections of Ontario’s climate. Predictions of future climate may varyfrom those shown here due to uncertainty in the rate of global release of greenhouse gasesdue to human activity, unknown or inaccurately quantified feedback responsesreleasing/absorbing greenhouse gases from land and water ecosystems, and shortcomingsassociated with climate modelling. Do not rely on this map for legal administrative purposes.This map may contain cartographic errors or omissions.
""
""
""
""
""
""
""
""
""
""
""""
""
""
""
""""""
""
""
""
""
""
""
""
""
""
""
""
""
""
""
""
""
""
""
""Hearst
Bancroft
London
ParrySound
PikangikumPickleLake
FortSevern
Peawanuck
Webequie
Kitchenuhmaykoosib
FortHope
Cochrane
Timmins
SiouxLookout
Red Lake
Windsor
Sarnia
NiagaraFalls
Toronto
BarrieOwenSound Kingston
Ottawa
SaultSte.Marie
ThunderBay
Marathon
FortFrances
Kenora
Sudbury
Longlac
SandyLake
Ignace
Attawapiskat
Kashechewan
Armstrong
Wawa
Moosonee
´
100 0 100 200 300 400 500km
2071-2100
Annual Precipitation
"" Settlement
Provincial / State Boundary
Annual Precipitation (mm)< 300300 to 400400 to 500500 to 600600 to 700700 to 800800 to 900900 to 10001000 to 11001100 to 12001200 to 13001300 to 1400
Figure 4.D
Notes:D.W. McKenney, J.H. Pedlar, K. Lawrence, P.A. Gray, S. Colombo, and W.J. Crins. 2010.Current and Projected Future Climatic Conditions for Ecoregions and Selected NaturalHeritage Areas in Ontario. Ontario Ministry of Natural Resources, Applied Research andDevelopment Branch, Climate Change Research Report CCRR-16. Sault Ste. Marie ON.
Climate information derived from spatial climate data provided by Natural Resources Canada,Canadian Forestry Service, Sault Ste. Marie.
Published February, 2010, © 2010, Queen's Printer for Ontario. This map is a product of theApplied Research and Development Branch, Ontario Ministry of Natural Resources and theCanadian Forest Service. Produced By: The Provincial Geomatics Service Centre, PGSCProject ID: #8411. Projection: Lambert Conformal Conic. Datum: North American Datum 1983.This map is intended for the purposes of illustration and discussion only. It shows one of arange of possible future projections of Ontario’s climate. Predictions of future climate may varyfrom those shown here due to uncertainty in the rate of global release of greenhouse gasesdue to human activity, unknown or inaccurately quantified feedback responsesreleasing/absorbing greenhouse gases from land and water ecosystems, and shortcomingsassociated with climate modelling. Do not rely on this map for legal administrative purposes.This map may contain cartographic errors or omissions.
CGCM2A2Scenario
CGCM2A2Scenario
12 CLIMATE CHANGE RESEARCH REPORT CCRR-16
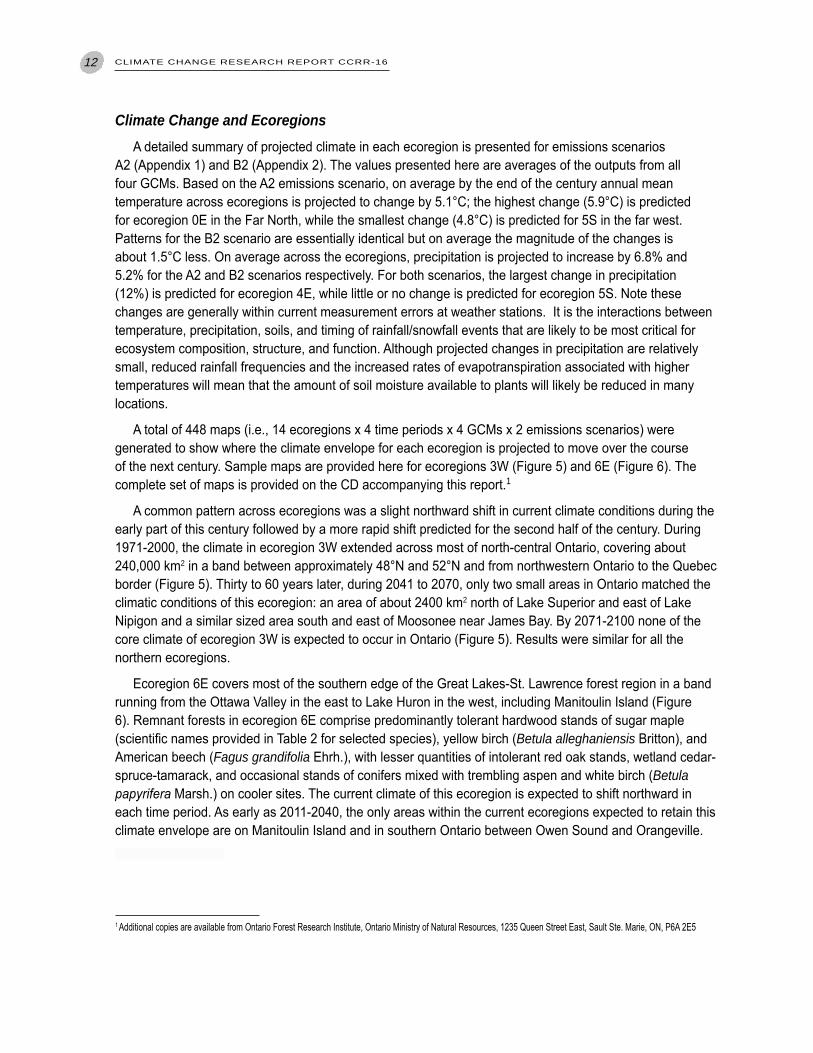
Climate Change and EcoregionsA detailed summary of projected climate in each ecoregion is presented for emissions scenarios
A2 (Appendix 1) and B2 (Appendix 2). The values presented here are averages of the outputs from all four GCMs. Based on the A2 emissions scenario, on average by the end of the century annual mean temperature across ecoregions is projected to change by 5.1°C; the highest change (5.9°C) is predicted for ecoregion 0E in the Far North, while the smallest change (4.8°C) is predicted for 5S in the far west. Patterns for the B2 scenario are essentially identical but on average the magnitude of the changes is about 1.5°C less. On average across the ecoregions, precipitation is projected to increase by 6.8% and 5.2% for the A2 and B2 scenarios respectively. For both scenarios, the largest change in precipitation (12%) is predicted for ecoregion 4E, while little or no change is predicted for ecoregion 5S. Note these changes are generally within current measurement errors at weather stations. It is the interactions between temperature, precipitation, soils, and timing of rainfall/snowfall events that are likely to be most critical for ecosystem composition, structure, and function. Although projected changes in precipitation are relatively small, reduced rainfall frequencies and the increased rates of evapotranspiration associated with higher temperatures will mean that the amount of soil moisture available to plants will likely be reduced in many locations.
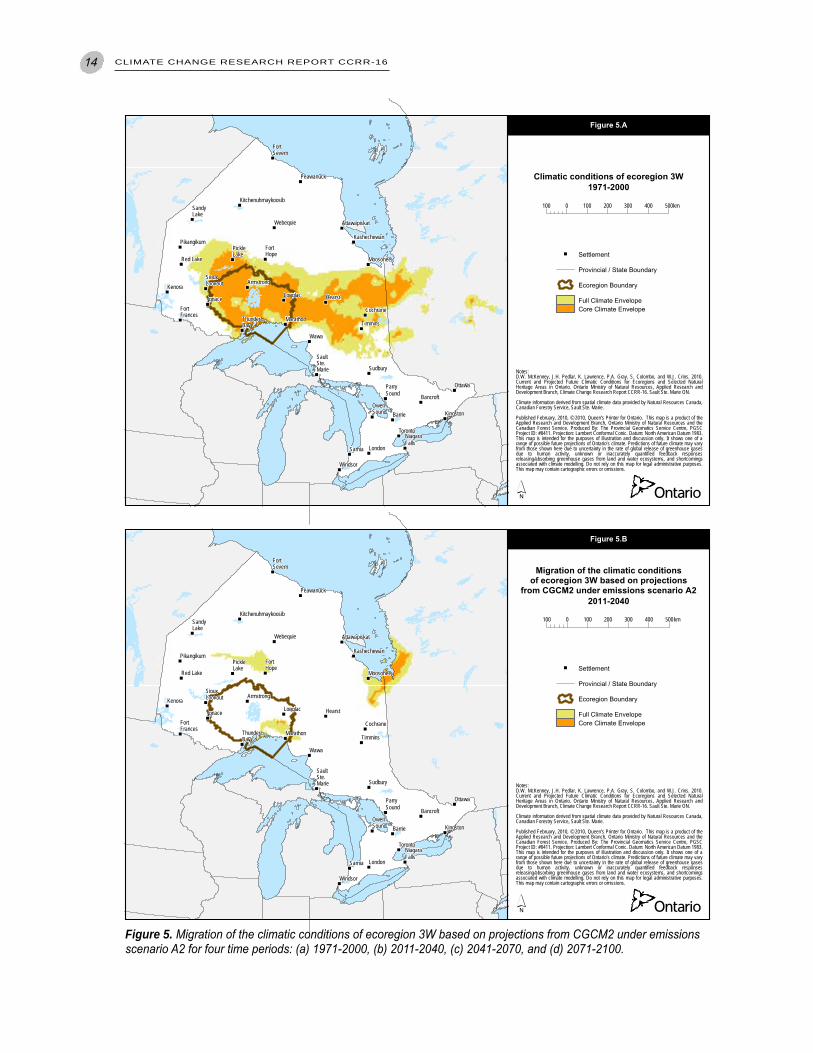
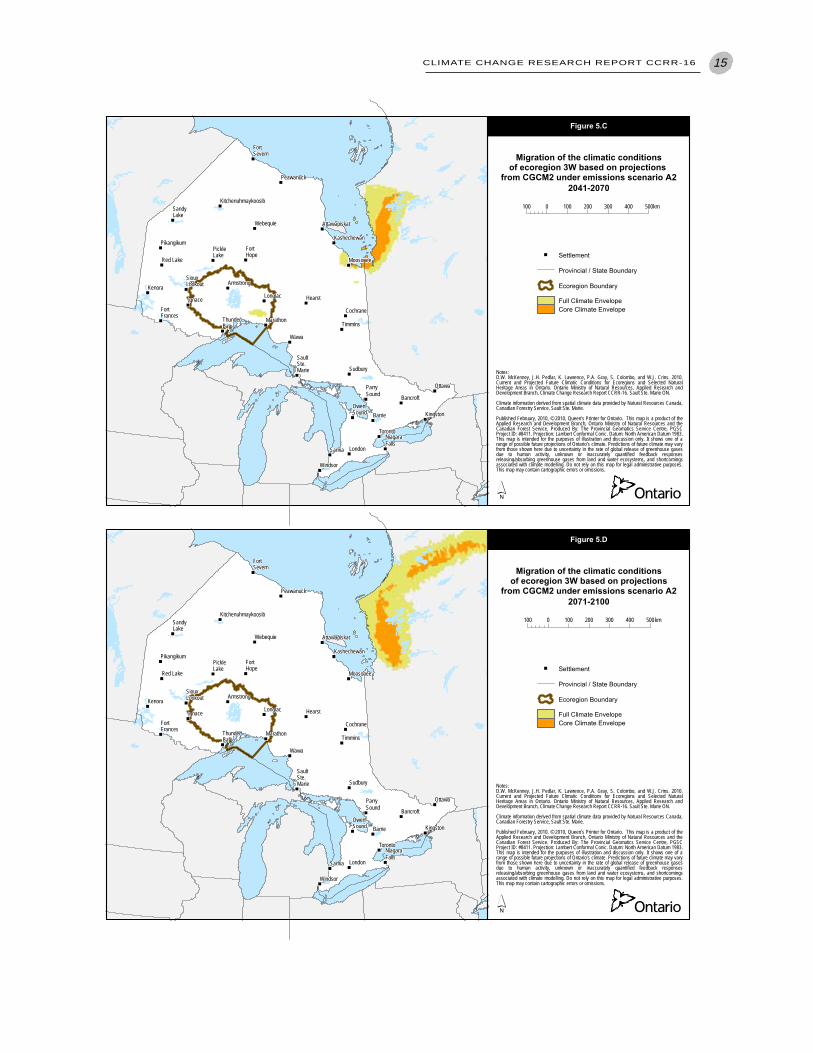
A total of 448 maps (i.e., 14 ecoregions x 4 time periods x 4 GCMs x 2 emissions scenarios) were generated to show where the climate envelope for each ecoregion is projected to move over the course of the next century. Sample maps are provided here for ecoregions 3W (Figure 5) and 6E (Figure 6). The complete set of maps is provided on the CD accompanying this report.1
A common pattern across ecoregions was a slight northward shift in current climate conditions during the early part of this century followed by a more rapid shift predicted for the second half of the century. During 1971-2000, the climate in ecoregion 3W extended across most of north-central Ontario, covering about 240,000 km2 in a band between approximately 48°N and 52°N and from northwestern Ontario to the Quebec border (Figure 5). Thirty to 60 years later, during 2041 to 2070, only two small areas in Ontario matched the climatic conditions of this ecoregion: an area of about 2400 km2 north of Lake Superior and east of Lake Nipigon and a similar sized area south and east of Moosonee near James Bay. By 2071-2100 none of the core climate of ecoregion 3W is expected to occur in Ontario (Figure 5). Results were similar for all the northern ecoregions.
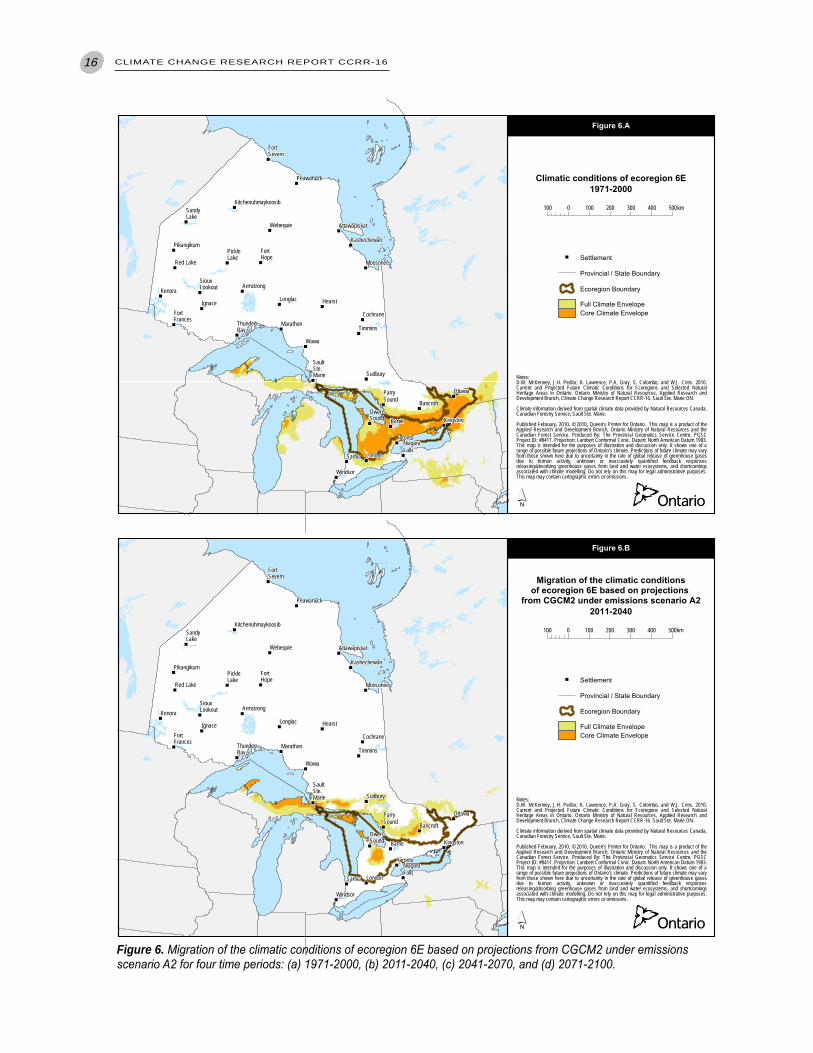
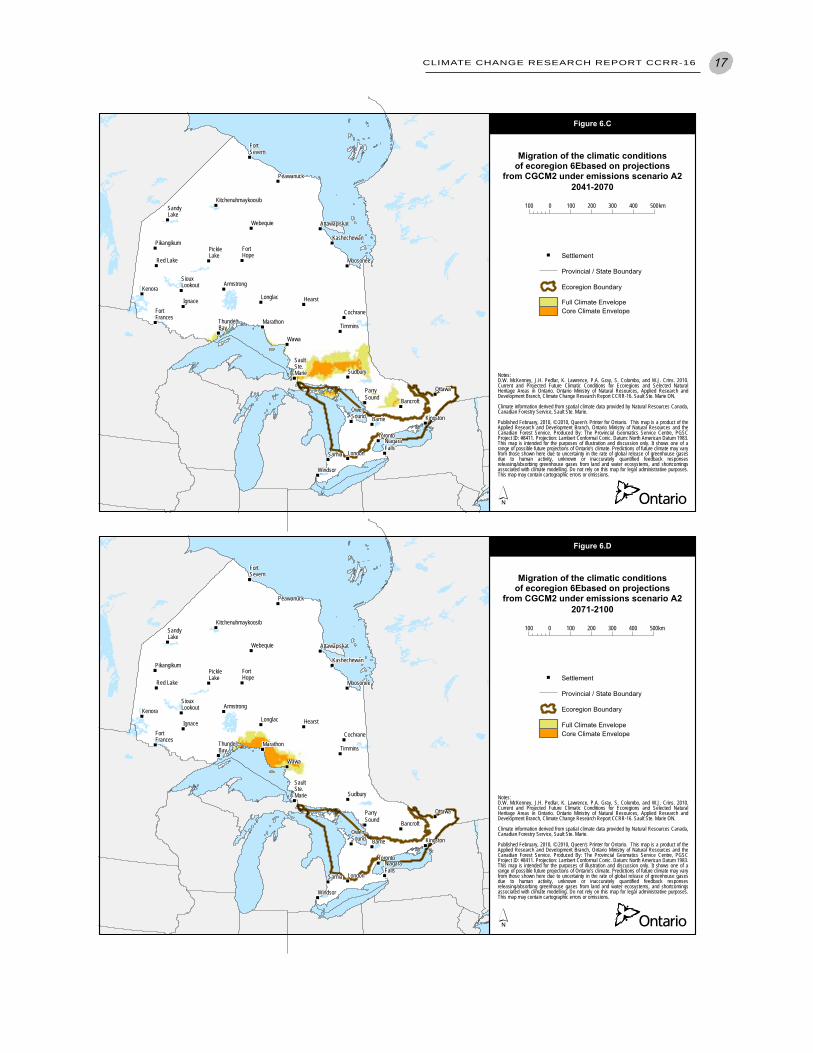
Ecoregion 6E covers most of the southern edge of the Great Lakes-St. Lawrence forest region in a band running from the Ottawa Valley in the east to Lake Huron in the west, including Manitoulin Island (Figure 6). Remnant forests in ecoregion 6E comprise predominantly tolerant hardwood stands of sugar maple (scientific names provided in Table 2 for selected species), yellow birch (Betula alleghaniensis Britton), and American beech (Fagus grandifolia Ehrh.), with lesser quantities of intolerant red oak stands, wetland cedar-spruce-tamarack, and occasional stands of conifers mixed with trembling aspen and white birch (Betula papyrifera Marsh.) on cooler sites. The current climate of this ecoregion is expected to shift northward in each time period. As early as 2011-2040, the only areas within the current ecoregions expected to retain this climate envelope are on Manitoulin Island and in southern Ontario between Owen Sound and Orangeville.
1AdditionalcopiesareavailablefromOntarioForestResearchInstitute,OntarioMinistryofNaturalResources,1235QueenStreetEast,SaultSte.Marie,ON,P6A2E5
CLIMATE CHANGE RESEARCH REPORT CCRR-16 13
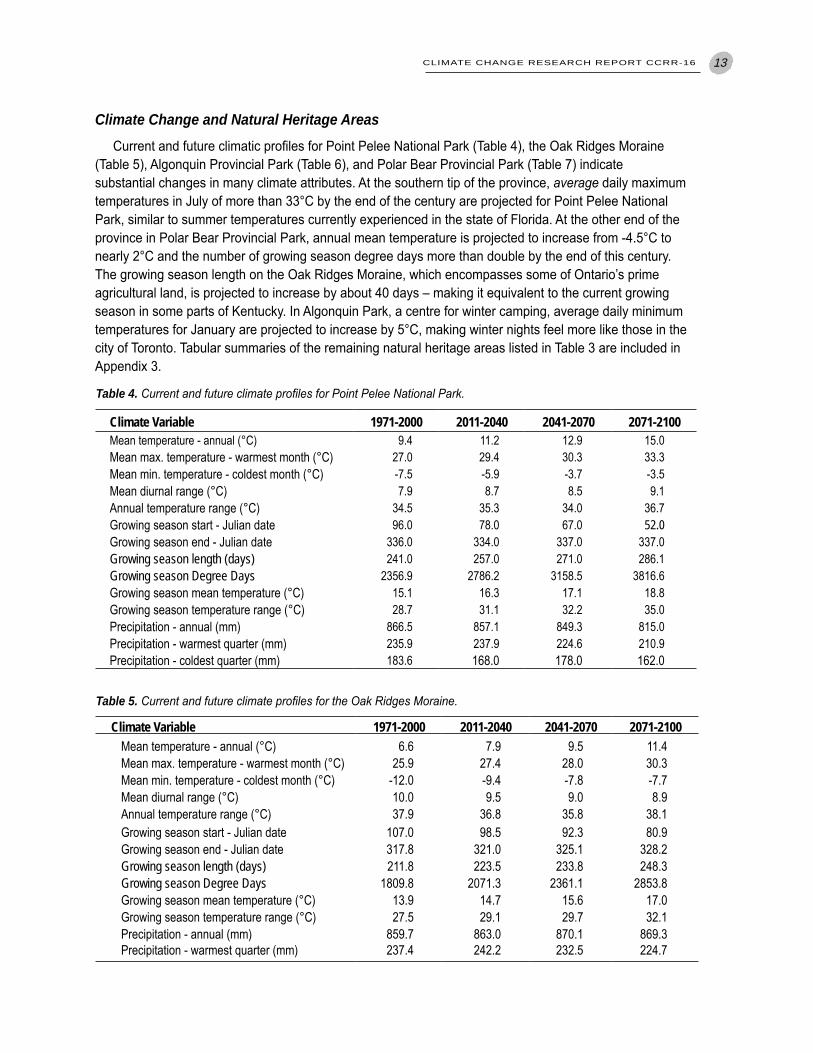
Climate Change and Natural Heritage AreasCurrent and future climatic profiles for Point Pelee National Park (Table 4), the Oak Ridges Moraine
(Table 5), Algonquin Provincial Park (Table 6), and Polar Bear Provincial Park (Table 7) indicate substantial changes in many climate attributes. At the southern tip of the province, average daily maximum temperatures in July of more than 33°C by the end of the century are projected for Point Pelee National Park, similar to summer temperatures currently experienced in the state of Florida. At the other end of the province in Polar Bear Provincial Park, annual mean temperature is projected to increase from -4.5°C to nearly 2°C and the number of growing season degree days more than double by the end of this century. The growing season length on the Oak Ridges Moraine, which encompasses some of Ontario’s prime agricultural land, is projected to increase by about 40 days – making it equivalent to the current growing season in some parts of Kentucky. In Algonquin Park, a centre for winter camping, average daily minimum temperatures for January are projected to increase by 5°C, making winter nights feel more like those in the city of Toronto. Tabular summaries of the remaining natural heritage areas listed in Table 3 are included in Appendix 3.
Table 4. Current and future climate profiles for Point Pelee National Park.
Climate Variable 1971-2000 2011-2040 2041-2070 2071-2100Meantemperature-annual(°C) 9.4 11.2 12.9 15.0Meanmax.temperature-warmestmonth(°C) 27.0 29.4 30.3 33.3Meanmin.temperature-coldestmonth(°C) -7.5 -5.9 -3.7 -3.5Meandiurnalrange(°C) 7.9 8.7 8.5 9.1Annualtemperaturerange(°C) 34.5 35.3 34.0 36.7Growingseasonstart-Juliandate 96.0 78.0 67.0 52.0Growingseasonend-Juliandate 336.0 334.0 337.0 337.0Growing season length (days) 241.0 257.0 271.0 286.1Growing season Degree Days 2356.9 2786.2 3158.5 3816.6Growingseasonmeantemperature(°C) 15.1 16.3 17.1 18.8Growingseasontemperaturerange(°C) 28.7 31.1 32.2 35.0Precipitation-annual(mm) 866.5 857.1 849.3 815.0Precipitation-warmestquarter(mm) 235.9 237.9 224.6 210.9Precipitation-coldestquarter(mm) 183.6 168.0 178.0 162.0
Table 5. Current and future climate profiles for the Oak Ridges Moraine.
Climate Variable 1971-2000 2011-2040 2041-2070 2071-2100Meantemperature-annual(°C) 6.6 7.9 9.5 11.4Meanmax.temperature-warmestmonth(°C) 25.9 27.4 28.0 30.3Meanmin.temperature-coldestmonth(°C) -12.0 -9.4 -7.8 -7.7Meandiurnalrange(°C) 10.0 9.5 9.0 8.9Annualtemperaturerange(°C) 37.9 36.8 35.8 38.1Growingseasonstart-Juliandate 107.0 98.5 92.3 80.9Growingseasonend-Juliandate 317.8 321.0 325.1 328.2Growing season length (days) 211.8 223.5 233.8 248.3Growing season Degree Days 1809.8 2071.3 2361.1 2853.8Growingseasonmeantemperature(°C) 13.9 14.7 15.6 17.0Growingseasontemperaturerange(°C) 27.5 29.1 29.7 32.1Precipitation-annual(mm) 859.7 863.0 870.1 869.3Precipitation-warmestquarter(mm) 237.4 242.2 232.5 224.7
14 CLIMATE CHANGE RESEARCH REPORT CCRR-16
""
""
""
""
""
""
""
""
""
""
""""
""
""
""
""""""
""
""
""
""
""
""
""
""
""
""
""
""
""
""
""
""
""
""
""Hearst
Bancroft
London
ParrySound
PikangikumPickleLake
FortSevern
Peawanuck
Webequie
Kitchenuhmaykoosib
FortHope
Cochrane
Timmins
SiouxLookout
Red Lake
Windsor
Sarnia
NiagaraFalls
Toronto
BarrieOwenSound Kingston
Ottawa
SaultSte.Marie
ThunderBay
Marathon
FortFrances
Kenora
Sudbury
Longlac
SandyLake
Ignace
Attawapiskat
Kashechewan
Armstrong
Wawa
Moosonee
´
100 0 100 200 300 400 500km
1971-2000
Climatic conditions of ecoregion 3W
"" Settlement
Provincial / State Boundary
Ecoregion Boundary
Full Climate EnvelopeCore Climate Envelope
Figure 5.A
Notes:D.W. McKenney, J.H. Pedlar, K. Lawrence, P.A. Gray, S. Colombo, and W.J. Crins. 2010.Current and Projected Future Climatic Conditions for Ecoregions and Selected NaturalHeritage Areas in Ontario. Ontario Ministry of Natural Resources, Applied Research andDevelopment Branch, Climate Change Research Report CCRR-16. Sault Ste. Marie ON.
Climate information derived from spatial climate data provided by Natural Resources Canada,Canadian Forestry Service, Sault Ste. Marie.
Published February, 2010, © 2010, Queen's Printer for Ontario. This map is a product of theApplied Research and Development Branch, Ontario Ministry of Natural Resources and theCanadian Forest Service. Produced By: The Provincial Geomatics Service Centre, PGSCProject ID: #8411. Projection: Lambert Conformal Conic. Datum: North American Datum 1983.This map is intended for the purposes of illustration and discussion only. It shows one of arange of possible future projections of Ontario’s climate. Predictions of future climate may varyfrom those shown here due to uncertainty in the rate of global release of greenhouse gasesdue to human activity, unknown or inaccurately quantified feedback responsesreleasing/absorbing greenhouse gases from land and water ecosystems, and shortcomingsassociated with climate modelling. Do not rely on this map for legal administrative purposes.This map may contain cartographic errors or omissions.
""
""
""
""
""
""
""
""
""
""
""""
""
""
""
""""""
""
""
""
""
""
""
""
""
""
""
""
""
""
""
""
""
""
""
""Hearst
Bancroft
London
ParrySound
PikangikumPickleLake
FortSevern
Peawanuck
Webequie
Kitchenuhmaykoosib
FortHope
Cochrane
Timmins
SiouxLookout
Red Lake
Windsor
Sarnia
NiagaraFalls
Toronto
BarrieOwenSound Kingston
Ottawa
SaultSte.Marie
ThunderBay
Marathon
FortFrances
Kenora
Sudbury
Longlac
SandyLake
Ignace
Attawapiskat
Kashechewan
Armstrong
Wawa
Moosonee
´
100 0 100 200 300 400 500km
2011-2040
Migration of the climatic conditions
of ecoregion 3W based on projectionsfrom CGCM2 under emissions scenario A2
"" Settlement
Provincial / State Boundary
Ecoregion Boundary
Full Climate EnvelopeCore Climate Envelope
Figure 5.B
Notes:D.W. McKenney, J.H. Pedlar, K. Lawrence, P.A. Gray, S. Colombo, and W.J. Crins. 2010.Current and Projected Future Climatic Conditions for Ecoregions and Selected NaturalHeritage Areas in Ontario. Ontario Ministry of Natural Resources, Applied Research andDevelopment Branch, Climate Change Research Report CCRR-16. Sault Ste. Marie ON.
Climate information derived from spatial climate data provided by Natural Resources Canada,Canadian Forestry Service, Sault Ste. Marie.
Published February, 2010, © 2010, Queen's Printer for Ontario. This map is a product of theApplied Research and Development Branch, Ontario Ministry of Natural Resources and theCanadian Forest Service. Produced By: The Provincial Geomatics Service Centre, PGSCProject ID: #8411. Projection: Lambert Conformal Conic. Datum: North American Datum 1983.This map is intended for the purposes of illustration and discussion only. It shows one of arange of possible future projections of Ontario’s climate. Predictions of future climate may varyfrom those shown here due to uncertainty in the rate of global release of greenhouse gasesdue to human activity, unknown or inaccurately quantified feedback responsesreleasing/absorbing greenhouse gases from land and water ecosystems, and shortcomingsassociated with climate modelling. Do not rely on this map for legal administrative purposes.This map may contain cartographic errors or omissions.
Figure 5. Migration of the climatic conditions of ecoregion 3W based on projections from CGCM2 under emissions scenario A2 for four time periods: (a) 1971-2000, (b) 2011-2040, (c) 2041-2070, and (d) 2071-2100.
CLIMATE CHANGE RESEARCH REPORT CCRR-16 15
""
""
""
""
""
""
""
""
""
""
""""
""
""
""
""""""
""
""
""
""
""
""
""
""
""
""
""
""
""
""
""
""
""
""
""Hearst
Bancroft
London
ParrySound
PikangikumPickleLake
FortSevern
Peawanuck
Webequie
Kitchenuhmaykoosib
FortHope
Cochrane
Timmins
SiouxLookout
Red Lake
Windsor
Sarnia
NiagaraFalls
Toronto
BarrieOwenSound Kingston
Ottawa
SaultSte.Marie
ThunderBay
Marathon
FortFrances
Kenora
Sudbury
Longlac
SandyLake
Ignace
Attawapiskat
Kashechewan
Armstrong
Wawa
Moosonee
´
100 0 100 200 300 400 500km
2041-2070
Migration of the climatic conditions
of ecoregion 3W based on projections from CGCM2 under emissions scenario A2
"" Settlement
Provincial / State Boundary
Ecoregion Boundary
Full Climate EnvelopeCore Climate Envelope
Figure 5.C
Notes:D.W. McKenney, J.H. Pedlar, K. Lawrence, P.A. Gray, S. Colombo, and W.J. Crins. 2010.Current and Projected Future Climatic Conditions for Ecoregions and Selected NaturalHeritage Areas in Ontario. Ontario Ministry of Natural Resources, Applied Research andDevelopment Branch, Climate Change Research Report CCRR-16. Sault Ste. Marie ON.
Climate information derived from spatial climate data provided by Natural Resources Canada,Canadian Forestry Service, Sault Ste. Marie.
Published February, 2010, © 2010, Queen's Printer for Ontario. This map is a product of theApplied Research and Development Branch, Ontario Ministry of Natural Resources and theCanadian Forest Service. Produced By: The Provincial Geomatics Service Centre, PGSCProject ID: #8411. Projection: Lambert Conformal Conic. Datum: North American Datum 1983.This map is intended for the purposes of illustration and discussion only. It shows one of arange of possible future projections of Ontario’s climate. Predictions of future climate may varyfrom those shown here due to uncertainty in the rate of global release of greenhouse gasesdue to human activity, unknown or inaccurately quantified feedback responsesreleasing/absorbing greenhouse gases from land and water ecosystems, and shortcomingsassociated with climate modelling. Do not rely on this map for legal administrative purposes.This map may contain cartographic errors or omissions.
""
""
""
""
""
""
""
""
""
""
""""
""
""
""
""""""
""
""
""
""
""
""
""
""
""
""
""
""
""
""
""
""
""
""
""Hearst
Bancroft
London
ParrySound
PikangikumPickleLake
FortSevern
Peawanuck
Webequie
Kitchenuhmaykoosib
FortHope
Cochrane
Timmins
SiouxLookout
Red Lake
Windsor
Sarnia
NiagaraFalls
Toronto
BarrieOwenSound Kingston
Ottawa
SaultSte.Marie
ThunderBay
Marathon
FortFrances
Kenora
Sudbury
Longlac
SandyLake
Ignace
Attawapiskat
Kashechewan
Armstrong
Wawa
Moosonee
´
100 0 100 200 300 400 500km
2071-2100
Migration of the climatic conditions
of ecoregion 3W based on projectionsfrom CGCM2 under emissions scenario A2
"" Settlement
Provincial / State Boundary
Ecoregion Boundary
Full Climate EnvelopeCore Climate Envelope
Figure 5.D
Notes:D.W. McKenney, J.H. Pedlar, K. Lawrence, P.A. Gray, S. Colombo, and W.J. Crins. 2010.Current and Projected Future Climatic Conditions for Ecoregions and Selected NaturalHeritage Areas in Ontario. Ontario Ministry of Natural Resources, Applied Research andDevelopment Branch, Climate Change Research Report CCRR-16. Sault Ste. Marie ON.
Climate information derived from spatial climate data provided by Natural Resources Canada,Canadian Forestry Service, Sault Ste. Marie.
Published February, 2010, © 2010, Queen's Printer for Ontario. This map is a product of theApplied Research and Development Branch, Ontario Ministry of Natural Resources and theCanadian Forest Service. Produced By: The Provincial Geomatics Service Centre, PGSCProject ID: #8411. Projection: Lambert Conformal Conic. Datum: North American Datum 1983.This map is intended for the purposes of illustration and discussion only. It shows one of arange of possible future projections of Ontario’s climate. Predictions of future climate may varyfrom those shown here due to uncertainty in the rate of global release of greenhouse gasesdue to human activity, unknown or inaccurately quantified feedback responsesreleasing/absorbing greenhouse gases from land and water ecosystems, and shortcomingsassociated with climate modelling. Do not rely on this map for legal administrative purposes.This map may contain cartographic errors or omissions.
16 CLIMATE CHANGE RESEARCH REPORT CCRR-16
""
""
""
""
""
""
""
""
""
""
""""
""
""
""
""""""
""
""
""
""
""
""
""
""
""
""
""
""
""
""
""
""
""
""
""Hearst
Bancroft
London
ParrySound
PikangikumPickleLake
FortSevern
Peawanuck
Webequie
Kitchenuhmaykoosib
FortHope
Cochrane
Timmins
SiouxLookout
Red Lake
Windsor
Sarnia
NiagaraFalls
Toronto
BarrieOwenSound Kingston
Ottawa
SaultSte.Marie
ThunderBay
Marathon
FortFrances
Kenora
Sudbury
Longlac
SandyLake
Ignace
Attawapiskat
Kashechewan
Armstrong
Wawa
Moosonee
´
100 0 100 200 300 400 500km
1971-2000
Climatic conditions of ecoregion 6E
"" Settlement
Provincial / State Boundary
Ecoregion Boundary
Full Climate EnvelopeCore Climate Envelope
Figure 6.A
Notes:D.W. McKenney, J.H. Pedlar, K. Lawrence, P.A. Gray, S. Colombo, and W.J. Crins. 2010.Current and Projected Future Climatic Conditions for Ecoregions and Selected NaturalHeritage Areas in Ontario. Ontario Ministry of Natural Resources, Applied Research andDevelopment Branch, Climate Change Research Report CCRR-16. Sault Ste. Marie ON.
Climate information derived from spatial climate data provided by Natural Resources Canada,Canadian Forestry Service, Sault Ste. Marie.
Published February, 2010, © 2010, Queen's Printer for Ontario. This map is a product of theApplied Research and Development Branch, Ontario Ministry of Natural Resources and theCanadian Forest Service. Produced By: The Provincial Geomatics Service Centre, PGSCProject ID: #8411. Projection: Lambert Conformal Conic. Datum: North American Datum 1983.This map is intended for the purposes of illustration and discussion only. It shows one of arange of possible future projections of Ontario’s climate. Predictions of future climate may varyfrom those shown here due to uncertainty in the rate of global release of greenhouse gasesdue to human activity, unknown or inaccurately quantified feedback responsesreleasing/absorbing greenhouse gases from land and water ecosystems, and shortcomingsassociated with climate modelling. Do not rely on this map for legal administrative purposes.This map may contain cartographic errors or omissions.
""
""
""
""
""
""
""
""
""
""
""""
""
""
""
""""""
""
""
""
""
""
""
""
""
""
""
""
""
""
""
""
""
""
""
""Hearst
Bancroft
London
ParrySound
PikangikumPickleLake
FortSevern
Peawanuck
Webequie
Kitchenuhmaykoosib
FortHope
Cochrane
Timmins
SiouxLookout
Red Lake
Windsor
Sarnia
NiagaraFalls
Toronto
BarrieOwenSound Kingston
Ottawa
SaultSte.Marie
ThunderBay
Marathon
FortFrances
Kenora
Sudbury
Longlac
SandyLake
Ignace
Attawapiskat
Kashechewan
Armstrong
Wawa
Moosonee
´
100 0 100 200 300 400 500km
2011-2040
Migration of the climatic conditions
of ecoregion 6E based on projections from CGCM2 under emissions scenario A2
"" Settlement
Provincial / State Boundary
Ecoregion Boundary
Full Climate EnvelopeCore Climate Envelope
Figure 6.B
Notes:D.W. McKenney, J.H. Pedlar, K. Lawrence, P.A. Gray, S. Colombo, and W.J. Crins. 2010.Current and Projected Future Climatic Conditions for Ecoregions and Selected NaturalHeritage Areas in Ontario. Ontario Ministry of Natural Resources, Applied Research andDevelopment Branch, Climate Change Research Report CCRR-16. Sault Ste. Marie ON.
Climate information derived from spatial climate data provided by Natural Resources Canada,Canadian Forestry Service, Sault Ste. Marie.
Published February, 2010, © 2010, Queen's Printer for Ontario. This map is a product of theApplied Research and Development Branch, Ontario Ministry of Natural Resources and theCanadian Forest Service. Produced By: The Provincial Geomatics Service Centre, PGSCProject ID: #8411. Projection: Lambert Conformal Conic. Datum: North American Datum 1983.This map is intended for the purposes of illustration and discussion only. It shows one of arange of possible future projections of Ontario’s climate. Predictions of future climate may varyfrom those shown here due to uncertainty in the rate of global release of greenhouse gasesdue to human activity, unknown or inaccurately quantified feedback responsesreleasing/absorbing greenhouse gases from land and water ecosystems, and shortcomingsassociated with climate modelling. Do not rely on this map for legal administrative purposes.This map may contain cartographic errors or omissions.
Figure 6. Migration of the climatic conditions of ecoregion 6E based on projections from CGCM2 under emissions scenario A2 for four time periods: (a) 1971-2000, (b) 2011-2040, (c) 2041-2070, and (d) 2071-2100.
CLIMATE CHANGE RESEARCH REPORT CCRR-16 17
""
""
""
""
""
""
""
""
""
""
""""
""
""
""
""""""
""
""
""
""
""
""
""
""
""
""
""
""
""
""
""
""
""
""
""Hearst
Bancroft
London
ParrySound
PikangikumPickleLake
FortSevern
Peawanuck
Webequie
Kitchenuhmaykoosib
FortHope
Cochrane
Timmins
SiouxLookout
Red Lake
Windsor
Sarnia
NiagaraFalls
Toronto
BarrieOwenSound Kingston
Ottawa
SaultSte.Marie
ThunderBay
Marathon
FortFrances
Kenora
Sudbury
Longlac
SandyLake
Ignace
Attawapiskat
Kashechewan
Armstrong
Wawa
Moosonee
´
100 0 100 200 300 400 500km
2041-2070
Migration of the climatic conditions
of ecoregion 6Ebased on projectionsfrom CGCM2 under emissions scenario A2
"" Settlement
Provincial / State Boundary
Ecoregion Boundary
Full Climate EnvelopeCore Climate Envelope
Figure 6.C
Notes:D.W. McKenney, J.H. Pedlar, K. Lawrence, P.A. Gray, S. Colombo, and W.J. Crins. 2010.Current and Projected Future Climatic Conditions for Ecoregions and Selected NaturalHeritage Areas in Ontario. Ontario Ministry of Natural Resources, Applied Research andDevelopment Branch, Climate Change Research Report CCRR-16. Sault Ste. Marie ON.
Climate information derived from spatial climate data provided by Natural Resources Canada,Canadian Forestry Service, Sault Ste. Marie.
Published February, 2010, © 2010, Queen's Printer for Ontario. This map is a product of theApplied Research and Development Branch, Ontario Ministry of Natural Resources and theCanadian Forest Service. Produced By: The Provincial Geomatics Service Centre, PGSCProject ID: #8411. Projection: Lambert Conformal Conic. Datum: North American Datum 1983.This map is intended for the purposes of illustration and discussion only. It shows one of arange of possible future projections of Ontario’s climate. Predictions of future climate may varyfrom those shown here due to uncertainty in the rate of global release of greenhouse gasesdue to human activity, unknown or inaccurately quantified feedback responsesreleasing/absorbing greenhouse gases from land and water ecosystems, and shortcomingsassociated with climate modelling. Do not rely on this map for legal administrative purposes.This map may contain cartographic errors or omissions.
""
""
""
""
""
""
""
""
""
""
""""
""
""
""
""""""
""
""
""
""
""
""
""
""
""
""
""
""
""
""
""
""
""
""
""Hearst
Bancroft
London
ParrySound
PikangikumPickleLake
FortSevern
Peawanuck
Webequie
Kitchenuhmaykoosib
FortHope
Cochrane
Timmins
SiouxLookout
Red Lake
Windsor
Sarnia
NiagaraFalls
Toronto
BarrieOwenSound Kingston
Ottawa
SaultSte.Marie
ThunderBay
Marathon
FortFrances
Kenora
Sudbury
Longlac
SandyLake
Ignace
Attawapiskat
Kashechewan
Armstrong
Wawa
Moosonee
´
100 0 100 200 300 400 500km
2071-2100
Migration of the climatic conditions
of ecoregion 6Ebased on projectionsfrom CGCM2 under emissions scenario A2
"" Settlement
Provincial / State Boundary
Ecoregion Boundary
Full Climate EnvelopeCore Climate Envelope
Figure 6.D
Notes:D.W. McKenney, J.H. Pedlar, K. Lawrence, P.A. Gray, S. Colombo, and W.J. Crins. 2010.Current and Projected Future Climatic Conditions for Ecoregions and Selected NaturalHeritage Areas in Ontario. Ontario Ministry of Natural Resources, Applied Research andDevelopment Branch, Climate Change Research Report CCRR-16. Sault Ste. Marie ON.
Climate information derived from spatial climate data provided by Natural Resources Canada,Canadian Forestry Service, Sault Ste. Marie.
Published February, 2010, © 2010, Queen's Printer for Ontario. This map is a product of theApplied Research and Development Branch, Ontario Ministry of Natural Resources and theCanadian Forest Service. Produced By: The Provincial Geomatics Service Centre, PGSCProject ID: #8411. Projection: Lambert Conformal Conic. Datum: North American Datum 1983.This map is intended for the purposes of illustration and discussion only. It shows one of arange of possible future projections of Ontario’s climate. Predictions of future climate may varyfrom those shown here due to uncertainty in the rate of global release of greenhouse gasesdue to human activity, unknown or inaccurately quantified feedback responsesreleasing/absorbing greenhouse gases from land and water ecosystems, and shortcomingsassociated with climate modelling. Do not rely on this map for legal administrative purposes.This map may contain cartographic errors or omissions.
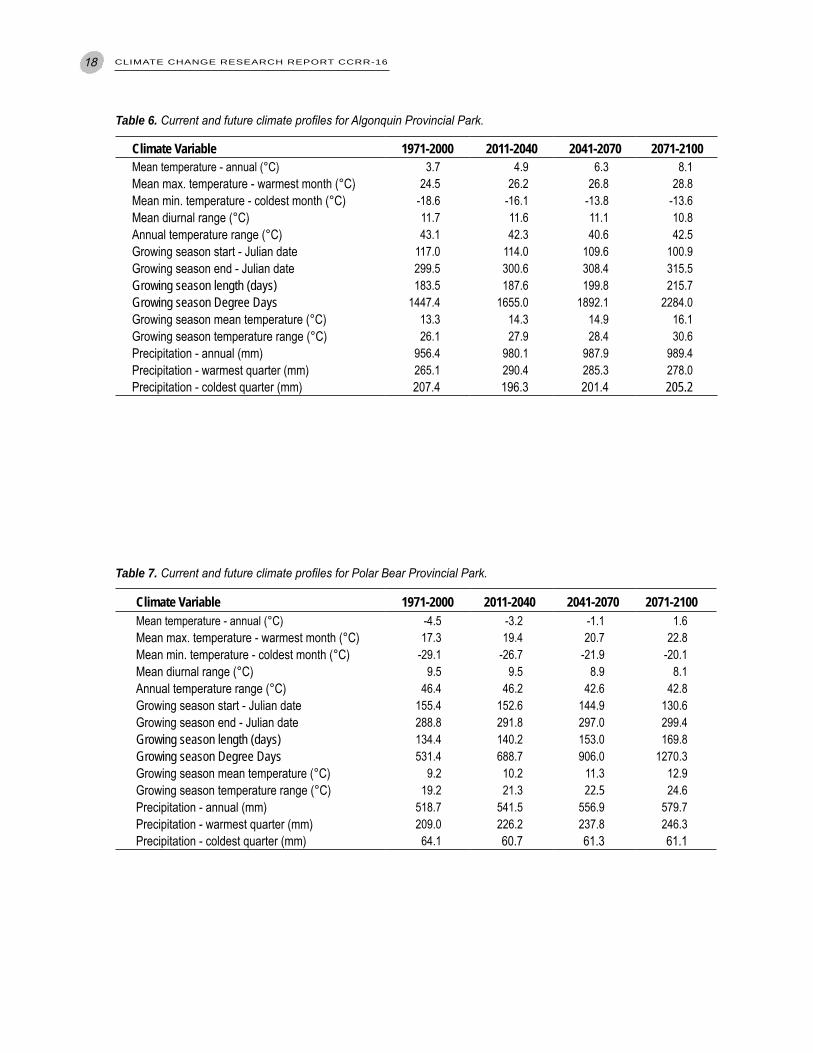
18 CLIMATE CHANGE RESEARCH REPORT CCRR-16
Table 6. Current and future climate profiles for Algonquin Provincial Park.
Climate Variable 1971-2000 2011-2040 2041-2070 2071-2100Meantemperature-annual(°C) 3.7 4.9 6.3 8.1Meanmax.temperature-warmestmonth(°C) 24.5 26.2 26.8 28.8Meanmin.temperature-coldestmonth(°C) -18.6 -16.1 -13.8 -13.6Meandiurnalrange(°C) 11.7 11.6 11.1 10.8Annualtemperaturerange(°C) 43.1 42.3 40.6 42.5Growingseasonstart-Juliandate 117.0 114.0 109.6 100.9Growingseasonend-Juliandate 299.5 300.6 308.4 315.5Growing season length (days) 183.5 187.6 199.8 215.7Growing season Degree Days 1447.4 1655.0 1892.1 2284.0Growingseasonmeantemperature(°C) 13.3 14.3 14.9 16.1Growingseasontemperaturerange(°C) 26.1 27.9 28.4 30.6Precipitation-annual(mm) 956.4 980.1 987.9 989.4Precipitation-warmestquarter(mm) 265.1 290.4 285.3 278.0Precipitation-coldestquarter(mm) 207.4 196.3 201.4 205.2
Table 7. Current and future climate profiles for Polar Bear Provincial Park.
Climate Variable 1971-2000 2011-2040 2041-2070 2071-2100Meantemperature-annual(°C) -4.5 -3.2 -1.1 1.6Meanmax.temperature-warmestmonth(°C) 17.3 19.4 20.7 22.8Meanmin.temperature-coldestmonth(°C) -29.1 -26.7 -21.9 -20.1Meandiurnalrange(°C) 9.5 9.5 8.9 8.1Annualtemperaturerange(°C) 46.4 46.2 42.6 42.8Growingseasonstart-Juliandate 155.4 152.6 144.9 130.6Growingseasonend-Juliandate 288.8 291.8 297.0 299.4Growing season length (days) 134.4 140.2 153.0 169.8Growing season Degree Days 531.4 688.7 906.0 1270.3Growingseasonmeantemperature(°C) 9.2 10.2 11.3 12.9Growingseasontemperaturerange(°C) 19.2 21.3 22.5 24.6Precipitation-annual(mm) 518.7 541.5 556.9 579.7Precipitation-warmestquarter(mm) 209.0 226.2 237.8 246.3Precipitation-coldestquarter(mm) 64.1 60.7 61.3 61.1
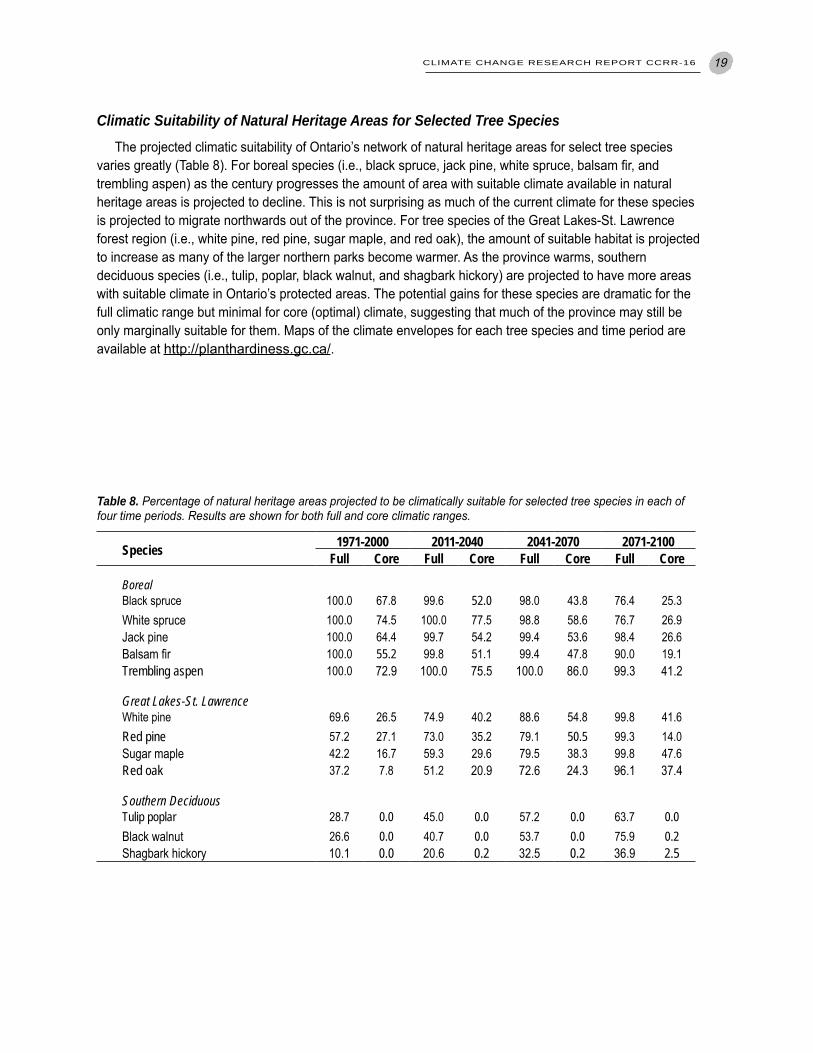
CLIMATE CHANGE RESEARCH REPORT CCRR-16 19
Climatic Suitability of Natural Heritage Areas for Selected Tree SpeciesThe projected climatic suitability of Ontario’s network of natural heritage areas for select tree species
varies greatly (Table 8). For boreal species (i.e., black spruce, jack pine, white spruce, balsam fir, and trembling aspen) as the century progresses the amount of area with suitable climate available in natural heritage areas is projected to decline. This is not surprising as much of the current climate for these species is projected to migrate northwards out of the province. For tree species of the Great Lakes-St. Lawrence forest region (i.e., white pine, red pine, sugar maple, and red oak), the amount of suitable habitat is projected to increase as many of the larger northern parks become warmer. As the province warms, southern deciduous species (i.e., tulip, poplar, black walnut, and shagbark hickory) are projected to have more areas with suitable climate in Ontario’s protected areas. The potential gains for these species are dramatic for the full climatic range but minimal for core (optimal) climate, suggesting that much of the province may still be only marginally suitable for them. Maps of the climate envelopes for each tree species and time period are available at http://planthardiness.gc.ca/.
Table 8. Percentage of natural heritage areas projected to be climatically suitable for selected tree species in each of four time periods. Results are shown for both full and core climatic ranges.
Species 1971-2000 2011-2040 2041-2070 2071-2100Full Core Full Core Full Core Full Core
BorealBlackspruce 100.0 67.8 99.6 52.0 98.0 43.8 76.4 25.3Whitespruce 100.0 74.5 100.0 77.5 98.8 58.6 76.7 26.9Jackpine 100.0 64.4 99.7 54.2 99.4 53.6 98.4 26.6Balsamfir 100.0 55.2 99.8 51.1 99.4 47.8 90.0 19.1Trembling aspen 100.0 72.9 100.0 75.5 100.0 86.0 99.3 41.2
Great Lakes-St. LawrenceWhitepine 69.6 26.5 74.9 40.2 88.6 54.8 99.8 41.6Red pine 57.2 27.1 73.0 35.2 79.1 50.5 99.3 14.0Sugarmaple 42.2 16.7 59.3 29.6 79.5 38.3 99.8 47.6Red oak 37.2 7.8 51.2 20.9 72.6 24.3 96.1 37.4
Southern DeciduousTulip poplar 28.7 0.0 45.0 0.0 57.2 0.0 63.7 0.0Blackwalnut 26.6 0.0 40.7 0.0 53.7 0.0 75.9 0.2Shagbarkhickory 10.1 0.0 20.6 0.2 32.5 0.2 36.9 2.5
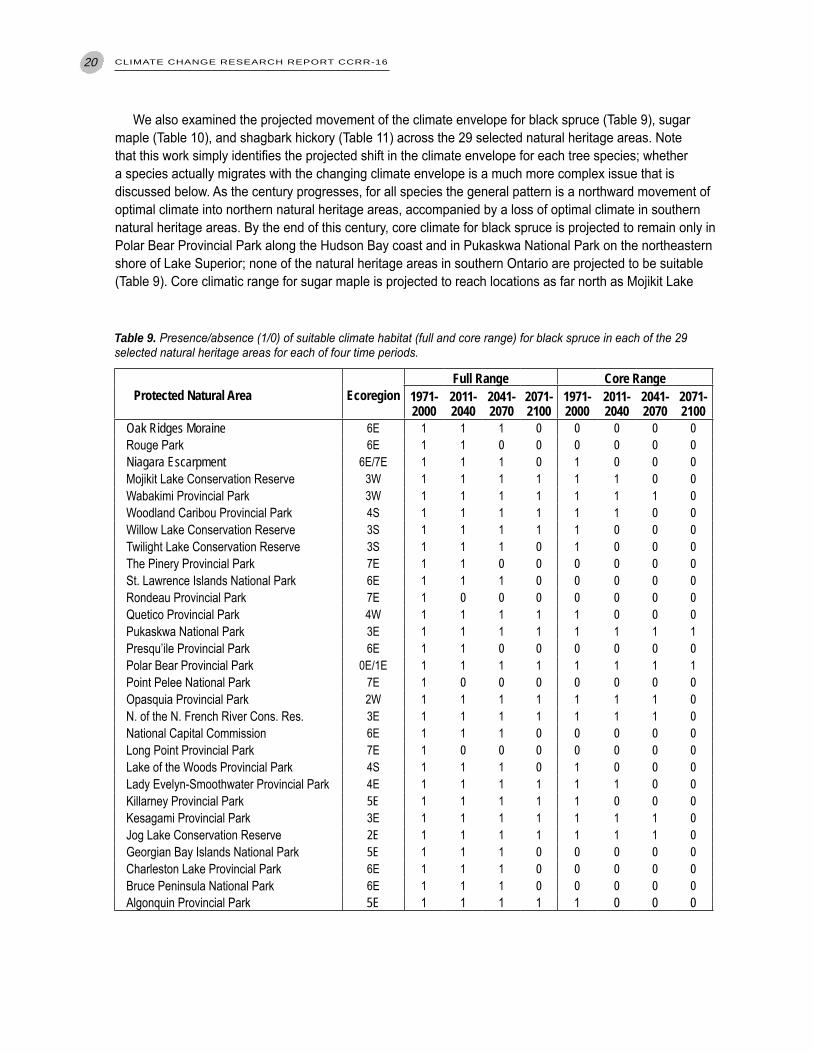
20 CLIMATE CHANGE RESEARCH REPORT CCRR-16
We also examined the projected movement of the climate envelope for black spruce (Table 9), sugar maple (Table 10), and shagbark hickory (Table 11) across the 29 selected natural heritage areas. Note that this work simply identifies the projected shift in the climate envelope for each tree species; whether a species actually migrates with the changing climate envelope is a much more complex issue that is discussed below. As the century progresses, for all species the general pattern is a northward movement of optimal climate into northern natural heritage areas, accompanied by a loss of optimal climate in southern natural heritage areas. By the end of this century, core climate for black spruce is projected to remain only in Polar Bear Provincial Park along the Hudson Bay coast and in Pukaskwa National Park on the northeastern shore of Lake Superior; none of the natural heritage areas in southern Ontario are projected to be suitable (Table 9). Core climatic range for sugar maple is projected to reach locations as far north as Mojikit Lake
Table 9. Presence/absence (1/0) of suitable climate habitat (full and core range) for black spruce in each of the 29 selected natural heritage areas for each of four time periods.
Protected Natural Area EcoregionFull Range Core Range
1971-2000
2011-2040
2041-2070
2071-2100
1971-2000
2011-2040
2041-2070
2071-2100
Oak Ridges Moraine 6E 1 1 1 0 0 0 0 0RougePark 6E 1 1 0 0 0 0 0 0Niagara Escarpment 6E/7E 1 1 1 0 1 0 0 0MojikitLakeConservationReserve 3W 1 1 1 1 1 1 0 0WabakimiProvincialPark 3W 1 1 1 1 1 1 1 0WoodlandCaribouProvincialPark 4S 1 1 1 1 1 1 0 0WillowLakeConservationReserve 3S 1 1 1 1 1 0 0 0TwilightLakeConservationReserve 3S 1 1 1 0 1 0 0 0ThePineryProvincialPark 7E 1 1 0 0 0 0 0 0St.LawrenceIslandsNationalPark 6E 1 1 1 0 0 0 0 0RondeauProvincialPark 7E 1 0 0 0 0 0 0 0QueticoProvincialPark 4W 1 1 1 1 1 0 0 0PukaskwaNationalPark 3E 1 1 1 1 1 1 1 1Presqu’ileProvincialPark 6E 1 1 0 0 0 0 0 0PolarBearProvincialPark 0E/1E 1 1 1 1 1 1 1 1PointPeleeNationalPark 7E 1 0 0 0 0 0 0 0OpasquiaProvincialPark 2W 1 1 1 1 1 1 1 0N.oftheN.FrenchRiverCons.Res. 3E 1 1 1 1 1 1 1 0NationalCapitalCommission 6E 1 1 1 0 0 0 0 0LongPointProvincialPark 7E 1 0 0 0 0 0 0 0LakeoftheWoodsProvincialPark 4S 1 1 1 0 1 0 0 0LadyEvelyn-SmoothwaterProvincialPark 4E 1 1 1 1 1 1 0 0KillarneyProvincialPark 5E 1 1 1 1 1 0 0 0KesagamiProvincialPark 3E 1 1 1 1 1 1 1 0JogLakeConservationReserve 2E 1 1 1 1 1 1 1 0GeorgianBayIslandsNationalPark 5E 1 1 1 0 0 0 0 0CharlestonLakeProvincialPark 6E 1 1 1 0 0 0 0 0BrucePeninsulaNationalPark 6E 1 1 1 0 0 0 0 0AlgonquinProvincialPark 5E 1 1 1 1 1 0 0 0
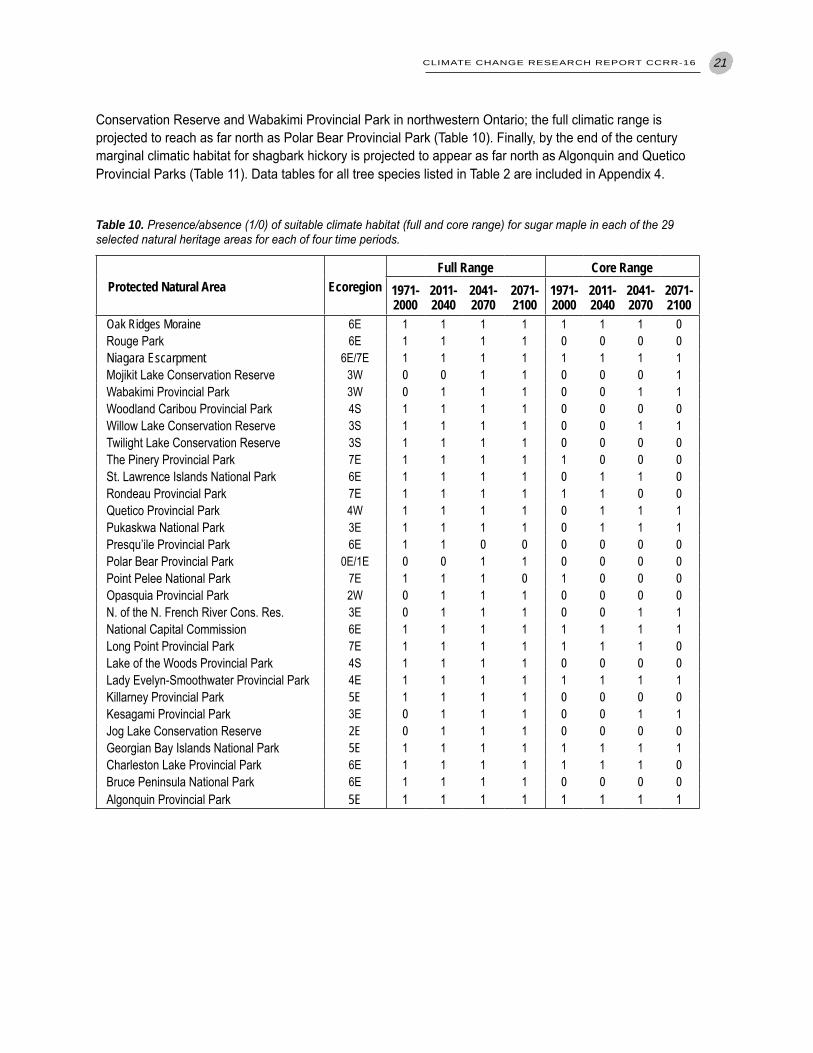
CLIMATE CHANGE RESEARCH REPORT CCRR-16 21
Table 10. Presence/absence (1/0) of suitable climate habitat (full and core range) for sugar maple in each of the 29 selected natural heritage areas for each of four time periods.
Protected Natural Area EcoregionFull Range Core Range
1971-2000
2011-2040
2041-2070
2071-2100
1971-2000
2011-2040
2041-2070
2071-2100
Oak Ridges Moraine 6E 1 1 1 1 1 1 1 0RougePark 6E 1 1 1 1 0 0 0 0Niagara Escarpment 6E/7E 1 1 1 1 1 1 1 1MojikitLakeConservationReserve 3W 0 0 1 1 0 0 0 1WabakimiProvincialPark 3W 0 1 1 1 0 0 1 1WoodlandCaribouProvincialPark 4S 1 1 1 1 0 0 0 0WillowLakeConservationReserve 3S 1 1 1 1 0 0 1 1TwilightLakeConservationReserve 3S 1 1 1 1 0 0 0 0ThePineryProvincialPark 7E 1 1 1 1 1 0 0 0St.LawrenceIslandsNationalPark 6E 1 1 1 1 0 1 1 0RondeauProvincialPark 7E 1 1 1 1 1 1 0 0QueticoProvincialPark 4W 1 1 1 1 0 1 1 1PukaskwaNationalPark 3E 1 1 1 1 0 1 1 1Presqu’ileProvincialPark 6E 1 1 0 0 0 0 0 0PolarBearProvincialPark 0E/1E 0 0 1 1 0 0 0 0PointPeleeNationalPark 7E 1 1 1 0 1 0 0 0OpasquiaProvincialPark 2W 0 1 1 1 0 0 0 0N.oftheN.FrenchRiverCons.Res. 3E 0 1 1 1 0 0 1 1NationalCapitalCommission 6E 1 1 1 1 1 1 1 1LongPointProvincialPark 7E 1 1 1 1 1 1 1 0LakeoftheWoodsProvincialPark 4S 1 1 1 1 0 0 0 0LadyEvelyn-SmoothwaterProvincialPark 4E 1 1 1 1 1 1 1 1KillarneyProvincialPark 5E 1 1 1 1 0 0 0 0KesagamiProvincialPark 3E 0 1 1 1 0 0 1 1JogLakeConservationReserve 2E 0 1 1 1 0 0 0 0GeorgianBayIslandsNationalPark 5E 1 1 1 1 1 1 1 1CharlestonLakeProvincialPark 6E 1 1 1 1 1 1 1 0BrucePeninsulaNationalPark 6E 1 1 1 1 0 0 0 0AlgonquinProvincialPark 5E 1 1 1 1 1 1 1 1
Conservation Reserve and Wabakimi Provincial Park in northwestern Ontario; the full climatic range is projected to reach as far north as Polar Bear Provincial Park (Table 10). Finally, by the end of the century marginal climatic habitat for shagbark hickory is projected to appear as far north as Algonquin and Quetico Provincial Parks (Table 11). Data tables for all tree species listed in Table 2 are included in Appendix 4.
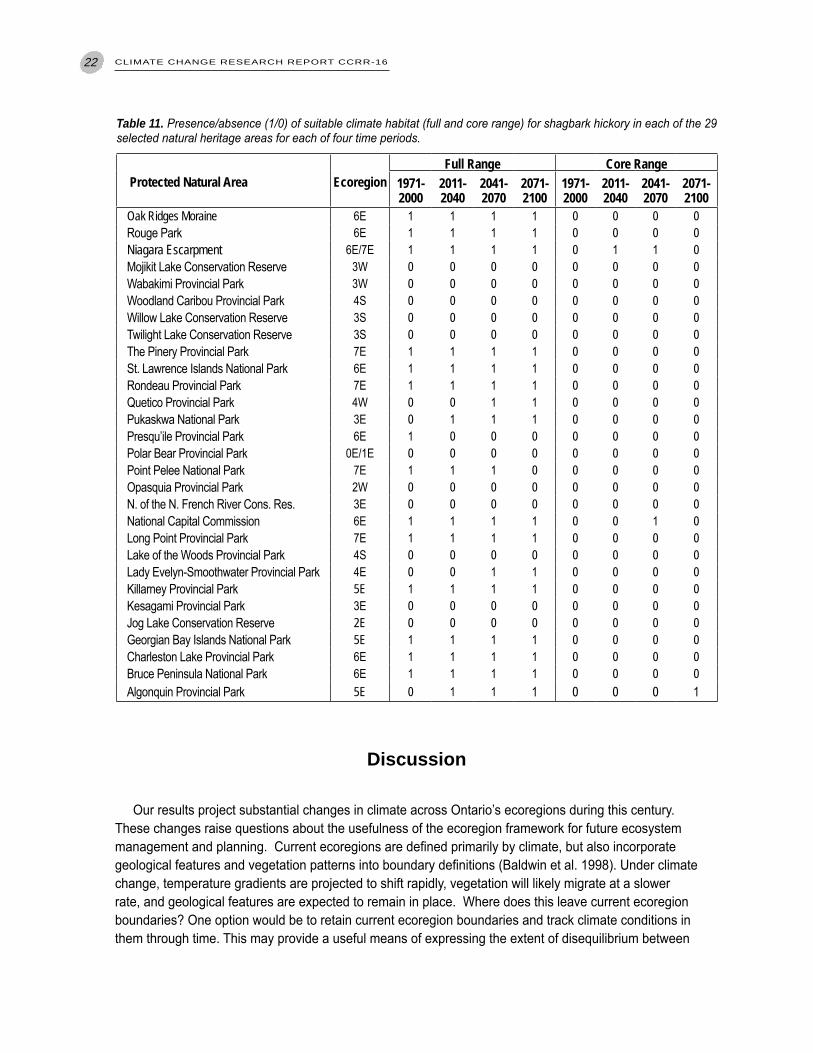
22 CLIMATE CHANGE RESEARCH REPORT CCRR-16
Table 11. Presence/absence (1/0) of suitable climate habitat (full and core range) for shagbark hickory in each of the 29 selected natural heritage areas for each of four time periods.
Protected Natural Area EcoregionFull Range Core Range
1971-2000
2011-2040
2041-2070
2071-2100
1971-2000
2011-2040
2041-2070
2071-2100
Oak Ridges Moraine 6E 1 1 1 1 0 0 0 0RougePark 6E 1 1 1 1 0 0 0 0Niagara Escarpment 6E/7E 1 1 1 1 0 1 1 0MojikitLakeConservationReserve 3W 0 0 0 0 0 0 0 0WabakimiProvincialPark 3W 0 0 0 0 0 0 0 0WoodlandCaribouProvincialPark 4S 0 0 0 0 0 0 0 0WillowLakeConservationReserve 3S 0 0 0 0 0 0 0 0TwilightLakeConservationReserve 3S 0 0 0 0 0 0 0 0ThePineryProvincialPark 7E 1 1 1 1 0 0 0 0St.LawrenceIslandsNationalPark 6E 1 1 1 1 0 0 0 0RondeauProvincialPark 7E 1 1 1 1 0 0 0 0QueticoProvincialPark 4W 0 0 1 1 0 0 0 0PukaskwaNationalPark 3E 0 1 1 1 0 0 0 0Presqu’ileProvincialPark 6E 1 0 0 0 0 0 0 0PolarBearProvincialPark 0E/1E 0 0 0 0 0 0 0 0PointPeleeNationalPark 7E 1 1 1 0 0 0 0 0OpasquiaProvincialPark 2W 0 0 0 0 0 0 0 0N.oftheN.FrenchRiverCons.Res. 3E 0 0 0 0 0 0 0 0NationalCapitalCommission 6E 1 1 1 1 0 0 1 0LongPointProvincialPark 7E 1 1 1 1 0 0 0 0LakeoftheWoodsProvincialPark 4S 0 0 0 0 0 0 0 0LadyEvelyn-SmoothwaterProvincialPark 4E 0 0 1 1 0 0 0 0KillarneyProvincialPark 5E 1 1 1 1 0 0 0 0KesagamiProvincialPark 3E 0 0 0 0 0 0 0 0JogLakeConservationReserve 2E 0 0 0 0 0 0 0 0GeorgianBayIslandsNationalPark 5E 1 1 1 1 0 0 0 0CharlestonLakeProvincialPark 6E 1 1 1 1 0 0 0 0BrucePeninsulaNationalPark 6E 1 1 1 1 0 0 0 0AlgonquinProvincialPark 5E 0 1 1 1 0 0 0 1
Discussion
Our results project substantial changes in climate across Ontario’s ecoregions during this century. These changes raise questions about the usefulness of the ecoregion framework for future ecosystem management and planning. Current ecoregions are defined primarily by climate, but also incorporate geological features and vegetation patterns into boundary definitions (Baldwin et al. 1998). Under climate change, temperature gradients are projected to shift rapidly, vegetation will likely migrate at a slower rate, and geological features are expected to remain in place. Where does this leave current ecoregion boundaries? One option would be to retain current ecoregion boundaries and track climate conditions in them through time. This may provide a useful means of expressing the extent of disequilibrium between
CLIMATE CHANGE RESEARCH REPORT CCRR-16 23
climate and existing vegetation over time. At the same time, identifying where former ecoregion climates have migrated to could provide a guide for planned adaptation that is linked to large-scale ecological function.
Given the powerful influence of latitude on temperature, the northward shift in ecoregion climate envelopes during the early part of this century is not surprising. However, the pattern observed here that climate envelopes get increasingly smaller and more scattered, or even disappear, as the century progresses does not follow from a simple northward migration of current climate conditions. We suggest this pattern results from a rapid northward shift in temperature in combination with relatively stable annual precipitation patterns (as seen in Figures 3 and 4). This asynchrony between major climatic gradients may result in novel climate combinations for large portions of the province. Williams et al. (2007) made global projections of “novel and disappearing” climates and identified the climate of northern Ontario as being at risk of disappearing by 2100.
There were large shifts in the climate envelopes of the tree species studied here, indicating potential changes in species composition across Ontario’s network of natural heritage areas. There are several important points concerning these findings. First, we do not suggest that tree populations will actually follow the projected shifts in climate. We simply identify where the climatic conditions in which a tree species currently grows are projected to move to; the extent to which tree species will actually shift with climate, through natural and/or assisted migration, is highly uncertain. Second, the above analysis, in which species’ climate envelopes are essentially moved across the province like chess pieces, ignores several important genetic considerations (see Aitken et al. 2008 for thorough discussion). Most importantly, populations tend to be adapted to local climate. Thus, as climate changes, trees in many locations may exhibit a decrease in growth even though they may remain well within the known climatic range of the species – if this maladaptation becomes too severe then disease, mortality, and competitive displacement are likely to follow. Conversely, the situation may arise where a species persists in a location even though the climate has changed beyond its known climatic limits. For instance, this may occur along the southern edge of a species’ distribution, particularly when the range limit is determined by non-climatic factors such as competitive interactions or a physical barrier. Finally, our climate envelope approach does not take into account the potential effect of increased atmospheric carbon levels on plant responses to changing climatic conditions (i.e., the CO2 fertilization effect). In particular, plants may show increased tolerance to moisture stress and modest temperature increases under elevated CO2 levels (Wullschleger et al. 2002). While this may translate into slight inaccuracies in the tree climate envelopes presented here during the early stages of climate change, the effects of CO2 fertilization are not likely to persist at the temperature increases projected for the mid-to-late part of this century. Despite these points, we suggest that this analysis has value in that it provides a sense of the magnitude of the problem that climate change poses for plant species and helps to inform the scale at which assisted migration efforts would have to be undertaken to successfully promote plant conservation.
Given the projected shift in the distribution and abundance of plants, animals, and other organisms, some natural heritage areas may, at some point, cease to preserve the suite of flora and fauna for which they were originally established. If no action is taken, widespread species may continue to be well represented within the system, but rare and endangered species that are restricted to only a few locations, may become extirpated. One option to offset the effects of climate change includes the use of assisted migration techniques to establish native species threatened by climate change. Natural heritage areas could be used as both sources of and centres to reestablish these species. At this point in the development of adaptation strategies and techniques, it is important to recognize that implementation of assisted migration strategies will require a philosophical shift for many natural heritage area managers who have traditionally worked to
24 CLIMATE CHANGE RESEARCH REPORT CCRR-16
maintain and/or preserve natural ecosystem processes with minimal human interference. Nonetheless, if climate change progresses as projected, assisted migration may be a necessary approach for conserving some species – and protected natural heritage areas represent a ready-made network of potential transplant locations. A healthy debate on the role and proper application of assisted colonization has begun in the scientific literature (McLachlan et al. 2007, Hunter 2007, Hoegh-Guldberg 2008, Ricciardi and Simberloff 2008). Citizen groups (e.g., the Torreya Guardians) have already started to transplant species of interest (McLachlan et al. 2007).
Any discussion of future climate projections is not complete without recognizing the uncertainties involved. We provided results for two emissions scenarios to cover a range of potential outcomes, but uncertainty remains about how much and how quickly greenhouse gas emissions will grow during the 21st century. While this introduces uncertainty, the IPCC (2007) suggests that even if emissions were to remain at year 2000 levels, temperature would still increase by about 1oC during this century. Over the past two decades, the GCMs have been continuously improved and the IPCC (2007) deems their projections to be very likely; nonetheless, unforeseen factors and interactions that alter the rate of climate change in unexpected ways are possible. Another major source of uncertainty is how flora and fauna will respond to changes in climate. Among the many unanswered questions: Will plants survive in situ better than anticipated due to physiological plasticity and the CO2 fertilization effect? What role will altered disturbance regimes (e.g., fire) and invasive species play in shaping plant and animal distributions? Will human-assisted migration play a role in plant conservation efforts? Clearly there are many unknowns in projecting ecosystem responses to climate change. The results presented here are intended as a starting point for discussions around climate change adaptation and mitigation.
Recommendations
As existing climate envelopes migrate and new climate envelopes emerge, ecosystem composition, structure, and function will change. In many cases, species distribution and abundance also will change. These changes will require adaptive responses by resource managers, which could be enhanced by:
1. Education: Encourage resource managers to use the time series maps to highlight the extent and speed of potential changes in climate.
2. More green space: To assist natural species migration, increase forest cover, connectivity, and patch size where these ecological elements are lacking.
3. Effective monitoring programs: Develop integrated monitoring programs to help detect and verify change as it occurs. This will help to guide strategic decisionmaking and calibrate future modelling efforts.
4. Ongoing ecoregion assessments: Regularly review the usefulness of Ontario’s ecosystem framework to ensure relevance and appropriate use in the context of a rapidly changing climate.
CLIMATE CHANGE RESEARCH REPORT CCRR-16 25
References
Aitken,S.N.,S.Yeaman,J.A.Holliday,T.WangandS.Curtis-McLane.2008.Adaptation,migration,orextirpation:Climatechangeoutcomesfortreepopulations.Evol.Appl.1:95-111.
Baldwin,D.J.B.,L.E.BandandA.H.Perera.1998.AquantitativebasisforusingOntario’sexistingeco-regionalizationsystems.Ont.Min.Nat.Resour.,Ont.For.Res.Inst.,SaultSte.Marie,ON.For.Res.Rep.No.151.70p.
Bates,B.C.,Z.W.Kundzewicz,S.WuandJ.Palutikof(eds.).2008.Climatechangeandwater.IntergovernmentalPanelonClimateChange,IPCCSecretariat,Geneva,CH.Tech.Pap.210p.
Beaumont,L.J.,L.HughesandM.Poulsen.2005.Predictingspeciesdistributions:UseofclimaticparametersinBIOCLIManditsimpactonpredictionsofspecies’currentandfuturedistributions.Ecol.Model.186:250-269.
Boer,G.J.,G.Flato,andD.Ramsden.2000.Atransientclimatechangesimulationwithhistoricalandprojectedgreenhousegasandaerosolforcing:projectedclimateforthe21stcentury.Clim.Dyn.16:427-451.
Burger,D.1993.RevisedSiteRegionsofOntario:Concepts,MethodologyandUtility.Ont.Min.Nat.Resour.,Ont.For.Res.Inst.,SaultSte.Marie,ON.For.Res.Rep.No.129.25p.
Chiotti,Q.andB.Lavender(LeadAuthors),K.Abraham,J.Casselman,S.Colombo,P.Crabbé,B.Crins,R.Davis,P.A.Gray,L.Ignace,C.Lemieux,R.McAlpine,M.Obbard,C.O’Hara,J.Richard,C.Sadowski,,M.TaylorandE.Wall(ContributingAuthors).2007.Ontario.Pp.231-274in D.S.Lemmen,F.J.Warren,J.,LacroixandE.Bush(eds.).FromImpactstoAdaptation:CanadainaChangingClimate2007.Gov.Can.,Ottawa,ON.448p.
Crins,W.J.,P.A.Gray,P.W.C.UhligandM.C.Wester.2009.TheecosystemsofOntario,Part1:Ecozonesandecoregions.Ont.Min.Nat.Resour.,Invent.Monit.Assess.,Peterborough,ON.SIBTERIMATR-01.71p.
Crins,W.J.2000[minormodifications,2002].Theecozones,ecoregions,andecodistrictsofOntario.PreparedfortheEcologicalLandClassificationWorkingGroup.Ont.Min.Nat.Resour.,Peterborough,ON.[map]
Collins,W.D.,C.M.Bitz,M.L.Blackmon,G.B.Bonan,C.S.Bretherton,J.A.Carton,P.Chang,S.C.Doney,J.J.Hack,T.B.Henderson,J.T.Kiehl,W.G.Large,D.S.McKenna,B.D.SanterandR.D.Smith.2006.TheCommunityClimateSystemModelVersion3(CCSM3).J.Clim.19:2122-2143.
Colombo,S.J.,D.W.McKenney,K.M.LawrenceandP.A.Gray.2007.ClimatechangeprojectionsforOntario:Apracticalguideforpolicymakersandplanners.Ont.Min.Nat.Resour.,Appl.Res.Develop.Br.,SaultSte.Marie,ON,ClimateChangeRes.Rep.05.37p+CD-ROM.
Gordon,C.,C.Cooper,C.A.Senior,H.Banks,J.M.Gregory,T.C.Johns,J.F.B.MitchellandR.A.Wood.2000.ThesimulationofSST,seaiceextentsandoceanheattransportsinaversionoftheHadleyCentrecoupledmodelwithoutfluxadjustments.Clim.Dyn.16:147-168.
Gordon,H.B.andS.P.O’Farrell.1997.TransientclimatechangeintheCSIROcoupledmodelwithdynamicseaice.MonthlyWeath.Rev.125:875-907.
Gray,P.A.,D.Paleczny,T.J.Beechey,B.King,M.Wester,R.J.Davidson,S.Janetos,S.B.FeildersandR.G.Davis.2009.Ontario’snaturalheritageareas:TheirdescriptionandrelationtotheIUCNclassification(Aprovisionalassessment).Ont.Min.Nat.Resour.,Peterborough,ON356p.
Availableat:http://www.mnr.gov.on.ca/en/Business/ClimateChange/2ColumnSubPage/288505.html.Hills,G.A.1961.Theecologicalbasisforlanduseplanning.Dept.LandsFor.,Maple,ON,Res.Rep.No.46.
244p.Houlder,D.J.,M.F.Hutchinson,H.A.NixandJ.P.McMahon.2000.ANUCLIMUserGuide,Version5.1.
AustralianNat.Univ.,CentreResour.Environ.Stud.,Canberra,AU.Hoegh-Guldberg,O.,L.Hughes,S.McIntyre,D.B.Lindenmayer,C.Parmesan,H.P.PossinghamandC.D.
Thomas.2008.Assistedcolonizationandrapidclimatechange.Science321:345-346.
26 CLIMATE CHANGE RESEARCH REPORT CCRR-16
Hunter,M.L.,Jr.2007.Climatechangeandmovingspecies:furtheringthedebateonassistedcolonization.Conserv.Biol.21:1356-1358.
Hutchinson,M.F.2001.ANUSPLINVersion4.2.AustralianNat.Univ.,CentreforResour.Environ.Stud.,Canberra,AU.
[IPCC]IntergovernmentalPanelonClimateChange.2007.ClimateChange2007:SynthesisReport.ContributionofWorkingGroupsI,IIandIIItotheFourthAssessmentReportoftheIntergovernmentalPanelonClimateChange.IPCC,Geneva,CH.104p.
McKenney,D.W.,P.Papadopol,K.Campbell,K.LawrenceandM.F.Hutchinson.2006a.SpatialmodelsofCanadianandNorthAmerican-wide1971-2000minimumandmaximumtemperature,totalprecipitationandderivedbioclimaticvariables.Can.For.Serv.,SaultSte.Marie,ON.FrontLineTech.NoteNo.106.
McKenney,D.W.,D.Price,P.Papadopol,M.SiltanenandKLawrence.2006b.High-resolutionclimatechangescenariosforNorthAmerica.Can.For.Serv.,SaultSte.Marie,ON.FrontLineTech.NoteNo.107.
McKenney,D.W.,P.Papadopol,K.Lawrence,K.CampbellandM.F.Hutchinson.2007a.CustomizedspatialclimatemodelsforCanada.Can.For.Serv.,SaultSte.Marie,ON.FrontLineTech.NoteNo.108.
McKenney,D.W.,J.H.Pedlar,K.Lawrence,K.CampbellandM.F.Hutchinson.2007b.Beyondtraditionalhardinesszones:Usingclimateenvelopestomapplantrangelimits.BioScience57:929-937.
McKenney,D.W.,J.H.Pedlar,K.Lawrence,K.CampbellandM.F.Hutchinson2007c.PotentialimpactsofclimatechangeonthedistributionofNorthAmericantrees.BioScience57:939-948.
McLachlan,J.S.,J.J.HellmannandM.W.Schwartz.2007.Aframeworkfordebateofassistedmigrationinaneraofclimatechange.Conserv.Biol.21:297–302.
Nakićenović,N.andR.Swart(eds.).2000.SpecialReportonEmissionsScenarios.CambridgeUniversityPress,Cambridge,UK.599p.
Nix,H.1986.AbiogeographicanalysisofAustralianelapidsnakes.Pp.4-15inR.Longmore,ed.AustraliaFloraandFaunaSer.No.7–AtlasofElapidSnakesofAustralia.BureauofFloraandFauna,Canberra,AU.
Overpeck,J.T.,P.J.BartleinandT.Webb.1991.PotentialmagnitudeoffuturevegetationchangeineasternNorthAmerica:comparisonswiththepast.Science254:692-695.
Ricciardi,A.andD.Simberloff.2008.Assistedcolonizationisnotaviableconservationstrategy.TrendsEcol.Evol.24:248-253.
Rowe,J.S.1961.Thelevel-of-integrationconceptinecology.Ecology42:420-427.
Sims,R.A.andP.Uhlig.1992.ThecurrentstatusofforestsiteclassificationinOntario.For.Chron.68:64-77.
Wahba,G.1990.Splinemodelsforobservationaldata.Soc.Indust.Appl.Math.,CBMS-NSFReg.Conf.Ser.Appl.Math.,Philadelphia,PA.169p.
Wiken,E.B.1986.TerrestrialecozonesofCanada.Env.Can.LandsDirect.,Ottawa,ON.Ecol.LandClass.Ser.No.19.19p.
Williams,J.W.,S.T.JacksonandJ.E.Kutzbach.2007.Projecteddistributionsofnovelanddisappearingclimatesby2100AD.Proc.Nat.Acad.Sci.104:5738–5742.
Woodward,F.I.1987.ClimateandPlantDistribution.CambridgeUniversityPress,Cambridge,UK.
Wullschleger,S.D.,T.J.TschaplinskiandR.J.Norby.2002.PlantwaterrelationsatelevatedCO2-implicationsforwater-limitedenvironments.PlantCellEnviron.25:319-331.
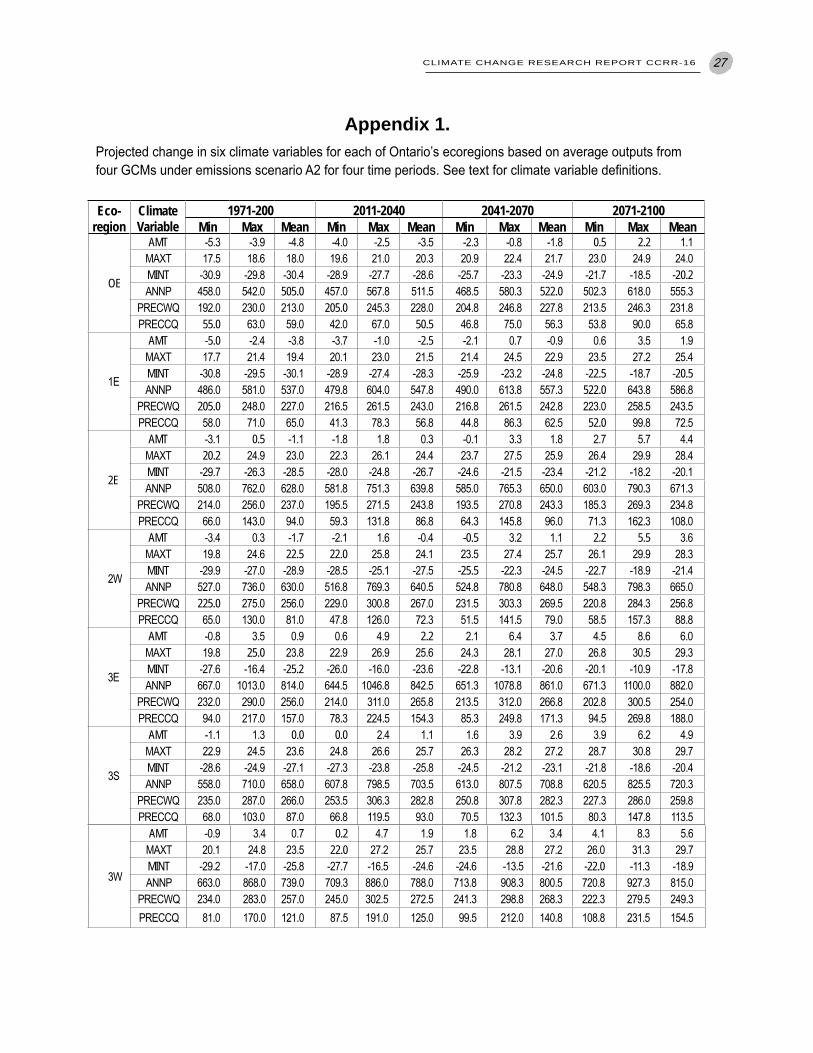
CLIMATE CHANGE RESEARCH REPORT CCRR-16 27
Appendix 1. Projected change in six climate variables for each of Ontario’s ecoregions based on average outputs from four GCMs under emissions scenario A2 for four time periods. See text for climate variable definitions.
Eco-region
Climate Variable
1971-200 2011-2040 2041-2070 2071-2100Min Max Mean Min Max Mean Min Max Mean Min Max Mean
OE
AMT -5.3 -3.9 -4.8 -4.0 -2.5 -3.5 -2.3 -0.8 -1.8 0.5 2.2 1.1MAXT 17.5 18.6 18.0 19.6 21.0 20.3 20.9 22.4 21.7 23.0 24.9 24.0MINT -30.9 -29.8 -30.4 -28.9 -27.7 -28.6 -25.7 -23.3 -24.9 -21.7 -18.5 -20.2ANNP 458.0 542.0 505.0 457.0 567.8 511.5 468.5 580.3 522.0 502.3 618.0 555.3
PRECWQ 192.0 230.0 213.0 205.0 245.3 228.0 204.8 246.8 227.8 213.5 246.3 231.8PRECCQ 55.0 63.0 59.0 42.0 67.0 50.5 46.8 75.0 56.3 53.8 90.0 65.8
1E
AMT -5.0 -2.4 -3.8 -3.7 -1.0 -2.5 -2.1 0.7 -0.9 0.6 3.5 1.9MAXT 17.7 21.4 19.4 20.1 23.0 21.5 21.4 24.5 22.9 23.5 27.2 25.4MINT -30.8 -29.5 -30.1 -28.9 -27.4 -28.3 -25.9 -23.2 -24.8 -22.5 -18.7 -20.5ANNP 486.0 581.0 537.0 479.8 604.0 547.8 490.0 613.8 557.3 522.0 643.8 586.8
PRECWQ 205.0 248.0 227.0 216.5 261.5 243.0 216.8 261.5 242.8 223.0 258.5 243.5PRECCQ 58.0 71.0 65.0 41.3 78.3 56.8 44.8 86.3 62.5 52.0 99.8 72.5
2E
AMT -3.1 0.5 -1.1 -1.8 1.8 0.3 -0.1 3.3 1.8 2.7 5.7 4.4MAXT 20.2 24.9 23.0 22.3 26.1 24.4 23.7 27.5 25.9 26.4 29.9 28.4MINT -29.7 -26.3 -28.5 -28.0 -24.8 -26.7 -24.6 -21.5 -23.4 -21.2 -18.2 -20.1ANNP 508.0 762.0 628.0 581.8 751.3 639.8 585.0 765.3 650.0 603.0 790.3 671.3
PRECWQ 214.0 256.0 237.0 195.5 271.5 243.8 193.5 270.8 243.3 185.3 269.3 234.8PRECCQ 66.0 143.0 94.0 59.3 131.8 86.8 64.3 145.8 96.0 71.3 162.3 108.0
2W
AMT -3.4 0.3 -1.7 -2.1 1.6 -0.4 -0.5 3.2 1.1 2.2 5.5 3.6MAXT 19.8 24.6 22.5 22.0 25.8 24.1 23.5 27.4 25.7 26.1 29.9 28.3MINT -29.9 -27.0 -28.9 -28.5 -25.1 -27.5 -25.5 -22.3 -24.5 -22.7 -18.9 -21.4ANNP 527.0 736.0 630.0 516.8 769.3 640.5 524.8 780.8 648.0 548.3 798.3 665.0
PRECWQ 225.0 275.0 256.0 229.0 300.8 267.0 231.5 303.3 269.5 220.8 284.3 256.8PRECCQ 65.0 130.0 81.0 47.8 126.0 72.3 51.5 141.5 79.0 58.5 157.3 88.8
3E
AMT -0.8 3.5 0.9 0.6 4.9 2.2 2.1 6.4 3.7 4.5 8.6 6.0MAXT 19.8 25.0 23.8 22.9 26.9 25.6 24.3 28.1 27.0 26.8 30.5 29.3MINT -27.6 -16.4 -25.2 -26.0 -16.0 -23.6 -22.8 -13.1 -20.6 -20.1 -10.9 -17.8ANNP 667.0 1013.0 814.0 644.5 1046.8 842.5 651.3 1078.8 861.0 671.3 1100.0 882.0
PRECWQ 232.0 290.0 256.0 214.0 311.0 265.8 213.5 312.0 266.8 202.8 300.5 254.0PRECCQ 94.0 217.0 157.0 78.3 224.5 154.3 85.3 249.8 171.3 94.5 269.8 188.0
3S
AMT -1.1 1.3 0.0 0.0 2.4 1.1 1.6 3.9 2.6 3.9 6.2 4.9MAXT 22.9 24.5 23.6 24.8 26.6 25.7 26.3 28.2 27.2 28.7 30.8 29.7MINT -28.6 -24.9 -27.1 -27.3 -23.8 -25.8 -24.5 -21.2 -23.1 -21.8 -18.6 -20.4ANNP 558.0 710.0 658.0 607.8 798.5 703.5 613.0 807.5 708.8 620.5 825.5 720.3
PRECWQ 235.0 287.0 266.0 253.5 306.3 282.8 250.8 307.8 282.3 227.3 286.0 259.8PRECCQ 68.0 103.0 87.0 66.8 119.5 93.0 70.5 132.3 101.5 80.3 147.8 113.5
3W
AMT -0.9 3.4 0.7 0.2 4.7 1.9 1.8 6.2 3.4 4.1 8.3 5.6MAXT 20.1 24.8 23.5 22.0 27.2 25.7 23.5 28.8 27.2 26.0 31.3 29.7MINT -29.2 -17.0 -25.8 -27.7 -16.5 -24.6 -24.6 -13.5 -21.6 -22.0 -11.3 -18.9ANNP 663.0 868.0 739.0 709.3 886.0 788.0 713.8 908.3 800.5 720.8 927.3 815.0
PRECWQ 234.0 283.0 257.0 245.0 302.5 272.5 241.3 298.8 268.3 222.3 279.5 249.3PRECCQ 81.0 170.0 121.0 87.5 191.0 125.0 99.5 212.0 140.8 108.8 231.5 154.5
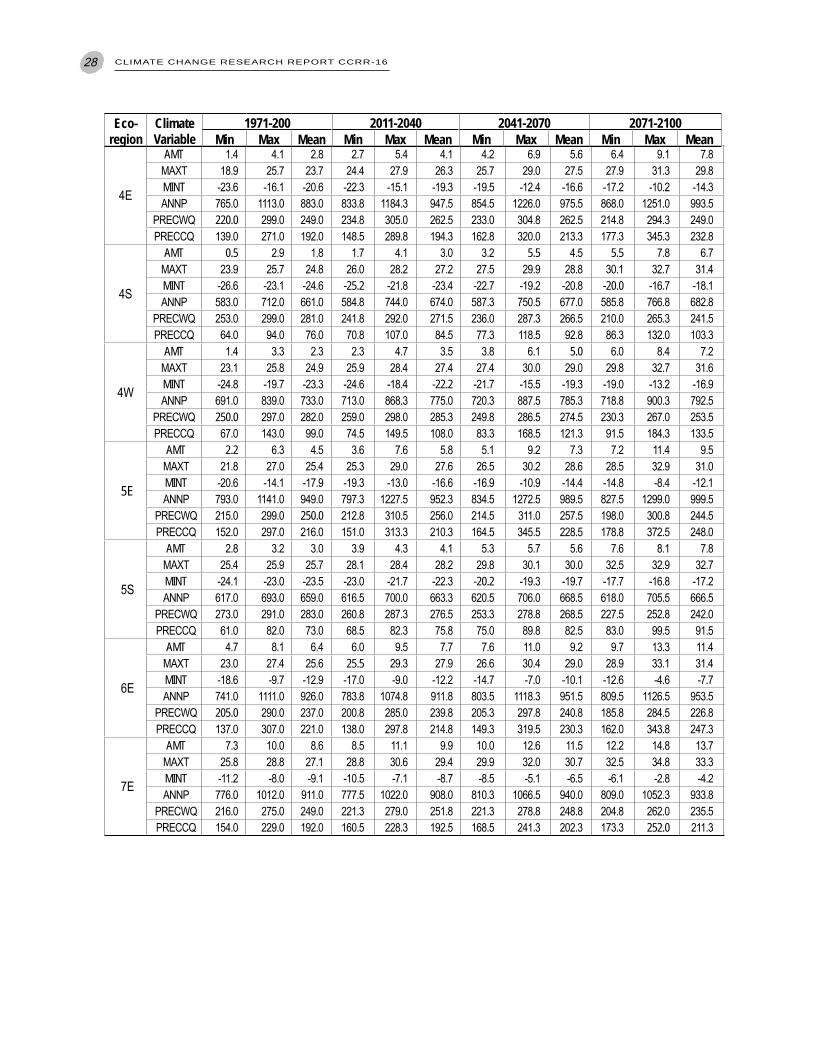
28 CLIMATE CHANGE RESEARCH REPORT CCRR-16
4E
AMT 1.4 4.1 2.8 2.7 5.4 4.1 4.2 6.9 5.6 6.4 9.1 7.8MAXT 18.9 25.7 23.7 24.4 27.9 26.3 25.7 29.0 27.5 27.9 31.3 29.8MINT -23.6 -16.1 -20.6 -22.3 -15.1 -19.3 -19.5 -12.4 -16.6 -17.2 -10.2 -14.3ANNP 765.0 1113.0 883.0 833.8 1184.3 947.5 854.5 1226.0 975.5 868.0 1251.0 993.5
PRECWQ 220.0 299.0 249.0 234.8 305.0 262.5 233.0 304.8 262.5 214.8 294.3 249.0PRECCQ 139.0 271.0 192.0 148.5 289.8 194.3 162.8 320.0 213.3 177.3 345.3 232.8
4S
AMT 0.5 2.9 1.8 1.7 4.1 3.0 3.2 5.5 4.5 5.5 7.8 6.7MAXT 23.9 25.7 24.8 26.0 28.2 27.2 27.5 29.9 28.8 30.1 32.7 31.4MINT -26.6 -23.1 -24.6 -25.2 -21.8 -23.4 -22.7 -19.2 -20.8 -20.0 -16.7 -18.1ANNP 583.0 712.0 661.0 584.8 744.0 674.0 587.3 750.5 677.0 585.8 766.8 682.8
PRECWQ 253.0 299.0 281.0 241.8 292.0 271.5 236.0 287.3 266.5 210.0 265.3 241.5PRECCQ 64.0 94.0 76.0 70.8 107.0 84.5 77.3 118.5 92.8 86.3 132.0 103.3
4W
AMT 1.4 3.3 2.3 2.3 4.7 3.5 3.8 6.1 5.0 6.0 8.4 7.2MAXT 23.1 25.8 24.9 25.9 28.4 27.4 27.4 30.0 29.0 29.8 32.7 31.6MINT -24.8 -19.7 -23.3 -24.6 -18.4 -22.2 -21.7 -15.5 -19.3 -19.0 -13.2 -16.9ANNP 691.0 839.0 733.0 713.0 868.3 775.0 720.3 887.5 785.3 718.8 900.3 792.5
PRECWQ 250.0 297.0 282.0 259.0 298.0 285.3 249.8 286.5 274.5 230.3 267.0 253.5PRECCQ 67.0 143.0 99.0 74.5 149.5 108.0 83.3 168.5 121.3 91.5 184.3 133.5
5E
AMT 2.2 6.3 4.5 3.6 7.6 5.8 5.1 9.2 7.3 7.2 11.4 9.5MAXT 21.8 27.0 25.4 25.3 29.0 27.6 26.5 30.2 28.6 28.5 32.9 31.0MINT -20.6 -14.1 -17.9 -19.3 -13.0 -16.6 -16.9 -10.9 -14.4 -14.8 -8.4 -12.1ANNP 793.0 1141.0 949.0 797.3 1227.5 952.3 834.5 1272.5 989.5 827.5 1299.0 999.5
PRECWQ 215.0 299.0 250.0 212.8 310.5 256.0 214.5 311.0 257.5 198.0 300.8 244.5PRECCQ 152.0 297.0 216.0 151.0 313.3 210.3 164.5 345.5 228.5 178.8 372.5 248.0
5S
AMT 2.8 3.2 3.0 3.9 4.3 4.1 5.3 5.7 5.6 7.6 8.1 7.8MAXT 25.4 25.9 25.7 28.1 28.4 28.2 29.8 30.1 30.0 32.5 32.9 32.7MINT -24.1 -23.0 -23.5 -23.0 -21.7 -22.3 -20.2 -19.3 -19.7 -17.7 -16.8 -17.2ANNP 617.0 693.0 659.0 616.5 700.0 663.3 620.5 706.0 668.5 618.0 705.5 666.5
PRECWQ 273.0 291.0 283.0 260.8 287.3 276.5 253.3 278.8 268.5 227.5 252.8 242.0PRECCQ 61.0 82.0 73.0 68.5 82.3 75.8 75.0 89.8 82.5 83.0 99.5 91.5
6E
AMT 4.7 8.1 6.4 6.0 9.5 7.7 7.6 11.0 9.2 9.7 13.3 11.4MAXT 23.0 27.4 25.6 25.5 29.3 27.9 26.6 30.4 29.0 28.9 33.1 31.4MINT -18.6 -9.7 -12.9 -17.0 -9.0 -12.2 -14.7 -7.0 -10.1 -12.6 -4.6 -7.7ANNP 741.0 1111.0 926.0 783.8 1074.8 911.8 803.5 1118.3 951.5 809.5 1126.5 953.5
PRECWQ 205.0 290.0 237.0 200.8 285.0 239.8 205.3 297.8 240.8 185.8 284.5 226.8PRECCQ 137.0 307.0 221.0 138.0 297.8 214.8 149.3 319.5 230.3 162.0 343.8 247.3
7E
AMT 7.3 10.0 8.6 8.5 11.1 9.9 10.0 12.6 11.5 12.2 14.8 13.7MAXT 25.8 28.8 27.1 28.8 30.6 29.4 29.9 32.0 30.7 32.5 34.8 33.3MINT -11.2 -8.0 -9.1 -10.5 -7.1 -8.7 -8.5 -5.1 -6.5 -6.1 -2.8 -4.2ANNP 776.0 1012.0 911.0 777.5 1022.0 908.0 810.3 1066.5 940.0 809.0 1052.3 933.8
PRECWQ 216.0 275.0 249.0 221.3 279.0 251.8 221.3 278.8 248.8 204.8 262.0 235.5PRECCQ 154.0 229.0 192.0 160.5 228.3 192.5 168.5 241.3 202.3 173.3 252.0 211.3
Eco-region
Climate Variable
1971-200 2011-2040 2041-2070 2071-2100Min Max Mean Min Max Mean Min Max Mean Min Max Mean
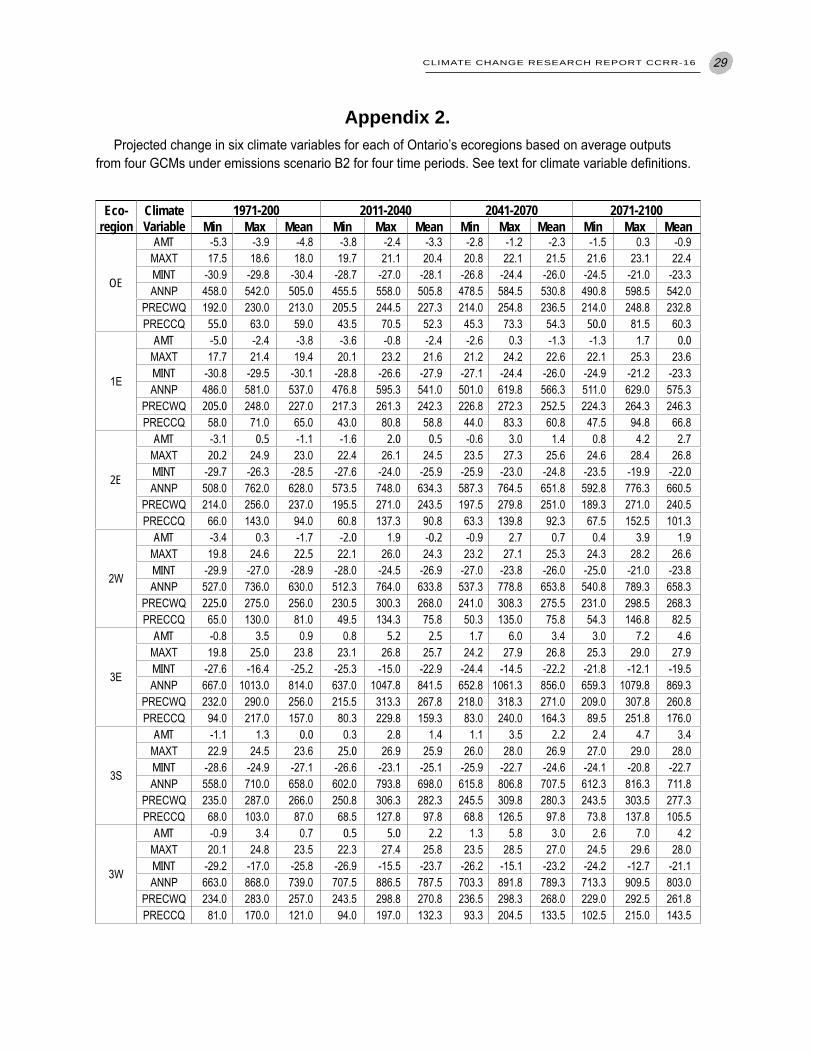
CLIMATE CHANGE RESEARCH REPORT CCRR-16 29
4E
AMT 1.4 4.1 2.8 2.7 5.4 4.1 4.2 6.9 5.6 6.4 9.1 7.8MAXT 18.9 25.7 23.7 24.4 27.9 26.3 25.7 29.0 27.5 27.9 31.3 29.8MINT -23.6 -16.1 -20.6 -22.3 -15.1 -19.3 -19.5 -12.4 -16.6 -17.2 -10.2 -14.3ANNP 765.0 1113.0 883.0 833.8 1184.3 947.5 854.5 1226.0 975.5 868.0 1251.0 993.5
PRECWQ 220.0 299.0 249.0 234.8 305.0 262.5 233.0 304.8 262.5 214.8 294.3 249.0PRECCQ 139.0 271.0 192.0 148.5 289.8 194.3 162.8 320.0 213.3 177.3 345.3 232.8
4S
AMT 0.5 2.9 1.8 1.7 4.1 3.0 3.2 5.5 4.5 5.5 7.8 6.7MAXT 23.9 25.7 24.8 26.0 28.2 27.2 27.5 29.9 28.8 30.1 32.7 31.4MINT -26.6 -23.1 -24.6 -25.2 -21.8 -23.4 -22.7 -19.2 -20.8 -20.0 -16.7 -18.1ANNP 583.0 712.0 661.0 584.8 744.0 674.0 587.3 750.5 677.0 585.8 766.8 682.8
PRECWQ 253.0 299.0 281.0 241.8 292.0 271.5 236.0 287.3 266.5 210.0 265.3 241.5PRECCQ 64.0 94.0 76.0 70.8 107.0 84.5 77.3 118.5 92.8 86.3 132.0 103.3
4W
AMT 1.4 3.3 2.3 2.3 4.7 3.5 3.8 6.1 5.0 6.0 8.4 7.2MAXT 23.1 25.8 24.9 25.9 28.4 27.4 27.4 30.0 29.0 29.8 32.7 31.6MINT -24.8 -19.7 -23.3 -24.6 -18.4 -22.2 -21.7 -15.5 -19.3 -19.0 -13.2 -16.9ANNP 691.0 839.0 733.0 713.0 868.3 775.0 720.3 887.5 785.3 718.8 900.3 792.5
PRECWQ 250.0 297.0 282.0 259.0 298.0 285.3 249.8 286.5 274.5 230.3 267.0 253.5PRECCQ 67.0 143.0 99.0 74.5 149.5 108.0 83.3 168.5 121.3 91.5 184.3 133.5
5E
AMT 2.2 6.3 4.5 3.6 7.6 5.8 5.1 9.2 7.3 7.2 11.4 9.5MAXT 21.8 27.0 25.4 25.3 29.0 27.6 26.5 30.2 28.6 28.5 32.9 31.0MINT -20.6 -14.1 -17.9 -19.3 -13.0 -16.6 -16.9 -10.9 -14.4 -14.8 -8.4 -12.1ANNP 793.0 1141.0 949.0 797.3 1227.5 952.3 834.5 1272.5 989.5 827.5 1299.0 999.5
PRECWQ 215.0 299.0 250.0 212.8 310.5 256.0 214.5 311.0 257.5 198.0 300.8 244.5PRECCQ 152.0 297.0 216.0 151.0 313.3 210.3 164.5 345.5 228.5 178.8 372.5 248.0
5S
AMT 2.8 3.2 3.0 3.9 4.3 4.1 5.3 5.7 5.6 7.6 8.1 7.8MAXT 25.4 25.9 25.7 28.1 28.4 28.2 29.8 30.1 30.0 32.5 32.9 32.7MINT -24.1 -23.0 -23.5 -23.0 -21.7 -22.3 -20.2 -19.3 -19.7 -17.7 -16.8 -17.2ANNP 617.0 693.0 659.0 616.5 700.0 663.3 620.5 706.0 668.5 618.0 705.5 666.5
PRECWQ 273.0 291.0 283.0 260.8 287.3 276.5 253.3 278.8 268.5 227.5 252.8 242.0PRECCQ 61.0 82.0 73.0 68.5 82.3 75.8 75.0 89.8 82.5 83.0 99.5 91.5
6E
AMT 4.7 8.1 6.4 6.0 9.5 7.7 7.6 11.0 9.2 9.7 13.3 11.4MAXT 23.0 27.4 25.6 25.5 29.3 27.9 26.6 30.4 29.0 28.9 33.1 31.4MINT -18.6 -9.7 -12.9 -17.0 -9.0 -12.2 -14.7 -7.0 -10.1 -12.6 -4.6 -7.7ANNP 741.0 1111.0 926.0 783.8 1074.8 911.8 803.5 1118.3 951.5 809.5 1126.5 953.5
PRECWQ 205.0 290.0 237.0 200.8 285.0 239.8 205.3 297.8 240.8 185.8 284.5 226.8PRECCQ 137.0 307.0 221.0 138.0 297.8 214.8 149.3 319.5 230.3 162.0 343.8 247.3
7E
AMT 7.3 10.0 8.6 8.5 11.1 9.9 10.0 12.6 11.5 12.2 14.8 13.7MAXT 25.8 28.8 27.1 28.8 30.6 29.4 29.9 32.0 30.7 32.5 34.8 33.3MINT -11.2 -8.0 -9.1 -10.5 -7.1 -8.7 -8.5 -5.1 -6.5 -6.1 -2.8 -4.2ANNP 776.0 1012.0 911.0 777.5 1022.0 908.0 810.3 1066.5 940.0 809.0 1052.3 933.8
PRECWQ 216.0 275.0 249.0 221.3 279.0 251.8 221.3 278.8 248.8 204.8 262.0 235.5PRECCQ 154.0 229.0 192.0 160.5 228.3 192.5 168.5 241.3 202.3 173.3 252.0 211.3
Eco-region
Climate Variable
1971-200 2011-2040 2041-2070 2071-2100Min Max Mean Min Max Mean Min Max Mean Min Max Mean
Appendix 2. Projected change in six climate variables for each of Ontario’s ecoregions based on average outputs
from four GCMs under emissions scenario B2 for four time periods. See text for climate variable definitions.
Eco-region
Climate Variable
1971-200 2011-2040 2041-2070 2071-2100Min Max Mean Min Max Mean Min Max Mean Min Max Mean
OE
AMT -5.3 -3.9 -4.8 -3.8 -2.4 -3.3 -2.8 -1.2 -2.3 -1.5 0.3 -0.9MAXT 17.5 18.6 18.0 19.7 21.1 20.4 20.8 22.1 21.5 21.6 23.1 22.4MINT -30.9 -29.8 -30.4 -28.7 -27.0 -28.1 -26.8 -24.4 -26.0 -24.5 -21.0 -23.3ANNP 458.0 542.0 505.0 455.5 558.0 505.8 478.5 584.5 530.8 490.8 598.5 542.0
PRECWQ 192.0 230.0 213.0 205.5 244.5 227.3 214.0 254.8 236.5 214.0 248.8 232.8PRECCQ 55.0 63.0 59.0 43.5 70.5 52.3 45.3 73.3 54.3 50.0 81.5 60.3
1E
AMT -5.0 -2.4 -3.8 -3.6 -0.8 -2.4 -2.6 0.3 -1.3 -1.3 1.7 0.0MAXT 17.7 21.4 19.4 20.1 23.2 21.6 21.2 24.2 22.6 22.1 25.3 23.6MINT -30.8 -29.5 -30.1 -28.8 -26.6 -27.9 -27.1 -24.4 -26.0 -24.9 -21.2 -23.3ANNP 486.0 581.0 537.0 476.8 595.3 541.0 501.0 619.8 566.3 511.0 629.0 575.3
PRECWQ 205.0 248.0 227.0 217.3 261.3 242.3 226.8 272.3 252.5 224.3 264.3 246.3PRECCQ 58.0 71.0 65.0 43.0 80.8 58.8 44.0 83.3 60.8 47.5 94.8 66.8
2E
AMT -3.1 0.5 -1.1 -1.6 2.0 0.5 -0.6 3.0 1.4 0.8 4.2 2.7MAXT 20.2 24.9 23.0 22.4 26.1 24.5 23.5 27.3 25.6 24.6 28.4 26.8MINT -29.7 -26.3 -28.5 -27.6 -24.0 -25.9 -25.9 -23.0 -24.8 -23.5 -19.9 -22.0ANNP 508.0 762.0 628.0 573.5 748.0 634.3 587.3 764.5 651.8 592.8 776.3 660.5
PRECWQ 214.0 256.0 237.0 195.5 271.0 243.5 197.5 279.8 251.0 189.3 271.0 240.5PRECCQ 66.0 143.0 94.0 60.8 137.3 90.8 63.3 139.8 92.3 67.5 152.5 101.3
2W
AMT -3.4 0.3 -1.7 -2.0 1.9 -0.2 -0.9 2.7 0.7 0.4 3.9 1.9MAXT 19.8 24.6 22.5 22.1 26.0 24.3 23.2 27.1 25.3 24.3 28.2 26.6MINT -29.9 -27.0 -28.9 -28.0 -24.5 -26.9 -27.0 -23.8 -26.0 -25.0 -21.0 -23.8ANNP 527.0 736.0 630.0 512.3 764.0 633.8 537.3 778.8 653.8 540.8 789.3 658.3
PRECWQ 225.0 275.0 256.0 230.5 300.3 268.0 241.0 308.3 275.5 231.0 298.5 268.3PRECCQ 65.0 130.0 81.0 49.5 134.3 75.8 50.3 135.0 75.8 54.3 146.8 82.5
3E
AMT -0.8 3.5 0.9 0.8 5.2 2.5 1.7 6.0 3.4 3.0 7.2 4.6MAXT 19.8 25.0 23.8 23.1 26.8 25.7 24.2 27.9 26.8 25.3 29.0 27.9MINT -27.6 -16.4 -25.2 -25.3 -15.0 -22.9 -24.4 -14.5 -22.2 -21.8 -12.1 -19.5ANNP 667.0 1013.0 814.0 637.0 1047.8 841.5 652.8 1061.3 856.0 659.3 1079.8 869.3
PRECWQ 232.0 290.0 256.0 215.5 313.3 267.8 218.0 318.3 271.0 209.0 307.8 260.8PRECCQ 94.0 217.0 157.0 80.3 229.8 159.3 83.0 240.0 164.3 89.5 251.8 176.0
3S
AMT -1.1 1.3 0.0 0.3 2.8 1.4 1.1 3.5 2.2 2.4 4.7 3.4MAXT 22.9 24.5 23.6 25.0 26.9 25.9 26.0 28.0 26.9 27.0 29.0 28.0MINT -28.6 -24.9 -27.1 -26.6 -23.1 -25.1 -25.9 -22.7 -24.6 -24.1 -20.8 -22.7ANNP 558.0 710.0 658.0 602.0 793.8 698.0 615.8 806.8 707.5 612.3 816.3 711.8
PRECWQ 235.0 287.0 266.0 250.8 306.3 282.3 245.5 309.8 280.3 243.5 303.5 277.3PRECCQ 68.0 103.0 87.0 68.5 127.8 97.8 68.8 126.5 97.8 73.8 137.8 105.5
3W
AMT -0.9 3.4 0.7 0.5 5.0 2.2 1.3 5.8 3.0 2.6 7.0 4.2MAXT 20.1 24.8 23.5 22.3 27.4 25.8 23.5 28.5 27.0 24.5 29.6 28.0MINT -29.2 -17.0 -25.8 -26.9 -15.5 -23.7 -26.2 -15.1 -23.2 -24.2 -12.7 -21.1ANNP 663.0 868.0 739.0 707.5 886.5 787.5 703.3 891.8 789.3 713.3 909.5 803.0
PRECWQ 234.0 283.0 257.0 243.5 298.8 270.8 236.5 298.3 268.0 229.0 292.5 261.8PRECCQ 81.0 170.0 121.0 94.0 197.0 132.3 93.3 204.5 133.5 102.5 215.0 143.5
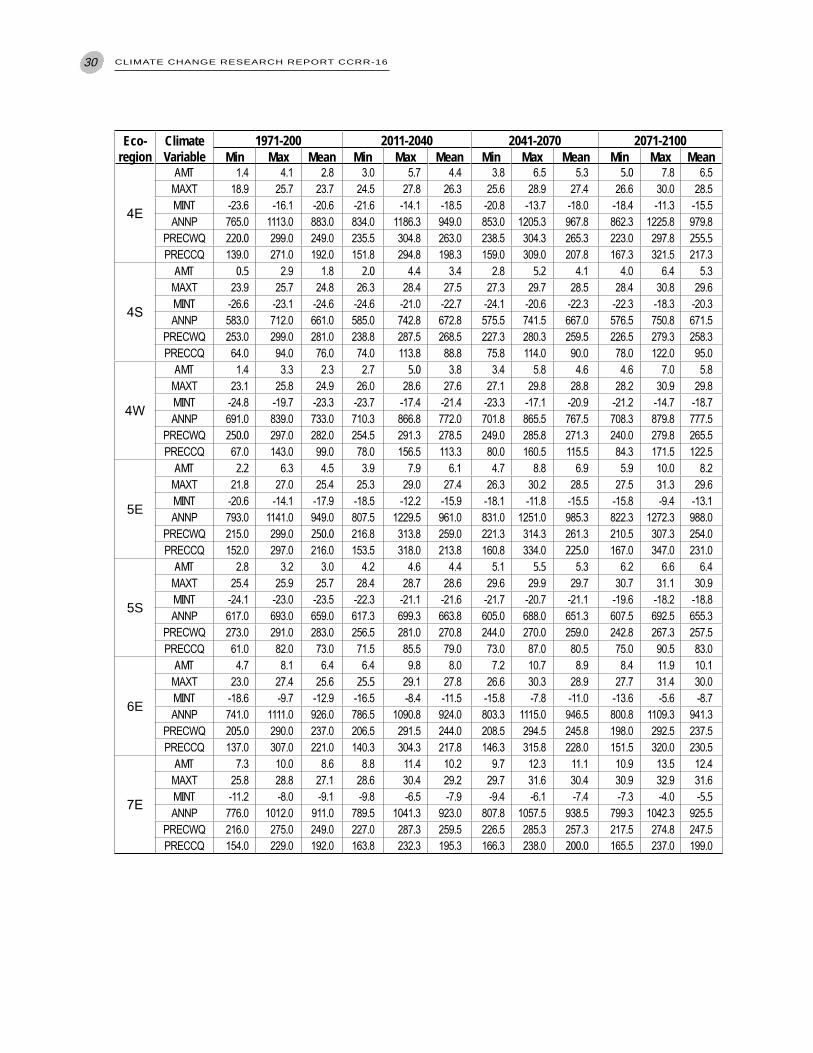
30 CLIMATE CHANGE RESEARCH REPORT CCRR-16
Eco-region
Climate Variable
1971-200 2011-2040 2041-2070 2071-2100Min Max Mean Min Max Mean Min Max Mean Min Max Mean
4E
AMT 1.4 4.1 2.8 3.0 5.7 4.4 3.8 6.5 5.3 5.0 7.8 6.5MAXT 18.9 25.7 23.7 24.5 27.8 26.3 25.6 28.9 27.4 26.6 30.0 28.5MINT -23.6 -16.1 -20.6 -21.6 -14.1 -18.5 -20.8 -13.7 -18.0 -18.4 -11.3 -15.5ANNP 765.0 1113.0 883.0 834.0 1186.3 949.0 853.0 1205.3 967.8 862.3 1225.8 979.8
PRECWQ 220.0 299.0 249.0 235.5 304.8 263.0 238.5 304.3 265.3 223.0 297.8 255.5PRECCQ 139.0 271.0 192.0 151.8 294.8 198.3 159.0 309.0 207.8 167.3 321.5 217.3
4S
AMT 0.5 2.9 1.8 2.0 4.4 3.4 2.8 5.2 4.1 4.0 6.4 5.3MAXT 23.9 25.7 24.8 26.3 28.4 27.5 27.3 29.7 28.5 28.4 30.8 29.6MINT -26.6 -23.1 -24.6 -24.6 -21.0 -22.7 -24.1 -20.6 -22.3 -22.3 -18.3 -20.3ANNP 583.0 712.0 661.0 585.0 742.8 672.8 575.5 741.5 667.0 576.5 750.8 671.5
PRECWQ 253.0 299.0 281.0 238.8 287.5 268.5 227.3 280.3 259.5 226.5 279.3 258.3PRECCQ 64.0 94.0 76.0 74.0 113.8 88.8 75.8 114.0 90.0 78.0 122.0 95.0
4W
AMT 1.4 3.3 2.3 2.7 5.0 3.8 3.4 5.8 4.6 4.6 7.0 5.8MAXT 23.1 25.8 24.9 26.0 28.6 27.6 27.1 29.8 28.8 28.2 30.9 29.8MINT -24.8 -19.7 -23.3 -23.7 -17.4 -21.4 -23.3 -17.1 -20.9 -21.2 -14.7 -18.7ANNP 691.0 839.0 733.0 710.3 866.8 772.0 701.8 865.5 767.5 708.3 879.8 777.5
PRECWQ 250.0 297.0 282.0 254.5 291.3 278.5 249.0 285.8 271.3 240.0 279.8 265.5PRECCQ 67.0 143.0 99.0 78.0 156.5 113.3 80.0 160.5 115.5 84.3 171.5 122.5
5E
AMT 2.2 6.3 4.5 3.9 7.9 6.1 4.7 8.8 6.9 5.9 10.0 8.2MAXT 21.8 27.0 25.4 25.3 29.0 27.4 26.3 30.2 28.5 27.5 31.3 29.6MINT -20.6 -14.1 -17.9 -18.5 -12.2 -15.9 -18.1 -11.8 -15.5 -15.8 -9.4 -13.1ANNP 793.0 1141.0 949.0 807.5 1229.5 961.0 831.0 1251.0 985.3 822.3 1272.3 988.0
PRECWQ 215.0 299.0 250.0 216.8 313.8 259.0 221.3 314.3 261.3 210.5 307.3 254.0PRECCQ 152.0 297.0 216.0 153.5 318.0 213.8 160.8 334.0 225.0 167.0 347.0 231.0
5S
AMT 2.8 3.2 3.0 4.2 4.6 4.4 5.1 5.5 5.3 6.2 6.6 6.4MAXT 25.4 25.9 25.7 28.4 28.7 28.6 29.6 29.9 29.7 30.7 31.1 30.9MINT -24.1 -23.0 -23.5 -22.3 -21.1 -21.6 -21.7 -20.7 -21.1 -19.6 -18.2 -18.8ANNP 617.0 693.0 659.0 617.3 699.3 663.8 605.0 688.0 651.3 607.5 692.5 655.3
PRECWQ 273.0 291.0 283.0 256.5 281.0 270.8 244.0 270.0 259.0 242.8 267.3 257.5PRECCQ 61.0 82.0 73.0 71.5 85.5 79.0 73.0 87.0 80.5 75.0 90.5 83.0
6E
AMT 4.7 8.1 6.4 6.4 9.8 8.0 7.2 10.7 8.9 8.4 11.9 10.1MAXT 23.0 27.4 25.6 25.5 29.1 27.8 26.6 30.3 28.9 27.7 31.4 30.0MINT -18.6 -9.7 -12.9 -16.5 -8.4 -11.5 -15.8 -7.8 -11.0 -13.6 -5.6 -8.7ANNP 741.0 1111.0 926.0 786.5 1090.8 924.0 803.3 1115.0 946.5 800.8 1109.3 941.3
PRECWQ 205.0 290.0 237.0 206.5 291.5 244.0 208.5 294.5 245.8 198.0 292.5 237.5PRECCQ 137.0 307.0 221.0 140.3 304.3 217.8 146.3 315.8 228.0 151.5 320.0 230.5
7E
AMT 7.3 10.0 8.6 8.8 11.4 10.2 9.7 12.3 11.1 10.9 13.5 12.4MAXT 25.8 28.8 27.1 28.6 30.4 29.2 29.7 31.6 30.4 30.9 32.9 31.6MINT -11.2 -8.0 -9.1 -9.8 -6.5 -7.9 -9.4 -6.1 -7.4 -7.3 -4.0 -5.5ANNP 776.0 1012.0 911.0 789.5 1041.3 923.0 807.8 1057.5 938.5 799.3 1042.3 925.5
PRECWQ 216.0 275.0 249.0 227.0 287.3 259.5 226.5 285.3 257.3 217.5 274.8 247.5PRECCQ 154.0 229.0 192.0 163.8 232.3 195.3 166.3 238.0 200.0 165.5 237.0 199.0
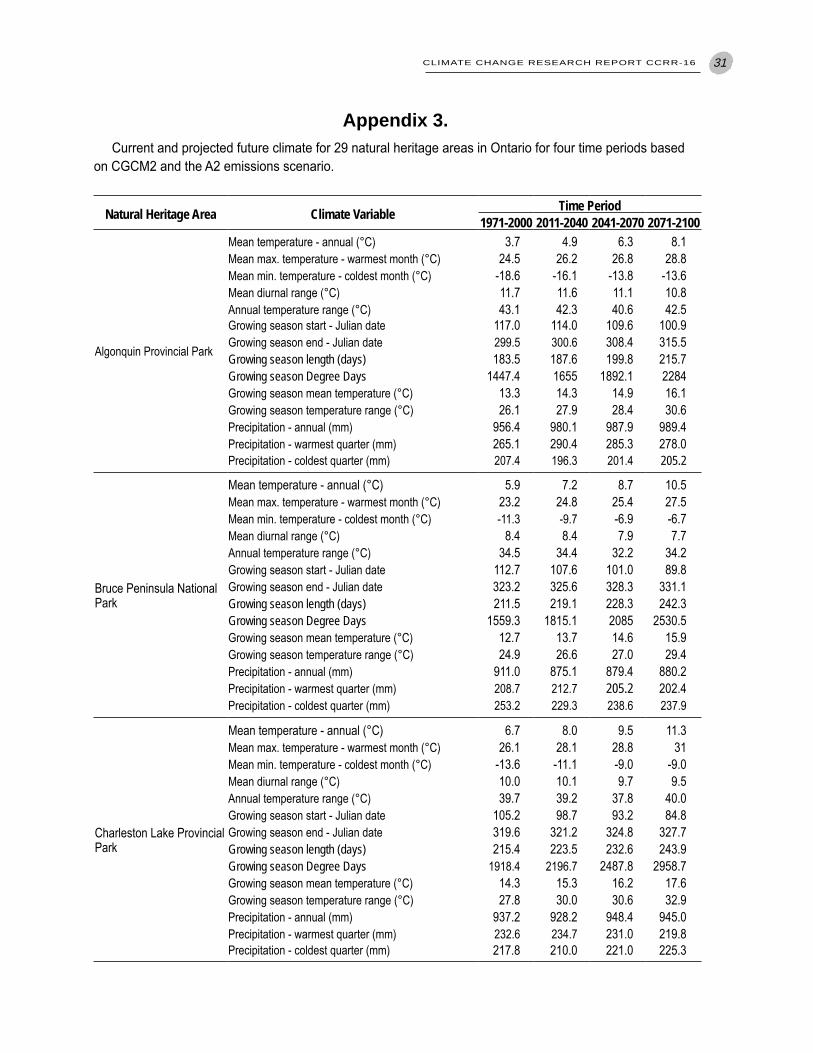
CLIMATE CHANGE RESEARCH REPORT CCRR-16 31
Appendix 3. Current and projected future climate for 29 natural heritage areas in Ontario for four time periods based
on CGCM2 and the A2 emissions scenario.
Natural Heritage Area Climate Variable Time Period1971-2000 2011-2040 2041-2070 2071-2100
AlgonquinProvincialPark
Meantemperature-annual(°C) 3.7 4.9 6.3 8.1Meanmax.temperature-warmestmonth(°C) 24.5 26.2 26.8 28.8Meanmin.temperature-coldestmonth(°C) -18.6 -16.1 -13.8 -13.6Meandiurnalrange(°C) 11.7 11.6 11.1 10.8Annualtemperaturerange(°C) 43.1 42.3 40.6 42.5Growingseasonstart-Juliandate 117.0 114.0 109.6 100.9Growingseasonend-Juliandate 299.5 300.6 308.4 315.5Growing season length (days) 183.5 187.6 199.8 215.7Growing season Degree Days 1447.4 1655 1892.1 2284Growingseasonmeantemperature(°C) 13.3 14.3 14.9 16.1Growingseasontemperaturerange(°C) 26.1 27.9 28.4 30.6Precipitation-annual(mm) 956.4 980.1 987.9 989.4Precipitation-warmestquarter(mm) 265.1 290.4 285.3 278.0Precipitation-coldestquarter(mm) 207.4 196.3 201.4 205.2
BrucePeninsulaNationalPark
Meantemperature-annual(°C) 5.9 7.2 8.7 10.5Meanmax.temperature-warmestmonth(°C) 23.2 24.8 25.4 27.5Meanmin.temperature-coldestmonth(°C) -11.3 -9.7 -6.9 -6.7Meandiurnalrange(°C) 8.4 8.4 7.9 7.7Annualtemperaturerange(°C) 34.5 34.4 32.2 34.2Growingseasonstart-Juliandate 112.7 107.6 101.0 89.8Growingseasonend-Juliandate 323.2 325.6 328.3 331.1Growing season length (days) 211.5 219.1 228.3 242.3Growing season Degree Days 1559.3 1815.1 2085 2530.5Growingseasonmeantemperature(°C) 12.7 13.7 14.6 15.9Growingseasontemperaturerange(°C) 24.9 26.6 27.0 29.4Precipitation-annual(mm) 911.0 875.1 879.4 880.2Precipitation-warmestquarter(mm) 208.7 212.7 205.2 202.4Precipitation-coldestquarter(mm) 253.2 229.3 238.6 237.9
CharlestonLakeProvincialPark
Meantemperature-annual(°C) 6.7 8.0 9.5 11.3Meanmax.temperature-warmestmonth(°C) 26.1 28.1 28.8 31Meanmin.temperature-coldestmonth(°C) -13.6 -11.1 -9.0 -9.0Meandiurnalrange(°C) 10.0 10.1 9.7 9.5Annualtemperaturerange(°C) 39.7 39.2 37.8 40.0Growingseasonstart-Juliandate 105.2 98.7 93.2 84.8Growingseasonend-Juliandate 319.6 321.2 324.8 327.7Growing season length (days) 215.4 223.5 232.6 243.9Growing season Degree Days 1918.4 2196.7 2487.8 2958.7Growingseasonmeantemperature(°C) 14.3 15.3 16.2 17.6Growingseasontemperaturerange(°C) 27.8 30.0 30.6 32.9Precipitation-annual(mm) 937.2 928.2 948.4 945.0Precipitation-warmestquarter(mm) 232.6 234.7 231.0 219.8Precipitation-coldestquarter(mm) 217.8 210.0 221.0 225.3
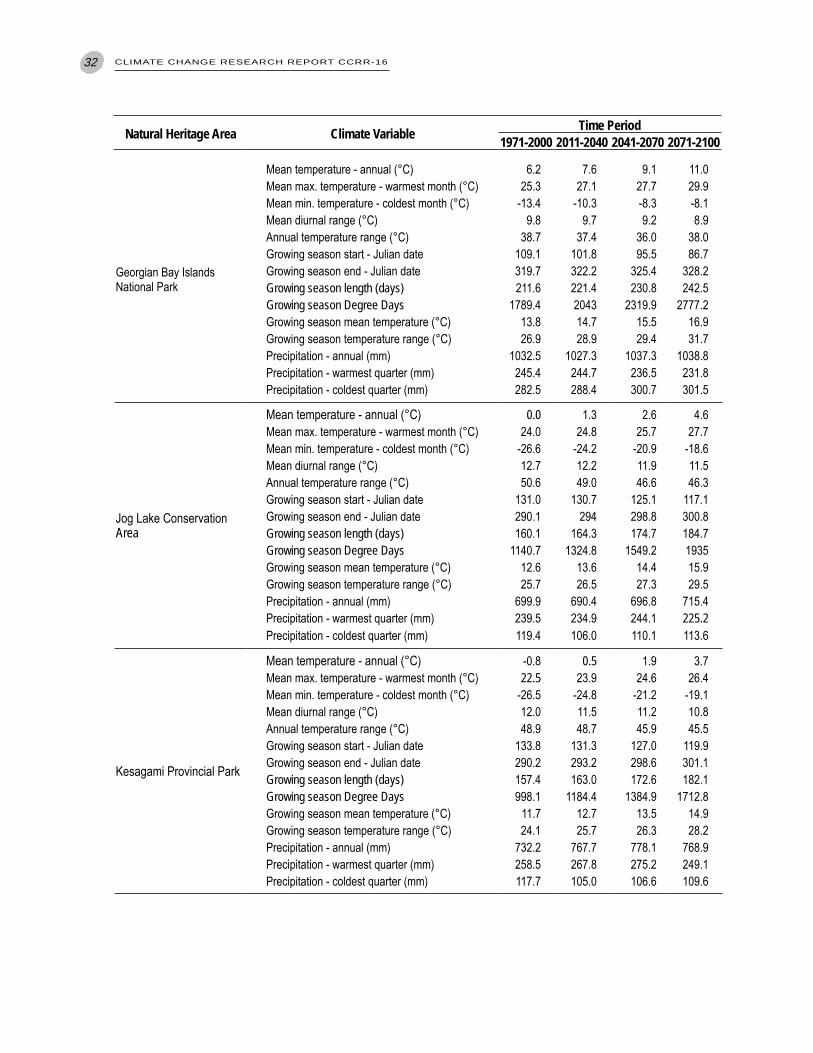
32 CLIMATE CHANGE RESEARCH REPORT CCRR-16
GeorgianBayIslandsNationalPark
Meantemperature-annual(°C) 6.2 7.6 9.1 11.0Meanmax.temperature-warmestmonth(°C) 25.3 27.1 27.7 29.9Meanmin.temperature-coldestmonth(°C) -13.4 -10.3 -8.3 -8.1Meandiurnalrange(°C) 9.8 9.7 9.2 8.9Annualtemperaturerange(°C) 38.7 37.4 36.0 38.0Growingseasonstart-Juliandate 109.1 101.8 95.5 86.7Growingseasonend-Juliandate 319.7 322.2 325.4 328.2Growing season length (days) 211.6 221.4 230.8 242.5Growing season Degree Days 1789.4 2043 2319.9 2777.2Growingseasonmeantemperature(°C) 13.8 14.7 15.5 16.9Growingseasontemperaturerange(°C) 26.9 28.9 29.4 31.7Precipitation-annual(mm) 1032.5 1027.3 1037.3 1038.8Precipitation-warmestquarter(mm) 245.4 244.7 236.5 231.8Precipitation-coldestquarter(mm) 282.5 288.4 300.7 301.5
JogLakeConservationArea
Meantemperature-annual(°C) 0.0 1.3 2.6 4.6Meanmax.temperature-warmestmonth(°C) 24.0 24.8 25.7 27.7Meanmin.temperature-coldestmonth(°C) -26.6 -24.2 -20.9 -18.6Meandiurnalrange(°C) 12.7 12.2 11.9 11.5Annualtemperaturerange(°C) 50.6 49.0 46.6 46.3Growingseasonstart-Juliandate 131.0 130.7 125.1 117.1Growingseasonend-Juliandate 290.1 294 298.8 300.8Growing season length (days) 160.1 164.3 174.7 184.7Growing season Degree Days 1140.7 1324.8 1549.2 1935Growingseasonmeantemperature(°C) 12.6 13.6 14.4 15.9Growingseasontemperaturerange(°C) 25.7 26.5 27.3 29.5Precipitation-annual(mm) 699.9 690.4 696.8 715.4Precipitation-warmestquarter(mm) 239.5 234.9 244.1 225.2Precipitation-coldestquarter(mm) 119.4 106.0 110.1 113.6
KesagamiProvincialPark
Meantemperature-annual(°C) -0.8 0.5 1.9 3.7Meanmax.temperature-warmestmonth(°C) 22.5 23.9 24.6 26.4Meanmin.temperature-coldestmonth(°C) -26.5 -24.8 -21.2 -19.1Meandiurnalrange(°C) 12.0 11.5 11.2 10.8Annualtemperaturerange(°C) 48.9 48.7 45.9 45.5Growingseasonstart-Juliandate 133.8 131.3 127.0 119.9Growingseasonend-Juliandate 290.2 293.2 298.6 301.1Growing season length (days) 157.4 163.0 172.6 182.1Growing season Degree Days 998.1 1184.4 1384.9 1712.8Growingseasonmeantemperature(°C) 11.7 12.7 13.5 14.9Growingseasontemperaturerange(°C) 24.1 25.7 26.3 28.2Precipitation-annual(mm) 732.2 767.7 778.1 768.9Precipitation-warmestquarter(mm) 258.5 267.8 275.2 249.1Precipitation-coldestquarter(mm) 117.7 105.0 106.6 109.6
Natural Heritage Area Climate Variable Time Period1971-2000 2011-2040 2041-2070 2071-2100
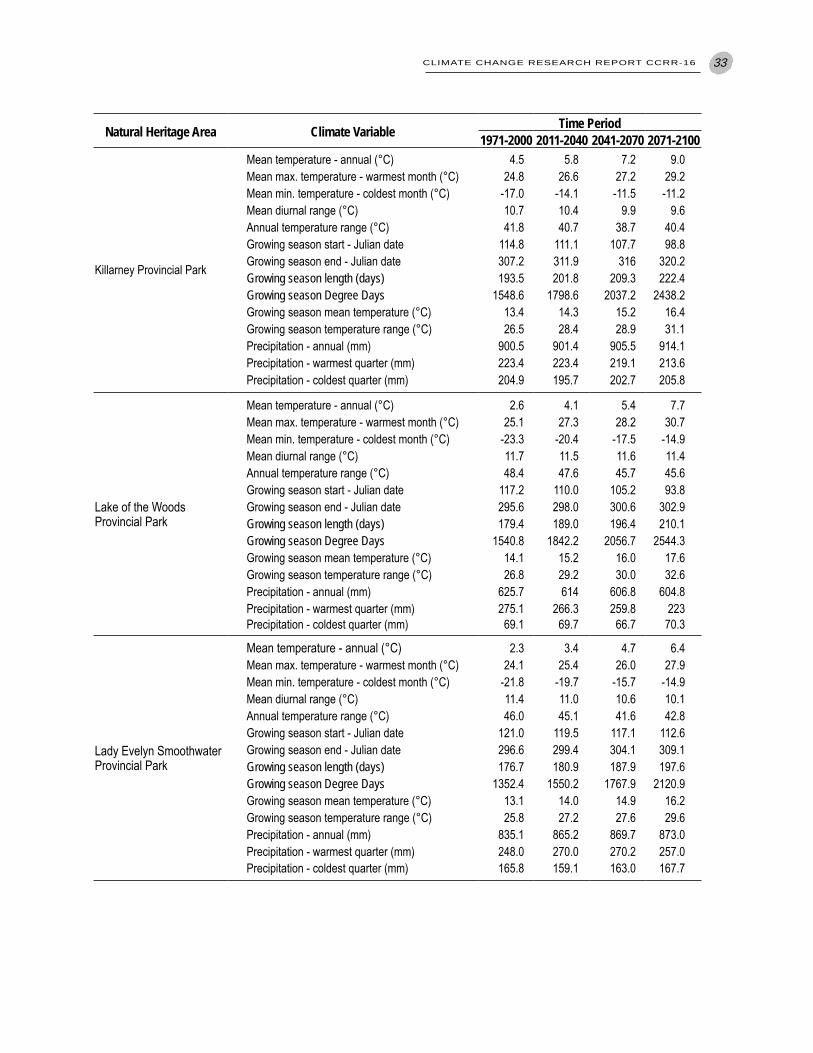
CLIMATE CHANGE RESEARCH REPORT CCRR-16 33
KillarneyProvincialPark
Meantemperature-annual(°C) 4.5 5.8 7.2 9.0Meanmax.temperature-warmestmonth(°C) 24.8 26.6 27.2 29.2Meanmin.temperature-coldestmonth(°C) -17.0 -14.1 -11.5 -11.2Meandiurnalrange(°C) 10.7 10.4 9.9 9.6Annualtemperaturerange(°C) 41.8 40.7 38.7 40.4Growingseasonstart-Juliandate 114.8 111.1 107.7 98.8Growingseasonend-Juliandate 307.2 311.9 316 320.2Growing season length (days) 193.5 201.8 209.3 222.4Growing season Degree Days 1548.6 1798.6 2037.2 2438.2Growingseasonmeantemperature(°C) 13.4 14.3 15.2 16.4Growingseasontemperaturerange(°C) 26.5 28.4 28.9 31.1Precipitation-annual(mm) 900.5 901.4 905.5 914.1Precipitation-warmestquarter(mm) 223.4 223.4 219.1 213.6Precipitation-coldestquarter(mm) 204.9 195.7 202.7 205.8
LakeoftheWoodsProvincialPark
Meantemperature-annual(°C) 2.6 4.1 5.4 7.7Meanmax.temperature-warmestmonth(°C) 25.1 27.3 28.2 30.7Meanmin.temperature-coldestmonth(°C) -23.3 -20.4 -17.5 -14.9Meandiurnalrange(°C) 11.7 11.5 11.6 11.4Annualtemperaturerange(°C) 48.4 47.6 45.7 45.6Growingseasonstart-Juliandate 117.2 110.0 105.2 93.8Growingseasonend-Juliandate 295.6 298.0 300.6 302.9Growing season length (days) 179.4 189.0 196.4 210.1Growing season Degree Days 1540.8 1842.2 2056.7 2544.3Growingseasonmeantemperature(°C) 14.1 15.2 16.0 17.6Growingseasontemperaturerange(°C) 26.8 29.2 30.0 32.6Precipitation-annual(mm) 625.7 614 606.8 604.8Precipitation-warmestquarter(mm) 275.1 266.3 259.8 223Precipitation-coldestquarter(mm) 69.1 69.7 66.7 70.3
LadyEvelynSmoothwaterProvincialPark
Meantemperature-annual(°C) 2.3 3.4 4.7 6.4Meanmax.temperature-warmestmonth(°C) 24.1 25.4 26.0 27.9Meanmin.temperature-coldestmonth(°C) -21.8 -19.7 -15.7 -14.9Meandiurnalrange(°C) 11.4 11.0 10.6 10.1Annualtemperaturerange(°C) 46.0 45.1 41.6 42.8Growingseasonstart-Juliandate 121.0 119.5 117.1 112.6Growingseasonend-Juliandate 296.6 299.4 304.1 309.1Growing season length (days) 176.7 180.9 187.9 197.6Growing season Degree Days 1352.4 1550.2 1767.9 2120.9Growingseasonmeantemperature(°C) 13.1 14.0 14.9 16.2Growingseasontemperaturerange(°C) 25.8 27.2 27.6 29.6Precipitation-annual(mm) 835.1 865.2 869.7 873.0Precipitation-warmestquarter(mm) 248.0 270.0 270.2 257.0Precipitation-coldestquarter(mm) 165.8 159.1 163.0 167.7
Natural Heritage Area Climate Variable Time Period1971-2000 2011-2040 2041-2070 2071-2100
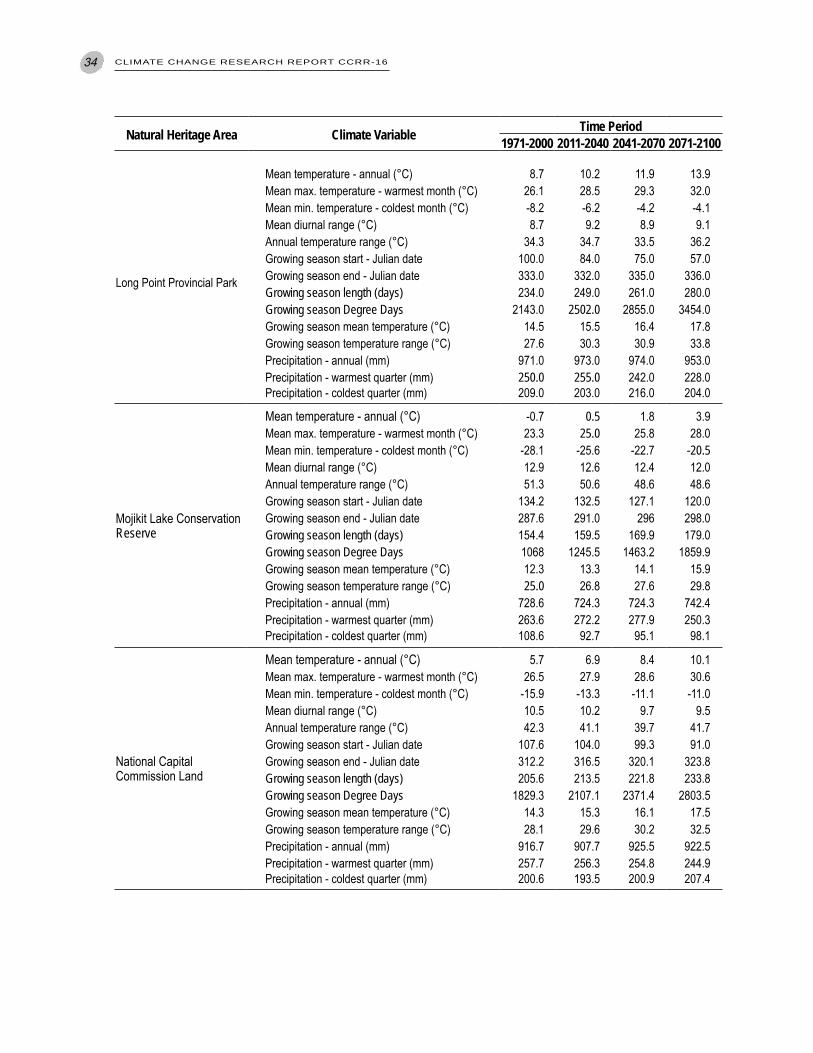
34 CLIMATE CHANGE RESEARCH REPORT CCRR-16
LongPointProvincialPark
Meantemperature-annual(°C) 8.7 10.2 11.9 13.9Meanmax.temperature-warmestmonth(°C) 26.1 28.5 29.3 32.0Meanmin.temperature-coldestmonth(°C) -8.2 -6.2 -4.2 -4.1Meandiurnalrange(°C) 8.7 9.2 8.9 9.1Annualtemperaturerange(°C) 34.3 34.7 33.5 36.2Growingseasonstart-Juliandate 100.0 84.0 75.0 57.0Growingseasonend-Juliandate 333.0 332.0 335.0 336.0Growing season length (days) 234.0 249.0 261.0 280.0Growing season Degree Days 2143.0 2502.0 2855.0 3454.0Growingseasonmeantemperature(°C) 14.5 15.5 16.4 17.8Growingseasontemperaturerange(°C) 27.6 30.3 30.9 33.8Precipitation-annual(mm) 971.0 973.0 974.0 953.0Precipitation-warmestquarter(mm) 250.0 255.0 242.0 228.0Precipitation-coldestquarter(mm) 209.0 203.0 216.0 204.0
MojikitLakeConservationReserve
Meantemperature-annual(°C) -0.7 0.5 1.8 3.9Meanmax.temperature-warmestmonth(°C) 23.3 25.0 25.8 28.0Meanmin.temperature-coldestmonth(°C) -28.1 -25.6 -22.7 -20.5Meandiurnalrange(°C) 12.9 12.6 12.4 12.0Annualtemperaturerange(°C) 51.3 50.6 48.6 48.6Growingseasonstart-Juliandate 134.2 132.5 127.1 120.0Growingseasonend-Juliandate 287.6 291.0 296 298.0Growing season length (days) 154.4 159.5 169.9 179.0Growing season Degree Days 1068 1245.5 1463.2 1859.9Growingseasonmeantemperature(°C) 12.3 13.3 14.1 15.9Growingseasontemperaturerange(°C) 25.0 26.8 27.6 29.8Precipitation-annual(mm) 728.6 724.3 724.3 742.4Precipitation-warmestquarter(mm) 263.6 272.2 277.9 250.3Precipitation-coldestquarter(mm) 108.6 92.7 95.1 98.1
NationalCapitalCommissionLand
Meantemperature-annual(°C) 5.7 6.9 8.4 10.1Meanmax.temperature-warmestmonth(°C) 26.5 27.9 28.6 30.6Meanmin.temperature-coldestmonth(°C) -15.9 -13.3 -11.1 -11.0Meandiurnalrange(°C) 10.5 10.2 9.7 9.5Annualtemperaturerange(°C) 42.3 41.1 39.7 41.7Growingseasonstart-Juliandate 107.6 104.0 99.3 91.0Growingseasonend-Juliandate 312.2 316.5 320.1 323.8Growing season length (days) 205.6 213.5 221.8 233.8Growing season Degree Days 1829.3 2107.1 2371.4 2803.5Growingseasonmeantemperature(°C) 14.3 15.3 16.1 17.5Growingseasontemperaturerange(°C) 28.1 29.6 30.2 32.5Precipitation-annual(mm) 916.7 907.7 925.5 922.5Precipitation-warmestquarter(mm) 257.7 256.3 254.8 244.9Precipitation-coldestquarter(mm) 200.6 193.5 200.9 207.4
Natural Heritage Area Climate Variable Time Period1971-2000 2011-2040 2041-2070 2071-2100
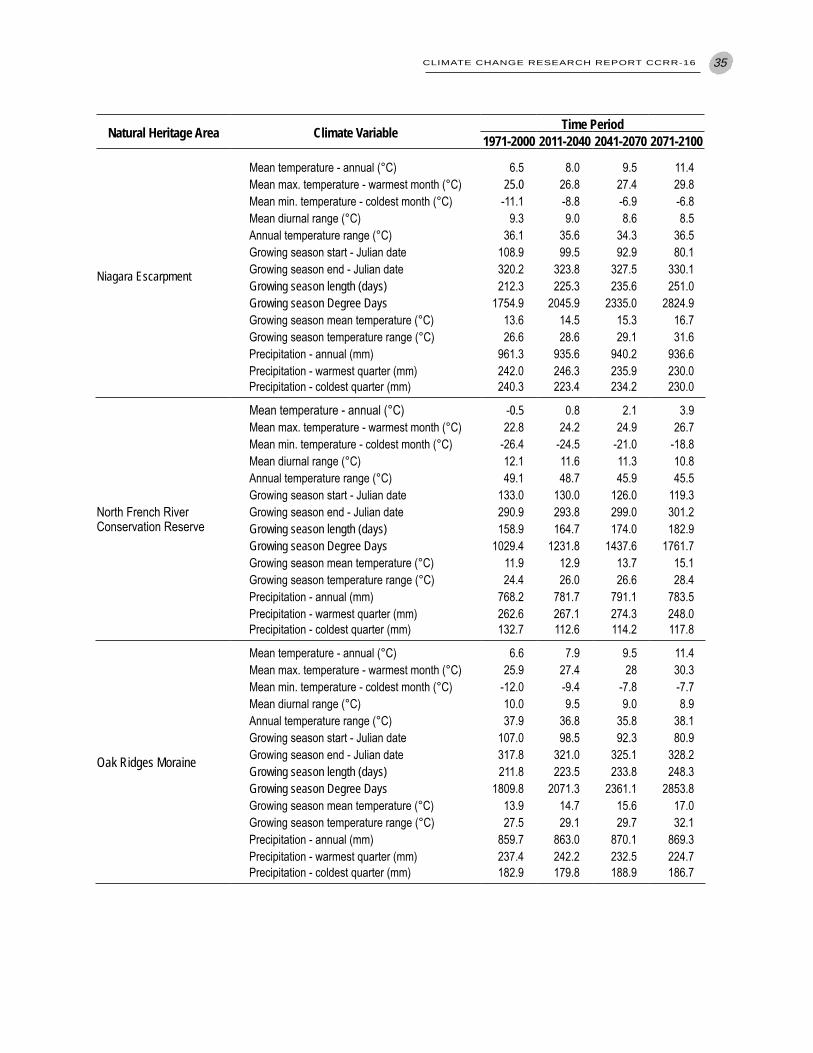
CLIMATE CHANGE RESEARCH REPORT CCRR-16 35
Niagara Escarpment
Meantemperature-annual(°C) 6.5 8.0 9.5 11.4Meanmax.temperature-warmestmonth(°C) 25.0 26.8 27.4 29.8Meanmin.temperature-coldestmonth(°C) -11.1 -8.8 -6.9 -6.8Meandiurnalrange(°C) 9.3 9.0 8.6 8.5Annualtemperaturerange(°C) 36.1 35.6 34.3 36.5Growingseasonstart-Juliandate 108.9 99.5 92.9 80.1Growingseasonend-Juliandate 320.2 323.8 327.5 330.1Growing season length (days) 212.3 225.3 235.6 251.0Growing season Degree Days 1754.9 2045.9 2335.0 2824.9Growingseasonmeantemperature(°C) 13.6 14.5 15.3 16.7Growingseasontemperaturerange(°C) 26.6 28.6 29.1 31.6Precipitation-annual(mm) 961.3 935.6 940.2 936.6Precipitation-warmestquarter(mm) 242.0 246.3 235.9 230.0Precipitation-coldestquarter(mm) 240.3 223.4 234.2 230.0
NorthFrenchRiverConservationReserve
Meantemperature-annual(°C) -0.5 0.8 2.1 3.9Meanmax.temperature-warmestmonth(°C) 22.8 24.2 24.9 26.7Meanmin.temperature-coldestmonth(°C) -26.4 -24.5 -21.0 -18.8Meandiurnalrange(°C) 12.1 11.6 11.3 10.8Annualtemperaturerange(°C) 49.1 48.7 45.9 45.5Growingseasonstart-Juliandate 133.0 130.0 126.0 119.3Growingseasonend-Juliandate 290.9 293.8 299.0 301.2Growing season length (days) 158.9 164.7 174.0 182.9Growing season Degree Days 1029.4 1231.8 1437.6 1761.7Growingseasonmeantemperature(°C) 11.9 12.9 13.7 15.1Growingseasontemperaturerange(°C) 24.4 26.0 26.6 28.4Precipitation-annual(mm) 768.2 781.7 791.1 783.5Precipitation-warmestquarter(mm) 262.6 267.1 274.3 248.0Precipitation-coldestquarter(mm) 132.7 112.6 114.2 117.8
Oak Ridges Moraine
Meantemperature-annual(°C) 6.6 7.9 9.5 11.4Meanmax.temperature-warmestmonth(°C) 25.9 27.4 28 30.3Meanmin.temperature-coldestmonth(°C) -12.0 -9.4 -7.8 -7.7Meandiurnalrange(°C) 10.0 9.5 9.0 8.9Annualtemperaturerange(°C) 37.9 36.8 35.8 38.1Growingseasonstart-Juliandate 107.0 98.5 92.3 80.9Growingseasonend-Juliandate 317.8 321.0 325.1 328.2Growing season length (days) 211.8 223.5 233.8 248.3Growing season Degree Days 1809.8 2071.3 2361.1 2853.8Growingseasonmeantemperature(°C) 13.9 14.7 15.6 17.0Growingseasontemperaturerange(°C) 27.5 29.1 29.7 32.1Precipitation-annual(mm) 859.7 863.0 870.1 869.3Precipitation-warmestquarter(mm) 237.4 242.2 232.5 224.7Precipitation-coldestquarter(mm) 182.9 179.8 188.9 186.7
Natural Heritage Area Climate Variable Time Period1971-2000 2011-2040 2041-2070 2071-2100
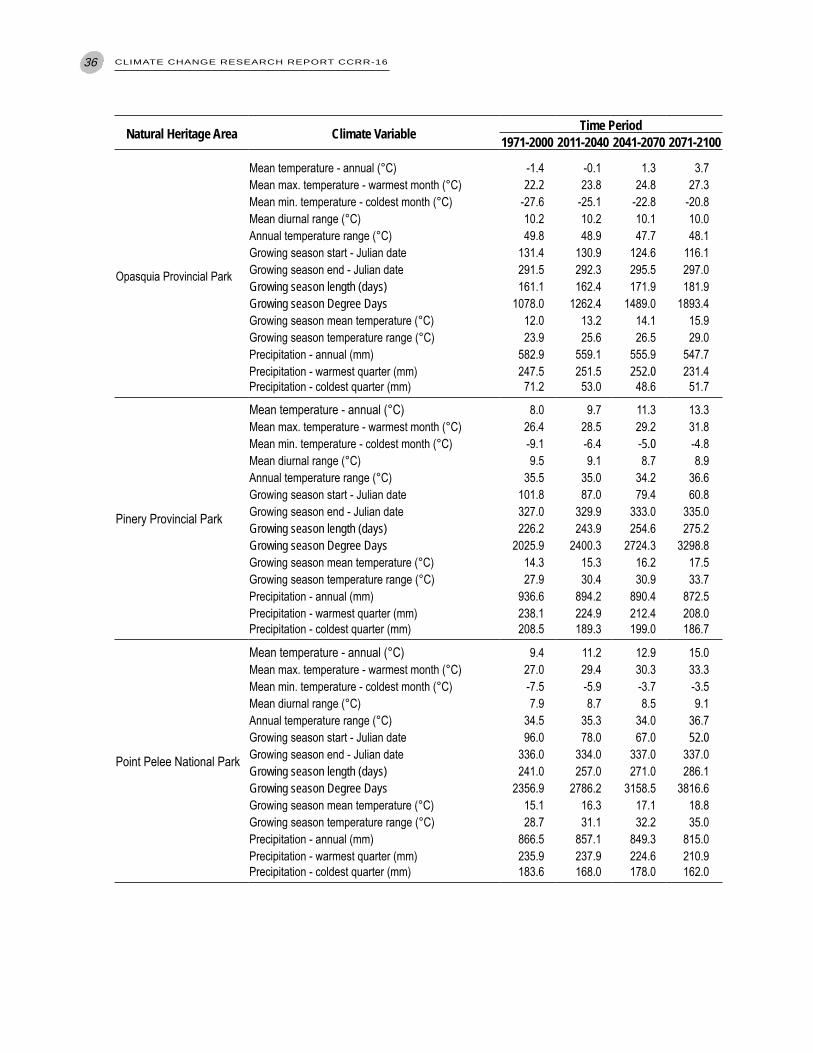
36 CLIMATE CHANGE RESEARCH REPORT CCRR-16
OpasquiaProvincialPark
Meantemperature-annual(°C) -1.4 -0.1 1.3 3.7Meanmax.temperature-warmestmonth(°C) 22.2 23.8 24.8 27.3Meanmin.temperature-coldestmonth(°C) -27.6 -25.1 -22.8 -20.8Meandiurnalrange(°C) 10.2 10.2 10.1 10.0Annualtemperaturerange(°C) 49.8 48.9 47.7 48.1Growingseasonstart-Juliandate 131.4 130.9 124.6 116.1Growingseasonend-Juliandate 291.5 292.3 295.5 297.0Growing season length (days) 161.1 162.4 171.9 181.9Growing season Degree Days 1078.0 1262.4 1489.0 1893.4Growingseasonmeantemperature(°C) 12.0 13.2 14.1 15.9Growingseasontemperaturerange(°C) 23.9 25.6 26.5 29.0Precipitation-annual(mm) 582.9 559.1 555.9 547.7Precipitation-warmestquarter(mm) 247.5 251.5 252.0 231.4Precipitation-coldestquarter(mm) 71.2 53.0 48.6 51.7
PineryProvincialPark
Meantemperature-annual(°C) 8.0 9.7 11.3 13.3Meanmax.temperature-warmestmonth(°C) 26.4 28.5 29.2 31.8Meanmin.temperature-coldestmonth(°C) -9.1 -6.4 -5.0 -4.8Meandiurnalrange(°C) 9.5 9.1 8.7 8.9Annualtemperaturerange(°C) 35.5 35.0 34.2 36.6Growingseasonstart-Juliandate 101.8 87.0 79.4 60.8Growingseasonend-Juliandate 327.0 329.9 333.0 335.0Growing season length (days) 226.2 243.9 254.6 275.2Growing season Degree Days 2025.9 2400.3 2724.3 3298.8Growingseasonmeantemperature(°C) 14.3 15.3 16.2 17.5Growingseasontemperaturerange(°C) 27.9 30.4 30.9 33.7Precipitation-annual(mm) 936.6 894.2 890.4 872.5Precipitation-warmestquarter(mm) 238.1 224.9 212.4 208.0Precipitation-coldestquarter(mm) 208.5 189.3 199.0 186.7
PointPeleeNationalPark
Meantemperature-annual(°C) 9.4 11.2 12.9 15.0Meanmax.temperature-warmestmonth(°C) 27.0 29.4 30.3 33.3Meanmin.temperature-coldestmonth(°C) -7.5 -5.9 -3.7 -3.5Meandiurnalrange(°C) 7.9 8.7 8.5 9.1Annualtemperaturerange(°C) 34.5 35.3 34.0 36.7Growingseasonstart-Juliandate 96.0 78.0 67.0 52.0Growingseasonend-Juliandate 336.0 334.0 337.0 337.0Growing season length (days) 241.0 257.0 271.0 286.1Growing season Degree Days 2356.9 2786.2 3158.5 3816.6Growingseasonmeantemperature(°C) 15.1 16.3 17.1 18.8Growingseasontemperaturerange(°C) 28.7 31.1 32.2 35.0Precipitation-annual(mm) 866.5 857.1 849.3 815.0Precipitation-warmestquarter(mm) 235.9 237.9 224.6 210.9Precipitation-coldestquarter(mm) 183.6 168.0 178.0 162.0
Natural Heritage Area Climate Variable Time Period1971-2000 2011-2040 2041-2070 2071-2100
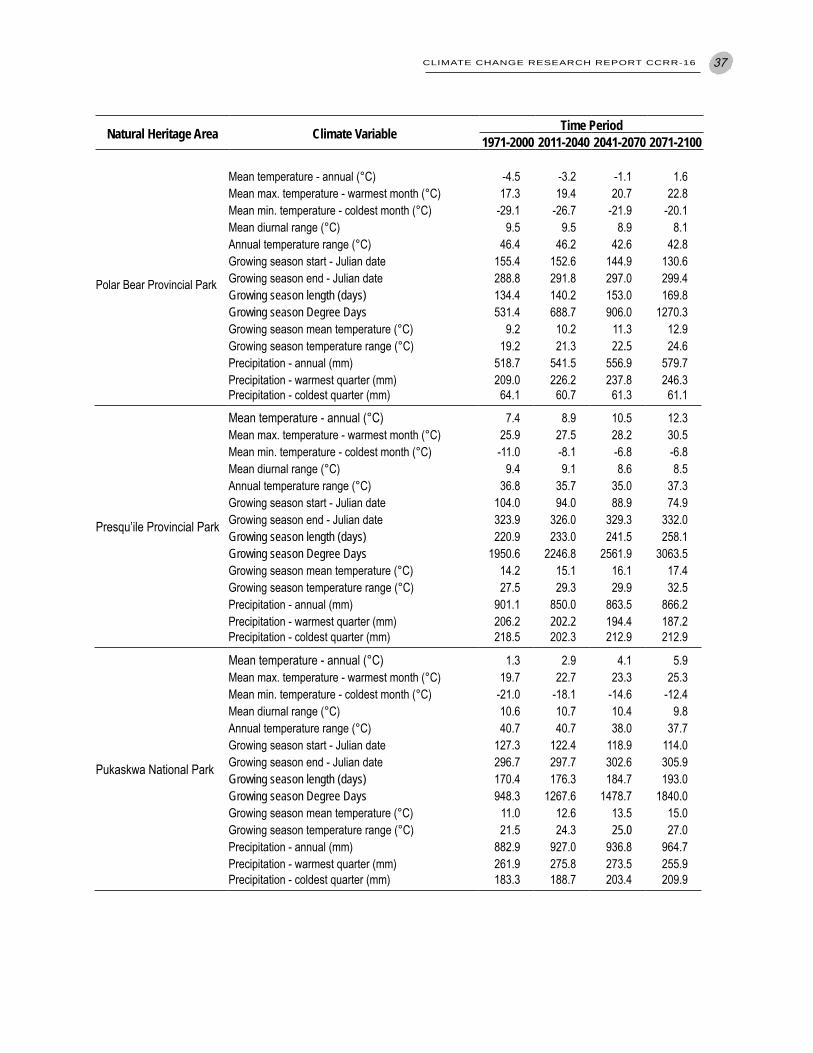
CLIMATE CHANGE RESEARCH REPORT CCRR-16 37
PolarBearProvincialPark
Meantemperature-annual(°C) -4.5 -3.2 -1.1 1.6Meanmax.temperature-warmestmonth(°C) 17.3 19.4 20.7 22.8Meanmin.temperature-coldestmonth(°C) -29.1 -26.7 -21.9 -20.1Meandiurnalrange(°C) 9.5 9.5 8.9 8.1Annualtemperaturerange(°C) 46.4 46.2 42.6 42.8Growingseasonstart-Juliandate 155.4 152.6 144.9 130.6Growingseasonend-Juliandate 288.8 291.8 297.0 299.4Growing season length (days) 134.4 140.2 153.0 169.8Growing season Degree Days 531.4 688.7 906.0 1270.3Growingseasonmeantemperature(°C) 9.2 10.2 11.3 12.9Growingseasontemperaturerange(°C) 19.2 21.3 22.5 24.6Precipitation-annual(mm) 518.7 541.5 556.9 579.7Precipitation-warmestquarter(mm) 209.0 226.2 237.8 246.3Precipitation-coldestquarter(mm) 64.1 60.7 61.3 61.1
Presqu’ileProvincialPark
Meantemperature-annual(°C) 7.4 8.9 10.5 12.3Meanmax.temperature-warmestmonth(°C) 25.9 27.5 28.2 30.5Meanmin.temperature-coldestmonth(°C) -11.0 -8.1 -6.8 -6.8Meandiurnalrange(°C) 9.4 9.1 8.6 8.5Annualtemperaturerange(°C) 36.8 35.7 35.0 37.3Growingseasonstart-Juliandate 104.0 94.0 88.9 74.9Growingseasonend-Juliandate 323.9 326.0 329.3 332.0Growing season length (days) 220.9 233.0 241.5 258.1Growing season Degree Days 1950.6 2246.8 2561.9 3063.5Growingseasonmeantemperature(°C) 14.2 15.1 16.1 17.4Growingseasontemperaturerange(°C) 27.5 29.3 29.9 32.5Precipitation-annual(mm) 901.1 850.0 863.5 866.2Precipitation-warmestquarter(mm) 206.2 202.2 194.4 187.2Precipitation-coldestquarter(mm) 218.5 202.3 212.9 212.9
PukaskwaNationalPark
Meantemperature-annual(°C) 1.3 2.9 4.1 5.9Meanmax.temperature-warmestmonth(°C) 19.7 22.7 23.3 25.3Meanmin.temperature-coldestmonth(°C) -21.0 -18.1 -14.6 -12.4Meandiurnalrange(°C) 10.6 10.7 10.4 9.8Annualtemperaturerange(°C) 40.7 40.7 38.0 37.7Growingseasonstart-Juliandate 127.3 122.4 118.9 114.0Growingseasonend-Juliandate 296.7 297.7 302.6 305.9Growing season length (days) 170.4 176.3 184.7 193.0Growing season Degree Days 948.3 1267.6 1478.7 1840.0Growingseasonmeantemperature(°C) 11.0 12.6 13.5 15.0Growingseasontemperaturerange(°C) 21.5 24.3 25.0 27.0Precipitation-annual(mm) 882.9 927.0 936.8 964.7Precipitation-warmestquarter(mm) 261.9 275.8 273.5 255.9Precipitation-coldestquarter(mm) 183.3 188.7 203.4 209.9
Natural Heritage Area Climate Variable Time Period1971-2000 2011-2040 2041-2070 2071-2100
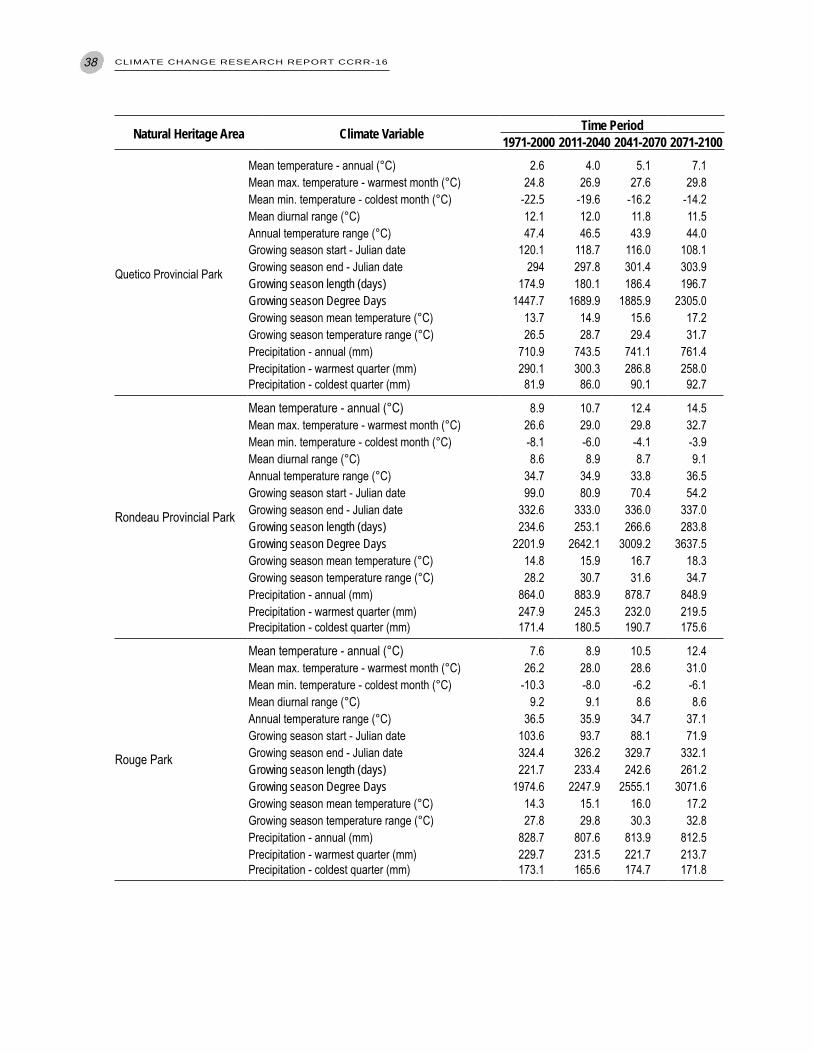
38 CLIMATE CHANGE RESEARCH REPORT CCRR-16
QueticoProvincialPark
Meantemperature-annual(°C) 2.6 4.0 5.1 7.1Meanmax.temperature-warmestmonth(°C) 24.8 26.9 27.6 29.8Meanmin.temperature-coldestmonth(°C) -22.5 -19.6 -16.2 -14.2Meandiurnalrange(°C) 12.1 12.0 11.8 11.5Annualtemperaturerange(°C) 47.4 46.5 43.9 44.0Growingseasonstart-Juliandate 120.1 118.7 116.0 108.1Growingseasonend-Juliandate 294 297.8 301.4 303.9Growing season length (days) 174.9 180.1 186.4 196.7Growing season Degree Days 1447.7 1689.9 1885.9 2305.0Growingseasonmeantemperature(°C) 13.7 14.9 15.6 17.2Growingseasontemperaturerange(°C) 26.5 28.7 29.4 31.7Precipitation-annual(mm) 710.9 743.5 741.1 761.4Precipitation-warmestquarter(mm) 290.1 300.3 286.8 258.0Precipitation-coldestquarter(mm) 81.9 86.0 90.1 92.7
RondeauProvincialPark
Meantemperature-annual(°C) 8.9 10.7 12.4 14.5Meanmax.temperature-warmestmonth(°C) 26.6 29.0 29.8 32.7Meanmin.temperature-coldestmonth(°C) -8.1 -6.0 -4.1 -3.9Meandiurnalrange(°C) 8.6 8.9 8.7 9.1Annualtemperaturerange(°C) 34.7 34.9 33.8 36.5Growingseasonstart-Juliandate 99.0 80.9 70.4 54.2Growingseasonend-Juliandate 332.6 333.0 336.0 337.0Growing season length (days) 234.6 253.1 266.6 283.8Growing season Degree Days 2201.9 2642.1 3009.2 3637.5Growingseasonmeantemperature(°C) 14.8 15.9 16.7 18.3Growingseasontemperaturerange(°C) 28.2 30.7 31.6 34.7Precipitation-annual(mm) 864.0 883.9 878.7 848.9Precipitation-warmestquarter(mm) 247.9 245.3 232.0 219.5Precipitation-coldestquarter(mm) 171.4 180.5 190.7 175.6
RougePark
Meantemperature-annual(°C) 7.6 8.9 10.5 12.4Meanmax.temperature-warmestmonth(°C) 26.2 28.0 28.6 31.0Meanmin.temperature-coldestmonth(°C) -10.3 -8.0 -6.2 -6.1Meandiurnalrange(°C) 9.2 9.1 8.6 8.6Annualtemperaturerange(°C) 36.5 35.9 34.7 37.1Growingseasonstart-Juliandate 103.6 93.7 88.1 71.9Growingseasonend-Juliandate 324.4 326.2 329.7 332.1Growing season length (days) 221.7 233.4 242.6 261.2Growing season Degree Days 1974.6 2247.9 2555.1 3071.6Growingseasonmeantemperature(°C) 14.3 15.1 16.0 17.2Growingseasontemperaturerange(°C) 27.8 29.8 30.3 32.8Precipitation-annual(mm) 828.7 807.6 813.9 812.5Precipitation-warmestquarter(mm) 229.7 231.5 221.7 213.7Precipitation-coldestquarter(mm) 173.1 165.6 174.7 171.8
Natural Heritage Area Climate Variable Time Period1971-2000 2011-2040 2041-2070 2071-2100
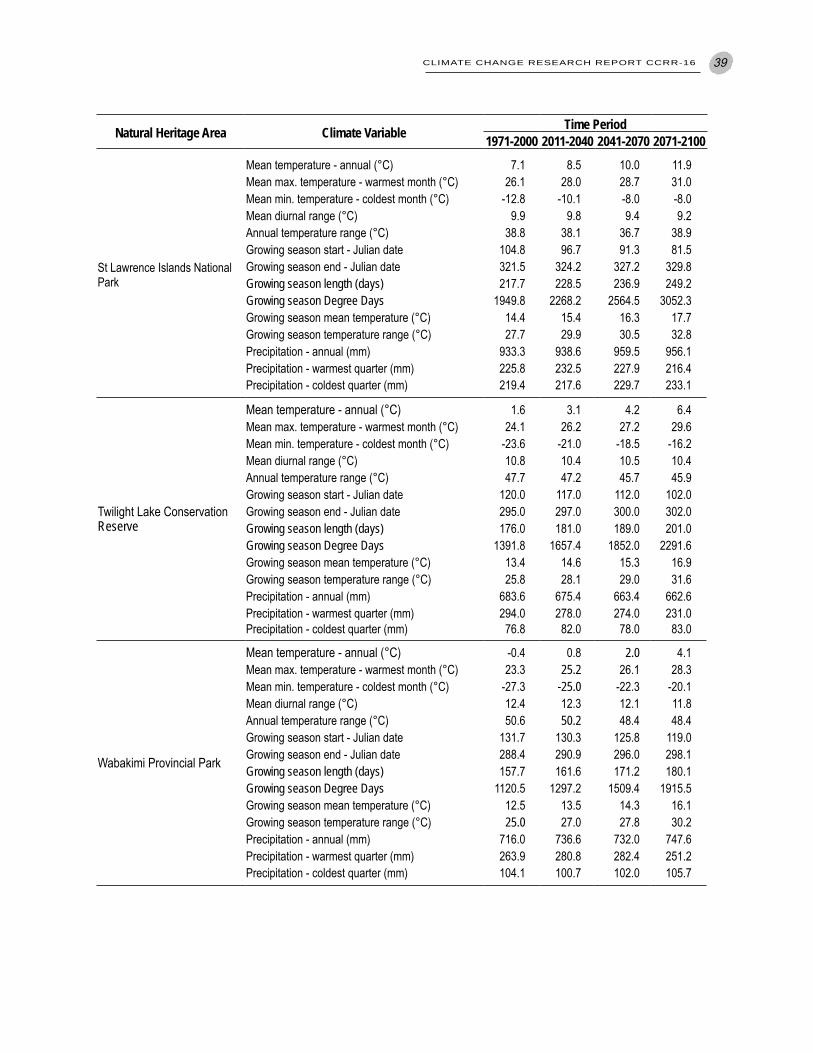
CLIMATE CHANGE RESEARCH REPORT CCRR-16 39
StLawrenceIslandsNationalPark
Meantemperature-annual(°C) 7.1 8.5 10.0 11.9Meanmax.temperature-warmestmonth(°C) 26.1 28.0 28.7 31.0Meanmin.temperature-coldestmonth(°C) -12.8 -10.1 -8.0 -8.0Meandiurnalrange(°C) 9.9 9.8 9.4 9.2Annualtemperaturerange(°C) 38.8 38.1 36.7 38.9Growingseasonstart-Juliandate 104.8 96.7 91.3 81.5Growingseasonend-Juliandate 321.5 324.2 327.2 329.8Growing season length (days) 217.7 228.5 236.9 249.2Growing season Degree Days 1949.8 2268.2 2564.5 3052.3Growingseasonmeantemperature(°C) 14.4 15.4 16.3 17.7Growingseasontemperaturerange(°C) 27.7 29.9 30.5 32.8Precipitation-annual(mm) 933.3 938.6 959.5 956.1Precipitation-warmestquarter(mm) 225.8 232.5 227.9 216.4Precipitation-coldestquarter(mm) 219.4 217.6 229.7 233.1
TwilightLakeConservationReserve
Meantemperature-annual(°C) 1.6 3.1 4.2 6.4Meanmax.temperature-warmestmonth(°C) 24.1 26.2 27.2 29.6Meanmin.temperature-coldestmonth(°C) -23.6 -21.0 -18.5 -16.2Meandiurnalrange(°C) 10.8 10.4 10.5 10.4Annualtemperaturerange(°C) 47.7 47.2 45.7 45.9Growingseasonstart-Juliandate 120.0 117.0 112.0 102.0Growingseasonend-Juliandate 295.0 297.0 300.0 302.0Growing season length (days) 176.0 181.0 189.0 201.0Growing season Degree Days 1391.8 1657.4 1852.0 2291.6Growingseasonmeantemperature(°C) 13.4 14.6 15.3 16.9Growingseasontemperaturerange(°C) 25.8 28.1 29.0 31.6Precipitation-annual(mm) 683.6 675.4 663.4 662.6Precipitation-warmestquarter(mm) 294.0 278.0 274.0 231.0Precipitation-coldestquarter(mm) 76.8 82.0 78.0 83.0
WabakimiProvincialPark
Meantemperature-annual(°C) -0.4 0.8 2.0 4.1Meanmax.temperature-warmestmonth(°C) 23.3 25.2 26.1 28.3Meanmin.temperature-coldestmonth(°C) -27.3 -25.0 -22.3 -20.1Meandiurnalrange(°C) 12.4 12.3 12.1 11.8Annualtemperaturerange(°C) 50.6 50.2 48.4 48.4Growingseasonstart-Juliandate 131.7 130.3 125.8 119.0Growingseasonend-Juliandate 288.4 290.9 296.0 298.1Growing season length (days) 157.7 161.6 171.2 180.1Growing season Degree Days 1120.5 1297.2 1509.4 1915.5Growingseasonmeantemperature(°C) 12.5 13.5 14.3 16.1Growingseasontemperaturerange(°C) 25.0 27.0 27.8 30.2Precipitation-annual(mm) 716.0 736.6 732.0 747.6Precipitation-warmestquarter(mm) 263.9 280.8 282.4 251.2Precipitation-coldestquarter(mm) 104.1 100.7 102.0 105.7
Natural Heritage Area Climate Variable Time Period1971-2000 2011-2040 2041-2070 2071-2100
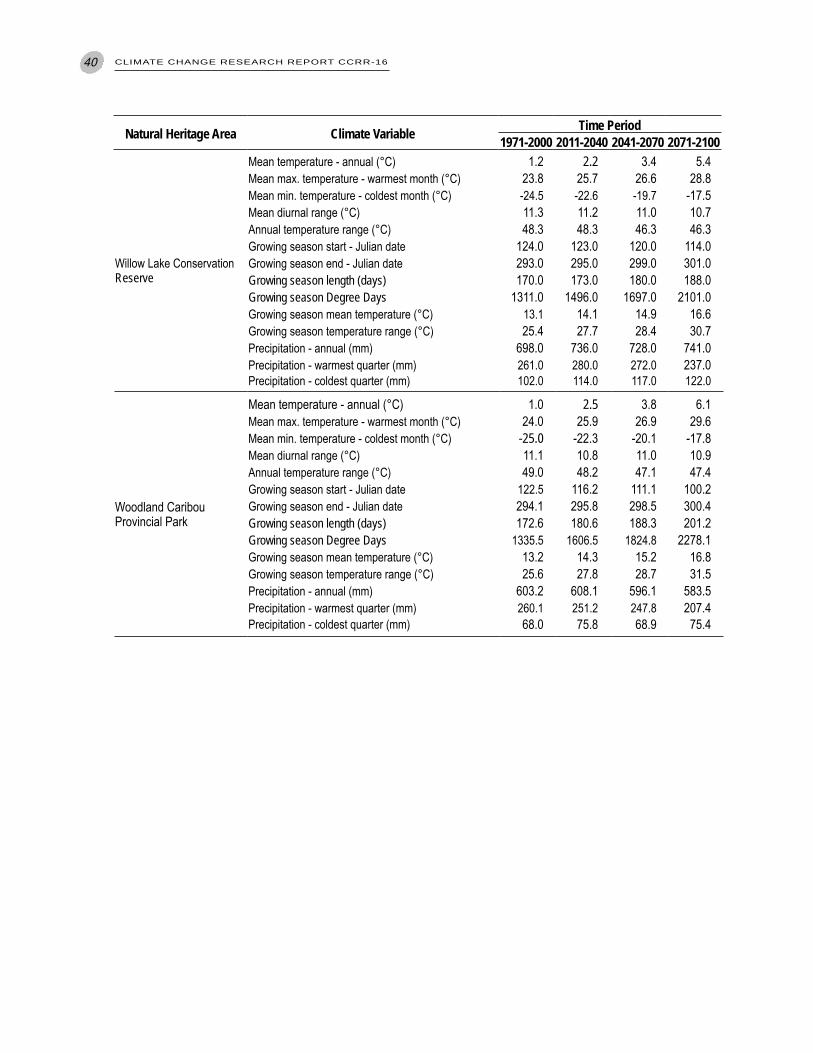
40 CLIMATE CHANGE RESEARCH REPORT CCRR-16
WillowLakeConservationReserve
Meantemperature-annual(°C) 1.2 2.2 3.4 5.4Meanmax.temperature-warmestmonth(°C) 23.8 25.7 26.6 28.8Meanmin.temperature-coldestmonth(°C) -24.5 -22.6 -19.7 -17.5Meandiurnalrange(°C) 11.3 11.2 11.0 10.7Annualtemperaturerange(°C) 48.3 48.3 46.3 46.3Growingseasonstart-Juliandate 124.0 123.0 120.0 114.0Growingseasonend-Juliandate 293.0 295.0 299.0 301.0Growing season length (days) 170.0 173.0 180.0 188.0Growing season Degree Days 1311.0 1496.0 1697.0 2101.0Growingseasonmeantemperature(°C) 13.1 14.1 14.9 16.6Growingseasontemperaturerange(°C) 25.4 27.7 28.4 30.7Precipitation-annual(mm) 698.0 736.0 728.0 741.0Precipitation-warmestquarter(mm) 261.0 280.0 272.0 237.0Precipitation-coldestquarter(mm) 102.0 114.0 117.0 122.0
WoodlandCaribouProvincialPark
Meantemperature-annual(°C) 1.0 2.5 3.8 6.1Meanmax.temperature-warmestmonth(°C) 24.0 25.9 26.9 29.6Meanmin.temperature-coldestmonth(°C) -25.0 -22.3 -20.1 -17.8Meandiurnalrange(°C) 11.1 10.8 11.0 10.9Annualtemperaturerange(°C) 49.0 48.2 47.1 47.4Growingseasonstart-Juliandate 122.5 116.2 111.1 100.2Growingseasonend-Juliandate 294.1 295.8 298.5 300.4Growing season length (days) 172.6 180.6 188.3 201.2Growing season Degree Days 1335.5 1606.5 1824.8 2278.1Growingseasonmeantemperature(°C) 13.2 14.3 15.2 16.8Growingseasontemperaturerange(°C) 25.6 27.8 28.7 31.5Precipitation-annual(mm) 603.2 608.1 596.1 583.5Precipitation-warmestquarter(mm) 260.1 251.2 247.8 207.4Precipitation-coldestquarter(mm) 68.0 75.8 68.9 75.4
Natural Heritage Area Climate Variable Time Period1971-2000 2011-2040 2041-2070 2071-2100
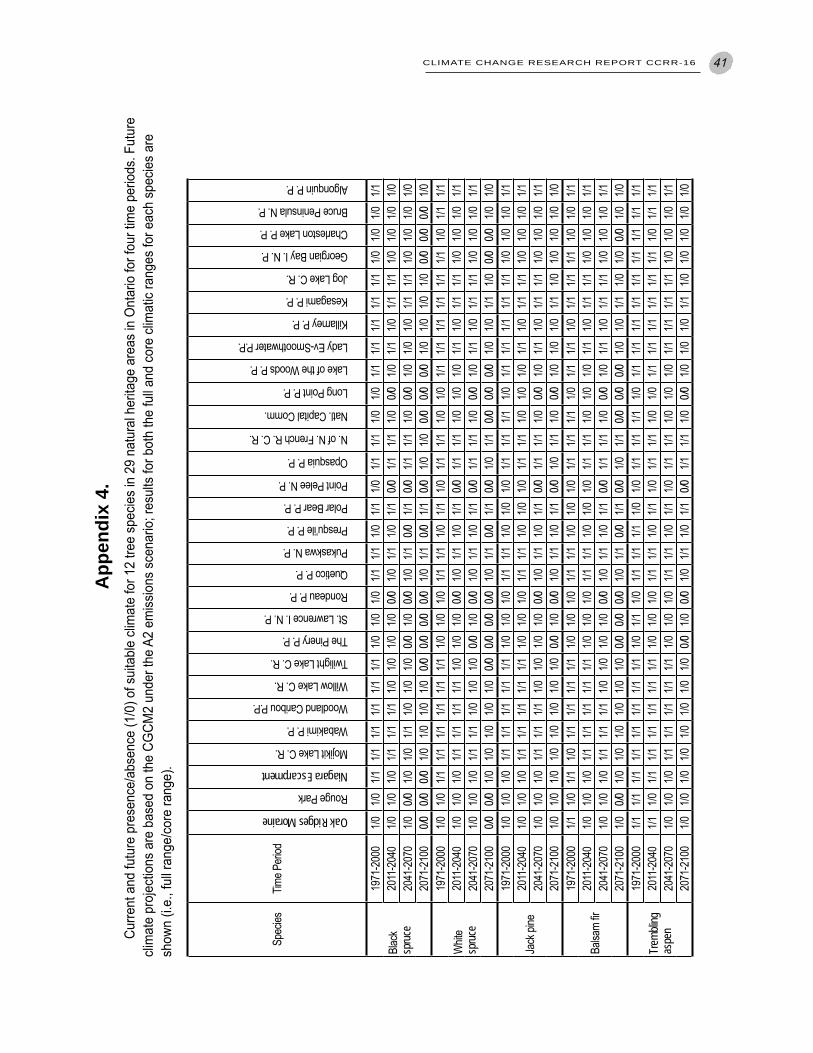
CLIMATE CHANGE RESEARCH REPORT CCRR-16 41
Species
TimeP
eriod
Oak Ridges Moraine
RougePark
Niagara Escarpment
MojikitLakeC.R.
WabakimiP.P.
WoodlandCaribouP.P.
WillowLakeC.R.
TwilightLakeC.R.
ThePineryP.P.
St.LawrenceI.N.P.
RondeauP.P.
QueticoP.P.
PukaskwaN.P.
Presqu’ileP.P.
PolarBearP.P.
PointPeleeN.P.
OpasquiaP.P.
N.ofN.FrenchR.C.R.
Natl.CapitalComm.
LongPointP.P.
LakeoftheWoodsP.P.
LadyEv-SmoothwaterP.P.
KillarneyP.P.
KesagamiP.P.
JogLakeC.R.
GeorgianBayI.N.P.
CharlestonLakeP.P.
BrucePeninsulaN.P.
AlgonquinP.P.
Black
spruc
e
1971-20
001/0
1/01/1
1/11/1
1/11/1
1/11/0
1/01/0
1/11/1
1/01/1
1/01/1
1/11/0
1/01/1
1/11/1
1/11/1
1/01/0
1/01/1
2011-20
401/0
1/01/0
1/11/1
1/11/0
1/01/0
1/00/0
1/01/1
1/01/1
0/01/1
1/11/0
0/01/0
1/11/0
1/11/1
1/01/0
1/01/0
2041-20
701/0
0/01/0
1/01/1
1/01/0
1/00/0
1/00/0
1/01/1
0/01/1
0/01/1
1/11/0
0/01/0
1/01/0
1/11/1
1/01/0
1/01/0
2071-21
000/0
0/00/0
1/01/0
1/01/0
0/00/0
0/00/0
1/01/1
0/01/1
0/01/0
1/00/0
0/00/0
1/01/0
1/01/0
0/00/0
0/01/0
White
spruc
e
1971-20
001/0
1/01/1
1/11/1
1/11/1
1/11/0
1/01/0
1/11/1
1/01/1
1/01/1
1/11/0
1/01/1
1/11/1
1/11/1
1/11/0
1/11/1
2011-20
401/0
1/01/0
1/11/1
1/11/1
1/01/0
1/00/0
1/01/1
1/01/1
0/01/1
1/11/0
1/01/0
1/11/0
1/11/1
1/01/0
1/01/1
2041-20
701/0
1/01/0
1/11/1
1/01/0
1/00/0
1/00/0
1/01/1
1/01/1
0/01/1
1/11/0
0/01/0
1/11/0
1/11/1
1/01/0
1/01/1
2071-21
000/0
0/01/0
1/01/0
1/01/0
0/00/0
0/00/0
1/01/1
0/01/1
0/01/0
1/10/0
0/00/0
1/01/0
1/11/0
0/00/0
1/01/0
Jackpine
1971-20
001/0
1/01/0
1/11/1
1/11/1
1/11/0
1/01/0
1/11/1
1/01/0
1/01/1
1/11/1
1/01/1
1/11/1
1/11/1
1/01/0
1/01/1
2011-20
401/0
1/01/0
1/11/1
1/11/1
1/11/0
1/01/0
1/11/1
1/01/0
1/01/1
1/11/0
1/01/0
1/11/0
1/11/1
1/01/0
1/01/1
2041-20
701/0
1/01/0
1/11/1
1/11/0
1/01/0
1/00/0
1/01/1
1/01/1
0/01/1
1/11/0
0/01/0
1/11/0
1/11/1
1/01/0
1/01/1
2071-21
001/0
1/01/0
1/01/0
1/01/0
1/00/0
1/00/0
1/01/1
1/01/1
0/01/0
1/11/0
0/01/0
1/01/0
1/11/0
1/01/0
1/01/0
Balsa
mfir
1971-20
001/1
1/01/1
1/01/1
1/11/1
1/11/0
1/01/0
1/11/1
1/01/0
1/01/1
1/11/1
1/01/1
1/11/0
1/11/1
1/11/0
1/01/1
2011-20
401/0
1/01/0
1/11/1
1/11/1
1/11/0
1/01/0
1/11/1
1/01/0
1/01/1
1/11/0
1/01/0
1/11/0
1/11/1
1/01/0
1/01/1
2041-20
701/0
1/01/0
1/11/1
1/11/0
1/01/0
1/00/0
1/01/1
1/01/1
0/01/1
1/11/0
0/01/0
1/11/0
1/11/1
1/01/0
1/01/1
2071-21
001/0
0/01/0
1/01/0
1/01/0
1/00/0
0/00/0
1/01/1
0/01/1
0/01/0
1/10/0
0/00/0
1/01/0
1/11/0
1/00/0
1/01/0
Trem
bling
as
pen
1971-20
001/1
1/11/1
1/11/1
1/11/1
1/11/0
1/11/0
1/11/1
1/11/0
1/01/1
1/11/1
1/01/1
1/11/1
1/11/1
1/11/1
1/11/1
2011-20
401/1
1/01/1
1/11/1
1/11/1
1/11/0
1/01/0
1/11/1
1/01/1
1/01/1
1/11/0
1/01/1
1/11/1
1/11/1
1/11/0
1/11/1
2041-20
701/0
1/01/0
1/11/1
1/11/1
1/11/0
1/01/0
1/11/1
1/01/1
1/01/1
1/11/0
1/01/0
1/11/1
1/11/1
1/01/0
1/01/1
2071-21
001/0
1/01/0
1/01/0
1/01/0
1/00/0
1/00/0
1/01/1
1/01/1
0/01/1
1/11/0
0/01/0
1/01/0
1/11/0
1/01/0
1/01/0
App
endi
x 4.
Cu
rrent
and
futu
re p
rese
nce/
abse
nce
(1/0
) of s
uita
ble
clim
ate
for 1
2 tre
e sp
ecie
s in
29
natu
ral h
erita
ge a
reas
in O
ntar
io fo
r fou
r tim
e pe
riods
. Fut
ure
clim
ate
proj
ectio
ns a
re b
ased
on
the
CGCM
2 un
der t
he A
2 em
issio
ns s
cena
rio; r
esul
ts fo
r bot
h th
e fu
ll and
cor
e cli
mat
ic ra
nges
for e
ach
spec
ies
are
show
n (i.
e., f
ull r
ange
/cor
e ra
nge)
.
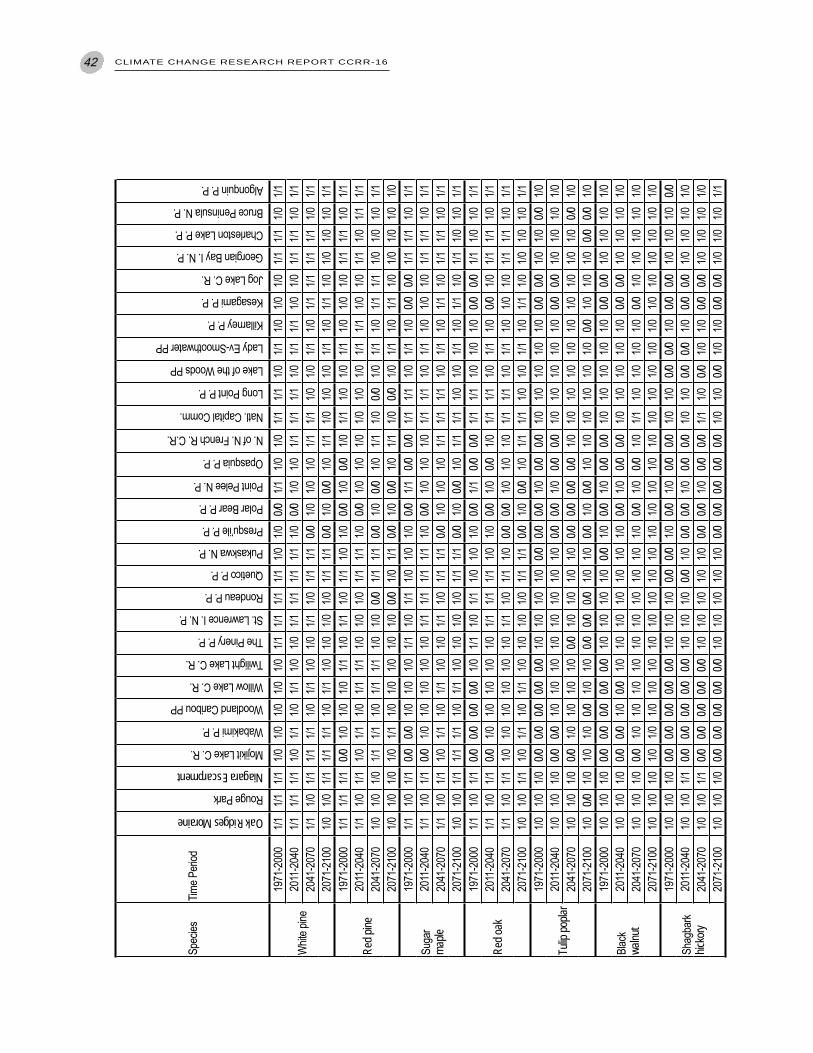
42 CLIMATE CHANGE RESEARCH REPORT CCRR-16
Species
TimeP
eriod
Oak Ridges Moraine
RougePark
Niagara Escarpment
MojikitLakeC.R.
WabakimiP.P.
WoodlandCaribouPP
WillowLakeC.R.
TwilightLakeC.R.
ThePineryP.P.
St.LawrenceI.N.P.
RondeauP.P.
QueticoP.P.
PukaskwaN.P.
Presqu’ileP.P.
PolarBearP.P.
PointPeleeN.P.
OpasquiaP.P.
N.ofN.FrenchR.C.R.
Natl.CapitalComm.
LongPointP.P.
LakeoftheWoodsPP
LadyEv-SmoothwaterPP
KillarneyP.P.
KesagamiP.P.
JogLakeC.R.
GeorgianBayI.N.P.
CharlestonLakeP.P.
BrucePeninsulaN.P.
AlgonquinP.P.
Whitep
ine
1971-20
001/1
1/11/1
1/01/0
1/01/0
1/01/1
1/11/1
1/11/0
1/00/0
1/11/0
1/01/1
1/11/0
1/11/0
1/01/0
1/11/1
1/01/1
2011-20
401/1
1/11/1
1/01/1
1/01/1
1/01/0
1/11/1
1/11/1
1/00/0
1/01/0
1/11/1
1/11/0
1/11/1
1/01/0
1/11/1
1/01/1
2041-20
701/1
1/01/1
1/11/1
1/01/1
1/01/0
1/11/0
1/11/1
0/01/0
1/01/0
1/11/1
1/01/0
1/11/0
1/11/1
1/11/1
1/01/1
2071-21
001/0
1/01/1
1/11/1
1/01/1
1/01/0
1/01/0
1/11/1
0/01/0
0/01/0
1/11/0
1/01/0
1/11/0
1/11/0
1/01/0
1/01/1
Red p
ine
1971-20
001/1
1/11/1
0/01/0
1/01/0
1/11/0
1/11/0
1/11/0
1/00/0
1/00/0
1/01/1
1/01/0
1/11/0
1/01/0
1/11/1
1/01/1
2011-20
401/1
1/01/1
1/01/1
1/01/1
1/11/0
1/01/0
1/11/1
1/00/0
1/01/0
1/01/0
1/01/0
1/11/1
1/01/0
1/11/0
1/11/1
2041-20
701/0
1/01/0
1/11/1
1/01/1
1/11/0
1/00/0
1/11/1
0/01/0
0/01/0
1/11/0
0/01/0
1/11/0
1/11/1
1/01/0
1/01/1
2071-21
001/0
1/01/0
1/01/1
1/01/0
1/01/0
1/00/0
1/01/1
0/01/0
0/01/0
1/11/0
0/01/0
1/11/0
1/11/0
1/01/0
1/01/0
Sugar
maple
1971-20
001/1
1/01/1
0/00/0
1/01/0
1/01/1
1/01/1
1/01/0
1/00/0
1/10/0
0/01/1
1/11/0
1/11/0
0/00/0
1/11/1
1/01/1
2011-20
401/1
1/01/1
0/01/0
1/01/0
1/01/0
1/11/1
1/11/1
1/00/0
1/01/0
1/01/1
1/11/0
1/11/0
1/01/0
1/11/1
1/01/1
2041-20
701/1
1/01/1
1/01/1
1/01/1
1/01/0
1/11/0
1/11/1
0/01/0
1/01/0
1/11/1
1/11/0
1/11/0
1/11/0
1/11/1
1/01/1
2071-21
001/0
1/01/1
1/11/1
1/01/1
1/01/0
1/01/0
1/11/1
0/01/0
0/01/0
1/11/1
1/01/0
1/11/0
1/11/0
1/11/0
1/01/1
Red o
ak
1971-20
001/1
1/01/1
0/00/0
0/00/0
1/01/1
1/01/1
1/01/0
1/00/0
1/10/0
0/01/1
1/11/0
1/01/0
0/00/0
1/11/0
1/01/1
2011-20
401/1
1/01/1
0/01/0
1/01/0
1/01/0
1/11/1
1/11/0
1/00/0
1/00/0
1/01/1
1/11/0
1/11/0
0/01/0
1/11/1
1/01/1
2041-20
701/1
1/01/1
1/01/0
1/01/0
1/01/0
1/11/0
1/11/0
0/00/0
1/01/0
1/01/1
1/11/0
1/11/0
1/01/0
1/11/1
1/01/1
2071-21
001/0
1/01/1
1/01/1
1/01/1
1/01/0
1/01/0
1/11/1
0/01/0
0/01/0
1/11/1
1/01/0
1/11/0
1/11/0
1/01/0
1/01/1
Tulip
popla
r
1971-20
001/0
1/01/0
0/00/0
0/00/0
0/01/0
1/01/0
1/00/0
0/00/0
1/00/0
0/01/0
1/01/0
1/01/0
0/00/0
1/01/0
0/01/0
2011-20
401/0
1/01/0
0/00/0
1/01/0
1/01/0
1/01/0
1/01/0
0/00/0
1/00/0
0/01/0
1/01/0
1/01/0
0/00/0
1/01/0
1/01/0
2041-20
701/0
1/01/0
0/01/0
1/01/0
1/00/0
1/01/0
1/01/0
0/00/0
0/00/0
1/01/0
1/01/0
1/01/0
1/01/0
1/01/0
0/01/0
2071-21
001/0
0/01/0
1/01/0
0/01/0
1/00/0
0/00/0
1/01/0
0/01/0
0/01/0
1/01/0
1/01/0
1/00/0
1/01/0
1/00/0
0/01/0
Black
walnu
t
1971-20
001/0
1/01/0
0/00/0
0/00/0
0/01/0
1/01/0
1/00/0
1/00/0
1/00/0
0/01/0
1/01/0
1/01/0
0/00/0
1/01/0
1/01/0
2011-20
401/0
1/01/0
0/00/0
1/00/0
1/01/0
1/01/0
1/01/0
1/00/0
1/00/0
0/01/0
1/01/0
1/01/0
0/00/0
1/01/0
1/01/0
2041-20
701/0
1/01/0
0/01/0
1/01/0
1/01/0
1/01/0
1/01/0
1/00/0
1/00/0
1/01/1
1/01/0
1/01/0
0/01/0
1/01/0
1/01/0
2071-21
001/0
1/01/0
1/01/0
1/01/0
1/01/0
1/01/0
1/01/0
1/01/0
1/01/0
1/01/0
1/01/0
1/01/0
1/01/0
1/01/0
1/01/0
Shagbark
hicko
ry
1971-20
001/0
1/01/0
0/00/0
0/00/0
0/01/0
1/01/0
0/00/0
1/00/0
1/00/0
0/01/0
1/00/0
0/01/0
0/00/0
1/01/0
1/00/0
2011-20
401/0
1/01/1
0/00/0
0/00/0
0/01/0
1/01/0
0/01/0
0/00/0
1/00/0
0/01/0
1/00/0
0/01/0
0/00/0
1/01/0
1/01/0
2041-20
701/0
1/01/1
0/00/0
0/00/0
0/01/0
1/01/0
1/01/0
0/00/0
1/00/0
0/01/1
1/00/0
1/01/0
0/00/0
1/01/0
1/01/0
2071-21
001/0
1/01/0
0/00/0
0/00/0
0/01/0
1/01/0
1/01/0
0/00/0
0/00/0
0/01/0
1/00/0
1/01/0
0/00/0
1/01/0
1/01/1
Climate Change Research Reports
CCRR-01 Wotton, M., K. Logan and R. McAlpine. 2005. Climate Change and the Future Fire Environment in Ontario: Fire Occurrence and Fire Management Impacts in Ontario Under a Changing Climate. Ontario Ministry of Natural Resources, Applied Research and Development Branch, Sault Ste. Marie, ON. Climate Change Research Report CCRR-01. 23 p.
CCRR-02 Boivin, J., J.-N. Candau, J. Chen, S. Colombo and M. Ter-Mikaelian. 2005. The Ontario Ministry of Natural Resources Large-Scale Forest Carbon Project: A Summary. Ontario Ministry of Natural Resources, Applied Research and Development Branch, Sault Ste. Marie, ON. Climate Change Research Report CCRR-02. 11 p.
CCRR-03 Colombo, S.J., W.C. Parker, N. Luckai, Q. Dang and T. Cai. 2005. The Effects of Forest Management on Carbon Storage in Ontario’s Forests. Ontario Ministry of Natural Resources, Applied Research and Development Branch, Sault Ste. Marie, ON. Climate Change Research Report CCRR-03. 113 p.
CCRR-04 Hunt, L.M. and J. Moore. 2006. The Potential Impacts of Climate Change on Recreational Fishing in Northern Ontario. Ontario Ministry of Natural Resources, Applied Research and Development Branch, Sault Ste. Marie, ON. Climate Change Research Report CCRR-04. 32 p.
CCRR-05 Colombo, S.J., D.W. McKenney, K.M. Lawrence and P.A. Gray. 2007. Climate Change Projections for Ontario: Practical Information for Policymakers and Planners. Ontario Ministry of Natural Resources, Applied Research and Development Branch, Sault Ste. Marie, ON. Climate Change Research Report CCRR-05. 37 p.
CCRR-06 Lemieux, C.J., D.J. Scott, P.A. Gray and R.G. Davis. 2007. Climate Change and Ontario’s Provincial Parks: Towards an Adaptation Strategy. Ontario Ministry of Natural Resources, Applied Research and Development Branch, Sault Ste. Marie, ON. Climate Change Research Report CCRR-06. 82 p.
CCRR-07 Carter, T., W. Gunter, M. Lazorek and R. Craig. 2007. Geological Sequestration of Carbon Dioxide: A Technology Review and Analysis of Opportunities in Ontario. Ontario Ministry of Natural Resources, Applied Research and Development Branch, Sault Ste. Marie, ON. Climate Change Research Report CCRR-07. 24 p.
CCRR-08 Browne, S.A. and L.M Hunt. 2007. Climate Change and Nature-based Tourism, Outdoor Recreation, and Forestry in Ontario: Potential Effects and Adaptation Strategies. Ontario Ministry of Natural Resources, Applied Research and Development Branch, Sault Ste. Marie, ON. Climate Change Research Report CCRR-08. 50 p.
CCRR-09 Varrin, R. J. Bowman and P.A. Gray. 2007. The Known and Potential Effects of Climate Change on Biodiversity in Ontario’s Terrestrial Ecosystems: Case Studies and Recommendations for Adaptation. Ontario Ministry of Natural Resources, Applied Research and Development Branch, Sault Ste. Marie, ON. Climate Change Research Report CCRR-09. 34 p + append.
CCRR-10 Dixon, R.L., J. Gleeson and K. Curren. (In prep.) Climate Change and Renewable Energy in Ontario: Mitigation and Adaptation. Ontario Ministry of Natural Resources, Applied Research and Development Branch, Sault Ste. Marie, ON. Climate Change Research Report CCRR-10.
CCRR-11 Dove, D., I. Cameron and L. Demal. 2008. (In prep.) Climate Change and Ontario’s Water Resources: A Discussion of Potential Impacts and Water Resource Management Considerations. Ontario Ministry of Natural Resources, Applied Research and Development Branch, Sault Ste. Marie, ON. Climate Change Research Report CCRR-11.
CCRR-12 Colombo, S.J. 2008. Ontario’s Forests and Forestry in a Changing Climate. Ontario Ministry of Natural Resources, Applied Research and Development Branch, Sault Ste. Marie, ON. Climate Change Research Report CCRR-12. 21 p.
CCRR-13 Candau, J.-N. and R. Fleming. 2008. Forecasting the Response to Climate Change of the Major Natural Biotic Disturbance Regime in Ontario’s Forests: The Spruce Budworm. Ontario Ministry of Natural Resources, Applied Research and Development Branch, Sault Ste. Marie, ON. Climate Change Research Report CCRR-13. 14 p.
CCRR-14 Minns, C.K., B.J. Shuter and J.L. McDermid. 2009. Regional Projects of Climate Change Effects on Ontario Lake Trout (Salvelinus namaycush) Populations. Ontario Ministry of Natural Resources, Applied Research and Development Branch, Sault Ste. Marie, ON. Climate Change Research Report CCRR-14. 11 p.
CCRR-15 Subedi, N., M. Sharma, and J. Parton. 2009. An Evaluation of Site Index Models for Young Black Spruce and Jack Pine Plantations in a Changing Climate. Ontario Ministry of Natural Resources, Applied Research and Development Branch, Sault Ste. Marie, ON. Climate Change Research Report CCRR-15. 16 p.


52623(0.3k P.R., 10 03 31)ISBN 978-1-4435-2276-2 (print)ISBN 978-1-4435-2277-9 (pdf)