Embed Size (px)
Citation preview

Brain (2000), 123, 340–352
Cortical dysfunction in non-demented Parkinson’sdisease patientsA combined 31P-MRS and 18FDG-PET study
M. T. M. Hu,2,5 S. D. Taylor-Robinson,1,3 K. Ray Chaudhuri,5 J. D. Bell,1 C. Labbe,2 V. J.Cunningham,2 M. J. Koepp,2,6 A. Hammers,2 R. G. Morris,4 N. Turjanski2,4 and D. J. Brooks2,4,6
1Robert Steiner MR Unit, 2Medical Research Council Correspondence to: Dr Michele Hu, Medical ResearchCyclotron Unit, 3Division of Medicine and 4Division of Council Cyclotron Unit, Imperial College School ofNeuroscience, Imperial College School of Medicine, Medicine, Hammersmith Hospital, Du Cane Rd,Hammersmith Hospital, 5Department of Neurosciences, London W12 ONN, UKGuys, King’s, St Thomas’s Hospital Medical School andInstitute of Psychiatry and 6Institute of Neurology,London, UK
SummaryRegional cerebral phosphorus-31 magnetic resonancespectroscopy (31P-MRS) was performed in 10 non-demented Parkinson’s disease patients and nine age-matched control subjects. Five of the patients undergoing31P-MRS and four additional Parkinson’s disease patientshad cerebral 2-[18F]fluoro-2-deoxy-D-glucose PET (18FDG-PET), the results of which were compared with thoseof eight age-matched control subjects. All Parkinson’sdisease patients underwent neuropsychological testingincluding performance and verbal subtests of the WechslerAdult Intelligence Scale—Revised, Boston Naming Test,Controlled Oral Word Association test (FAS Test) andCalifornia Learning Test to exclude clinical dementia. 31PMR spectra from right and left temporo-parietal cortex,occipital cortex and a central voxel incorporating basalganglia and brainstem were obtained. 31P MR peakarea ratios of signals from phosphomonoesters (PMEs),inorganic phosphate (Pi), phosphodiesters (PDEs), α-ATP,γ-ATP and phosphocreatine (PCr) relative to β-ATP weremeasured. Relative percentage peak areas of PMEs, Pi,PDEs, PCr, and α-, β- and γ-ATP signals were alsomeasured with respect to the total 31P-MRS signal. Signi-ficant bilateral increases in the Pi/β-ATP ratio were foundin temporoparietal cortex (P � 0.002 right and P � 0.014
Keywords: Parkinson’s disease; magnetic resonance spectroscopy; PET; glucose; dementia
Abbreviations: ADP � adenosine diphosphate; ATP � adenosine triphosphate; Cho � choline; CSI � chemical shiftimaging; CVLT � California Verbal Learning Test; DLB � dementia with Lewy bodies; 18FDG-PET � cerebral 2-[18F]fluoro-2-deoxy-D-glucose PET; 1H-MRS � proton magnetic resonance spectroscopy; H&Y � Hoehn and Yahr; MNI � MontrealNeurological Institute; 31P-MRS � phosphorus-31 magnetic resonance spectroscopy; MSA � multiple system atrophy;NAA � N-acetylaspartate; PCr � phosphocreatine; NART � National Adult Reading Test; Pi � inorganic phosphate;PDE � phosphodiesters; PME � phosphomonoesters; PVC � partial volume effect correction; rCMRGlc � regional cerebral
© Oxford University Press 2000
left cortex) for the non-demented Parkinson’s diseasepatients compared with controls. In the right temporopari-etal cortex, there was also a significant increase in themean relative percentage Pi (P � 0.001). 18FDG-PETrevealed absolute bilateral reductions in glucose metabol-ism after partial volume effect correction in posteriorparietal and temporal cortical grey matter (P < 0.01 andP < 0.05, respectively) for the Parkinson’s disease group,using both volume of interest analysis and statisticalparametric mapping. There were significant correlationsbetween right temporoparietal Pi/β-ATP ratios and estim-ated reductions in performance IQ (r � 0.96, P � 0.001).Left temporoparietal Pi/β-ATP ratios correlated with fullscale IQ and verbal IQ (r � �0.82, P � 0.006, r � �0.86,P � 0.003, respectively). In summary, temporoparietalcortical hypometabolism was seen in non-demented Par-kinson’s disease patients with both 31P-MRS and 18FDG-PET, suggesting that both glycolytic and oxidative path-ways are impaired. This dysfunction may reflect eitherthe presence of primary cortical pathology or deaffer-entation of striato-cortical projections. 31P-MRS and18FDG-PET may both provide useful predictors of futurecognitive impairment in a subset of Parkinson’s diseasepatients who go on to develop dementia.

Cortical dysfunction in Parkinson’s disease 341
metabolic rate for glucose; SPM � statistical parametric mapping; VOI � volume of interest; WAIS-R � Wechsler AdultIntelligence Scale—Revised
IntroductionThe prevalence of clinical dementia is significantly higher inParkinson’s disease than in the general population—estimatesrange from 10 to 40%—and the incidence increases with age(Brown and Marsden, 1984; Mayeux et al., 1992; Tisonet al., 1995). Pathological processes responsible for cognitiveimpairment in Parkinson’s disease patients are multifacetedand may include striatal and extrastriatal dopamine deficiency,loss of ascending noradrenergic, cholinergic and serotonergicprojections to cortex, disruption of corticostriatal connectionsand the presence of co-existent Alzheimer’s pathology,vascular infarcts or cortical Lewy bodies (Lees and Smith,1983; Brown et al., 1984; Cooper et al., 1991). However,specific cognitive deficits are recognized in clinically non-demented Parkinson’s disease patients even early in thecourse of the disease; impairment of visuospatial capacity,attentional control, planning, short-term memory andimmediate recall have all been reported (Lees and Smith,1983; Brown et al., 1984; Cooper et al., 1991; Sagar, 1996).Many of these deficits are thought to arise from frontal lobedysfunction, but the neurochemical and neuropathologicalsubstrates remain unclear. Not all patients with Parkinson’sdisease and cognitive impairment go on to develop frankdementia. Risk factors for dementia at diagnosis may includebeing elderly, rapidly progressive motor disability, poor verbalfluency and poor ability on visuospatial subtests of theWechsler Adult Intelligence Scale (WAIS) (Sagar, 1996;Mahieux et al., 1998). The challenge is to identify early riskfactors for the development of cortical pathology so thatneuroprotection can be developed and targeted at appro-priate patients.
Phosphorus-31 magnetic resonance spectroscopy (31P-MRS) is a non-invasive technique that allows cerebralmetabolism to be studied in vivo providing information onlevels of cerebral phospholipids and high energy phosphatessuch as phosphocreatine (PCr) and adenosine triphosphate(ATP) (Coutts et al., 1989). This technique has been used tostudy Alzheimer’s dementia (Pettegrew et al., 1988; Brownet al., 1989), but not Parkinson’s disease with dementia.Cerebral 2-[18F]fluoro-2-deoxy-D-glucose PET (18FDG-PET)has demonstrated reduced glucose metabolism in frontal andtemporoparietal association areas in Alzheimer’s dementia(Goto et al., 1993; Vander Borght et al., 1997), Parkinson’sdisease with dementia (Peppard et al., 1992; Goto et al.,1993; Vander Borght et al., 1997) and dementia with Lewybodies (DLB) (Minoshima et al., 1997). To our knowledge,31P-MRS and PET techniques have not, as yet, been combinedto study resting cortical function in Parkinson’s diseasepatients in the absence of overt clinical dementia. Usingproton magnetic resonance spectrocopy (1H-MRS), wereported previously temporoparietal cortical reductions inN-acetylaspartate/creatine (NAA/Cr) ratios in 17 non-
demented Parkinson’s disease patients which correlated withestimated cognitive decline (Hu et al., 1999). Following onfrom these findings, we have combined 31P-MRS and 18FDG-PET techniques with neuropsychological testing to investigatecortical function in a subgroup of the original 1H-MRS cohortof non-demented Parkinson’s disease patients.
MethodsPatients and control subjectsTen Parkinson’s disease patients (mean age 62.2 � 7.0years) and nine age-matched healthy volunteers (mean age56.8 � 7.7 years) participated in the 31P-MRS study. Informedconsent was obtained from each subject according to thedeclaration of Helsinki (1991) and the study was approvedby the ethics committee of Imperial College School ofMedicine/Hammersmith, Queen Charlotte’s and Chelsea andActon hospitals. All patients fulfilled the United KingdomParkinson’s Disease Society Brain Bank criteria for clinicaldiagnosis of idiopathic Parkinson’s disease (Hughes et al.,1992). The patients were rated Hoehn and Yahr (H&Y) stageI–IV in the ‘off’ state following overnight withdrawal ofmedication (mean 2.45 � 1.0), and had a mean clinicaldisease duration of 5.9 � 3.8 years (range 2.2–15.0 years).All patients were receiving levodopa medication and fourwere taking additional dopamine agonist therapy includingapomorphine, pergolide and cabergoline. Of the 10 patientswho had 31P-MRS, seven also had 18FDG-PET within 3months. Unfortunately, arterial blood sampling was notpossible in two of the seven patients undergoing 18FDG-PET, hence these two patients were excluded from thefinal analysis. A further four Parkinson’s disease patientswho had not had 31P-MRS, matched for age, diseaseduration and severity to the above group, also underwent18FDG-PET. Findings in these nine Parkinson’s diseasepatients (mean age 64.4 � 8.3 years, mean clinical diseaseduration 7.4 � 5.3 years, mean H&Y 2.8 � 1.0) werecompared with those of eight separate healthy age-matchedcontrols (mean age 61.0 � 5.5 years). On the same day asMRS or PET, all Parkinson’s disease patients underwentneuropsychological testing (in the ‘on’ state while receivinganti-parkinsonian medication). All patients also completed aGeriatric Depression Score (Yesavage et al., 1983) and a BeckDepression Inventory (Beck, 1978). Patients experiencingsymptoms suggestive of DLB, such as visual hallucinations,paranoid delusions or fluctuating confusion (McKeith et al.,1996), were excluded from the study.
MRINine of the ten Parkinson’s disease patients underwent a T1-weighted volumetric MRI [TR (retention time) 21 ms, TE
342 M. T. M. Hu et al.
(echo time) 6 ms, 128 contiguous 1.3 mm thick sagittalimages] using a 1.0 T Picker HPQ scanner on the same dayas MRS, and this was inspected visually for evidence ofcortical and subcortical atrophy and used to correct the18FDG-PET volume of interest (VOI) analysis for partialvolume effects. For both MRI and MRS examinations,patients were scanned in the ‘off’ phase following overnightwithdrawal of medication. This avoided movement artefactsarising from dyskinesias. Two Parkinson’s disease patientswere severely disabled and required apomorphine injectionsbefore PET but were clinically ‘off’ at the time of the scan.
31P-MRS31P-MRS of the brain was performed at the MagneticResonance unit of the Hammersmith Hospital using a Pickerprototype spectroscopy system, based on a whole-bodymagnet (Oxford Magnet Technology, Oxford, UK), operatingat 1.5 T. A 1H/31P enveloping birdcage coil was used, whichcomfortably encompassed the entire head. The proton signalwas used for shimming and to acquire T1-weighted axialimages in order to position a 4 cm transverse slice at thelevel of the basal ganglia (Taylor-Robinson et al., 1999). Thethree-dimensional chemical shift imaging (3D CSI)technique (TR 5000 ms) was used to obtain spectra frommultiple contiguous voxels covering all the brain in theselected slice. CSI resolution was 40 � 40 � 40 mm, givinga voxel size of 64 cm3. Total examination time was ~60 min.Four VOIs covering right and left temporoparietal (predomi-nantly temporal) cortex, occipital cortex and a central voxelincluding the basal ganglia (predominantly thalamus andglobus pallidus) and brainstem (including substantia nigra)were analysed in each patient (see Fig.1). In the Parkinson’sdisease patients, it was not possible to sample right temporo-parietal cortex in two patients, and left temporoparietal cortexin one patient due to voxel contamination by skull and scalptissue. The more posterior temporoparietal VOIs were notanalysed, as these frequently were contaminated by signalfrom skull and scalp tissue. It was also not possible to samplefrontal lobe spectra consistently in this study owing toinhomogeneity arising from frontal eye fields and sinuses.
The 31P MR spectra were convolved with a cosine filterin all three spatial directions, a 30 ms exponential filter andwere phased manually. The baseline roll was removed using aknowledge-based algorithm (Saeed, 1995). A manual baselinecorrection was used, where necessary, and peak areas ofphosphomonoester (PME), inorganic phosphate (Pi),phosphodiester (PDE), α-ATP, γ-ATP, β-ATP and PCr signalswere measured using the NMR1® spectral processingprogram. Intracellular pH was calculated from the chemicalshift of Pi relative to PCr in each voxel (Coutts et al., 1989).The data were fitted to inverse polynomial functions, sinceoverlapping resonances in the 31P MR spectrum precludedthe use of bell-shaped functions such as Lorenzian or Gaussiancurve fitting. Inverse polynomial functions gave the best fitin terms of both curve fitting and reproducible results. The
peak area of each 31P MR resonance was expressed as apercentage of the total 31P MR signal area, and as a ratio ofthe β-ATP signal area (Taylor-Robinson et al., 1999). Allresults were rechecked by a blinded observer (S.D.T-R.).
18FDG-PETAll patients and volunteers fasted overnight prior to 18FDG-PET. All anti-parkinsonian medications were discontinued12 h prior to the PET scan, with the exception of onepatient who was severely disabled and required apomorphineinjections, but was clinically ‘off’ at the time of the scan.18FDG-PET was performed in 3D mode with the septaretracted using a Siemens 953b/CTI PET camera (CTI,Knoxville, Tenn., USA). The performance characteristicshave been described previously (Spinks et al., 1992) andthe axial resolution is 5 mm (Bailey, 1992). Studies wereperformed with the subject’s eyes open in a dimly litroom with minimal auditory stimulation. Controls received5.01 � 0.41 mCi (185.4 � 15.2 MBq) and subjects5.20 � 0.13 mCi (192.4 � 4.8 MBq) of FDG by intravenousinjection. The time course of plasma 18F radioactivity wasdetermined by continuous on-line sampling of radial arterialblood (Ranicar et al., 1991). A dynamic 3D series, consistingof 21 frames over 60 min, was acquired over the wholebrain volume. Voxel-by-voxel parametric images of regionalcerebral metabolic rate for glucose (rCMRGlc) were producedfrom brain uptake and plasma input functions using spectralanalysis (Cunningham and Jones, 1993).
18FDG-PET images were analysed using both VOI andstatistical parametric mapping (SPM; Wellcome Departmentof Cognitive Neurology, London, UK) approaches. We usedAnalyze© version 7.0 and Matlab (Mathworks Inc., Sherborn,Mass., USA) to perform image manipulation and measure-ments. An anatomical template that divided the entire braininto 42 cortical and subcortical VOIs was defined on theMontreal Neurological Institute (MNI) brain template(SPM96). This VOI template was then transformed and co-aligned to the individual patient’s MRI. The basal ganglia(caudate, lentiform and thalamic nuclei) and motor, orbitof-rontal and dorsolateral prefrontal cortex were defined indi-vidually on the patient’s MRI brain, and superimposed ontothe individualized VOI template. The high resolution volumeacquisition MRI scans were then segmented automaticallyinto probability images of grey matter, white matter and CSFusing a clustering, maximum likelihood ‘Mixture Model’algorithm (Hartigan, 1975). After co-registering theprobability images and VOIs to the parametric rCMRGlcimages (Woods et al., 1993), estimation of partial volumeeffects causing overspill of radioactivity into VOIs fromsurrounding tissue due to the lower resolution of PET wascalculated as described and validated autoradiographicallyelsewhere (Koepp et al., 1997, 1998; Labbe et al., 1998).We report only the estimated grey matter activity contribu-tions to the neocortical VOIs. At all stages, the templatenormalization and image co-registration were checked visu-

Cortical dysfunction in Parkinson’s disease 343
ally for anatomical accuracy using Analyze. SPM96 software(Friston et al., 1991) was used to transform and co-align18FDG-PET add images to an 18FDG-PET add image templatealready in MNI space. These normalization parameters werethen applied to computed rCMRGlc images, and smoothingof 10 � 10 � 10 mm was applied. Statistical analysis wasperformed on the normalized, smoothed rCMRGlc imagesusing a single subject with replication of conditionstechnique, with a height threshold of P � 0.01 uncorrectedand a P � 0.05 extent threshold.
Statistical analysisComparisons between Parkinson’s disease patient and controlgroups were made using Student’s sample t-test statistics.Correlations between 31P-MRS metabolite ratios andrCMRGlc values, and between 31P-MRS metabolite ratios/rCMRGlc values and neuropsychological testing were inter-rogated with the Pearson rank statistic. Because of the numberof comparisons made, a P-value �0.01 was consideredsignificant, while a P-value between 0.05 and 0.01 wasreported as a trend.
Results31P MR spectroscopyThe cerebral 31P MR spectrum from a healthy volunteercontains at least seven resonances which can be attributed to
Fig. 1 Basal ganglia slice through a Parkinson’s disease patient brain with a 31P 3D CSI grid appliedshowing volume of interest location. Volumes of interest are right temporoparietal cortex (A),central voxel incorporating thalamus and brainstem (B), left temporoparietal cortex (C) and occipitalcortex (D).
PMEs, Pi, PDEs, PCr, γ-ATP, α-ATP and β-ATP (Bottomleyet al., 1984). The PME and PDE peaks are multi-component;the α-ATP peak contains contributions from α-ADP andNADH and the γ-ATP peak contains contributions from β-ADP (Iles et al., 1985). Representative spectra from thetemporoparietal cortex of a Parkinson’s disease patient anda healthy volunteer are shown in Fig. 2.
In voxels localized to temporoparietal cortex, there weresignificant bilateral increases in the mean Pi/β-ATP ratioof the Parkinson’s disease patients compared with healthyvolunteers (P � 0.002 right, P � 0.014 left cortex). In righttemporoparietal cortex, three Parkinson’s disease patients hadvalues that fell �2.5 SD above the normal mean, in lefttemporoparietal cortex two Parkinson’s disease patients hadvalues that fell 2.5 SD, and four �2 SD above the mean(Fig. 3). There was also a significant increase in the meanrelative percentage of Pi signal in right temporoparietal cortex(P � 0.001), with a non-significant trend towards an increasein the left temporoparietal cortex (P � 0.079) (Table 1). Inright temporoparietal cortex, one patient had a relativepercentage Pi that fell 2.5 SD above the normal mean, andfive patients had values that fell 2 SD above the normalmean. In left temporoparietal cortex, one patient had a relativepercentage Pi that was 2 SD above the normal mean (Fig.4). No other significant differences, including pH values, wereobserved in the remaining cortical voxels of the Parkinson’sdisease cohort.
In the central voxel incorporating thalamus, globus pallidus

344 M. T. M. Hu et al.
Fig. 2 Representative 31P MR spectra from temporoparietal cortexof (A) a normal volunteer and (B) a Parkinson’s disease patient.
Fig. 3 Scatter plot of Pi/β-ATP ratios in temporoparietal cortex of normal volunteers (diamonds) andParkinson’s disease (PD) patients (squares).
and brainstem (including substantia nigra), we found signi-ficant decreases in the mean relative percentage of β-ATP(P � 0.01), with associated increases in mean PME/β-ATP,PDE/β-ATP, PCr/β-ATP ratios (P � 0.05) and Pi/β-ATPratios (P � 0.002) (Table 1). There were no significantcorrelations between central voxel 31P signals and age, diseaseduration or ‘off ‘motor UPDRS scores. No other significantdifferences in 31P resonances, ratios or pH were observedwith this central voxel.
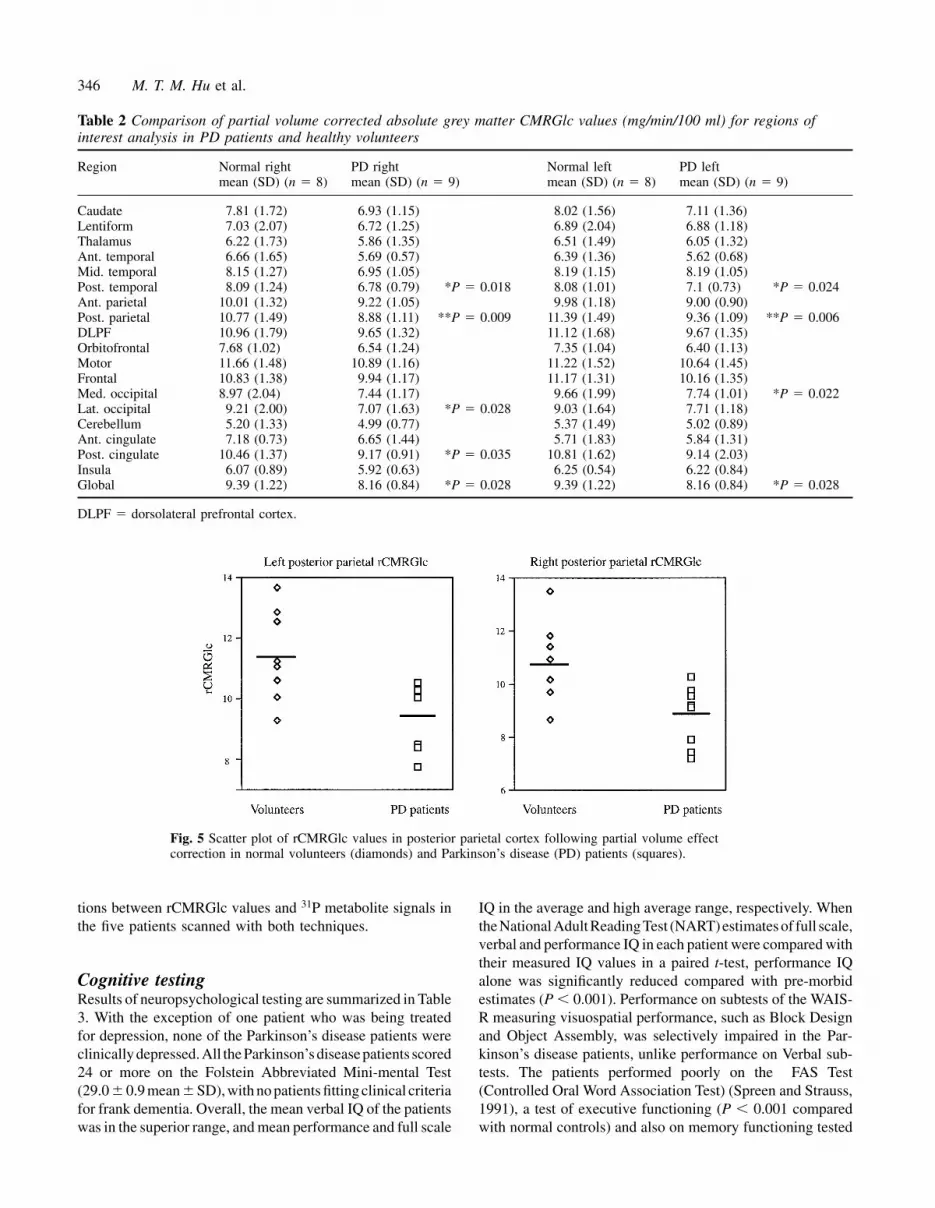
18FDG-PETResults of 18FDG-PET are summarized in Table 2. Significantbilateral rCMRGlc reductions were found after partial volumeeffect correction (PVC) in the mean posterior temporal andposterior parietal grey matter (P � 0.05 and P � 0.01,respectively) of Parkinson’s disease patients compared withcontrols. Three out of nine Parkinson’s disease patients hadeither right or left posterior parietal rCMRGlc values (in twopatients these reductions were bilateral) that fell �2 SDbelow the normal mean after PVC (Fig. 5). One patient alsohad left posterior temporal rCMRGlc values that fell �2 SDbelow the normal mean after PVC (Fig. 6). None of thepatients had rCMRGlc values that fell 2.5 SD below thenormal mean following PVC. The mean combined temporaland parietal lobe grey matter rCMRGlc of the Parkinson’sdisease group was also bilaterally significantly reduced whencompared with normal volunteers (P � 0.02 right and lefttemporoparietal cortex). Other areas with reduced rCMRGlcwere right lateral and left medial occipital lobe grey matter(P � 0.05), and mean right posterior cingulate PVC greymatter rCMRGlc (P � 0.05), while left posterior cingulategrey matter showed a non-significant trend towards reduction(P � 0.08). There were no significant differences in basal

Cortical dysfunction in Parkinson’s disease 345
Table 1 Comparison of temporoparietal and central voxel metabolite ratios and percentageof total 31P signal in the patient and control populations
Metabolite ratio Region Parkinson’s population Control populationmean (SD) (n � 10) mean (SD) (n � 9)
PME/β-ATP Right T-P 0.95 (0.23) 0.79 (0.34)Left T-P 0.87 (0.34) 0.80 (0.34)
PDE/β-ATP Right T-P 4.71 (0.82) 4.46 (1.12)Left T-P 5.27 (1.11) 4.49 (1.60)
Pi/β-ATP Right T-P 1.07 (0.24) 0.66 (0.22) **P � 0.002Left T-P 0.96 (0.27) 0.62 (0.24) *P � 0.014
PCr/β-ATP Right T-P 1.63 (0.45) 1.40 (0.29)Left T-P 1.82 (0.58) 1.80 (0.76)
PME/β-ATP Central voxel 1.00 (0.32) 0.67 (0.18) *P � 0.013PDE/β-ATP Central voxel 6.38 (2.42) 4.07 (1.23) *P � 0.019Pi/β-ATP Central voxel 1.00 (0.32) 0.56 (0.14) **P � 0.002PCr/β-ATP Central voxel 1.84 (0.83) 1.15 (0.29) *P �0.039
Metabolite %%PME Right T-P 7.93 (2.37) 6.88 (1.93)
Left T-P 6.43 (2.00) 5.23 (1.72)%PDE Right T-P 39.64 (4.78) 40.63 (3.32)
Left T-P 39.48 (1.45) 38.51 (4.22)%Pi Right T-P 8.73 (1.17) 5.87 (1.55) **P � 0.001
Left T-P 7.19 (1.30) 5.94 (1.51)% PCr Right T-P 13.36 (3.34) 12.16 (1.78)
Left T-P 13.46 (2.08) 14.00 (3.1)%β-ATP Right T-P 8.34 (1.09) 9.52 (2.00)
Left T-P 7.83 (1.80) 9.69 (3.81)%PME Central voxel 6.86 (1.11) 6.88 (1.64)%PDE Central voxel 43.08 (4.28) 40.56 (4.65)%Pi Central voxel 7.22 (2.63) 5.84 (1.25)%PCr Central voxel 12.45 (2.69) 11.18 (2.12)%β-ATP Central voxel 7.41 (2.10) 10.66 (2.73) **P � 0.01
T-P � temporoparietal cortex.
Fig. 4 Scatter plot of relative percentage Pi values in temporoparietal cortex of normal volunteers(diamonds) and Parkinson’s disease (PD) patients (squares).
ganglia rCMRGlc between Parkinson’s disease patients andvolunteers. Overall, the mean PVC grey matter rCMRGlcfor all the regions of interest sampled was reduced in theParkinson’s disease group compared with controls (P � 0.05).
Results of SPM are shown in Fig. 7. This also localizedsignificant bilateral reductions in rCMRGlc in the posteriortemporal and parietal cortex of Parkinson’s disease patientscompared with controls. There were no significant correla-
346 M. T. M. Hu et al.
Table 2 Comparison of partial volume corrected absolute grey matter CMRGlc values (mg/min/100 ml) for regions ofinterest analysis in PD patients and healthy volunteers
Region Normal right PD right Normal left PD leftmean (SD) (n � 8) mean (SD) (n � 9) mean (SD) (n � 8) mean (SD) (n � 9)
Caudate 7.81 (1.72) 6.93 (1.15) 8.02 (1.56) 7.11 (1.36)Lentiform 7.03 (2.07) 6.72 (1.25) 6.89 (2.04) 6.88 (1.18)Thalamus 6.22 (1.73) 5.86 (1.35) 6.51 (1.49) 6.05 (1.32)Ant. temporal 6.66 (1.65) 5.69 (0.57) 6.39 (1.36) 5.62 (0.68)Mid. temporal 8.15 (1.27) 6.95 (1.05) 8.19 (1.15) 8.19 (1.05)Post. temporal 8.09 (1.24) 6.78 (0.79) *P � 0.018 8.08 (1.01) 7.1 (0.73) *P � 0.024Ant. parietal 10.01 (1.32) 9.22 (1.05) 9.98 (1.18) 9.00 (0.90)Post. parietal 10.77 (1.49) 8.88 (1.11) **P � 0.009 11.39 (1.49) 9.36 (1.09) **P � 0.006DLPF 10.96 (1.79) 9.65 (1.32) 11.12 (1.68) 9.67 (1.35)Orbitofrontal 7.68 (1.02) 6.54 (1.24) 7.35 (1.04) 6.40 (1.13)Motor 11.66 (1.48) 10.89 (1.16) 11.22 (1.52) 10.64 (1.45)Frontal 10.83 (1.38) 9.94 (1.17) 11.17 (1.31) 10.16 (1.35)Med. occipital 8.97 (2.04) 7.44 (1.17) 9.66 (1.99) 7.74 (1.01) *P � 0.022Lat. occipital 9.21 (2.00) 7.07 (1.63) *P � 0.028 9.03 (1.64) 7.71 (1.18)Cerebellum 5.20 (1.33) 4.99 (0.77) 5.37 (1.49) 5.02 (0.89)Ant. cingulate 7.18 (0.73) 6.65 (1.44) 5.71 (1.83) 5.84 (1.31)Post. cingulate 10.46 (1.37) 9.17 (0.91) *P � 0.035 10.81 (1.62) 9.14 (2.03)Insula 6.07 (0.89) 5.92 (0.63) 6.25 (0.54) 6.22 (0.84)Global 9.39 (1.22) 8.16 (0.84) *P � 0.028 9.39 (1.22) 8.16 (0.84) *P � 0.028
DLPF � dorsolateral prefrontal cortex.
Fig. 5 Scatter plot of rCMRGlc values in posterior parietal cortex following partial volume effectcorrection in normal volunteers (diamonds) and Parkinson’s disease (PD) patients (squares).
tions between rCMRGlc values and 31P metabolite signals inthe five patients scanned with both techniques.
Cognitive testingResults of neuropsychological testing are summarized in Table3. With the exception of one patient who was being treatedfor depression, none of the Parkinson’s disease patients wereclinically depressed. All the Parkinson’s disease patients scored24 or more on the Folstein Abbreviated Mini-mental Test(29.0 � 0.9 mean � SD), with no patients fitting clinical criteriafor frank dementia. Overall, the mean verbal IQ of the patientswas in the superior range, and mean performance and full scale
IQ in the average and high average range, respectively. Whenthe NationalAdult ReadingTest (NART)estimates of full scale,verbal and performance IQ in each patient were compared withtheir measured IQ values in a paired t-test, performance IQalone was significantly reduced compared with pre-morbidestimates (P � 0.001). Performance on subtests of the WAIS-R measuring visuospatial performance, such as Block Designand Object Assembly, was selectively impaired in the Par-kinson’s disease patients, unlike performance on Verbal sub-tests. The patients performed poorly on the FAS Test(Controlled Oral Word Association Test) (Spreen and Strauss,1991), a test of executive functioning (P � 0.001 comparedwith normal controls) and also on memory functioning tested

Cortical dysfunction in Parkinson’s disease 347
Fig. 6 Scatter plot of rCMRGlc values in posterior temporal cortex following partial volume effectcorrection in normal volunteers (diamonds) and Parkinson’s disease (PD) patients (squares).
Fig. 7 Absolute reductions in glucose metabolism in Parkinson’s disease patients compared with normalvolunteers using SPM.
using the CVLT (P � 0.0025 compared with normal controls).When the reductions in verbal, performance and full scale IQwere estimated by subtracting calculated IQ values from pre-morbid scores on the NART, performance IQ was impairedmore than full scale IQ, whereas the verbal IQ actually showeda higher level compared with pre-morbid estimates, possiblydue to the NART underestimating intelligence in the moreable patients.
Cognitive testing and 31P-MRS/18FDG-PETSignificant correlations were found between Pi/β-ATP ratiosin right temporoparietal cortex and estimated reductions in
performance IQ (r � 0.96, P � 0.001) (Fig. 8). In lefttemporoparietal cortex, significant correlations were foundbetween Pi/β-ATP ratios and full scale IQ (r � –0.82, P �0.006) and verbal IQ (r � �0.86, P � 0.003), with a trendto correlations between estimated reductions in verbal IQ(r � 0.70, P � 0.04). Left temporoparietal Pi/β-ATP ratiosand individual subtests of the WAIS-R including DigitSpan (r � –0.79, P � 0.01) and Similarities (r � –0.82,P � 0.007) were also correlated, with a trend towardcorrelations between the relative percentage of Pi signal fromleft temporoparietal cortex and NART pre-morbid estimatesof verbal and full scale IQ (r � –0.68, P � 0.046 and r �–0.67, P � 0.047, respectively). No significant correlations

348 M. T. M. Hu et al.
Table 3 Neuropsychology results of the Parkinson’s diseasepatients undergoing 31P-MRS compared with age-matchedcontrol data
Neuropsychological test Parkinson’s disease Control data(n � 10)
Folstein AMT 29.0 � 0.9 29.2 � 1.3Full scale IQ 112.1 � 10.9 100 � 15Verbal IQ 121.9 � 16.4 100 � 15Performance IQ 97.2 � 9.2 100 � 15NART full scale IQ 115.7 � 9.1 100 � 15NART verbal IQ 113.6 � 8.1 100 � 15NART performance IQ 114.5 � 8.0 100 � 15Difference verbal IQ �9.2 � 12.9Difference performance IQ 17.3 � 10.1Difference full scale IQ 3.6 � 9.0WAIS-RDigit Span 10.2 � 1.75 10.0 � 3.0Vocabulary 12.2 � 2.9 10.0 � 3.0Comprehension 15.3 � 3.0 10.0 � 3.0Similarities 14.6 � 2.5 10.0 � 3.0Block Design 9.9 � 1.5 10.0 � 3.0Object Assembly 8.8 � 2.8 10.0 � 3.0Boston Naming Test 58.5 � 5.1 56.7 � 3.0FAS 29.0 � 0.9** 37.6 � 10.9CVLT 37.5 � 11.4* 47.9 � 10.0Beck Depression Inventory 9.3 � 8.7Geriatric Depression Scale 3.4 � 2.7
Results are quoted as mean � standard deviation. All WAIS-Rsubtest values are quoted as age-scaled scores. The difference inverbal, performance and full scale IQ was calculated as theNART pre-morbid estimate of IQ minus the actual IQ ascalculated from the WAIS-R. **P � 0.001, *P � 0.003significance on t-test comparison with normal controls. Controlreference ranges are quoted as means for male and female, for60–64 year age group, with education �12 years whereapplicable (Nelson, 1982; Van Gorp et al., 1986; Spreen andStrauss, 1991; Paolo et al., 1997).
Fig. 8 Correlation between right temporoparietal cortex Pi/β-ATPratio and estimated reductions in performance IQ in theParkinson’s disease group.
were found between reductions in grey matter glucose utiliza-tion and any neuropsychological test.
Volumetric MRI imagingThis showed on inspection that three out of 10 Parkinson’sdisease patients had mild global cerebral atrophy whencompared with 10 age-matched normal controls.
DiscussionThis is the first study to combine both 31P-MRS and 18FDG-PET in the study of non-demented Parkinson’s diseasepatients and to correlate regional brain metabolism withneuropsychological testing. These two techniques have beencombined previously to study Alzheimer’s dementia patients(Murphy et al., 1993), where significant glucose hypo-metabolism in the presence of normal 31P-MRS was demon-strated. No correlations with dementia severity were found.In our study, both 31P-MRS and 18FDG-PET demonstratedsignificant bilateral abnormalities of temporoparietalcortical function in non-demented Parkinson’s diseasepatients. 31P-MRS changes correlated significantly withneuropsychological measures of global cognitive decline andindividual neuropsychological tests assessing languagefunction.
31P-MRS is particularly relevant for in vivo clinical studiesas resonances of central importance in oxidative metabolismsuch as PCr, ATP and Pi are readily observed, and intracellularpH can be measured, the chemical shift of Pi being pHdependent. However, the Pi signal represents only ~40% ofthe total intracellular levels of Pi (Iles et al., 1985) becausethe Pi bound to the mitochondrial inner membrane is notmobile and thus is MR invisible. Levels of MR-measurablemetabolites such as Pi, ATP and ADP reflect oxidativephosphorylation status, and a rise in the Pi/β-ATP ratio reflectsimpairment of this bioenergetic pathway (Iles et al., 1985).
Our results suggest that several bioenergetic abnormalitiesare occurring in the temporoparietal cortex of non-demented Parkinson’s disease patients. Compared withnormal volunteers, we found significant increases in thePi/β-ATP ratio and Pi resonance, when expressed as apercentage of the total MR-detectable phosphorus signal. Nochange was observed in the PCr, PDE, PME and α-, β- andγ-ATP resonances. Under normal circumstances, PCr acts asan energy reservoir in brain tissue, being a ‘high energy’phosphate source for ATP generation (Conn et al., 1987). Inconditions such as hypoxia, the requirements for ATP cannotbe met by oxidative phosphorylation in the mitochondria(Nioka et al., 1987). PCr is therefore utilized in theseconditions and, as PCr falls, Pi increases, while reductionsin ATP are minimized because of the buffering effect ofcreatine kinase. Our finding of an elevation in both Pi/β-ATPratios and relative percentage Pi signal could reflect a shiftin Pi from mitochondria to cytoplasm (and hence an increasein MR-detectable Pi signal) brought about by impaired

Cortical dysfunction in Parkinson’s disease 349
mitochondrial oxidative phosphorylation and a resultantcompensatory change in anaerobic glycolysis in the cytoplasmin order to maintain ATP/PCr levels. As the percentage levelsof ATP and PCr were unaltered in our study, we concludethat the system must be compensated. This is in contrast toacute conditions such as ischaemic stroke where ATP andPCr levels are reduced (Levine et al., 1992). We previouslyhave studied the same group of patients with 1H-MRS anddemonstrated significant reductions in temporoparietal NAA/Cr ratios, while choline (Cho) to Cr ratios remained constant,providing circumstantial evidence that the reduced NAA/Crratio was occurring secondarily to reduced NAA synthesis(Hu et al., 1999). NAA is synthesized by the mitochondria(Bates et al., 1996) and is present almost exclusively withinneurons and their processes within adult brain (Birken andOldendorf, 1989; Vion-Dury et al., 1994). These findings,therefore, provide further evidence of impaired corticalmitochondrial function in this group of non-dementedParkinson’s disease patients.
All our patients except one were right handed. In the leftand, therefore, dominant hemisphere, significant correlationswere found between Pi/β-ATP ratios and verbal and full scaleIQ, as well as Similarities and Digit Span subtests of theWAIS-R, which are all measures of dominant temporoparietalfunction (Kolb and Whishaw, 1990). Significant correlationswere found between right temporoparietal Pi/β-ATP ratios andestimated reductions in performance IQ. The non-dominanttemporoparietal lobe is involved in tests of visuospatialfunction such as the Block Design and Object Assemblysubtests of the WAIS-R (Kolb and Whishaw, 1990), whichare reflected in the performance IQ score. This may explainthe correlations found between estimated reductions inperformance IQ and the right temporoparietal Pi/β-ATP ratio.As far as we are aware, this is the first study to correlate31P-MRS with neuropsychological testing in non-dementedParkinson’s disease patients.
In our study, 18FDG-PET demonstrated significant bilateraltemporoparietal reductions in grey matter glucose metabolismwhich failed to correlate with measures of neuropsychologicaltesting. Animal studies have shown that cerebral glucosemetabolism primarily reflects afferent synaptic activity(Sokoloff, 1977; Auker et al., 1983), hence the reductions seenmay reflect dysfunction of afferent synaptic or interneuronalconnections in the temporoparietal cortex in Parkinson’sdisease. Corticostriatal connections between the parietal andtemporal cortex, and ipsilateral striatum may have a role inthe preparation and kinematic coding of movement (see Huet al., 1999 for references). Disruption of these circuits inParkinson’s disease with reductions in cortical inputs mayaccount for some of the temporoparietal metabolicabnormalities we have observed. Previous 18FDG-PET studiesin demented Parkinson’s disease patients have shown globalreductions in frontal and temporoparietal glucose metabolismsimilar to that seen in Alzheimer’s dementia patients (Peppardet al., 1992; Goto et al., 1993; Vander Borght et al., 1997).The magnitude of the reductions in rCMRGlc reported in
demented Parkinson’s disease patients ranged from 28 to40% of normal subject values, in comparison with thesmaller reductions in temporoparietal and occipital rCMRGlc(13–23%) we found in non-demented Parkinson’s diseasepatients. With progression of disease and development ofdementia, rCMRGlc decreased particularly in parietal andoccipital cortex (Piert et al., 1996). Neuropathological studieshave shown that additional occipital hypometabolism maydistinguish patients with DLB from patients with Alzheimer’spathology (Minoshima et al., 1997). It is interesting tonote that as well as temporoparietal grey matter rCMRGlcreductions, we also found significant reductions in lateraland medial occipital, as well as posterior cingulate greymatter rCMRGlc metabolism in the Parkinson’s diseasepatients. In agreement with our results, previous 18FDGand oxygen-15 PET studies have demonstrated absolutereductions in temporoparietal glucose and oxidativemetabolism in non-demented and demented Parkinson’sdisease patients (Lenzi et al., 1979; Piert et al., 1996).Eidelberg and colleagues have shown patterns of relativeglucose hypometabolism in lateral frontal, paracentral,inferior parietal and parieto-occipital areas of non-dementedParkinson’s disease patients (Eidelberg et al., 1990, 1994).In this study, we applied a novel MRI-based technique tocalculate partial volume effect-corrected absolute values forgrey matter rCMRGlc, results of which are broadly inagreement with the above studies.
The areas of temporoparietal rCMRGlc reduction appearto be more posterior than the corresponding temporoparietalcortical areas sampled with 31P-MRS. However, we wereunable to sample the most posterior temporoparietal cortexwith 31P-MRS due to technical limitations. Furthermore, wewere unable to demonstrate frontal lobe dysfunction inParkinson’s disease with the 31P-MRS technique as we wereprevented from sampling frontal cortex due to technicallimitations (see Methods). 18FDG-PET showed a trendtowards reduced resting rCMRGlc in the frontal regionswhich did not reach significance in our study. This does notexclude the presence of frontal dysfunction. Playford andcolleagues have shown failure of frontal activation inParkinson’s disease although resting regional cerebral bloodflow was normal (Playford et al., 1992).
The significant correlations demonstrated between 31P-MRS measures and neuropsychological testing in the absenceof parallel correlations between 18FDG-PET andneuropsychological measures is intriguing. One explanationmight be differences in variance across the 18FDG-PET and31P MR data set, although this does not appear to be thecase, as both rCMRGlc values and 31P peak ratios andpercentages have similar distributions about the mean. Asecond possibility may be that different Parkinson’s diseaseand control populations were used for the 18FDG-PET and31P-MRS studies. Hence, although the populations wereclosely matched for age and disease severity, the variancemay have contributed to the difference in results. A finalexplanation may be that deficits in oxidative phosphorylation

350 M. T. M. Hu et al.
are more pertinent to cognitive function than deficits inglycolysis.
Our 31P-MRS findings for the central voxel, incorporatingpredominantly thalamus, globus pallidus, lateral ventricles,brainstem (including substantia nigra) and adjacent whitematter, are more difficult to interpret. We found significantdecreases in the relative percentage of β-ATP and associatedincreases in PME, PDE, PCr and Pi/β-ATP ratios. In theadult brain, ATP levels begin to fall when the PCr poolis reduced by 50% (Tsuji et al., 1995), reflectingdecompensation of the oxidative phosphorylation system.Much controversy exists concerning the contribution ofmitochondrial dysfunction to the pathogenesis of Parkinson’sdisease. Several post-mortem studies have reported moderatereductions in mitochondrial complex I respiratory chainactivity in the substantia nigra of Parkinson’s disease patientscompared with age-matched controls (Schapira et al., 1992;DiMauro, 1993). Interpretation of the results found in thecentral voxel are limited by its 64 cm3 size; however, thesubstantia nigra and its projections have a high density ofmitochondria, and one intriguing possibility for these findingsis that they reflect impaired mitochondrial function withinthe substantia nigra of Parkinson’s disease patients. However,the nigral contribution to the total 31P-MRS signal willprobably be small due to its relatively small size. Dopamineand its metabolites have been shown to produce either noinhibition or very weak inhibition of mitochondrial complexI activity and NADH-linked mitochondrial respiration(Morikawa et al., 1996; McLaughlin et al., 1998), suggestingthat dopaminergic therapy in the Parkinson’s disease groupalone could not account for the abnormalities found.Alternatively, impaired mitochondrial function in the thalamicnuclei due to excessive inhibitory input from the basal gangliaoutput nuclei (substantia nigra pars reticulata and internalglobus pallidus) postulated to occur in Parkinson’s disease(DeLong, 1990) might also explain these results.
We were not able to perform absolute quantification of31P-MRS metabolites in this study as this requires furthersequences and would have prolonged the examination timeunacceptably for the patients. However, by expressing resultsas a percentage of the total 31P signal which remainsunchanged (Hope et al., 1984), an internal reference is, ineffect, used (Taylor-Robinson et al., 1999). It seems unlikelythat our results can be explained by an increased degree ofatrophy in the Parkinson’s disease group for several reasons.(i) Volumetric fine slice MRIs performed in nine of the 10Parkinson’s disease patients showed no significant differencesin cerebral atrophy when inspected visually and comparedwith eight age-matched controls. (ii) The concentration of Pi
and β-ATP in CSF is an order of magnitude smaller than theconcentration in brain, and relatively small differences in theproportion of CSF in the MRS volume should have little, ifany, effect on ratios or percentages (Siegel et al., 1989). (iii)The concentration of β-ATP and Pi is similar in both greyand white matter (Buchli et al., 1994), hence it is unlikelythat the differences reported here are due to different
quantities of grey and white matter in the VOI. (iv) Partialvolume-corrected rCMRGlc values were reduced in thetemporoparietal cortex of the Parkinson’s disease groupcompared with normal subjects.
Further larger scale, longitudinal studies using combined31P-MRS and 18FDG-PET studies to investigate corticalfunction in Parkinson’s disease should address whether thechanges we have found in non-demented patients withParkinson’s disease are useful predictors for the developmentof future dementia, or whether these changes are a commonfinding in Parkinson’s disease uncomplicated by dementia.If the former is the case, these techniques may be useful intargeting neuroprotective strategies at appropriate patients.
AcknowledgementsWe thank all the radiographers at the MRC Cyclotron Unit,Hammersmith Hospital for their help and support, and DrEraldo Paulesu, Neurologist and Neuropsychologist, PETCentre, San Raffaele Hospital, Milan for his generousprovision of the 18FDG-PET template. M.T.M.H. is supportedby an Action Research Training Fellowship, Action Research,UK. The MRC and Picker International supported work inthe Robert Steiner MR Unit.
ReferencesAuker CR, Meszler RM, Carpenter DO. Apparent discrepancybetween single-unit activity and [14C]deoxyglucose labeling in optictectum of the rattlesnake. J Neurophysiol 1983; 49: 1504–16.
Bailey DL. 3D acquisition and reconstruction in positron emissiontomography. [Review]. Ann Nucl Med 1992; 6: 123–30.
Bates TE, Strangward M, Keelan J, Davey GP, Munro PM, ClarkeJB. Inhibition of N-acetylaspartate production: implications for 1HMRS studies in vivo. Neuroreport 1996; 31: 1397–400.
Beck AT. Beck Depression Inventory. San Antonio (TX): ThePsychological Corporation; 1978.
Birken DL, Oldendorf WH. N-acetyl-L-aspartic acid: a literaturereview of a compound prominent in 1H-NMR spectroscopic studiesof brain. [Review]. Neurosci Biobehav Rev 1989; 13: 23–31.
Bottomley PA, Hart HR Jr, Edelstein WA, Schenck JF, Smith LS,Leue WM, et al. Anatomy and metabolism of the normal humanbrain studied by magnetic resonance at 1.5 Tesla. Radiology 1984;150: 441–6.
Brown GG, Levine SR, Gorell JM, Pettegrew JW, Gdowski JW,Bueri JA, et al. In vivo 31P NMR profiles of Alzheimer’s diseaseand multiple subcortical infarct dementia. Neurology 1989; 39:1423–7.
Brown RG, Marsden CD. How common is dementia in Parkinson’sdisease? Lancet 1984; 2: 1262–5.
Brown RG, Marsden CD, Quinn N, Wyke MA. Alterations incognitive performance and affect-arousal state during fluctuationsin motor function in Parkinson’s disease. J Neurol NeurosurgPsychiatry 1984; 47: 454–65.

Cortical dysfunction in Parkinson’s disease 351
Buchli R, Duc CO, Martin E, Boesiger P. Assessment of absolutemetabolite concentrations in human tissue by 31P MRS in vivo. PartI: cerebrum, cerebellum, cerebral gray and white matter. MagnReson Med 1994; 32: 447–52.
Conn EE, Stumpf PK, Bruening G, Doi RH. Outlines ofbiochemistry. 5th edn. New York: John Wiley; 1987.
Cooper JA, Sagar HJ, Jordan N, Harvey NS, Sullivan EV. Cognitiveimpairment in early, untreated Parkinson’s disease and itsrelationship to motor disability. Brain 1991; 114: 2095–122.
Coutts GA, Bryant DJ, Collins AG, Cox IJ, Sargentoni J, GadianDG. 31P magnetic resonance spectroscopy of the normal humanbrain. Approaches using four dimensional chemical shift imagingand phase mapping techniques. NMR Biomed 1989; 1: 190–7.
Cunningham VJ, Jones T. Spectral analysis of dynamic PET studies.J Cereb Blood Flow Metab 1993; 13: 15–23.
DeLong MR. Primate models of movement disorders of basalganglia origin. [Review]. Trends Neurosci 1990; 13: 281–5.
DiMauro S. Mitochondrial involvement in Parkinson’s disease: thecontroversy continues [editorial]. Neurology 1993; 43: 2170–2.
Eidelberg D, Moeeler JR, Dhawan V, Sidtis JJ, Ginos JZ, Strother SC,et al. The metabolic anatomy of Parkinson’s disease: complementary[18F]fluorodeoxyglucose and [18F]fluorodopa positron emissiontomographic studies. Mov Disord 1990; 5: 203–13.
Eidelberg D, Moeller JR, Dhawan V, Spetsieris P, Takikawa S,Ishikawa T, et al. The metabolic topography of parkinsonism. JCereb Blood Flow Metab 1994; 14: 783–801.
Friston KJ, Frith CD, Liddle PF, Frackowiak RS. Comparingfunctional (PET) images: the assessment of significant change. JCereb Blood Flow Metab 1991; 11: 690–9.
Goto I, Taniwaki T, Hosokawa S, Otsuka M, Ichiya Y, Ichimiya A.Positron emission tomographic (PET) studies in dementia. J NeurolSci 1993; 114: 1–6.
Hartigan JA. Clustering algorithms. New York: John Wiley; 1975.
Hope PL, Costello AM, Cady EB, Delpy DT, Tofts PS, Chu A,et al. Cerebral energy metabolism studied with phosphorus NMRspectroscopy in normal and birth-asphyxiated infants. Lancet 1984;2: 366–70.
Hu MT, Taylor-Robinson SD, Chaudhuri KR, Bell JD, Morris RG,Clough C, et al. Evidence for cortical dysfunction in clinicallynon-demented patients with Parkinson’s disease: a proton MRspectroscopy study. J Neurol Neurosurg Psychiatry 1999; 67: 20–6.
Hughes AJ, Daniel SE, Kilford L, Lees AJ. Accuracy of clinicaldiagnosis of idiopathic Parkinson’s disease: a clinico-pathologicalstudy of 100 cases. J Neurol Neurosurg Psychiatry 1992; 55: 181–4.
Iles RA, Stevens AN, Griffiths JR, Morris PG. Phosphorylationstatus of liver by 31P NMR spectroscopy, and its implications formetabolic control. A comparison of 31P NMR spectroscopy (in vivoand in vitro) with chemical and enzymic determinations of ATP,ADP and Pi. Biochem J 1985; 229: 141–51.
International Committee of Medical Journal Editors. Statementsfrom the Vancouver Group. Br Med J 1991; 302: 1194.
Koepp MJ, Richardson MP, Labbe C, Brooks DJ, Cunningham VJ,
Ashburner J, et al. 11C-flumazenil PET, volumetric MRI, andquantitative pathology in mesial temporal lobe epilepsy. Neurology1997; 49: 764–73.
Koepp MJ, Hand KS, Labbe C, Richardson MP, Van Paesschen W,Baird VH, et al. In vivo [11C]flumazenil PET correlates with exvivo [3H]flumazenil autoradiography in hippocampal sclerosis. AnnNeurol 1998; 43: 618–26.
Kolb B, Whishaw IQ. Principles of cerebral asymmetry. In: KolbB, Whishaw IQ. Fundamentals of human neuropsychology. 3rd edn.New York: W.H. Freeman; 1990. p. 347–82.
Labbe C, Koepp M, Ashburner J, Spinks T, Richardson M, DuncanJ, et al. Absolute PET quantification with correction for partialvolume effects within cerebral structures. In: Carson RE, Daube-Witherspoon ME, Herscovitch P, editors. Quantitative functionalbrain imaging with positron emission tomography. San Diego:Academic Press; 1998. p. 59–66.
Lees AJ, Smith E. Cognitive deficits in the early stages of Parkinson’sdisease. Brain 1983; 106: 257–70.
Lenzi GL, Jones T, Reid JL, Moss S. Regional impairment ofcerebral oxidative metabolism in Parkinson’s disease. J NeurolNeurosurg Psychiatry 1979; 42: 59–62.
Levine SR, Helpern JA, Welch KM, Vande Linde AM, Sawaya KL,Brown EE, et al. Human focal cerebral ischemia: evaluation ofbrain pH and energy metabolism with P-31 NMR spectroscopy.Radiology 1992; 185: 537–44.
Mahieux F, Fenelon G, Flahault A, Manifacier M-J, Michelet D,Boller F. Neuropsychological prediction of dementia in Parkinson’sdisease. J Neurol Neurosurg Psychiatry 1998; 64: 178–83.
Mayeux R, Denaro J, Hemenegildo N, Marder K, Tang MX, CoteLJ, et al. A population-based investigation of Parkinson’s diseasewith and without dementia: relationship to age and gender. ArchNeurol 1992; 49: 492–7.
McKeith IG, Galasko D, Kosaka K, Perry EK, Dickson DW, HansenLA, et al. Consensus guidelines for the clinical and pathologicdiagnosis of dementia with Lewy bodies (DLB): report of theconsortium on DLB international workshop. [Review]. Neurology1996; 47: 1113–24.
McLaughlin BA, Nelson D, Erecinska M, Chesselet MF. Toxicityof dopamine to striatal neurons in vitro and potentiation of celldeath by a mitochondrial inhibitor. J Neurochem 1998; 70: 2406–15.
Minoshima S, Foster NL, Frey KA, Wahl RL, Burdette JH, KuhlDE. Can FDG PET distinguish dementia patients with cortical Lewybodies from pure Alzheimer’s disease? [abstract]. J Nucl Med 1997;38 (5 Suppl): 70P–71P.
Morikawa N, Nakagawa-Hattori Y, Mizuno Y. Effect of dopamine,dimethoxyphenylethylamine, papaverine, and related compounds onmitochondrial respiration and complex I activity. J Neurochem1996; 66: 1174–81.
Murphy DG, Bottomley PA, Salerno JA, DeCarli C, Mentis MJ,Grady CL, et al. An in vivo study of phosphorus and glucosemetabolism in Alzheimer’s disease using magnetic resonancespectroscopy and PET. Arch Gen Psychiatry 1993; 50: 341–9.
Nelson HE. National Adult Reading Test (NART) 2nd edn. Oxford:NFER-Nelson; 1991.

352 M. T. M. Hu et al.
Nioka S, Chance B, Hilberman M, Subramanian HV, Leigh JS Jr,Veech RL, et al. Relationship between intracellular pH and energymetabolism in dog brain as measured by 31P NMR. J Appl Physiol1987; 62: 2094–102.
Paolo AM, Troster AI, Ryan JJ. California Verbal Learning Test:normative data for the elderly. J Clin Exp Neuropsychol 1997; 19:220–34.
Peppard RF, Martin WR, Carr GD, Grochowski E, Schulzer M,Guttman M, et al. Cerebral glucose metabolism in Parkinson’sdisease with and without dementia. Arch Neurol 1992; 49: 1262–8.
Pettegrew JW, Moossy J, Withers G, McKeag D, Panchalingam K.31P nuclear magnetic resonance study of the brain in Alzheimer’sdisease. J Neuropathol Exp Neurol 1988; 47: 235–48.
Piert M, Koeppe RA, Giordani B, Minoshima S, Kuhl DE.Determination of regional rate constants from dynamic FDG-PETstudies in Parkinson’s disease. J Nucl Med 1996; 37: 1115–22.
Playford ED, Jenkins IH, Passingham RE, Nutt J, Frackowiak RS,Brooks DJ. Impaired mesial frontal and putamen activation inParkinson’s disease: a positron emission tomography study. AnnNeurol 1992; 32: 151–61.
Ranicar AS, Williams CW, Schnorr L, Clark JC, Rhodes CG,Bloomfield PM, et al. The on-line monitoring of continuouslywithdrawn arterial blood during PET studies using a single BGO/photomultiplier assembly and non-stick tubing. Med Prog Technol1991; 17: 259–64.
Saeed N. A knowledge-based approach to deconvolve the watercomponent in in vivo proton MR spectroscopy. J Comput AssistTomogr 1995; 19: 830–7.
Sagar HJ. Psychopharmacology of cognitive impairment inParkinson’s disease. In: Perry R, McKeith I, Perry E, editors.Dementia with Lewy body. Clinical, pathological and treatmentissues. Cambridge: Cambridge University Press, 1996; p. 363–79.
Schapira AH, Mann VM, Cooper JM, Krige D, Jenner PJ, MarsdenCD. Mitochondrial function in Parkinson’s disease. [Review]. AnnNeurol 1992; 32 Suppl: S116–24.
Siegel GJ, Agranoff BW, Albers RW, Molinoff P. Basicneurochemistry: molecular, cellular and medical aspects. 4th ed.New York: Raven Press; 1989.
Sokoloff L. Relation between physiological function and energy
metabolism in the central nervous system. [Review]. J Neurochem1977; 29: 13–26.
Spinks TJ, Jones T, Bailey DL, Townsend DW, Grootoonk S,Bloomfield PM, et al. Physical performance of a positron tomographfor brain imaging with retractable septa. Phys Med Biol 1992; 37:1637–55.
Spreen O, Strauss E. Controlled oral word association (wordfluency). In: Spreen O, Strauss E. A compendium ofneuropsychological tests. Administration, norms and commentary.Oxford: Oxford University Press; 1991. p. 219–27.
Taylor-Robinson SD, Buckley C, Changani KK, Hodgson HJ,Bell JD. Cerebral proton and phosphorus-31 magnetic resonancespectroscopy in patients with subclinical hepatic encephalopathy.Liver. In press 1999.
Tison F, Dartigues JF, Auriacombe S, Letenneur L, Boller F,Alperovitch A. Dementia in Parkinson’s disease: a population-basedstudy in ambulatory and institutionalized individuals. Neurology1995; 45: 705–8.
Tsuji M, Allred E, Jensen F, Holtzman D. Phosphocreatine and ATPregulation in the hypoxic developing rat brain. Brain Res Dev BrainRes 1995; 85: 192–200.
Van Gorp WG, Satz P, Kiersche ME, Henry R. Normative data onthe Boston Naming Test for a group of normal older adults. J ClinExp Neuropsychol 1986; 8: 702–5.
Vander Borght T, Minoshima S, Giordani B, Foster NL, Frey KA,Berent S, et al. Cerebral metabolic differences in Parkinson’s andAlzheimer’s diseases matched for dementia severity. J Nucl Med1997; 38: 797–802.
Vion-Dury J, Meyerhoff DJ, Cozzone PJ, Weiner MW. What mightbe the impact on neurology of the analysis of brain metabolism byin vivo magnetic resonance spectroscopy? [editorial]. [Review]. JNeurol 1994; 241: 354–71.
Woods RP, Mazziotta JC, Cherry SR. MRI-PET registration withautomated algorithm. J Comput Assist Tomogr 1993; 17: 536–46.
Yesavage JA, Brink TL, Rose TL, Lum O, Huang V, Adey M, et al.Development and validation of a geriatric depression screeningscale: a preliminary report. J Psychiatr Res 1983; 17: 37–49.
Received June 7, 1999. Revised August 19, 1999.Accepted September 6, 1999


