Embed Size (px)
Citation preview

Neuronal gene expression in non-demented individuals withintermediate Alzheimer’s Disease neuropathology
Winnie S. Lianga,b, Travis Dunckleya,b, Thomas G. Beachb,c, Andrew Groverb,c, DiegoMastroenib,c, Keri Ramseya, Richard J. Casellib,d, Walter A. Kukulle, Daniel McKeelf, JohnC. Morrisf, Christine M. Huletteg, Donald Schmechelg, Eric M. Reimana,b,h, JosephRogersb,c, and Dietrich A. Stephana,b,i,*aNeurogenomics Division, Translational Genomics Research Institute, Phoenix, AZ 85004, USAbArizona Alzheimer’s Disease Consortium, Phoenix, AZ 85006, USAcSun Health Research Institute, Sun City, AZ 85351, USAdDepartment of Neurology, Mayo Clinic, Scottsdale, AZ 85259, USAeNational Alzheimer’s Coordinating Center, Seattle, WA 98105, USAfWashington University Alzheimer’s Disease Research Center, St. Louis, MO 63108, USAgDuke University Alzheimer’s Disease Research Center, Durham, NC 27705, USAhBanner Alzheimer’s Institute, Phoenix, AZ 85006, USAiNavigenics, Redwood Shores, CA 94065, USA
AbstractWhile the clinical and neuropathological characterization of Alzheimer’s Disease (AD) is welldefined, our understanding of the progression of pathologic mechanisms in AD remains unclear.Post-mortem brains from individuals who did not fulfill clinical criteria for AD may still demonstratemeasurable levels of AD pathologies to suggest that they may have presented with clinical symptomshad they lived longer or are able to stave off disease progression. Comparison between suchindividuals and those clinically diagnosed and pathologically confirmed to have AD will be key indelineating AD pathogenesis and neuroprotection. In this study, we expression profiled laser capturemicrodissected non-tangle bearing neurons in 6 post-mortem brain regions that are differentiallyaffected in the AD brain from 10 non-demented individuals demonstrating intermediate ADneuropathologies (NDAD; Braak stage of II through IV and CERAD rating of moderate to frequent)and evaluated this data against that from individuals who have been diagnosed with late onset ADas well as healthy elderly controls. We identified common statistically significant expression changesin both NDAD and AD brains that may establish a degenerative link between the two cohorts, inaddition to NDAD specific transcriptomic changes. These findings pinpoint novel targets fordeveloping earlier diagnostics and preventative therapies for AD prior to diagnosis of probable AD.We also provide this high-quality, low post-mortem interval (PMI), cell-specific, and region-specificNDAD/AD reference data set to the community as a public resource.
© 2008 Elsevier Inc. All rights reserved.*Corresponding author at: Neurogenomics Division, The Translational Genomics Research Institute, 445 North Fifth Street, Phoenix,AZ 85004, USA. Tel.: +1 602 343 8727; fax: +1 602 343 8844.Conflict of interest statementThe authors state that there are no actual or potential conflicts of interest.
NIH Public AccessAuthor ManuscriptNeurobiol Aging. Author manuscript; available in PMC 2010 April 1.
Published in final edited form as:Neurobiol Aging. 2010 April ; 31(4): 549–566. doi:10.1016/j.neurobiolaging.2008.05.013.
NIH
-PA Author Manuscript
NIH
-PA Author Manuscript
NIH
-PA Author Manuscript

KeywordsLaser capture microdissection; Affymetrix microarrays; Expression profiling; Neuron;Transcriptomics
1. IntroductionWith its increasing incidence, Alzheimer’s Disease (AD) has become a major concern for boththe research community as well as the aging global population. Because identification ofpathological markers is currently the only approach to confirming diagnosis, physicians andresearchers have begun to focus on developing early diagnostic tools to allow for earlierpreventative measures. One potential approach is to consider earlier stages of AD in whichindividuals do not demonstrate clinical criteria for AD dementia but may demonstrateintermediate levels of AD neuropathology (Braak stage of II, III, or IV with moderate tofrequent neuritic plaques) evaluated post-mortemly. This characterization suggests that theseindividuals may have developed clinical AD symptoms had they lived longer, or are able tostave off disease progression. Evaluating such individuals compared to those who had beenclinically diagnosed and histopathologically confirmed to have AD will help to elucidate theneuronal processes that may drive disease progression or neuroprotection. To begin to elucidatethis putative relationship, we expression profiled laser capture microdissected non-tanglebearing cortical neurons from six functionally discrete post-mortem brain regions. Theseregions, which have been found to display differential susceptibilities to AD pathologies, werecollected from 10 non-demented individuals that demonstrate intermediate levels of ADneuropathology (NDAD). This analysis builds upon the global neuronal expression resource(Liang et al., 2008) we have established focusing on healthy elderly controls and patients whohad been diagnosed with late onset AD, and aims to provide a catalog of expression signaturesthat characterizes transcriptomic changes across control, NDAD, and AD brains.
The six regions profiled have differential susceptibilities to AD pathologies and include theentorhinal cortex (EC), hippocampus (HIP), middle temporal gyrus (MTG), posterior cingulatecortex (PC), superior frontal gyrus (SFG), and primary visual cortex (VCX). Based on analysisconsolidating statistically significant gene expression changes in NDAD patients compared tocontrols and AD patients compared to controls, we have identified significant commonexpression changes in both NDAD and AD brains in addition to expression signatures thataccount for regional changes across NDAD and AD brains. These findings provide insight intopathogenic mechanisms that may link the progression from NDAD to AD in different parts ofthe human brain and also identifies novel targets for developing improved diagnostics andpreventative therapeutics against AD.
2. Methods2.1. Tissue collection
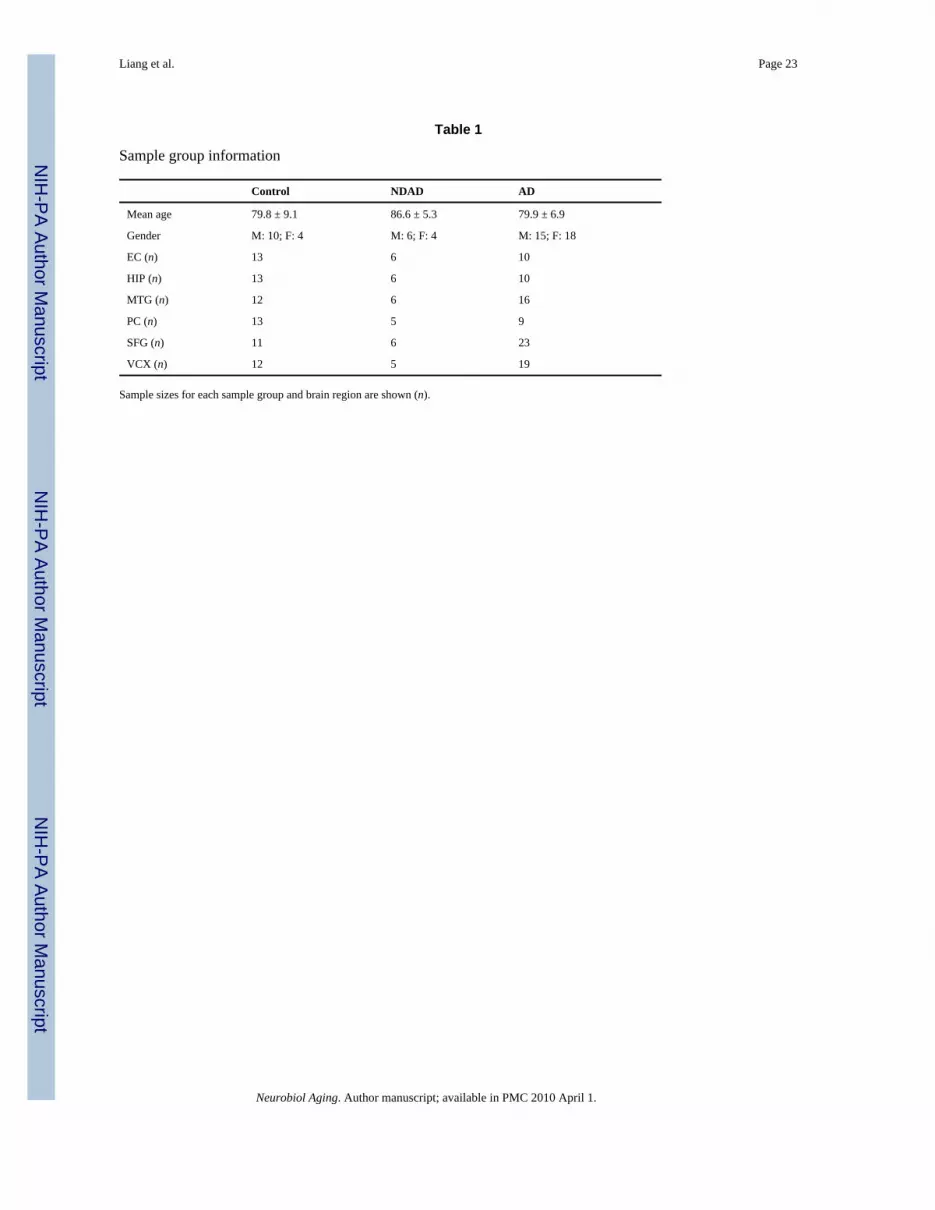
Brain samples were collected at two Alzheimer’s Disease Centers (Washington University andSun Health Research Institute) from clinically classified non-demented individuals whodemonstrate intermediate levels of AD pathologies (6 males and 4 females) with a mean ageof 86.6±5.3. Individuals were matched as closely as possible for their mean age at death andgender. Subjects in this group have a Braak stage of II to IV with a CERAD neuritic plaquedensity of moderate or frequent. Tissue collection from healthy elderly control and AD sampleswas previously described (Liang et al., 2008; Liang et al., 2007). Samples were collected (meanpost-mortem interval (PMI) of 2.5 h) from six brain regions that are either histopathologicallyor metabolically relevant to AD—these include the EC (BA 28 and 34), SFG (BA 10 and 11),
Liang et al. Page 2
Neurobiol Aging. Author manuscript; available in PMC 2010 April 1.
NIH
-PA Author Manuscript
NIH
-PA Author Manuscript
NIH
-PA Author Manuscript

HIP, VCX (BA 17), MTG (BA 21 and 37), and the PC (BA 23 and 31). Following dissection,samples were frozen, sectioned (8 µm), and fixed on glass slides.
Brain sections were stained with a combination of Thioflavin-S (Sigma; Dallas, TX) and 1%Neutral Red (Fisher Scientific; Chicago, IL) and pyramidal neurons were identified by theircharacteristic size, shape, and location within the region of interest, while tangles wereidentified by the fluorescence of Thioflavin-S staining. In the EC, the large stellate neuronslacking Thioflavin-S staining were collected from layer II and pyramidal cells lackingThioflavin-S staining were collected from CA1 of the HIP. The CA1 region was selected forstudy because this area is the most affected and earliest affected region in the hippocampus interms of tangle formation, and this region has already been expression profiled inneurologically healthy elderly individuals. In all other regions, cortical layer III pyramidalneurons lacking Thioflavin-S staining were collected (for all collected neurons, cell bodieswere extracted). For each individual, approximately five hundred histopathologically normalpyramidal neurons were collected from the EC, HIP, MTG, PC, SFG, and VCX using LCMwith the Arcturus Veritas Automated Laser Capture Microdissection System (Mountain View,CA). Cells were collected onto Arcturus CapSure Macro-LCM Caps and extracted accordingto the manufacturer’s protocol. Total RNA was isolated from the cell lysate using the ArcturusPicoPure RNA Isolation Kit with DNase I treatment using Qiagen’s RNase-free DNase Set(Valencia, CA).
2.2. Expression profilingExpression profiling, hybridization, and array scanning was performed as previously described(Liang et al., 2008; Liang et al., 2007). Isolated total RNA from each sample of ~500 neuronswas double round amplified, cleaned, and biotin-labeled using Affymetrix’s GeneChip Two-Cycle Target Labeling kit (Santa Clara, CA) with a T7 promoter and Ambion’s MEGAscriptT7 High Yield Transcription kit (Austin, TX) as per manufacturer’s protocol. Amplified andlabeled cRNA was quantitated on a spectrophotometer and run on a 1% TAE gel to check foran evenly distributed range of transcript sizes. Twenty micrograms of cRNA was fragmentedto approximately 35–200 bp by alkaline treatment (200 mM Tris-acetate, pH 8.2, 500 mMKOAc, 150 mM MgOAc) and run on a 1% TAE gel to verify fragmentation. Separatehybridization cocktails were made using 15µg of fragmented cRNA from each sample as perAffymetrix’s protocol.
Two hundred microliters (containing 10µg of fragmented cRNA) of each cocktail wasseparately hybridized to an Affymetrix Human Genome U133 Plus 2.0 Array for 16h at 45°Cin the Hybridization Oven 640. The Affymetrix Human Genome Arrays measure theexpression of over 47,000 transcripts and variants, including 38,500 characterized humangenes. Arrays were washed on Affymetrix’s upgraded GeneChip Fluidics Station 450 using aprimary streptavidin phycoerythrin (SAPE) stain, subsequent biotinylated antibody stain, andsecondary SAPE stain. Arrays were scanned on Affymetrix’s GeneChip Scanner 3000 7G withAutoLoader. Scanned images obtained by the Affymetrix GeneChip Operating Software(GCOS) v1.2 were used to extract raw signal intensity values per probe set on the array.MAS5.0 was used to calculate detection calls (absent, marginal, or present) and to scale allraw chip data to 150 to normalize signal intensities for inter-array comparisons. Reportsgenerated by GCOS were reviewed for quality control—we looked for at least 20% presentcalls, a maximum 3′/5′ GAPDH ratio of 30.5, and a scaling factor under 11. Thirteen arraysthat failed to pass these standards were not included in further analyses.
Liang et al. Page 3
Neurobiol Aging. Author manuscript; available in PMC 2010 April 1.
NIH
-PA Author Manuscript
NIH
-PA Author Manuscript
NIH
-PA Author Manuscript
2.3. Pyramidal cell quality controlTo ensure neuronal cell purity in the samples, expression of GFAP, an astrocyte cell marker,was evaluated. Five samples that had GFAP expression greater than 2 S.D. from the mean wereremoved from statistical analyses.
2.4. Statistical analysisData for samples from neurologically healthy elderly controls and AD-afflicted individualswere generated in previous studies (Liang et al., 2008; Liang et al., 2007). Microarray datafiles of the normal samples are available on the Gene Expression Omnibus (GEO) site athttp://www.ncbi.nlm.nih.gov/geo/query/acc.cgi?acc=GSE5281 (project accession#GSE5281)and regional analyses are posted at http://www.tgen.org/neurogenomics/data/). A summary ofthe mean ages, gender numbers, and number of samples used for statistical analyses (acrossall groups) are shown in Table 1. As a metric of quality, R-squared values were calculated andaveraged for each region within each sample group—these values are posted on thesupplementary data site at http://www.tgen.org/neurogenomics/data.
Direct comparisons between brains of neurologically healthy and NDAD brains wereperformed between all brain regions to analyze expression differences. For each analysis, genesthat did not demonstrate at least approximately 10% present calls for each region-specificcomparison were removed using Genespring GX 7.3 Expression Analysis software (AgilentTechnologies; Palo Alto, CA). A two-tailed unpaired t-test, assuming unequal variances (withmultiple testing corrections using the Benjamini and Hochberg False Discovery Rate (FDR)),was applied to each comparison in Excel to locate genes that are statistically significant indifferentiating expression between healthy and NDAD brains: for each analysis, genes that hada maximum P-value of 0.01 were collected and those genes whose average NDAD signal andaverage control signal were both below a threshold of 150 were removed. Fold change valueswere determined by calculating the ratio between the average scaled expression signal (for allsamples) for a gene from the NDAD sample region and the average scaled expression signalfor the same gene from the normal samples.
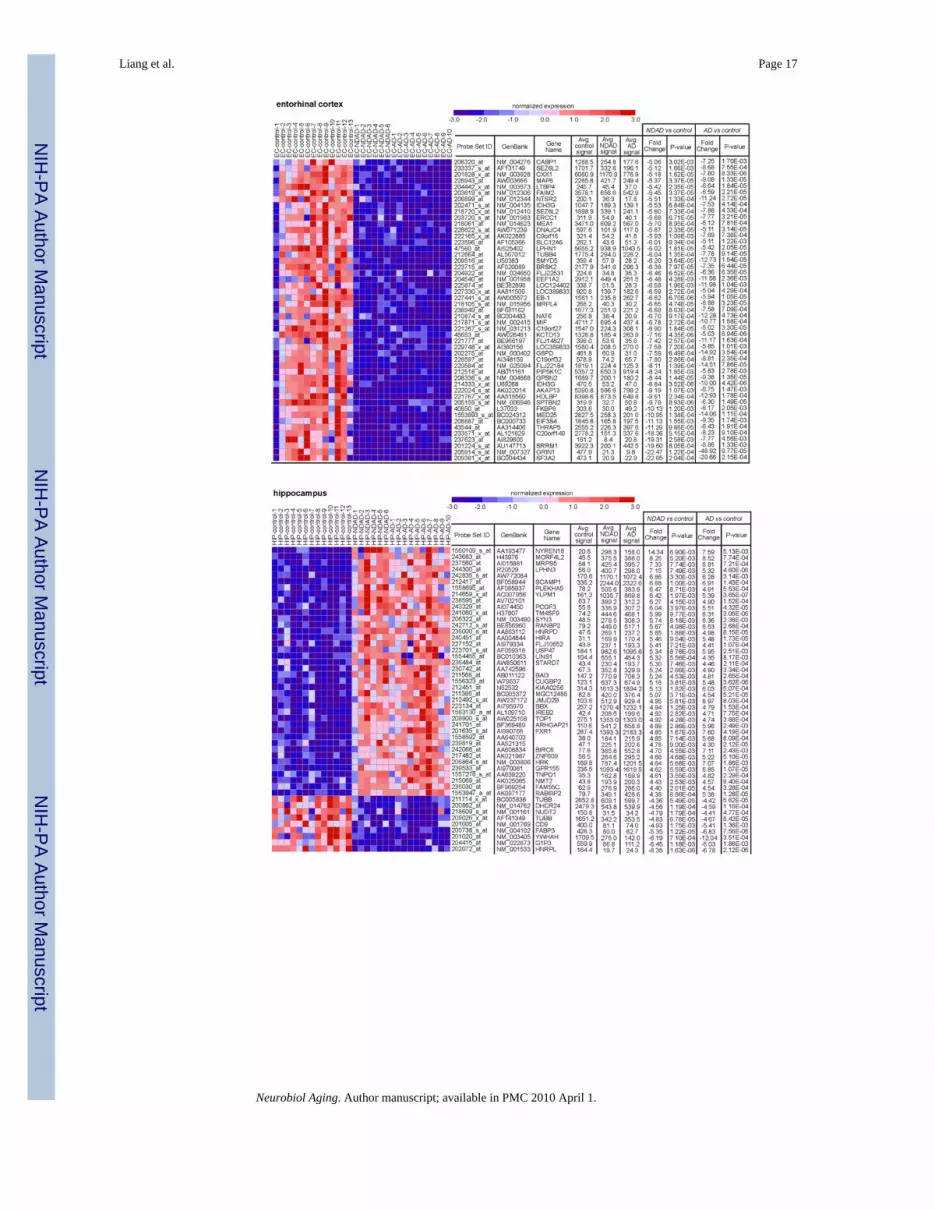
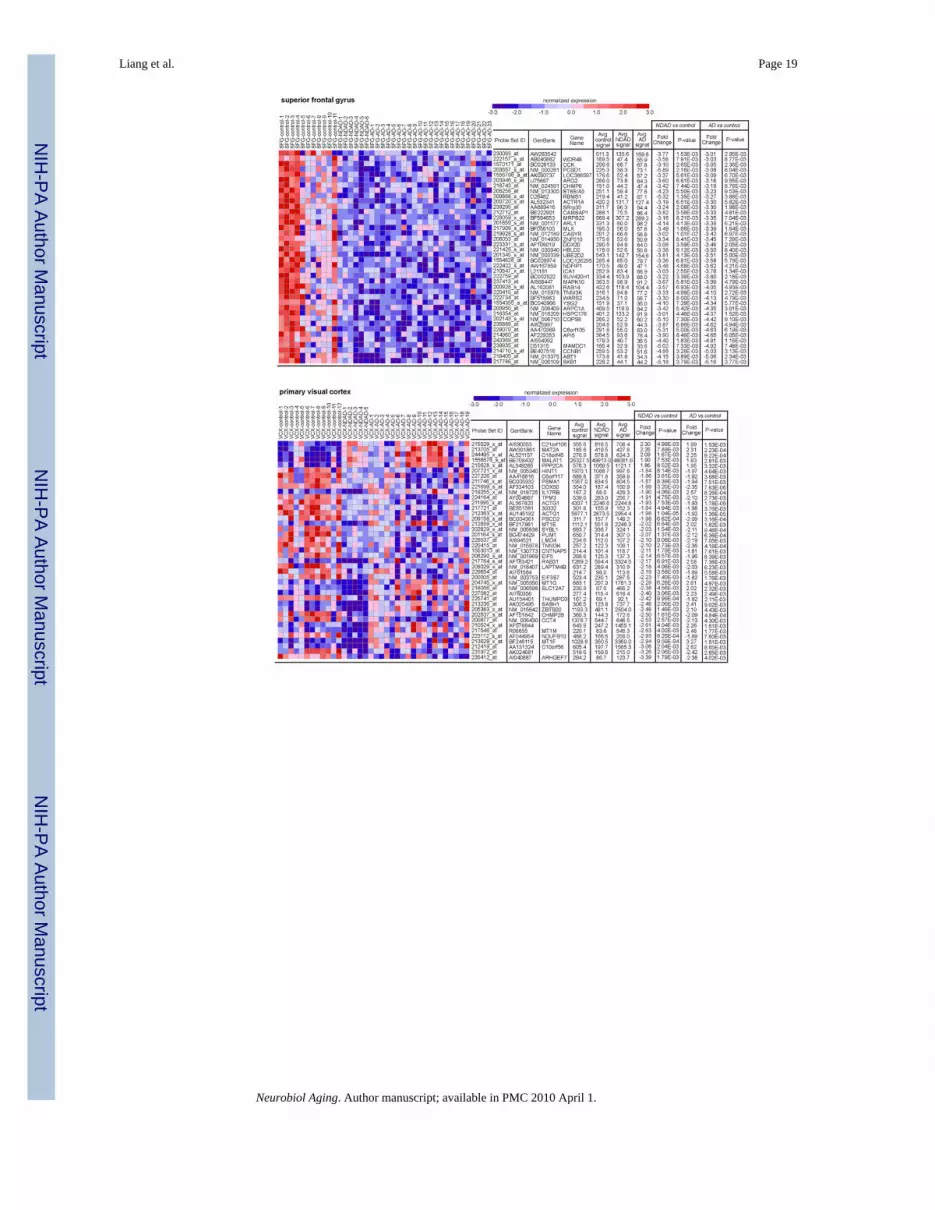
Using this approach we identified sets of genes that were specifically up or down-regulatedbetween normal and NDAD brains for each of the six brain regions-of-study. Maps for genesshowing the greatest statistically significant (P < 0.01, corrected) changes in the NDAD versuscontrols analysis were assembled. For the EC, a minimum (increased or decreased) fold changeof 6 was applied, for the HIP a 5.4-fold change, for the MTG an 6.2-fold change, for the PC a4-fold change, for the SFG a 4.8-fold change, and for the VCX a 2.9-fold change. Heat mapsfor each brain region were created using GeneCluster v2.0 with no gene or sample clusteringapplied and are located on a supplementary data site athttp://www.tgen.org/neurogenomics/data.
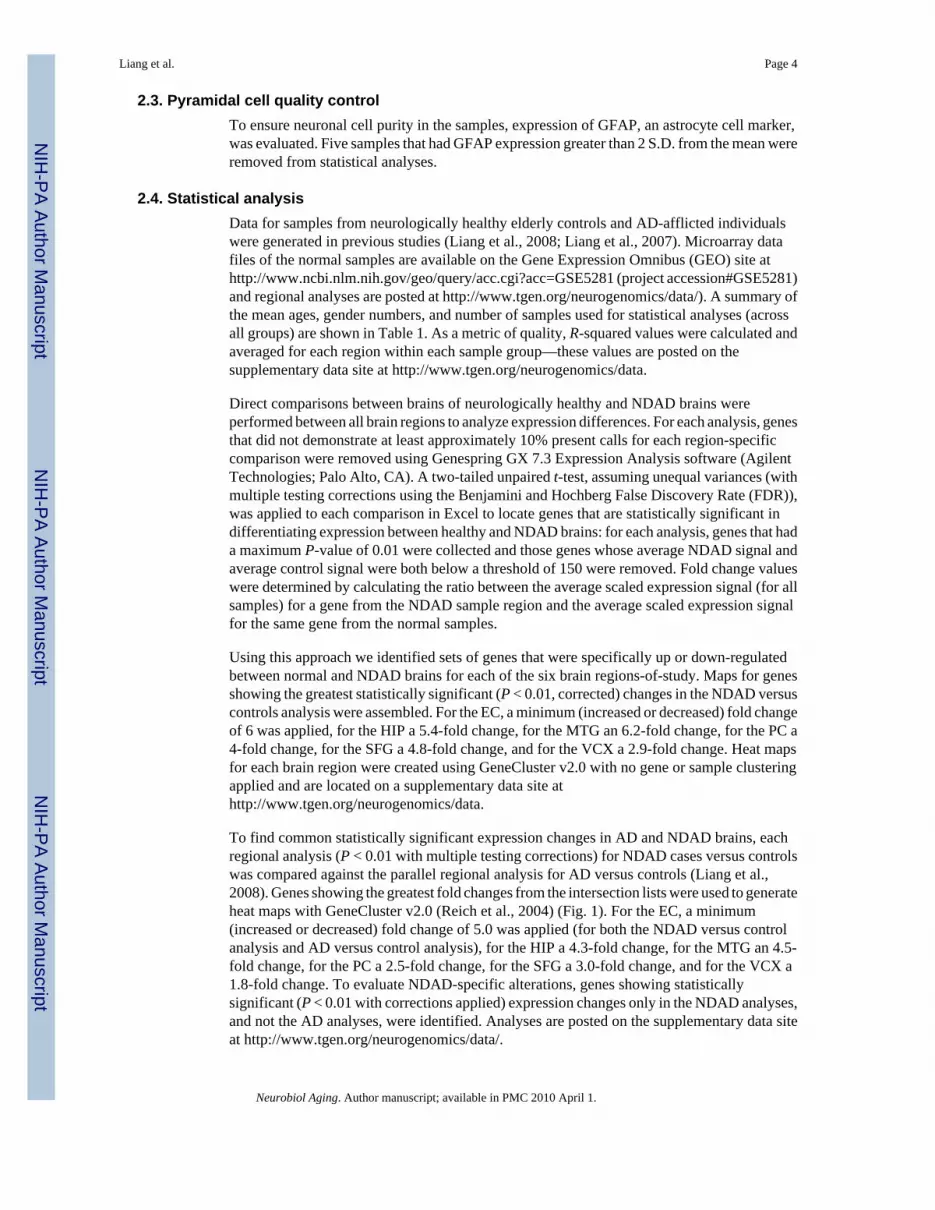
To find common statistically significant expression changes in AD and NDAD brains, eachregional analysis (P < 0.01 with multiple testing corrections) for NDAD cases versus controlswas compared against the parallel regional analysis for AD versus controls (Liang et al.,2008). Genes showing the greatest fold changes from the intersection lists were used to generateheat maps with GeneCluster v2.0 (Reich et al., 2004) (Fig. 1). For the EC, a minimum(increased or decreased) fold change of 5.0 was applied (for both the NDAD versus controlanalysis and AD versus control analysis), for the HIP a 4.3-fold change, for the MTG an 4.5-fold change, for the PC a 2.5-fold change, for the SFG a 3.0-fold change, and for the VCX a1.8-fold change. To evaluate NDAD-specific alterations, genes showing statisticallysignificant (P < 0.01 with corrections applied) expression changes only in the NDAD analyses,and not the AD analyses, were identified. Analyses are posted on the supplementary data siteat http://www.tgen.org/neurogenomics/data/.
Liang et al. Page 4
Neurobiol Aging. Author manuscript; available in PMC 2010 April 1.
NIH
-PA Author Manuscript
NIH
-PA Author Manuscript
NIH
-PA Author Manuscript

To identify expression patterns that account for the greatest amount of variance across diseasestates (healthy controls, NDAD, and AD) in each region, principle components analysis (PCA)was applied. PCA reduces a multi-dimensional data set to two dimensions by performingcovariance analysis across the three sample groups. Genes showing at least ~10% present callsfor each region were input into Genespring GX 7.3 for PCA analysis. For each region, threeprinciple components were identified (the number of components is determined by the numberof sample groups). The first component accounts for the greatest amount of variance acrosshealthy control, NDAD, and AD brains, while the third component accounts for the leastamount of variance. For each component, correlation values are measured for each gene in theinput list—correlation values range from 0 to 1 with a value of 1 indicating that the gene hasan identical expression signature to the specific component. Genes demonstrating a correlationvalue of 1 to component 1 for each region are listed in Table 5 and regional component graphsare shown in Fig. 2—the percentage of expression variance accounted for by each componentis shown. Additional correlation data is listed on the supplementary data site.
2.5. Data postingMIAME-compliant microarray data files are located on the Gene Expression Omnibus (GEO)site at http://www.ncbi.nlm.nih.gov/geo/query/acc.cgi?acc=GSE5281 (projectaccession#GSE5281). Fold change and P-value data for each of the six regions across healthycontrol, NDAD, and AD brains are available online at:http://www.tgen.org/neurogenomics/data/. Posted lists show region-specific P-values and foldchanges, and expression signals for genes that have at least approximately 10% present callsacross regional samples with a maximum P-value of 0.01 with multiple testing correctionsapplied (no fold change thresholds have been applied on these lists).
2.6. RT-PCR validation of neuron-specific candidate genesTotal RNA was isolated from cortical grey matter from unprofiled MTG (controls: n = 9,NDAD cases: n = 8, AD cases: n = 9) and PC (controls: n = 8, NDAD cases: n = 8, AD cases:n = 11) frozen tissue using the RNAspin Mini kit (GE Healthcare Life Sciences; Piscataway,NJ) using manufacturers protocol modified by increasing initial volume of buffer RA1 to 500µl to prevent subsequent column blockage. RNA quality was assessed on an Agilent 2100Bioanalyzer (Santa Clara, CA) using Agilent RNA Nanochips. RIN numbers of 6.5 (range 6.5–9.0) and above were considered sufficient for this analysis. cDNA was generated using theSuperscript First Strand Synthesis kit (Invitrogen; Carlsbad, CA) using 1 µg of total RNA ina 40 µl reaction. Quantitative RT-PCR was performed using Taqman primer/probe sets(Applied Biosystems; Foster City, CA) to amplify the following neuron-specific genetranscripts; MAP1B (microtubule-associated protein 1B; Hs00195485_m1), GRIA1(glutamate receptor, ionotropic, AMPA 1; Hs00181348_m1) and GRIA3 (glutamate receptor,ionotropic, AMPA 3; Hs00241485_m1). Five assays for non-neuronal mRNA transcripts wereperformed, of which the first four are AD-related; APOE (apolipoprotein E;Hs0003037354_mH), APP (amyloid precursor protein; Hs00169098_m1), BACE1 (beta-siteAPP-cleaving enzyme 1; Hs00201573_m1), COX5B (cytochrome c oxidase subunit Vb;Hs00426948_m1) and MAP4 (microtubule-associated protein 4; Hs01104794_m1). Levels ofβ-Gluconuridase (GUSB 4333767F) mRNA were used for normalization of samples; this genetranscript did not show significant expression changes between AD and ND in the gene arrayanalysis, and has been successfully employed for this purpose previously (Barrachina et al.,2006; Kuwano et al., 2006). qRT-PCR reactions were performed in 30 µl reactions usingTaqman Gene Expression Master Mix (Applied Biosys-tems) according to manufacturersprotocol on a BioRad iCycler IQ qPCR system (Hercules, CA). Threshold values werecalculated using the maximum curvature approach. Ct values were used to calculate foldchanges using the 2−ΔΔCt method (Livak and Schmittgen, 2001). Significance of observedchanges was ascertained using the Student’s t-test.
Liang et al. Page 5
Neurobiol Aging. Author manuscript; available in PMC 2010 April 1.
NIH
-PA Author Manuscript
NIH
-PA Author Manuscript
NIH
-PA Author Manuscript
3. Results and discussionIn this study, we gene expression profiled non-tangle bearing cortical neurons from the post-mortem brains of non-demented individuals who have been histopathologically confirmed todemonstrate intermediate pathologies associated with AD through Braak and CERAD staging.This study completes a high-quality expression data set that we have established to evaluateneuronal gene expression changes that characterize healthy elderly controls, non-dementedindividuals with intermediate AD neuropathology, and AD patients in different areas of thebrain that are relevant to AD. By defining neuronal expression levels across healthy elderlyindividuals, NDAD individuals, and those diagnosed with late-onset AD, these findingsprovide insight into disease progression and the processes that may drive neurodegenerationor neuropro tection.
3.1. Common expression changes in NDAD and AD brainsIn order to identify common expression changes in NDAD and AD brains, we compared ourdata with our previous study in which we similarly profiled neurons from the brains of healthyelderly controls and individuals that have been clinically and histopathologically confirmed tohave AD (Liang et al., 2008). Comparison of expression changes in NDAD versus controlbrains and AD versus control brains led to the identification of a significant overlap of genesdemonstrating statistically significant (P < 0.01, corrected for multiple comparisons)expression changes within each regional analysis. In the EC, 1887 genes showed significantchanges in both NDAD and AD brains compared to controls, 1892 genes demonstrated changesin the HIP of both NDAD and AD brains, 2755 genes in the MTG, 503 genes in the PC, 226genes in the SFG, and 178 genes in the VCX. Interestingly, the SFG, a region that demonstratesmetabolic changes associated with normal aging (Angelie et al., 2001; Convit et al., 2001;Ivancevic et al., 2000; Loessner et al., 1995; Moeller et al., 1996), and the VCX, a region foundto be relatively spared from AD pathologies (Metsaars et al., 2003), showed the least amountof transcriptomic changes across healthy elderly, NDAD, and AD brains, while the greatestchanges were found in brain regions that have increased susceptibilities to AD pathologiesincluding neurofibrillary tangles (NFTs) (Bobinski et al., 1999; Bouras et al., 1994; Braak andBraak, 1992; de Leon et al., 1989; Du et al., 2003; Fox et al., 1996; Frisoni et al., 1999; Hymanet al., 1984) in the EC and HIP, and amyloid plaques (Braak and Braak, 1991; Mirra et al.,1991; Thal et al., 2002) and metabolic deficits (Blesa et al., 1996; Jack et al., 1998; Mielke etal., 1994, 1998; Small et al., 2000) in the MTG and PC. Dendrograms listing genesdemonstrating the greatest expression changes in both NDAD and AD brains compared tocontrols for each region are shown in Fig. 1.
Due to the breadth of the data, we focused our attention on genes that have roles in mechanismsthat have been previously implicated as being associated with AD to assess if these pathogenicpathways may be enacted in NDAD brains. These mechanisms include pathways leading toformation of NFTs and amyloid plaques, ubiquitin–proteasomal pathways, and pathwayssurrounding synaptic degeneration.
3.1.1. Common expression changes in NDAD and AD brains: tangle and plaquerelated pathways—With regards to pathological markers of AD, NFTs form as a result ofintraneuronal aggregation of tau, while extracellular plaques form as a result of the aggregationof insoluble 40–42 amino acid long Abeta proteins. In the EC and MTG, decreased expressionwas identified for microtubule-associated protein tau (MAPT) across NDAD and AD brains(Table 2), while multiple probes in the HIP demonstrated both increased and decreasedexpression. Past studies have identified isoform specific (3-repeat and 4-repeat) tau expressionin the temporal region (Conrad et al., 2007) and cerebellar cortex (Boutajangout et al., 2004),and in cholinergic basal forebrain and hippocampal CA1 neurons of AD brains (Ginsberg et
Liang et al. Page 6
Neurobiol Aging. Author manuscript; available in PMC 2010 April 1.
NIH
-PA Author Manuscript
NIH
-PA Author Manuscript
NIH
-PA Author Manuscript

al., 2006). However, the Affymetrix Human Genome U133 Plus 2.0 array does not specificallydistinguish between 3-repeat and 4-repeat tau isoforms so that isoform-specific expression isnot considered in this study. Even so, because of the presence of multiple probes targetedagainst MAPT, differences in expression changes between probes suggest that isoform-specificexpression is present. In the HIP, 3 MAPT probes demonstrated significant opposite changesin expression levels in NDAD brains (Table 2). While 206401_s_at and 203928_x_at targetthe entire length of MAPT and demonstrate increased expression, 225379_at targets the 3′untranslated region (UTR) and demonstrates decreased expression. Because 206401_s_at and203928_x_at cover the entire MAPT gene, including alternatively spliced exons, their changesin expression may represent differential expression of different isoforms. Because 225379_attargets the 3′ UTR, this probe evaluates all variants and thus likely represents the net changein expression of MAPT. While isoform-specific expression changes have been identified inAD brains, past studies have not found changes in MAPT expression in post-mortem braintissue (Goedert et al., 1989) and single cells in AD (Hemby et al., 2003). Another studyevaluated gene expression differences in tangle bearing hippocampal CA1 neurons from ADbrains compared to non-tangle bearing CA1 neurons in both AD brains and healthy brains anddid not detect any expression changes of the 3-repeat and 4-repeat isoforms (Ginsberg et al.,2000). However, in this particular study, gene expression of non-tangle bearing neurons fromAD and control brains defined the baseline of expression so that disease specific changes inhealthy neurons are not evaluated. Despite these findings, we identified changes in MAPTexpression between healthy neurons in NDAD brains and healthy neurons in control brains (toparallel greater expression changes in healthy neurons in AD brains compared to that in controlbrains). The primarily decreased net expression of MAPT across control, NDAD, and ADbrains found here may demonstrate cellular efforts to inhibit aggregation of tau into NFTs ata timepoint prior to onset of measureable cognitive deficits.
Cellular efforts to inhibit NFT formation may also be demonstrated by decreased expressionof kinases that can phosphorylate tau—these include MAP/microtubule affinity-regulatingkinases (MARK3, MARK4), cyclin-dependent kinase 5 (CDK5), PTEN-induced putativekinase 1 (PINK1), and tau tubulin kinase 2 (TTBK2) (Kitano-Takahashi et al., 2007) (Table2). Along with decreases, increased expression for putative tau kinases were also identified(Table 2). The decreased expression of tau in certain regions along with altered expression ofkinases that may phosphorylate tau suggests that neurons may be initiating responses to lessenor inhibit tangle formation at stages prior to detectable disease onset.
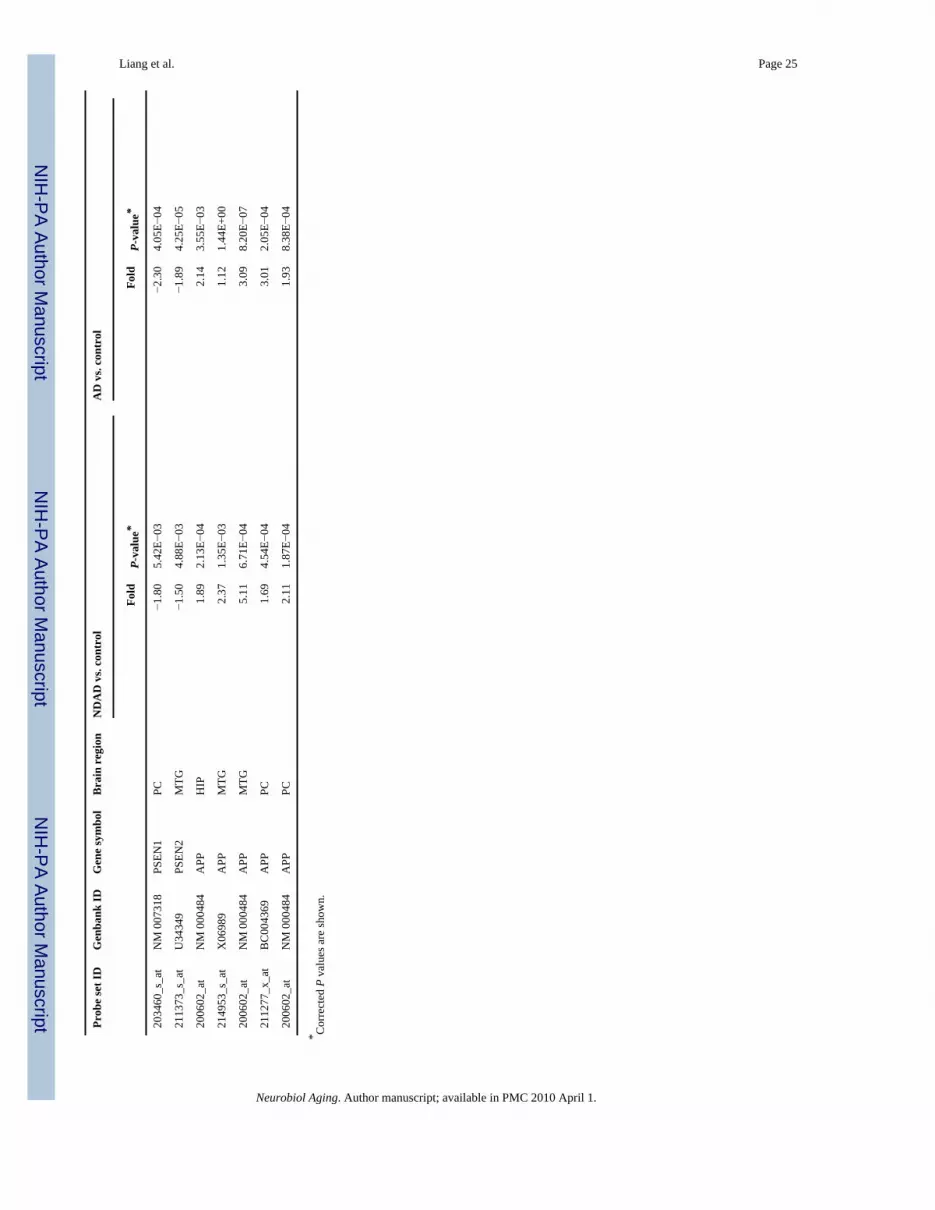
Evaluation of relevant factors in plaque formation pathways also led to the identification ofaltered expression of beta-secretase (BACE1), presenilins 1 and 2 (PSEN1, PSEN2), and APP(Table 2). Decreased expression was found for BACE1, the enzyme that makes the initial cleavein APP during sequential processing to generate Abeta proteins (Selkoe, 2001;Selkoe andSchenk, 2003;Sinha et al., 1999;Vassar et al., 1999;Yan et al., 1999), in NDAD and AD brains(compared to controls). In contrast, another study focusing on the temporal neocortex identifiedan absence of BACE expression changes between AD and control brains (Matsui et al.,2007)—this difference may be derived from the earlier degenerative timepoint considered inthis study as well as the cellular specificity of this study. Furthermore, presenilins 1 and 2,components of the gamma secretase complex, showed decreased expression (Table 2). Incontrast, in AD brains, PSEN1 demonstrated increased expression in the temporal neocortex(Matsui et al., 2007). Lastly, APP demonstrated increased expression (Table 2) to possiblycorrelate with the moderate to frequent CERAD ratings assigned for the profiled NDAD andAD brains. However, other studies have shown varied results regarding APP mRNA levels inAD brains. While one study identified increased levels of APP isoforms containing a Kunitz-type serine protease inhibitor domain in the cerebral cortices of AD brains (Preece et al.,2004), another study also identified this trend but did not find changes in overall levels of APPmRNA in the temporal neo-cortices of AD and control brains (Matsui et al., 2007). In contrast,
Liang et al. Page 7
Neurobiol Aging. Author manuscript; available in PMC 2010 April 1.
NIH
-PA Author Manuscript
NIH
-PA Author Manuscript
NIH
-PA Author Manuscript
Johnston et al. (1996) identified reductions in total APP mRNA levels in the mid-temporalcortices of AD brains. Although our APP expression findings contrast with these previousstudies (and although we were unable to differentiate between APP mRNA isoforms on theAffymetrix array), it has been shown that APP expression differs greatly across subjects andthus may contribute to the differences found (Harrison et al., 1996;Oyama et al., 1991,1993;Robinson et al., 1994). Additionally, as results from APP expression studies may differ,we considered both NDAD and AD cases and focused on neuron-specific regional expressionto differentiate the findings presented here from whole tissue studies. The changes identifiedhere suggest that common pathogenic or neuroprotective mechanisms are enacted in bothNDAD and AD brains with regards to plaque formation. It is also particularly interesting tonote the absence of significant expression alterations of NFT and plaque formation elementsin the SFG and VCX, regions that are more spared from the hallmark AD pathologies.
3.1.2. Common expression changes in NDAD and AD brains: ubiquitin–proteasomal pathways—The toxicity of protein aggregates in the form of NFTs andplaques may also be related to changes or deficits in the ubiquitin–proteasomal pathway, aprimary avenue for protein degradation. Across NDAD and AD brains and across all profiledregions, elements in the ubiquitin–proteasomal pathway showed both up-regulated and down-regulated expression with the lowest number of affected elements in the SFG and VCX. Alteredexpression was identified for ubiquitins (UBB, UBC), ubiquitin-conjugating enzymes(UBE1C, UBE1DC1, UBE2D2, UBE2D3, UBE2H, UBE2I, UBE2J1, UBE2L3, UBE2R2),ubiquitin specific peptidases (USP1, USP2, USP4, USP6-8, USP10, USP11, USP16, USP21,USP22, USP31, USP33, USP34, USP36, USP37, USP42, USP46-48, USP50, USP53, USP54),and proteasomal sub-units (PSMA1, PSMA5-7, PSMB1-7, PSMB10, PSMC1-3, PSMC5,PSMD1, PSMD4, PSMD11). The EC, SFG, and VCX showed solely decreased expression inNDAD and AD brains, while the HIP, MTG, and PC showed both increased and decreasedexpression for different subunits. Such dysregulated expression of ubiquitin–proteasomalpathway components indicates that this pathway is altered in NDAD and AD brains and mayrepresent neuroprotective or pathogenic efforts (particularly with regards to the formation ofplaques and tangles) that may begin at NDAD stages and potentially progress to AD.
3.1.3. Common expression changes in NDAD and AD brains: loss of synapticconnections—Another characteristic marker of AD is brain atrophy and loss of synapticconnections. To assess relevant expression changes that may affect such degeneration, weevaluated genes encoding synaptic proteins. These proteins include synaptosomal-associatedprotein, 25kDa (SNAP25), syntaxins (STX), synapsins (SYN), synap-tobrevins (vesicle-associated membrane protein; VAMP), synaptogyrins (SYNGR), and synaptotagmins (SYT)(refer to Table 3). SNAP-25, STX, and VAMP make up the SNARE complex, whose assemblyallows for synaptic exocytosis (Sollner et al., 1993) and thus influences inter-neuronalcommunications. SYNs are phosphoproteins that help to regulate neurotransmitter release(Hackett et al., 1990;Hilfiker et al., 1998;Jovanovic et al., 2001,2000;Li et al., 1995;Llinas etal., 1985,1991;Rosahl et al., 1995) and also may have roles in establishing synaptic contacts.Finally, SYNGRs are suggested to be involved in vesicle exocytosis and membrane trafficking(Belizaire et al., 2004;Janz et al., 1999;Sugita et al., 1999), while SYTs are synaptic vesicleproteins that act as calcium sensors to support fast exocytosis and neurotransmitter release(Saraswati et al., 2007). Both up-regulated and down-regulated expression was identified forthese synaptic factors (Table 3) to indicate drastic changes in demand for these proteins. Inaddition, increased expression of SYNs has been found to be correlated with establishingsynaptic contacts (Ferreira et al., 2000;Lohmann et al., 1978;Melloni and DeGennaro, 1994)to suggest that the increased and decreased expression seen in this study may be correlatedwith a loss and establishment of synaptic contacts in NDAD brains. Such changes in contactsmay ultimately lead to deficits in synaptic functions if contacts are not properly re-established.
Liang et al. Page 8
Neurobiol Aging. Author manuscript; available in PMC 2010 April 1.
NIH
-PA Author Manuscript
NIH
-PA Author Manuscript
NIH
-PA Author Manuscript
3.2. Unique expression changes in NDAD brainsIn addition to significant common expression changes in NDAD brains and AD brainscompared to controls, unique statistically significant (P < 0.01, corrected) expression changesin NDAD brains (and absent or not significant in AD brains) were also identified. Pathwayanalysis using MetaCore GeneGo identified processes that contain these uniquely expressedgenes. Data for these genes and all processes for each regional analysis are located on thesupplementary data site. Interestingly, learning and/or memory processes were found to beaffected in the EC, HIP, MTG, PC, and SFG of NDAD brains. Down-regulated genes fromthese processes include APOE, CHST10 (carbohydrate sulfotransferase 10), CTNND2(catenin, delta 2), EGR1 (early growth response 1), ABI2 (Abl interactor 2), FYN (FYNoncogene), GM2A (GM2 ganglioside activator), PRKCB1 (protein kinase C, beta 1), PTN(pleiotrophin), S100B (S100 calcium binding protein, beta), and SHC3 (SHC transformingprotein 3) (refer to Table 4). Up-regulated genes from learning and/or memory processesinclude ABI2, EFNB2 (ephrin-B2), MAPT, GRM7 (glutamate receptor, metabotropic 7),LAMB1 (laminin, beta 1), PRKACB (protein kinase, cAMP-dependent, catalytic, beta), andVDAC3 (voltage-dependent anion channel 3). While the NDAD patients did not meet clinicalcriteria for dementia, these transcriptomic changes precede stages during which dementiasymptoms are detectable and may represent compensatory efforts targeted against onset ofcognitive deficits. These learning/memory genes may thus represent novel factors to considerin developing earlier diagnostics and treatments.
Regional analysis of unique expression changes also identified additional affected pathwaysincluding cell communication (in the EC), neuron recognition (EC), neurite development (EC),cell organization and biogenesis (EC, HIP, PC, VCX), synaptic transmission (HIP, PC),regulation of neurotransmitter levels (HIP), intracellular transport (HIP, MTG, PC, VCX),smooth ER calcium ion homeostasis (MTG), neurophysiological process (PC), and negativeregulation of apoptosis (SFG). Interestingly, in the VCX, the region found to be most sparedfrom AD pathologies, the majority of the top processes include metabolic (protein, primary,cellular, macromolecule) and biosynthesis pathways, which may lend insight into earlier eventsthat may influence this region’s protection from plaque and tangle formation. While theimplications for these process-specific changes are not clear, this analysis provides evidenceof specific changes in NDAD brains apart from AD brains that may define an early timepointin neurodegeneration.
3.3. Regional expression variance across sample groupsTo consider a more global perspective of expression changes across the control, NDAD, andAD sample groups, principle components analysis (PCA) was applied for each region. Thisanalysis evaluates expression levels across all three sample groups and pinpoints expressionpatterns (also referred to as components) that account for the greatest amount of expressionvariance across these groups. The components identified from this analysis, along with thepercentage of variance accounted for by each component, are shown in Fig. 2. Those genesthat demonstrate a signature identical to the first component (with a correlation value of 1),and thus demonstrate the greatest expression changes across the three sample groups, are listedin Table 5. Briefly, for the EC, HIP, and PC, component 1 for each of these regions demonstratesan overall decrease in expression levels across control, NDAD, and AD brains. In contrast, forthe MTG, SFG, and VCX, component 1 for these regions demonstrates an increase inexpression levels across control, NDAD, and AD brains.
Evaluation of the genes accounting for the greatest amount of expression changes within eachregion and across the three sample groups led to the identification of potentially biologicallyrelevant factors in AD pathogenesis. The first is cathepsin D (CTSD), a gene that has beensuggested to demonstrate a genetic association with AD risk and pathogenesis (Davidson et
Liang et al. Page 9
Neurobiol Aging. Author manuscript; available in PMC 2010 April 1.
NIH
-PA Author Manuscript
NIH
-PA Author Manuscript
NIH
-PA Author Manuscript
al., 2006; Mariani et al., 2006; Papassotiropoulos et al., 2000) and which codes for a proteasethat may cleave apoE to generate fragments found in plaques (Zhou et al., 2006). CTSD,correlating with component 1 in the EC, demonstrates a decrease in expression starting fromcontrol brains, to NDAD brains, and to AD brains—this trend may represent neuroprotectiveefforts to inhibit plaque formation. Genes coding for enzymes that have primary roles in theubiquitin–proteasomal pathway also demonstrated this downward trend across healthy brainsto NDAD brains and to AD brains. These genes include UBR1 (ubiquitin protein ligase E3)which correlates with EC component 1 and UBE2I (ubiquitin-conjugating enzyme E2I), whichcorrelates with PC component 1. These UBR1/UBE2I signatures suggest that their degradativepathways may be operating at lower levels in NDAD brains and more so in AD brains. Suchdown-regulation may represent a weakening of the ubiquitin–proteasomal system to ultimatelyallow buildup of NFTs. Also correlating with EC component 1 is neurexin 1 (NRXN1), whosetranscripts can be alternatively spliced to generate alpha or beta isoforms. Interestingly, beta-neurexins interact with neuroligins to form and stabilize synapses (Benson et al., 2001;Scheiffele, 2003; Waites et al., 2005) so that the decreasing levels of expression shown by ECcomponent 1 parallels characteristic loss of synaptic connections in AD brains and potentiallyin NDAD brains to a lesser extent.
PCA analysis of HIP also identified a number of interesting genes that correlate withcomponent 1 in this region. First is CCS (copper chaperone for superoxide dismutase), whichbinds copper and complexes with and activates superoxide dismutase 1 (SOD1) (Brown et al.,2004; Culotta et al., 1997; Furukawa et al., 2004; Rae et al., 2001; Rothstein et al., 1999;Schmidt et al., 1999), an enzyme responsible for destroying free radicals. As AD pathogenesisis suggested to be influenced by oxidative stress resulting from free radicals (Markesbery,1997), the expression signature for component 1 indicates a decrease in expression of CCSfrom healthy control brains to NDAD brains and to AD brains. This gradual decrease maydemonstrate weakened neuronal efforts directed at fighting free radical toxicity in NDAD andAD brains. Second is ABAD (3-hydroxyacyl-CoA dehydro-genase type II), which has beenfound to be up-regulated in affected neurons in AD (Yan et al., 1997) and has been found tolink Abeta to mitochondrial toxicity in AD (Lustbader et al., 2004). While HIP component 1indicates a decrease in expression in NDAD and AD brains compared to controls, this findingcorrelates with our profiling of non-tangle bearing neurons. Also correlating with HIPcomponent 1 is CAPNS1 (calpain, small subunit 1), which codes for a subunit common to allcalpains. Increased activity of calpain has been suggested to be involved in AD developmentdue to its association with perturbed calcium homeostasis (LaFerla, 2002; Mattson and Chan,2003; Nixon, 2003; Vanderklish and Bahr, 2000). Thus, across NDAD and AD brains, thedecreased expression of CAPNS1 may represent neuroprotective efforts enacted in healthyneurons of NDAD and AD brains.
Overall, PCA analysis identifies the expression trends within each region profiled and providesa general overview of region-specific transcriptomic changes that may be associated withdisease progression. In the EC, HIP, and PC, significant down-regulation of gene expressionis prevalent across control, NDAD, and AD brains, whereas in the MTG, SFG, and VCX,significant up-regulation of gene expression is seen. While further studies are necessary todecipher the implications of these changes, it is apparent that region-specific transcriptomicchanges occur across brains of healthy elderly individuals, non-demented individuals withintermediate AD neuropathology, and clinically diagnosed AD patients with ADneuropathology, and may be key in understanding the timeline of AD pathogenesis.
3.4. RT-PCR validation of selected genesTo validate gene expression changes in NDAD brains, we performed RT-PCR on unprofiledfresh frozen brain sections from additional healthy elderly controls, NDAD cases, and AD
Liang et al. Page 10
Neurobiol Aging. Author manuscript; available in PMC 2010 April 1.
NIH
-PA Author Manuscript
NIH
-PA Author Manuscript
NIH
-PA Author Manuscript

cases. Based on the NDAD analyses, genes were selected for validation based on statisticalsignificance (P < 0.05, corrected), relevance to AD, and availability of brain tissue. Based onthese criteria, GRIA1, GRIA3, MAP1B, APOE, APP, BACE1, COX5B, and MAP4 wereevaluated in the MTG and APOE, APP, BACE1, COX5B, and MAP4 were evaluated in thePC. Results from RT-PCR analysis, along with the respective array data, are shown in Table6 and Fig. 3.
In the MTG, RT-PCR data validated expression changes in NDAD brains compared to healthyelderly control brains for GRIA1, APOE, BACE1, COX5B, and MAP4 (all demon-strateddecreased expression in NDAD brains compared to controls). Non-significant changes wereidentified for MAP1B and opposite (down-regulated) changes were found for APP.Furthermore, RT-PCR analysis of AD MTG samples compared to control samples validateddown-regulated expression changes for GRIA1, MAP1B, and COX5B. In the PC, RT-PCRdata also validated expression changes in NDAD brains compared to controls for APOE,BACE1, and COX5B (these genes all showed down-regulated expression in NDAD brainscompared to controls), while opposite changes were identified for APP and MAP4. Along withthe NDAD validation, RT-PCR also validated down-regulated AD versus control expressionchanges in the PC for APOE and COX5B, while APP and MAP4 demonstrated non-significantchanges. This RT-PCR data provides independent validation of the majority of expressionchanges of relevant genes selected from array analysis of the MTG and PC.
4. SummaryIn this study, we expression profiled non-tangle bearing neurons from the post-mortem brainsof non-demented individuals who demonstrated median levels of AD pathologies in the brain.The findings we present here build upon our previous study in which we similarly evaluatedneurons from healthy elderly control brains and AD brains, and provide molecular informationabout an earlier state during AD pathogenesis. Significant overlapping expression changeswere identified in both NDAD and AD brains compared to controls and may thus define atimeline of AD pathogenesis for which factors involved in formation of AD pathologies alreadydemonstrate expression changes in NDAD brains. Overall,we have generated a high-quality,low PMI, novel expression data set that defines the neuronal tran-scriptome in healthy elderly,NDAD, and AD brains. This resource will help to elucidate AD pathogenesis and identifiesnovel targets for developing improved diagnostics and therapeutics against AD. Lastly, weprovide this data set to the scientific community as a public resource.
Supplementary MaterialRefer to Web version on PubMed Central for supplementary material.
AcknowledgmentsWe would like to thank Nick Lehmans (Translational Genomics Research Institute) for help in setting up thesupplementary data site, Lucia Sue (Sun Health Research Institute) for help with obtaining neuropathological data,and Elizabeth Salomon (Translational Genomics Research Institute) for assistance with GEO data posting. We wouldalso like to thank the National Institute on Aging’s Alzheimer’s Disease Centers program and the National Alzheimer’sCoordinating Center for help in obtaining samples for analysis.
This project was funded by grants from: the National Institute on Aging (#K01AG024079 to TD; 1-RO1-AG023193to DAS; RO1-5U24NS051872 to DAS (NIH Neuroscience Microarray Consortium); P30 AG19610 to EMR; P50AG05681 to JCM; P01 AG03991 to JCM; AG05128 for the Duke University ADC), the National Alzheimer’sCoordinating Center (U01AG016976), the Arizona Alzheimer’s Research Center (to EMR) under a collaborativeagreement from the National Institute on Aging, and the State of Arizona to the Arizona Parkinson’s Disease Center(Arizona Biomedical Research Commission contract 0011).
Liang et al. Page 11
Neurobiol Aging. Author manuscript; available in PMC 2010 April 1.
NIH
-PA Author Manuscript
NIH
-PA Author Manuscript
NIH
-PA Author Manuscript

ReferencesAngelie E, Bonmartin A, Boudraa A, Gonnaud PM, Mallet JJ, Sappey-Marinier D. Regional differences
and metabolic changes in normal aging of the human brain: proton MR spectroscopic imaging study.Am. J. Neuroradiol 2001;22(1):119–127. [PubMed: 11158897]
Barrachina M, Castano E, Ferrer I. TaqMan PCR assay in the control of RNA normalization in humanpost-mortem brain tissue. Neu-rochem. Int 2006;49(3):276–284.
Belizaire R, Komanduri C, Wooten K, Chen M, Thaller C, Janz R. Characterization of synaptogyrin 3as a new synaptic vesicle protein. J. Comp. Neurol 2004;470(3):266–281. [PubMed: 14755516]
Benson DL, Colman DR, Huntley GW. Molecules, maps and synapse specificity. Nat. Rev. Neurosci2001;2(12):899–909. [PubMed: 11733797]
Blesa R, Mohr E, Miletich RS, Hildebrand K, Sampson M, Chase TN. Cerebral metabolic changes inAlzheimer’s disease: neu-robehavioral patterns. Dementia 1996;7(5):239–245. [PubMed: 8872413]
Bobinski M, de Leon MJ, Convit A, De Santi S, Wegiel J, Tarshish CY, Saint Louis LA, WisniewskiHM. MRI of entorhinal cortex in mild Alzheimer’s disease. Lancet 1999;353(9146):38–40. [PubMed:10023955]
Bouras C, Hof PR, Giannakopoulos P, Michel JP, Morrison JH. Regional distribution of neurofibrillarytangles and senile plaques in the cerebral cortex of elderly patients: a quantitative evaluation of a one-year autopsy population from a geriatric hospital. Cereb. Cortex 1994;4(2):138–150. [PubMed:8038565]
Boutajangout A, Boom A, Leroy K, Brion JP. Expression of tau mRNA and soluble tau isoforms inaffected and non-affected brain areas in Alzheimer’s disease. FEBS Lett 2004;576(1–2):183–189.[PubMed: 15474035]
Braak H, Braak E. The human entorhinal cortex: normal morphology and lamina-specific pathology invarious diseases. Neurosci. Res 1992;15(1–2):6–31. [PubMed: 1336586]
Braak H, Braak E. Neuropathological stageing of Alzheimer-related changes. Acta Neuropathol. (Berl.)1991;82(4):239–259. [PubMed: 1759558]
Brown NM, Torres AS, Doan PE, O’Halloran TV. Oxygen and the copper chaperone CCS regulateposttranslational activation of Cu, Zn superoxide dismutase. Proc. Natl. Acad. Sci. U.S.A 2004;101(15):5518–5523. [PubMed: 15064408]
Conrad C, Zhu J, Conrad C, Schoenfeld D, Fang Z, Ingelsson M, Stamm S, Church G, Hyman BT. Singlemolecule profiling of tau gene expression in Alzheimer’s disease. J. Neurochem 2007;103(3):1228–1236. [PubMed: 17727636]
Convit A, Wolf OT, de Leon MJ, Patalinjug M, Kandil E, Caraos C, Scherer A, Saint Louis LA, CancroR. Volumetric analysis of the pre-frontal regions: findings in aging and schizophrenia. PsychiatryRes 2001;107(2):61–73. [PubMed: 11530273]
Culotta VC, Klomp LW, Strain J, Casareno RL, Krems B, Gitlin JD. The copper chaperone for superoxidedismutase. J. Biol. Chem 1997;272(38):23469–23472. [PubMed: 9295278]
Davidson Y, Gibbons L, Pritchard A, Hardicre J, Wren J, Tian J, Shi J, Stopford C, Julien C, ThompsonJ, Payton A, Thaker U, Hayes AJ, Iwatsubo T, Pickering-Brown SM, Pendleton N, Horan MA, BurnsA, Purandare N, Lendon CL, Neary D, Snowden JS, Mann DM. Genetic associations betweencathepsin D exon 2 C → T polymorphism and Alzheimer’s disease, and pathological correlationswith genotype. J. Neurol. Neurosurg. Psychiatry 2006;77(4):515–517. [PubMed: 16543533]
de Leon MJ, George AE, Stylopoulos LA, Smith G, Miller DC. Early marker for Alzheimer’s disease:the atrophic hippocampus. Lancet 1989;2(8664):672–673. [PubMed: 2570916]
Du AT, Schuff N, Zhu XP, Jagust WJ, Miller BL, Reed BR, Kramer JH, Mungas D, Yaffe K, Chui HC,Weiner MW. Atrophy rates of entorhinal cortex in AD and normal aging. Neurology 2003;60(3):481–486. [PubMed: 12578931]
Ferreira A, Kao HT, Feng J, Rapoport M, Greengard P. Synapsin III: developmental expression,subcellular localization, and role in axon formation. J. Neurosci 2000;20(10):3736–3744. [PubMed:10804215]
Fox NC, Warrington EK, Stevens JM, Rossor MN. Atrophy of the hippocampal formation in early familialAlzheimer’s disease. A longitudinal MRI study of at-risk members of a family with an amyloid
Liang et al. Page 12
Neurobiol Aging. Author manuscript; available in PMC 2010 April 1.
NIH
-PA Author Manuscript
NIH
-PA Author Manuscript
NIH
-PA Author Manuscript
precursor protein 717Val-Gly mutation. Ann. N.Y. Acad. Sci 1996;777:226–232. [PubMed:8624089]
Frisoni GB, Laakso MP, Beltramello A, Geroldi C, Bianchetti A, Soininen H, Trabucchi M. Hippocampaland entorhinal cortex atrophy in frontotemporal dementia and Alzheimer’s disease. Neurology1999;52(1):91–100. [PubMed: 9921854]
Furukawa Y, Torres AS, O’Halloran TV. Oxygen-induced maturation of SOD1: a key role for disulfideformation by the copper chaperone CCS. Embo J 2004;23(14):2872–2881. [PubMed: 15215895]
Ginsberg SD, Che S, Counts SE, Mufson EJ. Shift in the ratio of three-repeat tau and four-repeat taumRNAs in individual cholinergic basal forebrain neurons in mild cognitive impairment andAlzheimer’s disease. J. Neurochem 2006;96(5):1401–1408. [PubMed: 16478530]
Ginsberg SD, Hemby SE, Lee VM, Eberwine JH, Trojanowski JQ. Expression profile of transcripts inAlzheimer’s disease tangle-bearing CA1 neurons. Ann. Neurol 2000;48(1):77–87. [PubMed:10894219]
Goedert M, Spillantini MG, Jakes R, Rutherford D, Crowther RA. Multiple isoforms of humanmicrotubule-associated protein tau: sequences and localization in neurofibrillary tangles ofAlzheimer’s disease. Neuron 1989;3(4):519–526. [PubMed: 2484340]
Hackett JT, Cochran SL, Greenfield LJ Jr, Brosius DC, Ueda T. Synapsin I injected presynaptically intogoldfish mauthner axons reduces quantal synaptic transmission. J. Neurophysiol 1990;63(4):701–706. [PubMed: 2160524]
Harrison PJ, Wighton-Benn WH, Heffernan JM, Sanders MW, Pearson RC. Amyloid precursor proteinmRNAs in Alzheimer’s disease. Neurodegeneration 1996;5(4):409–415. [PubMed: 9117555]
Hemby SE, Trojanowski JQ, Ginsberg SD. Neuron-specific age-related decreases in dopamine receptorsubtype mRNAs. J. Comp. Neurol 2003;456(2):176–183. [PubMed: 12509874]
Hilfiker S, Schweizer FE, Kao HT, Czernik AJ, Greengard P, Augustine GJ. Two sites of action forsynapsin domain E in regulating neurotransmitter release. Nat. Neurosci 1998;1(1):29–35. [PubMed:10195105]
Hyman BT, Van Hoesen GW, Damasio AR, Barnes CL. Alzheimer’s disease: cell-specific pathologyisolates the hippocampal formation. Science 1984;225(4667):1168–1170. [PubMed: 6474172]
Ivancevic V, Alavi A, Souder E, Mozley PD, Gur RE, Benard F, Munz DL. Regional cerebral glucosemetabolism in healthy volunteers determined by fluordeoxyglucose positron emission tomography:appearance and variance in the transaxial, coronal, and sagittal planes. Clin. Nucl. Med 2000;25(8):596–602. [PubMed: 10944013]
Jack CR Jr, Petersen RC, Xu Y, O’Brien PC, Smith GE, Ivnik RJ, Tangalos EG, Kokmen E. Rate ofmedial temporal lobe atrophy in typical aging and Alzheimer’s disease. Neurology 1998;51(4):993–999. [PubMed: 9781519]
Janz R, Sudhof TC, Hammer RE, Unni V, Siegelbaum SA, Bol-shakov VY. Essential roles in synapticplasticity for synaptogyrin I and synaptophysin I. Neuron 1999;24(3):687–700. [PubMed: 10595519]
Johnston JA, Norgren S, Ravid R, Wasco W, Winblad B, Lannfelt L, Cowburn RF. Quantification ofAPP and APLP2 mRNA in APOE genotyped Alzheimer’s disease brains. Brain Res. Mol. Brain Res1996;43(1–2):85–95. [PubMed: 9037522]
Jovanovic JN, Czernik AJ, Fienberg AA, Greengard P, Sihra TS. Synapsins as mediators of BDNF-enhanced neurotransmitter release. Nat. Neurosci 2000;3(4):323–329. [PubMed: 10725920]
Jovanovic JN, Sihra TS, Nairn AC, Hemmings HC Jr, Greengard P, Czernik AJ. Opposing changes inphosphorylation of specific sites in synapsin I during Ca2+-dependent glutamate release in isolatednerve terminals. J. Neurosci 2001;21(20):7944–7953. [PubMed: 11588168]
Kitano-Takahashi M, Morita H, Kondo S, Tomizawa K, Kato R, Tanio M, Shirota Y, Takahashi H, SugioS, Kohno T. Expression, purification and crystallization ofahuman tau-tubulin kinase 2 that phos-phorylates tau protein. Acta Crystallogr. Sect. F: Struct. Biol. Cryst. Commun 2007;63(Pt 7):602–604.
Kuwano R, Miyashita A, Arai H, Asada T, Imagawa M, Shoji M, Higuchi S, Urakami K, Kakita A,Takahashi H, Tsukie T, Toyabe S, Akazawa K, Kanazawa I, Ihara Y. Dynamin-binding protein geneon chromosome 10q is associated with late-onset Alzheimer’s disease. Hum. Mol. Genet 2006;15(13):2170–2182. [PubMed: 16740596]
Liang et al. Page 13
Neurobiol Aging. Author manuscript; available in PMC 2010 April 1.
NIH
-PA Author Manuscript
NIH
-PA Author Manuscript
NIH
-PA Author Manuscript

LaFerla FM. Calcium dyshomeostasis and intracellular signalling in Alzheimer’s disease. Nat. Rev.Neurosci 2002;3(11):862–872. [PubMed: 12415294]
Li L, Chin LS, Shupliakov O, Brodin L, Sihra TS, Hvalby O, Jensen V, Zheng D, McNamara JO,Greengard P, Andersen P. Impairment of synaptic vesicle clustering and of synaptic transmission,and increased seizure propensity, in synapsin I-deficient mice. Proc. Natl. Acad. Sci. U.S.A 1995;92(20):9235–9239. [PubMed: 7568108]
Liang WS, Dunckley T, Beach TG, Grover A, Mastroeni D, Ramsey K, Caselli RJ, Kukull WA, McKeelD, Morris JC, Hulette CM, Schmechel D, Reiman EM, Rogers J, Stephan DA. Altered neuronal geneexpression in brain regions differentially affected by Alzheimer’s Disease: a reference data set.Physiol. Genomics. 2008
Liang WS, Dunckley T, Beach TG, Grover A, Mastroeni D, Walker DG, Caselli RJ, Kukull WA, McKeelD, Morris JC, Hulette C, Schmechel D, Alexander GE, Reiman EM, Rogers J, Stephan DA. Geneexpression profiles in anatomically and functionally distinct regions of the normal aged human brain.Physiol. Genomics 2007;28(3):311–322. [PubMed: 17077275]
Livak KJ, Schmittgen TD. Analysis of relative gene expression data using real-time quantitative PCRand the 2(-Delta Delta C(T)) method. Methods 2001;25(4):402–408. [PubMed: 11846609]
Llinas R, Gruner JA, Sugimori M, McGuinness TL, Greengard P. Regulation by synapsin I and Ca(2+)-calmodulin-dependent protein kinase II of the transmitter release in squid giant synapse. J. Physiol1991;436:257–282. [PubMed: 1676419]
Llinas R, McGuinness TL, Leonard CS, Sugimori M, Greengard P. Intraterminal injection of synapsin Ior calcium/calmodulin-dependent protein kinase II alters neurotransmitter release at the squid giantsynapse. Proc. Natl. Acad. Sci. U.S.A 1985;82(9):3035–3039. [PubMed: 2859595]
Loessner A, Alavi A, Lewandrowski KU, Mozley D, Souder E, Gur RE. Regional cerebral functiondetermined by FDG-PET in healthy volunteers: normal patterns and changes with age. J. Nucl. Med1995;36(7):1141–1149. [PubMed: 7790936]
Lohmann SM, Ueda T, Greengard P. Ontogeny of synaptic phos-phoproteins in brain. Proc. Natl. Acad.Sci. U.S.A 1978;75(8):4037–4041. [PubMed: 211513]
Lustbader JW, Cirilli M, Lin C, Xu HW, Takuma K, Wang N, Caspersen C, Chen X, Pollak S, ChaneyM, Trinchese F, Liu S, Gunn-Moore F, Lue LF, Walker DG, Kuppusamy P, Zewier ZL, Arancio O,Stern D, Yan SS, Wu H. ABAD directly links Abeta to mitochondrial toxicity in Alzheimer’s disease.Science 2004;304(5669):448–452. [PubMed: 15087549]
Mariani E, Seripa D, Ingegni T, Nocentini G, Mangialasche F, Ercolani S, Cherubini A, Metastasio A,Pilotto A, Senin U, Mecocci P. Interaction of CTSD and A2M polymorphisms in the risk forAlzheimer’s disease. J. Neurol. Sci 2006;247(2):187–191. [PubMed: 16784755]
Markesbery WR. Oxidative stress hypothesis in Alzheimer’s disease. Free Radic. Biol. Med 1997;23(1):134–147. [PubMed: 9165306]
Matsui T, Ingelsson M, Fukumoto H, Ramasamy K, Kowa H, Frosch MP, Irizarry MC, Hyman BT.Expression of APP pathway mRNAs and proteins in Alzheimer’s disease. Brain Res 2007;1161:116–123. [PubMed: 17586478]
Mattson MP, Chan SL. Neuronal and glial calcium signaling in Alzheimer’s disease. Cell Calcium2003;34(4–5):385–397. [PubMed: 12909083]
Melloni RH Jr, DeGennaro LJ. Temporal onset of synapsin I gene expression coincides with neuronaldifferentiation during the development of the nervous system. J. Comp. Neurol 1994;342(3):449–462. [PubMed: 8021345]
Metsaars WP, Hauw JJ, van Welsem ME, Duyckaerts C. A grading system of Alzheimer disease lesionsin neocortical areas. Neurobiol. Aging 2003;24(4):563–572. [PubMed: 12714113]
Mielke R, Herholz K, Grond M, Kessler J, Heiss WD. Clinical deterioration in probable Alzheimer’sdisease correlates with progressive metabolic impairment of association areas. Dementia 1994;5(1):36–41. [PubMed: 8156085]
Mielke R, Kessler J, Szelies B, Herholz K, Wienhard K, Heiss WD. Normal and pathological aging—findings of positron-emission-tomography. J. Neural. Transm 1998;105(8–9):821–837. [PubMed:9869321]
Mirra SS, Heyman A, McKeel D, Sumi SM, Crain BJ, Brownlee LM, Vogel FS, Hughes JP, van BelleG, Berg L. The consortium to establish a registry for Alzheimer’s Disease (CERAD). Part II.
Liang et al. Page 14
Neurobiol Aging. Author manuscript; available in PMC 2010 April 1.
NIH
-PA Author Manuscript
NIH
-PA Author Manuscript
NIH
-PA Author Manuscript
Standardization of the neuropathologic assessment of Alzheimer’s disease. Neurology 1991;41(4):479–486. [PubMed: 2011243]
Moeller JR, Ishikawa T, Dhawan V, Spetsieris P, Mandel F, Alexander GE, Grady C, Pietrini P, EidelbergD. The metabolic topography of normal aging. J. Cereb. Blood Flow Metab 1996;16(3):385–398.[PubMed: 8621743]
Nixon RA. The calpains in aging and aging-related diseases. Ageing Res. Rev 2003;2(4):407–418.[PubMed: 14522243]
Oyama F, Shimada H, Oyama R, Titani K, Ihara Y. Beta-amyloid protein precursor and tau mRNA levelsversus beta-amyloid plaque and neurofibrillary tangles in the aged human brain. J. Neurochem1993;60(5):1658–1664. [PubMed: 8473889]
Oyama F, Shimada H, Oyama R, Titani K, Ihara Y. Differential expression of beta amyloid proteinprecursor (APP) and tau mRNA in the aged human brain: individual variability and correlationbetween APP-751 and four-repeat tau. J. Neuropathol. Exp. Neurol 1991;50(5):560–578. [PubMed:1910077]
Papassotiropoulos A, Bagli M, Kurz A, Kornhuber J, Forstl H, Maier W, Pauls J, Lautenschlager N, HeunR. A genetic variation of cathepsin D is a major risk factor for Alzheimer’s disease. Ann. Neurol2000;47(3):399–403. [PubMed: 10716266]
Preece P, Virley DJ, Costandi M, Coombes R, Moss SJ, Mudge AW, Jazin E, Cairns NJ. Amyloidprecursor protein mRNA levels in Alzheimer’s disease brain. Brain Res. Mol. Brain Res 2004;122(1):1–9. [PubMed: 14992810]
Rae TD, Torres AS, Pufahl RA, O’Halloran TV. Mechanism of Cu, Zn-superoxide dismutase activationby the human metallochaperone hCCS. J. Biol. Chem 2001;276(7):5166–5176. [PubMed: 11018045]
Reich M, Ohm K, Angelo M, Tamayo P, Mesirov JP. GeneClus-ter 2.0: an advanced toolset for bioarrayanalysis. Bioinformatics 2004;20(11):1797–1798. [PubMed: 14988123]
Robinson CA, Clark AW, Parhad IM, Fung TS, Bou SS. Gene expression in Alzheimer neocortex as afunction of age and pathologic severity. Neurobiol. Aging 1994;15(6):681–690. [PubMed: 7891822]
Rosahl TW, Spillane D, Missler M, Herz J, Selig DK, Wolff JR, Hammer RE, Malenka RC, Sudhof TC.Essential functions of synapsins I and II in synaptic vesicle regulation. Nature 1995;375(6531):488–493. [PubMed: 7777057]
Rothstein JD, Dykes-Hoberg M, Corson LB, Becker M, Cleveland DW, Price DL, Culotta VC, WongPC. The copper chaperone CCS is abundant in neurons and astrocytes in human and rodent brain. J.Neurochem 1999;72(1):422–429. [PubMed: 9886096]
Saraswati S, Adolfsen B, Littleton JT. Characterization of the role of the Synaptotagmin family as calciumsensors in facilitation and asynchronous neurotransmitter release. Proc. Natl. Acad. Sci. U.S.A2007;104(35):14122–14127. [PubMed: 17709738]
Scheiffele P. Cell-cell signaling during synapse formation in the CNS. Annu. Rev. Neurosci 2003;26:485–508. [PubMed: 12626697]
Schmidt PJ, Rae TD, Pufahl RA, Hamma T, Strain J, O’Halloran TV, Culotta VC. Multiple proteindomains contribute to the action of the copper chaperone for superoxide dismutase. J. Biol. Chem1999;274(34):23719–23725. [PubMed: 10446130]
Selkoe DJ. Alzheimer’s disease: genes, proteins, and therapy. Physiol. Rev 2001;81(2):741–766.[PubMed: 11274343]
Selkoe DJ, Schenk D. Alzheimer’s disease: molecular understanding predicts amyloid-basedtherapeutics. Annu. Rev. Pharmacol. Toxicol 2003;43:545–584. [PubMed: 12415125]
Sinha S, Anderson JP, Barbour R, Basi GS, Caccavello R, Davis D, Doan M, Dovey HF, Frigon N, HongJ, Jacobson-Croak K, Jewett N, Keim P, Knops J, Lieberburg I, Power M, Tan H, Tatsuno G, TungJ, Schenk D, Seubert P, Suomensaari SM, Wang S, Walker D, Zhao J, McConlogue L, John V.Purification and cloning of amyloid precursor protein beta-secretase from human brain. Nature1999;402(6761):537–540. [PubMed: 10591214]
Small GW, Ercoli LM, Silverman DH, Huang SC, Komo S, Bookheimer SY, Lavretsky H, Miller K,Siddarth P, Rasgon NL, Mazziotta JC, Saxena S, Wu HM, Mega MS, Cummings JL, Saunders AM,Pericak-Vance MA, Roses AD, Barrio JR, Phelps ME. Cerebral metabolic and cognitive decline inpersons at genetic risk for Alzheimer’s disease. Proc. Natl. Acad. Sci. U.S.A 2000;97(11):6037–6042. [PubMed: 10811879]
Liang et al. Page 15
Neurobiol Aging. Author manuscript; available in PMC 2010 April 1.
NIH
-PA Author Manuscript
NIH
-PA Author Manuscript
NIH
-PA Author Manuscript
Sollner T, Whiteheart SW, Brunner M, Erdjument-Bromage H, Geromanos S, Tempst P, Rothman JE.SNAP receptors implicated in vesicle targeting and fusion. Nature 1993;362(6418):318–324.[PubMed: 8455717]
Sugita S, Janz R, Sudhof TC. Synaptogyrins regulate Ca2+-dependent exocytosis in PC12 cells. J. Biol.Chem 1999;274(27):18893–18901. [PubMed: 10383386]
Thal DR, Rub U, Orantes M, Braak H. Phases of A beta-deposition in the human brain and its relevancefor the development of AD. Neurology 2002;58(12):1791–1800. [PubMed: 12084879]
Vanderklish PW, Bahr BA. The pathogenic activation of calpain: a marker and mediator of cellulartoxicity and disease states. Int. J. Exp. Pathol 2000;81(5):323–339. [PubMed: 11168679]
Vassar R, Bennett BD, Babu-Khan S, Kahn S, Mendiaz EA, Denis P, Teplow DB, Ross S, Amarante P,Loeloff R, Luo Y, Fisher S, Fuller J, Edenson S, Lile J, Jarosinski MA, Biere AL, Curran E, BurgessT, Louis JC, Collins F, Treanor J, Rogers G, Citron M. Beta-secretase cleavage of Alzheimer’samyloid precursor protein by the transmembrane aspartic protease BACE. Science 1999;286(5440):735–741. [PubMed: 10531052]
Waites CL, Craig AM, Garner CC. Mechanisms of vertebrate synaptogenesis. Annu. Rev. Neurosci2005;28:251–274. [PubMed: 16022596]
Yan R, Bienkowski MJ, Shuck ME, Miao H, Tory MC, Pauley AM, Brashier JR, Stratman NC, MathewsWR, Buhl AE, Carter DB, Tomasselli AG, Parodi LA, Heinrikson RL, Gurney ME. Membrane-anchored aspartyl protease with Alzheimer’s disease beta-secretase activity. Nature 1999;402(6761):533–537. [PubMed: 10591213]
Yan SD, Fu J, Soto C, Chen X, Zhu H, Al-Mohanna F, Collison K, Zhu A, Stern E, Saido T, TohyamaM, Ogawa S, Roher A, Stern D. An intracellular protein that binds amyloid-beta peptide and mediatesneurotoxicity in Alzheimer’s disease. Nature 1997;389(6652):689–695. [PubMed: 9338779]
Zhou W, Scott SA, Shelton SB, Crutcher KA. Cathepsin D-mediated proteolysis of apolipoprotein E:possible role in Alzheimer’s disease. Neuroscience 2006;143(3):689–701. [PubMed: 16997486]
Liang et al. Page 16
Neurobiol Aging. Author manuscript; available in PMC 2010 April 1.
NIH
-PA Author Manuscript
NIH
-PA Author Manuscript
NIH
-PA Author Manuscript
Liang et al. Page 17
Neurobiol Aging. Author manuscript; available in PMC 2010 April 1.
NIH
-PA Author Manuscript
NIH
-PA Author Manuscript
NIH
-PA Author Manuscript

Liang et al. Page 18
Neurobiol Aging. Author manuscript; available in PMC 2010 April 1.
NIH
-PA Author Manuscript
NIH
-PA Author Manuscript
NIH
-PA Author Manuscript
Liang et al. Page 19
Neurobiol Aging. Author manuscript; available in PMC 2010 April 1.
NIH
-PA Author Manuscript
NIH
-PA Author Manuscript
NIH
-PA Author Manuscript

Fig. 1.Common expression changes in NDAD and AD. Regional dendrograms of statisticallysignificant genes (P< 0.01, corrected for multiple testing) demonstrating parallel expressionchanges are shown. Genes shown have the greatest changes in expression for both the NDADvs. controls analysis and AD vs. controls analysis.
Liang et al. Page 20
Neurobiol Aging. Author manuscript; available in PMC 2010 April 1.
NIH
-PA Author Manuscript
NIH
-PA Author Manuscript
NIH
-PA Author Manuscript

Fig. 2.Regional principal components analysis. Three principal components are shown for eachregion across healthy controls, NDAD brains, and AD brains (x-axis). The y-axis representsthe logged normalized intensity value. The percentage of expression variance (across controls,NDAD, and AD brains) that each component accounts for is listed.
Liang et al. Page 21
Neurobiol Aging. Author manuscript; available in PMC 2010 April 1.
NIH
-PA Author Manuscript
NIH
-PA Author Manuscript
NIH
-PA Author Manuscript
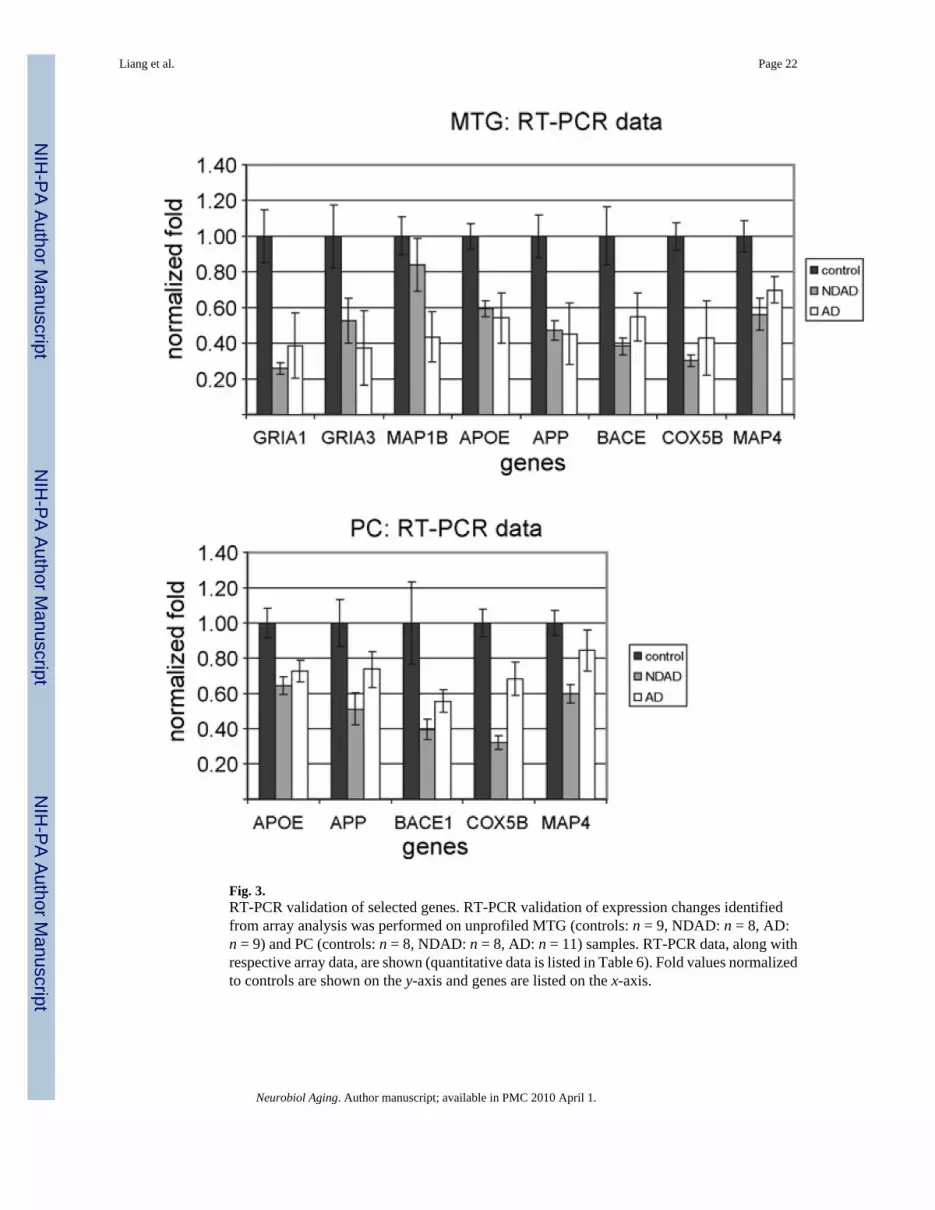
Fig. 3.RT-PCR validation of selected genes. RT-PCR validation of expression changes identifiedfrom array analysis was performed on unprofiled MTG (controls: n = 9, NDAD: n = 8, AD:n = 9) and PC (controls: n = 8, NDAD: n = 8, AD: n = 11) samples. RT-PCR data, along withrespective array data, are shown (quantitative data is listed in Table 6). Fold values normalizedto controls are shown on the y-axis and genes are listed on the x-axis.
Liang et al. Page 22
Neurobiol Aging. Author manuscript; available in PMC 2010 April 1.
NIH
-PA Author Manuscript
NIH
-PA Author Manuscript
NIH
-PA Author Manuscript
NIH
-PA Author Manuscript
NIH
-PA Author Manuscript
NIH
-PA Author Manuscript
Liang et al. Page 23
Table 1
Sample group information
Control NDAD AD
Mean age 79.8 ± 9.1 86.6 ± 5.3 79.9 ± 6.9
Gender M: 10; F: 4 M: 6; F: 4 M: 15; F: 18
EC (n) 13 6 10
HIP (n) 13 6 10
MTG (n) 12 6 16
PC (n) 13 5 9
SFG (n) 11 6 23
VCX (n) 12 5 19
Sample sizes for each sample group and brain region are shown (n).
Neurobiol Aging. Author manuscript; available in PMC 2010 April 1.

NIH
-PA Author Manuscript
NIH
-PA Author Manuscript
NIH
-PA Author Manuscript
Liang et al. Page 24
Tabl
e 2
Com
mon
exp
ress
ion
chan
ges i
n N
DA
D a
nd A
D b
rain
s: ta
ngle
and
pla
que
path
way
fact
ors
Prob
e se
t ID
Gen
bank
IDG
ene
sym
bol
Bra
in r
egio
nN
DA
D v
s. co
ntro
lA
D v
s. co
ntro
l
Fold
P-va
lue*
Fold
P-va
lue*
2039
29_s
_at
AI0
5635
9M
APT
EC−2
.32
2.41
E−05
−1.4
66.
76E−
03
2064
01_s
_at
J037
78M
APT
HIP
2.73
7.86
E−03
1.85
1.71
E−02
2039
28_
x_at
AI8
7074
9M
APT
HIP
2.48
5.15
E−04
2.23
6.84
E−04
2253
79_a
tA
A19
9717
MA
PTH
IP−2
.40
6.12
E−05
−2.1
51.
35E−
04
2039
30_s
_at
NM
016
835
MA
PTM
TG−1
.90
2.90
E−02
−1.9
91.
81E−
02
2253
79_a
tA
A19
9717
MA
PTM
TG−2
.00
7.44
E−03
−2.2
13.
29E−
03
2266
53_a
tA
B04
0910
MA
RK
1M
TG2.
512.
76E−
031.
498.
36E−
03
2391
66_a
tR
9819
2M
AR
K3
EC−3
.75
1.47
E−03
−1.1
03.
90E+
00
2025
68_s
_at
AI7
4563
9M
AR
K3
HIP
−2.0
82.
24E−
05−2
.37
5.33
E−06
2025
68_s
_at
AI7
4563
9M
AR
K3
MTG
−1.6
12.
76E−
03−1
.59
8.89
E−04
5506
5_at
AL1
2055
4M
AR
K4
EC−4
.32
1.51
E−05
−2.3
92.
44E−
04
2215
60_a
tA
B04
9127
MA
RK
4EC
−5.0
71.
44E−
05−2
.52
2.56
E−04
2042
47_s
_at
NM
004
935
CD
K5
EC−2
.49
1.21
E−03
−3.8
76.
51E−
06
2042
47_s
_at
NM
004
935
CD
K5
HIP
−2.0
32.
43E−
03−1
.91
4.62
E−03
2042
47_s
_at
NM
004
935
CD
K5
MTG
−2.4
92.
95E−
03−4
.33
3.62
E−04
2090
18_s
_at
BF4
3247
8PI
NK
1EC
−2.2
86.
85E−
05−1
.89
3.60
E−04
2090
19_s
_at
AF3
1687
3PI
NK
1H
IP−2
.61
5.56
E−04
−2.2
36.
52E−
04
2139
22_a
tA
W29
4686
TTB
K2
MTG
4.66
8.02
E−05
3.53
3.09
E−06
2139
22_a
tA
W29
4686
TTB
K2
HIP
3.81
3.38
E−04
3.52
1.17
E−07
2310
86_a
tB
F939
127
BA
CE1
EC−1
.98
4.40
E−04
−1.0
46.
53E+
00
2224
63_s
_at
AF1
9072
5B
AC
E1EC
−3.2
81.
70E−
04−1
.66
1.49
E−02
2224
62_s
_at
AI6
5342
5B
AC
E1EC
−3.0
61.
94E−
05−1
.77
1.36
E−03
2224
62_s
_at
AI6
5342
5B
AC
E1H
IP−1
.47
6.26
E−03
−1.1
74.
84E−
01
2179
04_s
_at
NM
012
104
BA
CE1
HIP
−1.6
84.
45E−
03−1
.93
3.77
E−05
2179
04_s
_at
NM
012
104
BA
CE1
MTG
−1.7
59.
56E−
06−1
.32
2.58
E−03
2034
60_s
_at
NM
007
318
PSEN
1H
IP−1
.92
5.33
E−03
−1.6
43.
44E−
02
2265
77_a
tN
4984
4PS
EN1
MTG
−2.0
63.
95E−
03−1
.53
1.91
E−02
Neurobiol Aging. Author manuscript; available in PMC 2010 April 1.
NIH
-PA Author Manuscript
NIH
-PA Author Manuscript
NIH
-PA Author Manuscript
Liang et al. Page 25
Prob
e se
t ID
Gen
bank
IDG
ene
sym
bol
Bra
in r
egio
nN
DA
D v
s. co
ntro
lA
D v
s. co
ntro
l
Fold
P-va
lue*
Fold
P-va
lue*
2034
60_s
_at
NM
007
318
PSEN
1PC
−1.8
05.
42E−
03−2
.30
4.05
E−04
2113
73_s
_at
U34
349
PSEN
2M
TG−1
.50
4.88
E−03
−1.8
94.
25E−
05
2006
02_a
tN
M 0
0048
4A
PPH
IP1.
892.
13E−
042.
143.
55E−
03
2149
53_s
_at
X06
989
APP
MTG
2.37
1.35
E−03
1.12
1.44
E+00
2006
02_a
tN
M 0
0048
4A
PPM
TG5.
116.
71E−
043.
098.
20E−
07
2112
77_x
_at
BC
0043
69A
PPPC
1.69
4.54
E−04
3.01
2.05
E−04
2006
02_a
tN
M 0
0048
4A
PPPC
2.11
1.87
E−04
1.93
8.38
E−04
* Cor
rect
ed P
val
ues a
re sh
own.
Neurobiol Aging. Author manuscript; available in PMC 2010 April 1.

NIH
-PA Author Manuscript
NIH
-PA Author Manuscript
NIH
-PA Author Manuscript
Liang et al. Page 26
Tabl
e 3
Com
mon
exp
ress
ion
chan
ges i
n N
DA
D a
nd A
D b
rain
s: sy
napt
ic fa
ctor
s
Prob
e se
t ID
Gen
bank
IDG
ene
sym
bol
Bra
in r
egio
nN
DA
D v
s. co
ntro
lA
D v
s. co
ntro
l
Fold
P-va
lue*
Fold
P-va
lue*
1556
629_
a_at
AI8
0634
6SN
AP2
5EC
−3.2
61.
46E−
06−2
.52
7.50
E−06
1556
629_
a_at
AI8
0634
6SN
AP2
5H
IP2.
156.
30E−
032.
158.
46E−
05
2025
07_s
_at
L197
60SN
AP2
5M
TG−4
.07
1.02
E−03
−14.
272.
04E−
04
2025
08_s
_at
NM
003
081
SNA
P25
VC
X1.
907.
75E−
04−1
.28
3.33
E−01
2047
29_s
_at
NM
004
603
STX
1AH
IP−1
.60
5.85
E−03
−1.7
25.
18E−
03
2047
29_s
_at
NM
004
603
STX
1AM
TG−1
.69
5.35
E−03
−2.4
59.
18E−
05
2092
38_a
tB
E966
922
STX
3AH
IP−1
.54
3.66
E−03
−1.7
61.
62E−
03
2306
91_a
tR
8592
9ST
X1B
2EC
−4.9
54.
85E−
07−3
.49
1.49
E−06
2127
99_a
tB
E217
875
STX
6M
TG1.
606.
86E−
031.
021.
83E+
01
2046
90_a
tN
M 0
0485
3ST
X8
MTG
−3.0
64.
38E−
04−3
.10
4.36
E−04
2046
90_a
tN
M 0
0485
3ST
X8
HIP
−2.1
26.
93E−
04−2
.99
1.59
E−05
2126
25_a
tN
M 0
0376
5ST
X10
EC−2
.24
1.90
E−04
1.09
2.15
E+00
2126
25_a
tN
M 0
0376
5ST
X10
MTG
−2.0
94.
99E−
04−1
.33
1.11
E−01
2214
99_s
_at
AK
0269
70ST
X16
VC
X−1
.79
1.01
E−02
1.04
6.87
E+00
2227
08_s
_at
AW
0146
19ST
X17
VC
X−2
.20
8.86
E−03
−1.5
51.
47E−
03
2280
91_a
tA
I800
609
STX
17H
IP1.
503.
34E−
031.
213.
74E−
01
2280
91_a
tA
I800
609
STX
17M
TG1.
612.
03E−
031.
204.
33E−
01
2227
08_s
_at
AW
0146
19ST
X17
PC−2
.45
1.74
E−04
−1.4
01.
61E−
01
2227
08_s
_at
AW
0146
19ST
X17
SFG
−3.1
13.
94E−
03−2
.30
1.14
E−02
2187
63_a
tN
M 0
1693
0ST
X18
HIP
−2.1
82.
51E−
05−2
.34
2.20
E−05
2187
63_a
tN
M 0
1693
0ST
X18
MTG
−2.6
52.
02E−
05−1
.67
1.99
E−04
2187
63_a
tN
M 0
1693
0ST
X18
PC−1
.46
8.63
E−03
−1.2
39.
62E−
01
2219
14_a
tH
1984
3SY
N1
EC−7
.49
1.85
E−05
−4.9
24.
04E−
05
2102
47_a
tA
W13
9618
SYN
2EC
−3.1
12.
34E−
04−3
.31
1.79
E−04
2063
22_a
tN
M 0
0349
0SY
N3
EC−2
.52
7.56
E−05
−3.3
54.
12E−
06
2219
14_a
tH
1984
3SY
N1
HIP
−2.1
22.
71E−
04−1
.40
7.55
E−02
2219
14_a
tH
1984
3SY
N1
MTG
−1.6
38.
53E−
03−2
.48
1.41
E−04
Neurobiol Aging. Author manuscript; available in PMC 2010 April 1.

NIH
-PA Author Manuscript
NIH
-PA Author Manuscript
NIH
-PA Author Manuscript
Liang et al. Page 27
Prob
e se
t ID
Gen
bank
IDG
ene
sym
bol
Bra
in r
egio
nN
DA
D v
s. co
ntro
lA
D v
s. co
ntro
l
Fold
P-va
lue*
Fold
P-va
lue*
2219
14_a
tH
1984
3SY
N1
PC−1
.77
3.77
E−03
−1.3
52.
55E−
01
2290
39_a
tB
E220
333
SYN
2H
IP−2
.01
5.17
E−03
−3.0
91.
59E−
04
2103
15_a
tA
F077
737
SYN
2H
IP1.
844.
85E−
031.
801.
10E−
02
2063
22_a
tN
M 0
0349
0SY
N3
HIP
5.74
8.18
E−03
6.36
2.38
E−03
2063
22_a
tN
M 0
0349
0SY
N3
MTG
3.37
5.28
E−03
2.04
7.24
E−02
2042
87_a
tN
M 0
0471
1SY
NG
R1
EC−1
.95
2.95
E−04
−2.6
52.
16E−
05
2056
91_a
tN
M 0
0420
9SY
NG
R3
EC−2
.37
2.06
E−03
−4.7
31.
15E−
04
2039
99_a
tA
V73
1490
SYT1
MTG
−1.5
42.
47E−
03−3
.93
9.17
E−10
2239
01_a
tA
L136
594
SYT3
EC−2
.04
8.15
E−04
−2.4
01.
50E−
04
2239
01_a
tA
L136
594
SYT3
MTG
−2.0
13.
08E−
03−1
.94
2.47
E−03
2061
62_x
_at
NM
003
180
SYT5
EC−3
.42
9.06
E−05
−2.7
02.
80E−
04
2442
27_a
tA
I863
338
SYT6
EC−2
.83
1.47
E−03
1.75
6.87
E−02
2442
27_a
tA
I863
338
SYT6
SFG
−2.4
92.
84E−
03−1
.06
1.13
E+01
2326
77_a
tA
U14
6128
SYT1
1EC
−4.2
23.
62E−
04−1
.78
2.27
E−02
2091
98_s
_at
BC
0042
91SY
T11
VC
X1.
248.
14E−
031.
054.
00E+
00
2280
72_a
tA
K02
4280
SYT1
2EC
−3.5
32.
73E−
04−1
.82
1.07
E−02
2260
86_a
tA
B03
7848
SYT1
3H
IP−2
.77
1.87
E−04
−2.2
81.
64E−
04
2056
13_a
tN
M 0
1652
4SY
T17
EC−3
.87
6.19
E−04
−2.2
45.
66E−
03
2056
13_a
tN
M 0
1652
4SY
T17
MTG
−1.9
47.
35E−
031.
091.
86E+
00
2056
13_a
tN
M 0
1652
4SY
T17
VC
X−2
.66
4.87
E−04
1.67
6.60
E−03
2133
26_a
tA
U15
0319
VA
MP1
VC
X1.
522.
61E−
04−1
.38
8.47
E−02
2015
56_s
_at
BC
0027
37V
AM
P2EC
−4.2
72.
82E−
05−1
.63
1.62
E−02
2147
92_x
_at
AI9
5511
9V
AM
P2EC
−6.3
21.
18E−
05−1
.65
3.07
E−02
2015
56_s
_at
BC
0027
37V
AM
P2SF
G−2
.94
8.11
E−03
−3.7
84.
04E−
03
2013
36_a
tB
C00
3570
VA
MP3
HIP
−2.0
21.
18E−
03−1
.36
2.88
E−01
2013
36_a
tB
C00
3570
VA
MP3
MTG
−2.2
11.
06E−
031.
121.
82E+
00
2013
36_a
tB
C00
3570
VA
MP3
PC−1
.76
7.18
E−03
−1.2
51.
14E+
00
2134
80_a
tA
F052
100
VA
MP4
MTG
1.96
1.93
E−04
1.28
1.39
E−01
2134
80_a
tA
F052
100
VA
MP4
VC
X1.
542.
40E−
03−1
.40
3.66
E−02
Neurobiol Aging. Author manuscript; available in PMC 2010 April 1.

NIH
-PA Author Manuscript
NIH
-PA Author Manuscript
NIH
-PA Author Manuscript
Liang et al. Page 28* C
orre
cted
P v
alue
s are
show
n.
Neurobiol Aging. Author manuscript; available in PMC 2010 April 1.

NIH
-PA Author Manuscript
NIH
-PA Author Manuscript
NIH
-PA Author Manuscript
Liang et al. Page 29
Tabl
e 4
Uni
que
expr
essi
on c
hang
es in
ND
AD
bra
ins
Prob
e se
t ID
Gen
bank
IDG
ene
sym
bol
Bra
in r
egio
nN
DA
D v
s. co
ntro
l
Fold
P-va
lue*
2251
12_a
tA
A05
8571
AB
I2H
IP1.
335.
12E−
03
2250
98_a
tB
F245
400
AB
I2H
IP2.
272.
41E−
04
2250
98_a
tB
F245
400
AB
I2M
TG1.
703.
66E−
05
2033
81_s
_at
N33
009
APO
EEC
−3.4
55.
18E−
03
2033
82_s
_at
NM
000
041
APO
EEC
−4.3
56.
54E−
04
2128
84_x
_at
AI3
5886
7A
POE
EC−5
.01
1.46
E−04
2033
82_s
_at
NM
000
041
APO
EH
IP−2
.40
3.82
E−03
2128
84_x
_at
AI3
5886
7A
POE
HIP
−2.2
61.
23E−
03
2033
81_s
_at
N33
009
APO
EH
IP−5
.05
5.36
E−04
2033
81_s
_at
N33
009
APO
EM
TG−2
.75
9.06
E−04
2033
82_s
_at
NM
000
041
APO
EM
TG−3
.00
1.44
E−04
2128
84_x
_at
AI3
5886
7A
POE
MTG
−2.5
82.
07E−
05
2128
84_x
_at
AI3
5886
7A
POE
PC−2
.02
2.40
E−03
2033
81_s
_at
N33
009
APO
EPC
−2.4
71.
52E−
03
2040
65_a
tN
M 0
0485
4C
HST
10H
IP−1
.95
5.45
E−03
2096
18_a
tU
9613
6C
TNN
D2
HIP
−1.7
12.
92E−
03
2096
18_a
tU
9613
6C
TNN
D2
MTG
−1.6
45.
90E−
03
2026
68_a
tB
F001
670
EFN
B2
HIP
1.97
1.86
E−03
2274
04_s
_at
AI4
5919
4EG
R1
EC−2
.07
1.04
E−03
2016
93_s
_at
AV
7339
50EG
R1
EC−3
.14
1.60
E−04
2274
04_s
_at
AI4
5919
4EG
R1
PC−1
.99
2.52
E−03
2160
33_s
_at
S747
74FY
NEC
−3.2
66.
07E−
03
2101
05_s
_at
M14
333
FYN
EC−3
.04
4.41
E−07
2160
33_s
_at
S747
74FY
NH
IP−2
.73
6.50
E−03
2160
33_s
_at
S747
74FY
NM
TG−2
.85
2.20
E−03
2127
37_a
tA
L513
583
GM
2AEC
−2.4
35.
07E−
03
2127
37_a
tA
L513
583
GM
2AM
TG−1
.69
7.63
E−03
Neurobiol Aging. Author manuscript; available in PMC 2010 April 1.
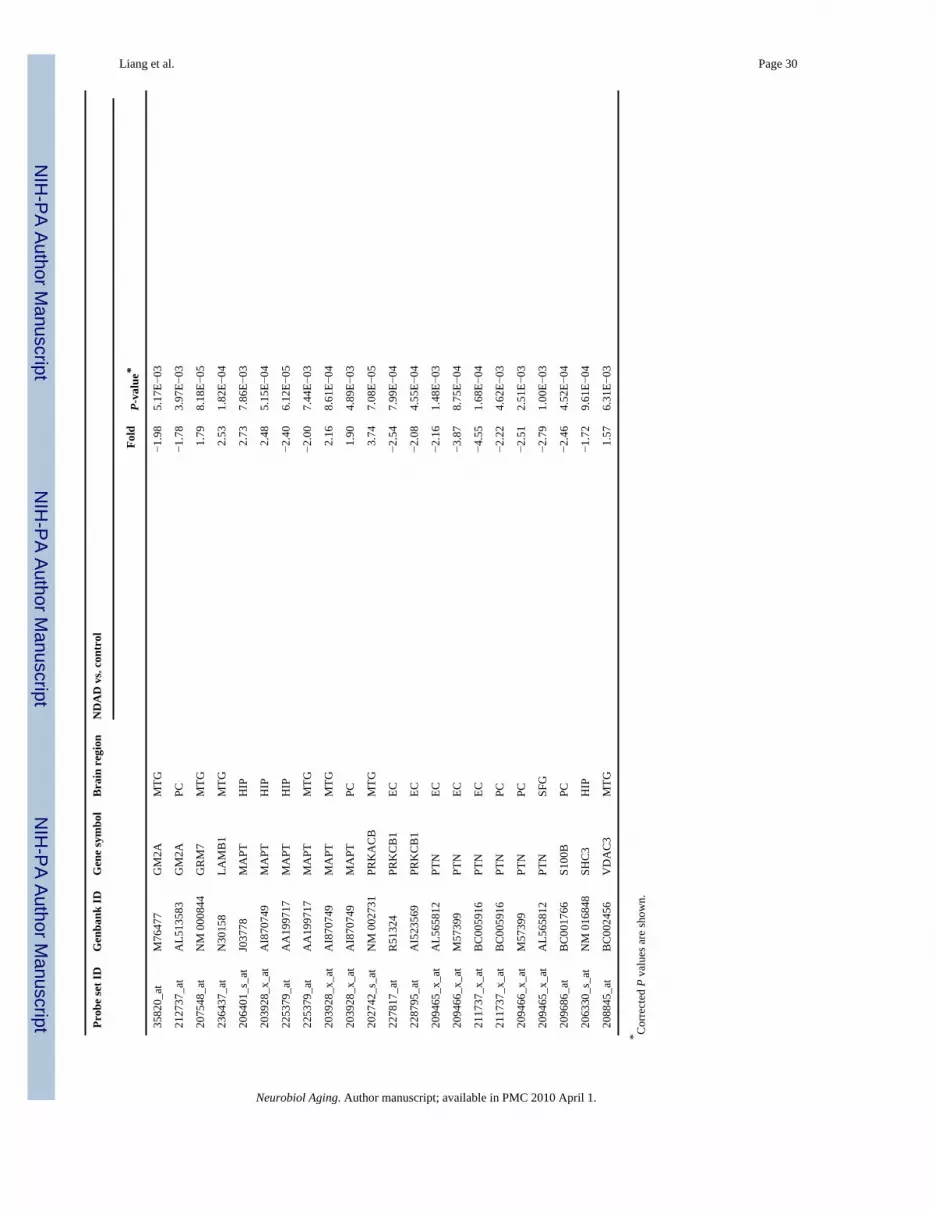
NIH
-PA Author Manuscript
NIH
-PA Author Manuscript
NIH
-PA Author Manuscript
Liang et al. Page 30
Prob
e se
t ID
Gen
bank
IDG
ene
sym
bol
Bra
in r
egio
nN
DA
D v
s. co
ntro
l
Fold
P-va
lue*
3582
0_at
M76
477
GM
2AM
TG−1
.98
5.17
E−03
2127
37_a
tA
L513
583
GM
2APC
−1.7
83.
97E−
03
2075
48_a
tN
M 0
0084
4G
RM
7M
TG1.
798.
18E−
05
2364
37_a
tN
3015
8LA
MB
1M
TG2.
531.
82E−
04
2064
01_s
_at
J037
78M
APT
HIP
2.73
7.86
E−03
2039
28_x
_at
AI8
7074
9M
APT
HIP
2.48
5.15
E−04
2253
79_a
tA
A19
9717
MA
PTH
IP−2
.40
6.12
E−05
2253
79_a
tA
A19
9717
MA
PTM
TG−2
.00
7.44
E−03
2039
28_x
_at
AI8
7074
9M
APT
MTG
2.16
8.61
E−04
2039
28_x
_at
AI8
7074
9M
APT
PC1.
904.
89E−
03
2027
42_s
_at
NM
002
731
PRK
AC
BM
TG3.
747.
08E−
05
2278
17_a
tR
5132
4PR
KC
B1
EC−2
.54
7.99
E−04
2287
95_a
tA
I523
569
PRK
CB
1EC
−2.0
84.
55E−
04
2094
65_x
_at
AL5
6581
2PT
NEC
−2.1
61.
48E−
03
2094
66_x
_at
M57
399
PTN
EC−3
.87
8.75
E−04
2117
37_x
_at
BC
0059
16PT
NEC
−4.5
51.
68E−
04
2117
37_x
_at
BC
0059
16PT
NPC
−2.2
24.
62E−
03
2094
66_x
_at
M57
399
PTN
PC−2
.51
2.51
E−03
2094
65_x
_at
AL5
6581
2PT
NSF
G−2
.79
1.00
E−03
2096
86_a
tB
C00
1766
S100
BPC
−2.4
64.
52E−
04
2063
30_s
_at
NM
016
848
SHC
3H
IP−1
.72
9.61
E−04
2088
45_a
tB
C00
2456
VD
AC
3M
TG1.
576.
31E−
03
* Cor
rect
ed P
val
ues a
re sh
own.
Neurobiol Aging. Author manuscript; available in PMC 2010 April 1.

NIH
-PA Author Manuscript
NIH
-PA Author Manuscript
NIH
-PA Author Manuscript
Liang et al. Page 31
Tabl
e 5
Reg
iona
l prin
cipa
l com
pone
nts a
naly
sis
Bra
in r
egio
nPr
obe
set I
DG
enba
nk ID
Gen
e sy
mbo
lB
rain
reg
ion
Prob
e se
t ID
Gen
bank
IDG
ene
sym
bol
EC20
0766
_at
NM
001
909
CTS
DM
TG21
3347
_x_a
tA
W13
2023
RPS
4X
EC20
4212
_at
NM
005
469
AC
OT8
MTG
2321
60_s
_at
AL1
3726
2TN
IP2
EC22
7876
_at
AW
0071
89K
IAA
1688
MTG
2257
82_a
tA
W02
7333
MSR
B3
EC21
8580
_x_a
tN
M 0
1790
0A
UR
KA
IP1
MTG
2123
77_s
_at
AU
1584
95N
OTC
H2
EC15
5810
2_at
AK
0554
38TM
6SF1
MTG
2282
14_a
tA
W24
2286
SOX
6
EC20
8977
_x_a
tB
C00
4188
TUB
B2
MTG
2269
13_s
_at
BF5
2705
0SO
X8
EC21
2085
_at
AA
9168
51SL
C25
A6
MTG
2119
62_s
_at
BG
2503
10ZF
P36L
1
EC15
5574
0_a_
atA
F483
549
MR
AP
MTG
2406
48_a
tA
W10
4578
LOC
4407
28
EC23
8528
_at
AI3
6104
3U
BR
1M
TG20
4906
_at
BC
0023
63R
PS6K
A2
EC20
9914
_s_a
tA
W14
9405
NR
XN
1M
TG21
2923
_s_a
tA
K02
4828
C6o
rf14
5
EC20
4143
_s_a
tN
M 0
1751
2EN
OSF
1PC
2260
31_a
tA
A52
3733
FLJ2
0097
EC22
3319
_at
AF2
7266
3G
PHN
PC21
8877
_s_a
tN
M 0
2182
0C
6orf
75
EC21
0998
_s_a
tM
7722
7H
GF
PC20
6833
_s_a
tN
M 0
0110
8A
CY
P2
EC15
6737
4_at
AJ0
1159
6PC
2382
06_a
tA
I089
319
EC20
2192
_s_a
tN
M 0
0589
0G
AS7
PC22
2975
_s_a
tA
I423
180
CSD
E1
EC20
4120
_s_a
tN
M 0
0112
3A
DK
PC23
5195
_at
BG
1099
88FB
XW
2
HIP
2177
40_x
_at
NM
000
972
RPL
7APC
2407
48_a
tA
I939
338
HIP
2038
65_s
_at
NM
015
833
AD
AR
B1
PC20
8880
_s_a
tA
B01
9219
C20
orf1
4
HIP
2064
91_s
_at
NM
003
827
NA
PAPC
2016
78_s
_at
NM
020
187
DC
12
HIP
2064
57_s
_at
NM
000
792
DIO
1PC
2174
52_s
_at
Y15
014
B3G
ALT
2
HIP
2271
44_a
tA
A47
6916
C22
orf9
PC22
2627
_at
AK
0022
05V
PS54
HIP
2225
05_a
tB
F510
801
LMB
R1
PC53
071_
s_at
AI8
8541
1FL
J222
22
HIP
2013
86_s
_at
AF2
7989
1D
HX
15PC
2181
25_s
_at
NM
018
246
CC
DC
25
HIP
2246
06_a
tB
G25
0721
KLF
6PC
2135
35_s
_at
AA
9106
14U
BE2
I
HIP
2177
92_a
tN
M 0
1442
6SN
X5
PC22
2459
_at
BG
1098
65C
1orf
108
HIP
2008
22_x
_at
NM
000
365
TPI1
PC22
3093
_at
T992
15A
NK
H
HIP
2047
01_s
_at
NM
004
809
STO
ML1
PC21
9248
_at
NM
025
264
THU
MPD
2
HIP
2035
22_a
tN
M 0
0512
5C
CS
PC22
6650
_at
AI9
8406
1ZF
AN
D2A
HIP
2250
77_a
tA
A89
0703
LOC
2836
80PC
2250
18_a
tB
F512
188
SPIR
E1
Neurobiol Aging. Author manuscript; available in PMC 2010 April 1.
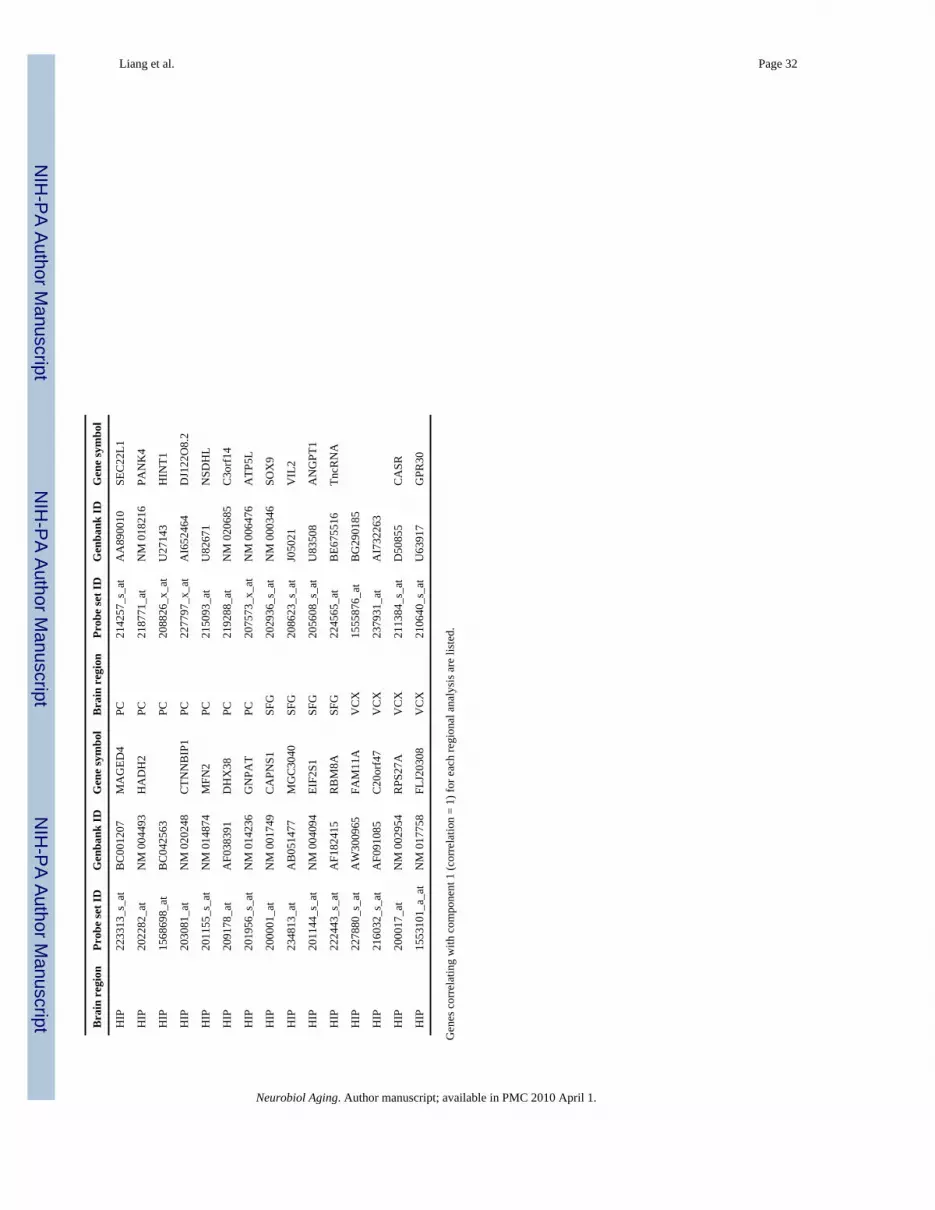
NIH
-PA Author Manuscript
NIH
-PA Author Manuscript
NIH
-PA Author Manuscript
Liang et al. Page 32
Bra
in r
egio
nPr
obe
set I
DG
enba
nk ID
Gen
e sy
mbo
lB
rain
reg
ion
Prob
e se
t ID
Gen
bank
IDG
ene
sym
bol
HIP
2233
13_s
_at
BC
0012
07M
AG
ED4
PC21
4257
_s_a
tA
A89
0010
SEC
22L1
HIP
2022
82_a
tN
M 0
0449
3H
AD
H2
PC21
8771
_at
NM
018
216
PAN
K4
HIP
1568
698_
atB
C04
2563
PC20
8826
_x_a
tU
2714
3H
INT1
HIP
2030
81_a
tN
M 0
2024
8C
TNN
BIP
1PC
2277
97_x
_at
AI6
5246
4D
J122
O8.
2
HIP
2011
55_s
_at
NM
014
874
MFN
2PC
2150
93_a
tU
8267
1N
SDH
L
HIP
2091
78_a
tA
F038
391
DH
X38
PC21
9288
_at
NM
020
685
C3o
rf14
HIP
2019
56_s
_at
NM
014
236
GN
PAT
PC20
7573
_x_a
tN
M 0
0647
6A
TP5L
HIP
2000
01_a
tN
M 0
0174
9C
APN
S1SF
G20
2936
_s_a
tN
M 0
0034
6SO
X9
HIP
2348
13_a
tA
B05
1477
MG
C30
40SF
G20
8623
_s_a
tJ0
5021
VIL
2
HIP
2011
44_s
_at
NM
004
094
EIF2
S1SF
G20
5608
_s_a
tU
8350
8A
NG
PT1
HIP
2224
43_s
_at
AF1
8241
5R
BM
8ASF
G22
4565
_at
BE6
7551
6Tn
cRN
A
HIP
2278
80_s
_at
AW
3009
65FA
M11
AV
CX
1555
876_
atB
G29
0185
HIP
2160
32_s
_at
AF0
9108
5C
20or
f47
VC
X23
7931
_at
AI7
3226
3
HIP
2000
17_a
tN
M 0
0295
4R
PS27
AV
CX
2113
84_s
_at
D50
855
CA
SR
HIP
1553
101_
a_at
NM
017
758
FLJ2
0308
VC
X21
0640
_s_a
tU
6391
7G
PR30
Gen
es c
orre
latin
g w
ith c
ompo
nent
1 (c
orre
latio
n =
1) fo
r eac
h re
gion
al a
naly
sis a
re li
sted
.
Neurobiol Aging. Author manuscript; available in PMC 2010 April 1.
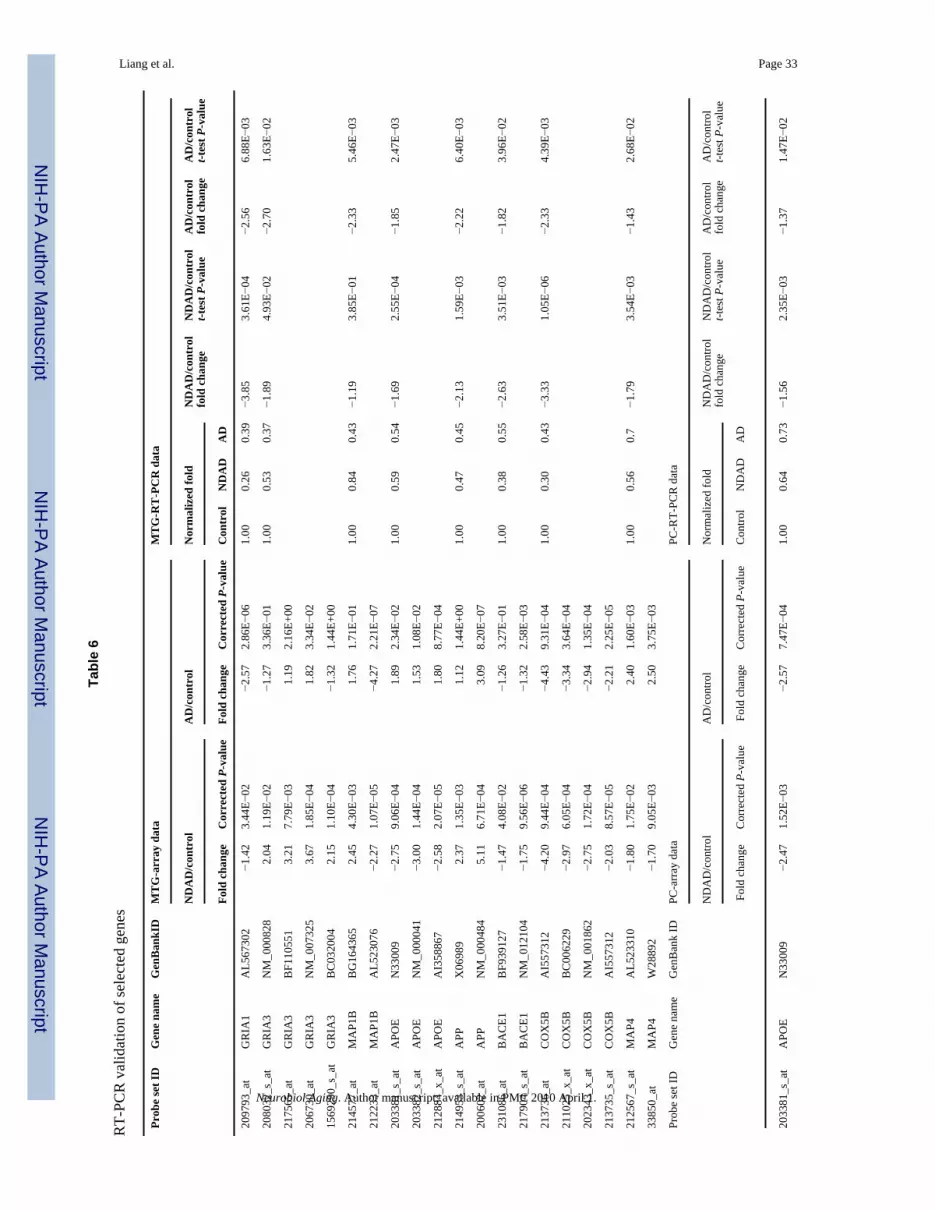
NIH
-PA Author Manuscript
NIH
-PA Author Manuscript
NIH
-PA Author Manuscript
Liang et al. Page 33
Tabl
e 6
RT-
PCR
val
idat
ion
of se
lect
ed g
enes
Prob
e se
t ID
Gen
e na
me
Gen
Ban
kID
MT
G-a
rray
dat
aM
TG
-RT
-PC
R d
ata
ND
AD
/con
trol
AD
/con
trol
Nor
mal
ized
fold
ND
AD
/con
trol
fold
cha
nge
ND
AD
/con
trol
t-tes
t P-v
alue
AD
/con
trol
fold
cha
nge
AD
/con
trol
t-tes
t P-v
alue
Fold
cha
nge
Cor
rect
ed P
-val
ueFo
ld c
hang
eC
orre
cted
P-v
alue
Con
trol
ND
AD
AD
2097
93_a
tG
RIA
1A
L567
302
−1.4
23.
44E−
02−2
.57
2.86
E−06
1.00
0.26
0.39
−3.8
53.
61E−
04−2
.56
6.88
E−03
2080
32_s
_at
GR
IA3
NM
_000
828
2.04
1.19
E−02
−1.2
73.
36E−
011.
000.
530.
37−1
.89
4.93
E−02
−2.7
01.
63E−
02
2175
65_a
tG
RIA
3B
F110
551
3.21
7.79
E−03
1.19
2.16
E+00
2067
30_a
tG
RIA
3N
M_0
0732
53.
671.
85E−
041.
823.
34E−
02
1569
290_
s_at
GR
IA3
BC
0320
042.
151.
10E−
04−1
.32
1.44
E+00
2145
77_a
tM
AP1
BB
G16
4365
2.45
4.30
E−03
1.76
1.71
E−01
1.00
0.84
0.43
−1.1
93.
85E−
01−2
.33
5.46
E−03
2122
33_a
tM
AP1
BA
L523
076
−2.2
71.
07E−
05−4
.27
2.21
E−07
2033
81_s
_at
APO
EN
3300
9−2
.75
9.06
E−04
1.89
2.34
E−02
1.00
0.59
0.54
−1.6
92.
55E−
04−1
.85
2.47
E−03
2033
82_s
_at
APO
EN
M_0
0004
1−3
.00
1.44
E−04
1.53
1.08
E−02
2128
84_x
_at
APO
EA
I358
867
−2.5
82.
07E−
051.
808.
77E−
04
2149
53_s
_at
APP
X06
989
2.37
1.35
E−03
1.12
1.44
E+00
1.00
0.47
0.45
−2.1
31.
59E−
03−2
.22
6.40
E−03
2006
02_a
tA
PPN
M_0
0048
45.
116.
71E−
043.
098.
20E−
07
2310
86_a
tB
AC
E1B
F939
127
−1.4
74.
08E−
02−1
.26
3.27
E−01
1.00
0.38
0.55
−2.6
33.
51E−
03−1
.82
3.96
E−02
2179
04_s
_at
BA
CE1
NM
_012
104
−1.7
59.
56E−
06−1
.32
2.58
E−03
2137
36_a
tC
OX
5BA
I557
312
−4.2
09.
44E−
04−4
.43
9.31
E−04
1.00
0.30
0.43
−3.3
31.
05E−
06−2
.33
4.39
E−03
2110
25_x
_at
CO
X5B
BC
0062
29−2
.97
6.05
E−04
−3.3
43.
64E−
04
2023
43_x
_at
CO
X5B
NM
_001
862
−2.7
51.
72E−
04−2
.94
1.35
E−04
2137
35_s
_at
CO
X5B
AI5
5731
2−2
.03
8.57
E−05
−2.2
12.
25E−
05
2125
67_s
_at
MA
P4A
L523
310
−1.8
01.
75E−
022.
401.
60E−
031.
000.
560.
7−1
.79
3.54
E−03
−1.4
32.
68E−
02
3385
0_at
MA
P4W
2889
2−1
.70
9.05
E−03
2.50
3.75
E−03
Prob
e se
t ID
Gen
e na
me
Gen
Ban
k ID
PC-a
rray
dat
aPC
-RT-
PCR
dat
a
ND
AD
/con
trol
AD
/con
trol
Nor
mal
ized
fold
ND
AD
/con
trol
fold
cha
nge
ND
AD
/con
trol
t-tes
t P-v
alue
AD
/con
trol
fold
cha
nge
AD
/con
trol
t-tes
t P-v
alue
Fold
cha
nge
Cor
rect
ed P
-val
ueFo
ld c
hang
eC
orre
cted
P-v
alue
Con
trol
ND
AD
AD
2033
81_s
_at
APO
EN
3300
9−2
.47
1.52
E−03
−2.5
77.
47E−
041.
000.
640.
73−1
.56
2.35
E−03
−1.3
71.
47E−
02
Neurobiol Aging. Author manuscript; available in PMC 2010 April 1.
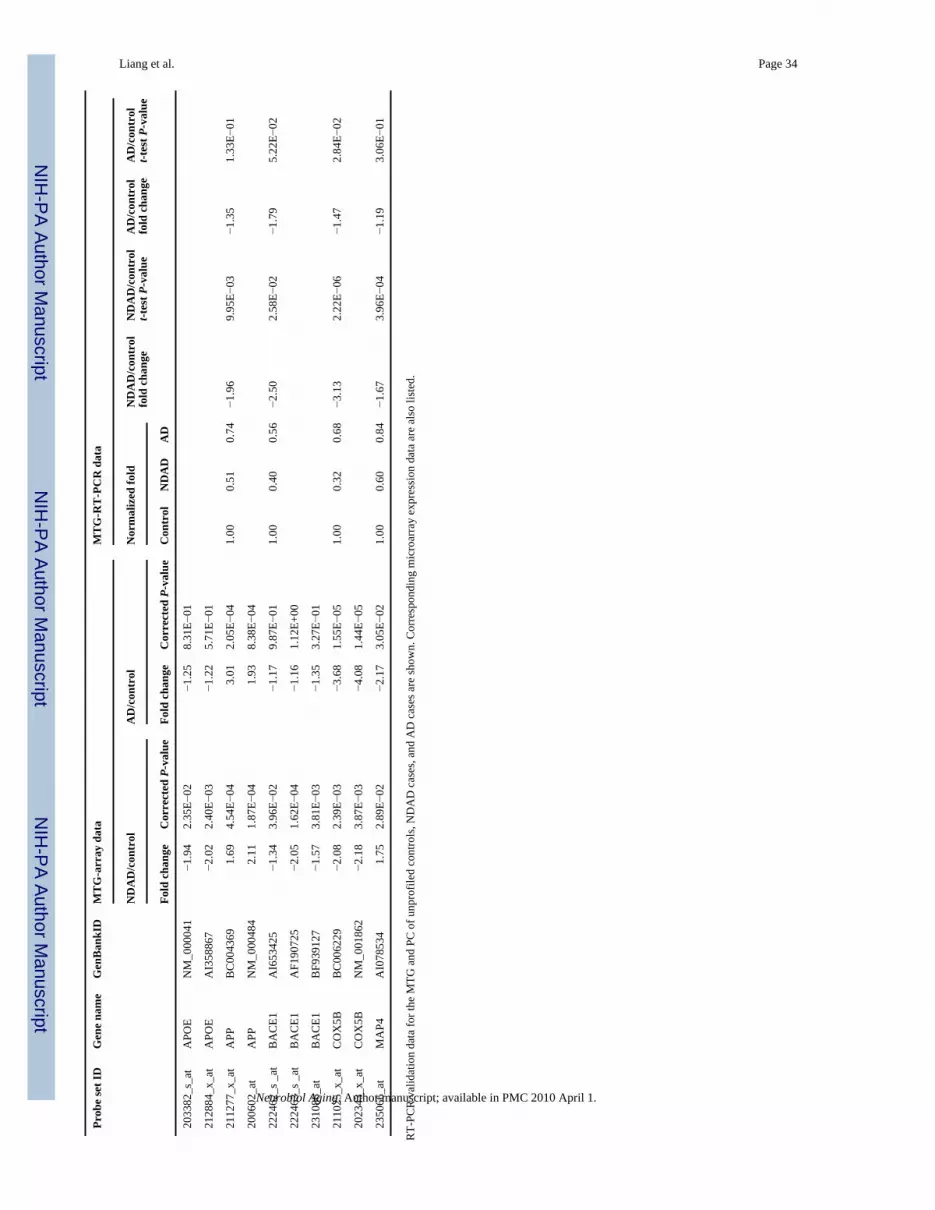
NIH
-PA Author Manuscript
NIH
-PA Author Manuscript
NIH
-PA Author Manuscript
Liang et al. Page 34
Prob
e se
t ID
Gen
e na
me
Gen
Ban
kID
MT
G-a
rray
dat
aM
TG
-RT
-PC
R d
ata
ND
AD
/con
trol
AD
/con
trol
Nor
mal
ized
fold
ND
AD
/con
trol
fold
cha
nge
ND
AD
/con
trol
t-tes
t P-v
alue
AD
/con
trol
fold
cha
nge
AD
/con
trol
t-tes
t P-v
alue
Fold
cha
nge
Cor
rect
ed P
-val
ueFo
ld c
hang
eC
orre
cted
P-v
alue
Con
trol
ND
AD
AD
2033
82_s
_at
APO
EN
M_0
0004
1−1
.94
2.35
E−02
−1.2
58.
31E−
01
2128
84_x
_at
APO
EA
I358
867
−2.0
22.
40E−
03−1
.22
5.71
E−01
2112
77_x
_at
APP
BC
0043
691.
694.
54E−
043.
012.
05E−
041.
000.
510.
74−1
.96
9.95
E−03
−1.3
51.
33E−
01
2006
02_a
tA
PPN
M_0
0048
42.
111.
87E−
041.
938.
38E−
04
2224
62_s
_at
BA
CE1
AI6
5342
5−1
.34
3.96
E−02
−1.1
79.
87E−
011.
000.
400.
56−2
.50
2.58
E−02
−1.7
95.
22E−
02
2224
63_s
_at
BA
CE1
AF1
9072
5−2
.05
1.62
E−04
−1.1
61.
12E+
00
2310
86_a
tB
AC
E1B
F939
127
−1.5
73.
81E−
03−1
.35
3.27
E−01
2110
25_x
_at
CO
X5B
BC
0062
29−2
.08
2.39
E−03
−3.6
81.
55E−
051.
000.
320.
68−3
.13
2.22
E−06
−1.4
72.
84E−
02
2023
43_x
_at
CO
X5B
NM
_001
862
−2.1
83.
87E−
03−4
.08
1.44
E−05
2350
66_a
tM
AP4
AI0
7853
41.
752.
89E−
02−2
.17
3.05
E−02
1.00
0.60
0.84
−1.6
73.
96E−
04−1
.19
3.06
E−01
RT-
PCR
val
idat
ion
data
for t
he M
TG a
nd P
C o
f unp
rofil
ed c
ontro
ls, N
DA
D c
ases
, and
AD
cas
es a
re sh
own.
Cor
resp
ondi
ng m
icro
arra
y ex
pres
sion
dat
a ar
e al
so li
sted
.
Neurobiol Aging. Author manuscript; available in PMC 2010 April 1.


