Embed Size (px)
Citation preview
Melisande Cardona, Néstor Duch-Brown and Bertin Martens
2015
Institute for Prospective Technological Studies Digital Economy Working Paper (2015-06)
Consumer Perceptions of (Cross-border) eCommerce in the EU Digital Single Market
European Commission
Joint Research Centre
Institute for Prospective Technological Studies
Contact information
Address: Edificio Expo. c/ Inca Garcilaso, 3. E-41092 Seville (Spain)
E-mail: [email protected]
Tel.: +34 954488318
Fax: +34 954488300
JRC Science Hub
https://ec.europa.eu/jrc
This publication is a Working Paper by the Joint Research Centre of the European Commission. It results from the Digital
Economy Research Programme at the JRC Institute for Prospective Technological Studies, which carries out economic
research on information society and EU Digital Agenda policy issues, with a focus on growth, jobs and innovation in the
Single Market. The Digital Economy Research Programme is co-financed by the Directorate General Communications
Networks, Content and Technology.
Legal Notice
This publication is a Technical Report by the Joint Research Centre, the European Commission’s in-house science service.
It aims to provide evidence-based scientific support to the European policy-making process. The scientific output
expressed does not imply a policy position of the European Commission. Neither the European Commission nor any person
acting on behalf of the Commission is responsible for the use which might be made of this publication.
All images © European Union 2015
JRC97231
ISSN 1831-9408 (online)
Spain: European Commission, Joint Research Centre, 2015
© European Union, 2015
Reproduction is authorised provided the source is acknowledged.
Abstract
This report presents empirical evidence about the obstacles that European consumers face when trying to buy online
goods and services in other EU Member States. It relies on data from a consumer survey carried out in February-March
2015 in the EU28. By comparing named websites with respondents’ answers on the location of web shops, we find that
77% correctly assess whether a website is located domestically or in a foreign country. In addition, the report finds that
prices, variety and transaction costs are strong drivers to shift consumer purchases of goods from offline to online shops,
as predicted by economic theory. Consumers’ perceptions of risks still holds them back from online transactions, which
leaves some margin for policy makers to improve the regulatory and institutional setting. The results are less conclusive
for online access to digital media content and for shifting online purchases from domestic to foreign markets
1
Summary
This report presents empirical evidence about the obstacles that European consumers face when
trying to buy online goods and services in other EU Member States. It relies on data from a
consumer survey carried out in February-March 2015 in the EU28. By comparing named websites
with respondents’ answers on the location of web shops, we find that 77% correctly assess
whether a website is located domestically or in a foreign country. In addition, the report finds that
prices, variety and transaction costs are strong drivers to shift consumer purchases of goods from
offline to online shops, as predicted by economic theory. Consumers’ perceptions of risk still hold
them back from online transactions, which leaves some margin for policy makers to improve the
regulatory and institutional setting. The results are less conclusive for online access to digital
media content and for shifting online purchases from domestic to foreign markets.
2
1. Introduction
E-commerce plays an important role in the EU economy. It has grown at impressive rates during
the past 15 years and in 2014 represented 7% of total retail trade (Duch-Brown et al., 2015).
However, it mainly takes place within Member States’ own domestic markets, and cross-border e-
commerce seems to be lagging behind. The Digital Agenda Scoreboard (European Commission,
2014) reports that more than 50% of all consumers buy online but only 15% buy online across the
border. Gomez et al (2014) report that only 18% of all B2C e-commerce spending in the EU was
cross-border spending between Member States in 2011. The rapid rise of the Internet in the last
two decades nurtured the idea of “the death of distance” (Cairncross, 2001): it was thought that
geographic distance and country borders would be of no consequence any more with online
transactions. We know today that this is largely overstated. Geographical distance and national
borders remain important factors in online trade (Blum&Goldfarb 2006, Lendle et al, 2013; Gomez
et al, 2014 ; Alaveras & Martens, 2015 ). Besides distance, these studies identify differences in
consumer preferences, including cultural differences, such as language, as sources of online cross-
border trade costs.
The EU is a geographically-segmented market along cultural, historical and institutional borders.
One of its main policy objectives is to de-fragment this market and create a Single Market and,
more recently, a Digital Single Market for online exchanges. While policy makers cannot change
geographic distance or language, EU Digital Single Market policies seek to help consumers and
producers to shift from offline to online markets and reduce the regulatory trade costs associated
with crossing national borders. Many online trade barriers originated in offline markets (Coppel,
2000) and have now become more important since e-commerce has unfolded as an important
distribution channel. These barriers include differences in tax regimes, online payments systems,
consumer protection rules, copyright and other regulatory and vertical restraints in online
distribution. A key question for policy makers is how much impact these barriers have on
geographic and vertical online market fragmentation. Here we use consumer survey data to gauge
the drivers of market fragmentation.
From the start of the internet, economists have examined incentives for consumers to shift from
offline to online trade. Three types of incentives are usually distinguished: price competition,
increased variety and lower transaction or trade costs. Earlier studies (Brynjolfsson, Hu & Smith,
2003 ; Chevalier&Goolsbee, 2003) found some evidence for lower prices online. Recent studies
however are more doubtful about this effect (Duch-Brown et al., 2014). This may be an indication
that competition between online and offline markets is becoming more effective and that price
differences are not necessarily the main driver for consumers. Higher online product variety is also
3
a source of consumer welfare: consumers get more of the things they actually want (Brynjolfsson
et al., 2003, Dixit et al., 1977). Civic Consulting (2011) estimates that, in the current fragmented EU
Digital Single Market, consumer welfare gains from increased online choice and lower prices could
reach nearly 12 billion €. Last but not least, consumer welfare may increase because transaction,
trade and information costs diminish when shopping online. Transaction costs have two sides: real
costs and residual uncertainty (North, 1992). Real cost savings occur because collecting information
about available products is less time consuming online than offline. Reductions in real transaction
costs constitute an incentive to go online. So far, few studies have looked into the incentive effect
of time gains in online transactions (Brynjolfsson & Hu, 2012; Goolsbee & Klenow, 2006 ; Pantea &
Martens, 2014). Residual uncertainty relates to consumers’ perceptions of risk and lack of trust
which may constitute a disincentive to buy online. This is where consumer survey data can be very
useful. These three sources of consumer (dis-)incentives may also play a role in (de-)motivating
consumers to buy cross-border. Duch-Brown & Martens (2014) estimate consumer welfare gains
from lower prices in cross-border trade. Francois et al (2014) find that the shift from offline to
online shopping reduces cross-border transaction costs. This has a positive welfare effect for
consumers and stimulates GDP; however it puts pressure on trade margins and output in domestic
retail services.
The main objective of the present study is to gauge the relative importance of these (dis)incentives
for consumers to switch from offline shopping to buying online and to buying cross-border. We use
data from an online consumer survey in the EU28 in the first quarter of 2015. The survey covers
the three types of incentives and barriers mentioned above: prices, variety and transaction costs.
Moreover, the survey data enable us to relate the impact of subjectively-perceived barriers to
online (cross-border) trade on more objectively measured behaviour. This provides useful input for
policy makers to assess where they can contribute most to eliminating these consumer welfare-
reducing barriers.
This report is structured as follows. Section 2 discusses the data and possible sources of sample
bias. We focus mainly on the reliability of respondents’ answers about webshop location. Section 3
uses regression analysis to estimate the relative importance of different drivers and impediments
to shifting from offline to online and from domestic to cross-border shopping online. Section 4
uses the survey data to build a cross-border bilateral online trade matrix and to estimate a gravity
trade model. Section 5 analyses additional consumer clickstream data, which were gathered in two
countries, together with the survey data. Section 6 presents some conclusions.
4
2. The consumer survey data
The survey was commissioned by the European Commission’s Directorate General for Consumers
(DG JUST)1. It was carried out by in the first quarter of 2015. It surveyed a total of 22,848
respondents in the 28 Member States of the EU.2 The sample was designed to be representative of
the European online population.3
The structure of the questionnaire is presented in Annex. It consists of four blocks. The first block
investigates what consumers bought online over the last 12 months, how often they did so and
where, and how much they spent online. Online purchases are grouped into three categories
(tangible goods, online services, digital content).4 The second block asks more specific questions
about the last online purchase, including the online search process, characteristics of the online
shop and the delivery. The third block asks about reasons for buying online. The last block
examines the obstacles that consumers face in their online purchases. This covers delivery
problems, actions undertaken to remedy them and concerns about buying online at home and
abroad. The reasons for buying online and abroad cover the three types of incentives discussed
above: prices, variety and transaction costs. The concerns are related to the residual uncertainty
part of transaction costs.
In addition, the survey was complemented with consumer clickstream data collection and a diary
questionnaire that was administered to a subsample of 1,054 respondents in two countries only
(Belgium and Poland – about 500 respondents per country). The respondents were volunteers
selected from the core survey sample and included consumers who planned to make an online
purchase over a 2-week period. Clickstream data were collected by means of a tracking device that
was installed with the consumers’ permission on their computers. The diary survey complemented
the clickstream data and asked questions on purchasing behaviour during the weeks the clicks were
tracked. This allowed us to make unique cross-checks between more subjective replies to the
survey and more objectively-observed clickstream behaviour.
1 The complete survey consists of a core consumer questionnaire applied to respondents in all the EU28
and an additional clickstream dataset for a subsample of consumers in only two countries (Belgium and Poland). For all the analysis presented in this report, the data were cleaned from outliers. E.g. respondents who claimed to buy every product group daily (over 25 different products) were eliminated and the top 2% regarding the question of money spent were trimmed.
2 We did not use the consumer data collected for Iceland and Norway. 3 For a more complete description of the sampling methodology see GfK. 2015. "Identifying the Main Cross-
Border Obstacles to the Digital Single Market and Where They Matter Most," European Commission, http://ec.europa.eu/consumers/consumer_evidence/market_studies/obstacles_dsm/docs/21.09_dsm_final_report.pdf.
4 The category “tangible goods” includes all physical goods (books, CDs, electrical appliances, toys), as well as offline services purchased online (booking travel services or buying tickets online). The “online services” category asks about the online usage of communication services (Email, Telephoning), web-based applications, social networks and cloud computing.
5
The target population of the survey was the European online population. The sample is broadly
representative of the target population. Remaining gender and age biases were corrected with
weighting factors since younger age groups and women were slightly overrepresented. We use the
weighted values in this analysis unless otherwise mentioned.
The fact that the sample is not randomly drawn from a population but based on responses to an
appeal for voluntary participation may be another source of sample bias. As a result, online
panellists are probably more active and expert internet users (compared to the overall population
of internet users). At the same time, they are probably less affluent than the general online
population (more free time available and interested in the small sums of money they can get from
participating in online surveys). We cannot measure or correct for this potential source of sample
bias.
We cross-checked respondents’ assumptions about the location of the website where they carried
out their last online purchase (“in my country”, “in another EU country”, “outside the EU”) with the
actual location of the online shop as observed in another study (Alaveras et.al., 2015). Correcting
for possible biases in consumer perceptions on the geographic location of a website is important in
order to correctly gauge the actual extent of geographic market segmentation in the Digital Single
Market. Most studies measuring the extent of cross-border e-commerce within the EU rely on
survey information (European Commission, 2013). But typically, online shops do not display the
location of their offices very prominently. In fact, it can be very difficult to know where an e-shop is
based and hence misperceptions can prevail.
From the respondents (21,657) who answered the questions on their last purchase, 84% used a
website to place their orders, 14% used an App and a mere 2% purchased via an Appstore. Most of
the users who purchased via websites gave some details about the website they used, though half
of these sites do not contain a full address (uniform resource locator, URL), but just a name (e.g.
Zalando). Alternatively, respondents left a comment (e.g. “do not remember”). With the remaining
information and after some basic cleaning, we managed to merge 8,816 website entries from the
survey with an existing database on the geographic origin of online shops.5 This subsample is
representative of the entire sample.
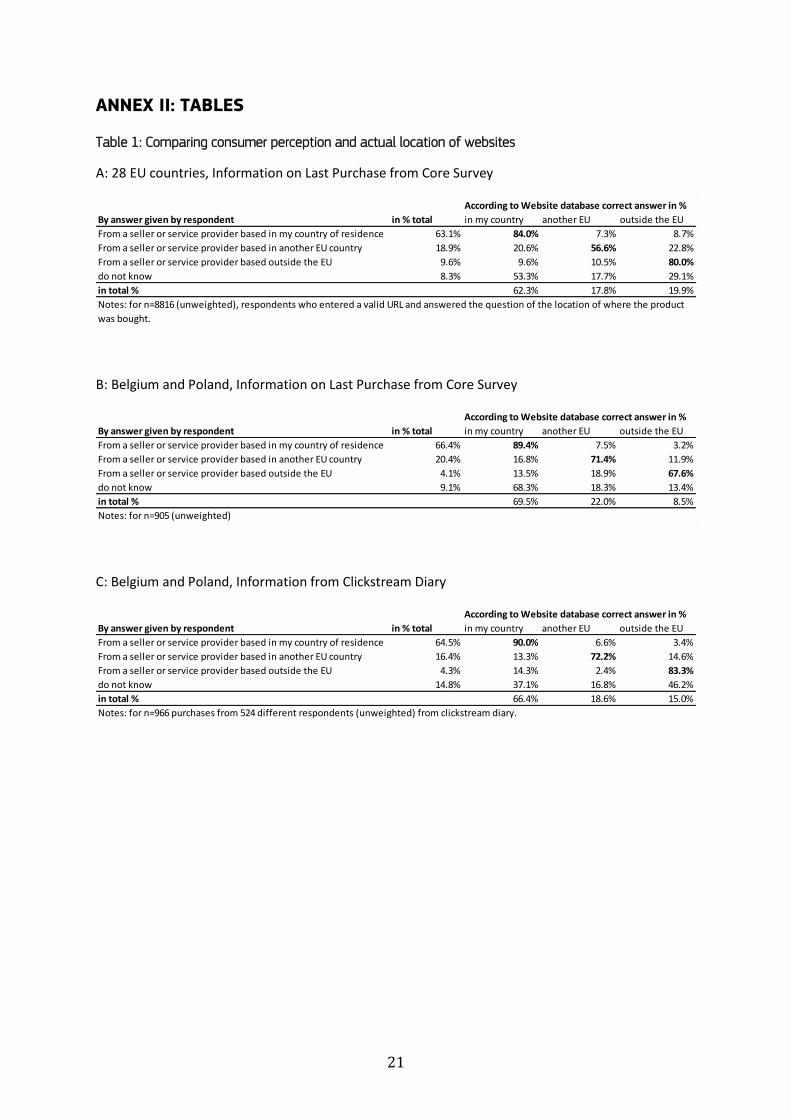
The results (see Table 1) show that cross-border purchases are largely reported as such. From the
respondents who reported a domestic purchase, 84% actually bought on a domestic website; while
16% were actually buying in another country. Conversely, about 21% of those who reported buying
5 The online shop location data were derived from Amazon Alexa data on website traffic. For a more
detailed discussion of the data and methodology for determining the website location (Alaveras G. and Martens B., 2015)
6
from a shop in another EU Member State were actually buying at home. In total, 71% of all
respondents correctly classified the geographic location of the website from which they bought. It
may well be that consumers confuse to some extent “foreign location” with “foreign language” on
websites. We cannot verify this directly because we have no information on the language used by
the website where consumers purchased. Another reason may be that the location of a web-shop
becomes even less visible when purchasing digital content and no physical delivery is involved.
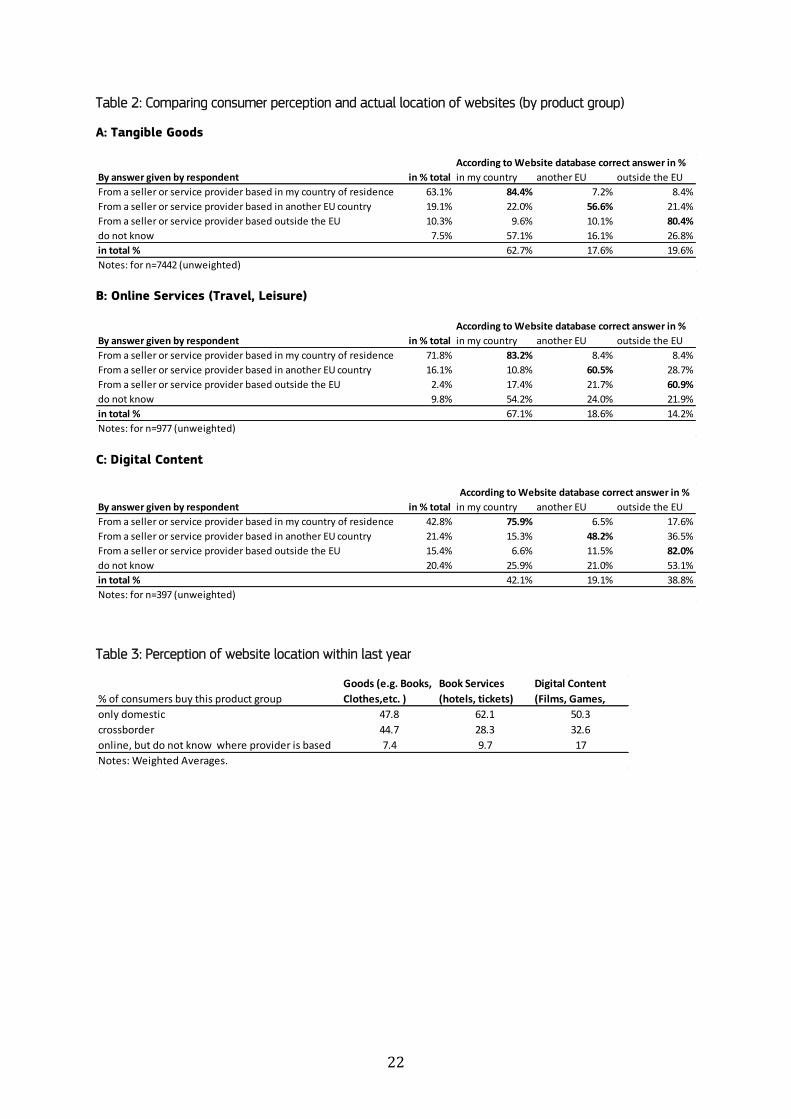
Indeed, the correct answers were highest for tangible goods (see Table 2). However, purchases of
digital content represent only 5% of the sample and this cannot explain all the observed
misperceptions in this sample. Despite the observed misconceptions in location of webshops, the
conclusions drawn from the survey are largely not distorted. Table 1 shows that the distribution of
perceived and of actual purchases are similar, only the cross-border purchases outside the EU are
underreported.
Similar questions were asked in the consumer diary surveys in Poland and Belgium. Here, we were
able to match 966 purchases (from a total of 1,723 reported purchases) from 527 respondents
(See Table 1C). The overall accuracy of correctly locating the web shop is 73% in the diary survey,
similar to the percentage observed in the core survey. On average, the two countries show a similar
pattern to the EU28 average. A closer look at the Polish survey, however, reveals that respondents
are far more focused on domestic shopping than respondents in Belgium. In total, 82.7% of Polish
respondents reported buying on domestic websites. The website “allegro.pl”, a Polish online auction
website, is cited as the URL for an overwhelming majority of the respondents. This applies much
less to Belgium, where the two most frequently-cited websites were foreign (“bol.com” and then
“amazon.fr”). Consequently the percentage of domestic orders in the Belgian diary survey (46%)
lies below the European average. Countries with the highest domestic purchases are France (86%),
and Germany (92%)6). At the other end of the scale, less than 5% of respondents used domestic
websites in Cyprus, Luxembourg and Malta. In addition Ireland, Austria and Croatia have a low
home bias (between 25% and 35%). For the clickstream analysis, it is interesting to keep in mind
that Poland has a moderately high home bias whereas in Belgium it is relatively low.
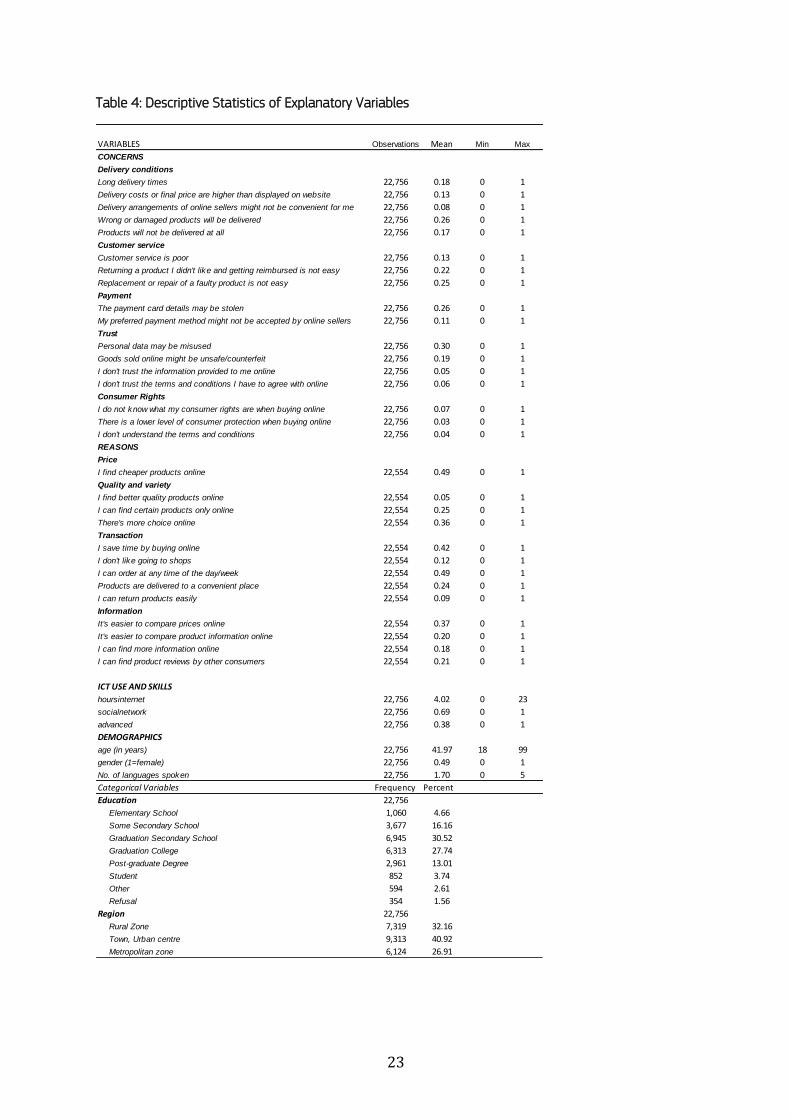
In the regressions, we used the survey replies to explain e-commerce consumption. We grouped the
explanatory variables into four categories: Concerns, Reasons, ICT Use and Demographics. The
summary statistics for these covariates are shown in Table 4.7 The ICT use variables were derived
from the usage of online services. The “Social network” use dummy takes value 1 when
6 This numbers are based on unweighted averages on the merged subsample. 7 These summary statistics were compiled after some basic cleaning of the data e.g. for respondents who
claim to buy every product category every day.
7
respondents participate in social networks at least once a week. “Advanced” refers to the usage of
online services to transfer and store files.
3. Drivers and impediments to online domestic and cross-border
purchases
To understand how different concerns about shopping online and reasons for doing so shape
consumer decisions, we distinguish between the extensive margin (the number of persons who
shop online) and the intensive margin (expenditure on online shopping). We run separate
regressions on the survey data for each of these margins. See Table 5a/5b and Table 6 for the
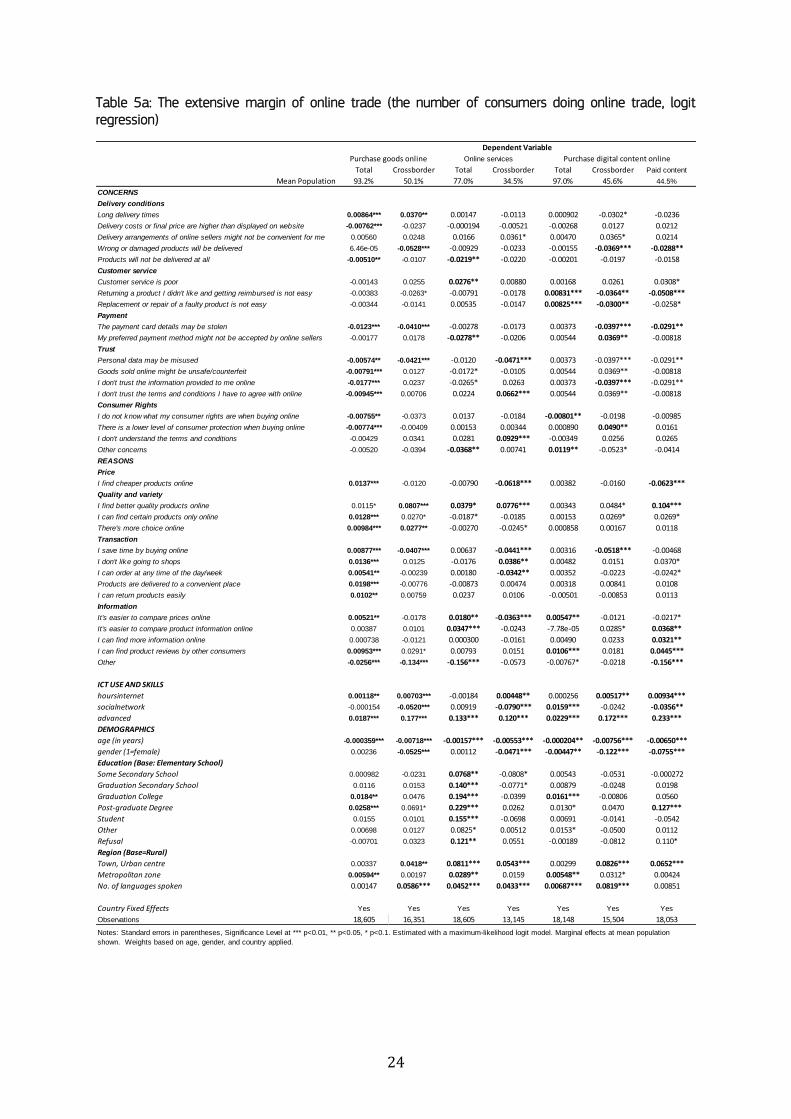
extensive margin and Table 7 for the intensive margin. First, we examine the factors that affect a
consumer’s decision to buy online and to buy abroad (cross-border). The dependent variable in this
logit regression is a dummy that takes the value 1 when a respondent has purchased online within
the last 12 months (columns titled “total” in Tables Table 5a/b). We run a separate logit regression
within the group of online purchasers when purchases have been made cross-border, with the
dependent variable taking the value of 1 if this is the case (regressions titled “Crossborder” in Table
5a/b).8 Second, we look into the drivers of the volume of online purchases in total and purchases
abroad (Table 7). The dependent variable in this OLS regression is the Euro amount spent on online
purchases
Moreover, for cross-border purchases, we should make a distinction between a consumer’s
subjective perception of the geographic location of the seller (abroad or at home) and the
objectively-verified location (See Table 7). However, we can only make this comparison with a
smaller data sample on the last purchase, for which we have website information. We run the logit
regression twice, once with the information given by the respondent on the geographic location of
the seller and a second time with the corrected location information (as explained above). Note
that using the perceived location not only generates a larger sample of observations but also better
information that helps us understand the conscious decision to buy on a website in another country.
Table 5a reports the marginal effects calculated for the population average (i.e. all the explanatory
variables are estimated as deviations from the mean value). While the magnitude of the
coefficients in the logit regression is difficult to interpret, the marginal effect coefficients measure
8 The dependent variables are constructed from the Questions 2a (Answers 1-10 for tangible goods and
answers 11, 12 for services) and Q4a (digital content). If any of the products in the group was bought at least once, the respondent was coded as 1 for being an online shopper for the product category, 0 if no product was bought. The coding for the cross-border variable is based on answers in Q2b and Q4d. If any of the products from the product category was bought in another country in the EU or outside the EU, the respondent was coded with 1 for being a cross-border online shopper. They were coded as 0 when they bought all products at home, and coded as missing if they never knew where they bought or did not buy
the product at all ; see the questionnaire flow chart in the Annex III.
8
the impact in percentage points on the dependent variable. For example, concerns about payment
card details being stolen decreases the likelihood that a consumer buys online by 1.23 percentage
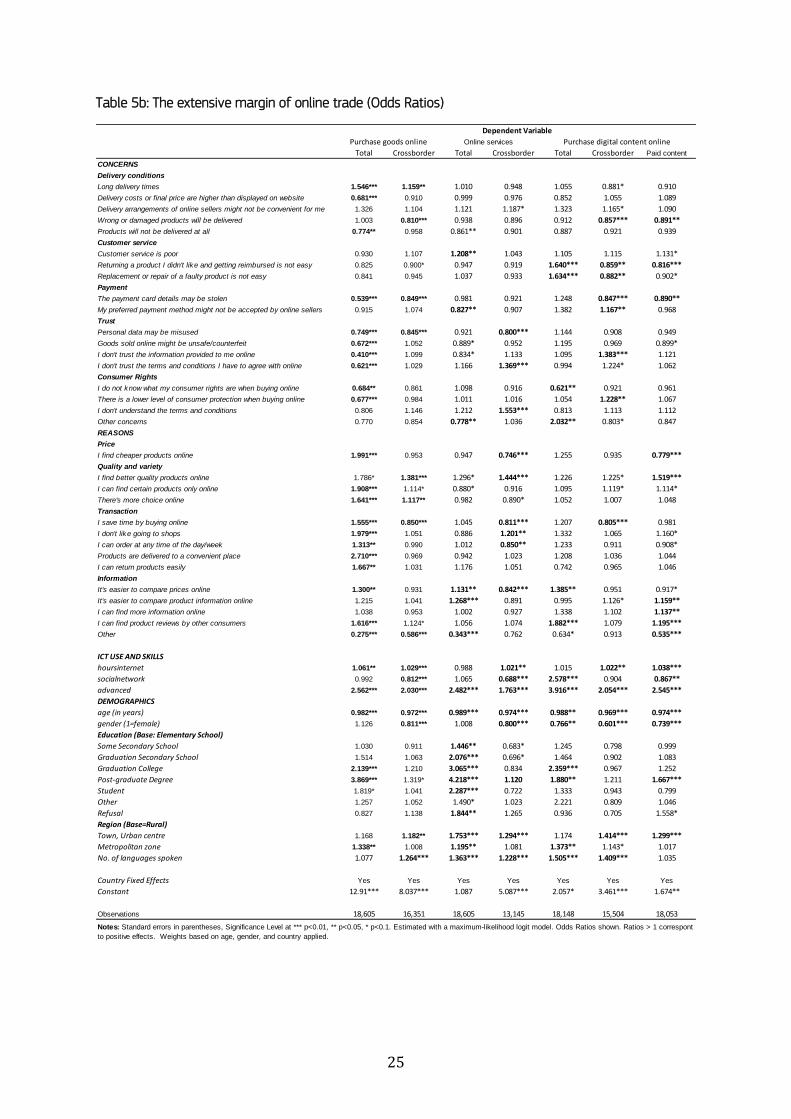
points and the likelihood that he buys cross-border by 4.1 percentage points. Furthermore, we
include a table with the odds ratios (Table 5b). These are obtained by taking the exponent of the
logistic regression coefficient and they represent the ratio of the probability of success and failure.
Price changes the likelihood of buying goods online by 1.4 percentage points. The corresponding
odds ratio for this item is 1.99 or nearly 2, which means that respondents interested in cheaper
products are nearly twice as likely to buy goods online as respondents who do not think that price is
a major reason for e-commerce.
Survey questions are grouped into four categories: Concerns, Reasons, ICT use and Demographics.
The “reasons” categories roughly correspond to the three economic motives for consumers to shift
consumption expenditure from offline to online purchases: prices, variety and quality, and
transaction and information costs or the real transaction costs. We expect “reasons” variables to
come with a positive sign in the regressions. The “concerns” category covers the residual
uncertainty dimension of transaction costs, including factors such as trust, quality of the delivery
and post-contractual uncertainties about application of consumer rights and settling disputes in
online transactions. Concerns variables should show a negative sign in the regressions: more
concerns should logically reduce the number of consumers and the volume of online trade. ICT use
variables are considered to be good proxies for the online skills and savviness of consumers. More
savviness should have a positive impact on online transactions. The demographic variables control
for sample bias in age and education. Age and education are considered to be good proxy variables
for income, in the absence of an objective income variable in the survey.9 We also add country fixed
effects to the regressions to control for possible country-specific factors including country sample
bias. The tables show the results for consumers who shop online and cross-border for three
different product groups: goods, travel services and online digital media content. Statistically
significant coefficients up to the 5% level are marked in bold. Non-significant coefficients can be
considered as zero and are not relevant in the analysis.
The “reasons” group shows the expected positive sign for price, variety and transaction cost related
questions. Cross-border purchases of goods are mainly driven by quality reasons. The pattern of
drivers becomes more fragmented for travel services and media content where quality and some
types of transaction costs still play a role. Only quality and more choice seem to matter for cross-
border purchases of travel services and digital media content. Some results for cross-border travel
9 Another possible proxy for income is the question about the financial situation, in which respondents are
asked whether it is easy or difficult to make ends meet every month. Though it provides an equally interesting proxy, it relies on respondents’ subjective perceptions of their financial situation.
9
services and for paid digital content are counter-intuitive with negative signs; this needs further
investigation. The “concerns” group of variables shows considerable negative impact in the first
column only, for trust and consumer rights-related issues. Beyond that, the pattern becomes more
dispersed and it is hard to find a story line in all this. Somewhat surprisingly, digital content buyers
report significant problems with damaged and undelivered products and returning products.
Concern about payment cards (“details may be stolen”) mainly affects consumers who consciously
download digital content cross-border or pay for this service.
The marginal effect for the purchase decisions are very small because, for the mean population,
the probability of shopping online is already quite high and therefore only changes marginally with
reasons or concerns. The demographic control variables mostly follow the expected patterns. Online
purchases diminish with age – although online expenditure increases with age (see Table 7).
Women spend less on online purchases than men. Education levels are positively correlated with
the decision to buy online, for goods, travel services and digital content. However, education is
correlated with online expenditure only for goods, less for travel services and not at all for cross-
border digital media content. But consumption of digital content is not necessarily linked to
monetary payment. When only paid online content is taken into account, the highest educational
level becomes significant again. Knowledge of languages is also positively correlated with online
purchases and so are advanced internet skills.
A somewhat peculiar variable is the use of social networks: more frequent users tend to avoid
shopping cross-border. The cross-tabulations in the original GfK report show that frequent use of
social networks is positively correlated with younger age and difficult financial situation, which may
explain the effect. In fact, the probability of purchasing cross border is reduced by 5 or 8
percentage points for goods and services respectively. Furthermore empirical research has shown
that social networks are predominantly formed by geographically local ties (Takhteyev et al., 2012),
therefore its increased usage may support the diffusion of local websites and web shops.
An interesting finding is that consumers in urban areas are more inclined to buy online than those
living in rural areas. Intuitively, one would expect the contrary to be true because urban consumers
already have access to a wider variety of goods at lower transaction costs (transport and time).
However, the demand for variety and the opportunity cost of time may be higher in urban areas
thereby pushing more consumers onto the internet.
To compare potential different drivers and concerns regarding purchases within and outside the EU,
we re-ran the extensive margin regressions separately for cross-border purchases within the EU
(columns labelled “EU”) and outside the EU (“WW” for worldwide) (Table 6). There is a considerable
overlap for these purchase decisions. From the online cross-border shoppers, only a few buy
10
exclusively within the EU (50% of EU shoppers also buy outside the EU) and even fewer buy cross-
border exclusively outside the EU (90% of worldwide shoppers also buy in another EU country).
Consequently the differences in the coefficients are rather subtle.
Table 7 applies the same patterns to identify statistically significant factors at the intensive margin
or the volume of online trade. Again we find that price, variety and transaction costs constitute
strong incentives for consumers to shift from offline to online purchases of goods. The drivers for
the decision to consume digital content are somewhat less clear.
The demographics picture at the intensive margin has some interesting features. First, education
becomes a stronger explanatory variable for the volume of online purchases at all educational
levels. This is probably linked to the fact that education is correlated with income and thus with
purchasing power. On the other hand, education is a poor explanatory variable for purchases of
digital content. Clearly, students access online digital content cross-border more often irrespective
of their age. Taking into account that the reference education level for these regressions is primary
school level, it implies that there is no significant difference in behaviour between these school age
groups. Second, age is now positively correlated with online expenditures. The true explanatory
variable here is probably again income and purchasing power that are positively correlated with
age.
The dependent variable of the regression is measured in the logarithms of Euros spent on online
goods; therefore the displayed coefficients in Table 7 reflect the percentage changes in
expenditure. If respondents name “There’s more choice online” as a main reason for buying online,
they will spend 22% more on online goods in total and 15.5% more cross-border. Similarly,
respondents who worry about not understanding the terms and conditions when buying online,
spend 25% less on online goods.
To account for the problem of consumer misperceptions about where they buy, we run the cross-
border logit models on the website data provided with the questions on the last purchase (Table 8).
This combines all types of goods (and therefore product fixed effects are introduced). The first
column shows the results for the uncorrected data for the full sample. Despite slight differences,
the general picture remains comparable to the cross-border regressions in the previous tables (e.g.
Table 5). The second column shows the results for the reduced sample, but still using the perceived
cross-border information as the dependent variable. This reduces sample size from nearly 16,000
to about 6,700 observations. Therefore differences between the two columns are due to sample
selection issues, because we can only use the corrected country information for respondents who
enter an entirely valid URL. This is correlated with education. Looking into the sample differences, a
disproportionately higher number of respondents who are students or have college degrees have
11
entered valid website addresses. Within this sample, however, education no longer has a significant
effect on the decision to buy cross-border. For the regression with the reduced sample the signs of
the coefficients remain the same, but significance is lost in some coefficients. When we look at the
last column, with reduced sample and corrected data as the dependent variable, we find that signs
overall remain the same, but significance is gained and lost. Notably, respondents who worry about
theft of payment card details consciously buy less cross-border, but actually use international
sellers just as much. This might suggest that the reputation of a known foreign seller, most
probably selling in the same language, matters more than an unknown local website in terms of
trust. Respondents who value e-commerce for finding better quality and specific products
consciously buy more cross-border, but in the corrected version it shows that they do not shop
abroad disproportionately often. The number of languages spoken and advanced use of the
internet leads to increased cross-border purchases in all three regressions.
In a further step towards identifying barriers, we applied principal component analysis (PCA) to the
17 items on concerns about e-commerce. PCA is a common multivariate technique to reduce the
number of variables, overcome multi-collinearity issues or develop an index out of different
variables. In a first step, independent principal components are constructed from linear
combinations of the originally surveyed variables. We chose five components10 and interpreted
them according to the variables that contributed the highest loadings (or correlation). Table 9
shows the results. Loadings above 0.5 are considered to be strong. Components 2 to 5 roughly
represent the groupings we used in the previous regressions, while the strongest first component
pools variables related to cyber-crime (stealing payment details and misuse of data).
In a second step we replaced the original variables in the intensive margin regressions with the
principal components. The results (Table 10) underline the fact that concerns related to cybercrime
issues (misuse of data, payment details being stolen) are strongly negatively correlated with
purchasing online and with the conscious decision to buy in foreign countries. Another interesting
result is that remedies, which mainly combine the answers of “Returning a product is not easy” and
“Replace or repair is not easy” now have a significant impact on buying goods online and cross-
border, unlike the single items. As expected the remaining covariates show similar results to the
regressions on the single concerns variables.
Finally, it is important to note, that it is not possible to identify the direction of causality of the
concerns and reasons with these regressions, because they are not clear exogenous variables. For
example, the concern of “payment card details may be stolen” showing a negative coefficient, does
10 In our case, the 5th component was the last to have an eigenvalue of bigger than 1, which is commonly
suggested as a good indication for selection of components.
12
not imply that this concern keeps respondents from purchasing online. The statistically significant
relationship exists, but could also describe a consequence of experiences with online shopping.
Careful interpretation of the coefficients using underlying theory and further scrutiny of interesting
results are necessary.
4. An analysis of cross-border trade patterns
We used the survey data on the amount spent on domestic and foreign purchases of goods and
services to construct a 28 x 32 online trade matrix for the EU28 Member States. We combined the
information on expenditure with information about the geographic location of the providers (Q2d-
Q2f and Q2e for goods and Q4f-h & Q4e for digital content; see the questionnaire flow chart in the
Annex III). Expenditure is split into "total”, “in another EU country” and “outside the EU”. The
difference between the first and the last two is assumed to equal domestic expenditure - a
question not asked explicitly in the survey.11 The survey does not have details on cross-border
expenditure by country. Due to the lack of more precise information, we allocated expenditure “in
another EU country” equally among the EU countries listed by each respondent, and similarly for
“sellers based outside the EU”. Since cross-border trade normally decreases with distance, this
allocation procedure will result in an over-estimation of expenditure (the intensive margin of trade)
in far-away countries compared to nearby countries. On the other hand, we can assume that
consumers would mention further-away countries less frequently, which would ensure some
correction of the extensive margin of bilateral trade. However, the net effect is still likely to be an
overestimation of long-distance trade. The matrix is presented in Table 11.
Average expenditure by country is the weighted averages of all online shoppers in that country
(Table 11). The numbers given in the table are the weighted average Euro values calculated from
the survey multiplied by the e-commerce population. The size of the e-commerce population is
taken from Eurostat as the number of people who have purchased online at least once within the
last year.12 The numbers in the trade matrix are therefore inflated by the e-commerce population to
project the actual monetary e-commerce expenditure of the countries. From the 868 cells of the
matrix, 46 have the value 0 because the country combination was not cited by any respondent in
the survey. Malta and Estonia were not cited at all by respondents in other countries as a
destination of an e-commerce shopping tour.
11 Respondents who do not know where the online seller is based are not included in these calculations and
it is therefore assumed that their expenditure distribution resembles that of the remaining population. 12 Though the consumer survey was conducted 2015, the questions of online expenditure refer to the
consumption within the last year and therefore covers largely 2014. Therefore the adequate Eurostat data is taken from 2014.
13
We compare this country matrix with a second bilateral trade matrix with trade data corrected for
the actual geographic location of the website (Table 12). However, some important caveats must
be taken into account for the corrected trade matrix. Firstly, it uses information on the last
purchase only. Second, it uses only websites for which we have a verified geographic origin. Thus,
the sample size is reduced to less than half (n=8816). This may leave enough observations at
country level; on average we have about 300 observations per country. However, this may be too
limited a number to fill up the 28 x 32 = 896 cells in the matrix. . For 642 (70%) of the country
combinations, no last purchase was made. The cross-border purchases within the EU are
concentrated around Germany, Netherlands and UK.
The same matrix has been calculated for 2011 (Gomez et al., 2014), with the difference that the
past survey only included tangible goods and therefore travel services, for example, were not
included. We compare the data from the consumer surveys with e-commerce retail information
provided by the market research firm Euromonitor in Table 13.13 In most cases, the calculations
based on the consumer survey are larger than the industry data, which indicates that respondents
might overestimate the value of their purchases. Both sources coincide in the identification of the
Top 3 e-commerce countries and show roughly similar estimates. For smaller e-commerce
countries the differences become larger and estimations less precise due to smaller and less
representative survey samples and fewer trade statistics from Euromonitor.
Table 14 breaks up these e-commerce expenditures into amounts spent at home, in other EU
countries and outside the EU. If we can assume that misreporting of cross-border transactions
remains constant, the home market share has decreased over time. Some small countries with
relatively low rates of domestic online purchases (Luxembourg, Malta and Cyprus) buy substantially
more online in their country 2015 compared to 2011. Additionally it is worth mentioning that two
of the countries (Czech Republic and Hungary) with a high domestic market share in Table 14 show
a very different picture when we look at the corrected data from the last purchase (Table 12),
where domestic shares are less than 25%.
We apply the well-known gravity model of international trade to the bilateral trade matrix, in line
with previous research (Blum & Goldfarb, 2006; Hortaçsu, 2010; Lendl et al., 2012; Gomez et al,
2014). This model explains the value of bilateral trade between two countries as a function of the
cultural and geographic distance between them, consumer preferences and country-specific fixed
effects. Apart from transport costs directly linked to geographic distance, the distance coefficient
in the model may also cover other cross-border trade costs including costs due to regulatory
13 Data sources for the Euromonitor Passport database are official statistics, trade associations, trade press,
company research, trade interviews and other trade sources.
14
differences between countries, financial transaction costs, and information costs incurred in
bringing the trading partners together in a transaction, among others. Goods still need to be
physically transported to the consumer, even though they have been bought online. We therefore
assume that transport costs remain important in online trade. However, online digital media
content is not subject to transport costs since it can be directly downloaded by the consumer.
Hence, we should expect the distance coefficient associated with pure digital trade to be lower than
those related to transactions that require physical delivery.
Empirical applications of the gravity model include variables indicating other types of proximity,
beyond distance. For instance, a dummy variable indicating whether two countries are contiguous
controls for potentially shared cultural traits or historical relations among their respective
populations. Shared language turns out to be significant in most cases, since it captures the trade
costs related to "cultural distance" (Blum & Goldfarb, 2006). For cross-border e-commerce,
language may be an important measure of cultural distance, especially in a B2C trading
environment where a shared language is essential (Gomez-Herrera et al., 2014). The gravity
equation can also handle observations on domestic trade (when the country of origin and
destination are the same). Following Gomez-Herrera et al. (2014), we introduce a dummy variable
for domestic trade observations in the gravity model. The coefficient on this dummy is an indicator
of home bias or the extent of consumer preference for domestic over foreign products. The home
bias factor essentially measures consumers’ "natural" preference for the home market. We
estimate home bias for both goods and digital content and compare them to see if the nature of
the product has an effect on consumer preferences for domestically produced/delivered goods.
Since many factors remain uncontrolled, we also introduce importer and exporter country fixed
effects to account for many unobserved country factors.
Table 15 presents the results of the gravity equation estimation; Table 16 compares the 2015 and
2011 online trade data and the geographically corrected and not-corrected data. The first column
in Table 15 shows aggregate results for the EU countries; columns two and three show results for
goods and online digital media content respectively. The results are consistent with what we
expected a priori. First, the distance elasticity is negative (-0.598), indicating that trade costs are
relevant. The coefficient is somewhat higher than it is when estimated using the data from a 2011
EU e-commerce consumer survey (-0.332 in Table 16). The value of the distance elasticity is
considerably smaller for online digital media content (-0.0717). A similar very weak distance effect
(-0.055) for digital content was found for digital albums based on iTunes data (Gomez et al., 2015).
This can be attributed to the fact that digital media do not entail physical delivery costs that
depend on geographic distance. The survey data therefore confirm that distance matters much less
for digital content.
15
Shared cultural traits should have a positive effect on bilateral trade flows. This is confirmed by
contiguity (shared border) and shared language coefficients in the gravity regressions. Again, the
value of the coefficients is lower for online digital media content than for goods. This implies that
shared cultural traits matter less for digital media content than for goods. This may be due to
‘superstar’ effects, which are prevalent in cultural industries. We have experimented with different
language distance variables (Melitz et al., 2014). This confirmed the robustness of the results.
Finally, we find that home bias is significant, meaning that consumers show strong preferences for
the products sold domestically. A home bias coefficient of 3.765 implies that consumers are 43
times (e3.765=43) more likely to buy a product from a domestic online seller than a foreign one. In
this respect, there are no significant differences between goods and online content. A paradox of
online trade is that, even though e-commerce and cross-border trade online significantly reduce
trade costs, consumers show strong preferences for their home country sellers. This creates an
important demand-driven obstacle to intra-EU online trade that cannot be addressed through
regulatory and trade cost reducing policy measures (Gomez et al, 2014).
Comparing the 2011 and 2015 gravity estimates for goods, we can see that the home bias
decreases somewhat, while the distance effect increases considerably (Table 16). This would
indicate that in the online world, domestic purchases have become less important while cross-
border purchases focus more on nearby countries. When we add the gravity estimation of the
geographically corrected trade matrix to this picture, we observe a further decrease in home bias
and a decrease of the distance effect. Taking into account the important caveats in the
interpretation of the corrected gravity matrix, we refrain from drawing any firm conclusions from
these results.
5. Clickstream Data
As an add-on to the survey, clickstream data for two countries (Belgium and Poland) were collected
from approximately 500 respondents each, which gave us the unique opportunity to compare the
survey results with actual clickstreaming behaviour. As a first comparison, we matched the
websites of the survey with the website location database (as discussed in Section 2.2). In this
case, because the website addresses are fully provided by the clickstream recording and we could
match nearly 99% of the 61,417 different websites in the clickstream dataset. The diversification
of websites is nearly identical between the countries, the Belgian and Polish participants clicked on
31,989 and 31,808 different websites respectively. Almost all websites are only used in one of the
two countries (96%), while only 4% of the websites are used in both countries. This could
potentially point to a rather dispersed digital single market, but in fact this finding is in line with
previous studies (Alaveras et al., 2015), which show that the majority of local websites form part of
16
the long tail of websites, which only accumulate a few of the total number of clicks. While only a
few large international platforms (YouTube, facebook etc.) are used in most countries, they receive
most of the total number of clicks.
To obtain some cross-tabulations for clickstreaming behaviour, we create different subgroups from
information obtained from the core and diary survey. A descriptive summary of these subgroups is
given in Table 17. The first section “Purchases according to diary” divides the sample into whether
purchases were completed during the time the online behaviour was recorded. 62% of the
clickstreaming participants bought a good online, only marginally more (66%) bought a good
offline during the same period. Interestingly services14 were bought more often online (29.9%) than
offline (10%). Most participants consumed some form of digital content online (90%), but only
27% paid for this consumption.
Table 18 compares the average time spent online. Reassuringly, we find that observed clickstream
data confirms claims made by those respondents in the core survey who say they spend less time
on the internet per day. Furthermore, as expected, younger and older people spend more time
online than the age group “35-54”, which has the highest work force participation. Furthermore
purchasers always spend more time online than non-purchasers. This is also the case, albeit to a
lesser extent, for offline purchases. How far this is related to actual online research regarding the
products may be revealed by further analysis of the clickstream data and used categories.
Table 20 shows how the recorded time spent online is allocated between websites based in the
home country, in the EU or outside the EU (as identified by the website database). Firstly, we see
that a much higher percentage of users in Poland click on websites of their own country than they
do in Belgium. Once more, language is an obvious explanation, as Belgium, unlike Poland, shares its
main two languages with big neighbouring countries. The home bias also tends to increase with
purchases undertaken. An interesting, and less expected result is that the higher the respondents’
education, the more time they spend on websites of their own country. One likely explanation is
that these groups use local websites more often than they use international platforms for social
networks.
In a further table we calculated the average time spent by Belgian or Polish respondents on
websites from different countries and compared this with the times spent from the country matrix
(Table 20). We would expect the same cultural and language barriers for both behaviours. However,
Table 20 reveals that these barriers are greater when respondents make purchases than they are
when they just click on websites. The percentage of e-commerce expenditure by Belgians on
14 As in Section 3, “services” here includes booking travel services or buying tickets.
17
Belgian websites (according to their response on the location) is 62%, though they only spend 40%
of their time online on these sites. The difference in Poland is smaller but at a higher level: 80% of
e-commerce expenditure by Poles happens on Polish websites during 72% of their online time. Both
countries exhibit exceptionally high e-commerce home-bias, compared to other EU countries. Most
of the time on foreign websites is spent in countries that share a language or on US websites,
which are usually platforms that contain local information in a local language (in both countries,
the most popular US websites are YouTube and facebook). Regarding e-commerce, most money
spent outside the home country goes to European web shops.
6. Conclusions
In this study, we used online consumer survey data for the EU28 to gauge the relative importance
of various drivers and impediments to shifting from offline to online and cross-border shopping for
goods and digital media content. The questionnaire covered the three traditional economic drivers
for shifting to online purchases: lower prices, more variety and lower transaction costs. It included
demographic variables that enabled us to control for possible sample bias. Moreover, it enabled us
to correct subjective consumer perceptions on where they buy with the objective geographic
location of the online shop.
We find that a fairly robust set of factors motivate consumers to shift their purchases from offline
to online shops, both for goods and for digital media content. As predicted by economic theory,
prices, variety and transaction costs are the main drivers of that shift. These drivers work both at
the extensive (number of consumers) and the intensive (volume of trade) margin for goods.
Economic theory is less clear about the drivers for cross-border trade and this is reflected in the
outcomes of the survey. The regressions suggest that variety more than price seem to be the main
motivating factor to buy goods online in other countries at both the extensive and intensive margin
(number of consumers). At the intensive margin, transaction costs come into play again. The
picture is less clear for online purchases of digital media content. Some transaction cost issues
play a role for domestic purchases and variety motives seem to work for cross-border purchases.
However, there is no consistent picture across all questions in the survey and across the intensive
and extensive margins.
The EU policy objective, under the Digital Agenda, for 50% of all consumers to buy online has
already been reached. The consumer survey confirms that there are indeed strong economic
incentives for consumers to shift their purchases from offline to online shops. However, cross-
border online consumption remains below the target of 20% in the official statistics. By cross-
checking survey information with the actual websites the respondents have bought from, we find
that survey statistics, though not completely precise, are to a large extent reliable, though cross-
18
border purchases outside the EU may be underreported. This survey confirms that consumer
incentives to go cross-border are more difficult to pinpoint. Price, quality and variety all seem to
matter, though quality and variety in choice seem to be the major drivers for going cross-border.
Under the new Digital Single Market policy package, EU policy makers seek to promote initiatives
that would facilitate more cross-border online trade in the Digital Single Market. Policy makers do
not need to focus so much on the positive incentives that consumers receive through market
forces. Instead, they need to look at consumer concerns that stop them from buying online and
cross-border. There is some evidence that consumers lack both knowledge about their rights and
trust in cross-border transactions. Worries about data misuse or payment card details being stolen
seem to be an obstacle to a seamless European digital market. Long delivery times also seem to be
an issue with many online consumers.
In the absence of any reliable statistics on cross-border online trade in goods and services, the
consumer survey data also enabled us to estimate a bilateral online trade matrix between the
EU28. With the help of the standard gravity model, we find that around 85% of the observed trade
patterns are determined by consumer preference variables, such as preference for the home
market, language and geographic proximity (neighbouring countries). This would suggest that there
is relatively little room left for policy makers to further facilitate this consumer welfare-enhancing
shift to online and cross-border shopping.
Furthermore, the clickstream data reveal that the home bias is larger for shopping than surfing
behaviour and that online and offline shoppers spend more time on the internet than non-shoppers.
Further scrutiny of the clickstream data and linking the information to the online purchases
revealed in the diary may allow estimation of online search costs.
19
ANNEX I: REFERENCES
Alaveras, Georgios and Bertin Martens. 2015. "Online Services Trade in the Eu Digital Single Market," Digital Economy Working Paper (Forthcoming), JRC/IPTS Blum, Bernardo S. and Avi Goldfarb. 2006. "Does the Internet Defy the Law of Gravity?" Journal of International Economics, 70(2), 384-405. Brynjolfsson, Erik; Yu Hu and Michael D Smith. 2003. "Consumer Surplus in the Digital Economy: Estimating the Value of Increased Product Variety at Online Booksellers." Management Science, 49(11), 1580-96. Cairncross, Frances. 2001. The Death of Distance: How the Communications Revolution Is Changing Our Lives. Harvard Business Press. Chevalier, Judith and Austan Goolsbee. 2003. "Measuring Prices and Price Competition Online: Amazon. Com and Barnesandnoble. Com." Quantitative Marketing and Economics, 1(2), 203-22. Civic Consulting. 2011. "Consumer Market Study on the Functioning of E-Commerce and Internet Marketing and Selling Techniques in the Retail of Goods," http://ec.europa.eu/consumers/consumer_research/market_studies/docs/study_ecommerce_goods_en.pdf. Coppel, Jonathan. 2000. "E-Commerce." Dixit, Avinash K and Joseph E Stiglitz. 1977. "Monopolistic Competition and Optimum Product Diversity." The American Economic Review, 297-308. Duch-Brown, Nestor and Bertin Martens. 2014. "Consumer Benefits from the Eu Digital Single Market: Evidence from Household Appliances Markets," Digital Economy Working Paper, JRC/IPTS, Duch-Brown, Nestor and Bertin Martens. 2015. "The Dsm," Digital Economy working paper (forthcoming), JRC-IPTS European Commission. 2013. "The Consumer Conditions Scoreboard," http://ec.europa.eu/consumers/consumer_evidence/consumer_scoreboards/9_edition/docs/cms_9_en.pdf. European Commission. 2014. "Digital Agenda Scoreboard 2014," Progress Report Digital Agenda Targets 2014. https://ec.europa.eu/digital-agenda/en/news/scoreboard-2014-progress-report-digital-agenda-targets-2014. Francois, Joseph; Bertin Martens and Fan Yang. 2014. "The Macro-Economic Impact of Cross-Border Ecommerce in the Eu," Digital Economy Working Paper, JRC/IPTS, GfK. 2015. "Identifying the Main Cross-Border Obstacles to the Digital Single Market and Where They Matter Most," European Commission, http://ec.europa.eu/consumers/consumer_evidence/market_studies/obstacles_dsm/docs/21.09_dsm_final_report.pdf. Gomez, Estrella and Bertin Martens. 2015. "Language, Copyright and Geographic Segmentation in the Eu Digital Single Market for Music and Film," Digital Economy Working Paper 2015-04, Gomez, Estrella; Bertin Martens and Geomina Turlea. 2014. "The Drivers and Impediments to Online Cross-Border Trade in the Eu." Information Economics and Policy, 27. Goolsbee, Austan and Peter J Klenow. 2006. "Valuing Consumer Products by the Time Spent Using Them: An Application to the Internet," National Bureau of Economic Research, Lendle, Andreas; Simon Schropp; Marcelo Olarreaga and Pierre-Louis Vezina. 2012. "There Goes Gravity: How Ebay Reduces Trade Costs."
20
Melitz, Jacques and Farid Toubal. 2014. "Native Language, Spoken Language, Translation and Trade." Journal of International Economics, 93(2), 351-63. North, Douglass Cecil. 1992. Transaction Costs, Institutions, and Economic Performance. ICS Press San Francisco, CA. Pantea, Smaranda and Bertin Martens. 2014. "The Value of the Internet for Consumers " Digital Economy Working Paper 2014-08, JRC/IPTS, Takhteyev, Yuri; Anatoliy Gruzd and Barry Wellman. 2012. "Geography of Twitter Networks." Social networks, 34(1), 73-81.
21
ANNEX II: TABLES
Table 1: Comparing consumer perception and actual location of websites
A: 28 EU countries, Information on Last Purchase from Core Survey
B: Belgium and Poland, Information on Last Purchase from Core Survey
C: Belgium and Poland, Information from Clickstream Diary
According to Website database correct answer in %
By answer given by respondent in % total in my country another EU outside the EU
From a seller or service provider based in my country of residence 63.1% 84.0% 7.3% 8.7%
From a seller or service provider based in another EU country 18.9% 20.6% 56.6% 22.8%
From a seller or service provider based outside the EU 9.6% 9.6% 10.5% 80.0%
do not know 8.3% 53.3% 17.7% 29.1%
in total % 62.3% 17.8% 19.9%
Notes: for n=8816 (unweighted), respondents who entered a valid URL and answered the question of the location of where the product
was bought.
According to Website database correct answer in %
By answer given by respondent in % total in my country another EU outside the EU
From a seller or service provider based in my country of residence 66.4% 89.4% 7.5% 3.2%
From a seller or service provider based in another EU country 20.4% 16.8% 71.4% 11.9%
From a seller or service provider based outside the EU 4.1% 13.5% 18.9% 67.6%
do not know 9.1% 68.3% 18.3% 13.4%
in total % 69.5% 22.0% 8.5%
Notes: for n=905 (unweighted)
According to Website database correct answer in %
By answer given by respondent in % total in my country another EU outside the EU
From a seller or service provider based in my country of residence 64.5% 90.0% 6.6% 3.4%
From a seller or service provider based in another EU country 16.4% 13.3% 72.2% 14.6%
From a seller or service provider based outside the EU 4.3% 14.3% 2.4% 83.3%
do not know 14.8% 37.1% 16.8% 46.2%
in total % 66.4% 18.6% 15.0%
Notes: for n=966 purchases from 524 different respondents (unweighted) from clickstream diary.
22
Table 2: Comparing consumer perception and actual location of websites (by product group)
A: Tangible Goods
B: Online Services (Travel, Leisure)
C: Digital Content
Table 3: Perception of website location within last year
According to Website database correct answer in %
By answer given by respondent in % total in my country another EU outside the EU
From a seller or service provider based in my country of residence 63.1% 84.4% 7.2% 8.4%
From a seller or service provider based in another EU country 19.1% 22.0% 56.6% 21.4%
From a seller or service provider based outside the EU 10.3% 9.6% 10.1% 80.4%
do not know 7.5% 57.1% 16.1% 26.8%
in total % 62.7% 17.6% 19.6%
Notes: for n=7442 (unweighted)
According to Website database correct answer in %
By answer given by respondent in % total in my country another EU outside the EU
From a seller or service provider based in my country of residence 71.8% 83.2% 8.4% 8.4%
From a seller or service provider based in another EU country 16.1% 10.8% 60.5% 28.7%
From a seller or service provider based outside the EU 2.4% 17.4% 21.7% 60.9%
do not know 9.8% 54.2% 24.0% 21.9%
in total % 67.1% 18.6% 14.2%
Notes: for n=977 (unweighted)
By answer given by respondent in % total in my country another EU outside the EU
From a seller or service provider based in my country of residence 42.8% 75.9% 6.5% 17.6%
From a seller or service provider based in another EU country 21.4% 15.3% 48.2% 36.5%
From a seller or service provider based outside the EU 15.4% 6.6% 11.5% 82.0%
do not know 20.4% 25.9% 21.0% 53.1%
in total % 42.1% 19.1% 38.8%
Notes: for n=397 (unweighted)
According to Website database correct answer in %
% of consumers buy this product group
Goods (e.g. Books,
Clothes,etc. )
Book Services
(hotels, tickets)
Digital Content
(Films, Games,
only domestic 47.8 62.1 50.3
crossborder 44.7 28.3 32.6
online, but do not know where provider is based 7.4 9.7 17
Notes: Weighted Averages.
23
Table 4: Descriptive Statistics of Explanatory Variables
VARIABLES Observations Mean Min Max
CONCERNS
Delivery conditions
Long delivery times 22,756 0.18 0 1
Delivery costs or final price are higher than displayed on website 22,756 0.13 0 1
Delivery arrangements of online sellers might not be convenient for me 22,756 0.08 0 1
Wrong or damaged products will be delivered 22,756 0.26 0 1
Products will not be delivered at all 22,756 0.17 0 1
Customer service
Customer service is poor 22,756 0.13 0 1
Returning a product I didn't like and getting reimbursed is not easy 22,756 0.22 0 1
Replacement or repair of a faulty product is not easy 22,756 0.25 0 1
Payment
The payment card details may be stolen 22,756 0.26 0 1
My preferred payment method might not be accepted by online sellers 22,756 0.11 0 1
Trust
Personal data may be misused 22,756 0.30 0 1
Goods sold online might be unsafe/counterfeit 22,756 0.19 0 1
I don't trust the information provided to me online 22,756 0.05 0 1
I don't trust the terms and conditions I have to agree with online 22,756 0.06 0 1
Consumer Rights
I do not know what my consumer rights are when buying online 22,756 0.07 0 1
There is a lower level of consumer protection when buying online 22,756 0.03 0 1
I don't understand the terms and conditions 22,756 0.04 0 1
REASONS
Price
I find cheaper products online 22,554 0.49 0 1
Quality and variety
I find better quality products online 22,554 0.05 0 1
I can find certain products only online 22,554 0.25 0 1
There's more choice online 22,554 0.36 0 1
Transaction
I save time by buying online 22,554 0.42 0 1
I don't like going to shops 22,554 0.12 0 1
I can order at any time of the day/week 22,554 0.49 0 1
Products are delivered to a convenient place 22,554 0.24 0 1
I can return products easily 22,554 0.09 0 1
Information
It's easier to compare prices online 22,554 0.37 0 1
It's easier to compare product information online 22,554 0.20 0 1
I can find more information online 22,554 0.18 0 1
I can find product reviews by other consumers 22,554 0.21 0 1
ICT USE AND SKILLS
hoursinternet 22,756 4.02 0 23
socialnetwork 22,756 0.69 0 1
advanced 22,756 0.38 0 1
DEMOGRAPHICS
age (in years) 22,756 41.97 18 99
gender (1=female) 22,756 0.49 0 1
No. of languages spoken 22,756 1.70 0 5
Categorical Variables Frequency Percent
Education 22,756
Elementary School 1,060 4.66
Some Secondary School 3,677 16.16
Graduation Secondary School 6,945 30.52
Graduation College 6,313 27.74
Post-graduate Degree 2,961 13.01
Student 852 3.74
Other 594 2.61
Refusal 354 1.56
Region 22,756
Rural Zone 7,319 32.16
Town, Urban centre 9,313 40.92
Metropolitan zone 6,124 26.91
24
Table 5a: The extensive margin of online trade (the number of consumers doing online trade, logit regression)
Total Crossborder Total Crossborder Total Crossborder Paid content
Mean Population 93.2% 50.1% 77.0% 34.5% 97.0% 45.6% 44.5%
CONCERNS
Delivery conditions
Long delivery times 0.00864*** 0.0370** 0.00147 -0.0113 0.000902 -0.0302* -0.0236
Delivery costs or final price are higher than displayed on website -0.00762*** -0.0237 -0.000194 -0.00521 -0.00268 0.0127 0.0212
Delivery arrangements of online sellers might not be convenient for me 0.00560 0.0248 0.0166 0.0361* 0.00470 0.0365* 0.0214
Wrong or damaged products will be delivered 6.46e-05 -0.0528*** -0.00929 -0.0233 -0.00155 -0.0369*** -0.0288**
Products will not be delivered at all -0.00510** -0.0107 -0.0219** -0.0220 -0.00201 -0.0197 -0.0158
Customer service
Customer service is poor -0.00143 0.0255 0.0276** 0.00880 0.00168 0.0261 0.0308*
Returning a product I didn't like and getting reimbursed is not easy -0.00383 -0.0263* -0.00791 -0.0178 0.00831*** -0.0364** -0.0508***
Replacement or repair of a faulty product is not easy -0.00344 -0.0141 0.00535 -0.0147 0.00825*** -0.0300** -0.0258*
Payment
The payment card details may be stolen -0.0123*** -0.0410*** -0.00278 -0.0173 0.00373 -0.0397*** -0.0291**
My preferred payment method might not be accepted by online sellers -0.00177 0.0178 -0.0278** -0.0206 0.00544 0.0369** -0.00818
Trust
Personal data may be misused -0.00574** -0.0421*** -0.0120 -0.0471*** 0.00373 -0.0397*** -0.0291**
Goods sold online might be unsafe/counterfeit -0.00791*** 0.0127 -0.0172* -0.0105 0.00544 0.0369** -0.00818
I don't trust the information provided to me online -0.0177*** 0.0237 -0.0265* 0.0263 0.00373 -0.0397*** -0.0291**
I don't trust the terms and conditions I have to agree with online -0.00945*** 0.00706 0.0224 0.0662*** 0.00544 0.0369** -0.00818
Consumer Rights
I do not know what my consumer rights are when buying online -0.00755** -0.0373 0.0137 -0.0184 -0.00801** -0.0198 -0.00985
There is a lower level of consumer protection when buying online -0.00774*** -0.00409 0.00153 0.00344 0.000890 0.0490** 0.0161
I don't understand the terms and conditions -0.00429 0.0341 0.0281 0.0929*** -0.00349 0.0256 0.0265
Other concerns -0.00520 -0.0394 -0.0368** 0.00741 0.0119** -0.0523* -0.0414
REASONS
Price
I find cheaper products online 0.0137*** -0.0120 -0.00790 -0.0618*** 0.00382 -0.0160 -0.0623***
Quality and variety
I find better quality products online 0.0115* 0.0807*** 0.0379* 0.0776*** 0.00343 0.0484* 0.104***
I can find certain products only online 0.0128*** 0.0270* -0.0187* -0.0185 0.00153 0.0269* 0.0269*
There's more choice online 0.00984*** 0.0277** -0.00270 -0.0245* 0.000858 0.00167 0.0118
Transaction
I save time by buying online 0.00877*** -0.0407*** 0.00637 -0.0441*** 0.00316 -0.0518*** -0.00468
I don't like going to shops 0.0136*** 0.0125 -0.0176 0.0386** 0.00482 0.0151 0.0370*
I can order at any time of the day/week 0.00541** -0.00239 0.00180 -0.0342** 0.00352 -0.0223 -0.0242*
Products are delivered to a convenient place 0.0198*** -0.00776 -0.00873 0.00474 0.00318 0.00841 0.0108
I can return products easily 0.0102** 0.00759 0.0237 0.0106 -0.00501 -0.00853 0.0113
Information
It's easier to compare prices online 0.00521** -0.0178 0.0180** -0.0363*** 0.00547** -0.0121 -0.0217*
It's easier to compare product information online 0.00387 0.0101 0.0347*** -0.0243 -7.78e-05 0.0285* 0.0368**
I can find more information online 0.000738 -0.0121 0.000300 -0.0161 0.00490 0.0233 0.0321**
I can find product reviews by other consumers 0.00953*** 0.0291* 0.00793 0.0151 0.0106*** 0.0181 0.0445***
Other -0.0256*** -0.134*** -0.156*** -0.0573 -0.00767* -0.0218 -0.156***
ICT USE AND SKILLS
hoursinternet 0.00118** 0.00703*** -0.00184 0.00448** 0.000256 0.00517** 0.00934***
socialnetwork -0.000154 -0.0520*** 0.00919 -0.0790*** 0.0159*** -0.0242 -0.0356**
advanced 0.0187*** 0.177*** 0.133*** 0.120*** 0.0229*** 0.172*** 0.233***
DEMOGRAPHICS
age (in years) -0.000359*** -0.00718*** -0.00157*** -0.00553*** -0.000204** -0.00756*** -0.00650***
gender (1=female) 0.00236 -0.0525*** 0.00112 -0.0471*** -0.00447** -0.122*** -0.0755***
Education (Base: Elementary School)
Some Secondary School 0.000982 -0.0231 0.0768** -0.0808* 0.00543 -0.0531 -0.000272
Graduation Secondary School 0.0116 0.0153 0.140*** -0.0771* 0.00879 -0.0248 0.0198
Graduation College 0.0184** 0.0476 0.194*** -0.0399 0.0161*** -0.00806 0.0560
Post-graduate Degree 0.0258*** 0.0691* 0.229*** 0.0262 0.0130* 0.0470 0.127***
Student 0.0155 0.0101 0.155*** -0.0698 0.00691 -0.0141 -0.0542
Other 0.00698 0.0127 0.0825* 0.00512 0.0153* -0.0500 0.0112
Refusal -0.00701 0.0323 0.121** 0.0551 -0.00189 -0.0812 0.110*
Region (Base=Rural)
Town, Urban centre 0.00337 0.0418** 0.0811*** 0.0543*** 0.00299 0.0826*** 0.0652***
Metropolitan zone 0.00594** 0.00197 0.0289** 0.0159 0.00548** 0.0312* 0.00424
No. of languages spoken 0.00147 0.0586*** 0.0452*** 0.0433*** 0.00687*** 0.0819*** 0.00851
Country Fixed Effects Yes Yes Yes Yes Yes Yes Yes
Observations 18,605 16,351 18,605 13,145 18,148 15,504 18,053
Dependent Variable
Purchase goods online Online services Purchase digital content online
Notes: Standard errors in parentheses, Significance Level at *** p<0.01, ** p<0.05, * p<0.1. Estimated with a maximum-likelihood logit model. Marginal effects at mean population
shown. Weights based on age, gender, and country applied.
25
Table 5b: The extensive margin of online trade (Odds Ratios)
Total Crossborder Total Crossborder Total Crossborder Paid content
CONCERNS
Delivery conditions
Long delivery times 1.546*** 1.159** 1.010 0.948 1.055 0.881* 0.910
Delivery costs or final price are higher than displayed on website 0.681*** 0.910 0.999 0.976 0.852 1.055 1.089
Delivery arrangements of online sellers might not be convenient for me 1.326 1.104 1.121 1.187* 1.323 1.165* 1.090
Wrong or damaged products will be delivered 1.003 0.810*** 0.938 0.896 0.912 0.857*** 0.891**
Products will not be delivered at all 0.774** 0.958 0.861** 0.901 0.887 0.921 0.939
Customer service
Customer service is poor 0.930 1.107 1.208** 1.043 1.105 1.115 1.131*
Returning a product I didn't like and getting reimbursed is not easy 0.825 0.900* 0.947 0.919 1.640*** 0.859** 0.816***
Replacement or repair of a faulty product is not easy 0.841 0.945 1.037 0.933 1.634*** 0.882** 0.902*
Payment
The payment card details may be stolen 0.539*** 0.849*** 0.981 0.921 1.248 0.847*** 0.890**
My preferred payment method might not be accepted by online sellers 0.915 1.074 0.827** 0.907 1.382 1.167** 0.968
Trust
Personal data may be misused 0.749*** 0.845*** 0.921 0.800*** 1.144 0.908 0.949
Goods sold online might be unsafe/counterfeit 0.672*** 1.052 0.889* 0.952 1.195 0.969 0.899*
I don't trust the information provided to me online 0.410*** 1.099 0.834* 1.133 1.095 1.383*** 1.121
I don't trust the terms and conditions I have to agree with online 0.621*** 1.029 1.166 1.369*** 0.994 1.224* 1.062
Consumer Rights
I do not know what my consumer rights are when buying online 0.684** 0.861 1.098 0.916 0.621** 0.921 0.961
There is a lower level of consumer protection when buying online 0.677*** 0.984 1.011 1.016 1.054 1.228** 1.067
I don't understand the terms and conditions 0.806 1.146 1.212 1.553*** 0.813 1.113 1.112
Other concerns 0.770 0.854 0.778** 1.036 2.032** 0.803* 0.847
REASONS
Price
I find cheaper products online 1.991*** 0.953 0.947 0.746*** 1.255 0.935 0.779***
Quality and variety
I find better quality products online 1.786* 1.381*** 1.296* 1.444*** 1.226 1.225* 1.519***
I can find certain products only online 1.908*** 1.114* 0.880* 0.916 1.095 1.119* 1.114*
There's more choice online 1.641*** 1.117** 0.982 0.890* 1.052 1.007 1.048
Transaction
I save time by buying online 1.555*** 0.850*** 1.045 0.811*** 1.207 0.805*** 0.981
I don't like going to shops 1.979*** 1.051 0.886 1.201** 1.332 1.065 1.160*
I can order at any time of the day/week 1.313** 0.990 1.012 0.850** 1.233 0.911 0.908*
Products are delivered to a convenient place 2.710*** 0.969 0.942 1.023 1.208 1.036 1.044
I can return products easily 1.667** 1.031 1.176 1.051 0.742 0.965 1.046
Information
It's easier to compare prices online 1.300** 0.931 1.131** 0.842*** 1.385** 0.951 0.917*
It's easier to compare product information online 1.215 1.041 1.268*** 0.891 0.995 1.126* 1.159**
I can find more information online 1.038 0.953 1.002 0.927 1.338 1.102 1.137**
I can find product reviews by other consumers 1.616*** 1.124* 1.056 1.074 1.882*** 1.079 1.195***
Other 0.275*** 0.586*** 0.343*** 0.762 0.634* 0.913 0.535***
ICT USE AND SKILLS
hoursinternet 1.061** 1.029*** 0.988 1.021** 1.015 1.022** 1.038***
socialnetwork 0.992 0.812*** 1.065 0.688*** 2.578*** 0.904 0.867**
advanced 2.562*** 2.030*** 2.482*** 1.763*** 3.916*** 2.054*** 2.545***
DEMOGRAPHICS
age (in years) 0.982*** 0.972*** 0.989*** 0.974*** 0.988** 0.969*** 0.974***
gender (1=female) 1.126 0.811*** 1.008 0.800*** 0.766** 0.601*** 0.739***
Education (Base: Elementary School)
Some Secondary School 1.030 0.911 1.446** 0.683* 1.245 0.798 0.999
Graduation Secondary School 1.514 1.063 2.076*** 0.696* 1.464 0.902 1.083
Graduation College 2.139*** 1.210 3.065*** 0.834 2.359*** 0.967 1.252
Post-graduate Degree 3.869*** 1.319* 4.218*** 1.120 1.880** 1.211 1.667***
Student 1.819* 1.041 2.287*** 0.722 1.333 0.943 0.799
Other 1.257 1.052 1.490* 1.023 2.221 0.809 1.046
Refusal 0.827 1.138 1.844** 1.265 0.936 0.705 1.558*
Region (Base=Rural)
Town, Urban centre 1.168 1.182** 1.753*** 1.294*** 1.174 1.414*** 1.299***
Metropolitan zone 1.338** 1.008 1.195** 1.081 1.373** 1.143* 1.017
No. of languages spoken 1.077 1.264*** 1.363*** 1.228*** 1.505*** 1.409*** 1.035
Country Fixed Effects Yes Yes Yes Yes Yes Yes Yes
Constant 12.91*** 8.037*** 1.087 5.087*** 2.057* 3.461*** 1.674**
Observations 18,605 16,351 18,605 13,145 18,148 15,504 18,053
Dependent Variable
Purchase goods online Online services Purchase digital content online
Notes: Standard errors in parentheses, Significance Level at *** p<0.01, ** p<0.05, * p<0.1. Estimated with a maximum-likelihood logit model. Odds Ratios shown. Ratios > 1 correspont
to positive effects. Weights based on age, gender, and country applied.
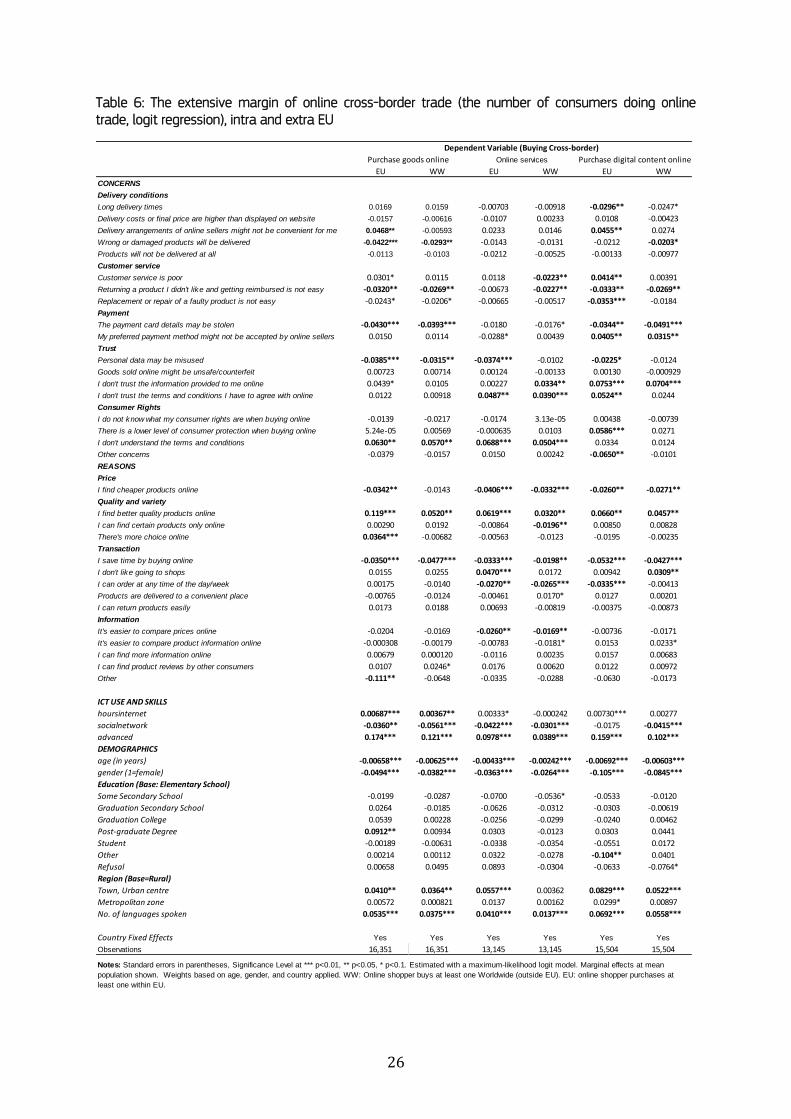
26
Table 6: The extensive margin of online cross-border trade (the number of consumers doing online trade, logit regression), intra and extra EU
EU WW EU WW EU WW
CONCERNS
Delivery conditions
Long delivery times 0.0169 0.0159 -0.00703 -0.00918 -0.0296** -0.0247*
Delivery costs or final price are higher than displayed on website -0.0157 -0.00616 -0.0107 0.00233 0.0108 -0.00423
Delivery arrangements of online sellers might not be convenient for me 0.0468** -0.00593 0.0233 0.0146 0.0455** 0.0274
Wrong or damaged products will be delivered -0.0422*** -0.0293** -0.0143 -0.0131 -0.0212 -0.0203*
Products will not be delivered at all -0.0113 -0.0103 -0.0212 -0.00525 -0.00133 -0.00977
Customer service
Customer service is poor 0.0301* 0.0115 0.0118 -0.0223** 0.0414** 0.00391
Returning a product I didn't like and getting reimbursed is not easy -0.0320** -0.0269** -0.00673 -0.0227** -0.0333** -0.0269**
Replacement or repair of a faulty product is not easy -0.0243* -0.0206* -0.00665 -0.00517 -0.0353*** -0.0184
Payment
The payment card details may be stolen -0.0430*** -0.0393*** -0.0180 -0.0176* -0.0344** -0.0491***
My preferred payment method might not be accepted by online sellers 0.0150 0.0114 -0.0288* 0.00439 0.0405** 0.0315**
Trust
Personal data may be misused -0.0385*** -0.0315** -0.0374*** -0.0102 -0.0225* -0.0124
Goods sold online might be unsafe/counterfeit 0.00723 0.00714 0.00124 -0.00133 0.00130 -0.000929
I don't trust the information provided to me online 0.0439* 0.0105 0.00227 0.0334** 0.0753*** 0.0704***
I don't trust the terms and conditions I have to agree with online 0.0122 0.00918 0.0487** 0.0390*** 0.0524** 0.0244
Consumer Rights
I do not know what my consumer rights are when buying online -0.0139 -0.0217 -0.0174 3.13e-05 0.00438 -0.00739
There is a lower level of consumer protection when buying online 5.24e-05 0.00569 -0.000635 0.0103 0.0586*** 0.0271
I don't understand the terms and conditions 0.0630** 0.0570** 0.0688*** 0.0504*** 0.0334 0.0124
Other concerns -0.0379 -0.0157 0.0150 0.00242 -0.0650** -0.0101
REASONS
Price
I find cheaper products online -0.0342** -0.0143 -0.0406*** -0.0332*** -0.0260** -0.0271**
Quality and variety
I find better quality products online 0.119*** 0.0520** 0.0619*** 0.0320** 0.0660** 0.0457**
I can find certain products only online 0.00290 0.0192 -0.00864 -0.0196** 0.00850 0.00828
There's more choice online 0.0364*** -0.00682 -0.00563 -0.0123 -0.0195 -0.00235
Transaction
I save time by buying online -0.0350*** -0.0477*** -0.0333*** -0.0198** -0.0532*** -0.0427***
I don't like going to shops 0.0155 0.0255 0.0470*** 0.0172 0.00942 0.0309**
I can order at any time of the day/week 0.00175 -0.0140 -0.0270** -0.0265*** -0.0335*** -0.00413
Products are delivered to a convenient place -0.00765 -0.0124 -0.00461 0.0170* 0.0127 0.00201
I can return products easily 0.0173 0.0188 0.00693 -0.00819 -0.00375 -0.00873
Information
It's easier to compare prices online -0.0204 -0.0169 -0.0260** -0.0169** -0.00736 -0.0171
It's easier to compare product information online -0.000308 -0.00179 -0.00783 -0.0181* 0.0153 0.0233*
I can find more information online 0.00679 0.000120 -0.0116 0.00235 0.0157 0.00683
I can find product reviews by other consumers 0.0107 0.0246* 0.0176 0.00620 0.0122 0.00972
Other -0.111** -0.0648 -0.0335 -0.0288 -0.0630 -0.0173
ICT USE AND SKILLS
hoursinternet 0.00687*** 0.00367** 0.00333* -0.000242 0.00730*** 0.00277
socialnetwork -0.0360** -0.0561*** -0.0422*** -0.0301*** -0.0175 -0.0415***
advanced 0.174*** 0.121*** 0.0978*** 0.0389*** 0.159*** 0.102***
DEMOGRAPHICS
age (in years) -0.00658*** -0.00625*** -0.00433*** -0.00242*** -0.00692*** -0.00603***
gender (1=female) -0.0494*** -0.0382*** -0.0363*** -0.0264*** -0.105*** -0.0845***
Education (Base: Elementary School)
Some Secondary School -0.0199 -0.0287 -0.0700 -0.0536* -0.0533 -0.0120
Graduation Secondary School 0.0264 -0.0185 -0.0626 -0.0312 -0.0303 -0.00619
Graduation College 0.0539 0.00228 -0.0256 -0.0299 -0.0240 0.00462
Post-graduate Degree 0.0912** 0.00934 0.0303 -0.0123 0.0303 0.0441
Student -0.00189 -0.00631 -0.0338 -0.0354 -0.0551 0.0172
Other 0.00214 0.00112 0.0322 -0.0278 -0.104** 0.0401
Refusal 0.00658 0.0495 0.0893 -0.0304 -0.0633 -0.0764*
Region (Base=Rural)
Town, Urban centre 0.0410** 0.0364** 0.0557*** 0.00362 0.0829*** 0.0522***
Metropolitan zone 0.00572 0.000821 0.0137 0.00162 0.0299* 0.00897
No. of languages spoken 0.0535*** 0.0375*** 0.0410*** 0.0137*** 0.0692*** 0.0558***
Country Fixed Effects Yes Yes Yes Yes Yes Yes
Observations 16,351 16,351 13,145 13,145 15,504 15,504
Dependent Variable (Buying Cross-border)
Purchase goods online Online services Purchase digital content online
Notes: Standard errors in parentheses, Significance Level at *** p<0.01, ** p<0.05, * p<0.1. Estimated with a maximum-likelihood logit model. Marginal effects at mean
population shown. Weights based on age, gender, and country applied. WW: Online shopper buys at least one Worldwide (outside EU). EU: online shopper purchases at
least one within EU.
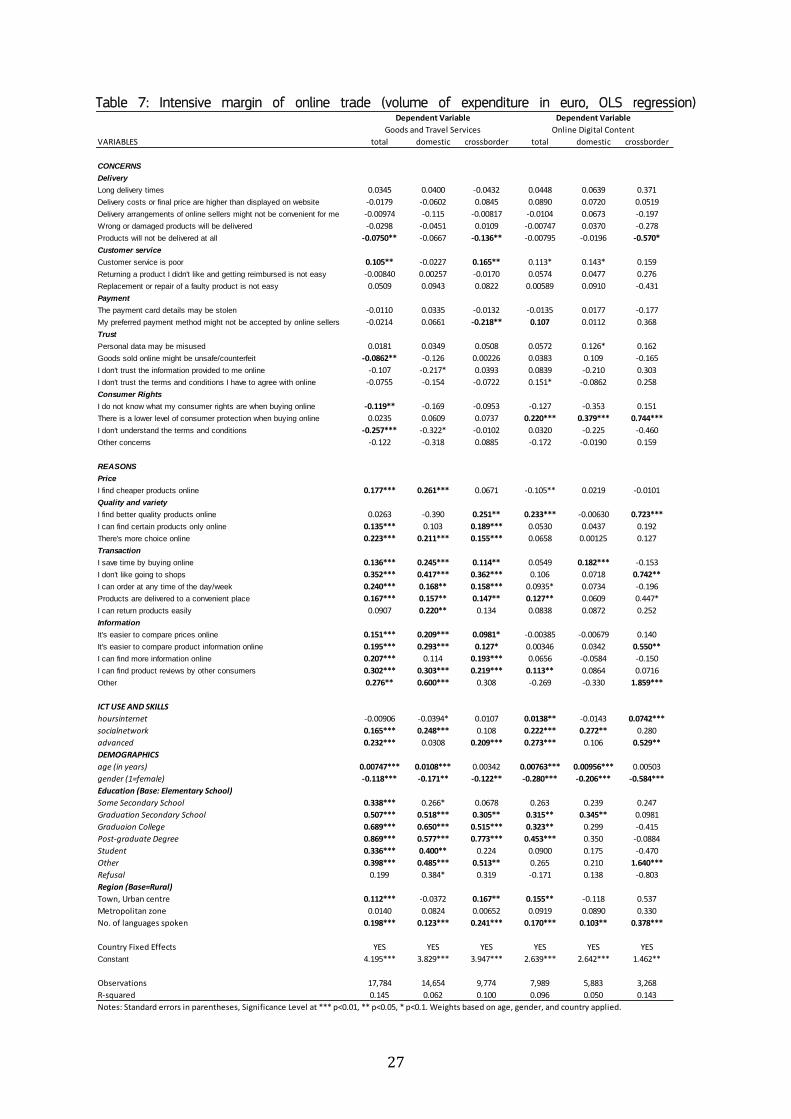
27
Table 7: Intensive margin of online trade (volume of expenditure in euro, OLS regression)
VARIABLES total domestic crossborder total domestic crossborder
CONCERNS
Delivery
Long delivery times 0.0345 0.0400 -0.0432 0.0448 0.0639 0.371
Delivery costs or final price are higher than displayed on website -0.0179 -0.0602 0.0845 0.0890 0.0720 0.0519
Delivery arrangements of online sellers might not be convenient for me -0.00974 -0.115 -0.00817 -0.0104 0.0673 -0.197
Wrong or damaged products will be delivered -0.0298 -0.0451 0.0109 -0.00747 0.0370 -0.278
Products will not be delivered at all -0.0750** -0.0667 -0.136** -0.00795 -0.0196 -0.570*
Customer service
Customer service is poor 0.105** -0.0227 0.165** 0.113* 0.143* 0.159
Returning a product I didn't like and getting reimbursed is not easy -0.00840 0.00257 -0.0170 0.0574 0.0477 0.276
Replacement or repair of a faulty product is not easy 0.0509 0.0943 0.0822 0.00589 0.0910 -0.431
Payment
The payment card details may be stolen -0.0110 0.0335 -0.0132 -0.0135 0.0177 -0.177
My preferred payment method might not be accepted by online sellers -0.0214 0.0661 -0.218** 0.107 0.0112 0.368
Trust
Personal data may be misused 0.0181 0.0349 0.0508 0.0572 0.126* 0.162
Goods sold online might be unsafe/counterfeit -0.0862** -0.126 0.00226 0.0383 0.109 -0.165
I don't trust the information provided to me online -0.107 -0.217* 0.0393 0.0839 -0.210 0.303
I don't trust the terms and conditions I have to agree with online -0.0755 -0.154 -0.0722 0.151* -0.0862 0.258
Consumer Rights
I do not know what my consumer rights are when buying online -0.119** -0.169 -0.0953 -0.127 -0.353 0.151
There is a lower level of consumer protection when buying online 0.0235 0.0609 0.0737 0.220*** 0.379*** 0.744***
I don't understand the terms and conditions -0.257*** -0.322* -0.0102 0.0320 -0.225 -0.460
Other concerns -0.122 -0.318 0.0885 -0.172 -0.0190 0.159
REASONS
Price
I find cheaper products online 0.177*** 0.261*** 0.0671 -0.105** 0.0219 -0.0101
Quality and variety
I find better quality products online 0.0263 -0.390 0.251** 0.233*** -0.00630 0.723***
I can find certain products only online 0.135*** 0.103 0.189*** 0.0530 0.0437 0.192
There's more choice online 0.223*** 0.211*** 0.155*** 0.0658 0.00125 0.127
Transaction
I save time by buying online 0.136*** 0.245*** 0.114** 0.0549 0.182*** -0.153
I don't like going to shops 0.352*** 0.417*** 0.362*** 0.106 0.0718 0.742**
I can order at any time of the day/week 0.240*** 0.168** 0.158*** 0.0935* 0.0734 -0.196
Products are delivered to a convenient place 0.167*** 0.157** 0.147** 0.127** 0.0609 0.447*
I can return products easily 0.0907 0.220** 0.134 0.0838 0.0872 0.252
Information
It's easier to compare prices online 0.151*** 0.209*** 0.0981* -0.00385 -0.00679 0.140
It's easier to compare product information online 0.195*** 0.293*** 0.127* 0.00346 0.0342 0.550**
I can find more information online 0.207*** 0.114 0.193*** 0.0656 -0.0584 -0.150
I can find product reviews by other consumers 0.302*** 0.303*** 0.219*** 0.113** 0.0864 0.0716
Other 0.276** 0.600*** 0.308 -0.269 -0.330 1.859***
ICT USE AND SKILLS
hoursinternet -0.00906 -0.0394* 0.0107 0.0138** -0.0143 0.0742***
socialnetwork 0.165*** 0.248*** 0.108 0.222*** 0.272** 0.280
advanced 0.232*** 0.0308 0.209*** 0.273*** 0.106 0.529**
DEMOGRAPHICS
age (in years) 0.00747*** 0.0108*** 0.00342 0.00763*** 0.00956*** 0.00503
gender (1=female) -0.118*** -0.171** -0.122** -0.280*** -0.206*** -0.584***
Education (Base: Elementary School)
Some Secondary School 0.338*** 0.266* 0.0678 0.263 0.239 0.247
Graduation Secondary School 0.507*** 0.518*** 0.305** 0.315** 0.345** 0.0981
Graduaion College 0.689*** 0.650*** 0.515*** 0.323** 0.299 -0.415
Post-graduate Degree 0.869*** 0.577*** 0.773*** 0.453*** 0.350 -0.0884
Student 0.336*** 0.400** 0.224 0.0900 0.175 -0.470
Other 0.398*** 0.485*** 0.513** 0.265 0.210 1.640***
Refusal 0.199 0.384* 0.319 -0.171 0.138 -0.803
Region (Base=Rural)
Town, Urban centre 0.112*** -0.0372 0.167** 0.155** -0.118 0.537
Metropolitan zone 0.0140 0.0824 0.00652 0.0919 0.0890 0.330
No. of languages spoken 0.198*** 0.123*** 0.241*** 0.170*** 0.103** 0.378***
Country Fixed Effects YES YES YES YES YES YES
Constant 4.195*** 3.829*** 3.947*** 2.639*** 2.642*** 1.462**
Observations 17,784 14,654 9,774 7,989 5,883 3,268
R-squared 0.145 0.062 0.100 0.096 0.050 0.143
Notes: Standard errors in parentheses, Significance Level at *** p<0.01, ** p<0.05, * p<0.1. Weights based on age, gender, and country applied.
Goods and Travel Services
Dependent Variable Dependent Variable
Online Digital Content
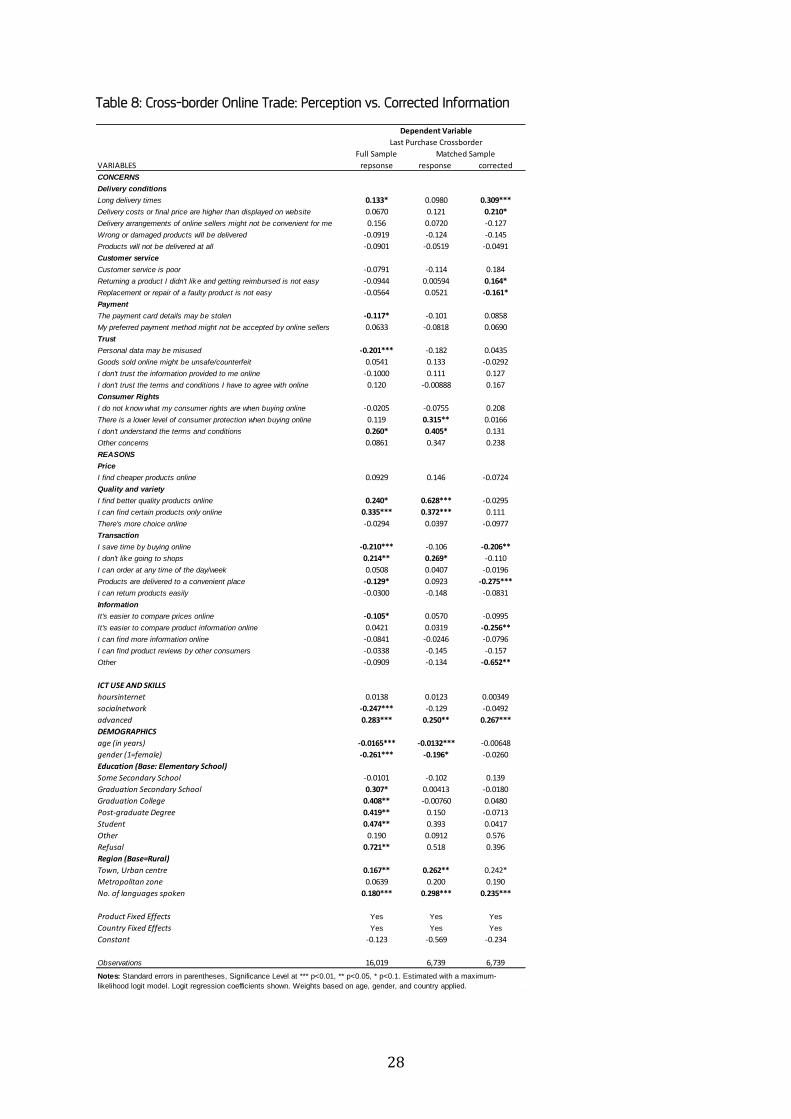
28
Table 8: Cross-border Online Trade: Perception vs. Corrected Information
Full Sample
VARIABLES repsonse response corrected
CONCERNS
Delivery conditions
Long delivery times 0.133* 0.0980 0.309***
Delivery costs or final price are higher than displayed on website 0.0670 0.121 0.210*
Delivery arrangements of online sellers might not be convenient for me 0.156 0.0720 -0.127
Wrong or damaged products will be delivered -0.0919 -0.124 -0.145
Products will not be delivered at all -0.0901 -0.0519 -0.0491
Customer service
Customer service is poor -0.0791 -0.114 0.184
Returning a product I didn't like and getting reimbursed is not easy -0.0944 0.00594 0.164*
Replacement or repair of a faulty product is not easy -0.0564 0.0521 -0.161*
Payment
The payment card details may be stolen -0.117* -0.101 0.0858
My preferred payment method might not be accepted by online sellers 0.0633 -0.0818 0.0690
Trust
Personal data may be misused -0.201*** -0.182 0.0435
Goods sold online might be unsafe/counterfeit 0.0541 0.133 -0.0292
I don't trust the information provided to me online -0.1000 0.111 0.127
I don't trust the terms and conditions I have to agree with online 0.120 -0.00888 0.167
Consumer Rights
I do not know what my consumer rights are when buying online -0.0205 -0.0755 0.208
There is a lower level of consumer protection when buying online 0.119 0.315** 0.0166
I don't understand the terms and conditions 0.260* 0.405* 0.131
Other concerns 0.0861 0.347 0.238
REASONS
Price
I find cheaper products online 0.0929 0.146 -0.0724
Quality and variety
I find better quality products online 0.240* 0.628*** -0.0295
I can find certain products only online 0.335*** 0.372*** 0.111
There's more choice online -0.0294 0.0397 -0.0977
Transaction
I save time by buying online -0.210*** -0.106 -0.206**
I don't like going to shops 0.214** 0.269* -0.110
I can order at any time of the day/week 0.0508 0.0407 -0.0196
Products are delivered to a convenient place -0.129* 0.0923 -0.275***
I can return products easily -0.0300 -0.148 -0.0831
Information
It's easier to compare prices online -0.105* 0.0570 -0.0995
It's easier to compare product information online 0.0421 0.0319 -0.256**
I can find more information online -0.0841 -0.0246 -0.0796
I can find product reviews by other consumers -0.0338 -0.145 -0.157
Other -0.0909 -0.134 -0.652**
ICT USE AND SKILLS
hoursinternet 0.0138 0.0123 0.00349
socialnetwork -0.247*** -0.129 -0.0492
advanced 0.283*** 0.250** 0.267***
DEMOGRAPHICS
age (in years) -0.0165*** -0.0132*** -0.00648
gender (1=female) -0.261*** -0.196* -0.0260
Education (Base: Elementary School)
Some Secondary School -0.0101 -0.102 0.139
Graduation Secondary School 0.307* 0.00413 -0.0180
Graduation College 0.408** -0.00760 0.0480
Post-graduate Degree 0.419** 0.150 -0.0713
Student 0.474** 0.393 0.0417
Other 0.190 0.0912 0.576
Refusal 0.721** 0.518 0.396
Region (Base=Rural)
Town, Urban centre 0.167** 0.262** 0.242*
Metropolitan zone 0.0639 0.200 0.190
No. of languages spoken 0.180*** 0.298*** 0.235***
Product Fixed Effects Yes Yes Yes
Country Fixed Effects Yes Yes Yes
Constant -0.123 -0.569 -0.234
Observations 16,019 6,739 6,739
Dependent Variable
Last Purchase Crossborder
Matched Sample
Notes: Standard errors in parentheses, Significance Level at *** p<0.01, ** p<0.05, * p<0.1. Estimated with a maximum-
likelihood logit model. Logit regression coefficients shown. Weights based on age, gender, and country applied.
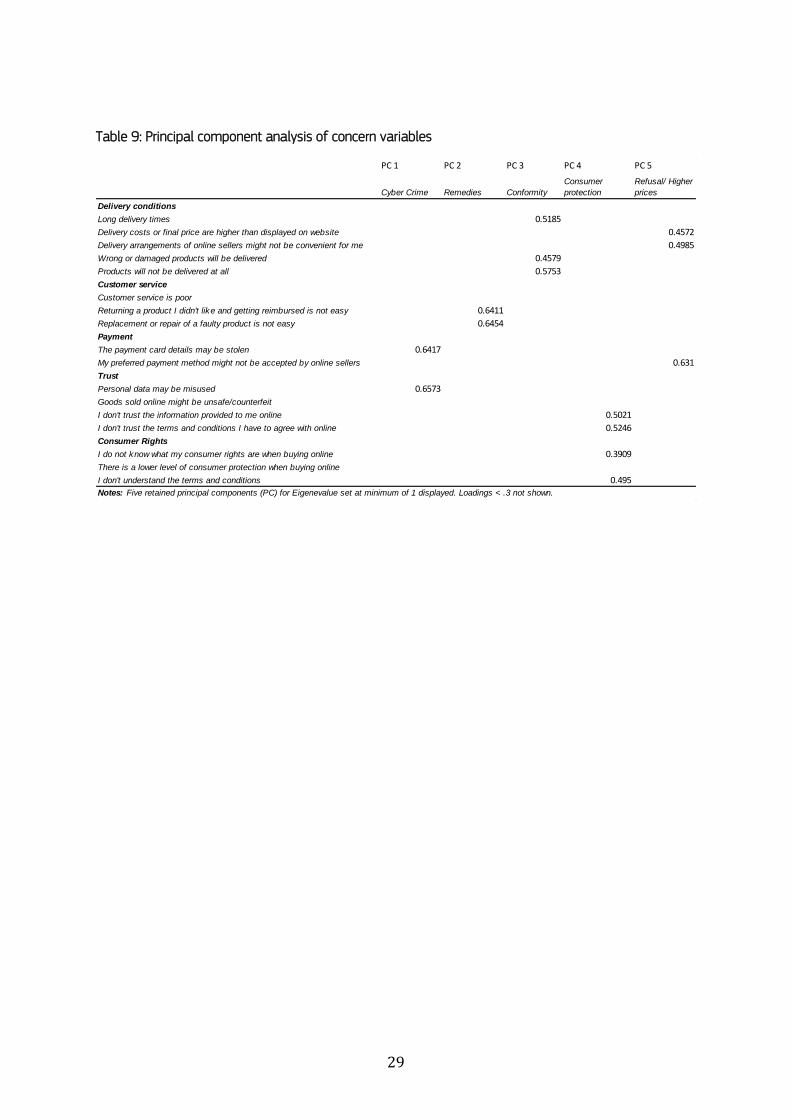
29
Table 9: Principal component analysis of concern variables
PC 1 PC 2 PC 3 PC 4 PC 5
Cyber Crime Remedies Conformity
Consumer
protection
Refusal/ Higher
prices
Delivery conditions
Long delivery times 0.5185
Delivery costs or final price are higher than displayed on website 0.4572
Delivery arrangements of online sellers might not be convenient for me 0.4985
Wrong or damaged products will be delivered 0.4579
Products will not be delivered at all 0.5753
Customer service
Customer service is poor
Returning a product I didn't like and getting reimbursed is not easy 0.6411
Replacement or repair of a faulty product is not easy 0.6454
Payment
The payment card details may be stolen 0.6417
My preferred payment method might not be accepted by online sellers 0.631
Trust
Personal data may be misused 0.6573
Goods sold online might be unsafe/counterfeit
I don't trust the information provided to me online 0.5021
I don't trust the terms and conditions I have to agree with online 0.5246
Consumer Rights
I do not know what my consumer rights are when buying online 0.3909
There is a lower level of consumer protection when buying online
I don't understand the terms and conditions 0.495
Notes: Five retained principal components (PC) for Eigenevalue set at minimum of 1 displayed. Loadings < .3 not shown.
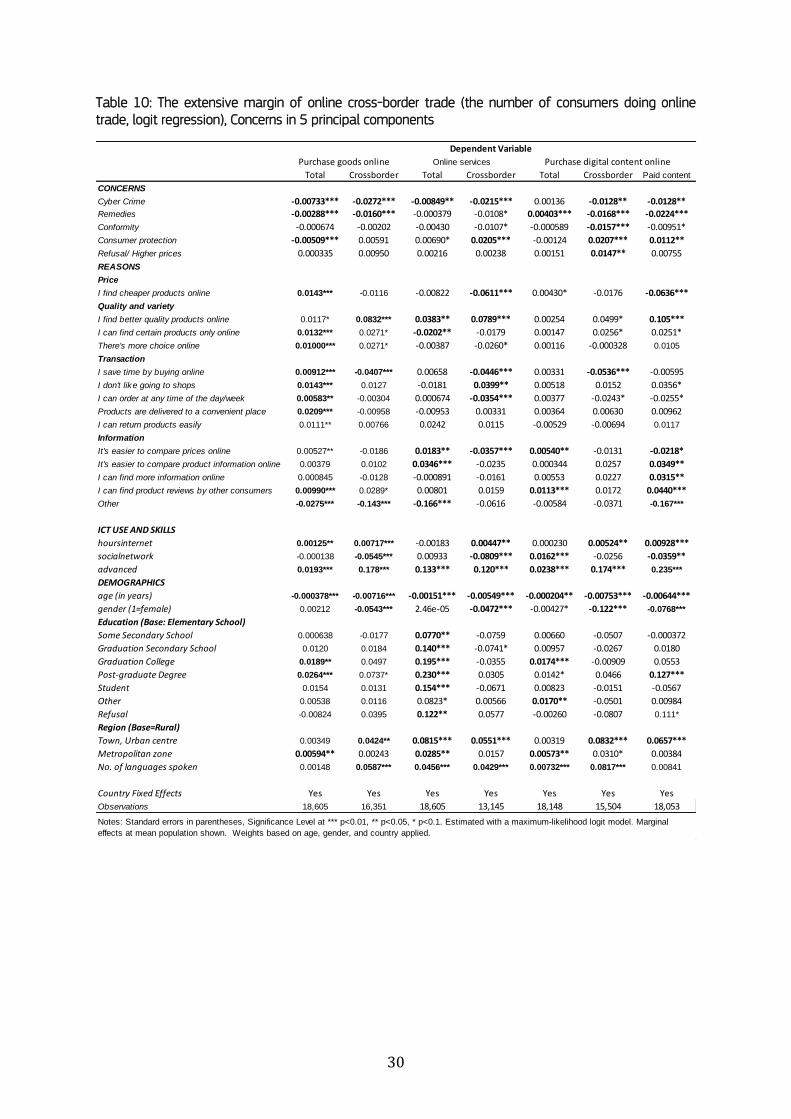
30
Table 10: The extensive margin of online cross-border trade (the number of consumers doing online trade, logit regression), Concerns in 5 principal components
Total Crossborder Total Crossborder Total Crossborder Paid content
CONCERNS
Cyber Crime -0.00733*** -0.0272*** -0.00849** -0.0215*** 0.00136 -0.0128** -0.0128**
Remedies -0.00288*** -0.0160*** -0.000379 -0.0108* 0.00403*** -0.0168*** -0.0224***
Conformity -0.000674 -0.00202 -0.00430 -0.0107* -0.000589 -0.0157*** -0.00951*
Consumer protection -0.00509*** 0.00591 0.00690* 0.0205*** -0.00124 0.0207*** 0.0112**
Refusal/ Higher prices 0.000335 0.00950 0.00216 0.00238 0.00151 0.0147** 0.00755
REASONS
Price
I find cheaper products online 0.0143*** -0.0116 -0.00822 -0.0611*** 0.00430* -0.0176 -0.0636***
Quality and variety
I find better quality products online 0.0117* 0.0832*** 0.0383** 0.0789*** 0.00254 0.0499* 0.105***
I can find certain products only online 0.0132*** 0.0271* -0.0202** -0.0179 0.00147 0.0256* 0.0251*
There's more choice online 0.01000*** 0.0271* -0.00387 -0.0260* 0.00116 -0.000328 0.0105
Transaction
I save time by buying online 0.00912*** -0.0407*** 0.00658 -0.0446*** 0.00331 -0.0536*** -0.00595
I don't like going to shops 0.0143*** 0.0127 -0.0181 0.0399** 0.00518 0.0152 0.0356*
I can order at any time of the day/week 0.00583** -0.00304 0.000674 -0.0354*** 0.00377 -0.0243* -0.0255*
Products are delivered to a convenient place 0.0209*** -0.00958 -0.00953 0.00331 0.00364 0.00630 0.00962
I can return products easily 0.0111** 0.00766 0.0242 0.0115 -0.00529 -0.00694 0.0117
Information
It's easier to compare prices online 0.00527** -0.0186 0.0183** -0.0357*** 0.00540** -0.0131 -0.0218*
It's easier to compare product information online 0.00379 0.0102 0.0346*** -0.0235 0.000344 0.0257 0.0349**
I can find more information online 0.000845 -0.0128 -0.000891 -0.0161 0.00553 0.0227 0.0315**
I can find product reviews by other consumers 0.00990*** 0.0289* 0.00801 0.0159 0.0113*** 0.0172 0.0440***
Other -0.0275*** -0.143*** -0.166*** -0.0616 -0.00584 -0.0371 -0.167***
ICT USE AND SKILLS
hoursinternet 0.00125** 0.00717*** -0.00183 0.00447** 0.000230 0.00524** 0.00928***
socialnetwork -0.000138 -0.0545*** 0.00933 -0.0809*** 0.0162*** -0.0256 -0.0359**
advanced 0.0193*** 0.178*** 0.133*** 0.120*** 0.0238*** 0.174*** 0.235***
DEMOGRAPHICS
age (in years) -0.000378*** -0.00716*** -0.00151*** -0.00549*** -0.000204** -0.00753*** -0.00644***
gender (1=female) 0.00212 -0.0543*** 2.46e-05 -0.0472*** -0.00427* -0.122*** -0.0768***
Education (Base: Elementary School)
Some Secondary School 0.000638 -0.0177 0.0770** -0.0759 0.00660 -0.0507 -0.000372
Graduation Secondary School 0.0120 0.0184 0.140*** -0.0741* 0.00957 -0.0267 0.0180
Graduation College 0.0189** 0.0497 0.195*** -0.0355 0.0174*** -0.00909 0.0553
Post-graduate Degree 0.0264*** 0.0737* 0.230*** 0.0305 0.0142* 0.0466 0.127***
Student 0.0154 0.0131 0.154*** -0.0671 0.00823 -0.0151 -0.0567
Other 0.00538 0.0116 0.0823* 0.00566 0.0170** -0.0501 0.00984
Refusal -0.00824 0.0395 0.122** 0.0577 -0.00260 -0.0807 0.111*
Region (Base=Rural)
Town, Urban centre 0.00349 0.0424** 0.0815*** 0.0551*** 0.00319 0.0832*** 0.0657***
Metropolitan zone 0.00594** 0.00243 0.0285** 0.0157 0.00573** 0.0310* 0.00384
No. of languages spoken 0.00148 0.0587*** 0.0456*** 0.0429*** 0.00732*** 0.0817*** 0.00841
Country Fixed Effects Yes Yes Yes Yes Yes Yes Yes
Observations 18,605 16,351 18,605 13,145 18,148 15,504 18,053
Dependent Variable
Purchase goods online Online services Purchase digital content online
Notes: Standard errors in parentheses, Significance Level at *** p<0.01, ** p<0.05, * p<0.1. Estimated with a maximum-likelihood logit model. Marginal
effects at mean population shown. Weights based on age, gender, and country applied.
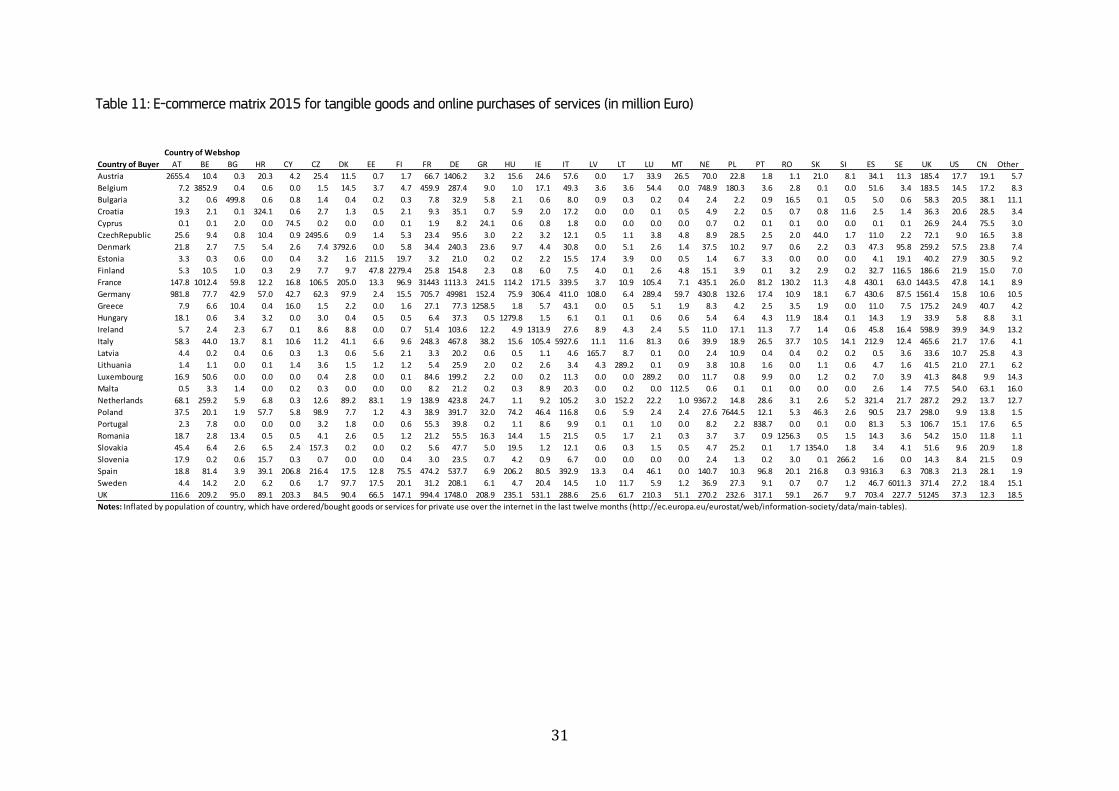
31
Table 11: E-commerce matrix 2015 for tangible goods and online purchases of services (in million Euro)
Country of Webshop
Country of Buyer AT BE BG HR CY CZ DK EE FI FR DE GR HU IE IT LV LT LU MT NE PL PT RO SK SI ES SE UK US CN Other
Austria 2655.4 10.4 0.3 20.3 4.2 25.4 11.5 0.7 1.7 66.7 1406.2 3.2 15.6 24.6 57.6 0.0 1.7 33.9 26.5 70.0 22.8 1.8 1.1 21.0 8.1 34.1 11.3 185.4 17.7 19.1 5.7
Belgium 7.2 3852.9 0.4 0.6 0.0 1.5 14.5 3.7 4.7 459.9 287.4 9.0 1.0 17.1 49.3 3.6 3.6 54.4 0.0 748.9 180.3 3.6 2.8 0.1 0.0 51.6 3.4 183.5 14.5 17.2 8.3
Bulgaria 3.2 0.6 499.8 0.6 0.8 1.4 0.4 0.2 0.3 7.8 32.9 5.8 2.1 0.6 8.0 0.9 0.3 0.2 0.4 2.4 2.2 0.9 16.5 0.1 0.5 5.0 0.6 58.3 20.5 38.1 11.1
Croatia 19.3 2.1 0.1 324.1 0.6 2.7 1.3 0.5 2.1 9.3 35.1 0.7 5.9 2.0 17.2 0.0 0.0 0.1 0.5 4.9 2.2 0.5 0.7 0.8 11.6 2.5 1.4 36.3 20.6 28.5 3.4
Cyprus 0.1 0.1 2.0 0.0 74.5 0.2 0.0 0.0 0.1 1.9 8.2 24.1 0.6 0.8 1.8 0.0 0.0 0.0 0.0 0.7 0.2 0.1 0.1 0.0 0.0 0.1 0.1 26.9 24.4 75.5 3.0
CzechRepublic 25.6 9.4 0.8 10.4 0.9 2495.6 0.9 1.4 5.3 23.4 95.6 3.0 2.2 3.2 12.1 0.5 1.1 3.8 4.8 8.9 28.5 2.5 2.0 44.0 1.7 11.0 2.2 72.1 9.0 16.5 3.8
Denmark 21.8 2.7 7.5 5.4 2.6 7.4 3792.6 0.0 5.8 34.4 240.3 23.6 9.7 4.4 30.8 0.0 5.1 2.6 1.4 37.5 10.2 9.7 0.6 2.2 0.3 47.3 95.8 259.2 57.5 23.8 7.4
Estonia 3.3 0.3 0.6 0.0 0.4 3.2 1.6 211.5 19.7 3.2 21.0 0.2 0.2 2.2 15.5 17.4 3.9 0.0 0.5 1.4 6.7 3.3 0.0 0.0 0.0 4.1 19.1 40.2 27.9 30.5 9.2
Finland 5.3 10.5 1.0 0.3 2.9 7.7 9.7 47.8 2279.4 25.8 154.8 2.3 0.8 6.0 7.5 4.0 0.1 2.6 4.8 15.1 3.9 0.1 3.2 2.9 0.2 32.7 116.5 186.6 21.9 15.0 7.0
France 147.8 1012.4 59.8 12.2 16.8 106.5 205.0 13.3 96.9 31443 1113.3 241.5 114.2 171.5 339.5 3.7 10.9 105.4 7.1 435.1 26.0 81.2 130.2 11.3 4.8 430.1 63.0 1443.5 47.8 14.1 8.9
Germany 981.8 77.7 42.9 57.0 42.7 62.3 97.9 2.4 15.5 705.7 49981 152.4 75.9 306.4 411.0 108.0 6.4 289.4 59.7 430.8 132.6 17.4 10.9 18.1 6.7 430.6 87.5 1561.4 15.8 10.6 10.5
Greece 7.9 6.6 10.4 0.4 16.0 1.5 2.2 0.0 1.6 27.1 77.3 1258.5 1.8 5.7 43.1 0.0 0.5 5.1 1.9 8.3 4.2 2.5 3.5 1.9 0.0 11.0 7.5 175.2 24.9 40.7 4.2
Hungary 18.1 0.6 3.4 3.2 0.0 3.0 0.4 0.5 0.5 6.4 37.3 0.5 1279.8 1.5 6.1 0.1 0.1 0.6 0.6 5.4 6.4 4.3 11.9 18.4 0.1 14.3 1.9 33.9 5.8 8.8 3.1
Ireland 5.7 2.4 2.3 6.7 0.1 8.6 8.8 0.0 0.7 51.4 103.6 12.2 4.9 1313.9 27.6 8.9 4.3 2.4 5.5 11.0 17.1 11.3 7.7 1.4 0.6 45.8 16.4 598.9 39.9 34.9 13.2
Italy 58.3 44.0 13.7 8.1 10.6 11.2 41.1 6.6 9.6 248.3 467.8 38.2 15.6 105.4 5927.6 11.1 11.6 81.3 0.6 39.9 18.9 26.5 37.7 10.5 14.1 212.9 12.4 465.6 21.7 17.6 4.1
Latvia 4.4 0.2 0.4 0.6 0.3 1.3 0.6 5.6 2.1 3.3 20.2 0.6 0.5 1.1 4.6 165.7 8.7 0.1 0.0 2.4 10.9 0.4 0.4 0.2 0.2 0.5 3.6 33.6 10.7 25.8 4.3
Lithuania 1.4 1.1 0.0 0.1 1.4 3.6 1.5 1.2 1.2 5.4 25.9 2.0 0.2 2.6 3.4 4.3 289.2 0.1 0.9 3.8 10.8 1.6 0.0 1.1 0.6 4.7 1.6 41.5 21.0 27.1 6.2
Luxembourg 16.9 50.6 0.0 0.0 0.0 0.4 2.8 0.0 0.1 84.6 199.2 2.2 0.0 0.2 11.3 0.0 0.0 289.2 0.0 11.7 0.8 9.9 0.0 1.2 0.2 7.0 3.9 41.3 84.8 9.9 14.3
Malta 0.5 3.3 1.4 0.0 0.2 0.3 0.0 0.0 0.0 8.2 21.2 0.2 0.3 8.9 20.3 0.0 0.2 0.0 112.5 0.6 0.1 0.1 0.0 0.0 0.0 2.6 1.4 77.5 54.0 63.1 16.0
Netherlands 68.1 259.2 5.9 6.8 0.3 12.6 89.2 83.1 1.9 138.9 423.8 24.7 1.1 9.2 105.2 3.0 152.2 22.2 1.0 9367.2 14.8 28.6 3.1 2.6 5.2 321.4 21.7 287.2 29.2 13.7 12.7
Poland 37.5 20.1 1.9 57.7 5.8 98.9 7.7 1.2 4.3 38.9 391.7 32.0 74.2 46.4 116.8 0.6 5.9 2.4 2.4 27.6 7644.5 12.1 5.3 46.3 2.6 90.5 23.7 298.0 9.9 13.8 1.5
Portugal 2.3 7.8 0.0 0.0 0.0 3.2 1.8 0.0 0.6 55.3 39.8 0.2 1.1 8.6 9.9 0.1 0.1 1.0 0.0 8.2 2.2 838.7 0.0 0.1 0.0 81.3 5.3 106.7 15.1 17.6 6.5
Romania 18.7 2.8 13.4 0.5 0.5 4.1 2.6 0.5 1.2 21.2 55.5 16.3 14.4 1.5 21.5 0.5 1.7 2.1 0.3 3.7 3.7 0.9 1256.3 0.5 1.5 14.3 3.6 54.2 15.0 11.8 1.1
Slovakia 45.4 6.4 2.6 6.5 2.4 157.3 0.2 0.0 0.2 5.6 47.7 5.0 19.5 1.2 12.1 0.6 0.3 1.5 0.5 4.7 25.2 0.1 1.7 1354.0 1.8 3.4 4.1 51.6 9.6 20.9 1.8
Slovenia 17.9 0.2 0.6 15.7 0.3 0.7 0.0 0.0 0.4 3.0 23.5 0.7 4.2 0.9 6.7 0.0 0.0 0.0 0.0 2.4 1.3 0.2 3.0 0.1 266.2 1.6 0.0 14.3 8.4 21.5 0.9
Spain 18.8 81.4 3.9 39.1 206.8 216.4 17.5 12.8 75.5 474.2 537.7 6.9 206.2 80.5 392.9 13.3 0.4 46.1 0.0 140.7 10.3 96.8 20.1 216.8 0.3 9316.3 6.3 708.3 21.3 28.1 1.9
Sweden 4.4 14.2 2.0 6.2 0.6 1.7 97.7 17.5 20.1 31.2 208.1 6.1 4.7 20.4 14.5 1.0 11.7 5.9 1.2 36.9 27.3 9.1 0.7 0.7 1.2 46.7 6011.3 371.4 27.2 18.4 15.1
UK 116.6 209.2 95.0 89.1 203.3 84.5 90.4 66.5 147.1 994.4 1748.0 208.9 235.1 531.1 288.6 25.6 61.7 210.3 51.1 270.2 232.6 317.1 59.1 26.7 9.7 703.4 227.7 51245 37.3 12.3 18.5
Notes: Inflated by population of country, which have ordered/bought goods or services for private use over the internet in the last twelve months (http://ec.europa.eu/eurostat/web/information-society/data/main-tables).
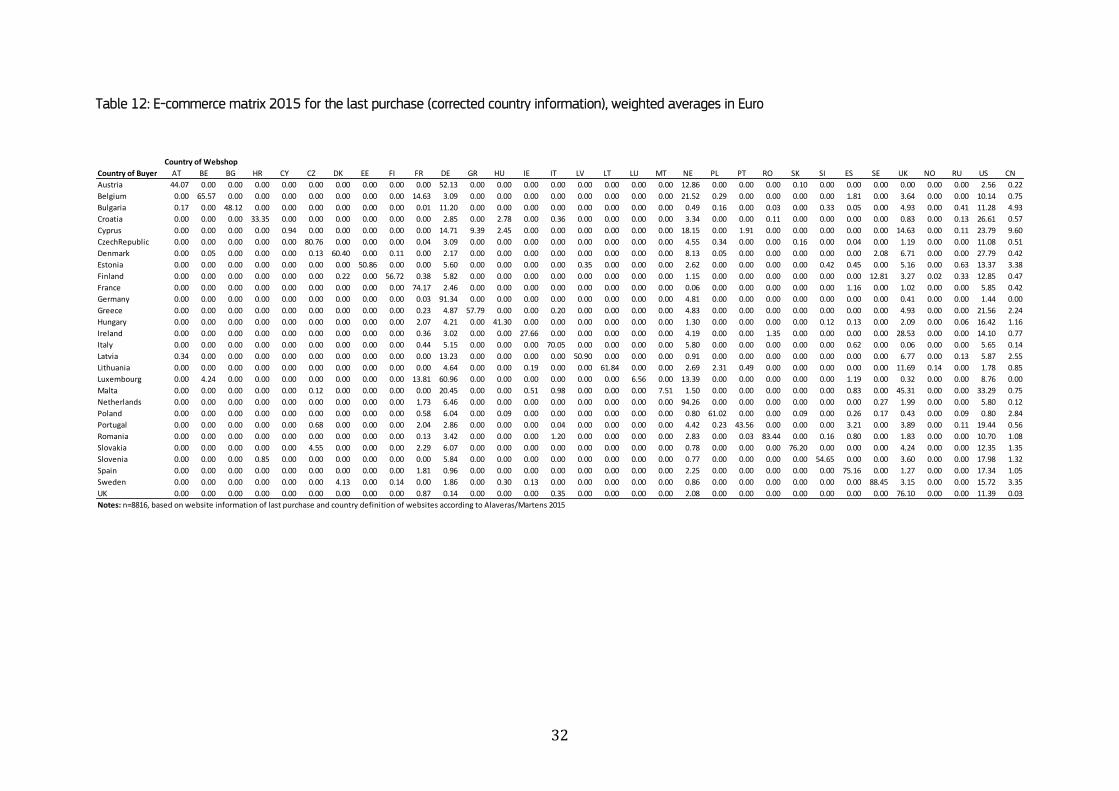
32
Table 12: E-commerce matrix 2015 for the last purchase (corrected country information), weighted averages in Euro
Country of Buyer AT BE BG HR CY CZ DK EE FI FR DE GR HU IE IT LV LT LU MT NE PL PT RO SK SI ES SE UK NO RU US CN
Austria 44.07 0.00 0.00 0.00 0.00 0.00 0.00 0.00 0.00 0.00 52.13 0.00 0.00 0.00 0.00 0.00 0.00 0.00 0.00 12.86 0.00 0.00 0.00 0.10 0.00 0.00 0.00 0.00 0.00 0.00 2.56 0.22
Belgium 0.00 65.57 0.00 0.00 0.00 0.00 0.00 0.00 0.00 14.63 3.09 0.00 0.00 0.00 0.00 0.00 0.00 0.00 0.00 21.52 0.29 0.00 0.00 0.00 0.00 1.81 0.00 3.64 0.00 0.00 10.14 0.75
Bulgaria 0.17 0.00 48.12 0.00 0.00 0.00 0.00 0.00 0.00 0.01 11.20 0.00 0.00 0.00 0.00 0.00 0.00 0.00 0.00 0.49 0.16 0.00 0.03 0.00 0.33 0.05 0.00 4.93 0.00 0.41 11.28 4.93
Croatia 0.00 0.00 0.00 33.35 0.00 0.00 0.00 0.00 0.00 0.00 2.85 0.00 2.78 0.00 0.36 0.00 0.00 0.00 0.00 3.34 0.00 0.00 0.11 0.00 0.00 0.00 0.00 0.83 0.00 0.13 26.61 0.57
Cyprus 0.00 0.00 0.00 0.00 0.94 0.00 0.00 0.00 0.00 0.00 14.71 9.39 2.45 0.00 0.00 0.00 0.00 0.00 0.00 18.15 0.00 1.91 0.00 0.00 0.00 0.00 0.00 14.63 0.00 0.11 23.79 9.60
CzechRepublic 0.00 0.00 0.00 0.00 0.00 80.76 0.00 0.00 0.00 0.04 3.09 0.00 0.00 0.00 0.00 0.00 0.00 0.00 0.00 4.55 0.34 0.00 0.00 0.16 0.00 0.04 0.00 1.19 0.00 0.00 11.08 0.51
Denmark 0.00 0.05 0.00 0.00 0.00 0.13 60.40 0.00 0.11 0.00 2.17 0.00 0.00 0.00 0.00 0.00 0.00 0.00 0.00 8.13 0.05 0.00 0.00 0.00 0.00 0.00 2.08 6.71 0.00 0.00 27.79 0.42
Estonia 0.00 0.00 0.00 0.00 0.00 0.00 0.00 50.86 0.00 0.00 5.60 0.00 0.00 0.00 0.00 0.35 0.00 0.00 0.00 2.62 0.00 0.00 0.00 0.00 0.42 0.45 0.00 5.16 0.00 0.63 13.37 3.38
Finland 0.00 0.00 0.00 0.00 0.00 0.00 0.22 0.00 56.72 0.38 5.82 0.00 0.00 0.00 0.00 0.00 0.00 0.00 0.00 1.15 0.00 0.00 0.00 0.00 0.00 0.00 12.81 3.27 0.02 0.33 12.85 0.47
France 0.00 0.00 0.00 0.00 0.00 0.00 0.00 0.00 0.00 74.17 2.46 0.00 0.00 0.00 0.00 0.00 0.00 0.00 0.00 0.06 0.00 0.00 0.00 0.00 0.00 1.16 0.00 1.02 0.00 0.00 5.85 0.42
Germany 0.00 0.00 0.00 0.00 0.00 0.00 0.00 0.00 0.00 0.03 91.34 0.00 0.00 0.00 0.00 0.00 0.00 0.00 0.00 4.81 0.00 0.00 0.00 0.00 0.00 0.00 0.00 0.41 0.00 0.00 1.44 0.00
Greece 0.00 0.00 0.00 0.00 0.00 0.00 0.00 0.00 0.00 0.23 4.87 57.79 0.00 0.00 0.20 0.00 0.00 0.00 0.00 4.83 0.00 0.00 0.00 0.00 0.00 0.00 0.00 4.93 0.00 0.00 21.56 2.24
Hungary 0.00 0.00 0.00 0.00 0.00 0.00 0.00 0.00 0.00 2.07 4.21 0.00 41.30 0.00 0.00 0.00 0.00 0.00 0.00 1.30 0.00 0.00 0.00 0.00 0.12 0.13 0.00 2.09 0.00 0.06 16.42 1.16
Ireland 0.00 0.00 0.00 0.00 0.00 0.00 0.00 0.00 0.00 0.36 3.02 0.00 0.00 27.66 0.00 0.00 0.00 0.00 0.00 4.19 0.00 0.00 1.35 0.00 0.00 0.00 0.00 28.53 0.00 0.00 14.10 0.77
Italy 0.00 0.00 0.00 0.00 0.00 0.00 0.00 0.00 0.00 0.44 5.15 0.00 0.00 0.00 70.05 0.00 0.00 0.00 0.00 5.80 0.00 0.00 0.00 0.00 0.00 0.62 0.00 0.06 0.00 0.00 5.65 0.14
Latvia 0.34 0.00 0.00 0.00 0.00 0.00 0.00 0.00 0.00 0.00 13.23 0.00 0.00 0.00 0.00 50.90 0.00 0.00 0.00 0.91 0.00 0.00 0.00 0.00 0.00 0.00 0.00 6.77 0.00 0.13 5.87 2.55
Lithuania 0.00 0.00 0.00 0.00 0.00 0.00 0.00 0.00 0.00 0.00 4.64 0.00 0.00 0.19 0.00 0.00 61.84 0.00 0.00 2.69 2.31 0.49 0.00 0.00 0.00 0.00 0.00 11.69 0.14 0.00 1.78 0.85
Luxembourg 0.00 4.24 0.00 0.00 0.00 0.00 0.00 0.00 0.00 13.81 60.96 0.00 0.00 0.00 0.00 0.00 0.00 6.56 0.00 13.39 0.00 0.00 0.00 0.00 0.00 1.19 0.00 0.32 0.00 0.00 8.76 0.00
Malta 0.00 0.00 0.00 0.00 0.00 0.12 0.00 0.00 0.00 0.00 20.45 0.00 0.00 0.51 0.98 0.00 0.00 0.00 7.51 1.50 0.00 0.00 0.00 0.00 0.00 0.83 0.00 45.31 0.00 0.00 33.29 0.75
Netherlands 0.00 0.00 0.00 0.00 0.00 0.00 0.00 0.00 0.00 1.73 6.46 0.00 0.00 0.00 0.00 0.00 0.00 0.00 0.00 94.26 0.00 0.00 0.00 0.00 0.00 0.00 0.27 1.99 0.00 0.00 5.80 0.12
Poland 0.00 0.00 0.00 0.00 0.00 0.00 0.00 0.00 0.00 0.58 6.04 0.00 0.09 0.00 0.00 0.00 0.00 0.00 0.00 0.80 61.02 0.00 0.00 0.09 0.00 0.26 0.17 0.43 0.00 0.09 0.80 2.84
Portugal 0.00 0.00 0.00 0.00 0.00 0.68 0.00 0.00 0.00 2.04 2.86 0.00 0.00 0.00 0.04 0.00 0.00 0.00 0.00 4.42 0.23 43.56 0.00 0.00 0.00 3.21 0.00 3.89 0.00 0.11 19.44 0.56
Romania 0.00 0.00 0.00 0.00 0.00 0.00 0.00 0.00 0.00 0.13 3.42 0.00 0.00 0.00 1.20 0.00 0.00 0.00 0.00 2.83 0.00 0.03 83.44 0.00 0.16 0.80 0.00 1.83 0.00 0.00 10.70 1.08
Slovakia 0.00 0.00 0.00 0.00 0.00 4.55 0.00 0.00 0.00 2.29 6.07 0.00 0.00 0.00 0.00 0.00 0.00 0.00 0.00 0.78 0.00 0.00 0.00 76.20 0.00 0.00 0.00 4.24 0.00 0.00 12.35 1.35
Slovenia 0.00 0.00 0.00 0.85 0.00 0.00 0.00 0.00 0.00 0.00 5.84 0.00 0.00 0.00 0.00 0.00 0.00 0.00 0.00 0.77 0.00 0.00 0.00 0.00 54.65 0.00 0.00 3.60 0.00 0.00 17.98 1.32
Spain 0.00 0.00 0.00 0.00 0.00 0.00 0.00 0.00 0.00 1.81 0.96 0.00 0.00 0.00 0.00 0.00 0.00 0.00 0.00 2.25 0.00 0.00 0.00 0.00 0.00 75.16 0.00 1.27 0.00 0.00 17.34 1.05
Sweden 0.00 0.00 0.00 0.00 0.00 0.00 4.13 0.00 0.14 0.00 1.86 0.00 0.30 0.13 0.00 0.00 0.00 0.00 0.00 0.86 0.00 0.00 0.00 0.00 0.00 0.00 88.45 3.15 0.00 0.00 15.72 3.35
UK 0.00 0.00 0.00 0.00 0.00 0.00 0.00 0.00 0.00 0.87 0.14 0.00 0.00 0.00 0.35 0.00 0.00 0.00 0.00 2.08 0.00 0.00 0.00 0.00 0.00 0.00 0.00 76.10 0.00 0.00 11.39 0.03
Notes: n=8816, based on website information of last purchase and country definition of websites according to Alaveras/Martens 2015
Country of Webshop
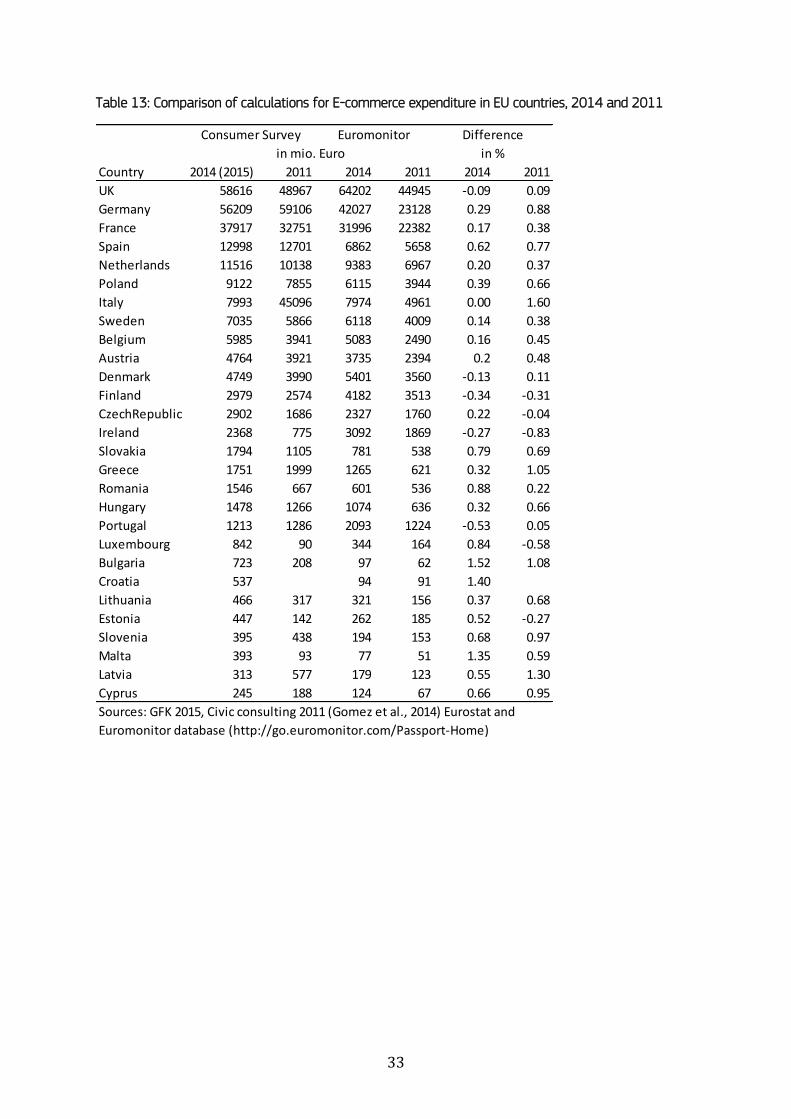
33
Table 13: Comparison of calculations for E-commerce expenditure in EU countries, 2014 and 2011
Country 2014 (2015) 2011 2014 2011 2014 2011
UK 58616 48967 64202 44945 -0.09 0.09
Germany 56209 59106 42027 23128 0.29 0.88
France 37917 32751 31996 22382 0.17 0.38
Spain 12998 12701 6862 5658 0.62 0.77
Netherlands 11516 10138 9383 6967 0.20 0.37
Poland 9122 7855 6115 3944 0.39 0.66
Italy 7993 45096 7974 4961 0.00 1.60
Sweden 7035 5866 6118 4009 0.14 0.38
Belgium 5985 3941 5083 2490 0.16 0.45
Austria 4764 3921 3735 2394 0.2 0.48
Denmark 4749 3990 5401 3560 -0.13 0.11
Finland 2979 2574 4182 3513 -0.34 -0.31
CzechRepublic 2902 1686 2327 1760 0.22 -0.04
Ireland 2368 775 3092 1869 -0.27 -0.83
Slovakia 1794 1105 781 538 0.79 0.69
Greece 1751 1999 1265 621 0.32 1.05
Romania 1546 667 601 536 0.88 0.22
Hungary 1478 1266 1074 636 0.32 0.66
Portugal 1213 1286 2093 1224 -0.53 0.05
Luxembourg 842 90 344 164 0.84 -0.58
Bulgaria 723 208 97 62 1.52 1.08
Croatia 537 94 91 1.40
Lithuania 466 317 321 156 0.37 0.68
Estonia 447 142 262 185 0.52 -0.27
Slovenia 395 438 194 153 0.68 0.97
Malta 393 93 77 51 1.35 0.59
Latvia 313 577 179 123 0.55 1.30
Cyprus 245 188 124 67 0.66 0.95
Sources: GFK 2015, Civic consulting 2011 (Gomez et al., 2014) Eurostat and
Euromonitor database (http://go.euromonitor.com/Passport-Home)
Consumer Survey Euromonitor Difference
in mio. Euro in %
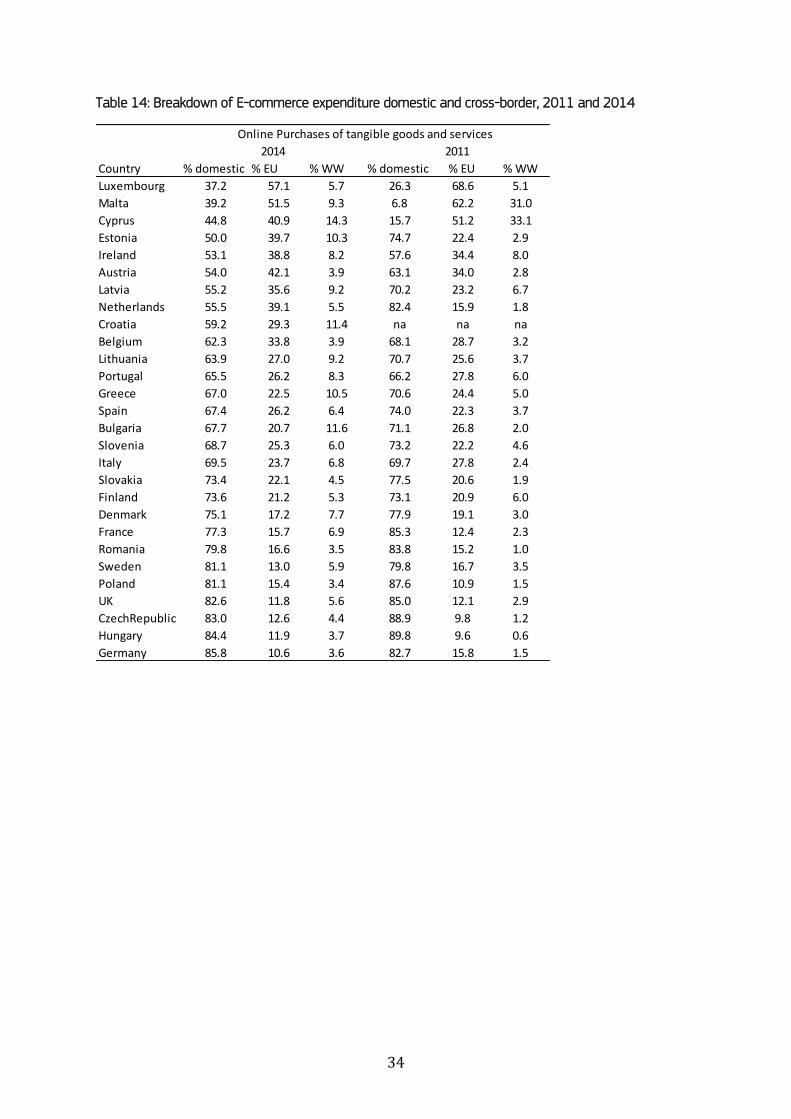
34
Table 14: Breakdown of E-commerce expenditure domestic and cross-border, 2011 and 2014
Country % domestic % EU % WW % domestic % EU % WW
Luxembourg 37.2 57.1 5.7 26.3 68.6 5.1
Malta 39.2 51.5 9.3 6.8 62.2 31.0
Cyprus 44.8 40.9 14.3 15.7 51.2 33.1
Estonia 50.0 39.7 10.3 74.7 22.4 2.9
Ireland 53.1 38.8 8.2 57.6 34.4 8.0
Austria 54.0 42.1 3.9 63.1 34.0 2.8
Latvia 55.2 35.6 9.2 70.2 23.2 6.7
Netherlands 55.5 39.1 5.5 82.4 15.9 1.8
Croatia 59.2 29.3 11.4 na na na
Belgium 62.3 33.8 3.9 68.1 28.7 3.2
Lithuania 63.9 27.0 9.2 70.7 25.6 3.7
Portugal 65.5 26.2 8.3 66.2 27.8 6.0
Greece 67.0 22.5 10.5 70.6 24.4 5.0
Spain 67.4 26.2 6.4 74.0 22.3 3.7
Bulgaria 67.7 20.7 11.6 71.1 26.8 2.0
Slovenia 68.7 25.3 6.0 73.2 22.2 4.6
Italy 69.5 23.7 6.8 69.7 27.8 2.4
Slovakia 73.4 22.1 4.5 77.5 20.6 1.9
Finland 73.6 21.2 5.3 73.1 20.9 6.0
Denmark 75.1 17.2 7.7 77.9 19.1 3.0
France 77.3 15.7 6.9 85.3 12.4 2.3
Romania 79.8 16.6 3.5 83.8 15.2 1.0
Sweden 81.1 13.0 5.9 79.8 16.7 3.5
Poland 81.1 15.4 3.4 87.6 10.9 1.5
UK 82.6 11.8 5.6 85.0 12.1 2.9
CzechRepublic 83.0 12.6 4.4 88.9 9.8 1.2
Hungary 84.4 11.9 3.7 89.8 9.6 0.6
Germany 85.8 10.6 3.6 82.7 15.8 1.5
2014 2011
Online Purchases of tangible goods and services
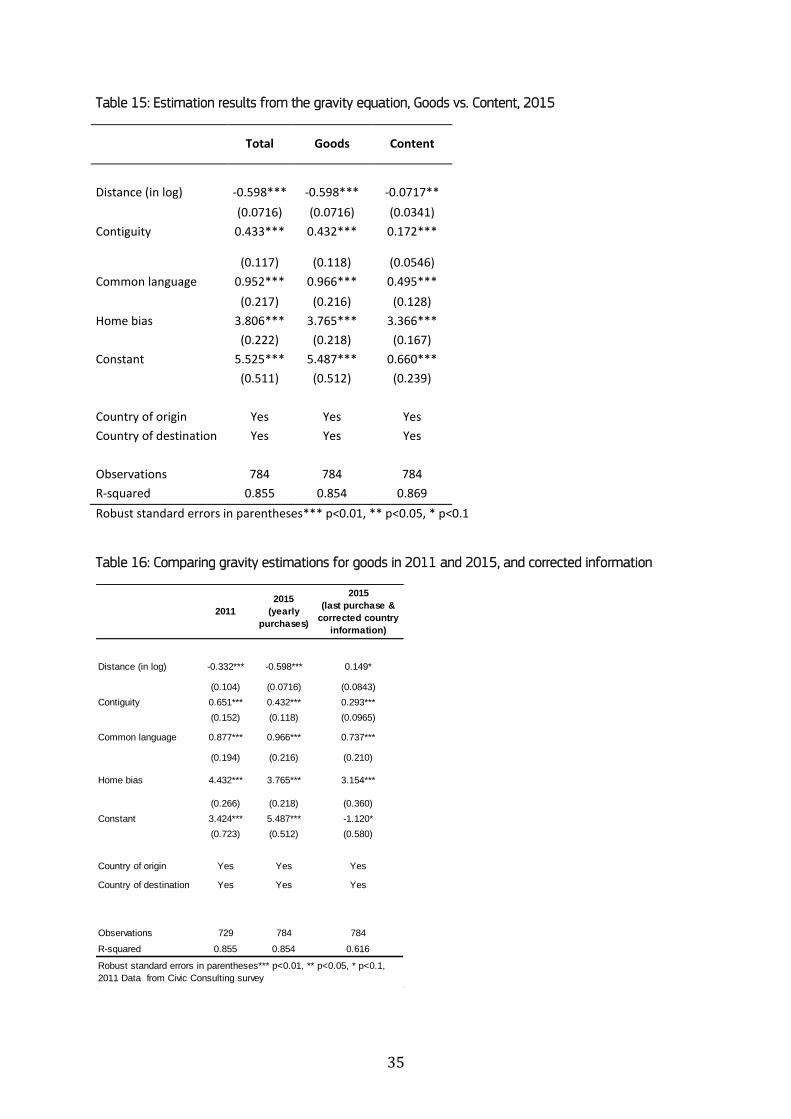
35
Table 15: Estimation results from the gravity equation, Goods vs. Content, 2015
Total Goods Content
Distance (in log) -0.598*** -0.598*** -0.0717**
(0.0716) (0.0716) (0.0341)
Contiguity 0.433*** 0.432*** 0.172***
(0.117) (0.118) (0.0546)
Common language 0.952*** 0.966*** 0.495***
(0.217) (0.216) (0.128)
Home bias 3.806*** 3.765*** 3.366***
(0.222) (0.218) (0.167)
Constant 5.525*** 5.487*** 0.660***
(0.511) (0.512) (0.239)
Country of origin Yes Yes Yes
Country of destination Yes Yes Yes
Observations 784 784 784
R-squared 0.855 0.854 0.869
Robust standard errors in parentheses*** p<0.01, ** p<0.05, * p<0.1
Table 16: Comparing gravity estimations for goods in 2011 and 2015, and corrected information
Distance (in log) -0.332*** -0.598*** 0.149*
(0.104) (0.0716) (0.0843)
Contiguity 0.651*** 0.432*** 0.293***
(0.152) (0.118) (0.0965)
Common language 0.877*** 0.966*** 0.737***
(0.194) (0.216) (0.210)
Home bias 4.432*** 3.765*** 3.154***
(0.266) (0.218) (0.360)
Constant 3.424*** 5.487*** -1.120*
(0.723) (0.512) (0.580)
Country of origin Yes Yes Yes
Country of destination Yes Yes Yes
Observations 729 784 784
R-squared 0.855 0.854 0.616
2011
2015
(yearly
purchases)
2015
(last purchase &
corrected country
information)
Robust standard errors in parentheses*** p<0.01, ** p<0.05, * p<0.1,
2011 Data from Civic Consulting survey
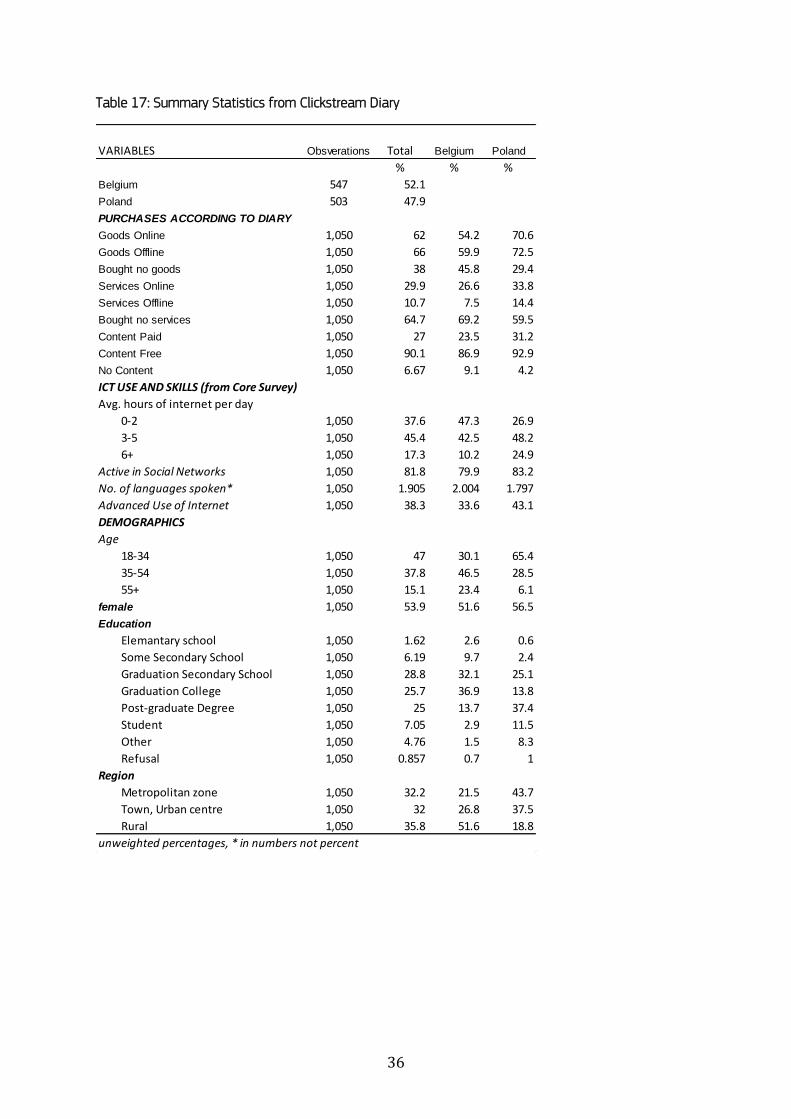
36
Table 17: Summary Statistics from Clickstream Diary
VARIABLES Obsverations Total Belgium Poland
% % %
Belgium 547 52.1
Poland 503 47.9
PURCHASES ACCORDING TO DIARY
Goods Online 1,050 62 54.2 70.6
Goods Offline 1,050 66 59.9 72.5
Bought no goods 1,050 38 45.8 29.4
Services Online 1,050 29.9 26.6 33.8
Services Offline 1,050 10.7 7.5 14.4
Bought no services 1,050 64.7 69.2 59.5
Content Paid 1,050 27 23.5 31.2
Content Free 1,050 90.1 86.9 92.9
No Content 1,050 6.67 9.1 4.2
ICT USE AND SKILLS (from Core Survey)
Avg. hours of internet per day
0-2 1,050 37.6 47.3 26.9
3-5 1,050 45.4 42.5 48.2
6+ 1,050 17.3 10.2 24.9
Active in Social Networks 1,050 81.8 79.9 83.2
No. of languages spoken* 1,050 1.905 2.004 1.797
Advanced Use of Internet 1,050 38.3 33.6 43.1
DEMOGRAPHICS
Age
18-34 1,050 47 30.1 65.4
35-54 1,050 37.8 46.5 28.5
55+ 1,050 15.1 23.4 6.1
female 1,050 53.9 51.6 56.5
Education
Elemantary school 1,050 1.62 2.6 0.6
Some Secondary School 1,050 6.19 9.7 2.4
Graduation Secondary School 1,050 28.8 32.1 25.1
Graduation College 1,050 25.7 36.9 13.8
Post-graduate Degree 1,050 25 13.7 37.4
Student 1,050 7.05 2.9 11.5
Other 1,050 4.76 1.5 8.3
Refusal 1,050 0.857 0.7 1
Region
Metropolitan zone 1,050 32.2 21.5 43.7
Town, Urban centre 1,050 32 26.8 37.5
Rural 1,050 35.8 51.6 18.8
unweighted percentages, * in numbers not percent
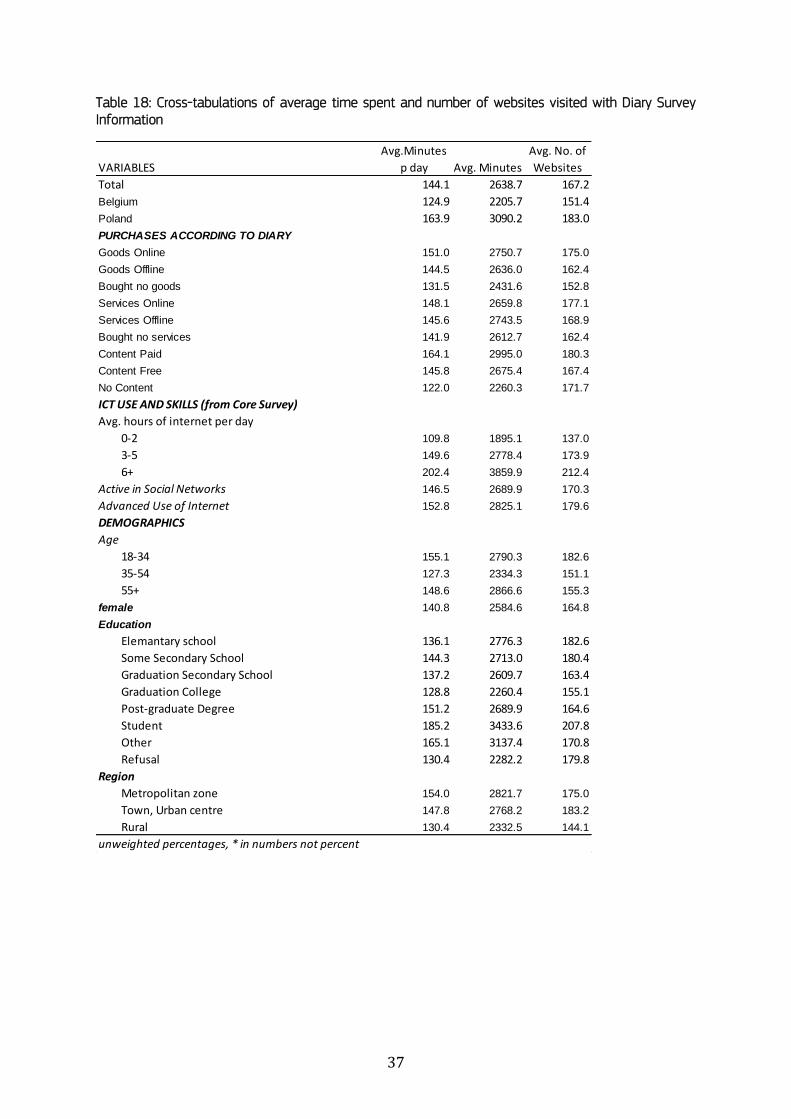
37
Table 18: Cross-tabulations of average time spent and number of websites visited with Diary Survey Information
VARIABLES
Total 144.1 2638.7 167.2
Belgium 124.9 2205.7 151.4
Poland 163.9 3090.2 183.0
PURCHASES ACCORDING TO DIARY
Goods Online 151.0 2750.7 175.0
Goods Offline 144.5 2636.0 162.4
Bought no goods 131.5 2431.6 152.8
Services Online 148.1 2659.8 177.1
Services Offline 145.6 2743.5 168.9
Bought no services 141.9 2612.7 162.4
Content Paid 164.1 2995.0 180.3
Content Free 145.8 2675.4 167.4
No Content 122.0 2260.3 171.7
ICT USE AND SKILLS (from Core Survey)
Avg. hours of internet per day
0-2 109.8 1895.1 137.0
3-5 149.6 2778.4 173.9
6+ 202.4 3859.9 212.4
Active in Social Networks 146.5 2689.9 170.3
Advanced Use of Internet 152.8 2825.1 179.6
DEMOGRAPHICS
Age
18-34 155.1 2790.3 182.6
35-54 127.3 2334.3 151.1
55+ 148.6 2866.6 155.3
female 140.8 2584.6 164.8
Education
Elemantary school 136.1 2776.3 182.6
Some Secondary School 144.3 2713.0 180.4
Graduation Secondary School 137.2 2609.7 163.4
Graduation College 128.8 2260.4 155.1
Post-graduate Degree 151.2 2689.9 164.6
Student 185.2 3433.6 207.8
Other 165.1 3137.4 170.8
Refusal 130.4 2282.2 179.8
Region
Metropolitan zone 154.0 2821.7 175.0
Town, Urban centre 147.8 2768.2 183.2
Rural 130.4 2332.5 144.1
unweighted percentages, * in numbers not percent
Avg.Minutes
p day Avg. Minutes
Avg. No. of
Websites
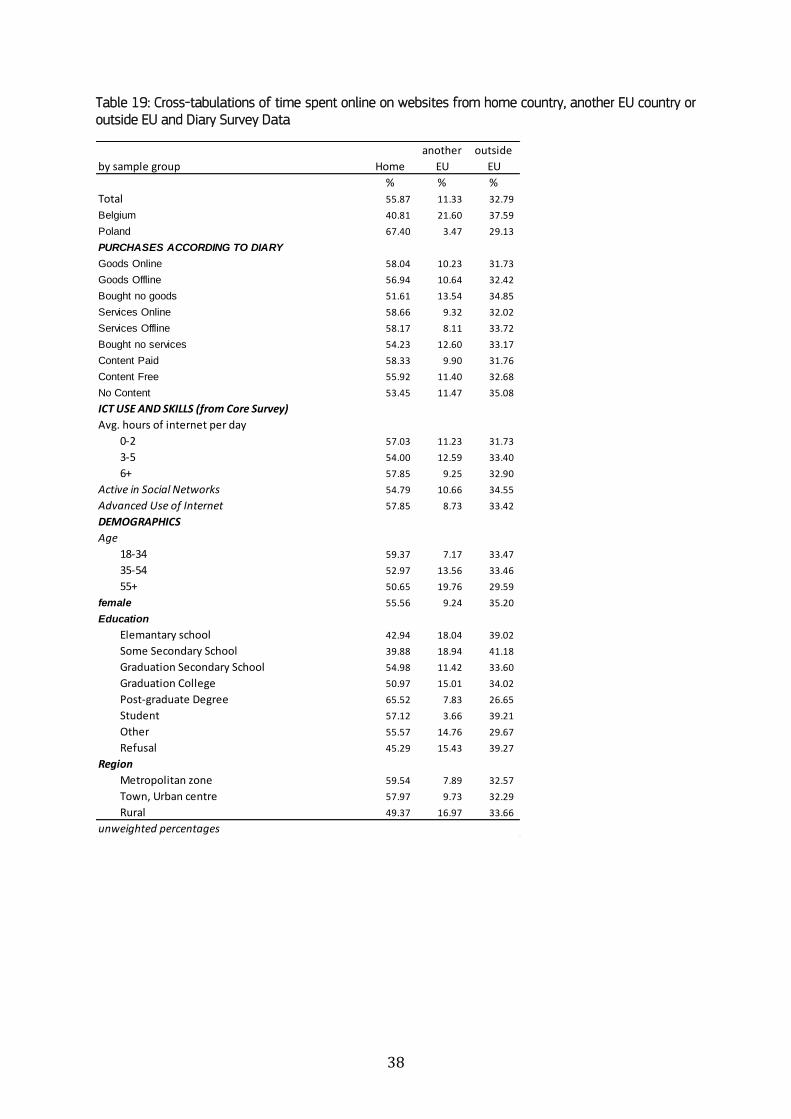
38
Table 19: Cross-tabulations of time spent online on websites from home country, another EU country or outside EU and Diary Survey Data
by sample group
% % %
Total 55.87 11.33 32.79
Belgium 40.81 21.60 37.59
Poland 67.40 3.47 29.13
PURCHASES ACCORDING TO DIARY
Goods Online 58.04 10.23 31.73
Goods Offline 56.94 10.64 32.42
Bought no goods 51.61 13.54 34.85
Services Online 58.66 9.32 32.02
Services Offline 58.17 8.11 33.72
Bought no services 54.23 12.60 33.17
Content Paid 58.33 9.90 31.76
Content Free 55.92 11.40 32.68
No Content 53.45 11.47 35.08
ICT USE AND SKILLS (from Core Survey)
Avg. hours of internet per day
0-2 57.03 11.23 31.73
3-5 54.00 12.59 33.40
6+ 57.85 9.25 32.90
Active in Social Networks 54.79 10.66 34.55
Advanced Use of Internet 57.85 8.73 33.42
DEMOGRAPHICS
Age
18-34 59.37 7.17 33.47
35-54 52.97 13.56 33.46
55+ 50.65 19.76 29.59
female 55.56 9.24 35.20
Education
Elemantary school 42.94 18.04 39.02
Some Secondary School 39.88 18.94 41.18
Graduation Secondary School 54.98 11.42 33.60
Graduation College 50.97 15.01 34.02
Post-graduate Degree 65.52 7.83 26.65
Student 57.12 3.66 39.21
Other 55.57 14.76 29.67
Refusal 45.29 15.43 39.27
Region
Metropolitan zone 59.54 7.89 32.57
Town, Urban centre 57.97 9.73 32.29
Rural 49.37 16.97 33.66
unweighted percentages
Home
another
EU
outside
EU
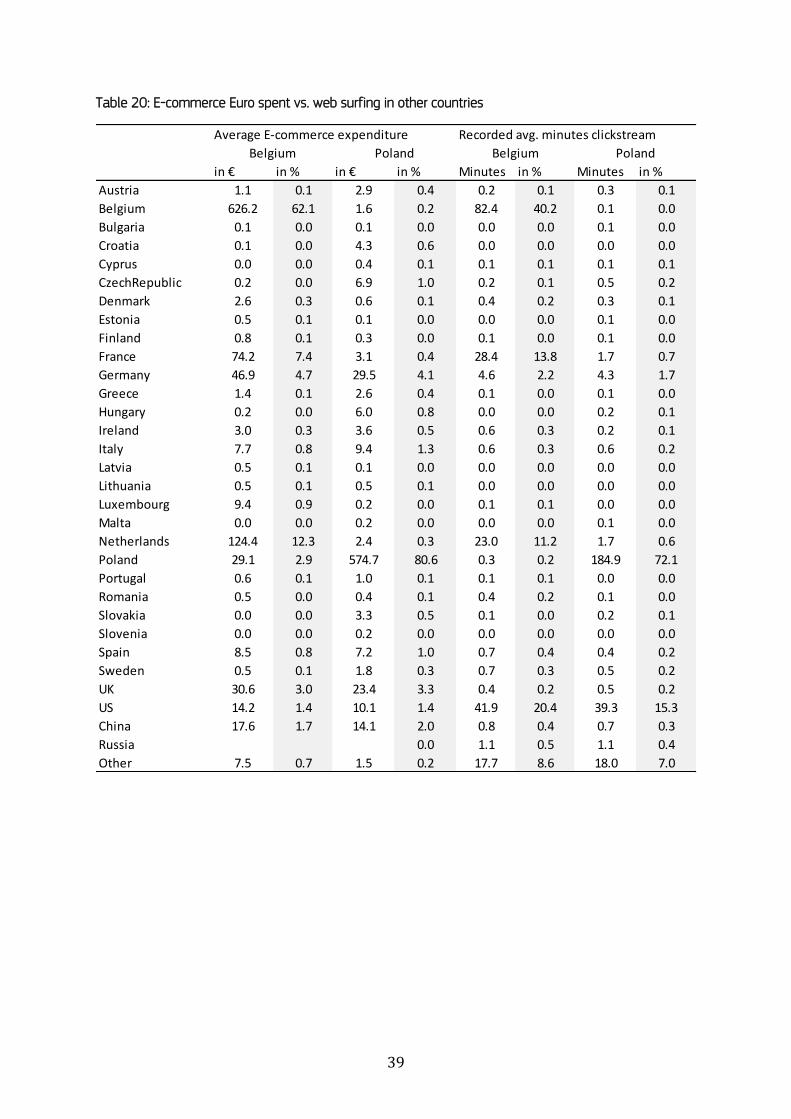
39
Table 20: E-commerce Euro spent vs. web surfing in other countries
Average E-commerce expenditure Recorded avg. minutes clickstream
in € in % in € in % Minutes in % Minutes in %
Austria 1.1 0.1 2.9 0.4 0.2 0.1 0.3 0.1
Belgium 626.2 62.1 1.6 0.2 82.4 40.2 0.1 0.0
Bulgaria 0.1 0.0 0.1 0.0 0.0 0.0 0.1 0.0
Croatia 0.1 0.0 4.3 0.6 0.0 0.0 0.0 0.0
Cyprus 0.0 0.0 0.4 0.1 0.1 0.1 0.1 0.1
CzechRepublic 0.2 0.0 6.9 1.0 0.2 0.1 0.5 0.2
Denmark 2.6 0.3 0.6 0.1 0.4 0.2 0.3 0.1
Estonia 0.5 0.1 0.1 0.0 0.0 0.0 0.1 0.0
Finland 0.8 0.1 0.3 0.0 0.1 0.0 0.1 0.0
France 74.2 7.4 3.1 0.4 28.4 13.8 1.7 0.7
Germany 46.9 4.7 29.5 4.1 4.6 2.2 4.3 1.7
Greece 1.4 0.1 2.6 0.4 0.1 0.0 0.1 0.0
Hungary 0.2 0.0 6.0 0.8 0.0 0.0 0.2 0.1
Ireland 3.0 0.3 3.6 0.5 0.6 0.3 0.2 0.1
Italy 7.7 0.8 9.4 1.3 0.6 0.3 0.6 0.2
Latvia 0.5 0.1 0.1 0.0 0.0 0.0 0.0 0.0
Lithuania 0.5 0.1 0.5 0.1 0.0 0.0 0.0 0.0
Luxembourg 9.4 0.9 0.2 0.0 0.1 0.1 0.0 0.0
Malta 0.0 0.0 0.2 0.0 0.0 0.0 0.1 0.0
Netherlands 124.4 12.3 2.4 0.3 23.0 11.2 1.7 0.6
Poland 29.1 2.9 574.7 80.6 0.3 0.2 184.9 72.1
Portugal 0.6 0.1 1.0 0.1 0.1 0.1 0.0 0.0
Romania 0.5 0.0 0.4 0.1 0.4 0.2 0.1 0.0
Slovakia 0.0 0.0 3.3 0.5 0.1 0.0 0.2 0.1
Slovenia 0.0 0.0 0.2 0.0 0.0 0.0 0.0 0.0
Spain 8.5 0.8 7.2 1.0 0.7 0.4 0.4 0.2
Sweden 0.5 0.1 1.8 0.3 0.7 0.3 0.5 0.2
UK 30.6 3.0 23.4 3.3 0.4 0.2 0.5 0.2
US 14.2 1.4 10.1 1.4 41.9 20.4 39.3 15.3
China 17.6 1.7 14.1 2.0 0.8 0.4 0.7 0.3
Russia 0.0 1.1 0.5 1.1 0.4
Other 7.5 0.7 1.5 0.2 17.7 8.6 18.0 7.0
Belgium Poland Belgium Poland
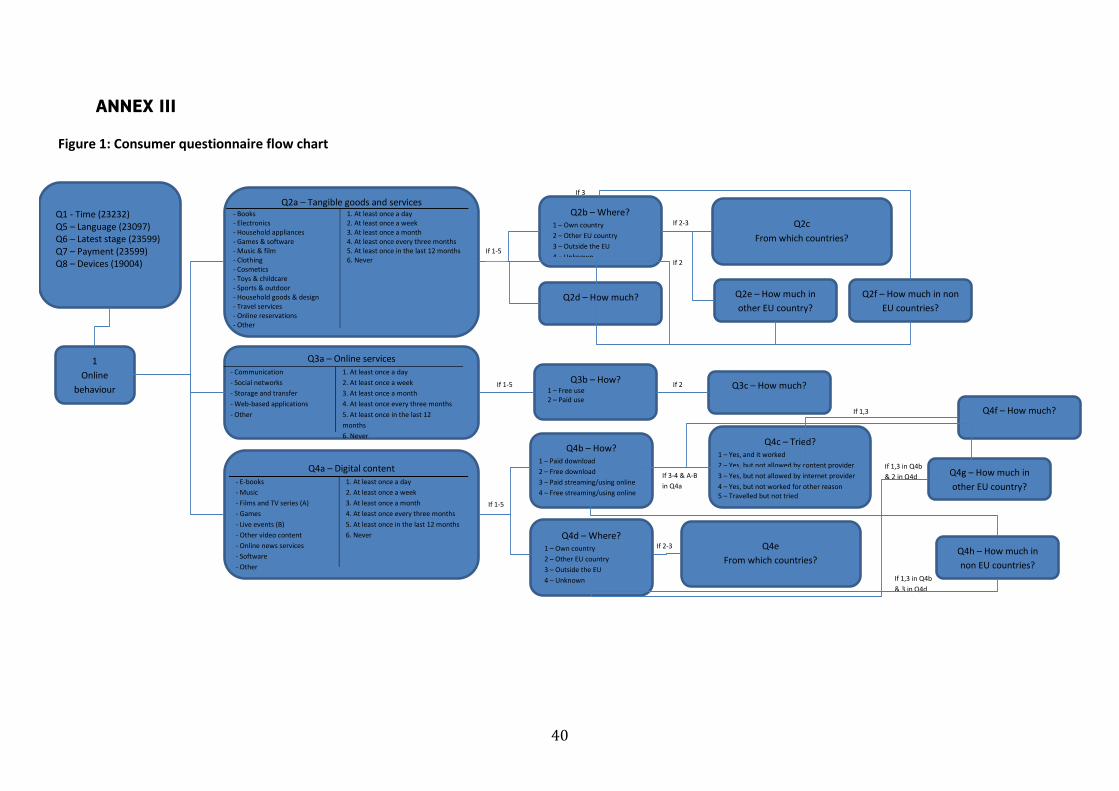
40
ANNEX III
Figure 1: Consumer questionnaire flow chart
If 1-5
If 1,3 in Q4b
& 3 in Q4d
If 1,3 in Q4b
& 2 in Q4d
If 1,3
If 3-4 & A-B
in Q4a
If 2-3
If 1-5 If 2
If 3
Q1 - Time (23232) Q5 – Language (23097) Q6 – Latest stage (23599) Q7 – Payment (23599) Q8 – Devices (19004)
Q2c
From which countries?
Q2a – Tangible goods and services - Books - Electronics - Household appliances - Games & software - Music & film - Clothing - Cosmetics - Toys & childcare - Sports & outdoor - Household goods & design - Travel services - Online reservations - Other
1. At least once a day 2. At least once a week 3. At least once a month 4. At least once every three months 5. At least once in the last 12 months 6. Never
1 Online
behaviour
Q2e – How much in
other EU country?
Q2f – How much in non
EU countries?
Q3a – Online services - Communication
- Social networks
- Storage and transfer
- Web-based applications
- Other
1. At least once a day
2. At least once a week
3. At least once a month
4. At least once every three months
5. At least once in the last 12
months
6. Never
Q4a – Digital content - E-books
- Music
- Films and TV series (A)
- Games
- Live events (B)
- Other video content
- Online news services
- Software
- Other
1. At least once a day
2. At least once a week
3. At least once a month
4. At least once every three months
5. At least once in the last 12 months
6. Never
Q2b – Where? 1 – Own country 2 – Other EU country 3 – Outside the EU 4 – Unknown
Q2d – How much?
Q3b – How? 1 – Free use 2 – Paid use
Q3c – How much?
Q4b – How? 1 – Paid download 2 – Free download
3 – Paid streaming/using online
4 – Free streaming/using online
Q4d – Where? 1 – Own country 2 – Other EU country 3 – Outside the EU 4 – Unknown
Q4c – Tried? 1 – Yes, and it worked 2 – Yes, but not allowed by content provider 3 – Yes, but not allowed by internet provider 4 – Yes, but not worked for other reason 5 – Travelled but not tried
Q4e From which countries?
Q4f – How much?
Q4g – How much in
other EU country?
Q4h – How much in
non EU countries?
If 2-3
If 1-5 If 2
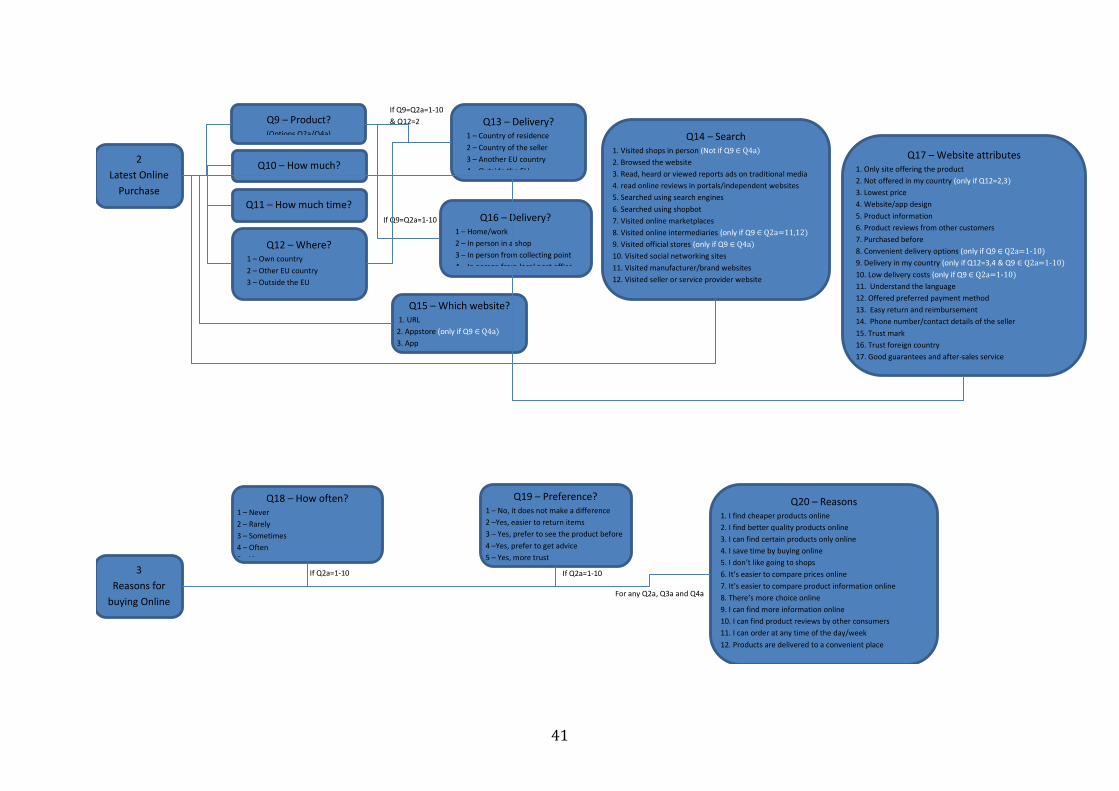
41
If Q9=Q2a=1-10
If Q9=Q2a=1-10
& Q12=2
2 Latest Online
Purchase
Q10 – How much?
Q9 – Product? (Options Q2a/Q4a)
Q11 – How much time?
Q12 – Where? 1 – Own country 2 – Other EU country 3 – Outside the EU 4 – Unknown
Q13 – Delivery? 1 – Country of residence 2 – Country of the seller 3 – Another EU country 4 – Outside the EU
Q14 – Search 1. Visited shops in person (Not if Q9 ∈ Q4a) 2. Browsed the website 3. Read, heard or viewed reports ads on traditional media 4. read online reviews in portals/independent websites 5. Searched using search engines 6. Searched using shopbot
7. Visited online marketplaces
8. Visited online intermediaries (only if Q9 ∈ Q2a=11,12)
9. Visited official stores (only if Q9 ∈ Q4a)
10. Visited social networking sites
11. Visited manufacturer/brand websites
12. Visited seller or service provider website
13. Contacted online or phone customer service
Q15 – Which website? 1. URL
2. Appstore (only if Q9 ∈ Q4a)
3. App
Q16 – Delivery? 1 – Home/work 2 – In person in a shop 3 – In person from collecting point 4 – In person from local post office
Q17 – Website attributes 1. Only site offering the product 2. Not offered in my country (only if Q12=2,3) 3. Lowest price 4. Website/app design 5. Product information 6. Product reviews from other customers 7. Purchased before 8. Convenient delivery options (only if Q9 ∈ Q2a=1-10)
9. Delivery in my country (only if Q12=3,4 & Q9 ∈ Q2a=1-10) 10. Low delivery costs (only if Q9 ∈ Q2a=1-10) 11. Understand the language 12. Offered preferred payment method 13. Easy return and reimbursement
14. Phone number/contact details of the seller
15. Trust mark
16. Trust foreign country
17. Good guarantees and after-sales service
18. Reputation
For any Q2a, Q3a and Q4a
If Q2a=1-10 If Q2a=1-10 3 Reasons for
buying Online
Q18 – How often? 1 – Never 2 – Rarely 3 – Sometimes 4 – Often
5 - Always
Q19 – Preference? 1 – No, it does not make a difference 2 –Yes, easier to return items 3 – Yes, prefer to see the product before 4 –Yes, prefer to get advice 5 – Yes, more trust
Q20 – Reasons 1. I find cheaper products online
2. I find better quality products online
3. I can find certain products only online
4. I save time by buying online
5. I don’t like going to shops
6. It’s easier to compare prices online
7. It’s easier to compare product information online
8. There’s more choice online
9. I can find more information online
10. I can find product reviews by other consumers
11. I can order at any time of the day/week
12. Products are delivered to a convenient place
13. I can return products easily
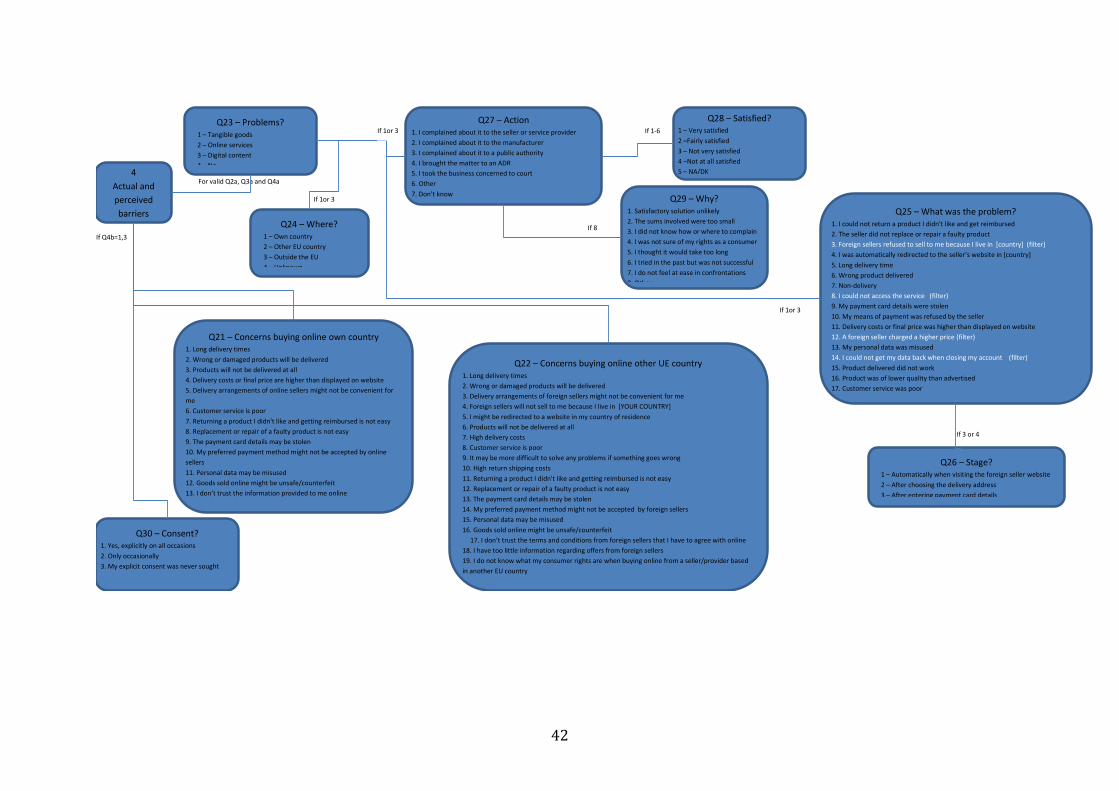
42
If 8
If 1or 3
For valid Q2a, Q3a and Q4a 4
Actual and
perceived
barriers
Q21 – Concerns buying online own country 1. Long delivery times
2. Wrong or damaged products will be delivered
3. Products will not be delivered at all
4. Delivery costs or final price are higher than displayed on website
5. Delivery arrangements of online sellers might not be convenient for
me
6. Customer service is poor
7. Returning a product I didn't like and getting reimbursed is not easy
8. Replacement or repair of a faulty product is not easy
9. The payment card details may be stolen
10. My preferred payment method might not be accepted by online
sellers
11. Personal data may be misused
12. Goods sold online might be unsafe/counterfeit
13. I don’t trust the information provided to me online
14. I don’t trust the terms and conditions I have to agree with online
Q22 – Concerns buying online other UE country 1. Long delivery times
2. Wrong or damaged products will be delivered
3. Delivery arrangements of foreign sellers might not be convenient for me
4. Foreign sellers will not sell to me because I live in [YOUR COUNTRY]
5. I might be redirected to a website in my country of residence
6. Products will not be delivered at all
7. High delivery costs
8. Customer service is poor
9. It may be more difficult to solve any problems if something goes wrong
10. High return shipping costs
11. Returning a product I didn't like and getting reimbursed is not easy
12. Replacement or repair of a faulty product is not easy
13. The payment card details may be stolen
14. My preferred payment method might not be accepted by foreign sellers
15. Personal data may be misused
16. Goods sold online might be unsafe/counterfeit
17. I don’t trust the terms and conditions from foreign sellers that I have to agree with online
18. I have too little information regarding offers from foreign sellers
19. I do not know what my consumer rights are when buying online from a seller/provider based
in another EU country
20. The level of consumer protection in other EU countries is lower than in my country
Q23 – Problems? 1 – Tangible goods 2 – Online services 3 – Digital content 4 – No
Q24 – Where? 1 – Own country 2 – Other EU country 3 – Outside the EU 4 – Unknown
Q25 – What was the problem? 1. I could not return a product I didn't like and get reimbursed
2. The seller did not replace or repair a faulty product
3. Foreign sellers refused to sell to me because I live in [country] (filter)
4. I was automatically redirected to the seller’s website in [country]
5. Long delivery time
6. Wrong product delivered
7. Non-delivery
8. I could not access the service (filter)
9. My payment card details were stolen
10. My means of payment was refused by the seller
11. Delivery costs or final price was higher than displayed on website
12. A foreign seller charged a higher price (filter)
13. My personal data was misused
14. I could not get my data back when closing my account (filter)
15. Product delivered did not work
16. Product was of lower quality than advertised
17. Customer service was poor
18. The terms and conditions were not respected by the seller/provider
Q26 – Stage? 1 – Automatically when visiting the foreign seller website 2 – After choosing the delivery address 3 – After entering payment card details
Q30 – Consent? 1. Yes, explicitly on all occasions
2. Only occasionally
3. My explicit consent was never sought
Q29 – Why? 1. Satisfactory solution unlikely
2. The sums involved were too small
3. I did not know how or where to complain
4. I was not sure of my rights as a consumer
5. I thought it would take too long
6. I tried in the past but was not successful
7. I do not feel at ease in confrontations
8. Other
Q28 – Satisfied? 1 – Very satisfied 2 –Fairly satisfied 3 – Not very satisfied 4 –Not at all satisfied 5 – NA/DK
Q27 – Action 1. I complained about it to the seller or service provider
2. I complained about it to the manufacturer
3. I complained about it to a public authority
4. I brought the matter to an ADR
5. I took the business concerned to court
6. Other
7. Don’t know
8. I didn’t take any action
If Q4b=1,3
If 1-6
If 3 or 4
If 1or 3
If 1or 3
Europe Direct is a service to help you find answers to your questions about the European Union
Freephone number (*): 00 800 6 7 8 9 10 11
(*) Certain mobile telephone operators do not allow access to 00 800 numbers or these calls may be billed.
A great deal of additional information on the European Union is available on the Internet.
It can be accessed through the Europa server http://europa.eu.
How to obtain EU publications
Our publications are available from EU Bookshop (http://bookshop.europa.eu),
where you can place an order with the sales agent of your choice.
The Publications Office has a worldwide network of sales agents.
You can obtain their contact details by sending a fax to (352) 29 29-42758.
European Commission
Joint Research Centre – Institute for Prospective Technological Studies
Title: Consumer Perceptions of (Cross-border) eCommerce in the EU Digital Single Market
Authors: Melisande Cardona, Néstor Duch-Brown and Bertin Martens
Spain: European Commission, Joint Research Centre
2015 – 42 pp. – 21.0 x 29.7 cm
EUR – Scientific and Technical Research series – ISSN 1831-9408 (online)
JRC Mission As the Commission’s in-house science service, the Joint Research Centre’s mission is to provide EU policies with independent, evidence-based scientific and technical support throughout the whole policy cycle. Working in close cooperation with policy Directorates-General, the JRC addresses key societal challenges while stimulating innovation through developing new methods, tools and standards, and sharing its know-how with the Member States, the scientific community and international partners.
Serving society Stimulating innovation Supporting legislation


