Embed Size (px)
Citation preview

Ecommerce Quarterly Benchmarks
Q3 2021
INTRODUCTIONOur quarterly ecommerce benchmark report includes average order value,
page views, bounce rates, add-to-cart rates, cart abandonment rates, and
conversion rates by device, source channel, and more. To produce this
proprietary data, we analyzed billions of customer sessions across 250+
retailer brands.
SUMMARYAs the holiday season approaches, we’re expecting a solid increase in desirable
shopping behavior, reinforced by positive trends we’ve seen through 2021, along
with the already positive behavior during the holiday season in 2020, when
retailers felt the effects of the pandemic effects even more. Visitors continue
to grow more impatient with higher expectations as they engage digitally.
Finding the products that meet their needs quicker with frictionless journeys
continues to be the top areas of focus and overall brand value proposition as
brand loyalty continues to face disruption.
B E N C H M A R K S
Session Distribution 4
Bounce Rate 8
Average Page Views 12
Add-to-Cart 16
Abandoned Cart 20
Conversion Rate 24
Average Order Value 28
2. ECOMMERCE QUARTERLY BENCHMARKS | Q3 2021
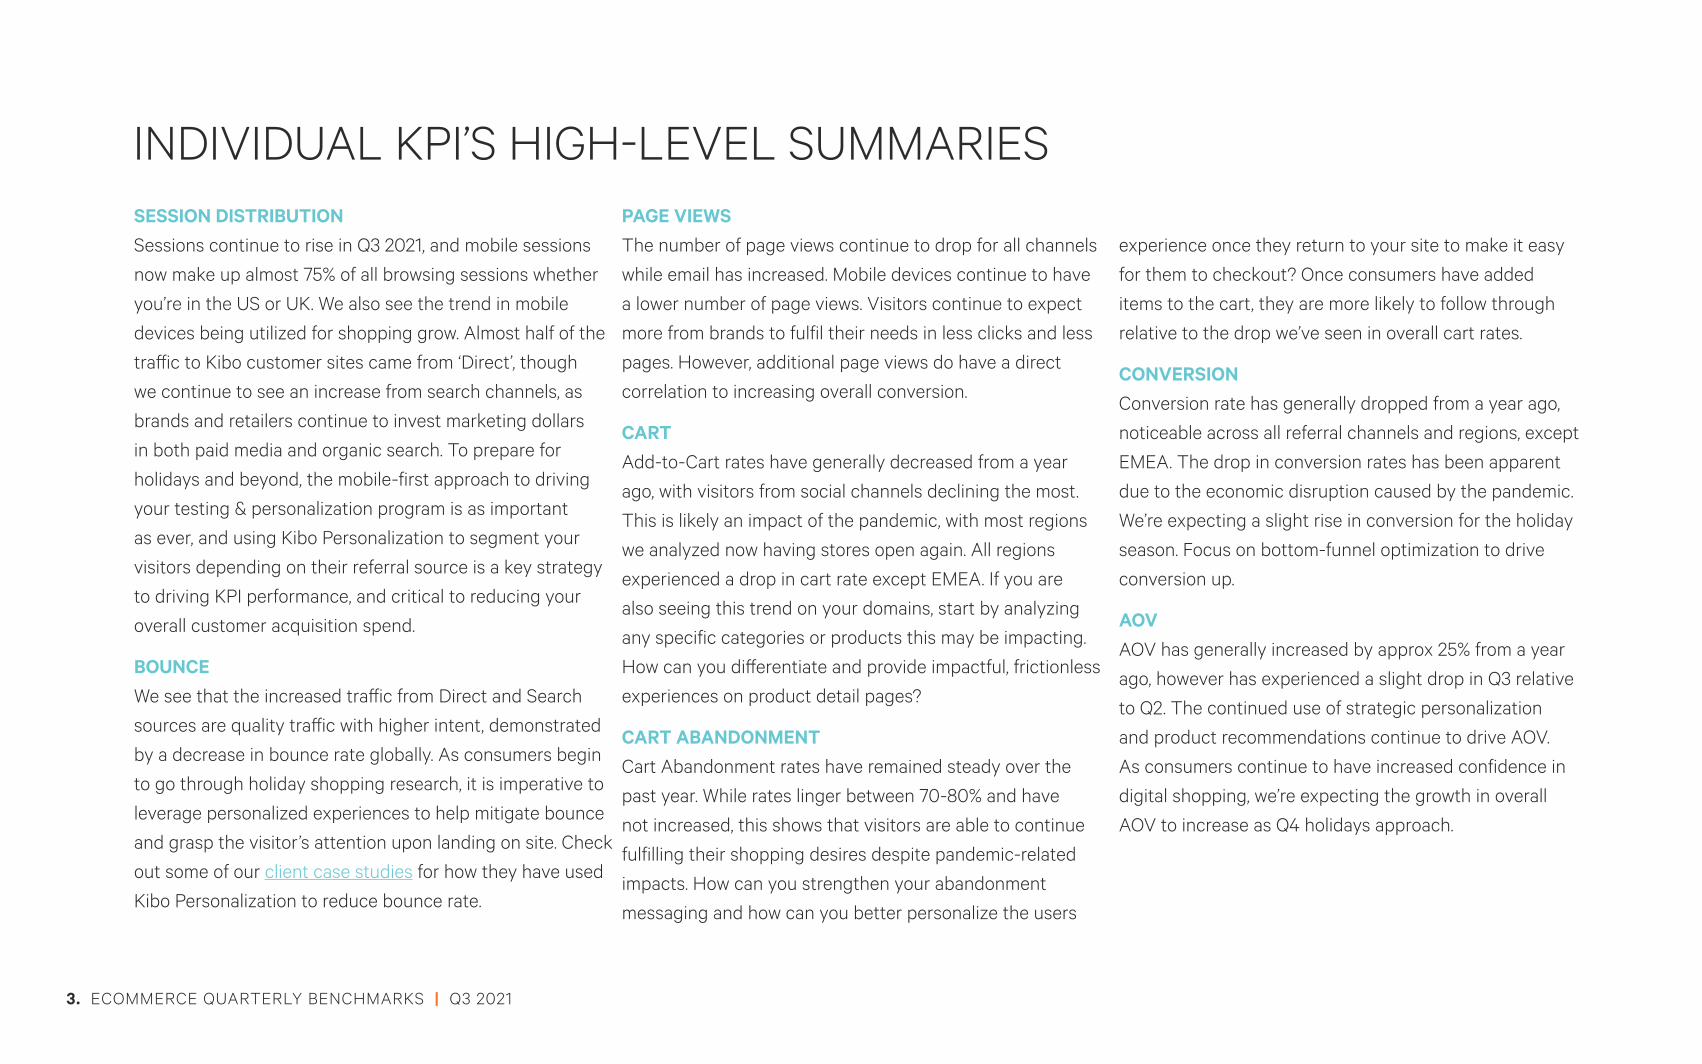
INDIVIDUAL KPI’S HIGH-LEVEL SUMMARIESSESSION DISTRIBUTION Sessions continue to rise in Q3 2021, and mobile sessions
now make up almost 75% of all browsing sessions whether
you’re in the US or UK. We also see the trend in mobile
devices being utilized for shopping grow. Almost half of the
traffic to Kibo customer sites came from ‘Direct’, though
we continue to see an increase from search channels, as
brands and retailers continue to invest marketing dollars
in both paid media and organic search. To prepare for
holidays and beyond, the mobile-first approach to driving
your testing & personalization program is as important
as ever, and using Kibo Personalization to segment your
visitors depending on their referral source is a key strategy
to driving KPI performance, and critical to reducing your
overall customer acquisition spend.
BOUNCE We see that the increased traffic from Direct and Search
sources are quality traffic with higher intent, demonstrated
by a decrease in bounce rate globally. As consumers begin
to go through holiday shopping research, it is imperative to
leverage personalized experiences to help mitigate bounce
and grasp the visitor’s attention upon landing on site. Check
out some of our client case studies for how they have used
Kibo Personalization to reduce bounce rate.
PAGE VIEWS The number of page views continue to drop for all channels
while email has increased. Mobile devices continue to have
a lower number of page views. Visitors continue to expect
more from brands to fulfil their needs in less clicks and less
pages. However, additional page views do have a direct
correlation to increasing overall conversion.
CART Add-to-Cart rates have generally decreased from a year
ago, with visitors from social channels declining the most.
This is likely an impact of the pandemic, with most regions
we analyzed now having stores open again. All regions
experienced a drop in cart rate except EMEA. If you are
also seeing this trend on your domains, start by analyzing
any specific categories or products this may be impacting.
How can you differentiate and provide impactful, frictionless
experiences on product detail pages?
CART ABANDONMENT Cart Abandonment rates have remained steady over the
past year. While rates linger between 70-80% and have
not increased, this shows that visitors are able to continue
fulfilling their shopping desires despite pandemic-related
impacts. How can you strengthen your abandonment
messaging and how can you better personalize the users
experience once they return to your site to make it easy
for them to checkout? Once consumers have added
items to the cart, they are more likely to follow through
relative to the drop we’ve seen in overall cart rates.
CONVERSION Conversion rate has generally dropped from a year ago,
noticeable across all referral channels and regions, except
EMEA. The drop in conversion rates has been apparent
due to the economic disruption caused by the pandemic.
We’re expecting a slight rise in conversion for the holiday
season. Focus on bottom-funnel optimization to drive
conversion up.
AOVAOV has generally increased by approx 25% from a year
ago, however has experienced a slight drop in Q3 relative
to Q2. The continued use of strategic personalization
and product recommendations continue to drive AOV.
As consumers continue to have increased confidence in
digital shopping, we’re expecting the growth in overall
AOV to increase as Q4 holidays approach.
3. ECOMMERCE QUARTERLY BENCHMARKS | Q3 2021
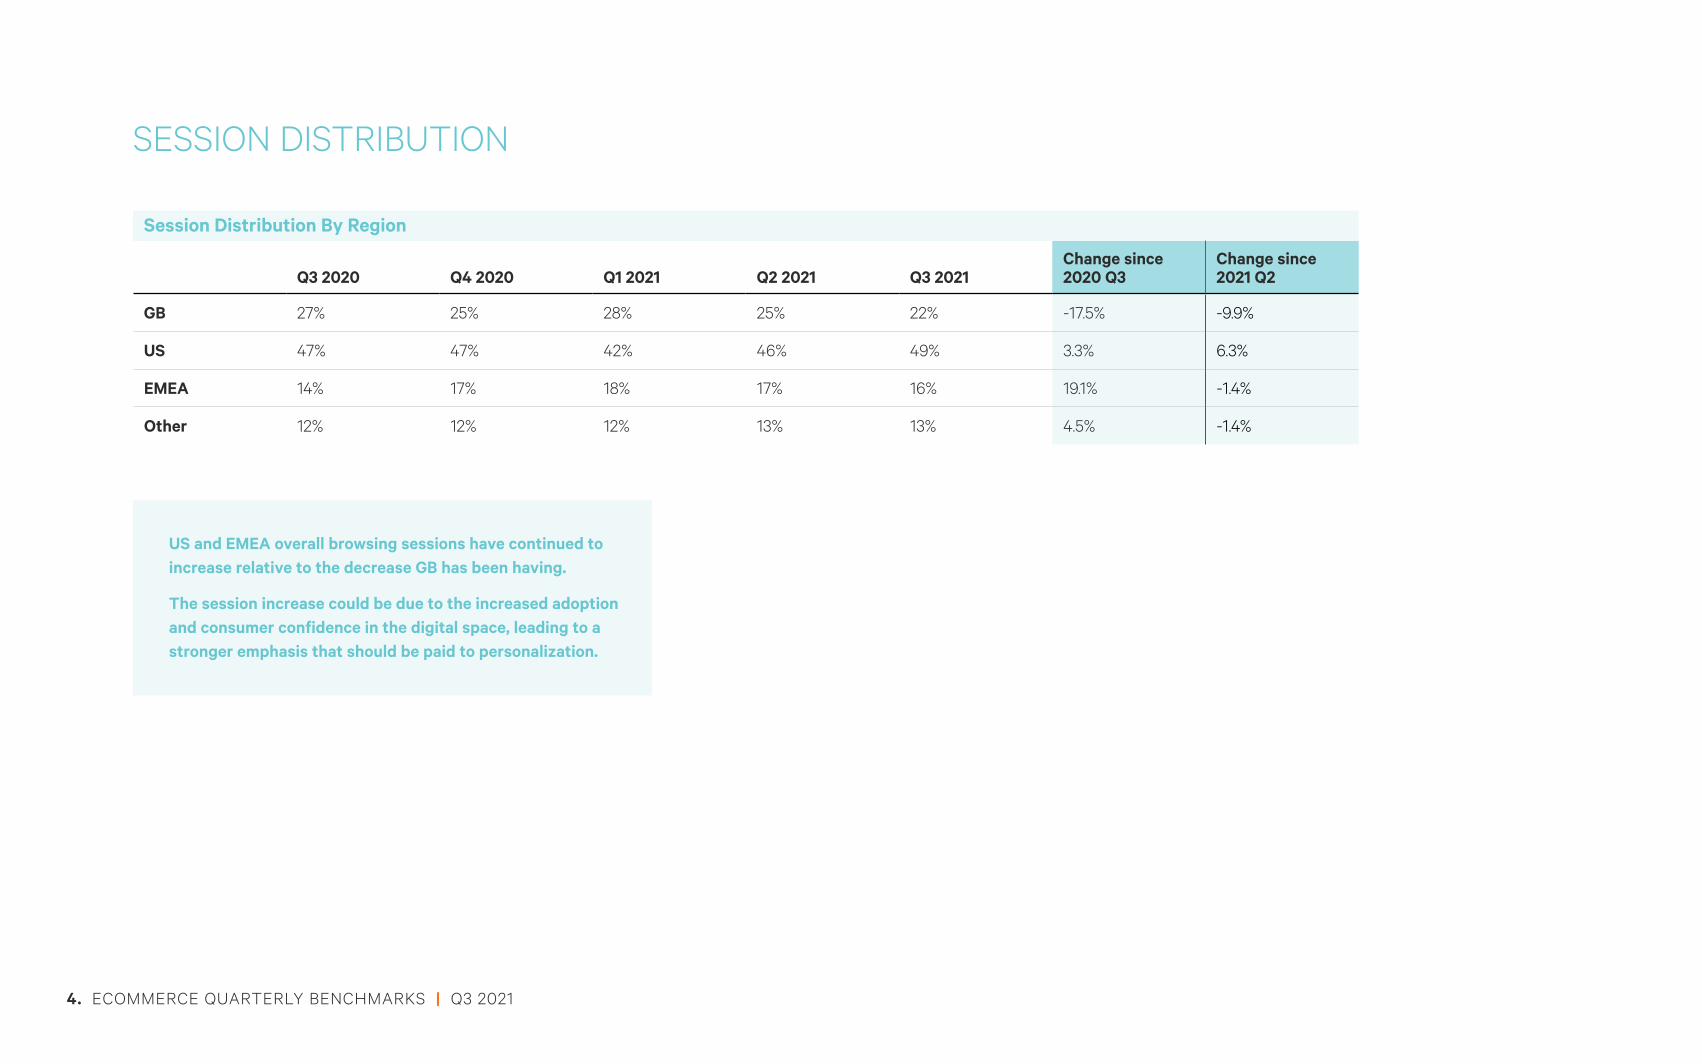
SESSION DISTRIBUTION
Session Distribution By Region
Q3 2020 Q4 2020 Q1 2021 Q2 2021 Q3 2021Change since 2020 Q3
Change since 2021 Q2
GB 27% 25% 28% 25% 22% -17.5% -9.9%
US 47% 47% 42% 46% 49% 3.3% 6.3%
EMEA 14% 17% 18% 17% 16% 19.1% -1.4%
Other 12% 12% 12% 13% 13% 4.5% -1.4%
US and EMEA overall browsing sessions have continued to increase relative to the decrease GB has been having.
The session increase could be due to the increased adoption and consumer confidence in the digital space, leading to a stronger emphasis that should be paid to personalization.
4. ECOMMERCE QUARTERLY BENCHMARKS | Q3 2021
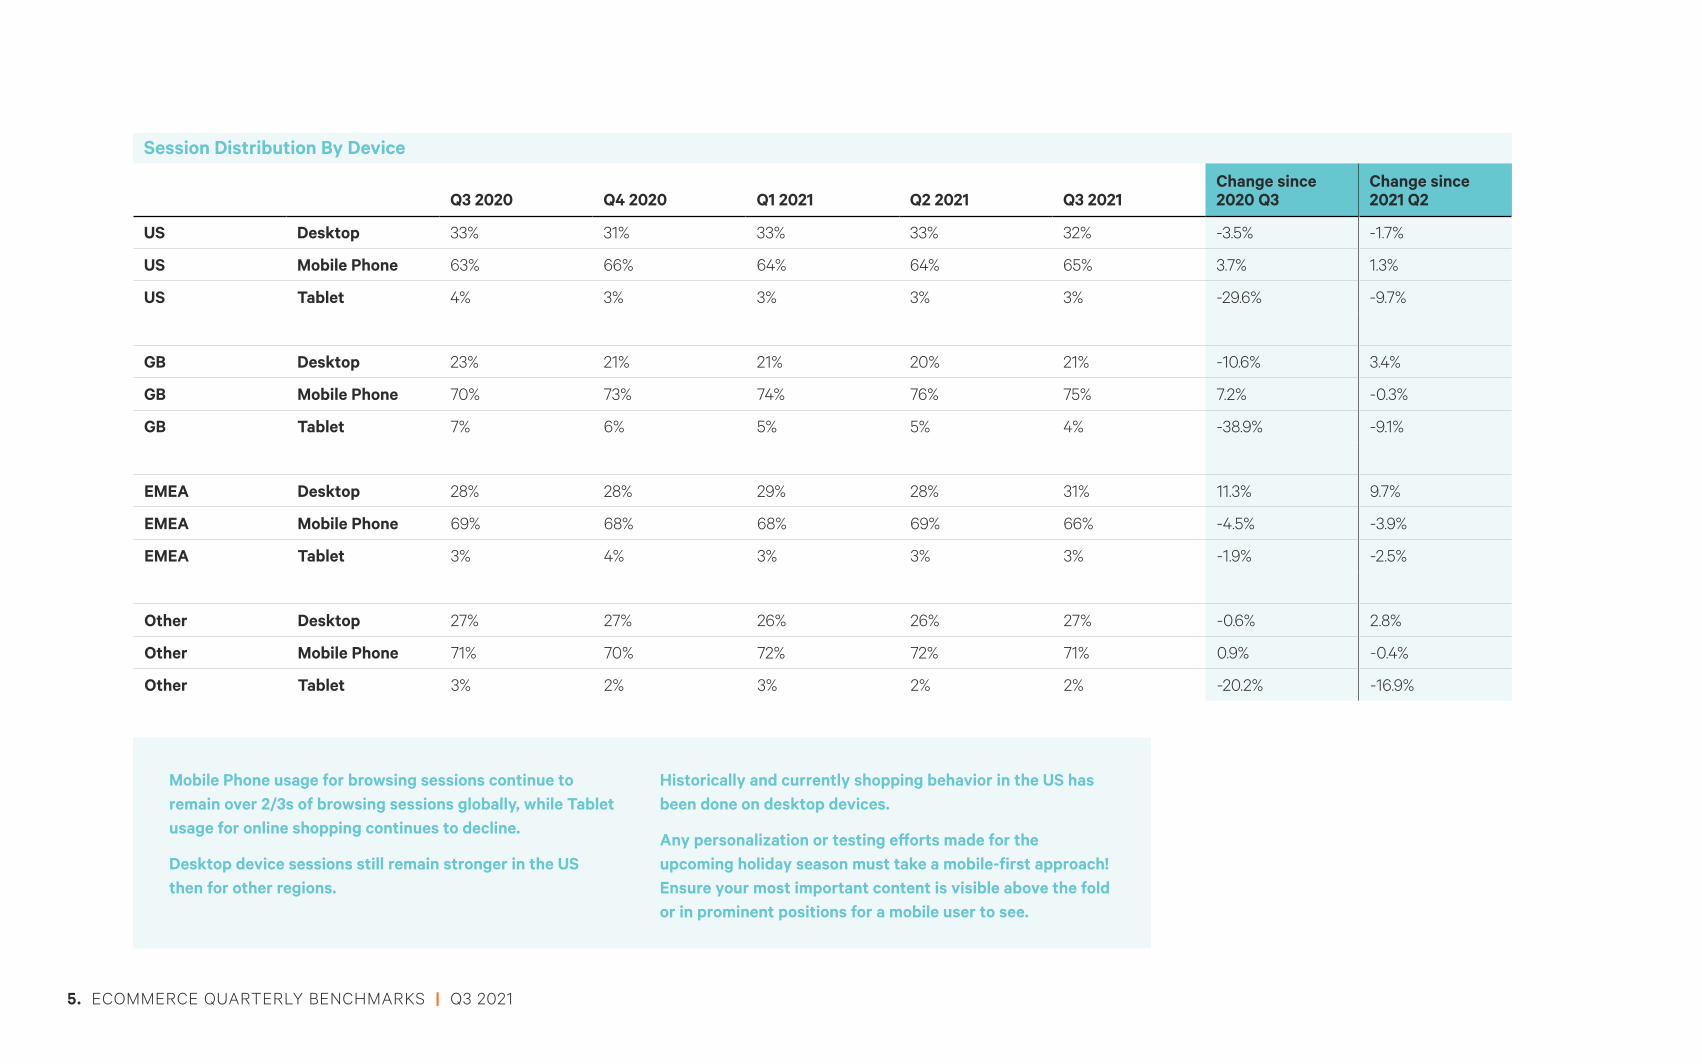
Session Distribution By Device
Q3 2020 Q4 2020 Q1 2021 Q2 2021 Q3 2021Change since 2020 Q3
Change since 2021 Q2
US Desktop 33% 31% 33% 33% 32% -3.5% -1.7%
US Mobile Phone 63% 66% 64% 64% 65% 3.7% 1.3%
US Tablet 4% 3% 3% 3% 3% -29.6% -9.7%
GB Desktop 23% 21% 21% 20% 21% -10.6% 3.4%
GB Mobile Phone 70% 73% 74% 76% 75% 7.2% -0.3%
GB Tablet 7% 6% 5% 5% 4% -38.9% -9.1%
EMEA Desktop 28% 28% 29% 28% 31% 11.3% 9.7%
EMEA Mobile Phone 69% 68% 68% 69% 66% -4.5% -3.9%
EMEA Tablet 3% 4% 3% 3% 3% -1.9% -2.5%
Other Desktop 27% 27% 26% 26% 27% -0.6% 2.8%
Other Mobile Phone 71% 70% 72% 72% 71% 0.9% -0.4%
Other Tablet 3% 2% 3% 2% 2% -20.2% -16.9%
Mobile Phone usage for browsing sessions continue to remain over 2/3s of browsing sessions globally, while Tablet usage for online shopping continues to decline.
Desktop device sessions still remain stronger in the US then for other regions.
Historically and currently shopping behavior in the US has been done on desktop devices.
Any personalization or testing efforts made for the upcoming holiday season must take a mobile-first approach! Ensure your most important content is visible above the fold or in prominent positions for a mobile user to see.
5. ECOMMERCE QUARTERLY BENCHMARKS | Q3 2021
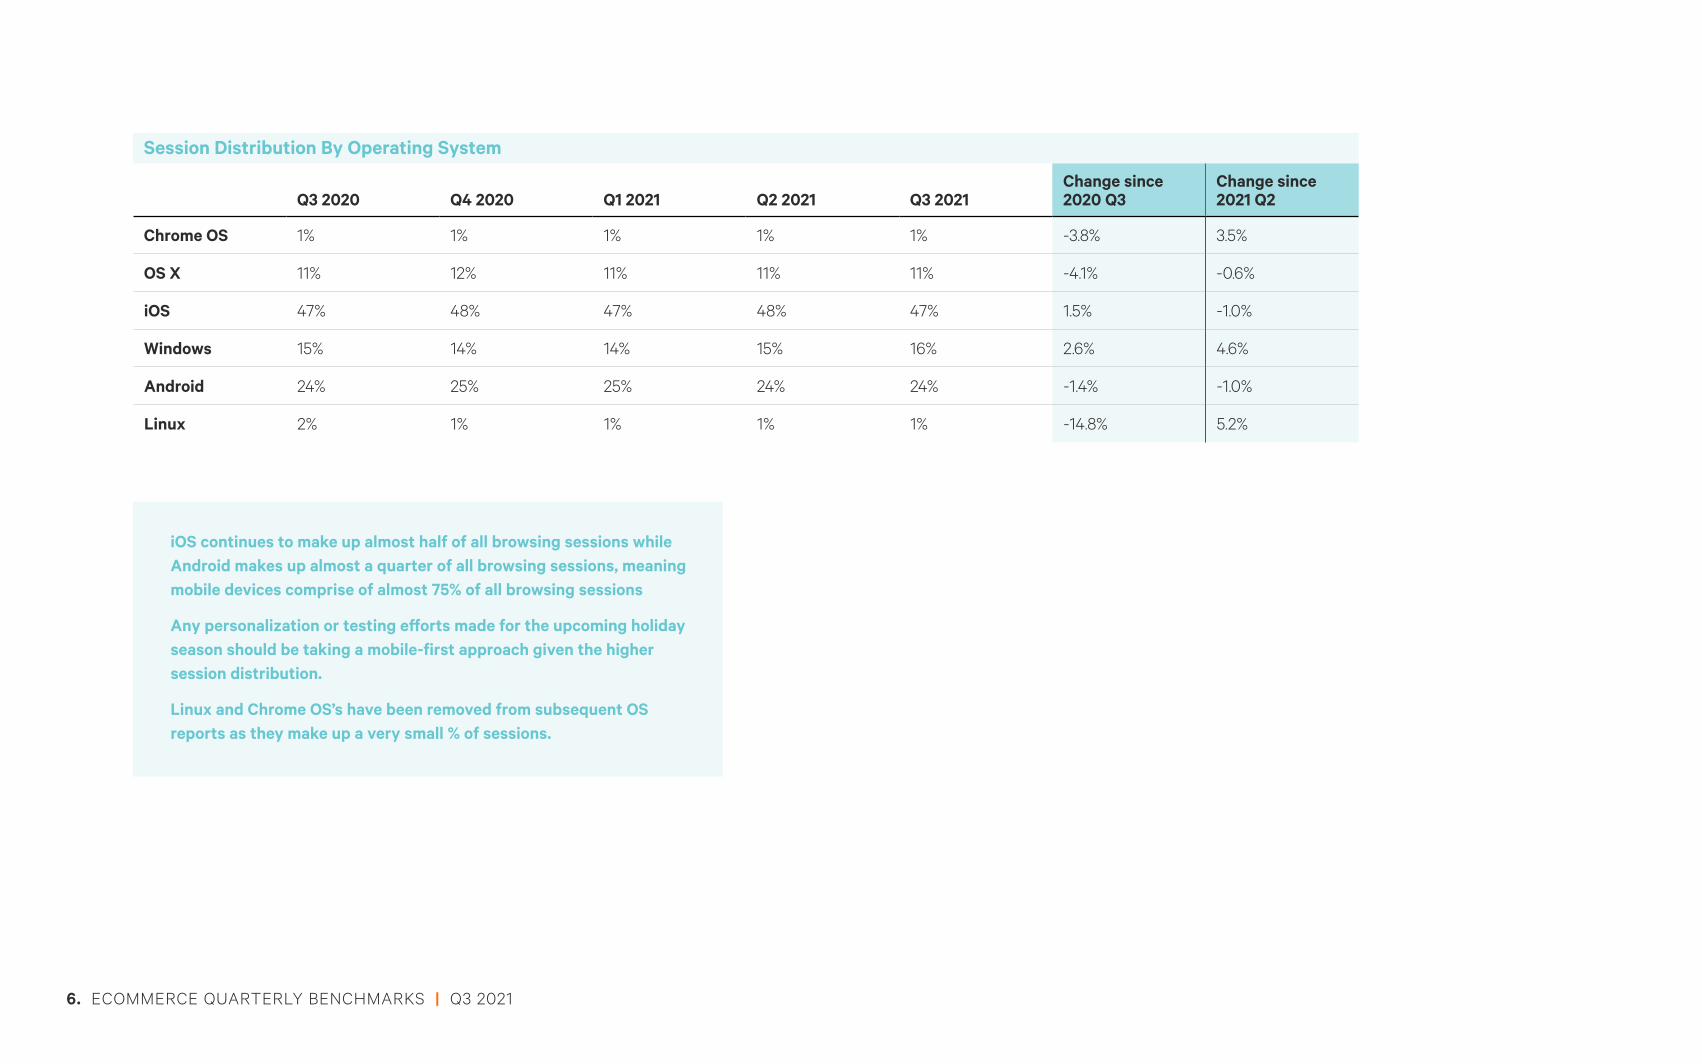
Session Distribution By Operating System
Q3 2020 Q4 2020 Q1 2021 Q2 2021 Q3 2021Change since 2020 Q3
Change since 2021 Q2
Chrome OS 1% 1% 1% 1% 1% -3.8% 3.5%
OS X 11% 12% 11% 11% 11% -4.1% -0.6%
iOS 47% 48% 47% 48% 47% 1.5% -1.0%
Windows 15% 14% 14% 15% 16% 2.6% 4.6%
Android 24% 25% 25% 24% 24% -1.4% -1.0%
Linux 2% 1% 1% 1% 1% -14.8% 5.2%
iOS continues to make up almost half of all browsing sessions while Android makes up almost a quarter of all browsing sessions, meaning mobile devices comprise of almost 75% of all browsing sessions
Any personalization or testing efforts made for the upcoming holiday season should be taking a mobile-first approach given the higher session distribution.
Linux and Chrome OS’s have been removed from subsequent OS reports as they make up a very small % of sessions.
6. ECOMMERCE QUARTERLY BENCHMARKS | Q3 2021
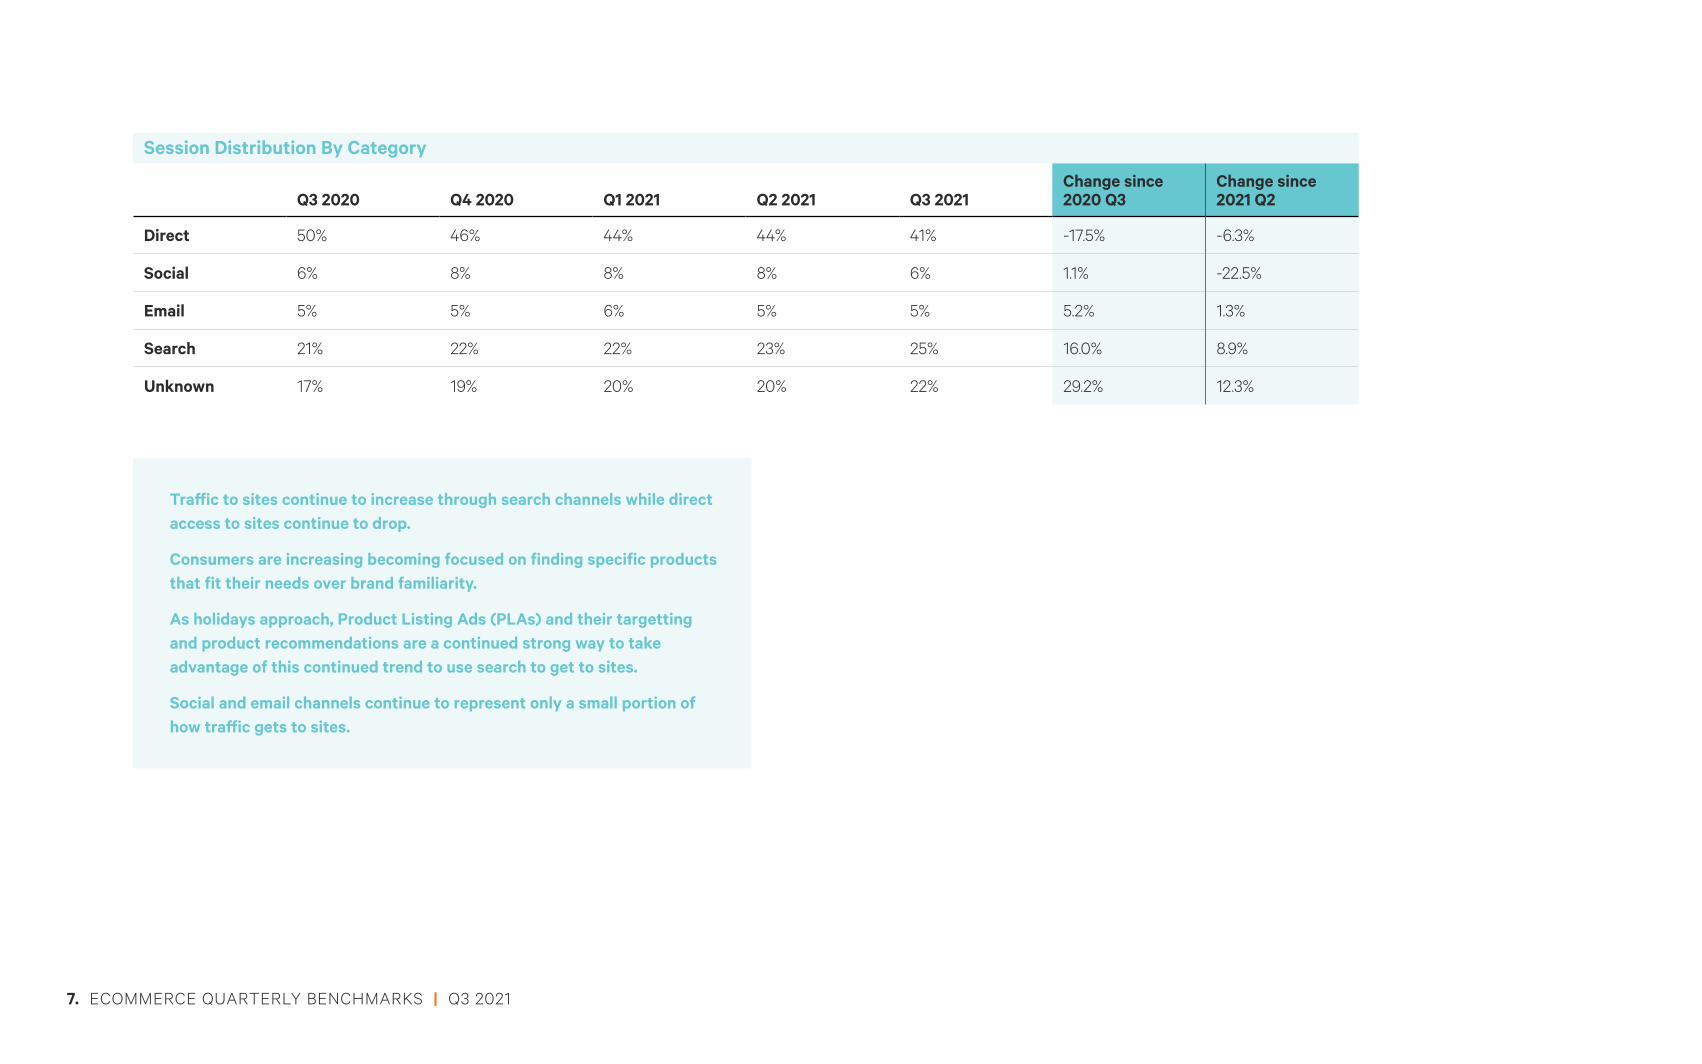
Session Distribution By Category
Q3 2020 Q4 2020 Q1 2021 Q2 2021 Q3 2021Change since 2020 Q3
Change since 2021 Q2
Direct 50% 46% 44% 44% 41% -17.5% -6.3%
Social 6% 8% 8% 8% 6% 1.1% -22.5%
Email 5% 5% 6% 5% 5% 5.2% 1.3%
Search 21% 22% 22% 23% 25% 16.0% 8.9%
Unknown 17% 19% 20% 20% 22% 29.2% 12.3%
Traffic to sites continue to increase through search channels while direct access to sites continue to drop.
Consumers are increasing becoming focused on finding specific products that fit their needs over brand familiarity.
As holidays approach, Product Listing Ads (PLAs) and their targetting and product recommendations are a continued strong way to take advantage of this continued trend to use search to get to sites.
Social and email channels continue to represent only a small portion of how traffic gets to sites.
7. ECOMMERCE QUARTERLY BENCHMARKS | Q3 2021
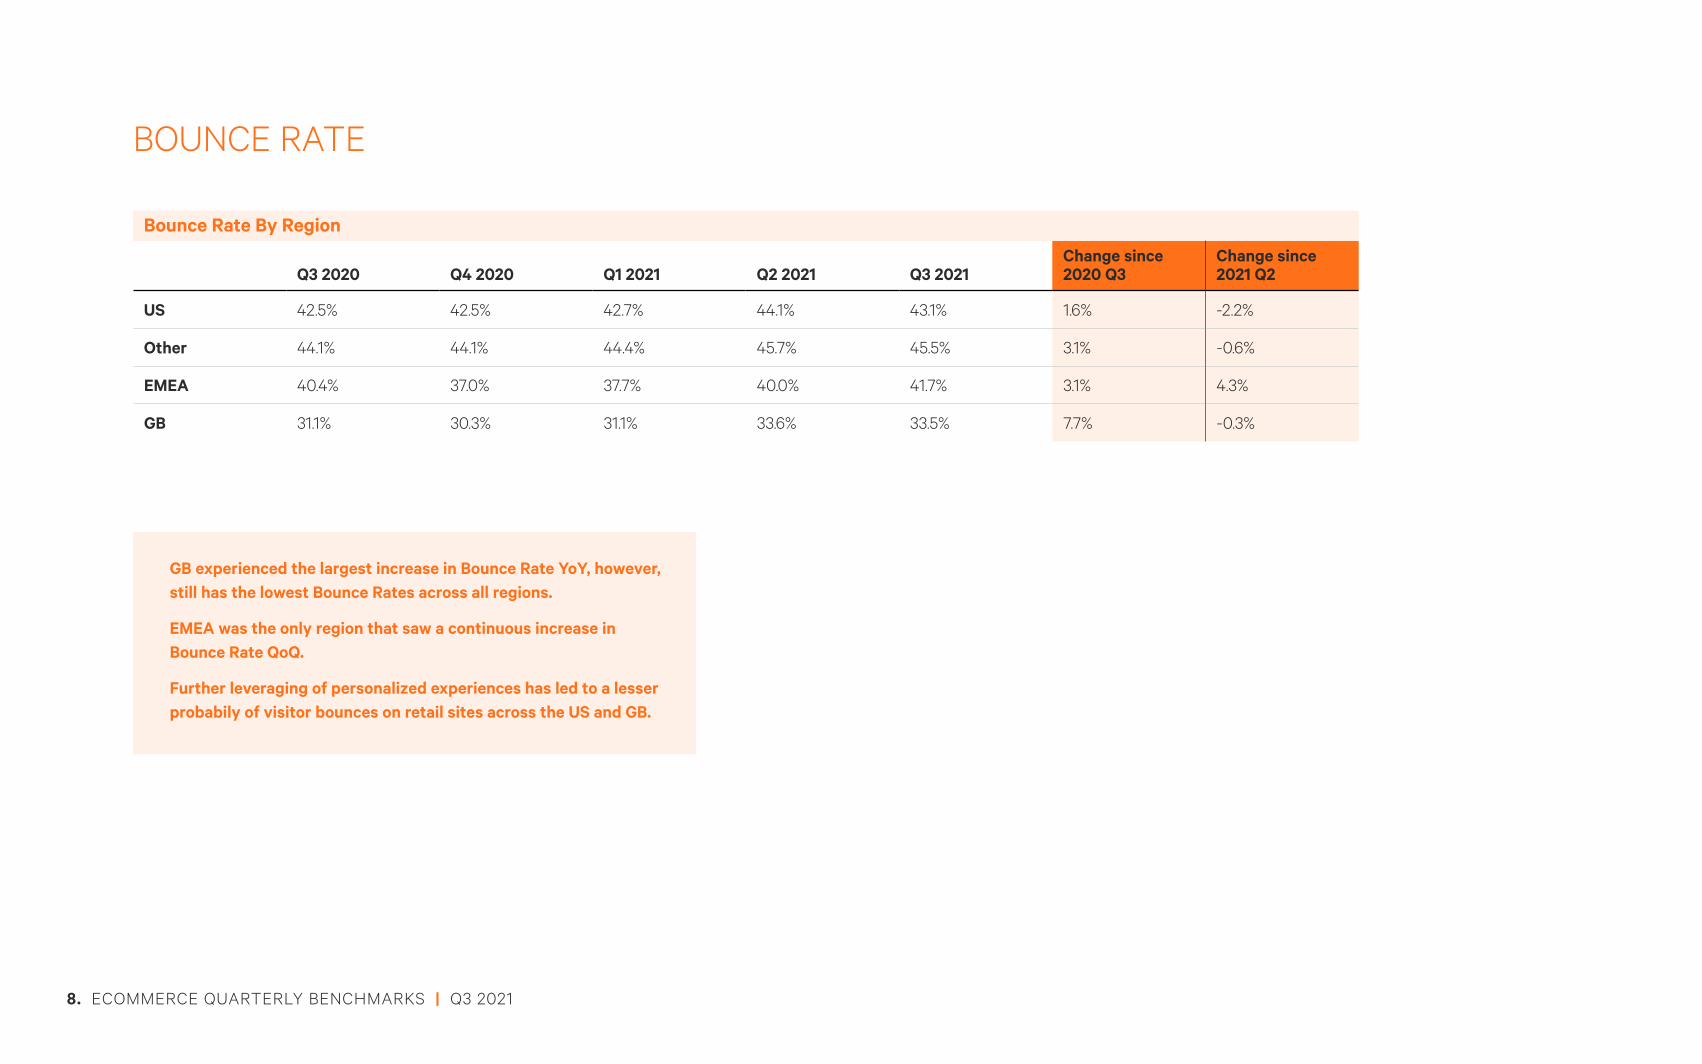
BOUNCE RATE
Bounce Rate By Region
Q3 2020 Q4 2020 Q1 2021 Q2 2021 Q3 2021Change since 2020 Q3
Change since 2021 Q2
US 42.5% 42.5% 42.7% 44.1% 43.1% 1.6% -2.2%
Other 44.1% 44.1% 44.4% 45.7% 45.5% 3.1% -0.6%
EMEA 40.4% 37.0% 37.7% 40.0% 41.7% 3.1% 4.3%
GB 31.1% 30.3% 31.1% 33.6% 33.5% 7.7% -0.3%
GB experienced the largest increase in Bounce Rate YoY, however, still has the lowest Bounce Rates across all regions.
EMEA was the only region that saw a continuous increase in Bounce Rate QoQ.
Further leveraging of personalized experiences has led to a lesser probabily of visitor bounces on retail sites across the US and GB.
8. ECOMMERCE QUARTERLY BENCHMARKS | Q3 2021
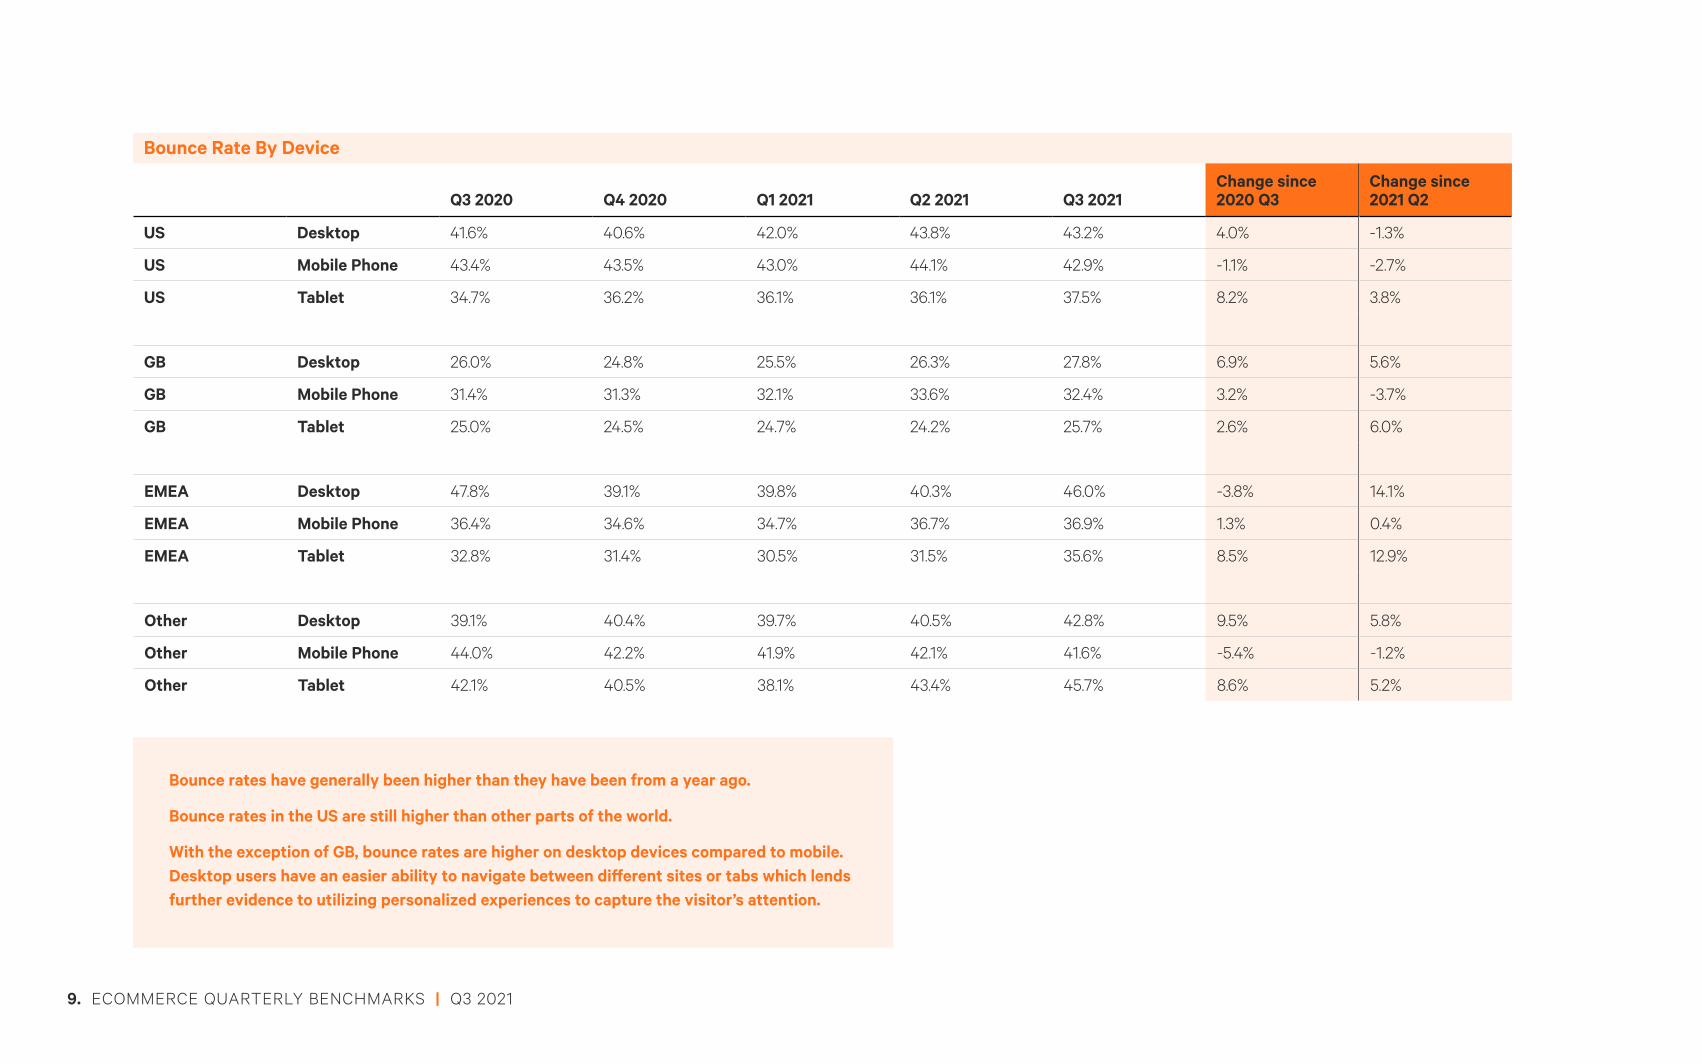
Bounce Rate By Device
Q3 2020 Q4 2020 Q1 2021 Q2 2021 Q3 2021Change since 2020 Q3
Change since 2021 Q2
US Desktop 41.6% 40.6% 42.0% 43.8% 43.2% 4.0% -1.3%
US Mobile Phone 43.4% 43.5% 43.0% 44.1% 42.9% -1.1% -2.7%
US Tablet 34.7% 36.2% 36.1% 36.1% 37.5% 8.2% 3.8%
GB Desktop 26.0% 24.8% 25.5% 26.3% 27.8% 6.9% 5.6%
GB Mobile Phone 31.4% 31.3% 32.1% 33.6% 32.4% 3.2% -3.7%
GB Tablet 25.0% 24.5% 24.7% 24.2% 25.7% 2.6% 6.0%
EMEA Desktop 47.8% 39.1% 39.8% 40.3% 46.0% -3.8% 14.1%
EMEA Mobile Phone 36.4% 34.6% 34.7% 36.7% 36.9% 1.3% 0.4%
EMEA Tablet 32.8% 31.4% 30.5% 31.5% 35.6% 8.5% 12.9%
Other Desktop 39.1% 40.4% 39.7% 40.5% 42.8% 9.5% 5.8%
Other Mobile Phone 44.0% 42.2% 41.9% 42.1% 41.6% -5.4% -1.2%
Other Tablet 42.1% 40.5% 38.1% 43.4% 45.7% 8.6% 5.2%
Bounce rates have generally been higher than they have been from a year ago.
Bounce rates in the US are still higher than other parts of the world.
With the exception of GB, bounce rates are higher on desktop devices compared to mobile. Desktop users have an easier ability to navigate between different sites or tabs which lends further evidence to utilizing personalized experiences to capture the visitor’s attention.
9. ECOMMERCE QUARTERLY BENCHMARKS | Q3 2021
Bounce Rate By Operating System
Q3 2020 Q4 2020 Q1 2021 Q2 2021 Q3 2021Change since 2020 Q3
Change since 2021 Q2
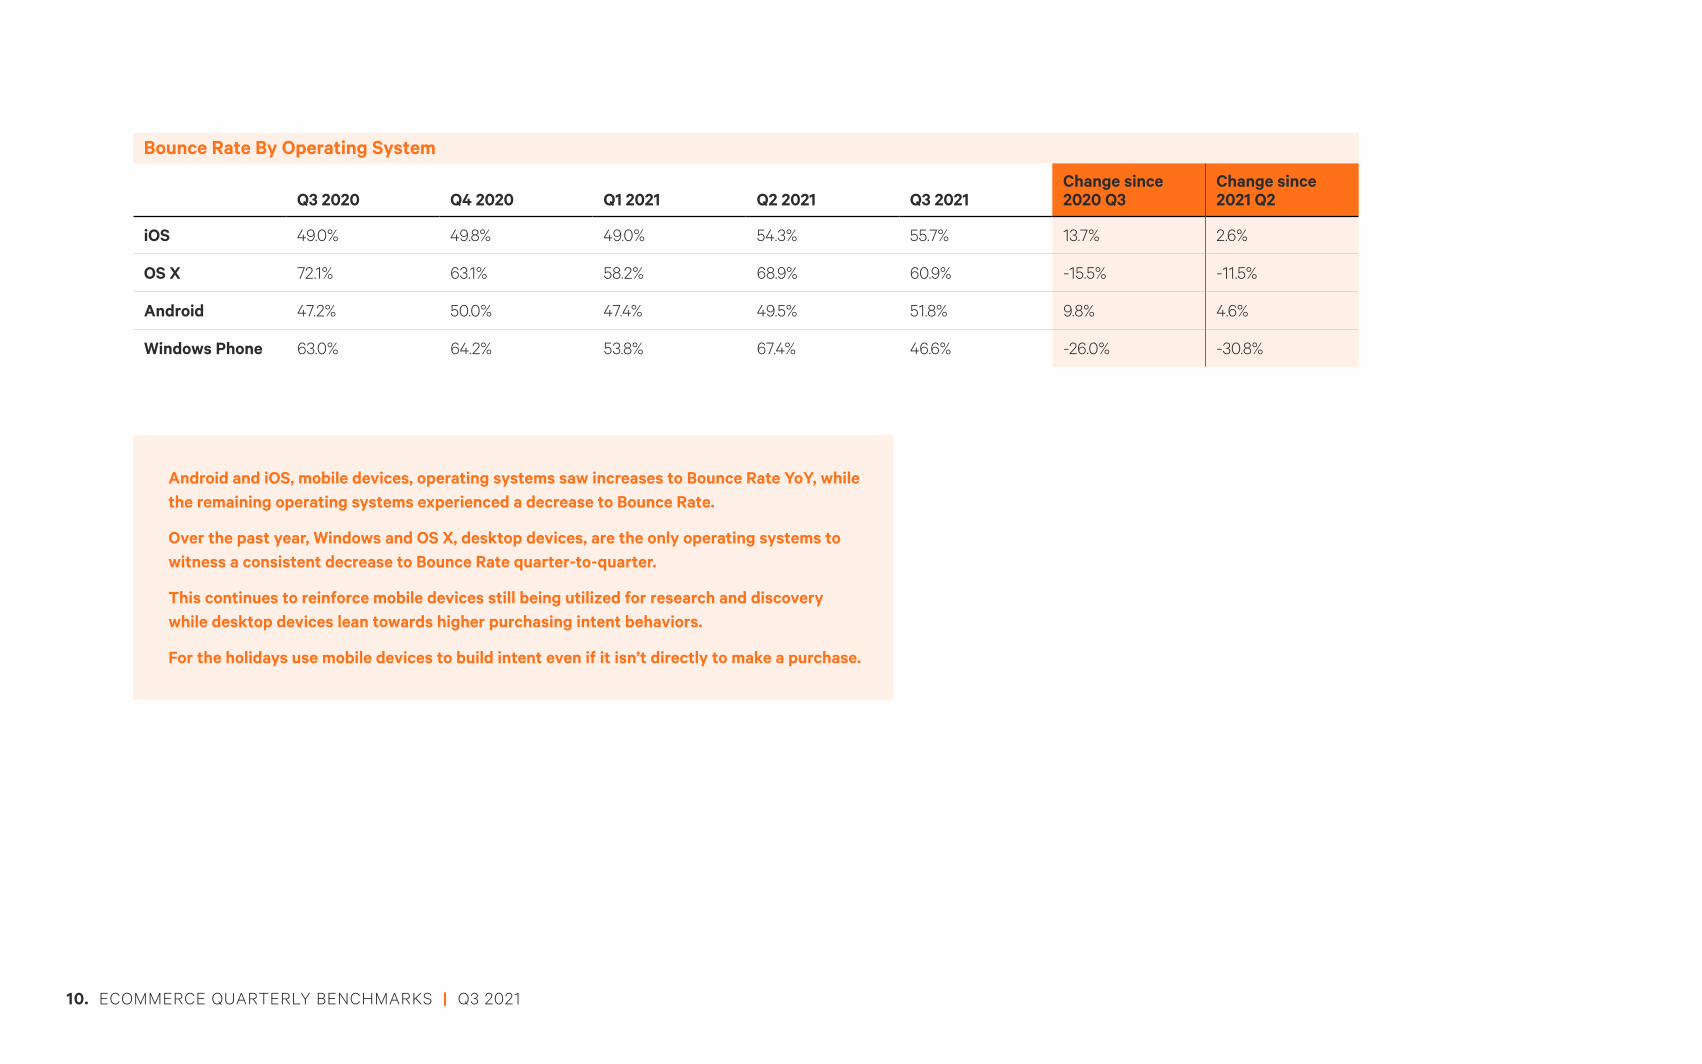
iOS 49.0% 49.8% 49.0% 54.3% 55.7% 13.7% 2.6%
OS X 72.1% 63.1% 58.2% 68.9% 60.9% -15.5% -11.5%
Android 47.2% 50.0% 47.4% 49.5% 51.8% 9.8% 4.6%
Windows Phone 63.0% 64.2% 53.8% 67.4% 46.6% -26.0% -30.8%
Android and iOS, mobile devices, operating systems saw increases to Bounce Rate YoY, while the remaining operating systems experienced a decrease to Bounce Rate.
Over the past year, Windows and OS X, desktop devices, are the only operating systems to witness a consistent decrease to Bounce Rate quarter-to-quarter.
This continues to reinforce mobile devices still being utilized for research and discovery while desktop devices lean towards higher purchasing intent behaviors.
For the holidays use mobile devices to build intent even if it isn’t directly to make a purchase.
10. ECOMMERCE QUARTERLY BENCHMARKS | Q3 2021
Bounce Rate By Source
Q3 2020 Q4 2020 Q1 2021 Q2 2021 Q3 2021Change since 2020 Q3
Change since 2021 Q2
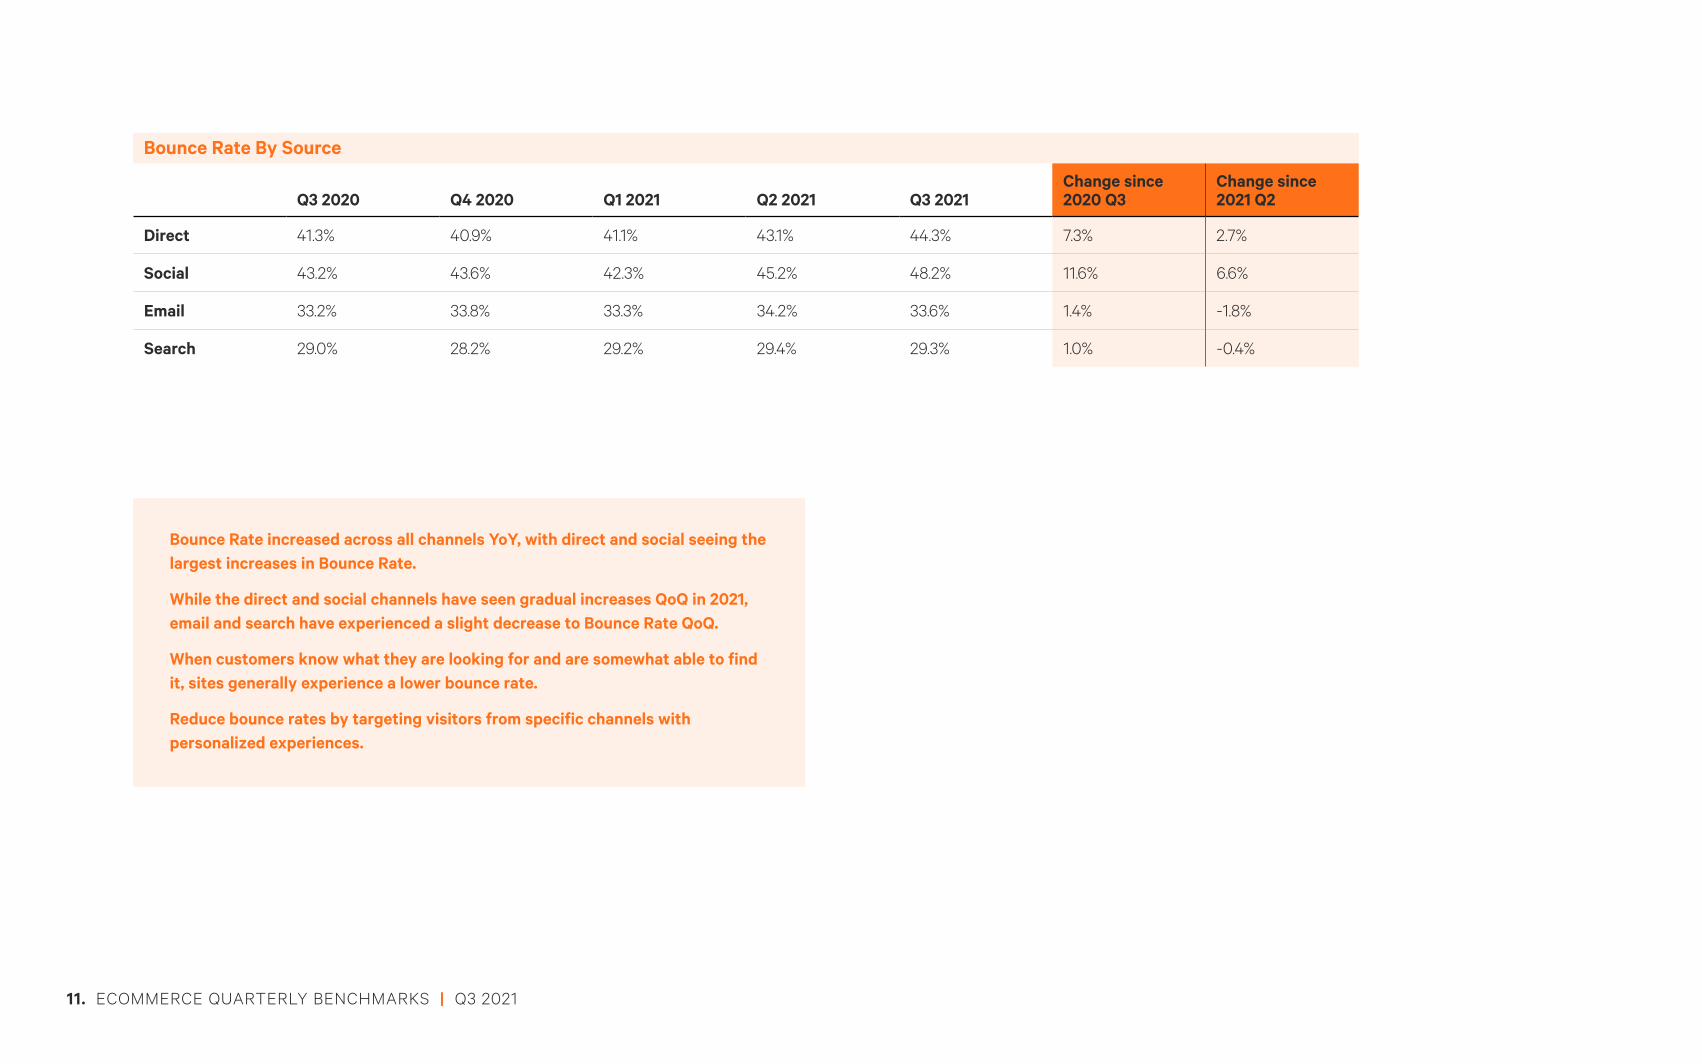
Direct 41.3% 40.9% 41.1% 43.1% 44.3% 7.3% 2.7%
Social 43.2% 43.6% 42.3% 45.2% 48.2% 11.6% 6.6%
Email 33.2% 33.8% 33.3% 34.2% 33.6% 1.4% -1.8%
Search 29.0% 28.2% 29.2% 29.4% 29.3% 1.0% -0.4%
Bounce Rate increased across all channels YoY, with direct and social seeing the largest increases in Bounce Rate.
While the direct and social channels have seen gradual increases QoQ in 2021, email and search have experienced a slight decrease to Bounce Rate QoQ.
When customers know what they are looking for and are somewhat able to find it, sites generally experience a lower bounce rate.
Reduce bounce rates by targeting visitors from specific channels with personalized experiences.
11. ECOMMERCE QUARTERLY BENCHMARKS | Q3 2021
AVERAGE PAGE VIEWS
Average Page Views By Region
Q3 2020 Q4 2020 Q1 2021 Q2 2021 Q3 2021Change since 2020 Q3
Change since 2021 Q2
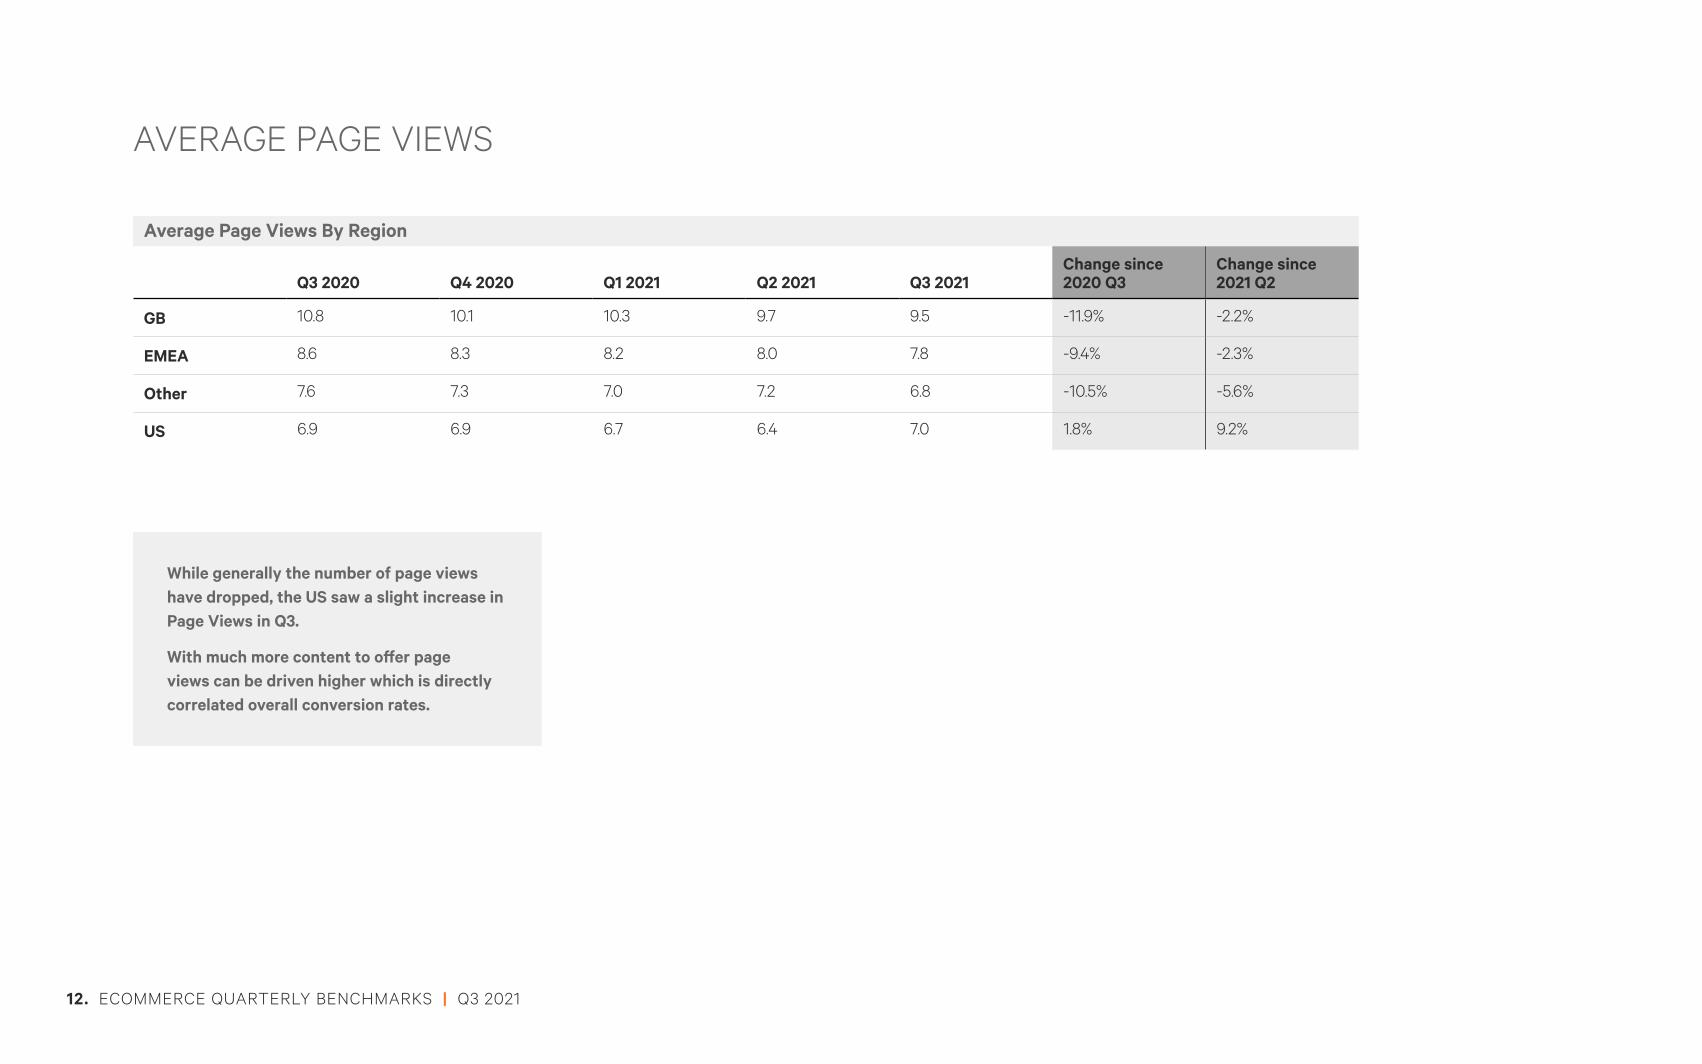
GB 10.8 10.1 10.3 9.7 9.5 -11.9% -2.2%
EMEA 8.6 8.3 8.2 8.0 7.8 -9.4% -2.3%
Other 7.6 7.3 7.0 7.2 6.8 -10.5% -5.6%
US 6.9 6.9 6.7 6.4 7.0 1.8% 9.2%
While generally the number of page views have dropped, the US saw a slight increase in Page Views in Q3.
With much more content to offer page views can be driven higher which is directly correlated overall conversion rates.
12. ECOMMERCE QUARTERLY BENCHMARKS | Q3 2021
Average Page Views By Device
Q3 2020 Q4 2020 Q1 2021 Q2 2021 Q3 2021Change since 2020 Q3
Change since 2021 Q2
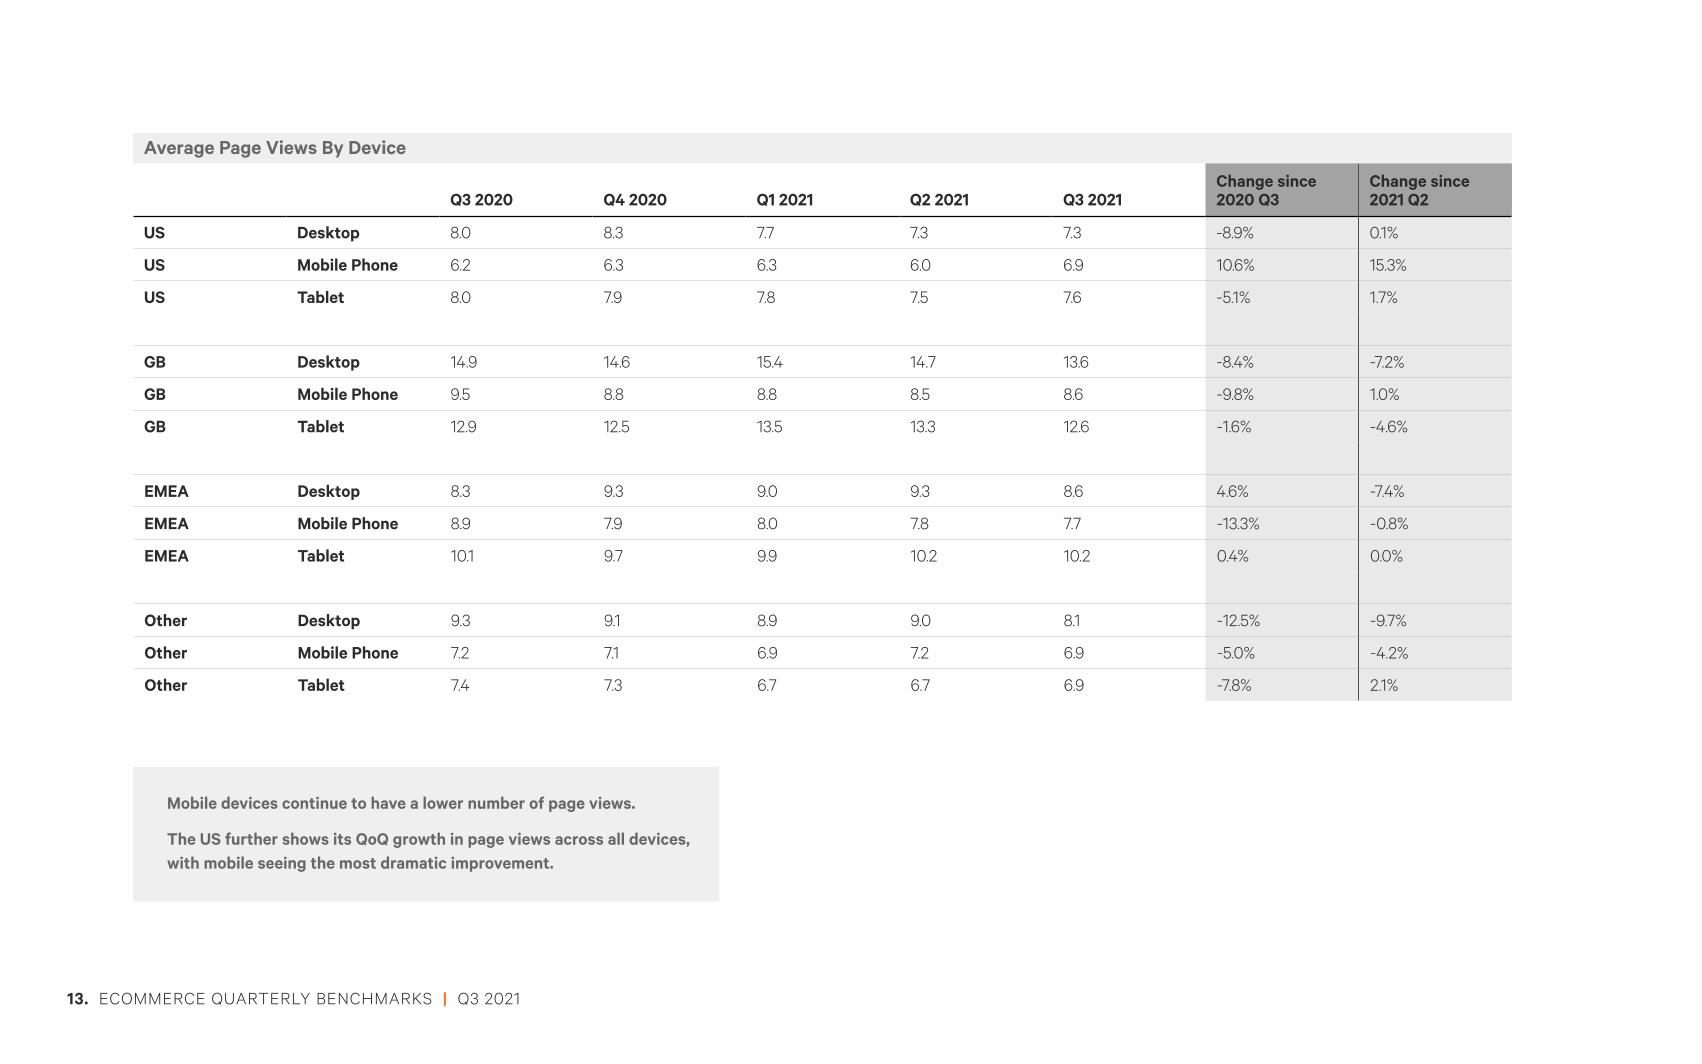
US Desktop 8.0 8.3 7.7 7.3 7.3 -8.9% 0.1%
US Mobile Phone 6.2 6.3 6.3 6.0 6.9 10.6% 15.3%
US Tablet 8.0 7.9 7.8 7.5 7.6 -5.1% 1.7%
GB Desktop 14.9 14.6 15.4 14.7 13.6 -8.4% -7.2%
GB Mobile Phone 9.5 8.8 8.8 8.5 8.6 -9.8% 1.0%
GB Tablet 12.9 12.5 13.5 13.3 12.6 -1.6% -4.6%
EMEA Desktop 8.3 9.3 9.0 9.3 8.6 4.6% -7.4%
EMEA Mobile Phone 8.9 7.9 8.0 7.8 7.7 -13.3% -0.8%
EMEA Tablet 10.1 9.7 9.9 10.2 10.2 0.4% 0.0%
Other Desktop 9.3 9.1 8.9 9.0 8.1 -12.5% -9.7%
Other Mobile Phone 7.2 7.1 6.9 7.2 6.9 -5.0% -4.2%
Other Tablet 7.4 7.3 6.7 6.7 6.9 -7.8% 2.1%
Mobile devices continue to have a lower number of page views.
The US further shows its QoQ growth in page views across all devices, with mobile seeing the most dramatic improvement.
13. ECOMMERCE QUARTERLY BENCHMARKS | Q3 2021
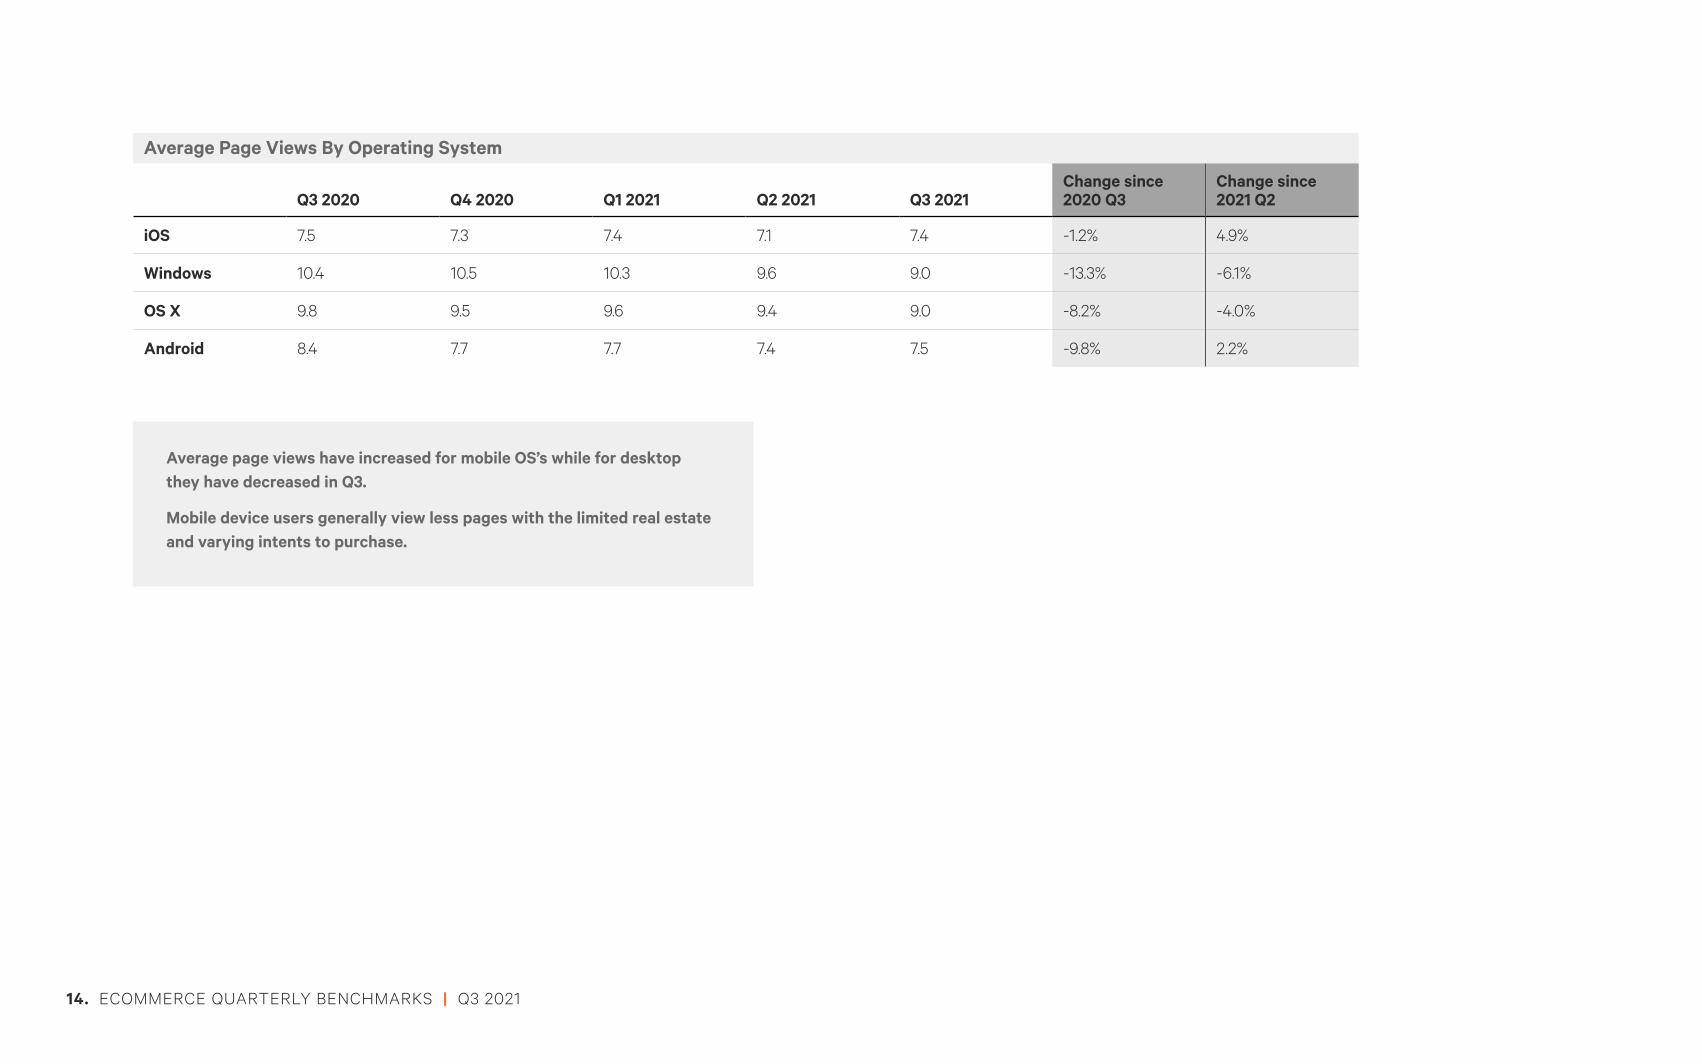
Average Page Views By Operating System
Q3 2020 Q4 2020 Q1 2021 Q2 2021 Q3 2021Change since 2020 Q3
Change since 2021 Q2
iOS 7.5 7.3 7.4 7.1 7.4 -1.2% 4.9%
Windows 10.4 10.5 10.3 9.6 9.0 -13.3% -6.1%
OS X 9.8 9.5 9.6 9.4 9.0 -8.2% -4.0%
Android 8.4 7.7 7.7 7.4 7.5 -9.8% 2.2%
Average page views have increased for mobile OS’s while for desktop they have decreased in Q3.
Mobile device users generally view less pages with the limited real estate and varying intents to purchase.
14. ECOMMERCE QUARTERLY BENCHMARKS | Q3 2021
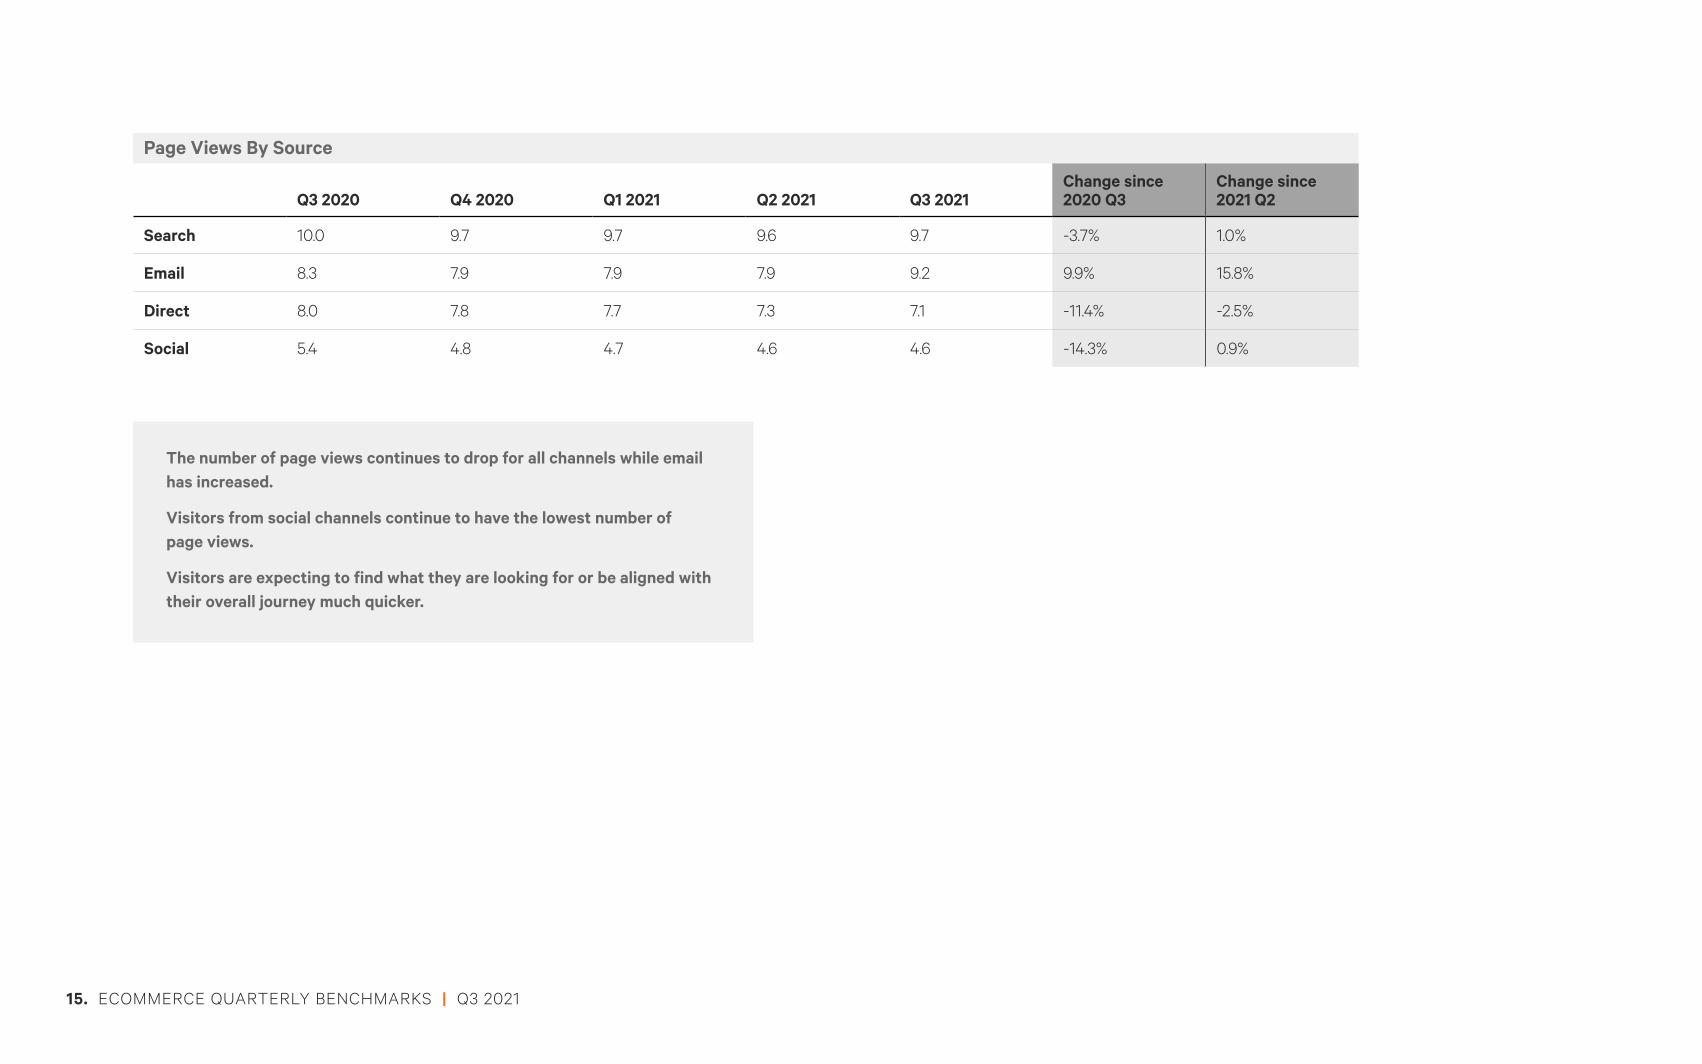
Page Views By Source
Q3 2020 Q4 2020 Q1 2021 Q2 2021 Q3 2021Change since 2020 Q3
Change since 2021 Q2
Search 10.0 9.7 9.7 9.6 9.7 -3.7% 1.0%
Email 8.3 7.9 7.9 7.9 9.2 9.9% 15.8%
Direct 8.0 7.8 7.7 7.3 7.1 -11.4% -2.5%
Social 5.4 4.8 4.7 4.6 4.6 -14.3% 0.9%
The number of page views continues to drop for all channels while email has increased.
Visitors from social channels continue to have the lowest number of page views.
Visitors are expecting to find what they are looking for or be aligned with their overall journey much quicker.
15. ECOMMERCE QUARTERLY BENCHMARKS | Q3 2021
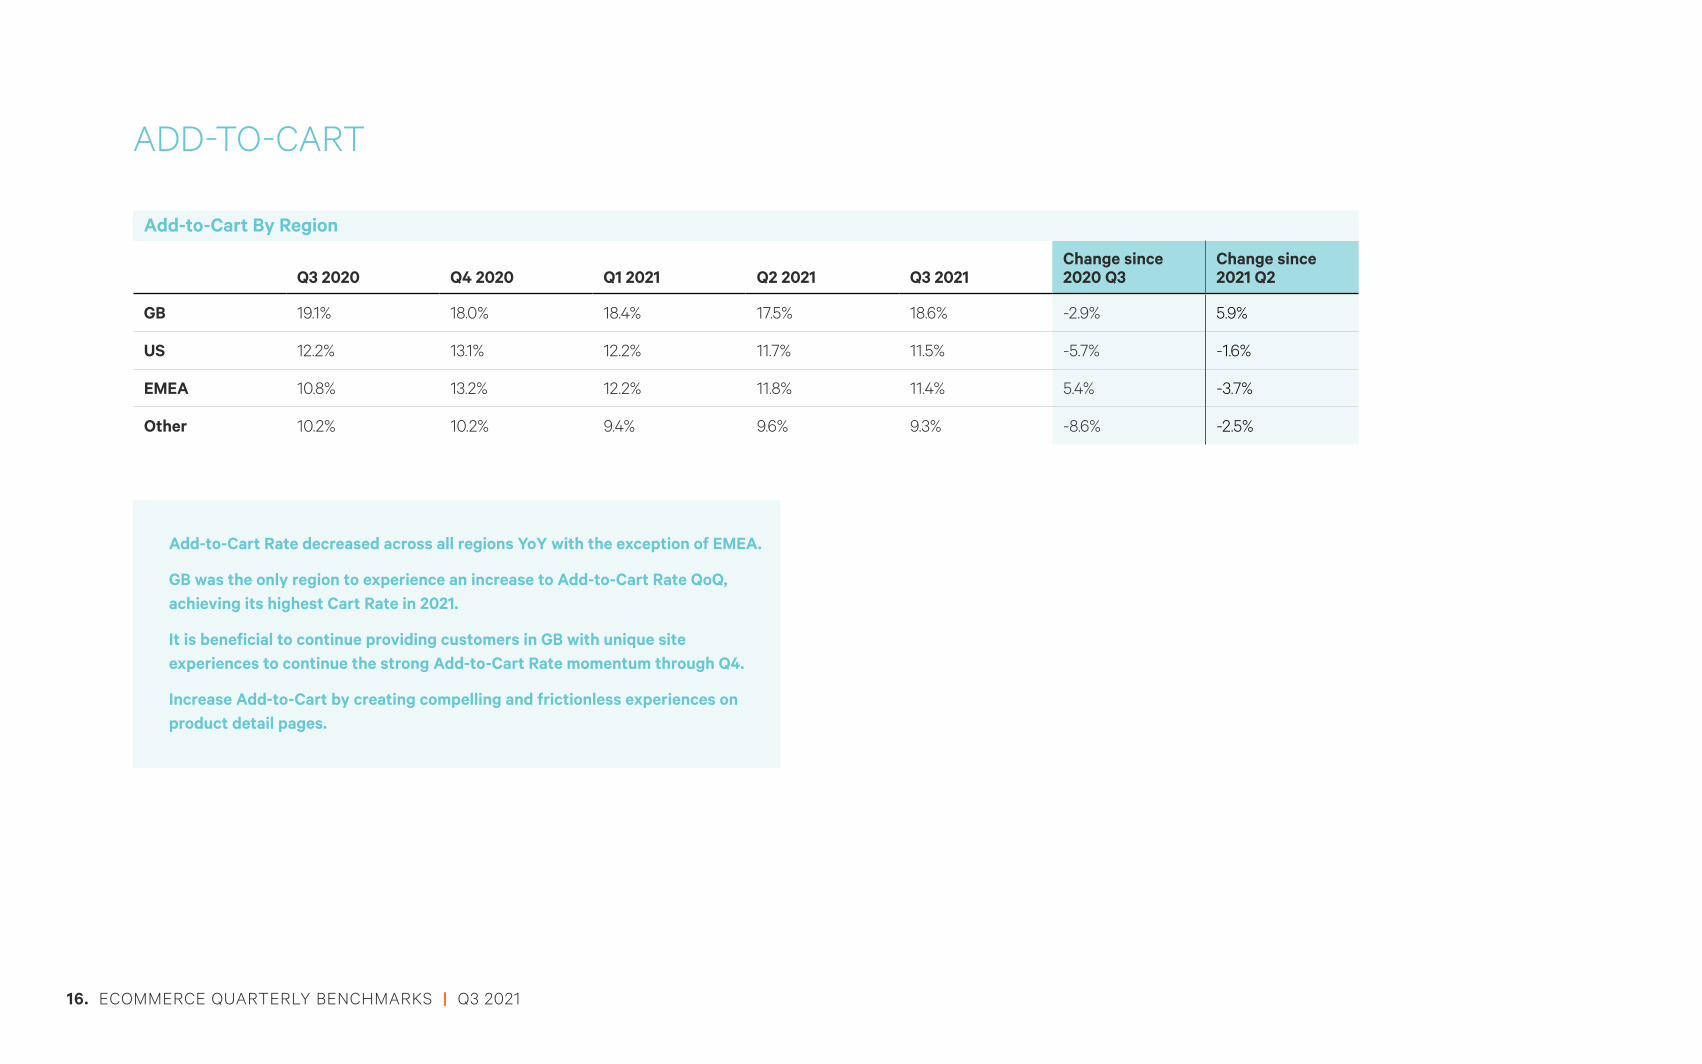
ADD-TO-CART
Add-to-Cart By Region
Q3 2020 Q4 2020 Q1 2021 Q2 2021 Q3 2021Change since 2020 Q3
Change since 2021 Q2
GB 19.1% 18.0% 18.4% 17.5% 18.6% -2.9% 5.9%
US 12.2% 13.1% 12.2% 11.7% 11.5% -5.7% -1.6%
EMEA 10.8% 13.2% 12.2% 11.8% 11.4% 5.4% -3.7%
Other 10.2% 10.2% 9.4% 9.6% 9.3% -8.6% -2.5%
Add-to-Cart Rate decreased across all regions YoY with the exception of EMEA.
GB was the only region to experience an increase to Add-to-Cart Rate QoQ, achieving its highest Cart Rate in 2021.
It is beneficial to continue providing customers in GB with unique site experiences to continue the strong Add-to-Cart Rate momentum through Q4.
Increase Add-to-Cart by creating compelling and frictionless experiences on product detail pages.
16. ECOMMERCE QUARTERLY BENCHMARKS | Q3 2021
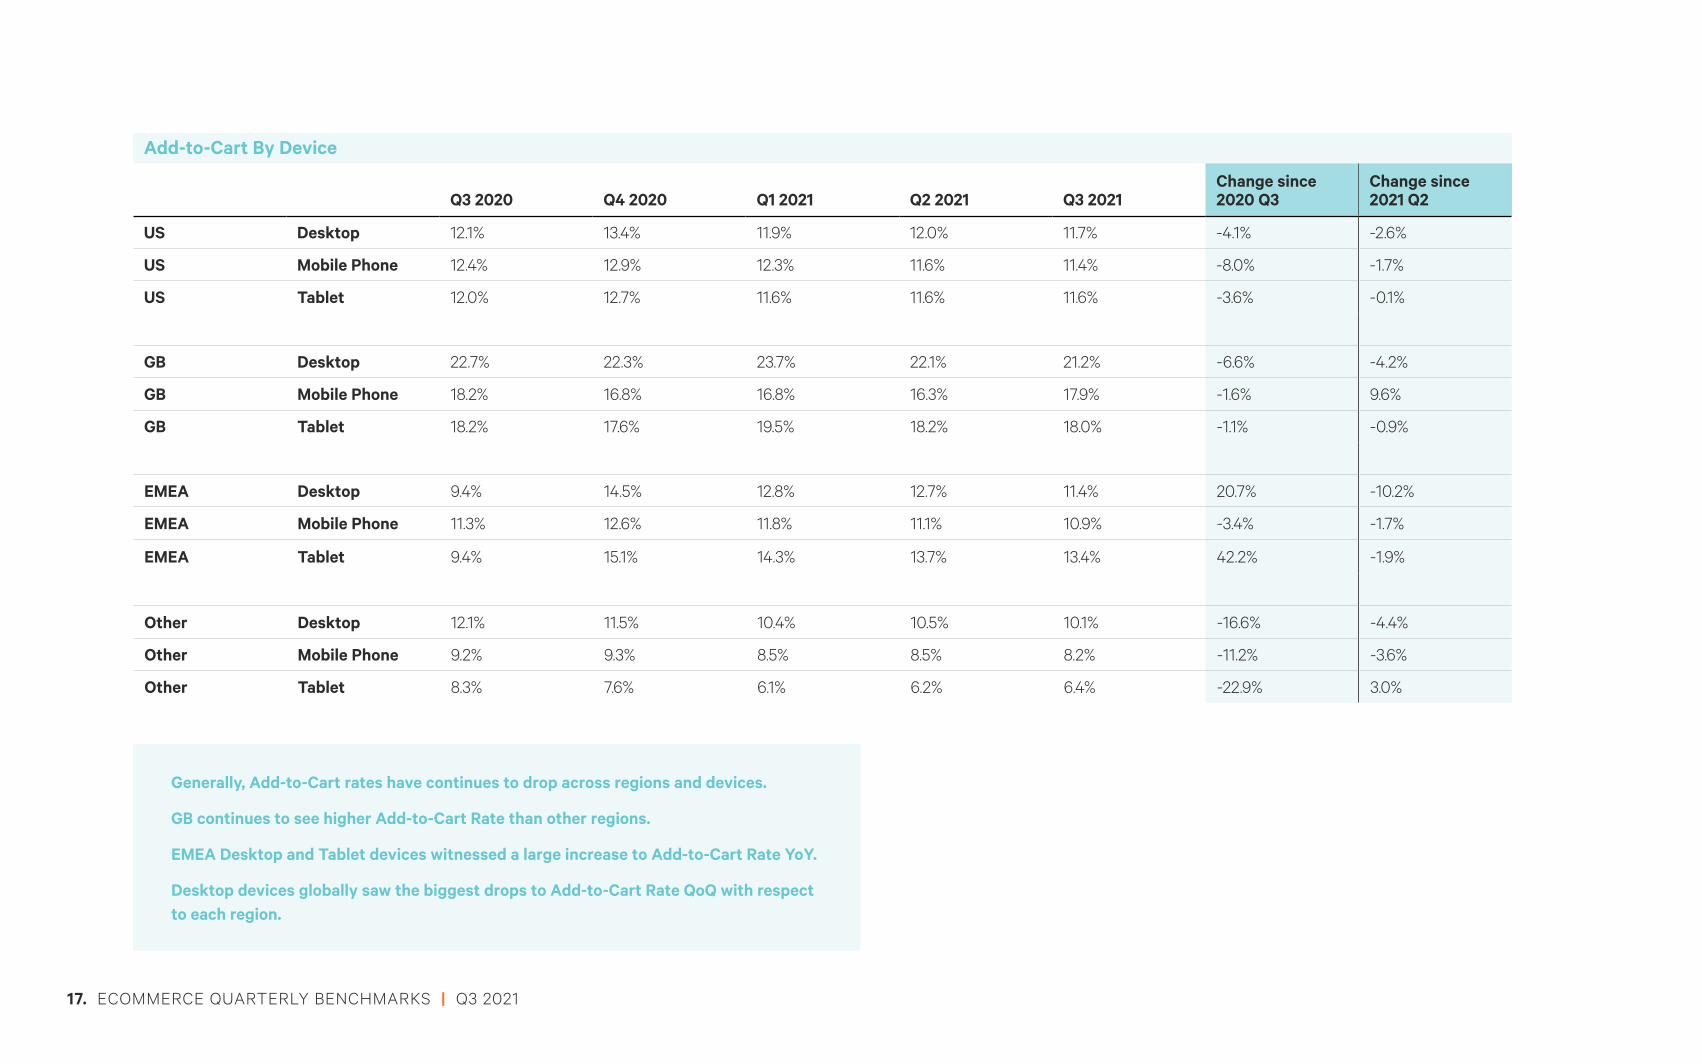
Add-to-Cart By Device
Q3 2020 Q4 2020 Q1 2021 Q2 2021 Q3 2021Change since 2020 Q3
Change since 2021 Q2
US Desktop 12.1% 13.4% 11.9% 12.0% 11.7% -4.1% -2.6%
US Mobile Phone 12.4% 12.9% 12.3% 11.6% 11.4% -8.0% -1.7%
US Tablet 12.0% 12.7% 11.6% 11.6% 11.6% -3.6% -0.1%
GB Desktop 22.7% 22.3% 23.7% 22.1% 21.2% -6.6% -4.2%
GB Mobile Phone 18.2% 16.8% 16.8% 16.3% 17.9% -1.6% 9.6%
GB Tablet 18.2% 17.6% 19.5% 18.2% 18.0% -1.1% -0.9%
EMEA Desktop 9.4% 14.5% 12.8% 12.7% 11.4% 20.7% -10.2%
EMEA Mobile Phone 11.3% 12.6% 11.8% 11.1% 10.9% -3.4% -1.7%
EMEA Tablet 9.4% 15.1% 14.3% 13.7% 13.4% 42.2% -1.9%
Other Desktop 12.1% 11.5% 10.4% 10.5% 10.1% -16.6% -4.4%
Other Mobile Phone 9.2% 9.3% 8.5% 8.5% 8.2% -11.2% -3.6%
Other Tablet 8.3% 7.6% 6.1% 6.2% 6.4% -22.9% 3.0%
Generally, Add-to-Cart rates have continues to drop across regions and devices.
GB continues to see higher Add-to-Cart Rate than other regions.
EMEA Desktop and Tablet devices witnessed a large increase to Add-to-Cart Rate YoY.
Desktop devices globally saw the biggest drops to Add-to-Cart Rate QoQ with respect to each region.
17. ECOMMERCE QUARTERLY BENCHMARKS | Q3 2021
Add-to-Cart By Operating System
Q3 2020 Q4 2020 Q1 2021 Q2 2021 Q3 2021Change since 2020 Q3
Change since 2021 Q2
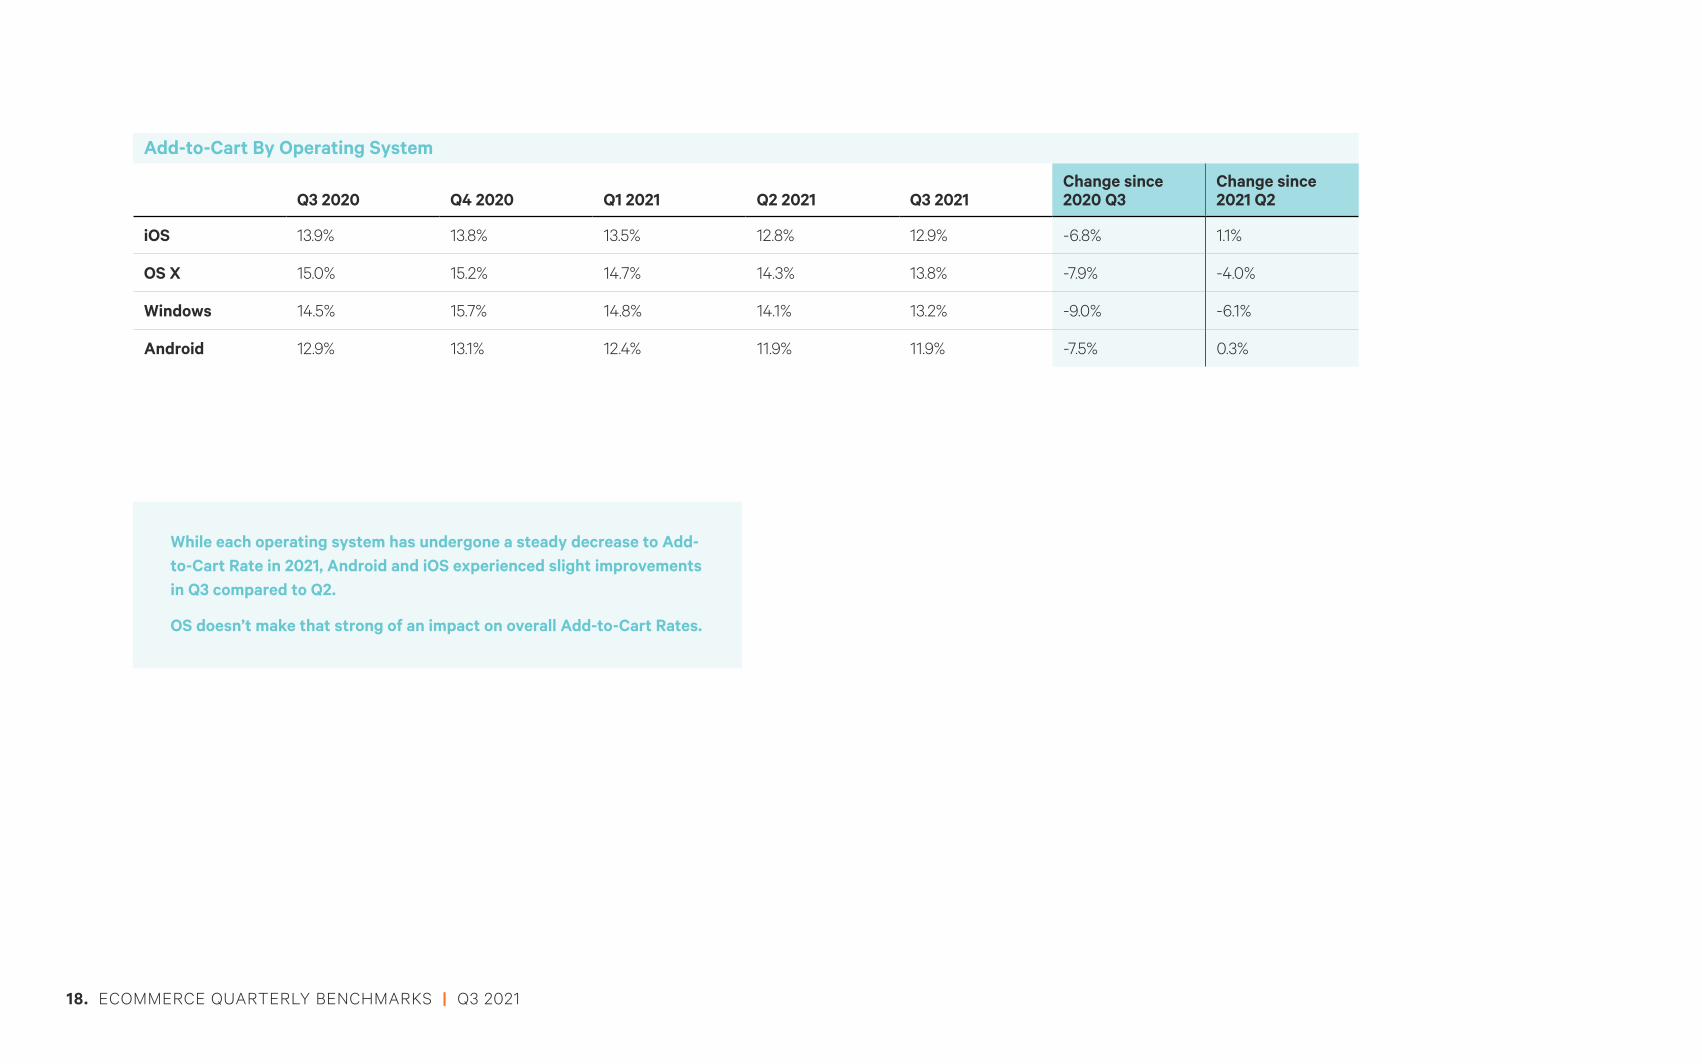
iOS 13.9% 13.8% 13.5% 12.8% 12.9% -6.8% 1.1%
OS X 15.0% 15.2% 14.7% 14.3% 13.8% -7.9% -4.0%
Windows 14.5% 15.7% 14.8% 14.1% 13.2% -9.0% -6.1%
Android 12.9% 13.1% 12.4% 11.9% 11.9% -7.5% 0.3%
While each operating system has undergone a steady decrease to Add-to-Cart Rate in 2021, Android and iOS experienced slight improvements in Q3 compared to Q2.
OS doesn’t make that strong of an impact on overall Add-to-Cart Rates.
18. ECOMMERCE QUARTERLY BENCHMARKS | Q3 2021
Add-to-Cart By Source
Q3 2020 Q4 2020 Q1 2021 Q2 2021 Q3 2021Change since 2020 Q3
Change since 2021 Q2
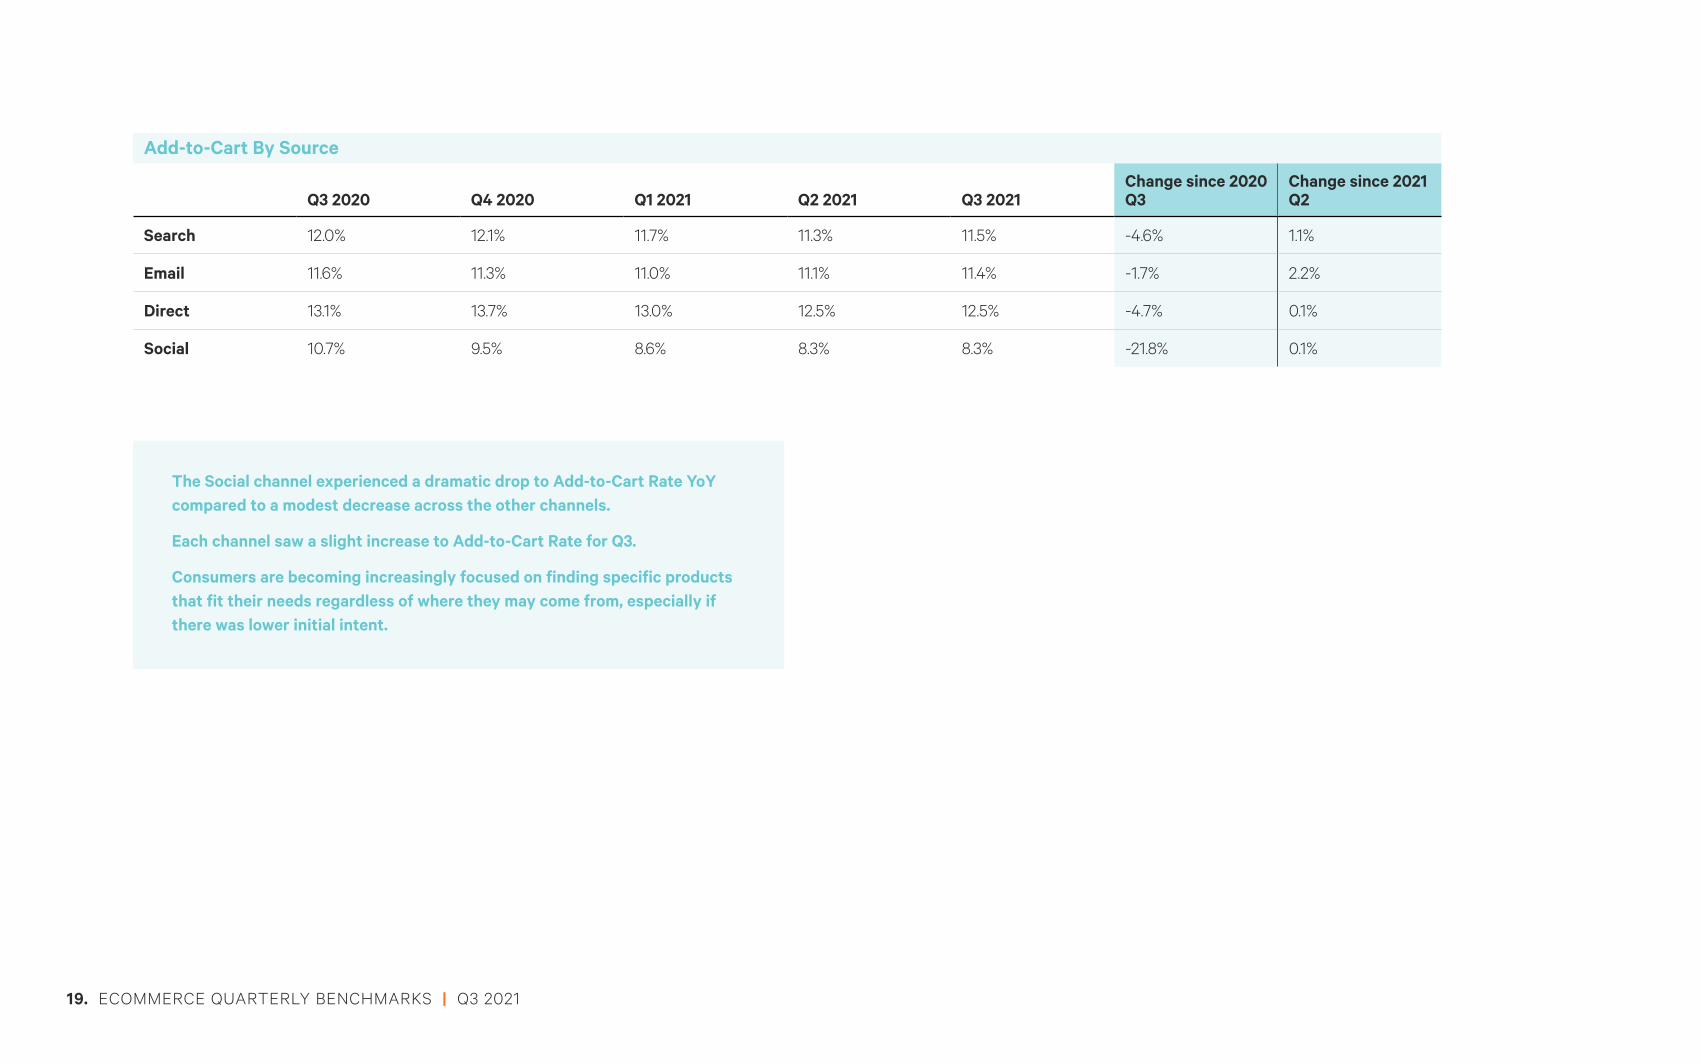
Search 12.0% 12.1% 11.7% 11.3% 11.5% -4.6% 1.1%
Email 11.6% 11.3% 11.0% 11.1% 11.4% -1.7% 2.2%
Direct 13.1% 13.7% 13.0% 12.5% 12.5% -4.7% 0.1%
Social 10.7% 9.5% 8.6% 8.3% 8.3% -21.8% 0.1%
The Social channel experienced a dramatic drop to Add-to-Cart Rate YoY compared to a modest decrease across the other channels.
Each channel saw a slight increase to Add-to-Cart Rate for Q3.
Consumers are becoming increasingly focused on finding specific products that fit their needs regardless of where they may come from, especially if there was lower initial intent.
19. ECOMMERCE QUARTERLY BENCHMARKS | Q3 2021
ABANDONED CART
Abandoned Cart By Region
Q3 2020 Q4 2020 Q1 2021 Q2 2021 Q3 2021Change since 2020 Q3
Change since 2021 Q2
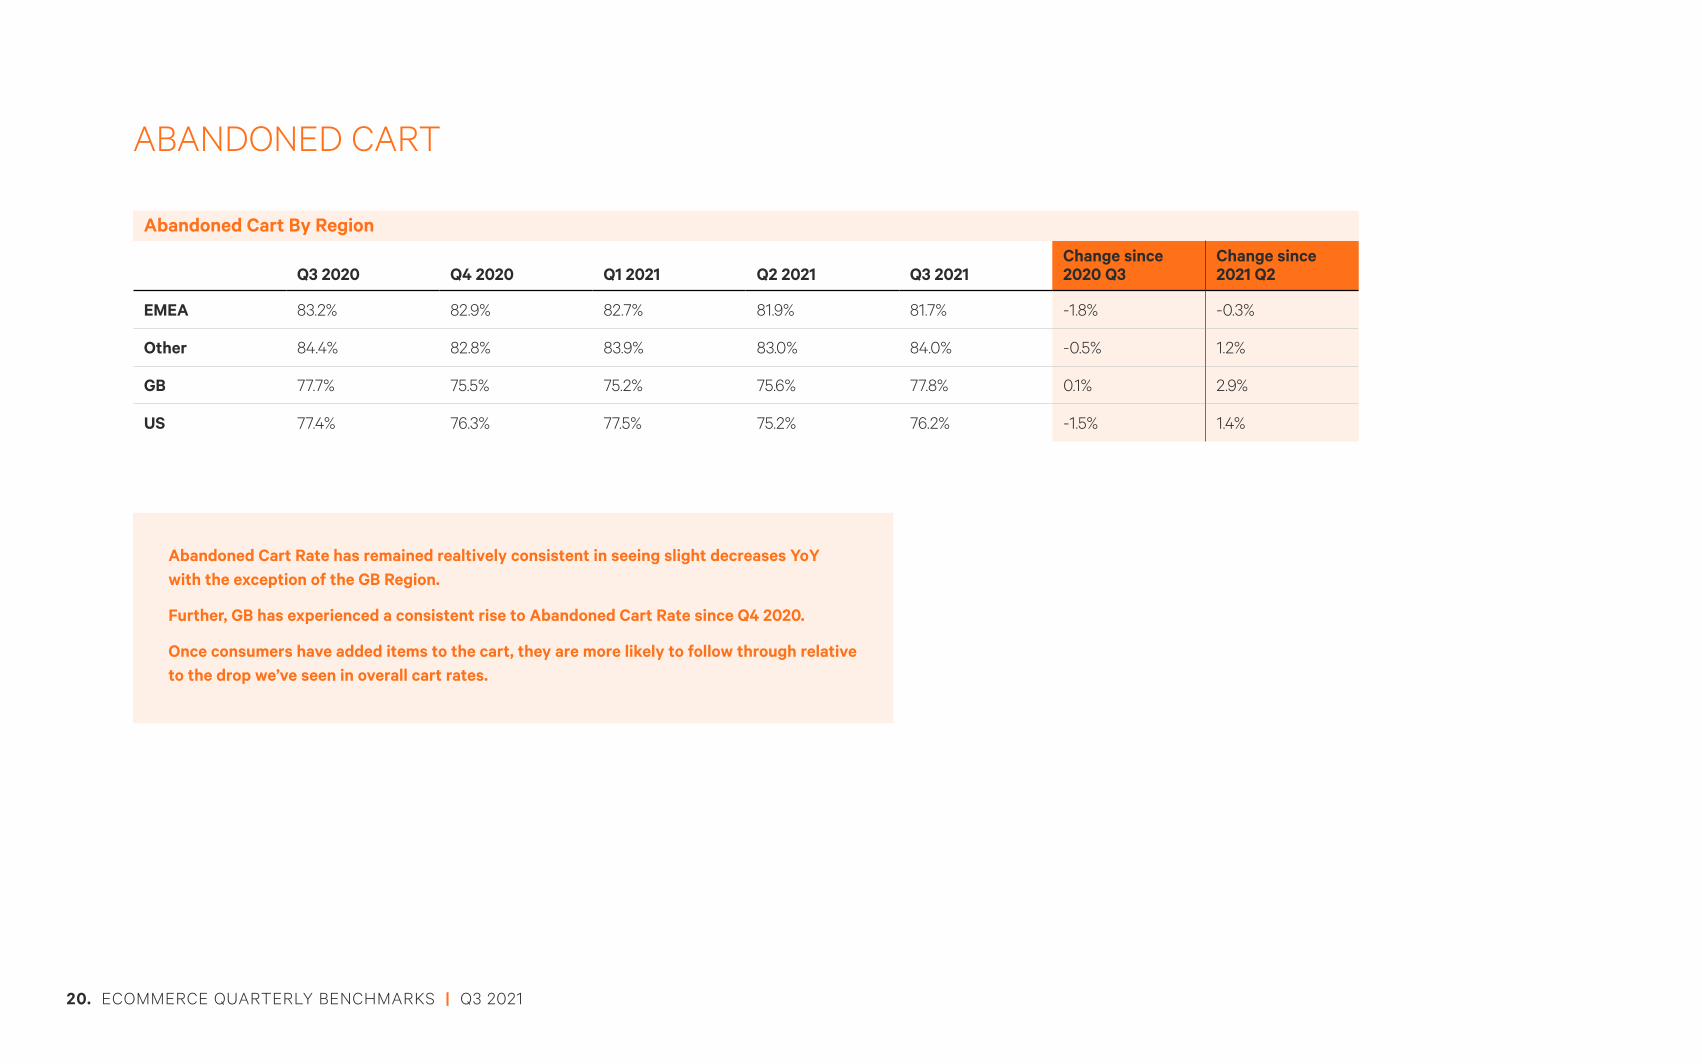
EMEA 83.2% 82.9% 82.7% 81.9% 81.7% -1.8% -0.3%
Other 84.4% 82.8% 83.9% 83.0% 84.0% -0.5% 1.2%
GB 77.7% 75.5% 75.2% 75.6% 77.8% 0.1% 2.9%
US 77.4% 76.3% 77.5% 75.2% 76.2% -1.5% 1.4%
Abandoned Cart Rate has remained realtively consistent in seeing slight decreases YoY with the exception of the GB Region.
Further, GB has experienced a consistent rise to Abandoned Cart Rate since Q4 2020.
Once consumers have added items to the cart, they are more likely to follow through relative to the drop we’ve seen in overall cart rates.
20. ECOMMERCE QUARTERLY BENCHMARKS | Q3 2021
Abandoned Cart By Device
Q3 2020 Q4 2020 Q1 2021 Q2 2021 Q3 2021Change since 2020 Q3
Change since 2021 Q2
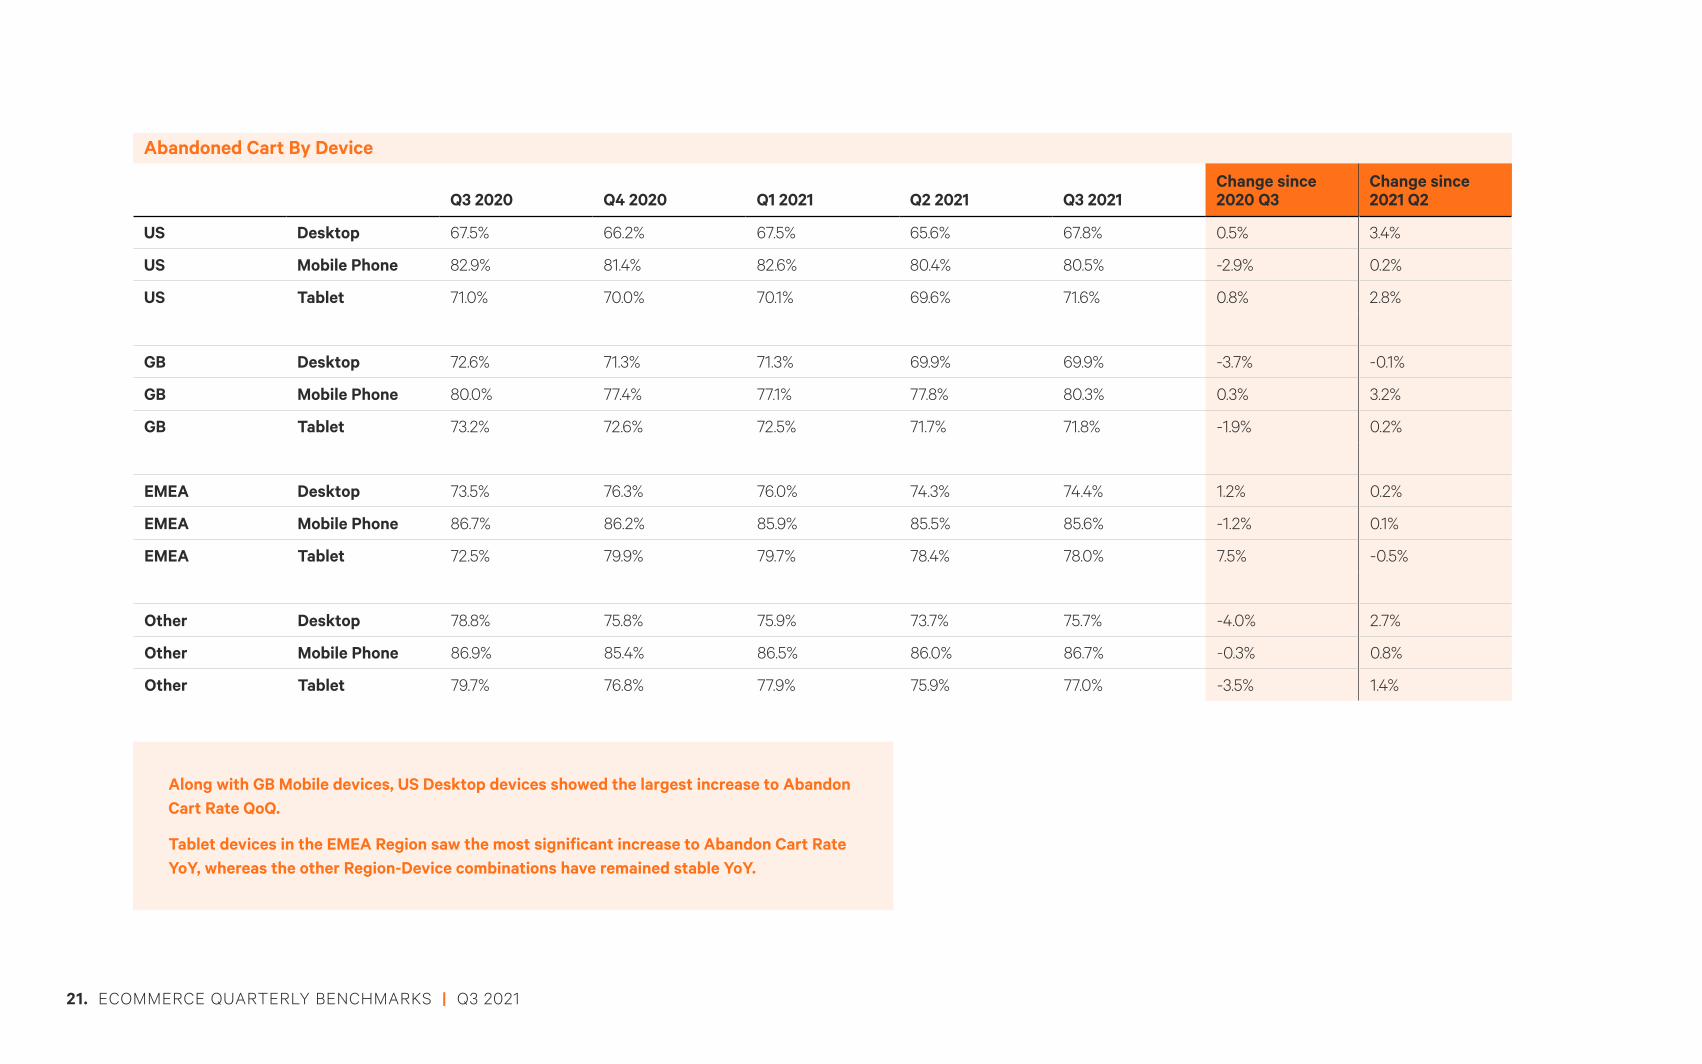
US Desktop 67.5% 66.2% 67.5% 65.6% 67.8% 0.5% 3.4%
US Mobile Phone 82.9% 81.4% 82.6% 80.4% 80.5% -2.9% 0.2%
US Tablet 71.0% 70.0% 70.1% 69.6% 71.6% 0.8% 2.8%
GB Desktop 72.6% 71.3% 71.3% 69.9% 69.9% -3.7% -0.1%
GB Mobile Phone 80.0% 77.4% 77.1% 77.8% 80.3% 0.3% 3.2%
GB Tablet 73.2% 72.6% 72.5% 71.7% 71.8% -1.9% 0.2%
EMEA Desktop 73.5% 76.3% 76.0% 74.3% 74.4% 1.2% 0.2%
EMEA Mobile Phone 86.7% 86.2% 85.9% 85.5% 85.6% -1.2% 0.1%
EMEA Tablet 72.5% 79.9% 79.7% 78.4% 78.0% 7.5% -0.5%
Other Desktop 78.8% 75.8% 75.9% 73.7% 75.7% -4.0% 2.7%
Other Mobile Phone 86.9% 85.4% 86.5% 86.0% 86.7% -0.3% 0.8%
Other Tablet 79.7% 76.8% 77.9% 75.9% 77.0% -3.5% 1.4%
Along with GB Mobile devices, US Desktop devices showed the largest increase to Abandon Cart Rate QoQ.
Tablet devices in the EMEA Region saw the most significant increase to Abandon Cart Rate YoY, whereas the other Region-Device combinations have remained stable YoY.
21. ECOMMERCE QUARTERLY BENCHMARKS | Q3 2021
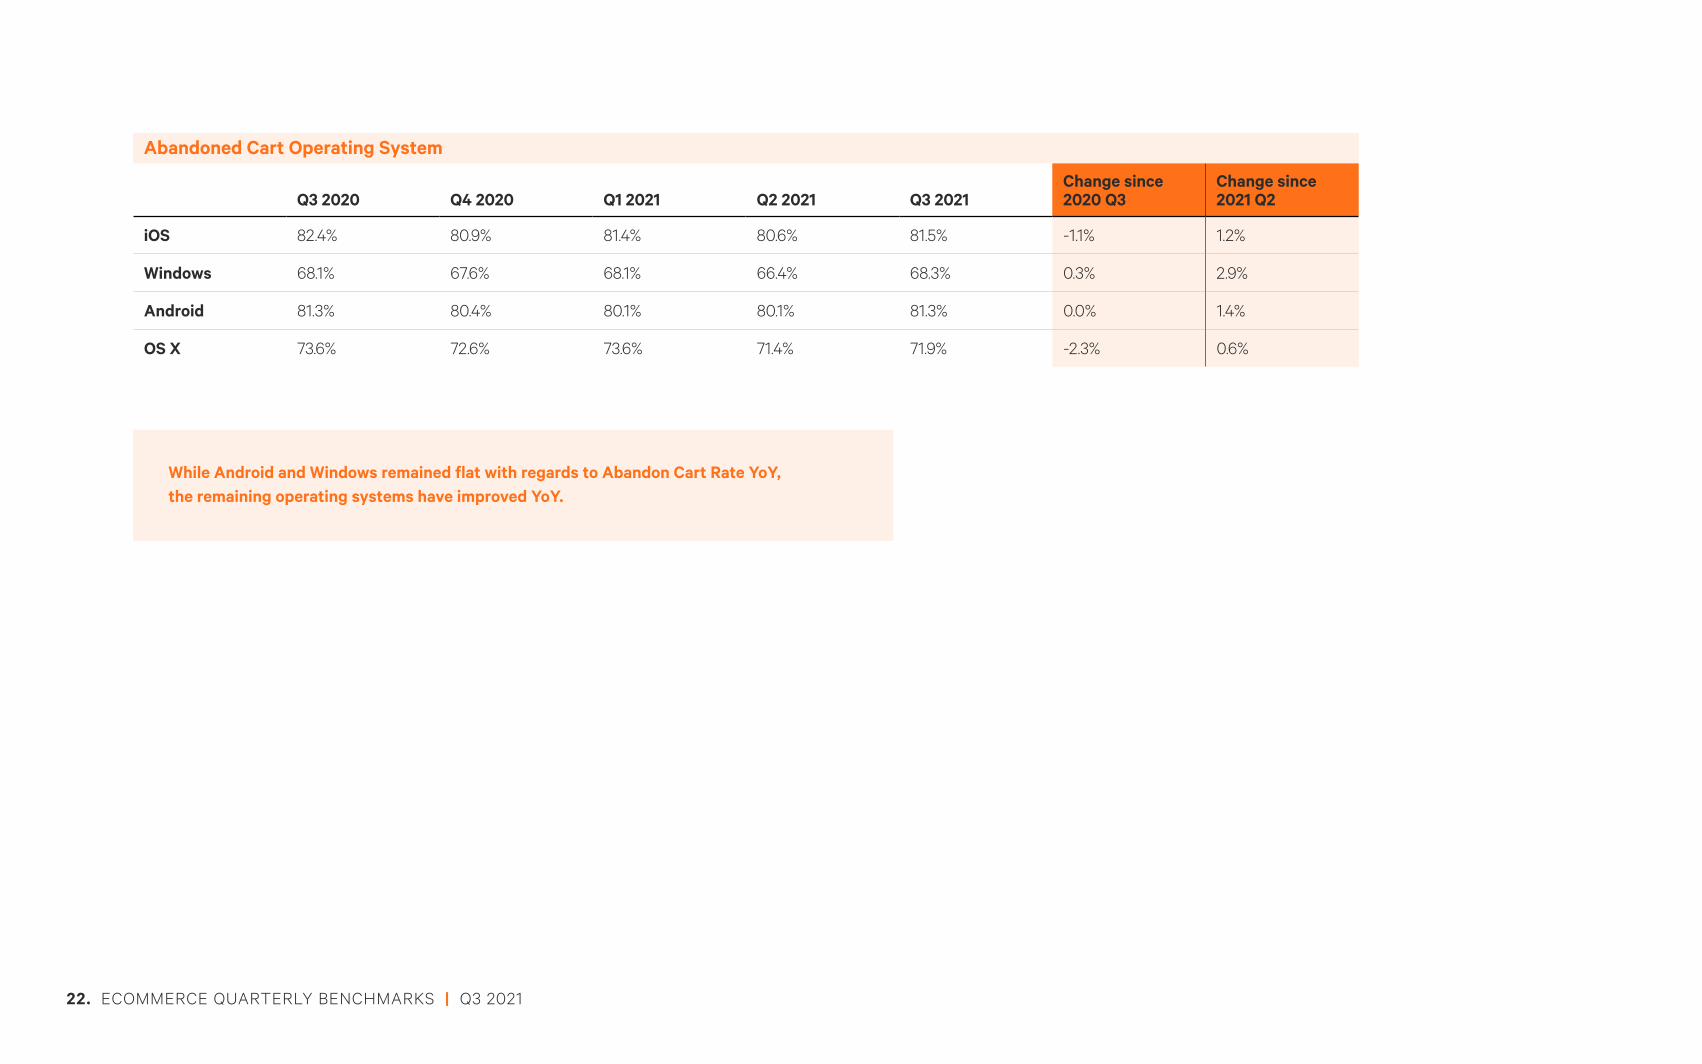
Abandoned Cart Operating System
Q3 2020 Q4 2020 Q1 2021 Q2 2021 Q3 2021Change since 2020 Q3
Change since 2021 Q2
iOS 82.4% 80.9% 81.4% 80.6% 81.5% -1.1% 1.2%
Windows 68.1% 67.6% 68.1% 66.4% 68.3% 0.3% 2.9%
Android 81.3% 80.4% 80.1% 80.1% 81.3% 0.0% 1.4%
OS X 73.6% 72.6% 73.6% 71.4% 71.9% -2.3% 0.6%
While Android and Windows remained flat with regards to Abandon Cart Rate YoY, the remaining operating systems have improved YoY.
22. ECOMMERCE QUARTERLY BENCHMARKS | Q3 2021
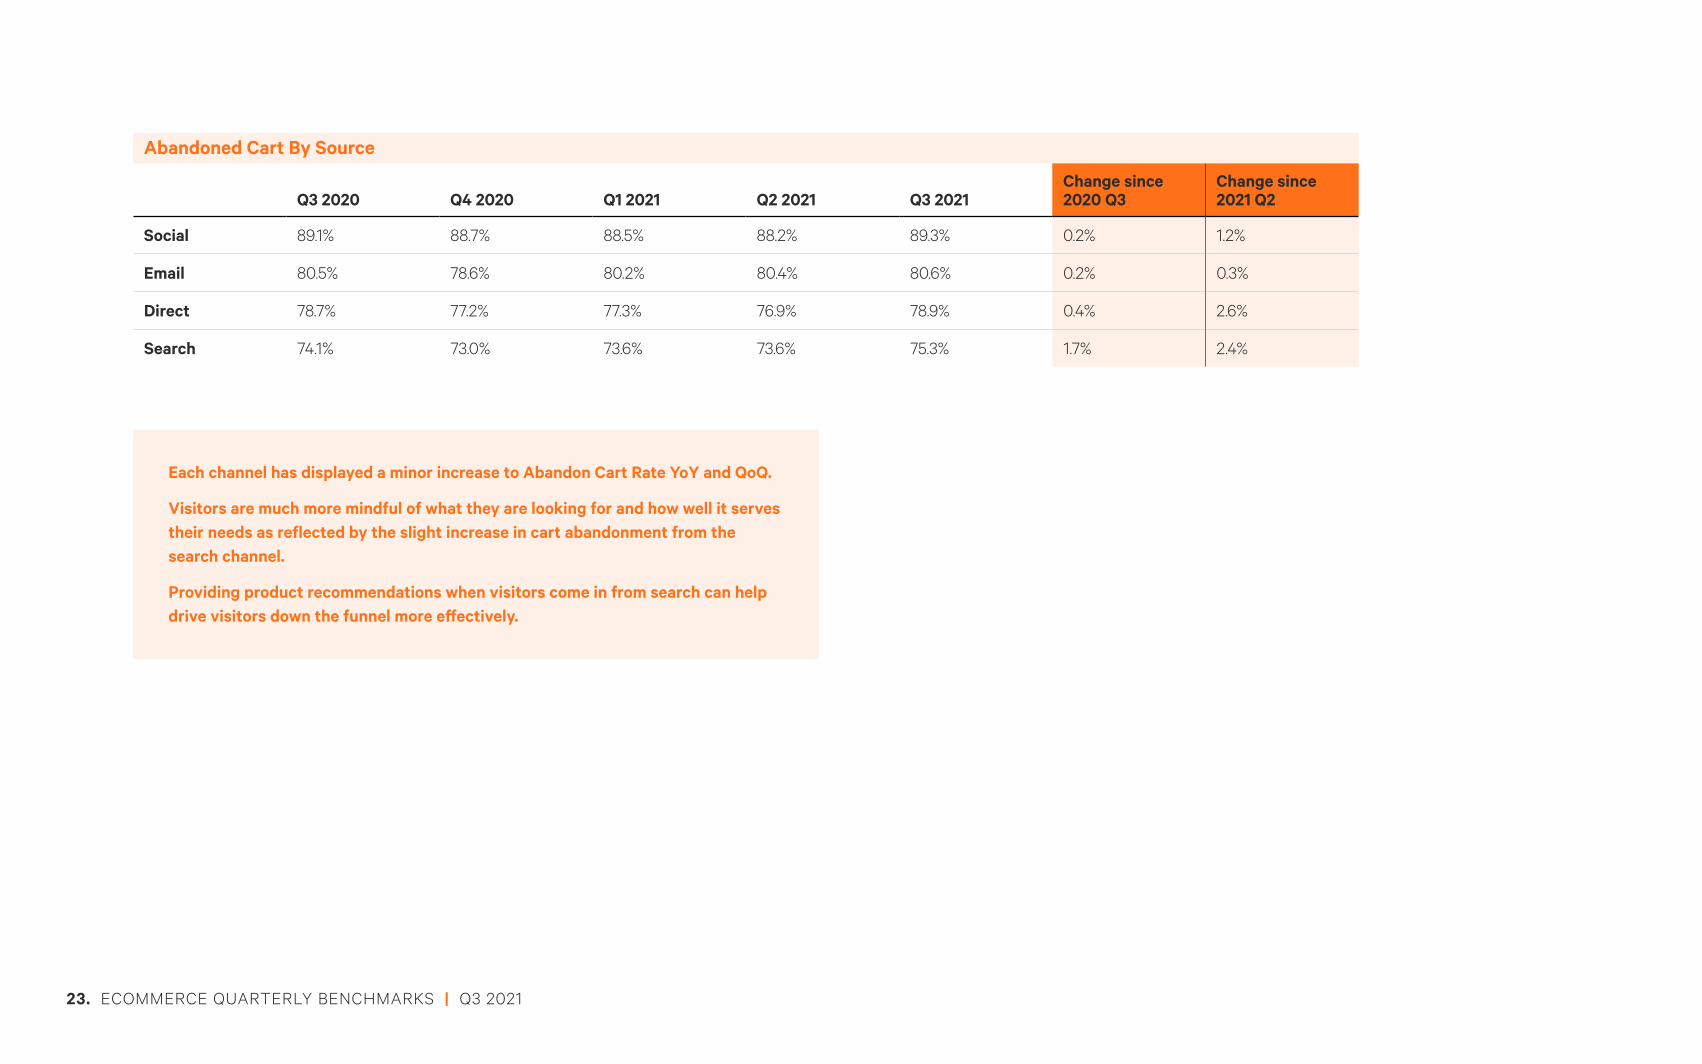
Abandoned Cart By Source
Q3 2020 Q4 2020 Q1 2021 Q2 2021 Q3 2021Change since 2020 Q3
Change since 2021 Q2
Social 89.1% 88.7% 88.5% 88.2% 89.3% 0.2% 1.2%
Email 80.5% 78.6% 80.2% 80.4% 80.6% 0.2% 0.3%
Direct 78.7% 77.2% 77.3% 76.9% 78.9% 0.4% 2.6%
Search 74.1% 73.0% 73.6% 73.6% 75.3% 1.7% 2.4%
Each channel has displayed a minor increase to Abandon Cart Rate YoY and QoQ.
Visitors are much more mindful of what they are looking for and how well it serves their needs as reflected by the slight increase in cart abandonment from the search channel.
Providing product recommendations when visitors come in from search can help drive visitors down the funnel more effectively.
23. ECOMMERCE QUARTERLY BENCHMARKS | Q3 2021
CONVERSION RATE
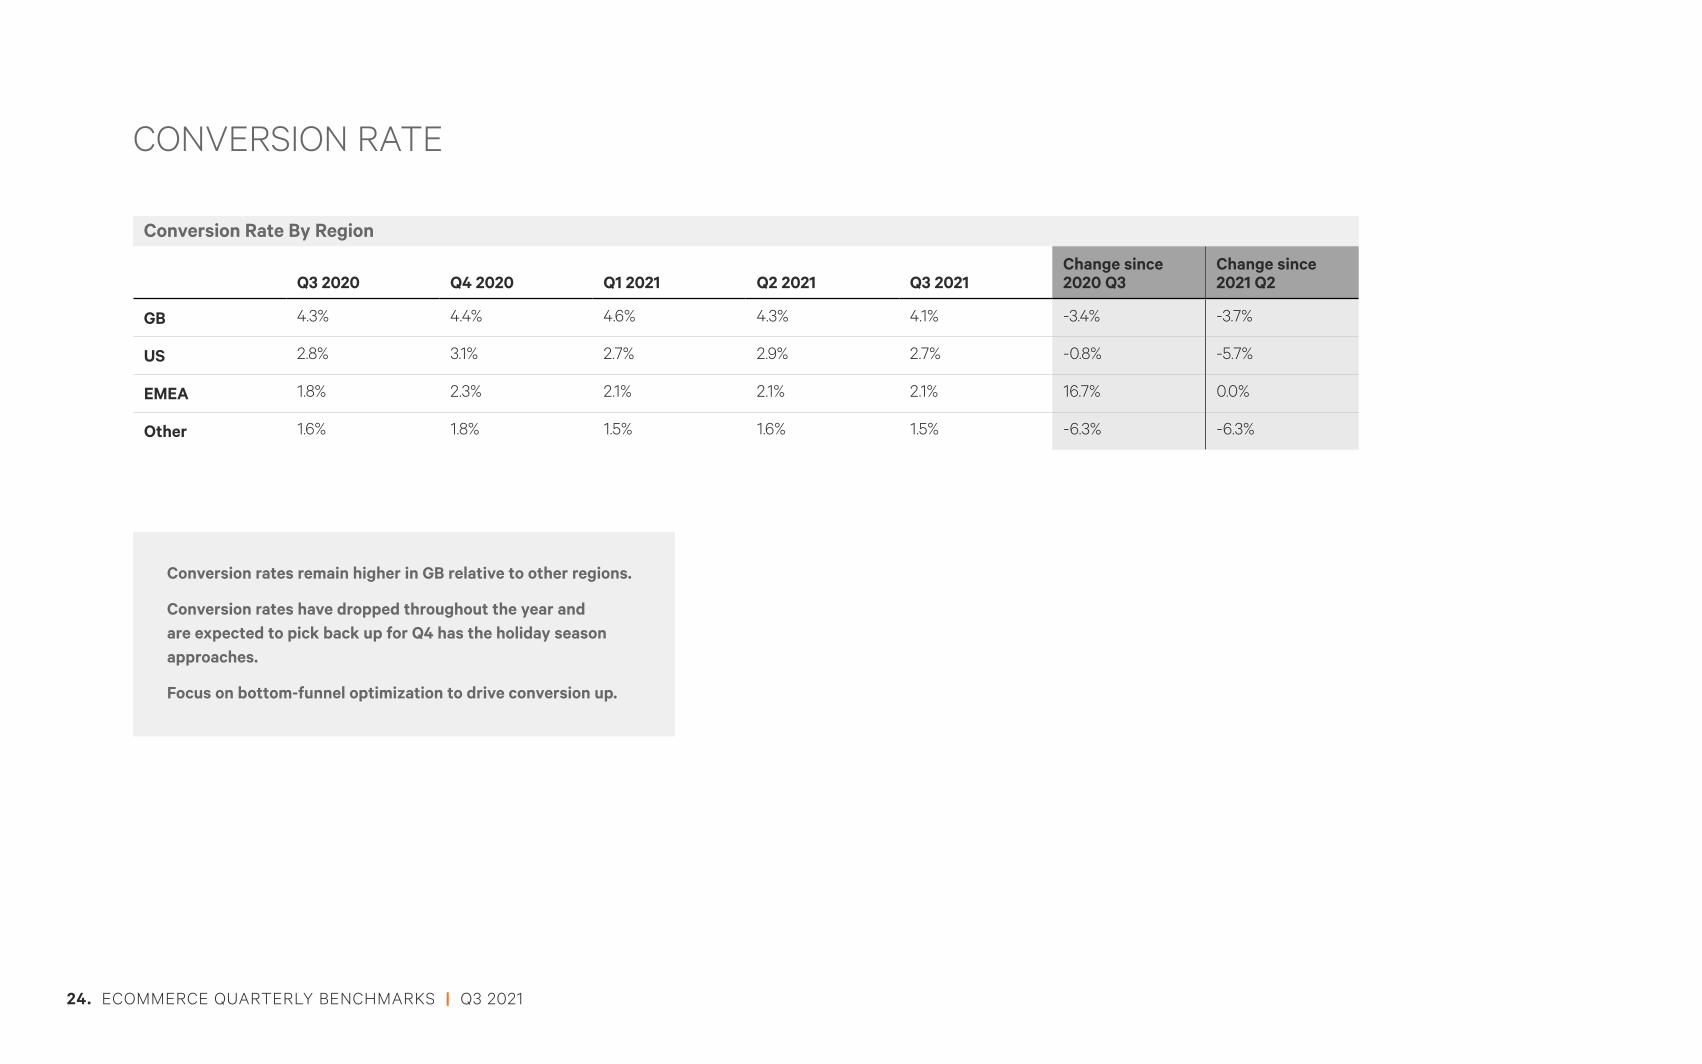
Conversion Rate By Region
Q3 2020 Q4 2020 Q1 2021 Q2 2021 Q3 2021Change since 2020 Q3
Change since 2021 Q2
GB 4.3% 4.4% 4.6% 4.3% 4.1% -3.4% -3.7%
US 2.8% 3.1% 2.7% 2.9% 2.7% -0.8% -5.7%
EMEA 1.8% 2.3% 2.1% 2.1% 2.1% 16.7% 0.0%
Other 1.6% 1.8% 1.5% 1.6% 1.5% -6.3% -6.3%
Conversion rates remain higher in GB relative to other regions.
Conversion rates have dropped throughout the year and are expected to pick back up for Q4 has the holiday season approaches.
Focus on bottom-funnel optimization to drive conversion up.
24. ECOMMERCE QUARTERLY BENCHMARKS | Q3 2021
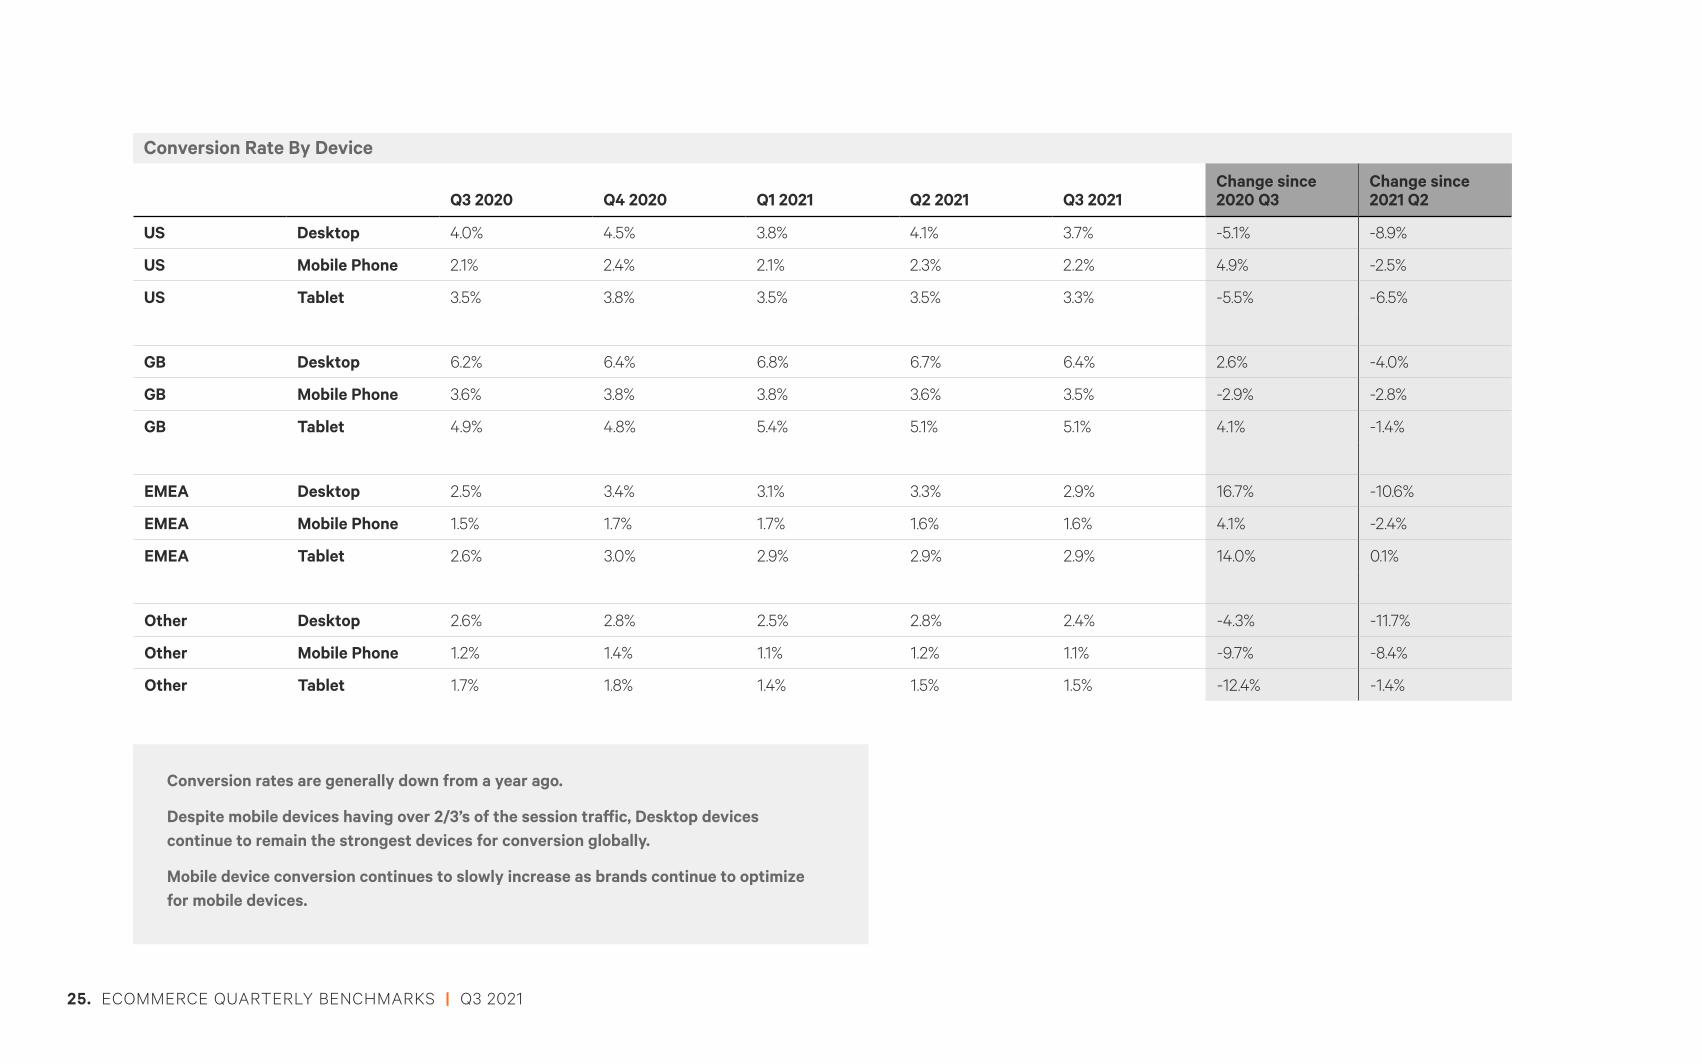
Conversion Rate By Device
Q3 2020 Q4 2020 Q1 2021 Q2 2021 Q3 2021Change since 2020 Q3
Change since 2021 Q2
US Desktop 4.0% 4.5% 3.8% 4.1% 3.7% -5.1% -8.9%
US Mobile Phone 2.1% 2.4% 2.1% 2.3% 2.2% 4.9% -2.5%
US Tablet 3.5% 3.8% 3.5% 3.5% 3.3% -5.5% -6.5%
GB Desktop 6.2% 6.4% 6.8% 6.7% 6.4% 2.6% -4.0%
GB Mobile Phone 3.6% 3.8% 3.8% 3.6% 3.5% -2.9% -2.8%
GB Tablet 4.9% 4.8% 5.4% 5.1% 5.1% 4.1% -1.4%
EMEA Desktop 2.5% 3.4% 3.1% 3.3% 2.9% 16.7% -10.6%
EMEA Mobile Phone 1.5% 1.7% 1.7% 1.6% 1.6% 4.1% -2.4%
EMEA Tablet 2.6% 3.0% 2.9% 2.9% 2.9% 14.0% 0.1%
Other Desktop 2.6% 2.8% 2.5% 2.8% 2.4% -4.3% -11.7%
Other Mobile Phone 1.2% 1.4% 1.1% 1.2% 1.1% -9.7% -8.4%
Other Tablet 1.7% 1.8% 1.4% 1.5% 1.5% -12.4% -1.4%
Conversion rates are generally down from a year ago.
Despite mobile devices having over 2/3’s of the session traffic, Desktop devices continue to remain the strongest devices for conversion globally.
Mobile device conversion continues to slowly increase as brands continue to optimize for mobile devices.
25. ECOMMERCE QUARTERLY BENCHMARKS | Q3 2021
Conversion Rate By Operating System
Q3 2020 Q4 2020 Q1 2021 Q2 2021 Q3 2021Change since 2020 Q3
Change since 2021 Q2
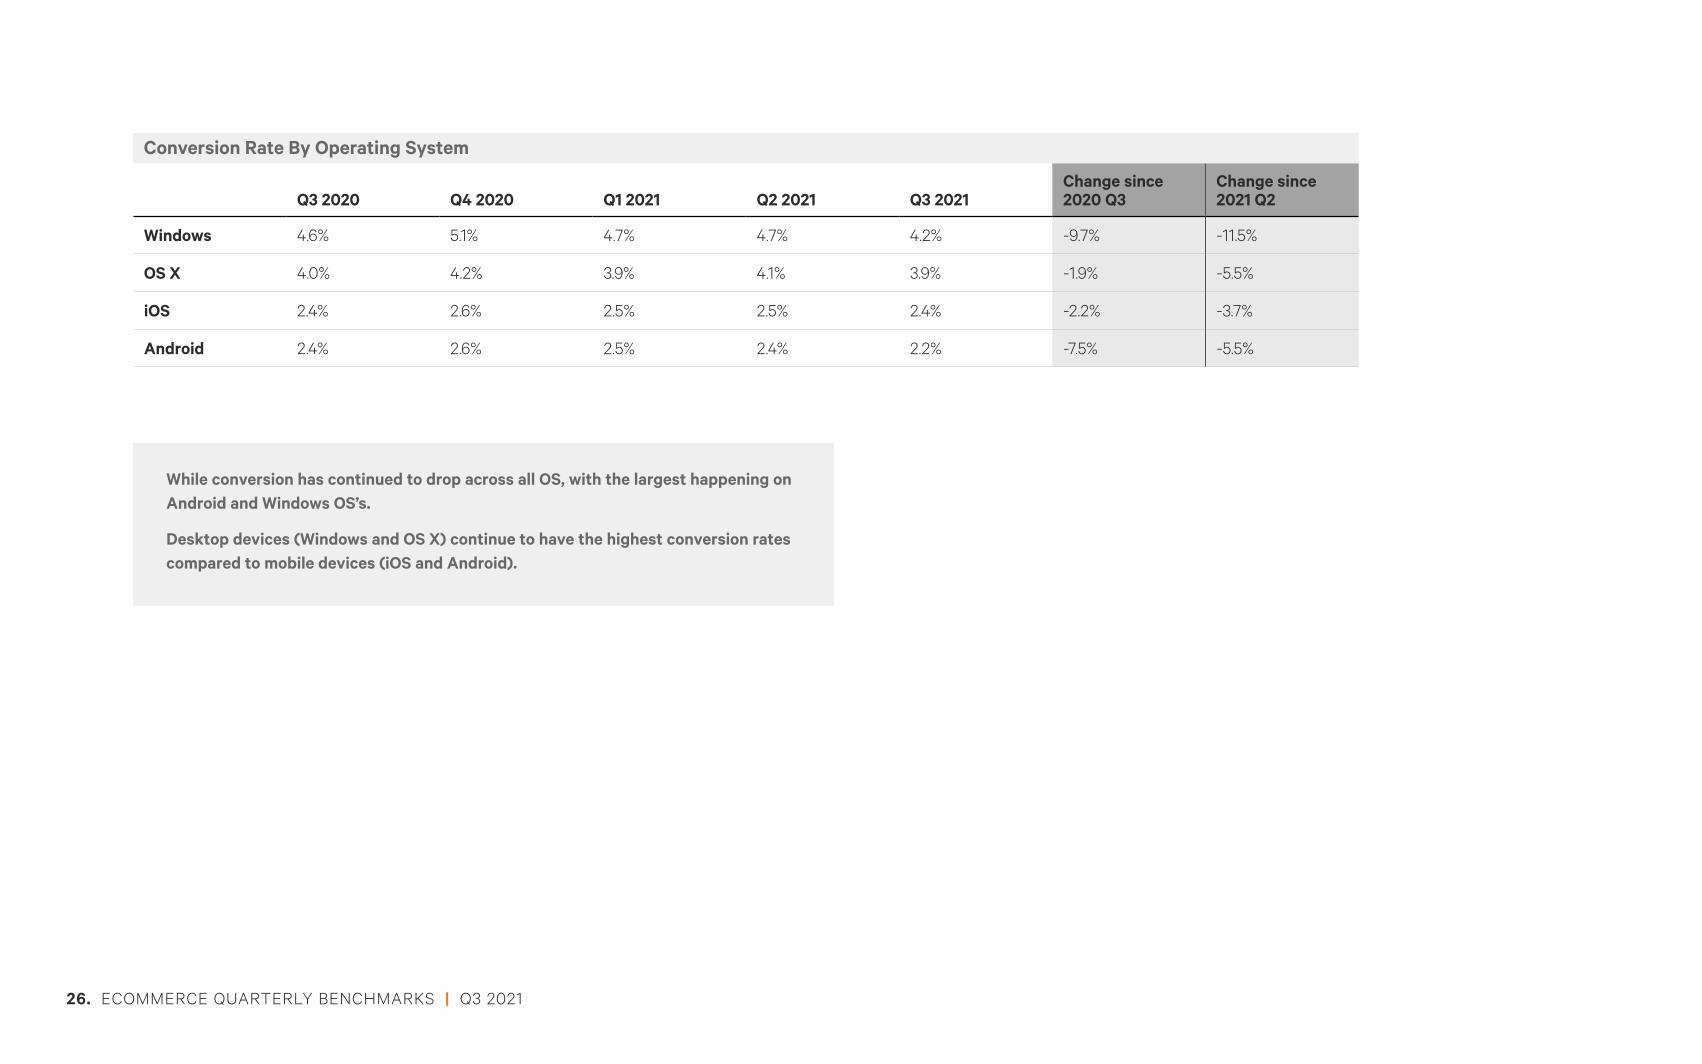
Windows 4.6% 5.1% 4.7% 4.7% 4.2% -9.7% -11.5%
OS X 4.0% 4.2% 3.9% 4.1% 3.9% -1.9% -5.5%
iOS 2.4% 2.6% 2.5% 2.5% 2.4% -2.2% -3.7%
Android 2.4% 2.6% 2.5% 2.4% 2.2% -7.5% -5.5%
While conversion has continued to drop across all OS, with the largest happening on Android and Windows OS’s.
Desktop devices (Windows and OS X) continue to have the highest conversion rates compared to mobile devices (iOS and Android).
26. ECOMMERCE QUARTERLY BENCHMARKS | Q3 2021
Conversion Rate By Source
Q3 2020 Q4 2020 Q1 2021 Q2 2021 Q3 2021Change since 2020 Q3
Change since 2021 Q2
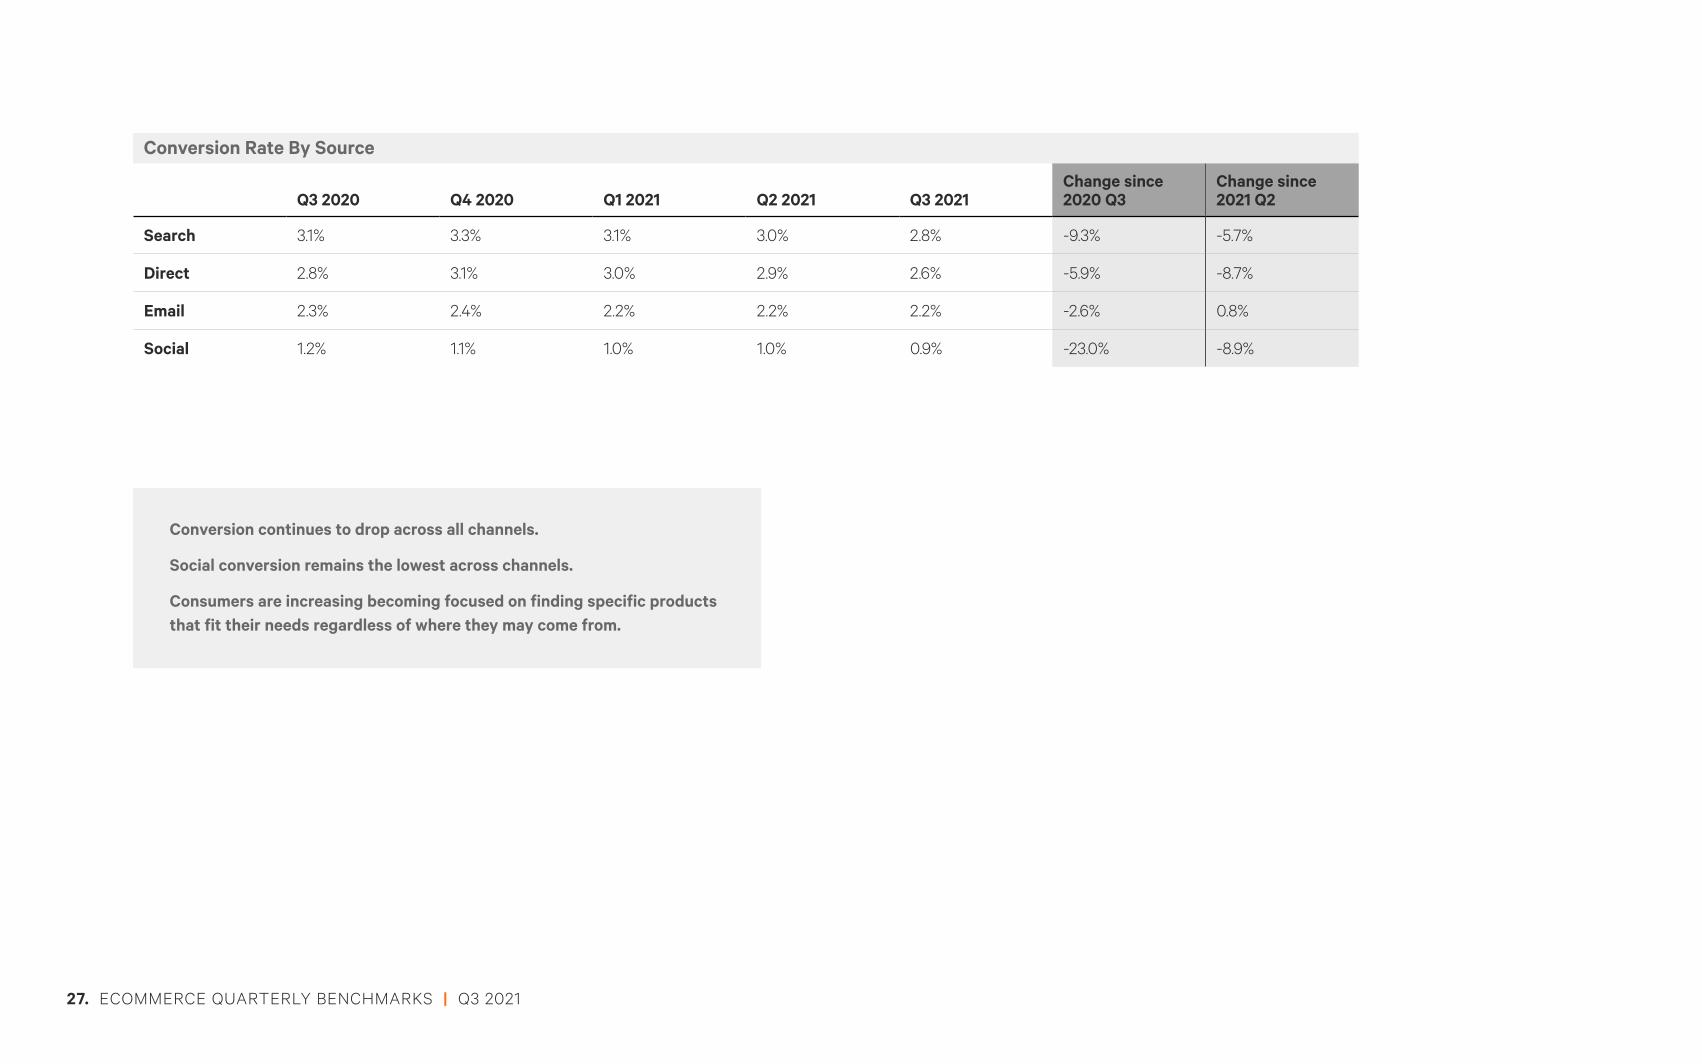
Search 3.1% 3.3% 3.1% 3.0% 2.8% -9.3% -5.7%
Direct 2.8% 3.1% 3.0% 2.9% 2.6% -5.9% -8.7%
Email 2.3% 2.4% 2.2% 2.2% 2.2% -2.6% 0.8%
Social 1.2% 1.1% 1.0% 1.0% 0.9% -23.0% -8.9%
Conversion continues to drop across all channels.
Social conversion remains the lowest across channels.
Consumers are increasing becoming focused on finding specific products that fit their needs regardless of where they may come from.
27. ECOMMERCE QUARTERLY BENCHMARKS | Q3 2021
AVERAGE ORDER VALUE
Average Order Value By Region
Q3 2020 (USD) Q4 2020 (USD) Q1 2021 (USD) Q2 2021 (USD) Q3 2021 (USD)Change since 2020 Q3
Change since 2021 Q2
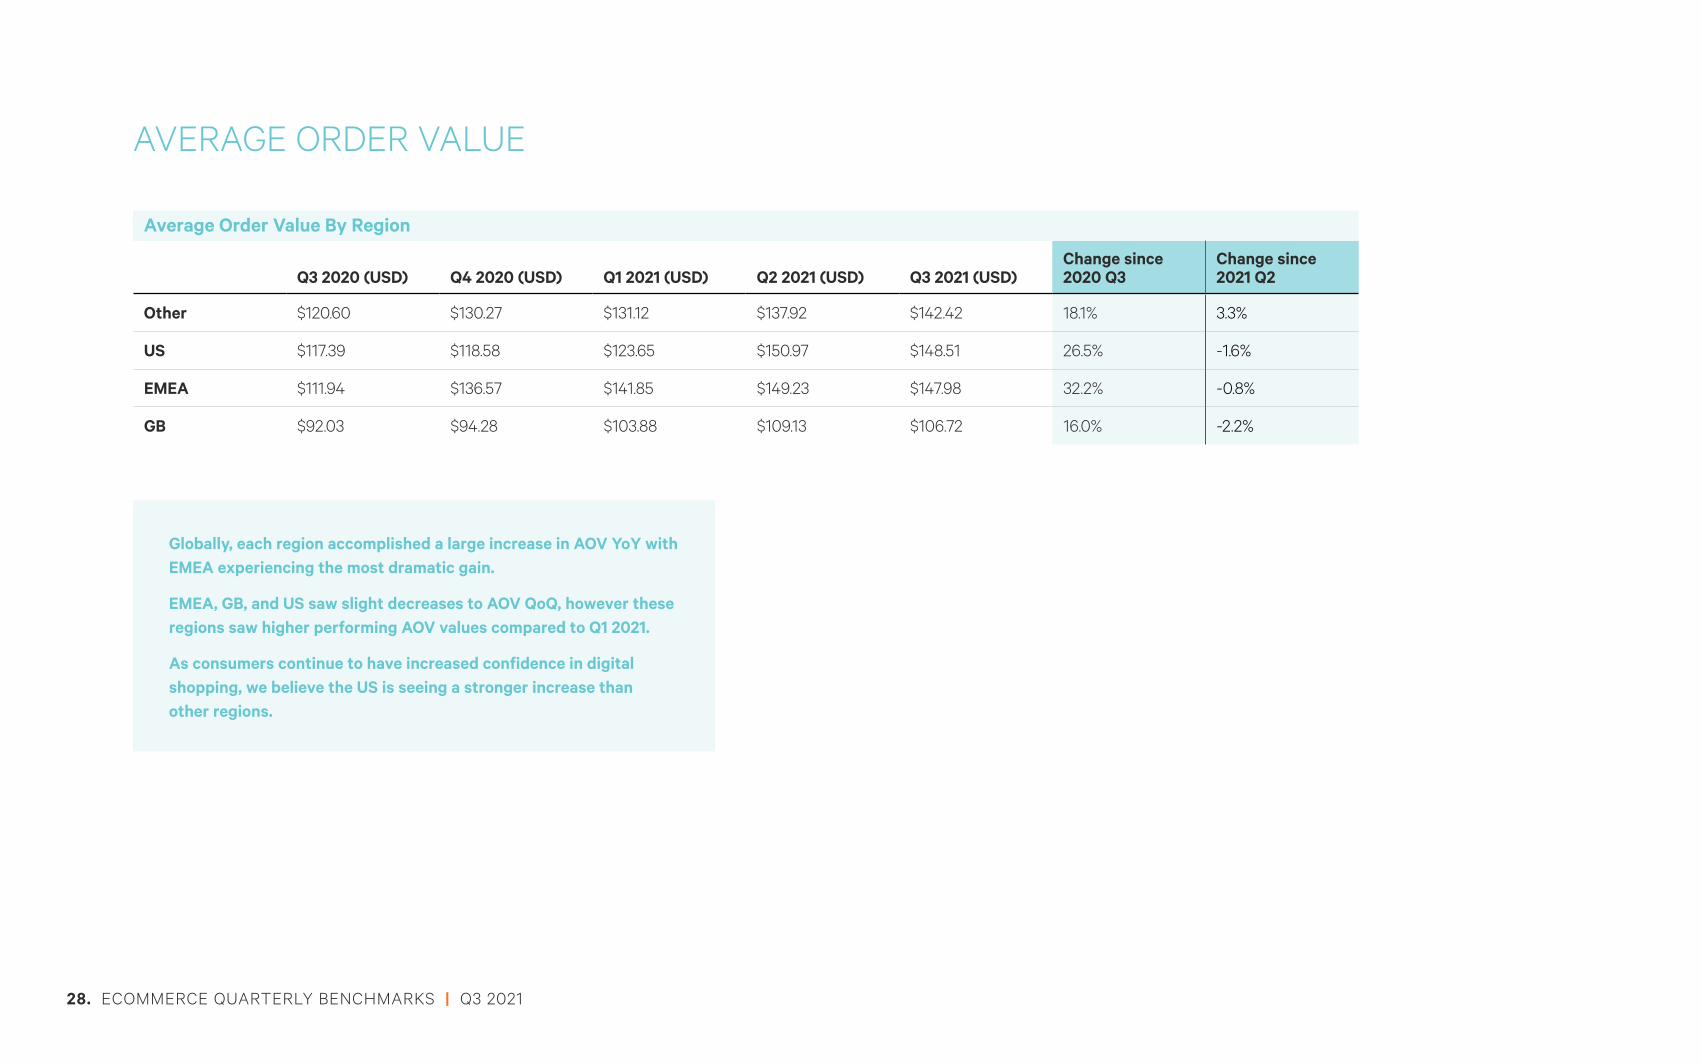
Other $120.60 $130.27 $131.12 $137.92 $142.42 18.1% 3.3%
US $117.39 $118.58 $123.65 $150.97 $148.51 26.5% -1.6%
EMEA $111.94 $136.57 $141.85 $149.23 $147.98 32.2% -0.8%
GB $92.03 $94.28 $103.88 $109.13 $106.72 16.0% -2.2%
Globally, each region accomplished a large increase in AOV YoY with EMEA experiencing the most dramatic gain.
EMEA, GB, and US saw slight decreases to AOV QoQ, however these regions saw higher performing AOV values compared to Q1 2021.
As consumers continue to have increased confidence in digital shopping, we believe the US is seeing a stronger increase than other regions.
28. ECOMMERCE QUARTERLY BENCHMARKS | Q3 2021
Average Order Value By Device
Q3 2020 (USD) Q4 2020 (USD) Q1 2021 (USD) Q2 2021 (USD) Q3 2021 (USD)Change since 2020 Q3
Change since 2021 Q2
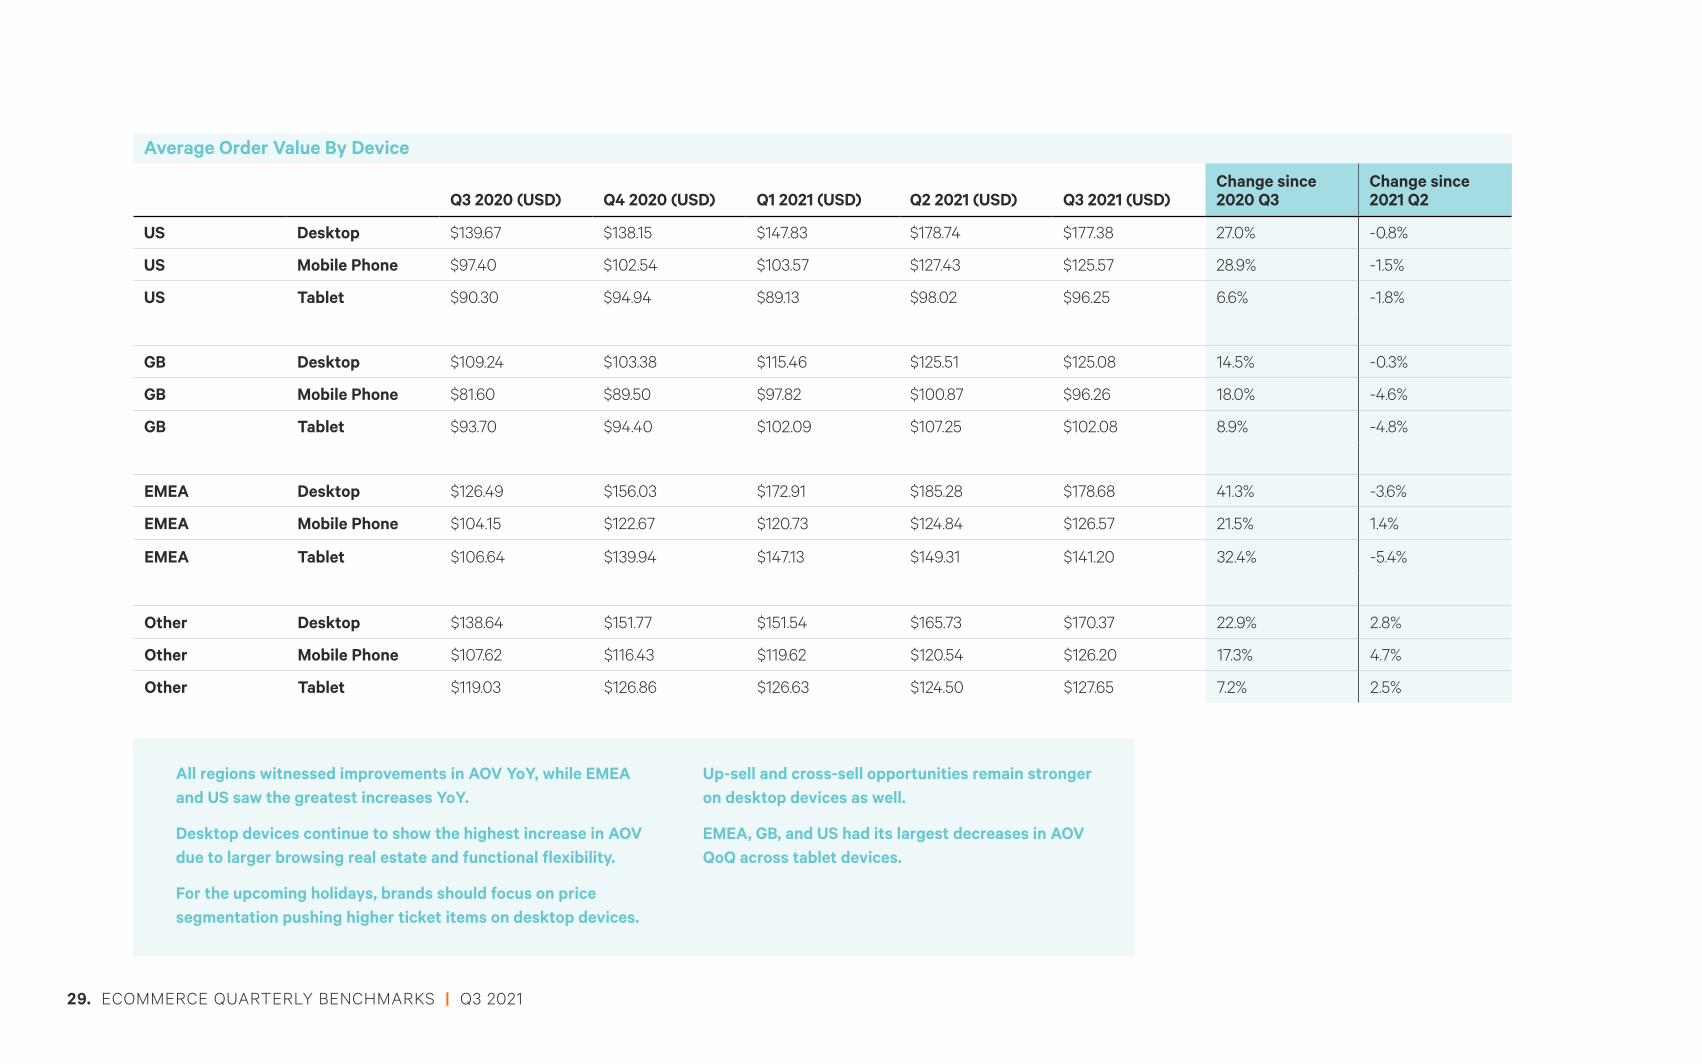
US Desktop $139.67 $138.15 $147.83 $178.74 $177.38 27.0% -0.8%
US Mobile Phone $97.40 $102.54 $103.57 $127.43 $125.57 28.9% -1.5%
US Tablet $90.30 $94.94 $89.13 $98.02 $96.25 6.6% -1.8%
GB Desktop $109.24 $103.38 $115.46 $125.51 $125.08 14.5% -0.3%
GB Mobile Phone $81.60 $89.50 $97.82 $100.87 $96.26 18.0% -4.6%
GB Tablet $93.70 $94.40 $102.09 $107.25 $102.08 8.9% -4.8%
EMEA Desktop $126.49 $156.03 $172.91 $185.28 $178.68 41.3% -3.6%
EMEA Mobile Phone $104.15 $122.67 $120.73 $124.84 $126.57 21.5% 1.4%
EMEA Tablet $106.64 $139.94 $147.13 $149.31 $141.20 32.4% -5.4%
Other Desktop $138.64 $151.77 $151.54 $165.73 $170.37 22.9% 2.8%
Other Mobile Phone $107.62 $116.43 $119.62 $120.54 $126.20 17.3% 4.7%
Other Tablet $119.03 $126.86 $126.63 $124.50 $127.65 7.2% 2.5%
All regions witnessed improvements in AOV YoY, while EMEA and US saw the greatest increases YoY.
Desktop devices continue to show the highest increase in AOV due to larger browsing real estate and functional flexibility.
For the upcoming holidays, brands should focus on price segmentation pushing higher ticket items on desktop devices.
Up-sell and cross-sell opportunities remain stronger on desktop devices as well.
EMEA, GB, and US had its largest decreases in AOV QoQ across tablet devices.
29. ECOMMERCE QUARTERLY BENCHMARKS | Q3 2021
Average Order Value By Operating System
Q3 2020 (USD) Q4 2020 (USD) Q1 2021 (USD) Q2 2021 (USD) Q3 2021 (USD)Change since 2020 Q3
Change since 2021 Q2
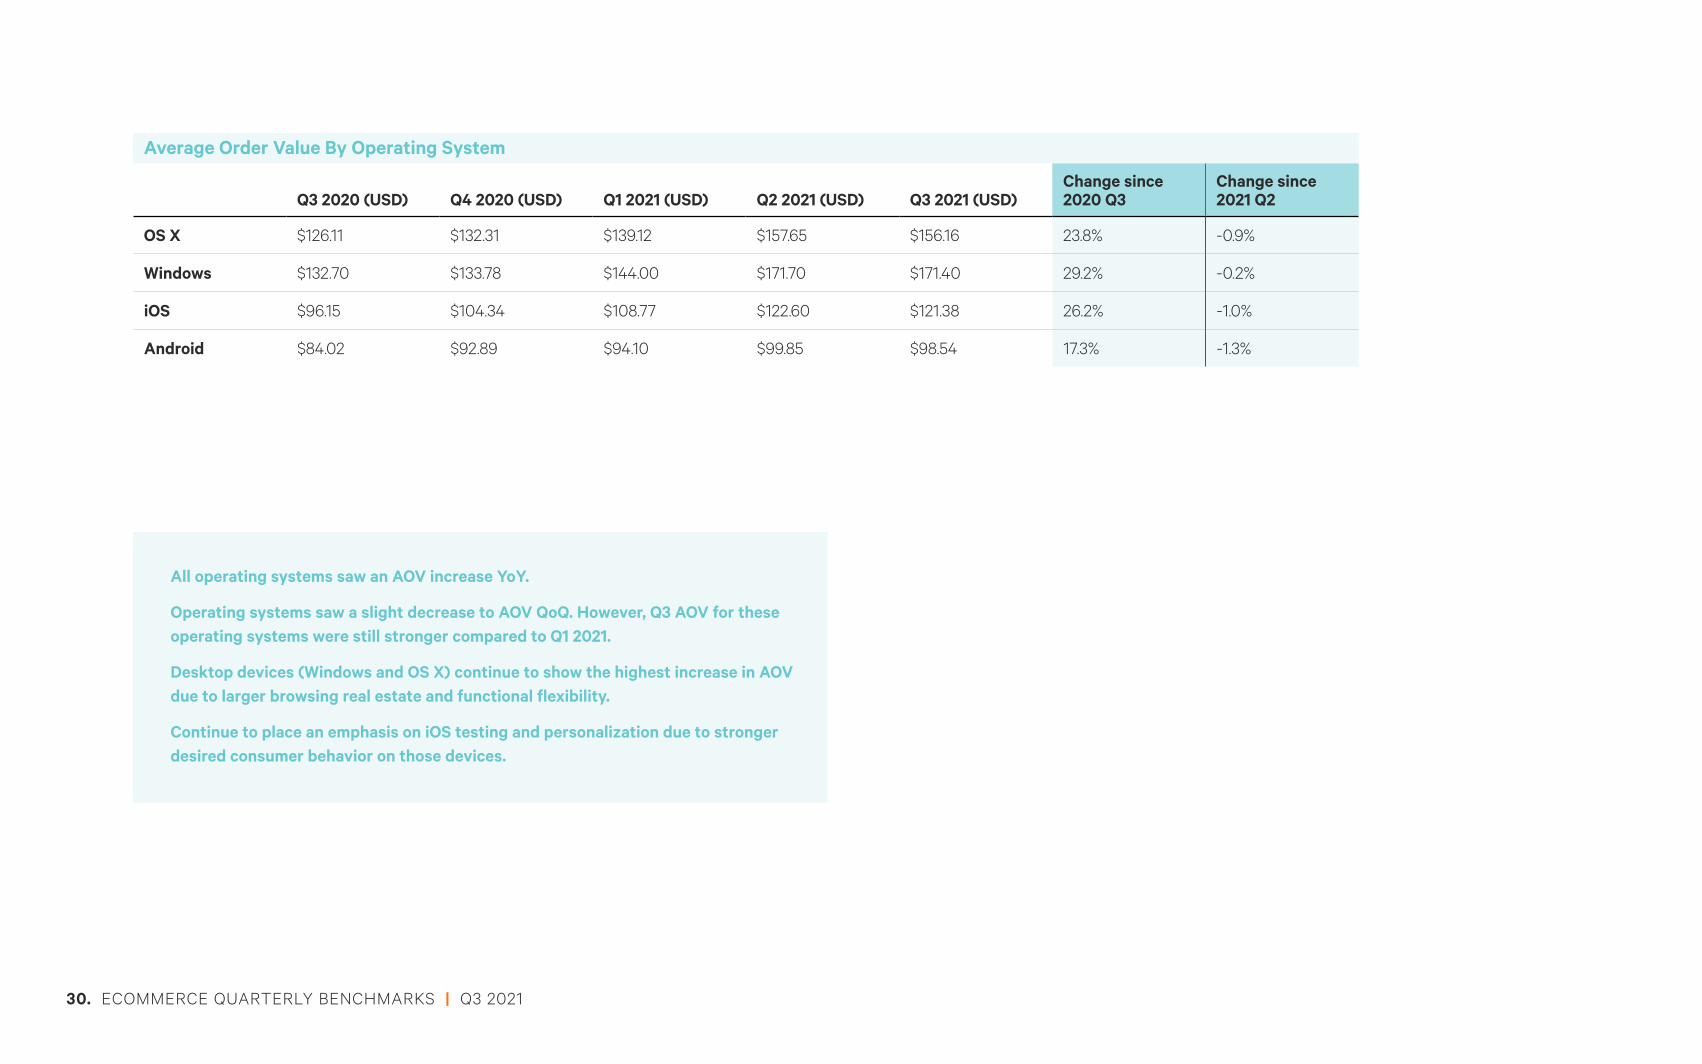
OS X $126.11 $132.31 $139.12 $157.65 $156.16 23.8% -0.9%
Windows $132.70 $133.78 $144.00 $171.70 $171.40 29.2% -0.2%
iOS $96.15 $104.34 $108.77 $122.60 $121.38 26.2% -1.0%
Android $84.02 $92.89 $94.10 $99.85 $98.54 17.3% -1.3%
All operating systems saw an AOV increase YoY.
Operating systems saw a slight decrease to AOV QoQ. However, Q3 AOV for these operating systems were still stronger compared to Q1 2021.
Desktop devices (Windows and OS X) continue to show the highest increase in AOV due to larger browsing real estate and functional flexibility.
Continue to place an emphasis on iOS testing and personalization due to stronger desired consumer behavior on those devices.
30. ECOMMERCE QUARTERLY BENCHMARKS | Q3 2021
Average Order Value By Source
Q3 2020 (USD) Q4 2020 (USD) Q1 2021 (USD) Q2 2021 (USD) Q3 2021 (USD)Change since 2020 Q3
Change since 2021 Q2
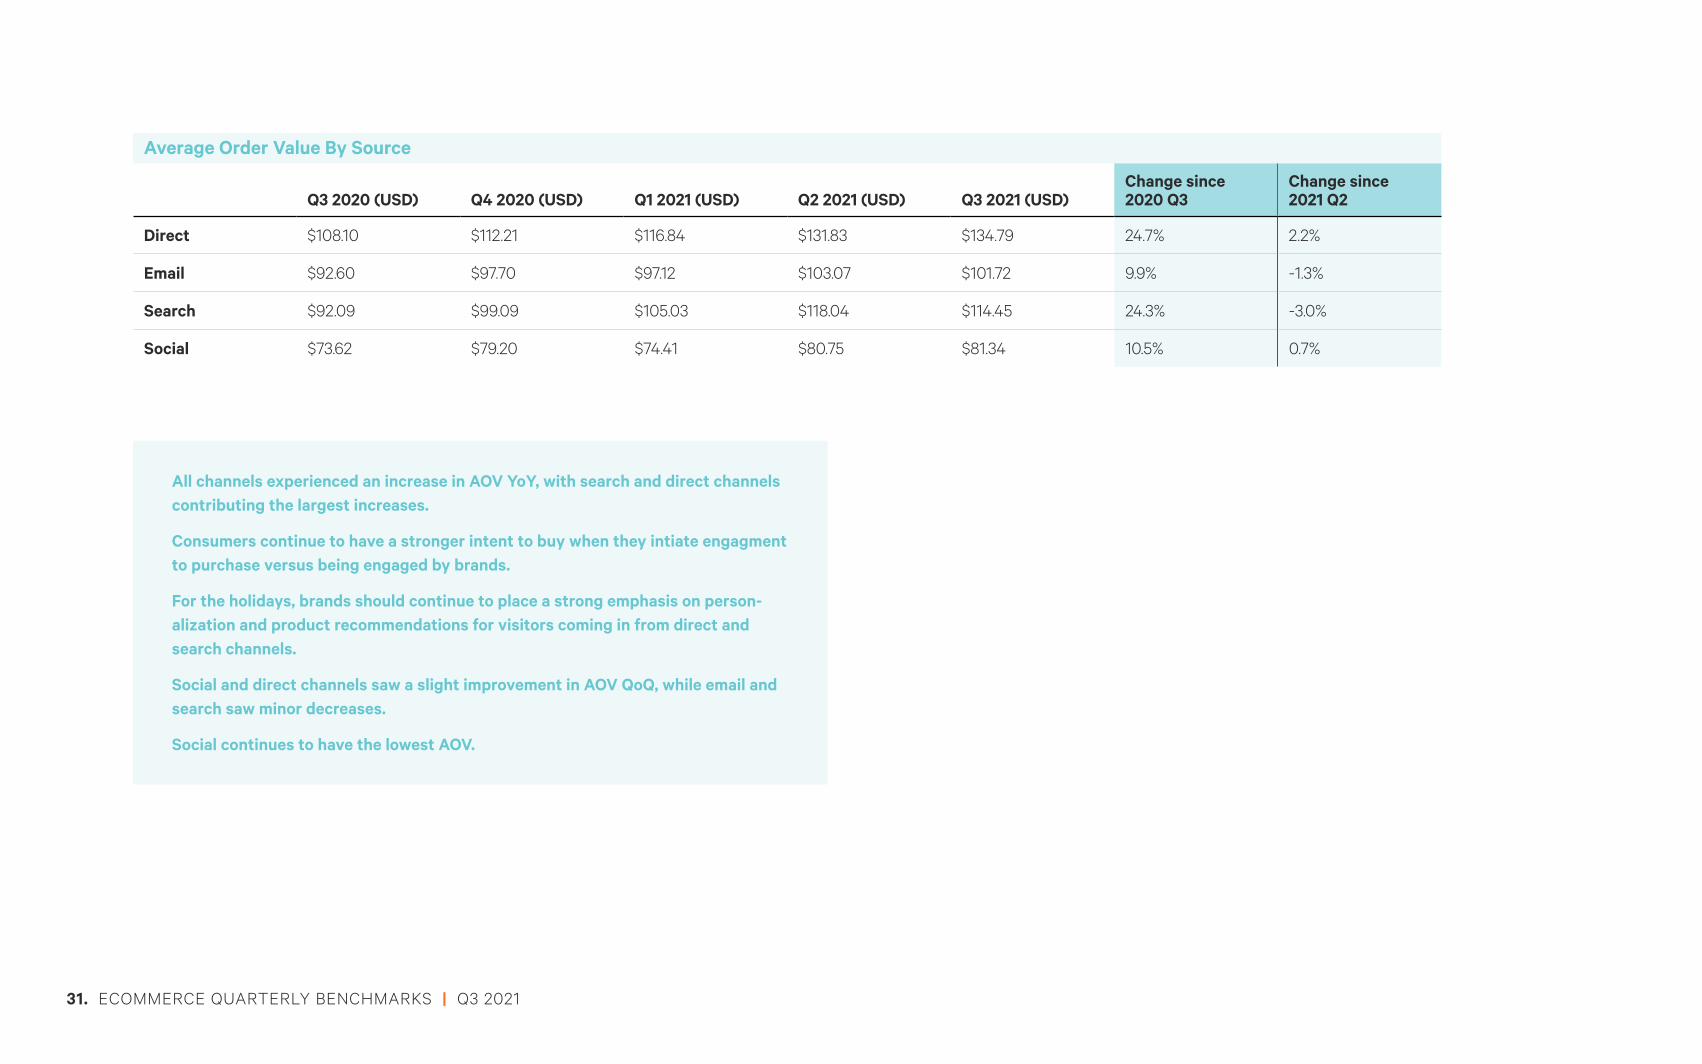
Direct $108.10 $112.21 $116.84 $131.83 $134.79 24.7% 2.2%
Email $92.60 $97.70 $97.12 $103.07 $101.72 9.9% -1.3%
Search $92.09 $99.09 $105.03 $118.04 $114.45 24.3% -3.0%
Social $73.62 $79.20 $74.41 $80.75 $81.34 10.5% 0.7%
All channels experienced an increase in AOV YoY, with search and direct channels contributing the largest increases.
Consumers continue to have a stronger intent to buy when they intiate engagment to purchase versus being engaged by brands.
For the holidays, brands should continue to place a strong emphasis on person-alization and product recommendations for visitors coming in from direct and search channels.
Social and direct channels saw a slight improvement in AOV QoQ, while email and search saw minor decreases.
Social continues to have the lowest AOV.
31. ECOMMERCE QUARTERLY BENCHMARKS | Q3 2021
POWERFUL PERSONALIZATIONKibo Personalization, the leading and most experienced personalization solution on the market, empowers
marketers to delight customers by enabling everything from quick one-off content changes to complex
personalization across the entire customer journey.
Contact us
kibocommerce.com https://www.linkedin.com/company/kibocommerce/


