Embed Size (px)
Citation preview
Q3 2021
US PE Breakdown
Sponsored by
Sponsored by
ContentsExecutive summary 2
Overview 3-9
Liberty GTS: Claims trends give dealmakers clues to pitfalls
10
Deals by size and sector 11
Spotlight: US PE fund performance 13-14
Q&A: Stout 16-17
Exits 18-24
Fundraising and performance 26-30
PitchBook Data, Inc.
John Gabbert Founder, CEONizar Tarhuni Senior Director, Institutional Research & Editorial
Institutional Research Group
AnalysisWylie Fernyhough Senior Analyst, PE Lead [email protected]
Rebecca Springer, Ph.D. Analyst, PE [email protected]
Jinny Choi Analyst, PE [email protected] [email protected]
DataAndrew Akers, CFA Quantitative Research Analyst
Charlie Farber Data Analyst
Publishing
Designed by Joey Schaffer & Julia Midkiff
Published on October 12, 2021
Click here for PitchBook’s report methodologies.
Executive summary
Rebecca Springer, Ph.D. Analyst, PE
Jinny Choi Analyst, PE
Wylie Fernyhough Senior Analyst, PE Lead
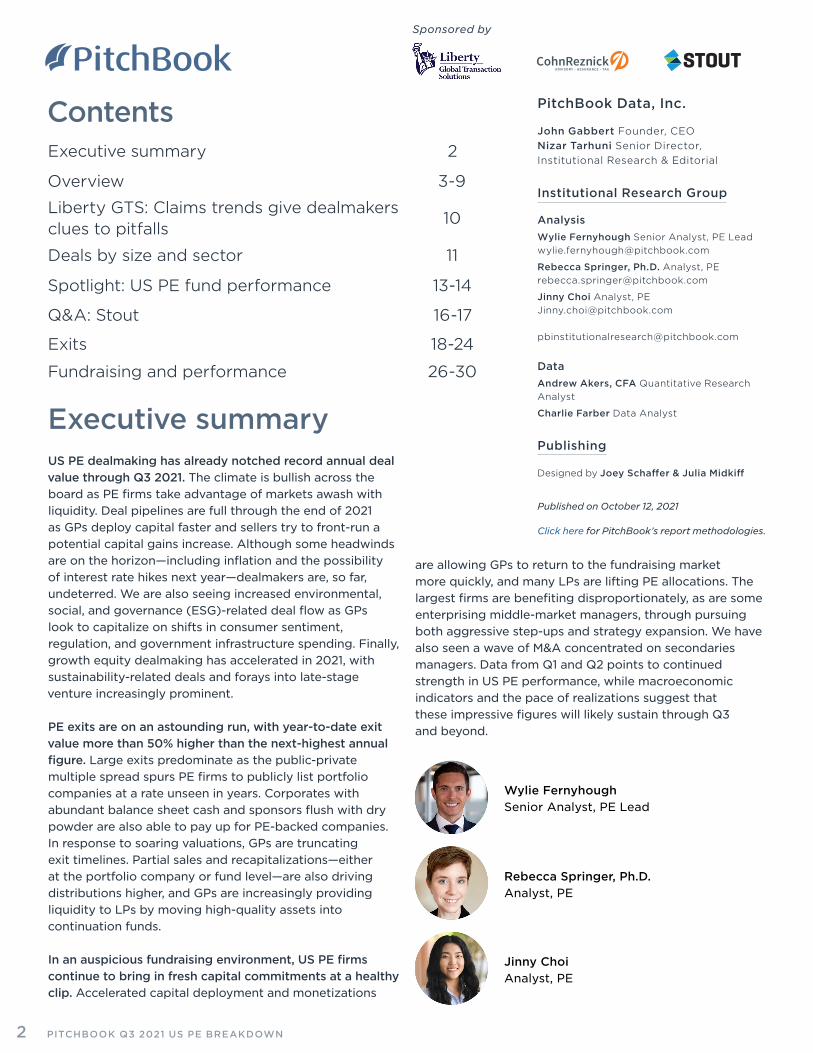
US PE dealmaking has already notched record annual deal value through Q3 2021. The climate is bullish across the board as PE firms take advantage of markets awash with liquidity. Deal pipelines are full through the end of 2021 as GPs deploy capital faster and sellers try to front-run a potential capital gains increase. Although some headwinds are on the horizon—including inflation and the possibility of interest rate hikes next year—dealmakers are, so far, undeterred. We are also seeing increased environmental, social, and governance (ESG)-related deal flow as GPs look to capitalize on shifts in consumer sentiment, regulation, and government infrastructure spending. Finally, growth equity dealmaking has accelerated in 2021, with sustainability-related deals and forays into late-stage venture increasingly prominent.
PE exits are on an astounding run, with year-to-date exit value more than 50% higher than the next-highest annual figure. Large exits predominate as the public-private multiple spread spurs PE firms to publicly list portfolio companies at a rate unseen in years. Corporates with abundant balance sheet cash and sponsors flush with dry powder are also able to pay up for PE-backed companies. In response to soaring valuations, GPs are truncating exit timelines. Partial sales and recapitalizations—either at the portfolio company or fund level—are also driving distributions higher, and GPs are increasingly providing liquidity to LPs by moving high-quality assets into continuation funds.
In an auspicious fundraising environment, US PE firms continue to bring in fresh capital commitments at a healthy clip. Accelerated capital deployment and monetizations
are allowing GPs to return to the fundraising market more quickly, and many LPs are lifting PE allocations. The largest firms are benefiting disproportionately, as are some enterprising middle-market managers, through pursuing both aggressive step-ups and strategy expansion. We have also seen a wave of M&A concentrated on secondaries managers. Data from Q1 and Q2 points to continued strength in US PE performance, while macroeconomic indicators and the pace of realizations suggest that these impressive figures will likely sustain through Q3 and beyond.
PITCHBOOK Q3 2021 US PE BREAKDOWN2
Sponsored by
Overview
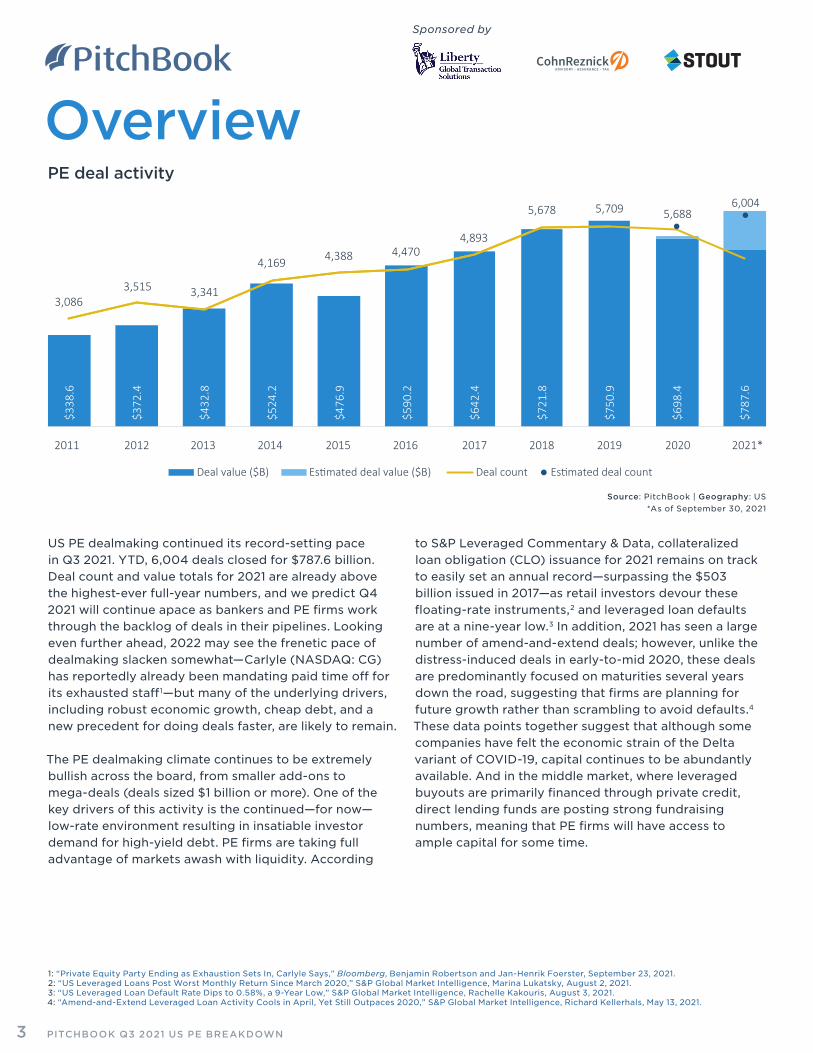
US PE dealmaking continued its record-setting pace in Q3 2021. YTD, 6,004 deals closed for $787.6 billion. Deal count and value totals for 2021 are already above the highest-ever full-year numbers, and we predict Q4 2021 will continue apace as bankers and PE firms work through the backlog of deals in their pipelines. Looking even further ahead, 2022 may see the frenetic pace of dealmaking slacken somewhat—Carlyle (NASDAQ: CG) has reportedly already been mandating paid time off for its exhausted staff1—but many of the underlying drivers, including robust economic growth, cheap debt, and a new precedent for doing deals faster, are likely to remain.
The PE dealmaking climate continues to be extremely bullish across the board, from smaller add-ons to mega-deals (deals sized $1 billion or more). One of the key drivers of this activity is the continued—for now—low-rate environment resulting in insatiable investor demand for high-yield debt. PE firms are taking full advantage of markets awash with liquidity. According
$338
.6
$372
.4
$432
.8
$524
.2
$476
.9
$590
.2
$642
.4
$721
.8
$750
.9
$698
.4
$787
.6
3,0863,515 3,341
4,169 4,388 4,4704,893
5,678 5,709 5,6886,004
2011 2012 2013 2014 2015 2016 2017 2018 2019 2020 2021*
Deal value ($B) Estimated deal value ($B) Deal count Estimated deal count
PE deal activity
Source: PitchBook | Geography: US *As of September 30, 2021
to S&P Leveraged Commentary & Data, collateralized loan obligation (CLO) issuance for 2021 remains on track to easily set an annual record—surpassing the $503 billion issued in 2017—as retail investors devour these floating-rate instruments,2 and leveraged loan defaults are at a nine-year low.3 In addition, 2021 has seen a large number of amend-and-extend deals; however, unlike the distress-induced deals in early-to-mid 2020, these deals are predominantly focused on maturities several years down the road, suggesting that firms are planning for future growth rather than scrambling to avoid defaults.4 These data points together suggest that although some companies have felt the economic strain of the Delta variant of COVID-19, capital continues to be abundantly available. And in the middle market, where leveraged buyouts are primarily financed through private credit, direct lending funds are posting strong fundraising numbers, meaning that PE firms will have access to ample capital for some time.
1: “Private Equity Party Ending as Exhaustion Sets In, Carlyle Says,” Bloomberg, Benjamin Robertson and Jan-Henrik Foerster, September 23, 2021. 2: “US Leveraged Loans Post Worst Monthly Return Since March 2020,” S&P Global Market Intelligence, Marina Lukatsky, August 2, 2021. 3: “US Leveraged Loan Default Rate Dips to 0.58%, a 9-Year Low,” S&P Global Market Intelligence, Rachelle Kakouris, August 3, 2021. 4: “Amend-and-Extend Leveraged Loan Activity Cools in April, Yet Still Outpaces 2020,” S&P Global Market Intelligence, Richard Kellerhals, May 13, 2021.
PITCHBOOK Q3 2021 US PE BREAKDOWN3
Sponsored by
Overview
0%
0.5%
1.0%
1.5%
2.0%
2.5%
3 Month 1 Year 5 Year 10 Year 30 Year
Sept 30, 2021Apr 1, 2021Sept 30, 2020
5.3%
4.0%
-3%
-2%
-1%
0%
1%
2%
3%
4%
5%
6%
2001
2003
2005
2007
2009
2011
2013
2015
2017
2019
2021
*
CPI Core CPI
US Treasury yield curve*Consumer price index, YoY % change
0%
10%
20%
30%
40%
50%
60%
70%
80%
90%
100%
2011
2012
2013
2014
2015
2016
2017
2018
2019
2020
2021
*
$1B+
$500M-$1B
$100M-$500M
$25M-$100M
Under$25M
Share of PE deal count with no backing by size
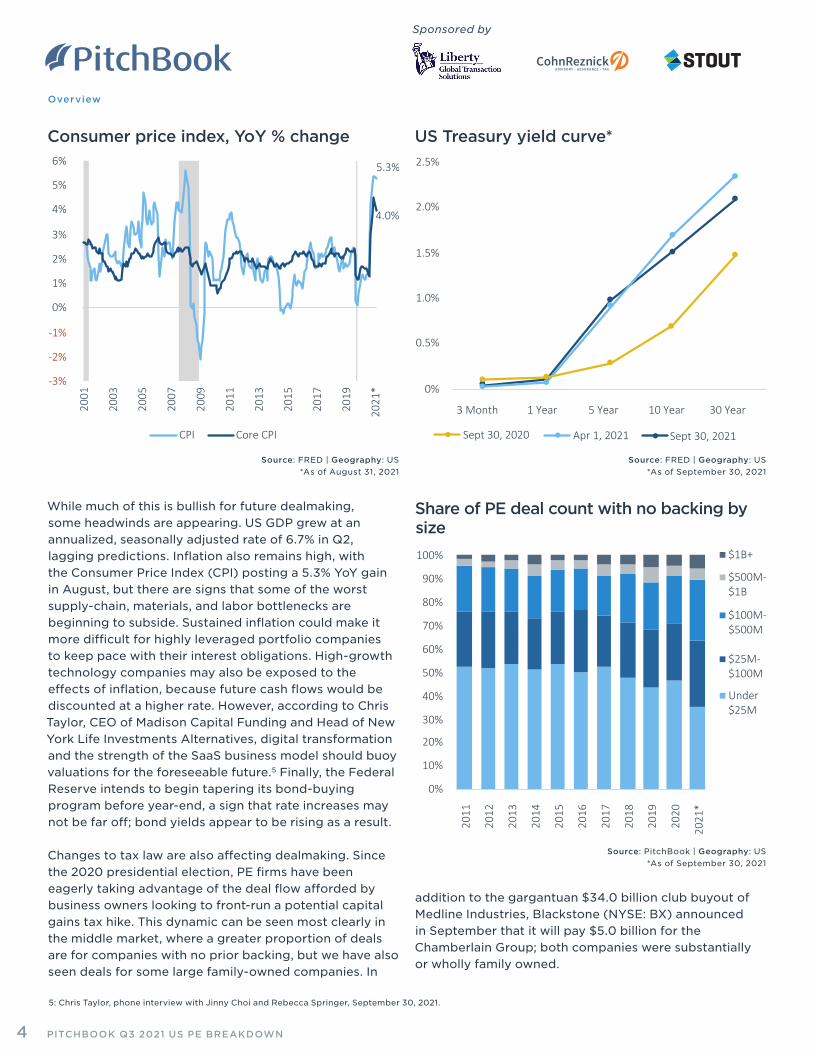
While much of this is bullish for future dealmaking, some headwinds are appearing. US GDP grew at an annualized, seasonally adjusted rate of 6.7% in Q2, lagging predictions. Inflation also remains high, with the Consumer Price Index (CPI) posting a 5.3% YoY gain in August, but there are signs that some of the worst supply-chain, materials, and labor bottlenecks are beginning to subside. Sustained inflation could make it more difficult for highly leveraged portfolio companies to keep pace with their interest obligations. High-growth technology companies may also be exposed to the effects of inflation, because future cash flows would be discounted at a higher rate. However, according to Chris Taylor, CEO of Madison Capital Funding and Head of New York Life Investments Alternatives, digital transformation and the strength of the SaaS business model should buoy valuations for the foreseeable future.5 Finally, the Federal Reserve intends to begin tapering its bond-buying program before year-end, a sign that rate increases may not be far off; bond yields appear to be rising as a result.
Changes to tax law are also affecting dealmaking. Since the 2020 presidential election, PE firms have been eagerly taking advantage of the deal flow afforded by business owners looking to front-run a potential capital gains tax hike. This dynamic can be seen most clearly in the middle market, where a greater proportion of deals are for companies with no prior backing, but we have also seen deals for some large family-owned companies. In
Source: FRED | Geography: US *As of August 31, 2021
Source: FRED | Geography: US *As of September 30, 2021
Source: PitchBook | Geography: US *As of September 30, 2021
5: Chris Taylor, phone interview with Jinny Choi and Rebecca Springer, September 30, 2021.
addition to the gargantuan $34.0 billion club buyout of Medline Industries, Blackstone (NYSE: BX) announced in September that it will pay $5.0 billion for the Chamberlain Group; both companies were substantially or wholly family owned.
PITCHBOOK Q3 2021 US PE BREAKDOWN4
Sponsored by
Overview
0%
10%
20%
30%
40%
50%
60%
70%
80%
90%
100%
2011
2012
2013
2014
2015
2016
2017
2018
2019
2020
2021
*
5+
3-5
0-3
1,40
0
1,61
6
1,55
0
2,03
1
2,13
2
2,25
0
2,48
5
3,07
0
3,22
0
3,24
1
2,81
4
1,06
2
1,26
6
1,04
4 1,28
1
1,40
8
1,32
9
1,47
0 1,61
5
1,52
3
1,35
6
1,03
1
56.9% 56.1%59.8% 61.3% 60.2% 62.9% 62.8%
65.5% 67.9%70.5% 73.2%
2011
2012
2013
2014
2015
2016
2017
2018
2019
2020
2021
*
Add-on Non add-on Add-on % of buyout
Share of PE buyouts by holding period (years) and exit year
Add-on % of US buyout activity
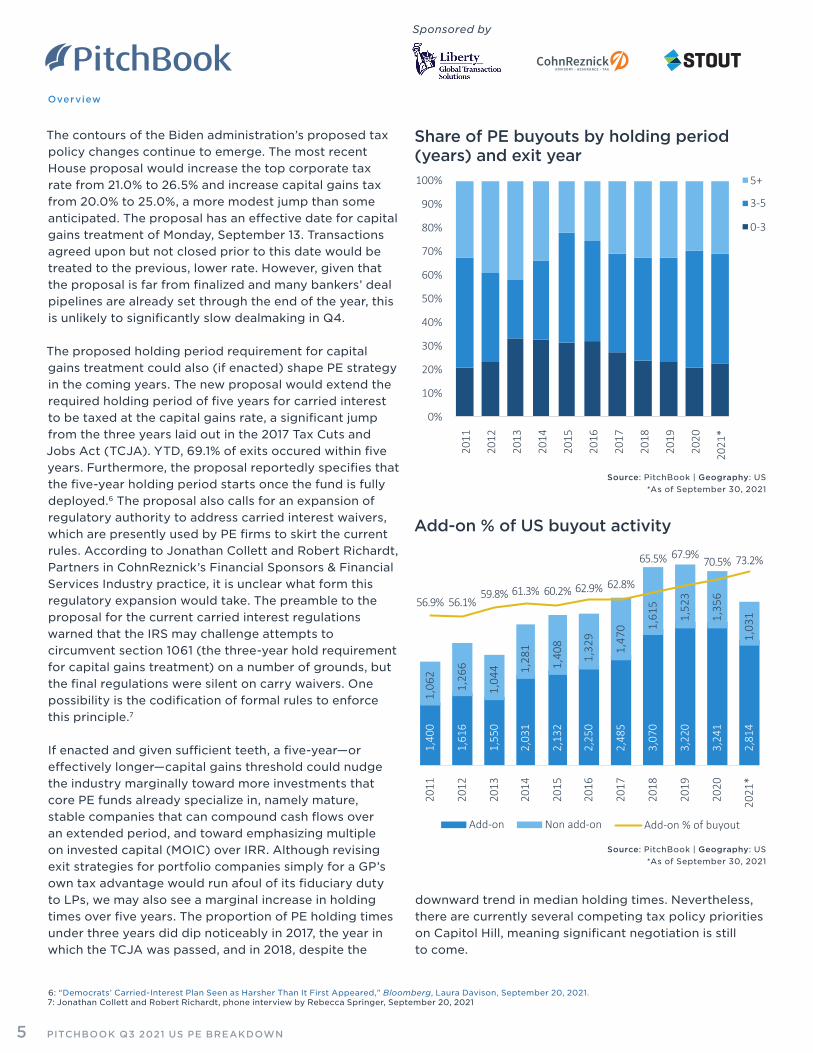
The contours of the Biden administration’s proposed tax policy changes continue to emerge. The most recent House proposal would increase the top corporate tax rate from 21.0% to 26.5% and increase capital gains tax from 20.0% to 25.0%, a more modest jump than some anticipated. The proposal has an effective date for capital gains treatment of Monday, September 13. Transactions agreed upon but not closed prior to this date would be treated to the previous, lower rate. However, given that the proposal is far from finalized and many bankers’ deal pipelines are already set through the end of the year, this is unlikely to significantly slow dealmaking in Q4.
The proposed holding period requirement for capital gains treatment could also (if enacted) shape PE strategy in the coming years. The new proposal would extend the required holding period of five years for carried interest to be taxed at the capital gains rate, a significant jump from the three years laid out in the 2017 Tax Cuts and Jobs Act (TCJA). YTD, 69.1% of exits occured within five years. Furthermore, the proposal reportedly specifies that the five-year holding period starts once the fund is fully deployed.6 The proposal also calls for an expansion of regulatory authority to address carried interest waivers, which are presently used by PE firms to skirt the current rules. According to Jonathan Collett and Robert Richardt, Partners in CohnReznick’s Financial Sponsors & Financial Services Industry practice, it is unclear what form this regulatory expansion would take. The preamble to the proposal for the current carried interest regulations warned that the IRS may challenge attempts to circumvent section 1061 (the three-year hold requirement for capital gains treatment) on a number of grounds, but the final regulations were silent on carry waivers. One possibility is the codification of formal rules to enforce this principle.7
If enacted and given sufficient teeth, a five-year—or effectively longer—capital gains threshold could nudge the industry marginally toward more investments that core PE funds already specialize in, namely mature, stable companies that can compound cash flows over an extended period, and toward emphasizing multiple on invested capital (MOIC) over IRR. Although revising exit strategies for portfolio companies simply for a GP’s own tax advantage would run afoul of its fiduciary duty to LPs, we may also see a marginal increase in holding times over five years. The proportion of PE holding times under three years did dip noticeably in 2017, the year in which the TCJA was passed, and in 2018, despite the
downward trend in median holding times. Nevertheless, there are currently several competing tax policy priorities on Capitol Hill, meaning significant negotiation is still to come.
6: “Democrats’ Carried-Interest Plan Seen as Harsher Than It First Appeared,” Bloomberg, Laura Davison, September 20, 2021.7: Jonathan Collett and Robert Richardt, phone interview by Rebecca Springer, September 20, 2021
Source: PitchBook | Geography: US *As of September 30, 2021
Source: PitchBook | Geography: US *As of September 30, 2021
PITCHBOOK Q3 2021 US PE BREAKDOWN5
Sponsored by
Overview
0% 20% 40% 60% 80%
Decreased
Stayed the same
Increased
0%20%40%60%80%
LP
Both
GP
Other
Decreased for other reasons
Decreased temporarily due to the global pandemic lockdowns
Stayed the same
Increased
How have the events of 2020 and 2021 impacted your focus on sustainable investing?*
How do you think the events of 2020 and 2021 have impacted the industry participants’ focus on sustainable investing?*
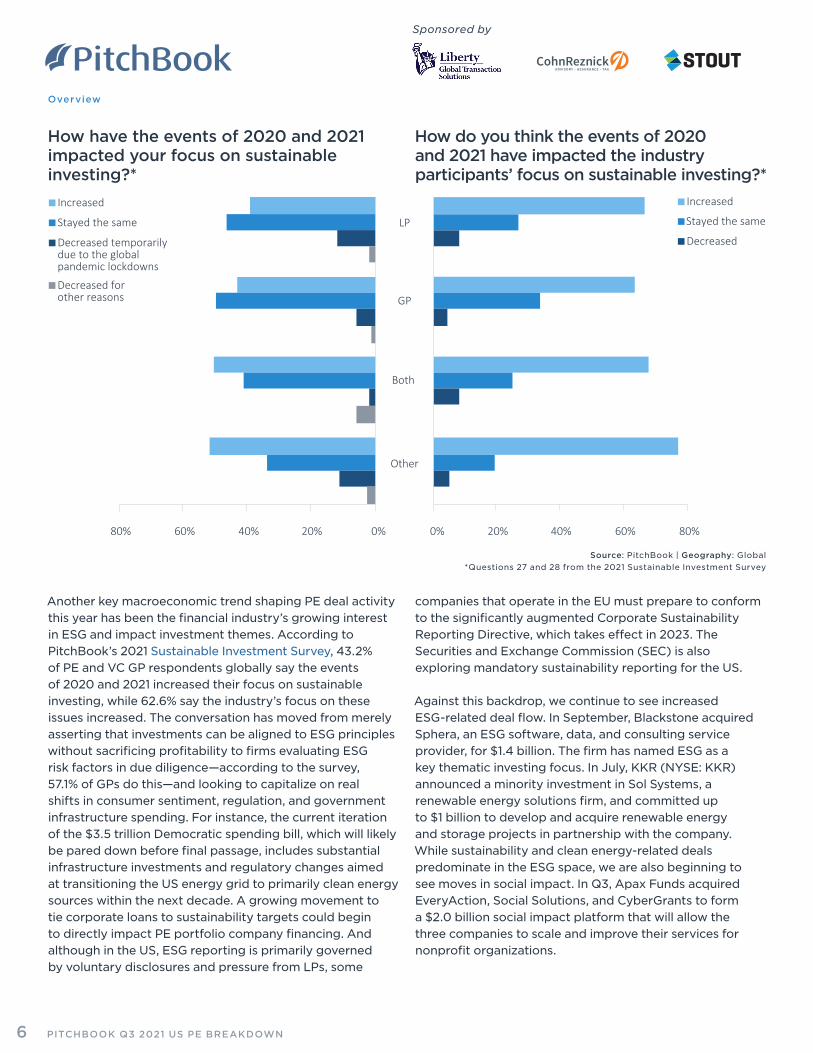
Another key macroeconomic trend shaping PE deal activity this year has been the financial industry’s growing interest in ESG and impact investment themes. According to PitchBook’s 2021 Sustainable Investment Survey, 43.2% of PE and VC GP respondents globally say the events of 2020 and 2021 increased their focus on sustainable investing, while 62.6% say the industry’s focus on these issues increased. The conversation has moved from merely asserting that investments can be aligned to ESG principles without sacrificing profitability to firms evaluating ESG risk factors in due diligence—according to the survey, 57.1% of GPs do this—and looking to capitalize on real shifts in consumer sentiment, regulation, and government infrastructure spending. For instance, the current iteration of the $3.5 trillion Democratic spending bill, which will likely be pared down before final passage, includes substantial infrastructure investments and regulatory changes aimed at transitioning the US energy grid to primarily clean energy sources within the next decade. A growing movement to tie corporate loans to sustainability targets could begin to directly impact PE portfolio company financing. And although in the US, ESG reporting is primarily governed by voluntary disclosures and pressure from LPs, some
companies that operate in the EU must prepare to conform to the significantly augmented Corporate Sustainability Reporting Directive, which takes effect in 2023. The Securities and Exchange Commission (SEC) is also exploring mandatory sustainability reporting for the US.
Against this backdrop, we continue to see increased ESG-related deal flow. In September, Blackstone acquired Sphera, an ESG software, data, and consulting service provider, for $1.4 billion. The firm has named ESG as a key thematic investing focus. In July, KKR (NYSE: KKR) announced a minority investment in Sol Systems, a renewable energy solutions firm, and committed up to $1 billion to develop and acquire renewable energy and storage projects in partnership with the company. While sustainability and clean energy-related deals predominate in the ESG space, we are also beginning to see moves in social impact. In Q3, Apax Funds acquired EveryAction, Social Solutions, and CyberGrants to form a $2.0 billion social impact platform that will allow the three companies to scale and improve their services for nonprofit organizations.
Source: PitchBook | Geography: Global*Questions 27 and 28 from the 2021 Sustainable Investment Survey
PITCHBOOK Q3 2021 US PE BREAKDOWN6
Sponsored by
Overview
$56.
7
$30.
0
$88.
2 $15.
2
$42.
1
$68.
2
$83.
3
$72.
2
$60.
4
$78.
3
$95.
1$6
7.0
62
49
55
3336
5452
4542
36 34
2011 2012 2013 2014 2015 2016 2017 2018 2019 2020 2021*
Deal value ($B) Dell EMC ($B) Deal count
PE take-private deal activity
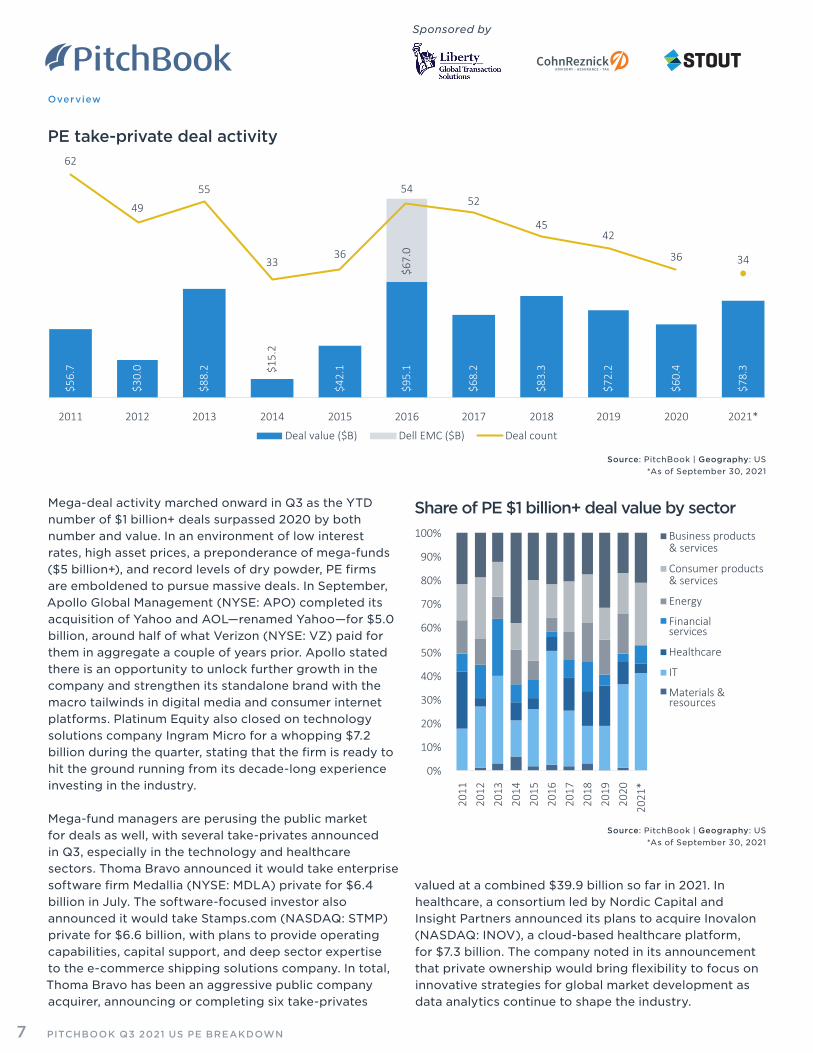
Mega-deal activity marched onward in Q3 as the YTD number of $1 billion+ deals surpassed 2020 by both number and value. In an environment of low interest rates, high asset prices, a preponderance of mega-funds ($5 billion+), and record levels of dry powder, PE firms are emboldened to pursue massive deals. In September, Apollo Global Management (NYSE: APO) completed its acquisition of Yahoo and AOL—renamed Yahoo—for $5.0 billion, around half of what Verizon (NYSE: VZ) paid for them in aggregate a couple of years prior. Apollo stated there is an opportunity to unlock further growth in the company and strengthen its standalone brand with the macro tailwinds in digital media and consumer internet platforms. Platinum Equity also closed on technology solutions company Ingram Micro for a whopping $7.2 billion during the quarter, stating that the firm is ready to hit the ground running from its decade-long experience investing in the industry.
Mega-fund managers are perusing the public market for deals as well, with several take-privates announced in Q3, especially in the technology and healthcare sectors. Thoma Bravo announced it would take enterprise software firm Medallia (NYSE: MDLA) private for $6.4 billion in July. The software-focused investor also announced it would take Stamps.com (NASDAQ: STMP) private for $6.6 billion, with plans to provide operating capabilities, capital support, and deep sector expertise to the e-commerce shipping solutions company. In total, Thoma Bravo has been an aggressive public company acquirer, announcing or completing six take-privates
0%
10%
20%
30%
40%
50%
60%
70%
80%
90%
100%
2011
2012
2013
2014
2015
2016
2017
2018
2019
2020
2021
*
Business products & services
Consumer products & services
Energy
Financialservices
Healthcare
IT
Materials &resources
Share of PE $1 billion+ deal value by sector
valued at a combined $39.9 billion so far in 2021. In healthcare, a consortium led by Nordic Capital and Insight Partners announced its plans to acquire Inovalon (NASDAQ: INOV), a cloud-based healthcare platform, for $7.3 billion. The company noted in its announcement that private ownership would bring flexibility to focus on innovative strategies for global market development as data analytics continue to shape the industry.
Source: PitchBook | Geography: US *As of September 30, 2021
Source: PitchBook | Geography: US *As of September 30, 2021
PITCHBOOK Q3 2021 US PE BREAKDOWN7
Sponsored by
Overview
0%
10%
20%
30%
40%
50%
60%
70%
80%
90%
100%
2011
2012
2013
2014
2015
2016
2017
2018
2019
2020
2021
*
PE growth/expansion
Buyout/LBO
$23.
1
$21.
3
$44.
2
$50.
9
$42.
3
$60.
4
$65.
6
$76.
4
$97.
7
$97.
4
$112
.2
200253 263
353 370
441
566
685651
687 668
2011
2012
2013
2014
2015
2016
2017
2018
2019
2020
2021
*
Deal value ($B) Deal count
Share of PE deal count by type, excluding add-ons
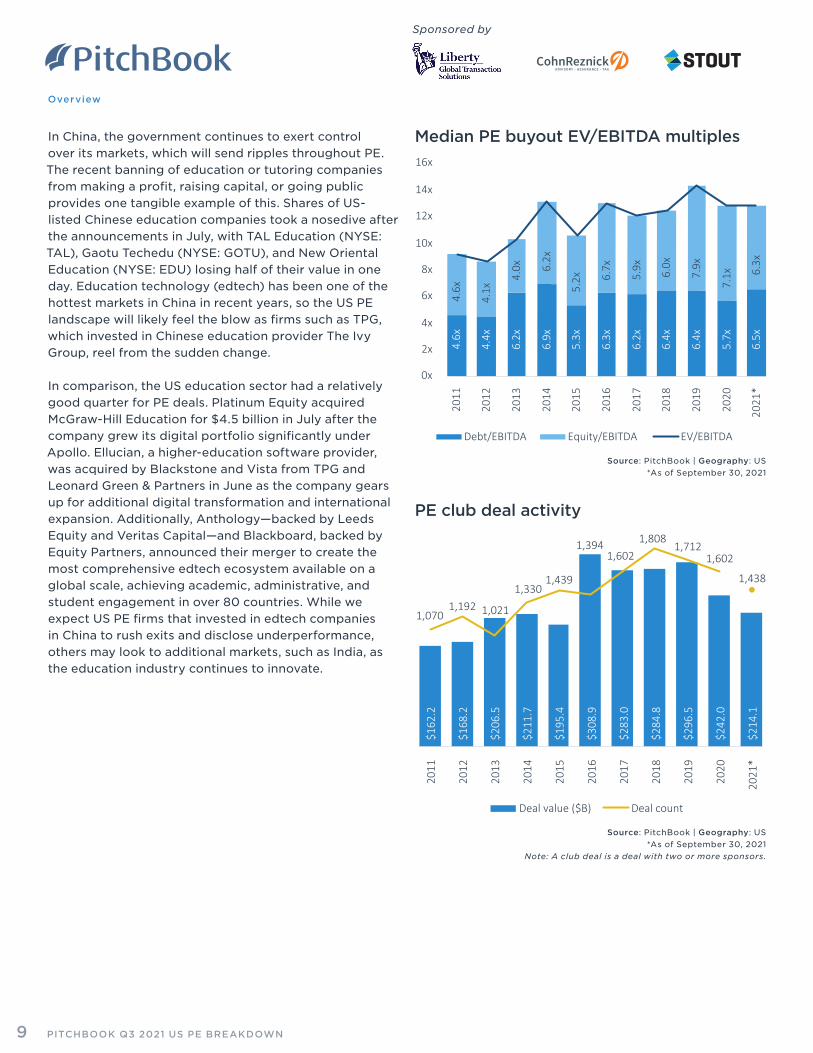
Software PE deal activity
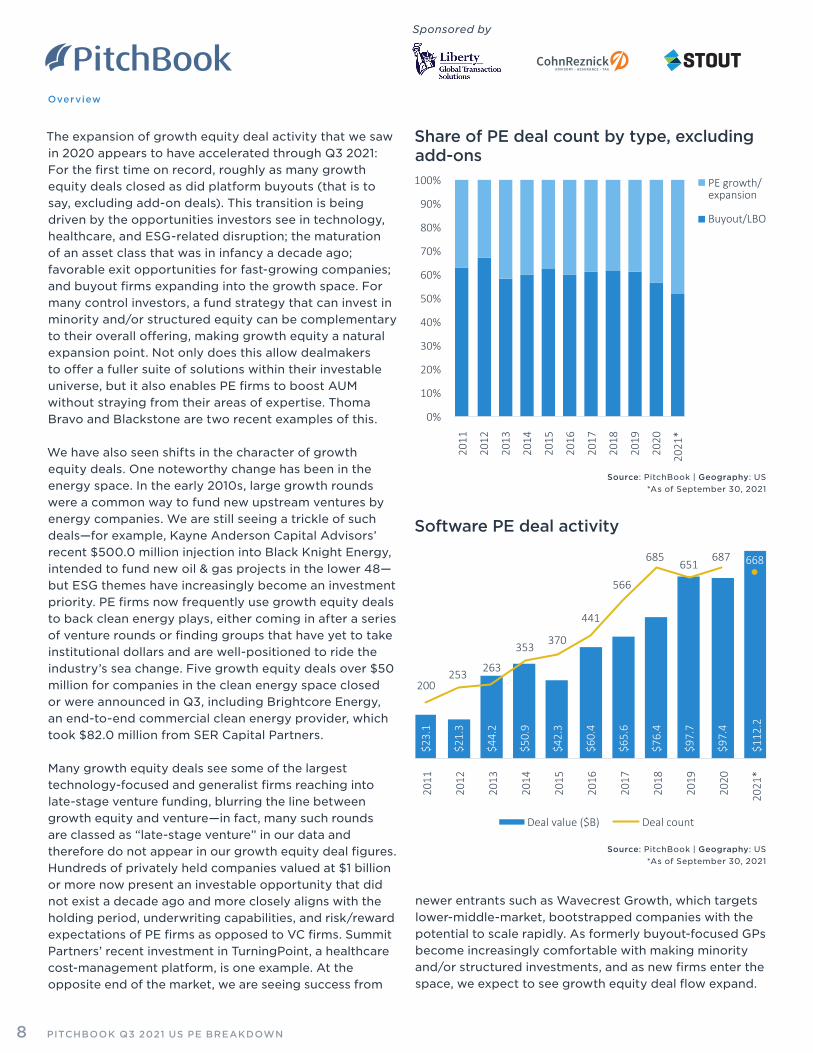
The expansion of growth equity deal activity that we saw in 2020 appears to have accelerated through Q3 2021: For the first time on record, roughly as many growth equity deals closed as did platform buyouts (that is to say, excluding add-on deals). This transition is being driven by the opportunities investors see in technology, healthcare, and ESG-related disruption; the maturation of an asset class that was in infancy a decade ago; favorable exit opportunities for fast-growing companies; and buyout firms expanding into the growth space. For many control investors, a fund strategy that can invest in minority and/or structured equity can be complementary to their overall offering, making growth equity a natural expansion point. Not only does this allow dealmakers to offer a fuller suite of solutions within their investable universe, but it also enables PE firms to boost AUM without straying from their areas of expertise. Thoma Bravo and Blackstone are two recent examples of this.
We have also seen shifts in the character of growth equity deals. One noteworthy change has been in the energy space. In the early 2010s, large growth rounds were a common way to fund new upstream ventures by energy companies. We are still seeing a trickle of such deals—for example, Kayne Anderson Capital Advisors’ recent $500.0 million injection into Black Knight Energy, intended to fund new oil & gas projects in the lower 48—but ESG themes have increasingly become an investment priority. PE firms now frequently use growth equity deals to back clean energy plays, either coming in after a series of venture rounds or finding groups that have yet to take institutional dollars and are well-positioned to ride the industry’s sea change. Five growth equity deals over $50 million for companies in the clean energy space closed or were announced in Q3, including Brightcore Energy, an end-to-end commercial clean energy provider, which took $82.0 million from SER Capital Partners.
Many growth equity deals see some of the largest technology-focused and generalist firms reaching into late-stage venture funding, blurring the line between growth equity and venture—in fact, many such rounds are classed as “late-stage venture” in our data and therefore do not appear in our growth equity deal figures. Hundreds of privately held companies valued at $1 billion or more now present an investable opportunity that did not exist a decade ago and more closely aligns with the holding period, underwriting capabilities, and risk/reward expectations of PE firms as opposed to VC firms. Summit Partners’ recent investment in TurningPoint, a healthcare cost-management platform, is one example. At the opposite end of the market, we are seeing success from
newer entrants such as Wavecrest Growth, which targets lower-middle-market, bootstrapped companies with the potential to scale rapidly. As formerly buyout-focused GPs become increasingly comfortable with making minority and/or structured investments, and as new firms enter the space, we expect to see growth equity deal flow expand.
Source: PitchBook | Geography: US *As of September 30, 2021
Source: PitchBook | Geography: US *As of September 30, 2021
PITCHBOOK Q3 2021 US PE BREAKDOWN8
Sponsored by
Overview
4.6x
4.4x
6.2x
6.9x
5.3x
6.3x
6.2x
6.4x
6.4x
5.7x
6.5x
4.6x
4.1x
4.0x 6.
2x
5.2x 6.
7x
5.9x 6.0x
7.9x
7.1x 6.
3x
0x
2x
4x
6x
8x
10x
12x
14x
16x
2011
2012
2013
2014
2015
2016
2017
2018
2019
2020
2021
*
Debt/EBITDA Equity/EBITDA EV/EBITDA$1
62.2
$168
.2
$206
.5
$211
.7
$195
.4
$308
.9
$283
.0
$284
.8
$296
.5
$242
.0
$214
.1
1,0701,192 1,021
1,3301,439
1,3941,602
1,8081,712
1,602
1,438
2011
2012
2013
2014
2015
2016
2017
2018
2019
2020
2021
*
Deal value ($B) Deal count
Median PE buyout EV/EBITDA multiples
PE club deal activity
In China, the government continues to exert control over its markets, which will send ripples throughout PE. The recent banning of education or tutoring companies from making a profit, raising capital, or going public provides one tangible example of this. Shares of US-listed Chinese education companies took a nosedive after the announcements in July, with TAL Education (NYSE: TAL), Gaotu Techedu (NYSE: GOTU), and New Oriental Education (NYSE: EDU) losing half of their value in one day. Education technology (edtech) has been one of the hottest markets in China in recent years, so the US PE landscape will likely feel the blow as firms such as TPG, which invested in Chinese education provider The Ivy Group, reel from the sudden change.
In comparison, the US education sector had a relatively good quarter for PE deals. Platinum Equity acquired McGraw-Hill Education for $4.5 billion in July after the company grew its digital portfolio significantly under Apollo. Ellucian, a higher-education software provider, was acquired by Blackstone and Vista from TPG and Leonard Green & Partners in June as the company gears up for additional digital transformation and international expansion. Additionally, Anthology—backed by Leeds Equity and Veritas Capital—and Blackboard, backed by Equity Partners, announced their merger to create the most comprehensive edtech ecosystem available on a global scale, achieving academic, administrative, and student engagement in over 80 countries. While we expect US PE firms that invested in edtech companies in China to rush exits and disclose underperformance, others may look to additional markets, such as India, as the education industry continues to innovate.
Source: PitchBook | Geography: US *As of September 30, 2021
Source: PitchBook | Geography: US *As of September 30, 2021
Note: A club deal is a deal with two or more sponsors.
PITCHBOOK Q3 2021 US PE BREAKDOWN9
Sponsored by
Liberty GTS: Claims trendsgive dealmakers clues to pitfallsLiberty GTS recently published its annual Claims Briefing, which provides insight into key points that M&A transaction teams and advisors need to be privy to. Tax is a common source of smaller claims. Large tax-related claims remain uncommon. However, smaller tax claims regularly come through and typically involve either corporation tax or sales tax issues. We are seeing more import tax claims relating to the increasingly complex global supply networks. Environmental tax claims are also increasing as governments drive greener corporate practices via the tax system.
Accounting & financial issues are behind some of our largest claims. These issues remain significant, especially in the Americas. Many of these claims involve stock and inventory issues and can be very large, some in excess of $50m. We also see a high number of claims relating to revenue recognition issues, including overestimation of expected revenue, reallocation of costs, or even management fabricating revenue for goods yet to be supplied.
Financials can also be manipulated through asset impairment recognition delays, the understatement of allowances, or overstatement of accounts receivables. Dealmakers beware: Lack of due diligence here can be expensive for all sides. Financials manipulation could become more common, as COVID-19-induced pressures and uncertainty may galvanize management teams to cross lines to remain in business. This risk may be exacerbated if oversights and checks become diluted due to remote working and diminished staffing.
Material contracts need checking with counterparties. In 2020’s study, we reported that claims involving contract-related issues were on the rise, especially in the Americas. This trend has continued. The most common issues involve the failure to disclose changes to high-revenue contracts. In several of these cases, had the buyer spoken to the key customer concerned, the issue would likely have been discovered prior to signing—a point to note for future deal diligence.
Wage-related disputes are on the rise. These types of claims can be surprisingly expensive and can result in additional tax liabilities plus an increased wage bill. Wage claims are a growing risk area and carry an added social
inflation exposure—especially in the US, where they are susceptible to plaintiff-friendly jury awards. Cyber claims are an emerging area of risk. The past 12 months have seen a flood of claims involving cyberattacks, with victims including financial institutions, healthcare companies, education establishments, and infrastructure. M&A insurers increasingly see cyberattacks as a risk that businesses ought to manage by purchasing bespoke cyber policies with suitable cover and adequate limits. IT claims look set to continue rising. Claims involving software licensing shortfalls also continue to grow, and we believe this is an unstoppable trend given the rise in audits carried out by software vendors.
Major IT projects partway through rollout at time of sale are becoming increasingly common claims sources. These claims typically relate to missed milestones, higher-than-expected costs, or project failure.
Be wary of ongoing disputes during a deal. Third-party claims relating to disputes that were ongoing at the time of acquisition comprise a significant portion of claims notifications, and the number has been steadily increasing: Around 39% of our notifications so far in 2021 have involved a third-party claim—up from around 21% in 2020. We expect this to become an increasingly common issue going forward, and we advise M&A teams to perform careful due diligence around possible disputes in target companies.
Check, check, and check again. The summary above highlights growing sources of dispute after deals have been transacted, thus providing a useful checklist for dealmakers. The ways in which sellers can manipulate values are manifold, but the answer to many of them is check, check, and check again. Due diligence must mean just that.
Simon joined Liberty GTS in February 2019 as a dedicated M&A Claims Counsel and now oversees the GTS claims practice.
Simon Radcliffe Head of Liberty GTS Claims Liberty GTS
PITCHBOOK Q3 2021 US PE BREAKDOWN10
Sponsored by
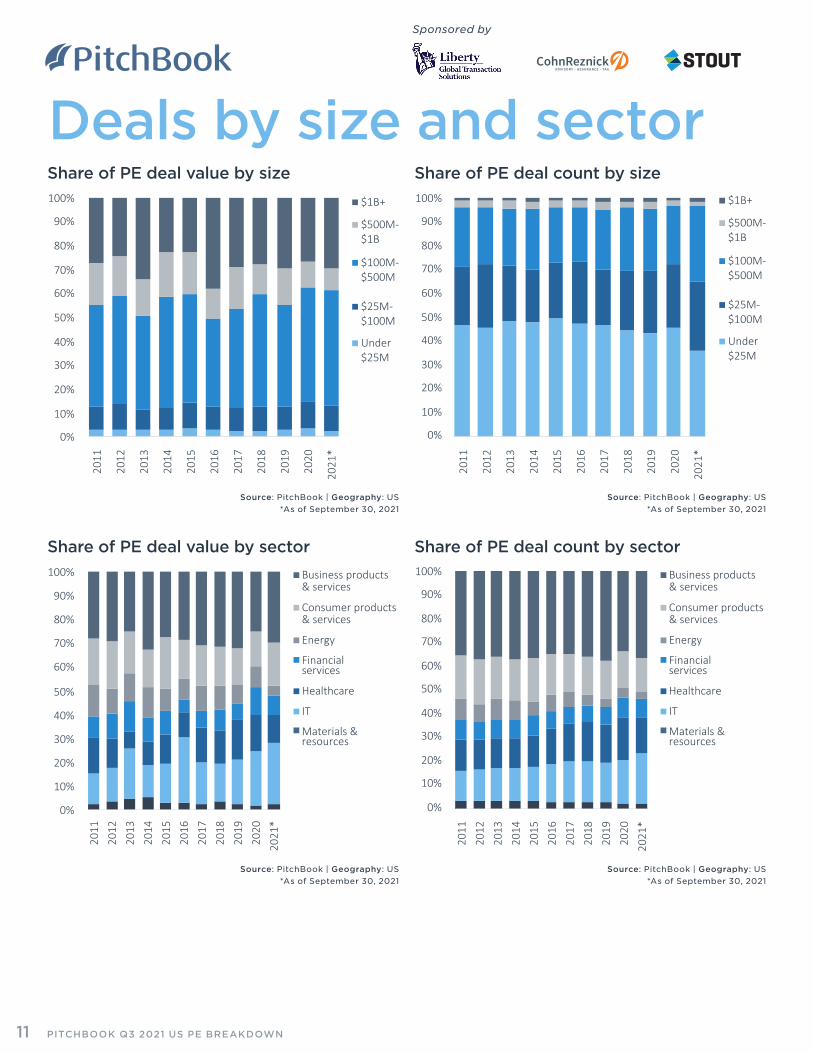
Deals by size and sector
0%
10%
20%
30%
40%
50%
60%
70%
80%
90%
100%
2011
2012
2013
2014
2015
2016
2017
2018
2019
2020
2021
*
$1B+
$500M-$1B
$100M-$500M
$25M-$100M
Under$25M
0%
10%
20%
30%
40%
50%
60%
70%
80%
90%
100%
2011
2012
2013
2014
2015
2016
2017
2018
2019
2020
2021
*
Business products & services
Consumer products & services
Energy
Financialservices
Healthcare
IT
Materials &resources
0%
10%
20%
30%
40%
50%
60%
70%
80%
90%
100%
2011
2012
2013
2014
2015
2016
2017
2018
2019
2020
2021
*
$1B+
$500M-$1B
$100M-$500M
$25M-$100M
Under$25M
0%
10%
20%
30%
40%
50%
60%
70%
80%
90%
100%
2011
2012
2013
2014
2015
2016
2017
2018
2019
2020
2021
*
Business products & services
Consumer products & services
Energy
Financialservices
Healthcare
IT
Materials &resources
Share of PE deal value by size
Share of PE deal value by sector
Share of PE deal count by size
Share of PE deal count by sector
Source: PitchBook | Geography: US *As of September 30, 2021
Source: PitchBook | Geography: US *As of September 30, 2021
Source: PitchBook | Geography: US *As of September 30, 2021
Source: PitchBook | Geography: US *As of September 30, 2021
PITCHBOOK Q3 2021 US PE BREAKDOWN11
Sponsored by
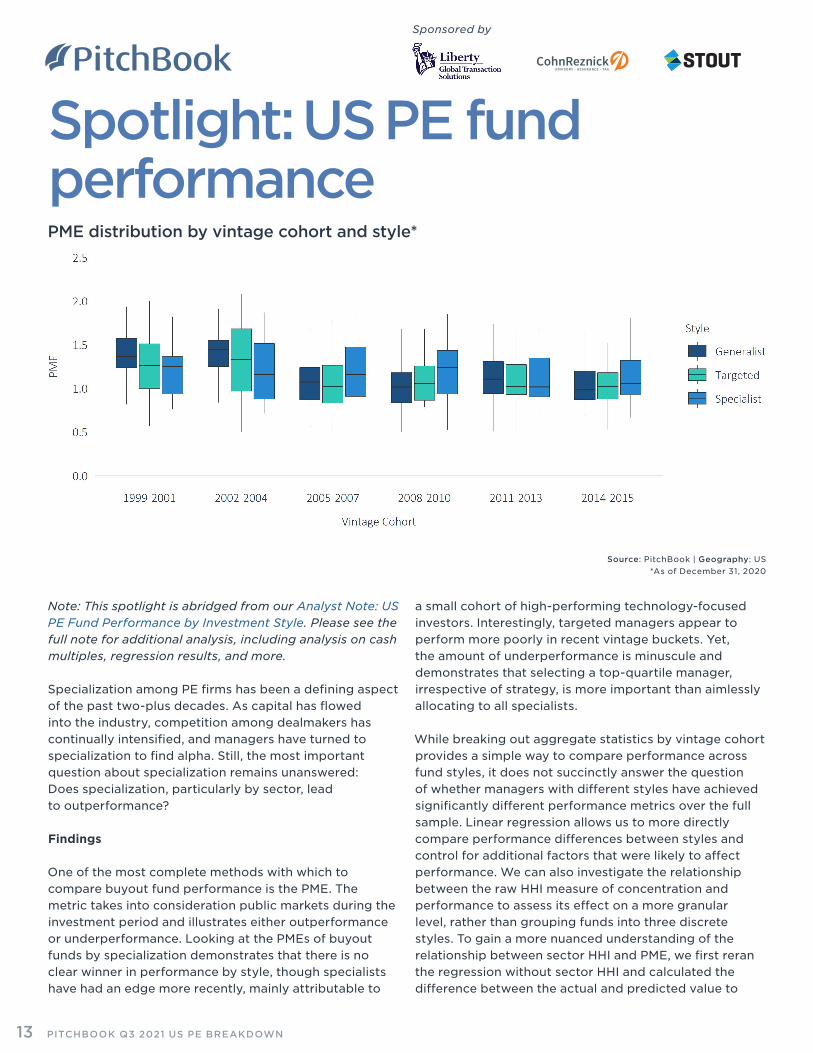
Spotlight: US PE fund performancePME DistributionsPME distribution by vintage cohort and style*
Note: This spotlight is abridged from our Analyst Note: US PE Fund Performance by Investment Style. Please see the full note for additional analysis, including analysis on cash multiples, regression results, and more.
Specialization among PE firms has been a defining aspect of the past two-plus decades. As capital has flowed into the industry, competition among dealmakers has continually intensified, and managers have turned to specialization to find alpha. Still, the most important question about specialization remains unanswered: Does specialization, particularly by sector, lead to outperformance?
Findings
One of the most complete methods with which to compare buyout fund performance is the PME. The metric takes into consideration public markets during the investment period and illustrates either outperformance or underperformance. Looking at the PMEs of buyout funds by specialization demonstrates that there is no clear winner in performance by style, though specialists have had an edge more recently, mainly attributable to
a small cohort of high-performing technology-focused investors. Interestingly, targeted managers appear to perform more poorly in recent vintage buckets. Yet, the amount of underperformance is minuscule and demonstrates that selecting a top-quartile manager, irrespective of strategy, is more important than aimlessly allocating to all specialists.
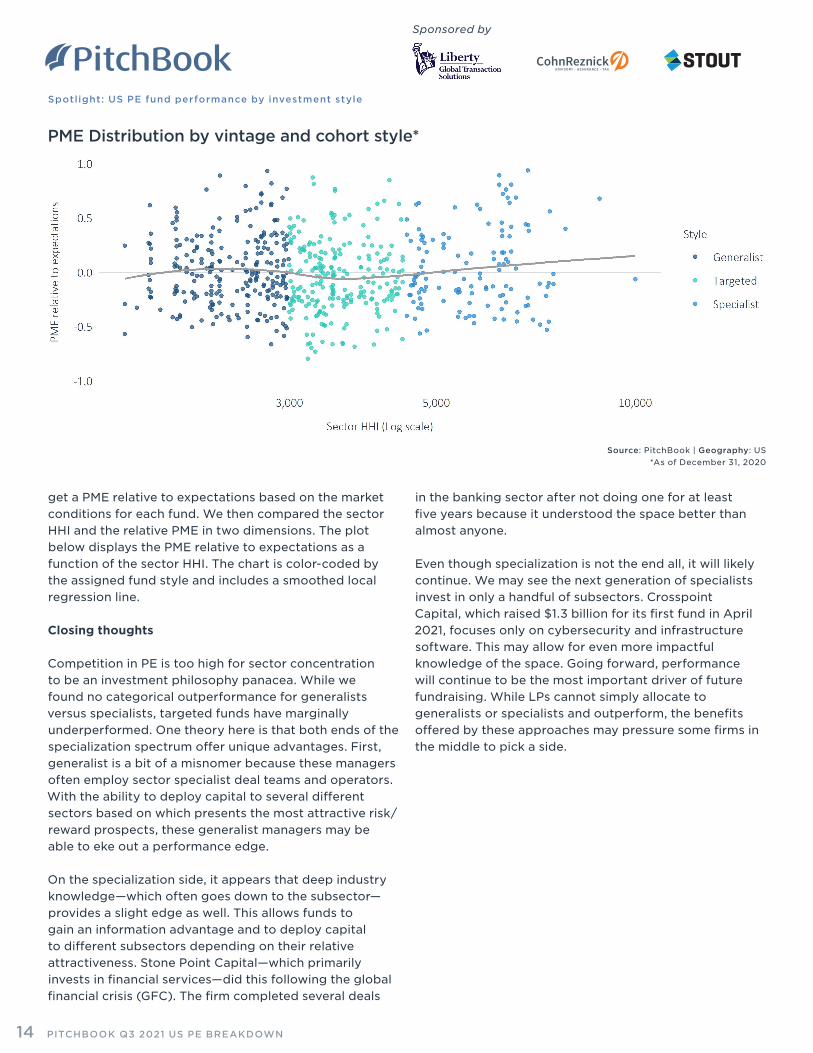
While breaking out aggregate statistics by vintage cohort provides a simple way to compare performance across fund styles, it does not succinctly answer the question of whether managers with different styles have achieved significantly different performance metrics over the full sample. Linear regression allows us to more directly compare performance differences between styles and control for additional factors that were likely to affect performance. We can also investigate the relationship between the raw HHI measure of concentration and performance to assess its effect on a more granular level, rather than grouping funds into three discrete styles. To gain a more nuanced understanding of the relationship between sector HHI and PME, we first reran the regression without sector HHI and calculated the difference between the actual and predicted value to
Source: PitchBook | Geography: US *As of December 31, 2020
PITCHBOOK Q3 2021 US PE BREAKDOWN13
Sponsored by
Spotlight: US PE fund performance by investment style
PME Distribution by vintage and cohort style*
get a PME relative to expectations based on the market conditions for each fund. We then compared the sector HHI and the relative PME in two dimensions. The plot below displays the PME relative to expectations as a function of the sector HHI. The chart is color-coded by the assigned fund style and includes a smoothed local regression line.
Closing thoughts
Competition in PE is too high for sector concentration to be an investment philosophy panacea. While we found no categorical outperformance for generalists versus specialists, targeted funds have marginally underperformed. One theory here is that both ends of the specialization spectrum offer unique advantages. First, generalist is a bit of a misnomer because these managers often employ sector specialist deal teams and operators. With the ability to deploy capital to several different sectors based on which presents the most attractive risk/reward prospects, these generalist managers may be able to eke out a performance edge.
On the specialization side, it appears that deep industry knowledge—which often goes down to the subsector—provides a slight edge as well. This allows funds to gain an information advantage and to deploy capital to different subsectors depending on their relative attractiveness. Stone Point Capital—which primarily invests in financial services—did this following the global financial crisis (GFC). The firm completed several deals
in the banking sector after not doing one for at least five years because it understood the space better than almost anyone.
Even though specialization is not the end all, it will likely continue. We may see the next generation of specialists invest in only a handful of subsectors. Crosspoint Capital, which raised $1.3 billion for its first fund in April 2021, focuses only on cybersecurity and infrastructure software. This may allow for even more impactful knowledge of the space. Going forward, performance will continue to be the most important driver of future fundraising. While LPs cannot simply allocate to generalists or specialists and outperform, the benefits offered by these approaches may pressure some firms in the middle to pick a side.
Source: PitchBook | Geography: US *As of December 31, 2020
PITCHBOOK Q3 2021 US PE BREAKDOWN14
Sponsored by
DECADES OF DEALMAKING.DEEP INDUSTRY INSIGHT.
For 30 years, Stout has developed and nurtured productive, long-term relationships with leading global middle market private equity firms, family-owned businesses, and public companies. We offer deep expertise within mergers and acquisitions, special situations, and capital markets.
Driven by maximizing value for clients, we bring the full strength of our industry expertise to bear across the most dynamic sectors of industrials, healthcare, TMT, consumer, business services, and more. Let us relentlessly deliver for you.
Stout is a trade name for Stout Risius Ross, LLC, Stout Advisors SA, Stout Bluepeak Asia Ltd., Stout GmbH, MB e Associati S.r.l., Stout Park Ltd, and Stout Capital, LLC, a FINRA-registered broker-dealer and SIPC member firm. The terms “Stout” or the “firm” refer to one or more of these legally separate and independent advisory practices. Please see www.stout.com/about to learn more.
stout.com
STOUT INVESTMENT BANKING.
Q&A: StoutAs we head into the last months of 2021, which key indicators in the PE market are you watching most closely?
Tricia: With low interest rates and plentiful capital under management, PE has been on a tear this year, pushing for new platform investments and record add-on acquisitions. This, coupled with possible capital-gains increases on the horizon, has made for a perfect storm of sellers wanting to conclude transactions before year-end and buyers eager to deploy as much capital as possible, as soon as possible. We’re certainly watching the market for regulatory changes but expect continued PE activity into 2021 as freely flowing capital reigns.
Kevin: We’ve been seeing PE firms become much more selective given the rapid rise in the quantum of transactions hitting the market. Firms are dropping much earlier from processes if they don’t feel they have a unique angle or a clear view of the potential process dynamics. This backdrop has impacted process pace and strategy in a meaningful way. As we enter Q4 2021, we will be closely monitoring how firms adjust to a more “normalized” level of deal activity.
What are the primary concerns clients have in the current market that they bring to you as they work through transactions, from either the buy or sell side? Tricia: Most private sellers are completely focused on the potential tax changes and trying to get transactions done before year-end. With the proposed increase in capital gains from 20% to 25%, rather than the much higher 39.6%, anxiety levels have dropped and transactions may start to move at a more normal, measured pace. On the buy side, for the first time in years, we’re seeing a dearth of available third-party due diligence providers—finding available quality of earnings (QoE) and technology specialists for confirmatory due diligence seems to be a gating factor. From every sector, we are hearing, “schedule early!” or else we may not be able to close by year-end.
Kevin: Given how busy the market has been, sellers are concerned they aren’t getting the right “mind-share” from the most logical PE buyers for their potential business. Conversion percentage data from confidential information memorandum (CIM) to indication of interest (IOI) has trended down, so the data supports that concern. It has never been more important to have a clear, crisp
investment thesis and a focused marketing strategy. For buyers, they are focused on high-quality businesses and/or industries where they have prior experience and/or operating partner bench strength.
Over the past couple of years, which aspects of due diligence and broader transaction advisory have gotten easier, and which have gotten harder? Tricia: We’ve seen a whole new paradigm for due diligence and transaction advisory in the time of COVID-19. So much of what had been previously done in person is now handled by phone or Zoom, possibly more efficiently. Conversely, it has never been easier to add too many people to the transaction teams. The multiple workstreams of accounting, technical, and employee due diligence can now all happen simultaneously, consuming seller attention without proper guidance.
Kevin: It’s truly remarkable how quickly due diligence processes have evolved to become mainly virtual. The in-person management presentations have returned, but it can be easier to host pre-launch “fireside chats” virtually with a targeted group of buyers in any given process. The ability to create more connectivity early on in a process has become important in a crowded field of
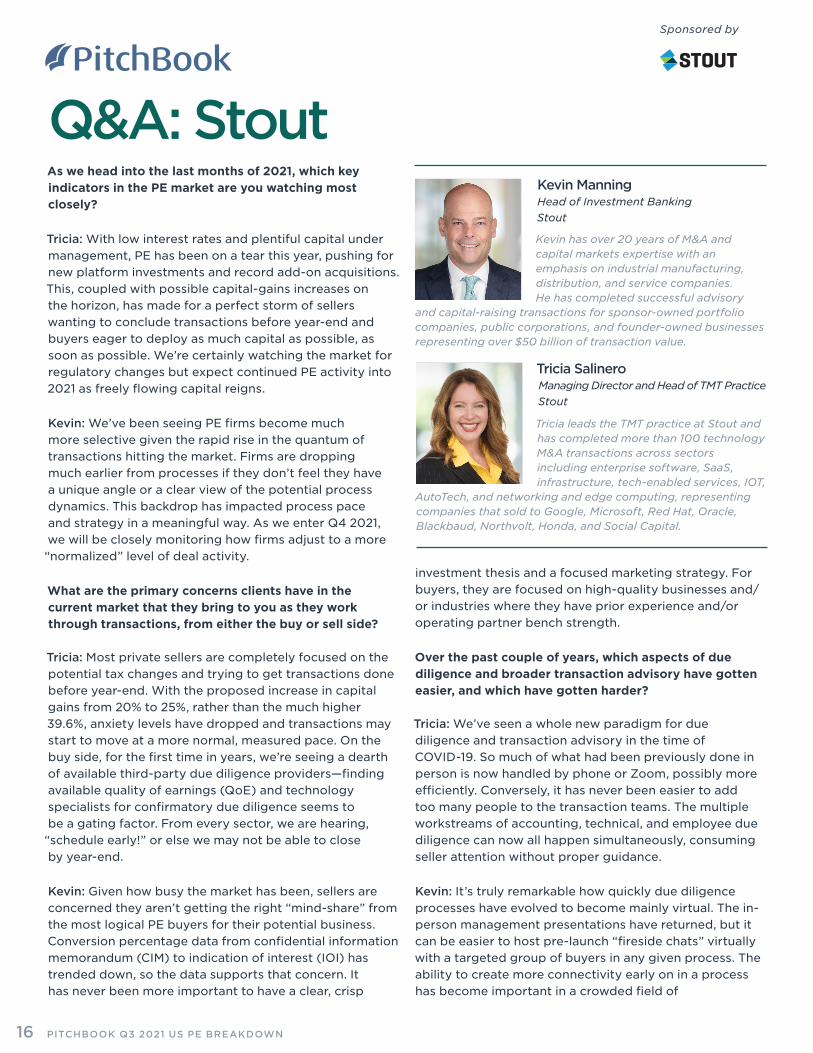
Kevin has over 20 years of M&A and capital markets expertise with an emphasis on industrial manufacturing, distribution, and service companies. He has completed successful advisory
and capital-raising transactions for sponsor-owned portfolio companies, public corporations, and founder-owned businesses representing over $50 billion of transaction value.
Kevin Manning Head of Investment Banking Stout
Tricia leads the TMT practice at Stout and has completed more than 100 technology M&A transactions across sectors including enterprise software, SaaS, infrastructure, tech-enabled services, IOT,
AutoTech, and networking and edge computing, representing companies that sold to Google, Microsoft, Red Hat, Oracle, Blackbaud, Northvolt, Honda, and Social Capital.
Tricia Salinero Managing Director and Head of TMT Practice Stout
Sponsored by
PITCHBOOK Q3 2021 US PE BREAKDOWN16
Sponsored by
Q&A: Stout
deals. Scheduling in-person meetings when needed has become more challenging given how jammed everyone’s schedules have become with the expansion of virtual diligence—“everyone is stacked up almost every day.”
Given the current dealmaking environment, which risks are underrated by PE fund managers that they and their prospective portfolio companies should be monitoring?
Tricia: We would argue that every PE fund manager should take a second and third look at net working capital (NWC) across the portfolio and particularly in targeted acquisitions. COVID-19 bumps in revenue, inventory and supply-chain issues, use of PPP funds, and signing of multiyear contracts with cash paid upfront have all distorted NWC in ways that impact the dealmaking process. While there’s always arm-wrestling over these items close to transaction completion, it’s worthwhile to look back at historical levels, pre-pandemic.
Kevin: Evaluating a normalized level of earnings has become even more complex given the pandemic backdrop. Yes, there are COVID-19 bumps to analyze—but there are also counterbalancing COVID-19 add-backs, medium- and longer-term implications on numerous end-market drivers for every business, employee insurance cost implications, employee availability concerns as it relates to supporting strategic growth initiatives, and supply-chain constraints and/or pricing volatility given international shipping challenges. All of these factors are also drivers of any debt underwriting process, so we’ve seen an even wider range of leverage availability due to these complexities. Therefore, casting a wider net from a financing perspective is important.
From a sector perspective, where do you see the most potential for dealmaking that is not yet taking place, and why?
Tricia: PitchBook estimates that the $50 billion digital software market will grow to $120 billion by 2025. This is a highly fragmented market, where the switching costs have traditionally been low. However, in the last few years, many of these companies have found ways to increase their customer stickiness, improve growth in recurring revenue models, and prove ROI. We see an incredible opportunity for sponsors to roll up and aggregate enterprise revenue in this market. To date, there has been a lack of middle-market strategics to act as the center of gravity for smaller companies.
Kevin: We are seeing a rise in activity related to anything service-oriented. Many of these businesses are localized or regional and typically have a repeatable and/or recurring theme to their revenues and earnings. Service roll-up strategies aren’t new, but the breadth of those types of businesses that are being evaluated has expanded dramatically. Beyond services, technology, healthcare, e-commerce, and food & beverage-related businesses that provide a “new, value-added” capability are unique opportunities that should drive significant interest for the foreseeable future.
It appears there are still significant shortages in various supply chains, potentially due to the unique confluence of shocks stemming from adverse weather and the COVID-19 pandemic—how have you noticed these affecting clients across different sectors?
Tricia: For hardware-related clients in particular, those shortages are rippling through the profit and loss statement (P&L) and balance sheet and into the dealmaking process, resulting in heightened attention on NWC. For example, we have a client now that is stockpiling inventory in response to suppliers asking for large preorders, as well as long lead times. The NWC analysis not only has to consider the COVID-19 bump in business, but also the result of a positive purchase price adjustment as the extra inventory increases asset value. On the flip side, another client predicts that the inventory shortages will delay installation and implementation, potentially pushing out revenue recognition by two quarters and hurting the bottom line.
Kevin: We’ve seen a real focus on financing a breadth of reshoring opportunities, given the reality of the supply-chain shortages many industries are facing. With significant advancements in automation, numerous industries are reconsidering the economic benefits of strategic domestic production capabilities versus foreign supply-chain dependencies. These potential investments take many years before they result in meaningful impact—in the meantime, companies are also proactively looking at other ways to diversify their supply base. Ultimately, even if the supply-chain shocks subside, we expect a greater emphasis on geographic diversity when it comes to supply-chain concentration issues.
PITCHBOOK Q3 2021 US PE BREAKDOWN17
Sponsored by
Exits
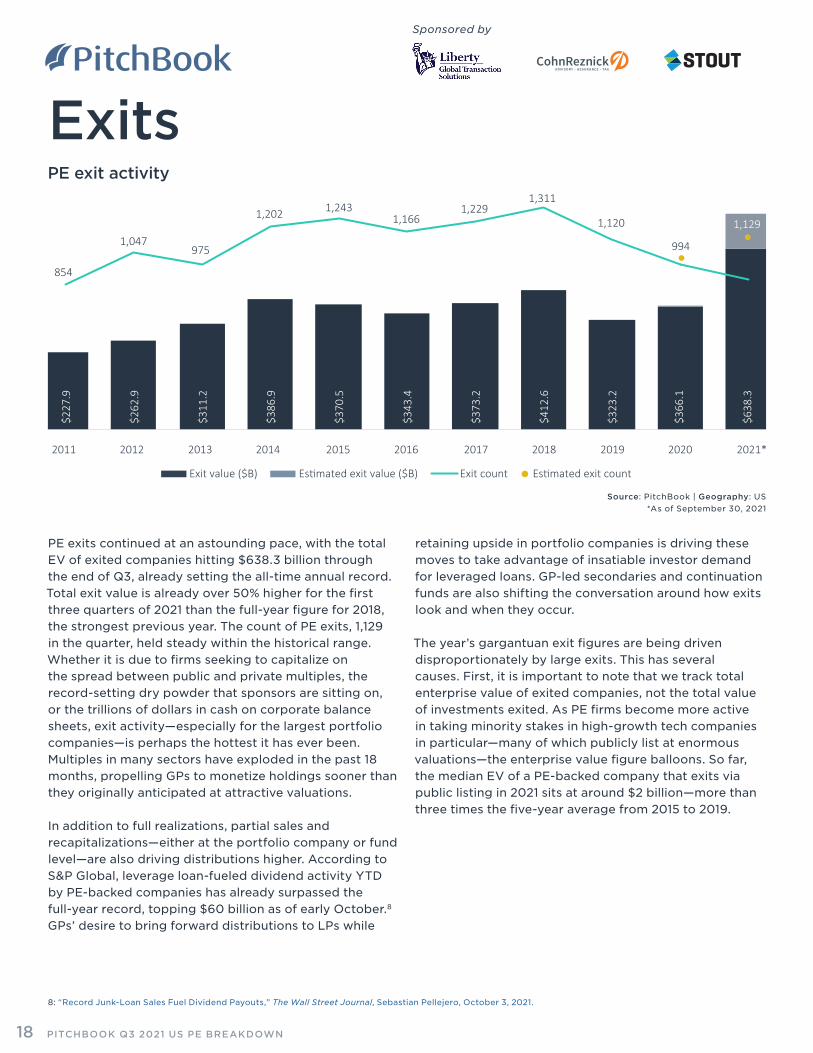
PE exits continued at an astounding pace, with the total EV of exited companies hitting $638.3 billion through the end of Q3, already setting the all-time annual record. Total exit value is already over 50% higher for the first three quarters of 2021 than the full-year figure for 2018, the strongest previous year. The count of PE exits, 1,129 in the quarter, held steady within the historical range. Whether it is due to firms seeking to capitalize on the spread between public and private multiples, the record-setting dry powder that sponsors are sitting on, or the trillions of dollars in cash on corporate balance sheets, exit activity—especially for the largest portfolio companies—is perhaps the hottest it has ever been. Multiples in many sectors have exploded in the past 18 months, propelling GPs to monetize holdings sooner than they originally anticipated at attractive valuations.
In addition to full realizations, partial sales and recapitalizations—either at the portfolio company or fund level—are also driving distributions higher. According to S&P Global, leverage loan-fueled dividend activity YTD by PE-backed companies has already surpassed the full-year record, topping $60 billion as of early October.8 GPs’ desire to bring forward distributions to LPs while
$227
.9
$262
.9
$311
.2
$386
.9
$370
.5
$343
.4
$373
.2
$412
.6
$323
.2
$366
.1
$638
.3
854
1,047975
1,202 1,2431,166
1,2291,311
1,120
994
1,129
2011 2012 2013 2014 2015 2016 2017 2018 2019 2020 2021*
Exit value ($B) Estimated exit value ($B) Exit count Estimated exit count
PE exit activity
Source: PitchBook | Geography: US *As of September 30, 2021
retaining upside in portfolio companies is driving these moves to take advantage of insatiable investor demand for leveraged loans. GP-led secondaries and continuation funds are also shifting the conversation around how exits look and when they occur.
The year’s gargantuan exit figures are being driven disproportionately by large exits. This has several causes. First, it is important to note that we track total enterprise value of exited companies, not the total value of investments exited. As PE firms become more active in taking minority stakes in high-growth tech companies in particular—many of which publicly list at enormous valuations—the enterprise value figure balloons. So far, the median EV of a PE-backed company that exits via public listing in 2021 sits at around $2 billion—more than three times the five-year average from 2015 to 2019.
8: “Record Junk-Loan Sales Fuel Dividend Payouts,” The Wall Street Journal, Sebastian Pellejero, October 3, 2021.
PITCHBOOK Q3 2021 US PE BREAKDOWN18
Sponsored by
Exits
$73.
1 $29.
5
$109
.4
$86.
6
$43.
5 $36.
8
$43.
4
$52.
3 $35.
2
$121
.7
$238
.6
3943
70
4943
5459
32
56
104
2011
2012
2013
2014
2015
2016
2017
2018
2019
2020
2021
*
Exit value ($B) Exit count
77
PE public listing exit activity
12.8x
12.8x
20.0x18.0x
0x
4x
8x
12x
16x
20x
24x
2011
2012
2013
2014
2015
2016
2017
2018
2019
2020
2021
*
PE buyout EV/EBITDA (median)S&P 500 ex financials EV/EBITDA
Median PE buyout versus S&P 500 multiples
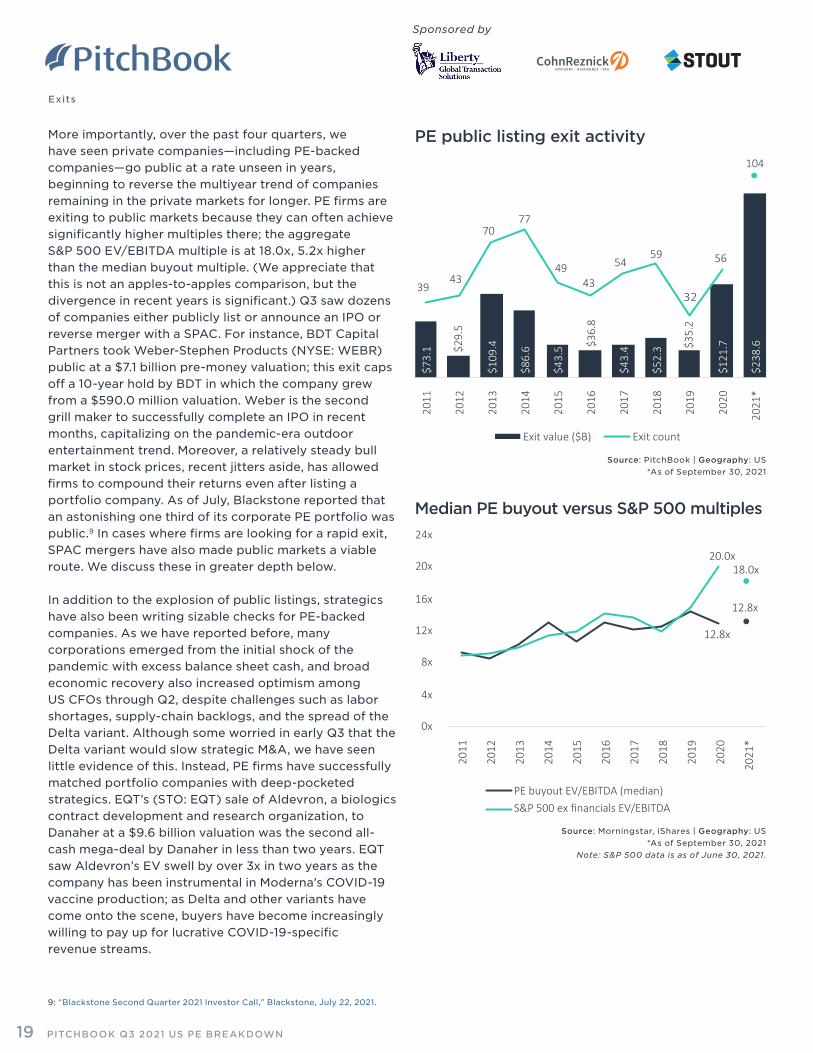
More importantly, over the past four quarters, we have seen private companies—including PE-backed companies—go public at a rate unseen in years, beginning to reverse the multiyear trend of companies remaining in the private markets for longer. PE firms are exiting to public markets because they can often achieve significantly higher multiples there; the aggregate S&P 500 EV/EBITDA multiple is at 18.0x, 5.2x higher than the median buyout multiple. (We appreciate that this is not an apples-to-apples comparison, but the divergence in recent years is significant.) Q3 saw dozens of companies either publicly list or announce an IPO or reverse merger with a SPAC. For instance, BDT Capital Partners took Weber-Stephen Products (NYSE: WEBR) public at a $7.1 billion pre-money valuation; this exit caps off a 10-year hold by BDT in which the company grew from a $590.0 million valuation. Weber is the second grill maker to successfully complete an IPO in recent months, capitalizing on the pandemic-era outdoor entertainment trend. Moreover, a relatively steady bull market in stock prices, recent jitters aside, has allowed firms to compound their returns even after listing a portfolio company. As of July, Blackstone reported that an astonishing one third of its corporate PE portfolio was public.9 In cases where firms are looking for a rapid exit, SPAC mergers have also made public markets a viable route. We discuss these in greater depth below.
In addition to the explosion of public listings, strategics have also been writing sizable checks for PE-backed companies. As we have reported before, many corporations emerged from the initial shock of the pandemic with excess balance sheet cash, and broad economic recovery also increased optimism among US CFOs through Q2, despite challenges such as labor shortages, supply-chain backlogs, and the spread of the Delta variant. Although some worried in early Q3 that the Delta variant would slow strategic M&A, we have seen little evidence of this. Instead, PE firms have successfully matched portfolio companies with deep-pocketed strategics. EQT’s (STO: EQT) sale of Aldevron, a biologics contract development and research organization, to Danaher at a $9.6 billion valuation was the second all-cash mega-deal by Danaher in less than two years. EQT saw Aldevron’s EV swell by over 3x in two years as the company has been instrumental in Moderna’s COVID-19 vaccine production; as Delta and other variants have come onto the scene, buyers have become increasingly willing to pay up for lucrative COVID-19-specific revenue streams.
9: “Blackstone Second Quarter 2021 Investor Call,” Blackstone, July 22, 2021.
Source: PitchBook | Geography: US *As of September 30, 2021
Source: Morningstar, iShares | Geography: US *As of September 30, 2021
Note: S&P 500 data is as of June 30, 2021.
PITCHBOOK Q3 2021 US PE BREAKDOWN19
Sponsored by
Exits
$1,994.4
$0
$500
$1,000
$1,500
$2,000
$2,500
2011
2012
2013
2014
2015
2016
2017
2018
2019
2020
2021
*
US nonfinancial corporate balance sheet cash ($B)
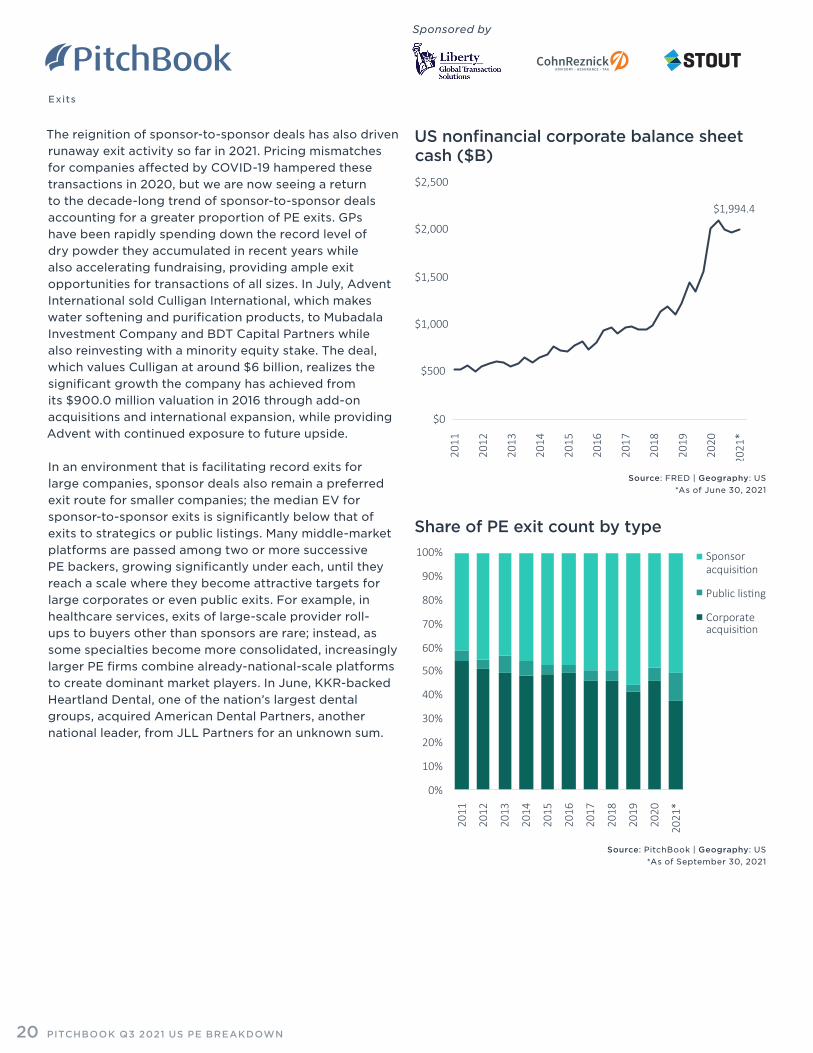
The reignition of sponsor-to-sponsor deals has also driven runaway exit activity so far in 2021. Pricing mismatches for companies affected by COVID-19 hampered these transactions in 2020, but we are now seeing a return to the decade-long trend of sponsor-to-sponsor deals accounting for a greater proportion of PE exits. GPs have been rapidly spending down the record level of dry powder they accumulated in recent years while also accelerating fundraising, providing ample exit opportunities for transactions of all sizes. In July, Advent International sold Culligan International, which makes water softening and purification products, to Mubadala Investment Company and BDT Capital Partners while also reinvesting with a minority equity stake. The deal, which values Culligan at around $6 billion, realizes the significant growth the company has achieved from its $900.0 million valuation in 2016 through add-on acquisitions and international expansion, while providing Advent with continued exposure to future upside.
In an environment that is facilitating record exits for large companies, sponsor deals also remain a preferred exit route for smaller companies; the median EV for sponsor-to-sponsor exits is significantly below that of exits to strategics or public listings. Many middle-market platforms are passed among two or more successive PE backers, growing significantly under each, until they reach a scale where they become attractive targets for large corporates or even public exits. For example, in healthcare services, exits of large-scale provider roll-ups to buyers other than sponsors are rare; instead, as some specialties become more consolidated, increasingly larger PE firms combine already-national-scale platforms to create dominant market players. In June, KKR-backed Heartland Dental, one of the nation’s largest dental groups, acquired American Dental Partners, another national leader, from JLL Partners for an unknown sum.
Source: FRED | Geography: US *As of June 30, 2021
0%
10%
20%
30%
40%
50%
60%
70%
80%
90%
100%
2011
2012
2013
2014
2015
2016
2017
2018
2019
2020
2021
*
Sponsoracquisition
Public listing
Corporateacquisition
Share of PE exit count by type
Source: PitchBook | Geography: US *As of September 30, 2021
PITCHBOOK Q3 2021 US PE BREAKDOWN20
Sponsored by
Exits
10.2 10.0
7.47.0
5.0 4.9
3.5 3.6
2.5 2.6
0
2
4
6
8
10
12
2011
2012
2013
2014
2015
2016
2017
2018
2019
2020
2021
*
Top Decile Top Quartile MedianLower Quartile Lower Decile
PE buyout holding period (years) by exit year
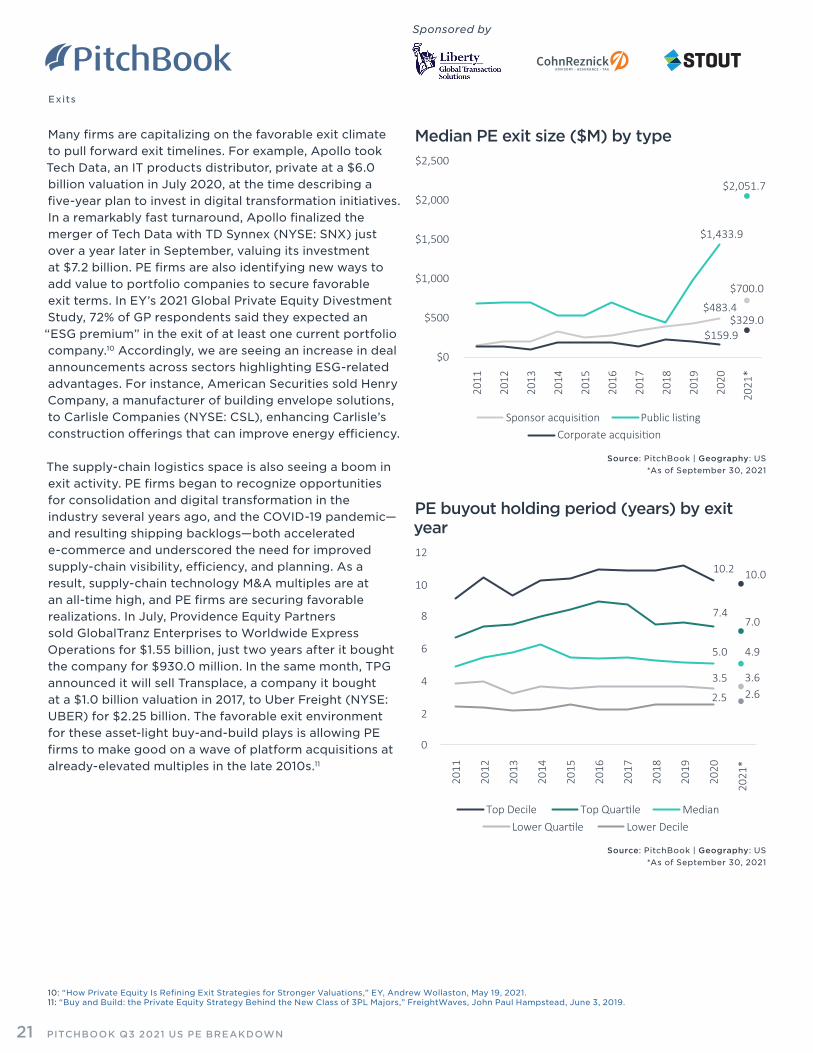
Many firms are capitalizing on the favorable exit climate to pull forward exit timelines. For example, Apollo took Tech Data, an IT products distributor, private at a $6.0 billion valuation in July 2020, at the time describing a five-year plan to invest in digital transformation initiatives. In a remarkably fast turnaround, Apollo finalized the merger of Tech Data with TD Synnex (NYSE: SNX) just over a year later in September, valuing its investment at $7.2 billion. PE firms are also identifying new ways to add value to portfolio companies to secure favorable exit terms. In EY’s 2021 Global Private Equity Divestment Study, 72% of GP respondents said they expected an “ESG premium” in the exit of at least one current portfolio company.10 Accordingly, we are seeing an increase in deal announcements across sectors highlighting ESG-related advantages. For instance, American Securities sold Henry Company, a manufacturer of building envelope solutions, to Carlisle Companies (NYSE: CSL), enhancing Carlisle’s construction offerings that can improve energy efficiency.
The supply-chain logistics space is also seeing a boom in exit activity. PE firms began to recognize opportunities for consolidation and digital transformation in the industry several years ago, and the COVID-19 pandemic—and resulting shipping backlogs—both accelerated e-commerce and underscored the need for improved supply-chain visibility, efficiency, and planning. As a result, supply-chain technology M&A multiples are at an all-time high, and PE firms are securing favorable realizations. In July, Providence Equity Partners sold GlobalTranz Enterprises to Worldwide Express Operations for $1.55 billion, just two years after it bought the company for $930.0 million. In the same month, TPG announced it will sell Transplace, a company it bought at a $1.0 billion valuation in 2017, to Uber Freight (NYSE: UBER) for $2.25 billion. The favorable exit environment for these asset-light buy-and-build plays is allowing PE firms to make good on a wave of platform acquisitions at already-elevated multiples in the late 2010s.11
10: “How Private Equity Is Refining Exit Strategies for Stronger Valuations,” EY, Andrew Wollaston, May 19, 2021. 11: “Buy and Build: the Private Equity Strategy Behind the New Class of 3PL Majors,” FreightWaves, John Paul Hampstead, June 3, 2019.
Source: PitchBook | Geography: US *As of September 30, 2021
$483.4
$700.0
$1,433.9
$2,051.7
$159.9$329.0
$0
$500
$1,000
$1,500
$2,000
$2,500
2011
2012
2013
2014
2015
2016
2017
2018
2019
2020
2021
*
Sponsor acquisition Public listingCorporate acquisition
Median PE exit size ($M) by type
Source: PitchBook | Geography: US *As of September 30, 2021
PITCHBOOK Q3 2021 US PE BREAKDOWN21
Sponsored by
Exits
0%
10%
20%
30%
40%
50%
60%
70%
80%
90%
100%
2011
2012
2013
2014
2015
2016
2017
2018
2019
2020
2021
*
$1B+
$500M-$1B
$100M-$500M
$25M-$100M
Under$25M
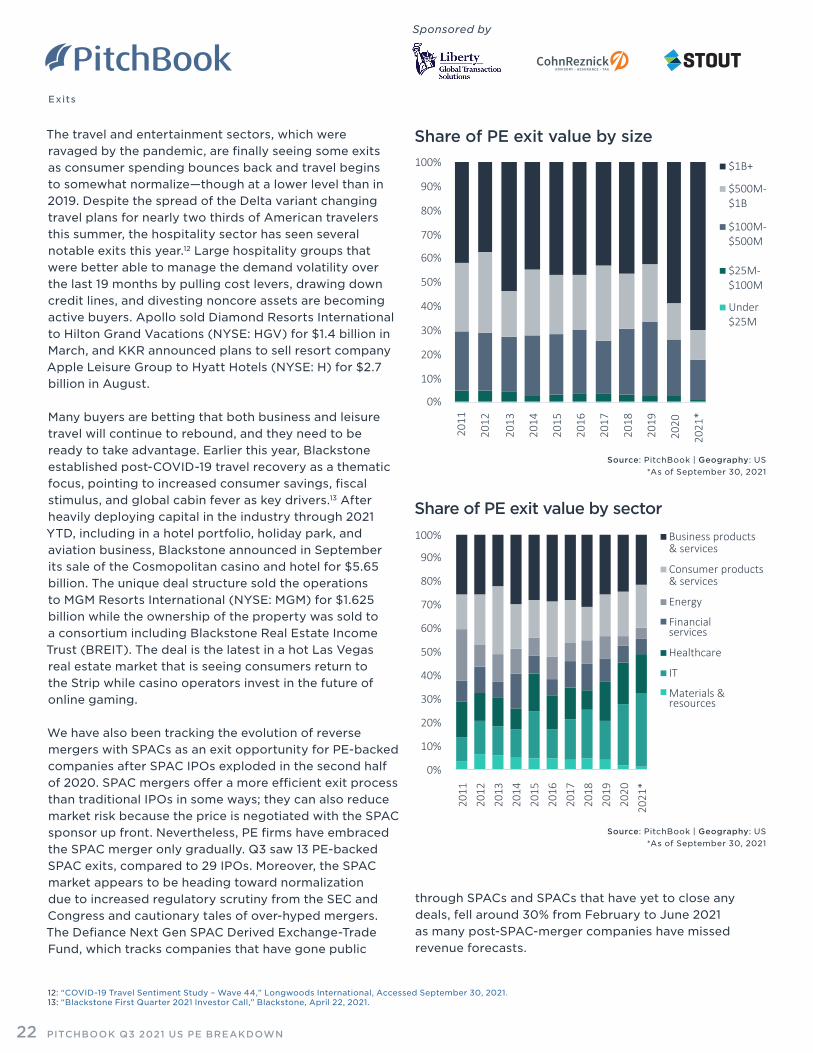
Share of PE exit value by size
0%
10%
20%
30%
40%
50%
60%
70%
80%
90%
100%
2011
2012
2013
2014
2015
2016
2017
2018
2019
2020
2021
*
Business products & services
Consumer products & services
Energy
Financialservices
Healthcare
IT
Materials &resources
Share of PE exit value by sector
The travel and entertainment sectors, which were ravaged by the pandemic, are finally seeing some exits as consumer spending bounces back and travel begins to somewhat normalize—though at a lower level than in 2019. Despite the spread of the Delta variant changing travel plans for nearly two thirds of American travelers this summer, the hospitality sector has seen several notable exits this year.12 Large hospitality groups that were better able to manage the demand volatility over the last 19 months by pulling cost levers, drawing down credit lines, and divesting noncore assets are becoming active buyers. Apollo sold Diamond Resorts International to Hilton Grand Vacations (NYSE: HGV) for $1.4 billion in March, and KKR announced plans to sell resort company Apple Leisure Group to Hyatt Hotels (NYSE: H) for $2.7 billion in August.
Many buyers are betting that both business and leisure travel will continue to rebound, and they need to be ready to take advantage. Earlier this year, Blackstone established post-COVID-19 travel recovery as a thematic focus, pointing to increased consumer savings, fiscal stimulus, and global cabin fever as key drivers.13 After heavily deploying capital in the industry through 2021 YTD, including in a hotel portfolio, holiday park, and aviation business, Blackstone announced in September its sale of the Cosmopolitan casino and hotel for $5.65 billion. The unique deal structure sold the operations to MGM Resorts International (NYSE: MGM) for $1.625 billion while the ownership of the property was sold to a consortium including Blackstone Real Estate Income Trust (BREIT). The deal is the latest in a hot Las Vegas real estate market that is seeing consumers return to the Strip while casino operators invest in the future of online gaming.
We have also been tracking the evolution of reverse mergers with SPACs as an exit opportunity for PE-backed companies after SPAC IPOs exploded in the second half of 2020. SPAC mergers offer a more efficient exit process than traditional IPOs in some ways; they can also reduce market risk because the price is negotiated with the SPAC sponsor up front. Nevertheless, PE firms have embraced the SPAC merger only gradually. Q3 saw 13 PE-backed SPAC exits, compared to 29 IPOs. Moreover, the SPAC market appears to be heading toward normalization due to increased regulatory scrutiny from the SEC and Congress and cautionary tales of over-hyped mergers. The Defiance Next Gen SPAC Derived Exchange-Trade Fund, which tracks companies that have gone public
12: “COVID-19 Travel Sentiment Study – Wave 44,” Longwoods International, Accessed September 30, 2021. 13: “Blackstone First Quarter 2021 Investor Call,” Blackstone, April 22, 2021.
through SPACs and SPACs that have yet to close any deals, fell around 30% from February to June 2021 as many post-SPAC-merger companies have missed revenue forecasts.
Source: PitchBook | Geography: US *As of September 30, 2021
Source: PitchBook | Geography: US *As of September 30, 2021
PITCHBOOK Q3 2021 US PE BREAKDOWN22
Sponsored by
Exits
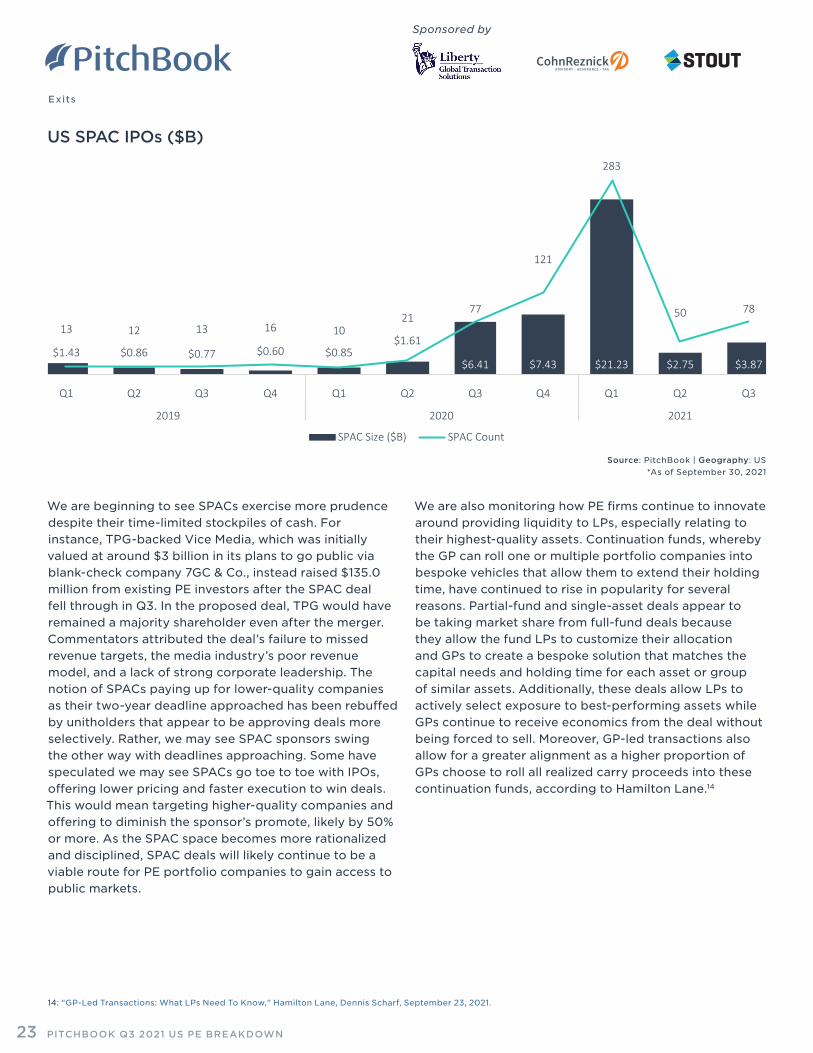
$1.43 $0.86 $0.77 $0.60 $0.85$1.61
$6.41 $7.43 $21.23 $2.75 $3.87
13 12 13 16 1021
77
121
283
50 78
Q1 Q2 Q3 Q4 Q1 Q2 Q3 Q4 Q1 Q2 Q3
2019 2020 2021
SPAC Size ($B) SPAC Count
US SPAC IPOs ($B)
We are beginning to see SPACs exercise more prudence despite their time-limited stockpiles of cash. For instance, TPG-backed Vice Media, which was initially valued at around $3 billion in its plans to go public via blank-check company 7GC & Co., instead raised $135.0 million from existing PE investors after the SPAC deal fell through in Q3. In the proposed deal, TPG would have remained a majority shareholder even after the merger. Commentators attributed the deal’s failure to missed revenue targets, the media industry’s poor revenue model, and a lack of strong corporate leadership. The notion of SPACs paying up for lower-quality companies as their two-year deadline approached has been rebuffed by unitholders that appear to be approving deals more selectively. Rather, we may see SPAC sponsors swing the other way with deadlines approaching. Some have speculated we may see SPACs go toe to toe with IPOs, offering lower pricing and faster execution to win deals. This would mean targeting higher-quality companies and offering to diminish the sponsor’s promote, likely by 50% or more. As the SPAC space becomes more rationalized and disciplined, SPAC deals will likely continue to be a viable route for PE portfolio companies to gain access to public markets.
We are also monitoring how PE firms continue to innovate around providing liquidity to LPs, especially relating to their highest-quality assets. Continuation funds, whereby the GP can roll one or multiple portfolio companies into bespoke vehicles that allow them to extend their holding time, have continued to rise in popularity for several reasons. Partial-fund and single-asset deals appear to be taking market share from full-fund deals because they allow the fund LPs to customize their allocation and GPs to create a bespoke solution that matches the capital needs and holding time for each asset or group of similar assets. Additionally, these deals allow LPs to actively select exposure to best-performing assets while GPs continue to receive economics from the deal without being forced to sell. Moreover, GP-led transactions also allow for a greater alignment as a higher proportion of GPs choose to roll all realized carry proceeds into these continuation funds, according to Hamilton Lane.14
14: “GP-Led Transactions: What LPs Need To Know,” Hamilton Lane, Dennis Scharf, September 23, 2021.
Source: PitchBook | Geography: US *As of September 30, 2021
PITCHBOOK Q3 2021 US PE BREAKDOWN23
Sponsored by
Exits
0x
1x
2x
3x
4x
5x
6x
7x
Single asset deals Multi asset (partial fund) Multi asset (full fund)
Assets Fund
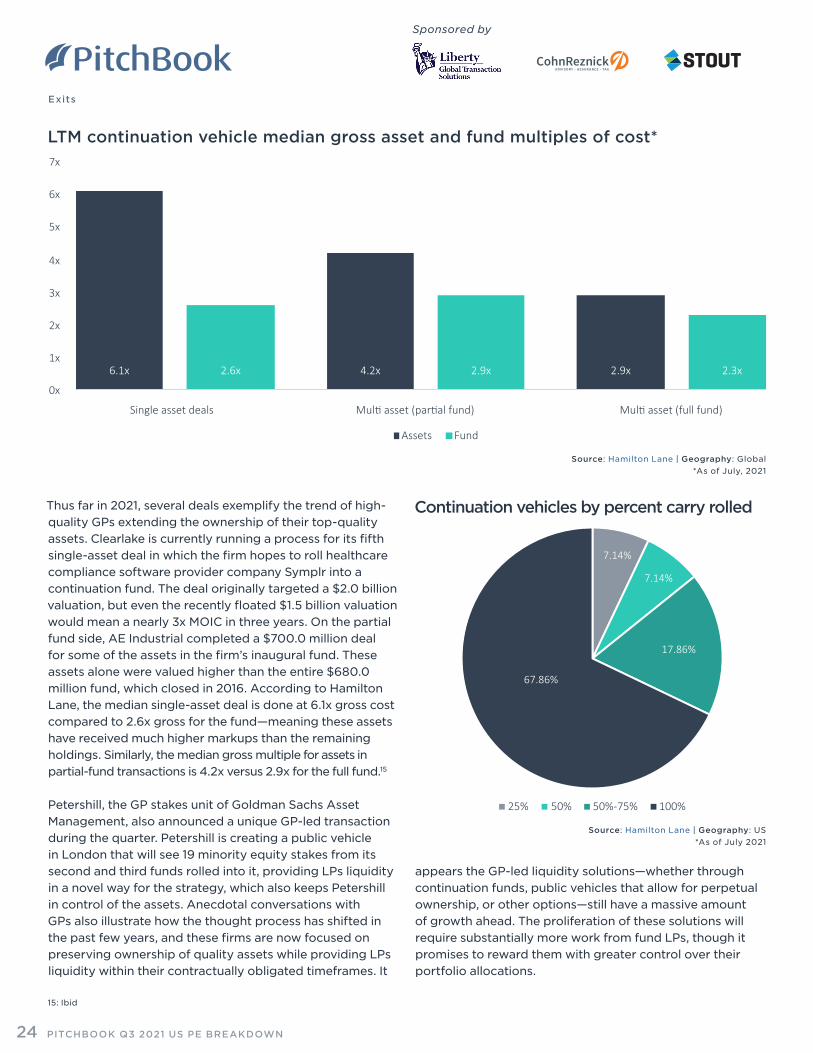
6.1x 2.6x 4.2x 2.9x 2.9x 2.3x
LTM continuation vehicle median gross asset and fund multiples of cost*
Source: Hamilton Lane | Geography: Global *As of July, 2021
Thus far in 2021, several deals exemplify the trend of high-quality GPs extending the ownership of their top-quality assets. Clearlake is currently running a process for its fifth single-asset deal in which the firm hopes to roll healthcare compliance software provider company Symplr into a continuation fund. The deal originally targeted a $2.0 billion valuation, but even the recently floated $1.5 billion valuation would mean a nearly 3x MOIC in three years. On the partial fund side, AE Industrial completed a $700.0 million deal for some of the assets in the firm’s inaugural fund. These assets alone were valued higher than the entire $680.0 million fund, which closed in 2016. According to Hamilton Lane, the median single-asset deal is done at 6.1x gross cost compared to 2.6x gross for the fund—meaning these assets have received much higher markups than the remaining holdings. Similarly, the median gross multiple for assets in partial-fund transactions is 4.2x versus 2.9x for the full fund.15
Petershill, the GP stakes unit of Goldman Sachs Asset Management, also announced a unique GP-led transaction during the quarter. Petershill is creating a public vehicle in London that will see 19 minority equity stakes from its second and third funds rolled into it, providing LPs liquidity in a novel way for the strategy, which also keeps Petershill in control of the assets. Anecdotal conversations with GPs also illustrate how the thought process has shifted in the past few years, and these firms are now focused on preserving ownership of quality assets while providing LPs liquidity within their contractually obligated timeframes. It
appears the GP-led liquidity solutions—whether through continuation funds, public vehicles that allow for perpetual ownership, or other options—still have a massive amount of growth ahead. The proliferation of these solutions will require substantially more work from fund LPs, though it promises to reward them with greater control over their portfolio allocations.
15: Ibid
7.14%
7.14%
17.86%
67.86%
25% 50% 50%-75% 100%
Continuation vehicles by percent carry rolled
Source: Hamilton Lane | Geography: US *As of July 2021
PITCHBOOK Q3 2021 US PE BREAKDOWN24

Sponsored by
Quality of Pricing® (QoP®) is a unique service dedicated to quickly identifying margin improvement opportunities and risks to provide the clarity and confidence you seek throughout the transaction process.
Learn more at www.INSIGHT2PROFIT.com
QUALITY OF PRICING.HOW YOUR HUNCH BECOMES A SURE THING.
OPPORTUNITY, SEIZED.
Sponsored by
Fundraising and performance
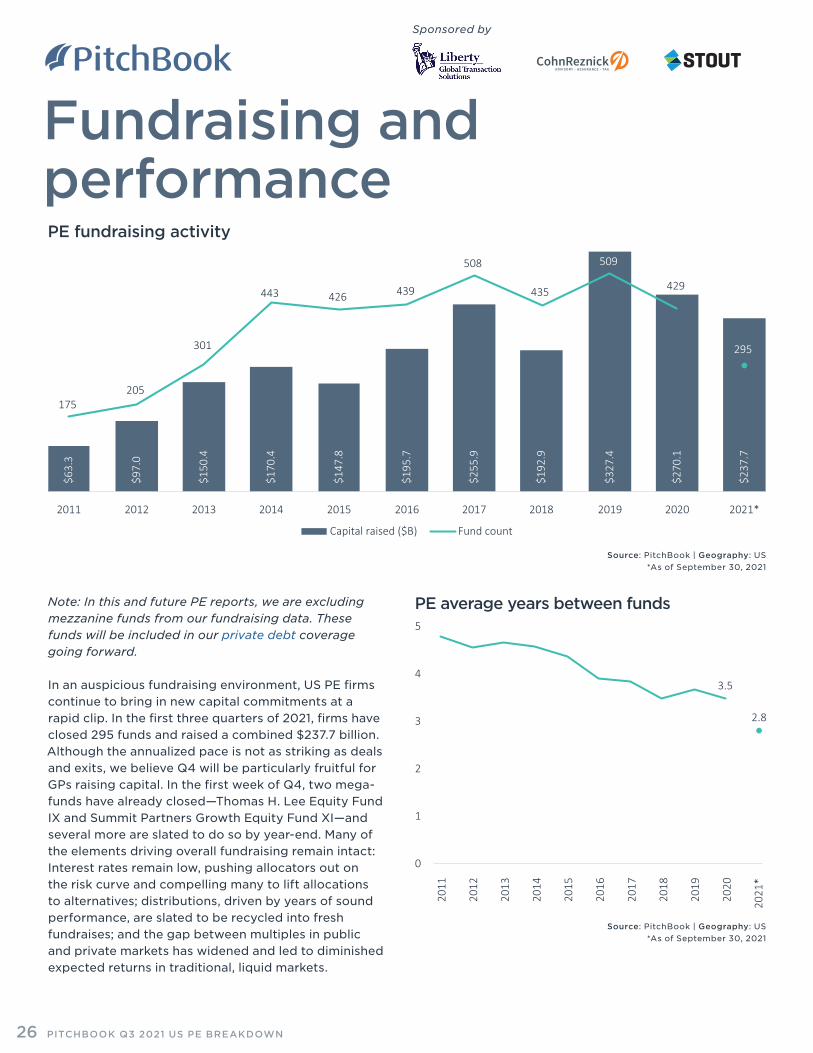
Note: In this and future PE reports, we are excluding mezzanine funds from our fundraising data. These funds will be included in our private debt coverage going forward.
In an auspicious fundraising environment, US PE firms continue to bring in new capital commitments at a rapid clip. In the first three quarters of 2021, firms have closed 295 funds and raised a combined $237.7 billion. Although the annualized pace is not as striking as deals and exits, we believe Q4 will be particularly fruitful for GPs raising capital. In the first week of Q4, two mega-funds have already closed—Thomas H. Lee Equity Fund IX and Summit Partners Growth Equity Fund XI—and several more are slated to do so by year-end. Many of the elements driving overall fundraising remain intact: Interest rates remain low, pushing allocators out on the risk curve and compelling many to lift allocations to alternatives; distributions, driven by years of sound performance, are slated to be recycled into fresh fundraises; and the gap between multiples in public and private markets has widened and led to diminished expected returns in traditional, liquid markets.
$63.
3
$97.
0
$150
.4
$170
.4
$147
.8
$195
.7
$255
.9
$192
.9
$327
.4
$270
.1
$237
.7
175 205
301
443 426 439
508
435
509
429
295
2011 2012 2013 2014 2015 2016 2017 2018 2019 2020 2021*
Capital raised ($B) Fund count
PE fundraising activity
0
1
2
3
4
5
2011
2012
2013
2014
2015
2016
2017
2018
2019
2020
2021
*
2.8
3.5
PE average years between funds
Source: PitchBook | Geography: US *As of September 30, 2021
Source: PitchBook | Geography: US *As of September 30, 2021
PITCHBOOK Q3 2021 US PE BREAKDOWN26
Sponsored by
Fundraising and performance
0%
10%
20%
30%
40%
50%
60%
70%
80%
90%
2011
2012
2013
2014
2015
2016
2017
2018
2019
2020
2021
*51
.5%
47.7
%
% of funds that stepped up from the previous fund Median % step-up from previous fund
Proportion of PE step-up funds and median size increase
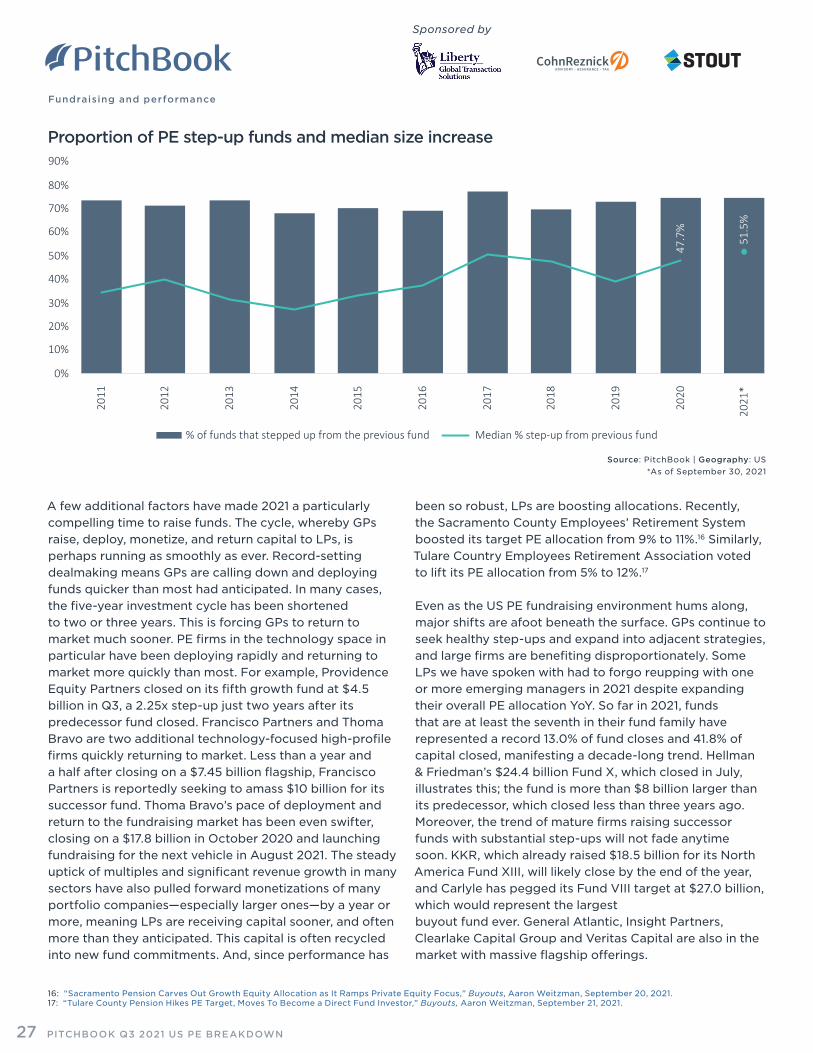
A few additional factors have made 2021 a particularly compelling time to raise funds. The cycle, whereby GPs raise, deploy, monetize, and return capital to LPs, is perhaps running as smoothly as ever. Record-setting dealmaking means GPs are calling down and deploying funds quicker than most had anticipated. In many cases, the five-year investment cycle has been shortened to two or three years. This is forcing GPs to return to market much sooner. PE firms in the technology space in particular have been deploying rapidly and returning to market more quickly than most. For example, Providence Equity Partners closed on its fifth growth fund at $4.5 billion in Q3, a 2.25x step-up just two years after its predecessor fund closed. Francisco Partners and Thoma Bravo are two additional technology-focused high-profile firms quickly returning to market. Less than a year and a half after closing on a $7.45 billion flagship, Francisco Partners is reportedly seeking to amass $10 billion for its successor fund. Thoma Bravo’s pace of deployment and return to the fundraising market has been even swifter, closing on a $17.8 billion in October 2020 and launching fundraising for the next vehicle in August 2021. The steady uptick of multiples and significant revenue growth in many sectors have also pulled forward monetizations of many portfolio companies—especially larger ones—by a year or more, meaning LPs are receiving capital sooner, and often more than they anticipated. This capital is often recycled into new fund commitments. And, since performance has
16: “Sacramento Pension Carves Out Growth Equity Allocation as It Ramps Private Equity Focus,” Buyouts, Aaron Weitzman, September 20, 2021.17: “Tulare County Pension Hikes PE Target, Moves To Become a Direct Fund Investor,” Buyouts, Aaron Weitzman, September 21, 2021.
Source: PitchBook | Geography: US *As of September 30, 2021
been so robust, LPs are boosting allocations. Recently, the Sacramento County Employees’ Retirement System boosted its target PE allocation from 9% to 11%.16 Similarly, Tulare Country Employees Retirement Association voted to lift its PE allocation from 5% to 12%.17
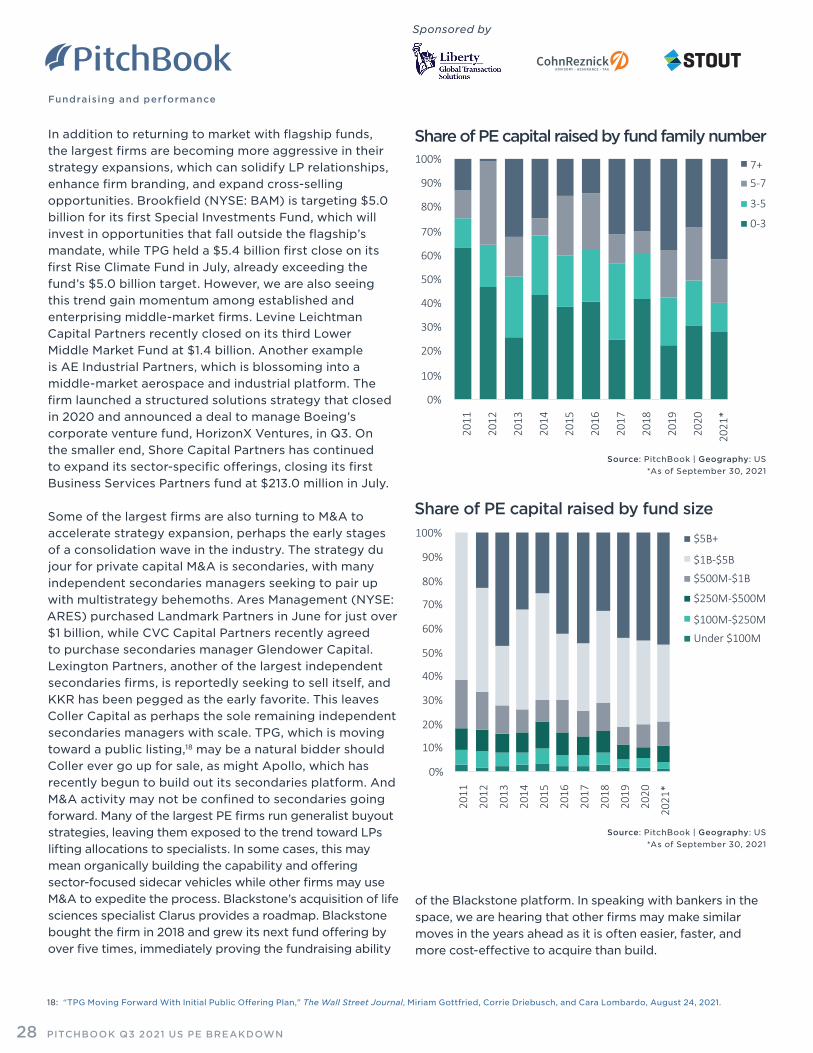
Even as the US PE fundraising environment hums along, major shifts are afoot beneath the surface. GPs continue to seek healthy step-ups and expand into adjacent strategies, and large firms are benefiting disproportionately. Some LPs we have spoken with had to forgo reupping with one or more emerging managers in 2021 despite expanding their overall PE allocation YoY. So far in 2021, funds that are at least the seventh in their fund family have represented a record 13.0% of fund closes and 41.8% of capital closed, manifesting a decade-long trend. Hellman & Friedman’s $24.4 billion Fund X, which closed in July, illustrates this; the fund is more than $8 billion larger than its predecessor, which closed less than three years ago. Moreover, the trend of mature firms raising successor funds with substantial step-ups will not fade anytime soon. KKR, which already raised $18.5 billion for its North America Fund XIII, will likely close by the end of the year, and Carlyle has pegged its Fund VIII target at $27.0 billion, which would represent the largestbuyout fund ever. General Atlantic, Insight Partners, Clearlake Capital Group and Veritas Capital are also in the market with massive flagship offerings.
PITCHBOOK Q3 2021 US PE BREAKDOWN27
Sponsored by
Fundraising and performance
0%
10%
20%
30%
40%
50%
60%
70%
80%
90%
100%
2011
2012
2013
2014
2015
2016
2017
2018
2019
2020
2021
*
$5B+
$1B-$5B
$500M-$1B
$250M-$500M
$100M-$250M
Under $100M
Share of PE capital raised by fund size
In addition to returning to market with flagship funds, the largest firms are becoming more aggressive in their strategy expansions, which can solidify LP relationships, enhance firm branding, and expand cross-selling opportunities. Brookfield (NYSE: BAM) is targeting $5.0 billion for its first Special Investments Fund, which will invest in opportunities that fall outside the flagship’s mandate, while TPG held a $5.4 billion first close on its first Rise Climate Fund in July, already exceeding the fund’s $5.0 billion target. However, we are also seeing this trend gain momentum among established and enterprising middle-market firms. Levine Leichtman Capital Partners recently closed on its third Lower Middle Market Fund at $1.4 billion. Another example is AE Industrial Partners, which is blossoming into a middle-market aerospace and industrial platform. The firm launched a structured solutions strategy that closed in 2020 and announced a deal to manage Boeing’s corporate venture fund, HorizonX Ventures, in Q3. On the smaller end, Shore Capital Partners has continued to expand its sector-specific offerings, closing its first Business Services Partners fund at $213.0 million in July.
Some of the largest firms are also turning to M&A to accelerate strategy expansion, perhaps the early stages of a consolidation wave in the industry. The strategy du jour for private capital M&A is secondaries, with many independent secondaries managers seeking to pair up with multistrategy behemoths. Ares Management (NYSE: ARES) purchased Landmark Partners in June for just over $1 billion, while CVC Capital Partners recently agreed to purchase secondaries manager Glendower Capital. Lexington Partners, another of the largest independent secondaries firms, is reportedly seeking to sell itself, and KKR has been pegged as the early favorite. This leaves Coller Capital as perhaps the sole remaining independent secondaries managers with scale. TPG, which is moving toward a public listing,18 may be a natural bidder should Coller ever go up for sale, as might Apollo, which has recently begun to build out its secondaries platform. And M&A activity may not be confined to secondaries going forward. Many of the largest PE firms run generalist buyout strategies, leaving them exposed to the trend toward LPs lifting allocations to specialists. In some cases, this may mean organically building the capability and offering sector-focused sidecar vehicles while other firms may use M&A to expedite the process. Blackstone’s acquisition of life sciences specialist Clarus provides a roadmap. Blackstone bought the firm in 2018 and grew its next fund offering by over five times, immediately proving the fundraising ability
of the Blackstone platform. In speaking with bankers in the space, we are hearing that other firms may make similar moves in the years ahead as it is often easier, faster, and more cost-effective to acquire than build.
Source: PitchBook | Geography: US *As of September 30, 2021
18: “TPG Moving Forward With Initial Public Offering Plan,” The Wall Street Journal, Miriam Gottfried, Corrie Driebusch, and Cara Lombardo, August 24, 2021.
0%
10%
20%
30%
40%
50%
60%
70%
80%
90%
100%
2011
2012
2013
2014
2015
2016
2017
2018
2019
2020
2021
*
7+
5-7
3-5
0-3
Share of PE capital raised by fund family number
Source: PitchBook | Geography: US *As of September 30, 2021
PITCHBOOK Q3 2021 US PE BREAKDOWN28
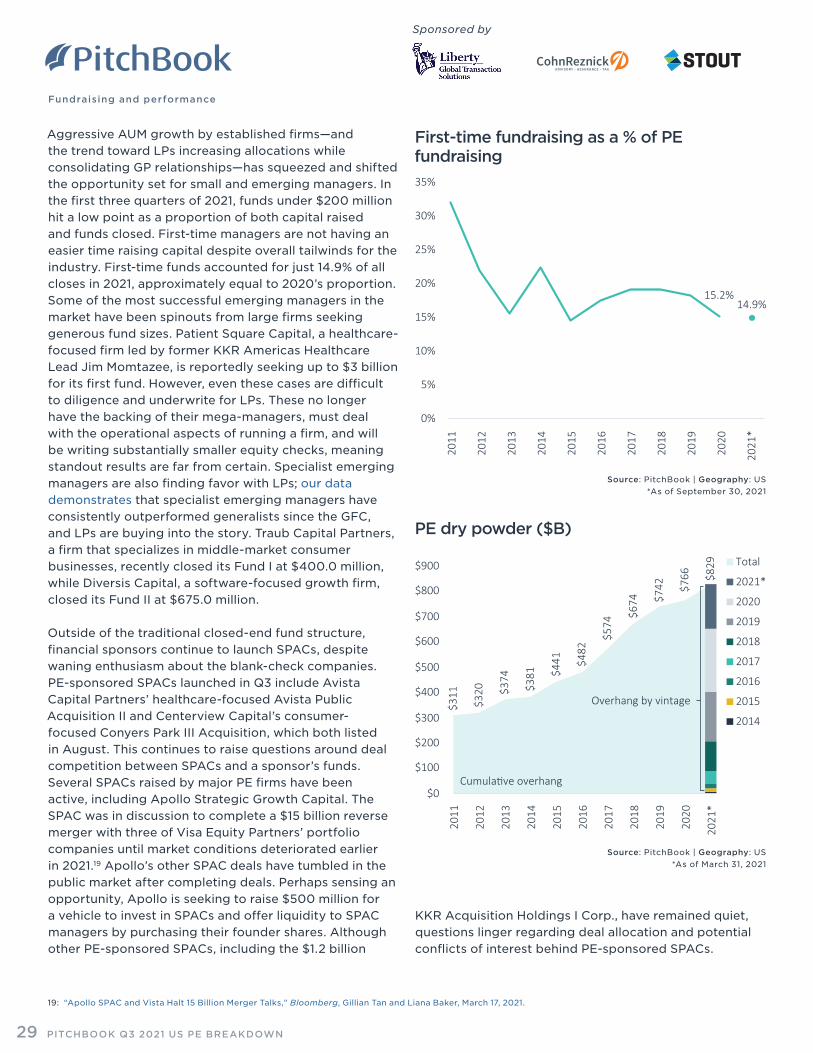
Sponsored by
Fundraising and performance
15.2%14.9%
0%
5%
10%
15%
20%
25%
30%
35%
2011
2012
2013
2014
2015
2016
2017
2018
2019
2020
2021
*
First-time fundraising as a % of PE fundraising
Aggressive AUM growth by established firms—and the trend toward LPs increasing allocations while consolidating GP relationships—has squeezed and shifted the opportunity set for small and emerging managers. In the first three quarters of 2021, funds under $200 million hit a low point as a proportion of both capital raised and funds closed. First-time managers are not having an easier time raising capital despite overall tailwinds for the industry. First-time funds accounted for just 14.9% of all closes in 2021, approximately equal to 2020’s proportion. Some of the most successful emerging managers in the market have been spinouts from large firms seeking generous fund sizes. Patient Square Capital, a healthcare-focused firm led by former KKR Americas Healthcare Lead Jim Momtazee, is reportedly seeking up to $3 billion for its first fund. However, even these cases are difficult to diligence and underwrite for LPs. These no longer have the backing of their mega-managers, must deal with the operational aspects of running a firm, and will be writing substantially smaller equity checks, meaning standout results are far from certain. Specialist emerging managers are also finding favor with LPs; our data demonstrates that specialist emerging managers have consistently outperformed generalists since the GFC, and LPs are buying into the story. Traub Capital Partners, a firm that specializes in middle-market consumer businesses, recently closed its Fund I at $400.0 million, while Diversis Capital, a software-focused growth firm, closed its Fund II at $675.0 million.
Outside of the traditional closed-end fund structure, financial sponsors continue to launch SPACs, despite waning enthusiasm about the blank-check companies. PE-sponsored SPACs launched in Q3 include Avista Capital Partners’ healthcare-focused Avista Public Acquisition II and Centerview Capital’s consumer-focused Conyers Park III Acquisition, which both listed in August. This continues to raise questions around deal competition between SPACs and a sponsor’s funds. Several SPACs raised by major PE firms have been active, including Apollo Strategic Growth Capital. The SPAC was in discussion to complete a $15 billion reverse merger with three of Visa Equity Partners’ portfolio companies until market conditions deteriorated earlier in 2021.19 Apollo’s other SPAC deals have tumbled in the public market after completing deals. Perhaps sensing an opportunity, Apollo is seeking to raise $500 million for a vehicle to invest in SPACs and offer liquidity to SPAC managers by purchasing their founder shares. Although other PE-sponsored SPACs, including the $1.2 billion
KKR Acquisition Holdings I Corp., have remained quiet, questions linger regarding deal allocation and potential conflicts of interest behind PE-sponsored SPACs.
19: “Apollo SPAC and Vista Halt 15 Billion Merger Talks,” Bloomberg, Gillian Tan and Liana Baker, March 17, 2021.
Source: PitchBook | Geography: US *As of September 30, 2021
2011
2012
2013
2014
2015
2016
2017
2018
2019
2020
2021
*$8
29
$311
$320 $3
74
$381 $4
41 $482
$574
$674 $7
42 $766
$0
$100
$200
$300
$400
$500
$600
$700
$800
$900 Total
2021*
2020
2019
2018
2017
2016
2015
2014
Cumulative overhang
Overhang by vintage
PE dry powder ($B)
Source: PitchBook | Geography: US *As of March 31, 2021
PITCHBOOK Q3 2021 US PE BREAKDOWN29
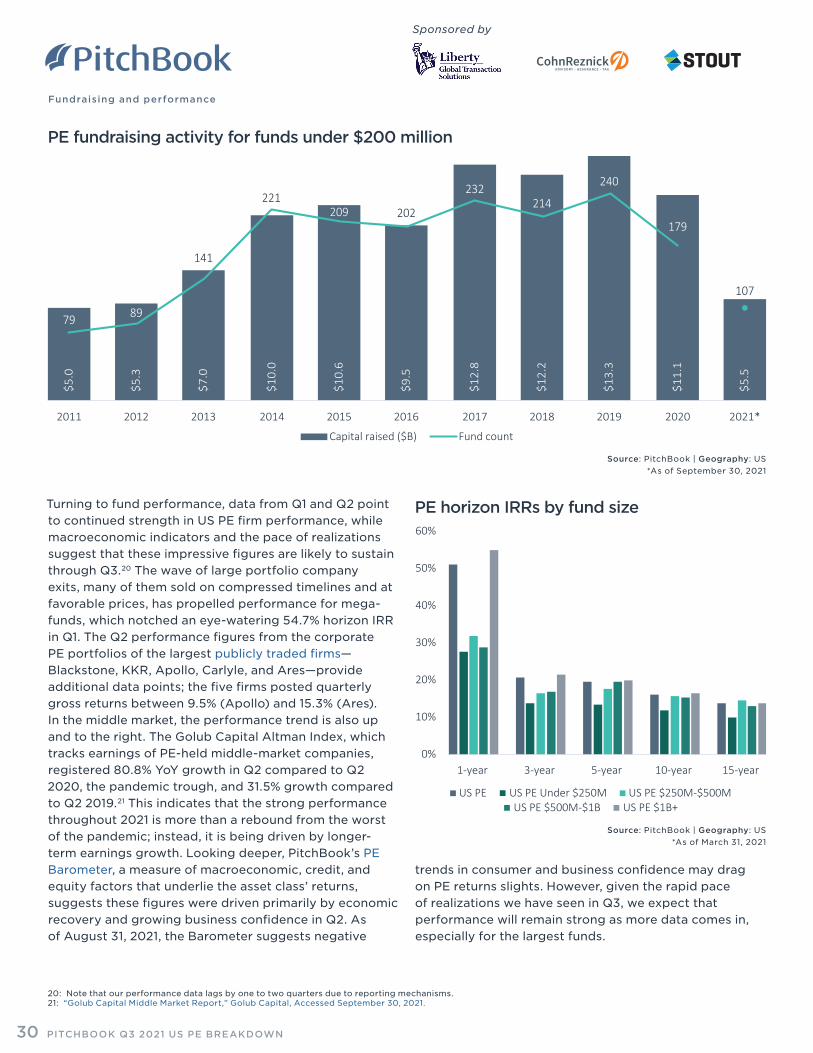
Sponsored by
Fundraising and performance
$5.0
$5.3
$7.0
$10.
0
$10.
6
$9.5
$12.
8
$12.
2
$13.
3
$11.
1
$5.5
79 89
141
221209 202
232214
240
179
107
2011 2012 2013 2014 2015 2016 2017 2018 2019 2020 2021*
Capital raised ($B) Fund count
0%
10%
20%
30%
40%
50%
60%
1-year 3-year 5-year 10-year 15-year
US PE US PE Under $250M US PE $250M-$500MUS PE $500M-$1B US PE $1B+
PE fundraising activity for funds under $200 million
PE horizon IRRs by fund sizeTurning to fund performance, data from Q1 and Q2 point to continued strength in US PE firm performance, while macroeconomic indicators and the pace of realizations suggest that these impressive figures are likely to sustain through Q3.20 The wave of large portfolio company exits, many of them sold on compressed timelines and at favorable prices, has propelled performance for mega-funds, which notched an eye-watering 54.7% horizon IRR in Q1. The Q2 performance figures from the corporate PE portfolios of the largest publicly traded firms—Blackstone, KKR, Apollo, Carlyle, and Ares—provide additional data points; the five firms posted quarterly gross returns between 9.5% (Apollo) and 15.3% (Ares). In the middle market, the performance trend is also up and to the right. The Golub Capital Altman Index, which tracks earnings of PE-held middle-market companies, registered 80.8% YoY growth in Q2 compared to Q2 2020, the pandemic trough, and 31.5% growth compared to Q2 2019.21 This indicates that the strong performance throughout 2021 is more than a rebound from the worst of the pandemic; instead, it is being driven by longer-term earnings growth. Looking deeper, PitchBook’s PE Barometer, a measure of macroeconomic, credit, and equity factors that underlie the asset class’ returns, suggests these figures were driven primarily by economic recovery and growing business confidence in Q2. As of August 31, 2021, the Barometer suggests negative
20: Note that our performance data lags by one to two quarters due to reporting mechanisms.21: “Golub Capital Middle Market Report,” Golub Capital, Accessed September 30, 2021.
trends in consumer and business confidence may drag on PE returns slights. However, given the rapid pace of realizations we have seen in Q3, we expect that performance will remain strong as more data comes in, especially for the largest funds.
Source: PitchBook | Geography: US *As of September 30, 2021
Source: PitchBook | Geography: US *As of March 31, 2021
PITCHBOOK Q3 2021 US PE BREAKDOWN30
COPYRIGHT © 2021 by PitchBook Data, Inc. All rights reserved. No part of this publication may be reproduced in any form or by any means—graphic, electronic, or mechanical, including photocopying, recording, taping, and information storage and retrieval systems—without the express written permission of PitchBook Data, Inc. Contents are based on information from sources believed to be reliable, but accuracy and completeness cannot be guaranteed. Nothing herein should be construed as any past, current or future recommendation to buy or sell any security or an offer to sell, or a solicitation of an offer to buy any security. This material does not purport to contain all of the information that a prospective investor may wish to consider and is not to be relied upon as such or used in substitution for the exercise of independent judgment.
Q2 2021 US PE Middle Market Report
Download the report here
Analyst Note: GP Stakes in an Institutional Portfolio
Download the report here
Analyst Note: Beyond Fund I
Download the report here
Analyst Note: US PE Fund Performance by Investment Style
Download the report here
COPYRIGHT © 2021 by PitchBook Data, Inc. All rights reserved. No part of this publication may be reproduced in any form or by any means—graphic, electronic, or mechanical, including photocopying, recording, taping, and information storage and retrieval systems—without the express written permission of PitchBook Data, Inc. Contents are based on information from sources believed to be reliable, but accuracy and completeness cannot be guaranteed. Nothing herein should be construed as any past, current or future recommendation to buy or sell any security or an offer to sell, or a solicitation of an offer to buy any security. This material does not purport to contain all of the information that a prospective investor may wish to consider and is not to be relied upon as such or used in substitution for the exercise of independent judgment.
Additional research
US Private Equity
Analyst Note: Analysis of Public PE Firm Earnings: Q2 2021
Download the report here
Analyst Note: Seeding and Anchoring PE Managers
Download the report here
More research available at pitchbook.com/news/reports