Embed Size (px)
Citation preview
AGENDA REPORT SUMMARY
CONSENT CALENDAR
Agenda Item #s 6,7,8, & 9
Reviewed By: City Attorney City Manager
CJ Finance Director
JH SE
Meeting Date: November 10, 2020 Subject: Building Electrification and Electric Vehicle Infrastructure Reach Codes –
Proposed Reach Codes for 2019 Energy Code Prepared by: Environmental Commission and Staff Reviewed by: Jon Biggs, Community Development Director Approved by: Chris Jordan, City Manager Attachment(s):
1. Ordinance No. 2020-470A 2. Ordinance No. 2020-470B 3. Ordinance No. 2020-470C 4. Ordinance No. 2020-471
Initiated by: Environmental Commission Previous Council Consideration: November 19, 2019; September 22, 2020, October 27, 2020 Fiscal Impact: None Environmental Review: The City Council hereby finds and determines that this Ordinance has been assessed in accordance with the California Environmental Quality Act (Cal. Pub. Res. Code, § 21000 et seq.) (“CEQA”) and the State CEQA Guidelines (14 Cal. Code Regs. § 15000 et seq.) and is categorically exempt from CEQA under CEQA Guidelines, § 15061(b)(3), which exempts from CEQA any project where it can be seen with certainty that there is no possibility that the activity in question may have a significant effect on the environment. Adoption of the proposed Ordinance would not be an activity with potential to cause significant adverse effect on the environment because the changes made to the California Energy Code are to provide more protection to the environment, and therefore is exempt from CEQA. It is also exempt from CEQA pursuant to CEQA Guidelines, § 15308 which exempts actions taken by regulatory agencies for the enhancement and protection of the environment. As such, the Ordinance is categorically exempt from CEQA.
Subject: Building Electrification and Electric Vehicle Infrastructure Reach Codes – Proposed Reach Codes for 2019 Energy Code and the 2019 Green Building Standards Code
November 10, 2020 Page 2
Policy Question(s) for Council Consideration: • Does the Council wish to adopt Building Electrification and Electric Vehicle Infrastructure
Codes containing requirements that limits power sources to principally electric appliances, fixtures, and equipment?
Summary: Every three years, the State of California adopts new building standards that are organized in Title 24 of the California Code of Regulations, referred to as the California Building Standards Code. The City has adopted the 2019 building codes, which became effective statewide on January 1, 2020. Cities and counties can adopt amendments to building codes that have requirements that exceed minimum building code requirements. Reach codes provide requirements that exceed the standards for the energy and green building standards codes and require the installation of electric vehicle infrastructure in new construction. The energy reach codes must be approved by the California Energy Commission (“CEC”) before they can be enforced by a local government. To obtain CEC approval, a local government must find that the energy reach code is cost-effective, and the CEC must find that the reach code will require the diminution of energy consumption levels permitted by the state code. Recommendation: The Environmental Commission recommends the City Council adopt building electrification and electric vehicle reach codes, which amend the 2019 California Building Standards Code that was adopted, and became effective on January 1, 2020; to help reduce carbon emissions associated with new construction, reduce costs in new construction, improve indoor air quality and safety of our building stock, support affordable housing, and increase adoption of electric vehicles. Purpose The ordinance will put into effect requirements that mandate newly constructed buildings be all-electric with exceptions, and the installation of electric vehicle charging infrastructure for new construction. Background On November 19, 2019, the Environmental Commission presented the City Council with a Mixed-Fuel Reach Code Ordinance. During the first reading of the Ordinance, Council directed the Environmental Commission to pursue an All-Electric Reach Code Ordinance and to conduct community outreach. On September 22, 2020, a public hearing of this ordinance was held, at which time the Environmental Commission and staff provided an overview of the reach code measures proposed in the ordinance, described the reach code development process, and explained findings that the energy reach code is cost-effective and will require the diminution of energy consumption levels permitted by the state
Subject: Building Electrification and Electric Vehicle Infrastructure Reach Codes – Proposed Reach Codes for 2019 Energy Code and the 2019 Green Building Standards Code
November 10, 2020 Page 3
Energy Code. Council by motion directed staff to make modifications to the Building and Electrification Reach Code ordinance building type/use and reintroduce the ordinances. On October 27, 2020, Council introduced the Building Electrification Reach Codes ordinance and waived its reading. No changes have been done since the introduction of the ordinance and we recommend its adoption.
Discussion/Analysis On October 27, 2020, by motion Council directed staff to modify the Electric Vehicle Infrastructure Reach Code ordinances, introduced the ordinances, as amended, and waived their reading. Changes have been made and incorporated since the introduction of the ordinance per Council’s direction and we recommend their adoption. Substantive changes or modifications to the code may not be made between the introduction of an ordinance and its adoption. Any substantive change to the ordinance would require its re-introduction. Options
1) Adopt Ordinance No. 2020-470A, Ordinance No. 2020-470B, and Ordinance No. 2020-470C, in the recommended sequence, amending chapter 12.22 Energy Code of Title 12 of the Los Altos Municipal code relating to amendments to the 2019 California Energy Code for All-Electric Buildings and adopt Ordinance No. 2020-471 amending chapter 12.26 Green Building Standards Code for Electric Vehicle Infrastructure.
Advantages: Reduce carbon emissions associated with new construction, improve indoor
air quality and building safety, support affordable housing, and increase adoption of electric vehicles.
Disadvantages: Fail to follow PCE and SVCE member agencies that have already adopted
reach codes to reduce carbon emissions associated with new construction, Fail to adopt a policy that advances the City’s sustainability and GHG emission reductions in line with Council Strategic Goals and Objectives 7. Do not take advantage of an opportunity to improve new building indoor air quality and safety, support affordable housing, and increase adoption of electric vehicles.
2) Do not adopt the Ordinance(s) and provide staff direction on changes to the Ordinance(s).
Advantages: Modifications can be made to the Ordinance(s) as necessary before being
reintroduced
Subject: Building Electrification and Electric Vehicle Infrastructure Reach Codes – Proposed Reach Codes for 2019 Energy Code and the 2019 Green Building Standards Code
November 10, 2020 Page 4
Disadvantages: Implementation will be delayed and allow for continued environmental harm
and action to further environmental goals will be delayed Recommendation The staff recommends Option 1.
ATTACHMENT 1
Ordinance No. 2020-470A Page 1 of 4
ORDINANCE NO. 2020-470A AN ORDINANCE OF THE CITY COUNCIL OF THE CITY OF LOS ALTOS
AMENDING CHAPTER 12.22 ENERGY CODE OF TITLE 12 OF THE LOS ALTOS MUNICIPAL CODE RELATING TO AMENDMENTS TO THE 2019 CALIFORNIA
ENERGY CODE FOR ALL-ELECTRIC SINGLE-FAMILY BUILDINGS, MULTI-FAMILY BUILDINGS HAVING FROM TWO TO NINE RESIDENTIAL UNITS, AND
DETACHED ACCESSORY DWELLING UNIT BUILDINGS WHEREAS, the California Building Standards Commission adopted and published an updated Title 24 of the California Code of Regulations, known as the 2019 California Building Standards Code, that became effective statewide on January 1, 2020; and WHEREAS, California Health and Safety Code Sections 17958.5, 17958.7 and 18941.5 authorize cities to adopt the California Building Standards Code with modifications determined to be reasonably necessary because of local climatic, geological, or topographical conditions; and WHEREAS, the City of Los Altos has adopted the 2019 California Building Standards Code with local amendments; and WHEREAS, the City has adopted the 2019 California Energy Code in the 2019 California Building Standards Code, Part 6 of Title 24 of the California Code of Regulations, which implements minimum energy efficiency standards in buildings through mandatory requirements, prescriptive standards, and performances standards; and WHEREAS, Public Resources Code Section 25402.l(h)(2) and Section 10-106 Locally Adopted Energy Standards of the California Administrative Code, Title 24 of the California Code of Regulations, Part I, establish a process which allows local adoption of energy standards that are more stringent than the statewide standards, provided that such local standards are cost effective and the California Energy Commission finds that the standards will require buildings to be designed to consume no more energy than permitted by the California Energy Code; and WHEREAS, the City Council wishes to amend portions of the California Energy Code and affirms that such local modifications are cost effective and will result in designs that consume no more energy than that permitted under the 2019 California Energy Code; and WHEREAS, the City’s Climate Action Plan sets forth the goal to support initiatives that promote environmental sustainability and reduce the City’s greenhouse gas emissions. NOW THEREFORE, the City Council of the City of Los Altos does hereby ordain as follows:
SECTION 1. AMENDMENT OF CODE. Chapter 12.22 of Title 12 of the Los Altos Municipal Code is hereby amended in its entirety to read as follows: Chapter 12.22 ENERGY CODE
ATTACHMENT 1
Ordinance No. 2020-470A Page 2 of 4
Section 12.22.010 Adoption of the California Energy Code.
There is hereby adopted by reference as if fully set forth herein, the 2019 California Energy Code, contained in the California Code of Regulations, Title 24, Part 6, published by the International Code Council, and each and all of its regulations and provisions. One copy is on file for use and examination by the public in the office of the Building Official.
Section 12.22.020 Amendments for All-Electric Buildings. A. Amend Section 100.1(b) of the Energy Code by adding the following definitions to read as
follows: ALL-ELECTRIC BUILDING is a building that has no natural gas or propane plumbing installed within the building.
NEWLY CONSTRUCTED BUILDING (Applicable to Chapter 12.22 Energy Code Section 12.22.020 Amendments) is a building that has never been used or occupied for any purpose and supported by 1) a new structural foundation, 2) an existing, structural foundation where a building has been demolished and removed to floor or below, or 3) a combination of 1) and 2).
PUBLIC BUILDING is a building used by the public for any purpose, such as assembly, education, entertainment, or worship.
SCIENTIFIC LABORATORY BUILDING is a building or area where research, experiments, and measurement in medical, life, and physical sciences are performed and/or stored requiring examination of fine details. The building may include workbenches, countertops, scientific instruments, and supporting offices.
Subchapter 1 Section 100.0(e)2. A. is deleted and replaced to read as follows, based on express finding of necessity set forth of this Ordinance.
B. Amend Section 100.0(e)2. A. of the Energy Code to read as follows:
2. Newly constructed buildings.
A. Sections 110.0 through 110.12 apply to all newly constructed buildings within the scope of Section 100.0(a). In addition, newly constructed buildings shall meet the requirements of Subsections B, C, D or E, as applicable and shall be an all-electric building as defined in Section 100.1(b).
Exception 1: Residential Single-Family Dwellings, Detached ADUs (Accessory Dwelling Units), Multifamily Dwellings with two to nine units may install non-electric (natural gas-fueled) cooking and fireplace appliances if the applicant complies with the prewiring provisions, Subsection 12.22.020 B.3.
3. Wiring to accommodate future electric appliances or equipment.
ATTACHMENT 1
Ordinance No. 2020-470A Page 3 of 4
(a) If a non-electric appliance or piece of equipment is allowed to be installed, the appliance or equipment location must also be electrically pre-wired for future electric appliance or equipment installation, including:
i. A dedicated circuit, phased appropriately, with a minimum amperage requirement for a comparable electric appliance with an electrical receptacle or junction box that is connected to the electric panel with conductors of adequate capacity, extending to within 3 feet of the appliance and accessible with no obstructions. Appropriately sized conduit may be installed in lieu of conductors; and
ii. Both ends of the unused conductor or conduit shall be labeled with the words “For Future
Electric appliance or equipment” and be electrically isolated; and iii. A reserved circuit breaker space shall be installed in the electrical panel adjacent to the circuit
breaker for the branch circuit and labeled for each circuit, an example is as follows (i.e. “For Future Electric Range;”); and,
iv. All electrical components, including conductors, receptacles, junction boxes, or blank covers,
related to this section shall be installed in accordance with the California Electrical Code.
SECTION 2.
The following findings support that the above amendments and modifications are reasonably necessary because of local climatic, geological or topographical conditions:
The City of Los Altos is located in Climate Zone 4 as established in the 2019 California Energy Code. Climate Zone 4 includes Santa Clara County, San Benito County, portions of Monterey County and San Luis Obispo. The City experiences an average of 19 inches of precipitation per year. In Los Altos, January is the rainiest month of the year while July is the driest month of the year. Temperatures average about 80 degrees Fahrenheit in the summer and about 40 degrees Fahrenheit in the winter. These climatic conditions along with the effects of climate change caused by Green House Gas (GHG) emissions generated from burning natural gas to heat buildings and emissions from Vehicle Miles Traveled results in an overall increase in global average temperature. Higher global temperatures are contributing to rising sea levels, record heat waves, droughts, wildfires and floods. The above local amendments to the 2019 California Energy Code are necessary to combat the ever-increasing harmful effects of global climate change. Implementation of the proposed code amendments will achieve decarbonization and provide an accelerated path to reduce GHG emissions. The proposed Ordinance containing these amendments would ensure that new buildings use cleaner sources of energy which helps meet the goal of cutting carbon emissions in half by 2030. All-electric building design benefits the health, welfare, and resiliency of Los Altos and its residents.
SECTION 3. CONSTITUTIONALITY.
ATTACHMENT 1
Ordinance No. 2020-470A Page 4 of 4
If any section, subsection, sentence, clause or phrase of this code is for any reason held to be invalid or unconstitutional, such decision shall not affect the validity of the remaining portions of this code. SECTION 4. CEQA.
The City Council hereby finds and determines that this Ordinance has been assessed in accordance with the California Environmental Quality Act (Cal. Pub. Res. Code, § 21000 et seq.) (“CEQA”) and the State CEQA Guidelines (14 Cal. Code Regs. § 15000 et seq.) and is categorically exempt from CEQA under CEQA Guidelines, § 15061(b)(3), which exempts from CEQA any project where it can be seen with certainty that there is no possibility that the activity in question may have a significant effect on the environment. Adoption of the proposed Ordinance would not be an activity with potential to cause significant adverse effect on the environment because the changes made to the California Energy Code within are enacted to provide more protection to the environment, and therefore is exempt from CEQA. It is also exempt from CEQA pursuant to CEQA Guidelines, § 15308 which exempts actions taken by regulatory agencies for the enhancement and protection of the environment. As such, the Ordinance is categorically exempt from CEQA. SECTION 5. PUBLICATION.
This Ordinance shall be published as provided in Government Code section 36933. SECTION 6. EFFECTIVE DATE.
This Ordinance shall be effective upon the commencement of the thirty-first (31st) day following the adoption date. The City Council’s findings of cost-effectiveness and energy savings will be filed with the California Energy Commission pursuant to Title 24 Chapter 10-106 before this ordinance takes effect. The foregoing Ordinance was duly and properly introduced at a regular meeting of the City Council of the City of Los Altos held on _______, 2020 and was thereafter, at a regular meeting held on ____________, 2020 passed and adopted by the following vote: AYES: NOES: ABSENT: ABSTAIN: ____________________________________ Janis C. Pepper, Mayor ATTEST ___________________________________ Andrea Chelemengos MMC, City Clerk
ATTACHMENT 2
Ordinance No. 2020-470B Page 1 of 4
ORDINANCE NO. 2020-470B
AN ORDINANCE OF THE CITY COUNCIL OF THE CITY OF LOS ALTOS AMENDING CHAPTER 12.22 ENERGY CODE OF TITLE 12 OF THE LOS ALTOS MUNICIPAL CODE RELATING TO AMENDMENTS TO THE 2019 CALIFORNIA
ENERGY CODE FOR ALL-ELECTRIC MULTI-FAMILY RESIDENTIAL DEVELOPMENTS HAVING TEN (10) OR MORE UNITS
WHEREAS, the California Building Standards Commission adopted and published an updated Title 24 of the California Code of Regulations, known as the 2019 California Building Standards Code, that became effective statewide on January 1, 2020; and WHEREAS, California Health and Safety Code Sections 17958.5, 17958.7 and 18941.5 authorize cities to adopt the California Building Standards Code with modifications determined to be reasonably necessary because of local climatic, geological, or topographical conditions; and WHEREAS, the City of Los Altos has adopted the 2019 California Building Standards Code with local amendments; and WHEREAS, the City has adopted the 2019 California Energy Code in the 2019 California Building Standards Code, Part 6 of Title 24 of the California Code of Regulations, which implements minimum energy efficiency standards in buildings through mandatory requirements, prescriptive standards, and performances standards; and WHEREAS, Public Resources Code Section 25402.l(h)(2) and Section 10-106 Locally Adopted Energy Standards of the California Administrative Code, Title 24 of the California Code of Regulations, Part I, establish a process which allows local adoption of energy standards that are more stringent than the statewide standards, provided that such local standards are cost effective and the California Energy Commission finds that the standards will require buildings to be designed to consume no more energy than permitted by the California Energy Code; and WHEREAS, the City Council wishes to amend portions of the California Energy Code and affirms that such local modifications are cost effective and will result in designs that consume no more energy than that permitted under the 2019 California Energy Code; and WHEREAS, the City’s Climate Action Plan sets forth the goal to support initiatives that promote environmental sustainability and reduce the City’s greenhouse gas emissions. NOW THEREFORE, the City Council of the City of Los Altos does hereby ordain as follows:
SECTION 1. AMENDMENT OF CODE. Chapter 12.22 of Title 12 of the Los Altos Municipal Code is hereby amended in its entirety to read as follows: Chapter 12.22 ENERGY CODE
ATTACHMENT 2
Ordinance No. 2020-470B Page 2 of 4
Section 12.22.010 Adoption of the California Energy Code.
There is hereby adopted by reference as if fully set forth herein, the 2019 California Energy Code, contained in the California Code of Regulations, Title 24, Part 6, published by the International Code Council, and each and all of its regulations and provisions. One copy is on file for use and examination by the public in the office of the Building Official.
Section 12.22.020 Amendments for All-Electric Buildings. A. Amend Section 100.0(e)2. A. of the Energy Code to include the underlined language as follows:
2. Newly constructed buildings.
A. Sections 110.0 through 110.12 apply to all newly constructed buildings within the scope of Section 100.0(a). In addition, newly constructed buildings shall meet the requirements of Subsections B, C, D or E, as applicable and shall be an all-electric building as defined in Section 100.1(b).
Exception 1: Residential Single-Family Dwellings, Detached ADUs (Accessory Dwelling Units), Multifamily Dwellings with two to nine units may install non-electric (natural gas-fueled) cooking and fireplace appliances if the applicant complies with the prewiring provisions, Subsection 12.22.020 B.3.
SECTION 2.
The following findings support that the above amendments and modifications are reasonably necessary because of local climatic, geological or topographical conditions:
The City of Los Altos is located in Climate Zone 4 as established in the 2019 California Energy Code. Climate Zone 4 includes Santa Clara County, San Benito County, portions of Monterey County and San Luis Obispo. The City experiences an average of 19 inches of precipitation per year. In Los Altos, January is the rainiest month of the year while July is the driest month of the year. Temperatures average about 80 degrees Fahrenheit in the summer and about 40 degrees Fahrenheit in the winter. These climatic conditions along with the effects of climate change caused by Green House Gas (GHG) emissions generated from burning natural gas to heat buildings and emissions from Vehicle Miles Traveled results in an overall increase in global average temperature. Higher global temperatures are contributing to rising sea levels, record heat waves, droughts, wildfires and floods. The above local amendments to the 2019 California Energy Code are necessary to combat the ever-increasing harmful effects of global climate change. Implementation of the proposed code amendments will achieve decarbonization and provide an accelerated path to reduce GHG emissions. The proposed Ordinance containing these amendments would ensure that new buildings use cleaner sources of energy which helps meet the goal of cutting carbon emissions in half by 2030.
ATTACHMENT 2
Ordinance No. 2020-470B Page 3 of 4
All-electric building design benefits the health, welfare, and resiliency of Los Altos and its residents.
SECTION 3. CONSTITUTIONALITY.
If any section, subsection, sentence, clause or phrase of this code is for any reason held to be invalid or unconstitutional, such decision shall not affect the validity of the remaining portions of this code. SECTION 4. CEQA.
The City Council hereby finds and determines that this Ordinance has been assessed in accordance with the California Environmental Quality Act (Cal. Pub. Res. Code, § 21000 et seq.) (“CEQA”) and the State CEQA Guidelines (14 Cal. Code Regs. § 15000 et seq.) and is categorically exempt from CEQA under CEQA Guidelines, § 15061(b)(3), which exempts from CEQA any project where it can be seen with certainty that there is no possibility that the activity in question may have a significant effect on the environment. Adoption of the proposed Ordinance would not be an activity with potential to cause significant adverse effect on the environment because the changes made to the California Energy Code within are enacted to provide more protection to the environment, and therefore is exempt from CEQA. It is also exempt from CEQA pursuant to CEQA Guidelines, § 15308 which exempts actions taken by regulatory agencies for the enhancement and protection of the environment. As such, the Ordinance is categorically exempt from CEQA. SECTION 5. PUBLICATION.
This Ordinance shall be published as provided in Government Code section 36933. SECTION 6. EFFECTIVE DATE.
This Ordinance shall be effective upon the commencement of the thirty-first (31st) day following the adoption date. The City Council’s findings of cost-effectiveness and energy savings will be filed with the California Energy Commission pursuant to Title 24 Chapter 10-106 before this ordinance takes effect. The foregoing Ordinance was duly and properly introduced at a regular meeting of the City Council of the City of Los Altos held on _______, 2020 and was thereafter, at a regular meeting held on ____________, 2020 passed and adopted by the following vote: AYES: NOES: ABSENT: ABSTAIN: ____________________________________ Janis C. Pepper, Mayor

ATTACHMENT 2
Ordinance No. 2020-470B Page 4 of 4
ATTEST ___________________________________ Andrea Chelemengos MMC, City Clerk
ATTACHMENT 3
Ordinance No. 2020-470C Page 1 of 4
ORDINANCE NO. 2020-470C
AN ORDINANCE OF THE CITY COUNCIL OF THE CITY OF LOS ALTOS AMENDING CHAPTER 12.22 ENERGY CODE OF TITLE 12 OF THE LOS ALTOS MUNICIPAL CODE RELATING TO AMENDMENTS TO THE 2019 CALIFORNIA
ENERGY CODE FOR ALL-ELECTRIC NON-RESIDENTIAL BUILDINGS, SCIENTIFIC LABORATORY BUILDINGS, AND PUBLIC BUILDINGS
WHEREAS, the California Building Standards Commission adopted and published an updated Title 24 of the California Code of Regulations, known as the 2019 California Building Standards Code, that became effective statewide on January 1, 2020; and WHEREAS, California Health and Safety Code Sections 17958.5, 17958.7 and 18941.5 authorize cities to adopt the California Building Standards Code with modifications determined to be reasonably necessary because of local climatic, geological, or topographical conditions; and WHEREAS, the City of Los Altos has adopted the 2019 California Building Standards Code with local amendments; and WHEREAS, the City has adopted the 2019 California Energy Code in the 2019 California Building Standards Code, Part 6 of Title 24 of the California Code of Regulations, which implements minimum energy efficiency standards in buildings through mandatory requirements, prescriptive standards, and performances standards; and WHEREAS, Public Resources Code Section 25402.l(h)(2) and Section 10-106 Locally Adopted Energy Standards of the California Administrative Code, Title 24 of the California Code of Regulations, Part I, establish a process which allows local adoption of energy standards that are more stringent than the statewide standards, provided that such local standards are cost effective and the California Energy Commission finds that the standards will require buildings to be designed to consume no more energy than permitted by the California Energy Code; and WHEREAS, the City Council wishes to amend portions of the California Energy Code and affirms that such local modifications are cost effective and will result in designs that consume no more energy than that permitted under the 2019 California Energy Code; and WHEREAS, the City’s Climate Action Plan sets forth the goal to support initiatives that promote environmental sustainability and reduce the City’s greenhouse gas emissions. NOW THEREFORE, the City Council of the City of Los Altos does hereby ordain as follows:
SECTION 1. AMENDMENT OF CODE. Chapter 12.22 of Title 12 of the Los Altos Municipal Code is hereby amended in its entirety to read as follows: Chapter 12.22 ENERGY CODE
ATTACHMENT 3
Ordinance No. 2020-470C Page 2 of 4
Section 12.22.010 Adoption of the California Energy Code.
There is hereby adopted by reference as if fully set forth herein, the 2019 California Energy Code, contained in the California Code of Regulations, Title 24, Part 6, published by the International Code Council, and each and all of its regulations and provisions. One copy is on file for use and examination by the public in the office of the Building Official.
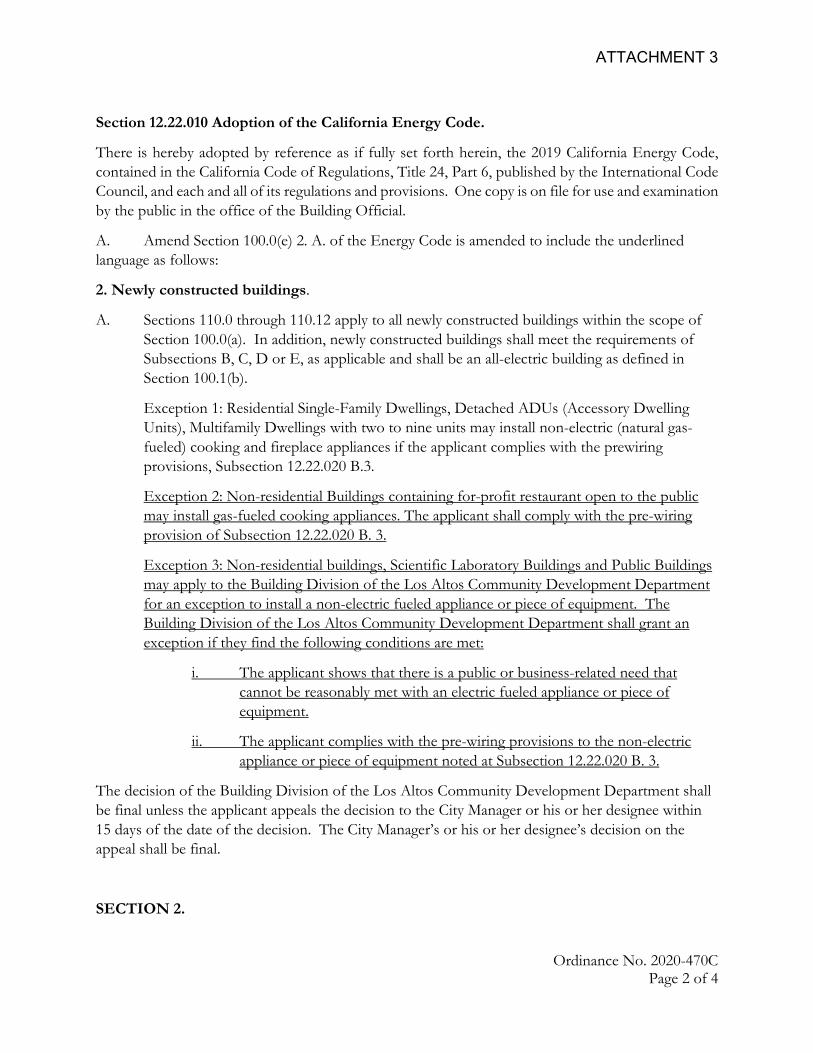
A. Amend Section 100.0(e) 2. A. of the Energy Code is amended to include the underlined language as follows:
2. Newly constructed buildings.
A. Sections 110.0 through 110.12 apply to all newly constructed buildings within the scope of Section 100.0(a). In addition, newly constructed buildings shall meet the requirements of Subsections B, C, D or E, as applicable and shall be an all-electric building as defined in Section 100.1(b).
Exception 1: Residential Single-Family Dwellings, Detached ADUs (Accessory Dwelling Units), Multifamily Dwellings with two to nine units may install non-electric (natural gas-fueled) cooking and fireplace appliances if the applicant complies with the prewiring provisions, Subsection 12.22.020 B.3.
Exception 2: Non-residential Buildings containing for-profit restaurant open to the public may install gas-fueled cooking appliances. The applicant shall comply with the pre-wiring provision of Subsection 12.22.020 B. 3.
Exception 3: Non-residential buildings, Scientific Laboratory Buildings and Public Buildings may apply to the Building Division of the Los Altos Community Development Department for an exception to install a non-electric fueled appliance or piece of equipment. The Building Division of the Los Altos Community Development Department shall grant an exception if they find the following conditions are met:
i. The applicant shows that there is a public or business-related need that cannot be reasonably met with an electric fueled appliance or piece of equipment.
ii. The applicant complies with the pre-wiring provisions to the non-electric appliance or piece of equipment noted at Subsection 12.22.020 B. 3.
The decision of the Building Division of the Los Altos Community Development Department shall be final unless the applicant appeals the decision to the City Manager or his or her designee within 15 days of the date of the decision. The City Manager’s or his or her designee’s decision on the appeal shall be final.
SECTION 2.
ATTACHMENT 3
Ordinance No. 2020-470C Page 3 of 4
The following findings support that the above amendments and modifications are reasonably necessary because of local climatic, geological or topographical conditions:
The City of Los Altos is located in Climate Zone 4 as established in the 2019 California Energy Code. Climate Zone 4 includes Santa Clara County, San Benito County, portions of Monterey County and San Luis Obispo. The City experiences an average of 19 inches of precipitation per year. In Los Altos, January is the rainiest month of the year while July is the driest month of the year. Temperatures average about 80 degrees Fahrenheit in the summer and about 40 degrees Fahrenheit in the winter. These climatic conditions along with the effects of climate change caused by Green House Gas (GHG) emissions generated from burning natural gas to heat buildings and emissions from Vehicle Miles Traveled results in an overall increase in global average temperature. Higher global temperatures are contributing to rising sea levels, record heat waves, droughts, wildfires and floods. The above local amendments to the 2019 California Energy Code are necessary to combat the ever-increasing harmful effects of global climate change. Implementation of the proposed code amendments will achieve decarbonization and provide an accelerated path to reduce GHG emissions. The proposed Ordinance containing these amendments would ensure that new buildings use cleaner sources of energy which helps meet the goal of cutting carbon emissions in half by 2030. All-electric building design benefits the health, welfare, and resiliency of Los Altos and its residents.
SECTION 3. CONSTITUTIONALITY.
If any section, subsection, sentence, clause or phrase of this code is for any reason held to be invalid or unconstitutional, such decision shall not affect the validity of the remaining portions of this code. SECTION 4. CEQA.
The City Council hereby finds and determines that this Ordinance has been assessed in accordance with the California Environmental Quality Act (Cal. Pub. Res. Code, § 21000 et seq.) (“CEQA”) and the State CEQA Guidelines (14 Cal. Code Regs. § 15000 et seq.) and is categorically exempt from CEQA under CEQA Guidelines, § 15061(b)(3), which exempts from CEQA any project where it can be seen with certainty that there is no possibility that the activity in question may have a significant effect on the environment. Adoption of the proposed Ordinance would not be an activity with potential to cause significant adverse effect on the environment because the changes made to the California Energy Code within are enacted to provide more protection to the environment, and therefore is exempt from CEQA. It is also exempt from CEQA pursuant to CEQA Guidelines, § 15308 which exempts actions taken by regulatory agencies for the enhancement and protection of the environment. As such, the Ordinance is categorically exempt from CEQA. SECTION 5. PUBLICATION.
This Ordinance shall be published as provided in Government Code section 36933.
ATTACHMENT 3
Ordinance No. 2020-470C Page 4 of 4
SECTION 6. EFFECTIVE DATE.
This Ordinance shall be effective upon the commencement of the thirty-first (31st) day following the adoption date. The City Council’s findings of cost-effectiveness and energy savings will be filed with the California Energy Commission pursuant to Title 24 Chapter 10-106 before this ordinance takes effect. The foregoing Ordinance was duly and properly introduced at a regular meeting of the City Council of the City of Los Altos held on _______, 2020 and was thereafter, at a regular meeting held on ____________, 2020 passed and adopted by the following vote: AYES: NOES: ABSENT: ABSTAIN: ____________________________________ Janis C. Pepper, Mayor ATTEST ___________________________________ Andrea Chelemengos MMC, City Clerk
ATTACHMENT 4
Ordinance No. 2020-471 Page 1 of 9
ORDINANCE NO. 2020-471
AN ORDINANCE OF THE CITY COUNCIL OF THE CITY OF LOS ALTOS AMENDING CHAPTER 12.26 GREEN BUILDING STANDARDS CODE OF TITLE 12 OF THE LOS ALTOS MUNICIPAL CODE RELATING TO AMENDMENTS TO THE
2019 CALIFORNIA GREEN BUILDING STANDARDS CODE FOR ELECTRIC VEHICLE (EV) INFRASTRUCTURE
WHEREAS, the City of Los Altos has seen significant sales of both electric vehicles (EV) and plug-in hybrid electric vehicles (“PHEV”); and WHEREAS, the interest in EVs has grown alongside greater EV model availability, increased vehicle range, and expanded EV charging infrastructure in the region; and WHEREAS, EV charging infrastructure available at locations they frequent, including one-and two-family dwellings, multi-family residences, and commercial properties is important for continued adoption of EVs; and WHEREAS, the installation of the electric vehicle supply equipment (EVSE) is made cost effective when the infrastructure is installed during the initial construction phase as opposed to retrofitting existing buildings to accommodate the new electrical equipment; and WHEREAS, the City of Los Altos supports this nascent industry for plug-in electric vehicles and its efforts in constructing EV charging infrastructure as this further supports the City’s sustainability goals; and WHEREAS, the California Building Standards Commission adopted and published an updated Title 24 of the California Code of Regulations, known as the 2019 California Building Standards Code, that became effective statewide on January 1, 2020; and WHEREAS, California Health and Safety Code Sections 17958.5, 17958.7 and 18941.5 authorize cities to adopt the California Building Standards Code with modifications determined to be reasonably necessary because of local climatic, geological or topographical conditions; and WHEREAS, the City of Los Altos has adopted the 2019 California Building Standards Code with local amendments; and WHEREAS, the City has adopted the 2019 California Green Building Standards Code in the 2019 California Building Standards Code, Title 24, Part 11, which enhances the design and construction of buildings through the use of building concepts having a reduced negative impact or positive environmental impact and encouraging sustainable construction practices; and
ATTACHMENT 4
Ordinance No. 2020-471 Page 2 of 9
WHEREAS, the City Council wishes to amend portions of the California Green Building Standards Code and affirms the modifications are determined to be reasonably necessary because of local climatic, geological or topographical conditions, ensure that new buildings can charge a greater number of electric vehicles beyond state code requirements and reduce greenhouse gas emissions. NOW THEREFORE, the City Council of the City of Los Altos does hereby ordain as follows:
SECTION 1. AMENDMENT OF CODE. Chapter 12.26 of Title 12 of the Los Altos Municipal Code is hereby amended in its entirety to read as follows: Chapter 12.26 CALIFORNIA GREEN BUILDING STANDARDS CODE Section 12.26.010 Adoption of the California Green Building Standards Code Section 12.26.020 Amendments, Additions or Deletions Section 12.26.030 Definitions Section 12.26.010 Adoption of the California Green Building Standards Code There is hereby adopted by reference as if fully set forth herein, the 2019 California Green Building Standards Code, contained in the California Code of Regulations, Title 24, Part 11, published by the International Code Council, and each and all of its regulations and provisions. One copy is on file for use and examination by the public in the office of the Building Official. Section 12.26.020 Amendments, Additions or Deletions The 2019 California Green Building Standards Code referred to in Section 12.26.010 is adopted, together with Chapters 1 Administration, 4 Residential Mandatory Measures, and 5 Nonresidential Mandatory Measures, of the 2019 California Green Building Standards Code, with the following amendments as follows: Chapter 1 Section 102.4 Scope and Mandatory Compliance is hereby added to read as follows. Section 102.4 Scope and Mandatory Compliance A. This code contains both mandatory and voluntary green building measures. Mandatory and
voluntary measures are identified in the appropriate chapters contained in this code. Compliance measures and methods shall be by one of the following measures approved by the Building Official.
The means by which compliance measures are achieved shall be mandatory measures with
appendix sections voluntarily applied, building division mandatory check list, whole house Build it Green GreenPoint check list, LEED, other recognized point systems, Title 24 Part 6 Energy Efficiency Standards, or equivalent approved methods. Green Building Compliance measures in addition to checklists shall be incorporated into the project drawings approved by the Building
ATTACHMENT 4
Ordinance No. 2020-471 Page 3 of 9
Official prior to building permit submittal. Prior to issuance of a building permit, the owner or responsible Registered Design Professional
acting as the owner’s agent shall employ and/or retain a Qualified Green Building Professional to the satisfaction of the Building Official, and prior to final inspection shall submit verification that the project is in compliance with this ordinance.
Chapter 4 Section 4.106.4 Electric vehicle (EV) charging for new construction thru 4.106.4.2.5 are deleted and replaced to read as follows, based upon express findings set forth in this Ordinance Section 4.106.4, 4.106.4.1 and 4.106.2 are amended to read as follows: 4.106.4 Electric vehicle (EV) charging for new construction. New construction shall comply with Sections 4.106.4.1, 4.106.4.2, or 4.106.4.3 to facilitate future installation and use of EV chargers. Electric vehicle supply equipment (EVSE) shall be installed in accordance with the California Electrical Code, Article 625. Exceptions: 1. Where there is no commercial power supply. 2. If no additional parking facilities are provided, then Accessory Dwelling Units (ADU) and Junior
Accessory Dwelling Units (JADU). 4.106.4.1 New one- and two-family dwellings and townhouses with attached or detached private garages. For each dwelling unit, install at least one Level 2 EV Ready Space in the garage. If multiple (two or more) garage parking spaces are provided for a dwelling unit, install at least two Level 2 EV Ready Spaces. 4.106.4.1.1 Identification. The raceway termination location shall be permanently and visibly marked as “Level 2 EV-Ready”. 4.106.4.2 New multifamily dwellings. The following requirements apply to all new multifamily dwellings: 1. For multifamily buildings with less than or equal to 20 dwelling units, install at least one Level 2
EV Ready Space for each dwelling unit. 2. When more than 20 multifamily dwelling units are constructed on a building site
a. 25% of the dwelling units with parking space(s) shall be provided with at least one Level 2 EV Ready Space. Calculations for the required minimum number of Level 2 EV Ready spaces shall be rounded up to the nearest whole number and not less than 21 spaces.
ATTACHMENT 4
Ordinance No. 2020-471 Page 4 of 9
b. In addition, each remaining dwelling unit with parking space(s) shall be provided with at least one Level 1 EV Ready Space.
Exception: For all multifamily Affordable Housing, 10% of dwelling units with parking space(s) shall be provided with at least one Level 2 EV Ready Space. Calculations for the required minimum number of Level 2 EV Ready spaces shall be rounded up to the nearest whole number. The remaining dwelling units with parking space(s) shall each be provided with at least one Level 1 EV Ready Space. Notes:
1. ALMS may be installed to decrease electrical service and transformer costs associated with EV Charging Equipment subject to review of the authority having jurisdiction.
2. Installation of Level 2 EV Ready Spaces above the minimum number required level may offset the minimum number Level 1 EV Ready Spaces required on a 1:1 basis.
3. The requirements apply to multifamily buildings with parking spaces including: a) assigned or leased to individual dwelling units, and b) unassigned residential parking.
4. Local jurisdictions may consider allowing exceptions through their local process, on a case by case basis, if a building permit applicant provides documentation detailing that the increased cost of utility service or on-site transformer capacity would exceed an average of $4,500 among parking spaces with Level 2 EV Ready Spaces and Level 1 EV Ready Spaces. If costs are found to exceed this level, the applicant shall provide EV infrastructure up to a level that would not exceed this cost for utility service or on-site transformer capacity.
5. In order to adhere to accessibility requirements in accordance with California Building Code Chapters 11A and/or 11B, it is recommended that all accessible parking spaces for covered newly constructed multifamily dwellings are provided with at least a Level 1 or Level 2 EV Ready Spaces.
4.106.4.2.1.1 Electric vehicle charging stations (EVCS). When EV chargers are installed, EV spaces required by Section 4.106.4.2.2, Item 3, shall comply with at least one of the following options:
1. The EV space shall be located adjacent to an accessible parking space meeting the requirements of the California Building Code, Chapter 11A, to allow use of the EV charger from the accessible parking space.
2. The EV space shall be located on an accessible route, as defined in the California Building Code, Chapter 2, to the building.
Exception: Electric vehicle charging stations designed and constructed in compliance with the California Building Code, Chapter 11B, are not required to comply with Section 4.106.4.2.1.1 and Section 4.106.4.2.2, Item 3. Note: Electric vehicle charging stations serving public housing are required to comply with the California Building Code, Chapter 11 B. Section 4.106.4.2.2 Electric vehicle charging space (EV space) dimensions.
ATTACHMENT 4
Ordinance No. 2020-471 Page 5 of 9
Refer to local authority having jurisdiction for parking dimension requirements. 4.106.4.2.3 Deleted 4.106.4.2.4 Deleted 4.106.4.2.5 Deleted Chapter 5 Section 5.106.5.3 Electric vehicle (EV) charging thru 5.106.5.3.5 are deleted and replaced to read as follows, based upon express findings set forth in this Ordinance Section 5.106.5.3 thru 5.106.5.3.5 are amended to read as follows: 5.106.5.3 Electric vehicle (EV) charging. [N] New construction shall comply with Section 5.106.5.3.1 or Section 5.106.5.3.2 to facilitate future installation and use of EV. Exceptions:
1. Where there is no commercial power supply. 5.106.5.3.1 Office and Institutional buildings. In nonresidential new construction buildings designated primarily for office use and institutional buildings, with parking:
1. When 10 or more parking spaces are constructed, 50% of the available parking spaces on site shall be equipped with Level 2 EVCS;
2. An additional 20% shall be provided with at least Level 1 EV Ready Spaces; and 3. An additional 30% shall be at least Level 2 EV Capable.
Calculations for the required minimum number of spaces equipped with Level 2 EVCS, Level 1 EV Ready spaces and EV Capable spaces shall all be rounded up to the nearest whole number. Construction plans and specifications shall demonstrate that all raceways shall be a minimum of 1” and sufficient for installation of EVCS at all required Level 1 EV Ready and EV Capable spaces; Electrical calculations shall substantiate the design of the electrical system to include the rating of equipment and any on-site distribution transformers, and have sufficient capacity to simultaneously charge EVs at all required EV spaces including Level 1 EV Ready and EV Capable spaces; and service panel or subpanel(s) shall have sufficient capacity to accommodate the required number of dedicated branch circuit(s) for the future installation of the EVSE. Notes:
1. ALMS may be installed to increase the number of EV chargers or the amperage or voltage beyond the minimum requirements in this code. The option does not allow for installing less electrical panel capacity than would be required without ALMS.
ATTACHMENT 4
Ordinance No. 2020-471 Page 6 of 9
5.106.5.3.2 Other nonresidential buildings. In nonresidential new construction buildings that are not designated primarily for office use, such as those for retail uses:
1. When 10 or more parking spaces are constructed, 6% of the available parking spaces on site shall be equipped with Level 2 EVCS;
2. An additional 5% shall be at least Level 1 EV Ready. Calculations for the required minimum number of spaces equipped with Level 2 EVCS and Level 1 EV Ready spaces shall be rounded up to the nearest whole number
Exception: Installation of each Direct Current Fast Charger with the capacity to provide at least 80 kW output may substitute for six Level 2 EVCS and five EV Ready spaces after a minimum of six Level 2 EVCS and five Level 1 EV Ready spaces are installed.
5.106.5.3.3 Clean Air Vehicle Parking Designation. EVCS qualify as designated parking as described in Section 5.106.5.2 Designated parking for clean air vehicles. Notes:
1. The California Department of Transportation adopts and publishes the California Manual on Uniform Traffic Control Devices (California MUTCD) to provide uniform standards and specifications for all official traffic control devices in California. Zero Emission Vehicle Signs and Pavement Markings can be found in the New Policies & Directives number 13-01. www.dot.ca.gov/hq/traffops/policy/13-01.pdf.
2. See Vehicle Code Section 22511 for EV charging spaces signage in off-street parking facilities and for use of EV charging spaces.
3. The Governor’s Office of Planning and Research published a Zero-Emission Vehicle Community Readiness Guidebook which provides helpful information for local governments, residents and businesses. www.opr.ca.gov/ docs/ZEV_Guidebook.pdf.
4. Section 11B-812 of the California Building Code requires that a facility providing EVCS for public and common use also provide one or more accessible EVCS as specified in Table 11B-228.3.2.1.
5. It is encouraged that shared parking, EV Ready are designated as “EV preferred.” 5.106.5.3.4 [N] Identification. The raceway termination location shall be permanently and visibly marked as “EV Ready”. 5.106.5.3.5 Deleted. Section 12.26.030 Definitions. For the purpose of this chapter, certain words and phrases used herein are defined as follows:
ATTACHMENT 4
Ordinance No. 2020-471 Page 7 of 9
“Affordable Housing” means a housing development project, as defined in Government Code Section 65589.5(h)(2), in which at least forty percent (40%) of the units within the project are required by deed, regulatory restriction contained in an agreement with a government agency, or other recorded document, to be made available at an affordable housing cost as defined in Health and Safety Code Section 50052.5, or at an affordable rent as defined in Health and Safety Code Section 50053, to persons and families of low or moderate income as defined by Section 50093 of the Health and Safety Code, lower income households as defined by Section 50079.5 of the Health and Safety Code, very low income households as defined by Section 50105 of the Health and Safety Code, or extremely low income households as defined by Section 50106 of the Health and Safety Code, for a period of 55 years for rental housing or 45 years for owner-occupied housing.
“Automatic Load Management Systems (ALMS)” means a control system which allows multiple EV chargers or EV-Ready electric vehicle outlets to share a circuit or panel and automatically reduce power at each charger, providing the opportunity to reduce electrical infrastructure costs and/or provide demand response capability. ALMS systems must be designed to deliver at least 1.4kW to each EV Capable, EV Ready or EVCS space served by the ALMS. The connected amperage on-site shall not be lower than the required connected amperage per Part 11, 2019 California Green Building Code for the relevant building types. “Build It Green” means the Build It Green organization. Build It Green is a California professional non-profit membership organization whose mission is to promote healthy, energy and resource-efficient buildings. “Direct Current Fast Chargers” capable of charging at 20-400kW and delivers DC power directly to the battery and therefore able to charge faster. Examples of this type of charger include Superchargers and DC Fast Chargers currently used at some public and commercial sites. “Electric Vehicle Charging Station (EVCS)” means a parking space that includes installation of electric vehicle supply equipment (EVSE) with a minimum capacity of 30 amperes connected to a circuit serving a Level 2 EV Ready Space. EVCS installation may be used to satisfy a Level 2 EV Ready Space requirement. “EV Capable” means a parking space linked to a listed electrical panel with sufficient capacity to provide at least 110/120 volts and 20 amperes to the parking space. Raceways linking the electrical panel and parking space only need to be installed in spaces that will be inaccessible in the future, either trenched underground or where penetrations to walls, floors, or other partitions would otherwise be required for future installation of branch circuits. Raceways must be at least 1” in diameter and may be sized for multiple circuits as allowed by the California Electrical Code. The panel circuit directory shall identify the overcurrent protective device space(s) reserved for EV charging as “EV CAPABLE.” Construction documents shall indicate future completion of raceway from the panel to the parking space, via the installed inaccessible raceways. “Green Point Rated” means the rating system developed by Build It Green.
ATTACHMENT 4
Ordinance No. 2020-471 Page 8 of 9
“LEED” means the “Leadership in Energy and Environmental Design” program developed by the U.S. Green Building Council. The U.S. Green Building Council is a National professional non-profit membership organization whose mission is to promote buildings that are environmentally responsible. “LEED Accredited Professional” means a person or organization determined by the Building Official to be qualified to perform inspections and provide documentation to assure compliance with the U.S. Green Building Council LEED requirements. “Level 1 EV Ready Space” means a parking space served by a complete electric circuit with a minimum of 110/120 volt, 20-ampere capacity including electrical panel capacity, overprotection device, a minimum 1” diameter raceway that may include multiple circuits as allowed by the California Electrical Code, wiring, and either a) a receptacle labelled “Electric Vehicle Outlet” with at least a ½” font adjacent to the parking space, or b) electric vehicle supply equipment (EVSE). “Level 2 EV Ready Space” means a parking space served by a complete electric circuit with 208/240 volt, 40-ampere capacity including electrical panel capacity, overprotection device, a minimum 1” diameter raceway that may include multiple circuits as allowed by the California Electrical Code, wiring, and either a) a receptacle labelled “Electric Vehicle Outlet” with at least a ½” font adjacent to the parking space, or b) electric vehicle supply equipment (EVSE) with a minimum output of 30 amperes. “Qualified Green Building Professional” means a person trained through the USGBC as a “LEED AP” (accredited professional), or through Build It Green as a GreenPoint Rater, or other qualifications when acceptable to the Building Official. A certified green building professional, architect, designer, builder, or building inspector may be considered a qualified green building professional when determined appropriate by the Building Official. “Structural Renovations” means existing portions of roof framing and/or exterior walls removed for the purpose of rebuilding and remodeling. SECTION 3. CONSTITUTIONALITY.
If any section, subsection, sentence, clause or phrase of this code is for any reason held to be invalid or unconstitutional, such decision shall not affect the validity of the remaining portions of this code. SECTION 4. CEQA.
The City Council hereby finds and determines that this Ordinance has been assessed in accordance with the California Environmental Quality Act (Cal. Pub. Res. Code, § 21000 et seq.) (“CEQA”) and the State CEQA Guidelines (14 Cal. Code Regs. § 15000 et seq.) and is categorically exempt from CEQA under CEQA Guidelines, § 15061(b)(3), which exempts from CEQA any project where it can be seen with certainty that there is no possibility that the activity in question may have a significant effect on the environment. Adoption of the proposed Ordinance would not be an activity with potential to cause significant adverse effect on the environment because the changes made to the California Green Buildings Standards Code within are enacted to provide more protection to the environment, and therefore is exempt from CEQA. It is also exempt from CEQA pursuant to CEQA Guidelines, § 15308 which exempts actions taken by regulatory agencies for the

ATTACHMENT 4
Ordinance No. 2020-471 Page 9 of 9
enhancement and protection of the environment. As such, the Ordinance is categorically exempt from CEQA. SECTION 5. PUBLICATION.
This Ordinance shall be published as provided in Government Code section 36933. SECTION 6. EFFECTIVE DATE.
This Ordinance shall be effective upon the commencement of the thirty-first (31st) day following the adoption date. The foregoing Ordinance was duly and properly introduced at a regular meeting of the City Council of the City of Los Altos held on _______, 2020 and was thereafter, at a regular meeting held on ____________, 2020 passed and adopted by the following vote: AYES: NOES: ABSENT: ABSTAIN: ____________________________________ Jan Pepper, Mayor ATTEST ___________________________________ Andrea Chelemengos MMC, City Clerk
Margin?
Title 24, Parts 6 and 11 Local Energy Efficiency Ordinances
2019 Cost-effectiveness Study:
Low-Rise Residential New Construction
Prepared for:
Kelly Cunningham
Codes and Standards Program
Pacific Gas and Electric Company
Prepared by:
Frontier Energy, Inc.
Misti Bruceri & Associates, LLC
Last Modified: August 01, 2019
ATTACHMENT 5

LEGAL NOTICE
This report was prepared by Pacific Gas and Electric Company and funded by the California utility customers under the auspices of the California Public Utilities Commission.
Copyright 2019, Pacific Gas and Electric Company. All rights reserved, except that this document may be used, copied, and distributed without modification.
Neither PG&E nor any of its employees makes any warranty, express or implied; or assumes any legal liability or responsibility for the accuracy, completeness or usefulness of any data, information, method, product, policy or process disclosed in this document; or represents that its use will not infringe any privately-owned rights including, but not limited to, patents, trademarks or copyrights.
ATTACHMENT 5
2019 Energy Efficiency Ordinance Cost-effectiveness Study
Table of Contents Acronyms ........................................................................................................................................................ 5
1 Introduction ............................................................................................................................................ 1
2 Methodology and Assumptions.............................................................................................................. 1
2.1 Building Prototypes ........................................................................................................................ 1
2.2 Measure Analysis ............................................................................................................................ 3
2.2.1 Federal Preemption ................................................................................................................ 4
2.2.2 Energy Design Rating .............................................................................................................. 4
2.2.3 Energy Efficiency Measures .................................................................................................... 5
2.3 Package Development .................................................................................................................... 8
2.3.1 Solar Photovoltaics (PV) ......................................................................................................... 8
2.3.2 Energy Storage (Batteries) ...................................................................................................... 8
2.4 Incremental Costs ........................................................................................................................... 9
2.5 Cost-effectiveness ........................................................................................................................ 13
2.5.1 On-Bill Customer Lifecycle Cost ............................................................................................ 13
2.5.2 TDV Lifecycle Cost ................................................................................................................. 15
2.6 Electrification Evaluation .............................................................................................................. 15
2.7 Greenhouse Gas Emissions ........................................................................................................... 18
3 Results .................................................................................................................................................. 18
3.1 PV and Battery System Sizing ....................................................................................................... 19
3.2 Single Family Results .................................................................................................................... 21
3.2.1 GHG Emission Reductions .................................................................................................... 26
3.3 Multifamily Results ....................................................................................................................... 26
3.3.1 GHG Emission Reductions .................................................................................................... 32
3.4 Electrification Results ................................................................................................................... 32
3.4.1 Single Family ......................................................................................................................... 33
3.4.2 Multifamily ........................................................................................................................... 33
4 Conclusions & Summary ....................................................................................................................... 41
5 References ............................................................................................................................................ 44
Appendix A – California Climate Zone Map .................................................................................................. 46
Appendix B – Utility Tariff Details................................................................................................................. 47
Appendix C – Single Family Detailed Results ................................................................................................ 57
Appendix D – Single Family Measure Summary ........................................................................................... 61
Appendix E – Multifamily Detailed Results .................................................................................................. 68
Appendix F – Multifamily Measure Summary .............................................................................................. 72
Appendix G – Results by Climate Zone ......................................................................................................... 79
ATTACHMENT 5
2019 Energy Efficiency Ordinance Cost-effectiveness Study
List of Tables Table 1: Prototype Characteristics .............................................................................................................................2 Table 2: Characteristics of the Mixed Fuel vs All-Electric Prototype ..........................................................................3 Table 3: Lifetime of Water Heating & Space Conditioning Equipment Measures .....................................................9 Table 4: Incremental Cost Assumptions .................................................................................................................. 10 Table 5: IOU Utility Tariffs Applied Based on Climate Zone .................................................................................... 14 Table 6: Incremental Costs – All-Electric Code Compliant Home Compared to a Mixed Fuel Code Compliant Home ................................................................................................................................................................................. 16 Table 7: PV & Battery Sizing Details by Package Type ............................................................................................. 20 Table 8: Single Family Package Lifetime Incremental Costs .................................................................................... 22 Table 9: Single Family Package Cost-Effectiveness Results for the Mixed Fuel Case 1,2 .......................................... 23 Table 10: Single Family Package Cost-Effectiveness Results for the All-Electric Case1,2 ......................................... 24 Table 11: Multifamily Package Incremental Costs per Dwelling Unit ..................................................................... 28 Table 12: Multifamily Package Cost-Effectiveness Results for the Mixed Fuel Case1,2 ........................................... 29 Table 13: Multifamily Package Cost-effectiveness Results for the All-Electric Case1,2 ............................................ 30 Table 14: Single Family Electrification Results ....................................................................................................... 34 Table 15: Comparison of Single Family On-Bill Cost Effectiveness Results with Additional PV ............................. 36 Table 16: Multifamily Electrification Results (Per Dwelling Unit) .......................................................................... 38 Table 17: Comparison of Multifamily On-Bill Cost Effectiveness Results with Additional PV (Per Dwelling Unit) 39 Table 18: Summary of Single Family Target EDR Margins ....................................................................................... 43 Table 19: Summary of Multifamily Target EDR Margins ......................................................................................... 43 Table 20: PG&E Baseline Territory by Climate Zone .............................................................................................. 48 Table 21: SCE Baseline Territory by Climate Zone .................................................................................................. 51 Table 22: SoCalGas Baseline Territory by Climate Zone ......................................................................................... 53 Table 23: SDG&E Baseline Territory by Climate Zone ............................................................................................ 54 Table 24: Real Utility Rate Escalation Rate Assumptions ........................................................................................ 56 Table 25: Single Family Mixed Fuel Efficiency Package Cost-Effectiveness Results ................................................ 57 Table 26: Single Family Mixed Fuel Efficiency & PV/Battery Package Cost-Effectiveness Results .......................... 58 Table 27: Single Family All-Electric Efficiency Package Cost-Effectiveness Results ................................................ 59 Table 28: Single Family All-Electric Efficiency & PV-PV/Battery Package Cost-Effectiveness Results ..................... 60 Table 29: Single Family Mixed Fuel Efficiency – Non-Preempted Package Measure Summary ............................. 61 Table 30: Single Family Mixed Fuel Efficiency – Equipment, Preempted Package Measure Summary .................. 62 Table 31: Single Family Mixed Fuel Efficiency & PV/Battery Package Measure Summary ..................................... 63 Table 32: Single Family All-Electric Efficiency – Non-Preempted Package Measure Summary .............................. 64 Table 33: Single Family All-Electric Efficiency – Equipment, Preempted Package Measure Summary .................. 65 Table 34: Single Family All-Electric Efficiency & PV Package Measure Summary ................................................... 66 Table 35: Single Family All-Electric Efficiency & PV/Battery Package Measure Summary ...................................... 67 Table 36: Multifamily Mixed Fuel Efficiency Package Cost-Effectiveness Results .................................................. 68 Table 37: Multifamily Mixed Fuel Efficiency & PV/Battery Package Cost-Effectiveness Results ............................ 69 Table 38: Multifamily All-Electric Efficiency Package Cost-Effectiveness Results ................................................... 70 Table 39: Multifamily All-Electric Efficiency & PV-PV/Battery Package Cost-Effectiveness Results ....................... 71 Table 40: Multifamily Mixed Fuel Efficiency – Non-Preempted Package Measure Summary ................................ 72 Table 41: Multifamily Mixed Fuel Efficiency – Equipment, Preempted Package Measure Summary .................... 73 Table 42: Multifamily Mixed Fuel Efficiency & PV/Battery Package Measure Summary ....................................... 74 Table 43: Multifamily All-Electric Efficiency – Non-Preempted Package Measure Summary ................................. 75 Table 44: Multifamily All-Electric Efficiency – Equipment, Preempted Package Measure Summary ..................... 76 Table 45: Multifamily All-Electric Efficiency & PV Package Measure Summary ...................................................... 77 Table 46: Multifamily All-Electric Efficiency & PV/Battery Package Measure Summary ........................................ 78 Table 47: Single Family Climate Zone 1 Results Summary ...................................................................................... 80
ATTACHMENT 5
2019 Energy Efficiency Ordinance Cost-effectiveness Study
Table 48: Multifamily Climate Zone 1 Results Summary (Per Dwelling Unit) ......................................................... 81 Table 49: Single Family Climate Zone 2 Results Summary ...................................................................................... 82 Table 50: Multifamily Climate Zone 2 Results Summary (Per Dwelling Unit) ......................................................... 83 Table 51: Single Family Climate Zone 3 Results Summary ...................................................................................... 84 Table 52: Multifamily Climate Zone 3 Results Summary (Per Dwelling Unit) ......................................................... 85 Table 53: Single Family Climate Zone 4 Results Summary ...................................................................................... 86 Table 54: Multifamily Climate Zone 4 Results Summary (Per Dwelling Unit) ......................................................... 87 Table 55: Single Family Climate Zone 5 PG&E Results Summary ............................................................................ 88 Table 56: Multifamily Climate Zone 5 PG&E Results Summary (Per Dwelling Unit) ............................................... 89 Table 57: Single Family Climate Zone 5 PG&E/SoCalGas Results Summary ............................................................ 90 Table 58: Multifamily Climate Zone 5 PG&E/SoCalGas Results Summary (Per Dwelling Unit) ............................... 91 Table 59: Single Family Climate Zone 6 Results Summary ...................................................................................... 92 Table 60: Multifamily Climate Zone 6 Results Summary (Per Dwelling Unit) ......................................................... 93 Table 61: Single Family Climate Zone 7 Results Summary ...................................................................................... 94 Table 62: Multifamily Climate Zone 7 Results Summary (Per Dwelling Unit) ......................................................... 95 Table 63: Single Family Climate Zone 8 Results Summary ...................................................................................... 96 Table 64: Multifamily Climate Zone 8 Results Summary (Per Dwelling Unit) ......................................................... 97 Table 65: Single Family Climate Zone 9 Results Summary ...................................................................................... 98 Table 66: Multifamily Climate Zone 9 Results Summary (Per Dwelling Unit) ......................................................... 99 Table 67: Single Family Climate Zone 10 SCE/SoCalGas Results Summary ........................................................... 100 Table 68: Multifamily Climate Zone 10 SCE/SoCalGas Results Summary (Per Dwelling Unit) .............................. 101 Table 69: Single Family Climate Zone 10 SDGE Results Summary......................................................................... 102 Table 70: Multifamily Climate Zone 10 SDGE Results Summary (Per Dwelling Unit) ............................................ 103 Table 71: Single Family Climate Zone 11 Results Summary .................................................................................. 104 Table 72: Multifamily Climate Zone 11 Results Summary (Per Dwelling Unit) ..................................................... 105 Table 73: Single Family Climate Zone 12 Results Summary .................................................................................. 106 Table 74: Multifamily Climate Zone 12 Results Summary (Per Dwelling Unit) ..................................................... 107 Table 75: Single Family Climate Zone 13 Results Summary .................................................................................. 108 Table 76: Multifamily Climate Zone 13 Results Summary (Per Dwelling Unit) ..................................................... 109 Table 77: Single Family Climate Zone 14 SCE/SoCalGas Results Summary ........................................................... 110 Table 78: Multifamily Climate Zone 14 SCE/SoCalGas Results Summary (Per Dwelling Unit) .............................. 111 Table 79: Single Family Climate Zone 14 SDGE Results Summary......................................................................... 112 Table 80: Multifamily Climate Zone 14 SDGE Results Summary (Per Dwelling Unit) ............................................ 113 Table 81: Single Family Climate Zone 15 Results Summary .................................................................................. 114 Table 82: Multifamily Climate Zone 15 Results Summary (Per Dwelling Unit) ..................................................... 115 Table 83: Single Family Climate Zone 16 Results Summary .................................................................................. 116 Table 84: Multifamily Climate Zone 16 Results Summary (Per Dwelling Unit) ..................................................... 117
List of Figures Figure 1: Graphical description of EDR scores (courtesy of Energy Code Ace) ..........................................................5 Figure 2: B/C ratio comparison for PV and battery sizing ....................................................................................... 20 Figure 3: Single family Total EDR comparison ......................................................................................................... 25 Figure 4: Single family EDR Margin comparison (based on Efficiency EDR Margin for the Efficiency packages and the Total EDR Margin for the Efficiency & PV and Efficiency & PV/Battery packages) ........................................... 25 Figure 5: Single family greenhouse gas emissions comparison............................................................................... 26 Figure 6: Multifamily Total EDR comparison ........................................................................................................... 31 Figure 7: Multifamily EDR Margin comparison (based on Efficiency EDR Margin for the Efficiency packages and the Total EDR Margin for the Efficiency & PV and Efficiency & PV/Battery packages) ........................................... 31 Figure 8: Multifamily greenhouse gas emissions comparison ................................................................................ 32
ATTACHMENT 5
2019 Energy Efficiency Ordinance Cost-effectiveness Study
Figure 9: B/C ratio results for a single family all-electric code compliant home versus a mixed fuel code compliant home ........................................................................................................................................................................ 36 Figure 10: B/C ratio results for the single family Efficiency & PV all-electric home versus a mixed fuel code compliant home ...................................................................................................................................................... 37 Figure 11: B/C ratio results for the single family neutral cost package all-electric home versus a mixed fuel code compliant home ...................................................................................................................................................... 37 Figure 12: B/C ratio results for a multifamily all-electric code compliant home versus a mixed fuel code compliant home ...................................................................................................................................................... 40 Figure 13: B/C ratio results for the multifamily Efficiency & PV all-electric home versus a mixed fuel code compliant home ...................................................................................................................................................... 40 Figure 14: B/C ratio results for the multifamily neutral cost package all-electric home versus a mixed fuel code compliant home ...................................................................................................................................................... 41 Figure 15: Map of California Climate Zones (courtesy of the California Energy Commission) ............................... 46
ATTACHMENT 5
2019 Energy Efficiency Ordinance Cost-effectiveness Study
Acronyms
2020 PV$ Present value costs in 2020
ACH50 Air Changes per Hour at 50 pascals pressure differential
ACM Alternative Calculation Method
AFUE Annual Fuel Utilization Efficiency
B/C Lifecycle Benefit-to-Cost Ratio
BEopt Building Energy Optimization Tool
BSC Building Standards Commission
CAHP California Advanced Homes Program
CBECC-Res Computer program developed by the California Energy Commission for use in demonstrating compliance with the California Residential Building Energy Efficiency Standards
CFI California Flexible Installation
CFM Cubic Feet per Minute
CMFNH California Multifamily New Homes
CO2 Carbon Dioxide
CPC California Plumbing Code
CZ California Climate Zone
DHW Domestic Hot Water
DOE Department of Energy
DWHR Drain Water Heat Recovery
EDR Energy Design Rating
EER Energy Efficiency Ratio
EF Energy Factor
GHG Greenhouse Gas
HERS Rater Home Energy Rating System Rater
HPA High Performance Attic
HPWH Heat Pump Water Heater
HSPF Heating Seasonal Performance Factor
HVAC Heating, Ventilation, and Air Conditioning
IECC International Energy Conservation Code
IOU Investor Owned Utility
kBtu kilo-British thermal unit
kWh Kilowatt Hour
LBNL Lawrence Berkeley National Laboratory
ATTACHMENT 5
2019 Energy Efficiency Ordinance Cost-effectiveness Study
LCC Lifecycle Cost
LLAHU Low Leakage Air Handler Unit
VLLDCS Verified Low Leakage Ducts in Conditioned Space
MF Multifamily
NAECA National Appliance Energy Conservation Act
NEEA Northwest Energy Efficiency Alliance
NEM Net Energy Metering
NPV Net Present Value
NREL National Renewable Energy Laboratory
PG&E Pacific Gas and Electric Company
PV Photovoltaic
SCE Southern California Edison
SDG&E San Diego Gas and Electric
SEER Seasonal Energy Efficiency Ratio
SF Single Family
CASE Codes and Standards Enhancement
TDV Time Dependent Valuation
Therm Unit for quantity of heat that equals 100,000 British thermal units
Title 24 Title 24, Part 6
TOU Time-Of-Use
UEF Uniform Energy Factor
ZNE Zero-net Energy
ATTACHMENT 5
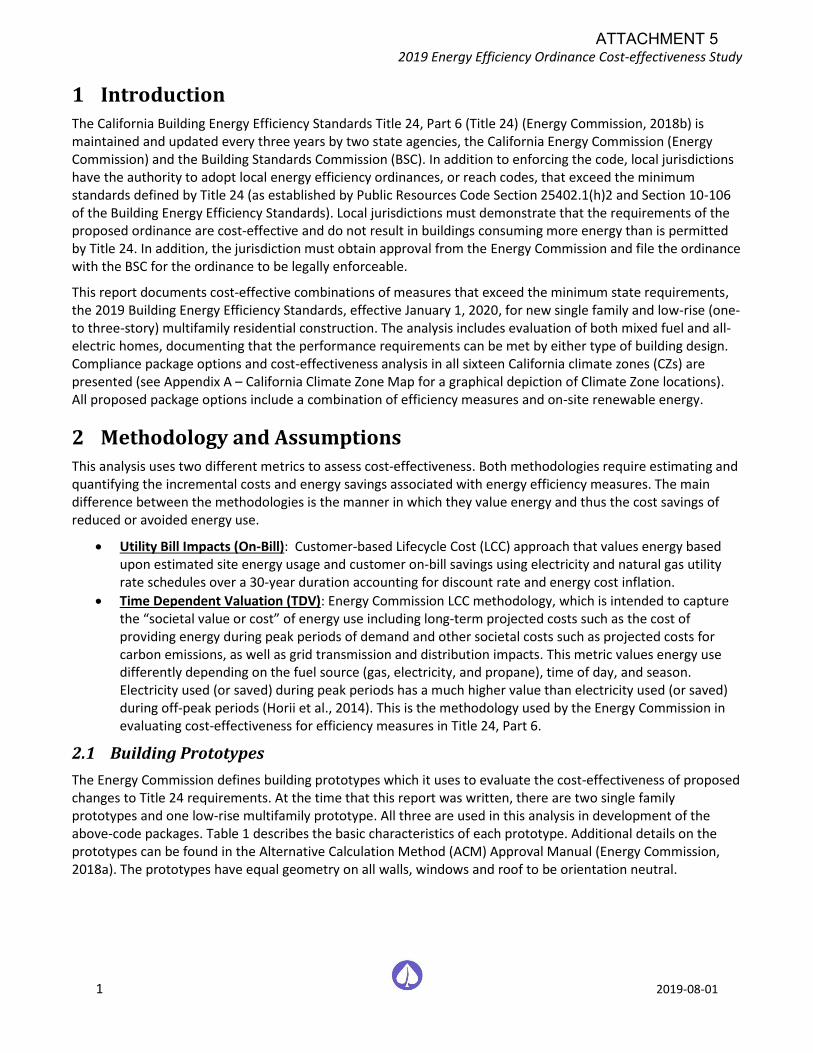
2019 Energy Efficiency Ordinance Cost-effectiveness Study
1 2019-08-01
1 Introduction The California Building Energy Efficiency Standards Title 24, Part 6 (Title 24) (Energy Commission, 2018b) is maintained and updated every three years by two state agencies, the California Energy Commission (Energy Commission) and the Building Standards Commission (BSC). In addition to enforcing the code, local jurisdictions have the authority to adopt local energy efficiency ordinances, or reach codes, that exceed the minimum standards defined by Title 24 (as established by Public Resources Code Section 25402.1(h)2 and Section 10-106 of the Building Energy Efficiency Standards). Local jurisdictions must demonstrate that the requirements of the proposed ordinance are cost-effective and do not result in buildings consuming more energy than is permitted by Title 24. In addition, the jurisdiction must obtain approval from the Energy Commission and file the ordinance with the BSC for the ordinance to be legally enforceable.
This report documents cost-effective combinations of measures that exceed the minimum state requirements, the 2019 Building Energy Efficiency Standards, effective January 1, 2020, for new single family and low-rise (one- to three-story) multifamily residential construction. The analysis includes evaluation of both mixed fuel and all-electric homes, documenting that the performance requirements can be met by either type of building design. Compliance package options and cost-effectiveness analysis in all sixteen California climate zones (CZs) are presented (see Appendix A – California Climate Zone Map for a graphical depiction of Climate Zone locations). All proposed package options include a combination of efficiency measures and on-site renewable energy.
2 Methodology and Assumptions This analysis uses two different metrics to assess cost-effectiveness. Both methodologies require estimating and quantifying the incremental costs and energy savings associated with energy efficiency measures. The main difference between the methodologies is the manner in which they value energy and thus the cost savings of reduced or avoided energy use.
• Utility Bill Impacts (On-Bill): Customer-based Lifecycle Cost (LCC) approach that values energy based upon estimated site energy usage and customer on-bill savings using electricity and natural gas utility rate schedules over a 30-year duration accounting for discount rate and energy cost inflation.
• Time Dependent Valuation (TDV): Energy Commission LCC methodology, which is intended to capture the “societal value or cost” of energy use including long-term projected costs such as the cost of providing energy during peak periods of demand and other societal costs such as projected costs for carbon emissions, as well as grid transmission and distribution impacts. This metric values energy use differently depending on the fuel source (gas, electricity, and propane), time of day, and season. Electricity used (or saved) during peak periods has a much higher value than electricity used (or saved) during off-peak periods (Horii et al., 2014). This is the methodology used by the Energy Commission in evaluating cost-effectiveness for efficiency measures in Title 24, Part 6.
2.1 Building Prototypes
The Energy Commission defines building prototypes which it uses to evaluate the cost-effectiveness of proposed changes to Title 24 requirements. At the time that this report was written, there are two single family prototypes and one low-rise multifamily prototype. All three are used in this analysis in development of the above-code packages. Table 1 describes the basic characteristics of each prototype. Additional details on the prototypes can be found in the Alternative Calculation Method (ACM) Approval Manual (Energy Commission, 2018a). The prototypes have equal geometry on all walls, windows and roof to be orientation neutral.
ATTACHMENT 5
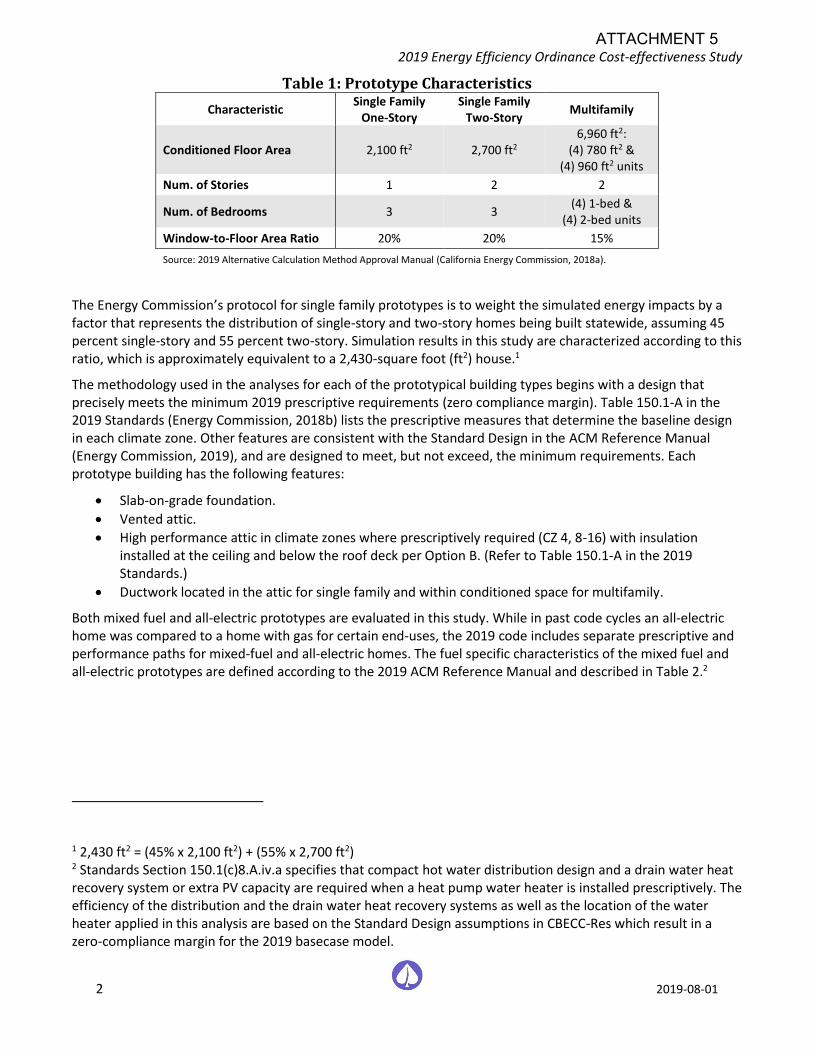
2019 Energy Efficiency Ordinance Cost-effectiveness Study
2 2019-08-01
Table 1: Prototype Characteristics
Characteristic Single Family
One-Story Single Family
Two-Story Multifamily
Conditioned Floor Area 2,100 ft2 2,700 ft2 6,960 ft2:
(4) 780 ft2 & (4) 960 ft2 units
Num. of Stories 1 2 2
Num. of Bedrooms 3 3 (4) 1-bed &
(4) 2-bed units
Window-to-Floor Area Ratio 20% 20% 15%
Source: 2019 Alternative Calculation Method Approval Manual (California Energy Commission, 2018a).
The Energy Commission’s protocol for single family prototypes is to weight the simulated energy impacts by a factor that represents the distribution of single-story and two-story homes being built statewide, assuming 45 percent single-story and 55 percent two-story. Simulation results in this study are characterized according to this ratio, which is approximately equivalent to a 2,430-square foot (ft2) house.1
The methodology used in the analyses for each of the prototypical building types begins with a design that precisely meets the minimum 2019 prescriptive requirements (zero compliance margin). Table 150.1-A in the 2019 Standards (Energy Commission, 2018b) lists the prescriptive measures that determine the baseline design in each climate zone. Other features are consistent with the Standard Design in the ACM Reference Manual (Energy Commission, 2019), and are designed to meet, but not exceed, the minimum requirements. Each prototype building has the following features:
• Slab-on-grade foundation.
• Vented attic.
• High performance attic in climate zones where prescriptively required (CZ 4, 8-16) with insulation installed at the ceiling and below the roof deck per Option B. (Refer to Table 150.1-A in the 2019 Standards.)
• Ductwork located in the attic for single family and within conditioned space for multifamily.
Both mixed fuel and all-electric prototypes are evaluated in this study. While in past code cycles an all-electric home was compared to a home with gas for certain end-uses, the 2019 code includes separate prescriptive and performance paths for mixed-fuel and all-electric homes. The fuel specific characteristics of the mixed fuel and all-electric prototypes are defined according to the 2019 ACM Reference Manual and described in Table 2.2
1 2,430 ft2 = (45% x 2,100 ft2) + (55% x 2,700 ft2) 2 Standards Section 150.1(c)8.A.iv.a specifies that compact hot water distribution design and a drain water heat recovery system or extra PV capacity are required when a heat pump water heater is installed prescriptively. The efficiency of the distribution and the drain water heat recovery systems as well as the location of the water heater applied in this analysis are based on the Standard Design assumptions in CBECC-Res which result in a zero-compliance margin for the 2019 basecase model.
ATTACHMENT 5
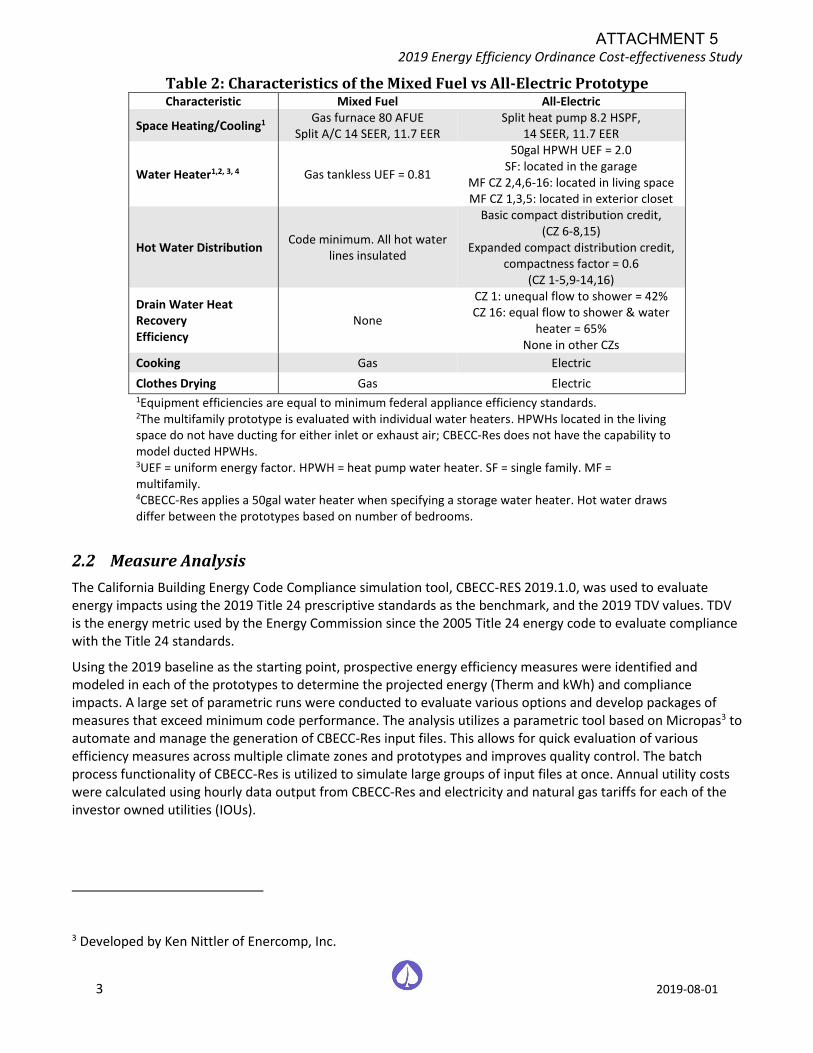
2019 Energy Efficiency Ordinance Cost-effectiveness Study
3 2019-08-01
Table 2: Characteristics of the Mixed Fuel vs All-Electric Prototype Characteristic Mixed Fuel All-Electric
Space Heating/Cooling1 Gas furnace 80 AFUE Split A/C 14 SEER, 11.7 EER
Split heat pump 8.2 HSPF, 14 SEER, 11.7 EER
Water Heater1,2, 3, 4 Gas tankless UEF = 0.81
50gal HPWH UEF = 2.0 SF: located in the garage
MF CZ 2,4,6-16: located in living space MF CZ 1,3,5: located in exterior closet
Hot Water Distribution Code minimum. All hot water
lines insulated
Basic compact distribution credit, (CZ 6-8,15)
Expanded compact distribution credit, compactness factor = 0.6
(CZ 1-5,9-14,16)
Drain Water Heat Recovery Efficiency
None
CZ 1: unequal flow to shower = 42% CZ 16: equal flow to shower & water
heater = 65% None in other CZs
Cooking Gas Electric
Clothes Drying Gas Electric 1Equipment efficiencies are equal to minimum federal appliance efficiency standards. 2The multifamily prototype is evaluated with individual water heaters. HPWHs located in the living space do not have ducting for either inlet or exhaust air; CBECC-Res does not have the capability to model ducted HPWHs. 3UEF = uniform energy factor. HPWH = heat pump water heater. SF = single family. MF = multifamily. 4CBECC-Res applies a 50gal water heater when specifying a storage water heater. Hot water draws differ between the prototypes based on number of bedrooms.
2.2 Measure Analysis
The California Building Energy Code Compliance simulation tool, CBECC-RES 2019.1.0, was used to evaluate energy impacts using the 2019 Title 24 prescriptive standards as the benchmark, and the 2019 TDV values. TDV is the energy metric used by the Energy Commission since the 2005 Title 24 energy code to evaluate compliance with the Title 24 standards.
Using the 2019 baseline as the starting point, prospective energy efficiency measures were identified and modeled in each of the prototypes to determine the projected energy (Therm and kWh) and compliance impacts. A large set of parametric runs were conducted to evaluate various options and develop packages of measures that exceed minimum code performance. The analysis utilizes a parametric tool based on Micropas3 to automate and manage the generation of CBECC-Res input files. This allows for quick evaluation of various efficiency measures across multiple climate zones and prototypes and improves quality control. The batch process functionality of CBECC-Res is utilized to simulate large groups of input files at once. Annual utility costs were calculated using hourly data output from CBECC-Res and electricity and natural gas tariffs for each of the investor owned utilities (IOUs).
3 Developed by Ken Nittler of Enercomp, Inc.
ATTACHMENT 5
2019 Energy Efficiency Ordinance Cost-effectiveness Study
4 2019-08-01
The Reach Codes Team selected packages and measures based on cost-effectiveness as well as decades of experience with residential architects, builders, and engineers along with general knowledge of the relative acceptance of many measures.
2.2.1 Federal Preemption
The Department of Energy (DOE) sets minimum efficiency standards for equipment and appliances that are federally regulated under the National Appliance Energy Conservation Act (NAECA), including heating, cooling, and water heating equipment. Since state and local governments are prohibited from adopting policies that mandate higher minimum efficiencies than the federal standards require, the focus of this study is to identify and evaluate cost-effective packages that do not include high efficiency equipment. While this study is limited by federal preemption, in practice builders may use any package of compliant measures to achieve the performance goals, including high efficiency appliances. Often, these measures are the simplest and most affordable measures to increase energy performance.
2.2.2 Energy Design Rating
The 2019 Title 24 code introduces California’s Energy Design Rating (EDR) as the primary metric to demonstrate compliance with the energy code. EDR is still based on TDV but it uses a building that is compliant with the 2006 International Energy Conservation Code (IECC) as the reference building. The reference building has an EDR score of 100 while a zero-net energy (ZNE) home has an EDR score of zero (Energy Commission, 2018d). See Figure 1 for a graphical representation of this. While the Reference Building is used to determine the rating, the Proposed Design is still compared to the Standard Design based on the prescriptive baseline assumptions to determine compliance.
The EDR is calculated by CBECC-Res and has two components:
1. An “Efficiency EDR” which represents the building’s energy use without solar generation.4 2. A “Total EDR” that represents the final energy use of the building based on the combined impact of
efficiency measures, PV generation and demand flexibility.
For a building to comply, two criteria are required:
(1) the proposed Efficiency EDR must be equal to or less than the Efficiency EDR of the Standard Design, and (2) the proposed Total EDR must be equal to or less than the Total EDR of the Standard Design.
Single family prototypes used in this analysis that are minimally compliant with the 2019 Title 24 code achieve a Total EDR between 20 and 35 in most climates.
This concept, consistent with California’s “loading order” which prioritizes energy efficiency ahead of renewable generation, requires projects meet a minimum Efficiency EDR before PV is credited but allows for PV to be traded off with additional efficiency when meeting the Total EDR. A project may improve on building efficiency beyond the minimum required and subsequently reduce the PV generation capacity required to achieve the required Total EDR but may not increase the size of the PV system and trade this off with a reduction of efficiency measures. Figure 1 graphically summarizes how both Efficiency EDR and PV / demand flexibility EDR are used to calculate the Total EDR used in the 2019 code and in this analysis.
4 While there is no compliance credit for solar PV as there is under the 2016 Standards, the credit for installing electric storage battery systems that meet minimum qualifications can be applied to the Efficiency EDR.
ATTACHMENT 5
2019 Energy Efficiency Ordinance Cost-effectiveness Study
5 2019-08-01
Figure 1: Graphical description of EDR scores (courtesy of Energy Code Ace5)
Results from this analysis are presented as EDR Margin, a reduction in the EDR score relative to the Standard Design. EDR Margin is a better metric to use than absolute EDR in the context of a reach code because absolute values vary, based on the home design and characteristics such as size and orientation. This approach aligns with how compliance is determined for the 2019 Title 24 code, as well as utility incentive programs, such as the California Advanced Homes Program (CAHP) & California Multifamily New Homes (CMFNH), which require minimum performance criteria based on an EDR Margin for low-rise residential projects. The EDR Margin is calculated according to Equation 1 for the two efficiency packages and Equation 2 for the Efficiency & PV and Efficiency & PV/Battery packages (see Section 2.3).
Equation 1 𝐸𝐷𝑅 𝑀𝑎𝑟𝑔𝑖𝑛𝒆𝒇𝒇𝒊𝒄𝒊𝒆𝒏𝒄𝒚 = 𝑆𝑡𝑎𝑛𝑑𝑎𝑟𝑑 𝐷𝑒𝑠𝑖𝑔𝑛 𝑬𝒇𝒇𝒊𝒄𝒊𝒆𝒏𝒄𝒚 𝐸𝐷𝑅 − 𝑃𝑟𝑜𝑝𝑜𝑠𝑒𝑑 𝐷𝑒𝑠𝑖𝑔𝑛 𝑬𝒇𝒇𝒊𝒄𝒊𝒆𝒏𝒄𝒚 𝐸𝐷𝑅
Equation 2 𝐸𝐷𝑅 𝑀𝑎𝑟𝑔𝑖𝑛𝒆𝒇𝒇𝒊𝒄𝒊𝒆𝒏𝒄𝒚 & 𝑷𝑽 = 𝑆𝑡𝑎𝑛𝑑𝑎𝑟𝑑 𝐷𝑒𝑠𝑖𝑔𝑛 𝑻𝒐𝒕𝒂𝒍 𝐸𝐷𝑅 − 𝑃𝑟𝑜𝑝𝑜𝑠𝑒𝑑 𝐷𝑒𝑠𝑖𝑔𝑛 𝑻𝒐𝒕𝒂𝒍 𝐸𝐷𝑅
2.2.3 Energy Efficiency Measures
Following are descriptions of each of the efficiency measures evaluated under this analysis. Because not all of the measures described below were found to be cost-effective and cost-effectiveness varied by climate zone, not all measures are included in all packages and some of the measures listed are not included in any final package. For a list of measures included in each efficiency package by climate zone, see Appendix D – Single Family Measure Summary and Appendix F – Multifamily Measure Summary.
Reduced Infiltration (ACH50): Reduce infiltration in single family homes from the default infiltration assumption of five (5) air changes per hour at 50 Pascals (ACH50)6 by 40 to 60 percent to either 3 ACH50 or 2 ACH50. HERS
5 https://energycodeace.com/
6 Whole house leakage tested at a pressure difference of 50 Pascals between indoors and outdoors.
ATTACHMENT 5
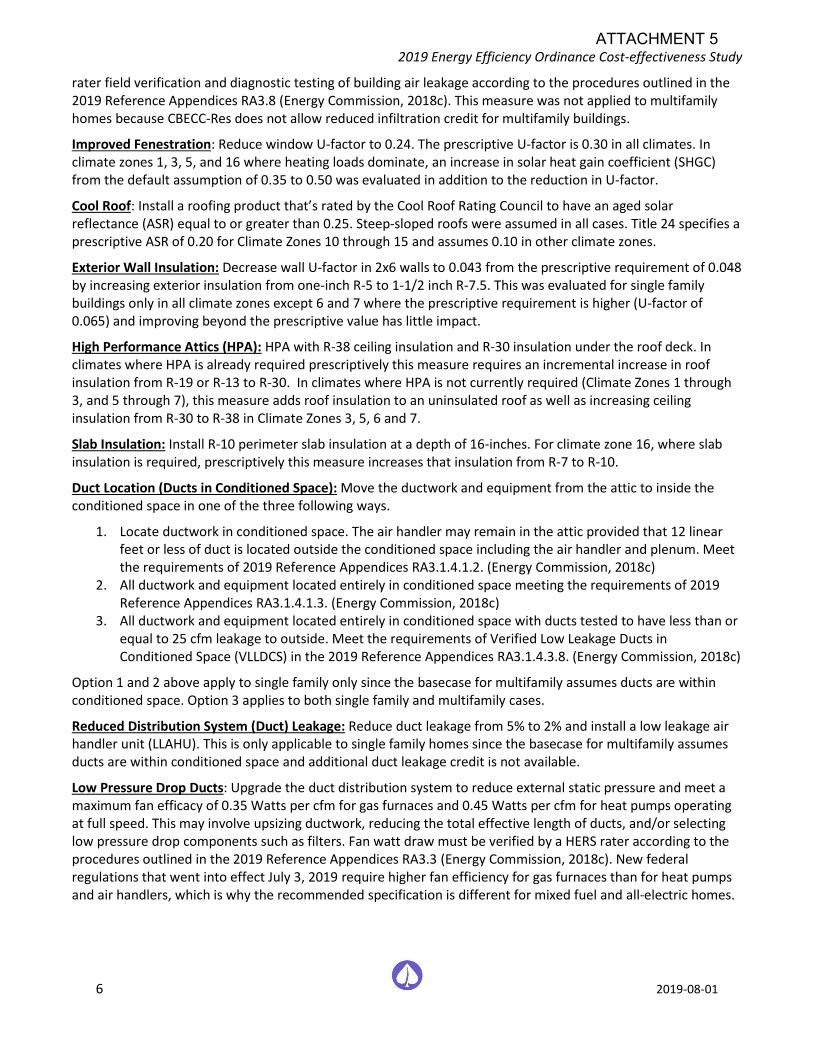
2019 Energy Efficiency Ordinance Cost-effectiveness Study
6 2019-08-01
rater field verification and diagnostic testing of building air leakage according to the procedures outlined in the 2019 Reference Appendices RA3.8 (Energy Commission, 2018c). This measure was not applied to multifamily homes because CBECC-Res does not allow reduced infiltration credit for multifamily buildings.
Improved Fenestration: Reduce window U-factor to 0.24. The prescriptive U-factor is 0.30 in all climates. In climate zones 1, 3, 5, and 16 where heating loads dominate, an increase in solar heat gain coefficient (SHGC) from the default assumption of 0.35 to 0.50 was evaluated in addition to the reduction in U-factor.
Cool Roof: Install a roofing product that’s rated by the Cool Roof Rating Council to have an aged solar reflectance (ASR) equal to or greater than 0.25. Steep-sloped roofs were assumed in all cases. Title 24 specifies a prescriptive ASR of 0.20 for Climate Zones 10 through 15 and assumes 0.10 in other climate zones.
Exterior Wall Insulation: Decrease wall U-factor in 2x6 walls to 0.043 from the prescriptive requirement of 0.048 by increasing exterior insulation from one-inch R-5 to 1-1/2 inch R-7.5. This was evaluated for single family buildings only in all climate zones except 6 and 7 where the prescriptive requirement is higher (U-factor of 0.065) and improving beyond the prescriptive value has little impact.
High Performance Attics (HPA): HPA with R-38 ceiling insulation and R-30 insulation under the roof deck. In climates where HPA is already required prescriptively this measure requires an incremental increase in roof insulation from R-19 or R-13 to R-30. In climates where HPA is not currently required (Climate Zones 1 through 3, and 5 through 7), this measure adds roof insulation to an uninsulated roof as well as increasing ceiling insulation from R-30 to R-38 in Climate Zones 3, 5, 6 and 7.
Slab Insulation: Install R-10 perimeter slab insulation at a depth of 16-inches. For climate zone 16, where slab insulation is required, prescriptively this measure increases that insulation from R-7 to R-10.
Duct Location (Ducts in Conditioned Space): Move the ductwork and equipment from the attic to inside the conditioned space in one of the three following ways.
1. Locate ductwork in conditioned space. The air handler may remain in the attic provided that 12 linear feet or less of duct is located outside the conditioned space including the air handler and plenum. Meet the requirements of 2019 Reference Appendices RA3.1.4.1.2. (Energy Commission, 2018c)
2. All ductwork and equipment located entirely in conditioned space meeting the requirements of 2019 Reference Appendices RA3.1.4.1.3. (Energy Commission, 2018c)
3. All ductwork and equipment located entirely in conditioned space with ducts tested to have less than or equal to 25 cfm leakage to outside. Meet the requirements of Verified Low Leakage Ducts in Conditioned Space (VLLDCS) in the 2019 Reference Appendices RA3.1.4.3.8. (Energy Commission, 2018c)
Option 1 and 2 above apply to single family only since the basecase for multifamily assumes ducts are within conditioned space. Option 3 applies to both single family and multifamily cases.
Reduced Distribution System (Duct) Leakage: Reduce duct leakage from 5% to 2% and install a low leakage air handler unit (LLAHU). This is only applicable to single family homes since the basecase for multifamily assumes ducts are within conditioned space and additional duct leakage credit is not available.
Low Pressure Drop Ducts: Upgrade the duct distribution system to reduce external static pressure and meet a maximum fan efficacy of 0.35 Watts per cfm for gas furnaces and 0.45 Watts per cfm for heat pumps operating at full speed. This may involve upsizing ductwork, reducing the total effective length of ducts, and/or selecting low pressure drop components such as filters. Fan watt draw must be verified by a HERS rater according to the procedures outlined in the 2019 Reference Appendices RA3.3 (Energy Commission, 2018c). New federal regulations that went into effect July 3, 2019 require higher fan efficiency for gas furnaces than for heat pumps and air handlers, which is why the recommended specification is different for mixed fuel and all-electric homes.
ATTACHMENT 5
2019 Energy Efficiency Ordinance Cost-effectiveness Study
7 2019-08-01
HERS Verification of Hot Water Pipe Insulation: The California Plumbing Code (CPC) requires pipe insulation on all hot water lines. This measure provides credit for HERS rater verification of pipe insulation requirements according to the procedures outlined in the 2019 Reference Appendices RA3.6.3. (Energy Commission, 2018c)
Compact Hot Water Distribution: Two credits for compact hot water distribution were evaluated.
1. Basic Credit: Design the hot water distribution system to meet minimum requirements for the basic compact hot water distribution credit according to the procedures outlined in the 2019 Reference Appendices RA4.4.6 (Energy Commission, 2018c). In many single family homes this may require moving the water heater from an exterior to an interior garage wall. Multifamily homes with individual water heaters are expected to easily meet this credit with little or no alteration to plumbing design. CBECC-Res software assumes a 30% reduction in distribution losses for the basic credit.
2. Expanded Credit: Design the hot water distribution system to meet minimum requirements for the expanded compact hot water distribution credit according to the procedures outlined in the 2019 Reference Appendices RA3.6.5 (Energy Commission, 2018c). In addition to requiring HERS verification that the minimum requirements for the basic compact distribution credit are met, this credit also imposes limitations on pipe location, maximum pipe diameter, and recirculation system controls allowed.
Drain Water Heat Recovery (DWHR): For multifamily buildings add DWHR that serves the showers in an unequal flow configuration (pre-heated water is piped directly to the shower) with 50% efficiency. This upgrade assumes all apartments are served by a DWHR with one unit serving each apartment individually. For a slab-on-grade building this requires a horizontal unit for the first-floor apartments.
Federally Preempted Measures:
The following additional measures were evaluated. Because these measures require upgrading appliances that are federally regulated to high efficiency models, they cannot be used to show cost-effectiveness in a local ordinance. The measures and packages are presented here to show that there are several options for builders to meet the performance targets. Heating and cooling capacities are autosized by CBECC-Res in all cases.
High Efficiency Furnace: For the mixed-fuel prototypes, upgrade natural gas furnace to one of two condensing furnace options with an efficiency of 92% or 96% AFUE.
High Efficiency Air Conditioner: For the mixed-fuel prototypes, upgrade the air conditioner to either single-stage SEER 16 / EER 13 or two-stage SEER 18 / EER 14 equipment.
High Efficiency Heat Pump: For the all-electric prototypes, upgrade the heat pump to either single-stage SEER 16 / EER 13 / HSPF 9 or two-stage SEER 18 / EER 14 / HSPF 10 equipment.
High Efficiency Tankless Water Heater: For the mixed-fuel prototype, upgrade tankless water heater to a condensing unit with a rated Uniform Energy Factor (UEF) of 0.96.
High Efficiency Heat Pump Water Heater (HPWH): For the all-electric prototypes, upgrade the federal minimum heat pump water heater to a HPWH that meets the Northwest Energy Efficiency Alliance (NEEA)7 Tier 3 rating. The evaluated NEEA water heater is an 80gal unit and is applied to all three building prototypes. Using the same
7 Based on operational challenges experienced in the past, NEEA established rating test criteria to ensure newly installed HPWHs perform adequately, especially in colder climates. The NEEA rating requires an Energy Factor equal to the ENERGY STAR performance level and includes requirements regarding noise and prioritizing heat pump use over supplemental electric resistance heating.
ATTACHMENT 5
2019 Energy Efficiency Ordinance Cost-effectiveness Study
8 2019-08-01
water heater provides consistency in performance across all the equipment upgrade cases, even though hot water draws differ across the prototypes.
2.3 Package Development
Three to four packages were evaluated for each prototype and climate zone, as described below.
1) Efficiency – Non-Preempted: This package uses only efficiency measures that don’t trigger federal preemption issues including envelope, and water heating and duct distribution efficiency measures.
2) Efficiency – Equipment, Preempted: This package shows an alternative design that applies HVAC and water heating equipment that are more efficient than federal standards. The Reach Code Team considers this more reflective of how builders meet above code requirements in practice.
3) Efficiency & PV: Using the Efficiency – Non-Preempted Package as a starting point8, PV capacity is added to offset most of the estimated electricity use. This only applies to the all-electric case, since for the mixed fuel cases, 100% of the projected electricity use is already being offset as required by 2019 Title 24, Part 6.
4) Efficiency & PV/Battery: Using the Efficiency & PV Package as a starting point, PV capacity is added as well as a battery system.
2.3.1 Solar Photovoltaics (PV)
Installation of on-site PV is required in the 2019 residential code. The PV sizing methodology in each package was developed to offset annual building electricity use and avoid oversizing which would violate net energy metering (NEM) rules.9 In all cases, PV is evaluated in CBECC-Res according to the California Flexible Installation (CFI) assumptions.
The Reach Code Team used two options within the CBECC-Res software for sizing the PV system, described below. Analysis was conducted to determine the most appropriate sizing method for each package which is described in the results.
• Standard Design PV – the same PV capacity as is required for the Standard Design case10
• Specify PV System Scaling – a PV system sized to offset a specified percentage of the estimated electricity use of the Proposed Design case
2.3.2 Energy Storage (Batteries)
A battery system was evaluated in CBECC-Res with control type set to “Time of Use” and with default efficiencies of 95% for both charging and discharging. The “Time of Use” option assumes batteries are charged anytime PV generation is greater than the house load but controls when the battery storage system discharges. During the summer months (July – September) the battery begins to discharge at the beginning of the peak period at a maximum rate until fully discharged. During discharge the battery first serves the house load but will
8 In cases where there was no cost-effective Efficiency – Non-Preempted Package, the most cost-effective efficiency measures for that climate zone were also included in the Efficiency & PV Package in order to provide a combination of both efficiency and PV beyond code minimum.
9 NEM rules apply to the IOU territories only.
10 The Standard Design PV system is sized to offset the electricity use of the building loads which are typically electric in a mixed fuel home, which includes all loads except space heating, water heating, clothes drying, and cooking.
ATTACHMENT 5
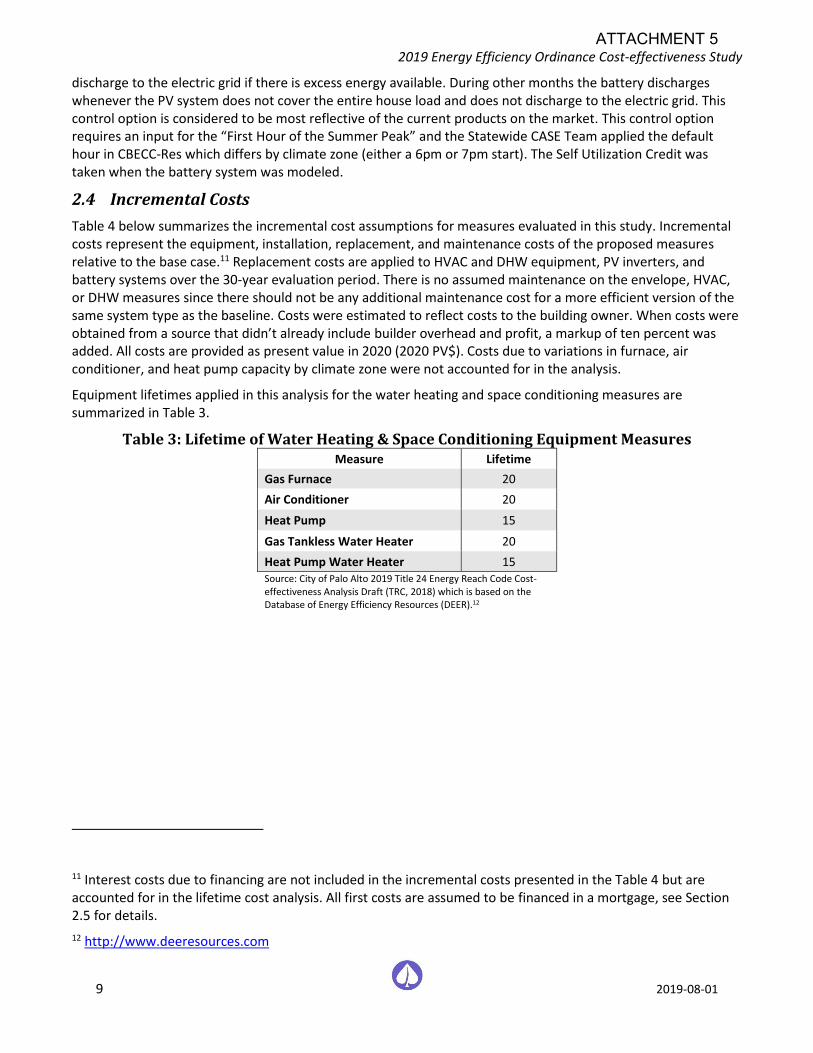
2019 Energy Efficiency Ordinance Cost-effectiveness Study
9 2019-08-01
discharge to the electric grid if there is excess energy available. During other months the battery discharges whenever the PV system does not cover the entire house load and does not discharge to the electric grid. This control option is considered to be most reflective of the current products on the market. This control option requires an input for the “First Hour of the Summer Peak” and the Statewide CASE Team applied the default hour in CBECC-Res which differs by climate zone (either a 6pm or 7pm start). The Self Utilization Credit was taken when the battery system was modeled.
2.4 Incremental Costs
Table 4 below summarizes the incremental cost assumptions for measures evaluated in this study. Incremental costs represent the equipment, installation, replacement, and maintenance costs of the proposed measures relative to the base case.11 Replacement costs are applied to HVAC and DHW equipment, PV inverters, and battery systems over the 30-year evaluation period. There is no assumed maintenance on the envelope, HVAC, or DHW measures since there should not be any additional maintenance cost for a more efficient version of the same system type as the baseline. Costs were estimated to reflect costs to the building owner. When costs were obtained from a source that didn’t already include builder overhead and profit, a markup of ten percent was added. All costs are provided as present value in 2020 (2020 PV$). Costs due to variations in furnace, air conditioner, and heat pump capacity by climate zone were not accounted for in the analysis.
Equipment lifetimes applied in this analysis for the water heating and space conditioning measures are summarized in Table 3.
Table 3: Lifetime of Water Heating & Space Conditioning Equipment Measures Measure Lifetime
Gas Furnace 20
Air Conditioner 20
Heat Pump 15
Gas Tankless Water Heater 20
Heat Pump Water Heater 15 Source: City of Palo Alto 2019 Title 24 Energy Reach Code Cost- effectiveness Analysis Draft (TRC, 2018) which is based on the Database of Energy Efficiency Resources (DEER).12
11 Interest costs due to financing are not included in the incremental costs presented in the Table 4 but are accounted for in the lifetime cost analysis. All first costs are assumed to be financed in a mortgage, see Section 2.5 for details.
12 http://www.deeresources.com
ATTACHMENT 5
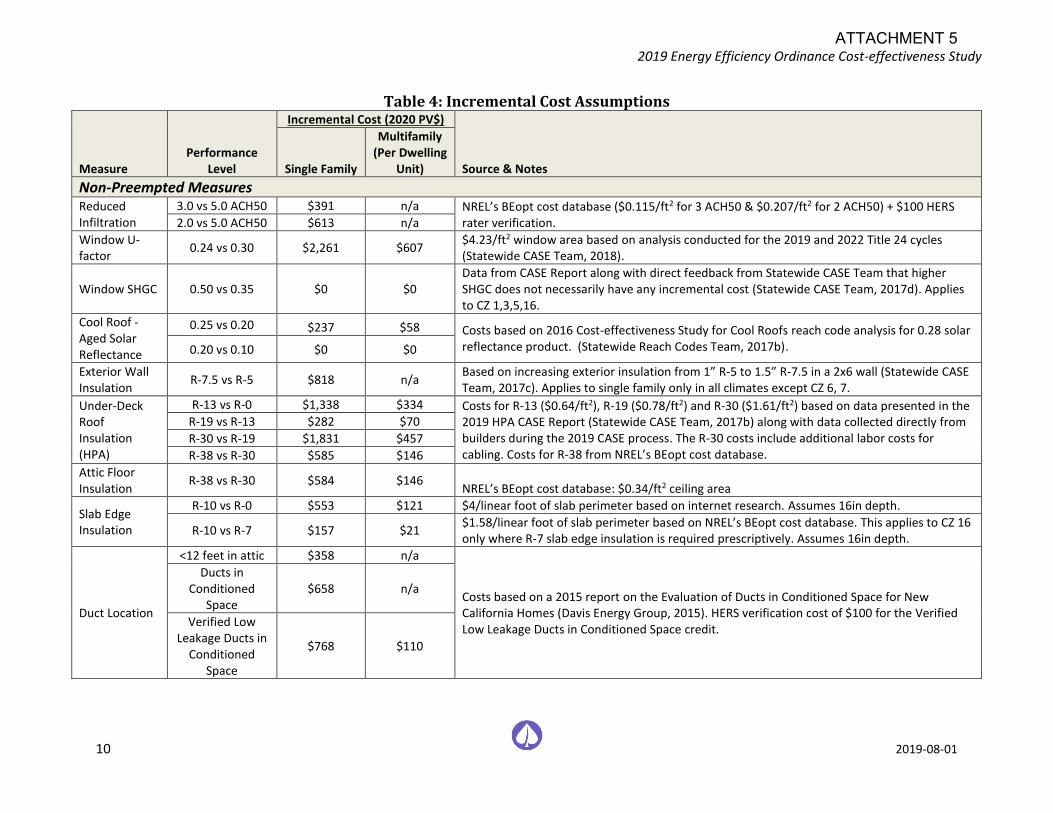
2019 Energy Efficiency Ordinance Cost-effectiveness Study
10 2019-08-01
Table 4: Incremental Cost Assumptions
Measure Performance
Level
Incremental Cost (2020 PV$)
Source & Notes Single Family
Multifamily (Per Dwelling
Unit)
Non-Preempted Measures Reduced Infiltration
3.0 vs 5.0 ACH50 $391 n/a NREL’s BEopt cost database ($0.115/ft2 for 3 ACH50 & $0.207/ft2 for 2 ACH50) + $100 HERS rater verification. 2.0 vs 5.0 ACH50 $613 n/a
Window U-factor
0.24 vs 0.30 $2,261 $607 $4.23/ft2 window area based on analysis conducted for the 2019 and 2022 Title 24 cycles (Statewide CASE Team, 2018).
Window SHGC 0.50 vs 0.35 $0 $0 Data from CASE Report along with direct feedback from Statewide CASE Team that higher SHGC does not necessarily have any incremental cost (Statewide CASE Team, 2017d). Applies to CZ 1,3,5,16.
Cool Roof - Aged Solar Reflectance
0.25 vs 0.20 $237 $58 Costs based on 2016 Cost-effectiveness Study for Cool Roofs reach code analysis for 0.28 solar reflectance product. (Statewide Reach Codes Team, 2017b). 0.20 vs 0.10 $0 $0
Exterior Wall Insulation
R-7.5 vs R-5 $818 n/a Based on increasing exterior insulation from 1” R-5 to 1.5” R-7.5 in a 2x6 wall (Statewide CASE Team, 2017c). Applies to single family only in all climates except CZ 6, 7.
Under-Deck Roof Insulation (HPA)
R-13 vs R-0 $1,338 $334 Costs for R-13 ($0.64/ft2), R-19 ($0.78/ft2) and R-30 ($1.61/ft2) based on data presented in the 2019 HPA CASE Report (Statewide CASE Team, 2017b) along with data collected directly from builders during the 2019 CASE process. The R-30 costs include additional labor costs for cabling. Costs for R-38 from NREL’s BEopt cost database.
R-19 vs R-13 $282 $70
R-30 vs R-19 $1,831 $457
R-38 vs R-30 $585 $146
Attic Floor Insulation
R-38 vs R-30 $584 $146 NREL’s BEopt cost database: $0.34/ft2 ceiling area
Slab Edge Insulation
R-10 vs R-0 $553 $121 $4/linear foot of slab perimeter based on internet research. Assumes 16in depth.
R-10 vs R-7 $157 $21 $1.58/linear foot of slab perimeter based on NREL’s BEopt cost database. This applies to CZ 16 only where R-7 slab edge insulation is required prescriptively. Assumes 16in depth.
Duct Location
<12 feet in attic $358 n/a
Costs based on a 2015 report on the Evaluation of Ducts in Conditioned Space for New California Homes (Davis Energy Group, 2015). HERS verification cost of $100 for the Verified Low Leakage Ducts in Conditioned Space credit.
Ducts in Conditioned
Space $658 n/a
Verified Low Leakage Ducts in
Conditioned Space
$768 $110
ATTACHMENT 5
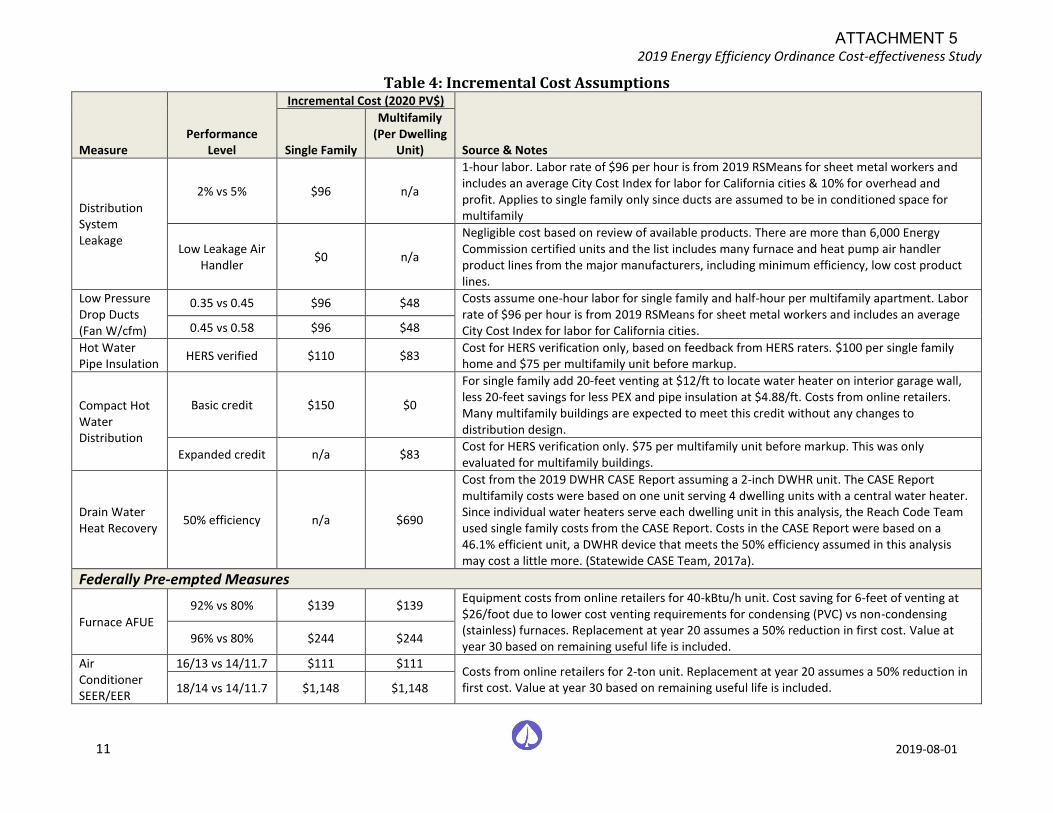
2019 Energy Efficiency Ordinance Cost-effectiveness Study
11 2019-08-01
Table 4: Incremental Cost Assumptions
Measure Performance
Level
Incremental Cost (2020 PV$)
Source & Notes Single Family
Multifamily (Per Dwelling
Unit)
Distribution System Leakage
2% vs 5% $96 n/a
1-hour labor. Labor rate of $96 per hour is from 2019 RSMeans for sheet metal workers and includes an average City Cost Index for labor for California cities & 10% for overhead and profit. Applies to single family only since ducts are assumed to be in conditioned space for multifamily
Low Leakage Air Handler
$0 n/a
Negligible cost based on review of available products. There are more than 6,000 Energy Commission certified units and the list includes many furnace and heat pump air handler product lines from the major manufacturers, including minimum efficiency, low cost product lines.
Low Pressure Drop Ducts (Fan W/cfm)
0.35 vs 0.45 $96 $48 Costs assume one-hour labor for single family and half-hour per multifamily apartment. Labor rate of $96 per hour is from 2019 RSMeans for sheet metal workers and includes an average City Cost Index for labor for California cities. 0.45 vs 0.58 $96 $48
Hot Water Pipe Insulation
HERS verified $110 $83 Cost for HERS verification only, based on feedback from HERS raters. $100 per single family home and $75 per multifamily unit before markup.
Compact Hot Water Distribution
Basic credit $150 $0
For single family add 20-feet venting at $12/ft to locate water heater on interior garage wall, less 20-feet savings for less PEX and pipe insulation at $4.88/ft. Costs from online retailers. Many multifamily buildings are expected to meet this credit without any changes to distribution design.
Expanded credit n/a $83 Cost for HERS verification only. $75 per multifamily unit before markup. This was only evaluated for multifamily buildings.
Drain Water Heat Recovery
50% efficiency n/a $690
Cost from the 2019 DWHR CASE Report assuming a 2-inch DWHR unit. The CASE Report multifamily costs were based on one unit serving 4 dwelling units with a central water heater. Since individual water heaters serve each dwelling unit in this analysis, the Reach Code Team used single family costs from the CASE Report. Costs in the CASE Report were based on a 46.1% efficient unit, a DWHR device that meets the 50% efficiency assumed in this analysis may cost a little more. (Statewide CASE Team, 2017a).
Federally Pre-empted Measures
Furnace AFUE
92% vs 80% $139 $139 Equipment costs from online retailers for 40-kBtu/h unit. Cost saving for 6-feet of venting at $26/foot due to lower cost venting requirements for condensing (PVC) vs non-condensing (stainless) furnaces. Replacement at year 20 assumes a 50% reduction in first cost. Value at year 30 based on remaining useful life is included.
96% vs 80% $244 $244
Air Conditioner SEER/EER
16/13 vs 14/11.7 $111 $111 Costs from online retailers for 2-ton unit. Replacement at year 20 assumes a 50% reduction in first cost. Value at year 30 based on remaining useful life is included. 18/14 vs 14/11.7 $1,148 $1,148
ATTACHMENT 5
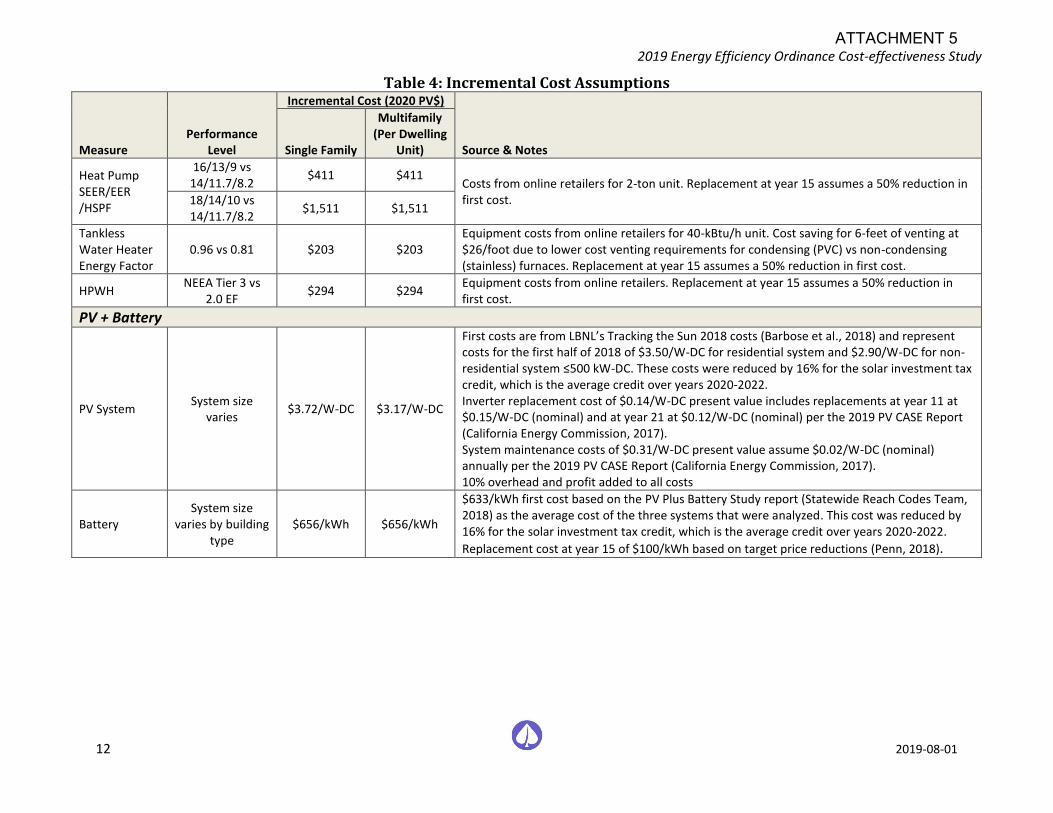
2019 Energy Efficiency Ordinance Cost-effectiveness Study
12 2019-08-01
Table 4: Incremental Cost Assumptions
Measure Performance
Level
Incremental Cost (2020 PV$)
Source & Notes Single Family
Multifamily (Per Dwelling
Unit)
Heat Pump SEER/EER /HSPF
16/13/9 vs 14/11.7/8.2
$411 $411 Costs from online retailers for 2-ton unit. Replacement at year 15 assumes a 50% reduction in first cost. 18/14/10 vs
14/11.7/8.2 $1,511 $1,511
Tankless Water Heater Energy Factor
0.96 vs 0.81 $203 $203 Equipment costs from online retailers for 40-kBtu/h unit. Cost saving for 6-feet of venting at $26/foot due to lower cost venting requirements for condensing (PVC) vs non-condensing (stainless) furnaces. Replacement at year 15 assumes a 50% reduction in first cost.
HPWH NEEA Tier 3 vs
2.0 EF $294 $294
Equipment costs from online retailers. Replacement at year 15 assumes a 50% reduction in first cost.
PV + Battery
PV System System size
varies $3.72/W-DC $3.17/W-DC
First costs are from LBNL’s Tracking the Sun 2018 costs (Barbose et al., 2018) and represent costs for the first half of 2018 of $3.50/W-DC for residential system and $2.90/W-DC for non-residential system ≤500 kW-DC. These costs were reduced by 16% for the solar investment tax credit, which is the average credit over years 2020-2022. Inverter replacement cost of $0.14/W-DC present value includes replacements at year 11 at $0.15/W-DC (nominal) and at year 21 at $0.12/W-DC (nominal) per the 2019 PV CASE Report (California Energy Commission, 2017). System maintenance costs of $0.31/W-DC present value assume $0.02/W-DC (nominal) annually per the 2019 PV CASE Report (California Energy Commission, 2017). 10% overhead and profit added to all costs
Battery System size
varies by building type
$656/kWh $656/kWh
$633/kWh first cost based on the PV Plus Battery Study report (Statewide Reach Codes Team, 2018) as the average cost of the three systems that were analyzed. This cost was reduced by 16% for the solar investment tax credit, which is the average credit over years 2020-2022.
Replacement cost at year 15 of $100/kWh based on target price reductions (Penn, 2018).
ATTACHMENT 5
2019 Energy Efficiency Ordinance Cost-effectiveness Study
13 2019-08-01
2.5 Cost-effectiveness
Cost-effectiveness was evaluated for all sixteen climate zones and is presented based on both TDV energy, using the Energy Commission’s LCC methodology, and an On-Bill approach using residential customer utility rates. Both methodologies require estimating and quantifying the value of the energy impact associated with energy efficiency measures over the life of the measures (30 years) as compared to the prescriptive Title 24 requirements.
Results are presented as a lifecycle benefit-to-cost (B/C) ratio, a net present value (NPV) metric which represents the cost-effectiveness of a measure over a 30-year lifetime taking into account discounting of future savings and costs and financing of incremental first costs. A value of one indicates the NPV of the savings over the life of the measure is equivalent to the NPV of the lifetime incremental cost of that measure. A value greater than one represents a positive return on investment. The B/C ratio is calculated according to Equation 3.
Equation 3
𝐵𝑒𝑛𝑒𝑓𝑖𝑡 − 𝑡𝑜 − 𝐶𝑜𝑠𝑡 𝑅𝑎𝑡𝑖𝑜 =𝑁𝑃𝑉 𝑜𝑓 𝑙𝑖𝑓𝑒𝑡𝑖𝑚𝑒 𝑏𝑒𝑛𝑒𝑓𝑖𝑡
𝑁𝑃𝑉 𝑜𝑓 𝑙𝑖𝑓𝑒𝑡𝑖𝑚𝑒 𝑐𝑜𝑠𝑡
In most cases the benefit is represented by annual utility savings or TDV savings and the cost by incremental first cost and replacement costs. However, in some cases a measure may have incremental cost savings but with increased energy related costs. In this case, the benefit is the lower first cost and the cost is the increase in utility bills. The lifetime costs or benefits are calculated according to Equation 4.
Equation 4 𝑵𝑷𝑽 𝒐𝒇 𝒍𝒊𝒇𝒆𝒕𝒊𝒎𝒆 𝒄𝒐𝒔𝒕/𝒃𝒆𝒏𝒆𝒇𝒊𝒕 = ∑ 𝑨𝒏𝒏𝒖𝒂𝒍 𝒄𝒐𝒔𝒕/𝒃𝒆𝒏𝒆𝒇𝒊𝒕𝒕 ∗ (𝟏 + 𝒓)𝒕𝒏
𝒕=𝟏 Where:
• n = analysis term
• r = discount rate
The following summarizes the assumptions applied in this analysis to both methodologies.
• Analysis term of 30-years
• Real discount rate of 3 percent
• Inflation rate of 2 percent
• First incremental costs are financed into a 30-year mortgage
• Mortgage interest rate of 4.5 percent
• Average tax rate of 20 percent (to account for tax savings due to loan interest deductions)
2.5.1 On-Bill Customer Lifecycle Cost
Residential utility rates were used to calculate utility costs for all cases and determine On-Bill customer cost-effectiveness for the proposed packages. The Reach Codes Team obtained the recommended utility rates from each IOU based on the assumption that the reach codes go into effect January of 2020. Annual utility costs were calculated using hourly electricity and gas output from CBECC-Res and applying the utility tariffs summarized in Table 5. Appendix B – Utility Tariff Details includes the utility rate schedules used for this study. The applicable residential time-of-use (TOU) rate was applied to all cases.13 Annual electricity production in excess of annual electricity consumption is credited to the utility account at the applicable wholesale rate based on the approved
13 Under NEM rulings by the CPUC (D-16-01-144, 1/28/16), all new PV customers shall be in an approved TOU rate structure. https://www.cpuc.ca.gov/General.aspx?id=3800
ATTACHMENT 5
2019 Energy Efficiency Ordinance Cost-effectiveness Study
14 2019-08-01
NEM2 tariffs for that utility. Minimum daily use billing and mandatory non-bypassable charges have been applied. Future change to the NEM tariffs are likely; however, there is a lot of uncertainty about what those changes will be and if they will become effective during the 2019 code cycle (2020-2022). The net surplus compensation rates for each utility are as follows:14
• PG&E: $0.0287 / kWh
• SCE: $0.0301 / kWh
• SDG&E: $0.0355 / kWh
Utility rates were applied to each climate zone based on the predominant IOU serving the population of each zone according to Two SCE tariff options were evaluated: TOU-D-4-9 and TOU-D-PRIME. The TOU-D-PRIME rate is only available to customers with heat pumps for either space or water heating, a battery storage system, or an electric vehicle and therefore was only evaluated for the all-electric cases and the Efficiency & PV/Battery packages. The rate which resulted in the lowest annual cost to the customer was used for this analysis, which was TOU-D-4-9 in all cases with the exception of the single family all-electric cases in Climate Zone 14.
Table 5. Climate Zones 10 and 14 are evaluated with both SCE/SoCalGas and SDG&E tariffs since each utility has customers within these climate zones. Climate Zone 5 is evaluated under both PG&E and SoCalGas natural gas rates.
Two SCE tariff options were evaluated: TOU-D-4-9 and TOU-D-PRIME. The TOU-D-PRIME rate is only available to customers with heat pumps for either space or water heating, a battery storage system, or an electric vehicle and therefore was only evaluated for the all-electric cases and the Efficiency & PV/Battery packages. The rate which resulted in the lowest annual cost to the customer was used for this analysis, which was TOU-D-4-9 in all cases with the exception of the single family all-electric cases in Climate Zone 14.
Table 5: IOU Utility Tariffs Applied Based on Climate Zone
Climate Zones Electric / Gas
Utility Electricity
(Time-of-use) Natural
Gas
1-5, 11-13, 16 PG&E E-TOU, Option B G1
5 PG&E / SoCalGas E-TOU, Option B GR
6, 8-10, 14, 15 SCE / SoCal Gas TOU-D-4-9 or TOU-D-PRIME
GR
7, 10, 14 SDG&E TOU-DR1 GR
Source: Utility websites, See Appendix B – Utility Tariff Details for details
on the tariffs applied.
Utility rates are assumed to escalate over time, using assumptions from research conducted by Energy and Environmental Economics (E3) in the 2019 study Residential Building Electrification in California study (Energy & Environmental Economics, 2019). Escalation of natural gas rates between 2019 and 2022 is based on the currently filed General Rate Cases (GRCs) for PG&E, SoCalGas and SDG&E. From 2023 through 2025, gas rates are assumed to escalate at 4% per year above inflation, which reflects historical rate increases between 2013 and 2018. Escalation of electricity rates from 2019 through 2025 is assumed to be 2% per year above inflation, based on electric utility estimates. After 2025, escalation rates for both natural gas and electric rates are assumed to drop to a more conservative 1% escalation per year above inflation for long-term rate trajectories beginning in 2026 through 2050. See Appendix B – Utility Tariff Details for additional details.
14 Net surplus compensation rates based on 1-year average February 2018 – January 2019.
ATTACHMENT 5
2019 Energy Efficiency Ordinance Cost-effectiveness Study
15 2019-08-01
2.5.2 TDV Lifecycle Cost
Cost-effectiveness was also assessed using the Energy Commission’s TDV LCC methodology. TDV is a normalized monetary format developed and used by the Energy Commission for comparing electricity and natural gas savings, and it considers the cost of electricity and natural gas consumed during different times of the day and year. The 2019 TDV values are based on long term discounted costs of 30 years for all residential measures. The CBECC-Res simulation software outputs are in terms of TDV kBTUs. The present value of the energy cost savings in dollars is calculated by multiplying the TDV kBTU savings by a net present value (NPV) factor, also developed by the Energy Commission. The NPV factor is $0.173/TDV kBtu for residential buildings.
Like the customer B/C ratio, a TDV B/C ratio value of one indicates the savings over the life of the measure are equivalent to the incremental cost of that measure. A value greater than one represents a positive return on investment. The ratio is calculated according to Equation 5.
Equation 5
𝑇𝐷𝑉 𝐵𝑒𝑛𝑒𝑓𝑖𝑡 − 𝑡𝑜 − 𝐶𝑜𝑠𝑡 𝑅𝑎𝑡𝑖𝑜 =𝑇𝐷𝑉 𝑒𝑛𝑒𝑟𝑔𝑦 𝑠𝑎𝑣𝑖𝑛𝑔𝑠 ∗ 𝑁𝑃𝑉 𝑓𝑎𝑐𝑡𝑜𝑟
𝑁𝑃𝑉 𝑜𝑓 𝑙𝑖𝑓𝑒𝑡𝑖𝑚𝑒 𝑖𝑛𝑐𝑟𝑒𝑚𝑒𝑛𝑡𝑎𝑙 𝑐𝑜𝑠𝑡
2.6 Electrification Evaluation
In addition to evaluating upgrades to mixed fuel and all-electric buildings independently that do not result in fuel switching, the Reach Code Team also analyzed the impact on construction costs, utility costs, and TDV when a builder specifies and installs electric appliances instead of the gas appliances typically found in a mixed fuel building. This analysis compared the code compliant mixed fuel prototype, which uses gas for space heating, water heating, cooking, and clothes drying, with the code compliant all-electric prototype. It also compared the all-electric Efficiency & PV Package with the code compliance mixed fuel prototype. In these cases, the relative costs between natural gas and electric appliances, differences between in-house electricity and gas infrastructure and the associated infrastructure costs for providing gas to the building were also included.
A variety of sources were reviewed when determining incremental costs. The sources are listed below.
• SMUD All-Electric Homes Electrification Case Study (EPRI, 2016)
• City of Palo Alto 2019 Title 24 Energy Reach Code Cost-effectiveness Analysis (TRC, 2018)
• Building Electrification Market Assessment (E3, 2019)
• Decarbonization of Heating Energy Use in California Buildings (Hopkins et al., 2018)
• Analysis of the Role of Gas for a Low-Carbon California Future (Navigant, 2008)
• Rulemaking No. 15-03-010 An Order Instituting Rulemaking to Identify Disadvantaged Communities in the San Joaquin Valley and Analyze Economically Feasible Options to Increase Access to Affordable Energy in Those Disadvantages Communities (California Public Utilities Commission, 2016)
• 2010-2012 WO017 Ex Ante Measure Cost Study: Final Report (Itron, 2014)
• Natural gas infrastructure costs provided by utility staff through the Reach Code subprogram
• Costs obtained from builders, contractors and developers
Incremental costs are presented in Table 6. Values in parentheses represent a lower cost or cost reduction in the electric option relative to mixed fuel. The costs from the available sources varied widely, making it difficult to develop narrow cost estimates for each component. For certain components data is provided with a low to high range as well as what were determined to be typical costs and ultimately applied in this analysis. Two sets of typical costs are presented, one which is applied in the On-Bill cost effectiveness methodology and another applied in the TDV methodology. Details of these differences are explained in the discussion of site gas infrastructure costs in the following pages.
ATTACHMENT 5
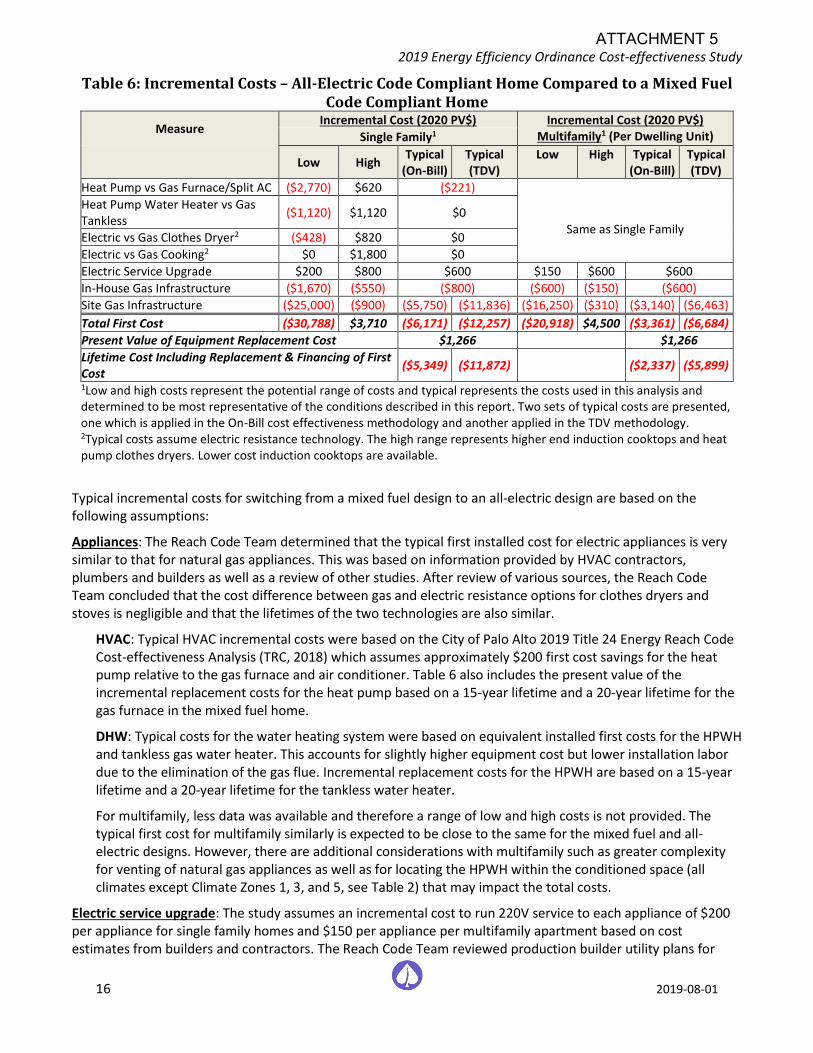
2019 Energy Efficiency Ordinance Cost-effectiveness Study
16 2019-08-01
Table 6: Incremental Costs – All-Electric Code Compliant Home Compared to a Mixed Fuel Code Compliant Home
Measure Incremental Cost (2020 PV$) Incremental Cost (2020 PV$)
Multifamily1 (Per Dwelling Unit) Single Family1
Low High Typical
(On-Bill) Typical (TDV)
Low High Typical (On-Bill)
Typical (TDV)
Heat Pump vs Gas Furnace/Split AC ($2,770) $620 ($221)
Same as Single Family
Heat Pump Water Heater vs Gas Tankless
($1,120) $1,120 $0
Electric vs Gas Clothes Dryer2 ($428) $820 $0
Electric vs Gas Cooking2 $0 $1,800 $0
Electric Service Upgrade $200 $800 $600 $150 $600 $600
In-House Gas Infrastructure ($1,670) ($550) ($800) ($600) ($150) ($600)
Site Gas Infrastructure ($25,000) ($900) ($5,750) ($11,836) ($16,250) ($310) ($3,140) ($6,463)
Total First Cost ($30,788) $3,710 ($6,171) ($12,257) ($20,918) $4,500 ($3,361) ($6,684)
Present Value of Equipment Replacement Cost $1,266 $1,266
Lifetime Cost Including Replacement & Financing of First Cost
($5,349) ($11,872)
($2,337) ($5,899)
1Low and high costs represent the potential range of costs and typical represents the costs used in this analysis and determined to be most representative of the conditions described in this report. Two sets of typical costs are presented, one which is applied in the On-Bill cost effectiveness methodology and another applied in the TDV methodology. 2Typical costs assume electric resistance technology. The high range represents higher end induction cooktops and heat pump clothes dryers. Lower cost induction cooktops are available.
Typical incremental costs for switching from a mixed fuel design to an all-electric design are based on the following assumptions:
Appliances: The Reach Code Team determined that the typical first installed cost for electric appliances is very similar to that for natural gas appliances. This was based on information provided by HVAC contractors, plumbers and builders as well as a review of other studies. After review of various sources, the Reach Code Team concluded that the cost difference between gas and electric resistance options for clothes dryers and stoves is negligible and that the lifetimes of the two technologies are also similar.
HVAC: Typical HVAC incremental costs were based on the City of Palo Alto 2019 Title 24 Energy Reach Code Cost-effectiveness Analysis (TRC, 2018) which assumes approximately $200 first cost savings for the heat pump relative to the gas furnace and air conditioner. Table 6 also includes the present value of the incremental replacement costs for the heat pump based on a 15-year lifetime and a 20-year lifetime for the gas furnace in the mixed fuel home.
DHW: Typical costs for the water heating system were based on equivalent installed first costs for the HPWH and tankless gas water heater. This accounts for slightly higher equipment cost but lower installation labor due to the elimination of the gas flue. Incremental replacement costs for the HPWH are based on a 15-year lifetime and a 20-year lifetime for the tankless water heater.
For multifamily, less data was available and therefore a range of low and high costs is not provided. The typical first cost for multifamily similarly is expected to be close to the same for the mixed fuel and all-electric designs. However, there are additional considerations with multifamily such as greater complexity for venting of natural gas appliances as well as for locating the HPWH within the conditioned space (all climates except Climate Zones 1, 3, and 5, see Table 2) that may impact the total costs.
Electric service upgrade: The study assumes an incremental cost to run 220V service to each appliance of $200 per appliance for single family homes and $150 per appliance per multifamily apartment based on cost estimates from builders and contractors. The Reach Code Team reviewed production builder utility plans for
ATTACHMENT 5
2019 Energy Efficiency Ordinance Cost-effectiveness Study
17 2019-08-01
mixed-fuel homes and consulted with contractors to estimate which electricity and/or natural gas services are usually provided to the dryer and oven. Typical practice varied, with some builders providing both gas and electric service to both appliances, others providing both services to only one of the appliances, and some only providing gas. For this study, the Reach Code Team determined that for single family homes the typical cost is best qualified by the practice of providing 220V service and gas to either the dryer and the oven and only gas service to the other. For multifamily buildings it’s assumed that only gas is provided to the dryer and oven in the mixed fuel home.
It is assumed that no upgrades to the electrical panel are required and that a 200 Amp panel is typically installed for both mixed fuel and all-electric new construction homes. There are no incremental electrical site infrastructure requirements.
In-house gas infrastructure (from meter to appliances): Installation cost to run a gas line from the meter to the appliance location is $200 per appliance for single family and $150 per appliance per multifamily apartment based on cost estimates from builders and contractors. The cost estimate includes providing gas to the water heater, furnace, dryer and cooktop.
Site gas infrastructure: The cost-effective analysis components with the highest degree of variability are the costs for on-site gas infrastructure. These costs can be project dependent and may be significantly impacted by such factors as utility territory, site characteristics, distance to the nearest gas main and main location, joint trenching, whether work is conducted by the utility or a private contractor, and number of dwelling units per development. All gas utilities participating in this study were solicited for cost information. The typical infrastructure costs for single family homes presented in Table 6 are based on cost data provided by PG&E and reflect those for a new subdivision in an undeveloped area requiring the installation of natural gas infrastructure, including a main line. Infrastructure costs for infill development can also be highly variable and may be higher than in an undeveloped area. The additional costs associated with disruption of existing roads, sidewalks, and other structures can be significant. Total typical costs in Table 6 assume $10,000 for extension of a gas main, $1,686 for a service lateral, and $150 for the meter.
Utility Gas Main Extensions rules15 specify that the developer has the option to only pay 50% of the total cost for a main extension after subtraction of allowances for installation of gas appliances. This 50% refund and the appliance allowance deductions are accounted for in the site gas infrastructure costs under the On-Bill cost-effectiveness methodology. The net costs to the utility after partial reimbursement from the developer are included in utility ratebase and recovered via rates to all customers. The total cost of $5,750 presented in Table 6 reflects a 50% refund on the $10,000 extension and appliance deductions of $1,086 for a furnace, water heater, cooktop, and dryer. Under the On-Bill methodology this analysis assumes this developer option will remain available through 2022 and that the cost savings are passed along to the customer.
The 50% refund and appliance deductions were not applied to the site gas infrastructure costs under the TDV cost-effectiveness methodology based on input received from the Energy Commission and agreement from the Reach Code technical advisory team that the approach is appropriate. TDV cost savings impacts extend beyond the customer and account for societal impacts of energy use. Accounting for the full cost of the infrastructure upgrades was determined to be justified when evaluating under the TDV methodology.
15 PG&E Rule 15: https://www.pge.com/tariffs/tm2/pdf/GAS_RULES_15.pdf
SoCalGas Rule 20: https://www.socalgas.com/regulatory/tariffs/tm2/pdf/20.pdf
SDG&E Rule 15: http://regarchive.sdge.com/tm2/pdf/GAS_GAS-RULES_GRULE15.pdf
ATTACHMENT 5
2019 Energy Efficiency Ordinance Cost-effectiveness Study
18 2019-08-01
Less information was available for the costs associated with gas infrastructure for low-rise multifamily development. The typical cost in Table 6 for the On-Bill methodology is based on TRC’s City of Palo Alto 2019 Title 24 Energy Reach Code Cost-effectiveness Analysis (TRC, 2018). These costs, provided by the City of Palo Alto, are approximately $25,100 for an 8-unit new construction building and reflect connection to an existing main for infill development. Specific costs include plan review, connection charges, meter and manifold, plumbing distribution, and street cut fees. While these costs are specifically based on infill development and from one municipal utility, the estimates are less than those provided by PG&E reflecting the average cost differences charged to the developer between single family and multifamily in an undeveloped area (after accounting for deductions per the Gas Main Extensions rule). To convert costs charged to the developer to account for the full infrastructure upgrade cost (costs applied in the TDV methodology analysis), a factor of 2.0616 was calculated based on the single family analysis. This same factor was applied to the multifamily cost of $3,140 to arrive at $6,463 (see Table 6).
2.7 Greenhouse Gas Emissions
Equivalent CO2 emission savings were calculated based on outputs from the CBECC-Res simulation software. Electricity emissions vary by region and by hour of the year. CBECC-Res applies two distinct hourly profiles, one for Climate Zones 1 through 5 and 11 through 13 and another for Climate Zones 6 through 10 and 14 through 16. For natural gas a fixed factor of 0.005307 metric tons/therm is used. To compare the mixed fuel and all-electric cases side-by-side, greenhouse gas (GHG) emissions are presented as CO2-equivalent emissions per square foot of conditioned floor area.
3 Results The primary objective of the evaluation is to identify cost-effective, non-preempted performance targets for both single family and low-rise multifamily prototypes, under both mixed fuel and all-electric cases, to support the design of local ordinances requiring new low-rise residential buildings to exceed the minimum state requirements. The packages presented are representative examples of designs and measures that can be used to meet the requirements. In practice, a builder can use any combination of non-preempted or preempted compliant measures to meet the requirements.
This analysis covered all sixteen climate zones and evaluated two efficiency packages, including a non-preempted package and a preempted package that includes upgrades to federally regulated equipment, an Efficiency & PV Package for the all-electric scenario only, and an Efficiency & PV/Battery Package. For the efficiency-only packages, measures were refined to ensure that the non-preempted package was cost-effective based on one of the two metrics applied in this study, TDV or On-Bill. The preempted equipment package, which the Reach Code Team considers to be a package of upgrades most reflective of what builders commonly apply to exceed code requirements, was designed to be cost-effective based on the On-Bill cost-effectiveness approach.
Results are presented as EDR Margin instead of compliance margin. EDR is the metric used to determine code compliance in the 2019 cycle. Target EDR Margin is based on taking the calculated EDR Margin for the case and rounding down to the next half of a whole number. Target EDR Margin for the Efficiency Package are defined based on the lower of the EDR Margin of the non-preempted package and the equipment, preempted package. For example, if for a particular case the cost-effective non-preempted package has an EDR Margin of 3 and the preempted package an EDR Margin of 4, the Target EDR Margin is set at 3.
16 This factor includes the elimination of the 50% refund for the main extension and adding back in the appliance allowance deductions.
ATTACHMENT 5
2019 Energy Efficiency Ordinance Cost-effectiveness Study
19 2019-08-01
For a package to qualify, a minimum EDR Margin of 0.5 was required. This is to say that a package that only achieved an EDR Margin of 0.4, for example, was not considered. An EDR Margin less than 0.5 generally corresponds to a compliance margin lower than 5% and was considered too small to ensure repeatable results. In certain cases, the Reach Code Team did not identify a cost-effective package that achieved the minimum EDR Margin of 0.5.
Although some of the efficiency measures evaluated were not cost-effective and were eliminated, the following measures are included in at least one package:
• Reduced infiltration
• Improved fenestration
• Improved cool roofs
• High performance attics
• Slab insulation
• Reduced duct leakage
• Verified low leakage ducts in conditioned space
• Low pressure-drop distribution system
• Compact hot water distribution system, basic and expanded
• High efficiency furnace, air conditioner & heat pump (preempted)
• High efficiency tankless water heater & heat pump water heater (preempted)
3.1 PV and Battery System Sizing
The approach to determining the size of the PV and battery systems varied based on each package and the source fuel. Table 7 describes the PV and battery sizing approaches applied to each of the four packages. For the Efficiency Non-preempted and Efficiency – Equipment, Preempted packages a different method was applied to each the two fuel scenarios. In all mixed fuel cases, the PV was sized to offset 100% of the estimated electrical load and any electricity savings from efficiency measures were traded off with a smaller PV system. Not downsizing the PV system after adding efficiency measures runs the risk of producing more electricity than is consumed, reducing cost-effectiveness and violating NEM rules. While the impact of this in most cases is minor, analysis confirmed that cost-effectiveness improved when reducing the system size to offset 100% of the electricity usage as opposed to keeping the PV system the same size as the Standard Design.
In the all-electric Efficiency cases, the PV system size was left to match the Standard Design (Std Design PV), and the inclusion of energy efficiency measures was not traded off with a reduced capacity PV system. Because the PV system is sized to meet the electricity load of a mixed fuel home, it is cost-effective to keep the PV system the same size and offset a greater percentage of the electrical load.
For the Efficiency & PV case on the all-electric home, the Reach Code Team evaluated PV system sizing to offset 100%, 90% and 80% of the total calculated electricity use. Of these three, sizing to 90% proved to be the most cost-effective based on customer utility bills. This is a result of the impact of the annual minimum bill which is around $120 across all the utilities. The “sweet spot” is a PV system that reduces electricity bills just enough to match the annual minimum bill; increasing the PV size beyond this adds first cost but does not result in utility bill savings.
ATTACHMENT 5

2019 Energy Efficiency Ordinance Cost-effectiveness Study
20 2019-08-01
Table 7: PV & Battery Sizing Details by Package Type Package Mixed Fuel All-Electric
Efficiency (Envelope & Equipment) PV Scaled @ 100% electricity Std Design PV
Efficiency & PV n/a PV Scaled @ 90%
Efficiency & PV/Battery PV Scaled @ 100% electricity
5kWh / SF home 2.75kWh/ MF apt
PV Scaled @ 100% 5kWh / SF home 2.75kWh/ MF apt
A sensitivity analysis was conducted to determine the appropriate battery and PV capacity for the Efficiency & PV/Battery Packages using the 1-story 2,100 square foot prototype in Climate Zone 12. Results are shown in Figure 2. The current version of CBECC-Res requires a minimum battery size of 5 kWh to qualify for the self-utilization credit. CBECC-Res allows for PV oversizing up to 160% of the building’s estimated electricity load when battery storage systems are installed; however, the Reach Code Team considered this high, potentially problematic from a grid perspective, and likely not acceptable to the utilities or customers. The Reach Code Team compared cost-effectiveness of 5kWh and 7.5kWh battery systems as well as of PV systems sized to offset 90%, 100%, or 120% of the estimated electrical load.
Results show that from an on-bill perspective a smaller battery size is more cost-effective. The sensitivity analysis also showed that increasing the PV capacity from 90% to 120% of the electricity use reduced cost-effectiveness. From the TDV perspective there was little difference in results across all the scenarios, with the larger battery size being marginally more cost-effective. Based on these results, the Reach Code Team applied to the Efficiency & PV/Battery Package a 5kWh battery system for single family homes with PV sized to offset 100% of the electricity load. Even though PV scaled to 90% was the most cost-effective, sizing was increased to 100% to evaluate greater generation beyond the Efficiency & PV Package and to achieve zero net electricity. These results also show that in isolation, the inclusion of a battery system reduces cost-effectiveness compared to the same size PV system without batteries.
For multifamily buildings the battery capacity was scaled to reflect the average ratio of battery size to PV system capacity (kWh/kW) for the single family Efficiency & PV Package. This resulted in a 22kWh battery for the multifamily building, or 2.75kWh per apartment.
Figure 2: B/C ratio comparison for PV and battery sizing
On-Bill = 1.9 (TDV = 1.84)
On-Bill = 1.49 (TDV = 1.9)
On-Bill = 1.37 (TDV = 1.88)
On-Bill = 1.35 (TDV = 1.91)
On-Bill = 1.23 (TDV = 1.9)
On-Bill = 1.14 (TDV = 1.87)
On-Bill = 1.04 (TDV = 1.88)
ATTACHMENT 5
2019 Energy Efficiency Ordinance Cost-effectiveness Study
21 2019-08-01
3.2 Single Family Results
Table 8 through Table 10 contain cost effectiveness findings for the single family packages. Table 8 summarizes the package costs for all of the mixed fuel and all-electric efficiency, PV and battery packages. The mixed fuel results are evaluated and presented relative to a mixed fuel code compliant basecase while the all-electric results are relative to an all-electric code compliant basecase.
Table 9 and Table 10 present the B/C ratios for all the single family packages according to both the On-Bill and TDV methodologies for the mixed fuel and the all-electric cases, respectively. Results are cost-effective based on TDV for all cases except for Climate Zone 7 where no cost-effective combination of non-preempted efficiency measures was found that met the minimum 0.5 EDR Margin threshold. Cases where the B/C ratio is indicated as “>1” refer to instances where there are incremental cost savings in addition to annual utility bill savings. In these cases, there is no cost associated with the upgrade and benefits are realized immediately.
Figure 3 presents a comparison of Total EDRs for single family buildings and Figure 4 presents the EDR Margin results. Each graph compares the mixed fuel and all-electric cases as well as the various packages. The EDR Margin for the Efficiency Package for most climates is between 1.0 and 5.5 for mixed fuel cases and slightly higher, between 1.5 and 6.5, for the all-electric design. No cost-effective mixed fuel or all-electric non-preempted Efficiency package was found Climate Zone 7.
For the mixed fuel case, the Efficiency & PV/Battery Package increased the EDR Margin to values between 7.0 and 10.5. Because of the limitations on oversizing PV systems to offset natural gas use it is not feasible to achieve higher EDR Margins by increasing PV system capacity.
For the all-electric case, the Efficiency & PV Package resulted in EDR Margins of 11.0 to 19.0 for most climates; adding a battery system increased the EDR Margin by an additional 7 to 13 points. Climate zones 1 and 16, which have high heating loads, have much higher EDR Margins for the Efficiency & PV package (26.5-31.0). The Standard Design PV, which is what is applied in the all-electric Efficiency Package, is not sized to offset any of the heating load. When the PV system is sized to offset 90% of the total electricity use, the increase is substantial as a result. In contrast, in Climate Zone 15 the Standard Design PV system is already sized to cover the cooling electricity load, which represents 40% of whole building electricity use. Therefore, increasing the PV size to offset 90% of the electric load in this climate only results in adding approximately 120 Watts of PV capacity and subsequently a negligible impact on the EDR.
Additional results details can be found in Appendix C – Single Family Detailed Results with summaries of measures included in each of the packages in Appendix D – Single Family Measure Summary. A summary of results by climate zone is presented in Appendix G – Results by Climate Zone.
ATTACHMENT 5
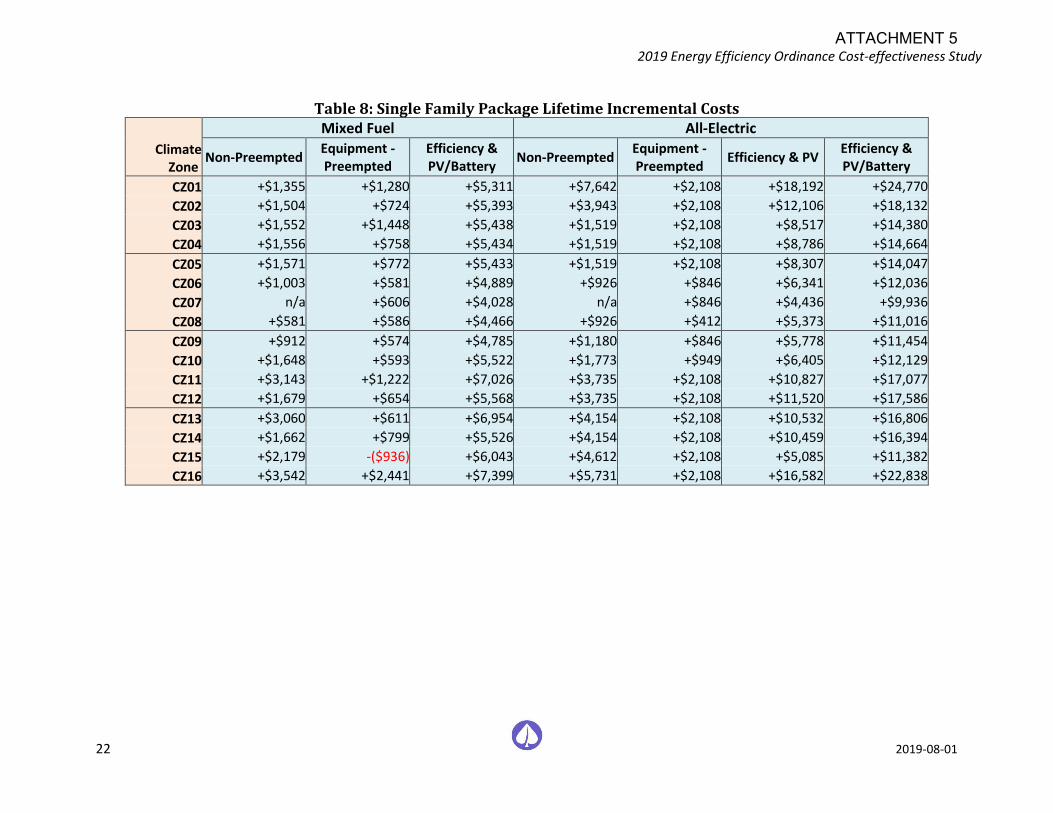
2019 Energy Efficiency Ordinance Cost-effectiveness Study
22 2019-08-01
Table 8: Single Family Package Lifetime Incremental Costs
Climate Zone
Mixed Fuel All-Electric
Non-Preempted Equipment - Preempted
Efficiency & PV/Battery
Non-Preempted Equipment - Preempted
Efficiency & PV Efficiency & PV/Battery
CZ01 +$1,355 +$1,280 +$5,311 +$7,642 +$2,108 +$18,192 +$24,770
CZ02 +$1,504 +$724 +$5,393 +$3,943 +$2,108 +$12,106 +$18,132
CZ03 +$1,552 +$1,448 +$5,438 +$1,519 +$2,108 +$8,517 +$14,380
CZ04 +$1,556 +$758 +$5,434 +$1,519 +$2,108 +$8,786 +$14,664
CZ05 +$1,571 +$772 +$5,433 +$1,519 +$2,108 +$8,307 +$14,047
CZ06 +$1,003 +$581 +$4,889 +$926 +$846 +$6,341 +$12,036
CZ07 n/a +$606 +$4,028 n/a +$846 +$4,436 +$9,936
CZ08 +$581 +$586 +$4,466 +$926 +$412 +$5,373 +$11,016
CZ09 +$912 +$574 +$4,785 +$1,180 +$846 +$5,778 +$11,454
CZ10 +$1,648 +$593 +$5,522 +$1,773 +$949 +$6,405 +$12,129
CZ11 +$3,143 +$1,222 +$7,026 +$3,735 +$2,108 +$10,827 +$17,077
CZ12 +$1,679 +$654 +$5,568 +$3,735 +$2,108 +$11,520 +$17,586
CZ13 +$3,060 +$611 +$6,954 +$4,154 +$2,108 +$10,532 +$16,806
CZ14 +$1,662 +$799 +$5,526 +$4,154 +$2,108 +$10,459 +$16,394
CZ15 +$2,179 -($936) +$6,043 +$4,612 +$2,108 +$5,085 +$11,382
CZ16 +$3,542 +$2,441 +$7,399 +$5,731 +$2,108 +$16,582 +$22,838
ATTACHMENT 5
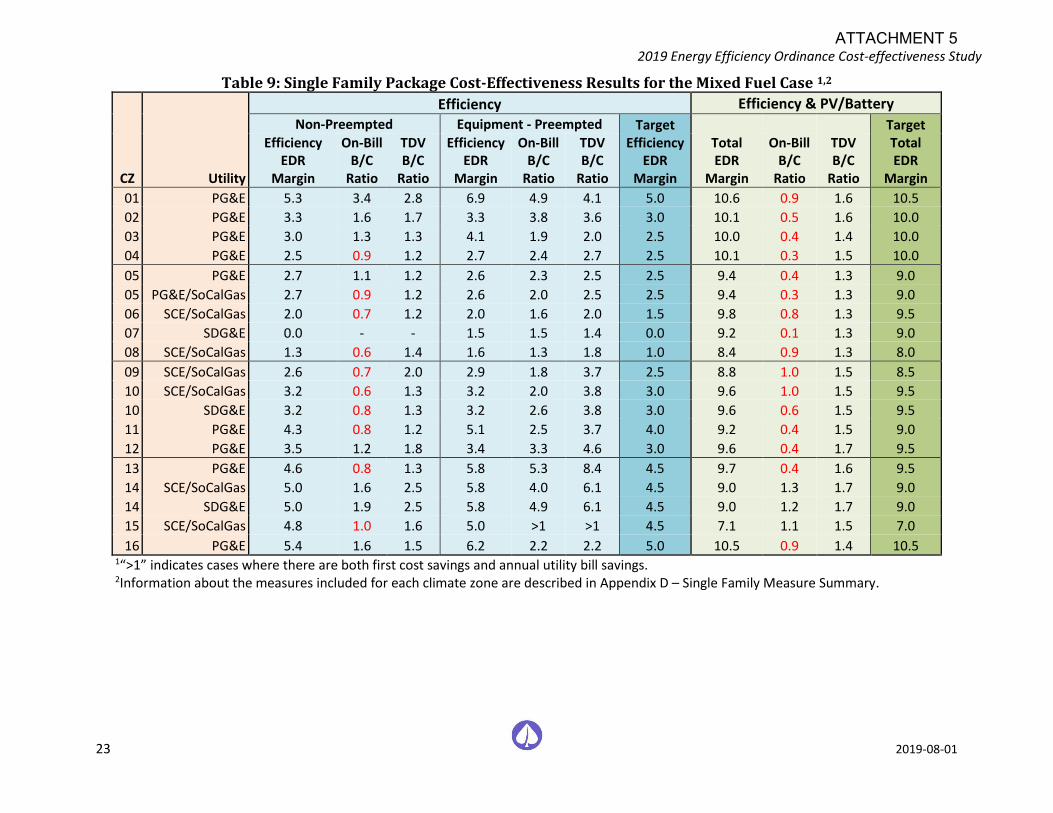
2019 Energy Efficiency Ordinance Cost-effectiveness Study
23 2019-08-01
Table 9: Single Family Package Cost-Effectiveness Results for the Mixed Fuel Case 1,2
CZ Utility
Efficiency Efficiency & PV/Battery
Non-Preempted Equipment - Preempted Target Efficiency
EDR Margin
Target Total EDR
Margin
Efficiency EDR
Margin
On-Bill B/C
Ratio
TDV B/C
Ratio
Efficiency EDR
Margin
On-Bill B/C
Ratio
TDV B/C
Ratio
Total EDR
Margin
On-Bill B/C
Ratio
TDV B/C
Ratio
01 PG&E 5.3 3.4 2.8 6.9 4.9 4.1 5.0 10.6 0.9 1.6 10.5
02 PG&E 3.3 1.6 1.7 3.3 3.8 3.6 3.0 10.1 0.5 1.6 10.0
03 PG&E 3.0 1.3 1.3 4.1 1.9 2.0 2.5 10.0 0.4 1.4 10.0
04 PG&E 2.5 0.9 1.2 2.7 2.4 2.7 2.5 10.1 0.3 1.5 10.0
05 PG&E 2.7 1.1 1.2 2.6 2.3 2.5 2.5 9.4 0.4 1.3 9.0
05 PG&E/SoCalGas 2.7 0.9 1.2 2.6 2.0 2.5 2.5 9.4 0.3 1.3 9.0
06 SCE/SoCalGas 2.0 0.7 1.2 2.0 1.6 2.0 1.5 9.8 0.8 1.3 9.5
07 SDG&E 0.0 - - 1.5 1.5 1.4 0.0 9.2 0.1 1.3 9.0
08 SCE/SoCalGas 1.3 0.6 1.4 1.6 1.3 1.8 1.0 8.4 0.9 1.3 8.0
09 SCE/SoCalGas 2.6 0.7 2.0 2.9 1.8 3.7 2.5 8.8 1.0 1.5 8.5
10 SCE/SoCalGas 3.2 0.6 1.3 3.2 2.0 3.8 3.0 9.6 1.0 1.5 9.5
10 SDG&E 3.2 0.8 1.3 3.2 2.6 3.8 3.0 9.6 0.6 1.5 9.5
11 PG&E 4.3 0.8 1.2 5.1 2.5 3.7 4.0 9.2 0.4 1.5 9.0
12 PG&E 3.5 1.2 1.8 3.4 3.3 4.6 3.0 9.6 0.4 1.7 9.5
13 PG&E 4.6 0.8 1.3 5.8 5.3 8.4 4.5 9.7 0.4 1.6 9.5
14 SCE/SoCalGas 5.0 1.6 2.5 5.8 4.0 6.1 4.5 9.0 1.3 1.7 9.0
14 SDG&E 5.0 1.9 2.5 5.8 4.9 6.1 4.5 9.0 1.2 1.7 9.0
15 SCE/SoCalGas 4.8 1.0 1.6 5.0 >1 >1 4.5 7.1 1.1 1.5 7.0
16 PG&E 5.4 1.6 1.5 6.2 2.2 2.2 5.0 10.5 0.9 1.4 10.5 1“>1” indicates cases where there are both first cost savings and annual utility bill savings. 2Information about the measures included for each climate zone are described in Appendix D – Single Family Measure Summary.
ATTACHMENT 5
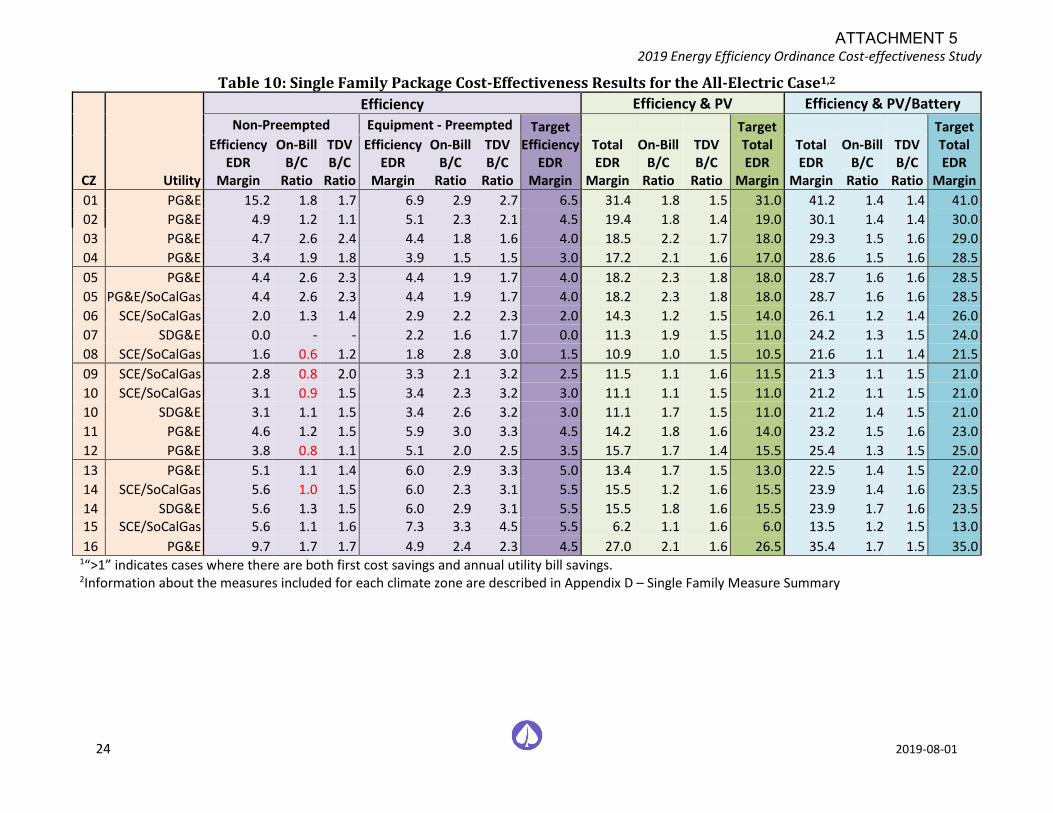
2019 Energy Efficiency Ordinance Cost-effectiveness Study
24 2019-08-01
Table 10: Single Family Package Cost-Effectiveness Results for the All-Electric Case1,2
CZ Utility
Efficiency Efficiency & PV Efficiency & PV/Battery
Non-Preempted Equipment - Preempted Target Efficiency
EDR Margin
Target Total EDR
Margin
Target Total EDR
Margin
Efficiency EDR
Margin
On-Bill B/C
Ratio
TDV B/C
Ratio
Efficiency EDR
Margin
On-Bill B/C
Ratio
TDV B/C
Ratio
Total EDR
Margin
On-Bill B/C
Ratio
TDV B/C
Ratio
Total EDR
Margin
On-Bill B/C
Ratio
TDV B/C
Ratio
01 PG&E 15.2 1.8 1.7 6.9 2.9 2.7 6.5 31.4 1.8 1.5 31.0 41.2 1.4 1.4 41.0
02 PG&E 4.9 1.2 1.1 5.1 2.3 2.1 4.5 19.4 1.8 1.4 19.0 30.1 1.4 1.4 30.0
03 PG&E 4.7 2.6 2.4 4.4 1.8 1.6 4.0 18.5 2.2 1.7 18.0 29.3 1.5 1.6 29.0
04 PG&E 3.4 1.9 1.8 3.9 1.5 1.5 3.0 17.2 2.1 1.6 17.0 28.6 1.5 1.6 28.5
05 PG&E 4.4 2.6 2.3 4.4 1.9 1.7 4.0 18.2 2.3 1.8 18.0 28.7 1.6 1.6 28.5
05 PG&E/SoCalGas 4.4 2.6 2.3 4.4 1.9 1.7 4.0 18.2 2.3 1.8 18.0 28.7 1.6 1.6 28.5
06 SCE/SoCalGas 2.0 1.3 1.4 2.9 2.2 2.3 2.0 14.3 1.2 1.5 14.0 26.1 1.2 1.4 26.0
07 SDG&E 0.0 - - 2.2 1.6 1.7 0.0 11.3 1.9 1.5 11.0 24.2 1.3 1.5 24.0
08 SCE/SoCalGas 1.6 0.6 1.2 1.8 2.8 3.0 1.5 10.9 1.0 1.5 10.5 21.6 1.1 1.4 21.5
09 SCE/SoCalGas 2.8 0.8 2.0 3.3 2.1 3.2 2.5 11.5 1.1 1.6 11.5 21.3 1.1 1.5 21.0
10 SCE/SoCalGas 3.1 0.9 1.5 3.4 2.3 3.2 3.0 11.1 1.1 1.5 11.0 21.2 1.1 1.5 21.0
10 SDG&E 3.1 1.1 1.5 3.4 2.6 3.2 3.0 11.1 1.7 1.5 11.0 21.2 1.4 1.5 21.0
11 PG&E 4.6 1.2 1.5 5.9 3.0 3.3 4.5 14.2 1.8 1.6 14.0 23.2 1.5 1.6 23.0
12 PG&E 3.8 0.8 1.1 5.1 2.0 2.5 3.5 15.7 1.7 1.4 15.5 25.4 1.3 1.5 25.0
13 PG&E 5.1 1.1 1.4 6.0 2.9 3.3 5.0 13.4 1.7 1.5 13.0 22.5 1.4 1.5 22.0
14 SCE/SoCalGas 5.6 1.0 1.5 6.0 2.3 3.1 5.5 15.5 1.2 1.6 15.5 23.9 1.4 1.6 23.5
14 SDG&E 5.6 1.3 1.5 6.0 2.9 3.1 5.5 15.5 1.8 1.6 15.5 23.9 1.7 1.6 23.5 15 SCE/SoCalGas 5.6 1.1 1.6 7.3 3.3 4.5 5.5 6.2 1.1 1.6 6.0 13.5 1.2 1.5 13.0
16 PG&E 9.7 1.7 1.7 4.9 2.4 2.3 4.5 27.0 2.1 1.6 26.5 35.4 1.7 1.5 35.0 1“>1” indicates cases where there are both first cost savings and annual utility bill savings. 2Information about the measures included for each climate zone are described in Appendix D – Single Family Measure Summary
ATTACHMENT 5
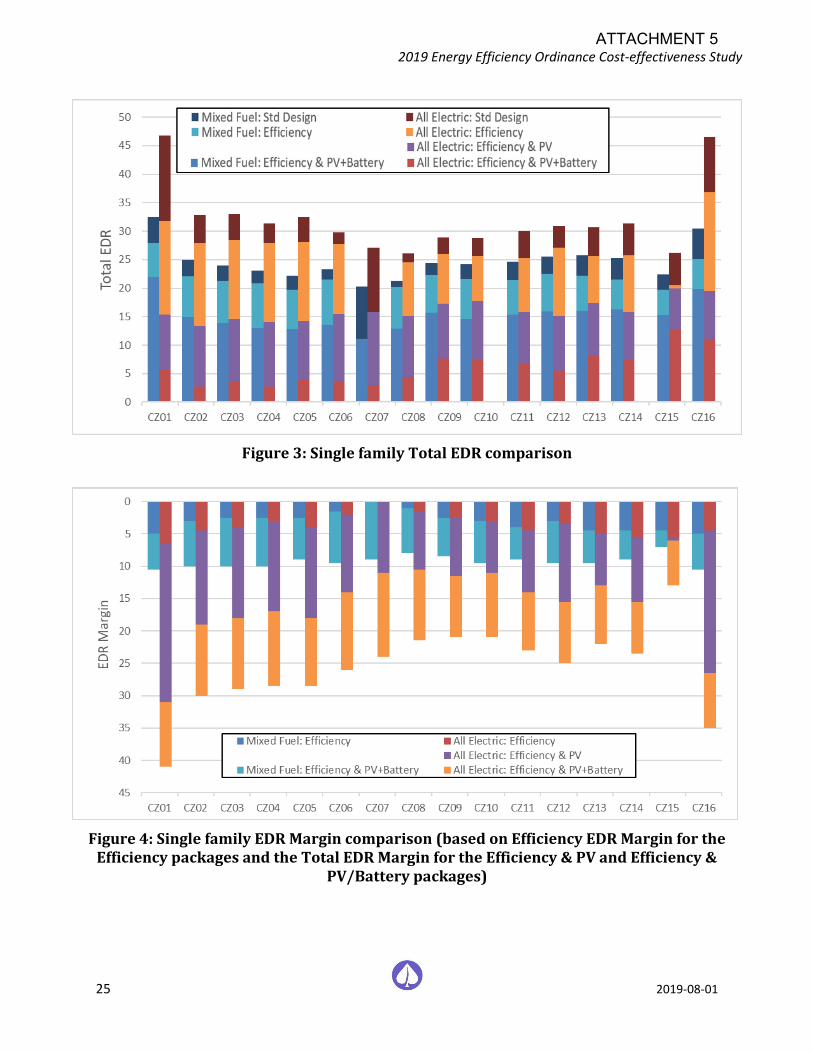
2019 Energy Efficiency Ordinance Cost-effectiveness Study
25 2019-08-01
Figure 3: Single family Total EDR comparison
Figure 4: Single family EDR Margin comparison (based on Efficiency EDR Margin for the Efficiency packages and the Total EDR Margin for the Efficiency & PV and Efficiency &
PV/Battery packages)
ATTACHMENT 5
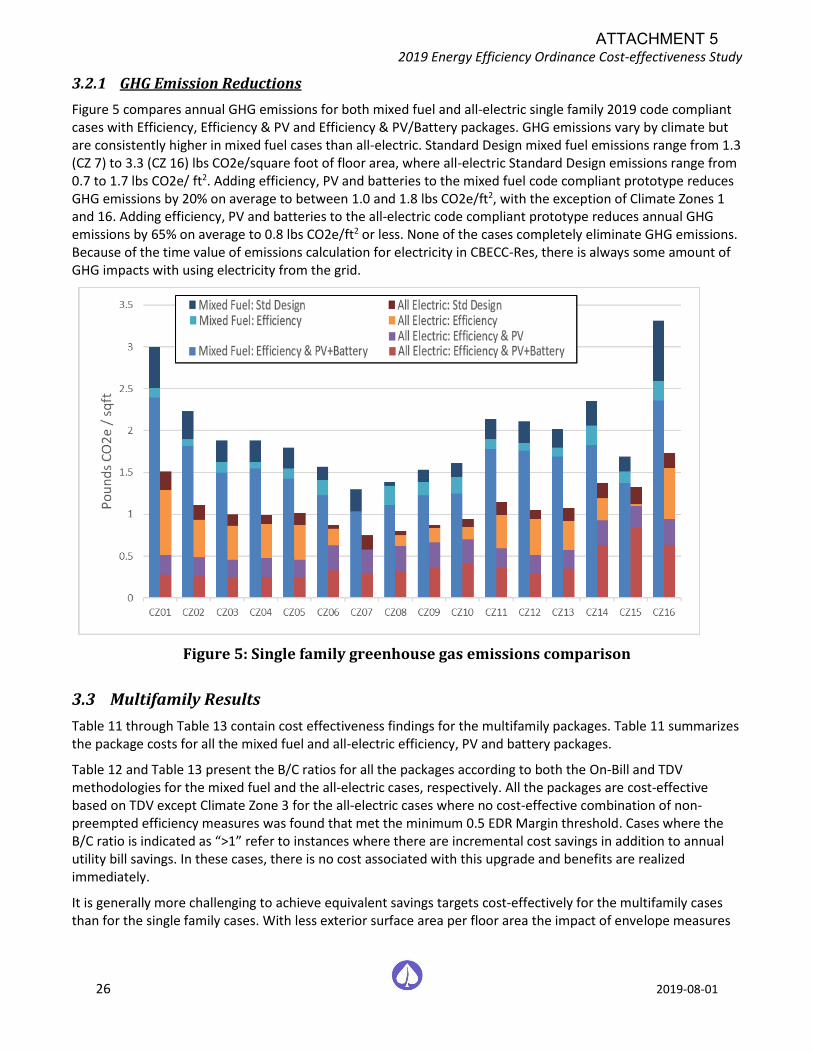
2019 Energy Efficiency Ordinance Cost-effectiveness Study
26 2019-08-01
3.2.1 GHG Emission Reductions
Figure 5 compares annual GHG emissions for both mixed fuel and all-electric single family 2019 code compliant cases with Efficiency, Efficiency & PV and Efficiency & PV/Battery packages. GHG emissions vary by climate but are consistently higher in mixed fuel cases than all-electric. Standard Design mixed fuel emissions range from 1.3 (CZ 7) to 3.3 (CZ 16) lbs CO2e/square foot of floor area, where all-electric Standard Design emissions range from 0.7 to 1.7 lbs CO2e/ ft2. Adding efficiency, PV and batteries to the mixed fuel code compliant prototype reduces GHG emissions by 20% on average to between 1.0 and 1.8 lbs CO2e/ft2, with the exception of Climate Zones 1 and 16. Adding efficiency, PV and batteries to the all-electric code compliant prototype reduces annual GHG emissions by 65% on average to 0.8 lbs CO2e/ft2 or less. None of the cases completely eliminate GHG emissions. Because of the time value of emissions calculation for electricity in CBECC-Res, there is always some amount of GHG impacts with using electricity from the grid.
Figure 5: Single family greenhouse gas emissions comparison
3.3 Multifamily Results
Table 11 through Table 13 contain cost effectiveness findings for the multifamily packages. Table 11 summarizes the package costs for all the mixed fuel and all-electric efficiency, PV and battery packages.
Table 12 and Table 13 present the B/C ratios for all the packages according to both the On-Bill and TDV methodologies for the mixed fuel and the all-electric cases, respectively. All the packages are cost-effective based on TDV except Climate Zone 3 for the all-electric cases where no cost-effective combination of non-preempted efficiency measures was found that met the minimum 0.5 EDR Margin threshold. Cases where the B/C ratio is indicated as “>1” refer to instances where there are incremental cost savings in addition to annual utility bill savings. In these cases, there is no cost associated with this upgrade and benefits are realized immediately.
It is generally more challenging to achieve equivalent savings targets cost-effectively for the multifamily cases than for the single family cases. With less exterior surface area per floor area the impact of envelope measures
ATTACHMENT 5
2019 Energy Efficiency Ordinance Cost-effectiveness Study
27 2019-08-01
is diminished in multifamily buildings. Ducts are already assumed to be within conditioned space and therefore only one of the duct measures found to be cost-effective in single family homes can be applied.
Figure 6 presents a comparison of Total EDRs for the multifamily cases and Figure 7 presents the EDR Margin results. Each graph compares the mixed fuel and all-electric cases as well as the various packages. Cost-effective efficiency packages were found for all mixed fuel cases. The Target EDR Margins for the mixed fuel Efficiency Package are 0.5 for Climate Zones 3, 5 and 7, between 1.0 and 2.5 for Climate Zones 1, 2, 4, 6, 8 through 12 and 16, and between 3.0 and 4.0 in Climate Zones 13 through 15. For the all-electric case, no cost-effective non-preempted efficiency packages were found in Climate Zone 3. The Target EDR Margins are between 0.5 and 2.5 for Climate Zones 2, 4 through 10 and 12, and between 3.0 and 4.0 in Climate Zones 1, 11, and 13 through 16.
For the mixed fuel case, the Efficiency & PV/Battery Package results in an EDR Margin of between 8.5 and 11.5 across all climate zones. Most of these packages were not found to be cost-effective based on utility bill savings alone, but they all are cost-effective based on TDV energy savings. For the all-electric case, the Efficiency & PV Package resulted in EDR Margins of 10.5 to 17.5 for most climates; adding a battery system increased the EDR Margin by an additional 10 to 15 points. Climate zones 1 and 16, which have high heating loads, have much higher EDR Margins for the Efficiency & PV package (19.5-22.5). The Standard Design PV, which is what is applied in the Efficiency Package, is not sized to offset any of the heating load. When the PV system is sized to offset 90% of the total electricity use, the increase is substantial as a result. In Climate Zone 15 the Standard Design PV system is already sized to cover the cooling electricity load, which represents 30% of whole building electricity use. Therefore, increasing the PV size to offset 90% of the electric load in this climate only results in adding approximately 240 Watts of PV capacity per apartment and subsequently a much smaller impact on the EDR than in other climate zones. Because of the limitations on oversizing PV systems to offset natural gas use it is not feasible to achieve comparable EDR Margins for the mixed fuel case as in the all-electric case.
Additional results details can be found in Appendix E – Multifamily Detailed Results with summaries of measures included in each of the packages in Appendix F – Multifamily Measure Summary. A summary of results by climate zone is presented in Appendix G – Results by Climate Zone.
ATTACHMENT 5
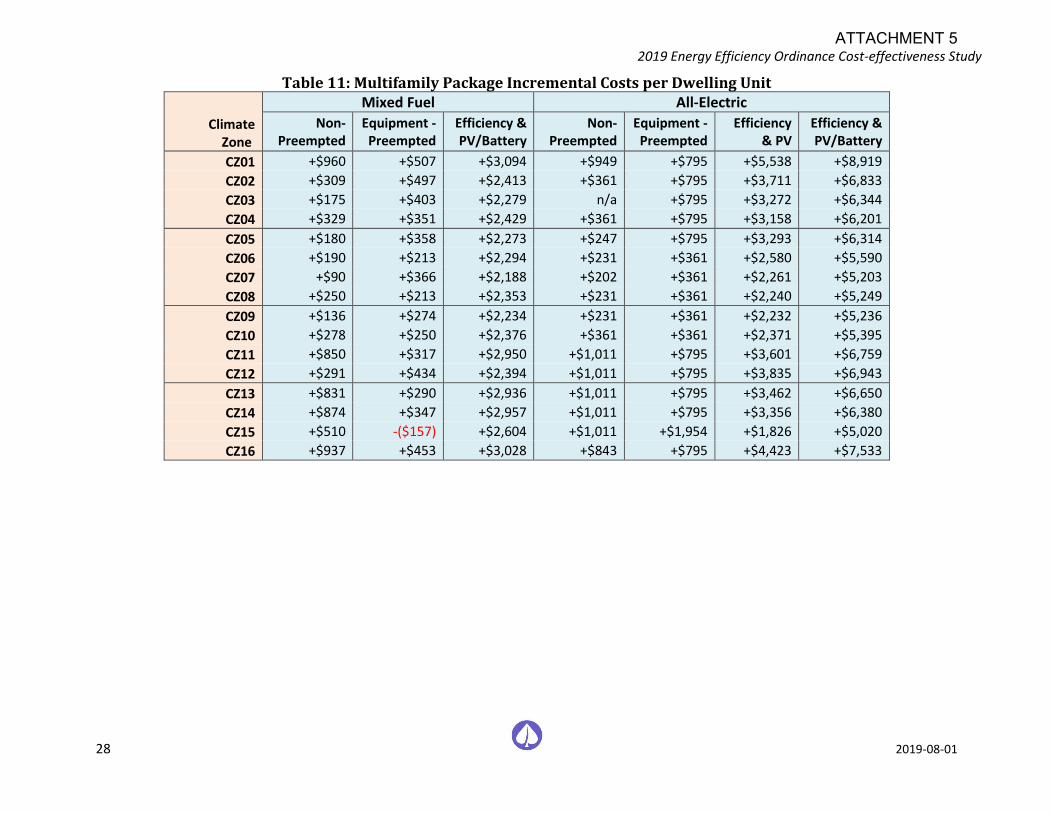
2019 Energy Efficiency Ordinance Cost-effectiveness Study
28 2019-08-01
Table 11: Multifamily Package Incremental Costs per Dwelling Unit
Climate Zone
Mixed Fuel All-Electric
Non-Preempted
Equipment - Preempted
Efficiency & PV/Battery
Non-Preempted
Equipment - Preempted
Efficiency & PV
Efficiency & PV/Battery
CZ01 +$960 +$507 +$3,094 +$949 +$795 +$5,538 +$8,919
CZ02 +$309 +$497 +$2,413 +$361 +$795 +$3,711 +$6,833
CZ03 +$175 +$403 +$2,279 n/a +$795 +$3,272 +$6,344
CZ04 +$329 +$351 +$2,429 +$361 +$795 +$3,158 +$6,201
CZ05 +$180 +$358 +$2,273 +$247 +$795 +$3,293 +$6,314
CZ06 +$190 +$213 +$2,294 +$231 +$361 +$2,580 +$5,590
CZ07 +$90 +$366 +$2,188 +$202 +$361 +$2,261 +$5,203
CZ08 +$250 +$213 +$2,353 +$231 +$361 +$2,240 +$5,249
CZ09 +$136 +$274 +$2,234 +$231 +$361 +$2,232 +$5,236
CZ10 +$278 +$250 +$2,376 +$361 +$361 +$2,371 +$5,395
CZ11 +$850 +$317 +$2,950 +$1,011 +$795 +$3,601 +$6,759
CZ12 +$291 +$434 +$2,394 +$1,011 +$795 +$3,835 +$6,943
CZ13 +$831 +$290 +$2,936 +$1,011 +$795 +$3,462 +$6,650
CZ14 +$874 +$347 +$2,957 +$1,011 +$795 +$3,356 +$6,380
CZ15 +$510 -($157) +$2,604 +$1,011 +$1,954 +$1,826 +$5,020
CZ16 +$937 +$453 +$3,028 +$843 +$795 +$4,423 +$7,533
ATTACHMENT 5
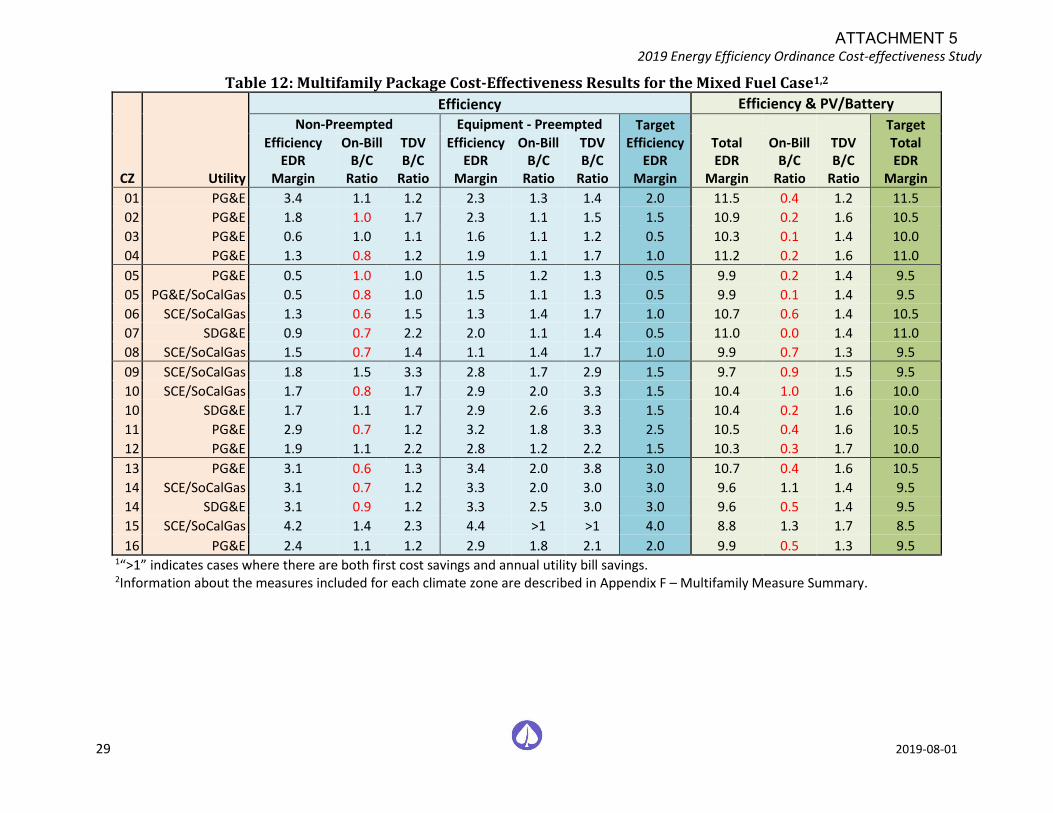
2019 Energy Efficiency Ordinance Cost-effectiveness Study
29 2019-08-01
Table 12: Multifamily Package Cost-Effectiveness Results for the Mixed Fuel Case1,2
CZ Utility
Efficiency Efficiency & PV/Battery
Non-Preempted Equipment - Preempted Target Efficiency
EDR Margin
Target Total EDR
Margin
Efficiency EDR
Margin
On-Bill B/C
Ratio
TDV B/C
Ratio
Efficiency EDR
Margin
On-Bill B/C
Ratio
TDV B/C
Ratio
Total EDR
Margin
On-Bill B/C
Ratio
TDV B/C
Ratio
01 PG&E 3.4 1.1 1.2 2.3 1.3 1.4 2.0 11.5 0.4 1.2 11.5
02 PG&E 1.8 1.0 1.7 2.3 1.1 1.5 1.5 10.9 0.2 1.6 10.5
03 PG&E 0.6 1.0 1.1 1.6 1.1 1.2 0.5 10.3 0.1 1.4 10.0
04 PG&E 1.3 0.8 1.2 1.9 1.1 1.7 1.0 11.2 0.2 1.6 11.0
05 PG&E 0.5 1.0 1.0 1.5 1.2 1.3 0.5 9.9 0.2 1.4 9.5
05 PG&E/SoCalGas 0.5 0.8 1.0 1.5 1.1 1.3 0.5 9.9 0.1 1.4 9.5
06 SCE/SoCalGas 1.3 0.6 1.5 1.3 1.4 1.7 1.0 10.7 0.6 1.4 10.5
07 SDG&E 0.9 0.7 2.2 2.0 1.1 1.4 0.5 11.0 0.0 1.4 11.0
08 SCE/SoCalGas 1.5 0.7 1.4 1.1 1.4 1.7 1.0 9.9 0.7 1.3 9.5
09 SCE/SoCalGas 1.8 1.5 3.3 2.8 1.7 2.9 1.5 9.7 0.9 1.5 9.5
10 SCE/SoCalGas 1.7 0.8 1.7 2.9 2.0 3.3 1.5 10.4 1.0 1.6 10.0
10 SDG&E 1.7 1.1 1.7 2.9 2.6 3.3 1.5 10.4 0.2 1.6 10.0
11 PG&E 2.9 0.7 1.2 3.2 1.8 3.3 2.5 10.5 0.4 1.6 10.5
12 PG&E 1.9 1.1 2.2 2.8 1.2 2.2 1.5 10.3 0.3 1.7 10.0
13 PG&E 3.1 0.6 1.3 3.4 2.0 3.8 3.0 10.7 0.4 1.6 10.5
14 SCE/SoCalGas 3.1 0.7 1.2 3.3 2.0 3.0 3.0 9.6 1.1 1.4 9.5
14 SDG&E 3.1 0.9 1.2 3.3 2.5 3.0 3.0 9.6 0.5 1.4 9.5
15 SCE/SoCalGas 4.2 1.4 2.3 4.4 >1 >1 4.0 8.8 1.3 1.7 8.5
16 PG&E 2.4 1.1 1.2 2.9 1.8 2.1 2.0 9.9 0.5 1.3 9.5 1“>1” indicates cases where there are both first cost savings and annual utility bill savings. 2Information about the measures included for each climate zone are described in Appendix F – Multifamily Measure Summary.
ATTACHMENT 5
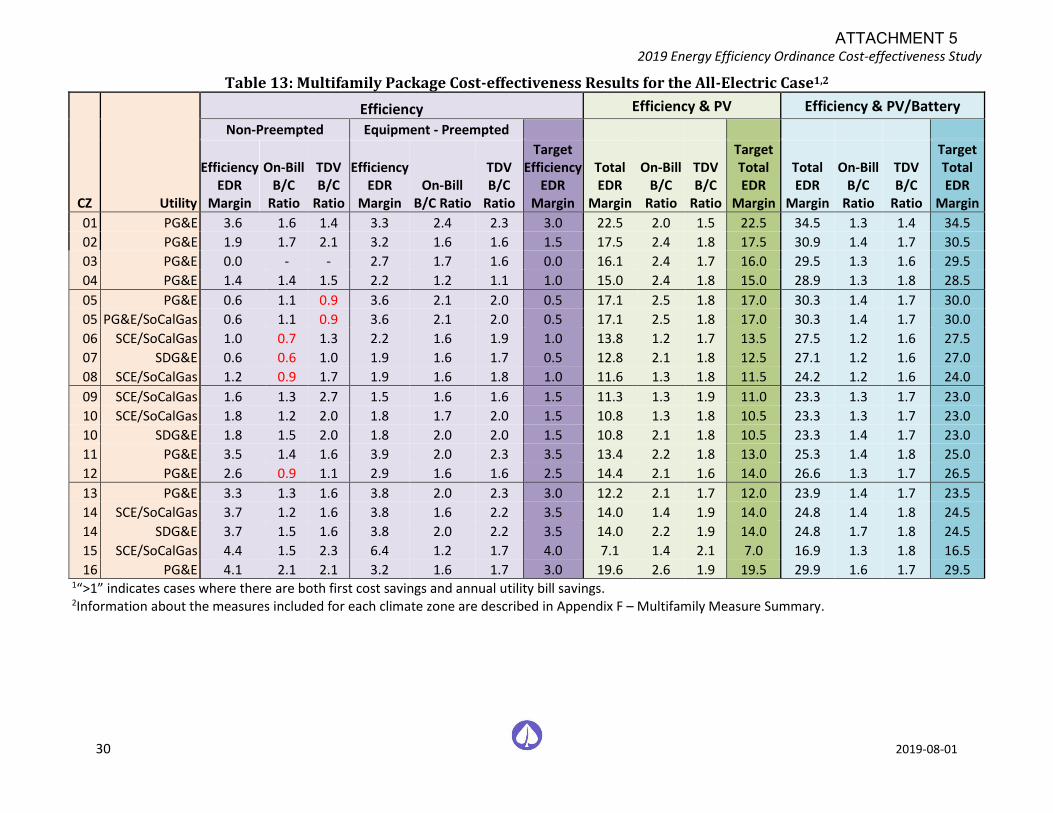
2019 Energy Efficiency Ordinance Cost-effectiveness Study
30 2019-08-01
Table 13: Multifamily Package Cost-effectiveness Results for the All-Electric Case1,2
CZ Utility
Efficiency Efficiency & PV Efficiency & PV/Battery
Non-Preempted Equipment - Preempted
Efficiency EDR
Margin
On-Bill B/C
Ratio
TDV B/C
Ratio
Efficiency EDR
Margin On-Bill
B/C Ratio
TDV B/C
Ratio
Target Efficiency
EDR Margin
Total EDR
Margin
On-Bill B/C
Ratio
TDV B/C
Ratio
Target Total EDR
Margin
Total EDR
Margin
On-Bill B/C
Ratio
TDV B/C
Ratio
Target Total EDR
Margin
01 PG&E 3.6 1.6 1.4 3.3 2.4 2.3 3.0 22.5 2.0 1.5 22.5 34.5 1.3 1.4 34.5
02 PG&E 1.9 1.7 2.1 3.2 1.6 1.6 1.5 17.5 2.4 1.8 17.5 30.9 1.4 1.7 30.5
03 PG&E 0.0 - - 2.7 1.7 1.6 0.0 16.1 2.4 1.7 16.0 29.5 1.3 1.6 29.5
04 PG&E 1.4 1.4 1.5 2.2 1.2 1.1 1.0 15.0 2.4 1.8 15.0 28.9 1.3 1.8 28.5
05 PG&E 0.6 1.1 0.9 3.6 2.1 2.0 0.5 17.1 2.5 1.8 17.0 30.3 1.4 1.7 30.0
05 PG&E/SoCalGas 0.6 1.1 0.9 3.6 2.1 2.0 0.5 17.1 2.5 1.8 17.0 30.3 1.4 1.7 30.0
06 SCE/SoCalGas 1.0 0.7 1.3 2.2 1.6 1.9 1.0 13.8 1.2 1.7 13.5 27.5 1.2 1.6 27.5
07 SDG&E 0.6 0.6 1.0 1.9 1.6 1.7 0.5 12.8 2.1 1.8 12.5 27.1 1.2 1.6 27.0
08 SCE/SoCalGas 1.2 0.9 1.7 1.9 1.6 1.8 1.0 11.6 1.3 1.8 11.5 24.2 1.2 1.6 24.0
09 SCE/SoCalGas 1.6 1.3 2.7 1.5 1.6 1.6 1.5 11.3 1.3 1.9 11.0 23.3 1.3 1.7 23.0
10 SCE/SoCalGas 1.8 1.2 2.0 1.8 1.7 2.0 1.5 10.8 1.3 1.8 10.5 23.3 1.3 1.7 23.0
10 SDG&E 1.8 1.5 2.0 1.8 2.0 2.0 1.5 10.8 2.1 1.8 10.5 23.3 1.4 1.7 23.0
11 PG&E 3.5 1.4 1.6 3.9 2.0 2.3 3.5 13.4 2.2 1.8 13.0 25.3 1.4 1.8 25.0
12 PG&E 2.6 0.9 1.1 2.9 1.6 1.6 2.5 14.4 2.1 1.6 14.0 26.6 1.3 1.7 26.5
13 PG&E 3.3 1.3 1.6 3.8 2.0 2.3 3.0 12.2 2.1 1.7 12.0 23.9 1.4 1.7 23.5
14 SCE/SoCalGas 3.7 1.2 1.6 3.8 1.6 2.2 3.5 14.0 1.4 1.9 14.0 24.8 1.4 1.8 24.5
14 SDG&E 3.7 1.5 1.6 3.8 2.0 2.2 3.5 14.0 2.2 1.9 14.0 24.8 1.7 1.8 24.5
15 SCE/SoCalGas 4.4 1.5 2.3 6.4 1.2 1.7 4.0 7.1 1.4 2.1 7.0 16.9 1.3 1.8 16.5
16 PG&E 4.1 2.1 2.1 3.2 1.6 1.7 3.0 19.6 2.6 1.9 19.5 29.9 1.6 1.7 29.5 1“>1” indicates cases where there are both first cost savings and annual utility bill savings. 2Information about the measures included for each climate zone are described in Appendix F – Multifamily Measure Summary.
ATTACHMENT 5
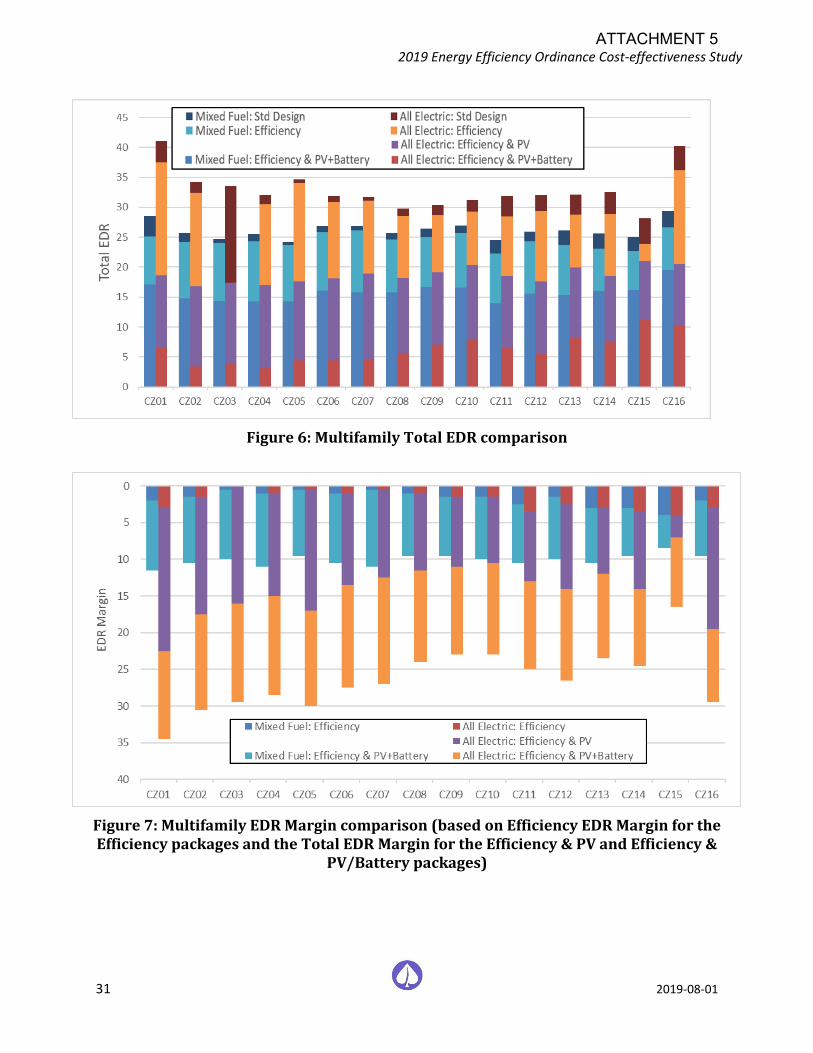
2019 Energy Efficiency Ordinance Cost-effectiveness Study
31 2019-08-01
Figure 6: Multifamily Total EDR comparison
Figure 7: Multifamily EDR Margin comparison (based on Efficiency EDR Margin for the Efficiency packages and the Total EDR Margin for the Efficiency & PV and Efficiency &
PV/Battery packages)
ATTACHMENT 5
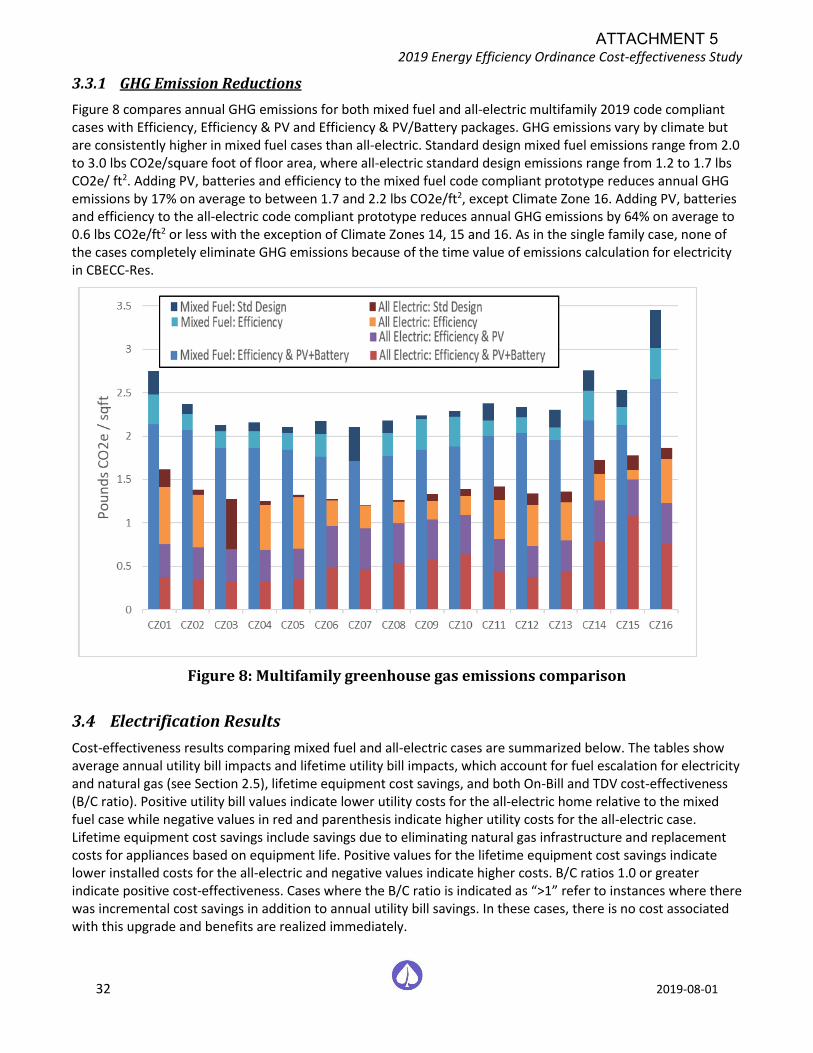
2019 Energy Efficiency Ordinance Cost-effectiveness Study
32 2019-08-01
3.3.1 GHG Emission Reductions
Figure 8 compares annual GHG emissions for both mixed fuel and all-electric multifamily 2019 code compliant cases with Efficiency, Efficiency & PV and Efficiency & PV/Battery packages. GHG emissions vary by climate but are consistently higher in mixed fuel cases than all-electric. Standard design mixed fuel emissions range from 2.0 to 3.0 lbs CO2e/square foot of floor area, where all-electric standard design emissions range from 1.2 to 1.7 lbs CO2e/ ft2. Adding PV, batteries and efficiency to the mixed fuel code compliant prototype reduces annual GHG emissions by 17% on average to between 1.7 and 2.2 lbs CO2e/ft2, except Climate Zone 16. Adding PV, batteries and efficiency to the all-electric code compliant prototype reduces annual GHG emissions by 64% on average to 0.6 lbs CO2e/ft2 or less with the exception of Climate Zones 14, 15 and 16. As in the single family case, none of the cases completely eliminate GHG emissions because of the time value of emissions calculation for electricity in CBECC-Res.
Figure 8: Multifamily greenhouse gas emissions comparison
3.4 Electrification Results
Cost-effectiveness results comparing mixed fuel and all-electric cases are summarized below. The tables show average annual utility bill impacts and lifetime utility bill impacts, which account for fuel escalation for electricity and natural gas (see Section 2.5), lifetime equipment cost savings, and both On-Bill and TDV cost-effectiveness (B/C ratio). Positive utility bill values indicate lower utility costs for the all-electric home relative to the mixed fuel case while negative values in red and parenthesis indicate higher utility costs for the all-electric case. Lifetime equipment cost savings include savings due to eliminating natural gas infrastructure and replacement costs for appliances based on equipment life. Positive values for the lifetime equipment cost savings indicate lower installed costs for the all-electric and negative values indicate higher costs. B/C ratios 1.0 or greater indicate positive cost-effectiveness. Cases where the B/C ratio is indicated as “>1” refer to instances where there was incremental cost savings in addition to annual utility bill savings. In these cases, there is no cost associated with this upgrade and benefits are realized immediately.
ATTACHMENT 5
2019 Energy Efficiency Ordinance Cost-effectiveness Study
33 2019-08-01
Three scenarios were evaluated:
1. 2019 Code Compliant: Compares a 2019 code compliant all-electric home with a 2019 code compliant mixed fuel home.
2. Efficiency & PV Package: Compares an all-electric home with efficiency and PV sized to 90% of the annual electricity use to a 2019 code compliant mixed fuel home. The first cost savings in the code compliant all-electric house is invested in above code efficiency and PV reflective of the Efficiency & PV packages described above.
3. Neutral Cost Package: Compares an all-electric home with PV beyond code minimum with a 2019 code compliant mixed fuel home. The PV system for the all-electric case is sized to result in a zero lifetime incremental cost relative to a mixed fuel home.
3.4.1 Single Family
Table 14, Table 15, Figure 9, Figure 10, and Figure 11 present results of cost-effectiveness analysis for electrification of single family buildings, according to both the On-Bill and TDV methodologies. Based on typical cost assumptions arrived at for this analysis, the lifetime equipment costs for the single family code compliant all-electric option are approximately $5,350 less than the mixed fuel code compliant option. Cost savings are entirely due to the elimination of gas infrastructure, which was assumed to be a savings of $5,750. When evaluating cost-effectiveness based on TDV, the Utility Gas Main Extensions rules 50% refund and appliance allowance deduction are not applied and therefore the cost savings are twice as much.
Under the Efficiency & PV Package and the On-Bill analysis, the incremental cost of the efficiency and PV is typically more than the cost savings seen in the code compliant case, which results in a net cost increase in most climate zones for the all-electric case. In climates with small heating loads (7 and 15) there continues to be an incremental cost savings for the all-electric home. With the TDV analysis, there is still an incremental cost savings in all climates except 1 and 16 for single family.
Utility impacts differ by climate zone and utility, but utility costs for the code compliant all-electric option are typically higher than for the compliant mixed fuel design. There are utility cost savings across all climates zones and building types for the all-electric Efficiency & PV Package, resulting in a more cost-effective option.
The all-electric code compliant option is cost-effective based on the On-Bill approach for single family homes in Climate Zones 6 through 9, 10 (SCE/SoCalGas territory only), and 15. The code compliant option is cost-effective based on the TDV methodology in all climate zones except 1 and 16. If the same costs used for the On-Bill approach are also used for the TDV approach (incorporating the Utility Gas Main Extensions rules 50% refund and appliance allowance deduction), the all-electric code compliant option is cost-effective in Climate Zones 6 through 10. The Efficiency & PV all-electric option is cost-effective in all climate zones based on both the On-Bill and TDV methodologies. In many cases it is cost-effective immediately with lower equipment and utility costs.
The last set of results in Table 14 shows the neutral cost case where the cost savings for the all-electric code compliant home is invested in a larger PV system, resulting in a lifetime incremental cost of zero based on the On-Bill approach. This package results in utility cost savings in all cases except Climate Zones 1, 14 (SCE/SoCalGas territory only), and 16. For these three cases the Reach Code Team evaluated how much additional PV would be required to result in a cost-effective package. These results are presented in Table 15 and show that an additional 1.6kW in Climate Zone 1 results in a B/C ratio of 1.1. For Climate Zone 14 and 16 adding 0.25kW and 1.2kW, respectively, results in a B/C ratio of 1.2. Neutral cost cases are cost-effective based on the TDV methodology in all climate zones except 16.
3.4.2 Multifamily
Multifamily results are found in Table 16, Table 17, Figure 12, Figure 13, and Figure 14. Lifetime costs for the multifamily code compliant all-electric option are approximately $2,300 less than the mixed fuel code compliant option, entirely due to the elimination of gas infrastructure. When evaluating cost-effectiveness based on TDV,
ATTACHMENT 5
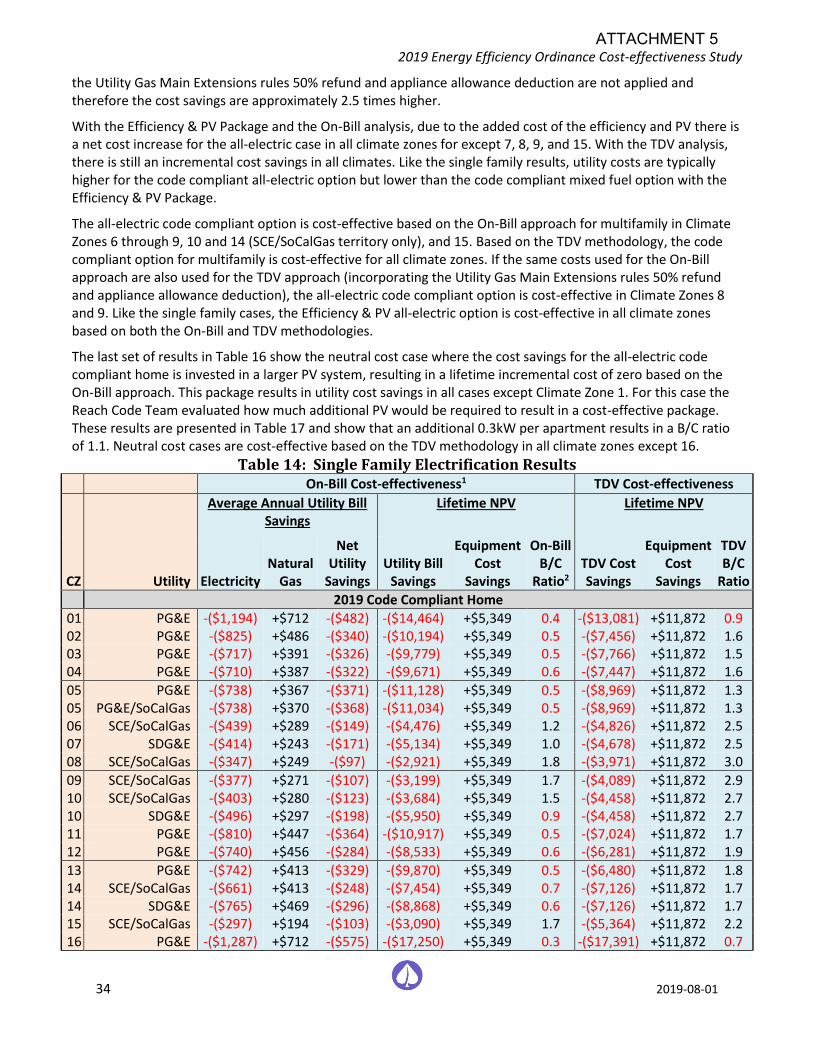
2019 Energy Efficiency Ordinance Cost-effectiveness Study
34 2019-08-01
the Utility Gas Main Extensions rules 50% refund and appliance allowance deduction are not applied and therefore the cost savings are approximately 2.5 times higher.
With the Efficiency & PV Package and the On-Bill analysis, due to the added cost of the efficiency and PV there is a net cost increase for the all-electric case in all climate zones for except 7, 8, 9, and 15. With the TDV analysis, there is still an incremental cost savings in all climates. Like the single family results, utility costs are typically higher for the code compliant all-electric option but lower than the code compliant mixed fuel option with the Efficiency & PV Package.
The all-electric code compliant option is cost-effective based on the On-Bill approach for multifamily in Climate Zones 6 through 9, 10 and 14 (SCE/SoCalGas territory only), and 15. Based on the TDV methodology, the code compliant option for multifamily is cost-effective for all climate zones. If the same costs used for the On-Bill approach are also used for the TDV approach (incorporating the Utility Gas Main Extensions rules 50% refund and appliance allowance deduction), the all-electric code compliant option is cost-effective in Climate Zones 8 and 9. Like the single family cases, the Efficiency & PV all-electric option is cost-effective in all climate zones based on both the On-Bill and TDV methodologies.
The last set of results in Table 16 show the neutral cost case where the cost savings for the all-electric code compliant home is invested in a larger PV system, resulting in a lifetime incremental cost of zero based on the On-Bill approach. This package results in utility cost savings in all cases except Climate Zone 1. For this case the Reach Code Team evaluated how much additional PV would be required to result in a cost-effective package. These results are presented in Table 17 and show that an additional 0.3kW per apartment results in a B/C ratio of 1.1. Neutral cost cases are cost-effective based on the TDV methodology in all climate zones except 16.
Table 14: Single Family Electrification Results On-Bill Cost-effectiveness1 TDV Cost-effectiveness
CZ Utility
Average Annual Utility Bill Savings
Lifetime NPV Lifetime NPV
Electricity Natural
Gas
Net Utility
Savings Utility Bill
Savings
Equipment Cost
Savings
On-Bill B/C
Ratio2
TDV Cost Savings
Equipment Cost
Savings
TDV B/C
Ratio
2019 Code Compliant Home
01 PG&E -($1,194) +$712 -($482) -($14,464) +$5,349 0.4 -($13,081) +$11,872 0.9 02 PG&E -($825) +$486 -($340) -($10,194) +$5,349 0.5 -($7,456) +$11,872 1.6 03 PG&E -($717) +$391 -($326) -($9,779) +$5,349 0.5 -($7,766) +$11,872 1.5 04 PG&E -($710) +$387 -($322) -($9,671) +$5,349 0.6 -($7,447) +$11,872 1.6
05 PG&E -($738) +$367 -($371) -($11,128) +$5,349 0.5 -($8,969) +$11,872 1.3 05 PG&E/SoCalGas -($738) +$370 -($368) -($11,034) +$5,349 0.5 -($8,969) +$11,872 1.3 06 SCE/SoCalGas -($439) +$289 -($149) -($4,476) +$5,349 1.2 -($4,826) +$11,872 2.5 07 SDG&E -($414) +$243 -($171) -($5,134) +$5,349 1.0 -($4,678) +$11,872 2.5 08 SCE/SoCalGas -($347) +$249 -($97) -($2,921) +$5,349 1.8 -($3,971) +$11,872 3.0
09 SCE/SoCalGas -($377) +$271 -($107) -($3,199) +$5,349 1.7 -($4,089) +$11,872 2.9 10 SCE/SoCalGas -($403) +$280 -($123) -($3,684) +$5,349 1.5 -($4,458) +$11,872 2.7 10 SDG&E -($496) +$297 -($198) -($5,950) +$5,349 0.9 -($4,458) +$11,872 2.7 11 PG&E -($810) +$447 -($364) -($10,917) +$5,349 0.5 -($7,024) +$11,872 1.7 12 PG&E -($740) +$456 -($284) -($8,533) +$5,349 0.6 -($6,281) +$11,872 1.9
13 PG&E -($742) +$413 -($329) -($9,870) +$5,349 0.5 -($6,480) +$11,872 1.8 14 SCE/SoCalGas -($661) +$413 -($248) -($7,454) +$5,349 0.7 -($7,126) +$11,872 1.7 14 SDG&E -($765) +$469 -($296) -($8,868) +$5,349 0.6 -($7,126) +$11,872 1.7 15 SCE/SoCalGas -($297) +$194 -($103) -($3,090) +$5,349 1.7 -($5,364) +$11,872 2.2 16 PG&E -($1,287) +$712 -($575) -($17,250) +$5,349 0.3 -($17,391) +$11,872 0.7
ATTACHMENT 5
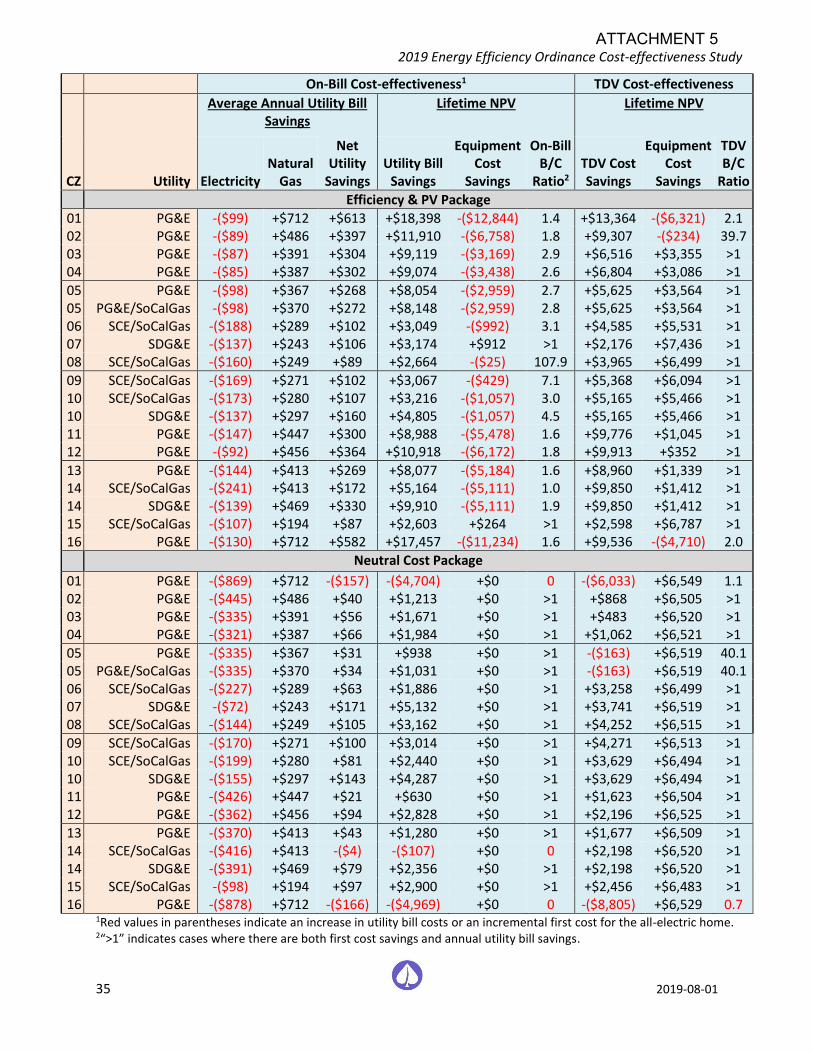
2019 Energy Efficiency Ordinance Cost-effectiveness Study
35 2019-08-01
On-Bill Cost-effectiveness1 TDV Cost-effectiveness
CZ Utility
Average Annual Utility Bill Savings
Lifetime NPV Lifetime NPV
Electricity Natural
Gas
Net Utility
Savings Utility Bill
Savings
Equipment Cost
Savings
On-Bill B/C
Ratio2
TDV Cost Savings
Equipment Cost
Savings
TDV B/C
Ratio
Efficiency & PV Package
01 PG&E -($99) +$712 +$613 +$18,398 -($12,844) 1.4 +$13,364 -($6,321) 2.1 02 PG&E -($89) +$486 +$397 +$11,910 -($6,758) 1.8 +$9,307 -($234) 39.7 03 PG&E -($87) +$391 +$304 +$9,119 -($3,169) 2.9 +$6,516 +$3,355 >1 04 PG&E -($85) +$387 +$302 +$9,074 -($3,438) 2.6 +$6,804 +$3,086 >1
05 PG&E -($98) +$367 +$268 +$8,054 -($2,959) 2.7 +$5,625 +$3,564 >1 05 PG&E/SoCalGas -($98) +$370 +$272 +$8,148 -($2,959) 2.8 +$5,625 +$3,564 >1 06 SCE/SoCalGas -($188) +$289 +$102 +$3,049 -($992) 3.1 +$4,585 +$5,531 >1 07 SDG&E -($137) +$243 +$106 +$3,174 +$912 >1 +$2,176 +$7,436 >1 08 SCE/SoCalGas -($160) +$249 +$89 +$2,664 -($25) 107.9 +$3,965 +$6,499 >1
09 SCE/SoCalGas -($169) +$271 +$102 +$3,067 -($429) 7.1 +$5,368 +$6,094 >1 10 SCE/SoCalGas -($173) +$280 +$107 +$3,216 -($1,057) 3.0 +$5,165 +$5,466 >1 10 SDG&E -($137) +$297 +$160 +$4,805 -($1,057) 4.5 +$5,165 +$5,466 >1 11 PG&E -($147) +$447 +$300 +$8,988 -($5,478) 1.6 +$9,776 +$1,045 >1 12 PG&E -($92) +$456 +$364 +$10,918 -($6,172) 1.8 +$9,913 +$352 >1
13 PG&E -($144) +$413 +$269 +$8,077 -($5,184) 1.6 +$8,960 +$1,339 >1 14 SCE/SoCalGas -($241) +$413 +$172 +$5,164 -($5,111) 1.0 +$9,850 +$1,412 >1 14 SDG&E -($139) +$469 +$330 +$9,910 -($5,111) 1.9 +$9,850 +$1,412 >1 15 SCE/SoCalGas -($107) +$194 +$87 +$2,603 +$264 >1 +$2,598 +$6,787 >1 16 PG&E -($130) +$712 +$582 +$17,457 -($11,234) 1.6 +$9,536 -($4,710) 2.0
Neutral Cost Package
01 PG&E -($869) +$712 -($157) -($4,704) +$0 0 -($6,033) +$6,549 1.1 02 PG&E -($445) +$486 +$40 +$1,213 +$0 >1 +$868 +$6,505 >1 03 PG&E -($335) +$391 +$56 +$1,671 +$0 >1 +$483 +$6,520 >1 04 PG&E -($321) +$387 +$66 +$1,984 +$0 >1 +$1,062 +$6,521 >1
05 PG&E -($335) +$367 +$31 +$938 +$0 >1 -($163) +$6,519 40.1 05 PG&E/SoCalGas -($335) +$370 +$34 +$1,031 +$0 >1 -($163) +$6,519 40.1 06 SCE/SoCalGas -($227) +$289 +$63 +$1,886 +$0 >1 +$3,258 +$6,499 >1 07 SDG&E -($72) +$243 +$171 +$5,132 +$0 >1 +$3,741 +$6,519 >1 08 SCE/SoCalGas -($144) +$249 +$105 +$3,162 +$0 >1 +$4,252 +$6,515 >1
09 SCE/SoCalGas -($170) +$271 +$100 +$3,014 +$0 >1 +$4,271 +$6,513 >1 10 SCE/SoCalGas -($199) +$280 +$81 +$2,440 +$0 >1 +$3,629 +$6,494 >1 10 SDG&E -($155) +$297 +$143 +$4,287 +$0 >1 +$3,629 +$6,494 >1 11 PG&E -($426) +$447 +$21 +$630 +$0 >1 +$1,623 +$6,504 >1 12 PG&E -($362) +$456 +$94 +$2,828 +$0 >1 +$2,196 +$6,525 >1
13 PG&E -($370) +$413 +$43 +$1,280 +$0 >1 +$1,677 +$6,509 >1 14 SCE/SoCalGas -($416) +$413 -($4) -($107) +$0 0 +$2,198 +$6,520 >1 14 SDG&E -($391) +$469 +$79 +$2,356 +$0 >1 +$2,198 +$6,520 >1 15 SCE/SoCalGas -($98) +$194 +$97 +$2,900 +$0 >1 +$2,456 +$6,483 >1 16 PG&E -($878) +$712 -($166) -($4,969) +$0 0 -($8,805) +$6,529 0.7
1Red values in parentheses indicate an increase in utility bill costs or an incremental first cost for the all-electric home. 2“>1” indicates cases where there are both first cost savings and annual utility bill savings.
ATTACHMENT 5
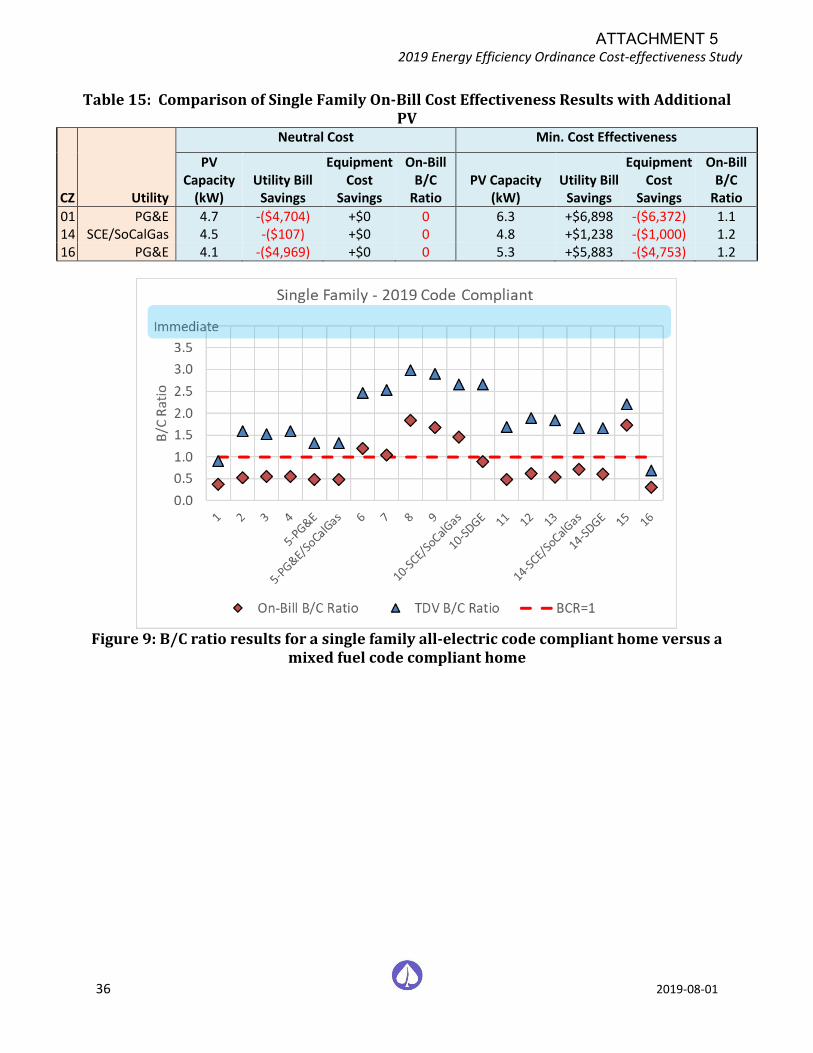
2019 Energy Efficiency Ordinance Cost-effectiveness Study
36 2019-08-01
Table 15: Comparison of Single Family On-Bill Cost Effectiveness Results with Additional PV
CZ Utility
Neutral Cost Min. Cost Effectiveness
PV Capacity
(kW) Utility Bill
Savings
Equipment Cost
Savings
On-Bill B/C
Ratio
PV Capacity (kW)
Utility Bill Savings
Equipment Cost
Savings
On-Bill B/C
Ratio
01 PG&E 4.7 -($4,704) +$0 0 6.3 +$6,898 -($6,372) 1.1 14 SCE/SoCalGas 4.5 -($107) +$0 0 4.8 +$1,238 -($1,000) 1.2 16 PG&E 4.1 -($4,969) +$0 0 5.3 +$5,883 -($4,753) 1.2
Figure 9: B/C ratio results for a single family all-electric code compliant home versus a
mixed fuel code compliant home
ATTACHMENT 5
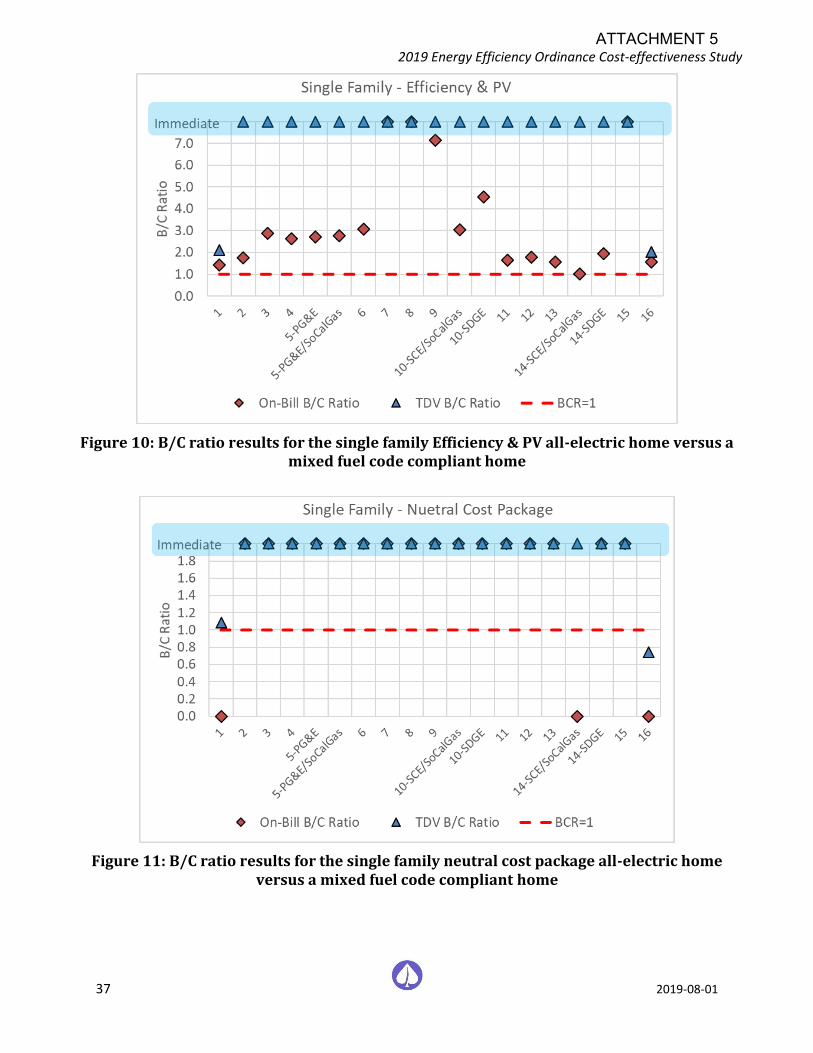
2019 Energy Efficiency Ordinance Cost-effectiveness Study
37 2019-08-01
Figure 10: B/C ratio results for the single family Efficiency & PV all-electric home versus a mixed fuel code compliant home
Figure 11: B/C ratio results for the single family neutral cost package all-electric home versus a mixed fuel code compliant home
ATTACHMENT 5
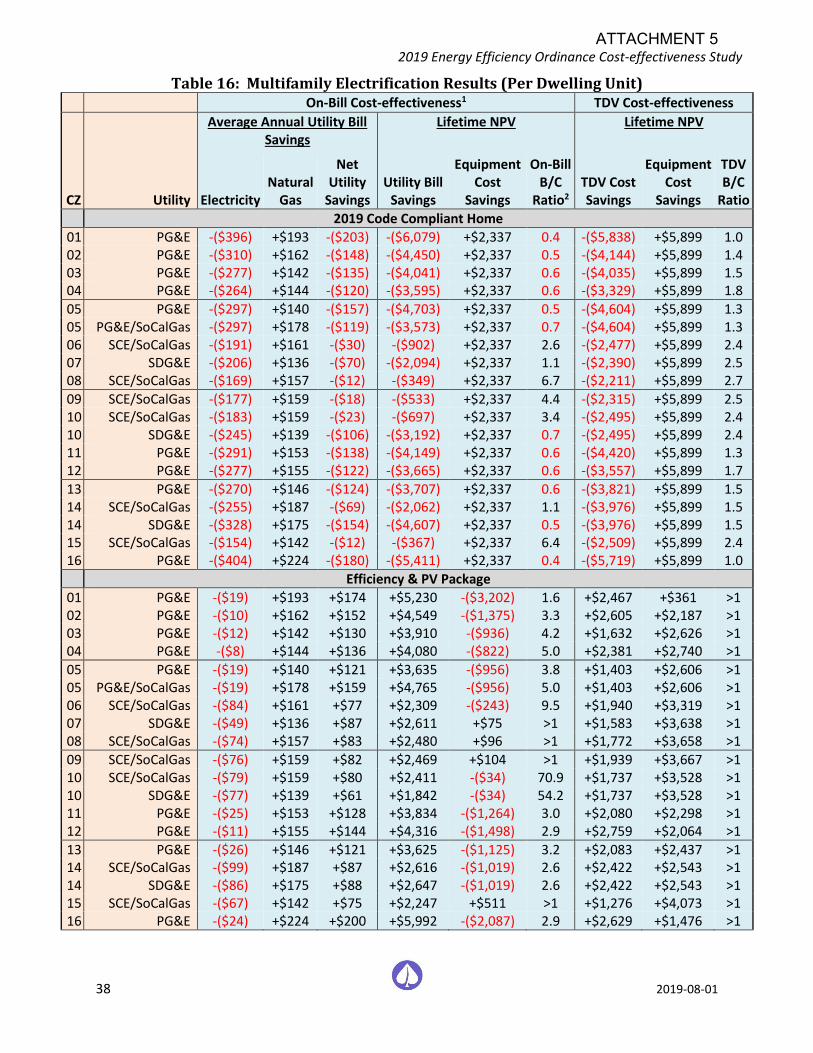
2019 Energy Efficiency Ordinance Cost-effectiveness Study
38 2019-08-01
Table 16: Multifamily Electrification Results (Per Dwelling Unit) On-Bill Cost-effectiveness1 TDV Cost-effectiveness
CZ Utility
Average Annual Utility Bill Savings
Lifetime NPV Lifetime NPV
Electricity Natural
Gas
Net Utility
Savings Utility Bill
Savings
Equipment Cost
Savings
On-Bill B/C
Ratio2
TDV Cost Savings
Equipment Cost
Savings
TDV B/C
Ratio
2019 Code Compliant Home
01 PG&E -($396) +$193 -($203) -($6,079) +$2,337 0.4 -($5,838) +$5,899 1.0 02 PG&E -($310) +$162 -($148) -($4,450) +$2,337 0.5 -($4,144) +$5,899 1.4 03 PG&E -($277) +$142 -($135) -($4,041) +$2,337 0.6 -($4,035) +$5,899 1.5 04 PG&E -($264) +$144 -($120) -($3,595) +$2,337 0.6 -($3,329) +$5,899 1.8
05 PG&E -($297) +$140 -($157) -($4,703) +$2,337 0.5 -($4,604) +$5,899 1.3 05 PG&E/SoCalGas -($297) +$178 -($119) -($3,573) +$2,337 0.7 -($4,604) +$5,899 1.3 06 SCE/SoCalGas -($191) +$161 -($30) -($902) +$2,337 2.6 -($2,477) +$5,899 2.4 07 SDG&E -($206) +$136 -($70) -($2,094) +$2,337 1.1 -($2,390) +$5,899 2.5 08 SCE/SoCalGas -($169) +$157 -($12) -($349) +$2,337 6.7 -($2,211) +$5,899 2.7
09 SCE/SoCalGas -($177) +$159 -($18) -($533) +$2,337 4.4 -($2,315) +$5,899 2.5 10 SCE/SoCalGas -($183) +$159 -($23) -($697) +$2,337 3.4 -($2,495) +$5,899 2.4 10 SDG&E -($245) +$139 -($106) -($3,192) +$2,337 0.7 -($2,495) +$5,899 2.4 11 PG&E -($291) +$153 -($138) -($4,149) +$2,337 0.6 -($4,420) +$5,899 1.3 12 PG&E -($277) +$155 -($122) -($3,665) +$2,337 0.6 -($3,557) +$5,899 1.7
13 PG&E -($270) +$146 -($124) -($3,707) +$2,337 0.6 -($3,821) +$5,899 1.5 14 SCE/SoCalGas -($255) +$187 -($69) -($2,062) +$2,337 1.1 -($3,976) +$5,899 1.5 14 SDG&E -($328) +$175 -($154) -($4,607) +$2,337 0.5 -($3,976) +$5,899 1.5 15 SCE/SoCalGas -($154) +$142 -($12) -($367) +$2,337 6.4 -($2,509) +$5,899 2.4 16 PG&E -($404) +$224 -($180) -($5,411) +$2,337 0.4 -($5,719) +$5,899 1.0
Efficiency & PV Package
01 PG&E -($19) +$193 +$174 +$5,230 -($3,202) 1.6 +$2,467 +$361 >1 02 PG&E -($10) +$162 +$152 +$4,549 -($1,375) 3.3 +$2,605 +$2,187 >1 03 PG&E -($12) +$142 +$130 +$3,910 -($936) 4.2 +$1,632 +$2,626 >1 04 PG&E -($8) +$144 +$136 +$4,080 -($822) 5.0 +$2,381 +$2,740 >1
05 PG&E -($19) +$140 +$121 +$3,635 -($956) 3.8 +$1,403 +$2,606 >1 05 PG&E/SoCalGas -($19) +$178 +$159 +$4,765 -($956) 5.0 +$1,403 +$2,606 >1 06 SCE/SoCalGas -($84) +$161 +$77 +$2,309 -($243) 9.5 +$1,940 +$3,319 >1 07 SDG&E -($49) +$136 +$87 +$2,611 +$75 >1 +$1,583 +$3,638 >1 08 SCE/SoCalGas -($74) +$157 +$83 +$2,480 +$96 >1 +$1,772 +$3,658 >1
09 SCE/SoCalGas -($76) +$159 +$82 +$2,469 +$104 >1 +$1,939 +$3,667 >1 10 SCE/SoCalGas -($79) +$159 +$80 +$2,411 -($34) 70.9 +$1,737 +$3,528 >1 10 SDG&E -($77) +$139 +$61 +$1,842 -($34) 54.2 +$1,737 +$3,528 >1 11 PG&E -($25) +$153 +$128 +$3,834 -($1,264) 3.0 +$2,080 +$2,298 >1 12 PG&E -($11) +$155 +$144 +$4,316 -($1,498) 2.9 +$2,759 +$2,064 >1
13 PG&E -($26) +$146 +$121 +$3,625 -($1,125) 3.2 +$2,083 +$2,437 >1 14 SCE/SoCalGas -($99) +$187 +$87 +$2,616 -($1,019) 2.6 +$2,422 +$2,543 >1 14 SDG&E -($86) +$175 +$88 +$2,647 -($1,019) 2.6 +$2,422 +$2,543 >1 15 SCE/SoCalGas -($67) +$142 +$75 +$2,247 +$511 >1 +$1,276 +$4,073 >1 16 PG&E -($24) +$224 +$200 +$5,992 -($2,087) 2.9 +$2,629 +$1,476 >1
ATTACHMENT 5
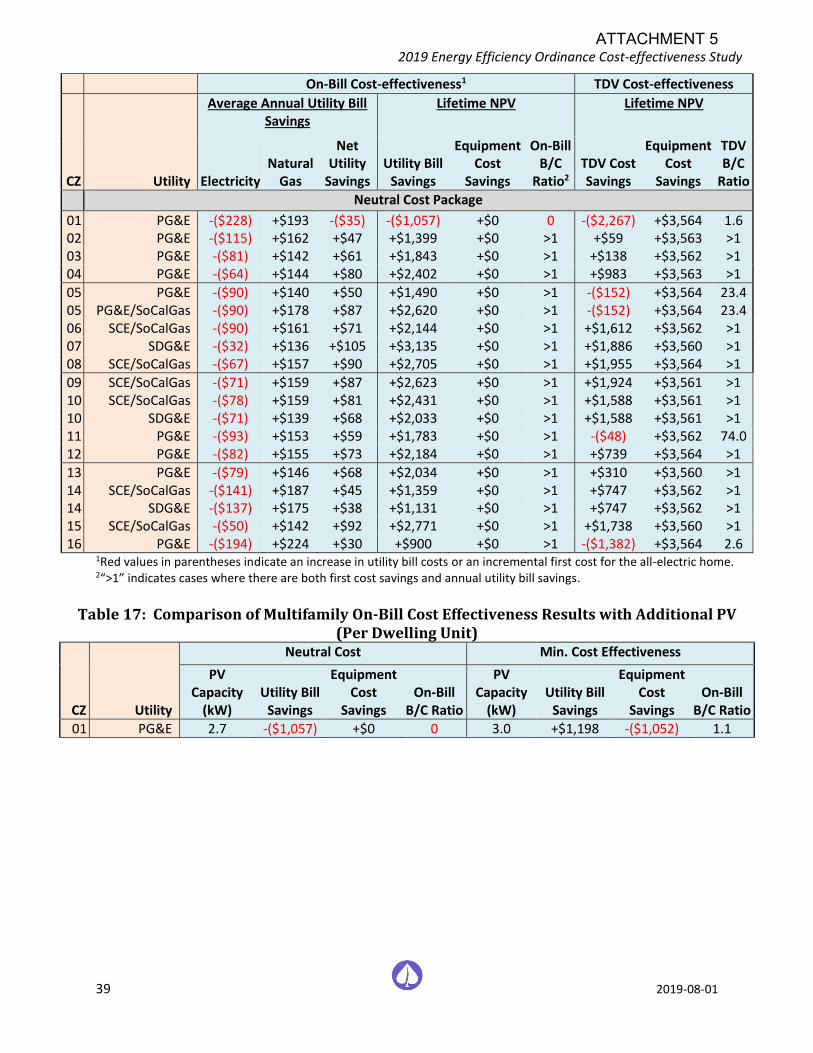
2019 Energy Efficiency Ordinance Cost-effectiveness Study
39 2019-08-01
On-Bill Cost-effectiveness1 TDV Cost-effectiveness
CZ Utility
Average Annual Utility Bill Savings
Lifetime NPV Lifetime NPV
Electricity Natural
Gas
Net Utility
Savings Utility Bill
Savings
Equipment Cost
Savings
On-Bill B/C
Ratio2
TDV Cost Savings
Equipment Cost
Savings
TDV B/C
Ratio
Neutral Cost Package
01 PG&E -($228) +$193 -($35) -($1,057) +$0 0 -($2,267) +$3,564 1.6 02 PG&E -($115) +$162 +$47 +$1,399 +$0 >1 +$59 +$3,563 >1 03 PG&E -($81) +$142 +$61 +$1,843 +$0 >1 +$138 +$3,562 >1 04 PG&E -($64) +$144 +$80 +$2,402 +$0 >1 +$983 +$3,563 >1
05 PG&E -($90) +$140 +$50 +$1,490 +$0 >1 -($152) +$3,564 23.4 05 PG&E/SoCalGas -($90) +$178 +$87 +$2,620 +$0 >1 -($152) +$3,564 23.4 06 SCE/SoCalGas -($90) +$161 +$71 +$2,144 +$0 >1 +$1,612 +$3,562 >1 07 SDG&E -($32) +$136 +$105 +$3,135 +$0 >1 +$1,886 +$3,560 >1 08 SCE/SoCalGas -($67) +$157 +$90 +$2,705 +$0 >1 +$1,955 +$3,564 >1
09 SCE/SoCalGas -($71) +$159 +$87 +$2,623 +$0 >1 +$1,924 +$3,561 >1 10 SCE/SoCalGas -($78) +$159 +$81 +$2,431 +$0 >1 +$1,588 +$3,561 >1 10 SDG&E -($71) +$139 +$68 +$2,033 +$0 >1 +$1,588 +$3,561 >1 11 PG&E -($93) +$153 +$59 +$1,783 +$0 >1 -($48) +$3,562 74.0 12 PG&E -($82) +$155 +$73 +$2,184 +$0 >1 +$739 +$3,564 >1
13 PG&E -($79) +$146 +$68 +$2,034 +$0 >1 +$310 +$3,560 >1 14 SCE/SoCalGas -($141) +$187 +$45 +$1,359 +$0 >1 +$747 +$3,562 >1 14 SDG&E -($137) +$175 +$38 +$1,131 +$0 >1 +$747 +$3,562 >1 15 SCE/SoCalGas -($50) +$142 +$92 +$2,771 +$0 >1 +$1,738 +$3,560 >1 16 PG&E -($194) +$224 +$30 +$900 +$0 >1 -($1,382) +$3,564 2.6
1Red values in parentheses indicate an increase in utility bill costs or an incremental first cost for the all-electric home. 2“>1” indicates cases where there are both first cost savings and annual utility bill savings.
Table 17: Comparison of Multifamily On-Bill Cost Effectiveness Results with Additional PV
(Per Dwelling Unit)
CZ Utility
Neutral Cost Min. Cost Effectiveness
PV Capacity
(kW) Utility Bill
Savings
Equipment Cost
Savings On-Bill
B/C Ratio
PV Capacity
(kW) Utility Bill
Savings
Equipment Cost
Savings On-Bill
B/C Ratio
01 PG&E 2.7 -($1,057) +$0 0 3.0 +$1,198 -($1,052) 1.1
ATTACHMENT 5
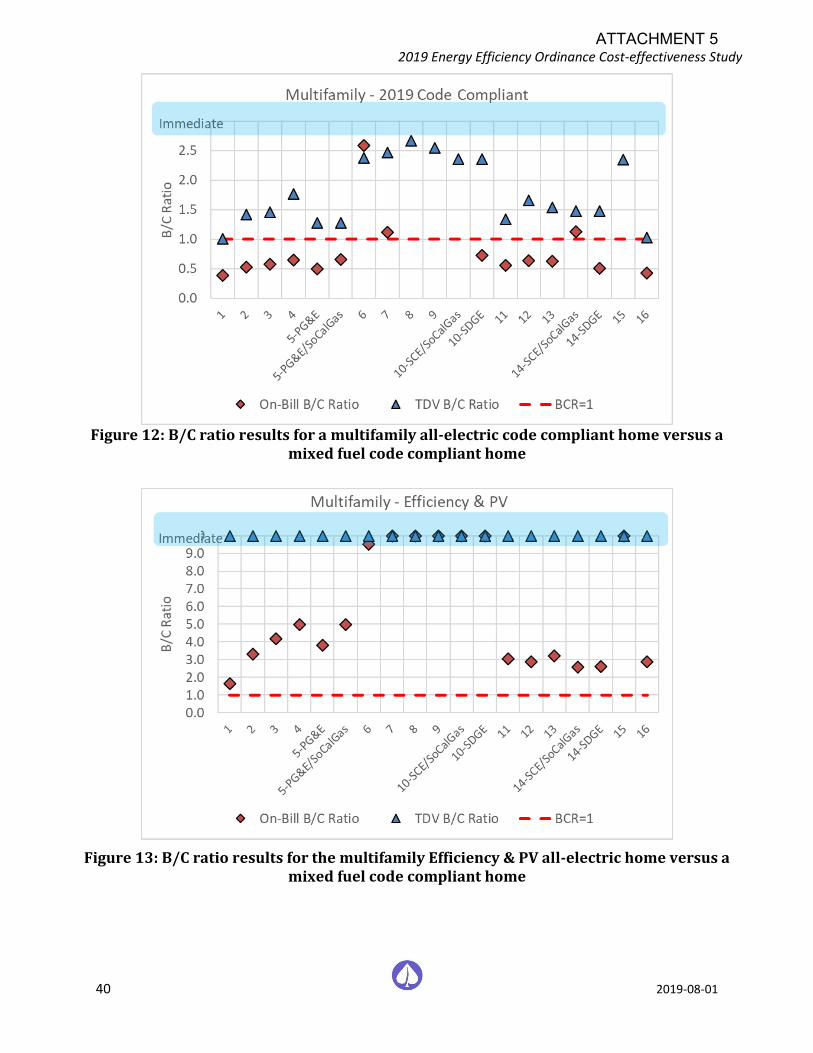
2019 Energy Efficiency Ordinance Cost-effectiveness Study
40 2019-08-01
Figure 12: B/C ratio results for a multifamily all-electric code compliant home versus a
mixed fuel code compliant home
Figure 13: B/C ratio results for the multifamily Efficiency & PV all-electric home versus a mixed fuel code compliant home
ATTACHMENT 5
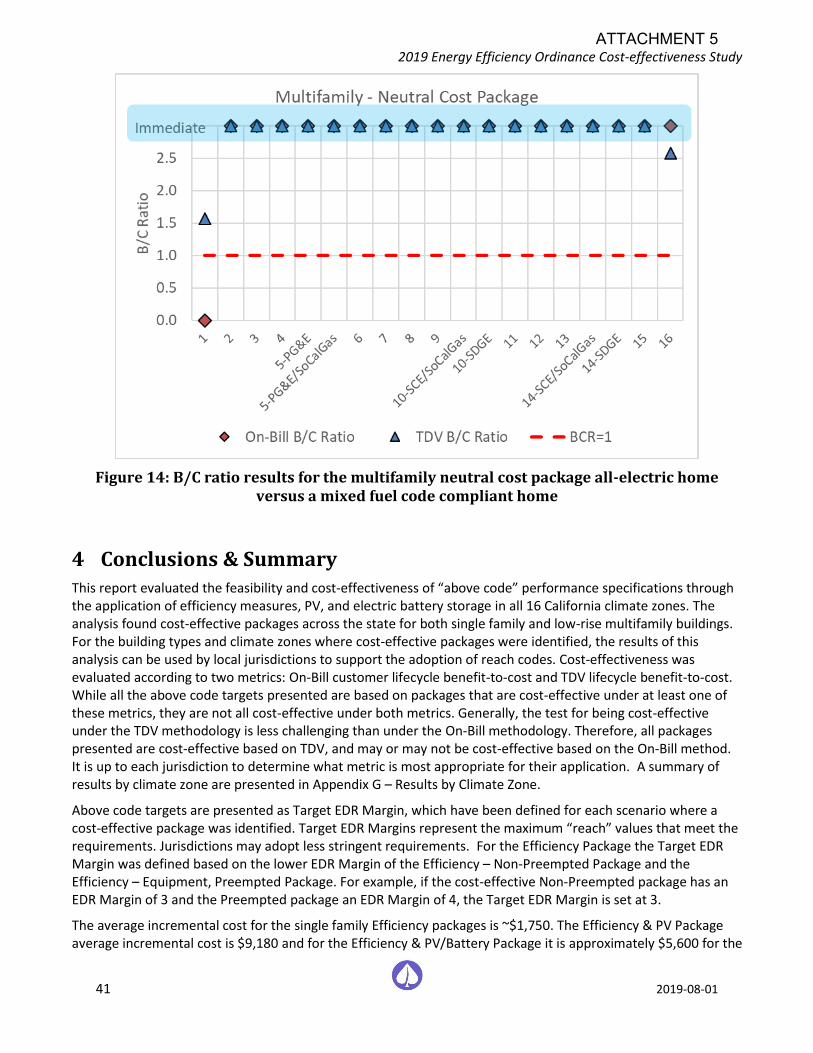
2019 Energy Efficiency Ordinance Cost-effectiveness Study
41 2019-08-01
Figure 14: B/C ratio results for the multifamily neutral cost package all-electric home versus a mixed fuel code compliant home
4 Conclusions & Summary This report evaluated the feasibility and cost-effectiveness of “above code” performance specifications through the application of efficiency measures, PV, and electric battery storage in all 16 California climate zones. The analysis found cost-effective packages across the state for both single family and low-rise multifamily buildings. For the building types and climate zones where cost-effective packages were identified, the results of this analysis can be used by local jurisdictions to support the adoption of reach codes. Cost-effectiveness was evaluated according to two metrics: On-Bill customer lifecycle benefit-to-cost and TDV lifecycle benefit-to-cost. While all the above code targets presented are based on packages that are cost-effective under at least one of these metrics, they are not all cost-effective under both metrics. Generally, the test for being cost-effective under the TDV methodology is less challenging than under the On-Bill methodology. Therefore, all packages presented are cost-effective based on TDV, and may or may not be cost-effective based on the On-Bill method. It is up to each jurisdiction to determine what metric is most appropriate for their application. A summary of results by climate zone are presented in Appendix G – Results by Climate Zone.
Above code targets are presented as Target EDR Margin, which have been defined for each scenario where a cost-effective package was identified. Target EDR Margins represent the maximum “reach” values that meet the requirements. Jurisdictions may adopt less stringent requirements. For the Efficiency Package the Target EDR Margin was defined based on the lower EDR Margin of the Efficiency – Non-Preempted Package and the Efficiency – Equipment, Preempted Package. For example, if the cost-effective Non-Preempted package has an EDR Margin of 3 and the Preempted package an EDR Margin of 4, the Target EDR Margin is set at 3.
The average incremental cost for the single family Efficiency packages is ~$1,750. The Efficiency & PV Package average incremental cost is $9,180 and for the Efficiency & PV/Battery Package it is approximately $5,600 for the
ATTACHMENT 5
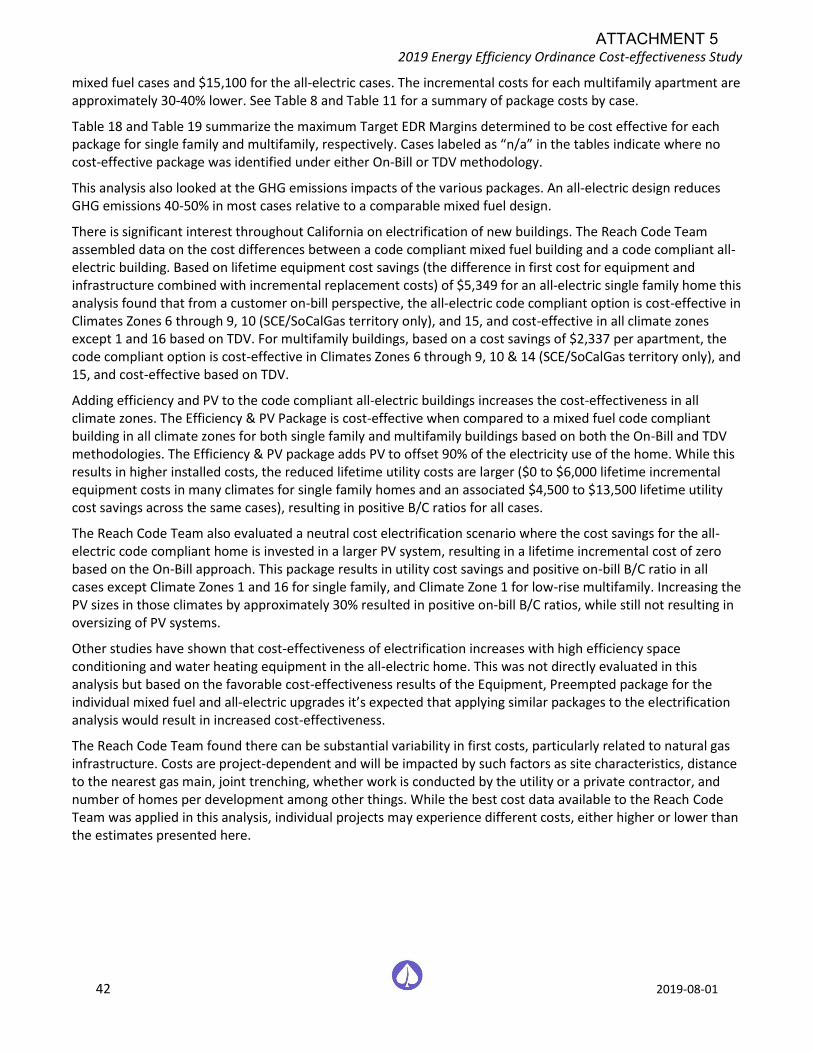
2019 Energy Efficiency Ordinance Cost-effectiveness Study
42 2019-08-01
mixed fuel cases and $15,100 for the all-electric cases. The incremental costs for each multifamily apartment are approximately 30-40% lower. See Table 8 and Table 11 for a summary of package costs by case.
Table 18 and Table 19 summarize the maximum Target EDR Margins determined to be cost effective for each package for single family and multifamily, respectively. Cases labeled as “n/a” in the tables indicate where no cost-effective package was identified under either On-Bill or TDV methodology.
This analysis also looked at the GHG emissions impacts of the various packages. An all-electric design reduces GHG emissions 40-50% in most cases relative to a comparable mixed fuel design.
There is significant interest throughout California on electrification of new buildings. The Reach Code Team assembled data on the cost differences between a code compliant mixed fuel building and a code compliant all-electric building. Based on lifetime equipment cost savings (the difference in first cost for equipment and infrastructure combined with incremental replacement costs) of $5,349 for an all-electric single family home this analysis found that from a customer on-bill perspective, the all-electric code compliant option is cost-effective in Climates Zones 6 through 9, 10 (SCE/SoCalGas territory only), and 15, and cost-effective in all climate zones except 1 and 16 based on TDV. For multifamily buildings, based on a cost savings of $2,337 per apartment, the code compliant option is cost-effective in Climates Zones 6 through 9, 10 & 14 (SCE/SoCalGas territory only), and 15, and cost-effective based on TDV.
Adding efficiency and PV to the code compliant all-electric buildings increases the cost-effectiveness in all climate zones. The Efficiency & PV Package is cost-effective when compared to a mixed fuel code compliant building in all climate zones for both single family and multifamily buildings based on both the On-Bill and TDV methodologies. The Efficiency & PV package adds PV to offset 90% of the electricity use of the home. While this results in higher installed costs, the reduced lifetime utility costs are larger ($0 to $6,000 lifetime incremental equipment costs in many climates for single family homes and an associated $4,500 to $13,500 lifetime utility cost savings across the same cases), resulting in positive B/C ratios for all cases.
The Reach Code Team also evaluated a neutral cost electrification scenario where the cost savings for the all-electric code compliant home is invested in a larger PV system, resulting in a lifetime incremental cost of zero based on the On-Bill approach. This package results in utility cost savings and positive on-bill B/C ratio in all cases except Climate Zones 1 and 16 for single family, and Climate Zone 1 for low-rise multifamily. Increasing the PV sizes in those climates by approximately 30% resulted in positive on-bill B/C ratios, while still not resulting in oversizing of PV systems.
Other studies have shown that cost-effectiveness of electrification increases with high efficiency space conditioning and water heating equipment in the all-electric home. This was not directly evaluated in this analysis but based on the favorable cost-effectiveness results of the Equipment, Preempted package for the individual mixed fuel and all-electric upgrades it’s expected that applying similar packages to the electrification analysis would result in increased cost-effectiveness.
The Reach Code Team found there can be substantial variability in first costs, particularly related to natural gas infrastructure. Costs are project-dependent and will be impacted by such factors as site characteristics, distance to the nearest gas main, joint trenching, whether work is conducted by the utility or a private contractor, and number of homes per development among other things. While the best cost data available to the Reach Code Team was applied in this analysis, individual projects may experience different costs, either higher or lower than the estimates presented here.
ATTACHMENT 5
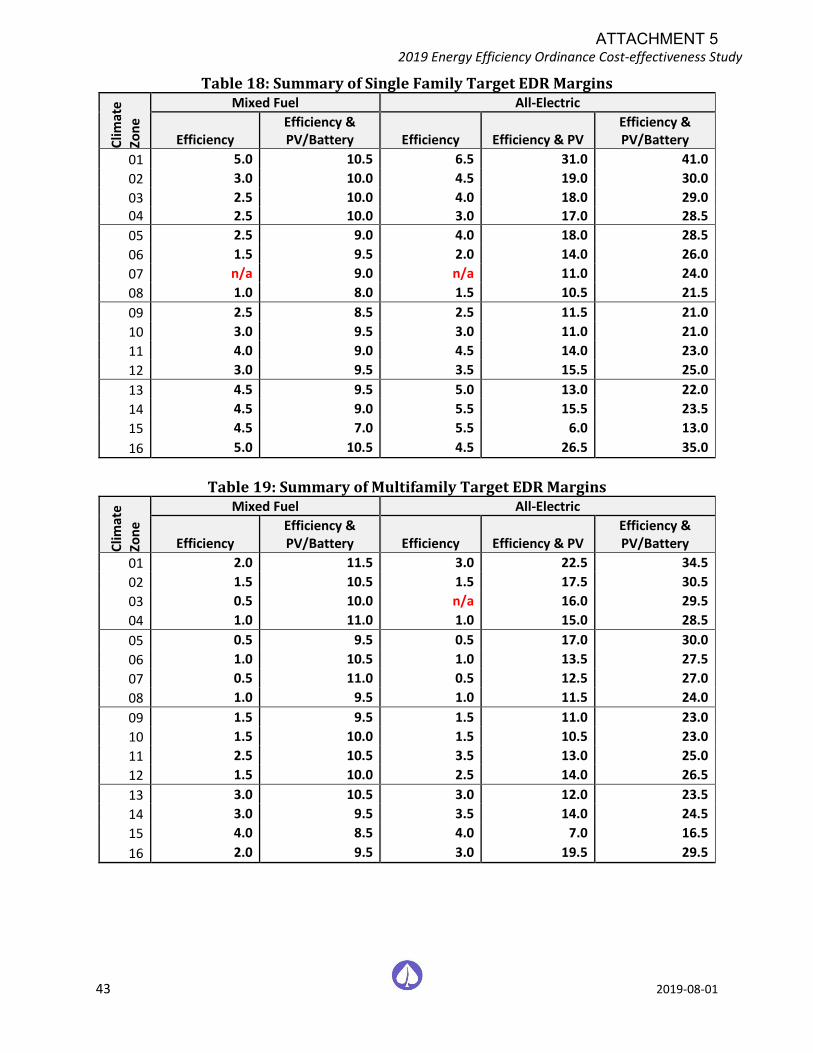
2019 Energy Efficiency Ordinance Cost-effectiveness Study
43 2019-08-01
Table 18: Summary of Single Family Target EDR Margins
Clim
ate
Zo
ne
Mixed Fuel All-Electric
Efficiency Efficiency & PV/Battery Efficiency Efficiency & PV
Efficiency & PV/Battery
01 5.0 10.5 6.5 31.0 41.0
02 3.0 10.0 4.5 19.0 30.0
03 2.5 10.0 4.0 18.0 29.0
04 2.5 10.0 3.0 17.0 28.5
05 2.5 9.0 4.0 18.0 28.5
06 1.5 9.5 2.0 14.0 26.0
07 n/a 9.0 n/a 11.0 24.0
08 1.0 8.0 1.5 10.5 21.5
09 2.5 8.5 2.5 11.5 21.0
10 3.0 9.5 3.0 11.0 21.0
11 4.0 9.0 4.5 14.0 23.0
12 3.0 9.5 3.5 15.5 25.0
13 4.5 9.5 5.0 13.0 22.0
14 4.5 9.0 5.5 15.5 23.5
15 4.5 7.0 5.5 6.0 13.0
16 5.0 10.5 4.5 26.5 35.0
Table 19: Summary of Multifamily Target EDR Margins
Clim
ate
Zo
ne
Mixed Fuel All-Electric
Efficiency Efficiency & PV/Battery Efficiency Efficiency & PV
Efficiency & PV/Battery
01 2.0 11.5 3.0 22.5 34.5
02 1.5 10.5 1.5 17.5 30.5
03 0.5 10.0 n/a 16.0 29.5
04 1.0 11.0 1.0 15.0 28.5
05 0.5 9.5 0.5 17.0 30.0
06 1.0 10.5 1.0 13.5 27.5
07 0.5 11.0 0.5 12.5 27.0
08 1.0 9.5 1.0 11.5 24.0
09 1.5 9.5 1.5 11.0 23.0
10 1.5 10.0 1.5 10.5 23.0
11 2.5 10.5 3.5 13.0 25.0
12 1.5 10.0 2.5 14.0 26.5
13 3.0 10.5 3.0 12.0 23.5
14 3.0 9.5 3.5 14.0 24.5
15 4.0 8.5 4.0 7.0 16.5
16 2.0 9.5 3.0 19.5 29.5
ATTACHMENT 5
2019 Energy Efficiency Ordinance Cost-effectiveness Study
44 2019-08-01
5 References California Energy Commission. 2017. Rooftop Solar PV System. Measure number: 2019-Res-PV-D Prepared by Energy and Environmental Economics, Inc. https://efiling.energy.ca.gov/getdocument.aspx?tn=221366
California Energy Commission. 2018a. 2019 Alternative Calculation Method Approval Manual. CEC-400-2018-023-CMF. December 2018. California Energy Commission. https://www.energy.ca.gov/2018publications/CEC-400-2018-023/CEC-400-2018-023-CMF.pdf
California Energy Commission. 2018b. 2019 Building Energy Efficiency Standards for Residential and Nonresidential Buildings. CEC-400-2018-020-CMF. December 2018. California Energy Commission. https://www.energy.ca.gov/2018publications/CEC-400-2018-020/CEC-400-2018-020-CMF.pdf
California Energy Commission. 2018c. 2019 Reference Appendices. CEC-400-2018-021-CMF. December 2018. California Energy Commission. https://www.energy.ca.gov/2018publications/CEC-400-2018-021/CEC-400-2018-021-CMF.pdf
California Energy Commission. 2018d. 2019 Residential Compliance Manual. CEC-400-2018-017-CMF. December
2018. California Energy Commission. https://www.energy.ca.gov/2018publications/CEC-400-2018-017/CEC-400-
2018-017-CMF.pdf
California Energy Commission. 2019. 2019 Residential Alternative Calculation Method Reference Manual. CEC-400-2019-005-CMF. May 2019. California Energy Commission. https://www.energy.ca.gov/2019publications/CEC-400-2019-005/CEC-400-2019-005-CMF.pdf
California Public Utilities Commission. 2016. Rulemaking No. 15-03-010 An Order Instituting Rulemaking to Identify Disadvantaged Communities in the San Joaquin Valley and Analyze Economically Feasible Options to Increase Access to Affordable Energy in Those Disadvantages Communities. Proposed Decision of Commissioner Guzman Aceves. April 07, 2017. http://docs.cpuc.ca.gov/PublishedDocs/Efile/G000/M183/K389/183389022.PDF
Davis Energy Group. 2015. Evaluation of Ducts in Conditioned Space for New California Homes. Prepared for Pacific Gas and Electric Company. March 2015. https://www.etcc-ca.com/reports/evaluation-ducts-conditioned-space-new-california-homes
Energy & Environmental Economics. 2019. Residential Building Electrification in California. April 2019. https://www.ethree.com/wp-content/uploads/2019/04/E3_Residential_Building_Electrification_in_California_April_2019.pdf
EPRI. 2016. SMUD All-Electric Homes Electrification Case Study: Summary for the Three-Prong Test Discussion. Electric Power Research Institute, Inc. September. 2016. Presentation to Sacramento Municipal Utility District.
Horii, B., E. Cutter, N. Kapur, J. Arent, and D. Conotyannis. 2014. “Time Dependent Valuation of Energy for Developing Building Energy Efficiency Standards.” http://www.energy.ca.gov/title24/2016standards/prerulemaking/documents/2014-07-09_workshop/2017_TDV_Documents/
Itron. 2014. 2010-2012 WO017 Ex Ante Measure Cost Study: Final Report. Itron. May 2014. Presented to California Public Utilities Commission.
Barbose, Galen and Darghouth, Naim. 2018. Tracking the Sun. Installed Price Trends for Distributed Photovoltaic Systems in the United States – 2018 Edition. Lawrence Berkeley National Laboratory. September 2018. https://emp.lbl.gov/sites/default/files/tracking_the_sun_2018_edition_final_0.pdf
Navigant. 2018. Analysis of the Role of Gas for a Low-Carbon California Future. July 24, 2018. Prepared for Southern California Gas Company. https://www.socalgas.com/1443741887279/SoCalGas_Renewable_Gas_Final-Report.pdf
ATTACHMENT 5
2019 Energy Efficiency Ordinance Cost-effectiveness Study
45 2019-08-01
Penn, Ivan. 2018. Cheaper Battery Is Unveiled as a Step to a Carbon-Free Grid. The New York Times. September 2018. https://www.nytimes.com/2018/09/26/business/energy-environment/zinc-battery-solar-power.html. Accessed January 29, 2019.
Statewide CASE Team. 2017a. Codes and Standards Enhancement (CASE) Initiative Drain Water Heat Recovery – Final Report. July 2017. http://title24stakeholders.com/wp-content/uploads/2017/09/2019-T24-CASE-Report_DWHR_Final_September-2017.pdf
Statewide CASE Team. 2017b. Codes and Standards Enhancement (CASE) Initiative High Performance Attics – Final Report. September 2017. http://title24stakeholders.com/wp-content/uploads/2017/09/2019-T24-CASE-Report_HPA_Final_September-2017.pdf
Statewide CASE Team. 2017c. Codes and Standards Enhancement (CASE) Initiative High Performance Walls – Final Report. September 2017. http://title24stakeholders.com/wp-content/uploads/2017/09/2019-T24-CASE-Report_HPW_Final_September-2017.pdf
Statewide CASE Team. 2017d. Codes and Standards Enhancement (CASE) Initiative Residential High Performance Windows & Doors – Final Report. August 2017. http://title24stakeholders.com/wp-content/uploads/2017/09/2019-T24-CASE-Report_Res-Windows-and-Doors_Final_September-2017.pdf
Statewide CASE Team. 2018. Energy Savings Potential and Cost-Effectiveness Analysis of High Efficiency Windows in California. Prepared by Frontier Energy. May 2018. https://www.etcc-ca.com/reports/energy-savings-potential-and-cost-effectiveness-analysis-high-efficiency-windows-california
Statewide Reach Codes Team. 2016. CALGreen Cost-Effectiveness Study. Prepared for Pacific Gas and Electric Company. Prepared by Davis Energy Group. November 2016. http://localenergycodes.com/download/50/file_path/fieldList/2016%20RNC%20Tiers%201-2%20Cost-Eff%20Report
Statewide Reach Codes Team. 2017a. CALGreen All-Electric Cost-Effectiveness Study. Prepared for Pacific Gas and Electric Company. Prepared by Davis Energy Group. October 2017. http://localenergycodes.com/download/276/file_path/fieldList/2016%20RNC%20All-Electric%20Cost-Eff%20Report
Statewide Reach Codes Team. 2017b. 2016 Title 24 Residential Reach Code Recommendations: Cost-effectiveness Analysis for All California Climate Zones. Prepared for Southern California Edison. Prepared by TRC Energy Services. August 2017. http://localenergycodes.com/download/283/file_path/fieldList/2016%20RNC%20Reach%20Code%20Tier%203%20Cost-Eff%20Report
Statewide Reach Codes Team. 2018. PV + Battery Storage Study. Prepared for Pacific Gas and Electric Company. Prepared by EnergySoft. July, 2018. http://localenergycodes.com/download/430/file_path/fieldList/PV%20Plus%20Battery%20Storage%20Report
Hopkins, Asa, Takahashi, Kenji, Glick, Devi, Whited, Melissa. 2018. Decarbonization of Heating Energy Use in California Buildings. Synapse Energy Economics, Inc. October 2018. http://www.synapse-energy.com/sites/default/files/Decarbonization-Heating-CA-Buildings-17-092-1.pdf
TRC. 2018. City of Palo Alto 2019 Title 24 Energy Reach Code Cost-effectiveness Analysis Draft. September 2018. https://cityofpaloalto.org/civicax/filebank/documents/66742
ATTACHMENT 5

2019 Energy Efficiency Ordinance Cost-effectiveness Study
46 2019-08-01
Appendix A – California Climate Zone Map
Figure 15: Map of California Climate Zones (courtesy of the California Energy Commission17)
17 https://ww2.energy.ca.gov/maps/renewable/building_climate_zones.html
ATTACHMENT 5

2019 Energy Efficiency Ordinance Cost-effectiveness Study
47 2019-08-01
Appendix B – Utility Tariff Details PG&E ............................................................................................................................................................. 48
SCE ............................................................................................................................................................... 51
SoCalGas ....................................................................................................................................................... 53
SDG&E ........................................................................................................................................................... 54
Escalation Assumptions .............................................................................................................................. 56
ATTACHMENT 5

2019 Energy Efficiency Ordinance Cost-effectiveness Study
48 2019-08-01
PG&E
The following pages provide details on the PG&E electricity and natural gas tariffs applied in this study. Table 20 describes the baseline territories that were assumed for each climate zone.
Table 20: PG&E Baseline Territory by Climate Zone Baseline
Territory
CZ01 V
CZ02 X
CZ03 T
CZ04 X
CZ05 T
CZ11 R
CZ12 S
CZ13 R
CZ16 Y
The PG&E monthly gas rate in $/therm was applied on a monthly basis for the 12-month period ending January 2019 according to the rates shown below.
ATTACHMENT 5
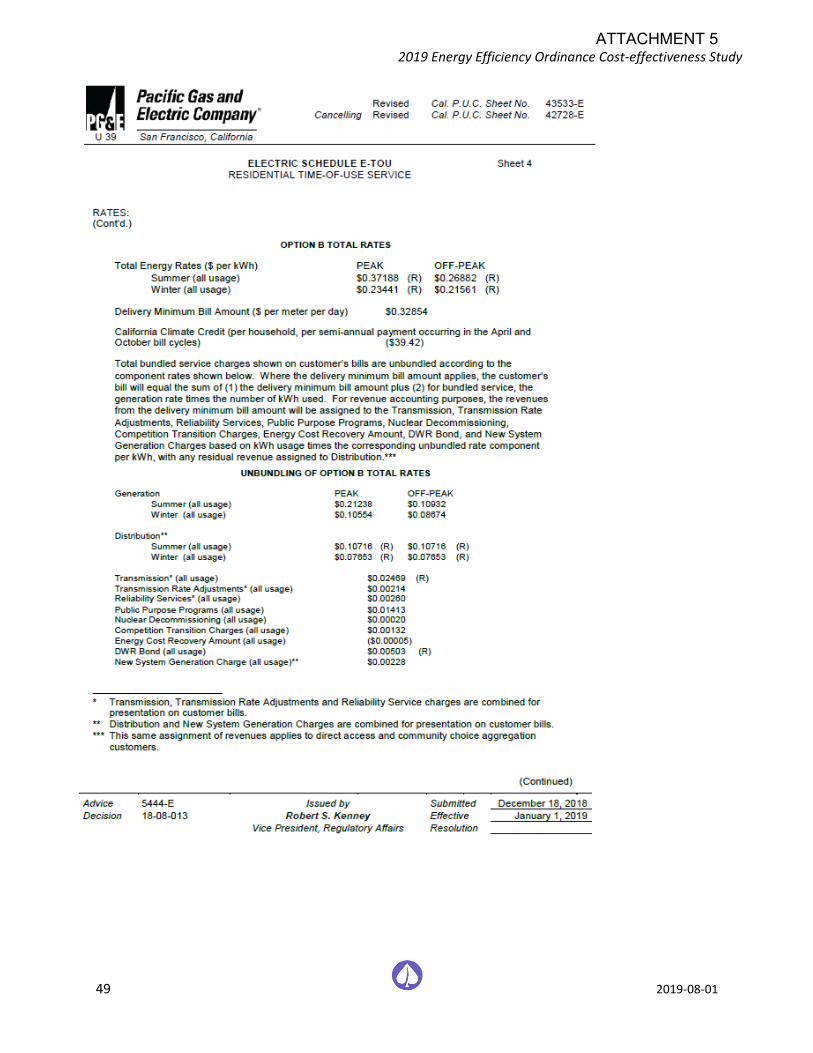
2019 Energy Efficiency Ordinance Cost-effectiveness Study
49 2019-08-01
ATTACHMENT 5
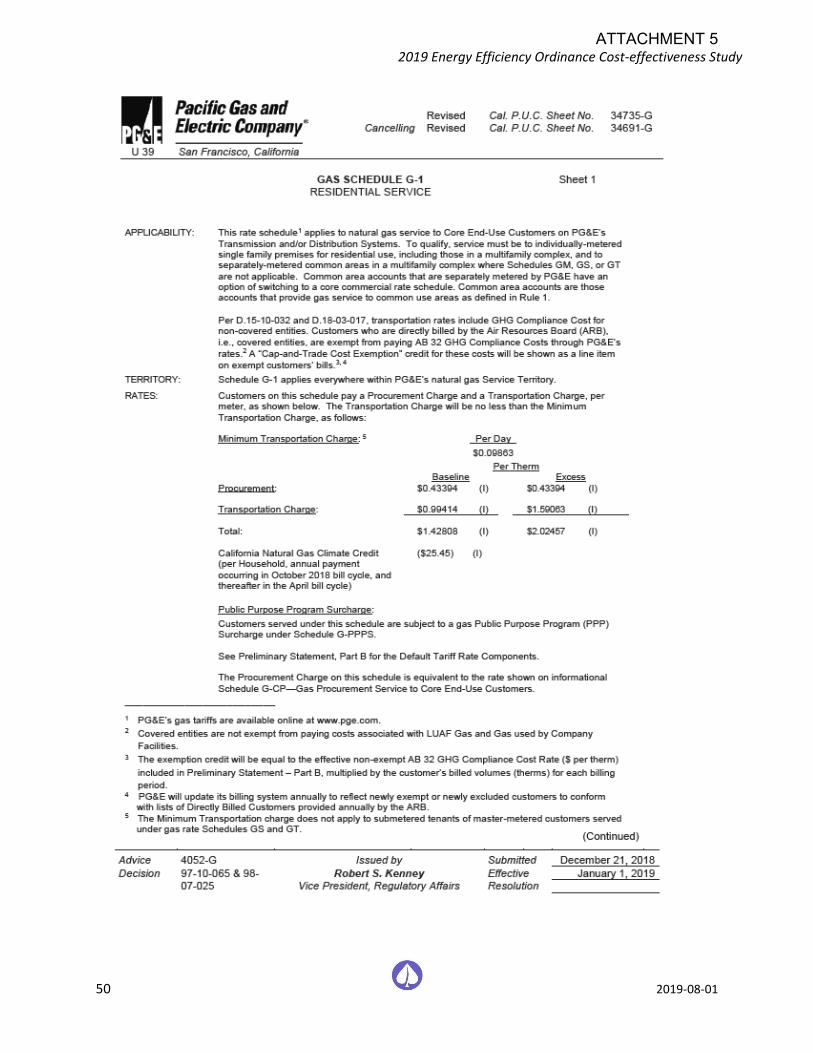
2019 Energy Efficiency Ordinance Cost-effectiveness Study
50 2019-08-01
ATTACHMENT 5
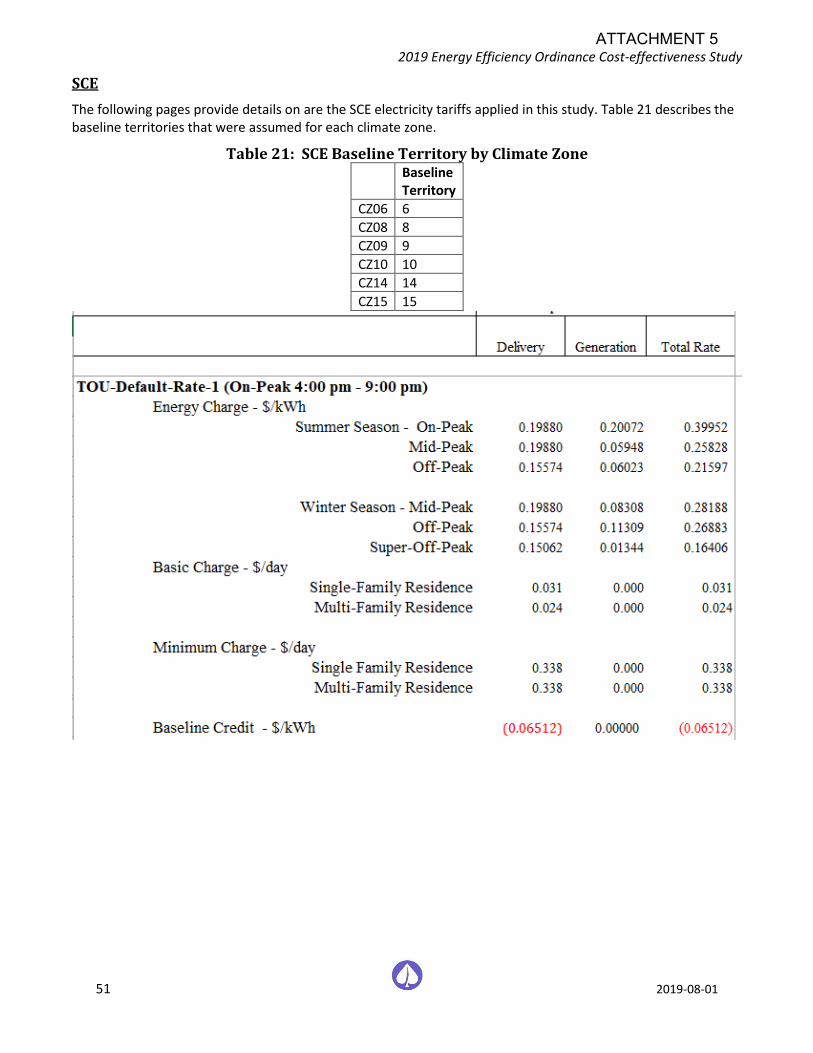
2019 Energy Efficiency Ordinance Cost-effectiveness Study
51 2019-08-01
SCE
The following pages provide details on are the SCE electricity tariffs applied in this study. Table 21 describes the baseline territories that were assumed for each climate zone.
Table 21: SCE Baseline Territory by Climate Zone Baseline
Territory
CZ06 6
CZ08 8
CZ09 9
CZ10 10
CZ14 14
CZ15 15
ATTACHMENT 5
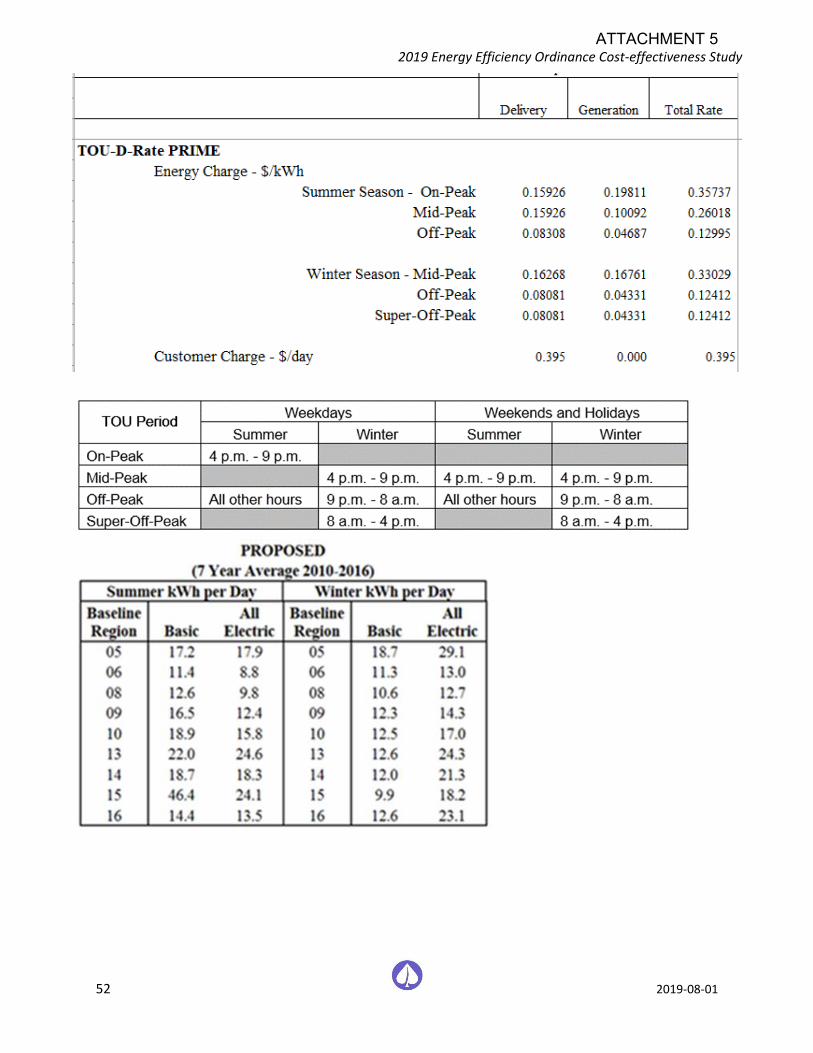
2019 Energy Efficiency Ordinance Cost-effectiveness Study
52 2019-08-01
ATTACHMENT 5
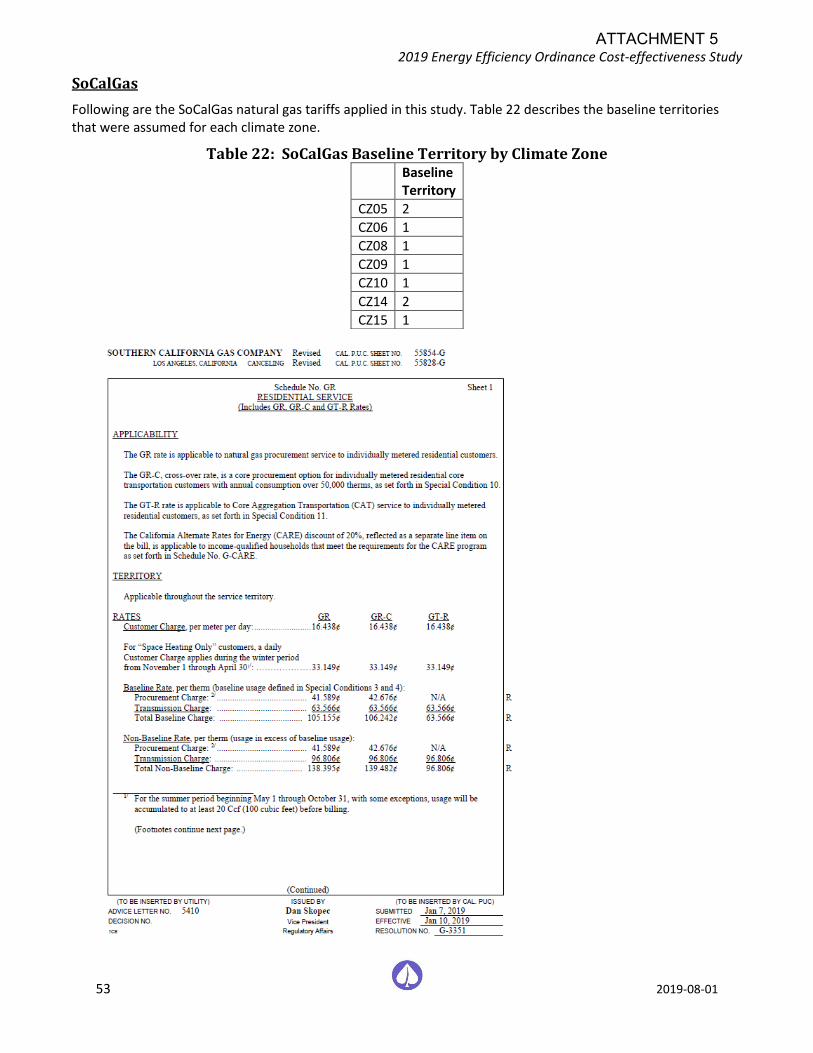
2019 Energy Efficiency Ordinance Cost-effectiveness Study
53 2019-08-01
SoCalGas
Following are the SoCalGas natural gas tariffs applied in this study. Table 22 describes the baseline territories that were assumed for each climate zone.
Table 22: SoCalGas Baseline Territory by Climate Zone Baseline
Territory
CZ05 2
CZ06 1
CZ08 1
CZ09 1
CZ10 1
CZ14 2
CZ15 1
ATTACHMENT 5
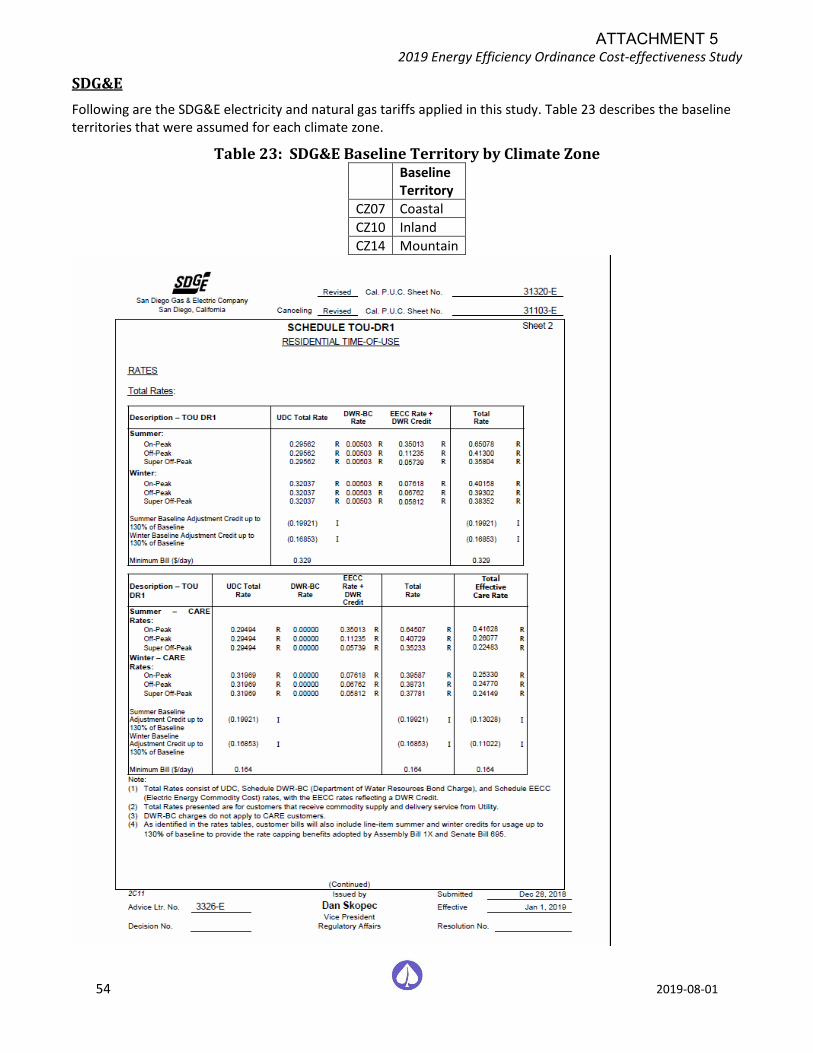
2019 Energy Efficiency Ordinance Cost-effectiveness Study
54 2019-08-01
SDG&E
Following are the SDG&E electricity and natural gas tariffs applied in this study. Table 23 describes the baseline territories that were assumed for each climate zone.
Table 23: SDG&E Baseline Territory by Climate Zone Baseline
Territory
CZ07 Coastal
CZ10 Inland
CZ14 Mountain
ATTACHMENT 5
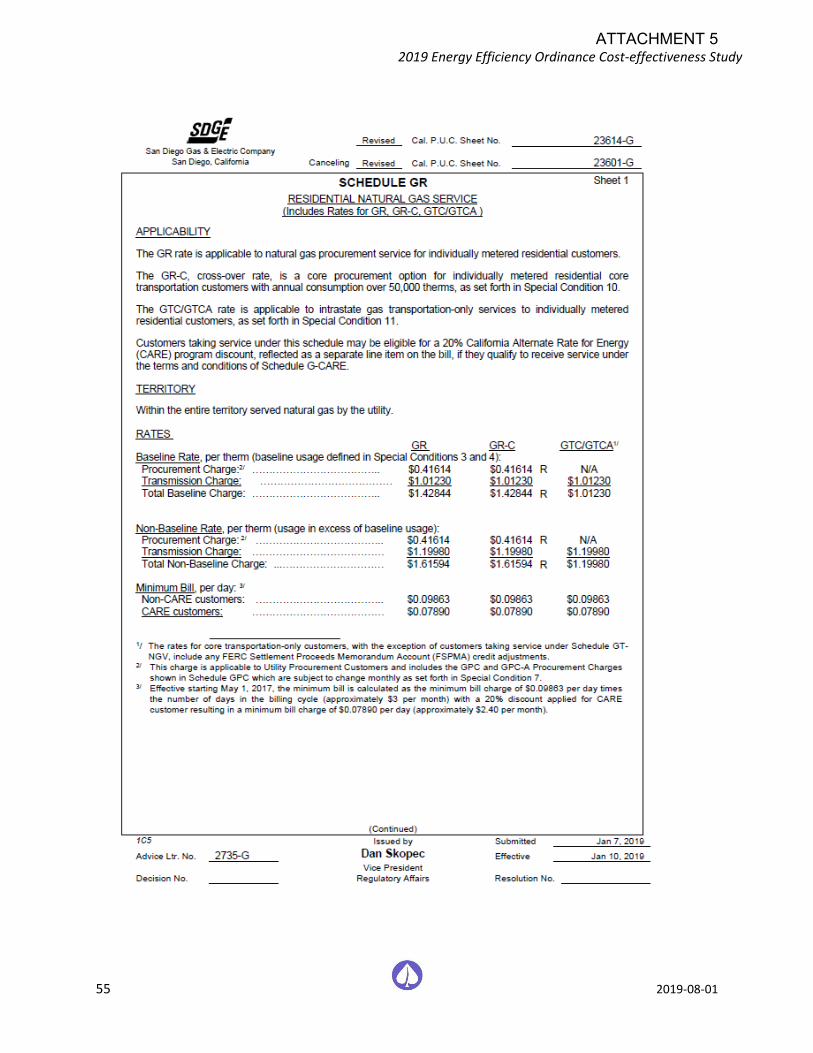
2019 Energy Efficiency Ordinance Cost-effectiveness Study
55 2019-08-01
ATTACHMENT 5

2019 Energy Efficiency Ordinance Cost-effectiveness Study
56 2019-08-01
Escalation Assumptions
The average annual escalation rates in the following table were used in this study and are from E3’s 2019 study Residential Building Electrification in California (Energy & Environmental Economics, 2019). These rates are applied to the 2019 rate schedules over a thirty-year period beginning in 2020. SDG&E was not covered in the E3 study. The Reach Code Team reviewed SDG&E’s GRC filing and applied the same approach that E3 applied for PG&E and SoCalGas to arrive at average escalation rates between 2020 and 2022.
Table 24: Real Utility Rate Escalation Rate Assumptions
Statewide Electric
Residential Average Rate (%/year, real)
Natural Gas Residential Core Rate (%/yr escalation, real)
PG&E SoCalGas SDG&E
2020 2.0% 1.48% 6.37% 5.00%
2021 2.0% 5.69% 4.12% 3.14%
2022 2.0% 1.11% 4.12% 2.94%
2023 2.0% 4.0% 4.0% 4.0%
2024 2.0% 4.0% 4.0% 4.0%
2025 2.0% 4.0% 4.0% 4.0%
2026 1.0% 1.0% 1.0% 1.0%
2027 1.0% 1.0% 1.0% 1.0%
2028 1.0% 1.0% 1.0% 1.0%
2029 1.0% 1.0% 1.0% 1.0%
2030 1.0% 1.0% 1.0% 1.0%
2031 1.0% 1.0% 1.0% 1.0%
2032 1.0% 1.0% 1.0% 1.0%
2033 1.0% 1.0% 1.0% 1.0%
2034 1.0% 1.0% 1.0% 1.0%
2035 1.0% 1.0% 1.0% 1.0%
2036 1.0% 1.0% 1.0% 1.0%
2037 1.0% 1.0% 1.0% 1.0%
2038 1.0% 1.0% 1.0% 1.0%
2039 1.0% 1.0% 1.0% 1.0%
2040 1.0% 1.0% 1.0% 1.0%
2041 1.0% 1.0% 1.0% 1.0%
2042 1.0% 1.0% 1.0% 1.0%
2043 1.0% 1.0% 1.0% 1.0%
2044 1.0% 1.0% 1.0% 1.0%
2045 1.0% 1.0% 1.0% 1.0%
2046 1.0% 1.0% 1.0% 1.0%
2047 1.0% 1.0% 1.0% 1.0%
2048 1.0% 1.0% 1.0% 1.0%
2049 1.0% 1.0% 1.0% 1.0%
ATTACHMENT 5
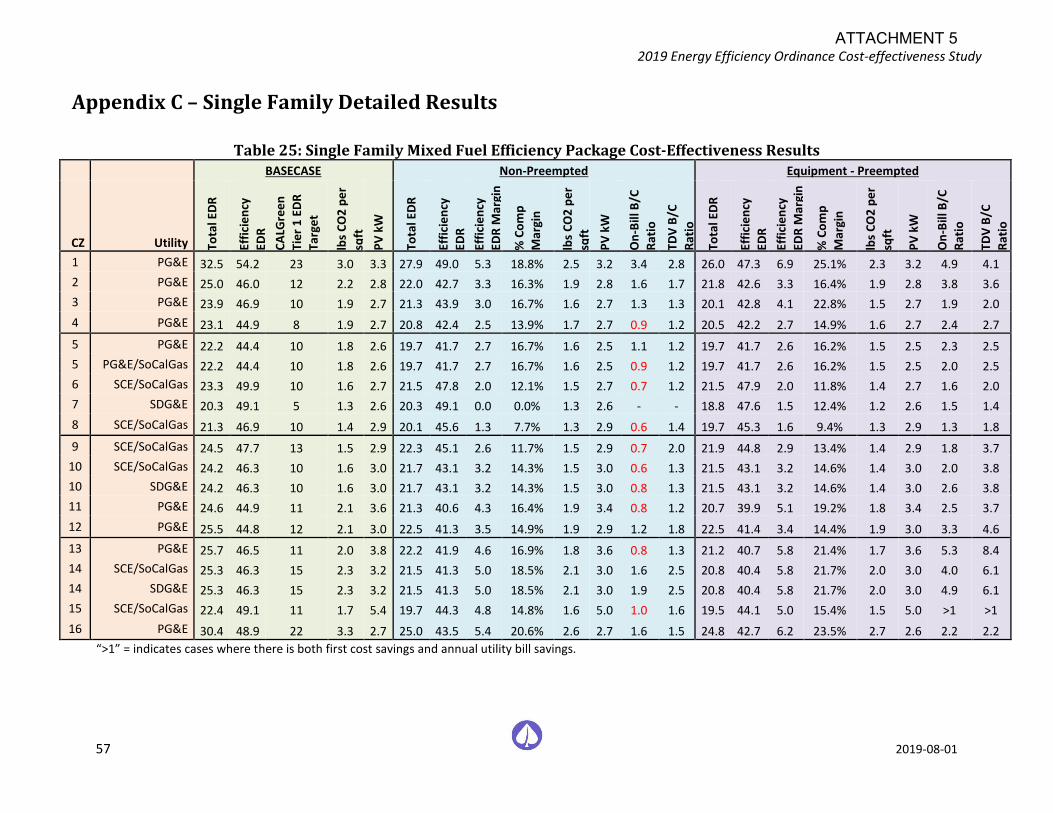
2019 Energy Efficiency Ordinance Cost-effectiveness Study
57 2019-08-01
Appendix C – Single Family Detailed Results
Table 25: Single Family Mixed Fuel Efficiency Package Cost-Effectiveness Results
BASECASE Non-Preempted Equipment - Preempted
CZ Utility Tota
l ED
R
Effi
cie
ncy
EDR
CA
LGre
en
Tie
r 1
ED
R
Targ
et
lbs
CO
2 p
er
sqft
PV
kW
Tota
l ED
R
Effi
cie
ncy
EDR
Effi
cie
ncy
EDR
Mar
gin
% C
om
p
Mar
gin
lbs
CO
2 p
er
sqft
PV
kW
On
-Bill
B/C
Rat
io
TDV
B/C
Rat
io
Tota
l ED
R
Effi
cie
ncy
EDR
Effi
cie
ncy
EDR
Mar
gin
% C
om
p
Mar
gin
lbs
CO
2 p
er
sqft
PV
kW
On
-Bill
B/C
Rat
io
TDV
B/C
Rat
io
1 PG&E 32.5 54.2 23 3.0 3.3 27.9 49.0 5.3 18.8% 2.5 3.2 3.4 2.8 26.0 47.3 6.9 25.1% 2.3 3.2 4.9 4.1
2 PG&E 25.0 46.0 12 2.2 2.8 22.0 42.7 3.3 16.3% 1.9 2.8 1.6 1.7 21.8 42.6 3.3 16.4% 1.9 2.8 3.8 3.6
3 PG&E 23.9 46.9 10 1.9 2.7 21.3 43.9 3.0 16.7% 1.6 2.7 1.3 1.3 20.1 42.8 4.1 22.8% 1.5 2.7 1.9 2.0
4 PG&E 23.1 44.9 8 1.9 2.7 20.8 42.4 2.5 13.9% 1.7 2.7 0.9 1.2 20.5 42.2 2.7 14.9% 1.6 2.7 2.4 2.7
5 PG&E 22.2 44.4 10 1.8 2.6 19.7 41.7 2.7 16.7% 1.6 2.5 1.1 1.2 19.7 41.7 2.6 16.2% 1.5 2.5 2.3 2.5
5 PG&E/SoCalGas 22.2 44.4 10 1.8 2.6 19.7 41.7 2.7 16.7% 1.6 2.5 0.9 1.2 19.7 41.7 2.6 16.2% 1.5 2.5 2.0 2.5
6 SCE/SoCalGas 23.3 49.9 10 1.6 2.7 21.5 47.8 2.0 12.1% 1.5 2.7 0.7 1.2 21.5 47.9 2.0 11.8% 1.4 2.7 1.6 2.0
7 SDG&E 20.3 49.1 5 1.3 2.6 20.3 49.1 0.0 0.0% 1.3 2.6 - - 18.8 47.6 1.5 12.4% 1.2 2.6 1.5 1.4
8 SCE/SoCalGas 21.3 46.9 10 1.4 2.9 20.1 45.6 1.3 7.7% 1.3 2.9 0.6 1.4 19.7 45.3 1.6 9.4% 1.3 2.9 1.3 1.8
9 SCE/SoCalGas 24.5 47.7 13 1.5 2.9 22.3 45.1 2.6 11.7% 1.5 2.9 0.7 2.0 21.9 44.8 2.9 13.4% 1.4 2.9 1.8 3.7
10 SCE/SoCalGas 24.2 46.3 10 1.6 3.0 21.7 43.1 3.2 14.3% 1.5 3.0 0.6 1.3 21.5 43.1 3.2 14.6% 1.4 3.0 2.0 3.8
10 SDG&E 24.2 46.3 10 1.6 3.0 21.7 43.1 3.2 14.3% 1.5 3.0 0.8 1.3 21.5 43.1 3.2 14.6% 1.4 3.0 2.6 3.8
11 PG&E 24.6 44.9 11 2.1 3.6 21.3 40.6 4.3 16.4% 1.9 3.4 0.8 1.2 20.7 39.9 5.1 19.2% 1.8 3.4 2.5 3.7
12 PG&E 25.5 44.8 12 2.1 3.0 22.5 41.3 3.5 14.9% 1.9 2.9 1.2 1.8 22.5 41.4 3.4 14.4% 1.9 3.0 3.3 4.6
13 PG&E 25.7 46.5 11 2.0 3.8 22.2 41.9 4.6 16.9% 1.8 3.6 0.8 1.3 21.2 40.7 5.8 21.4% 1.7 3.6 5.3 8.4
14 SCE/SoCalGas 25.3 46.3 15 2.3 3.2 21.5 41.3 5.0 18.5% 2.1 3.0 1.6 2.5 20.8 40.4 5.8 21.7% 2.0 3.0 4.0 6.1
14 SDG&E 25.3 46.3 15 2.3 3.2 21.5 41.3 5.0 18.5% 2.1 3.0 1.9 2.5 20.8 40.4 5.8 21.7% 2.0 3.0 4.9 6.1
15 SCE/SoCalGas 22.4 49.1 11 1.7 5.4 19.7 44.3 4.8 14.8% 1.6 5.0 1.0 1.6 19.5 44.1 5.0 15.4% 1.5 5.0 >1 >1
16 PG&E 30.4 48.9 22 3.3 2.7 25.0 43.5 5.4 20.6% 2.6 2.7 1.6 1.5 24.8 42.7 6.2 23.5% 2.7 2.6 2.2 2.2
“>1” = indicates cases where there is both first cost savings and annual utility bill savings.
ATTACHMENT 5
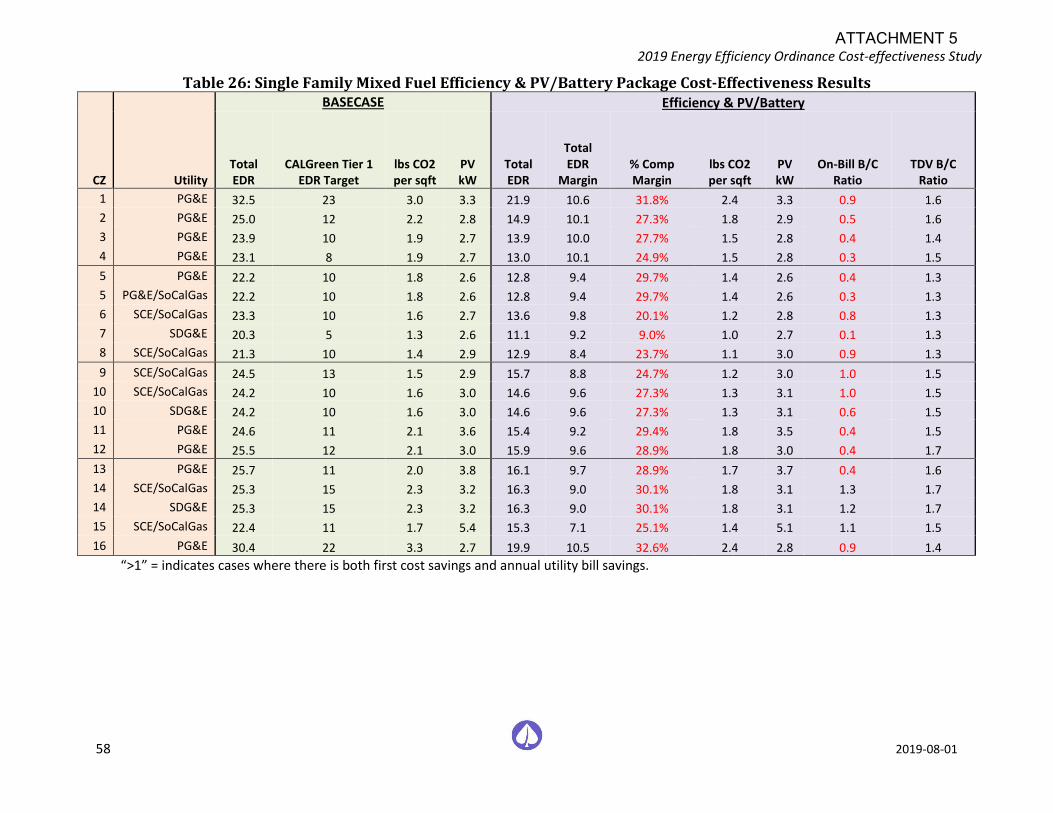
2019 Energy Efficiency Ordinance Cost-effectiveness Study
58 2019-08-01
Table 26: Single Family Mixed Fuel Efficiency & PV/Battery Package Cost-Effectiveness Results
CZ Utility
BASECASE Efficiency & PV/Battery
Total EDR
CALGreen Tier 1 EDR Target
lbs CO2 per sqft
PV kW
Total EDR
Total EDR
Margin % Comp Margin
lbs CO2 per sqft
PV kW
On-Bill B/C Ratio
TDV B/C Ratio
1 PG&E 32.5 23 3.0 3.3 21.9 10.6 31.8% 2.4 3.3 0.9 1.6 2 PG&E 25.0 12 2.2 2.8 14.9 10.1 27.3% 1.8 2.9 0.5 1.6 3 PG&E 23.9 10 1.9 2.7 13.9 10.0 27.7% 1.5 2.8 0.4 1.4 4 PG&E 23.1 8 1.9 2.7 13.0 10.1 24.9% 1.5 2.8 0.3 1.5 5 PG&E 22.2 10 1.8 2.6 12.8 9.4 29.7% 1.4 2.6 0.4 1.3 5 PG&E/SoCalGas 22.2 10 1.8 2.6 12.8 9.4 29.7% 1.4 2.6 0.3 1.3 6 SCE/SoCalGas 23.3 10 1.6 2.7 13.6 9.8 20.1% 1.2 2.8 0.8 1.3 7 SDG&E 20.3 5 1.3 2.6 11.1 9.2 9.0% 1.0 2.7 0.1 1.3 8 SCE/SoCalGas 21.3 10 1.4 2.9 12.9 8.4 23.7% 1.1 3.0 0.9 1.3
9 SCE/SoCalGas 24.5 13 1.5 2.9 15.7 8.8 24.7% 1.2 3.0 1.0 1.5 10 SCE/SoCalGas 24.2 10 1.6 3.0 14.6 9.6 27.3% 1.3 3.1 1.0 1.5 10 SDG&E 24.2 10 1.6 3.0 14.6 9.6 27.3% 1.3 3.1 0.6 1.5 11 PG&E 24.6 11 2.1 3.6 15.4 9.2 29.4% 1.8 3.5 0.4 1.5 12 PG&E 25.5 12 2.1 3.0 15.9 9.6 28.9% 1.8 3.0 0.4 1.7
13 PG&E 25.7 11 2.0 3.8 16.1 9.7 28.9% 1.7 3.7 0.4 1.6 14 SCE/SoCalGas 25.3 15 2.3 3.2 16.3 9.0 30.1% 1.8 3.1 1.3 1.7 14 SDG&E 25.3 15 2.3 3.2 16.3 9.0 30.1% 1.8 3.1 1.2 1.7 15 SCE/SoCalGas 22.4 11 1.7 5.4 15.3 7.1 25.1% 1.4 5.1 1.1 1.5 16 PG&E 30.4 22 3.3 2.7 19.9 10.5 32.6% 2.4 2.8 0.9 1.4
“>1” = indicates cases where there is both first cost savings and annual utility bill savings.
ATTACHMENT 5
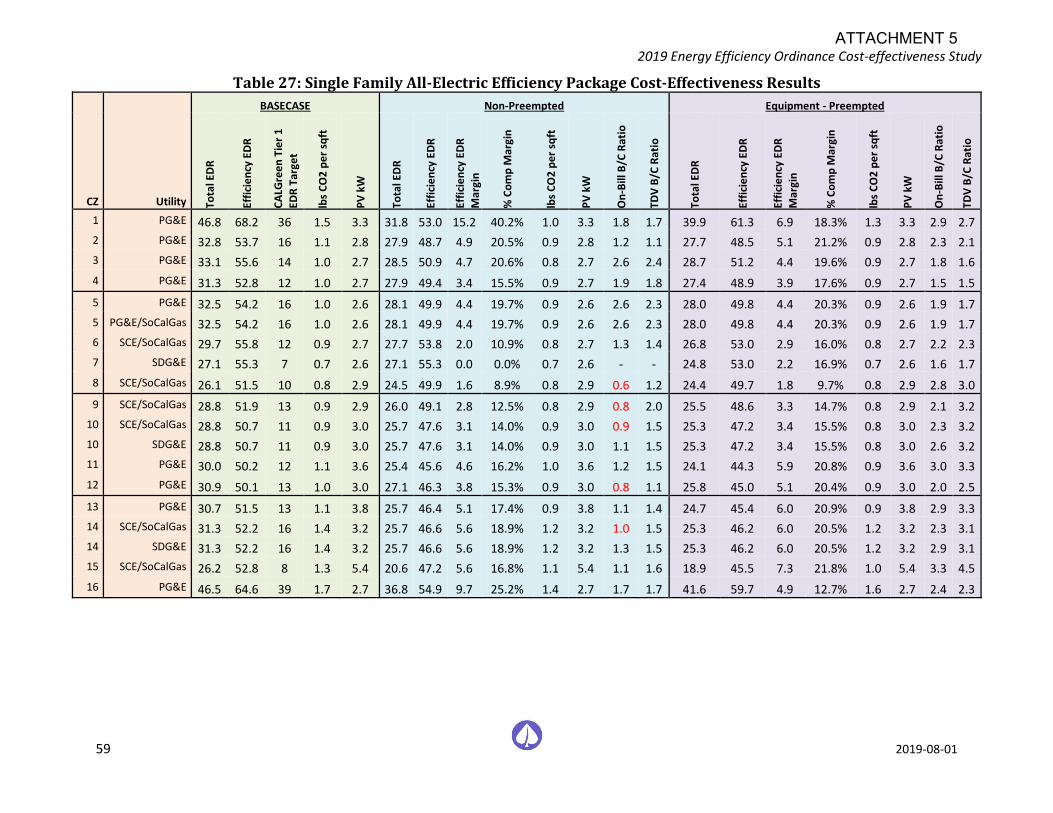
2019 Energy Efficiency Ordinance Cost-effectiveness Study
59 2019-08-01
Table 27: Single Family All-Electric Efficiency Package Cost-Effectiveness Results
CZ Utility
BASECASE Non-Preempted Equipment - Preempted
Tota
l ED
R
Effi
cie
ncy
ED
R
CA
LGre
en
Tie
r 1
EDR
Tar
get
lbs
CO
2 p
er
sqft
PV
kW
Tota
l ED
R
Effi
cie
ncy
ED
R
Effi
cie
ncy
ED
R
Mar
gin
% C
om
p M
argi
n
lbs
CO
2 p
er
sqft
PV
kW
On
-Bill
B/C
Rat
io
TDV
B/C
Rat
io
Tota
l ED
R
Effi
cie
ncy
ED
R
Effi
cie
ncy
ED
R
Mar
gin
% C
om
p M
argi
n
lbs
CO
2 p
er
sqft
PV
kW
On
-Bill
B/C
Rat
io
TDV
B/C
Rat
io
1 PG&E 46.8 68.2 36 1.5 3.3 31.8 53.0 15.2 40.2% 1.0 3.3 1.8 1.7 39.9 61.3 6.9 18.3% 1.3 3.3 2.9 2.7
2 PG&E 32.8 53.7 16 1.1 2.8 27.9 48.7 4.9 20.5% 0.9 2.8 1.2 1.1 27.7 48.5 5.1 21.2% 0.9 2.8 2.3 2.1
3 PG&E 33.1 55.6 14 1.0 2.7 28.5 50.9 4.7 20.6% 0.8 2.7 2.6 2.4 28.7 51.2 4.4 19.6% 0.9 2.7 1.8 1.6
4 PG&E 31.3 52.8 12 1.0 2.7 27.9 49.4 3.4 15.5% 0.9 2.7 1.9 1.8 27.4 48.9 3.9 17.6% 0.9 2.7 1.5 1.5
5 PG&E 32.5 54.2 16 1.0 2.6 28.1 49.9 4.4 19.7% 0.9 2.6 2.6 2.3 28.0 49.8 4.4 20.3% 0.9 2.6 1.9 1.7
5 PG&E/SoCalGas 32.5 54.2 16 1.0 2.6 28.1 49.9 4.4 19.7% 0.9 2.6 2.6 2.3 28.0 49.8 4.4 20.3% 0.9 2.6 1.9 1.7
6 SCE/SoCalGas 29.7 55.8 12 0.9 2.7 27.7 53.8 2.0 10.9% 0.8 2.7 1.3 1.4 26.8 53.0 2.9 16.0% 0.8 2.7 2.2 2.3
7 SDG&E 27.1 55.3 7 0.7 2.6 27.1 55.3 0.0 0.0% 0.7 2.6 - - 24.8 53.0 2.2 16.9% 0.7 2.6 1.6 1.7
8 SCE/SoCalGas 26.1 51.5 10 0.8 2.9 24.5 49.9 1.6 8.9% 0.8 2.9 0.6 1.2 24.4 49.7 1.8 9.7% 0.8 2.9 2.8 3.0
9 SCE/SoCalGas 28.8 51.9 13 0.9 2.9 26.0 49.1 2.8 12.5% 0.8 2.9 0.8 2.0 25.5 48.6 3.3 14.7% 0.8 2.9 2.1 3.2
10 SCE/SoCalGas 28.8 50.7 11 0.9 3.0 25.7 47.6 3.1 14.0% 0.9 3.0 0.9 1.5 25.3 47.2 3.4 15.5% 0.8 3.0 2.3 3.2
10 SDG&E 28.8 50.7 11 0.9 3.0 25.7 47.6 3.1 14.0% 0.9 3.0 1.1 1.5 25.3 47.2 3.4 15.5% 0.8 3.0 2.6 3.2
11 PG&E 30.0 50.2 12 1.1 3.6 25.4 45.6 4.6 16.2% 1.0 3.6 1.2 1.5 24.1 44.3 5.9 20.8% 0.9 3.6 3.0 3.3
12 PG&E 30.9 50.1 13 1.0 3.0 27.1 46.3 3.8 15.3% 0.9 3.0 0.8 1.1 25.8 45.0 5.1 20.4% 0.9 3.0 2.0 2.5
13 PG&E 30.7 51.5 13 1.1 3.8 25.7 46.4 5.1 17.4% 0.9 3.8 1.1 1.4 24.7 45.4 6.0 20.9% 0.9 3.8 2.9 3.3
14 SCE/SoCalGas 31.3 52.2 16 1.4 3.2 25.7 46.6 5.6 18.9% 1.2 3.2 1.0 1.5 25.3 46.2 6.0 20.5% 1.2 3.2 2.3 3.1
14 SDG&E 31.3 52.2 16 1.4 3.2 25.7 46.6 5.6 18.9% 1.2 3.2 1.3 1.5 25.3 46.2 6.0 20.5% 1.2 3.2 2.9 3.1
15 SCE/SoCalGas 26.2 52.8 8 1.3 5.4 20.6 47.2 5.6 16.8% 1.1 5.4 1.1 1.6 18.9 45.5 7.3 21.8% 1.0 5.4 3.3 4.5
16 PG&E 46.5 64.6 39 1.7 2.7 36.8 54.9 9.7 25.2% 1.4 2.7 1.7 1.7 41.6 59.7 4.9 12.7% 1.6 2.7 2.4 2.3
ATTACHMENT 5
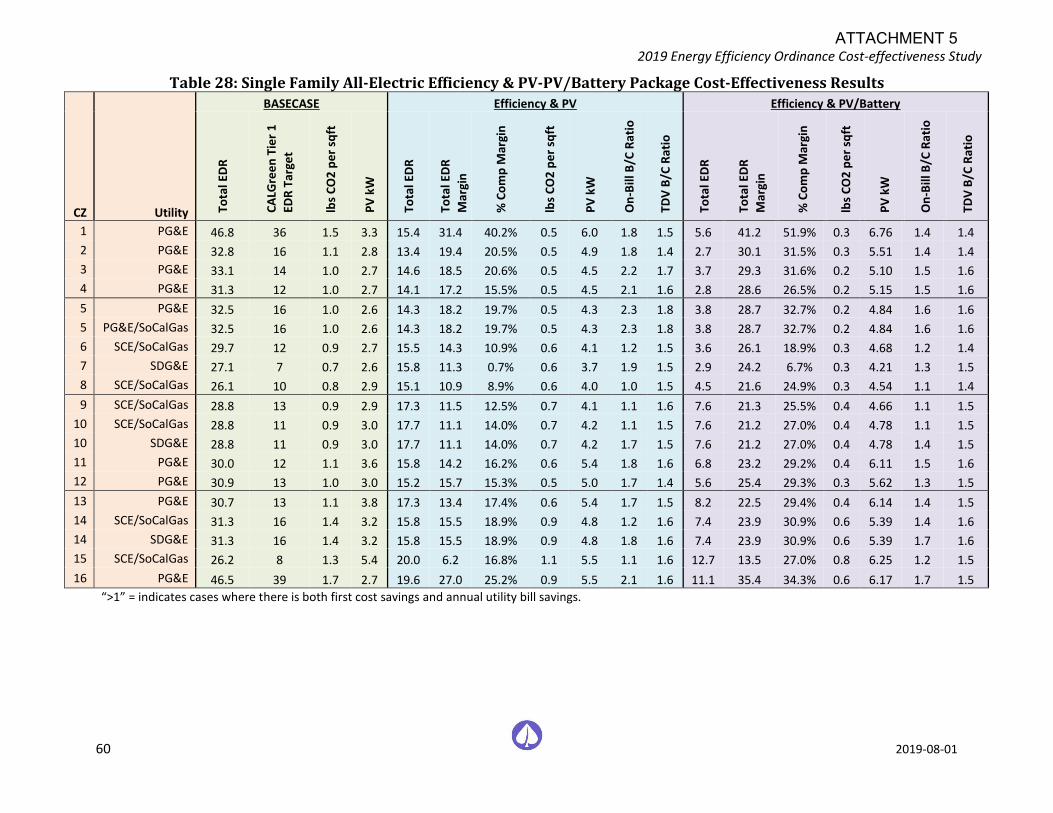
2019 Energy Efficiency Ordinance Cost-effectiveness Study
60 2019-08-01
Table 28: Single Family All-Electric Efficiency & PV-PV/Battery Package Cost-Effectiveness Results
CZ Utility
BASECASE Efficiency & PV Efficiency & PV/Battery
Tota
l ED
R
CA
LGre
en
Tie
r 1
EDR
Tar
get
lbs
CO
2 p
er
sqft
PV
kW
Tota
l ED
R
Tota
l ED
R
Mar
gin
% C
om
p M
argi
n
lbs
CO
2 p
er
sqft
PV
kW
On
-Bill
B/C
Rat
io
TDV
B/C
Rat
io
Tota
l ED
R
Tota
l ED
R
Mar
gin
% C
om
p M
argi
n
lbs
CO
2 p
er
sqft
PV
kW
On
-Bill
B/C
Rat
io
TDV
B/C
Rat
io
1 PG&E 46.8 36 1.5 3.3 15.4 31.4 40.2% 0.5 6.0 1.8 1.5 5.6 41.2 51.9% 0.3 6.76 1.4 1.4
2 PG&E 32.8 16 1.1 2.8 13.4 19.4 20.5% 0.5 4.9 1.8 1.4 2.7 30.1 31.5% 0.3 5.51 1.4 1.4
3 PG&E 33.1 14 1.0 2.7 14.6 18.5 20.6% 0.5 4.5 2.2 1.7 3.7 29.3 31.6% 0.2 5.10 1.5 1.6
4 PG&E 31.3 12 1.0 2.7 14.1 17.2 15.5% 0.5 4.5 2.1 1.6 2.8 28.6 26.5% 0.2 5.15 1.5 1.6
5 PG&E 32.5 16 1.0 2.6 14.3 18.2 19.7% 0.5 4.3 2.3 1.8 3.8 28.7 32.7% 0.2 4.84 1.6 1.6
5 PG&E/SoCalGas 32.5 16 1.0 2.6 14.3 18.2 19.7% 0.5 4.3 2.3 1.8 3.8 28.7 32.7% 0.2 4.84 1.6 1.6
6 SCE/SoCalGas 29.7 12 0.9 2.7 15.5 14.3 10.9% 0.6 4.1 1.2 1.5 3.6 26.1 18.9% 0.3 4.68 1.2 1.4
7 SDG&E 27.1 7 0.7 2.6 15.8 11.3 0.7% 0.6 3.7 1.9 1.5 2.9 24.2 6.7% 0.3 4.21 1.3 1.5
8 SCE/SoCalGas 26.1 10 0.8 2.9 15.1 10.9 8.9% 0.6 4.0 1.0 1.5 4.5 21.6 24.9% 0.3 4.54 1.1 1.4
9 SCE/SoCalGas 28.8 13 0.9 2.9 17.3 11.5 12.5% 0.7 4.1 1.1 1.6 7.6 21.3 25.5% 0.4 4.66 1.1 1.5
10 SCE/SoCalGas 28.8 11 0.9 3.0 17.7 11.1 14.0% 0.7 4.2 1.1 1.5 7.6 21.2 27.0% 0.4 4.78 1.1 1.5
10 SDG&E 28.8 11 0.9 3.0 17.7 11.1 14.0% 0.7 4.2 1.7 1.5 7.6 21.2 27.0% 0.4 4.78 1.4 1.5
11 PG&E 30.0 12 1.1 3.6 15.8 14.2 16.2% 0.6 5.4 1.8 1.6 6.8 23.2 29.2% 0.4 6.11 1.5 1.6
12 PG&E 30.9 13 1.0 3.0 15.2 15.7 15.3% 0.5 5.0 1.7 1.4 5.6 25.4 29.3% 0.3 5.62 1.3 1.5
13 PG&E 30.7 13 1.1 3.8 17.3 13.4 17.4% 0.6 5.4 1.7 1.5 8.2 22.5 29.4% 0.4 6.14 1.4 1.5
14 SCE/SoCalGas 31.3 16 1.4 3.2 15.8 15.5 18.9% 0.9 4.8 1.2 1.6 7.4 23.9 30.9% 0.6 5.39 1.4 1.6
14 SDG&E 31.3 16 1.4 3.2 15.8 15.5 18.9% 0.9 4.8 1.8 1.6 7.4 23.9 30.9% 0.6 5.39 1.7 1.6
15 SCE/SoCalGas 26.2 8 1.3 5.4 20.0 6.2 16.8% 1.1 5.5 1.1 1.6 12.7 13.5 27.0% 0.8 6.25 1.2 1.5
16 PG&E 46.5 39 1.7 2.7 19.6 27.0 25.2% 0.9 5.5 2.1 1.6 11.1 35.4 34.3% 0.6 6.17 1.7 1.5
“>1” = indicates cases where there is both first cost savings and annual utility bill savings.
ATTACHMENT 5
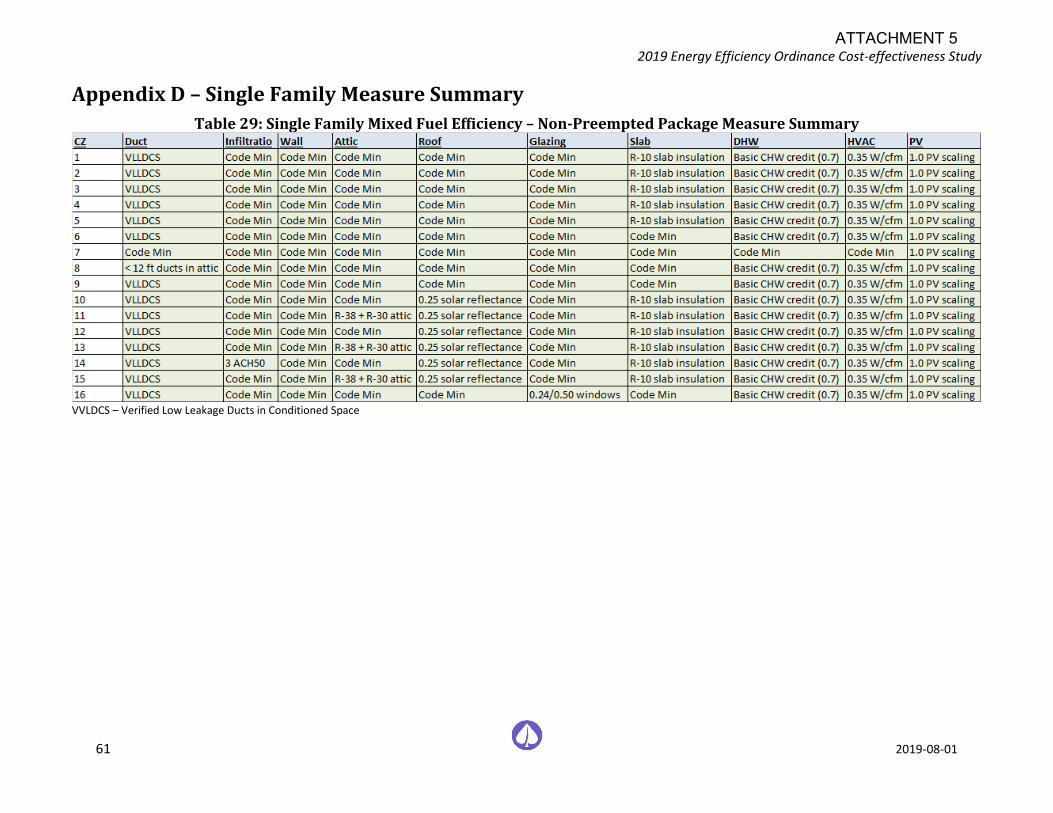
2019 Energy Efficiency Ordinance Cost-effectiveness Study
61 2019-08-01
Appendix D – Single Family Measure Summary
Table 29: Single Family Mixed Fuel Efficiency – Non-Preempted Package Measure Summary
VVLDCS – Verified Low Leakage Ducts in Conditioned Space
ATTACHMENT 5
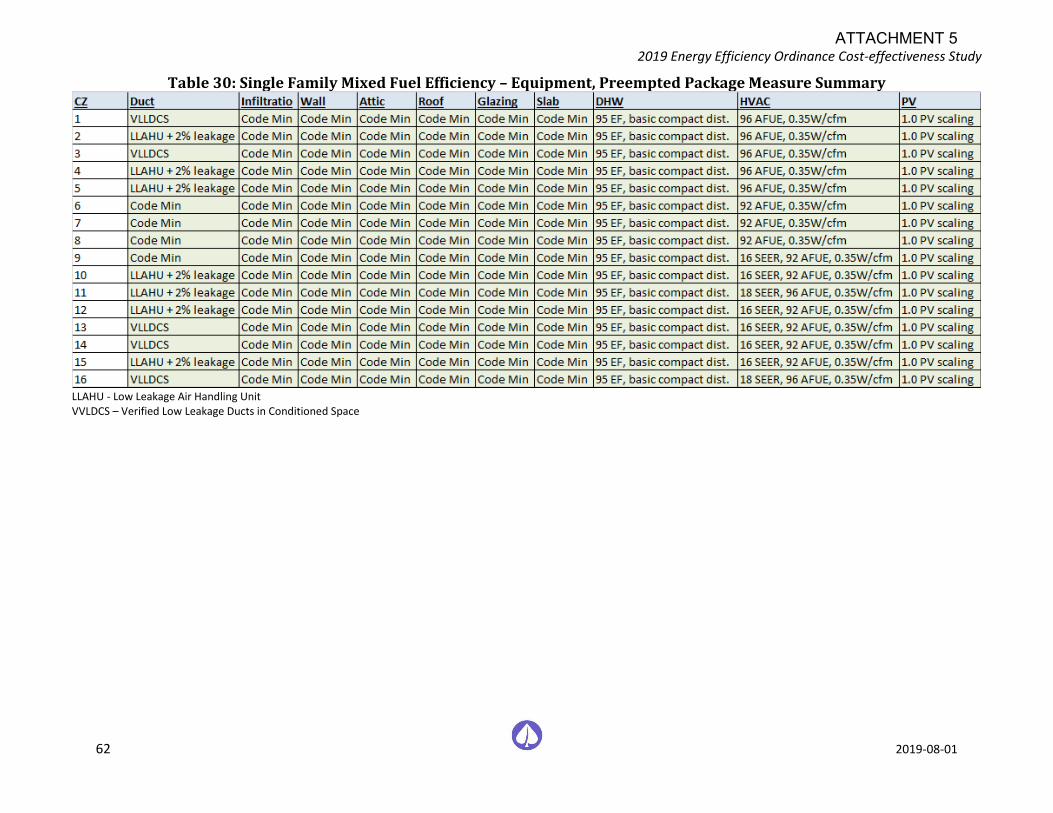
2019 Energy Efficiency Ordinance Cost-effectiveness Study
62 2019-08-01
Table 30: Single Family Mixed Fuel Efficiency – Equipment, Preempted Package Measure Summary
LLAHU - Low Leakage Air Handling Unit VVLDCS – Verified Low Leakage Ducts in Conditioned Space
ATTACHMENT 5
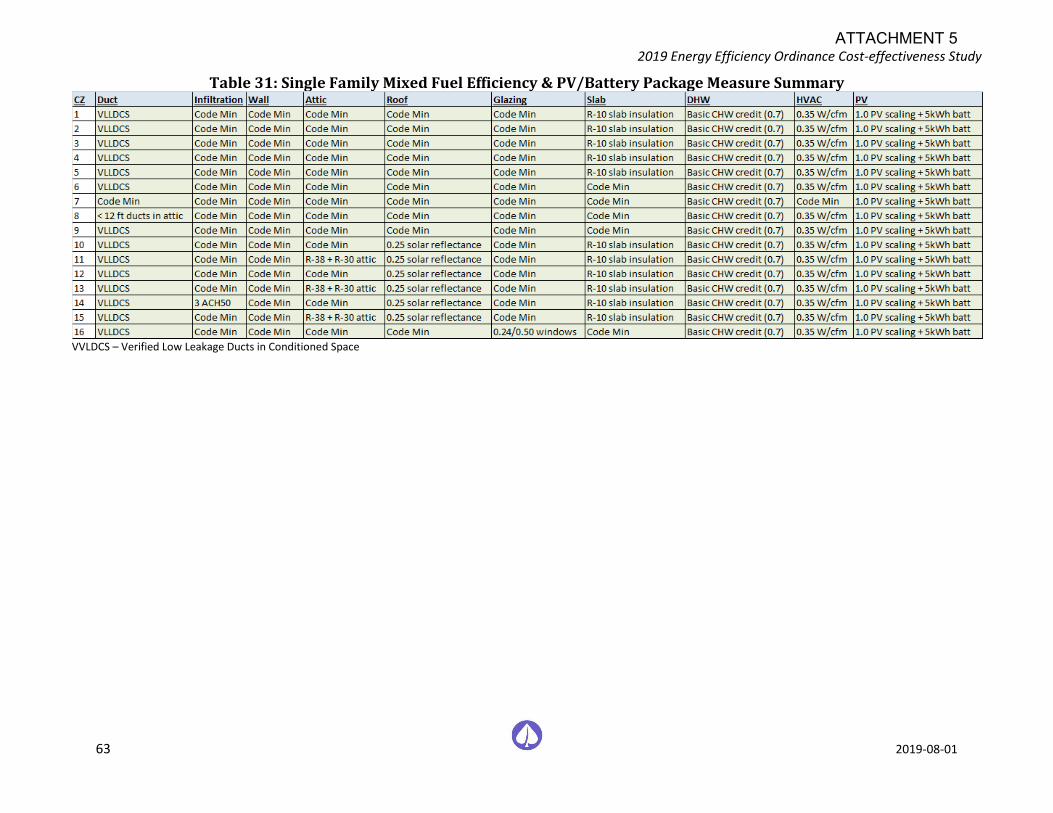
2019 Energy Efficiency Ordinance Cost-effectiveness Study
63 2019-08-01
Table 31: Single Family Mixed Fuel Efficiency & PV/Battery Package Measure Summary
VVLDCS – Verified Low Leakage Ducts in Conditioned Space
ATTACHMENT 5
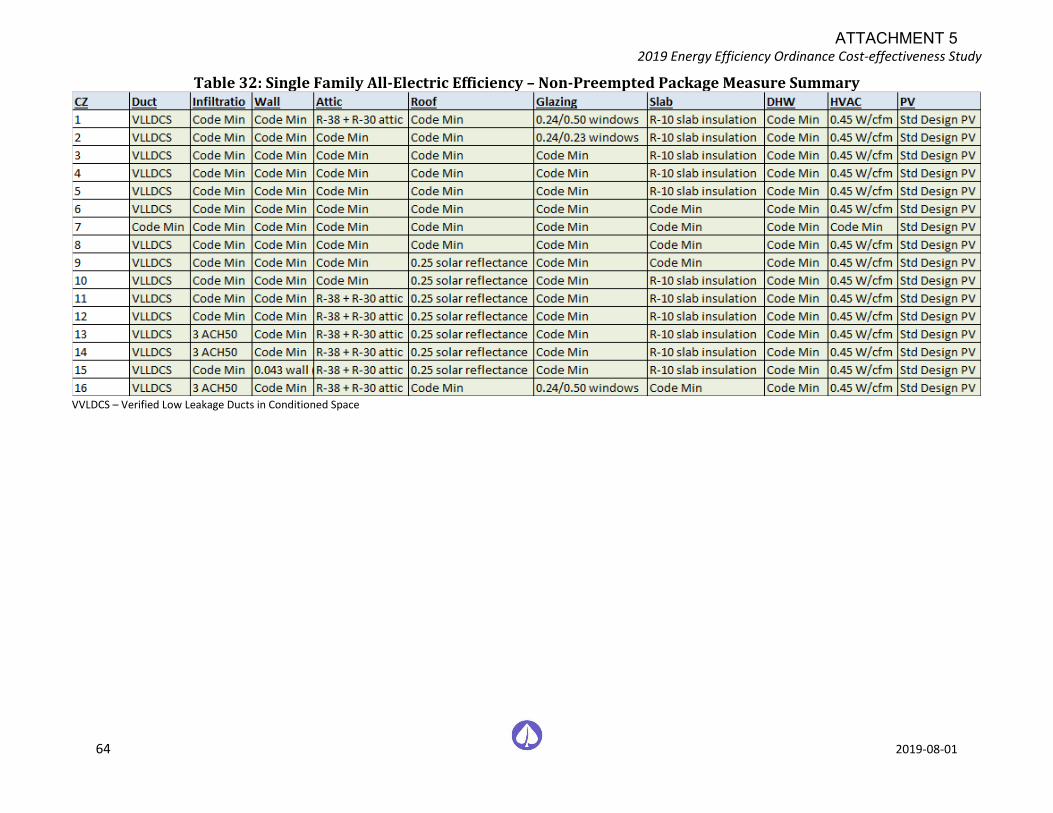
2019 Energy Efficiency Ordinance Cost-effectiveness Study
64 2019-08-01
Table 32: Single Family All-Electric Efficiency – Non-Preempted Package Measure Summary
VVLDCS – Verified Low Leakage Ducts in Conditioned Space
ATTACHMENT 5
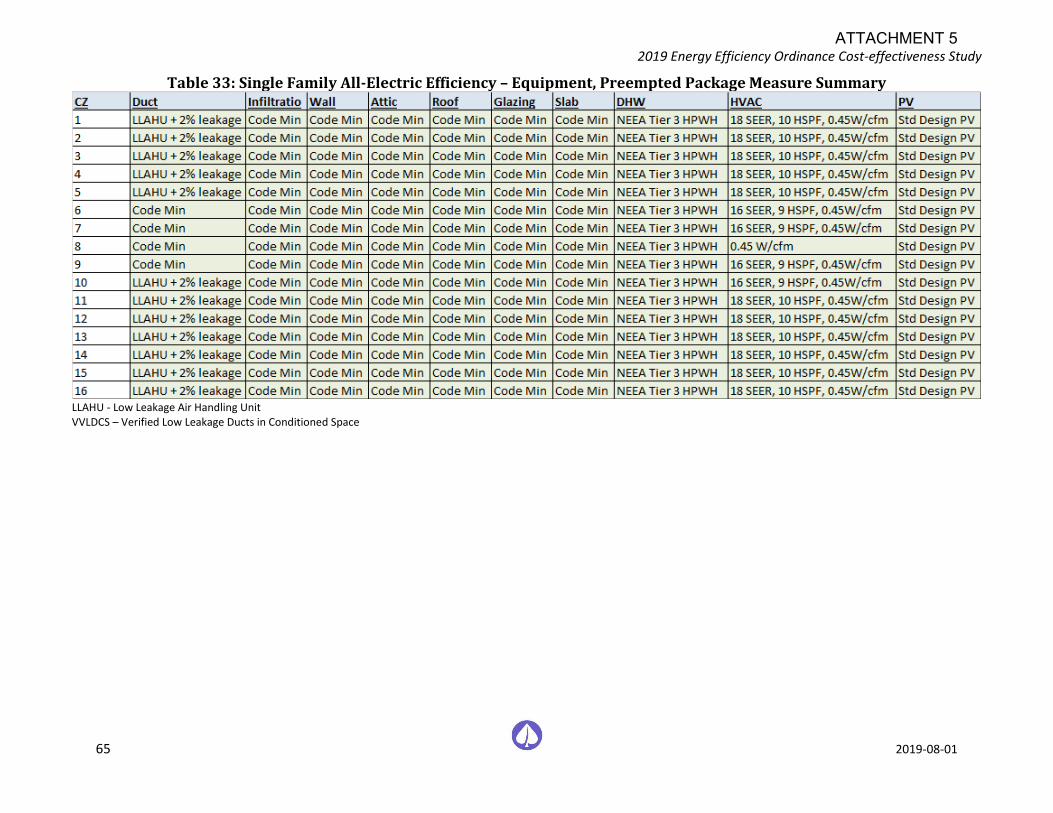
2019 Energy Efficiency Ordinance Cost-effectiveness Study
65 2019-08-01
Table 33: Single Family All-Electric Efficiency – Equipment, Preempted Package Measure Summary
LLAHU - Low Leakage Air Handling Unit VVLDCS – Verified Low Leakage Ducts in Conditioned Space
ATTACHMENT 5
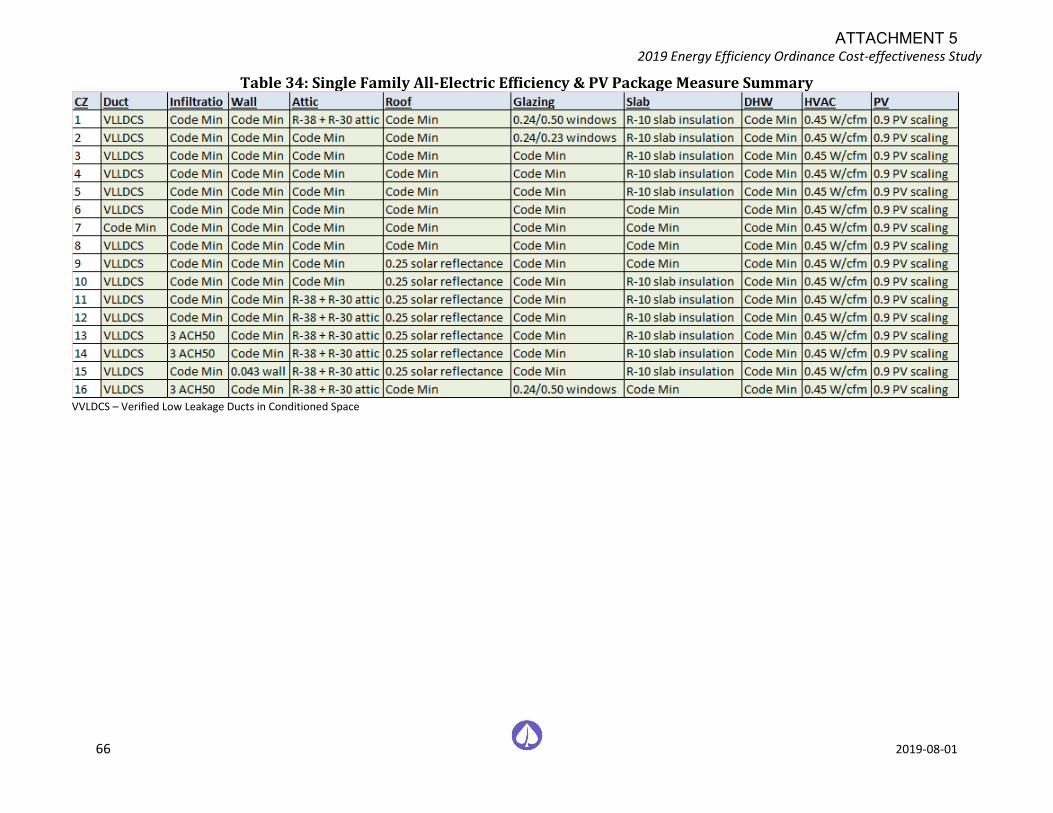
2019 Energy Efficiency Ordinance Cost-effectiveness Study
66 2019-08-01
Table 34: Single Family All-Electric Efficiency & PV Package Measure Summary
VVLDCS – Verified Low Leakage Ducts in Conditioned Space
ATTACHMENT 5
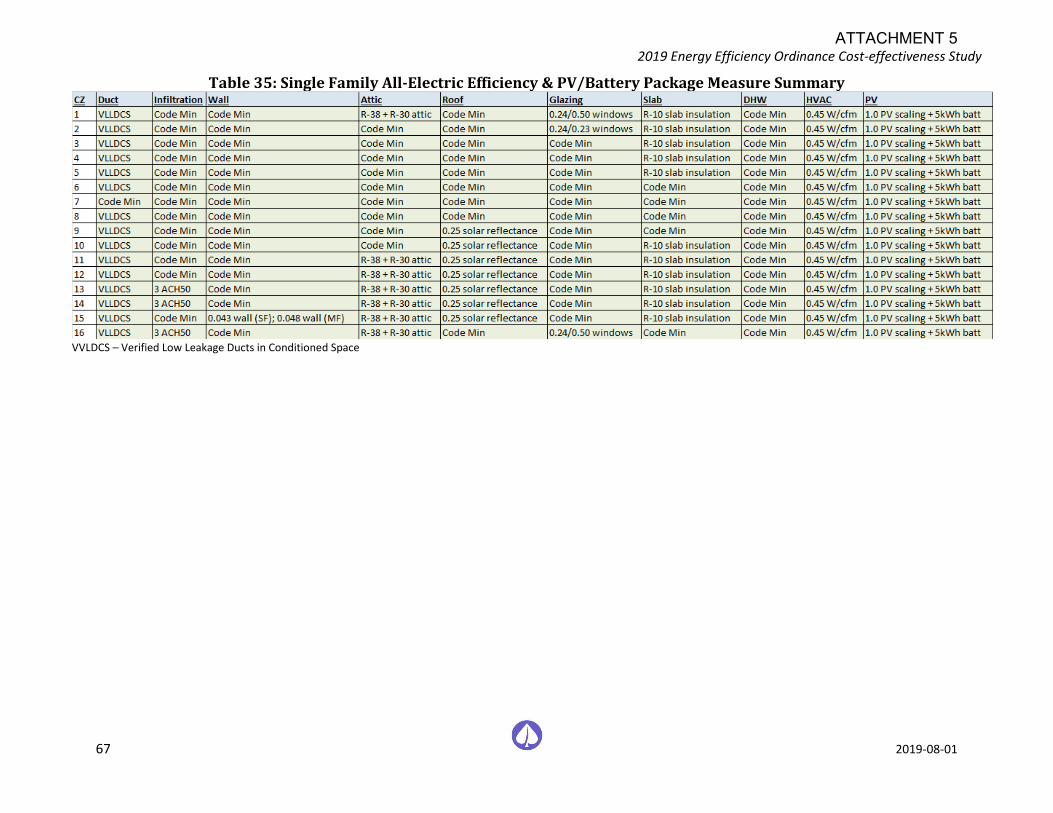
2019 Energy Efficiency Ordinance Cost-effectiveness Study
67 2019-08-01
Table 35: Single Family All-Electric Efficiency & PV/Battery Package Measure Summary
VVLDCS – Verified Low Leakage Ducts in Conditioned Space
ATTACHMENT 5
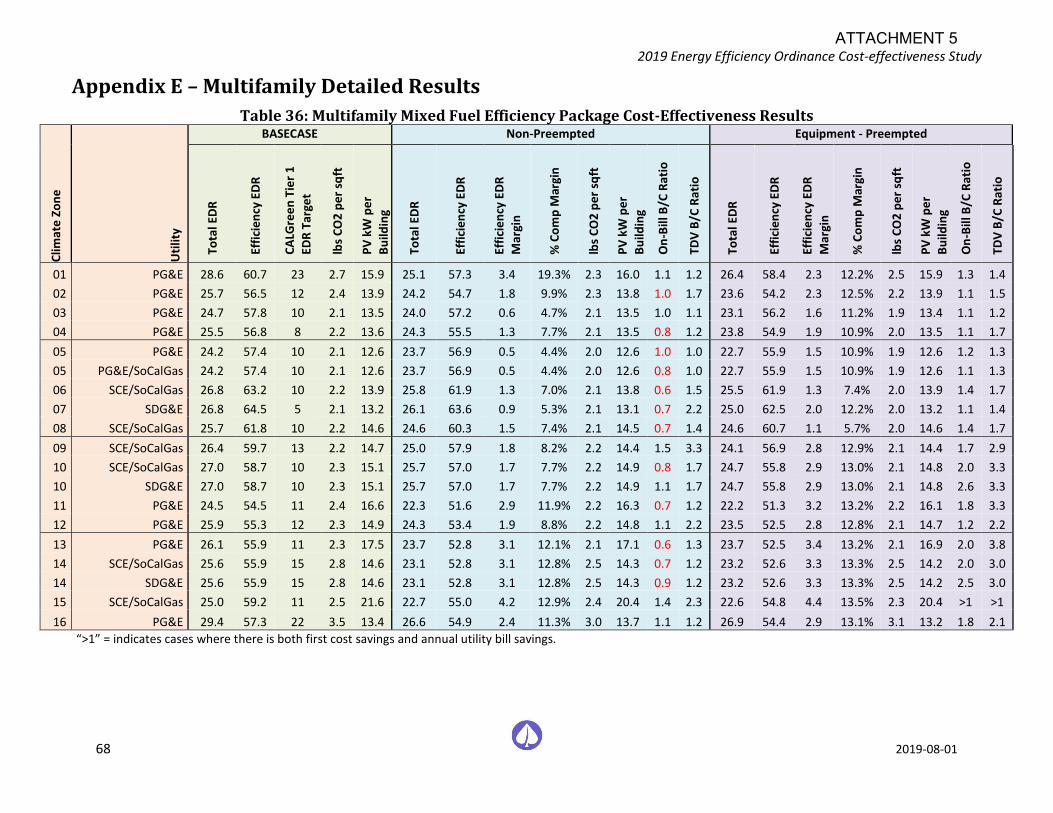
2019 Energy Efficiency Ordinance Cost-effectiveness Study
68 2019-08-01
Appendix E – Multifamily Detailed Results
Table 36: Multifamily Mixed Fuel Efficiency Package Cost-Effectiveness Results
Clim
ate
Zo
ne
Uti
lity
BASECASE Non-Preempted Equipment - Preempted
Tota
l ED
R
Effi
cie
ncy
ED
R
CA
LGre
en
Tie
r 1
EDR
Tar
get
lbs
CO
2 p
er
sqft
PV
kW
pe
r
Bu
ildin
g
Tota
l ED
R
Effi
cie
ncy
ED
R
Effi
cie
ncy
ED
R
Mar
gin
% C
om
p M
argi
n
lbs
CO
2 p
er
sqft
PV
kW
pe
r
Bu
ildin
g
On
-Bill
B/C
Rat
io
TDV
B/C
Rat
io
Tota
l ED
R
Effi
cie
ncy
ED
R
Effi
cie
ncy
ED
R
Mar
gin
% C
om
p M
argi
n
lbs
CO
2 p
er
sqft
PV
kW
pe
r
Bu
ildin
g
On
-Bill
B/C
Rat
io
TDV
B/C
Rat
io
01 PG&E 28.6 60.7 23 2.7 15.9 25.1 57.3 3.4 19.3% 2.3 16.0 1.1 1.2 26.4 58.4 2.3 12.2% 2.5 15.9 1.3 1.4
02 PG&E 25.7 56.5 12 2.4 13.9 24.2 54.7 1.8 9.9% 2.3 13.8 1.0 1.7 23.6 54.2 2.3 12.5% 2.2 13.9 1.1 1.5
03 PG&E 24.7 57.8 10 2.1 13.5 24.0 57.2 0.6 4.7% 2.1 13.5 1.0 1.1 23.1 56.2 1.6 11.2% 1.9 13.4 1.1 1.2
04 PG&E 25.5 56.8 8 2.2 13.6 24.3 55.5 1.3 7.7% 2.1 13.5 0.8 1.2 23.8 54.9 1.9 10.9% 2.0 13.5 1.1 1.7
05 PG&E 24.2 57.4 10 2.1 12.6 23.7 56.9 0.5 4.4% 2.0 12.6 1.0 1.0 22.7 55.9 1.5 10.9% 1.9 12.6 1.2 1.3
05 PG&E/SoCalGas 24.2 57.4 10 2.1 12.6 23.7 56.9 0.5 4.4% 2.0 12.6 0.8 1.0 22.7 55.9 1.5 10.9% 1.9 12.6 1.1 1.3
06 SCE/SoCalGas 26.8 63.2 10 2.2 13.9 25.8 61.9 1.3 7.0% 2.1 13.8 0.6 1.5 25.5 61.9 1.3 7.4% 2.0 13.9 1.4 1.7
07 SDG&E 26.8 64.5 5 2.1 13.2 26.1 63.6 0.9 5.3% 2.1 13.1 0.7 2.2 25.0 62.5 2.0 12.2% 2.0 13.2 1.1 1.4
08 SCE/SoCalGas 25.7 61.8 10 2.2 14.6 24.6 60.3 1.5 7.4% 2.1 14.5 0.7 1.4 24.6 60.7 1.1 5.7% 2.0 14.6 1.4 1.7
09 SCE/SoCalGas 26.4 59.7 13 2.2 14.7 25.0 57.9 1.8 8.2% 2.2 14.4 1.5 3.3 24.1 56.9 2.8 12.9% 2.1 14.4 1.7 2.9
10 SCE/SoCalGas 27.0 58.7 10 2.3 15.1 25.7 57.0 1.7 7.7% 2.2 14.9 0.8 1.7 24.7 55.8 2.9 13.0% 2.1 14.8 2.0 3.3
10 SDG&E 27.0 58.7 10 2.3 15.1 25.7 57.0 1.7 7.7% 2.2 14.9 1.1 1.7 24.7 55.8 2.9 13.0% 2.1 14.8 2.6 3.3
11 PG&E 24.5 54.5 11 2.4 16.6 22.3 51.6 2.9 11.9% 2.2 16.3 0.7 1.2 22.2 51.3 3.2 13.2% 2.2 16.1 1.8 3.3
12 PG&E 25.9 55.3 12 2.3 14.9 24.3 53.4 1.9 8.8% 2.2 14.8 1.1 2.2 23.5 52.5 2.8 12.8% 2.1 14.7 1.2 2.2
13 PG&E 26.1 55.9 11 2.3 17.5 23.7 52.8 3.1 12.1% 2.1 17.1 0.6 1.3 23.7 52.5 3.4 13.2% 2.1 16.9 2.0 3.8
14 SCE/SoCalGas 25.6 55.9 15 2.8 14.6 23.1 52.8 3.1 12.8% 2.5 14.3 0.7 1.2 23.2 52.6 3.3 13.3% 2.5 14.2 2.0 3.0
14 SDG&E 25.6 55.9 15 2.8 14.6 23.1 52.8 3.1 12.8% 2.5 14.3 0.9 1.2 23.2 52.6 3.3 13.3% 2.5 14.2 2.5 3.0
15 SCE/SoCalGas 25.0 59.2 11 2.5 21.6 22.7 55.0 4.2 12.9% 2.4 20.4 1.4 2.3 22.6 54.8 4.4 13.5% 2.3 20.4 >1 >1
16 PG&E 29.4 57.3 22 3.5 13.4 26.6 54.9 2.4 11.3% 3.0 13.7 1.1 1.2 26.9 54.4 2.9 13.1% 3.1 13.2 1.8 2.1
“>1” = indicates cases where there is both first cost savings and annual utility bill savings.
ATTACHMENT 5
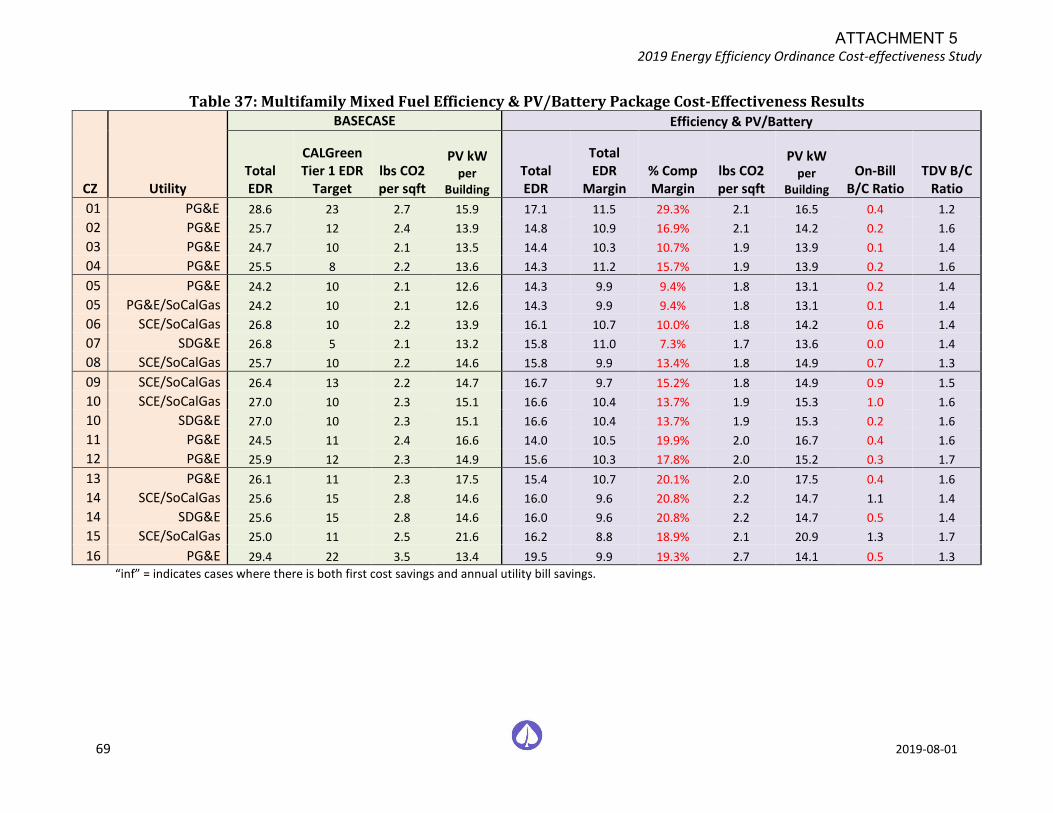
2019 Energy Efficiency Ordinance Cost-effectiveness Study
69 2019-08-01
Table 37: Multifamily Mixed Fuel Efficiency & PV/Battery Package Cost-Effectiveness Results
CZ Utility
BASECASE Efficiency & PV/Battery
Total EDR
CALGreen Tier 1 EDR
Target lbs CO2 per sqft
PV kW
per Building
Total EDR
Total EDR
Margin % Comp Margin
lbs CO2 per sqft
PV kW
per Building
On-Bill B/C Ratio
TDV B/C Ratio
01 PG&E 28.6 23 2.7 15.9 17.1 11.5 29.3% 2.1 16.5 0.4 1.2
02 PG&E 25.7 12 2.4 13.9 14.8 10.9 16.9% 2.1 14.2 0.2 1.6
03 PG&E 24.7 10 2.1 13.5 14.4 10.3 10.7% 1.9 13.9 0.1 1.4
04 PG&E 25.5 8 2.2 13.6 14.3 11.2 15.7% 1.9 13.9 0.2 1.6
05 PG&E 24.2 10 2.1 12.6 14.3 9.9 9.4% 1.8 13.1 0.2 1.4
05 PG&E/SoCalGas 24.2 10 2.1 12.6 14.3 9.9 9.4% 1.8 13.1 0.1 1.4
06 SCE/SoCalGas 26.8 10 2.2 13.9 16.1 10.7 10.0% 1.8 14.2 0.6 1.4
07 SDG&E 26.8 5 2.1 13.2 15.8 11.0 7.3% 1.7 13.6 0.0 1.4
08 SCE/SoCalGas 25.7 10 2.2 14.6 15.8 9.9 13.4% 1.8 14.9 0.7 1.3
09 SCE/SoCalGas 26.4 13 2.2 14.7 16.7 9.7 15.2% 1.8 14.9 0.9 1.5
10 SCE/SoCalGas 27.0 10 2.3 15.1 16.6 10.4 13.7% 1.9 15.3 1.0 1.6
10 SDG&E 27.0 10 2.3 15.1 16.6 10.4 13.7% 1.9 15.3 0.2 1.6
11 PG&E 24.5 11 2.4 16.6 14.0 10.5 19.9% 2.0 16.7 0.4 1.6
12 PG&E 25.9 12 2.3 14.9 15.6 10.3 17.8% 2.0 15.2 0.3 1.7
13 PG&E 26.1 11 2.3 17.5 15.4 10.7 20.1% 2.0 17.5 0.4 1.6
14 SCE/SoCalGas 25.6 15 2.8 14.6 16.0 9.6 20.8% 2.2 14.7 1.1 1.4
14 SDG&E 25.6 15 2.8 14.6 16.0 9.6 20.8% 2.2 14.7 0.5 1.4
15 SCE/SoCalGas 25.0 11 2.5 21.6 16.2 8.8 18.9% 2.1 20.9 1.3 1.7
16 PG&E 29.4 22 3.5 13.4 19.5 9.9 19.3% 2.7 14.1 0.5 1.3 “inf” = indicates cases where there is both first cost savings and annual utility bill savings.
ATTACHMENT 5
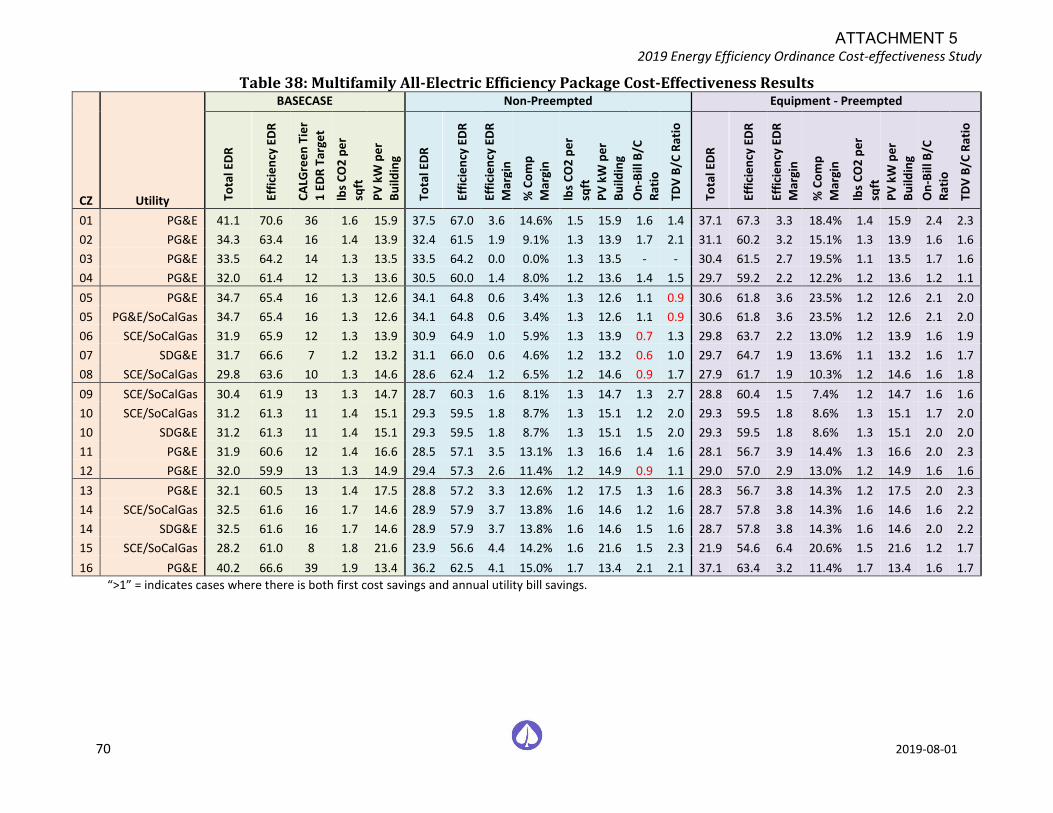
2019 Energy Efficiency Ordinance Cost-effectiveness Study
70 2019-08-01
Table 38: Multifamily All-Electric Efficiency Package Cost-Effectiveness Results
CZ Utility
BASECASE Non-Preempted Equipment - Preempted
Tota
l ED
R
Effi
cie
ncy
ED
R
CA
LGre
en
Tie
r
1 E
DR
Tar
get
lbs
CO
2 p
er
sqft
PV
kW
pe
r
Bu
ildin
g
Tota
l ED
R
Effi
cie
ncy
ED
R
Effi
cie
ncy
ED
R
Mar
gin
% C
om
p
Mar
gin
lbs
CO
2 p
er
sqft
PV
kW
pe
r
Bu
ildin
g
On
-Bill
B/C
Rat
io
TDV
B/C
Rat
io
Tota
l ED
R
Effi
cie
ncy
ED
R
Effi
cie
ncy
ED
R
Mar
gin
% C
om
p
Mar
gin
lbs
CO
2 p
er
sqft
PV
kW
pe
r
Bu
ildin
g
On
-Bill
B/C
Rat
io
TDV
B/C
Rat
io
01 PG&E 41.1 70.6 36 1.6 15.9 37.5 67.0 3.6 14.6% 1.5 15.9 1.6 1.4 37.1 67.3 3.3 18.4% 1.4 15.9 2.4 2.3
02 PG&E 34.3 63.4 16 1.4 13.9 32.4 61.5 1.9 9.1% 1.3 13.9 1.7 2.1 31.1 60.2 3.2 15.1% 1.3 13.9 1.6 1.6
03 PG&E 33.5 64.2 14 1.3 13.5 33.5 64.2 0.0 0.0% 1.3 13.5 - - 30.4 61.5 2.7 19.5% 1.1 13.5 1.7 1.6
04 PG&E 32.0 61.4 12 1.3 13.6 30.5 60.0 1.4 8.0% 1.2 13.6 1.4 1.5 29.7 59.2 2.2 12.2% 1.2 13.6 1.2 1.1
05 PG&E 34.7 65.4 16 1.3 12.6 34.1 64.8 0.6 3.4% 1.3 12.6 1.1 0.9 30.6 61.8 3.6 23.5% 1.2 12.6 2.1 2.0
05 PG&E/SoCalGas 34.7 65.4 16 1.3 12.6 34.1 64.8 0.6 3.4% 1.3 12.6 1.1 0.9 30.6 61.8 3.6 23.5% 1.2 12.6 2.1 2.0
06 SCE/SoCalGas 31.9 65.9 12 1.3 13.9 30.9 64.9 1.0 5.9% 1.3 13.9 0.7 1.3 29.8 63.7 2.2 13.0% 1.2 13.9 1.6 1.9
07 SDG&E 31.7 66.6 7 1.2 13.2 31.1 66.0 0.6 4.6% 1.2 13.2 0.6 1.0 29.7 64.7 1.9 13.6% 1.1 13.2 1.6 1.7
08 SCE/SoCalGas 29.8 63.6 10 1.3 14.6 28.6 62.4 1.2 6.5% 1.2 14.6 0.9 1.7 27.9 61.7 1.9 10.3% 1.2 14.6 1.6 1.8
09 SCE/SoCalGas 30.4 61.9 13 1.3 14.7 28.7 60.3 1.6 8.1% 1.3 14.7 1.3 2.7 28.8 60.4 1.5 7.4% 1.2 14.7 1.6 1.6
10 SCE/SoCalGas 31.2 61.3 11 1.4 15.1 29.3 59.5 1.8 8.7% 1.3 15.1 1.2 2.0 29.3 59.5 1.8 8.6% 1.3 15.1 1.7 2.0
10 SDG&E 31.2 61.3 11 1.4 15.1 29.3 59.5 1.8 8.7% 1.3 15.1 1.5 2.0 29.3 59.5 1.8 8.6% 1.3 15.1 2.0 2.0
11 PG&E 31.9 60.6 12 1.4 16.6 28.5 57.1 3.5 13.1% 1.3 16.6 1.4 1.6 28.1 56.7 3.9 14.4% 1.3 16.6 2.0 2.3
12 PG&E 32.0 59.9 13 1.3 14.9 29.4 57.3 2.6 11.4% 1.2 14.9 0.9 1.1 29.0 57.0 2.9 13.0% 1.2 14.9 1.6 1.6
13 PG&E 32.1 60.5 13 1.4 17.5 28.8 57.2 3.3 12.6% 1.2 17.5 1.3 1.6 28.3 56.7 3.8 14.3% 1.2 17.5 2.0 2.3
14 SCE/SoCalGas 32.5 61.6 16 1.7 14.6 28.9 57.9 3.7 13.8% 1.6 14.6 1.2 1.6 28.7 57.8 3.8 14.3% 1.6 14.6 1.6 2.2
14 SDG&E 32.5 61.6 16 1.7 14.6 28.9 57.9 3.7 13.8% 1.6 14.6 1.5 1.6 28.7 57.8 3.8 14.3% 1.6 14.6 2.0 2.2
15 SCE/SoCalGas 28.2 61.0 8 1.8 21.6 23.9 56.6 4.4 14.2% 1.6 21.6 1.5 2.3 21.9 54.6 6.4 20.6% 1.5 21.6 1.2 1.7
16 PG&E 40.2 66.6 39 1.9 13.4 36.2 62.5 4.1 15.0% 1.7 13.4 2.1 2.1 37.1 63.4 3.2 11.4% 1.7 13.4 1.6 1.7
“>1” = indicates cases where there is both first cost savings and annual utility bill savings.
ATTACHMENT 5
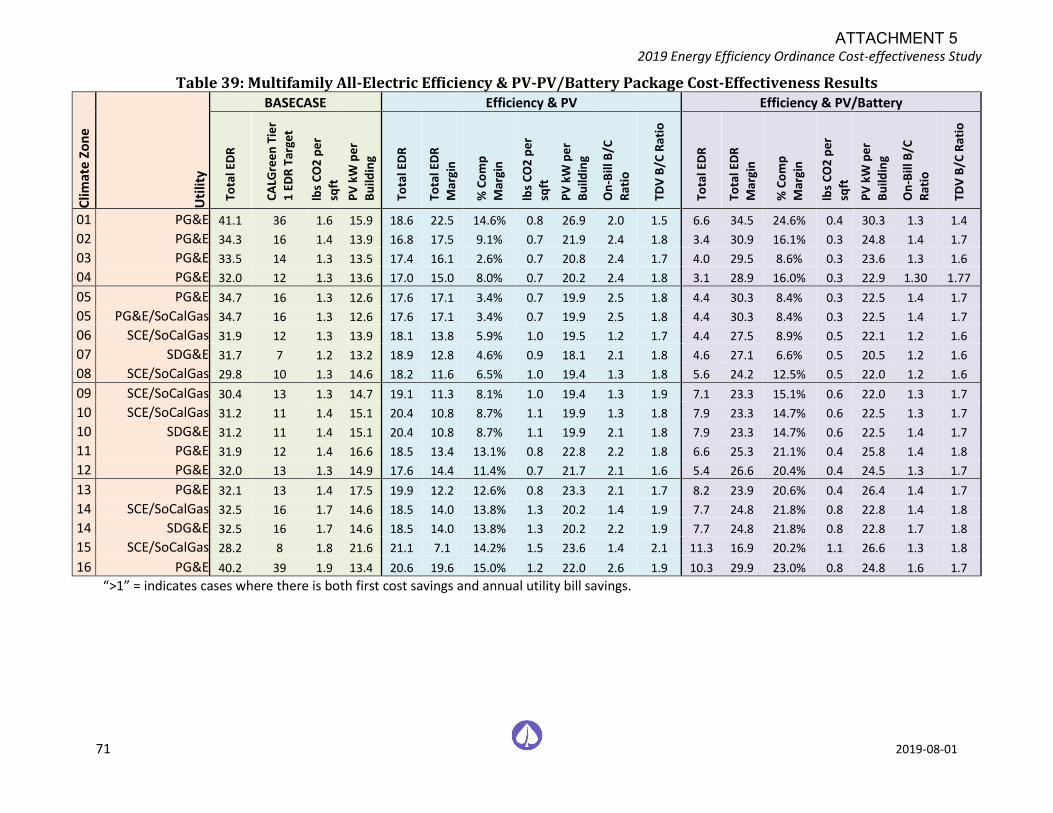
2019 Energy Efficiency Ordinance Cost-effectiveness Study
71 2019-08-01
Table 39: Multifamily All-Electric Efficiency & PV-PV/Battery Package Cost-Effectiveness Results C
limat
e Zo
ne
Uti
lity
BASECASE Efficiency & PV Efficiency & PV/Battery
Tota
l ED
R
CA
LGre
en
Tie
r
1 E
DR
Tar
get
lbs
CO
2 p
er
sqft
PV
kW
pe
r
Bu
ildin
g
Tota
l ED
R
Tota
l ED
R
Mar
gin
% C
om
p
Mar
gin
lbs
CO
2 p
er
sqft
PV
kW
pe
r
Bu
ildin
g
On
-Bill
B/C
Rat
io
TDV
B/C
Rat
io
Tota
l ED
R
Tota
l ED
R
Mar
gin
% C
om
p
Mar
gin
lbs
CO
2 p
er
sqft
PV
kW
pe
r
Bu
ildin
g
On
-Bill
B/C
Rat
io
TDV
B/C
Rat
io
01 PG&E 41.1 36 1.6 15.9 18.6 22.5 14.6% 0.8 26.9 2.0 1.5 6.6 34.5 24.6% 0.4 30.3 1.3 1.4
02 PG&E 34.3 16 1.4 13.9 16.8 17.5 9.1% 0.7 21.9 2.4 1.8 3.4 30.9 16.1% 0.3 24.8 1.4 1.7
03 PG&E 33.5 14 1.3 13.5 17.4 16.1 2.6% 0.7 20.8 2.4 1.7 4.0 29.5 8.6% 0.3 23.6 1.3 1.6
04 PG&E 32.0 12 1.3 13.6 17.0 15.0 8.0% 0.7 20.2 2.4 1.8 3.1 28.9 16.0% 0.3 22.9 1.30 1.77
05 PG&E 34.7 16 1.3 12.6 17.6 17.1 3.4% 0.7 19.9 2.5 1.8 4.4 30.3 8.4% 0.3 22.5 1.4 1.7
05 PG&E/SoCalGas 34.7 16 1.3 12.6 17.6 17.1 3.4% 0.7 19.9 2.5 1.8 4.4 30.3 8.4% 0.3 22.5 1.4 1.7
06 SCE/SoCalGas 31.9 12 1.3 13.9 18.1 13.8 5.9% 1.0 19.5 1.2 1.7 4.4 27.5 8.9% 0.5 22.1 1.2 1.6
07 SDG&E 31.7 7 1.2 13.2 18.9 12.8 4.6% 0.9 18.1 2.1 1.8 4.6 27.1 6.6% 0.5 20.5 1.2 1.6
08 SCE/SoCalGas 29.8 10 1.3 14.6 18.2 11.6 6.5% 1.0 19.4 1.3 1.8 5.6 24.2 12.5% 0.5 22.0 1.2 1.6
09 SCE/SoCalGas 30.4 13 1.3 14.7 19.1 11.3 8.1% 1.0 19.4 1.3 1.9 7.1 23.3 15.1% 0.6 22.0 1.3 1.7
10 SCE/SoCalGas 31.2 11 1.4 15.1 20.4 10.8 8.7% 1.1 19.9 1.3 1.8 7.9 23.3 14.7% 0.6 22.5 1.3 1.7
10 SDG&E 31.2 11 1.4 15.1 20.4 10.8 8.7% 1.1 19.9 2.1 1.8 7.9 23.3 14.7% 0.6 22.5 1.4 1.7
11 PG&E 31.9 12 1.4 16.6 18.5 13.4 13.1% 0.8 22.8 2.2 1.8 6.6 25.3 21.1% 0.4 25.8 1.4 1.8
12 PG&E 32.0 13 1.3 14.9 17.6 14.4 11.4% 0.7 21.7 2.1 1.6 5.4 26.6 20.4% 0.4 24.5 1.3 1.7
13 PG&E 32.1 13 1.4 17.5 19.9 12.2 12.6% 0.8 23.3 2.1 1.7 8.2 23.9 20.6% 0.4 26.4 1.4 1.7
14 SCE/SoCalGas 32.5 16 1.7 14.6 18.5 14.0 13.8% 1.3 20.2 1.4 1.9 7.7 24.8 21.8% 0.8 22.8 1.4 1.8
14 SDG&E 32.5 16 1.7 14.6 18.5 14.0 13.8% 1.3 20.2 2.2 1.9 7.7 24.8 21.8% 0.8 22.8 1.7 1.8
15 SCE/SoCalGas 28.2 8 1.8 21.6 21.1 7.1 14.2% 1.5 23.6 1.4 2.1 11.3 16.9 20.2% 1.1 26.6 1.3 1.8
16 PG&E 40.2 39 1.9 13.4 20.6 19.6 15.0% 1.2 22.0 2.6 1.9 10.3 29.9 23.0% 0.8 24.8 1.6 1.7 “>1” = indicates cases where there is both first cost savings and annual utility bill savings.
ATTACHMENT 5
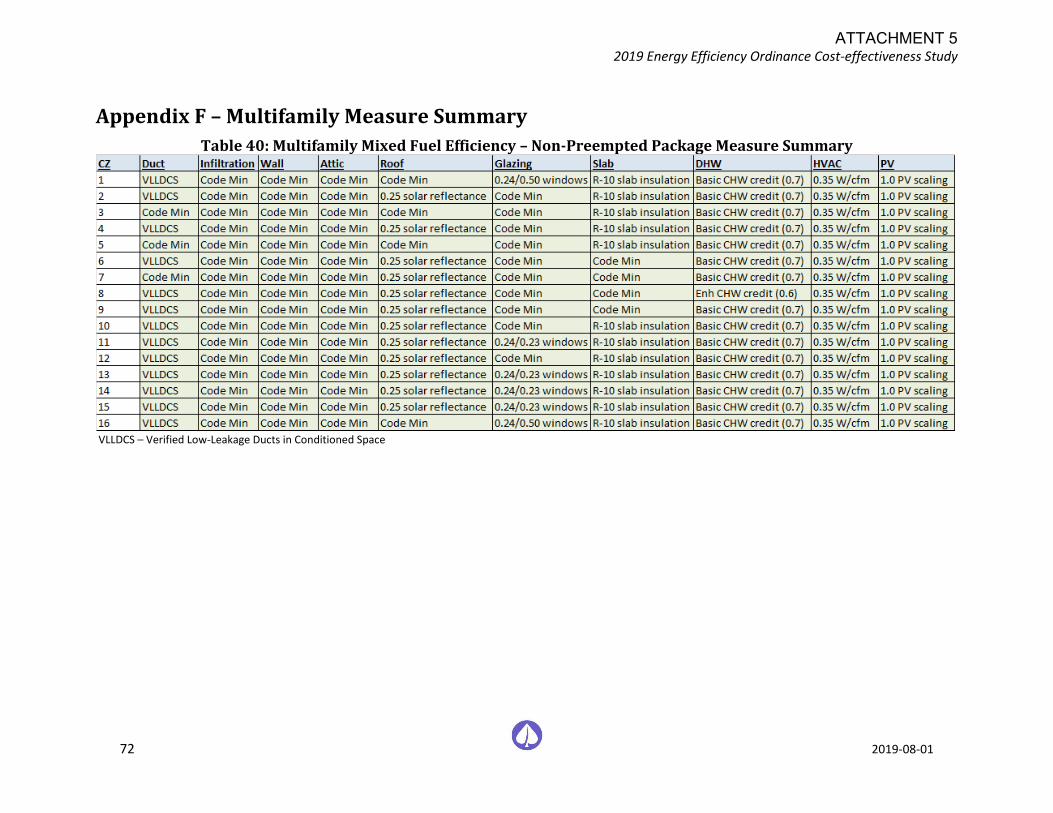
2019 Energy Efficiency Ordinance Cost-effectiveness Study
72 2019-08-01
Appendix F – Multifamily Measure Summary
Table 40: Multifamily Mixed Fuel Efficiency – Non-Preempted Package Measure Summary
VLLDCS – Verified Low-Leakage Ducts in Conditioned Space
ATTACHMENT 5
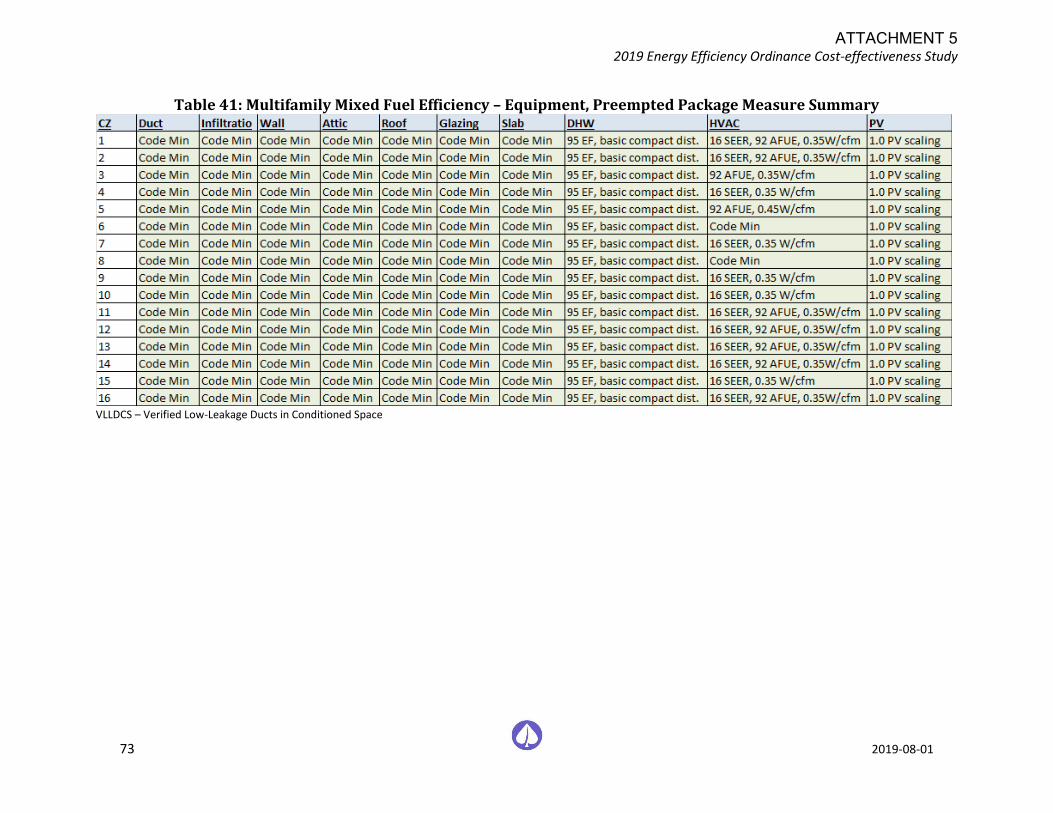
2019 Energy Efficiency Ordinance Cost-effectiveness Study
73 2019-08-01
Table 41: Multifamily Mixed Fuel Efficiency – Equipment, Preempted Package Measure Summary
VLLDCS – Verified Low-Leakage Ducts in Conditioned Space
ATTACHMENT 5
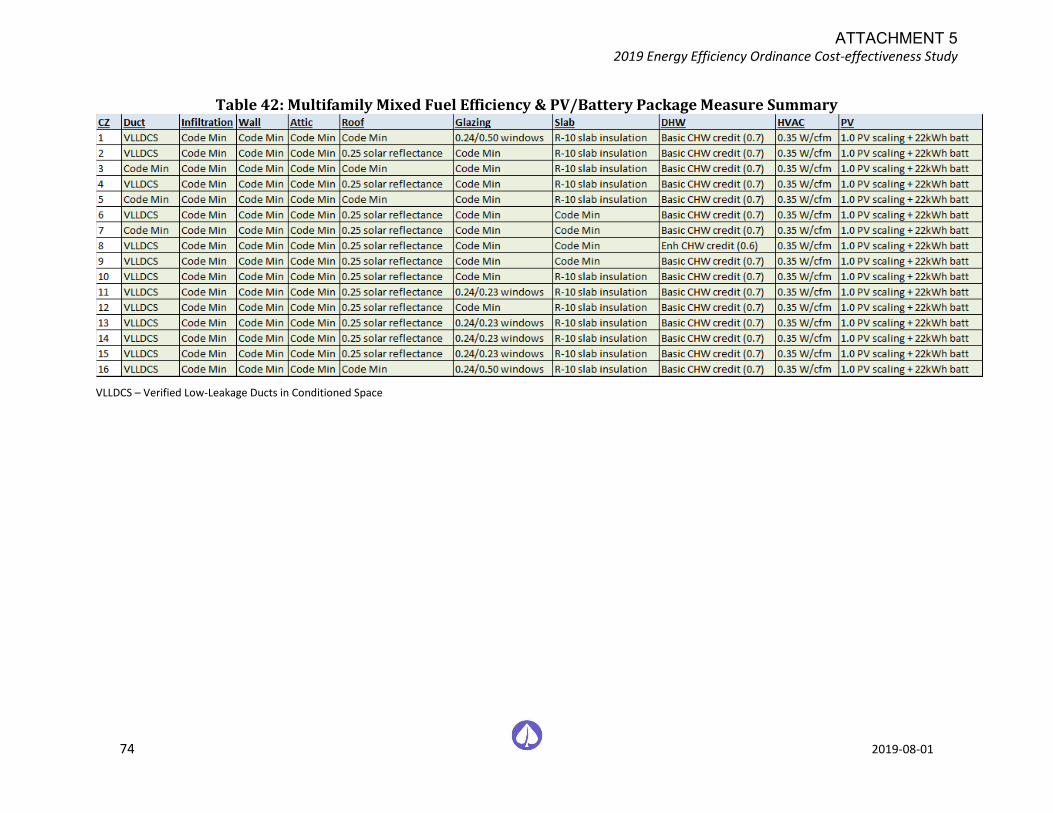
2019 Energy Efficiency Ordinance Cost-effectiveness Study
74 2019-08-01
Table 42: Multifamily Mixed Fuel Efficiency & PV/Battery Package Measure Summary
VLLDCS – Verified Low-Leakage Ducts in Conditioned Space
ATTACHMENT 5
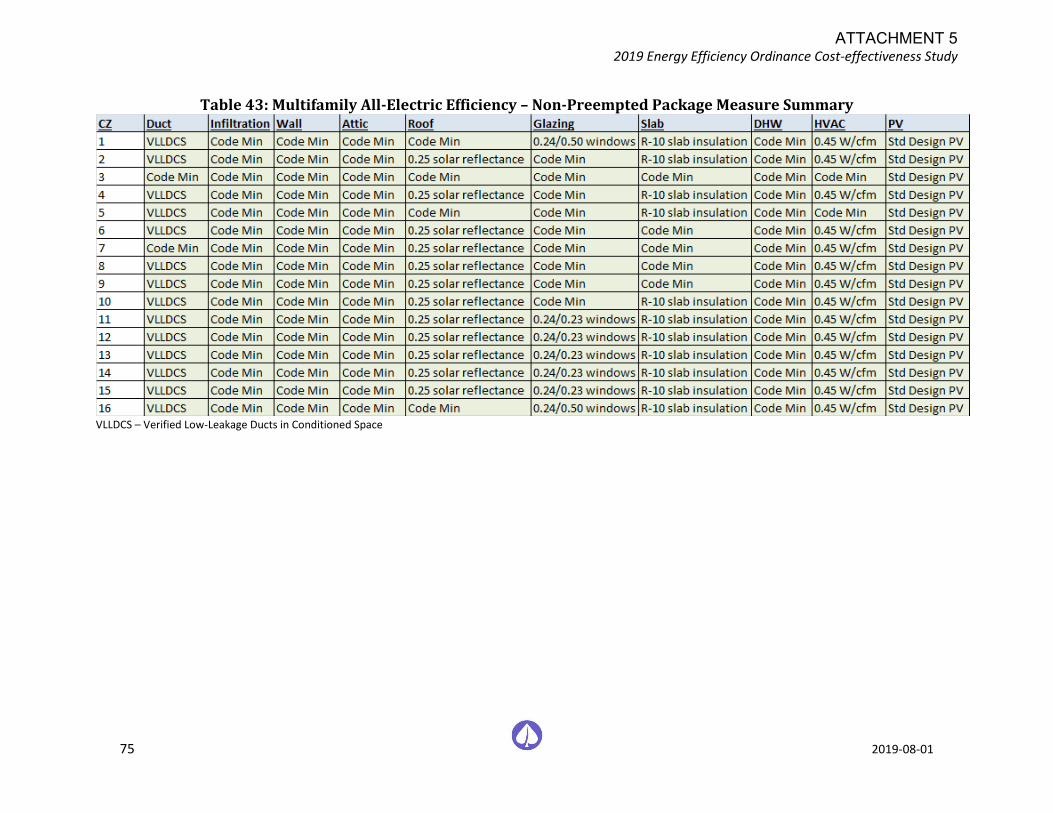
2019 Energy Efficiency Ordinance Cost-effectiveness Study
75 2019-08-01
Table 43: Multifamily All-Electric Efficiency – Non-Preempted Package Measure Summary
VLLDCS – Verified Low-Leakage Ducts in Conditioned Space
ATTACHMENT 5
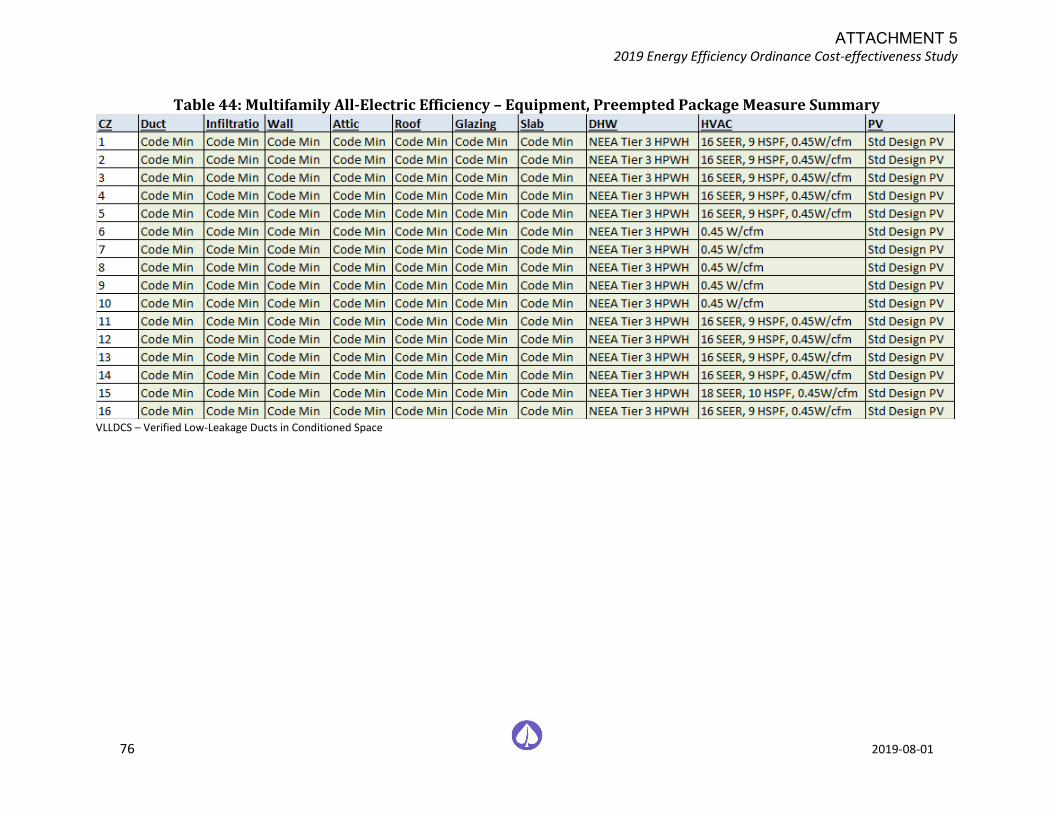
2019 Energy Efficiency Ordinance Cost-effectiveness Study
76 2019-08-01
Table 44: Multifamily All-Electric Efficiency – Equipment, Preempted Package Measure Summary
VLLDCS – Verified Low-Leakage Ducts in Conditioned Space
ATTACHMENT 5
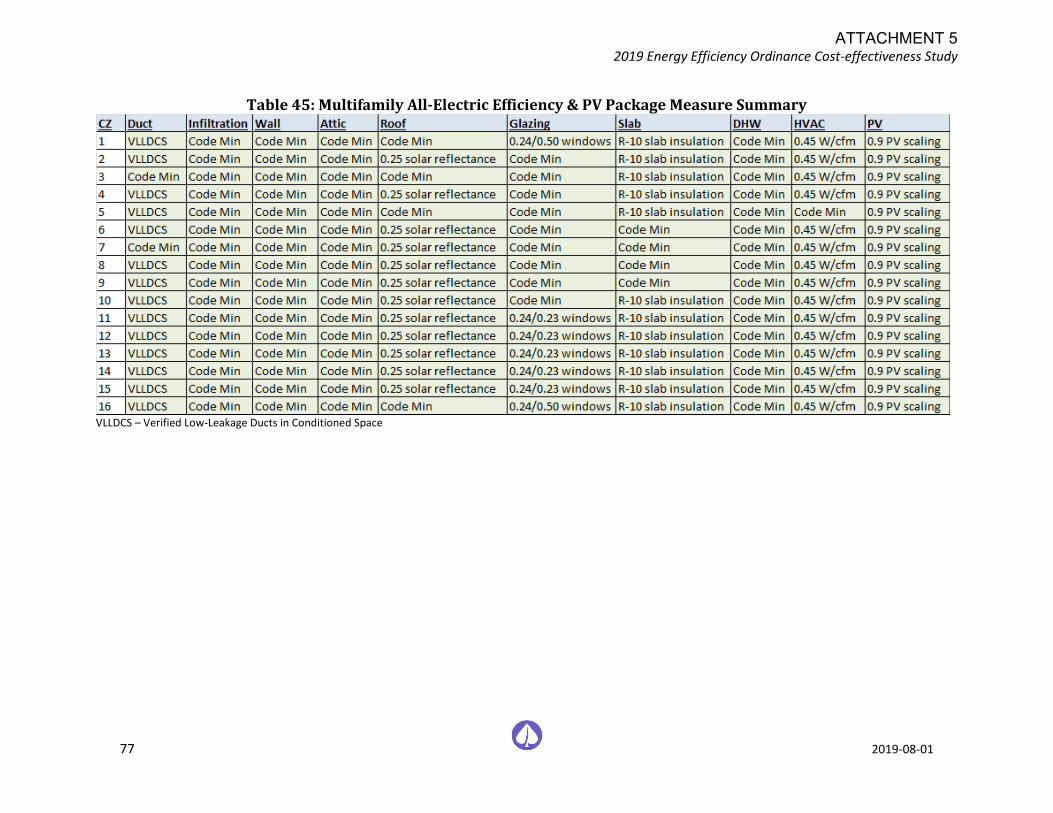
2019 Energy Efficiency Ordinance Cost-effectiveness Study
77 2019-08-01
Table 45: Multifamily All-Electric Efficiency & PV Package Measure Summary
VLLDCS – Verified Low-Leakage Ducts in Conditioned Space
ATTACHMENT 5
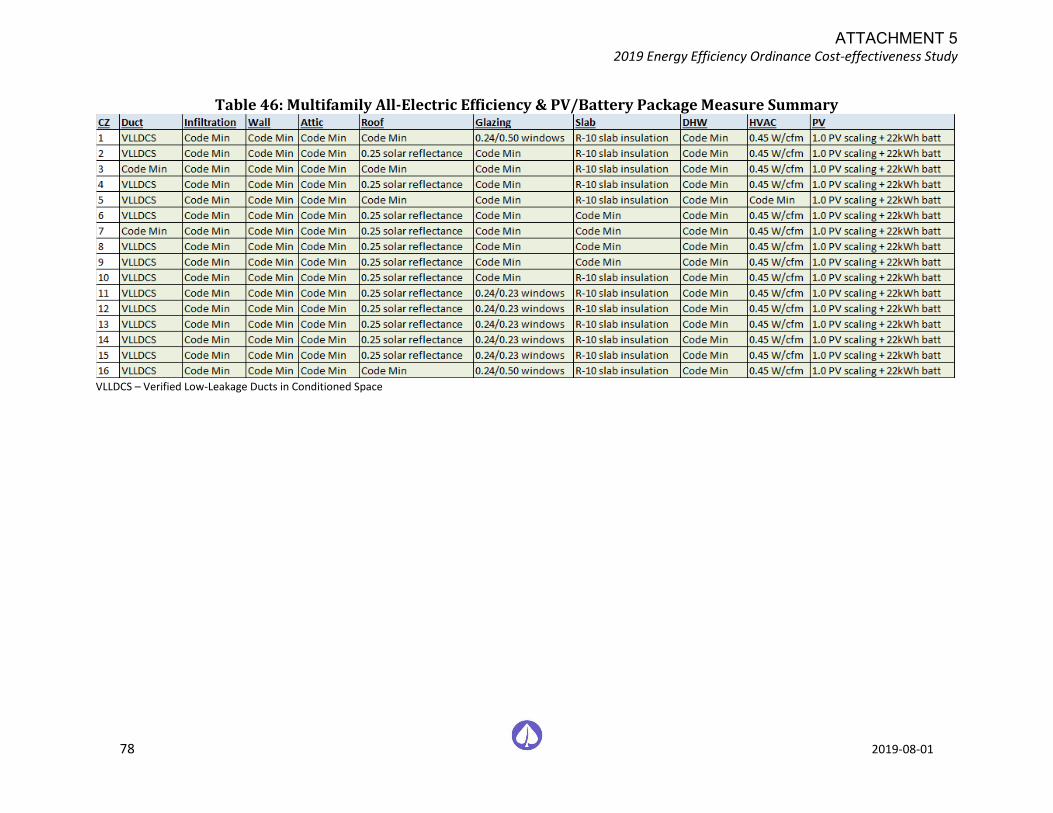
2019 Energy Efficiency Ordinance Cost-effectiveness Study
78 2019-08-01
Table 46: Multifamily All-Electric Efficiency & PV/Battery Package Measure Summary
VLLDCS – Verified Low-Leakage Ducts in Conditioned Space
ATTACHMENT 5
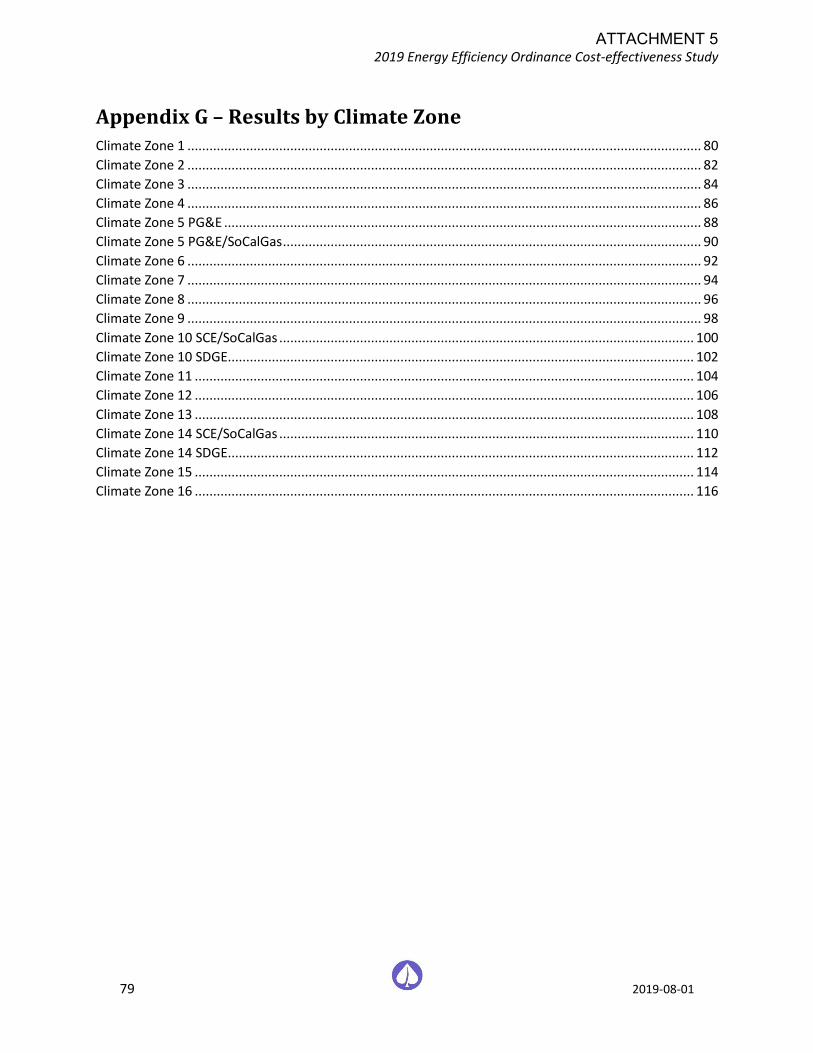
2019 Energy Efficiency Ordinance Cost-effectiveness Study
79 2019-08-01
Appendix G – Results by Climate Zone Climate Zone 1 ............................................................................................................................................ 80
Climate Zone 2 ............................................................................................................................................ 82
Climate Zone 3 ............................................................................................................................................ 84
Climate Zone 4 ............................................................................................................................................ 86
Climate Zone 5 PG&E .................................................................................................................................. 88
Climate Zone 5 PG&E/SoCalGas .................................................................................................................. 90
Climate Zone 6 ............................................................................................................................................ 92
Climate Zone 7 ............................................................................................................................................ 94
Climate Zone 8 ............................................................................................................................................ 96
Climate Zone 9 ............................................................................................................................................ 98
Climate Zone 10 SCE/SoCalGas ................................................................................................................. 100
Climate Zone 10 SDGE............................................................................................................................... 102
Climate Zone 11 ........................................................................................................................................ 104
Climate Zone 12 ........................................................................................................................................ 106
Climate Zone 13 ........................................................................................................................................ 108
Climate Zone 14 SCE/SoCalGas ................................................................................................................. 110
Climate Zone 14 SDGE............................................................................................................................... 112
Climate Zone 15 ........................................................................................................................................ 114
Climate Zone 16 ........................................................................................................................................ 116
ATTACHMENT 5
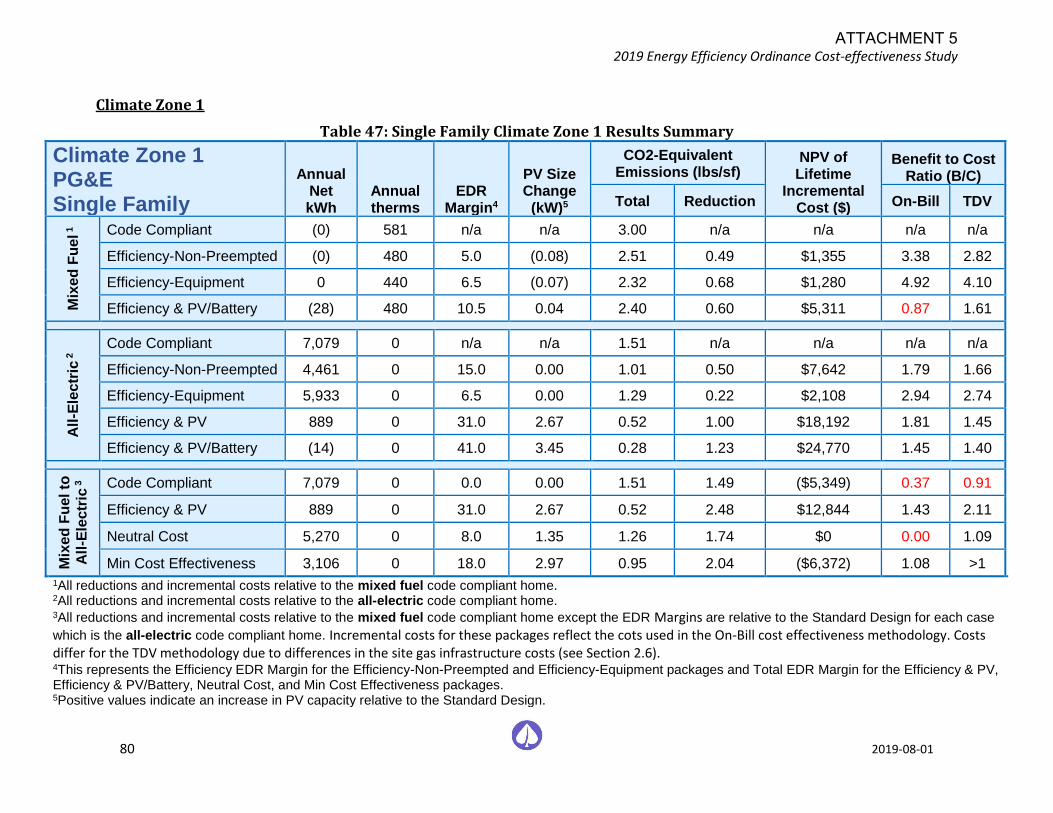
2019 Energy Efficiency Ordinance Cost-effectiveness Study
80 2019-08-01
Climate Zone 1
Table 47: Single Family Climate Zone 1 Results Summary
Climate Zone 1 PG&E Single Family
Annual Net kWh
Annual therms
EDR Margin4
PV Size Change
(kW)5
CO2-Equivalent Emissions (lbs/sf)
NPV of Lifetime
Incremental Cost ($)
Benefit to Cost Ratio (B/C)
Total Reduction On-Bill TDV
Mix
ed
Fu
el 1
Code Compliant (0) 581 n/a n/a 3.00 n/a n/a n/a n/a
Efficiency-Non-Preempted (0) 480 5.0 (0.08) 2.51 0.49 $1,355 3.38 2.82
Efficiency-Equipment 0 440 6.5 (0.07) 2.32 0.68 $1,280 4.92 4.10
Efficiency & PV/Battery (28) 480 10.5 0.04 2.40 0.60 $5,311 0.87 1.61
All
-Ele
ctr
ic 2 Code Compliant 7,079 0 n/a n/a 1.51 n/a n/a n/a n/a
Efficiency-Non-Preempted 4,461 0 15.0 0.00 1.01 0.50 $7,642 1.79 1.66
Efficiency-Equipment 5,933 0 6.5 0.00 1.29 0.22 $2,108 2.94 2.74
Efficiency & PV 889 0 31.0 2.67 0.52 1.00 $18,192 1.81 1.45
Efficiency & PV/Battery (14) 0 41.0 3.45 0.28 1.23 $24,770 1.45 1.40
Mix
ed
Fu
el to
All
-Ele
ctr
ic 3
Code Compliant 7,079 0 0.0 0.00 1.51 1.49 ($5,349) 0.37 0.91
Efficiency & PV 889 0 31.0 2.67 0.52 2.48 $12,844 1.43 2.11
Neutral Cost 5,270 0 8.0 1.35 1.26 1.74 $0 0.00 1.09
Min Cost Effectiveness 3,106 0 18.0 2.97 0.95 2.04 ($6,372) 1.08 >1
1All reductions and incremental costs relative to the mixed fuel code compliant home. 2All reductions and incremental costs relative to the all-electric code compliant home. 3All reductions and incremental costs relative to the mixed fuel code compliant home except the EDR Margins are relative to the Standard Design for each case
which is the all-electric code compliant home. Incremental costs for these packages reflect the cots used in the On-Bill cost effectiveness methodology. Costs differ for the TDV methodology due to differences in the site gas infrastructure costs (see Section 2.6). 4This represents the Efficiency EDR Margin for the Efficiency-Non-Preempted and Efficiency-Equipment packages and Total EDR Margin for the Efficiency & PV, Efficiency & PV/Battery, Neutral Cost, and Min Cost Effectiveness packages. 5Positive values indicate an increase in PV capacity relative to the Standard Design.
ATTACHMENT 5
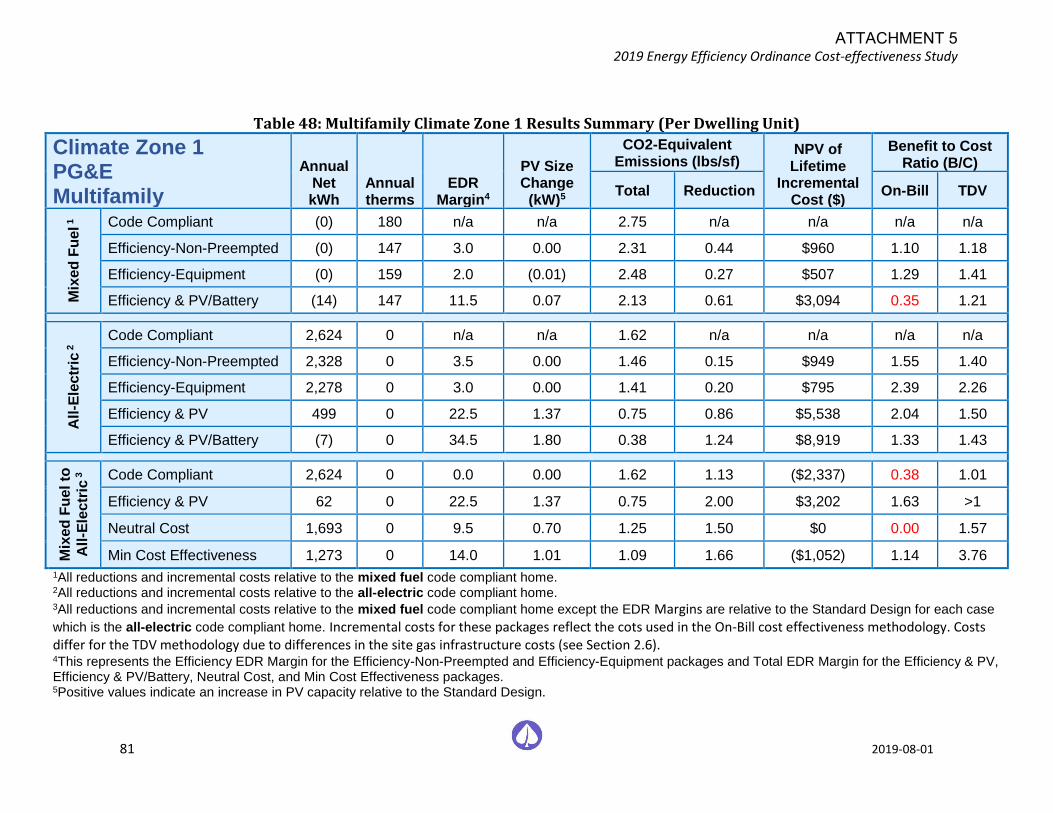
2019 Energy Efficiency Ordinance Cost-effectiveness Study
81 2019-08-01
Table 48: Multifamily Climate Zone 1 Results Summary (Per Dwelling Unit)
Climate Zone 1 PG&E Multifamily
Annual Net kWh
Annual therms
EDR Margin4
PV Size Change
(kW)5
CO2-Equivalent Emissions (lbs/sf)
NPV of Lifetime
Incremental Cost ($)
Benefit to Cost Ratio (B/C)
Total Reduction On-Bill TDV
Mix
ed
Fu
el 1
Code Compliant (0) 180 n/a n/a 2.75 n/a n/a n/a n/a
Efficiency-Non-Preempted (0) 147 3.0 0.00 2.31 0.44 $960 1.10 1.18
Efficiency-Equipment (0) 159 2.0 (0.01) 2.48 0.27 $507 1.29 1.41
Efficiency & PV/Battery (14) 147 11.5 0.07 2.13 0.61 $3,094 0.35 1.21
All
-Ele
ctr
ic 2 Code Compliant 2,624 0 n/a n/a 1.62 n/a n/a n/a n/a
Efficiency-Non-Preempted 2,328 0 3.5 0.00 1.46 0.15 $949 1.55 1.40
Efficiency-Equipment 2,278 0 3.0 0.00 1.41 0.20 $795 2.39 2.26
Efficiency & PV 499 0 22.5 1.37 0.75 0.86 $5,538 2.04 1.50
Efficiency & PV/Battery (7) 0 34.5 1.80 0.38 1.24 $8,919 1.33 1.43
Mix
ed
Fu
el to
All
-Ele
ctr
ic 3
Code Compliant 2,624 0 0.0 0.00 1.62 1.13 ($2,337) 0.38 1.01
Efficiency & PV 62 0 22.5 1.37 0.75 2.00 $3,202 1.63 >1
Neutral Cost 1,693 0 9.5 0.70 1.25 1.50 $0 0.00 1.57
Min Cost Effectiveness 1,273 0 14.0 1.01 1.09 1.66 ($1,052) 1.14 3.76
1All reductions and incremental costs relative to the mixed fuel code compliant home. 2All reductions and incremental costs relative to the all-electric code compliant home. 3All reductions and incremental costs relative to the mixed fuel code compliant home except the EDR Margins are relative to the Standard Design for each case
which is the all-electric code compliant home. Incremental costs for these packages reflect the cots used in the On-Bill cost effectiveness methodology. Costs differ for the TDV methodology due to differences in the site gas infrastructure costs (see Section 2.6). 4This represents the Efficiency EDR Margin for the Efficiency-Non-Preempted and Efficiency-Equipment packages and Total EDR Margin for the Efficiency & PV, Efficiency & PV/Battery, Neutral Cost, and Min Cost Effectiveness packages. 5Positive values indicate an increase in PV capacity relative to the Standard Design.
ATTACHMENT 5
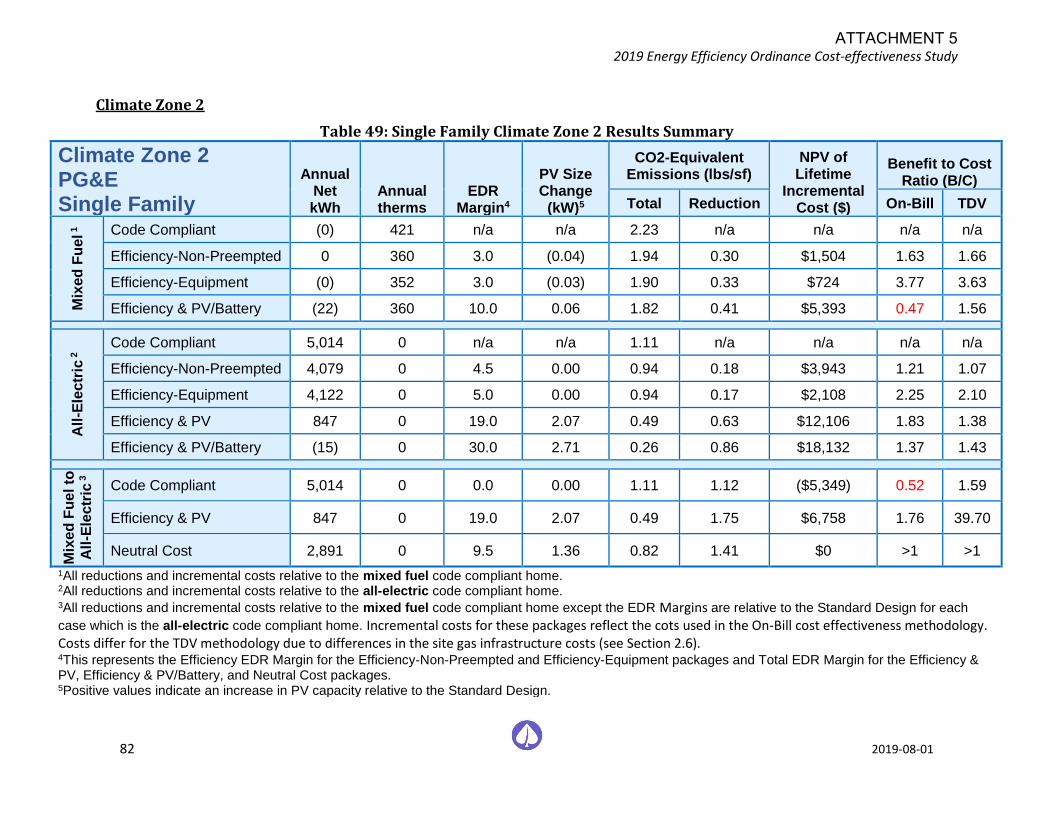
2019 Energy Efficiency Ordinance Cost-effectiveness Study
82 2019-08-01
Climate Zone 2
Table 49: Single Family Climate Zone 2 Results Summary
Climate Zone 2 PG&E Single Family
Annual Net kWh
Annual therms
EDR Margin4
PV Size Change
(kW)5
CO2-Equivalent Emissions (lbs/sf)
NPV of Lifetime
Incremental Cost ($)
Benefit to Cost Ratio (B/C)
Total Reduction On-Bill TDV
Mix
ed
Fu
el 1
Code Compliant (0) 421 n/a n/a 2.23 n/a n/a n/a n/a
Efficiency-Non-Preempted 0 360 3.0 (0.04) 1.94 0.30 $1,504 1.63 1.66
Efficiency-Equipment (0) 352 3.0 (0.03) 1.90 0.33 $724 3.77 3.63
Efficiency & PV/Battery (22) 360 10.0 0.06 1.82 0.41 $5,393 0.47 1.56
All
-Ele
ctr
ic 2 Code Compliant 5,014 0 n/a n/a 1.11 n/a n/a n/a n/a
Efficiency-Non-Preempted 4,079 0 4.5 0.00 0.94 0.18 $3,943 1.21 1.07
Efficiency-Equipment 4,122 0 5.0 0.00 0.94 0.17 $2,108 2.25 2.10
Efficiency & PV 847 0 19.0 2.07 0.49 0.63 $12,106 1.83 1.38
Efficiency & PV/Battery (15) 0 30.0 2.71 0.26 0.86 $18,132 1.37 1.43
Mix
ed
Fu
el to
All
-Ele
ctr
ic 3
Code Compliant 5,014 0 0.0 0.00 1.11 1.12 ($5,349) 0.52 1.59
Efficiency & PV 847 0 19.0 2.07 0.49 1.75 $6,758 1.76 39.70
Neutral Cost 2,891 0 9.5 1.36 0.82 1.41 $0 >1 >1
1All reductions and incremental costs relative to the mixed fuel code compliant home. 2All reductions and incremental costs relative to the all-electric code compliant home. 3All reductions and incremental costs relative to the mixed fuel code compliant home except the EDR Margins are relative to the Standard Design for each
case which is the all-electric code compliant home. Incremental costs for these packages reflect the cots used in the On-Bill cost effectiveness methodology. Costs differ for the TDV methodology due to differences in the site gas infrastructure costs (see Section 2.6). 4This represents the Efficiency EDR Margin for the Efficiency-Non-Preempted and Efficiency-Equipment packages and Total EDR Margin for the Efficiency & PV, Efficiency & PV/Battery, and Neutral Cost packages. 5Positive values indicate an increase in PV capacity relative to the Standard Design.
ATTACHMENT 5
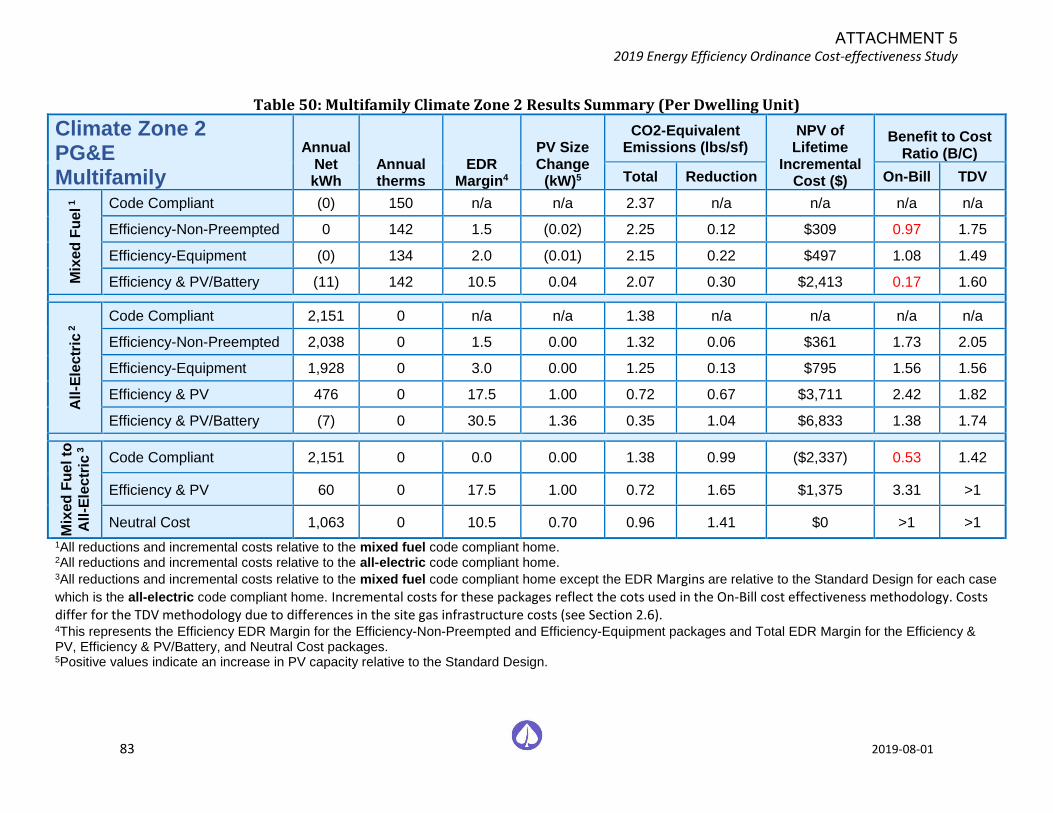
2019 Energy Efficiency Ordinance Cost-effectiveness Study
83 2019-08-01
Table 50: Multifamily Climate Zone 2 Results Summary (Per Dwelling Unit)
Climate Zone 2 PG&E Multifamily
Annual Net kWh
Annual therms
EDR Margin4
PV Size Change
(kW)5
CO2-Equivalent Emissions (lbs/sf)
NPV of Lifetime
Incremental Cost ($)
Benefit to Cost Ratio (B/C)
Total Reduction On-Bill TDV
Mix
ed
Fu
el 1
Code Compliant (0) 150 n/a n/a 2.37 n/a n/a n/a n/a
Efficiency-Non-Preempted 0 142 1.5 (0.02) 2.25 0.12 $309 0.97 1.75
Efficiency-Equipment (0) 134 2.0 (0.01) 2.15 0.22 $497 1.08 1.49
Efficiency & PV/Battery (11) 142 10.5 0.04 2.07 0.30 $2,413 0.17 1.60
All
-Ele
ctr
ic 2 Code Compliant 2,151 0 n/a n/a 1.38 n/a n/a n/a n/a
Efficiency-Non-Preempted 2,038 0 1.5 0.00 1.32 0.06 $361 1.73 2.05
Efficiency-Equipment 1,928 0 3.0 0.00 1.25 0.13 $795 1.56 1.56
Efficiency & PV 476 0 17.5 1.00 0.72 0.67 $3,711 2.42 1.82
Efficiency & PV/Battery (7) 0 30.5 1.36 0.35 1.04 $6,833 1.38 1.74
Mix
ed
Fu
el to
All
-Ele
ctr
ic 3
Code Compliant 2,151 0 0.0 0.00 1.38 0.99 ($2,337) 0.53 1.42
Efficiency & PV 60 0 17.5 1.00 0.72 1.65 $1,375 3.31 >1
Neutral Cost 1,063 0 10.5 0.70 0.96 1.41 $0 >1 >1
1All reductions and incremental costs relative to the mixed fuel code compliant home. 2All reductions and incremental costs relative to the all-electric code compliant home. 3All reductions and incremental costs relative to the mixed fuel code compliant home except the EDR Margins are relative to the Standard Design for each case
which is the all-electric code compliant home. Incremental costs for these packages reflect the cots used in the On-Bill cost effectiveness methodology. Costs differ for the TDV methodology due to differences in the site gas infrastructure costs (see Section 2.6). 4This represents the Efficiency EDR Margin for the Efficiency-Non-Preempted and Efficiency-Equipment packages and Total EDR Margin for the Efficiency & PV, Efficiency & PV/Battery, and Neutral Cost packages. 5Positive values indicate an increase in PV capacity relative to the Standard Design.
ATTACHMENT 5
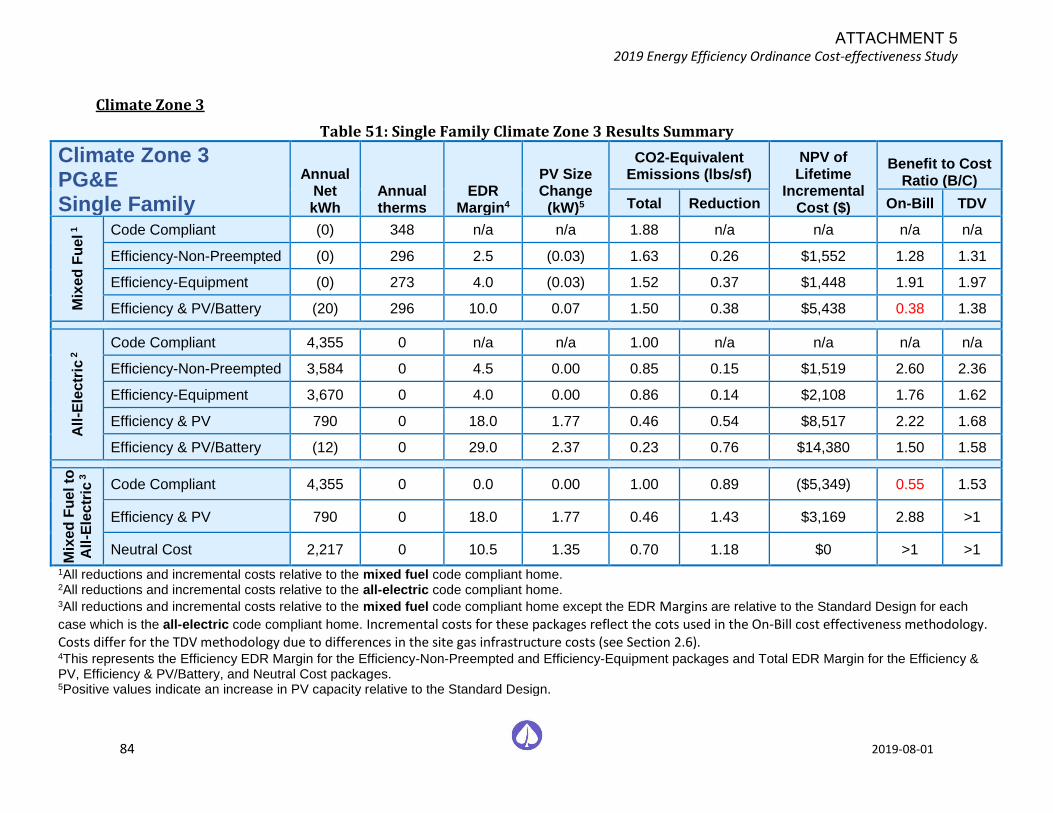
2019 Energy Efficiency Ordinance Cost-effectiveness Study
84 2019-08-01
Climate Zone 3
Table 51: Single Family Climate Zone 3 Results Summary
Climate Zone 3 PG&E Single Family
Annual Net kWh
Annual therms
EDR Margin4
PV Size Change
(kW)5
CO2-Equivalent Emissions (lbs/sf)
NPV of Lifetime
Incremental Cost ($)
Benefit to Cost Ratio (B/C)
Total Reduction On-Bill TDV
Mix
ed
Fu
el 1
Code Compliant (0) 348 n/a n/a 1.88 n/a n/a n/a n/a
Efficiency-Non-Preempted (0) 296 2.5 (0.03) 1.63 0.26 $1,552 1.28 1.31
Efficiency-Equipment (0) 273 4.0 (0.03) 1.52 0.37 $1,448 1.91 1.97
Efficiency & PV/Battery (20) 296 10.0 0.07 1.50 0.38 $5,438 0.38 1.38
All
-Ele
ctr
ic 2 Code Compliant 4,355 0 n/a n/a 1.00 n/a n/a n/a n/a
Efficiency-Non-Preempted 3,584 0 4.5 0.00 0.85 0.15 $1,519 2.60 2.36
Efficiency-Equipment 3,670 0 4.0 0.00 0.86 0.14 $2,108 1.76 1.62
Efficiency & PV 790 0 18.0 1.77 0.46 0.54 $8,517 2.22 1.68
Efficiency & PV/Battery (12) 0 29.0 2.37 0.23 0.76 $14,380 1.50 1.58
Mix
ed
Fu
el to
All
-Ele
ctr
ic 3
Code Compliant 4,355 0 0.0 0.00 1.00 0.89 ($5,349) 0.55 1.53
Efficiency & PV 790 0 18.0 1.77 0.46 1.43 $3,169 2.88 >1
Neutral Cost 2,217 0 10.5 1.35 0.70 1.18 $0 >1 >1
1All reductions and incremental costs relative to the mixed fuel code compliant home. 2All reductions and incremental costs relative to the all-electric code compliant home. 3All reductions and incremental costs relative to the mixed fuel code compliant home except the EDR Margins are relative to the Standard Design for each
case which is the all-electric code compliant home. Incremental costs for these packages reflect the cots used in the On-Bill cost effectiveness methodology. Costs differ for the TDV methodology due to differences in the site gas infrastructure costs (see Section 2.6). 4This represents the Efficiency EDR Margin for the Efficiency-Non-Preempted and Efficiency-Equipment packages and Total EDR Margin for the Efficiency & PV, Efficiency & PV/Battery, and Neutral Cost packages. 5Positive values indicate an increase in PV capacity relative to the Standard Design.
ATTACHMENT 5
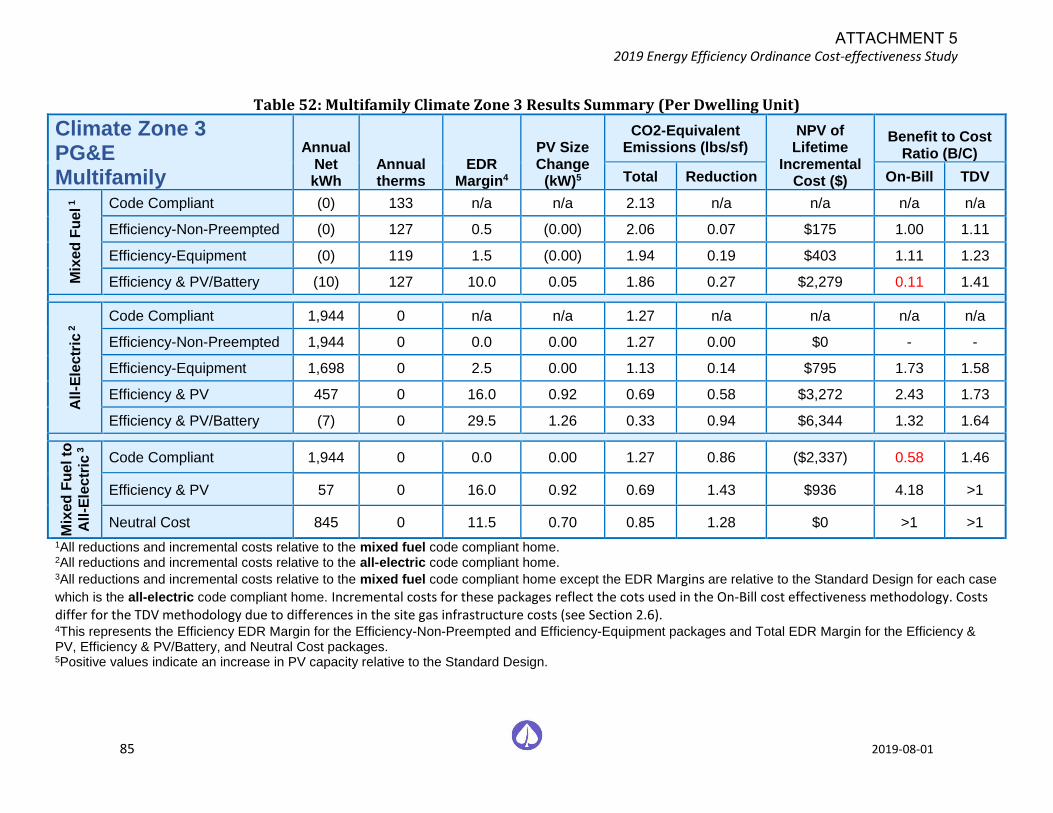
2019 Energy Efficiency Ordinance Cost-effectiveness Study
85 2019-08-01
Table 52: Multifamily Climate Zone 3 Results Summary (Per Dwelling Unit)
Climate Zone 3 PG&E Multifamily
Annual Net kWh
Annual therms
EDR Margin4
PV Size Change
(kW)5
CO2-Equivalent Emissions (lbs/sf)
NPV of Lifetime
Incremental Cost ($)
Benefit to Cost Ratio (B/C)
Total Reduction On-Bill TDV
Mix
ed
Fu
el 1
Code Compliant (0) 133 n/a n/a 2.13 n/a n/a n/a n/a
Efficiency-Non-Preempted (0) 127 0.5 (0.00) 2.06 0.07 $175 1.00 1.11
Efficiency-Equipment (0) 119 1.5 (0.00) 1.94 0.19 $403 1.11 1.23
Efficiency & PV/Battery (10) 127 10.0 0.05 1.86 0.27 $2,279 0.11 1.41
All
-Ele
ctr
ic 2 Code Compliant 1,944 0 n/a n/a 1.27 n/a n/a n/a n/a
Efficiency-Non-Preempted 1,944 0 0.0 0.00 1.27 0.00 $0 - -
Efficiency-Equipment 1,698 0 2.5 0.00 1.13 0.14 $795 1.73 1.58
Efficiency & PV 457 0 16.0 0.92 0.69 0.58 $3,272 2.43 1.73
Efficiency & PV/Battery (7) 0 29.5 1.26 0.33 0.94 $6,344 1.32 1.64
Mix
ed
Fu
el to
All
-Ele
ctr
ic 3
Code Compliant 1,944 0 0.0 0.00 1.27 0.86 ($2,337) 0.58 1.46
Efficiency & PV 57 0 16.0 0.92 0.69 1.43 $936 4.18 >1
Neutral Cost 845 0 11.5 0.70 0.85 1.28 $0 >1 >1
1All reductions and incremental costs relative to the mixed fuel code compliant home. 2All reductions and incremental costs relative to the all-electric code compliant home. 3All reductions and incremental costs relative to the mixed fuel code compliant home except the EDR Margins are relative to the Standard Design for each case
which is the all-electric code compliant home. Incremental costs for these packages reflect the cots used in the On-Bill cost effectiveness methodology. Costs differ for the TDV methodology due to differences in the site gas infrastructure costs (see Section 2.6). 4This represents the Efficiency EDR Margin for the Efficiency-Non-Preempted and Efficiency-Equipment packages and Total EDR Margin for the Efficiency & PV, Efficiency & PV/Battery, and Neutral Cost packages. 5Positive values indicate an increase in PV capacity relative to the Standard Design.
ATTACHMENT 5

2019 Energy Efficiency Ordinance Cost-effectiveness Study
86 2019-08-01
Climate Zone 4
Table 53: Single Family Climate Zone 4 Results Summary
Climate Zone 4 PG&E Single Family
Annual Net kWh
Annual therms
EDR Margin4
PV Size Change
(kW)5
CO2-Equivalent Emissions (lbs/sf)
NPV of Lifetime
Incremental Cost ($)
Benefit to Cost Ratio (B/C)
Total Reduction On-Bill TDV
Mix
ed
Fu
el 1
Code Compliant 0 347 n/a n/a 1.88 n/a n/a n/a n/a
Efficiency-Non-Preempted 0 306 2.5 (0.03) 1.68 0.20 $1,556 0.93 1.15
Efficiency-Equipment (0) 294 2.5 (0.02) 1.62 0.26 $758 2.39 2.67
Efficiency & PV/Battery (18) 306 10.0 0.07 1.55 0.33 $5,434 0.30 1.48
All
-Ele
ctr
ic 2 Code Compliant 4,342 0 n/a n/a 1.00 n/a n/a n/a n/a
Efficiency-Non-Preempted 3,775 0 3.0 0.00 0.89 0.11 $1,519 1.92 1.84
Efficiency-Equipment 3,747 0 3.5 0.00 0.88 0.12 $2,108 1.52 1.52
Efficiency & PV 814 0 17.0 1.84 0.48 0.52 $8,786 2.13 1.62
Efficiency & PV/Battery (11) 0 28.5 2.44 0.25 0.75 $14,664 1.46 1.61
Mix
ed
Fu
el to
All
-Ele
ctr
ic 3
Code Compliant 4,342 0 0.0 0.00 1.00 0.88 ($5,349) 0.55 1.59
Efficiency & PV 814 0 17.0 1.84 0.48 1.40 $3,438 2.64 >1
Neutral Cost 2,166 0 10.0 1.35 0.70 1.18 $0 >1 >1
1All reductions and incremental costs relative to the mixed fuel code compliant home. 2All reductions and incremental costs relative to the all-electric code compliant home. 3All reductions and incremental costs relative to the mixed fuel code compliant home except the EDR Margins are relative to the Standard Design for each
case which is the all-electric code compliant home. Incremental costs for these packages reflect the cots used in the On-Bill cost effectiveness methodology. Costs differ for the TDV methodology due to differences in the site gas infrastructure costs (see Section 2.6). 4This represents the Efficiency EDR Margin for the Efficiency-Non-Preempted and Efficiency-Equipment packages and Total EDR Margin for the Efficiency & PV, Efficiency & PV/Battery, and Neutral Cost packages. 5Positive values indicate an increase in PV capacity relative to the Standard Design.
ATTACHMENT 5

2019 Energy Efficiency Ordinance Cost-effectiveness Study
87 2019-08-01
Table 54: Multifamily Climate Zone 4 Results Summary (Per Dwelling Unit)
Climate Zone 4 PG&E Multifamily
Annual Net kWh
Annual therms
EDR Margin4
PV Size Change
(kW)5
CO2-Equivalent Emissions (lbs/sf)
NPV of Lifetime
Incremental Cost ($)
Benefit to Cost Ratio (B/C)
Total Reduction On-Bill TDV
Mix
ed
Fu
el 1
Code Compliant (0) 134 n/a n/a 2.16 n/a n/a n/a n/a
Efficiency-Non-Preempted (0) 127 1.0 (0.01) 2.06 0.10 $329 0.75 1.24
Efficiency-Equipment (0) 123 1.5 (0.01) 2.01 0.15 $351 1.06 1.74
Efficiency & PV/Battery (9) 127 11.0 0.04 1.87 0.29 $2,429 0.17 1.60
All
-Ele
ctr
ic 2 Code Compliant 1,887 0 n/a n/a 1.25 n/a n/a n/a n/a
Efficiency-Non-Preempted 1,794 0 1.0 0.00 1.21 0.05 $361 1.38 1.54
Efficiency-Equipment 1,712 0 2.0 0.00 1.15 0.10 $795 1.23 1.09
Efficiency & PV 453 0 15.0 0.83 0.69 0.57 $3,158 2.43 1.81
Efficiency & PV/Battery (7) 0 28.5 1.17 0.32 0.93 $6,201 1.30 1.77
Mix
ed
Fu
el to
All
-Ele
ctr
ic 3
Code Compliant 1,887 0 0.0 0.00 1.25 0.90 ($2,337) 0.65 1.77
Efficiency & PV 57 0 15.0 0.83 0.69 1.47 $822 4.96 >1
Neutral Cost 767 0 11.0 0.70 0.82 1.33 $0 >1 >1
1All reductions and incremental costs relative to the mixed fuel code compliant home. 2All reductions and incremental costs relative to the all-electric code compliant home. 3All reductions and incremental costs relative to the mixed fuel code compliant home except the EDR Margins are relative to the Standard Design for each case
which is the all-electric code compliant home. Incremental costs for these packages reflect the cots used in the On-Bill cost effectiveness methodology. Costs differ for the TDV methodology due to differences in the site gas infrastructure costs (see Section 2.6). 4This represents the Efficiency EDR Margin for the Efficiency-Non-Preempted and Efficiency-Equipment packages and Total EDR Margin for the Efficiency & PV, Efficiency & PV/Battery, and Neutral Cost packages. 5Positive values indicate an increase in PV capacity relative to the Standard Design..
ATTACHMENT 5
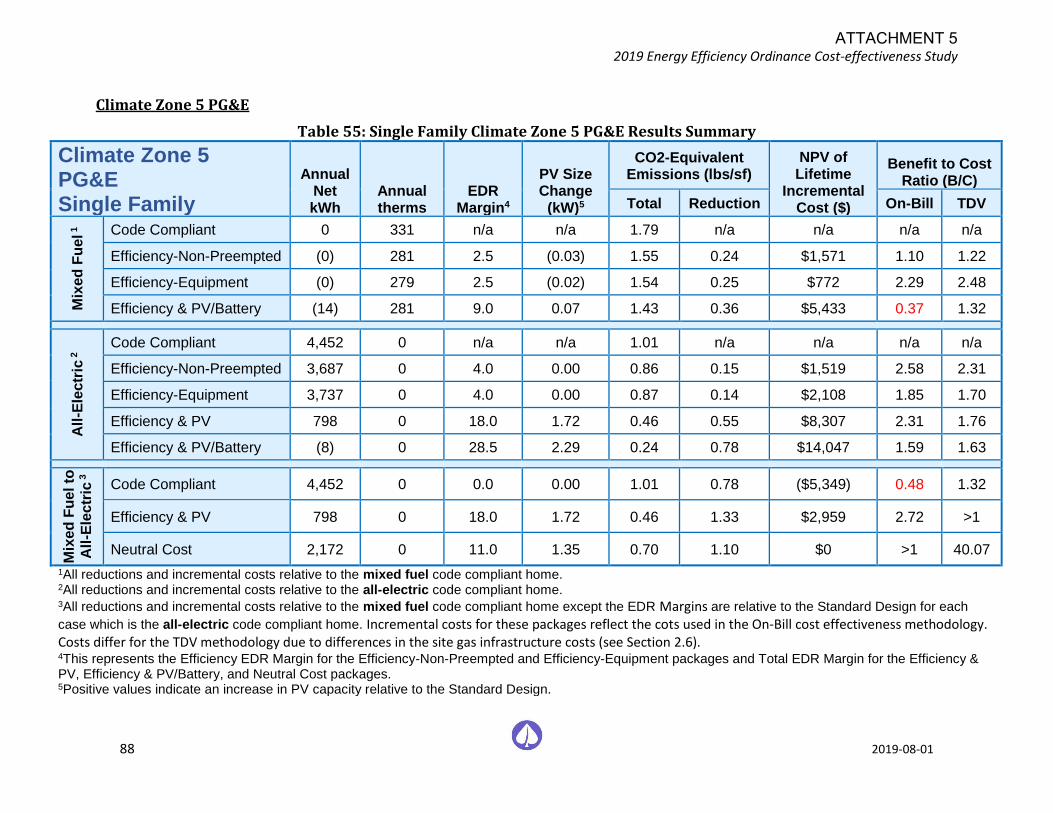
2019 Energy Efficiency Ordinance Cost-effectiveness Study
88 2019-08-01
Climate Zone 5 PG&E
Table 55: Single Family Climate Zone 5 PG&E Results Summary
Climate Zone 5 PG&E Single Family
Annual Net kWh
Annual therms
EDR Margin4
PV Size Change
(kW)5
CO2-Equivalent Emissions (lbs/sf)
NPV of Lifetime
Incremental Cost ($)
Benefit to Cost Ratio (B/C)
Total Reduction On-Bill TDV
Mix
ed
Fu
el 1
Code Compliant 0 331 n/a n/a 1.79 n/a n/a n/a n/a
Efficiency-Non-Preempted (0) 281 2.5 (0.03) 1.55 0.24 $1,571 1.10 1.22
Efficiency-Equipment (0) 279 2.5 (0.02) 1.54 0.25 $772 2.29 2.48
Efficiency & PV/Battery (14) 281 9.0 0.07 1.43 0.36 $5,433 0.37 1.32
All
-Ele
ctr
ic 2 Code Compliant 4,452 0 n/a n/a 1.01 n/a n/a n/a n/a
Efficiency-Non-Preempted 3,687 0 4.0 0.00 0.86 0.15 $1,519 2.58 2.31
Efficiency-Equipment 3,737 0 4.0 0.00 0.87 0.14 $2,108 1.85 1.70
Efficiency & PV 798 0 18.0 1.72 0.46 0.55 $8,307 2.31 1.76
Efficiency & PV/Battery (8) 0 28.5 2.29 0.24 0.78 $14,047 1.59 1.63
Mix
ed
Fu
el to
All
-Ele
ctr
ic 3
Code Compliant 4,452 0 0.0 0.00 1.01 0.78 ($5,349) 0.48 1.32
Efficiency & PV 798 0 18.0 1.72 0.46 1.33 $2,959 2.72 >1
Neutral Cost 2,172 0 11.0 1.35 0.70 1.10 $0 >1 40.07
1All reductions and incremental costs relative to the mixed fuel code compliant home. 2All reductions and incremental costs relative to the all-electric code compliant home. 3All reductions and incremental costs relative to the mixed fuel code compliant home except the EDR Margins are relative to the Standard Design for each
case which is the all-electric code compliant home. Incremental costs for these packages reflect the cots used in the On-Bill cost effectiveness methodology. Costs differ for the TDV methodology due to differences in the site gas infrastructure costs (see Section 2.6). 4This represents the Efficiency EDR Margin for the Efficiency-Non-Preempted and Efficiency-Equipment packages and Total EDR Margin for the Efficiency & PV, Efficiency & PV/Battery, and Neutral Cost packages. 5Positive values indicate an increase in PV capacity relative to the Standard Design.
ATTACHMENT 5
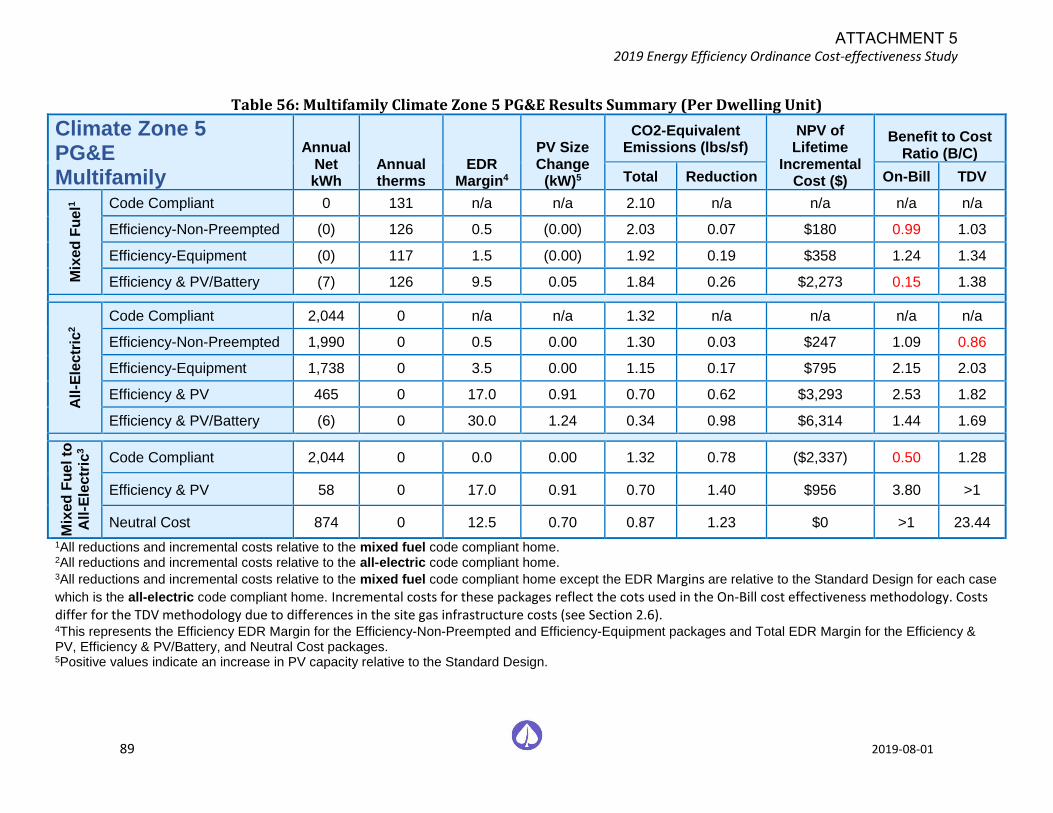
2019 Energy Efficiency Ordinance Cost-effectiveness Study
89 2019-08-01
Table 56: Multifamily Climate Zone 5 PG&E Results Summary (Per Dwelling Unit)
Climate Zone 5 PG&E Multifamily
Annual Net kWh
Annual therms
EDR Margin4
PV Size Change
(kW)5
CO2-Equivalent Emissions (lbs/sf)
NPV of Lifetime
Incremental Cost ($)
Benefit to Cost Ratio (B/C)
Total Reduction On-Bill TDV
Mix
ed
Fu
el1
Code Compliant 0 131 n/a n/a 2.10 n/a n/a n/a n/a
Efficiency-Non-Preempted (0) 126 0.5 (0.00) 2.03 0.07 $180 0.99 1.03
Efficiency-Equipment (0) 117 1.5 (0.00) 1.92 0.19 $358 1.24 1.34
Efficiency & PV/Battery (7) 126 9.5 0.05 1.84 0.26 $2,273 0.15 1.38
All
-Ele
ctr
ic2 Code Compliant 2,044 0 n/a n/a 1.32 n/a n/a n/a n/a
Efficiency-Non-Preempted 1,990 0 0.5 0.00 1.30 0.03 $247 1.09 0.86
Efficiency-Equipment 1,738 0 3.5 0.00 1.15 0.17 $795 2.15 2.03
Efficiency & PV 465 0 17.0 0.91 0.70 0.62 $3,293 2.53 1.82
Efficiency & PV/Battery (6) 0 30.0 1.24 0.34 0.98 $6,314 1.44 1.69
Mix
ed
Fu
el to
All
-Ele
ctr
ic3
Code Compliant 2,044 0 0.0 0.00 1.32 0.78 ($2,337) 0.50 1.28
Efficiency & PV 58 0 17.0 0.91 0.70 1.40 $956 3.80 >1
Neutral Cost 874 0 12.5 0.70 0.87 1.23 $0 >1 23.44
1All reductions and incremental costs relative to the mixed fuel code compliant home. 2All reductions and incremental costs relative to the all-electric code compliant home. 3All reductions and incremental costs relative to the mixed fuel code compliant home except the EDR Margins are relative to the Standard Design for each case
which is the all-electric code compliant home. Incremental costs for these packages reflect the cots used in the On-Bill cost effectiveness methodology. Costs differ for the TDV methodology due to differences in the site gas infrastructure costs (see Section 2.6). 4This represents the Efficiency EDR Margin for the Efficiency-Non-Preempted and Efficiency-Equipment packages and Total EDR Margin for the Efficiency & PV, Efficiency & PV/Battery, and Neutral Cost packages. 5Positive values indicate an increase in PV capacity relative to the Standard Design.
ATTACHMENT 5
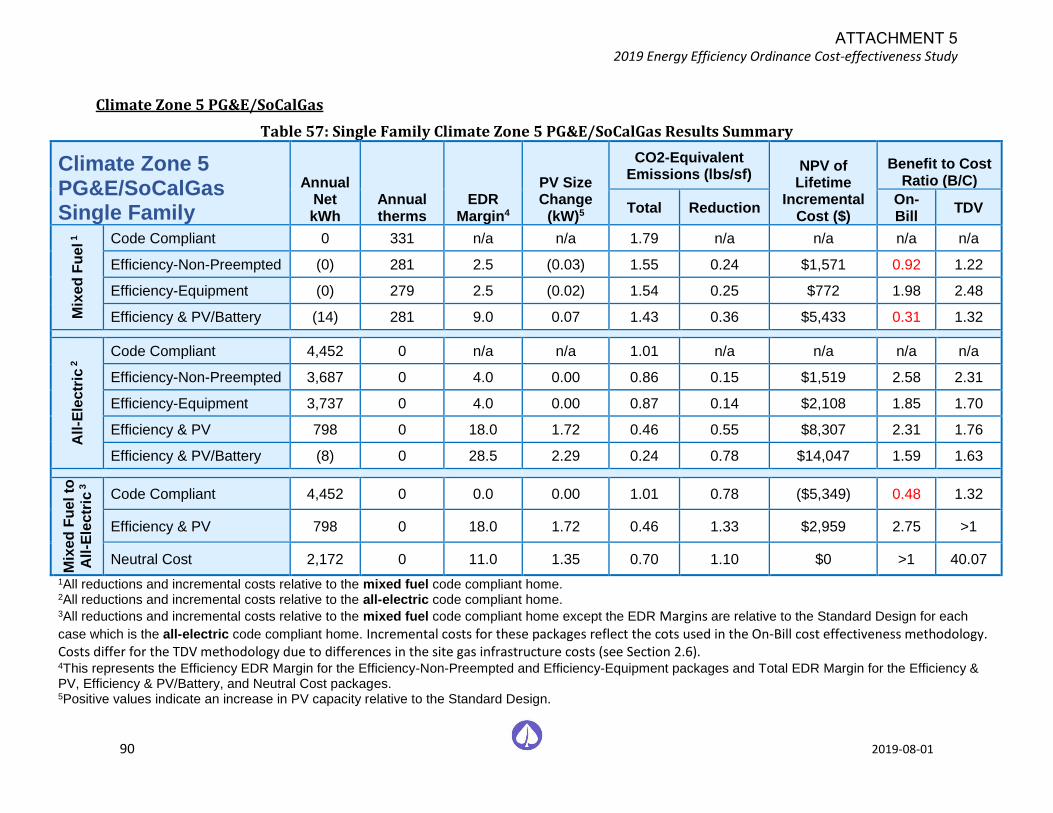
2019 Energy Efficiency Ordinance Cost-effectiveness Study
90 2019-08-01
Climate Zone 5 PG&E/SoCalGas
Table 57: Single Family Climate Zone 5 PG&E/SoCalGas Results Summary
Climate Zone 5 PG&E/SoCalGas Single Family
Annual Net kWh
Annual therms
EDR Margin4
PV Size Change
(kW)5
CO2-Equivalent Emissions (lbs/sf)
NPV of Lifetime
Incremental Cost ($)
Benefit to Cost Ratio (B/C)
Total Reduction On-Bill
TDV
Mix
ed
Fu
el 1
Code Compliant 0 331 n/a n/a 1.79 n/a n/a n/a n/a
Efficiency-Non-Preempted (0) 281 2.5 (0.03) 1.55 0.24 $1,571 0.92 1.22
Efficiency-Equipment (0) 279 2.5 (0.02) 1.54 0.25 $772 1.98 2.48
Efficiency & PV/Battery (14) 281 9.0 0.07 1.43 0.36 $5,433 0.31 1.32
All
-Ele
ctr
ic 2 Code Compliant 4,452 0 n/a n/a 1.01 n/a n/a n/a n/a
Efficiency-Non-Preempted 3,687 0 4.0 0.00 0.86 0.15 $1,519 2.58 2.31
Efficiency-Equipment 3,737 0 4.0 0.00 0.87 0.14 $2,108 1.85 1.70
Efficiency & PV 798 0 18.0 1.72 0.46 0.55 $8,307 2.31 1.76
Efficiency & PV/Battery (8) 0 28.5 2.29 0.24 0.78 $14,047 1.59 1.63
Mix
ed
Fu
el to
All
-Ele
ctr
ic 3
Code Compliant 4,452 0 0.0 0.00 1.01 0.78 ($5,349) 0.48 1.32
Efficiency & PV 798 0 18.0 1.72 0.46 1.33 $2,959 2.75 >1
Neutral Cost 2,172 0 11.0 1.35 0.70 1.10 $0 >1 40.07
1All reductions and incremental costs relative to the mixed fuel code compliant home. 2All reductions and incremental costs relative to the all-electric code compliant home. 3All reductions and incremental costs relative to the mixed fuel code compliant home except the EDR Margins are relative to the Standard Design for each
case which is the all-electric code compliant home. Incremental costs for these packages reflect the cots used in the On-Bill cost effectiveness methodology. Costs differ for the TDV methodology due to differences in the site gas infrastructure costs (see Section 2.6). 4This represents the Efficiency EDR Margin for the Efficiency-Non-Preempted and Efficiency-Equipment packages and Total EDR Margin for the Efficiency & PV, Efficiency & PV/Battery, and Neutral Cost packages. 5Positive values indicate an increase in PV capacity relative to the Standard Design.
ATTACHMENT 5
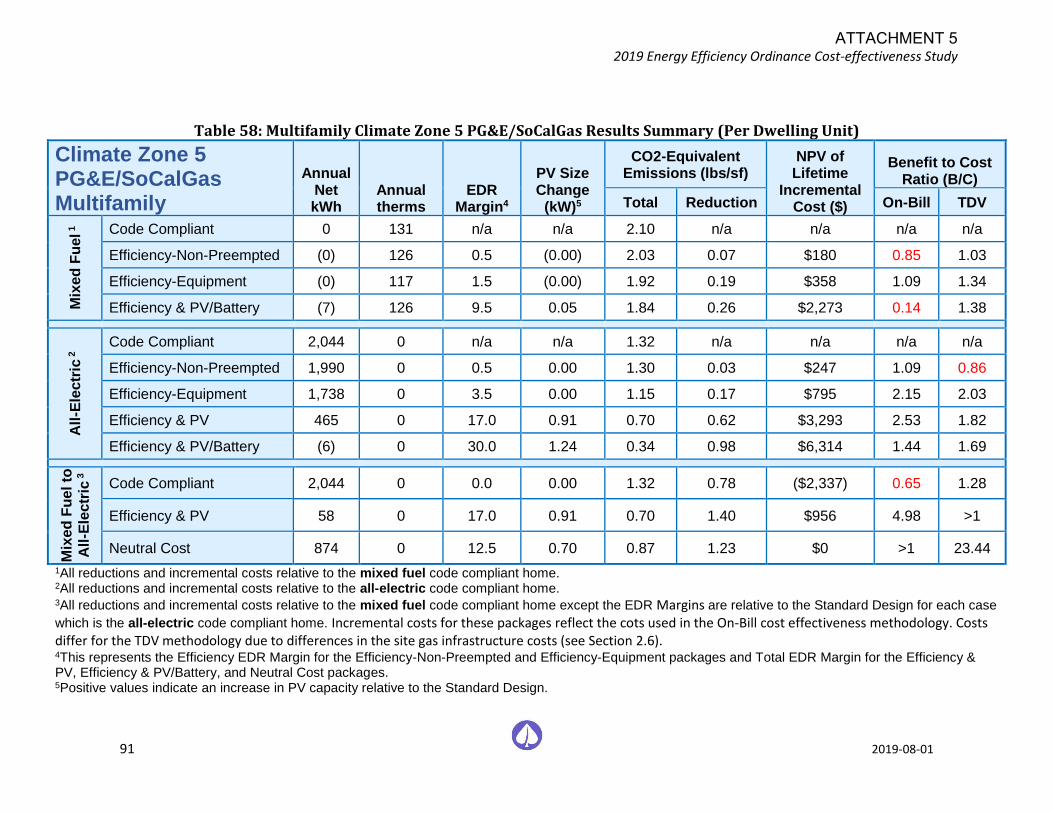
2019 Energy Efficiency Ordinance Cost-effectiveness Study
91 2019-08-01
Table 58: Multifamily Climate Zone 5 PG&E/SoCalGas Results Summary (Per Dwelling Unit)
Climate Zone 5 PG&E/SoCalGas Multifamily
Annual Net kWh
Annual therms
EDR Margin4
PV Size Change
(kW)5
CO2-Equivalent Emissions (lbs/sf)
NPV of Lifetime
Incremental Cost ($)
Benefit to Cost Ratio (B/C)
Total Reduction On-Bill TDV
Mix
ed
Fu
el 1
Code Compliant 0 131 n/a n/a 2.10 n/a n/a n/a n/a
Efficiency-Non-Preempted (0) 126 0.5 (0.00) 2.03 0.07 $180 0.85 1.03
Efficiency-Equipment (0) 117 1.5 (0.00) 1.92 0.19 $358 1.09 1.34
Efficiency & PV/Battery (7) 126 9.5 0.05 1.84 0.26 $2,273 0.14 1.38
All
-Ele
ctr
ic 2 Code Compliant 2,044 0 n/a n/a 1.32 n/a n/a n/a n/a
Efficiency-Non-Preempted 1,990 0 0.5 0.00 1.30 0.03 $247 1.09 0.86
Efficiency-Equipment 1,738 0 3.5 0.00 1.15 0.17 $795 2.15 2.03
Efficiency & PV 465 0 17.0 0.91 0.70 0.62 $3,293 2.53 1.82
Efficiency & PV/Battery (6) 0 30.0 1.24 0.34 0.98 $6,314 1.44 1.69
Mix
ed
Fu
el to
All
-Ele
ctr
ic 3
Code Compliant 2,044 0 0.0 0.00 1.32 0.78 ($2,337) 0.65 1.28
Efficiency & PV 58 0 17.0 0.91 0.70 1.40 $956 4.98 >1
Neutral Cost 874 0 12.5 0.70 0.87 1.23 $0 >1 23.44
1All reductions and incremental costs relative to the mixed fuel code compliant home. 2All reductions and incremental costs relative to the all-electric code compliant home. 3All reductions and incremental costs relative to the mixed fuel code compliant home except the EDR Margins are relative to the Standard Design for each case
which is the all-electric code compliant home. Incremental costs for these packages reflect the cots used in the On-Bill cost effectiveness methodology. Costs differ for the TDV methodology due to differences in the site gas infrastructure costs (see Section 2.6). 4This represents the Efficiency EDR Margin for the Efficiency-Non-Preempted and Efficiency-Equipment packages and Total EDR Margin for the Efficiency & PV, Efficiency & PV/Battery, and Neutral Cost packages. 5Positive values indicate an increase in PV capacity relative to the Standard Design.
ATTACHMENT 5

2019 Energy Efficiency Ordinance Cost-effectiveness Study
92 2019-08-01
Climate Zone 6
Table 59: Single Family Climate Zone 6 Results Summary
Climate Zone 6 SCE/SoCalGas Single Family
Annual Net kWh
Annual therms
EDR Margin4
PV Size Change
(kW)5
CO2-Equivalent Emissions (lbs/sf)
NPV of Lifetime
Incremental Cost ($)
Benefit to Cost Ratio (B/C)
Total Reduction On-Bill TDV
Mix
ed
Fu
el 1
Code Compliant (0) 249 n/a n/a 1.57 n/a n/a n/a n/a
Efficiency-Non-Preempted 0 229 2.0 (0.02) 1.47 0.10 $1,003 0.66 1.15
Efficiency-Equipment (0) 218 1.5 (0.01) 1.41 0.15 $581 1.58 2.04
Efficiency & PV/Battery (13) 229 9.5 0.08 1.22 0.34 $4,889 0.84 1.27
All
-Ele
ctr
ic 2 Code Compliant 3,099 0 n/a n/a 0.87 n/a n/a n/a n/a
Efficiency-Non-Preempted 2,885 0 2.0 0.00 0.83 0.05 $926 1.31 1.41
Efficiency-Equipment 2,746 0 2.5 0.00 0.80 0.08 $846 2.20 2.29
Efficiency & PV 722 0 14.0 1.37 0.63 0.24 $6,341 1.19 1.48
Efficiency & PV/Battery (6) 0 26.0 1.93 0.33 0.55 $12,036 1.15 1.43
Mix
ed
Fu
el to
All
-Ele
ctr
ic 3
Code Compliant 3,099 0 0.0 0.00 0.87 0.69 ($5,349) 1.19 2.46
Efficiency & PV 722 0 14.0 1.37 0.63 0.93 $992 3.07 >1
Neutral Cost 959 0 12.0 1.36 0.67 0.89 $0 >1 >1
1All reductions and incremental costs relative to the mixed fuel code compliant home. 2All reductions and incremental costs relative to the all-electric code compliant home. 3All reductions and incremental costs relative to the mixed fuel code compliant home except the EDR Margins are relative to the Standard Design for each
case which is the all-electric code compliant home. Incremental costs for these packages reflect the cots used in the On-Bill cost effectiveness methodology. Costs differ for the TDV methodology due to differences in the site gas infrastructure costs (see Section 2.6). 4This represents the Efficiency EDR Margin for the Efficiency-Non-Preempted and Efficiency-Equipment packages and Total EDR Margin for the Efficiency & PV, Efficiency & PV/Battery, and Neutral Cost packages. 5Positive values indicate an increase in PV capacity relative to the Standard Design.
ATTACHMENT 5

2019 Energy Efficiency Ordinance Cost-effectiveness Study
93 2019-08-01
Table 60: Multifamily Climate Zone 6 Results Summary (Per Dwelling Unit)
Climate Zone 6 SCE/SoCalGas Multifamily
Annual Net kWh
Annual therms
EDR Margin4
PV Size Change
(kW)5
CO2-Equivalent Emissions (lbs/sf)
NPV of Lifetime
Incremental Cost ($)
Benefit to Cost Ratio (B/C)
Total Reduction On-Bill TDV
Mix
ed
Fu
el 1
Code Compliant (0) 114 n/a n/a 2.17 n/a n/a n/a n/a
Efficiency-Non-Preempted (0) 112 1.0 (0.01) 2.14 0.03 $190 0.65 1.49
Efficiency-Equipment (0) 103 1.0 (0.00) 2.03 0.15 $213 1.43 1.74
Efficiency & PV/Battery (6) 112 10.5 0.04 1.76 0.41 $2,294 0.56 1.35
All
-Ele
ctr
ic 2 Code Compliant 1,558 0 n/a n/a 1.28 n/a n/a n/a n/a
Efficiency-Non-Preempted 1,531 0 1.0 0.00 1.26 0.02 $231 0.65 1.34
Efficiency-Equipment 1,430 0 2.0 0.00 1.20 0.08 $361 1.62 1.91
Efficiency & PV 427 0 13.5 0.70 0.97 0.31 $2,580 1.24 1.71
Efficiency & PV/Battery (5) 0 27.5 1.02 0.49 0.79 $5,590 1.22 1.58
Mix
ed
Fu
el to
All
-Ele
ctr
ic 3
Code Compliant 1,558 0 0.0 0.00 1.28 0.90 ($2,337) 2.59 2.38
Efficiency & PV 53 0 13.5 0.70 0.97 1.20 $243 9.50 >1
Neutral Cost 459 0 12.5 0.70 0.99 1.18 $0 >1 >1
1All reductions and incremental costs relative to the mixed fuel code compliant home. 2All reductions and incremental costs relative to the all-electric code compliant home. 3All reductions and incremental costs relative to the mixed fuel code compliant home except the EDR Margins are relative to the Standard Design for each case
which is the all-electric code compliant home. Incremental costs for these packages reflect the cots used in the On-Bill cost effectiveness methodology. Costs differ for the TDV methodology due to differences in the site gas infrastructure costs (see Section 2.6). 4This represents the Efficiency EDR Margin for the Efficiency-Non-Preempted and Efficiency-Equipment packages and Total EDR Margin for the Efficiency & PV, Efficiency & PV/Battery, and Neutral Cost packages. 5Positive values indicate an increase in PV capacity relative to the Standard Design.
ATTACHMENT 5
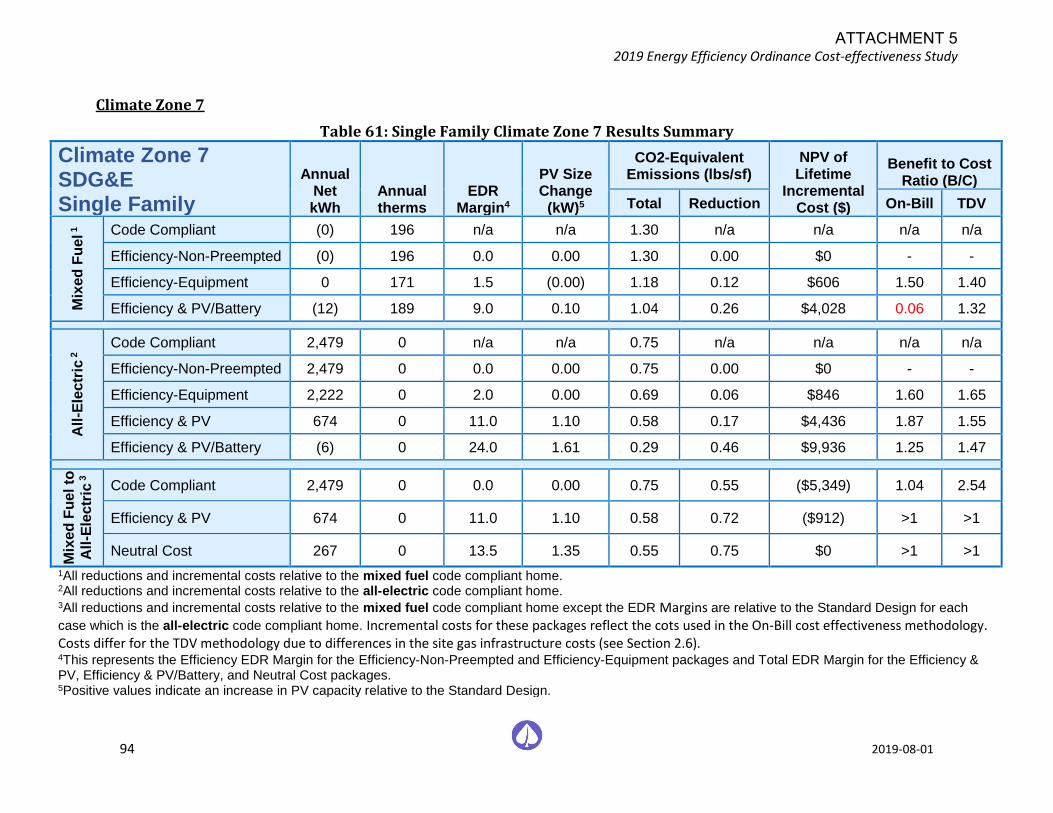
2019 Energy Efficiency Ordinance Cost-effectiveness Study
94 2019-08-01
Climate Zone 7
Table 61: Single Family Climate Zone 7 Results Summary
Climate Zone 7 SDG&E Single Family
Annual Net kWh
Annual therms
EDR Margin4
PV Size Change
(kW)5
CO2-Equivalent Emissions (lbs/sf)
NPV of Lifetime
Incremental Cost ($)
Benefit to Cost Ratio (B/C)
Total Reduction On-Bill TDV
Mix
ed
Fu
el 1
Code Compliant (0) 196 n/a n/a 1.30 n/a n/a n/a n/a
Efficiency-Non-Preempted (0) 196 0.0 0.00 1.30 0.00 $0 - -
Efficiency-Equipment 0 171 1.5 (0.00) 1.18 0.12 $606 1.50 1.40
Efficiency & PV/Battery (12) 189 9.0 0.10 1.04 0.26 $4,028 0.06 1.32
All
-Ele
ctr
ic 2 Code Compliant 2,479 0 n/a n/a 0.75 n/a n/a n/a n/a
Efficiency-Non-Preempted 2,479 0 0.0 0.00 0.75 0.00 $0 - -
Efficiency-Equipment 2,222 0 2.0 0.00 0.69 0.06 $846 1.60 1.65
Efficiency & PV 674 0 11.0 1.10 0.58 0.17 $4,436 1.87 1.55
Efficiency & PV/Battery (6) 0 24.0 1.61 0.29 0.46 $9,936 1.25 1.47
Mix
ed
Fu
el to
All
-Ele
ctr
ic 3
Code Compliant 2,479 0 0.0 0.00 0.75 0.55 ($5,349) 1.04 2.54
Efficiency & PV 674 0 11.0 1.10 0.58 0.72 ($912) >1 >1
Neutral Cost 267 0 13.5 1.35 0.55 0.75 $0 >1 >1
1All reductions and incremental costs relative to the mixed fuel code compliant home. 2All reductions and incremental costs relative to the all-electric code compliant home. 3All reductions and incremental costs relative to the mixed fuel code compliant home except the EDR Margins are relative to the Standard Design for each
case which is the all-electric code compliant home. Incremental costs for these packages reflect the cots used in the On-Bill cost effectiveness methodology. Costs differ for the TDV methodology due to differences in the site gas infrastructure costs (see Section 2.6). 4This represents the Efficiency EDR Margin for the Efficiency-Non-Preempted and Efficiency-Equipment packages and Total EDR Margin for the Efficiency & PV, Efficiency & PV/Battery, and Neutral Cost packages. 5Positive values indicate an increase in PV capacity relative to the Standard Design.
ATTACHMENT 5
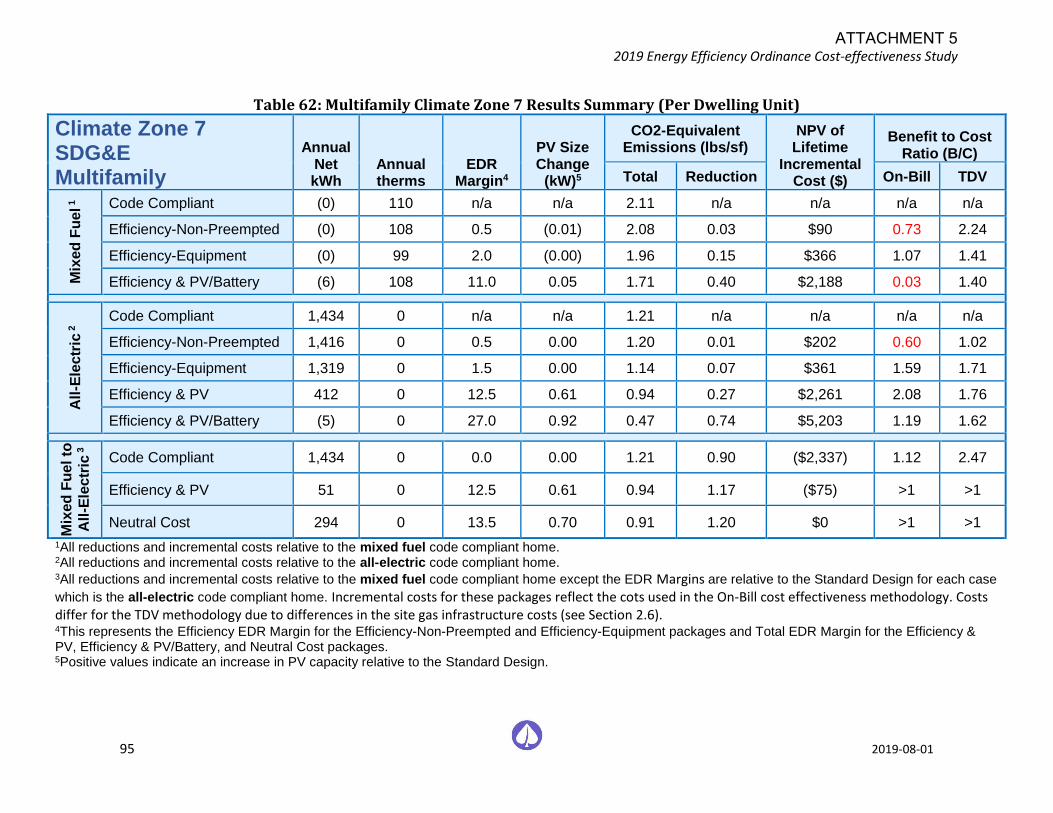
2019 Energy Efficiency Ordinance Cost-effectiveness Study
95 2019-08-01
Table 62: Multifamily Climate Zone 7 Results Summary (Per Dwelling Unit)
Climate Zone 7 SDG&E Multifamily
Annual Net kWh
Annual therms
EDR Margin4
PV Size Change
(kW)5
CO2-Equivalent Emissions (lbs/sf)
NPV of Lifetime
Incremental Cost ($)
Benefit to Cost Ratio (B/C)
Total Reduction On-Bill TDV
Mix
ed
Fu
el 1
Code Compliant (0) 110 n/a n/a 2.11 n/a n/a n/a n/a
Efficiency-Non-Preempted (0) 108 0.5 (0.01) 2.08 0.03 $90 0.73 2.24
Efficiency-Equipment (0) 99 2.0 (0.00) 1.96 0.15 $366 1.07 1.41
Efficiency & PV/Battery (6) 108 11.0 0.05 1.71 0.40 $2,188 0.03 1.40
All
-Ele
ctr
ic 2 Code Compliant 1,434 0 n/a n/a 1.21 n/a n/a n/a n/a
Efficiency-Non-Preempted 1,416 0 0.5 0.00 1.20 0.01 $202 0.60 1.02
Efficiency-Equipment 1,319 0 1.5 0.00 1.14 0.07 $361 1.59 1.71
Efficiency & PV 412 0 12.5 0.61 0.94 0.27 $2,261 2.08 1.76
Efficiency & PV/Battery (5) 0 27.0 0.92 0.47 0.74 $5,203 1.19 1.62
Mix
ed
Fu
el to
All
-Ele
ctr
ic 3
Code Compliant 1,434 0 0.0 0.00 1.21 0.90 ($2,337) 1.12 2.47
Efficiency & PV 51 0 12.5 0.61 0.94 1.17 ($75) >1 >1
Neutral Cost 294 0 13.5 0.70 0.91 1.20 $0 >1 >1
1All reductions and incremental costs relative to the mixed fuel code compliant home. 2All reductions and incremental costs relative to the all-electric code compliant home. 3All reductions and incremental costs relative to the mixed fuel code compliant home except the EDR Margins are relative to the Standard Design for each case
which is the all-electric code compliant home. Incremental costs for these packages reflect the cots used in the On-Bill cost effectiveness methodology. Costs differ for the TDV methodology due to differences in the site gas infrastructure costs (see Section 2.6). 4This represents the Efficiency EDR Margin for the Efficiency-Non-Preempted and Efficiency-Equipment packages and Total EDR Margin for the Efficiency & PV, Efficiency & PV/Battery, and Neutral Cost packages. 5Positive values indicate an increase in PV capacity relative to the Standard Design.
ATTACHMENT 5
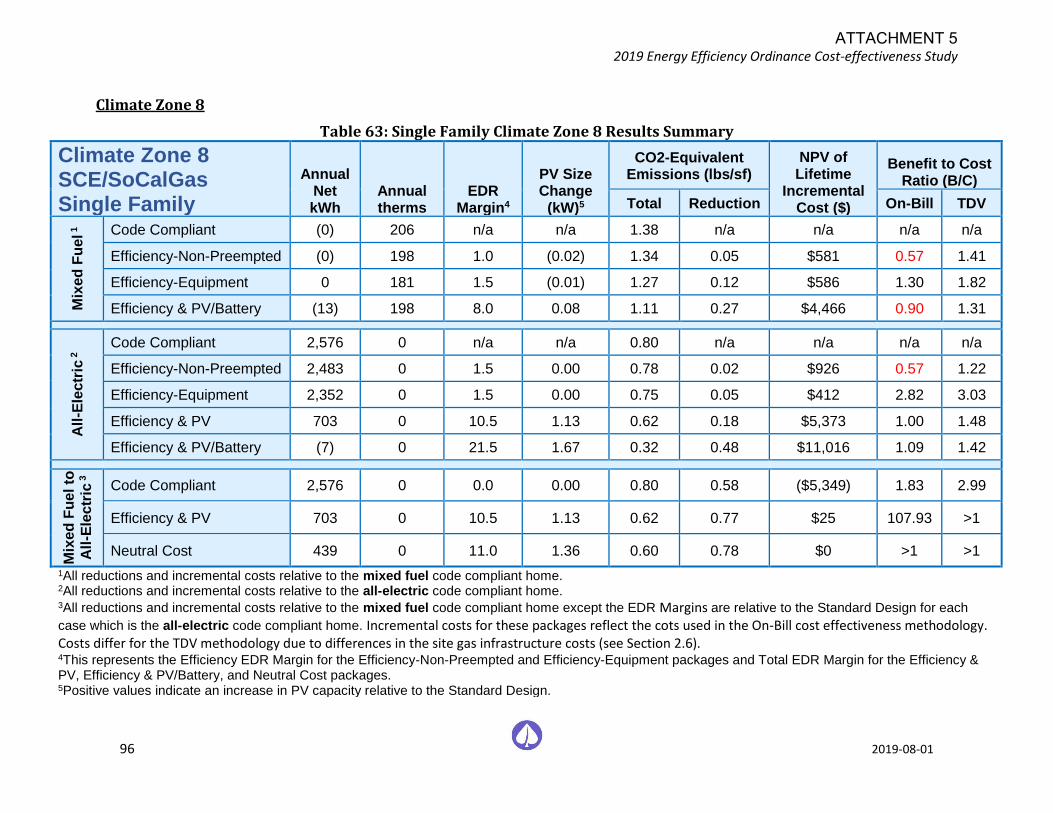
2019 Energy Efficiency Ordinance Cost-effectiveness Study
96 2019-08-01
Climate Zone 8
Table 63: Single Family Climate Zone 8 Results Summary
Climate Zone 8 SCE/SoCalGas Single Family
Annual Net kWh
Annual therms
EDR Margin4
PV Size Change
(kW)5
CO2-Equivalent Emissions (lbs/sf)
NPV of Lifetime
Incremental Cost ($)
Benefit to Cost Ratio (B/C)
Total Reduction On-Bill TDV
Mix
ed
Fu
el 1
Code Compliant (0) 206 n/a n/a 1.38 n/a n/a n/a n/a
Efficiency-Non-Preempted (0) 198 1.0 (0.02) 1.34 0.05 $581 0.57 1.41
Efficiency-Equipment 0 181 1.5 (0.01) 1.27 0.12 $586 1.30 1.82
Efficiency & PV/Battery (13) 198 8.0 0.08 1.11 0.27 $4,466 0.90 1.31
All
-Ele
ctr
ic 2 Code Compliant 2,576 0 n/a n/a 0.80 n/a n/a n/a n/a
Efficiency-Non-Preempted 2,483 0 1.5 0.00 0.78 0.02 $926 0.57 1.22
Efficiency-Equipment 2,352 0 1.5 0.00 0.75 0.05 $412 2.82 3.03
Efficiency & PV 703 0 10.5 1.13 0.62 0.18 $5,373 1.00 1.48
Efficiency & PV/Battery (7) 0 21.5 1.67 0.32 0.48 $11,016 1.09 1.42
Mix
ed
Fu
el to
All
-Ele
ctr
ic 3
Code Compliant 2,576 0 0.0 0.00 0.80 0.58 ($5,349) 1.83 2.99
Efficiency & PV 703 0 10.5 1.13 0.62 0.77 $25 107.93 >1
Neutral Cost 439 0 11.0 1.36 0.60 0.78 $0 >1 >1
1All reductions and incremental costs relative to the mixed fuel code compliant home. 2All reductions and incremental costs relative to the all-electric code compliant home. 3All reductions and incremental costs relative to the mixed fuel code compliant home except the EDR Margins are relative to the Standard Design for each
case which is the all-electric code compliant home. Incremental costs for these packages reflect the cots used in the On-Bill cost effectiveness methodology. Costs differ for the TDV methodology due to differences in the site gas infrastructure costs (see Section 2.6). 4This represents the Efficiency EDR Margin for the Efficiency-Non-Preempted and Efficiency-Equipment packages and Total EDR Margin for the Efficiency & PV, Efficiency & PV/Battery, and Neutral Cost packages. 5Positive values indicate an increase in PV capacity relative to the Standard Design.
ATTACHMENT 5
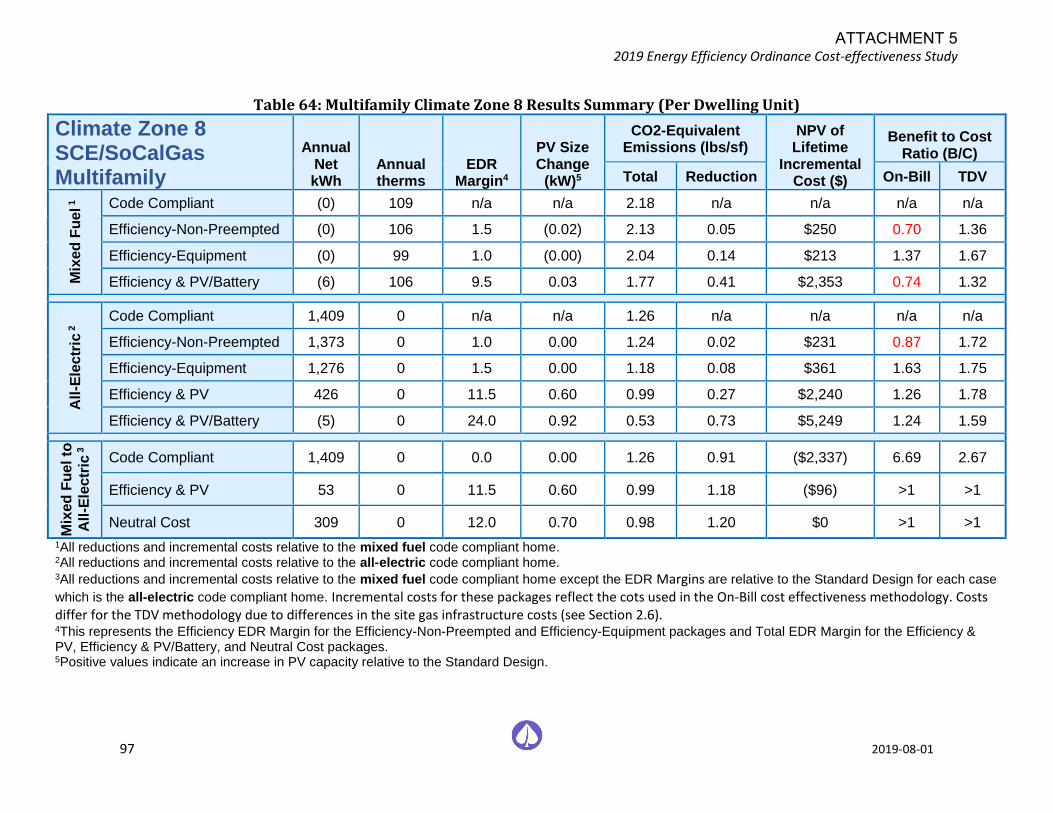
2019 Energy Efficiency Ordinance Cost-effectiveness Study
97 2019-08-01
Table 64: Multifamily Climate Zone 8 Results Summary (Per Dwelling Unit)
Climate Zone 8 SCE/SoCalGas Multifamily
Annual Net kWh
Annual therms
EDR Margin4
PV Size Change
(kW)5
CO2-Equivalent Emissions (lbs/sf)
NPV of Lifetime
Incremental Cost ($)
Benefit to Cost Ratio (B/C)
Total Reduction On-Bill TDV
Mix
ed
Fu
el 1
Code Compliant (0) 109 n/a n/a 2.18 n/a n/a n/a n/a
Efficiency-Non-Preempted (0) 106 1.5 (0.02) 2.13 0.05 $250 0.70 1.36
Efficiency-Equipment (0) 99 1.0 (0.00) 2.04 0.14 $213 1.37 1.67
Efficiency & PV/Battery (6) 106 9.5 0.03 1.77 0.41 $2,353 0.74 1.32
All
-Ele
ctr
ic 2 Code Compliant 1,409 0 n/a n/a 1.26 n/a n/a n/a n/a
Efficiency-Non-Preempted 1,373 0 1.0 0.00 1.24 0.02 $231 0.87 1.72
Efficiency-Equipment 1,276 0 1.5 0.00 1.18 0.08 $361 1.63 1.75
Efficiency & PV 426 0 11.5 0.60 0.99 0.27 $2,240 1.26 1.78
Efficiency & PV/Battery (5) 0 24.0 0.92 0.53 0.73 $5,249 1.24 1.59
Mix
ed
Fu
el to
All
-Ele
ctr
ic 3
Code Compliant 1,409 0 0.0 0.00 1.26 0.91 ($2,337) 6.69 2.67
Efficiency & PV 53 0 11.5 0.60 0.99 1.18 ($96) >1 >1
Neutral Cost 309 0 12.0 0.70 0.98 1.20 $0 >1 >1
1All reductions and incremental costs relative to the mixed fuel code compliant home. 2All reductions and incremental costs relative to the all-electric code compliant home. 3All reductions and incremental costs relative to the mixed fuel code compliant home except the EDR Margins are relative to the Standard Design for each case
which is the all-electric code compliant home. Incremental costs for these packages reflect the cots used in the On-Bill cost effectiveness methodology. Costs differ for the TDV methodology due to differences in the site gas infrastructure costs (see Section 2.6). 4This represents the Efficiency EDR Margin for the Efficiency-Non-Preempted and Efficiency-Equipment packages and Total EDR Margin for the Efficiency & PV, Efficiency & PV/Battery, and Neutral Cost packages. 5Positive values indicate an increase in PV capacity relative to the Standard Design.
ATTACHMENT 5

2019 Energy Efficiency Ordinance Cost-effectiveness Study
98 2019-08-01
Climate Zone 9
Table 65: Single Family Climate Zone 9 Results Summary
Climate Zone 9 SCE/SoCalGas Single Family
Annual Net kWh
Annual therms
EDR Margin4
PV Size Change
(kW)5
CO2-Equivalent Emissions (lbs/sf)
NPV of Lifetime
Incremental Cost ($)
Benefit to Cost Ratio (B/C)
Total Reduction On-Bill TDV
Mix
ed
Fu
el 1
Code Compliant 0 229 n/a n/a 1.53 n/a n/a n/a n/a
Efficiency-Non-Preempted (0) 216 2.5 (0.04) 1.46 0.07 $912 0.69 1.97
Efficiency-Equipment 0 201 2.5 (0.04) 1.38 0.15 $574 1.80 3.66
Efficiency & PV/Battery (14) 216 8.5 0.05 1.23 0.30 $4,785 0.99 1.48
All
-Ele
ctr
ic 2 Code Compliant 2,801 0 n/a n/a 0.87 n/a n/a n/a n/a
Efficiency-Non-Preempted 2,645 0 2.5 0.00 0.84 0.04 $1,180 0.78 1.96
Efficiency-Equipment 2,460 0 3.0 0.00 0.80 0.07 $846 2.11 3.22
Efficiency & PV 745 0 11.5 1.16 0.66 0.21 $5,778 1.08 1.64
Efficiency & PV/Battery (9) 0 21.0 1.72 0.37 0.50 $11,454 1.11 1.53
Mix
ed
Fu
el to
All
-Ele
ctr
ic 3
Code Compliant 2,801 0 0.0 0.00 0.87 0.66 ($5,349) 1.67 2.90
Efficiency & PV 745 0 11.5 1.16 0.66 0.87 $429 7.15 >1
Neutral Cost 594 0 10.0 1.36 0.67 0.86 $0 >1 >1
1All reductions and incremental costs relative to the mixed fuel code compliant home. 2All reductions and incremental costs relative to the all-electric code compliant home. 3All reductions and incremental costs relative to the mixed fuel code compliant home except the EDR Margins are relative to the Standard Design for each
case which is the all-electric code compliant home. Incremental costs for these packages reflect the cots used in the On-Bill cost effectiveness methodology. Costs differ for the TDV methodology due to differences in the site gas infrastructure costs (see Section 2.6). 4This represents the Efficiency EDR Margin for the Efficiency-Non-Preempted and Efficiency-Equipment packages and Total EDR Margin for the Efficiency & PV, Efficiency & PV/Battery, and Neutral Cost packages. 5Positive values indicate an increase in PV capacity relative to the Standard Design.
ATTACHMENT 5
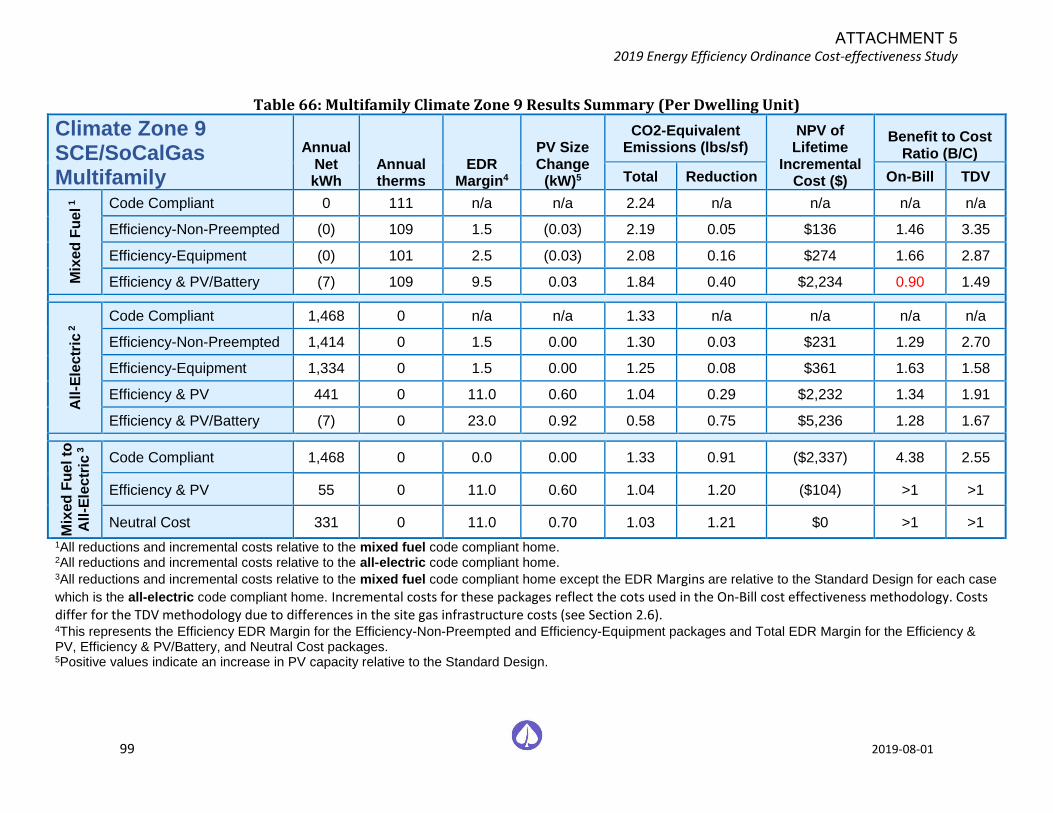
2019 Energy Efficiency Ordinance Cost-effectiveness Study
99 2019-08-01
Table 66: Multifamily Climate Zone 9 Results Summary (Per Dwelling Unit)
Climate Zone 9 SCE/SoCalGas Multifamily
Annual Net kWh
Annual therms
EDR Margin4
PV Size Change
(kW)5
CO2-Equivalent Emissions (lbs/sf)
NPV of Lifetime
Incremental Cost ($)
Benefit to Cost Ratio (B/C)
Total Reduction On-Bill TDV
Mix
ed
Fu
el 1
Code Compliant 0 111 n/a n/a 2.24 n/a n/a n/a n/a
Efficiency-Non-Preempted (0) 109 1.5 (0.03) 2.19 0.05 $136 1.46 3.35
Efficiency-Equipment (0) 101 2.5 (0.03) 2.08 0.16 $274 1.66 2.87
Efficiency & PV/Battery (7) 109 9.5 0.03 1.84 0.40 $2,234 0.90 1.49
All
-Ele
ctr
ic 2 Code Compliant 1,468 0 n/a n/a 1.33 n/a n/a n/a n/a
Efficiency-Non-Preempted 1,414 0 1.5 0.00 1.30 0.03 $231 1.29 2.70
Efficiency-Equipment 1,334 0 1.5 0.00 1.25 0.08 $361 1.63 1.58
Efficiency & PV 441 0 11.0 0.60 1.04 0.29 $2,232 1.34 1.91
Efficiency & PV/Battery (7) 0 23.0 0.92 0.58 0.75 $5,236 1.28 1.67
Mix
ed
Fu
el to
All
-Ele
ctr
ic 3
Code Compliant 1,468 0 0.0 0.00 1.33 0.91 ($2,337) 4.38 2.55
Efficiency & PV 55 0 11.0 0.60 1.04 1.20 ($104) >1 >1
Neutral Cost 331 0 11.0 0.70 1.03 1.21 $0 >1 >1
1All reductions and incremental costs relative to the mixed fuel code compliant home. 2All reductions and incremental costs relative to the all-electric code compliant home. 3All reductions and incremental costs relative to the mixed fuel code compliant home except the EDR Margins are relative to the Standard Design for each case
which is the all-electric code compliant home. Incremental costs for these packages reflect the cots used in the On-Bill cost effectiveness methodology. Costs differ for the TDV methodology due to differences in the site gas infrastructure costs (see Section 2.6). 4This represents the Efficiency EDR Margin for the Efficiency-Non-Preempted and Efficiency-Equipment packages and Total EDR Margin for the Efficiency & PV, Efficiency & PV/Battery, and Neutral Cost packages. 5Positive values indicate an increase in PV capacity relative to the Standard Design.
ATTACHMENT 5
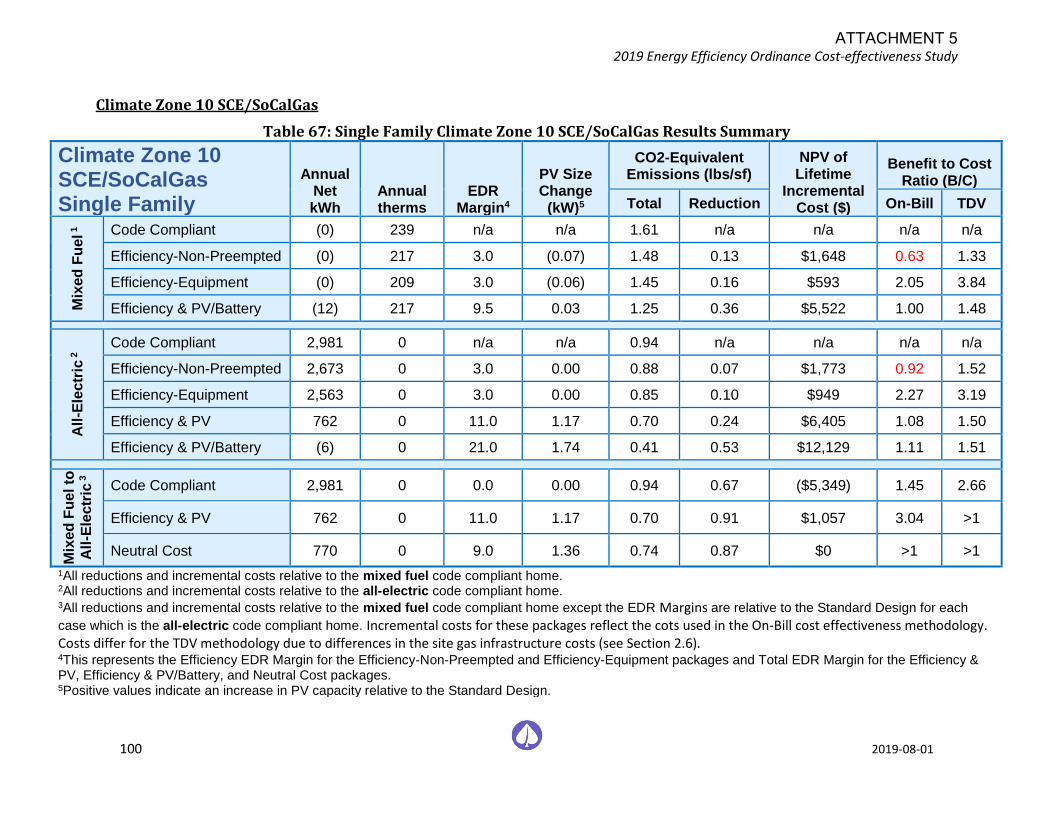
2019 Energy Efficiency Ordinance Cost-effectiveness Study
100 2019-08-01
Climate Zone 10 SCE/SoCalGas
Table 67: Single Family Climate Zone 10 SCE/SoCalGas Results Summary
Climate Zone 10 SCE/SoCalGas Single Family
Annual Net kWh
Annual therms
EDR Margin4
PV Size Change
(kW)5
CO2-Equivalent Emissions (lbs/sf)
NPV of Lifetime
Incremental Cost ($)
Benefit to Cost Ratio (B/C)
Total Reduction On-Bill TDV
Mix
ed
Fu
el 1
Code Compliant (0) 239 n/a n/a 1.61 n/a n/a n/a n/a
Efficiency-Non-Preempted (0) 217 3.0 (0.07) 1.48 0.13 $1,648 0.63 1.33
Efficiency-Equipment (0) 209 3.0 (0.06) 1.45 0.16 $593 2.05 3.84
Efficiency & PV/Battery (12) 217 9.5 0.03 1.25 0.36 $5,522 1.00 1.48
All
-Ele
ctr
ic 2 Code Compliant 2,981 0 n/a n/a 0.94 n/a n/a n/a n/a
Efficiency-Non-Preempted 2,673 0 3.0 0.00 0.88 0.07 $1,773 0.92 1.52
Efficiency-Equipment 2,563 0 3.0 0.00 0.85 0.10 $949 2.27 3.19
Efficiency & PV 762 0 11.0 1.17 0.70 0.24 $6,405 1.08 1.50
Efficiency & PV/Battery (6) 0 21.0 1.74 0.41 0.53 $12,129 1.11 1.51
Mix
ed
Fu
el to
All
-Ele
ctr
ic 3
Code Compliant 2,981 0 0.0 0.00 0.94 0.67 ($5,349) 1.45 2.66
Efficiency & PV 762 0 11.0 1.17 0.70 0.91 $1,057 3.04 >1
Neutral Cost 770 0 9.0 1.36 0.74 0.87 $0 >1 >1
1All reductions and incremental costs relative to the mixed fuel code compliant home. 2All reductions and incremental costs relative to the all-electric code compliant home. 3All reductions and incremental costs relative to the mixed fuel code compliant home except the EDR Margins are relative to the Standard Design for each
case which is the all-electric code compliant home. Incremental costs for these packages reflect the cots used in the On-Bill cost effectiveness methodology. Costs differ for the TDV methodology due to differences in the site gas infrastructure costs (see Section 2.6). 4This represents the Efficiency EDR Margin for the Efficiency-Non-Preempted and Efficiency-Equipment packages and Total EDR Margin for the Efficiency & PV, Efficiency & PV/Battery, and Neutral Cost packages. 5Positive values indicate an increase in PV capacity relative to the Standard Design.
ATTACHMENT 5
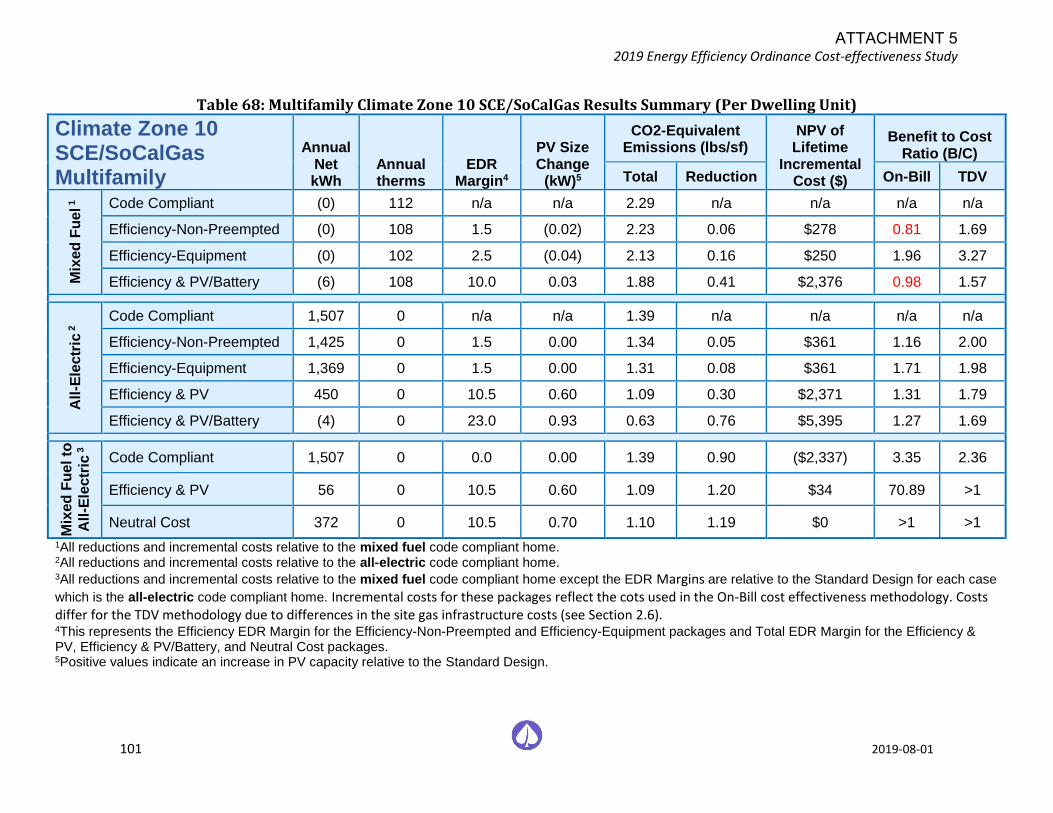
2019 Energy Efficiency Ordinance Cost-effectiveness Study
101 2019-08-01
Table 68: Multifamily Climate Zone 10 SCE/SoCalGas Results Summary (Per Dwelling Unit)
Climate Zone 10 SCE/SoCalGas Multifamily
Annual Net kWh
Annual therms
EDR Margin4
PV Size Change
(kW)5
CO2-Equivalent Emissions (lbs/sf)
NPV of Lifetime
Incremental Cost ($)
Benefit to Cost Ratio (B/C)
Total Reduction On-Bill TDV
Mix
ed
Fu
el 1
Code Compliant (0) 112 n/a n/a 2.29 n/a n/a n/a n/a
Efficiency-Non-Preempted (0) 108 1.5 (0.02) 2.23 0.06 $278 0.81 1.69
Efficiency-Equipment (0) 102 2.5 (0.04) 2.13 0.16 $250 1.96 3.27
Efficiency & PV/Battery (6) 108 10.0 0.03 1.88 0.41 $2,376 0.98 1.57
All
-Ele
ctr
ic 2 Code Compliant 1,507 0 n/a n/a 1.39 n/a n/a n/a n/a
Efficiency-Non-Preempted 1,425 0 1.5 0.00 1.34 0.05 $361 1.16 2.00
Efficiency-Equipment 1,369 0 1.5 0.00 1.31 0.08 $361 1.71 1.98
Efficiency & PV 450 0 10.5 0.60 1.09 0.30 $2,371 1.31 1.79
Efficiency & PV/Battery (4) 0 23.0 0.93 0.63 0.76 $5,395 1.27 1.69
Mix
ed
Fu
el to
All
-Ele
ctr
ic 3
Code Compliant 1,507 0 0.0 0.00 1.39 0.90 ($2,337) 3.35 2.36
Efficiency & PV 56 0 10.5 0.60 1.09 1.20 $34 70.89 >1
Neutral Cost 372 0 10.5 0.70 1.10 1.19 $0 >1 >1
1All reductions and incremental costs relative to the mixed fuel code compliant home. 2All reductions and incremental costs relative to the all-electric code compliant home. 3All reductions and incremental costs relative to the mixed fuel code compliant home except the EDR Margins are relative to the Standard Design for each case
which is the all-electric code compliant home. Incremental costs for these packages reflect the cots used in the On-Bill cost effectiveness methodology. Costs differ for the TDV methodology due to differences in the site gas infrastructure costs (see Section 2.6). 4This represents the Efficiency EDR Margin for the Efficiency-Non-Preempted and Efficiency-Equipment packages and Total EDR Margin for the Efficiency & PV, Efficiency & PV/Battery, and Neutral Cost packages. 5Positive values indicate an increase in PV capacity relative to the Standard Design.
ATTACHMENT 5
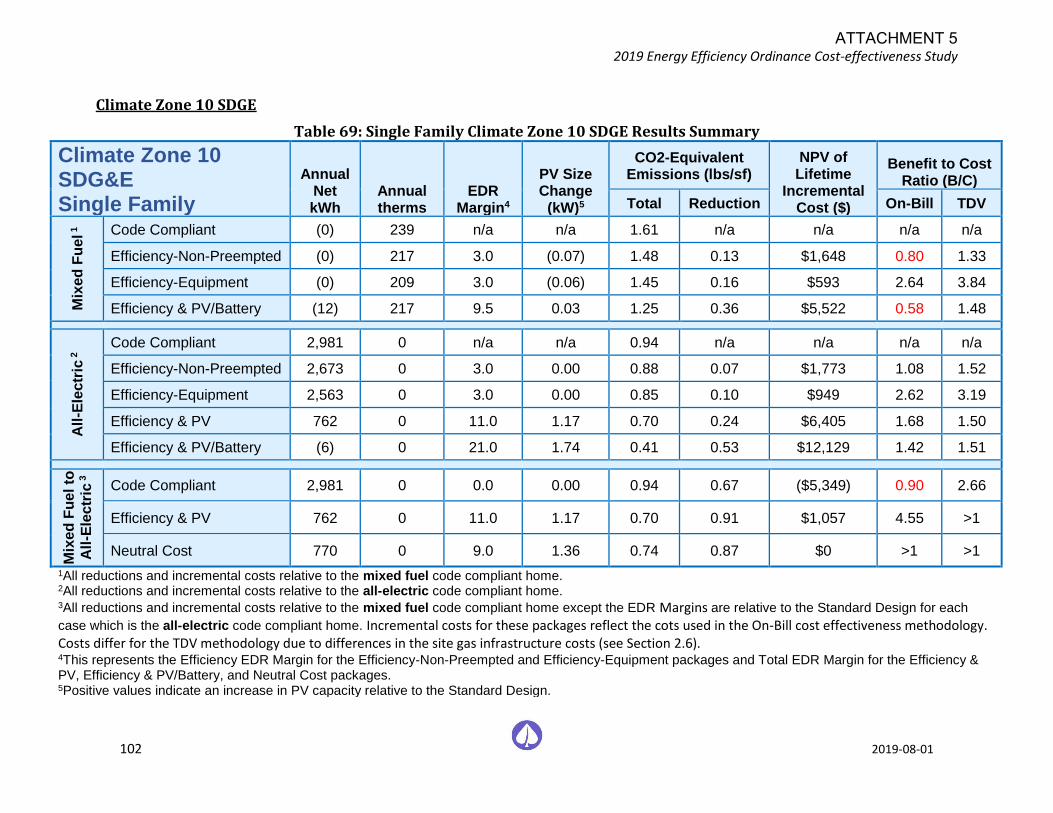
2019 Energy Efficiency Ordinance Cost-effectiveness Study
102 2019-08-01
Climate Zone 10 SDGE
Table 69: Single Family Climate Zone 10 SDGE Results Summary
Climate Zone 10 SDG&E Single Family
Annual Net kWh
Annual therms
EDR Margin4
PV Size Change
(kW)5
CO2-Equivalent Emissions (lbs/sf)
NPV of Lifetime
Incremental Cost ($)
Benefit to Cost Ratio (B/C)
Total Reduction On-Bill TDV
Mix
ed
Fu
el 1
Code Compliant (0) 239 n/a n/a 1.61 n/a n/a n/a n/a
Efficiency-Non-Preempted (0) 217 3.0 (0.07) 1.48 0.13 $1,648 0.80 1.33
Efficiency-Equipment (0) 209 3.0 (0.06) 1.45 0.16 $593 2.64 3.84
Efficiency & PV/Battery (12) 217 9.5 0.03 1.25 0.36 $5,522 0.58 1.48
All
-Ele
ctr
ic 2 Code Compliant 2,981 0 n/a n/a 0.94 n/a n/a n/a n/a
Efficiency-Non-Preempted 2,673 0 3.0 0.00 0.88 0.07 $1,773 1.08 1.52
Efficiency-Equipment 2,563 0 3.0 0.00 0.85 0.10 $949 2.62 3.19
Efficiency & PV 762 0 11.0 1.17 0.70 0.24 $6,405 1.68 1.50
Efficiency & PV/Battery (6) 0 21.0 1.74 0.41 0.53 $12,129 1.42 1.51
Mix
ed
Fu
el to
All
-Ele
ctr
ic 3
Code Compliant 2,981 0 0.0 0.00 0.94 0.67 ($5,349) 0.90 2.66
Efficiency & PV 762 0 11.0 1.17 0.70 0.91 $1,057 4.55 >1
Neutral Cost 770 0 9.0 1.36 0.74 0.87 $0 >1 >1
1All reductions and incremental costs relative to the mixed fuel code compliant home. 2All reductions and incremental costs relative to the all-electric code compliant home. 3All reductions and incremental costs relative to the mixed fuel code compliant home except the EDR Margins are relative to the Standard Design for each
case which is the all-electric code compliant home. Incremental costs for these packages reflect the cots used in the On-Bill cost effectiveness methodology. Costs differ for the TDV methodology due to differences in the site gas infrastructure costs (see Section 2.6). 4This represents the Efficiency EDR Margin for the Efficiency-Non-Preempted and Efficiency-Equipment packages and Total EDR Margin for the Efficiency & PV, Efficiency & PV/Battery, and Neutral Cost packages. 5Positive values indicate an increase in PV capacity relative to the Standard Design.
ATTACHMENT 5

2019 Energy Efficiency Ordinance Cost-effectiveness Study
103 2019-08-01
Table 70: Multifamily Climate Zone 10 SDGE Results Summary (Per Dwelling Unit)
Climate Zone 10 SDG&E Multifamily
Annual Net kWh
Annual therms
EDR Margin4
PV Size Change
(kW)5
CO2-Equivalent Emissions (lbs/sf)
NPV of Lifetime
Incremental Cost ($)
Benefit to Cost Ratio (B/C)
Total Reduction On-Bill TDV
Mix
ed
Fu
el 1
Code Compliant (0) 112 n/a n/a 2.29 n/a n/a n/a n/a
Efficiency-Non-Preempted (0) 108 1.5 (0.02) 2.23 0.06 $278 1.09 1.69
Efficiency-Equipment (0) 102 2.5 (0.04) 2.13 0.16 $250 2.60 3.27
Efficiency & PV/Battery (6) 108 10.0 0.03 1.88 0.41 $2,376 0.23 1.57
All
-Ele
ctr
ic 2 Code Compliant 1,507 0 n/a n/a 1.39 n/a n/a n/a n/a
Efficiency-Non-Preempted 1,425 0 1.5 0.00 1.34 0.05 $361 1.53 2.00
Efficiency-Equipment 1,369 0 1.5 0.00 1.31 0.08 $361 2.05 1.98
Efficiency & PV 450 0 10.5 0.60 1.09 0.30 $2,371 2.12 1.79
Efficiency & PV/Battery (4) 0 23.0 0.93 0.63 0.76 $5,395 1.44 1.69
Mix
ed
Fu
el to
All
-Ele
ctr
ic 3
Code Compliant 1,507 0 0.0 0.00 1.39 0.90 ($2,337) 0.73 2.36
Efficiency & PV 56 0 10.5 0.60 1.09 1.20 $34 54.15 >1
Neutral Cost 372 0 10.5 0.70 1.10 1.19 $0 >1 >1
1All reductions and incremental costs relative to the mixed fuel code compliant home. 2All reductions and incremental costs relative to the all-electric code compliant home. 3All reductions and incremental costs relative to the mixed fuel code compliant home except the EDR Margins are relative to the Standard Design for each case
which is the all-electric code compliant home. Incremental costs for these packages reflect the cots used in the On-Bill cost effectiveness methodology. Costs differ for the TDV methodology due to differences in the site gas infrastructure costs (see Section 2.6). 4This represents the Efficiency EDR Margin for the Efficiency-Non-Preempted and Efficiency-Equipment packages and Total EDR Margin for the Efficiency & PV, Efficiency & PV/Battery, and Neutral Cost packages. 5Positive values indicate an increase in PV capacity relative to the Standard Design.
ATTACHMENT 5
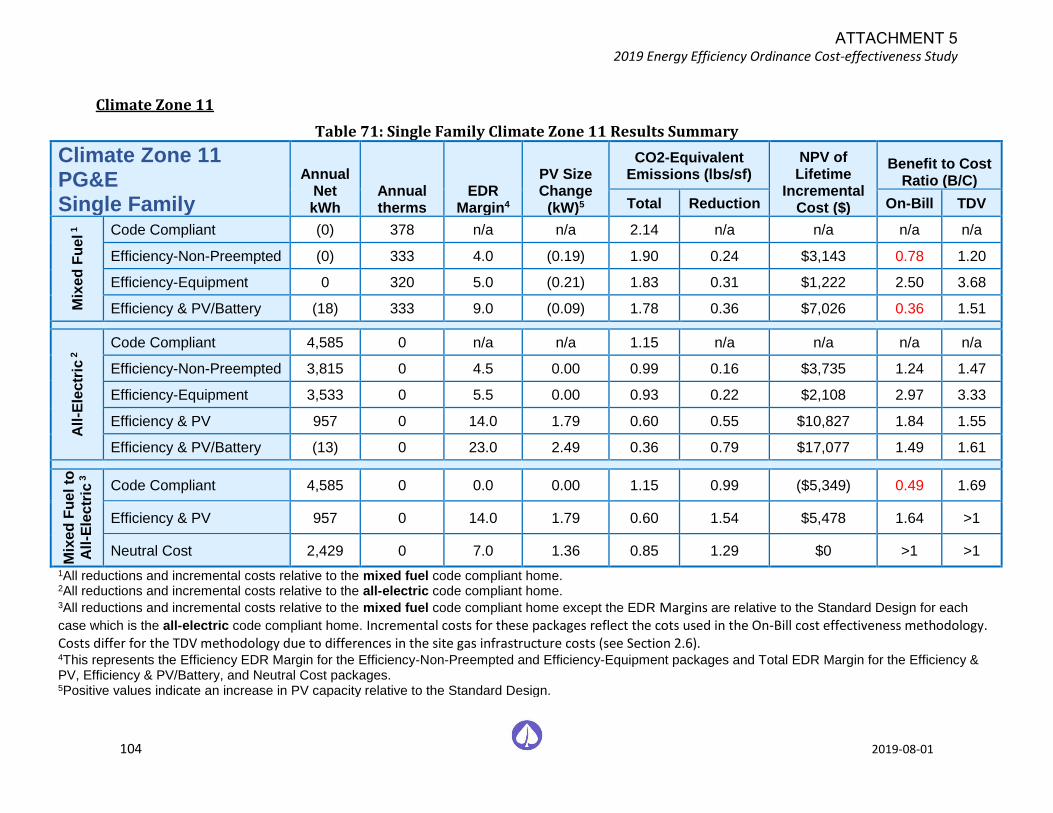
2019 Energy Efficiency Ordinance Cost-effectiveness Study
104 2019-08-01
Climate Zone 11
Table 71: Single Family Climate Zone 11 Results Summary
Climate Zone 11 PG&E Single Family
Annual Net kWh
Annual therms
EDR Margin4
PV Size Change
(kW)5
CO2-Equivalent Emissions (lbs/sf)
NPV of Lifetime
Incremental Cost ($)
Benefit to Cost Ratio (B/C)
Total Reduction On-Bill TDV
Mix
ed
Fu
el 1
Code Compliant (0) 378 n/a n/a 2.14 n/a n/a n/a n/a
Efficiency-Non-Preempted (0) 333 4.0 (0.19) 1.90 0.24 $3,143 0.78 1.20
Efficiency-Equipment 0 320 5.0 (0.21) 1.83 0.31 $1,222 2.50 3.68
Efficiency & PV/Battery (18) 333 9.0 (0.09) 1.78 0.36 $7,026 0.36 1.51
All
-Ele
ctr
ic 2 Code Compliant 4,585 0 n/a n/a 1.15 n/a n/a n/a n/a
Efficiency-Non-Preempted 3,815 0 4.5 0.00 0.99 0.16 $3,735 1.24 1.47
Efficiency-Equipment 3,533 0 5.5 0.00 0.93 0.22 $2,108 2.97 3.33
Efficiency & PV 957 0 14.0 1.79 0.60 0.55 $10,827 1.84 1.55
Efficiency & PV/Battery (13) 0 23.0 2.49 0.36 0.79 $17,077 1.49 1.61
Mix
ed
Fu
el to
All
-Ele
ctr
ic 3
Code Compliant 4,585 0 0.0 0.00 1.15 0.99 ($5,349) 0.49 1.69
Efficiency & PV 957 0 14.0 1.79 0.60 1.54 $5,478 1.64 >1
Neutral Cost 2,429 0 7.0 1.36 0.85 1.29 $0 >1 >1
1All reductions and incremental costs relative to the mixed fuel code compliant home. 2All reductions and incremental costs relative to the all-electric code compliant home. 3All reductions and incremental costs relative to the mixed fuel code compliant home except the EDR Margins are relative to the Standard Design for each
case which is the all-electric code compliant home. Incremental costs for these packages reflect the cots used in the On-Bill cost effectiveness methodology. Costs differ for the TDV methodology due to differences in the site gas infrastructure costs (see Section 2.6). 4This represents the Efficiency EDR Margin for the Efficiency-Non-Preempted and Efficiency-Equipment packages and Total EDR Margin for the Efficiency & PV, Efficiency & PV/Battery, and Neutral Cost packages. 5Positive values indicate an increase in PV capacity relative to the Standard Design.
ATTACHMENT 5

2019 Energy Efficiency Ordinance Cost-effectiveness Study
105 2019-08-01
Table 72: Multifamily Climate Zone 11 Results Summary (Per Dwelling Unit)
Climate Zone 11 PG&E Multifamily
Annual Net kWh
Annual therms
EDR Margin4
PV Size Change
(kW)5
CO2-Equivalent Emissions (lbs/sf)
NPV of Lifetime
Incremental Cost ($)
Benefit to Cost Ratio (B/C)
Total Reduction On-Bill TDV
Mix
ed
Fu
el 1
Code Compliant (0) 141 n/a n/a 2.38 n/a n/a n/a n/a
Efficiency-Non-Preempted 0 127 2.5 (0.05) 2.18 0.20 $850 0.65 1.17
Efficiency-Equipment (0) 126 3.0 (0.06) 2.16 0.22 $317 1.84 3.29
Efficiency & PV/Battery (9) 127 10.5 0.01 2.00 0.38 $2,950 0.39 1.60
All
-Ele
ctr
ic 2 Code Compliant 1,974 0 n/a n/a 1.42 n/a n/a n/a n/a
Efficiency-Non-Preempted 1,732 0 3.5 0.00 1.29 0.13 $1,011 1.40 1.64
Efficiency-Equipment 1,707 0 3.5 0.00 1.26 0.16 $795 2.02 2.33
Efficiency & PV 504 0 13.0 0.77 0.81 0.61 $3,601 2.22 1.81
Efficiency & PV/Battery (6) 0 25.0 1.14 0.45 0.98 $6,759 1.42 1.81
Mix
ed
Fu
el to
All
-Ele
ctr
ic 3
Code Compliant 1,974 0 0.0 0.00 1.42 0.96 ($2,337) 0.56 1.33
Efficiency & PV 63 0 13.0 0.77 0.81 1.56 $1,264 3.03 >1
Neutral Cost 866 0 9.0 0.70 0.99 1.38 $0 >1 73.96
1All reductions and incremental costs relative to the mixed fuel code compliant home. 2All reductions and incremental costs relative to the all-electric code compliant home. 3All reductions and incremental costs relative to the mixed fuel code compliant home except the EDR Margins are relative to the Standard Design for each case
which is the all-electric code compliant home. Incremental costs for these packages reflect the cots used in the On-Bill cost effectiveness methodology. Costs differ for the TDV methodology due to differences in the site gas infrastructure costs (see Section 2.6). 4This represents the Efficiency EDR Margin for the Efficiency-Non-Preempted and Efficiency-Equipment packages and Total EDR Margin for the Efficiency & PV, Efficiency & PV/Battery, and Neutral Cost packages. 5Positive values indicate an increase in PV capacity relative to the Standard Design.
ATTACHMENT 5

2019 Energy Efficiency Ordinance Cost-effectiveness Study
106 2019-08-01
Climate Zone 12
Table 73: Single Family Climate Zone 12 Results Summary
Climate Zone 12 PG&E Single Family
Annual Net kWh
Annual therms
EDR Margin4
PV Size Change
(kW)5
CO2-Equivalent Emissions (lbs/sf)
NPV of Lifetime
Incremental Cost ($)
Benefit to Cost Ratio (B/C)
Total Reduction On-Bill TDV
Mix
ed
Fu
el 1
Code Compliant (0) 390 n/a n/a 2.11 n/a n/a n/a n/a
Efficiency-Non-Preempted (0) 344 3.5 (0.06) 1.88 0.23 $1,679 1.18 1.83
Efficiency-Equipment 0 338 3.0 (0.05) 1.85 0.26 $654 3.31 4.65
Efficiency & PV/Battery (23) 344 9.5 0.04 1.76 0.35 $5,568 0.43 1.72
All
-Ele
ctr
ic 2 Code Compliant 4,492 0 n/a n/a 1.05 n/a n/a n/a n/a
Efficiency-Non-Preempted 3,958 0 3.5 0.00 0.94 0.10 $3,735 0.78 1.06
Efficiency-Equipment 3,721 0 5.0 0.00 0.90 0.15 $2,108 2.00 2.51
Efficiency & PV 867 0 15.5 1.97 0.51 0.53 $11,520 1.69 1.41
Efficiency & PV/Battery (15) 0 25.0 2.62 0.29 0.76 $17,586 1.29 1.48
Mix
ed
Fu
el to
All
-Ele
ctr
ic 3
Code Compliant 4,492 0 0.0 0.00 1.05 1.07 ($5,349) 0.63 1.89
Efficiency & PV 867 0 15.5 1.97 0.51 1.60 $6,172 1.77 >1
Neutral Cost 2,374 0 8.0 1.35 0.76 1.36 $0 >1 >1
1All reductions and incremental costs relative to the mixed fuel code compliant home. 2All reductions and incremental costs relative to the all-electric code compliant home. 3All reductions and incremental costs relative to the mixed fuel code compliant home except the EDR Margins are relative to the Standard Design for each
case which is the all-electric code compliant home. Incremental costs for these packages reflect the cots used in the On-Bill cost effectiveness methodology. Costs differ for the TDV methodology due to differences in the site gas infrastructure costs (see Section 2.6). 4This represents the Efficiency EDR Margin for the Efficiency-Non-Preempted and Efficiency-Equipment packages and Total EDR Margin for the Efficiency & PV, Efficiency & PV/Battery, and Neutral Cost packages. 5Positive values indicate an increase in PV capacity relative to the Standard Design.
ATTACHMENT 5

2019 Energy Efficiency Ordinance Cost-effectiveness Study
107 2019-08-01
Table 74: Multifamily Climate Zone 12 Results Summary (Per Dwelling Unit)
Climate Zone 12 PG&E Multifamily
Annual Net kWh
Annual therms
EDR Margin4
PV Size Change
(kW)5
CO2-Equivalent Emissions (lbs/sf)
NPV of Lifetime
Incremental Cost ($)
Benefit to Cost Ratio (B/C)
Total Reduction On-Bill TDV
Mix
ed
Fu
el 1
Code Compliant (0) 143 n/a n/a 2.33 n/a n/a n/a n/a
Efficiency-Non-Preempted (0) 135 1.5 (0.02) 2.21 0.12 $291 1.10 2.22
Efficiency-Equipment 0 128 2.5 (0.03) 2.12 0.21 $434 1.25 2.22
Efficiency & PV/Battery (11) 135 10.0 0.03 2.03 0.30 $2,394 0.30 1.75
All
-Ele
ctr
ic 2 Code Compliant 1,963 0 n/a n/a 1.34 n/a n/a n/a n/a
Efficiency-Non-Preempted 1,792 0 2.5 0.00 1.24 0.09 $1,011 0.91 1.12
Efficiency-Equipment 1,744 0 2.5 0.00 1.21 0.13 $795 1.56 1.63
Efficiency & PV 472 0 14.0 0.84 0.73 0.60 $3,835 2.08 1.65
Efficiency & PV/Battery (8) 0 26.5 1.20 0.38 0.96 $6,943 1.26 1.68
Mix
ed
Fu
el to
All
-Ele
ctr
ic 3
Code Compliant 1,963 0 0.0 0.00 1.34 1.00 ($2,337) 0.64 1.66
Efficiency & PV 59 0 14.0 0.84 0.73 1.60 $1,498 2.88 >1
Neutral Cost 872 0 9.5 0.70 0.92 1.42 $0 >1 >1
1All reductions and incremental costs relative to the mixed fuel code compliant home. 2All reductions and incremental costs relative to the all-electric code compliant home. 3All reductions and incremental costs relative to the mixed fuel code compliant home except the EDR Margins are relative to the Standard Design for each case
which is the all-electric code compliant home. Incremental costs for these packages reflect the cots used in the On-Bill cost effectiveness methodology. Costs differ for the TDV methodology due to differences in the site gas infrastructure costs (see Section 2.6). 4This represents the Efficiency EDR Margin for the Efficiency-Non-Preempted and Efficiency-Equipment packages and Total EDR Margin for the Efficiency & PV, Efficiency & PV/Battery, and Neutral Cost packages. 5Positive values indicate an increase in PV capacity relative to the Standard Design.
ATTACHMENT 5

2019 Energy Efficiency Ordinance Cost-effectiveness Study
108 2019-08-01
Climate Zone 13
Table 75: Single Family Climate Zone 13 Results Summary
Climate Zone 13 PG&E Single Family
Annual Net kWh
Annual therms
EDR Margin4
PV Size Change
(kW)5
CO2-Equivalent Emissions (lbs/sf)
NPV of Lifetime
Incremental Cost ($)
Benefit to Cost Ratio (B/C)
Total Reduction On-Bill TDV
Mix
ed
Fu
el 1
Code Compliant (0) 352 n/a n/a 2.02 n/a n/a n/a n/a
Efficiency-Non-Preempted (0) 311 4.5 (0.21) 1.80 0.22 $3,060 0.76 1.28
Efficiency-Equipment (0) 292 5.5 (0.24) 1.70 0.32 $611 5.26 8.40
Efficiency & PV/Battery (19) 311 9.5 (0.11) 1.69 0.33 $6,954 0.36 1.56
All
-Ele
ctr
ic 2 Code Compliant 4,180 0 n/a n/a 1.08 n/a n/a n/a n/a
Efficiency-Non-Preempted 3,428 0 5.0 0.00 0.92 0.15 $4,154 1.12 1.40
Efficiency-Equipment 3,177 0 6.0 0.00 0.87 0.21 $2,108 2.88 3.30
Efficiency & PV 934 0 13.0 1.61 0.57 0.50 $10,532 1.70 1.47
Efficiency & PV/Battery (11) 0 22.0 2.32 0.35 0.73 $16,806 1.40 1.54
Mix
ed
Fu
el to
All
-Ele
ctr
ic 3
Code Compliant 4,180 0 0.0 0.00 1.08 0.94 ($5,349) 0.54 1.83
Efficiency & PV 934 0 13.0 1.61 0.57 1.44 $5,184 1.56 >1
Neutral Cost 2,092 0 7.0 1.36 0.79 1.23 $0 >1 >1
1All reductions and incremental costs relative to the mixed fuel code compliant home. 2All reductions and incremental costs relative to the all-electric code compliant home. 3All reductions and incremental costs relative to the mixed fuel code compliant home except the EDR Margins are relative to the Standard Design for each
case which is the all-electric code compliant home. Incremental costs for these packages reflect the cots used in the On-Bill cost effectiveness methodology. Costs differ for the TDV methodology due to differences in the site gas infrastructure costs (see Section 2.6). 4This represents the Efficiency EDR Margin for the Efficiency-Non-Preempted and Efficiency-Equipment packages and Total EDR Margin for the Efficiency & PV, Efficiency & PV/Battery, and Neutral Cost packages. 5Positive values indicate an increase in PV capacity relative to the Standard Design.
ATTACHMENT 5
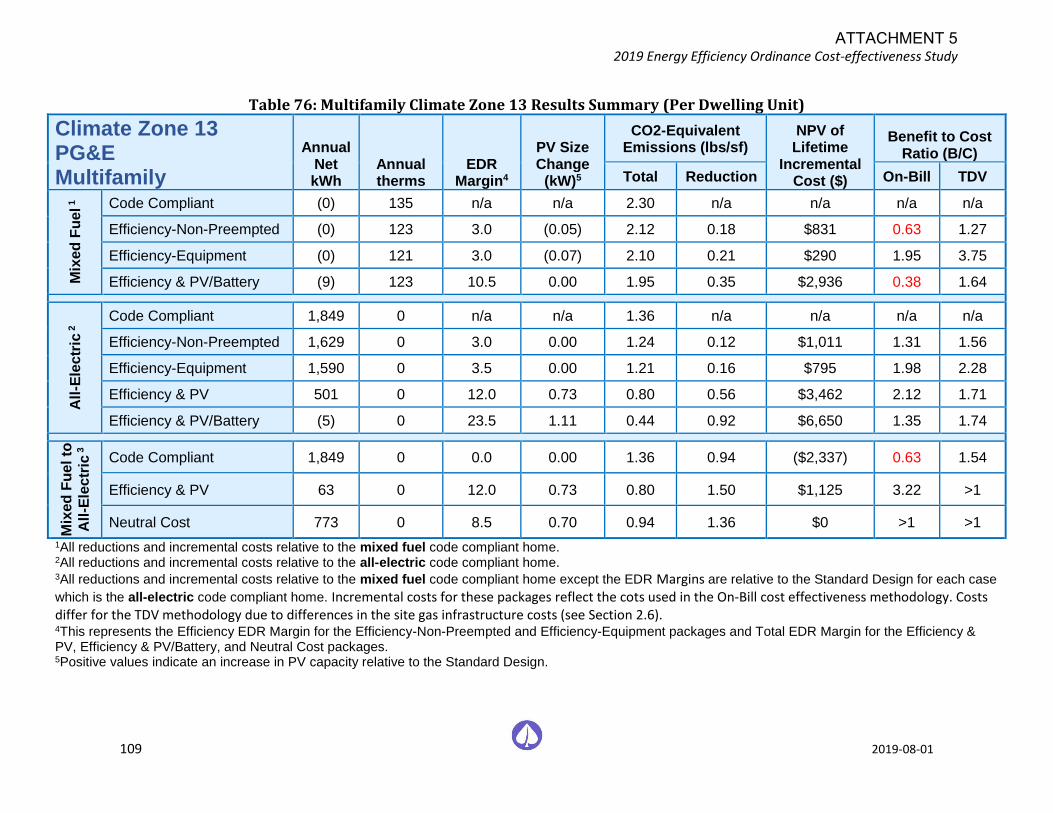
2019 Energy Efficiency Ordinance Cost-effectiveness Study
109 2019-08-01
Table 76: Multifamily Climate Zone 13 Results Summary (Per Dwelling Unit)
Climate Zone 13 PG&E Multifamily
Annual Net kWh
Annual therms
EDR Margin4
PV Size Change
(kW)5
CO2-Equivalent Emissions (lbs/sf)
NPV of Lifetime
Incremental Cost ($)
Benefit to Cost Ratio (B/C)
Total Reduction On-Bill TDV
Mix
ed
Fu
el 1
Code Compliant (0) 135 n/a n/a 2.30 n/a n/a n/a n/a
Efficiency-Non-Preempted (0) 123 3.0 (0.05) 2.12 0.18 $831 0.63 1.27
Efficiency-Equipment (0) 121 3.0 (0.07) 2.10 0.21 $290 1.95 3.75
Efficiency & PV/Battery (9) 123 10.5 0.00 1.95 0.35 $2,936 0.38 1.64
All
-Ele
ctr
ic 2 Code Compliant 1,849 0 n/a n/a 1.36 n/a n/a n/a n/a
Efficiency-Non-Preempted 1,629 0 3.0 0.00 1.24 0.12 $1,011 1.31 1.56
Efficiency-Equipment 1,590 0 3.5 0.00 1.21 0.16 $795 1.98 2.28
Efficiency & PV 501 0 12.0 0.73 0.80 0.56 $3,462 2.12 1.71
Efficiency & PV/Battery (5) 0 23.5 1.11 0.44 0.92 $6,650 1.35 1.74
Mix
ed
Fu
el to
All
-Ele
ctr
ic 3
Code Compliant 1,849 0 0.0 0.00 1.36 0.94 ($2,337) 0.63 1.54
Efficiency & PV 63 0 12.0 0.73 0.80 1.50 $1,125 3.22 >1
Neutral Cost 773 0 8.5 0.70 0.94 1.36 $0 >1 >1
1All reductions and incremental costs relative to the mixed fuel code compliant home. 2All reductions and incremental costs relative to the all-electric code compliant home. 3All reductions and incremental costs relative to the mixed fuel code compliant home except the EDR Margins are relative to the Standard Design for each case
which is the all-electric code compliant home. Incremental costs for these packages reflect the cots used in the On-Bill cost effectiveness methodology. Costs differ for the TDV methodology due to differences in the site gas infrastructure costs (see Section 2.6). 4This represents the Efficiency EDR Margin for the Efficiency-Non-Preempted and Efficiency-Equipment packages and Total EDR Margin for the Efficiency & PV, Efficiency & PV/Battery, and Neutral Cost packages. 5Positive values indicate an increase in PV capacity relative to the Standard Design.
ATTACHMENT 5
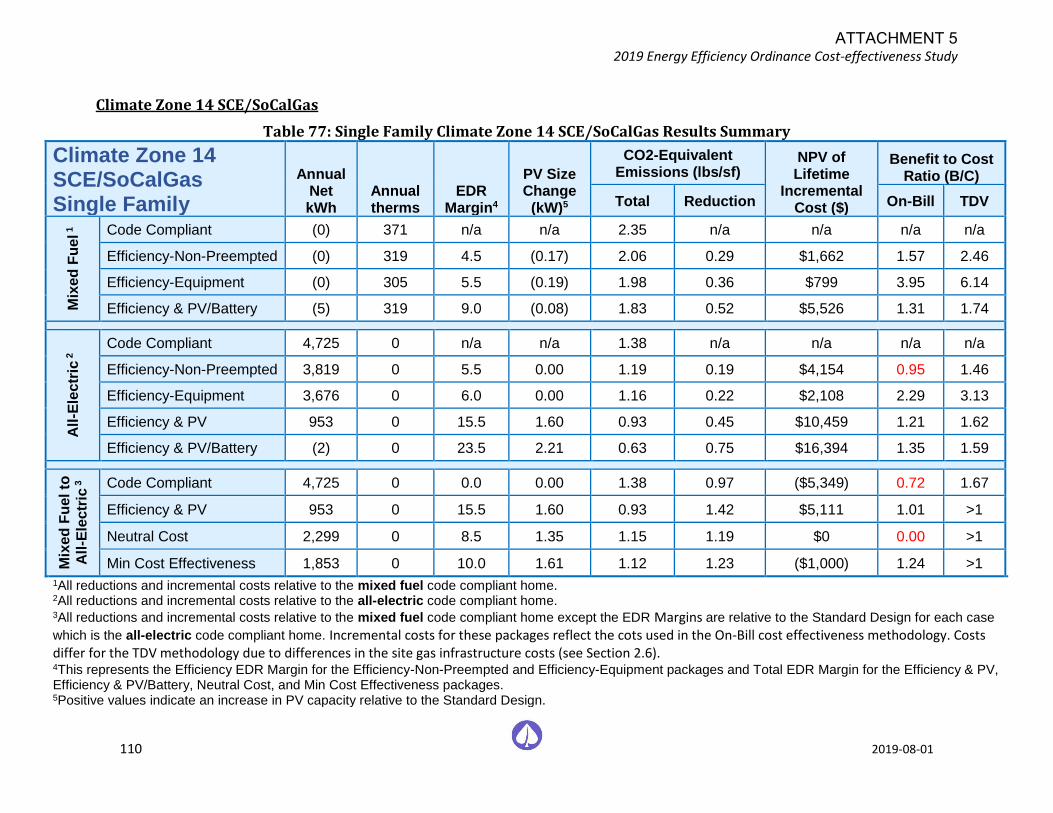
2019 Energy Efficiency Ordinance Cost-effectiveness Study
110 2019-08-01
Climate Zone 14 SCE/SoCalGas
Table 77: Single Family Climate Zone 14 SCE/SoCalGas Results Summary
Climate Zone 14 SCE/SoCalGas Single Family
Annual Net kWh
Annual therms
EDR Margin4
PV Size Change
(kW)5
CO2-Equivalent Emissions (lbs/sf)
NPV of Lifetime
Incremental Cost ($)
Benefit to Cost Ratio (B/C)
Total Reduction On-Bill TDV
Mix
ed
Fu
el 1
Code Compliant (0) 371 n/a n/a 2.35 n/a n/a n/a n/a
Efficiency-Non-Preempted (0) 319 4.5 (0.17) 2.06 0.29 $1,662 1.57 2.46
Efficiency-Equipment (0) 305 5.5 (0.19) 1.98 0.36 $799 3.95 6.14
Efficiency & PV/Battery (5) 319 9.0 (0.08) 1.83 0.52 $5,526 1.31 1.74
All
-Ele
ctr
ic 2 Code Compliant 4,725 0 n/a n/a 1.38 n/a n/a n/a n/a
Efficiency-Non-Preempted 3,819 0 5.5 0.00 1.19 0.19 $4,154 0.95 1.46
Efficiency-Equipment 3,676 0 6.0 0.00 1.16 0.22 $2,108 2.29 3.13
Efficiency & PV 953 0 15.5 1.60 0.93 0.45 $10,459 1.21 1.62
Efficiency & PV/Battery (2) 0 23.5 2.21 0.63 0.75 $16,394 1.35 1.59
Mix
ed
Fu
el to
All
-Ele
ctr
ic 3
Code Compliant 4,725 0 0.0 0.00 1.38 0.97 ($5,349) 0.72 1.67
Efficiency & PV 953 0 15.5 1.60 0.93 1.42 $5,111 1.01 >1
Neutral Cost 2,299 0 8.5 1.35 1.15 1.19 $0 0.00 >1
Min Cost Effectiveness 1,853 0 10.0 1.61 1.12 1.23 ($1,000) 1.24 >1
1All reductions and incremental costs relative to the mixed fuel code compliant home. 2All reductions and incremental costs relative to the all-electric code compliant home. 3All reductions and incremental costs relative to the mixed fuel code compliant home except the EDR Margins are relative to the Standard Design for each case
which is the all-electric code compliant home. Incremental costs for these packages reflect the cots used in the On-Bill cost effectiveness methodology. Costs differ for the TDV methodology due to differences in the site gas infrastructure costs (see Section 2.6). 4This represents the Efficiency EDR Margin for the Efficiency-Non-Preempted and Efficiency-Equipment packages and Total EDR Margin for the Efficiency & PV, Efficiency & PV/Battery, Neutral Cost, and Min Cost Effectiveness packages. 5Positive values indicate an increase in PV capacity relative to the Standard Design.
ATTACHMENT 5
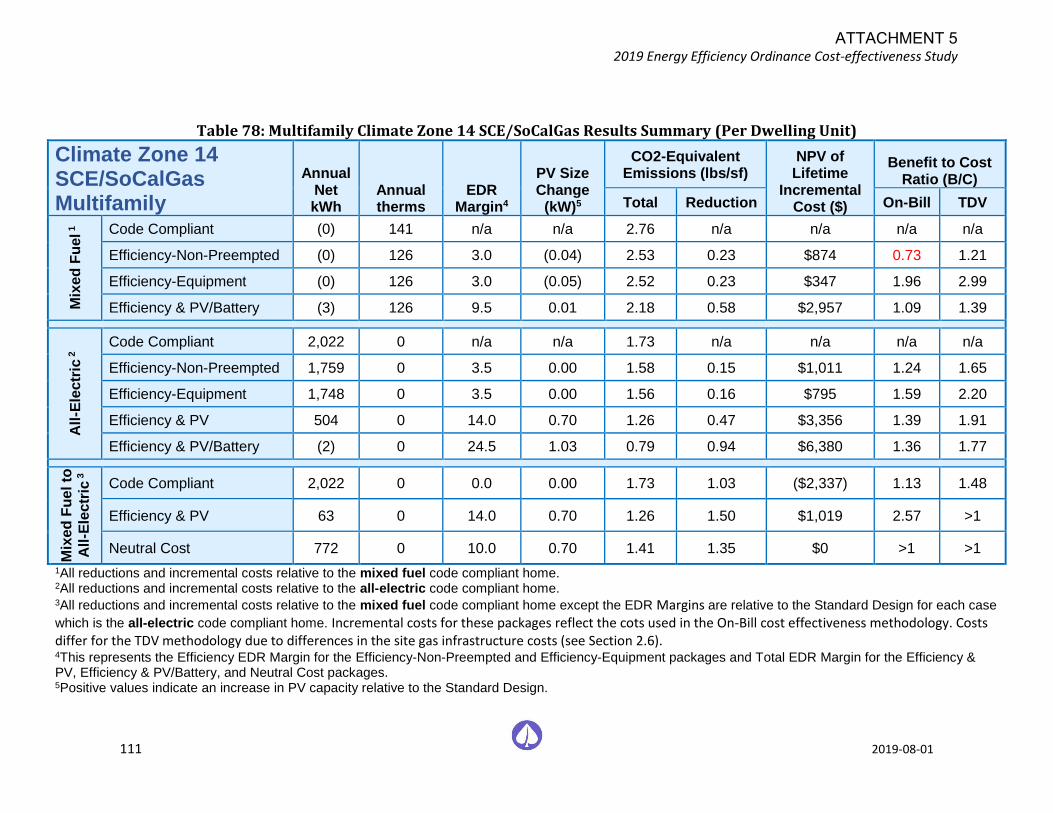
2019 Energy Efficiency Ordinance Cost-effectiveness Study
111 2019-08-01
Table 78: Multifamily Climate Zone 14 SCE/SoCalGas Results Summary (Per Dwelling Unit)
Climate Zone 14 SCE/SoCalGas Multifamily
Annual Net kWh
Annual therms
EDR Margin4
PV Size Change
(kW)5
CO2-Equivalent Emissions (lbs/sf)
NPV of Lifetime
Incremental Cost ($)
Benefit to Cost Ratio (B/C)
Total Reduction On-Bill TDV
Mix
ed
Fu
el 1
Code Compliant (0) 141 n/a n/a 2.76 n/a n/a n/a n/a
Efficiency-Non-Preempted (0) 126 3.0 (0.04) 2.53 0.23 $874 0.73 1.21
Efficiency-Equipment (0) 126 3.0 (0.05) 2.52 0.23 $347 1.96 2.99
Efficiency & PV/Battery (3) 126 9.5 0.01 2.18 0.58 $2,957 1.09 1.39
All
-Ele
ctr
ic 2 Code Compliant 2,022 0 n/a n/a 1.73 n/a n/a n/a n/a
Efficiency-Non-Preempted 1,759 0 3.5 0.00 1.58 0.15 $1,011 1.24 1.65
Efficiency-Equipment 1,748 0 3.5 0.00 1.56 0.16 $795 1.59 2.20
Efficiency & PV 504 0 14.0 0.70 1.26 0.47 $3,356 1.39 1.91
Efficiency & PV/Battery (2) 0 24.5 1.03 0.79 0.94 $6,380 1.36 1.77
Mix
ed
Fu
el to
All
-Ele
ctr
ic 3
Code Compliant 2,022 0 0.0 0.00 1.73 1.03 ($2,337) 1.13 1.48
Efficiency & PV 63 0 14.0 0.70 1.26 1.50 $1,019 2.57 >1
Neutral Cost 772 0 10.0 0.70 1.41 1.35 $0 >1 >1
1All reductions and incremental costs relative to the mixed fuel code compliant home. 2All reductions and incremental costs relative to the all-electric code compliant home. 3All reductions and incremental costs relative to the mixed fuel code compliant home except the EDR Margins are relative to the Standard Design for each case
which is the all-electric code compliant home. Incremental costs for these packages reflect the cots used in the On-Bill cost effectiveness methodology. Costs differ for the TDV methodology due to differences in the site gas infrastructure costs (see Section 2.6). 4This represents the Efficiency EDR Margin for the Efficiency-Non-Preempted and Efficiency-Equipment packages and Total EDR Margin for the Efficiency & PV, Efficiency & PV/Battery, and Neutral Cost packages. 5Positive values indicate an increase in PV capacity relative to the Standard Design.
ATTACHMENT 5
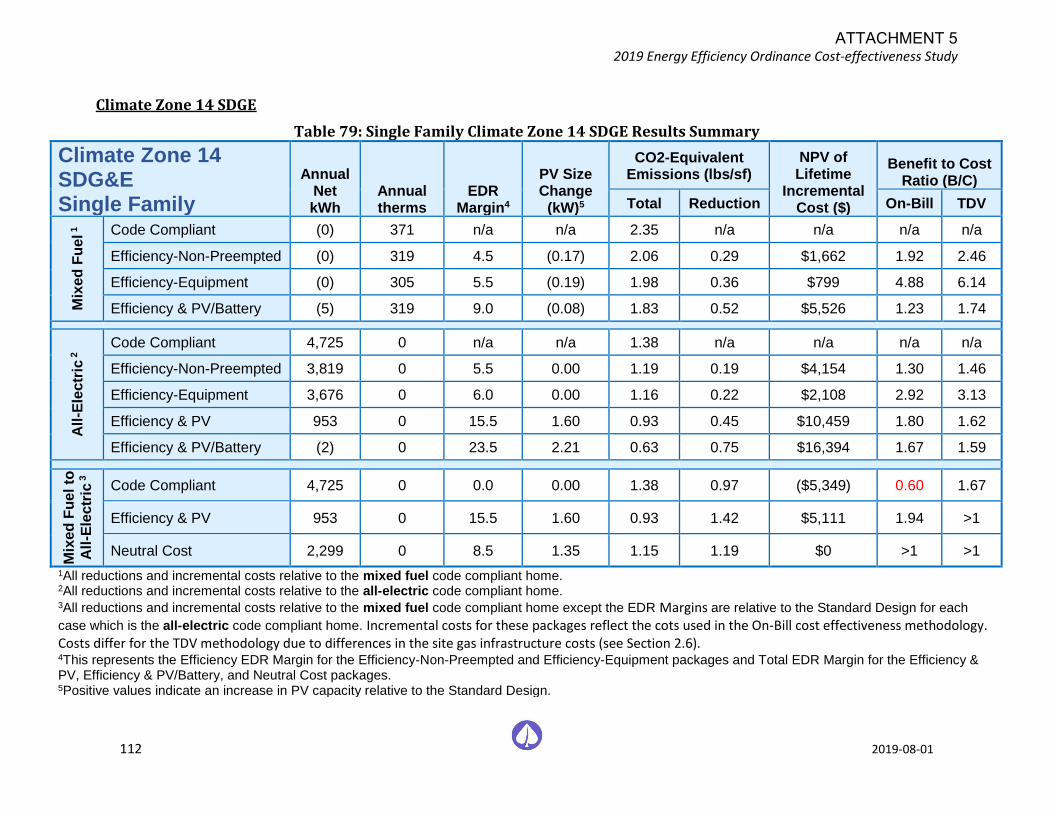
2019 Energy Efficiency Ordinance Cost-effectiveness Study
112 2019-08-01
Climate Zone 14 SDGE
Table 79: Single Family Climate Zone 14 SDGE Results Summary
Climate Zone 14 SDG&E Single Family
Annual Net kWh
Annual therms
EDR Margin4
PV Size Change
(kW)5
CO2-Equivalent Emissions (lbs/sf)
NPV of Lifetime
Incremental Cost ($)
Benefit to Cost Ratio (B/C)
Total Reduction On-Bill TDV
Mix
ed
Fu
el 1
Code Compliant (0) 371 n/a n/a 2.35 n/a n/a n/a n/a
Efficiency-Non-Preempted (0) 319 4.5 (0.17) 2.06 0.29 $1,662 1.92 2.46
Efficiency-Equipment (0) 305 5.5 (0.19) 1.98 0.36 $799 4.88 6.14
Efficiency & PV/Battery (5) 319 9.0 (0.08) 1.83 0.52 $5,526 1.23 1.74
All
-Ele
ctr
ic 2 Code Compliant 4,725 0 n/a n/a 1.38 n/a n/a n/a n/a
Efficiency-Non-Preempted 3,819 0 5.5 0.00 1.19 0.19 $4,154 1.30 1.46
Efficiency-Equipment 3,676 0 6.0 0.00 1.16 0.22 $2,108 2.92 3.13
Efficiency & PV 953 0 15.5 1.60 0.93 0.45 $10,459 1.80 1.62
Efficiency & PV/Battery (2) 0 23.5 2.21 0.63 0.75 $16,394 1.67 1.59
Mix
ed
Fu
el to
All
-Ele
ctr
ic 3
Code Compliant 4,725 0 0.0 0.00 1.38 0.97 ($5,349) 0.60 1.67
Efficiency & PV 953 0 15.5 1.60 0.93 1.42 $5,111 1.94 >1
Neutral Cost 2,299 0 8.5 1.35 1.15 1.19 $0 >1 >1
1All reductions and incremental costs relative to the mixed fuel code compliant home. 2All reductions and incremental costs relative to the all-electric code compliant home. 3All reductions and incremental costs relative to the mixed fuel code compliant home except the EDR Margins are relative to the Standard Design for each
case which is the all-electric code compliant home. Incremental costs for these packages reflect the cots used in the On-Bill cost effectiveness methodology. Costs differ for the TDV methodology due to differences in the site gas infrastructure costs (see Section 2.6). 4This represents the Efficiency EDR Margin for the Efficiency-Non-Preempted and Efficiency-Equipment packages and Total EDR Margin for the Efficiency & PV, Efficiency & PV/Battery, and Neutral Cost packages. 5Positive values indicate an increase in PV capacity relative to the Standard Design.
ATTACHMENT 5

2019 Energy Efficiency Ordinance Cost-effectiveness Study
113 2019-08-01
Table 80: Multifamily Climate Zone 14 SDGE Results Summary (Per Dwelling Unit)
Climate Zone 14 SDG&E Multifamily
Annual Net kWh
Annual therms
EDR Margin4
PV Size Change
(kW)5
CO2-Equivalent Emissions (lbs/sf)
NPV of Lifetime
Incremental Cost ($)
Benefit to Cost Ratio (B/C)
Total Reduction On-Bill TDV
Mix
ed
Fu
el 1
Code Compliant (0) 141 n/a n/a 2.76 n/a n/a n/a n/a
Efficiency-Non-Preempted (0) 126 3.0 (0.04) 2.53 0.23 $874 0.93 1.21
Efficiency-Equipment (0) 126 3.0 (0.05) 2.52 0.23 $347 2.48 2.99
Efficiency & PV/Battery (3) 126 9.5 0.01 2.18 0.58 $2,957 0.51 1.39
All
-Ele
ctr
ic 2 Code Compliant 2,022 0 n/a n/a 1.73 n/a n/a n/a n/a
Efficiency-Non-Preempted 1,759 0 3.5 0.00 1.58 0.15 $1,011 1.47 1.65
Efficiency-Equipment 1,748 0 3.5 0.00 1.56 0.16 $795 2.00 2.20
Efficiency & PV 504 0 14.0 0.70 1.26 0.47 $3,356 2.16 1.91
Efficiency & PV/Battery (2) 0 24.5 1.03 0.79 0.94 $6,380 1.69 1.77
Mix
ed
Fu
el to
All
-Ele
ctr
ic 3
Code Compliant 2,022 0 0.0 0.00 1.73 1.03 ($2,337) 0.51 1.48
Efficiency & PV 63 0 14.0 0.70 1.26 1.50 $1,019 2.60 >1
Neutral Cost 772 0 10.0 0.70 1.41 1.35 $0 >1 >1
1All reductions and incremental costs relative to the mixed fuel code compliant home. 2All reductions and incremental costs relative to the all-electric code compliant home. 3All reductions and incremental costs relative to the mixed fuel code compliant home except the EDR Margins are relative to the Standard Design for each case
which is the all-electric code compliant home. Incremental costs for these packages reflect the cots used in the On-Bill cost effectiveness methodology. Costs differ for the TDV methodology due to differences in the site gas infrastructure costs (see Section 2.6). 4This represents the Efficiency EDR Margin for the Efficiency-Non-Preempted and Efficiency-Equipment packages and Total EDR Margin for the Efficiency & PV, Efficiency & PV/Battery, and Neutral Cost packages. 5Positive values indicate an increase in PV capacity relative to the Standard Design.
ATTACHMENT 5
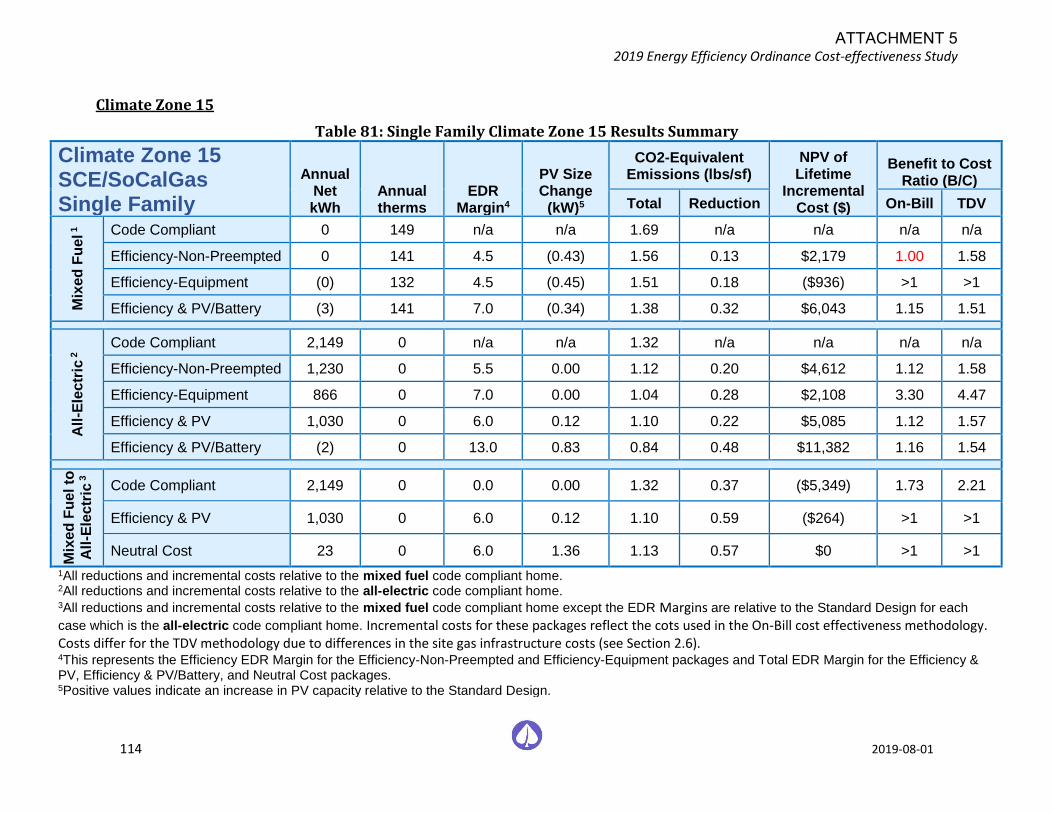
2019 Energy Efficiency Ordinance Cost-effectiveness Study
114 2019-08-01
Climate Zone 15
Table 81: Single Family Climate Zone 15 Results Summary
Climate Zone 15 SCE/SoCalGas Single Family
Annual Net kWh
Annual therms
EDR Margin4
PV Size Change
(kW)5
CO2-Equivalent Emissions (lbs/sf)
NPV of Lifetime
Incremental Cost ($)
Benefit to Cost Ratio (B/C)
Total Reduction On-Bill TDV
Mix
ed
Fu
el 1
Code Compliant 0 149 n/a n/a 1.69 n/a n/a n/a n/a
Efficiency-Non-Preempted 0 141 4.5 (0.43) 1.56 0.13 $2,179 1.00 1.58
Efficiency-Equipment (0) 132 4.5 (0.45) 1.51 0.18 ($936) >1 >1
Efficiency & PV/Battery (3) 141 7.0 (0.34) 1.38 0.32 $6,043 1.15 1.51
All
-Ele
ctr
ic 2 Code Compliant 2,149 0 n/a n/a 1.32 n/a n/a n/a n/a
Efficiency-Non-Preempted 1,230 0 5.5 0.00 1.12 0.20 $4,612 1.12 1.58
Efficiency-Equipment 866 0 7.0 0.00 1.04 0.28 $2,108 3.30 4.47
Efficiency & PV 1,030 0 6.0 0.12 1.10 0.22 $5,085 1.12 1.57
Efficiency & PV/Battery (2) 0 13.0 0.83 0.84 0.48 $11,382 1.16 1.54
Mix
ed
Fu
el to
All
-Ele
ctr
ic 3
Code Compliant 2,149 0 0.0 0.00 1.32 0.37 ($5,349) 1.73 2.21
Efficiency & PV 1,030 0 6.0 0.12 1.10 0.59 ($264) >1 >1
Neutral Cost 23 0 6.0 1.36 1.13 0.57 $0 >1 >1
1All reductions and incremental costs relative to the mixed fuel code compliant home. 2All reductions and incremental costs relative to the all-electric code compliant home. 3All reductions and incremental costs relative to the mixed fuel code compliant home except the EDR Margins are relative to the Standard Design for each
case which is the all-electric code compliant home. Incremental costs for these packages reflect the cots used in the On-Bill cost effectiveness methodology. Costs differ for the TDV methodology due to differences in the site gas infrastructure costs (see Section 2.6). 4This represents the Efficiency EDR Margin for the Efficiency-Non-Preempted and Efficiency-Equipment packages and Total EDR Margin for the Efficiency & PV, Efficiency & PV/Battery, and Neutral Cost packages. 5Positive values indicate an increase in PV capacity relative to the Standard Design.
ATTACHMENT 5
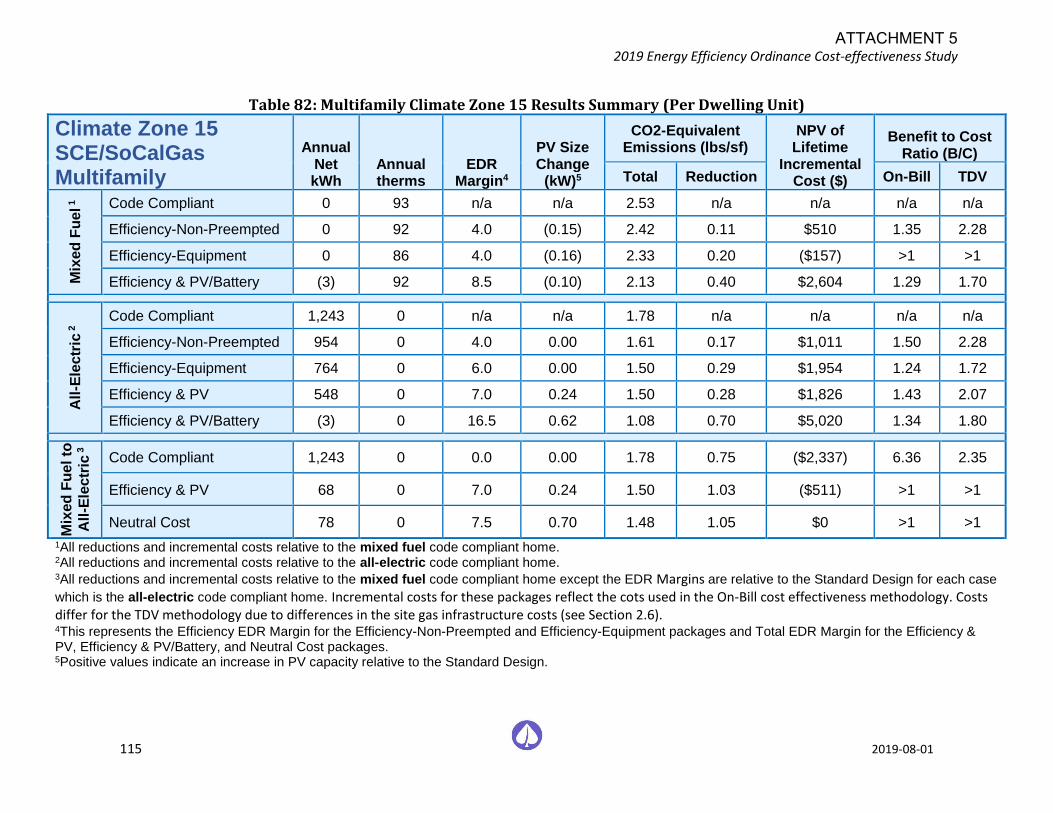
2019 Energy Efficiency Ordinance Cost-effectiveness Study
115 2019-08-01
Table 82: Multifamily Climate Zone 15 Results Summary (Per Dwelling Unit)
Climate Zone 15 SCE/SoCalGas Multifamily
Annual Net kWh
Annual therms
EDR Margin4
PV Size Change
(kW)5
CO2-Equivalent Emissions (lbs/sf)
NPV of Lifetime
Incremental Cost ($)
Benefit to Cost Ratio (B/C)
Total Reduction On-Bill TDV
Mix
ed
Fu
el 1
Code Compliant 0 93 n/a n/a 2.53 n/a n/a n/a n/a
Efficiency-Non-Preempted 0 92 4.0 (0.15) 2.42 0.11 $510 1.35 2.28
Efficiency-Equipment 0 86 4.0 (0.16) 2.33 0.20 ($157) >1 >1
Efficiency & PV/Battery (3) 92 8.5 (0.10) 2.13 0.40 $2,604 1.29 1.70
All
-Ele
ctr
ic 2 Code Compliant 1,243 0 n/a n/a 1.78 n/a n/a n/a n/a
Efficiency-Non-Preempted 954 0 4.0 0.00 1.61 0.17 $1,011 1.50 2.28
Efficiency-Equipment 764 0 6.0 0.00 1.50 0.29 $1,954 1.24 1.72
Efficiency & PV 548 0 7.0 0.24 1.50 0.28 $1,826 1.43 2.07
Efficiency & PV/Battery (3) 0 16.5 0.62 1.08 0.70 $5,020 1.34 1.80
Mix
ed
Fu
el to
All
-Ele
ctr
ic 3
Code Compliant 1,243 0 0.0 0.00 1.78 0.75 ($2,337) 6.36 2.35
Efficiency & PV 68 0 7.0 0.24 1.50 1.03 ($511) >1 >1
Neutral Cost 78 0 7.5 0.70 1.48 1.05 $0 >1 >1
1All reductions and incremental costs relative to the mixed fuel code compliant home. 2All reductions and incremental costs relative to the all-electric code compliant home. 3All reductions and incremental costs relative to the mixed fuel code compliant home except the EDR Margins are relative to the Standard Design for each case
which is the all-electric code compliant home. Incremental costs for these packages reflect the cots used in the On-Bill cost effectiveness methodology. Costs differ for the TDV methodology due to differences in the site gas infrastructure costs (see Section 2.6). 4This represents the Efficiency EDR Margin for the Efficiency-Non-Preempted and Efficiency-Equipment packages and Total EDR Margin for the Efficiency & PV, Efficiency & PV/Battery, and Neutral Cost packages. 5Positive values indicate an increase in PV capacity relative to the Standard Design.
ATTACHMENT 5
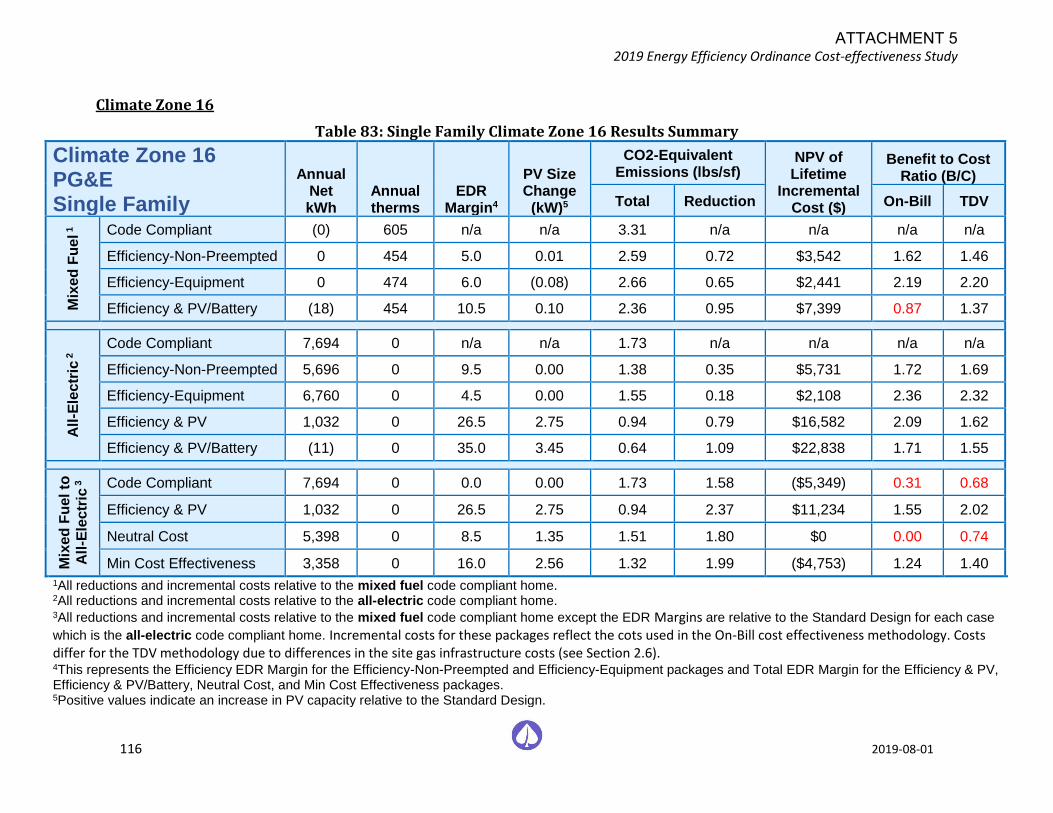
2019 Energy Efficiency Ordinance Cost-effectiveness Study
116 2019-08-01
Climate Zone 16
Table 83: Single Family Climate Zone 16 Results Summary
Climate Zone 16 PG&E Single Family
Annual Net kWh
Annual therms
EDR Margin4
PV Size Change
(kW)5
CO2-Equivalent Emissions (lbs/sf)
NPV of Lifetime
Incremental Cost ($)
Benefit to Cost Ratio (B/C)
Total Reduction On-Bill TDV
Mix
ed
Fu
el 1
Code Compliant (0) 605 n/a n/a 3.31 n/a n/a n/a n/a
Efficiency-Non-Preempted 0 454 5.0 0.01 2.59 0.72 $3,542 1.62 1.46
Efficiency-Equipment 0 474 6.0 (0.08) 2.66 0.65 $2,441 2.19 2.20
Efficiency & PV/Battery (18) 454 10.5 0.10 2.36 0.95 $7,399 0.87 1.37
All
-Ele
ctr
ic 2 Code Compliant 7,694 0 n/a n/a 1.73 n/a n/a n/a n/a
Efficiency-Non-Preempted 5,696 0 9.5 0.00 1.38 0.35 $5,731 1.72 1.69
Efficiency-Equipment 6,760 0 4.5 0.00 1.55 0.18 $2,108 2.36 2.32
Efficiency & PV 1,032 0 26.5 2.75 0.94 0.79 $16,582 2.09 1.62
Efficiency & PV/Battery (11) 0 35.0 3.45 0.64 1.09 $22,838 1.71 1.55
Mix
ed
Fu
el to
All
-Ele
ctr
ic 3
Code Compliant 7,694 0 0.0 0.00 1.73 1.58 ($5,349) 0.31 0.68
Efficiency & PV 1,032 0 26.5 2.75 0.94 2.37 $11,234 1.55 2.02
Neutral Cost 5,398 0 8.5 1.35 1.51 1.80 $0 0.00 0.74
Min Cost Effectiveness 3,358 0 16.0 2.56 1.32 1.99 ($4,753) 1.24 1.40
1All reductions and incremental costs relative to the mixed fuel code compliant home. 2All reductions and incremental costs relative to the all-electric code compliant home. 3All reductions and incremental costs relative to the mixed fuel code compliant home except the EDR Margins are relative to the Standard Design for each case
which is the all-electric code compliant home. Incremental costs for these packages reflect the cots used in the On-Bill cost effectiveness methodology. Costs differ for the TDV methodology due to differences in the site gas infrastructure costs (see Section 2.6). 4This represents the Efficiency EDR Margin for the Efficiency-Non-Preempted and Efficiency-Equipment packages and Total EDR Margin for the Efficiency & PV, Efficiency & PV/Battery, Neutral Cost, and Min Cost Effectiveness packages. 5Positive values indicate an increase in PV capacity relative to the Standard Design.
ATTACHMENT 5
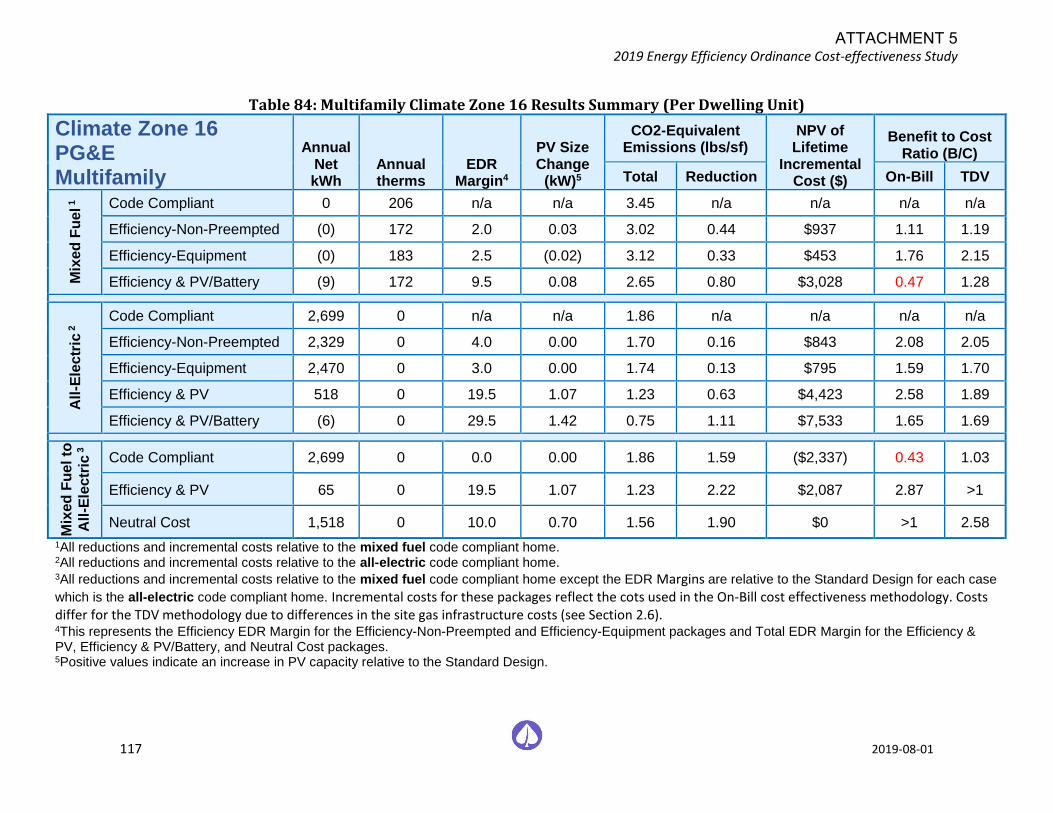
2019 Energy Efficiency Ordinance Cost-effectiveness Study
117 2019-08-01
Table 84: Multifamily Climate Zone 16 Results Summary (Per Dwelling Unit)
Climate Zone 16 PG&E Multifamily
Annual Net kWh
Annual therms
EDR Margin4
PV Size Change
(kW)5
CO2-Equivalent Emissions (lbs/sf)
NPV of Lifetime
Incremental Cost ($)
Benefit to Cost Ratio (B/C)
Total Reduction On-Bill TDV
Mix
ed
Fu
el 1
Code Compliant 0 206 n/a n/a 3.45 n/a n/a n/a n/a
Efficiency-Non-Preempted (0) 172 2.0 0.03 3.02 0.44 $937 1.11 1.19
Efficiency-Equipment (0) 183 2.5 (0.02) 3.12 0.33 $453 1.76 2.15
Efficiency & PV/Battery (9) 172 9.5 0.08 2.65 0.80 $3,028 0.47 1.28
All
-Ele
ctr
ic 2 Code Compliant 2,699 0 n/a n/a 1.86 n/a n/a n/a n/a
Efficiency-Non-Preempted 2,329 0 4.0 0.00 1.70 0.16 $843 2.08 2.05
Efficiency-Equipment 2,470 0 3.0 0.00 1.74 0.13 $795 1.59 1.70
Efficiency & PV 518 0 19.5 1.07 1.23 0.63 $4,423 2.58 1.89
Efficiency & PV/Battery (6) 0 29.5 1.42 0.75 1.11 $7,533 1.65 1.69
Mix
ed
Fu
el to
All
-Ele
ctr
ic 3
Code Compliant 2,699 0 0.0 0.00 1.86 1.59 ($2,337) 0.43 1.03
Efficiency & PV 65 0 19.5 1.07 1.23 2.22 $2,087 2.87 >1
Neutral Cost 1,518 0 10.0 0.70 1.56 1.90 $0 >1 2.58
1All reductions and incremental costs relative to the mixed fuel code compliant home. 2All reductions and incremental costs relative to the all-electric code compliant home. 3All reductions and incremental costs relative to the mixed fuel code compliant home except the EDR Margins are relative to the Standard Design for each case
which is the all-electric code compliant home. Incremental costs for these packages reflect the cots used in the On-Bill cost effectiveness methodology. Costs differ for the TDV methodology due to differences in the site gas infrastructure costs (see Section 2.6). 4This represents the Efficiency EDR Margin for the Efficiency-Non-Preempted and Efficiency-Equipment packages and Total EDR Margin for the Efficiency & PV, Efficiency & PV/Battery, and Neutral Cost packages. 5Positive values indicate an increase in PV capacity relative to the Standard Design.
ATTACHMENT 5
Title 24, Parts 6 and 11 Local Energy Efficiency Ordinances
2019 Nonresidential New Construction Reach Code Cost Effectiveness Study
Prepared for: Christopher Kuch
Codes and Standards Program Southern California Edison Company
Prepared by: TRC
EnergySoft
Last Modified: July 25, 2019
ATTACHMENT 6

LEGAL NOTICE
This report was prepared by Southern California Edison Company (SCE) and funded by the California utility customers under the auspices of the California Public Utilities Commission. Copyright 2019, Southern California Edison Company. All rights reserved, except that this document may be used, copied, and distributed without modification. Neither SCE nor any of its employees makes any warranty, express or implied; or assumes any legal liability or responsibility for the accuracy, completeness or usefulness of any data, information, method, product, policy or process disclosed in this document; or represents that its use will not infringe any privately-owned rights including, but not limited to, patents, trademarks or copyrights.
ATTACHMENT 6
Table of Contents 1 Introduction ............................................................................................................................................. 1 2 Methodology and Assumptions ............................................................................................................... 3
2.1 Building Prototypes .......................................................................................................................... 3 2.2 Cost Effectiveness ............................................................................................................................ 5
3 Measure Description and Cost ................................................................................................................. 7 3.1 Energy Efficiency Measures ............................................................................................................. 7
3.1.1 Envelope ................................................................................................................................... 8
3.1.2 HVAC and SWH ......................................................................................................................... 8
3.1.3 Lighting ..................................................................................................................................... 9
3.2 Solar Photovoltaics and Battery Measures .................................................................................... 13 3.2.1 Solar Photovoltaics ................................................................................................................. 13
3.2.2 Battery Storage ...................................................................................................................... 15
3.2.3 PV-only and PV+Battery Packages ......................................................................................... 16
3.3 All Electric Measures ...................................................................................................................... 16 3.3.1 HVAC and Water Heating ....................................................................................................... 16
3.3.2 Infrastructure Impacts ........................................................................................................... 20
3.4 Preempted High Efficiency Appliances .......................................................................................... 22 3.5 Greenhouse Gas Emissions ............................................................................................................ 22
4 Results .................................................................................................................................................... 23 4.1 Cost Effectiveness Results – Medium Office .................................................................................. 24 4.2 Cost Effectiveness Results – Medium Retail .................................................................................. 33 4.3 Cost Effectiveness Results – Small Hotel ....................................................................................... 41 4.4 Cost Effectiveness Results – PV-only and PV+Battery ................................................................... 50
5 Summary, Conclusions, and Further Considerations ............................................................................. 55 5.1 Summary ........................................................................................................................................ 55 5.2 Conclusions and Further Considerations ....................................................................................... 58
6 Appendices ............................................................................................................................................. 60 6.1 Map of California Climate Zones .................................................................................................... 60 6.2 Lighting Efficiency Measures .......................................................................................................... 61 6.3 Drain Water Heat Recovery Measure Analysis .............................................................................. 61 6.4 Utility Rate Schedules .................................................................................................................... 62 6.5 Mixed Fuel Baseline Energy Figures ............................................................................................... 63 6.6 Hotel TDV Cost Effectiveness with Propane Baseline .................................................................... 65 6.7 PV-only and PV+Battery-only Cost Effectiveness Results Details .................................................. 69
6.7.1 Cost Effectiveness Results – Medium Office .......................................................................... 69
6.7.2 Cost Effectiveness Results – Medium Retail .......................................................................... 79
6.7.3 Cost Effectiveness Results – Small Hotel ............................................................................... 88
6.8 List of Relevant Efficiency Measures Explored .............................................................................. 97 6.9 Additional Rates Analysis - Healdsburg ........................................................................................ 102
ATTACHMENT 6
List of Figures Figure 1. Measure Category and Package Overview ....................................................................................... 2 Figure 2. Prototype Characteristics Summary ................................................................................................. 4 Figure 3. Utility Tariffs used based on Climate Zone ....................................................................................... 6 Figure 4. Energy Efficiency Measures - Specification and Cost ...................................................................... 10 Figure 5. Medium Office – Annual Percent kWh Offset with 135 kW Array ................................................. 13 Figure 6. Medium Retail – Annual Percent kWh Offset with 110 kW Array .................................................. 14 Figure 7. Small Hotel – Annual Percent kWh Offset with 80 kW Array ......................................................... 14 Figure 8. Medium Office Upfront PV Costs .................................................................................................... 15 Figure 9. All-Electric HVAC and Water Heating Characteristics Summary. .................................................... 17 Figure 10. Medium Office HVAC System Costs .............................................................................................. 18 Figure 11. Medium Retail HVAC System Costs .............................................................................................. 19 Figure 12. Small Hotel HVAC and Water Heating System Costs .................................................................... 20 Figure 13. Medium Office Electrical Infrastructure Costs for All-Electric Design .......................................... 21 Figure 14. Natural Gas Infrastructure Cost Savings for All-Electric Prototypes ............................................. 22 Figure 15. High Efficiency Appliance Assumptions ........................................................................................ 22 Figure 16. Package Summary ......................................................................................................................... 23 Figure 17. Cost Effectiveness for Medium Office Package 1A – Mixed-Fuel + EE ......................................... 26 Figure 18. Cost Effectiveness for Medium Office Package 1B – Mixed-Fuel + EE + PV + B............................ 27 Figure 19. Cost Effectiveness for Medium Office Package 1C – Mixed-Fuel + HE ......................................... 28 Figure 20. Cost Effectiveness for Medium Office Package 2 – All-Electric Federal Code Minimum ............. 29 Figure 21. Cost Effectiveness for Medium Office Package 3A – All-Electric + EE .......................................... 30 Figure 22. Cost Effectiveness for Medium Office Package 3B – All-Electric + EE + PV + B ............................ 31 Figure 23. Cost Effectiveness for Medium Office Package 3C – All-Electric + HE .......................................... 32 Figure 24. Cost Effectiveness for Medium Retail Package 1A – Mixed-Fuel + EE .......................................... 34 Figure 25. Cost Effectiveness for Medium Retail Package 1B – Mixed-Fuel + EE + PV + B ............................ 35 Figure 26. Cost Effectiveness for Medium Retail Package 1C – Mixed-Fuel + HE.......................................... 36 Figure 27. Cost Effectiveness for Medium Retail Package 2 – All-Electric Federal Code Minimum .............. 37 Figure 28. Cost Effectiveness for Medium Retail Package 3A – All-Electric + EE ........................................... 38 Figure 29. Cost Effectiveness for Medium Retail Package 3B – All-Electric + EE + PV + B ............................. 39 Figure 30. Cost Effectiveness for Medium Retail Package 3C – All-Electric + HE .......................................... 40 Figure 31. Cost Effectiveness for Small Hotel Package 1A – Mixed-Fuel + EE ............................................... 43 Figure 32. Cost Effectiveness for Small Hotel Package 1B – Mixed-Fuel + EE + PV + B ................................. 44 Figure 33. Cost Effectiveness for Small Hotel Package 1C – Mixed-Fuel + HE ............................................... 45 Figure 34. Cost Effectiveness for Small Hotel Package 2 – All-Electric Federal Code Minimum ................... 46 Figure 35. Cost Effectiveness for Small Hotel Package 3A – All-Electric + EE ................................................ 47 Figure 36. Cost Effectiveness for Small Hotel Package 3B – All-Electric + EE + PV + B .................................. 48 Figure 37. Cost Effectiveness for Small Hotel Package 3C – All-Electric + HE ................................................ 49 Figure 38. Cost Effectiveness for Medium Office - PV and Battery ............................................................... 52 Figure 39. Cost Effectiveness for Medium Retail - PV and Battery ................................................................ 53 Figure 40. Cost Effectiveness for Small Hotel - PV and Battery ..................................................................... 54 Figure 41. Medium Office Summary of Compliance Margin and Cost Effectiveness .................................... 56 Figure 42. Medium Retail Summary of Compliance Margin and Cost Effectiveness ..................................... 57 Figure 43. Small Hotel Summary of Compliance Margin and Cost Effectiveness .......................................... 58 Figure 44. Map of California Climate Zones ................................................................................................... 60 Figure 45. Impact of Lighting Measures on Proposed LPDs by Space Function ............................................ 61
ATTACHMENT 6
Figure 46. Utility Tariffs Analyzed Based on Climate Zone – Detailed View .................................................. 62 Figure 47. Medium Office – Mixed Fuel Baseline .......................................................................................... 63 Figure 48. Medium Retail – Mixed Fuel Baseline ........................................................................................... 64 Figure 49. Small Hotel – Mixed Fuel Baseline ................................................................................................ 65 Figure 50. TDV Cost Effectiveness for Small Hotel, Propane Baseline – Package 2 All-Electric Federal Code Minimum ........................................................................................................................................................ 66 Figure 51. TDV Cost Effectiveness for Small Hotel, Propane Baseline – Package 3A (All-Electric + EE) ........ 67 Figure 52. TDV Cost Effectiveness for Small Hotel, Propane Baseline – Package 3B (All-Electric + EE + PV) 67 Figure 53. TDV Cost Effectiveness for Small Hotel, Propane Baseline – Package 3C (All Electric + HE) ........ 68 Figure 54. Cost Effectiveness for Medium Office - Mixed Fuel + 3kW PV ..................................................... 71 Figure 55. Cost Effectiveness for Medium Office – Mixed Fuel + 3kW PV + 5 kWh Battery ......................... 72 Figure 56. Cost Effectiveness for Medium Office – Mixed Fuel + 135kW PV ................................................ 73 Figure 57. Cost Effectiveness for Medium Office – Mixed Fuel + 135kW PV + 50 kWh Battery ................... 74 Figure 58. Cost Effectiveness for Medium Office– All-Electric + 3kW PV ...................................................... 75 Figure 59. Cost Effectiveness for Medium Office – All-Electric + 3kW PV + 5 kWh Battery .......................... 76 Figure 60. Cost Effectiveness for Medium Office – All-Electric + 135kW PV ................................................. 77 Figure 61. Cost Effectiveness for Medium Office – All-Electric + 135kW PV + 50 kWh Battery .................... 78 Figure 62. Cost Effectiveness for Medium Retail – Mixed-Fuel + 3kW PV..................................................... 80 Figure 63. Cost Effectiveness for Medium Retail – Mixed Fuel + 3kW PV + 5 kWh Battery .......................... 81 Figure 64. Cost Effectiveness for Medium Retail – Mixed-Fuel + 110kW PV ................................................ 82 Figure 65. Cost Effectiveness for Medium Retail – Mixed-Fuel + 110 kW PV + 50 kWh Battery ................... 83 Figure 66. Cost Effectiveness for Medium Retail – All-Electric + 3kW PV ..................................................... 84 Figure 67. Cost Effectiveness for Medium Retail – All-Electric + 3kW PV + 5 kWh Battery........................... 85 Figure 68. Cost Effectiveness for Medium Retail – All-Electric + 110kW PV ................................................. 86 Figure 69. Cost Effectiveness for Medium Retail – All-Electric + 110kW PV + 50 kWh Battery .................... 87 Figure 70. Cost Effectiveness for Small Hotel – Mixed Fuel + 3kW PV .......................................................... 89 Figure 71. Cost Effectiveness for Small Hotel – Mixed Fuel + 3kW PV + 5 kWh Battery ............................... 90 Figure 72. Cost Effectiveness for Small Hotel - Mixed Fuel +80kW PV .......................................................... 91 Figure 73. Cost Effectiveness for Small Hotel – Mixed Fuel + 80kW PV + 50 kWh Battery ........................... 92 Figure 74. Cost Effectiveness for Small Hotel – All-Electric + 3kW PV ........................................................... 93 Figure 75. Cost Effectiveness for Small Hotel – All-Electric + 3kW PV + 5 kWh Battery ................................ 94 Figure 76. Cost Effectiveness for Small Hotel – All-Electric + 80kW PV ......................................................... 95 Figure 77. Cost Effectiveness for Small Hotel – All-Electric + 80kW PV + 50 kWh Battery ............................ 96 Figure 78. List of Relevant Efficiency Measures Explored ............................................................................. 97 Figure 79. Healdsburg Utility Rates Analysis – Medium Office, All Packages Cost Effectiveness Summary103 Figure 80. Healdsburg Utility Rates Analysis – Medium Retail, All Packages Cost Effectiveness Summary 104 Figure 81. Healdsburg Utility Rates Analysis – Small Hotel, All Packages Cost Effectiveness Summary ..... 105
ATTACHMENT 6
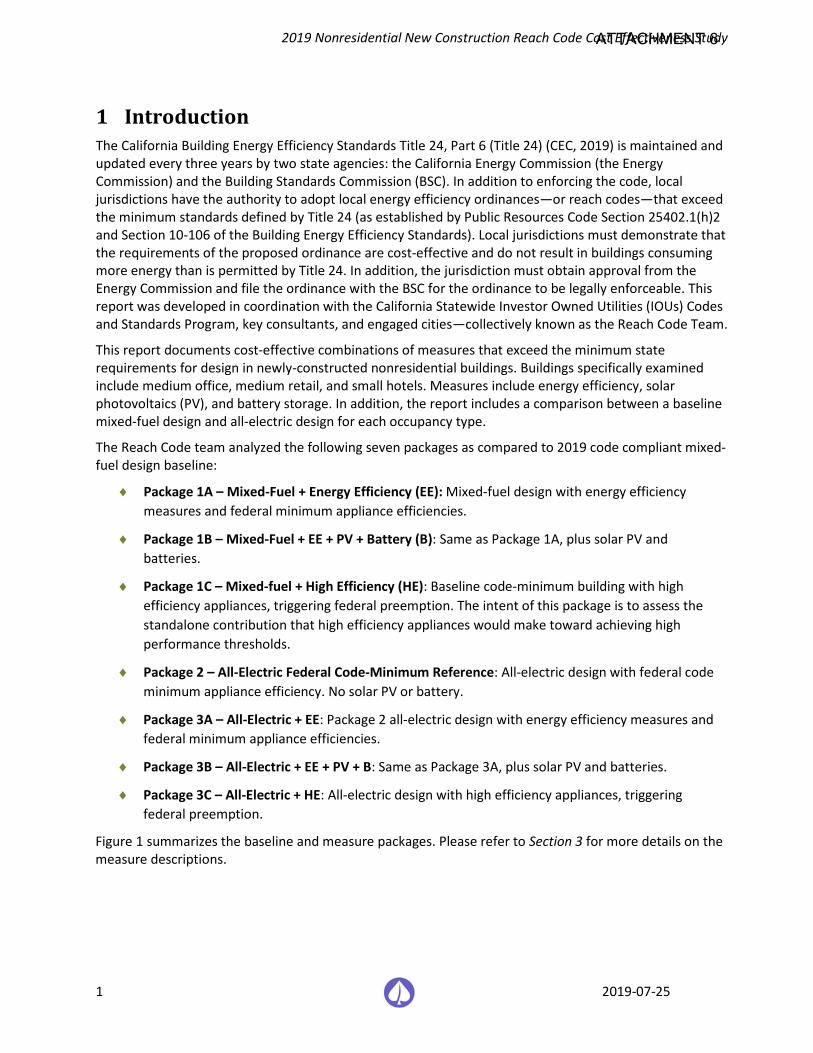
2019 Nonresidential New Construction Reach Code Cost Effectiveness Study
1 2019-07-25
1 Introduction The California Building Energy Efficiency Standards Title 24, Part 6 (Title 24) (CEC, 2019) is maintained and updated every three years by two state agencies: the California Energy Commission (the Energy Commission) and the Building Standards Commission (BSC). In addition to enforcing the code, local jurisdictions have the authority to adopt local energy efficiency ordinances—or reach codes—that exceed the minimum standards defined by Title 24 (as established by Public Resources Code Section 25402.1(h)2 and Section 10-106 of the Building Energy Efficiency Standards). Local jurisdictions must demonstrate that the requirements of the proposed ordinance are cost-effective and do not result in buildings consuming more energy than is permitted by Title 24. In addition, the jurisdiction must obtain approval from the Energy Commission and file the ordinance with the BSC for the ordinance to be legally enforceable. This report was developed in coordination with the California Statewide Investor Owned Utilities (IOUs) Codes and Standards Program, key consultants, and engaged cities—collectively known as the Reach Code Team.
This report documents cost-effective combinations of measures that exceed the minimum state requirements for design in newly-constructed nonresidential buildings. Buildings specifically examined include medium office, medium retail, and small hotels. Measures include energy efficiency, solar photovoltaics (PV), and battery storage. In addition, the report includes a comparison between a baseline mixed-fuel design and all-electric design for each occupancy type.
The Reach Code team analyzed the following seven packages as compared to 2019 code compliant mixed-fuel design baseline:
♦ Package 1A – Mixed-Fuel + Energy Efficiency (EE): Mixed-fuel design with energy efficiency measures and federal minimum appliance efficiencies.
♦ Package 1B – Mixed-Fuel + EE + PV + Battery (B): Same as Package 1A, plus solar PV and batteries.
♦ Package 1C – Mixed-fuel + High Efficiency (HE): Baseline code-minimum building with high efficiency appliances, triggering federal preemption. The intent of this package is to assess the standalone contribution that high efficiency appliances would make toward achieving high performance thresholds.
♦ Package 2 – All-Electric Federal Code-Minimum Reference: All-electric design with federal code minimum appliance efficiency. No solar PV or battery.
♦ Package 3A – All-Electric + EE: Package 2 all-electric design with energy efficiency measures and federal minimum appliance efficiencies.
♦ Package 3B – All-Electric + EE + PV + B: Same as Package 3A, plus solar PV and batteries.
♦ Package 3C – All-Electric + HE: All-electric design with high efficiency appliances, triggering federal preemption.
Figure 1 summarizes the baseline and measure packages. Please refer to Section 3 for more details on the measure descriptions.
ATTACHMENT 6
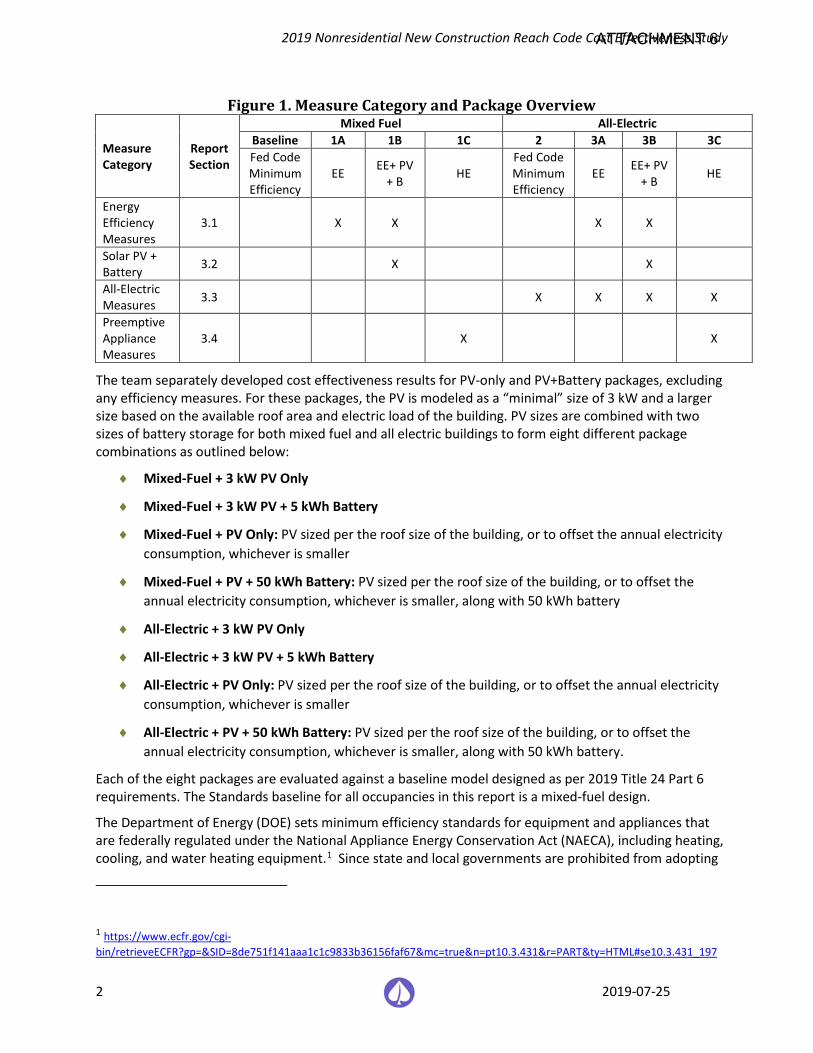
2019 Nonresidential New Construction Reach Code Cost Effectiveness Study
2 2019-07-25
Figure 1. Measure Category and Package Overview
Measure Category
Report Section
Mixed Fuel All-Electric Baseline 1A 1B 1C 2 3A 3B 3C Fed Code Minimum Efficiency
EE EE+ PV + B HE
Fed Code Minimum Efficiency
EE EE+ PV + B HE
Energy Efficiency Measures
3.1 X X X X
Solar PV + Battery 3.2 X X
All-Electric Measures 3.3 X X X X
Preemptive Appliance Measures
3.4 X X
The team separately developed cost effectiveness results for PV-only and PV+Battery packages, excluding any efficiency measures. For these packages, the PV is modeled as a “minimal” size of 3 kW and a larger size based on the available roof area and electric load of the building. PV sizes are combined with two sizes of battery storage for both mixed fuel and all electric buildings to form eight different package combinations as outlined below:
♦ Mixed-Fuel + 3 kW PV Only
♦ Mixed-Fuel + 3 kW PV + 5 kWh Battery
♦ Mixed-Fuel + PV Only: PV sized per the roof size of the building, or to offset the annual electricity consumption, whichever is smaller
♦ Mixed-Fuel + PV + 50 kWh Battery: PV sized per the roof size of the building, or to offset the annual electricity consumption, whichever is smaller, along with 50 kWh battery
♦ All-Electric + 3 kW PV Only
♦ All-Electric + 3 kW PV + 5 kWh Battery
♦ All-Electric + PV Only: PV sized per the roof size of the building, or to offset the annual electricity consumption, whichever is smaller
♦ All-Electric + PV + 50 kWh Battery: PV sized per the roof size of the building, or to offset the annual electricity consumption, whichever is smaller, along with 50 kWh battery.
Each of the eight packages are evaluated against a baseline model designed as per 2019 Title 24 Part 6 requirements. The Standards baseline for all occupancies in this report is a mixed-fuel design.
The Department of Energy (DOE) sets minimum efficiency standards for equipment and appliances that are federally regulated under the National Appliance Energy Conservation Act (NAECA), including heating, cooling, and water heating equipment.1 Since state and local governments are prohibited from adopting
1 https://www.ecfr.gov/cgi-bin/retrieveECFR?gp=&SID=8de751f141aaa1c1c9833b36156faf67&mc=true&n=pt10.3.431&r=PART&ty=HTML#se10.3.431_197
ATTACHMENT 6
2019 Nonresidential New Construction Reach Code Cost Effectiveness Study
3 2019-07-25
higher minimum efficiencies than the federal standards require, the focus of this study is to identify and evaluate cost-effective packages that do not include high efficiency equipment. However, because high efficiency appliances are often the easiest and most affordable measures to increase energy performance, this study provides an analysis of high efficiency appliances for informational purposes. While federal preemption would limit a reach code, in practice, builders may install any package of compliant measures to achieve the performance requirements, including higher efficiency appliances that are federally regulated.
2 Methodology and Assumptions With input from several stakeholders, the Reach Codes team selected three building types—medium office, medium retail, and small hotel—to represent a predominant segment of nonresidential new construction in the state.
This analysis used both on-bill and time dependent valuation of energy (TDV) based approaches to evaluate cost-effectiveness. Both methodologies require estimating and quantifying the energy savings associated with energy efficiency measures, as well as quantifying the costs associated with the measures. The main difference between the methodologies is the valuation of energy and thus the cost savings of reduced or avoided energy use. TDV was developed by the Energy Commission to reflect the time dependent value of energy including long-term projected costs of energy such as the cost of providing energy during peak periods of demand and other societal costs including projected costs for carbon emissions. With the TDV approach, electricity used (or saved) during peak periods has a much higher value than electricity used (or saved) during off-peak periods.2
The Reach Code Team performed energy simulations using EnergyPro 8.0 software for 2019 Title 24 code compliance analysis, which uses CBECC-Com 2019.1.0 for the calculation engine. The baseline prototype models in all climate zones have been designed to have compliance margins as close as possible to 0 to reflect a prescriptively-built building.3
2.1 Building Prototypes The DOE provides building prototype models which, when modified to comply with 2019 Title 24 requirements, can be used to evaluate the cost effectiveness of efficiency measures. These prototypes have historically been used by the California Energy Commission to assess potential code enhancements. The Reach Code Team performed analysis on a medium office, a medium retail, and a small hotel prototype.
Water heating includes both service water heating (SWH) for office and retail buildings and domestic hot water for hotels. In this report, water heating or SWH is used to refer to both. The Standard Design HVAC and SWH systems are based on the system maps included in the 2019 Nonresidential Alternate
2 Horii, B., E. Cutter, N. Kapur, J. Arent, and D. Conotyannis. 2014. “Time Dependent Valuation of Energy for Developing Building Energy Efficiency Standards.” Available at: http://www.energy.ca.gov/title24/2016standards/prerulemaking/documents/2014-07-09_workshop/2017_TDV_Documents 3 EnergySoft and TRC were able to develop most baseline prototypes to achieve a compliance margin of less than +/-1 percent except for few models that were at +/- 6 percent. This indicates these prototypes are not exactly prescriptive according to compliance software calculations. To calculate incremental impacts, TRC conservatively compared the package results to that of the proposed design of baseline prototypes (not the standard design).
ATTACHMENT 6
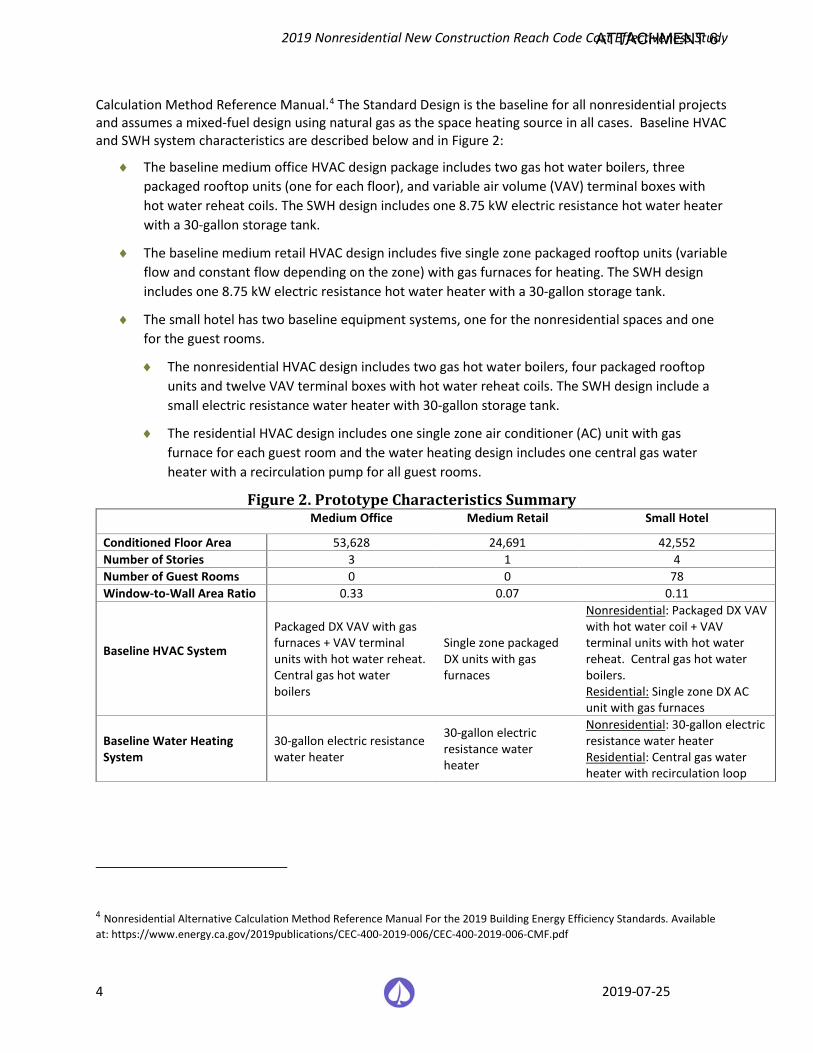
2019 Nonresidential New Construction Reach Code Cost Effectiveness Study
4 2019-07-25
Calculation Method Reference Manual.4 The Standard Design is the baseline for all nonresidential projects and assumes a mixed-fuel design using natural gas as the space heating source in all cases. Baseline HVAC and SWH system characteristics are described below and in Figure 2:
♦ The baseline medium office HVAC design package includes two gas hot water boilers, three packaged rooftop units (one for each floor), and variable air volume (VAV) terminal boxes with hot water reheat coils. The SWH design includes one 8.75 kW electric resistance hot water heater with a 30-gallon storage tank.
♦ The baseline medium retail HVAC design includes five single zone packaged rooftop units (variable flow and constant flow depending on the zone) with gas furnaces for heating. The SWH design includes one 8.75 kW electric resistance hot water heater with a 30-gallon storage tank.
♦ The small hotel has two baseline equipment systems, one for the nonresidential spaces and one for the guest rooms.
♦ The nonresidential HVAC design includes two gas hot water boilers, four packaged rooftop units and twelve VAV terminal boxes with hot water reheat coils. The SWH design include a small electric resistance water heater with 30-gallon storage tank.
♦ The residential HVAC design includes one single zone air conditioner (AC) unit with gas furnace for each guest room and the water heating design includes one central gas water heater with a recirculation pump for all guest rooms.
Figure 2. Prototype Characteristics Summary Medium Office Medium Retail Small Hotel
Conditioned Floor Area 53,628 24,691 42,552 Number of Stories 3 1 4 Number of Guest Rooms 0 0 78 Window-to-Wall Area Ratio 0.33 0.07 0.11
Baseline HVAC System
Packaged DX VAV with gas furnaces + VAV terminal units with hot water reheat. Central gas hot water boilers
Single zone packaged DX units with gas furnaces
Nonresidential: Packaged DX VAV with hot water coil + VAV terminal units with hot water reheat. Central gas hot water boilers. Residential: Single zone DX AC unit with gas furnaces
Baseline Water Heating System
30-gallon electric resistance water heater
30-gallon electric resistance water heater
Nonresidential: 30-gallon electric resistance water heater Residential: Central gas water heater with recirculation loop
4 Nonresidential Alternative Calculation Method Reference Manual For the 2019 Building Energy Efficiency Standards. Available at: https://www.energy.ca.gov/2019publications/CEC-400-2019-006/CEC-400-2019-006-CMF.pdf
ATTACHMENT 6
2019 Nonresidential New Construction Reach Code Cost Effectiveness Study
5 2019-07-25
2.2 Cost Effectiveness The Reach Code Team analyzed the cost effectiveness of the packages by applying them to building prototypes (as applicable) using the life cycle cost methodology, which is approved and used by the Energy Commission to establish cost effective building energy standards (Title 24, Part 6).5
Per Energy Commission’s methodology, the Reach Code Team assessed the incremental costs of the energy efficiency measure packages and compared them to the energy cost savings over the measure life of 15 years. Incremental costs represent the equipment, installation, replacements, and maintenance costs of the proposed measure relative to the 2019 Title 24 Standards minimum requirements. The energy savings benefits are estimated using both TDV of energy and typical utility rates for each building type:
♦ Time Dependent Valuation: TDV is a normalized monetary format developed and used by the Energy Commission for comparing electricity and natural gas savings, and it considers the cost of electricity and natural gas consumed during different times of the day and year. Simulation outputs are translated to TDV savings benefits using 2019 TDV multipliers and 15-year discounted costs for the nonresidential measure packages.
♦ Utility bill impacts (On-bill): Utility energy costs are estimated by applying appropriate IOU rates to estimated annual electricity and natural gas consumption. The energy bill savings are calculated as the difference in utility costs between the baseline and proposed package over a 15-year duration accounting for discount rate and energy cost escalation.
In coordination with the IOU rate team, and rate experts at a few electric publicly owned utilities (POUs), the Reach Code Team used the current nonresidential utility rates publicly available at the time of analysis to analyze the cost effectiveness for each proposed package. The utility tariffs, summarized in Figure 3, were determined based on the annual load profile of each prototype, and the most prevalent rate in each territory. For some prototypes there are multiple options for rates because of the varying load profiles of mixed-fuel buildings versus all-electric buildings. Tariffs were integrated in EnergyPro software to be applied to the hourly electricity and gas outputs. The Reach Code Team did not attempt to compare or test a variety of tariffs to determine their impact on cost effectiveness.
The currently available and applicable time-of–use (TOU) nonresidential rates are applied to both the base and proposed cases with PV systems.6 Any annual electricity production in excess of annual electricity consumption is credited at the applicable wholesale rate based on the approved NEM tariffs for that utility. For a more detailed breakdown of the rates selected refer to Appendix 6.4 Utility Rate Schedules. Note that most utility time-of-use rates will be updated in the near future, which can affect cost effectiveness results. For example, Pacific Gas and Electric Company (PG&E) will introduce new rates for new service connections in late 2019, and existing accounts will be automatically rolled over to new rates in November 2020.
5 Architectural Energy Corporation (January 2011) Life-Cycle Cost Methodology. California Energy Commission. Available at: http://www.energy.ca.gov/title24/2013standards/prerulemaking/documents/general_cec_documents/2011-01-14_LCC_Methodology_2013.pdf 6 Under NEM rulings by the CPUC (D-16-01-144, 1/28/16), all new PV customers shall be in an approved TOU rate structure. As of March 2016, all new PG&E net energy metering (NEM) customers are enrolled in a time-of-use rate. (http://www.pge.com/en/myhome/saveenergymoney/plans/tou/index.page?).
ATTACHMENT 6
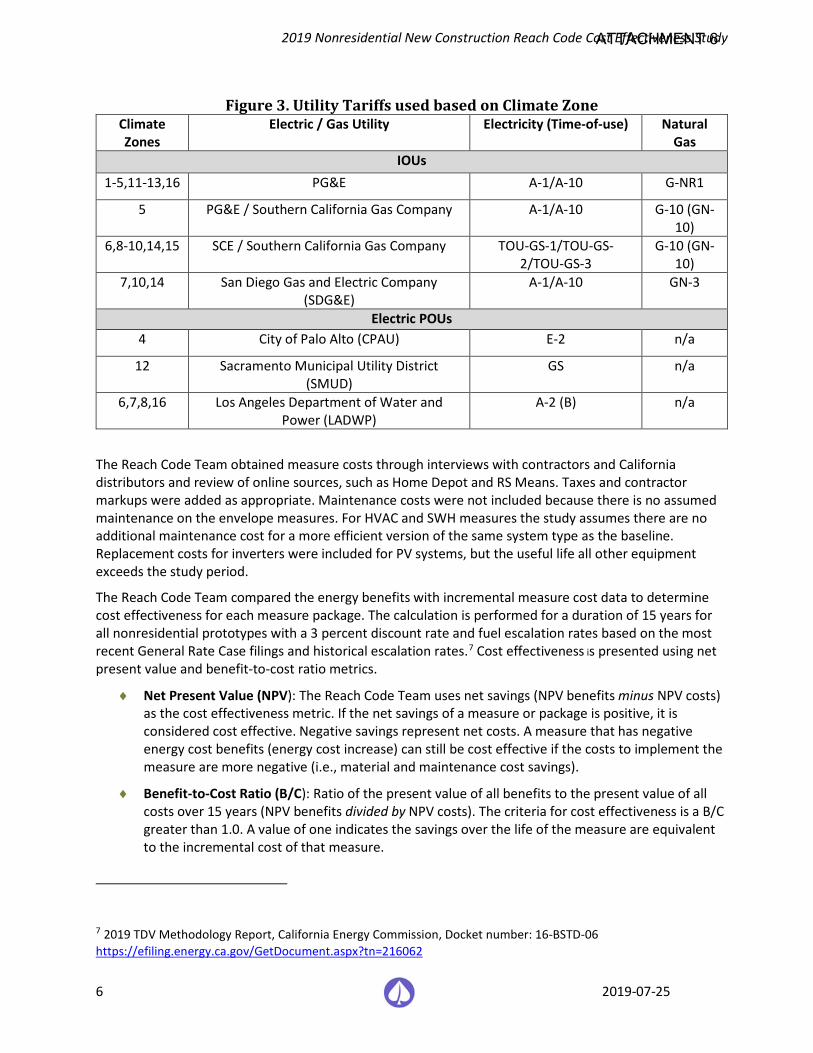
2019 Nonresidential New Construction Reach Code Cost Effectiveness Study
6 2019-07-25
Figure 3. Utility Tariffs used based on Climate Zone Climate Zones
Electric / Gas Utility Electricity (Time-of-use) Natural Gas
IOUs 1-5,11-13,16 PG&E A-1/A-10 G-NR1
5 PG&E / Southern California Gas Company A-1/A-10 G-10 (GN-10)
6,8-10,14,15 SCE / Southern California Gas Company TOU-GS-1/TOU-GS-2/TOU-GS-3
G-10 (GN-10)
7,10,14 San Diego Gas and Electric Company (SDG&E)
A-1/A-10 GN-3
Electric POUs 4 City of Palo Alto (CPAU) E-2 n/a
12 Sacramento Municipal Utility District (SMUD)
GS n/a
6,7,8,16 Los Angeles Department of Water and Power (LADWP)
A-2 (B) n/a
The Reach Code Team obtained measure costs through interviews with contractors and California distributors and review of online sources, such as Home Depot and RS Means. Taxes and contractor markups were added as appropriate. Maintenance costs were not included because there is no assumed maintenance on the envelope measures. For HVAC and SWH measures the study assumes there are no additional maintenance cost for a more efficient version of the same system type as the baseline. Replacement costs for inverters were included for PV systems, but the useful life all other equipment exceeds the study period.
The Reach Code Team compared the energy benefits with incremental measure cost data to determine cost effectiveness for each measure package. The calculation is performed for a duration of 15 years for all nonresidential prototypes with a 3 percent discount rate and fuel escalation rates based on the most recent General Rate Case filings and historical escalation rates.7 Cost effectiveness is presented using net present value and benefit-to-cost ratio metrics.
♦ Net Present Value (NPV): The Reach Code Team uses net savings (NPV benefits minus NPV costs) as the cost effectiveness metric. If the net savings of a measure or package is positive, it is considered cost effective. Negative savings represent net costs. A measure that has negative energy cost benefits (energy cost increase) can still be cost effective if the costs to implement the measure are more negative (i.e., material and maintenance cost savings).
♦ Benefit-to-Cost Ratio (B/C): Ratio of the present value of all benefits to the present value of all costs over 15 years (NPV benefits divided by NPV costs). The criteria for cost effectiveness is a B/C greater than 1.0. A value of one indicates the savings over the life of the measure are equivalent to the incremental cost of that measure.
7 2019 TDV Methodology Report, California Energy Commission, Docket number: 16-BSTD-06 https://efiling.energy.ca.gov/GetDocument.aspx?tn=216062
ATTACHMENT 6
2019 Nonresidential New Construction Reach Code Cost Effectiveness Study
7 2019-07-25
There are several special circumstances to consider when reviewing these results:
♦ Improving the efficiency of a project often requires an initial incremental investment. However, some packages result in initial construction cost savings (negative incremental cost), and either energy cost savings (positive benefits), or increased energy costs (negative benefits). Typically, utility bill savings are categorized as a ‘benefit’ while incremental construction costs are treated as ‘costs.’ In cases where both construction costs are negative and utility bill savings are negative, the construction cost savings are treated as the ‘benefit’ while the utility bill negative savings are the ‘cost.’
♦ In cases where a measure package is cost effective immediately (i.e., there are upfront cost savings and lifetime energy cost savings), cost effectiveness is represented by “>1”.
♦ The B/C ratios sometimes appear very high even though the cost numbers are not very high (for example, an upfront cost of $1 but on-bill savings of $200 over 30 years would equate to a B/C ratio of 200). NPV is also displayed to clarify these potentially confusing conclusions – in the example, the NPV would be equal to a modest $199.
3 Measure Description and Cost Using the 2019 Title 24 code baseline as the starting point, The Reach Code Team identified potential measure packages to determine the projected energy (therm and kWh) and compliance impacts. The Reach Code Team developed an initial measure list based on experience with designers and contractors along with general knowledge of the relative acceptance and preferences of many measures, as well as their incremental costs.
The measures are categorized into energy efficiency, solar PV and battery, all-electric, and preempted high efficiency measures in subsections below.
3.1 Energy Efficiency Measures This section describes all the energy efficiency measures considered for this analysis to develop a non-preempted, cost-effective efficiency measure package. The Reach Code Team assessed the cost-effectiveness of measures for all climate zones individually and found that the packages did not need to vary by climate zone, with the exception of a solar heat gain coefficient measure in hotels, as described in more detail below. The measures were developed based on reviews of proposed 2022 Title 24 codes and standards enhancement measures, as well as ASHRAE 90.1 and ASHRAE 189.1 Standards. Please refer to Appendix Section 6.86.7 for a list of efficiency measures that were considered but not implemented.
ATTACHMENT 6
2019 Nonresidential New Construction Reach Code Cost Effectiveness Study
8 2019-07-25
Figure 4 provides a summary of the cost of each measure and the applicability of each measure to the prototype buildings.
3.1.1 Envelope ♦ Modify Solar Heat Gain Coefficient (SHGC) fenestration
♦ Office and Retail - All Climate Zones: reduce window SHGC from the prescriptive value of 0.25 to 0.22
♦ Hotel
♦ Climate zones 1, 2, 3, 5, and 16: Increase the SHGC for all nonresidential spaces from the prescriptive value of 0.25 to 0.45 in both common and guest room spaces.
♦ Climate zones 4, and 6-15: Reduce window SHGC from the prescriptive value of 0.25 to 0.22, only for common spaces.
In all cases, the fenestration visible transmittance and U-factor remain at prescriptive values.
♦ Fenestration as a function of orientation: Limit the amount of fenestration area as a function of orientation. East-facing and west-facing windows are each limited to one-half of the average amount of north-facing and south-facing windows.
3.1.2 HVAC and SWH ♦ Drain water heat recovery (DWHR): Add shower drain heat recovery in hotel guest rooms. DWHR
captures waste heat from a shower drain line and uses it to preheat hot water. Note that this measure cannot currently be modeled on hotel/motel spaces, and the Reach Code Team integrated estimated savings outside of modeling software based on SWH savings in residential scenarios. Please see Appendix Section 6.3 for details on energy savings analysis.
♦ VAV box minimum flow: Reduce VAV box minimum airflows from the current T24 prescriptive requirement of 20 percent of maximum (design) airflow to the T24 zone ventilation minimums.
♦ Economizers on small capacity systems: Require economizers and staged fan control in units with cooling capacity ≥ 33,000 Btu/hr and ≤ 54,000 Btu/hr, which matches the requirement in the 2018 International Green Construction Code and adopts ANSI/ASHRAE/ICC/USGBC/IES Standard 189.1. This measure reduces the T24 prescriptive threshold on air handling units that are required to have economizers, which is > 54,000 Btu/hr.
♦ Solar thermal hot water: For all-electric hotel only, add solar thermal water heating to supply the following portions of the water heating load, measured in solar savings fraction (SSF):
♦ 20 percent SSF in CZs 2, 3, and 5-9
♦ 25 percent in CZ4
♦ 35 percent SSF in CZs 1 and 10-16.
ATTACHMENT 6
2019 Nonresidential New Construction Reach Code Cost Effectiveness Study
9 2019-07-25
3.1.3 Lighting ♦ Interior lighting reduced lighting power density (LPD): Reduce LPD by 15 percent for Medium
Office, 10 percent for Medium Retail and by 10 percent for the nonresidential areas of the Small Hotel.
♦ Institutional tuning: Limit the maximum output or maximum power draw of lighting to 85 percent of full light output or full power draw.
♦ Daylight dimming plus off: Turn daylight-controlled lights completely off when the daylight available in the daylit zone is greater than 150 percent of the illuminance received from the general lighting system at full power. There is no associated cost with this measure, as the 2019 T24 Standards already require multilevel lighting and daylight sensors in primary and secondary daylit spaces. This measure is simply a revised control strategy and does not increase the number of sensors required or labor to install and program a sensor.
♦ Occupant sensing in open plan offices: In an open plan office area greater than 250 ft2, control lighting based on occupant sensing controls. Two workstations per occupancy sensor.
Details on the applicability and impact of each measure by building type and by space function can be found in Appendices 6.2. The appendix also includes the resulting LPD that is modeled as the proposed by building type and by space function.
ATTACHMENT 6
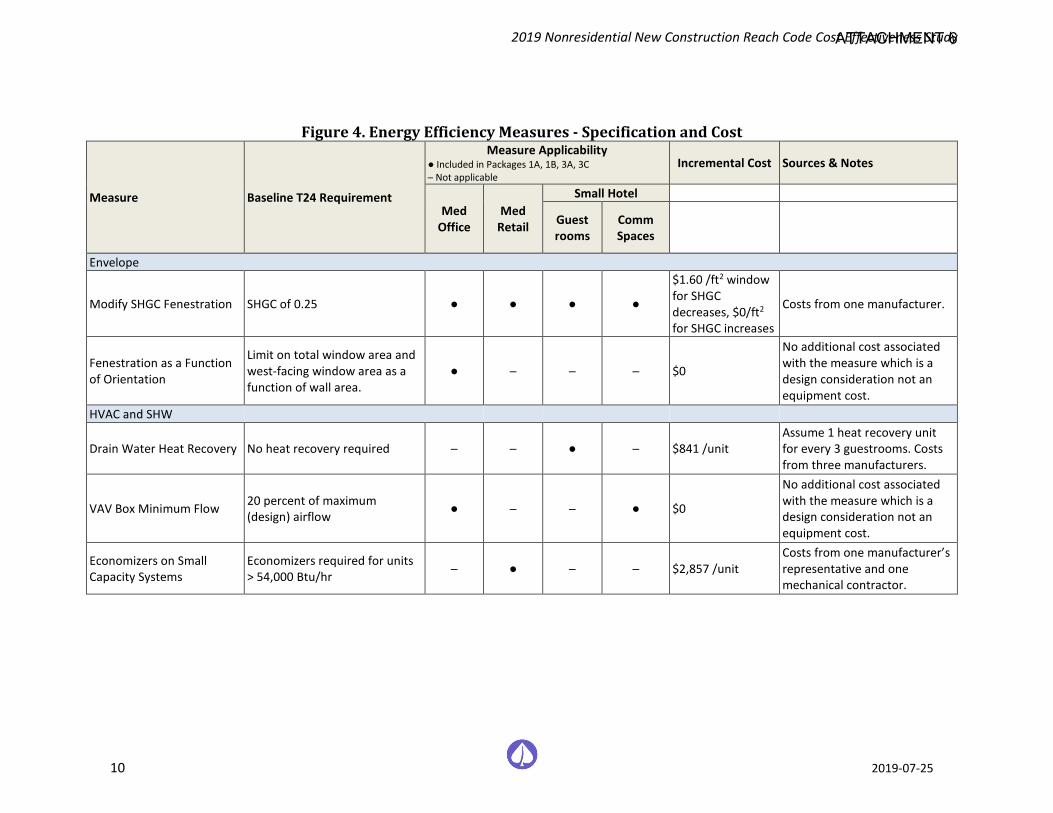
2019 Nonresidential New Construction Reach Code Cost Effectiveness Study
10 2019-07-25
Figure 4. Energy Efficiency Measures - Specification and Cost
Measure Baseline T24 Requirement
Measure Applicability ● Included in Packages 1A, 1B, 3A, 3C ─ Not applicable
Incremental Cost Sources & Notes
Med Office
Med Retail
Small Hotel
Guest rooms
Comm Spaces
Envelope
Modify SHGC Fenestration SHGC of 0.25 ● ● ● ●
$1.60 /ft2 window for SHGC decreases, $0/ft2
for SHGC increases
Costs from one manufacturer.
Fenestration as a Function of Orientation
Limit on total window area and west-facing window area as a function of wall area.
● ─ ─ ─ $0
No additional cost associated with the measure which is a design consideration not an equipment cost.
HVAC and SHW
Drain Water Heat Recovery No heat recovery required ─ ─ ● ─ $841 /unit Assume 1 heat recovery unit for every 3 guestrooms. Costs from three manufacturers.
VAV Box Minimum Flow 20 percent of maximum (design) airflow ● ─ ─ ● $0
No additional cost associated with the measure which is a design consideration not an equipment cost.
Economizers on Small Capacity Systems
Economizers required for units > 54,000 Btu/hr ─ ● ─ ─ $2,857 /unit
Costs from one manufacturer’s representative and one mechanical contractor.
ATTACHMENT 6
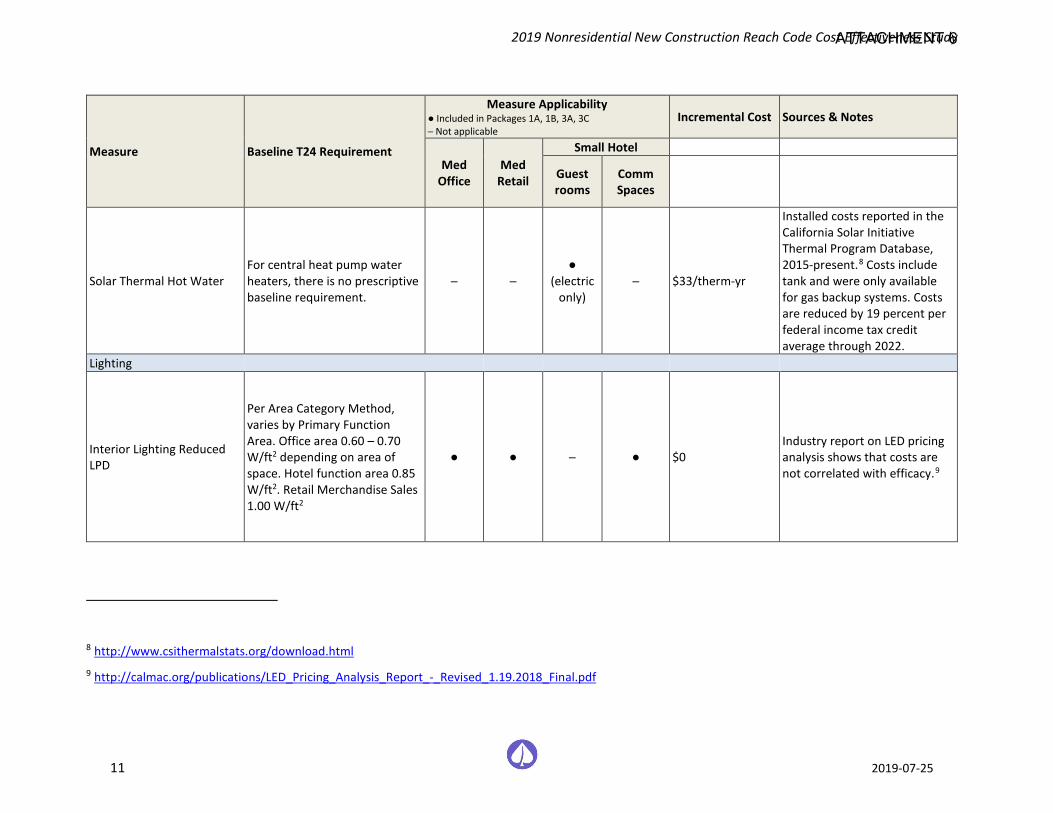
2019 Nonresidential New Construction Reach Code Cost Effectiveness Study
11 2019-07-25
Measure Baseline T24 Requirement
Measure Applicability ● Included in Packages 1A, 1B, 3A, 3C ─ Not applicable
Incremental Cost Sources & Notes
Med Office
Med Retail
Small Hotel
Guest rooms
Comm Spaces
Solar Thermal Hot Water For central heat pump water heaters, there is no prescriptive baseline requirement.
─ ─ ●
(electric only)
─ $33/therm-yr
Installed costs reported in the California Solar Initiative Thermal Program Database, 2015-present.8 Costs include tank and were only available for gas backup systems. Costs are reduced by 19 percent per federal income tax credit average through 2022.
Lighting
Interior Lighting Reduced LPD
Per Area Category Method, varies by Primary Function Area. Office area 0.60 – 0.70 W/ft2 depending on area of space. Hotel function area 0.85 W/ft2. Retail Merchandise Sales 1.00 W/ft2
● ● ─ ● $0 Industry report on LED pricing analysis shows that costs are not correlated with efficacy.9
8 http://www.csithermalstats.org/download.html 9 http://calmac.org/publications/LED_Pricing_Analysis_Report_-_Revised_1.19.2018_Final.pdf
ATTACHMENT 6
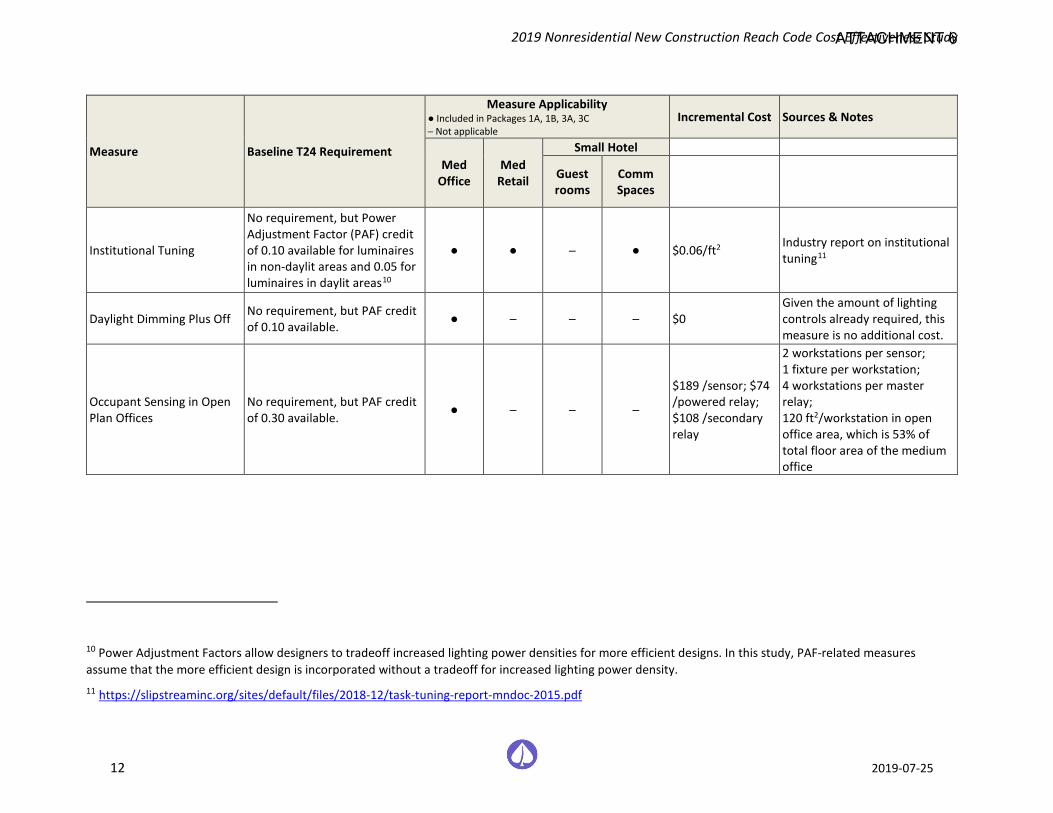
2019 Nonresidential New Construction Reach Code Cost Effectiveness Study
12 2019-07-25
Measure Baseline T24 Requirement
Measure Applicability ● Included in Packages 1A, 1B, 3A, 3C ─ Not applicable
Incremental Cost Sources & Notes
Med Office
Med Retail
Small Hotel
Guest rooms
Comm Spaces
Institutional Tuning
No requirement, but Power Adjustment Factor (PAF) credit of 0.10 available for luminaires in non-daylit areas and 0.05 for luminaires in daylit areas10
● ● ─ ● $0.06/ft2 Industry report on institutional tuning11
Daylight Dimming Plus Off No requirement, but PAF credit of 0.10 available. ● ─ ─ ─ $0
Given the amount of lighting controls already required, this measure is no additional cost.
Occupant Sensing in Open Plan Offices
No requirement, but PAF credit of 0.30 available. ● ─ ─ ─
$189 /sensor; $74 /powered relay; $108 /secondary relay
2 workstations per sensor; 1 fixture per workstation; 4 workstations per master relay; 120 ft2/workstation in open office area, which is 53% of total floor area of the medium office
10 Power Adjustment Factors allow designers to tradeoff increased lighting power densities for more efficient designs. In this study, PAF-related measures assume that the more efficient design is incorporated without a tradeoff for increased lighting power density. 11 https://slipstreaminc.org/sites/default/files/2018-12/task-tuning-report-mndoc-2015.pdf
ATTACHMENT 6
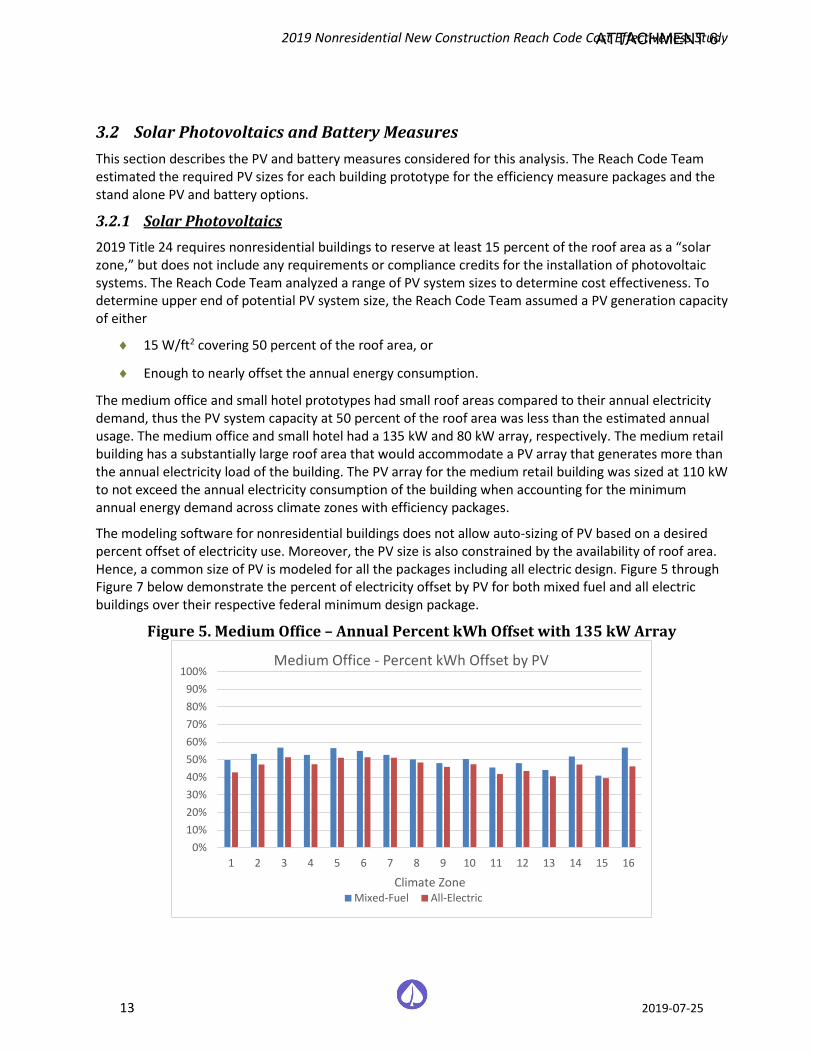
2019 Nonresidential New Construction Reach Code Cost Effectiveness Study
13 2019-07-25
3.2 Solar Photovoltaics and Battery Measures This section describes the PV and battery measures considered for this analysis. The Reach Code Team estimated the required PV sizes for each building prototype for the efficiency measure packages and the stand alone PV and battery options.
3.2.1 Solar Photovoltaics 2019 Title 24 requires nonresidential buildings to reserve at least 15 percent of the roof area as a “solar zone,” but does not include any requirements or compliance credits for the installation of photovoltaic systems. The Reach Code Team analyzed a range of PV system sizes to determine cost effectiveness. To determine upper end of potential PV system size, the Reach Code Team assumed a PV generation capacity of either
♦ 15 W/ft2 covering 50 percent of the roof area, or
♦ Enough to nearly offset the annual energy consumption.
The medium office and small hotel prototypes had small roof areas compared to their annual electricity demand, thus the PV system capacity at 50 percent of the roof area was less than the estimated annual usage. The medium office and small hotel had a 135 kW and 80 kW array, respectively. The medium retail building has a substantially large roof area that would accommodate a PV array that generates more than the annual electricity load of the building. The PV array for the medium retail building was sized at 110 kW to not exceed the annual electricity consumption of the building when accounting for the minimum annual energy demand across climate zones with efficiency packages.
The modeling software for nonresidential buildings does not allow auto-sizing of PV based on a desired percent offset of electricity use. Moreover, the PV size is also constrained by the availability of roof area. Hence, a common size of PV is modeled for all the packages including all electric design. Figure 5 through Figure 7 below demonstrate the percent of electricity offset by PV for both mixed fuel and all electric buildings over their respective federal minimum design package.
Figure 5. Medium Office – Annual Percent kWh Offset with 135 kW Array
0%10%20%30%40%50%60%70%80%90%
100%
1 2 3 4 5 6 7 8 9 10 11 12 13 14 15 16
Climate Zone
Medium Office - Percent kWh Offset by PV
Mixed-Fuel All-Electric
ATTACHMENT 6
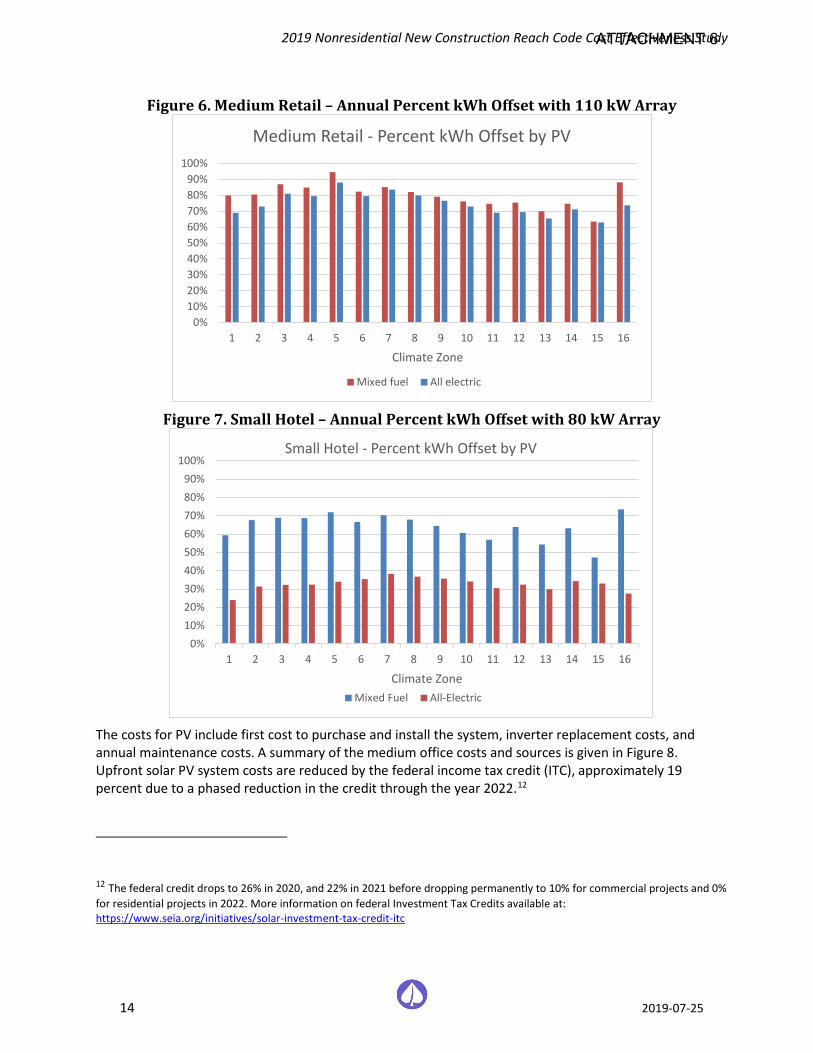
2019 Nonresidential New Construction Reach Code Cost Effectiveness Study
14 2019-07-25
Figure 6. Medium Retail – Annual Percent kWh Offset with 110 kW Array
Figure 7. Small Hotel – Annual Percent kWh Offset with 80 kW Array
The costs for PV include first cost to purchase and install the system, inverter replacement costs, and annual maintenance costs. A summary of the medium office costs and sources is given in Figure 8. Upfront solar PV system costs are reduced by the federal income tax credit (ITC), approximately 19 percent due to a phased reduction in the credit through the year 2022.12
12 The federal credit drops to 26% in 2020, and 22% in 2021 before dropping permanently to 10% for commercial projects and 0% for residential projects in 2022. More information on federal Investment Tax Credits available at: https://www.seia.org/initiatives/solar-investment-tax-credit-itc
0%10%20%30%40%50%60%70%80%90%
100%
1 2 3 4 5 6 7 8 9 10 11 12 13 14 15 16
Climate Zone
Medium Retail - Percent kWh Offset by PV
Mixed fuel All electric
0%10%20%30%40%50%60%70%80%90%
100%
1 2 3 4 5 6 7 8 9 10 11 12 13 14 15 16
Climate Zone
Small Hotel - Percent kWh Offset by PV
Mixed Fuel All-Electric
ATTACHMENT 6
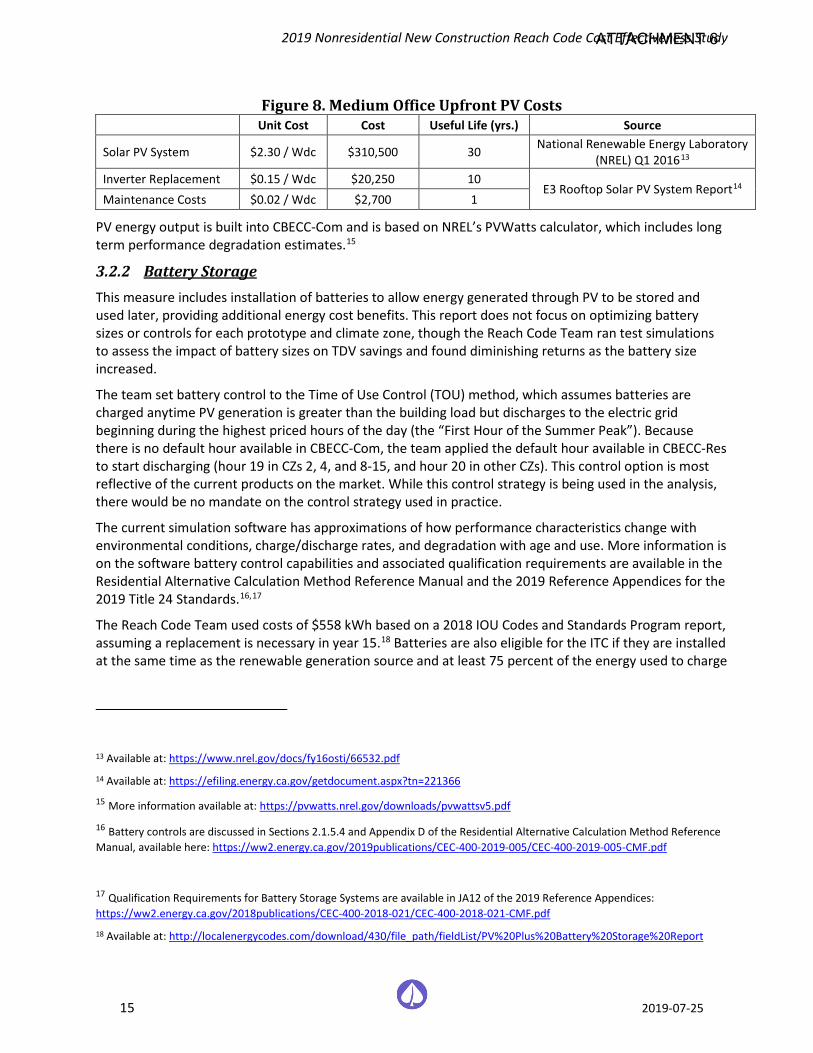
2019 Nonresidential New Construction Reach Code Cost Effectiveness Study
15 2019-07-25
Figure 8. Medium Office Upfront PV Costs Unit Cost Cost Useful Life (yrs.) Source
Solar PV System $2.30 / Wdc $310,500 30 National Renewable Energy Laboratory (NREL) Q1 201613
Inverter Replacement $0.15 / Wdc $20,250 10 E3 Rooftop Solar PV System Report14
Maintenance Costs $0.02 / Wdc $2,700 1
PV energy output is built into CBECC-Com and is based on NREL’s PVWatts calculator, which includes long term performance degradation estimates.15
3.2.2 Battery Storage This measure includes installation of batteries to allow energy generated through PV to be stored and used later, providing additional energy cost benefits. This report does not focus on optimizing battery sizes or controls for each prototype and climate zone, though the Reach Code Team ran test simulations to assess the impact of battery sizes on TDV savings and found diminishing returns as the battery size increased.
The team set battery control to the Time of Use Control (TOU) method, which assumes batteries are charged anytime PV generation is greater than the building load but discharges to the electric grid beginning during the highest priced hours of the day (the “First Hour of the Summer Peak”). Because there is no default hour available in CBECC-Com, the team applied the default hour available in CBECC-Res to start discharging (hour 19 in CZs 2, 4, and 8-15, and hour 20 in other CZs). This control option is most reflective of the current products on the market. While this control strategy is being used in the analysis, there would be no mandate on the control strategy used in practice.
The current simulation software has approximations of how performance characteristics change with environmental conditions, charge/discharge rates, and degradation with age and use. More information is on the software battery control capabilities and associated qualification requirements are available in the Residential Alternative Calculation Method Reference Manual and the 2019 Reference Appendices for the 2019 Title 24 Standards.16,17
The Reach Code Team used costs of $558 kWh based on a 2018 IOU Codes and Standards Program report, assuming a replacement is necessary in year 15.18 Batteries are also eligible for the ITC if they are installed at the same time as the renewable generation source and at least 75 percent of the energy used to charge
13 Available at: https://www.nrel.gov/docs/fy16osti/66532.pdf
14 Available at: https://efiling.energy.ca.gov/getdocument.aspx?tn=221366
15 More information available at: https://pvwatts.nrel.gov/downloads/pvwattsv5.pdf
16 Battery controls are discussed in Sections 2.1.5.4 and Appendix D of the Residential Alternative Calculation Method Reference Manual, available here: https://ww2.energy.ca.gov/2019publications/CEC-400-2019-005/CEC-400-2019-005-CMF.pdf
17 Qualification Requirements for Battery Storage Systems are available in JA12 of the 2019 Reference Appendices: https://ww2.energy.ca.gov/2018publications/CEC-400-2018-021/CEC-400-2018-021-CMF.pdf 18 Available at: http://localenergycodes.com/download/430/file_path/fieldList/PV%20Plus%20Battery%20Storage%20Report
ATTACHMENT 6
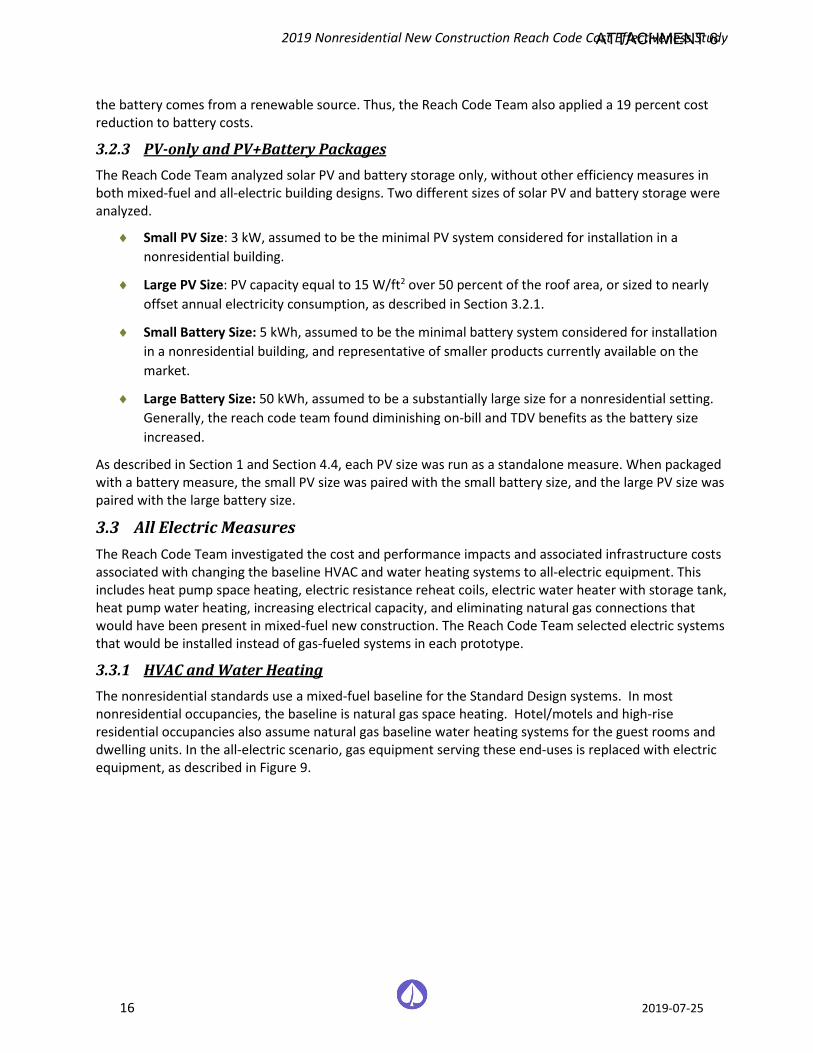
2019 Nonresidential New Construction Reach Code Cost Effectiveness Study
16 2019-07-25
the battery comes from a renewable source. Thus, the Reach Code Team also applied a 19 percent cost reduction to battery costs.
3.2.3 PV-only and PV+Battery Packages The Reach Code Team analyzed solar PV and battery storage only, without other efficiency measures in both mixed-fuel and all-electric building designs. Two different sizes of solar PV and battery storage were analyzed.
♦ Small PV Size: 3 kW, assumed to be the minimal PV system considered for installation in a nonresidential building.
♦ Large PV Size: PV capacity equal to 15 W/ft2 over 50 percent of the roof area, or sized to nearly offset annual electricity consumption, as described in Section 3.2.1.
♦ Small Battery Size: 5 kWh, assumed to be the minimal battery system considered for installation in a nonresidential building, and representative of smaller products currently available on the market.
♦ Large Battery Size: 50 kWh, assumed to be a substantially large size for a nonresidential setting. Generally, the reach code team found diminishing on-bill and TDV benefits as the battery size increased.
As described in Section 1 and Section 4.4, each PV size was run as a standalone measure. When packaged with a battery measure, the small PV size was paired with the small battery size, and the large PV size was paired with the large battery size.
3.3 All Electric Measures The Reach Code Team investigated the cost and performance impacts and associated infrastructure costs associated with changing the baseline HVAC and water heating systems to all-electric equipment. This includes heat pump space heating, electric resistance reheat coils, electric water heater with storage tank, heat pump water heating, increasing electrical capacity, and eliminating natural gas connections that would have been present in mixed-fuel new construction. The Reach Code Team selected electric systems that would be installed instead of gas-fueled systems in each prototype.
3.3.1 HVAC and Water Heating The nonresidential standards use a mixed-fuel baseline for the Standard Design systems. In most nonresidential occupancies, the baseline is natural gas space heating. Hotel/motels and high-rise residential occupancies also assume natural gas baseline water heating systems for the guest rooms and dwelling units. In the all-electric scenario, gas equipment serving these end-uses is replaced with electric equipment, as described in Figure 9.
ATTACHMENT 6
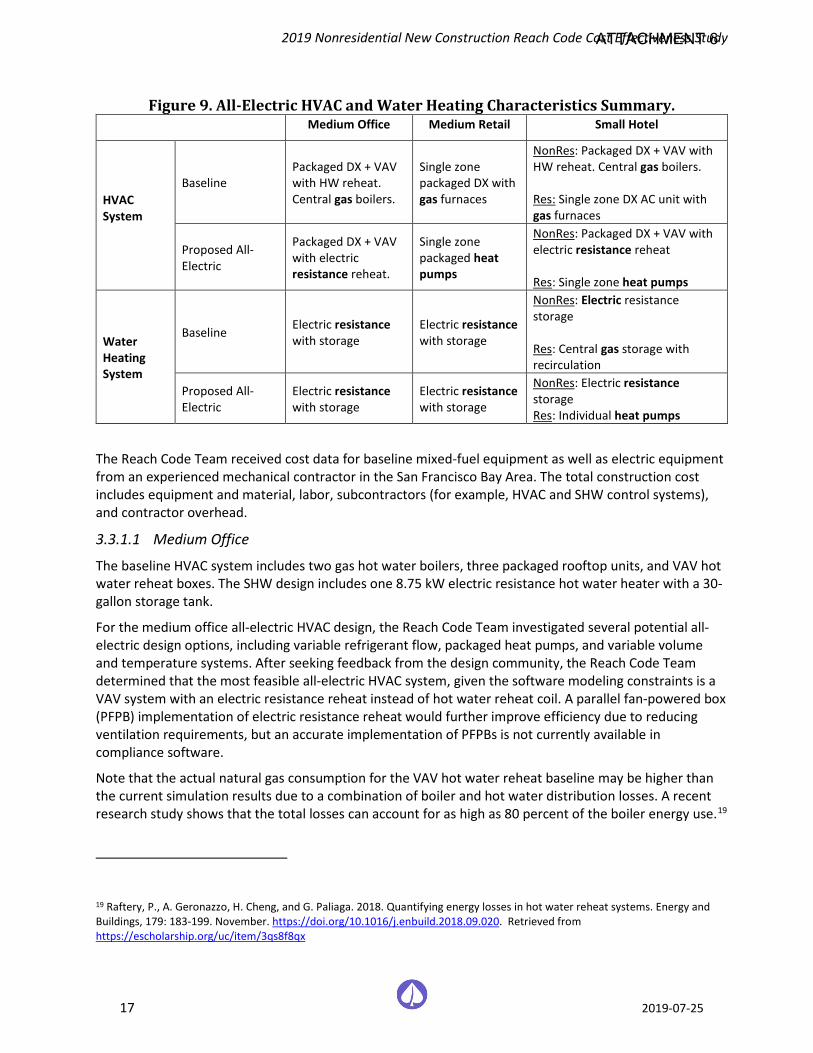
2019 Nonresidential New Construction Reach Code Cost Effectiveness Study
17 2019-07-25
Figure 9. All-Electric HVAC and Water Heating Characteristics Summary. Medium Office Medium Retail Small Hotel
HVAC System
Baseline Packaged DX + VAV with HW reheat. Central gas boilers.
Single zone packaged DX with gas furnaces
NonRes: Packaged DX + VAV with HW reheat. Central gas boilers. Res: Single zone DX AC unit with gas furnaces
Proposed All-Electric
Packaged DX + VAV with electric resistance reheat.
Single zone packaged heat pumps
NonRes: Packaged DX + VAV with electric resistance reheat Res: Single zone heat pumps
Water Heating System
Baseline Electric resistance with storage
Electric resistance with storage
NonRes: Electric resistance storage Res: Central gas storage with recirculation
Proposed All-Electric
Electric resistance with storage
Electric resistance with storage
NonRes: Electric resistance storage Res: Individual heat pumps
The Reach Code Team received cost data for baseline mixed-fuel equipment as well as electric equipment from an experienced mechanical contractor in the San Francisco Bay Area. The total construction cost includes equipment and material, labor, subcontractors (for example, HVAC and SHW control systems), and contractor overhead.
3.3.1.1 Medium Office
The baseline HVAC system includes two gas hot water boilers, three packaged rooftop units, and VAV hot water reheat boxes. The SHW design includes one 8.75 kW electric resistance hot water heater with a 30-gallon storage tank.
For the medium office all-electric HVAC design, the Reach Code Team investigated several potential all-electric design options, including variable refrigerant flow, packaged heat pumps, and variable volume and temperature systems. After seeking feedback from the design community, the Reach Code Team determined that the most feasible all-electric HVAC system, given the software modeling constraints is a VAV system with an electric resistance reheat instead of hot water reheat coil. A parallel fan-powered box (PFPB) implementation of electric resistance reheat would further improve efficiency due to reducing ventilation requirements, but an accurate implementation of PFPBs is not currently available in compliance software.
Note that the actual natural gas consumption for the VAV hot water reheat baseline may be higher than the current simulation results due to a combination of boiler and hot water distribution losses. A recent research study shows that the total losses can account for as high as 80 percent of the boiler energy use.19
19 Raftery, P., A. Geronazzo, H. Cheng, and G. Paliaga. 2018. Quantifying energy losses in hot water reheat systems. Energy and Buildings, 179: 183-199. November. https://doi.org/10.1016/j.enbuild.2018.09.020. Retrieved from https://escholarship.org/uc/item/3qs8f8qx
ATTACHMENT 6
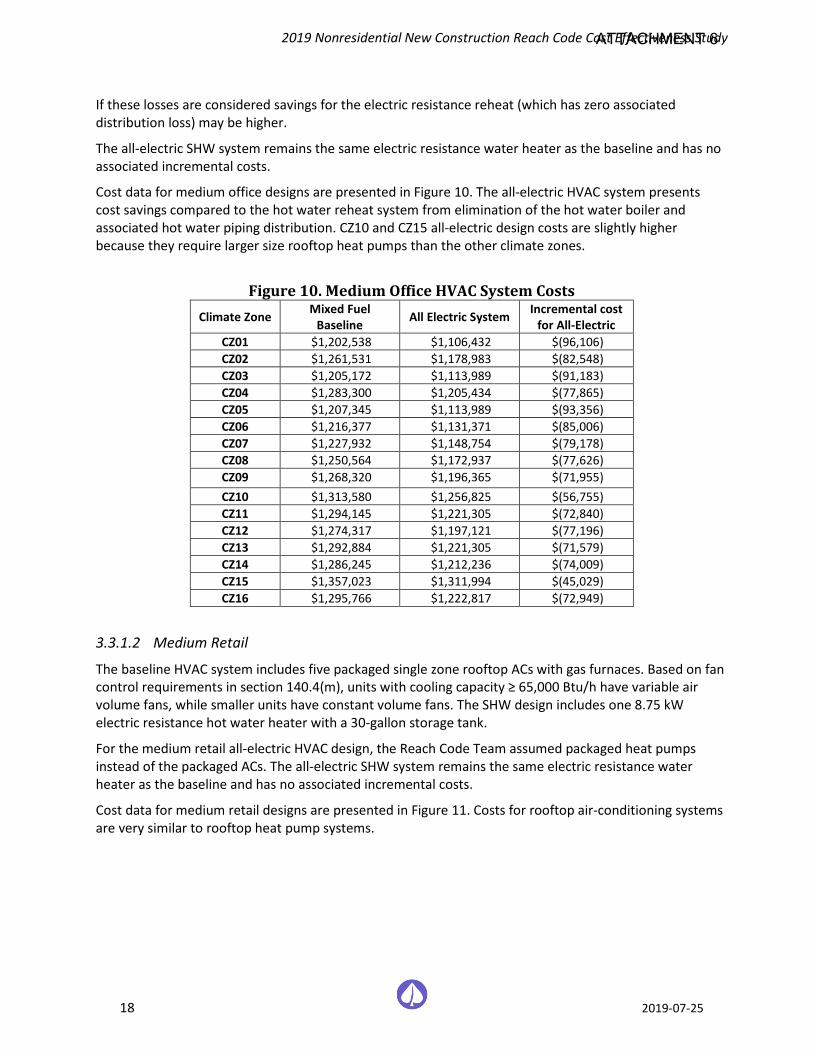
2019 Nonresidential New Construction Reach Code Cost Effectiveness Study
18 2019-07-25
If these losses are considered savings for the electric resistance reheat (which has zero associated distribution loss) may be higher.
The all-electric SHW system remains the same electric resistance water heater as the baseline and has no associated incremental costs.
Cost data for medium office designs are presented in Figure 10. The all-electric HVAC system presents cost savings compared to the hot water reheat system from elimination of the hot water boiler and associated hot water piping distribution. CZ10 and CZ15 all-electric design costs are slightly higher because they require larger size rooftop heat pumps than the other climate zones.
Figure 10. Medium Office HVAC System Costs
Climate Zone Mixed Fuel Baseline All Electric System Incremental cost
for All-Electric CZ01 $1,202,538 $1,106,432 $(96,106) CZ02 $1,261,531 $1,178,983 $(82,548) CZ03 $1,205,172 $1,113,989 $(91,183) CZ04 $1,283,300 $1,205,434 $(77,865) CZ05 $1,207,345 $1,113,989 $(93,356) CZ06 $1,216,377 $1,131,371 $(85,006) CZ07 $1,227,932 $1,148,754 $(79,178) CZ08 $1,250,564 $1,172,937 $(77,626) CZ09 $1,268,320 $1,196,365 $(71,955) CZ10 $1,313,580 $1,256,825 $(56,755) CZ11 $1,294,145 $1,221,305 $(72,840) CZ12 $1,274,317 $1,197,121 $(77,196) CZ13 $1,292,884 $1,221,305 $(71,579) CZ14 $1,286,245 $1,212,236 $(74,009) CZ15 $1,357,023 $1,311,994 $(45,029) CZ16 $1,295,766 $1,222,817 $(72,949)
3.3.1.2 Medium Retail
The baseline HVAC system includes five packaged single zone rooftop ACs with gas furnaces. Based on fan control requirements in section 140.4(m), units with cooling capacity ≥ 65,000 Btu/h have variable air volume fans, while smaller units have constant volume fans. The SHW design includes one 8.75 kW electric resistance hot water heater with a 30-gallon storage tank.
For the medium retail all-electric HVAC design, the Reach Code Team assumed packaged heat pumps instead of the packaged ACs. The all-electric SHW system remains the same electric resistance water heater as the baseline and has no associated incremental costs.
Cost data for medium retail designs are presented in Figure 11. Costs for rooftop air-conditioning systems are very similar to rooftop heat pump systems.
ATTACHMENT 6
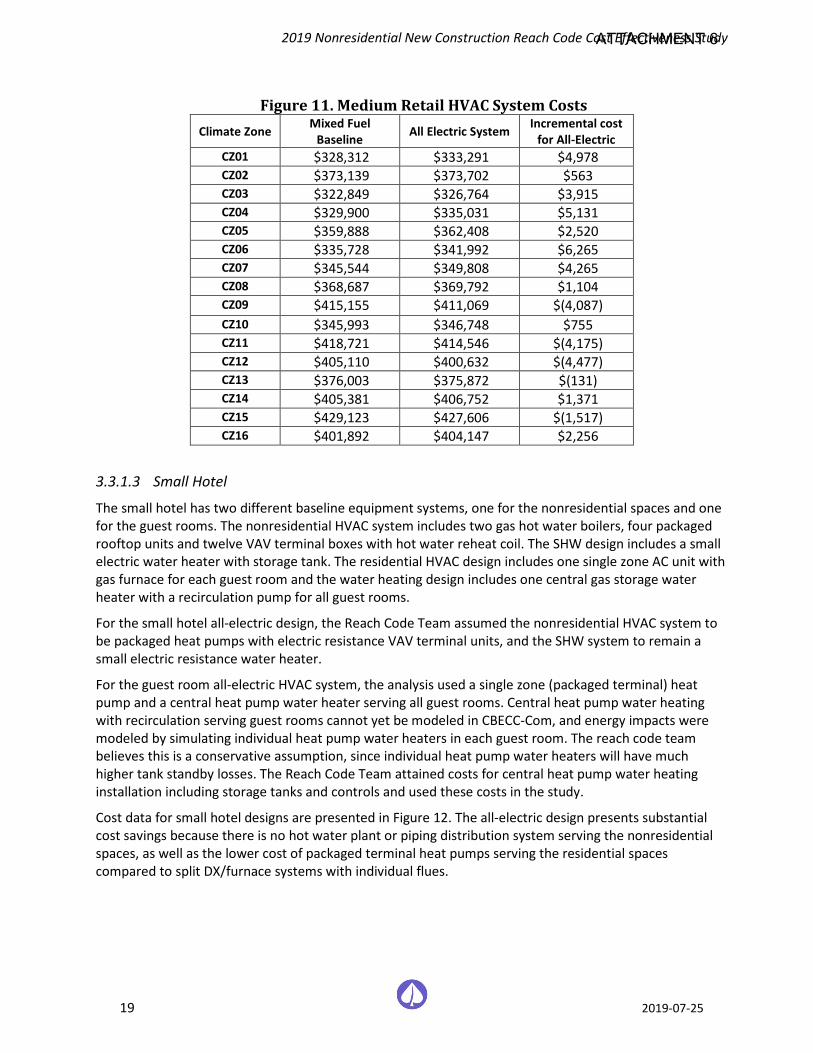
2019 Nonresidential New Construction Reach Code Cost Effectiveness Study
19 2019-07-25
Figure 11. Medium Retail HVAC System Costs Climate Zone Mixed Fuel
Baseline All Electric System Incremental cost for All-Electric
CZ01 $328,312 $333,291 $4,978 CZ02 $373,139 $373,702 $563 CZ03 $322,849 $326,764 $3,915 CZ04 $329,900 $335,031 $5,131 CZ05 $359,888 $362,408 $2,520 CZ06 $335,728 $341,992 $6,265 CZ07 $345,544 $349,808 $4,265 CZ08 $368,687 $369,792 $1,104 CZ09 $415,155 $411,069 $(4,087) CZ10 $345,993 $346,748 $755 CZ11 $418,721 $414,546 $(4,175) CZ12 $405,110 $400,632 $(4,477) CZ13 $376,003 $375,872 $(131) CZ14 $405,381 $406,752 $1,371 CZ15 $429,123 $427,606 $(1,517) CZ16 $401,892 $404,147 $2,256
3.3.1.3 Small Hotel
The small hotel has two different baseline equipment systems, one for the nonresidential spaces and one for the guest rooms. The nonresidential HVAC system includes two gas hot water boilers, four packaged rooftop units and twelve VAV terminal boxes with hot water reheat coil. The SHW design includes a small electric water heater with storage tank. The residential HVAC design includes one single zone AC unit with gas furnace for each guest room and the water heating design includes one central gas storage water heater with a recirculation pump for all guest rooms.
For the small hotel all-electric design, the Reach Code Team assumed the nonresidential HVAC system to be packaged heat pumps with electric resistance VAV terminal units, and the SHW system to remain a small electric resistance water heater.
For the guest room all-electric HVAC system, the analysis used a single zone (packaged terminal) heat pump and a central heat pump water heater serving all guest rooms. Central heat pump water heating with recirculation serving guest rooms cannot yet be modeled in CBECC-Com, and energy impacts were modeled by simulating individual heat pump water heaters in each guest room. The reach code team believes this is a conservative assumption, since individual heat pump water heaters will have much higher tank standby losses. The Reach Code Team attained costs for central heat pump water heating installation including storage tanks and controls and used these costs in the study.
Cost data for small hotel designs are presented in Figure 12. The all-electric design presents substantial cost savings because there is no hot water plant or piping distribution system serving the nonresidential spaces, as well as the lower cost of packaged terminal heat pumps serving the residential spaces compared to split DX/furnace systems with individual flues.
ATTACHMENT 6
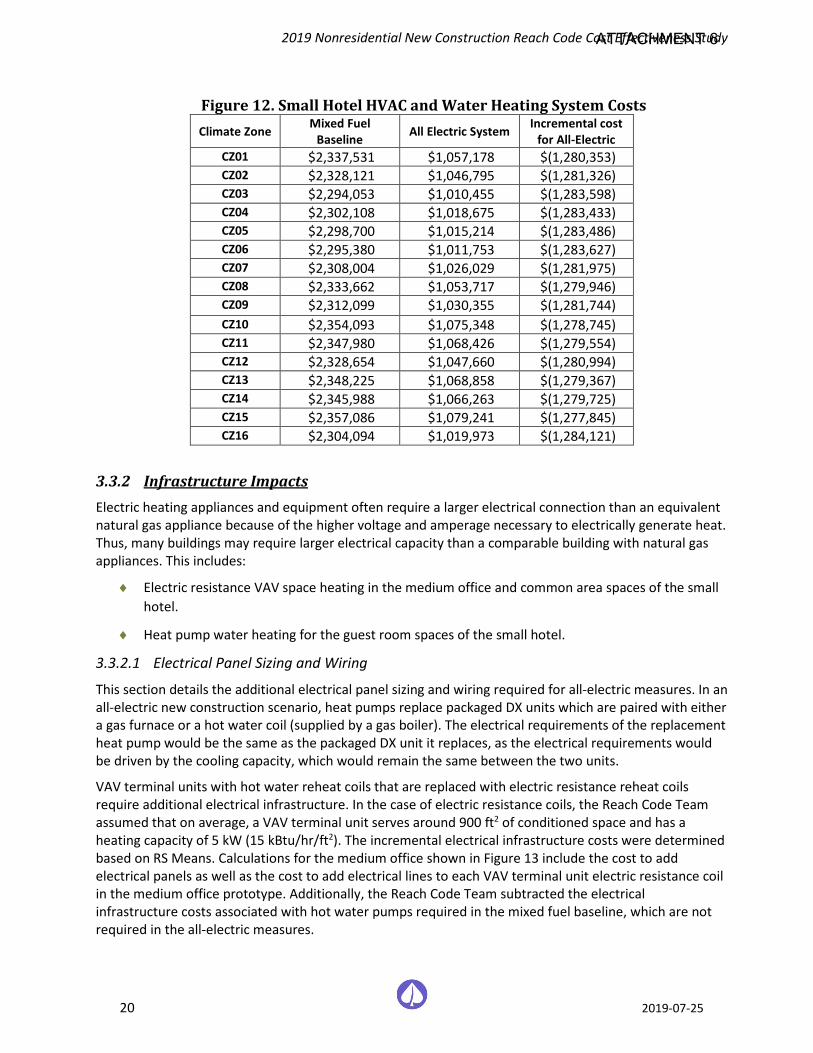
2019 Nonresidential New Construction Reach Code Cost Effectiveness Study
20 2019-07-25
Figure 12. Small Hotel HVAC and Water Heating System Costs Climate Zone Mixed Fuel
Baseline All Electric System Incremental cost for All-Electric
CZ01 $2,337,531 $1,057,178 $(1,280,353) CZ02 $2,328,121 $1,046,795 $(1,281,326) CZ03 $2,294,053 $1,010,455 $(1,283,598) CZ04 $2,302,108 $1,018,675 $(1,283,433) CZ05 $2,298,700 $1,015,214 $(1,283,486) CZ06 $2,295,380 $1,011,753 $(1,283,627) CZ07 $2,308,004 $1,026,029 $(1,281,975) CZ08 $2,333,662 $1,053,717 $(1,279,946) CZ09 $2,312,099 $1,030,355 $(1,281,744) CZ10 $2,354,093 $1,075,348 $(1,278,745) CZ11 $2,347,980 $1,068,426 $(1,279,554) CZ12 $2,328,654 $1,047,660 $(1,280,994) CZ13 $2,348,225 $1,068,858 $(1,279,367) CZ14 $2,345,988 $1,066,263 $(1,279,725) CZ15 $2,357,086 $1,079,241 $(1,277,845) CZ16 $2,304,094 $1,019,973 $(1,284,121)
3.3.2 Infrastructure Impacts Electric heating appliances and equipment often require a larger electrical connection than an equivalent natural gas appliance because of the higher voltage and amperage necessary to electrically generate heat. Thus, many buildings may require larger electrical capacity than a comparable building with natural gas appliances. This includes:
♦ Electric resistance VAV space heating in the medium office and common area spaces of the small hotel.
♦ Heat pump water heating for the guest room spaces of the small hotel.
3.3.2.1 Electrical Panel Sizing and Wiring
This section details the additional electrical panel sizing and wiring required for all-electric measures. In an all-electric new construction scenario, heat pumps replace packaged DX units which are paired with either a gas furnace or a hot water coil (supplied by a gas boiler). The electrical requirements of the replacement heat pump would be the same as the packaged DX unit it replaces, as the electrical requirements would be driven by the cooling capacity, which would remain the same between the two units.
VAV terminal units with hot water reheat coils that are replaced with electric resistance reheat coils require additional electrical infrastructure. In the case of electric resistance coils, the Reach Code Team assumed that on average, a VAV terminal unit serves around 900 ft2 of conditioned space and has a heating capacity of 5 kW (15 kBtu/hr/ft2). The incremental electrical infrastructure costs were determined based on RS Means. Calculations for the medium office shown in Figure 13 include the cost to add electrical panels as well as the cost to add electrical lines to each VAV terminal unit electric resistance coil in the medium office prototype. Additionally, the Reach Code Team subtracted the electrical infrastructure costs associated with hot water pumps required in the mixed fuel baseline, which are not required in the all-electric measures.
ATTACHMENT 6
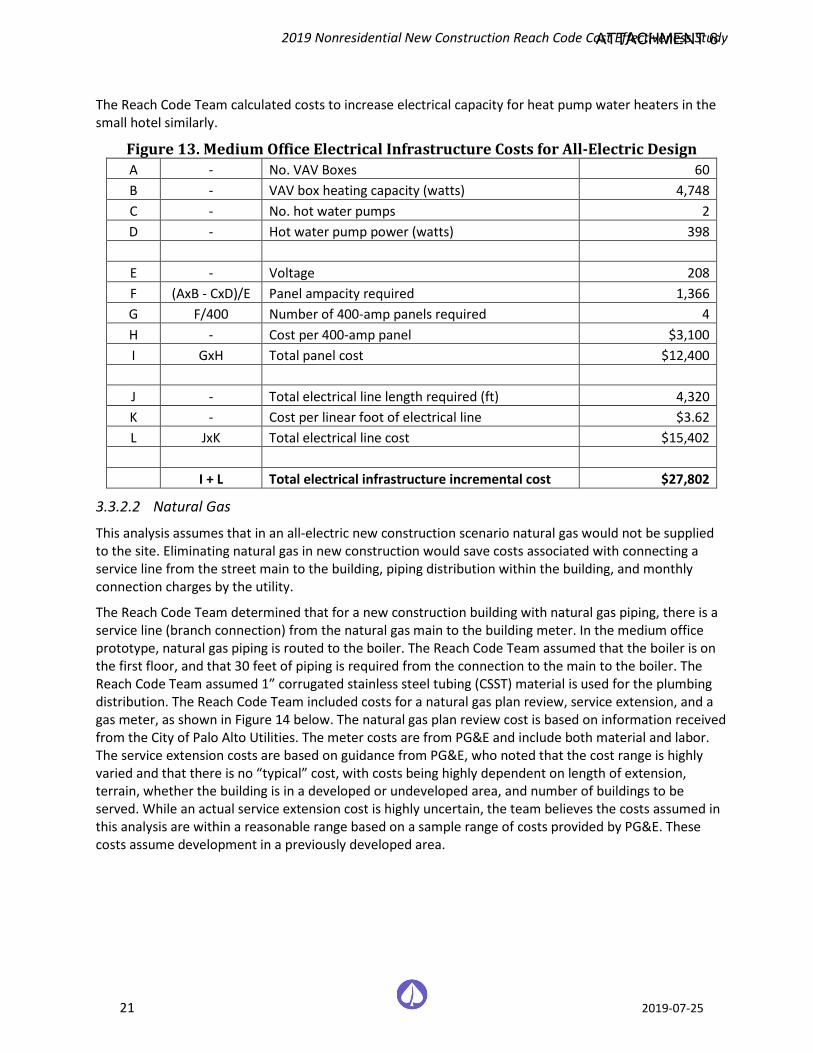
2019 Nonresidential New Construction Reach Code Cost Effectiveness Study
21 2019-07-25
The Reach Code Team calculated costs to increase electrical capacity for heat pump water heaters in the small hotel similarly.
Figure 13. Medium Office Electrical Infrastructure Costs for All-Electric Design A - No. VAV Boxes 60 B - VAV box heating capacity (watts) 4,748 C - No. hot water pumps 2 D - Hot water pump power (watts) 398
E - Voltage 208 F (AxB - CxD)/E Panel ampacity required 1,366 G F/400 Number of 400-amp panels required 4 H - Cost per 400-amp panel $3,100 I GxH Total panel cost $12,400
J - Total electrical line length required (ft) 4,320 K - Cost per linear foot of electrical line $3.62 L JxK Total electrical line cost $15,402
I + L Total electrical infrastructure incremental cost $27,802
3.3.2.2 Natural Gas
This analysis assumes that in an all-electric new construction scenario natural gas would not be supplied to the site. Eliminating natural gas in new construction would save costs associated with connecting a service line from the street main to the building, piping distribution within the building, and monthly connection charges by the utility.
The Reach Code Team determined that for a new construction building with natural gas piping, there is a service line (branch connection) from the natural gas main to the building meter. In the medium office prototype, natural gas piping is routed to the boiler. The Reach Code Team assumed that the boiler is on the first floor, and that 30 feet of piping is required from the connection to the main to the boiler. The Reach Code Team assumed 1” corrugated stainless steel tubing (CSST) material is used for the plumbing distribution. The Reach Code Team included costs for a natural gas plan review, service extension, and a gas meter, as shown in Figure 14 below. The natural gas plan review cost is based on information received from the City of Palo Alto Utilities. The meter costs are from PG&E and include both material and labor. The service extension costs are based on guidance from PG&E, who noted that the cost range is highly varied and that there is no “typical” cost, with costs being highly dependent on length of extension, terrain, whether the building is in a developed or undeveloped area, and number of buildings to be served. While an actual service extension cost is highly uncertain, the team believes the costs assumed in this analysis are within a reasonable range based on a sample range of costs provided by PG&E. These costs assume development in a previously developed area.
ATTACHMENT 6
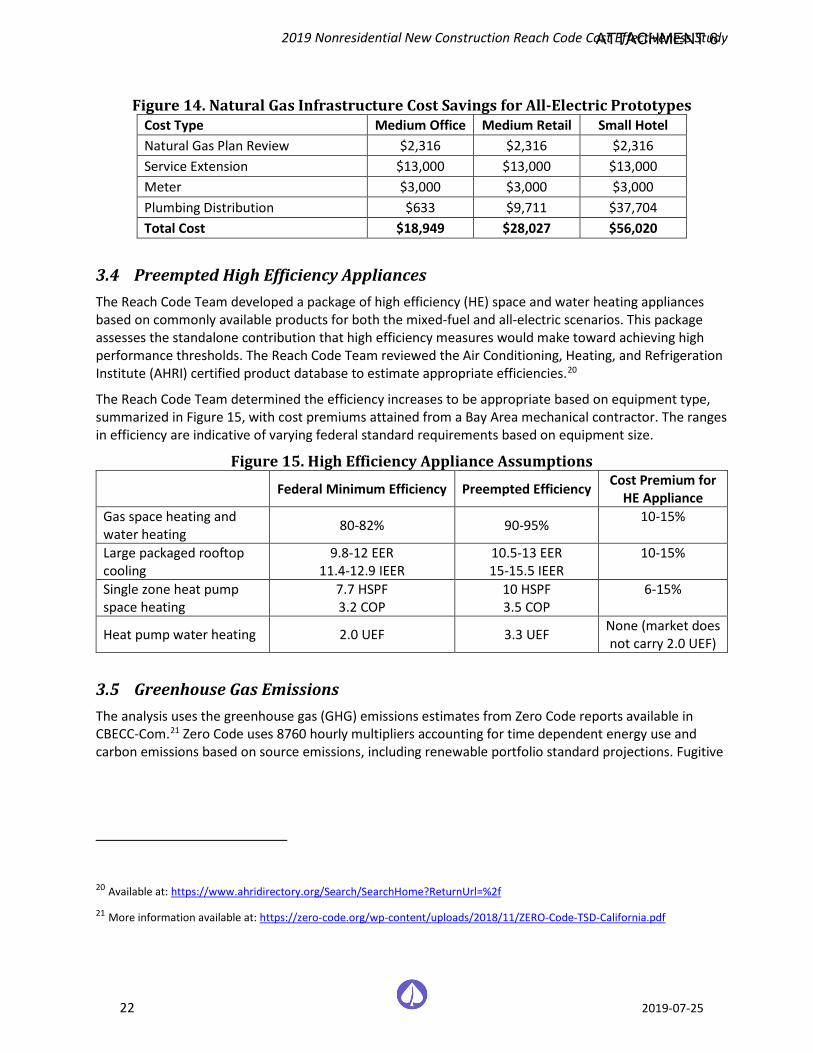
2019 Nonresidential New Construction Reach Code Cost Effectiveness Study
22 2019-07-25
Figure 14. Natural Gas Infrastructure Cost Savings for All-Electric Prototypes Cost Type Medium Office Medium Retail Small Hotel Natural Gas Plan Review $2,316 $2,316 $2,316 Service Extension $13,000 $13,000 $13,000 Meter $3,000 $3,000 $3,000 Plumbing Distribution $633 $9,711 $37,704 Total Cost $18,949 $28,027 $56,020
3.4 Preempted High Efficiency Appliances The Reach Code Team developed a package of high efficiency (HE) space and water heating appliances based on commonly available products for both the mixed-fuel and all-electric scenarios. This package assesses the standalone contribution that high efficiency measures would make toward achieving high performance thresholds. The Reach Code Team reviewed the Air Conditioning, Heating, and Refrigeration Institute (AHRI) certified product database to estimate appropriate efficiencies.20
The Reach Code Team determined the efficiency increases to be appropriate based on equipment type, summarized in Figure 15, with cost premiums attained from a Bay Area mechanical contractor. The ranges in efficiency are indicative of varying federal standard requirements based on equipment size.
Figure 15. High Efficiency Appliance Assumptions Federal Minimum Efficiency Preempted Efficiency Cost Premium for
HE Appliance Gas space heating and water heating 80-82% 90-95% 10-15%
Large packaged rooftop cooling
9.8-12 EER 11.4-12.9 IEER
10.5-13 EER 15-15.5 IEER
10-15%
Single zone heat pump space heating
7.7 HSPF 3.2 COP
10 HSPF 3.5 COP
6-15%
Heat pump water heating 2.0 UEF 3.3 UEF None (market does not carry 2.0 UEF)
3.5 Greenhouse Gas Emissions The analysis uses the greenhouse gas (GHG) emissions estimates from Zero Code reports available in CBECC-Com.21 Zero Code uses 8760 hourly multipliers accounting for time dependent energy use and carbon emissions based on source emissions, including renewable portfolio standard projections. Fugitive
20 Available at: https://www.ahridirectory.org/Search/SearchHome?ReturnUrl=%2f
21 More information available at: https://zero-code.org/wp-content/uploads/2018/11/ZERO-Code-TSD-California.pdf
ATTACHMENT 6
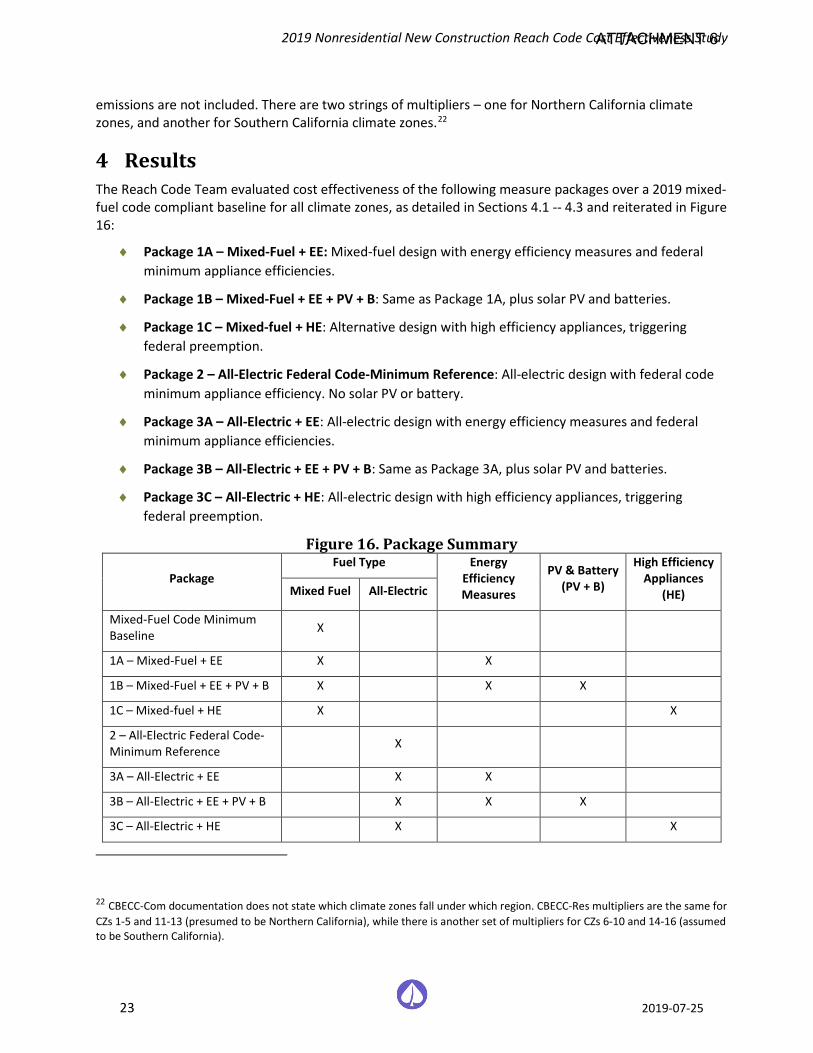
2019 Nonresidential New Construction Reach Code Cost Effectiveness Study
23 2019-07-25
emissions are not included. There are two strings of multipliers – one for Northern California climate zones, and another for Southern California climate zones.22
4 Results The Reach Code Team evaluated cost effectiveness of the following measure packages over a 2019 mixed-fuel code compliant baseline for all climate zones, as detailed in Sections 4.1 -- 4.3 and reiterated in Figure 16:
♦ Package 1A – Mixed-Fuel + EE: Mixed-fuel design with energy efficiency measures and federal minimum appliance efficiencies.
♦ Package 1B – Mixed-Fuel + EE + PV + B: Same as Package 1A, plus solar PV and batteries.
♦ Package 1C – Mixed-fuel + HE: Alternative design with high efficiency appliances, triggering federal preemption.
♦ Package 2 – All-Electric Federal Code-Minimum Reference: All-electric design with federal code minimum appliance efficiency. No solar PV or battery.
♦ Package 3A – All-Electric + EE: All-electric design with energy efficiency measures and federal minimum appliance efficiencies.
♦ Package 3B – All-Electric + EE + PV + B: Same as Package 3A, plus solar PV and batteries.
♦ Package 3C – All-Electric + HE: All-electric design with high efficiency appliances, triggering federal preemption.
Figure 16. Package Summary
Package Fuel Type Energy
Efficiency Measures
PV & Battery (PV + B)
High Efficiency Appliances
(HE) Mixed Fuel All-Electric
Mixed-Fuel Code Minimum Baseline X
1A – Mixed-Fuel + EE X X
1B – Mixed-Fuel + EE + PV + B X X X
1C – Mixed-fuel + HE X X
2 – All-Electric Federal Code-Minimum Reference X
3A – All-Electric + EE X X
3B – All-Electric + EE + PV + B X X X
3C – All-Electric + HE X X
22 CBECC-Com documentation does not state which climate zones fall under which region. CBECC-Res multipliers are the same for CZs 1-5 and 11-13 (presumed to be Northern California), while there is another set of multipliers for CZs 6-10 and 14-16 (assumed to be Southern California).
ATTACHMENT 6
2019 Nonresidential New Construction Reach Code Cost Effectiveness Study
24 2019-07-25
Section 4.4 presents the results of the PV-only and PV+Battery analysis.
The TDV and on-bill based cost effectiveness results are presented in terms of B/C ratio and NPV in this section. What constitutes a ‘benefit’ or a ‘cost’ varies with the scenarios because both energy savings and incremental construction costs may be negative depending on the package. Typically, utility bill savings are categorized as a ‘benefit’ while incremental construction costs are treated as ‘costs.’ In cases where both construction costs are negative and utility bill savings are negative, the construction cost savings are treated as the ‘benefit’ while the utility bill negative savings are as the ‘cost.’
Overarching factors to keep in mind when reviewing the results include:
♦ To pass the Energy Commission’s application process, local reach codes must both be cost effective and exceed the energy performance budget using TDV (i.e., have a positive compliance margin). To emphasize these two important factors, the figures in this Section highlight in green the modeling results that have either a positive compliance margin or are cost effective. This will allow readers to identify whether a scenario is fully or partially supportive of a reach code, and the opportunities/challenges that the scenario presents. Conversely, Section 4.4 only highlights results that both have a positive compliance margin and are cost effective, to allow readers to identify reach code-ready scenarios.
♦ Note: Compliance margin represents the proportion of energy usage that is saved compared to the baseline, measured on a TDV basis.
♦ The Energy Commission does not currently allow compliance credit for either solar PV or battery storage. Thus, the compliance margins in Packages 1A are the same as 1B, and Package 3A is the same as 3B. However, The Reach Code Team did include the impact of solar PV and battery when calculating TDV cost-effectiveness.
♦ When performance modeling residential buildings, the Energy Commission allows the Standard Design to be electric if the Proposed Design is electric, which removes TDV-related penalties and associated negative compliance margins. This essentially allows for a compliance pathway for all-electric residential buildings. Nonresidential buildings are not treated in the same way and are compared to a mixed-fuel standard design.
♦ Results do not include an analysis and comparison of utility rates. As mentioned in Section 2.2, The Reach Code Team coordinated with utilities to select tariffs for each prototype given the annual energy demand profile and the most prevalent rates in each utility territory. The Reach Code Team did not compare a variety of tariffs to determine their impact on cost effectiveness. Note that most utility time-of-use rates are continuously updated, which can affect cost effectiveness results.
♦ As a point of comparison, mixed-fuel baseline energy figures are provided in Appendix 6.5.
4.1 Cost Effectiveness Results – Medium Office Figure 17 through Figure 23 contain the cost-effectiveness findings for the Medium Office packages. Notable findings for each package include:
♦ 1A – Mixed-Fuel + EE: Packages achieve +12 to +20 percent compliance margins depending on climate zone. All packages are cost effective in all climate zones using the TDV approach. All packages are cost effective using the On-Bill approach except for LADWP territory.
ATTACHMENT 6
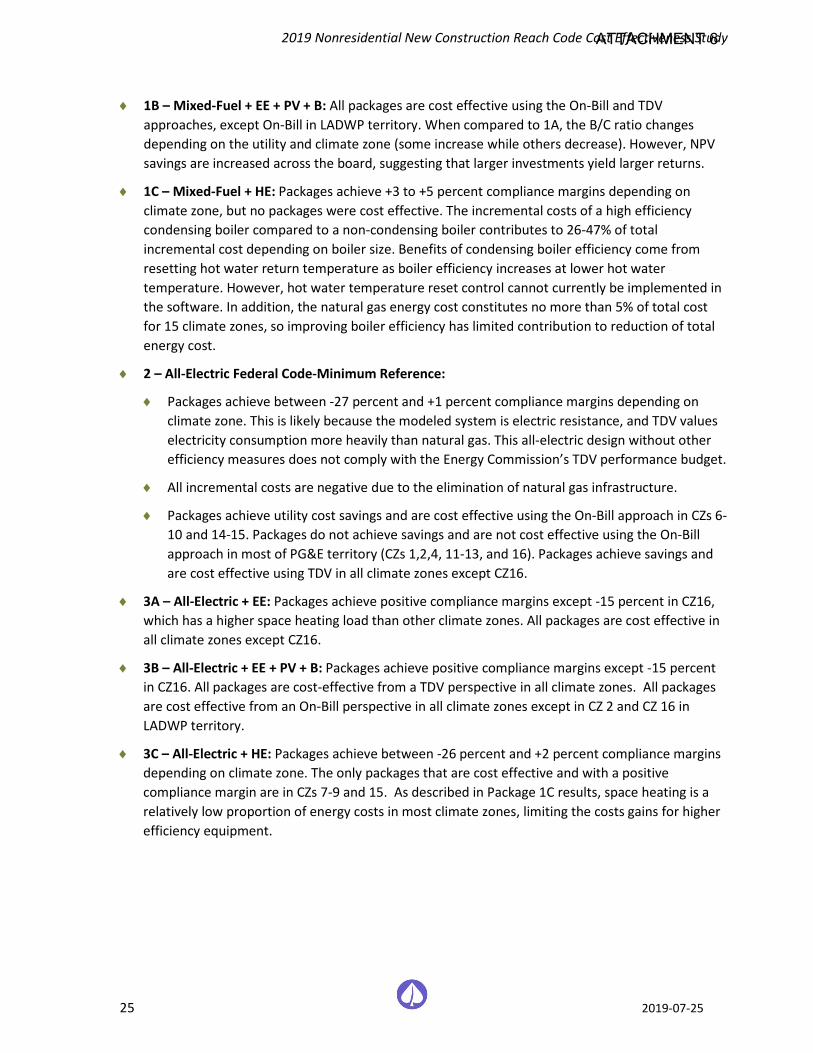
2019 Nonresidential New Construction Reach Code Cost Effectiveness Study
25 2019-07-25
♦ 1B – Mixed-Fuel + EE + PV + B: All packages are cost effective using the On-Bill and TDV approaches, except On-Bill in LADWP territory. When compared to 1A, the B/C ratio changes depending on the utility and climate zone (some increase while others decrease). However, NPV savings are increased across the board, suggesting that larger investments yield larger returns.
♦ 1C – Mixed-Fuel + HE: Packages achieve +3 to +5 percent compliance margins depending on climate zone, but no packages were cost effective. The incremental costs of a high efficiency condensing boiler compared to a non-condensing boiler contributes to 26-47% of total incremental cost depending on boiler size. Benefits of condensing boiler efficiency come from resetting hot water return temperature as boiler efficiency increases at lower hot water temperature. However, hot water temperature reset control cannot currently be implemented in the software. In addition, the natural gas energy cost constitutes no more than 5% of total cost for 15 climate zones, so improving boiler efficiency has limited contribution to reduction of total energy cost.
♦ 2 – All-Electric Federal Code-Minimum Reference:
♦ Packages achieve between -27 percent and +1 percent compliance margins depending on climate zone. This is likely because the modeled system is electric resistance, and TDV values electricity consumption more heavily than natural gas. This all-electric design without other efficiency measures does not comply with the Energy Commission’s TDV performance budget.
♦ All incremental costs are negative due to the elimination of natural gas infrastructure.
♦ Packages achieve utility cost savings and are cost effective using the On-Bill approach in CZs 6-10 and 14-15. Packages do not achieve savings and are not cost effective using the On-Bill approach in most of PG&E territory (CZs 1,2,4, 11-13, and 16). Packages achieve savings and are cost effective using TDV in all climate zones except CZ16.
♦ 3A – All-Electric + EE: Packages achieve positive compliance margins except -15 percent in CZ16, which has a higher space heating load than other climate zones. All packages are cost effective in all climate zones except CZ16.
♦ 3B – All-Electric + EE + PV + B: Packages achieve positive compliance margins except -15 percent in CZ16. All packages are cost-effective from a TDV perspective in all climate zones. All packages are cost effective from an On-Bill perspective in all climate zones except in CZ 2 and CZ 16 in LADWP territory.
♦ 3C – All-Electric + HE: Packages achieve between -26 percent and +2 percent compliance margins depending on climate zone. The only packages that are cost effective and with a positive compliance margin are in CZs 7-9 and 15. As described in Package 1C results, space heating is a relatively low proportion of energy costs in most climate zones, limiting the costs gains for higher efficiency equipment.
ATTACHMENT 6
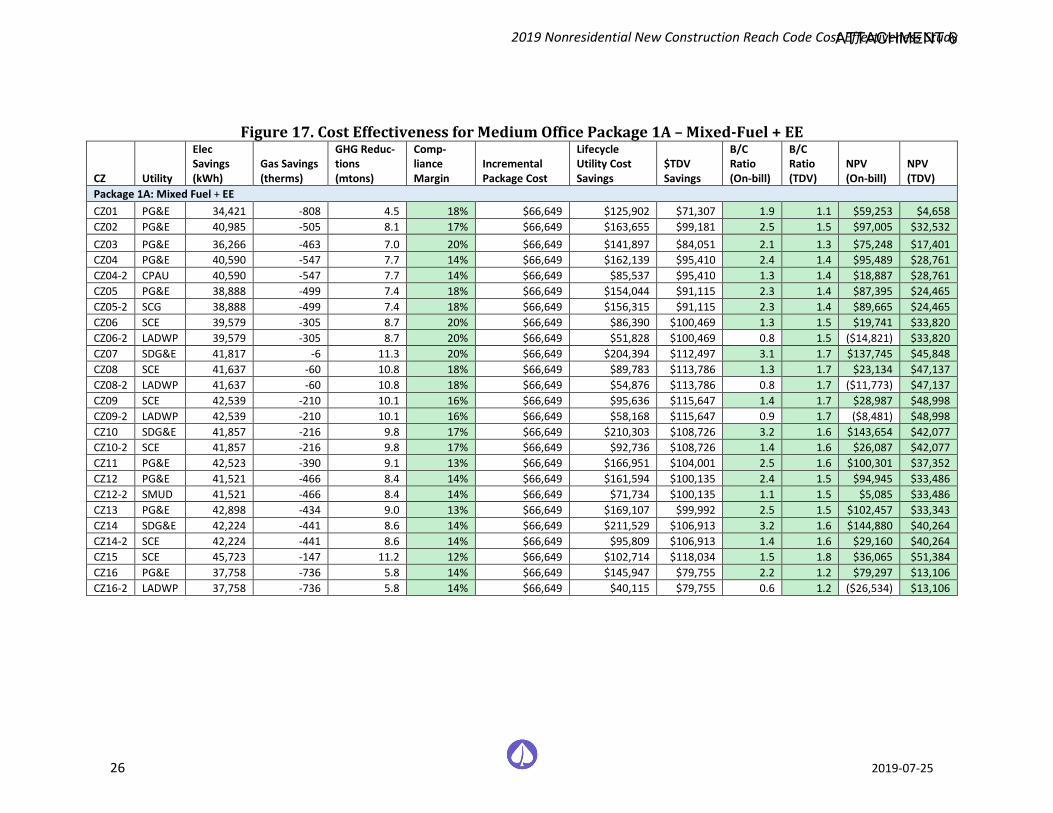
2019 Nonresidential New Construction Reach Code Cost Effectiveness Study
26 2019-07-25
Figure 17. Cost Effectiveness for Medium Office Package 1A – Mixed-Fuel + EE
CZ Utility
Elec Savings (kWh)
Gas Savings (therms)
GHG Reduc-tions (mtons)
Comp-liance Margin
Incremental Package Cost
Lifecycle Utility Cost Savings
$TDV Savings
B/C Ratio (On-bill)
B/C Ratio (TDV)
NPV (On-bill)
NPV (TDV)
Package 1A: Mixed Fuel + EE CZ01 PG&E 34,421 -808 4.5 18% $66,649 $125,902 $71,307 1.9 1.1 $59,253 $4,658 CZ02 PG&E 40,985 -505 8.1 17% $66,649 $163,655 $99,181 2.5 1.5 $97,005 $32,532 CZ03 PG&E 36,266 -463 7.0 20% $66,649 $141,897 $84,051 2.1 1.3 $75,248 $17,401 CZ04 PG&E 40,590 -547 7.7 14% $66,649 $162,139 $95,410 2.4 1.4 $95,489 $28,761 CZ04-2 CPAU 40,590 -547 7.7 14% $66,649 $85,537 $95,410 1.3 1.4 $18,887 $28,761 CZ05 PG&E 38,888 -499 7.4 18% $66,649 $154,044 $91,115 2.3 1.4 $87,395 $24,465 CZ05-2 SCG 38,888 -499 7.4 18% $66,649 $156,315 $91,115 2.3 1.4 $89,665 $24,465 CZ06 SCE 39,579 -305 8.7 20% $66,649 $86,390 $100,469 1.3 1.5 $19,741 $33,820 CZ06-2 LADWP 39,579 -305 8.7 20% $66,649 $51,828 $100,469 0.8 1.5 ($14,821) $33,820 CZ07 SDG&E 41,817 -6 11.3 20% $66,649 $204,394 $112,497 3.1 1.7 $137,745 $45,848 CZ08 SCE 41,637 -60 10.8 18% $66,649 $89,783 $113,786 1.3 1.7 $23,134 $47,137 CZ08-2 LADWP 41,637 -60 10.8 18% $66,649 $54,876 $113,786 0.8 1.7 ($11,773) $47,137 CZ09 SCE 42,539 -210 10.1 16% $66,649 $95,636 $115,647 1.4 1.7 $28,987 $48,998 CZ09-2 LADWP 42,539 -210 10.1 16% $66,649 $58,168 $115,647 0.9 1.7 ($8,481) $48,998 CZ10 SDG&E 41,857 -216 9.8 17% $66,649 $210,303 $108,726 3.2 1.6 $143,654 $42,077 CZ10-2 SCE 41,857 -216 9.8 17% $66,649 $92,736 $108,726 1.4 1.6 $26,087 $42,077 CZ11 PG&E 42,523 -390 9.1 13% $66,649 $166,951 $104,001 2.5 1.6 $100,301 $37,352 CZ12 PG&E 41,521 -466 8.4 14% $66,649 $161,594 $100,135 2.4 1.5 $94,945 $33,486 CZ12-2 SMUD 41,521 -466 8.4 14% $66,649 $71,734 $100,135 1.1 1.5 $5,085 $33,486 CZ13 PG&E 42,898 -434 9.0 13% $66,649 $169,107 $99,992 2.5 1.5 $102,457 $33,343 CZ14 SDG&E 42,224 -441 8.6 14% $66,649 $211,529 $106,913 3.2 1.6 $144,880 $40,264 CZ14-2 SCE 42,224 -441 8.6 14% $66,649 $95,809 $106,913 1.4 1.6 $29,160 $40,264 CZ15 SCE 45,723 -147 11.2 12% $66,649 $102,714 $118,034 1.5 1.8 $36,065 $51,384 CZ16 PG&E 37,758 -736 5.8 14% $66,649 $145,947 $79,755 2.2 1.2 $79,297 $13,106 CZ16-2 LADWP 37,758 -736 5.8 14% $66,649 $40,115 $79,755 0.6 1.2 ($26,534) $13,106
ATTACHMENT 6
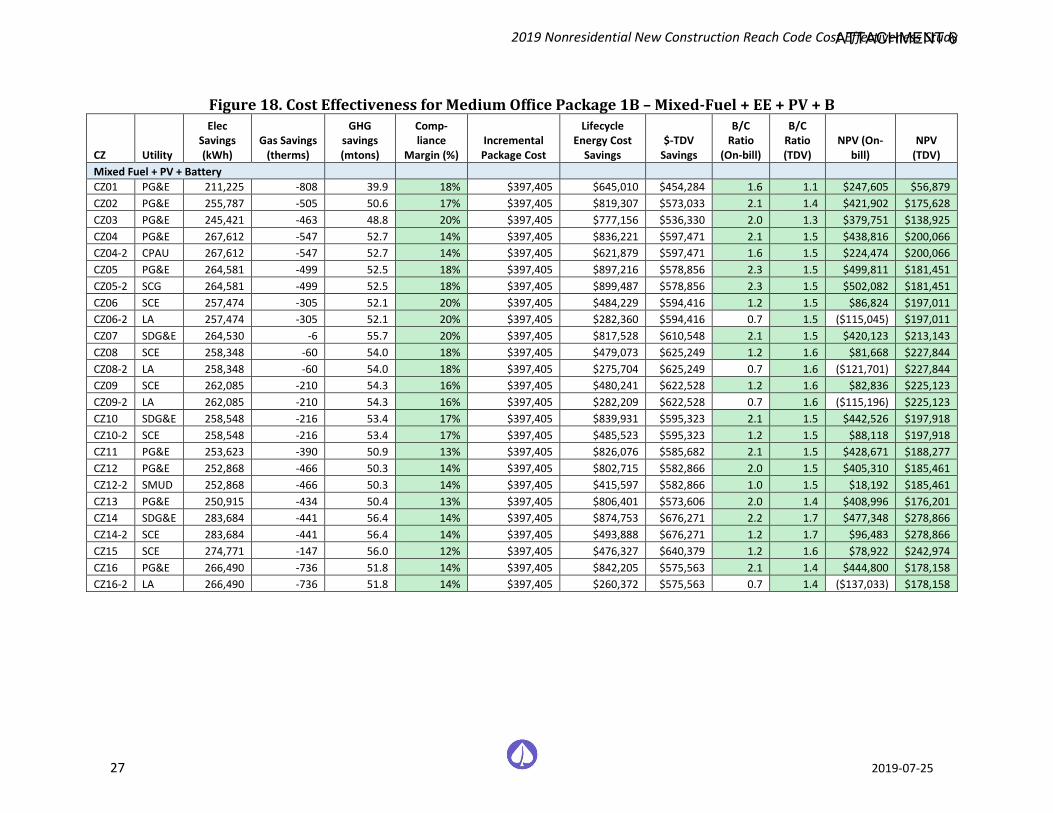
2019 Nonresidential New Construction Reach Code Cost Effectiveness Study
27 2019-07-25
Figure 18. Cost Effectiveness for Medium Office Package 1B – Mixed-Fuel + EE + PV + B
CZ Utility
Elec Savings (kWh)
Gas Savings (therms)
GHG savings (mtons)
Comp-liance
Margin (%) Incremental Package Cost
Lifecycle Energy Cost
Savings $-TDV
Savings
B/C Ratio
(On-bill)
B/C Ratio (TDV)
NPV (On-bill)
NPV (TDV)
Mixed Fuel + PV + Battery CZ01 PG&E 211,225 -808 39.9 18% $397,405 $645,010 $454,284 1.6 1.1 $247,605 $56,879 CZ02 PG&E 255,787 -505 50.6 17% $397,405 $819,307 $573,033 2.1 1.4 $421,902 $175,628 CZ03 PG&E 245,421 -463 48.8 20% $397,405 $777,156 $536,330 2.0 1.3 $379,751 $138,925 CZ04 PG&E 267,612 -547 52.7 14% $397,405 $836,221 $597,471 2.1 1.5 $438,816 $200,066 CZ04-2 CPAU 267,612 -547 52.7 14% $397,405 $621,879 $597,471 1.6 1.5 $224,474 $200,066 CZ05 PG&E 264,581 -499 52.5 18% $397,405 $897,216 $578,856 2.3 1.5 $499,811 $181,451 CZ05-2 SCG 264,581 -499 52.5 18% $397,405 $899,487 $578,856 2.3 1.5 $502,082 $181,451 CZ06 SCE 257,474 -305 52.1 20% $397,405 $484,229 $594,416 1.2 1.5 $86,824 $197,011 CZ06-2 LA 257,474 -305 52.1 20% $397,405 $282,360 $594,416 0.7 1.5 ($115,045) $197,011 CZ07 SDG&E 264,530 -6 55.7 20% $397,405 $817,528 $610,548 2.1 1.5 $420,123 $213,143 CZ08 SCE 258,348 -60 54.0 18% $397,405 $479,073 $625,249 1.2 1.6 $81,668 $227,844 CZ08-2 LA 258,348 -60 54.0 18% $397,405 $275,704 $625,249 0.7 1.6 ($121,701) $227,844 CZ09 SCE 262,085 -210 54.3 16% $397,405 $480,241 $622,528 1.2 1.6 $82,836 $225,123 CZ09-2 LA 262,085 -210 54.3 16% $397,405 $282,209 $622,528 0.7 1.6 ($115,196) $225,123 CZ10 SDG&E 258,548 -216 53.4 17% $397,405 $839,931 $595,323 2.1 1.5 $442,526 $197,918 CZ10-2 SCE 258,548 -216 53.4 17% $397,405 $485,523 $595,323 1.2 1.5 $88,118 $197,918 CZ11 PG&E 253,623 -390 50.9 13% $397,405 $826,076 $585,682 2.1 1.5 $428,671 $188,277 CZ12 PG&E 252,868 -466 50.3 14% $397,405 $802,715 $582,866 2.0 1.5 $405,310 $185,461 CZ12-2 SMUD 252,868 -466 50.3 14% $397,405 $415,597 $582,866 1.0 1.5 $18,192 $185,461 CZ13 PG&E 250,915 -434 50.4 13% $397,405 $806,401 $573,606 2.0 1.4 $408,996 $176,201 CZ14 SDG&E 283,684 -441 56.4 14% $397,405 $874,753 $676,271 2.2 1.7 $477,348 $278,866 CZ14-2 SCE 283,684 -441 56.4 14% $397,405 $493,888 $676,271 1.2 1.7 $96,483 $278,866 CZ15 SCE 274,771 -147 56.0 12% $397,405 $476,327 $640,379 1.2 1.6 $78,922 $242,974 CZ16 PG&E 266,490 -736 51.8 14% $397,405 $842,205 $575,563 2.1 1.4 $444,800 $178,158 CZ16-2 LA 266,490 -736 51.8 14% $397,405 $260,372 $575,563 0.7 1.4 ($137,033) $178,158
ATTACHMENT 6
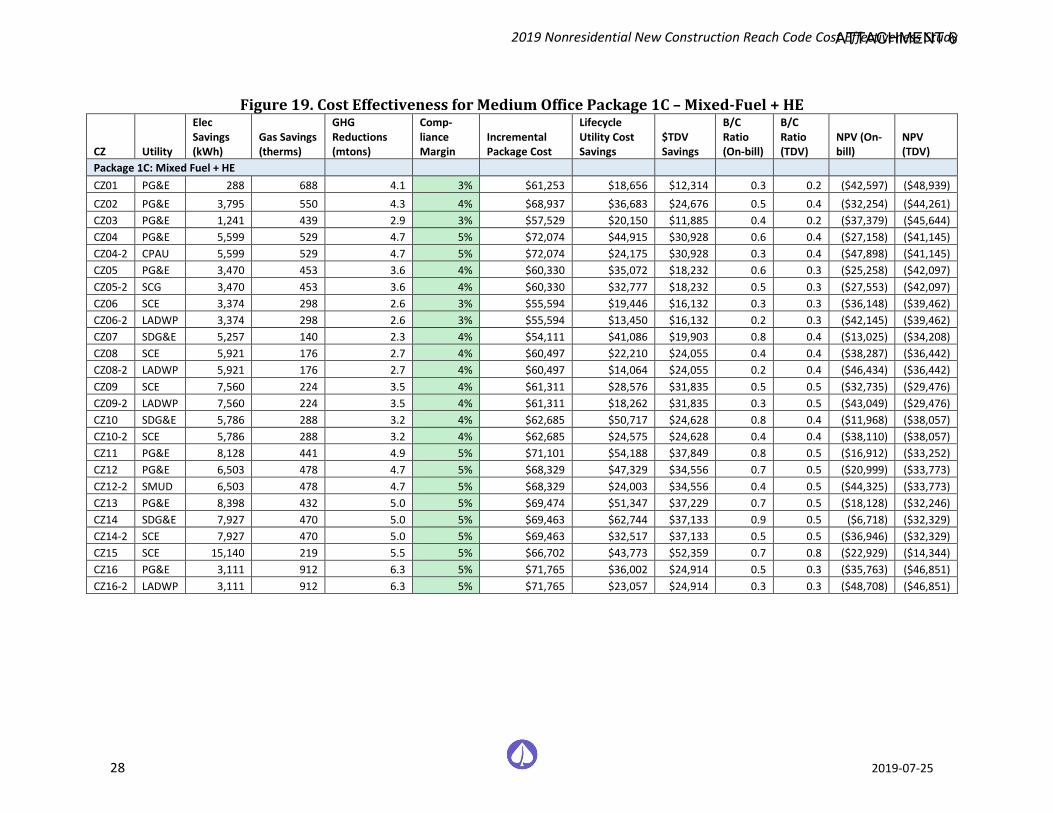
2019 Nonresidential New Construction Reach Code Cost Effectiveness Study
28 2019-07-25
Figure 19. Cost Effectiveness for Medium Office Package 1C – Mixed-Fuel + HE
CZ Utility
Elec Savings (kWh)
Gas Savings (therms)
GHG Reductions (mtons)
Comp-liance Margin
Incremental Package Cost
Lifecycle Utility Cost Savings
$TDV Savings
B/C Ratio (On-bill)
B/C Ratio (TDV)
NPV (On-bill)
NPV (TDV)
Package 1C: Mixed Fuel + HE CZ01 PG&E 288 688 4.1 3% $61,253 $18,656 $12,314 0.3 0.2 ($42,597) ($48,939) CZ02 PG&E 3,795 550 4.3 4% $68,937 $36,683 $24,676 0.5 0.4 ($32,254) ($44,261) CZ03 PG&E 1,241 439 2.9 3% $57,529 $20,150 $11,885 0.4 0.2 ($37,379) ($45,644) CZ04 PG&E 5,599 529 4.7 5% $72,074 $44,915 $30,928 0.6 0.4 ($27,158) ($41,145) CZ04-2 CPAU 5,599 529 4.7 5% $72,074 $24,175 $30,928 0.3 0.4 ($47,898) ($41,145) CZ05 PG&E 3,470 453 3.6 4% $60,330 $35,072 $18,232 0.6 0.3 ($25,258) ($42,097) CZ05-2 SCG 3,470 453 3.6 4% $60,330 $32,777 $18,232 0.5 0.3 ($27,553) ($42,097) CZ06 SCE 3,374 298 2.6 3% $55,594 $19,446 $16,132 0.3 0.3 ($36,148) ($39,462) CZ06-2 LADWP 3,374 298 2.6 3% $55,594 $13,450 $16,132 0.2 0.3 ($42,145) ($39,462) CZ07 SDG&E 5,257 140 2.3 4% $54,111 $41,086 $19,903 0.8 0.4 ($13,025) ($34,208) CZ08 SCE 5,921 176 2.7 4% $60,497 $22,210 $24,055 0.4 0.4 ($38,287) ($36,442) CZ08-2 LADWP 5,921 176 2.7 4% $60,497 $14,064 $24,055 0.2 0.4 ($46,434) ($36,442) CZ09 SCE 7,560 224 3.5 4% $61,311 $28,576 $31,835 0.5 0.5 ($32,735) ($29,476) CZ09-2 LADWP 7,560 224 3.5 4% $61,311 $18,262 $31,835 0.3 0.5 ($43,049) ($29,476) CZ10 SDG&E 5,786 288 3.2 4% $62,685 $50,717 $24,628 0.8 0.4 ($11,968) ($38,057) CZ10-2 SCE 5,786 288 3.2 4% $62,685 $24,575 $24,628 0.4 0.4 ($38,110) ($38,057) CZ11 PG&E 8,128 441 4.9 5% $71,101 $54,188 $37,849 0.8 0.5 ($16,912) ($33,252) CZ12 PG&E 6,503 478 4.7 5% $68,329 $47,329 $34,556 0.7 0.5 ($20,999) ($33,773) CZ12-2 SMUD 6,503 478 4.7 5% $68,329 $24,003 $34,556 0.4 0.5 ($44,325) ($33,773) CZ13 PG&E 8,398 432 5.0 5% $69,474 $51,347 $37,229 0.7 0.5 ($18,128) ($32,246) CZ14 SDG&E 7,927 470 5.0 5% $69,463 $62,744 $37,133 0.9 0.5 ($6,718) ($32,329) CZ14-2 SCE 7,927 470 5.0 5% $69,463 $32,517 $37,133 0.5 0.5 ($36,946) ($32,329) CZ15 SCE 15,140 219 5.5 5% $66,702 $43,773 $52,359 0.7 0.8 ($22,929) ($14,344) CZ16 PG&E 3,111 912 6.3 5% $71,765 $36,002 $24,914 0.5 0.3 ($35,763) ($46,851) CZ16-2 LADWP 3,111 912 6.3 5% $71,765 $23,057 $24,914 0.3 0.3 ($48,708) ($46,851)
ATTACHMENT 6
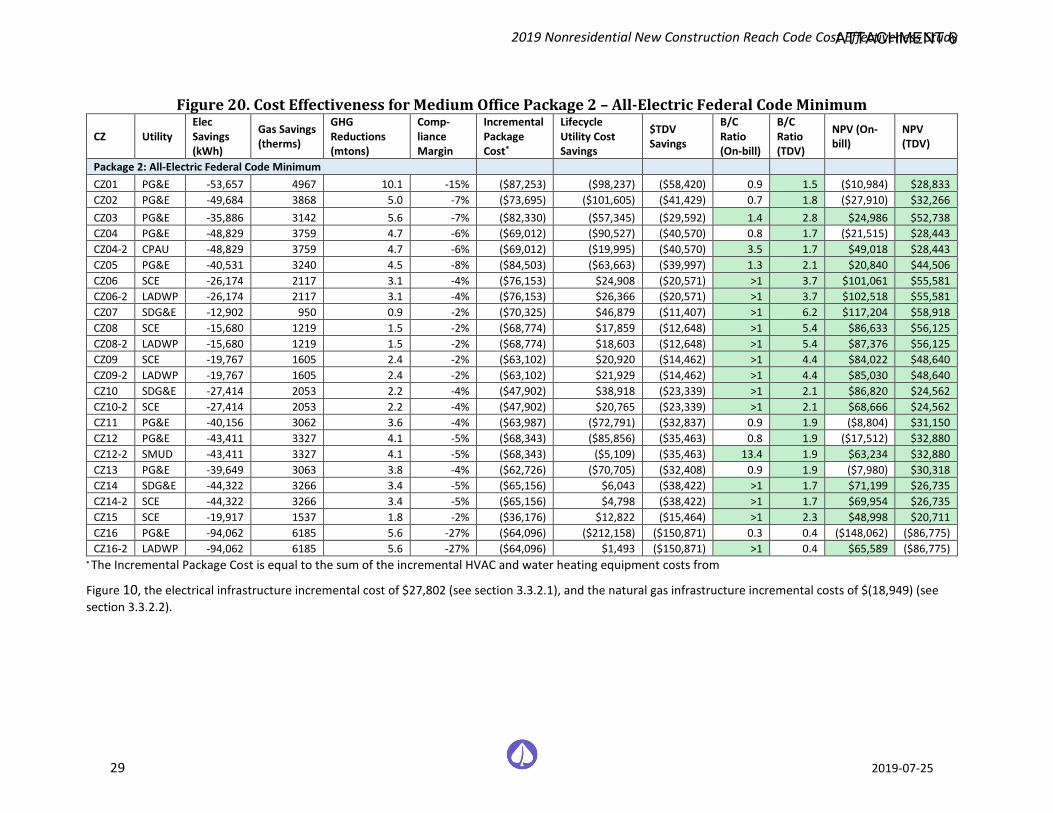
2019 Nonresidential New Construction Reach Code Cost Effectiveness Study
29 2019-07-25
Figure 20. Cost Effectiveness for Medium Office Package 2 – All-Electric Federal Code Minimum
CZ Utility Elec Savings (kWh)
Gas Savings (therms)
GHG Reductions (mtons)
Comp-liance Margin
Incremental Package Cost*
Lifecycle Utility Cost Savings
$TDV Savings
B/C Ratio (On-bill)
B/C Ratio (TDV)
NPV (On-bill)
NPV (TDV)
Package 2: All-Electric Federal Code Minimum CZ01 PG&E -53,657 4967 10.1 -15% ($87,253) ($98,237) ($58,420) 0.9 1.5 ($10,984) $28,833 CZ02 PG&E -49,684 3868 5.0 -7% ($73,695) ($101,605) ($41,429) 0.7 1.8 ($27,910) $32,266 CZ03 PG&E -35,886 3142 5.6 -7% ($82,330) ($57,345) ($29,592) 1.4 2.8 $24,986 $52,738 CZ04 PG&E -48,829 3759 4.7 -6% ($69,012) ($90,527) ($40,570) 0.8 1.7 ($21,515) $28,443 CZ04-2 CPAU -48,829 3759 4.7 -6% ($69,012) ($19,995) ($40,570) 3.5 1.7 $49,018 $28,443 CZ05 PG&E -40,531 3240 4.5 -8% ($84,503) ($63,663) ($39,997) 1.3 2.1 $20,840 $44,506 CZ06 SCE -26,174 2117 3.1 -4% ($76,153) $24,908 ($20,571) >1 3.7 $101,061 $55,581 CZ06-2 LADWP -26,174 2117 3.1 -4% ($76,153) $26,366 ($20,571) >1 3.7 $102,518 $55,581 CZ07 SDG&E -12,902 950 0.9 -2% ($70,325) $46,879 ($11,407) >1 6.2 $117,204 $58,918 CZ08 SCE -15,680 1219 1.5 -2% ($68,774) $17,859 ($12,648) >1 5.4 $86,633 $56,125 CZ08-2 LADWP -15,680 1219 1.5 -2% ($68,774) $18,603 ($12,648) >1 5.4 $87,376 $56,125 CZ09 SCE -19,767 1605 2.4 -2% ($63,102) $20,920 ($14,462) >1 4.4 $84,022 $48,640 CZ09-2 LADWP -19,767 1605 2.4 -2% ($63,102) $21,929 ($14,462) >1 4.4 $85,030 $48,640 CZ10 SDG&E -27,414 2053 2.2 -4% ($47,902) $38,918 ($23,339) >1 2.1 $86,820 $24,562 CZ10-2 SCE -27,414 2053 2.2 -4% ($47,902) $20,765 ($23,339) >1 2.1 $68,666 $24,562 CZ11 PG&E -40,156 3062 3.6 -4% ($63,987) ($72,791) ($32,837) 0.9 1.9 ($8,804) $31,150 CZ12 PG&E -43,411 3327 4.1 -5% ($68,343) ($85,856) ($35,463) 0.8 1.9 ($17,512) $32,880 CZ12-2 SMUD -43,411 3327 4.1 -5% ($68,343) ($5,109) ($35,463) 13.4 1.9 $63,234 $32,880 CZ13 PG&E -39,649 3063 3.8 -4% ($62,726) ($70,705) ($32,408) 0.9 1.9 ($7,980) $30,318 CZ14 SDG&E -44,322 3266 3.4 -5% ($65,156) $6,043 ($38,422) >1 1.7 $71,199 $26,735 CZ14-2 SCE -44,322 3266 3.4 -5% ($65,156) $4,798 ($38,422) >1 1.7 $69,954 $26,735 CZ15 SCE -19,917 1537 1.8 -2% ($36,176) $12,822 ($15,464) >1 2.3 $48,998 $20,711 CZ16 PG&E -94,062 6185 5.6 -27% ($64,096) ($212,158) ($150,871) 0.3 0.4 ($148,062) ($86,775) CZ16-2 LADWP -94,062 6185 5.6 -27% ($64,096) $1,493 ($150,871) >1 0.4 $65,589 ($86,775)
* The Incremental Package Cost is equal to the sum of the incremental HVAC and water heating equipment costs from
Figure 10, the electrical infrastructure incremental cost of $27,802 (see section 3.3.2.1), and the natural gas infrastructure incremental costs of $(18,949) (see section 3.3.2.2).
ATTACHMENT 6
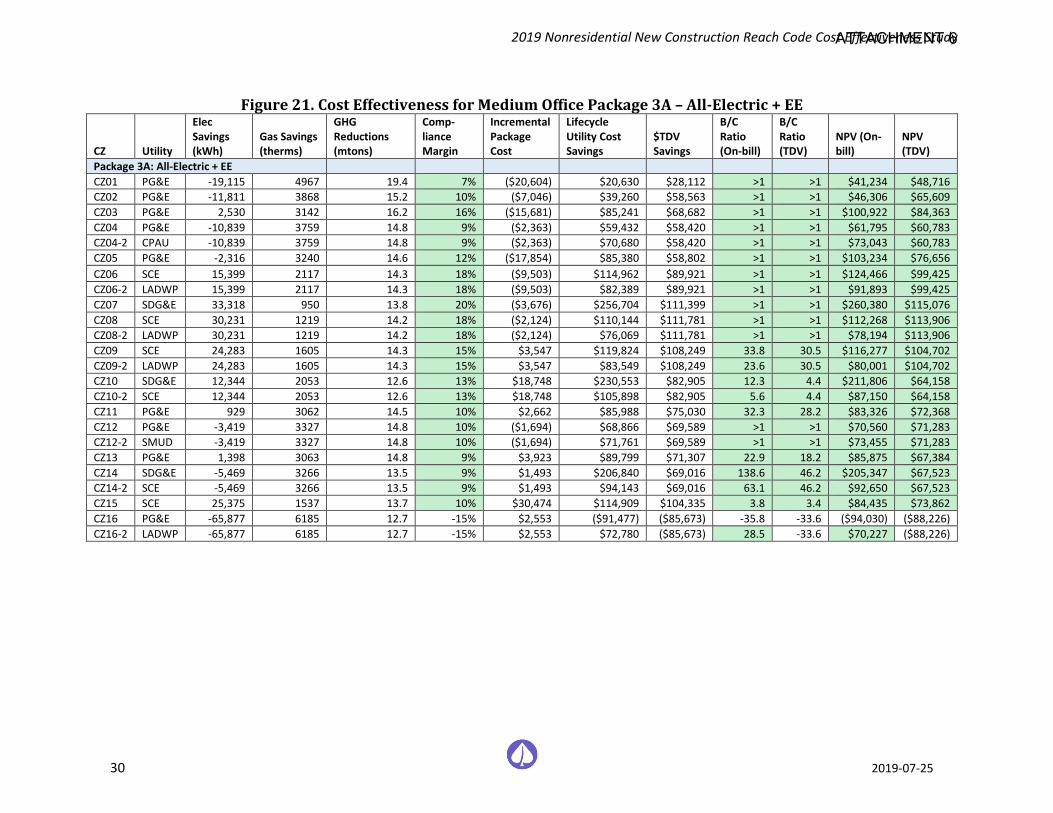
2019 Nonresidential New Construction Reach Code Cost Effectiveness Study
30 2019-07-25
Figure 21. Cost Effectiveness for Medium Office Package 3A – All-Electric + EE
CZ Utility
Elec Savings (kWh)
Gas Savings (therms)
GHG Reductions (mtons)
Comp-liance Margin
Incremental Package Cost
Lifecycle Utility Cost Savings
$TDV Savings
B/C Ratio (On-bill)
B/C Ratio (TDV)
NPV (On-bill)
NPV (TDV)
Package 3A: All-Electric + EE CZ01 PG&E -19,115 4967 19.4 7% ($20,604) $20,630 $28,112 >1 >1 $41,234 $48,716 CZ02 PG&E -11,811 3868 15.2 10% ($7,046) $39,260 $58,563 >1 >1 $46,306 $65,609 CZ03 PG&E 2,530 3142 16.2 16% ($15,681) $85,241 $68,682 >1 >1 $100,922 $84,363 CZ04 PG&E -10,839 3759 14.8 9% ($2,363) $59,432 $58,420 >1 >1 $61,795 $60,783 CZ04-2 CPAU -10,839 3759 14.8 9% ($2,363) $70,680 $58,420 >1 >1 $73,043 $60,783 CZ05 PG&E -2,316 3240 14.6 12% ($17,854) $85,380 $58,802 >1 >1 $103,234 $76,656 CZ06 SCE 15,399 2117 14.3 18% ($9,503) $114,962 $89,921 >1 >1 $124,466 $99,425 CZ06-2 LADWP 15,399 2117 14.3 18% ($9,503) $82,389 $89,921 >1 >1 $91,893 $99,425 CZ07 SDG&E 33,318 950 13.8 20% ($3,676) $256,704 $111,399 >1 >1 $260,380 $115,076 CZ08 SCE 30,231 1219 14.2 18% ($2,124) $110,144 $111,781 >1 >1 $112,268 $113,906 CZ08-2 LADWP 30,231 1219 14.2 18% ($2,124) $76,069 $111,781 >1 >1 $78,194 $113,906 CZ09 SCE 24,283 1605 14.3 15% $3,547 $119,824 $108,249 33.8 30.5 $116,277 $104,702 CZ09-2 LADWP 24,283 1605 14.3 15% $3,547 $83,549 $108,249 23.6 30.5 $80,001 $104,702 CZ10 SDG&E 12,344 2053 12.6 13% $18,748 $230,553 $82,905 12.3 4.4 $211,806 $64,158 CZ10-2 SCE 12,344 2053 12.6 13% $18,748 $105,898 $82,905 5.6 4.4 $87,150 $64,158 CZ11 PG&E 929 3062 14.5 10% $2,662 $85,988 $75,030 32.3 28.2 $83,326 $72,368 CZ12 PG&E -3,419 3327 14.8 10% ($1,694) $68,866 $69,589 >1 >1 $70,560 $71,283 CZ12-2 SMUD -3,419 3327 14.8 10% ($1,694) $71,761 $69,589 >1 >1 $73,455 $71,283 CZ13 PG&E 1,398 3063 14.8 9% $3,923 $89,799 $71,307 22.9 18.2 $85,875 $67,384 CZ14 SDG&E -5,469 3266 13.5 9% $1,493 $206,840 $69,016 138.6 46.2 $205,347 $67,523 CZ14-2 SCE -5,469 3266 13.5 9% $1,493 $94,143 $69,016 63.1 46.2 $92,650 $67,523 CZ15 SCE 25,375 1537 13.7 10% $30,474 $114,909 $104,335 3.8 3.4 $84,435 $73,862 CZ16 PG&E -65,877 6185 12.7 -15% $2,553 ($91,477) ($85,673) -35.8 -33.6 ($94,030) ($88,226) CZ16-2 LADWP -65,877 6185 12.7 -15% $2,553 $72,780 ($85,673) 28.5 -33.6 $70,227 ($88,226)
ATTACHMENT 6
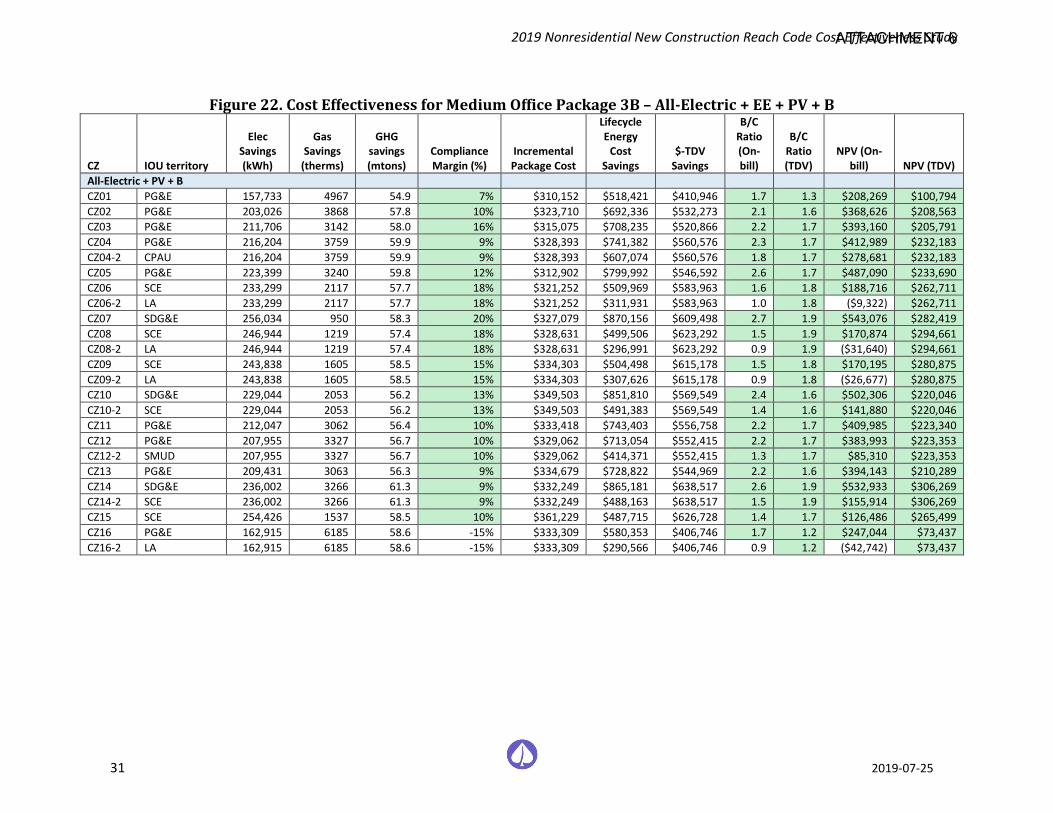
2019 Nonresidential New Construction Reach Code Cost Effectiveness Study
31 2019-07-25
Figure 22. Cost Effectiveness for Medium Office Package 3B – All-Electric + EE + PV + B
CZ IOU territory
Elec Savings (kWh)
Gas Savings
(therms)
GHG savings (mtons)
Compliance Margin (%)
Incremental Package Cost
Lifecycle Energy
Cost Savings
$-TDV Savings
B/C Ratio (On-bill)
B/C Ratio (TDV)
NPV (On-bill) NPV (TDV)
All-Electric + PV + B CZ01 PG&E 157,733 4967 54.9 7% $310,152 $518,421 $410,946 1.7 1.3 $208,269 $100,794 CZ02 PG&E 203,026 3868 57.8 10% $323,710 $692,336 $532,273 2.1 1.6 $368,626 $208,563 CZ03 PG&E 211,706 3142 58.0 16% $315,075 $708,235 $520,866 2.2 1.7 $393,160 $205,791 CZ04 PG&E 216,204 3759 59.9 9% $328,393 $741,382 $560,576 2.3 1.7 $412,989 $232,183 CZ04-2 CPAU 216,204 3759 59.9 9% $328,393 $607,074 $560,576 1.8 1.7 $278,681 $232,183 CZ05 PG&E 223,399 3240 59.8 12% $312,902 $799,992 $546,592 2.6 1.7 $487,090 $233,690 CZ06 SCE 233,299 2117 57.7 18% $321,252 $509,969 $583,963 1.6 1.8 $188,716 $262,711 CZ06-2 LA 233,299 2117 57.7 18% $321,252 $311,931 $583,963 1.0 1.8 ($9,322) $262,711 CZ07 SDG&E 256,034 950 58.3 20% $327,079 $870,156 $609,498 2.7 1.9 $543,076 $282,419 CZ08 SCE 246,944 1219 57.4 18% $328,631 $499,506 $623,292 1.5 1.9 $170,874 $294,661 CZ08-2 LA 246,944 1219 57.4 18% $328,631 $296,991 $623,292 0.9 1.9 ($31,640) $294,661 CZ09 SCE 243,838 1605 58.5 15% $334,303 $504,498 $615,178 1.5 1.8 $170,195 $280,875 CZ09-2 LA 243,838 1605 58.5 15% $334,303 $307,626 $615,178 0.9 1.8 ($26,677) $280,875 CZ10 SDG&E 229,044 2053 56.2 13% $349,503 $851,810 $569,549 2.4 1.6 $502,306 $220,046 CZ10-2 SCE 229,044 2053 56.2 13% $349,503 $491,383 $569,549 1.4 1.6 $141,880 $220,046 CZ11 PG&E 212,047 3062 56.4 10% $333,418 $743,403 $556,758 2.2 1.7 $409,985 $223,340 CZ12 PG&E 207,955 3327 56.7 10% $329,062 $713,054 $552,415 2.2 1.7 $383,993 $223,353 CZ12-2 SMUD 207,955 3327 56.7 10% $329,062 $414,371 $552,415 1.3 1.7 $85,310 $223,353 CZ13 PG&E 209,431 3063 56.3 9% $334,679 $728,822 $544,969 2.2 1.6 $394,143 $210,289 CZ14 SDG&E 236,002 3266 61.3 9% $332,249 $865,181 $638,517 2.6 1.9 $532,933 $306,269 CZ14-2 SCE 236,002 3266 61.3 9% $332,249 $488,163 $638,517 1.5 1.9 $155,914 $306,269 CZ15 SCE 254,426 1537 58.5 10% $361,229 $487,715 $626,728 1.4 1.7 $126,486 $265,499 CZ16 PG&E 162,915 6185 58.6 -15% $333,309 $580,353 $406,746 1.7 1.2 $247,044 $73,437 CZ16-2 LA 162,915 6185 58.6 -15% $333,309 $290,566 $406,746 0.9 1.2 ($42,742) $73,437
ATTACHMENT 6
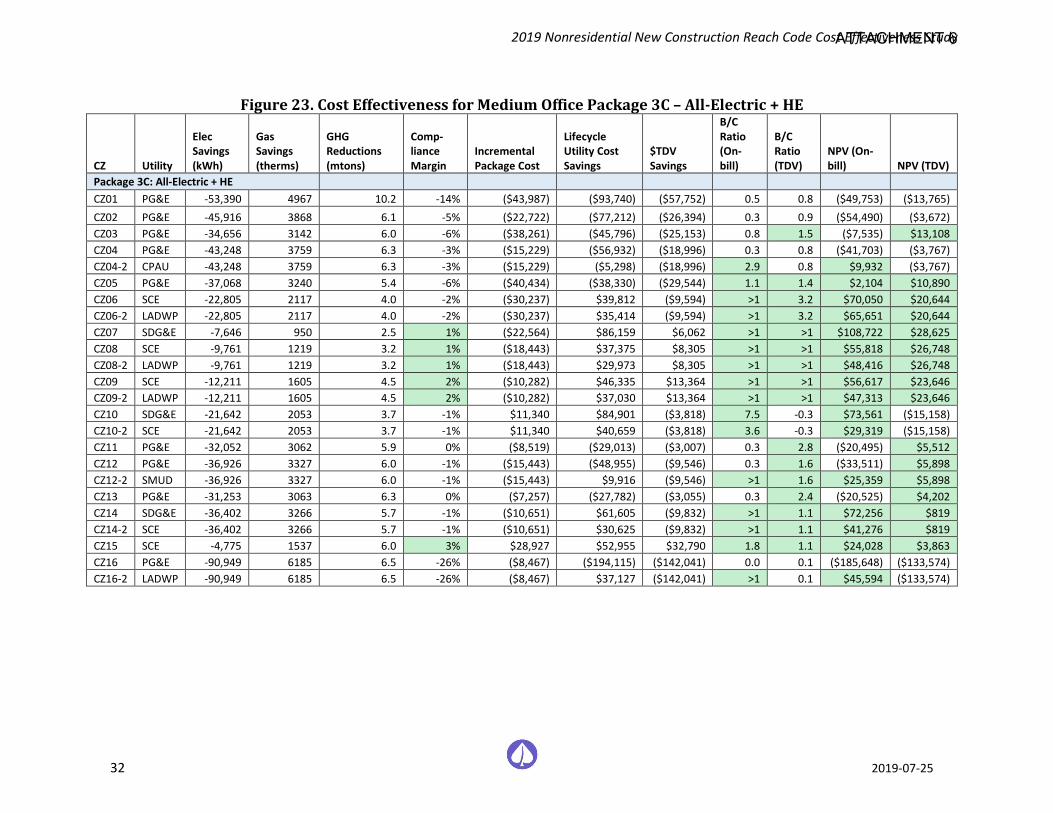
2019 Nonresidential New Construction Reach Code Cost Effectiveness Study
32 2019-07-25
Figure 23. Cost Effectiveness for Medium Office Package 3C – All-Electric + HE
CZ Utility
Elec Savings (kWh)
Gas Savings (therms)
GHG Reductions (mtons)
Comp-liance Margin
Incremental Package Cost
Lifecycle Utility Cost Savings
$TDV Savings
B/C Ratio (On-bill)
B/C Ratio (TDV)
NPV (On-bill) NPV (TDV)
Package 3C: All-Electric + HE CZ01 PG&E -53,390 4967 10.2 -14% ($43,987) ($93,740) ($57,752) 0.5 0.8 ($49,753) ($13,765) CZ02 PG&E -45,916 3868 6.1 -5% ($22,722) ($77,212) ($26,394) 0.3 0.9 ($54,490) ($3,672) CZ03 PG&E -34,656 3142 6.0 -6% ($38,261) ($45,796) ($25,153) 0.8 1.5 ($7,535) $13,108 CZ04 PG&E -43,248 3759 6.3 -3% ($15,229) ($56,932) ($18,996) 0.3 0.8 ($41,703) ($3,767) CZ04-2 CPAU -43,248 3759 6.3 -3% ($15,229) ($5,298) ($18,996) 2.9 0.8 $9,932 ($3,767) CZ05 PG&E -37,068 3240 5.4 -6% ($40,434) ($38,330) ($29,544) 1.1 1.4 $2,104 $10,890 CZ06 SCE -22,805 2117 4.0 -2% ($30,237) $39,812 ($9,594) >1 3.2 $70,050 $20,644 CZ06-2 LADWP -22,805 2117 4.0 -2% ($30,237) $35,414 ($9,594) >1 3.2 $65,651 $20,644 CZ07 SDG&E -7,646 950 2.5 1% ($22,564) $86,159 $6,062 >1 >1 $108,722 $28,625 CZ08 SCE -9,761 1219 3.2 1% ($18,443) $37,375 $8,305 >1 >1 $55,818 $26,748 CZ08-2 LADWP -9,761 1219 3.2 1% ($18,443) $29,973 $8,305 >1 >1 $48,416 $26,748 CZ09 SCE -12,211 1605 4.5 2% ($10,282) $46,335 $13,364 >1 >1 $56,617 $23,646 CZ09-2 LADWP -12,211 1605 4.5 2% ($10,282) $37,030 $13,364 >1 >1 $47,313 $23,646 CZ10 SDG&E -21,642 2053 3.7 -1% $11,340 $84,901 ($3,818) 7.5 -0.3 $73,561 ($15,158) CZ10-2 SCE -21,642 2053 3.7 -1% $11,340 $40,659 ($3,818) 3.6 -0.3 $29,319 ($15,158) CZ11 PG&E -32,052 3062 5.9 0% ($8,519) ($29,013) ($3,007) 0.3 2.8 ($20,495) $5,512 CZ12 PG&E -36,926 3327 6.0 -1% ($15,443) ($48,955) ($9,546) 0.3 1.6 ($33,511) $5,898 CZ12-2 SMUD -36,926 3327 6.0 -1% ($15,443) $9,916 ($9,546) >1 1.6 $25,359 $5,898 CZ13 PG&E -31,253 3063 6.3 0% ($7,257) ($27,782) ($3,055) 0.3 2.4 ($20,525) $4,202 CZ14 SDG&E -36,402 3266 5.7 -1% ($10,651) $61,605 ($9,832) >1 1.1 $72,256 $819 CZ14-2 SCE -36,402 3266 5.7 -1% ($10,651) $30,625 ($9,832) >1 1.1 $41,276 $819 CZ15 SCE -4,775 1537 6.0 3% $28,927 $52,955 $32,790 1.8 1.1 $24,028 $3,863 CZ16 PG&E -90,949 6185 6.5 -26% ($8,467) ($194,115) ($142,041) 0.0 0.1 ($185,648) ($133,574) CZ16-2 LADWP -90,949 6185 6.5 -26% ($8,467) $37,127 ($142,041) >1 0.1 $45,594 ($133,574)
ATTACHMENT 6
2019 Nonresidential New Construction Reach Code Cost Effectiveness Study
33 2019-07-25
4.2 Cost Effectiveness Results – Medium Retail Figure 24 through Figure 30 contain the cost-effectiveness findings for the Medium Retail packages. Notable findings for each package include:
♦ 1A – Mixed-Fuel + EE:
♦ Packages achieve +9% to +18% compliance margins depending on climate zone, and all packages are cost effective in all climate zones.
♦ Incremental package costs vary across climate zones because of the HVAC system size in some climate zones are small enough (<54 kBtu/h) to have the economizers measure applied.
♦ B/C ratios are high compared to other prototypes because the measures applied are primarily low-cost lighting measures. This suggests room for the inclusion of other energy efficiency measures with lower cost-effectiveness to achieve even higher compliance margins for a cost effective package.
♦ 1B – Mixed-Fuel + EE + PV + B: All packages are cost effective using both the On-Bill and TDV approach, except On-Bill in LADWP territory. Adding PV and battery to the efficiency packages reduces the B/C ratio but increases overall NPV savings.
♦ 1C – Mixed-fuel + HE: Packages achieve +1 to +4% compliance margins depending on climate zone, and packages are cost effective in all climate zones except CZs 1, 3 and 5 using the TDV approach.
♦ 2 – All-Electric Federal Code-Minimum Reference:
♦ Packages achieve between -12% and +1% compliance margins depending on climate zone.
♦ Packages achieve positive savings using both the On-Bill and TDV approaches in CZs 6-10 and 14-15. Packages do not achieve On-Bill or TDV savings in most of PG&E territory (CZs 1, 2, 4, 5, 12-13, and 16).
♦ Packages are cost effective in all climate zones except CZ16.
♦ All incremental costs are negative primarily due to elimination of natural gas infrastructure.
♦ 3A – All-Electric + EE: Packages achieve between +3% and +16% compliance margins depending on climate zone. All packages are cost effective in all climate zones.
♦ 3B – All-Electric + EE + PV + B: All packages are cost effective using both the On-Bill and TDV approaches, except On-Bill in LADWP territory. Adding PV and Battery to the efficiency package reduces the B/C ratio but increases overall NPV savings.
♦ 3C – All-Electric + HE: Packages achieve between -8% and +5% compliance margins depending on climate zone, and packages are cost effective using both On-Bill and TDV approaches in all CZs except CZs 1 and 16.
ATTACHMENT 6
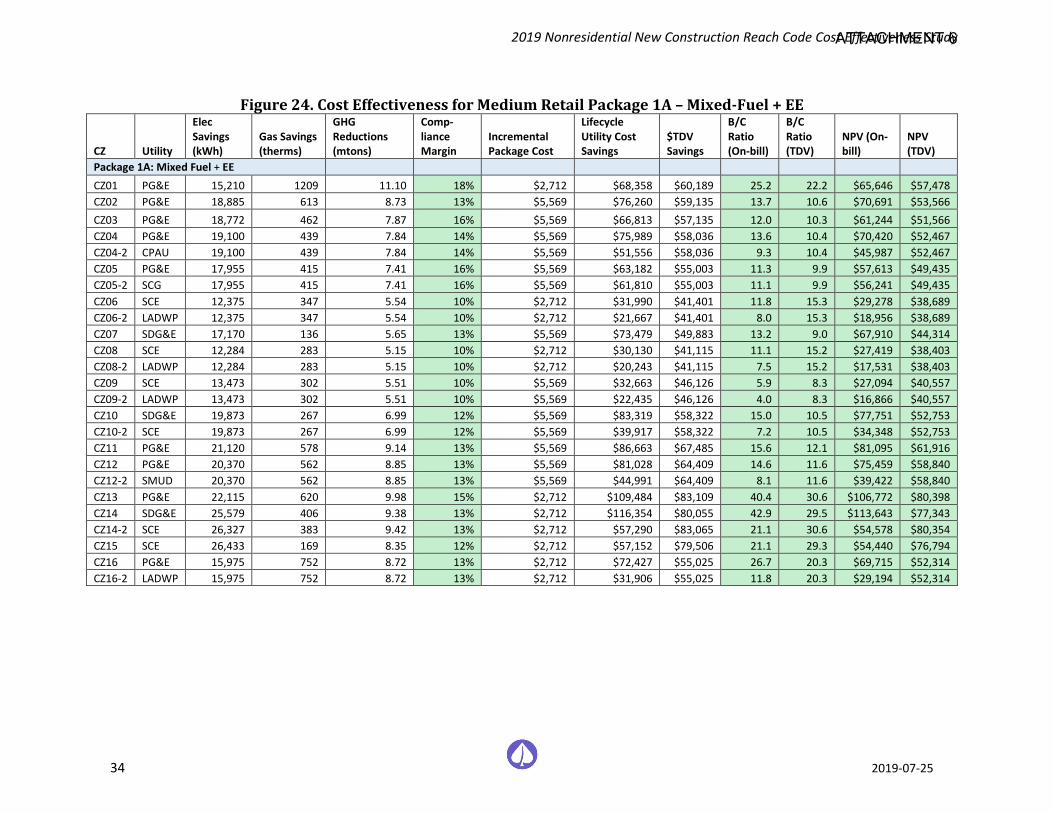
2019 Nonresidential New Construction Reach Code Cost Effectiveness Study
34 2019-07-25
Figure 24. Cost Effectiveness for Medium Retail Package 1A – Mixed-Fuel + EE
CZ Utility
Elec Savings (kWh)
Gas Savings (therms)
GHG Reductions (mtons)
Comp-liance Margin
Incremental Package Cost
Lifecycle Utility Cost Savings
$TDV Savings
B/C Ratio (On-bill)
B/C Ratio (TDV)
NPV (On-bill)
NPV (TDV)
Package 1A: Mixed Fuel + EE
CZ01 PG&E 15,210 1209 11.10 18% $2,712 $68,358 $60,189 25.2 22.2 $65,646 $57,478 CZ02 PG&E 18,885 613 8.73 13% $5,569 $76,260 $59,135 13.7 10.6 $70,691 $53,566 CZ03 PG&E 18,772 462 7.87 16% $5,569 $66,813 $57,135 12.0 10.3 $61,244 $51,566 CZ04 PG&E 19,100 439 7.84 14% $5,569 $75,989 $58,036 13.6 10.4 $70,420 $52,467 CZ04-2 CPAU 19,100 439 7.84 14% $5,569 $51,556 $58,036 9.3 10.4 $45,987 $52,467 CZ05 PG&E 17,955 415 7.41 16% $5,569 $63,182 $55,003 11.3 9.9 $57,613 $49,435 CZ05-2 SCG 17,955 415 7.41 16% $5,569 $61,810 $55,003 11.1 9.9 $56,241 $49,435 CZ06 SCE 12,375 347 5.54 10% $2,712 $31,990 $41,401 11.8 15.3 $29,278 $38,689 CZ06-2 LADWP 12,375 347 5.54 10% $2,712 $21,667 $41,401 8.0 15.3 $18,956 $38,689 CZ07 SDG&E 17,170 136 5.65 13% $5,569 $73,479 $49,883 13.2 9.0 $67,910 $44,314 CZ08 SCE 12,284 283 5.15 10% $2,712 $30,130 $41,115 11.1 15.2 $27,419 $38,403 CZ08-2 LADWP 12,284 283 5.15 10% $2,712 $20,243 $41,115 7.5 15.2 $17,531 $38,403 CZ09 SCE 13,473 302 5.51 10% $5,569 $32,663 $46,126 5.9 8.3 $27,094 $40,557 CZ09-2 LADWP 13,473 302 5.51 10% $5,569 $22,435 $46,126 4.0 8.3 $16,866 $40,557 CZ10 SDG&E 19,873 267 6.99 12% $5,569 $83,319 $58,322 15.0 10.5 $77,751 $52,753 CZ10-2 SCE 19,873 267 6.99 12% $5,569 $39,917 $58,322 7.2 10.5 $34,348 $52,753 CZ11 PG&E 21,120 578 9.14 13% $5,569 $86,663 $67,485 15.6 12.1 $81,095 $61,916 CZ12 PG&E 20,370 562 8.85 13% $5,569 $81,028 $64,409 14.6 11.6 $75,459 $58,840 CZ12-2 SMUD 20,370 562 8.85 13% $5,569 $44,991 $64,409 8.1 11.6 $39,422 $58,840 CZ13 PG&E 22,115 620 9.98 15% $2,712 $109,484 $83,109 40.4 30.6 $106,772 $80,398 CZ14 SDG&E 25,579 406 9.38 13% $2,712 $116,354 $80,055 42.9 29.5 $113,643 $77,343 CZ14-2 SCE 26,327 383 9.42 13% $2,712 $57,290 $83,065 21.1 30.6 $54,578 $80,354 CZ15 SCE 26,433 169 8.35 12% $2,712 $57,152 $79,506 21.1 29.3 $54,440 $76,794 CZ16 PG&E 15,975 752 8.72 13% $2,712 $72,427 $55,025 26.7 20.3 $69,715 $52,314 CZ16-2 LADWP 15,975 752 8.72 13% $2,712 $31,906 $55,025 11.8 20.3 $29,194 $52,314
ATTACHMENT 6
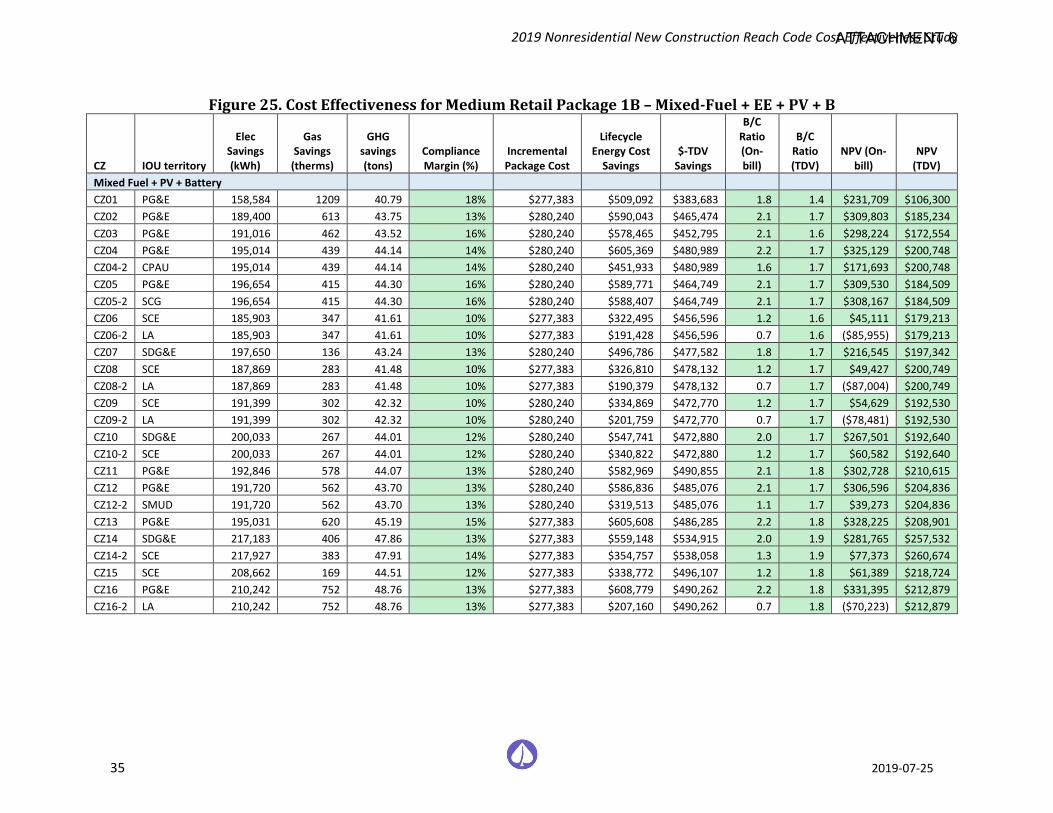
2019 Nonresidential New Construction Reach Code Cost Effectiveness Study
35 2019-07-25
Figure 25. Cost Effectiveness for Medium Retail Package 1B – Mixed-Fuel + EE + PV + B
CZ IOU territory
Elec Savings (kWh)
Gas Savings
(therms)
GHG savings (tons)
Compliance Margin (%)
Incremental Package Cost
Lifecycle Energy Cost
Savings $-TDV
Savings
B/C Ratio (On-bill)
B/C Ratio (TDV)
NPV (On-bill)
NPV (TDV)
Mixed Fuel + PV + Battery CZ01 PG&E 158,584 1209 40.79 18% $277,383 $509,092 $383,683 1.8 1.4 $231,709 $106,300 CZ02 PG&E 189,400 613 43.75 13% $280,240 $590,043 $465,474 2.1 1.7 $309,803 $185,234 CZ03 PG&E 191,016 462 43.52 16% $280,240 $578,465 $452,795 2.1 1.6 $298,224 $172,554 CZ04 PG&E 195,014 439 44.14 14% $280,240 $605,369 $480,989 2.2 1.7 $325,129 $200,748 CZ04-2 CPAU 195,014 439 44.14 14% $280,240 $451,933 $480,989 1.6 1.7 $171,693 $200,748 CZ05 PG&E 196,654 415 44.30 16% $280,240 $589,771 $464,749 2.1 1.7 $309,530 $184,509 CZ05-2 SCG 196,654 415 44.30 16% $280,240 $588,407 $464,749 2.1 1.7 $308,167 $184,509 CZ06 SCE 185,903 347 41.61 10% $277,383 $322,495 $456,596 1.2 1.6 $45,111 $179,213 CZ06-2 LA 185,903 347 41.61 10% $277,383 $191,428 $456,596 0.7 1.6 ($85,955) $179,213 CZ07 SDG&E 197,650 136 43.24 13% $280,240 $496,786 $477,582 1.8 1.7 $216,545 $197,342 CZ08 SCE 187,869 283 41.48 10% $277,383 $326,810 $478,132 1.2 1.7 $49,427 $200,749 CZ08-2 LA 187,869 283 41.48 10% $277,383 $190,379 $478,132 0.7 1.7 ($87,004) $200,749 CZ09 SCE 191,399 302 42.32 10% $280,240 $334,869 $472,770 1.2 1.7 $54,629 $192,530 CZ09-2 LA 191,399 302 42.32 10% $280,240 $201,759 $472,770 0.7 1.7 ($78,481) $192,530 CZ10 SDG&E 200,033 267 44.01 12% $280,240 $547,741 $472,880 2.0 1.7 $267,501 $192,640 CZ10-2 SCE 200,033 267 44.01 12% $280,240 $340,822 $472,880 1.2 1.7 $60,582 $192,640 CZ11 PG&E 192,846 578 44.07 13% $280,240 $582,969 $490,855 2.1 1.8 $302,728 $210,615 CZ12 PG&E 191,720 562 43.70 13% $280,240 $586,836 $485,076 2.1 1.7 $306,596 $204,836 CZ12-2 SMUD 191,720 562 43.70 13% $280,240 $319,513 $485,076 1.1 1.7 $39,273 $204,836 CZ13 PG&E 195,031 620 45.19 15% $277,383 $605,608 $486,285 2.2 1.8 $328,225 $208,901 CZ14 SDG&E 217,183 406 47.86 13% $277,383 $559,148 $534,915 2.0 1.9 $281,765 $257,532 CZ14-2 SCE 217,927 383 47.91 14% $277,383 $354,757 $538,058 1.3 1.9 $77,373 $260,674 CZ15 SCE 208,662 169 44.51 12% $277,383 $338,772 $496,107 1.2 1.8 $61,389 $218,724 CZ16 PG&E 210,242 752 48.76 13% $277,383 $608,779 $490,262 2.2 1.8 $331,395 $212,879 CZ16-2 LA 210,242 752 48.76 13% $277,383 $207,160 $490,262 0.7 1.8 ($70,223) $212,879
ATTACHMENT 6
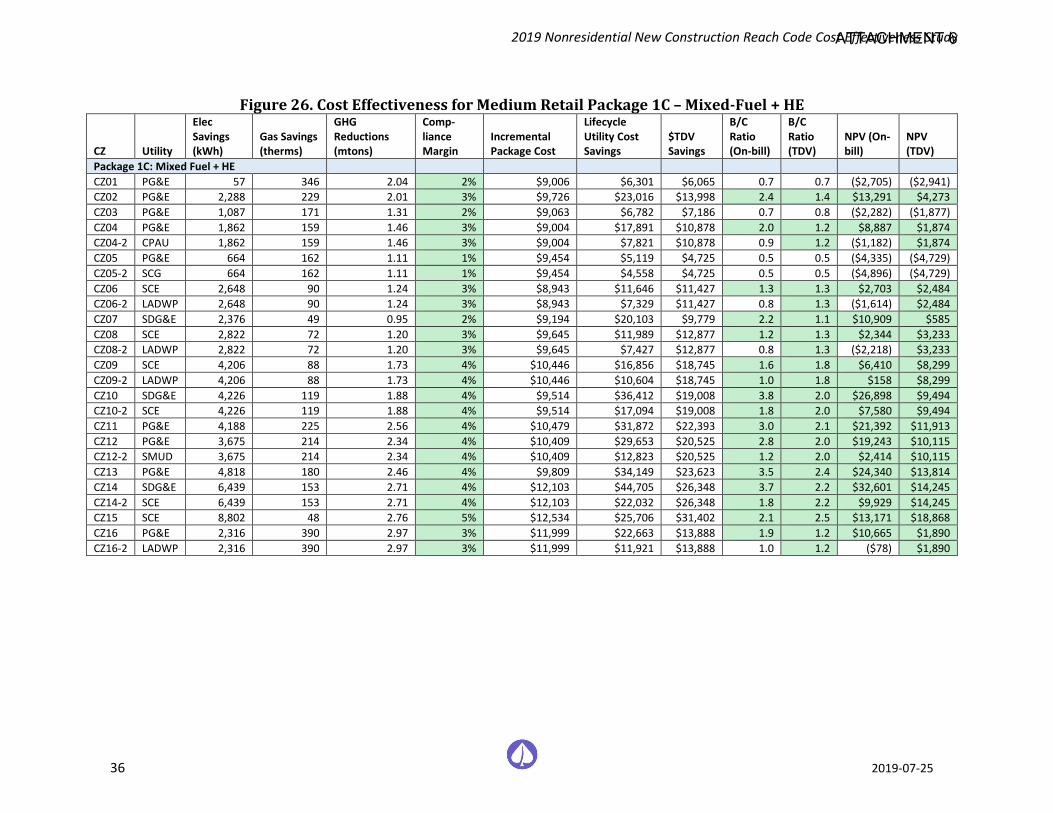
2019 Nonresidential New Construction Reach Code Cost Effectiveness Study
36 2019-07-25
Figure 26. Cost Effectiveness for Medium Retail Package 1C – Mixed-Fuel + HE
CZ Utility
Elec Savings (kWh)
Gas Savings (therms)
GHG Reductions (mtons)
Comp-liance Margin
Incremental Package Cost
Lifecycle Utility Cost Savings
$TDV Savings
B/C Ratio (On-bill)
B/C Ratio (TDV)
NPV (On-bill)
NPV (TDV)
Package 1C: Mixed Fuel + HE CZ01 PG&E 57 346 2.04 2% $9,006 $6,301 $6,065 0.7 0.7 ($2,705) ($2,941) CZ02 PG&E 2,288 229 2.01 3% $9,726 $23,016 $13,998 2.4 1.4 $13,291 $4,273 CZ03 PG&E 1,087 171 1.31 2% $9,063 $6,782 $7,186 0.7 0.8 ($2,282) ($1,877) CZ04 PG&E 1,862 159 1.46 3% $9,004 $17,891 $10,878 2.0 1.2 $8,887 $1,874 CZ04-2 CPAU 1,862 159 1.46 3% $9,004 $7,821 $10,878 0.9 1.2 ($1,182) $1,874 CZ05 PG&E 664 162 1.11 1% $9,454 $5,119 $4,725 0.5 0.5 ($4,335) ($4,729) CZ05-2 SCG 664 162 1.11 1% $9,454 $4,558 $4,725 0.5 0.5 ($4,896) ($4,729) CZ06 SCE 2,648 90 1.24 3% $8,943 $11,646 $11,427 1.3 1.3 $2,703 $2,484 CZ06-2 LADWP 2,648 90 1.24 3% $8,943 $7,329 $11,427 0.8 1.3 ($1,614) $2,484 CZ07 SDG&E 2,376 49 0.95 2% $9,194 $20,103 $9,779 2.2 1.1 $10,909 $585 CZ08 SCE 2,822 72 1.20 3% $9,645 $11,989 $12,877 1.2 1.3 $2,344 $3,233 CZ08-2 LADWP 2,822 72 1.20 3% $9,645 $7,427 $12,877 0.8 1.3 ($2,218) $3,233 CZ09 SCE 4,206 88 1.73 4% $10,446 $16,856 $18,745 1.6 1.8 $6,410 $8,299 CZ09-2 LADWP 4,206 88 1.73 4% $10,446 $10,604 $18,745 1.0 1.8 $158 $8,299 CZ10 SDG&E 4,226 119 1.88 4% $9,514 $36,412 $19,008 3.8 2.0 $26,898 $9,494 CZ10-2 SCE 4,226 119 1.88 4% $9,514 $17,094 $19,008 1.8 2.0 $7,580 $9,494 CZ11 PG&E 4,188 225 2.56 4% $10,479 $31,872 $22,393 3.0 2.1 $21,392 $11,913 CZ12 PG&E 3,675 214 2.34 4% $10,409 $29,653 $20,525 2.8 2.0 $19,243 $10,115 CZ12-2 SMUD 3,675 214 2.34 4% $10,409 $12,823 $20,525 1.2 2.0 $2,414 $10,115 CZ13 PG&E 4,818 180 2.46 4% $9,809 $34,149 $23,623 3.5 2.4 $24,340 $13,814 CZ14 SDG&E 6,439 153 2.71 4% $12,103 $44,705 $26,348 3.7 2.2 $32,601 $14,245 CZ14-2 SCE 6,439 153 2.71 4% $12,103 $22,032 $26,348 1.8 2.2 $9,929 $14,245 CZ15 SCE 8,802 48 2.76 5% $12,534 $25,706 $31,402 2.1 2.5 $13,171 $18,868 CZ16 PG&E 2,316 390 2.97 3% $11,999 $22,663 $13,888 1.9 1.2 $10,665 $1,890 CZ16-2 LADWP 2,316 390 2.97 3% $11,999 $11,921 $13,888 1.0 1.2 ($78) $1,890
ATTACHMENT 6
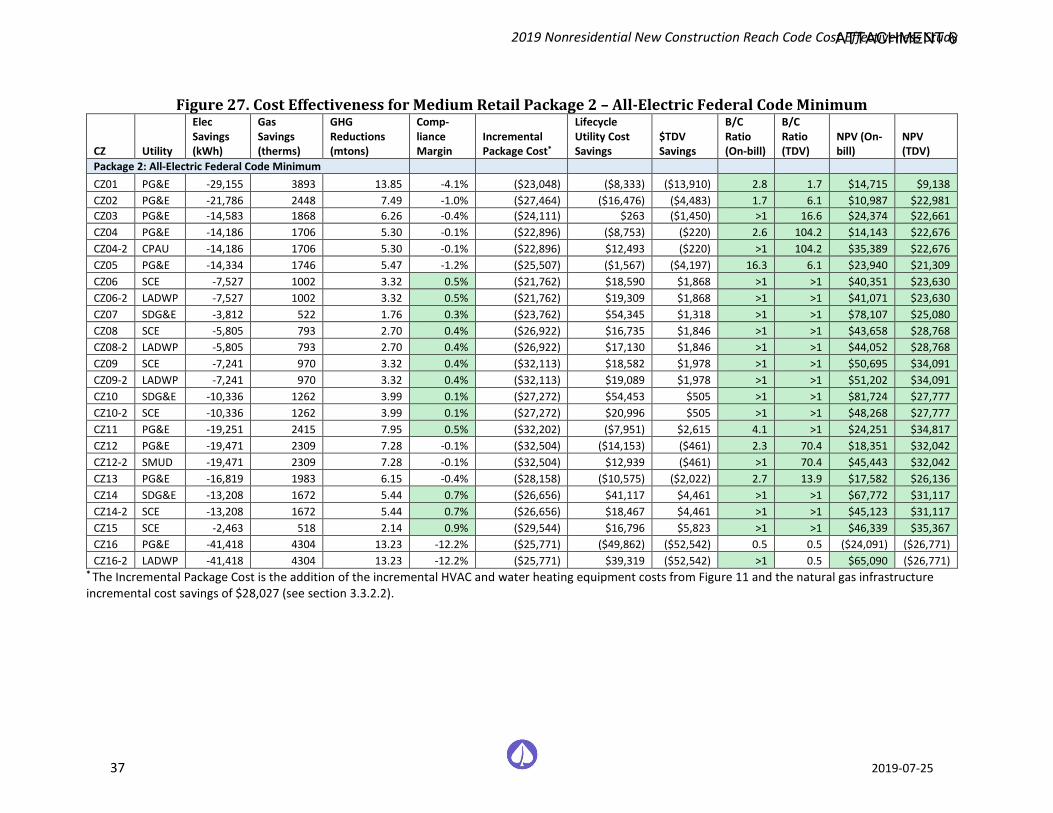
2019 Nonresidential New Construction Reach Code Cost Effectiveness Study
37 2019-07-25
Figure 27. Cost Effectiveness for Medium Retail Package 2 – All-Electric Federal Code Minimum
CZ Utility
Elec Savings (kWh)
Gas Savings (therms)
GHG Reductions (mtons)
Comp-liance Margin
Incremental Package Cost*
Lifecycle Utility Cost Savings
$TDV Savings
B/C Ratio (On-bill)
B/C Ratio (TDV)
NPV (On-bill)
NPV (TDV)
Package 2: All-Electric Federal Code Minimum CZ01 PG&E -29,155 3893 13.85 -4.1% ($23,048) ($8,333) ($13,910) 2.8 1.7 $14,715 $9,138 CZ02 PG&E -21,786 2448 7.49 -1.0% ($27,464) ($16,476) ($4,483) 1.7 6.1 $10,987 $22,981 CZ03 PG&E -14,583 1868 6.26 -0.4% ($24,111) $263 ($1,450) >1 16.6 $24,374 $22,661 CZ04 PG&E -14,186 1706 5.30 -0.1% ($22,896) ($8,753) ($220) 2.6 104.2 $14,143 $22,676 CZ04-2 CPAU -14,186 1706 5.30 -0.1% ($22,896) $12,493 ($220) >1 104.2 $35,389 $22,676 CZ05 PG&E -14,334 1746 5.47 -1.2% ($25,507) ($1,567) ($4,197) 16.3 6.1 $23,940 $21,309 CZ06 SCE -7,527 1002 3.32 0.5% ($21,762) $18,590 $1,868 >1 >1 $40,351 $23,630 CZ06-2 LADWP -7,527 1002 3.32 0.5% ($21,762) $19,309 $1,868 >1 >1 $41,071 $23,630 CZ07 SDG&E -3,812 522 1.76 0.3% ($23,762) $54,345 $1,318 >1 >1 $78,107 $25,080 CZ08 SCE -5,805 793 2.70 0.4% ($26,922) $16,735 $1,846 >1 >1 $43,658 $28,768 CZ08-2 LADWP -5,805 793 2.70 0.4% ($26,922) $17,130 $1,846 >1 >1 $44,052 $28,768 CZ09 SCE -7,241 970 3.32 0.4% ($32,113) $18,582 $1,978 >1 >1 $50,695 $34,091 CZ09-2 LADWP -7,241 970 3.32 0.4% ($32,113) $19,089 $1,978 >1 >1 $51,202 $34,091 CZ10 SDG&E -10,336 1262 3.99 0.1% ($27,272) $54,453 $505 >1 >1 $81,724 $27,777 CZ10-2 SCE -10,336 1262 3.99 0.1% ($27,272) $20,996 $505 >1 >1 $48,268 $27,777 CZ11 PG&E -19,251 2415 7.95 0.5% ($32,202) ($7,951) $2,615 4.1 >1 $24,251 $34,817 CZ12 PG&E -19,471 2309 7.28 -0.1% ($32,504) ($14,153) ($461) 2.3 70.4 $18,351 $32,042 CZ12-2 SMUD -19,471 2309 7.28 -0.1% ($32,504) $12,939 ($461) >1 70.4 $45,443 $32,042 CZ13 PG&E -16,819 1983 6.15 -0.4% ($28,158) ($10,575) ($2,022) 2.7 13.9 $17,582 $26,136 CZ14 SDG&E -13,208 1672 5.44 0.7% ($26,656) $41,117 $4,461 >1 >1 $67,772 $31,117 CZ14-2 SCE -13,208 1672 5.44 0.7% ($26,656) $18,467 $4,461 >1 >1 $45,123 $31,117 CZ15 SCE -2,463 518 2.14 0.9% ($29,544) $16,796 $5,823 >1 >1 $46,339 $35,367 CZ16 PG&E -41,418 4304 13.23 -12.2% ($25,771) ($49,862) ($52,542) 0.5 0.5 ($24,091) ($26,771) CZ16-2 LADWP -41,418 4304 13.23 -12.2% ($25,771) $39,319 ($52,542) >1 0.5 $65,090 ($26,771)
* The Incremental Package Cost is the addition of the incremental HVAC and water heating equipment costs from Figure 11 and the natural gas infrastructure incremental cost savings of $28,027 (see section 3.3.2.2).
ATTACHMENT 6
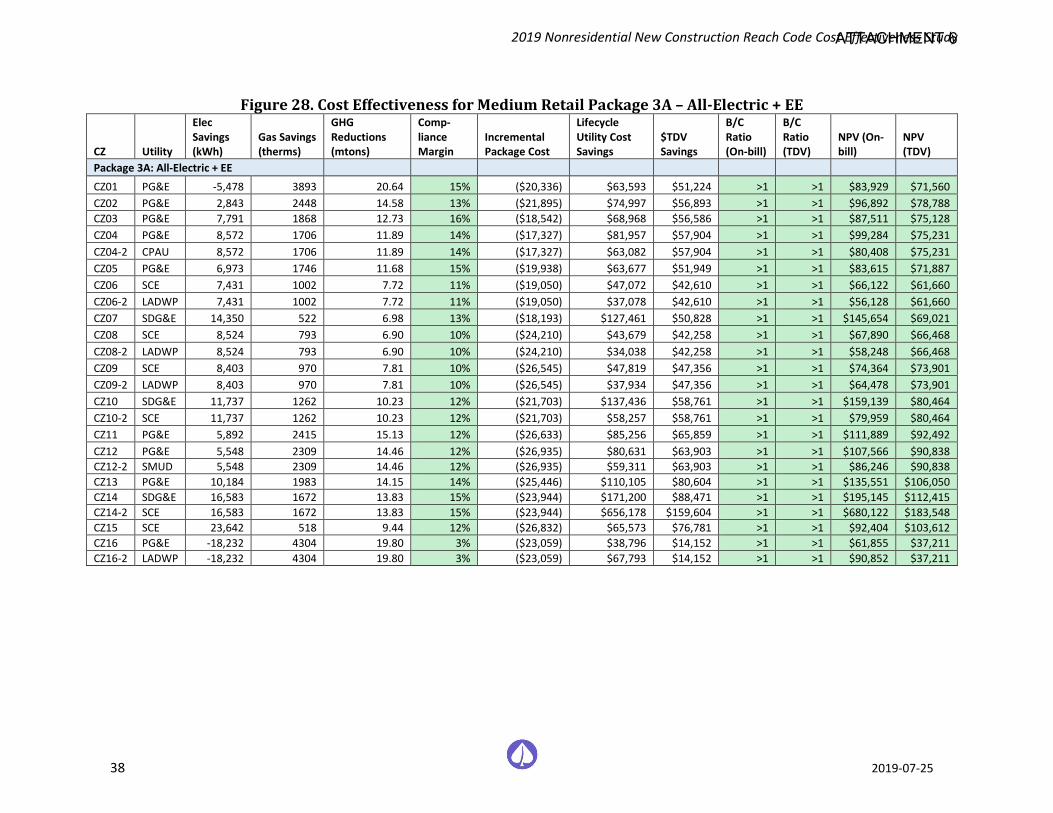
2019 Nonresidential New Construction Reach Code Cost Effectiveness Study
38 2019-07-25
Figure 28. Cost Effectiveness for Medium Retail Package 3A – All-Electric + EE
CZ Utility
Elec Savings (kWh)
Gas Savings (therms)
GHG Reductions (mtons)
Comp-liance Margin
Incremental Package Cost
Lifecycle Utility Cost Savings
$TDV Savings
B/C Ratio (On-bill)
B/C Ratio (TDV)
NPV (On-bill)
NPV (TDV)
Package 3A: All-Electric + EE
CZ01 PG&E -5,478 3893 20.64 15% ($20,336) $63,593 $51,224 >1 >1 $83,929 $71,560 CZ02 PG&E 2,843 2448 14.58 13% ($21,895) $74,997 $56,893 >1 >1 $96,892 $78,788 CZ03 PG&E 7,791 1868 12.73 16% ($18,542) $68,968 $56,586 >1 >1 $87,511 $75,128 CZ04 PG&E 8,572 1706 11.89 14% ($17,327) $81,957 $57,904 >1 >1 $99,284 $75,231 CZ04-2 CPAU 8,572 1706 11.89 14% ($17,327) $63,082 $57,904 >1 >1 $80,408 $75,231 CZ05 PG&E 6,973 1746 11.68 15% ($19,938) $63,677 $51,949 >1 >1 $83,615 $71,887 CZ06 SCE 7,431 1002 7.72 11% ($19,050) $47,072 $42,610 >1 >1 $66,122 $61,660 CZ06-2 LADWP 7,431 1002 7.72 11% ($19,050) $37,078 $42,610 >1 >1 $56,128 $61,660 CZ07 SDG&E 14,350 522 6.98 13% ($18,193) $127,461 $50,828 >1 >1 $145,654 $69,021 CZ08 SCE 8,524 793 6.90 10% ($24,210) $43,679 $42,258 >1 >1 $67,890 $66,468 CZ08-2 LADWP 8,524 793 6.90 10% ($24,210) $34,038 $42,258 >1 >1 $58,248 $66,468 CZ09 SCE 8,403 970 7.81 10% ($26,545) $47,819 $47,356 >1 >1 $74,364 $73,901 CZ09-2 LADWP 8,403 970 7.81 10% ($26,545) $37,934 $47,356 >1 >1 $64,478 $73,901 CZ10 SDG&E 11,737 1262 10.23 12% ($21,703) $137,436 $58,761 >1 >1 $159,139 $80,464 CZ10-2 SCE 11,737 1262 10.23 12% ($21,703) $58,257 $58,761 >1 >1 $79,959 $80,464 CZ11 PG&E 5,892 2415 15.13 12% ($26,633) $85,256 $65,859 >1 >1 $111,889 $92,492 CZ12 PG&E 5,548 2309 14.46 12% ($26,935) $80,631 $63,903 >1 >1 $107,566 $90,838 CZ12-2 SMUD 5,548 2309 14.46 12% ($26,935) $59,311 $63,903 >1 >1 $86,246 $90,838 CZ13 PG&E 10,184 1983 14.15 14% ($25,446) $110,105 $80,604 >1 >1 $135,551 $106,050 CZ14 SDG&E 16,583 1672 13.83 15% ($23,944) $171,200 $88,471 >1 >1 $195,145 $112,415 CZ14-2 SCE 16,583 1672 13.83 15% ($23,944) $656,178 $159,604 >1 >1 $680,122 $183,548 CZ15 SCE 23,642 518 9.44 12% ($26,832) $65,573 $76,781 >1 >1 $92,404 $103,612 CZ16 PG&E -18,232 4304 19.80 3% ($23,059) $38,796 $14,152 >1 >1 $61,855 $37,211 CZ16-2 LADWP -18,232 4304 19.80 3% ($23,059) $67,793 $14,152 >1 >1 $90,852 $37,211
ATTACHMENT 6
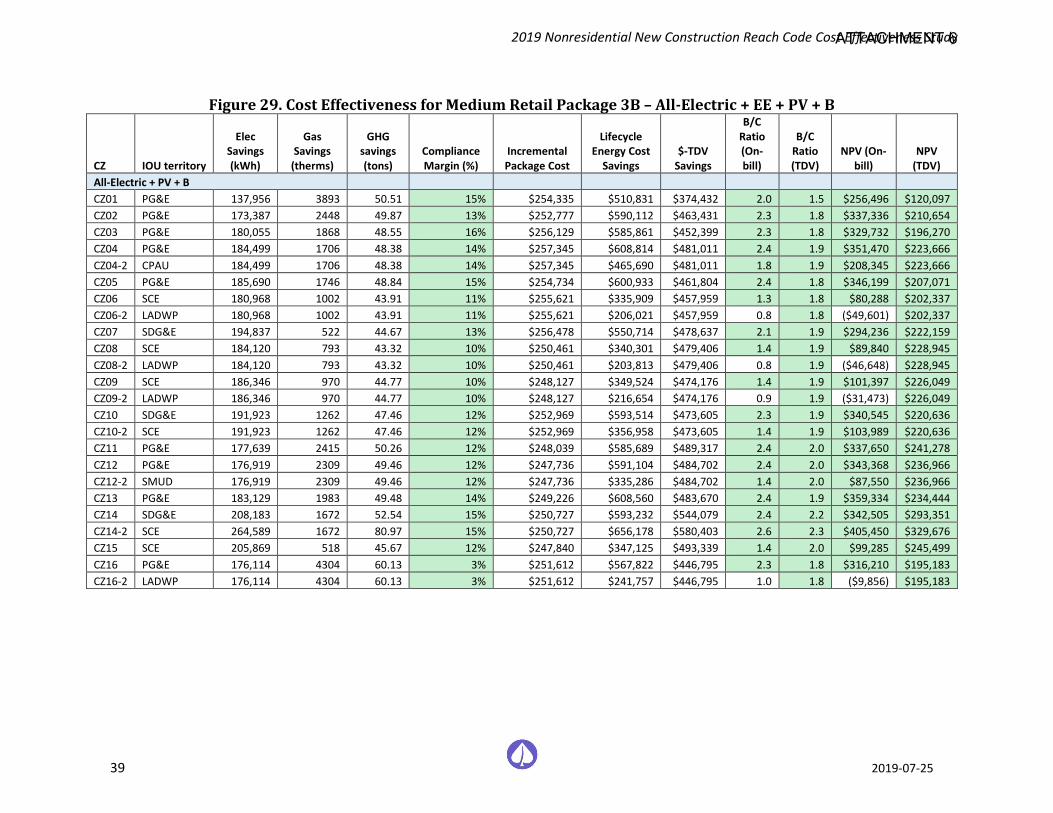
2019 Nonresidential New Construction Reach Code Cost Effectiveness Study
39 2019-07-25
Figure 29. Cost Effectiveness for Medium Retail Package 3B – All-Electric + EE + PV + B
CZ IOU territory
Elec Savings (kWh)
Gas Savings
(therms)
GHG savings (tons)
Compliance Margin (%)
Incremental Package Cost
Lifecycle Energy Cost
Savings $-TDV
Savings
B/C Ratio (On-bill)
B/C Ratio (TDV)
NPV (On-bill)
NPV (TDV)
All-Electric + PV + B CZ01 PG&E 137,956 3893 50.51 15% $254,335 $510,831 $374,432 2.0 1.5 $256,496 $120,097 CZ02 PG&E 173,387 2448 49.87 13% $252,777 $590,112 $463,431 2.3 1.8 $337,336 $210,654 CZ03 PG&E 180,055 1868 48.55 16% $256,129 $585,861 $452,399 2.3 1.8 $329,732 $196,270 CZ04 PG&E 184,499 1706 48.38 14% $257,345 $608,814 $481,011 2.4 1.9 $351,470 $223,666 CZ04-2 CPAU 184,499 1706 48.38 14% $257,345 $465,690 $481,011 1.8 1.9 $208,345 $223,666 CZ05 PG&E 185,690 1746 48.84 15% $254,734 $600,933 $461,804 2.4 1.8 $346,199 $207,071 CZ06 SCE 180,968 1002 43.91 11% $255,621 $335,909 $457,959 1.3 1.8 $80,288 $202,337 CZ06-2 LADWP 180,968 1002 43.91 11% $255,621 $206,021 $457,959 0.8 1.8 ($49,601) $202,337 CZ07 SDG&E 194,837 522 44.67 13% $256,478 $550,714 $478,637 2.1 1.9 $294,236 $222,159 CZ08 SCE 184,120 793 43.32 10% $250,461 $340,301 $479,406 1.4 1.9 $89,840 $228,945 CZ08-2 LADWP 184,120 793 43.32 10% $250,461 $203,813 $479,406 0.8 1.9 ($46,648) $228,945 CZ09 SCE 186,346 970 44.77 10% $248,127 $349,524 $474,176 1.4 1.9 $101,397 $226,049 CZ09-2 LADWP 186,346 970 44.77 10% $248,127 $216,654 $474,176 0.9 1.9 ($31,473) $226,049 CZ10 SDG&E 191,923 1262 47.46 12% $252,969 $593,514 $473,605 2.3 1.9 $340,545 $220,636 CZ10-2 SCE 191,923 1262 47.46 12% $252,969 $356,958 $473,605 1.4 1.9 $103,989 $220,636 CZ11 PG&E 177,639 2415 50.26 12% $248,039 $585,689 $489,317 2.4 2.0 $337,650 $241,278 CZ12 PG&E 176,919 2309 49.46 12% $247,736 $591,104 $484,702 2.4 2.0 $343,368 $236,966 CZ12-2 SMUD 176,919 2309 49.46 12% $247,736 $335,286 $484,702 1.4 2.0 $87,550 $236,966 CZ13 PG&E 183,129 1983 49.48 14% $249,226 $608,560 $483,670 2.4 1.9 $359,334 $234,444 CZ14 SDG&E 208,183 1672 52.54 15% $250,727 $593,232 $544,079 2.4 2.2 $342,505 $293,351 CZ14-2 SCE 264,589 1672 80.97 15% $250,727 $656,178 $580,403 2.6 2.3 $405,450 $329,676 CZ15 SCE 205,869 518 45.67 12% $247,840 $347,125 $493,339 1.4 2.0 $99,285 $245,499 CZ16 PG&E 176,114 4304 60.13 3% $251,612 $567,822 $446,795 2.3 1.8 $316,210 $195,183 CZ16-2 LADWP 176,114 4304 60.13 3% $251,612 $241,757 $446,795 1.0 1.8 ($9,856) $195,183
ATTACHMENT 6
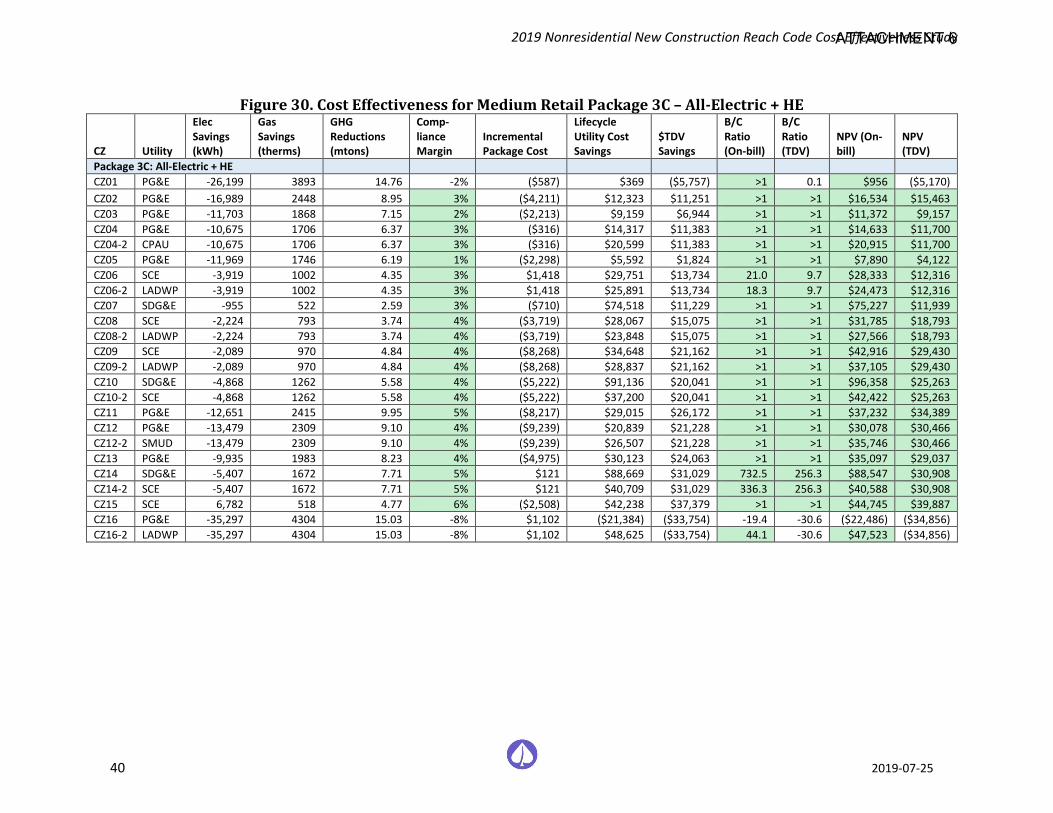
2019 Nonresidential New Construction Reach Code Cost Effectiveness Study
40 2019-07-25
Figure 30. Cost Effectiveness for Medium Retail Package 3C – All-Electric + HE
CZ Utility
Elec Savings (kWh)
Gas Savings (therms)
GHG Reductions (mtons)
Comp-liance Margin
Incremental Package Cost
Lifecycle Utility Cost Savings
$TDV Savings
B/C Ratio (On-bill)
B/C Ratio (TDV)
NPV (On-bill)
NPV (TDV)
Package 3C: All-Electric + HE CZ01 PG&E -26,199 3893 14.76 -2% ($587) $369 ($5,757) >1 0.1 $956 ($5,170) CZ02 PG&E -16,989 2448 8.95 3% ($4,211) $12,323 $11,251 >1 >1 $16,534 $15,463 CZ03 PG&E -11,703 1868 7.15 2% ($2,213) $9,159 $6,944 >1 >1 $11,372 $9,157 CZ04 PG&E -10,675 1706 6.37 3% ($316) $14,317 $11,383 >1 >1 $14,633 $11,700 CZ04-2 CPAU -10,675 1706 6.37 3% ($316) $20,599 $11,383 >1 >1 $20,915 $11,700 CZ05 PG&E -11,969 1746 6.19 1% ($2,298) $5,592 $1,824 >1 >1 $7,890 $4,122 CZ06 SCE -3,919 1002 4.35 3% $1,418 $29,751 $13,734 21.0 9.7 $28,333 $12,316 CZ06-2 LADWP -3,919 1002 4.35 3% $1,418 $25,891 $13,734 18.3 9.7 $24,473 $12,316 CZ07 SDG&E -955 522 2.59 3% ($710) $74,518 $11,229 >1 >1 $75,227 $11,939 CZ08 SCE -2,224 793 3.74 4% ($3,719) $28,067 $15,075 >1 >1 $31,785 $18,793 CZ08-2 LADWP -2,224 793 3.74 4% ($3,719) $23,848 $15,075 >1 >1 $27,566 $18,793 CZ09 SCE -2,089 970 4.84 4% ($8,268) $34,648 $21,162 >1 >1 $42,916 $29,430 CZ09-2 LADWP -2,089 970 4.84 4% ($8,268) $28,837 $21,162 >1 >1 $37,105 $29,430 CZ10 SDG&E -4,868 1262 5.58 4% ($5,222) $91,136 $20,041 >1 >1 $96,358 $25,263 CZ10-2 SCE -4,868 1262 5.58 4% ($5,222) $37,200 $20,041 >1 >1 $42,422 $25,263 CZ11 PG&E -12,651 2415 9.95 5% ($8,217) $29,015 $26,172 >1 >1 $37,232 $34,389 CZ12 PG&E -13,479 2309 9.10 4% ($9,239) $20,839 $21,228 >1 >1 $30,078 $30,466 CZ12-2 SMUD -13,479 2309 9.10 4% ($9,239) $26,507 $21,228 >1 >1 $35,746 $30,466 CZ13 PG&E -9,935 1983 8.23 4% ($4,975) $30,123 $24,063 >1 >1 $35,097 $29,037 CZ14 SDG&E -5,407 1672 7.71 5% $121 $88,669 $31,029 732.5 256.3 $88,547 $30,908 CZ14-2 SCE -5,407 1672 7.71 5% $121 $40,709 $31,029 336.3 256.3 $40,588 $30,908 CZ15 SCE 6,782 518 4.77 6% ($2,508) $42,238 $37,379 >1 >1 $44,745 $39,887 CZ16 PG&E -35,297 4304 15.03 -8% $1,102 ($21,384) ($33,754) -19.4 -30.6 ($22,486) ($34,856) CZ16-2 LADWP -35,297 4304 15.03 -8% $1,102 $48,625 ($33,754) 44.1 -30.6 $47,523 ($34,856)
ATTACHMENT 6
2019 Nonresidential New Construction Reach Code Cost Effectiveness Study
41 2019-07-25
4.3 Cost Effectiveness Results – Small Hotel The following issues must be considered when reviewing the Small Hotel results:
♦ The Small Hotel is a mix of residential and nonresidential space types, which results in different occupancy and load profiles than the office and retail prototypes.
♦ A potential laundry load has not been examined for the Small Hotel. The Reach Code Team attempted to characterize and apply the energy use intensity of laundry loads in hotels but did not find readily available data for use. Thus, cost effectiveness including laundry systems has not been examined.
♦ Contrary to the office and retail prototypes, the Small Hotel baseline water heater is a central gas storage type. Current compliance software cannot model central heat pump water heater systems with recirculation serving guest rooms.23 The only modeling option for heat pump water heating is individual water heaters at each guest room even though this is a very uncommon configuration. TRC modeled individual heat pump water heaters but as a proxy for central heat pump water heating performance, but integrated costs associated with tank and controls for central heat pump water heating into cost effectiveness calculations.
♦ Assuming central heat pump water heating also enabled the inclusion of a solar hot water thermal collection system, which was a key efficiency measure to achieving compliance in nearly all climate zones.
Figure 31 through Figure 37 contain the cost-effectiveness findings for the Small Hotel packages. Notable findings for each package include:
♦ 1A – Mixed-Fuel + EE:
♦ Packages achieve +3 to +10% compliance margins depending on climate zone.
♦ Packages are cost effective using either the On-Bill or TDV approach in all CZs except 12 (using SMUD rates), 14 (using SCE rates), and 15 (with SCE rates).
♦ The hotel is primarily guest rooms with a smaller proportion of nonresidential space. Thus, the inexpensive VAV minimum flow measure and lighting measures that have been applied to the entirety of the Medium Office and Medium Retail prototypes have a relatively small impact in the Small Hotel.24
♦ 1B – Mixed-Fuel + EE + PV + B: Packages are cost effective using either the On-Bill or TDV approach in all CZs. Solar PV generally increases cost effectiveness compared to efficiency-only, particularly when using an NPV metric.
♦ 1C – Mixed-Fuel + HE: Packages achieve +2 to +5% compliance margins depending on climate zone. The package is cost effective using the On-Bill approach in a minority of climate zones, and cost effective using TDV approach only in CZ15.
23 The IOUs and CEC are actively working on including central heat pump water heater modeling with recirculation systems in early 2020. 24 Title 24 requires that hotel/motel guest room lighting design comply with the residential lighting standards, which are all mandatory and are not awarded compliance credit for improved efficacy.
ATTACHMENT 6
2019 Nonresidential New Construction Reach Code Cost Effectiveness Study
42 2019-07-25
♦ 2 – All-Electric Federal Code-Minimum Reference:
♦ This all-electric design does not comply with the Energy Commission’s TDV performance budget. Packages achieve between -50% and -4% compliance margins depending on climate zone. This may be because the modeled HW system is constrained to having an artificially low efficiency to avoid triggering federal pre-emption, and the heat pump space heating systems must operate overnight when operation is less efficient.
♦ All packages are cost effective in all climate zones.
♦ 3A – All-Electric + EE: Packages achieve positive compliance margins in all CZs ranging from 0% to +17%, except CZ16 which had a -18% compliance margin. All packages are cost effective in all climate zones. The improved degree of cost effectiveness outcomes in Package 3A compared to Package 1A appear to be due to the significant incremental package cost savings.
♦ 3B – All-Electric + EE + PV + B: All packages are cost effective. Packages improve in B/C ratio when compared to 3A and increase in magnitude of overall NPV savings. PV appears to be more cost-effective with higher building electricity loads.
♦ 3C – All-Electric + HE:
♦ Packages do not comply with Title 24 in all CZs except CZ15 which resulted in a +0.04% compliance margin.
♦ All packages are cost effective.
ATTACHMENT 6
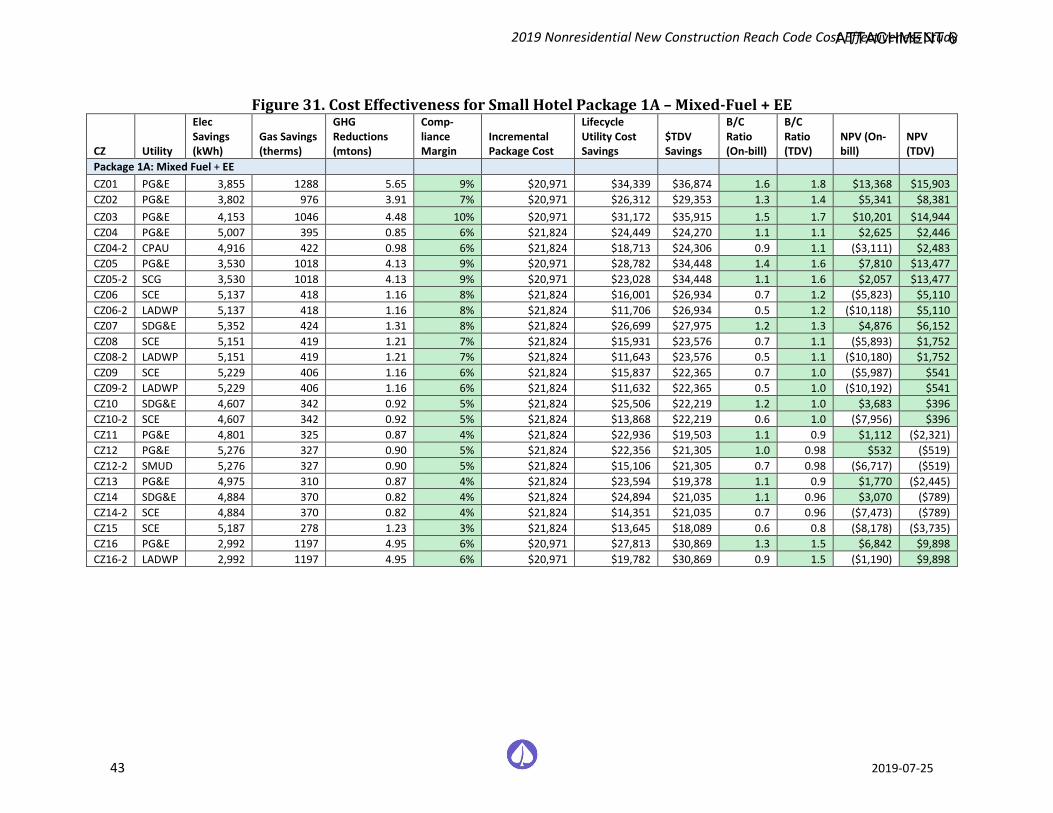
2019 Nonresidential New Construction Reach Code Cost Effectiveness Study
43 2019-07-25
Figure 31. Cost Effectiveness for Small Hotel Package 1A – Mixed-Fuel + EE
CZ Utility
Elec Savings (kWh)
Gas Savings (therms)
GHG Reductions (mtons)
Comp-liance Margin
Incremental Package Cost
Lifecycle Utility Cost Savings
$TDV Savings
B/C Ratio (On-bill)
B/C Ratio (TDV)
NPV (On-bill)
NPV (TDV)
Package 1A: Mixed Fuel + EE CZ01 PG&E 3,855 1288 5.65 9% $20,971 $34,339 $36,874 1.6 1.8 $13,368 $15,903 CZ02 PG&E 3,802 976 3.91 7% $20,971 $26,312 $29,353 1.3 1.4 $5,341 $8,381 CZ03 PG&E 4,153 1046 4.48 10% $20,971 $31,172 $35,915 1.5 1.7 $10,201 $14,944 CZ04 PG&E 5,007 395 0.85 6% $21,824 $24,449 $24,270 1.1 1.1 $2,625 $2,446 CZ04-2 CPAU 4,916 422 0.98 6% $21,824 $18,713 $24,306 0.9 1.1 ($3,111) $2,483 CZ05 PG&E 3,530 1018 4.13 9% $20,971 $28,782 $34,448 1.4 1.6 $7,810 $13,477 CZ05-2 SCG 3,530 1018 4.13 9% $20,971 $23,028 $34,448 1.1 1.6 $2,057 $13,477 CZ06 SCE 5,137 418 1.16 8% $21,824 $16,001 $26,934 0.7 1.2 ($5,823) $5,110 CZ06-2 LADWP 5,137 418 1.16 8% $21,824 $11,706 $26,934 0.5 1.2 ($10,118) $5,110 CZ07 SDG&E 5,352 424 1.31 8% $21,824 $26,699 $27,975 1.2 1.3 $4,876 $6,152 CZ08 SCE 5,151 419 1.21 7% $21,824 $15,931 $23,576 0.7 1.1 ($5,893) $1,752 CZ08-2 LADWP 5,151 419 1.21 7% $21,824 $11,643 $23,576 0.5 1.1 ($10,180) $1,752 CZ09 SCE 5,229 406 1.16 6% $21,824 $15,837 $22,365 0.7 1.0 ($5,987) $541 CZ09-2 LADWP 5,229 406 1.16 6% $21,824 $11,632 $22,365 0.5 1.0 ($10,192) $541 CZ10 SDG&E 4,607 342 0.92 5% $21,824 $25,506 $22,219 1.2 1.0 $3,683 $396 CZ10-2 SCE 4,607 342 0.92 5% $21,824 $13,868 $22,219 0.6 1.0 ($7,956) $396 CZ11 PG&E 4,801 325 0.87 4% $21,824 $22,936 $19,503 1.1 0.9 $1,112 ($2,321) CZ12 PG&E 5,276 327 0.90 5% $21,824 $22,356 $21,305 1.0 0.98 $532 ($519) CZ12-2 SMUD 5,276 327 0.90 5% $21,824 $15,106 $21,305 0.7 0.98 ($6,717) ($519) CZ13 PG&E 4,975 310 0.87 4% $21,824 $23,594 $19,378 1.1 0.9 $1,770 ($2,445) CZ14 SDG&E 4,884 370 0.82 4% $21,824 $24,894 $21,035 1.1 0.96 $3,070 ($789) CZ14-2 SCE 4,884 370 0.82 4% $21,824 $14,351 $21,035 0.7 0.96 ($7,473) ($789) CZ15 SCE 5,187 278 1.23 3% $21,824 $13,645 $18,089 0.6 0.8 ($8,178) ($3,735) CZ16 PG&E 2,992 1197 4.95 6% $20,971 $27,813 $30,869 1.3 1.5 $6,842 $9,898 CZ16-2 LADWP 2,992 1197 4.95 6% $20,971 $19,782 $30,869 0.9 1.5 ($1,190) $9,898
ATTACHMENT 6
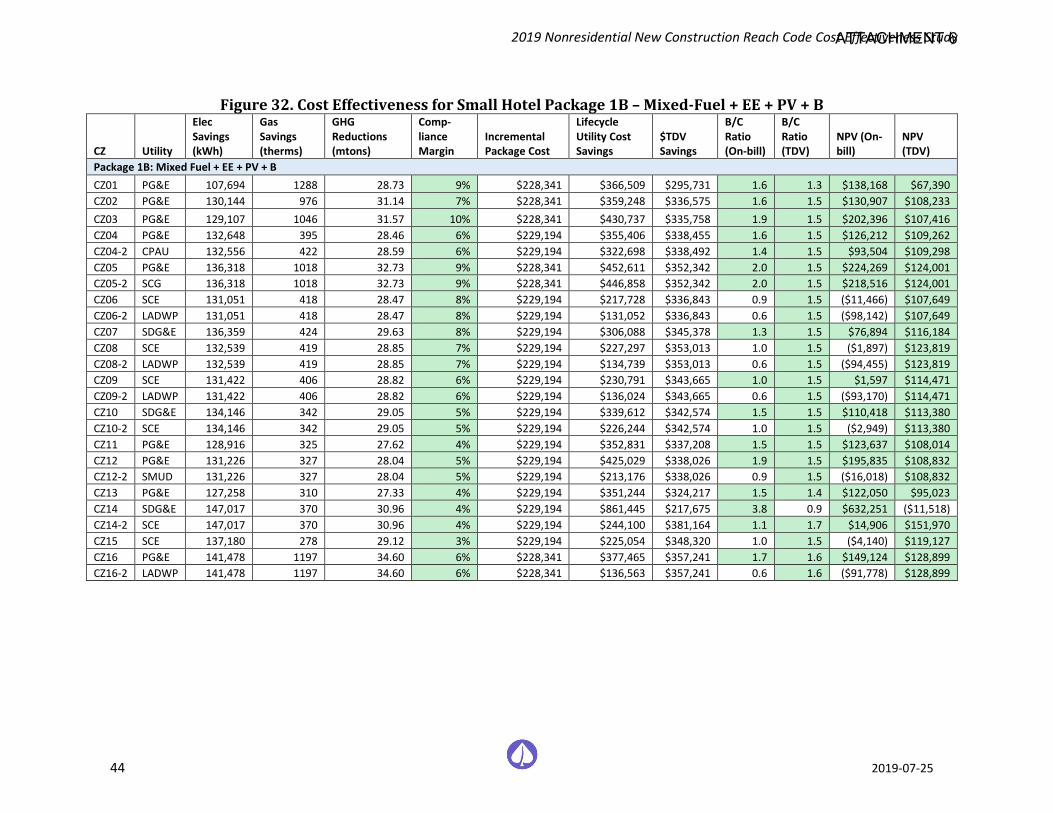
2019 Nonresidential New Construction Reach Code Cost Effectiveness Study
44 2019-07-25
Figure 32. Cost Effectiveness for Small Hotel Package 1B – Mixed-Fuel + EE + PV + B
CZ Utility
Elec Savings (kWh)
Gas Savings (therms)
GHG Reductions (mtons)
Comp-liance Margin
Incremental Package Cost
Lifecycle Utility Cost Savings
$TDV Savings
B/C Ratio (On-bill)
B/C Ratio (TDV)
NPV (On-bill)
NPV (TDV)
Package 1B: Mixed Fuel + EE + PV + B CZ01 PG&E 107,694 1288 28.73 9% $228,341 $366,509 $295,731 1.6 1.3 $138,168 $67,390 CZ02 PG&E 130,144 976 31.14 7% $228,341 $359,248 $336,575 1.6 1.5 $130,907 $108,233 CZ03 PG&E 129,107 1046 31.57 10% $228,341 $430,737 $335,758 1.9 1.5 $202,396 $107,416 CZ04 PG&E 132,648 395 28.46 6% $229,194 $355,406 $338,455 1.6 1.5 $126,212 $109,262 CZ04-2 CPAU 132,556 422 28.59 6% $229,194 $322,698 $338,492 1.4 1.5 $93,504 $109,298 CZ05 PG&E 136,318 1018 32.73 9% $228,341 $452,611 $352,342 2.0 1.5 $224,269 $124,001 CZ05-2 SCG 136,318 1018 32.73 9% $228,341 $446,858 $352,342 2.0 1.5 $218,516 $124,001 CZ06 SCE 131,051 418 28.47 8% $229,194 $217,728 $336,843 0.9 1.5 ($11,466) $107,649 CZ06-2 LADWP 131,051 418 28.47 8% $229,194 $131,052 $336,843 0.6 1.5 ($98,142) $107,649 CZ07 SDG&E 136,359 424 29.63 8% $229,194 $306,088 $345,378 1.3 1.5 $76,894 $116,184 CZ08 SCE 132,539 419 28.85 7% $229,194 $227,297 $353,013 1.0 1.5 ($1,897) $123,819 CZ08-2 LADWP 132,539 419 28.85 7% $229,194 $134,739 $353,013 0.6 1.5 ($94,455) $123,819 CZ09 SCE 131,422 406 28.82 6% $229,194 $230,791 $343,665 1.0 1.5 $1,597 $114,471 CZ09-2 LADWP 131,422 406 28.82 6% $229,194 $136,024 $343,665 0.6 1.5 ($93,170) $114,471 CZ10 SDG&E 134,146 342 29.05 5% $229,194 $339,612 $342,574 1.5 1.5 $110,418 $113,380 CZ10-2 SCE 134,146 342 29.05 5% $229,194 $226,244 $342,574 1.0 1.5 ($2,949) $113,380 CZ11 PG&E 128,916 325 27.62 4% $229,194 $352,831 $337,208 1.5 1.5 $123,637 $108,014 CZ12 PG&E 131,226 327 28.04 5% $229,194 $425,029 $338,026 1.9 1.5 $195,835 $108,832 CZ12-2 SMUD 131,226 327 28.04 5% $229,194 $213,176 $338,026 0.9 1.5 ($16,018) $108,832 CZ13 PG&E 127,258 310 27.33 4% $229,194 $351,244 $324,217 1.5 1.4 $122,050 $95,023 CZ14 SDG&E 147,017 370 30.96 4% $229,194 $861,445 $217,675 3.8 0.9 $632,251 ($11,518) CZ14-2 SCE 147,017 370 30.96 4% $229,194 $244,100 $381,164 1.1 1.7 $14,906 $151,970 CZ15 SCE 137,180 278 29.12 3% $229,194 $225,054 $348,320 1.0 1.5 ($4,140) $119,127 CZ16 PG&E 141,478 1197 34.60 6% $228,341 $377,465 $357,241 1.7 1.6 $149,124 $128,899 CZ16-2 LADWP 141,478 1197 34.60 6% $228,341 $136,563 $357,241 0.6 1.6 ($91,778) $128,899
ATTACHMENT 6
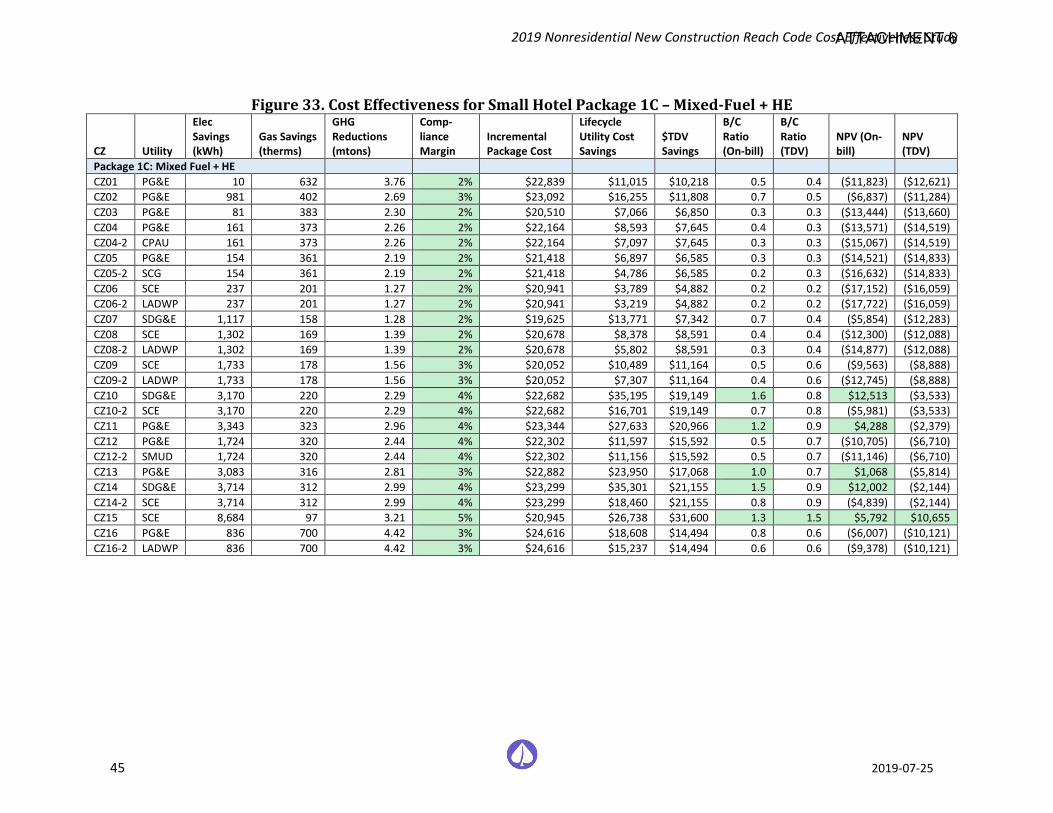
2019 Nonresidential New Construction Reach Code Cost Effectiveness Study
45 2019-07-25
Figure 33. Cost Effectiveness for Small Hotel Package 1C – Mixed-Fuel + HE
CZ Utility
Elec Savings (kWh)
Gas Savings (therms)
GHG Reductions (mtons)
Comp-liance Margin
Incremental Package Cost
Lifecycle Utility Cost Savings
$TDV Savings
B/C Ratio (On-bill)
B/C Ratio (TDV)
NPV (On-bill)
NPV (TDV)
Package 1C: Mixed Fuel + HE CZ01 PG&E 10 632 3.76 2% $22,839 $11,015 $10,218 0.5 0.4 ($11,823) ($12,621) CZ02 PG&E 981 402 2.69 3% $23,092 $16,255 $11,808 0.7 0.5 ($6,837) ($11,284) CZ03 PG&E 81 383 2.30 2% $20,510 $7,066 $6,850 0.3 0.3 ($13,444) ($13,660) CZ04 PG&E 161 373 2.26 2% $22,164 $8,593 $7,645 0.4 0.3 ($13,571) ($14,519) CZ04-2 CPAU 161 373 2.26 2% $22,164 $7,097 $7,645 0.3 0.3 ($15,067) ($14,519) CZ05 PG&E 154 361 2.19 2% $21,418 $6,897 $6,585 0.3 0.3 ($14,521) ($14,833) CZ05-2 SCG 154 361 2.19 2% $21,418 $4,786 $6,585 0.2 0.3 ($16,632) ($14,833) CZ06 SCE 237 201 1.27 2% $20,941 $3,789 $4,882 0.2 0.2 ($17,152) ($16,059) CZ06-2 LADWP 237 201 1.27 2% $20,941 $3,219 $4,882 0.2 0.2 ($17,722) ($16,059) CZ07 SDG&E 1,117 158 1.28 2% $19,625 $13,771 $7,342 0.7 0.4 ($5,854) ($12,283) CZ08 SCE 1,302 169 1.39 2% $20,678 $8,378 $8,591 0.4 0.4 ($12,300) ($12,088) CZ08-2 LADWP 1,302 169 1.39 2% $20,678 $5,802 $8,591 0.3 0.4 ($14,877) ($12,088) CZ09 SCE 1,733 178 1.56 3% $20,052 $10,489 $11,164 0.5 0.6 ($9,563) ($8,888) CZ09-2 LADWP 1,733 178 1.56 3% $20,052 $7,307 $11,164 0.4 0.6 ($12,745) ($8,888) CZ10 SDG&E 3,170 220 2.29 4% $22,682 $35,195 $19,149 1.6 0.8 $12,513 ($3,533) CZ10-2 SCE 3,170 220 2.29 4% $22,682 $16,701 $19,149 0.7 0.8 ($5,981) ($3,533) CZ11 PG&E 3,343 323 2.96 4% $23,344 $27,633 $20,966 1.2 0.9 $4,288 ($2,379) CZ12 PG&E 1,724 320 2.44 4% $22,302 $11,597 $15,592 0.5 0.7 ($10,705) ($6,710) CZ12-2 SMUD 1,724 320 2.44 4% $22,302 $11,156 $15,592 0.5 0.7 ($11,146) ($6,710) CZ13 PG&E 3,083 316 2.81 3% $22,882 $23,950 $17,068 1.0 0.7 $1,068 ($5,814) CZ14 SDG&E 3,714 312 2.99 4% $23,299 $35,301 $21,155 1.5 0.9 $12,002 ($2,144) CZ14-2 SCE 3,714 312 2.99 4% $23,299 $18,460 $21,155 0.8 0.9 ($4,839) ($2,144) CZ15 SCE 8,684 97 3.21 5% $20,945 $26,738 $31,600 1.3 1.5 $5,792 $10,655 CZ16 PG&E 836 700 4.42 3% $24,616 $18,608 $14,494 0.8 0.6 ($6,007) ($10,121) CZ16-2 LADWP 836 700 4.42 3% $24,616 $15,237 $14,494 0.6 0.6 ($9,378) ($10,121)
ATTACHMENT 6
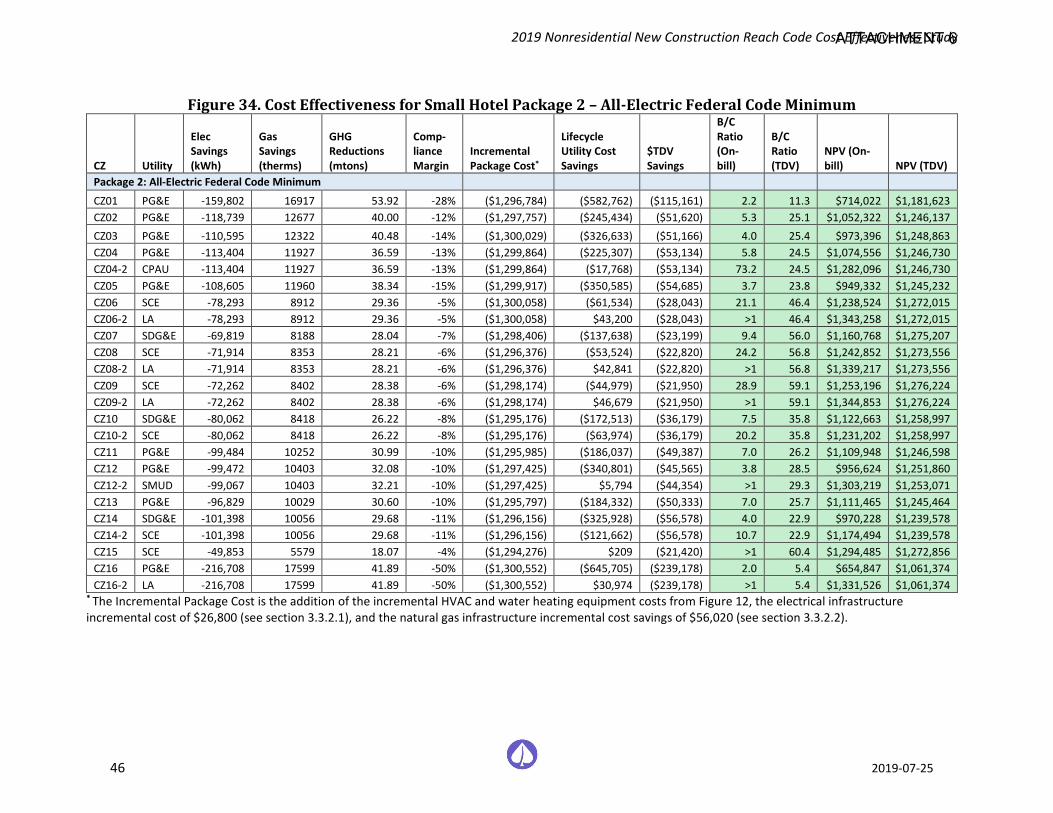
2019 Nonresidential New Construction Reach Code Cost Effectiveness Study
46 2019-07-25
Figure 34. Cost Effectiveness for Small Hotel Package 2 – All-Electric Federal Code Minimum
CZ Utility
Elec Savings (kWh)
Gas Savings (therms)
GHG Reductions (mtons)
Comp- liance Margin
Incremental Package Cost*
Lifecycle Utility Cost Savings
$TDV Savings
B/C Ratio (On-bill)
B/C Ratio (TDV)
NPV (On-bill) NPV (TDV)
Package 2: All-Electric Federal Code Minimum
CZ01 PG&E -159,802 16917 53.92 -28% ($1,296,784) ($582,762) ($115,161) 2.2 11.3 $714,022 $1,181,623 CZ02 PG&E -118,739 12677 40.00 -12% ($1,297,757) ($245,434) ($51,620) 5.3 25.1 $1,052,322 $1,246,137 CZ03 PG&E -110,595 12322 40.48 -14% ($1,300,029) ($326,633) ($51,166) 4.0 25.4 $973,396 $1,248,863 CZ04 PG&E -113,404 11927 36.59 -13% ($1,299,864) ($225,307) ($53,134) 5.8 24.5 $1,074,556 $1,246,730 CZ04-2 CPAU -113,404 11927 36.59 -13% ($1,299,864) ($17,768) ($53,134) 73.2 24.5 $1,282,096 $1,246,730 CZ05 PG&E -108,605 11960 38.34 -15% ($1,299,917) ($350,585) ($54,685) 3.7 23.8 $949,332 $1,245,232 CZ06 SCE -78,293 8912 29.36 -5% ($1,300,058) ($61,534) ($28,043) 21.1 46.4 $1,238,524 $1,272,015 CZ06-2 LA -78,293 8912 29.36 -5% ($1,300,058) $43,200 ($28,043) >1 46.4 $1,343,258 $1,272,015 CZ07 SDG&E -69,819 8188 28.04 -7% ($1,298,406) ($137,638) ($23,199) 9.4 56.0 $1,160,768 $1,275,207 CZ08 SCE -71,914 8353 28.21 -6% ($1,296,376) ($53,524) ($22,820) 24.2 56.8 $1,242,852 $1,273,556 CZ08-2 LA -71,914 8353 28.21 -6% ($1,296,376) $42,841 ($22,820) >1 56.8 $1,339,217 $1,273,556 CZ09 SCE -72,262 8402 28.38 -6% ($1,298,174) ($44,979) ($21,950) 28.9 59.1 $1,253,196 $1,276,224 CZ09-2 LA -72,262 8402 28.38 -6% ($1,298,174) $46,679 ($21,950) >1 59.1 $1,344,853 $1,276,224 CZ10 SDG&E -80,062 8418 26.22 -8% ($1,295,176) ($172,513) ($36,179) 7.5 35.8 $1,122,663 $1,258,997 CZ10-2 SCE -80,062 8418 26.22 -8% ($1,295,176) ($63,974) ($36,179) 20.2 35.8 $1,231,202 $1,258,997 CZ11 PG&E -99,484 10252 30.99 -10% ($1,295,985) ($186,037) ($49,387) 7.0 26.2 $1,109,948 $1,246,598 CZ12 PG&E -99,472 10403 32.08 -10% ($1,297,425) ($340,801) ($45,565) 3.8 28.5 $956,624 $1,251,860 CZ12-2 SMUD -99,067 10403 32.21 -10% ($1,297,425) $5,794 ($44,354) >1 29.3 $1,303,219 $1,253,071 CZ13 PG&E -96,829 10029 30.60 -10% ($1,295,797) ($184,332) ($50,333) 7.0 25.7 $1,111,465 $1,245,464 CZ14 SDG&E -101,398 10056 29.68 -11% ($1,296,156) ($325,928) ($56,578) 4.0 22.9 $970,228 $1,239,578 CZ14-2 SCE -101,398 10056 29.68 -11% ($1,296,156) ($121,662) ($56,578) 10.7 22.9 $1,174,494 $1,239,578 CZ15 SCE -49,853 5579 18.07 -4% ($1,294,276) $209 ($21,420) >1 60.4 $1,294,485 $1,272,856 CZ16 PG&E -216,708 17599 41.89 -50% ($1,300,552) ($645,705) ($239,178) 2.0 5.4 $654,847 $1,061,374 CZ16-2 LA -216,708 17599 41.89 -50% ($1,300,552) $30,974 ($239,178) >1 5.4 $1,331,526 $1,061,374
* The Incremental Package Cost is the addition of the incremental HVAC and water heating equipment costs from Figure 12, the electrical infrastructure incremental cost of $26,800 (see section 3.3.2.1), and the natural gas infrastructure incremental cost savings of $56,020 (see section 3.3.2.2).
ATTACHMENT 6
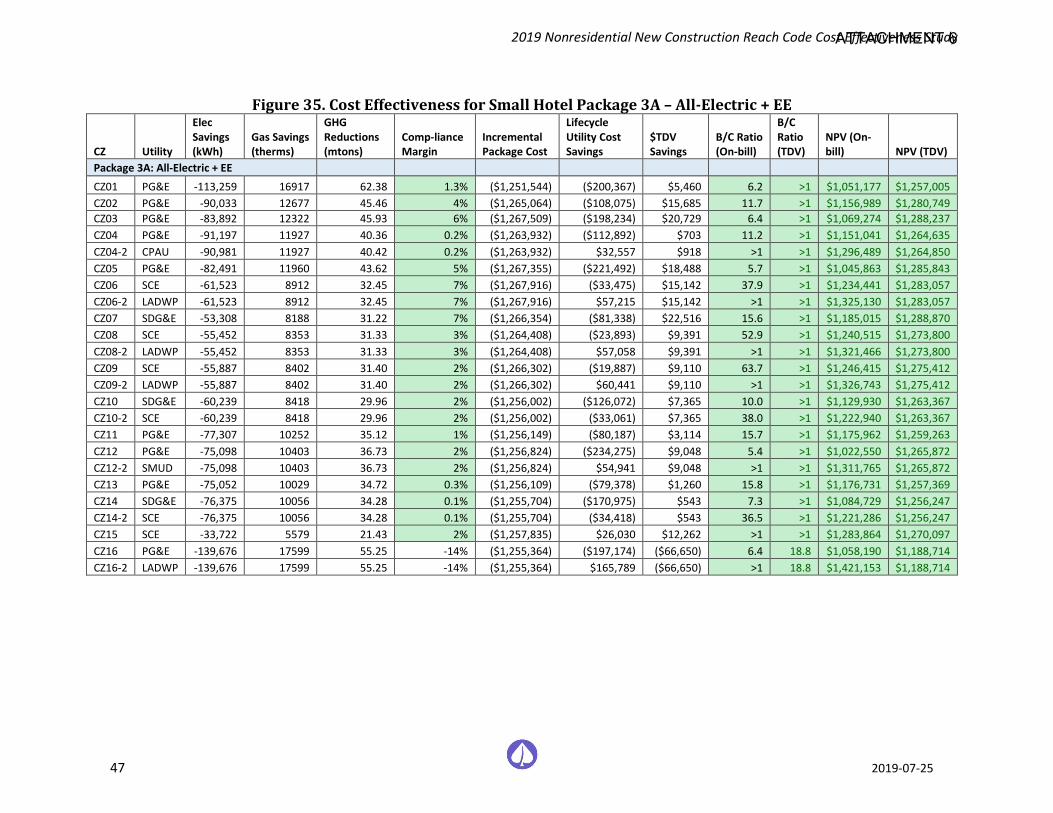
2019 Nonresidential New Construction Reach Code Cost Effectiveness Study
47 2019-07-25
Figure 35. Cost Effectiveness for Small Hotel Package 3A – All-Electric + EE
CZ Utility
Elec Savings (kWh)
Gas Savings (therms)
GHG Reductions (mtons)
Comp-liance Margin
Incremental Package Cost
Lifecycle Utility Cost Savings
$TDV Savings
B/C Ratio (On-bill)
B/C Ratio (TDV)
NPV (On-bill) NPV (TDV)
Package 3A: All-Electric + EE
CZ01 PG&E -113,259 16917 62.38 1.3% ($1,251,544) ($200,367) $5,460 6.2 >1 $1,051,177 $1,257,005 CZ02 PG&E -90,033 12677 45.46 4% ($1,265,064) ($108,075) $15,685 11.7 >1 $1,156,989 $1,280,749 CZ03 PG&E -83,892 12322 45.93 6% ($1,267,509) ($198,234) $20,729 6.4 >1 $1,069,274 $1,288,237 CZ04 PG&E -91,197 11927 40.36 0.2% ($1,263,932) ($112,892) $703 11.2 >1 $1,151,041 $1,264,635 CZ04-2 CPAU -90,981 11927 40.42 0.2% ($1,263,932) $32,557 $918 >1 >1 $1,296,489 $1,264,850 CZ05 PG&E -82,491 11960 43.62 5% ($1,267,355) ($221,492) $18,488 5.7 >1 $1,045,863 $1,285,843 CZ06 SCE -61,523 8912 32.45 7% ($1,267,916) ($33,475) $15,142 37.9 >1 $1,234,441 $1,283,057 CZ06-2 LADWP -61,523 8912 32.45 7% ($1,267,916) $57,215 $15,142 >1 >1 $1,325,130 $1,283,057 CZ07 SDG&E -53,308 8188 31.22 7% ($1,266,354) ($81,338) $22,516 15.6 >1 $1,185,015 $1,288,870 CZ08 SCE -55,452 8353 31.33 3% ($1,264,408) ($23,893) $9,391 52.9 >1 $1,240,515 $1,273,800 CZ08-2 LADWP -55,452 8353 31.33 3% ($1,264,408) $57,058 $9,391 >1 >1 $1,321,466 $1,273,800 CZ09 SCE -55,887 8402 31.40 2% ($1,266,302) ($19,887) $9,110 63.7 >1 $1,246,415 $1,275,412 CZ09-2 LADWP -55,887 8402 31.40 2% ($1,266,302) $60,441 $9,110 >1 >1 $1,326,743 $1,275,412 CZ10 SDG&E -60,239 8418 29.96 2% ($1,256,002) ($126,072) $7,365 10.0 >1 $1,129,930 $1,263,367 CZ10-2 SCE -60,239 8418 29.96 2% ($1,256,002) ($33,061) $7,365 38.0 >1 $1,222,940 $1,263,367 CZ11 PG&E -77,307 10252 35.12 1% ($1,256,149) ($80,187) $3,114 15.7 >1 $1,175,962 $1,259,263 CZ12 PG&E -75,098 10403 36.73 2% ($1,256,824) ($234,275) $9,048 5.4 >1 $1,022,550 $1,265,872 CZ12-2 SMUD -75,098 10403 36.73 2% ($1,256,824) $54,941 $9,048 >1 >1 $1,311,765 $1,265,872 CZ13 PG&E -75,052 10029 34.72 0.3% ($1,256,109) ($79,378) $1,260 15.8 >1 $1,176,731 $1,257,369 CZ14 SDG&E -76,375 10056 34.28 0.1% ($1,255,704) ($170,975) $543 7.3 >1 $1,084,729 $1,256,247 CZ14-2 SCE -76,375 10056 34.28 0.1% ($1,255,704) ($34,418) $543 36.5 >1 $1,221,286 $1,256,247 CZ15 SCE -33,722 5579 21.43 2% ($1,257,835) $26,030 $12,262 >1 >1 $1,283,864 $1,270,097 CZ16 PG&E -139,676 17599 55.25 -14% ($1,255,364) ($197,174) ($66,650) 6.4 18.8 $1,058,190 $1,188,714 CZ16-2 LADWP -139,676 17599 55.25 -14% ($1,255,364) $165,789 ($66,650) >1 18.8 $1,421,153 $1,188,714
ATTACHMENT 6
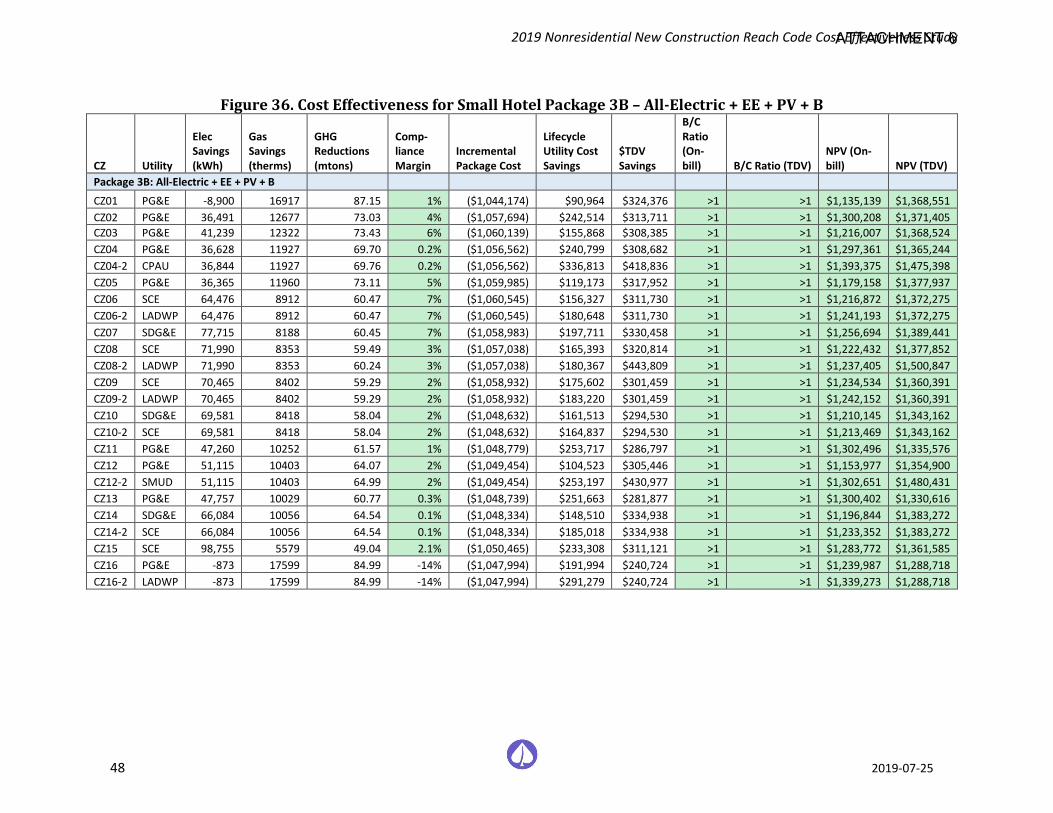
2019 Nonresidential New Construction Reach Code Cost Effectiveness Study
48 2019-07-25
Figure 36. Cost Effectiveness for Small Hotel Package 3B – All-Electric + EE + PV + B
CZ Utility
Elec Savings (kWh)
Gas Savings (therms)
GHG Reductions (mtons)
Comp-liance Margin
Incremental Package Cost
Lifecycle Utility Cost Savings
$TDV Savings
B/C Ratio (On-bill) B/C Ratio (TDV)
NPV (On-bill) NPV (TDV)
Package 3B: All-Electric + EE + PV + B
CZ01 PG&E -8,900 16917 87.15 1% ($1,044,174) $90,964 $324,376 >1 >1 $1,135,139 $1,368,551 CZ02 PG&E 36,491 12677 73.03 4% ($1,057,694) $242,514 $313,711 >1 >1 $1,300,208 $1,371,405 CZ03 PG&E 41,239 12322 73.43 6% ($1,060,139) $155,868 $308,385 >1 >1 $1,216,007 $1,368,524 CZ04 PG&E 36,628 11927 69.70 0.2% ($1,056,562) $240,799 $308,682 >1 >1 $1,297,361 $1,365,244 CZ04-2 CPAU 36,844 11927 69.76 0.2% ($1,056,562) $336,813 $418,836 >1 >1 $1,393,375 $1,475,398 CZ05 PG&E 36,365 11960 73.11 5% ($1,059,985) $119,173 $317,952 >1 >1 $1,179,158 $1,377,937 CZ06 SCE 64,476 8912 60.47 7% ($1,060,545) $156,327 $311,730 >1 >1 $1,216,872 $1,372,275 CZ06-2 LADWP 64,476 8912 60.47 7% ($1,060,545) $180,648 $311,730 >1 >1 $1,241,193 $1,372,275 CZ07 SDG&E 77,715 8188 60.45 7% ($1,058,983) $197,711 $330,458 >1 >1 $1,256,694 $1,389,441 CZ08 SCE 71,990 8353 59.49 3% ($1,057,038) $165,393 $320,814 >1 >1 $1,222,432 $1,377,852 CZ08-2 LADWP 71,990 8353 60.24 3% ($1,057,038) $180,367 $443,809 >1 >1 $1,237,405 $1,500,847 CZ09 SCE 70,465 8402 59.29 2% ($1,058,932) $175,602 $301,459 >1 >1 $1,234,534 $1,360,391 CZ09-2 LADWP 70,465 8402 59.29 2% ($1,058,932) $183,220 $301,459 >1 >1 $1,242,152 $1,360,391 CZ10 SDG&E 69,581 8418 58.04 2% ($1,048,632) $161,513 $294,530 >1 >1 $1,210,145 $1,343,162 CZ10-2 SCE 69,581 8418 58.04 2% ($1,048,632) $164,837 $294,530 >1 >1 $1,213,469 $1,343,162 CZ11 PG&E 47,260 10252 61.57 1% ($1,048,779) $253,717 $286,797 >1 >1 $1,302,496 $1,335,576 CZ12 PG&E 51,115 10403 64.07 2% ($1,049,454) $104,523 $305,446 >1 >1 $1,153,977 $1,354,900 CZ12-2 SMUD 51,115 10403 64.99 2% ($1,049,454) $253,197 $430,977 >1 >1 $1,302,651 $1,480,431 CZ13 PG&E 47,757 10029 60.77 0.3% ($1,048,739) $251,663 $281,877 >1 >1 $1,300,402 $1,330,616 CZ14 SDG&E 66,084 10056 64.54 0.1% ($1,048,334) $148,510 $334,938 >1 >1 $1,196,844 $1,383,272 CZ14-2 SCE 66,084 10056 64.54 0.1% ($1,048,334) $185,018 $334,938 >1 >1 $1,233,352 $1,383,272 CZ15 SCE 98,755 5579 49.04 2.1% ($1,050,465) $233,308 $311,121 >1 >1 $1,283,772 $1,361,585 CZ16 PG&E -873 17599 84.99 -14% ($1,047,994) $191,994 $240,724 >1 >1 $1,239,987 $1,288,718 CZ16-2 LADWP -873 17599 84.99 -14% ($1,047,994) $291,279 $240,724 >1 >1 $1,339,273 $1,288,718
ATTACHMENT 6
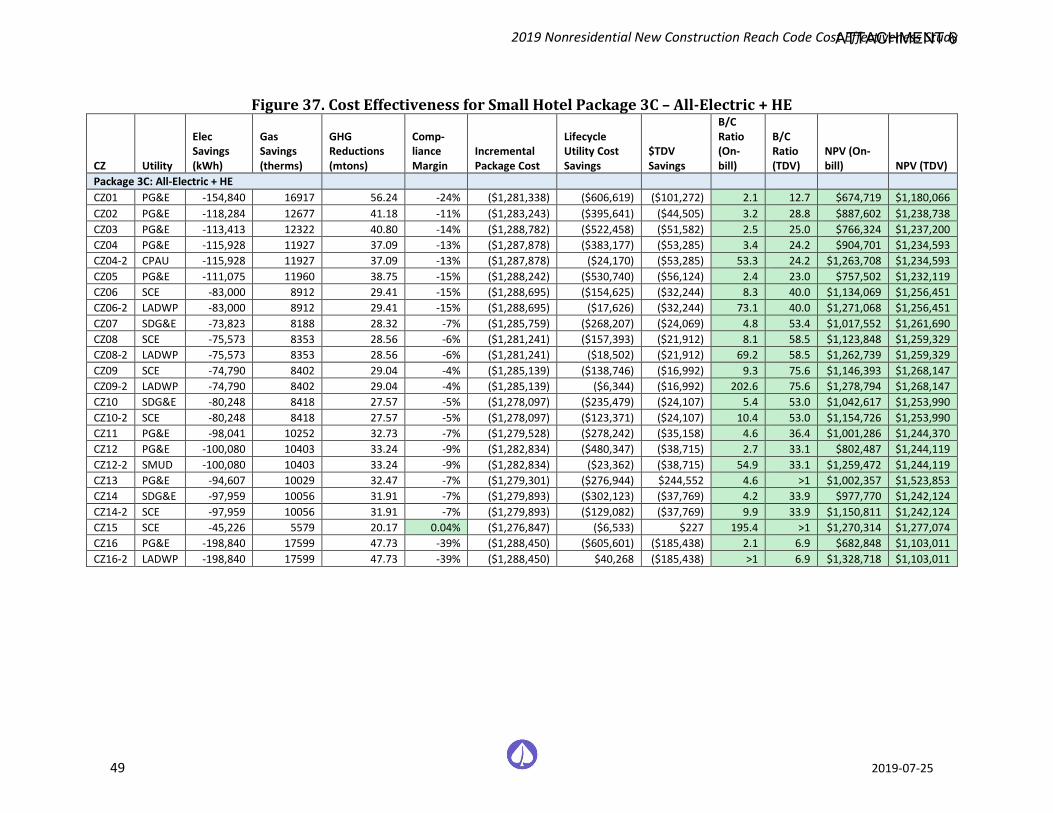
2019 Nonresidential New Construction Reach Code Cost Effectiveness Study
49 2019-07-25
Figure 37. Cost Effectiveness for Small Hotel Package 3C – All-Electric + HE
CZ Utility
Elec Savings (kWh)
Gas Savings (therms)
GHG Reductions (mtons)
Comp-liance Margin
Incremental Package Cost
Lifecycle Utility Cost Savings
$TDV Savings
B/C Ratio (On-bill)
B/C Ratio (TDV)
NPV (On-bill) NPV (TDV)
Package 3C: All-Electric + HE CZ01 PG&E -154,840 16917 56.24 -24% ($1,281,338) ($606,619) ($101,272) 2.1 12.7 $674,719 $1,180,066 CZ02 PG&E -118,284 12677 41.18 -11% ($1,283,243) ($395,641) ($44,505) 3.2 28.8 $887,602 $1,238,738 CZ03 PG&E -113,413 12322 40.80 -14% ($1,288,782) ($522,458) ($51,582) 2.5 25.0 $766,324 $1,237,200 CZ04 PG&E -115,928 11927 37.09 -13% ($1,287,878) ($383,177) ($53,285) 3.4 24.2 $904,701 $1,234,593 CZ04-2 CPAU -115,928 11927 37.09 -13% ($1,287,878) ($24,170) ($53,285) 53.3 24.2 $1,263,708 $1,234,593 CZ05 PG&E -111,075 11960 38.75 -15% ($1,288,242) ($530,740) ($56,124) 2.4 23.0 $757,502 $1,232,119 CZ06 SCE -83,000 8912 29.41 -15% ($1,288,695) ($154,625) ($32,244) 8.3 40.0 $1,134,069 $1,256,451 CZ06-2 LADWP -83,000 8912 29.41 -15% ($1,288,695) ($17,626) ($32,244) 73.1 40.0 $1,271,068 $1,256,451 CZ07 SDG&E -73,823 8188 28.32 -7% ($1,285,759) ($268,207) ($24,069) 4.8 53.4 $1,017,552 $1,261,690 CZ08 SCE -75,573 8353 28.56 -6% ($1,281,241) ($157,393) ($21,912) 8.1 58.5 $1,123,848 $1,259,329 CZ08-2 LADWP -75,573 8353 28.56 -6% ($1,281,241) ($18,502) ($21,912) 69.2 58.5 $1,262,739 $1,259,329 CZ09 SCE -74,790 8402 29.04 -4% ($1,285,139) ($138,746) ($16,992) 9.3 75.6 $1,146,393 $1,268,147 CZ09-2 LADWP -74,790 8402 29.04 -4% ($1,285,139) ($6,344) ($16,992) 202.6 75.6 $1,278,794 $1,268,147 CZ10 SDG&E -80,248 8418 27.57 -5% ($1,278,097) ($235,479) ($24,107) 5.4 53.0 $1,042,617 $1,253,990 CZ10-2 SCE -80,248 8418 27.57 -5% ($1,278,097) ($123,371) ($24,107) 10.4 53.0 $1,154,726 $1,253,990 CZ11 PG&E -98,041 10252 32.73 -7% ($1,279,528) ($278,242) ($35,158) 4.6 36.4 $1,001,286 $1,244,370 CZ12 PG&E -100,080 10403 33.24 -9% ($1,282,834) ($480,347) ($38,715) 2.7 33.1 $802,487 $1,244,119 CZ12-2 SMUD -100,080 10403 33.24 -9% ($1,282,834) ($23,362) ($38,715) 54.9 33.1 $1,259,472 $1,244,119 CZ13 PG&E -94,607 10029 32.47 -7% ($1,279,301) ($276,944) $244,552 4.6 >1 $1,002,357 $1,523,853 CZ14 SDG&E -97,959 10056 31.91 -7% ($1,279,893) ($302,123) ($37,769) 4.2 33.9 $977,770 $1,242,124 CZ14-2 SCE -97,959 10056 31.91 -7% ($1,279,893) ($129,082) ($37,769) 9.9 33.9 $1,150,811 $1,242,124 CZ15 SCE -45,226 5579 20.17 0.04% ($1,276,847) ($6,533) $227 195.4 >1 $1,270,314 $1,277,074 CZ16 PG&E -198,840 17599 47.73 -39% ($1,288,450) ($605,601) ($185,438) 2.1 6.9 $682,848 $1,103,011 CZ16-2 LADWP -198,840 17599 47.73 -39% ($1,288,450) $40,268 ($185,438) >1 6.9 $1,328,718 $1,103,011
ATTACHMENT 6
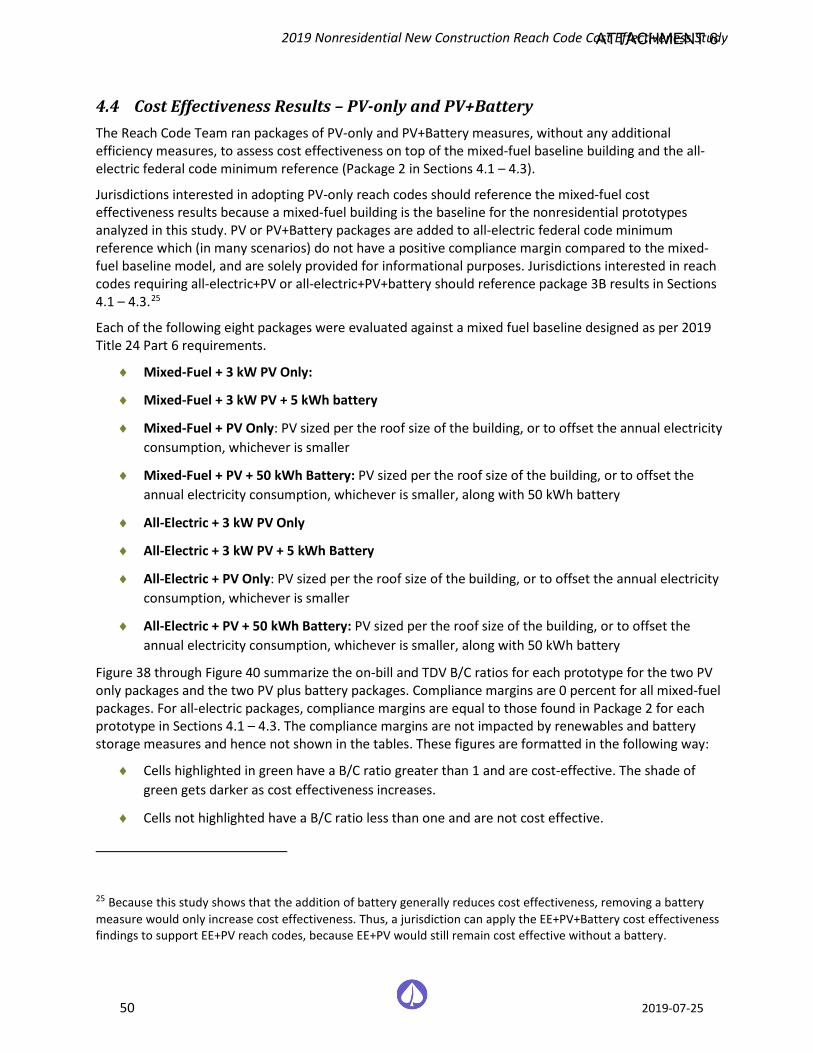
2019 Nonresidential New Construction Reach Code Cost Effectiveness Study
50 2019-07-25
4.4 Cost Effectiveness Results – PV-only and PV+Battery The Reach Code Team ran packages of PV-only and PV+Battery measures, without any additional efficiency measures, to assess cost effectiveness on top of the mixed-fuel baseline building and the all-electric federal code minimum reference (Package 2 in Sections 4.1 – 4.3).
Jurisdictions interested in adopting PV-only reach codes should reference the mixed-fuel cost effectiveness results because a mixed-fuel building is the baseline for the nonresidential prototypes analyzed in this study. PV or PV+Battery packages are added to all-electric federal code minimum reference which (in many scenarios) do not have a positive compliance margin compared to the mixed-fuel baseline model, and are solely provided for informational purposes. Jurisdictions interested in reach codes requiring all-electric+PV or all-electric+PV+battery should reference package 3B results in Sections 4.1 – 4.3.25
Each of the following eight packages were evaluated against a mixed fuel baseline designed as per 2019 Title 24 Part 6 requirements.
♦ Mixed-Fuel + 3 kW PV Only:
♦ Mixed-Fuel + 3 kW PV + 5 kWh battery
♦ Mixed-Fuel + PV Only: PV sized per the roof size of the building, or to offset the annual electricity consumption, whichever is smaller
♦ Mixed-Fuel + PV + 50 kWh Battery: PV sized per the roof size of the building, or to offset the annual electricity consumption, whichever is smaller, along with 50 kWh battery
♦ All-Electric + 3 kW PV Only
♦ All-Electric + 3 kW PV + 5 kWh Battery
♦ All-Electric + PV Only: PV sized per the roof size of the building, or to offset the annual electricity consumption, whichever is smaller
♦ All-Electric + PV + 50 kWh Battery: PV sized per the roof size of the building, or to offset the annual electricity consumption, whichever is smaller, along with 50 kWh battery
Figure 38 through Figure 40 summarize the on-bill and TDV B/C ratios for each prototype for the two PV only packages and the two PV plus battery packages. Compliance margins are 0 percent for all mixed-fuel packages. For all-electric packages, compliance margins are equal to those found in Package 2 for each prototype in Sections 4.1 – 4.3. The compliance margins are not impacted by renewables and battery storage measures and hence not shown in the tables. These figures are formatted in the following way:
♦ Cells highlighted in green have a B/C ratio greater than 1 and are cost-effective. The shade of green gets darker as cost effectiveness increases.
♦ Cells not highlighted have a B/C ratio less than one and are not cost effective.
25 Because this study shows that the addition of battery generally reduces cost effectiveness, removing a battery measure would only increase cost effectiveness. Thus, a jurisdiction can apply the EE+PV+Battery cost effectiveness findings to support EE+PV reach codes, because EE+PV would still remain cost effective without a battery.
ATTACHMENT 6

2019 Nonresidential New Construction Reach Code Cost Effectiveness Study
51 2019-07-25
Please see Appendix 6.7 for results in full detail. Generally, for mixed-fuel packages across all prototypes, all climate zones were proven to have cost effective outcomes using TDV except in CZ1 with a 3 kW PV + 5 kWh Battery scenario. Most climate zones also had On-Bill cost effectiveness. The addition of a battery slightly reduces cost effectiveness.
In all-electric packages, the results for most climate zones were found cost effective using both TDV and On-Bill approaches with larger PV systems or PV+Battery systems. Most 3 kW PV systems were also found to be cost effective except in some scenarios analyzing the Medium Office using the On-Bill method. CZ16 results continue to show challenges being cost effective with all electric buildings, likely due to the high heating loads in this climate. The addition of a battery slightly reduces the cost effectiveness for all-electric buildings with PV.
ATTACHMENT 6
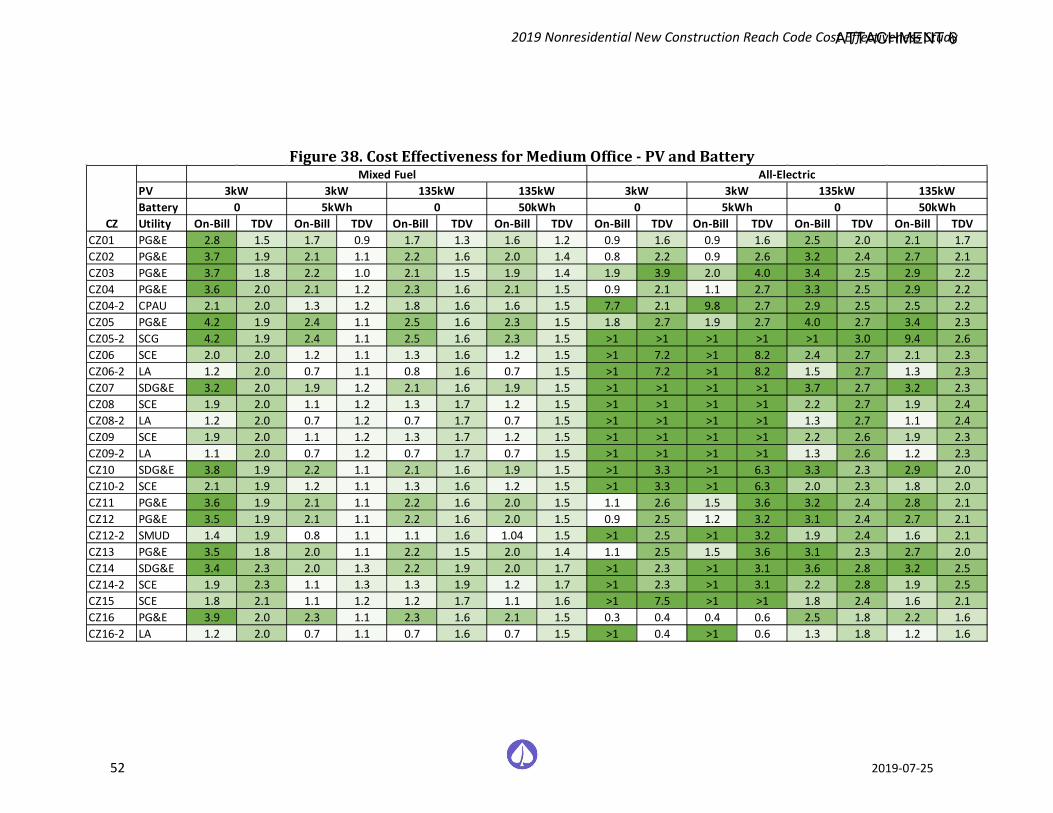
2019 Nonresidential New Construction Reach Code Cost Effectiveness Study
52 2019-07-25
Figure 38. Cost Effectiveness for Medium Office - PV and Battery
PVBatteryUtility On-Bill TDV On-Bill TDV On-Bill TDV On-Bill TDV On-Bill TDV On-Bill TDV On-Bill TDV On-Bill TDV
CZ01 PG&E 2.8 1.5 1.7 0.9 1.7 1.3 1.6 1.2 0.9 1.6 0.9 1.6 2.5 2.0 2.1 1.7CZ02 PG&E 3.7 1.9 2.1 1.1 2.2 1.6 2.0 1.4 0.8 2.2 0.9 2.6 3.2 2.4 2.7 2.1CZ03 PG&E 3.7 1.8 2.2 1.0 2.1 1.5 1.9 1.4 1.9 3.9 2.0 4.0 3.4 2.5 2.9 2.2CZ04 PG&E 3.6 2.0 2.1 1.2 2.3 1.6 2.1 1.5 0.9 2.1 1.1 2.7 3.3 2.5 2.9 2.2CZ04-2 CPAU 2.1 2.0 1.3 1.2 1.8 1.6 1.6 1.5 7.7 2.1 9.8 2.7 2.9 2.5 2.5 2.2CZ05 PG&E 4.2 1.9 2.4 1.1 2.5 1.6 2.3 1.5 1.8 2.7 1.9 2.7 4.0 2.7 3.4 2.3CZ05-2 SCG 4.2 1.9 2.4 1.1 2.5 1.6 2.3 1.5 >1 >1 >1 >1 >1 3.0 9.4 2.6CZ06 SCE 2.0 2.0 1.2 1.1 1.3 1.6 1.2 1.5 >1 7.2 >1 8.2 2.4 2.7 2.1 2.3CZ06-2 LA 1.2 2.0 0.7 1.1 0.8 1.6 0.7 1.5 >1 7.2 >1 8.2 1.5 2.7 1.3 2.3CZ07 SDG&E 3.2 2.0 1.9 1.2 2.1 1.6 1.9 1.5 >1 >1 >1 >1 3.7 2.7 3.2 2.3CZ08 SCE 1.9 2.0 1.1 1.2 1.3 1.7 1.2 1.5 >1 >1 >1 >1 2.2 2.7 1.9 2.4CZ08-2 LA 1.2 2.0 0.7 1.2 0.7 1.7 0.7 1.5 >1 >1 >1 >1 1.3 2.7 1.1 2.4CZ09 SCE 1.9 2.0 1.1 1.2 1.3 1.7 1.2 1.5 >1 >1 >1 >1 2.2 2.6 1.9 2.3CZ09-2 LA 1.1 2.0 0.7 1.2 0.7 1.7 0.7 1.5 >1 >1 >1 >1 1.3 2.6 1.2 2.3CZ10 SDG&E 3.8 1.9 2.2 1.1 2.1 1.6 1.9 1.5 >1 3.3 >1 6.3 3.3 2.3 2.9 2.0CZ10-2 SCE 2.1 1.9 1.2 1.1 1.3 1.6 1.2 1.5 >1 3.3 >1 6.3 2.0 2.3 1.8 2.0CZ11 PG&E 3.6 1.9 2.1 1.1 2.2 1.6 2.0 1.5 1.1 2.6 1.5 3.6 3.2 2.4 2.8 2.1CZ12 PG&E 3.5 1.9 2.1 1.1 2.2 1.6 2.0 1.5 0.9 2.5 1.2 3.2 3.1 2.4 2.7 2.1CZ12-2 SMUD 1.4 1.9 0.8 1.1 1.1 1.6 1.04 1.5 >1 2.5 >1 3.2 1.9 2.4 1.6 2.1CZ13 PG&E 3.5 1.8 2.0 1.1 2.2 1.5 2.0 1.4 1.1 2.5 1.5 3.6 3.1 2.3 2.7 2.0CZ14 SDG&E 3.4 2.3 2.0 1.3 2.2 1.9 2.0 1.7 >1 2.3 >1 3.1 3.6 2.8 3.2 2.5CZ14-2 SCE 1.9 2.3 1.1 1.3 1.3 1.9 1.2 1.7 >1 2.3 >1 3.1 2.2 2.8 1.9 2.5CZ15 SCE 1.8 2.1 1.1 1.2 1.2 1.7 1.1 1.6 >1 7.5 >1 >1 1.8 2.4 1.6 2.1CZ16 PG&E 3.9 2.0 2.3 1.1 2.3 1.6 2.1 1.5 0.3 0.4 0.4 0.6 2.5 1.8 2.2 1.6CZ16-2 LA 1.2 2.0 0.7 1.1 0.7 1.6 0.7 1.5 >1 0.4 >1 0.6 1.3 1.8 1.2 1.6
CZ
135kW0 05kWh 50kWh
3kW0
135kW0
3kW5kWh
135kW50kWh
Mixed Fuel All-Electric3kW 135kW3kW
ATTACHMENT 6
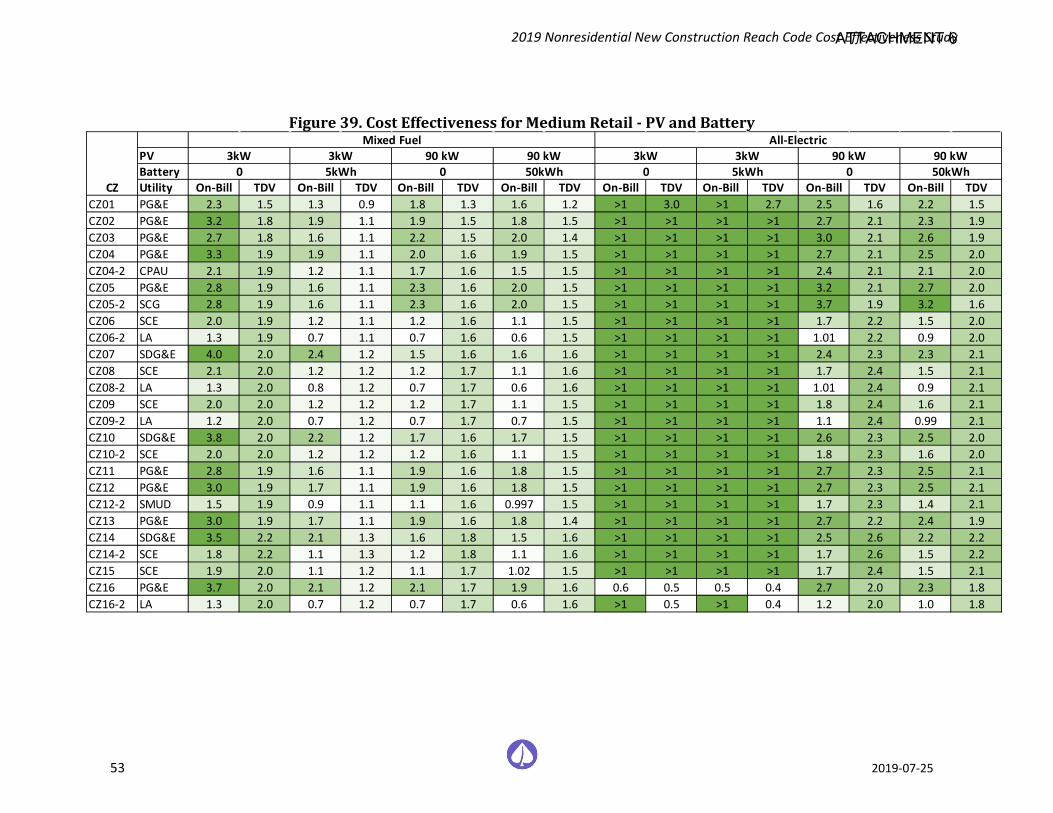
2019 Nonresidential New Construction Reach Code Cost Effectiveness Study
53 2019-07-25
Figure 39. Cost Effectiveness for Medium Retail - PV and Battery
PVBatteryUtility On-Bill TDV On-Bill TDV On-Bill TDV On-Bill TDV On-Bill TDV On-Bill TDV On-Bill TDV On-Bill TDV
CZ01 PG&E 2.3 1.5 1.3 0.9 1.8 1.3 1.6 1.2 >1 3.0 >1 2.7 2.5 1.6 2.2 1.5CZ02 PG&E 3.2 1.8 1.9 1.1 1.9 1.5 1.8 1.5 >1 >1 >1 >1 2.7 2.1 2.3 1.9CZ03 PG&E 2.7 1.8 1.6 1.1 2.2 1.5 2.0 1.4 >1 >1 >1 >1 3.0 2.1 2.6 1.9CZ04 PG&E 3.3 1.9 1.9 1.1 2.0 1.6 1.9 1.5 >1 >1 >1 >1 2.7 2.1 2.5 2.0CZ04-2 CPAU 2.1 1.9 1.2 1.1 1.7 1.6 1.5 1.5 >1 >1 >1 >1 2.4 2.1 2.1 2.0CZ05 PG&E 2.8 1.9 1.6 1.1 2.3 1.6 2.0 1.5 >1 >1 >1 >1 3.2 2.1 2.7 2.0CZ05-2 SCG 2.8 1.9 1.6 1.1 2.3 1.6 2.0 1.5 >1 >1 >1 >1 3.7 1.9 3.2 1.6CZ06 SCE 2.0 1.9 1.2 1.1 1.2 1.6 1.1 1.5 >1 >1 >1 >1 1.7 2.2 1.5 2.0CZ06-2 LA 1.3 1.9 0.7 1.1 0.7 1.6 0.6 1.5 >1 >1 >1 >1 1.01 2.2 0.9 2.0CZ07 SDG&E 4.0 2.0 2.4 1.2 1.5 1.6 1.6 1.6 >1 >1 >1 >1 2.4 2.3 2.3 2.1CZ08 SCE 2.1 2.0 1.2 1.2 1.2 1.7 1.1 1.6 >1 >1 >1 >1 1.7 2.4 1.5 2.1CZ08-2 LA 1.3 2.0 0.8 1.2 0.7 1.7 0.6 1.6 >1 >1 >1 >1 1.01 2.4 0.9 2.1CZ09 SCE 2.0 2.0 1.2 1.2 1.2 1.7 1.1 1.5 >1 >1 >1 >1 1.8 2.4 1.6 2.1CZ09-2 LA 1.2 2.0 0.7 1.2 0.7 1.7 0.7 1.5 >1 >1 >1 >1 1.1 2.4 0.99 2.1CZ10 SDG&E 3.8 2.0 2.2 1.2 1.7 1.6 1.7 1.5 >1 >1 >1 >1 2.6 2.3 2.5 2.0CZ10-2 SCE 2.0 2.0 1.2 1.2 1.2 1.6 1.1 1.5 >1 >1 >1 >1 1.8 2.3 1.6 2.0CZ11 PG&E 2.8 1.9 1.6 1.1 1.9 1.6 1.8 1.5 >1 >1 >1 >1 2.7 2.3 2.5 2.1CZ12 PG&E 3.0 1.9 1.7 1.1 1.9 1.6 1.8 1.5 >1 >1 >1 >1 2.7 2.3 2.5 2.1CZ12-2 SMUD 1.5 1.9 0.9 1.1 1.1 1.6 0.997 1.5 >1 >1 >1 >1 1.7 2.3 1.4 2.1CZ13 PG&E 3.0 1.9 1.7 1.1 1.9 1.6 1.8 1.4 >1 >1 >1 >1 2.7 2.2 2.4 1.9CZ14 SDG&E 3.5 2.2 2.1 1.3 1.6 1.8 1.5 1.6 >1 >1 >1 >1 2.5 2.6 2.2 2.2CZ14-2 SCE 1.8 2.2 1.1 1.3 1.2 1.8 1.1 1.6 >1 >1 >1 >1 1.7 2.6 1.5 2.2CZ15 SCE 1.9 2.0 1.1 1.2 1.1 1.7 1.02 1.5 >1 >1 >1 >1 1.7 2.4 1.5 2.1CZ16 PG&E 3.7 2.0 2.1 1.2 2.1 1.7 1.9 1.6 0.6 0.5 0.5 0.4 2.7 2.0 2.3 1.8CZ16-2 LA 1.3 2.0 0.7 1.2 0.7 1.7 0.6 1.6 >1 0.5 >1 0.4 1.2 2.0 1.0 1.8
3kW 90 kW3kW0 05kWh 50kWh
CZ
Mixed Fuel
0 05kWh 50kWh3kW 90 kW3kW 90 kW
All-Electric90 kW
ATTACHMENT 6
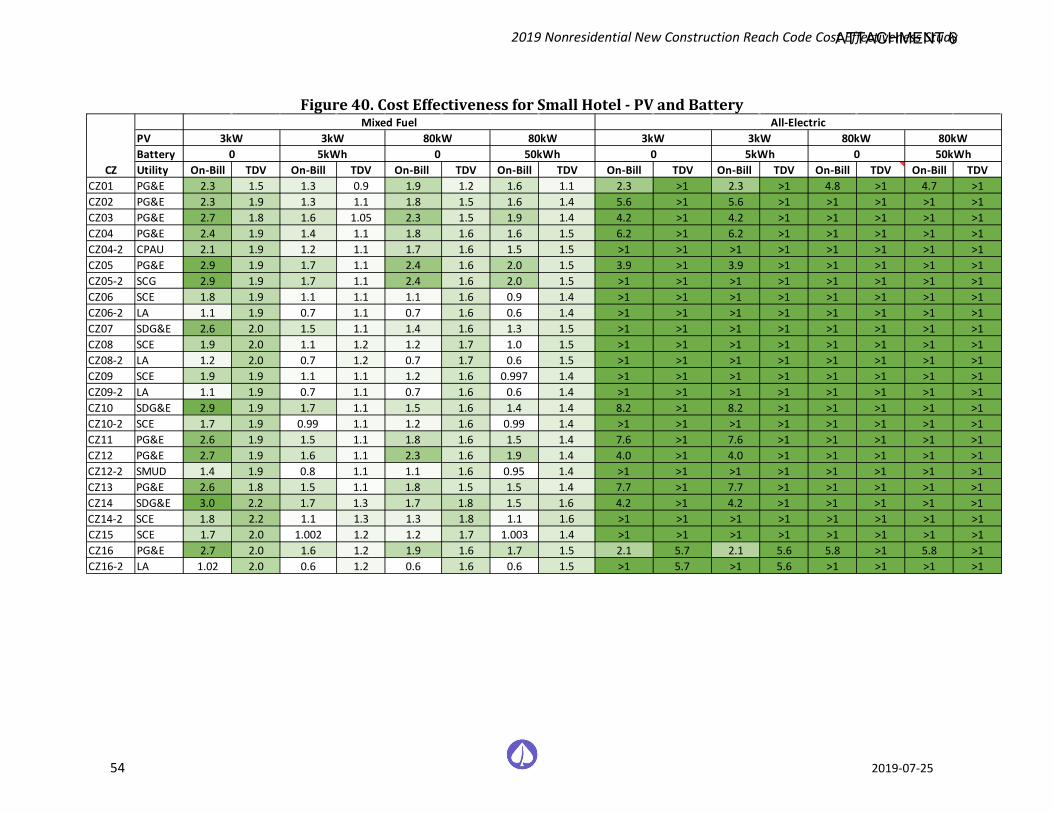
2019 Nonresidential New Construction Reach Code Cost Effectiveness Study
54 2019-07-25
Figure 40. Cost Effectiveness for Small Hotel - PV and Battery
PVBatteryUtility On-Bill TDV On-Bill TDV On-Bill TDV On-Bill TDV On-Bill TDV On-Bill TDV On-Bill TDV On-Bill TDV
CZ01 PG&E 2.3 1.5 1.3 0.9 1.9 1.2 1.6 1.1 2.3 >1 2.3 >1 4.8 >1 4.7 >1CZ02 PG&E 2.3 1.9 1.3 1.1 1.8 1.5 1.6 1.4 5.6 >1 5.6 >1 >1 >1 >1 >1CZ03 PG&E 2.7 1.8 1.6 1.05 2.3 1.5 1.9 1.4 4.2 >1 4.2 >1 >1 >1 >1 >1CZ04 PG&E 2.4 1.9 1.4 1.1 1.8 1.6 1.6 1.5 6.2 >1 6.2 >1 >1 >1 >1 >1CZ04-2 CPAU 2.1 1.9 1.2 1.1 1.7 1.6 1.5 1.5 >1 >1 >1 >1 >1 >1 >1 >1CZ05 PG&E 2.9 1.9 1.7 1.1 2.4 1.6 2.0 1.5 3.9 >1 3.9 >1 >1 >1 >1 >1CZ05-2 SCG 2.9 1.9 1.7 1.1 2.4 1.6 2.0 1.5 >1 >1 >1 >1 >1 >1 >1 >1CZ06 SCE 1.8 1.9 1.1 1.1 1.1 1.6 0.9 1.4 >1 >1 >1 >1 >1 >1 >1 >1CZ06-2 LA 1.1 1.9 0.7 1.1 0.7 1.6 0.6 1.4 >1 >1 >1 >1 >1 >1 >1 >1CZ07 SDG&E 2.6 2.0 1.5 1.1 1.4 1.6 1.3 1.5 >1 >1 >1 >1 >1 >1 >1 >1CZ08 SCE 1.9 2.0 1.1 1.2 1.2 1.7 1.0 1.5 >1 >1 >1 >1 >1 >1 >1 >1CZ08-2 LA 1.2 2.0 0.7 1.2 0.7 1.7 0.6 1.5 >1 >1 >1 >1 >1 >1 >1 >1CZ09 SCE 1.9 1.9 1.1 1.1 1.2 1.6 0.997 1.4 >1 >1 >1 >1 >1 >1 >1 >1CZ09-2 LA 1.1 1.9 0.7 1.1 0.7 1.6 0.6 1.4 >1 >1 >1 >1 >1 >1 >1 >1CZ10 SDG&E 2.9 1.9 1.7 1.1 1.5 1.6 1.4 1.4 8.2 >1 8.2 >1 >1 >1 >1 >1CZ10-2 SCE 1.7 1.9 0.99 1.1 1.2 1.6 0.99 1.4 >1 >1 >1 >1 >1 >1 >1 >1CZ11 PG&E 2.6 1.9 1.5 1.1 1.8 1.6 1.5 1.4 7.6 >1 7.6 >1 >1 >1 >1 >1CZ12 PG&E 2.7 1.9 1.6 1.1 2.3 1.6 1.9 1.4 4.0 >1 4.0 >1 >1 >1 >1 >1CZ12-2 SMUD 1.4 1.9 0.8 1.1 1.1 1.6 0.95 1.4 >1 >1 >1 >1 >1 >1 >1 >1CZ13 PG&E 2.6 1.8 1.5 1.1 1.8 1.5 1.5 1.4 7.7 >1 7.7 >1 >1 >1 >1 >1CZ14 SDG&E 3.0 2.2 1.7 1.3 1.7 1.8 1.5 1.6 4.2 >1 4.2 >1 >1 >1 >1 >1CZ14-2 SCE 1.8 2.2 1.1 1.3 1.3 1.8 1.1 1.6 >1 >1 >1 >1 >1 >1 >1 >1CZ15 SCE 1.7 2.0 1.002 1.2 1.2 1.7 1.003 1.4 >1 >1 >1 >1 >1 >1 >1 >1CZ16 PG&E 2.7 2.0 1.6 1.2 1.9 1.6 1.7 1.5 2.1 5.7 2.1 5.6 5.8 >1 5.8 >1CZ16-2 LA 1.02 2.0 0.6 1.2 0.6 1.6 0.6 1.5 >1 5.7 >1 5.6 >1 >1 >1 >1
5kWh 50kWh 0CZ
Mixed Fuel All-Electric3kW 80kW3kW 80kW 3kW 80kW3kW 80kW
05kWh 50kWh0 0
ATTACHMENT 6

2019 Nonresidential New Construction Reach Code Cost Effectiveness Study
55 2019-07-25
5 Summary, Conclusions, and Further Considerations The Reach Codes Team developed packages of energy efficiency measures as well as packages combining energy efficiency with PV generation and battery storage systems, simulated them in building modeling software, and gathered costs to determine the cost effectiveness of multiple scenarios. The Reach Codes team coordinated assumptions with multiple utilities, cities, and building community experts to develop a set of assumptions considered reasonable in the current market. Changing assumptions, such as the period of analysis, measure selection, cost assumptions, energy escalation rates, or utility tariffs are likely to change results.
5.1 Summary Figure 41 through Figure 43 summarize results for each prototype and depict the compliance margins achieved for each climate zone and package. Because local reach codes must both exceed the Energy Commission performance budget (i.e., have a positive compliance margin) and be cost-effective, the Reach Code Team highlighted cells meeting these two requirements to help clarify the upper boundary for potential reach code policies:
♦ Cells highlighted in green depict a positive compliance margin and cost-effective results using both On-Bill and TDV approaches.
♦ Cells highlighted in yellow depict a positive compliance and cost-effective results using either the On-Bill or TDV approach.
♦ Cells not highlighted either depict a negative compliance margin or a package that was not cost effective using either the On-Bill or TDV approach.
For more detail on the results in the Figures, please refer to Section 4 Results. As described in Section 4.4, PV-only and PV+Battery packages in the mixed-fuel building were found to be cost effective across all prototypes, climate zones, and packages using the TDV approach, and results are not reiterated in the following figures.
ATTACHMENT 6
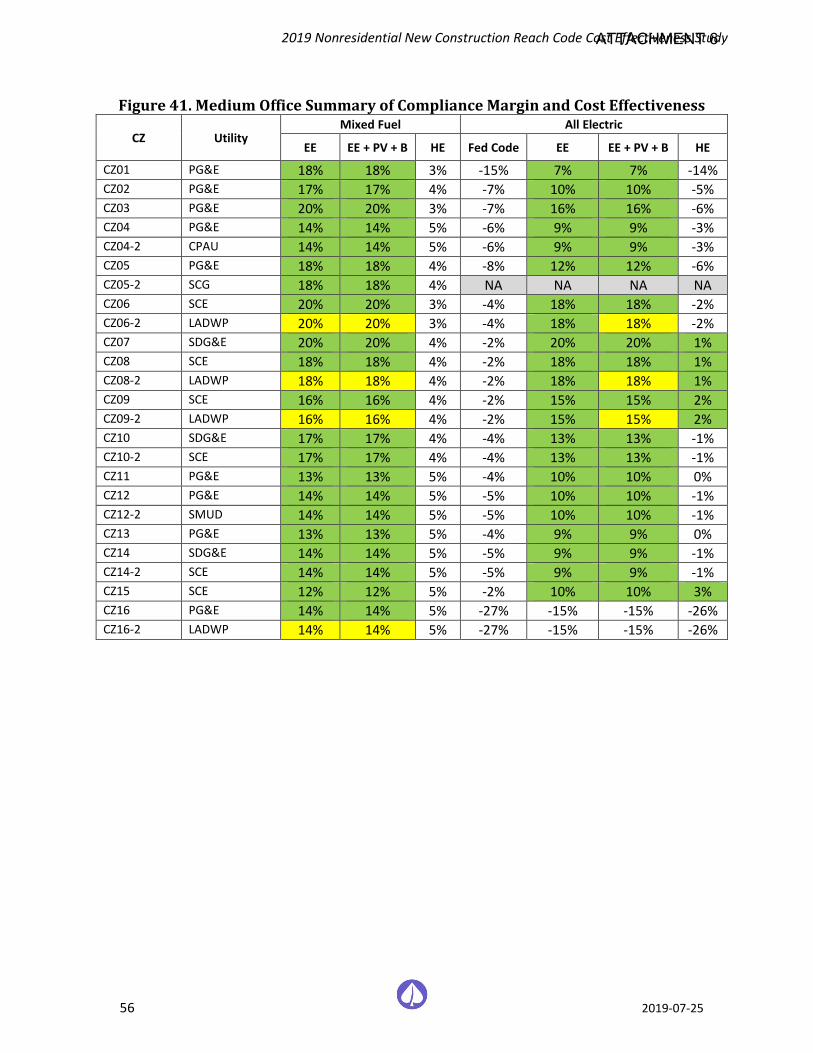
2019 Nonresidential New Construction Reach Code Cost Effectiveness Study
56 2019-07-25
Figure 41. Medium Office Summary of Compliance Margin and Cost Effectiveness
CZ Utility Mixed Fuel All Electric
EE EE + PV + B HE Fed Code EE EE + PV + B HE
CZ01 PG&E 18% 18% 3% -15% 7% 7% -14% CZ02 PG&E 17% 17% 4% -7% 10% 10% -5% CZ03 PG&E 20% 20% 3% -7% 16% 16% -6% CZ04 PG&E 14% 14% 5% -6% 9% 9% -3% CZ04-2 CPAU 14% 14% 5% -6% 9% 9% -3% CZ05 PG&E 18% 18% 4% -8% 12% 12% -6% CZ05-2 SCG 18% 18% 4% NA NA NA NA CZ06 SCE 20% 20% 3% -4% 18% 18% -2% CZ06-2 LADWP 20% 20% 3% -4% 18% 18% -2% CZ07 SDG&E 20% 20% 4% -2% 20% 20% 1% CZ08 SCE 18% 18% 4% -2% 18% 18% 1% CZ08-2 LADWP 18% 18% 4% -2% 18% 18% 1% CZ09 SCE 16% 16% 4% -2% 15% 15% 2% CZ09-2 LADWP 16% 16% 4% -2% 15% 15% 2% CZ10 SDG&E 17% 17% 4% -4% 13% 13% -1% CZ10-2 SCE 17% 17% 4% -4% 13% 13% -1% CZ11 PG&E 13% 13% 5% -4% 10% 10% 0% CZ12 PG&E 14% 14% 5% -5% 10% 10% -1% CZ12-2 SMUD 14% 14% 5% -5% 10% 10% -1% CZ13 PG&E 13% 13% 5% -4% 9% 9% 0% CZ14 SDG&E 14% 14% 5% -5% 9% 9% -1% CZ14-2 SCE 14% 14% 5% -5% 9% 9% -1% CZ15 SCE 12% 12% 5% -2% 10% 10% 3% CZ16 PG&E 14% 14% 5% -27% -15% -15% -26% CZ16-2 LADWP 14% 14% 5% -27% -15% -15% -26%
ATTACHMENT 6
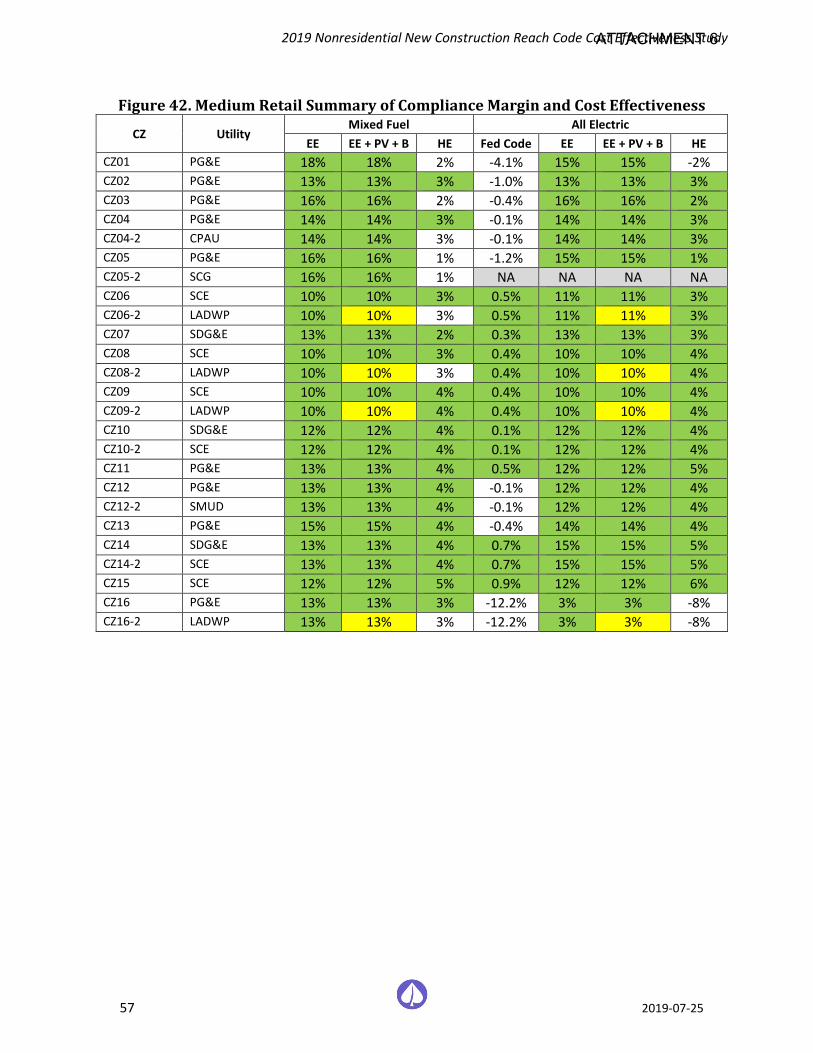
2019 Nonresidential New Construction Reach Code Cost Effectiveness Study
57 2019-07-25
Figure 42. Medium Retail Summary of Compliance Margin and Cost Effectiveness
CZ Utility Mixed Fuel All Electric
EE EE + PV + B HE Fed Code EE EE + PV + B HE CZ01 PG&E 18% 18% 2% -4.1% 15% 15% -2% CZ02 PG&E 13% 13% 3% -1.0% 13% 13% 3% CZ03 PG&E 16% 16% 2% -0.4% 16% 16% 2% CZ04 PG&E 14% 14% 3% -0.1% 14% 14% 3% CZ04-2 CPAU 14% 14% 3% -0.1% 14% 14% 3% CZ05 PG&E 16% 16% 1% -1.2% 15% 15% 1% CZ05-2 SCG 16% 16% 1% NA NA NA NA CZ06 SCE 10% 10% 3% 0.5% 11% 11% 3% CZ06-2 LADWP 10% 10% 3% 0.5% 11% 11% 3% CZ07 SDG&E 13% 13% 2% 0.3% 13% 13% 3% CZ08 SCE 10% 10% 3% 0.4% 10% 10% 4% CZ08-2 LADWP 10% 10% 3% 0.4% 10% 10% 4% CZ09 SCE 10% 10% 4% 0.4% 10% 10% 4% CZ09-2 LADWP 10% 10% 4% 0.4% 10% 10% 4% CZ10 SDG&E 12% 12% 4% 0.1% 12% 12% 4% CZ10-2 SCE 12% 12% 4% 0.1% 12% 12% 4% CZ11 PG&E 13% 13% 4% 0.5% 12% 12% 5% CZ12 PG&E 13% 13% 4% -0.1% 12% 12% 4% CZ12-2 SMUD 13% 13% 4% -0.1% 12% 12% 4% CZ13 PG&E 15% 15% 4% -0.4% 14% 14% 4% CZ14 SDG&E 13% 13% 4% 0.7% 15% 15% 5% CZ14-2 SCE 13% 13% 4% 0.7% 15% 15% 5% CZ15 SCE 12% 12% 5% 0.9% 12% 12% 6% CZ16 PG&E 13% 13% 3% -12.2% 3% 3% -8% CZ16-2 LADWP 13% 13% 3% -12.2% 3% 3% -8%
ATTACHMENT 6
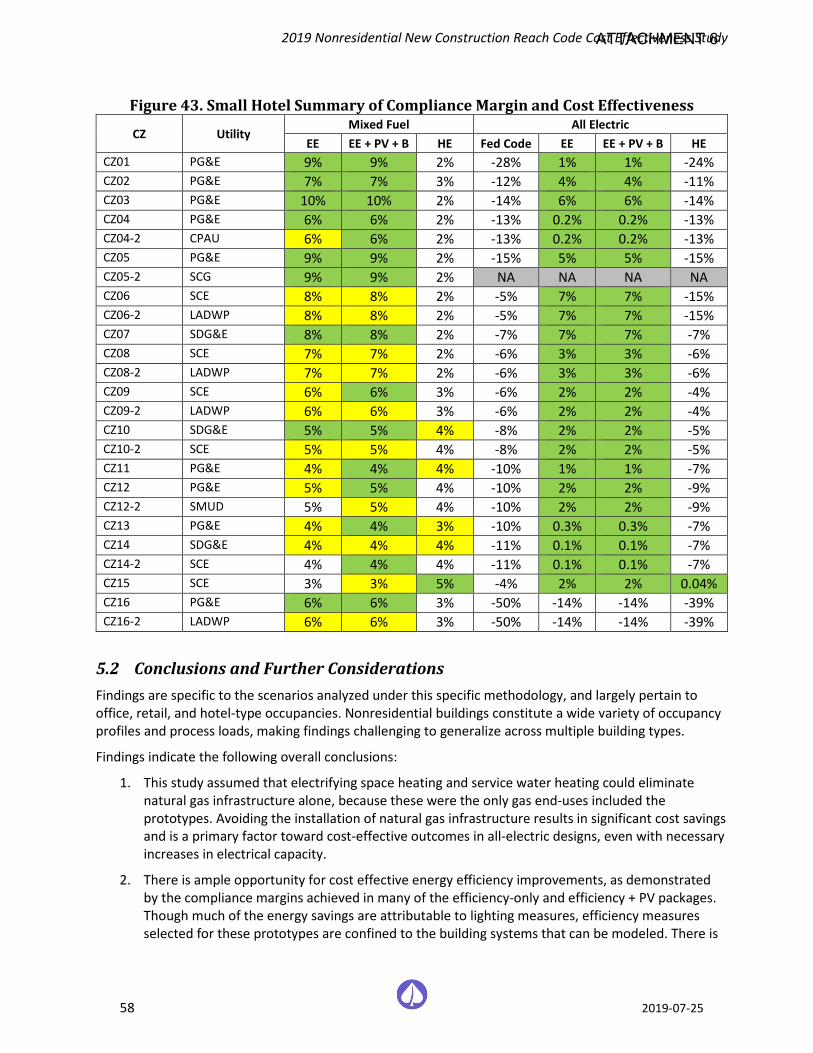
2019 Nonresidential New Construction Reach Code Cost Effectiveness Study
58 2019-07-25
Figure 43. Small Hotel Summary of Compliance Margin and Cost Effectiveness
CZ Utility Mixed Fuel All Electric
EE EE + PV + B HE Fed Code EE EE + PV + B HE CZ01 PG&E 9% 9% 2% -28% 1% 1% -24% CZ02 PG&E 7% 7% 3% -12% 4% 4% -11% CZ03 PG&E 10% 10% 2% -14% 6% 6% -14% CZ04 PG&E 6% 6% 2% -13% 0.2% 0.2% -13% CZ04-2 CPAU 6% 6% 2% -13% 0.2% 0.2% -13% CZ05 PG&E 9% 9% 2% -15% 5% 5% -15% CZ05-2 SCG 9% 9% 2% NA NA NA NA CZ06 SCE 8% 8% 2% -5% 7% 7% -15% CZ06-2 LADWP 8% 8% 2% -5% 7% 7% -15% CZ07 SDG&E 8% 8% 2% -7% 7% 7% -7% CZ08 SCE 7% 7% 2% -6% 3% 3% -6% CZ08-2 LADWP 7% 7% 2% -6% 3% 3% -6% CZ09 SCE 6% 6% 3% -6% 2% 2% -4% CZ09-2 LADWP 6% 6% 3% -6% 2% 2% -4% CZ10 SDG&E 5% 5% 4% -8% 2% 2% -5% CZ10-2 SCE 5% 5% 4% -8% 2% 2% -5% CZ11 PG&E 4% 4% 4% -10% 1% 1% -7% CZ12 PG&E 5% 5% 4% -10% 2% 2% -9% CZ12-2 SMUD 5% 5% 4% -10% 2% 2% -9% CZ13 PG&E 4% 4% 3% -10% 0.3% 0.3% -7% CZ14 SDG&E 4% 4% 4% -11% 0.1% 0.1% -7% CZ14-2 SCE 4% 4% 4% -11% 0.1% 0.1% -7% CZ15 SCE 3% 3% 5% -4% 2% 2% 0.04% CZ16 PG&E 6% 6% 3% -50% -14% -14% -39% CZ16-2 LADWP 6% 6% 3% -50% -14% -14% -39%
5.2 Conclusions and Further Considerations Findings are specific to the scenarios analyzed under this specific methodology, and largely pertain to office, retail, and hotel-type occupancies. Nonresidential buildings constitute a wide variety of occupancy profiles and process loads, making findings challenging to generalize across multiple building types.
Findings indicate the following overall conclusions:
1. This study assumed that electrifying space heating and service water heating could eliminate natural gas infrastructure alone, because these were the only gas end-uses included the prototypes. Avoiding the installation of natural gas infrastructure results in significant cost savings and is a primary factor toward cost-effective outcomes in all-electric designs, even with necessary increases in electrical capacity.
2. There is ample opportunity for cost effective energy efficiency improvements, as demonstrated by the compliance margins achieved in many of the efficiency-only and efficiency + PV packages. Though much of the energy savings are attributable to lighting measures, efficiency measures selected for these prototypes are confined to the building systems that can be modeled. There is
ATTACHMENT 6
2019 Nonresidential New Construction Reach Code Cost Effectiveness Study
59 2019-07-25
likely further opportunity for energy savings through measures that cannot be currently demonstrated in compliance software, such as high-performance control sequences or variable speed parallel fan powered boxes.
3. High efficiency appliances triggering federal preemption do not achieve as high compliance margins as the other efficiency measures analyzed in this study. Cost effectiveness appears to be dependent on the system type and building type. Nonetheless, specifying high efficiency equipment will always be a key feature in integrated design.
4. Regarding the Small Hotel prototype:
a. The Small Hotel presents a challenging prototype to cost-effectively exceed the state’s energy performance budget without efficiency measures. The Reach Code Team is uncertain of the precision of the results due to the inability to directly model either drain water heat recovery or a central heat pump water heater with a recirculation loop.
b. Hotel results may be applicable to high-rise (4 or more stories) multifamily buildings. Both hotel and multifamily buildings have the same or similar mandatory and prescriptive compliance options for hot water systems, lighting, and envelope. Furthermore, the Alternate Calculation Method Reference Manual specifies the same baseline HVAC system for both building types.
c. Hotel compliance margins were the lowest among the three building types analyzed, and thus the most conservative performance thresholds applicable to other nonresidential buildings not analyzed in this study. As stated previously, the varying occupancy and energy profiles of nonresidential buildings makes challenging to directly apply these results across all buildings.
5. Many all-electric and solar PV packages demonstrated greater GHG reductions than their mixed-fuel counterparts, contrary to TDV-based performance, suggesting a misalignment among the TDV metric and California’s long-term GHG-reduction goals. The Energy Commission has indicated that they are aware of this issue and are seeking to address it.
6. Changes to the Nonresidential Alternative Calculation Method (ACM) Reference Manual can drastically impact results. Two examples include:
a. When performance modeling residential buildings, the Standard Design is electric if the Proposed Design is electric, which removes TDV-related penalties and associated negative compliance margins. This essentially allows for a compliance pathway for all-electric residential buildings. If nonresidential buildings were treated in the same way, all-electric cost effectiveness using the TDV approach would improve.
b. The baseline mixed-fuel system for a hotel includes a furnace in each guest room, which carries substantial plumbing costs and labor costs for assembly. A change in the baseline system would lead to different base case costs and different cost effectiveness outcomes.
7. All-electric federal code-minimum packages appear to be cost effective, largely due to avoided natural gas infrastructure, but in most cases do not comply with the Energy Commission’s minimum performance budget (as described in item 7a above). For most cases it appears that adding cost-effective efficiency measures achieves compliance. All-electric nonresidential projects can leverage the initial cost savings of avoiding natural gas infrastructure by adding energy efficiency measures that would not be cost effective independently.
ATTACHMENT 6

2019 Nonresidential New Construction Reach Code Cost Effectiveness Study
60 2019-07-25
6 Appendices 6.1 Map of California Climate Zones Climate zone geographical boundaries are depicted in Figure 44. The map in Figure 44 along with a zip-code search directory is available at: https://ww2.energy.ca.gov/maps/renewable/building_climate_zones.html
Figure 44. Map of California Climate Zones
ATTACHMENT 6
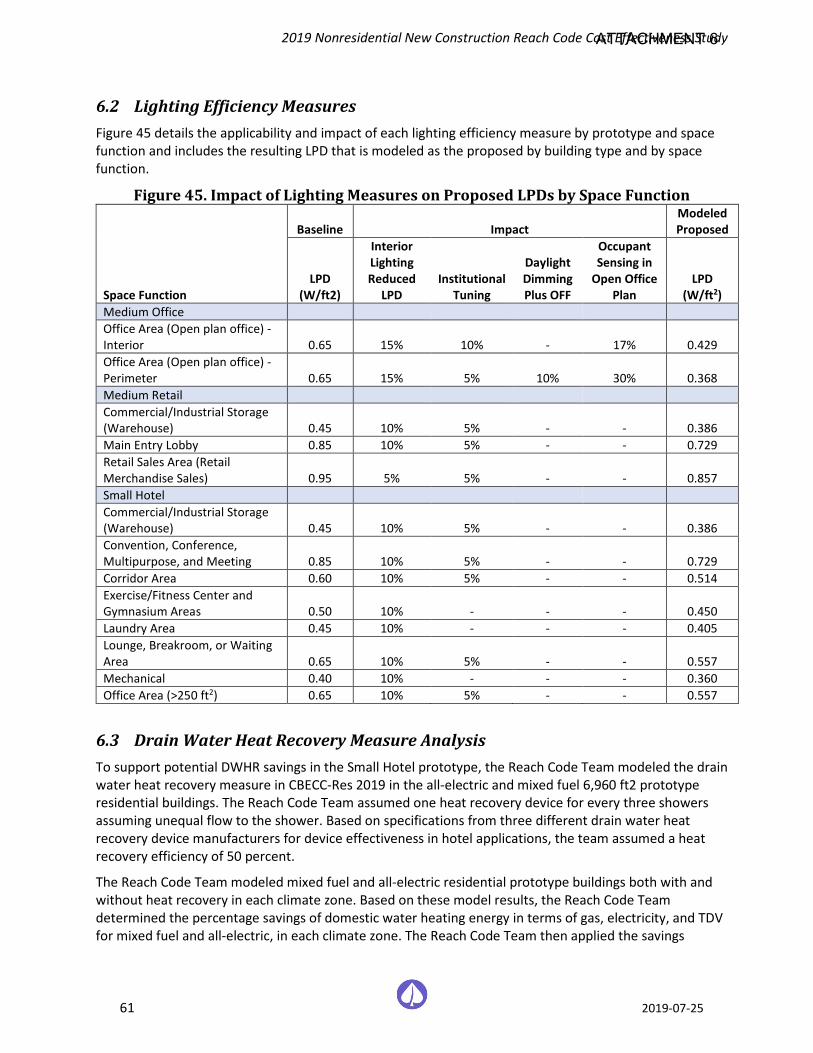
2019 Nonresidential New Construction Reach Code Cost Effectiveness Study
61 2019-07-25
6.2 Lighting Efficiency Measures Figure 45 details the applicability and impact of each lighting efficiency measure by prototype and space function and includes the resulting LPD that is modeled as the proposed by building type and by space function.
Figure 45. Impact of Lighting Measures on Proposed LPDs by Space Function
Space Function
Baseline Impact Modeled Proposed
LPD (W/ft2)
Interior Lighting Reduced
LPD Institutional
Tuning
Daylight Dimming Plus OFF
Occupant Sensing in
Open Office Plan
LPD (W/ft2)
Medium Office Office Area (Open plan office) - Interior 0.65 15% 10% - 17% 0.429 Office Area (Open plan office) - Perimeter 0.65 15% 5% 10% 30% 0.368 Medium Retail Commercial/Industrial Storage (Warehouse) 0.45 10% 5% - - 0.386 Main Entry Lobby 0.85 10% 5% - - 0.729 Retail Sales Area (Retail Merchandise Sales) 0.95 5% 5% - - 0.857 Small Hotel Commercial/Industrial Storage (Warehouse) 0.45 10% 5% - - 0.386 Convention, Conference, Multipurpose, and Meeting 0.85 10% 5% - - 0.729 Corridor Area 0.60 10% 5% - - 0.514 Exercise/Fitness Center and Gymnasium Areas 0.50 10% - - - 0.450 Laundry Area 0.45 10% - - - 0.405 Lounge, Breakroom, or Waiting Area 0.65 10% 5% - - 0.557 Mechanical 0.40 10% - - - 0.360 Office Area (>250 ft2) 0.65 10% 5% - - 0.557
6.3 Drain Water Heat Recovery Measure Analysis To support potential DWHR savings in the Small Hotel prototype, the Reach Code Team modeled the drain water heat recovery measure in CBECC-Res 2019 in the all-electric and mixed fuel 6,960 ft2 prototype residential buildings. The Reach Code Team assumed one heat recovery device for every three showers assuming unequal flow to the shower. Based on specifications from three different drain water heat recovery device manufacturers for device effectiveness in hotel applications, the team assumed a heat recovery efficiency of 50 percent.
The Reach Code Team modeled mixed fuel and all-electric residential prototype buildings both with and without heat recovery in each climate zone. Based on these model results, the Reach Code Team determined the percentage savings of domestic water heating energy in terms of gas, electricity, and TDV for mixed fuel and all-electric, in each climate zone. The Reach Code Team then applied the savings
ATTACHMENT 6
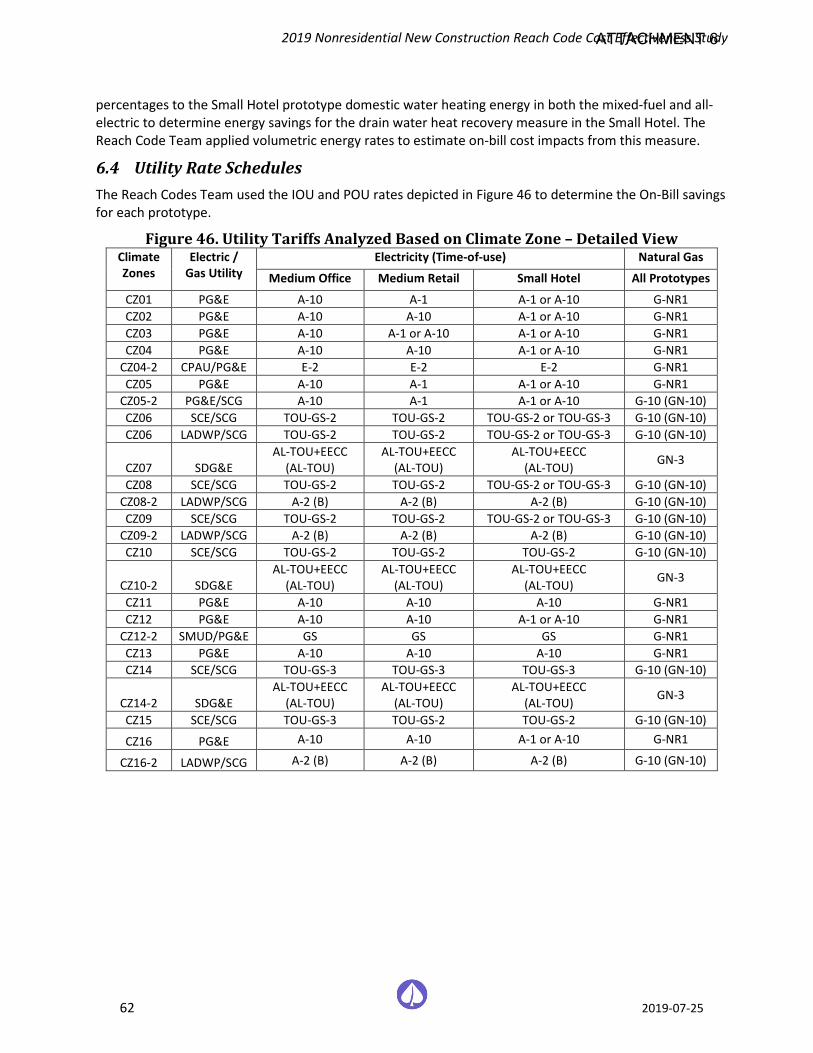
2019 Nonresidential New Construction Reach Code Cost Effectiveness Study
62 2019-07-25
percentages to the Small Hotel prototype domestic water heating energy in both the mixed-fuel and all-electric to determine energy savings for the drain water heat recovery measure in the Small Hotel. The Reach Code Team applied volumetric energy rates to estimate on-bill cost impacts from this measure.
6.4 Utility Rate Schedules The Reach Codes Team used the IOU and POU rates depicted in Figure 46 to determine the On-Bill savings for each prototype.
Figure 46. Utility Tariffs Analyzed Based on Climate Zone – Detailed View Climate Zones
Electric / Gas Utility
Electricity (Time-of-use) Natural Gas
Medium Office Medium Retail Small Hotel All Prototypes
CZ01 PG&E A-10 A-1 A-1 or A-10 G-NR1 CZ02 PG&E A-10 A-10 A-1 or A-10 G-NR1 CZ03 PG&E A-10 A-1 or A-10 A-1 or A-10 G-NR1 CZ04 PG&E A-10 A-10 A-1 or A-10 G-NR1
CZ04-2 CPAU/PG&E E-2 E-2 E-2 G-NR1 CZ05 PG&E A-10 A-1 A-1 or A-10 G-NR1
CZ05-2 PG&E/SCG A-10 A-1 A-1 or A-10 G-10 (GN-10) CZ06 SCE/SCG TOU-GS-2 TOU-GS-2 TOU-GS-2 or TOU-GS-3 G-10 (GN-10) CZ06 LADWP/SCG TOU-GS-2 TOU-GS-2 TOU-GS-2 or TOU-GS-3 G-10 (GN-10)
CZ07 SDG&E AL-TOU+EECC
(AL-TOU) AL-TOU+EECC
(AL-TOU) AL-TOU+EECC
(AL-TOU) GN-3
CZ08 SCE/SCG TOU-GS-2 TOU-GS-2 TOU-GS-2 or TOU-GS-3 G-10 (GN-10) CZ08-2 LADWP/SCG A-2 (B) A-2 (B) A-2 (B) G-10 (GN-10) CZ09 SCE/SCG TOU-GS-2 TOU-GS-2 TOU-GS-2 or TOU-GS-3 G-10 (GN-10)
CZ09-2 LADWP/SCG A-2 (B) A-2 (B) A-2 (B) G-10 (GN-10) CZ10 SCE/SCG TOU-GS-2 TOU-GS-2 TOU-GS-2 G-10 (GN-10)
CZ10-2 SDG&E AL-TOU+EECC
(AL-TOU) AL-TOU+EECC
(AL-TOU) AL-TOU+EECC
(AL-TOU) GN-3
CZ11 PG&E A-10 A-10 A-10 G-NR1 CZ12 PG&E A-10 A-10 A-1 or A-10 G-NR1
CZ12-2 SMUD/PG&E GS GS GS G-NR1 CZ13 PG&E A-10 A-10 A-10 G-NR1 CZ14 SCE/SCG TOU-GS-3 TOU-GS-3 TOU-GS-3 G-10 (GN-10)
CZ14-2 SDG&E AL-TOU+EECC
(AL-TOU) AL-TOU+EECC
(AL-TOU) AL-TOU+EECC
(AL-TOU) GN-3
CZ15 SCE/SCG TOU-GS-3 TOU-GS-2 TOU-GS-2 G-10 (GN-10)
CZ16 PG&E A-10 A-10 A-1 or A-10 G-NR1
CZ16-2 LADWP/SCG A-2 (B) A-2 (B) A-2 (B) G-10 (GN-10)
ATTACHMENT 6
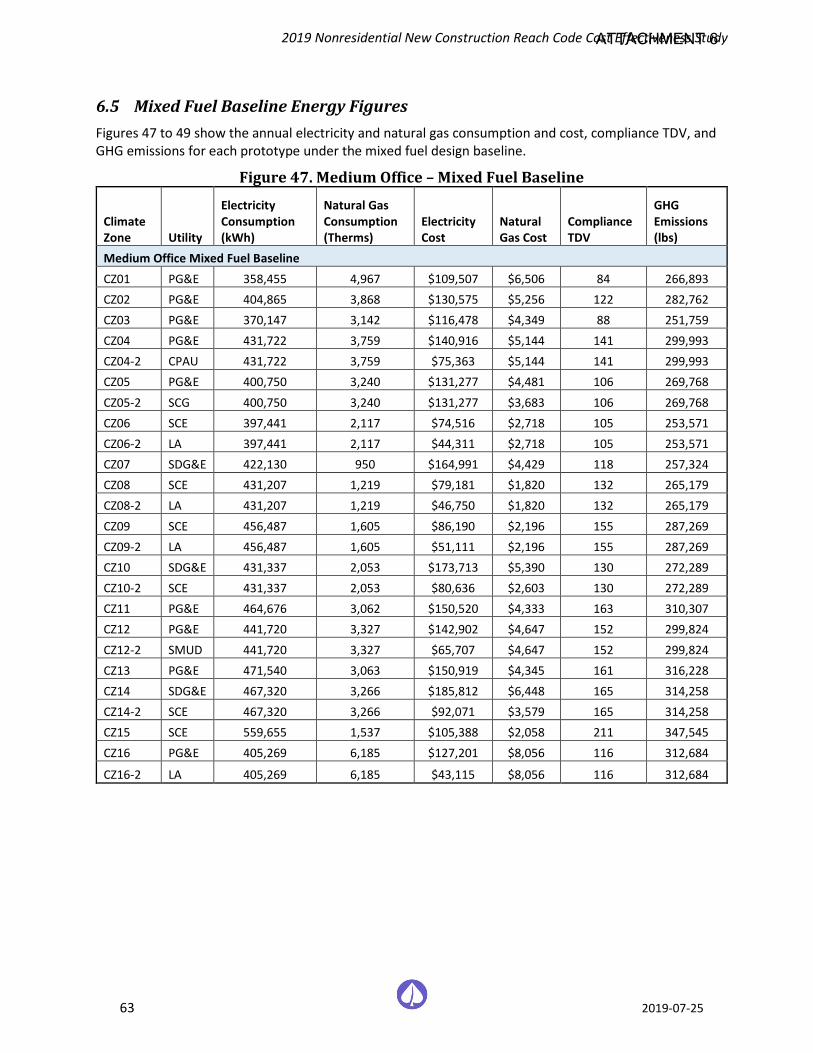
2019 Nonresidential New Construction Reach Code Cost Effectiveness Study
63 2019-07-25
6.5 Mixed Fuel Baseline Energy Figures Figures 47 to 49 show the annual electricity and natural gas consumption and cost, compliance TDV, and GHG emissions for each prototype under the mixed fuel design baseline.
Figure 47. Medium Office – Mixed Fuel Baseline
Climate Zone Utility
Electricity Consumption (kWh)
Natural Gas Consumption (Therms)
Electricity Cost
Natural Gas Cost
Compliance TDV
GHG Emissions (lbs)
Medium Office Mixed Fuel Baseline CZ01 PG&E 358,455 4,967 $109,507 $6,506 84 266,893 CZ02 PG&E 404,865 3,868 $130,575 $5,256 122 282,762 CZ03 PG&E 370,147 3,142 $116,478 $4,349 88 251,759 CZ04 PG&E 431,722 3,759 $140,916 $5,144 141 299,993 CZ04-2 CPAU 431,722 3,759 $75,363 $5,144 141 299,993 CZ05 PG&E 400,750 3,240 $131,277 $4,481 106 269,768 CZ05-2 SCG 400,750 3,240 $131,277 $3,683 106 269,768 CZ06 SCE 397,441 2,117 $74,516 $2,718 105 253,571 CZ06-2 LA 397,441 2,117 $44,311 $2,718 105 253,571 CZ07 SDG&E 422,130 950 $164,991 $4,429 118 257,324 CZ08 SCE 431,207 1,219 $79,181 $1,820 132 265,179 CZ08-2 LA 431,207 1,219 $46,750 $1,820 132 265,179 CZ09 SCE 456,487 1,605 $86,190 $2,196 155 287,269 CZ09-2 LA 456,487 1,605 $51,111 $2,196 155 287,269 CZ10 SDG&E 431,337 2,053 $173,713 $5,390 130 272,289 CZ10-2 SCE 431,337 2,053 $80,636 $2,603 130 272,289 CZ11 PG&E 464,676 3,062 $150,520 $4,333 163 310,307 CZ12 PG&E 441,720 3,327 $142,902 $4,647 152 299,824 CZ12-2 SMUD 441,720 3,327 $65,707 $4,647 152 299,824 CZ13 PG&E 471,540 3,063 $150,919 $4,345 161 316,228 CZ14 SDG&E 467,320 3,266 $185,812 $6,448 165 314,258 CZ14-2 SCE 467,320 3,266 $92,071 $3,579 165 314,258 CZ15 SCE 559,655 1,537 $105,388 $2,058 211 347,545 CZ16 PG&E 405,269 6,185 $127,201 $8,056 116 312,684
CZ16-2 LA 405,269 6,185 $43,115 $8,056 116 312,684
ATTACHMENT 6
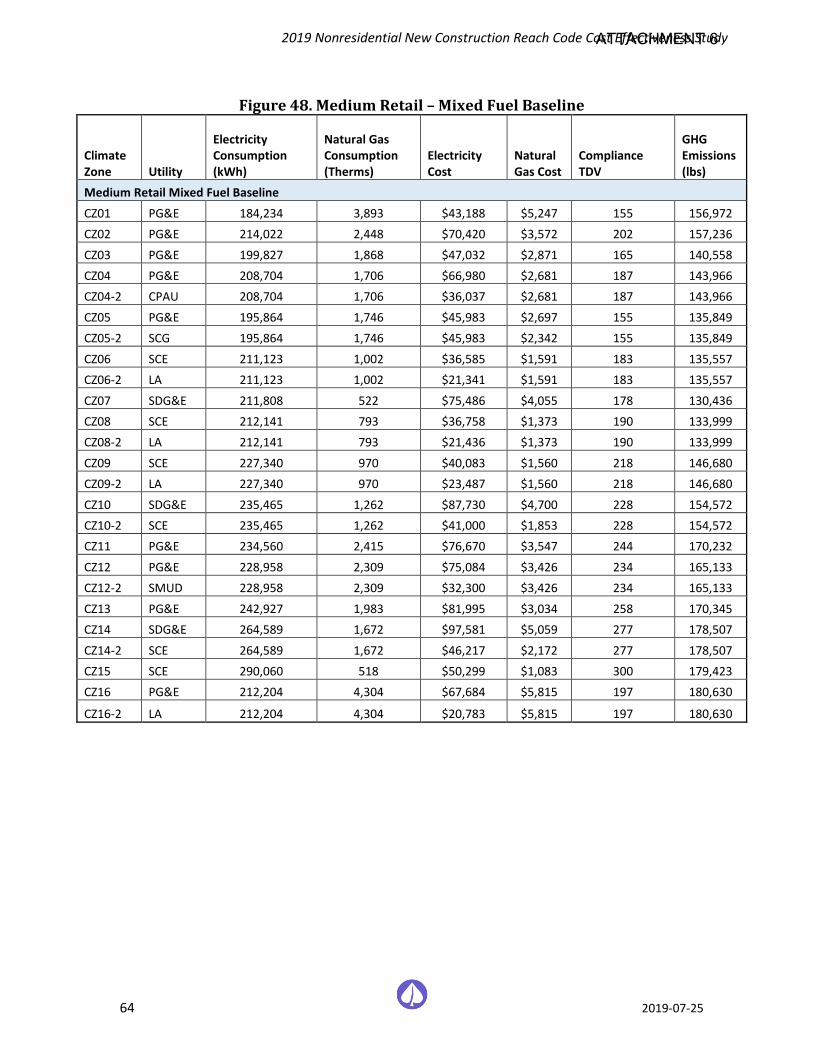
2019 Nonresidential New Construction Reach Code Cost Effectiveness Study
64 2019-07-25
Figure 48. Medium Retail – Mixed Fuel Baseline
Climate Zone Utility
Electricity Consumption (kWh)
Natural Gas Consumption (Therms)
Electricity Cost
Natural Gas Cost
Compliance TDV
GHG Emissions (lbs)
Medium Retail Mixed Fuel Baseline CZ01 PG&E 184,234 3,893 $43,188 $5,247 155 156,972 CZ02 PG&E 214,022 2,448 $70,420 $3,572 202 157,236 CZ03 PG&E 199,827 1,868 $47,032 $2,871 165 140,558 CZ04 PG&E 208,704 1,706 $66,980 $2,681 187 143,966 CZ04-2 CPAU 208,704 1,706 $36,037 $2,681 187 143,966 CZ05 PG&E 195,864 1,746 $45,983 $2,697 155 135,849 CZ05-2 SCG 195,864 1,746 $45,983 $2,342 155 135,849 CZ06 SCE 211,123 1,002 $36,585 $1,591 183 135,557 CZ06-2 LA 211,123 1,002 $21,341 $1,591 183 135,557 CZ07 SDG&E 211,808 522 $75,486 $4,055 178 130,436 CZ08 SCE 212,141 793 $36,758 $1,373 190 133,999 CZ08-2 LA 212,141 793 $21,436 $1,373 190 133,999 CZ09 SCE 227,340 970 $40,083 $1,560 218 146,680 CZ09-2 LA 227,340 970 $23,487 $1,560 218 146,680 CZ10 SDG&E 235,465 1,262 $87,730 $4,700 228 154,572 CZ10-2 SCE 235,465 1,262 $41,000 $1,853 228 154,572 CZ11 PG&E 234,560 2,415 $76,670 $3,547 244 170,232 CZ12 PG&E 228,958 2,309 $75,084 $3,426 234 165,133 CZ12-2 SMUD 228,958 2,309 $32,300 $3,426 234 165,133 CZ13 PG&E 242,927 1,983 $81,995 $3,034 258 170,345 CZ14 SDG&E 264,589 1,672 $97,581 $5,059 277 178,507 CZ14-2 SCE 264,589 1,672 $46,217 $2,172 277 178,507 CZ15 SCE 290,060 518 $50,299 $1,083 300 179,423 CZ16 PG&E 212,204 4,304 $67,684 $5,815 197 180,630
CZ16-2 LA 212,204 4,304 $20,783 $5,815 197 180,630
ATTACHMENT 6

2019 Nonresidential New Construction Reach Code Cost Effectiveness Study
65 2019-07-25
Figure 49. Small Hotel – Mixed Fuel Baseline
Climate Zone Utility
Electricity Consumption (kWh)
Natural Gas Consumption (Therms)
Electricity Cost
Natural Gas Cost
Compliance TDV
GHG Emissions (lbs)
Small Hotel Mixed Fuel Baseline CZ01 PG&E 177,734 16,936 40,778 20,465 110 340,491
CZ02 PG&E 189,319 12,696 53,396 15,664 110 293,056
CZ03 PG&E 183,772 12,341 42,325 15,210 98 284,217 CZ04 PG&E 187,482 11,945 52,118 14,806 106 281,851
CZ04-2 CPAU 187,482 11,945 32,176 14,806 106 281,851
CZ05 PG&E 187,150 11,979 43,182 14,733 98 281,183 CZ05-2 SCG 187,150 11,979 43,182 10,869 98 281,183
CZ06 SCE 191,764 8,931 28,036 8,437 98 244,664
CZ06-2 LA 191,764 8,931 16,636 8,437 98 244,664 CZ07 SDG&E 189,174 8,207 58,203 10,752 90 233,884
CZ08 SCE 190,503 8,372 27,823 7,991 94 236,544
CZ08-2 LA 190,503 8,372 16,555 7,991 94 236,544 CZ09 SCE 198,204 8,421 30,262 8,030 103 242,296
CZ09-2 LA 198,204 8,421 17,951 8,030 103 242,296
CZ10 SDG&E 215,364 8,437 71,713 10,926 122 255,622 CZ10-2 SCE 215,364 8,437 33,736 8,043 122 255,622
CZ11 PG&E 219,852 10,271 63,724 12,882 131 282,232
CZ12 PG&E 199,499 10,422 46,245 13,022 115 270,262 CZ12-2 SMUD 199,499 10,422 26,872 13,022 115 270,262
CZ13 PG&E 226,925 10,048 65,559 12,629 132 284,007
CZ14 SDG&E 226,104 10,075 73,621 12,167 134 283,287 CZ14-2 SCE 226,104 10,075 35,187 9,350 134 283,287
CZ15 SCE 280,595 5,598 42,852 5,777 152 260,378
CZ16 PG&E 191,231 17,618 51,644 21,581 127 358,590
CZ16-2 LA 191,231 17,618 16,029 21,581 127 358,590
6.6 Hotel TDV Cost Effectiveness with Propane Baseline The Reach Codes Team further analyzed TDV cost effectiveness of the all-electric packages with a mixed-fuel design baseline using propane instead of natural gas. Results for each package are shown in Figure 50. through Figure 53. below.
All electric models compared to a propane baseline have positive compliance margins in all climate zones when compared to results using a natural gas baseline. Compliance margin improvement is roughly 30 percent, which also leads to improved cost effectiveness for the all-electric packages. These outcomes are likely due to the TDV penalty associated with propane when compared to natural gas.
ATTACHMENT 6
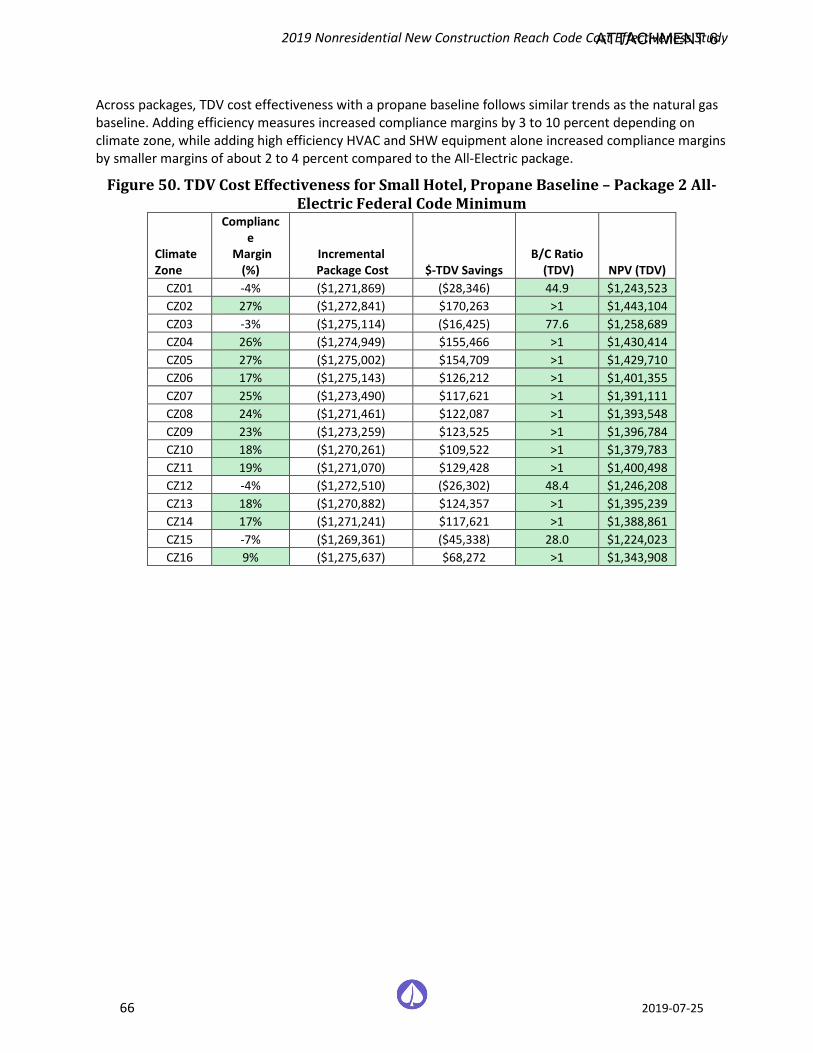
2019 Nonresidential New Construction Reach Code Cost Effectiveness Study
66 2019-07-25
Across packages, TDV cost effectiveness with a propane baseline follows similar trends as the natural gas baseline. Adding efficiency measures increased compliance margins by 3 to 10 percent depending on climate zone, while adding high efficiency HVAC and SHW equipment alone increased compliance margins by smaller margins of about 2 to 4 percent compared to the All-Electric package.
Figure 50. TDV Cost Effectiveness for Small Hotel, Propane Baseline – Package 2 All-Electric Federal Code Minimum
Climate Zone
Compliance
Margin (%)
Incremental Package Cost $-TDV Savings
B/C Ratio (TDV) NPV (TDV)
CZ01 -4% ($1,271,869) ($28,346) 44.9 $1,243,523 CZ02 27% ($1,272,841) $170,263 >1 $1,443,104 CZ03 -3% ($1,275,114) ($16,425) 77.6 $1,258,689 CZ04 26% ($1,274,949) $155,466 >1 $1,430,414 CZ05 27% ($1,275,002) $154,709 >1 $1,429,710 CZ06 17% ($1,275,143) $126,212 >1 $1,401,355 CZ07 25% ($1,273,490) $117,621 >1 $1,391,111 CZ08 24% ($1,271,461) $122,087 >1 $1,393,548 CZ09 23% ($1,273,259) $123,525 >1 $1,396,784 CZ10 18% ($1,270,261) $109,522 >1 $1,379,783 CZ11 19% ($1,271,070) $129,428 >1 $1,400,498 CZ12 -4% ($1,272,510) ($26,302) 48.4 $1,246,208 CZ13 18% ($1,270,882) $124,357 >1 $1,395,239 CZ14 17% ($1,271,241) $117,621 >1 $1,388,861 CZ15 -7% ($1,269,361) ($45,338) 28.0 $1,224,023 CZ16 9% ($1,275,637) $68,272 >1 $1,343,908
ATTACHMENT 6
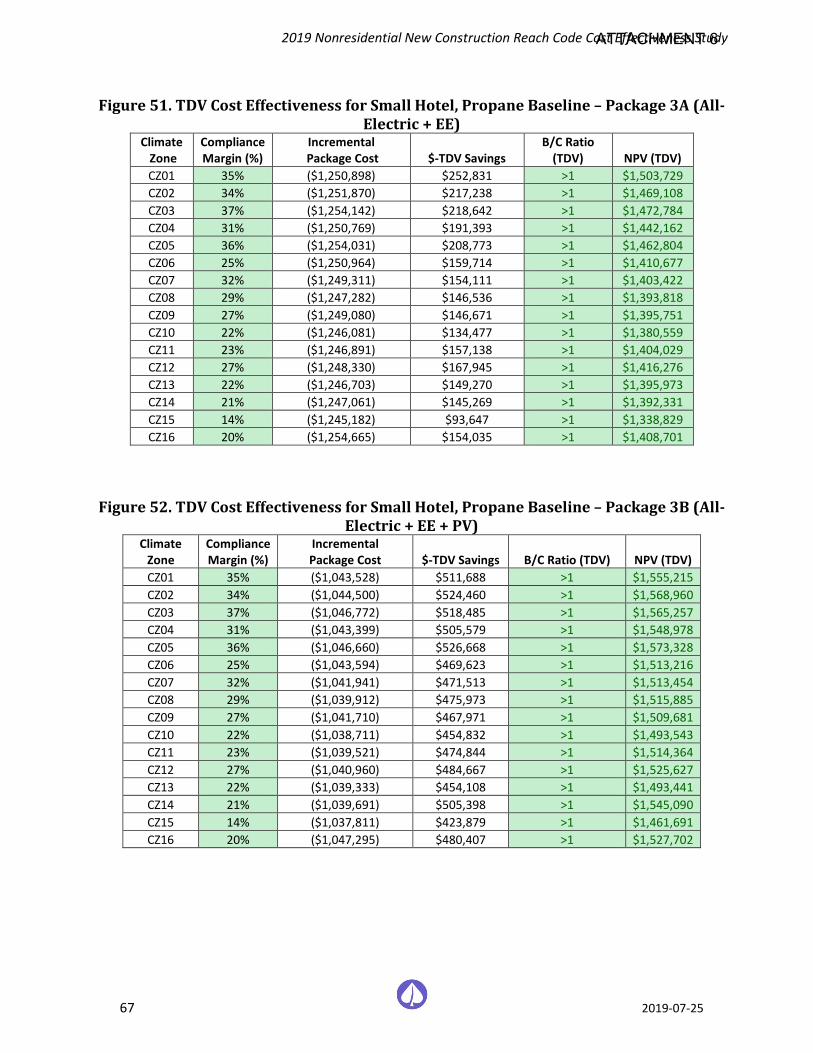
2019 Nonresidential New Construction Reach Code Cost Effectiveness Study
67 2019-07-25
Figure 51. TDV Cost Effectiveness for Small Hotel, Propane Baseline – Package 3A (All-Electric + EE)
Climate Zone
Compliance Margin (%)
Incremental Package Cost $-TDV Savings
B/C Ratio (TDV) NPV (TDV)
CZ01 35% ($1,250,898) $252,831 >1 $1,503,729 CZ02 34% ($1,251,870) $217,238 >1 $1,469,108 CZ03 37% ($1,254,142) $218,642 >1 $1,472,784 CZ04 31% ($1,250,769) $191,393 >1 $1,442,162 CZ05 36% ($1,254,031) $208,773 >1 $1,462,804 CZ06 25% ($1,250,964) $159,714 >1 $1,410,677 CZ07 32% ($1,249,311) $154,111 >1 $1,403,422 CZ08 29% ($1,247,282) $146,536 >1 $1,393,818 CZ09 27% ($1,249,080) $146,671 >1 $1,395,751 CZ10 22% ($1,246,081) $134,477 >1 $1,380,559 CZ11 23% ($1,246,891) $157,138 >1 $1,404,029 CZ12 27% ($1,248,330) $167,945 >1 $1,416,276 CZ13 22% ($1,246,703) $149,270 >1 $1,395,973 CZ14 21% ($1,247,061) $145,269 >1 $1,392,331 CZ15 14% ($1,245,182) $93,647 >1 $1,338,829 CZ16 20% ($1,254,665) $154,035 >1 $1,408,701
Figure 52. TDV Cost Effectiveness for Small Hotel, Propane Baseline – Package 3B (All-Electric + EE + PV)
Climate Zone
Compliance Margin (%)
Incremental Package Cost $-TDV Savings B/C Ratio (TDV) NPV (TDV)
CZ01 35% ($1,043,528) $511,688 >1 $1,555,215 CZ02 34% ($1,044,500) $524,460 >1 $1,568,960 CZ03 37% ($1,046,772) $518,485 >1 $1,565,257 CZ04 31% ($1,043,399) $505,579 >1 $1,548,978 CZ05 36% ($1,046,660) $526,668 >1 $1,573,328 CZ06 25% ($1,043,594) $469,623 >1 $1,513,216 CZ07 32% ($1,041,941) $471,513 >1 $1,513,454 CZ08 29% ($1,039,912) $475,973 >1 $1,515,885 CZ09 27% ($1,041,710) $467,971 >1 $1,509,681 CZ10 22% ($1,038,711) $454,832 >1 $1,493,543 CZ11 23% ($1,039,521) $474,844 >1 $1,514,364 CZ12 27% ($1,040,960) $484,667 >1 $1,525,627 CZ13 22% ($1,039,333) $454,108 >1 $1,493,441 CZ14 21% ($1,039,691) $505,398 >1 $1,545,090 CZ15 14% ($1,037,811) $423,879 >1 $1,461,691 CZ16 20% ($1,047,295) $480,407 >1 $1,527,702
ATTACHMENT 6
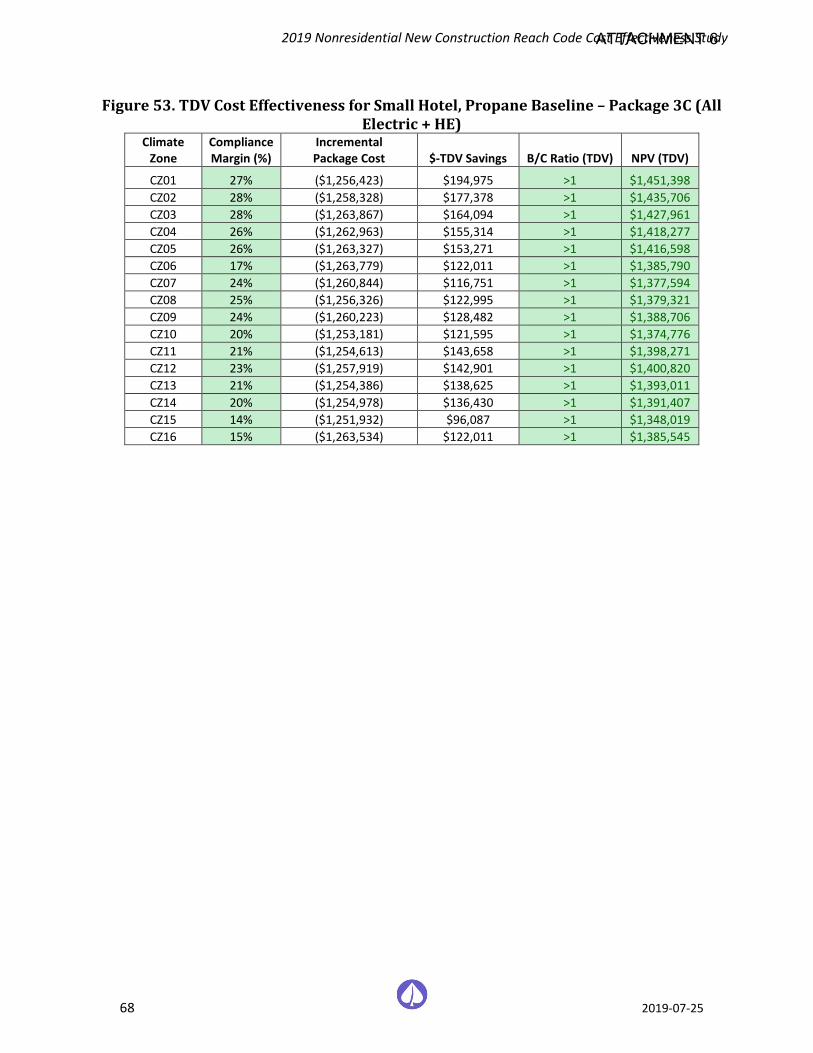
2019 Nonresidential New Construction Reach Code Cost Effectiveness Study
68 2019-07-25
Figure 53. TDV Cost Effectiveness for Small Hotel, Propane Baseline – Package 3C (All Electric + HE)
Climate Zone
Compliance Margin (%)
Incremental Package Cost $-TDV Savings B/C Ratio (TDV) NPV (TDV)
CZ01 27% ($1,256,423) $194,975 >1 $1,451,398 CZ02 28% ($1,258,328) $177,378 >1 $1,435,706 CZ03 28% ($1,263,867) $164,094 >1 $1,427,961 CZ04 26% ($1,262,963) $155,314 >1 $1,418,277 CZ05 26% ($1,263,327) $153,271 >1 $1,416,598 CZ06 17% ($1,263,779) $122,011 >1 $1,385,790 CZ07 24% ($1,260,844) $116,751 >1 $1,377,594 CZ08 25% ($1,256,326) $122,995 >1 $1,379,321 CZ09 24% ($1,260,223) $128,482 >1 $1,388,706 CZ10 20% ($1,253,181) $121,595 >1 $1,374,776 CZ11 21% ($1,254,613) $143,658 >1 $1,398,271 CZ12 23% ($1,257,919) $142,901 >1 $1,400,820 CZ13 21% ($1,254,386) $138,625 >1 $1,393,011 CZ14 20% ($1,254,978) $136,430 >1 $1,391,407 CZ15 14% ($1,251,932) $96,087 >1 $1,348,019 CZ16 15% ($1,263,534) $122,011 >1 $1,385,545
ATTACHMENT 6
2019 Nonresidential New Construction Reach Code Cost Effectiveness Study
69 2019-07-25
6.7 PV-only and PV+Battery-only Cost Effectiveness Results Details The Reach Code Tea evaluated cost effectiveness of installing a PV system and battery storage in six different measure combinations over a 2019 code-compliant baseline for all climate zones. The baseline for all nonresidential buildings is a mixed-fuel design.
All mixed fuel models are compliant with 2019 Title24, whereas all electric models can show negative compliance. The compliance margin is the same as that of their respective federal minimum design and is not affected by addition of solar PV or battery. These scenarios evaluate the cost effectiveness of PV and/or battery measure individually. The climate zones where all-electric design is not compliant will have the flexibility to ramp up the efficiency of appliance or add another measure to be code compliant, as per package 1B and 3B in main body of the report. The large negative lifecycle costs in all electric packages are due to lower all-electric HVAC system costs and avoided natural gas infrastructure costs. This is commonly applied across all climate zones and packages over any additional costs for PV and battery.
6.7.1 Cost Effectiveness Results – Medium Office Figure 54 through Figure 61 contain the cost-effectiveness findings for the Medium Office packages. Notable findings for each package include:
♦ Mixed-Fuel + 3 kW PV Only: All packages are cost effective using the On-Bill and TDV approaches.
♦ Mixed-Fuel + 3 kW PV + 5 kWh Battery: The packages are mostly cost effective on a TDV basis except in CZ1. As compared to the 3 kW PV only package, battery reduces cost effectiveness. This package is not cost effective for LADWP and SMUD territories using an On-Bill approach.
♦ Mixed-Fuel + PV only: The packages are less cost effective as compared to 3 kW PV packages in most climate zones. In areas served by LADWP, the B/C ratio is narrowly less than 1 and not cost effective.
♦ Mixed-Fuel + PV + 50 kWh Battery: The packages are cost effective in all climate zones except for in the areas served by LADWP. On-Bill and TDV B/C ratios are slightly lower compared to the PV only package.
♦ All-Electric + 3 kW PV: Packages are on-bill cost effective in ten of sixteen climate zones. Climate zones 1,2,4,12, and 16 were not found to be cost-effective from an on-bill perspective. These zones are within PG&E’s service area. Packages are cost effective using TDV in all climate zones except CZ16.
♦ All-Electric + 3 kW PV + 5 kWh Battery: Packages are slightly more cost effective than the previous minimal PV only package. Packages are on-bill cost effective in most climate zones except for 1,2 and 16 from an on-bill perspective. These zones are within PG&E’s service area. Packages are cost effective using TDV in all climate zones except CZ16.
♦ All-Electric + PV only: All packages are cost effective and achieve savings using the On-Bill and TDV approaches.
ATTACHMENT 6
2019 Nonresidential New Construction Reach Code Cost Effectiveness Study
70 2019-07-25
♦ All-Electric + PV + 50 kWh Battery: All packages are cost effective and achieve savings using the On-Bill and TDV approaches. On-Bill and TDV B/C ratios are slightly lower compared to the PV only package.
ATTACHMENT 6
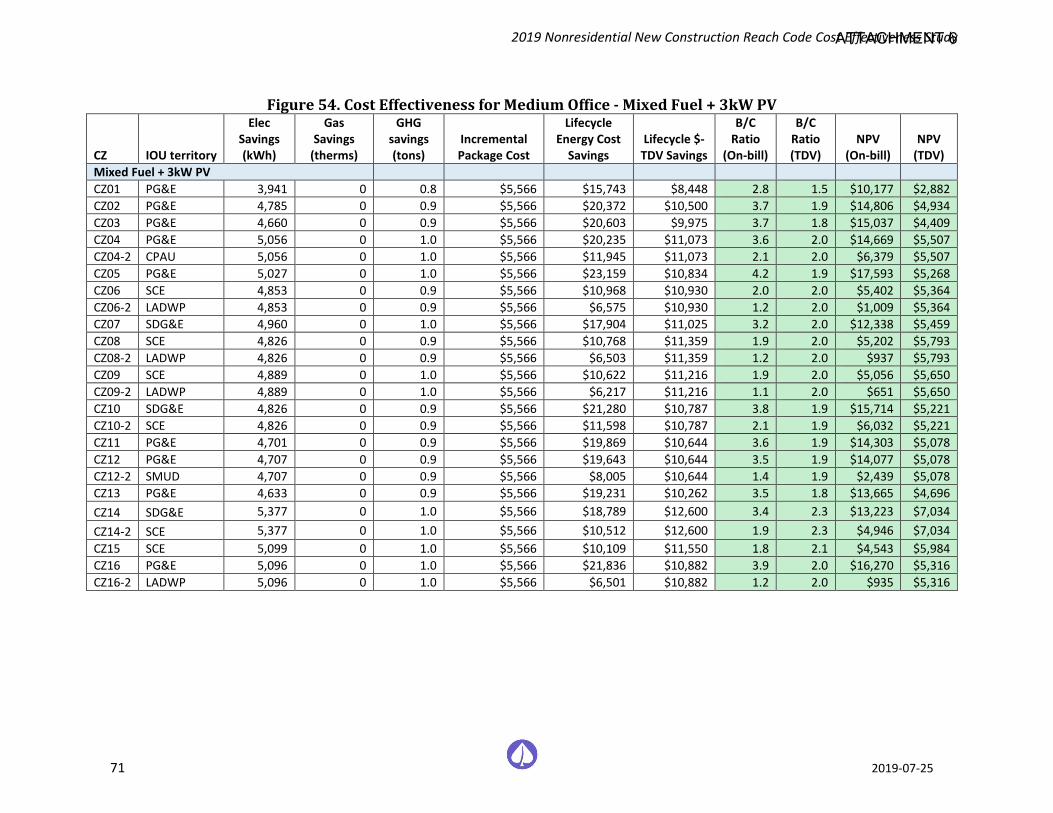
2019 Nonresidential New Construction Reach Code Cost Effectiveness Study
71 2019-07-25
Figure 54. Cost Effectiveness for Medium Office - Mixed Fuel + 3kW PV
CZ IOU territory
Elec Savings (kWh)
Gas Savings
(therms)
GHG savings (tons)
Incremental Package Cost
Lifecycle Energy Cost
Savings Lifecycle $-
TDV Savings
B/C Ratio
(On-bill)
B/C Ratio (TDV)
NPV (On-bill)
NPV (TDV)
Mixed Fuel + 3kW PV CZ01 PG&E 3,941 0 0.8 $5,566 $15,743 $8,448 2.8 1.5 $10,177 $2,882 CZ02 PG&E 4,785 0 0.9 $5,566 $20,372 $10,500 3.7 1.9 $14,806 $4,934 CZ03 PG&E 4,660 0 0.9 $5,566 $20,603 $9,975 3.7 1.8 $15,037 $4,409 CZ04 PG&E 5,056 0 1.0 $5,566 $20,235 $11,073 3.6 2.0 $14,669 $5,507 CZ04-2 CPAU 5,056 0 1.0 $5,566 $11,945 $11,073 2.1 2.0 $6,379 $5,507 CZ05 PG&E 5,027 0 1.0 $5,566 $23,159 $10,834 4.2 1.9 $17,593 $5,268 CZ06 SCE 4,853 0 0.9 $5,566 $10,968 $10,930 2.0 2.0 $5,402 $5,364 CZ06-2 LADWP 4,853 0 0.9 $5,566 $6,575 $10,930 1.2 2.0 $1,009 $5,364 CZ07 SDG&E 4,960 0 1.0 $5,566 $17,904 $11,025 3.2 2.0 $12,338 $5,459 CZ08 SCE 4,826 0 0.9 $5,566 $10,768 $11,359 1.9 2.0 $5,202 $5,793 CZ08-2 LADWP 4,826 0 0.9 $5,566 $6,503 $11,359 1.2 2.0 $937 $5,793 CZ09 SCE 4,889 0 1.0 $5,566 $10,622 $11,216 1.9 2.0 $5,056 $5,650 CZ09-2 LADWP 4,889 0 1.0 $5,566 $6,217 $11,216 1.1 2.0 $651 $5,650 CZ10 SDG&E 4,826 0 0.9 $5,566 $21,280 $10,787 3.8 1.9 $15,714 $5,221 CZ10-2 SCE 4,826 0 0.9 $5,566 $11,598 $10,787 2.1 1.9 $6,032 $5,221 CZ11 PG&E 4,701 0 0.9 $5,566 $19,869 $10,644 3.6 1.9 $14,303 $5,078 CZ12 PG&E 4,707 0 0.9 $5,566 $19,643 $10,644 3.5 1.9 $14,077 $5,078 CZ12-2 SMUD 4,707 0 0.9 $5,566 $8,005 $10,644 1.4 1.9 $2,439 $5,078 CZ13 PG&E 4,633 0 0.9 $5,566 $19,231 $10,262 3.5 1.8 $13,665 $4,696 CZ14 SDG&E 5,377 0 1.0 $5,566 $18,789 $12,600 3.4 2.3 $13,223 $7,034 CZ14-2 SCE 5,377 0 1.0 $5,566 $10,512 $12,600 1.9 2.3 $4,946 $7,034 CZ15 SCE 5,099 0 1.0 $5,566 $10,109 $11,550 1.8 2.1 $4,543 $5,984 CZ16 PG&E 5,096 0 1.0 $5,566 $21,836 $10,882 3.9 2.0 $16,270 $5,316 CZ16-2 LADWP 5,096 0 1.0 $5,566 $6,501 $10,882 1.2 2.0 $935 $5,316
ATTACHMENT 6
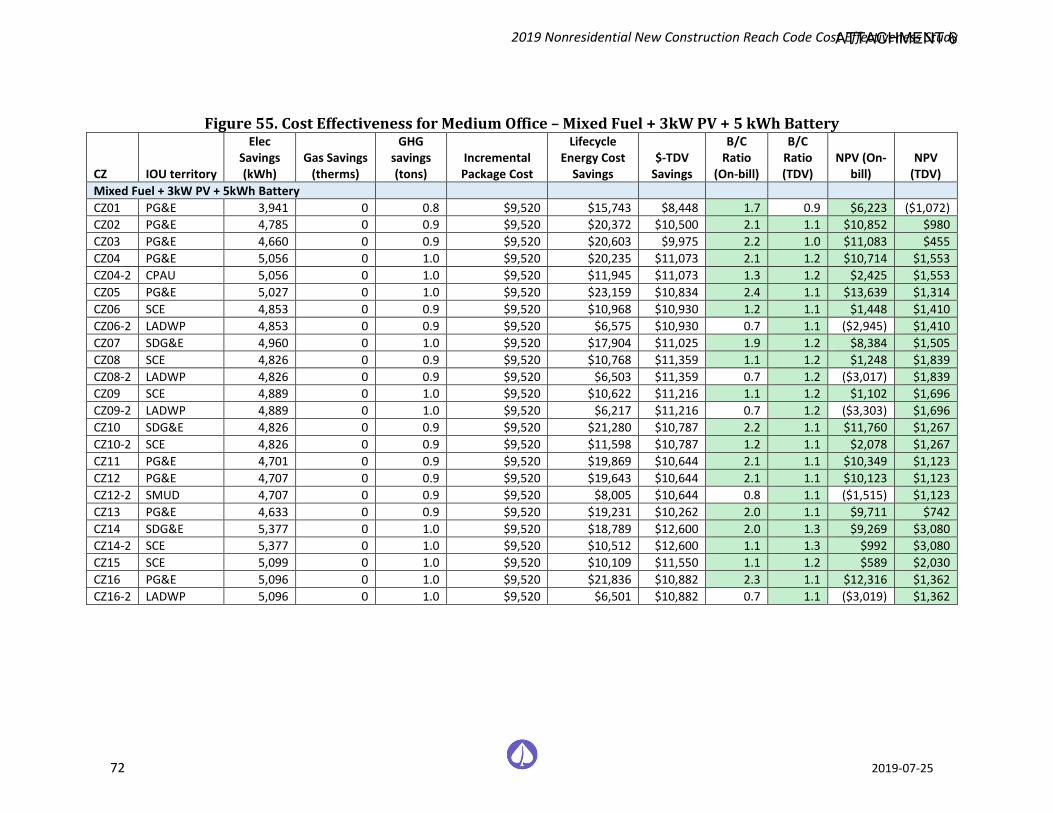
2019 Nonresidential New Construction Reach Code Cost Effectiveness Study
72 2019-07-25
Figure 55. Cost Effectiveness for Medium Office – Mixed Fuel + 3kW PV + 5 kWh Battery
CZ IOU territory
Elec Savings (kWh)
Gas Savings (therms)
GHG savings (tons)
Incremental Package Cost
Lifecycle Energy Cost
Savings $-TDV
Savings
B/C Ratio
(On-bill)
B/C Ratio (TDV)
NPV (On-bill)
NPV (TDV)
Mixed Fuel + 3kW PV + 5kWh Battery CZ01 PG&E 3,941 0 0.8 $9,520 $15,743 $8,448 1.7 0.9 $6,223 ($1,072) CZ02 PG&E 4,785 0 0.9 $9,520 $20,372 $10,500 2.1 1.1 $10,852 $980 CZ03 PG&E 4,660 0 0.9 $9,520 $20,603 $9,975 2.2 1.0 $11,083 $455 CZ04 PG&E 5,056 0 1.0 $9,520 $20,235 $11,073 2.1 1.2 $10,714 $1,553 CZ04-2 CPAU 5,056 0 1.0 $9,520 $11,945 $11,073 1.3 1.2 $2,425 $1,553 CZ05 PG&E 5,027 0 1.0 $9,520 $23,159 $10,834 2.4 1.1 $13,639 $1,314 CZ06 SCE 4,853 0 0.9 $9,520 $10,968 $10,930 1.2 1.1 $1,448 $1,410 CZ06-2 LADWP 4,853 0 0.9 $9,520 $6,575 $10,930 0.7 1.1 ($2,945) $1,410 CZ07 SDG&E 4,960 0 1.0 $9,520 $17,904 $11,025 1.9 1.2 $8,384 $1,505 CZ08 SCE 4,826 0 0.9 $9,520 $10,768 $11,359 1.1 1.2 $1,248 $1,839 CZ08-2 LADWP 4,826 0 0.9 $9,520 $6,503 $11,359 0.7 1.2 ($3,017) $1,839 CZ09 SCE 4,889 0 1.0 $9,520 $10,622 $11,216 1.1 1.2 $1,102 $1,696 CZ09-2 LADWP 4,889 0 1.0 $9,520 $6,217 $11,216 0.7 1.2 ($3,303) $1,696 CZ10 SDG&E 4,826 0 0.9 $9,520 $21,280 $10,787 2.2 1.1 $11,760 $1,267 CZ10-2 SCE 4,826 0 0.9 $9,520 $11,598 $10,787 1.2 1.1 $2,078 $1,267 CZ11 PG&E 4,701 0 0.9 $9,520 $19,869 $10,644 2.1 1.1 $10,349 $1,123 CZ12 PG&E 4,707 0 0.9 $9,520 $19,643 $10,644 2.1 1.1 $10,123 $1,123 CZ12-2 SMUD 4,707 0 0.9 $9,520 $8,005 $10,644 0.8 1.1 ($1,515) $1,123 CZ13 PG&E 4,633 0 0.9 $9,520 $19,231 $10,262 2.0 1.1 $9,711 $742 CZ14 SDG&E 5,377 0 1.0 $9,520 $18,789 $12,600 2.0 1.3 $9,269 $3,080 CZ14-2 SCE 5,377 0 1.0 $9,520 $10,512 $12,600 1.1 1.3 $992 $3,080 CZ15 SCE 5,099 0 1.0 $9,520 $10,109 $11,550 1.1 1.2 $589 $2,030 CZ16 PG&E 5,096 0 1.0 $9,520 $21,836 $10,882 2.3 1.1 $12,316 $1,362 CZ16-2 LADWP 5,096 0 1.0 $9,520 $6,501 $10,882 0.7 1.1 ($3,019) $1,362
ATTACHMENT 6
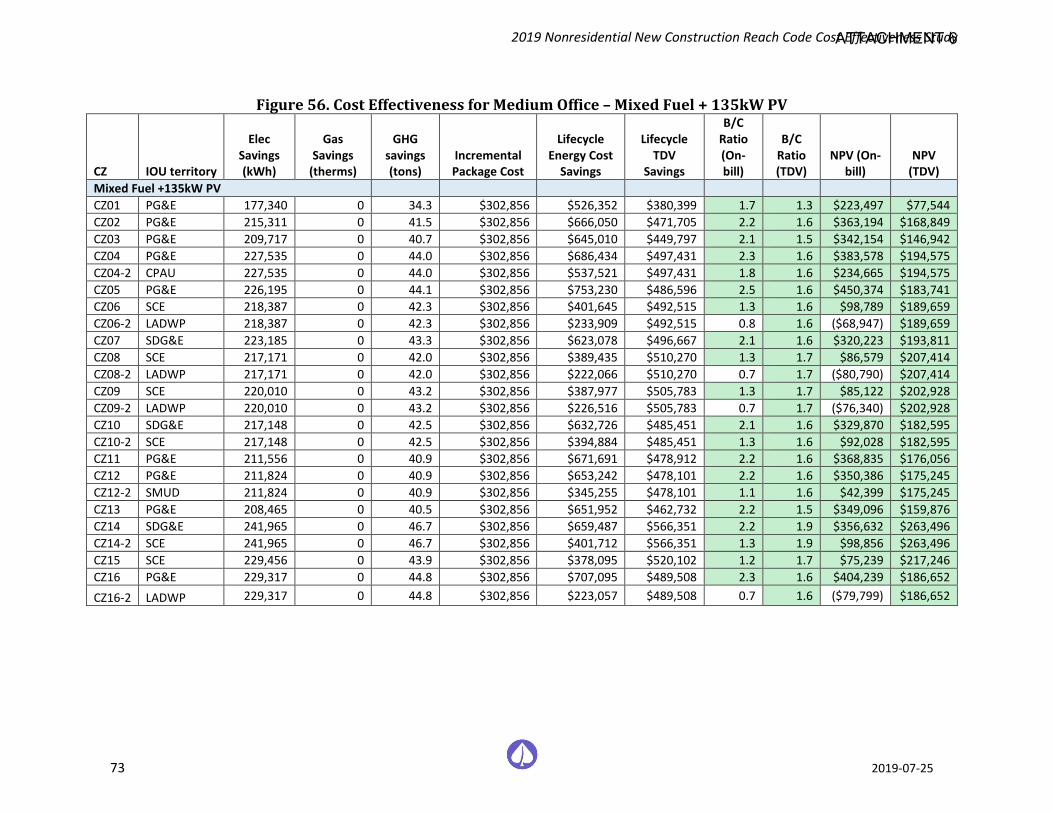
2019 Nonresidential New Construction Reach Code Cost Effectiveness Study
73 2019-07-25
Figure 56. Cost Effectiveness for Medium Office – Mixed Fuel + 135kW PV
CZ IOU territory
Elec Savings (kWh)
Gas Savings
(therms)
GHG savings (tons)
Incremental Package Cost
Lifecycle Energy Cost
Savings
Lifecycle TDV
Savings
B/C Ratio (On-bill)
B/C Ratio (TDV)
NPV (On-bill)
NPV (TDV)
Mixed Fuel +135kW PV CZ01 PG&E 177,340 0 34.3 $302,856 $526,352 $380,399 1.7 1.3 $223,497 $77,544 CZ02 PG&E 215,311 0 41.5 $302,856 $666,050 $471,705 2.2 1.6 $363,194 $168,849 CZ03 PG&E 209,717 0 40.7 $302,856 $645,010 $449,797 2.1 1.5 $342,154 $146,942 CZ04 PG&E 227,535 0 44.0 $302,856 $686,434 $497,431 2.3 1.6 $383,578 $194,575 CZ04-2 CPAU 227,535 0 44.0 $302,856 $537,521 $497,431 1.8 1.6 $234,665 $194,575 CZ05 PG&E 226,195 0 44.1 $302,856 $753,230 $486,596 2.5 1.6 $450,374 $183,741 CZ06 SCE 218,387 0 42.3 $302,856 $401,645 $492,515 1.3 1.6 $98,789 $189,659 CZ06-2 LADWP 218,387 0 42.3 $302,856 $233,909 $492,515 0.8 1.6 ($68,947) $189,659 CZ07 SDG&E 223,185 0 43.3 $302,856 $623,078 $496,667 2.1 1.6 $320,223 $193,811 CZ08 SCE 217,171 0 42.0 $302,856 $389,435 $510,270 1.3 1.7 $86,579 $207,414 CZ08-2 LADWP 217,171 0 42.0 $302,856 $222,066 $510,270 0.7 1.7 ($80,790) $207,414 CZ09 SCE 220,010 0 43.2 $302,856 $387,977 $505,783 1.3 1.7 $85,122 $202,928 CZ09-2 LADWP 220,010 0 43.2 $302,856 $226,516 $505,783 0.7 1.7 ($76,340) $202,928 CZ10 SDG&E 217,148 0 42.5 $302,856 $632,726 $485,451 2.1 1.6 $329,870 $182,595 CZ10-2 SCE 217,148 0 42.5 $302,856 $394,884 $485,451 1.3 1.6 $92,028 $182,595 CZ11 PG&E 211,556 0 40.9 $302,856 $671,691 $478,912 2.2 1.6 $368,835 $176,056 CZ12 PG&E 211,824 0 40.9 $302,856 $653,242 $478,101 2.2 1.6 $350,386 $175,245 CZ12-2 SMUD 211,824 0 40.9 $302,856 $345,255 $478,101 1.1 1.6 $42,399 $175,245 CZ13 PG&E 208,465 0 40.5 $302,856 $651,952 $462,732 2.2 1.5 $349,096 $159,876 CZ14 SDG&E 241,965 0 46.7 $302,856 $659,487 $566,351 2.2 1.9 $356,632 $263,496 CZ14-2 SCE 241,965 0 46.7 $302,856 $401,712 $566,351 1.3 1.9 $98,856 $263,496 CZ15 SCE 229,456 0 43.9 $302,856 $378,095 $520,102 1.2 1.7 $75,239 $217,246 CZ16 PG&E 229,317 0 44.8 $302,856 $707,095 $489,508 2.3 1.6 $404,239 $186,652 CZ16-2 LADWP 229,317 0 44.8 $302,856 $223,057 $489,508 0.7 1.6 ($79,799) $186,652
ATTACHMENT 6
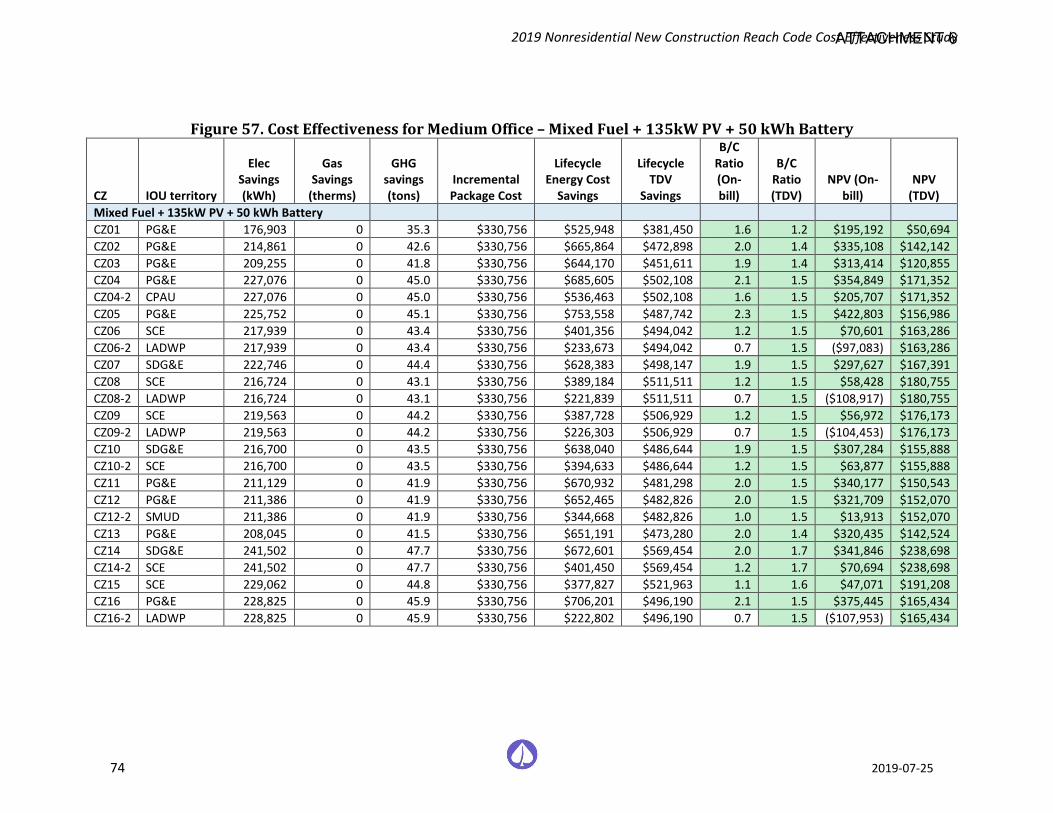
2019 Nonresidential New Construction Reach Code Cost Effectiveness Study
74 2019-07-25
Figure 57. Cost Effectiveness for Medium Office – Mixed Fuel + 135kW PV + 50 kWh Battery
CZ IOU territory
Elec Savings (kWh)
Gas Savings
(therms)
GHG savings (tons)
Incremental Package Cost
Lifecycle Energy Cost
Savings
Lifecycle TDV
Savings
B/C Ratio (On-bill)
B/C Ratio (TDV)
NPV (On-bill)
NPV (TDV)
Mixed Fuel + 135kW PV + 50 kWh Battery CZ01 PG&E 176,903 0 35.3 $330,756 $525,948 $381,450 1.6 1.2 $195,192 $50,694 CZ02 PG&E 214,861 0 42.6 $330,756 $665,864 $472,898 2.0 1.4 $335,108 $142,142 CZ03 PG&E 209,255 0 41.8 $330,756 $644,170 $451,611 1.9 1.4 $313,414 $120,855 CZ04 PG&E 227,076 0 45.0 $330,756 $685,605 $502,108 2.1 1.5 $354,849 $171,352 CZ04-2 CPAU 227,076 0 45.0 $330,756 $536,463 $502,108 1.6 1.5 $205,707 $171,352 CZ05 PG&E 225,752 0 45.1 $330,756 $753,558 $487,742 2.3 1.5 $422,803 $156,986 CZ06 SCE 217,939 0 43.4 $330,756 $401,356 $494,042 1.2 1.5 $70,601 $163,286 CZ06-2 LADWP 217,939 0 43.4 $330,756 $233,673 $494,042 0.7 1.5 ($97,083) $163,286 CZ07 SDG&E 222,746 0 44.4 $330,756 $628,383 $498,147 1.9 1.5 $297,627 $167,391 CZ08 SCE 216,724 0 43.1 $330,756 $389,184 $511,511 1.2 1.5 $58,428 $180,755 CZ08-2 LADWP 216,724 0 43.1 $330,756 $221,839 $511,511 0.7 1.5 ($108,917) $180,755 CZ09 SCE 219,563 0 44.2 $330,756 $387,728 $506,929 1.2 1.5 $56,972 $176,173 CZ09-2 LADWP 219,563 0 44.2 $330,756 $226,303 $506,929 0.7 1.5 ($104,453) $176,173 CZ10 SDG&E 216,700 0 43.5 $330,756 $638,040 $486,644 1.9 1.5 $307,284 $155,888 CZ10-2 SCE 216,700 0 43.5 $330,756 $394,633 $486,644 1.2 1.5 $63,877 $155,888 CZ11 PG&E 211,129 0 41.9 $330,756 $670,932 $481,298 2.0 1.5 $340,177 $150,543 CZ12 PG&E 211,386 0 41.9 $330,756 $652,465 $482,826 2.0 1.5 $321,709 $152,070 CZ12-2 SMUD 211,386 0 41.9 $330,756 $344,668 $482,826 1.0 1.5 $13,913 $152,070 CZ13 PG&E 208,045 0 41.5 $330,756 $651,191 $473,280 2.0 1.4 $320,435 $142,524 CZ14 SDG&E 241,502 0 47.7 $330,756 $672,601 $569,454 2.0 1.7 $341,846 $238,698 CZ14-2 SCE 241,502 0 47.7 $330,756 $401,450 $569,454 1.2 1.7 $70,694 $238,698 CZ15 SCE 229,062 0 44.8 $330,756 $377,827 $521,963 1.1 1.6 $47,071 $191,208 CZ16 PG&E 228,825 0 45.9 $330,756 $706,201 $496,190 2.1 1.5 $375,445 $165,434 CZ16-2 LADWP 228,825 0 45.9 $330,756 $222,802 $496,190 0.7 1.5 ($107,953) $165,434
ATTACHMENT 6
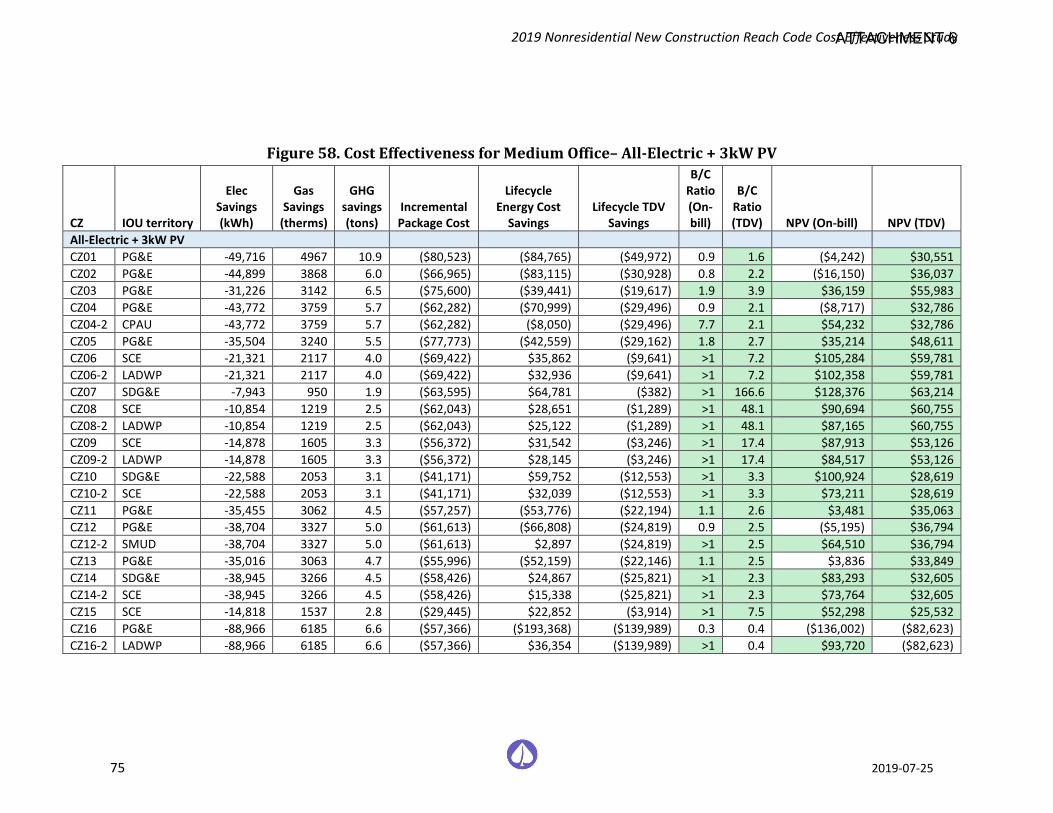
2019 Nonresidential New Construction Reach Code Cost Effectiveness Study
75 2019-07-25
Figure 58. Cost Effectiveness for Medium Office– All-Electric + 3kW PV
CZ IOU territory
Elec Savings (kWh)
Gas Savings
(therms)
GHG savings (tons)
Incremental Package Cost
Lifecycle Energy Cost
Savings Lifecycle TDV
Savings
B/C Ratio (On-bill)
B/C Ratio (TDV) NPV (On-bill) NPV (TDV)
All-Electric + 3kW PV CZ01 PG&E -49,716 4967 10.9 ($80,523) ($84,765) ($49,972) 0.9 1.6 ($4,242) $30,551 CZ02 PG&E -44,899 3868 6.0 ($66,965) ($83,115) ($30,928) 0.8 2.2 ($16,150) $36,037 CZ03 PG&E -31,226 3142 6.5 ($75,600) ($39,441) ($19,617) 1.9 3.9 $36,159 $55,983 CZ04 PG&E -43,772 3759 5.7 ($62,282) ($70,999) ($29,496) 0.9 2.1 ($8,717) $32,786 CZ04-2 CPAU -43,772 3759 5.7 ($62,282) ($8,050) ($29,496) 7.7 2.1 $54,232 $32,786 CZ05 PG&E -35,504 3240 5.5 ($77,773) ($42,559) ($29,162) 1.8 2.7 $35,214 $48,611 CZ06 SCE -21,321 2117 4.0 ($69,422) $35,862 ($9,641) >1 7.2 $105,284 $59,781 CZ06-2 LADWP -21,321 2117 4.0 ($69,422) $32,936 ($9,641) >1 7.2 $102,358 $59,781 CZ07 SDG&E -7,943 950 1.9 ($63,595) $64,781 ($382) >1 166.6 $128,376 $63,214 CZ08 SCE -10,854 1219 2.5 ($62,043) $28,651 ($1,289) >1 48.1 $90,694 $60,755 CZ08-2 LADWP -10,854 1219 2.5 ($62,043) $25,122 ($1,289) >1 48.1 $87,165 $60,755 CZ09 SCE -14,878 1605 3.3 ($56,372) $31,542 ($3,246) >1 17.4 $87,913 $53,126 CZ09-2 LADWP -14,878 1605 3.3 ($56,372) $28,145 ($3,246) >1 17.4 $84,517 $53,126 CZ10 SDG&E -22,588 2053 3.1 ($41,171) $59,752 ($12,553) >1 3.3 $100,924 $28,619 CZ10-2 SCE -22,588 2053 3.1 ($41,171) $32,039 ($12,553) >1 3.3 $73,211 $28,619 CZ11 PG&E -35,455 3062 4.5 ($57,257) ($53,776) ($22,194) 1.1 2.6 $3,481 $35,063 CZ12 PG&E -38,704 3327 5.0 ($61,613) ($66,808) ($24,819) 0.9 2.5 ($5,195) $36,794 CZ12-2 SMUD -38,704 3327 5.0 ($61,613) $2,897 ($24,819) >1 2.5 $64,510 $36,794 CZ13 PG&E -35,016 3063 4.7 ($55,996) ($52,159) ($22,146) 1.1 2.5 $3,836 $33,849 CZ14 SDG&E -38,945 3266 4.5 ($58,426) $24,867 ($25,821) >1 2.3 $83,293 $32,605 CZ14-2 SCE -38,945 3266 4.5 ($58,426) $15,338 ($25,821) >1 2.3 $73,764 $32,605 CZ15 SCE -14,818 1537 2.8 ($29,445) $22,852 ($3,914) >1 7.5 $52,298 $25,532 CZ16 PG&E -88,966 6185 6.6 ($57,366) ($193,368) ($139,989) 0.3 0.4 ($136,002) ($82,623) CZ16-2 LADWP -88,966 6185 6.6 ($57,366) $36,354 ($139,989) >1 0.4 $93,720 ($82,623)
ATTACHMENT 6
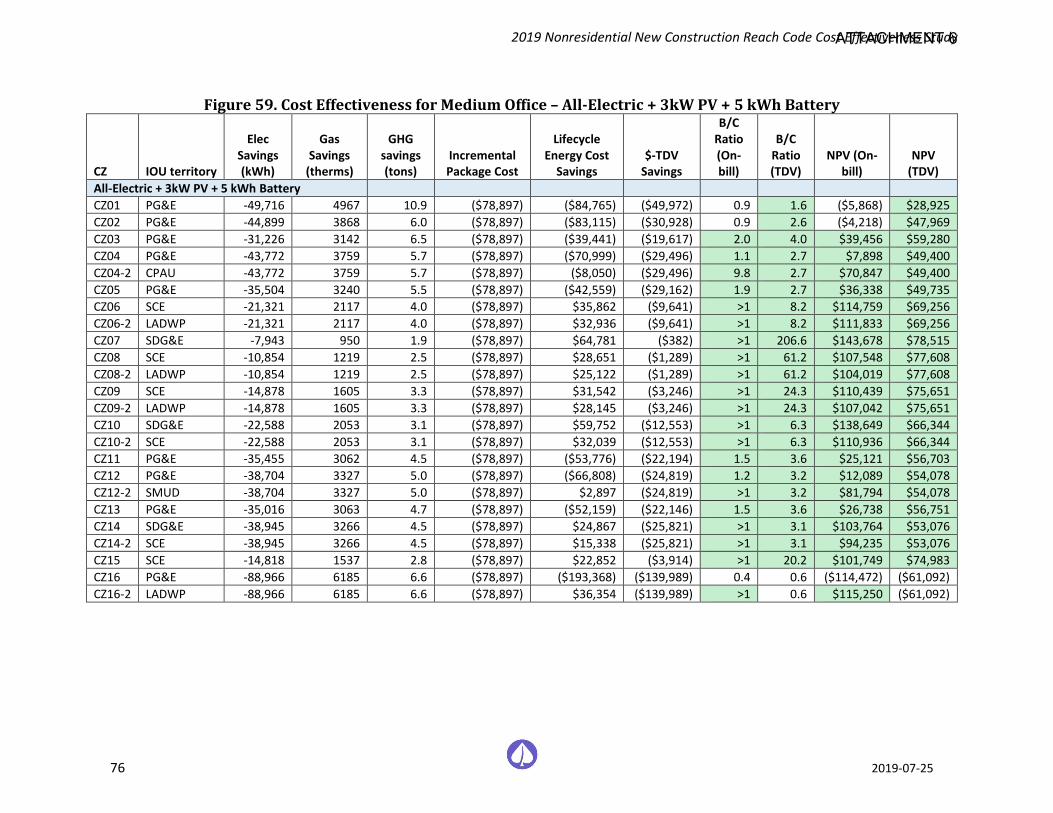
2019 Nonresidential New Construction Reach Code Cost Effectiveness Study
76 2019-07-25
Figure 59. Cost Effectiveness for Medium Office – All-Electric + 3kW PV + 5 kWh Battery
CZ IOU territory
Elec Savings (kWh)
Gas Savings
(therms)
GHG savings (tons)
Incremental Package Cost
Lifecycle Energy Cost
Savings $-TDV
Savings
B/C Ratio (On-bill)
B/C Ratio (TDV)
NPV (On-bill)
NPV (TDV)
All-Electric + 3kW PV + 5 kWh Battery CZ01 PG&E -49,716 4967 10.9 ($78,897) ($84,765) ($49,972) 0.9 1.6 ($5,868) $28,925 CZ02 PG&E -44,899 3868 6.0 ($78,897) ($83,115) ($30,928) 0.9 2.6 ($4,218) $47,969 CZ03 PG&E -31,226 3142 6.5 ($78,897) ($39,441) ($19,617) 2.0 4.0 $39,456 $59,280 CZ04 PG&E -43,772 3759 5.7 ($78,897) ($70,999) ($29,496) 1.1 2.7 $7,898 $49,400 CZ04-2 CPAU -43,772 3759 5.7 ($78,897) ($8,050) ($29,496) 9.8 2.7 $70,847 $49,400 CZ05 PG&E -35,504 3240 5.5 ($78,897) ($42,559) ($29,162) 1.9 2.7 $36,338 $49,735 CZ06 SCE -21,321 2117 4.0 ($78,897) $35,862 ($9,641) >1 8.2 $114,759 $69,256 CZ06-2 LADWP -21,321 2117 4.0 ($78,897) $32,936 ($9,641) >1 8.2 $111,833 $69,256 CZ07 SDG&E -7,943 950 1.9 ($78,897) $64,781 ($382) >1 206.6 $143,678 $78,515 CZ08 SCE -10,854 1219 2.5 ($78,897) $28,651 ($1,289) >1 61.2 $107,548 $77,608 CZ08-2 LADWP -10,854 1219 2.5 ($78,897) $25,122 ($1,289) >1 61.2 $104,019 $77,608 CZ09 SCE -14,878 1605 3.3 ($78,897) $31,542 ($3,246) >1 24.3 $110,439 $75,651 CZ09-2 LADWP -14,878 1605 3.3 ($78,897) $28,145 ($3,246) >1 24.3 $107,042 $75,651 CZ10 SDG&E -22,588 2053 3.1 ($78,897) $59,752 ($12,553) >1 6.3 $138,649 $66,344 CZ10-2 SCE -22,588 2053 3.1 ($78,897) $32,039 ($12,553) >1 6.3 $110,936 $66,344 CZ11 PG&E -35,455 3062 4.5 ($78,897) ($53,776) ($22,194) 1.5 3.6 $25,121 $56,703 CZ12 PG&E -38,704 3327 5.0 ($78,897) ($66,808) ($24,819) 1.2 3.2 $12,089 $54,078 CZ12-2 SMUD -38,704 3327 5.0 ($78,897) $2,897 ($24,819) >1 3.2 $81,794 $54,078 CZ13 PG&E -35,016 3063 4.7 ($78,897) ($52,159) ($22,146) 1.5 3.6 $26,738 $56,751 CZ14 SDG&E -38,945 3266 4.5 ($78,897) $24,867 ($25,821) >1 3.1 $103,764 $53,076 CZ14-2 SCE -38,945 3266 4.5 ($78,897) $15,338 ($25,821) >1 3.1 $94,235 $53,076 CZ15 SCE -14,818 1537 2.8 ($78,897) $22,852 ($3,914) >1 20.2 $101,749 $74,983 CZ16 PG&E -88,966 6185 6.6 ($78,897) ($193,368) ($139,989) 0.4 0.6 ($114,472) ($61,092) CZ16-2 LADWP -88,966 6185 6.6 ($78,897) $36,354 ($139,989) >1 0.6 $115,250 ($61,092)
ATTACHMENT 6
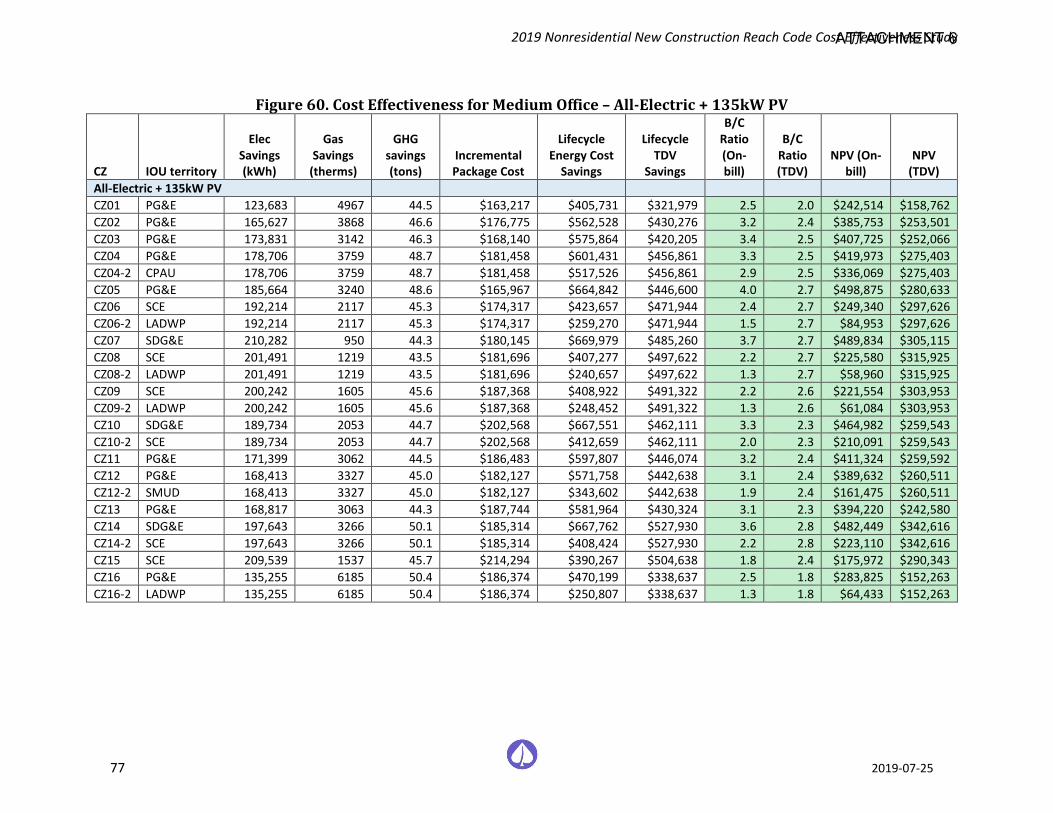
2019 Nonresidential New Construction Reach Code Cost Effectiveness Study
77 2019-07-25
Figure 60. Cost Effectiveness for Medium Office – All-Electric + 135kW PV
CZ IOU territory
Elec Savings (kWh)
Gas Savings
(therms)
GHG savings (tons)
Incremental Package Cost
Lifecycle Energy Cost
Savings
Lifecycle TDV
Savings
B/C Ratio (On-bill)
B/C Ratio (TDV)
NPV (On-bill)
NPV (TDV)
All-Electric + 135kW PV CZ01 PG&E 123,683 4967 44.5 $163,217 $405,731 $321,979 2.5 2.0 $242,514 $158,762 CZ02 PG&E 165,627 3868 46.6 $176,775 $562,528 $430,276 3.2 2.4 $385,753 $253,501 CZ03 PG&E 173,831 3142 46.3 $168,140 $575,864 $420,205 3.4 2.5 $407,725 $252,066 CZ04 PG&E 178,706 3759 48.7 $181,458 $601,431 $456,861 3.3 2.5 $419,973 $275,403 CZ04-2 CPAU 178,706 3759 48.7 $181,458 $517,526 $456,861 2.9 2.5 $336,069 $275,403 CZ05 PG&E 185,664 3240 48.6 $165,967 $664,842 $446,600 4.0 2.7 $498,875 $280,633 CZ06 SCE 192,214 2117 45.3 $174,317 $423,657 $471,944 2.4 2.7 $249,340 $297,626 CZ06-2 LADWP 192,214 2117 45.3 $174,317 $259,270 $471,944 1.5 2.7 $84,953 $297,626 CZ07 SDG&E 210,282 950 44.3 $180,145 $669,979 $485,260 3.7 2.7 $489,834 $305,115 CZ08 SCE 201,491 1219 43.5 $181,696 $407,277 $497,622 2.2 2.7 $225,580 $315,925 CZ08-2 LADWP 201,491 1219 43.5 $181,696 $240,657 $497,622 1.3 2.7 $58,960 $315,925 CZ09 SCE 200,242 1605 45.6 $187,368 $408,922 $491,322 2.2 2.6 $221,554 $303,953 CZ09-2 LADWP 200,242 1605 45.6 $187,368 $248,452 $491,322 1.3 2.6 $61,084 $303,953 CZ10 SDG&E 189,734 2053 44.7 $202,568 $667,551 $462,111 3.3 2.3 $464,982 $259,543 CZ10-2 SCE 189,734 2053 44.7 $202,568 $412,659 $462,111 2.0 2.3 $210,091 $259,543 CZ11 PG&E 171,399 3062 44.5 $186,483 $597,807 $446,074 3.2 2.4 $411,324 $259,592 CZ12 PG&E 168,413 3327 45.0 $182,127 $571,758 $442,638 3.1 2.4 $389,632 $260,511 CZ12-2 SMUD 168,413 3327 45.0 $182,127 $343,602 $442,638 1.9 2.4 $161,475 $260,511 CZ13 PG&E 168,817 3063 44.3 $187,744 $581,964 $430,324 3.1 2.3 $394,220 $242,580 CZ14 SDG&E 197,643 3266 50.1 $185,314 $667,762 $527,930 3.6 2.8 $482,449 $342,616 CZ14-2 SCE 197,643 3266 50.1 $185,314 $408,424 $527,930 2.2 2.8 $223,110 $342,616 CZ15 SCE 209,539 1537 45.7 $214,294 $390,267 $504,638 1.8 2.4 $175,972 $290,343 CZ16 PG&E 135,255 6185 50.4 $186,374 $470,199 $338,637 2.5 1.8 $283,825 $152,263 CZ16-2 LADWP 135,255 6185 50.4 $186,374 $250,807 $338,637 1.3 1.8 $64,433 $152,263
ATTACHMENT 6

2019 Nonresidential New Construction Reach Code Cost Effectiveness Study
78 2019-07-25
Figure 61. Cost Effectiveness for Medium Office – All-Electric + 135kW PV + 50 kWh Battery
CZ IOU territory
Elec Savings (kWh)
Gas Savings
(therms)
GHG savings (tons)
Incremental Package Cost
Lifecycle Energy Cost
Savings
Lifecycle TDV
Savings
B/C Ratio (On-bill)
B/C Ratio (TDV)
NPV (On-bill)
NPV (TDV)
All-Electric + 135kW PV + 50 kWh Battery CZ01 PG&E 123,280 4967 45.4 $191,117 $404,994 $323,077 2.1 1.7 $213,877 $131,960 CZ02 PG&E 165,200 3868 47.7 $204,675 $561,747 $431,469 2.7 2.1 $357,072 $226,795 CZ03 PG&E 173,384 3142 47.4 $196,040 $575,043 $422,019 2.9 2.2 $379,003 $225,979 CZ04 PG&E 178,259 3759 49.8 $209,358 $600,621 $461,634 2.9 2.2 $391,263 $252,276 CZ04-2 CPAU 178,259 3759 49.8 $209,358 $516,495 $461,634 2.5 2.2 $307,137 $252,276 CZ05 PG&E 185,229 3240 49.7 $193,867 $664,046 $447,793 3.4 2.3 $470,179 $253,926 CZ06 SCE 191,767 2117 46.5 $202,217 $423,369 $473,519 2.1 2.3 $221,152 $271,301 CZ06-2 LADWP 191,767 2117 46.5 $202,217 $259,033 $473,519 1.3 2.3 $56,816 $271,301 CZ07 SDG&E 209,848 950 45.4 $208,045 $675,307 $486,787 3.2 2.3 $467,262 $278,743 CZ08 SCE 201,047 1219 44.7 $209,596 $407,027 $498,910 1.9 2.4 $197,430 $289,314 CZ08-2 LADWP 201,047 1219 44.7 $209,596 $240,432 $498,910 1.1 2.4 $30,835 $289,314 CZ09 SCE 199,802 1605 46.6 $215,268 $408,676 $492,515 1.9 2.3 $193,408 $277,246 CZ09-2 LADWP 199,802 1605 46.6 $215,268 $248,242 $492,515 1.2 2.3 $32,974 $277,246 CZ10 SDG&E 189,293 2053 45.7 $230,468 $672,867 $463,352 2.9 2.0 $442,399 $232,884 CZ10-2 SCE 189,293 2053 45.7 $230,468 $412,412 $463,352 1.8 2.0 $181,944 $232,884 CZ11 PG&E 170,987 3062 45.5 $214,383 $597,062 $448,509 2.8 2.1 $382,680 $234,126 CZ12 PG&E 167,995 3327 46.0 $210,027 $571,002 $447,411 2.7 2.1 $360,975 $237,384 CZ12-2 SMUD 167,995 3327 46.0 $210,027 $343,043 $447,411 1.6 2.1 $133,017 $237,384 CZ13 PG&E 168,408 3063 45.3 $215,644 $581,225 $440,920 2.7 2.0 $365,580 $225,275 CZ14 SDG&E 197,188 3266 51.2 $213,214 $680,893 $531,080 3.2 2.5 $467,679 $317,866 CZ14-2 SCE 197,188 3266 51.2 $213,214 $408,166 $531,080 1.9 2.5 $194,952 $317,866 CZ15 SCE 209,148 1537 46.6 $242,194 $390,000 $506,499 1.6 2.1 $147,806 $264,305 CZ16 PG&E 134,809 6185 51.4 $214,274 $469,378 $341,978 2.2 1.6 $255,105 $127,704 CZ16-2 LADWP 134,809 6185 51.4 $214,274 $250,580 $341,978 1.2 1.6 $36,306 $127,704
ATTACHMENT 6
2019 Nonresidential New Construction Reach Code Cost Effectiveness Study
79 2019-07-25
6.7.2 Cost Effectiveness Results – Medium Retail Figure 62 through Figure 69 contain the cost-effectiveness findings for the Medium Retail packages. Notable findings for each package include:
♦ Mixed-Fuel + 3 kW PV: Packages are cost effective and achieve savings for all climate zones using the On-Bill and TDV approaches.
♦ Mixed-Fuel + 3 kW PV + 5 kWh Battery: The packages are less cost effective as compared to the 3 kW PV only package and not cost effective for LADWP and SMUD service area.
♦ Mixed-Fuel + PV only: Packages achieve positive energy cost savings and are cost effective using the On-Bill approach for all climate zones except for LADWP territory (CZs 6, 8, 9 and 16). Packages achieve positive savings and are cost effective using the TDV approach for all climate zones.
♦ Mixed Fuel + PV + 5 kWh Battery: Adding battery slightly reduces On-Bill B/C ratios but is still cost effective for all climate zones except for LADWP territory. Packages achieve savings and cost effective using the TDV approach for all climate zones.
♦ All-Electric + 3 kW PV: Packages are cost effective using the On-Bill and TDV approach for all climate zones except for CZ16 under PG&E service.
♦ All-Electric + 3 kW PV + 5 kWh Battery: Similar to minimal PV only package, adding battery is cost effective as well using the On-Bill and TDV approach for all climate zones except for CZ16 under PG&E service.
♦ All-Electric + PV only: Packages are cost effective and achieve savings in all climate zones for both the On-Bill and TDV approaches
♦ All-Electric + PV + 50 kWh Battery: Adding battery slightly reduces B/C ratios for both the On-Bill and TDV approaches. Packages are not cost effective for all climate zones except CZ6, CZ8 and CZ9 under LADWP service area.
ATTACHMENT 6
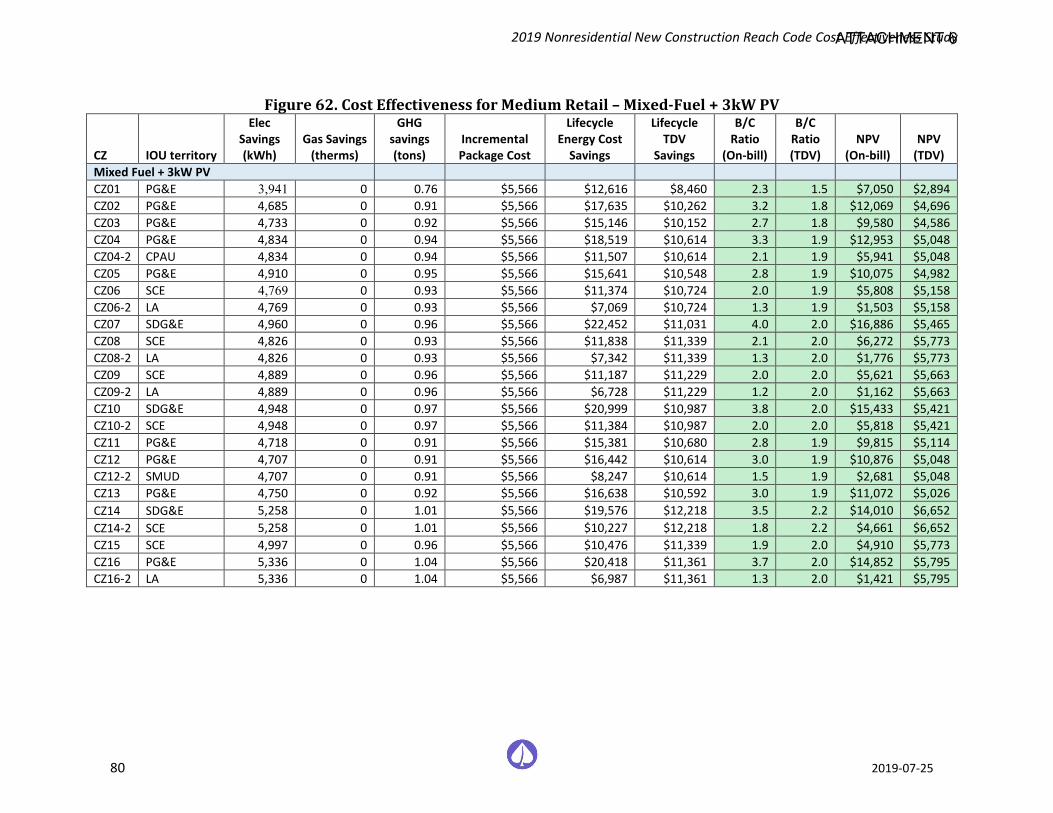
2019 Nonresidential New Construction Reach Code Cost Effectiveness Study
80 2019-07-25
Figure 62. Cost Effectiveness for Medium Retail – Mixed-Fuel + 3kW PV
CZ IOU territory
Elec Savings (kWh)
Gas Savings (therms)
GHG savings (tons)
Incremental Package Cost
Lifecycle Energy Cost
Savings
Lifecycle TDV
Savings
B/C Ratio
(On-bill)
B/C Ratio (TDV)
NPV (On-bill)
NPV (TDV)
Mixed Fuel + 3kW PV CZ01 PG&E 3,941 0 0.76 $5,566 $12,616 $8,460 2.3 1.5 $7,050 $2,894 CZ02 PG&E 4,685 0 0.91 $5,566 $17,635 $10,262 3.2 1.8 $12,069 $4,696 CZ03 PG&E 4,733 0 0.92 $5,566 $15,146 $10,152 2.7 1.8 $9,580 $4,586 CZ04 PG&E 4,834 0 0.94 $5,566 $18,519 $10,614 3.3 1.9 $12,953 $5,048 CZ04-2 CPAU 4,834 0 0.94 $5,566 $11,507 $10,614 2.1 1.9 $5,941 $5,048 CZ05 PG&E 4,910 0 0.95 $5,566 $15,641 $10,548 2.8 1.9 $10,075 $4,982 CZ06 SCE 4,769 0 0.93 $5,566 $11,374 $10,724 2.0 1.9 $5,808 $5,158 CZ06-2 LA 4,769 0 0.93 $5,566 $7,069 $10,724 1.3 1.9 $1,503 $5,158 CZ07 SDG&E 4,960 0 0.96 $5,566 $22,452 $11,031 4.0 2.0 $16,886 $5,465 CZ08 SCE 4,826 0 0.93 $5,566 $11,838 $11,339 2.1 2.0 $6,272 $5,773 CZ08-2 LA 4,826 0 0.93 $5,566 $7,342 $11,339 1.3 2.0 $1,776 $5,773 CZ09 SCE 4,889 0 0.96 $5,566 $11,187 $11,229 2.0 2.0 $5,621 $5,663 CZ09-2 LA 4,889 0 0.96 $5,566 $6,728 $11,229 1.2 2.0 $1,162 $5,663 CZ10 SDG&E 4,948 0 0.97 $5,566 $20,999 $10,987 3.8 2.0 $15,433 $5,421 CZ10-2 SCE 4,948 0 0.97 $5,566 $11,384 $10,987 2.0 2.0 $5,818 $5,421 CZ11 PG&E 4,718 0 0.91 $5,566 $15,381 $10,680 2.8 1.9 $9,815 $5,114 CZ12 PG&E 4,707 0 0.91 $5,566 $16,442 $10,614 3.0 1.9 $10,876 $5,048 CZ12-2 SMUD 4,707 0 0.91 $5,566 $8,247 $10,614 1.5 1.9 $2,681 $5,048 CZ13 PG&E 4,750 0 0.92 $5,566 $16,638 $10,592 3.0 1.9 $11,072 $5,026 CZ14 SDG&E 5,258 0 1.01 $5,566 $19,576 $12,218 3.5 2.2 $14,010 $6,652 CZ14-2 SCE 5,258 0 1.01 $5,566 $10,227 $12,218 1.8 2.2 $4,661 $6,652 CZ15 SCE 4,997 0 0.96 $5,566 $10,476 $11,339 1.9 2.0 $4,910 $5,773 CZ16 PG&E 5,336 0 1.04 $5,566 $20,418 $11,361 3.7 2.0 $14,852 $5,795 CZ16-2 LA 5,336 0 1.04 $5,566 $6,987 $11,361 1.3 2.0 $1,421 $5,795
ATTACHMENT 6
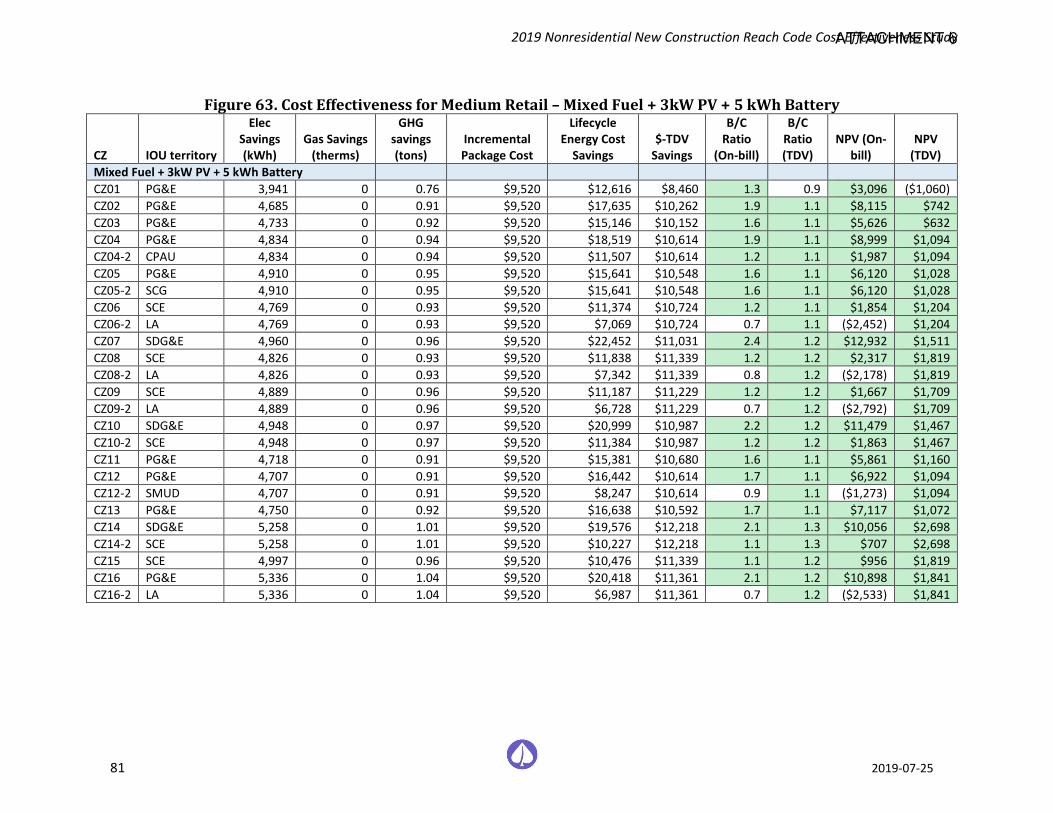
2019 Nonresidential New Construction Reach Code Cost Effectiveness Study
81 2019-07-25
Figure 63. Cost Effectiveness for Medium Retail – Mixed Fuel + 3kW PV + 5 kWh Battery
CZ IOU territory
Elec Savings (kWh)
Gas Savings (therms)
GHG savings (tons)
Incremental Package Cost
Lifecycle Energy Cost
Savings $-TDV
Savings
B/C Ratio
(On-bill)
B/C Ratio (TDV)
NPV (On-bill)
NPV (TDV)
Mixed Fuel + 3kW PV + 5 kWh Battery CZ01 PG&E 3,941 0 0.76 $9,520 $12,616 $8,460 1.3 0.9 $3,096 ($1,060) CZ02 PG&E 4,685 0 0.91 $9,520 $17,635 $10,262 1.9 1.1 $8,115 $742 CZ03 PG&E 4,733 0 0.92 $9,520 $15,146 $10,152 1.6 1.1 $5,626 $632 CZ04 PG&E 4,834 0 0.94 $9,520 $18,519 $10,614 1.9 1.1 $8,999 $1,094 CZ04-2 CPAU 4,834 0 0.94 $9,520 $11,507 $10,614 1.2 1.1 $1,987 $1,094 CZ05 PG&E 4,910 0 0.95 $9,520 $15,641 $10,548 1.6 1.1 $6,120 $1,028 CZ05-2 SCG 4,910 0 0.95 $9,520 $15,641 $10,548 1.6 1.1 $6,120 $1,028 CZ06 SCE 4,769 0 0.93 $9,520 $11,374 $10,724 1.2 1.1 $1,854 $1,204 CZ06-2 LA 4,769 0 0.93 $9,520 $7,069 $10,724 0.7 1.1 ($2,452) $1,204 CZ07 SDG&E 4,960 0 0.96 $9,520 $22,452 $11,031 2.4 1.2 $12,932 $1,511 CZ08 SCE 4,826 0 0.93 $9,520 $11,838 $11,339 1.2 1.2 $2,317 $1,819 CZ08-2 LA 4,826 0 0.93 $9,520 $7,342 $11,339 0.8 1.2 ($2,178) $1,819 CZ09 SCE 4,889 0 0.96 $9,520 $11,187 $11,229 1.2 1.2 $1,667 $1,709 CZ09-2 LA 4,889 0 0.96 $9,520 $6,728 $11,229 0.7 1.2 ($2,792) $1,709 CZ10 SDG&E 4,948 0 0.97 $9,520 $20,999 $10,987 2.2 1.2 $11,479 $1,467 CZ10-2 SCE 4,948 0 0.97 $9,520 $11,384 $10,987 1.2 1.2 $1,863 $1,467 CZ11 PG&E 4,718 0 0.91 $9,520 $15,381 $10,680 1.6 1.1 $5,861 $1,160 CZ12 PG&E 4,707 0 0.91 $9,520 $16,442 $10,614 1.7 1.1 $6,922 $1,094 CZ12-2 SMUD 4,707 0 0.91 $9,520 $8,247 $10,614 0.9 1.1 ($1,273) $1,094 CZ13 PG&E 4,750 0 0.92 $9,520 $16,638 $10,592 1.7 1.1 $7,117 $1,072 CZ14 SDG&E 5,258 0 1.01 $9,520 $19,576 $12,218 2.1 1.3 $10,056 $2,698 CZ14-2 SCE 5,258 0 1.01 $9,520 $10,227 $12,218 1.1 1.3 $707 $2,698 CZ15 SCE 4,997 0 0.96 $9,520 $10,476 $11,339 1.1 1.2 $956 $1,819 CZ16 PG&E 5,336 0 1.04 $9,520 $20,418 $11,361 2.1 1.2 $10,898 $1,841 CZ16-2 LA 5,336 0 1.04 $9,520 $6,987 $11,361 0.7 1.2 ($2,533) $1,841
ATTACHMENT 6
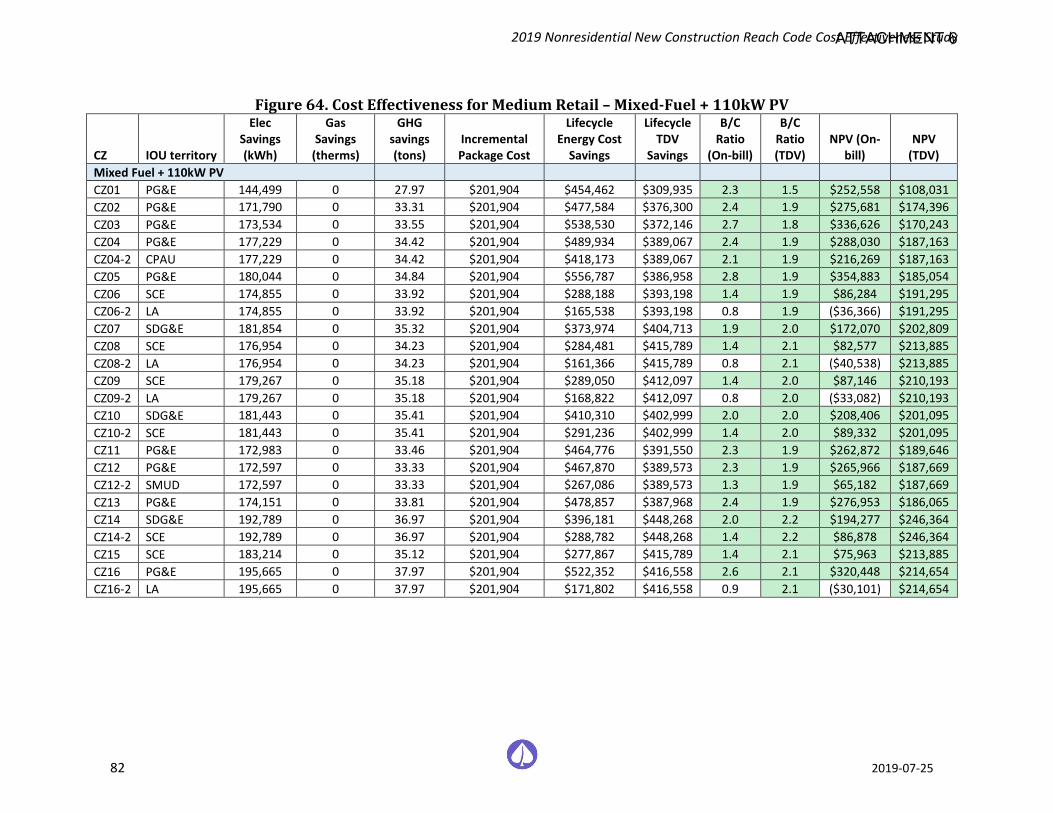
2019 Nonresidential New Construction Reach Code Cost Effectiveness Study
82 2019-07-25
Figure 64. Cost Effectiveness for Medium Retail – Mixed-Fuel + 110kW PV
CZ IOU territory
Elec Savings (kWh)
Gas Savings
(therms)
GHG savings (tons)
Incremental Package Cost
Lifecycle Energy Cost
Savings
Lifecycle TDV
Savings
B/C Ratio
(On-bill)
B/C Ratio (TDV)
NPV (On-bill)
NPV (TDV)
Mixed Fuel + 110kW PV CZ01 PG&E 144,499 0 27.97 $201,904 $454,462 $309,935 2.3 1.5 $252,558 $108,031 CZ02 PG&E 171,790 0 33.31 $201,904 $477,584 $376,300 2.4 1.9 $275,681 $174,396 CZ03 PG&E 173,534 0 33.55 $201,904 $538,530 $372,146 2.7 1.8 $336,626 $170,243 CZ04 PG&E 177,229 0 34.42 $201,904 $489,934 $389,067 2.4 1.9 $288,030 $187,163 CZ04-2 CPAU 177,229 0 34.42 $201,904 $418,173 $389,067 2.1 1.9 $216,269 $187,163 CZ05 PG&E 180,044 0 34.84 $201,904 $556,787 $386,958 2.8 1.9 $354,883 $185,054 CZ06 SCE 174,855 0 33.92 $201,904 $288,188 $393,198 1.4 1.9 $86,284 $191,295 CZ06-2 LA 174,855 0 33.92 $201,904 $165,538 $393,198 0.8 1.9 ($36,366) $191,295 CZ07 SDG&E 181,854 0 35.32 $201,904 $373,974 $404,713 1.9 2.0 $172,070 $202,809 CZ08 SCE 176,954 0 34.23 $201,904 $284,481 $415,789 1.4 2.1 $82,577 $213,885 CZ08-2 LA 176,954 0 34.23 $201,904 $161,366 $415,789 0.8 2.1 ($40,538) $213,885 CZ09 SCE 179,267 0 35.18 $201,904 $289,050 $412,097 1.4 2.0 $87,146 $210,193 CZ09-2 LA 179,267 0 35.18 $201,904 $168,822 $412,097 0.8 2.0 ($33,082) $210,193 CZ10 SDG&E 181,443 0 35.41 $201,904 $410,310 $402,999 2.0 2.0 $208,406 $201,095 CZ10-2 SCE 181,443 0 35.41 $201,904 $291,236 $402,999 1.4 2.0 $89,332 $201,095 CZ11 PG&E 172,983 0 33.46 $201,904 $464,776 $391,550 2.3 1.9 $262,872 $189,646 CZ12 PG&E 172,597 0 33.33 $201,904 $467,870 $389,573 2.3 1.9 $265,966 $187,669 CZ12-2 SMUD 172,597 0 33.33 $201,904 $267,086 $389,573 1.3 1.9 $65,182 $187,669 CZ13 PG&E 174,151 0 33.81 $201,904 $478,857 $387,968 2.4 1.9 $276,953 $186,065 CZ14 SDG&E 192,789 0 36.97 $201,904 $396,181 $448,268 2.0 2.2 $194,277 $246,364 CZ14-2 SCE 192,789 0 36.97 $201,904 $288,782 $448,268 1.4 2.2 $86,878 $246,364 CZ15 SCE 183,214 0 35.12 $201,904 $277,867 $415,789 1.4 2.1 $75,963 $213,885 CZ16 PG&E 195,665 0 37.97 $201,904 $522,352 $416,558 2.6 2.1 $320,448 $214,654 CZ16-2 LA 195,665 0 37.97 $201,904 $171,802 $416,558 0.9 2.1 ($30,101) $214,654
ATTACHMENT 6
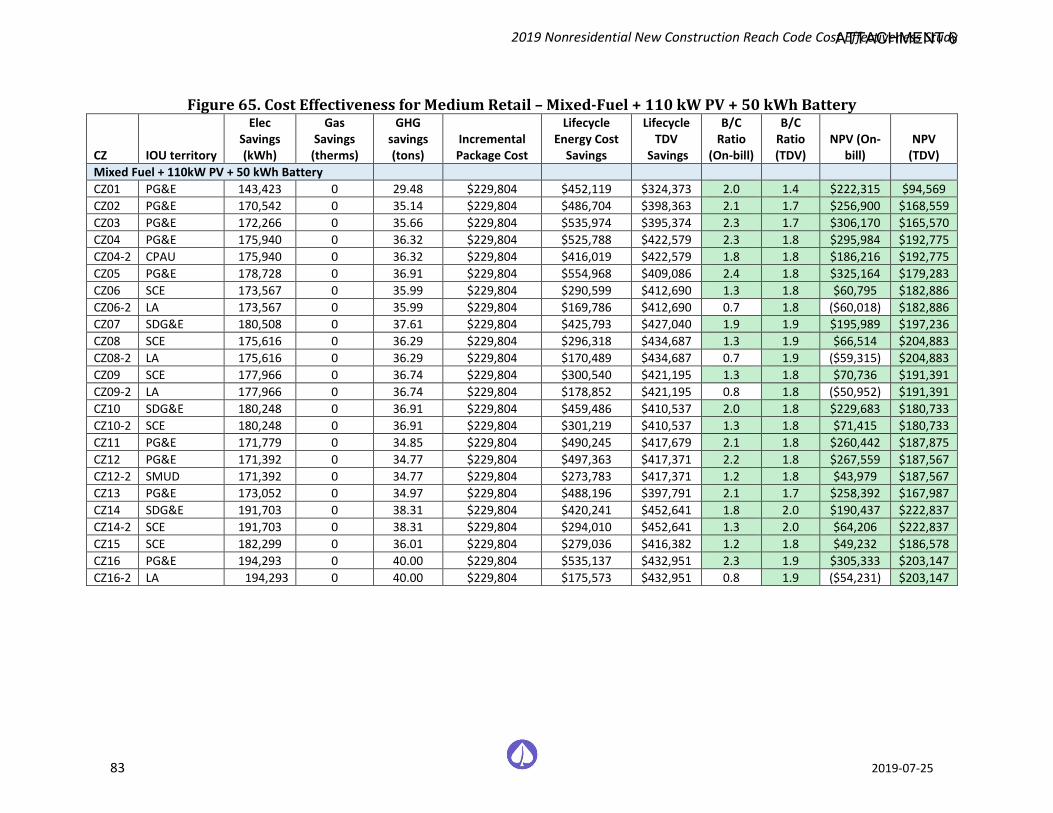
2019 Nonresidential New Construction Reach Code Cost Effectiveness Study
83 2019-07-25
Figure 65. Cost Effectiveness for Medium Retail – Mixed-Fuel + 110 kW PV + 50 kWh Battery
CZ IOU territory
Elec Savings (kWh)
Gas Savings
(therms)
GHG savings (tons)
Incremental Package Cost
Lifecycle Energy Cost
Savings
Lifecycle TDV
Savings
B/C Ratio
(On-bill)
B/C Ratio (TDV)
NPV (On-bill)
NPV (TDV)
Mixed Fuel + 110kW PV + 50 kWh Battery CZ01 PG&E 143,423 0 29.48 $229,804 $452,119 $324,373 2.0 1.4 $222,315 $94,569 CZ02 PG&E 170,542 0 35.14 $229,804 $486,704 $398,363 2.1 1.7 $256,900 $168,559 CZ03 PG&E 172,266 0 35.66 $229,804 $535,974 $395,374 2.3 1.7 $306,170 $165,570 CZ04 PG&E 175,940 0 36.32 $229,804 $525,788 $422,579 2.3 1.8 $295,984 $192,775 CZ04-2 CPAU 175,940 0 36.32 $229,804 $416,019 $422,579 1.8 1.8 $186,216 $192,775 CZ05 PG&E 178,728 0 36.91 $229,804 $554,968 $409,086 2.4 1.8 $325,164 $179,283 CZ06 SCE 173,567 0 35.99 $229,804 $290,599 $412,690 1.3 1.8 $60,795 $182,886 CZ06-2 LA 173,567 0 35.99 $229,804 $169,786 $412,690 0.7 1.8 ($60,018) $182,886 CZ07 SDG&E 180,508 0 37.61 $229,804 $425,793 $427,040 1.9 1.9 $195,989 $197,236 CZ08 SCE 175,616 0 36.29 $229,804 $296,318 $434,687 1.3 1.9 $66,514 $204,883 CZ08-2 LA 175,616 0 36.29 $229,804 $170,489 $434,687 0.7 1.9 ($59,315) $204,883 CZ09 SCE 177,966 0 36.74 $229,804 $300,540 $421,195 1.3 1.8 $70,736 $191,391 CZ09-2 LA 177,966 0 36.74 $229,804 $178,852 $421,195 0.8 1.8 ($50,952) $191,391 CZ10 SDG&E 180,248 0 36.91 $229,804 $459,486 $410,537 2.0 1.8 $229,683 $180,733 CZ10-2 SCE 180,248 0 36.91 $229,804 $301,219 $410,537 1.3 1.8 $71,415 $180,733 CZ11 PG&E 171,779 0 34.85 $229,804 $490,245 $417,679 2.1 1.8 $260,442 $187,875 CZ12 PG&E 171,392 0 34.77 $229,804 $497,363 $417,371 2.2 1.8 $267,559 $187,567 CZ12-2 SMUD 171,392 0 34.77 $229,804 $273,783 $417,371 1.2 1.8 $43,979 $187,567 CZ13 PG&E 173,052 0 34.97 $229,804 $488,196 $397,791 2.1 1.7 $258,392 $167,987 CZ14 SDG&E 191,703 0 38.31 $229,804 $420,241 $452,641 1.8 2.0 $190,437 $222,837 CZ14-2 SCE 191,703 0 38.31 $229,804 $294,010 $452,641 1.3 2.0 $64,206 $222,837 CZ15 SCE 182,299 0 36.01 $229,804 $279,036 $416,382 1.2 1.8 $49,232 $186,578 CZ16 PG&E 194,293 0 40.00 $229,804 $535,137 $432,951 2.3 1.9 $305,333 $203,147 CZ16-2 LA 194,293 0 40.00 $229,804 $175,573 $432,951 0.8 1.9 ($54,231) $203,147
ATTACHMENT 6
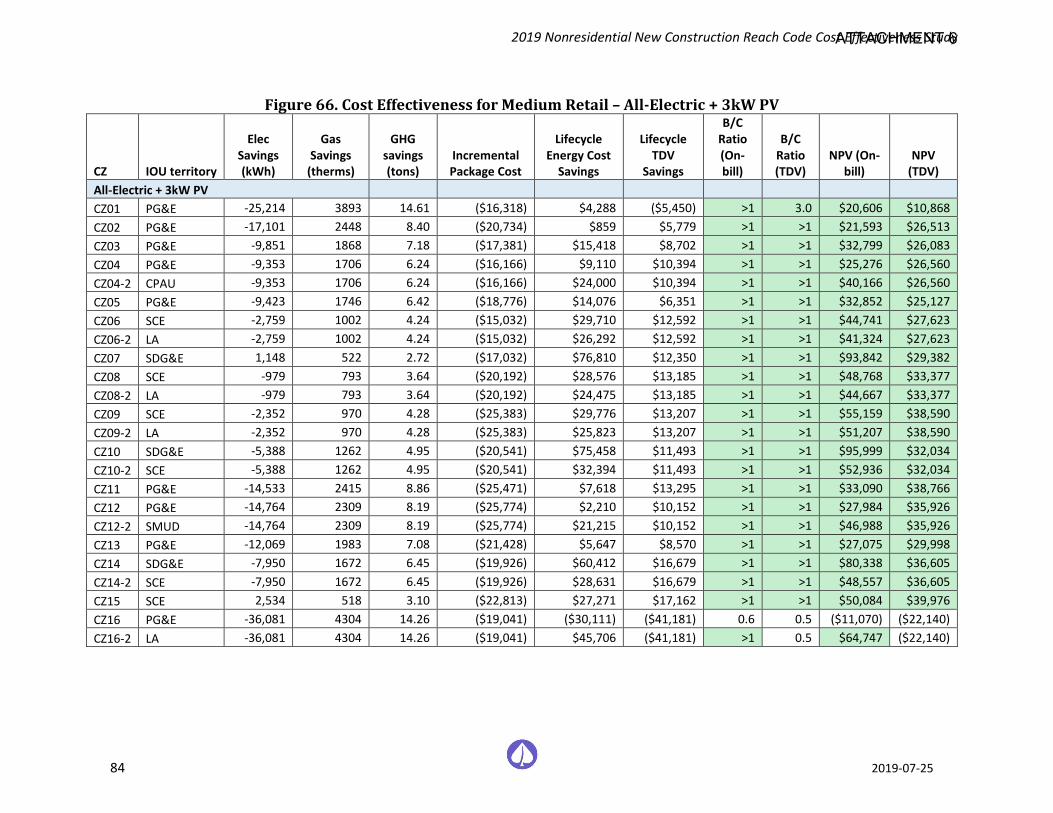
2019 Nonresidential New Construction Reach Code Cost Effectiveness Study
84 2019-07-25
Figure 66. Cost Effectiveness for Medium Retail – All-Electric + 3kW PV
CZ IOU territory
Elec Savings (kWh)
Gas Savings
(therms)
GHG savings (tons)
Incremental Package Cost
Lifecycle Energy Cost
Savings
Lifecycle TDV
Savings
B/C Ratio (On-bill)
B/C Ratio (TDV)
NPV (On-bill)
NPV (TDV)
All-Electric + 3kW PV CZ01 PG&E -25,214 3893 14.61 ($16,318) $4,288 ($5,450) >1 3.0 $20,606 $10,868 CZ02 PG&E -17,101 2448 8.40 ($20,734) $859 $5,779 >1 >1 $21,593 $26,513 CZ03 PG&E -9,851 1868 7.18 ($17,381) $15,418 $8,702 >1 >1 $32,799 $26,083 CZ04 PG&E -9,353 1706 6.24 ($16,166) $9,110 $10,394 >1 >1 $25,276 $26,560 CZ04-2 CPAU -9,353 1706 6.24 ($16,166) $24,000 $10,394 >1 >1 $40,166 $26,560 CZ05 PG&E -9,423 1746 6.42 ($18,776) $14,076 $6,351 >1 >1 $32,852 $25,127 CZ06 SCE -2,759 1002 4.24 ($15,032) $29,710 $12,592 >1 >1 $44,741 $27,623 CZ06-2 LA -2,759 1002 4.24 ($15,032) $26,292 $12,592 >1 >1 $41,324 $27,623 CZ07 SDG&E 1,148 522 2.72 ($17,032) $76,810 $12,350 >1 >1 $93,842 $29,382 CZ08 SCE -979 793 3.64 ($20,192) $28,576 $13,185 >1 >1 $48,768 $33,377 CZ08-2 LA -979 793 3.64 ($20,192) $24,475 $13,185 >1 >1 $44,667 $33,377 CZ09 SCE -2,352 970 4.28 ($25,383) $29,776 $13,207 >1 >1 $55,159 $38,590 CZ09-2 LA -2,352 970 4.28 ($25,383) $25,823 $13,207 >1 >1 $51,207 $38,590 CZ10 SDG&E -5,388 1262 4.95 ($20,541) $75,458 $11,493 >1 >1 $95,999 $32,034 CZ10-2 SCE -5,388 1262 4.95 ($20,541) $32,394 $11,493 >1 >1 $52,936 $32,034 CZ11 PG&E -14,533 2415 8.86 ($25,471) $7,618 $13,295 >1 >1 $33,090 $38,766 CZ12 PG&E -14,764 2309 8.19 ($25,774) $2,210 $10,152 >1 >1 $27,984 $35,926 CZ12-2 SMUD -14,764 2309 8.19 ($25,774) $21,215 $10,152 >1 >1 $46,988 $35,926 CZ13 PG&E -12,069 1983 7.08 ($21,428) $5,647 $8,570 >1 >1 $27,075 $29,998 CZ14 SDG&E -7,950 1672 6.45 ($19,926) $60,412 $16,679 >1 >1 $80,338 $36,605 CZ14-2 SCE -7,950 1672 6.45 ($19,926) $28,631 $16,679 >1 >1 $48,557 $36,605 CZ15 SCE 2,534 518 3.10 ($22,813) $27,271 $17,162 >1 >1 $50,084 $39,976 CZ16 PG&E -36,081 4304 14.26 ($19,041) ($30,111) ($41,181) 0.6 0.5 ($11,070) ($22,140) CZ16-2 LA -36,081 4304 14.26 ($19,041) $45,706 ($41,181) >1 0.5 $64,747 ($22,140)
ATTACHMENT 6
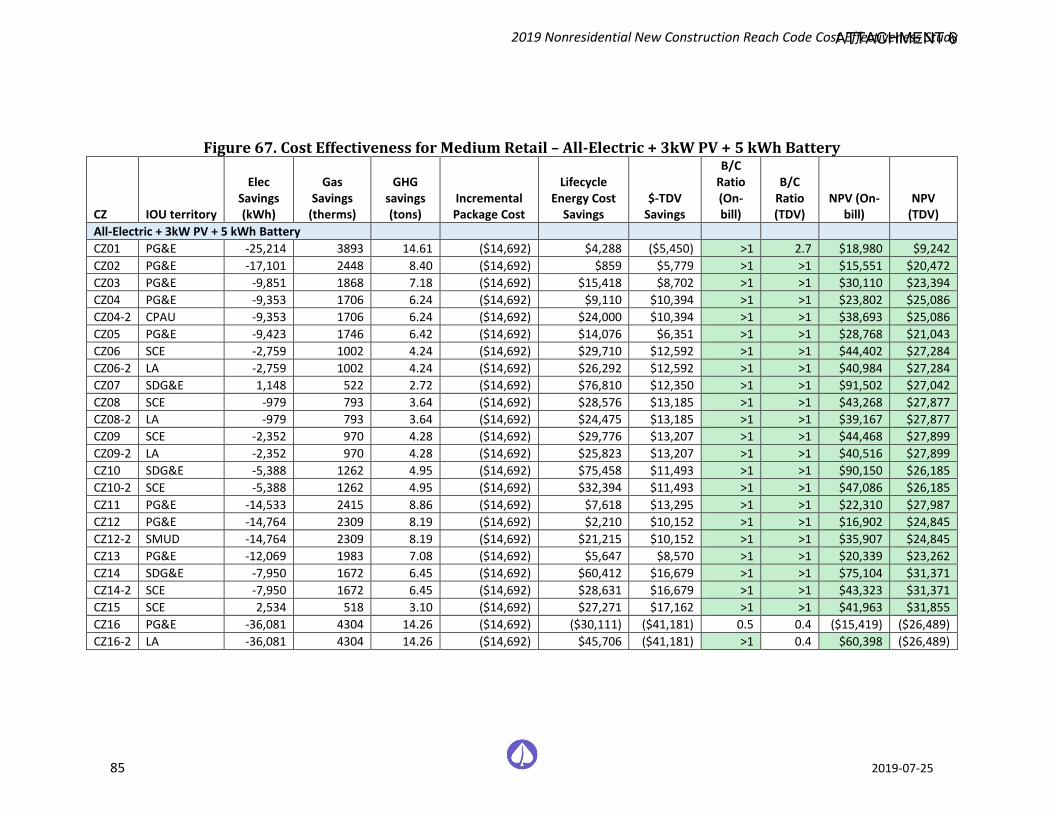
2019 Nonresidential New Construction Reach Code Cost Effectiveness Study
85 2019-07-25
Figure 67. Cost Effectiveness for Medium Retail – All-Electric + 3kW PV + 5 kWh Battery
CZ IOU territory
Elec Savings (kWh)
Gas Savings
(therms)
GHG savings (tons)
Incremental Package Cost
Lifecycle Energy Cost
Savings $-TDV
Savings
B/C Ratio (On-bill)
B/C Ratio (TDV)
NPV (On-bill)
NPV (TDV)
All-Electric + 3kW PV + 5 kWh Battery CZ01 PG&E -25,214 3893 14.61 ($14,692) $4,288 ($5,450) >1 2.7 $18,980 $9,242 CZ02 PG&E -17,101 2448 8.40 ($14,692) $859 $5,779 >1 >1 $15,551 $20,472 CZ03 PG&E -9,851 1868 7.18 ($14,692) $15,418 $8,702 >1 >1 $30,110 $23,394 CZ04 PG&E -9,353 1706 6.24 ($14,692) $9,110 $10,394 >1 >1 $23,802 $25,086 CZ04-2 CPAU -9,353 1706 6.24 ($14,692) $24,000 $10,394 >1 >1 $38,693 $25,086 CZ05 PG&E -9,423 1746 6.42 ($14,692) $14,076 $6,351 >1 >1 $28,768 $21,043 CZ06 SCE -2,759 1002 4.24 ($14,692) $29,710 $12,592 >1 >1 $44,402 $27,284 CZ06-2 LA -2,759 1002 4.24 ($14,692) $26,292 $12,592 >1 >1 $40,984 $27,284 CZ07 SDG&E 1,148 522 2.72 ($14,692) $76,810 $12,350 >1 >1 $91,502 $27,042 CZ08 SCE -979 793 3.64 ($14,692) $28,576 $13,185 >1 >1 $43,268 $27,877 CZ08-2 LA -979 793 3.64 ($14,692) $24,475 $13,185 >1 >1 $39,167 $27,877 CZ09 SCE -2,352 970 4.28 ($14,692) $29,776 $13,207 >1 >1 $44,468 $27,899 CZ09-2 LA -2,352 970 4.28 ($14,692) $25,823 $13,207 >1 >1 $40,516 $27,899 CZ10 SDG&E -5,388 1262 4.95 ($14,692) $75,458 $11,493 >1 >1 $90,150 $26,185 CZ10-2 SCE -5,388 1262 4.95 ($14,692) $32,394 $11,493 >1 >1 $47,086 $26,185 CZ11 PG&E -14,533 2415 8.86 ($14,692) $7,618 $13,295 >1 >1 $22,310 $27,987 CZ12 PG&E -14,764 2309 8.19 ($14,692) $2,210 $10,152 >1 >1 $16,902 $24,845 CZ12-2 SMUD -14,764 2309 8.19 ($14,692) $21,215 $10,152 >1 >1 $35,907 $24,845 CZ13 PG&E -12,069 1983 7.08 ($14,692) $5,647 $8,570 >1 >1 $20,339 $23,262 CZ14 SDG&E -7,950 1672 6.45 ($14,692) $60,412 $16,679 >1 >1 $75,104 $31,371 CZ14-2 SCE -7,950 1672 6.45 ($14,692) $28,631 $16,679 >1 >1 $43,323 $31,371 CZ15 SCE 2,534 518 3.10 ($14,692) $27,271 $17,162 >1 >1 $41,963 $31,855 CZ16 PG&E -36,081 4304 14.26 ($14,692) ($30,111) ($41,181) 0.5 0.4 ($15,419) ($26,489) CZ16-2 LA -36,081 4304 14.26 ($14,692) $45,706 ($41,181) >1 0.4 $60,398 ($26,489)
ATTACHMENT 6
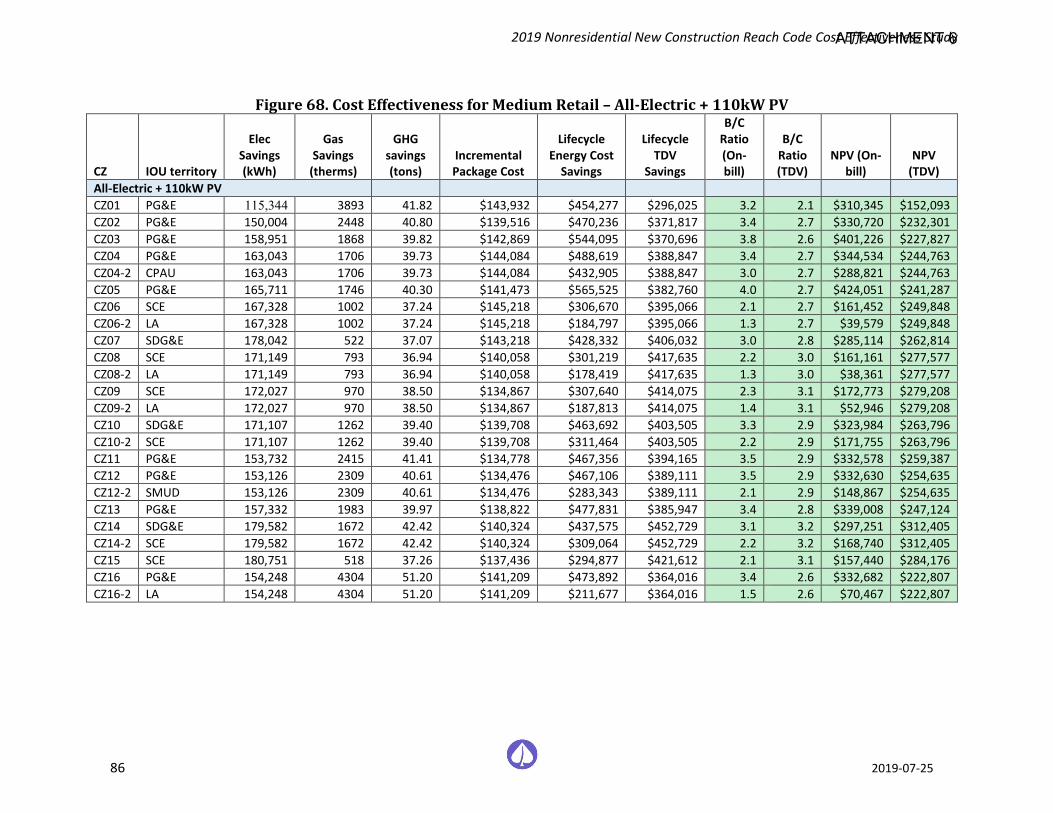
2019 Nonresidential New Construction Reach Code Cost Effectiveness Study
86 2019-07-25
Figure 68. Cost Effectiveness for Medium Retail – All-Electric + 110kW PV
CZ IOU territory
Elec Savings (kWh)
Gas Savings
(therms)
GHG savings (tons)
Incremental Package Cost
Lifecycle Energy Cost
Savings
Lifecycle TDV
Savings
B/C Ratio (On-bill)
B/C Ratio (TDV)
NPV (On-bill)
NPV (TDV)
All-Electric + 110kW PV CZ01 PG&E 115,344 3893 41.82 $143,932 $454,277 $296,025 3.2 2.1 $310,345 $152,093 CZ02 PG&E 150,004 2448 40.80 $139,516 $470,236 $371,817 3.4 2.7 $330,720 $232,301 CZ03 PG&E 158,951 1868 39.82 $142,869 $544,095 $370,696 3.8 2.6 $401,226 $227,827 CZ04 PG&E 163,043 1706 39.73 $144,084 $488,619 $388,847 3.4 2.7 $344,534 $244,763 CZ04-2 CPAU 163,043 1706 39.73 $144,084 $432,905 $388,847 3.0 2.7 $288,821 $244,763 CZ05 PG&E 165,711 1746 40.30 $141,473 $565,525 $382,760 4.0 2.7 $424,051 $241,287 CZ06 SCE 167,328 1002 37.24 $145,218 $306,670 $395,066 2.1 2.7 $161,452 $249,848 CZ06-2 LA 167,328 1002 37.24 $145,218 $184,797 $395,066 1.3 2.7 $39,579 $249,848 CZ07 SDG&E 178,042 522 37.07 $143,218 $428,332 $406,032 3.0 2.8 $285,114 $262,814 CZ08 SCE 171,149 793 36.94 $140,058 $301,219 $417,635 2.2 3.0 $161,161 $277,577 CZ08-2 LA 171,149 793 36.94 $140,058 $178,419 $417,635 1.3 3.0 $38,361 $277,577 CZ09 SCE 172,027 970 38.50 $134,867 $307,640 $414,075 2.3 3.1 $172,773 $279,208 CZ09-2 LA 172,027 970 38.50 $134,867 $187,813 $414,075 1.4 3.1 $52,946 $279,208 CZ10 SDG&E 171,107 1262 39.40 $139,708 $463,692 $403,505 3.3 2.9 $323,984 $263,796 CZ10-2 SCE 171,107 1262 39.40 $139,708 $311,464 $403,505 2.2 2.9 $171,755 $263,796 CZ11 PG&E 153,732 2415 41.41 $134,778 $467,356 $394,165 3.5 2.9 $332,578 $259,387 CZ12 PG&E 153,126 2309 40.61 $134,476 $467,106 $389,111 3.5 2.9 $332,630 $254,635 CZ12-2 SMUD 153,126 2309 40.61 $134,476 $283,343 $389,111 2.1 2.9 $148,867 $254,635 CZ13 PG&E 157,332 1983 39.97 $138,822 $477,831 $385,947 3.4 2.8 $339,008 $247,124 CZ14 SDG&E 179,582 1672 42.42 $140,324 $437,575 $452,729 3.1 3.2 $297,251 $312,405 CZ14-2 SCE 179,582 1672 42.42 $140,324 $309,064 $452,729 2.2 3.2 $168,740 $312,405 CZ15 SCE 180,751 518 37.26 $137,436 $294,877 $421,612 2.1 3.1 $157,440 $284,176 CZ16 PG&E 154,248 4304 51.20 $141,209 $473,892 $364,016 3.4 2.6 $332,682 $222,807 CZ16-2 LA 154,248 4304 51.20 $141,209 $211,677 $364,016 1.5 2.6 $70,467 $222,807
ATTACHMENT 6
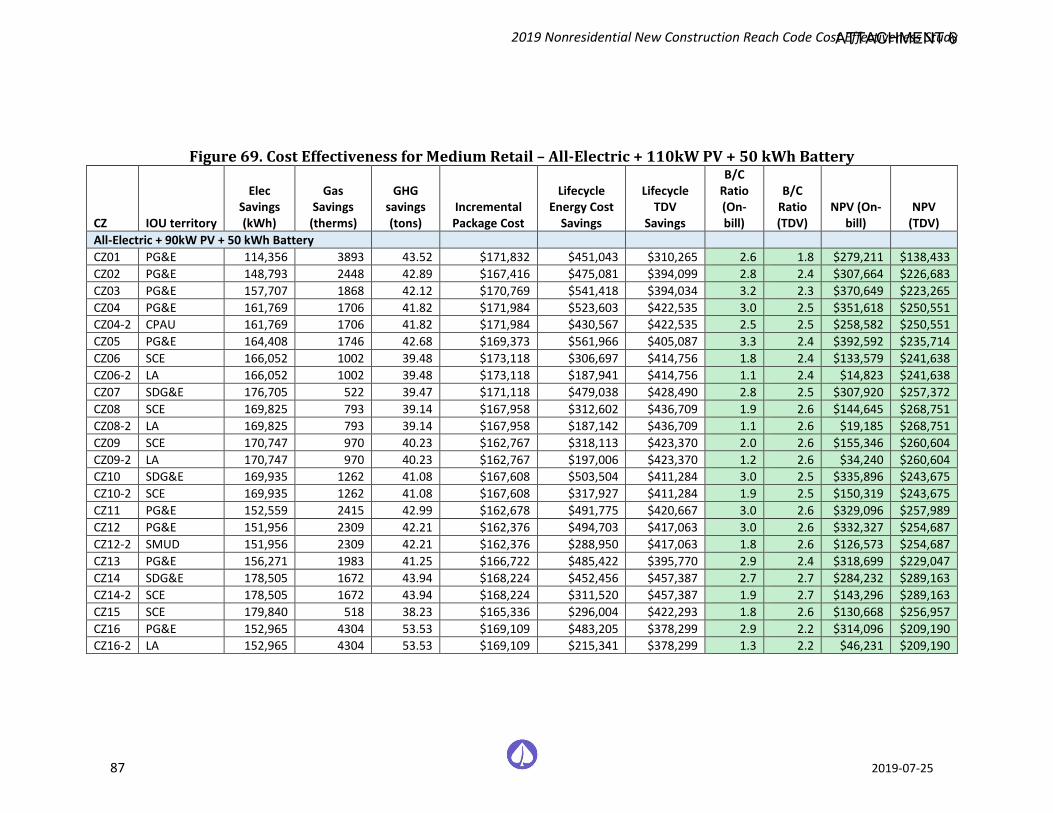
2019 Nonresidential New Construction Reach Code Cost Effectiveness Study
87 2019-07-25
Figure 69. Cost Effectiveness for Medium Retail – All-Electric + 110kW PV + 50 kWh Battery
CZ IOU territory
Elec Savings (kWh)
Gas Savings
(therms)
GHG savings (tons)
Incremental Package Cost
Lifecycle Energy Cost
Savings
Lifecycle TDV
Savings
B/C Ratio (On-bill)
B/C Ratio (TDV)
NPV (On-bill)
NPV (TDV)
All-Electric + 90kW PV + 50 kWh Battery CZ01 PG&E 114,356 3893 43.52 $171,832 $451,043 $310,265 2.6 1.8 $279,211 $138,433 CZ02 PG&E 148,793 2448 42.89 $167,416 $475,081 $394,099 2.8 2.4 $307,664 $226,683 CZ03 PG&E 157,707 1868 42.12 $170,769 $541,418 $394,034 3.2 2.3 $370,649 $223,265 CZ04 PG&E 161,769 1706 41.82 $171,984 $523,603 $422,535 3.0 2.5 $351,618 $250,551 CZ04-2 CPAU 161,769 1706 41.82 $171,984 $430,567 $422,535 2.5 2.5 $258,582 $250,551 CZ05 PG&E 164,408 1746 42.68 $169,373 $561,966 $405,087 3.3 2.4 $392,592 $235,714 CZ06 SCE 166,052 1002 39.48 $173,118 $306,697 $414,756 1.8 2.4 $133,579 $241,638 CZ06-2 LA 166,052 1002 39.48 $173,118 $187,941 $414,756 1.1 2.4 $14,823 $241,638 CZ07 SDG&E 176,705 522 39.47 $171,118 $479,038 $428,490 2.8 2.5 $307,920 $257,372 CZ08 SCE 169,825 793 39.14 $167,958 $312,602 $436,709 1.9 2.6 $144,645 $268,751 CZ08-2 LA 169,825 793 39.14 $167,958 $187,142 $436,709 1.1 2.6 $19,185 $268,751 CZ09 SCE 170,747 970 40.23 $162,767 $318,113 $423,370 2.0 2.6 $155,346 $260,604 CZ09-2 LA 170,747 970 40.23 $162,767 $197,006 $423,370 1.2 2.6 $34,240 $260,604 CZ10 SDG&E 169,935 1262 41.08 $167,608 $503,504 $411,284 3.0 2.5 $335,896 $243,675 CZ10-2 SCE 169,935 1262 41.08 $167,608 $317,927 $411,284 1.9 2.5 $150,319 $243,675 CZ11 PG&E 152,559 2415 42.99 $162,678 $491,775 $420,667 3.0 2.6 $329,096 $257,989 CZ12 PG&E 151,956 2309 42.21 $162,376 $494,703 $417,063 3.0 2.6 $332,327 $254,687 CZ12-2 SMUD 151,956 2309 42.21 $162,376 $288,950 $417,063 1.8 2.6 $126,573 $254,687 CZ13 PG&E 156,271 1983 41.25 $166,722 $485,422 $395,770 2.9 2.4 $318,699 $229,047 CZ14 SDG&E 178,505 1672 43.94 $168,224 $452,456 $457,387 2.7 2.7 $284,232 $289,163 CZ14-2 SCE 178,505 1672 43.94 $168,224 $311,520 $457,387 1.9 2.7 $143,296 $289,163 CZ15 SCE 179,840 518 38.23 $165,336 $296,004 $422,293 1.8 2.6 $130,668 $256,957 CZ16 PG&E 152,965 4304 53.53 $169,109 $483,205 $378,299 2.9 2.2 $314,096 $209,190 CZ16-2 LA 152,965 4304 53.53 $169,109 $215,341 $378,299 1.3 2.2 $46,231 $209,190
ATTACHMENT 6
2019 Nonresidential New Construction Reach Code Cost Effectiveness Study
88 2019-07-25
6.7.3 Cost Effectiveness Results – Small Hotel Figure 70 through Figure 77 contain the cost-effectiveness findings for the Small Hotel packages. Notable findings for each package include:
♦ Mixed-Fuel + 3 kW PV: Packages are cost effective and achieve savings for all climate zones for both the On-Bill and TDV approaches.
♦ Mixed-Fuel + 3 kW PV + 5 kWh Battery: The packages are less cost effective as compared to the previous minimal PV only package and not cost effective for LADWP and SMUD service area. The addition of battery reduces the cost effectiveness of packages.
♦ Mixed-Fuel + PV only: Packages are cost effective and achieve savings for the On-Bill approach for all climate zones except for LADWP territory. Packages are cost effective and achieve savings for the TDV approach for all climate zones.
♦ Mixed-Fuel + PV + 50 kWh Battery: Adding battery slightly reduces On-Bill B/C ratios. Packages are not cost effective for LADWP territory, SMUD territory as well as for climate zones 6,8,9 under PG&E service area.
♦ All-Electric + 3 kW PV: All packages are cost effective using the On-Bill approach. All packages are cost effective using the TDV approach but do not achieve positive energy cost savings.
♦ All-Electric + 3 kW PV + 5 kWh Battery: Similar to minimal PV only package, all packages are cost effective using the On-Bill approach. All packages are cost effective using the TDV approach but do not achieve positive energy cost savings.
♦ All-Electric + PV only: All packages are cost effective for both On-Bill and TDV approaches. Packages achieve on-bill savings for all climate zones.
♦ All-Electric + PV + 50 kWh Battery: Adding battery slightly reduces On-Bill B/C ratios but is still cost effective for all climate zones.
ATTACHMENT 6

2019 Nonresidential New Construction Reach Code Cost Effectiveness Study
89 2019-07-25
Figure 70. Cost Effectiveness for Small Hotel – Mixed Fuel + 3kW PV
CZ IOU territory
Elec Savings (kWh)
Gas Savings
(therms)
GHG savings (tons)
Incremental Package Cost
Lifecycle Energy Cost
Savings Lifecycle $-
TDV Savings
B/C Ratio
(On-bill)
B/C Ratio (TDV)
NPV (On-bill)
NPV (TDV)
Mixed Fuel + 3kW PV CZ01 PG&E 3,941 0 0.8 $5,566 $12,616 $8,326 2.3 1.5 $7,050 $2,760 CZ02 PG&E 4,785 0 0.9 $5,566 $12,639 $10,332 2.3 1.9 $7,073 $4,766 CZ03 PG&E 4,733 0 0.9 $5,566 $15,146 $9,991 2.7 1.8 $9,580 $4,425 CZ04 PG&E 4,834 0 1.0 $5,566 $13,266 $10,445 2.4 1.9 $7,700 $4,879 CZ04-2 CPAU 4,834 0 1.0 $5,566 $11,507 $10,445 2.1 1.9 $5,941 $4,879 CZ05 PG&E 5,027 0 1.0 $5,566 $16,048 $10,634 2.9 1.9 $10,482 $5,068 CZ06 SCE 4,769 0 0.9 $5,566 $10,276 $10,559 1.8 1.9 $4,710 $4,993 CZ06-2 LA 4,769 0 0.9 $5,566 $6,307 $10,559 1.1 1.9 $741 $4,993 CZ07 SDG&E 4,960 0 1.0 $5,566 $14,576 $10,861 2.6 2.0 $9,010 $5,295 CZ08 SCE 4,824 0 0.9 $5,566 $10,837 $11,202 1.9 2.0 $5,271 $5,636 CZ08-2 LA 4,824 0 0.9 $5,566 $6,505 $11,202 1.2 2.0 $939 $5,636 CZ09 SCE 4,779 0 0.9 $5,566 $10,298 $10,824 1.9 1.9 $4,732 $5,258 CZ09-2 LA 4,779 0 0.9 $5,566 $6,201 $10,824 1.1 1.9 $635 $5,258 CZ10 SDG&E 4,905 0 1.0 $5,566 $16,302 $10,710 2.9 1.9 $10,736 $5,144 CZ10-2 SCE 4,905 0 1.0 $5,566 $9,468 $10,710 1.7 1.9 $3,902 $5,144 CZ11 PG&E 4,701 0 0.9 $5,566 $14,193 $10,483 2.6 1.9 $8,627 $4,917 CZ12 PG&E 4,770 0 0.9 $5,566 $15,262 $10,596 2.7 1.9 $9,696 $5,030 CZ12-2 SMUD 4,770 0 0.9 $5,566 $7,848 $10,596 1.4 1.9 $2,282 $5,030 CZ13 PG&E 4,633 0 0.9 $5,566 $14,674 $10,105 2.6 1.8 $9,108 $4,539 CZ14 SDG&E 5,377 0 1.1 $5,566 $16,615 $12,375 3.0 2.2 $11,049 $6,809 CZ14-2 SCE 5,377 0 1.1 $5,566 $10,021 $12,375 1.8 2.2 $4,455 $6,809 CZ15 SCE 4,997 0 1.0 $5,566 $9,542 $11,164 1.7 2.0 $3,976 $5,598 CZ16 PG&E 5,240 0 1.0 $5,566 $14,961 $10,975 2.7 2.0 $9,395 $5,409 CZ16-2 LA 5,240 0 1.0 $5,566 $5,670 $10,975 1.0 2.0 $104 $5,409
ATTACHMENT 6
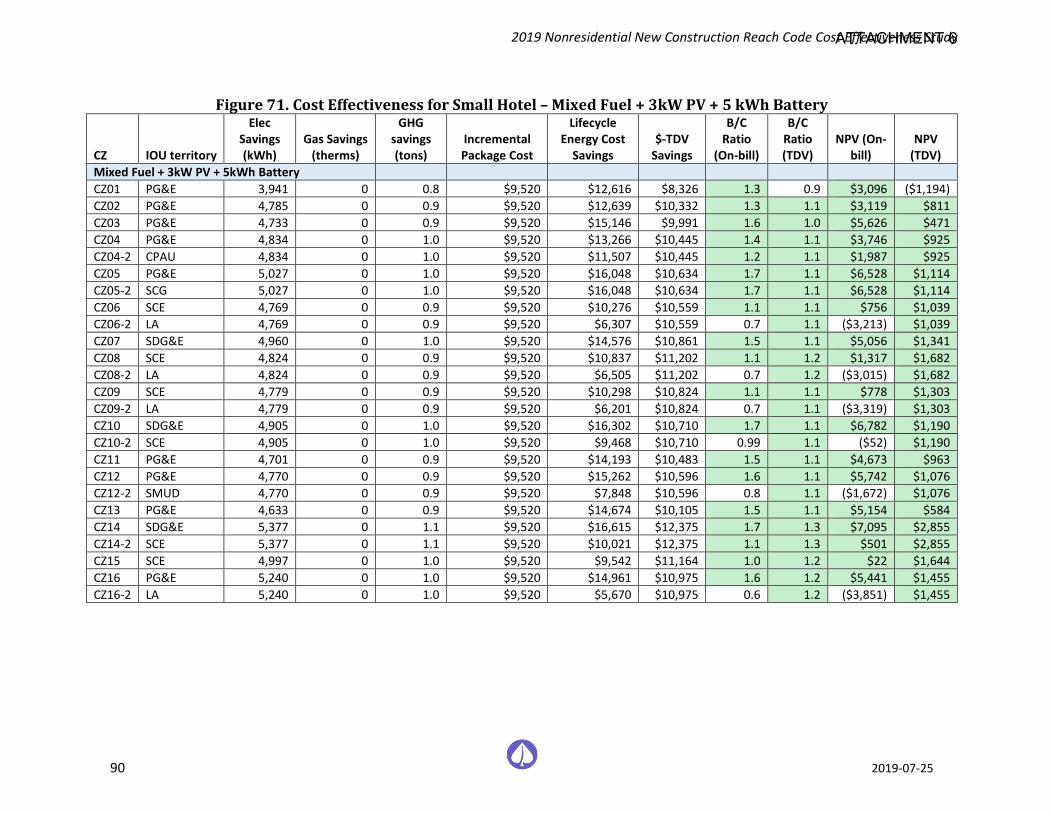
2019 Nonresidential New Construction Reach Code Cost Effectiveness Study
90 2019-07-25
Figure 71. Cost Effectiveness for Small Hotel – Mixed Fuel + 3kW PV + 5 kWh Battery
CZ IOU territory
Elec Savings (kWh)
Gas Savings (therms)
GHG savings (tons)
Incremental Package Cost
Lifecycle Energy Cost
Savings $-TDV
Savings
B/C Ratio
(On-bill)
B/C Ratio (TDV)
NPV (On-bill)
NPV (TDV)
Mixed Fuel + 3kW PV + 5kWh Battery CZ01 PG&E 3,941 0 0.8 $9,520 $12,616 $8,326 1.3 0.9 $3,096 ($1,194) CZ02 PG&E 4,785 0 0.9 $9,520 $12,639 $10,332 1.3 1.1 $3,119 $811 CZ03 PG&E 4,733 0 0.9 $9,520 $15,146 $9,991 1.6 1.0 $5,626 $471 CZ04 PG&E 4,834 0 1.0 $9,520 $13,266 $10,445 1.4 1.1 $3,746 $925 CZ04-2 CPAU 4,834 0 1.0 $9,520 $11,507 $10,445 1.2 1.1 $1,987 $925 CZ05 PG&E 5,027 0 1.0 $9,520 $16,048 $10,634 1.7 1.1 $6,528 $1,114 CZ05-2 SCG 5,027 0 1.0 $9,520 $16,048 $10,634 1.7 1.1 $6,528 $1,114 CZ06 SCE 4,769 0 0.9 $9,520 $10,276 $10,559 1.1 1.1 $756 $1,039 CZ06-2 LA 4,769 0 0.9 $9,520 $6,307 $10,559 0.7 1.1 ($3,213) $1,039 CZ07 SDG&E 4,960 0 1.0 $9,520 $14,576 $10,861 1.5 1.1 $5,056 $1,341 CZ08 SCE 4,824 0 0.9 $9,520 $10,837 $11,202 1.1 1.2 $1,317 $1,682 CZ08-2 LA 4,824 0 0.9 $9,520 $6,505 $11,202 0.7 1.2 ($3,015) $1,682 CZ09 SCE 4,779 0 0.9 $9,520 $10,298 $10,824 1.1 1.1 $778 $1,303 CZ09-2 LA 4,779 0 0.9 $9,520 $6,201 $10,824 0.7 1.1 ($3,319) $1,303 CZ10 SDG&E 4,905 0 1.0 $9,520 $16,302 $10,710 1.7 1.1 $6,782 $1,190 CZ10-2 SCE 4,905 0 1.0 $9,520 $9,468 $10,710 0.99 1.1 ($52) $1,190 CZ11 PG&E 4,701 0 0.9 $9,520 $14,193 $10,483 1.5 1.1 $4,673 $963 CZ12 PG&E 4,770 0 0.9 $9,520 $15,262 $10,596 1.6 1.1 $5,742 $1,076 CZ12-2 SMUD 4,770 0 0.9 $9,520 $7,848 $10,596 0.8 1.1 ($1,672) $1,076 CZ13 PG&E 4,633 0 0.9 $9,520 $14,674 $10,105 1.5 1.1 $5,154 $584 CZ14 SDG&E 5,377 0 1.1 $9,520 $16,615 $12,375 1.7 1.3 $7,095 $2,855 CZ14-2 SCE 5,377 0 1.1 $9,520 $10,021 $12,375 1.1 1.3 $501 $2,855 CZ15 SCE 4,997 0 1.0 $9,520 $9,542 $11,164 1.0 1.2 $22 $1,644 CZ16 PG&E 5,240 0 1.0 $9,520 $14,961 $10,975 1.6 1.2 $5,441 $1,455 CZ16-2 LA 5,240 0 1.0 $9,520 $5,670 $10,975 0.6 1.2 ($3,851) $1,455
ATTACHMENT 6
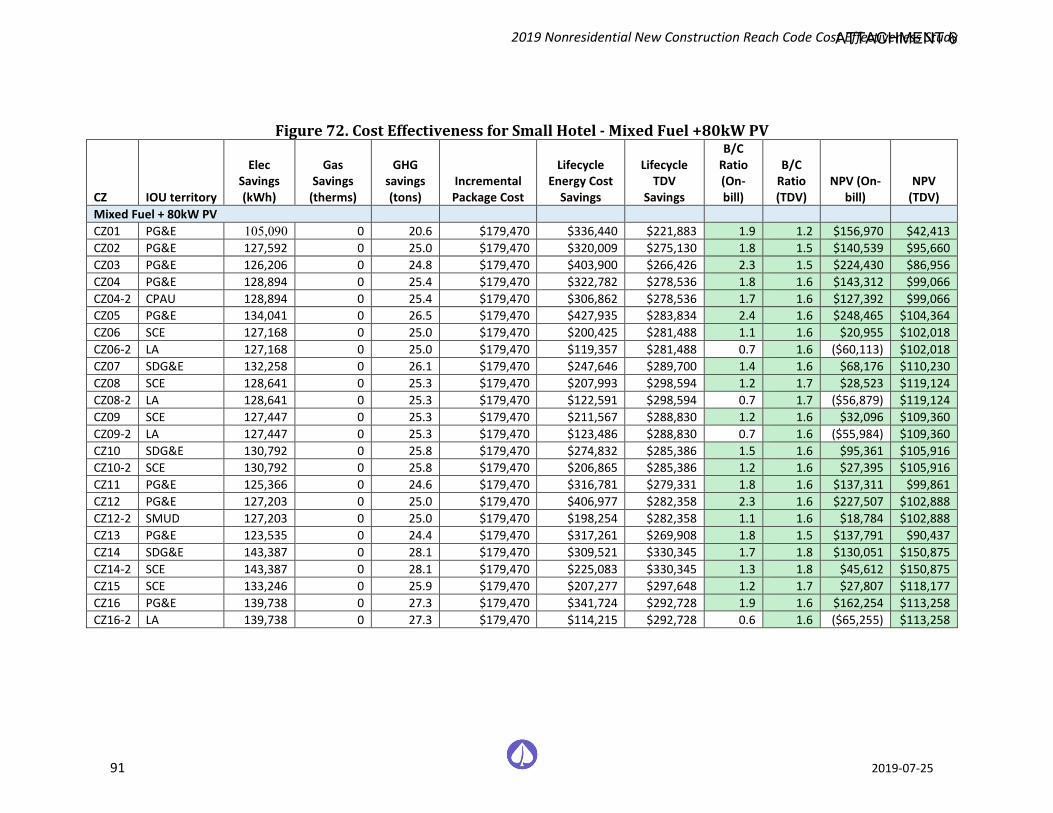
2019 Nonresidential New Construction Reach Code Cost Effectiveness Study
91 2019-07-25
Figure 72. Cost Effectiveness for Small Hotel - Mixed Fuel +80kW PV
CZ IOU territory
Elec Savings (kWh)
Gas Savings
(therms)
GHG savings (tons)
Incremental Package Cost
Lifecycle Energy Cost
Savings
Lifecycle TDV
Savings
B/C Ratio (On-bill)
B/C Ratio (TDV)
NPV (On-bill)
NPV (TDV)
Mixed Fuel + 80kW PV CZ01 PG&E 105,090 0 20.6 $179,470 $336,440 $221,883 1.9 1.2 $156,970 $42,413 CZ02 PG&E 127,592 0 25.0 $179,470 $320,009 $275,130 1.8 1.5 $140,539 $95,660 CZ03 PG&E 126,206 0 24.8 $179,470 $403,900 $266,426 2.3 1.5 $224,430 $86,956 CZ04 PG&E 128,894 0 25.4 $179,470 $322,782 $278,536 1.8 1.6 $143,312 $99,066 CZ04-2 CPAU 128,894 0 25.4 $179,470 $306,862 $278,536 1.7 1.6 $127,392 $99,066 CZ05 PG&E 134,041 0 26.5 $179,470 $427,935 $283,834 2.4 1.6 $248,465 $104,364 CZ06 SCE 127,168 0 25.0 $179,470 $200,425 $281,488 1.1 1.6 $20,955 $102,018 CZ06-2 LA 127,168 0 25.0 $179,470 $119,357 $281,488 0.7 1.6 ($60,113) $102,018 CZ07 SDG&E 132,258 0 26.1 $179,470 $247,646 $289,700 1.4 1.6 $68,176 $110,230 CZ08 SCE 128,641 0 25.3 $179,470 $207,993 $298,594 1.2 1.7 $28,523 $119,124 CZ08-2 LA 128,641 0 25.3 $179,470 $122,591 $298,594 0.7 1.7 ($56,879) $119,124 CZ09 SCE 127,447 0 25.3 $179,470 $211,567 $288,830 1.2 1.6 $32,096 $109,360 CZ09-2 LA 127,447 0 25.3 $179,470 $123,486 $288,830 0.7 1.6 ($55,984) $109,360 CZ10 SDG&E 130,792 0 25.8 $179,470 $274,832 $285,386 1.5 1.6 $95,361 $105,916 CZ10-2 SCE 130,792 0 25.8 $179,470 $206,865 $285,386 1.2 1.6 $27,395 $105,916 CZ11 PG&E 125,366 0 24.6 $179,470 $316,781 $279,331 1.8 1.6 $137,311 $99,861 CZ12 PG&E 127,203 0 25.0 $179,470 $406,977 $282,358 2.3 1.6 $227,507 $102,888 CZ12-2 SMUD 127,203 0 25.0 $179,470 $198,254 $282,358 1.1 1.6 $18,784 $102,888 CZ13 PG&E 123,535 0 24.4 $179,470 $317,261 $269,908 1.8 1.5 $137,791 $90,437 CZ14 SDG&E 143,387 0 28.1 $179,470 $309,521 $330,345 1.7 1.8 $130,051 $150,875 CZ14-2 SCE 143,387 0 28.1 $179,470 $225,083 $330,345 1.3 1.8 $45,612 $150,875 CZ15 SCE 133,246 0 25.9 $179,470 $207,277 $297,648 1.2 1.7 $27,807 $118,177 CZ16 PG&E 139,738 0 27.3 $179,470 $341,724 $292,728 1.9 1.6 $162,254 $113,258 CZ16-2 LA 139,738 0 27.3 $179,470 $114,215 $292,728 0.6 1.6 ($65,255) $113,258
ATTACHMENT 6
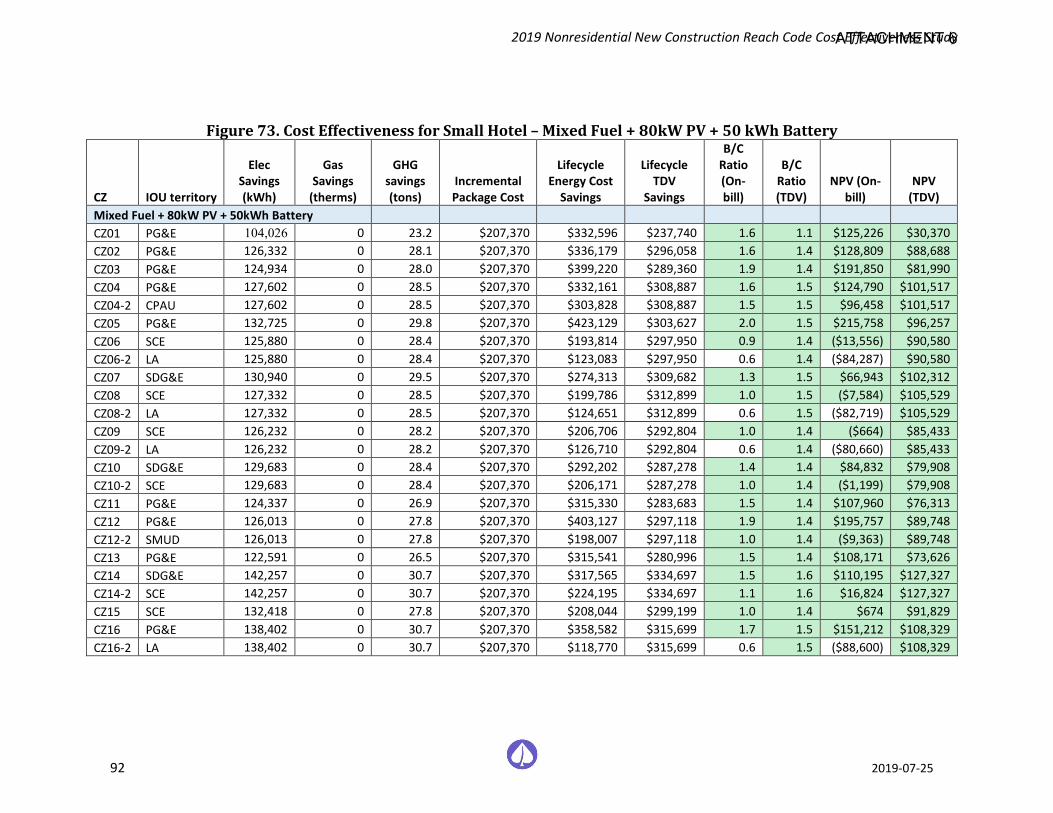
2019 Nonresidential New Construction Reach Code Cost Effectiveness Study
92 2019-07-25
Figure 73. Cost Effectiveness for Small Hotel – Mixed Fuel + 80kW PV + 50 kWh Battery
CZ IOU territory
Elec Savings (kWh)
Gas Savings
(therms)
GHG savings (tons)
Incremental Package Cost
Lifecycle Energy Cost
Savings
Lifecycle TDV
Savings
B/C Ratio (On-bill)
B/C Ratio (TDV)
NPV (On-bill)
NPV (TDV)
Mixed Fuel + 80kW PV + 50kWh Battery CZ01 PG&E 104,026 0 23.2 $207,370 $332,596 $237,740 1.6 1.1 $125,226 $30,370 CZ02 PG&E 126,332 0 28.1 $207,370 $336,179 $296,058 1.6 1.4 $128,809 $88,688 CZ03 PG&E 124,934 0 28.0 $207,370 $399,220 $289,360 1.9 1.4 $191,850 $81,990 CZ04 PG&E 127,602 0 28.5 $207,370 $332,161 $308,887 1.6 1.5 $124,790 $101,517 CZ04-2 CPAU 127,602 0 28.5 $207,370 $303,828 $308,887 1.5 1.5 $96,458 $101,517 CZ05 PG&E 132,725 0 29.8 $207,370 $423,129 $303,627 2.0 1.5 $215,758 $96,257 CZ06 SCE 125,880 0 28.4 $207,370 $193,814 $297,950 0.9 1.4 ($13,556) $90,580 CZ06-2 LA 125,880 0 28.4 $207,370 $123,083 $297,950 0.6 1.4 ($84,287) $90,580 CZ07 SDG&E 130,940 0 29.5 $207,370 $274,313 $309,682 1.3 1.5 $66,943 $102,312 CZ08 SCE 127,332 0 28.5 $207,370 $199,786 $312,899 1.0 1.5 ($7,584) $105,529 CZ08-2 LA 127,332 0 28.5 $207,370 $124,651 $312,899 0.6 1.5 ($82,719) $105,529 CZ09 SCE 126,232 0 28.2 $207,370 $206,706 $292,804 1.0 1.4 ($664) $85,433 CZ09-2 LA 126,232 0 28.2 $207,370 $126,710 $292,804 0.6 1.4 ($80,660) $85,433 CZ10 SDG&E 129,683 0 28.4 $207,370 $292,202 $287,278 1.4 1.4 $84,832 $79,908 CZ10-2 SCE 129,683 0 28.4 $207,370 $206,171 $287,278 1.0 1.4 ($1,199) $79,908 CZ11 PG&E 124,337 0 26.9 $207,370 $315,330 $283,683 1.5 1.4 $107,960 $76,313 CZ12 PG&E 126,013 0 27.8 $207,370 $403,127 $297,118 1.9 1.4 $195,757 $89,748 CZ12-2 SMUD 126,013 0 27.8 $207,370 $198,007 $297,118 1.0 1.4 ($9,363) $89,748 CZ13 PG&E 122,591 0 26.5 $207,370 $315,541 $280,996 1.5 1.4 $108,171 $73,626 CZ14 SDG&E 142,257 0 30.7 $207,370 $317,565 $334,697 1.5 1.6 $110,195 $127,327 CZ14-2 SCE 142,257 0 30.7 $207,370 $224,195 $334,697 1.1 1.6 $16,824 $127,327 CZ15 SCE 132,418 0 27.8 $207,370 $208,044 $299,199 1.0 1.4 $674 $91,829 CZ16 PG&E 138,402 0 30.7 $207,370 $358,582 $315,699 1.7 1.5 $151,212 $108,329 CZ16-2 LA 138,402 0 30.7 $207,370 $118,770 $315,699 0.6 1.5 ($88,600) $108,329
ATTACHMENT 6
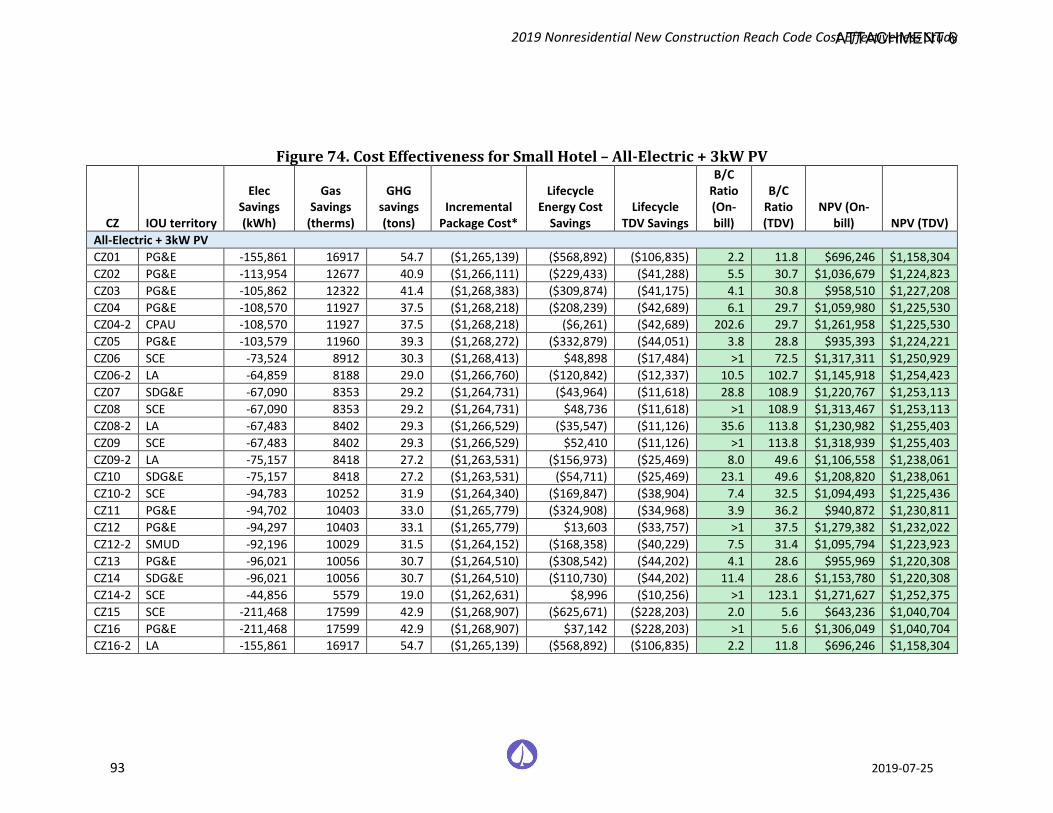
2019 Nonresidential New Construction Reach Code Cost Effectiveness Study
93 2019-07-25
Figure 74. Cost Effectiveness for Small Hotel – All-Electric + 3kW PV
CZ IOU territory
Elec Savings (kWh)
Gas Savings
(therms)
GHG savings (tons)
Incremental Package Cost*
Lifecycle Energy Cost
Savings Lifecycle
TDV Savings
B/C Ratio (On-bill)
B/C Ratio (TDV)
NPV (On-bill) NPV (TDV)
All-Electric + 3kW PV CZ01 PG&E -155,861 16917 54.7 ($1,265,139) ($568,892) ($106,835) 2.2 11.8 $696,246 $1,158,304 CZ02 PG&E -113,954 12677 40.9 ($1,266,111) ($229,433) ($41,288) 5.5 30.7 $1,036,679 $1,224,823 CZ03 PG&E -105,862 12322 41.4 ($1,268,383) ($309,874) ($41,175) 4.1 30.8 $958,510 $1,227,208 CZ04 PG&E -108,570 11927 37.5 ($1,268,218) ($208,239) ($42,689) 6.1 29.7 $1,059,980 $1,225,530 CZ04-2 CPAU -108,570 11927 37.5 ($1,268,218) ($6,261) ($42,689) 202.6 29.7 $1,261,958 $1,225,530 CZ05 PG&E -103,579 11960 39.3 ($1,268,272) ($332,879) ($44,051) 3.8 28.8 $935,393 $1,224,221 CZ06 SCE -73,524 8912 30.3 ($1,268,413) $48,898 ($17,484) >1 72.5 $1,317,311 $1,250,929 CZ06-2 LA -64,859 8188 29.0 ($1,266,760) ($120,842) ($12,337) 10.5 102.7 $1,145,918 $1,254,423 CZ07 SDG&E -67,090 8353 29.2 ($1,264,731) ($43,964) ($11,618) 28.8 108.9 $1,220,767 $1,253,113 CZ08 SCE -67,090 8353 29.2 ($1,264,731) $48,736 ($11,618) >1 108.9 $1,313,467 $1,253,113 CZ08-2 LA -67,483 8402 29.3 ($1,266,529) ($35,547) ($11,126) 35.6 113.8 $1,230,982 $1,255,403 CZ09 SCE -67,483 8402 29.3 ($1,266,529) $52,410 ($11,126) >1 113.8 $1,318,939 $1,255,403 CZ09-2 LA -75,157 8418 27.2 ($1,263,531) ($156,973) ($25,469) 8.0 49.6 $1,106,558 $1,238,061 CZ10 SDG&E -75,157 8418 27.2 ($1,263,531) ($54,711) ($25,469) 23.1 49.6 $1,208,820 $1,238,061 CZ10-2 SCE -94,783 10252 31.9 ($1,264,340) ($169,847) ($38,904) 7.4 32.5 $1,094,493 $1,225,436 CZ11 PG&E -94,702 10403 33.0 ($1,265,779) ($324,908) ($34,968) 3.9 36.2 $940,872 $1,230,811 CZ12 PG&E -94,297 10403 33.1 ($1,265,779) $13,603 ($33,757) >1 37.5 $1,279,382 $1,232,022 CZ12-2 SMUD -92,196 10029 31.5 ($1,264,152) ($168,358) ($40,229) 7.5 31.4 $1,095,794 $1,223,923 CZ13 PG&E -96,021 10056 30.7 ($1,264,510) ($308,542) ($44,202) 4.1 28.6 $955,969 $1,220,308 CZ14 SDG&E -96,021 10056 30.7 ($1,264,510) ($110,730) ($44,202) 11.4 28.6 $1,153,780 $1,220,308 CZ14-2 SCE -44,856 5579 19.0 ($1,262,631) $8,996 ($10,256) >1 123.1 $1,271,627 $1,252,375 CZ15 SCE -211,468 17599 42.9 ($1,268,907) ($625,671) ($228,203) 2.0 5.6 $643,236 $1,040,704 CZ16 PG&E -211,468 17599 42.9 ($1,268,907) $37,142 ($228,203) >1 5.6 $1,306,049 $1,040,704 CZ16-2 LA -155,861 16917 54.7 ($1,265,139) ($568,892) ($106,835) 2.2 11.8 $696,246 $1,158,304
ATTACHMENT 6
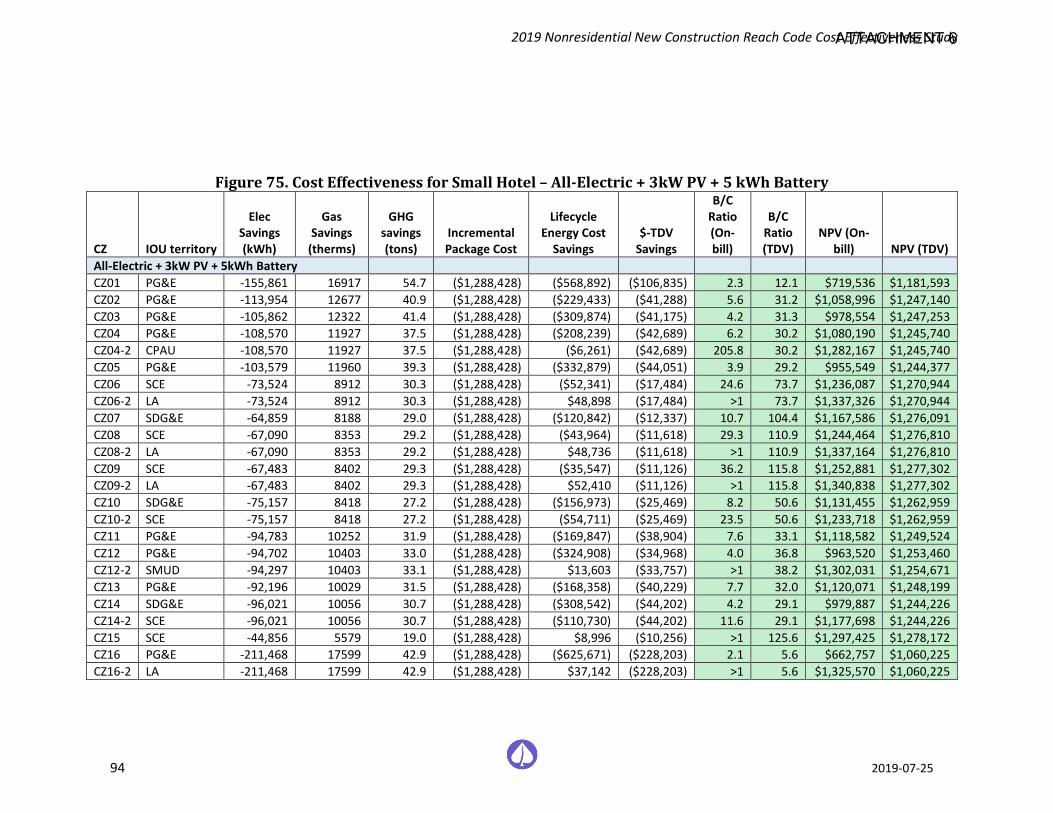
2019 Nonresidential New Construction Reach Code Cost Effectiveness Study
94 2019-07-25
Figure 75. Cost Effectiveness for Small Hotel – All-Electric + 3kW PV + 5 kWh Battery
CZ IOU territory
Elec Savings (kWh)
Gas Savings
(therms)
GHG savings (tons)
Incremental Package Cost
Lifecycle Energy Cost
Savings $-TDV
Savings
B/C Ratio (On-bill)
B/C Ratio (TDV)
NPV (On-bill) NPV (TDV)
All-Electric + 3kW PV + 5kWh Battery CZ01 PG&E -155,861 16917 54.7 ($1,288,428) ($568,892) ($106,835) 2.3 12.1 $719,536 $1,181,593 CZ02 PG&E -113,954 12677 40.9 ($1,288,428) ($229,433) ($41,288) 5.6 31.2 $1,058,996 $1,247,140 CZ03 PG&E -105,862 12322 41.4 ($1,288,428) ($309,874) ($41,175) 4.2 31.3 $978,554 $1,247,253 CZ04 PG&E -108,570 11927 37.5 ($1,288,428) ($208,239) ($42,689) 6.2 30.2 $1,080,190 $1,245,740 CZ04-2 CPAU -108,570 11927 37.5 ($1,288,428) ($6,261) ($42,689) 205.8 30.2 $1,282,167 $1,245,740 CZ05 PG&E -103,579 11960 39.3 ($1,288,428) ($332,879) ($44,051) 3.9 29.2 $955,549 $1,244,377 CZ06 SCE -73,524 8912 30.3 ($1,288,428) ($52,341) ($17,484) 24.6 73.7 $1,236,087 $1,270,944 CZ06-2 LA -73,524 8912 30.3 ($1,288,428) $48,898 ($17,484) >1 73.7 $1,337,326 $1,270,944 CZ07 SDG&E -64,859 8188 29.0 ($1,288,428) ($120,842) ($12,337) 10.7 104.4 $1,167,586 $1,276,091 CZ08 SCE -67,090 8353 29.2 ($1,288,428) ($43,964) ($11,618) 29.3 110.9 $1,244,464 $1,276,810 CZ08-2 LA -67,090 8353 29.2 ($1,288,428) $48,736 ($11,618) >1 110.9 $1,337,164 $1,276,810 CZ09 SCE -67,483 8402 29.3 ($1,288,428) ($35,547) ($11,126) 36.2 115.8 $1,252,881 $1,277,302 CZ09-2 LA -67,483 8402 29.3 ($1,288,428) $52,410 ($11,126) >1 115.8 $1,340,838 $1,277,302 CZ10 SDG&E -75,157 8418 27.2 ($1,288,428) ($156,973) ($25,469) 8.2 50.6 $1,131,455 $1,262,959 CZ10-2 SCE -75,157 8418 27.2 ($1,288,428) ($54,711) ($25,469) 23.5 50.6 $1,233,718 $1,262,959 CZ11 PG&E -94,783 10252 31.9 ($1,288,428) ($169,847) ($38,904) 7.6 33.1 $1,118,582 $1,249,524 CZ12 PG&E -94,702 10403 33.0 ($1,288,428) ($324,908) ($34,968) 4.0 36.8 $963,520 $1,253,460 CZ12-2 SMUD -94,297 10403 33.1 ($1,288,428) $13,603 ($33,757) >1 38.2 $1,302,031 $1,254,671 CZ13 PG&E -92,196 10029 31.5 ($1,288,428) ($168,358) ($40,229) 7.7 32.0 $1,120,071 $1,248,199 CZ14 SDG&E -96,021 10056 30.7 ($1,288,428) ($308,542) ($44,202) 4.2 29.1 $979,887 $1,244,226 CZ14-2 SCE -96,021 10056 30.7 ($1,288,428) ($110,730) ($44,202) 11.6 29.1 $1,177,698 $1,244,226 CZ15 SCE -44,856 5579 19.0 ($1,288,428) $8,996 ($10,256) >1 125.6 $1,297,425 $1,278,172 CZ16 PG&E -211,468 17599 42.9 ($1,288,428) ($625,671) ($228,203) 2.1 5.6 $662,757 $1,060,225 CZ16-2 LA -211,468 17599 42.9 ($1,288,428) $37,142 ($228,203) >1 5.6 $1,325,570 $1,060,225
ATTACHMENT 6
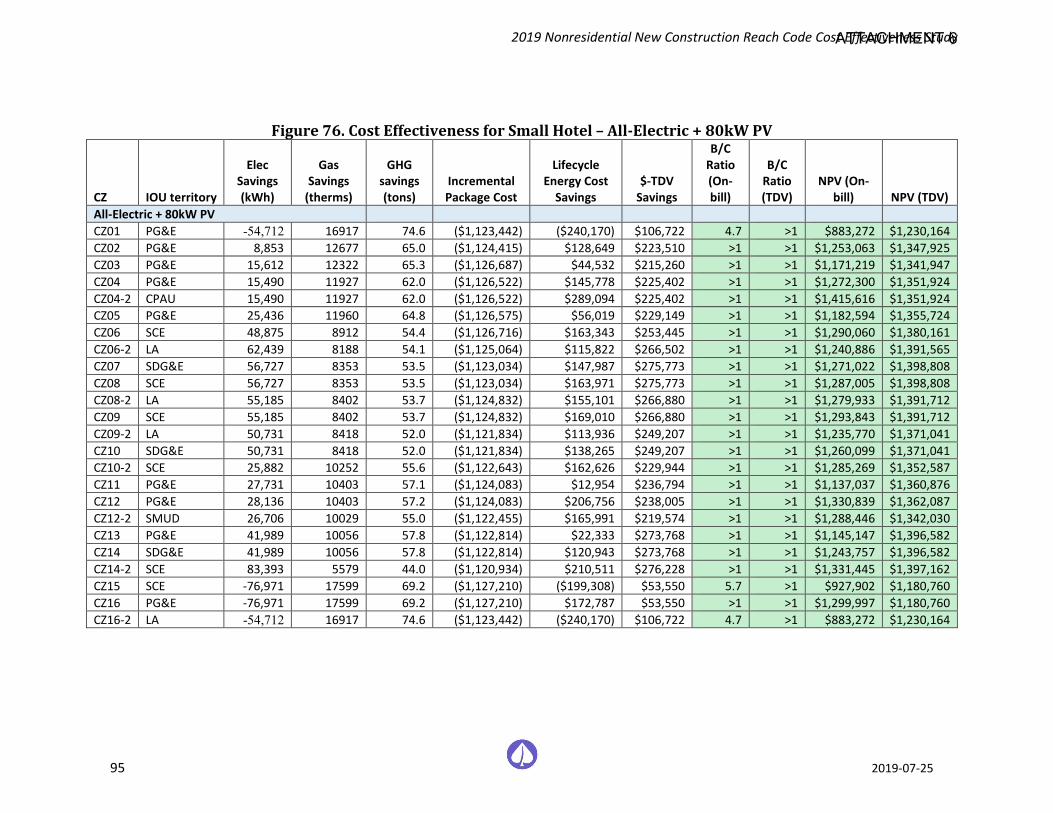
2019 Nonresidential New Construction Reach Code Cost Effectiveness Study
95 2019-07-25
Figure 76. Cost Effectiveness for Small Hotel – All-Electric + 80kW PV
CZ IOU territory
Elec Savings (kWh)
Gas Savings
(therms)
GHG savings (tons)
Incremental Package Cost
Lifecycle Energy Cost
Savings $-TDV
Savings
B/C Ratio (On-bill)
B/C Ratio (TDV)
NPV (On-bill) NPV (TDV)
All-Electric + 80kW PV CZ01 PG&E -54,712 16917 74.6 ($1,123,442) ($240,170) $106,722 4.7 >1 $883,272 $1,230,164 CZ02 PG&E 8,853 12677 65.0 ($1,124,415) $128,649 $223,510 >1 >1 $1,253,063 $1,347,925 CZ03 PG&E 15,612 12322 65.3 ($1,126,687) $44,532 $215,260 >1 >1 $1,171,219 $1,341,947 CZ04 PG&E 15,490 11927 62.0 ($1,126,522) $145,778 $225,402 >1 >1 $1,272,300 $1,351,924 CZ04-2 CPAU 15,490 11927 62.0 ($1,126,522) $289,094 $225,402 >1 >1 $1,415,616 $1,351,924 CZ05 PG&E 25,436 11960 64.8 ($1,126,575) $56,019 $229,149 >1 >1 $1,182,594 $1,355,724 CZ06 SCE 48,875 8912 54.4 ($1,126,716) $163,343 $253,445 >1 >1 $1,290,060 $1,380,161 CZ06-2 LA 62,439 8188 54.1 ($1,125,064) $115,822 $266,502 >1 >1 $1,240,886 $1,391,565 CZ07 SDG&E 56,727 8353 53.5 ($1,123,034) $147,987 $275,773 >1 >1 $1,271,022 $1,398,808 CZ08 SCE 56,727 8353 53.5 ($1,123,034) $163,971 $275,773 >1 >1 $1,287,005 $1,398,808 CZ08-2 LA 55,185 8402 53.7 ($1,124,832) $155,101 $266,880 >1 >1 $1,279,933 $1,391,712 CZ09 SCE 55,185 8402 53.7 ($1,124,832) $169,010 $266,880 >1 >1 $1,293,843 $1,391,712 CZ09-2 LA 50,731 8418 52.0 ($1,121,834) $113,936 $249,207 >1 >1 $1,235,770 $1,371,041 CZ10 SDG&E 50,731 8418 52.0 ($1,121,834) $138,265 $249,207 >1 >1 $1,260,099 $1,371,041 CZ10-2 SCE 25,882 10252 55.6 ($1,122,643) $162,626 $229,944 >1 >1 $1,285,269 $1,352,587 CZ11 PG&E 27,731 10403 57.1 ($1,124,083) $12,954 $236,794 >1 >1 $1,137,037 $1,360,876 CZ12 PG&E 28,136 10403 57.2 ($1,124,083) $206,756 $238,005 >1 >1 $1,330,839 $1,362,087 CZ12-2 SMUD 26,706 10029 55.0 ($1,122,455) $165,991 $219,574 >1 >1 $1,288,446 $1,342,030 CZ13 PG&E 41,989 10056 57.8 ($1,122,814) $22,333 $273,768 >1 >1 $1,145,147 $1,396,582 CZ14 SDG&E 41,989 10056 57.8 ($1,122,814) $120,943 $273,768 >1 >1 $1,243,757 $1,396,582 CZ14-2 SCE 83,393 5579 44.0 ($1,120,934) $210,511 $276,228 >1 >1 $1,331,445 $1,397,162 CZ15 SCE -76,971 17599 69.2 ($1,127,210) ($199,308) $53,550 5.7 >1 $927,902 $1,180,760 CZ16 PG&E -76,971 17599 69.2 ($1,127,210) $172,787 $53,550 >1 >1 $1,299,997 $1,180,760 CZ16-2 LA -54,712 16917 74.6 ($1,123,442) ($240,170) $106,722 4.7 >1 $883,272 $1,230,164
ATTACHMENT 6
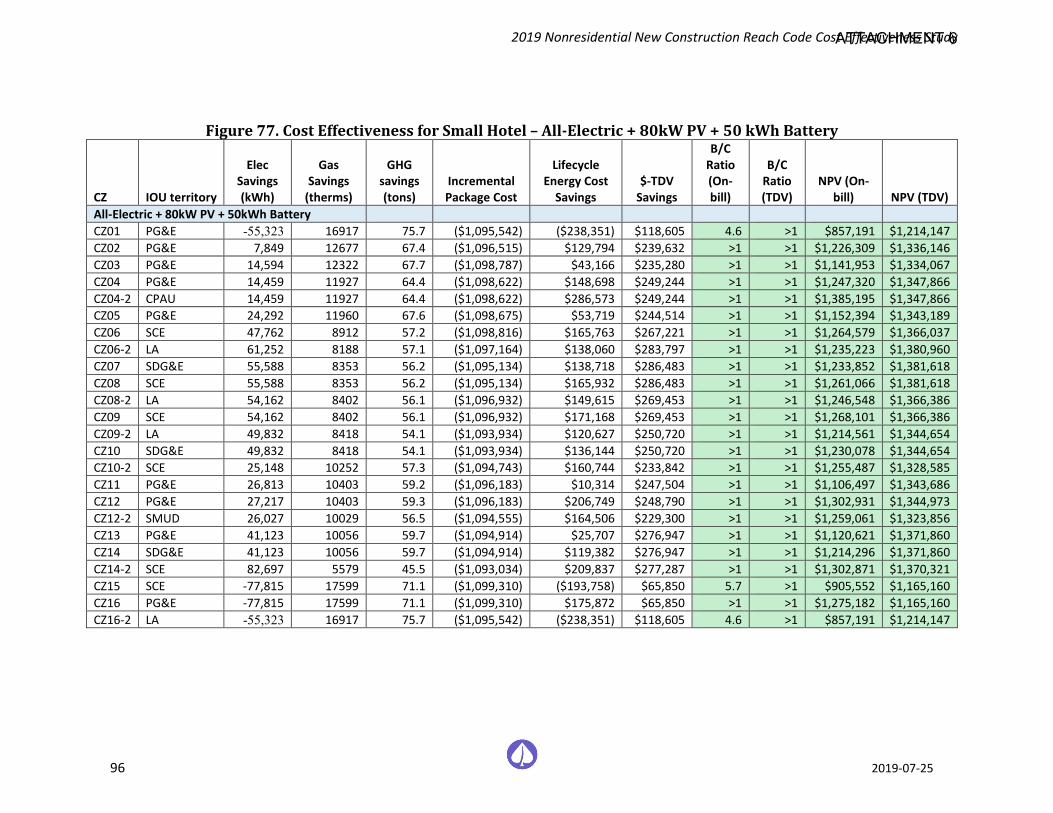
2019 Nonresidential New Construction Reach Code Cost Effectiveness Study
96 2019-07-25
Figure 77. Cost Effectiveness for Small Hotel – All-Electric + 80kW PV + 50 kWh Battery
CZ IOU territory
Elec Savings (kWh)
Gas Savings
(therms)
GHG savings (tons)
Incremental Package Cost
Lifecycle Energy Cost
Savings $-TDV
Savings
B/C Ratio (On-bill)
B/C Ratio (TDV)
NPV (On-bill) NPV (TDV)
All-Electric + 80kW PV + 50kWh Battery CZ01 PG&E -55,323 16917 75.7 ($1,095,542) ($238,351) $118,605 4.6 >1 $857,191 $1,214,147 CZ02 PG&E 7,849 12677 67.4 ($1,096,515) $129,794 $239,632 >1 >1 $1,226,309 $1,336,146 CZ03 PG&E 14,594 12322 67.7 ($1,098,787) $43,166 $235,280 >1 >1 $1,141,953 $1,334,067 CZ04 PG&E 14,459 11927 64.4 ($1,098,622) $148,698 $249,244 >1 >1 $1,247,320 $1,347,866 CZ04-2 CPAU 14,459 11927 64.4 ($1,098,622) $286,573 $249,244 >1 >1 $1,385,195 $1,347,866 CZ05 PG&E 24,292 11960 67.6 ($1,098,675) $53,719 $244,514 >1 >1 $1,152,394 $1,343,189 CZ06 SCE 47,762 8912 57.2 ($1,098,816) $165,763 $267,221 >1 >1 $1,264,579 $1,366,037 CZ06-2 LA 61,252 8188 57.1 ($1,097,164) $138,060 $283,797 >1 >1 $1,235,223 $1,380,960 CZ07 SDG&E 55,588 8353 56.2 ($1,095,134) $138,718 $286,483 >1 >1 $1,233,852 $1,381,618 CZ08 SCE 55,588 8353 56.2 ($1,095,134) $165,932 $286,483 >1 >1 $1,261,066 $1,381,618 CZ08-2 LA 54,162 8402 56.1 ($1,096,932) $149,615 $269,453 >1 >1 $1,246,548 $1,366,386 CZ09 SCE 54,162 8402 56.1 ($1,096,932) $171,168 $269,453 >1 >1 $1,268,101 $1,366,386 CZ09-2 LA 49,832 8418 54.1 ($1,093,934) $120,627 $250,720 >1 >1 $1,214,561 $1,344,654 CZ10 SDG&E 49,832 8418 54.1 ($1,093,934) $136,144 $250,720 >1 >1 $1,230,078 $1,344,654 CZ10-2 SCE 25,148 10252 57.3 ($1,094,743) $160,744 $233,842 >1 >1 $1,255,487 $1,328,585 CZ11 PG&E 26,813 10403 59.2 ($1,096,183) $10,314 $247,504 >1 >1 $1,106,497 $1,343,686 CZ12 PG&E 27,217 10403 59.3 ($1,096,183) $206,749 $248,790 >1 >1 $1,302,931 $1,344,973 CZ12-2 SMUD 26,027 10029 56.5 ($1,094,555) $164,506 $229,300 >1 >1 $1,259,061 $1,323,856 CZ13 PG&E 41,123 10056 59.7 ($1,094,914) $25,707 $276,947 >1 >1 $1,120,621 $1,371,860 CZ14 SDG&E 41,123 10056 59.7 ($1,094,914) $119,382 $276,947 >1 >1 $1,214,296 $1,371,860 CZ14-2 SCE 82,697 5579 45.5 ($1,093,034) $209,837 $277,287 >1 >1 $1,302,871 $1,370,321 CZ15 SCE -77,815 17599 71.1 ($1,099,310) ($193,758) $65,850 5.7 >1 $905,552 $1,165,160 CZ16 PG&E -77,815 17599 71.1 ($1,099,310) $175,872 $65,850 >1 >1 $1,275,182 $1,165,160 CZ16-2 LA -55,323 16917 75.7 ($1,095,542) ($238,351) $118,605 4.6 >1 $857,191 $1,214,147
ATTACHMENT 6
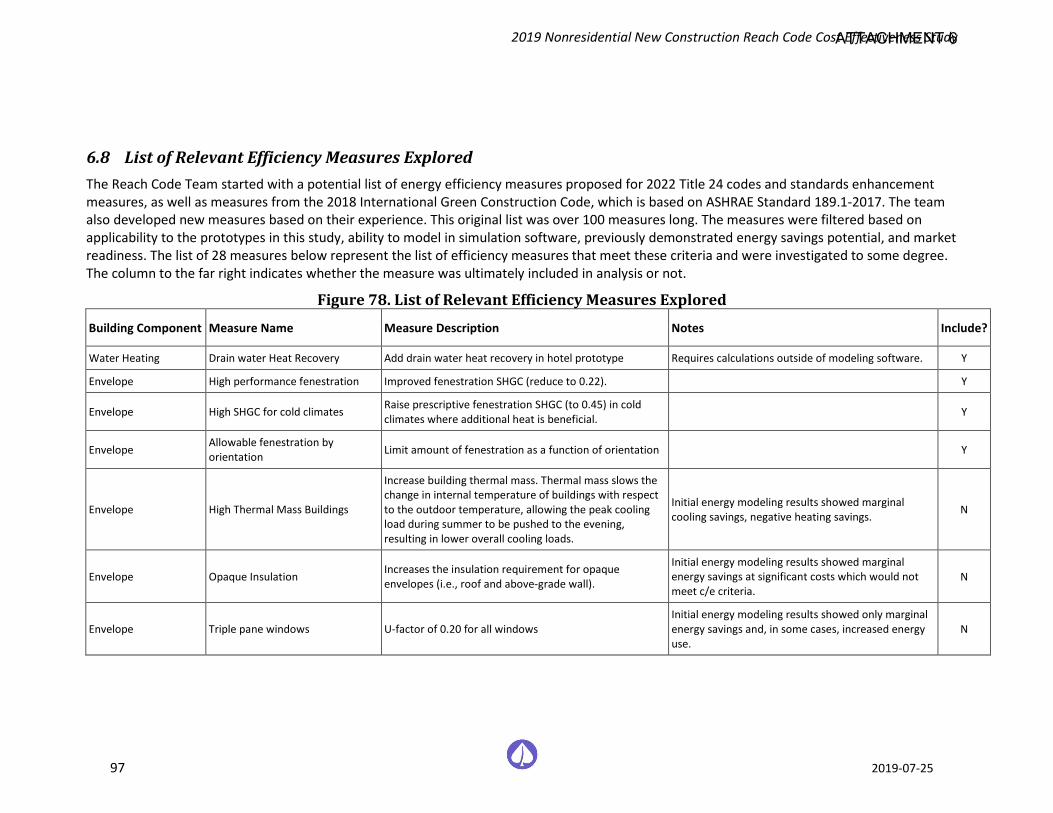
2019 Nonresidential New Construction Reach Code Cost Effectiveness Study
97 2019-07-25
6.8 List of Relevant Efficiency Measures Explored The Reach Code Team started with a potential list of energy efficiency measures proposed for 2022 Title 24 codes and standards enhancement measures, as well as measures from the 2018 International Green Construction Code, which is based on ASHRAE Standard 189.1-2017. The team also developed new measures based on their experience. This original list was over 100 measures long. The measures were filtered based on applicability to the prototypes in this study, ability to model in simulation software, previously demonstrated energy savings potential, and market readiness. The list of 28 measures below represent the list of efficiency measures that meet these criteria and were investigated to some degree. The column to the far right indicates whether the measure was ultimately included in analysis or not.
Figure 78. List of Relevant Efficiency Measures Explored
Building Component Measure Name Measure Description Notes Include?
Water Heating Drain water Heat Recovery Add drain water heat recovery in hotel prototype Requires calculations outside of modeling software. Y
Envelope High performance fenestration Improved fenestration SHGC (reduce to 0.22). Y
Envelope High SHGC for cold climates Raise prescriptive fenestration SHGC (to 0.45) in cold climates where additional heat is beneficial. Y
Envelope Allowable fenestration by orientation Limit amount of fenestration as a function of orientation Y
Envelope High Thermal Mass Buildings
Increase building thermal mass. Thermal mass slows the change in internal temperature of buildings with respect to the outdoor temperature, allowing the peak cooling load during summer to be pushed to the evening, resulting in lower overall cooling loads.
Initial energy modeling results showed marginal cooling savings, negative heating savings. N
Envelope Opaque Insulation Increases the insulation requirement for opaque envelopes (i.e., roof and above-grade wall).
Initial energy modeling results showed marginal energy savings at significant costs which would not meet c/e criteria.
N
Envelope Triple pane windows U-factor of 0.20 for all windows Initial energy modeling results showed only marginal energy savings and, in some cases, increased energy use.
N
ATTACHMENT 6
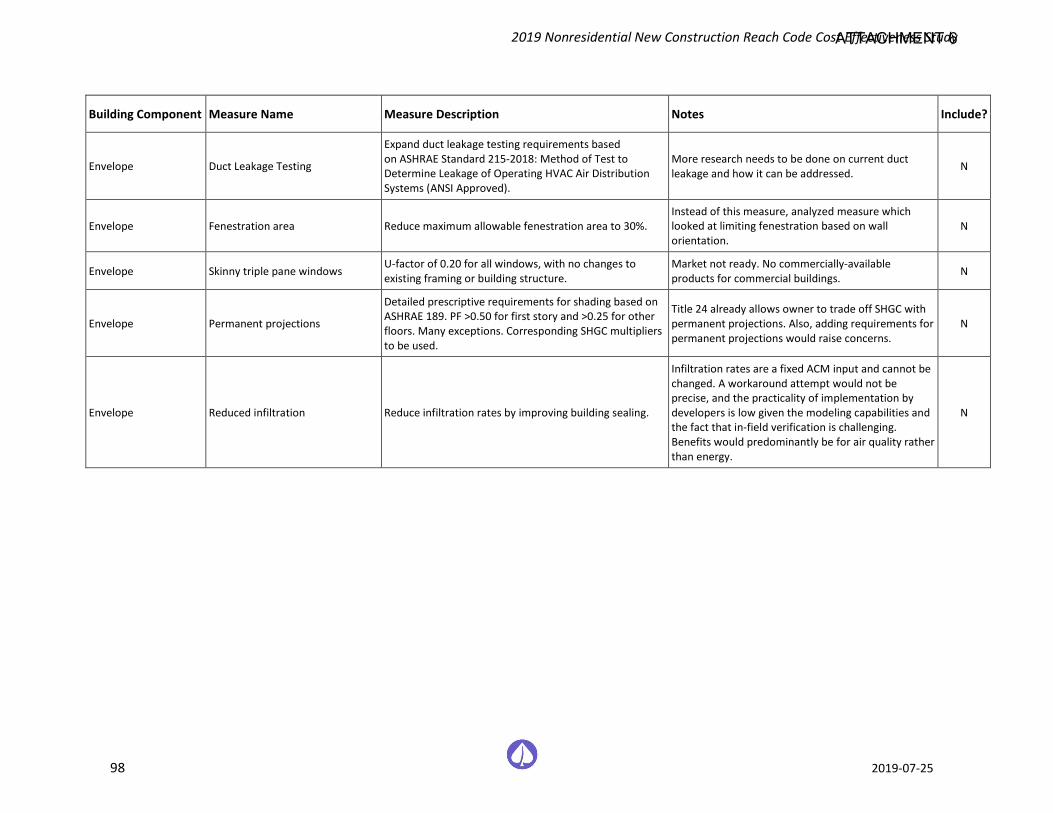
2019 Nonresidential New Construction Reach Code Cost Effectiveness Study
98 2019-07-25
Building Component Measure Name Measure Description Notes Include?
Envelope Duct Leakage Testing
Expand duct leakage testing requirements based on ASHRAE Standard 215-2018: Method of Test to Determine Leakage of Operating HVAC Air Distribution Systems (ANSI Approved).
More research needs to be done on current duct leakage and how it can be addressed. N
Envelope Fenestration area Reduce maximum allowable fenestration area to 30%. Instead of this measure, analyzed measure which looked at limiting fenestration based on wall orientation.
N
Envelope Skinny triple pane windows U-factor of 0.20 for all windows, with no changes to existing framing or building structure.
Market not ready. No commercially-available products for commercial buildings. N
Envelope Permanent projections
Detailed prescriptive requirements for shading based on ASHRAE 189. PF >0.50 for first story and >0.25 for other floors. Many exceptions. Corresponding SHGC multipliers to be used.
Title 24 already allows owner to trade off SHGC with permanent projections. Also, adding requirements for permanent projections would raise concerns.
N
Envelope Reduced infiltration Reduce infiltration rates by improving building sealing.
Infiltration rates are a fixed ACM input and cannot be changed. A workaround attempt would not be precise, and the practicality of implementation by developers is low given the modeling capabilities and the fact that in-field verification is challenging. Benefits would predominantly be for air quality rather than energy.
N
ATTACHMENT 6
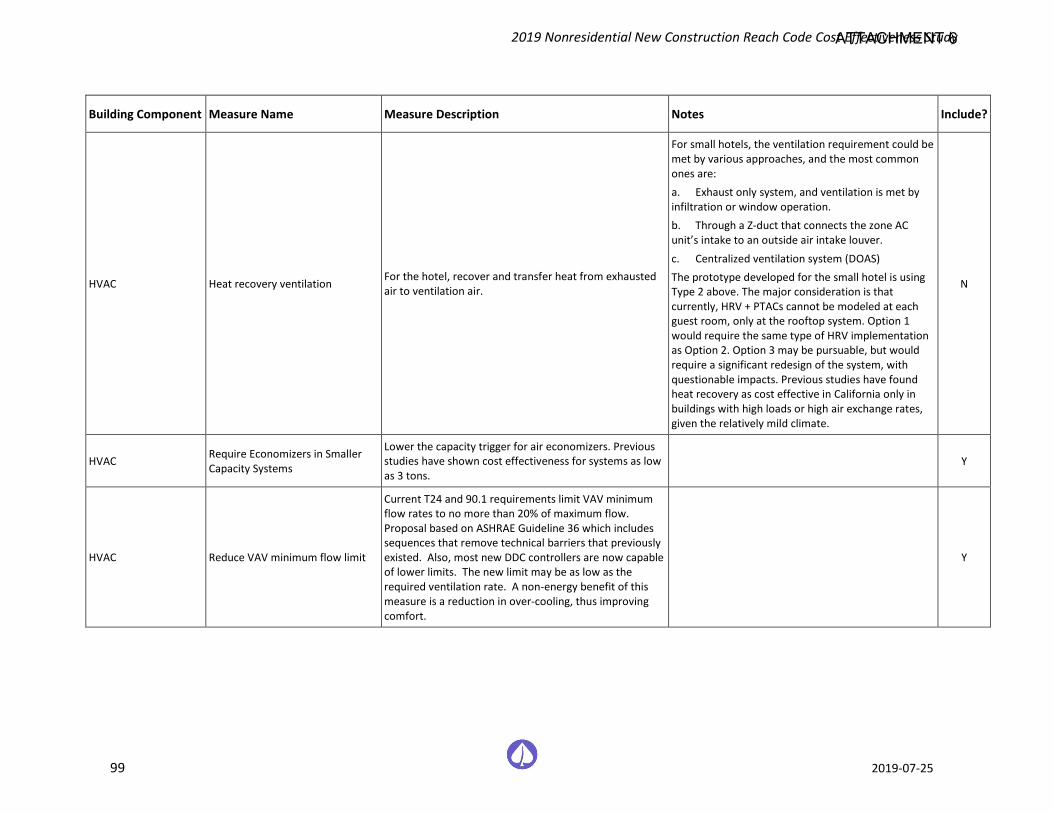
2019 Nonresidential New Construction Reach Code Cost Effectiveness Study
99 2019-07-25
Building Component Measure Name Measure Description Notes Include?
HVAC Heat recovery ventilation For the hotel, recover and transfer heat from exhausted air to ventilation air.
For small hotels, the ventilation requirement could be met by various approaches, and the most common ones are: a. Exhaust only system, and ventilation is met by infiltration or window operation. b. Through a Z-duct that connects the zone AC unit’s intake to an outside air intake louver. c. Centralized ventilation system (DOAS) The prototype developed for the small hotel is using Type 2 above. The major consideration is that currently, HRV + PTACs cannot be modeled at each guest room, only at the rooftop system. Option 1 would require the same type of HRV implementation as Option 2. Option 3 may be pursuable, but would require a significant redesign of the system, with questionable impacts. Previous studies have found heat recovery as cost effective in California only in buildings with high loads or high air exchange rates, given the relatively mild climate.
N
HVAC Require Economizers in Smaller Capacity Systems
Lower the capacity trigger for air economizers. Previous studies have shown cost effectiveness for systems as low as 3 tons.
Y
HVAC Reduce VAV minimum flow limit
Current T24 and 90.1 requirements limit VAV minimum flow rates to no more than 20% of maximum flow. Proposal based on ASHRAE Guideline 36 which includes sequences that remove technical barriers that previously existed. Also, most new DDC controllers are now capable of lower limits. The new limit may be as low as the required ventilation rate. A non-energy benefit of this measure is a reduction in over-cooling, thus improving comfort.
Y
ATTACHMENT 6
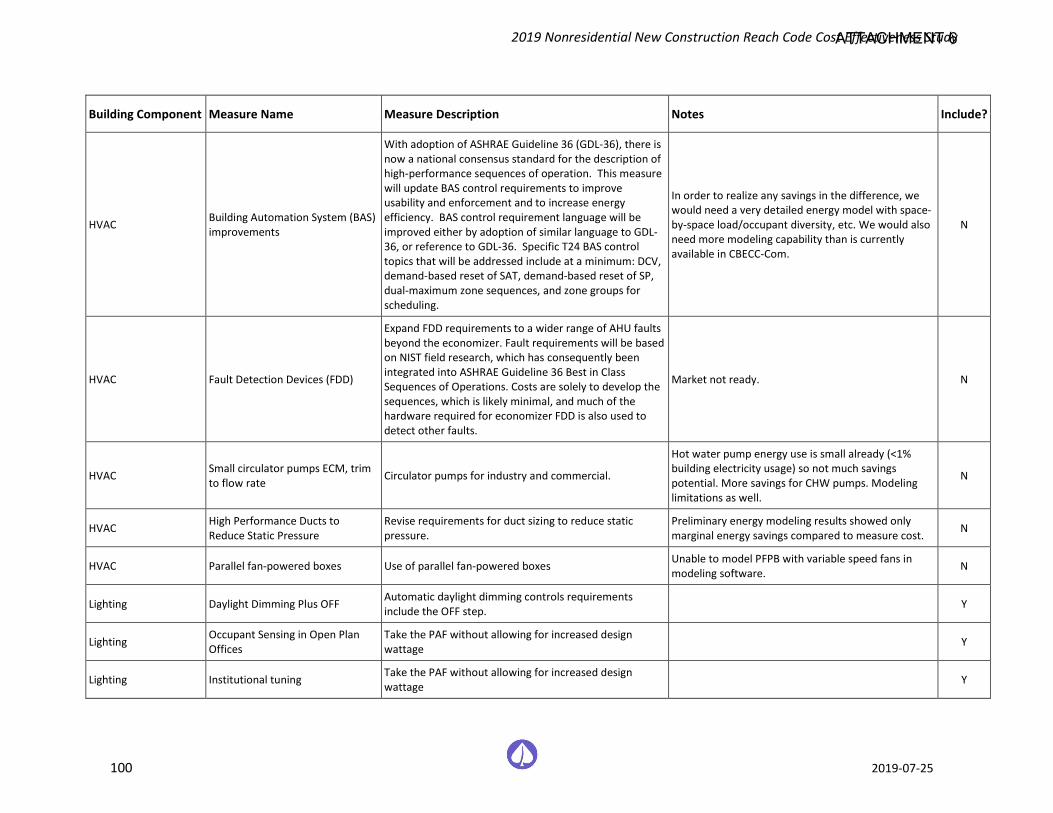
2019 Nonresidential New Construction Reach Code Cost Effectiveness Study
100 2019-07-25
Building Component Measure Name Measure Description Notes Include?
HVAC Building Automation System (BAS) improvements
With adoption of ASHRAE Guideline 36 (GDL-36), there is now a national consensus standard for the description of high-performance sequences of operation. This measure will update BAS control requirements to improve usability and enforcement and to increase energy efficiency. BAS control requirement language will be improved either by adoption of similar language to GDL-36, or reference to GDL-36. Specific T24 BAS control topics that will be addressed include at a minimum: DCV, demand-based reset of SAT, demand-based reset of SP, dual-maximum zone sequences, and zone groups for scheduling.
In order to realize any savings in the difference, we would need a very detailed energy model with space-by-space load/occupant diversity, etc. We would also need more modeling capability than is currently available in CBECC-Com.
N
HVAC Fault Detection Devices (FDD)
Expand FDD requirements to a wider range of AHU faults beyond the economizer. Fault requirements will be based on NIST field research, which has consequently been integrated into ASHRAE Guideline 36 Best in Class Sequences of Operations. Costs are solely to develop the sequences, which is likely minimal, and much of the hardware required for economizer FDD is also used to detect other faults.
Market not ready. N
HVAC Small circulator pumps ECM, trim to flow rate Circulator pumps for industry and commercial.
Hot water pump energy use is small already (<1% building electricity usage) so not much savings potential. More savings for CHW pumps. Modeling limitations as well.
N
HVAC High Performance Ducts to Reduce Static Pressure
Revise requirements for duct sizing to reduce static pressure.
Preliminary energy modeling results showed only marginal energy savings compared to measure cost. N
HVAC Parallel fan-powered boxes Use of parallel fan-powered boxes Unable to model PFPB with variable speed fans in modeling software. N
Lighting Daylight Dimming Plus OFF Automatic daylight dimming controls requirements include the OFF step. Y
Lighting Occupant Sensing in Open Plan Offices
Take the PAF without allowing for increased design wattage Y
Lighting Institutional tuning Take the PAF without allowing for increased design wattage Y
ATTACHMENT 6
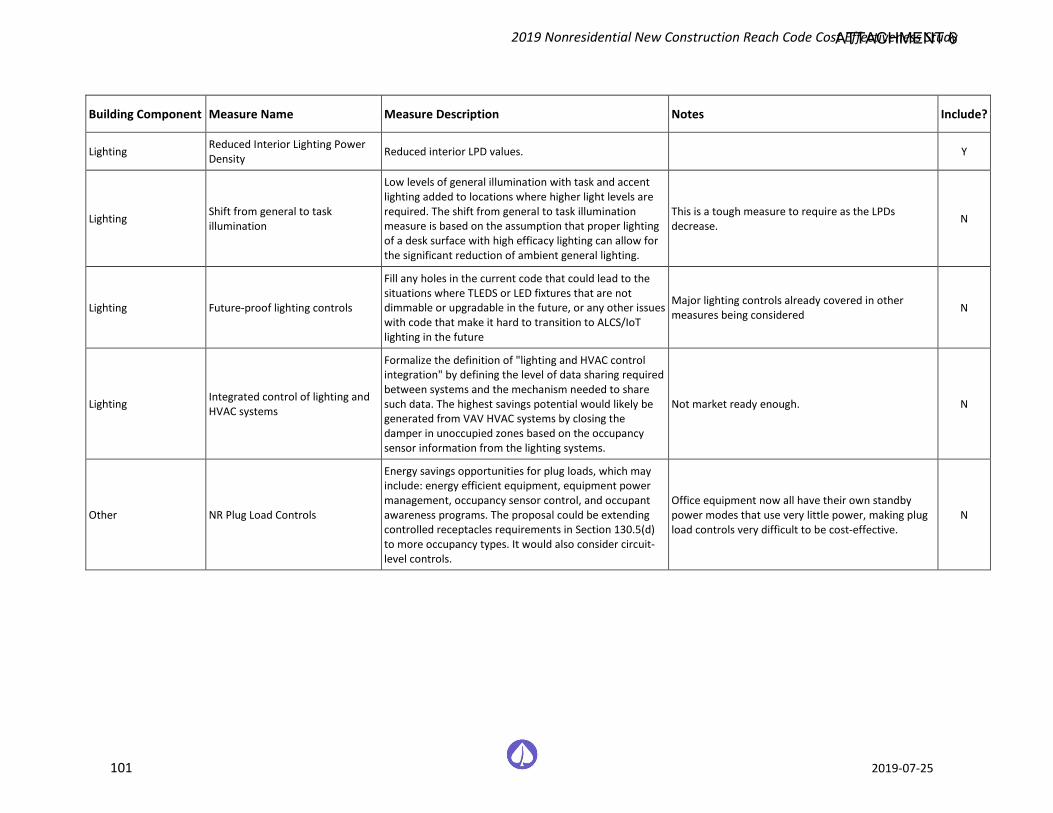
2019 Nonresidential New Construction Reach Code Cost Effectiveness Study
101 2019-07-25
Building Component Measure Name Measure Description Notes Include?
Lighting Reduced Interior Lighting Power Density Reduced interior LPD values. Y
Lighting Shift from general to task illumination
Low levels of general illumination with task and accent lighting added to locations where higher light levels are required. The shift from general to task illumination measure is based on the assumption that proper lighting of a desk surface with high efficacy lighting can allow for the significant reduction of ambient general lighting.
This is a tough measure to require as the LPDs decrease. N
Lighting Future-proof lighting controls
Fill any holes in the current code that could lead to the situations where TLEDS or LED fixtures that are not dimmable or upgradable in the future, or any other issues with code that make it hard to transition to ALCS/IoT lighting in the future
Major lighting controls already covered in other measures being considered N
Lighting Integrated control of lighting and HVAC systems
Formalize the definition of "lighting and HVAC control integration" by defining the level of data sharing required between systems and the mechanism needed to share such data. The highest savings potential would likely be generated from VAV HVAC systems by closing the damper in unoccupied zones based on the occupancy sensor information from the lighting systems.
Not market ready enough. N
Other NR Plug Load Controls
Energy savings opportunities for plug loads, which may include: energy efficient equipment, equipment power management, occupancy sensor control, and occupant awareness programs. The proposal could be extending controlled receptacles requirements in Section 130.5(d) to more occupancy types. It would also consider circuit-level controls.
Office equipment now all have their own standby power modes that use very little power, making plug load controls very difficult to be cost-effective.
N
ATTACHMENT 6

2019 Nonresidential New Construction Reach Code Cost Effectiveness Study
102 2019-07-25
6.9 Additional Rates Analysis - Healdsburg After the final version of the report was released, the Reach Code Team provided additional cost effectiveness analysis in Climate Zone 2 using City of Healdsburg electric utility rates and PG&E gas rates. All aspects of the methodology remain the same, and the results for each package and prototype are aggregated below in Figure 79 through Figure 81. Results generally indicate:
♦ Mixed fuel prototypes achieve positive compliance margins for EE packages and are cost effective.
♦ All-electric prototypes achieve slightly lower compliance margins than mixed fuel for EE packages and are cost effective.
♦ All PV and PV+Battery packages are cost effective both using an on-bill and TDV approach.
ATTACHMENT 6
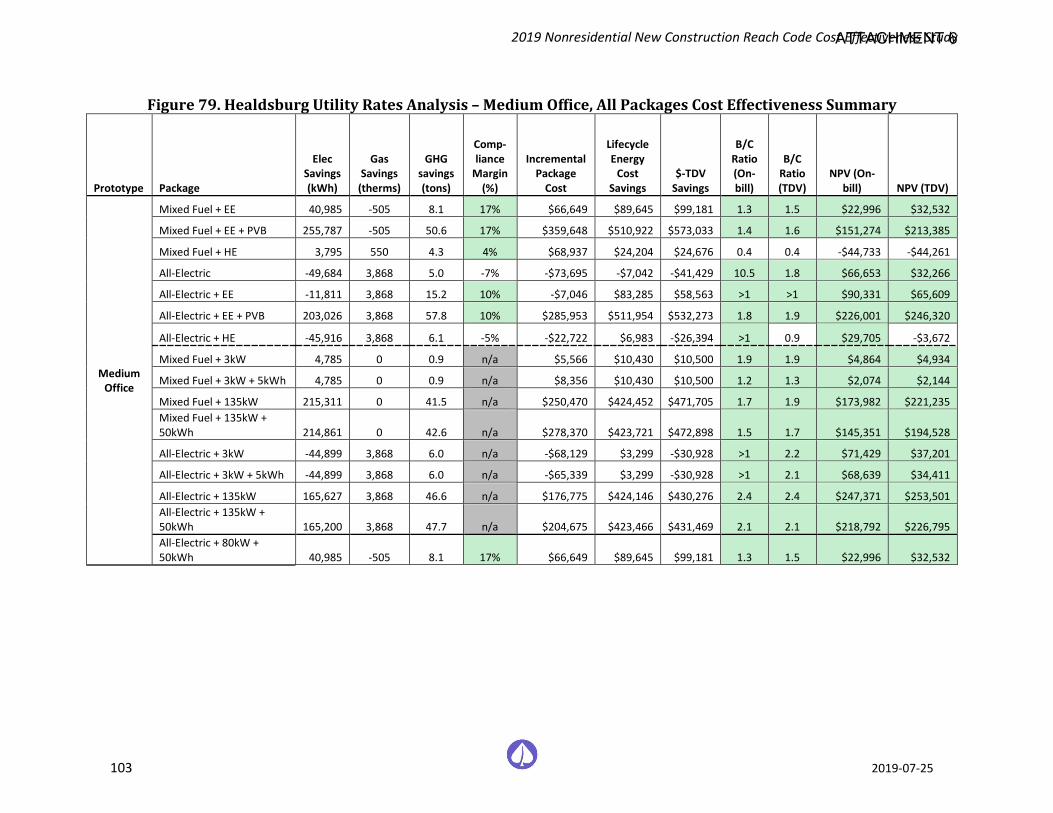
2019 Nonresidential New Construction Reach Code Cost Effectiveness Study
103 2019-07-25
Figure 79. Healdsburg Utility Rates Analysis – Medium Office, All Packages Cost Effectiveness Summary
Prototype Package
Elec Savings (kWh)
Gas Savings
(therms)
GHG savings (tons)
Comp-liance
Margin (%)
Incremental Package
Cost
Lifecycle Energy
Cost Savings
$-TDV Savings
B/C Ratio (On-bill)
B/C Ratio (TDV)
NPV (On-bill) NPV (TDV)
Medium Office
Mixed Fuel + EE 40,985 -505 8.1 17% $66,649 $89,645 $99,181 1.3 1.5 $22,996 $32,532
Mixed Fuel + EE + PVB 255,787 -505 50.6 17% $359,648 $510,922 $573,033 1.4 1.6 $151,274 $213,385
Mixed Fuel + HE 3,795 550 4.3 4% $68,937 $24,204 $24,676 0.4 0.4 -$44,733 -$44,261
All-Electric -49,684 3,868 5.0 -7% -$73,695 -$7,042 -$41,429 10.5 1.8 $66,653 $32,266
All-Electric + EE -11,811 3,868 15.2 10% -$7,046 $83,285 $58,563 >1 >1 $90,331 $65,609
All-Electric + EE + PVB 203,026 3,868 57.8 10% $285,953 $511,954 $532,273 1.8 1.9 $226,001 $246,320
All-Electric + HE -45,916 3,868 6.1 -5% -$22,722 $6,983 -$26,394 >1 0.9 $29,705 -$3,672
Mixed Fuel + 3kW 4,785 0 0.9 n/a $5,566 $10,430 $10,500 1.9 1.9 $4,864 $4,934
Mixed Fuel + 3kW + 5kWh 4,785 0 0.9 n/a $8,356 $10,430 $10,500 1.2 1.3 $2,074 $2,144
Mixed Fuel + 135kW 215,311 0 41.5 n/a $250,470 $424,452 $471,705 1.7 1.9 $173,982 $221,235 Mixed Fuel + 135kW + 50kWh 214,861 0 42.6 n/a $278,370 $423,721 $472,898 1.5 1.7 $145,351 $194,528
All-Electric + 3kW -44,899 3,868 6.0 n/a -$68,129 $3,299 -$30,928 >1 2.2 $71,429 $37,201
All-Electric + 3kW + 5kWh -44,899 3,868 6.0 n/a -$65,339 $3,299 -$30,928 >1 2.1 $68,639 $34,411
All-Electric + 135kW 165,627 3,868 46.6 n/a $176,775 $424,146 $430,276 2.4 2.4 $247,371 $253,501 All-Electric + 135kW + 50kWh 165,200 3,868 47.7 n/a $204,675 $423,466 $431,469 2.1 2.1 $218,792 $226,795 All-Electric + 80kW + 50kWh 40,985 -505 8.1 17% $66,649 $89,645 $99,181 1.3 1.5 $22,996 $32,532
ATTACHMENT 6
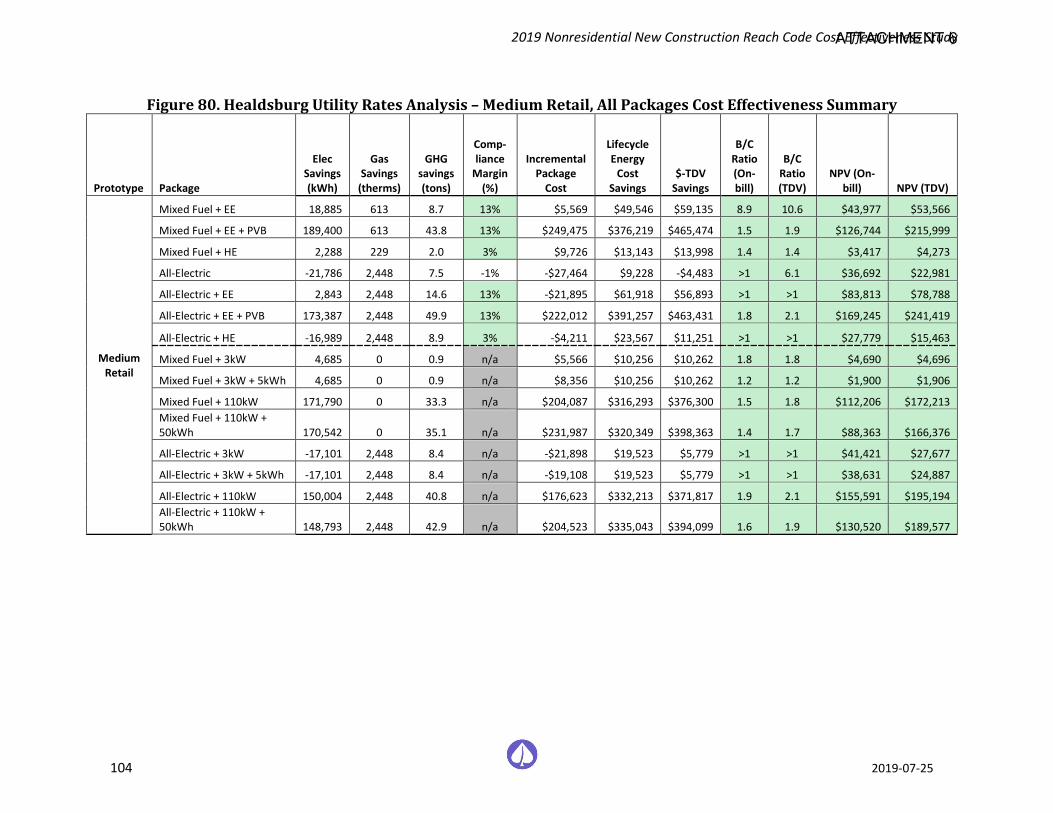
2019 Nonresidential New Construction Reach Code Cost Effectiveness Study
104 2019-07-25
Figure 80. Healdsburg Utility Rates Analysis – Medium Retail, All Packages Cost Effectiveness Summary
Prototype Package
Elec Savings (kWh)
Gas Savings
(therms)
GHG savings (tons)
Comp-liance
Margin (%)
Incremental Package
Cost
Lifecycle Energy
Cost Savings
$-TDV Savings
B/C Ratio (On-bill)
B/C Ratio (TDV)
NPV (On-bill) NPV (TDV)
Medium Retail
Mixed Fuel + EE 18,885 613 8.7 13% $5,569 $49,546 $59,135 8.9 10.6 $43,977 $53,566
Mixed Fuel + EE + PVB 189,400 613 43.8 13% $249,475 $376,219 $465,474 1.5 1.9 $126,744 $215,999
Mixed Fuel + HE 2,288 229 2.0 3% $9,726 $13,143 $13,998 1.4 1.4 $3,417 $4,273
All-Electric -21,786 2,448 7.5 -1% -$27,464 $9,228 -$4,483 >1 6.1 $36,692 $22,981
All-Electric + EE 2,843 2,448 14.6 13% -$21,895 $61,918 $56,893 >1 >1 $83,813 $78,788
All-Electric + EE + PVB 173,387 2,448 49.9 13% $222,012 $391,257 $463,431 1.8 2.1 $169,245 $241,419
All-Electric + HE -16,989 2,448 8.9 3% -$4,211 $23,567 $11,251 >1 >1 $27,779 $15,463
Mixed Fuel + 3kW 4,685 0 0.9 n/a $5,566 $10,256 $10,262 1.8 1.8 $4,690 $4,696
Mixed Fuel + 3kW + 5kWh 4,685 0 0.9 n/a $8,356 $10,256 $10,262 1.2 1.2 $1,900 $1,906
Mixed Fuel + 110kW 171,790 0 33.3 n/a $204,087 $316,293 $376,300 1.5 1.8 $112,206 $172,213 Mixed Fuel + 110kW + 50kWh 170,542 0 35.1 n/a $231,987 $320,349 $398,363 1.4 1.7 $88,363 $166,376
All-Electric + 3kW -17,101 2,448 8.4 n/a -$21,898 $19,523 $5,779 >1 >1 $41,421 $27,677
All-Electric + 3kW + 5kWh -17,101 2,448 8.4 n/a -$19,108 $19,523 $5,779 >1 >1 $38,631 $24,887
All-Electric + 110kW 150,004 2,448 40.8 n/a $176,623 $332,213 $371,817 1.9 2.1 $155,591 $195,194 All-Electric + 110kW + 50kWh 148,793 2,448 42.9 n/a $204,523 $335,043 $394,099 1.6 1.9 $130,520 $189,577
ATTACHMENT 6
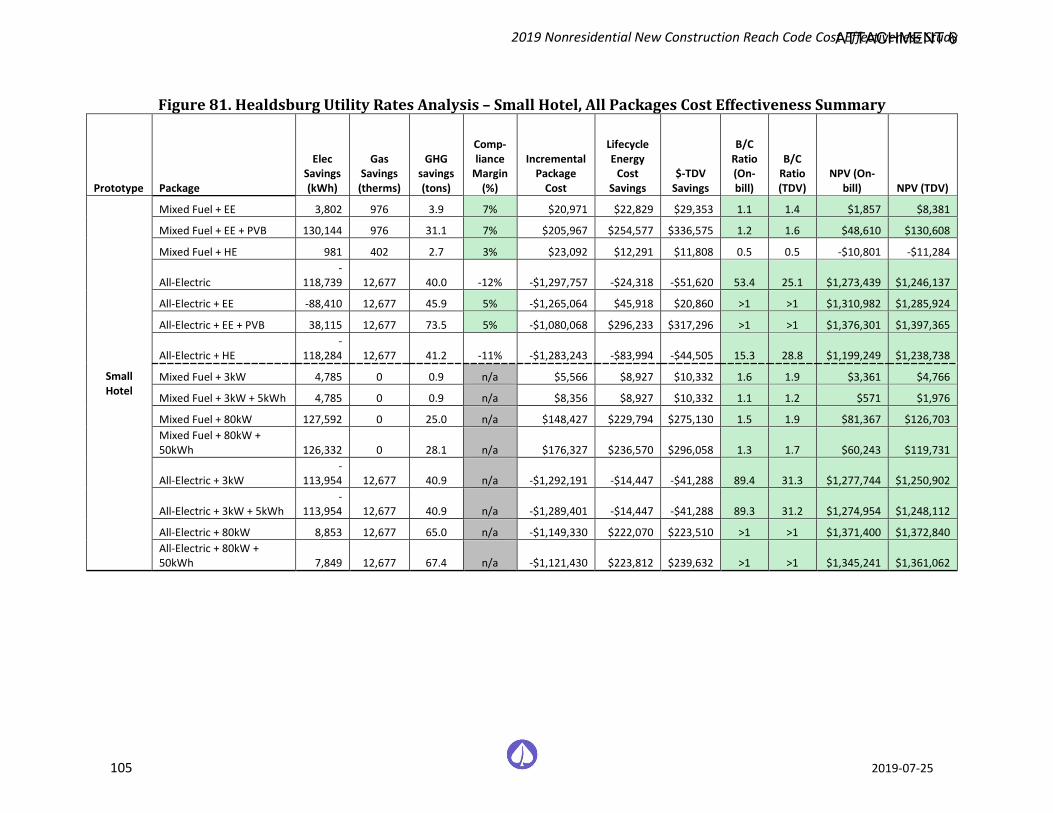
2019 Nonresidential New Construction Reach Code Cost Effectiveness Study
105 2019-07-25
Figure 81. Healdsburg Utility Rates Analysis – Small Hotel, All Packages Cost Effectiveness Summary
Prototype Package
Elec Savings (kWh)
Gas Savings
(therms)
GHG savings (tons)
Comp-liance
Margin (%)
Incremental Package
Cost
Lifecycle Energy
Cost Savings
$-TDV Savings
B/C Ratio (On-bill)
B/C Ratio (TDV)
NPV (On-bill) NPV (TDV)
Small Hotel
Mixed Fuel + EE 3,802 976 3.9 7% $20,971 $22,829 $29,353 1.1 1.4 $1,857 $8,381
Mixed Fuel + EE + PVB 130,144 976 31.1 7% $205,967 $254,577 $336,575 1.2 1.6 $48,610 $130,608
Mixed Fuel + HE 981 402 2.7 3% $23,092 $12,291 $11,808 0.5 0.5 -$10,801 -$11,284
All-Electric -
118,739 12,677 40.0 -12% -$1,297,757 -$24,318 -$51,620 53.4 25.1 $1,273,439 $1,246,137
All-Electric + EE -88,410 12,677 45.9 5% -$1,265,064 $45,918 $20,860 >1 >1 $1,310,982 $1,285,924
All-Electric + EE + PVB 38,115 12,677 73.5 5% -$1,080,068 $296,233 $317,296 >1 >1 $1,376,301 $1,397,365
All-Electric + HE -
118,284 12,677 41.2 -11% -$1,283,243 -$83,994 -$44,505 15.3 28.8 $1,199,249 $1,238,738
Mixed Fuel + 3kW 4,785 0 0.9 n/a $5,566 $8,927 $10,332 1.6 1.9 $3,361 $4,766
Mixed Fuel + 3kW + 5kWh 4,785 0 0.9 n/a $8,356 $8,927 $10,332 1.1 1.2 $571 $1,976
Mixed Fuel + 80kW 127,592 0 25.0 n/a $148,427 $229,794 $275,130 1.5 1.9 $81,367 $126,703 Mixed Fuel + 80kW + 50kWh 126,332 0 28.1 n/a $176,327 $236,570 $296,058 1.3 1.7 $60,243 $119,731
All-Electric + 3kW -
113,954 12,677 40.9 n/a -$1,292,191 -$14,447 -$41,288 89.4 31.3 $1,277,744 $1,250,902
All-Electric + 3kW + 5kWh -
113,954 12,677 40.9 n/a -$1,289,401 -$14,447 -$41,288 89.3 31.2 $1,274,954 $1,248,112
All-Electric + 80kW 8,853 12,677 65.0 n/a -$1,149,330 $222,070 $223,510 >1 >1 $1,371,400 $1,372,840 All-Electric + 80kW + 50kWh 7,849 12,677 67.4 n/a -$1,121,430 $223,812 $239,632 >1 >1 $1,345,241 $1,361,062
ATTACHMENT 6

Margin?
Title 24, Parts 6 and 11 Local Energy Efficiency Ordinances
2019 Mid-Rise New Construction Reach Code Cost-Effectiveness Study
Prepared for:
Kelly Cunningham
Codes and Standards Program
Pacific Gas and Electric Company
Prepared by:
Frontier Energy, Inc.
Misti Bruceri & Associates, LLC
EnergySoft
Last Modified: June 22, 2020
ATTACHMENT 7

1
LEGAL NOTICE
This report was prepared by Pacific Gas and Electric Company and funded by the California utility customers under the auspices of the California Public Utilities Commission.
Copyright 2019, Pacific Gas and Electric Company. All rights reserved, except that this document may be used, copied, and distributed without modification.
Neither PG&E nor any of its employees makes any warranty, express or implied; or assumes any legal liability or responsibility for the accuracy, completeness or usefulness of any data, information, method, product, policy or process disclosed in this document; or represents that its use will not infringe any privately-owned rights including, but not limited to, patents, trademarks or copyrights.
ATTACHMENT 7
2019 Mid-Rise Residential New Construction Cost-Effectiveness Study
i
Table of Contents Acronyms ........................................................................................................................................................ iii
1 Introduction ............................................................................................................................................. 1
2 Methodology and Assumptions............................................................................................................... 1
2.1 Building Prototypes ......................................................................................................................... 1
2.2 Measure Analysis ............................................................................................................................. 3
2.2.1 Federal Preemption ................................................................................................................ 3
2.2.2 Energy Efficiency Measures .................................................................................................... 3
2.2.3 All Electric Measures .............................................................................................................. 4
2.2.4 Renewable Energy .................................................................................................................. 5
2.3 Package Development ..................................................................................................................... 6
2.4 Incremental Costs ............................................................................................................................ 6
2.4.1 Energy Efficiency Measure Costs ............................................................................................ 6
2.4.2 All Electric Measure Costs ...................................................................................................... 8
2.4.3 Natural Gas Infrastructure Costs ............................................................................................ 9
2.5 Cost-effectiveness ......................................................................................................................... 10
2.5.1 On-Bill Customer Lifecycle Cost ............................................................................................ 11
2.5.2 TDV Lifecycle Cost ................................................................................................................. 12
2.6 Greenhouse Gas Emissions ............................................................................................................ 12
3 Results ................................................................................................................................................... 13
3.1 Mid-Rise Multifamily Results ......................................................................................................... 13
Efficiency Only: ..................................................................................................................................... 13
Efficiency + PV: ..................................................................................................................................... 14
4 Conclusions & Summary ........................................................................................................................ 20
5 References ............................................................................................................................................. 22
Appendix A – California Climate Zone Map ................................................................................................... 24
Appendix B – Utility Tariff Details.................................................................................................................. 25
Appendix C – PG&E Gas Infrastructure Cost Memo ...................................................................................... 47
Appendix D – Detailed Results Mixed-Fuel ................................................................................................... 50
Appendix E – Detailed Results All-Electric ..................................................................................................... 53
ATTACHMENT 7
2019 Mid-Rise Residential New Construction Cost-Effectiveness Study
ii
List of Tables Table 1: Prototype Characteristics .............................................................................................................................2 Table 2: Incremental Cost Assumptions .....................................................................................................................7 Table 3: Costs for Gas versus Electric Water Heating Equipment over 30-Year Period of Analysis ...........................8 Table 4: Solar Thermal Detailed Costs over 30-Year Period of Analysis ....................................................................9 Table 5: Natural Gas Infrastructure Cost Savings for All-Electric Building .................................................................9 Table 6: IOU Utility Tariffs Applied Based on Climate Zone .................................................................................... 12 Table 7: Mixed-Fuel Package Results: Efficiency Only (SAVINGS/COST PER APARTMENT) .................................... 15 Table 8: Mixed-Fuel Package Results: PV + Efficiency 0.3 kWDC per Apartment (SAVINGS/COST PER APARTMENT) ................................................................................................................................................................................. 16 Table 9: All-Electric Package Results: Efficiency Only (SAVINGS/COSTS PER APARTMENT) ................................... 17 Table 10: All-Electric Package Results: PV + Efficiency 0.1 kWDC per Apartment (SAVINGS/COSTS PER APARTMENT) ........................................................................................................................................................... 18 Table 11: Mixed-Fuel Measure Package Summary ................................................................................................. 19 Table 12: All-Electric Measure Package Summary .................................................................................................. 19 Table 13: Mid-Rise Multifamily Summary of Compliance Margin and Cost-Effectiveness ..................................... 21 Table 14: PG&E Baseline Territory by Climate Zone .............................................................................................. 26 Table 15: PG&E Monthly Gas Rate ($/Therm) ........................................................................................................ 26 Table 16: SCE Baseline Territory by Climate Zone .................................................................................................. 32 Table 17: SoCalGas Baseline Territory by Climate Zone ......................................................................................... 35 Table 18: SoCalGas Monthly Gas Rate ($/Therm) .................................................................................................. 35 Table 19: SDG&E Baseline Territory by Climate Zone ............................................................................................ 38 Table 20: SDG&E Monthly Gas Rate ($/Therm) ...................................................................................................... 41 Table 22: Real Utility Rate Escalation Rate Assumptions ........................................................................................ 46 Table 23: Mixed-Fuel Efficiency Only Package Results (SAVINGS/COST PER APARTMENT)1 .................................. 50 Table 24: Mixed-Fuel Efficiency + PV Package Results (SAVINGS/COST PER APARTMENT)1 ................................. 51 Table 25: Mixed-Fuel Efficiency + PV Package Results , cont. (SAVINGS/COST PER APARTMENT)1 ....................... 52
List of Figures
Figure 1: 5-story mid-rise multifamily prototype depiction. ......................................................................................2 Figure 2: Prescriptive central heat pump water heater system schematic................................................................5 Figure 3: Map of California climate zones. (Source, California Energy Commission) ............................................. 24
ATTACHMENT 7
2019 Mid-Rise Residential New Construction Cost-Effectiveness Study
iii
Acronyms 2020 PV$ Present value costs in 2020
ACM Alternative Calculation Method
B/C Lifecycle Benefit-to-Cost Ratio
BSC Building Standards Commission
CBECC-Com Computer program developed by the California Energy Commission for use in demonstrating compliance with the California Residential Building Energy Efficiency Standards
CFI California Flexible Installation
CFM Cubic Feet per Minute
CPC California Plumbing Code
CZ California Climate Zone
DHW Domestic Hot Water
DOE Department of Energy
DWHR Drain Water Heat Recovery
EDR Energy Design Rating
EER Energy Efficiency Ratio
EF Energy Factor
EPS Expanded Polystyrene
HERS Rater Home Energy Rating System Rater
HPWH Heat Pump Water Heater
HVAC Heating, Ventilation, and Air Conditioning
IOU Investor Owned Utility
kBtu kilo-British thermal unit
kWh Kilowatt Hour
kWDC Kilowatt Direct Current. Nominal rated power of a photovoltaic system
LBNL Lawrence Berkeley National Laboratory
LCC Lifecycle Cost
MF Multifamily
NAECA National Appliance Energy Conservation Act
NEM Net Energy Metering
NPV Net Present Value
PG&E Pacific Gas and Electric Company
PV Photovoltaic
SCE Southern California Edison
ATTACHMENT 7
2019 Mid-Rise Residential New Construction Cost-Effectiveness Study
iv
SDG&E San Diego Gas and Electric
SF Solar Fraction
SHGC Solar Heat Gain Coefficient
SMUD Sacramento Municipal Utility District
CASE Codes and Standards Enhancement
TDV Time Dependent Valuation
Therm Unit for quantity of heat that equals 100,000 British thermal units
Title 24 Title 24, Part 6
TOU Time-Of-Use
UEF Uniform Energy Factor
W Watts
ATTACHMENT 7
2019 Mid-Rise Residential New Construction Cost-Effectiveness Study
1 2020-06-22
1 Introduction The California Building Energy Efficiency Standards Title 24, Part 6 (Title 24) (California Energy Commission, 2018b) is maintained and updated every three years by two state agencies, the California Energy Commission (Energy Commission) and the Building Standards Commission (BSC). In addition to enforcing the code, local jurisdictions have the authority to adopt local energy efficiency ordinances, or reach codes, that exceed the minimum standards defined by Title 24 (as established by Public Resources Code Section 25402.1(h)2 and Section 10-106 of the Building Energy Efficiency Standards). Local jurisdictions must demonstrate that the requirements of the proposed ordinance are cost-effective and do not result in buildings consuming more energy than is permitted by Title 24. In addition, the jurisdiction must obtain approval from the Energy Commission and file the ordinance with the BSC for the ordinance to be legally enforceable.
This report documents cost-effective combinations of measures that exceed the minimum state requirements, the 2019 Building Energy Efficiency Standards, effective January 1, 2020, for new mid-rise (four- to seven-story) multifamily residential construction. The analysis includes evaluation of both mixed-fuel and all-electric residential construction, documenting that the performance requirements can be met by either type of building design. Compliance package options and cost-effectiveness analysis in all 16 California climate zones (CZs) are presented (see Appendix A – California Climate Zone Map for a graphical depiction of Climate Zone locations).
2 Methodology and Assumptions This analysis uses two different metrics to assess cost-effectiveness. Both methodologies require estimating and quantifying the incremental costs and energy savings associated with energy efficiency measures. The main difference between the methodologies is the manner in which they value energy and thus the cost savings of reduced or avoided energy use:
• Utility Bill Impacts (On-Bill): Customer-based Lifecycle Cost (LCC) approach that values energy based upon estimated site energy usage and customer on-bill savings using electricity and natural gas utility rate schedules over a 30-year duration accounting for discount rate and energy cost inflation.
• Time Dependent Valuation (TDV): Energy Commission LCC methodology, which is intended to capture the “societal value or cost” of energy use including long-term projected costs, such as the cost of providing energy during peak periods of demand and other societal costs, such as projected costs for carbon emissions, as well as grid transmission and distribution impacts. This metric values energy use differently depending on the fuel source (gas, electricity, and propane), time of day, and season. Electricity used (or saved) during peak periods has a much higher value than electricity used (or saved) during off-peak periods (Horii et al., 2014). This is the methodology used by the Energy Commission in evaluating cost-effectiveness for efficiency measures in Title 24, Part 6.
2.1 Building Prototypes
The Energy Commission defines building prototypes which it uses to evaluate the cost-effectiveness of proposed changes to Title 24 requirements. The CEC recently developed new prototype designs for multifamily buildings to more closely reflect typical designs for new multifamily buildings across the state. The new prototypes include two low-rise residential designs, a mid-rise, and a high-rise design. At the time that this report was written, there was one mid-rise multifamily prototype, which is used in this analysis in development of the above-code packages (TRC, 2019). The midrise prototype is a 6-story building with one below-grade parking level, ground floor commercial space, and four stories of residential space. Table 1 describes the basic characteristics of the mid-rise prototype and Figure 1 shows a depiction of the building.
ATTACHMENT 7
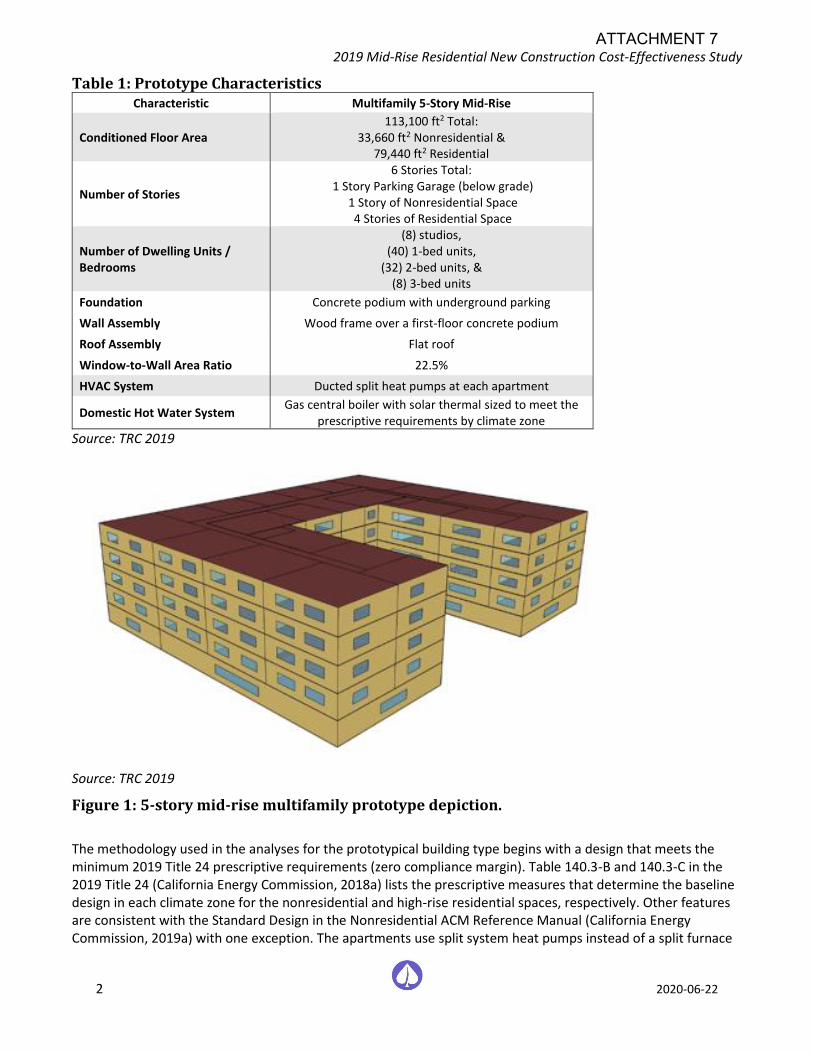
2019 Mid-Rise Residential New Construction Cost-Effectiveness Study
2 2020-06-22
Table 1: Prototype Characteristics Characteristic Multifamily 5-Story Mid-Rise
Conditioned Floor Area 113,100 ft2 Total:
33,660 ft2 Nonresidential & 79,440 ft2 Residential
Number of Stories
6 Stories Total: 1 Story Parking Garage (below grade)
1 Story of Nonresidential Space 4 Stories of Residential Space
Number of Dwelling Units / Bedrooms
(8) studios, (40) 1-bed units,
(32) 2-bed units, & (8) 3-bed units
Foundation Concrete podium with underground parking
Wall Assembly Wood frame over a first-floor concrete podium
Roof Assembly Flat roof
Window-to-Wall Area Ratio 22.5%
HVAC System Ducted split heat pumps at each apartment
Domestic Hot Water System Gas central boiler with solar thermal sized to meet the
prescriptive requirements by climate zone
Source: TRC 2019
Source: TRC 2019
Figure 1: 5-story mid-rise multifamily prototype depiction.
The methodology used in the analyses for the prototypical building type begins with a design that meets the minimum 2019 Title 24 prescriptive requirements (zero compliance margin). Table 140.3-B and 140.3-C in the 2019 Title 24 (California Energy Commission, 2018a) lists the prescriptive measures that determine the baseline design in each climate zone for the nonresidential and high-rise residential spaces, respectively. Other features are consistent with the Standard Design in the Nonresidential ACM Reference Manual (California Energy Commission, 2019a) with one exception. The apartments use split system heat pumps instead of a split furnace
ATTACHMENT 7
2019 Mid-Rise Residential New Construction Cost-Effectiveness Study
3 2020-06-22
and air conditioner that is prescribed in Table 2 of the Nonresidential ACM Reference Manual. This modeling choice was made to better reflect current market data, which shows heat pumps to be the most common system type and a very low prevalence of gas furnaces for multifamily buildings four stories and greater. This is based on a report completed by TRC (TRC, 2019) and validated by analysis of CA HERS Registry Data by SCE that showed 47% of low-rise multifamily new construction in the 2013 and 2016 code cycles had electric space heating. The analysis also assumed electric cooking in the apartment units to reflect current market data. Laundry was not addressed in this study. The building prototype assumes central laundry facilities and no laundry in the units.
2.2 Measure Analysis
EnergyPro 8.1, which uses the California Building Energy Code Compliance simulation tool, CBECC-Com 2019.1.2, as the simulation engine, was used to evaluate energy impacts using the 2019 Title 24 prescriptive standards as the benchmark, and the 2019 TDV values. CBECC-Com was used for this analysis to evaluate the mid-rise building for code compliance under the 2019 non-residential standards. TDV is the energy metric used by the Energy Commission since the 2005 Title 24 energy code to evaluate compliance with the Title 24 Standards.
Using the 2019 baseline as the starting point, prospective energy efficiency measures were identified and modeled to determine the projected site energy (Therm and kWh) and compliance impacts. Annual utility costs were calculated using hourly data output from CBECC-Com, and electricity and natural gas tariffs for each of the investor owned utilities (IOUs).
This analysis focused on the residential apartments only. A prior study and report demonstrated the cost-effectiveness of above code packages for nonresidential buildings (Statewide Reach Code Team, 2019a). The Statewide Reach Code Team selected measures for evaluation based on the residential and nonresidential 2019 reach code analysis ((Statewide Reach Code Team, 2019a), (Statewide Reach Code Team, 2019b)) as well as experience with and outreach to architects, builders, and engineers along with general knowledge of the relative acceptance of many measures. Efficiency measure packages found to be cost-effective in the nonresidential building reach code analysis were applied to the nonresidential spaces for evaluating performance relative to compliance, but the incremental costs and energy impacts of these measures on the nonresidential spaces were not included in this analysis. Refer to the nonresidential reach code study for more details (Statewide Reach Code Team, 2019a).
2.2.1 Federal Preemption
The Department of Energy (DOE) sets minimum efficiency standards for equipment and appliances that are federally regulated under the National Appliance Energy Conservation Act (NAECA), including heating, cooling, and water heating equipment. Since state and local governments are prohibited from adopting policies that mandate higher minimum efficiencies than the federal standards require, the focus of this study is to identify and evaluate cost-effective packages that do not include high efficiency equipment. While this study is limited by federal preemption, in practice builders may use any package of compliant measures to achieve the performance goals, including high efficiency appliances. Often, these measures are the simplest and most affordable measures to increase energy performance.
2.2.2 Energy Efficiency Measures
Following are descriptions of each of the efficiency measures evaluated for the residential spaces under this analysis. Because not all of the measures described below were found to be cost-effective, and cost-effectiveness varied by climate zone, not all measures are included in all packages and some of the measures listed are not included in any final package.
Improved Fenestration – Lower U-factor: Reduce window U-factor to 0.25 Btu/hr-ft2-°F. The prescriptive maximum U-factor is 0.36 in all climates. This measure is applied to all windows on floors two through five.
ATTACHMENT 7
2019 Mid-Rise Residential New Construction Cost-Effectiveness Study
4 2020-06-22
Improved Fenestration – Lower SHGC: Reduce window solar heat gain coefficient (SHGC) to 0.22. The prescriptive maximum SHGC is 0.25 for fixed windows in all climates. The Statewide Reach Code Team evaluated increased SHGC in heating dominated climates (Climate Zone 1, 3, 5, and 16) but results were better with a lower SHGC. This measure is applied to all windows on floors two through five.
Exterior Wall Insulation: Add one inch of R-4 exterior continuous insulation. To meet the prescriptive wall requirements, it’s assumed that exterior wall insulation is used in the basecase, therefore this measure adds additional R-value to existing exterior insulation. This measure is applied to all walls on floors two through five.
HERS Verification of Hot Water Pipe Insulation: The California Plumbing Code (CPC) requires pipe insulation on all hot water lines. This measure provides credit for HERS Rater verification of pipe insulation requirements according to the procedures outlined in the 2019 Reference Appendices RA3.6.3. (California Energy Commission, 2018b).
Low Pressure Drop Ducts: Upgrade the duct distribution system to reduce external static pressure and meet a maximum fan efficacy of 0.25 watts per cfm operating at full speed. This may involve upsizing ductwork, reducing the total effective length of ducts, and/or selecting low pressure drop components, such as filters. This measure is applied to the ducted split heat pumps serving the apartments.
Solar Thermal: Prescriptively, central water heating systems require a solar thermal system with a 20% solar fraction in Climates Zones 1 through 9 and 35% solar fraction in Climate Zones 10 through 16. This measure upgrades the prescriptive solar thermal system to meet a 50% solar fraction in all climates, assuming there is available roof space for the additional collectors.
Drain Water Heat Recovery: Add drain water heat recovery with a 50% effectiveness to serve all the apartments. The assumption is for an unequal flow design where the output of the heat exchanger feeds only the cold water inlets to the apartment showers, not the water heater cold water makeup.
Efficiency measures were applied to the nonresidential spaces based on the 2019 Nonresidential Reach Code Cost-Effectiveness Study (Statewide Reach Code Team, 2019a).
2.2.3 All Electric Measures
This analysis assumes that the basecase prototype model uses individual heat pumps for space heating and all electric appliances in the apartments. Therefore, the domestic hot water system is the only equipment serving the apartment spaces to electrify in the all-electric design . The Statewide Reach Code Team evaluated two configurations for electric heat pump water heaters (HPWHs) described below.
Clustered Heat Pump Water Heater: This clustered design uses residential integrated storage HPWHs to serve
more than one apartment; 4 to 5 bedrooms on average for a total of 32 HPWHs in the 88-unit building. The
water heaters are located in interior closets throughout the building and designed for short plumbing runs
without using a hot water recirculation loop. A minimum efficiency 2.0 UEF HPWH was used for this analysis (to
avoid federal preemption). This approach has been selectively used in multifamily projects because of its
reliance on lower cost small capacity HPWH products. Since it uses residential equipment with each HPWH
serving fewer than 8 apartments the CBECC-Com compliance software had the capability to evaluate this design
strategy, even before central HPWH recirculation options were incorporated into the software. The clustered
strategy is not a prescriptive option but is allowed in the performance path if the water heater serves no more
than 8 units and has no recirculation control. The standard design assumes solar thermal, so the proposed
design is penalized in compliance for no solar thermal and made up with other efficiency measures.
ATTACHMENT 7
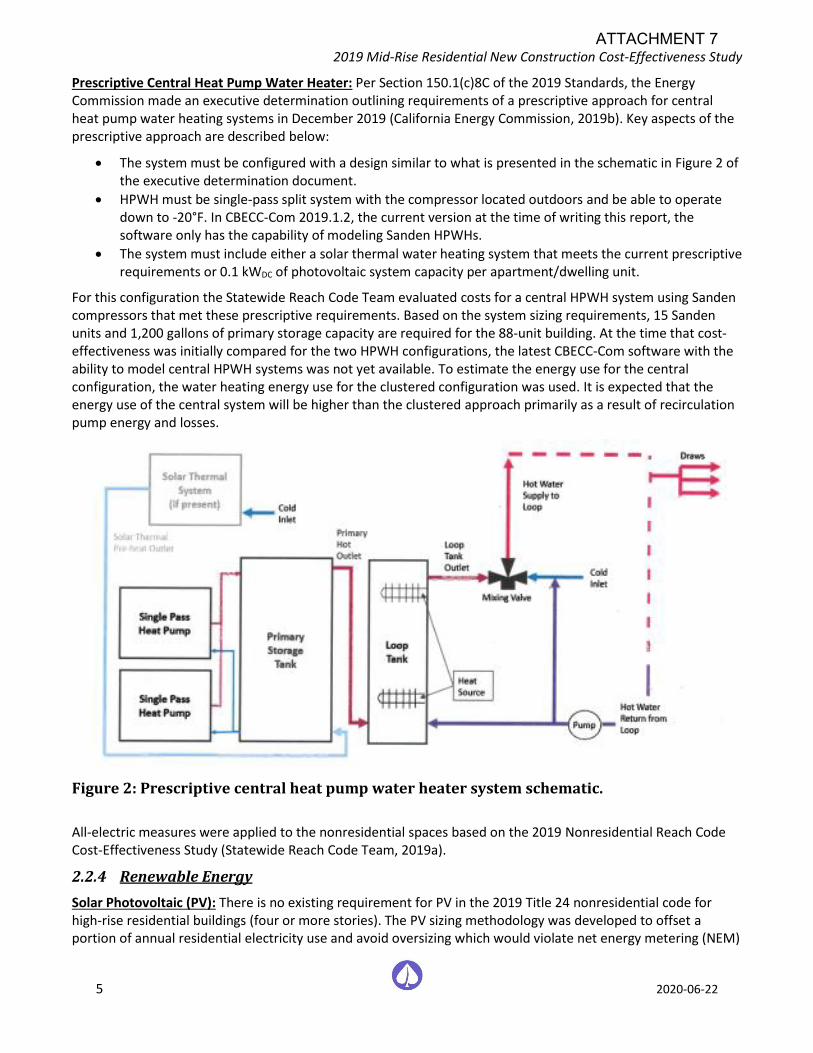
2019 Mid-Rise Residential New Construction Cost-Effectiveness Study
5 2020-06-22
Prescriptive Central Heat Pump Water Heater: Per Section 150.1(c)8C of the 2019 Standards, the Energy Commission made an executive determination outlining requirements of a prescriptive approach for central heat pump water heating systems in December 2019 (California Energy Commission, 2019b). Key aspects of the prescriptive approach are described below:
• The system must be configured with a design similar to what is presented in the schematic in Figure 2 of the executive determination document.
• HPWH must be single-pass split system with the compressor located outdoors and be able to operate down to -20°F. In CBECC-Com 2019.1.2, the current version at the time of writing this report, the software only has the capability of modeling Sanden HPWHs.
• The system must include either a solar thermal water heating system that meets the current prescriptive requirements or 0.1 kWDC of photovoltaic system capacity per apartment/dwelling unit.
For this configuration the Statewide Reach Code Team evaluated costs for a central HPWH system using Sanden compressors that met these prescriptive requirements. Based on the system sizing requirements, 15 Sanden units and 1,200 gallons of primary storage capacity are required for the 88-unit building. At the time that cost-effectiveness was initially compared for the two HPWH configurations, the latest CBECC-Com software with the ability to model central HPWH systems was not yet available. To estimate the energy use for the central configuration, the water heating energy use for the clustered configuration was used. It is expected that the energy use of the central system will be higher than the clustered approach primarily as a result of recirculation pump energy and losses.
Figure 2: Prescriptive central heat pump water heater system schematic.
All-electric measures were applied to the nonresidential spaces based on the 2019 Nonresidential Reach Code Cost-Effectiveness Study (Statewide Reach Code Team, 2019a).
2.2.4 Renewable Energy
Solar Photovoltaic (PV): There is no existing requirement for PV in the 2019 Title 24 nonresidential code for high-rise residential buildings (four or more stories). The PV sizing methodology was developed to offset a portion of annual residential electricity use and avoid oversizing which would violate net energy metering (NEM)
ATTACHMENT 7

2019 Mid-Rise Residential New Construction Cost-Effectiveness Study
6 2020-06-22
rules. In all cases, PV is evaluated using the PV simulations within CBECC-Com using a Standard module type, 180 degree azimuth, and 22 degree .tilt. The analysis evaluated PV system capacities equal to 0.1, 0.2, 0.3, and 1 kWDC per apartment. The PV system offsets approximately XX4%, XX8%, XX13%, and 42%, of the apartment electricity usage, respectively. Assuming 15 Watts per square foot for a typical commercial PV system, 1 kWDC per apartment, or 88 kWDC total, would take up about 25% of the total roof area.
2.3 Package Development
Four packages were evaluated for each climate zone, as described below.
1) Efficiency – Mixed-fuel: This package applies efficiency measures that don’t trigger federal preemption including envelope, water heating distribution, and duct distribution efficiency measures.
2) Efficiency – All Electric: This package applies efficiency measures that don’t trigger federal preemption in addition to converting any natural gas appliances to electric appliances. For the residential spaces, only water heating is converted from natural gas to electric.
3) Efficiency & PV – Mixed-fuel: Beginning with the Efficiency Package , PV was added to offset a portion of the apartment estimated electricity use.
4) Efficiency & PV – All Electric: Beginning with the Efficiency Package, PV was added to offset a portion of the apartment estimated electricity use.
2.4 Incremental Costs
2.4.1 Energy Efficiency Measure Costs
Table 22 summarizes the incremental cost assumptions for measures evaluated in this study relative to the residential parts of the building. Incremental costs represent the equipment, installation, replacement, and maintenance costs of the proposed measures relative to the base case. Replacement costs are applied to PV inverters and battery systems over the 30-year evaluation period. There is no assumed maintenance on the envelope, HVAC, or DHW measures. Costs were estimated to reflect costs to the building owner. When costs were obtained from a source that did not already include builder overhead and profit, a markup of 10% was added. All costs are provided as present value in 2020 (2020 PV$). Costs due to variations in furnace, air conditioner, and heat pump capacity by climate zone were not accounted for in the analysis.
ATTACHMENT 7
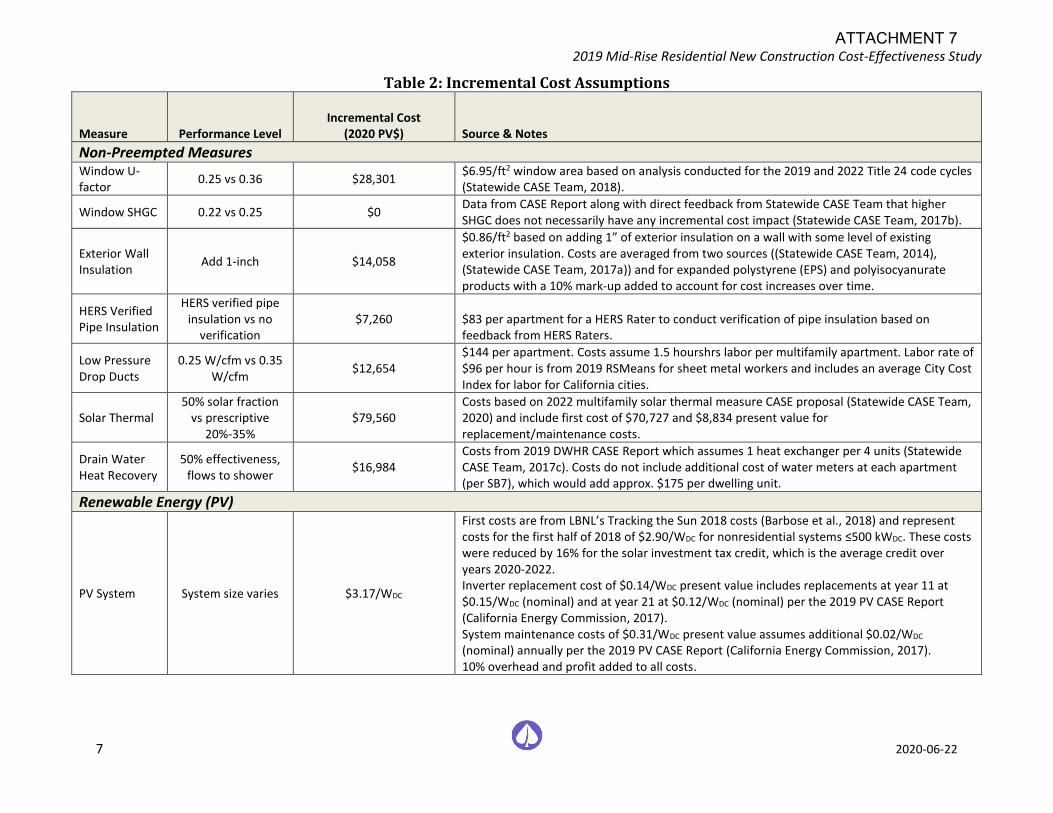
2019 Mid-Rise Residential New Construction Cost-Effectiveness Study
7 2020-06-22
Table 2: Incremental Cost Assumptions
Measure Performance Level Incremental Cost
(2020 PV$) Source & Notes
Non-Preempted Measures Window U-factor
0.25 vs 0.36 $28,301 $6.95/ft2 window area based on analysis conducted for the 2019 and 2022 Title 24 code cycles (Statewide CASE Team, 2018).
Window SHGC 0.22 vs 0.25 $0 Data from CASE Report along with direct feedback from Statewide CASE Team that higher SHGC does not necessarily have any incremental cost impact (Statewide CASE Team, 2017b).
Exterior Wall Insulation
Add 1-inch $14,058
$0.86/ft2 based on adding 1” of exterior insulation on a wall with some level of existing exterior insulation. Costs are averaged from two sources ((Statewide CASE Team, 2014), (Statewide CASE Team, 2017a)) and for expanded polystyrene (EPS) and polyisocyanurate products with a 10% mark-up added to account for cost increases over time.
HERS Verified Pipe Insulation
HERS verified pipe insulation vs no
verification $7,260 $83 per apartment for a HERS Rater to conduct verification of pipe insulation based on
feedback from HERS Raters.
Low Pressure Drop Ducts
0.25 W/cfm vs 0.35 W/cfm
$12,654 $144 per apartment. Costs assume 1.5 hourshrs labor per multifamily apartment. Labor rate of $96 per hour is from 2019 RSMeans for sheet metal workers and includes an average City Cost Index for labor for California cities.
Solar Thermal 50% solar fraction
vs prescriptive 20%-35%
$79,560 Costs based on 2022 multifamily solar thermal measure CASE proposal (Statewide CASE Team, 2020) and include first cost of $70,727 and $8,834 present value for replacement/maintenance costs.
Drain Water Heat Recovery
50% effectiveness, flows to shower
$16,984 Costs from 2019 DWHR CASE Report which assumes 1 heat exchanger per 4 units (Statewide CASE Team, 2017c). Costs do not include additional cost of water meters at each apartment (per SB7), which would add approx. $175 per dwelling unit.
Renewable Energy (PV)
PV System System size varies $3.17/WDC
First costs are from LBNL’s Tracking the Sun 2018 costs (Barbose et al., 2018) and represent costs for the first half of 2018 of $2.90/WDC for nonresidential systems ≤500 kWDC. These costs were reduced by 16% for the solar investment tax credit, which is the average credit over years 2020-2022. Inverter replacement cost of $0.14/WDC present value includes replacements at year 11 at $0.15/WDC (nominal) and at year 21 at $0.12/WDC (nominal) per the 2019 PV CASE Report (California Energy Commission, 2017). System maintenance costs of $0.31/WDC present value assumes additional $0.02/WDC (nominal) annually per the 2019 PV CASE Report (California Energy Commission, 2017). 10% overhead and profit added to all costs.
ATTACHMENT 7
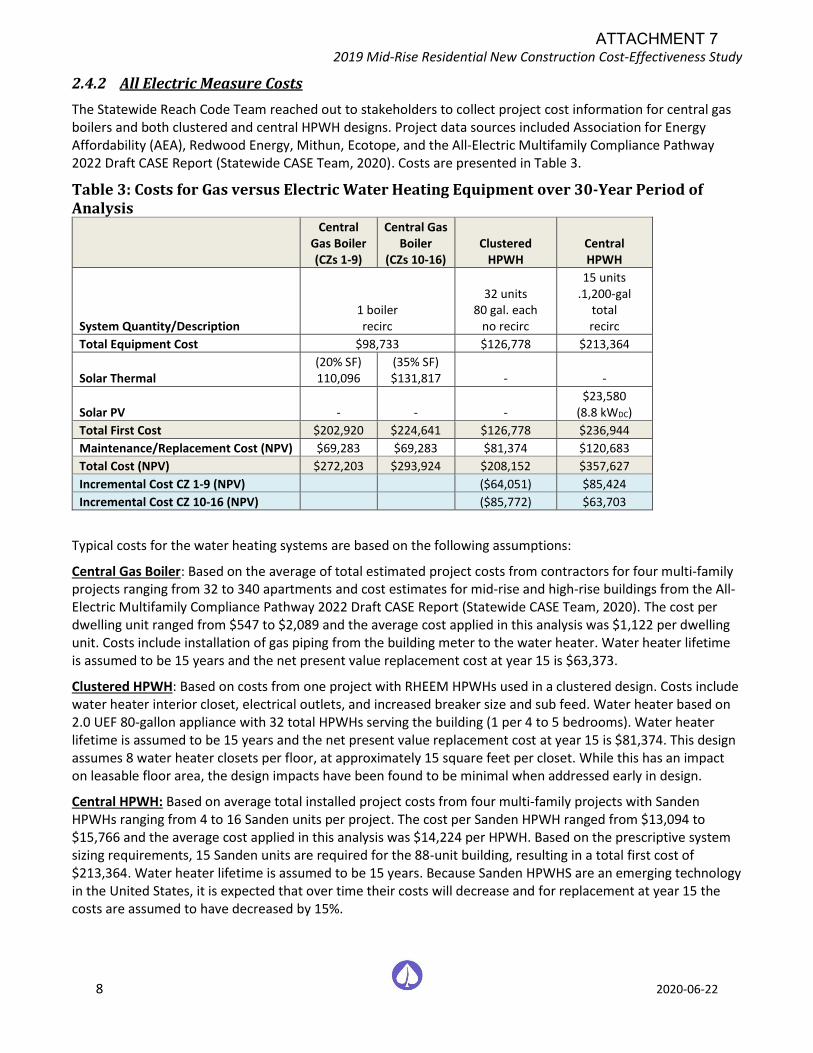
2019 Mid-Rise Residential New Construction Cost-Effectiveness Study
8 2020-06-22
2.4.2 All Electric Measure Costs
The Statewide Reach Code Team reached out to stakeholders to collect project cost information for central gas boilers and both clustered and central HPWH designs. Project data sources included Association for Energy Affordability (AEA), Redwood Energy, Mithun, Ecotope, and the All-Electric Multifamily Compliance Pathway 2022 Draft CASE Report (Statewide CASE Team, 2020). Costs are presented in Table 3.
Table 3: Costs for Gas versus Electric Water Heating Equipment over 30-Year Period of Analysis
Central Gas Boiler (CZs 1-9)
Central Gas Boiler
(CZs 10-16) Clustered
HPWH Central HPWH
System Quantity/Description 1 boiler recirc
32 units 80 gal. each
no recirc
15 units .1,200-gal
total recirc
Total Equipment Cost $98,733 $126,778 $213,364
Solar Thermal (20% SF) 110,096
(35% SF) $131,817 - -
Solar PV - - - $23,580
(8.8 kWDC)
Total First Cost $202,920 $224,641 $126,778 $236,944
Maintenance/Replacement Cost (NPV) $69,283 $69,283 $81,374 $120,683
Total Cost (NPV) $272,203 $293,924 $208,152 $357,627
Incremental Cost CZ 1-9 (NPV) ($64,051) $85,424
Incremental Cost CZ 10-16 (NPV) ($85,772) $63,703
Typical costs for the water heating systems are based on the following assumptions:
Central Gas Boiler: Based on the average of total estimated project costs from contractors for four multi-family projects ranging from 32 to 340 apartments and cost estimates for mid-rise and high-rise buildings from the All-Electric Multifamily Compliance Pathway 2022 Draft CASE Report (Statewide CASE Team, 2020). The cost per dwelling unit ranged from $547 to $2,089 and the average cost applied in this analysis was $1,122 per dwelling unit. Costs include installation of gas piping from the building meter to the water heater. Water heater lifetime is assumed to be 15 years and the net present value replacement cost at year 15 is $63,373.
Clustered HPWH: Based on costs from one project with RHEEM HPWHs used in a clustered design. Costs include water heater interior closet, electrical outlets, and increased breaker size and sub feed. Water heater based on 2.0 UEF 80-gallon appliance with 32 total HPWHs serving the building (1 per 4 to 5 bedrooms). Water heater lifetime is assumed to be 15 years and the net present value replacement cost at year 15 is $81,374. This design assumes 8 water heater closets per floor, at approximately 15 square feet per closet. While this has an impact on leasable floor area, the design impacts have been found to be minimal when addressed early in design.
Central HPWH: Based on average total installed project costs from four multi-family projects with Sanden HPWHs ranging from 4 to 16 Sanden units per project. The cost per Sanden HPWH ranged from $13,094 to $15,766 and the average cost applied in this analysis was $14,224 per HPWH. Based on the prescriptive system sizing requirements, 15 Sanden units are required for the 88-unit building, resulting in a total first cost of $213,364. Water heater lifetime is assumed to be 15 years. Because Sanden HPWHS are an emerging technology in the United States, it is expected that over time their costs will decrease and for replacement at year 15 the costs are assumed to have decreased by 15%.
ATTACHMENT 7
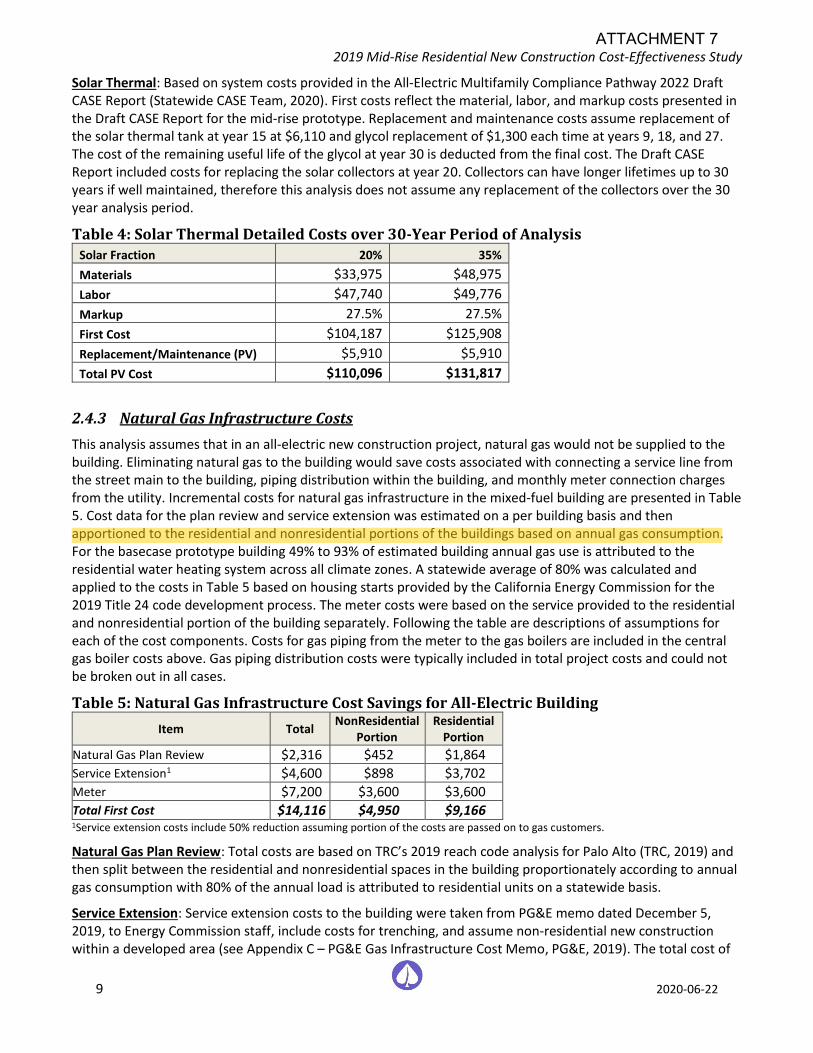
2019 Mid-Rise Residential New Construction Cost-Effectiveness Study
9 2020-06-22
Solar Thermal: Based on system costs provided in the All-Electric Multifamily Compliance Pathway 2022 Draft CASE Report (Statewide CASE Team, 2020). First costs reflect the material, labor, and markup costs presented in the Draft CASE Report for the mid-rise prototype. Replacement and maintenance costs assume replacement of the solar thermal tank at year 15 at $6,110 and glycol replacement of $1,300 each time at years 9, 18, and 27. The cost of the remaining useful life of the glycol at year 30 is deducted from the final cost. The Draft CASE Report included costs for replacing the solar collectors at year 20. Collectors can have longer lifetimes up to 30 years if well maintained, therefore this analysis does not assume any replacement of the collectors over the 30 year analysis period.
Table 4: Solar Thermal Detailed Costs over 30-Year Period of Analysis Solar Fraction 20% 35%
Materials $33,975 $48,975
Labor $47,740 $49,776
Markup 27.5% 27.5%
First Cost $104,187 $125,908
Replacement/Maintenance (PV) $5,910 $5,910
Total PV Cost $110,096 $131,817
2.4.3 Natural Gas Infrastructure Costs
This analysis assumes that in an all-electric new construction project, natural gas would not be supplied to the building. Eliminating natural gas to the building would save costs associated with connecting a service line from the street main to the building, piping distribution within the building, and monthly meter connection charges from the utility. Incremental costs for natural gas infrastructure in the mixed-fuel building are presented in Table 5. Cost data for the plan review and service extension was estimated on a per building basis and then apportioned to the residential and nonresidential portions of the buildings based on annual gas consumption. For the basecase prototype building 49% to 93% of estimated building annual gas use is attributed to the residential water heating system across all climate zones. A statewide average of 80% was calculated and applied to the costs in Table 5 based on housing starts provided by the California Energy Commission for the 2019 Title 24 code development process. The meter costs were based on the service provided to the residential and nonresidential portion of the building separately. Following the table are descriptions of assumptions for each of the cost components. Costs for gas piping from the meter to the gas boilers are included in the central gas boiler costs above. Gas piping distribution costs were typically included in total project costs and could not be broken out in all cases.
Table 5: Natural Gas Infrastructure Cost Savings for All-Electric Building
Item Total NonResidential
Portion Residential
Portion
Natural Gas Plan Review $2,316 $452 $1,864 Service Extension1 $4,600 $898 $3,702 Meter $7,200 $3,600 $3,600 Total First Cost $14,116 $4,950 $9,166 1Service extension costs include 50% reduction assuming portion of the costs are passed on to gas customers.
Natural Gas Plan Review: Total costs are based on TRC’s 2019 reach code analysis for Palo Alto (TRC, 2019) and then split between the residential and nonresidential spaces in the building proportionately according to annual gas consumption with 80% of the annual load is attributed to residential units on a statewide basis.
Service Extension: Service extension costs to the building were taken from PG&E memo dated December 5, 2019, to Energy Commission staff, include costs for trenching, and assume non-residential new construction within a developed area (see Appendix C – PG&E Gas Infrastructure Cost Memo, PG&E, 2019). The total cost of
ATTACHMENT 7
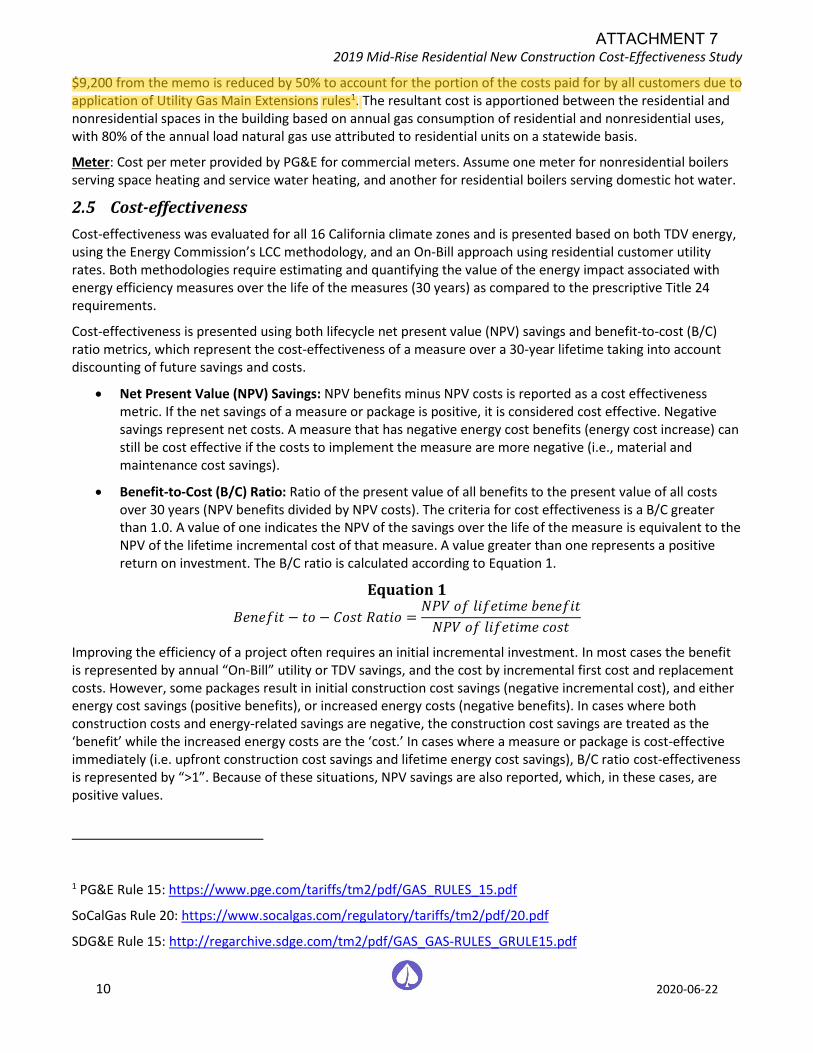
2019 Mid-Rise Residential New Construction Cost-Effectiveness Study
10 2020-06-22
$9,200 from the memo is reduced by 50% to account for the portion of the costs paid for by all customers due to application of Utility Gas Main Extensions rules1. The resultant cost is apportioned between the residential and nonresidential spaces in the building based on annual gas consumption of residential and nonresidential uses, with 80% of the annual load natural gas use attributed to residential units on a statewide basis.
Meter: Cost per meter provided by PG&E for commercial meters. Assume one meter for nonresidential boilers serving space heating and service water heating, and another for residential boilers serving domestic hot water.
2.5 Cost-effectiveness
Cost-effectiveness was evaluated for all 16 California climate zones and is presented based on both TDV energy, using the Energy Commission’s LCC methodology, and an On-Bill approach using residential customer utility rates. Both methodologies require estimating and quantifying the value of the energy impact associated with energy efficiency measures over the life of the measures (30 years) as compared to the prescriptive Title 24 requirements.
Cost-effectiveness is presented using both lifecycle net present value (NPV) savings and benefit-to-cost (B/C) ratio metrics, which represent the cost-effectiveness of a measure over a 30-year lifetime taking into account discounting of future savings and costs.
• Net Present Value (NPV) Savings: NPV benefits minus NPV costs is reported as a cost effectiveness metric. If the net savings of a measure or package is positive, it is considered cost effective. Negative savings represent net costs. A measure that has negative energy cost benefits (energy cost increase) can still be cost effective if the costs to implement the measure are more negative (i.e., material and maintenance cost savings).
• Benefit-to-Cost (B/C) Ratio: Ratio of the present value of all benefits to the present value of all costs over 30 years (NPV benefits divided by NPV costs). The criteria for cost effectiveness is a B/C greater than 1.0. A value of one indicates the NPV of the savings over the life of the measure is equivalent to the NPV of the lifetime incremental cost of that measure. A value greater than one represents a positive return on investment. The B/C ratio is calculated according to Equation 1.
Equation 1
𝐵𝑒𝑛𝑒𝑓𝑖𝑡 − 𝑡𝑜 − 𝐶𝑜𝑠𝑡 𝑅𝑎𝑡𝑖𝑜 =𝑁𝑃𝑉 𝑜𝑓 𝑙𝑖𝑓𝑒𝑡𝑖𝑚𝑒 𝑏𝑒𝑛𝑒𝑓𝑖𝑡
𝑁𝑃𝑉 𝑜𝑓 𝑙𝑖𝑓𝑒𝑡𝑖𝑚𝑒 𝑐𝑜𝑠𝑡
Improving the efficiency of a project often requires an initial incremental investment. In most cases the benefit is represented by annual “On-Bill” utility or TDV savings, and the cost by incremental first cost and replacement costs. However, some packages result in initial construction cost savings (negative incremental cost), and either energy cost savings (positive benefits), or increased energy costs (negative benefits). In cases where both construction costs and energy-related savings are negative, the construction cost savings are treated as the ‘benefit’ while the increased energy costs are the ‘cost.’ In cases where a measure or package is cost-effective immediately (i.e. upfront construction cost savings and lifetime energy cost savings), B/C ratio cost-effectiveness is represented by “>1”. Because of these situations, NPV savings are also reported, which, in these cases, are positive values.
1 PG&E Rule 15: https://www.pge.com/tariffs/tm2/pdf/GAS_RULES_15.pdf
SoCalGas Rule 20: https://www.socalgas.com/regulatory/tariffs/tm2/pdf/20.pdf
SDG&E Rule 15: http://regarchive.sdge.com/tm2/pdf/GAS_GAS-RULES_GRULE15.pdf
ATTACHMENT 7
2019 Mid-Rise Residential New Construction Cost-Effectiveness Study
11 2020-06-22
The lifetime costs or benefits are calculated according to Equation 2.
Equation 2 𝑷𝑽 𝒐𝒇 𝒍𝒊𝒇𝒆𝒕𝒊𝒎𝒆 𝒄𝒐𝒔𝒕/𝒃𝒆𝒏𝒆𝒇𝒊𝒕 = ∑ 𝑨𝒏𝒏𝒖𝒂𝒍 𝒄𝒐𝒔𝒕/𝒃𝒆𝒏𝒆𝒇𝒊𝒕𝒕 ∗ (𝟏 + 𝒓)𝒕𝒏
𝒕=𝟏 Where:
• n = analysis term
• r = real discount rate
• t = year at which cost/benefit is incurred
The following summarizes the assumptions applied in this analysis to both methodologies.
• Analysis term of 30 years
• Real discount rate of 3% (does not include inflation)
2.5.1 On-Bill Customer Lifecycle Cost
Residential utility rates were used to calculate utility costs for all cases and determine On-Bill customer cost-effectiveness for the proposed packages. Utility costs of the nonresidential spaces were not evaluated in this study, only apartment and water heating energy use. The Statewide Reach Code Team obtained the recommended utility rates from each IOU based on the assumption that the reach codes go into effect in 2020. Annual utility costs were calculated using hourly electricity and gas output from CBECC-Com, and applying the utility tariffs summarized in Table 6. Appendix B – Utility Tariff Details includes details on the utility rate schedules used for this study. The applicable residential time-of-use (TOU) rate was applied to all cases. For cases with PV generation, the approved NEM2 tariffs were applied along with minimum daily use billing and mandatory non-bypassable charges. For the PV cases annual electric production was always less than annual electricity consumption; and therefore, no credits for surplus generation were necessary. Future changes to the NEM tariffs are likely; however, there is a lot of uncertainty about what those changes will be and if they will become effective during the 2019 Title 24 code cycle (2020-2022).
Based on guidance from the IOUs, the residential electric TOU tariffs that apply to individually metered residential apartments were also used to calculate electricity costs for the central water heating systems. Where baseline allowances are included in the tariffs (SCE TOU-D and SDG&E TOU-DR1) the allowances were applied on a per unit basis for all-electric service.
Based on guidance from the IOUs, master metered multifamily service gas tariffs were used to calculate gas costs for the central water heating systems. The baseline quantities were applied on a per unit basis, as is defined in the schedules, and when available water heating only baseline values were used.
Utility rates were applied to each climate zone based on the predominant IOU serving the population of each zone according to Table 6. Climate Zones 10 and 14 are evaluated with both SCE/SoCalGas and SDG&E tariffs since each utility has customers within these climate zones. Climate Zone 5 is evaluated under both PG&E and SoCalGas natural gas rates. Two municipal utility rates were also evaluated, Sacramento Municipal Utility District (SMUD) in Climate Zone 12 and City of Palo Alto Utilities (CPAU) in Climate Zone 4.
ATTACHMENT 7
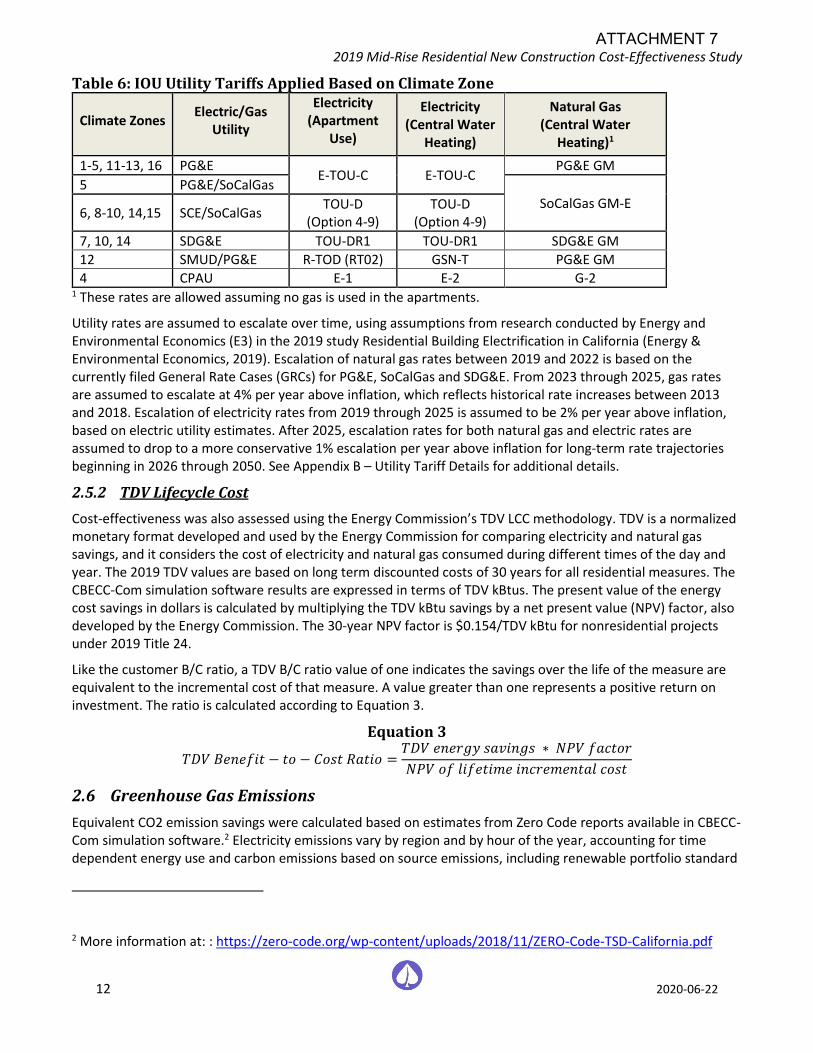
2019 Mid-Rise Residential New Construction Cost-Effectiveness Study
12 2020-06-22
Table 6: IOU Utility Tariffs Applied Based on Climate Zone
Climate Zones Electric/Gas
Utility
Electricity (Apartment
Use)
Electricity (Central Water
Heating)
Natural Gas (Central Water
Heating)1
1-5, 11-13, 16 PG&E E-TOU-C E-TOU-C
PG&E GM
5 PG&E/SoCalGas
SoCalGas GM-E 6, 8-10, 14,15 SCE/SoCalGas
TOU-D (Option 4-9)
TOU-D (Option 4-9)
7, 10, 14 SDG&E TOU-DR1 TOU-DR1 SDG&E GM
12 SMUD/PG&E R-TOD (RT02) GSN-T PG&E GM
4 CPAU E-1 E-2 G-2 1 These rates are allowed assuming no gas is used in the apartments.
Utility rates are assumed to escalate over time, using assumptions from research conducted by Energy and Environmental Economics (E3) in the 2019 study Residential Building Electrification in California (Energy & Environmental Economics, 2019). Escalation of natural gas rates between 2019 and 2022 is based on the currently filed General Rate Cases (GRCs) for PG&E, SoCalGas and SDG&E. From 2023 through 2025, gas rates are assumed to escalate at 4% per year above inflation, which reflects historical rate increases between 2013 and 2018. Escalation of electricity rates from 2019 through 2025 is assumed to be 2% per year above inflation, based on electric utility estimates. After 2025, escalation rates for both natural gas and electric rates are assumed to drop to a more conservative 1% escalation per year above inflation for long-term rate trajectories beginning in 2026 through 2050. See Appendix B – Utility Tariff Details for additional details.
2.5.2 TDV Lifecycle Cost
Cost-effectiveness was also assessed using the Energy Commission’s TDV LCC methodology. TDV is a normalized monetary format developed and used by the Energy Commission for comparing electricity and natural gas savings, and it considers the cost of electricity and natural gas consumed during different times of the day and year. The 2019 TDV values are based on long term discounted costs of 30 years for all residential measures. The CBECC-Com simulation software results are expressed in terms of TDV kBtus. The present value of the energy cost savings in dollars is calculated by multiplying the TDV kBtu savings by a net present value (NPV) factor, also developed by the Energy Commission. The 30-year NPV factor is $0.154/TDV kBtu for nonresidential projects under 2019 Title 24.
Like the customer B/C ratio, a TDV B/C ratio value of one indicates the savings over the life of the measure are equivalent to the incremental cost of that measure. A value greater than one represents a positive return on investment. The ratio is calculated according to Equation 3.
Equation 3
𝑇𝐷𝑉 𝐵𝑒𝑛𝑒𝑓𝑖𝑡 − 𝑡𝑜 − 𝐶𝑜𝑠𝑡 𝑅𝑎𝑡𝑖𝑜 =𝑇𝐷𝑉 𝑒𝑛𝑒𝑟𝑔𝑦 𝑠𝑎𝑣𝑖𝑛𝑔𝑠 ∗ 𝑁𝑃𝑉 𝑓𝑎𝑐𝑡𝑜𝑟
𝑁𝑃𝑉 𝑜𝑓 𝑙𝑖𝑓𝑒𝑡𝑖𝑚𝑒 𝑖𝑛𝑐𝑟𝑒𝑚𝑒𝑛𝑡𝑎𝑙 𝑐𝑜𝑠𝑡
2.6 Greenhouse Gas Emissions
Equivalent CO2 emission savings were calculated based on estimates from Zero Code reports available in CBECC-Com simulation software.2 Electricity emissions vary by region and by hour of the year, accounting for time dependent energy use and carbon emissions based on source emissions, including renewable portfolio standard
2 More information at: : https://zero-code.org/wp-content/uploads/2018/11/ZERO-Code-TSD-California.pdf
ATTACHMENT 7
2019 Mid-Rise Residential New Construction Cost-Effectiveness Study
13 2020-06-22
projections. Two distinct hourly profiles, one for Climate Zones 1 through 5 and 11 through 13 and another for Climate Zones 6 through 10 and 14 through 16. For natural gas a fixed factor of 0.005307 metric tons/therm is used. To compare the mixed fuel and all-electric cases side-by-side, greenhouse gas (GHG) emissions are presented as CO2-equivalent emissions per dwelling unit.
3 Results
The primary objective of the evaluation is to identify cost-effective, non-preempted performance targets for mid-rise multifamily buildings, under both mixed-fuel and all-electric cases, to support the design of local ordinances requiring new mid-rise residential buildings to exceed the minimum state requirements. The packages presented are representative examples of designs and measures that can be used to meet the requirements. In practice, a builder can use any combination of non-preempted or preempted compliant measures to meet the requirements.
This analysis evaluated a package of efficiency measures applied to a mixed-fuel design and a similar package for an all-electric design. Each design was evaluated using the predominant utility rates in all 16 California climate zones. Solar PV was also added to the efficiency packages and a sensitivity analysis was conducted at various PV system capacities to optimize cost-effectiveness.
Although some of the efficiency measures evaluated were not cost-effective and were eliminated, the following measures are included in at least one package:
• Improved fenestration
• Wall insulation
• Low pressure-drop distribution system
• HERS verified pipe insulation
The following measures were evaluated but were found to not be cost-effective and were not included in any of the packages.
• Solar thermal system with higher solar fraction than prescriptive requirements
• Drain water heat recovery
Cost-effectiveness results for the all-electric case are based upon the clustered HPWH approach only. Lower first costs with the clustered approach resulted in better cost-effectiveness than the central HPWH design.
3.1 Mid-Rise Multifamily Results
Table 7 and Table 9 present results for the mixed-fuel and all-electric packages, respectively. Each table shows cost-effectiveness results for Efficiency Only packages and Efficiency + PV packages (with a 17.6 kWDC PV system sized based on 0.2 kWDC per apartment). Both mixed-fuel and all-electric results are relative to the mixed-fuel 2019 Title 24 prescriptive baseline. B/C ratios for all packages are presented according to both the On-Bill and TDV methodologies for the mixed-fuel and the all-electric cases, respectively. Detailed results are presented in Appendix D – Detailed Results Mixed-Fuel and Appendix E – Detailed Results All-Electric.
Efficiency Only:
Compliance margins for the Mixed-Fuel Efficiency Only cases range from 5% to 8%, which meets the CALGreen Tier 1 energy performance requirement for high-rise residential buildings. Mixed-Fuel Efficiency Only cases are cost-effective based on TDV in all climate zones except for 1 and 16. The cases are cost-effective from an On-Bill perspective in all climate zones except 1.
The All-Electric Efficiency Only package does not meet minimum code requirements in Climate Zones 1 and 16. Compliance margins for all other climate zones range from 1% to 5%. All-Electric Efficiency Only cases are cost-
ATTACHMENT 7

2019 Mid-Rise Residential New Construction Cost-Effectiveness Study
14 2020-06-22
effective in all climate zones based on TDV. Cost-effectiveness from an On-Bill perspective is favorable in all climate zones except 1, 16, and 5 in SCG territory.
Efficiency + PV:
Several PV system size options were evaluated for the Efficiency + PV packages. Of the PV system sizes evaluated, 0.2 kWDC per apartment represents the smallest system that resulted in B/C ratios greater than one based on both metrics in all climate zones for the mixed-fuel scenario. Adding a 0.1 kWDC per apartment in the all-electric cases, resulted in B/C ratios greater than one in all climate zones.
Table 11 and Table 12 describe the efficiency measures included in the mixed-fuel and all-electric packages, respectively.
ATTACHMENT 7
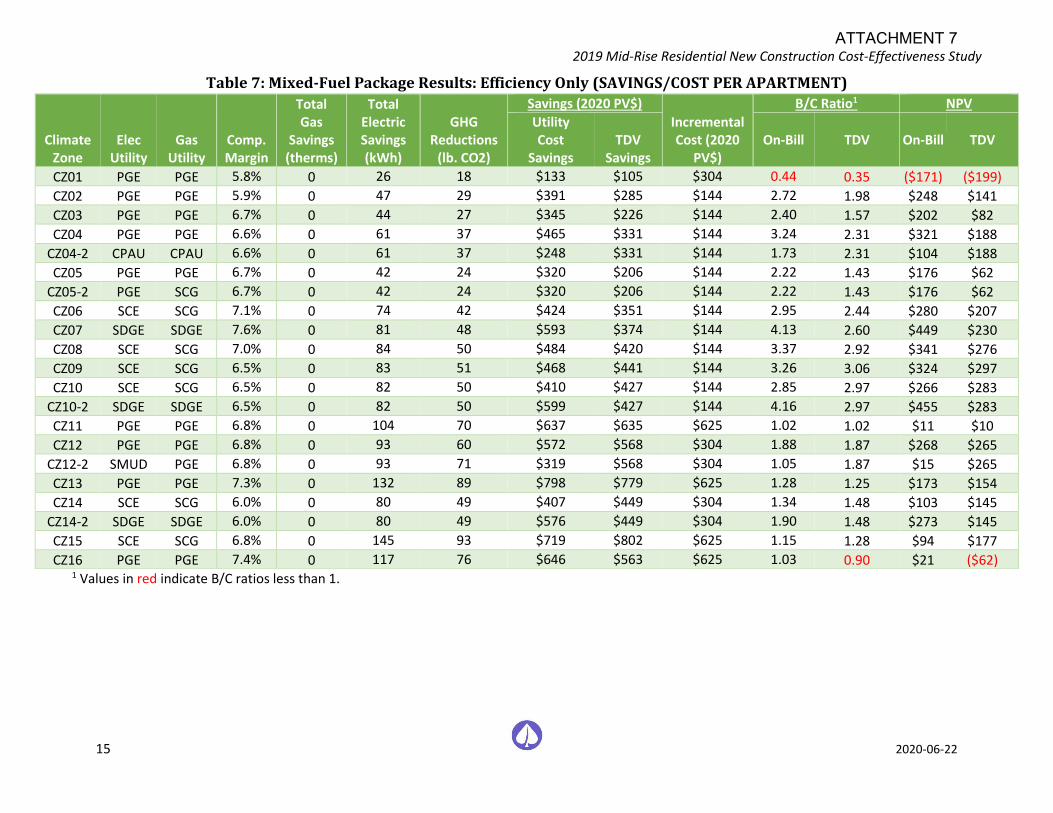
2019 Mid-Rise Residential New Construction Cost-Effectiveness Study
15 2020-06-22
Table 7: Mixed-Fuel Package Results: Efficiency Only (SAVINGS/COST PER APARTMENT)
1 Values in red indicate B/C ratios less than 1.
Climate Zone
Elec Utility
Gas Utility
Comp. Margin
Total Gas
Savings (therms)
Total Electric Savings (kWh)
GHG Reductions
(lb. CO2)
Savings (2020 PV$)
Incremental Cost (2020
PV$)
B/C Ratio1 NPV
Utility Cost
Savings TDV
Savings On-Bill
TDV On-Bill
TDV
CZ01 PGE PGE 5.8% 0 26 18 $133 $105 $304 0.44 0.35 ($171) ($199)
CZ02 PGE PGE 5.9% 0 47 29 $391 $285 $144 2.72 1.98 $248 $141
CZ03 PGE PGE 6.7% 0 44 27 $345 $226 $144 2.40 1.57 $202 $82
CZ04 PGE PGE 6.6% 0 61 37 $465 $331 $144 3.24 2.31 $321 $188
CZ04-2 CPAU CPAU 6.6% 0 61 37 $248 $331 $144 1.73 2.31 $104 $188
CZ05 PGE PGE 6.7% 0 42 24 $320 $206 $144 2.22 1.43 $176 $62
CZ05-2 PGE SCG 6.7% 0 42 24 $320 $206 $144 2.22 1.43 $176 $62
CZ06 SCE SCG 7.1% 0 74 42 $424 $351 $144 2.95 2.44 $280 $207
CZ07 SDGE SDGE 7.6% 0 81 48 $593 $374 $144 4.13 2.60 $449 $230
CZ08 SCE SCG 7.0% 0 84 50 $484 $420 $144 3.37 2.92 $341 $276
CZ09 SCE SCG 6.5% 0 83 51 $468 $441 $144 3.26 3.06 $324 $297
CZ10 SCE SCG 6.5% 0 82 50 $410 $427 $144 2.85 2.97 $266 $283
CZ10-2 SDGE SDGE 6.5% 0 82 50 $599 $427 $144 4.16 2.97 $455 $283
CZ11 PGE PGE 6.8% 0 104 70 $637 $635 $625 1.02 1.02 $11 $10
CZ12 PGE PGE 6.8% 0 93 60 $572 $568 $304 1.88 1.87 $268 $265
CZ12-2 SMUD PGE 6.8% 0 93 71 $319 $568 $304 1.05 1.87 $15 $265
CZ13 PGE PGE 7.3% 0 132 89 $798 $779 $625 1.28 1.25 $173 $154
CZ14 SCE SCG 6.0% 0 80 49 $407 $449 $304 1.34 1.48 $103 $145
CZ14-2 SDGE SDGE 6.0% 0 80 49 $576 $449 $304 1.90 1.48 $273 $145
CZ15 SCE SCG 6.8% 0 145 93 $719 $802 $625 1.15 1.28 $94 $177
CZ16 PGE PGE 7.4% 0 117 76 $646 $563 $625 1.03 0.90 $21 ($62)
ATTACHMENT 7
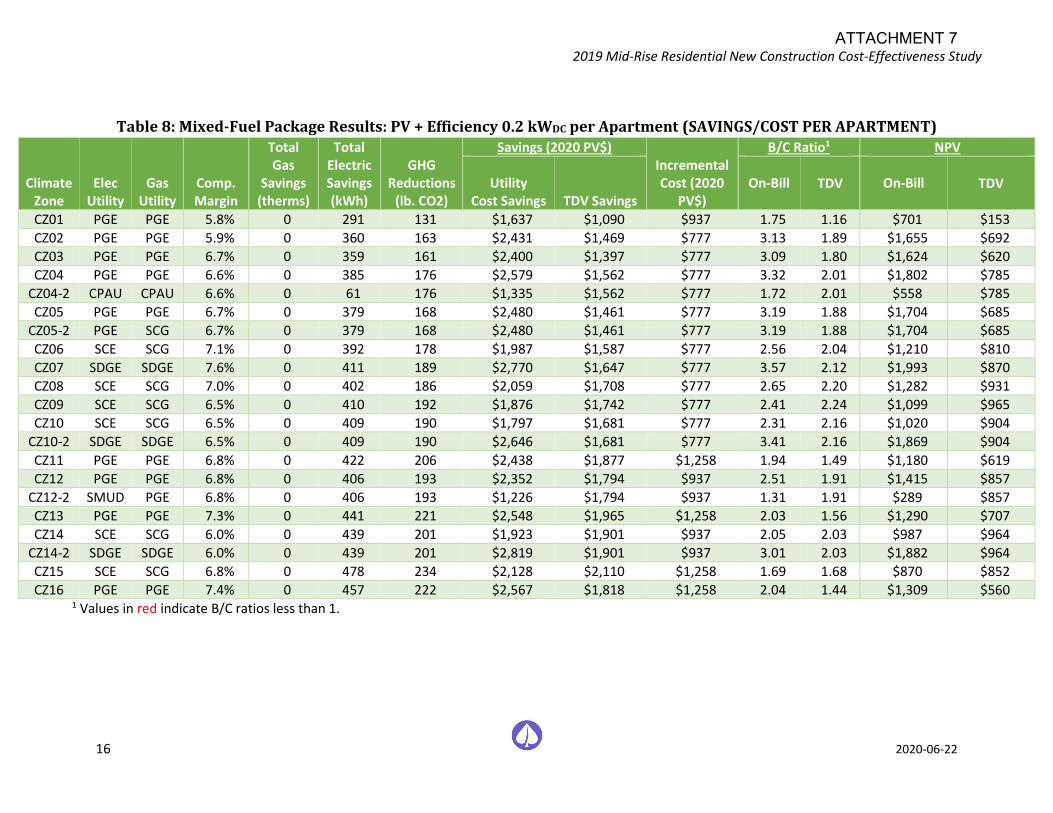
2019 Mid-Rise Residential New Construction Cost-Effectiveness Study
16 2020-06-22
Table 8: Mixed-Fuel Package Results: PV + Efficiency 0.2 kWDC per Apartment (SAVINGS/COST PER APARTMENT)
1 Values in red indicate B/C ratios less than 1.
Climate Zone
Elec Utility
Gas Utility
Comp. Margin
Total Gas
Savings (therms)
Total Electric Savings (kWh)
GHG Reductions
(lb. CO2)
Savings (2020 PV$) Incremental Cost (2020
PV$)
B/C Ratio1 NPV
Utility Cost Savings TDV Savings
On-Bill
TDV On-Bill
TDV
CZ01 PGE PGE 5.8% 0 291 131 $1,637 $1,090 $937 1.75 1.16 $701 $153
CZ02 PGE PGE 5.9% 0 360 163 $2,431 $1,469 $777 3.13 1.89 $1,655 $692
CZ03 PGE PGE 6.7% 0 359 161 $2,400 $1,397 $777 3.09 1.80 $1,624 $620
CZ04 PGE PGE 6.6% 0 385 176 $2,579 $1,562 $777 3.32 2.01 $1,802 $785
CZ04-2 CPAU CPAU 6.6% 0 61 176 $1,335 $1,562 $777 1.72 2.01 $558 $785
CZ05 PGE PGE 6.7% 0 379 168 $2,480 $1,461 $777 3.19 1.88 $1,704 $685
CZ05-2 PGE SCG 6.7% 0 379 168 $2,480 $1,461 $777 3.19 1.88 $1,704 $685
CZ06 SCE SCG 7.1% 0 392 178 $1,987 $1,587 $777 2.56 2.04 $1,210 $810
CZ07 SDGE SDGE 7.6% 0 411 189 $2,770 $1,647 $777 3.57 2.12 $1,993 $870
CZ08 SCE SCG 7.0% 0 402 186 $2,059 $1,708 $777 2.65 2.20 $1,282 $931
CZ09 SCE SCG 6.5% 0 410 192 $1,876 $1,742 $777 2.41 2.24 $1,099 $965
CZ10 SCE SCG 6.5% 0 409 190 $1,797 $1,681 $777 2.31 2.16 $1,020 $904
CZ10-2 SDGE SDGE 6.5% 0 409 190 $2,646 $1,681 $777 3.41 2.16 $1,869 $904
CZ11 PGE PGE 6.8% 0 422 206 $2,438 $1,877 $1,258 1.94 1.49 $1,180 $619
CZ12 PGE PGE 6.8% 0 406 193 $2,352 $1,794 $937 2.51 1.91 $1,415 $857
CZ12-2 SMUD PGE 6.8% 0 406 193 $1,226 $1,794 $937 1.31 1.91 $289 $857
CZ13 PGE PGE 7.3% 0 441 221 $2,548 $1,965 $1,258 2.03 1.56 $1,290 $707
CZ14 SCE SCG 6.0% 0 439 201 $1,923 $1,901 $937 2.05 2.03 $987 $964
CZ14-2 SDGE SDGE 6.0% 0 439 201 $2,819 $1,901 $937 3.01 2.03 $1,882 $964
CZ15 SCE SCG 6.8% 0 478 234 $2,128 $2,110 $1,258 1.69 1.68 $870 $852
CZ16 PGE PGE 7.4% 0 457 222 $2,567 $1,818 $1,258 2.04 1.44 $1,309 $560
ATTACHMENT 7
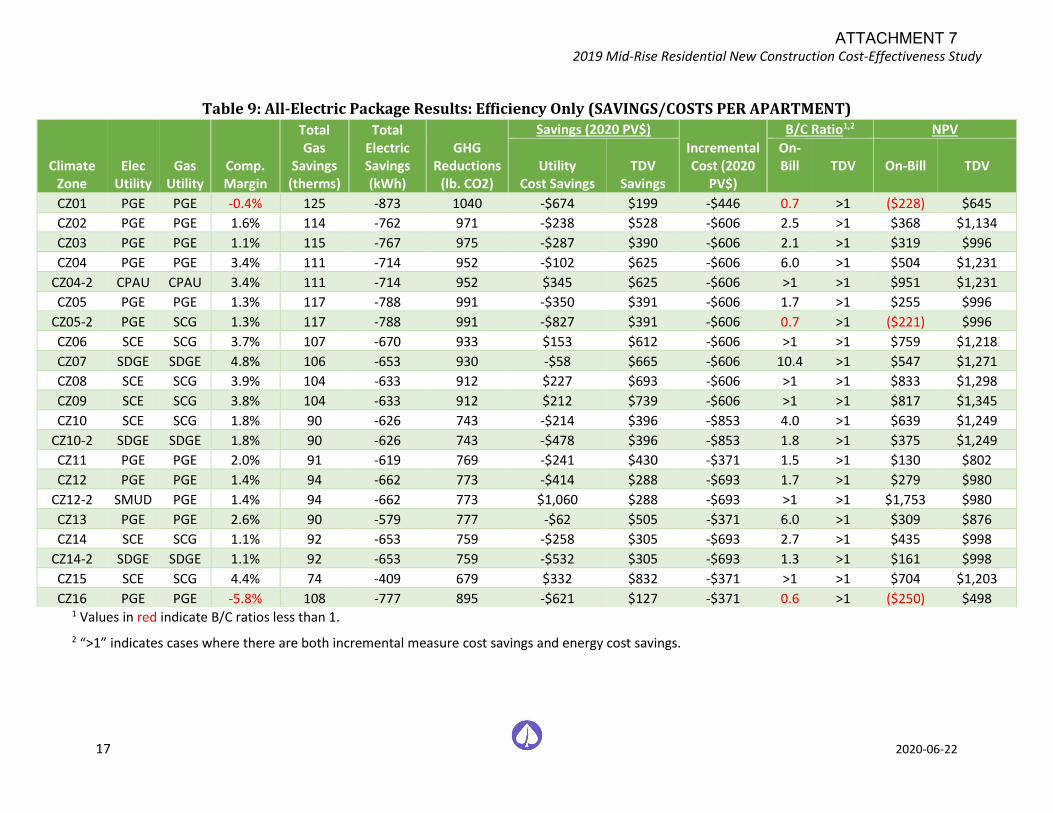
2019 Mid-Rise Residential New Construction Cost-Effectiveness Study
17 2020-06-22
Table 9: All-Electric Package Results: Efficiency Only (SAVINGS/COSTS PER APARTMENT)
1 Values in red indicate B/C ratios less than 1.
2 “>1” indicates cases where there are both incremental measure cost savings and energy cost savings.
Climate Zone
Elec Utility
Gas Utility
Comp. Margin
Total Gas
Savings (therms)
Total Electric Savings (kWh)
GHG Reductions
(lb. CO2)
Savings (2020 PV$)
Incremental Cost (2020
PV$)
B/C Ratio1,2 NPV
Utility Cost Savings
TDV Savings
On-Bill
TDV On-Bill
TDV
CZ01 PGE PGE -0.4% 125 -873 1040 -$674 $199 -$446 0.7 >1 ($228) $645
CZ02 PGE PGE 1.6% 114 -762 971 -$238 $528 -$606 2.5 >1 $368 $1,134
CZ03 PGE PGE 1.1% 115 -767 975 -$287 $390 -$606 2.1 >1 $319 $996
CZ04 PGE PGE 3.4% 111 -714 952 -$102 $625 -$606 6.0 >1 $504 $1,231
CZ04-2 CPAU CPAU 3.4% 111 -714 952 $345 $625 -$606 >1 >1 $951 $1,231
CZ05 PGE PGE 1.3% 117 -788 991 -$350 $391 -$606 1.7 >1 $255 $996
CZ05-2 PGE SCG 1.3% 117 -788 991 -$827 $391 -$606 0.7 >1 ($221) $996
CZ06 SCE SCG 3.7% 107 -670 933 $153 $612 -$606 >1 >1 $759 $1,218
CZ07 SDGE SDGE 4.8% 106 -653 930 -$58 $665 -$606 10.4 >1 $547 $1,271
CZ08 SCE SCG 3.9% 104 -633 912 $227 $693 -$606 >1 >1 $833 $1,298
CZ09 SCE SCG 3.8% 104 -633 912 $212 $739 -$606 >1 >1 $817 $1,345
CZ10 SCE SCG 1.8% 90 -626 743 -$214 $396 -$853 4.0 >1 $639 $1,249
CZ10-2 SDGE SDGE 1.8% 90 -626 743 -$478 $396 -$853 1.8 >1 $375 $1,249
CZ11 PGE PGE 2.0% 91 -619 769 -$241 $430 -$371 1.5 >1 $130 $802
CZ12 PGE PGE 1.4% 94 -662 773 -$414 $288 -$693 1.7 >1 $279 $980
CZ12-2 SMUD PGE 1.4% 94 -662 773 $1,060 $288 -$693 >1 >1 $1,753 $980
CZ13 PGE PGE 2.6% 90 -579 777 -$62 $505 -$371 6.0 >1 $309 $876
CZ14 SCE SCG 1.1% 92 -653 759 -$258 $305 -$693 2.7 >1 $435 $998
CZ14-2 SDGE SDGE 1.1% 92 -653 759 -$532 $305 -$693 1.3 >1 $161 $998
CZ15 SCE SCG 4.4% 74 -409 679 $332 $832 -$371 >1 >1 $704 $1,203
CZ16 PGE PGE -5.8% 108 -777 895 -$621 $127 -$371 0.6 >1 ($250) $498
ATTACHMENT 7
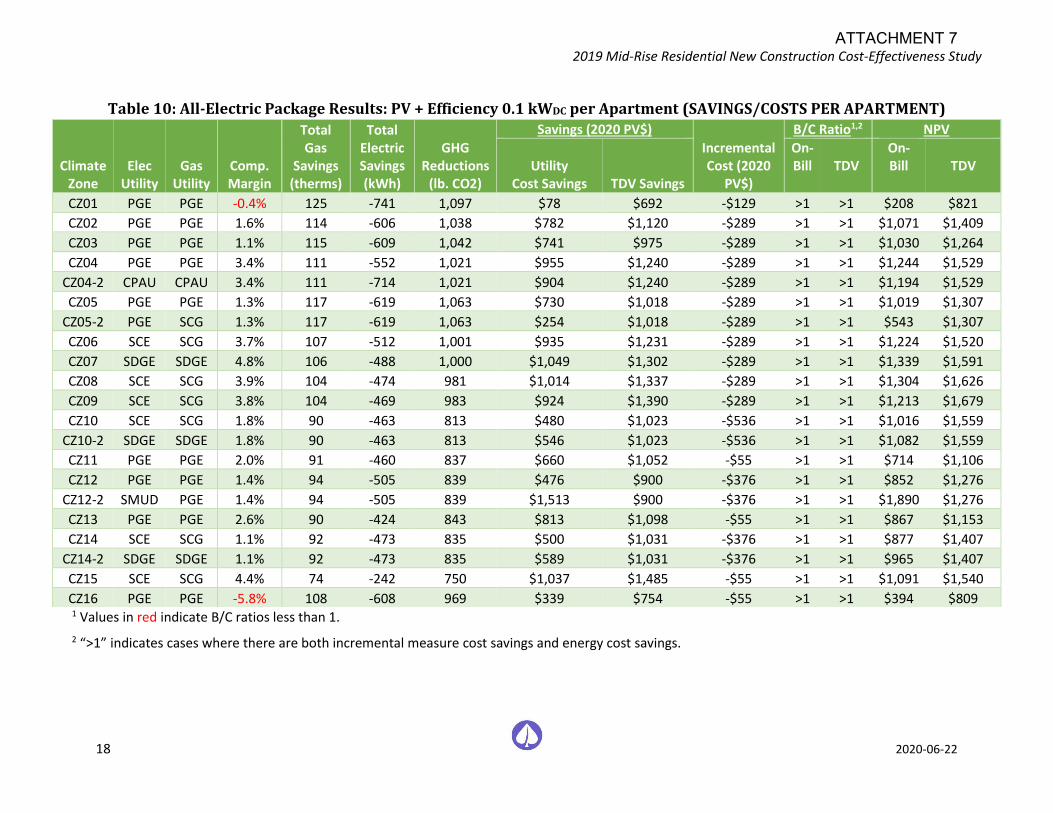
2019 Mid-Rise Residential New Construction Cost-Effectiveness Study
18 2020-06-22
Table 10: All-Electric Package Results: PV + Efficiency 0.1 kWDC per Apartment (SAVINGS/COSTS PER APARTMENT)
1 Values in red indicate B/C ratios less than 1.
2 “>1” indicates cases where there are both incremental measure cost savings and energy cost savings.
Climate Zone
Elec Utility
Gas Utility
Comp. Margin
Total Gas
Savings (therms)
Total Electric Savings (kWh)
GHG Reductions
(lb. CO2)
Savings (2020 PV$)
Incremental Cost (2020
PV$)
B/C Ratio1,2 NPV
Utility Cost Savings TDV Savings
On-Bill
TDV
On-Bill
TDV
CZ01 PGE PGE -0.4% 125 -741 1,097 $78 $692 -$129 >1 >1 $208 $821
CZ02 PGE PGE 1.6% 114 -606 1,038 $782 $1,120 -$289 >1 >1 $1,071 $1,409
CZ03 PGE PGE 1.1% 115 -609 1,042 $741 $975 -$289 >1 >1 $1,030 $1,264
CZ04 PGE PGE 3.4% 111 -552 1,021 $955 $1,240 -$289 >1 >1 $1,244 $1,529
CZ04-2 CPAU CPAU 3.4% 111 -714 1,021 $904 $1,240 -$289 >1 >1 $1,194 $1,529
CZ05 PGE PGE 1.3% 117 -619 1,063 $730 $1,018 -$289 >1 >1 $1,019 $1,307
CZ05-2 PGE SCG 1.3% 117 -619 1,063 $254 $1,018 -$289 >1 >1 $543 $1,307
CZ06 SCE SCG 3.7% 107 -512 1,001 $935 $1,231 -$289 >1 >1 $1,224 $1,520
CZ07 SDGE SDGE 4.8% 106 -488 1,000 $1,049 $1,302 -$289 >1 >1 $1,339 $1,591
CZ08 SCE SCG 3.9% 104 -474 981 $1,014 $1,337 -$289 >1 >1 $1,304 $1,626
CZ09 SCE SCG 3.8% 104 -469 983 $924 $1,390 -$289 >1 >1 $1,213 $1,679
CZ10 SCE SCG 1.8% 90 -463 813 $480 $1,023 -$536 >1 >1 $1,016 $1,559
CZ10-2 SDGE SDGE 1.8% 90 -463 813 $546 $1,023 -$536 >1 >1 $1,082 $1,559
CZ11 PGE PGE 2.0% 91 -460 837 $660 $1,052 -$55 >1 >1 $714 $1,106
CZ12 PGE PGE 1.4% 94 -505 839 $476 $900 -$376 >1 >1 $852 $1,276
CZ12-2 SMUD PGE 1.4% 94 -505 839 $1,513 $900 -$376 >1 >1 $1,890 $1,276
CZ13 PGE PGE 2.6% 90 -424 843 $813 $1,098 -$55 >1 >1 $867 $1,153
CZ14 SCE SCG 1.1% 92 -473 835 $500 $1,031 -$376 >1 >1 $877 $1,407
CZ14-2 SDGE SDGE 1.1% 92 -473 835 $589 $1,031 -$376 >1 >1 $965 $1,407
CZ15 SCE SCG 4.4% 74 -242 750 $1,037 $1,485 -$55 >1 >1 $1,091 $1,540
CZ16 PGE PGE -5.8% 108 -608 969 $339 $754 -$55 >1 >1 $394 $809
ATTACHMENT 7
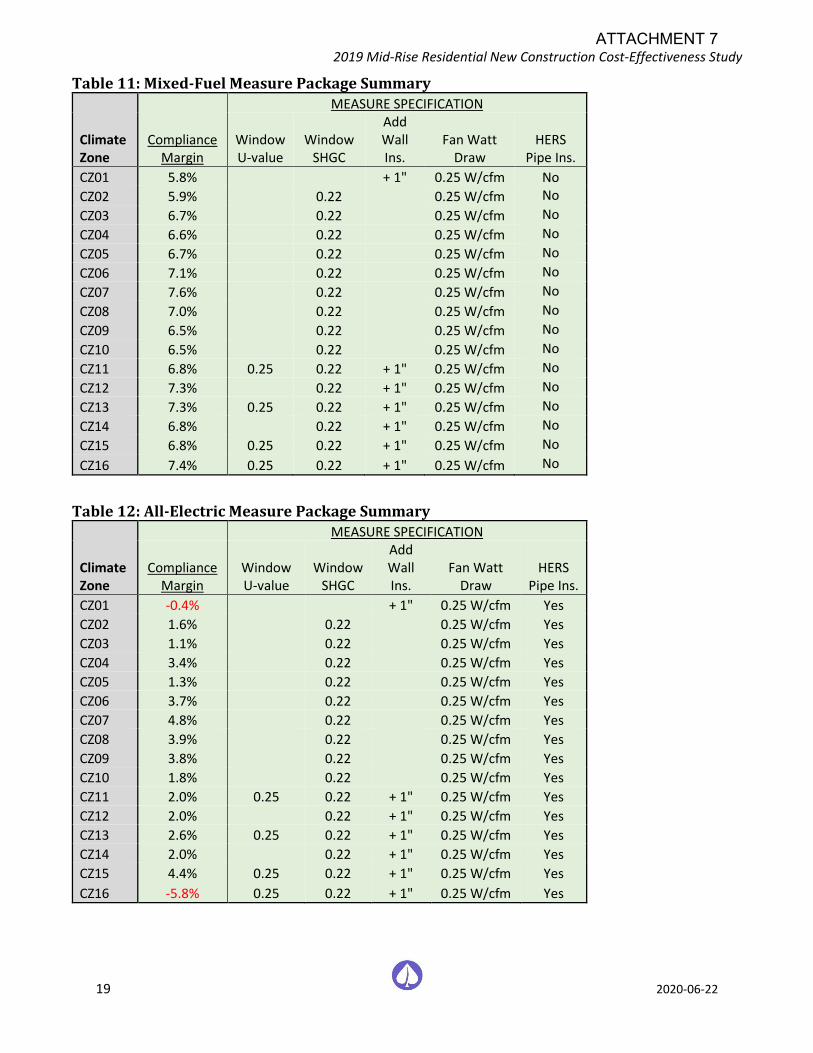
2019 Mid-Rise Residential New Construction Cost-Effectiveness Study
19 2020-06-22
Table 11: Mixed-Fuel Measure Package Summary
Climate Zone
Compliance Margin
MEASURE SPECIFICATION
Window U-value
Window SHGC
Add Wall Ins.
Fan Watt Draw
HERS Pipe Ins.
CZ01 5.8% + 1" 0.25 W/cfm No
CZ02 5.9% 0.22 0.25 W/cfm No
CZ03 6.7% 0.22 0.25 W/cfm No
CZ04 6.6% 0.22 0.25 W/cfm No
CZ05 6.7% 0.22 0.25 W/cfm No
CZ06 7.1% 0.22 0.25 W/cfm No
CZ07 7.6% 0.22 0.25 W/cfm No
CZ08 7.0% 0.22 0.25 W/cfm No
CZ09 6.5% 0.22 0.25 W/cfm No
CZ10 6.5% 0.22 0.25 W/cfm No
CZ11 6.8% 0.25 0.22 + 1" 0.25 W/cfm No
CZ12 7.3% 0.22 + 1" 0.25 W/cfm No
CZ13 7.3% 0.25 0.22 + 1" 0.25 W/cfm No
CZ14 6.8% 0.22 + 1" 0.25 W/cfm No
CZ15 6.8% 0.25 0.22 + 1" 0.25 W/cfm No
CZ16 7.4% 0.25 0.22 + 1" 0.25 W/cfm No
Table 12: All-Electric Measure Package Summary
Climate Zone
MEASURE SPECIFICATION
Compliance Margin
Window U-value
Window SHGC
Add Wall Ins.
Fan Watt Draw
HERS Pipe Ins.
CZ01 -0.4% + 1" 0.25 W/cfm Yes
CZ02 1.6% 0.22 0.25 W/cfm Yes
CZ03 1.1% 0.22 0.25 W/cfm Yes
CZ04 3.4% 0.22 0.25 W/cfm Yes
CZ05 1.3% 0.22 0.25 W/cfm Yes
CZ06 3.7% 0.22 0.25 W/cfm Yes
CZ07 4.8% 0.22 0.25 W/cfm Yes
CZ08 3.9% 0.22 0.25 W/cfm Yes
CZ09 3.8% 0.22 0.25 W/cfm Yes
CZ10 1.8% 0.22 0.25 W/cfm Yes
CZ11 2.0% 0.25 0.22 + 1" 0.25 W/cfm Yes
CZ12 2.0% 0.22 + 1" 0.25 W/cfm Yes
CZ13 2.6% 0.25 0.22 + 1" 0.25 W/cfm Yes
CZ14 2.0% 0.22 + 1" 0.25 W/cfm Yes
CZ15 4.4% 0.25 0.22 + 1" 0.25 W/cfm Yes
CZ16 -5.8% 0.25 0.22 + 1" 0.25 W/cfm Yes
ATTACHMENT 7
2019 Mid-Rise Residential New Construction Cost-Effectiveness Study
20 2020-06-22
4 Conclusions & Summary This report evaluated the feasibility and cost-effectiveness of “above code” performance specifications for newly constructed mid-rise multifamily buildings. The analysis included application of efficiency measures, electric appliances, and PV in all 16 California climate zones, and found cost-effective packages across the state. For the building designs and climate zones where cost-effective packages were identified, the results of this analysis can be used by local jurisdictions to support the adoption of reach codes. Cost-effectiveness was evaluated according to two metrics: On-Bill customer lifecycle benefit-to-cost ratio and TDV lifecycle benefit-to-cost ratio.
For mixed-fuel buildings, this analysis demonstrates that there are cost-effective Efficiency Only packages that achieve a minimum 5% compliance margin in most climate zones. The exception is Climate Zone 1 where the package was not cost-effective based on either the TDV or the On-Bill methodology. In all other cases the package is cost-effective for at least one of the metrics.
When 0.1 kWDC per apartment is included, all climate zones are cost-effective based on at least one of the metrics. The addition of 0.1 kWDC per apartment, or 8.8 kWDC total for the building, results in an incremental cost for the PV system of $27,855. When 0.2 kWDC per apartment is included, all climate zones are cost-effective based on both metrics. The addition of 0.2 kWDC per apartment, or 17.6 kWDC for the building, results in an incremental cost for the PV system of $55,711.
This study evaluated electrification of residential loads in new mid-rise multifamily buildings. Based on typical construction across California, the basecase condition incorporated all electric appliances within the apartment spaces. As a result, only central water heating was converted from natural gas to electric as part of this analysis. For all-electric buildings, this analysis demonstrates that there are cost-effective All-Electric Efficiency Only packages that meet minimum Title 24 code compliance in all climate zones except 1 and 16. The package is cost-effective based on the TDV methodology in all climate zones. It is cost-effective based on the On-Bill methodology in Climate Zones 2 through 15, except for Climate Zones 5 in SCG territory.
When 0.1 kWDC per apartment is included, all climate zones are cost-effective based on both metrics. The addition of 0.1 kWDC per apartment, or 8.8 kWDC for the building, results in an incremental cost for the PV system of $27,855.
Additional considerations
• This study found that electrification of central domestic hot water loads, in combination with efficiency measures, can result in a benefit to the consumer through lower utility bills under certain electricity and gas tariff scenarios (Climate Zones 6, 8, 9, 15, 4 in CPAU territory, and 12 in SMUD territory territory). The all-electric results demonstrate a trend with On-Bill cost-effectiveness across the different electric utilities. Net Present Value in SCE and SDG&E territories, as well as SMUD and CPAU territories, are typically higher than the cases in PG&E territory. This indicates that rate design can play an important role in encouraging or discouraging electrification.
• This study did not evaluate federally preempted high efficiency appliances. Specifying high efficiency equipment is a viable approach to meeting Title 24 code compliance and local ordinance requirements and is commonly used by project teams. Other studies have found that efficiency packages and electrification packages that employ high efficiency equipment can be quite cost-effective ((Statewide Reach Code Team, 2019b), (Energy & Environmental Economics. 2019)).
• If PV capacity is added to both the mixed-fuel and all-electric efficiency packages, all cases are cost-effective based on at least one of the two evaluated metrics. In some cases, cost-effectiveness improves, and in other cases it decreases relative to the case with efficiency and/or electrification measures only. The cost-effectiveness of adding PV up to 1 kW per apartment, as an independent measure, results in On-Bill benefit-to-cost ratios between 2.3 and 3.1 for PGE territory, 2.1 to 2.3 for SCE territory, and 3.2 to 3.5 for SDG&E territory. The TDV B/C ratio for PV alone is approximately 2.0 for most climate zones
ATTACHMENT 7
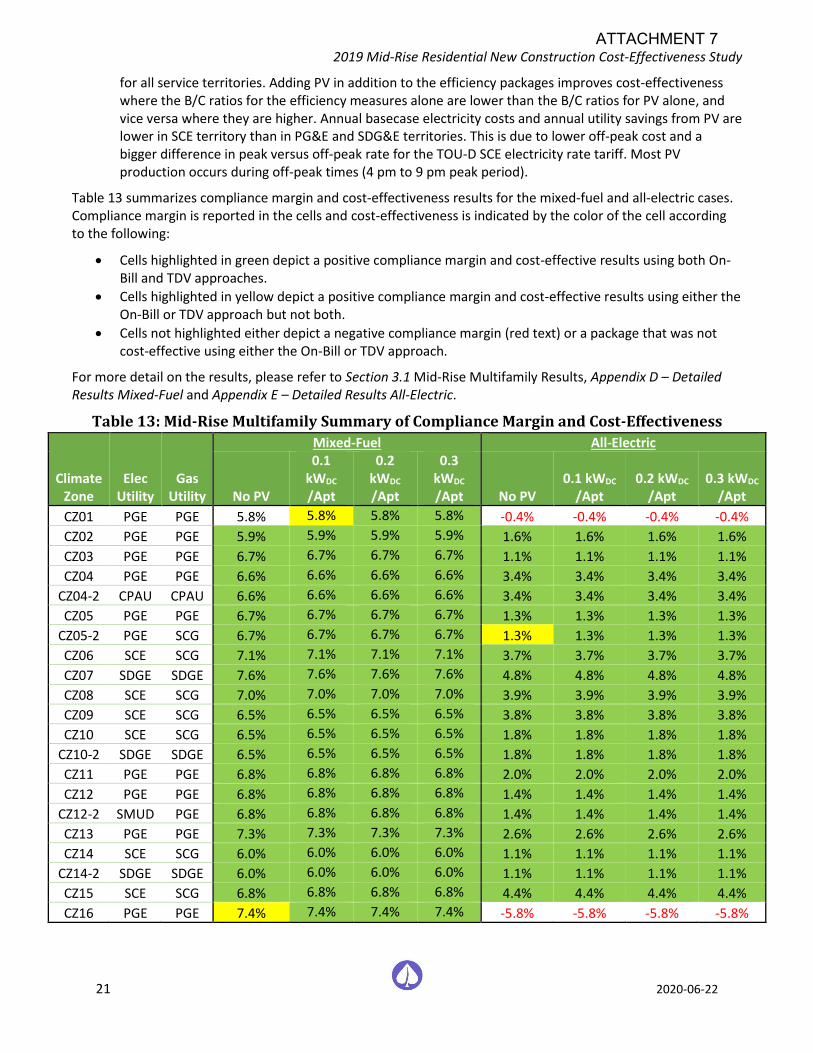
2019 Mid-Rise Residential New Construction Cost-Effectiveness Study
21 2020-06-22
for all service territories. Adding PV in addition to the efficiency packages improves cost-effectiveness where the B/C ratios for the efficiency measures alone are lower than the B/C ratios for PV alone, and vice versa where they are higher. Annual basecase electricity costs and annual utility savings from PV are lower in SCE territory than in PG&E and SDG&E territories. This is due to lower off-peak cost and a bigger difference in peak versus off-peak rate for the TOU-D SCE electricity rate tariff. Most PV production occurs during off-peak times (4 pm to 9 pm peak period).
Table 13 summarizes compliance margin and cost-effectiveness results for the mixed-fuel and all-electric cases. Compliance margin is reported in the cells and cost-effectiveness is indicated by the color of the cell according to the following:
• Cells highlighted in green depict a positive compliance margin and cost-effective results using both On-Bill and TDV approaches.
• Cells highlighted in yellow depict a positive compliance margin and cost-effective results using either the On-Bill or TDV approach but not both.
• Cells not highlighted either depict a negative compliance margin (red text) or a package that was not cost-effective using either the On-Bill or TDV approach.
For more detail on the results, please refer to Section 3.1 Mid-Rise Multifamily Results, Appendix D – Detailed Results Mixed-Fuel and Appendix E – Detailed Results All-Electric.
Table 13: Mid-Rise Multifamily Summary of Compliance Margin and Cost-Effectiveness
Climate Zone
Elec Utility
Gas Utility
Mixed-Fuel All-Electric
No PV
0.1 kWDC /Apt
0.2 kWDC /Apt
0.3 kWDC /Apt No PV
0.1 kWDC /Apt
0.2 kWDC /Apt
0.3 kWDC /Apt
CZ01 PGE PGE 5.8% 5.8% 5.8% 5.8% -0.4% -0.4% -0.4% -0.4%
CZ02 PGE PGE 5.9% 5.9% 5.9% 5.9% 1.6% 1.6% 1.6% 1.6%
CZ03 PGE PGE 6.7% 6.7% 6.7% 6.7% 1.1% 1.1% 1.1% 1.1%
CZ04 PGE PGE 6.6% 6.6% 6.6% 6.6% 3.4% 3.4% 3.4% 3.4%
CZ04-2 CPAU CPAU 6.6% 6.6% 6.6% 6.6% 3.4% 3.4% 3.4% 3.4%
CZ05 PGE PGE 6.7% 6.7% 6.7% 6.7% 1.3% 1.3% 1.3% 1.3%
CZ05-2 PGE SCG 6.7% 6.7% 6.7% 6.7% 1.3% 1.3% 1.3% 1.3%
CZ06 SCE SCG 7.1% 7.1% 7.1% 7.1% 3.7% 3.7% 3.7% 3.7%
CZ07 SDGE SDGE 7.6% 7.6% 7.6% 7.6% 4.8% 4.8% 4.8% 4.8%
CZ08 SCE SCG 7.0% 7.0% 7.0% 7.0% 3.9% 3.9% 3.9% 3.9%
CZ09 SCE SCG 6.5% 6.5% 6.5% 6.5% 3.8% 3.8% 3.8% 3.8%
CZ10 SCE SCG 6.5% 6.5% 6.5% 6.5% 1.8% 1.8% 1.8% 1.8%
CZ10-2 SDGE SDGE 6.5% 6.5% 6.5% 6.5% 1.8% 1.8% 1.8% 1.8%
CZ11 PGE PGE 6.8% 6.8% 6.8% 6.8% 2.0% 2.0% 2.0% 2.0%
CZ12 PGE PGE 6.8% 6.8% 6.8% 6.8% 1.4% 1.4% 1.4% 1.4%
CZ12-2 SMUD PGE 6.8% 6.8% 6.8% 6.8% 1.4% 1.4% 1.4% 1.4%
CZ13 PGE PGE 7.3% 7.3% 7.3% 7.3% 2.6% 2.6% 2.6% 2.6%
CZ14 SCE SCG 6.0% 6.0% 6.0% 6.0% 1.1% 1.1% 1.1% 1.1%
CZ14-2 SDGE SDGE 6.0% 6.0% 6.0% 6.0% 1.1% 1.1% 1.1% 1.1%
CZ15 SCE SCG 6.8% 6.8% 6.8% 6.8% 4.4% 4.4% 4.4% 4.4%
CZ16 PGE PGE 7.4% 7.4% 7.4% 7.4% -5.8% -5.8% -5.8% -5.8%
ATTACHMENT 7
2019 Mid-Rise Residential New Construction Cost-Effectiveness Study
22 2020-06-22
5 References California Energy Commission. 2017. Rooftop Solar PV System. Measure number: 2019-Res-PV-D Prepared by Energy and Environmental Economics, Inc. https://efiling.energy.ca.gov/getdocument.aspx?tn=221366
California Energy Commission. 2018a. 2019 Building Energy Efficiency Standards for Residential and Nonresidential Buildings. CEC-400-2018-020-CMF. December 2018. California Energy Commission. https://www.energy.ca.gov/2018publications/CEC-400-2018-020/CEC-400-2018-020-CMF.pdf
California Energy Commission. 2018b. 2019 Reference Appendices. CEC-400-2018-021-CMF. December 2018. California Energy Commission. https://www.energy.ca.gov/2018publications/CEC-400-2018-021/CEC-400-2018-021-CMF.pdf
California Energy Commission. 2019a. 2019 Nonresidential Alternative Calculation Method Reference Manual. CEC-400-2019-006-CMF. May 2019. California Energy Commission. https://ww2.energy.ca.gov/2019publications/CEC-400-2019-006/CEC-400-2019-006-CMF.pdf
California Energy Commission. 2019b. Executive Director Determination Pursuant to Section 150.1(c)8C for Central Heat Pump Water Heating System. December 26, 2019. https://efiling.energy.ca.gov/GetDocument.aspx?tn=231318&DocumentContentId=63067
Energy & Environmental Economics. 2019. Residential Building Electrification in California. April 2019. https://www.ethree.com/wp-content/uploads/2019/04/E3_Residential_Building_Electrification_in_California_April_2019.pdf
Horii, B., E. Cutter, N. Kapur, J. Arent, and D. Conotyannis. 2014. “Time Dependent Valuation of Energy for Developing Building Energy Efficiency Standards.” http://www.energy.ca.gov/title24/2016standards/prerulemaking/documents/2014-07-09_workshop/2017_TDV_Documents/
Barbose, Galen and Darghouth, Naim. 2018. Tracking the Sun. Installed Price Trends for Distributed Photovoltaic Systems in the United States – 2018 Edition. Lawrence Berkeley National Laboratory. September 2018. https://emp.lbl.gov/sites/default/files/tracking_the_sun_2018_edition_final_0.pdf
Statewide CASE Team. 2014. Codes and Standards Enhancement (CASE) Initiative Nonresidential Opaque Envelope. December 2014. https://title24stakeholders.com/wp-content/uploads/2019/02/2016-T24-CASE-Report-NR-Opaque-Envelope-Dec2014-V3.pdf
Statewide CASE Team. 2017a. Codes and Standards Enhancement (CASE) Initiative High Performance Walls – Final Report. September 2017. http://title24stakeholders.com/wp-content/uploads/2017/09/2019-T24-CASE-Report_HPW_Final_September-2017.pdf
Statewide CASE Team. 2017b. Codes and Standards Enhancement (CASE) Initiative Residential High Performance Windows & Doors – Final Report. August 2017. http://title24stakeholders.com/wp-content/uploads/2017/09/2019-T24-CASE-Report_Res-Windows-and-Doors_Final_September-2017.pdf
Statewide CASE Team. 2017c. Codes and Standards Enhancement (CASE) Initiative Drain Water Heat Recovery – Final Report. July 2017. https://title24stakeholders.com/wp-content/uploads/2017/09/2019-T24-CASE-Report_DWHR_Final_September-2017.pdf
Statewide CASE Team. 2018. Energy Savings Potential and Cost-Effectiveness Analysis of High Efficiency Windows in California. Prepared by Frontier Energy. May 2018. https://www.etcc-ca.com/reports/energy-savings-potential-and-cost-effectiveness-analysis-high-efficiency-windows-california
Statewide CASE Team. 2020. All-Electric Multifamily Compliance Pathway Draft CASE Report. https://title24stakeholders.com/wp-content/uploads/2018/10/2022-T24-Draft-CASE-Report_MF-All-Electric.pdf
ATTACHMENT 7

2019 Mid-Rise Residential New Construction Cost-Effectiveness Study
23 2020-06-22
Statewide Reach Code Team. 2019a. 2019 Nonresidential New Construction Reach Code Cost Effectiveness Study. Prepared for Southern California Edison. Prepared by TRC. July 25, 2019. https://localenergycodes.com/download/801/file_path/fieldList/2019%20NR%20NC%20Cost%20Effectiveness%20Study-2019-07-25.pdf
Statewide Reach Code Te am. 2019b. 2019 Cost-effectiveness Study: Low-Rise Residential New Construction. Prepared for Pacific Gas and Electric Company. Prepared by Frontier Energy. August 1, 2019. https://localenergycodes.com/download/800/file_path/fieldList/2019%20Res%20NC%20Reach%20Codes
TRC. 2018. City of Palo Alto 2019 Title 24 Energy Reach Code Cost-effectiveness Analysis Draft. September 2018. https://cityofpaloalto.org/civicax/filebank/documents/66742
TRC. 2019. Multifamily Prototypes. June 7, 2019. Submitted to Southern California Edison. https://title24stakeholders.com/wp-content/uploads/2019/06/SCE-MFModeling_MultifamilyPrototypesReport_2019-06-07_clean.pdf
ATTACHMENT 7

2019 Mid-Rise Residential New Construction Cost-Effectiveness Study
24 2020-06-22
Appendix A – California Climate Zone Map
Figure 3: Map of California climate zones. (Source, California Energy Commission3)
3 https://ww2.energy.ca.gov/maps/renewable/building_climate_zones.html
ATTACHMENT 7

2019 Mid-Rise Residential New Construction Cost-Effectiveness Study
25 2020-06-22
Appendix B – Utility Tariff Details PG&E ............................................................................................................................................................. 26
SCE ............................................................................................................................................................... 32
SoCalGas ....................................................................................................................................................... 35
SDG&E ........................................................................................................................................................... 38
SMUD............................................................................................................................................................. 42
Escalation Assumptions .............................................................................................................................. 44
ATTACHMENT 7
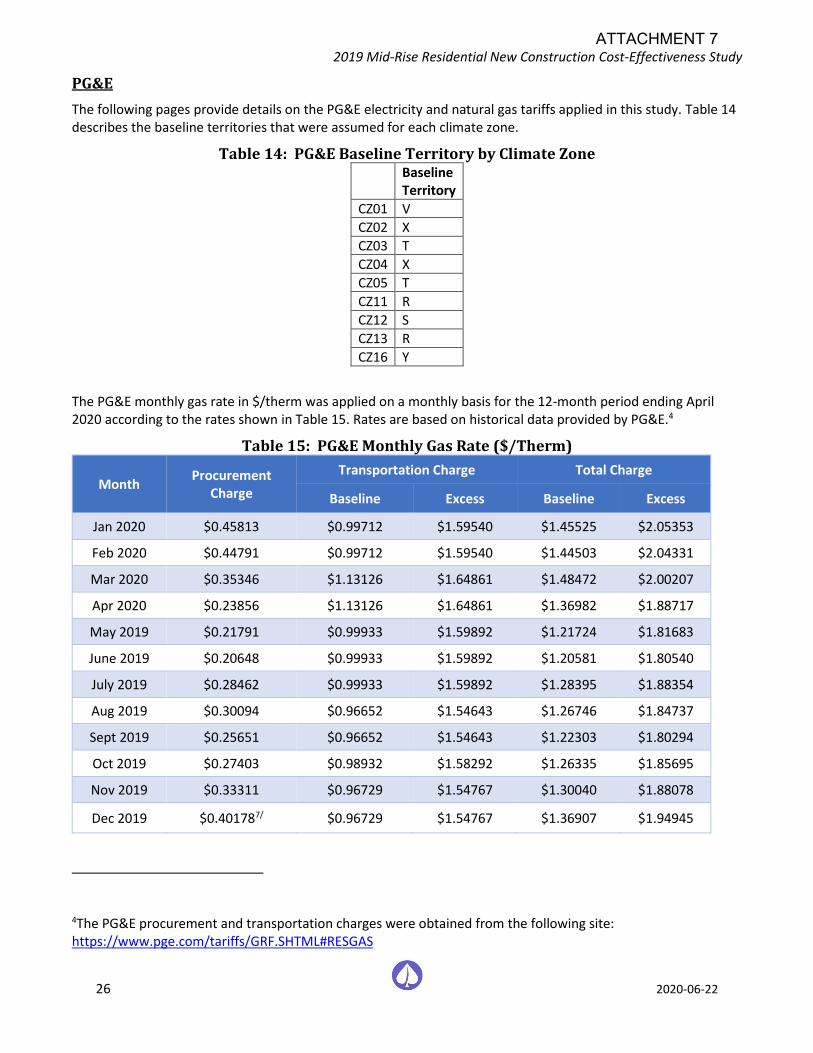
2019 Mid-Rise Residential New Construction Cost-Effectiveness Study
26 2020-06-22
PG&E
The following pages provide details on the PG&E electricity and natural gas tariffs applied in this study. Table 14 describes the baseline territories that were assumed for each climate zone.
Table 14: PG&E Baseline Territory by Climate Zone Baseline
Territory
CZ01 V
CZ02 X
CZ03 T
CZ04 X
CZ05 T
CZ11 R
CZ12 S
CZ13 R
CZ16 Y
The PG&E monthly gas rate in $/therm was applied on a monthly basis for the 12-month period ending April 2020 according to the rates shown in Table 15. Rates are based on historical data provided by PG&E.4
Table 15: PG&E Monthly Gas Rate ($/Therm)
Month Procurement
Charge
Transportation Charge Total Charge
Baseline Excess Baseline Excess
Jan 2020 $0.45813 $0.99712 $1.59540 $1.45525 $2.05353
Feb 2020 $0.44791 $0.99712 $1.59540 $1.44503 $2.04331
Mar 2020 $0.35346 $1.13126 $1.64861 $1.48472 $2.00207
Apr 2020 $0.23856 $1.13126 $1.64861 $1.36982 $1.88717
May 2019 $0.21791 $0.99933 $1.59892 $1.21724 $1.81683
June 2019 $0.20648 $0.99933 $1.59892 $1.20581 $1.80540
July 2019 $0.28462 $0.99933 $1.59892 $1.28395 $1.88354
Aug 2019 $0.30094 $0.96652 $1.54643 $1.26746 $1.84737
Sept 2019 $0.25651 $0.96652 $1.54643 $1.22303 $1.80294
Oct 2019 $0.27403 $0.98932 $1.58292 $1.26335 $1.85695
Nov 2019 $0.33311 $0.96729 $1.54767 $1.30040 $1.88078
Dec 2019 $0.401787/ $0.96729 $1.54767 $1.36907 $1.94945
4The PG&E procurement and transportation charges were obtained from the following site: https://www.pge.com/tariffs/GRF.SHTML#RESGAS
ATTACHMENT 7
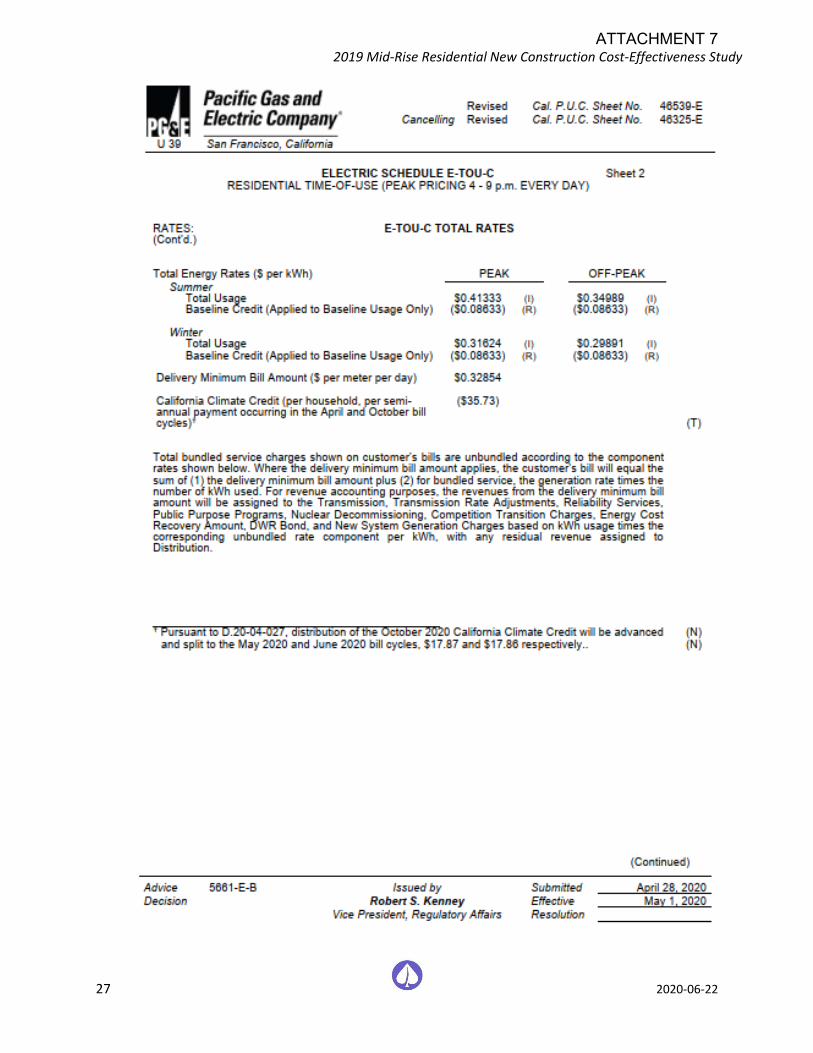
2019 Mid-Rise Residential New Construction Cost-Effectiveness Study
27 2020-06-22
ATTACHMENT 7
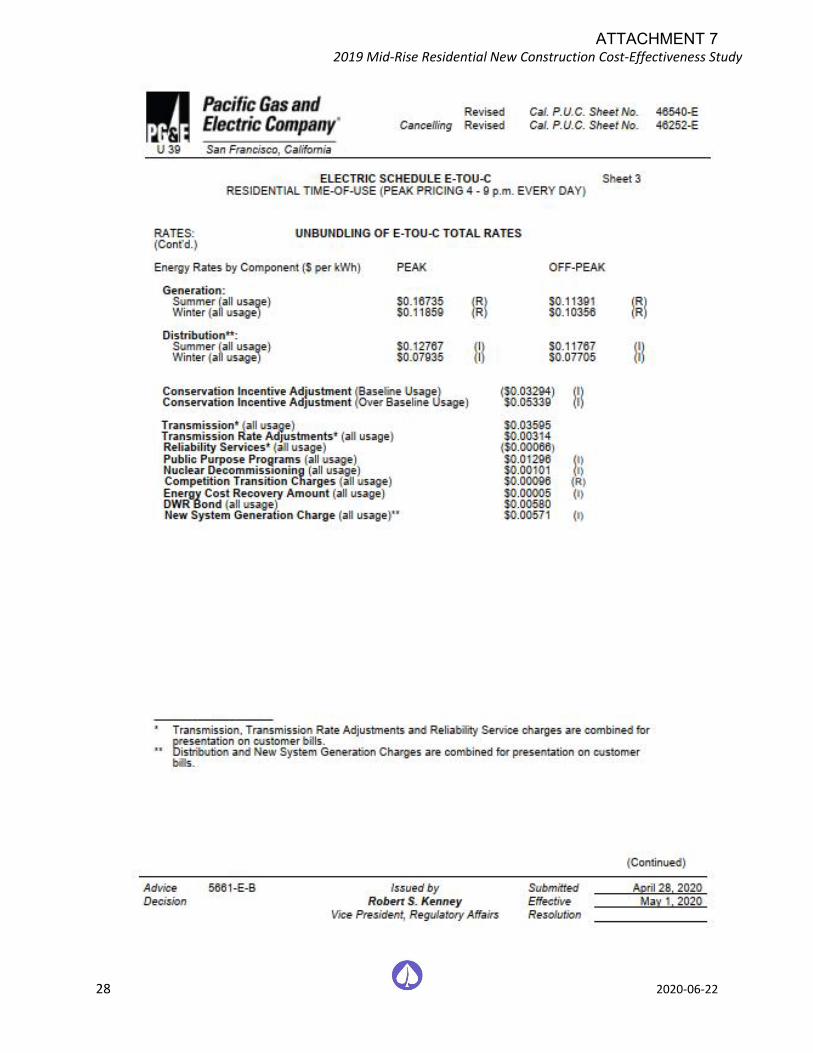
2019 Mid-Rise Residential New Construction Cost-Effectiveness Study
28 2020-06-22
ATTACHMENT 7
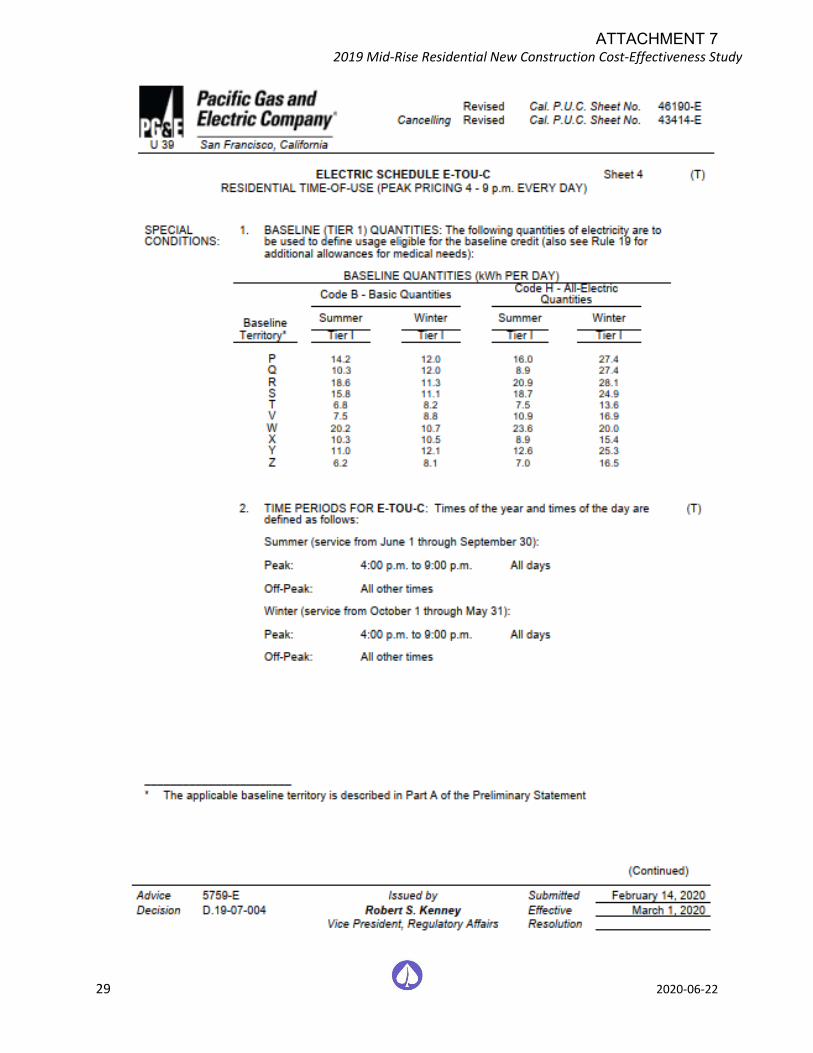
2019 Mid-Rise Residential New Construction Cost-Effectiveness Study
29 2020-06-22
ATTACHMENT 7
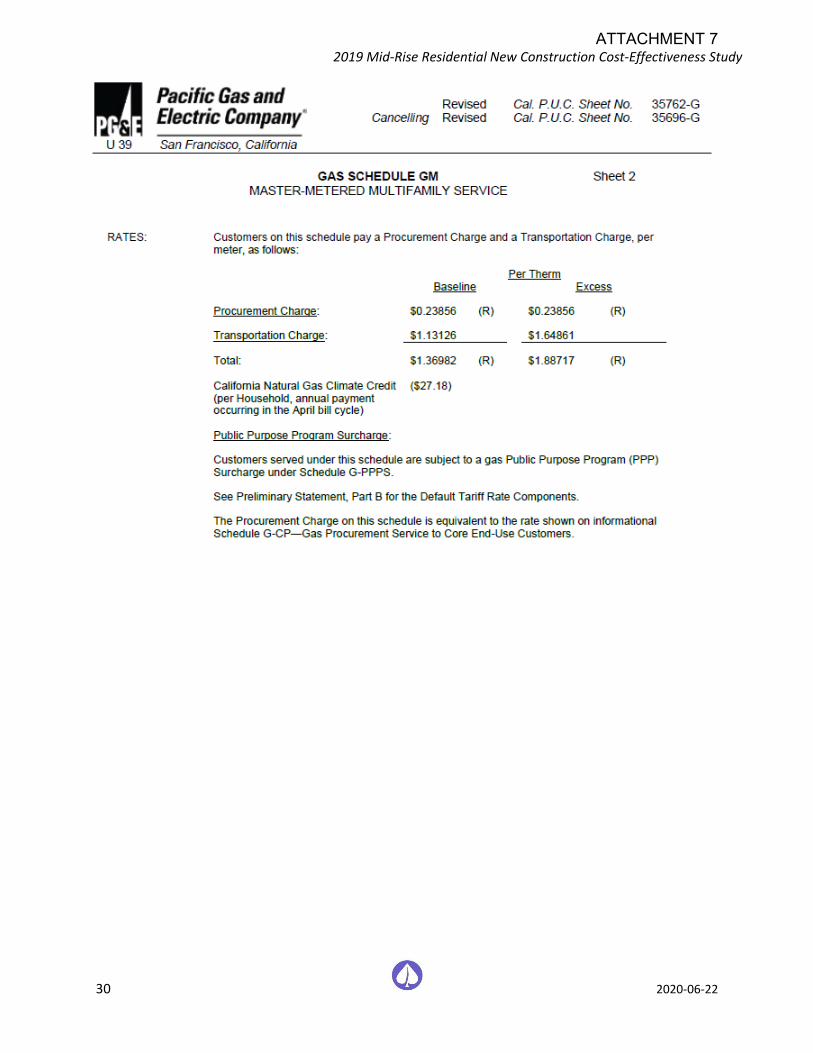
2019 Mid-Rise Residential New Construction Cost-Effectiveness Study
30 2020-06-22
ATTACHMENT 7
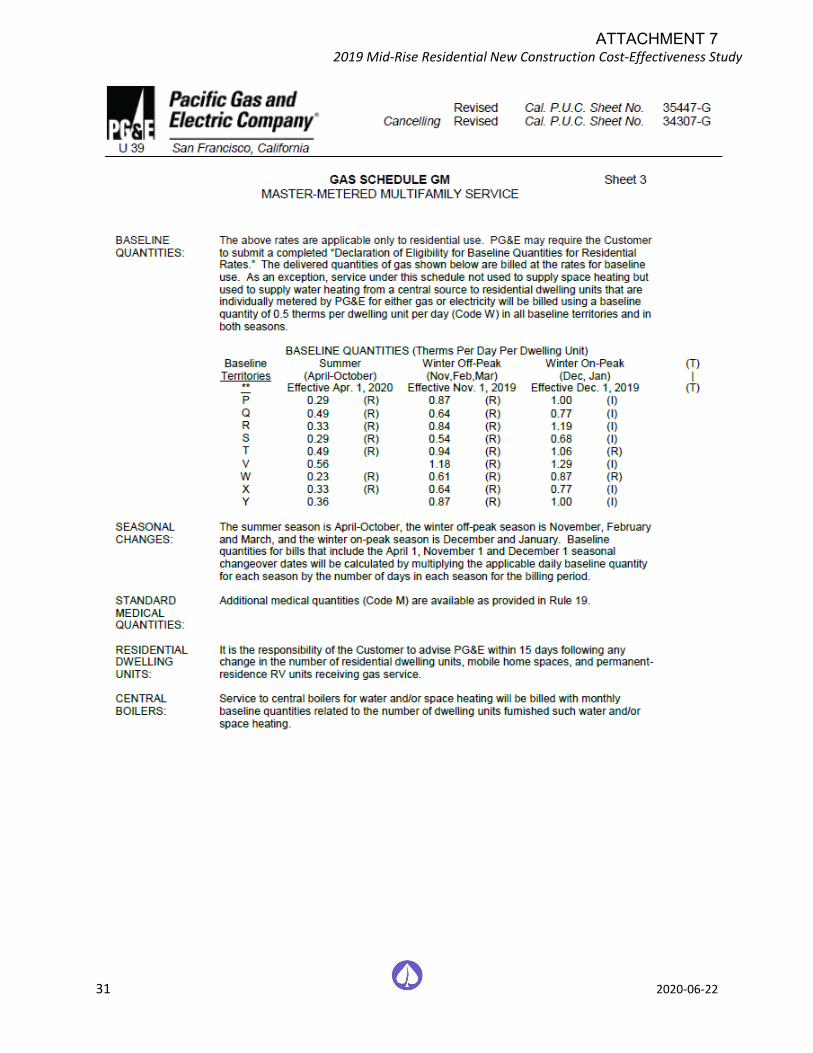
2019 Mid-Rise Residential New Construction Cost-Effectiveness Study
31 2020-06-22
ATTACHMENT 7
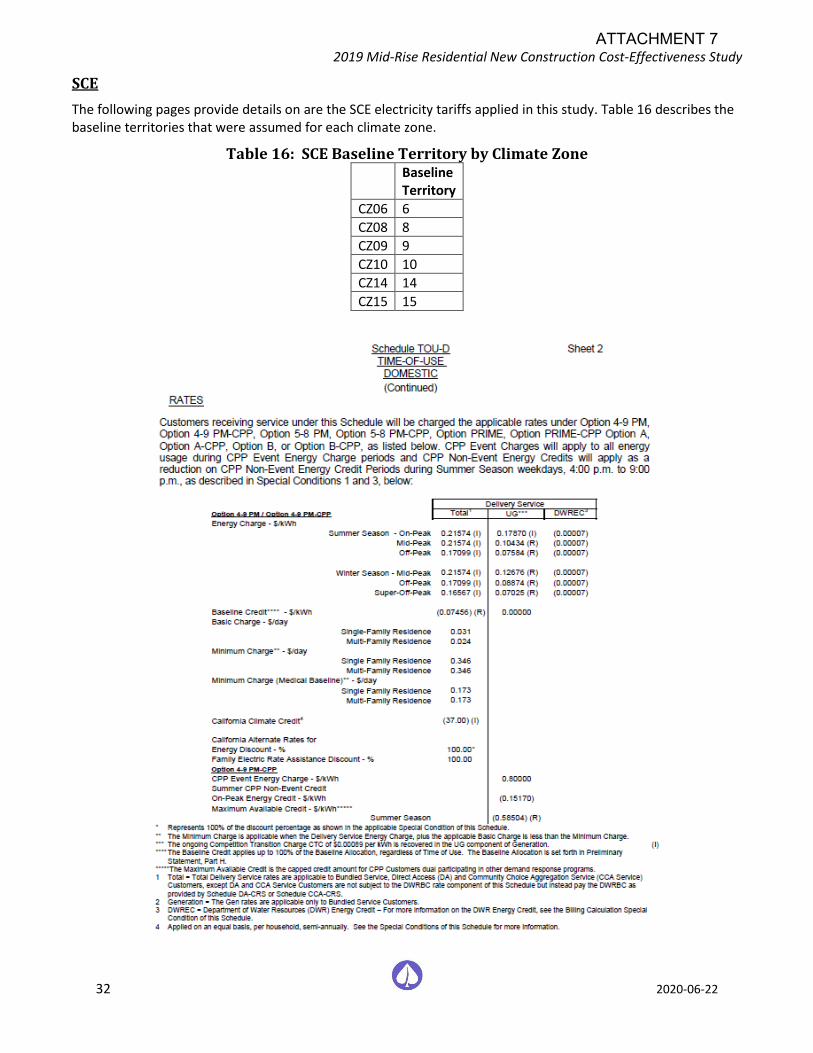
2019 Mid-Rise Residential New Construction Cost-Effectiveness Study
32 2020-06-22
SCE
The following pages provide details on are the SCE electricity tariffs applied in this study. Table 16 describes the baseline territories that were assumed for each climate zone.
Table 16: SCE Baseline Territory by Climate Zone Baseline
Territory
CZ06 6
CZ08 8
CZ09 9
CZ10 10
CZ14 14
CZ15 15
ATTACHMENT 7
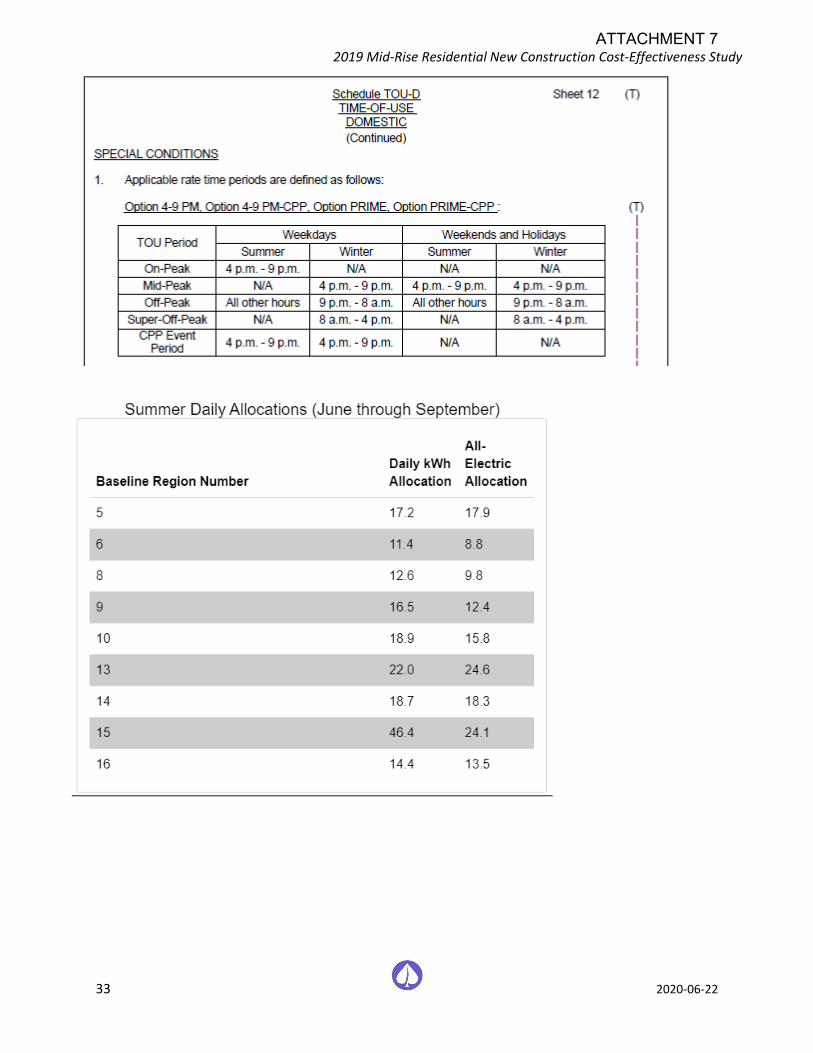
2019 Mid-Rise Residential New Construction Cost-Effectiveness Study
33 2020-06-22
ATTACHMENT 7
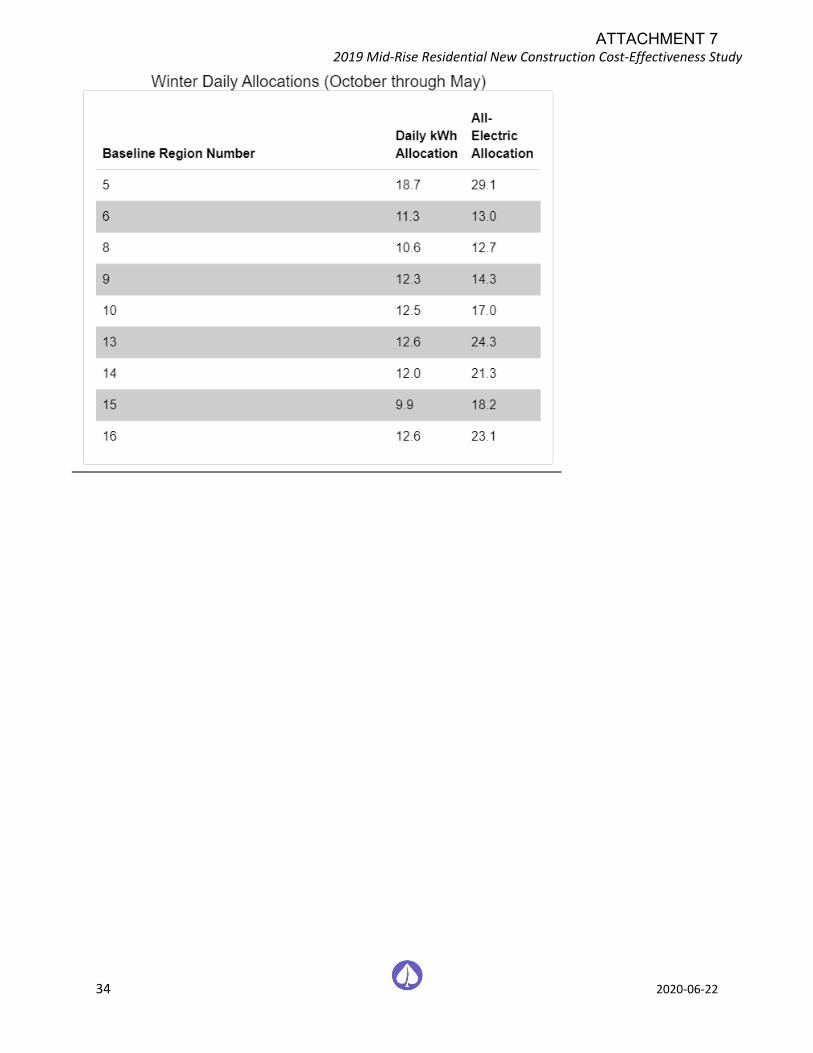
2019 Mid-Rise Residential New Construction Cost-Effectiveness Study
34 2020-06-22
ATTACHMENT 7
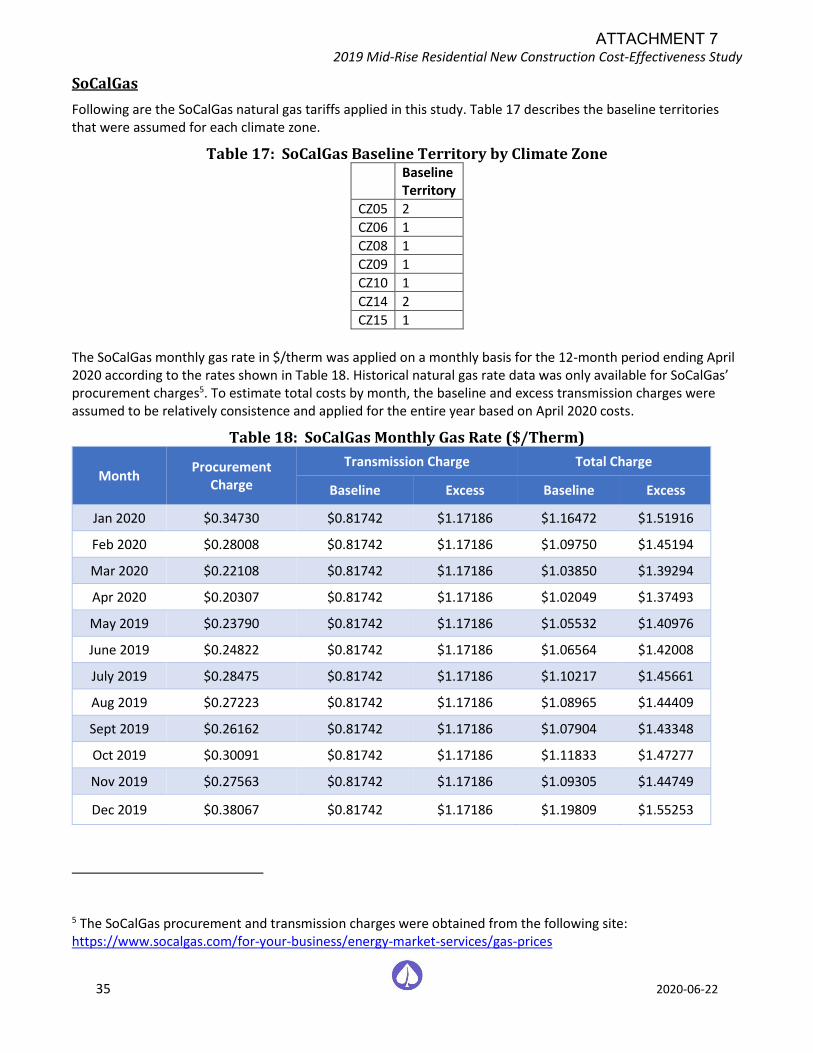
2019 Mid-Rise Residential New Construction Cost-Effectiveness Study
35 2020-06-22
SoCalGas
Following are the SoCalGas natural gas tariffs applied in this study. Table 17 describes the baseline territories that were assumed for each climate zone.
Table 17: SoCalGas Baseline Territory by Climate Zone Baseline
Territory
CZ05 2
CZ06 1
CZ08 1
CZ09 1
CZ10 1
CZ14 2
CZ15 1
The SoCalGas monthly gas rate in $/therm was applied on a monthly basis for the 12-month period ending April 2020 according to the rates shown in Table 18. Historical natural gas rate data was only available for SoCalGas’ procurement charges5. To estimate total costs by month, the baseline and excess transmission charges were assumed to be relatively consistence and applied for the entire year based on April 2020 costs.
Table 18: SoCalGas Monthly Gas Rate ($/Therm)
Month Procurement
Charge
Transmission Charge Total Charge
Baseline Excess Baseline Excess
Jan 2020 $0.34730 $0.81742 $1.17186 $1.16472 $1.51916
Feb 2020 $0.28008 $0.81742 $1.17186 $1.09750 $1.45194
Mar 2020 $0.22108 $0.81742 $1.17186 $1.03850 $1.39294
Apr 2020 $0.20307 $0.81742 $1.17186 $1.02049 $1.37493
May 2019 $0.23790 $0.81742 $1.17186 $1.05532 $1.40976
June 2019 $0.24822 $0.81742 $1.17186 $1.06564 $1.42008
July 2019 $0.28475 $0.81742 $1.17186 $1.10217 $1.45661
Aug 2019 $0.27223 $0.81742 $1.17186 $1.08965 $1.44409
Sept 2019 $0.26162 $0.81742 $1.17186 $1.07904 $1.43348
Oct 2019 $0.30091 $0.81742 $1.17186 $1.11833 $1.47277
Nov 2019 $0.27563 $0.81742 $1.17186 $1.09305 $1.44749
Dec 2019 $0.38067 $0.81742 $1.17186 $1.19809 $1.55253
5 The SoCalGas procurement and transmission charges were obtained from the following site: https://www.socalgas.com/for-your-business/energy-market-services/gas-prices
ATTACHMENT 7
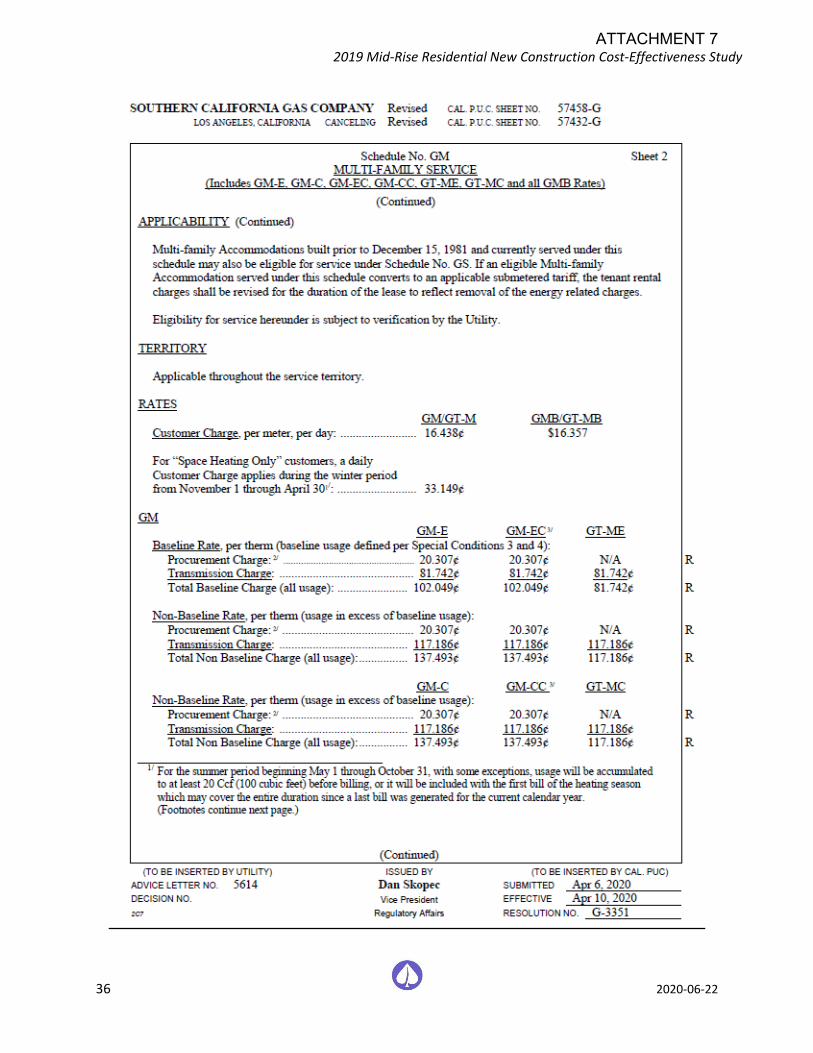
2019 Mid-Rise Residential New Construction Cost-Effectiveness Study
36 2020-06-22
ATTACHMENT 7

2019 Mid-Rise Residential New Construction Cost-Effectiveness Study
37 2020-06-22
ATTACHMENT 7
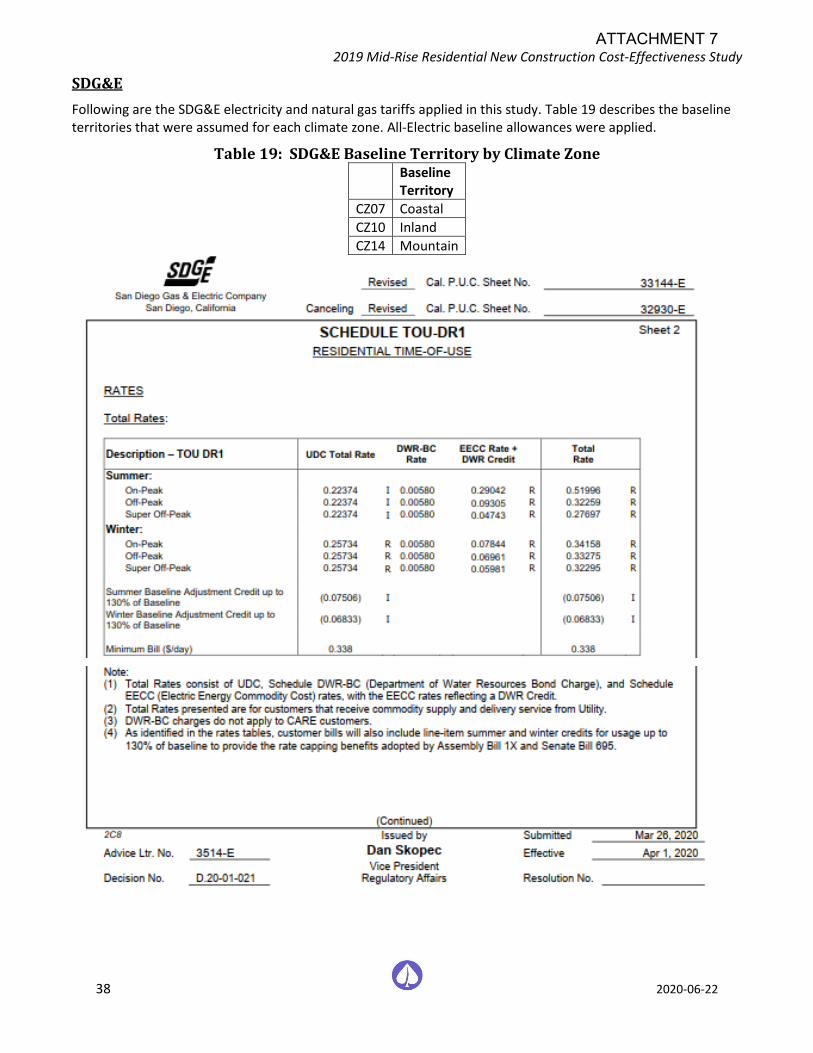
2019 Mid-Rise Residential New Construction Cost-Effectiveness Study
38 2020-06-22
SDG&E
Following are the SDG&E electricity and natural gas tariffs applied in this study. Table 19 describes the baseline territories that were assumed for each climate zone. All-Electric baseline allowances were applied.
Table 19: SDG&E Baseline Territory by Climate Zone Baseline
Territory
CZ07 Coastal
CZ10 Inland
CZ14 Mountain
ATTACHMENT 7
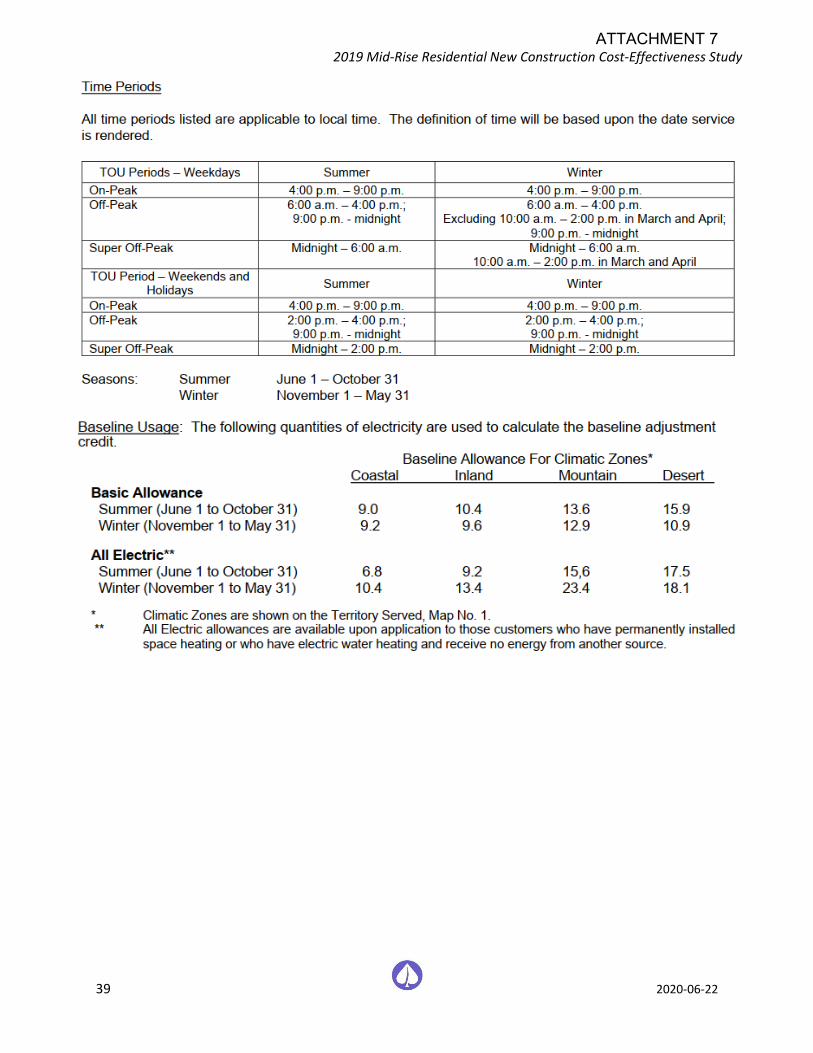
2019 Mid-Rise Residential New Construction Cost-Effectiveness Study
39 2020-06-22
ATTACHMENT 7
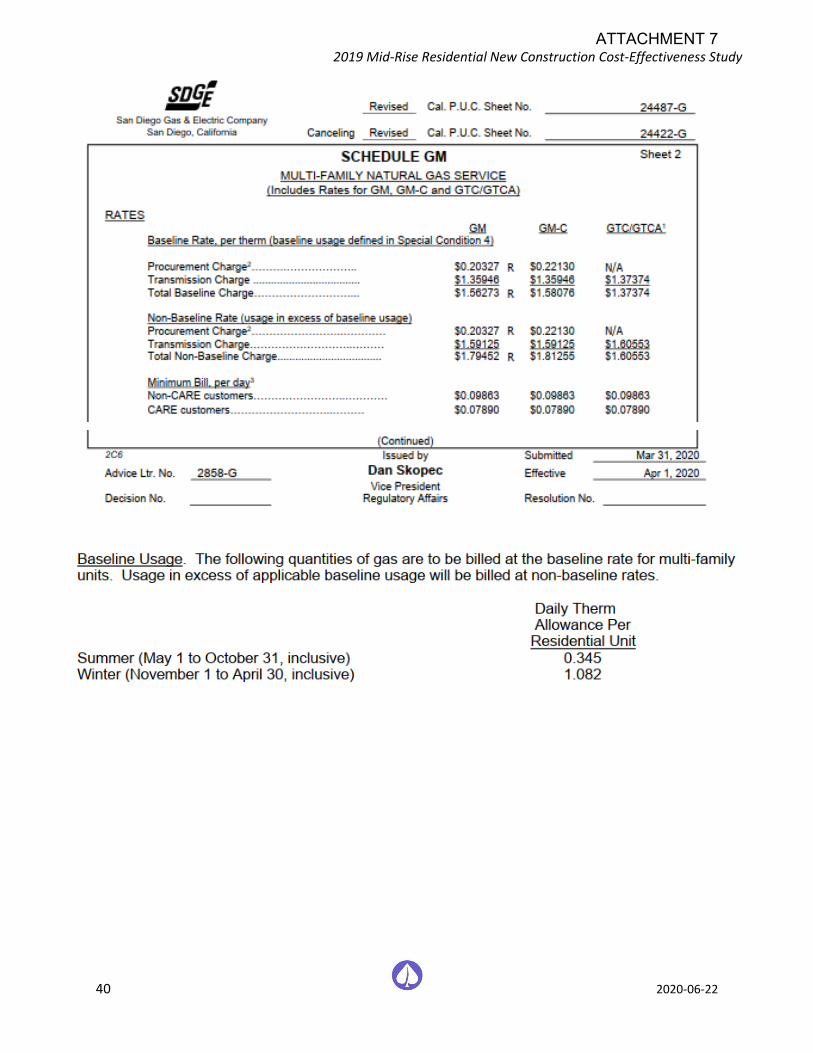
2019 Mid-Rise Residential New Construction Cost-Effectiveness Study
40 2020-06-22
ATTACHMENT 7
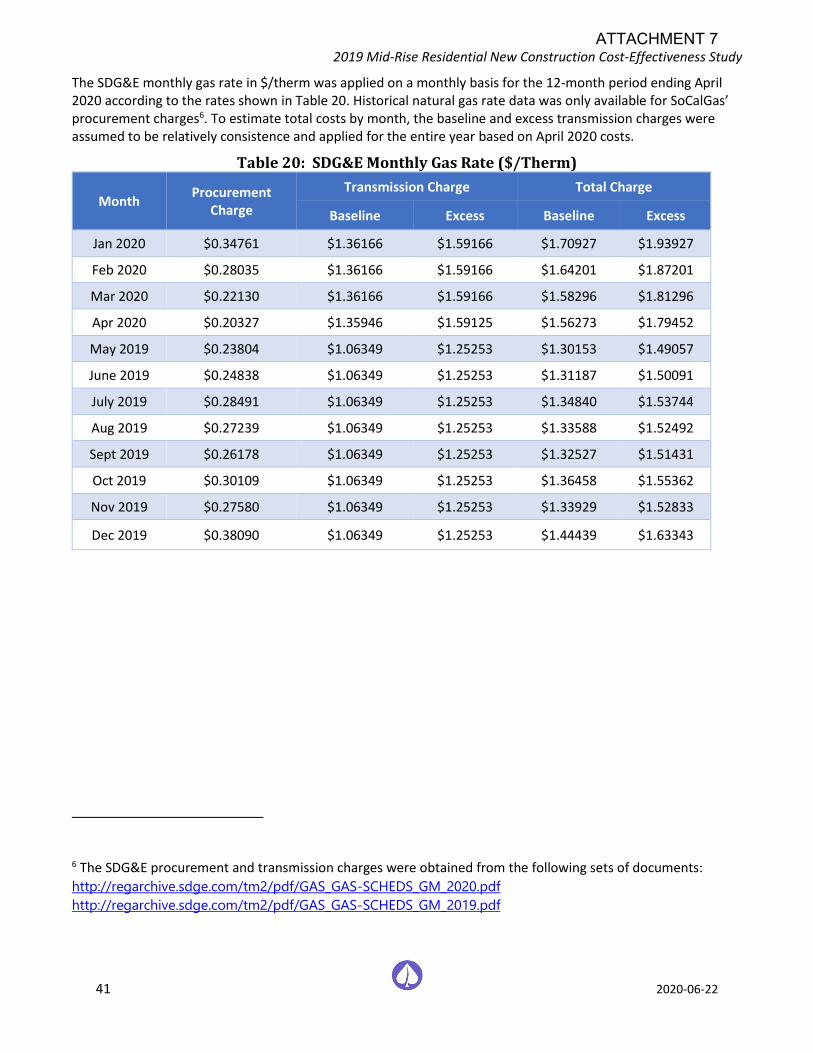
2019 Mid-Rise Residential New Construction Cost-Effectiveness Study
41 2020-06-22
The SDG&E monthly gas rate in $/therm was applied on a monthly basis for the 12-month period ending April 2020 according to the rates shown in Table 20. Historical natural gas rate data was only available for SoCalGas’ procurement charges6. To estimate total costs by month, the baseline and excess transmission charges were assumed to be relatively consistence and applied for the entire year based on April 2020 costs.
Table 20: SDG&E Monthly Gas Rate ($/Therm)
Month Procurement
Charge
Transmission Charge Total Charge
Baseline Excess Baseline Excess
Jan 2020 $0.34761 $1.36166 $1.59166 $1.70927 $1.93927
Feb 2020 $0.28035 $1.36166 $1.59166 $1.64201 $1.87201
Mar 2020 $0.22130 $1.36166 $1.59166 $1.58296 $1.81296
Apr 2020 $0.20327 $1.35946 $1.59125 $1.56273 $1.79452
May 2019 $0.23804 $1.06349 $1.25253 $1.30153 $1.49057
June 2019 $0.24838 $1.06349 $1.25253 $1.31187 $1.50091
July 2019 $0.28491 $1.06349 $1.25253 $1.34840 $1.53744
Aug 2019 $0.27239 $1.06349 $1.25253 $1.33588 $1.52492
Sept 2019 $0.26178 $1.06349 $1.25253 $1.32527 $1.51431
Oct 2019 $0.30109 $1.06349 $1.25253 $1.36458 $1.55362
Nov 2019 $0.27580 $1.06349 $1.25253 $1.33929 $1.52833
Dec 2019 $0.38090 $1.06349 $1.25253 $1.44439 $1.63343
6 The SDG&E procurement and transmission charges were obtained from the following sets of documents:
http://regarchive.sdge.com/tm2/pdf/GAS_GAS-SCHEDS_GM_2020.pdf
http://regarchive.sdge.com/tm2/pdf/GAS_GAS-SCHEDS_GM_2019.pdf
ATTACHMENT 7
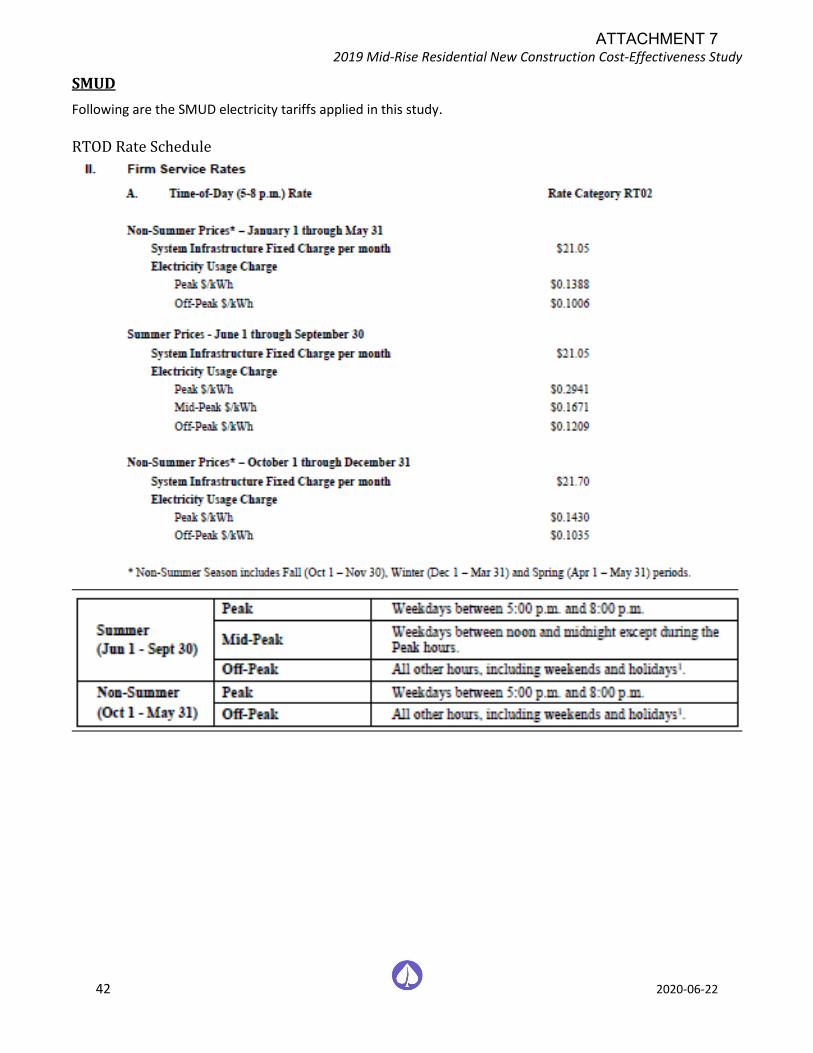
2019 Mid-Rise Residential New Construction Cost-Effectiveness Study
42 2020-06-22
SMUD
Following are the SMUD electricity tariffs applied in this study. RTOD Rate Schedule
ATTACHMENT 7
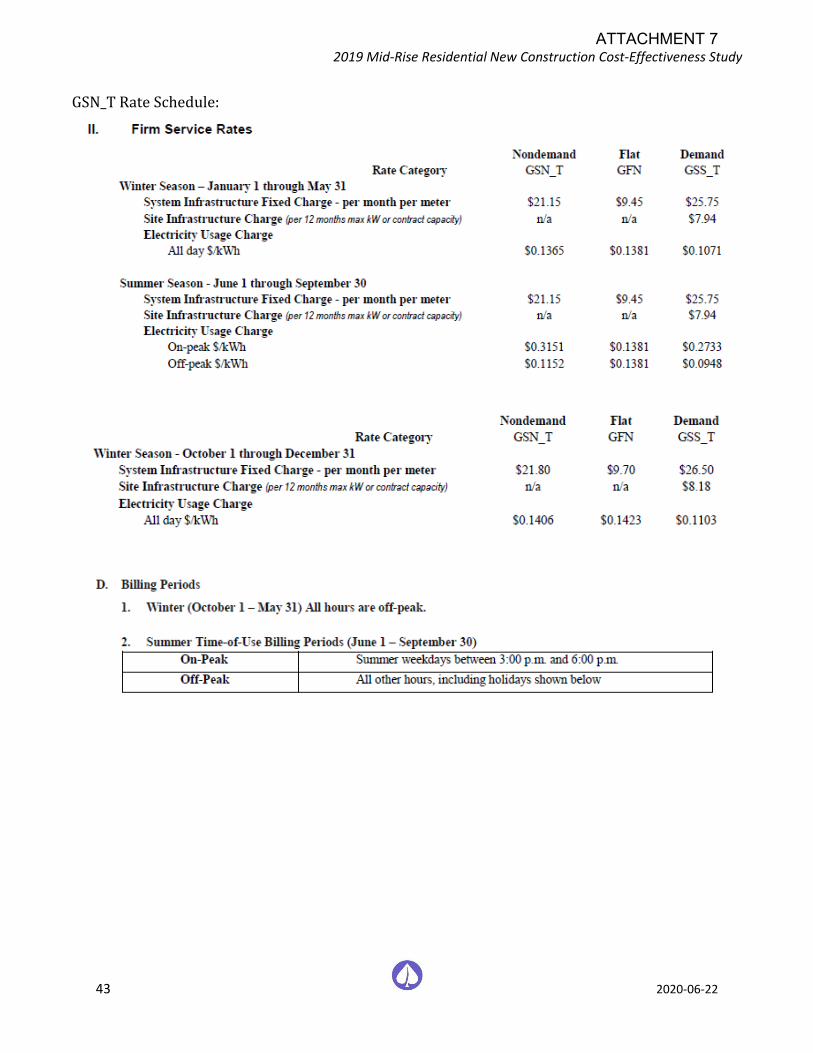
2019 Mid-Rise Residential New Construction Cost-Effectiveness Study
43 2020-06-22
GSN_T Rate Schedule:
ATTACHMENT 7
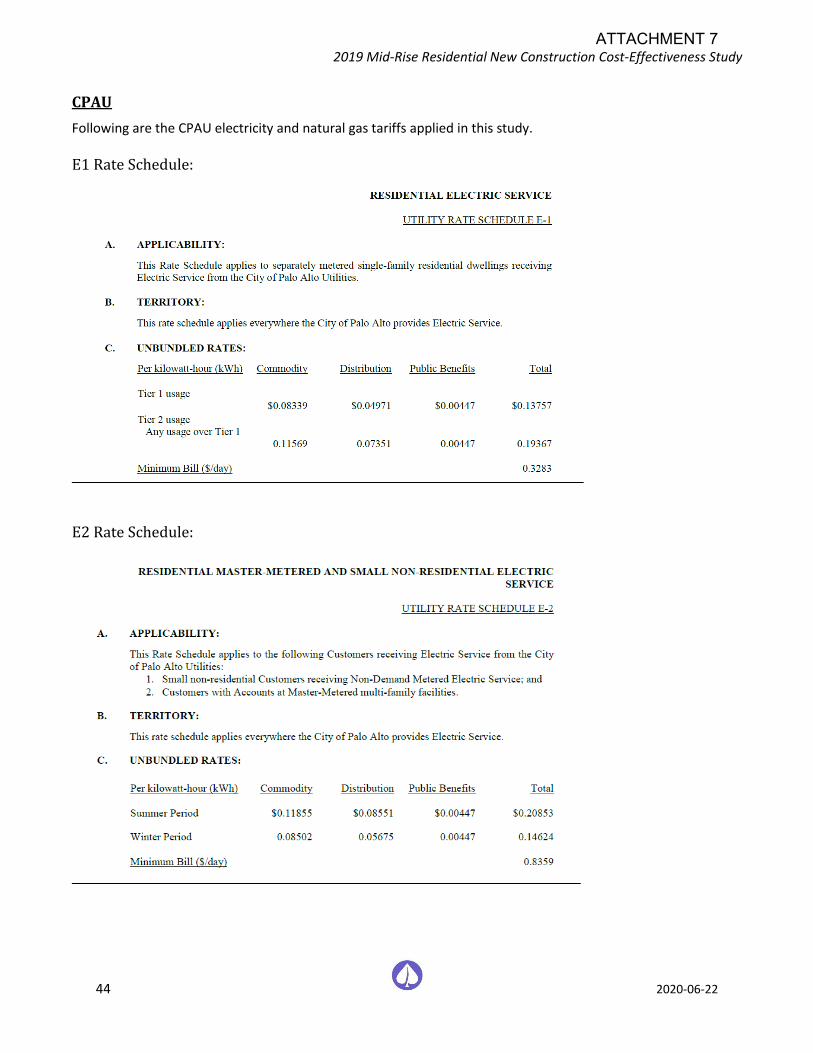
2019 Mid-Rise Residential New Construction Cost-Effectiveness Study
44 2020-06-22
CPAU
Following are the CPAU electricity and natural gas tariffs applied in this study.
E1 Rate Schedule:
E2 Rate Schedule:
ATTACHMENT 7
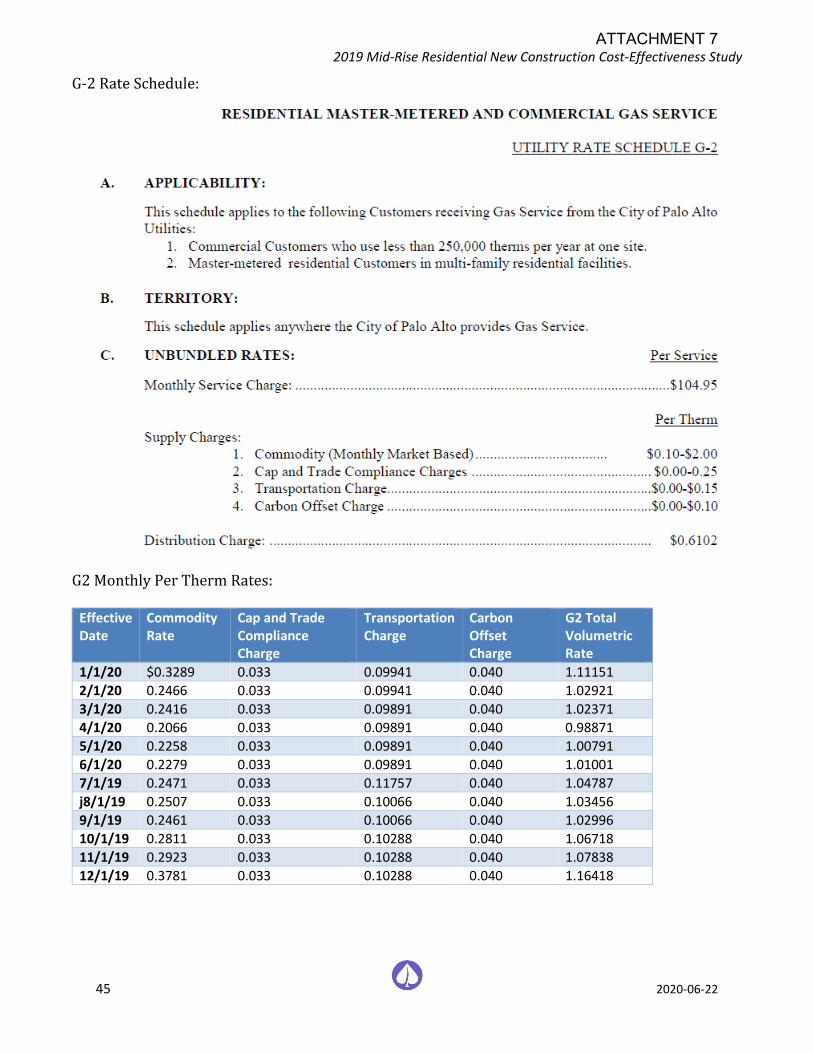
2019 Mid-Rise Residential New Construction Cost-Effectiveness Study
45 2020-06-22
G-2 Rate Schedule:
G2 Monthly Per Therm Rates:
Effective Date
Commodity Rate
Cap and Trade Compliance Charge
Transportation Charge
Carbon Offset Charge
G2 Total Volumetric Rate
1/1/20 $0.3289 0.033 0.09941 0.040 1.11151
2/1/20 0.2466 0.033 0.09941 0.040 1.02921
3/1/20 0.2416 0.033 0.09891 0.040 1.02371
4/1/20 0.2066 0.033 0.09891 0.040 0.98871
5/1/20 0.2258 0.033 0.09891 0.040 1.00791
6/1/20 0.2279 0.033 0.09891 0.040 1.01001
7/1/19 0.2471 0.033 0.11757 0.040 1.04787
j8/1/19 0.2507 0.033 0.10066 0.040 1.03456
9/1/19 0.2461 0.033 0.10066 0.040 1.02996
10/1/19 0.2811 0.033 0.10288 0.040 1.06718
11/1/19 0.2923 0.033 0.10288 0.040 1.07838
12/1/19 0.3781 0.033 0.10288 0.040 1.16418
ATTACHMENT 7
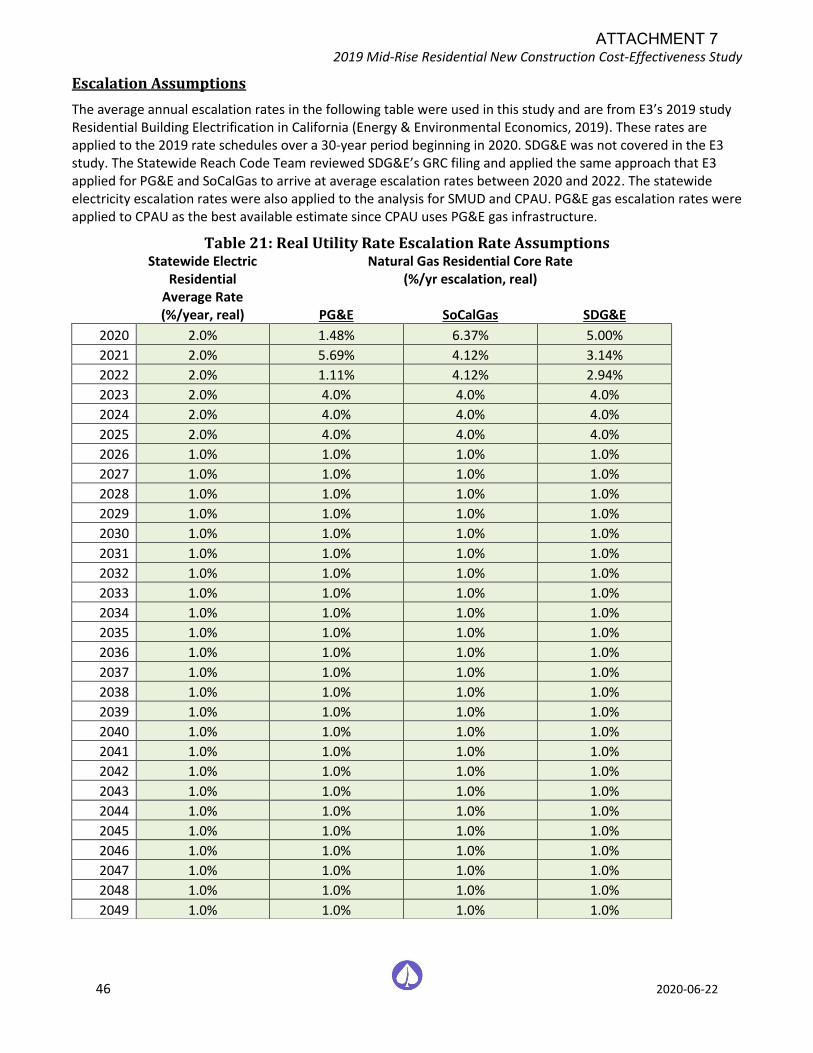
2019 Mid-Rise Residential New Construction Cost-Effectiveness Study
46 2020-06-22
Escalation Assumptions
The average annual escalation rates in the following table were used in this study and are from E3’s 2019 study Residential Building Electrification in California (Energy & Environmental Economics, 2019). These rates are applied to the 2019 rate schedules over a 30-year period beginning in 2020. SDG&E was not covered in the E3 study. The Statewide Reach Code Team reviewed SDG&E’s GRC filing and applied the same approach that E3 applied for PG&E and SoCalGas to arrive at average escalation rates between 2020 and 2022. The statewide electricity escalation rates were also applied to the analysis for SMUD and CPAU. PG&E gas escalation rates were applied to CPAU as the best available estimate since CPAU uses PG&E gas infrastructure.
Table 21: Real Utility Rate Escalation Rate Assumptions
Statewide Electric
Residential Average Rate (%/year, real)
Natural Gas Residential Core Rate (%/yr escalation, real)
PG&E SoCalGas SDG&E
2020 2.0% 1.48% 6.37% 5.00%
2021 2.0% 5.69% 4.12% 3.14%
2022 2.0% 1.11% 4.12% 2.94%
2023 2.0% 4.0% 4.0% 4.0%
2024 2.0% 4.0% 4.0% 4.0%
2025 2.0% 4.0% 4.0% 4.0%
2026 1.0% 1.0% 1.0% 1.0%
2027 1.0% 1.0% 1.0% 1.0%
2028 1.0% 1.0% 1.0% 1.0%
2029 1.0% 1.0% 1.0% 1.0%
2030 1.0% 1.0% 1.0% 1.0%
2031 1.0% 1.0% 1.0% 1.0%
2032 1.0% 1.0% 1.0% 1.0%
2033 1.0% 1.0% 1.0% 1.0%
2034 1.0% 1.0% 1.0% 1.0%
2035 1.0% 1.0% 1.0% 1.0%
2036 1.0% 1.0% 1.0% 1.0%
2037 1.0% 1.0% 1.0% 1.0%
2038 1.0% 1.0% 1.0% 1.0%
2039 1.0% 1.0% 1.0% 1.0%
2040 1.0% 1.0% 1.0% 1.0%
2041 1.0% 1.0% 1.0% 1.0%
2042 1.0% 1.0% 1.0% 1.0%
2043 1.0% 1.0% 1.0% 1.0%
2044 1.0% 1.0% 1.0% 1.0%
2045 1.0% 1.0% 1.0% 1.0%
2046 1.0% 1.0% 1.0% 1.0%
2047 1.0% 1.0% 1.0% 1.0%
2048 1.0% 1.0% 1.0% 1.0%
2049 1.0% 1.0% 1.0% 1.0%
ATTACHMENT 7
2019 Mid-Rise Residential New Construction Cost-Effectiveness Study
47 2020-06-22
Appendix C – PG&E Gas Infrastructure Cost Memo
ATTACHMENT 7

2019 Mid-Rise Residential New Construction Cost-Effectiveness Study
48 2020-06-22
ATTACHMENT 7

2019 Mid-Rise Residential New Construction Cost-Effectiveness Study
49 2020-06-22
ATTACHMENT 7
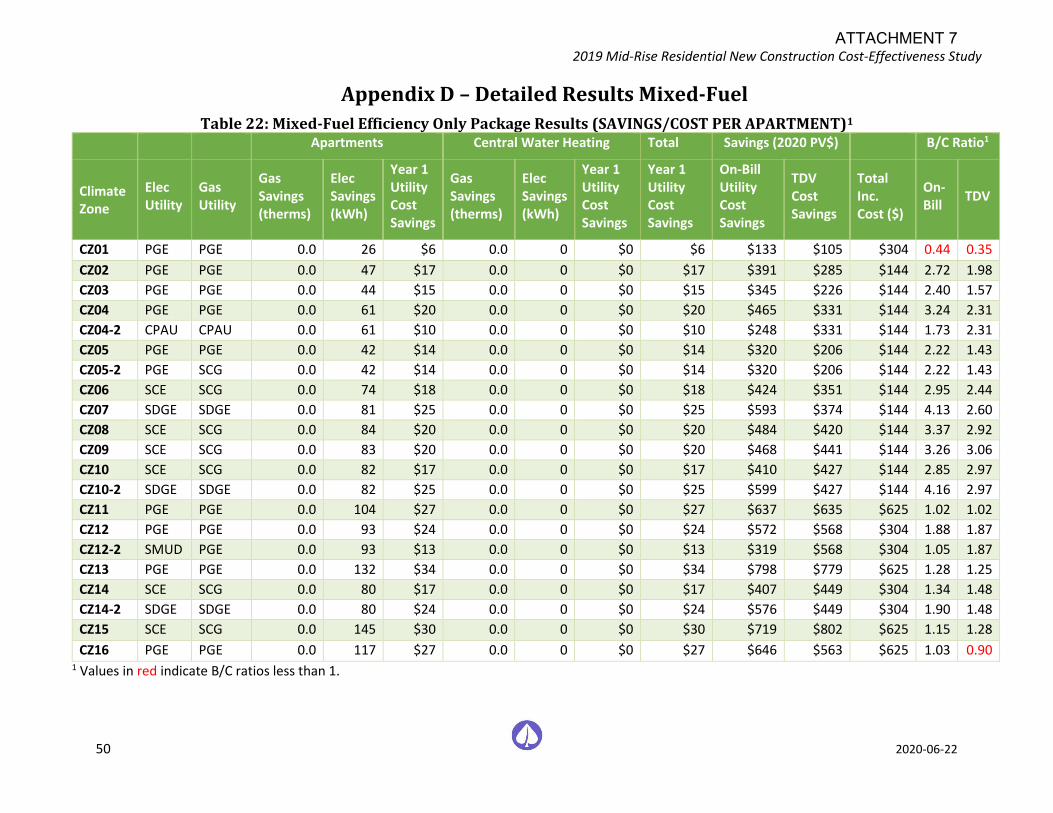
2019 Mid-Rise Residential New Construction Cost-Effectiveness Study
50 2020-06-22
Appendix D – Detailed Results Mixed-Fuel
Table 22: Mixed-Fuel Efficiency Only Package Results (SAVINGS/COST PER APARTMENT)1
Apartments Central Water Heating Total Savings (2020 PV$) B/C Ratio1
Climate Zone
Elec Utility
Gas Utility
Gas Savings (therms)
Elec Savings (kWh)
Year 1 Utility Cost Savings
Gas Savings (therms)
Elec Savings (kWh)
Year 1 Utility Cost Savings
Year 1 Utility Cost Savings
On-Bill Utility Cost Savings
TDV Cost Savings
Total Inc. Cost ($)
On-Bill
TDV
CZ01 PGE PGE 0.0 26 $6 0.0 0 $0 $6 $133 $105 $304 0.44 0.35
CZ02 PGE PGE 0.0 47 $17 0.0 0 $0 $17 $391 $285 $144 2.72 1.98
CZ03 PGE PGE 0.0 44 $15 0.0 0 $0 $15 $345 $226 $144 2.40 1.57
CZ04 PGE PGE 0.0 61 $20 0.0 0 $0 $20 $465 $331 $144 3.24 2.31
CZ04-2 CPAU CPAU 0.0 61 $10 0.0 0 $0 $10 $248 $331 $144 1.73 2.31
CZ05 PGE PGE 0.0 42 $14 0.0 0 $0 $14 $320 $206 $144 2.22 1.43
CZ05-2 PGE SCG 0.0 42 $14 0.0 0 $0 $14 $320 $206 $144 2.22 1.43
CZ06 SCE SCG 0.0 74 $18 0.0 0 $0 $18 $424 $351 $144 2.95 2.44
CZ07 SDGE SDGE 0.0 81 $25 0.0 0 $0 $25 $593 $374 $144 4.13 2.60
CZ08 SCE SCG 0.0 84 $20 0.0 0 $0 $20 $484 $420 $144 3.37 2.92
CZ09 SCE SCG 0.0 83 $20 0.0 0 $0 $20 $468 $441 $144 3.26 3.06
CZ10 SCE SCG 0.0 82 $17 0.0 0 $0 $17 $410 $427 $144 2.85 2.97
CZ10-2 SDGE SDGE 0.0 82 $25 0.0 0 $0 $25 $599 $427 $144 4.16 2.97
CZ11 PGE PGE 0.0 104 $27 0.0 0 $0 $27 $637 $635 $625 1.02 1.02
CZ12 PGE PGE 0.0 93 $24 0.0 0 $0 $24 $572 $568 $304 1.88 1.87
CZ12-2 SMUD PGE 0.0 93 $13 0.0 0 $0 $13 $319 $568 $304 1.05 1.87
CZ13 PGE PGE 0.0 132 $34 0.0 0 $0 $34 $798 $779 $625 1.28 1.25
CZ14 SCE SCG 0.0 80 $17 0.0 0 $0 $17 $407 $449 $304 1.34 1.48
CZ14-2 SDGE SDGE 0.0 80 $24 0.0 0 $0 $24 $576 $449 $304 1.90 1.48
CZ15 SCE SCG 0.0 145 $30 0.0 0 $0 $30 $719 $802 $625 1.15 1.28
CZ16 PGE PGE 0.0 117 $27 0.0 0 $0 $27 $646 $563 $625 1.03 0.90 1 Values in red indicate B/C ratios less than 1.
ATTACHMENT 7
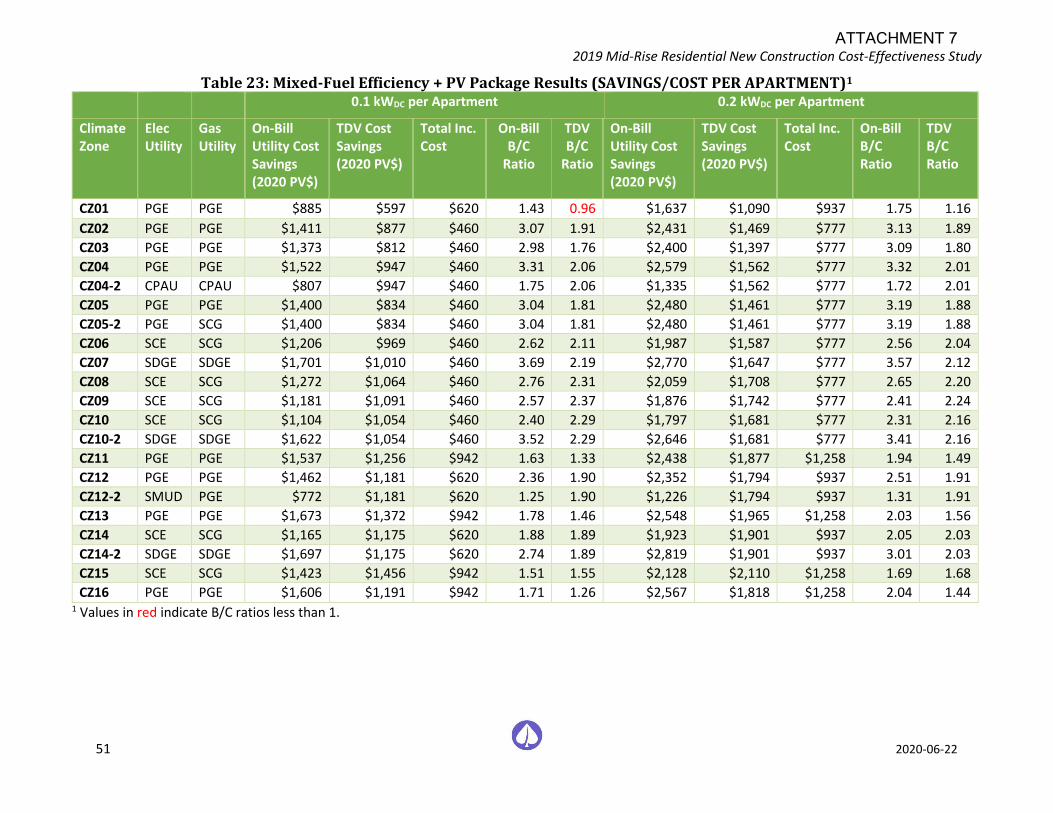
2019 Mid-Rise Residential New Construction Cost-Effectiveness Study
51 2020-06-22
Table 23: Mixed-Fuel Efficiency + PV Package Results (SAVINGS/COST PER APARTMENT)1
0.1 kWDC per Apartment 0.2 kWDC per Apartment
Climate Zone
Elec Utility
Gas Utility
On-Bill Utility Cost Savings (2020 PV$)
TDV Cost Savings (2020 PV$)
Total Inc. Cost
On-Bill B/C
Ratio
TDV B/C
Ratio
On-Bill Utility Cost Savings (2020 PV$)
TDV Cost Savings (2020 PV$)
Total Inc. Cost
On-Bill B/C Ratio
TDV B/C Ratio
CZ01 PGE PGE $885 $597 $620 1.43 0.96 $1,637 $1,090 $937 1.75 1.16
CZ02 PGE PGE $1,411 $877 $460 3.07 1.91 $2,431 $1,469 $777 3.13 1.89
CZ03 PGE PGE $1,373 $812 $460 2.98 1.76 $2,400 $1,397 $777 3.09 1.80
CZ04 PGE PGE $1,522 $947 $460 3.31 2.06 $2,579 $1,562 $777 3.32 2.01
CZ04-2 CPAU CPAU $807 $947 $460 1.75 2.06 $1,335 $1,562 $777 1.72 2.01
CZ05 PGE PGE $1,400 $834 $460 3.04 1.81 $2,480 $1,461 $777 3.19 1.88
CZ05-2 PGE SCG $1,400 $834 $460 3.04 1.81 $2,480 $1,461 $777 3.19 1.88
CZ06 SCE SCG $1,206 $969 $460 2.62 2.11 $1,987 $1,587 $777 2.56 2.04
CZ07 SDGE SDGE $1,701 $1,010 $460 3.69 2.19 $2,770 $1,647 $777 3.57 2.12
CZ08 SCE SCG $1,272 $1,064 $460 2.76 2.31 $2,059 $1,708 $777 2.65 2.20
CZ09 SCE SCG $1,181 $1,091 $460 2.57 2.37 $1,876 $1,742 $777 2.41 2.24
CZ10 SCE SCG $1,104 $1,054 $460 2.40 2.29 $1,797 $1,681 $777 2.31 2.16
CZ10-2 SDGE SDGE $1,622 $1,054 $460 3.52 2.29 $2,646 $1,681 $777 3.41 2.16
CZ11 PGE PGE $1,537 $1,256 $942 1.63 1.33 $2,438 $1,877 $1,258 1.94 1.49
CZ12 PGE PGE $1,462 $1,181 $620 2.36 1.90 $2,352 $1,794 $937 2.51 1.91
CZ12-2 SMUD PGE $772 $1,181 $620 1.25 1.90 $1,226 $1,794 $937 1.31 1.91
CZ13 PGE PGE $1,673 $1,372 $942 1.78 1.46 $2,548 $1,965 $1,258 2.03 1.56
CZ14 SCE SCG $1,165 $1,175 $620 1.88 1.89 $1,923 $1,901 $937 2.05 2.03
CZ14-2 SDGE SDGE $1,697 $1,175 $620 2.74 1.89 $2,819 $1,901 $937 3.01 2.03
CZ15 SCE SCG $1,423 $1,456 $942 1.51 1.55 $2,128 $2,110 $1,258 1.69 1.68
CZ16 PGE PGE $1,606 $1,191 $942 1.71 1.26 $2,567 $1,818 $1,258 2.04 1.44 1 Values in red indicate B/C ratios less than 1.
ATTACHMENT 7
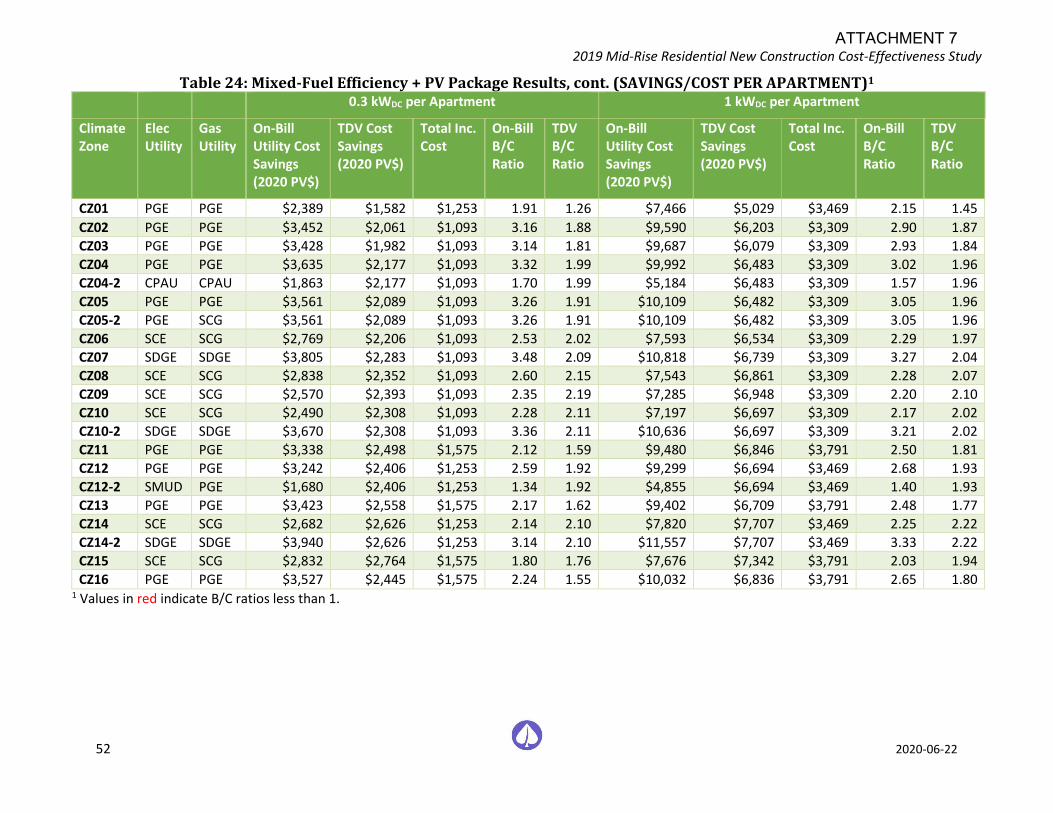
2019 Mid-Rise Residential New Construction Cost-Effectiveness Study
52 2020-06-22
Table 24: Mixed-Fuel Efficiency + PV Package Results, cont. (SAVINGS/COST PER APARTMENT)1 0.3 kWDC per Apartment 1 kWDC per Apartment
Climate Zone
Elec Utility
Gas Utility
On-Bill Utility Cost Savings (2020 PV$)
TDV Cost Savings (2020 PV$)
Total Inc. Cost
On-Bill B/C Ratio
TDV B/C Ratio
On-Bill Utility Cost Savings (2020 PV$)
TDV Cost Savings (2020 PV$)
Total Inc. Cost
On-Bill B/C Ratio
TDV B/C Ratio
CZ01 PGE PGE $2,389 $1,582 $1,253 1.91 1.26 $7,466 $5,029 $3,469 2.15 1.45
CZ02 PGE PGE $3,452 $2,061 $1,093 3.16 1.88 $9,590 $6,203 $3,309 2.90 1.87
CZ03 PGE PGE $3,428 $1,982 $1,093 3.14 1.81 $9,687 $6,079 $3,309 2.93 1.84
CZ04 PGE PGE $3,635 $2,177 $1,093 3.32 1.99 $9,992 $6,483 $3,309 3.02 1.96
CZ04-2 CPAU CPAU $1,863 $2,177 $1,093 1.70 1.99 $5,184 $6,483 $3,309 1.57 1.96
CZ05 PGE PGE $3,561 $2,089 $1,093 3.26 1.91 $10,109 $6,482 $3,309 3.05 1.96
CZ05-2 PGE SCG $3,561 $2,089 $1,093 3.26 1.91 $10,109 $6,482 $3,309 3.05 1.96
CZ06 SCE SCG $2,769 $2,206 $1,093 2.53 2.02 $7,593 $6,534 $3,309 2.29 1.97
CZ07 SDGE SDGE $3,805 $2,283 $1,093 3.48 2.09 $10,818 $6,739 $3,309 3.27 2.04
CZ08 SCE SCG $2,838 $2,352 $1,093 2.60 2.15 $7,543 $6,861 $3,309 2.28 2.07
CZ09 SCE SCG $2,570 $2,393 $1,093 2.35 2.19 $7,285 $6,948 $3,309 2.20 2.10
CZ10 SCE SCG $2,490 $2,308 $1,093 2.28 2.11 $7,197 $6,697 $3,309 2.17 2.02
CZ10-2 SDGE SDGE $3,670 $2,308 $1,093 3.36 2.11 $10,636 $6,697 $3,309 3.21 2.02
CZ11 PGE PGE $3,338 $2,498 $1,575 2.12 1.59 $9,480 $6,846 $3,791 2.50 1.81
CZ12 PGE PGE $3,242 $2,406 $1,253 2.59 1.92 $9,299 $6,694 $3,469 2.68 1.93
CZ12-2 SMUD PGE $1,680 $2,406 $1,253 1.34 1.92 $4,855 $6,694 $3,469 1.40 1.93
CZ13 PGE PGE $3,423 $2,558 $1,575 2.17 1.62 $9,402 $6,709 $3,791 2.48 1.77
CZ14 SCE SCG $2,682 $2,626 $1,253 2.14 2.10 $7,820 $7,707 $3,469 2.25 2.22
CZ14-2 SDGE SDGE $3,940 $2,626 $1,253 3.14 2.10 $11,557 $7,707 $3,469 3.33 2.22
CZ15 SCE SCG $2,832 $2,764 $1,575 1.80 1.76 $7,676 $7,342 $3,791 2.03 1.94
CZ16 PGE PGE $3,527 $2,445 $1,575 2.24 1.55 $10,032 $6,836 $3,791 2.65 1.80 1 Values in red indicate B/C ratios less than 1.
ATTACHMENT 7
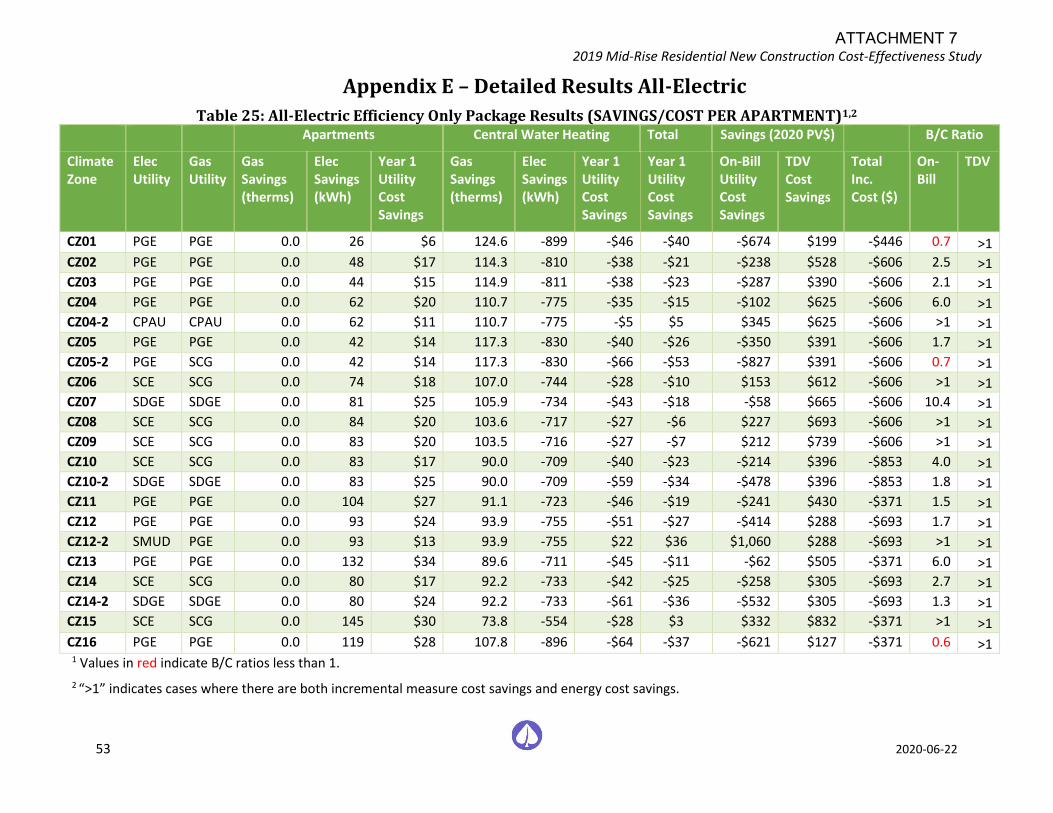
2019 Mid-Rise Residential New Construction Cost-Effectiveness Study
53 2020-06-22
Appendix E – Detailed Results All-Electric
Table 25: All-Electric Efficiency Only Package Results (SAVINGS/COST PER APARTMENT)1,2
Apartments Central Water Heating Total Savings (2020 PV$) B/C Ratio
Climate Zone
Elec Utility
Gas Utility
Gas Savings (therms)
Elec Savings (kWh)
Year 1 Utility Cost Savings
Gas Savings (therms)
Elec Savings (kWh)
Year 1 Utility Cost Savings
Year 1 Utility Cost Savings
On-Bill Utility Cost Savings
TDV Cost Savings
Total Inc. Cost ($)
On-Bill
TDV
CZ01 PGE PGE 0.0 26 $6 124.6 -899 -$46 -$40 -$674 $199 -$446 0.7 >1
CZ02 PGE PGE 0.0 48 $17 114.3 -810 -$38 -$21 -$238 $528 -$606 2.5 >1
CZ03 PGE PGE 0.0 44 $15 114.9 -811 -$38 -$23 -$287 $390 -$606 2.1 >1
CZ04 PGE PGE 0.0 62 $20 110.7 -775 -$35 -$15 -$102 $625 -$606 6.0 >1
CZ04-2 CPAU CPAU 0.0 62 $11 110.7 -775 -$5 $5 $345 $625 -$606 >1 >1
CZ05 PGE PGE 0.0 42 $14 117.3 -830 -$40 -$26 -$350 $391 -$606 1.7 >1
CZ05-2 PGE SCG 0.0 42 $14 117.3 -830 -$66 -$53 -$827 $391 -$606 0.7 >1
CZ06 SCE SCG 0.0 74 $18 107.0 -744 -$28 -$10 $153 $612 -$606 >1 >1
CZ07 SDGE SDGE 0.0 81 $25 105.9 -734 -$43 -$18 -$58 $665 -$606 10.4 >1
CZ08 SCE SCG 0.0 84 $20 103.6 -717 -$27 -$6 $227 $693 -$606 >1 >1
CZ09 SCE SCG 0.0 83 $20 103.5 -716 -$27 -$7 $212 $739 -$606 >1 >1
CZ10 SCE SCG 0.0 83 $17 90.0 -709 -$40 -$23 -$214 $396 -$853 4.0 >1
CZ10-2 SDGE SDGE 0.0 83 $25 90.0 -709 -$59 -$34 -$478 $396 -$853 1.8 >1
CZ11 PGE PGE 0.0 104 $27 91.1 -723 -$46 -$19 -$241 $430 -$371 1.5 >1
CZ12 PGE PGE 0.0 93 $24 93.9 -755 -$51 -$27 -$414 $288 -$693 1.7 >1
CZ12-2 SMUD PGE 0.0 93 $13 93.9 -755 $22 $36 $1,060 $288 -$693 >1 >1
CZ13 PGE PGE 0.0 132 $34 89.6 -711 -$45 -$11 -$62 $505 -$371 6.0 >1
CZ14 SCE SCG 0.0 80 $17 92.2 -733 -$42 -$25 -$258 $305 -$693 2.7 >1
CZ14-2 SDGE SDGE 0.0 80 $24 92.2 -733 -$61 -$36 -$532 $305 -$693 1.3 >1
CZ15 SCE SCG 0.0 145 $30 73.8 -554 -$28 $3 $332 $832 -$371 >1 >1
CZ16 PGE PGE 0.0 119 $28 107.8 -896 -$64 -$37 -$621 $127 -$371 0.6 >1 1 Values in red indicate B/C ratios less than 1.
2 “>1” indicates cases where there are both incremental measure cost savings and energy cost savings.
ATTACHMENT 7
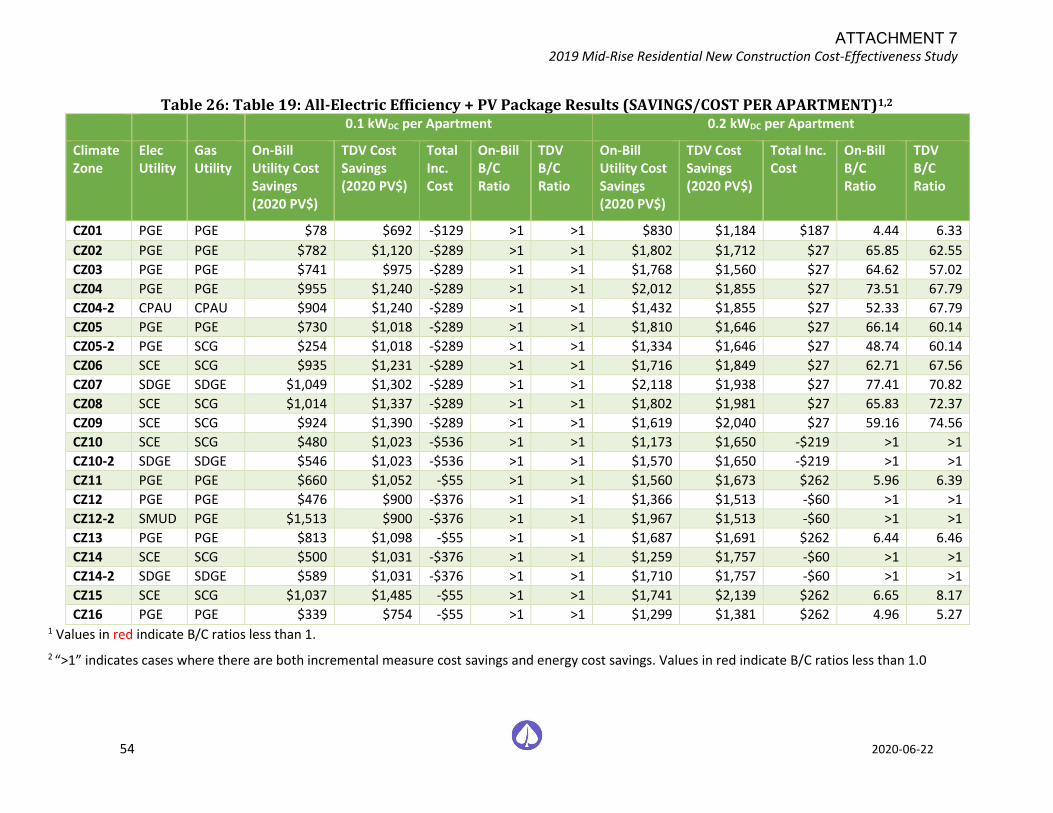
2019 Mid-Rise Residential New Construction Cost-Effectiveness Study
54 2020-06-22
Table 26: Table 19: All-Electric Efficiency + PV Package Results (SAVINGS/COST PER APARTMENT)1,2
0.1 kWDC per Apartment 0.2 kWDC per Apartment
Climate Zone
Elec Utility
Gas Utility
On-Bill Utility Cost Savings (2020 PV$)
TDV Cost Savings (2020 PV$)
Total Inc. Cost
On-Bill B/C Ratio
TDV B/C Ratio
On-Bill Utility Cost Savings (2020 PV$)
TDV Cost Savings (2020 PV$)
Total Inc. Cost
On-Bill B/C Ratio
TDV B/C Ratio
CZ01 PGE PGE $78 $692 -$129 >1 >1 $830 $1,184 $187 4.44 6.33
CZ02 PGE PGE $782 $1,120 -$289 >1 >1 $1,802 $1,712 $27 65.85 62.55
CZ03 PGE PGE $741 $975 -$289 >1 >1 $1,768 $1,560 $27 64.62 57.02
CZ04 PGE PGE $955 $1,240 -$289 >1 >1 $2,012 $1,855 $27 73.51 67.79
CZ04-2 CPAU CPAU $904 $1,240 -$289 >1 >1 $1,432 $1,855 $27 52.33 67.79
CZ05 PGE PGE $730 $1,018 -$289 >1 >1 $1,810 $1,646 $27 66.14 60.14
CZ05-2 PGE SCG $254 $1,018 -$289 >1 >1 $1,334 $1,646 $27 48.74 60.14
CZ06 SCE SCG $935 $1,231 -$289 >1 >1 $1,716 $1,849 $27 62.71 67.56
CZ07 SDGE SDGE $1,049 $1,302 -$289 >1 >1 $2,118 $1,938 $27 77.41 70.82
CZ08 SCE SCG $1,014 $1,337 -$289 >1 >1 $1,802 $1,981 $27 65.83 72.37
CZ09 SCE SCG $924 $1,390 -$289 >1 >1 $1,619 $2,040 $27 59.16 74.56
CZ10 SCE SCG $480 $1,023 -$536 >1 >1 $1,173 $1,650 -$219 >1 >1
CZ10-2 SDGE SDGE $546 $1,023 -$536 >1 >1 $1,570 $1,650 -$219 >1 >1
CZ11 PGE PGE $660 $1,052 -$55 >1 >1 $1,560 $1,673 $262 5.96 6.39
CZ12 PGE PGE $476 $900 -$376 >1 >1 $1,366 $1,513 -$60 >1 >1
CZ12-2 SMUD PGE $1,513 $900 -$376 >1 >1 $1,967 $1,513 -$60 >1 >1
CZ13 PGE PGE $813 $1,098 -$55 >1 >1 $1,687 $1,691 $262 6.44 6.46
CZ14 SCE SCG $500 $1,031 -$376 >1 >1 $1,259 $1,757 -$60 >1 >1
CZ14-2 SDGE SDGE $589 $1,031 -$376 >1 >1 $1,710 $1,757 -$60 >1 >1
CZ15 SCE SCG $1,037 $1,485 -$55 >1 >1 $1,741 $2,139 $262 6.65 8.17
CZ16 PGE PGE $339 $754 -$55 >1 >1 $1,299 $1,381 $262 4.96 5.27 1 Values in red indicate B/C ratios less than 1.
2 “>1” indicates cases where there are both incremental measure cost savings and energy cost savings. Values in red indicate B/C ratios less than 1.0
ATTACHMENT 7
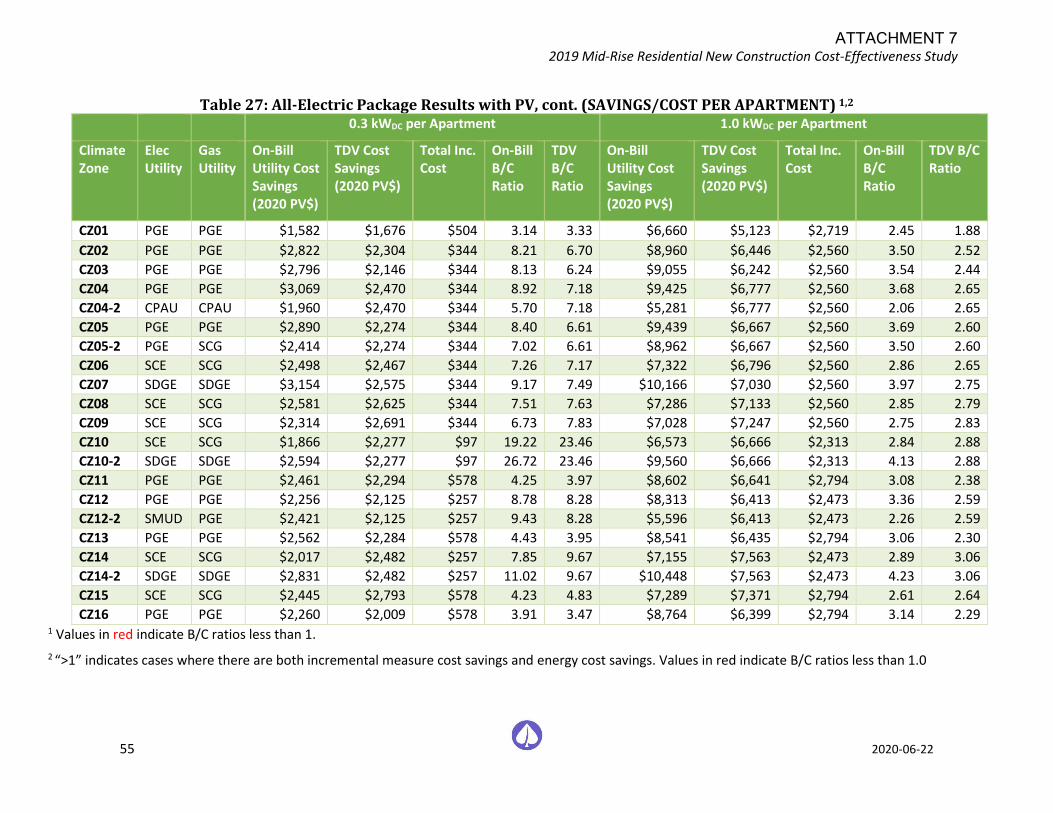
2019 Mid-Rise Residential New Construction Cost-Effectiveness Study
55 2020-06-22
Table 27: All-Electric Package Results with PV, cont. (SAVINGS/COST PER APARTMENT) 1,2 0.3 kWDC per Apartment 1.0 kWDC per Apartment
Climate Zone
Elec Utility
Gas Utility
On-Bill Utility Cost Savings (2020 PV$)
TDV Cost Savings (2020 PV$)
Total Inc. Cost
On-Bill B/C Ratio
TDV B/C Ratio
On-Bill Utility Cost Savings (2020 PV$)
TDV Cost Savings (2020 PV$)
Total Inc. Cost
On-Bill B/C Ratio
TDV B/C Ratio
CZ01 PGE PGE $1,582 $1,676 $504 3.14 3.33 $6,660 $5,123 $2,719 2.45 1.88
CZ02 PGE PGE $2,822 $2,304 $344 8.21 6.70 $8,960 $6,446 $2,560 3.50 2.52
CZ03 PGE PGE $2,796 $2,146 $344 8.13 6.24 $9,055 $6,242 $2,560 3.54 2.44
CZ04 PGE PGE $3,069 $2,470 $344 8.92 7.18 $9,425 $6,777 $2,560 3.68 2.65
CZ04-2 CPAU CPAU $1,960 $2,470 $344 5.70 7.18 $5,281 $6,777 $2,560 2.06 2.65
CZ05 PGE PGE $2,890 $2,274 $344 8.40 6.61 $9,439 $6,667 $2,560 3.69 2.60
CZ05-2 PGE SCG $2,414 $2,274 $344 7.02 6.61 $8,962 $6,667 $2,560 3.50 2.60
CZ06 SCE SCG $2,498 $2,467 $344 7.26 7.17 $7,322 $6,796 $2,560 2.86 2.65
CZ07 SDGE SDGE $3,154 $2,575 $344 9.17 7.49 $10,166 $7,030 $2,560 3.97 2.75
CZ08 SCE SCG $2,581 $2,625 $344 7.51 7.63 $7,286 $7,133 $2,560 2.85 2.79
CZ09 SCE SCG $2,314 $2,691 $344 6.73 7.83 $7,028 $7,247 $2,560 2.75 2.83
CZ10 SCE SCG $1,866 $2,277 $97 19.22 23.46 $6,573 $6,666 $2,313 2.84 2.88
CZ10-2 SDGE SDGE $2,594 $2,277 $97 26.72 23.46 $9,560 $6,666 $2,313 4.13 2.88
CZ11 PGE PGE $2,461 $2,294 $578 4.25 3.97 $8,602 $6,641 $2,794 3.08 2.38
CZ12 PGE PGE $2,256 $2,125 $257 8.78 8.28 $8,313 $6,413 $2,473 3.36 2.59
CZ12-2 SMUD PGE $2,421 $2,125 $257 9.43 8.28 $5,596 $6,413 $2,473 2.26 2.59
CZ13 PGE PGE $2,562 $2,284 $578 4.43 3.95 $8,541 $6,435 $2,794 3.06 2.30
CZ14 SCE SCG $2,017 $2,482 $257 7.85 9.67 $7,155 $7,563 $2,473 2.89 3.06
CZ14-2 SDGE SDGE $2,831 $2,482 $257 11.02 9.67 $10,448 $7,563 $2,473 4.23 3.06
CZ15 SCE SCG $2,445 $2,793 $578 4.23 4.83 $7,289 $7,371 $2,794 2.61 2.64
CZ16 PGE PGE $2,260 $2,009 $578 3.91 3.47 $8,764 $6,399 $2,794 3.14 2.29 1 Values in red indicate B/C ratios less than 1.
2 “>1” indicates cases where there are both incremental measure cost savings and energy cost savings. Values in red indicate B/C ratios less than 1.0
ATTACHMENT 7
www.energy-solution.com
Electric Vehicle Infrastructure Cost Analysis
Report for Peninsula Clean Energy (PCE) &
Silicon Valley Clean Energy (SVCE)
1 Ed Pike contributed to this project while an employee at Energy Solutions.
To: Peninsula Clean Energy & Silicon Valley Clean Energy
From: Tim Minezaki, Engineer II
Cassidee Kido, Project Manager
Ed Pike, Senior Engineer1
Energy Solutions
Date: November 20, 2019
ATTACHMENT 8
Table of Contents
1. Executive Summary ...................................................................................................................................... 1
EV Infrastructure: New Construction vs. Retrofit: Customer costs ................................................... 1
EV Infrastructure: Building size / Transformers ..................................................................................... 2
Reach Code Context ..................................................................................................................................... 3
2. Background and Purpose ............................................................................................................................ 4
Purpose ............................................................................................................................................................ 4
California’s EV Infrastructure Policy Goals .............................................................................................. 4
CALGreen and Beyond ................................................................................................................................. 5
3. Cost Modeling ................................................................................................................................................ 8
Scenarios ......................................................................................................................................................... 8
Buildings Types Descriptions ............................................................................................................ 8
Results ............................................................................................................................................................ 10
Cost Savings Due to EVSE Installation in New Construction ............................................................ 14
EVSE Installation ................................................................................................................................ 14
Good Design Practices ...................................................................................................................... 14
Methodology ....................................................................................................................................... 15
4. Distribution Transformer Study .............................................................................................................. 17
Primary Transformers (utility-owned, often with customer costs) ................................................... 17
Secondary Transformers (customer-owned) ......................................................................................... 19
Transformer-sizing and other considerations ....................................................................................... 20
Appendix A: Cost Estimates by Type of Expense ........................................................................................... 1
Appendix B: Permitting and Inspection Costs ................................................................................................. 3
Appendix C: Methodology Details ..................................................................................................................... 4
General Assumptions .................................................................................................................................... 4
Data Sources................................................................................................................................................... 4
Soft Costs ........................................................................................................................................................ 5
Permit and Inspection Fees ............................................................................................................... 5
Construction Management ................................................................................................................ 7
Raceways, Wire, and Termination Point .................................................................................................. 7
Demolition, Reconstruction, and Repaving ............................................................................................. 8
Contingencies ................................................................................................................................................. 8
Transformers .................................................................................................................................................. 9
Task Descriptions ........................................................................................................................................ 10
Appendix D: EV Capable Installation Configurations .................................................................................... 1
ATTACHMENT 8
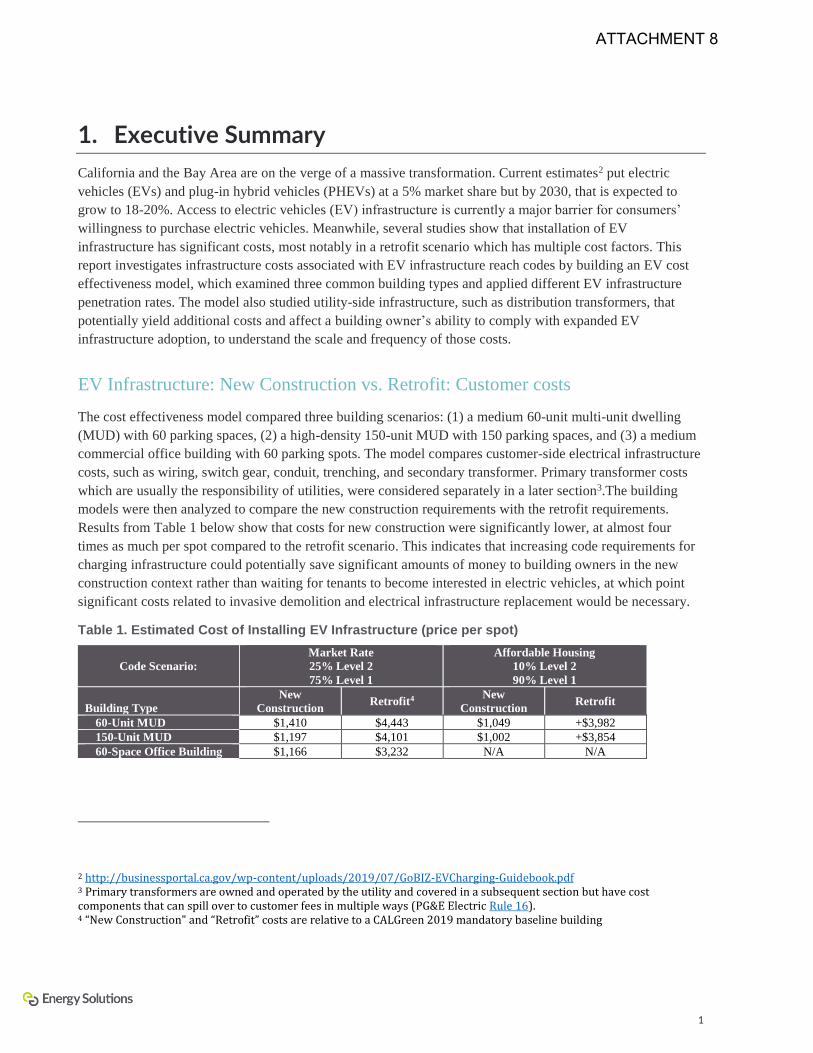
1
1. Executive Summary
California and the Bay Area are on the verge of a massive transformation. Current estimates2 put electric
vehicles (EVs) and plug-in hybrid vehicles (PHEVs) at a 5% market share but by 2030, that is expected to
grow to 18-20%. Access to electric vehicles (EV) infrastructure is currently a major barrier for consumers’
willingness to purchase electric vehicles. Meanwhile, several studies show that installation of EV
infrastructure has significant costs, most notably in a retrofit scenario which has multiple cost factors. This
report investigates infrastructure costs associated with EV infrastructure reach codes by building an EV cost
effectiveness model, which examined three common building types and applied different EV infrastructure
penetration rates. The model also studied utility-side infrastructure, such as distribution transformers, that
potentially yield additional costs and affect a building owner’s ability to comply with expanded EV
infrastructure adoption, to understand the scale and frequency of those costs.
EV Infrastructure: New Construction vs. Retrofit: Customer costs
The cost effectiveness model compared three building scenarios: (1) a medium 60-unit multi-unit dwelling
(MUD) with 60 parking spaces, (2) a high-density 150-unit MUD with 150 parking spaces, and (3) a medium
commercial office building with 60 parking spots. The model compares customer-side electrical infrastructure
costs, such as wiring, switch gear, conduit, trenching, and secondary transformer. Primary transformer costs
which are usually the responsibility of utilities, were considered separately in a later section3.The building
models were then analyzed to compare the new construction requirements with the retrofit requirements.
Results from Table 1 below show that costs for new construction were significantly lower, at almost four
times as much per spot compared to the retrofit scenario. This indicates that increasing code requirements for
charging infrastructure could potentially save significant amounts of money to building owners in the new
construction context rather than waiting for tenants to become interested in electric vehicles, at which point
significant costs related to invasive demolition and electrical infrastructure replacement would be necessary.
Table 1. Estimated Cost of Installing EV Infrastructure (price per spot)
Code Scenario:
Market Rate
25% Level 2
75% Level 1
Affordable Housing
10% Level 2
90% Level 1
Building Type
New
Construction Retrofit4
New
Construction Retrofit
60-Unit MUD $1,410 $4,443 $1,049 +$3,982
150-Unit MUD $1,197 $4,101 $1,002 +$3,854
60-Space Office Building $1,166 $3,232 N/A N/A
2 http://businessportal.ca.gov/wp-content/uploads/2019/07/GoBIZ-EVCharging-Guidebook.pdf 3 Primary transformers are owned and operated by the utility and covered in a subsequent section but have cost components that can spill over to customer fees in multiple ways (PG&E Electric Rule 16). 4 “New Construction" and “Retrofit” costs are relative to a CALGreen 2019 mandatory baseline building
ATTACHMENT 8
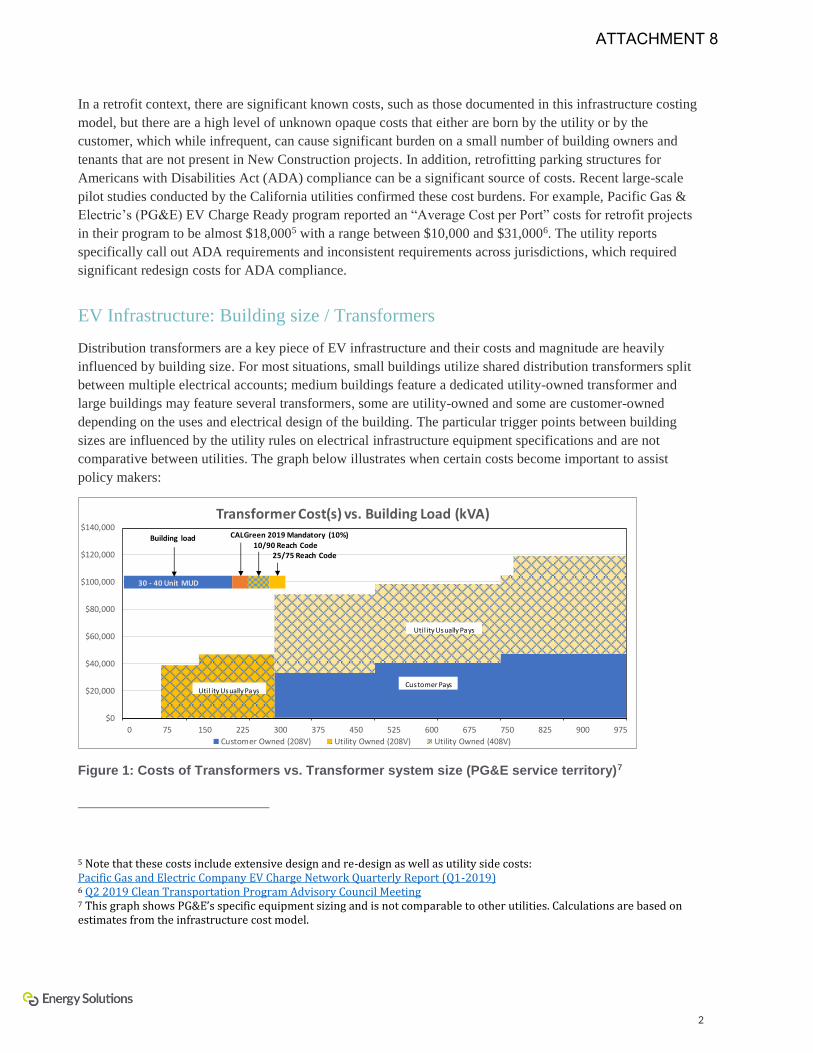
2
In a retrofit context, there are significant known costs, such as those documented in this infrastructure costing
model, but there are a high level of unknown opaque costs that either are born by the utility or by the
customer, which while infrequent, can cause significant burden on a small number of building owners and
tenants that are not present in New Construction projects. In addition, retrofitting parking structures for
Americans with Disabilities Act (ADA) compliance can be a significant source of costs. Recent large-scale
pilot studies conducted by the California utilities confirmed these cost burdens. For example, Pacific Gas &
Electric’s (PG&E) EV Charge Ready program reported an “Average Cost per Port” costs for retrofit projects
in their program to be almost $18,0005 with a range between $10,000 and $31,0006. The utility reports
specifically call out ADA requirements and inconsistent requirements across jurisdictions, which required
significant redesign costs for ADA compliance.
EV Infrastructure: Building size / Transformers
Distribution transformers are a key piece of EV infrastructure and their costs and magnitude are heavily
influenced by building size. For most situations, small buildings utilize shared distribution transformers split
between multiple electrical accounts; medium buildings feature a dedicated utility-owned transformer and
large buildings may feature several transformers, some are utility-owned and some are customer-owned
depending on the uses and electrical design of the building. The particular trigger points between building
sizes are influenced by the utility rules on electrical infrastructure equipment specifications and are not
comparative between utilities. The graph below illustrates when certain costs become important to assist
policy makers:
Figure 1: Costs of Transformers vs. Transformer system size (PG&E service territory)7
5 Note that these costs include extensive design and re-design as well as utility side costs: Pacific Gas and Electric Company EV Charge Network Quarterly Report (Q1-2019) 6 Q2 2019 Clean Transportation Program Advisory Council Meeting 7 This graph shows PG&E’s specific equipment sizing and is not comparable to other utilities. Calculations are based on estimates from the infrastructure cost model.
$0
$20,000
$40,000
$60,000
$80,000
$100,000
$120,000
$140,000
0 75 150 225 300 375 450 525 600 675 750 825 900 975
Transformer Cost(s) vs. Building Load (kVA)
Customer Owned (208V) Utility Owned (208V) Utility Owned (408V)
10/90 Reach Code25/75 Reach Code
Building load CALGreen 2019 Mandatory (10%)
Uti l ity Usually Pays
Customer PaysUti l ity Usually Pays
30 - 40 Unit MUD
ATTACHMENT 8

3
Costs of distribution and/or service-line upgrades are partially split between customer and utility. Customers
are responsible for excavation, conduits, and protective structures. Utilities are typically responsible for
wiring, metering, and transformer(s) (where necessary), however, utility costs can spill over into customer
costs anytime that the costs exceed the preset “allowance” for a customer, based on historical energy usage.8
In addition, if new load, does not materialize, the utility is able to assess additional charges for the difference
in expected revenue. Currently, costs are described by California Public Utilities Commission’s (CPUC)
Electric Rules 2, 15, and 16 which lay out which party is responsible for these costs, however, these costs are
complicated, opaque, and hard to predict. Luckily,the CPUC is tracking costs related to EV infrastructure and
has found that utility-side infrastructure upgrades triggered by EV-only projects are rare. To date, for PG&E’s
service territory found only 3% of projects required distribution or service-line upgrades to accommodate EV
infrastructure. However those costs spanned a wide cost range from $14 to $338,274 (additional details on this
study can be found in the Transformers section below).
Reach Code Context
This study investigated EV-infrastructure reach codes for communities in the jurisdiction of Silicon Valley
Clean Energy (SVCE) and Peninsula Clean Energy (PCE), shown in Table 4 below. The study found that
increasing the electric vehicle infrastructure requirements for new construction will save significant costs for
all buildings when compared to a retrofitting. The study also found that transformer capacity limitations are
not expected to occur very frequently and that even in the retrofit context most buildings should be able to
meet the added load. For those that do not have significant capacity, utilizing lower power “Level 1” ports or
load management may be a promising options.
Buildings near the boundary conditions highlighted above in Figure 1, in particular those that approach the
300 kVA capacity size9, face added risk of electrical infrastructure upgrade costs. For owners of those new
buildings, the electrical systems would have to accommodate a second transformer and associated electrical
infrastructure and the owner/developer would need to bear those costs estimated to be approximately $50,000
(or significantly more in a retrofit context).
8 Customers have an “allowance” based on their billing history to fund utility upgrades, but if allowance costs are exceeded, they are charged directly to the customer (PG&E Electric Rule 15 & Rule 16). This allowance is based on the net revenue of the customer account. In addition, if the expected load does not materialize to use the system upgrade, the utility is permitted to recover their costs from the customer. 9 For example, for a 30-40 unit MUD, this may be a consideration as shown in Figure 1.
ATTACHMENT 8
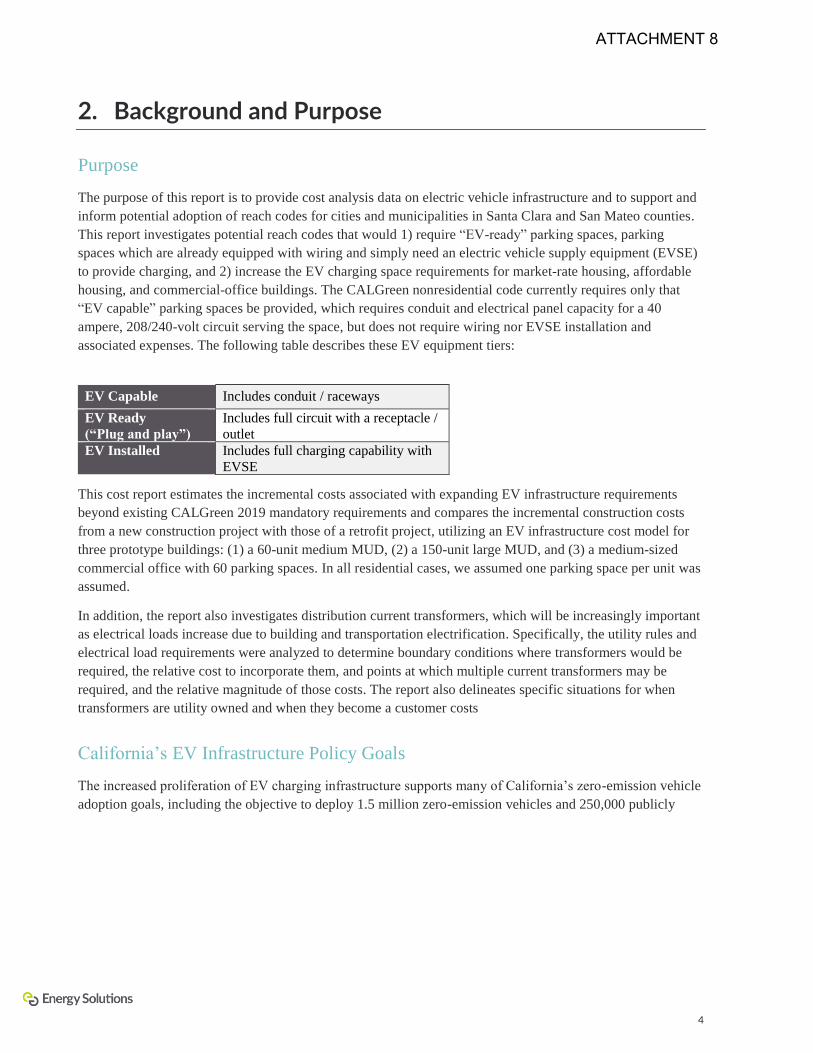
4
2. Background and Purpose
Purpose
The purpose of this report is to provide cost analysis data on electric vehicle infrastructure and to support and
inform potential adoption of reach codes for cities and municipalities in Santa Clara and San Mateo counties.
This report investigates potential reach codes that would 1) require “EV-ready” parking spaces, parking
spaces which are already equipped with wiring and simply need an electric vehicle supply equipment (EVSE)
to provide charging, and 2) increase the EV charging space requirements for market-rate housing, affordable
housing, and commercial-office buildings. The CALGreen nonresidential code currently requires only that
“EV capable” parking spaces be provided, which requires conduit and electrical panel capacity for a 40
ampere, 208/240-volt circuit serving the space, but does not require wiring nor EVSE installation and
associated expenses. The following table describes these EV equipment tiers:
EV Capable Includes conduit / raceways
EV Ready
(“Plug and play”)
Includes full circuit with a receptacle /
outlet
EV Installed Includes full charging capability with
EVSE
This cost report estimates the incremental costs associated with expanding EV infrastructure requirements
beyond existing CALGreen 2019 mandatory requirements and compares the incremental construction costs
from a new construction project with those of a retrofit project, utilizing an EV infrastructure cost model for
three prototype buildings: (1) a 60-unit medium MUD, (2) a 150-unit large MUD, and (3) a medium-sized
commercial office with 60 parking spaces. In all residential cases, we assumed one parking space per unit was
assumed.
In addition, the report also investigates distribution current transformers, which will be increasingly important
as electrical loads increase due to building and transportation electrification. Specifically, the utility rules and
electrical load requirements were analyzed to determine boundary conditions where transformers would be
required, the relative cost to incorporate them, and points at which multiple current transformers may be
required, and the relative magnitude of those costs. The report also delineates specific situations for when
transformers are utility owned and when they become a customer costs
California’s EV Infrastructure Policy Goals
The increased proliferation of EV charging infrastructure supports many of California’s zero-emission vehicle
adoption goals, including the objective to deploy 1.5 million zero-emission vehicles and 250,000 publicly
ATTACHMENT 8
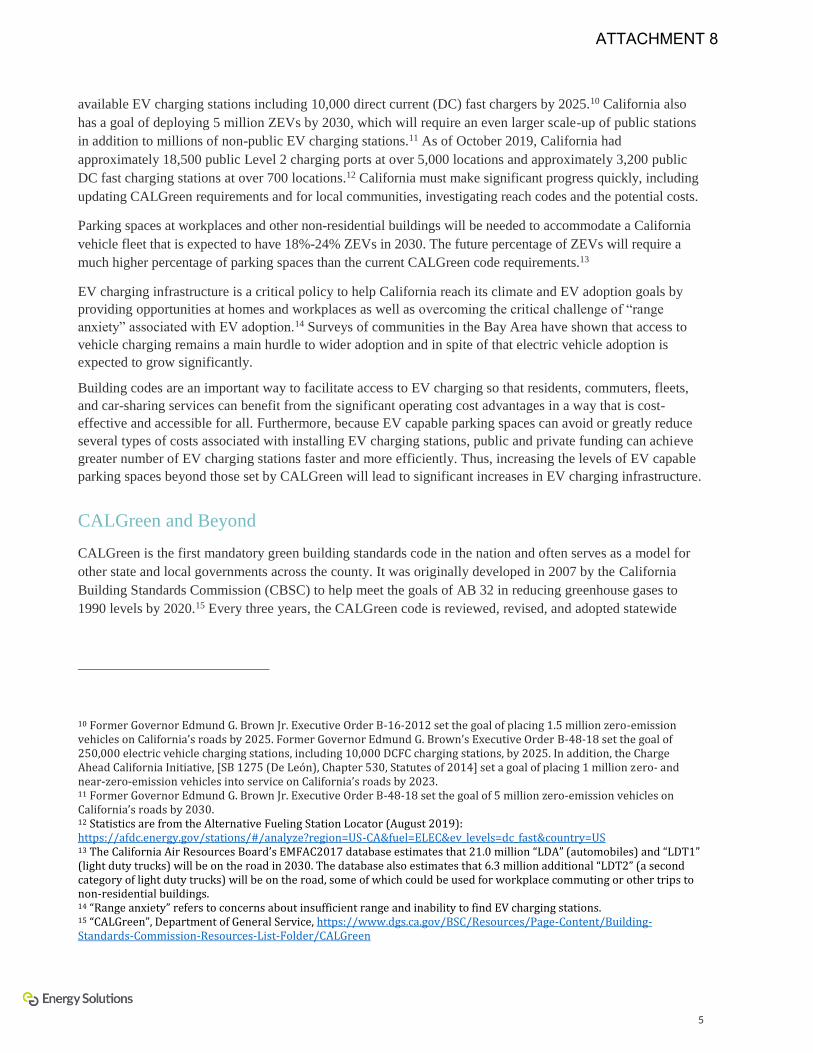
5
available EV charging stations including 10,000 direct current (DC) fast chargers by 2025.10 California also
has a goal of deploying 5 million ZEVs by 2030, which will require an even larger scale-up of public stations
in addition to millions of non-public EV charging stations.11 As of October 2019, California had
approximately 18,500 public Level 2 charging ports at over 5,000 locations and approximately 3,200 public
DC fast charging stations at over 700 locations.12 California must make significant progress quickly, including
updating CALGreen requirements and for local communities, investigating reach codes and the potential costs.
Parking spaces at workplaces and other non-residential buildings will be needed to accommodate a California
vehicle fleet that is expected to have 18%-24% ZEVs in 2030. The future percentage of ZEVs will require a
much higher percentage of parking spaces than the current CALGreen code requirements.13
EV charging infrastructure is a critical policy to help California reach its climate and EV adoption goals by
providing opportunities at homes and workplaces as well as overcoming the critical challenge of “range
anxiety” associated with EV adoption.14 Surveys of communities in the Bay Area have shown that access to
vehicle charging remains a main hurdle to wider adoption and in spite of that electric vehicle adoption is
expected to grow significantly.
Building codes are an important way to facilitate access to EV charging so that residents, commuters, fleets,
and car-sharing services can benefit from the significant operating cost advantages in a way that is cost-
effective and accessible for all. Furthermore, because EV capable parking spaces can avoid or greatly reduce
several types of costs associated with installing EV charging stations, public and private funding can achieve
greater number of EV charging stations faster and more efficiently. Thus, increasing the levels of EV capable
parking spaces beyond those set by CALGreen will lead to significant increases in EV charging infrastructure.
CALGreen and Beyond
CALGreen is the first mandatory green building standards code in the nation and often serves as a model for
other state and local governments across the county. It was originally developed in 2007 by the California
Building Standards Commission (CBSC) to help meet the goals of AB 32 in reducing greenhouse gases to
1990 levels by 2020.15 Every three years, the CALGreen code is reviewed, revised, and adopted statewide
10 Former Governor Edmund G. Brown Jr. Executive Order B-16-2012 set the goal of placing 1.5 million zero-emission vehicles on California’s roads by 2025. Former Governor Edmund G. Brown’s Executive Order B-48-18 set the goal of 250,000 electric vehicle charging stations, including 10,000 DCFC charging stations, by 2025. In addition, the Charge Ahead California Initiative, [SB 1275 (De León), Chapter 530, Statutes of 2014] set a goal of placing 1 million zero- and near-zero-emission vehicles into service on California’s roads by 2023. 11 Former Governor Edmund G. Brown Jr. Executive Order B-48-18 set the goal of 5 million zero-emission vehicles on California’s roads by 2030. 12 Statistics are from the Alternative Fueling Station Locator (August 2019): https://afdc.energy.gov/stations/#/analyze?region=US-CA&fuel=ELEC&ev_levels=dc_fast&country=US 13 The California Air Resources Board’s EMFAC2017 database estimates that 21.0 million “LDA” (automobiles) and “LDT1” (light duty trucks) will be on the road in 2030. The database also estimates that 6.3 million additional “LDT2” (a second category of light duty trucks) will be on the road, some of which could be used for workplace commuting or other trips to non-residential buildings. 14 “Range anxiety” refers to concerns about insufficient range and inability to find EV charging stations. 15 “CALGreen”, Department of General Service, https://www.dgs.ca.gov/BSC/Resources/Page-Content/Building-Standards-Commission-Resources-List-Folder/CALGreen
ATTACHMENT 8
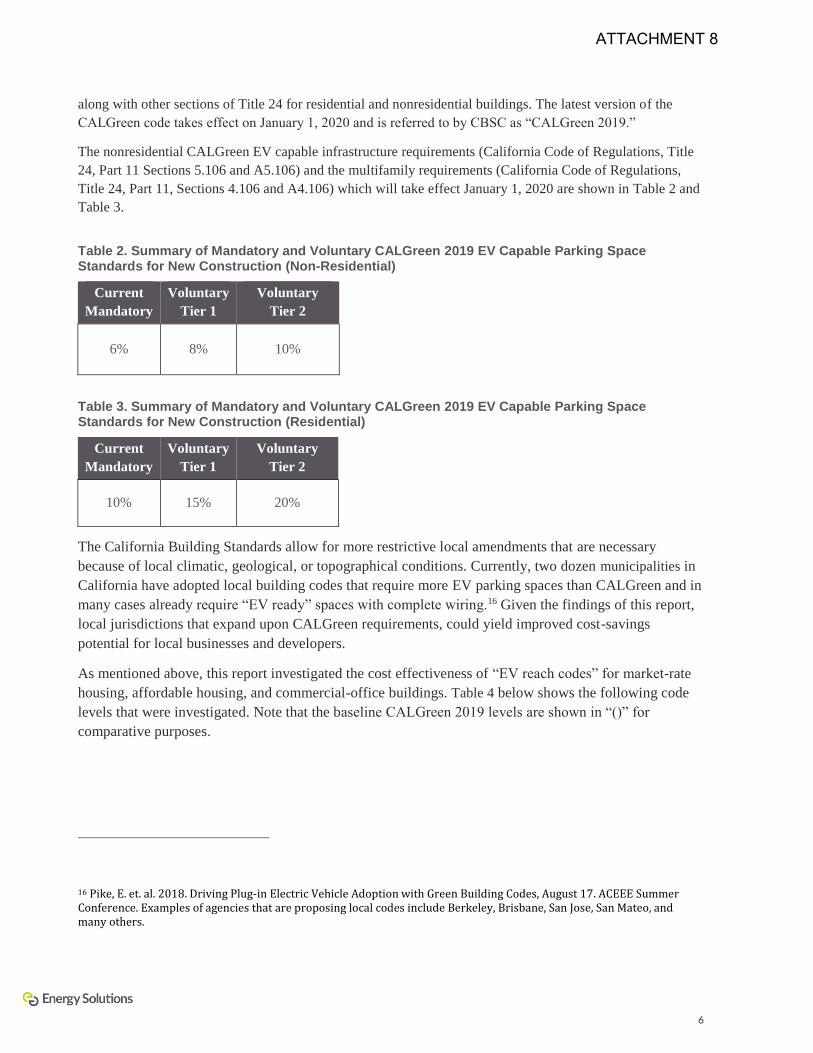
6
along with other sections of Title 24 for residential and nonresidential buildings. The latest version of the
CALGreen code takes effect on January 1, 2020 and is referred to by CBSC as “CALGreen 2019.”
The nonresidential CALGreen EV capable infrastructure requirements (California Code of Regulations, Title
24, Part 11 Sections 5.106 and A5.106) and the multifamily requirements (California Code of Regulations,
Title 24, Part 11, Sections 4.106 and A4.106) which will take effect January 1, 2020 are shown in Table 2 and
Table 3.
Table 2. Summary of Mandatory and Voluntary CALGreen 2019 EV Capable Parking Space Standards for New Construction (Non-Residential)
Current
Mandatory
Voluntary
Tier 1
Voluntary
Tier 2
6% 8% 10%
Table 3. Summary of Mandatory and Voluntary CALGreen 2019 EV Capable Parking Space Standards for New Construction (Residential)
Current
Mandatory
Voluntary
Tier 1
Voluntary
Tier 2
10% 15% 20%
The California Building Standards allow for more restrictive local amendments that are necessary
because of local climatic, geological, or topographical conditions. Currently, two dozen municipalities in
California have adopted local building codes that require more EV parking spaces than CALGreen and in
many cases already require “EV ready” spaces with complete wiring.16 Given the findings of this report,
local jurisdictions that expand upon CALGreen requirements, could yield improved cost-savings
potential for local businesses and developers.
As mentioned above, this report investigated the cost effectiveness of “EV reach codes” for market-rate
housing, affordable housing, and commercial-office buildings. Table 4 below shows the following code
levels that were investigated. Note that the baseline CALGreen 2019 levels are shown in “()” for
comparative purposes.
16 Pike, E. et. al. 2018. Driving Plug-in Electric Vehicle Adoption with Green Building Codes, August 17. ACEEE Summer Conference. Examples of agencies that are proposing local codes include Berkeley, Brisbane, San Jose, San Mateo, and many others.
ATTACHMENT 8
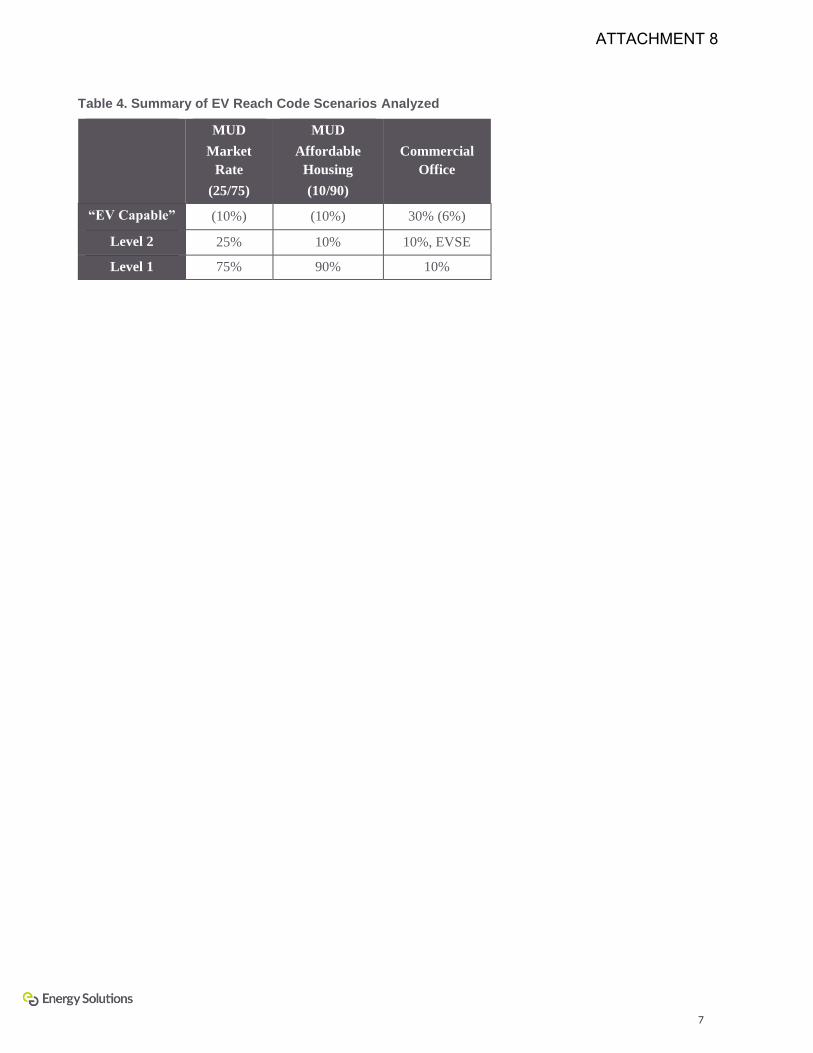
7
Table 4. Summary of EV Reach Code Scenarios Analyzed
MUD
Market
Rate
(25/75)
MUD
Affordable
Housing
(10/90)
Commercial
Office
“EV Capable” (10%) (10%) 30% (6%)
Level 2 25% 10% 10%, EVSE
Level 1 75% 90% 10%
ATTACHMENT 8
8
3. Cost Modeling
Scenarios
The model investigates three prototype building models at the CALGreen 2019 mandatory requirement level.
Those models were then analyzed for EV infrastructure installation costs as described in the scenarios
described in Table 4 above for a new construction scenario and a retrofit scenario for a total of thirteen runs in
the cost model. Table 5 below provides a high-level view of the building prototype models in terms of number
of parking spaces, approximate building area, parking lot area, and number of stories. These buildings
represent hypothetical building scenarios that are based on several assumptions and may not be reflective of
any one building. Please refer to the appendix and methodology for additional details.
Buildings Types Descriptions
60-unit MUD: A 60-unit apartment building with enclosed parking with 60 parking spaces to represent a
medium-sized MUD building.
150-unit MUD: A 150-unit apartment building with enclosed parking with 150 parking spaces to representing
a large MUD building.
60-space Commercial Office: An open parking lot with 60 spaces, to representing a medium-sized office
building.
T R A N S F O R M E R - R E L A T E D D E F I N I T I O N S :
Primary Transformer: A utility-owned transformer used to convert medium voltage utility distribution lines
(normally 12kV) to customer level power at either 480V/277V for large buildings or 208V/120V or
240V/120V for medium buildings. Primary transformers are owned and operated by the utility but any
upgrade installation costs are partially split with the building owner.
Secondary Transformer: A customer-owned transformer that converts 480V/277V power down to 208V/120V
service (or 240V/120V). Usually only necessary for medium-sized or large-sized buildings.
Headroom: Additional space left for transformer sizing to account for future unspecified load, typically 20%.
ATTACHMENT 8
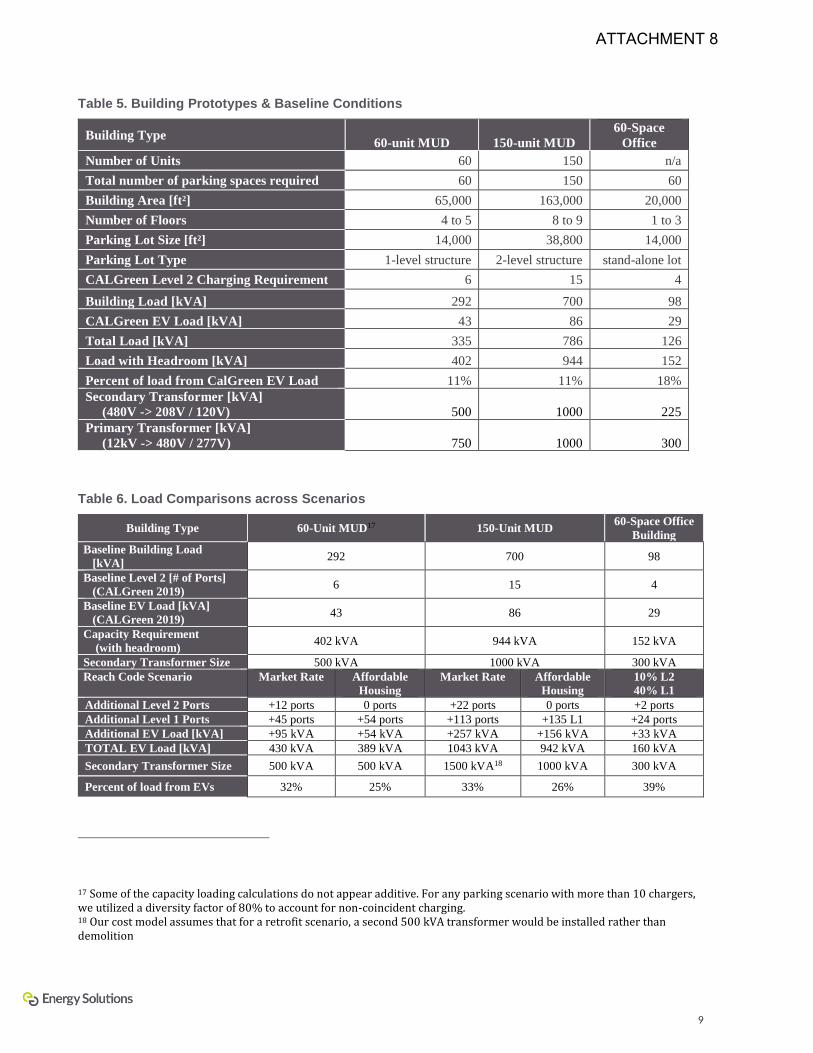
9
Table 5. Building Prototypes & Baseline Conditions
Building Type 60-unit MUD 150-unit MUD
60-Space
Office
Number of Units 60 150 n/a
Total number of parking spaces required 60 150 60
Building Area [ft²] 65,000 163,000 20,000
Number of Floors 4 to 5 8 to 9 1 to 3
Parking Lot Size [ft²] 14,000 38,800 14,000
Parking Lot Type 1-level structure 2-level structure stand-alone lot
CALGreen Level 2 Charging Requirement 6 15 4
Building Load [kVA] 292 700 98
CALGreen EV Load [kVA] 43 86 29
Total Load [kVA] 335 786 126
Load with Headroom [kVA] 402 944 152
Percent of load from CalGreen EV Load 11% 11% 18%
Secondary Transformer [kVA]
(480V -> 208V / 120V) 500 1000 225
Primary Transformer [kVA]
(12kV -> 480V / 277V) 750 1000 300
Table 6. Load Comparisons across Scenarios
Building Type 60-Unit MUD17 150-Unit MUD 60-Space Office
Building
Baseline Building Load
[kVA] 292 700 98
Baseline Level 2 [# of Ports]
(CALGreen 2019) 6 15 4
Baseline EV Load [kVA]
(CALGreen 2019) 43 86 29
Capacity Requirement
(with headroom) 402 kVA 944 kVA 152 kVA
Secondary Transformer Size 500 kVA 1000 kVA 300 kVA
Reach Code Scenario Market Rate Affordable
Housing
Market Rate Affordable
Housing
10% L2
40% L1
Additional Level 2 Ports +12 ports 0 ports +22 ports 0 ports +2 ports
Additional Level 1 Ports +45 ports +54 ports +113 ports +135 L1 +24 ports
Additional EV Load [kVA] +95 kVA +54 kVA +257 kVA +156 kVA +33 kVA
TOTAL EV Load [kVA] 430 kVA 389 kVA 1043 kVA 942 kVA 160 kVA
Secondary Transformer Size 500 kVA 500 kVA 1500 kVA18 1000 kVA 300 kVA
Percent of load from EVs 32% 25% 33% 26% 39%
17 Some of the capacity loading calculations do not appear additive. For any parking scenario with more than 10 chargers, we utilized a diversity factor of 80% to account for non-coincident charging. 18 Our cost model assumes that for a retrofit scenario, a second 500 kVA transformer would be installed rather than demolition
ATTACHMENT 8
10
Results
The results of the cost analysis model show that installing EV capable spaces as a stand-alone retrofit are
close to four times as expensive compared to during new construction. Costs for these project types are shown
in Table 7 and Table 9 with detailed breakdowns in Appendix A.
Several factors related to building types affect these results:
• Costs per space are generally higher for small buildings with a small number of retrofits for EV
capable infrastructure. Smaller projects must divide fixed costs among fewer spaces than larger
projects.
• Buildings that are at the cusp of needing an upgraded switch gear or transformers represent
significant cost increases to add electric vehicles, particularly in a retrofit context where there are
large costs from demolition and site disruption. The prototypes we studied were unable to illustrate
this point so additional narrative about these costs have been added in the ‘Distribution Transformers’
section. For this study, the prototype buildings we used only surpassed the baseline transformer
capacity on one scenario – and the loading was such that we did not expect significant demolition was
not expected. Switch gear and secondary transformer costs were included but did not include added
costs for demolition, removal, or expansion of electrical rooms19 -or- any costs associated with utility-
owned primary transformer upgrades20.
• Our cost model found that enclosed parking was less expensive than an open parking lot. This is
because surface-mounted conduit is often less expensive to retrofit than trenching, and repairing
surface parking areas. However, enclosed parking is usually much more expensive when considering
ADA compliance due to grading, restriping, and accounting for path of travel.
Several factors related to project type affect these results:
• Installing conduit in new construction is much less expensive than retrofitting it later for several
reasons.
o Demolition, disposal of materials, and repair of surface parking areas is not required.
o Conduit can be installed directly underneath parking rather than routing around existing
barriers. In addition, less expensive PVC (plastic) conduit can be installed in the parking
floor (tied to rebar before concrete is poured) rather than surface mounted later. While wiring
of branch circuits is not included in this report, these shorter lengths will also reduce wiring
costs.
o Running conduit through existing buildings will likely require demolition of walls, and
potentially through floors as well21
o Requiring that new electrical service panels contain capacity for EV capable infrastructure
can achieve economies of scale and avoid the situations where an electrical room must be
19 Demolition, Removal, and expansion of electrical rooms were not considered because they are highly dependent on site-specific factors that are difficult to estimate from the generic building prototypes we developed. 20 Utility-side transformer costs are analyzed in a separate section 21 X-ray cameras are usually used to prevent damage to concrete structures.
ATTACHMENT 8
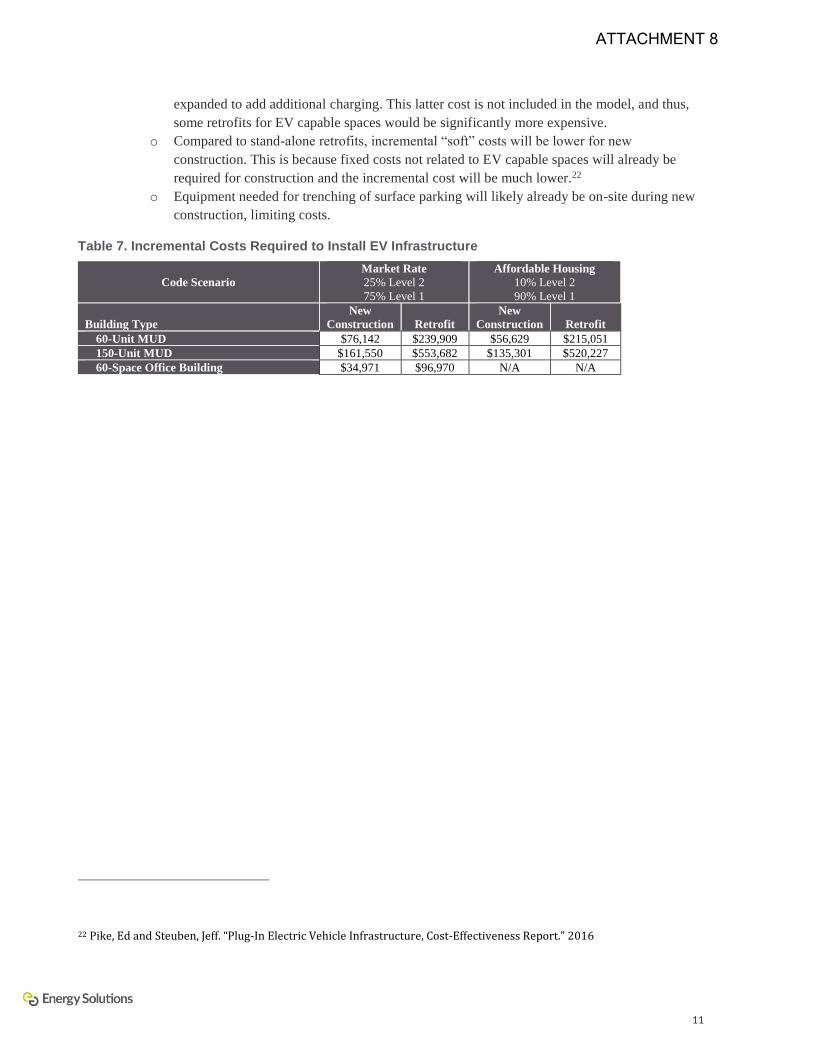
11
expanded to add additional charging. This latter cost is not included in the model, and thus,
some retrofits for EV capable spaces would be significantly more expensive.
o Compared to stand-alone retrofits, incremental “soft” costs will be lower for new
construction. This is because fixed costs not related to EV capable spaces will already be
required for construction and the incremental cost will be much lower.22
o Equipment needed for trenching of surface parking will likely already be on-site during new
construction, limiting costs.
Table 7. Incremental Costs Required to Install EV Infrastructure
Code Scenario
Market Rate
25% Level 2
75% Level 1
Affordable Housing
10% Level 2
90% Level 1
Building Type
New
Construction Retrofit
New
Construction Retrofit
60-Unit MUD $76,142 $239,909 $56,629 $215,051
150-Unit MUD $161,550 $553,682 $135,301 $520,227
60-Space Office Building $34,971 $96,970 N/A N/A
22 Pike, Ed and Steuben, Jeff. “Plug-In Electric Vehicle Infrastructure, Cost-Effectiveness Report.” 2016
ATTACHMENT 8
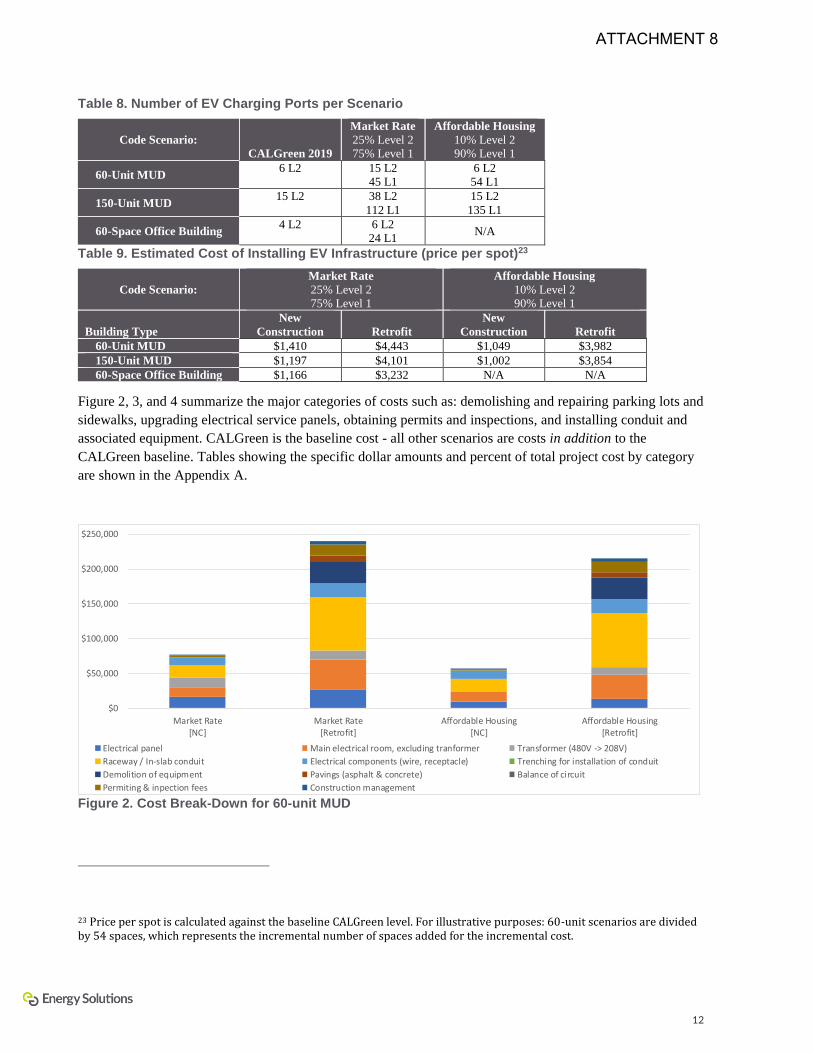
12
Table 8. Number of EV Charging Ports per Scenario
Code Scenario:
CALGreen 2019
Market Rate
25% Level 2
75% Level 1
Affordable Housing
10% Level 2
90% Level 1
60-Unit MUD 6 L2 15 L2
45 L1
6 L2
54 L1
150-Unit MUD 15 L2 38 L2
112 L1
15 L2
135 L1
60-Space Office Building 4 L2 6 L2
24 L1 N/A
Table 9. Estimated Cost of Installing EV Infrastructure (price per spot)23
Code Scenario:
Market Rate
25% Level 2
75% Level 1
Affordable Housing
10% Level 2
90% Level 1
Building Type
New
Construction Retrofit
New
Construction Retrofit
60-Unit MUD $1,410 $4,443 $1,049 $3,982
150-Unit MUD $1,197 $4,101 $1,002 $3,854
60-Space Office Building $1,166 $3,232 N/A N/A
Figure 2, 3, and 4 summarize the major categories of costs such as: demolishing and repairing parking lots and
sidewalks, upgrading electrical service panels, obtaining permits and inspections, and installing conduit and
associated equipment. CALGreen is the baseline cost - all other scenarios are costs in addition to the
CALGreen baseline. Tables showing the specific dollar amounts and percent of total project cost by category
are shown in the Appendix A.
Figure 2. Cost Break-Down for 60-unit MUD
23 Price per spot is calculated against the baseline CALGreen level. For illustrative purposes: 60-unit scenarios are divided by 54 spaces, which represents the incremental number of spaces added for the incremental cost.
$0
$50,000
$100,000
$150,000
$200,000
$250,000
Market Rate[NC]
Market Rate[Retrofit]
Affordable Housing[NC]
Affordable Housing[Retrofit]
Electrical panel Main electrical room, excluding tranformer Transformer (480V -> 208V)
Raceway / In-slab conduit Electrical components (wire, receptacle) Trenching for installation of conduit
Demolition of equipment Pavings (asphalt & concrete) Balance of circuit
Permiting & inpection fees Construction management
ATTACHMENT 8
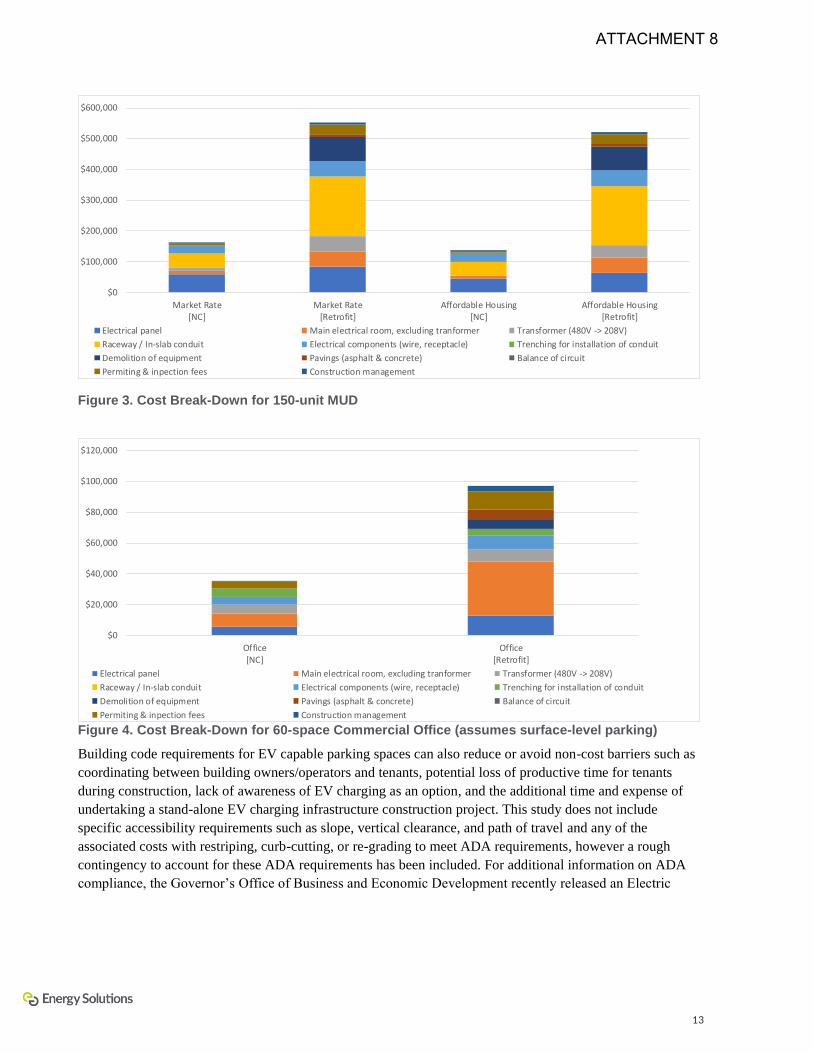
13
Figure 3. Cost Break-Down for 150-unit MUD
Figure 4. Cost Break-Down for 60-space Commercial Office (assumes surface-level parking)
Building code requirements for EV capable parking spaces can also reduce or avoid non-cost barriers such as
coordinating between building owners/operators and tenants, potential loss of productive time for tenants
during construction, lack of awareness of EV charging as an option, and the additional time and expense of
undertaking a stand-alone EV charging infrastructure construction project. This study does not include
specific accessibility requirements such as slope, vertical clearance, and path of travel and any of the
associated costs with restriping, curb-cutting, or re-grading to meet ADA requirements, however a rough
contingency to account for these ADA requirements has been included. For additional information on ADA
compliance, the Governor’s Office of Business and Economic Development recently released an Electric
$0
$100,000
$200,000
$300,000
$400,000
$500,000
$600,000
Market Rate[NC]
Market Rate[Retrofit]
Affordable Housing[NC]
Affordable Housing[Retrofit]
Electrical panel Main electrical room, excluding tranformer Transformer (480V -> 208V)
Raceway / In-slab conduit Electrical components (wire, receptacle) Trenching for installation of conduit
Demolition of equipment Pavings (asphalt & concrete) Balance of circuit
Permiting & inpection fees Construction management
$0
$20,000
$40,000
$60,000
$80,000
$100,000
$120,000
Office[NC]
Office[Retrofit]
Electrical panel Main electrical room, excluding tranformer Transformer (480V -> 208V)
Raceway / In-slab conduit Electrical components (wire, receptacle) Trenching for installation of conduit
Demolition of equipment Pavings (asphalt & concrete) Balance of circuit
Permiting & inpection fees Construction management
ATTACHMENT 8
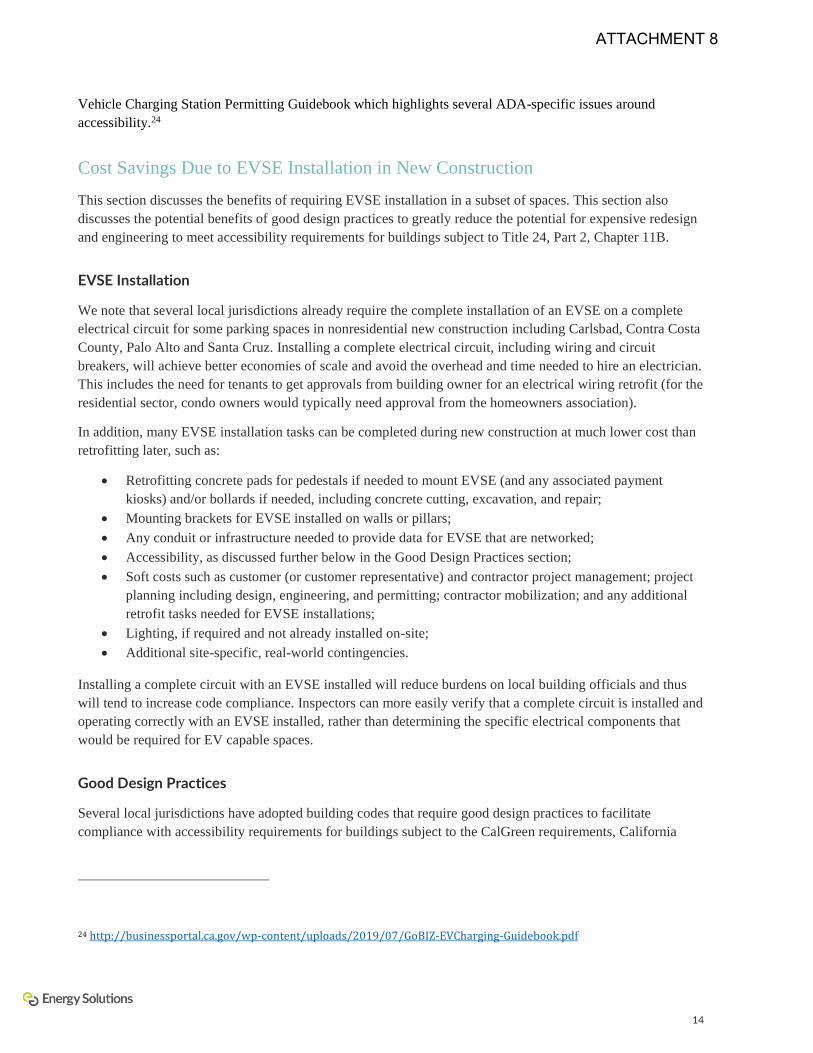
14
Vehicle Charging Station Permitting Guidebook which highlights several ADA-specific issues around
accessibility.24
Cost Savings Due to EVSE Installation in New Construction
This section discusses the benefits of requiring EVSE installation in a subset of spaces. This section also
discusses the potential benefits of good design practices to greatly reduce the potential for expensive redesign
and engineering to meet accessibility requirements for buildings subject to Title 24, Part 2, Chapter 11B.
EVSE Installation
We note that several local jurisdictions already require the complete installation of an EVSE on a complete
electrical circuit for some parking spaces in nonresidential new construction including Carlsbad, Contra Costa
County, Palo Alto and Santa Cruz. Installing a complete electrical circuit, including wiring and circuit
breakers, will achieve better economies of scale and avoid the overhead and time needed to hire an electrician.
This includes the need for tenants to get approvals from building owner for an electrical wiring retrofit (for the
residential sector, condo owners would typically need approval from the homeowners association).
In addition, many EVSE installation tasks can be completed during new construction at much lower cost than
retrofitting later, such as:
• Retrofitting concrete pads for pedestals if needed to mount EVSE (and any associated payment
kiosks) and/or bollards if needed, including concrete cutting, excavation, and repair;
• Mounting brackets for EVSE installed on walls or pillars;
• Any conduit or infrastructure needed to provide data for EVSE that are networked;
• Accessibility, as discussed further below in the Good Design Practices section;
• Soft costs such as customer (or customer representative) and contractor project management; project
planning including design, engineering, and permitting; contractor mobilization; and any additional
retrofit tasks needed for EVSE installations;
• Lighting, if required and not already installed on-site;
• Additional site-specific, real-world contingencies.
Installing a complete circuit with an EVSE installed will reduce burdens on local building officials and thus
will tend to increase code compliance. Inspectors can more easily verify that a complete circuit is installed and
operating correctly with an EVSE installed, rather than determining the specific electrical components that
would be required for EV capable spaces.
Good Design Practices
Several local jurisdictions have adopted building codes that require good design practices to facilitate
compliance with accessibility requirements for buildings subject to the CalGreen requirements, California
24 http://businessportal.ca.gov/wp-content/uploads/2019/07/GoBIZ-EVCharging-Guidebook.pdf
ATTACHMENT 8
15
Code of Regulations Title 24, Part 2, Chapter 11B Section 11B-812. Section 11B-812 requires that a facility
providing Electric Vehicle Charging Stations (EVCS), i.e. a parking spaces with an EVSE installed, for public
and common use also provide one or more accessible EVCS, as specified in Table 11B-228.3.2.1. Chapter
11B applies to certain facilities including, but not limited to, public accommodations and publicly-funded
housing (see Part 2, Section 1.9 of the California Building Code). It does not require review prior to
construction of whether a building is designed to allow compliance with these requirements, and local codes
require good design practices to fill this gap.
These local codes typically require that projects subject to the California Code of Regulations Title 24, Part 2,
Chapter 11B, document how many accessible EVCS would be required as per Title 24, Chapter 11B to
convert all required EV capable or EV ready parking spaces to EVCS. They also typically require that the
builder demonstrate that the facility is designed such that compliance with accessibility standards, including
Chapter 11B accessible routes, will be feasible for the required accessible EVCS at the time of EVCS
installation.25
We note that retrofitting spaces that were not designed to facilitate compliance with accessibility requirements
can be very expensive. For instance, this study finds that removing and repairing about 100 to 300 linear feet
of surface parking that add conduit to non-accessible parking spaces for a small or medium facility can cost
$11,500 to $32,000 in demolition and repair costs. While the scope of work for accessibility retrofits may be
different from the conduit installation task, this information indicates that the types of costs required for
accessibility retrofits (absent good design practices) may be similarly significant and in retrofit contexts may
be cost prohibitive, space prohibitive, or both.
Methodology
The methodology for this report is similar to prior 2016 reports for the City of Oakland (with funding from the
City of Oakland and grant funding from the California Energy Commission), and for the City and County of
San Francisco (with funding from Pacific Gas & Electric and in-kind support from the City and County of San
Francisco).26 27
The cost analysis model that breaks each scenario and number of EV capable parking spaces into individual
tasks and quantities, as shown in Appendix C. The model also contains estimates for the costs of each job
task. Estimates of retrofit and new construction costs per job task are largely based on RS Means, a
construction cost reference handbook for residential and nonresidential hardware and related installation
25 For instance, section 11B-812 requires that “Parking spaces, access aisles and vehicular routes serving them shall provide a vertical clearance of 98 inches (2489 mm) minimum.” It also requires that parking spaces and access aisles meet maximum slope requirements of 1 unit vertical in 48 units horizontal (2.083 percent slope) in any direction at the time of new building construction or renovation. Section 11B-812.5 contains accessible route requirements. In addition, Title 24 Part 11 Section 4.106.4.2 requires that developers meet certain aspects of accessibility requirements at the time of new construction for a limited number of parking spaces. 26 Pike, Ed and Steuben, Jeff. “Plug-In Electric Vehicle Infrastructure, Cost-Effectiveness Report.” 2016; and Pike, Ed, Jeffrey Steuben , and Evan Kamei. 2016. "Plug-In Electric Vehicle Infrastructure Cost-Effectiveness Report for San Francisco.” 27 Pike, Ed, Jeffrey Steuben , and Evan Kamei. 2016. "Plug-In Electric Vehicle Infrastructure Cost-Effectiveness Report for San Francisco."
ATTACHMENT 8
16
costs.28 Additional costs for contractor labor, permits, architectural drawings, plans, site and/or load studies
(for retrofit projects), inspections, and local permit and inspection fees are based on the resources listed in
Appendix B and C. Additional information used to model these costs includes feedback from industry and
utility experts, engineering estimates, and direct experience. For additional details on the methodology and
information specific to the EV capable parking space details, please see Appendix C and Appendix D.
The cost analysis model includes hypothetical installation scenarios to compare costs between different
numbers of EV capable parking space for new construction and retrofit projects. Actual project costs and
configurations will vary; these cases are intended to provide representative examples for comparison purposes
rather than to estimate site-specific costs. The model excludes project-specific costs outside the scope of EV
capable parking space building code compliance such as acquisition and installation of the EVSE, signage,
lighting, pedestal mounts, bollards, wheel stops, any required accessibility retrofit, and any other factors
outside of CALGreen EV capable parking spaces requirements.29 (Codes that address accessibility during
alterations and additions such as the City of Fremont, City of Oakland, and City and County of San Francisco
local codes can result in significant cost savings compared to changing these design parameters later as part of
a stand-alone retrofit project. 30)
Recent editions to this model have added secondary transformers costs and electrical room costs (switchgear).
The model still excludes utility-side infrastructure, such as concrete transformer pads, utility service
connections, and associated demolition, to accommodate potential swap-out for a larger capacity primary
transformer. Additional information on those costs can be found in the Table 7 of the Transformers section
below.
Furthermore, the scenarios do not include sub-metering or separate metering equipment, which are optional,
but could be selected by a building owner to access a special electricity rate.31 Primary model costs are based
on the City of Sacramento with a correction for PCE and SVCE’s service area based on an average of San
Jose and San Mateo’s labor and material costs for the first quarter of 2019.
28 For additional information, see www.rsmeans.com. 29 RS Means specifies a range of potential design costs, while noting that design costs will likely be 50 percent higher for alterations. We note that wheel stops may cost $150-$200 each and bollards may cost $500-$750 each based on input from an installer and RS Means costs for equipment types similar to bollards. 30 San Francisco Green Building Code 2016: http://library.amlegal.com/nxt/gateway.dll/California/sfbuilding/greenbuildingcode2016edition?f=templates$fn=default.htm$3.0$vid=amlegal:sanfrancisco_ca$anc=JD_GreenBuilding 31 A sub-meter may be a desirable add-on for some building owners or PEV drivers to allocate electricity costs and/or provide access to utility PEV charging electricity tariffs, though some special electricity rates for PEV owners are available through whole-house rates and utilities are also conducting pilots of metering via electric vehicle service equipment. The authors believe that builders wishing to install a socket for a sub-meter at the time of new construction may achieve cost savings compared to retrofits but have not quantified this potential.
ATTACHMENT 8
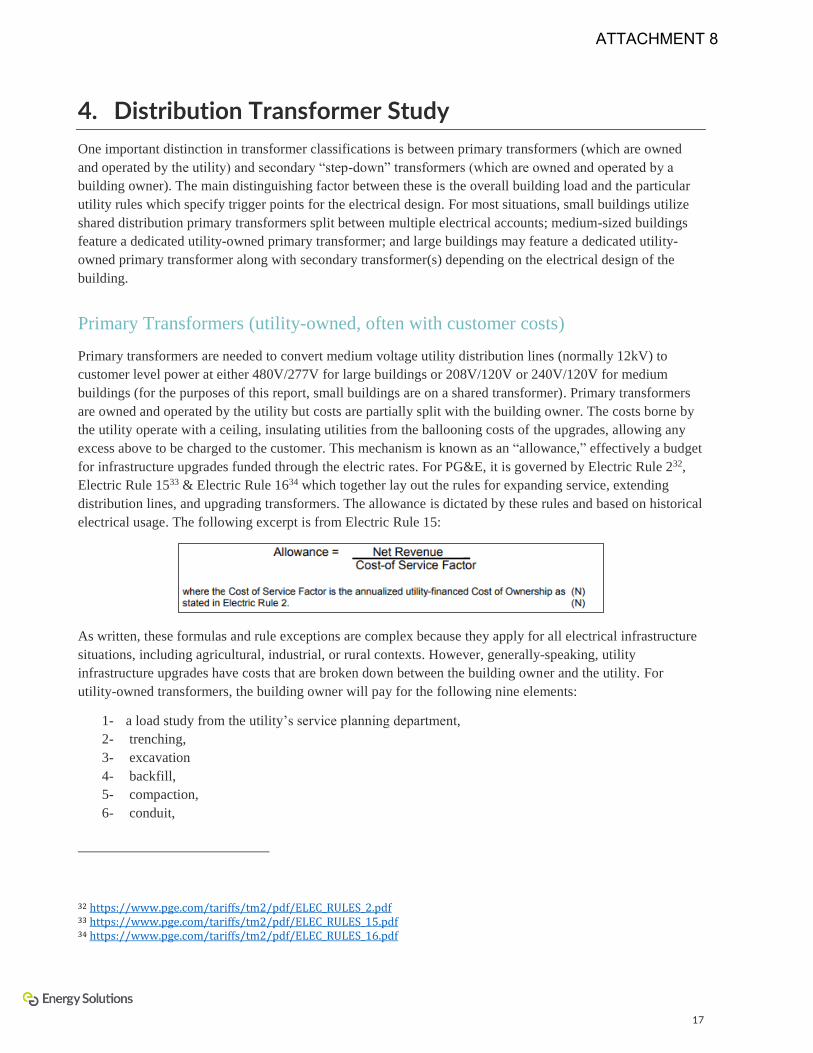
17
4. Distribution Transformer Study
One important distinction in transformer classifications is between primary transformers (which are owned
and operated by the utility) and secondary “step-down” transformers (which are owned and operated by a
building owner). The main distinguishing factor between these is the overall building load and the particular
utility rules which specify trigger points for the electrical design. For most situations, small buildings utilize
shared distribution primary transformers split between multiple electrical accounts; medium-sized buildings
feature a dedicated utility-owned primary transformer; and large buildings may feature a dedicated utility-
owned primary transformer along with secondary transformer(s) depending on the electrical design of the
building.
Primary Transformers (utility-owned, often with customer costs)
Primary transformers are needed to convert medium voltage utility distribution lines (normally 12kV) to
customer level power at either 480V/277V for large buildings or 208V/120V or 240V/120V for medium
buildings (for the purposes of this report, small buildings are on a shared transformer). Primary transformers
are owned and operated by the utility but costs are partially split with the building owner. The costs borne by
the utility operate with a ceiling, insulating utilities from the ballooning costs of the upgrades, allowing any
excess above to be charged to the customer. This mechanism is known as an “allowance,” effectively a budget
for infrastructure upgrades funded through the electric rates. For PG&E, it is governed by Electric Rule 232,
Electric Rule 1533 & Electric Rule 1634 which together lay out the rules for expanding service, extending
distribution lines, and upgrading transformers. The allowance is dictated by these rules and based on historical
electrical usage. The following excerpt is from Electric Rule 15:
As written, these formulas and rule exceptions are complex because they apply for all electrical infrastructure
situations, including agricultural, industrial, or rural contexts. However, generally-speaking, utility
infrastructure upgrades have costs that are broken down between the building owner and the utility. For
utility-owned transformers, the building owner will pay for the following nine elements:
1- a load study from the utility’s service planning department,
2- trenching,
3- excavation
4- backfill,
5- compaction,
6- conduit,
32 https://www.pge.com/tariffs/tm2/pdf/ELEC_RULES_2.pdf 33 https://www.pge.com/tariffs/tm2/pdf/ELEC_RULES_15.pdf 34 https://www.pge.com/tariffs/tm2/pdf/ELEC_RULES_16.pdf
ATTACHMENT 8
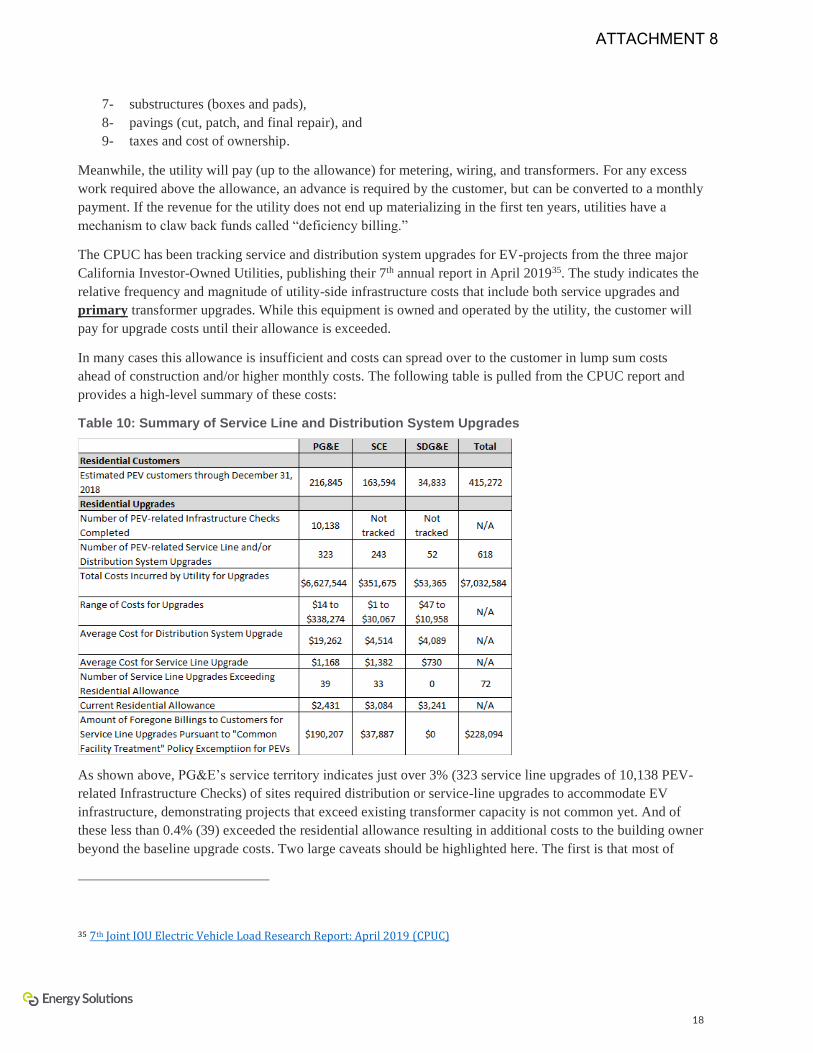
18
7- substructures (boxes and pads),
8- pavings (cut, patch, and final repair), and
9- taxes and cost of ownership.
Meanwhile, the utility will pay (up to the allowance) for metering, wiring, and transformers. For any excess
work required above the allowance, an advance is required by the customer, but can be converted to a monthly
payment. If the revenue for the utility does not end up materializing in the first ten years, utilities have a
mechanism to claw back funds called “deficiency billing.”
The CPUC has been tracking service and distribution system upgrades for EV-projects from the three major
California Investor-Owned Utilities, publishing their 7th annual report in April 201935. The study indicates the
relative frequency and magnitude of utility-side infrastructure costs that include both service upgrades and
primary transformer upgrades. While this equipment is owned and operated by the utility, the customer will
pay for upgrade costs until their allowance is exceeded.
In many cases this allowance is insufficient and costs can spread over to the customer in lump sum costs
ahead of construction and/or higher monthly costs. The following table is pulled from the CPUC report and
provides a high-level summary of these costs:
Table 10: Summary of Service Line and Distribution System Upgrades
As shown above, PG&E’s service territory indicates just over 3% (323 service line upgrades of 10,138 PEV-
related Infrastructure Checks) of sites required distribution or service-line upgrades to accommodate EV
infrastructure, demonstrating projects that exceed existing transformer capacity is not common yet. And of
these less than 0.4% (39) exceeded the residential allowance resulting in additional costs to the building owner
beyond the baseline upgrade costs. Two large caveats should be highlighted here. The first is that most of
35 7th Joint IOU Electric Vehicle Load Research Report: April 2019 (CPUC)
ATTACHMENT 8
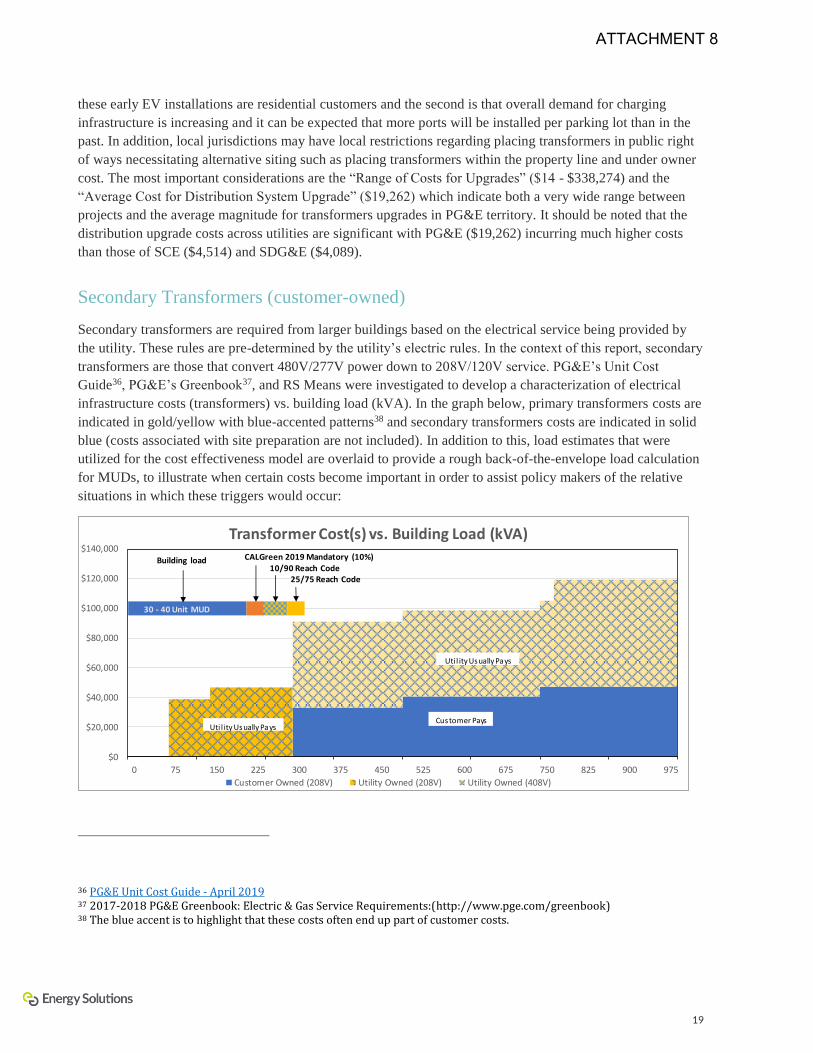
19
these early EV installations are residential customers and the second is that overall demand for charging
infrastructure is increasing and it can be expected that more ports will be installed per parking lot than in the
past. In addition, local jurisdictions may have local restrictions regarding placing transformers in public right
of ways necessitating alternative siting such as placing transformers within the property line and under owner
cost. The most important considerations are the “Range of Costs for Upgrades” ($14 - $338,274) and the
“Average Cost for Distribution System Upgrade” ($19,262) which indicate both a very wide range between
projects and the average magnitude for transformers upgrades in PG&E territory. It should be noted that the
distribution upgrade costs across utilities are significant with PG&E ($19,262) incurring much higher costs
than those of SCE ($4,514) and SDG&E ($4,089).
Secondary Transformers (customer-owned)
Secondary transformers are required from larger buildings based on the electrical service being provided by
the utility. These rules are pre-determined by the utility’s electric rules. In the context of this report, secondary
transformers are those that convert 480V/277V power down to 208V/120V service. PG&E’s Unit Cost
Guide36, PG&E’s Greenbook37, and RS Means were investigated to develop a characterization of electrical
infrastructure costs (transformers) vs. building load (kVA). In the graph below, primary transformers costs are
indicated in gold/yellow with blue-accented patterns38 and secondary transformers costs are indicated in solid
blue (costs associated with site preparation are not included). In addition to this, load estimates that were
utilized for the cost effectiveness model are overlaid to provide a rough back-of-the-envelope load calculation
for MUDs, to illustrate when certain costs become important in order to assist policy makers of the relative
situations in which these triggers would occur:
36 PG&E Unit Cost Guide - April 2019 37 2017-2018 PG&E Greenbook: Electric & Gas Service Requirements:(http://www.pge.com/greenbook) 38 The blue accent is to highlight that these costs often end up part of customer costs.
$0
$20,000
$40,000
$60,000
$80,000
$100,000
$120,000
$140,000
0 75 150 225 300 375 450 525 600 675 750 825 900 975
Transformer Cost(s) vs. Building Load (kVA)
Customer Owned (208V) Utility Owned (208V) Utility Owned (408V)
10/90 Reach Code25/75 Reach Code
Building load CALGreen 2019 Mandatory (10%)
Uti l ity Usually Pays
Customer PaysUti l ity Usually Pays
30 - 40 Unit MUD
ATTACHMENT 8
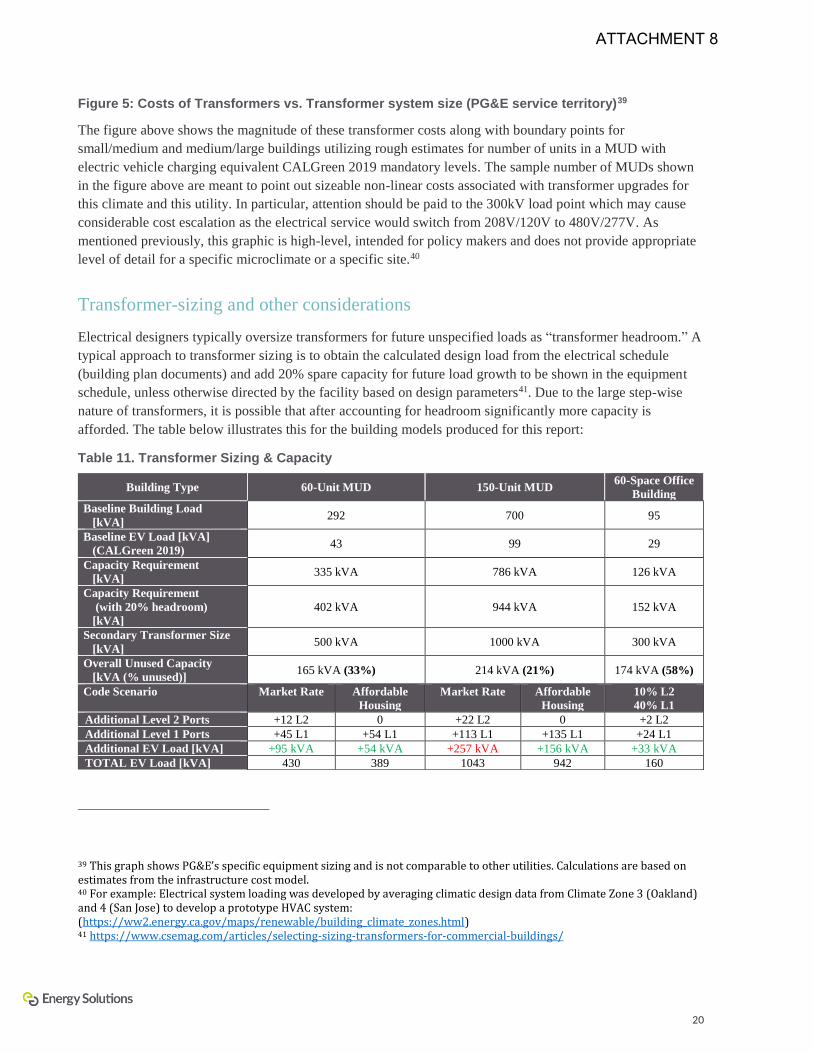
20
Figure 5: Costs of Transformers vs. Transformer system size (PG&E service territory)39
The figure above shows the magnitude of these transformer costs along with boundary points for
small/medium and medium/large buildings utilizing rough estimates for number of units in a MUD with
electric vehicle charging equivalent CALGreen 2019 mandatory levels. The sample number of MUDs shown
in the figure above are meant to point out sizeable non-linear costs associated with transformer upgrades for
this climate and this utility. In particular, attention should be paid to the 300kV load point which may cause
considerable cost escalation as the electrical service would switch from 208V/120V to 480V/277V. As
mentioned previously, this graphic is high-level, intended for policy makers and does not provide appropriate
level of detail for a specific microclimate or a specific site.40
Transformer-sizing and other considerations
Electrical designers typically oversize transformers for future unspecified loads as “transformer headroom.” A
typical approach to transformer sizing is to obtain the calculated design load from the electrical schedule
(building plan documents) and add 20% spare capacity for future load growth to be shown in the equipment
schedule, unless otherwise directed by the facility based on design parameters41. Due to the large step-wise
nature of transformers, it is possible that after accounting for headroom significantly more capacity is
afforded. The table below illustrates this for the building models produced for this report:
Table 11. Transformer Sizing & Capacity
Building Type 60-Unit MUD 150-Unit MUD 60-Space Office
Building
Baseline Building Load
[kVA] 292 700 95
Baseline EV Load [kVA]
(CALGreen 2019) 43 99 29
Capacity Requirement
[kVA] 335 kVA 786 kVA 126 kVA
Capacity Requirement
(with 20% headroom)
[kVA]
402 kVA 944 kVA 152 kVA
Secondary Transformer Size
[kVA] 500 kVA 1000 kVA 300 kVA
Overall Unused Capacity
[kVA (% unused)] 165 kVA (33%) 214 kVA (21%) 174 kVA (58%)
Code Scenario Market Rate Affordable
Housing
Market Rate Affordable
Housing
10% L2
40% L1
Additional Level 2 Ports +12 L2 0 +22 L2 0 +2 L2
Additional Level 1 Ports +45 L1 +54 L1 +113 L1 +135 L1 +24 L1
Additional EV Load [kVA] +95 kVA +54 kVA +257 kVA +156 kVA +33 kVA
TOTAL EV Load [kVA] 430 389 1043 942 160
39 This graph shows PG&E’s specific equipment sizing and is not comparable to other utilities. Calculations are based on estimates from the infrastructure cost model. 40 For example: Electrical system loading was developed by averaging climatic design data from Climate Zone 3 (Oakland) and 4 (San Jose) to develop a prototype HVAC system: (https://ww2.energy.ca.gov/maps/renewable/building_climate_zones.html) 41 https://www.csemag.com/articles/selecting-sizing-transformers-for-commercial-buildings/
ATTACHMENT 8
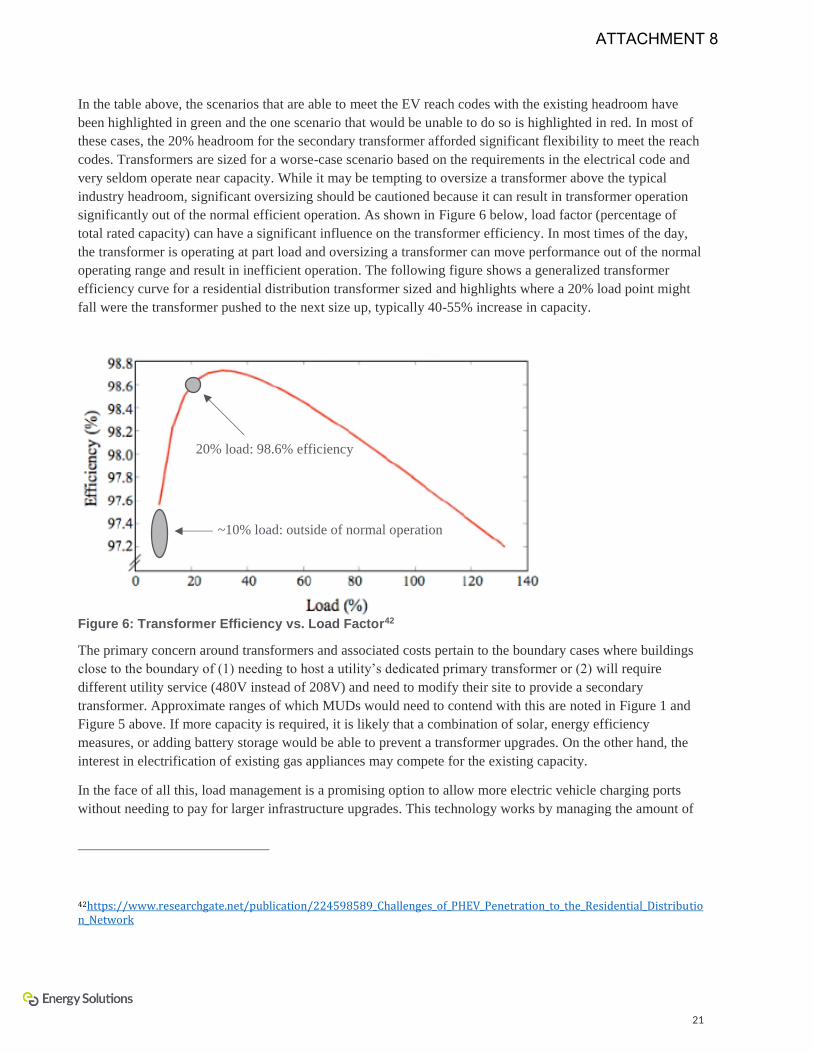
21
In the table above, the scenarios that are able to meet the EV reach codes with the existing headroom have
been highlighted in green and the one scenario that would be unable to do so is highlighted in red. In most of
these cases, the 20% headroom for the secondary transformer afforded significant flexibility to meet the reach
codes. Transformers are sized for a worse-case scenario based on the requirements in the electrical code and
very seldom operate near capacity. While it may be tempting to oversize a transformer above the typical
industry headroom, significant oversizing should be cautioned because it can result in transformer operation
significantly out of the normal efficient operation. As shown in Figure 6 below, load factor (percentage of
total rated capacity) can have a significant influence on the transformer efficiency. In most times of the day,
the transformer is operating at part load and oversizing a transformer can move performance out of the normal
operating range and result in inefficient operation. The following figure shows a generalized transformer
efficiency curve for a residential distribution transformer sized and highlights where a 20% load point might
fall were the transformer pushed to the next size up, typically 40-55% increase in capacity.
Figure 6: Transformer Efficiency vs. Load Factor42
The primary concern around transformers and associated costs pertain to the boundary cases where buildings
close to the boundary of (1) needing to host a utility’s dedicated primary transformer or (2) will require
different utility service (480V instead of 208V) and need to modify their site to provide a secondary
transformer. Approximate ranges of which MUDs would need to contend with this are noted in Figure 1 and
Figure 5 above. If more capacity is required, it is likely that a combination of solar, energy efficiency
measures, or adding battery storage would be able to prevent a transformer upgrades. On the other hand, the
interest in electrification of existing gas appliances may compete for the existing capacity.
In the face of all this, load management is a promising option to allow more electric vehicle charging ports
without needing to pay for larger infrastructure upgrades. This technology works by managing the amount of
42https://www.researchgate.net/publication/224598589_Challenges_of_PHEV_Penetration_to_the_Residential_Distribution_Network
20% load: 98.6% efficiency
~10% load: outside of normal operation
ATTACHMENT 8

22
throughput to individual charging ports based on what the control system defines for limitations. To date, this
feature has primarily been marketed to limit electrical demand charges but could be utilized to prevent over-
loading panels and/or transformers. Load management for electric vehicles is still nascent technology and
would benefit with more developed industry standards. However, the National Electric Code has permitted
power management since 2014 but industry may need training to create packaged solutions that can reassure
plan checkers and building inspectors.43
43 California Electrical Code (Title 24, Part 3): Article 750.30 – Load Management
ATTACHMENT 8
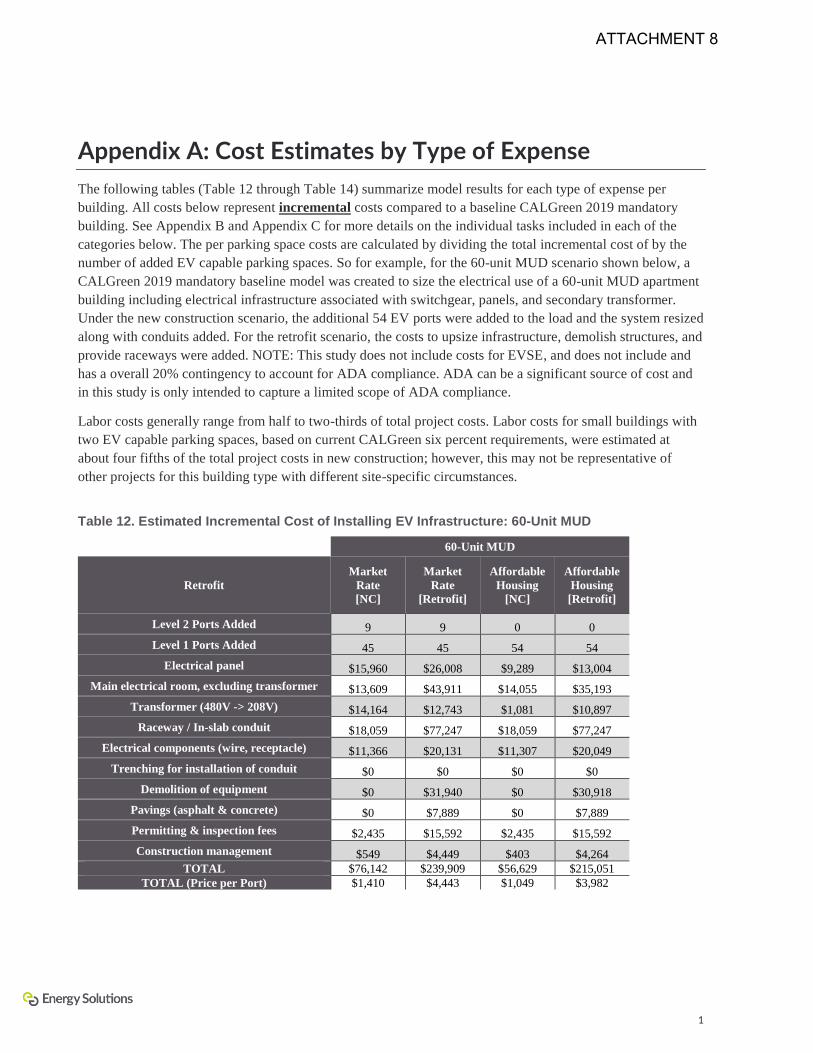
1
Appendix A: Cost Estimates by Type of Expense
The following tables (Table 12 through Table 14) summarize model results for each type of expense per
building. All costs below represent incremental costs compared to a baseline CALGreen 2019 mandatory
building. See Appendix B and Appendix C for more details on the individual tasks included in each of the
categories below. The per parking space costs are calculated by dividing the total incremental cost of by the
number of added EV capable parking spaces. So for example, for the 60-unit MUD scenario shown below, a
CALGreen 2019 mandatory baseline model was created to size the electrical use of a 60-unit MUD apartment
building including electrical infrastructure associated with switchgear, panels, and secondary transformer.
Under the new construction scenario, the additional 54 EV ports were added to the load and the system resized
along with conduits added. For the retrofit scenario, the costs to upsize infrastructure, demolish structures, and
provide raceways were added. NOTE: This study does not include costs for EVSE, and does not include and
has a overall 20% contingency to account for ADA compliance. ADA can be a significant source of cost and
in this study is only intended to capture a limited scope of ADA compliance.
Labor costs generally range from half to two-thirds of total project costs. Labor costs for small buildings with
two EV capable parking spaces, based on current CALGreen six percent requirements, were estimated at
about four fifths of the total project costs in new construction; however, this may not be representative of
other projects for this building type with different site-specific circumstances.
Table 12. Estimated Incremental Cost of Installing EV Infrastructure: 60-Unit MUD
60-Unit MUD
Retrofit
Market
Rate
[NC]
Market
Rate
[Retrofit]
Affordable
Housing
[NC]
Affordable
Housing
[Retrofit]
Level 2 Ports Added 9 9 0 0
Level 1 Ports Added 45 45 54 54
Electrical panel $15,960 $26,008 $9,289 $13,004
Main electrical room, excluding transformer $13,609 $43,911 $14,055 $35,193
Transformer (480V -> 208V) $14,164 $12,743 $1,081 $10,897
Raceway / In-slab conduit $18,059 $77,247 $18,059 $77,247
Electrical components (wire, receptacle) $11,366 $20,131 $11,307 $20,049
Trenching for installation of conduit $0 $0 $0 $0
Demolition of equipment $0 $31,940 $0 $30,918
Pavings (asphalt & concrete) $0 $7,889 $0 $7,889
Permitting & inspection fees $2,435 $15,592 $2,435 $15,592
Construction management $549 $4,449 $403 $4,264
TOTAL $76,142 $239,909 $56,629 $215,051
TOTAL (Price per Port) $1,410 $4,443 $1,049 $3,982
ATTACHMENT 8
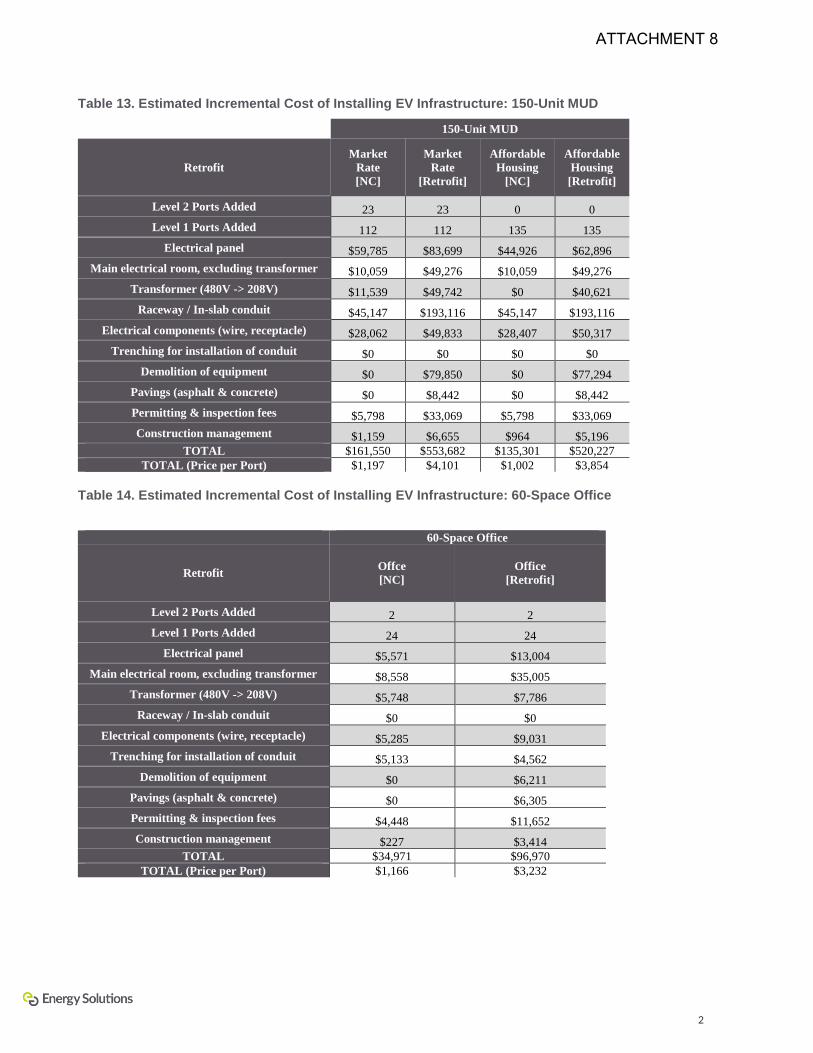
2
Table 13. Estimated Incremental Cost of Installing EV Infrastructure: 150-Unit MUD
150-Unit MUD
Retrofit
Market
Rate
[NC]
Market
Rate
[Retrofit]
Affordable
Housing
[NC]
Affordable
Housing
[Retrofit]
Level 2 Ports Added 23 23 0 0
Level 1 Ports Added 112 112 135 135
Electrical panel $59,785 $83,699 $44,926 $62,896
Main electrical room, excluding transformer $10,059 $49,276 $10,059 $49,276
Transformer (480V -> 208V) $11,539 $49,742 $0 $40,621
Raceway / In-slab conduit $45,147 $193,116 $45,147 $193,116
Electrical components (wire, receptacle) $28,062 $49,833 $28,407 $50,317
Trenching for installation of conduit $0 $0 $0 $0
Demolition of equipment $0 $79,850 $0 $77,294
Pavings (asphalt & concrete) $0 $8,442 $0 $8,442
Permitting & inspection fees $5,798 $33,069 $5,798 $33,069
Construction management $1,159 $6,655 $964 $5,196
TOTAL $161,550 $553,682 $135,301 $520,227
TOTAL (Price per Port) $1,197 $4,101 $1,002 $3,854
Table 14. Estimated Incremental Cost of Installing EV Infrastructure: 60-Space Office
60-Space Office
Retrofit Offce
[NC]
Office
[Retrofit]
Level 2 Ports Added 2 2
Level 1 Ports Added 24 24
Electrical panel $5,571 $13,004
Main electrical room, excluding transformer $8,558 $35,005
Transformer (480V -> 208V) $5,748 $7,786
Raceway / In-slab conduit $0 $0
Electrical components (wire, receptacle) $5,285 $9,031
Trenching for installation of conduit $5,133 $4,562
Demolition of equipment $0 $6,211
Pavings (asphalt & concrete) $0 $6,305
Permitting & inspection fees $4,448 $11,652
Construction management $227 $3,414
TOTAL $34,971 $96,970
TOTAL (Price per Port) $1,166 $3,232
ATTACHMENT 8
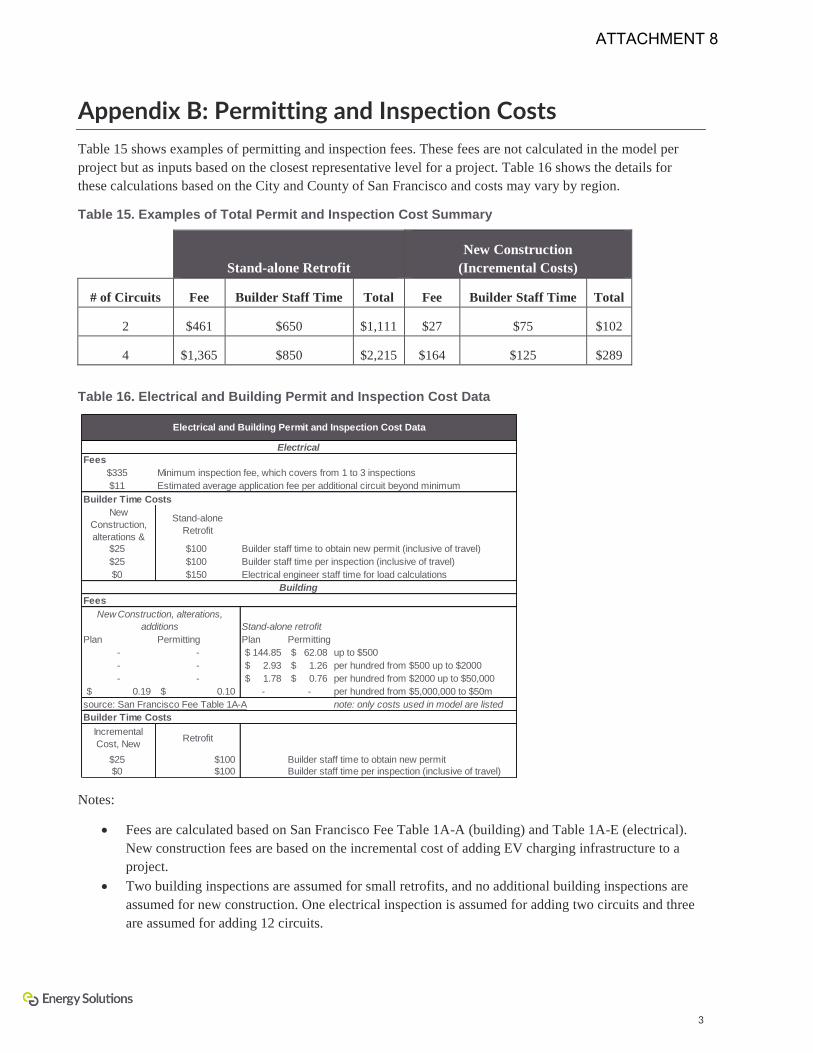
3
Appendix B: Permitting and Inspection Costs
Table 15 shows examples of permitting and inspection fees. These fees are not calculated in the model per
project but as inputs based on the closest representative level for a project. Table 16 shows the details for
these calculations based on the City and County of San Francisco and costs may vary by region.
Table 15. Examples of Total Permit and Inspection Cost Summary
Stand-alone Retrofit
New Construction
(Incremental Costs)
# of Circuits Fee Builder Staff Time Total Fee Builder Staff Time Total
2 $461 $650 $1,111 $27 $75 $102
4 $1,365 $850 $2,215 $164 $125 $289
Table 16. Electrical and Building Permit and Inspection Cost Data
Notes:
• Fees are calculated based on San Francisco Fee Table 1A-A (building) and Table 1A-E (electrical).
New construction fees are based on the incremental cost of adding EV charging infrastructure to a
project.
• Two building inspections are assumed for small retrofits, and no additional building inspections are
assumed for new construction. One electrical inspection is assumed for adding two circuits and three
are assumed for adding 12 circuits.
Fees
$335
$11 Estimated average application fee per additional circuit beyond minimum
New
Construction,
alterations &
Stand-alone
Retrofit
$25 $100 Builder staff time to obtain new permit (inclusive of travel)
$25 $100 Builder staff time per inspection (inclusive of travel)
$0 $150 Electrical engineer staff time for load calculations
Fees
Stand-alone retrofit
Plan Permitting Plan Permitting
- - 144.85$ 62.08$ up to $500
- - 2.93$ 1.26$ per hundred from $500 up to $2000
- - 1.78$ 0.76$ per hundred from $2000 up to $50,000
0.19$ 0.10$ - - per hundred from $5,000,000 to $50m
source: San Francisco Fee Table 1A-A note: only costs used in model are listed
Incremental
Cost, New Retrofit
$25 $100 Builder staff time to obtain new permit
$0 $100 Builder staff time per inspection (inclusive of travel)
Electrical and Building Permit and Inspection Cost Data
Builder Time Costs
Minimum inspection fee, which covers from 1 to 3 inspections
Builder Time Costs
Electrical
Building
New Construction, alterations,
additions
ATTACHMENT 8
4
Appendix C: Methodology Details
This appendix provides additional details on the general assumptions used in the models, data sources for per
unit equipment and other costs, and the methods used to determine the quantities needed for each expense
type. This appendix does not contain data specific to the scenarios that were modeled, but rather a more
general overview of the cost model.
General Assumptions
• Cost estimates include a fixed general overhead and profit factor.44
• Labor costs and equipment costs are based on cost estimates from RSMeans 2019 Q1 and utilize
standard union rates.
• RSMeans cost data specified Sacramento, CA with a geographic correction which averaged the RS
Means City Cost Index of San Mateo and San Jose.
• In some cases, RS Means contains minimum retrofit task costs.45 Where related tasks had separate
minimum task costs but the labor crew could likely perform more than one related task, the model
applied one minimum labor charge.
• Building electrical infrastructure was sized utilizing W/ft² engineering calculations for lighting, air
conditioning, and other major appliances.
• Building area was estimated using US Census Data
• Common area is assumed for Laundry usage
• Air Conditioner sizing was calculated based on California Climate Zone data for Zone 3 and Zone 4
• California CEUS46 data is utilized to determine demand for offices
Data Sources
Estimates of per unit equipment and installation costs were based on retrofit and new construction costs from
RS Means, a construction cost reference handbook and online tool for hardware and related installation costs.
The City and County of San Francisco rates were used for permit and inspection fee sheets; and the authors
estimated costs for contractor labor for permitting, inspections, site inspection, and architectural plans. Cost
data from RS Means was for 2018 and was scaled to 2019 using U.S. Bureau of Labor Statistics Producer
Price Index statistics. Additional data sources include: feedback from industry experts, engineering estimates,
and direct experience to capture different tasks required for the scenarios that were analyzed. This appendix
contains a list of all tasks included in the analysis.
44 Individual RS Means line items related to overhead (under General Requirements) are assumed to be addressed by overhead and profit. 45 Minimum task costs are typically not relevant for new construction due to the overall project scale. 46 http://capabilities.itron.com/CeusWeb/ChartsSF/Default2.aspx
ATTACHMENT 8
5
Soft Costs
Permit and Inspection Fees
Permitting costs for breaking concrete and electrical permit fees are based on available information from the
City and County of San Francisco fees.47 The total estimated costs include rough and final building and
electrical permit fees where applicable. The cost for adding EV capable spaces during construction of a new
building is assumed to be relatively low. Builder time spent towards permit filing and inspections is included
at $100 per hour spent on site. Permit and inspection costs can vary between regions.
The model includes a small amount of labor to accommodate permitting and inspection of elements specific to
EV capable parking spaces in new construction and alterations and additions, since these activities are already
required and minimal additional effort should be needed to add EV capable infrastructure.
Since economies of scale occur with larger quantities, these fees generally scale up with increasing quantities
of EV capable infrastructure, though they are not completely scalable. Costs are higher for outdoor circuits
than for indoor circuits due to trenching and are higher for retrofits than for new construction or alterations
and additions due to demolition, repaving, and repairs.48
A R C H I T E C T U R A L P L A N F E E S
Costs to add EV capable parking spaces to architectural plans and drawings will vary between projects based
on their overall complexity. They are based on the estimated number of hours for each project and a fee of
$150/hour before geographic adjustments. Costs will also vary if the project is new construction or a retrofit.
In the former case, costs will be relatively minor because the architectural firm will likely be familiar with the
plan of the building and can easily influence relevant design decisions like adding EV capable infrastructure.
For retrofit projects, costs will likely be significantly higher due to the need to investigate and accommodate
more complex on-site conditions such as: longer conduit runs, demolition and reconstruction, meeting
accessibility requirements based on existing conditions, and/or more limited options for electrical room and
panel placement.
A minimal incremental cost is required for adding several EV capable parking spaces to a new building or
alteration and addition. In contrast, preparing construction plans for large numbers of EV capable parking
spaces to an existing building may take a significant amount of time considering the layout and construction
details for each parking space and existing site conditions. Costs will partially scale by the number of EV
capable parking spaces.
L O A D S T U D Y / S I T E C O N D I T I O N S S T U D Y
Additional expenses are required for stand-alone retrofits at medium or large buildings to assess existing load
and other conditions. The load study is necessary to determine the current electrical supply capacity, such as
47 See Table 1A-A and Table 1A-E 48 We note that efforts are underway to streamline permitting and inspections of EV charging infrastructure including EV capable parking spaces.
ATTACHMENT 8
6
the transformer and other systems related to the main electrical supply and the current actual load.49 The study
will then determine which on-site upgrades may be needed to install EV capable parking spaces. In addition,
site-specific conditions may need to be determined such as current concrete conditions, soils conditions, and/
or other conditions. A load study at a facility where other site condition studies aren’t needed is assumed to
cost $1,000. Factors such as demolition and/or a greater number of EV parking spaces will drive costs up and
a more complex study is assumed to cost $5,000 in this report (prior to prime contractor expenses). X-ray
costs are roughly $1,000 for a half dozen images, which may be enough for retrofit installations at a medium
sized facility, however, more may be required for a 150-space garage.50 A specific site may require more or
less resources depending on actual conditions.
Assuming alterations and additions originally intended for non-EV charging purposes will require an
assessment of load and existing conditions, the assessment would also suffice for EV charging as well.
E L E C T R I C A L P A N E L L O C A T I O N S A N D S I Z I N G
Some electrical panels are located in the main electrical room while others are distributed closer to EV
parking spaces to reduce branch circuit lengths and costs. Distributed panels are more practical in locations
with convenient wall mounting locations protected from weather and vandalism. All panel and sub-panel
conduits are assumed to be installed in 1 ½ inch steel surface-mounted conduits for 225 ampere panels (to
carry 250 MCM wire) or 2-inch conduits for 400 ampere panels (to carry 600 MCM wire) to provide a high
level of protection and allow for easy visual inspection.
In some cases, a panel installed in new construction can be upsized to serve both base loads (such as garage
lighting, elevators, and miscellaneous outlets) and EV charging loads. In other cases, panels for EV charging
are sized to their maximum practical size (typically 400 amperes) just to meet EV charging needs. (Panels are
generally limited by electrical panel capacity rather than physical size for EV electrical infrastructure. A
single-phase 400-ampere panel has electrical capacity for 10 circuits and typically has physical space for 15
40-amperes circuits even if they utilize double slot 20-ampere breakers.)
The type of electrical panels will depend on whether a building is served by three-phase (4-wire) electrical
service or one-phase (3-wire) electrical service. Medium and large commercial buildings and multifamily
buildings usually receive three-phase service. When a panel receives three phases of electricity instead of one,
it can accommodate additional EV capable parking spaces. However, the phases must be “balanced”, which
restricts how many additional circuits for EV capable parking spaces can be accommodated. We assumed that
three-phase 225 ampere panels can accommodate 9 40-amp circuits and three-phase 400 ampere panels can
accommodate 15 40 ampere circuits based on interviews with contractors and an electrical design firm.
49 Transformers are usually sized based on the typical maximum actual load of a building. Unlike electrical panels and electrical circuits, transformers can be under loaded to extend their lifetime of fully loading, or even occasionally overloaded without causing an immediate reliability issue but with potential reduced long-term lifetime. 50 Concrete X- Ray Imaging, Penhall, https://www.penhall.com/concrete-x-ray-imaging/ accessed 7-4-2019.
ATTACHMENT 8
7
Construction Management
The model also includes a cost factor to represent additional fixed costs incurred by contractors for retrofit
installations prior to project initiation. These costs include contractor time spent traveling to a site for
surveying, evaluating existing conditions, estimating project costs, and preparing bids. Costs will vary based
on the complexity of the project.51 For new construction, these costs likely do not apply or require minimal
additional effort to address EV capable electrical infrastructure. The construction management category also
includes general permit application fees.
Raceways, Wire, and Termination Point
PVC materials (i.e. plastic) are included for branch circuit conduits installed in new construction of enclosed
parking areas and alterations and additions to enclosed parking that remove the parking surface, while wall
and ceiling-mounted metal conduit is assumed for stand-alone retrofits. The authors assumed that intermediate
metal conduit was installed for any outdoor raceway in trenches to provide corrosion resistance and for any
indoor retrofit cases where walls and floors will not be replaced. Additional raceways may be needed between
floors and inaccessible areas.
1¼-inch raceways are generally assumed to carry up to twelve #8 wires rated at 40 amperes (three per circuit)
to support 30-ampere EVSE, with the potential to add wiring for a fifth circuit where convenient.52,53 Some
additional raceways are also needed to serve individual termination locations (i.e. a main conduit run carrying
four wires may end at one receptacle pair and a local distribution conduit would carry the other pair to its
termination point). These short distribution raceways were also sized at one and a quarter inches for
simplicity; though they could be sized at one inch or below, we do not expect that this difference would be
significant. In some cases, raceways installed in-slab during new construction will accommodate more and/or
higher capacity wires than retrofits that are wall mounted and encounter additional bends at corners and
obstacles, limiting their capacity. These potential cost savings are site-specific and not included in the model.
Wire is not included for branch circuits for EV capable parking spaces. Wires for any distributed panels that
are noted in the scenario summary table are included in the costs.
The length of raceways within a given floor for enclosed parking at new construction and repaving are
calculated based on direct routes from the electrical panel to the termination point since no obstacles are
present during new construction. Retrofitting surface-mounted conduit is generally assumed to be twice as
long in new construction because they must follow walls and ceilings with less direct routing. Compared to
new construction, raceway distances are increased by 125 percent for gut rehabilitation because significant
51 This estimate assumes that contractors win some of their bids for retrofit projects. The success rate will vary based on specific circumstances. For instance, a sole source contacting mechanism would result in a higher success rate while a contracting mechanism requiring three or more bids would result in a lower success rate. Actual costs will vary from project to project. 52 Because EV charging is consider a continuous load, the circuit capacity must be at least 25 percent higher than the end load. 53 We note that higher capacity #6 wire could also be installed at a rate of four sets per 1 ¼ inch conduit without larger sized conduit, unless conduit capacity is limited due to bends that restrict fill rates. For an example of allowable fill rates, see Elliot Electric Supply “Conduit Fill Table” at https://www.elliottelectric.com/StaticPages/ElectricalReferences/ElectricalTables/Conduit_Fill_Table.aspx.
ATTACHMENT 8
8
portions of the building are removed while some obstructions may remain. Raceway distances are also
increased by 150 percent for stand-alone retrofits in outdoor trenches to account for indirect routing (i.e.
avoiding existing infrastructure). Surface mounted retrofit distances are increased by 200 percent, compared to
new construction, due to the long distances to follow existing walls and to account for routing around existing
obstacles.
Actual configurations can vary based on site-specific circumstances. For instance, if several EV parking
spaces are located a significant distance from the main electrical panel, a single (larger) raceway run to an
additional electrical panel closer to EV parking spaces can be installed with raceways branching from the
panel to the planned EVSE location. This configuration would most likely save costs in buildings where the
reduced length of raceways would exceed additional electric panel costs. Raceways for electrical panels
outside of the main electrical room are sized (at ½ inch intervals, i.e. 1 ½ inch or 2 inches) based on the wire
needed to serve that panel.
Conduits will generally terminate at a receptacle with an outlet box with a face plate and no EVSE (i.e. the
unit that connects to the vehicle) installed at the time of construction. Local municipal building codes can also
require a specific type of receptacle, which does not have a large impact on the cost-effectiveness of code.
Receptacles are assumed to be installed in pairs to serve parking spaces on either side of the pair.
No additional curbs or bollards are assumed at the termination point. Local jurisdictions may wish to include a
requirement for anchor points for EVSE near the termination point if the EVSE can be wall-mounted, which
should not significantly affect the cost of EV capable building codes.
Demolition, Reconstruction, and Repaving
The model contains several job types related to demolition, construction, and repaving for stand-alone projects
and projects where parking areas and/or electrical rooms are undergoing renovations that would allow
installation of this equipment without any further demolition and reconstruction.
For both enclosed and surface parking, demolition for electrical rooms includes cutting and/or drilling,
breaking large pieces into smaller pieces, minimum equipment/labor costs, loading and disposal.
Reconstruction costs include concrete work (cost for pouring slabs is used as a proxy), reinforcing rods,
forms, and minimum labor charges.
Demolition for parking areas include cutting a three-foot-wide section of pavement to allow two-foot-wide
trenches; backhoe rental to trench, mobilization and operation, and disposal of materials. Some trenching
would also be required for adding EV capable parking spaces in new construction, when repaving existing
parking or adding parking. In these cases, costs would likely be much lower due to the presence of trenching
equipment on-site to meet other project needs unrelated to EV capable parking spaces.
Contingencies
A 20 percent contingency was applied for stand-alone retrofit projects based on RS Means. Contingencies are
necessary because specific challenges may not be visible at the start of a stand-alone retrofit project or
because existing conditions may be difficult to alter without expanding the scope and cost of a retrofit project
- for instance if an electrical room lacks space for additional panel(s) or was originally constructed far from
parking spaces. A general contingency was not added for EV capable parking spaces installed as part of a
ATTACHMENT 8
9
larger retrofit project such as resurfacing or building new parking spaces at an existing site because the
conditions will more closely resemble new construction, given their broader scope. In addition, specific cost
increases were already included to address higher costs for alterations and additions compared to new
construction, such as conservatively assuming that additional parking spaces would be located further from
electrical power than existing spaces.
On top of this, another 20 percent contingency was applied to estimate potential costs for accessibility (ADA)
compliance associated with restriping, adjusting path of travel, vertical clearances, and slope modifications.
ADA compliance costs can be significant but are not the focus of this report.
Transformers
Transformer costs related to secondary or “step down” transformers have been incorporated into this cost
model. Only the wiring costs are considered, not the additional costs for a concrete pad, or disposal of the
previous transformer. As mentioned previously, these transformers are used to “step down” 480 V service to
208/240 V for buildings connected to 480 V power, which in PG&E’s service area consist of buildings in the
300kVA and up range. CARB has found that EV charging generally represents a relatively small fraction of
overall building power demand in multifamily housing with 10% EV Capable parking spaces. These
transformer upgrades are often not necessary to support EV charging infrastructure for buildings but may be
more likely with the higher EV infrastructure requirements such as those considered in this report.
An electrical engineering firm and several contractors were consulted with and confirmed that they have
found that levels of EV capable parking spaces proposed for CALGreen typically would not require a
transformer upgrade, noting the typical headroom of 20% is usually sufficient to cover this growth. It was
noted that in some cases, a potential off-site utility infrastructure upgrade could be required, as noted in the
Primary Transformers section above.
In the case that EV infrastructure would trigger an expensive switchgear or transformer upgrade it should be
investigated whether retrofits that include more energy-efficient lighting and other equipment meeting current
mandatory California, ENERGY STAR®, and/or federal standards.
We expect that in cases where a transformer upgrade would be required to install EV capable infrastructure,
building codes requiring EV capable parking spaces and associated electrical capacity could achieve
significant cost savings related to these costs. Stand-alone transformer retrofits could require replacing
conduits serving the transformer, replacing the transformer pad or adding a new pad, and adding an additional
transformer or upgrading an existing transformer. By comparison, designing the electrical room for adequate
capacity would allow the installation of larger sized conduits and/or transformer pads during initial
construction at minimal cost. While we have not quantified all of these costs, the incremental cost of installing
a 3” conduit instead of a 2” conduit would be very small compared to breaking existing concrete to install a
larger sized conduit later.
ATTACHMENT 8
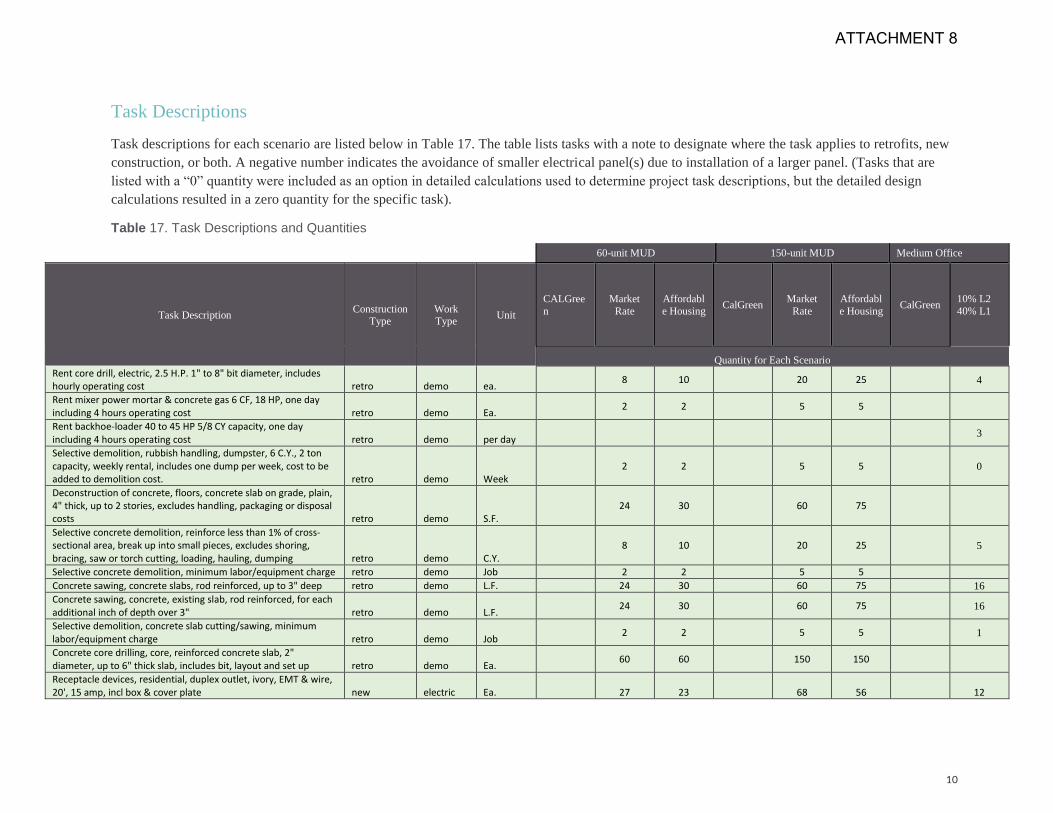
10
Task Descriptions
Task descriptions for each scenario are listed below in Table 17. The table lists tasks with a note to designate where the task applies to retrofits, new
construction, or both. A negative number indicates the avoidance of smaller electrical panel(s) due to installation of a larger panel. (Tasks that are
listed with a “0” quantity were included as an option in detailed calculations used to determine project task descriptions, but the detailed design
calculations resulted in a zero quantity for the specific task).
Table 17. Task Descriptions and Quantities
60-unit MUD 150-unit MUD Medium Office
Task Description Construction
Type Work Type
Unit
CALGree
n
Market
Rate
Affordabl
e Housing CalGreen
Market
Rate
Affordabl
e Housing CalGreen
10% L2
40% L1
Quantity for Each Scenario
Rent core drill, electric, 2.5 H.P. 1" to 8" bit diameter, includes hourly operating cost retro demo ea.
8 10 20 25 4
Rent mixer power mortar & concrete gas 6 CF, 18 HP, one day including 4 hours operating cost retro demo Ea.
2 2 5 5
Rent backhoe-loader 40 to 45 HP 5/8 CY capacity, one day including 4 hours operating cost retro demo per day
3
Selective demolition, rubbish handling, dumpster, 6 C.Y., 2 ton capacity, weekly rental, includes one dump per week, cost to be added to demolition cost. retro demo Week
2 2 5 5 0
Deconstruction of concrete, floors, concrete slab on grade, plain, 4" thick, up to 2 stories, excludes handling, packaging or disposal costs retro demo S.F.
24 30 60 75
Selective concrete demolition, reinforce less than 1% of cross-sectional area, break up into small pieces, excludes shoring, bracing, saw or torch cutting, loading, hauling, dumping retro demo C.Y.
8 10 20 25 5
Selective concrete demolition, minimum labor/equipment charge retro demo Job 2 2 5 5
Concrete sawing, concrete slabs, rod reinforced, up to 3" deep retro demo L.F. 24 30 60 75 16
Concrete sawing, concrete, existing slab, rod reinforced, for each additional inch of depth over 3" retro demo L.F.
24 30 60 75 16
Selective demolition, concrete slab cutting/sawing, minimum labor/equipment charge retro demo Job
2 2 5 5 1
Concrete core drilling, core, reinforced concrete slab, 2" diameter, up to 6" thick slab, includes bit, layout and set up retro demo Ea.
60 60 150 150
Receptacle devices, residential, duplex outlet, ivory, EMT & wire, 20', 15 amp, incl box & cover plate new electric Ea. 27 23 68 56 12
ATTACHMENT 8
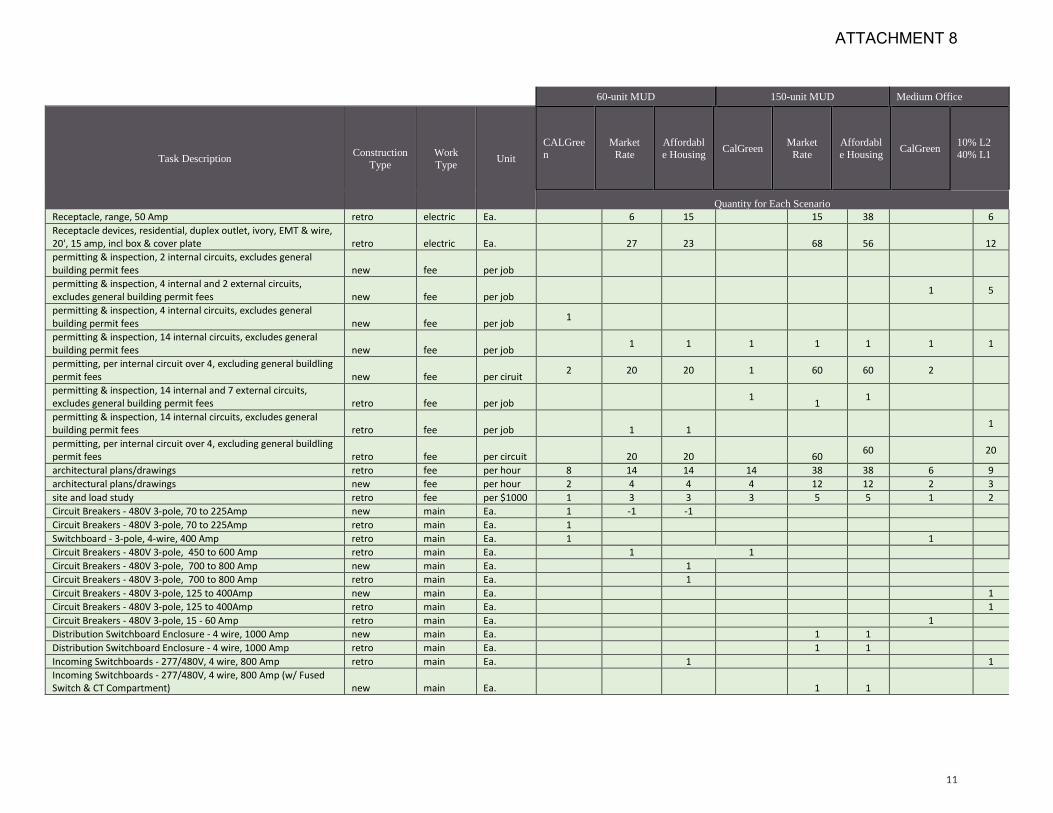
11
60-unit MUD 150-unit MUD Medium Office
Task Description Construction
Type
Work
Type Unit
CALGree
n
Market
Rate
Affordabl
e Housing CalGreen
Market
Rate
Affordabl
e Housing CalGreen
10% L2
40% L1
Quantity for Each Scenario
Receptacle, range, 50 Amp retro electric Ea. 6 15 15 38 6
Receptacle devices, residential, duplex outlet, ivory, EMT & wire, 20', 15 amp, incl box & cover plate retro electric Ea. 27 23 68 56 12
permitting & inspection, 2 internal circuits, excludes general building permit fees new fee per job
permitting & inspection, 4 internal and 2 external circuits, excludes general building permit fees new fee per job
1 5
permitting & inspection, 4 internal circuits, excludes general building permit fees new fee per job
1
permitting & inspection, 14 internal circuits, excludes general building permit fees new fee per job
1 1 1 1 1 1 1
permitting, per internal circuit over 4, excluding general buildling permit fees new fee per ciruit
2 20 20 1 60 60 2
permitting & inspection, 14 internal and 7 external circuits, excludes general building permit fees retro fee per job
1 1
1
permitting & inspection, 14 internal circuits, excludes general building permit fees retro fee per job 1 1
1
permitting, per internal circuit over 4, excluding general buildling permit fees retro fee per circuit 20 20
60
60 20
architectural plans/drawings retro fee per hour 8 14 14 14 38 38 6 9
architectural plans/drawings new fee per hour 2 4 4 4 12 12 2 3
site and load study retro fee per $1000 1 3 3 3 5 5 1 2
Circuit Breakers - 480V 3-pole, 70 to 225Amp new main Ea. 1 -1 -1 Circuit Breakers - 480V 3-pole, 70 to 225Amp retro main Ea. 1 Switchboard - 3-pole, 4-wire, 400 Amp retro main Ea. 1 1 Circuit Breakers - 480V 3-pole, 450 to 600 Amp retro main Ea. 1 1 Circuit Breakers - 480V 3-pole, 700 to 800 Amp new main Ea. 1 Circuit Breakers - 480V 3-pole, 700 to 800 Amp retro main Ea. 1 Circuit Breakers - 480V 3-pole, 125 to 400Amp new main Ea. 1
Circuit Breakers - 480V 3-pole, 125 to 400Amp retro main Ea. 1
Circuit Breakers - 480V 3-pole, 15 - 60 Amp retro main Ea. 1 Distribution Switchboard Enclosure - 4 wire, 1000 Amp new main Ea. 1 1 Distribution Switchboard Enclosure - 4 wire, 1000 Amp retro main Ea. 1 1 Incoming Switchboards - 277/480V, 4 wire, 800 Amp retro main Ea. 1 1
Incoming Switchboards - 277/480V, 4 wire, 800 Amp (w/ Fused Switch & CT Compartment) new main Ea. 1 1
ATTACHMENT 8
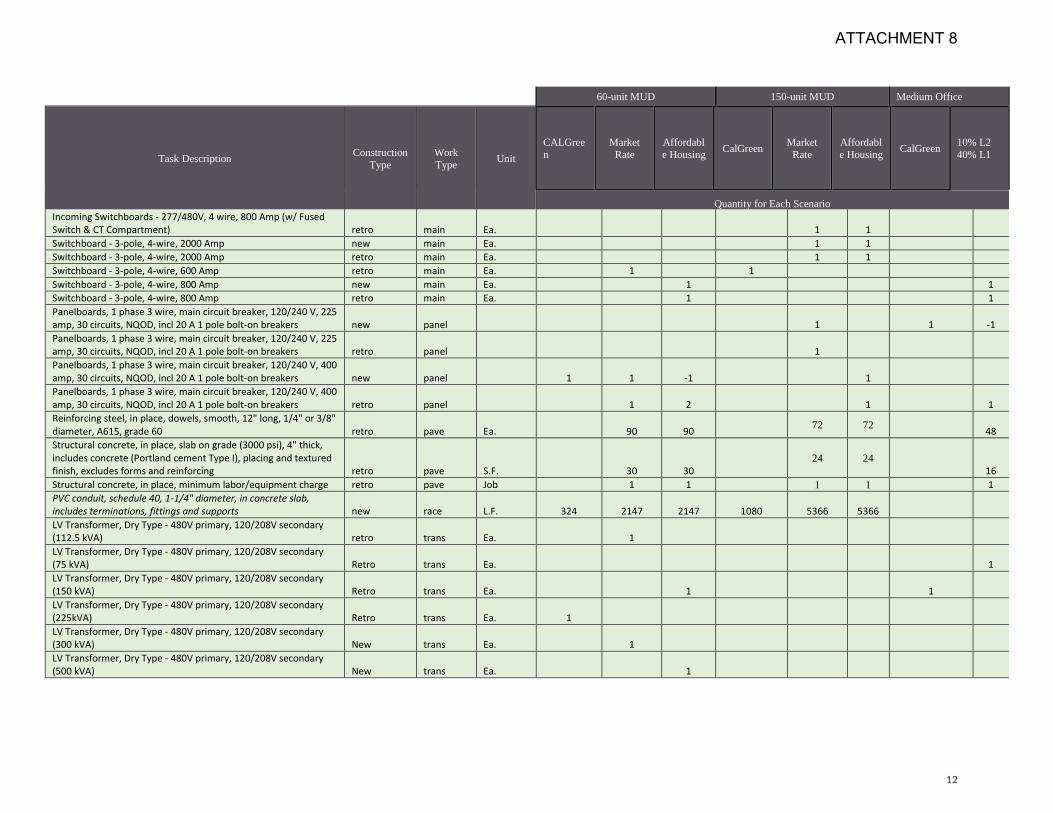
12
60-unit MUD 150-unit MUD Medium Office
Task Description Construction
Type
Work
Type Unit
CALGree
n
Market
Rate
Affordabl
e Housing CalGreen
Market
Rate
Affordabl
e Housing CalGreen
10% L2
40% L1
Quantity for Each Scenario
Incoming Switchboards - 277/480V, 4 wire, 800 Amp (w/ Fused Switch & CT Compartment) retro main Ea. 1 1 Switchboard - 3-pole, 4-wire, 2000 Amp new main Ea. 1 1 Switchboard - 3-pole, 4-wire, 2000 Amp retro main Ea. 1 1 Switchboard - 3-pole, 4-wire, 600 Amp retro main Ea. 1 1 Switchboard - 3-pole, 4-wire, 800 Amp new main Ea. 1 1
Switchboard - 3-pole, 4-wire, 800 Amp retro main Ea. 1 1
Panelboards, 1 phase 3 wire, main circuit breaker, 120/240 V, 225 amp, 30 circuits, NQOD, incl 20 A 1 pole bolt-on breakers new panel 1 1 -1
Panelboards, 1 phase 3 wire, main circuit breaker, 120/240 V, 225 amp, 30 circuits, NQOD, incl 20 A 1 pole bolt-on breakers retro panel 1 Panelboards, 1 phase 3 wire, main circuit breaker, 120/240 V, 400 amp, 30 circuits, NQOD, incl 20 A 1 pole bolt-on breakers new panel 1 1 -1 1 Panelboards, 1 phase 3 wire, main circuit breaker, 120/240 V, 400 amp, 30 circuits, NQOD, incl 20 A 1 pole bolt-on breakers retro panel 1 2 1 1
Reinforcing steel, in place, dowels, smooth, 12" long, 1/4" or 3/8" diameter, A615, grade 60 retro pave Ea.
90 90
72 72 48
Structural concrete, in place, slab on grade (3000 psi), 4" thick, includes concrete (Portland cement Type I), placing and textured finish, excludes forms and reinforcing retro pave S.F.
30 30
24 24
16
Structural concrete, in place, minimum labor/equipment charge retro pave Job 1 1 1 1 1
PVC conduit, schedule 40, 1-1/4" diameter, in concrete slab, includes terminations, fittings and supports new race L.F. 324 2147 2147 1080 5366 5366 LV Transformer, Dry Type - 480V primary, 120/208V secondary (112.5 kVA) retro trans Ea. 1 LV Transformer, Dry Type - 480V primary, 120/208V secondary (75 kVA) Retro trans Ea. 1
LV Transformer, Dry Type - 480V primary, 120/208V secondary (150 kVA) Retro trans Ea. 1 1 LV Transformer, Dry Type - 480V primary, 120/208V secondary (225kVA) Retro trans Ea. 1 LV Transformer, Dry Type - 480V primary, 120/208V secondary (300 kVA) New trans Ea. 1 LV Transformer, Dry Type - 480V primary, 120/208V secondary (500 kVA) New trans Ea. 1
ATTACHMENT 8
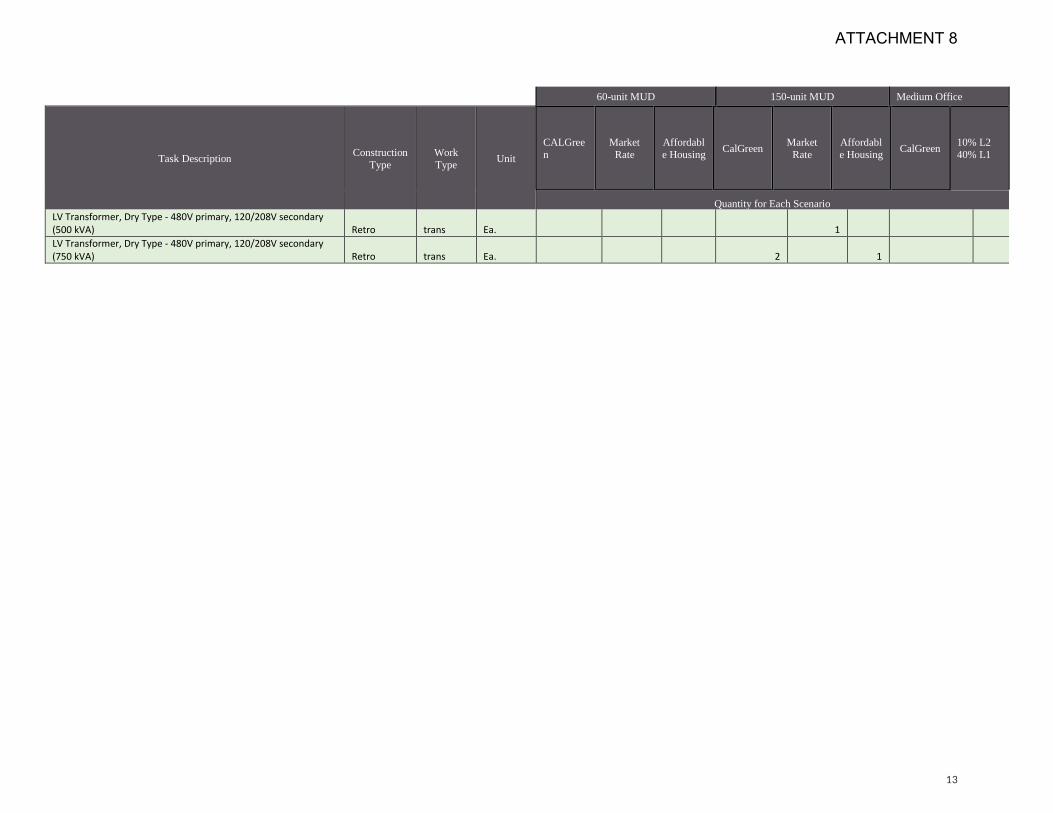
13
60-unit MUD 150-unit MUD Medium Office
Task Description Construction
Type
Work
Type Unit
CALGree
n
Market
Rate
Affordabl
e Housing CalGreen
Market
Rate
Affordabl
e Housing CalGreen
10% L2
40% L1
Quantity for Each Scenario
LV Transformer, Dry Type - 480V primary, 120/208V secondary (500 kVA) Retro trans Ea. 1
LV Transformer, Dry Type - 480V primary, 120/208V secondary (750 kVA) Retro trans Ea. 2 1
ATTACHMENT 8
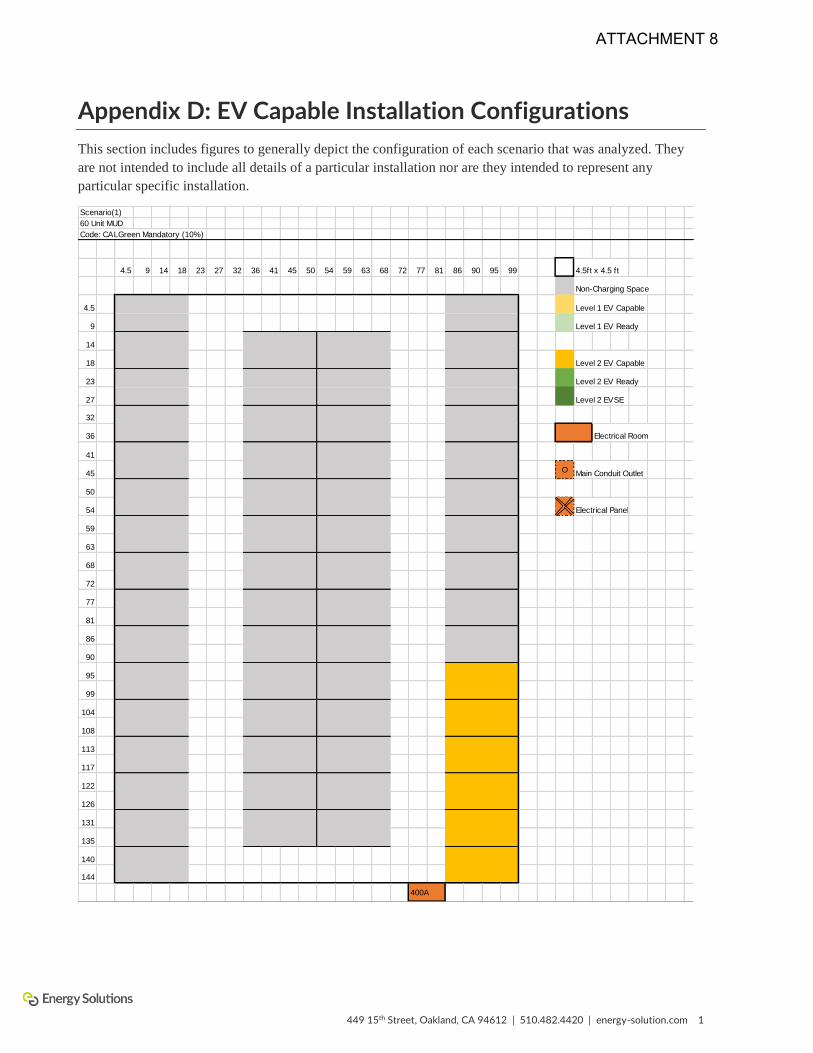
449 15th Street, Oakland, CA 94612 | 510.482.4420 | energy-solution.com 1
Appendix D: EV Capable Installation Configurations
This section includes figures to generally depict the configuration of each scenario that was analyzed. They
are not intended to include all details of a particular installation nor are they intended to represent any
particular specific installation.
Scenario(1)
60 Unit MUD
Code: CALGreen Mandatory (10%)
4.5 9 14 18 23 27 32 36 41 45 50 54 59 63 68 72 77 81 86 90 95 99 4.5ft x 4.5 ft
Non-Charging Space
4.5 Level 1 EV Capable
9 Level 1 EV Ready
14
18 Level 2 EV Capable
23 Level 2 EV Ready
27 Level 2 EVSE
32
36 Electrical Room
41
45 O Main Conduit Outlet
50
54 Electrical Panel
59
63
68
72
77
81
86
90
95
99
104
108
113
117
122
126
131
135
140
144
400A
ATTACHMENT 8
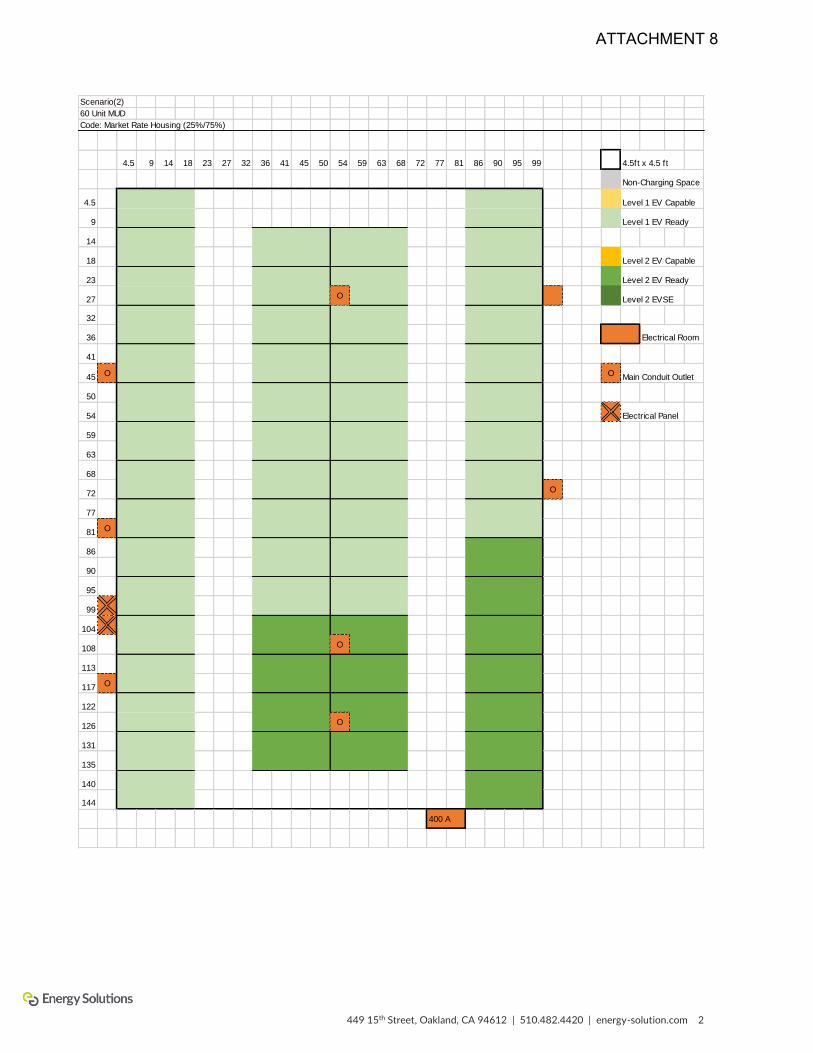
449 15th Street, Oakland, CA 94612 | 510.482.4420 | energy-solution.com 2
Scenario(2)
60 Unit MUD
Code: Market Rate Housing (25%/75%)
4.5 9 14 18 23 27 32 36 41 45 50 54 59 63 68 72 77 81 86 90 95 99 4.5ft x 4.5 ft
Non-Charging Space
4.5 Level 1 EV Capable
9 Level 1 EV Ready
14
18 Level 2 EV Capable
23 Level 2 EV Ready
27 O Level 2 EVSE
32
36 Electrical Room
41
45 O O Main Conduit Outlet
50
54 Electrical Panel
59
63
68
72 O
77
81 O
86
90
95
99
104
108 O
113
117 O
122
126 O
131
135
140
144
400 A
ATTACHMENT 8
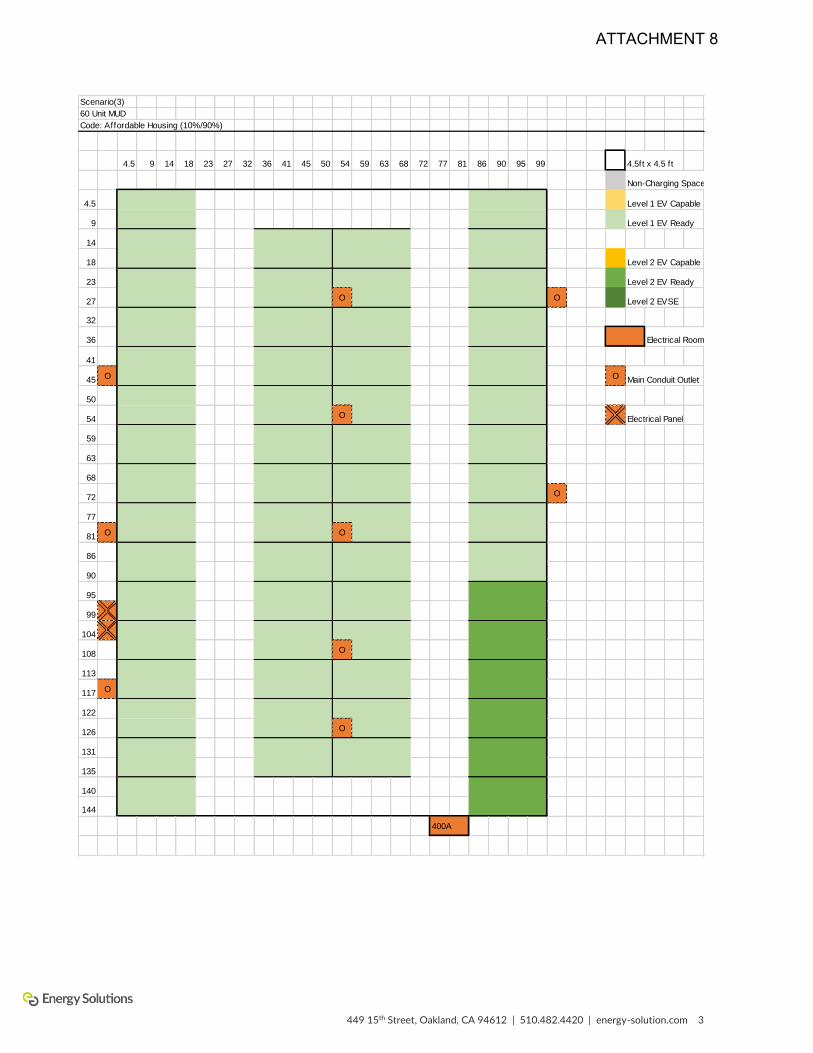
449 15th Street, Oakland, CA 94612 | 510.482.4420 | energy-solution.com 3
Scenario(3)
60 Unit MUD
Code: Affordable Housing (10%/90%)
4.5 9 14 18 23 27 32 36 41 45 50 54 59 63 68 72 77 81 86 90 95 99 4.5ft x 4.5 ft
Non-Charging Space
4.5 Level 1 EV Capable
9 Level 1 EV Ready
14
18 Level 2 EV Capable
23 Level 2 EV Ready
27 O O Level 2 EVSE
32
36 Electrical Room
41
45 O O Main Conduit Outlet
50
54 O Electrical Panel
59
63
68
72 O
77
81 O O
86
90
95
99
104
108 O
113
117 O
122
126 O
131
135
140
144
400A
ATTACHMENT 8
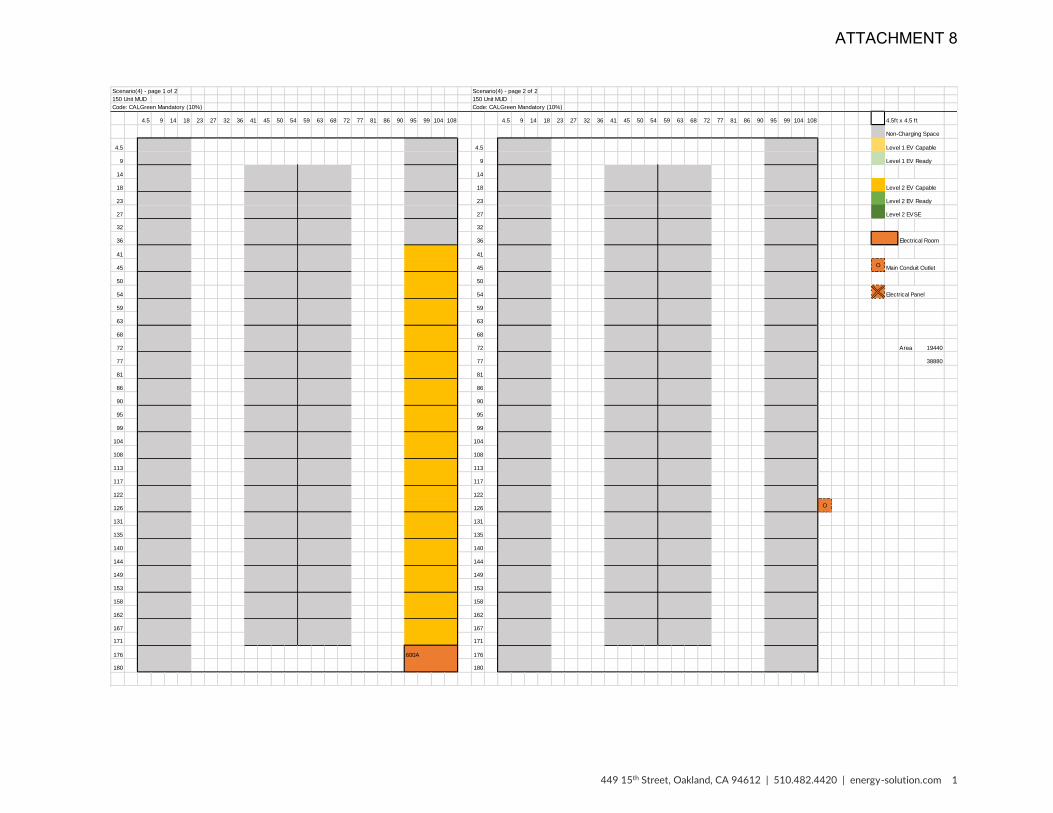
449 15th Street, Oakland, CA 94612 | 510.482.4420 | energy-solution.com 1
Scenario(4) - page 1 of 2 Scenario(4) - page 2 of 2
150 Unit MUD 150 Unit MUD
Code: CALGreen Mandatory (10%) Code: CALGreen Mandatory (10%)
4.5 9 14 18 23 27 32 36 41 45 50 54 59 63 68 72 77 81 86 90 95 99 104 108 4.5 9 14 18 23 27 32 36 41 45 50 54 59 63 68 72 77 81 86 90 95 99 104 108 4.5ft x 4.5 ft
Non-Charging Space
4.5 4.5 Level 1 EV Capable
9 9 Level 1 EV Ready
14 14
18 18 Level 2 EV Capable
23 23 Level 2 EV Ready
27 27 Level 2 EVSE
32 32
36 36 Electrical Room
41 41
45 45 O Main Conduit Outlet
50 50
54 54 Electrical Panel
59 59
63 63
68 68
72 72 Area 19440
77 77 38880
81 81
86 86
90 90
95 95
99 99
104 104
108 108
113 113
117 117
122 122
126 126 O
131 131
135 135
140 140
144 144
149 149
153 153
158 158
162 162
167 167
171 171
176 600A 176
180 180
ATTACHMENT 8
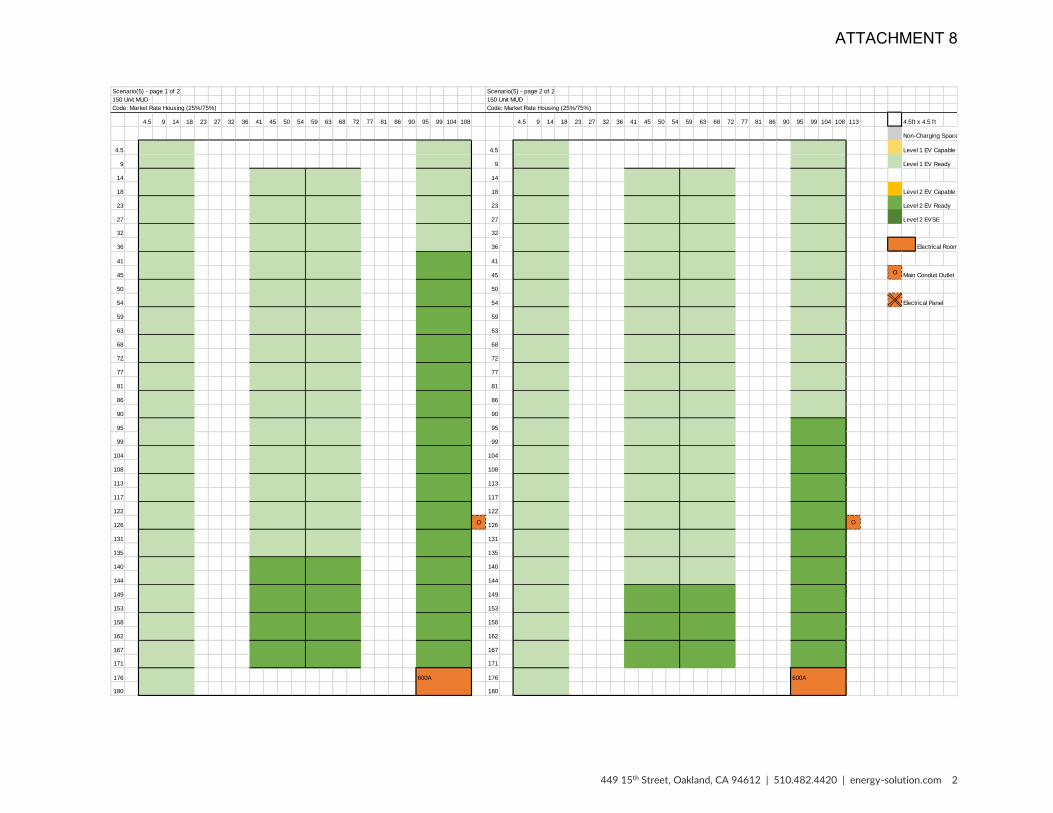
449 15th Street, Oakland, CA 94612 | 510.482.4420 | energy-solution.com 2
Scenario(5) - page 1 of 2 Scenario(5) - page 2 of 2
150 Unit MUD 150 Unit MUD
Code: Market Rate Housing (25%/75%) Code: Market Rate Housing (25%/75%)
4.5 9 14 18 23 27 32 36 41 45 50 54 59 63 68 72 77 81 86 90 95 99 104 108 4.5 9 14 18 23 27 32 36 41 45 50 54 59 63 68 72 77 81 86 90 95 99 104 108 113 4.5ft x 4.5 ft
Non-Charging Space
4.5 4.5 Level 1 EV Capable
9 9 Level 1 EV Ready
14 14
18 18 Level 2 EV Capable
23 23 Level 2 EV Ready
27 27 Level 2 EVSE
32 32
36 36 Electrical Room
41 41
45 45 O Main Conduit Outlet
50 50
54 54 Electrical Panel
59 59
63 63
68 68
72 72
77 77
81 81
86 86
90 90
95 95
99 99
104 104
108 108
113 113
117 117
122 122
126 O 126 O
131 131
135 135
140 140
144 144
149 149
153 153
158 158
162 162
167 167
171 171
176 600A 176 600A
180 180
ATTACHMENT 8
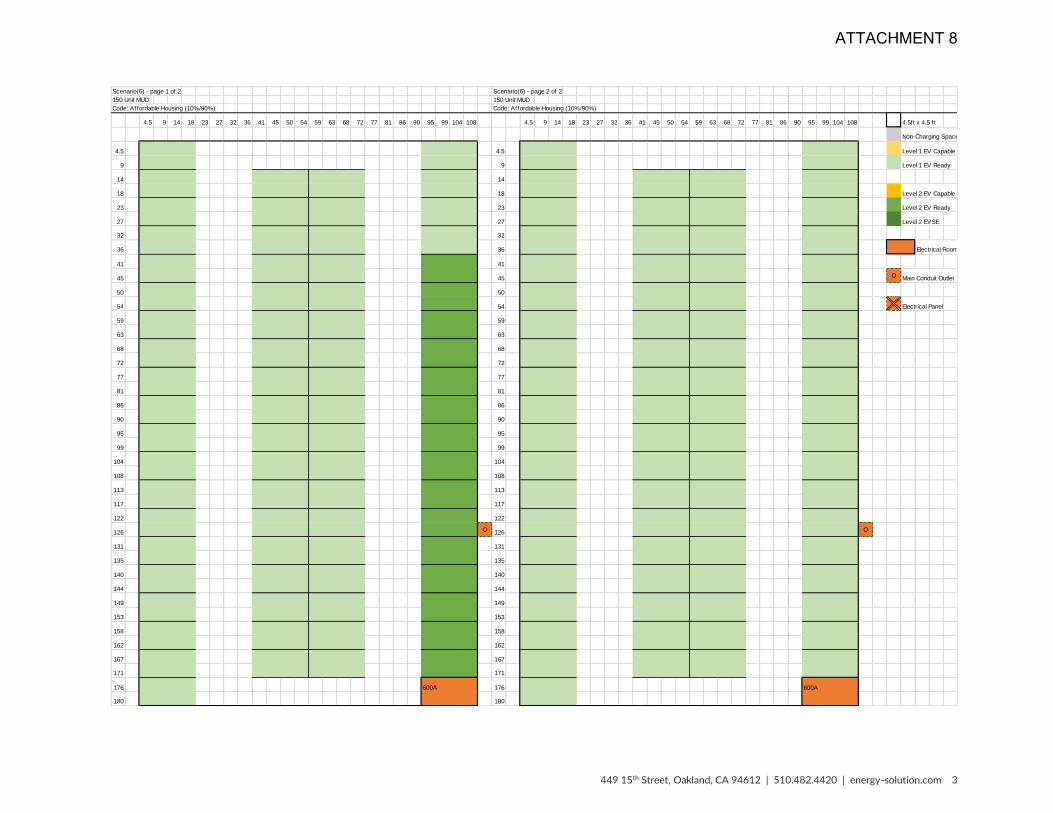
449 15th Street, Oakland, CA 94612 | 510.482.4420 | energy-solution.com 3
Scenario(6) - page 1 of 2 Scenario(6) - page 2 of 2
150 Unit MUD 150 Unit MUD
Code: Affordable Housing (10%/90%) Code: Affordable Housing (10%/90%)
4.5 9 14 18 23 27 32 36 41 45 50 54 59 63 68 72 77 81 86 90 95 99 104 108 4.5 9 14 18 23 27 32 36 41 45 50 54 59 63 68 72 77 81 86 90 95 99 104 108 4.5ft x 4.5 ft
Non-Charging Space
4.5 4.5 Level 1 EV Capable
9 9 Level 1 EV Ready
14 14
18 18 Level 2 EV Capable
23 23 Level 2 EV Ready
27 27 Level 2 EVSE
32 32
36 36 Electrical Room
41 41
45 45 O Main Conduit Outlet
50 50
54 54 Electrical Panel
59 59
63 63
68 68
72 72
77 77
81 81
86 86
90 90
95 95
99 99
104 104
108 108
113 113
117 117
122 122
126 O 126 O
131 131
135 135
140 140
144 144
149 149
153 153
158 158
162 162
167 167
171 171
176 600A 176 600A
180 180
ATTACHMENT 8
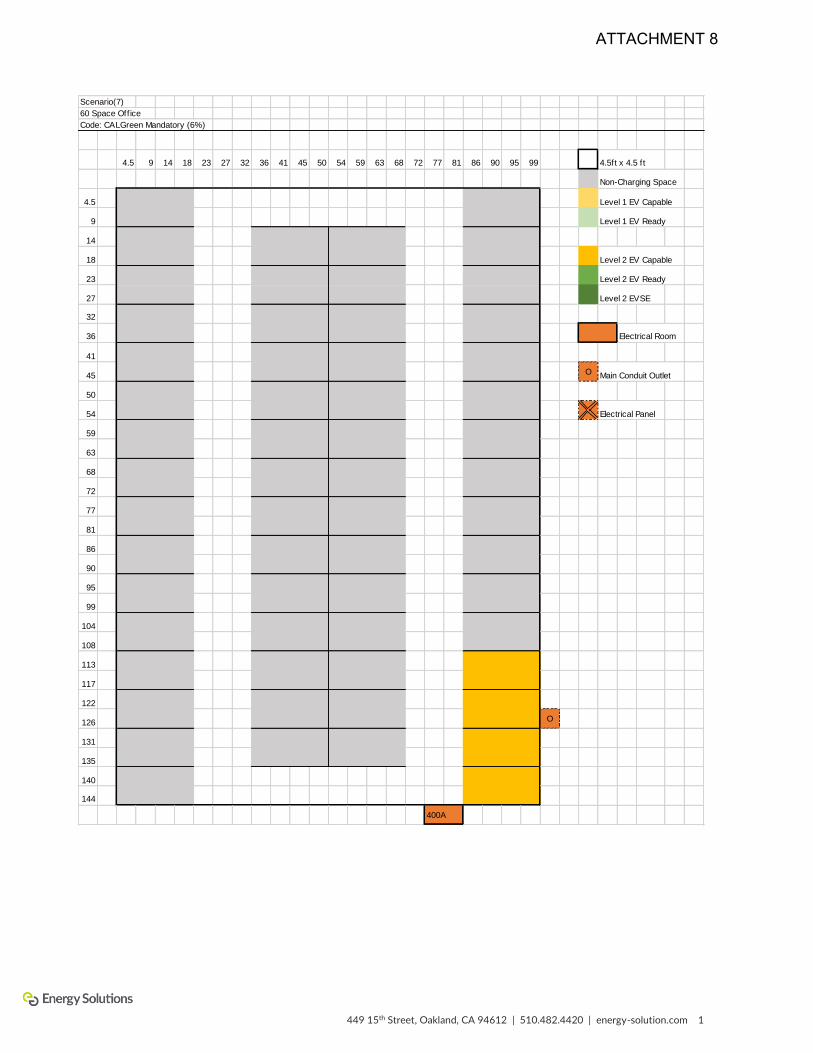
449 15th Street, Oakland, CA 94612 | 510.482.4420 | energy-solution.com 1
Scenario(7)
60 Space Office
Code: CALGreen Mandatory (6%)
4.5 9 14 18 23 27 32 36 41 45 50 54 59 63 68 72 77 81 86 90 95 99 4.5ft x 4.5 ft
Non-Charging Space
4.5 Level 1 EV Capable
9 Level 1 EV Ready
14
18 Level 2 EV Capable
23 Level 2 EV Ready
27 Level 2 EVSE
32
36 Electrical Room
41
45 O Main Conduit Outlet
50
54 Electrical Panel
59
63
68
72
77
81
86
90
95
99
104
108
113
117
122
126 O
131
135
140
144
400A
ATTACHMENT 8
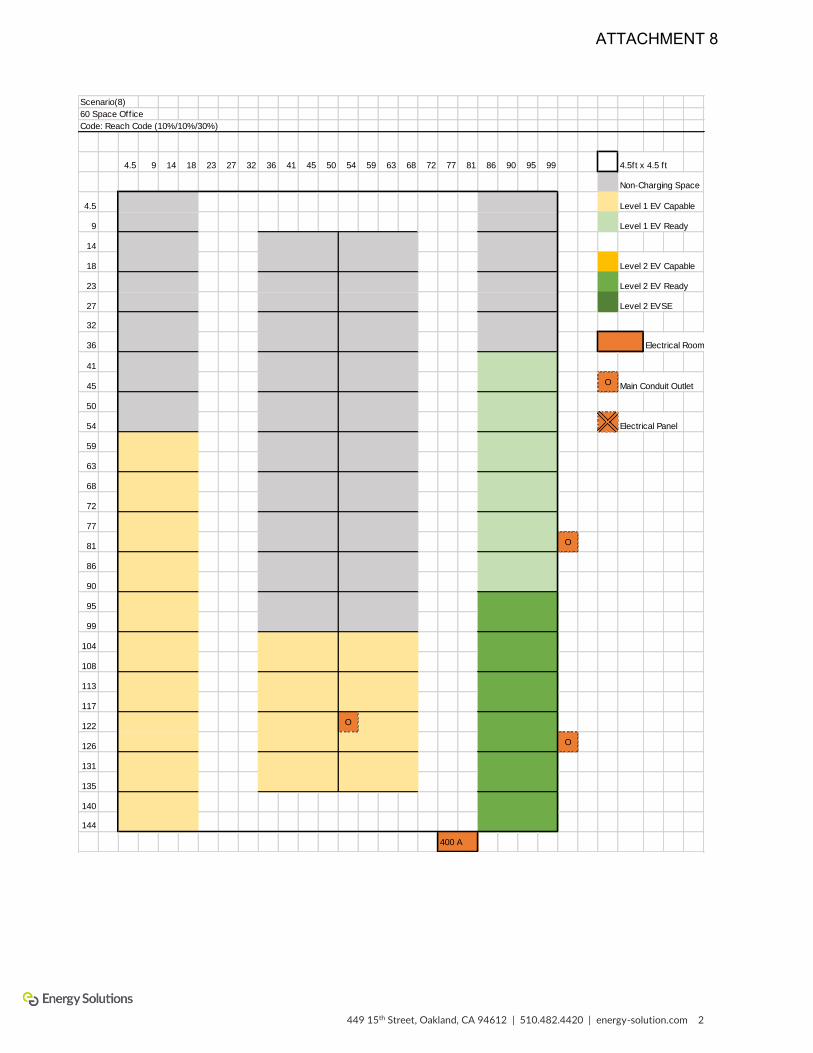
449 15th Street, Oakland, CA 94612 | 510.482.4420 | energy-solution.com 2
Scenario(8)
60 Space Office
Code: Reach Code (10%/10%/30%)
4.5 9 14 18 23 27 32 36 41 45 50 54 59 63 68 72 77 81 86 90 95 99 4.5ft x 4.5 ft
Non-Charging Space
4.5 Level 1 EV Capable
9 Level 1 EV Ready
14
18 Level 2 EV Capable
23 Level 2 EV Ready
27 Level 2 EVSE
32
36 Electrical Room
41
45 O Main Conduit Outlet
50
54 Electrical Panel
59
63
68
72
77
81 O
86
90
95
99
104
108
113
117
122 O
126 O
131
135
140
144
400 A
ATTACHMENT 8

sierraclub.org/loma-prieta ~ 3921 East Bayshore Road, Suite 204, Palo Alto, CA 94303
SAN MATEO, SANTA CLARA & SAN BENITO COUNTIES
October 27, 2020 Los Altos City Council 1 North San Antonio Road Los Altos, CA 94022 Via email to: [email protected] RE: 10.27.2020 City Council Agenda Item 7: Reach Codes
Dear Los Altos City Councilmembers,
We are living in a climate crisis that poses an existential threat to the survival of organized human life
and global biodiversity. The scientific consensus on climate change tells us that our society must rapidly
transition away from fossil fuels. The Sierra Club Loma Prieta Chapter is pleased that the Los Altos City
Council will consider the adoption of Reach Codes tonight. It is imperative that we no longer continue to
build more unnecessary fossil fuel pipelines that are a cost, health, and climate hazard to our
community and to future generations.
The Loma Prieta Chapter would like to thank all of the City Councilmembers and City Staff who have
worked hard to bring the code before us in its current form. While we hope that Los Altos will adopt a
fully all-electric code in the near future, we also believe it is imperative that the City move forward
tonight with the Reach Code as presented in the staff report.
We hope you take this important step to help the community transition away from fossil fuels and
towards a future that is healthy for our residents and ecosystems.
Sincerely,
Dashiell Leeds, Conservation Assistant, Sierra Club Loma Prieta Chapter
Cc: James Eggers, Executive Director, Sierra Club Loma Prieta Chapter