Embed Size (px)
Citation preview
15588/1561/6201176v1
November 27, 2015 GFI Real Estate Limited 140 Broadway, 41st Floor New York, NY 10005 USA
Re: Fair Value Appraisals – Consent to include within Financial Statements
Dear Sirs, We hereby give our full consent to GFI Real Estate Limited (the "Company") to the inclusion of our Appraisal Reports dated November 17, 2015, November 27, 2015, and November 27, 2015 (Effective date – September 30, 2015) regarding Harbour Club at 49000 Denton Road, Belleville, MI, Ace Hotel at 1186-1198 Broadway, New York, NY, and The Beekman Hotel at 5 Beekman and 115 Nassau Streets, New York, NY in their entirety, within the Company's Financial Statements for September 30, 2015, to be published by the Company no later than November 30, 2015, and any ensuing financial statements, and within any other filing to be filed and/or disclosed by the Company to the Israel Securities Authority and/or to be published by the Company. In addition, we hereby give our full consent to the inclusion of a copy of this letter within the Company's Financial Statements and other filings as aforesaid. Yours faithfully, __________ Kenneth P. Riggs, Jr. President
APPRAISAL OF
Harbour Club 49000 Denton Rd
Belleville, MI, 48111
As of September 30, 2015
GFI Capital Holdings, LLC Jennifer McLean
140 Broadway, 41st Floor
New York, NY 10005
Prepared for
RERC
6600 Westown Parkway, Suite 260 West Des Moines, IA 50266
(515) 309-7600 www.rerc.com
Prepared by
APPRAISAL REPORT
RERC is an SEC-Registered Investment Advisor
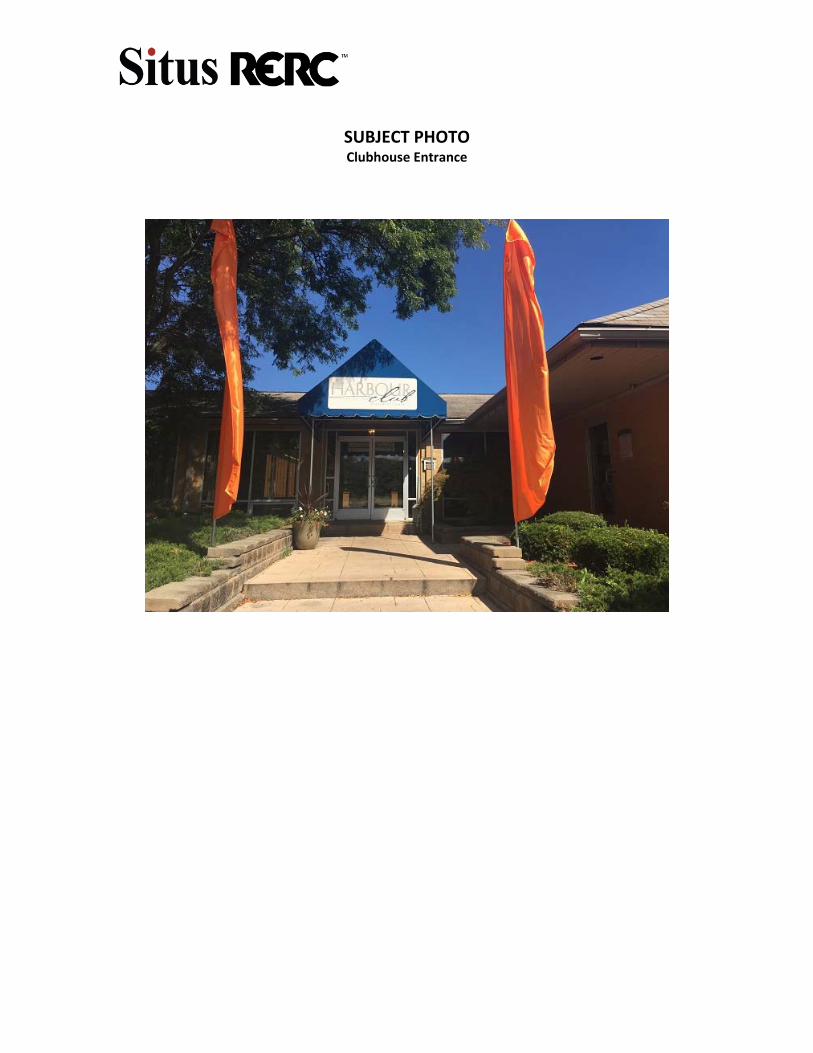
SUBJECT PHOTO Clubhouse Entrance
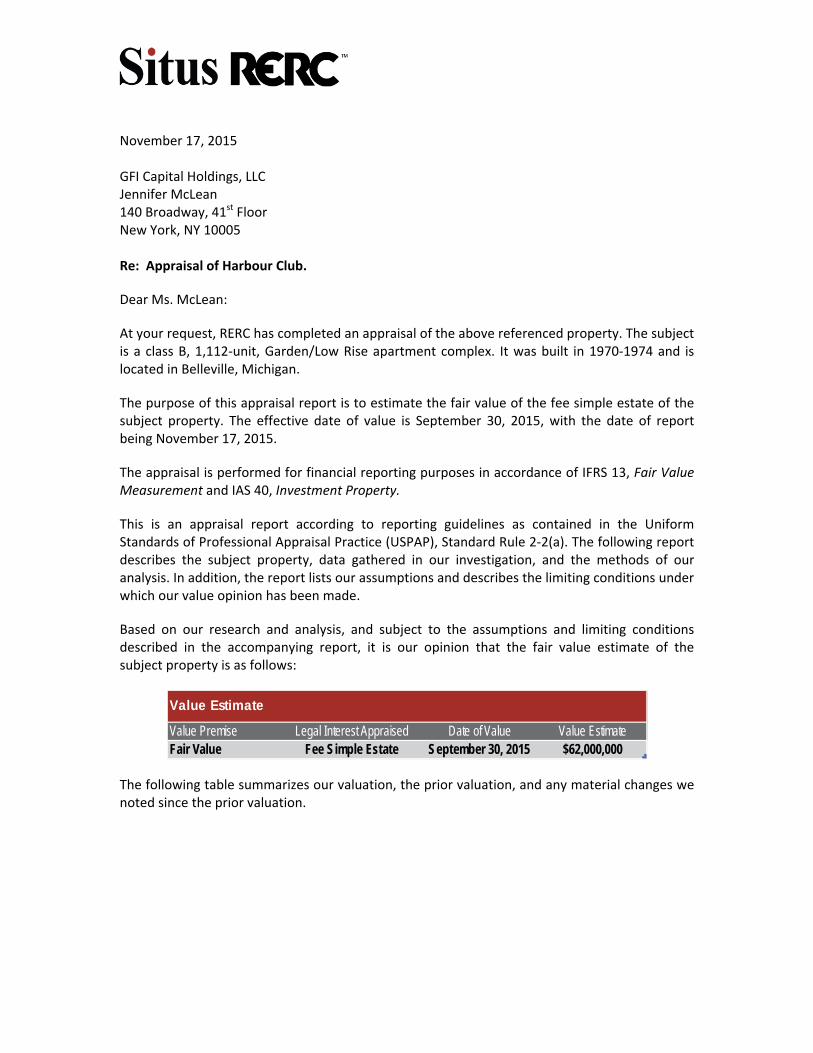
November 17, 2015 GFI Capital Holdings, LLC Jennifer McLean 140 Broadway, 41st Floor New York, NY 10005 Re: Appraisal of Harbour Club.
Dear Ms. McLean:
At your request, RERC has completed an appraisal of the above referenced property. The subject is a class B, 1,112‐unit, Garden/Low Rise apartment complex. It was built in 1970‐1974 and is located in Belleville, Michigan.
The purpose of this appraisal report is to estimate the fair value of the fee simple estate of the subject property. The effective date of value is September 30, 2015, with the date of report being November 17, 2015.
The appraisal is performed for financial reporting purposes in accordance of IFRS 13, Fair Value Measurement and IAS 40, Investment Property.
This is an appraisal report according to reporting guidelines as contained in the Uniform Standards of Professional Appraisal Practice (USPAP), Standard Rule 2‐2(a). The following report describes the subject property, data gathered in our investigation, and the methods of our analysis. In addition, the report lists our assumptions and describes the limiting conditions under which our value opinion has been made.
Based on our research and analysis, and subject to the assumptions and limiting conditions described in the accompanying report, it is our opinion that the fair value estimate of the subject property is as follows:
Value Premise Legal Interest Appraised Date of Value Value EstimateFair Value Fee Simple Estate September 30, 2015 $62,000,000
Value Estimate
The following table summarizes our valuation, the prior valuation, and any material changes we noted since the prior valuation.
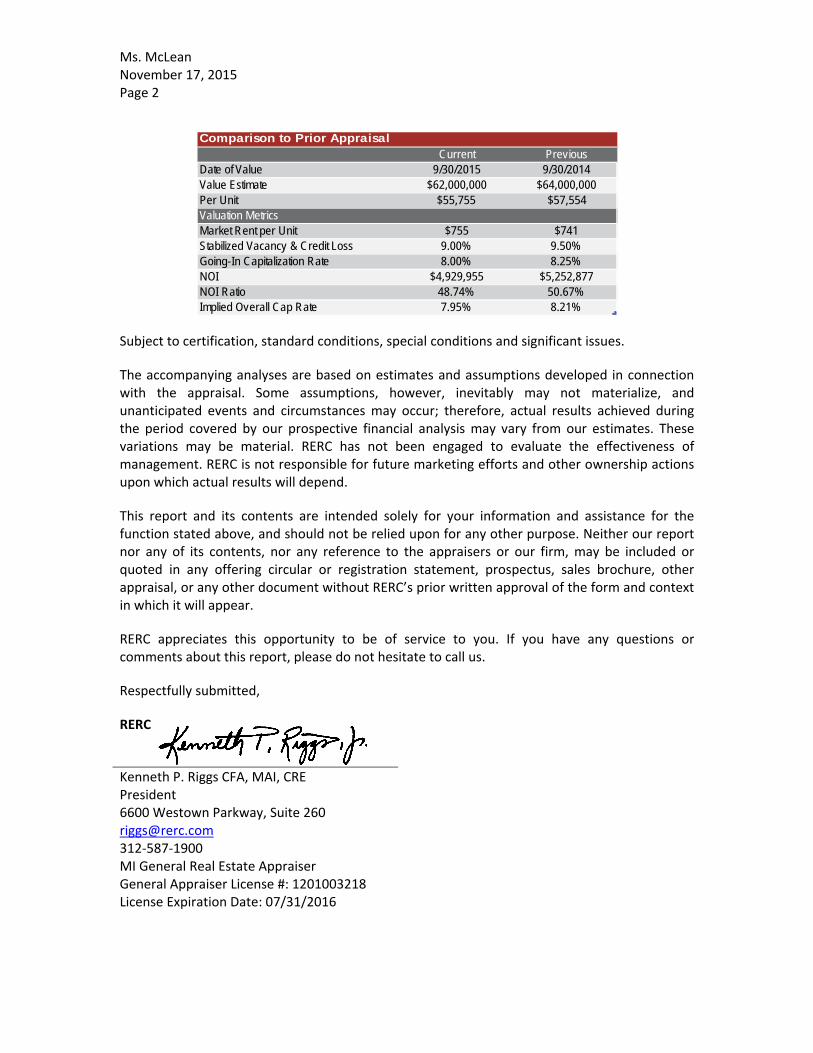
Ms. McLean November 17, 2015 Page 2
Current PreviousDate of Value 9/30/2015 9/30/2014Value Estimate $62,000,000 $64,000,000Per Unit $55,755 $57,554Valuation MetricsMarket Rent per Unit $755 $741Stabilized Vacancy & Credit Loss 9.00% 9.50%Going-In Capitalization Rate 8.00% 8.25%NOI $4,929,955 $5,252,877NOI Ratio 48.74% 50.67%Implied Overall Cap Rate 7.95% 8.21%
Comparison to Prior Appraisal
Subject to certification, standard conditions, special conditions and significant issues.
The accompanying analyses are based on estimates and assumptions developed in connection with the appraisal. Some assumptions, however, inevitably may not materialize, and unanticipated events and circumstances may occur; therefore, actual results achieved during the period covered by our prospective financial analysis may vary from our estimates. These variations may be material. RERC has not been engaged to evaluate the effectiveness of management. RERC is not responsible for future marketing efforts and other ownership actions upon which actual results will depend.
This report and its contents are intended solely for your information and assistance for the function stated above, and should not be relied upon for any other purpose. Neither our report nor any of its contents, nor any reference to the appraisers or our firm, may be included or quoted in any offering circular or registration statement, prospectus, sales brochure, other appraisal, or any other document without RERC’s prior written approval of the form and context in which it will appear.
RERC appreciates this opportunity to be of service to you. If you have any questions or comments about this report, please do not hesitate to call us.
Respectfully submitted,
RERC
Kenneth P. Riggs CFA, MAI, CRE President 6600 Westown Parkway, Suite 260 [email protected] 312‐587‐1900 MI General Real Estate Appraiser General Appraiser License #: 1201003218 License Expiration Date: 07/31/2016
TABLE OF CONTENTS
TABLE OF CONTENTS
EXECUTIVE SUMMARY ...................................................................................................................... 6
INTRODUCTION ................................................................................................................................ 8
THE REGION .................................................................................................................................... 14
THE NEIGHBORHOOD ..................................................................................................................... 21
THE PROPERTY ................................................................................................................................ 25
REAL ESTATE TAXES ........................................................................................................................ 33
NATIONAL APARTMENT MARKET ANALYSIS .................................................................................. 35
APARTMENT MARKET ANALYSIS .................................................................................................... 44
HIGHEST AND BEST USE ................................................................................................................. 51
VALUATION METHODOLOGY ......................................................................................................... 54
SALES COMPARISON APPROACH .................................................................................................... 55
INCOME APPROACH ....................................................................................................................... 65
RECONCILIATION OF VALUE ESTIMATES ........................................................................................ 92
CERTIFICATION ............................................................................................................................... 94
ASSUMPTIONS AND LIMITING CONDITIONS .................................................................................. 95
ADDENDA Subject Photographs Improved Sales Rent Roll Operating Statements Qualifications Licenses
EXECUTIVE SUMMARY
6
EXECUTIVE SUMMARY
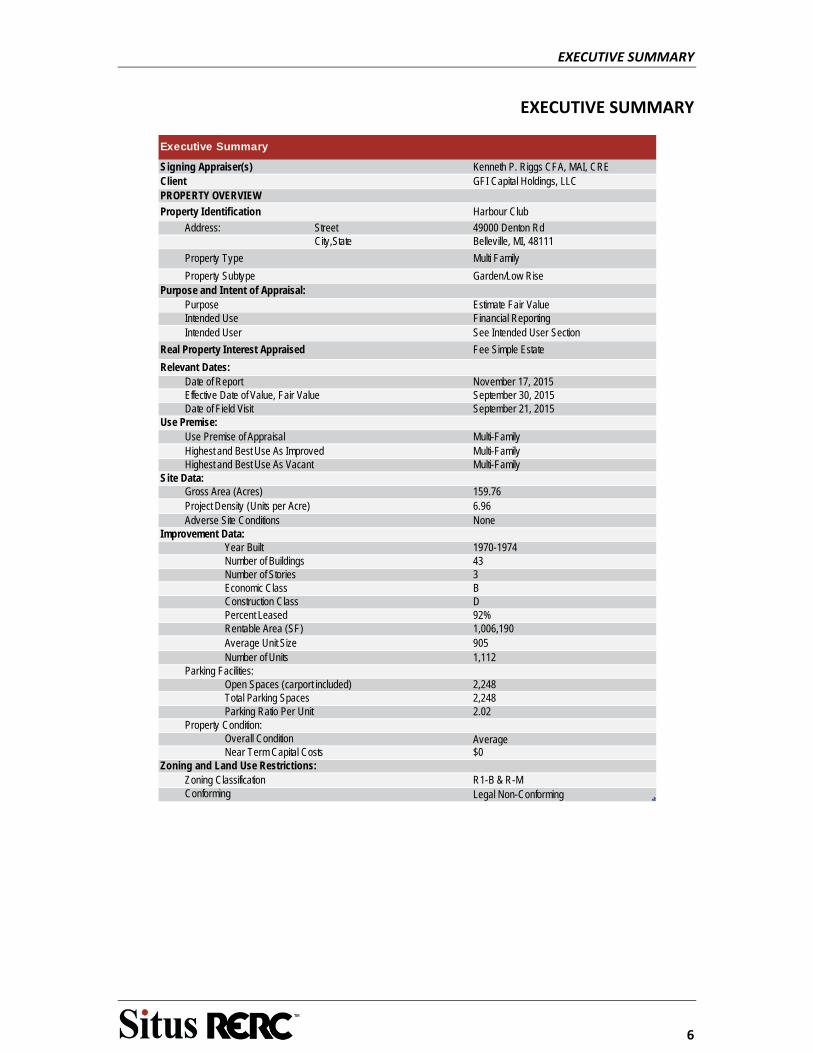
Signing Appraiser(s) Kenneth P. Riggs CFA, MAI, CREClient GFI Capital Holdings, LLCPROPERTY OVERVIEW
Property Identification Harbour Club
Address: Street 49000 Denton RdCity,State Belleville, MI, 48111
Property Type Multi Family
Property Subtype Garden/Low RisePurpose and Intent of Appraisal:
Purpose Estimate Fair ValueIntended Use Financial ReportingIntended User See Intended User Section
Real Property Interest Appraised Fee Simple Estate
Relevant Dates:Date of Report November 17, 2015Effective Date of Value, Fair Value September 30, 2015Date of Field Visit September 21, 2015
Use Premise:Use Premise of Appraisal Multi-FamilyHighest and Best Use As Improved Multi-FamilyHighest and Best Use As Vacant Multi-Family
Site Data:Gross Area (Acres) 159.76Project Density (Units per Acre) 6.96Adverse Site Conditions None
Improvement Data:Year Built 1970-1974Number of Buildings 43Number of Stories 3Economic Class BConstruction Class DPercent Leased 92%Rentable Area (SF) 1,006,190Average Unit Size 905Number of Units 1,112
Parking Facilities:Open Spaces (carport included) 2,248Total Parking Spaces 2,248Parking Ratio Per Unit 2.02
Property Condition:Overall Condition AverageNear Term Capital Costs $0
Zoning and Land Use Restrictions:Zoning Classification R1-B & R-MConforming Legal Non-Conforming
Executive Summary

EXECUTIVE SUMMARY
7
Sales Comparison Approach:Indicated Value $62,000,000Indicated Value per Unit $55,755
Income Capitalization Approach:Direct Capitalization Analysis:
Capitalization Rate 8.00%Indicated Value Estimate $62,000,000Indicated Value per Unit $55,755
Final Value EstimateValue Estimate $62,000,000
Indicated Value per Unit $55,755
Implied EGIM 6.13Implied Overall Cap Rate 7.95%
Value Indications
INTRODUCTION
8
INTRODUCTION
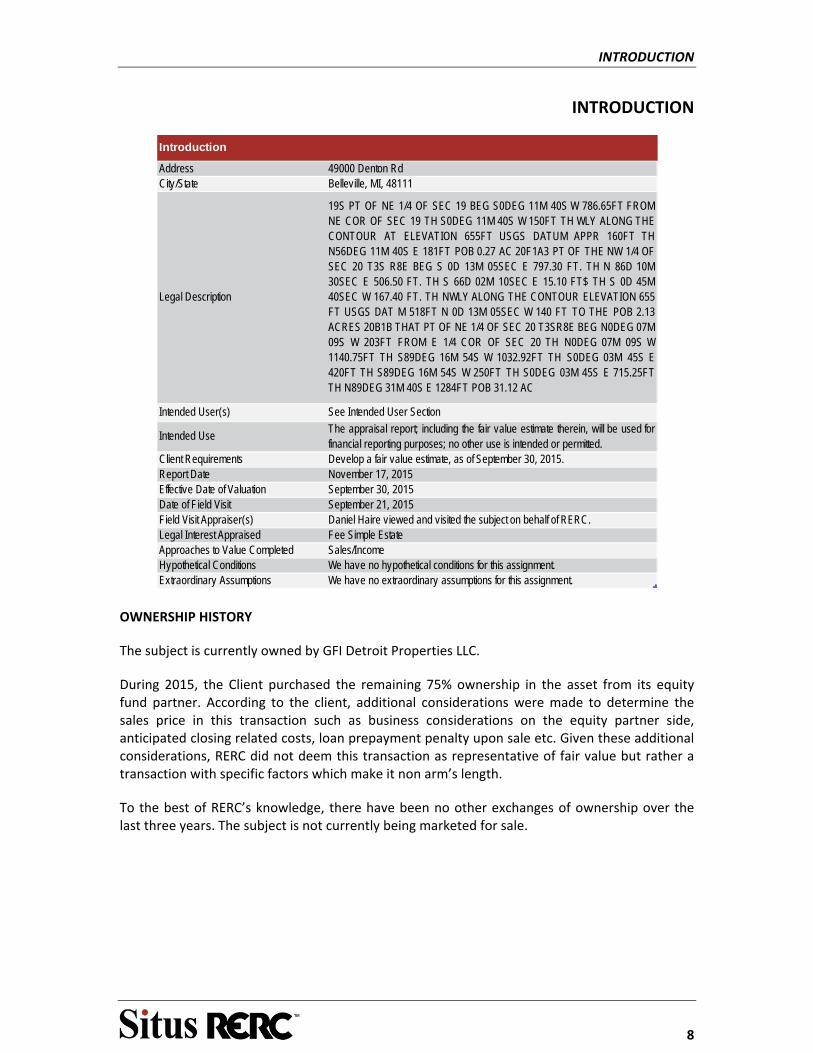
Address 49000 Denton RdCity/State Belleville, MI, 48111
Legal Description
19S PT OF NE 1/4 OF SEC 19 BEG S0DEG 11M 40S W 786.65FT FROMNE COR OF SEC 19 TH S0DEG 11M 40S W 150FT TH WLY ALONG THECONTOUR AT ELEVATION 655FT USGS DATUM APPR 160FT THN56DEG 11M 40S E 181FT POB 0.27 AC 20F1A3 PT OF THE NW 1/4 OFSEC 20 T3S R8E BEG S 0D 13M 05SEC E 797.30 FT. TH N 86D 10M30SEC E 506.50 FT. TH S 66D 02M 10SEC E 15.10 FT$ TH S 0D 45M40SEC W 167.40 FT. TH NWLY ALONG THE CONTOUR ELEVATION 655FT USGS DAT M 518FT N 0D 13M 05SEC W 140 FT TO THE POB 2.13ACRES 20B1B THAT PT OF NE 1/4 OF SEC 20 T3SR8E BEG N0DEG 07M09S W 203FT FROM E 1/4 COR OF SEC 20 TH N0DEG 07M 09S W1140.75FT TH S89DEG 16M 54S W 1032.92FT TH S0DEG 03M 45S E420FT TH S89DEG 16M 54S W 250FT TH S0DEG 03M 45S E 715.25FTTH N89DEG 31M 40S E 1284FT POB 31.12 AC
Intended User(s) See Intended User Section
Intended UseThe appraisal report; including the fair value estimate therein, will be used forfinancial reporting purposes; no other use is intended or permitted.
Client Requirements Develop a fair value estimate, as of September 30, 2015.Report Date November 17, 2015Effective Date of Valuation September 30, 2015Date of Field Visit September 21, 2015Field Visit Appraiser(s) Daniel Haire viewed and visited the subject on behalf of RERC.Legal Interest Appraised Fee Simple EstateApproaches to Value Completed Sales/IncomeHypothetical Conditions We have no hypothetical conditions for this assignment.Extraordinary Assumptions We have no extraordinary assumptions for this assignment.
Introduction
OWNERSHIP HISTORY
The subject is currently owned by GFI Detroit Properties LLC.
During 2015, the Client purchased the remaining 75% ownership in the asset from its equity fund partner. According to the client, additional considerations were made to determine the sales price in this transaction such as business considerations on the equity partner side, anticipated closing related costs, loan prepayment penalty upon sale etc. Given these additional considerations, RERC did not deem this transaction as representative of fair value but rather a transaction with specific factors which make it non arm’s length.
To the best of RERC’s knowledge, there have been no other exchanges of ownership over the last three years. The subject is not currently being marketed for sale.
INTRODUCTION
9
NATURE AND SCOPE OF THE ASSIGNMENT
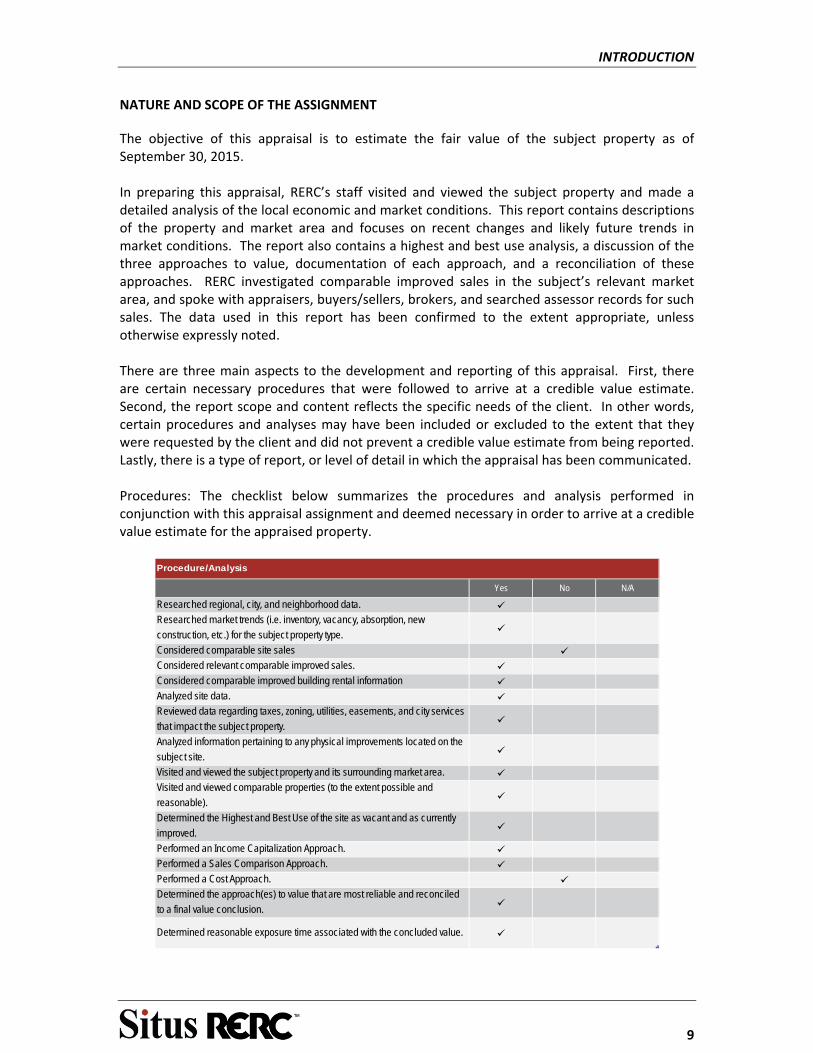
The objective of this appraisal is to estimate the fair value of the subject property as of September 30, 2015. In preparing this appraisal, RERC’s staff visited and viewed the subject property and made a detailed analysis of the local economic and market conditions. This report contains descriptions of the property and market area and focuses on recent changes and likely future trends in market conditions. The report also contains a highest and best use analysis, a discussion of the three approaches to value, documentation of each approach, and a reconciliation of these approaches. RERC investigated comparable improved sales in the subject’s relevant market area, and spoke with appraisers, buyers/sellers, brokers, and searched assessor records for such sales. The data used in this report has been confirmed to the extent appropriate, unless otherwise expressly noted. There are three main aspects to the development and reporting of this appraisal. First, there are certain necessary procedures that were followed to arrive at a credible value estimate. Second, the report scope and content reflects the specific needs of the client. In other words, certain procedures and analyses may have been included or excluded to the extent that they were requested by the client and did not prevent a credible value estimate from being reported. Lastly, there is a type of report, or level of detail in which the appraisal has been communicated. Procedures: The checklist below summarizes the procedures and analysis performed in conjunction with this appraisal assignment and deemed necessary in order to arrive at a credible value estimate for the appraised property.
Yes No N/A
Researched regional, city, and neighborhood data. Researched market trends (i.e. inventory, vacancy, absorption, new
construction, etc.) for the subject property type.
Considered comparable site sales Considered relevant comparable improved sales. Considered comparable improved building rental information Analyzed site data. Reviewed data regarding taxes, zoning, utilities, easements, and city services
that impact the subject property.
Analyzed information pertaining to any physical improvements located on the
subject site.
Visited and viewed the subject property and its surrounding market area. Visited and viewed comparable properties (to the extent possible and
reasonable).
Determined the Highest and Best Use of the site as vacant and as currently
improved.
Performed an Income Capitalization Approach. Performed a Sales Comparison Approach. Performed a Cost Approach. Determined the approach(es) to value that are most reliable and reconciled
to a final value conclusion.
Determined reasonable exposure time associated with the concluded value.
Procedure/Analysis
INTRODUCTION
10
Report Type: The report is an appraisal report that complies with the reporting requirements set forth in Standards Rule 2 of the Uniform Standards of Professional Appraisal Practice. The report details the property, data gathered in our investigation and our methods of analysis. In addition, the report lists our assumptions and describes the limiting conditions under which our value opinion has been made.
DEFINITION OF VALUE
For financial reporting purposes, the type of value is fair value. Fair value is defined by IFRS 13, Fair Value Measurement, as the “price that would be received to sell an asset or paid to transfer a liability in an orderly transaction between market participants at the measurement date.”
Implicit in this definition is the definition of market value. The market value definition used in this analysis is used by agencies that regulate federally insured financial institutions in the United States. Market value means the most probable price that a property should bring in a competitive and open market under all conditions requisite to a fair sales, the buyer and seller each acting prudently and knowledgably, and assuming the price is not affected by undue stimulus. Implicit in this definition is the consummation of a sale as of a specified date and the passing of title from seller to buyer under conditions whereby
Buyer and seller are typically motivated;
Both parties are well informed or well advised, and acting in what they consider their best interests;
A reasonable time is allowed for exposure in the open market;
Payment is made in terms of cash in U.S. dollars or in terms of financial arrangements comparable thereto; and
The price represents the normal consideration for the property sold unaffected by special or creative financing or sales concessions granted by anyone associated with the sale.1
1(12 C.F.R Part 34.42(g); 55 Federal Register 34696, August 24, 1990, as amended at 57 Federal Register 12202, April 9, 1992; 59 Federal Register 29499, June 7, 1994)
INTEREST APPRAISED
The real property interest appraised is considered to be the fee simple estate of the subject property.
The Dictionary of Real Estate Appraisal, 5th edition defines the fee simple estate as:
“Absolute ownership unencumbered by any other interest or estate, subject only to the limitations imposed by the governmental powers of taxation, eminent domain, police power, and escheat.”
INTRODUCTION
11
INTENDED USER
As specified in the engagement agreement between RERC and GFI Capital Holdings, LLC dated October 9, 2015, the Services (defined in the engagement agreement) and the Report (defined in the engagement agreement) are for the use and benefit of, and may be relied upon solely by the GFI Capital Holdings, LLC (the “Company”), its Affiliates (defined in the engagement agreement), and GFI Real Estate Limited. The Report shall remain confidential, but for the purposes of its Intended Use (defined in the engagement agreement), RERC understands that the Report will be disclosed to the following:
a. Independent auditors, accountants, attorneys and other professionals acting on behalf of the Company its Affiliates, and GFI Real Estate Limited;
b. Governmental agencies having regulatory authority over the Company, its Affiliates, and GFI Real Estate Limited; and
c. Designated persons pursuant to an order or legal process of any court or governmental agency having jurisdiction over the Company, its Affiliates, and GFI Real Estate Limited.
RERC understands that the Report is to be used to aid GFI Capital Holdings, LLC and its Affiliates in the preparation of Financial Statements for the GFI Real Estate Limited. The Report is to be used in whole and not in part. No part of the Report shall be used in conjunction with any other analysis. Except as otherwise stated herein, the Report may not be used by any person other than the parties to whom it is addressed or for purposes other than that for which it was prepared. No part of the Report shall be conveyed to the public through advertising, or used in any sales, promotion, offering or SEC material without RERC’s prior written consent.
In providing any consent RERC will note that an appraisal: (1) is an estimate of value as of a point in time, (2) is not a guarantee of financial results, (3) is not a due diligence document beyond the estimate of value. No matter the care exercised, the results achieved in an actual transaction may be different than the appraisal results, as the appraisal is an estimate of value. Any opinion of value is inherently subjective and the results speculative, as they are based on information available at the time the value opinion was being prepared, and are influenced by matters relating to operations, projections of the future, as well as the appraisers’ interpretation of the market. As such, relying on an appraisal is subject to risks and uncertainties. The appraisal report is prepared for the specifically identified use and user and not intended, permitted, nor appropriate to be relied on for other uses or by other users. The reader and user must rely on their own due diligence and analysis of the subject property in evaluating the overall security transaction, and not rely on the appraisal for their final decision making. In addition, the reader and user is/are encouraged to refer to the definition of fair value (previously defined).
INTRODUCTION
12
EXPOSURE TIME
The following definition from the Dictionary of Real Estate Appraisal, 5th edition, is used for exposure time.
1. The time a property remains on the market. 2. The estimated length of time the property interest being appraised would have been
offered on the market prior to the hypothetical consummation of a sale at market value on the effective date of the appraisal; a retrospective estimate based on an analysis of past events assuming a competitive and open market.
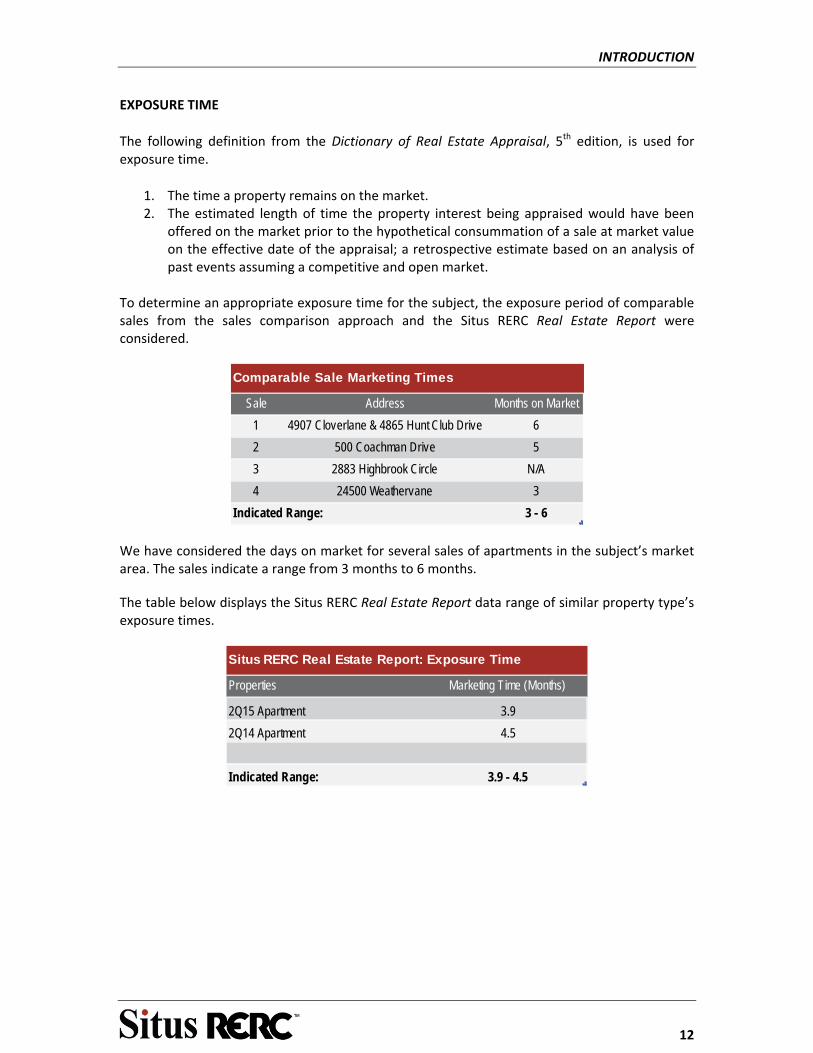
To determine an appropriate exposure time for the subject, the exposure period of comparable sales from the sales comparison approach and the Situs RERC Real Estate Report were considered.
Sale Address Months on Market
1 4907 Cloverlane & 4865 Hunt Club Drive 6
2 500 Coachman Drive 5
3 2883 Highbrook Circle N/A
4 24500 Weathervane 3
Indicated Range: 3 - 6
Comparable Sale Marketing Times
We have considered the days on market for several sales of apartments in the subject’s market area. The sales indicate a range from 3 months to 6 months.
The table below displays the Situs RERC Real Estate Report data range of similar property type’s exposure times.
Properties Marketing Time (Months)
2Q15 Apartment 3.9
2Q14 Apartment 4.5
Indicated Range: 3.9 - 4.5
Situs RERC Real Estate Report: Exposure Time
INTRODUCTION
13
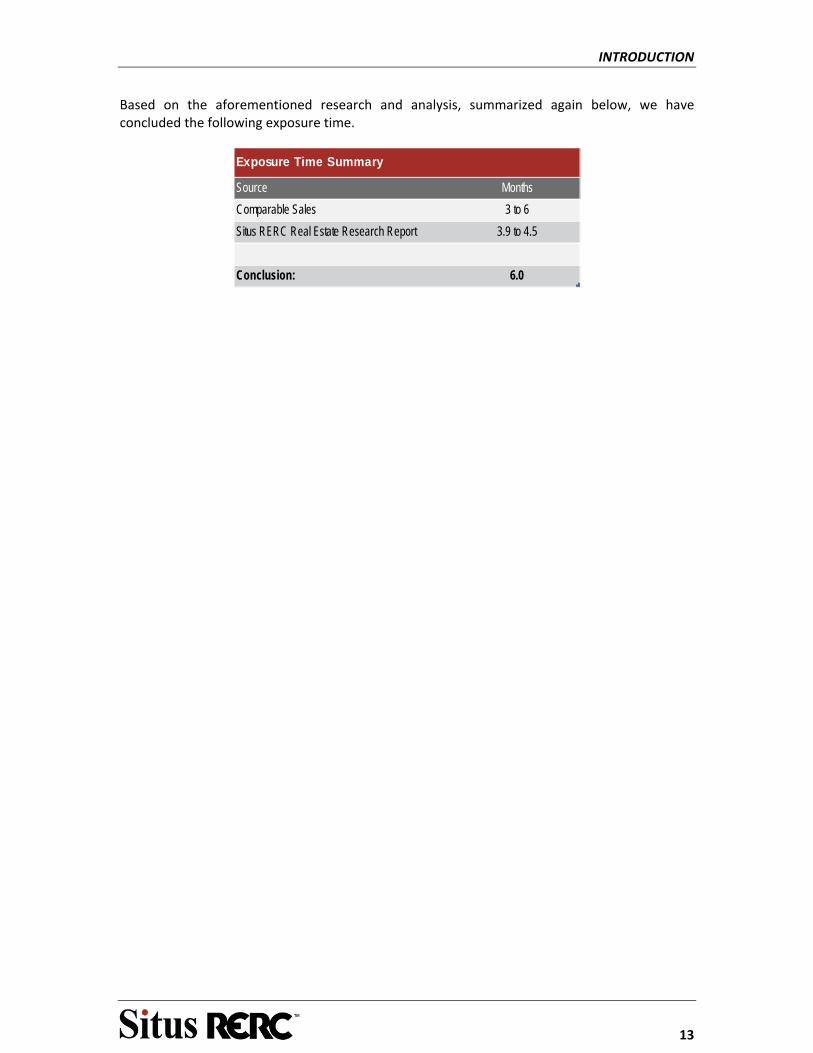
Based on the aforementioned research and analysis, summarized again below, we have concluded the following exposure time.
Source Months
Comparable Sales 3 to 6
Situs RERC Real Estate Research Report 3.9 to 4.5
Conclusion: 6.0
Exposure Time Summary

THE REGION
14
THE REGION
Regional Analysis: A survey of the industries and businesses that generate employment and income in a community as well as the rate of population growth and levels of income, both of which are functions of employment. Economic base analysis is used to forecast the level and composition of future economic activity. (The Dictionary of Real Estate Appraisal, 5th edition)
OVERVIEW
The value of the subject property is affected by various influences of the surrounding region. Infrastructure, base employment, and overall social, economic, and political conditions in the area form the background against which the property is considered. Primary sources of data include the Site To Do Business Online and The Bureau of Labor Statistics.
The subject property is located in Belleville, Wayne County, Michigan in the Detroit‐Warren‐Dearborn, MI Metro Area. The MSA is located in Southeast Michigan, consisting of the city of Detroit and its surrounding area. The area includes a variety of natural landscapes, parks, and beaches, with a recreational coastline linking the Great Lakes. The subject’s location within the region is displayed in the map below.
Subject

THE REGION
15
MARKET PROFILE
The following market profile indicates that the subject market is healthy with sustainable, moderate population, household and income growth.
State of Michigan 2010 2015 2020 2010-2015 2015-2020
Population 9,883,640 9,870,786 9,944,000 0.0% 0.1%
Households 3,872,508 3,902,559 3,943,165 0.2% 0.2%
Median HH Income N/A $49,402 $56,701 N/A 2.8%
Median Age 38.8 39.9 40.7 0.6% 0.4%
Detroit-Warren-Dearborn, MI Metro Area
Population 4,296,250 4,261,580 4,278,482 -0.2% 0.1%
Households 1,682,111 1,682,649 1,694,370 0.0% 0.1%
Median HH Income N/A $52,839 $62,034 N/A 3.3%
Median Age 39.0 40.3 41.2 0.7% 0.4%
Wayne County
Population 1,820,584 1,751,579 1,709,289 -0.8% -0.5%
Households 702,749 682,376 668,376 -0.6% -0.4%
Median HH Income N/A $41,008 $48,578 N/A 3.4%
Median Age 37.2 38.4 39.2 0.6% 0.4%
Belleville
Population 3,991 3,927 3,855 -0.3% -0.4%
Households 1,755 1,728 1,698 -0.3% -0.3%
Median HH Income N/A $40,179 $48,791 N/A 4.0%
Median Age 40.1 40.8 41.7 0.3% 0.4%
Source: STDB Online
Market Profile
49000 Denton Rd
2010, 2015, 2020
Compounded Annual % Change
MARKET PROFILE ANALYSIS
The market profile indicates that the Detroit‐Warren‐Dearborn MSA experienced growth rate decreases from 2010 to 2015 at ‐0.2% for population, while households remained stagnant. Negative growth rates for Wayne County were higher than the MSA at ‐0.8% for the population and ‐0.6% for households. Population growth for the State of Michigan remained materially unchanged at 0.0%, while households increased 0.2%. The City of Belleville experienced a negative growth rate from 2010 to 2015 of ‐0.3% for population and ‐0.3% for households. The State of Michigan and Detroit‐ Warren‐ Dearborn, MI MSA are projected to experience a slight increase in population from 2015 to 2020, while all other observed geographical areas are expected to continue to experience negative growth.

THE REGION
16
ECONOMIC FORCES
The Greater Detroit Region has a strong and currently revitalizing economic base. Since 2006, the Detroit Region has seen in excess of $12 billion invested in commercial, industrial, and residential properties. Moreover, major American corporations including Quicken Loans and Blue Cross Blue Shield have added over 12,000 jobs in downtown Detroit alone in the past 4 years. Recent metrics further elucidate the revitalization occurring in the Detroit Region as gross domestic product has increased 14% since the beginnings of the nation’s economic recovery from recession in 2009. These effects have been felt in a major way among the working class population as personal incomes are up over 6% relative to 2010 figures.
To catalyze private sector growth and small business generation Michigan replaced its Michigan Business Tax with a simpler corporate income tax effective January 2012. This less complicated business taxation structure reduced business taxes by approximately 86%, reducing operations costs, and resulting in continued investment in Michigan as a whole, with significant investments taking place in the Detroit Metro. Personal property taxes on business have also begun their phase‐out in Michigan effective January 2014. The Tax Foundation ranks Michigan’s overall business tax climate 12th in the nation, with corporate taxation specifically ranking as high as 7th in the nation.
Beyond incentivizing taxation and the upshot economic growth, varieties of grant, loan, and other economic assistance monies are available for competitive start‐ups and projects in the Detroit Metro. These include the Michigan Business Development Program from the Michigan Strategic Fund in cooperation with the Michigan Economic Development Corporation, and the Industrial Property Tax Abatement for new business investment in manufacturing, renovation of existing plants, and technology operations. Moreover, rehabilitation projects have newly been awarded 100% abatement by the State of Michigan pursuant to the Commercial Rehabilitation Act P.A. 210, provided the commercial properties are at a minimum of 15 years old.
The culmination of positive economic indicators and actively evolving programs for business incentives, as well as the strong unemployment trends elucidated in the employment section of this report, Detroit appears well positioned for continued recovery. EMPLOYMENT
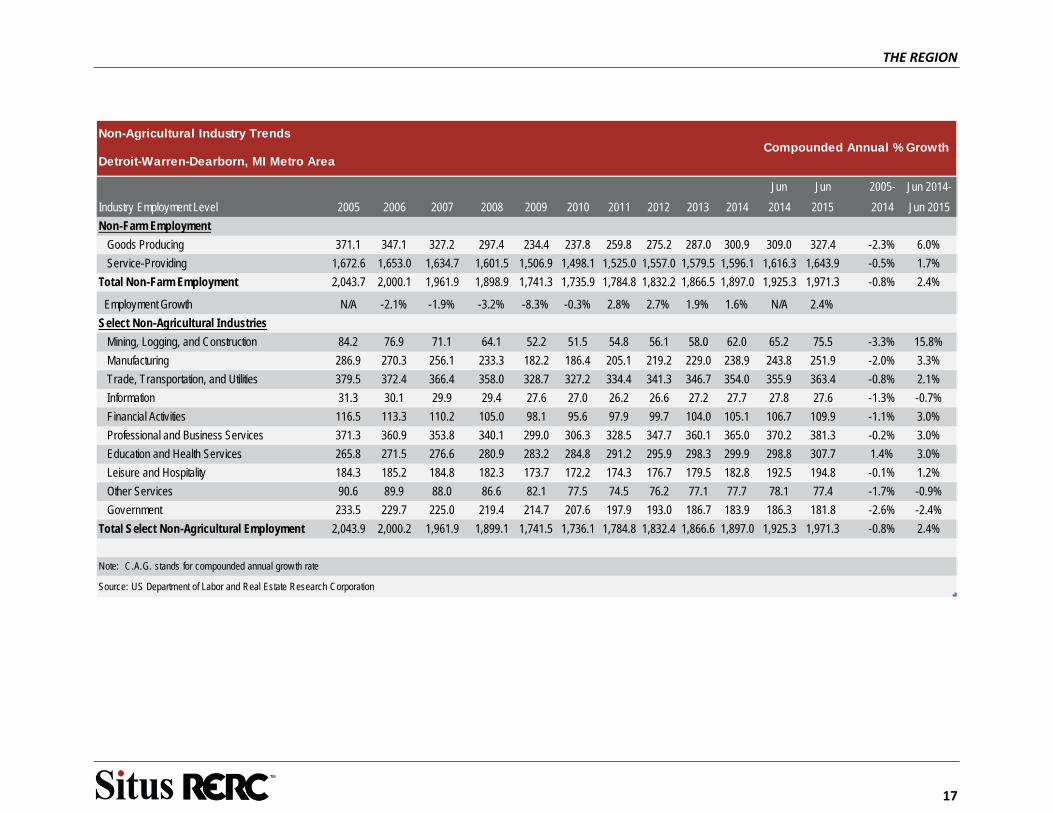
An overview of the total civilian labor force in the Detroit‐Warren‐Dearborn, MI Metro Area from 2005 through 2014 is included in the following chart supplied by the Bureau of Labor Statistics. From June 2014 to June 2015, the trend shows an increase of 2.4%. When looking at the industries separately, over the past ten years all sectors reported negative growth with Mining, Logging, and Construction reporting the largest negative growth.
The following table presents a more detailed picture of the non‐agricultural industry trends from 2005 to June 2015.
THE REGION
17
Non-Agricultural Industry Trends
Detroit-Warren-Dearborn, MI Metro Area
Jun Jun 2005- Jun 2014-
Industry Employment Level 2005 2006 2007 2008 2009 2010 2011 2012 2013 2014 2014 2015 2014 Jun 2015
Non-Farm Employment
Goods Producing 371.1 347.1 327.2 297.4 234.4 237.8 259.8 275.2 287.0 300.9 309.0 327.4 -2.3% 6.0%
Service-Providing 1,672.6 1,653.0 1,634.7 1,601.5 1,506.9 1,498.1 1,525.0 1,557.0 1,579.5 1,596.1 1,616.3 1,643.9 -0.5% 1.7%
Total Non-Farm Employment 2,043.7 2,000.1 1,961.9 1,898.9 1,741.3 1,735.9 1,784.8 1,832.2 1,866.5 1,897.0 1,925.3 1,971.3 -0.8% 2.4%
Employment Growth N/A -2.1% -1.9% -3.2% -8.3% -0.3% 2.8% 2.7% 1.9% 1.6% N/A 2.4%
Select Non-Agricultural Industries
Mining, Logging, and Construction 84.2 76.9 71.1 64.1 52.2 51.5 54.8 56.1 58.0 62.0 65.2 75.5 -3.3% 15.8%
Manufacturing 286.9 270.3 256.1 233.3 182.2 186.4 205.1 219.2 229.0 238.9 243.8 251.9 -2.0% 3.3%
Trade, Transportation, and Utilities 379.5 372.4 366.4 358.0 328.7 327.2 334.4 341.3 346.7 354.0 355.9 363.4 -0.8% 2.1%
Information 31.3 30.1 29.9 29.4 27.6 27.0 26.2 26.6 27.2 27.7 27.8 27.6 -1.3% -0.7%
Financial Activities 116.5 113.3 110.2 105.0 98.1 95.6 97.9 99.7 104.0 105.1 106.7 109.9 -1.1% 3.0%
Professional and Business Services 371.3 360.9 353.8 340.1 299.0 306.3 328.5 347.7 360.1 365.0 370.2 381.3 -0.2% 3.0%
Education and Health Services 265.8 271.5 276.6 280.9 283.2 284.8 291.2 295.9 298.3 299.9 298.8 307.7 1.4% 3.0%
Leisure and Hospitality 184.3 185.2 184.8 182.3 173.7 172.2 174.3 176.7 179.5 182.8 192.5 194.8 -0.1% 1.2%
Other Services 90.6 89.9 88.0 86.6 82.1 77.5 74.5 76.2 77.1 77.7 78.1 77.4 -1.7% -0.9%
Government 233.5 229.7 225.0 219.4 214.7 207.6 197.9 193.0 186.7 183.9 186.3 181.8 -2.6% -2.4%
Total Select Non-Agricultural Employment 2,043.9 2,000.2 1,961.9 1,899.1 1,741.5 1,736.1 1,784.8 1,832.4 1,866.6 1,897.0 1,925.3 1,971.3 -0.8% 2.4%
Note: C.A.G. stands for compounded annual grow th rate
Source: US Department of Labor and Real Estate Research Corporation
Compounded Annual % Growth
THE REGION
18
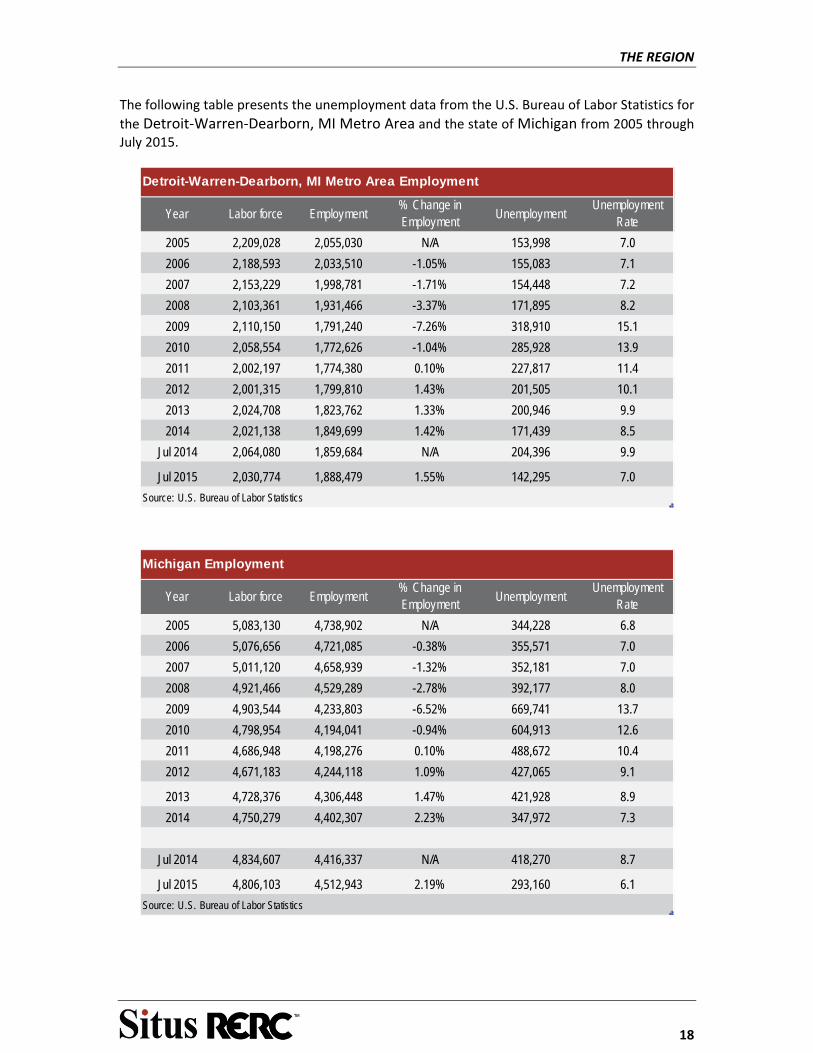
The following table presents the unemployment data from the U.S. Bureau of Labor Statistics for
the Detroit‐Warren‐Dearborn, MI Metro Area and the state of Michigan from 2005 through July 2015.
Year Labor force Employment% Change in Employment
UnemploymentUnemployment
Rate
2005 2,209,028 2,055,030 N/A 153,998 7.0
2006 2,188,593 2,033,510 -1.05% 155,083 7.1
2007 2,153,229 1,998,781 -1.71% 154,448 7.2
2008 2,103,361 1,931,466 -3.37% 171,895 8.2
2009 2,110,150 1,791,240 -7.26% 318,910 15.1
2010 2,058,554 1,772,626 -1.04% 285,928 13.9
2011 2,002,197 1,774,380 0.10% 227,817 11.4
2012 2,001,315 1,799,810 1.43% 201,505 10.1
2013 2,024,708 1,823,762 1.33% 200,946 9.9
2014 2,021,138 1,849,699 1.42% 171,439 8.5
Jul 2014 2,064,080 1,859,684 N/A 204,396 9.9
Jul 2015 2,030,774 1,888,479 1.55% 142,295 7.0
Source: U.S. Bureau of Labor Statistics
Year Labor force Employment% Change in Employment
UnemploymentUnemployment
Rate
2005 5,083,130 4,738,902 N/A 344,228 6.8
2006 5,076,656 4,721,085 -0.38% 355,571 7.0
2007 5,011,120 4,658,939 -1.32% 352,181 7.0
2008 4,921,466 4,529,289 -2.78% 392,177 8.0
2009 4,903,544 4,233,803 -6.52% 669,741 13.7
2010 4,798,954 4,194,041 -0.94% 604,913 12.6
2011 4,686,948 4,198,276 0.10% 488,672 10.4
2012 4,671,183 4,244,118 1.09% 427,065 9.1
2013 4,728,376 4,306,448 1.47% 421,928 8.9
2014 4,750,279 4,402,307 2.23% 347,972 7.3
Jul 2014 4,834,607 4,416,337 N/A 418,270 8.7
Jul 2015 4,806,103 4,512,943 2.19% 293,160 6.1
Source: U.S. Bureau of Labor Statistics
Detroit-Warren-Dearborn, MI Metro Area Employment
Michigan Employment

THE REGION
19
Unemployment rates for the MSA and the state have historically mirrored one another fairly closely. In 2009 and 2010, unemployment rates increased for the state of Michigan and the Detroit‐ Warren‐ Dearborn, MI MSA, reaching a 10‐year high in 2009, with unemployment rates at 13.7% and 15.1% respectively. Since 2011, unemployment rates have seen a steady decrease reaching as low as 6.1% in July 2015 for the State and 7.0% for the MSA.
TRANSPORTATION
The Detroit‐Warren‐Dearborn area is served by Interstate 75, Interstate 94, Interstate 96, Interstate 275 and U.S. Highway 23.
Interstate 75 is the second longest north‐south highway from northwest of Miami, Florida to Sault Ste. Marie, Michigan and passes through the states of Florida, Georgia, Tennessee, Kentucky, Ohio, and Michigan. It enters Michigan near Lake Erie until Monroe where it continues northeastward to enter Detroit and its surrounding areas. The highway has intersections with other interstates including Interstate 375 (Chrysler Freeway), Interstate 94, Interstate 96, Michigan Highway 10 and Michigan Highway 8 (Davison Freeway). Other intersections within the state include Interstate 475, Interstate 69. After crossing the Detroit metropolitan area, the freeway reaches Pontiac, heads north towards Saginaw, travels north to Bay City before a major interchange with U.S. Route 127, and then crosses over to Mackinac Bridge continuing t the Canadian border in Sault Ste. Marie. Interstate 275 provides north south connectivity, connecting the cities of Carleton, Romulus, Livonia and Farmington Hills, and the counties of Monroe and Wayne. U.S. Highway 23 runs from Jacksonville, Florida to Mackinaw City, Michigan. In Michigan, it is a major north–south state trunk line highway that runs through the Lower Peninsula serving as a freeway bypass to the west of Metro Detroit and a scenic highway through the northern portion of the state along Lake Huron. It runs concurrently with Interstate 75 from Flint to Bay City.
Interstate 94 is an east–west highway from Billing, Montana to Port Huron, Michigan. The highway connects Interstate 90 to the west providing connectivity to the cities of Butte and Seattle in Washington. The highway connects the states of Montana, North Dakota, Minnesota, Wisconsin, Illinois, Indiana and Michigan. In Michigan, Interstate 94 runs north along Lake Michigan to St. Joseph before heading east toward Detroit. The highway serves as a connecting link to major cities including Madison in Wisconsin, Chicago in Illinois, and Fargo in North Dakota.
Interstate 96 runs east‐west through traverses the state of Michigan and serves to connect the cities of Grand Rapids, Brighton, Lancing and Detroit.
Air Transportation is provided by Detroit Metropolitan Wayne County Airport, the busiest airport in Michigan is served by 13 passenger airlines connecting the region to 180 destinations through its non‐stop services. The airport provides connectivity to domestic and international destinations. The airport handled 32,513,555 passengers in 2014. The airport transported air cargo of 202,066 tons in 2014. Detroit Metropolitan Wayne County Airport is a hub for Delta Air Lines and Spirit Airlines. Other airports serving the area are Ann Arbor Municipal Airport (ARB), Oakland County International Airport (PTK) and Willow Run Airport (YIP).
THE REGION
20
Rail Transportation to the region is provided by Amtrak through its Wolverine service between Chicago, Illinois, and Pontiac.
Water transportation is provided by Port of Detroit. The Port of Detroit is located along the west side of the Detroit River, and is the largest seaport in the state of Michigan. The port consists of multiple marine terminals handling general, liquid, and bulk cargo as well as passengers.
CONCLUSION
In summary, the economic base of the Detroit Metro Region is concentrated in a variety of industries, but primarily automotive manufacturing. Other strong sectors include government, healthcare, and education. The community and overall state have decreasing unemployment and Detroit specifically has a rapidly expanding downtown employment base. Commercial development is being catalyzed by a multitude incentive programs including attractive corporate tax regulations, availability of state monies for start‐up companies and the rehabilitation of existing commercial properties.
THE NEIGHBORHOOD
21
THE NEIGHBORHOOD
Neighborhood Analysis: The objective analysis of observable and/or quantifiable data indicating discernible patterns of urban growth, structure, and change that may detract from or enhance property values. (The Dictionary of Real Estate Appraisal, 5th edition)
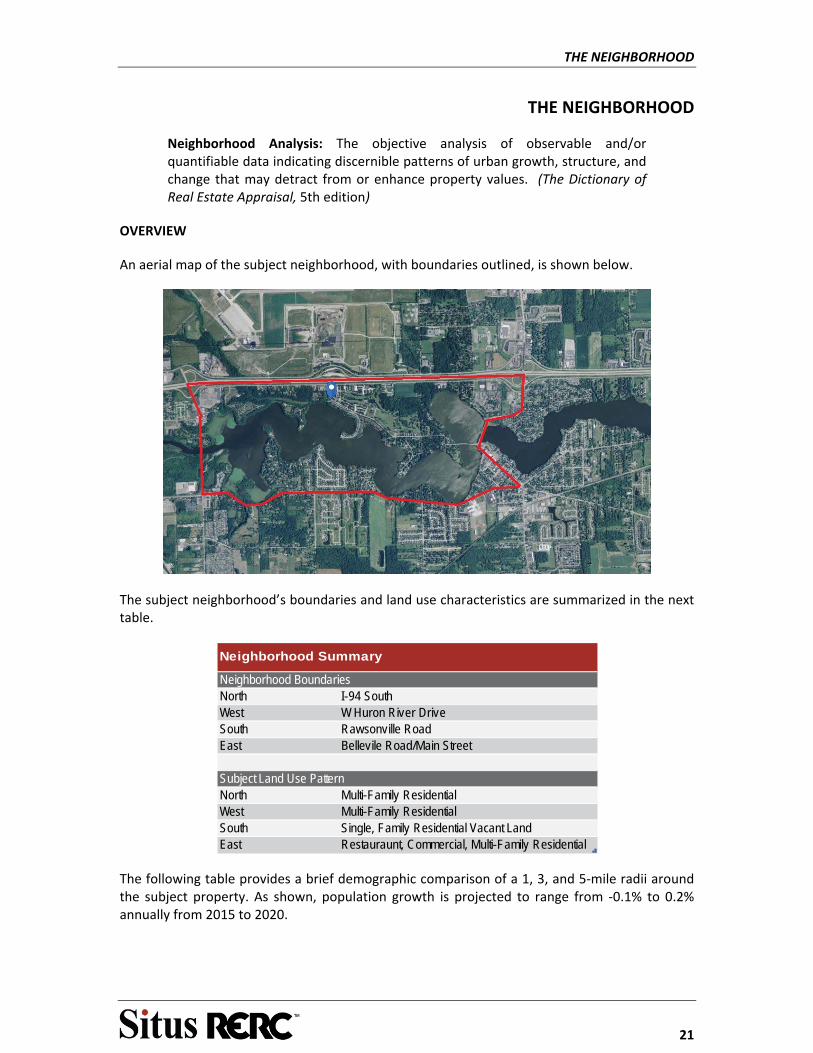
OVERVIEW
An aerial map of the subject neighborhood, with boundaries outlined, is shown below.
The subject neighborhood’s boundaries and land use characteristics are summarized in the next table.
The following table provides a brief demographic comparison of a 1, 3, and 5‐mile radii around the subject property. As shown, population growth is projected to range from ‐0.1% to 0.2% annually from 2015 to 2020.
Neighborhood BoundariesNorth I-94 SouthWest W Huron River DriveSouth Rawsonville RoadEast Bellevile Road/Main Street
Subject Land Use PatternNorth Multi-Family ResidentialWest Multi-Family ResidentialSouth Single, Family Residential Vacant LandEast Restauraunt, Commercial, Multi-Family Residential
Neighborhood Summary
THE NEIGHBORHOOD
22
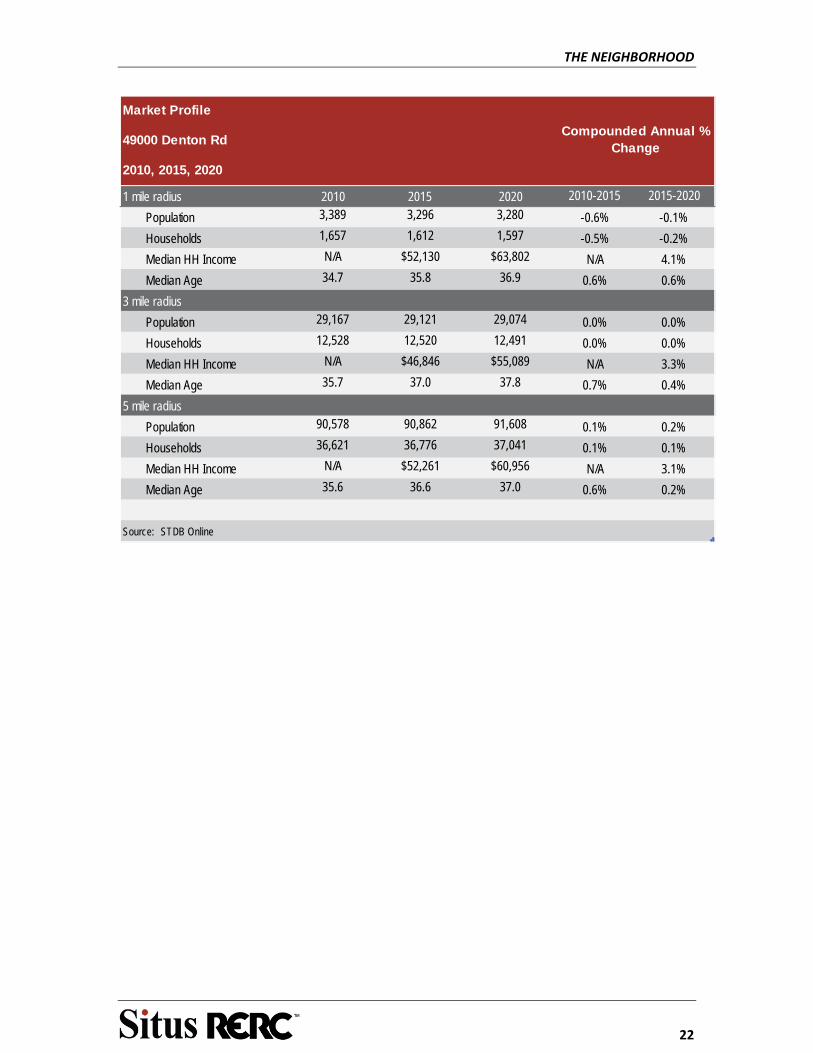
Market Profile
49000 Denton Rd
2010, 2015, 2020
1 mile radius 2010 2015 2020 2010-2015 2015-2020
Population 3,389 3,296 3,280 -0.6% -0.1%
Households 1,657 1,612 1,597 -0.5% -0.2%
Median HH Income N/A $52,130 $63,802 N/A 4.1%
Median Age 34.7 35.8 36.9 0.6% 0.6%
3 mile radius
Population 29,167 29,121 29,074 0.0% 0.0%
Households 12,528 12,520 12,491 0.0% 0.0%
Median HH Income N/A $46,846 $55,089 N/A 3.3%
Median Age 35.7 37.0 37.8 0.7% 0.4%
5 mile radius
Population 90,578 90,862 91,608 0.1% 0.2%
Households 36,621 36,776 37,041 0.1% 0.1%
Median HH Income N/A $52,261 $60,956 N/A 3.1%
Median Age 35.6 36.6 37.0 0.6% 0.2%
Source: STDB Online
Compounded Annual % Change
THE NEIGHBORHOOD
23
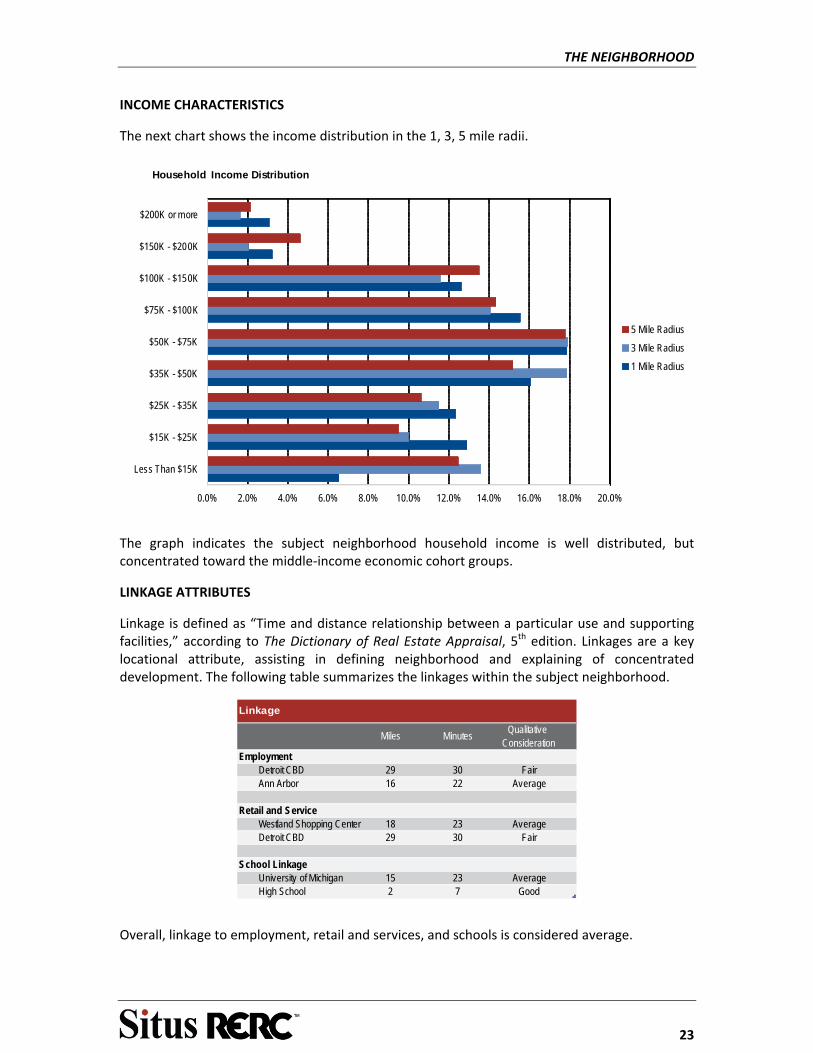
INCOME CHARACTERISTICS
The next chart shows the income distribution in the 1, 3, 5 mile radii.
0.0% 2.0% 4.0% 6.0% 8.0% 10.0% 12.0% 14.0% 16.0% 18.0% 20.0%
Less Than $15K
$15K - $25K
$25K - $35K
$35K - $50K
$50K - $75K
$75K - $100K
$100K - $150K
$150K - $200K
$200K or more
Household Income Distribution
5 Mile Radius
3 Mile Radius
1 Mile Radius
The graph indicates the subject neighborhood household income is well distributed, but concentrated toward the middle‐income economic cohort groups.
LINKAGE ATTRIBUTES
Linkage is defined as “Time and distance relationship between a particular use and supporting facilities,” according to The Dictionary of Real Estate Appraisal, 5th edition. Linkages are a key locational attribute, assisting in defining neighborhood and explaining of concentrated development. The following table summarizes the linkages within the subject neighborhood.
Overall, linkage to employment, retail and services, and schools is considered average.
Miles MinutesQualitative
ConsiderationEmployment
Detroit CBD 29 30 FairAnn Arbor 16 22 Average
Retail and ServiceWestland Shopping Center 18 23 AverageDetroit CBD 29 30 Fair
School LinkageUniversity of Michigan 15 23 AverageHigh School 2 7 Good
Linkage
THE NEIGHBORHOOD
24
EDUCATION
Schools in the immediate area of the subject property include the Van Buren Public School District. The Van Buren Public School District is home to approximately 5,200 students. The University of Michigan is located approximately 15 miles away in Ann Arbor. Overall Linkage to schools is average for the neighborhood.
LAND USE AND DEVELOPMENT PATTERNS
The primary use of land in the neighborhood is multi and single‐family residential. Some portions of the western edge of the neighborhood with residential use as the community continue to expand. Retail and service uses are primarily concentrated along Belleville Road and Main Street along the eastern boundary of the neighborhood. Belleville High School is located along the southeastern boundary of the neighborhood.
The overall trend for the neighborhood is for expansion to the west with primarily residential development. Commercial uses will continue to locate along primary corridors to capitalize on the high traffic visibility. CONCLUSION
Development in the subject neighborhood is likely given the availability of vacant land. With the existing access to primary traffic artery the neighborhood should continue to maintain and attract business and households and remain stable for the mid to long‐term future.
THE PROPERTY
25
THE PROPERTY
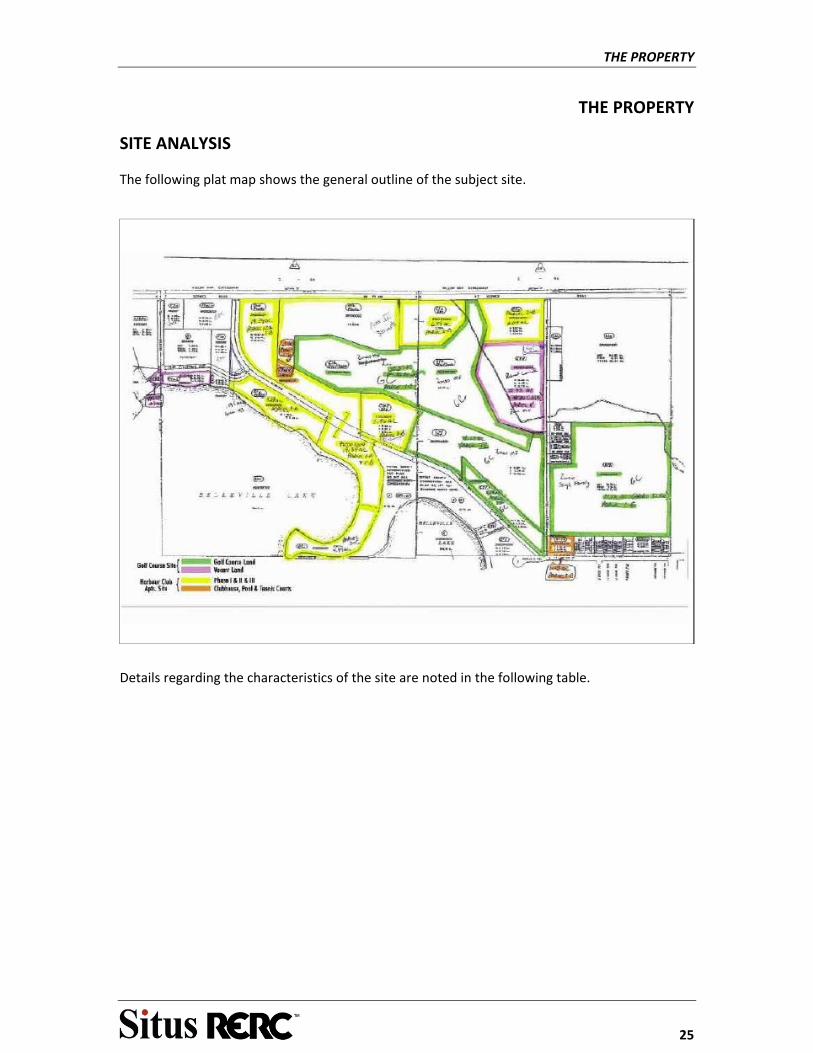
SITE ANALYSIS
The following plat map shows the general outline of the subject site.
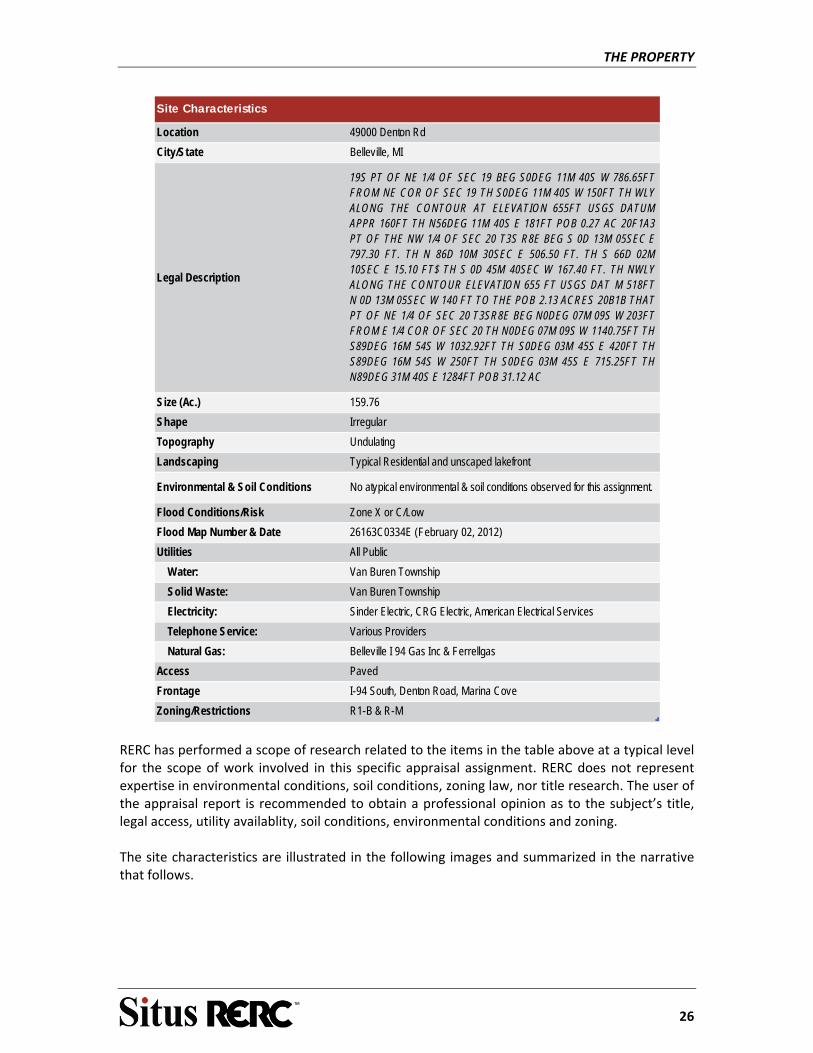
Details regarding the characteristics of the site are noted in the following table.
THE PROPERTY
26
Location 49000 Denton Rd
City/State Belleville, MI
Legal Description
19S PT OF NE 1/4 OF SEC 19 BEG S0DEG 11M 40S W 786.65FTFROM NE COR OF SEC 19 TH S0DEG 11M 40S W 150FT TH WLYALONG THE CONTOUR AT ELEVATION 655FT USGS DATUMAPPR 160FT TH N56DEG 11M 40S E 181FT POB 0.27 AC 20F1A3PT OF THE NW 1/4 OF SEC 20 T3S R8E BEG S 0D 13M 05SEC E797.30 FT. TH N 86D 10M 30SEC E 506.50 FT. TH S 66D 02M10SEC E 15.10 FT$ TH S 0D 45M 40SEC W 167.40 FT. TH NWLYALONG THE CONTOUR ELEVATION 655 FT USGS DAT M 518FTN 0D 13M 05SEC W 140 FT TO THE POB 2.13 ACRES 20B1B THATPT OF NE 1/4 OF SEC 20 T3SR8E BEG N0DEG 07M 09S W 203FTFROM E 1/4 COR OF SEC 20 TH N0DEG 07M 09S W 1140.75FT THS89DEG 16M 54S W 1032.92FT TH S0DEG 03M 45S E 420FT THS89DEG 16M 54S W 250FT TH S0DEG 03M 45S E 715.25FT THN89DEG 31M 40S E 1284FT POB 31.12 AC
Size (Ac.) 159.76
Shape Irregular
Topography Undulating
Landscaping Typical Residential and unscaped lakefront
Environmental & Soil Conditions No atypical environmental & soil conditions observed for this assignment.
Flood Conditions/Risk Zone X or C/Low
Flood Map Number & Date 26163C0334E (February 02, 2012)
Utilities All Public
Water: Van Buren Township
Solid Waste: Van Buren Township
Electricity: Sinder Electric, CRG Electric, American Electrical Services
Telephone Service: Various Providers
Natural Gas: Belleville I 94 Gas Inc & Ferrellgas
Access Paved
Frontage I-94 South, Denton Road, Marina Cove
Zoning/Restrictions R1-B & R-M
Site Characteristics
RERC has performed a scope of research related to the items in the table above at a typical level for the scope of work involved in this specific appraisal assignment. RERC does not represent expertise in environmental conditions, soil conditions, zoning law, nor title research. The user of the appraisal report is recommended to obtain a professional opinion as to the subject’s title, legal access, utility availablity, soil conditions, environmental conditions and zoning. The site characteristics are illustrated in the following images and summarized in the narrative that follows.

THE PROPERTY
27
FLOOD HAZARD
The subject’s flood hazard risk was noted in the site characteristics table and displayed on the following flood map.
THE PROPERTY
28
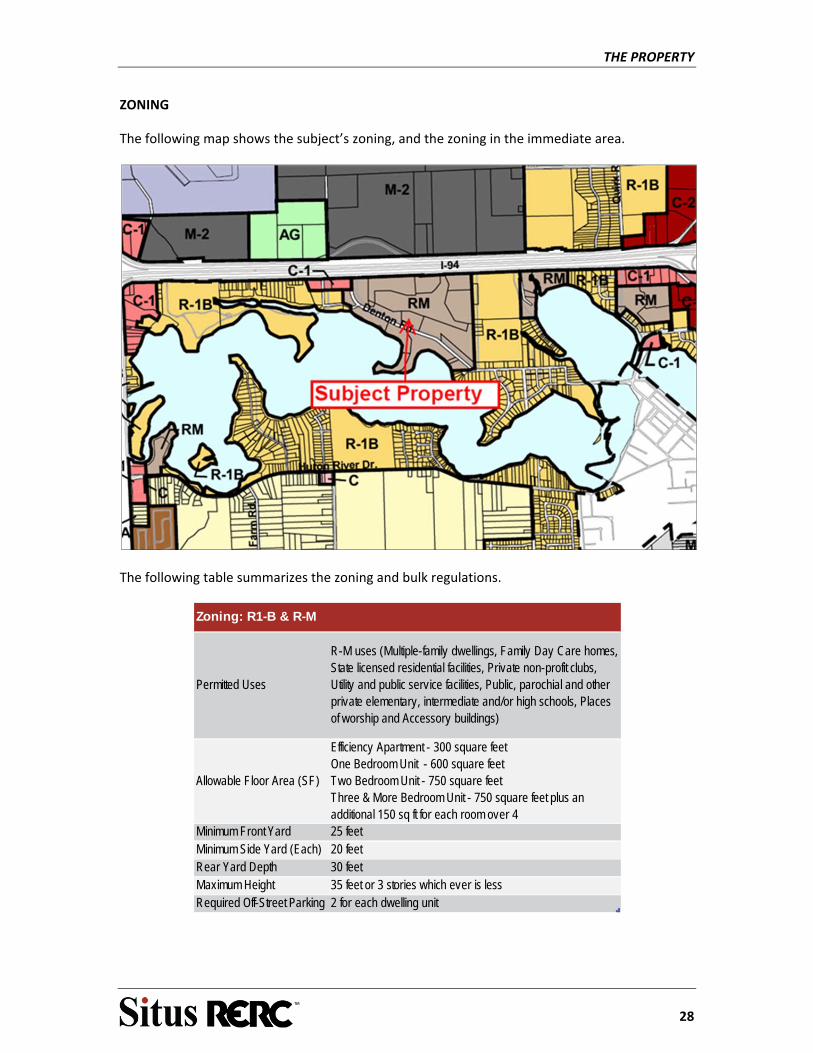
ZONING
The following map shows the subject’s zoning, and the zoning in the immediate area.
The following table summarizes the zoning and bulk regulations.
Permitted Uses
R-M uses (Multiple-family dwellings, Family Day Care homes, State licensed residential facilities, Private non-profit clubs, Utility and public service facilities, Public, parochial and other private elementary, intermediate and/or high schools, Places of worship and Accessory buildings)
Allowable Floor Area (SF)
Efficiency Apartment - 300 square feetOne Bedroom Unit - 600 square feetTwo Bedroom Unit - 750 square feetThree & More Bedroom Unit - 750 square feet plus anadditional 150 sq ft for each room over 4
Minimum Front Yard 25 feetMinimum Side Yard (Each) 20 feetRear Yard Depth 30 feetMaximum Height 35 feet or 3 stories which ever is lessRequired Off-Street Parking 2 for each dwelling unit
Zoning: R1-B & R-M
THE PROPERTY
29
RERC is unaware of any deed restrictions impacting the subject. The subject appears to be a legal, non‐conforming use to the zoning ordinance as portions of the subject site are zoned for single‐family use, but are improved with apartments. Property management indicated that portions of the golf course land at the subject may be utilized as single‐family homes as portions of the subject’s golf course land were zoned to single‐family prior to the construction of the golf course.
ACCESS AND VISIBILITY
The site is situated along Denton Road, I‐94 Service Road and Marina Cove with adequate curb cuts from each road.
FUNCTIONAL UTILITY
For a multi‐family development parcel, the subject has typical utility. The size, shape, utility availability and access are typical for a property like the subject.
EASEMENTS
No atypical easements appear to exist based on our physical observation of the subject. A title report was not provided to confirm or identify atypical easements. The user of the appraisal report is recommended to obtain a professional opinion as to the subject’s title and potential restrictions or benefits of easement.
CONCLUSION ‐ SITE
The subject site is situated north of Lake Belleville along I‐94 Service Road, Denton Drive, and Marina Cove. The surrounding area is improved with single‐family residences, multi‐family residences, churches, schools, retail & service developments, and recreational facilities.
The size, shape, and topography of the site appear adequate to support multi‐family development. All of the required utilities are available to the site. The site and its characteristics appear to be adequate to support multi‐family use.

THE PROPERTY
30
IMPROVEMENT ANALYSIS
The following table summarizes the pertinent information on the subject improvements.
Property Attributes
Year Built 1970-1974
Number of Buildings 43
Number of Stories 3
Number of Units 1,112
Economic Class B
Construction Class D
Style Garden Apartment
Property Condition Average
Construction Quality Average
Gross Building Area 1,106,809
Occupancy 92%
Total Parking Spaces 2,248
Property Overview
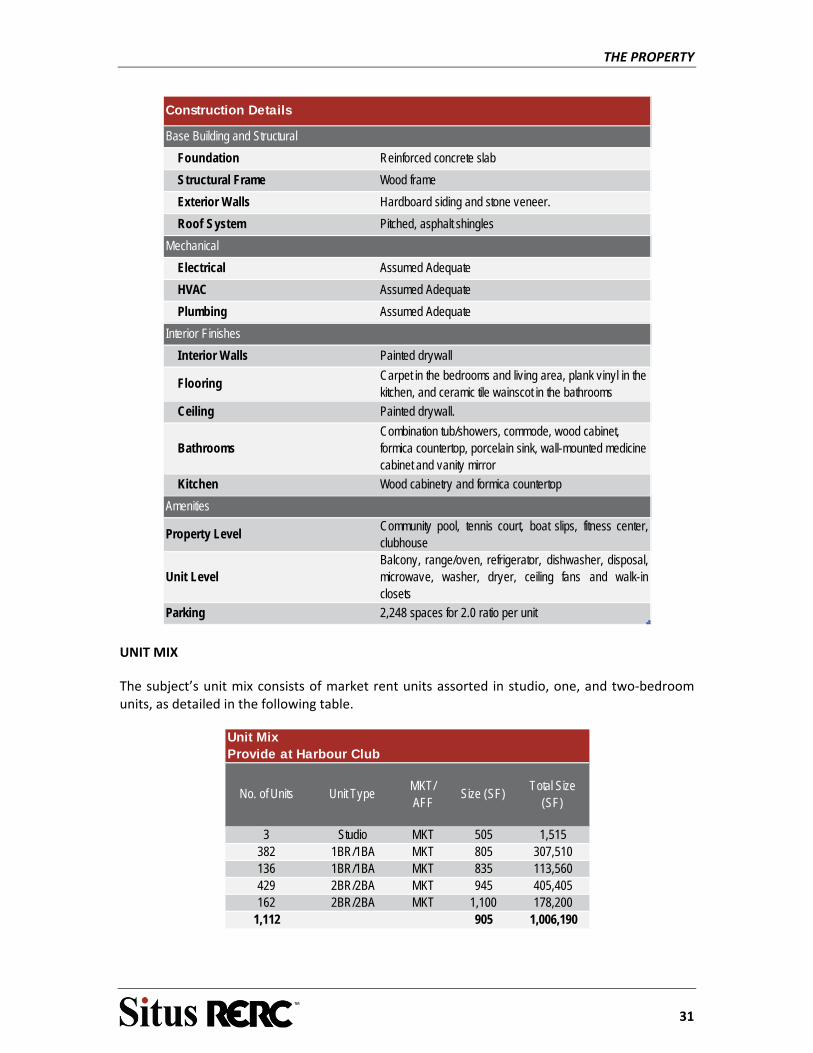
CONSTRUCTION DETAILS
Construction details for the improvements are noted as follows.
THE PROPERTY
31
Base Building and Structural
Foundation Reinforced concrete slab
Structural Frame Wood frame
Exterior Walls Hardboard siding and stone veneer.
Roof System Pitched, asphalt shingles
Mechanical
Electrical Assumed Adequate
HVAC Assumed Adequate
Plumbing Assumed Adequate
Interior Finishes
Interior Walls Painted drywall
FlooringCarpet in the bedrooms and living area, plank vinyl in the kitchen, and ceramic tile wainscot in the bathrooms
Ceiling Painted drywall.
BathroomsCombination tub/showers, commode, wood cabinet, formica countertop, porcelain sink, wall-mounted medicine cabinet and vanity mirror
Kitchen Wood cabinetry and formica countertop
Amenities
Property LevelCommunity pool, tennis court, boat slips, fitness center,clubhouse
Unit LevelBalcony, range/oven, refrigerator, dishwasher, disposal,microwave, washer, dryer, ceiling fans and walk-inclosets
Parking 2,248 spaces for 2.0 ratio per unit
Construction Details
UNIT MIX
The subject’s unit mix consists of market rent units assorted in studio, one, and two‐bedroom units, as detailed in the following table.
Unit MixProvide at Harbour Club
No. of Units Unit TypeMKT/AFF
Size (SF)Total Size
(SF)
3 Studio MKT 505 1,515382 1BR/1BA MKT 805 307,510136 1BR/1BA MKT 835 113,560429 2BR/2BA MKT 945 405,405162 2BR/2BA MKT 1,100 178,200
1,112 905 1,006,190
THE PROPERTY
32
The subject property has 2,248 open and carport spaces for a parking ratio of 2.0 stalls per unit.
FUNCTIONAL DESIGN
The design of the property is functional for continued multi‐family, use. The unit mix, unit sizes and layout are functional and well designed for apartment use. The improvements are similar to and competitive with properties in the surrounding neighborhood.
We do not note any functional inadequacies that would adversely affect the value of the property. The building has typical utility for continuation of the current use.
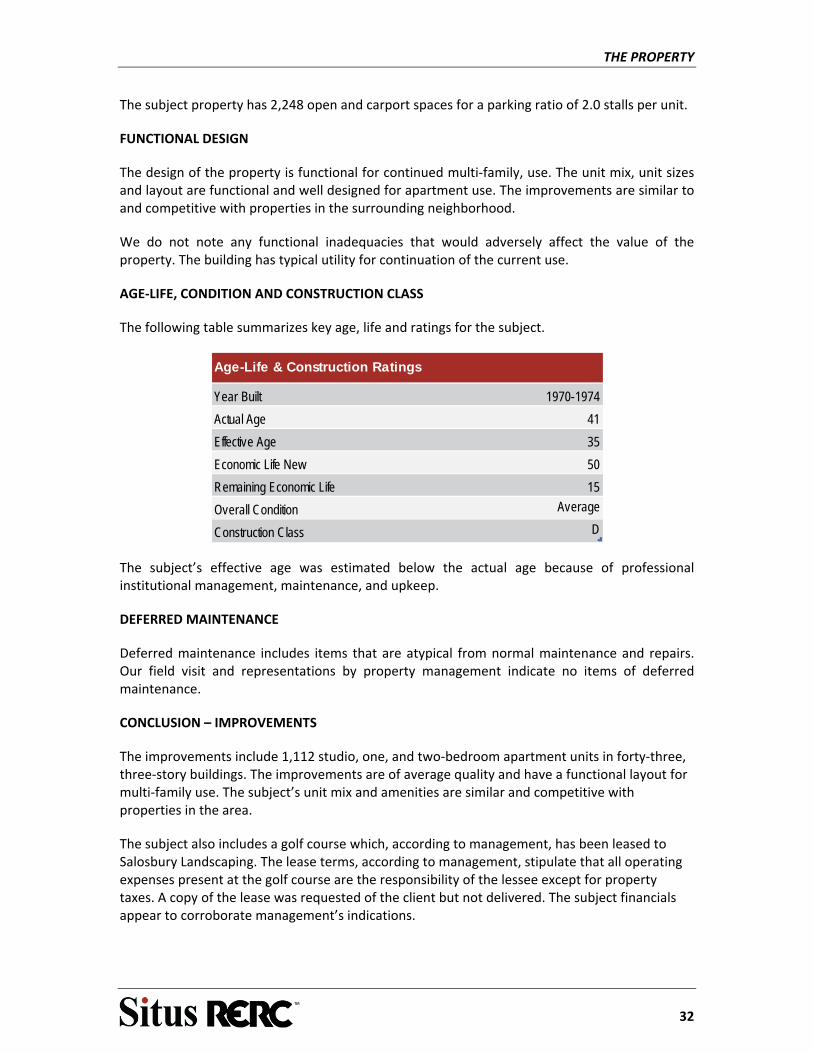
AGE‐LIFE, CONDITION AND CONSTRUCTION CLASS
The following table summarizes key age, life and ratings for the subject.
Year Built 1970-1974
Actual Age 41
Effective Age 35
Economic Life New 50
Remaining Economic Life 15
Overall Condition Average
Construction Class D
Age-Life & Construction Ratings
The subject’s effective age was estimated below the actual age because of professional institutional management, maintenance, and upkeep.
DEFERRED MAINTENANCE
Deferred maintenance includes items that are atypical from normal maintenance and repairs. Our field visit and representations by property management indicate no items of deferred maintenance.
CONCLUSION – IMPROVEMENTS
The improvements include 1,112 studio, one, and two‐bedroom apartment units in forty‐three, three‐story buildings. The improvements are of average quality and have a functional layout for multi‐family use. The subject’s unit mix and amenities are similar and competitive with properties in the area.
The subject also includes a golf course which, according to management, has been leased to Salosbury Landscaping. The lease terms, according to management, stipulate that all operating expenses present at the golf course are the responsibility of the lessee except for property taxes. A copy of the lease was requested of the client but not delivered. The subject financials appear to corroborate management’s indications.
REAL ESTATE TAXES
33
REAL ESTATE TAXES
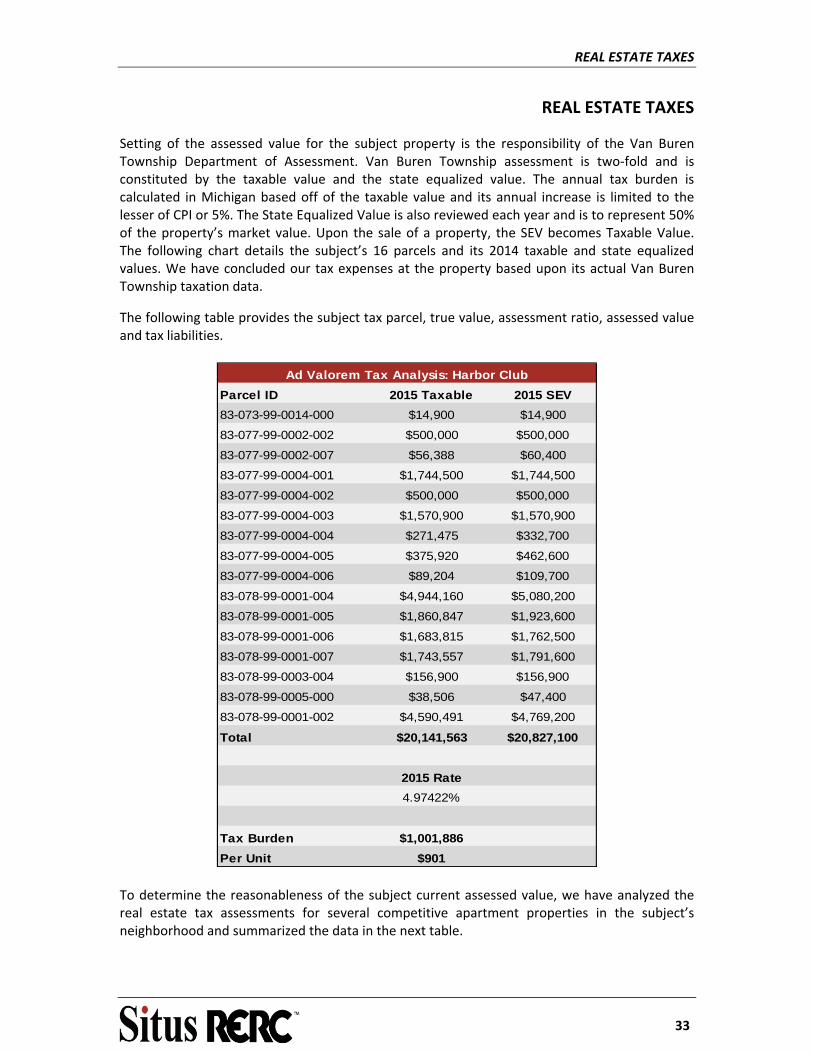
Setting of the assessed value for the subject property is the responsibility of the Van Buren Township Department of Assessment. Van Buren Township assessment is two‐fold and is constituted by the taxable value and the state equalized value. The annual tax burden is calculated in Michigan based off of the taxable value and its annual increase is limited to the lesser of CPI or 5%. The State Equalized Value is also reviewed each year and is to represent 50% of the property’s market value. Upon the sale of a property, the SEV becomes Taxable Value. The following chart details the subject’s 16 parcels and its 2014 taxable and state equalized values. We have concluded our tax expenses at the property based upon its actual Van Buren Township taxation data.
The following table provides the subject tax parcel, true value, assessment ratio, assessed value and tax liabilities.
Parcel ID 2015 Taxable 2015 SEV
83-073-99-0014-000 $14,900 $14,900
83-077-99-0002-002 $500,000 $500,000
83-077-99-0002-007 $56,388 $60,400
83-077-99-0004-001 $1,744,500 $1,744,500
83-077-99-0004-002 $500,000 $500,000
83-077-99-0004-003 $1,570,900 $1,570,900
83-077-99-0004-004 $271,475 $332,700
83-077-99-0004-005 $375,920 $462,600
83-077-99-0004-006 $89,204 $109,700
83-078-99-0001-004 $4,944,160 $5,080,200
83-078-99-0001-005 $1,860,847 $1,923,600
83-078-99-0001-006 $1,683,815 $1,762,500
83-078-99-0001-007 $1,743,557 $1,791,600
83-078-99-0003-004 $156,900 $156,900
83-078-99-0005-000 $38,506 $47,400
83-078-99-0001-002 $4,590,491 $4,769,200
Total $20,141,563 $20,827,100
2015 Rate
4.97422%
Tax Burden $1,001,886
Per Unit $901
Ad Valorem Tax Analysis: Harbor Club
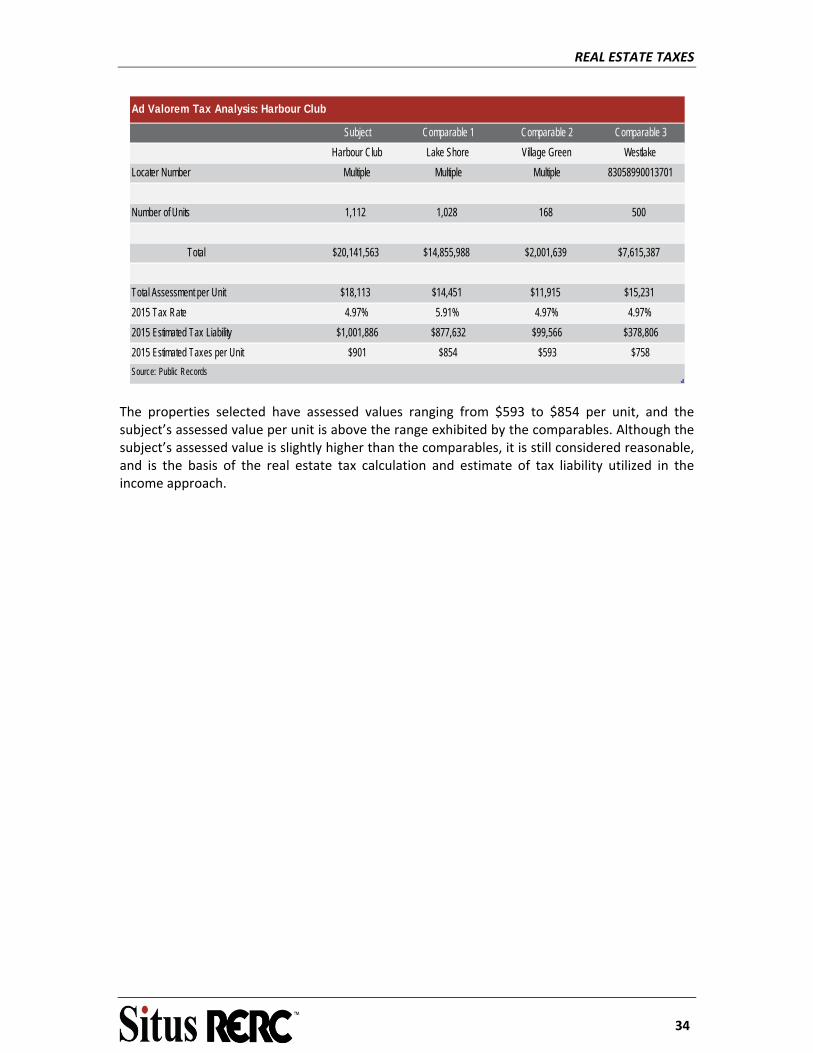
To determine the reasonableness of the subject current assessed value, we have analyzed the real estate tax assessments for several competitive apartment properties in the subject’s neighborhood and summarized the data in the next table.
REAL ESTATE TAXES
34
Subject Comparable 1 Comparable 2 Comparable 3
Harbour Club Lake Shore Village Green Westlake
Locater Number Multiple Multiple Multiple 83058990013701
Number of Units 1,112 1,028 168 500
Total $20,141,563 $14,855,988 $2,001,639 $7,615,387
Total Assessment per Unit $18,113 $14,451 $11,915 $15,231
2015 Tax Rate 4.97% 5.91% 4.97% 4.97%
2015 Estimated Tax Liability $1,001,886 $877,632 $99,566 $378,806
2015 Estimated Taxes per Unit $901 $854 $593 $758
Source: Public Records
Ad Valorem Tax Analysis: Harbour Club
The properties selected have assessed values ranging from $593 to $854 per unit, and the subject’s assessed value per unit is above the range exhibited by the comparables. Although the subject’s assessed value is slightly higher than the comparables, it is still considered reasonable, and is the basis of the real estate tax calculation and estimate of tax liability utilized in the income approach.
NATIONAL APARTMENT MARKET ANALYSIS
35
NATIONAL APARTMENT MARKET ANALYSIS
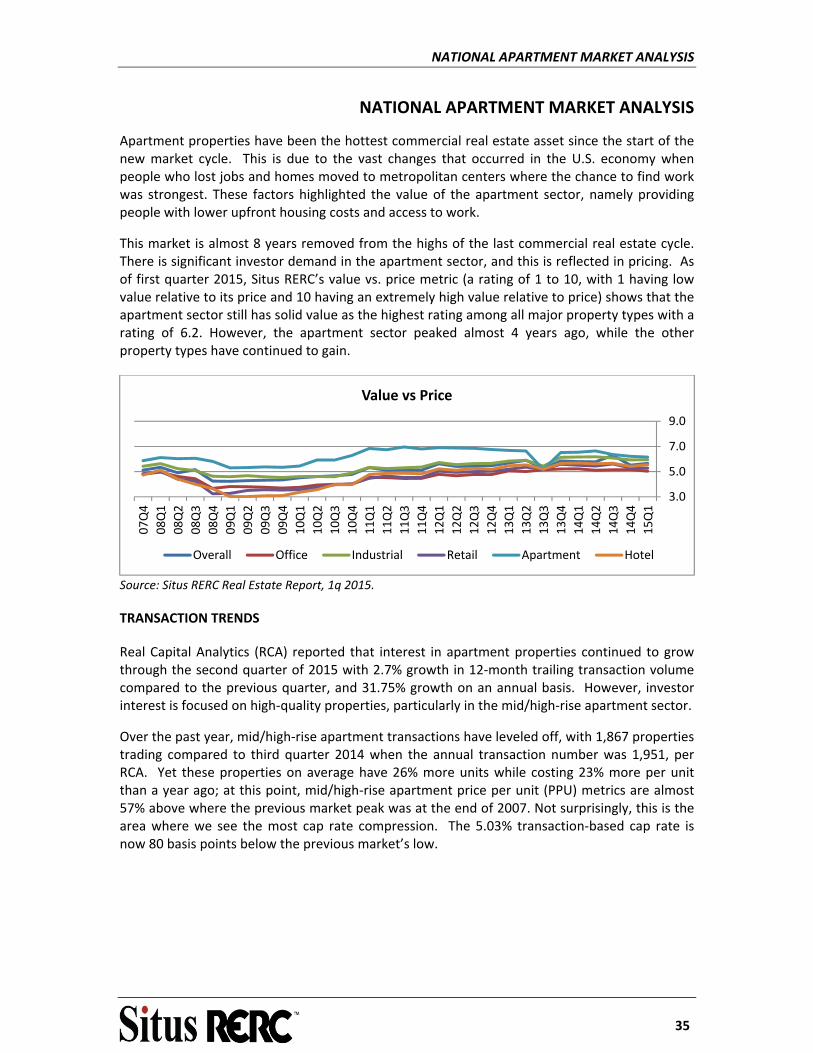
Apartment properties have been the hottest commercial real estate asset since the start of the new market cycle. This is due to the vast changes that occurred in the U.S. economy when people who lost jobs and homes moved to metropolitan centers where the chance to find work was strongest. These factors highlighted the value of the apartment sector, namely providing people with lower upfront housing costs and access to work.
This market is almost 8 years removed from the highs of the last commercial real estate cycle. There is significant investor demand in the apartment sector, and this is reflected in pricing. As of first quarter 2015, Situs RERC’s value vs. price metric (a rating of 1 to 10, with 1 having low value relative to its price and 10 having an extremely high value relative to price) shows that the apartment sector still has solid value as the highest rating among all major property types with a rating of 6.2. However, the apartment sector peaked almost 4 years ago, while the other property types have continued to gain.
Source: Situs RERC Real Estate Report, 1q 2015.
TRANSACTION TRENDS
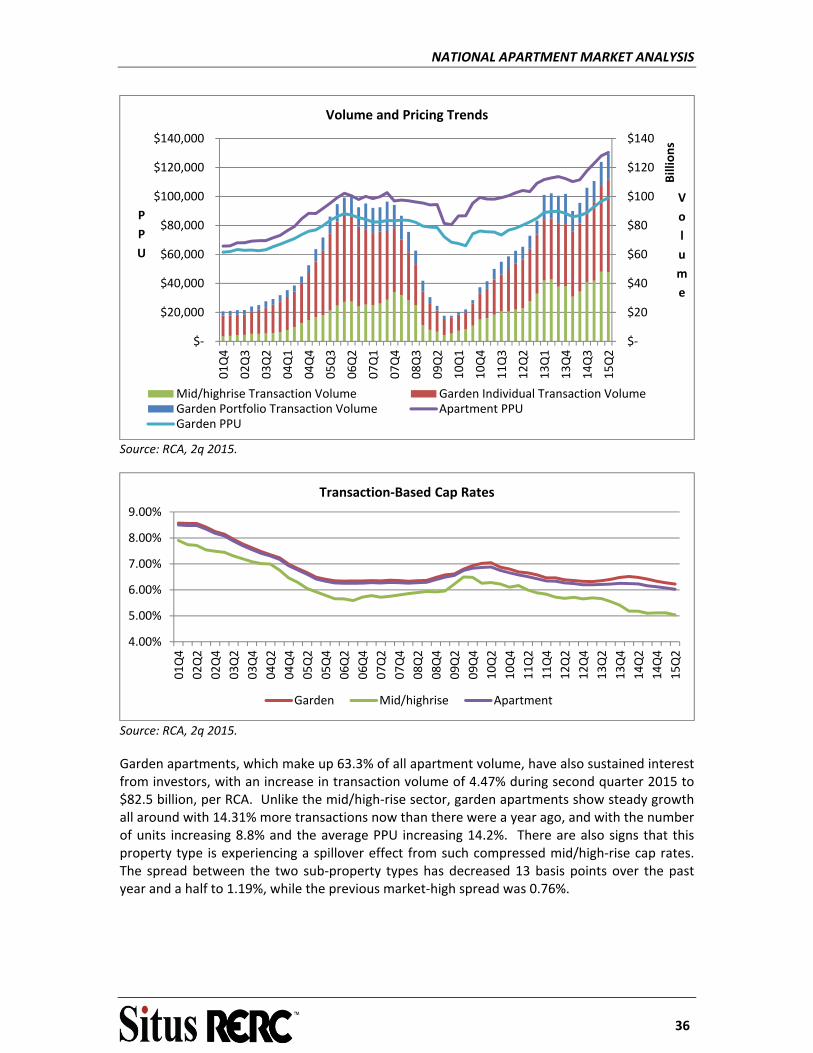
Real Capital Analytics (RCA) reported that interest in apartment properties continued to grow through the second quarter of 2015 with 2.7% growth in 12‐month trailing transaction volume compared to the previous quarter, and 31.75% growth on an annual basis. However, investor interest is focused on high‐quality properties, particularly in the mid/high‐rise apartment sector.
Over the past year, mid/high‐rise apartment transactions have leveled off, with 1,867 properties trading compared to third quarter 2014 when the annual transaction number was 1,951, per RCA. Yet these properties on average have 26% more units while costing 23% more per unit than a year ago; at this point, mid/high‐rise apartment price per unit (PPU) metrics are almost 57% above where the previous market peak was at the end of 2007. Not surprisingly, this is the area where we see the most cap rate compression. The 5.03% transaction‐based cap rate is now 80 basis points below the previous market’s low.
3.0
5.0
7.0
9.0
15Q1
14Q4
14Q3
14Q2
14Q1
13Q4
13Q3
13Q2
13Q1
12Q4
12Q3
12Q2
12Q1
11Q4
11Q3
11Q2
11Q1
10Q4
10Q3
10Q2
10Q1
09Q4
09Q3
09Q2
09Q1
08Q4
08Q3
08Q2
08Q1
07Q4
Value vs Price
Overall Office Industrial Retail Apartment Hotel
NATIONAL APARTMENT MARKET ANALYSIS
36
Source: RCA, 2q 2015.
Source: RCA, 2q 2015.
Garden apartments, which make up 63.3% of all apartment volume, have also sustained interest from investors, with an increase in transaction volume of 4.47% during second quarter 2015 to $82.5 billion, per RCA. Unlike the mid/high‐rise sector, garden apartments show steady growth all around with 14.31% more transactions now than there were a year ago, and with the number of units increasing 8.8% and the average PPU increasing 14.2%. There are also signs that this property type is experiencing a spillover effect from such compressed mid/high‐rise cap rates. The spread between the two sub‐property types has decreased 13 basis points over the past year and a half to 1.19%, while the previous market‐high spread was 0.76%.
$‐
$20
$40
$60
$80
$100
$120
$140
$‐
$20,000
$40,000
$60,000
$80,000
$100,000
$120,000
$140,000
01Q4
02Q3
03Q2
04Q1
04Q4
05Q3
06Q2
07Q1
07Q4
08Q3
09Q2
10Q1
10Q4
11Q3
12Q2
13Q1
13Q4
14Q3
15Q2
V
o
l
u
m
e
Billions
P
P
U
Volume and Pricing Trends
Mid/highrise Transaction Volume Garden Individual Transaction VolumeGarden Portfolio Transaction Volume Apartment PPUGarden PPU
4.00%
5.00%
6.00%
7.00%
8.00%
9.00%
01Q4
02Q2
02Q4
03Q2
03Q4
04Q2
04Q4
05Q2
05Q4
06Q2
06Q4
07Q2
07Q4
08Q2
08Q4
09Q2
09Q4
10Q2
10Q4
11Q2
11Q4
12Q2
12Q4
13Q2
13Q4
14Q2
14Q4
15Q2
Transaction‐Based Cap Rates
Garden Mid/highrise Apartment
NATIONAL APARTMENT MARKET ANALYSIS
37
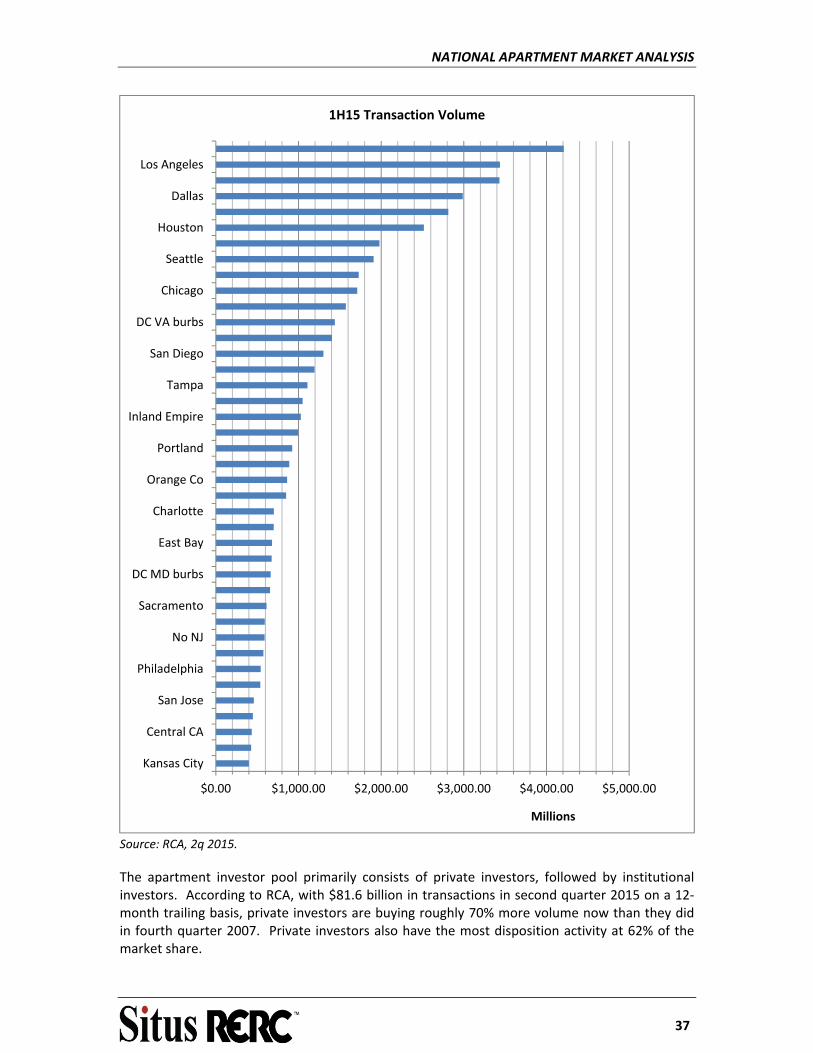
Source: RCA, 2q 2015.
The apartment investor pool primarily consists of private investors, followed by institutional investors. According to RCA, with $81.6 billion in transactions in second quarter 2015 on a 12‐month trailing basis, private investors are buying roughly 70% more volume now than they did in fourth quarter 2007. Private investors also have the most disposition activity at 62% of the market share.
$0.00 $1,000.00 $2,000.00 $3,000.00 $4,000.00 $5,000.00
Kansas City
Central CA
San Jose
Philadelphia
No NJ
Sacramento
DC MD burbs
East Bay
Charlotte
Orange Co
Portland
Inland Empire
Tampa
San Diego
DC VA burbs
Chicago
Seattle
Houston
Dallas
Los Angeles
Millions
1H15 Transaction Volume
NATIONAL APARTMENT MARKET ANALYSIS
38
Source: RCA, 2q 2015.
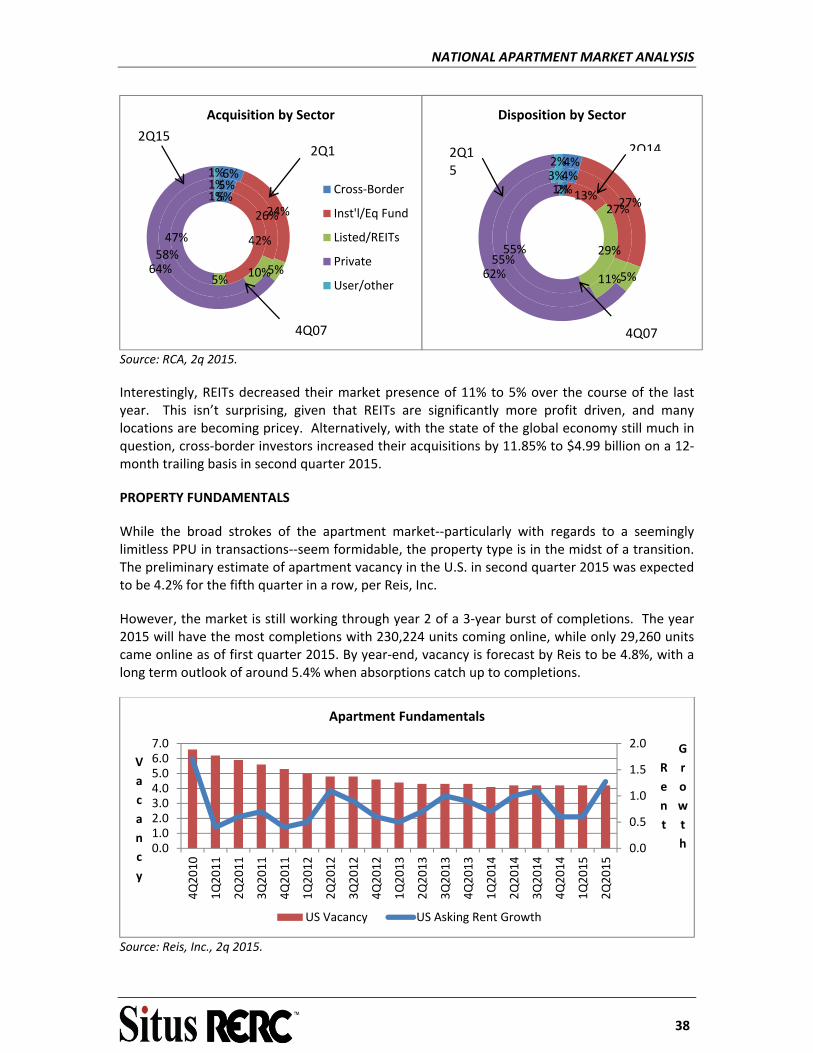
Interestingly, REITs decreased their market presence of 11% to 5% over the course of the last year. This isn’t surprising, given that REITs are significantly more profit driven, and many locations are becoming pricey. Alternatively, with the state of the global economy still much in question, cross‐border investors increased their acquisitions by 11.85% to $4.99 billion on a 12‐month trailing basis in second quarter 2015.
PROPERTY FUNDAMENTALS
While the broad strokes of the apartment market‐‐particularly with regards to a seemingly limitless PPU in transactions‐‐seem formidable, the property type is in the midst of a transition. The preliminary estimate of apartment vacancy in the U.S. in second quarter 2015 was expected to be 4.2% for the fifth quarter in a row, per Reis, Inc.
However, the market is still working through year 2 of a 3‐year burst of completions. The year 2015 will have the most completions with 230,224 units coming online, while only 29,260 units came online as of first quarter 2015. By year‐end, vacancy is forecast by Reis to be 4.8%, with a long term outlook of around 5.4% when absorptions catch up to completions.
Source: Reis, Inc., 2q 2015.
5%
42%
5%
47%
1%5%
26%
10%
58%
1%6%
24%
5%64%
1%
Acquisition by Sector
Cross‐Border
Inst'l/Eq Fund
Listed/REITs
Private
User/other
2Q12Q15
4Q07
0.0
0.5
1.0
1.5
2.0
0.01.02.03.04.05.06.07.0
4Q2010
1Q2011
2Q2011
3Q2011
4Q2011
1Q2012
2Q2012
3Q2012
4Q2012
1Q2013
2Q2013
3Q2013
4Q2013
1Q2014
2Q2014
3Q2014
4Q2014
1Q2015
2Q2015
R
e
n
t
G
r
o
w
t
h
V
a
c
a
n
c
y
Apartment Fundamentals
US Vacancy US Asking Rent Growth
2%13%
29%55%
1%4%
27%
11%
55%
3%4%
27%
5%62%
2%
Disposition by Sector
2Q142Q15
4Q07
NATIONAL APARTMENT MARKET ANALYSIS
39
Source: Reis, Inc., 2q 2015.
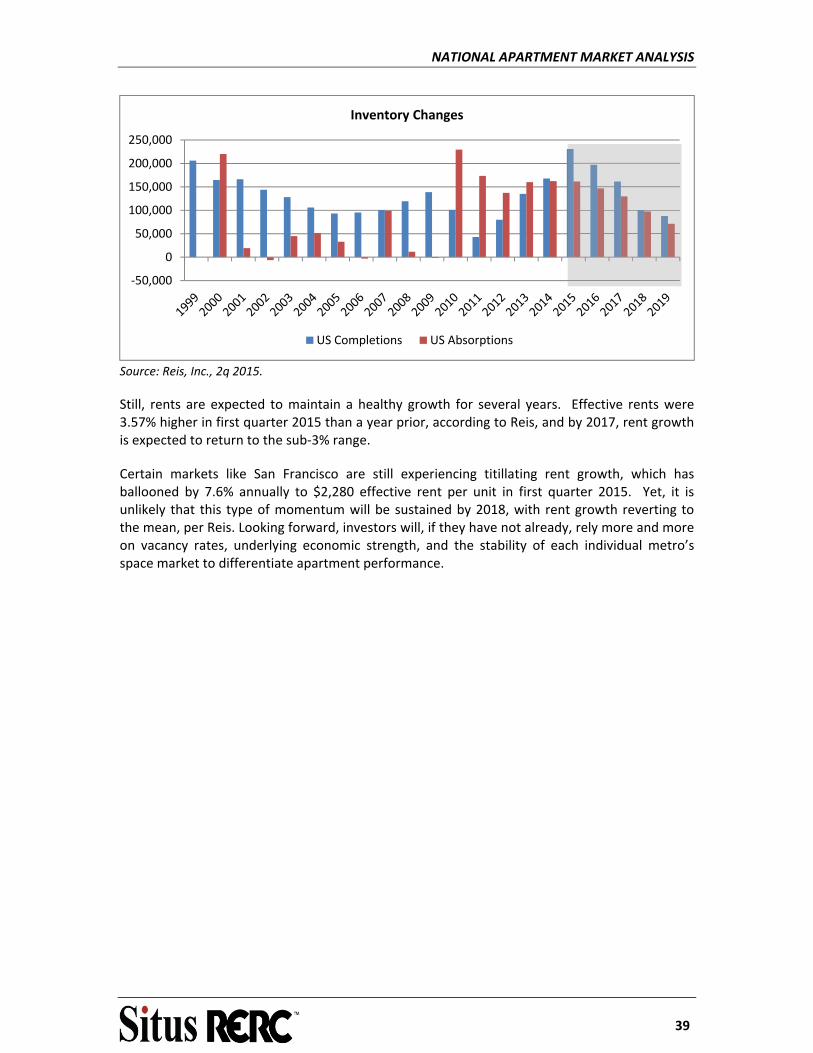
Still, rents are expected to maintain a healthy growth for several years. Effective rents were 3.57% higher in first quarter 2015 than a year prior, according to Reis, and by 2017, rent growth is expected to return to the sub‐3% range.
Certain markets like San Francisco are still experiencing titillating rent growth, which has ballooned by 7.6% annually to $2,280 effective rent per unit in first quarter 2015. Yet, it is unlikely that this type of momentum will be sustained by 2018, with rent growth reverting to the mean, per Reis. Looking forward, investors will, if they have not already, rely more and more on vacancy rates, underlying economic strength, and the stability of each individual metro’s space market to differentiate apartment performance.
‐50,000
0
50,000
100,000
150,000
200,000
250,000
Inventory Changes
US Completions US Absorptions
NATIONAL APARTMENT MARKET ANALYSIS
40
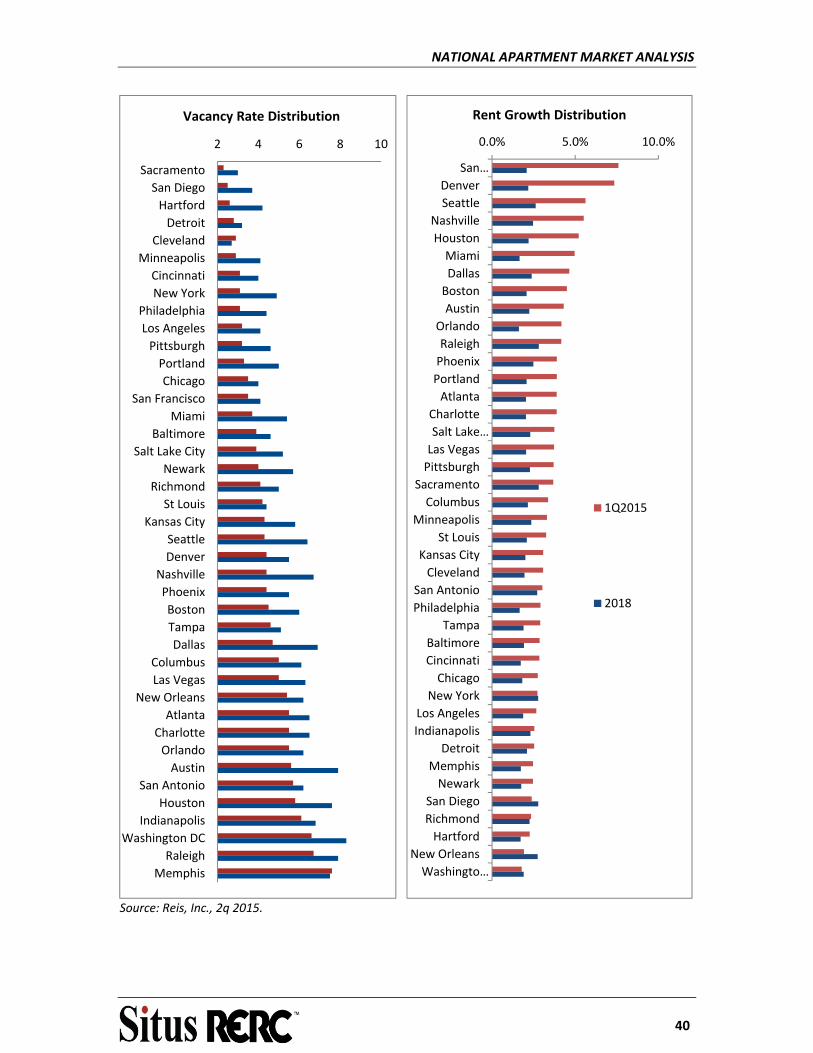
Source: Reis, Inc., 2q 2015.
2 4 6 8 10
Sacramento
San Diego
Hartford
Detroit
Cleveland
Minneapolis
Cincinnati
New York
Philadelphia
Los Angeles
Pittsburgh
Portland
Chicago
San Francisco
Miami
Baltimore
Salt Lake City
Newark
Richmond
St Louis
Kansas City
Seattle
Denver
Nashville
Phoenix
Boston
Tampa
Dallas
Columbus
Las Vegas
New Orleans
Atlanta
Charlotte
Orlando
Austin
San Antonio
Houston
Indianapolis
Washington DC
Raleigh
Memphis
Vacancy Rate Distribution
0.0% 5.0% 10.0%
San…
Denver
Seattle
Nashville
Houston
Miami
Dallas
Boston
Austin
Orlando
Raleigh
Phoenix
Portland
Atlanta
Charlotte
Salt Lake…
Las Vegas
Pittsburgh
Sacramento
Columbus
Minneapolis
St Louis
Kansas City
Cleveland
San Antonio
Philadelphia
Tampa
Baltimore
Cincinnati
Chicago
New York
Los Angeles
Indianapolis
Detroit
Memphis
Newark
San Diego
Richmond
Hartford
New Orleans
Washingto…
Rent Growth Distribution
1Q2015
2018
NATIONAL APARTMENT MARKET ANALYSIS
41
PROPERTY RETURNS
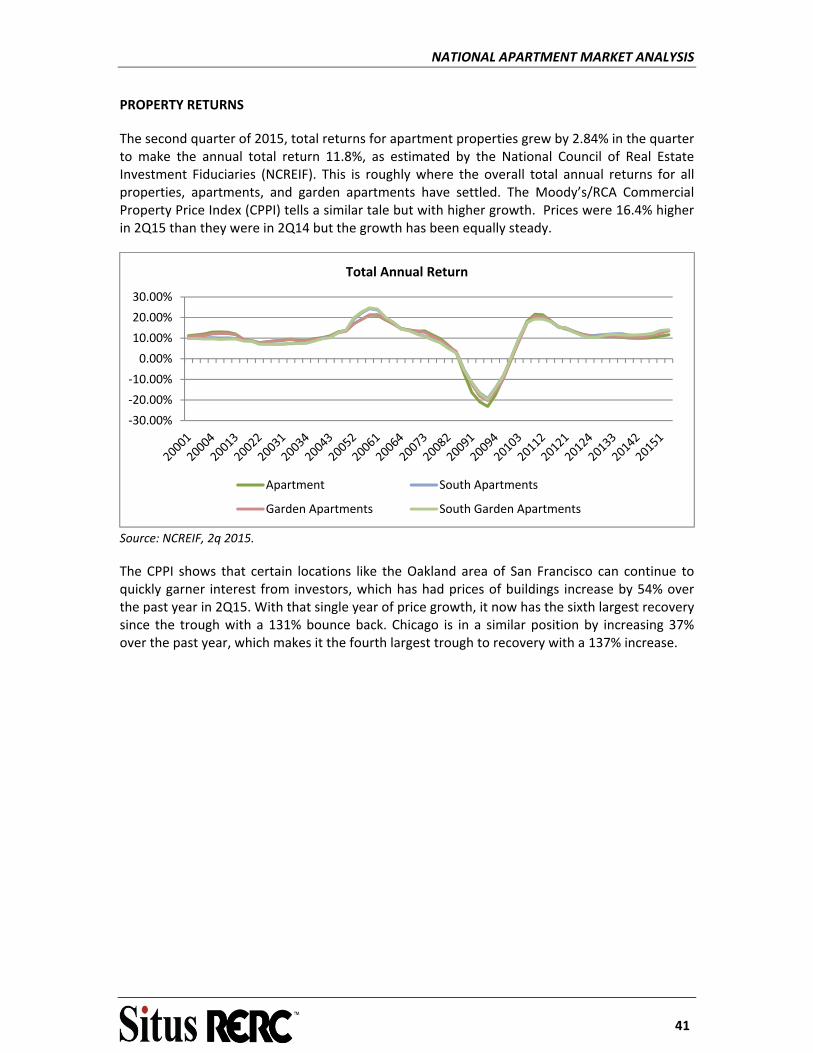
The second quarter of 2015, total returns for apartment properties grew by 2.84% in the quarter to make the annual total return 11.8%, as estimated by the National Council of Real Estate Investment Fiduciaries (NCREIF). This is roughly where the overall total annual returns for all properties, apartments, and garden apartments have settled. The Moody’s/RCA Commercial Property Price Index (CPPI) tells a similar tale but with higher growth. Prices were 16.4% higher in 2Q15 than they were in 2Q14 but the growth has been equally steady.
Source: NCREIF, 2q 2015.
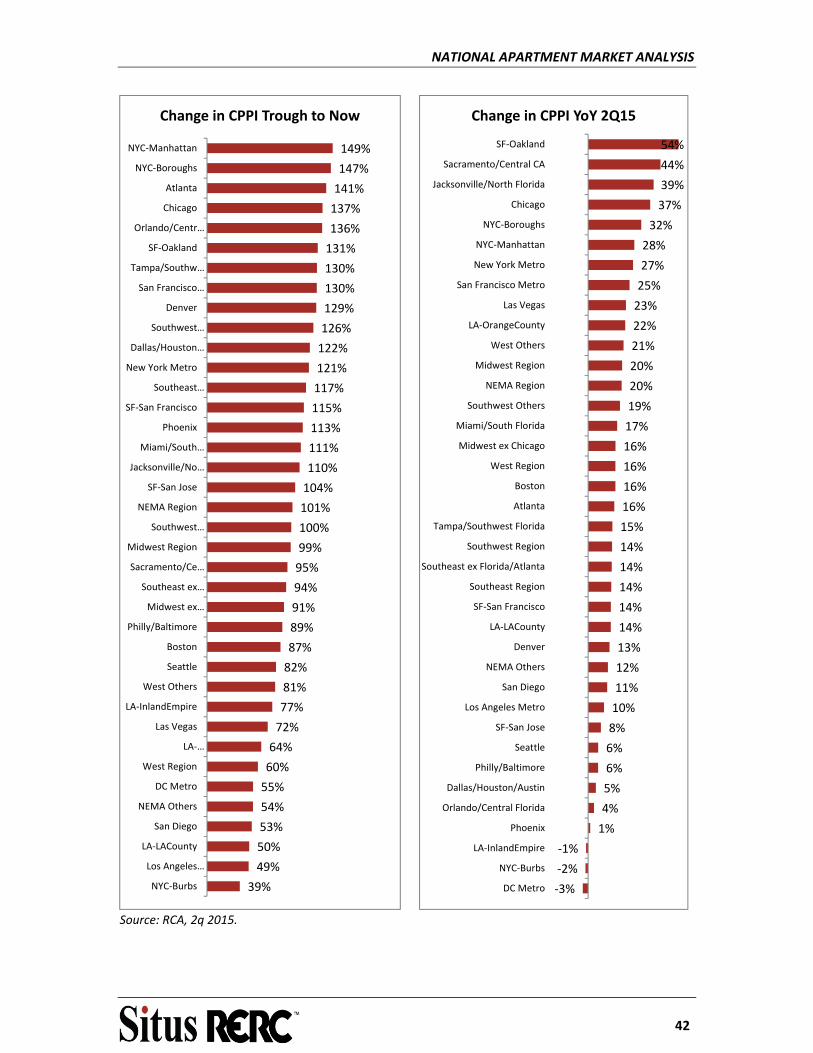
The CPPI shows that certain locations like the Oakland area of San Francisco can continue to quickly garner interest from investors, which has had prices of buildings increase by 54% over the past year in 2Q15. With that single year of price growth, it now has the sixth largest recovery since the trough with a 131% bounce back. Chicago is in a similar position by increasing 37% over the past year, which makes it the fourth largest trough to recovery with a 137% increase.
‐30.00%
‐20.00%
‐10.00%
0.00%
10.00%
20.00%
30.00%
Total Annual Return
Apartment South Apartments
Garden Apartments South Garden Apartments
NATIONAL APARTMENT MARKET ANALYSIS
42
Source: RCA, 2q 2015.
149%
147%
141%
137%
136%
131%
130%
130%
129%
126%
122%
121%
117%
115%
113%
111%
110%
104%
101%
100%
99%
95%
94%
91%
89%
87%
82%
81%
77%
72%
64%
60%
55%
54%
53%
50%
49%
39%
NYC‐Manhattan
NYC‐Boroughs
Atlanta
Chicago
Orlando/Centr…
SF‐Oakland
Tampa/Southw…
San Francisco…
Denver
Southwest…
Dallas/Houston…
New York Metro
Southeast…
SF‐San Francisco
Phoenix
Miami/South…
Jacksonville/No…
SF‐San Jose
NEMA Region
Southwest…
Midwest Region
Sacramento/Ce…
Southeast ex…
Midwest ex…
Philly/Baltimore
Boston
Seattle
West Others
LA‐InlandEmpire
Las Vegas
LA‐…
West Region
DC Metro
NEMA Others
San Diego
LA‐LACounty
Los Angeles…
NYC‐Burbs
Change in CPPI Trough to Now
54%
44%
39%
37%
32%
28%
27%
25%
23%
22%
21%
20%
20%
19%
17%
16%
16%
16%
16%
15%
14%
14%
14%
14%
14%
13%
12%
11%
10%
8%
6%
6%
5%
4%
1%
‐1%
‐2%
‐3%
SF‐Oakland
Sacramento/Central CA
Jacksonville/North Florida
Chicago
NYC‐Boroughs
NYC‐Manhattan
New York Metro
San Francisco Metro
Las Vegas
LA‐OrangeCounty
West Others
Midwest Region
NEMA Region
Southwest Others
Miami/South Florida
Midwest ex Chicago
West Region
Boston
Atlanta
Tampa/Southwest Florida
Southwest Region
Southeast ex Florida/Atlanta
Southeast Region
SF‐San Francisco
LA‐LACounty
Denver
NEMA Others
San Diego
Los Angeles Metro
SF‐San Jose
Seattle
Philly/Baltimore
Dallas/Houston/Austin
Orlando/Central Florida
Phoenix
LA‐InlandEmpire
NYC‐Burbs
DC Metro
Change in CPPI YoY 2Q15
NATIONAL APARTMENT MARKET ANALYSIS
43
CONCLUSION
For investors, the current apartment market is still strong without a lot of weaknesses to suggest otherwise. And yet, there are hints that the underlying apartment market could be brittle. The apartment market may be unable to make a fluid transition while confronting hurdles such as extreme upward price pressures on top tier assets, the absorption of a burst of new apartment properties, improving outlook of other commercial real estate property types, or an increase in the Federal Funds Rate that could be larger than anticipated. The consequence of the latter will ultimately be an increased lending rate for commercial real estate making current compressed cap rates harder to justify. The apartment market is not devoid of opportunities or gems in the rough, but the boom this property type has experienced, in large part, may be over sooner than later.
APARTMENT MARKET ANALYSIS
44
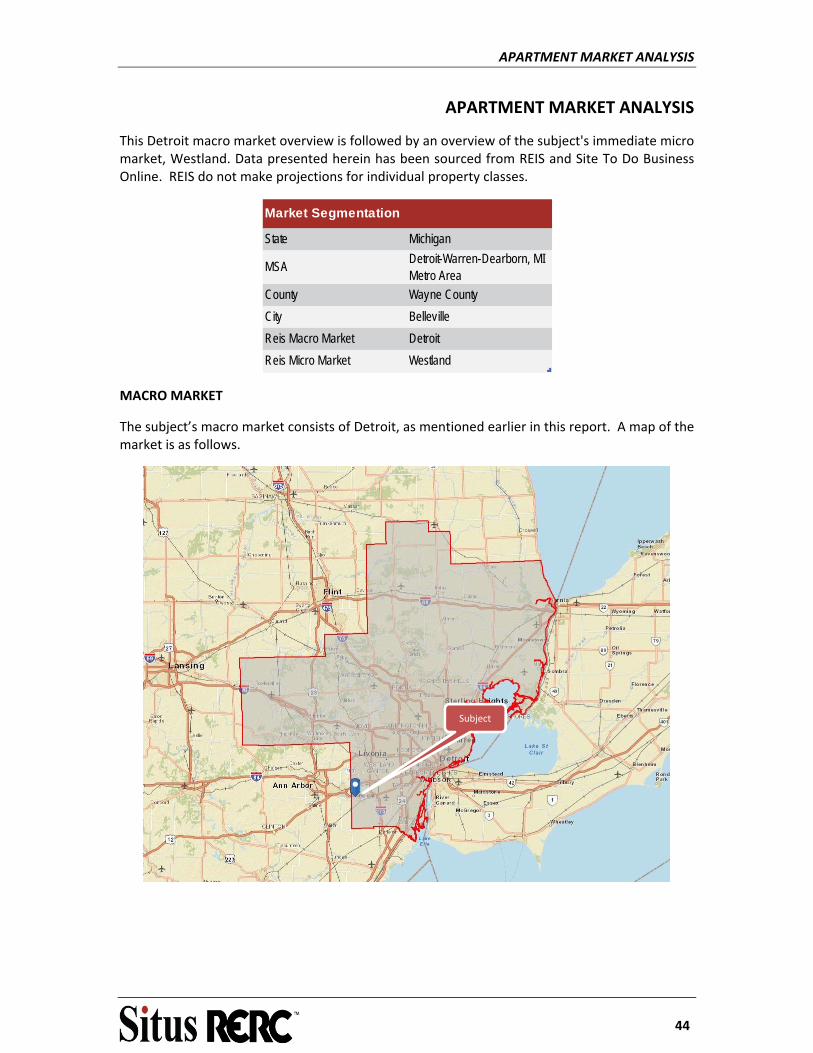
APARTMENT MARKET ANALYSIS
This Detroit macro market overview is followed by an overview of the subject's immediate micro market, Westland. Data presented herein has been sourced from REIS and Site To Do Business Online. REIS do not make projections for individual property classes.
State Michigan
MSADetroit-Warren-Dearborn, MI Metro Area
County Wayne County
City Belleville
Reis Macro Market Detroit
Reis Micro Market Westland
Market Segmentation
MACRO MARKET
The subject’s macro market consists of Detroit, as mentioned earlier in this report. A map of the market is as follows.
Subject
APARTMENT MARKET ANALYSIS
45
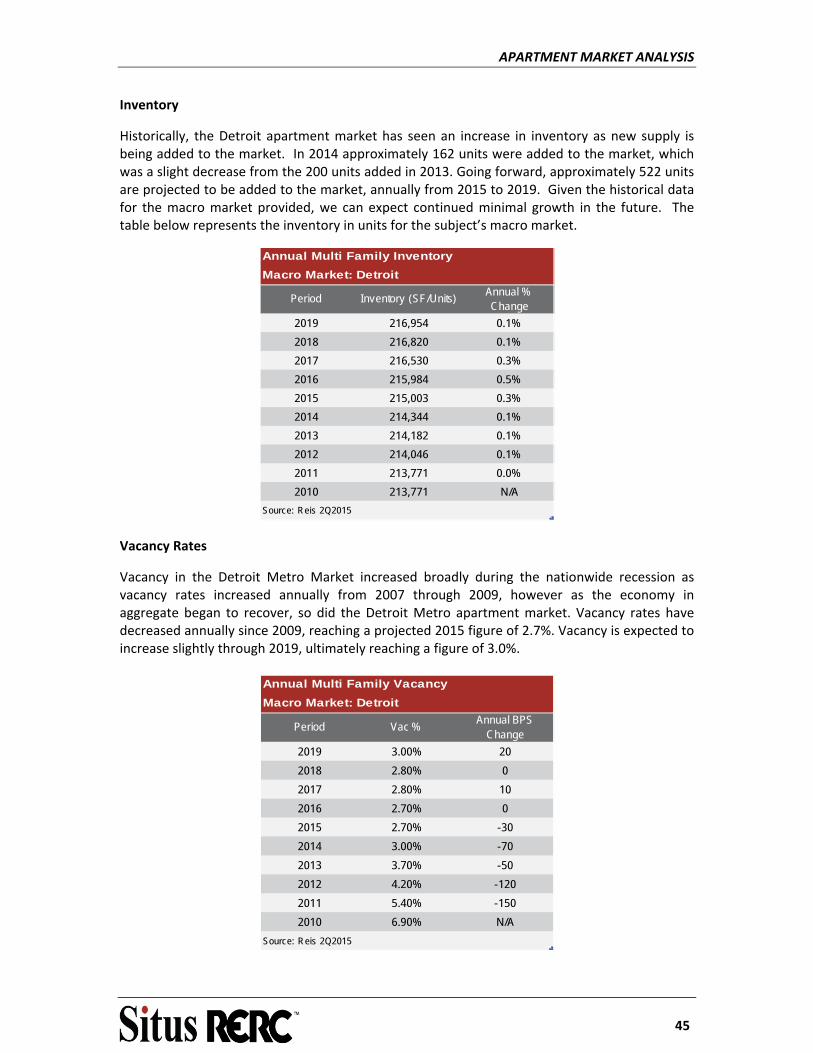
Inventory
Historically, the Detroit apartment market has seen an increase in inventory as new supply is being added to the market. In 2014 approximately 162 units were added to the market, which was a slight decrease from the 200 units added in 2013. Going forward, approximately 522 units are projected to be added to the market, annually from 2015 to 2019. Given the historical data for the macro market provided, we can expect continued minimal growth in the future. The table below represents the inventory in units for the subject’s macro market.
Annual Multi Family Inventory
Macro Market: Detroit
Period Inventory (SF/Units)Annual % Change
2019 216,954 0.1%
2018 216,820 0.1%
2017 216,530 0.3%
2016 215,984 0.5%
2015 215,003 0.3%
2014 214,344 0.1%
2013 214,182 0.1%
2012 214,046 0.1%
2011 213,771 0.0%
2010 213,771 N/A
Source: Reis 2Q2015
Vacancy Rates
Vacancy in the Detroit Metro Market increased broadly during the nationwide recession as vacancy rates increased annually from 2007 through 2009, however as the economy in aggregate began to recover, so did the Detroit Metro apartment market. Vacancy rates have decreased annually since 2009, reaching a projected 2015 figure of 2.7%. Vacancy is expected to increase slightly through 2019, ultimately reaching a figure of 3.0%.
Annual Multi Family Vacancy
Macro Market: Detroit
Period Vac %Annual BPS
Change
2019 3.00% 20
2018 2.80% 0
2017 2.80% 10
2016 2.70% 0
2015 2.70% -30
2014 3.00% -70
2013 3.70% -50
2012 4.20% -120
2011 5.40% -150
2010 6.90% N/A
Source: Reis 2Q2015
APARTMENT MARKET ANALYSIS
46
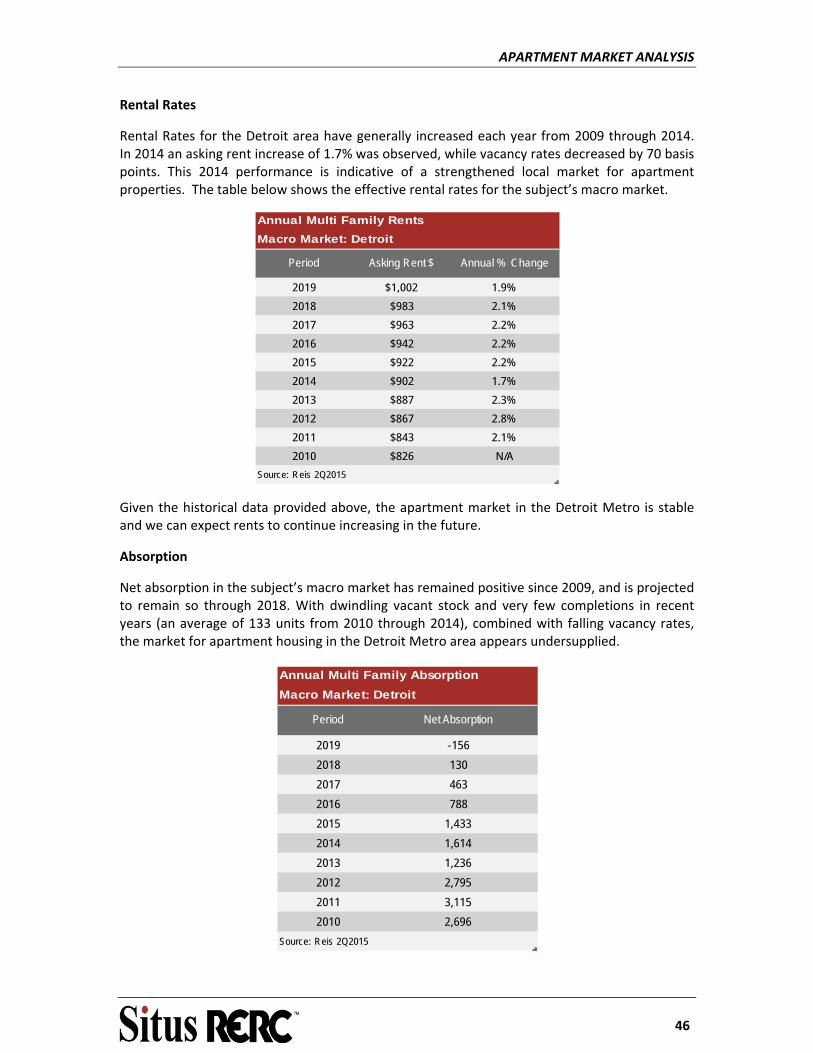
Rental Rates
Rental Rates for the Detroit area have generally increased each year from 2009 through 2014. In 2014 an asking rent increase of 1.7% was observed, while vacancy rates decreased by 70 basis points. This 2014 performance is indicative of a strengthened local market for apartment properties. The table below shows the effective rental rates for the subject’s macro market.
Annual Multi Family Rents
Macro Market: Detroit
Period Asking Rent $ Annual % Change
2019 $1,002 1.9%
2018 $983 2.1%
2017 $963 2.2%
2016 $942 2.2%
2015 $922 2.2%
2014 $902 1.7%
2013 $887 2.3%
2012 $867 2.8%
2011 $843 2.1%
2010 $826 N/A
Source: Reis 2Q2015
Given the historical data provided above, the apartment market in the Detroit Metro is stable and we can expect rents to continue increasing in the future.
Absorption
Net absorption in the subject’s macro market has remained positive since 2009, and is projected to remain so through 2018. With dwindling vacant stock and very few completions in recent years (an average of 133 units from 2010 through 2014), combined with falling vacancy rates, the market for apartment housing in the Detroit Metro area appears undersupplied.
Annual Multi Family Absorption
Macro Market: Detroit
Period Net Absorption
2019 -156
2018 130
2017 463
2016 788
2015 1,433
2014 1,614
2013 1,236
2012 2,795
2011 3,115
2010 2,696
Source: Reis 2Q2015

APARTMENT MARKET ANALYSIS
47
MICRO MARKET
The subject’s micro market consists of the Westland submarket, as mentioned earlier in this report. A map of the submarket is as follows.
Inventory
Over the past 5 years, inventory has remained stagnant in the micro market. From 2009 to 2014, there have been no units added to the market. Given the historical data for the micro market, we can expect minimal growth in the future. The table below represents the inventory in units for the subject’s micro market.
Annual Multi Family Inventory
Westland
Period Inventory (SF/Units)Annual % Change
2019 26,511 0.0%
2018 26,511 0.0%
2017 26,511 0.0%
2016 26,511 0.0%
2015 26,511 0.0%
2014 26,511 0.0%
2013 26,511 0.0%
2012 26,511 0.0%
2011 26,511 0.0%
2010 26,511 N/A
Source: Reis 2Q2015
Subject
APARTMENT MARKET ANALYSIS
48
Vacancy Rates
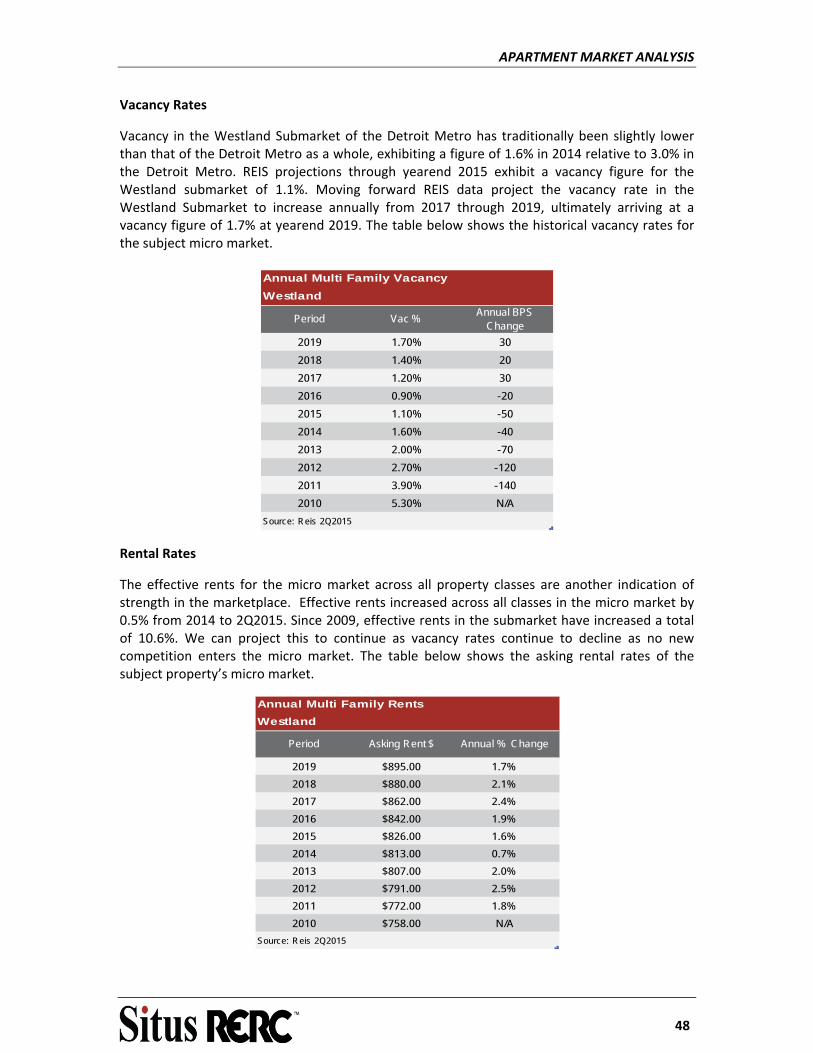
Vacancy in the Westland Submarket of the Detroit Metro has traditionally been slightly lower than that of the Detroit Metro as a whole, exhibiting a figure of 1.6% in 2014 relative to 3.0% in the Detroit Metro. REIS projections through yearend 2015 exhibit a vacancy figure for the Westland submarket of 1.1%. Moving forward REIS data project the vacancy rate in the Westland Submarket to increase annually from 2017 through 2019, ultimately arriving at a vacancy figure of 1.7% at yearend 2019. The table below shows the historical vacancy rates for the subject micro market.
Annual Multi Family Vacancy
Westland
Period Vac %Annual BPS
Change
2019 1.70% 30
2018 1.40% 20
2017 1.20% 30
2016 0.90% -20
2015 1.10% -50
2014 1.60% -40
2013 2.00% -70
2012 2.70% -120
2011 3.90% -140
2010 5.30% N/A
Source: Reis 2Q2015
Rental Rates
The effective rents for the micro market across all property classes are another indication of strength in the marketplace. Effective rents increased across all classes in the micro market by 0.5% from 2014 to 2Q2015. Since 2009, effective rents in the submarket have increased a total of 10.6%. We can project this to continue as vacancy rates continue to decline as no new competition enters the micro market. The table below shows the asking rental rates of the subject property’s micro market.
Annual Multi Family Rents
Westland
Period Asking Rent $ Annual % Change
2019 $895.00 1.7%
2018 $880.00 2.1%
2017 $862.00 2.4%
2016 $842.00 1.9%
2015 $826.00 1.6%
2014 $813.00 0.7%
2013 $807.00 2.0%
2012 $791.00 2.5%
2011 $772.00 1.8%
2010 $758.00 N/A
Source: Reis 2Q2015
APARTMENT MARKET ANALYSIS
49
Absorption
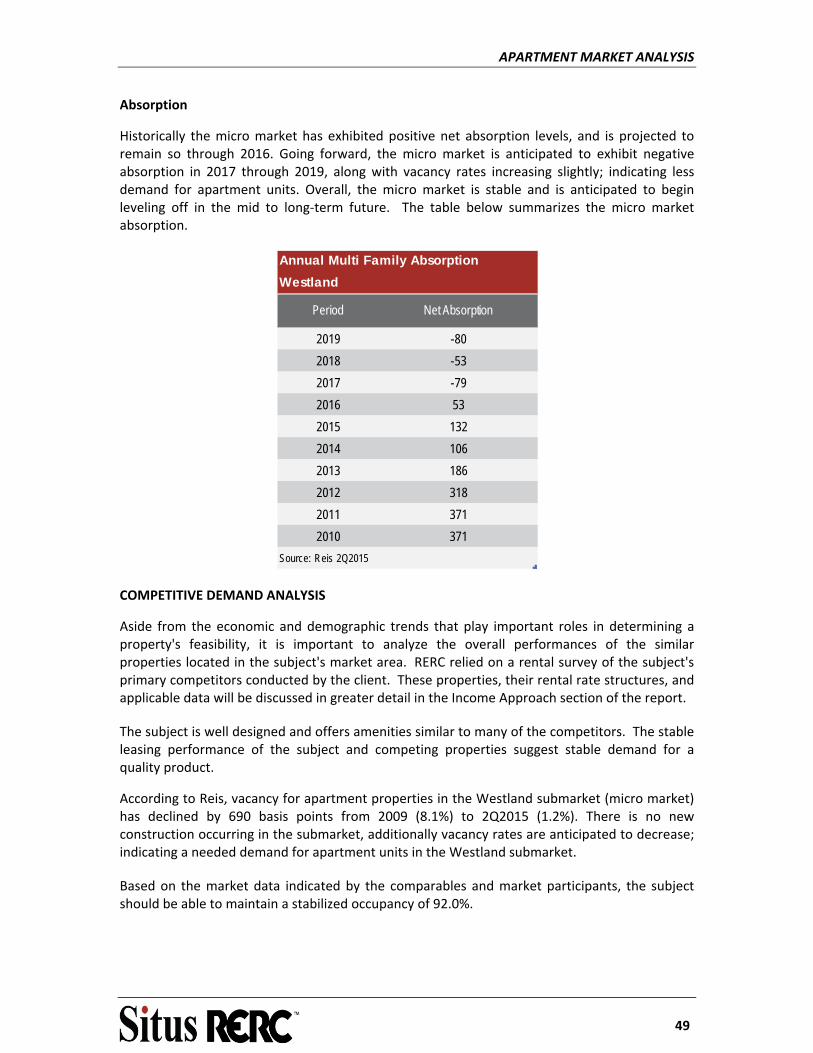
Historically the micro market has exhibited positive net absorption levels, and is projected to remain so through 2016. Going forward, the micro market is anticipated to exhibit negative absorption in 2017 through 2019, along with vacancy rates increasing slightly; indicating less demand for apartment units. Overall, the micro market is stable and is anticipated to begin leveling off in the mid to long‐term future. The table below summarizes the micro market absorption.
Annual Multi Family Absorption
Westland
Period Net Absorption
2019 -80
2018 -53
2017 -79
2016 53
2015 132
2014 106
2013 186
2012 318
2011 371
2010 371
Source: Reis 2Q2015
COMPETITIVE DEMAND ANALYSIS
Aside from the economic and demographic trends that play important roles in determining a property's feasibility, it is important to analyze the overall performances of the similar properties located in the subject's market area. RERC relied on a rental survey of the subject's primary competitors conducted by the client. These properties, their rental rate structures, and applicable data will be discussed in greater detail in the Income Approach section of the report.
The subject is well designed and offers amenities similar to many of the competitors. The stable leasing performance of the subject and competing properties suggest stable demand for a quality product.
According to Reis, vacancy for apartment properties in the Westland submarket (micro market) has declined by 690 basis points from 2009 (8.1%) to 2Q2015 (1.2%). There is no new construction occurring in the submarket, additionally vacancy rates are anticipated to decrease; indicating a needed demand for apartment units in the Westland submarket.
Based on the market data indicated by the comparables and market participants, the subject should be able to maintain a stabilized occupancy of 92.0%.
APARTMENT MARKET ANALYSIS
50
MARKET ANALYSIS CONCLUSION
The apartment market in Detroit has shown positive recovery since the recession with increasing rental rates and declines in vacancy. There has been limited construction activity since 2009; we expect this trend to continue to the mid to long‐term future.
The subject’s micro market has experienced similar conditions as the overall metro area. Given the area demographics and continued development activity, it appears demand for comparable apartment properties and the subject improvements will continue to be favorable. The subject and its neighborhood are projected to experience a continued stable existence.
HIGHEST AND BEST USE
51
HIGHEST AND BEST USE
OVERVIEW
Highest and best use is defined by The Dictionary of Real Estate Appraisal, 5th edition as:
The reasonably probable and legal use of vacant land or an improved property, which is physically possible, appropriately supported, financially feasible and that results in the highest value.
Analyzing the site’s highest and best use requires consideration of all legal, physical and economic factors. Economic factors such as supply and demand are especially important. The highest and best use analysis is discussed on the following pages.
HIGHEST AND BEST USE, AS VACANT
Legal Permissibility
The subject is zoned R1‐B & R‐M, Multi‐Family and Single‐Family Residential. The R‐M district permits multi‐family use and single‐family use. The subject, given that portions of it are zoned single‐family residential is considered legal non‐conforming.
We are unaware of any deed restrictions impacting the subject. A title report was not provided to investigate this matter further and we assume no such restrictions exist.
Physical Possibility
The subject is adequately served by utilities and has an adequate shape and size, sufficient access to be a developable site. The flood map indicates the site is not prone to flooding. No soil reports were provided in conjunction with this appraisal. Based on the extent of development in the general neighborhood and immediate area, we assume (subject to engineering verification) that soil conditions are not affected by contaminants, and that the land has the load bearing capacity to adequately support any improvements that might reasonably be proposed thereon. There are no known physical reasons why the subject would not support any legally permissible development.
The existing improvements, as well as existing structures on nearby sites, provides additional evidence for the physical possibility of development. Thus, the physical aspects of the site do not seemingly present any constraints to development, within the confines of the site and legally permissible uses.
Financial Feasibility
Any use that is legally permissible, is possible within the subject's physical constraints, and provides a positive return to the land is considered financially feasible. Given the subject's location and zoning, multi‐family development is the only reasonably probable use to test for financial feasibility.
HIGHEST AND BEST USE
52
Based on the market analysis within this report, current multi‐family development appears feasible. Speculative development has not occurred in the market recently.
Maximum Profitability
The final test of highest and best use of the site as if vacant is that the use be maximally productive, yielding the highest return to the land. In the case of the subject as vacant, the analysis has indicated that a new multi‐family development would be most appropriate and the market conditions are not adequate to support such development; given there has been no new construction the most maximally profitable use would be a future multi‐family development,.
Highest and Best Use Conclusion, As Vacant
Based on the information presented above and that contained in the market and neighborhood analyses, we conclude that the highest and best use of the subject site as if vacant would be to hold for future development of an apartment property. The most probable user, as vacant is a local or regional apartment developer. Development is anticipated to occur in the next 1 to 3 years, depending on new supply in the market, as well as changes in vacancy, population, and rental rates.
HIGHEST AND BEST USE, AS IMPROVED
Legal Permissibility
As discussed, the subject site’s zoning and legal restrictions permit multi‐family rental use as well as single‐family residential use. The subject is a legal, non‐conforming use, as portions of its site are zoned for single‐family. Conversations with the Van Buren Township Assessment Department indicated that multi‐family use does not conform to the single‐family ordinance in Vane Buren Township; however the subject property is primarily zoned multi‐family and is considered a legal non‐conforming use according to the township.
Physical Possibility
The physical characteristics of the subject improvements were discussed in detail in the improvements analysis. Both the layout and position of the improvements are considered functional for apartment use.
Financial Feasibility
The financial feasibility of a property is based on the amount of rent which can be generated, less operating expenses required to generate that income; if a residual amount exists, then the land is being put to a productive use. As will be indicated in the income approach, the subject is projected to produce a positive net cash flow and utilization of the improvements for apartment use is financially feasible. Conversion of the improvements or modification of the improvements is not considered to provide a higher return to the land.
HIGHEST AND BEST USE
53
Maximum Profitability
The maximally profitable use of the subject as improved should conform to the neighborhood trends and be consistent with existing land uses. Although several uses may generate sufficient revenue to satisfy the required rate of return on investment and provide a return to the land, the single use that produces the highest price or value is typically the highest and best use. As shown in the applicable valuation sections, buildings that are similar to the subject have been acquired for continued multi‐family rental use. None of the comparable sales were purchased for conversion to a significantly different use. These comparables would indicate that the maximally productive use of the property is consistent with the existing use as a market rate apartment property.
Highest and Best Use Conclusion, As Improved
Based on the previous analysis, the highest and best use of the subject, as improved, is for multi‐family apartment use. The most probable user as improved is a local or regional apartment investor.
VALUATION METHODOLOGY
54
VALUATION METHODOLOGY
Any property is valued principally by means of one or more of the three approaches to value: income capitalization, sales comparison, and cost. The indications of these analyses and the weight accorded to each lead to an opinion of value. The three approaches are defined briefly as follows:
Cost Approach. The cost approach involves an analysis of the physical value of the property. That is, the current value of the land, assumed to be vacant, plus the depreciated cost of the improvements present on the site. Depreciated cost is based on the estimated cost of replacing the structural and site improvements, less any accrued depreciation from physical deterioration, functional obsolescence, and or external obsolescence.
Sales Comparison Approach. This approach is based on the principle of substitution. That is, when a property is replaceable in the market, its value tends to be set at the cost of acquiring an equally desirable substitute property, assuming no costly delay occurs in making the substitution. Since no two properties are ever truly identical, the necessary adjustments for differences in quality, location, size, services, and market appeal between the appraised property and comparable (substitute) properties are a function of the appraiser's experience and judgment.
Income Approach. This approach entails an analysis of the property in terms of its ability to provide a sufficient net annual return on investment capital. There are two techniques used to assess the economic potential of the appraised property; direct capitalization and discounted cash flow analysis. The discounted cash flow analysis technique discounts a property's forecasted future income flows over a stipulated holding period to arrive at an indication of present value. Direct capitalization employs an overall capitalization rate to a stabilized income stream to arrive at an indication of value.
The cost approach was not deemed required by the scope of work and therefore not developed. The sales comparison and income approaches provide reliable indications of fair value, independent of the cost approach.
SALES COMPARISON APPROACH
55
SALES COMPARISON APPROACH
The Sales Comparison Approach is defined by The Dictionary of Real Estate Appraisal, 5th edition, Appraisal Institute, as follows.
The process of deriving a value indication for the subject property by comparing market information for similar properties with the property being appraised, identifying appropriate units of comparison, and making qualitative comparisons with or quantitative adjustments to the sale prices (or unit prices, as appropriate) of the comparable properties based on relevant, market derived elements of comparison
The Sales Comparison Approach to value is based on the principal of substitution. That is, when a property is replaceable in the market, its value tends to be set at the cost of acquiring an equally desirable substitute property, assuming no costly delay occurs in making the substitution. Traditional appraisal techniques for estimating value by means of substitution involve the collection and analysis of sale and listing data on properties that have as many characteristics as possible similar to those of the property being evaluated. The validity of findings by this approach depends primarily on the quantity and quality of available data.
Because no two properties are ever truly identical, particularly income‐producing properties, the prices of market indicators must be adjusted to reflect the value of the property being appraised. Typically, adjustments reflect significant differences for such factors as the terms of the sale, market conditions changes, physical characteristics, and economic characters.
The subject is a 1,112‐unit, class B apartment property. We were able to locate four sales of similar quality apartment complexes in the subject’s relevant market area.
The sales located and analyzed further within the report are mapped on the following page and followed by a table summarizing the sales.
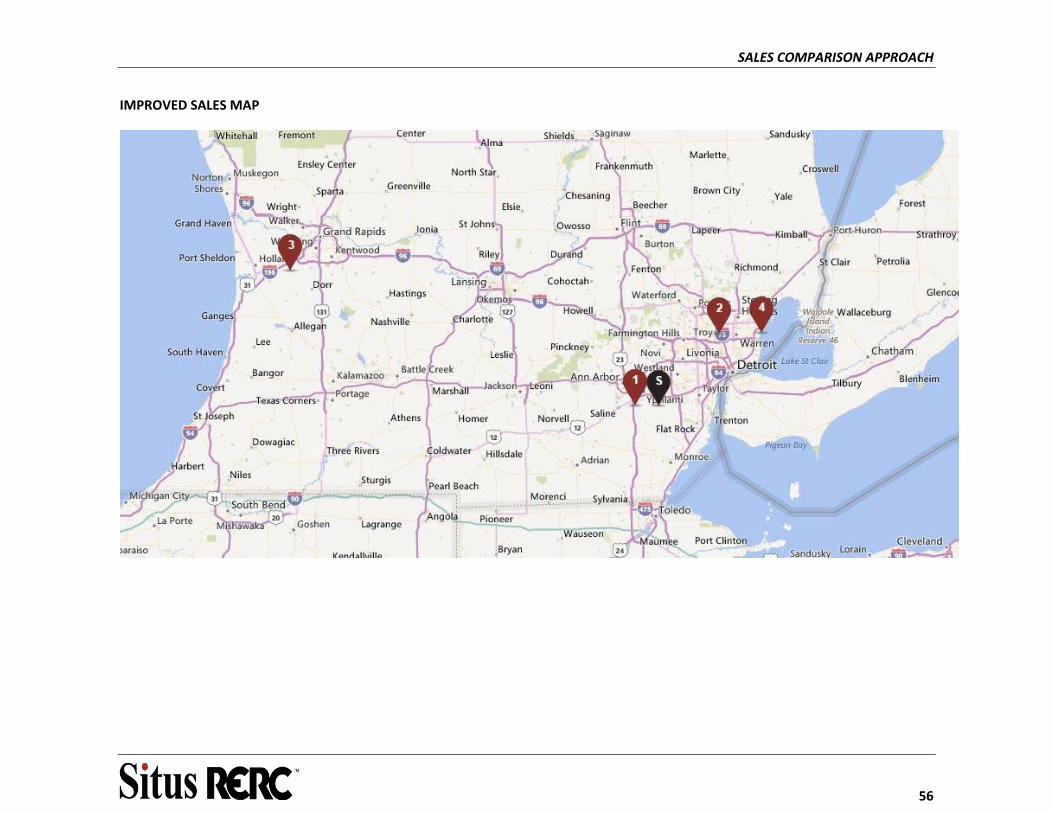
SALES COMPARISON APPROACH
56
IMPROVED SALES MAP
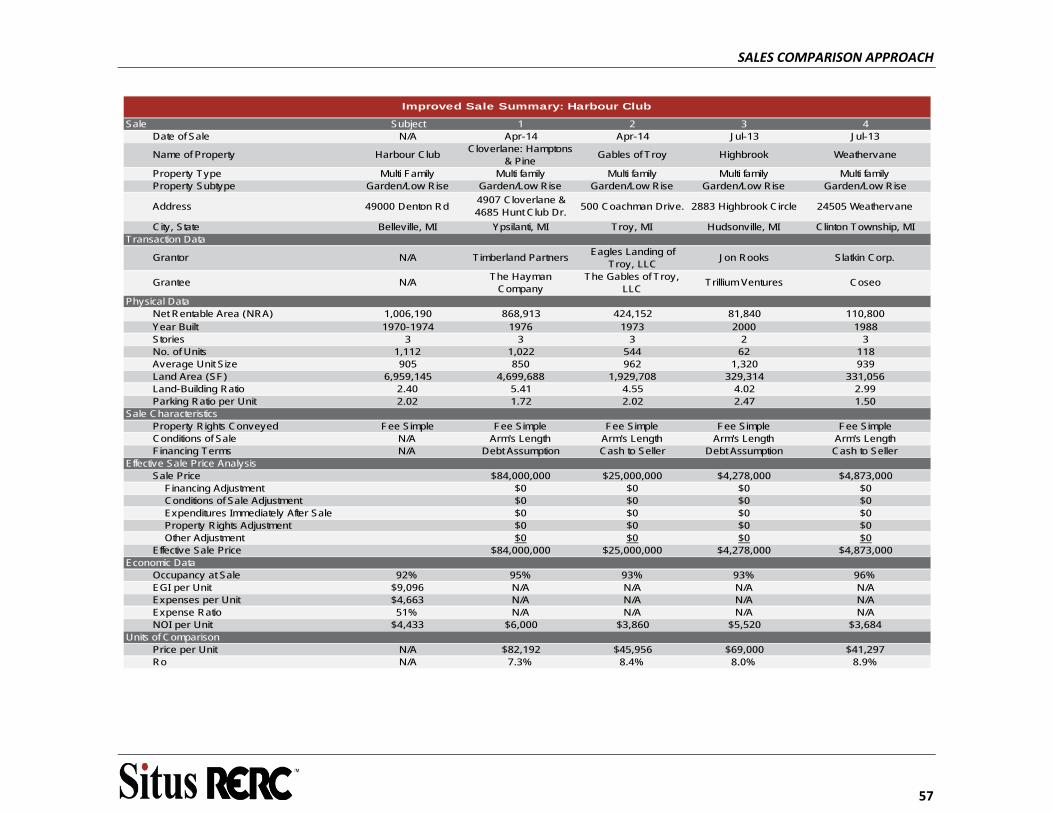
SALES COMPARISON APPROACH
57
Sale Subject 1 2 3 4Date of Sale N/A Apr-14 Apr-14 Jul-13 Jul-13
Name of Property Harbour ClubCloverlane: Hamptons
& PineGables of Troy Highbrook Weathervane
Property Type Multi Family Multi family Multi family Multi family Multi familyProperty Subtype Garden/Low Rise Garden/Low Rise Garden/Low Rise Garden/Low Rise Garden/Low Rise
Address 49000 Denton Rd4907 Cloverlane & 4685 Hunt Club Dr.
500 Coachman Drive. 2883 Highbrook Circle 24505 Weathervane
City, State Belleville, MI Ypsilanti, MI Troy, MI Hudsonville, MI Clinton Township, MITransaction Data
Grantor N/A Timberland PartnersEagles Landing of
Troy, LLCJon Rooks Slatkin Corp.
Grantee N/AThe Hayman
CompanyThe Gables of Troy,
LLCTrillium Ventures Coseo
Physical DataNet Rentable Area (NRA) 1,006,190 868,913 424,152 81,840 110,800Year Built 1970-1974 1976 1973 2000 1988Stories 3 3 3 2 3No. of Units 1,112 1,022 544 62 118Average Unit Size 905 850 962 1,320 939Land Area (SF) 6,959,145 4,699,688 1,929,708 329,314 331,056Land-Building Ratio 2.40 5.41 4.55 4.02 2.99Parking Ratio per Unit 2.02 1.72 2.02 2.47 1.50
Sale CharacteristicsProperty Rights Conveyed Fee Simple Fee Simple Fee Simple Fee Simple Fee SimpleConditions of Sale N/A Arm's Length Arm's Length Arm's Length Arm's LengthFinancing Terms N/A Debt Assumption Cash to Seller Debt Assumption Cash to Seller
Effective Sale Price AnalysisSale Price $84,000,000 $25,000,000 $4,278,000 $4,873,000
Financing Adjustment $0 $0 $0 $0Conditions of Sale Adjustment $0 $0 $0 $0Expenditures Immediately After Sale $0 $0 $0 $0Property Rights Adjustment $0 $0 $0 $0Other Adjustment $0 $0 $0 $0
Effective Sale Price $84,000,000 $25,000,000 $4,278,000 $4,873,000Economic Data
Occupancy at Sale 92% 95% 93% 93% 96%EGI per Unit $9,096 N/A N/A N/A N/AExpenses per Unit $4,663 N/A N/A N/A N/AExpense Ratio 51% N/A N/A N/A N/ANOI per Unit $4,433 $6,000 $3,860 $5,520 $3,684
Units of ComparisonPrice per Unit N/A $82,192 $45,956 $69,000 $41,297Ro N/A 7.3% 8.4% 8.0% 8.9%
Improved Sale Summary: Harbour Club
SALES COMPARISON APPROACH
58
ADJUSTMENT DISCUSSION AND ANALYSIS
Market participants indicate apartments being sold and marketed based on a price per unit. Therefore, we analyzed the comparable sales with this unit of comparison. Subjectivity of Adjustment Paired sales quantifying explicit adjustments are difficult to estimate given the number of sales and availability of the right combination of sales to extract the various adjustments. Without adequate data to extract quantitative assessments, an appraiser must rely on qualitative assessments. The appraiser forms these assessments based on many factors relating to prior experience, market observations and judgment as an experienced professional. The appraiser then can provide explicit quantitative adjustments based on these qualitative assessments, as long as the adjustments are not presented in a misleading manner. As stated throughout the history of valuation, an appraisal is not an exact science and relies on judgment and experience coupled with the best market information available. Given the nature of the assignment and the use of the report, we have presented explicit quantitative adjustments that in some cases reflect qualitative assessments based on our judgment as a professional. This decision process exists in many professional fields. According to The Appraisal of Real Estate, 14th edition, the sales comparison approach is not formulaic. It does not lend itself to detailed mathematical precision. Rather, it is based on judgment and experience as much as quantitative analysis. Method of Adjustment
The comparable sales are adjusted using the Base Percentage technique, a multiplicative method, rather than an additive method. According to the Base Adjusting in the Sales Comparison Approach paper published in the Appraisal Journal, a peer reviewed research publication, unlike a summation of percentage adjustments. The base adjusting method is applied within our analysis as it is considered a superior method than the additive adjustment method.
Conditions of Sale
Adjustments for conditions of sale are sometimes needed to reflect the motivations of buyers and sellers in sales that cause them not to be truly arms‐length transactions. Various conditions may exist, including an existing relationship between the parties; inadequate market exposure; financial constraints; or legal considerations that influence the price or timing of the sale.
None of the sales warranted an adjustment for this category.
Market Conditions
The sales occurred between July 2013 and April 2014. Apartment data from Reis indicates that at a market‐wide level, vacancy rates have decreased, with rental rates increasing. Capitalization rates have decreased in the Midwest region to 7.10% as of 2Q2015. Overall, the apartment market has remained stable with capitalization rates broadly compressing, and average rates in the Detroit metro decreasing 80 basis points, and the Midwestern region decreasing 50 basis points. Moreover, market participants surveyed indicated that overall rates for stable multi‐family properties in the Detroit metro and its outlying suburban areas have

SALES COMPARISON APPROACH
59
been compressing since mid‐2013, with some structural influences on the market continuing to keep downward pressure on capitalization rates and vacancy rates, and upward pressure on rental rates. This is also evidenced through Reis data.
The sales were adjusted upward for market conditions pursuant to the effective date of the report.
Location
The subject is located in Belleville, MI in the northwestern portion of the metro. It has average access to a primary thoroughfare, public transportation, schools, services and employment. It is in an area with available land for development and moderate expansion ability in the projected future.
In addition to market rents and occupancies in this market, we have considered the following selected demographic data when evaluating each comparable sale.
Selected Sale Demographics
Sale Subject 1 2 3 4Address 49000 Denton Rd 4907 Cloverlane & 4685 Hunt Club Dr. 500 Coachman Drive. 2883 Highbrook Circle 24505 Weathervane
City, State Belleville, MI Ypsilanti, MI Troy, MI Hudsonville, MI Clinton Township, MIPopulation
1-mi 3,296 6,247 6,879 4,943 15,1823-mi 29,121 58,659 86,591 23,546 75,7395-mi 90,862 137,012 270,186 65,263 165,021
Household1-mi 1,612 2,569 2,658 1,863 7,4563-mi 12,520 24,917 36,384 8,333 33,2855-mi 36,776 57,509 110,966 23,351 71,062
Median HH Income1-mi $52,130 $51,155 $58,017 $51,316 $37,7713-mi $46,846 $41,865 $64,163 $63,028 $44,0705-mi $52,261 $51,141 $68,043 $61,411 $46,312
Reis SubmarketAsking Rent $817 $1,027 $1,148 $800
Vacancy 1.10% 1.60% 1.80% 1.90%Source: STDB & Reis
Comparable 1 is located approximately 7 miles west of the subject along Highway 94 in Ypsilanti, MI in the Ann Arbor submarket. The location is considered attractive given its Ann Arbor school district, as well as its superior retail and service developments nearby, which support the higher rents in the submarket compared to the subject’s. A downward adjustment has been applied for the superior location of comparable 1.
Comparable 2 is located approximately 20 miles northeast of the subject in the Troy submarket. Its location is characterized by less dense and inferior quality commercial developments. Comparable 2 is located near Interstate 75 and has adequate access to employment, services, and schools. An upward adjustment is considered given inferior commercial developments in its neighborhood.
Comparable 3 is located along the western edge of Grand Rapids in Hudsonville, MI. The property is located in a residential neighborhood with poor access to supporting commercial uses. It is situated along Interstate 196 with adequate access to employment centers in Grand Rapids, which are considered inferior to those in the Detroit Metro. Comparable 3 has received an upward adjustment for its inferior location relative to the subject.
SALES COMPARISON APPROACH
60
Comparable 4 is located approximately 35 miles northeast of the subject in Clinton Township, MI in the Macomb County Submarket. The location is considered inferior to the subject property given its inferior access to primary thoroughfares, as well as the inferior commercial developments associated with its primarily residential neighborhood. An upward adjustment for location has been applied to comparable 4.
Average Unit Size
Differences in the average size of rental units at comparables relative to the subject requires adjustment as larger units typically rent for more per month than smaller units. We adjusted each sale based on the observed difference in rent due to more or less square footage. We then capitalize this difference and divide by the unadjusted sale price to get a percentage adjustment. The following illustrates the calculations.
Difference in Square Feet = (Subject Average Unit Size – Comparable Average Unit Size)
Rent Square Foot Adjustment= (Average Rent per Square Foot in Comparable Market * Contributory % of Additional Square Foot)
Adjusted Rent per Unit per Year = (Difference in Square Feet * Rent Square Feet Adjustment * 12 months)
Average Unit Size Adjustment = (Adjusted Rent per Unit per year / Cap Rate / Unadjusted Sale Price per Unit)
Year Built/Condition
We account for differences in year built/condition by estimating the effective age of the subject and comparables, then adjusting for an estimated annual depreciation rate. The sales require minimal to moderate adjustment.
Quality/Design
Sale 1 is the sale of two properties of superior quality to the subject with superior interior finishes as well as fireplaces and standard black appliance packages. Certain units also feature vaulted ceilings and available garages. This sale is adjusted downward to account for the superiority in quality and design relative to the subject. All other sale comparables are considered similar in quality/design to the subject and have received no adjustment.
Economic and Tenancy
The subject and comparables are stabilized and no adjustment is required.
Amenities
Sale 1 requires downward adjustment for superior amenities at its properties, including a dog park, man‐made ponds with balcony views, 24 hour maintenance, heated indoor pool, sundeck, and internet cafe. All other sales have similar amenities packages to the subject, except for the Lake Belleville infrastructure for recreation along the lake and the reduced greens fees and driving range benefits provided to residents at the subject at the adjoining Harbour Club Golf

SALES COMPARISON APPROACH
61
Course. Comparables 2, 3, and 4 do not have any lake access or man‐made lake and pond accessibility associated with them, and have been adjusted upward for amenities.
Sales Adjustment Grid
The next table summarizes the adjustments applied to the sales and indicated adjusted sale price per unit.

SALES COMPARISON APPROACH
62
Sale Subject 1 2 3 4
Name of Property Harbour Club Cloverlane: Hamptons & Pine Gables of Troy Highbrook Weathervane
Address 49000 Denton Rd4907 Cloverlane & 4685 Hunt
Club Dr.500 Coachman
Drive.2883 Highbrook
Circle24500 Weathervane
City, State Belleville, MI Ypsilanti, MI Troy, MI Hudsonville, MI Clinton Township, MIEffective Sale Price (ESP) NA $84,000,000 $25,000,000 $4,278,000 $4,873,000Net Rentable Area (SF) 1,006,190 868,913 424,152 81,840 110,800Number of Units 1,112 1,022 544 62 118ESP per Unit N/A $82,192 $45,956 $69,000 $41,297
Transactional Characteristics Attribute Adj Attribute Adj Attribute Adj Attribute AdjMarket Conditions (Time) N/A 4/1/14 1.04 4/1/14 1.04 7/1/13 1.07 7/1/13 1.07
Adjusted Sale Price N/A $87,360,000 1.04 $26,000,000 1.04 $4,577,460 1.07 $5,214,110 1.07Adjusted Sale Price per Unit N/A $85,479 $47,794 $73,830 $44,187
Property Characteristics Attribute Adj Attribute Adj Attribute Adj Attribute AdjLocation Average Superior 0.85 Inferior 1.10 Inferior 1.05 Inferior 1.20Average Unit Size 905 850 1.00 962 1.00 1,320 0.90 939 1.00Year Built/Condition 1970-1974/Average 1976/Good 0.96 1973 / Good 0.98 2000/Good 0.78 1988/Good 0.91Quality/Design Average Superior 0.90 Similar 1.00 Similar 1.00 Similar 1.00Economic/Tenancy 92% 95% 1.00 93% 1.00 93% 1.00 96% 1.00Amenities Typical Superior 0.90 Inferior 1.10 Inferior 1.10 Inferior 1.10
Total Property Adjustment 0.66 1.19 0.81 1.20Indicated Value per Unit $56,416 $56,875 $59,802 $53,025
Sales Adjustment Summary: Harbour Club
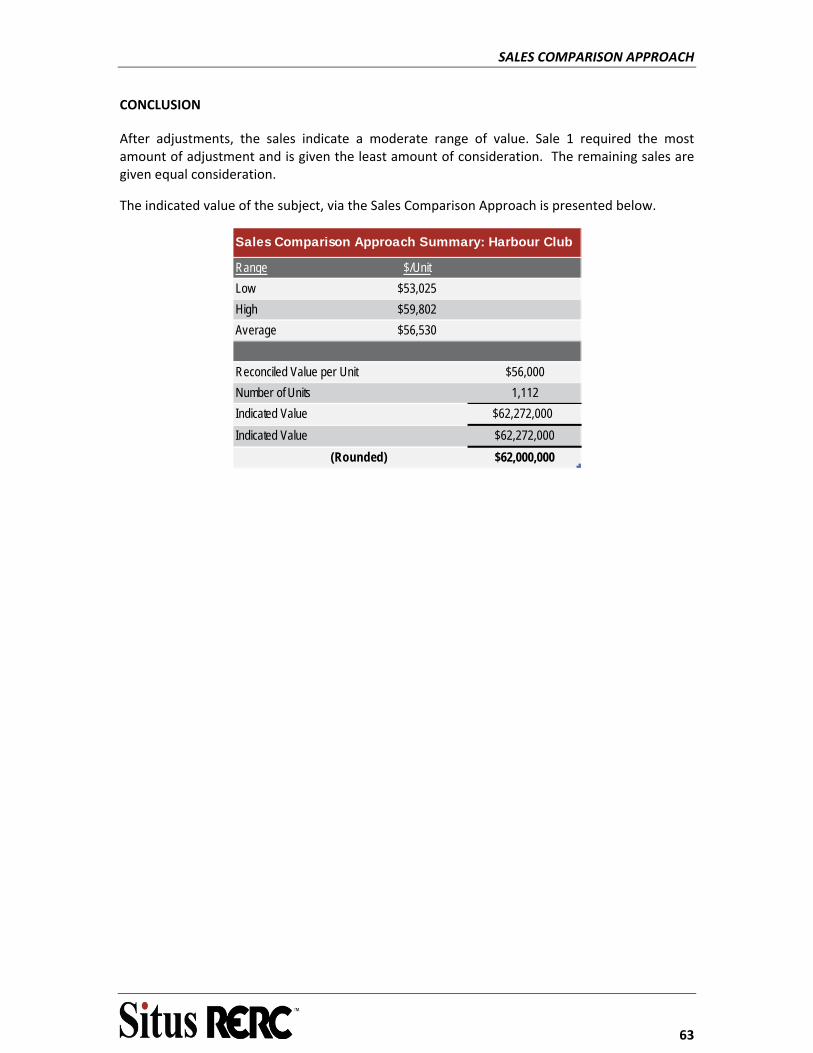
SALES COMPARISON APPROACH
63
CONCLUSION
After adjustments, the sales indicate a moderate range of value. Sale 1 required the most amount of adjustment and is given the least amount of consideration. The remaining sales are given equal consideration.
The indicated value of the subject, via the Sales Comparison Approach is presented below.
Range $/Unit
Low $53,025
High $59,802
Average $56,530
Reconciled Value per Unit $56,000
Number of Units 1,112
Indicated Value $62,272,000
Indicated Value $62,272,000
(Rounded) $62,000,000
Sales Comparison Approach Summary: Harbour Club

SALES COMPARISON APPROACH
64
REGRESSION ANALYSIS
Secondary support to the sales comparison approach is provided by a regression analysis between the comparable sales NOI per unit vs the sale price per unit. The charts below visually summarize the regression analysis and the data used.
Subject*$4,433
$0
$1,000
$2,000
$3,000
$4,000
$5,000
$6,000
$7,000
$0 $10,000 $20,000 $30,000 $40,000 $50,000 $60,000 $70,000 $80,000 $90,000
Net
Ope
ratin
g In
com
e pe
r Uni
t
Sale Price per Unit
Price/Unit vs. NOI/Unit
Sale SP/Unit NOI/Unit
1 $82,192 $6,000
2 $45,956 $3,860
3 $69,000 $5,520
4 $41,297 $3,684
Subject* $54,063 $4,433*The subject's NOI/Unit is based on our stabilized estimate from the
income approach.
NOI Regression Chart Summary
CONCLUSION
The subject property is in line with the comparable sales net operating income per unit. Overall, the regression analysis helps support our value conclusion of $56,000 per unit via the sales comparison approach.
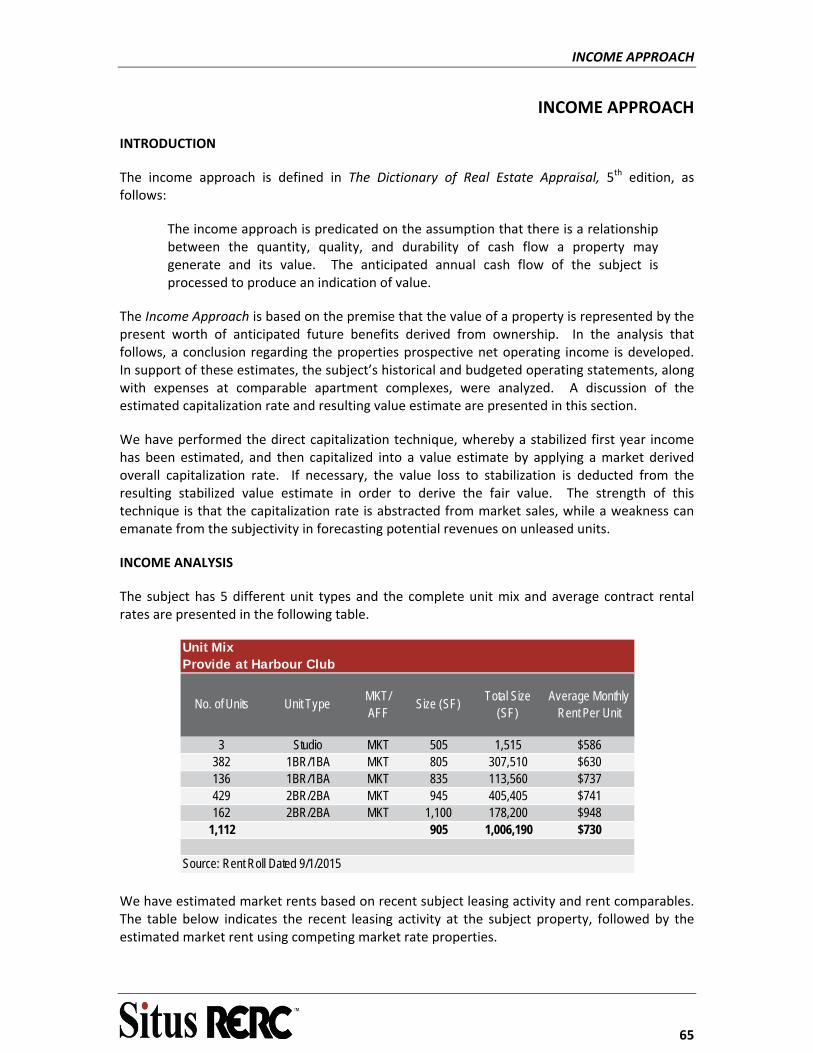
INCOME APPROACH
65
INCOME APPROACH
INTRODUCTION
The income approach is defined in The Dictionary of Real Estate Appraisal, 5th edition, as follows:
The income approach is predicated on the assumption that there is a relationship between the quantity, quality, and durability of cash flow a property may generate and its value. The anticipated annual cash flow of the subject is processed to produce an indication of value.
The Income Approach is based on the premise that the value of a property is represented by the present worth of anticipated future benefits derived from ownership. In the analysis that follows, a conclusion regarding the properties prospective net operating income is developed. In support of these estimates, the subject’s historical and budgeted operating statements, along with expenses at comparable apartment complexes, were analyzed. A discussion of the estimated capitalization rate and resulting value estimate are presented in this section.
We have performed the direct capitalization technique, whereby a stabilized first year income has been estimated, and then capitalized into a value estimate by applying a market derived overall capitalization rate. If necessary, the value loss to stabilization is deducted from the resulting stabilized value estimate in order to derive the fair value. The strength of this technique is that the capitalization rate is abstracted from market sales, while a weakness can emanate from the subjectivity in forecasting potential revenues on unleased units.
INCOME ANALYSIS
The subject has 5 different unit types and the complete unit mix and average contract rental rates are presented in the following table.
Unit MixProvide at Harbour Club
No. of Units Unit TypeMKT/AFF
Size (SF)Total Size
(SF)Average Monthly
Rent Per Unit
3 Studio MKT 505 1,515 $586382 1BR/1BA MKT 805 307,510 $630136 1BR/1BA MKT 835 113,560 $737429 2BR/2BA MKT 945 405,405 $741162 2BR/2BA MKT 1,100 178,200 $948
1,112 905 1,006,190 $730
Source: Rent Roll Dated 9/1/2015
We have estimated market rents based on recent subject leasing activity and rent comparables. The table below indicates the recent leasing activity at the subject property, followed by the estimated market rent using competing market rate properties.
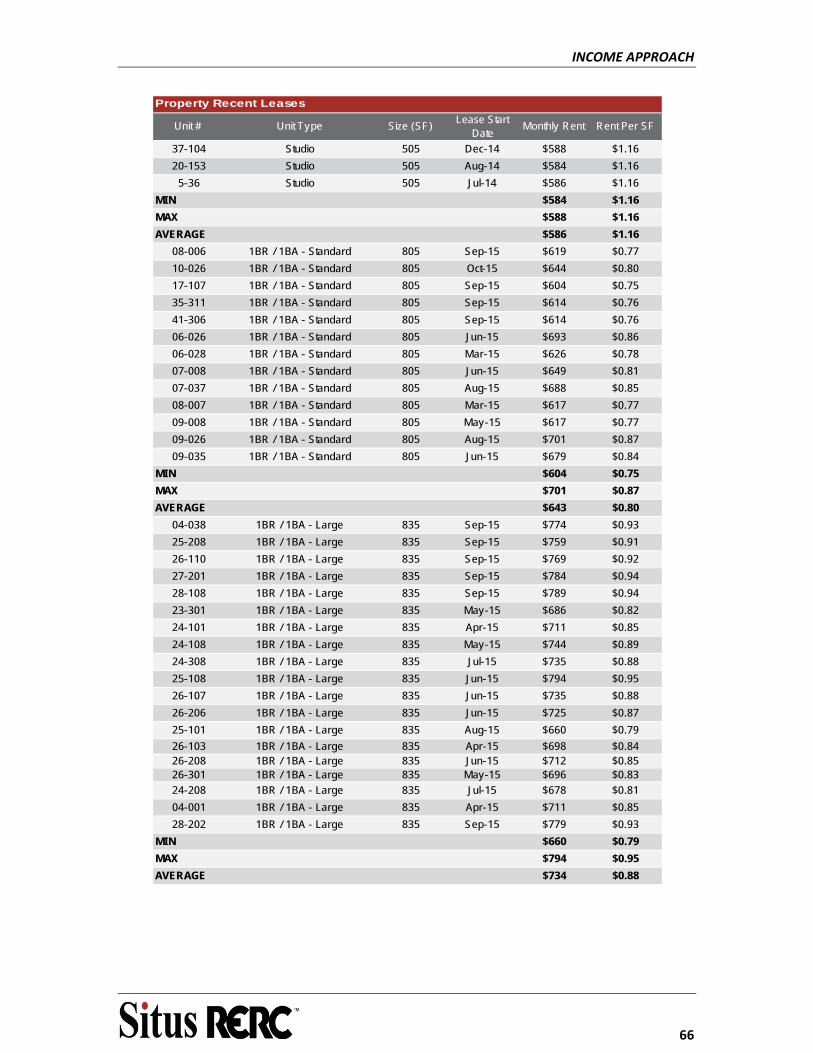
INCOME APPROACH
66
Unit # Unit Type Size (SF)Lease Start
DateMonthly Rent Rent Per SF
37-104 Studio 505 Dec-14 $588 $1.16
20-153 Studio 505 Aug-14 $584 $1.16
5-36 Studio 505 Jul-14 $586 $1.16
MIN $584 $1.16
MAX $588 $1.16
AVERAGE $586 $1.16
08-006 1BR / 1BA - Standard 805 Sep-15 $619 $0.77
10-026 1BR / 1BA - Standard 805 Oct-15 $644 $0.80
17-107 1BR / 1BA - Standard 805 Sep-15 $604 $0.75
35-311 1BR / 1BA - Standard 805 Sep-15 $614 $0.76
41-306 1BR / 1BA - Standard 805 Sep-15 $614 $0.76
06-026 1BR / 1BA - Standard 805 Jun-15 $693 $0.86
06-028 1BR / 1BA - Standard 805 Mar-15 $626 $0.78
07-008 1BR / 1BA - Standard 805 Jun-15 $649 $0.81
07-037 1BR / 1BA - Standard 805 Aug-15 $688 $0.85
08-007 1BR / 1BA - Standard 805 Mar-15 $617 $0.77
09-008 1BR / 1BA - Standard 805 May-15 $617 $0.77
09-026 1BR / 1BA - Standard 805 Aug-15 $701 $0.87
09-035 1BR / 1BA - Standard 805 Jun-15 $679 $0.84
MIN $604 $0.75
MAX $701 $0.87
AVERAGE $643 $0.80
04-038 1BR / 1BA - Large 835 Sep-15 $774 $0.93
25-208 1BR / 1BA - Large 835 Sep-15 $759 $0.91
26-110 1BR / 1BA - Large 835 Sep-15 $769 $0.92
27-201 1BR / 1BA - Large 835 Sep-15 $784 $0.94
28-108 1BR / 1BA - Large 835 Sep-15 $789 $0.94
23-301 1BR / 1BA - Large 835 May-15 $686 $0.82
24-101 1BR / 1BA - Large 835 Apr-15 $711 $0.85
24-108 1BR / 1BA - Large 835 May-15 $744 $0.89
24-308 1BR / 1BA - Large 835 Jul-15 $735 $0.88
25-108 1BR / 1BA - Large 835 Jun-15 $794 $0.95
26-107 1BR / 1BA - Large 835 Jun-15 $735 $0.88
26-206 1BR / 1BA - Large 835 Jun-15 $725 $0.87
25-101 1BR / 1BA - Large 835 Aug-15 $660 $0.79
26-103 1BR / 1BA - Large 835 Apr-15 $698 $0.8426-208 1BR / 1BA - Large 835 Jun-15 $712 $0.8526-301 1BR / 1BA - Large 835 May-15 $696 $0.83
24-208 1BR / 1BA - Large 835 Jul-15 $678 $0.81
04-001 1BR / 1BA - Large 835 Apr-15 $711 $0.85
28-202 1BR / 1BA - Large 835 Sep-15 $779 $0.93
MIN $660 $0.79
MAX $794 $0.95
AVERAGE $734 $0.88
Property Recent Leases
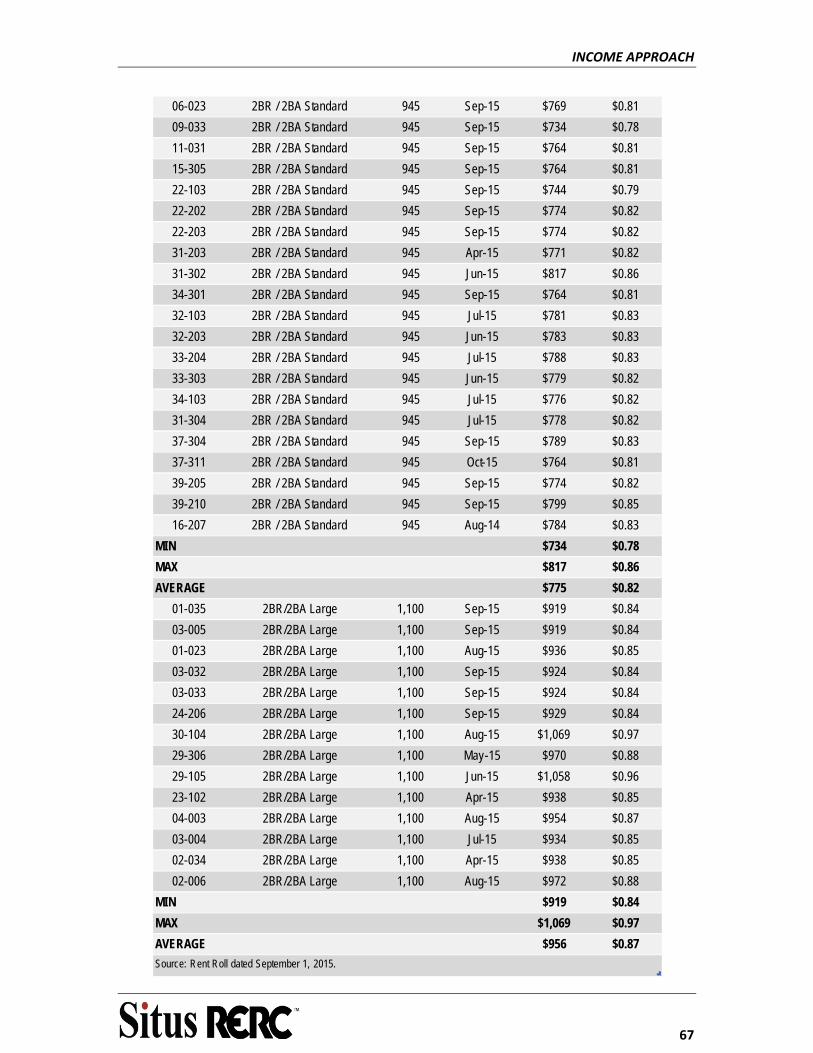
INCOME APPROACH
67
06-023 2BR / 2BA Standard 945 Sep-15 $769 $0.81
09-033 2BR / 2BA Standard 945 Sep-15 $734 $0.78
11-031 2BR / 2BA Standard 945 Sep-15 $764 $0.81
15-305 2BR / 2BA Standard 945 Sep-15 $764 $0.81
22-103 2BR / 2BA Standard 945 Sep-15 $744 $0.79
22-202 2BR / 2BA Standard 945 Sep-15 $774 $0.82
22-203 2BR / 2BA Standard 945 Sep-15 $774 $0.82
31-203 2BR / 2BA Standard 945 Apr-15 $771 $0.82
31-302 2BR / 2BA Standard 945 Jun-15 $817 $0.86
34-301 2BR / 2BA Standard 945 Sep-15 $764 $0.81
32-103 2BR / 2BA Standard 945 Jul-15 $781 $0.83
32-203 2BR / 2BA Standard 945 Jun-15 $783 $0.83
33-204 2BR / 2BA Standard 945 Jul-15 $788 $0.83
33-303 2BR / 2BA Standard 945 Jun-15 $779 $0.82
34-103 2BR / 2BA Standard 945 Jul-15 $776 $0.82
31-304 2BR / 2BA Standard 945 Jul-15 $778 $0.82
37-304 2BR / 2BA Standard 945 Sep-15 $789 $0.83
37-311 2BR / 2BA Standard 945 Oct-15 $764 $0.81
39-205 2BR / 2BA Standard 945 Sep-15 $774 $0.82
39-210 2BR / 2BA Standard 945 Sep-15 $799 $0.85
16-207 2BR / 2BA Standard 945 Aug-14 $784 $0.83
MIN $734 $0.78
MAX $817 $0.86
AVERAGE $775 $0.82
01-035 2BR/2BA Large 1,100 Sep-15 $919 $0.84
03-005 2BR/2BA Large 1,100 Sep-15 $919 $0.84
01-023 2BR/2BA Large 1,100 Aug-15 $936 $0.85
03-032 2BR/2BA Large 1,100 Sep-15 $924 $0.84
03-033 2BR/2BA Large 1,100 Sep-15 $924 $0.84
24-206 2BR/2BA Large 1,100 Sep-15 $929 $0.84
30-104 2BR/2BA Large 1,100 Aug-15 $1,069 $0.97
29-306 2BR/2BA Large 1,100 May-15 $970 $0.88
29-105 2BR/2BA Large 1,100 Jun-15 $1,058 $0.96
23-102 2BR/2BA Large 1,100 Apr-15 $938 $0.85
04-003 2BR/2BA Large 1,100 Aug-15 $954 $0.87
03-004 2BR/2BA Large 1,100 Jul-15 $934 $0.85
02-034 2BR/2BA Large 1,100 Apr-15 $938 $0.85
02-006 2BR/2BA Large 1,100 Aug-15 $972 $0.88
MIN $919 $0.84
MAX $1,069 $0.97
AVERAGE $956 $0.87
Source: Rent Roll dated September 1, 2015.
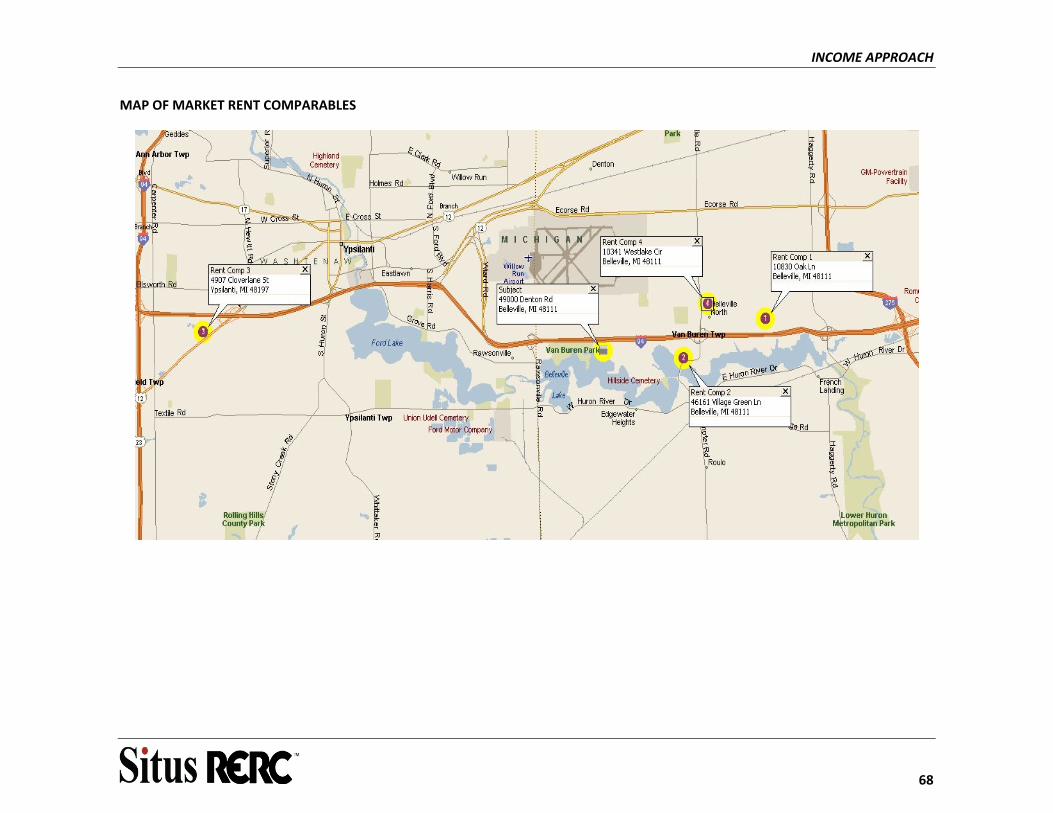
INCOME APPROACH
68
MAP OF MARKET RENT COMPARABLES
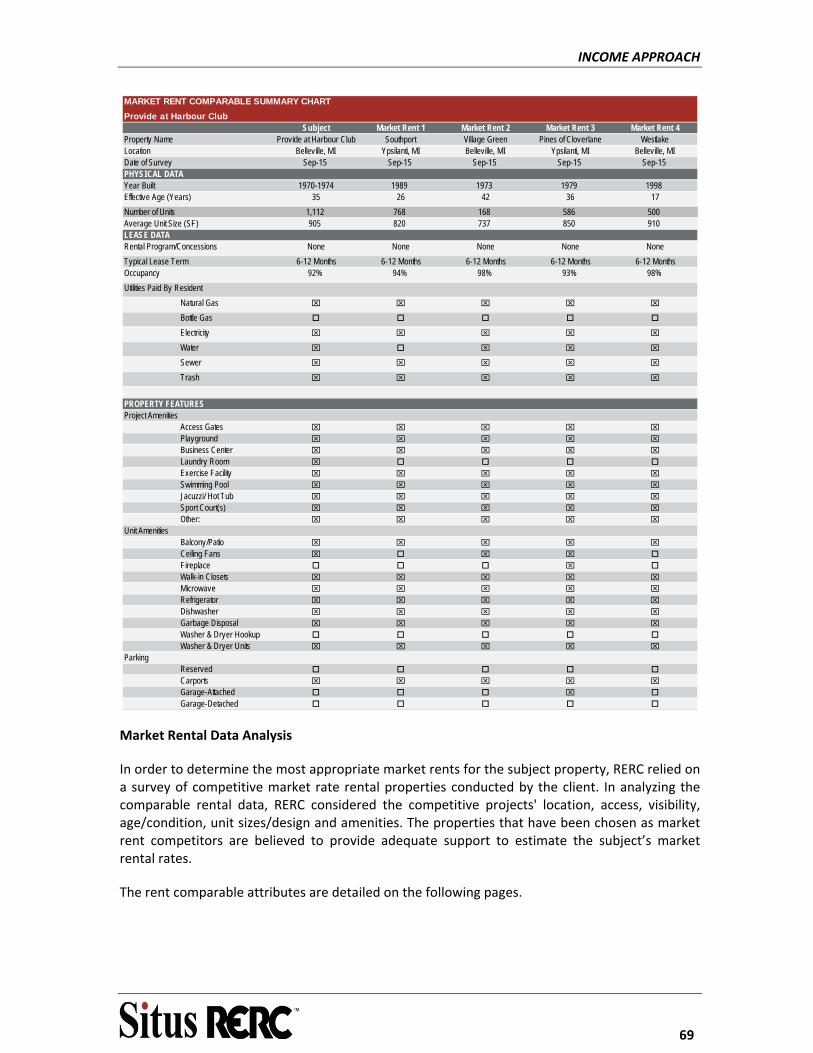
INCOME APPROACH
69
Subject Market Rent 1 Market Rent 2 Market Rent 3 Market Rent 4Property Name Provide at Harbour Club Southport Village Green Pines of Cloverlane WestlakeLocation Belleville, MI Ypsilanti, MI Belleville, MI Ypsilanti, MI Belleville, MIDate of Survey Sep-15 Sep-15 Sep-15 Sep-15 Sep-15PHYSICAL DATAYear Built 1970-1974 1989 1973 1979 1998Effective Age (Years) 35 26 42 36 17
Number of Units 1,112 768 168 586 500Average Unit Size (SF) 905 820 737 850 910LEASE DATARental Program/Concessions None None None None None
Typical Lease Term 6-12 Months 6-12 Months 6-12 Months 6-12 Months 6-12 MonthsOccupancy 92% 94% 98% 93% 98%
Utilities Paid By Resident
Natural Gas
Bottle Gas
Electricity
Water
Sewer
Trash
PROPERTY FEATURESProject Amenities
Access Gates Playground Business Center Laundry Room Exercise Facility Swimming Pool Jacuzzi/ Hot Tub Sport Court(s) Other:
Unit AmenitiesBalcony/Patio Ceiling Fans Fireplace Walk-in Closets Microwave Refrigerator Dishwasher Garbage Disposal Washer & Dryer Hookup Washer & Dryer Units
ParkingReserved Carports Garage-Attached Garage-Detached
MARKET RENT COMPARABLE SUMMARY CHART
Provide at Harbour Club
Market Rental Data Analysis
In order to determine the most appropriate market rents for the subject property, RERC relied on a survey of competitive market rate rental properties conducted by the client. In analyzing the comparable rental data, RERC considered the competitive projects' location, access, visibility, age/condition, unit sizes/design and amenities. The properties that have been chosen as market rent competitors are believed to provide adequate support to estimate the subject’s market rental rates.
The rent comparable attributes are detailed on the following pages.
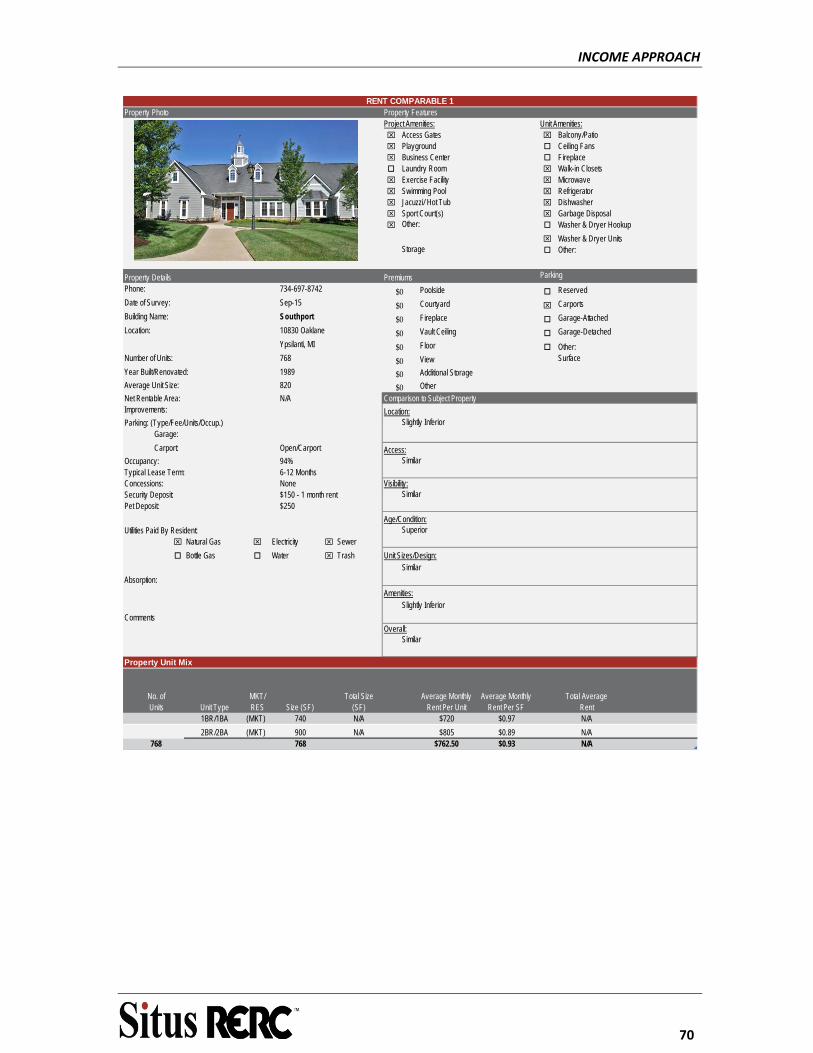
INCOME APPROACH
70
Project Amenities: Unit Amenities: Access Gates Balcony/Patio Playground Ceiling Fans Business Center Fireplace Laundry Room Walk-in Closets Exercise Facility Microwave Swimming Pool Refrigerator Jacuzzi/ Hot Tub Dishwasher Sport Court(s) Garbage Disposal Washer & Dryer Hookup
Washer & Dryer Units Other:
Property DetailsPhone: Poolside Reserved
Date of Survey: Sep-15 Courtyard Carports
Building Name: Fireplace Garage-Attached
Location: Vault Ceiling Garage-Detached
Floor Other:Number of Units: 768 View
Year Built/Renovated: 1989 Additional Storage
Average Unit Size: 820 Other
Net Rentable Area: N/AImprovements: Location:Parking: (Type/Fee/Units/Occup.)
Garage:
Carport: Access:Occupancy: 94%Typical Lease Term:Concessions: Visibility:Security Deposit:Pet Deposit:
Age/Condition:Utilities Paid By Resident:
Natural Gas Electricity Sewer
Bottle Gas Water Trash Unit Sizes/Design:
Absorption:
Amenities:
CommentsOverall:
1BR/1BA (MKT) 740 N/A $720 $0.97 N/A
2BR/2BA (MKT) 900 N/A $805 $0.89 N/A768 768 $762.50 $0.93 N/A
$150 - 1 month rent
No. of Units Unit Type
MKT/RES Size (SF)
Total Size (SF)
Slightly Inferior
Similar
Similar
Superior
Property Unit Mix
None
Open/Carport
6-12 Months
Similar
Slightly Inferior
Similar
Average Monthly Rent Per Unit
Total Average Rent
Property Photo
Storage
$0
$0
PICTURE NOT AVAILABLE
Property Features
Other:
734-697-8742
ParkingPremiums
$0
$0
Southport
10830 Oaklane
Ypsilanti, MI
$0
RENT COMPARABLE 1
$250
Average Monthly Rent Per SF
$0Comparison to Subject Property
Surface
$0
$0
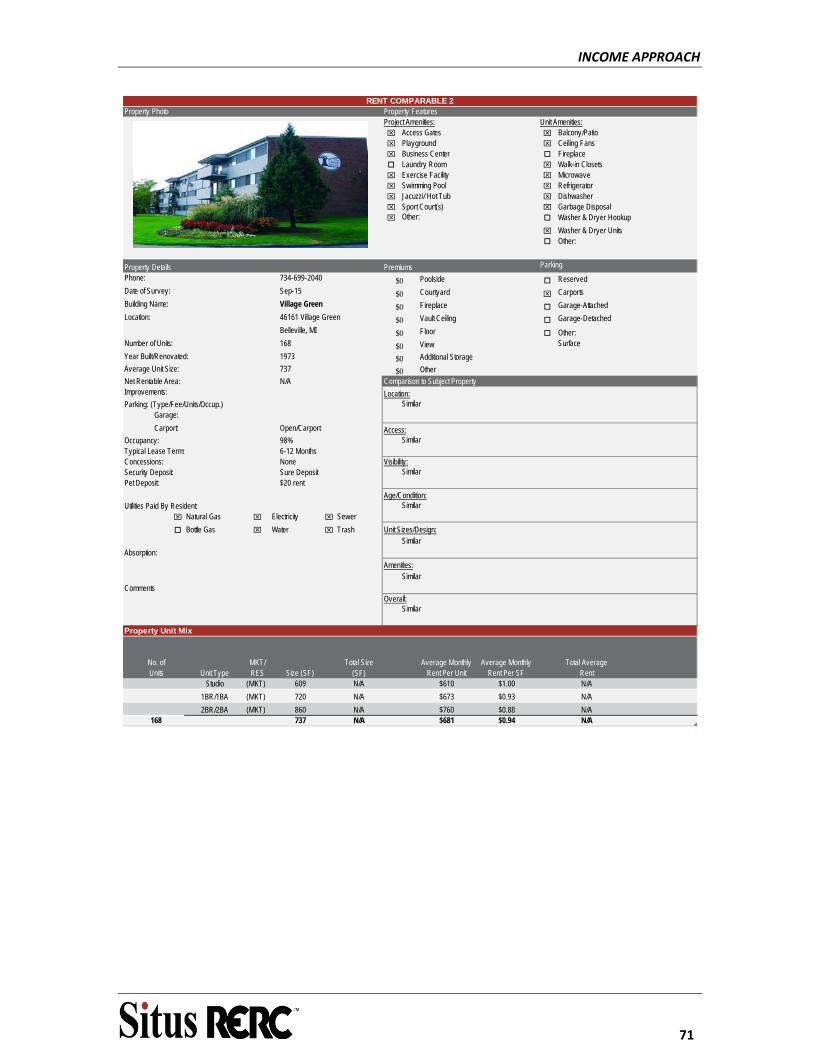
INCOME APPROACH
71
Project Amenities: Unit Amenities: Access Gates Balcony/Patio Playground Ceiling Fans Business Center Fireplace Laundry Room Walk-in Closets Exercise Facility Microwave Swimming Pool Refrigerator Jacuzzi/ Hot Tub Dishwasher Sport Court(s) Garbage Disposal Washer & Dryer Hookup
Washer & Dryer Units Other:
Property DetailsPhone: Poolside Reserved
Date of Survey: Sep-15 Courtyard Carports
Building Name: Fireplace Garage-Attached
Location: Vault Ceiling Garage-Detached
Floor Other:Number of Units: 168 View
Year Built/Renovated: 1973 Additional Storage
Average Unit Size: 737 Other
Net Rentable Area: N/AImprovements: Location:Parking: (Type/Fee/Units/Occup.)
Garage:
Carport: Access:Occupancy: 98%Typical Lease Term:Concessions: Visibility:Security Deposit:Pet Deposit:
Age/Condition:Utilities Paid By Resident:
Natural Gas Electricity Sewer
Bottle Gas Water Trash Unit Sizes/Design:
Absorption:
Amenities:
CommentsOverall:
Studio (MKT) 609 N/A $610 $1.00 N/A
1BR/1BA (MKT) 720 N/A $673 $0.93 N/A
2BR/2BA (MKT) 860 N/A $760 $0.88 N/A168 737 N/A $681 $0.94 N/A
Property Unit Mix
No. of Units Unit Type
MKT/RES Size (SF)
Total Size (SF)
Average Monthly Rent Per Unit
Average Monthly Rent Per SF
Total Average Rent
Similar
Similar
Similar
NoneSure Deposit Similar$20 rent
Similar
Comparison to Subject Property
Similar
Open/Carport
Similar6-12 Months
46161 Village Green $0Belleville, MI $0
$0 Surface
$0
$0
Premiums Parking
734-699-2040 $0
$0Village Green $0
RENT COMPARABLE 2Property Photo Property Features
PICTURE NOT AVAILABLE
Other:
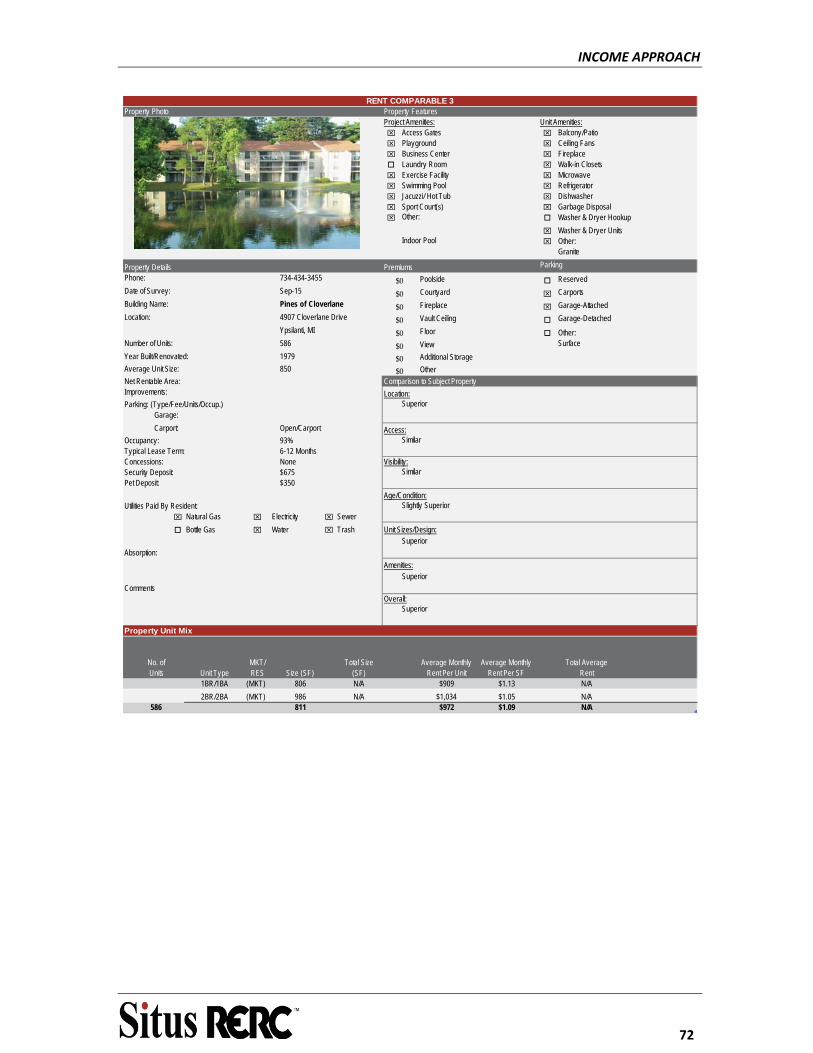
INCOME APPROACH
72
Project Amenities: Unit Amenities: Access Gates Balcony/Patio Playground Ceiling Fans Business Center Fireplace Laundry Room Walk-in Closets Exercise Facility Microwave Swimming Pool Refrigerator Jacuzzi/ Hot Tub Dishwasher Sport Court(s) Garbage Disposal Washer & Dryer Hookup
Washer & Dryer Units Other:
Property DetailsPhone: Poolside Reserved
Date of Survey: Sep-15 Courtyard Carports
Building Name: Fireplace Garage-Attached
Location: Vault Ceiling Garage-Detached
Floor Other:Number of Units: 586 View
Year Built/Renovated: 1979 Additional Storage
Average Unit Size: 850 Other
Net Rentable Area:Improvements: Location:Parking: (Type/Fee/Units/Occup.)
Garage:
Carport: Access:Occupancy: 93%Typical Lease Term:Concessions: Visibility:Security Deposit:Pet Deposit:
Age/Condition:Utilities Paid By Resident:
Natural Gas Electricity Sewer
Bottle Gas Water Trash Unit Sizes/Design:
Absorption:
Amenities:
CommentsOverall:
1BR/1BA (MKT) 806 N/A $909 $1.13 N/A
2BR/2BA (MKT) 986 N/A $1,034 $1.05 N/A586 811 $972 $1.09 N/A
Property Unit Mix
No. of Units Unit Type
MKT/RES Size (SF)
Total Size (SF)
Average Monthly Rent Per Unit
Average Monthly Rent Per SF
Total Average Rent
Superior
Superior
Superior
None$675 Similar$350
Slightly Superior
Comparison to Subject Property
Superior
Open/Carport
Similar6-12 Months
4907 Cloverlane Drive $0Ypsilanti, MI $0
$0 Surface
$0
$0
Premiums Parking
734-434-3455 $0
$0Pines of Cloverlane $0
RENT COMPARABLE 3Property Photo Property Features
PICTURE NOT AVAILABLE
Other:
Indoor PoolGranite
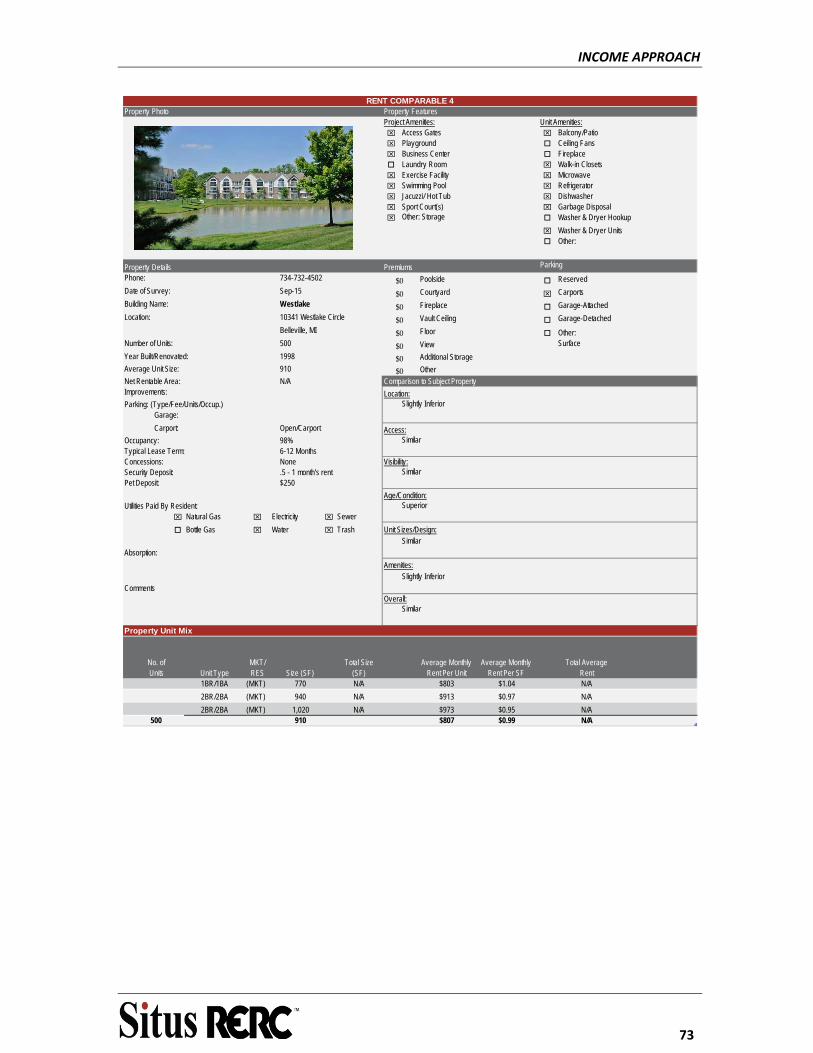
INCOME APPROACH
73
Project Amenities: Unit Amenities: Access Gates Balcony/Patio Playground Ceiling Fans Business Center Fireplace Laundry Room Walk-in Closets Exercise Facility Microwave Swimming Pool Refrigerator Jacuzzi/ Hot Tub Dishwasher Sport Court(s) Garbage Disposal Washer & Dryer Hookup
Washer & Dryer Units Other:
Property DetailsPhone: Poolside Reserved
Date of Survey: Sep-15 Courtyard Carports
Building Name: Fireplace Garage-Attached
Location: Vault Ceiling Garage-Detached
Floor Other:Number of Units: 500 View
Year Built/Renovated: 1998 Additional Storage
Average Unit Size: 910 Other
Net Rentable Area: N/AImprovements: Location:Parking: (Type/Fee/Units/Occup.)
Garage:
Carport: Access:Occupancy: 98%Typical Lease Term:Concessions: Visibility:Security Deposit:Pet Deposit:
Age/Condition:Utilities Paid By Resident:
Natural Gas Electricity Sewer
Bottle Gas Water Trash Unit Sizes/Design:
Absorption:
Amenities:
CommentsOverall:
1BR/1BA (MKT) 770 N/A $803 $1.04 N/A
2BR/2BA (MKT) 940 N/A $913 $0.97 N/A
2BR/2BA (MKT) 1,020 N/A $973 $0.95 N/A500 910 $807 $0.99 N/A
Property Unit Mix
No. of Units Unit Type
MKT/RES Size (SF)
Total Size (SF)
Average Monthly Rent Per Unit
Average Monthly Rent Per SF
Total Average Rent
Similar
Slightly Inferior
Similar
None.5 - 1 month's rent Similar$250
Superior
Comparison to Subject Property
Slightly Inferior
Open/Carport
Similar6-12 Months
10341 Westlake Circle $0Belleville, MI $0
$0 Surface
$0
$0
Premiums Parking
734-732-4502 $0
$0Westlake $0
RENT COMPARABLE 4Property Photo Property Features
PICTURE NOT AVAILABLE
Other: Storage
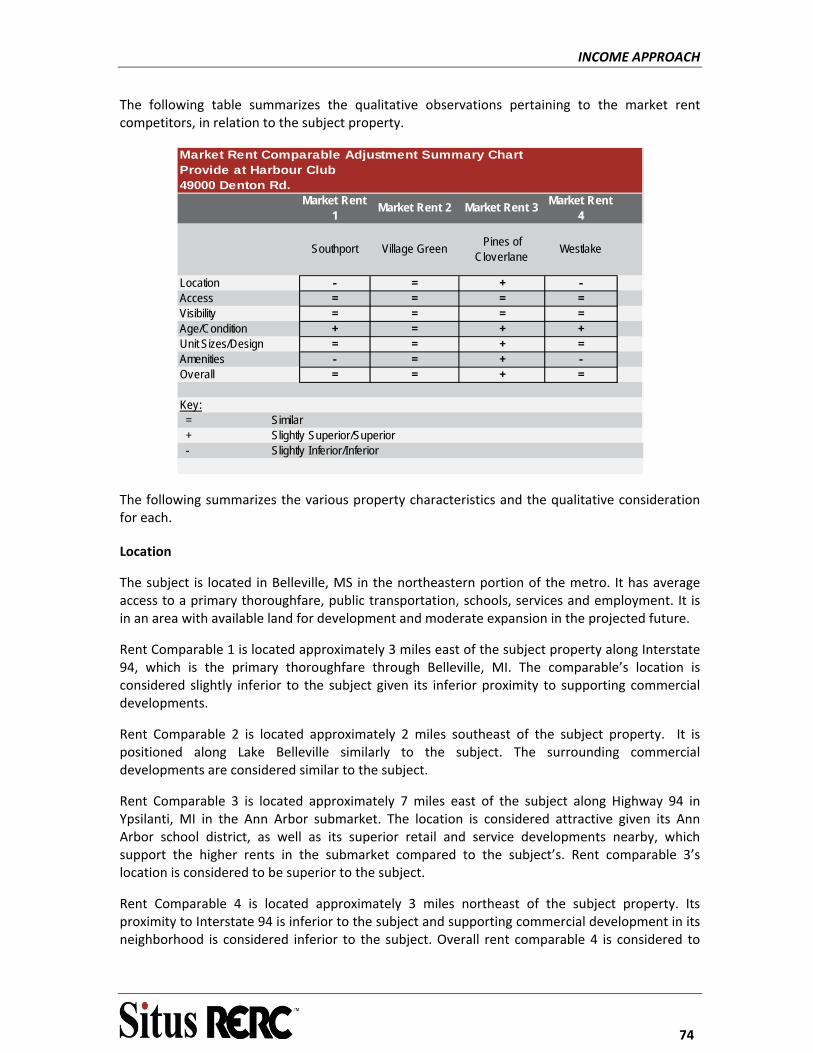
INCOME APPROACH
74
The following table summarizes the qualitative observations pertaining to the market rent competitors, in relation to the subject property.
Market Rent 1
Market Rent 2 Market Rent 3Market Rent
4
Southport Village GreenPines of
CloverlaneWestlake
Location - = + -Access = = = =Visibility = = = =Age/Condition + = + +Unit Sizes/Design = = + =Amenities - = + -Overall = = + =
Key: = Similar + Slightly Superior/Superior - Slightly Inferior/Inferior
Market Rent Comparable Adjustment Summary ChartProvide at Harbour Club49000 Denton Rd.
The following summarizes the various property characteristics and the qualitative consideration for each.
Location
The subject is located in Belleville, MS in the northeastern portion of the metro. It has average access to a primary thoroughfare, public transportation, schools, services and employment. It is in an area with available land for development and moderate expansion in the projected future.
Rent Comparable 1 is located approximately 3 miles east of the subject property along Interstate 94, which is the primary thoroughfare through Belleville, MI. The comparable’s location is considered slightly inferior to the subject given its inferior proximity to supporting commercial developments.
Rent Comparable 2 is located approximately 2 miles southeast of the subject property. It is positioned along Lake Belleville similarly to the subject. The surrounding commercial developments are considered similar to the subject.
Rent Comparable 3 is located approximately 7 miles east of the subject along Highway 94 in Ypsilanti, MI in the Ann Arbor submarket. The location is considered attractive given its Ann Arbor school district, as well as its superior retail and service developments nearby, which support the higher rents in the submarket compared to the subject’s. Rent comparable 3’s location is considered to be superior to the subject.
Rent Comparable 4 is located approximately 3 miles northeast of the subject property. Its proximity to Interstate 94 is inferior to the subject and supporting commercial development in its neighborhood is considered inferior to the subject. Overall rent comparable 4 is considered to
INCOME APPROACH
75
have a slightly inferior location relative to the subject.
Access
The subject and rent comparables are located on paved, public streets with similar access. Overall, no adjustments for access are necessary.
Visibility
All comparables have similar visibility from neighborhood roads and or frontage roads along Interstate 94. No adjustments are considered necessary for visibility.
Age/Condition
We account for differences in age/condition by estimating the effective age of the subject and rent comparables, then adjusting if necessary. Comparable 1 was constructed in 1989, comparable 3 was constructed in 1979, and comparable 4 was constructed in 1998. These properties are considered superior in age/condition relative to the subject.
Unit Sizes/Design
All of the rent comparables are have similar unit types apart from rent comparable three, which has available fireplaces, vaulted ceilings, more modern appliance packages, and available garages. Rent comparable three is considered superior in its overall design relative to the subject.
Amenities
Rent comparables 1 and 4 are considered to have slightly inferior amenities relative to the subject. Rent comparable 3 is considered to have superior amenities relative to the subject. Rent comparable 2 is considered similar when weighing community and in‐unit level amenity packages offered.
Overall
Overall rent comparables 1, 2, and 4 are considered similar to the subject. The subject is considered inferior to rent comparable 3.
Market Rent Estimates
The following tables summarize the subject’s average actual rental rates, the comparable rental rates and the RERC estimate of market rental rates.
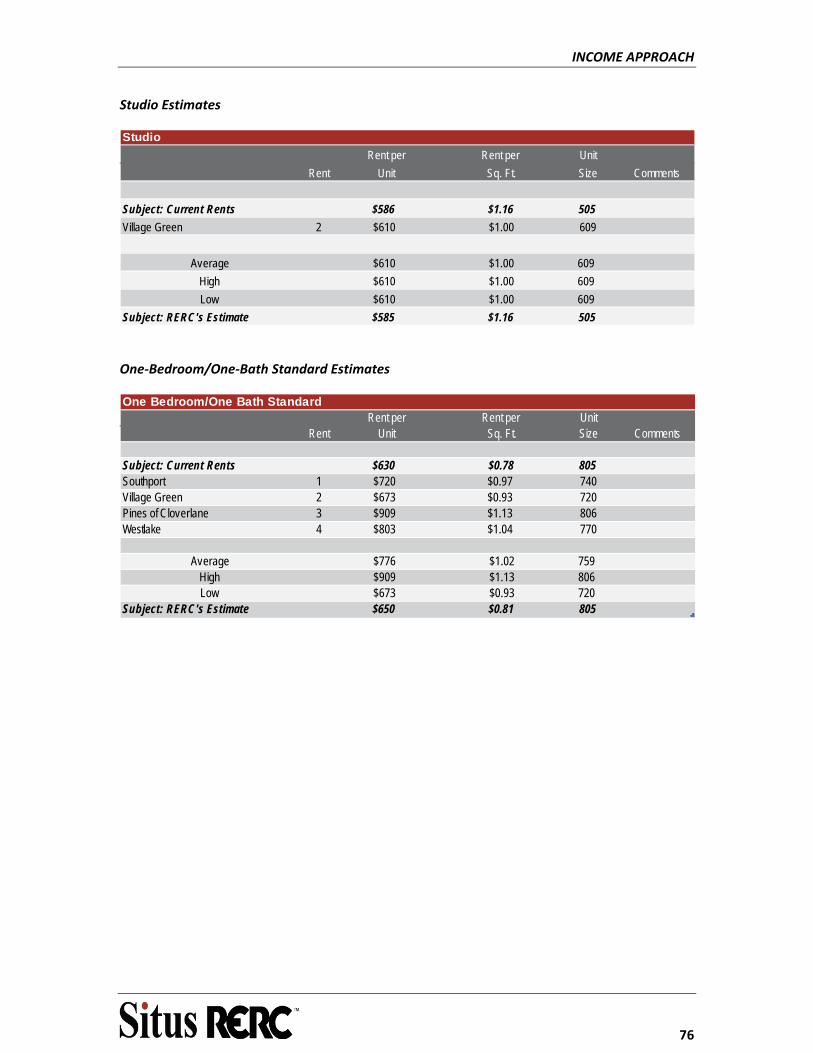
INCOME APPROACH
76
Studio Estimates
Rent per Rent per Unit
Rent Unit Sq. Ft. Size Comments
Subject: Current Rents $586 $1.16 505
Village Green 2 $610 $1.00 609
Average $610 $1.00 609
High $610 $1.00 609
Low $610 $1.00 609
Subject: RERC's Estimate $585 $1.16 505
Studio
One‐Bedroom/One‐Bath Standard Estimates
Rent per Rent per UnitRent Unit Sq. Ft. Size Comments
Subject: Current Rents $630 $0.78 805Southport 1 $720 $0.97 740Village Green 2 $673 $0.93 720Pines of Cloverlane 3 $909 $1.13 806Westlake 4 $803 $1.04 770
Average $776 $1.02 759High $909 $1.13 806Low $673 $0.93 720
Subject: RERC's Estimate $650 $0.81 805
One Bedroom/One Bath Standard
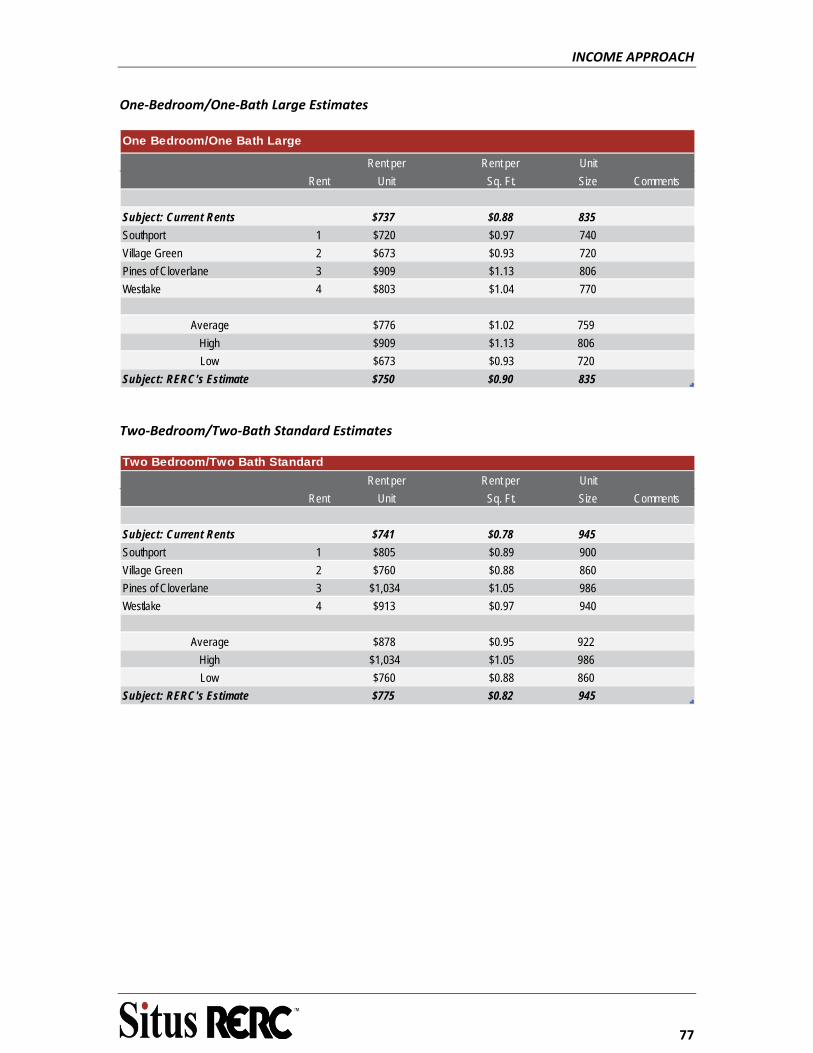
INCOME APPROACH
77
One‐Bedroom/One‐Bath Large Estimates
Rent per Rent per Unit
Rent Unit Sq. Ft. Size Comments
Subject: Current Rents $737 $0.88 835
Southport 1 $720 $0.97 740
Village Green 2 $673 $0.93 720
Pines of Cloverlane 3 $909 $1.13 806
Westlake 4 $803 $1.04 770
Average $776 $1.02 759
High $909 $1.13 806
Low $673 $0.93 720
Subject: RERC's Estimate $750 $0.90 835
One Bedroom/One Bath Large
Two‐Bedroom/Two‐Bath Standard Estimates
Rent per Rent per Unit
Rent Unit Sq. Ft. Size Comments
Subject: Current Rents $741 $0.78 945
Southport 1 $805 $0.89 900
Village Green 2 $760 $0.88 860
Pines of Cloverlane 3 $1,034 $1.05 986
Westlake 4 $913 $0.97 940
Average $878 $0.95 922
High $1,034 $1.05 986
Low $760 $0.88 860
Subject: RERC's Estimate $775 $0.82 945
Two Bedroom/Two Bath Standard
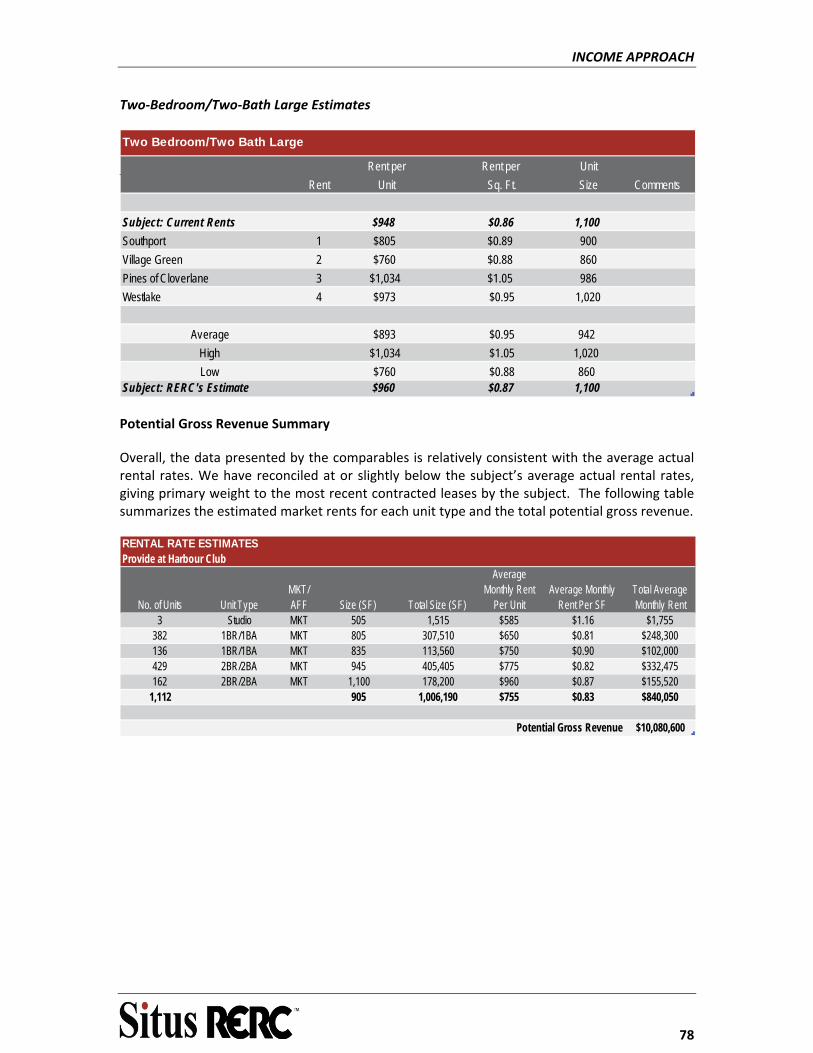
INCOME APPROACH
78
Two‐Bedroom/Two‐Bath Large Estimates
Rent per Rent per Unit
Rent Unit Sq. Ft. Size Comments
Subject: Current Rents $948 $0.86 1,100
Southport 1 $805 $0.89 900
Village Green 2 $760 $0.88 860
Pines of Cloverlane 3 $1,034 $1.05 986
Westlake 4 $973 $0.95 1,020
Average $893 $0.95 942
High $1,034 $1.05 1,020
Low $760 $0.88 860Subject: RERC's Estimate $960 $0.87 1,100
Two Bedroom/Two Bath Large
Potential Gross Revenue Summary
Overall, the data presented by the comparables is relatively consistent with the average actual rental rates. We have reconciled at or slightly below the subject’s average actual rental rates, giving primary weight to the most recent contracted leases by the subject. The following table summarizes the estimated market rents for each unit type and the total potential gross revenue.
RENTAL RATE ESTIMATES
No. of Units Unit TypeMKT/AFF Size (SF) Total Size (SF)
Average Monthly Rent
Per UnitAverage Monthly
Rent Per SFTotal Average Monthly Rent
3 Studio MKT 505 1,515 $585 $1.16 $1,755382 1BR/1BA MKT 805 307,510 $650 $0.81 $248,300136 1BR/1BA MKT 835 113,560 $750 $0.90 $102,000429 2BR/2BA MKT 945 405,405 $775 $0.82 $332,475162 2BR/2BA MKT 1,100 178,200 $960 $0.87 $155,520
1,112 905 1,006,190 $755 $0.83 $840,050
Potential Gross Revenue $10,080,600
Provide at Harbour Club
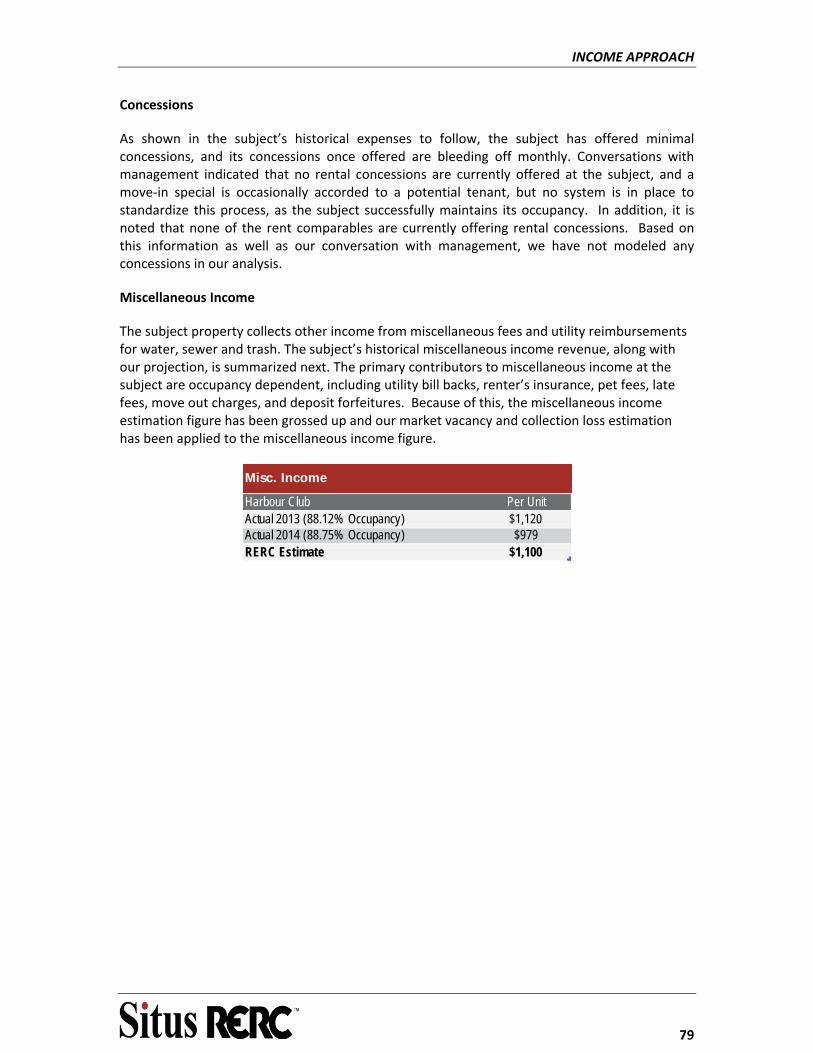
INCOME APPROACH
79
Concessions
As shown in the subject’s historical expenses to follow, the subject has offered minimal concessions, and its concessions once offered are bleeding off monthly. Conversations with management indicated that no rental concessions are currently offered at the subject, and a move‐in special is occasionally accorded to a potential tenant, but no system is in place to standardize this process, as the subject successfully maintains its occupancy. In addition, it is noted that none of the rent comparables are currently offering rental concessions. Based on this information as well as our conversation with management, we have not modeled any concessions in our analysis.
Miscellaneous Income
The subject property collects other income from miscellaneous fees and utility reimbursements for water, sewer and trash. The subject’s historical miscellaneous income revenue, along with our projection, is summarized next. The primary contributors to miscellaneous income at the subject are occupancy dependent, including utility bill backs, renter’s insurance, pet fees, late fees, move out charges, and deposit forfeitures. Because of this, the miscellaneous income estimation figure has been grossed up and our market vacancy and collection loss estimation has been applied to the miscellaneous income figure.
Misc. Income
Harbour Club Per UnitActual 2013 (88.12% Occupancy) $1,120Actual 2014 (88.75% Occupancy) $979RERC Estimate $1,100
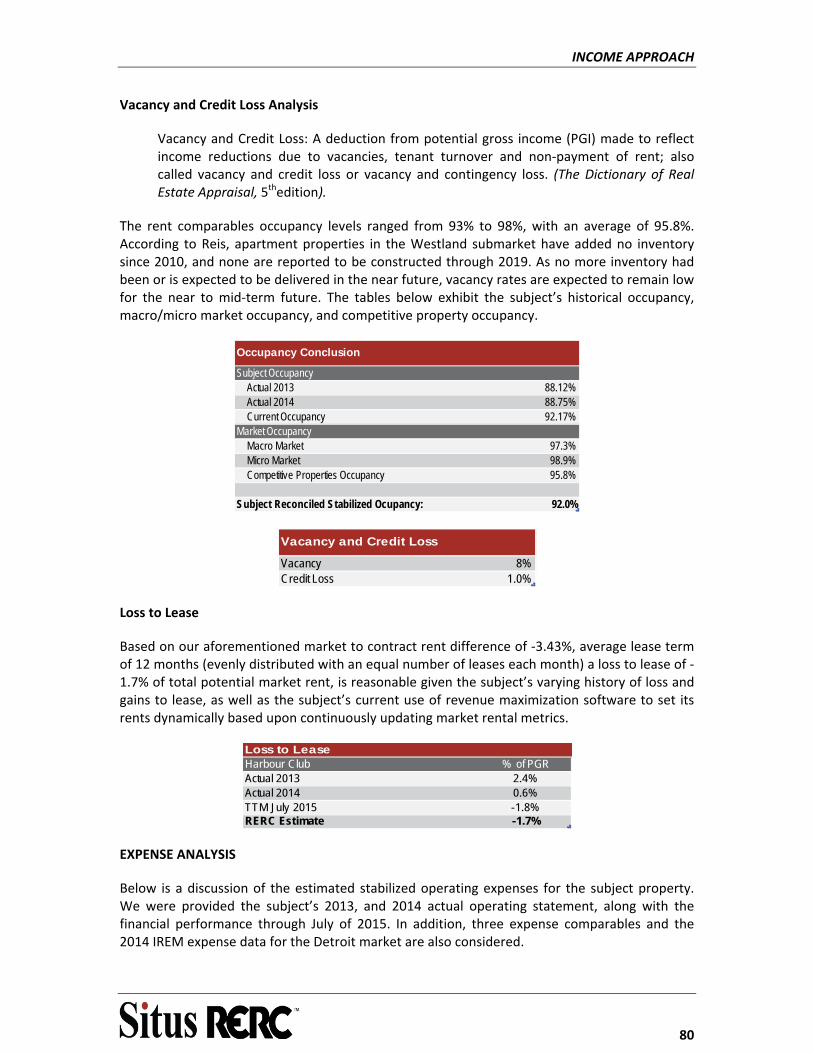
INCOME APPROACH
80
Vacancy and Credit Loss Analysis
Vacancy and Credit Loss: A deduction from potential gross income (PGI) made to reflect income reductions due to vacancies, tenant turnover and non‐payment of rent; also called vacancy and credit loss or vacancy and contingency loss. (The Dictionary of Real Estate Appraisal, 5thedition).
The rent comparables occupancy levels ranged from 93% to 98%, with an average of 95.8%. According to Reis, apartment properties in the Westland submarket have added no inventory since 2010, and none are reported to be constructed through 2019. As no more inventory had been or is expected to be delivered in the near future, vacancy rates are expected to remain low for the near to mid‐term future. The tables below exhibit the subject’s historical occupancy, macro/micro market occupancy, and competitive property occupancy.
Subject OccupancyActual 2013 88.12%Actual 2014 88.75%Current Occupancy 92.17%
Market OccupancyMacro Market 97.3%Micro Market 98.9%Competitive Properties Occupancy 95.8%
Subject Reconciled Stabilized Ocupancy: 92.0%
Occupancy Conclusion
Vacancy 8%Credit Loss 1.0%
Vacancy and Credit Loss
Loss to Lease
Based on our aforementioned market to contract rent difference of ‐3.43%, average lease term of 12 months (evenly distributed with an equal number of leases each month) a loss to lease of ‐1.7% of total potential market rent, is reasonable given the subject’s varying history of loss and gains to lease, as well as the subject’s current use of revenue maximization software to set its rents dynamically based upon continuously updating market rental metrics.
Loss to LeaseHarbour Club % of PGRActual 2013 2.4%Actual 2014 0.6%TTM July 2015 -1.8%RERC Estimate -1.7%
EXPENSE ANALYSIS
Below is a discussion of the estimated stabilized operating expenses for the subject property. We were provided the subject’s 2013, and 2014 actual operating statement, along with the financial performance through July of 2015. In addition, three expense comparables and the 2014 IREM expense data for the Detroit market are also considered.
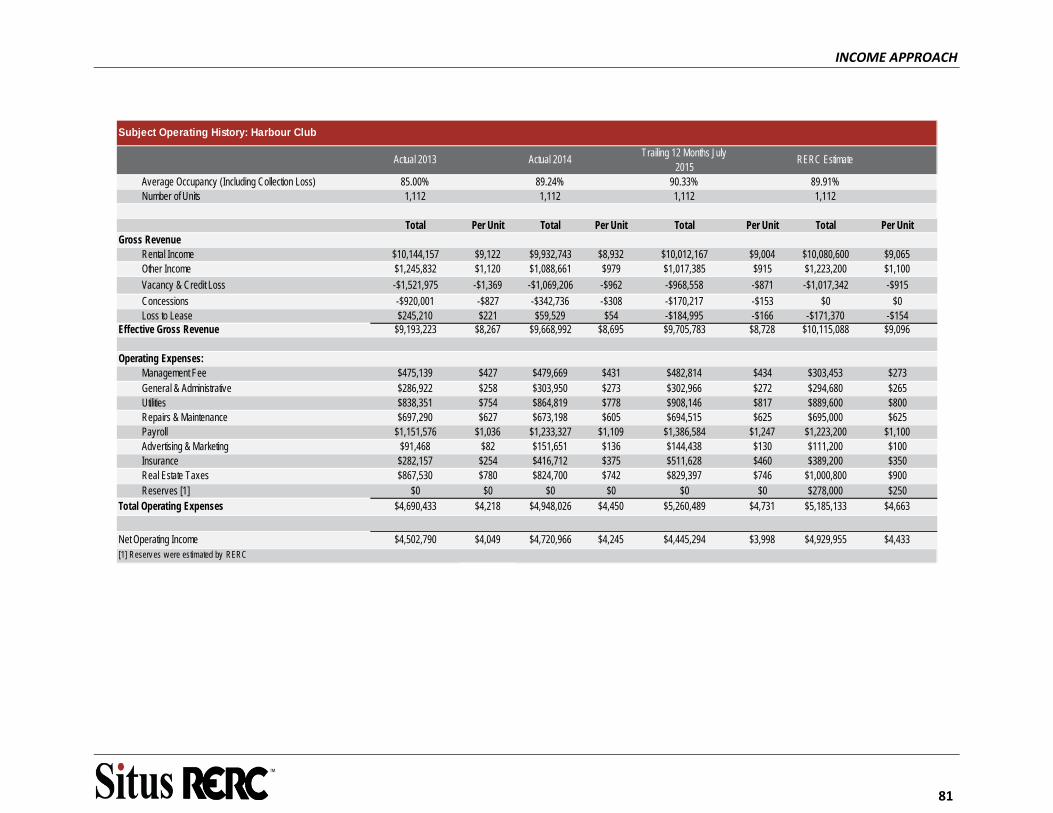
INCOME APPROACH
81
Actual 2013 Actual 2014Trailing 12 Months July
2015RERC Estimate
Average Occupancy (Including Collection Loss) 85.00% 89.24% 90.33% 89.91%Number of Units 1,112 1,112 1,112 1,112
Total Per Unit Total Per Unit Total Per Unit Total Per UnitGross Revenue
Rental Income $10,144,157 $9,122 $9,932,743 $8,932 $10,012,167 $9,004 $10,080,600 $9,065Other Income $1,245,832 $1,120 $1,088,661 $979 $1,017,385 $915 $1,223,200 $1,100
Vacancy & Credit Loss -$1,521,975 -$1,369 -$1,069,206 -$962 -$968,558 -$871 -$1,017,342 -$915
Concessions -$920,001 -$827 -$342,736 -$308 -$170,217 -$153 $0 $0Loss to Lease $245,210 $221 $59,529 $54 -$184,995 -$166 -$171,370 -$154
Effective Gross Revenue $9,193,223 $8,267 $9,668,992 $8,695 $9,705,783 $8,728 $10,115,088 $9,096
Operating Expenses:Management Fee $475,139 $427 $479,669 $431 $482,814 $434 $303,453 $273General & Administrative $286,922 $258 $303,950 $273 $302,966 $272 $294,680 $265Utilities $838,351 $754 $864,819 $778 $908,146 $817 $889,600 $800Repairs & Maintenance $697,290 $627 $673,198 $605 $694,515 $625 $695,000 $625Payroll $1,151,576 $1,036 $1,233,327 $1,109 $1,386,584 $1,247 $1,223,200 $1,100Advertising & Marketing $91,468 $82 $151,651 $136 $144,438 $130 $111,200 $100Insurance $282,157 $254 $416,712 $375 $511,628 $460 $389,200 $350Real Estate Taxes $867,530 $780 $824,700 $742 $829,397 $746 $1,000,800 $900Reserves [1] $0 $0 $0 $0 $0 $0 $278,000 $250
Total Operating Expenses $4,690,433 $4,218 $4,948,026 $4,450 $5,260,489 $4,731 $5,185,133 $4,663
Net Operating Income $4,502,790 $4,049 $4,720,966 $4,245 $4,445,294 $3,998 $4,929,955 $4,433[1] Reserv es w ere estimated by RERC
Subject Operating History: Harbour Club
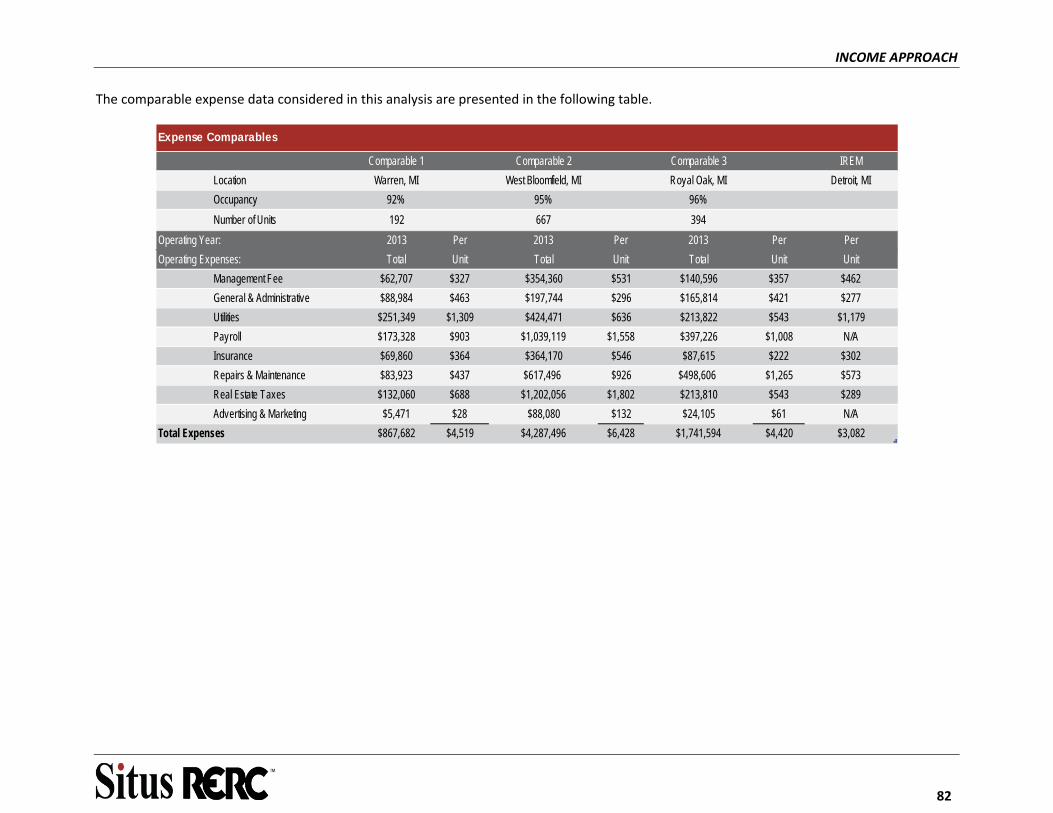
INCOME APPROACH
82
The comparable expense data considered in this analysis are presented in the following table.
Comparable 1 Comparable 2 Comparable 3 IREM
Location Warren, MI West Bloomfield, MI Royal Oak, MI Detroit, MI
Occupancy 92% 95% 96%
Number of Units 192 667 394
Operating Year: 2013 Per 2013 Per 2013 Per Per
Operating Expenses: Total Unit Total Unit Total Unit Unit
Management Fee $62,707 $327 $354,360 $531 $140,596 $357 $462
General & Administrative $88,984 $463 $197,744 $296 $165,814 $421 $277
Utilities $251,349 $1,309 $424,471 $636 $213,822 $543 $1,179
Payroll $173,328 $903 $1,039,119 $1,558 $397,226 $1,008 N/A
Insurance $69,860 $364 $364,170 $546 $87,615 $222 $302
Repairs & Maintenance $83,923 $437 $617,496 $926 $498,606 $1,265 $573
Real Estate Taxes $132,060 $688 $1,202,056 $1,802 $213,810 $543 $289
Advertising & Marketing $5,471 $28 $88,080 $132 $24,105 $61 N/A
Total Expenses $867,682 $4,519 $4,287,496 $6,428 $1,741,594 $4,420 $3,082
Expense Comparables
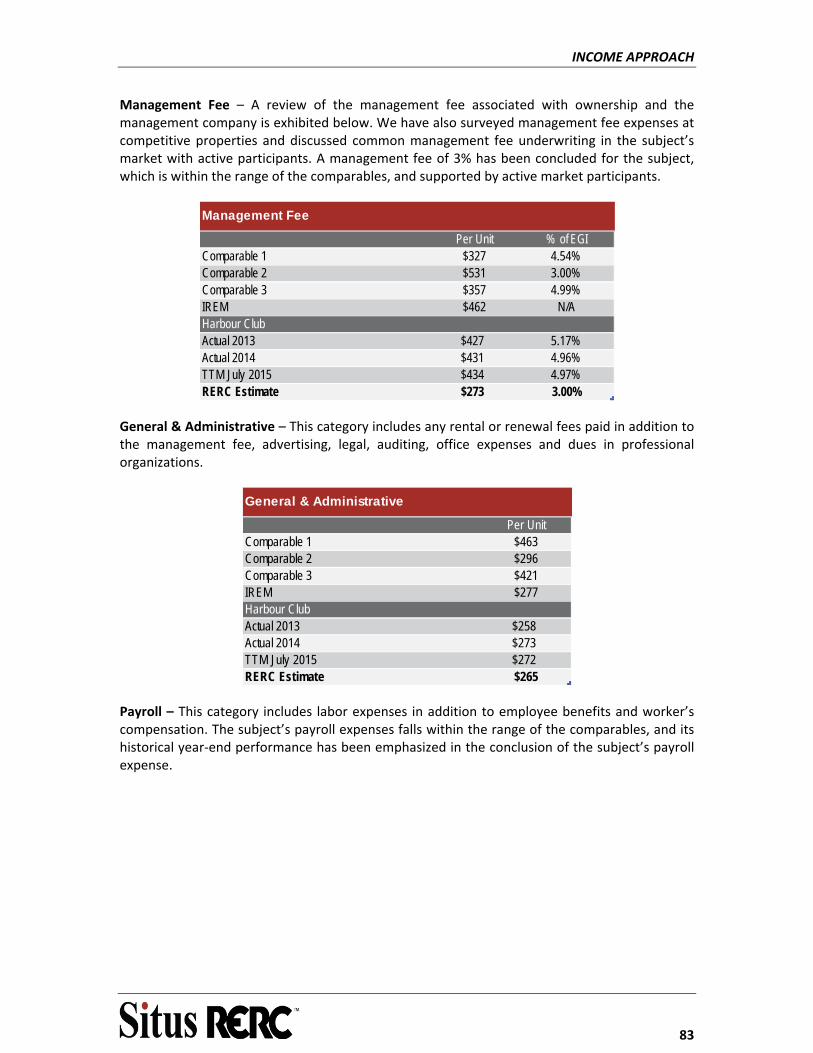
INCOME APPROACH
83
Management Fee – A review of the management fee associated with ownership and the management company is exhibited below. We have also surveyed management fee expenses at competitive properties and discussed common management fee underwriting in the subject’s market with active participants. A management fee of 3% has been concluded for the subject, which is within the range of the comparables, and supported by active market participants.
Per Unit % of EGIComparable 1 $327 4.54%Comparable 2 $531 3.00%Comparable 3 $357 4.99%IREM $462 N/AHarbour ClubActual 2013 $427 5.17%Actual 2014 $431 4.96%TTM July 2015 $434 4.97%RERC Estimate $273 3.00%
Management Fee
General & Administrative – This category includes any rental or renewal fees paid in addition to the management fee, advertising, legal, auditing, office expenses and dues in professional organizations.
General & Administrative
Per UnitComparable 1 $463Comparable 2 $296Comparable 3 $421IREM $277Harbour ClubActual 2013 $258Actual 2014 $273TTM July 2015 $272RERC Estimate $265
Payroll – This category includes labor expenses in addition to employee benefits and worker’s compensation. The subject’s payroll expenses falls within the range of the comparables, and its historical year‐end performance has been emphasized in the conclusion of the subject’s payroll expense.

INCOME APPROACH
84
Payroll
Per UnitComparable 1 $903Comparable 2 $1,558Comparable 3 $1,008Harbour ClubActual 2013 $1,036Actual 2014 $1,109TTM July 2015 $1,247RERC Estimate $1,100
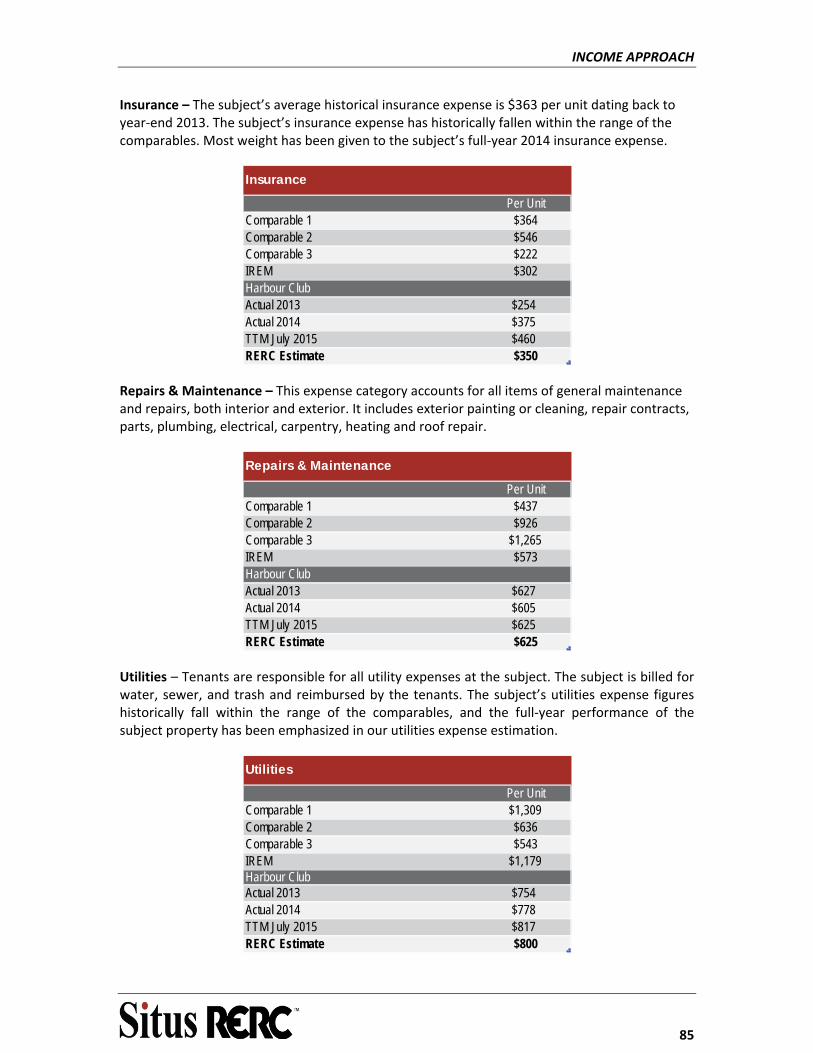
INCOME APPROACH
85
Insurance – The subject’s average historical insurance expense is $363 per unit dating back to year‐end 2013. The subject’s insurance expense has historically fallen within the range of the comparables. Most weight has been given to the subject’s full‐year 2014 insurance expense.
Insurance
Per UnitComparable 1 $364Comparable 2 $546Comparable 3 $222IREM $302Harbour ClubActual 2013 $254Actual 2014 $375TTM July 2015 $460RERC Estimate $350
Repairs & Maintenance – This expense category accounts for all items of general maintenance and repairs, both interior and exterior. It includes exterior painting or cleaning, repair contracts, parts, plumbing, electrical, carpentry, heating and roof repair.
Repairs & Maintenance
Per UnitComparable 1 $437Comparable 2 $926Comparable 3 $1,265IREM $573Harbour ClubActual 2013 $627Actual 2014 $605TTM July 2015 $625RERC Estimate $625
Utilities – Tenants are responsible for all utility expenses at the subject. The subject is billed for water, sewer, and trash and reimbursed by the tenants. The subject’s utilities expense figures historically fall within the range of the comparables, and the full‐year performance of the subject property has been emphasized in our utilities expense estimation.
Utilities
Per UnitComparable 1 $1,309Comparable 2 $636Comparable 3 $543IREM $1,179Harbour ClubActual 2013 $754Actual 2014 $778TTM July 2015 $817RERC Estimate $800
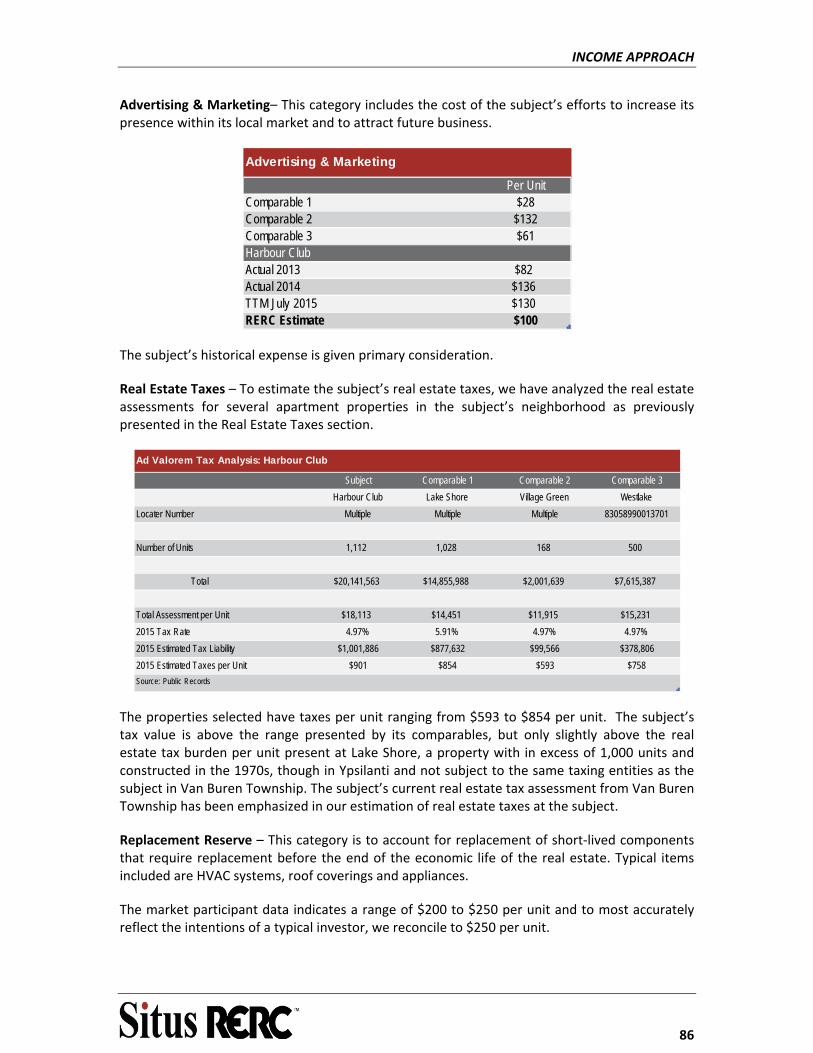
INCOME APPROACH
86
Advertising & Marketing– This category includes the cost of the subject’s efforts to increase its presence within its local market and to attract future business.
Advertising & Marketing
Per UnitComparable 1 $28Comparable 2 $132Comparable 3 $61Harbour ClubActual 2013 $82Actual 2014 $136TTM July 2015 $130RERC Estimate $100
The subject’s historical expense is given primary consideration.
Real Estate Taxes – To estimate the subject’s real estate taxes, we have analyzed the real estate assessments for several apartment properties in the subject’s neighborhood as previously presented in the Real Estate Taxes section.
Subject Comparable 1 Comparable 2 Comparable 3
Harbour Club Lake Shore Village Green Westlake
Locater Number Multiple Multiple Multiple 83058990013701
Number of Units 1,112 1,028 168 500
Total $20,141,563 $14,855,988 $2,001,639 $7,615,387
Total Assessment per Unit $18,113 $14,451 $11,915 $15,231
2015 Tax Rate 4.97% 5.91% 4.97% 4.97%
2015 Estimated Tax Liability $1,001,886 $877,632 $99,566 $378,806
2015 Estimated Taxes per Unit $901 $854 $593 $758
Source: Public Records
Ad Valorem Tax Analysis: Harbour Club
The properties selected have taxes per unit ranging from $593 to $854 per unit. The subject’s tax value is above the range presented by its comparables, but only slightly above the real estate tax burden per unit present at Lake Shore, a property with in excess of 1,000 units and constructed in the 1970s, though in Ypsilanti and not subject to the same taxing entities as the subject in Van Buren Township. The subject’s current real estate tax assessment from Van Buren Township has been emphasized in our estimation of real estate taxes at the subject.
Replacement Reserve – This category is to account for replacement of short‐lived components that require replacement before the end of the economic life of the real estate. Typical items included are HVAC systems, roof coverings and appliances.
The market participant data indicates a range of $200 to $250 per unit and to most accurately reflect the intentions of a typical investor, we reconcile to $250 per unit.
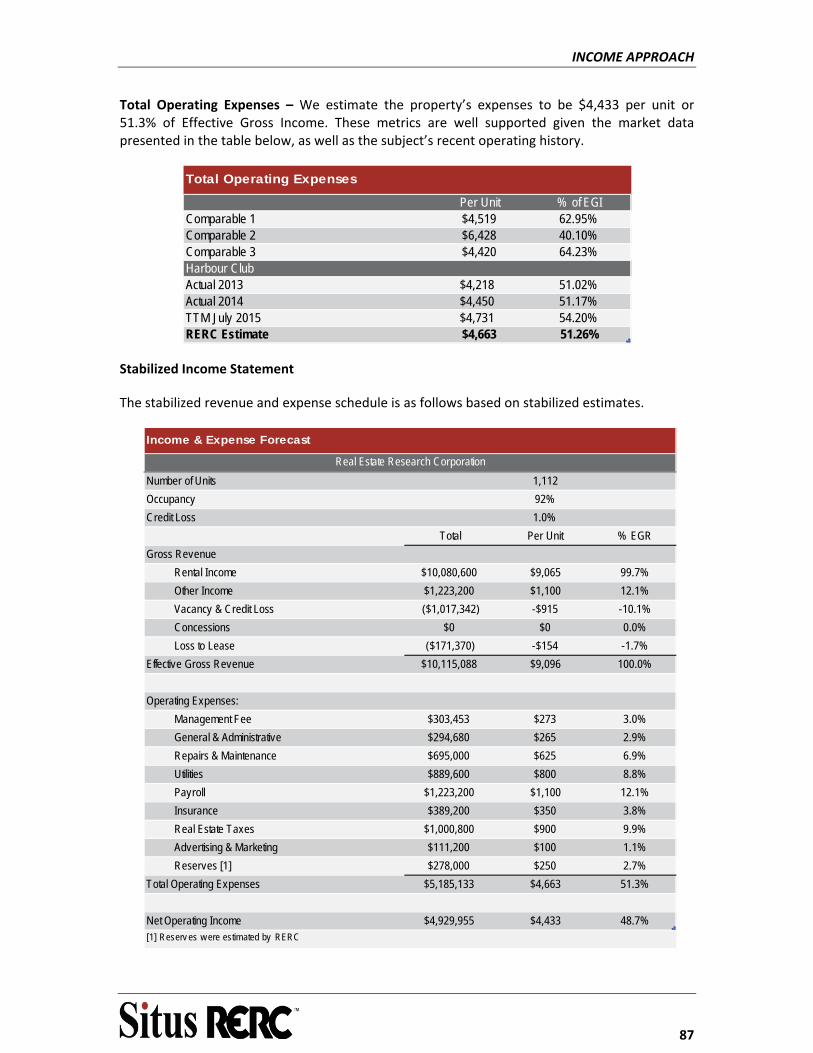
INCOME APPROACH
87
Total Operating Expenses – We estimate the property’s expenses to be $4,433 per unit or 51.3% of Effective Gross Income. These metrics are well supported given the market data presented in the table below, as well as the subject’s recent operating history.
Total Operating Expenses
Per Unit % of EGIComparable 1 $4,519 62.95%Comparable 2 $6,428 40.10%Comparable 3 $4,420 64.23%Harbour ClubActual 2013 $4,218 51.02%Actual 2014 $4,450 51.17%TTM July 2015 $4,731 54.20%RERC Estimate $4,663 51.26%
Stabilized Income Statement
The stabilized revenue and expense schedule is as follows based on stabilized estimates.
Number of Units 1,112
Occupancy 92%
Credit Loss 1.0%
Total Per Unit % EGR
Gross Revenue
Rental Income $10,080,600 $9,065 99.7%
Other Income $1,223,200 $1,100 12.1%
Vacancy & Credit Loss ($1,017,342) -$915 -10.1%
Concessions $0 $0 0.0%
Loss to Lease ($171,370) -$154 -1.7%
Effective Gross Revenue $10,115,088 $9,096 100.0%
Operating Expenses:
Management Fee $303,453 $273 3.0%
General & Administrative $294,680 $265 2.9%
Repairs & Maintenance $695,000 $625 6.9%
Utilities $889,600 $800 8.8%
Payroll $1,223,200 $1,100 12.1%
Insurance $389,200 $350 3.8%
Real Estate Taxes $1,000,800 $900 9.9%
Advertising & Marketing $111,200 $100 1.1%
Reserves [1] $278,000 $250 2.7%
Total Operating Expenses $5,185,133 $4,663 51.3%
Net Operating Income $4,929,955 $4,433 48.7%
Income & Expense Forecast
Real Estate Research Corporation
[1] Reserv es w ere estimated by RERC

INCOME APPROACH
88
OVERALL CAPITALIZATION RATE (RO) ANALYSIS
The overall capitalization rate (Ro) reflects the relationship between a point estimate of net operating income and value. The selection of the appropriate Ro is based on the following analysis.
Sales Data
We were able to extract capitalization rates from some of the sales presented in the Sales Comparison Approach. The information is summarized in the following table.
Sales Date Ro NOI/Unit Price/Unit
Sale 1 Apr-14 7.3% $6,000 $82,192
Sale 2 Apr-14 8.4% $3,860 $45,956
Sale 3 Jul-13 8.0% $5,520 $69,000
Sale 4 Jul-13 8.9% $3,684 $41,297
Indicated Cap Rate Range 7.30% - 8.90%
Capitalization Rate Summary
Based on the sales physical and economic characteristics and transaction dates in comparison to the subject’s, a capitalization rate in the middle of the range is deemed appropriate for the subject.
Market Participants
Discussions with market participants indicated Belleville was one of the more desirable neighborhoods in the Detroit Metro, though inferior to Ypsilanti and Ann Arbor. The table below summarizes the conversations with market participants and the overall reconciled value.
Individual/Firm Cap Rate
Berkadia 7.50% - 8.25%
Income Property Organization 7.75% - 8.25%
Indicated Range 7.50% - 8.25%
Market Participant Capitalization Rate Estimates
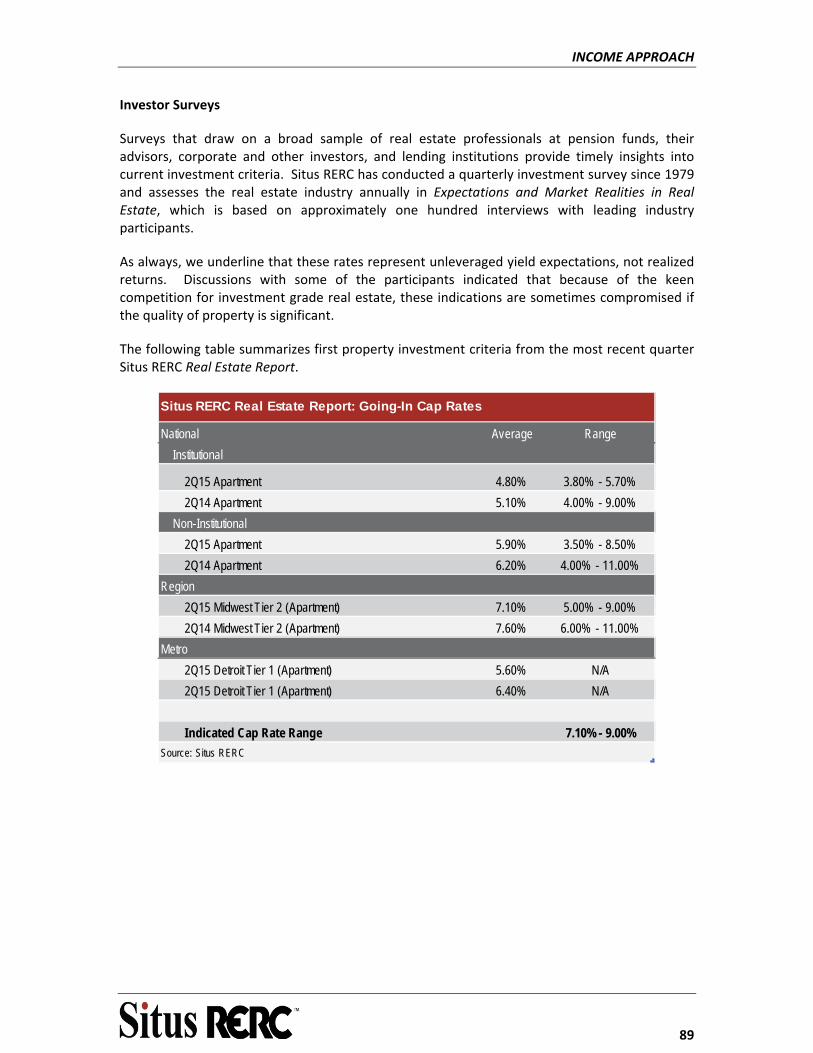
INCOME APPROACH
89
Investor Surveys
Surveys that draw on a broad sample of real estate professionals at pension funds, their advisors, corporate and other investors, and lending institutions provide timely insights into current investment criteria. Situs RERC has conducted a quarterly investment survey since 1979 and assesses the real estate industry annually in Expectations and Market Realities in Real Estate, which is based on approximately one hundred interviews with leading industry participants.
As always, we underline that these rates represent unleveraged yield expectations, not realized returns. Discussions with some of the participants indicated that because of the keen competition for investment grade real estate, these indications are sometimes compromised if the quality of property is significant.
The following table summarizes first property investment criteria from the most recent quarter Situs RERC Real Estate Report.
National Average Range
Institutional
2Q15 Apartment 4.80% 3.80% - 5.70%
2Q14 Apartment 5.10% 4.00% - 9.00%
Non-Institutional
2Q15 Apartment 5.90% 3.50% - 8.50%
2Q14 Apartment 6.20% 4.00% - 11.00%
Region
2Q15 Midwest Tier 2 (Apartment) 7.10% 5.00% - 9.00%
2Q14 Midwest Tier 2 (Apartment) 7.60% 6.00% - 11.00%
Metro
2Q15 Detroit Tier 1 (Apartment) 5.60% N/A
2Q15 Detroit Tier 1 (Apartment) 6.40% N/A
Indicated Cap Rate Range 7.10% - 9.00%
Source: Situs RERC
Situs RERC Real Estate Report: Going-In Cap Rates
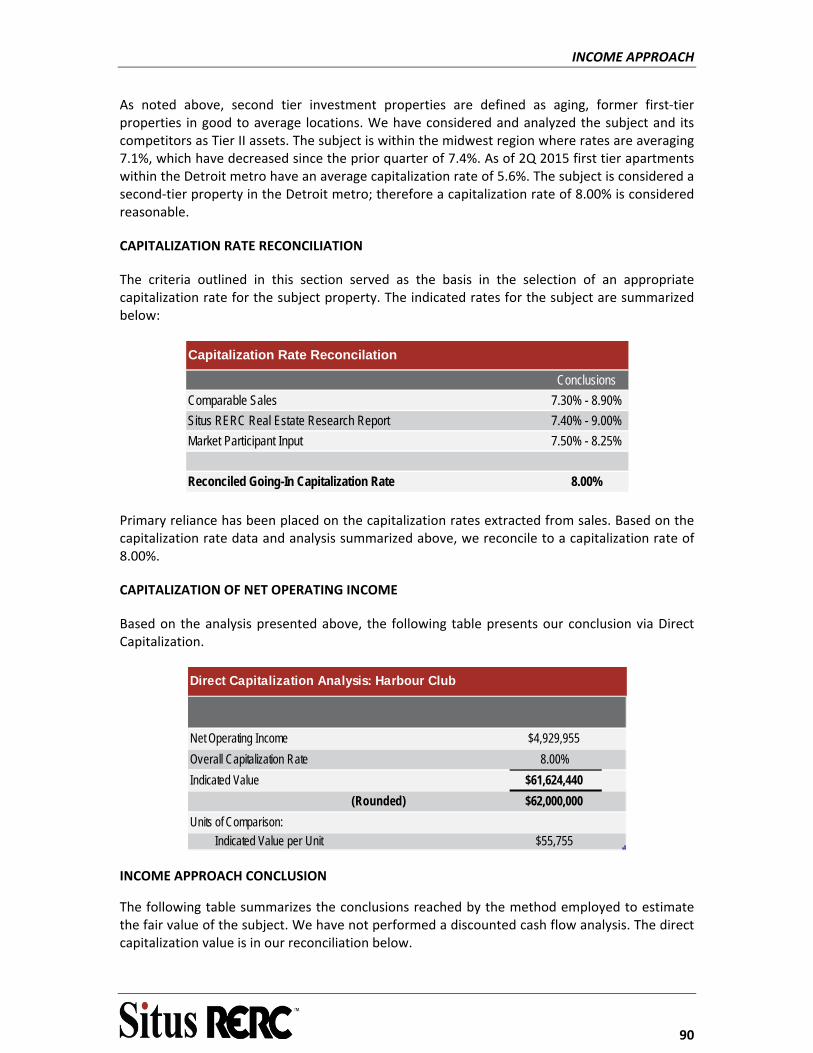
INCOME APPROACH
90
As noted above, second tier investment properties are defined as aging, former first‐tier properties in good to average locations. We have considered and analyzed the subject and its competitors as Tier II assets. The subject is within the midwest region where rates are averaging 7.1%, which have decreased since the prior quarter of 7.4%. As of 2Q 2015 first tier apartments within the Detroit metro have an average capitalization rate of 5.6%. The subject is considered a second‐tier property in the Detroit metro; therefore a capitalization rate of 8.00% is considered reasonable.
CAPITALIZATION RATE RECONCILIATION
The criteria outlined in this section served as the basis in the selection of an appropriate capitalization rate for the subject property. The indicated rates for the subject are summarized below:
Conclusions
Comparable Sales 7.30% - 8.90%
Situs RERC Real Estate Research Report 7.40% - 9.00%
Market Participant Input 7.50% - 8.25%
Reconciled Going-In Capitalization Rate 8.00%
Capitalization Rate Reconcilation
Primary reliance has been placed on the capitalization rates extracted from sales. Based on the capitalization rate data and analysis summarized above, we reconcile to a capitalization rate of 8.00%.
CAPITALIZATION OF NET OPERATING INCOME
Based on the analysis presented above, the following table presents our conclusion via Direct Capitalization.
Net Operating Income $4,929,955
Overall Capitalization Rate 8.00%
Indicated Value $61,624,440
(Rounded) $62,000,000
Units of Comparison:
Indicated Value per Unit $55,755
Direct Capitalization Analysis: Harbour Club
INCOME APPROACH CONCLUSION
The following table summarizes the conclusions reached by the method employed to estimate the fair value of the subject. We have not performed a discounted cash flow analysis. The direct capitalization value is in our reconciliation below.
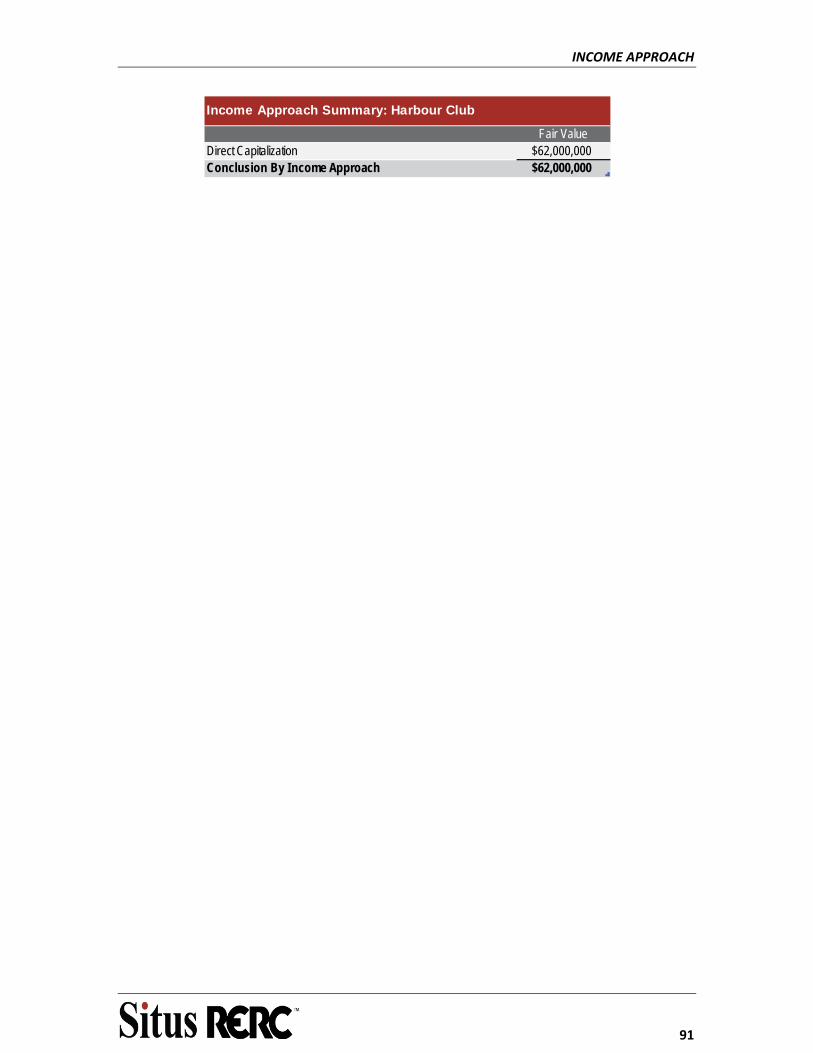
INCOME APPROACH
91
Fair ValueDirect Capitalization $62,000,000Conclusion By Income Approach $62,000,000
Income Approach Summary: Harbour Club

RECONCILIATION OF VALUE ESTIMATES
92
RECONCILIATION OF VALUE ESTIMATES
As a result of our investigation and analyses, our final estimates of fair value of the legal interest appraised herein, are as follows:
Fair ValueSales Comparison Approach $62,000,000Income Approach $62,000,000Final Value Estimate $62,000,000
Reconcilation
Cost Approach
The cost approach was not utilized in this report as market participants typically rely on the sales and income approaches for an indication of depreciation.
Sales Comparison Approach
The sales comparison approach was developed utilizing four sales of similar apartment properties from the Michigan market. The sales are recent and the adjustments are considered reasonable. Overall, the data was considered adequate to provide a reliable indication of value for the subject. The sales comparison approach is given weight in the final reconciliation.
Income Capitalization Approach
A potential investor would pay particular attention to the income approach as it provides an indication of the likely income, expenses and cash flow of the property. The subject’s specific analysis included a survey of six competitive market rate apartment properties to estimate market rent. Adequate market data for estimate of vacancy and the subject’s projected expenses was available. The capitalization rate selection included rates extracted from sales, survey data and market participants. Overall, the inputs were adequate to provide a reasonable indication of value. The income approach is given weight in the reconciliation.

RECONCILIATION OF VALUE ESTIMATES
93
VALUE CONCLUSION
To arrive at our value estimate, we visited and viewed the property. We researched and analyzed the area’s apartment market and estimated the subject’s position within said market area. Based on our research and analysis, and subject to the assumptions and limiting conditions described in the accompanying report, it is our opinion that the fair value the subject property is summarized in the table below.
Value Premise Legal Interest Appraised Date of Value Value EstimateFair Value Fee Simple Estate September 30, 2015 $62,000,000
Value Estimate
SENSITIVITY ANALYSIS
GFI Capital Holdings, LLC requested that we calculate the potential sensitivity around our fair value estimate. As part of the requested sensitivity analysis, we varied our implied overall capitalization rate estimate by 25 basis points and NOI estimate by 5.0%. The sensitivity calculations together with our fair value estimate are shown in the table below.
Sensitivity Analysis
$4,450,000 $4,680,000 $4,929,955 $5,180,000 $5,440,000
7.50% $59,300,000 $62,400,000 $66,000,000 $69,100,000 $72,500,000
7.75% $57,400,000 $60,400,000 $64,000,000 $66,800,000 $70,200,000
8.00% $55,600,000 $58,500,000 $62,000,000 $64,800,000 $68,000,000
8.25% $53,900,000 $56,700,000 $60,000,000 $62,800,000 $65,900,000
8.50% $52,400,000 $55,100,000 $58,000,000 $60,900,000 $64,000,000Cap
ital
izat
ion
Rat
e
Net Operating Income
CERTIFICATION
94
CERTIFICATION
I certify that, to the best of my knowledge and belief:
‐ The statements of fact contained in this report are true and correct.
‐ The reported analyses, opinions, and conclusions are limited only by the reported assumptions and limiting conditions and is my personal, impartial, and unbiased professional analyses, opinions, and conclusions.
‐ I have no present or prospective interest in the property that is the subject of this report and no personal interest with respect to the parties involved.
‐ I have no bias with respect to the property that is the subject of this report or to the parties involved with this assignment.
‐ My engagement in this assignment was not contingent upon developing or reporting predetermined results.
‐ My compensation for completing this assignment is not contingent upon the development or reporting of a predetermined value or direction in value that favors the cause of the client, the amount of the value opinion, the attainment of a stipulated result, or the occurrence of a subsequent event directly related to the intended use of this appraisal. ‐ Kenneth P. Riggs, CFA, MAI, CRE has not visited and viewed the subject property for this assignment. Daniel Haire visited and viewed the subject property on behalf of RERC.
‐ Daniel Haire provided real property appraisal assistance to the persons signing this certification. He assisted in the research and collection of data, analysis of approaches, and the preparation of the appraisal report. ‐ The reported analyses, opinions, and conclusions were developed, and this report has been prepared, in conformity with the Code of Professional Ethics and Standards of Professional Appraisal Practice of the Appraisal Institute, which includes the Uniform Standards of Professional Appraisal Practice.
‐ The use of this report is subject to the requirements of the Appraisal Institute relating to review by its duly authorized representatives.
‐ I have performed a previous appraisal or provided real property services related to the subject property within the three years prior to this assignment.
‐ As of the date of this report, Kenneth P. Riggs, CFA, MAI, CRE has completed the continuing education program of the Appraisal Institute for Designated Members.
RERC
Kenneth P. Riggs CFA, MAI, CRE
MI General Real Estate Appraiser General Appraiser License #: 1201003218 License Expiration Date: 7/31/2016
ASSUMPTIONS AND LIMITING CONDITIONS
ASSUMPTIONS AND LIMITING CONDITIONS
This appraisal report has been based on, and is subject to, the following general assumptions and limiting conditions:
• The value reported is only applicable to the purpose, function, and terms stated in this report and shall not be used for any other purpose.
• The appraisers have assumed that the reader (s) of this report is well versed in real estate and is a sophisticated and knowledgeable business person(s).
• No responsibility is assumed for the legal description provided or for matters pertaining to legal or title considerations. Title to the property is assumed to be good and marketable unless otherwise stated. The property is appraised free and clear of any or all liens or encumbrances unless otherwise stated. It is assumed that the use of the land and improvements is confined within the boundaries or property lines of the property described and that there is no encroachment or trespass unless noted in the report.
• Responsible ownership and competent property management are assumed.
• The information furnished by others is believed to be reliable, but no warranty is given for its accuracy.
• All engineering studies are assumed to be correct. The plot plans and illustrative material in this report are included only to help the reader visualize the property.
• It is assumed that there are no hidden or unapparent conditions of the property, subsoil, or structures that render it more or less valuable. No responsibility is assumed for such conditions or for obtaining the engineering studies that may be required to discover them.
• It is assumed that the property is in full compliance with all applicable federal, state, and local environmental regulations and laws unless the lack of compliance is stated, described and considered in the appraisal report. It is assumed that all required licenses, certificates of occupancy, consents, and other legislative or administrative authority from any local, state, or national government or private entity or organization have been or can be obtained or renewed for any use on which the value estimate contained in this report is based.
• It is assumed that the property conforms to all applicable zoning and use regulations and restrictions unless nonconformity has been identified, described and considered in the appraisal report.
• The appraisers shall not be required to give testimony as a witness or to appear in any capacity in any legal or administrative hearing or procedure, or to have any continued service responsibility unless compensated, by the engager of this report, in advance, according to their fee schedule then in effect.
• Unless otherwise stated in this report, the existence of hazardous materials, which may or may not be present on the property, was not observed by the appraiser. The appraiser has no knowledge of the existence of such material on or in the property. The appraiser, however is not
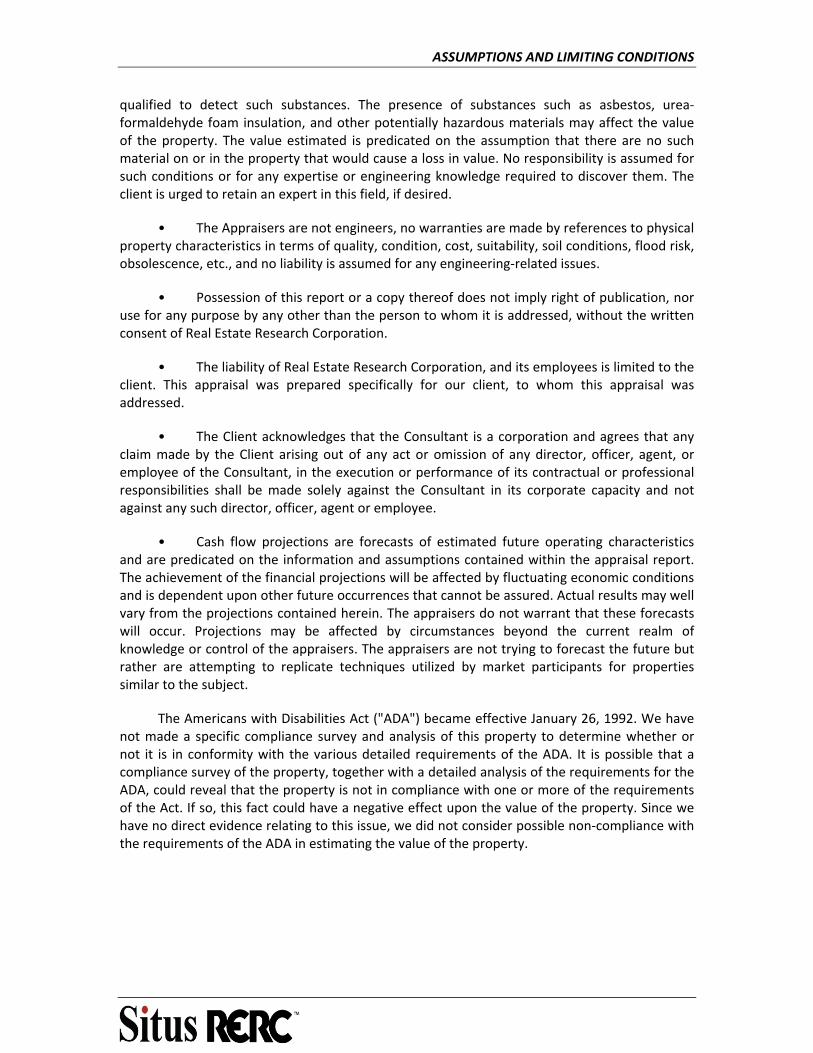
ASSUMPTIONS AND LIMITING CONDITIONS
qualified to detect such substances. The presence of substances such as asbestos, urea‐formaldehyde foam insulation, and other potentially hazardous materials may affect the value of the property. The value estimated is predicated on the assumption that there are no such material on or in the property that would cause a loss in value. No responsibility is assumed for such conditions or for any expertise or engineering knowledge required to discover them. The client is urged to retain an expert in this field, if desired.
• The Appraisers are not engineers, no warranties are made by references to physical property characteristics in terms of quality, condition, cost, suitability, soil conditions, flood risk, obsolescence, etc., and no liability is assumed for any engineering‐related issues.
• Possession of this report or a copy thereof does not imply right of publication, nor use for any purpose by any other than the person to whom it is addressed, without the written consent of Real Estate Research Corporation.
• The liability of Real Estate Research Corporation, and its employees is limited to the client. This appraisal was prepared specifically for our client, to whom this appraisal was addressed.
• The Client acknowledges that the Consultant is a corporation and agrees that any claim made by the Client arising out of any act or omission of any director, officer, agent, or employee of the Consultant, in the execution or performance of its contractual or professional responsibilities shall be made solely against the Consultant in its corporate capacity and not against any such director, officer, agent or employee.
• Cash flow projections are forecasts of estimated future operating characteristics and are predicated on the information and assumptions contained within the appraisal report. The achievement of the financial projections will be affected by fluctuating economic conditions and is dependent upon other future occurrences that cannot be assured. Actual results may well vary from the projections contained herein. The appraisers do not warrant that these forecasts will occur. Projections may be affected by circumstances beyond the current realm of knowledge or control of the appraisers. The appraisers are not trying to forecast the future but rather are attempting to replicate techniques utilized by market participants for properties similar to the subject.
The Americans with Disabilities Act ("ADA") became effective January 26, 1992. We have not made a specific compliance survey and analysis of this property to determine whether or not it is in conformity with the various detailed requirements of the ADA. It is possible that a compliance survey of the property, together with a detailed analysis of the requirements for the ADA, could reveal that the property is not in compliance with one or more of the requirements of the Act. If so, this fact could have a negative effect upon the value of the property. Since we have no direct evidence relating to this issue, we did not consider possible non‐compliance with the requirements of the ADA in estimating the value of the property.

SUBJECT PHOTOGRAPHS
SUBJECT PHOTOGRAPHS
The following pages include photos of the subject site and surround area.
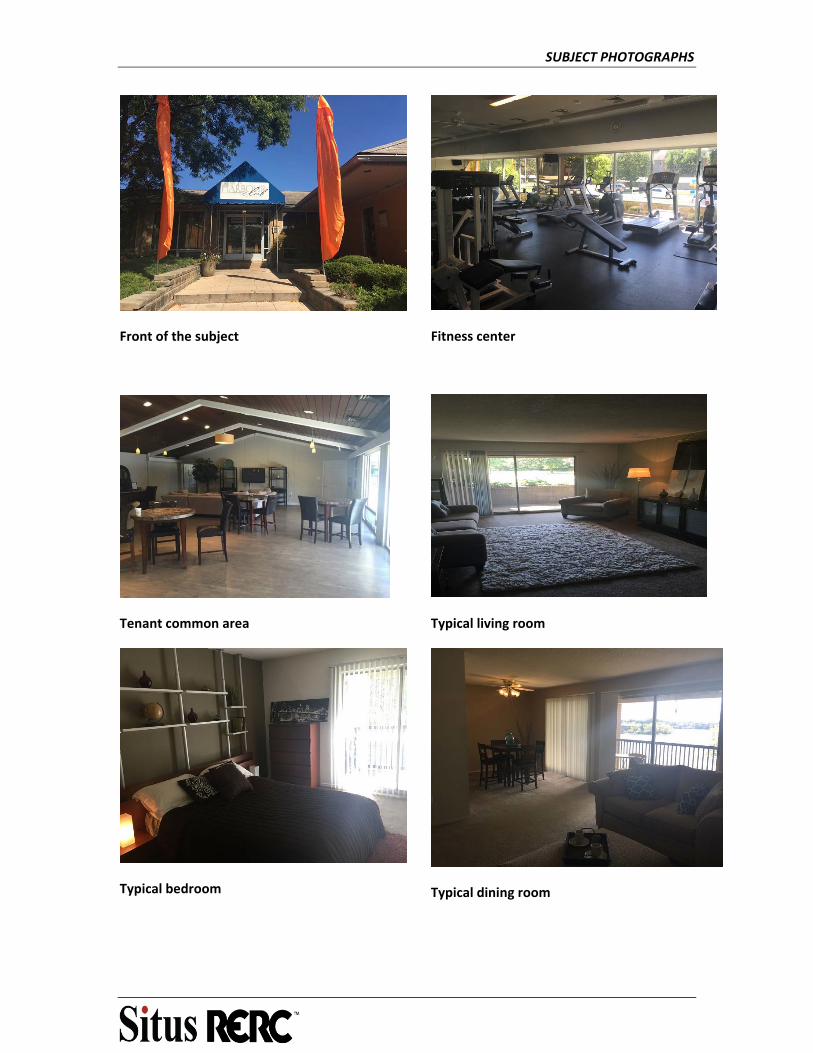
SUBJECT PHOTOGRAPHS
Front of the subject
Tenant common area
Typical bedroom
Fitness center
Typical living room
Typical dining room
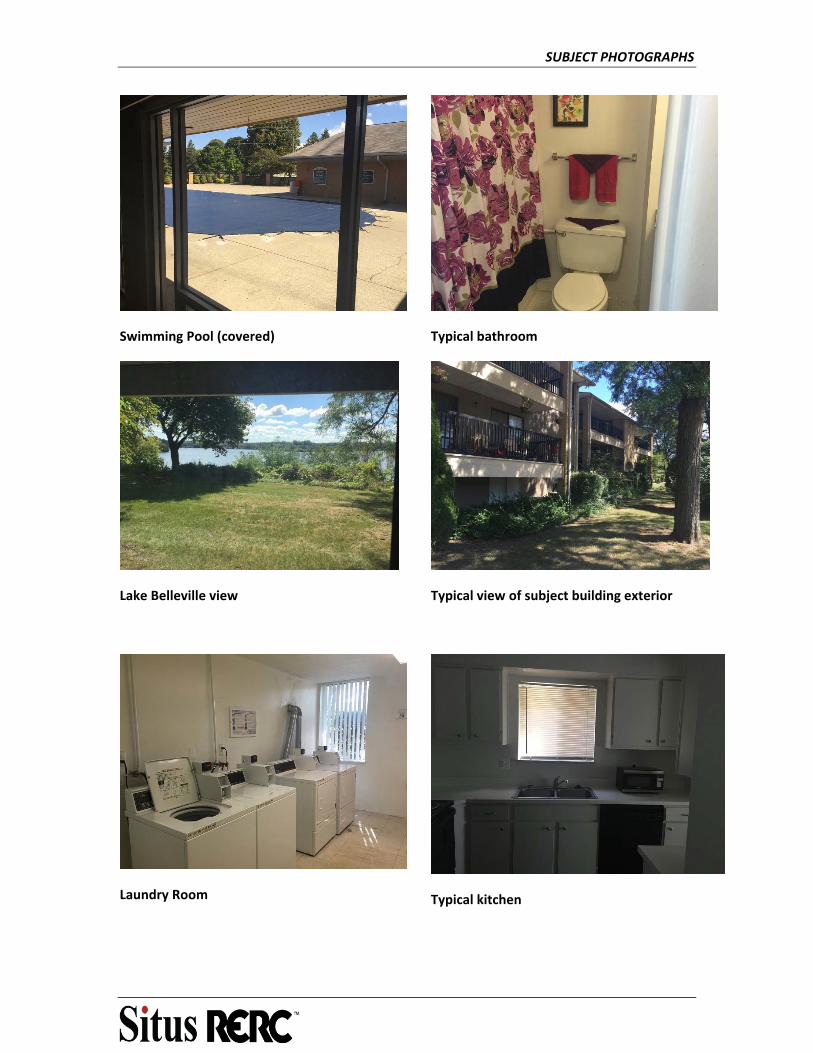
SUBJECT PHOTOGRAPHS
Swimming Pool (covered)
Lake Belleville view
Laundry Room
Typical bathroom
Typical view of subject building exterior
Typical kitchen
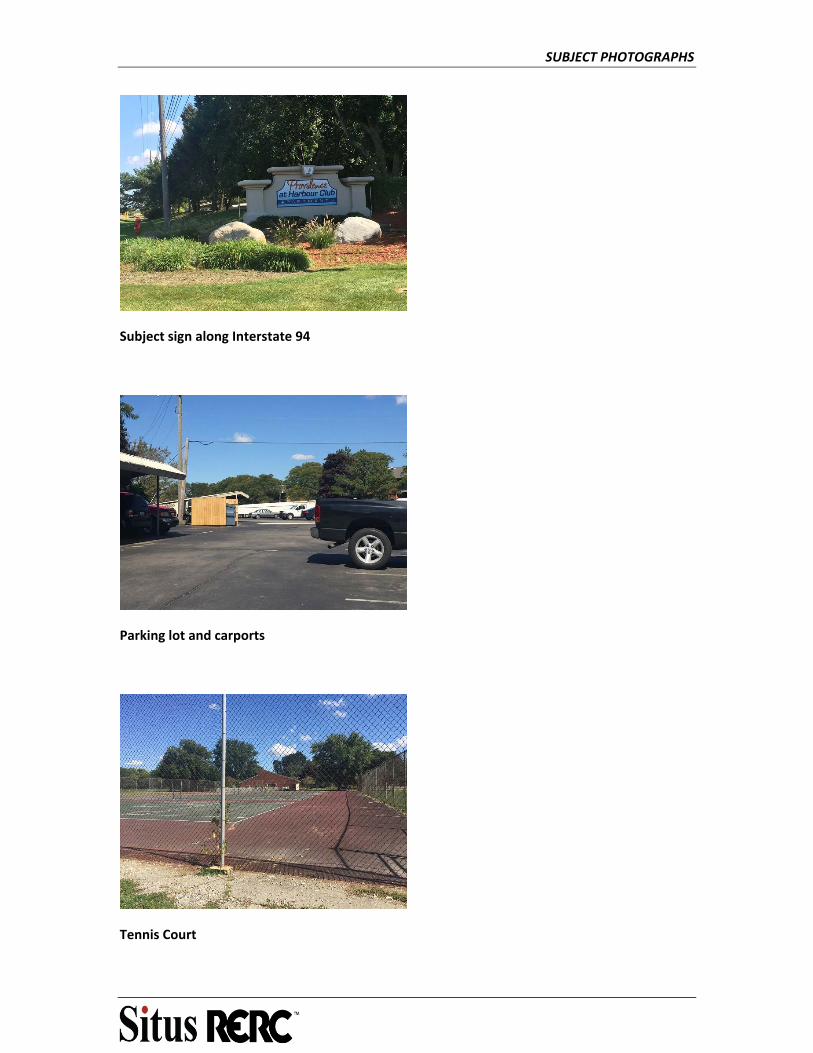
SUBJECT PHOTOGRAPHS
Subject sign along Interstate 94
Parking lot and carports
Tennis Court

IMPROVED SALES
IMPROVED SALES
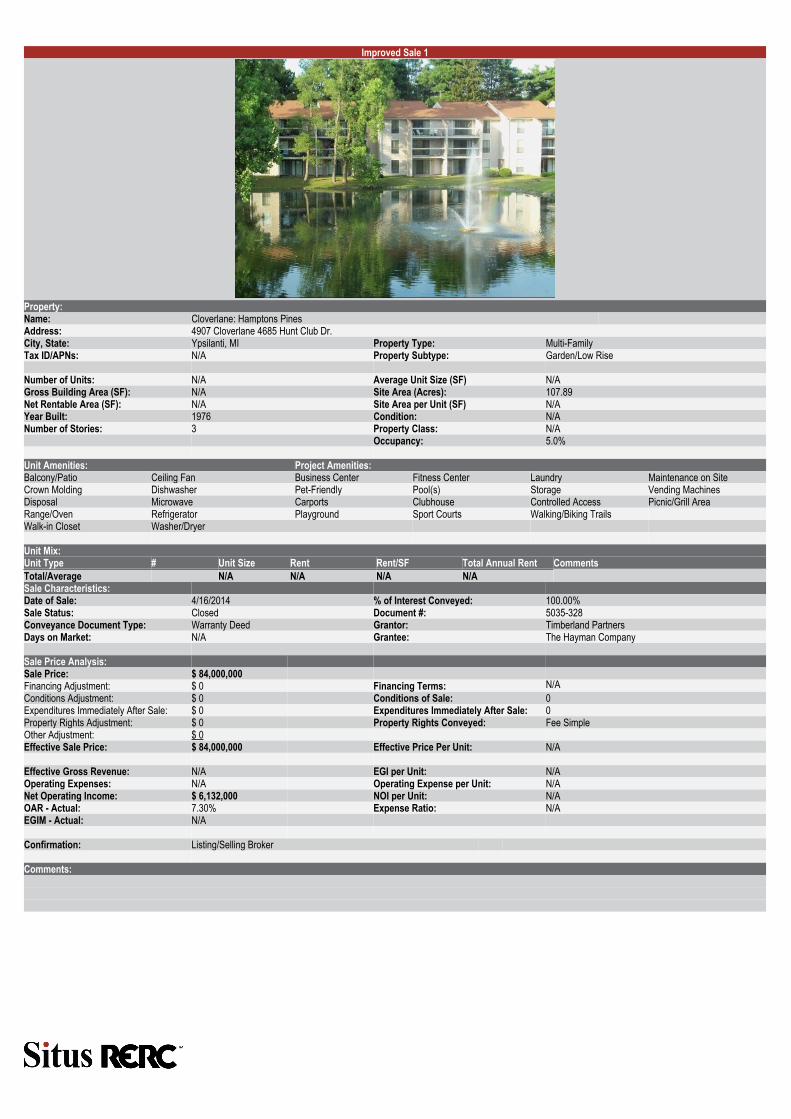
Improved Sale 1
Property:Name: Cloverlane: Hamptons PinesAddress: 4907 Cloverlane 4685 Hunt Club Dr.City, State: Ypsilanti, MI Property Type: Multi-FamilyTax ID/APNs: N/A Property Subtype: Garden/Low Rise
Number of Units: N/A Average Unit Size (SF) N/AGross Building Area (SF): N/A Site Area (Acres): 107.89Net Rentable Area (SF): N/A Site Area per Unit (SF) N/AYear Built: 1976 Condition: N/ANumber of Stories: 3 Property Class: N/A
Occupancy: 5.0%
Unit Amenities: Project Amenities:Balcony/Patio Ceiling Fan Business Center Fitness Center Laundry Maintenance on SiteCrown Molding Dishwasher Pet-Friendly Pool(s) Storage Vending MachinesDisposal Microwave Carports Clubhouse Controlled Access Picnic/Grill AreaRange/Oven Refrigerator Playground Sport Courts Walking/Biking TrailsWalk-in Closet Washer/Dryer
Unit Mix:Unit Type # Unit Size Rent Rent/SF Total Annual Rent CommentsTotal/Average N/A N/A N/A N/ASale Characteristics:Date of Sale: 4/16/2014 % of Interest Conveyed: 100.00%Sale Status: Closed Document #: 5035-328Conveyance Document Type: Warranty Deed Grantor: Timberland PartnersDays on Market: N/A Grantee: The Hayman Company
Sale Price Analysis:Sale Price: $ 84,000,000Financing Adjustment: $ 0 Financing Terms: N/AConditions Adjustment: $ 0 Conditions of Sale: 0Expenditures Immediately After Sale: $ 0 Expenditures Immediately After Sale: 0Property Rights Adjustment: $ 0 Property Rights Conveyed: Fee SimpleOther Adjustment: $ 0Effective Sale Price: $ 84,000,000 Effective Price Per Unit: N/A
Effective Gross Revenue: N/A EGI per Unit: N/AOperating Expenses: N/A Operating Expense per Unit: N/ANet Operating Income: $ 6,132,000 NOI per Unit: N/AOAR - Actual: 7.30% Expense Ratio: N/AEGIM - Actual: N/A
Confirmation: Listing/Selling Broker
Comments:

Improved Sale 2
Property:Name: Gables of TroyAddress: 500 Coachman Drive.City, State: Troy, MI Property Type: Multi-FamilyTax ID/APNs: N/A Property Subtype: Garden/Low Rise
Number of Units: N/A Average Unit Size (SF) N/AGross Building Area (SF): N/A Site Area (Acres): 44.30Net Rentable Area (SF): N/A Site Area per Unit (SF) N/AYear Built: 1973 Condition: N/ANumber of Stories: 3 Property Class: N/A
Occupancy: 7.0%
Unit Amenities: Project Amenities:Balcony/Patio Ceiling Fan Business Center Fitness Center Hot-Tub/Spa LaundryCrown Molding Dishwasher Maintenance on Site Pet-Friendly Pool(s) StorageDisposal Intercom System Vending Machines ClubhouseMicrowave Range/OvenRefrigerator Walk-in ClosetWasher/Dryer
Unit Mix:Unit Type # Unit Size Rent Rent/SF Total Annual Rent CommentsTotal/Average N/A N/A N/A N/ASale Characteristics:Date of Sale: 4/21/2014 % of Interest Conveyed: 100.00%Sale Status: Closed Document #: N/AConveyance Document Type: N/A Grantor: Eagles Landing of Troy, LLCDays on Market: N/A Grantee: The Gables of Troy, LLC
Sale Price Analysis:Sale Price: $ 25,000,000Financing Adjustment: $ 0 Financing Terms: Cash to SellerConditions Adjustment: $ 0 Conditions of Sale: Arm's LengthExpenditures Immediately After Sale: $ 0 Expenditures Immediately After Sale: N/AProperty Rights Adjustment: $ 0 Property Rights Conveyed: Fee SimpleOther Adjustment: $ 0Effective Sale Price: $ 25,000,000 Effective Price Per Unit: N/A
Effective Gross Revenue: N/A EGI per Unit: N/AOperating Expenses: N/A Operating Expense per Unit: N/ANet Operating Income: $ 2,100,000 NOI per Unit: N/AOAR - Actual: 8.40% Expense Ratio: N/AEGIM - Actual: N/A
Confirmation: Listing/Selling Broker
Comments:
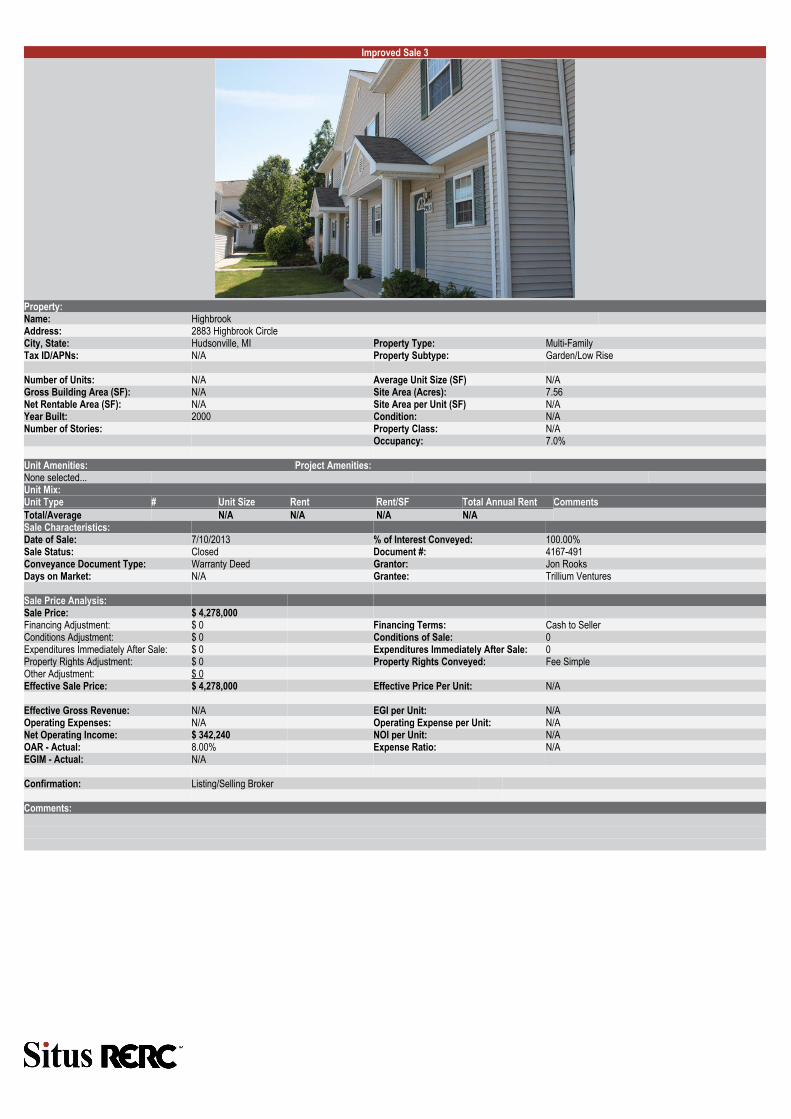
Improved Sale 3
Property:Name: HighbrookAddress: 2883 Highbrook CircleCity, State: Hudsonville, MI Property Type: Multi-FamilyTax ID/APNs: N/A Property Subtype: Garden/Low Rise
Number of Units: N/A Average Unit Size (SF) N/AGross Building Area (SF): N/A Site Area (Acres): 7.56Net Rentable Area (SF): N/A Site Area per Unit (SF) N/AYear Built: 2000 Condition: N/ANumber of Stories: Property Class: N/A
Occupancy: 7.0%
Unit Amenities: Project Amenities:None selected...Unit Mix:Unit Type # Unit Size Rent Rent/SF Total Annual Rent CommentsTotal/Average N/A N/A N/A N/ASale Characteristics:Date of Sale: 7/10/2013 % of Interest Conveyed: 100.00%Sale Status: Closed Document #: 4167-491Conveyance Document Type: Warranty Deed Grantor: Jon RooksDays on Market: N/A Grantee: Trillium Ventures
Sale Price Analysis:Sale Price: $ 4,278,000Financing Adjustment: $ 0 Financing Terms: Cash to SellerConditions Adjustment: $ 0 Conditions of Sale: 0Expenditures Immediately After Sale: $ 0 Expenditures Immediately After Sale: 0Property Rights Adjustment: $ 0 Property Rights Conveyed: Fee SimpleOther Adjustment: $ 0Effective Sale Price: $ 4,278,000 Effective Price Per Unit: N/A
Effective Gross Revenue: N/A EGI per Unit: N/AOperating Expenses: N/A Operating Expense per Unit: N/ANet Operating Income: $ 342,240 NOI per Unit: N/AOAR - Actual: 8.00% Expense Ratio: N/AEGIM - Actual: N/A
Confirmation: Listing/Selling Broker
Comments:
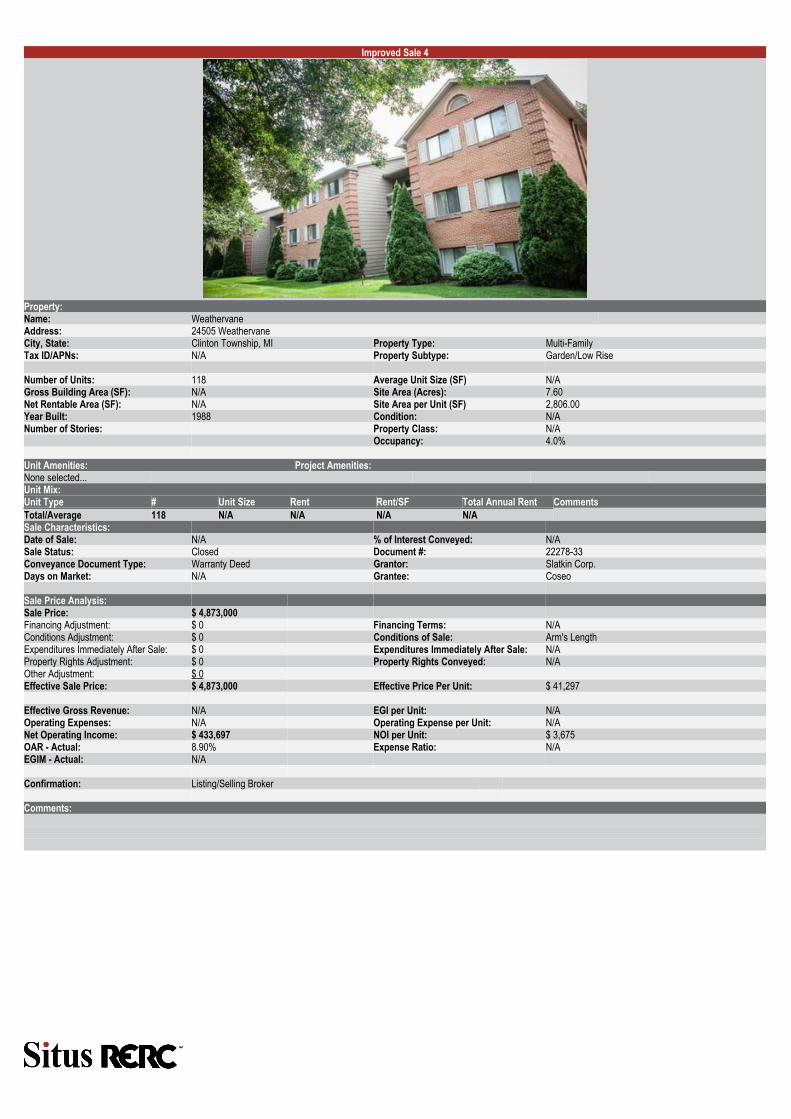
Improved Sale 4
Property:Name: WeathervaneAddress: 24505 WeathervaneCity, State: Clinton Township, MI Property Type: Multi-FamilyTax ID/APNs: N/A Property Subtype: Garden/Low Rise
Number of Units: 118 Average Unit Size (SF) N/AGross Building Area (SF): N/A Site Area (Acres): 7.60Net Rentable Area (SF): N/A Site Area per Unit (SF) 2,806.00Year Built: 1988 Condition: N/ANumber of Stories: Property Class: N/A
Occupancy: 4.0%
Unit Amenities: Project Amenities:None selected...Unit Mix:Unit Type # Unit Size Rent Rent/SF Total Annual Rent CommentsTotal/Average 118 N/A N/A N/A N/ASale Characteristics:Date of Sale: N/A % of Interest Conveyed: N/ASale Status: Closed Document #: 22278-33Conveyance Document Type: Warranty Deed Grantor: Slatkin Corp.Days on Market: N/A Grantee: Coseo
Sale Price Analysis:Sale Price: $ 4,873,000Financing Adjustment: $ 0 Financing Terms: N/AConditions Adjustment: $ 0 Conditions of Sale: Arm's LengthExpenditures Immediately After Sale: $ 0 Expenditures Immediately After Sale: N/AProperty Rights Adjustment: $ 0 Property Rights Conveyed: N/AOther Adjustment: $ 0Effective Sale Price: $ 4,873,000 Effective Price Per Unit: $ 41,297
Effective Gross Revenue: N/A EGI per Unit: N/AOperating Expenses: N/A Operating Expense per Unit: N/ANet Operating Income: $ 433,697 NOI per Unit: $ 3,675OAR - Actual: 8.90% Expense Ratio: N/AEGIM - Actual: N/A
Confirmation: Listing/Selling Broker
Comments:

RENT ROLL
RENT ROLL
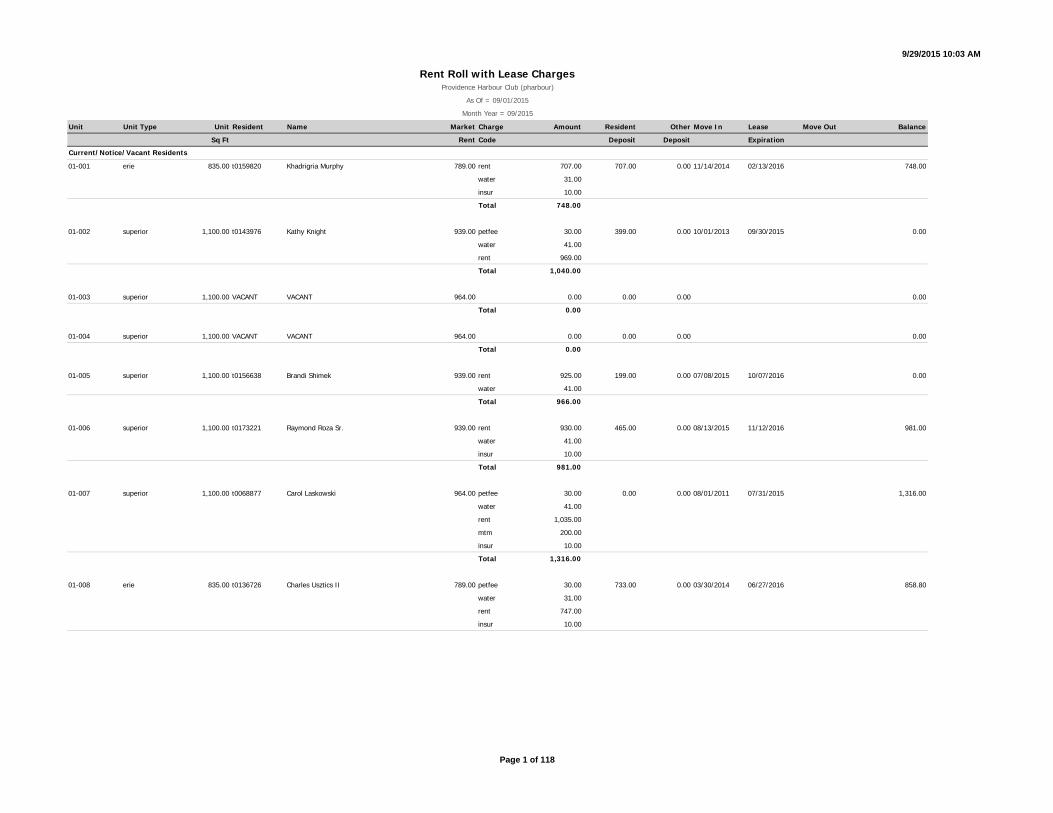
9/29/2015 10:03 AM
Unit Unit Type Unit Resident Name Market Charge Amount Resident Other Move In Lease Move Out Balance
Sq Ft Rent Code Deposit Deposit Expiration
01-001 erie 835.00 t0159820 Khadrigria Murphy 789.00 rent 707.00 707.00 0.00 11/14/2014 02/13/2016 748.00
water 31.00
insur 10.00
Total 748.00
01-002 superior 1,100.00 t0143976 Kathy Knight 939.00 petfee 30.00 399.00 0.00 10/01/2013 09/30/2015 0.00
water 41.00
rent 969.00
Total 1,040.00
01-003 superior 1,100.00 VACANT VACANT 964.00 0.00 0.00 0.00 0.00
Total 0.00
01-004 superior 1,100.00 VACANT VACANT 964.00 0.00 0.00 0.00 0.00
Total 0.00
01-005 superior 1,100.00 t0156638 Brandi Shimek 939.00 rent 925.00 199.00 0.00 07/08/2015 10/07/2016 0.00
water 41.00
Total 966.00
01-006 superior 1,100.00 t0173221 Raymond Roza Sr. 939.00 rent 930.00 465.00 0.00 08/13/2015 11/12/2016 981.00
water 41.00
insur 10.00
Total 981.00
01-007 superior 1,100.00 t0068877 Carol Laskowski 964.00 petfee 30.00 0.00 0.00 08/01/2011 07/31/2015 1,316.00
water 41.00
rent 1,035.00
mtm 200.00
insur 10.00
Total 1,316.00
01-008 erie 835.00 t0136726 Charles Usztics II 789.00 petfee 30.00 733.00 0.00 03/30/2014 06/27/2016 858.80
water 31.00
rent 747.00
insur 10.00
Rent Roll with Lease ChargesProvidence Harbour Club (pharbour)
As Of = 09/01/2015
Month Year = 09/2015
Current/Notice/Vacant Residents
Page 1 of 118

9/29/2015 10:03 AM
Unit Unit Type Unit Resident Name Market Charge Amount Resident Other Move In Lease Move Out Balance
Sq Ft Rent Code Deposit Deposit Expiration
Rent Roll with Lease ChargesProvidence Harbour Club (pharbour)
As Of = 09/01/2015
Month Year = 09/2015
Total 818.00
01-021 erie 835.00 t0136948 Michelle Allen 804.00 rent 777.00 434.25 0.00 06/29/2014 09/28/2015 838.00
petfee 30.00
water 31.00
Total 838.00
01-022 superior 1,100.00 t0149483 Betty Samuel 954.00 water 41.00 477.00 0.00 12/23/2013 12/28/2015 1,007.00
rent 976.00
Total 1,017.00
01-023 superior 1,100.00 t0143813 Eric Kaminski 929.00 rent 936.00 468.00 0.00 08/28/2015 10/28/2016 -11.29
water 41.00
Total 977.00
01-024 superior 1,100.00 t0093561 Eddie Hough 954.00 rent 981.00 490.50 0.00 06/30/2014 09/30/2015 1,019.00
water 41.00
Total 1,022.00
01-025 superior 1,100.00 t0093513 Veronica Lewis 954.00 water 41.00 0.00 0.00 06/25/2010 06/27/2016 1,026.00
rent 985.00
Total 1,026.00
01-026 superior 1,100.00 t0111780 Velma Wilson 929.00 petfee 20.00 0.00 0.00 04/26/2013 07/18/2016 1,067.00
water 41.00
rent 957.00
Total 1,018.00
01-027 superior 1,100.00 t0114576 Michael Eubank 954.00 water 41.00 150.00 0.00 12/01/2011 11/30/2015 1,045.00
rent 1,004.00
Total 1,045.00
01-028 erie 835.00 t0154688 Debra Boblett 779.00 rent 706.00 361.00 0.00 11/01/2014 09/30/2015 712.00
water 31.00
Total 737.00
01-031 erie 835.00 t0151736 Samantha Holley 769.00 rent 670.00 670.00 0.00 03/01/2015 02/29/2016 0.00
water 31.00
Total 701.00
01-032 superior 1,100.00 VACANT VACANT 919.00 0.00 0.00 0.00 0.00
Total 0.00
01-033 superior 1,100.00 t0173220 Eric Paymon 919.00 rent 907.00 454.00 0.00 08/08/2015 08/07/2016 958.00
water 41.00
Page 2 of 118

9/29/2015 10:03 AM
Unit Unit Type Unit Resident Name Market Charge Amount Resident Other Move In Lease Move Out Balance
Sq Ft Rent Code Deposit Deposit Expiration
Rent Roll with Lease ChargesProvidence Harbour Club (pharbour)
As Of = 09/01/2015
Month Year = 09/2015
insur 10.00
Total 958.00
01-034 superior 1,100.00 t0137323 Frances Cisse 944.00 water 41.00 199.00 0.00 09/18/2013 12/31/2015 -0.01
rent 984.00
Total 1,025.00
01-035 superior 1,100.00 VACANT VACANT 919.00 0.00 0.00 0.00 0.00
Total 0.00
01-036 superior 1,100.00 t0160666 Daijah Martin # 944.00 rent 989.00 399.00 0.00 10/25/2014 01/24/2016 09/13/2015 861.95
water 41.00
insur 10.00
Total 1,040.00
01-037 superior 1,100.00 t0154427 Rawia Safi 944.00 water 41.00 490.00 0.00 04/19/2014 10/12/2015 0.00
rent 979.00
insur 10.00
Total 1,030.00
01-038 erie 835.00 t0164696 Jacquelyn Coats 769.00 rent 703.00 199.00 0.00 01/17/2015 02/16/2016 734.00
water 31.00
Total 734.00
02-001 erie 835.00 t0104735 Evelyn Peru 789.00 water 31.00 125.00 0.00 03/13/2011 09/30/2015 761.00
rent 745.00
Total 776.00
02-002 superior 1,100.00 t0167770 Thomas Gottschalk 939.00 rent 936.00 199.00 0.00 04/04/2015 07/03/2016 987.00
water 41.00
insur 10.00
Total 987.00
02-003 superior 1,100.00 t0121216 Allen Bell 939.00 water 41.00 693.00 0.00 03/28/2012 03/28/2016 1,015.00
petfee 20.00
rent 956.00
Total 1,017.00
02-004 superior 1,100.00 t0154720 Thomas Dawson 964.00 water 41.00 449.00 0.00 05/18/2014 11/14/2016 950.00
rent 919.00
Total 960.00
02-005 superior 1,100.00 t0077113 Elaine Sunderlin 964.00 water 41.00 125.00 0.00 04/29/2009 09/30/2015 0.00
rent 906.00
Total 947.00
Page 3 of 118

9/29/2015 10:03 AM
Unit Unit Type Unit Resident Name Market Charge Amount Resident Other Move In Lease Move Out Balance
Sq Ft Rent Code Deposit Deposit Expiration
Rent Roll with Lease ChargesProvidence Harbour Club (pharbour)
As Of = 09/01/2015
Month Year = 09/2015
02-006 superior 1,100.00 t0161331 William Caudill 964.00 rent 972.00 199.00 0.00 08/17/2015 10/16/2016 1,023.00
water 41.00
insur 10.00
Total 1,023.00
02-007 superior 1,100.00 VACANT VACANT 964.00 0.00 0.00 0.00 0.00
Total 0.00
02-008 erie 835.00 t0164477 Bryce Amthor-Shaffer 789.00 rent 715.00 388.00 388.00 12/28/2014 03/27/2016 0.00
petfee 30.00
water 31.00
insur 10.00
Total 786.00
02-021 erie 835.00 t0162501 Channon Legier 779.00 rent 700.00 1,050.00 0.00 11/22/2014 02/21/2016 741.00
water 31.00
insur 10.00
Total 741.00
02-022 superior 1,100.00 t0126813 Rosa Baker 929.00 water 41.00 150.00 0.00 09/15/2012 09/29/2015 1,069.00
storage 25.00
rent 993.00
insur 10.00
Total 1,069.00
02-023 superior 1,100.00 t0172548 Jeffery Perry 929.00 rent 917.00 917.00 0.00 07/20/2015 10/19/2016 958.00
water 41.00
Total 958.00
02-024 superior 1,100.00 t0154882 Ali Mohammed Al Azba 929.00 water 41.00 468.00 0.00 05/01/2014 10/26/2016 530.00
rent 946.00
Total 987.00
02-025 superior 1,100.00 VACANT VACANT 929.00 0.00 0.00 0.00 0.00
Total 0.00
02-026 superior 1,100.00 t0160398 Horace Watkins 929.00 rent 970.00 970.00 0.00 10/03/2014 01/02/2016 1,019.00
water 41.00
insur 10.00
Total 1,021.00
02-027 superior 1,100.00 t0169106 Stephanie Schoenherr 929.00 rent 906.00 906.00 0.00 04/20/2015 07/19/2016 0.00
petfee 40.00
water 41.00
Page 4 of 118

9/29/2015 10:03 AM
Unit Unit Type Unit Resident Name Market Charge Amount Resident Other Move In Lease Move Out Balance
Sq Ft Rent Code Deposit Deposit Expiration
Rent Roll with Lease ChargesProvidence Harbour Club (pharbour)
As Of = 09/01/2015
Month Year = 09/2015
Total 987.00
02-028 erie 835.00 t0135800 David McNaughton 779.00 water 31.00 100.00 0.00 02/21/2013 01/25/2016 0.00
rent 883.00
Total 914.00
02-031 erie 835.00 t0162224 Pedro Lynn 769.00 rent 687.00 1,031.00 0.00 11/25/2014 02/24/2016 696.66
water 31.00
insur 10.00
Total 728.00
02-032 superior 1,100.00 t0157274 Carol Koty 919.00 rent 899.00 899.00 0.00 08/20/2014 11/19/2015 940.00
water 41.00
Total 940.00
02-033 superior 1,100.00 VACANT VACANT 919.00 0.00 0.00 0.00 0.00
Total 0.00
02-034 superior 1,100.00 t0165151 Anella French 919.00 rent 938.00 399.00 0.00 04/24/2015 07/23/2016 0.00
water 41.00
Total 979.00
02-035 superior 1,100.00 t0155010 Tyler Eller 944.00 concess -49.00 199.00 0.00 06/04/2014 05/30/2016 0.00
water 41.00
rent 995.00
Total 987.00
02-036 superior 1,100.00 VACANT VACANT 919.00 0.00 0.00 0.00 0.00
Total 0.00
02-037 superior 1,100.00 t0172330 Tokay stanley 919.00 rent 924.00 462.00 0.00 08/15/2015 10/14/2016 975.00
water 41.00
insur 10.00
Total 975.00
02-038 erie 835.00 t0155193 Tanner Youngs 769.00 rent 722.00 361.00 0.00 06/28/2014 09/27/2015 0.00
water 31.00
Total 753.00
03-001 erie 835.00 t0092914 Peter Pilarski 769.00 water 31.00 0.00 0.00 05/01/2010 04/11/2016 786.00
rent 755.00
Total 786.00
03-002 superior 1,100.00 VACANT VACANT 944.00 0.00 0.00 0.00 0.00
Total 0.00
Page 5 of 118

9/29/2015 10:03 AM
Unit Unit Type Unit Resident Name Market Charge Amount Resident Other Move In Lease Move Out Balance
Sq Ft Rent Code Deposit Deposit Expiration
Rent Roll with Lease ChargesProvidence Harbour Club (pharbour)
As Of = 09/01/2015
Month Year = 09/2015
03-003 superior 1,100.00 t0135148 Kimberly Brown 944.00 water 41.00 712.00 0.00 03/08/2013 02/29/2016 1,086.00
rent 976.00
insur 10.00
Total 1,027.00
03-004 superior 1,100.00 t0172261 Niki Dethloff 944.00 rent 934.00 467.00 0.00 07/11/2015 10/10/2016 985.00
water 41.00
insur 10.00
Total 985.00
03-005 superior 1,100.00 VACANT VACANT 919.00 0.00 0.00 0.00 0.00
Total 0.00
03-006 superior 1,100.00 t0082415 Ryan Drotar 919.00 petfee 20.00 0.00 0.00 08/07/2009 11/30/2016 -49.00
water 41.00
rent 964.00
Total 1,025.00
03-007 superior 1,100.00 VACANT VACANT 919.00 0.00 0.00 0.00 0.00
Total 0.00
03-008 erie 835.00 t0153166 David Dumas 794.00 water 31.00 352.00 0.00 04/08/2014 10/03/2016 0.00
rent 718.00
Total 749.00
03-021 erie 835.00 hc000049 James Moore 759.00 water 31.00 846.00 0.00 06/01/1979 11/30/2015 831.00
rent 800.00
Total 831.00
03-022 superior 1,100.00 t0152180 Blake Nordman 909.00 rent 909.00 909.00 0.00 06/01/2014 08/31/2015 09/02/2015 -20.00
water 41.00
storage 25.00
insur 10.00
Total 985.00
03-023 superior 1,100.00 hc000051 Arma Williams 909.00 water 41.00 250.00 0.00 11/30/1993 11/30/2015 1,014.00
rent 979.00
Total 1,020.00
03-024 superior 1,100.00 t0171909 Latifat Owe 909.00 rent 898.00 898.00 0.00 06/30/2015 09/29/2016 0.00
water 41.00
Total 939.00
03-025 superior 1,100.00 t0173244 William Dominguez 934.00 rent 917.00 917.00 0.00 08/01/2015 10/31/2016 968.00
Page 6 of 118
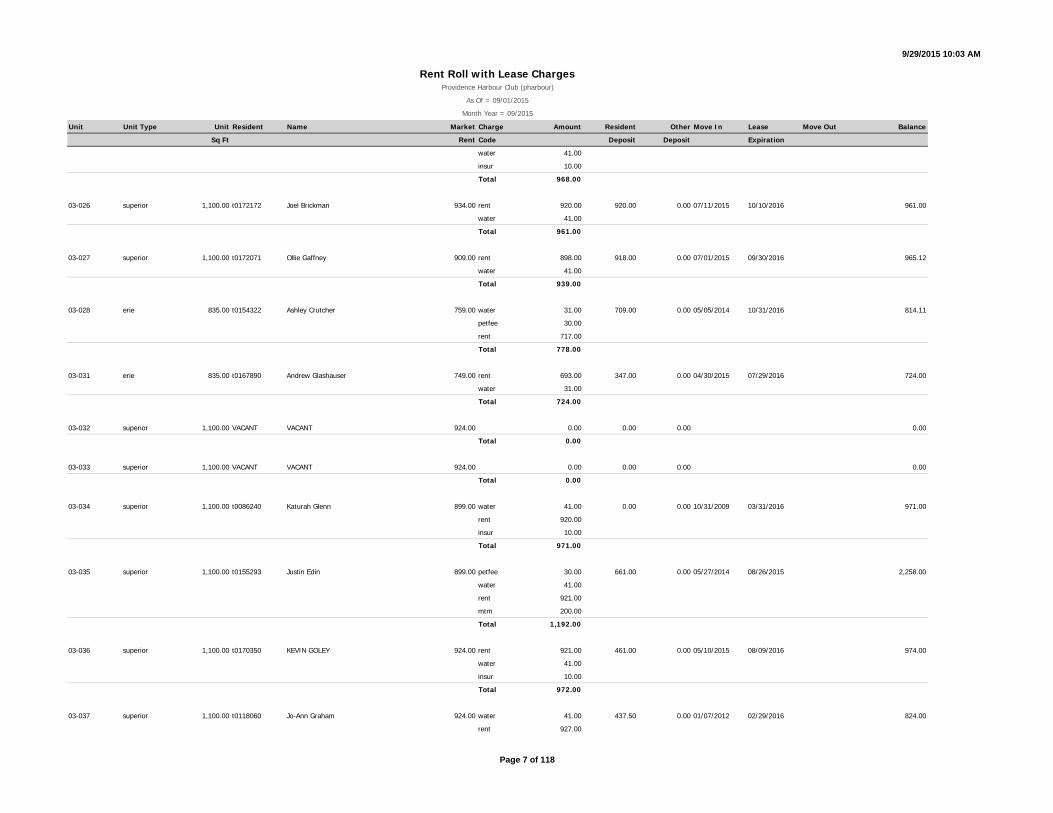
9/29/2015 10:03 AM
Unit Unit Type Unit Resident Name Market Charge Amount Resident Other Move In Lease Move Out Balance
Sq Ft Rent Code Deposit Deposit Expiration
Rent Roll with Lease ChargesProvidence Harbour Club (pharbour)
As Of = 09/01/2015
Month Year = 09/2015
water 41.00
insur 10.00
Total 968.00
03-026 superior 1,100.00 t0172172 Joel Brickman 934.00 rent 920.00 920.00 0.00 07/11/2015 10/10/2016 961.00
water 41.00
Total 961.00
03-027 superior 1,100.00 t0172071 Ollie Gaffney 909.00 rent 898.00 918.00 0.00 07/01/2015 09/30/2016 965.12
water 41.00
Total 939.00
03-028 erie 835.00 t0154322 Ashley Crutcher 759.00 water 31.00 709.00 0.00 05/05/2014 10/31/2016 814.11
petfee 30.00
rent 717.00
Total 778.00
03-031 erie 835.00 t0167890 Andrew Glashauser 749.00 rent 693.00 347.00 0.00 04/30/2015 07/29/2016 724.00
water 31.00
Total 724.00
03-032 superior 1,100.00 VACANT VACANT 924.00 0.00 0.00 0.00 0.00
Total 0.00
03-033 superior 1,100.00 VACANT VACANT 924.00 0.00 0.00 0.00 0.00
Total 0.00
03-034 superior 1,100.00 t0086240 Katurah Glenn 899.00 water 41.00 0.00 0.00 10/31/2009 03/31/2016 971.00
rent 920.00
insur 10.00
Total 971.00
03-035 superior 1,100.00 t0155293 Justin Edin 899.00 petfee 30.00 661.00 0.00 05/27/2014 08/26/2015 2,258.00
water 41.00
rent 921.00
mtm 200.00
Total 1,192.00
03-036 superior 1,100.00 t0170350 KEVIN GOLEY 924.00 rent 921.00 461.00 0.00 05/10/2015 08/09/2016 974.00
water 41.00
insur 10.00
Total 972.00
03-037 superior 1,100.00 t0118060 Jo-Ann Graham 924.00 water 41.00 437.50 0.00 01/07/2012 02/29/2016 824.00
rent 927.00
Page 7 of 118
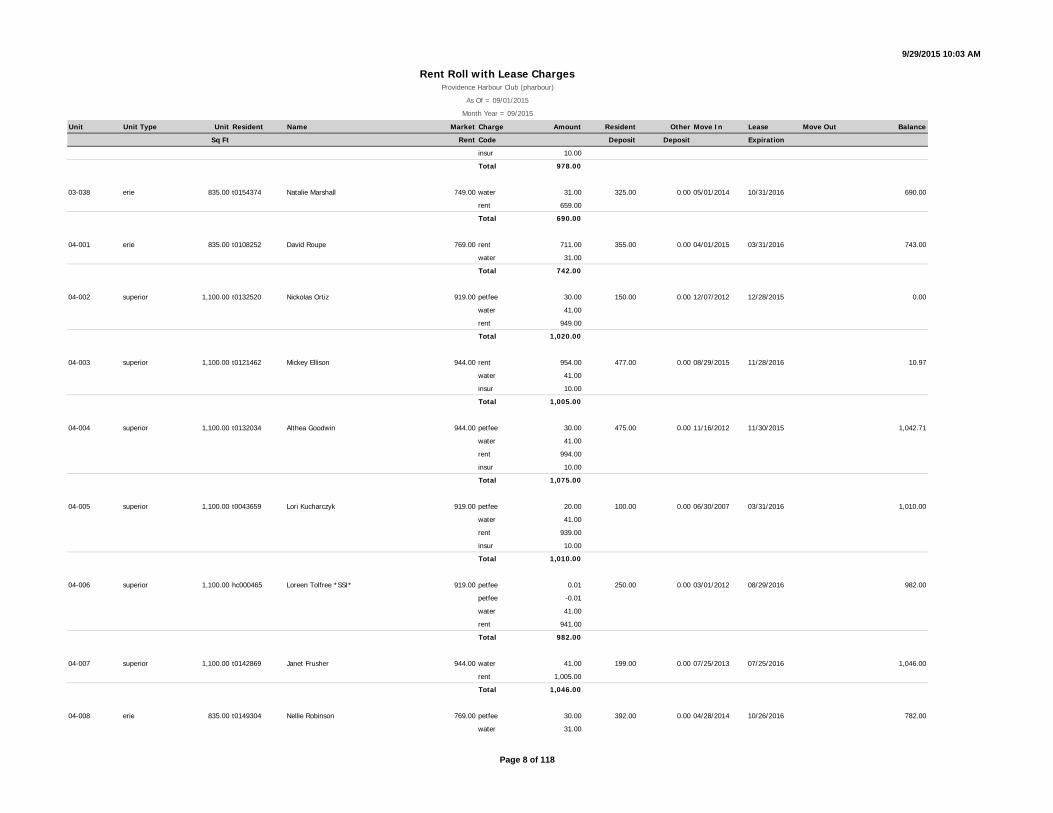
9/29/2015 10:03 AM
Unit Unit Type Unit Resident Name Market Charge Amount Resident Other Move In Lease Move Out Balance
Sq Ft Rent Code Deposit Deposit Expiration
Rent Roll with Lease ChargesProvidence Harbour Club (pharbour)
As Of = 09/01/2015
Month Year = 09/2015
insur 10.00
Total 978.00
03-038 erie 835.00 t0154374 Natalie Marshall 749.00 water 31.00 325.00 0.00 05/01/2014 10/31/2016 690.00
rent 659.00
Total 690.00
04-001 erie 835.00 t0108252 David Roupe 769.00 rent 711.00 355.00 0.00 04/01/2015 03/31/2016 743.00
water 31.00
Total 742.00
04-002 superior 1,100.00 t0132520 Nickolas Ortiz 919.00 petfee 30.00 150.00 0.00 12/07/2012 12/28/2015 0.00
water 41.00
rent 949.00
Total 1,020.00
04-003 superior 1,100.00 t0121462 Mickey Ellison 944.00 rent 954.00 477.00 0.00 08/29/2015 11/28/2016 10.97
water 41.00
insur 10.00
Total 1,005.00
04-004 superior 1,100.00 t0132034 Althea Goodwin 944.00 petfee 30.00 475.00 0.00 11/16/2012 11/30/2015 1,042.71
water 41.00
rent 994.00
insur 10.00
Total 1,075.00
04-005 superior 1,100.00 t0043659 Lori Kucharczyk 919.00 petfee 20.00 100.00 0.00 06/30/2007 03/31/2016 1,010.00
water 41.00
rent 939.00
insur 10.00
Total 1,010.00
04-006 superior 1,100.00 hc000465 Loreen Tolfree *SSI* 919.00 petfee 0.01 250.00 0.00 03/01/2012 08/29/2016 982.00
petfee -0.01
water 41.00
rent 941.00
Total 982.00
04-007 superior 1,100.00 t0142869 Janet Frusher 944.00 water 41.00 199.00 0.00 07/25/2013 07/25/2016 1,046.00
rent 1,005.00
Total 1,046.00
04-008 erie 835.00 t0149304 Nellie Robinson 769.00 petfee 30.00 392.00 0.00 04/28/2014 10/26/2016 782.00
water 31.00
Page 8 of 118

9/29/2015 10:03 AM
Unit Unit Type Unit Resident Name Market Charge Amount Resident Other Move In Lease Move Out Balance
Sq Ft Rent Code Deposit Deposit Expiration
Rent Roll with Lease ChargesProvidence Harbour Club (pharbour)
As Of = 09/01/2015
Month Year = 09/2015
rent 721.00
Total 782.00
04-021 erie 835.00 t0100439 Ronita James # 759.00 water 31.00 150.00 0.00 10/30/2010 10/19/2015 10/19/2015 0.00
rent 743.00
Total 774.00
04-022 superior 1,100.00 t0153279 Stephen Spann 909.00 water 41.00 199.00 0.00 03/24/2014 06/20/2016 1,015.30
insur 10.00
rent 973.00
Total 1,024.00
04-023 superior 1,100.00 VACANT VACANT 909.00 0.00 0.00 0.00 0.00
Total 0.00
04-024 superior 1,100.00 t0174234 Lynn Halverstadt 934.00 rent 959.00 480.00 0.00 08/21/2015 05/20/2016 0.33
water 41.00
insur 10.00
Total 1,010.00
04-025 superior 1,100.00 t0105747 Alicia Mills 909.00 water 41.00 175.00 0.00 05/28/2011 08/15/2016 2,253.00
rent 937.00
Total 978.00
04-026 superior 1,100.00 hc000075 Ronald Lipinski 934.00 water 41.00 200.00 0.00 12/09/2000 11/30/2015 0.00
rent 975.00
Total 1,016.00
04-027 superior 1,100.00 hc000076 Brian Melvin 909.00 water 41.00 200.00 0.00 05/30/1998 02/28/2016 0.00
rent 968.00
Total 1,009.00
04-028 erie 835.00 t0117852 Merry Austin 784.00 water 31.00 0.00 0.00 10/28/2013 10/19/2015 812.00
rent 781.00
Total 812.00
04-031 erie 835.00 t0167153 Marissa Page 774.00 rent 706.00 353.00 0.00 03/16/2015 06/15/2016 807.00
petfee 60.00
water 31.00
insur 10.00
Total 807.00
04-032 superior 1,100.00 t0135216 Anitra Jackson 899.00 water 41.00 675.00 0.00 02/27/2013 06/29/2016 958.00
rent 907.00
insur 10.00
Page 9 of 118

9/29/2015 10:03 AM
Unit Unit Type Unit Resident Name Market Charge Amount Resident Other Move In Lease Move Out Balance
Sq Ft Rent Code Deposit Deposit Expiration
Rent Roll with Lease ChargesProvidence Harbour Club (pharbour)
As Of = 09/01/2015
Month Year = 09/2015
Total 958.00
04-033 superior 1,100.00 t0162348 William Wells 924.00 rent 924.00 199.00 0.00 02/15/2015 02/14/2016 965.00
water 41.00
Total 965.00
04-034 superior 1,100.00 VACANT VACANT 899.00 0.00 0.00 0.00 0.00
Total 0.00
04-035 superior 1,100.00 t0155017 Patrick Dillon 899.00 rent 899.00 350.00 0.00 06/16/2014 09/13/2015 940.00
water 41.00
Total 940.00
04-036 superior 1,100.00 t0063906 Christina Marshall 899.00 water 41.00 250.00 0.00 10/17/2008 10/27/2015 -10.00
rent 935.00
Total 976.00
04-037 superior 1,100.00 VACANT VACANT 899.00 0.00 0.00 0.00 0.00
Total 0.00
04-038 erie 835.00 VACANT VACANT 774.00 0.00 0.00 0.00 0.00
Total 0.00
05-001 stclair 945.00 t0173587 Tom Isaac 704.00 rent 722.00 722.00 0.00 08/08/2015 10/07/2016 0.00
water 31.00
insur 10.00
Total 763.00
05-002 stclair 945.00 t0172728 Andrew Dobry 714.00 rent 732.00 732.00 0.00 08/15/2015 11/14/2016 -41.00
Total 732.00
05-003 stclair 945.00 t0088108 Brian Wilson 714.00 water 41.00 0.00 0.00 01/25/2013 01/18/2016 764.00
rent 713.00
insur 10.00
Total 764.00
05-006 huron 805.00 hc000087 Ronald Mazurkiewicz 604.00 petfee 20.00 100.00 0.00 04/28/2004 02/29/2016 677.00
water 31.00
rent 626.00
Total 677.00
05-007 huron 805.00 t0169759 James Hendrzak 604.00 rent 630.00 315.00 0.00 05/01/2015 07/31/2016 691.00
petfee 20.00
water 31.00
insur 10.00
Page 10 of 118

9/29/2015 10:03 AM
Unit Unit Type Unit Resident Name Market Charge Amount Resident Other Move In Lease Move Out Balance
Sq Ft Rent Code Deposit Deposit Expiration
Rent Roll with Lease ChargesProvidence Harbour Club (pharbour)
As Of = 09/01/2015
Month Year = 09/2015
Total 691.00
05-008 huron 805.00 hc000088 Adella Williams 594.00 water 31.00 200.00 0.00 10/15/1974 10/26/2015 726.00
rent 695.00
Total 726.00
05-021 stclair 945.00 t0120450 Donald Slater 734.00 petfee 30.00 0.00 0.00 05/01/2012 07/20/2016 0.00
water 41.00
rent 740.00
Total 811.00
05-022 stclair 945.00 t0155247 Gideon Amde 744.00 rent 674.00 674.00 0.00 05/31/2014 08/30/2015 09/02/2015 -0.24
water 41.00
insur 10.00
Total 725.00
05-023 stclair 945.00 t0103680 Sean Mckeehan 744.00 water 41.00 125.00 0.00 11/01/2011 10/27/2015 -739.00
rent 739.00
Total 780.00
05-024 stclair 945.00 VACANT VACANT 734.00 0.00 0.00 0.00 0.00
Total 0.00
05-025 huron 805.00 t0152173 Alexander Brayman 624.00 concess -29.00 199.00 0.00 03/14/2014 06/13/2016 0.00
water 31.00
rent 609.00
Total 611.00
05-026 huron 805.00 hc000093 Herbert Coleman 634.00 water 31.00 150.00 0.00 11/30/1990 11/30/2016 0.00
rent 649.00
Total 680.00
05-027 huron 805.00 t0152181 William Lanter Jr. 634.00 petfee 30.00 292.00 0.00 04/22/2014 05/23/2016 675.00
water 31.00
rent 614.00
Total 675.00
05-028 huron 805.00 t0147791 Felton Adams 624.00 water 31.00 624.00 0.00 11/15/2013 11/30/2015 677.00
rent 646.00
Total 677.00
05-031 stclair 945.00 t0142178 Amanda Yantaputt 734.00 water 41.00 199.00 0.00 08/02/2013 08/29/2016 807.00
rent 766.00
Total 807.00
Page 11 of 118

9/29/2015 10:03 AM
Unit Unit Type Unit Resident Name Market Charge Amount Resident Other Move In Lease Move Out Balance
Sq Ft Rent Code Deposit Deposit Expiration
Rent Roll with Lease ChargesProvidence Harbour Club (pharbour)
As Of = 09/01/2015
Month Year = 09/2015
05-032 stclair 945.00 t0170542 Raimon Williams 734.00 rent 711.00 711.00 0.00 05/19/2015 08/18/2016 804.00
water 41.00
Total 752.00
05-033 stclair 945.00 t0128487 LaShonnda Hardrick 734.00 water 41.00 0.00 0.00 12/14/2008 12/21/2015 785.89
rent 712.00
insur 10.00
Total 763.00
05-034 stclair 945.00 t0149527 Hasan Raheem * 724.00 water 41.00 724.00 0.00 01/14/2014 01/25/2016 825.00
rent 734.00
Total 775.00
05-035 huron 805.00 t0171437 Kristen Milligan 614.00 rent 679.00 339.00 0.00 06/29/2015 09/21/2016 0.00
water 31.00
Total 710.00
05-036 huron 805.00 t0165116 Tyler Stewart 624.00 rent 615.00 615.00 0.00 01/24/2015 04/23/2016 0.00
water 31.00
Total 646.00
05-037 huron 805.00 t0162528 Amanda Costello 624.00 rent 626.00 626.00 0.00 12/05/2014 03/04/2016 667.00
water 31.00
insur 10.00
Total 667.00
05-038 huron 805.00 t0155313 Robert Weck 624.00 water 31.00 199.00 0.00 12/07/2013 12/31/2015 0.00
rent 609.00
Total 640.00
06-001 stclair 945.00 t0160613 Amber Bieszk 714.00 rent 689.00 344.50 0.00 09/30/2014 12/29/2015 730.00
water 41.00
Total 730.00
06-002 stclair 945.00 t0153533 Crystal Duncan 729.00 water 41.00 199.00 0.00 04/01/2014 09/26/2016 698.00
insur 10.00
insur 10.00
insur 10.00
insur 10.00
rent 668.00
Total 749.00
06-003 stclair 945.00 t0161035 Steve Runnels 729.00 rent 698.00 199.00 0.00 10/14/2014 01/13/2016 0.00
water 41.00
insur 10.00
Page 12 of 118

9/29/2015 10:03 AM
Unit Unit Type Unit Resident Name Market Charge Amount Resident Other Move In Lease Move Out Balance
Sq Ft Rent Code Deposit Deposit Expiration
Rent Roll with Lease ChargesProvidence Harbour Club (pharbour)
As Of = 09/01/2015
Month Year = 09/2015
Total 749.00
06-006 huron 805.00 t0103608 Gary Cunningham 619.00 water 31.00 350.00 0.00 05/28/2011 05/25/2016 0.00
rent 626.00
Total 657.00
06-007 huron 805.00 t0159392 Felicia Hendrix 619.00 rent 633.00 633.00 0.00 10/15/2014 01/14/2016 674.00
water 31.00
insur 10.00
Total 674.00
06-008 huron 805.00 VACANT VACANT 604.00 0.00 0.00 0.00 0.00
Total 0.00
06-021 stclair 945.00 t0141900 April Austin 744.00 water 41.00 699.00 0.00 07/17/2013 10/31/2016 569.97
rent 723.00
Total 764.00
06-022 stclair 945.00 t0159458 Dejuan Gordon 759.00 rent 737.00 737.00 0.00 09/15/2014 12/14/2015 778.00
water 41.00
Total 778.00
06-023 stclair 945.00 t0154978 Heather Mullins 769.00 petfee 30.00 706.00 0.00 05/12/2014 08/11/2015 09/11/2015 1,050.48
water 41.00
insur 10.00
mtm 200.00
rent 769.00
Total 1,050.00
06-024 stclair 945.00 t0167382 Michael Fischer 759.00 rent 707.00 707.00 0.00 03/20/2015 06/19/2016 738.00
water 41.00
petfee 30.00
insur 10.00
Total 788.00
06-025 huron 805.00 t0158759 Jessica Boone 649.00 rent 642.00 321.00 0.00 08/30/2014 11/29/2015 703.00
water 31.00
petfee 30.00
Total 703.00
06-026 huron 805.00 t0171576 Nathan Houk 634.00 rent 693.00 693.00 0.00 06/27/2015 09/26/2016 724.00
water 31.00
Total 724.00
06-027 huron 805.00 t0118141 Ralph Miner 634.00 water 31.00 350.00 0.00 03/01/2012 02/29/2016 -1.00
Page 13 of 118

9/29/2015 10:03 AM
Unit Unit Type Unit Resident Name Market Charge Amount Resident Other Move In Lease Move Out Balance
Sq Ft Rent Code Deposit Deposit Expiration
Rent Roll with Lease ChargesProvidence Harbour Club (pharbour)
As Of = 09/01/2015
Month Year = 09/2015
rent 617.00
insur 10.00
Total 658.00
06-028 huron 805.00 t0166381 Debbie Podany 634.00 rent 626.00 313.00 0.00 03/02/2015 06/01/2016 657.00
water 31.00
Total 657.00
06-031 stclair 945.00 t0154826 LaDonn Nash 734.00 water 41.00 671.00 0.00 05/09/2014 11/07/2016 -644.70
rent 690.00
Total 731.00
06-032 stclair 945.00 hc000115 John Pavlic 749.00 water 41.00 200.00 0.00 05/07/1999 11/30/2015 811.00
rent 770.00
Total 811.00
06-033 stclair 945.00 VACANT VACANT 749.00 0.00 0.00 0.00 0.00
Total 0.00
06-034 stclair 945.00 t0158440 Amanda Stamper 734.00 rent 699.00 699.00 0.00 08/15/2014 11/14/2015 740.00
water 41.00
Total 740.00
06-035 huron 805.00 t0151824 David Hill 624.00 rent 610.00 199.00 0.00 08/02/2014 11/01/2015 0.00
water 31.00
insur 10.00
Total 651.00
06-036 huron 805.00 t0156697 Brie Anderson 639.00 water 31.00 945.00 0.00 07/03/2014 06/29/2016 678.00
rent 647.00
Total 678.00
06-037 huron 805.00 t0155299 Chris Chambers 639.00 rent 602.00 199.00 0.00 06/28/2014 09/27/2015 616.00
concess -30.00
water 31.00
insur 10.00
Total 613.00
06-038 huron 805.00 t0156959 Adefolake Bakare 624.00 rent 598.00 299.00 0.00 08/20/2014 11/19/2015 639.00
water 31.00
insur 10.00
Total 639.00
07-001 stclair 945.00 t0154948 Jessica Choquette 779.00 concess -34.00 199.00 0.00 05/31/2014 08/29/2016 719.65
water 41.00
Page 14 of 118

9/29/2015 10:03 AM
Unit Unit Type Unit Resident Name Market Charge Amount Resident Other Move In Lease Move Out Balance
Sq Ft Rent Code Deposit Deposit Expiration
Rent Roll with Lease ChargesProvidence Harbour Club (pharbour)
As Of = 09/01/2015
Month Year = 09/2015
insur 10.00
rent 702.00
Total 719.00
07-002 stclair 945.00 t0124072 Douglas Gregory 714.00 petfee 20.00 349.00 0.00 06/22/2012 05/23/2016 823.00
water 41.00
rent 752.00
insur 10.00
Total 823.00
07-003 stclair 945.00 t0167309 Brianna Young 714.00 rent 681.00 341.00 0.00 05/02/2015 08/01/2016 732.00
water 41.00
insur 10.00
Total 732.00
07-006 huron 805.00 VACANT VACANT 604.00 0.00 0.00 0.00 0.00
Total 0.00
07-007 huron 805.00 t0159235 Emily Hudson 604.00 rent 613.00 306.00 0.00 09/28/2014 12/27/2015 654.00
water 31.00
insur 10.00
Total 654.00
07-008 huron 805.00 t0170945 Phillip Jamison 594.00 rent 649.00 649.00 0.00 06/07/2015 09/06/2016 464.00
water 31.00
insur 10.00
Total 690.00
07-021 stclair 945.00 t0159027 Devonta Riley 734.00 rent 719.00 360.00 0.00 08/22/2014 11/21/2015 1,814.00
water 41.00
insur 10.00
Total 770.00
07-022 stclair 945.00 t0090131 Chrishana Howard* 744.00 water 41.00 0.00 0.00 04/01/2010 08/31/2015 37.00
rent 746.00
mtm 200.00
Total 987.00
07-023 stclair 945.00 t0155225 Lawanda Dixson 744.00 rent 655.00 328.00 0.00 06/14/2014 09/13/2015 782.15
petfee 60.00
water 41.00
insur 10.00
Total 766.00
07-024 stclair 945.00 t0154564 Renee Walker 734.00 concess -33.00 199.00 0.00 05/10/2014 10/31/2016 702.10
Page 15 of 118
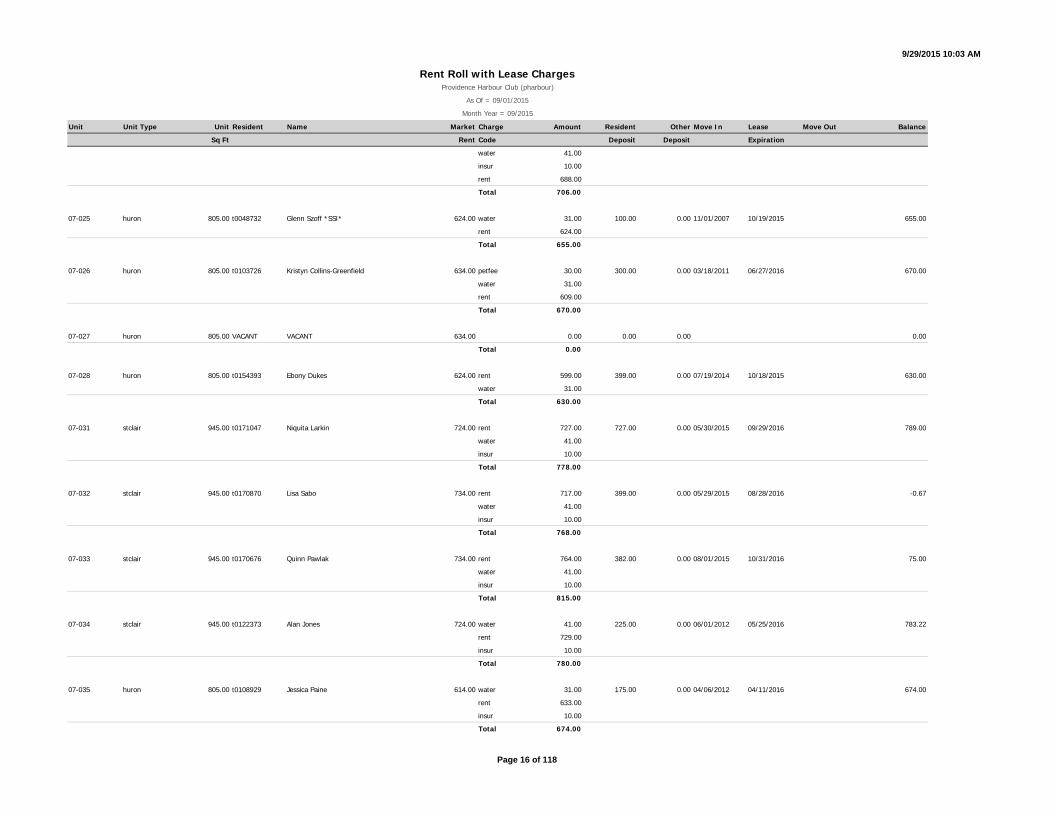
9/29/2015 10:03 AM
Unit Unit Type Unit Resident Name Market Charge Amount Resident Other Move In Lease Move Out Balance
Sq Ft Rent Code Deposit Deposit Expiration
Rent Roll with Lease ChargesProvidence Harbour Club (pharbour)
As Of = 09/01/2015
Month Year = 09/2015
water 41.00
insur 10.00
rent 688.00
Total 706.00
07-025 huron 805.00 t0048732 Glenn Szoff *SSI* 624.00 water 31.00 100.00 0.00 11/01/2007 10/19/2015 655.00
rent 624.00
Total 655.00
07-026 huron 805.00 t0103726 Kristyn Collins-Greenfield 634.00 petfee 30.00 300.00 0.00 03/18/2011 06/27/2016 670.00
water 31.00
rent 609.00
Total 670.00
07-027 huron 805.00 VACANT VACANT 634.00 0.00 0.00 0.00 0.00
Total 0.00
07-028 huron 805.00 t0154393 Ebony Dukes 624.00 rent 599.00 399.00 0.00 07/19/2014 10/18/2015 630.00
water 31.00
Total 630.00
07-031 stclair 945.00 t0171047 Niquita Larkin 724.00 rent 727.00 727.00 0.00 05/30/2015 09/29/2016 789.00
water 41.00
insur 10.00
Total 778.00
07-032 stclair 945.00 t0170870 Lisa Sabo 734.00 rent 717.00 399.00 0.00 05/29/2015 08/28/2016 -0.67
water 41.00
insur 10.00
Total 768.00
07-033 stclair 945.00 t0170676 Quinn Pawlak 734.00 rent 764.00 382.00 0.00 08/01/2015 10/31/2016 75.00
water 41.00
insur 10.00
Total 815.00
07-034 stclair 945.00 t0122373 Alan Jones 724.00 water 41.00 225.00 0.00 06/01/2012 05/25/2016 783.22
rent 729.00
insur 10.00
Total 780.00
07-035 huron 805.00 t0108929 Jessica Paine 614.00 water 31.00 175.00 0.00 04/06/2012 04/11/2016 674.00
rent 633.00
insur 10.00
Total 674.00
Page 16 of 118
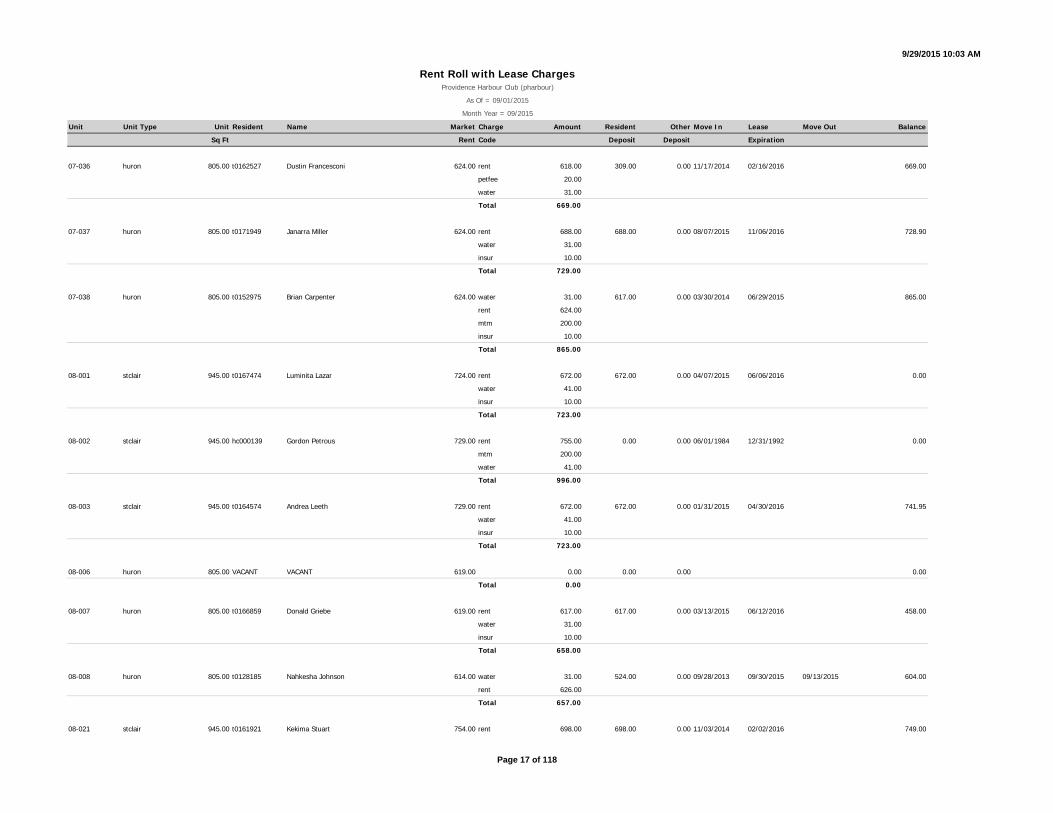
9/29/2015 10:03 AM
Unit Unit Type Unit Resident Name Market Charge Amount Resident Other Move In Lease Move Out Balance
Sq Ft Rent Code Deposit Deposit Expiration
Rent Roll with Lease ChargesProvidence Harbour Club (pharbour)
As Of = 09/01/2015
Month Year = 09/2015
07-036 huron 805.00 t0162527 Dustin Francesconi 624.00 rent 618.00 309.00 0.00 11/17/2014 02/16/2016 669.00
petfee 20.00
water 31.00
Total 669.00
07-037 huron 805.00 t0171949 Janarra Miller 624.00 rent 688.00 688.00 0.00 08/07/2015 11/06/2016 728.90
water 31.00
insur 10.00
Total 729.00
07-038 huron 805.00 t0152975 Brian Carpenter 624.00 water 31.00 617.00 0.00 03/30/2014 06/29/2015 865.00
rent 624.00
mtm 200.00
insur 10.00
Total 865.00
08-001 stclair 945.00 t0167474 Luminita Lazar 724.00 rent 672.00 672.00 0.00 04/07/2015 06/06/2016 0.00
water 41.00
insur 10.00
Total 723.00
08-002 stclair 945.00 hc000139 Gordon Petrous 729.00 rent 755.00 0.00 0.00 06/01/1984 12/31/1992 0.00
mtm 200.00
water 41.00
Total 996.00
08-003 stclair 945.00 t0164574 Andrea Leeth 729.00 rent 672.00 672.00 0.00 01/31/2015 04/30/2016 741.95
water 41.00
insur 10.00
Total 723.00
08-006 huron 805.00 VACANT VACANT 619.00 0.00 0.00 0.00 0.00
Total 0.00
08-007 huron 805.00 t0166859 Donald Griebe 619.00 rent 617.00 617.00 0.00 03/13/2015 06/12/2016 458.00
water 31.00
insur 10.00
Total 658.00
08-008 huron 805.00 t0128185 Nahkesha Johnson 614.00 water 31.00 524.00 0.00 09/28/2013 09/30/2015 09/13/2015 604.00
rent 626.00
Total 657.00
08-021 stclair 945.00 t0161921 Kekima Stuart 754.00 rent 698.00 698.00 0.00 11/03/2014 02/02/2016 749.00
Page 17 of 118

9/29/2015 10:03 AM
Unit Unit Type Unit Resident Name Market Charge Amount Resident Other Move In Lease Move Out Balance
Sq Ft Rent Code Deposit Deposit Expiration
Rent Roll with Lease ChargesProvidence Harbour Club (pharbour)
As Of = 09/01/2015
Month Year = 09/2015
water 41.00
insur 10.00
Total 749.00
08-022 stclair 945.00 t0174171 Kaman Kuhl 759.00 rent 777.00 389.00 0.00 08/15/2015 11/14/2016 828.00
water 41.00
insur 10.00
Total 828.00
08-023 stclair 945.00 hc000144 Paulette Dozier 759.00 water 41.00 150.00 0.00 04/03/1987 10/26/2015 0.00
rent 803.00
Total 844.00
08-024 stclair 945.00 t0163810 David Bradley 759.00 rent 705.00 199.00 199.00 12/13/2014 03/12/2016 756.00
water 41.00
insur 10.00
Total 756.00
08-025 huron 805.00 t0155398 Antony Matlock 649.00 water 31.00 199.00 0.00 06/28/2014 06/27/2016 0.00
rent 624.00
Total 655.00
08-026 huron 805.00 t0155612 Mirta Negroni 634.00 water 31.00 317.00 0.00 07/26/2014 07/18/2016 692.00
rent 651.00
insur 10.00
Total 692.00
08-027 huron 805.00 t0078217 Jami Gerstler 634.00 petfee 30.00 1.00 0.00 06/20/2009 06/27/2016 709.00
water 31.00
rent 648.00
Total 709.00
08-028 huron 805.00 t0149488 Stephen Hollister 644.00 water 31.00 322.00 0.00 12/23/2013 11/23/2015 685.00
rent 654.00
Total 685.00
08-031 stclair 945.00 hc000150 Henry James 744.00 water 41.00 325.00 0.00 07/08/1989 10/26/2015 09/26/2015 839.00
rent 798.00
Total 839.00
08-032 stclair 945.00 t0171067 Loren Bendzinski 749.00 rent 811.00 406.00 0.00 06/05/2015 01/04/2016 09/14/2015 862.00
water 41.00
insur 10.00
Total 862.00
Page 18 of 118

9/29/2015 10:03 AM
Unit Unit Type Unit Resident Name Market Charge Amount Resident Other Move In Lease Move Out Balance
Sq Ft Rent Code Deposit Deposit Expiration
Rent Roll with Lease ChargesProvidence Harbour Club (pharbour)
As Of = 09/01/2015
Month Year = 09/2015
08-033 stclair 945.00 VACANT VACANT 749.00 0.00 0.00 0.00 0.00
Total 0.00
08-034 stclair 945.00 VACANT VACANT 744.00 0.00 0.00 0.00 0.00
Total 0.00
08-035 huron 805.00 t0148099 Angelitia Gray 634.00 water 31.00 307.00 0.00 11/15/2013 11/30/2015 662.00
rent 631.00
Total 662.00
08-036 huron 805.00 t0142719 Edward Woods Jr. # 639.00 water 31.00 199.00 0.00 07/25/2013 07/31/2015 09/01/2015 1,132.00
rent 674.00
Total 705.00
08-037 huron 805.00 t0151131 Hille Justin 639.00 petfee 20.00 312.00 0.00 02/20/2014 05/16/2016 702.00
water 31.00
rent 641.00
insur 10.00
Total 702.00
08-038 huron 805.00 VACANT VACANT 624.00 0.00 0.00 0.00 0.00
Total 0.00
09-001 stclair 945.00 t0159018 Glen Weathers 704.00 rent 700.00 199.00 0.00 08/27/2014 11/26/2015 751.00
water 41.00
insur 10.00
Total 751.00
09-002 stclair 945.00 t0174012 Logan Gable 714.00 rent 837.00 419.00 0.00 08/21/2015 12/20/2015 834.36
water 41.00
insur 10.00
Total 888.00
09-003 stclair 945.00 t0170838 Kristina Zajac 714.00 rent 692.00 346.00 0.00 06/06/2015 09/05/2016 574.67
water 41.00
Total 733.00
09-006 huron 805.00 t0166558 Talha Qureshi 604.00 rent 604.00 302.00 0.00 02/28/2015 02/27/2016 0.00
water 31.00
insur 10.00
Total 645.00
09-007 huron 805.00 t0104896 Louis Hall 604.00 water 31.00 175.00 0.00 03/05/2011 03/28/2016 525.06
rent 609.00
Total 640.00
Page 19 of 118

9/29/2015 10:03 AM
Unit Unit Type Unit Resident Name Market Charge Amount Resident Other Move In Lease Move Out Balance
Sq Ft Rent Code Deposit Deposit Expiration
Rent Roll with Lease ChargesProvidence Harbour Club (pharbour)
As Of = 09/01/2015
Month Year = 09/2015
09-008 huron 805.00 t0170373 Jason Martinson 594.00 rent 617.00 199.00 0.00 05/18/2015 08/17/2016 648.00
water 31.00
Total 648.00
09-021 stclair 945.00 t0125343 Tiffany Rush 734.00 water 41.00 200.00 0.00 08/01/2012 07/25/2016 876.00
rent 765.00
Total 806.00
09-022 stclair 945.00 t0173195 Cody Duncan 744.00 rent 780.00 780.00 0.00 08/15/2015 11/30/2016 -40.02
water 41.00
insur 10.00
Total 831.00
09-023 stclair 945.00 t0151941 Francine Jones 744.00 water 41.00 674.00 0.00 03/01/2014 05/30/2016 09/01/2015 1,037.00
rent 692.00
insur 10.00
Total 743.00
09-024 stclair 945.00 t0169358 Elizabeth Nieman 734.00 rent 711.00 711.00 0.00 04/14/2015 07/12/2016 1,455.00
water 41.00
insur 10.00
Total 762.00
09-025 huron 805.00 t0116883 Willie Freeman 624.00 water 31.00 0.00 0.00 10/12/2013 10/19/2015 688.00
rent 657.00
Total 688.00
09-026 huron 805.00 t0172703 Kunhyo Kim 634.00 rent 701.00 351.00 0.00 08/21/2015 05/19/2016 0.00
water 31.00
insur 10.00
Total 742.00
09-027 huron 805.00 t0164542 Carlos Love 634.00 rent 624.00 624.00 200.00 12/30/2014 03/29/2016 711.39
water 31.00
insur 10.00
Total 665.00
09-028 huron 805.00 t0101907 Model 1 bed model 624.00 model -680.00 0.00 0.00 12/20/2010 04/30/2016 0.00
rent 680.00
Total 0.00
09-031 stclair 945.00 t0169685 Kyle White 724.00 rent 701.00 351.00 0.00 04/25/2015 07/24/2016 752.00
water 41.00
insur 10.00
Page 20 of 118

9/29/2015 10:03 AM
Unit Unit Type Unit Resident Name Market Charge Amount Resident Other Move In Lease Move Out Balance
Sq Ft Rent Code Deposit Deposit Expiration
Rent Roll with Lease ChargesProvidence Harbour Club (pharbour)
As Of = 09/01/2015
Month Year = 09/2015
Total 752.00
09-032 stclair 945.00 t0170784 Yaisha Wilson 734.00 rent 706.00 706.00 0.00 05/22/2015 08/21/2016 751.00
water 41.00
insur 10.00
Total 757.00
09-033 stclair 945.00 VACANT VACANT 734.00 0.00 0.00 0.00 0.00
Total 0.00
09-034 stclair 945.00 t0145518 Jessica Shelton 724.00 water 41.00 362.00 0.00 09/14/2013 09/26/2016 799.00
rent 759.00
Total 800.00
09-035 huron 805.00 t0172006 Karl Fletcher III 614.00 rent 679.00 340.00 0.00 06/30/2015 09/29/2016 720.34
water 31.00
insur 10.00
Total 720.00
09-036 huron 805.00 t0152164 Thomas Reddinger 624.00 rent 608.00 304.00 0.00 08/04/2014 11/03/2015 0.00
water 31.00
insur 10.00
Total 649.00
09-037 huron 805.00 t0154832 Martez Speed # 624.00 rent 616.00 308.00 0.00 02/11/2015 05/10/2016 657.00
water 31.00
insur 10.00
Total 657.00
09-038 huron 805.00 t0128355 Chad Roberts 614.00 water 31.00 0.00 0.00 08/28/2009 08/29/2016 -183.00
rent 651.00
Total 682.00
10-001 stclair 945.00 t0074192 ***Model*** 2 BR GOLF 744.00 model -805.00 0.00 0.00 03/12/2009 04/30/2016 0.00
rent 805.00
Total 0.00
10-002 stclair 945.00 t0166282 Nicole Peterson 764.00 rent 722.00 722.00 0.00 03/07/2015 09/06/2015 09/06/2015 773.00
water 41.00
insur 10.00
Total 773.00
10-003 stclair 945.00 t0119782 Nathan Johnson 764.00 water 41.00 289.50 0.00 02/27/2014 05/25/2016 782.00
rent 731.00
insur 10.00
Page 21 of 118
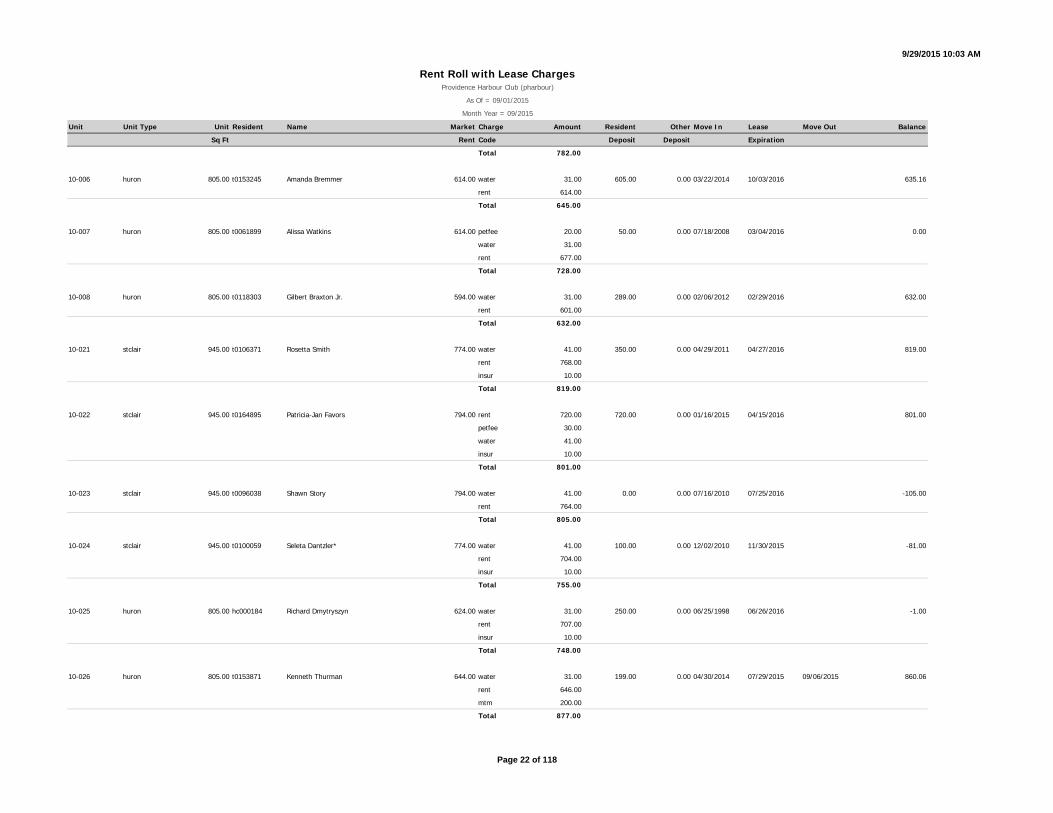
9/29/2015 10:03 AM
Unit Unit Type Unit Resident Name Market Charge Amount Resident Other Move In Lease Move Out Balance
Sq Ft Rent Code Deposit Deposit Expiration
Rent Roll with Lease ChargesProvidence Harbour Club (pharbour)
As Of = 09/01/2015
Month Year = 09/2015
Total 782.00
10-006 huron 805.00 t0153245 Amanda Bremmer 614.00 water 31.00 605.00 0.00 03/22/2014 10/03/2016 635.16
rent 614.00
Total 645.00
10-007 huron 805.00 t0061899 Alissa Watkins 614.00 petfee 20.00 50.00 0.00 07/18/2008 03/04/2016 0.00
water 31.00
rent 677.00
Total 728.00
10-008 huron 805.00 t0118303 Gilbert Braxton Jr. 594.00 water 31.00 289.00 0.00 02/06/2012 02/29/2016 632.00
rent 601.00
Total 632.00
10-021 stclair 945.00 t0106371 Rosetta Smith 774.00 water 41.00 350.00 0.00 04/29/2011 04/27/2016 819.00
rent 768.00
insur 10.00
Total 819.00
10-022 stclair 945.00 t0164895 Patricia-Jan Favors 794.00 rent 720.00 720.00 0.00 01/16/2015 04/15/2016 801.00
petfee 30.00
water 41.00
insur 10.00
Total 801.00
10-023 stclair 945.00 t0096038 Shawn Story 794.00 water 41.00 0.00 0.00 07/16/2010 07/25/2016 -105.00
rent 764.00
Total 805.00
10-024 stclair 945.00 t0100059 Seleta Dantzler* 774.00 water 41.00 100.00 0.00 12/02/2010 11/30/2015 -81.00
rent 704.00
insur 10.00
Total 755.00
10-025 huron 805.00 hc000184 Richard Dmytryszyn 624.00 water 31.00 250.00 0.00 06/25/1998 06/26/2016 -1.00
rent 707.00
insur 10.00
Total 748.00
10-026 huron 805.00 t0153871 Kenneth Thurman 644.00 water 31.00 199.00 0.00 04/30/2014 07/29/2015 09/06/2015 860.06
rent 646.00
mtm 200.00
Total 877.00
Page 22 of 118

9/29/2015 10:03 AM
Unit Unit Type Unit Resident Name Market Charge Amount Resident Other Move In Lease Move Out Balance
Sq Ft Rent Code Deposit Deposit Expiration
Rent Roll with Lease ChargesProvidence Harbour Club (pharbour)
As Of = 09/01/2015
Month Year = 09/2015
10-027 huron 805.00 t0170436 Malerie Schatzle 644.00 rent 638.00 319.00 0.00 06/08/2015 09/07/2016 0.00
petfee 40.00
water 31.00
Total 709.00
10-028 huron 805.00 t0171783 Nicole Haase 624.00 rent 690.00 199.00 0.00 06/27/2015 07/26/2016 0.00
water 31.00
insur 10.00
Total 731.00
10-031 stclair 945.00 t0095293 Elaine Chateau 764.00 water 41.00 0.00 0.00 09/04/2010 08/29/2016 0.00
rent 759.00
Total 800.00
10-032 stclair 945.00 t0151801 Shelby Woolford 784.00 petfee 30.00 359.00 0.00 04/25/2014 12/21/2015 905.65
water 41.00
insur 10.00
rent 813.00
Total 894.00
10-033 stclair 945.00 t0118163 Jennifer Smith 784.00 petfee 30.00 868.50 0.00 03/29/2014 09/26/2016 794.00
water 41.00
rent 723.00
Total 794.00
10-034 stclair 945.00 t0124127 Matthew Doty 764.00 water 41.00 0.00 0.00 07/15/2012 06/27/2016 0.00
rent 777.00
Total 818.00
10-035 huron 805.00 t0169351 Shavval Thompson 614.00 rent 633.00 399.00 0.00 06/01/2015 08/31/2016 0.00
water 31.00
Total 664.00
10-036 huron 805.00 t0137069 Marcel Franklin 634.00 water 31.00 200.00 0.00 04/06/2013 03/14/2016 0.00
rent 642.00
Total 673.00
10-037 huron 805.00 hc000950 Jessie Glover 634.00 water 31.00 0.00 0.00 11/08/2013 10/27/2015 671.00
rent 651.00
Total 682.00
10-038 huron 805.00 t0115654 Cindy Komajda 634.00 water 31.00 0.00 0.00 12/16/2011 01/18/2016 41.00
rent 610.00
Total 641.00
Page 23 of 118

9/29/2015 10:03 AM
Unit Unit Type Unit Resident Name Market Charge Amount Resident Other Move In Lease Move Out Balance
Sq Ft Rent Code Deposit Deposit Expiration
Rent Roll with Lease ChargesProvidence Harbour Club (pharbour)
As Of = 09/01/2015
Month Year = 09/2015
11-001 stclair 945.00 t0159865 Alec Brookover 744.00 rent 744.00 744.00 0.00 09/19/2014 09/18/2015 825.00
water 41.00
petfee 30.00
insur 10.00
Total 825.00
11-002 stclair 945.00 t0156070 Abid Abdraboh 754.00 rent 702.00 351.00 0.00 08/05/2014 11/04/2015 736.00
water 41.00
Total 743.00
11-003 stclair 945.00 t0169683 Anequa Barnes 754.00 rent 731.00 731.00 0.00 05/02/2015 08/01/2016 0.00
water 41.00
insur 10.00
Total 782.00
11-006 stclair 945.00 t0155181 Roy Sabo 754.00 rent 695.00 348.00 0.00 06/19/2014 09/18/2015 0.00
water 41.00
Total 736.00
11-007 stclair 945.00 t0167915 Katelyn Little 764.00 rent 733.00 733.00 0.00 05/01/2015 07/31/2016 784.00
petfee 20.00
water 41.00
insur 10.00
Total 804.00
11-008 stclair 945.00 t0165757 Gail Bradner 744.00 rent 744.00 744.00 0.00 03/28/2015 06/27/2016 0.00
water 41.00
Total 785.00
11-021 stclair 945.00 t0163492 Ralph Johnson *SSI* 774.00 rent 730.00 730.00 0.00 11/24/2014 02/23/2016 763.24
water 41.00
Total 771.00
11-022 stclair 945.00 t0149846 Danielle Cleary 784.00 water 41.00 784.00 0.00 12/31/2013 12/21/2015 835.00
rent 794.00
Total 835.00
11-023 stclair 945.00 t0121916 Jessica Ockerman 784.00 petfee 20.00 0.00 0.00 08/05/2012 07/25/2016 0.00
water 41.00
rent 789.00
Total 850.00
11-024 stclair 945.00 t0157155 James Edwards 774.00 rent 739.00 739.00 0.00 07/15/2014 10/14/2015 780.00
water 41.00
Total 780.00
Page 24 of 118

9/29/2015 10:03 AM
Unit Unit Type Unit Resident Name Market Charge Amount Resident Other Move In Lease Move Out Balance
Sq Ft Rent Code Deposit Deposit Expiration
Rent Roll with Lease ChargesProvidence Harbour Club (pharbour)
As Of = 09/01/2015
Month Year = 09/2015
11-025 stclair 945.00 t0153673 Tenequa Hamilton 774.00 rent 749.00 374.00 0.00 05/28/2015 08/22/2016 850.00
water 41.00
insur 10.00
Total 800.00
11-026 stclair 945.00 t0163972 Sherman Flake 784.00 rent 724.00 362.00 0.00 12/13/2014 03/12/2016 775.00
water 41.00
insur 10.00
Total 775.00
11-027 stclair 945.00 t0146266 Amy Aquinto 784.00 petfee 30.00 379.00 0.00 11/27/2013 11/30/2015 -100.00
water 41.00
rent 769.00
Total 840.00
11-028 stclair 945.00 VACANT VACANT 774.00 0.00 0.00 0.00 0.00
Total 0.00
11-031 stclair 945.00 VACANT VACANT 764.00 0.00 0.00 0.00 0.00
Total 0.00
11-032 stclair 945.00 t0126328 Alisha Harris 774.00 water 41.00 562.00 0.00 08/29/2012 08/31/2015 09/01/2015 0.00
rent 780.00
Total 821.00
11-033 stclair 945.00 hc000209 Cynthia Lilly 774.00 water 41.00 50.00 0.00 10/16/2004 10/26/2015 825.00
rent 784.00
Total 825.00
11-034 stclair 945.00 t0155545 Nichole Hutcherson 764.00 water 41.00 718.00 0.00 05/31/2014 02/29/2016 769.00
rent 728.00
Total 769.00
11-035 stclair 945.00 t0156100 Jon Mastin 764.00 rent 692.00 329.00 0.00 07/15/2014 10/14/2015 733.00
water 41.00
Total 733.00
11-036 stclair 945.00 t0121021 Brittala Coach 774.00 water 41.00 175.00 0.00 04/01/2012 03/28/2016 0.00
rent 764.00
Total 805.00
11-037 stclair 945.00 t0054357 Steven Lai 774.00 water 41.00 200.00 0.00 04/07/2008 07/11/2016 0.00
petfee 30.00
rent 757.00
Page 25 of 118
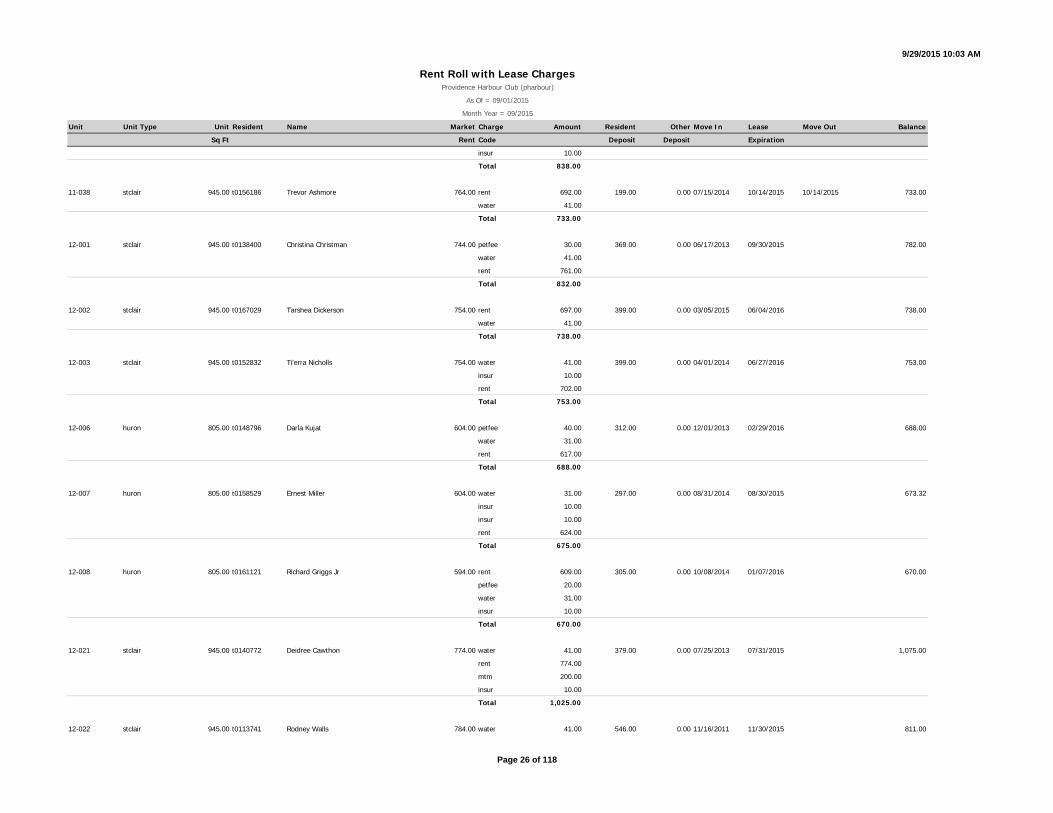
9/29/2015 10:03 AM
Unit Unit Type Unit Resident Name Market Charge Amount Resident Other Move In Lease Move Out Balance
Sq Ft Rent Code Deposit Deposit Expiration
Rent Roll with Lease ChargesProvidence Harbour Club (pharbour)
As Of = 09/01/2015
Month Year = 09/2015
insur 10.00
Total 838.00
11-038 stclair 945.00 t0156186 Trevor Ashmore 764.00 rent 692.00 199.00 0.00 07/15/2014 10/14/2015 10/14/2015 733.00
water 41.00
Total 733.00
12-001 stclair 945.00 t0138400 Christina Christman 744.00 petfee 30.00 369.00 0.00 06/17/2013 09/30/2015 782.00
water 41.00
rent 761.00
Total 832.00
12-002 stclair 945.00 t0167029 Tarshea Dickerson 754.00 rent 697.00 399.00 0.00 03/05/2015 06/04/2016 738.00
water 41.00
Total 738.00
12-003 stclair 945.00 t0152832 Ti'erra Nicholls 754.00 water 41.00 399.00 0.00 04/01/2014 06/27/2016 753.00
insur 10.00
rent 702.00
Total 753.00
12-006 huron 805.00 t0148796 Darla Kujat 604.00 petfee 40.00 312.00 0.00 12/01/2013 02/29/2016 688.00
water 31.00
rent 617.00
Total 688.00
12-007 huron 805.00 t0158529 Ernest Miller 604.00 water 31.00 297.00 0.00 08/31/2014 08/30/2015 673.32
insur 10.00
insur 10.00
rent 624.00
Total 675.00
12-008 huron 805.00 t0161121 Richard Griggs Jr 594.00 rent 609.00 305.00 0.00 10/08/2014 01/07/2016 670.00
petfee 20.00
water 31.00
insur 10.00
Total 670.00
12-021 stclair 945.00 t0140772 Deidree Cawthon 774.00 water 41.00 379.00 0.00 07/25/2013 07/31/2015 1,075.00
rent 774.00
mtm 200.00
insur 10.00
Total 1,025.00
12-022 stclair 945.00 t0113741 Rodney Walls 784.00 water 41.00 546.00 0.00 11/16/2011 11/30/2015 811.00
Page 26 of 118

9/29/2015 10:03 AM
Unit Unit Type Unit Resident Name Market Charge Amount Resident Other Move In Lease Move Out Balance
Sq Ft Rent Code Deposit Deposit Expiration
Rent Roll with Lease ChargesProvidence Harbour Club (pharbour)
As Of = 09/01/2015
Month Year = 09/2015
rent 770.00
Total 811.00
12-023 stclair 945.00 t0159710 Samantha Kelch 784.00 rent 746.00 373.00 0.00 09/11/2014 12/10/2015 797.00
water 41.00
insur 10.00
Total 797.00
12-024 stclair 945.00 t0137599 Cecilly Moore 774.00 water 31.00 200.00 0.00 06/08/2013 05/23/2016 3.00
rent 665.00
Total 696.00
12-025 huron 805.00 t0171449 Keow Lee 624.00 rent 691.00 199.00 0.00 06/12/2015 06/11/2016 732.00
water 31.00
insur 10.00
Total 732.00
12-026 huron 805.00 t0166286 Joseph Lohry 634.00 rent 626.00 313.00 0.00 02/19/2015 02/18/2016 667.00
water 31.00
insur 10.00
Total 667.00
12-027 huron 805.00 t0146870 Rachel Patton 634.00 rent 615.00 615.00 0.00 02/28/2015 02/27/2016 676.00
petfee 30.00
water 31.00
Total 676.00
12-028 huron 805.00 t0166934 Nicholas Millington 624.00 rent 626.00 626.00 0.00 03/13/2015 12/12/2015 697.00
petfee 30.00
water 31.00
insur 10.00
Total 697.00
12-031 stclair 945.00 t0162570 Latina Faulkner 764.00 rent 717.00 717.00 0.00 11/24/2014 02/23/2016 0.00
water 41.00
insur 10.00
Total 768.00
12-032 stclair 945.00 t0160131 Alandis Norwood 774.00 rent 765.00 382.50 0.00 09/19/2014 12/18/2015 836.00
water 41.00
petfee 20.00
insur 10.00
Total 836.00
12-033 stclair 945.00 t0096413 Nicole Price* 774.00 water 41.00 200.00 0.00 09/02/2010 09/30/2015 721.00
Page 27 of 118

9/29/2015 10:03 AM
Unit Unit Type Unit Resident Name Market Charge Amount Resident Other Move In Lease Move Out Balance
Sq Ft Rent Code Deposit Deposit Expiration
Rent Roll with Lease ChargesProvidence Harbour Club (pharbour)
As Of = 09/01/2015
Month Year = 09/2015
rent 700.00
Total 741.00
12-034 stclair 945.00 t0140995 Tanisha Webb 764.00 water 41.00 739.00 0.00 06/25/2013 09/30/2015 0.00
rent 761.00
Total 802.00
12-035 huron 805.00 t0159364 Martez Sanders 614.00 rent 624.00 624.00 0.00 09/13/2014 12/12/2015 655.00
water 31.00
Total 655.00
12-036 huron 805.00 t0159330 Briana Lindsey 624.00 rent 619.00 309.50 0.00 05/08/2015 12/08/2015 659.70
water 31.00
insur 10.00
Total 660.00
12-037 huron 805.00 t0150725 Raphael Massingil 624.00 water 31.00 624.00 0.00 02/15/2014 05/09/2016 -0.02
rent 641.00
insur 10.00
Total 682.00
12-038 huron 805.00 t0170370 Mark Munson 614.00 rent 733.00 367.00 0.00 05/09/2015 09/08/2015 09/08/2015 567.60
water 31.00
insur 10.00
Total 774.00
13-001 stclair 945.00 t0153474 Tommy Sanford 744.00 water 41.00 337.00 0.00 04/01/2014 06/27/2016 743.00
rent 692.00
insur 10.00
Total 743.00
13-002 stclair 945.00 hc000232 Glen Hill 754.00 water 41.00 70.00 0.00 04/11/2006 03/14/2016 792.00
rent 751.00
Total 792.00
13-003 stclair 945.00 t0114632 Joseph Wysocki 754.00 water 41.00 364.00 0.00 11/03/2011 10/26/2015 924.00
rent 883.00
Total 924.00
13-006 stclair 945.00 t0168903 Gabriel Saldana 754.00 rent 715.00 715.00 0.00 04/10/2015 07/09/2016 0.00
water 41.00
insur 10.00
Total 766.00
13-007 stclair 945.00 t0163643 Timothy Holmes 754.00 rent 700.00 700.00 0.00 12/15/2014 03/14/2016 605.00
Page 28 of 118

9/29/2015 10:03 AM
Unit Unit Type Unit Resident Name Market Charge Amount Resident Other Move In Lease Move Out Balance
Sq Ft Rent Code Deposit Deposit Expiration
Rent Roll with Lease ChargesProvidence Harbour Club (pharbour)
As Of = 09/01/2015
Month Year = 09/2015
water 41.00
Total 741.00
13-008 stclair 945.00 t0163591 Brieanna Todd 744.00 rent 694.00 347.00 0.00 12/11/2014 03/10/2016 654.50
water 31.00
insur 10.00
Total 735.00
13-021 stclair 945.00 t0171791 Olivia Hannosh 774.00 rent 786.00 199.00 0.00 06/26/2015 09/25/2016 0.00
petfee 30.00
water 41.00
Total 857.00
13-022 stclair 945.00 t0154755 Keniesha Nance 784.00 rent 733.00 366.00 0.00 08/29/2014 11/28/2015 -56.00
water 41.00
insur 10.00
Total 784.00
13-023 stclair 945.00 t0086043 Willie Coleman 784.00 water 41.00 0.00 0.00 11/23/2009 12/28/2015 758.00
rent 707.00
insur 10.00
Total 758.00
13-024 stclair 945.00 t0121373 Kammy Koch 774.00 petfee 30.00 364.50 0.00 05/25/2012 08/15/2016 0.00
water 41.00
rent 780.00
insur 10.00
Total 861.00
13-025 stclair 945.00 t0097157 Jeffery Nixon 774.00 water 41.00 200.00 0.00 07/29/2010 07/25/2016 0.00
rent 799.00
Total 840.00
13-026 stclair 945.00 t0150967 Georgia Wales 784.00 water 41.00 377.00 0.00 03/20/2014 05/23/2016 810.00
rent 769.00
Total 810.00
13-027 stclair 945.00 t0160946 Raven Pinson 784.00 rent 741.00 371.00 0.00 03/30/2015 06/29/2016 245.00
petfee 40.00
water 41.00
Total 822.00
13-028 stclair 945.00 t0166500 Kyla Winters- Sweet 774.00 rent 707.00 707.00 0.00 03/04/2015 06/03/2016 778.00
petfee 30.00
water 41.00
Page 29 of 118

9/29/2015 10:03 AM
Unit Unit Type Unit Resident Name Market Charge Amount Resident Other Move In Lease Move Out Balance
Sq Ft Rent Code Deposit Deposit Expiration
Rent Roll with Lease ChargesProvidence Harbour Club (pharbour)
As Of = 09/01/2015
Month Year = 09/2015
Total 778.00
13-031 stclair 945.00 t0148540 Jonathan Poponak 774.00 water 41.00 327.00 0.00 11/25/2013 11/23/2015 0.00
rent 795.00
Total 836.00
13-032 stclair 945.00 t0166389 Phillisa Johnson 774.00 rent 729.00 364.00 0.00 04/18/2015 07/17/2016 780.00
water 41.00
insur 10.00
Total 780.00
13-033 stclair 945.00 t0156694 John Mason III 774.00 rent 699.00 1,049.00 0.00 07/11/2014 10/10/2015 730.00
water 31.00
Total 730.00
13-034 stclair 945.00 t0159629 Kelly Fannin 764.00 rent 731.00 366.00 0.00 09/22/2014 12/21/2015 822.00
water 41.00
Total 772.00
13-035 stclair 945.00 t0121272 Merica James 764.00 water 41.00 0.00 0.00 06/01/2012 08/29/2016 822.81
rent 786.00
Total 827.00
13-036 stclair 945.00 t0132644 Eddie Turner Jr. 774.00 petfee 30.00 380.00 0.00 11/29/2012 11/23/2015 840.00
water 41.00
rent 759.00
insur 10.00
Total 840.00
13-037 stclair 945.00 t0155744 Micah Troup 774.00 rent 682.00 682.00 0.00 08/15/2014 11/14/2015 732.94
water 41.00
insur 10.00
Total 733.00
13-038 stclair 945.00 t0140940 Erin Ramsey 764.00 water 41.00 375.00 0.00 07/20/2013 07/25/2016 852.00
petfee 30.00
rent 781.00
Total 852.00
14-101 stclair 945.00 t0140556 Beverly Walls *SSI* 744.00 petfee 30.00 369.00 0.00 06/25/2013 09/29/2016 836.00
water 41.00
rent 762.00
insur 10.00
Total 843.00
Page 30 of 118

9/29/2015 10:03 AM
Unit Unit Type Unit Resident Name Market Charge Amount Resident Other Move In Lease Move Out Balance
Sq Ft Rent Code Deposit Deposit Expiration
Rent Roll with Lease ChargesProvidence Harbour Club (pharbour)
As Of = 09/01/2015
Month Year = 09/2015
14-102 stclair 945.00 t0147337 Deante Teamer 754.00 water 41.00 754.00 0.00 11/01/2013 10/19/2015 879.00
rent 775.00
Total 816.00
14-103 stclair 945.00 t0140699 James Smith 754.00 water 41.00 369.00 0.00 06/14/2013 09/26/2016 -29.00
insur 10.00
rent 762.00
Total 813.00
14-106 stclair 945.00 t0161415 Nicole Reedus 754.00 rent 712.00 356.00 0.00 10/16/2014 01/15/2016 1,930.36
water 41.00
insur 10.00
Total 763.00
14-107 stclair 945.00 t0170567 Lakeshia Wilson 754.00 rent 746.00 399.00 0.00 06/01/2015 05/31/2016 284.00
water 41.00
Total 787.00
14-108 stclair 945.00 t0144137 Alyssa McCune 744.00 water 41.00 199.00 0.00 08/30/2014 08/30/2015 770.00
rent 729.00
Total 770.00
14-201 stclair 945.00 t0170638 Robert Ladd 774.00 rent 746.00 746.00 0.00 05/30/2015 05/29/2016 787.00
water 41.00
Total 787.00
14-202 stclair 945.00 t0084445 Sarah Gause 784.00 water 41.00 0.00 0.00 12/16/2011 11/30/2015 806.00
rent 765.00
Total 806.00
14-203 stclair 945.00 t0172709 Stephanie Hook 784.00 rent 798.00 798.00 0.00 08/01/2015 10/31/2016 849.00
water 41.00
insur 10.00
Total 849.00
14-204 stclair 945.00 t0149543 Kimberly Tucker 774.00 water 41.00 756.00 0.00 03/01/2014 02/29/2016 817.00
rent 766.00
insur 10.00
Total 817.00
14-205 stclair 945.00 t0055049 Anita Dial 774.00 petfee 20.00 400.00 0.00 03/28/2008 09/26/2016 833.00
water 41.00
rent 772.00
Total 833.00
Page 31 of 118

9/29/2015 10:03 AM
Unit Unit Type Unit Resident Name Market Charge Amount Resident Other Move In Lease Move Out Balance
Sq Ft Rent Code Deposit Deposit Expiration
Rent Roll with Lease ChargesProvidence Harbour Club (pharbour)
As Of = 09/01/2015
Month Year = 09/2015
14-206 stclair 945.00 t0170754 Darrian Allard 784.00 rent 773.00 387.00 0.00 07/25/2015 07/24/2016 844.00
petfee 20.00
water 41.00
insur 10.00
Total 844.00
14-207 stclair 945.00 t0171169 Percia Bowser 784.00 rent 796.00 796.00 0.00 06/22/2015 09/21/2016 836.10
water 41.00
Total 837.00
14-208 stclair 945.00 t0167183 Emily Spencer 774.00 rent 722.00 722.00 0.00 03/14/2015 03/13/2016 866.00
water 41.00
insur 10.00
Total 773.00
14-301 stclair 945.00 t0161953 Shannon Stewart 764.00 rent 722.00 722.00 0.00 11/01/2014 10/31/2015 773.00
water 41.00
insur 10.00
Total 773.00
14-302 stclair 945.00 t0166682 Arbry Dinwieddie II 774.00 rent 743.00 372.00 0.00 05/01/2015 07/31/2016 794.00
water 41.00
insur 10.00
Total 794.00
14-303 stclair 945.00 t0171725 Michael Kotlarczyk 774.00 rent 796.00 796.00 0.00 07/01/2015 06/30/2016 837.00
water 41.00
Total 837.00
14-304 stclair 945.00 t0110977 Vincente Nesby 764.00 water 41.00 225.00 0.00 09/30/2011 09/30/2015 826.00
rent 785.00
Total 826.00
14-305 stclair 945.00 t0145299 Thomas Gitzen 764.00 water 41.00 199.00 0.00 09/07/2013 09/30/2015 0.00
petfee 30.00
rent 785.00
Total 856.00
14-306 stclair 945.00 t0135430 Kenneth Clerebout 774.00 water 41.00 0.00 0.00 03/23/2013 03/31/2016 0.00
petfee 20.00
rent 774.00
Total 835.00
14-307 stclair 945.00 t0170952 Mark Walls 774.00 rent 765.00 383.00 0.00 05/29/2015 08/28/2016 0.00
water 41.00
Page 32 of 118

9/29/2015 10:03 AM
Unit Unit Type Unit Resident Name Market Charge Amount Resident Other Move In Lease Move Out Balance
Sq Ft Rent Code Deposit Deposit Expiration
Rent Roll with Lease ChargesProvidence Harbour Club (pharbour)
As Of = 09/01/2015
Month Year = 09/2015
insur 10.00
Total 816.00
14-308 stclair 945.00 t0123968 Robert Moore Jr 764.00 water 41.00 175.00 0.00 06/30/2012 06/27/2016 844.00
rent 803.00
Total 844.00
15-101 stclair 945.00 t0154084 Kathy Carlington 744.00 water 41.00 0.00 0.00 09/30/2008 05/16/2016 0.00
petfee 40.00
rent 782.00
Total 863.00
15-102 stclair 945.00 t0166038 Julie Mata 754.00 rent 669.00 669.00 0.00 02/20/2015 05/19/2016 0.00
water 41.00
Total 710.00
15-103 stclair 945.00 t0144791 Felicia Walker 754.00 water 41.00 399.00 0.00 10/15/2013 01/31/2016 809.00
rent 768.00
Total 809.00
15-106 stclair 945.00 t0159054 Lakisha Hawkins *SSI* 754.00 rent 733.00 733.00 0.00 09/17/2014 12/16/2015 784.00
water 41.00
insur 10.00
Total 784.00
15-107 stclair 945.00 t0164903 Alona Mcclendon 754.00 rent 691.00 399.00 0.00 03/01/2015 05/31/2016 732.00
water 41.00
Total 732.00
15-108 stclair 945.00 t0162190 Amanda Thoma 744.00 rent 691.00 546.00 0.00 11/14/2014 02/13/2016 772.00
water 41.00
petfee 30.00
insur 10.00
Total 772.00
15-201 stclair 945.00 t0160006 LeConia Robin 774.00 rent 744.00 199.00 0.00 09/12/2014 12/11/2015 0.00
water 41.00
insur 10.00
Total 795.00
15-202 stclair 945.00 VACANT VACANT 784.00 0.00 0.00 0.00 0.00
Total 0.00
15-203 stclair 945.00 hc000277 Leonard Young 784.00 water 41.00 250.00 0.00 07/25/2005 07/25/2016 0.00
rent 832.00
Page 33 of 118

9/29/2015 10:03 AM
Unit Unit Type Unit Resident Name Market Charge Amount Resident Other Move In Lease Move Out Balance
Sq Ft Rent Code Deposit Deposit Expiration
Rent Roll with Lease ChargesProvidence Harbour Club (pharbour)
As Of = 09/01/2015
Month Year = 09/2015
Total 873.00
15-204 stclair 945.00 t0154463 Michael Caudill 774.00 water 41.00 354.00 0.00 05/28/2014 08/22/2016 774.97
rent 731.00
Total 772.00
15-205 stclair 945.00 t0146286 Jenna Cooke 774.00 petfee 30.00 699.00 0.00 11/01/2013 10/31/2015 0.00
water 41.00
rent 714.00
Total 785.00
15-206 stclair 945.00 t0152486 Cherise Floyd 784.00 water 41.00 368.00 0.00 02/28/2014 12/21/2015 796.00
rent 745.00
insur 10.00
Total 796.00
15-207 stclair 945.00 t0153738 Wilma Hall 784.00 water 41.00 357.00 0.00 04/12/2014 11/01/2016 763.51
insur 10.00
rent 733.00
Total 784.00
15-208 stclair 945.00 t0065426 Gregory Cook 774.00 water 41.00 0.00 0.00 01/25/2013 01/22/2016 815.00
rent 764.00
insur 10.00
Total 815.00
15-301 stclair 945.00 t0155316 Dajah Thomas 764.00 rent 781.00 390.00 0.00 08/15/2015 10/14/2016 832.00
water 41.00
insur 10.00
Total 832.00
15-302 stclair 945.00 t0156704 Shelby Cadwell 774.00 rent 704.00 352.00 0.00 07/27/2014 10/26/2015 755.00
water 41.00
insur 10.00
Total 755.00
15-303 stclair 945.00 t0171760 Channel Proctor 774.00 rent 787.00 394.00 0.00 06/24/2015 09/23/2016 833.53
water 41.00
insur 10.00
Total 838.00
15-304 stclair 945.00 t0146829 Melissa Hinken 764.00 water 41.00 382.00 0.00 10/23/2013 10/26/2015 826.00
rent 785.00
Total 826.00
Page 34 of 118

9/29/2015 10:03 AM
Unit Unit Type Unit Resident Name Market Charge Amount Resident Other Move In Lease Move Out Balance
Sq Ft Rent Code Deposit Deposit Expiration
Rent Roll with Lease ChargesProvidence Harbour Club (pharbour)
As Of = 09/01/2015
Month Year = 09/2015
15-305 stclair 945.00 VACANT VACANT 764.00 0.00 0.00 0.00 0.00
Total 0.00
15-306 stclair 945.00 t0158667 Kevin Debrosse 774.00 rent 751.00 376.00 0.00 08/01/2014 10/31/2015 822.00
petfee 30.00
water 41.00
Total 822.00
15-307 stclair 945.00 t0163737 Erin Hofmann 774.00 rent 724.00 724.00 0.02 12/13/2014 03/12/2016 0.00
petfee 50.00
water 41.00
Total 815.00
15-308 stclair 945.00 t0158821 Jamie Harshberger 764.00 rent 744.00 744.00 0.00 08/22/2014 11/21/2015 785.00
water 41.00
Total 785.00
16-101 stclair 945.00 VACANT VACANT 769.00 0.00 0.00 0.00 0.00
Total 0.00
16-102 stclair 945.00 t0169039 Samuel Passmore 754.00 rent 728.00 399.00 0.00 04/24/2015 07/23/2016 778.00
water 41.00
insur 10.00
Total 779.00
16-103 stclair 945.00 hc000291 Michelle Bukoski 754.00 water 41.00 300.00 0.00 06/20/1992 02/29/2016 0.00
rent 785.00
Total 826.00
16-106 stclair 945.00 t0090870 Gerlene Davis* 754.00 petfee 30.00 0.00 0.00 03/01/2010 02/28/2016 690.00
water 41.00
rent 728.00
Total 799.00
16-107 stclair 945.00 t0137711 Brett Gibbs 754.00 water 41.00 0.00 0.00 05/25/2013 05/16/2016 812.00
rent 771.00
Total 812.00
16-108 stclair 945.00 t0154190 Tracey Barbee 769.00 water 41.00 399.00 0.00 05/21/2014 11/14/2016 -315.00
rent 718.00
Total 759.00
16-201 stclair 945.00 t0104283 David Hill **SSI** 799.00 petfee 30.00 350.00 0.00 03/01/2011 02/29/2016 841.00
water 41.00
rent 761.00
Page 35 of 118

9/29/2015 10:03 AM
Unit Unit Type Unit Resident Name Market Charge Amount Resident Other Move In Lease Move Out Balance
Sq Ft Rent Code Deposit Deposit Expiration
Rent Roll with Lease ChargesProvidence Harbour Club (pharbour)
As Of = 09/01/2015
Month Year = 09/2015
insur 10.00
Total 842.00
16-202 stclair 945.00 t0140220 Dora Dexter 784.00 water 41.00 390.00 0.00 06/28/2013 06/27/2016 0.00
rent 813.00
Total 854.00
16-203 stclair 945.00 t0155043 Rita Osei-bonsu 784.00 water 41.00 199.00 0.00 06/02/2014 08/15/2016 655.56
insur 10.00
insur 10.00
rent 726.00
Total 787.00
16-204 stclair 945.00 hc000297 James Moye 799.00 water 41.00 25.00 0.00 05/01/1990 10/24/2016 895.00
rent 854.00
Total 895.00
16-205 stclair 945.00 hc000298 Terri Wadsworth 799.00 water 41.00 200.00 0.00 01/31/2005 12/28/2015 853.00
petfee 30.00
rent 782.00
Total 853.00
16-206 stclair 945.00 t0148228 James Kelley 784.00 water 41.00 387.00 0.00 11/26/2013 02/29/2016 831.00
rent 780.00
insur 10.00
Total 831.00
16-207 stclair 945.00 VACANT VACANT 784.00 0.00 0.00 0.00 0.00
Total 0.00
16-208 stclair 945.00 t0155375 Ashley Alston 799.00 rent 737.00 199.00 0.00 06/27/2014 09/26/2015 09/26/2015 903.01
concess -37.00
petfee 30.00
water 41.00
Total 771.00
16-301 stclair 945.00 hc000300 Janet Rushing 789.00 water 41.00 0.00 0.00 04/16/1990 11/23/2015 866.00
rent 825.00
Total 866.00
16-302 stclair 945.00 VACANT VACANT 774.00 0.00 0.00 0.00 0.00
Total 0.00
16-303 stclair 945.00 t0141129 Fatima Abdallah 804.00 water 41.00 188.00 0.00 07/26/2013 06/27/2016 865.00
insur 10.00
Page 36 of 118

9/29/2015 10:03 AM
Unit Unit Type Unit Resident Name Market Charge Amount Resident Other Move In Lease Move Out Balance
Sq Ft Rent Code Deposit Deposit Expiration
Rent Roll with Lease ChargesProvidence Harbour Club (pharbour)
As Of = 09/01/2015
Month Year = 09/2015
rent 814.00
Total 865.00
16-304 stclair 945.00 t0161622 Kyle Young 789.00 rent 735.00 367.00 0.00 10/31/2014 01/30/2016 773.00
water 41.00
insur 10.00
Total 786.00
16-305 stclair 945.00 t0163614 Kimberly Howard 789.00 rent 733.00 733.00 733.00 12/06/2014 03/05/2016 832.00
water 41.00
insur 10.00
Total 784.00
16-306 stclair 945.00 VACANT VACANT 774.00 0.00 0.00 0.00 0.00
Total 0.00
16-307 stclair 945.00 t0096920 Wanda Parrish 774.00 water 41.00 200.00 0.00 07/23/2010 11/30/2016 817.00
rent 774.00
Total 815.00
16-308 stclair 945.00 t0170655 GingerAnn Neslund 789.00 rent 769.00 384.50 0.00 05/22/2015 08/21/2016 830.00
petfee 20.00
water 41.00
Total 830.00
17-101 stclair 945.00 t0172326 Kieasha wilson 744.00 rent 762.00 399.00 0.00 08/18/2015 11/17/2016 803.00
water 41.00
Total 803.00
17-102 stclair 945.00 t0155832 Briana Hicks 764.00 rent 734.00 367.00 0.00 07/12/2014 10/11/2015 775.00
water 41.00
Total 775.00
17-103 stclair 945.00 t0162132 Veronica McDonald 754.00 rent 714.00 399.00 0.00 11/14/2014 11/13/2015 765.00
water 41.00
insur 10.00
Total 765.00
17-106 huron 805.00 t0162084 Tiffany Lehtola 604.00 rent 608.00 304.00 0.00 11/03/2014 11/02/2015 669.00
petfee 20.00
water 31.00
insur 10.00
Total 669.00
17-107 huron 805.00 VACANT VACANT 604.00 0.00 0.00 0.00 0.00
Page 37 of 118
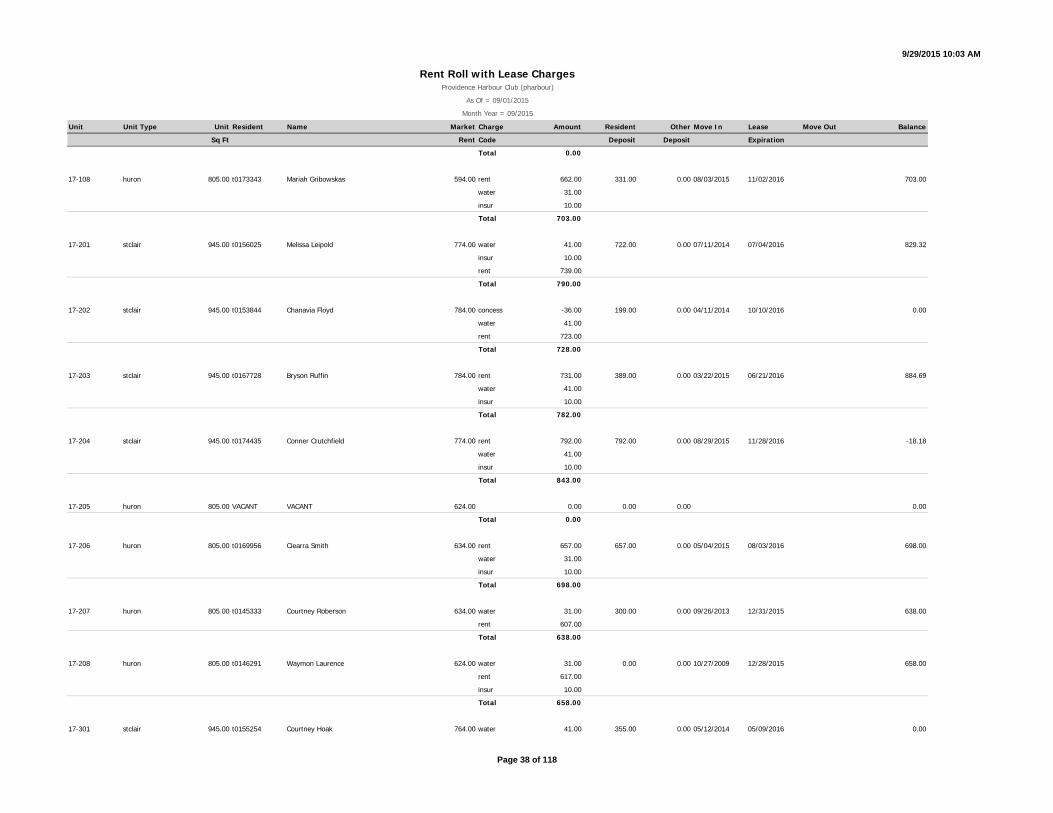
9/29/2015 10:03 AM
Unit Unit Type Unit Resident Name Market Charge Amount Resident Other Move In Lease Move Out Balance
Sq Ft Rent Code Deposit Deposit Expiration
Rent Roll with Lease ChargesProvidence Harbour Club (pharbour)
As Of = 09/01/2015
Month Year = 09/2015
Total 0.00
17-108 huron 805.00 t0173343 Mariah Gribowskas 594.00 rent 662.00 331.00 0.00 08/03/2015 11/02/2016 703.00
water 31.00
insur 10.00
Total 703.00
17-201 stclair 945.00 t0156025 Melissa Leipold 774.00 water 41.00 722.00 0.00 07/11/2014 07/04/2016 829.32
insur 10.00
rent 739.00
Total 790.00
17-202 stclair 945.00 t0153844 Chanavia Floyd 784.00 concess -36.00 199.00 0.00 04/11/2014 10/10/2016 0.00
water 41.00
rent 723.00
Total 728.00
17-203 stclair 945.00 t0167728 Bryson Ruffin 784.00 rent 731.00 389.00 0.00 03/22/2015 06/21/2016 884.69
water 41.00
insur 10.00
Total 782.00
17-204 stclair 945.00 t0174435 Conner Crutchfield 774.00 rent 792.00 792.00 0.00 08/29/2015 11/28/2016 -18.18
water 41.00
insur 10.00
Total 843.00
17-205 huron 805.00 VACANT VACANT 624.00 0.00 0.00 0.00 0.00
Total 0.00
17-206 huron 805.00 t0169956 Ciearra Smith 634.00 rent 657.00 657.00 0.00 05/04/2015 08/03/2016 698.00
water 31.00
insur 10.00
Total 698.00
17-207 huron 805.00 t0145333 Courtney Roberson 634.00 water 31.00 300.00 0.00 09/26/2013 12/31/2015 638.00
rent 607.00
Total 638.00
17-208 huron 805.00 t0146291 Waymon Laurence 624.00 water 31.00 0.00 0.00 10/27/2009 12/28/2015 658.00
rent 617.00
insur 10.00
Total 658.00
17-301 stclair 945.00 t0155254 Courtney Hoak 764.00 water 41.00 355.00 0.00 05/12/2014 05/09/2016 0.00
Page 38 of 118
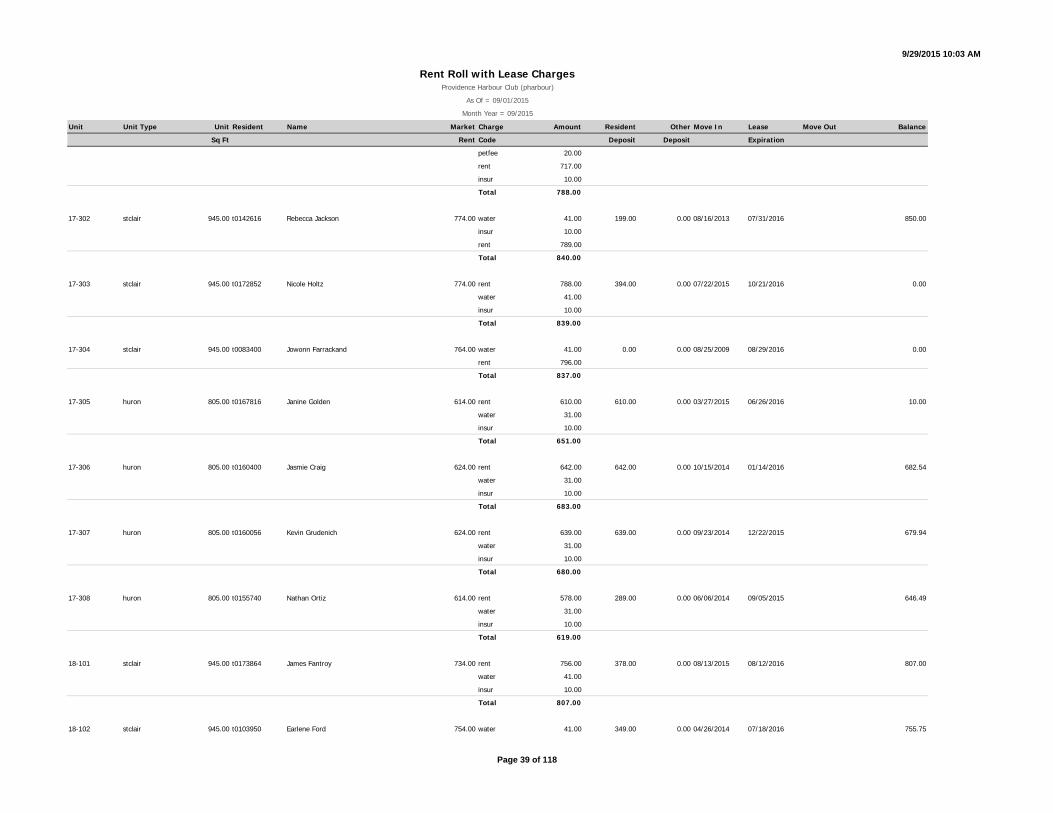
9/29/2015 10:03 AM
Unit Unit Type Unit Resident Name Market Charge Amount Resident Other Move In Lease Move Out Balance
Sq Ft Rent Code Deposit Deposit Expiration
Rent Roll with Lease ChargesProvidence Harbour Club (pharbour)
As Of = 09/01/2015
Month Year = 09/2015
petfee 20.00
rent 717.00
insur 10.00
Total 788.00
17-302 stclair 945.00 t0142616 Rebecca Jackson 774.00 water 41.00 199.00 0.00 08/16/2013 07/31/2016 850.00
insur 10.00
rent 789.00
Total 840.00
17-303 stclair 945.00 t0172852 Nicole Holtz 774.00 rent 788.00 394.00 0.00 07/22/2015 10/21/2016 0.00
water 41.00
insur 10.00
Total 839.00
17-304 stclair 945.00 t0083400 Jowonn Farrackand 764.00 water 41.00 0.00 0.00 08/25/2009 08/29/2016 0.00
rent 796.00
Total 837.00
17-305 huron 805.00 t0167816 Janine Golden 614.00 rent 610.00 610.00 0.00 03/27/2015 06/26/2016 10.00
water 31.00
insur 10.00
Total 651.00
17-306 huron 805.00 t0160400 Jasmie Craig 624.00 rent 642.00 642.00 0.00 10/15/2014 01/14/2016 682.54
water 31.00
insur 10.00
Total 683.00
17-307 huron 805.00 t0160056 Kevin Grudenich 624.00 rent 639.00 639.00 0.00 09/23/2014 12/22/2015 679.94
water 31.00
insur 10.00
Total 680.00
17-308 huron 805.00 t0155740 Nathan Ortiz 614.00 rent 578.00 289.00 0.00 06/06/2014 09/05/2015 646.49
water 31.00
insur 10.00
Total 619.00
18-101 stclair 945.00 t0173864 James Fantroy 734.00 rent 756.00 378.00 0.00 08/13/2015 08/12/2016 807.00
water 41.00
insur 10.00
Total 807.00
18-102 stclair 945.00 t0103950 Earlene Ford 754.00 water 41.00 349.00 0.00 04/26/2014 07/18/2016 755.75
Page 39 of 118

9/29/2015 10:03 AM
Unit Unit Type Unit Resident Name Market Charge Amount Resident Other Move In Lease Move Out Balance
Sq Ft Rent Code Deposit Deposit Expiration
Rent Roll with Lease ChargesProvidence Harbour Club (pharbour)
As Of = 09/01/2015
Month Year = 09/2015
rent 719.00
Total 760.00
18-103 stclair 945.00 t0144728 Clara Morrison 754.00 water 41.00 399.00 0.00 08/29/2013 08/31/2015 09/01/2015 0.00
rent 775.00
Total 816.00
18-106 stclair 945.00 t0171389 James Cleveland JR 754.00 rent 757.00 757.00 0.00 07/20/2015 10/19/2016 798.00
water 41.00
Total 798.00
18-107 stclair 945.00 t0155414 Tomika Cole 754.00 rent 668.00 199.00 0.00 07/10/2014 09/09/2015 708.00
concess -33.00
water 41.00
Total 676.00
18-108 stclair 945.00 t0123122 Marc Wandrie 734.00 water 41.00 554.00 0.00 06/23/2012 06/27/2016 0.00
insur 10.00
rent 772.00
Total 823.00
18-201 stclair 945.00 t0158503 Krystal Caasi 764.00 rent 725.00 363.00 0.00 07/28/2014 10/27/2015 776.00
water 41.00
insur 10.00
Total 776.00
18-202 stclair 945.00 hc000330 Clois Alexander 784.00 water 41.00 0.00 0.00 12/06/2004 10/26/2015 858.00
rent 817.00
Total 858.00
18-203 stclair 945.00 t0171461 William Jackson 784.00 rent 811.00 811.00 0.00 07/01/2015 09/30/2016 852.00
water 41.00
Total 852.00
18-204 stclair 945.00 t0154984 Mary Jones-*SSI* 764.00 water 41.00 345.00 0.00 06/15/2014 06/13/2016 756.00
rent 705.00
insur 10.00
Total 756.00
18-205 stclair 945.00 t0163715 Patrick Avery 764.00 rent 719.00 719.00 0.00 12/03/2014 03/02/2016 770.00
water 41.00
insur 10.00
Total 770.00
18-206 stclair 945.00 t0129071 Joy Hurling 784.00 water 41.00 562.00 0.00 03/01/2013 02/22/2016 830.00
Page 40 of 118

9/29/2015 10:03 AM
Unit Unit Type Unit Resident Name Market Charge Amount Resident Other Move In Lease Move Out Balance
Sq Ft Rent Code Deposit Deposit Expiration
Rent Roll with Lease ChargesProvidence Harbour Club (pharbour)
As Of = 09/01/2015
Month Year = 09/2015
rent 789.00
Total 830.00
18-207 stclair 945.00 t0159537 Mable Kelly 784.00 rent 770.00 385.00 0.00 09/12/2014 12/11/2015 811.00
water 41.00
Total 811.00
18-208 stclair 945.00 t0169676 Wendy Jewell 764.00 rent 766.00 199.00 0.00 04/24/2015 10/23/2015 827.00
water 41.00
insur 10.00
Total 817.00
18-301 stclair 945.00 t0144190 Jessica Payne 754.00 water 41.00 399.00 0.00 08/17/2013 11/28/2016 775.00
insur 10.00
rent 724.00
Total 775.00
18-302 stclair 945.00 t0160114 Margaret Roach 774.00 rent 744.00 372.00 0.00 09/22/2014 09/21/2015 09/28/2015 810.00
water 41.00
insur 10.00
Total 795.00
18-303 stclair 945.00 t0170817 Deshaney Dumas 774.00 rent 746.00 373.00 0.00 05/22/2015 08/21/2016 0.00
water 41.00
insur 10.00
Total 797.00
18-304 stclair 945.00 t0170890 Tyler Richards 754.00 rent 733.00 367.00 0.00 05/29/2015 08/28/2016 0.00
petfee 30.00
water 41.00
insur 10.00
Total 814.00
18-305 stclair 945.00 t0155836 James Pop 754.00 rent 681.00 681.00 0.00 06/07/2014 09/06/2015 674.80
water 41.00
insur 10.00
Total 732.00
18-306 stclair 945.00 t0105531 Gregory Smith 774.00 water 41.00 669.00 0.00 04/08/2011 08/29/2016 795.00
insur 10.00
rent 744.00
Total 795.00
18-307 stclair 945.00 VACANT VACANT 774.00 0.00 0.00 0.00 0.00
Total 0.00
Page 41 of 118

9/29/2015 10:03 AM
Unit Unit Type Unit Resident Name Market Charge Amount Resident Other Move In Lease Move Out Balance
Sq Ft Rent Code Deposit Deposit Expiration
Rent Roll with Lease ChargesProvidence Harbour Club (pharbour)
As Of = 09/01/2015
Month Year = 09/2015
18-308 stclair 945.00 t0167307 Belford Oliver 754.00 rent 720.00 720.00 0.00 04/24/2015 07/23/2016 864.80
water 41.00
insur 10.00
Total 771.00
19-101 stclair 945.00 t0103835 Theda Black* 734.00 storage 25.00 550.00 0.00 02/02/2011 01/31/2016 771.00
water 41.00
rent 733.00
Total 799.00
19-102 stclair 945.00 t0162562 Felicia Crane 754.00 rent 719.00 360.00 0.00 11/24/2014 02/23/2016 770.00
water 41.00
insur 10.00
Total 770.00
19-103 stclair 945.00 t0170267 Mallory Winzeler 754.00 rent 733.00 733.00 0.00 06/01/2015 05/31/2016 624.00
petfee 40.00
water 41.00
insur 10.00
Total 824.00
19-106 stclair 945.00 t0169395 Daniel VonHolten 754.00 rent 731.00 366.00 0.00 04/30/2015 07/29/2016 0.01
water 41.00
Total 772.00
19-107 stclair 945.00 t0154736 Laquisha Smith 754.00 water 41.00 690.00 0.00 05/01/2014 10/31/2016 750.00
rent 709.00
Total 750.00
19-108 stclair 945.00 t0156937 Dammone Stoudemire 734.00 rent 699.00 350.00 0.00 07/17/2014 10/16/2015 0.00
water 41.00
Total 740.00
19-110 stclair 945.00 t0155068 Tracy Rush-Byers 754.00 water 41.00 346.00 0.00 05/15/2014 05/11/2016 741.00
rent 700.00
Total 741.00
19-111 stclair 945.00 t0154681 Hayat Ali 754.00 rent 705.00 705.00 0.00 06/14/2014 09/13/2015 0.00
water 41.00
insur 10.00
Total 756.00
19-112 stclair 945.00 t0153558 Melissa Hubbard 734.00 concess -36.00 399.00 0.00 05/22/2014 08/15/2016 374.00
water 41.00
Page 42 of 118

9/29/2015 10:03 AM
Unit Unit Type Unit Resident Name Market Charge Amount Resident Other Move In Lease Move Out Balance
Sq Ft Rent Code Deposit Deposit Expiration
Rent Roll with Lease ChargesProvidence Harbour Club (pharbour)
As Of = 09/01/2015
Month Year = 09/2015
petfee 20.00
rent 749.00
Total 774.00
19-201 stclair 945.00 t0169806 Dolores Kuszak 764.00 rent 748.00 374.00 0.00 06/27/2015 09/26/2016 0.00
water 41.00
insur 10.00
petfee 30.00
Total 829.00
19-202 stclair 945.00 t0169970 Katelin Strine- Danner 784.00 rent 770.00 770.00 0.00 05/11/2015 05/10/2016 881.99
water 41.00
insur 10.00
Total 821.00
19-203 stclair 945.00 t0143837 Tineka Hurst 784.00 rent 758.00 199.00 0.00 09/30/2014 12/29/2015 799.00
water 41.00
Total 799.00
19-204 stclair 945.00 t0133430 Ruth Frazier 764.00 water 41.00 0.00 0.00 12/29/2012 12/21/2015 800.00
rent 759.00
Total 800.00
19-205 stclair 945.00 t0170773 Takeyia Patrick 764.00 rent 754.00 399.00 0.00 06/12/2015 09/11/2016 795.00
water 41.00
Total 795.00
19-206 stclair 945.00 t0159491 Michelle Grieve 784.00 rent 748.00 199.00 0.00 08/20/2014 11/19/2015 718.00
water 41.00
insur 10.00
Total 799.00
19-207 stclair 945.00 t0156181 Prudence Cantrell 784.00 rent 748.00 748.00 0.00 07/01/2014 09/30/2015 09/30/2015 797.62
water 41.00
insur 10.00
Total 799.00
19-208 stclair 945.00 t0162177 Terry Cheeks 764.00 rent 726.00 363.00 0.00 11/07/2014 11/06/2015 786.00
water 41.00
insur 10.00
Total 777.00
19-209 stclair 945.00 t0171455 Gabrielle Lampman 754.00 rent 782.00 782.00 0.00 07/09/2015 10/08/2016 823.61
water 41.00
Total 823.00
Page 43 of 118
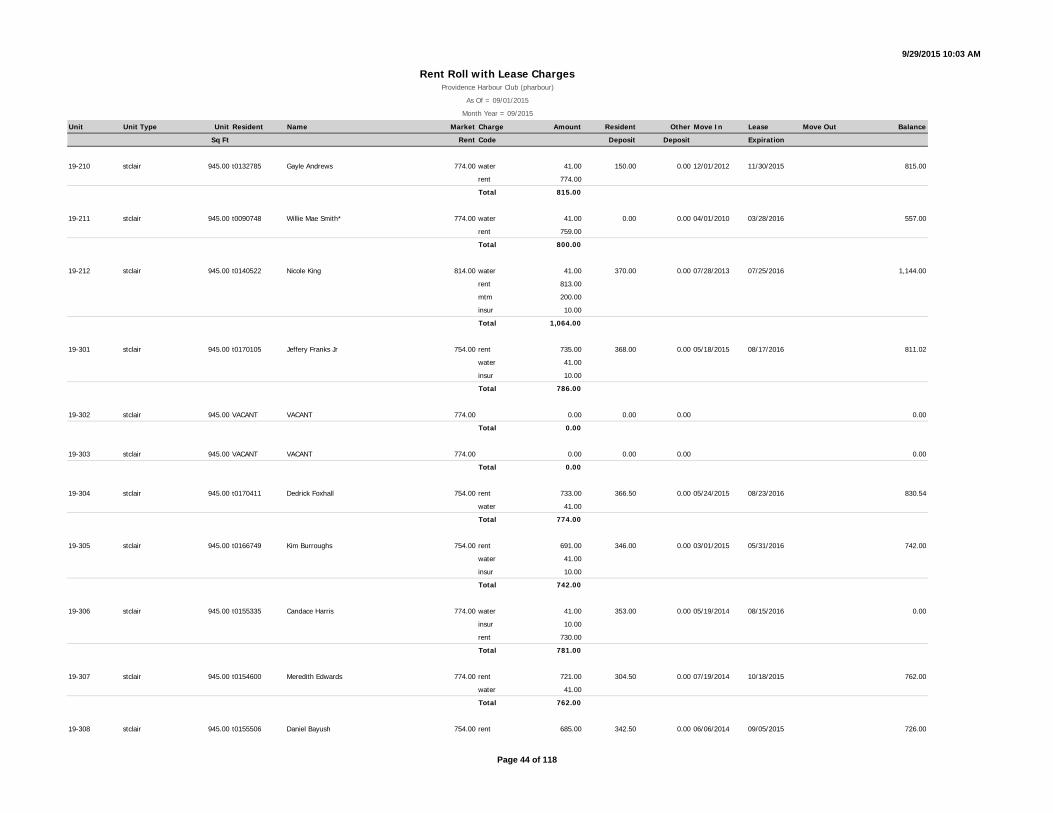
9/29/2015 10:03 AM
Unit Unit Type Unit Resident Name Market Charge Amount Resident Other Move In Lease Move Out Balance
Sq Ft Rent Code Deposit Deposit Expiration
Rent Roll with Lease ChargesProvidence Harbour Club (pharbour)
As Of = 09/01/2015
Month Year = 09/2015
19-210 stclair 945.00 t0132785 Gayle Andrews 774.00 water 41.00 150.00 0.00 12/01/2012 11/30/2015 815.00
rent 774.00
Total 815.00
19-211 stclair 945.00 t0090748 Willie Mae Smith* 774.00 water 41.00 0.00 0.00 04/01/2010 03/28/2016 557.00
rent 759.00
Total 800.00
19-212 stclair 945.00 t0140522 Nicole King 814.00 water 41.00 370.00 0.00 07/28/2013 07/25/2016 1,144.00
rent 813.00
mtm 200.00
insur 10.00
Total 1,064.00
19-301 stclair 945.00 t0170105 Jeffery Franks Jr 754.00 rent 735.00 368.00 0.00 05/18/2015 08/17/2016 811.02
water 41.00
insur 10.00
Total 786.00
19-302 stclair 945.00 VACANT VACANT 774.00 0.00 0.00 0.00 0.00
Total 0.00
19-303 stclair 945.00 VACANT VACANT 774.00 0.00 0.00 0.00 0.00
Total 0.00
19-304 stclair 945.00 t0170411 Dedrick Foxhall 754.00 rent 733.00 366.50 0.00 05/24/2015 08/23/2016 830.54
water 41.00
Total 774.00
19-305 stclair 945.00 t0166749 Kim Burroughs 754.00 rent 691.00 346.00 0.00 03/01/2015 05/31/2016 742.00
water 41.00
insur 10.00
Total 742.00
19-306 stclair 945.00 t0155335 Candace Harris 774.00 water 41.00 353.00 0.00 05/19/2014 08/15/2016 0.00
insur 10.00
rent 730.00
Total 781.00
19-307 stclair 945.00 t0154600 Meredith Edwards 774.00 rent 721.00 304.50 0.00 07/19/2014 10/18/2015 762.00
water 41.00
Total 762.00
19-308 stclair 945.00 t0155506 Daniel Bayush 754.00 rent 685.00 342.50 0.00 06/06/2014 09/05/2015 726.00
Page 44 of 118

9/29/2015 10:03 AM
Unit Unit Type Unit Resident Name Market Charge Amount Resident Other Move In Lease Move Out Balance
Sq Ft Rent Code Deposit Deposit Expiration
Rent Roll with Lease ChargesProvidence Harbour Club (pharbour)
As Of = 09/01/2015
Month Year = 09/2015
water 41.00
Total 726.00
19-309 stclair 945.00 t0120821 Velesa Moore* 754.00 petfee 30.00 546.75 0.00 04/01/2012 04/11/2016 578.00
water 41.00
rent 759.00
insur 10.00
Total 840.00
19-310 stclair 945.00 VACANT VACANT 774.00 0.00 0.00 0.00 0.00
Total 0.00
19-311 stclair 945.00 t0165886 Nicole Anderson 774.00 rent 715.00 715.00 0.00 02/20/2015 05/19/2016 796.85
petfee 30.00
water 41.00
insur 10.00
Total 796.00
19-312 stclair 945.00 t0108626 Candace Stephenson 754.00 water 41.00 150.00 0.00 08/27/2011 08/31/2015 -160.00
rent 780.00
mtm 200.00
Total 1,021.00
20-101 stclair 945.00 t0165057 Joyce Jones 734.00 rent 665.00 665.00 0.00 01/23/2015 04/22/2016 715.86
water 41.00
insur 10.00
Total 716.00
20-102 stclair 945.00 VACANT VACANT 734.00 0.00 0.00 0.00 0.00
Total 0.00
20-103 stclair 945.00 t0170851 Erika Mclemore 734.00 rent 706.00 373.00 0.00 06/21/2015 09/20/2016 0.00
water 41.00
Total 747.00
20-106 huron 805.00 t0102218 Ryan Jones 604.00 water 31.00 250.00 0.00 11/20/2010 08/22/2016 594.00
rent 563.00
Total 594.00
20-107 huron 805.00 t0151097 Lleana Blossom 604.00 water 31.00 291.00 0.00 02/21/2014 05/16/2016 0.00
rent 606.00
Total 637.00
20-108 huron 805.00 t0155959 Everette # Holland *SSI* 604.00 water 31.00 568.00 0.00 05/27/2014 08/22/2016 633.00
insur 10.00
Page 45 of 118
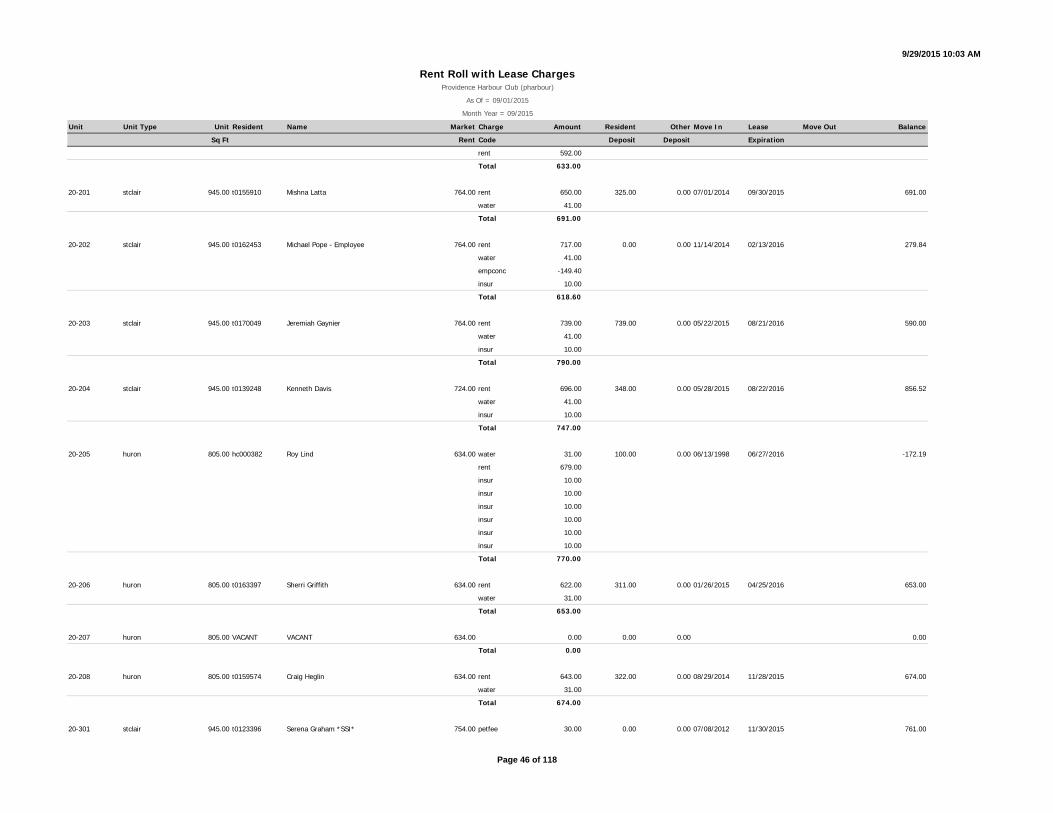
9/29/2015 10:03 AM
Unit Unit Type Unit Resident Name Market Charge Amount Resident Other Move In Lease Move Out Balance
Sq Ft Rent Code Deposit Deposit Expiration
Rent Roll with Lease ChargesProvidence Harbour Club (pharbour)
As Of = 09/01/2015
Month Year = 09/2015
rent 592.00
Total 633.00
20-201 stclair 945.00 t0155910 Mishna Latta 764.00 rent 650.00 325.00 0.00 07/01/2014 09/30/2015 691.00
water 41.00
Total 691.00
20-202 stclair 945.00 t0162453 Michael Pope - Employee 764.00 rent 717.00 0.00 0.00 11/14/2014 02/13/2016 279.84
water 41.00
empconc -149.40
insur 10.00
Total 618.60
20-203 stclair 945.00 t0170049 Jeremiah Gaynier 764.00 rent 739.00 739.00 0.00 05/22/2015 08/21/2016 590.00
water 41.00
insur 10.00
Total 790.00
20-204 stclair 945.00 t0139248 Kenneth Davis 724.00 rent 696.00 348.00 0.00 05/28/2015 08/22/2016 856.52
water 41.00
insur 10.00
Total 747.00
20-205 huron 805.00 hc000382 Roy Lind 634.00 water 31.00 100.00 0.00 06/13/1998 06/27/2016 -172.19
rent 679.00
insur 10.00
insur 10.00
insur 10.00
insur 10.00
insur 10.00
insur 10.00
Total 770.00
20-206 huron 805.00 t0163397 Sherri Griffith 634.00 rent 622.00 311.00 0.00 01/26/2015 04/25/2016 653.00
water 31.00
Total 653.00
20-207 huron 805.00 VACANT VACANT 634.00 0.00 0.00 0.00 0.00
Total 0.00
20-208 huron 805.00 t0159574 Craig Heglin 634.00 rent 643.00 322.00 0.00 08/29/2014 11/28/2015 674.00
water 31.00
Total 674.00
20-301 stclair 945.00 t0123396 Serena Graham *SSI* 754.00 petfee 30.00 0.00 0.00 07/08/2012 11/30/2015 761.00
Page 46 of 118

9/29/2015 10:03 AM
Unit Unit Type Unit Resident Name Market Charge Amount Resident Other Move In Lease Move Out Balance
Sq Ft Rent Code Deposit Deposit Expiration
Rent Roll with Lease ChargesProvidence Harbour Club (pharbour)
As Of = 09/01/2015
Month Year = 09/2015
water 41.00
rent 750.00
Total 821.00
20-302 stclair 945.00 t0171817 Stevi Hall 754.00 rent 769.00 769.00 0.00 07/30/2015 10/29/2016 842.06
petfee 20.00
water 41.00
insur 10.00
Total 840.00
20-303 stclair 945.00 t0164167 Nikki Myslinski 754.00 rent 698.00 349.00 349.00 12/17/2014 03/16/2016 799.00
petfee 60.00
water 41.00
Total 799.00
20-304 stclair 945.00 t0167723 Antoine Williamson 754.00 rent 718.00 718.00 0.00 04/17/2015 07/16/2016 0.00
water 41.00
insur 10.00
Total 769.00
20-305 huron 805.00 t0161846 Madelin Sanders 624.00 rent 609.00 305.00 305.00 01/07/2015 04/06/2016 632.86
water 31.00
Total 640.00
20-306 huron 805.00 t0158247 Gregory Guro 624.00 water 31.00 602.00 0.00 07/19/2014 10/17/2016 0.00
rent 612.00
Total 643.00
20-307 huron 805.00 t0165138 Scott Caudill 624.00 rent 617.00 399.00 0.00 02/08/2015 05/07/2016 0.00
petfee 20.00
water 31.00
insur 10.00
Total 678.00
20-308 huron 805.00 t0122624 Cedric Brooks 624.00 water 31.00 0.00 0.00 05/13/2012 11/23/2015 709.61
rent 668.00
insur 10.00
Total 709.00
22-101 stclair 945.00 t0072576 Becky Jenkins 734.00 storage 25.00 300.00 0.00 01/10/2009 07/25/2016 -12.00
water 41.00
rent 767.00
Total 833.00
22-102 stclair 945.00 t0143442 Alvin Boykin 744.00 water 41.00 199.00 0.00 08/31/2013 08/31/2015 763.00
Page 47 of 118

9/29/2015 10:03 AM
Unit Unit Type Unit Resident Name Market Charge Amount Resident Other Move In Lease Move Out Balance
Sq Ft Rent Code Deposit Deposit Expiration
Rent Roll with Lease ChargesProvidence Harbour Club (pharbour)
As Of = 09/01/2015
Month Year = 09/2015
insur 10.00
rent 712.00
Total 763.00
22-103 stclair 945.00 VACANT VACANT 744.00 0.00 0.00 0.00 0.00
Total 0.00
22-106 huron 805.00 t0174340 Jacob Pabolo 594.00 rent 640.00 640.00 0.00 08/21/2015 11/20/2016 298.00
water 31.00
insur 10.00
Total 681.00
22-107 huron 805.00 VACANT VACANT 594.00 0.00 0.00 0.00 0.00
Total 0.00
22-108 huron 805.00 t0166667 Teron Turner 584.00 rent 579.00 290.00 0.00 04/03/2015 07/02/2016 56.29
water 31.00
insur 10.00
Total 620.00
22-201 stclair 945.00 t0154283 Pamela Woods 764.00 rent 691.00 346.00 0.00 06/21/2014 09/20/2015 738.00
water 41.00
Total 732.00
22-202 stclair 945.00 VACANT VACANT 774.00 0.00 0.00 0.00 0.00
Total 0.00
22-203 stclair 945.00 VACANT VACANT 774.00 0.00 0.00 0.00 0.00
Total 0.00
22-204 stclair 945.00 t0149587 Kasandra Burks 764.00 water 41.00 382.00 0.00 12/24/2013 12/28/2015 815.00
rent 774.00
Total 815.00
22-205 huron 805.00 t0081980 Danielle Balish 614.00 rent 601.00 0.00 0.00 07/30/2014 10/29/2015 733.00
water 31.00
insur 10.00
Total 642.00
22-206 huron 805.00 t0078905 Edward Poslaiko 624.00 water 31.00 0.00 0.00 05/01/2011 07/20/2016 649.00
rent 618.00
Total 649.00
22-207 huron 805.00 hc000429 Barbra Fairman 624.00 petfee 40.00 170.00 0.00 03/10/2006 09/30/2015 0.00
water 31.00
Page 48 of 118

9/29/2015 10:03 AM
Unit Unit Type Unit Resident Name Market Charge Amount Resident Other Move In Lease Move Out Balance
Sq Ft Rent Code Deposit Deposit Expiration
Rent Roll with Lease ChargesProvidence Harbour Club (pharbour)
As Of = 09/01/2015
Month Year = 09/2015
rent 638.00
Total 709.00
22-208 huron 805.00 t0158439 Terrence Kelley 614.00 water 31.00 302.00 0.00 07/28/2014 10/24/2016 594.00
rent 613.00
insur 10.00
Total 654.00
22-301 stclair 945.00 t0148682 David Adams 754.00 rent 702.00 702.00 0.00 03/20/2015 06/19/2016 -0.66
petfee 20.00
water 41.00
Total 763.00
22-302 stclair 945.00 t0153362 Trenise Truett 764.00 water 41.00 353.00 0.00 04/29/2014 01/25/2016 812.91
rent 782.00
Total 823.00
22-303 stclair 945.00 t0168913 Bryan Morrissey 764.00 rent 728.00 728.00 0.00 04/17/2015 07/16/2016 602.00
water 41.00
insur 10.00
Total 779.00
22-304 stclair 945.00 t0172604 Brittany James 754.00 rent 792.00 396.00 0.00 08/15/2015 11/14/2016 10.00
water 41.00
Total 833.00
22-305 huron 805.00 t0158214 Hannah Cluckey 604.00 rent 581.00 291.00 0.00 07/26/2014 10/25/2015 818.00
water 31.00
insur 10.00
Total 622.00
22-306 huron 805.00 t0139473 Jason Ivey 614.00 petfee 30.00 309.00 0.00 05/16/2013 05/23/2016 0.00
water 31.00
rent 639.00
Total 700.00
22-307 huron 805.00 t0166165 Melanie Mansfield 614.00 water 31.00 100.00 0.00 03/27/2013 03/28/2016 640.00
rent 589.00
insur 10.00
Total 630.00
22-308 huron 805.00 t0140524 Beth-Ann Kubala 604.00 water 31.00 310.00 0.00 09/27/2013 09/29/2015 0.00
petfee 20.00
rent 637.00
Total 688.00
Page 49 of 118

9/29/2015 10:03 AM
Unit Unit Type Unit Resident Name Market Charge Amount Resident Other Move In Lease Move Out Balance
Sq Ft Rent Code Deposit Deposit Expiration
Rent Roll with Lease ChargesProvidence Harbour Club (pharbour)
As Of = 09/01/2015
Month Year = 09/2015
23-101 erie 835.00 VACANT VACANT 769.00 0.00 0.00 0.00 0.00
Total 0.00
23-102 superior 1,100.00 t0152964 Tiffany Lyn Pukey 919.00 rent 938.00 469.00 0.00 04/28/2015 07/28/2016 989.00
water 41.00
insur 10.00
Total 989.00
23-103 superior 1,100.00 t0145748 Dawn Grimes 919.00 water 41.00 899.00 0.00 04/16/2011 11/09/2015 1,008.00
rent 967.00
Total 1,008.00
23-104 superior 1,100.00 t0090880 Sheila Weston 919.00 rent 924.00 462.00 0.00 05/28/2015 08/22/2016 975.00
water 41.00
insur 10.00
Total 975.00
23-105 superior 1,100.00 t0150634 David Yeo 919.00 water 41.00 455.00 0.00 01/17/2014 05/30/2016 976.00
rent 925.00
insur 10.00
Total 976.00
23-106 superior 1,100.00 hc000442 Aundree Young 944.00 water 41.00 275.00 0.00 07/20/2005 07/25/2016 0.00
rent 1,021.00
Total 1,062.00
23-107 superior 1,100.00 t0069630 Marisa Arnold 919.00 water 41.00 0.00 0.00 12/31/2008 11/01/2016 1,013.00
rent 972.00
Total 1,013.00
23-108 erie 835.00 t0155855 Lisa Burton 769.00 rent 732.00 199.00 0.00 06/11/2014 09/10/2015 727.00
concess -36.00
water 31.00
Total 727.00
23-201 erie 835.00 t0075589 Robert Hendrickson 759.00 water 31.00 0.00 0.00 04/28/2009 07/27/2016 -17.09
rent 740.00
insur 10.00
Total 781.00
23-202 superior 1,100.00 t0124050 Annie Harris *SSI* 909.00 water 41.00 449.00 0.00 06/21/2012 06/27/2016 995.00
rent 946.00
insur 10.00
Total 997.00
Page 50 of 118

9/29/2015 10:03 AM
Unit Unit Type Unit Resident Name Market Charge Amount Resident Other Move In Lease Move Out Balance
Sq Ft Rent Code Deposit Deposit Expiration
Rent Roll with Lease ChargesProvidence Harbour Club (pharbour)
As Of = 09/01/2015
Month Year = 09/2015
23-203 superior 1,100.00 t0172889 Virginia Anderson 909.00 water 41.00 925.00 0.00 07/26/2013 07/25/2016 806.00
rent 965.00
Total 1,006.00
23-204 superior 1,100.00 t0085728 Kenneth Buczkowski 934.00 water 41.00 493.00 0.00 03/29/2014 09/26/2016 1,064.93
storage 25.00
rent 998.00
Total 1,064.00
23-205 superior 1,100.00 hc000449 Donald Friday 934.00 water 41.00 200.00 0.00 06/30/2004 05/23/2016 0.00
rent 1,082.00
Total 1,123.00
23-206 superior 1,100.00 hc000450 Thomas Bonner 909.00 water 41.00 200.00 0.00 07/28/2003 07/25/2016 1,023.00
rent 982.00
Total 1,023.00
23-207 superior 1,100.00 t0064057 Gwendolyn Nelson 909.00 water 41.00 500.00 0.00 09/26/2008 12/31/2015 0.00
rent 944.00
Total 985.00
23-208 erie 835.00 t0164768 Reyes Arreola 759.00 rent 705.00 353.00 0.00 01/26/2015 01/25/2016 58.00
water 31.00
insur 10.00
Total 746.00
23-301 erie 835.00 t0167921 Julie Stanfield 749.00 rent 686.00 343.00 0.00 05/01/2015 07/31/2016 717.00
water 31.00
Total 717.00
23-302 superior 1,100.00 t0107109 Angela Speed 899.00 water 41.00 250.00 0.00 06/22/2011 08/22/2016 974.00
rent 935.00
Total 976.00
23-303 superior 1,100.00 t0144806 Elizabeth Brown 899.00 petfee 30.00 399.00 0.00 09/10/2013 09/30/2015 986.60
water 41.00
rent 916.00
Total 987.00
23-304 superior 1,100.00 t0056586 Kelly Snider 919.00 petfee 20.00 200.00 0.00 06/09/2008 09/28/2016 1,021.00
water 41.00
rent 950.00
insur 10.00
Total 1,021.00
Page 51 of 118

9/29/2015 10:03 AM
Unit Unit Type Unit Resident Name Market Charge Amount Resident Other Move In Lease Move Out Balance
Sq Ft Rent Code Deposit Deposit Expiration
Rent Roll with Lease ChargesProvidence Harbour Club (pharbour)
As Of = 09/01/2015
Month Year = 09/2015
23-305 superior 1,100.00 t0162546 Laneisha Howard 899.00 rent 940.00 470.00 0.00 11/18/2014 02/17/2016 991.00
water 41.00
insur 10.00
Total 991.00
23-306 superior 1,100.00 VACANT VACANT 919.00 0.00 0.00 0.00 0.00
Total 0.00
23-307 superior 1,100.00 t0155169 Eric Robinson 899.00 rent 919.00 459.00 0.00 07/07/2014 10/06/2015 0.00
water 41.00
Total 960.00
23-308 erie 835.00 t0079617 Ted Rimer 749.00 water 31.00 1.00 0.00 06/27/2009 06/30/2015 0.00
rent 759.00
mtm 200.00
Total 990.00
24-101 erie 835.00 t0167939 Theresa Broughton 769.00 rent 711.00 356.00 0.00 04/10/2015 07/09/2016 762.00
petfee 20.00
water 31.00
Total 762.00
24-102 superior 1,100.00 hc000459 Ted Vincent 939.00 water 41.00 450.00 0.00 12/01/1978 09/30/2015 927.00
rent 939.00
concess -53.00
Total 927.00
24-103 superior 1,100.00 t0096461 Karen Montoya 939.00 water 41.00 200.00 0.00 09/18/2010 09/30/2015 1,023.00
rent 982.00
Total 1,023.00
24-104 superior 1,100.00 t0111359 Ivory Hood # 919.00 water 41.00 150.00 0.00 08/08/2011 11/30/2015 1,004.00
rent 963.00
Total 1,004.00
24-105 superior 1,100.00 t0092834 Paulette Perdue *SSI* 944.00 water 41.00 0.00 0.00 05/05/2010 04/11/2016 1,080.00
rent 987.00
Total 1,028.00
24-106 superior 1,100.00 t0112516 David Ferguson 919.00 water 41.00 0.00 0.00 10/01/2012 09/30/2015 0.00
petfee 20.00
rent 983.00
Total 1,044.00
Page 52 of 118
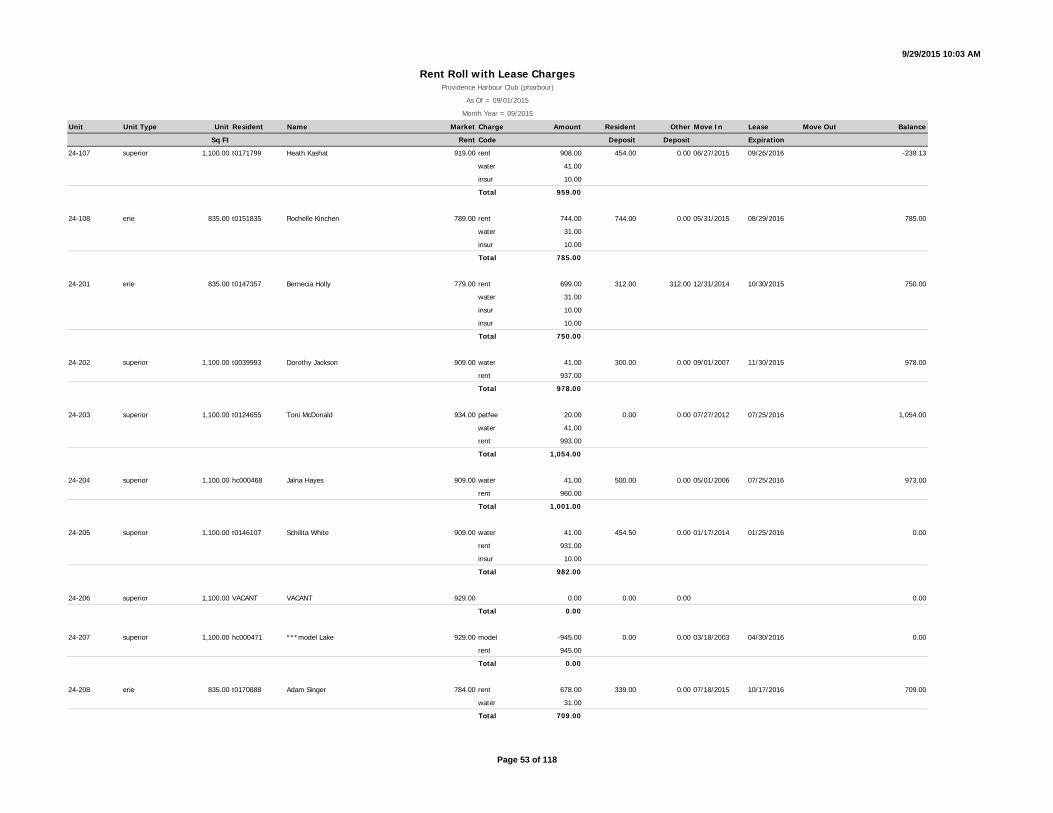
9/29/2015 10:03 AM
Unit Unit Type Unit Resident Name Market Charge Amount Resident Other Move In Lease Move Out Balance
Sq Ft Rent Code Deposit Deposit Expiration
Rent Roll with Lease ChargesProvidence Harbour Club (pharbour)
As Of = 09/01/2015
Month Year = 09/2015
24-107 superior 1,100.00 t0171799 Heath Kashat 919.00 rent 908.00 454.00 0.00 06/27/2015 09/26/2016 -239.13
water 41.00
insur 10.00
Total 959.00
24-108 erie 835.00 t0151835 Rochelle Kinchen 789.00 rent 744.00 744.00 0.00 05/31/2015 08/29/2016 785.00
water 31.00
insur 10.00
Total 785.00
24-201 erie 835.00 t0147357 Bernecia Holly 779.00 rent 699.00 312.00 312.00 12/31/2014 10/30/2015 750.00
water 31.00
insur 10.00
insur 10.00
Total 750.00
24-202 superior 1,100.00 t0039993 Dorothy Jackson 909.00 water 41.00 300.00 0.00 09/01/2007 11/30/2015 978.00
rent 937.00
Total 978.00
24-203 superior 1,100.00 t0124655 Toni McDonald 934.00 petfee 20.00 0.00 0.00 07/27/2012 07/25/2016 1,054.00
water 41.00
rent 993.00
Total 1,054.00
24-204 superior 1,100.00 hc000468 Jalna Hayes 909.00 water 41.00 500.00 0.00 05/01/2006 07/25/2016 973.00
rent 960.00
Total 1,001.00
24-205 superior 1,100.00 t0146107 Schilita White 909.00 water 41.00 454.50 0.00 01/17/2014 01/25/2016 0.00
rent 931.00
insur 10.00
Total 982.00
24-206 superior 1,100.00 VACANT VACANT 929.00 0.00 0.00 0.00 0.00
Total 0.00
24-207 superior 1,100.00 hc000471 ***model Lake 929.00 model -945.00 0.00 0.00 03/18/2003 04/30/2016 0.00
rent 945.00
Total 0.00
24-208 erie 835.00 t0170888 Adam Singer 784.00 rent 678.00 339.00 0.00 07/18/2015 10/17/2016 709.00
water 31.00
Total 709.00
Page 53 of 118

9/29/2015 10:03 AM
Unit Unit Type Unit Resident Name Market Charge Amount Resident Other Move In Lease Move Out Balance
Sq Ft Rent Code Deposit Deposit Expiration
Rent Roll with Lease ChargesProvidence Harbour Club (pharbour)
As Of = 09/01/2015
Month Year = 09/2015
24-301 erie 835.00 t0153763 Camille Hamilton-Hudson 769.00 water 31.00 707.00 0.00 04/15/2014 10/10/2016 804.16
insur 10.00
rent 721.00
Total 762.00
24-302 superior 1,100.00 hc000474 Peter Brama 919.00 storage 25.00 0.00 0.00 10/01/2006 09/30/2015 1,069.00
water 41.00
rent 1,003.00
Total 1,069.00
24-303 superior 1,100.00 t0148466 Mari Ross 899.00 petfee 30.00 899.00 0.00 11/29/2013 03/31/2016 0.00
water 41.00
rent 930.00
Total 1,001.00
24-304 superior 1,100.00 t0105473 Teresa Wall 944.00 petfee 30.00 350.00 0.00 04/15/2011 08/29/2016 1,070.00
petfee 20.00
water 41.00
rent 979.00
Total 1,070.00
24-305 superior 1,100.00 t0156689 Jeffrey Beal 919.00 rent 909.00 909.00 0.00 06/25/2014 09/24/2015 950.00
water 41.00
Total 950.00
24-306 superior 1,100.00 t0045529 Denise Lilly 939.00 water 41.00 200.00 0.00 08/01/2007 07/25/2016 1,058.00
rent 1,017.00
Total 1,058.00
24-307 superior 1,100.00 t0172622 Joel Rogers 919.00 rent 913.00 199.00 0.00 08/01/2015 10/17/2016 0.00
water 41.00
Total 954.00
24-308 erie 835.00 t0171349 Ali Esmaili 769.00 rent 735.00 368.00 0.00 07/12/2015 07/11/2016 774.64
water 31.00
insur 10.00
Total 776.00
25-101 erie 835.00 t0171415 Lauren Fultz 699.00 rent 660.00 399.00 0.00 08/07/2015 11/06/2016 696.00
petfee 30.00
water 31.00
Total 721.00
25-102 superior 1,100.00 t0159578 Curtis Ford 944.00 rent 999.00 500.00 0.00 09/13/2014 12/12/2015 1,060.00
petfee 20.00
Page 54 of 118

9/29/2015 10:03 AM
Unit Unit Type Unit Resident Name Market Charge Amount Resident Other Move In Lease Move Out Balance
Sq Ft Rent Code Deposit Deposit Expiration
Rent Roll with Lease ChargesProvidence Harbour Club (pharbour)
As Of = 09/01/2015
Month Year = 09/2015
water 41.00
Total 1,060.00
25-103 superior 1,100.00 t0153743 Lois Long 919.00 water 41.00 199.00 0.00 04/07/2014 07/27/2016 2,214.00
rent 903.00
insur 10.00
Total 954.00
25-104 superior 1,100.00 t0148681 Gerry Desselles @ 919.00 petfee 30.00 199.00 0.00 08/16/2013 10/31/2016 1,036.00
water 41.00
rent 965.00
Total 1,036.00
25-105 superior 1,100.00 t0136407 Janette Renton 919.00 water 41.00 0.00 0.00 03/27/2013 07/27/2016 -28.00
rent 953.00
Total 994.00
25-106 superior 1,100.00 t0156628 Chester Berbas Sr 919.00 rent 919.00 459.00 0.00 08/27/2014 11/26/2015 970.00
water 41.00
insur 10.00
Total 970.00
25-107 superior 1,100.00 t0140353 Shaneta Waddy 919.00 rent 919.00 199.00 0.00 04/01/2015 06/30/2016 960.00
water 41.00
Total 960.00
25-108 erie 835.00 t0170189 Martin Bazinau 794.00 rent 743.00 743.00 0.00 06/21/2015 02/20/2016 784.00
water 31.00
insur 10.00
Total 784.00
25-201 erie 835.00 t0159972 Christopher Gillyard - Employee 769.00 rent 769.00 0.00 0.00 09/30/2014 09/29/2015 736.98
water 31.00
empconc -154.00
insur 10.00
Total 656.00
25-202 superior 1,100.00 t0068672 John Schneider 909.00 petfee 20.00 125.00 0.00 10/30/2008 11/30/2015 0.00
water 41.00
rent 986.00
Total 1,047.00
25-203 superior 1,100.00 t0110602 Darren Walton # 934.00 water 41.00 200.00 0.00 07/26/2011 10/19/2015 10/19/2015 -2.00
rent 962.00
insur 10.00
Page 55 of 118
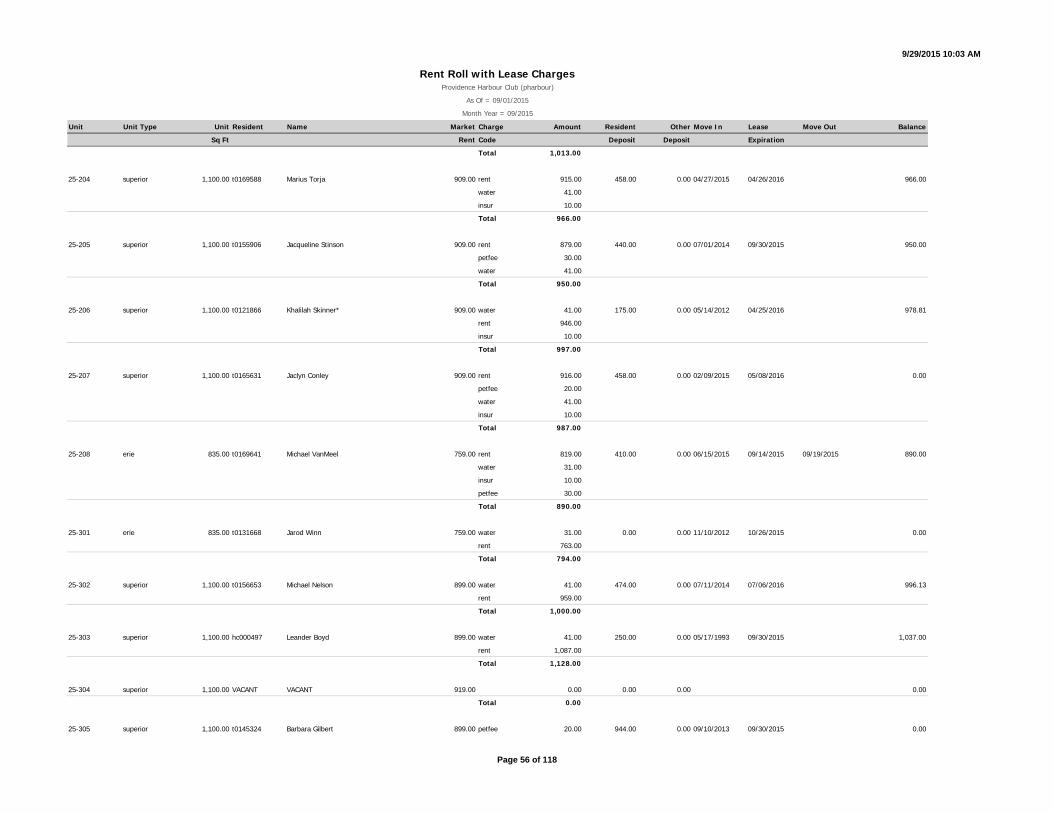
9/29/2015 10:03 AM
Unit Unit Type Unit Resident Name Market Charge Amount Resident Other Move In Lease Move Out Balance
Sq Ft Rent Code Deposit Deposit Expiration
Rent Roll with Lease ChargesProvidence Harbour Club (pharbour)
As Of = 09/01/2015
Month Year = 09/2015
Total 1,013.00
25-204 superior 1,100.00 t0169588 Marius Torja 909.00 rent 915.00 458.00 0.00 04/27/2015 04/26/2016 966.00
water 41.00
insur 10.00
Total 966.00
25-205 superior 1,100.00 t0155906 Jacqueline Stinson 909.00 rent 879.00 440.00 0.00 07/01/2014 09/30/2015 950.00
petfee 30.00
water 41.00
Total 950.00
25-206 superior 1,100.00 t0121866 Khalilah Skinner* 909.00 water 41.00 175.00 0.00 05/14/2012 04/25/2016 978.81
rent 946.00
insur 10.00
Total 997.00
25-207 superior 1,100.00 t0165631 Jaclyn Conley 909.00 rent 916.00 458.00 0.00 02/09/2015 05/08/2016 0.00
petfee 20.00
water 41.00
insur 10.00
Total 987.00
25-208 erie 835.00 t0169641 Michael VanMeel 759.00 rent 819.00 410.00 0.00 06/15/2015 09/14/2015 09/19/2015 890.00
water 31.00
insur 10.00
petfee 30.00
Total 890.00
25-301 erie 835.00 t0131668 Jarod Winn 759.00 water 31.00 0.00 0.00 11/10/2012 10/26/2015 0.00
rent 763.00
Total 794.00
25-302 superior 1,100.00 t0156653 Michael Nelson 899.00 water 41.00 474.00 0.00 07/11/2014 07/06/2016 996.13
rent 959.00
Total 1,000.00
25-303 superior 1,100.00 hc000497 Leander Boyd 899.00 water 41.00 250.00 0.00 05/17/1993 09/30/2015 1,037.00
rent 1,087.00
Total 1,128.00
25-304 superior 1,100.00 VACANT VACANT 919.00 0.00 0.00 0.00 0.00
Total 0.00
25-305 superior 1,100.00 t0145324 Barbara Gilbert 899.00 petfee 20.00 944.00 0.00 09/10/2013 09/30/2015 0.00
Page 56 of 118
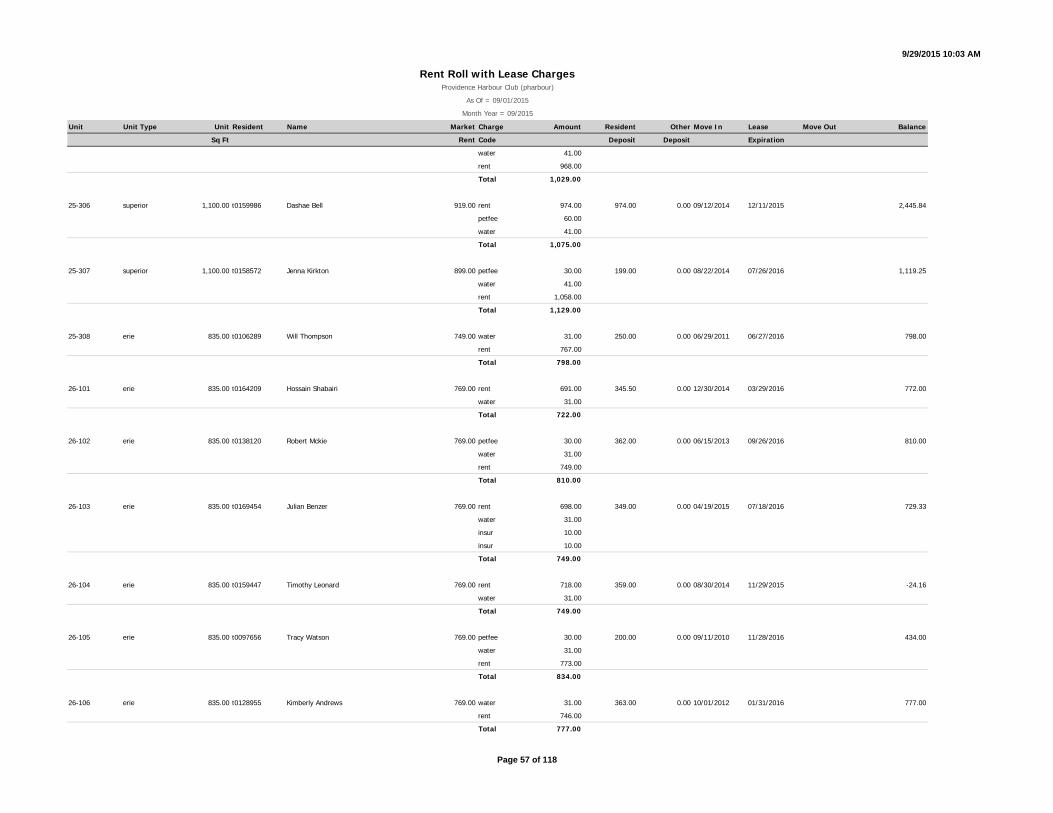
9/29/2015 10:03 AM
Unit Unit Type Unit Resident Name Market Charge Amount Resident Other Move In Lease Move Out Balance
Sq Ft Rent Code Deposit Deposit Expiration
Rent Roll with Lease ChargesProvidence Harbour Club (pharbour)
As Of = 09/01/2015
Month Year = 09/2015
water 41.00
rent 968.00
Total 1,029.00
25-306 superior 1,100.00 t0159986 Dashae Bell 919.00 rent 974.00 974.00 0.00 09/12/2014 12/11/2015 2,445.84
petfee 60.00
water 41.00
Total 1,075.00
25-307 superior 1,100.00 t0158572 Jenna Kirkton 899.00 petfee 30.00 199.00 0.00 08/22/2014 07/26/2016 1,119.25
water 41.00
rent 1,058.00
Total 1,129.00
25-308 erie 835.00 t0106289 Will Thompson 749.00 water 31.00 250.00 0.00 06/29/2011 06/27/2016 798.00
rent 767.00
Total 798.00
26-101 erie 835.00 t0164209 Hossain Shabairi 769.00 rent 691.00 345.50 0.00 12/30/2014 03/29/2016 772.00
water 31.00
Total 722.00
26-102 erie 835.00 t0138120 Robert Mckie 769.00 petfee 30.00 362.00 0.00 06/15/2013 09/26/2016 810.00
water 31.00
rent 749.00
Total 810.00
26-103 erie 835.00 t0169454 Julian Benzer 769.00 rent 698.00 349.00 0.00 04/19/2015 07/18/2016 729.33
water 31.00
insur 10.00
insur 10.00
Total 749.00
26-104 erie 835.00 t0159447 Timothy Leonard 769.00 rent 718.00 359.00 0.00 08/30/2014 11/29/2015 -24.16
water 31.00
Total 749.00
26-105 erie 835.00 t0097656 Tracy Watson 769.00 petfee 30.00 200.00 0.00 09/11/2010 11/28/2016 434.00
water 31.00
rent 773.00
Total 834.00
26-106 erie 835.00 t0128955 Kimberly Andrews 769.00 water 31.00 363.00 0.00 10/01/2012 01/31/2016 777.00
rent 746.00
Total 777.00
Page 57 of 118

9/29/2015 10:03 AM
Unit Unit Type Unit Resident Name Market Charge Amount Resident Other Move In Lease Move Out Balance
Sq Ft Rent Code Deposit Deposit Expiration
Rent Roll with Lease ChargesProvidence Harbour Club (pharbour)
As Of = 09/01/2015
Month Year = 09/2015
26-107 erie 835.00 t0171212 Jordan Berry 769.00 rent 735.00 368.00 0.00 06/22/2015 09/21/2016 750.14
water 31.00
insur 10.00
Total 776.00
26-108 erie 835.00 t0167462 Vanica Daniel 769.00 rent 710.00 710.00 0.00 04/01/2015 06/30/2016 741.00
water 31.00
Total 741.00
26-109 erie 835.00 hc000510 Nancy Laskowski 769.00 water 31.00 550.00 0.00 11/15/2006 11/30/2015 752.00
rent 721.00
Total 752.00
26-110 erie 835.00 VACANT VACANT 769.00 0.00 0.00 0.00 0.00
Total 0.00
26-201 erie 835.00 t0134584 Kelli Massey 784.00 water 31.00 543.75 0.00 01/26/2013 02/29/2016 -46.00
concess -54.00
rent 738.00
insur 10.00
Total 725.00
26-202 erie 835.00 t0144549 Ronald Herczak 759.00 water 31.00 199.00 0.00 08/23/2013 08/31/2015 -1,480.00
insur 10.00
rent 791.00
Total 832.00
26-203 erie 835.00 t0166347 Nicole Rieck 784.00 rent 723.00 181.00 0.00 02/27/2015 05/26/2016 754.00
water 31.00
Total 754.00
26-204 erie 835.00 t0063779 Jeanell Leath 759.00 water 31.00 0.00 0.00 09/13/2008 12/28/2015 864.00
rent 833.00
Total 864.00
26-205 erie 835.00 hc000515 Virginia Adams 759.00 water 31.00 150.00 0.00 10/12/2004 10/26/2015 0.00
rent 822.00
Total 853.00
26-206 erie 835.00 t0137432 Cynthia Thompson 759.00 rent 725.00 362.00 0.00 06/26/2015 09/25/2016 755.59
water 31.00
Total 756.00
26-207 erie 835.00 t0151974 Jennifer Garbin 759.00 water 31.00 721.00 0.00 03/01/2014 09/30/2016 0.00
Page 58 of 118

9/29/2015 10:03 AM
Unit Unit Type Unit Resident Name Market Charge Amount Resident Other Move In Lease Move Out Balance
Sq Ft Rent Code Deposit Deposit Expiration
Rent Roll with Lease ChargesProvidence Harbour Club (pharbour)
As Of = 09/01/2015
Month Year = 09/2015
rent 729.00
insur 10.00
Total 770.00
26-208 erie 835.00 t0170385 Stephanie Lovelace 759.00 rent 712.00 199.00 0.00 06/04/2015 09/03/2016 743.00
water 31.00
Total 743.00
26-209 erie 835.00 t0102207 Johnny Brown 759.00 rent 691.00 250.00 350.00 12/31/2014 12/30/2015 0.00
water 31.00
Total 722.00
26-210 erie 835.00 t0169066 Sean Lolley 759.00 rent 694.00 399.00 0.00 04/23/2015 04/22/2016 1,744.00
water 31.00
insur 10.00
Total 735.00
26-301 erie 835.00 t0169127 Robert Knight 749.00 rent 696.00 348.00 0.00 05/15/2015 08/14/2016 727.00
water 31.00
Total 727.00
26-302 erie 835.00 t0137371 Alicia Wilson 749.00 water 31.00 150.00 0.00 03/29/2013 06/29/2016 773.00
rent 732.00
insur 10.00
Total 773.00
26-303 erie 835.00 t0155542 Natalie Rayburn 749.00 rent 675.00 338.00 338.00 12/31/2014 10/17/2015 0.00
petfee 30.00
water 31.00
Total 736.00
26-304 erie 835.00 t0166057 Damon Eddy 769.00 rent 728.00 728.00 0.00 03/02/2015 12/01/2015 369.00
water 31.00
insur 10.00
Total 769.00
26-305 erie 835.00 t0160560 Sandra Brown* 749.00 rent 676.00 336.00 0.00 10/11/2014 09/30/2015 682.00
water 31.00
Total 707.00
26-306 erie 835.00 t0161984 Aja Alexander 769.00 rent 687.00 343.00 0.00 11/07/2014 02/06/2016 728.00
water 31.00
insur 10.00
Total 728.00
Page 59 of 118

9/29/2015 10:03 AM
Unit Unit Type Unit Resident Name Market Charge Amount Resident Other Move In Lease Move Out Balance
Sq Ft Rent Code Deposit Deposit Expiration
Rent Roll with Lease ChargesProvidence Harbour Club (pharbour)
As Of = 09/01/2015
Month Year = 09/2015
26-307 erie 835.00 t0146890 Robert Tucker 749.00 water 31.00 199.00 0.00 11/21/2013 07/13/2015 990.00
insur 10.00
mtm 200.00
rent 749.00
Total 990.00
26-308 erie 835.00 t0086676 Marilyn Maxwell 794.00 water 31.00 0.00 0.00 01/29/2010 01/25/2016 0.00
rent 804.00
Total 835.00
26-309 erie 835.00 t0141317 Macayla Arnold 749.00 rent 708.00 462.00 0.00 07/30/2014 10/29/2015 759.00
petfee 20.00
water 31.00
Total 759.00
26-310 erie 835.00 t0166346 Jacob Gittelson 749.00 rent 688.00 399.00 0.00 04/02/2015 07/01/2016 779.00
petfee 50.00
water 31.00
insur 10.00
Total 779.00
27-101 erie 835.00 t0148248 Juanita Austin *SSI* 769.00 water 31.00 554.00 0.00 12/31/2013 12/28/2015 754.00
rent 778.00
insur 10.00
Total 819.00
27-102 erie 835.00 t0169186 Charles Long *SSI* 769.00 rent 698.00 698.00 0.00 04/10/2015 07/09/2016 769.00
petfee 30.00
water 31.00
insur 10.00
Total 769.00
27-103 erie 835.00 t0170514 Jason Tenorio 769.00 rent 729.00 735.00 0.00 06/22/2015 09/20/2016 760.65
water 31.00
Total 760.00
27-104 erie 835.00 t0106781 James Moss 769.00 water 31.00 349.50 0.00 11/01/2013 02/29/2016 771.00
rent 740.00
Total 771.00
27-105 erie 835.00 t0098519 Edward Byers -Employee 769.00 water 23.00 0.00 0.00 08/24/2010 03/31/2016 582.00
empconc -216.00
rent 775.00
Total 582.00
Page 60 of 118

9/29/2015 10:03 AM
Unit Unit Type Unit Resident Name Market Charge Amount Resident Other Move In Lease Move Out Balance
Sq Ft Rent Code Deposit Deposit Expiration
Rent Roll with Lease ChargesProvidence Harbour Club (pharbour)
As Of = 09/01/2015
Month Year = 09/2015
27-106 erie 835.00 t0174456 William Boice 769.00 rent 750.00 375.00 0.00 08/31/2015 08/30/2016 -10.32
water 31.00
Total 781.00
27-107 erie 835.00 t0099321 Jonathan Peppers # 769.00 water 31.00 200.00 0.00 10/15/2010 01/31/2016 766.00
rent 735.00
Total 766.00
27-108 erie 835.00 t0154250 Brandy Holmes 769.00 petfee 30.00 399.00 0.00 04/27/2014 11/28/2016 997.26
water 31.00
insur 10.00
rent 721.00
Total 792.00
27-109 erie 835.00 t0143425 Branden Bomis 769.00 water 31.00 0.00 0.00 09/28/2013 11/30/2015 780.00
rent 749.00
Total 780.00
27-110 erie 835.00 t0169900 Cary Bielski 769.00 rent 710.00 355.00 0.00 05/01/2015 04/30/2016 0.00
petfee 20.00
water 31.00
Total 761.00
27-201 erie 835.00 VACANT VACANT 784.00 0.00 0.00 0.00 0.00
Total 0.00
27-202 erie 835.00 hc000537 Mark Blubaugh 759.00 storage 25.00 175.00 0.00 11/11/2001 11/30/2015 724.00
water 31.00
rent 868.00
Total 924.00
27-203 erie 835.00 t0169695 Joye jackson 759.00 rent 688.00 399.00 0.00 05/02/2015 08/01/2016 729.00
water 31.00
insur 10.00
Total 729.00
27-204 erie 835.00 t0148795 Erika Arrington 759.00 water 31.00 759.00 0.00 12/01/2013 11/30/2015 808.00
rent 777.00
Total 808.00
27-205 erie 835.00 t0169540 Rose Keller 759.00 rent 716.00 199.00 0.00 05/23/2015 08/22/2016 0.00
water 31.00
insur 10.00
Total 757.00
Page 61 of 118

9/29/2015 10:03 AM
Unit Unit Type Unit Resident Name Market Charge Amount Resident Other Move In Lease Move Out Balance
Sq Ft Rent Code Deposit Deposit Expiration
Rent Roll with Lease ChargesProvidence Harbour Club (pharbour)
As Of = 09/01/2015
Month Year = 09/2015
27-206 erie 835.00 t0154825 Ian Johnson 759.00 water 31.00 399.00 0.00 05/30/2014 08/25/2015 877.48
insur 10.00
rent 747.00
Total 788.00
27-207 erie 835.00 t0135320 Mark Yokley -Emp 784.00 water 31.00 0.00 0.00 02/22/2013 03/31/2016 0.00
empconc -170.00
rent 700.00
Total 561.00
27-208 erie 835.00 t0170325 Angel Cabrera 759.00 rent 712.00 712.00 0.00 05/12/2015 08/11/2016 753.00
water 31.00
insur 10.00
Total 753.00
27-209 erie 835.00 t0098124 James Rzepecki 759.00 rent 736.00 368.00 0.00 06/28/2015 09/27/2016 767.00
water 31.00
Total 767.00
27-210 erie 835.00 t0138137 Amritpal Singh 784.00 water 31.00 0.00 0.00 04/12/2013 01/31/2016 -10.00
rent 784.00
Total 815.00
27-301 erie 835.00 t0171836 Raymond Brice 749.00 rent 715.00 0.00 0.00 07/10/2015 07/09/2016 -15.50
water 31.00
Total 746.00
27-302 erie 835.00 t0171107 Tamadur Hamed 774.00 rent 794.00 794.00 0.00 06/01/2015 10/30/2015 -10.00
water 31.00
Total 825.00
27-303 erie 835.00 t0117048 Brandon Simmons 749.00 water 31.00 175.00 0.00 12/06/2011 11/30/2015 782.00
rent 751.00
Total 782.00
27-304 erie 835.00 t0121009 Clyde Wright 769.00 water 31.00 362.50 0.00 05/01/2012 04/11/2016 829.00
rent 787.00
insur 10.00
Total 828.00
27-305 erie 835.00 t0117366 Donald Moss 769.00 water 31.00 125.00 0.00 12/30/2011 04/30/2016 793.00
petfee 20.00
rent 742.00
Total 793.00
Page 62 of 118

9/29/2015 10:03 AM
Unit Unit Type Unit Resident Name Market Charge Amount Resident Other Move In Lease Move Out Balance
Sq Ft Rent Code Deposit Deposit Expiration
Rent Roll with Lease ChargesProvidence Harbour Club (pharbour)
As Of = 09/01/2015
Month Year = 09/2015
27-306 erie 835.00 t0108047 Jo Ann Thomas 774.00 petfee 30.00 400.00 0.00 06/01/2012 05/23/2016 822.39
water 31.00
rent 783.00
Total 844.00
27-307 erie 835.00 t0049117 Shanchez Wright *SSI* 749.00 rent 749.00 400.00 0.00 03/28/2015 03/27/2016 780.00
water 31.00
Total 780.00
27-308 erie 835.00 t0160564 Kristi Taylor 769.00 petfee 30.00 347.00 0.00 10/19/2014 06/13/2016 0.00
water 31.00
rent 718.00
insur 10.00
Total 789.00
27-309 erie 835.00 t0163545 John Walters 749.00 rent 675.00 338.00 0.00 12/01/2014 02/29/2016 0.00
water 31.00
insur 10.00
Total 716.00
27-310 erie 835.00 t0138102 Douglas Boatwright 774.00 water 31.00 362.50 0.00 04/30/2013 05/16/2016 786.49
rent 756.00
Total 787.00
28-101 erie 835.00 t0123970 Justin Johnson 789.00 water 31.00 0.00 0.00 08/10/2012 08/29/2016 0.00
rent 774.00
Total 805.00
28-102 erie 835.00 t0158335 Kenneth Kirby Jr 789.00 water 31.00 749.00 0.00 07/25/2014 10/02/2016 0.00
rent 754.00
Total 785.00
28-103 erie 835.00 t0123613 John Doran 789.00 water 31.00 175.00 0.00 06/26/2012 09/26/2016 765.00
rent 759.00
Total 790.00
28-104 erie 835.00 t0136908 Jesica Ruiz 789.00 water 31.00 0.00 0.00 03/15/2013 06/30/2015 09/30/2015 10.00
rent 757.00
mtm 200.00
Total 988.00
28-105 erie 835.00 t0166944 Walter Burcon 789.00 rent 723.00 723.00 0.00 03/15/2015 06/14/2016 0.00
water 31.00
insur 10.00
Total 764.00
Page 63 of 118
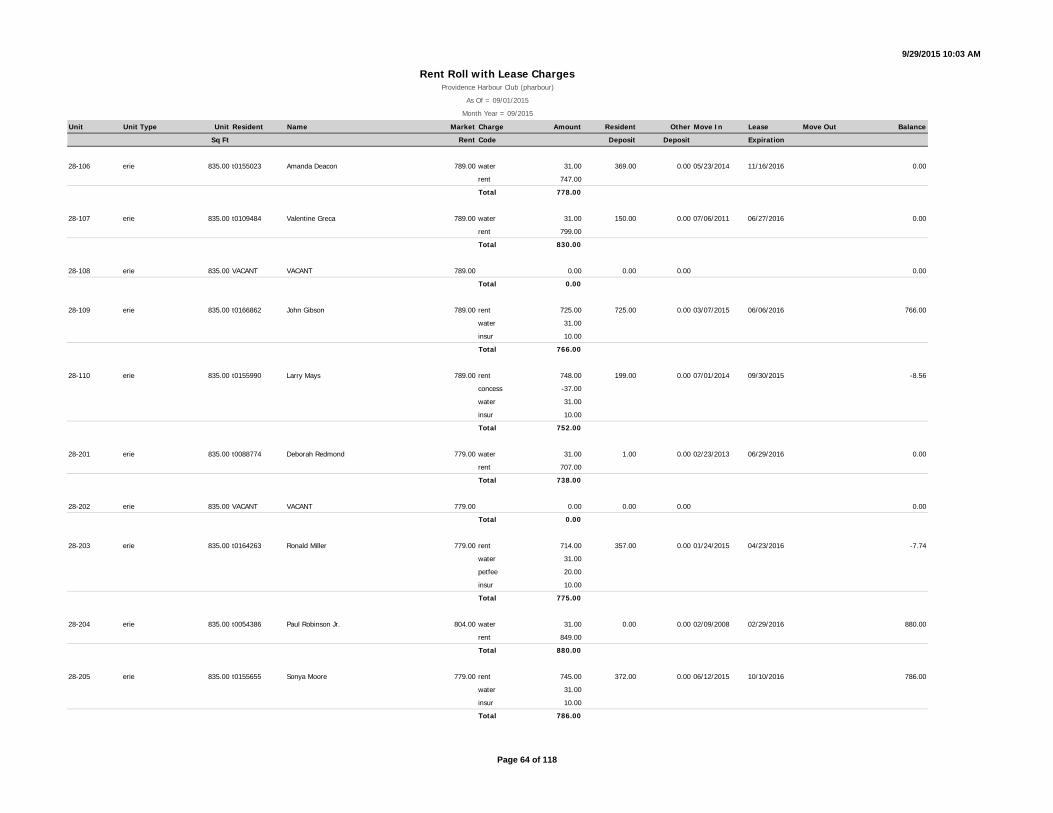
9/29/2015 10:03 AM
Unit Unit Type Unit Resident Name Market Charge Amount Resident Other Move In Lease Move Out Balance
Sq Ft Rent Code Deposit Deposit Expiration
Rent Roll with Lease ChargesProvidence Harbour Club (pharbour)
As Of = 09/01/2015
Month Year = 09/2015
28-106 erie 835.00 t0155023 Amanda Deacon 789.00 water 31.00 369.00 0.00 05/23/2014 11/16/2016 0.00
rent 747.00
Total 778.00
28-107 erie 835.00 t0109484 Valentine Greca 789.00 water 31.00 150.00 0.00 07/06/2011 06/27/2016 0.00
rent 799.00
Total 830.00
28-108 erie 835.00 VACANT VACANT 789.00 0.00 0.00 0.00 0.00
Total 0.00
28-109 erie 835.00 t0166862 John Gibson 789.00 rent 725.00 725.00 0.00 03/07/2015 06/06/2016 766.00
water 31.00
insur 10.00
Total 766.00
28-110 erie 835.00 t0155990 Larry Mays 789.00 rent 748.00 199.00 0.00 07/01/2014 09/30/2015 -8.56
concess -37.00
water 31.00
insur 10.00
Total 752.00
28-201 erie 835.00 t0088774 Deborah Redmond 779.00 water 31.00 1.00 0.00 02/23/2013 06/29/2016 0.00
rent 707.00
Total 738.00
28-202 erie 835.00 VACANT VACANT 779.00 0.00 0.00 0.00 0.00
Total 0.00
28-203 erie 835.00 t0164263 Ronald Miller 779.00 rent 714.00 357.00 0.00 01/24/2015 04/23/2016 -7.74
water 31.00
petfee 20.00
insur 10.00
Total 775.00
28-204 erie 835.00 t0054386 Paul Robinson Jr. 804.00 water 31.00 0.00 0.00 02/09/2008 02/29/2016 880.00
rent 849.00
Total 880.00
28-205 erie 835.00 t0155655 Sonya Moore 779.00 rent 745.00 372.00 0.00 06/12/2015 10/10/2016 786.00
water 31.00
insur 10.00
Total 786.00
Page 64 of 118

9/29/2015 10:03 AM
Unit Unit Type Unit Resident Name Market Charge Amount Resident Other Move In Lease Move Out Balance
Sq Ft Rent Code Deposit Deposit Expiration
Rent Roll with Lease ChargesProvidence Harbour Club (pharbour)
As Of = 09/01/2015
Month Year = 09/2015
28-206 erie 835.00 t0146045 Johnnie Byrd 779.00 water 31.00 363.00 0.00 10/04/2013 09/30/2015 795.00
rent 741.00
parking 20.00
Total 792.00
28-207 erie 835.00 t0145695 Louis Wilder *SSI* 779.00 water 31.00 0.00 0.00 09/13/2013 04/25/2016 802.00
rent 771.00
Total 802.00
28-208 erie 835.00 t0150861 Randall Edwards **SSI** 804.00 petfee 20.00 450.00 0.00 11/20/2006 10/31/2015 830.00
water 31.00
rent 779.00
Total 830.00
28-209 erie 835.00 hc000569 Lajuana Jackson 779.00 water 31.00 150.00 0.00 03/01/2005 10/26/2015 826.00
rent 795.00
Total 826.00
28-210 erie 835.00 hc000570 Dawn Fuller 779.00 water 31.00 0.00 0.00 12/06/2004 03/28/2016 20.00
rent 789.00
insur 10.00
Total 830.00
28-301 erie 835.00 t0173233 Artemio Chavez 769.00 rent 748.00 374.00 0.00 08/15/2015 11/14/2016 0.00
water 31.00
insur 10.00
Total 789.00
28-302 erie 835.00 t0160645 Jalen Dennis 769.00 rent 692.00 692.00 0.00 09/26/2014 12/25/2015 733.00
water 31.00
insur 10.00
Total 733.00
28-303 erie 835.00 t0140398 Kaley Strauch 794.00 water 31.00 375.00 0.00 06/14/2013 06/27/2016 823.00
rent 782.00
insur 10.00
Total 823.00
28-304 erie 835.00 hc000573 Curtis Meadows 814.00 water 31.00 100.00 0.00 06/01/2006 07/25/2016 860.00
rent 854.00
Total 885.00
28-305 erie 835.00 t0146965 Christina Rountree 769.00 concess -39.00 399.00 0.00 10/14/2013 10/19/2015 748.00
water 31.00
rent 747.00
Page 65 of 118

9/29/2015 10:03 AM
Unit Unit Type Unit Resident Name Market Charge Amount Resident Other Move In Lease Move Out Balance
Sq Ft Rent Code Deposit Deposit Expiration
Rent Roll with Lease ChargesProvidence Harbour Club (pharbour)
As Of = 09/01/2015
Month Year = 09/2015
insur 10.00
Total 749.00
28-306 erie 835.00 t0138522 Jasmine Clair 789.00 water 31.00 725.00 0.00 05/25/2013 08/22/2016 790.00
rent 749.00
insur 10.00
Total 790.00
28-307 erie 835.00 t0158526 James Widmark 794.00 rent 727.00 399.00 0.00 08/01/2014 11/14/2015 0.00
water 31.00
insur 10.00
Total 768.00
28-308 erie 835.00 t0122577 Marcus Jeter 814.00 water 31.00 0.00 0.00 09/15/2013 09/28/2015 -107.00
rent 776.00
Total 807.00
28-309 erie 835.00 t0165577 Alicia Wahlberg 769.00 rent 701.00 176.00 0.00 02/05/2015 02/04/2016 0.00
water 31.00
petfee 30.00
Total 762.00
28-310 erie 835.00 t0047501 Sid Frye 769.00 water 31.00 100.00 0.00 10/01/2007 09/29/2015 -7.84
rent 815.00
Total 846.00
29-101 erie 835.00 t0067412 John Mcilrath 789.00 water 31.00 125.00 0.00 11/29/2008 06/27/2016 0.00
rent 771.00
Total 802.00
29-102 superior 1,100.00 t0167157 Judith Biss 964.00 rent 964.00 468.00 0.00 05/03/2015 08/02/2016 -15.62
petfee 40.00
water 41.00
insur 10.00
Total 1,055.00
29-103 superior 1,100.00 t0171614 David Vergolini 939.00 rent 926.00 463.00 0.00 06/26/2015 08/25/2016 0.00
petfee 30.00
water 41.00
Total 997.00
29-104 superior 1,100.00 t0141465 Richard Fritz 939.00 water 41.00 199.00 0.00 08/01/2013 10/31/2015 991.00
rent 950.00
Total 991.00
Page 66 of 118

9/29/2015 10:03 AM
Unit Unit Type Unit Resident Name Market Charge Amount Resident Other Move In Lease Move Out Balance
Sq Ft Rent Code Deposit Deposit Expiration
Rent Roll with Lease ChargesProvidence Harbour Club (pharbour)
As Of = 09/01/2015
Month Year = 09/2015
29-105 superior 1,100.00 t0171653 Nicholas Norman 939.00 rent 1,058.00 1,058.00 0.00 06/23/2015 12/22/2015 1,109.00
water 41.00
insur 10.00
Total 1,109.00
29-106 superior 1,100.00 t0159779 Russell Connelly 939.00 rent 994.00 497.00 0.00 09/08/2014 12/07/2015 0.00
water 41.00
Total 1,035.00
29-107 superior 1,100.00 hc000585 Dianne Schley 939.00 petfee 20.00 200.00 0.00 05/06/2000 08/31/2016 996.00
water 41.00
rent 935.00
Total 996.00
29-108 erie 835.00 t0155431 David Deweese 779.00 rent 759.00 380.00 0.00 06/27/2014 09/26/2015 09/26/2015 790.00
water 31.00
Total 790.00
29-201 erie 835.00 hc000587 Robert Guffey Jr. 779.00 water 31.00 100.00 0.00 09/14/2002 09/30/2015 0.00
rent 770.00
Total 801.00
29-202 superior 1,100.00 t0158777 Calvin Denson 929.00 water 41.00 1,023.00 0.00 08/19/2014 11/18/2016 1,140.38
insur 10.00
rent 1,030.00
Total 1,081.00
29-203 superior 1,100.00 t0087073 Susie Moore 954.00 water 41.00 0.00 0.00 11/25/2009 11/30/2015 975.00
rent 934.00
Total 975.00
29-204 superior 1,100.00 t0103497 Amy Marshal 929.00 rent 925.00 463.00 0.00 07/25/2015 10/24/2016 0.00
petfee 20.00
water 41.00
Total 986.00
29-205 superior 1,100.00 t0167643 Demtris Rice 929.00 rent 926.00 926.00 0.00 03/24/2015 06/23/2016 0.00
water 41.00
insur 10.00
Total 977.00
29-206 superior 1,100.00 t0105728 Marshall Taylor *SSI* 954.00 water 41.00 450.00 0.00 04/09/2011 05/16/2016 1,013.00
rent 972.00
Total 1,013.00
Page 67 of 118

9/29/2015 10:03 AM
Unit Unit Type Unit Resident Name Market Charge Amount Resident Other Move In Lease Move Out Balance
Sq Ft Rent Code Deposit Deposit Expiration
Rent Roll with Lease ChargesProvidence Harbour Club (pharbour)
As Of = 09/01/2015
Month Year = 09/2015
29-207 superior 1,100.00 t0173418 Betty Kajtar 954.00 rent 943.00 472.00 0.00 07/31/2015 10/30/2016 993.06
water 41.00
insur 10.00
Total 994.00
29-208 erie 835.00 t0157105 Kent Fowler 779.00 water 31.00 374.00 0.00 08/25/2012 02/29/2016 853.00
rent 822.00
Total 853.00
29-301 erie 835.00 t0172358 Linda Love 769.00 water 31.00 0.00 0.00 07/19/2013 07/25/2016 245.00
petfee 30.00
insur 10.00
rent 764.00
Total 835.00
29-302 superior 1,100.00 t0140072 Andrew Huige 919.00 water 41.00 472.00 0.00 05/28/2013 08/31/2014 1,211.00
rent 970.00
mtm 200.00
Total 1,211.00
29-303 superior 1,100.00 t0136621 Jasmine Morris 919.00 rent 928.00 464.00 0.00 06/27/2015 09/26/2016 979.00
water 41.00
insur 10.00
Total 979.00
29-304 superior 1,100.00 t0123950 Sung Kim 964.00 petfee 30.00 712.50 0.00 07/28/2012 07/25/2016 1,091.00
water 41.00
rent 1,020.00
Total 1,091.00
29-305 superior 1,100.00 t0091830 George Miles 944.00 water 41.00 0.00 0.00 04/01/2010 03/28/2016 1,007.00
rent 972.00
Total 1,013.00
29-306 superior 1,100.00 t0166247 Deborah Bell *SSI* 964.00 rent 970.00 485.00 0.00 05/29/2015 08/31/2016 1,011.00
water 41.00
Total 1,011.00
29-307 superior 1,100.00 t0120594 Wynona Jordan 919.00 rent 965.00 350.00 350.00 12/15/2014 03/14/2016 1,056.00
water 41.00
Total 1,006.00
29-308 erie 835.00 hc000602 Carolyn (Joyce) Lattimore 769.00 water 31.00 100.00 0.00 04/01/1987 12/28/2015 0.00
rent 758.00
Total 789.00
Page 68 of 118
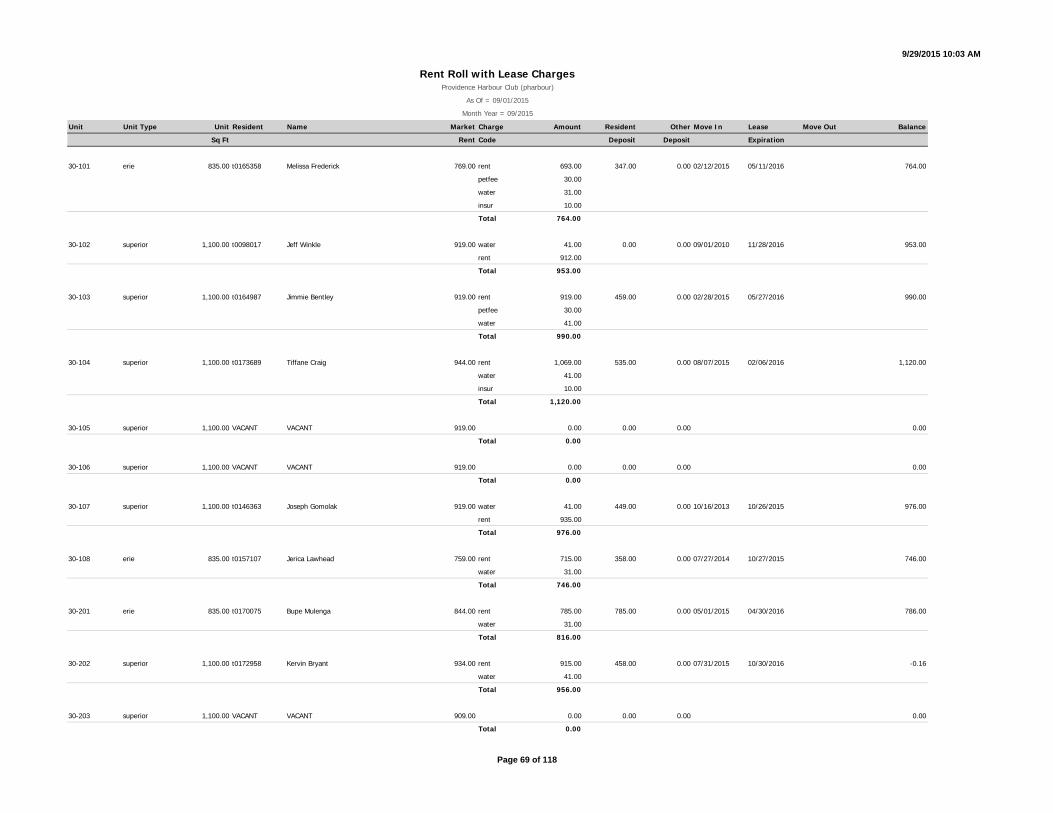
9/29/2015 10:03 AM
Unit Unit Type Unit Resident Name Market Charge Amount Resident Other Move In Lease Move Out Balance
Sq Ft Rent Code Deposit Deposit Expiration
Rent Roll with Lease ChargesProvidence Harbour Club (pharbour)
As Of = 09/01/2015
Month Year = 09/2015
30-101 erie 835.00 t0165358 Melissa Frederick 769.00 rent 693.00 347.00 0.00 02/12/2015 05/11/2016 764.00
petfee 30.00
water 31.00
insur 10.00
Total 764.00
30-102 superior 1,100.00 t0098017 Jeff Winkle 919.00 water 41.00 0.00 0.00 09/01/2010 11/28/2016 953.00
rent 912.00
Total 953.00
30-103 superior 1,100.00 t0164987 Jimmie Bentley 919.00 rent 919.00 459.00 0.00 02/28/2015 05/27/2016 990.00
petfee 30.00
water 41.00
Total 990.00
30-104 superior 1,100.00 t0173689 Tiffane Craig 944.00 rent 1,069.00 535.00 0.00 08/07/2015 02/06/2016 1,120.00
water 41.00
insur 10.00
Total 1,120.00
30-105 superior 1,100.00 VACANT VACANT 919.00 0.00 0.00 0.00 0.00
Total 0.00
30-106 superior 1,100.00 VACANT VACANT 919.00 0.00 0.00 0.00 0.00
Total 0.00
30-107 superior 1,100.00 t0146363 Joseph Gomolak 919.00 water 41.00 449.00 0.00 10/16/2013 10/26/2015 976.00
rent 935.00
Total 976.00
30-108 erie 835.00 t0157107 Jerica Lawhead 759.00 rent 715.00 358.00 0.00 07/27/2014 10/27/2015 746.00
water 31.00
Total 746.00
30-201 erie 835.00 t0170075 Bupe Mulenga 844.00 rent 785.00 785.00 0.00 05/01/2015 04/30/2016 786.00
water 31.00
Total 816.00
30-202 superior 1,100.00 t0172958 Kervin Bryant 934.00 rent 915.00 458.00 0.00 07/31/2015 10/30/2016 -0.16
water 41.00
Total 956.00
30-203 superior 1,100.00 VACANT VACANT 909.00 0.00 0.00 0.00 0.00
Total 0.00
Page 69 of 118

9/29/2015 10:03 AM
Unit Unit Type Unit Resident Name Market Charge Amount Resident Other Move In Lease Move Out Balance
Sq Ft Rent Code Deposit Deposit Expiration
Rent Roll with Lease ChargesProvidence Harbour Club (pharbour)
As Of = 09/01/2015
Month Year = 09/2015
30-204 superior 1,100.00 t0172012 Robin Cantrell 909.00 rent 916.00 458.00 0.00 06/29/2015 03/28/2016 0.00
water 41.00
Total 957.00
30-205 superior 1,100.00 t0085086 Virginia Sanders 934.00 water 41.00 0.00 0.00 12/01/2009 03/31/2016 992.00
rent 951.00
Total 992.00
30-206 superior 1,100.00 hc000614 Helen Anderson 909.00 water 41.00 200.00 0.00 05/19/1996 05/25/2016 -9.39
rent 960.00
insur 10.00
Total 1,011.00
30-207 superior 1,100.00 t0154285 Melissa Shipley 909.00 petfee 30.00 399.00 0.00 05/16/2014 08/15/2015 -6.03
water 41.00
mtm 200.00
rent 929.00
Total 1,200.00
30-208 erie 835.00 t0111349 Roger Rankins 759.00 petfee 30.00 200.00 0.00 08/12/2011 07/25/2016 0.00
water 31.00
insur 10.00
rent 789.00
Total 860.00
30-301 erie 835.00 t0155224 Mohammad Mosa 774.00 water 31.00 379.00 0.00 05/17/2014 11/16/2015 814.00
rent 783.00
Total 814.00
30-302 superior 1,100.00 t0172623 Keith Bees 899.00 rent 888.00 888.00 0.00 07/23/2015 10/22/2016 929.00
water 41.00
Total 929.00
30-303 superior 1,100.00 t0172625 Cristian Ramirez 899.00 rent 908.00 908.00 0.00 07/24/2015 10/23/2016 900.48
water 41.00
insur 10.00
Total 959.00
30-304 superior 1,100.00 t0172982 Maurice Dellihue 919.00 rent 907.00 0.00 0.00 07/23/2015 07/22/2016 70.75
water 41.00
empconc -948.00
Total 0.00
30-305 superior 1,100.00 t0157137 Rory Turner 899.00 rent 899.00 399.00 0.00 07/29/2014 10/28/2015 651.00
Page 70 of 118

9/29/2015 10:03 AM
Unit Unit Type Unit Resident Name Market Charge Amount Resident Other Move In Lease Move Out Balance
Sq Ft Rent Code Deposit Deposit Expiration
Rent Roll with Lease ChargesProvidence Harbour Club (pharbour)
As Of = 09/01/2015
Month Year = 09/2015
water 41.00
insur 10.00
storage 25.00
Total 975.00
30-306 superior 1,100.00 t0155330 Regional Regional Office 919.00 model -950.00 0.00 0.00 05/14/2014 05/14/2016 0.00
rent 950.00
Total 0.00
30-307 superior 1,100.00 t0171612 Frederick Shunk 924.00 rent 913.00 913.00 0.00 06/24/2015 09/23/2016 964.00
water 41.00
insur 10.00
Total 964.00
30-308 erie 835.00 t0165743 danny mong 749.00 rent 690.00 345.00 0.00 02/27/2015 05/26/2016 731.00
water 31.00
insur 10.00
Total 731.00
31-101 stclair 945.00 t0155834 Tanya Chambers 744.00 rent 727.00 363.00 0.00 09/19/2014 12/18/2015 778.00
water 41.00
insur 10.00
Total 778.00
31-102 stclair 945.00 t0149646 Jeremy Matt 769.00 water 41.00 374.00 0.00 01/02/2014 03/31/2016 0.00
rent 746.00
Total 787.00
31-103 stclair 945.00 t0161912 Tammy Elkins 769.00 rent 713.00 913.00 0.00 10/30/2014 01/29/2016 -784.00
petfee 30.00
water 41.00
Total 784.00
31-106 huron 805.00 VACANT VACANT 619.00 0.00 0.00 0.00 0.00
Total 0.00
31-107 huron 805.00 t0141872 Steve Bradford 619.00 water 31.00 300.00 0.00 07/05/2013 09/26/2016 344.00
rent 613.00
insur 10.00
Total 654.00
31-108 huron 805.00 t0156874 Daniel McCotter 594.00 water 31.00 291.00 0.00 07/13/2014 10/12/2015 0.00
rent 740.00
Total 771.00
Page 71 of 118

9/29/2015 10:03 AM
Unit Unit Type Unit Resident Name Market Charge Amount Resident Other Move In Lease Move Out Balance
Sq Ft Rent Code Deposit Deposit Expiration
Rent Roll with Lease ChargesProvidence Harbour Club (pharbour)
As Of = 09/01/2015
Month Year = 09/2015
31-201 stclair 945.00 t0160549 Tracey Lee 774.00 rent 743.00 743.00 0.00 10/15/2014 01/14/2016 794.00
water 41.00
insur 10.00
Total 794.00
31-202 stclair 945.00 t0076807 Anthony Vick II 799.00 water 41.00 0.00 0.00 06/26/2009 06/27/2016 1,278.00
rent 737.00
Total 778.00
31-203 stclair 945.00 t0167958 Gwendolyn Tucker 799.00 rent 771.00 199.00 0.00 04/30/2015 07/29/2016 802.40
petfee 30.00
water 41.00
insur 10.00
Total 852.00
31-204 stclair 945.00 hc000112 Jana Mitchell 774.00 water 41.00 199.00 0.00 05/27/2014 08/22/2016 777.65
rent 731.00
Total 772.00
31-205 huron 805.00 t0158294 Stanley Burkett 624.00 rent 651.00 651.00 0.00 11/01/2014 01/31/2016 692.00
water 31.00
insur 10.00
Total 692.00
31-206 huron 805.00 t0116858 Dartanya Smith 649.00 water 31.00 175.00 0.00 01/15/2012 09/30/2015 686.00
rent 645.00
insur 10.00
Total 686.00
31-207 huron 805.00 t0174583 Abdou Secka 649.00 rent 699.00 350.00 0.00 08/27/2015 11/30/2016 -24.65
water 31.00
insur 10.00
Total 740.00
31-208 huron 805.00 t0171095 Kathryn Klavinger 624.00 rent 680.00 340.00 0.00 06/05/2015 09/04/2016 750.87
petfee 30.00
water 31.00
insur 10.00
Total 751.00
31-301 stclair 945.00 t0169427 Robert Graham 764.00 rent 741.00 370.00 0.00 05/15/2015 07/14/2016 822.00
petfee 30.00
water 41.00
insur 10.00
Total 822.00
Page 72 of 118

9/29/2015 10:03 AM
Unit Unit Type Unit Resident Name Market Charge Amount Resident Other Move In Lease Move Out Balance
Sq Ft Rent Code Deposit Deposit Expiration
Rent Roll with Lease ChargesProvidence Harbour Club (pharbour)
As Of = 09/01/2015
Month Year = 09/2015
31-302 stclair 945.00 t0171292 Kevin Shephard 789.00 rent 817.00 817.00 0.00 06/24/2015 09/23/2016 0.00
water 41.00
Total 858.00
31-303 stclair 945.00 t0158790 Jessie Lyman 789.00 rent 738.00 569.00 0.00 09/16/2014 12/20/2015 809.00
petfee 30.00
water 41.00
Total 809.00
31-304 stclair 945.00 t0130078 Michelle Lyons 764.00 rent 778.00 389.00 0.00 07/18/2015 10/18/2016 828.78
water 41.00
insur 10.00
Total 829.00
31-305 huron 805.00 t0153611 Cory Gray 614.00 water 31.00 614.00 0.00 05/31/2014 11/28/2016 662.00
rent 631.00
Total 662.00
31-306 huron 805.00 t0096206 Maggie King* 639.00 rent 610.00 0.00 0.00 09/19/2012 09/30/2015 414.00
insur 10.00
Total 620.00
31-307 huron 805.00 t0160636 Inesha Spence 639.00 rent 639.00 319.00 0.00 10/02/2014 01/01/2016 0.00
water 31.00
insur 10.00
Total 680.00
31-308 huron 805.00 t0117570 Jeffrey Charbon 614.00 water 31.00 434.00 0.00 12/17/2011 01/18/2016 0.00
rent 613.00
insur 10.00
Total 654.00
32-101 stclair 945.00 t0144633 Anders Oygarden 744.00 water 41.00 199.00 0.00 08/29/2013 08/29/2016 0.00
rent 776.00
Total 817.00
32-102 stclair 945.00 t0136820 Hanife Broome 769.00 water 41.00 150.00 0.00 06/10/2013 05/27/2016 800.00
rent 749.00
insur 10.00
Total 800.00
32-103 stclair 945.00 t0172149 Hamidou Toure 769.00 rent 781.00 391.00 0.00 07/03/2015 10/02/2016 805.00
water 41.00
Total 822.00
Page 73 of 118

9/29/2015 10:03 AM
Unit Unit Type Unit Resident Name Market Charge Amount Resident Other Move In Lease Move Out Balance
Sq Ft Rent Code Deposit Deposit Expiration
Rent Roll with Lease ChargesProvidence Harbour Club (pharbour)
As Of = 09/01/2015
Month Year = 09/2015
32-106 huron 805.00 t0166958 Carolyn Mason 619.00 rent 634.00 317.00 0.00 03/27/2015 06/26/2016 -21.61
water 31.00
Total 665.00
32-107 huron 805.00 VACANT VACANT 619.00 0.00 0.00 0.00 0.00
Total 0.00
32-108 huron 805.00 t0155479 Cameron McCoy 594.00 rent 557.00 557.00 0.00 06/14/2014 09/13/2015 0.00
water 31.00
Total 588.00
32-201 stclair 945.00 t0160383 Sarah Hallinen 774.00 rent 774.00 199.00 0.00 10/10/2014 01/09/2016 -52.48
water 41.00
Total 815.00
32-202 stclair 945.00 t0095557 April Jackson 799.00 water 41.00 100.00 0.00 08/27/2010 08/29/2016 833.00
insur 10.00
rent 782.00
Total 833.00
32-203 stclair 945.00 t0169938 Candace Hicks 799.00 rent 783.00 392.00 0.00 06/18/2015 09/17/2016 824.00
water 41.00
Total 824.00
32-204 stclair 945.00 VACANT VACANT 774.00 0.00 0.00 0.00 0.00
Total 0.00
32-205 huron 805.00 t0164044 Janine Younkin 624.00 rent 610.00 305.00 0.00 12/12/2014 03/11/2016 0.00
water 31.00
Total 641.00
32-206 huron 805.00 t0164861 Richard Varnauskas 649.00 rent 649.00 325.00 0.00 02/07/2015 05/06/2016 730.00
petfee 40.00
water 31.00
insur 10.00
Total 730.00
32-207 huron 805.00 t0142534 Annice Jackson 649.00 water 31.00 332.00 0.00 11/01/2013 10/26/2015 10/26/2015 663.00
rent 682.00
Total 713.00
32-208 huron 805.00 t0169901 Jasmine Friday 624.00 rent 656.00 399.00 0.00 05/01/2015 04/30/2016 697.00
water 31.00
insur 10.00
Page 74 of 118

9/29/2015 10:03 AM
Unit Unit Type Unit Resident Name Market Charge Amount Resident Other Move In Lease Move Out Balance
Sq Ft Rent Code Deposit Deposit Expiration
Rent Roll with Lease ChargesProvidence Harbour Club (pharbour)
As Of = 09/01/2015
Month Year = 09/2015
Total 697.00
32-301 stclair 945.00 t0165128 Emily Grifka 764.00 rent 715.00 357.00 0.00 03/25/2015 06/24/2016 0.00
petfee 20.00
water 41.00
Total 776.00
32-302 stclair 945.00 t0144678 Remy Sherman 789.00 petfee 20.00 199.00 0.00 10/08/2013 10/19/2015 0.00
water 41.00
rent 722.00
Total 783.00
32-303 stclair 945.00 t0065302 Michael Steele 789.00 petfee 20.00 450.00 0.00 10/26/2008 08/29/2016 825.00
water 41.00
insur 10.00
rent 754.00
Total 825.00
32-304 stclair 945.00 t0144507 Nunnally Lashanda# 764.00 water 41.00 699.00 0.00 10/11/2013 10/31/2015 10/31/2015 737.00
rent 733.00
Total 774.00
32-305 huron 805.00 t0108681 Dorothea Watson* 614.00 rent 592.00 200.00 0.00 08/30/2011 08/29/2016 579.23
Total 592.00
32-306 huron 805.00 t0170500 Neda Nosrati 639.00 rent 677.00 339.00 0.00 05/19/2015 08/18/2016 0.00
water 31.00
insur 10.00
Total 718.00
32-307 huron 805.00 t0164436 Ledeanea Williams 639.00 rent 639.00 639.00 0.00 04/04/2015 07/03/2016 680.00
water 31.00
insur 10.00
Total 680.00
32-308 huron 805.00 t0134964 Henry Jones 614.00 water 31.00 464.00 0.00 03/01/2013 07/31/2015 -46.82
rent 614.00
mtm 150.00
Total 795.00
33-101 stclair 945.00 t0150876 Theresa Harris 744.00 rent 696.00 199.00 0.00 08/15/2014 11/14/2015 767.00
petfee 30.00
water 41.00
Total 767.00
Page 75 of 118

9/29/2015 10:03 AM
Unit Unit Type Unit Resident Name Market Charge Amount Resident Other Move In Lease Move Out Balance
Sq Ft Rent Code Deposit Deposit Expiration
Rent Roll with Lease ChargesProvidence Harbour Club (pharbour)
As Of = 09/01/2015
Month Year = 09/2015
33-102 stclair 945.00 t0159475 Veronica Jackson 744.00 rent 712.00 712.00 0.00 09/19/2014 09/18/2015 757.00
water 41.00
insur 10.00
Total 763.00
33-103 stclair 945.00 t0145651 Sandra Jackson 744.00 petfee 30.00 744.00 0.00 11/29/2013 11/30/2015 0.00
water 41.00
rent 765.00
Total 836.00
33-106 huron 805.00 t0152045 Christopher Pope 594.00 water 31.00 291.00 0.00 03/11/2014 06/08/2016 614.00
rent 583.00
Total 614.00
33-107 huron 805.00 t0167885 Tyler Miller 594.00 rent 589.00 295.00 0.00 04/04/2015 07/03/2016 620.00
water 31.00
Total 620.00
33-108 huron 805.00 t0166548 Joseph Boyer 594.00 rent 585.00 585.00 0.00 03/03/2015 06/02/2016 -0.39
water 31.00
insur 10.00
Total 626.00
33-201 stclair 945.00 hc000671 Leo White *SSI* 774.00 water 41.00 645.00 0.00 11/10/2005 05/23/2016 825.00
rent 777.00
insur 10.00
Total 828.00
33-202 stclair 945.00 t0140838 LaMonica Lee # 774.00 water 41.00 774.00 0.00 07/19/2013 09/30/2015 09/30/2015 1,793.10
rent 797.00
Total 838.00
33-203 stclair 945.00 t0137942 Keesha Williams *SSI* 774.00 rent 702.00 463.00 0.00 07/15/2014 10/14/2015 769.59
petfee 20.00
water 41.00
insur 10.00
Total 773.00
33-204 stclair 945.00 t0171792 Tonja White 774.00 rent 788.00 788.00 0.00 07/03/2015 10/01/2016 858.01
petfee 30.00
water 41.00
Total 859.00
33-205 huron 805.00 t0173325 Mary Heard 624.00 rent 693.00 347.00 0.00 08/03/2015 11/02/2016 9.35
water 31.00
Page 76 of 118

9/29/2015 10:03 AM
Unit Unit Type Unit Resident Name Market Charge Amount Resident Other Move In Lease Move Out Balance
Sq Ft Rent Code Deposit Deposit Expiration
Rent Roll with Lease ChargesProvidence Harbour Club (pharbour)
As Of = 09/01/2015
Month Year = 09/2015
Total 724.00
33-206 huron 805.00 t0160646 Edward McClenney 624.00 rent 620.00 310.00 0.00 10/03/2014 12/31/2015 09/29/2015 -7.00
water 31.00
petfee 30.00
Total 681.00
33-207 huron 805.00 t0152599 Linda Cunningham 624.00 water 31.00 312.00 0.00 04/27/2014 07/18/2016 665.00
rent 624.00
insur 10.00
Total 665.00
33-208 huron 805.00 VACANT VACANT 624.00 0.00 0.00 0.00 0.00
Total 0.00
33-301 stclair 945.00 t0166546 Jason Schwerin 764.00 rent 706.00 706.00 0.00 02/25/2015 02/24/2016 0.00
water 41.00
insur 10.00
Total 757.00
33-302 stclair 945.00 t0137007 Andru King 764.00 water 41.00 375.00 0.00 05/25/2013 05/16/2016 -0.26
petfee 30.00
rent 781.00
insur 10.00
Total 862.00
33-303 stclair 945.00 t0171705 Karma Ambers 764.00 rent 779.00 390.00 0.00 06/29/2015 09/28/2016 0.00
petfee 30.00
water 41.00
insur 10.00
Total 860.00
33-304 stclair 945.00 t0158528 Brittany Smith 764.00 water 41.00 369.00 0.00 08/27/2014 08/26/2015 0.00
insur 10.00
insur 10.00
rent 759.00
Total 820.00
33-305 huron 805.00 t0161156 Shala Stewart 614.00 rent 629.00 315.00 0.00 10/20/2014 01/19/2016 0.00
water 31.00
insur 10.00
Total 670.00
33-306 huron 805.00 t0058113 Latosha Seay 614.00 petfee 30.00 0.00 0.00 05/19/2008 05/23/2016 747.00
water 31.00
Page 77 of 118

9/29/2015 10:03 AM
Unit Unit Type Unit Resident Name Market Charge Amount Resident Other Move In Lease Move Out Balance
Sq Ft Rent Code Deposit Deposit Expiration
Rent Roll with Lease ChargesProvidence Harbour Club (pharbour)
As Of = 09/01/2015
Month Year = 09/2015
rent 686.00
Total 747.00
33-307 huron 805.00 t0159570 Miquel St. Aimie 614.00 water 31.00 464.00 0.00 09/24/2012 09/30/2015 667.00
rent 637.00
Total 668.00
33-308 huron 805.00 t0158313 Rachel Lee 614.00 rent 590.00 295.00 0.00 08/10/2014 11/09/2015 651.00
water 31.00
petfee 30.00
Total 651.00
34-101 stclair 945.00 t0155949 Pamela Jordan 744.00 rent 684.00 542.00 0.00 07/01/2014 09/30/2015 0.00
petfee 30.00
water 41.00
insur 10.00
Total 765.00
34-102 stclair 945.00 t0154452 Tausha Underwood 754.00 water 41.00 345.00 0.00 04/27/2014 10/24/2016 711.00
rent 712.00
Total 753.00
34-103 stclair 945.00 t0172789 Anthony Byrnes 754.00 rent 776.00 388.00 0.00 07/20/2015 07/19/2016 817.00
water 41.00
Total 817.00
34-106 huron 805.00 t0172483 Barbara Potter 604.00 rent 656.00 328.00 0.00 07/21/2015 10/20/2016 747.00
petfee 50.00
water 31.00
insur 10.00
Total 747.00
34-107 huron 805.00 hc000688 Glenn Shaw 604.00 water 31.00 150.00 0.00 08/15/2002 06/15/2015 0.00
rent 638.00
mtm 200.00
Total 869.00
34-108 huron 805.00 t0173162 Lauren Wallace 594.00 rent 668.00 334.00 0.00 08/21/2015 11/20/2016 661.58
water 31.00
insur 10.00
Total 709.00
34-201 stclair 945.00 hc000690 Curtis Neal 774.00 water 41.00 0.00 0.00 06/09/2005 09/26/2015 857.00
rent 875.00
Total 916.00
Page 78 of 118

9/29/2015 10:03 AM
Unit Unit Type Unit Resident Name Market Charge Amount Resident Other Move In Lease Move Out Balance
Sq Ft Rent Code Deposit Deposit Expiration
Rent Roll with Lease ChargesProvidence Harbour Club (pharbour)
As Of = 09/01/2015
Month Year = 09/2015
34-202 stclair 945.00 t0158423 Janos Juhasz 784.00 rent 752.00 576.00 0.00 08/15/2014 11/14/2015 813.00
petfee 20.00
water 41.00
Total 813.00
34-203 stclair 945.00 t0128300 Michelle Simmons 784.00 water 41.00 369.50 0.00 09/21/2012 09/29/2015 785.00
rent 744.00
Total 785.00
34-204 stclair 945.00 t0159358 Allyson Adams 774.00 rent 748.00 374.00 0.00 09/22/2014 12/21/2015 759.00
water 31.00
insur 10.00
Total 789.00
34-205 huron 805.00 t0154388 Matthew Thomas 624.00 water 31.00 624.00 0.00 04/30/2014 07/25/2016 -23.99
rent 648.00
Total 679.00
34-206 huron 805.00 t0158512 Carmen McCombs 634.00 petfee 30.00 497.00 0.00 08/16/2014 08/15/2016 662.26
water 31.00
rent 609.00
Total 670.00
34-207 huron 805.00 t0164649 Virgie Pitts 634.00 rent 620.00 310.00 310.00 01/02/2015 04/01/2016 651.68
water 31.00
insur 10.00
Total 661.00
34-208 huron 805.00 t0152819 David Hubert 624.00 water 31.00 307.00 0.00 03/15/2014 06/27/2016 679.93
insur 10.00
rent 630.00
Total 671.00
34-301 stclair 945.00 t0126366 Denise Hildreth # 764.00 petfee 30.00 380.00 0.00 08/09/2012 08/31/2015 09/21/2015 124.00
water 41.00
rent 759.00
Total 830.00
34-302 stclair 945.00 t0156066 Michele Coman 774.00 water 41.00 199.00 0.00 07/11/2014 07/04/2016 0.00
rent 709.00
Total 750.00
34-303 stclair 945.00 t0154185 Stefanie Slater 774.00 petfee 30.00 199.00 0.00 04/25/2014 07/18/2016 0.00
water 41.00
Page 79 of 118

9/29/2015 10:03 AM
Unit Unit Type Unit Resident Name Market Charge Amount Resident Other Move In Lease Move Out Balance
Sq Ft Rent Code Deposit Deposit Expiration
Rent Roll with Lease ChargesProvidence Harbour Club (pharbour)
As Of = 09/01/2015
Month Year = 09/2015
rent 733.00
Total 804.00
34-304 stclair 945.00 t0154508 Dawn Hartford 764.00 water 41.00 199.00 0.00 04/25/2014 07/18/2016 -215.63
rent 724.00
Total 765.00
34-305 huron 805.00 t0163921 Kiara Conway 614.00 rent 600.00 600.00 0.00 12/13/2014 03/12/2016 641.00
water 31.00
insur 10.00
Total 641.00
34-306 huron 805.00 VACANT VACANT 624.00 0.00 0.00 0.00 0.00
Total 0.00
34-307 huron 805.00 hc000699 Diane Swiger 624.00 water 31.00 100.00 0.00 02/29/1992 08/29/2016 0.00
rent 682.00
Total 713.00
34-308 huron 805.00 t0164662 Britney Johnson 614.00 rent 612.00 306.00 0.00 01/16/2015 04/15/2016 653.00
water 31.00
insur 10.00
Total 653.00
35-101 huron 805.00 t0155554 John Grimes 604.00 water 31.00 302.00 0.00 12/31/2013 03/31/2016 635.00
rent 604.00
Total 635.00
35-102 huron 805.00 t0157254 Candace Nash 594.00 water 31.00 290.00 0.00 07/28/2014 07/25/2016 0.00
rent 600.00
insur 10.00
Total 641.00
35-103 huron 805.00 t0088775 Nancy Jimick 594.00 petfee 30.00 0.00 0.00 01/08/2010 02/29/2016 682.00
water 31.00
rent 621.00
Total 682.00
35-106 stclair 945.00 t0154555 Joseph Polzin 744.00 water 41.00 340.00 0.00 04/22/2014 07/18/2016 0.00
rent 698.00
Total 739.00
35-107 stclair 945.00 t0167777 Maryssa Hutson 744.00 rent 708.00 708.00 0.00 04/16/2015 07/15/2016 1,792.00
water 41.00
insur 10.00
Page 80 of 118

9/29/2015 10:03 AM
Unit Unit Type Unit Resident Name Market Charge Amount Resident Other Move In Lease Move Out Balance
Sq Ft Rent Code Deposit Deposit Expiration
Rent Roll with Lease ChargesProvidence Harbour Club (pharbour)
As Of = 09/01/2015
Month Year = 09/2015
Total 759.00
35-108 stclair 945.00 t0140350 Cherie Anderson 754.00 water 41.00 374.00 0.00 08/03/2013 07/25/2016 823.00
rent 782.00
Total 823.00
35-110 huron 805.00 t0153016 April Mccullum 594.00 water 31.00 296.00 0.00 03/21/2014 03/21/2016 0.00
rent 601.00
Total 632.00
35-111 huron 805.00 t0161333 Nigel Walker 594.00 rent 605.00 302.00 0.00 10/25/2014 01/24/2016 0.00
water 31.00
insur 10.00
Total 646.00
35-112 huron 805.00 t0162233 Andrea Durham 604.00 rent 595.00 497.00 0.00 11/07/2014 02/06/2016 446.00
petfee 20.00
water 31.00
Total 646.00
35-201 huron 805.00 VACANT VACANT 669.00 0.00 0.00 0.00 0.00
Total 0.00
35-202 huron 805.00 t0155227 Alonya Dixson 624.00 rent 600.00 600.00 0.00 06/14/2014 09/13/2015 670.63
petfee 20.00
water 31.00
insur 10.00
Total 661.00
35-203 huron 805.00 t0155279 David Raschke 624.00 water 31.00 312.00 0.00 06/15/2014 06/13/2016 -9.00
rent 633.00
Total 664.00
35-204 huron 805.00 t0158794 Tameria Little 634.00 rent 641.00 641.00 0.00 09/29/2014 12/28/2015 692.00
water 41.00
insur 10.00
Total 692.00
35-205 stclair 945.00 t0139211 Deidre Armstead 784.00 rent 809.00 404.00 0.00 08/25/2015 10/24/2016 0.00
water 41.00
insur 10.00
Total 860.00
35-206 stclair 945.00 t0169565 Joshua Cook 774.00 rent 751.00 199.00 0.00 04/17/2015 07/16/2016 1,005.82
water 41.00
Page 81 of 118

9/29/2015 10:03 AM
Unit Unit Type Unit Resident Name Market Charge Amount Resident Other Move In Lease Move Out Balance
Sq Ft Rent Code Deposit Deposit Expiration
Rent Roll with Lease ChargesProvidence Harbour Club (pharbour)
As Of = 09/01/2015
Month Year = 09/2015
insur 10.00
Total 802.00
35-207 stclair 945.00 t0075961 Michael Valicenti 774.00 water 41.00 0.00 0.00 06/04/2009 05/18/2016 619.32
rent 781.00
Total 822.00
35-208 stclair 945.00 t0066582 Michael Edwards 784.00 water 41.00 250.00 0.00 09/12/2008 09/29/2015 09/29/2015 826.00
rent 785.00
Total 826.00
35-209 huron 805.00 hc000715 Albert Olah 634.00 water 31.00 100.00 0.00 11/15/1999 04/11/2016 0.00
rent 694.00
Total 725.00
35-210 huron 805.00 t0165699 Arica Radford 624.00 rent 607.00 607.00 0.00 02/05/2015 05/04/2016 0.00
water 31.00
insur 10.00
Total 648.00
35-211 huron 805.00 t0167161 Christopher Brauer 624.00 rent 629.00 314.00 0.00 03/14/2015 06/13/2016 670.00
water 31.00
insur 10.00
Total 670.00
35-212 huron 805.00 t0166637 Jesse Goforth 634.00 rent 632.00 316.00 0.00 04/11/2015 05/10/2016 0.00
water 31.00
petfee 30.00
Total 693.00
35-301 huron 805.00 t0160466 Robert Quinn 624.00 rent 618.00 618.00 0.00 09/20/2014 12/19/2015 639.00
water 31.00
Total 649.00
35-302 huron 805.00 t0095845 Christie Toth 614.00 water 31.00 0.00 0.00 06/15/2010 06/27/2016 0.00
rent 641.00
Total 672.00
35-303 huron 805.00 t0156898 Richard Hicks 614.00 rent 588.00 293.00 0.00 07/11/2014 10/10/2015 10/10/2015 0.00
water 31.00
insur 10.00
Total 629.00
35-304 huron 805.00 t0122472 Danny Jones 624.00 water 31.00 290.00 0.00 06/01/2012 02/28/2015 0.00
rent 624.00
Page 82 of 118

9/29/2015 10:03 AM
Unit Unit Type Unit Resident Name Market Charge Amount Resident Other Move In Lease Move Out Balance
Sq Ft Rent Code Deposit Deposit Expiration
Rent Roll with Lease ChargesProvidence Harbour Club (pharbour)
As Of = 09/01/2015
Month Year = 09/2015
mtm 200.00
Total 855.00
35-305 stclair 945.00 t0170114 Candace Little 774.00 water 41.00 561.50 0.00 12/08/2012 10/31/2015 822.00
rent 771.00
insur 10.00
Total 822.00
35-306 stclair 945.00 t0166335 Adam Noveskey 764.00 rent 708.00 350.00 0.00 03/30/2015 06/29/2016 0.00
petfee 20.00
water 41.00
insur 10.00
Total 779.00
35-307 stclair 945.00 t0100357 Tanisha Rice 764.00 water 41.00 175.00 0.00 09/01/2011 08/29/2016 837.00
rent 796.00
Total 837.00
35-308 stclair 945.00 t0167124 Laverne Cargile 774.00 rent 719.00 360.00 0.00 03/19/2015 06/18/2016 0.00
water 41.00
insur 10.00
Total 770.00
35-309 huron 805.00 t0158998 Troy Townsend 624.00 rent 630.00 630.00 0.00 08/23/2014 11/22/2015 669.93
water 31.00
insur 10.00
Total 671.00
35-310 huron 805.00 t0163950 Ikeyia Johnson 614.00 rent 599.00 299.00 0.00 02/21/2015 05/20/2016 0.00
water 31.00
Total 630.00
35-311 huron 805.00 VACANT VACANT 614.00 0.00 0.00 0.00 0.00
Total 0.00
35-312 huron 805.00 t0105213 Trina Hodge 624.00 petfee 20.00 225.00 0.00 03/22/2011 10/26/2015 31.00
petfee 30.00
water 31.00
rent 658.00
insur 10.00
Total 749.00
36-101 huron 805.00 t0168021 Dane Phillips 649.00 rent 653.00 327.00 0.00 04/11/2015 04/10/2016 0.00
water 31.00
insur 10.00
Page 83 of 118
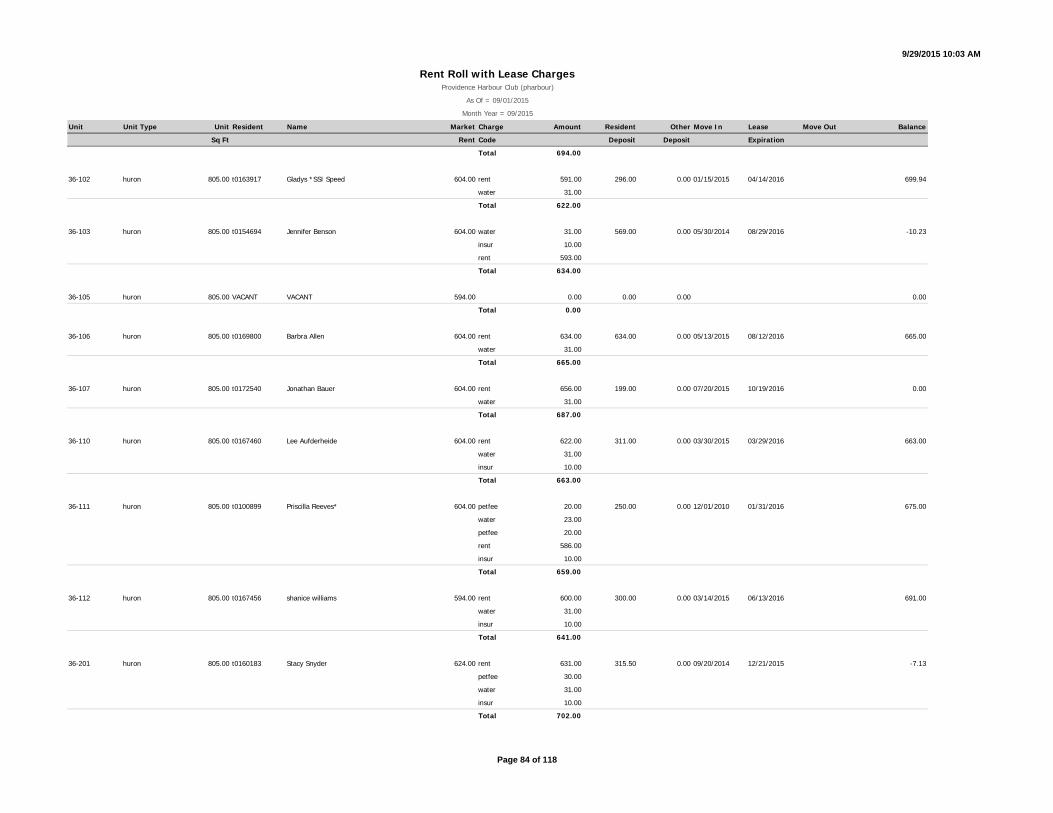
9/29/2015 10:03 AM
Unit Unit Type Unit Resident Name Market Charge Amount Resident Other Move In Lease Move Out Balance
Sq Ft Rent Code Deposit Deposit Expiration
Rent Roll with Lease ChargesProvidence Harbour Club (pharbour)
As Of = 09/01/2015
Month Year = 09/2015
Total 694.00
36-102 huron 805.00 t0163917 Gladys *SSI Speed 604.00 rent 591.00 296.00 0.00 01/15/2015 04/14/2016 699.94
water 31.00
Total 622.00
36-103 huron 805.00 t0154694 Jennifer Benson 604.00 water 31.00 569.00 0.00 05/30/2014 08/29/2016 -10.23
insur 10.00
rent 593.00
Total 634.00
36-105 huron 805.00 VACANT VACANT 594.00 0.00 0.00 0.00 0.00
Total 0.00
36-106 huron 805.00 t0169800 Barbra Allen 604.00 rent 634.00 634.00 0.00 05/13/2015 08/12/2016 665.00
water 31.00
Total 665.00
36-107 huron 805.00 t0172540 Jonathan Bauer 604.00 rent 656.00 199.00 0.00 07/20/2015 10/19/2016 0.00
water 31.00
Total 687.00
36-110 huron 805.00 t0167460 Lee Aufderheide 604.00 rent 622.00 311.00 0.00 03/30/2015 03/29/2016 663.00
water 31.00
insur 10.00
Total 663.00
36-111 huron 805.00 t0100899 Priscilla Reeves* 604.00 petfee 20.00 250.00 0.00 12/01/2010 01/31/2016 675.00
water 23.00
petfee 20.00
rent 586.00
insur 10.00
Total 659.00
36-112 huron 805.00 t0167456 shanice williams 594.00 rent 600.00 300.00 0.00 03/14/2015 06/13/2016 691.00
water 31.00
insur 10.00
Total 641.00
36-201 huron 805.00 t0160183 Stacy Snyder 624.00 rent 631.00 315.50 0.00 09/20/2014 12/21/2015 -7.13
petfee 30.00
water 31.00
insur 10.00
Total 702.00
Page 84 of 118

9/29/2015 10:03 AM
Unit Unit Type Unit Resident Name Market Charge Amount Resident Other Move In Lease Move Out Balance
Sq Ft Rent Code Deposit Deposit Expiration
Rent Roll with Lease ChargesProvidence Harbour Club (pharbour)
As Of = 09/01/2015
Month Year = 09/2015
36-202 huron 805.00 t0147970 Jasmine Bailey 634.00 water 31.00 317.00 0.00 11/15/2013 11/30/2015 687.00
rent 656.00
Total 687.00
36-203 huron 805.00 t0172760 Michael Steffen 634.00 rent 684.00 342.00 0.00 07/18/2015 10/15/2016 0.00
petfee 30.00
water 31.00
Total 745.00
36-204 huron 805.00 t0169113 Alexander Sorenson 624.00 rent 640.00 320.00 0.00 04/11/2015 04/10/2016 0.00
water 31.00
Total 671.00
36-205 huron 805.00 hc000737 Ralph Clark 624.00 water 31.00 100.00 0.00 08/01/2006 09/30/2015 725.00
rent 694.00
Total 725.00
36-206 huron 805.00 t0159584 Nima Haghighi 634.00 water 31.00 374.00 0.00 09/20/2014 08/31/2015 789.00
insur 10.00
rent 758.00
Total 799.00
36-207 huron 805.00 t0102865 Dariusz Jaworski 634.00 water 31.00 200.00 0.00 12/06/2010 08/31/2015 876.00
insur 10.00
insur 10.00
rent 867.00
Total 918.00
36-208 huron 805.00 t0168837 Elizabeth Doemer 624.00 rent 649.00 649.00 0.00 04/14/2015 07/13/2016 720.00
petfee 30.00
water 31.00
insur 10.00
Total 720.00
36-209 huron 805.00 t0137793 Edward Halls 624.00 petfee 30.00 314.00 0.00 04/25/2013 12/28/2015 4.00
water 31.00
rent 684.00
insur 10.00
Total 755.00
36-210 huron 805.00 t0174506 Gavin Rienne 634.00 rent 690.00 690.00 0.00 08/29/2015 08/28/2016 0.00
water 31.00
insur 10.00
Total 731.00
Page 85 of 118

9/29/2015 10:03 AM
Unit Unit Type Unit Resident Name Market Charge Amount Resident Other Move In Lease Move Out Balance
Sq Ft Rent Code Deposit Deposit Expiration
Rent Roll with Lease ChargesProvidence Harbour Club (pharbour)
As Of = 09/01/2015
Month Year = 09/2015
36-211 huron 805.00 VACANT VACANT 634.00 0.00 0.00 0.00 0.00
Total 0.00
36-212 huron 805.00 t0090308 Nicole Fortune 624.00 water 31.00 0.00 0.00 02/26/2010 02/29/2016 0.00
rent 621.00
Total 652.00
36-301 huron 805.00 t0156992 Tyler Beerman 614.00 rent 598.00 299.00 0.00 08/15/2014 11/14/2015 0.00
petfee 30.00
water 31.00
Total 659.00
36-302 huron 805.00 t0114740 Michael Wicker 624.00 water 31.00 150.00 0.00 11/14/2011 09/26/2016 -3.22
rent 631.00
Total 662.00
36-303 huron 805.00 t0140800 Charnee Smith 624.00 water 31.00 309.00 0.00 07/15/2013 07/25/2016 683.00
rent 652.00
Total 683.00
36-304 huron 805.00 t0154953 Kayla Graham 614.00 petfee 30.00 603.00 0.00 05/18/2014 11/16/2016 690.60
water 31.00
insur 10.00
rent 620.00
Total 691.00
36-305 huron 805.00 t0128994 Lekeicia Hicks 614.00 water 31.00 456.75 0.00 02/13/2013 10/26/2015 0.00
rent 635.00
Total 666.00
36-306 huron 805.00 t0156712 Kirsten Dunbar 624.00 rent 609.00 305.00 0.00 08/09/2014 11/08/2015 670.00
petfee 30.00
water 31.00
Total 670.00
36-307 huron 805.00 t0163940 Travis Prince 624.00 rent 610.00 199.00 0.00 12/13/2014 03/12/2016 651.00
water 31.00
insur 10.00
Total 651.00
36-308 huron 805.00 t0174391 Andrew Konnecke 614.00 rent 668.00 120.06 0.00 08/23/2015 11/22/2016 615.84
water 31.00
insur 10.00
Total 709.00
Page 86 of 118

9/29/2015 10:03 AM
Unit Unit Type Unit Resident Name Market Charge Amount Resident Other Move In Lease Move Out Balance
Sq Ft Rent Code Deposit Deposit Expiration
Rent Roll with Lease ChargesProvidence Harbour Club (pharbour)
As Of = 09/01/2015
Month Year = 09/2015
36-309 huron 805.00 t0171908 Yamili Marquez 614.00 rent 687.00 199.00 0.00 06/24/2015 06/23/2116 0.00
water 31.00
insur 10.00
Total 728.00
36-310 huron 805.00 t0155682 Jeffrey Szelag 624.00 water 31.00 294.00 0.00 06/01/2014 08/31/2015 635.06
rent 604.00
Total 635.00
36-311 huron 805.00 t0139595 Andrea Kelley # 624.00 water 31.00 399.00 0.00 08/23/2013 08/31/2015 09/01/2015 941.00
rent 636.00
Total 667.00
36-312 huron 805.00 t0145559 Dara Wise 614.00 petfee 30.00 300.00 0.00 09/20/2013 09/30/2015 677.00
water 31.00
rent 616.00
Total 677.00
37-101 stclair 945.00 t0148233 Jennifer Dunlap 744.00 water 41.00 744.00 0.00 11/09/2013 08/31/2015 777.00
insur 10.00
rent 825.00
Total 876.00
37-102 stclair 945.00 t0129621 Andre McQueen 769.00 water 41.00 369.00 0.00 10/27/2012 10/31/2015 801.00
rent 760.00
Total 801.00
37-103 stclair 945.00 t0155626 Dianna Delucca 769.00 rent 673.00 399.00 0.00 06/13/2014 09/06/2015 -1.00
water 41.00
concess -33.00
concone 300.00
Total 981.00
37-104 studio 505.00 t0163786 Tonya Laforest-Goedert 599.00 rent 588.00 588.00 0.00 12/03/2014 03/02/2016 0.00
petfee 30.00
water 31.00
insur 10.00
Total 659.00
37-106 stclair 945.00 t0167169 Arlinda Vines 769.00 rent 724.00 362.00 0.00 03/30/2015 06/29/2016 396.00
water 41.00
insur 10.00
Total 775.00
37-107 stclair 945.00 t0154569 Karen Ward 769.00 water 41.00 703.00 0.00 05/13/2014 08/08/2016 766.61
Page 87 of 118

9/29/2015 10:03 AM
Unit Unit Type Unit Resident Name Market Charge Amount Resident Other Move In Lease Move Out Balance
Sq Ft Rent Code Deposit Deposit Expiration
Rent Roll with Lease ChargesProvidence Harbour Club (pharbour)
As Of = 09/01/2015
Month Year = 09/2015
rent 726.00
Total 767.00
37-108 stclair 945.00 t0137091 Eric Warren 744.00 water 41.00 569.00 0.00 03/26/2013 04/11/2016 844.00
rent 793.00
insur 10.00
Total 844.00
37-110 stclair 945.00 t0123257 Alicia Lovett 769.00 water 41.00 250.00 0.00 07/31/2012 07/25/2016 785.00
rent 754.00
Total 795.00
37-111 stclair 945.00 t0169392 Lannette Cole 769.00 rent 769.00 385.00 0.00 05/30/2015 08/29/2016 0.00
water 41.00
Total 810.00
37-112 stclair 945.00 t0172951 Alicia Bonanno 774.00 rent 792.00 792.00 0.00 08/15/2015 11/14/2016 -31.62
water 41.00
insur 10.00
Total 843.00
37-201 stclair 945.00 VACANT VACANT 774.00 0.00 0.00 0.00 0.00
Total 0.00
37-202 stclair 945.00 t0164994 Nicole Laberdee 799.00 rent 728.00 364.00 0.00 01/19/2015 04/18/2016 0.00
petfee 20.00
water 41.00
insur 10.00
Total 799.00
37-203 stclair 945.00 t0079170 Walter Jones 799.00 water 41.00 0.00 0.00 06/02/2009 04/11/2016 834.00
rent 783.00
insur 10.00
Total 834.00
37-204 stclair 945.00 t0155635 Marc Fletcher 774.00 rent 696.00 199.00 0.00 06/13/2014 09/12/2015 702.00
concess -35.00
water 41.00
Total 702.00
37-205 stclair 945.00 t0140545 Stephanie Tillery 774.00 water 41.00 379.00 0.00 08/26/2013 11/30/2015 830.00
petfee 30.00
rent 759.00
Total 830.00
Page 88 of 118

9/29/2015 10:03 AM
Unit Unit Type Unit Resident Name Market Charge Amount Resident Other Move In Lease Move Out Balance
Sq Ft Rent Code Deposit Deposit Expiration
Rent Roll with Lease ChargesProvidence Harbour Club (pharbour)
As Of = 09/01/2015
Month Year = 09/2015
37-206 stclair 945.00 t0171655 Mary Ann Krause 799.00 rent 834.00 199.00 0.00 08/01/2015 10/31/2016 834.00
water 41.00
Total 875.00
37-207 stclair 945.00 t0173081 Kimberly Capobianco 799.00 rent 813.00 407.00 0.00 08/07/2015 11/06/2016 853.97
water 41.00
Total 854.00
37-208 stclair 945.00 t0100369 Takia Harden-Nelson* 774.00 water 41.00 250.00 0.00 12/10/2012 02/29/2016 1,240.00
rent 759.00
insur 10.00
Total 810.00
37-209 stclair 945.00 t0142773 Justin Ramsey 774.00 water 41.00 399.00 0.00 07/25/2013 07/31/2015 09/01/2015 -136.40
mtm 200.00
rent 782.00
Total 1,023.00
37-210 stclair 945.00 t0165621 Dustin Newstrom 799.00 rent 758.00 380.00 0.00 02/13/2015 02/12/2016 0.00
petfee 20.00
water 41.00
Total 819.00
37-211 stclair 945.00 t0170805 Matthew Wrubel 799.00 rent 771.00 199.00 0.00 06/05/2015 09/04/2016 0.00
water 41.00
Total 812.00
37-212 stclair 945.00 t0106228 Joseph Tonna 789.00 water 41.00 350.00 0.00 04/20/2011 04/25/2016 -40.00
rent 765.00
insur 10.00
Total 816.00
37-301 stclair 945.00 t0127960 George Ssensamba 789.00 water 41.00 0.00 0.00 10/26/2012 10/19/2015 825.00
rent 784.00
Total 825.00
37-302 stclair 945.00 t0152278 James Roop 764.00 water 41.00 347.00 0.00 02/28/2014 05/23/2016 754.29
rent 712.00
insur 10.00
Total 763.00
37-303 stclair 945.00 t0126179 Adam Hamami 764.00 water 41.00 150.00 0.00 08/11/2012 08/31/2015 1,015.00
rent 774.00
mtm 200.00
Total 1,015.00
Page 89 of 118

9/29/2015 10:03 AM
Unit Unit Type Unit Resident Name Market Charge Amount Resident Other Move In Lease Move Out Balance
Sq Ft Rent Code Deposit Deposit Expiration
Rent Roll with Lease ChargesProvidence Harbour Club (pharbour)
As Of = 09/01/2015
Month Year = 09/2015
37-304 stclair 945.00 VACANT VACANT 789.00 0.00 0.00 0.00 0.00
Total 0.00
37-305 stclair 945.00 t0166606 Jason Lohry 789.00 rent 736.00 199.00 0.00 03/31/2015 06/30/2016 0.00
water 41.00
insur 10.00
Total 787.00
37-306 stclair 945.00 t0106879 Rebecca Hinsman 764.00 water 41.00 325.00 200.00 06/25/2011 09/30/2015 848.00
rent 777.00
petfee 30.00
Total 848.00
37-307 stclair 945.00 t0172516 Kimberly Shankland 764.00 rent 786.00 393.00 0.00 07/18/2015 07/17/2016 0.00
water 41.00
Total 827.00
37-308 stclair 945.00 t0155914 Kendrea Kreer 789.00 rent 702.00 399.00 0.00 08/30/2014 11/29/2015 743.00
water 41.00
Total 743.00
37-309 stclair 945.00 t0152639 Tracey Hood 789.00 water 30.42 684.00 0.00 05/09/2014 11/02/2016 732.42
rent 702.00
Total 732.42
37-310 stclair 945.00 t0147796 Holly Hayes 764.00 rent 724.00 584.00 0.00 11/30/2014 02/29/2016 -71.17
petfee 30.00
water 41.00
insur 10.00
Total 805.00
37-311 stclair 945.00 t0122956 Jerry Bui 764.00 water 41.00 365.00 0.00 06/28/2012 09/30/2015 09/30/2015 0.00
rent 771.00
Total 812.00
37-312 stclair 945.00 t0135248 Jeremiah Kramer 744.00 water 41.00 0.00 0.00 02/15/2013 02/29/2016 0.00
rent 775.00
Total 816.00
38-101 huron 805.00 VACANT VACANT 619.00 0.00 0.00 0.00 0.00
Total 0.00
38-102 huron 805.00 t0151916 Garry Mundy 594.00 rent 599.00 599.00 0.00 08/31/2014 11/30/2015 660.00
petfee 20.00
Page 90 of 118
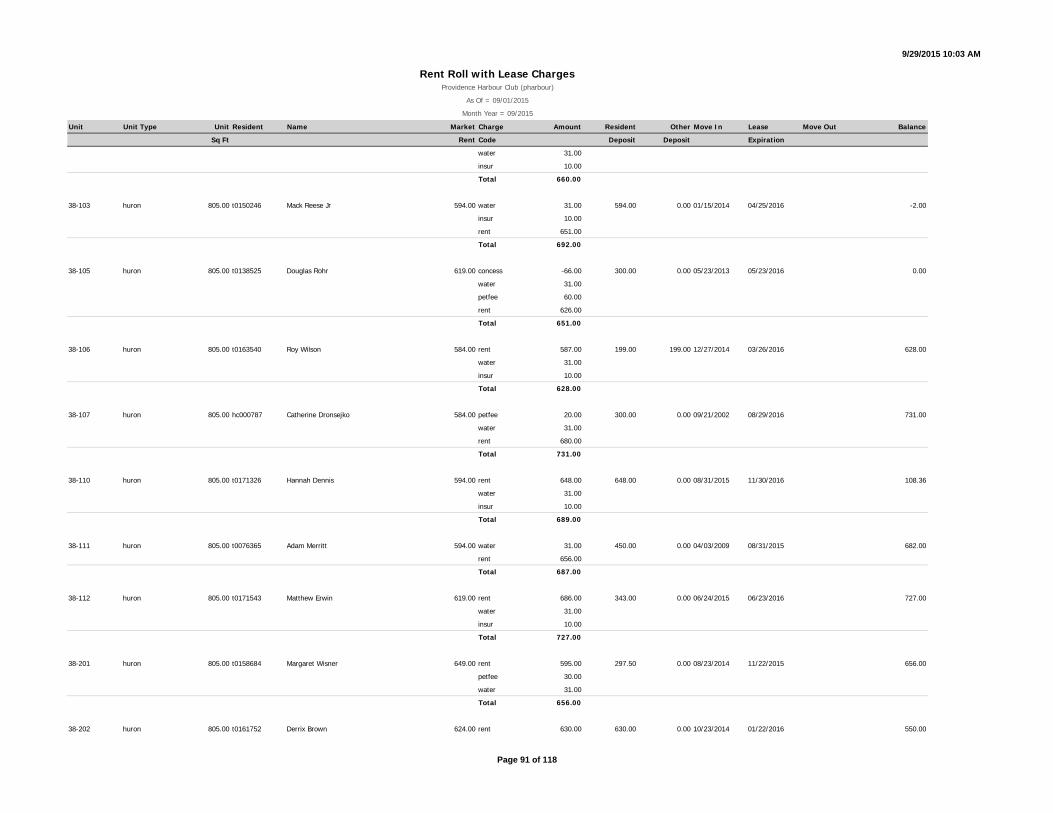
9/29/2015 10:03 AM
Unit Unit Type Unit Resident Name Market Charge Amount Resident Other Move In Lease Move Out Balance
Sq Ft Rent Code Deposit Deposit Expiration
Rent Roll with Lease ChargesProvidence Harbour Club (pharbour)
As Of = 09/01/2015
Month Year = 09/2015
water 31.00
insur 10.00
Total 660.00
38-103 huron 805.00 t0150246 Mack Reese Jr 594.00 water 31.00 594.00 0.00 01/15/2014 04/25/2016 -2.00
insur 10.00
rent 651.00
Total 692.00
38-105 huron 805.00 t0138525 Douglas Rohr 619.00 concess -66.00 300.00 0.00 05/23/2013 05/23/2016 0.00
water 31.00
petfee 60.00
rent 626.00
Total 651.00
38-106 huron 805.00 t0163540 Roy Wilson 584.00 rent 587.00 199.00 199.00 12/27/2014 03/26/2016 628.00
water 31.00
insur 10.00
Total 628.00
38-107 huron 805.00 hc000787 Catherine Dronsejko 584.00 petfee 20.00 300.00 0.00 09/21/2002 08/29/2016 731.00
water 31.00
rent 680.00
Total 731.00
38-110 huron 805.00 t0171326 Hannah Dennis 594.00 rent 648.00 648.00 0.00 08/31/2015 11/30/2016 108.36
water 31.00
insur 10.00
Total 689.00
38-111 huron 805.00 t0076365 Adam Merritt 594.00 water 31.00 450.00 0.00 04/03/2009 08/31/2015 682.00
rent 656.00
Total 687.00
38-112 huron 805.00 t0171543 Matthew Erwin 619.00 rent 686.00 343.00 0.00 06/24/2015 06/23/2016 727.00
water 31.00
insur 10.00
Total 727.00
38-201 huron 805.00 t0158684 Margaret Wisner 649.00 rent 595.00 297.50 0.00 08/23/2014 11/22/2015 656.00
petfee 30.00
water 31.00
Total 656.00
38-202 huron 805.00 t0161752 Derrix Brown 624.00 rent 630.00 630.00 0.00 10/23/2014 01/22/2016 550.00
Page 91 of 118

9/29/2015 10:03 AM
Unit Unit Type Unit Resident Name Market Charge Amount Resident Other Move In Lease Move Out Balance
Sq Ft Rent Code Deposit Deposit Expiration
Rent Roll with Lease ChargesProvidence Harbour Club (pharbour)
As Of = 09/01/2015
Month Year = 09/2015
water 31.00
insur 10.00
Total 671.00
38-203 huron 805.00 VACANT VACANT 624.00 0.00 0.00 0.00 0.00
Total 0.00
38-204 huron 805.00 t0107791 Mary Terrell* 649.00 water 31.00 175.00 0.00 07/01/2011 06/27/2016 9.00
insur 10.00
rent 619.00
Total 660.00
38-205 huron 805.00 hc000794 Iqbal Shah 649.00 water 31.00 150.00 0.00 06/28/2003 09/26/2016 690.00
rent 659.00
Total 690.00
38-206 huron 805.00 t0139626 Nicholas Patterson 614.00 water 31.00 314.50 0.00 05/25/2013 08/31/2015 665.00
insur 10.00
insur 10.00
insur 10.00
insur 10.00
insur 10.00
insur 10.00
insur 10.00
rent 682.00
Total 783.00
38-207 huron 805.00 t0164237 Gregory Howard 614.00 rent 607.00 607.00 0.00 01/22/2015 02/21/2016 577.66
water 31.00
insur 10.00
Total 648.00
38-208 huron 805.00 hc000797 Joe Chatman 649.00 water 31.00 0.00 0.00 03/03/2006 05/23/2016 601.46
rent 694.00
Total 725.00
38-209 huron 805.00 t0166868 Hector Medina 649.00 rent 647.00 971.00 0.00 03/07/2015 06/06/2016 688.00
water 31.00
insur 10.00
Total 688.00
38-210 huron 805.00 t0148141 Marcus Johnson 624.00 water 31.00 312.00 0.00 12/13/2013 12/28/2015 664.00
rent 633.00
Total 664.00
Page 92 of 118

9/29/2015 10:03 AM
Unit Unit Type Unit Resident Name Market Charge Amount Resident Other Move In Lease Move Out Balance
Sq Ft Rent Code Deposit Deposit Expiration
Rent Roll with Lease ChargesProvidence Harbour Club (pharbour)
As Of = 09/01/2015
Month Year = 09/2015
38-211 huron 805.00 t0156096 Sara Lucas 624.00 water 31.00 303.00 0.00 06/28/2014 06/27/2016 0.00
rent 624.00
insur 10.00
Total 665.00
38-212 huron 805.00 t0148771 Willie Brimm *SSI* 649.00 water 31.00 649.00 0.00 12/18/2013 12/31/2015 769.00
rent 658.00
insur 10.00
Total 699.00
38-301 huron 805.00 VACANT VACANT 639.00 0.00 0.00 0.00 0.00
Total 0.00
38-302 huron 805.00 t0156027 Erin Mastrogiacomo 614.00 water 31.00 303.00 0.00 08/16/2014 08/15/2016 0.00
rent 622.00
Total 653.00
38-303 huron 805.00 t0163524 Antonio Laboda 614.00 rent 626.00 626.00 0.00 12/13/2014 03/12/2016 667.11
water 31.00
insur 10.00
Total 667.00
38-304 huron 805.00 hc000805 Arthur Clark Jr. 639.00 water 31.00 100.00 0.00 12/26/2005 02/29/2016 671.00
rent 630.00
insur 10.00
Total 671.00
38-305 huron 805.00 t0142874 Shelby Baker 639.00 water 31.00 199.00 0.00 07/25/2013 07/25/2016 0.00
rent 709.00
Total 740.00
38-306 huron 805.00 t0163523 Darryl Bryant Jr 604.00 rent 599.00 399.00 0.00 02/03/2015 05/02/2016 630.00
water 31.00
Total 630.00
38-307 huron 805.00 VACANT VACANT 604.00 0.00 0.00 0.00 0.00
Total 0.00
38-308 huron 805.00 t0090571 Robert Davis 639.00 water 31.00 0.00 0.00 03/13/2010 06/30/2016 0.00
rent 614.00
insur 10.00
Total 655.00
38-309 huron 805.00 t0172591 Steven Murray 639.00 rent 674.00 336.00 0.00 07/20/2015 10/19/2016 0.00
water 31.00
Page 93 of 118

9/29/2015 10:03 AM
Unit Unit Type Unit Resident Name Market Charge Amount Resident Other Move In Lease Move Out Balance
Sq Ft Rent Code Deposit Deposit Expiration
Rent Roll with Lease ChargesProvidence Harbour Club (pharbour)
As Of = 09/01/2015
Month Year = 09/2015
Total 705.00
38-310 huron 805.00 t0169115 Timothy Griffin 614.00 rent 634.00 317.00 0.00 04/11/2015 04/10/2016 0.00
water 31.00
Total 665.00
38-311 huron 805.00 t0154924 Anthony Kelly 614.00 rent 653.00 326.00 0.00 05/23/2015 07/22/2016 684.00
water 31.00
Total 684.00
38-312 huron 805.00 t0110941 Soncierria Bridges 639.00 water 31.00 275.00 0.00 10/01/2011 09/30/2015 641.00
rent 610.00
Total 641.00
39-101 stclair 945.00 t0167018 David Harrison 744.00 rent 687.00 399.00 0.00 03/14/2015 06/13/2016 584.00
water 41.00
insur 10.00
Total 738.00
39-102 stclair 945.00 t0150779 Darla Wozniak 769.00 water 41.00 713.00 0.00 02/28/2014 08/22/2016 770.55
rent 722.00
insur 10.00
Total 773.00
39-103 stclair 945.00 t0148728 Shannon Brown 769.00 water 41.00 769.00 0.00 12/31/2013 12/28/2015 1,214.00
rent 779.00
Total 820.00
39-104 studio 505.00 t0166056 Candie Mincy *SSI* 599.00 rent 584.00 584.00 0.00 03/01/2015 05/31/2016 625.00
water 31.00
insur 10.00
Total 625.00
39-106 stclair 945.00 VACANT VACANT 769.00 0.00 0.00 0.00 0.00
Total 0.00
39-107 stclair 945.00 t0168954 Lesli Hill 769.00 rent 739.00 739.00 0.00 04/17/2015 07/16/2016 789.67
water 41.00
insur 10.00
Total 790.00
39-108 stclair 945.00 t0149857 Orville Schaller *SSI* 744.00 petfee 30.00 744.00 0.00 12/31/2013 03/31/2016 801.64
water 41.00
rent 741.00
Total 812.00
Page 94 of 118

9/29/2015 10:03 AM
Unit Unit Type Unit Resident Name Market Charge Amount Resident Other Move In Lease Move Out Balance
Sq Ft Rent Code Deposit Deposit Expiration
Rent Roll with Lease ChargesProvidence Harbour Club (pharbour)
As Of = 09/01/2015
Month Year = 09/2015
39-110 stclair 945.00 t0167187 Ashanda King 769.00 rent 717.00 359.00 0.00 03/24/2015 06/23/2016 750.00
water 41.00
insur 10.00
Total 768.00
39-111 stclair 945.00 hc000821 Carole Buckland *SSI* 769.00 water 41.00 100.00 0.00 10/21/1995 10/31/2016 801.00
rent 760.00
Total 801.00
39-112 stclair 945.00 t0153250 Robert Raymond 774.00 water 41.00 359.50 0.00 04/12/2014 03/11/2016 780.00
rent 729.00
insur 10.00
Total 780.00
39-201 stclair 945.00 t0170176 Samantha Todd 774.00 rent 766.00 383.00 0.00 05/16/2015 05/17/2016 807.00
water 41.00
Total 807.00
39-202 stclair 945.00 t0139151 Ervin Leblanc 799.00 water 41.00 379.00 0.00 05/25/2013 11/23/2015 921.00
petfee 30.00
rent 850.00
Total 921.00
39-203 stclair 945.00 t0163884 Brittani Effinger 799.00 water 41.00 787.00 0.00 12/10/2014 01/04/2016 846.00
rent 795.00
insur 10.00
Total 846.00
39-204 stclair 945.00 t0167735 Charles Hesson 774.00 rent 721.00 721.00 0.00 03/22/2015 06/22/2016 772.00
water 41.00
insur 10.00
Total 772.00
39-205 stclair 945.00 t0118059 Jasmine Lowe 774.00 water 41.00 350.00 0.00 01/13/2012 08/31/2015 09/01/2015 1,177.00
rent 769.00
Total 810.00
39-206 stclair 945.00 t0130657 Tony Casey 799.00 rent 717.00 150.00 0.00 10/31/2014 01/31/2016 695.41
water 41.00
insur 10.00
Total 768.00
39-207 stclair 945.00 t0166786 Jerome Gilbert Jr 799.00 rent 753.00 753.00 0.00 05/01/2015 07/31/2016 0.00
water 41.00
Page 95 of 118
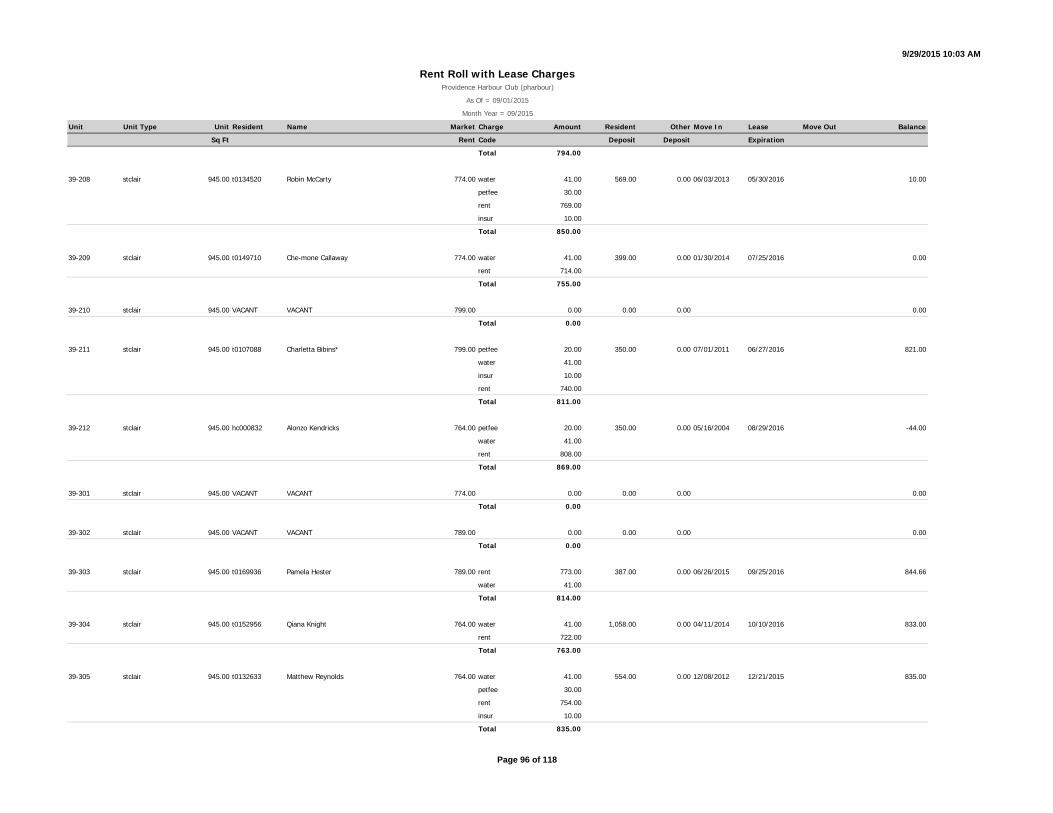
9/29/2015 10:03 AM
Unit Unit Type Unit Resident Name Market Charge Amount Resident Other Move In Lease Move Out Balance
Sq Ft Rent Code Deposit Deposit Expiration
Rent Roll with Lease ChargesProvidence Harbour Club (pharbour)
As Of = 09/01/2015
Month Year = 09/2015
Total 794.00
39-208 stclair 945.00 t0134520 Robin McCarty 774.00 water 41.00 569.00 0.00 06/03/2013 05/30/2016 10.00
petfee 30.00
rent 769.00
insur 10.00
Total 850.00
39-209 stclair 945.00 t0149710 Che-mone Callaway 774.00 water 41.00 399.00 0.00 01/30/2014 07/25/2016 0.00
rent 714.00
Total 755.00
39-210 stclair 945.00 VACANT VACANT 799.00 0.00 0.00 0.00 0.00
Total 0.00
39-211 stclair 945.00 t0107088 Charletta Bibins* 799.00 petfee 20.00 350.00 0.00 07/01/2011 06/27/2016 821.00
water 41.00
insur 10.00
rent 740.00
Total 811.00
39-212 stclair 945.00 hc000832 Alonzo Kendricks 764.00 petfee 20.00 350.00 0.00 05/16/2004 08/29/2016 -44.00
water 41.00
rent 808.00
Total 869.00
39-301 stclair 945.00 VACANT VACANT 774.00 0.00 0.00 0.00 0.00
Total 0.00
39-302 stclair 945.00 VACANT VACANT 789.00 0.00 0.00 0.00 0.00
Total 0.00
39-303 stclair 945.00 t0169936 Pamela Hester 789.00 rent 773.00 387.00 0.00 06/26/2015 09/25/2016 844.66
water 41.00
Total 814.00
39-304 stclair 945.00 t0152956 Qiana Knight 764.00 water 41.00 1,058.00 0.00 04/11/2014 10/10/2016 833.00
rent 722.00
Total 763.00
39-305 stclair 945.00 t0132633 Matthew Reynolds 764.00 water 41.00 554.00 0.00 12/08/2012 12/21/2015 835.00
petfee 30.00
rent 754.00
insur 10.00
Total 835.00
Page 96 of 118

9/29/2015 10:03 AM
Unit Unit Type Unit Resident Name Market Charge Amount Resident Other Move In Lease Move Out Balance
Sq Ft Rent Code Deposit Deposit Expiration
Rent Roll with Lease ChargesProvidence Harbour Club (pharbour)
As Of = 09/01/2015
Month Year = 09/2015
39-306 stclair 945.00 t0164668 Christina Gwozdek 789.00 rent 725.00 725.00 725.00 01/03/2015 04/02/2016 796.00
petfee 30.00
water 41.00
Total 796.00
39-307 stclair 945.00 t0162083 Brandon Ludy 789.00 rent 749.00 375.00 0.00 11/03/2014 11/02/2015 914.00
water 41.00
insur 10.00
Total 800.00
39-308 stclair 945.00 t0157360 Nicole Perry 764.00 rent 734.00 399.00 0.00 08/08/2014 11/07/2015 1,866.74
water 41.00
insur 10.00
Total 785.00
39-309 stclair 945.00 t0169517 Joshua Turner 764.00 rent 754.00 754.00 0.00 06/15/2015 09/14/2016 -3.00
water 41.00
Total 795.00
39-310 stclair 945.00 t0139657 Stacie Moorer 799.00 petfee 30.00 390.00 0.00 05/23/2013 08/22/2016 874.00
water 41.00
rent 793.00
insur 10.00
Total 874.00
39-311 stclair 945.00 t0158628 Briana Scott 789.00 rent 758.00 379.00 0.00 08/17/2014 11/16/2015 808.00
water 41.00
insur 10.00
Total 809.00
39-312 stclair 945.00 t0139209 Lucas Bailey 744.00 water 41.00 374.00 0.00 05/25/2013 09/28/2015 884.33
rent 837.00
insur 10.00
Total 888.00
40-101 huron 805.00 t0106833 Sonja Fraser *SSI* 594.00 petfee 30.00 175.00 0.00 06/20/2011 09/26/2016 679.00
water 31.00
rent 612.00
insur 10.00
Total 683.00
40-102 huron 805.00 t0133396 Glen Zirker 594.00 water 31.00 150.00 0.00 02/22/2013 02/29/2016 654.00
rent 613.00
insur 10.00
Page 97 of 118

9/29/2015 10:03 AM
Unit Unit Type Unit Resident Name Market Charge Amount Resident Other Move In Lease Move Out Balance
Sq Ft Rent Code Deposit Deposit Expiration
Rent Roll with Lease ChargesProvidence Harbour Club (pharbour)
As Of = 09/01/2015
Month Year = 09/2015
Total 654.00
40-103 huron 805.00 hc000846 Clinton Walter 594.00 water 31.00 150.00 0.00 08/07/2006 10/31/2016 625.00
rent 648.00
Total 679.00
40-105 huron 805.00 t0140587 Kevin Nelson Jr. 594.00 water 31.00 199.00 0.00 08/01/2013 07/25/2016 -575.00
rent 626.00
Total 657.00
40-106 huron 805.00 t0166258 Branden Mims 594.00 rent 588.00 588.00 0.00 03/01/2015 05/31/2016 628.00
water 31.00
insur 10.00
Total 629.00
40-107 huron 805.00 t0166664 Radhi Jagirdar 594.00 rent 586.00 293.00 0.00 03/07/2015 05/08/2016 637.04
water 31.00
insur 10.00
Total 627.00
40-110 huron 805.00 t0164187 Gene Hayes *SSI 594.00 rent 585.00 878.00 878.00 12/17/2014 03/16/2016 126.00
water 31.00
insur 10.00
Total 626.00
40-111 huron 805.00 t0170398 Calixto Mendendez 594.00 rent 617.00 308.50 0.00 05/23/2015 08/22/2016 -50.00
water 31.00
insur 10.00
Total 658.00
40-112 huron 805.00 t0162575 Montana Graszak 594.00 rent 588.00 294.00 0.00 11/22/2014 02/21/2016 -1.00
petfee 30.00
water 31.00
insur 10.00
Total 659.00
40-201 huron 805.00 t0166221 Vernard Patterson 624.00 rent 628.00 628.00 0.00 04/02/2015 07/01/2016 669.61
water 31.00
insur 10.00
Total 669.00
40-202 huron 805.00 t0150778 Christopher Whittaker 624.00 water 31.00 618.00 0.00 01/25/2014 03/31/2016 608.50
rent 615.00
insur 10.00
Total 656.00
Page 98 of 118

9/29/2015 10:03 AM
Unit Unit Type Unit Resident Name Market Charge Amount Resident Other Move In Lease Move Out Balance
Sq Ft Rent Code Deposit Deposit Expiration
Rent Roll with Lease ChargesProvidence Harbour Club (pharbour)
As Of = 09/01/2015
Month Year = 09/2015
40-203 huron 805.00 t0147637 Bradley Rocheleau 624.00 concess -31.00 297.00 0.00 10/23/2013 10/31/2015 681.00
petfee 45.00
water 31.00
rent 626.00
insur 10.00
Total 681.00
40-204 huron 805.00 t0153252 Deja Torrance 624.00 water 31.00 306.00 0.00 04/03/2014 07/01/2016 657.52
rent 627.00
Total 658.00
40-205 huron 805.00 t0174339 hunter rousseau 624.00 rent 680.00 201.58 0.00 08/23/2015 08/22/2016 621.32
water 31.00
insur 10.00
Total 721.00
40-206 huron 805.00 t0172609 Donald Keith 624.00 rent 674.00 337.00 0.00 07/10/2015 10/09/2016 715.00
water 31.00
insur 10.00
Total 715.00
40-207 huron 805.00 t0156073 Latrice Levy 624.00 petfee 30.00 308.00 0.00 07/15/2014 07/14/2016 0.00
water 31.00
rent 624.00
Total 685.00
40-208 huron 805.00 t0169858 Derrick Tomblin 624.00 rent 647.00 599.00 0.00 05/15/2015 08/14/2016 70.00
petfee 30.00
water 31.00
insur 10.00
Total 718.00
40-209 huron 805.00 t0146957 Clifford Eick 624.00 water 31.00 312.00 0.00 11/18/2013 11/23/2015 677.00
rent 646.00
Total 677.00
40-210 huron 805.00 t0142407 Jonte Clarke 624.00 water 31.00 199.00 0.00 08/13/2013 08/31/2015 707.00
rent 676.00
mtm 200.00
Total 907.00
40-211 huron 805.00 VACANT VACANT 624.00 0.00 0.00 0.00 0.00
Total 0.00
Page 99 of 118

9/29/2015 10:03 AM
Unit Unit Type Unit Resident Name Market Charge Amount Resident Other Move In Lease Move Out Balance
Sq Ft Rent Code Deposit Deposit Expiration
Rent Roll with Lease ChargesProvidence Harbour Club (pharbour)
As Of = 09/01/2015
Month Year = 09/2015
40-212 huron 805.00 t0158879 Branden Kenyon 624.00 rent 624.00 312.00 0.00 08/29/2014 11/28/2015 685.00
water 31.00
petfee 30.00
Total 685.00
40-301 huron 805.00 t0155201 Candice Mcadoo 614.00 water 31.00 558.00 0.00 05/30/2014 08/29/2015 10/01/2015 569.52
insur 10.00
rent 614.00
mtm 200.00
Total 855.00
40-302 huron 805.00 t0155592 Charlia Preston 614.00 rent 578.00 199.00 0.00 06/07/2014 09/06/2015 610.00
concess -29.00
petfee 30.00
water 31.00
Total 610.00
40-303 huron 805.00 t0158262 Michael lyons 614.00 rent 599.00 300.00 0.00 09/04/2014 12/03/2015 630.00
water 31.00
Total 630.00
40-304 huron 805.00 t0158481 Anthony Kersey 614.00 rent 629.00 399.00 0.00 08/08/2014 11/07/2015 639.71
water 31.00
insur 10.00
Total 670.00
40-305 huron 805.00 t0140448 Tanya Newrones 614.00 petfee 30.00 304.00 0.00 06/14/2013 06/27/2016 697.00
water 31.00
rent 636.00
Total 697.00
40-306 huron 805.00 t0170154 Charles Hunt 614.00 rent 646.00 646.00 0.00 05/11/2015 08/09/2016 687.00
water 31.00
insur 10.00
Total 687.00
40-307 huron 805.00 t0136319 Briana Warlix 614.00 water 31.00 464.00 0.00 03/25/2013 03/30/2016 758.00
rent 633.00
insur 10.00
Total 674.00
40-308 huron 805.00 t0162377 Tracy Endicott 614.00 rent 614.00 307.00 0.00 11/15/2014 02/14/2016 0.00
water 31.00
insur 10.00
Total 655.00
Page 100 of 118

9/29/2015 10:03 AM
Unit Unit Type Unit Resident Name Market Charge Amount Resident Other Move In Lease Move Out Balance
Sq Ft Rent Code Deposit Deposit Expiration
Rent Roll with Lease ChargesProvidence Harbour Club (pharbour)
As Of = 09/01/2015
Month Year = 09/2015
40-309 huron 805.00 t0166544 Matthew Eggert 614.00 rent 618.00 309.00 0.00 03/07/2015 03/06/2016 0.00
water 31.00
Total 649.00
40-310 huron 805.00 t0170943 Andrew Claflin 614.00 rent 664.00 199.00 0.00 05/31/2015 08/30/2016 705.00
water 31.00
insur 10.00
Total 705.00
40-311 huron 805.00 hc000870 Julie Skelly 614.00 water 31.00 100.00 0.00 08/01/1998 12/28/2015 690.00
rent 659.00
Total 690.00
40-312 huron 805.00 t0171274 Carlos Tarhini 614.00 rent 673.00 367.00 0.00 06/06/2015 09/05/2016 09/29/2015 -2.00
water 31.00
insur 10.00
Total 714.00
41-101 huron 805.00 t0171674 Charlene Ray 594.00 rent 654.00 327.00 0.00 07/15/2015 10/14/2016 0.00
petfee 60.00
water 31.00
Total 745.00
41-102 huron 805.00 t0162171 Jeff Nance 594.00 rent 598.00 199.00 0.00 12/01/2014 02/29/2016 639.00
water 31.00
insur 10.00
Total 639.00
41-103 huron 805.00 t0154833 Stephanie Dusseau 594.00 rent 595.00 297.00 0.00 08/24/2014 11/23/2015 10/01/2015 596.00
water 31.00
Total 626.00
41-105 huron 805.00 t0160049 David Kidwell 594.00 rent 600.00 300.00 0.00 09/29/2014 12/28/2015 700.74
petfee 60.00
water 31.00
insur 10.00
Total 701.00
41-106 huron 805.00 t0163948 Kimberly Lindsey *SSI* 594.00 rent 579.00 579.00 399.58 12/09/2014 03/08/2016 620.00
water 31.00
insur 10.00
Total 620.00
41-107 huron 805.00 t0174007 Jewel Thomas 594.00 rent 654.00 327.00 0.00 08/22/2015 11/21/2016 610.20
Page 101 of 118

9/29/2015 10:03 AM
Unit Unit Type Unit Resident Name Market Charge Amount Resident Other Move In Lease Move Out Balance
Sq Ft Rent Code Deposit Deposit Expiration
Rent Roll with Lease ChargesProvidence Harbour Club (pharbour)
As Of = 09/01/2015
Month Year = 09/2015
water 31.00
insur 10.00
Total 695.00
41-110 huron 805.00 t0158321 Ashley Moore 594.00 rent 568.00 284.00 0.00 08/15/2014 11/14/2015 609.00
water 31.00
insur 10.00
Total 609.00
41-111 huron 805.00 VACANT VACANT 594.00 0.00 0.00 0.00 0.00
Total 0.00
41-112 huron 805.00 VACANT VACANT 594.00 0.00 0.00 0.00 0.00
Total 0.00
41-201 huron 805.00 t0121934 Keondre Benson 624.00 water 31.00 300.00 0.00 08/16/2012 08/31/2015 749.00
insur 10.00
rent 708.00
Total 749.00
41-202 huron 805.00 t0160219 Carin Cole 624.00 rent 632.00 199.00 0.00 10/09/2014 01/08/2016 -38.00
water 31.00
Total 663.00
41-203 huron 805.00 t0152941 Vicky Vincent 624.00 water 31.00 624.00 0.00 03/22/2014 09/19/2016 0.00
petfee 30.00
rent 633.00
Total 694.00
41-204 huron 805.00 VACANT VACANT 644.00 0.00 0.00 0.00 0.00
Total 0.00
41-205 huron 805.00 t0122811 Ella Brown* 624.00 petfee 30.00 579.00 0.00 07/05/2012 06/27/2016 1,329.00
water 31.00
rent 599.00
insur 10.00
Total 670.00
41-206 huron 805.00 t0145711 Conrada Shephard 624.00 petfee 30.00 299.00 0.00 09/20/2013 09/30/2015 09/30/2015 677.00
water 31.00
rent 616.00
Total 677.00
41-207 huron 805.00 t0173698 Bruce Arquitt 624.00 rent 690.00 690.00 0.00 08/15/2015 10/14/2016 0.00
water 31.00
Page 102 of 118
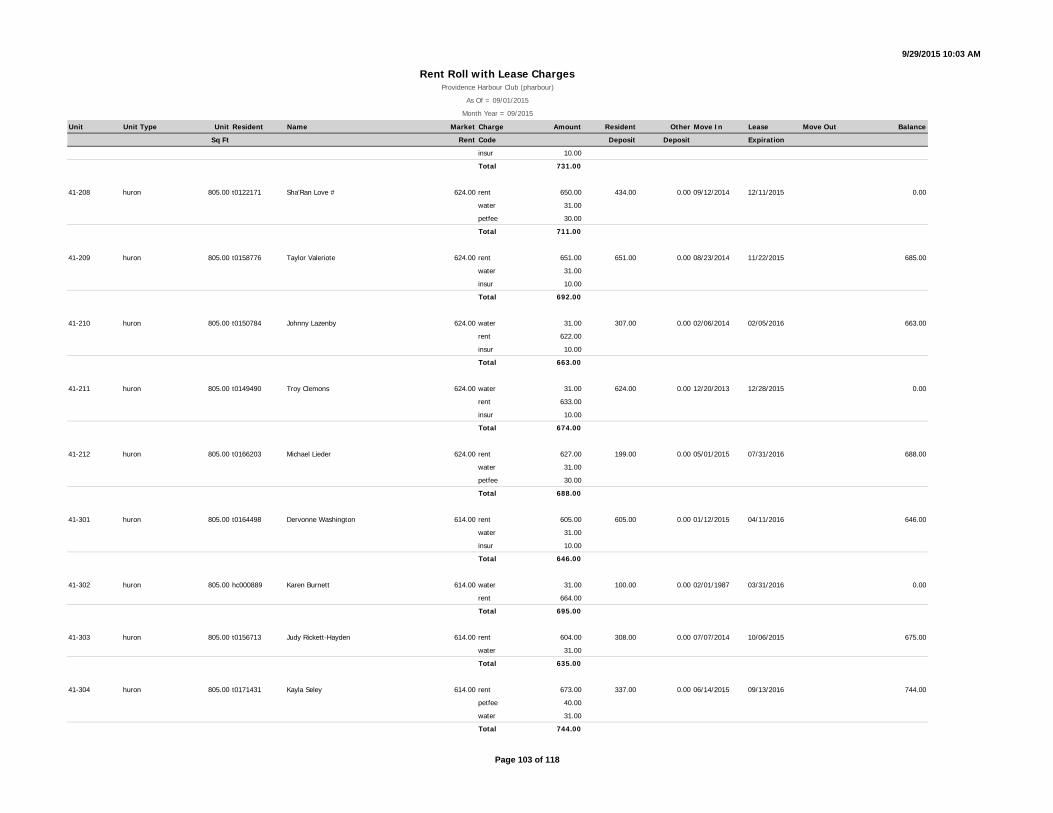
9/29/2015 10:03 AM
Unit Unit Type Unit Resident Name Market Charge Amount Resident Other Move In Lease Move Out Balance
Sq Ft Rent Code Deposit Deposit Expiration
Rent Roll with Lease ChargesProvidence Harbour Club (pharbour)
As Of = 09/01/2015
Month Year = 09/2015
insur 10.00
Total 731.00
41-208 huron 805.00 t0122171 Sha'Ran Love # 624.00 rent 650.00 434.00 0.00 09/12/2014 12/11/2015 0.00
water 31.00
petfee 30.00
Total 711.00
41-209 huron 805.00 t0158776 Taylor Valeriote 624.00 rent 651.00 651.00 0.00 08/23/2014 11/22/2015 685.00
water 31.00
insur 10.00
Total 692.00
41-210 huron 805.00 t0150784 Johnny Lazenby 624.00 water 31.00 307.00 0.00 02/06/2014 02/05/2016 663.00
rent 622.00
insur 10.00
Total 663.00
41-211 huron 805.00 t0149490 Troy Clemons 624.00 water 31.00 624.00 0.00 12/20/2013 12/28/2015 0.00
rent 633.00
insur 10.00
Total 674.00
41-212 huron 805.00 t0166203 Michael Lieder 624.00 rent 627.00 199.00 0.00 05/01/2015 07/31/2016 688.00
water 31.00
petfee 30.00
Total 688.00
41-301 huron 805.00 t0164498 Dervonne Washington 614.00 rent 605.00 605.00 0.00 01/12/2015 04/11/2016 646.00
water 31.00
insur 10.00
Total 646.00
41-302 huron 805.00 hc000889 Karen Burnett 614.00 water 31.00 100.00 0.00 02/01/1987 03/31/2016 0.00
rent 664.00
Total 695.00
41-303 huron 805.00 t0156713 Judy Rickett-Hayden 614.00 rent 604.00 308.00 0.00 07/07/2014 10/06/2015 675.00
water 31.00
Total 635.00
41-304 huron 805.00 t0171431 Kayla Seley 614.00 rent 673.00 337.00 0.00 06/14/2015 09/13/2016 744.00
petfee 40.00
water 31.00
Total 744.00
Page 103 of 118

9/29/2015 10:03 AM
Unit Unit Type Unit Resident Name Market Charge Amount Resident Other Move In Lease Move Out Balance
Sq Ft Rent Code Deposit Deposit Expiration
Rent Roll with Lease ChargesProvidence Harbour Club (pharbour)
As Of = 09/01/2015
Month Year = 09/2015
41-305 huron 805.00 t0137381 Samoyay Harrison 614.00 rent 637.00 318.00 0.00 05/01/2015 07/31/2016 658.00
water 31.00
insur 10.00
Total 678.00
41-306 huron 805.00 VACANT VACANT 614.00 0.00 0.00 0.00 0.00
Total 0.00
41-307 huron 805.00 VACANT VACANT 614.00 0.00 0.00 0.00 0.00
Total 0.00
41-308 huron 805.00 t0171432 Leo Wilson 614.00 rent 673.00 399.00 0.00 06/22/2015 09/21/2016 -113.90
water 31.00
Total 704.00
41-309 huron 805.00 t0173413 Eric Davis Jr 614.00 rent 690.00 690.00 0.00 08/15/2015 11/14/2016 0.00
water 31.00
insur 10.00
Total 731.00
41-310 huron 805.00 t0157214 Dana Castle 614.00 rent 589.00 589.00 0.00 07/11/2014 10/10/2015 620.00
water 31.00
Total 620.00
41-311 huron 805.00 t0108964 Reginald Vaughn 614.00 water 31.00 175.00 0.00 07/15/2011 07/25/2016 667.00
rent 636.00
Total 667.00
41-312 huron 805.00 t0093367 Regina Wiggins 614.00 water 31.00 0.00 0.00 05/09/2010 05/23/2016 -30.10
rent 627.00
Total 658.00
42-101 huron 805.00 t0138870 Thabiso Khumalo 619.00 water 31.00 299.00 0.00 05/02/2013 04/24/2016 10.00
rent 627.00
insur 10.00
Total 668.00
42-102 huron 805.00 t0165374 Michelle Taylor 594.00 rent 592.00 296.00 0.00 02/19/2015 05/18/2016 09/12/2015 -798.20
petfee 20.00
water 31.00
Total 643.00
42-103 huron 805.00 t0167918 James Newbill 594.00 rent 594.00 297.00 0.00 04/14/2015 07/13/2016 635.00
water 31.00
Page 104 of 118

9/29/2015 10:03 AM
Unit Unit Type Unit Resident Name Market Charge Amount Resident Other Move In Lease Move Out Balance
Sq Ft Rent Code Deposit Deposit Expiration
Rent Roll with Lease ChargesProvidence Harbour Club (pharbour)
As Of = 09/01/2015
Month Year = 09/2015
insur 10.00
Total 635.00
42-105 huron 805.00 t0067699 Phyllis Vogel 619.00 water 31.00 0.00 0.00 11/01/2008 10/26/2015 658.00
rent 627.00
Total 658.00
42-106 huron 805.00 t0164555 Stephen Simon 594.00 rent 595.00 595.00 0.00 01/24/2015 04/23/2016 -535.74
water 31.00
insur 10.00
Total 636.00
42-107 huron 805.00 t0092412 Amber Ogden 594.00 water 31.00 0.00 0.00 04/03/2010 03/14/2016 678.00
rent 627.00
insur 10.00
Total 668.00
42-110 huron 805.00 t0156707 Steven Byrd 604.00 rent 587.00 293.00 0.00 06/25/2014 09/24/2015 628.00
water 31.00
insur 10.00
Total 628.00
42-111 huron 805.00 t0155636 Tiffani Roland 594.00 rent 589.00 199.00 0.00 08/28/2014 11/27/2015 0.00
water 31.00
Total 620.00
42-112 huron 805.00 t0149787 Robert Hunter 619.00 water 31.00 309.50 0.00 01/11/2014 01/18/2016 659.00
rent 628.00
Total 659.00
42-201 huron 805.00 t0173532 Annie Callaway 649.00 water 31.00 649.00 0.00 05/09/2014 08/08/2015 09/01/2015 -38.61
mtm 200.00
rent 649.00
Total 880.00
42-202 huron 805.00 t0167663 Destini Wallace 624.00 rent 624.00 624.00 0.00 03/21/2015 06/20/2016 0.00
water 31.00
insur 10.00
Total 665.00
42-203 huron 805.00 t0170201 Keanna Hughes 624.00 rent 647.00 647.00 0.00 05/10/2015 08/09/2016 -10.00
water 31.00
insur 10.00
Total 688.00
Page 105 of 118

9/29/2015 10:03 AM
Unit Unit Type Unit Resident Name Market Charge Amount Resident Other Move In Lease Move Out Balance
Sq Ft Rent Code Deposit Deposit Expiration
Rent Roll with Lease ChargesProvidence Harbour Club (pharbour)
As Of = 09/01/2015
Month Year = 09/2015
42-204 huron 805.00 VACANT VACANT 649.00 0.00 0.00 0.00 0.00
Total 0.00
42-205 huron 805.00 t0154962 Michael Hill 649.00 rent 626.00 399.00 0.00 06/13/2014 09/12/2015 631.54
concess -31.00
water 31.00
Total 626.00
42-206 huron 805.00 t0085021 David Hampton 624.00 water 31.00 0.00 0.00 10/27/2009 10/05/2016 684.00
rent 653.00
Total 684.00
42-207 huron 805.00 VACANT VACANT 624.00 0.00 0.00 0.00 0.00
Total 0.00
42-208 huron 805.00 t0156780 Elijah Johnson 649.00 rent 622.00 622.00 0.00 07/01/2014 09/30/2015 0.00
water 31.00
insur 10.00
Total 663.00
42-209 huron 805.00 t0152641 Cassandra Donald 649.00 water 31.00 199.00 0.00 05/30/2014 08/29/2015 703.31
insur 10.00
insur 10.00
rent 652.00
Total 703.00
42-210 huron 805.00 t0159342 Sherikia Johnson 624.00 rent 640.00 0.00 0.00 09/06/2014 12/31/2015 672.28
water 31.00
insur 10.00
Total 681.00
42-211 huron 805.00 t0164285 Jamie Benam 624.00 rent 616.00 199.00 199.00 12/29/2014 03/28/2016 657.00
water 31.00
insur 10.00
Total 657.00
42-212 huron 805.00 VACANT VACANT 649.00 0.00 0.00 0.00 0.00
Total 0.00
42-301 huron 805.00 t0173212 Evana Ristovski 639.00 rent 685.00 685.00 0.00 08/21/2015 11/20/2016 5.77
water 31.00
insur 10.00
Total 726.00
42-302 huron 805.00 t0118961 Sharon Condoll* 614.00 water 31.00 350.00 0.00 06/01/2011 05/31/2016 635.00
Page 106 of 118

9/29/2015 10:03 AM
Unit Unit Type Unit Resident Name Market Charge Amount Resident Other Move In Lease Move Out Balance
Sq Ft Rent Code Deposit Deposit Expiration
Rent Roll with Lease ChargesProvidence Harbour Club (pharbour)
As Of = 09/01/2015
Month Year = 09/2015
rent 623.00
Total 654.00
42-303 huron 805.00 hc000918 Ronald Burk 614.00 water 31.00 250.00 0.00 03/05/2006 09/30/2015 679.00
rent 648.00
Total 679.00
42-304 huron 805.00 t0159677 Samuel Laidlaw 639.00 rent 673.00 199.00 0.00 09/06/2014 08/31/2016 478.17
water 31.00
Total 704.00
42-305 huron 805.00 t0160928 Dawn Trotter 639.00 rent 659.00 330.00 0.00 11/01/2014 01/31/2016 685.00
water 31.00
Total 690.00
42-306 huron 805.00 t0171464 Brandon Burgin 614.00 rent 673.00 337.00 0.00 06/19/2015 09/16/2016 714.00
water 31.00
insur 10.00
Total 714.00
42-307 huron 805.00 t0160708 April Stirgus 614.00 rent 616.00 616.00 0.00 10/04/2014 01/03/2016 647.00
water 31.00
Total 647.00
42-308 huron 805.00 t0162513 Tanora Lanier 639.00 rent 639.00 647.00 0.00 12/11/2014 03/10/2016 680.00
water 31.00
insur 10.00
Total 680.00
42-309 huron 805.00 t0112947 Rosa Goode 639.00 water 31.00 434.25 0.00 04/04/2012 03/30/2016 652.00
rent 621.00
Total 652.00
42-310 huron 805.00 t0158266 John Guelff 614.00 rent 627.00 627.00 0.00 08/08/2014 11/07/2015 163.55
water 31.00
Total 658.00
42-311 huron 805.00 t0078329 Patricia Leasure 614.00 petfee 30.00 0.00 0.00 08/01/2009 11/28/2016 708.00
water 31.00
rent 647.00
Total 708.00
42-312 huron 805.00 t0156806 Leah Cartwright 639.00 rent 614.00 1,121.00 0.00 07/20/2014 10/19/2015 645.00
water 31.00
Total 645.00
Page 107 of 118

9/29/2015 10:03 AM
Unit Unit Type Unit Resident Name Market Charge Amount Resident Other Move In Lease Move Out Balance
Sq Ft Rent Code Deposit Deposit Expiration
Rent Roll with Lease ChargesProvidence Harbour Club (pharbour)
As Of = 09/01/2015
Month Year = 09/2015
43-101 huron 805.00 t0144428 Andrew Buchner 594.00 water 31.00 199.00 0.00 08/23/2013 08/22/2015 694.00
rent 663.00
Total 694.00
43-102 huron 805.00 t0173430 Maegan Sawicki 604.00 rent 675.00 338.00 0.00 08/01/2015 10/31/2016 0.00
petfee 30.00
water 31.00
insur 10.00
Total 746.00
43-103 huron 805.00 t0170793 Alina Bajjey 604.00 rent 669.00 669.00 0.00 06/20/2015 09/19/2016 -700.00
water 31.00
Total 700.00
43-105 huron 805.00 t0164778 Stacey Gavin 594.00 rent 591.00 591.00 0.00 05/01/2015 07/31/2016 371.00
water 31.00
insur 10.00
Total 632.00
43-106 huron 805.00 t0112961 Richard Howell 604.00 petfee 30.00 200.00 0.00 10/15/2011 10/31/2015 686.00
water 31.00
rent 615.00
insur 10.00
Total 686.00
43-107 huron 805.00 t0106108 Bernard Kulas Jr 604.00 water 31.00 550.00 0.00 03/31/2011 03/31/2016 0.00
rent 588.00
insur 10.00
Total 629.00
43-110 huron 805.00 VACANT VACANT 604.00 0.00 0.00 0.00 0.00
Total 0.00
43-111 huron 805.00 t0046587 Aaron Wilkerson # 604.00 water 31.00 100.00 0.00 08/30/2007 08/31/2015 09/01/2015 0.00
rent 641.00
Total 672.00
43-112 huron 805.00 t0084821 Sarkis Takessian 594.00 water 31.00 0.00 0.00 10/26/2009 11/30/2015 0.00
rent 632.00
Total 663.00
43-201 huron 805.00 t0084358 Bethany Wagner 624.00 water 31.00 0.00 0.00 09/19/2009 09/15/2015 689.00
rent 658.00
Total 689.00
Page 108 of 118

9/29/2015 10:03 AM
Unit Unit Type Unit Resident Name Market Charge Amount Resident Other Move In Lease Move Out Balance
Sq Ft Rent Code Deposit Deposit Expiration
Rent Roll with Lease ChargesProvidence Harbour Club (pharbour)
As Of = 09/01/2015
Month Year = 09/2015
43-202 huron 805.00 t0126276 Martha Bostwick 634.00 water 31.00 315.00 0.00 05/25/2013 05/16/2016 -24.04
petfee 60.00
rent 657.00
Total 748.00
43-203 huron 805.00 t0160584 Xiaonan Liang 634.00 rent 636.00 318.00 0.00 09/19/2014 09/18/2015 0.00
water 31.00
insur 10.00
Total 677.00
43-204 huron 805.00 hc000939 Sheryl Burns 624.00 water 31.00 520.00 0.00 11/20/2002 03/25/2016 669.00
rent 618.00
insur 10.00
Total 659.00
43-205 huron 805.00 t0127071 Candace Bojarczyk 624.00 water 31.00 0.00 0.00 10/15/2012 10/31/2015 0.00
rent 645.00
Total 676.00
43-206 huron 805.00 t0166250 Christopher Nichol 634.00 rent 627.00 314.00 0.00 02/17/2015 05/16/2016 648.00
water 31.00
insur 10.00
Total 668.00
43-207 huron 805.00 t0166875 Gunjan Gusain 634.00 water 31.00 381.00 0.00 03/02/2015 09/26/2015 0.00
insur 10.00
rent 775.00
Total 816.00
43-208 huron 805.00 t0172952 Taruimi Russell 624.00 rent 683.00 342.00 0.00 08/01/2015 07/31/2016 0.00
water 31.00
insur 10.00
Total 724.00
43-209 huron 805.00 t0172590 Jon Kwarsick 624.00 rent 674.00 674.00 0.00 07/11/2015 10/10/2016 0.00
water 31.00
Total 705.00
43-210 huron 805.00 t0166366 Emily Galassini 634.00 rent 643.00 318.00 0.00 03/07/2015 03/06/2016 744.00
petfee 60.00
water 31.00
insur 10.00
Total 744.00
Page 109 of 118

9/29/2015 10:03 AM
Unit Unit Type Unit Resident Name Market Charge Amount Resident Other Move In Lease Move Out Balance
Sq Ft Rent Code Deposit Deposit Expiration
Rent Roll with Lease ChargesProvidence Harbour Club (pharbour)
As Of = 09/01/2015
Month Year = 09/2015
43-211 huron 805.00 t0174629 Kemrashi Lundy 634.00 rent 686.00 343.00 0.00 08/29/2015 11/28/2016 09/30/2015 10.36
water 31.00
insur 10.00
Total 727.00
43-212 huron 805.00 t0173443 Emily Smale 624.00 rent 700.00 700.00 0.00 08/15/2015 11/14/2016 0.00
water 31.00
Total 731.00
43-301 huron 805.00 t0117113 LeVar Walker 614.00 water 31.00 175.00 0.00 12/06/2011 11/30/2015 666.78
rent 636.00
Total 667.00
43-302 huron 805.00 t0164556 Juneisha Dickerson 624.00 rent 613.00 307.00 307.00 12/30/2014 03/29/2016 0.00
water 31.00
insur 10.00
Total 654.00
43-303 huron 805.00 VACANT VACANT 624.00 0.00 0.00 0.00 0.00
Total 0.00
43-304 huron 805.00 t0144587 Emmalee McCurdy 614.00 rent 622.00 399.00 0.00 09/03/2014 12/02/2015 663.00
water 31.00
insur 10.00
Total 663.00
43-305 huron 805.00 t0157000 Teresa Goodman 614.00 rent 614.00 614.00 0.00 06/25/2014 09/24/2015 624.04
water 31.00
insur 10.00
Total 655.00
43-306 huron 805.00 VACANT VACANT 624.00 0.00 0.00 0.00 0.00
Total 0.00
43-307 huron 805.00 t0173156 Deon Butler 624.00 rent 660.00 330.00 0.00 07/25/2015 10/24/2016 11.00
water 31.00
insur 10.00
insur 10.00
Total 711.00
43-308 huron 805.00 t0167919 Siri Chounlamany 614.00 rent 624.00 624.00 0.00 04/18/2015 07/17/2016 665.00
water 31.00
insur 10.00
Total 665.00
Page 110 of 118

9/29/2015 10:03 AM
Unit Unit Type Unit Resident Name Market Charge Amount Resident Other Move In Lease Move Out Balance
Sq Ft Rent Code Deposit Deposit Expiration
Rent Roll with Lease ChargesProvidence Harbour Club (pharbour)
As Of = 09/01/2015
Month Year = 09/2015
43-309 huron 805.00 t0171815 Carlie McGraw 614.00 rent 683.00 342.00 0.00 08/10/2015 11/09/2016 714.00
water 31.00
Total 714.00
43-310 huron 805.00 t0111367 Diane Austin 624.00 water 31.00 350.00 0.00 08/20/2011 08/29/2016 679.00
rent 648.00
Total 679.00
43-311 huron 805.00 t0146882 Gereld Svec 624.00 concess -31.00 199.00 0.00 10/30/2013 10/31/2015 -41.74
water 31.00
rent 611.00
Total 611.00
43-312 huron 805.00 t0172279 Sarah Casper 614.00 rent 687.00 687.00 0.00 07/06/2015 10/05/2016 748.00
petfee 20.00
water 31.00
insur 10.00
Total 748.00
44-101 stclair 945.00 hc000956 Maint ***Shop 754.00 model -795.00 0.00 0.00 08/01/1994 04/30/2016 0.00
rent 795.00
Total 0.00
44-102 stclair 945.00 t0161359 Ashely Denuyl 769.00 rent 734.00 367.00 0.00 10/30/2014 01/29/2016 09/30/2015 0.00
petfee 20.00
water 41.00
Total 795.00
44-103 stclair 945.00 t0173572 Scott Bressler 769.00 rent 787.00 787.00 0.00 08/10/2015 11/09/2016 857.91
petfee 30.00
water 41.00
Total 858.00
44-104 studio 505.00 t0165710 Kacie Johnson 609.00 rent 586.00 586.00 0.00 02/09/2015 05/08/2016 617.00
water 31.00
Total 617.00
44-106 stclair 945.00 t0172065 Dianna Romas 769.00 rent 788.00 199.00 0.00 07/17/2015 10/16/2016 849.00
water 41.00
petfee 20.00
Total 849.00
44-107 stclair 945.00 t0159687 Katie Johnson 769.00 rent 731.00 199.00 0.00 09/26/2014 12/25/2015 0.00
petfee 50.00
water 41.00
Page 111 of 118

9/29/2015 10:03 AM
Unit Unit Type Unit Resident Name Market Charge Amount Resident Other Move In Lease Move Out Balance
Sq Ft Rent Code Deposit Deposit Expiration
Rent Roll with Lease ChargesProvidence Harbour Club (pharbour)
As Of = 09/01/2015
Month Year = 09/2015
Total 822.00
44-108 stclair 945.00 t0170667 Angel Carrion 754.00 rent 770.00 770.00 0.00 06/28/2015 09/27/2016 819.40
water 41.00
insur 10.00
Total 821.00
44-110 stclair 945.00 t0171802 Breanca Solomon 769.00 rent 800.00 393.00 0.00 08/30/2015 08/29/2016 -0.02
petfee 60.00
water 41.00
insur 10.00
Total 911.00
44-111 stclair 945.00 t0134293 Anthony Pruitt 769.00 water 41.00 555.00 0.00 01/25/2013 02/29/2016 845.00
rent 759.00
Total 800.00
44-112 stclair 945.00 t0106496 Erica McLilley **SSI** 784.00 water 41.00 275.00 0.00 06/21/2013 09/26/2016 861.00
insur 10.00
rent 762.00
Total 813.00
44-201 stclair 945.00 t0155627 Thomas Zelenak 784.00 rent 757.00 293.00 0.00 09/27/2014 09/26/2015 798.00
water 41.00
Total 798.00
44-202 stclair 945.00 t0155282 Josh Harsany 799.00 rent 713.00 357.00 0.00 06/29/2014 09/28/2015 0.00
water 41.00
petfee 30.00
Total 784.00
44-203 stclair 945.00 t0130937 Kathrine Foscolo 799.00 water 41.00 369.00 0.00 12/15/2012 12/28/2015 725.00
rent 764.00
Total 805.00
44-204 stclair 945.00 VACANT VACANT 784.00 0.00 0.00 0.00 0.00
Total 0.00
44-205 stclair 945.00 t0159222 Antoinette Singer 784.00 rent 730.00 728.00 0.00 11/08/2014 02/07/2016 781.00
water 41.00
insur 10.00
Total 781.00
44-206 stclair 945.00 t0118694 Michael Askins 799.00 water 41.00 0.00 0.00 03/16/2012 06/27/2016 848.00
rent 756.00
Page 112 of 118

9/29/2015 10:03 AM
Unit Unit Type Unit Resident Name Market Charge Amount Resident Other Move In Lease Move Out Balance
Sq Ft Rent Code Deposit Deposit Expiration
Rent Roll with Lease ChargesProvidence Harbour Club (pharbour)
As Of = 09/01/2015
Month Year = 09/2015
Total 797.00
44-207 stclair 945.00 t0084242 Sean Nelson 799.00 petfee 20.00 0.00 0.00 10/07/2009 10/31/2015 0.00
water 41.00
rent 771.00
Total 832.00
44-208 stclair 945.00 t0160130 Isaac Mallett 784.00 rent 771.00 386.00 0.00 10/15/2014 01/15/2016 822.00
water 41.00
insur 10.00
Total 822.00
44-209 stclair 945.00 t0168965 Aaron Person 784.00 rent 722.00 722.00 0.00 05/02/2015 05/01/2016 0.00
water 41.00
insur 10.00
Total 773.00
44-210 stclair 945.00 t0170301 Peter Townsend II 799.00 rent 776.00 388.00 0.00 05/26/2015 08/25/2016 0.00
water 41.00
insur 10.00
Total 827.00
44-211 stclair 945.00 t0108398 Stella Austin 799.00 water 41.00 0.00 0.00 09/01/2011 02/29/2016 789.00
rent 808.00
Total 849.00
44-212 stclair 945.00 t0172761 Joe Pieroni 784.00 rent 821.00 199.00 0.00 08/14/2015 11/13/2016 862.00
water 41.00
Total 862.00
44-301 stclair 945.00 t0171692 Mark Pipis 774.00 rent 792.00 396.00 0.00 07/18/2015 10/17/2016 843.00
water 41.00
insur 10.00
Total 843.00
44-302 stclair 945.00 t0071955 Sharrita Carter 789.00 water 41.00 0.00 0.00 01/01/2009 10/31/2015 754.00
rent 713.00
Total 754.00
44-303 stclair 945.00 t0154669 Jessica Pigg 789.00 water 41.00 724.00 0.00 04/28/2014 07/27/2015 1,040.00
rent 789.00
mtm 200.00
insur 10.00
Total 1,040.00
Page 113 of 118

9/29/2015 10:03 AM
Unit Unit Type Unit Resident Name Market Charge Amount Resident Other Move In Lease Move Out Balance
Sq Ft Rent Code Deposit Deposit Expiration
Rent Roll with Lease ChargesProvidence Harbour Club (pharbour)
As Of = 09/01/2015
Month Year = 09/2015
44-304 stclair 945.00 t0081310 Keisha Bell 774.00 water 41.00 0.00 0.00 06/25/2013 09/26/2016 843.00
petfee 30.00
rent 772.00
Total 843.00
44-305 stclair 945.00 t0173292 Kerriann Ehlen 774.00 rent 788.00 394.00 0.00 07/30/2015 10/29/2016 0.00
water 41.00
Total 829.00
44-306 stclair 945.00 t0165548 Chelsea Wampler 789.00 rent 732.00 366.00 0.00 02/07/2015 05/06/2016 783.00
water 41.00
insur 10.00
Total 783.00
44-307 stclair 945.00 t0155321 Kristin Hicks 789.00 water 41.00 361.00 0.00 05/15/2014 08/08/2016 786.00
rent 745.00
Total 786.00
44-308 stclair 945.00 t0167476 Justine Williams 774.00 rent 724.00 362.00 0.00 05/02/2015 08/01/2016 775.00
water 41.00
insur 10.00
Total 775.00
44-309 stclair 945.00 t0138512 Samantha Struppa 774.00 water 41.00 375.00 0.00 04/27/2013 05/30/2016 825.00
rent 774.00
insur 10.00
Total 825.00
44-310 stclair 945.00 t0153526 Marie Mathiak 789.00 water 41.00 693.00 0.00 03/30/2014 06/27/2016 788.00
insur 10.00
rent 737.00
Total 788.00
44-311 stclair 945.00 t0167359 Valerie Curns 789.00 rent 737.00 369.00 0.00 03/20/2015 06/19/2016 10.80
water 41.00
insur 10.00
Total 788.00
44-312 stclair 945.00 t0146457 Anastasiya Slaughter 774.00 water 41.00 399.00 0.00 10/14/2013 10/26/2015 768.00
rent 727.00
Total 768.00
01-035 superior 1,100.00 t0174011 Brian Blount 919.00 0.00 0.00 0.00 09/09/2015 12/08/2016 -100.00
Total 0.00
Future Residents/Applicants
Page 114 of 118

9/29/2015 10:03 AM
Unit Unit Type Unit Resident Name Market Charge Amount Resident Other Move In Lease Move Out Balance
Sq Ft Rent Code Deposit Deposit Expiration
Rent Roll with Lease ChargesProvidence Harbour Club (pharbour)
As Of = 09/01/2015
Month Year = 09/2015
03-005 superior 1,100.00 t0174303 Kenneth Stambaugh 919.00 0.00 0.00 0.00 09/01/2015 08/31/2016 40.00
Total 0.00
03-007 superior 1,100.00 t0174716 Michael Friedhoff 919.00 0.00 0.00 0.00 10/12/2015 01/11/2017 0.00
Total 0.00
03-032 superior 1,100.00 t0171577 Ray Nowden 924.00 0.00 0.00 0.00 09/10/2015 09/09/2016 0.00
Total 0.00
03-033 superior 1,100.00 t0172910 Barbara Boyer 924.00 0.00 0.00 0.00 09/22/2015 12/21/2016 0.00
Total 0.00
04-023 superior 1,100.00 t0172191 Lindsay Szabo 909.00 0.00 0.00 0.00 09/03/2015 12/02/2016 150.00
Total 0.00
04-038 erie 835.00 t0173450 Jessica Howe 774.00 0.00 0.00 0.00 09/10/2015 12/09/2015 0.00
Total 0.00
06-023 stclair 945.00 t0174299 Haley Smith 769.00 0.00 0.00 0.00 10/01/2015 12/31/2016 -100.00
Total 0.00
08-006 huron 805.00 t0174354 Akita Gibson 619.00 0.00 0.00 0.00 09/04/2015 12/03/2016 -100.00
Total 0.00
09-033 stclair 945.00 t0174699 Bradley Walters 734.00 0.00 0.00 0.00 09/06/2015 12/05/2016 0.00
Total 0.00
10-026 huron 805.00 t0174542 Jacobie Taylor 644.00 0.00 0.00 0.00 10/01/2015 12/31/2016 0.00
Total 0.00
11-031 stclair 945.00 t0174798 Richard Byrd 764.00 0.00 0.00 0.00 09/04/2015 20.00
Total 0.00
15-305 stclair 945.00 t0174172 Seirra Williams 764.00 0.00 0.00 0.00 09/12/2015 12/11/2016 -40.00
Total 0.00
16-207 stclair 945.00 t0174401 Ranaya Williams 784.00 0.00 0.00 0.00 09/12/2015 12/11/2016 -40.00
Total 0.00
17-107 huron 805.00 t0174640 Kaylin Ledwidge-Cub 604.00 0.00 0.00 0.00 09/11/2015 11/30/2016 0.00
Total 0.00
22-103 stclair 945.00 t0173860 Tanisha Collins 744.00 0.00 0.00 0.00 09/01/2015 08/31/2016 0.00
Total 0.00
Page 115 of 118

9/29/2015 10:03 AM
Unit Unit Type Unit Resident Name Market Charge Amount Resident Other Move In Lease Move Out Balance
Sq Ft Rent Code Deposit Deposit Expiration
Rent Roll with Lease ChargesProvidence Harbour Club (pharbour)
As Of = 09/01/2015
Month Year = 09/2015
22-202 stclair 945.00 t0174751 Ciara Ruffin 774.00 0.00 0.00 0.00 09/12/2015 12/11/2016 0.00
Total 0.00
22-203 stclair 945.00 t0174273 Brianne Jones 774.00 0.00 0.00 0.00 09/12/2015 12/11/2016 -100.00
Total 0.00
23-306 superior 1,100.00 t0174815 Melissa Shepler 919.00 0.00 0.00 0.00 10/26/2015 -108.00
Total 0.00
24-206 superior 1,100.00 t0174718 Carol Jones 929.00 0.00 0.00 0.00 09/12/2015 12/11/2016 0.00
Total 0.00
25-208 erie 835.00 t0174580 Matt Harrison 759.00 0.00 0.00 0.00 09/26/2015 09/25/2016 20.00
Total 0.00
25-304 superior 1,100.00 t0173626 Paul Short 919.00 0.00 0.00 0.00 09/06/2015 12/05/2016 0.00
Total 0.00
26-110 erie 835.00 t0174752 Alexandrea Cooper 769.00 0.00 0.00 0.00 09/12/2015 0.00
Total 0.00
27-201 erie 835.00 t0172908 Jeremy McKee 784.00 0.00 0.00 0.00 09/15/2015 12/14/2016 0.00
Total 0.00
28-108 erie 835.00 t0174026 Burt sloan 789.00 0.00 0.00 0.00 09/10/2015 100.00
Total 0.00
28-202 erie 835.00 t0174243 Jaztin Hinacay 779.00 0.00 0.00 0.00 09/12/2015 09/11/2016 0.00
Total 0.00
30-105 superior 1,100.00 t0154748 Annie Callaway 919.00 0.00 0.00 0.00 09/01/2015 10/31/2016 0.00
Total 0.00
30-106 superior 1,100.00 t0174736 Richard Langston 919.00 0.00 0.00 0.00 10/03/2015 01/02/2017 0.00
Total 0.00
30-203 superior 1,100.00 t0174630 Julie McGraw 909.00 0.00 0.00 0.00 09/01/2015 08/25/2016 -37.00
Total 0.00
32-204 stclair 945.00 t0174703 Infane Jackson 774.00 0.00 0.00 0.00 09/12/2015 12/11/2016 0.00
Total 0.00
34-301 stclair 945.00 t0173645 Rachel Danyko 764.00 0.00 0.00 0.00 09/20/2015 12/19/2016 0.00
Total 0.00
Page 116 of 118
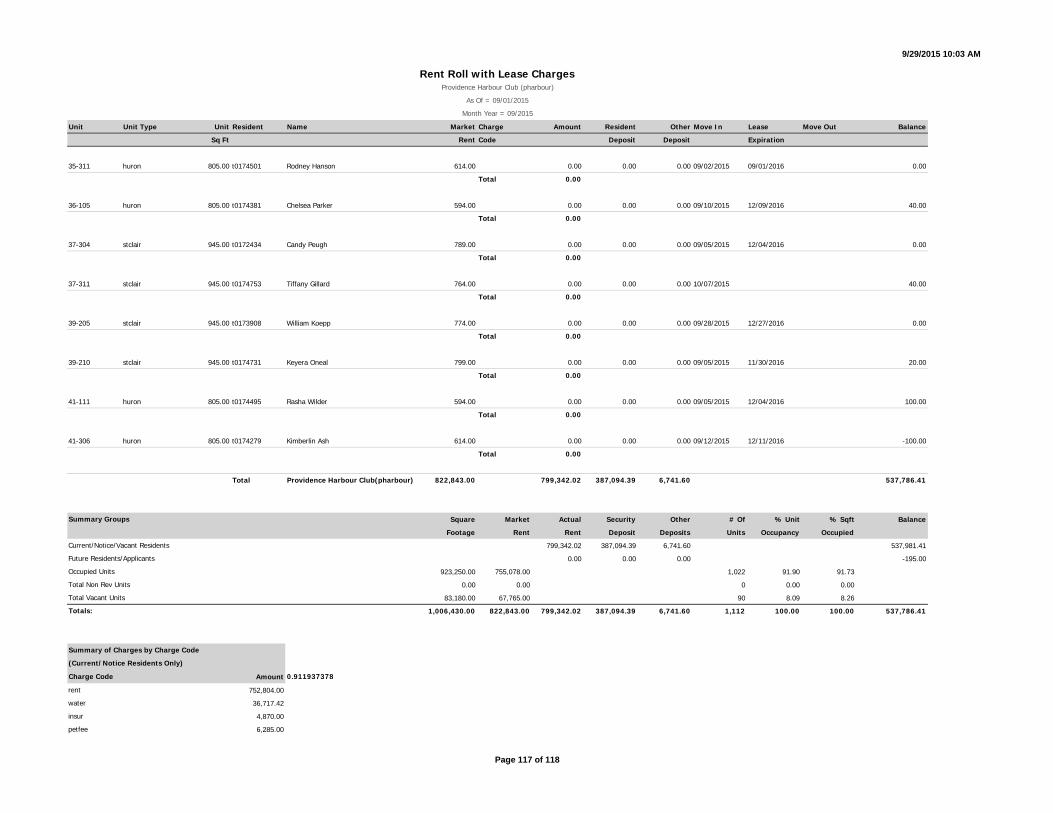
9/29/2015 10:03 AM
Unit Unit Type Unit Resident Name Market Charge Amount Resident Other Move In Lease Move Out Balance
Sq Ft Rent Code Deposit Deposit Expiration
Rent Roll with Lease ChargesProvidence Harbour Club (pharbour)
As Of = 09/01/2015
Month Year = 09/2015
35-311 huron 805.00 t0174501 Rodney Hanson 614.00 0.00 0.00 0.00 09/02/2015 09/01/2016 0.00
Total 0.00
36-105 huron 805.00 t0174381 Chelsea Parker 594.00 0.00 0.00 0.00 09/10/2015 12/09/2016 40.00
Total 0.00
37-304 stclair 945.00 t0172434 Candy Peugh 789.00 0.00 0.00 0.00 09/05/2015 12/04/2016 0.00
Total 0.00
37-311 stclair 945.00 t0174753 Tiffany Gillard 764.00 0.00 0.00 0.00 10/07/2015 40.00
Total 0.00
39-205 stclair 945.00 t0173908 William Koepp 774.00 0.00 0.00 0.00 09/28/2015 12/27/2016 0.00
Total 0.00
39-210 stclair 945.00 t0174731 Keyera Oneal 799.00 0.00 0.00 0.00 09/05/2015 11/30/2016 20.00
Total 0.00
41-111 huron 805.00 t0174495 Rasha Wilder 594.00 0.00 0.00 0.00 09/05/2015 12/04/2016 100.00
Total 0.00
41-306 huron 805.00 t0174279 Kimberlin Ash 614.00 0.00 0.00 0.00 09/12/2015 12/11/2016 -100.00
Total 0.00
Total Providence Harbour Club(pharbour) 822,843.00 799,342.02 387,094.39 6,741.60 537,786.41
Square Market Actual Security Other # Of % Unit % Sqft Balance
Footage Rent Rent Deposit Deposits Units Occupancy Occupied
799,342.02 387,094.39 6,741.60 537,981.41
0.00 0.00 0.00 -195.00
923,250.00 755,078.00 1,022 91.90 91.73
0.00 0.00 0 0.00 0.00
83,180.00 67,765.00 90 8.09 8.26
1,006,430.00 822,843.00 799,342.02 387,094.39 6,741.60 1,112 100.00 100.00 537,786.41
Amount
752,804.00
36,717.42
4,870.00
6,285.00
Summary Groups
Current/Notice/Vacant Residents
Future Residents/Applicants
Occupied Units
Total Non Rev Units
Total Vacant Units
Totals:
Summary of Charges by Charge Code
(Current/Notice Residents Only)
Charge Code 0.911937378
rent
water
insur
petfee
Page 117 of 118
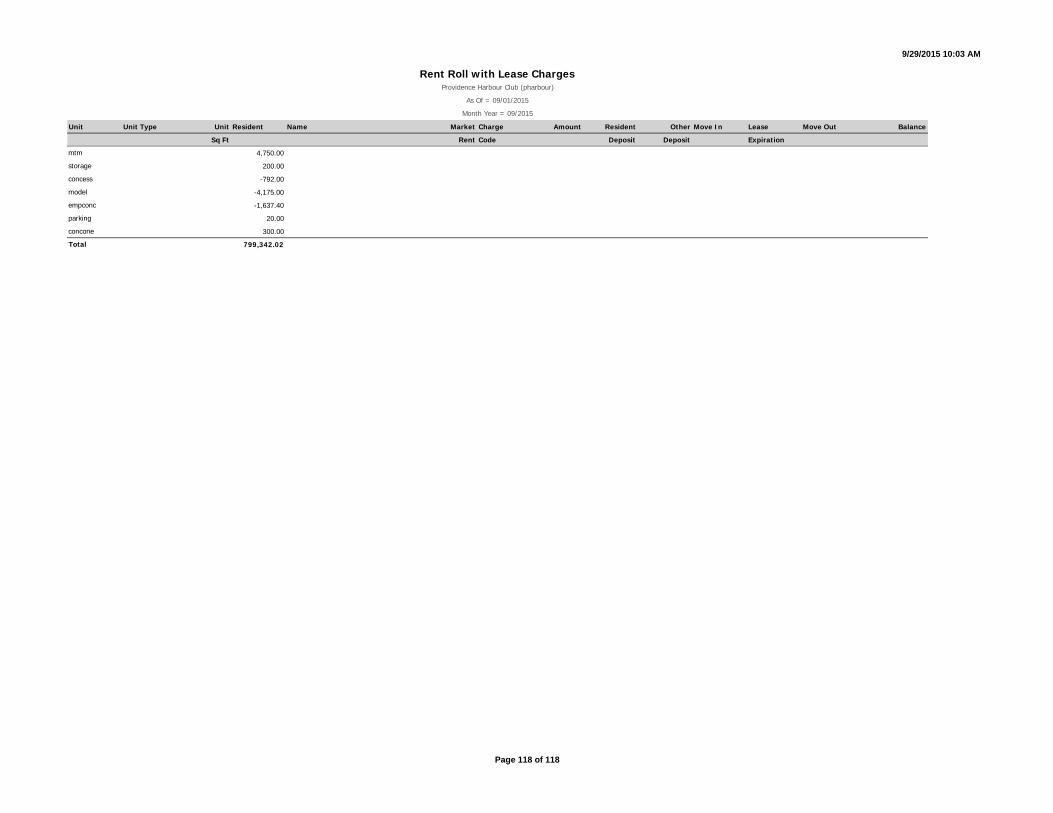
9/29/2015 10:03 AM
Unit Unit Type Unit Resident Name Market Charge Amount Resident Other Move In Lease Move Out Balance
Sq Ft Rent Code Deposit Deposit Expiration
Rent Roll with Lease ChargesProvidence Harbour Club (pharbour)
As Of = 09/01/2015
Month Year = 09/2015
4,750.00
200.00
-792.00
-4,175.00
-1,637.40
20.00
300.00
799,342.02
mtm
storage
concess
concone
Total
model
empconc
parking
Page 118 of 118
OPERATING STATEMENTS
OPERATING STATEMENTS
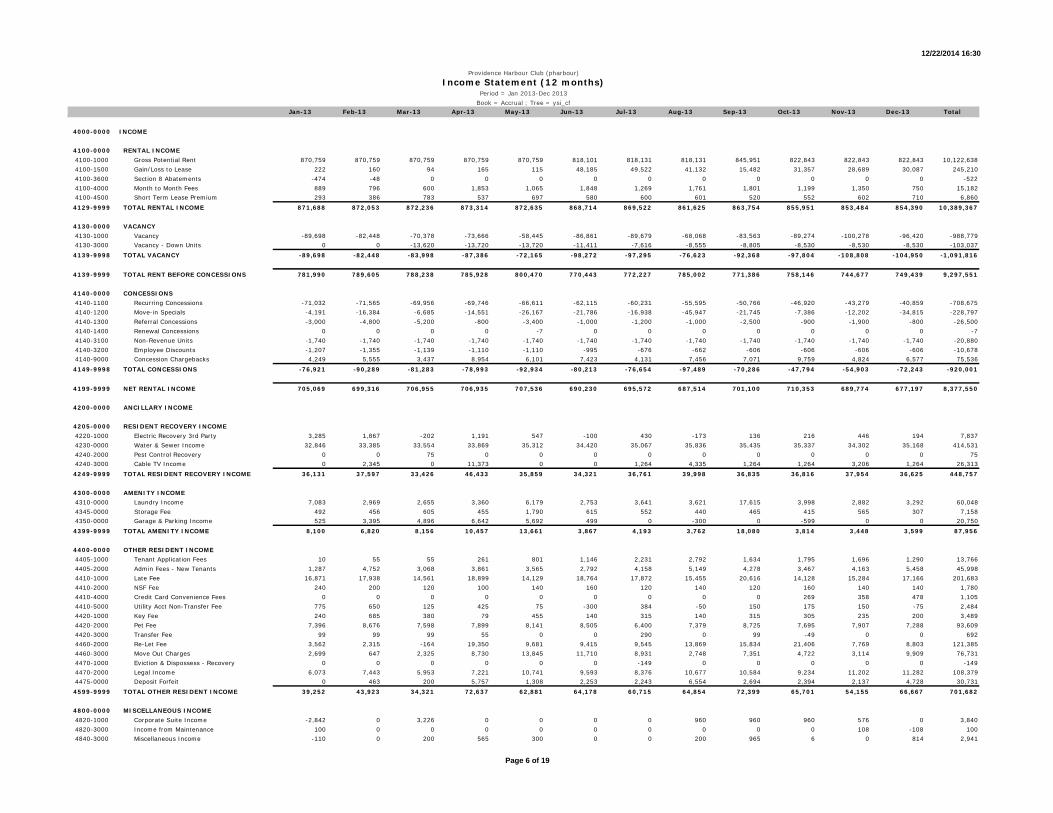
12/22/2014 16:30
Jan-13 Feb-13 Mar-13 Apr-13 May-13 Jun-13 Jul-13 Aug-13 Sep-13 Oct-13 Nov-13 Dec-13 Total
4000-0000 INCOME
4100-0000 RENTAL INCOME4100-1000 Gross Potential Rent 870,759 870,759 870,759 870,759 870,759 818,101 818,131 818,131 845,951 822,843 822,843 822,843 10,122,6384100-1500 Gain/Loss to Lease 222 160 94 165 115 48,185 49,522 41,132 15,482 31,357 28,689 30,087 245,2104100-3600 Section 8 Abatements -474 -48 0 0 0 0 0 0 0 0 0 0 -5224100-4000 Month to Month Fees 889 796 600 1,853 1,065 1,848 1,269 1,761 1,801 1,199 1,350 750 15,1824100-4500 Short Term Lease Premium 293 386 783 537 697 580 600 601 520 552 602 710 6,8604129-9999 TOTAL RENTAL INCOME 871,688 872,053 872,236 873,314 872,635 868,714 869,522 861,625 863,754 855,951 853,484 854,390 10,389,367
4130-0000 VACANCY4130-1000 Vacancy -89,698 -82,448 -70,378 -73,666 -58,445 -86,861 -89,679 -68,068 -83,563 -89,274 -100,278 -96,420 -988,7794130-3000 Vacancy - Down Units 0 0 -13,620 -13,720 -13,720 -11,411 -7,616 -8,555 -8,805 -8,530 -8,530 -8,530 -103,0374139-9998 TOTAL VACANCY -89,698 -82,448 -83,998 -87,386 -72,165 -98,272 -97,295 -76,623 -92,368 -97,804 -108,808 -104,950 -1,091,816
4139-9999 TOTAL RENT BEFORE CONCESSIONS 781,990 789,605 788,238 785,928 800,470 770,443 772,227 785,002 771,386 758,146 744,677 749,439 9,297,551
4140-0000 CONCESSIONS4140-1100 Recurring Concessions -71,032 -71,565 -69,956 -69,746 -66,611 -62,115 -60,231 -55,595 -50,766 -46,920 -43,279 -40,859 -708,6754140-1200 Move-in Specials -4,191 -16,384 -6,685 -14,551 -26,167 -21,786 -16,938 -45,947 -21,745 -7,386 -12,202 -34,815 -228,7974140-1300 Referral Concessions -3,000 -4,800 -5,200 -800 -3,400 -1,000 -1,200 -1,000 -2,500 -900 -1,900 -800 -26,5004140-1400 Renewal Concessions 0 0 0 0 -7 0 0 0 0 0 0 0 -74140-3100 Non-Revenue Units -1,740 -1,740 -1,740 -1,740 -1,740 -1,740 -1,740 -1,740 -1,740 -1,740 -1,740 -1,740 -20,8804140-3200 Employee Discounts -1,207 -1,355 -1,139 -1,110 -1,110 -995 -676 -662 -606 -606 -606 -606 -10,6784140-9000 Concession Chargebacks 4,249 5,555 3,437 8,954 6,101 7,423 4,131 7,456 7,071 9,759 4,824 6,577 75,5364149-9998 TOTAL CONCESSIONS -76,921 -90,289 -81,283 -78,993 -92,934 -80,213 -76,654 -97,489 -70,286 -47,794 -54,903 -72,243 -920,001
4199-9999 NET RENTAL INCOME 705,069 699,316 706,955 706,935 707,536 690,230 695,572 687,514 701,100 710,353 689,774 677,197 8,377,550
4200-0000 ANCILLARY INCOME
4205-0000 RESIDENT RECOVERY INCOME4220-1000 Electric Recovery 3rd Party 3,285 1,867 -202 1,191 547 -100 430 -173 136 216 446 194 7,8374230-0000 Water & Sewer Income 32,846 33,385 33,554 33,869 35,312 34,420 35,067 35,836 35,435 35,337 34,302 35,168 414,5314240-2000 Pest Control Recovery 0 0 75 0 0 0 0 0 0 0 0 0 754240-3000 Cable TV Income 0 2,345 0 11,373 0 0 1,264 4,335 1,264 1,264 3,206 1,264 26,3134249-9999 TOTAL RESIDENT RECOVERY INCOME 36,131 37,597 33,426 46,433 35,859 34,321 36,761 39,998 36,835 36,816 37,954 36,625 448,757
4300-0000 AMENITY INCOME4310-0000 Laundry Income 7,083 2,969 2,655 3,360 6,179 2,753 3,641 3,621 17,615 3,998 2,882 3,292 60,0484345-0000 Storage Fee 492 456 605 455 1,790 615 552 440 465 415 565 307 7,1584350-0000 Garage & Parking Income 525 3,395 4,896 6,642 5,692 499 0 -300 0 -599 0 0 20,7504399-9999 TOTAL AMENITY INCOME 8,100 6,820 8,156 10,457 13,661 3,867 4,193 3,762 18,080 3,814 3,448 3,599 87,956
4400-0000 OTHER RESIDENT INCOME4405-1000 Tenant Application Fees 10 55 55 261 801 1,146 2,231 2,792 1,634 1,795 1,696 1,290 13,7664405-2000 Admin Fees - New Tenants 1,287 4,752 3,068 3,861 3,565 2,792 4,158 5,149 4,278 3,467 4,163 5,458 45,9984410-1000 Late Fee 16,871 17,938 14,561 18,899 14,129 18,764 17,872 15,455 20,616 14,128 15,284 17,166 201,6834410-2000 NSF Fee 240 200 120 100 140 160 120 140 120 160 140 140 1,7804410-4000 Credit Card Convenience Fees 0 0 0 0 0 0 0 0 0 269 358 478 1,1054410-5000 Utility Acct Non-Transfer Fee 775 650 125 425 75 -300 384 -50 150 175 150 -75 2,4844420-1000 Key Fee 240 685 380 79 455 140 315 140 315 305 235 200 3,4894420-2000 Pet Fee 7,396 8,676 7,598 7,899 8,141 8,505 6,400 7,379 8,725 7,695 7,907 7,288 93,6094420-3000 Transfer Fee 99 99 99 55 0 0 290 0 99 -49 0 0 6924460-2000 Re-Let Fee 3,562 2,315 -164 19,350 9,681 9,415 9,545 13,869 15,834 21,406 7,769 8,803 121,3854460-3000 Move Out Charges 2,699 647 2,325 8,730 13,845 11,710 8,931 2,748 7,351 4,722 3,114 9,909 76,7314470-1000 Eviction & Dispossess - Recovery 0 0 0 0 0 0 -149 0 0 0 0 0 -1494470-2000 Legal Income 6,073 7,443 5,953 7,221 10,741 9,593 8,376 10,677 10,584 9,234 11,202 11,282 108,3794475-0000 Deposit Forfeit 0 463 200 5,757 1,308 2,253 2,243 6,554 2,694 2,394 2,137 4,728 30,7314599-9999 TOTAL OTHER RESIDENT INCOME 39,252 43,923 34,321 72,637 62,881 64,178 60,715 64,854 72,399 65,701 54,155 66,667 701,682
4800-0000 MISCELLANEOUS INCOME4820-1000 Corporate Suite Income -2,842 0 3,226 0 0 0 0 960 960 960 576 0 3,8404820-3000 Income from Maintenance 100 0 0 0 0 0 0 0 0 0 108 -108 1004840-3000 Miscellaneous Income -110 0 200 565 300 0 0 200 965 6 0 814 2,941
Providence Harbour Club (pharbour)
Income Statement (12 months)Period = Jan 2013-Dec 2013
Book = Accrual ; Tree = ysi_cf
Page 6 of 19
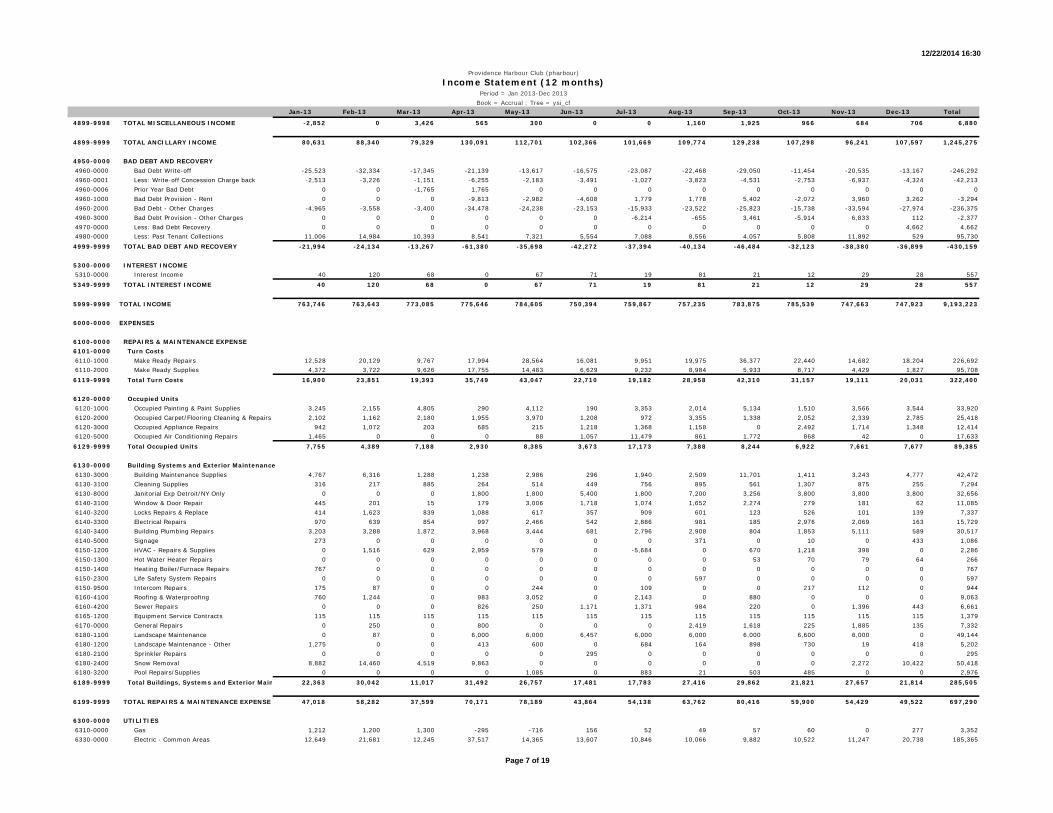
12/22/2014 16:30
Jan-13 Feb-13 Mar-13 Apr-13 May-13 Jun-13 Jul-13 Aug-13 Sep-13 Oct-13 Nov-13 Dec-13 Total
Providence Harbour Club (pharbour)
Income Statement (12 months)Period = Jan 2013-Dec 2013
Book = Accrual ; Tree = ysi_cf
4899-9998 TOTAL MISCELLANEOUS INCOME -2,852 0 3,426 565 300 0 0 1,160 1,925 966 684 706 6,880
4899-9999 TOTAL ANCILLARY INCOME 80,631 88,340 79,329 130,091 112,701 102,366 101,669 109,774 129,238 107,298 96,241 107,597 1,245,275
4950-0000 BAD DEBT AND RECOVERY4960-0000 Bad Debt Write-off -25,523 -32,334 -17,345 -21,139 -13,617 -16,575 -23,087 -22,468 -29,050 -11,454 -20,535 -13,167 -246,2924960-0001 Less: Write-off Concession Charge back -2,513 -3,226 -1,151 -6,255 -2,183 -3,491 -1,027 -3,823 -4,531 -2,753 -6,937 -4,324 -42,2134960-0006 Prior Year Bad Debt 0 0 -1,765 1,765 0 0 0 0 0 0 0 0 04960-1000 Bad Debt Provision - Rent 0 0 0 -9,813 -2,982 -4,608 1,779 1,778 5,402 -2,072 3,960 3,262 -3,2944960-2000 Bad Debt - Other Charges -4,965 -3,558 -3,400 -34,478 -24,238 -23,153 -15,933 -23,522 -25,823 -15,738 -33,594 -27,974 -236,3754960-3000 Bad Debt Provision - Other Charges 0 0 0 0 0 0 -6,214 -655 3,461 -5,914 6,833 112 -2,3774970-0000 Less: Bad Debt Recovery 0 0 0 0 0 0 0 0 0 0 0 4,662 4,6624980-0000 Less: Past Tenant Collections 11,006 14,984 10,393 8,541 7,321 5,554 7,088 8,556 4,057 5,808 11,892 529 95,7304999-9999 TOTAL BAD DEBT AND RECOVERY -21,994 -24,134 -13,267 -61,380 -35,698 -42,272 -37,394 -40,134 -46,484 -32,123 -38,380 -36,899 -430,159
5300-0000 INTEREST INCOME5310-0000 Interest Income 40 120 68 0 67 71 19 81 21 12 29 28 5575349-9999 TOTAL INTEREST INCOME 40 120 68 0 67 71 19 81 21 12 29 28 557
5999-9999 TOTAL INCOME 763,746 763,643 773,085 775,646 784,605 750,394 759,867 757,235 783,875 785,539 747,663 747,923 9,193,223
6000-0000 EXPENSES
6100-0000 REPAIRS & MAINTENANCE EXPENSE6101-0000 Turn Costs6110-1000 Make Ready Repairs 12,528 20,129 9,767 17,994 28,564 16,081 9,951 19,975 36,377 22,440 14,682 18,204 226,6926110-2000 Make Ready Supplies 4,372 3,722 9,626 17,755 14,483 6,629 9,232 8,984 5,933 8,717 4,429 1,827 95,7086119-9999 Total Turn Costs 16,900 23,851 19,393 35,749 43,047 22,710 19,182 28,958 42,310 31,157 19,111 20,031 322,400
6120-0000 Occupied Units6120-1000 Occupied Painting & Paint Supplies 3,245 2,155 4,805 290 4,112 190 3,353 2,014 5,134 1,510 3,566 3,544 33,9206120-2000 Occupied Carpet/Flooring Cleaning & Repairs 2,102 1,162 2,180 1,955 3,970 1,208 972 3,355 1,338 2,052 2,339 2,785 25,4186120-3000 Occupied Appliance Repairs 942 1,072 203 685 215 1,218 1,368 1,158 0 2,492 1,714 1,348 12,4146120-5000 Occupied Air Conditioning Repairs 1,465 0 0 0 88 1,057 11,479 861 1,772 868 42 0 17,6336129-9999 Total Occupied Units 7,755 4,389 7,188 2,930 8,385 3,673 17,173 7,388 8,244 6,922 7,661 7,677 89,385
6130-0000 Building Systems and Exterior Maintenance6130-3000 Building Maintenance Supplies 4,767 6,316 1,288 1,238 2,986 296 1,940 2,509 11,701 1,411 3,243 4,777 42,4726130-3100 Cleaning Supplies 316 217 885 264 514 449 756 895 561 1,307 875 255 7,2946130-8000 Janitorial Exp Detroit/NY Only 0 0 0 1,800 1,800 5,400 1,800 7,200 3,256 3,800 3,800 3,800 32,6566140-3100 Window & Door Repair 445 201 15 179 3,006 1,718 1,074 1,652 2,274 279 181 62 11,0856140-3200 Locks Repairs & Replace 414 1,623 839 1,088 617 357 909 601 123 526 101 139 7,3376140-3300 Electrical Repairs 970 639 854 997 2,466 542 2,886 981 185 2,976 2,069 163 15,7296140-3400 Building Plumbing Repairs 3,203 3,288 1,872 3,968 3,444 681 2,796 2,908 804 1,853 5,111 589 30,5176140-5000 Signage 273 0 0 0 0 0 0 371 0 10 0 433 1,0866150-1200 HVAC - Repairs & Supplies 0 1,516 629 2,959 579 0 -5,684 0 670 1,218 398 0 2,2866150-1300 Hot Water Heater Repairs 0 0 0 0 0 0 0 0 53 70 79 64 2666150-1400 Heating Boiler/Furnace Repairs 767 0 0 0 0 0 0 0 0 0 0 0 7676150-2300 Life Safety System Repairs 0 0 0 0 0 0 0 597 0 0 0 0 5976150-9500 Intercom Repairs 175 87 0 0 244 0 109 0 0 217 112 0 9446160-4100 Roofing & Waterproofing 760 1,244 0 983 3,052 0 2,143 0 880 0 0 0 9,0636160-4200 Sewer Repairs 0 0 0 826 250 1,171 1,371 984 220 0 1,396 443 6,6616165-1200 Equipment Service Contracts 115 115 115 115 115 115 115 115 115 115 115 115 1,3796170-0000 General Repairs 0 250 0 800 0 0 0 2,419 1,618 225 1,885 135 7,3326180-1100 Landscape Maintenance 0 87 0 6,000 6,000 6,457 6,000 6,000 6,000 6,600 6,000 0 49,1446180-1200 Landscape Maintenance - Other 1,275 0 0 413 600 0 684 164 898 730 19 418 5,2026180-2100 Sprinkler Repairs 0 0 0 0 0 295 0 0 0 0 0 0 2956180-2400 Snow Removal 8,882 14,460 4,519 9,863 0 0 0 0 0 0 2,272 10,422 50,4186180-3200 Pool Repairs/Supplies 0 0 0 0 1,085 0 883 21 503 485 0 0 2,9766189-9999 Total Buildings, Systems and Exterior Main 22,363 30,042 11,017 31,492 26,757 17,481 17,783 27,416 29,862 21,821 27,657 21,814 285,505
6199-9999 TOTAL REPAIRS & MAINTENANCE EXPENSE 47,018 58,282 37,599 70,171 78,189 43,864 54,138 63,762 80,416 59,900 54,429 49,522 697,290
6300-0000 UTILITIES6310-0000 Gas 1,212 1,200 1,300 -295 -716 156 52 49 57 60 0 277 3,3526330-0000 Electric - Common Areas 12,649 21,681 12,245 37,517 14,365 13,607 10,846 10,066 9,882 10,522 11,247 20,738 185,365
Page 7 of 19
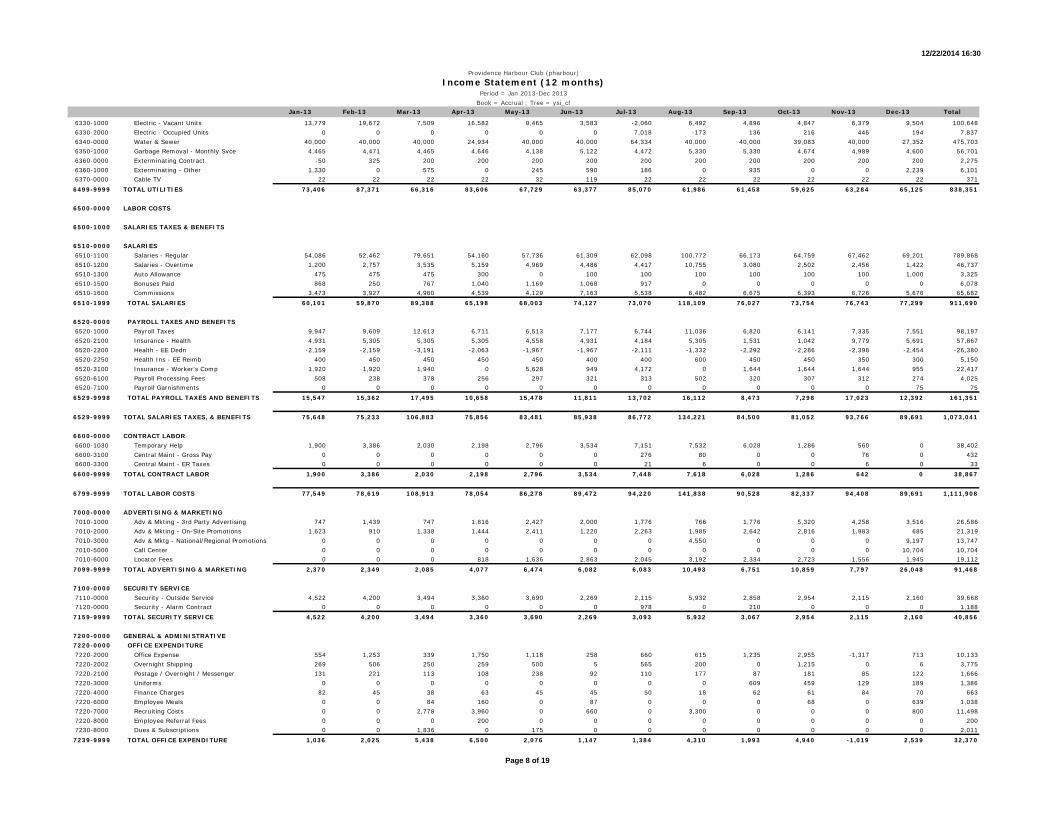
12/22/2014 16:30
Jan-13 Feb-13 Mar-13 Apr-13 May-13 Jun-13 Jul-13 Aug-13 Sep-13 Oct-13 Nov-13 Dec-13 Total
Providence Harbour Club (pharbour)
Income Statement (12 months)Period = Jan 2013-Dec 2013
Book = Accrual ; Tree = ysi_cf
6330-1000 Electric - Vacant Units 13,779 19,672 7,509 16,582 9,465 3,583 -2,060 6,492 4,896 4,847 6,379 9,504 100,6486330-2000 Electric - Occupied Units 0 0 0 0 0 0 7,018 -173 136 216 446 194 7,8376340-0000 Water & Sewer 40,000 40,000 40,000 24,934 40,000 40,000 64,334 40,000 40,000 39,083 40,000 27,352 475,7036350-1000 Garbage Removal - Monthly Svce 4,465 4,471 4,465 4,646 4,138 5,122 4,472 5,330 5,330 4,674 4,989 4,600 56,7016360-0000 Exterminating Contract -50 325 200 200 200 200 200 200 200 200 200 200 2,2756360-1000 Exterminating - Other 1,330 0 575 0 245 590 186 0 935 0 0 2,239 6,1016370-0000 Cable TV 22 22 22 22 32 119 22 22 22 22 22 22 3716499-9999 TOTAL UTILITIES 73,406 87,371 66,316 83,606 67,729 63,377 85,070 61,986 61,458 59,625 63,284 65,125 838,351
6500-0000 LABOR COSTS
6500-1000 SALARIES TAXES & BENEFITS
6510-0000 SALARIES6510-1100 Salaries - Regular 54,086 52,462 79,651 54,160 57,736 61,309 62,098 100,772 66,173 64,759 67,462 69,201 789,8686510-1200 Salaries - Overtime 1,200 2,757 3,535 5,159 4,969 4,486 4,417 10,755 3,080 2,502 2,456 1,422 46,7376510-1300 Auto Allowance 475 475 475 300 0 100 100 100 100 100 100 1,000 3,3256510-1500 Bonuses Paid 868 250 767 1,040 1,169 1,068 917 0 0 0 0 0 6,0786510-1600 Commissions 3,473 3,927 4,960 4,539 4,129 7,163 5,538 6,482 6,675 6,393 6,726 5,676 65,6826510-1999 TOTAL SALARIES 60,101 59,870 89,388 65,198 68,003 74,127 73,070 118,109 76,027 73,754 76,743 77,299 911,690
6520-0000 PAYROLL TAXES AND BENEFITS6520-1000 Payroll Taxes 9,947 9,609 12,613 6,711 6,513 7,177 6,744 11,036 6,820 6,141 7,335 7,551 98,1976520-2100 Insurance - Health 4,931 5,305 5,305 5,305 4,558 4,931 4,184 5,305 1,531 1,042 9,779 5,691 57,8676520-2200 Health - EE Dedn -2,159 -2,159 -3,191 -2,063 -1,967 -1,967 -2,111 -1,332 -2,292 -2,286 -2,398 -2,454 -26,3806520-2250 Health Ins - EE Reimb 400 450 450 450 450 400 400 600 450 450 350 300 5,1506520-3100 Insurance - Worker's Comp 1,920 1,920 1,940 0 5,628 949 4,172 0 1,644 1,644 1,644 955 22,4176520-6100 Payroll Processing Fees 508 238 378 256 297 321 313 502 320 307 312 274 4,0256520-7100 Payroll Garnishments 0 0 0 0 0 0 0 0 0 0 0 75 756529-9998 TOTAL PAYROLL TAXES AND BENEFITS 15,547 15,362 17,495 10,658 15,478 11,811 13,702 16,112 8,473 7,298 17,023 12,392 161,351
6529-9999 TOTAL SALARIES TAXES, & BENEFITS 75,648 75,233 106,883 75,856 83,481 85,938 86,772 134,221 84,500 81,052 93,766 89,691 1,073,041
6600-0000 CONTRACT LABOR6600-1030 Temporary Help 1,900 3,386 2,030 2,198 2,796 3,534 7,151 7,532 6,028 1,286 560 0 38,4026600-3100 Central Maint - Gross Pay 0 0 0 0 0 0 276 80 0 0 76 0 4326600-3300 Central Maint - ER Taxes 0 0 0 0 0 0 21 6 0 0 6 0 336600-9999 TOTAL CONTRACT LABOR 1,900 3,386 2,030 2,198 2,796 3,534 7,448 7,618 6,028 1,286 642 0 38,867
6799-9999 TOTAL LABOR COSTS 77,549 78,619 108,913 78,054 86,278 89,472 94,220 141,838 90,528 82,337 94,408 89,691 1,111,908
7000-0000 ADVERTISING & MARKETING7010-1000 Adv & Mkting - 3rd Party Advertising 747 1,439 747 1,816 2,427 2,000 1,776 766 1,776 5,320 4,258 3,516 26,5867010-2000 Adv & Mkting - On-Site Promotions 1,623 910 1,338 1,444 2,411 1,220 2,263 1,985 2,642 2,816 1,983 685 21,3197010-3000 Adv & Mktg - National/Regional Promotions 0 0 0 0 0 0 0 4,550 0 0 0 9,197 13,7477010-5000 Call Center 0 0 0 0 0 0 0 0 0 0 0 10,704 10,7047010-6000 Locator Fees 0 0 0 818 1,636 2,863 2,045 3,192 2,334 2,723 1,556 1,945 19,1127099-9999 TOTAL ADVERTISING & MARKETING 2,370 2,349 2,085 4,077 6,474 6,082 6,083 10,493 6,751 10,859 7,797 26,048 91,468
7100-0000 SECURITY SERVICE7110-0000 Security - Outside Service 4,522 4,200 3,494 3,360 3,690 2,269 2,115 5,932 2,858 2,954 2,115 2,160 39,6687120-0000 Security - Alarm Contract 0 0 0 0 0 0 978 0 210 0 0 0 1,1887159-9999 TOTAL SECURITY SERVICE 4,522 4,200 3,494 3,360 3,690 2,269 3,093 5,932 3,067 2,954 2,115 2,160 40,856
7200-0000 GENERAL & ADMINISTRATIVE7220-0000 OFFICE EXPENDITURE7220-2000 Office Expense 554 1,253 339 1,750 1,118 258 660 615 1,235 2,955 -1,317 713 10,1337220-2002 Overnight Shipping 269 506 250 259 500 5 565 200 0 1,215 0 6 3,7757220-2100 Postage / Overnight / Messenger 131 221 113 108 238 92 110 177 87 181 85 122 1,6667220-3000 Uniforms 0 0 0 0 0 0 0 0 609 459 129 189 1,3867220-4000 Finance Charges 82 45 38 63 45 45 50 18 62 61 84 70 6637220-6000 Employee Meals 0 0 84 160 0 87 0 0 0 68 0 639 1,0387220-7000 Recruiting Costs 0 0 2,778 3,960 0 660 0 3,300 0 0 0 800 11,4987220-8000 Employee Referral Fees 0 0 0 200 0 0 0 0 0 0 0 0 2007230-8000 Dues & Subscriptions 0 0 1,836 0 175 0 0 0 0 0 0 0 2,0117239-9999 TOTAL OFFICE EXPENDITURE 1,036 2,025 5,438 6,500 2,076 1,147 1,384 4,310 1,993 4,940 -1,019 2,539 32,370
Page 8 of 19
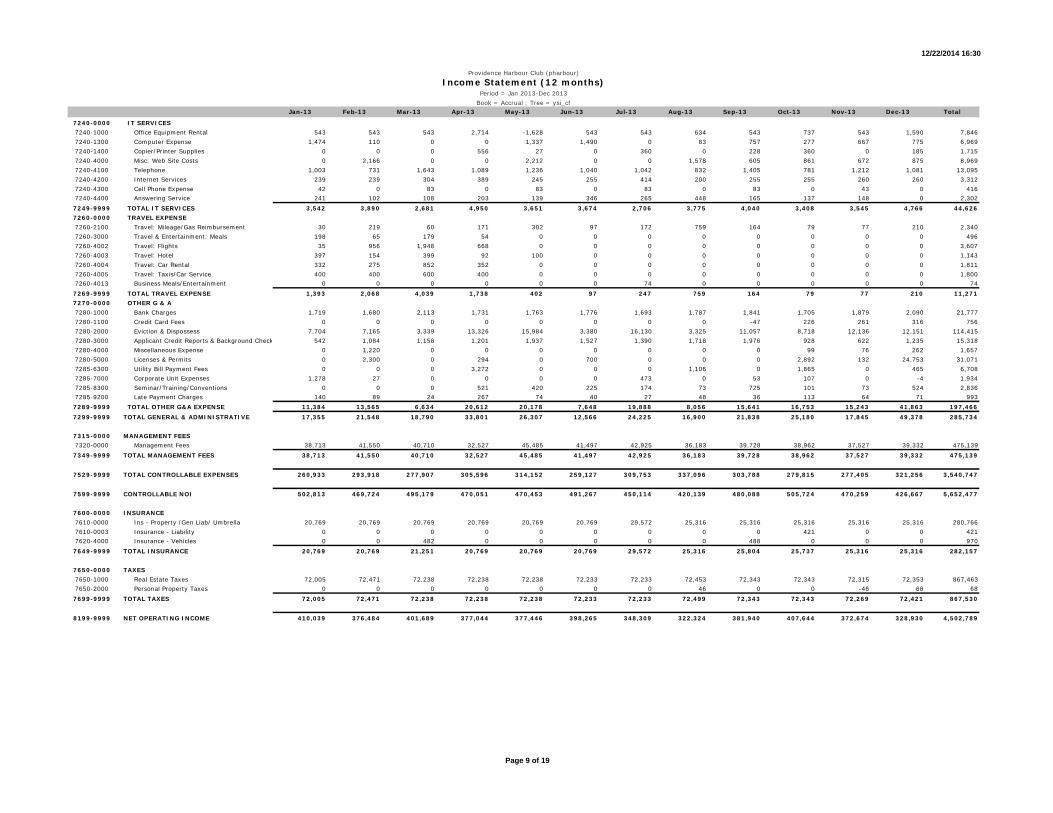
12/22/2014 16:30
Jan-13 Feb-13 Mar-13 Apr-13 May-13 Jun-13 Jul-13 Aug-13 Sep-13 Oct-13 Nov-13 Dec-13 Total
Providence Harbour Club (pharbour)
Income Statement (12 months)Period = Jan 2013-Dec 2013
Book = Accrual ; Tree = ysi_cf
7240-0000 IT SERVICES7240-1000 Office Equipment Rental 543 543 543 2,714 -1,628 543 543 634 543 737 543 1,590 7,8467240-1300 Computer Expense 1,474 110 0 0 1,337 1,490 0 83 757 277 667 775 6,9697240-1400 Copier/Printer Supplies 0 0 0 556 27 0 360 0 228 360 0 185 1,7157240-4000 Misc: Web Site Costs 0 2,166 0 0 2,212 0 0 1,578 605 861 672 875 8,9697240-4100 Telephone 1,003 731 1,643 1,089 1,236 1,040 1,042 832 1,405 781 1,212 1,081 13,0957240-4200 Internet Services 239 239 304 389 245 255 414 200 255 255 260 260 3,3127240-4300 Cell Phone Expense 42 0 83 0 83 0 83 0 83 0 43 0 4167240-4400 Answering Service 241 102 108 203 139 346 265 448 165 137 148 0 2,3027249-9999 TOTAL IT SERVICES 3,542 3,890 2,681 4,950 3,651 3,674 2,706 3,775 4,040 3,408 3,545 4,766 44,6267260-0000 TRAVEL EXPENSE7260-2100 Travel: Mileage/Gas Reimbursement 30 219 60 171 302 97 172 759 164 79 77 210 2,3407260-3000 Travel & Entertainment: Meals 198 65 179 54 0 0 0 0 0 0 0 0 4967260-4002 Travel: Flights 35 956 1,948 668 0 0 0 0 0 0 0 0 3,6077260-4003 Travel: Hotel 397 154 399 92 100 0 0 0 0 0 0 0 1,1437260-4004 Travel: Car Rental 332 275 852 352 0 0 0 0 0 0 0 0 1,8117260-4005 Travel: Taxis/Car Service 400 400 600 400 0 0 0 0 0 0 0 0 1,8007260-4013 Business Meals/Entertainment 0 0 0 0 0 0 74 0 0 0 0 0 747269-9999 TOTAL TRAVEL EXPENSE 1,393 2,068 4,039 1,738 402 97 247 759 164 79 77 210 11,2717270-0000 OTHER G & A7280-1000 Bank Charges 1,719 1,680 2,113 1,731 1,763 1,776 1,693 1,787 1,841 1,705 1,879 2,090 21,7777280-1100 Credit Card Fees 0 0 0 0 0 0 0 0 -47 226 261 316 7567280-2000 Eviction & Dispossess 7,704 7,165 3,339 13,326 15,984 3,380 16,130 3,325 11,057 8,718 12,136 12,151 114,4157280-3000 Applicant Credit Reports & Background Check 542 1,084 1,158 1,201 1,937 1,527 1,390 1,718 1,976 928 622 1,235 15,3187280-4000 Miscellaneous Expense 0 1,220 0 0 0 0 0 0 0 99 76 262 1,6577280-5000 Licenses & Permits 0 2,300 0 294 0 700 0 0 0 2,892 132 24,753 31,0717285-6300 Utility Bill Payment Fees 0 0 0 3,272 0 0 0 1,106 0 1,865 0 465 6,7087285-7000 Corporate Unit Expenses 1,278 27 0 0 0 0 473 0 53 107 0 -4 1,9347285-8300 Seminar/Training/Conventions 0 0 0 521 420 225 174 73 725 101 73 524 2,8367285-9200 Late Payment Charges 140 89 24 267 74 40 27 48 36 113 64 71 9937289-9999 TOTAL OTHER G&A EXPENSE 11,384 13,565 6,634 20,612 20,178 7,648 19,888 8,056 15,641 16,753 15,243 41,863 197,4667299-9999 TOTAL GENERAL & ADMINISTRATIVE 17,355 21,548 18,790 33,801 26,307 12,566 24,225 16,900 21,838 25,180 17,845 49,378 285,734
7315-0000 MANAGEMENT FEES7320-0000 Management Fees 38,713 41,550 40,710 32,527 45,485 41,497 42,925 36,183 39,728 38,962 37,527 39,332 475,1397349-9999 TOTAL MANAGEMENT FEES 38,713 41,550 40,710 32,527 45,485 41,497 42,925 36,183 39,728 38,962 37,527 39,332 475,139
7529-9999 TOTAL CONTROLLABLE EXPENSES 260,933 293,918 277,907 305,596 314,152 259,127 309,753 337,096 303,788 279,815 277,405 321,256 3,540,747
7599-9999 CONTROLLABLE NOI 502,813 469,724 495,179 470,051 470,453 491,267 450,114 420,139 480,088 505,724 470,259 426,667 5,652,477
7600-0000 INSURANCE7610-0000 Ins - Property /Gen Liab/ Umbrella 20,769 20,769 20,769 20,769 20,769 20,769 29,572 25,316 25,316 25,316 25,316 25,316 280,7667610-0003 Insurance - Liability 0 0 0 0 0 0 0 0 0 421 0 0 4217620-4000 Insurance - Vehicles 0 0 482 0 0 0 0 0 488 0 0 0 9707649-9999 TOTAL INSURANCE 20,769 20,769 21,251 20,769 20,769 20,769 29,572 25,316 25,804 25,737 25,316 25,316 282,157
7650-0000 TAXES7650-1000 Real Estate Taxes 72,005 72,471 72,238 72,238 72,238 72,233 72,233 72,453 72,343 72,343 72,315 72,353 867,4637650-2000 Personal Property Taxes 0 0 0 0 0 0 0 46 0 0 -46 68 687699-9999 TOTAL TAXES 72,005 72,471 72,238 72,238 72,238 72,233 72,233 72,499 72,343 72,343 72,269 72,421 867,530
8199-9999 NET OPERATING INCOME 410,039 376,484 401,689 377,044 377,446 398,265 348,309 322,324 381,940 407,644 372,674 328,930 4,502,789
Page 9 of 19

9/29/2015 10:01 AM
Jan 2014 Feb 2014 Mar 2014 Apr 2014 May 2014 Jun 2014 Jul 2014 Aug 2014 Sep 2014 Oct 2014 Nov 2014 Dec 2014 Total
4000-0000 INCOME
4100-0000 RENTAL INCOME
4100-1000 Gross Potential Rent 822,843.00 822,843.00 822,843.00 822,843.00 822,843.00 822,843.00 822,843.00 822,843.00 822,843.00 822,843.00 822,843.00 822,843.00 9,874,116.00
4100-1500 Gain/Loss to Lease 26,306.00 23,768.00 18,889.91 12,671.00 8,057.00 767.00 -1,167.39 -4,215.25 -3,315.19 -4,689.00 -7,373.00 -10,170.06 59,529.02
4100-2000 Rent 0.00 472.96 -472.96 0.00 0.00 0.00 0.00 0.00 0.00 0.00 0.00 0.00 0.00
4100-4000 Month to Month Fees 1,700.00 841.82 800.00 800.00 3,399.19 1,238.33 2,263.71 1,850.00 3,180.00 2,116.45 2,000.00 1,569.72 21,759.22
4100-4500 Short Term Lease Premium 605.65 744.64 725.00 725.00 850.81 1,128.39 1,125.97 975.97 496.53 521.94 332.50 380.00 8,612.40
4130-1000 Vacancy -94,298.42 -94,298.21 -108,685.48 -90,620.62 -78,779.53 -65,082.72 -37,401.30 -69,346.88 -55,004.43 -78,470.03 -74,670.56 -78,362.13 -925,020.31
4130-3000 Vacancy - Down Units -8,530.00 -9,299.00 0.00 0.00 0.00 0.00 0.00 0.00 0.00 0.00 0.00 0.00 -17,829.00
4140-1100 Less: Recurring Concessions -35,364.47 -32,527.51 -29,914.73 -26,286.01 -21,320.01 -17,762.60 -14,929.15 -12,209.79 -9,669.36 -7,833.11 -7,623.33 -5,501.18 -220,941.25
4140-1200 Less: Move-in Specials -8,050.63 -3,309.72 -4,216.64 -4,775.90 -8,580.01 -3,353.75 -10,845.97 -7,368.63 -4,371.78 -5,252.19 -6,329.90 -10,244.38 -76,699.50
4140-1300 Less: Referral Concessions -2,500.00 -1,000.00 -600.00 -1,500.00 -2,200.00 -1,500.00 -4,264.00 -1,899.00 -1,800.00 -1,800.00 -800.00 -400.00 -20,263.00
4140-3100 Non-Revenue Units -1,740.00 -1,740.00 -1,740.00 -1,740.00 -1,740.00 -2,690.00 -2,690.00 -2,690.00 -2,690.00 -2,690.00 -2,690.00 -2,690.00 -27,530.00
4140-3200 Employee Discounts -606.00 -723.75 -617.00 -693.00 -1,676.61 -156.33 -536.00 -536.00 -391.13 -690.00 -540.00 -540.00 -7,705.82
4960-0000 Bad Debt Write-off -8,628.66 -6,814.51 -8,717.35 -10,766.28 -12,969.00 -5,597.97 -9,525.95 -12,252.56 -17,633.42 -9,871.17 -6,326.36 -12,540.01 -121,643.24
4960-1000 Bad Debt Provision 245.60 -864.90 -3,016.80 840.77 2,488.24 -4,364.88 457.77 579.91 -1,079.19 0.00 0.00 0.00 -4,713.48
4140-9000 Concession Chargebacks 4,451.76 5,316.61 2,636.23 7,966.28 2,315.59 279.68 704.13 2,377.75 844.32 927.93 0.00 435.00 28,255.28
4960-0001 Less: Write-off Concession Charge back -3,498.24 -5,200.87 -2,170.76 -8,115.16 -2,501.04 -102.94 -285.00 -2,801.80 -156.00 0.00 0.00 0.00 -24,831.81
4199-9999 NET RENTAL INCOME 692,935.59 698,208.56 685,742.42 701,349.08 710,187.63 725,645.21 745,749.82 715,306.72 731,253.35 715,113.82 718,822.35 704,779.96 8,545,094.51
4200-0000 ANCILLARY INCOME
4220-1000 Electric Recovery 3rd Party 3,428.84 521.56 1,577.84 348.09 695.57 -399.04 217.41 331.07 729.95 513.51 293.99 438.00 8,696.79
4230-0000 Water & Sewer Income 34,937.50 35,070.40 34,885.06 35,314.92 35,982.10 36,539.71 38,045.18 36,381.47 37,256.06 36,080.73 36,251.57 36,033.88 432,778.58
4240-3000 Cable TV Income 1,263.64 3,229.42 1,263.64 1,263.64 3,517.93 1,263.64 1,263.64 1,263.64 1,263.64 1,263.64 4,294.53 1,263.64 22,414.64
4240-6000 Renter's Insurance 0.00 0.00 0.00 1.64 115.21 355.92 644.13 724.77 1,016.65 1,240.89 1,466.04 1,767.82 7,333.07
4310-0000 Laundry Income 2,887.06 0.00 3,266.16 3,382.83 3,040.39 3,736.69 2,867.39 3,278.54 3,867.58 3,925.39 2,903.82 2,900.00 36,055.85
4345-0000 Storage Fee 251.61 275.00 275.00 450.00 850.00 176.67 225.00 204.84 179.17 325.00 475.00 350.00 4,037.29
4350-0000 Garage & Parking Income 0.00 0.00 0.00 0.00 0.00 0.00 0.00 0.00 0.00 0.00 40.00 40.00 80.00
4405-1000 Tenant Application Fees 1,251.00 1,765.00 3,420.00 3,570.00 4,410.00 3,545.00 3,510.00 3,085.00 2,870.00 2,760.00 1,925.00 1,920.00 34,031.00
4405-2000 Admin Fees - New Tenants 2,181.00 3,568.00 4,281.00 3,524.00 4,396.00 8,468.00 5,509.00 5,399.00 4,701.00 3,600.00 2,700.00 3,100.00 51,427.00
4410-1000 Late Fee 20,694.09 21,200.00 10,161.47 14,660.00 11,446.00 19,661.50 16,296.00 17,798.37 16,144.00 14,380.00 15,110.00 20,820.00 198,371.43
4410-2000 NSF Fee 220.00 160.00 100.00 320.00 160.00 200.00 160.00 60.00 220.00 160.00 200.00 280.00 2,240.00
4410-4000 Credit Card Convenience Fees 519.58 859.75 909.51 831.26 1,045.58 1,086.79 1,336.23 1,122.67 738.78 1,022.43 660.07 962.56 11,095.21
4410-5000 Utility Acct Non-Transfer Fee 1,350.00 125.00 350.00 325.00 225.00 -100.00 75.00 300.00 450.00 200.00 -100.00 -75.00 3,125.00
4420-1000 Key Fee 355.00 360.00 350.00 315.00 220.00 200.00 180.00 190.00 470.00 1,010.00 587.00 415.00 4,652.00
Providence Harbour Club (pharbour)
Income Statement (12 months)Period = Jan 2014-Dec 2014
Book = Accrual,GAAP,TAX,BOND ; Tree = amis
Page 1 of 3
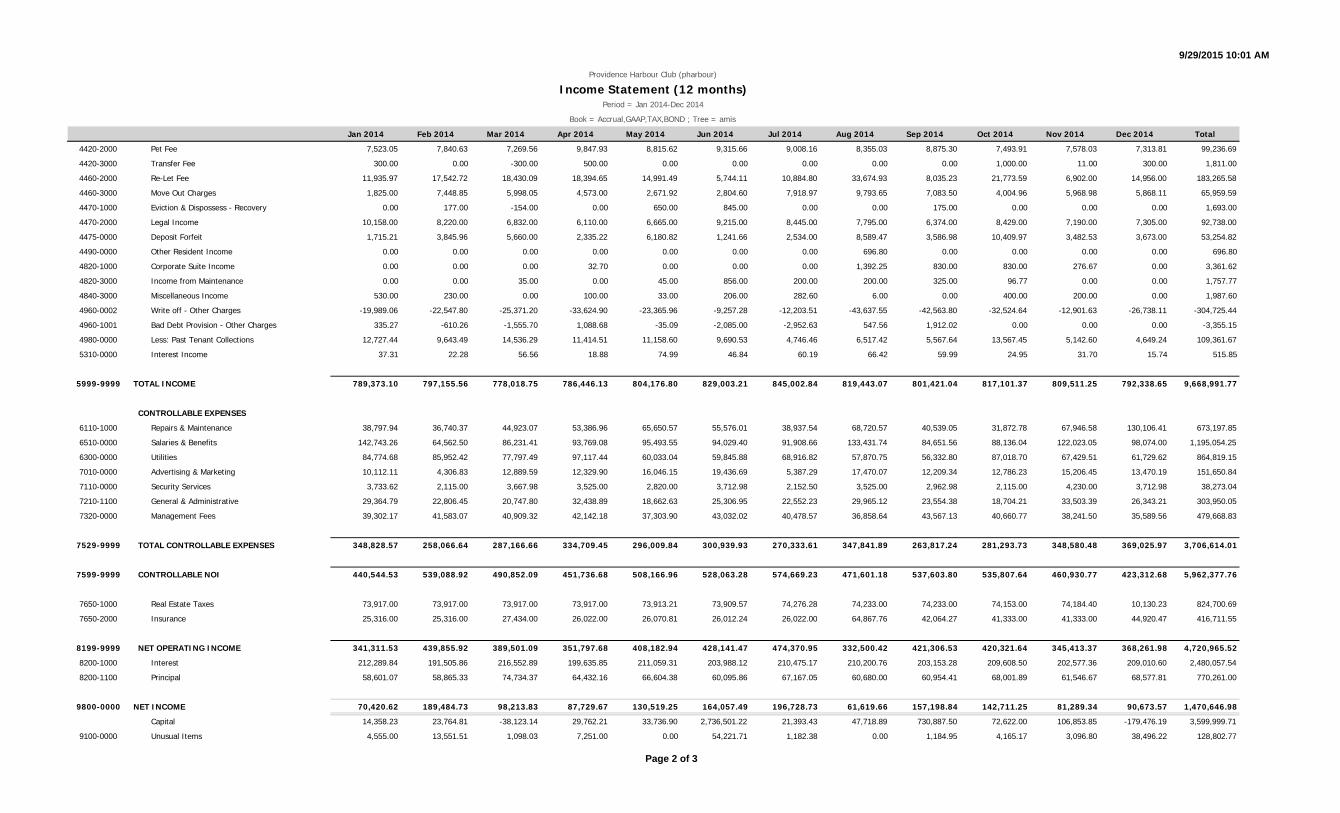
9/29/2015 10:01 AM
Jan 2014 Feb 2014 Mar 2014 Apr 2014 May 2014 Jun 2014 Jul 2014 Aug 2014 Sep 2014 Oct 2014 Nov 2014 Dec 2014 Total
Providence Harbour Club (pharbour)
Income Statement (12 months)Period = Jan 2014-Dec 2014
Book = Accrual,GAAP,TAX,BOND ; Tree = amis
4420-2000 Pet Fee 7,523.05 7,840.63 7,269.56 9,847.93 8,815.62 9,315.66 9,008.16 8,355.03 8,875.30 7,493.91 7,578.03 7,313.81 99,236.69
4420-3000 Transfer Fee 300.00 0.00 -300.00 500.00 0.00 0.00 0.00 0.00 0.00 1,000.00 11.00 300.00 1,811.00
4460-2000 Re-Let Fee 11,935.97 17,542.72 18,430.09 18,394.65 14,991.49 5,744.11 10,884.80 33,674.93 8,035.23 21,773.59 6,902.00 14,956.00 183,265.58
4460-3000 Move Out Charges 1,825.00 7,448.85 5,998.05 4,573.00 2,671.92 2,804.60 7,918.97 9,793.65 7,083.50 4,004.96 5,968.98 5,868.11 65,959.59
4470-1000 Eviction & Dispossess - Recovery 0.00 177.00 -154.00 0.00 650.00 845.00 0.00 0.00 175.00 0.00 0.00 0.00 1,693.00
4470-2000 Legal Income 10,158.00 8,220.00 6,832.00 6,110.00 6,665.00 9,215.00 8,445.00 7,795.00 6,374.00 8,429.00 7,190.00 7,305.00 92,738.00
4475-0000 Deposit Forfeit 1,715.21 3,845.96 5,660.00 2,335.22 6,180.82 1,241.66 2,534.00 8,589.47 3,586.98 10,409.97 3,482.53 3,673.00 53,254.82
4490-0000 Other Resident Income 0.00 0.00 0.00 0.00 0.00 0.00 0.00 696.80 0.00 0.00 0.00 0.00 696.80
4820-1000 Corporate Suite Income 0.00 0.00 0.00 32.70 0.00 0.00 0.00 1,392.25 830.00 830.00 276.67 0.00 3,361.62
4820-3000 Income from Maintenance 0.00 0.00 35.00 0.00 45.00 856.00 200.00 200.00 325.00 96.77 0.00 0.00 1,757.77
4840-3000 Miscellaneous Income 530.00 230.00 0.00 100.00 33.00 206.00 282.60 6.00 0.00 400.00 200.00 0.00 1,987.60
4960-0002 Write off - Other Charges -19,989.06 -22,547.80 -25,371.20 -33,624.90 -23,365.96 -9,257.28 -12,203.51 -43,637.55 -42,563.80 -32,524.64 -12,901.63 -26,738.11 -304,725.44
4960-1001 Bad Debt Provision - Other Charges 335.27 -610.26 -1,555.70 1,088.68 -35.09 -2,085.00 -2,952.63 547.56 1,912.02 0.00 0.00 0.00 -3,355.15
4980-0000 Less: Past Tenant Collections 12,727.44 9,643.49 14,536.29 11,414.51 11,158.60 9,690.53 4,746.46 6,517.42 5,567.64 13,567.45 5,142.60 4,649.24 109,361.67
5310-0000 Interest Income 37.31 22.28 56.56 18.88 74.99 46.84 60.19 66.42 59.99 24.95 31.70 15.74 515.85
5999-9999 TOTAL INCOME 789,373.10 797,155.56 778,018.75 786,446.13 804,176.80 829,003.21 845,002.84 819,443.07 801,421.04 817,101.37 809,511.25 792,338.65 9,668,991.77
CONTROLLABLE EXPENSES
6110-1000 Repairs & Maintenance 38,797.94 36,740.37 44,923.07 53,386.96 65,650.57 55,576.01 38,937.54 68,720.57 40,539.05 31,872.78 67,946.58 130,106.41 673,197.85
6510-0000 Salaries & Benefits 142,743.26 64,562.50 86,231.41 93,769.08 95,493.55 94,029.40 91,908.66 133,431.74 84,651.56 88,136.04 122,023.05 98,074.00 1,195,054.25
6300-0000 Utilities 84,774.68 85,952.42 77,797.49 97,117.44 60,033.04 59,845.88 68,916.82 57,870.75 56,332.80 87,018.70 67,429.51 61,729.62 864,819.15
7010-0000 Advertising & Marketing 10,112.11 4,306.83 12,889.59 12,329.90 16,046.15 19,436.69 5,387.29 17,470.07 12,209.34 12,786.23 15,206.45 13,470.19 151,650.84
7110-0000 Security Services 3,733.62 2,115.00 3,667.98 3,525.00 2,820.00 3,712.98 2,152.50 3,525.00 2,962.98 2,115.00 4,230.00 3,712.98 38,273.04
7210-1100 General & Administrative 29,364.79 22,806.45 20,747.80 32,438.89 18,662.63 25,306.95 22,552.23 29,965.12 23,554.38 18,704.21 33,503.39 26,343.21 303,950.05
7320-0000 Management Fees 39,302.17 41,583.07 40,909.32 42,142.18 37,303.90 43,032.02 40,478.57 36,858.64 43,567.13 40,660.77 38,241.50 35,589.56 479,668.83
7529-9999 TOTAL CONTROLLABLE EXPENSES 348,828.57 258,066.64 287,166.66 334,709.45 296,009.84 300,939.93 270,333.61 347,841.89 263,817.24 281,293.73 348,580.48 369,025.97 3,706,614.01
7599-9999 CONTROLLABLE NOI 440,544.53 539,088.92 490,852.09 451,736.68 508,166.96 528,063.28 574,669.23 471,601.18 537,603.80 535,807.64 460,930.77 423,312.68 5,962,377.76
7650-1000 Real Estate Taxes 73,917.00 73,917.00 73,917.00 73,917.00 73,913.21 73,909.57 74,276.28 74,233.00 74,233.00 74,153.00 74,184.40 10,130.23 824,700.69
7650-2000 Insurance 25,316.00 25,316.00 27,434.00 26,022.00 26,070.81 26,012.24 26,022.00 64,867.76 42,064.27 41,333.00 41,333.00 44,920.47 416,711.55
8199-9999 NET OPERATING INCOME 341,311.53 439,855.92 389,501.09 351,797.68 408,182.94 428,141.47 474,370.95 332,500.42 421,306.53 420,321.64 345,413.37 368,261.98 4,720,965.52
8200-1000 Interest 212,289.84 191,505.86 216,552.89 199,635.85 211,059.31 203,988.12 210,475.17 210,200.76 203,153.28 209,608.50 202,577.36 209,010.60 2,480,057.54
8200-1100 Principal 58,601.07 58,865.33 74,734.37 64,432.16 66,604.38 60,095.86 67,167.05 60,680.00 60,954.41 68,001.89 61,546.67 68,577.81 770,261.00
9800-0000 NET INCOME 70,420.62 189,484.73 98,213.83 87,729.67 130,519.25 164,057.49 196,728.73 61,619.66 157,198.84 142,711.25 81,289.34 90,673.57 1,470,646.98
Capital 14,358.23 23,764.81 -38,123.14 29,762.21 33,736.90 2,736,501.22 21,393.43 47,718.89 730,887.50 72,622.00 106,853.85 -179,476.19 3,599,999.71
9100-0000 Unusual Items 4,555.00 13,551.51 1,098.03 7,251.00 0.00 54,221.71 1,182.38 0.00 1,184.95 4,165.17 3,096.80 38,496.22 128,802.77
Page 2 of 3
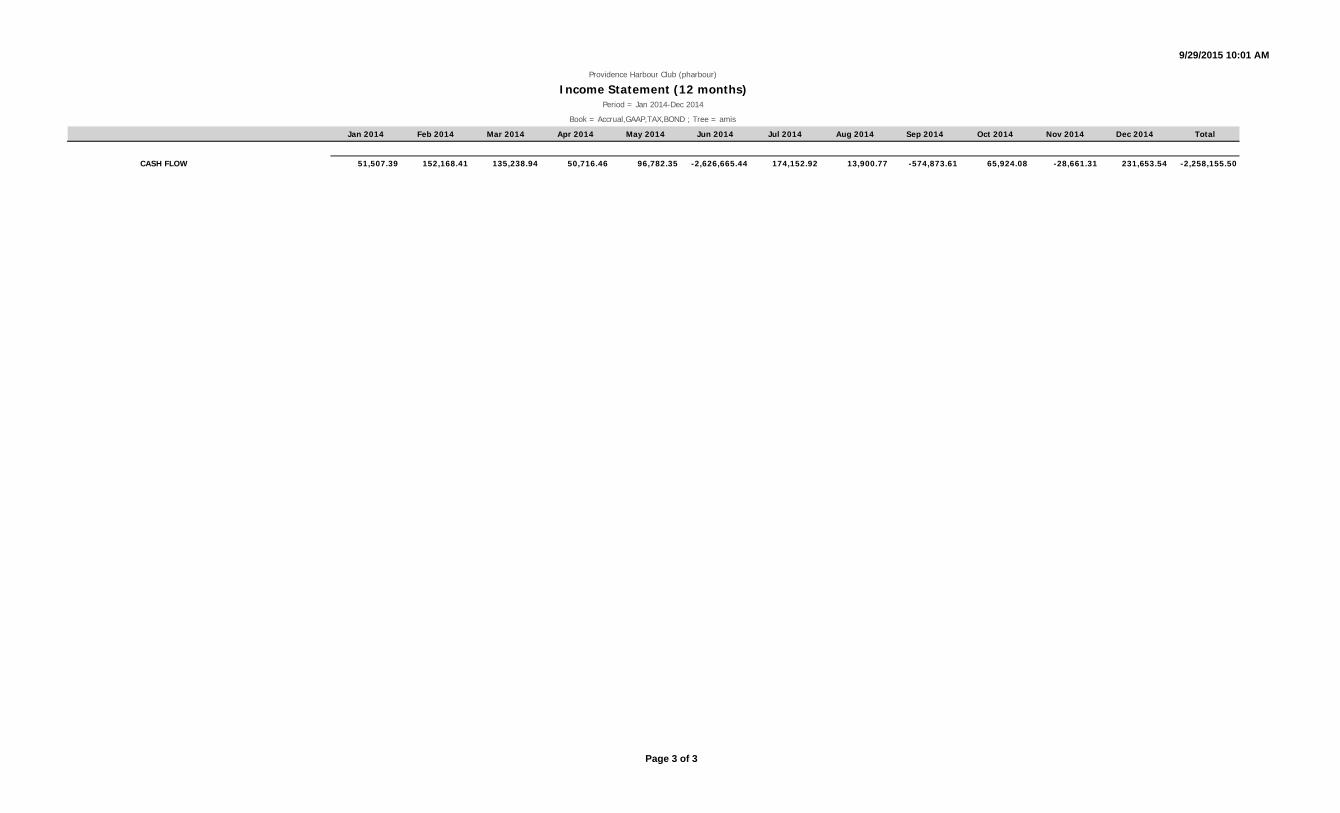
9/29/2015 10:01 AM
Jan 2014 Feb 2014 Mar 2014 Apr 2014 May 2014 Jun 2014 Jul 2014 Aug 2014 Sep 2014 Oct 2014 Nov 2014 Dec 2014 Total
Providence Harbour Club (pharbour)
Income Statement (12 months)Period = Jan 2014-Dec 2014
Book = Accrual,GAAP,TAX,BOND ; Tree = amis
CASH FLOW 51,507.39 152,168.41 135,238.94 50,716.46 96,782.35 -2,626,665.44 174,152.92 13,900.77 -574,873.61 65,924.08 -28,661.31 231,653.54 -2,258,155.50
Page 3 of 3
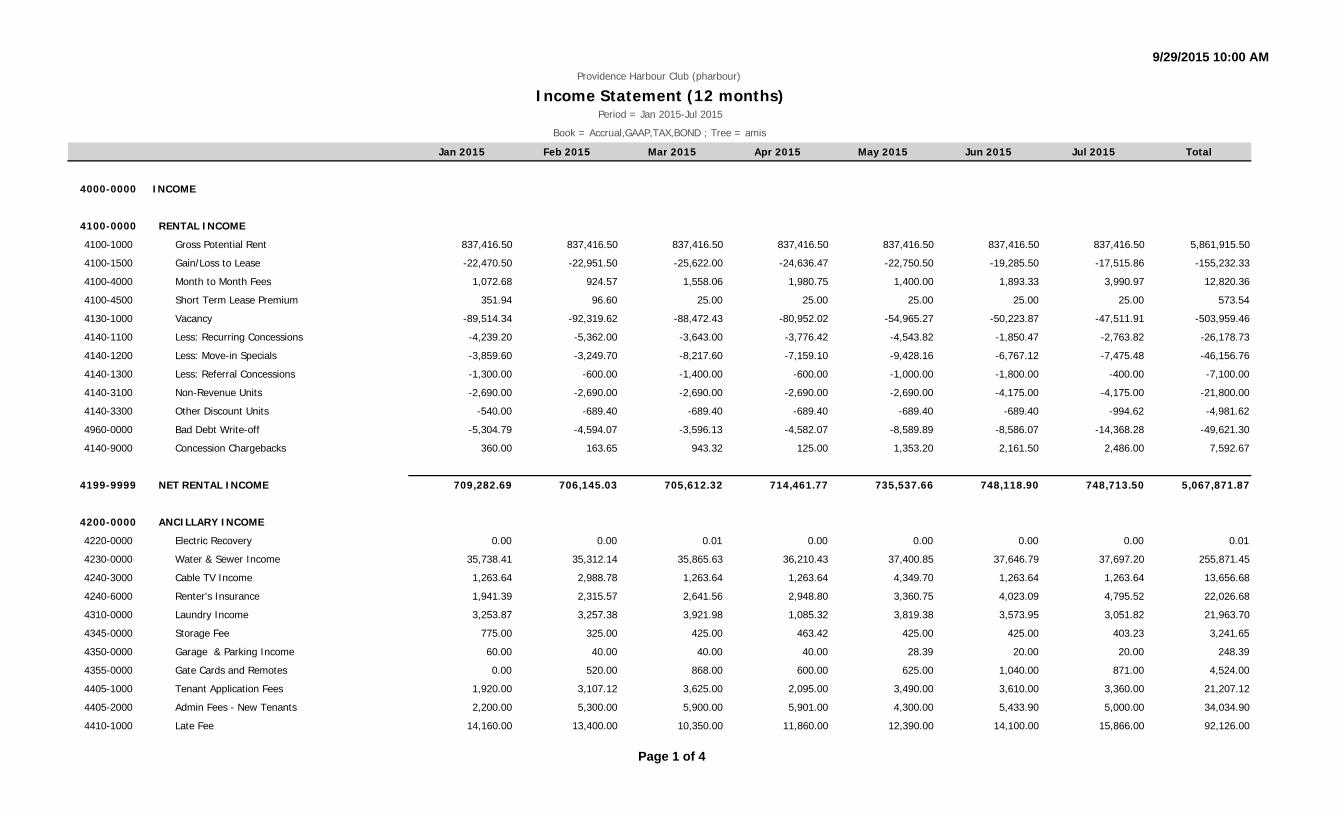
9/29/2015 10:00 AM
Jan 2015 Feb 2015 Mar 2015 Apr 2015 May 2015 Jun 2015 Jul 2015 Total
4000-0000 INCOME
4100-0000 RENTAL INCOME
4100-1000 Gross Potential Rent 837,416.50 837,416.50 837,416.50 837,416.50 837,416.50 837,416.50 837,416.50 5,861,915.50
4100-1500 Gain/Loss to Lease -22,470.50 -22,951.50 -25,622.00 -24,636.47 -22,750.50 -19,285.50 -17,515.86 -155,232.33
4100-4000 Month to Month Fees 1,072.68 924.57 1,558.06 1,980.75 1,400.00 1,893.33 3,990.97 12,820.36
4100-4500 Short Term Lease Premium 351.94 96.60 25.00 25.00 25.00 25.00 25.00 573.54
4130-1000 Vacancy -89,514.34 -92,319.62 -88,472.43 -80,952.02 -54,965.27 -50,223.87 -47,511.91 -503,959.46
4140-1100 Less: Recurring Concessions -4,239.20 -5,362.00 -3,643.00 -3,776.42 -4,543.82 -1,850.47 -2,763.82 -26,178.73
4140-1200 Less: Move-in Specials -3,859.60 -3,249.70 -8,217.60 -7,159.10 -9,428.16 -6,767.12 -7,475.48 -46,156.76
4140-1300 Less: Referral Concessions -1,300.00 -600.00 -1,400.00 -600.00 -1,000.00 -1,800.00 -400.00 -7,100.00
4140-3100 Non-Revenue Units -2,690.00 -2,690.00 -2,690.00 -2,690.00 -2,690.00 -4,175.00 -4,175.00 -21,800.00
4140-3300 Other Discount Units -540.00 -689.40 -689.40 -689.40 -689.40 -689.40 -994.62 -4,981.62
4960-0000 Bad Debt Write-off -5,304.79 -4,594.07 -3,596.13 -4,582.07 -8,589.89 -8,586.07 -14,368.28 -49,621.30
4140-9000 Concession Chargebacks 360.00 163.65 943.32 125.00 1,353.20 2,161.50 2,486.00 7,592.67
4199-9999 NET RENTAL INCOME 709,282.69 706,145.03 705,612.32 714,461.77 735,537.66 748,118.90 748,713.50 5,067,871.87
4200-0000 ANCILLARY INCOME
4220-0000 Electric Recovery 0.00 0.00 0.01 0.00 0.00 0.00 0.00 0.01
4230-0000 Water & Sewer Income 35,738.41 35,312.14 35,865.63 36,210.43 37,400.85 37,646.79 37,697.20 255,871.45
4240-3000 Cable TV Income 1,263.64 2,988.78 1,263.64 1,263.64 4,349.70 1,263.64 1,263.64 13,656.68
4240-6000 Renter's Insurance 1,941.39 2,315.57 2,641.56 2,948.80 3,360.75 4,023.09 4,795.52 22,026.68
4310-0000 Laundry Income 3,253.87 3,257.38 3,921.98 1,085.32 3,819.38 3,573.95 3,051.82 21,963.70
4345-0000 Storage Fee 775.00 325.00 425.00 463.42 425.00 425.00 403.23 3,241.65
4350-0000 Garage & Parking Income 60.00 40.00 40.00 40.00 28.39 20.00 20.00 248.39
4355-0000 Gate Cards and Remotes 0.00 520.00 868.00 600.00 625.00 1,040.00 871.00 4,524.00
4405-1000 Tenant Application Fees 1,920.00 3,107.12 3,625.00 2,095.00 3,490.00 3,610.00 3,360.00 21,207.12
4405-2000 Admin Fees - New Tenants 2,200.00 5,300.00 5,900.00 5,901.00 4,300.00 5,433.90 5,000.00 34,034.90
4410-1000 Late Fee 14,160.00 13,400.00 10,350.00 11,860.00 12,390.00 14,100.00 15,866.00 92,126.00
Providence Harbour Club (pharbour)
Income Statement (12 months)Period = Jan 2015-Jul 2015
Book = Accrual,GAAP,TAX,BOND ; Tree = amis
Page 1 of 4

9/29/2015 10:00 AM
Jan 2015 Feb 2015 Mar 2015 Apr 2015 May 2015 Jun 2015 Jul 2015 Total
Providence Harbour Club (pharbour)
Income Statement (12 months)Period = Jan 2015-Jul 2015
Book = Accrual,GAAP,TAX,BOND ; Tree = amis
4410-2000 NSF Fee 120.00 280.00 140.00 80.00 180.00 120.00 80.00 1,000.00
4410-3000 RUBS Billing Fee 800.00 1,300.00 750.00 0.00 0.00 1,100.00 300.00 4,250.00
4410-4000 Credit Card Convenience Fees 966.83 -966.83 0.00 0.00 0.00 0.00 0.00 0.00
4420-1000 Key Fee 795.00 280.00 0.00 0.00 0.00 0.00 0.00 1,075.00
4420-2000 Pet Fee 7,446.00 8,527.83 8,272.07 7,768.33 8,499.22 7,829.33 9,129.49 57,472.27
4420-3000 Transfer Fee 300.00 0.00 0.00 300.00 300.00 0.00 300.00 1,200.00
4460-2000 Re-Let Fee 8,980.52 20,328.54 15,386.00 13,174.00 8,141.00 28,051.00 20,438.00 114,499.06
Page 2 of 4
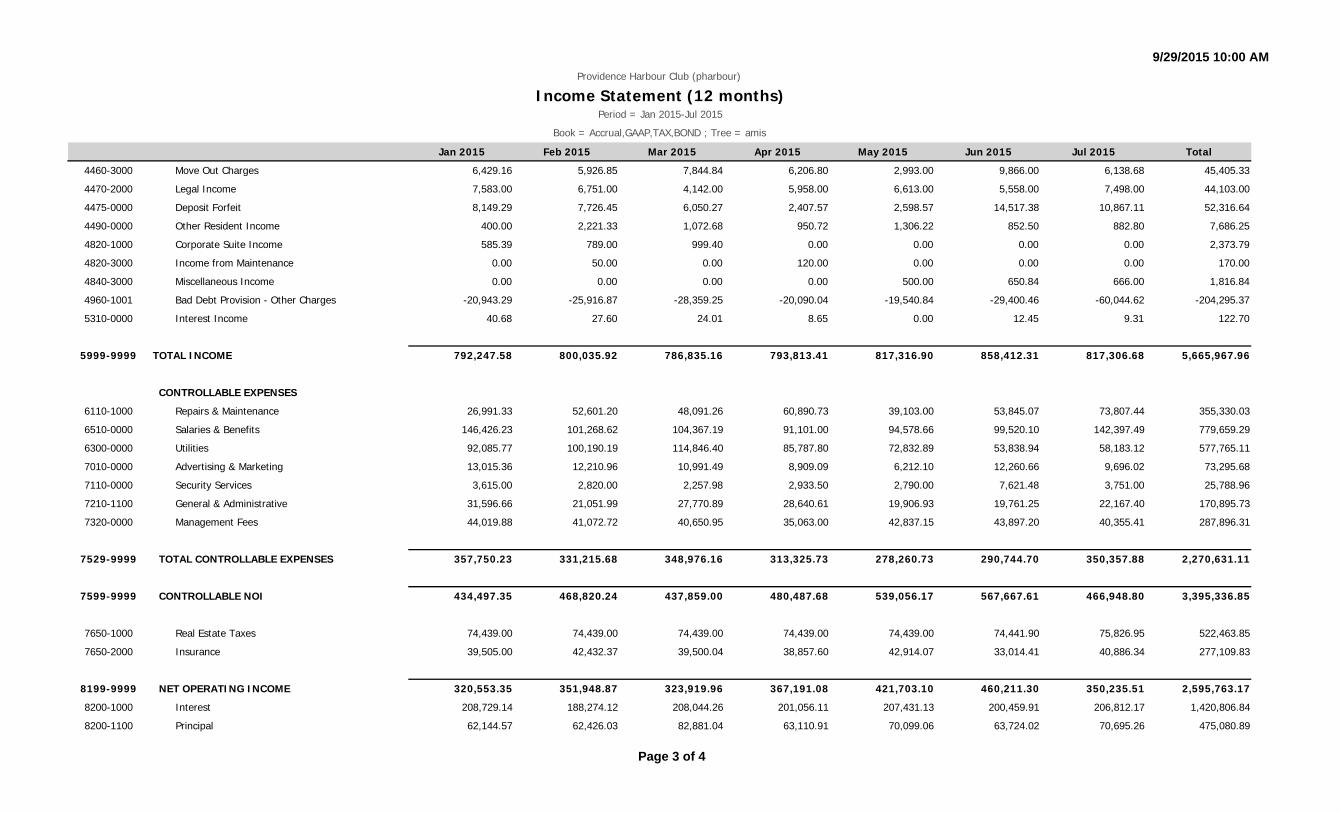
9/29/2015 10:00 AM
Jan 2015 Feb 2015 Mar 2015 Apr 2015 May 2015 Jun 2015 Jul 2015 Total
Providence Harbour Club (pharbour)
Income Statement (12 months)Period = Jan 2015-Jul 2015
Book = Accrual,GAAP,TAX,BOND ; Tree = amis
4460-3000 Move Out Charges 6,429.16 5,926.85 7,844.84 6,206.80 2,993.00 9,866.00 6,138.68 45,405.33
4470-2000 Legal Income 7,583.00 6,751.00 4,142.00 5,958.00 6,613.00 5,558.00 7,498.00 44,103.00
4475-0000 Deposit Forfeit 8,149.29 7,726.45 6,050.27 2,407.57 2,598.57 14,517.38 10,867.11 52,316.64
4490-0000 Other Resident Income 400.00 2,221.33 1,072.68 950.72 1,306.22 852.50 882.80 7,686.25
4820-1000 Corporate Suite Income 585.39 789.00 999.40 0.00 0.00 0.00 0.00 2,373.79
4820-3000 Income from Maintenance 0.00 50.00 0.00 120.00 0.00 0.00 0.00 170.00
4840-3000 Miscellaneous Income 0.00 0.00 0.00 0.00 500.00 650.84 666.00 1,816.84
4960-1001 Bad Debt Provision - Other Charges -20,943.29 -25,916.87 -28,359.25 -20,090.04 -19,540.84 -29,400.46 -60,044.62 -204,295.37
5310-0000 Interest Income 40.68 27.60 24.01 8.65 0.00 12.45 9.31 122.70
5999-9999 TOTAL INCOME 792,247.58 800,035.92 786,835.16 793,813.41 817,316.90 858,412.31 817,306.68 5,665,967.96
CONTROLLABLE EXPENSES
6110-1000 Repairs & Maintenance 26,991.33 52,601.20 48,091.26 60,890.73 39,103.00 53,845.07 73,807.44 355,330.03
6510-0000 Salaries & Benefits 146,426.23 101,268.62 104,367.19 91,101.00 94,578.66 99,520.10 142,397.49 779,659.29
6300-0000 Utilities 92,085.77 100,190.19 114,846.40 85,787.80 72,832.89 53,838.94 58,183.12 577,765.11
7010-0000 Advertising & Marketing 13,015.36 12,210.96 10,991.49 8,909.09 6,212.10 12,260.66 9,696.02 73,295.68
7110-0000 Security Services 3,615.00 2,820.00 2,257.98 2,933.50 2,790.00 7,621.48 3,751.00 25,788.96
7210-1100 General & Administrative 31,596.66 21,051.99 27,770.89 28,640.61 19,906.93 19,761.25 22,167.40 170,895.73
7320-0000 Management Fees 44,019.88 41,072.72 40,650.95 35,063.00 42,837.15 43,897.20 40,355.41 287,896.31
7529-9999 TOTAL CONTROLLABLE EXPENSES 357,750.23 331,215.68 348,976.16 313,325.73 278,260.73 290,744.70 350,357.88 2,270,631.11
7599-9999 CONTROLLABLE NOI 434,497.35 468,820.24 437,859.00 480,487.68 539,056.17 567,667.61 466,948.80 3,395,336.85
7650-1000 Real Estate Taxes 74,439.00 74,439.00 74,439.00 74,439.00 74,439.00 74,441.90 75,826.95 522,463.85
7650-2000 Insurance 39,505.00 42,432.37 39,500.04 38,857.60 42,914.07 33,014.41 40,886.34 277,109.83
8199-9999 NET OPERATING INCOME 320,553.35 351,948.87 323,919.96 367,191.08 421,703.10 460,211.30 350,235.51 2,595,763.17
8200-1000 Interest 208,729.14 188,274.12 208,044.26 201,056.11 207,431.13 200,459.91 206,812.17 1,420,806.84
8200-1100 Principal 62,144.57 62,426.03 82,881.04 63,110.91 70,099.06 63,724.02 70,695.26 475,080.89
Page 3 of 4
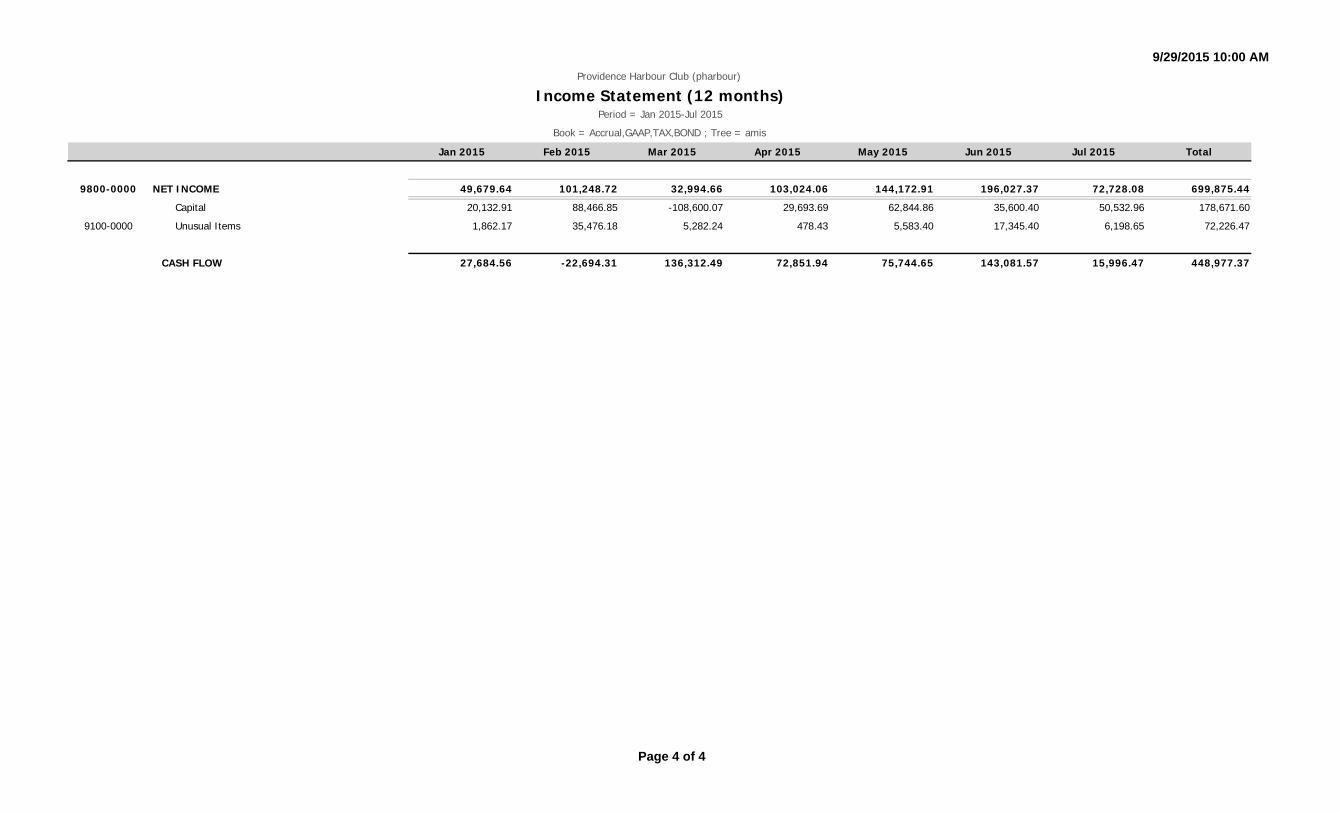
9/29/2015 10:00 AM
Jan 2015 Feb 2015 Mar 2015 Apr 2015 May 2015 Jun 2015 Jul 2015 Total
Providence Harbour Club (pharbour)
Income Statement (12 months)Period = Jan 2015-Jul 2015
Book = Accrual,GAAP,TAX,BOND ; Tree = amis
9800-0000 NET INCOME 49,679.64 101,248.72 32,994.66 103,024.06 144,172.91 196,027.37 72,728.08 699,875.44
Capital 20,132.91 88,466.85 -108,600.07 29,693.69 62,844.86 35,600.40 50,532.96 178,671.60
9100-0000 Unusual Items 1,862.17 35,476.18 5,282.24 478.43 5,583.40 17,345.40 6,198.65 72,226.47
CASH FLOW 27,684.56 -22,694.31 136,312.49 72,851.94 75,744.65 143,081.57 15,996.47 448,977.37
Page 4 of 4

QUALIFICATIONS/LICENSES
QUALIFICATIONS/LICENSES
Expertise. Experience. Execution.
™
ACADEMIC BACKGROUND
The University of Chicago Graduate School of BusinessM.B.A., business administration with a concentration in finance and statisticsKent State University, Ohio B.B.A., business administration and majors in finance and real estate
EXPERIENCE
Kenneth Riggs, Jr. has dedicated his entire career to commercial real estate, and his experience with this asset class is in great demand by many of the nation’s leading institutional property investors. His hands-on experience with financial analysis, property valuation, and strategic consulting, as reflected by the professional designations he has earned and the clients he has served, place him among the industry’s foremost real estate experts. Under his leadership, Situs RERC continues as one of the longest-serving national firms dedicated to real property research, valuation and valuation management services, independent fiduciary services, appraisal and litigation support, and real estate consulting.
Mr. Riggs is personally involved in and provides critical oversight and direction for a variety of key client activities, including serving as:
� Independent fiduciary for the real estate accounts for multiple major insurance companies and pension funds (RERC is an SEC-registered investment advisor.)
� Valuation consultant/manager for some of the world’s largest real estate portfolios.
� Publisher of the quarterly Situs RERC Real Estate Report and the Situs RERC Real Estate Report - European Edition, and co-publisher of the annual Expectations & Market Realities in Real Estate forecast report.
Mr. Riggs’ prominence within the commercial real estate industry has continued to expand over the years. In addition to being named as one of the industry’s top 25 most influential thought leaders by the National Association of REALTORS, he has served on the Appraisal Foundation Board of Trustees as a member of the executive committee, as well as the chief real estate economist for the CCIM Institute.
As 2012 chair of The Counselors of Real Estate®, one of Mr. Riggs’ major achievements was to lead the effort to establish the European chapter of The Counselors, thereby strategically extending The Counselors’ global vision beyond North America to the international markets. He also spoke at MIPIM, and had several articles and columns published in Estates Gazette and Immobilien Manager Vertag about the U.S. real estate market. Mr. Riggs also wrote several feature articles which were published in various issues of the Europe Real Estate Yearbook.
In 2014, Situs acquired RERC, and later that year, Mr. Riggs was named president of Situs RERC. Prior to his role with Situs RERC, Mr. Riggs served as president and CEO of RERC from 1991 to 2014. Earlier experience includes serving as director/senior manager of real estate valuation at Deloitte & Touche from 1988 to 1991, where he worked closely with large institutional investors, Fortune 500 companies, and foreign investors. In addition, Mr. Riggs served as senior manager of real estate valuation at Laventhol & Horwath from 1987 to 1988. As co-founder and partner for Houston Property Consultants from 1984 to 1986, he focused on providing commercial appraisals and consultation for such major clients as the FDIC and the Federal Home Loan Bank Board.
KENNETH P. RIGGS, JR.CFA, MAI, CRE, FRICS, CCIM
PRESIDENT
Expertise. Experience. Execution.
™
PROFESSIONAL AWARDS, DESIGNATIONS, AND ACCOMPLISHMENTS
Ken Riggs has earned the following designations, recognitions, and awards:
∙ Served as Chief Real Estate Economist of the CCIM Institute, 2010, 2011, 2012.
∙ Served as Chair, The Counselors of Real Estate®, 2012.
∙ One of only three investment committee members named to the National Real Estate Advisors/NEBF, 2009.
∙ Member of the Urban Land Institute (ULI)/Ernst & Young (E&I) Real Estate Consensus Forecast, Economists/Analysts, 2012-present.
∙ Named one of Real Estate’s 25 Most Influential Thought Leaders by the National Association of REALTORS®, 2006.
∙ CCIM, 2005. Received Certified Commercial Investment Member designation.
∙ FRICS, 2004. Received Fellowship of Royal Institution of Chartered Surveyors designation.
∙ CFA®, 2000. Received the Chartered Financial Analyst designation from the CFA Institute (formerly Association for Investment Management and Research/AIMR).
∙ CRE, 1995. Received the Counselor of Real Estate designation from The Counselors of Real Estate®.
∙ MAI, 1987. Received the Member of the Appraisal Institute designation from the Appraisal Institute.
∙ Homer Hoyt, Hoyt Fellow.
∙ Held Series 6, 7, and 66 NASD Securities Licenses (2004 to 2010).
∙ Appraisal Foundation Board of Trustees, member (2003 to Dec. 2005—served as Education Chair and Member of the Executive Committee).
∙ Mortgage Bankers Portfolio Investors Committee, ex officio, 2004.
∙ Adjunct Professor in Finance, University of Northern Iowa, 2002-2006.
∙ Member of CFA® Society of Iowa.
∙ Member of the Iowa Board of Realtors.
SPEAKING AND PUBLICATIONS EXPERIENCE
Mr. Riggs is much sought-after as a keynote speaker on real estate investment and market trends at conferences and seminars throughout the U.S. and Europe. Mr. Riggs has given hundreds of speeches to industry groups and private companies, with the audience size ranging from 50 to 1,000 or more professionals.
Mr. Riggs has also published articles and columns in such publications as Mortgage Banking, The Institutional Real Estate Letter, Commercial Real Estate Investment, Commercial Property Online, and Commercial Property Executive. In addition, he has been featured and quoted in such news sources as The Wall Street Journal, CNNmoney, Bloomberg News, Barron’s, MarketWatch, National Real Estate Investor, Real Estate Finance Today, Pensions & Investments, and many others.
KENNETH P. RIGGS, JR.CFA, MAI, CRE, FRICS, CCIM
PRESIDENT


APPRAISAL OF
Under Construction The Beekman Hotel
Located at 5 Beekman Street and 115 Nassau Street
New York, NY
As of September 30, 2015
MS. JENNIFER MCLEAN
GFI Capital Holdings, LLC 140 Broadway, 41st Floor
New York, NY 10005
Prepared for
RERC
150 E 52nd Street, Suite 4002 New York, NY 10022
(212) 294-1376 www.RERC.com
Prepared by
APPRAISAL REPORT
SITUS RERC is an SEC-Registered Investment Advisor
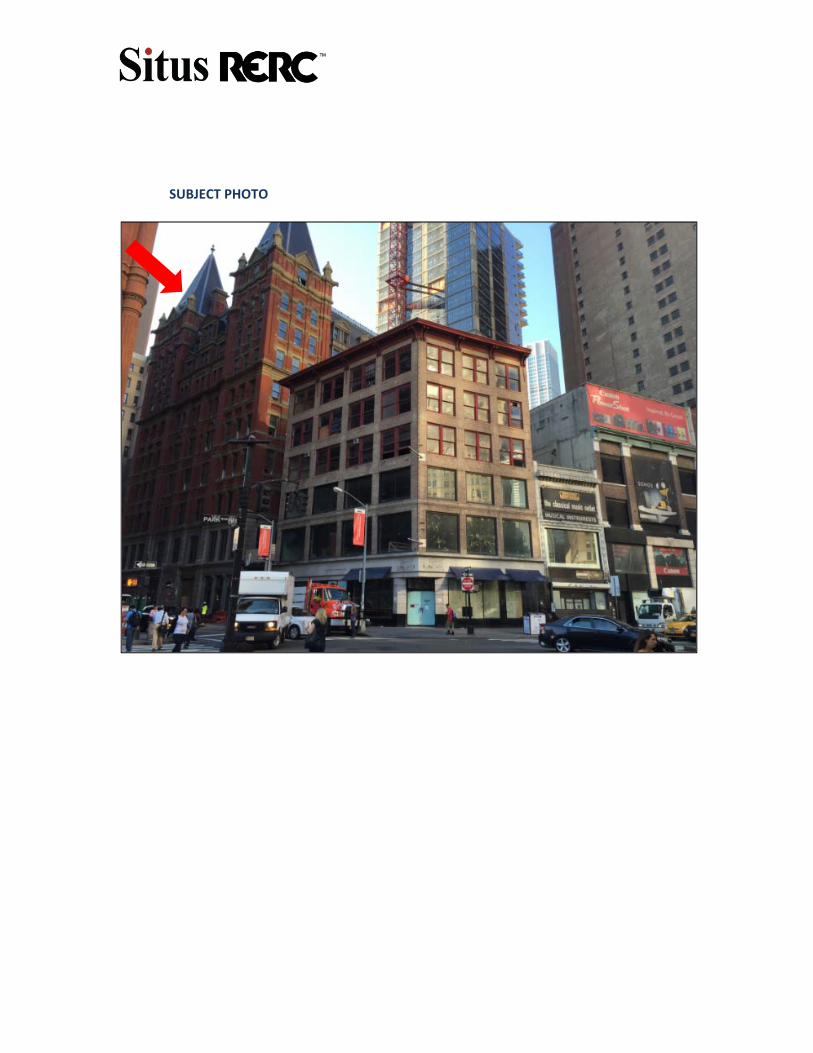
SUBJECT PHOTO
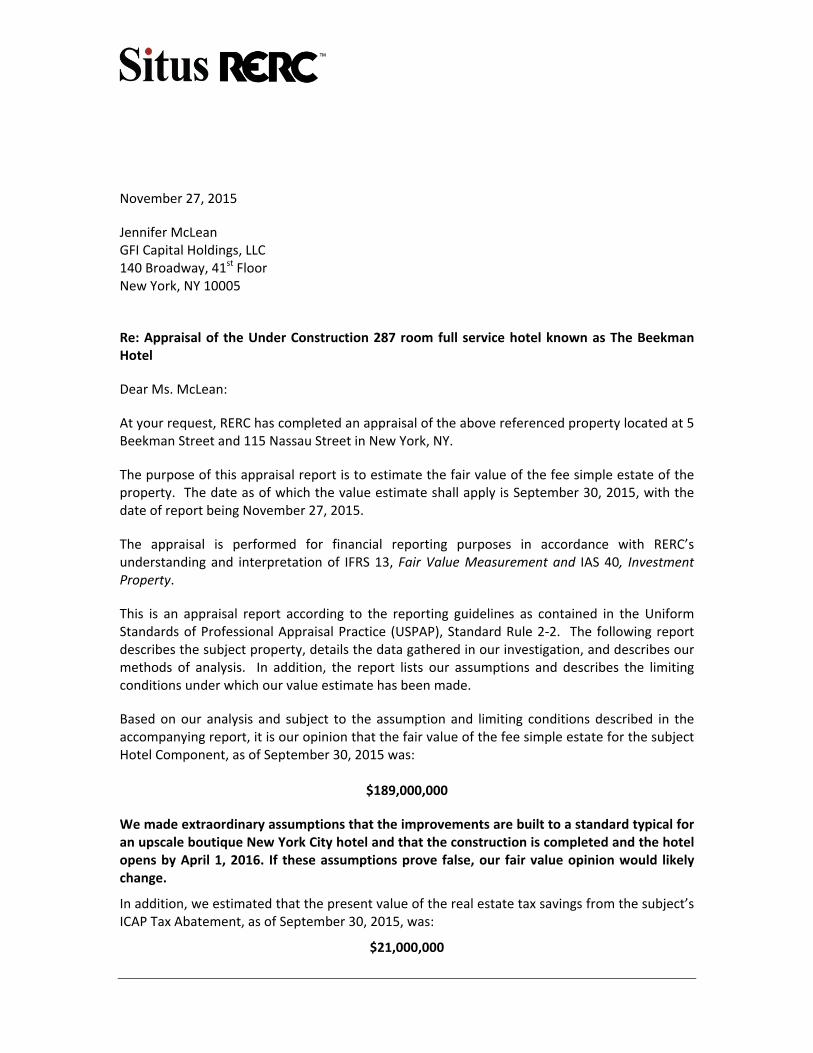
November 27, 2015
Jennifer McLean GFI Capital Holdings, LLC 140 Broadway, 41st Floor New York, NY 10005
Re: Appraisal of the Under Construction 287 room full service hotel known as The Beekman Hotel
Dear Ms. McLean:
At your request, RERC has completed an appraisal of the above referenced property located at 5 Beekman Street and 115 Nassau Street in New York, NY.
The purpose of this appraisal report is to estimate the fair value of the fee simple estate of the property. The date as of which the value estimate shall apply is September 30, 2015, with the date of report being November 27, 2015.
The appraisal is performed for financial reporting purposes in accordance with RERC’s understanding and interpretation of IFRS 13, Fair Value Measurement and IAS 40, Investment Property.
This is an appraisal report according to the reporting guidelines as contained in the Uniform Standards of Professional Appraisal Practice (USPAP), Standard Rule 2‐2. The following report describes the subject property, details the data gathered in our investigation, and describes our methods of analysis. In addition, the report lists our assumptions and describes the limiting conditions under which our value estimate has been made.
Based on our analysis and subject to the assumption and limiting conditions described in the accompanying report, it is our opinion that the fair value of the fee simple estate for the subject Hotel Component, as of September 30, 2015 was:
$189,000,000
We made extraordinary assumptions that the improvements are built to a standard typical for an upscale boutique New York City hotel and that the construction is completed and the hotel opens by April 1, 2016. If these assumptions prove false, our fair value opinion would likely change.
In addition, we estimated that the present value of the real estate tax savings from the subject’s ICAP Tax Abatement, as of September 30, 2015, was:
$21,000,000
November 27, 2015 Ms. McLean Page 2
The accompanying financial analyses are based on estimates and assumptions developed in connection with the appraisal. Some assumptions, however, inevitably may not materialize, and unanticipated events and circumstances may occur; therefore, actual results achieved during the period covered by our prospective financial analysis may vary from our estimates. These variations may be material. RERC is not responsible for future marketing efforts and other management actions upon which actual results will depend. This report and its contents are intended solely for your information and assistance for the function stated above, and should not be relied upon for any other purpose. Neither our report nor any of its contents, nor any reference to the appraisers or our firm, may be included or quoted in any offering circular or registration statement, prospectus, sales brochure, other appraisal, or any other document without Real Estate Research Corporation’s prior written approval of the form and context in which it will appear.
RERC appreciates this opportunity to be of service to you. If you have any questions or comments about this report, please do not hesitate to call us.
Respectfully submitted, RERC
‐‐‐‐‐‐‐‐‐‐‐‐‐‐‐‐‐‐‐‐‐‐‐‐‐‐‐‐‐‐‐‐‐‐‐‐‐‐‐‐‐‐‐‐‐‐‐‐‐‐‐‐
Lev Yagudayev, MAI Director 152 East 52nd Street, Suite 4002 New York, NY 10022 (212) 294‐1376 New York Certified Appraiser License Number: 46000044217 Expiration: March 6, 2017
TABLE OF CONTENTS
TABLE OF CONTENTS
TABLE OF CONTENTS ............................................................................................................................. 1
EXECUTIVE SUMMARY ........................................................................................................................... 6
INTRODUCTION ..................................................................................................................................... 8
REGIONAL ANALYSIS ........................................................................................................................... 14
THE NEIGHBORHOOD .......................................................................................................................... 22
LODGING MARKET ANALYSIS ............................................................................................................... 28
THE PROPERTY .................................................................................................................................... 44
REAL ESTATE TAXES ............................................................................................................................. 50
HIGHEST AND BEST USE ANALYSIS ....................................................................................................... 52
SALES COMPARISON APPROACH‐HOTEL .............................................................................................. 54
INCOME APPROACH HOTEL ................................................................................................................. 59
RECONCILIATION OF VALUE ESTIMATES ............................................................................................... 76
CERTIFICATION .................................................................................................................................... 78
ADDENDA Assumption and Limiting Conditions Subject Photographs Management Pro‐forma Anticipated Costs Report (“ACR”) STR Report Improved Sales Write‐ Ups State Certification Qualifications
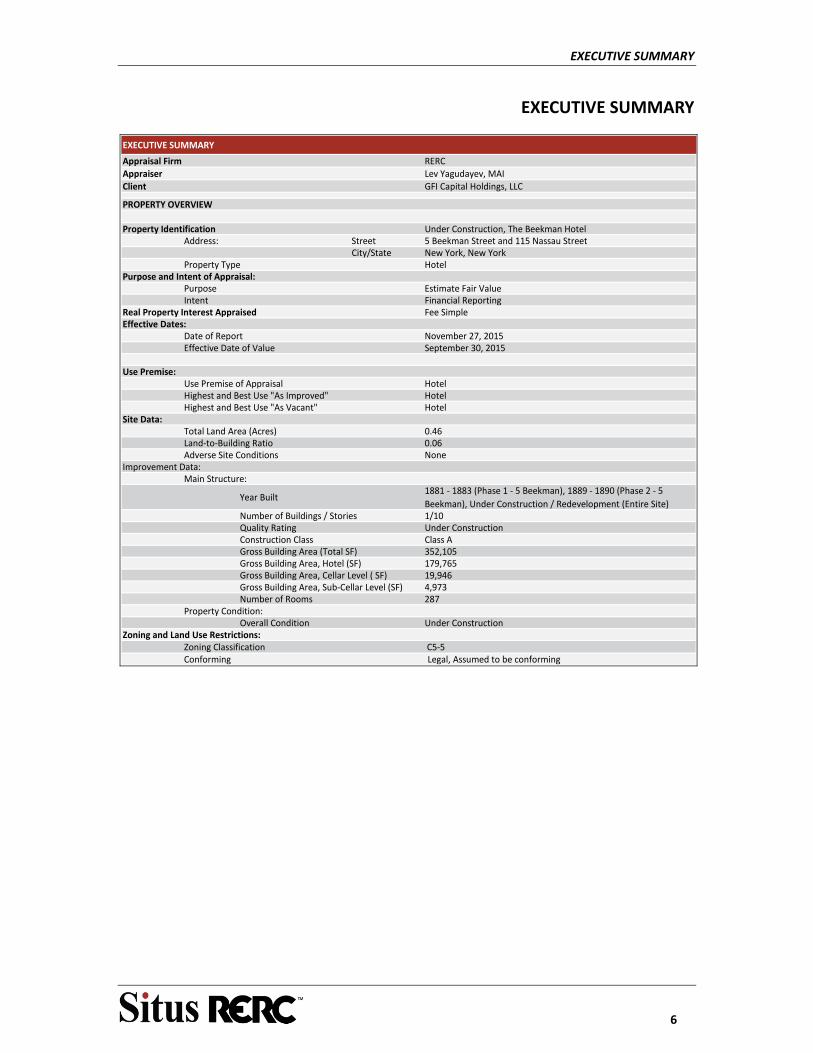
EXECUTIVE SUMMARY
6
EXECUTIVE SUMMARY
EXECUTIVE SUMMARY
Appraisal Firm RERCAppraiser Lev Yagudayev, MAIClient GFI Capital Holdings, LLC
PROPERTY OVERVIEW
Property Identification Under Construction, The Beekman HotelAddress: Street 5 Beekman Street and 115 Nassau Street
City/State New York, New YorkProperty Type Hotel
Purpose and Intent of Appraisal:Purpose Estimate Fair ValueIntent Financial Reporting
Real Property Interest Appraised Fee SimpleEffective Dates:
Date of Report November 27, 2015Effective Date of Value September 30, 2015
Use Premise:Use Premise of Appraisal HotelHighest and Best Use "As Improved" HotelHighest and Best Use "As Vacant" Hotel
Site Data:Total Land Area (Acres) 0.46Land‐to‐Building Ratio 0.06Adverse Site Conditions None
Improvement Data:Main Structure:
Year Built1881 ‐ 1883 (Phase 1 ‐ 5 Beekman), 1889 ‐ 1890 (Phase 2 ‐ 5
Beekman), Under Construction / Redevelopment (Entire Site)Number of Buildings / Stories 1/10Quality Rating Under ConstructionConstruction Class Class AGross Building Area (Total SF) 352,105Gross Building Area, Hotel (SF) 179,765Gross Building Area, Cellar Level ( SF) 19,946Gross Building Area, Sub‐Cellar Level (SF) 4,973Number of Rooms 287
Property Condition:Overall Condition Under Construction
Zoning and Land Use Restrictions:Zoning Classification C5‐5 Conforming Legal, Assumed to be conforming
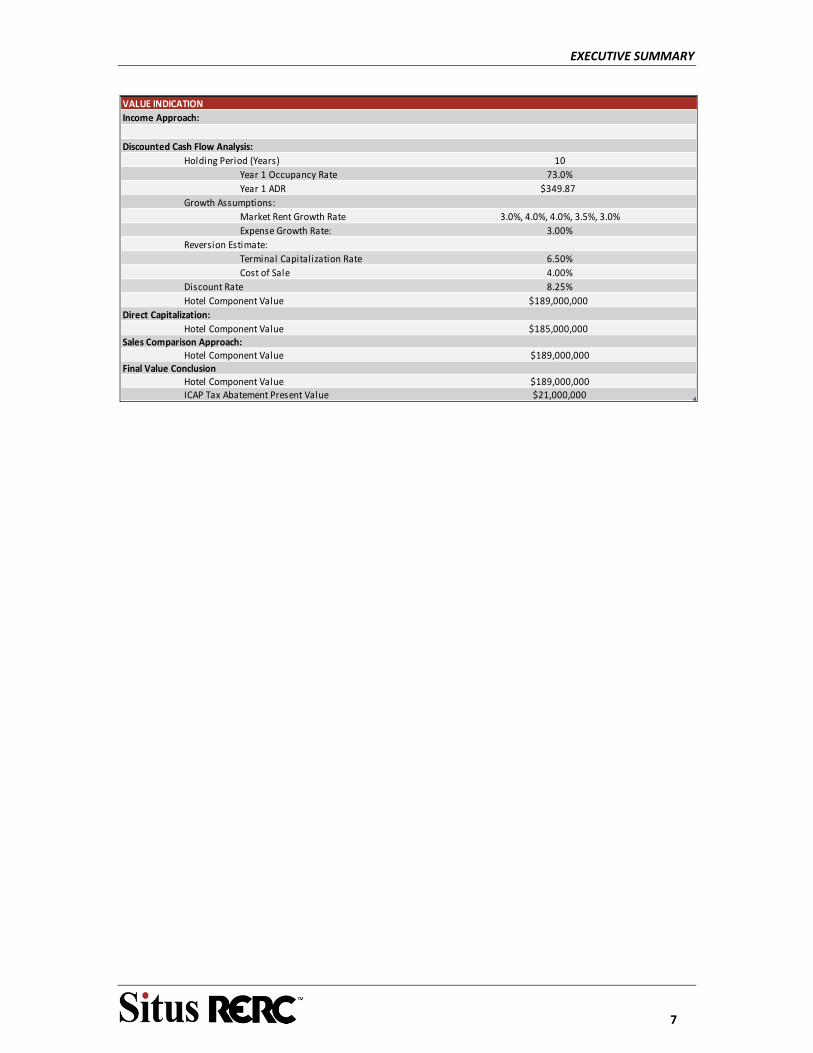
EXECUTIVE SUMMARY
7
VALUE INDICATION
Income Approach:
Discounted Cash Flow Analysis:
Holding Period (Years) 10
Year 1 Occupancy Rate 73.0%
Year 1 ADR $349.87
Growth Assumptions:
Market Rent Growth Rate 3.0%, 4.0%, 4.0%, 3.5%, 3.0%
Expense Growth Rate: 3.00%
Reversion Estimate:
Terminal Capitalization Rate 6.50%
Cost of Sale 4.00%
Discount Rate 8.25%
Hotel Component Value $189,000,000
Direct Capitalization:
Hotel Component Value $185,000,000Sales Comparison Approach:
Hotel Component Value $189,000,000Final Value Conclusion
Hotel Component Value $189,000,000ICAP Tax Abatement Present Value $21,000,000
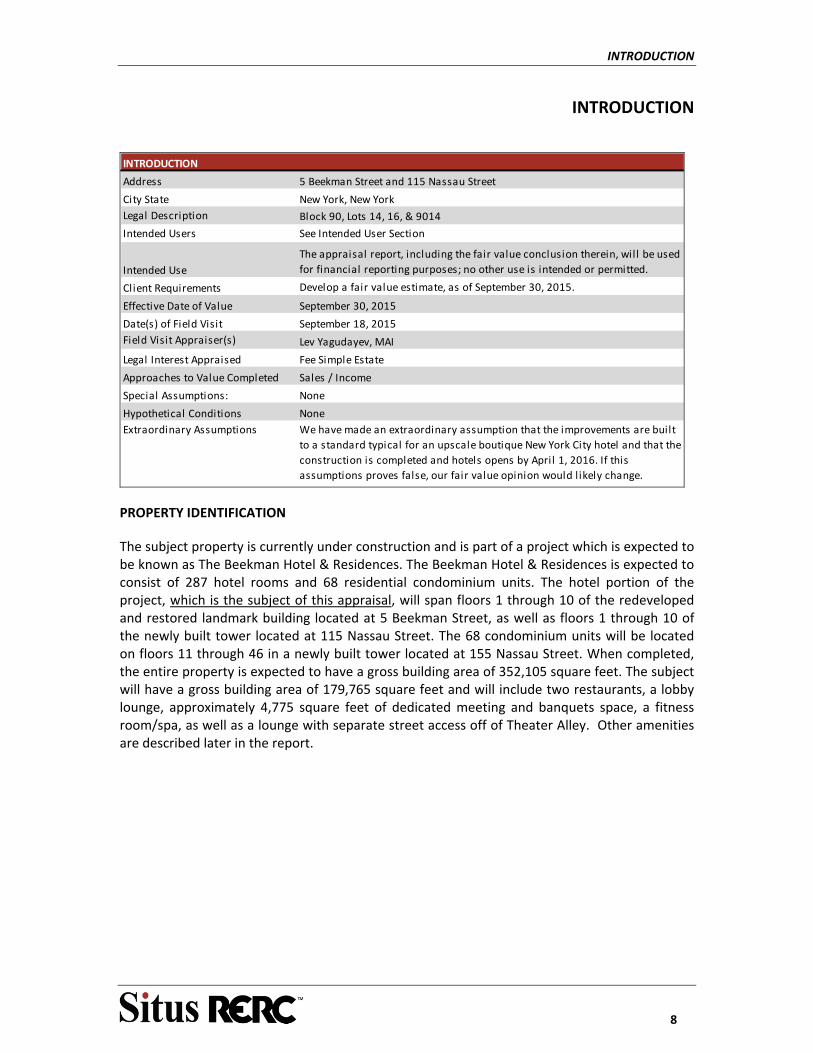
INTRODUCTION
8
INTRODUCTION
Address 5 Beekman Street and 115 Nassau Street
City State New York, New York
Legal Description Block 90, Lots 14, 16, & 9014
Intended Users See Intended User Section
Intended Use
The appraisal report, including the fair value conclusion therein, will be used
for financial reporting purposes; no other use is intended or permitted.
Client Requirements Develop a fair value estimate, as of September 30, 2015.
Effective Date of Value September 30, 2015
Date(s) of Field Visit September 18, 2015
Field Visit Appraiser(s) Lev Yagudayev, MAI
Legal Interest Appraised Fee Simple Estate
Approaches to Value Completed Sales / Income
Special Assumptions: None
Hypothetical Conditions None
Extraordinary Assumptions We have made an extraordinary assumption that the improvements are built
to a standard typical for an upscale boutique New York City hotel and that the
construction is completed and hotels opens by April 1, 2016. If this
assumptions proves false, our fair value opinion would l ikely change.
INTRODUCTION
PROPERTY IDENTIFICATION
The subject property is currently under construction and is part of a project which is expected to be known as The Beekman Hotel & Residences. The Beekman Hotel & Residences is expected to consist of 287 hotel rooms and 68 residential condominium units. The hotel portion of the project, which is the subject of this appraisal, will span floors 1 through 10 of the redeveloped and restored landmark building located at 5 Beekman Street, as well as floors 1 through 10 of the newly built tower located at 115 Nassau Street. The 68 condominium units will be located on floors 11 through 46 in a newly built tower located at 155 Nassau Street. When completed, the entire property is expected to have a gross building area of 352,105 square feet. The subject will have a gross building area of 179,765 square feet and will include two restaurants, a lobby lounge, approximately 4,775 square feet of dedicated meeting and banquets space, a fitness room/spa, as well as a lounge with separate street access off of Theater Alley. Other amenities are described later in the report.
INTRODUCTION
9
OWNERSHIP HISTORY
The subject is currently owned by 5 Beekman Property Owner LLC & Lana Luft LLC (both affiliates of GFI Capital Holdings, LLC). Lots 14 and 16 sold in two separate transactions. 5 Beekman Street (Lot 14) sold in March 2012 for $64,000,000. 5 Beekman building was constructed in two phases. The first phase from 1881 to 1883 and the second from 1889 to 1890. The building is landmarked and has an atrium style interior. At the time of sale, 5 Beekman Street was vacant and had been mostly vacant for a decade. A portion of its interior had reportedly been shuttered since the 1940’s. A conversation with ownership indicated that the additional air rights were not considered in the purchase of this property but were considered in the purchase of Lot 16. The vacant site at 115 Nassau Street (Lot 16) together with air rights from Lot 14 (Lot 9014) were purchased in June 2012 for $21,500,000. Reportedly, both sales represented arms‐length transactions without any concessions being reported. We are unaware of any other sales involving the subject in the previous three years. The subject is not listed for sale. Individual condos are being marketed for sale, as discussed later in this report, however are not part of the subject property and are outside of our analysis.
NATURE AND SCOPE OF THE APPRAISAL
The object on this appraisal is to estimate the fair value of the subject property as of September 30, 2015. In preparing this appraisal, RERC’s staff visited and observed the subject property and made a detailed analysis of the local economic and market conditions. This report contains descriptions of the property and market area and focuses on recent changes and likely future trends in market conditions. The report also contains a highest and best use analysis, a discussion of the three approaches to value, documentation of each approach, and a reconciliation of these approaches. RERC investigated comparable improved sales in the subject’s market area, and spoke with appraisers, buyers/sellers, brokers and searched assessor records for such sales. The data used in this report have been confirmed to the extent appropriate, unless otherwise expressly noted.
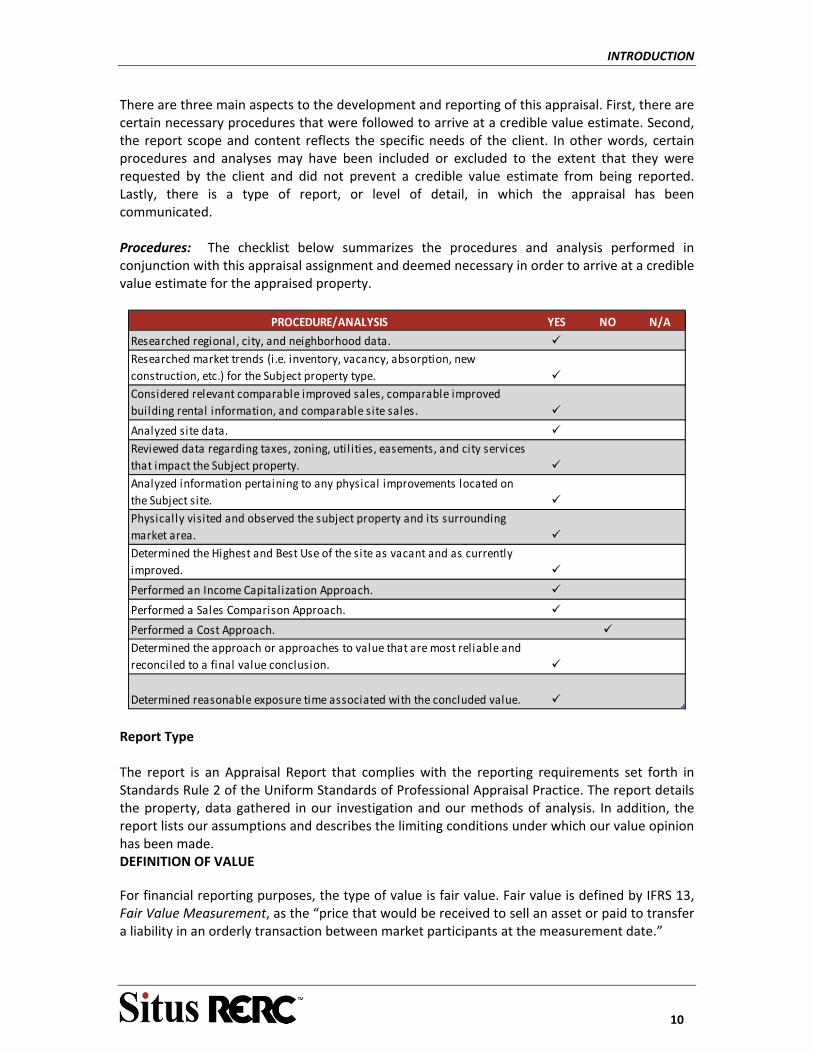
INTRODUCTION
10
There are three main aspects to the development and reporting of this appraisal. First, there are certain necessary procedures that were followed to arrive at a credible value estimate. Second, the report scope and content reflects the specific needs of the client. In other words, certain procedures and analyses may have been included or excluded to the extent that they were requested by the client and did not prevent a credible value estimate from being reported. Lastly, there is a type of report, or level of detail, in which the appraisal has been communicated. Procedures: The checklist below summarizes the procedures and analysis performed in conjunction with this appraisal assignment and deemed necessary in order to arrive at a credible value estimate for the appraised property.
PROCEDURE/ANALYSIS YES NO N/A
Researched regional, city, and neighborhood data. Researched market trends (i.e. inventory, vacancy, absorption, new
construction, etc.) for the Subject property type. Considered relevant comparable improved sales, comparable improved
building rental information, and comparable site sales.
Analyzed site data. Reviewed data regarding taxes, zoning, util ities, easements, and city services
that impact the Subject property. Analyzed information pertaining to any physical improvements located on
the Subject site. Physical ly visited and observed the subject property and its surrounding
market area. Determined the Highest and Best Use of the site as vacant and as currently
improved.
Performed an Income Capitalization Approach.
Performed a Sales Comparison Approach.
Performed a Cost Approach. Determined the approach or approaches to value that are most reliable and
reconciled to a final value conclusion.
Determined reasonable exposure time associated with the concluded value. Report Type The report is an Appraisal Report that complies with the reporting requirements set forth in Standards Rule 2 of the Uniform Standards of Professional Appraisal Practice. The report details the property, data gathered in our investigation and our methods of analysis. In addition, the report lists our assumptions and describes the limiting conditions under which our value opinion has been made. DEFINITION OF VALUE
For financial reporting purposes, the type of value is fair value. Fair value is defined by IFRS 13, Fair Value Measurement, as the “price that would be received to sell an asset or paid to transfer a liability in an orderly transaction between market participants at the measurement date.”
INTRODUCTION
11
Implicit in this definition is the definition of market value. The market value definition used in this analysis is used by agencies that regulate federally insured financial institutions in the United States. Market value means the most probable price that a property should bring in a competitive and open market under all conditions requisite to a fair sale, the buyer and seller each acting prudently and knowledgeable, and assuming the price is not affected by undue stimulus. Implicit in this definition is the consummation of a sale as of a specified date and the passing of title from seller to buyer under conditions whereby
Buyer and seller are typically motivated;
Both parties are well informed or well advised, and acting in what they consider their best interests;
A reasonable time is allowed for exposure in the open market;
Payment is made in terms of cash in U.S. dollars or in terms of financial arrangements comparable thereto; and
The price represents the normal consideration for the property sold unaffected by special or creative financing or sales concessions granted by anyone associated with the sale.1
INTEREST APPRAISED
The real property interest appraised is considered to be the fee simple estate of the subject property.
The Fifth edition of the Dictionary of Real Estate Appraisal defines the fee simple estate as:
“absolute ownership unencumbered by any other interest or estimate, subject only to the limitations imposed by the governmental powers of taxation, eminent domain, police power and escheat.”
INTENDED USER
As specified in the engagement agreement between RERC and GFI Capital Holdings, LLC dated October 9, 2015, the Services (defined in the engagement agreement) and the Report (defined in the engagement agreement) are for the use and benefit of, and may be relied upon solely by the GFI Capital Holdings, LLC (the “Company”), its Affiliates (defined in the engagement agreement), and GFI Real Estate Limited. The Report shall remain confidential, but for the purposes of its Intended Use (defined in the engagement agreement), RERC understands that the Report will be disclosed to the following:
a. Independent auditors, accountants, attorneys and other professionals acting on behalf of the Company its Affiliates, and GFI Real Estate Limited;
b. Governmental agencies having regulatory authority over the Company, its Affiliates,
1 (12 C.F.R Part 34.42(g); 55 Federal Register 34696, August 24, 1990, as amended at 57 Federal Register 12202, April 9, 1992; 59 Federal Register 29499, June 7, 1994)
INTRODUCTION
12
and GFI Real Estate Limited; and
c. Designated persons pursuant to an order or legal process of any court or governmental agency having jurisdiction over the Company, its Affiliates, and GFI Real Estate Limited.
RERC understands that the Report is to be used to aid GFI Capital Holdings, LLC and its Affiliates in the preparation of Financial Statements for the GFI Real Estate Limited. The Report is to be used in whole and not in part. No part of the Report shall be used in conjunction with any other analysis. Except as otherwise stated herein, the Report may not be used by any person other than the parties to whom it is addressed or for purposes other than that for which it was prepared. No part of the Report shall be conveyed to the public through advertising, or used in any sales, promotion, offering or SEC material without RERC’s prior written consent.
In providing any consent RERC will note that an appraisal: (1) is an estimate of value as of a point in time, (2) is not a guarantee of financial results, (3) is not a due diligence document beyond the estimate of value. No matter the care exercised, the results achieved in an actual transaction may be different than the appraisal results, as the appraisal is an estimate of value. Any opinion of value is inherently subjective and the results speculative, as they are based on information available at the time the value opinion was being prepared, and are influenced by matters relating to operations, projections of the future, as well as the appraisers’ interpretation of the market. As such, relying on an appraisal is subject to risks and uncertainties. The appraisal report is prepared for the specifically identified use and user and not intended, permitted, nor appropriate to be relied on for other uses or by other users. The reader and user must rely on their own due diligence and analysis of the subject property in evaluating the overall security transaction, and not rely on the appraisal for their final decision making. In addition, the reader and user is/are encouraged to refer to the definition of fair value (previously defined).
EXPOSURE PERIOD As defined by the Appraisal Standards Board of the Appraisal Foundation, the following definitions are used.
Exposure Time: The estimated length of time the property interest being appraised would have been offered on the market prior to the hypothetical consummation of a sale at market value on the effective date of the appraisal; a retrospective estimate based upon an analysis of past events assuming a competitive and open market.
To determine an appropriate exposure time for the subject, marketing times for similar properties were reviewed. Marketing times look forward to how long it will take to sell a property while exposure time looks backward to how long the property was on the market before it sold. An indication of an appropriate exposure time can be seen from reviewing marketing times.
According to the second quarter 2015 Situs RERC Real Estate Report, the marketing times for Hotels average 5.4 months, which is a decrease of 1.2 months from the second quarter 2014 results. This survey indicates that Hotels are fourth in marketing time. Based on this analysis and an analysis of the sales described in the sales comparison approach section of this report, we believe that an exposure period of six to twelve months is reasonable for the subject property.

INTRODUCTION
13
To provide additional support to our estimate of exposure periods, we looked to survey responses of institutional investors, the likely buyers and sellers of the subject property. According to the second quarter 2015 Situs RERC Real Estate Report, interviewees ranked Hotels third in category investment ranking. The current rating for Hotels is 6.3, which is a decrease of 0.2 points from the second quarter in 2014.
Finally, in addition to the above analyses, we have drawn upon our pension funds, banks, insurance companies, advisors and consultants throughout the country that responded to our SITUS RERC Industry Outlook: 2015. Based on the aforementioned research and analysis, we have concluded an exposure time estimate of six to twelve months for the subject is appropriate.
LIMITED CONDITIONS AND ASSUMPTIONS
This valuation report is subject to the general limiting conditions as well as the general and specific assumptions stated herein. Your attention is directed to the list of general and specific limiting conditions and assumptions contained in the Addenda of this report, as they are an integral part of the valuation process and value conclusion. Information and documents provided by the client are assumed to be correct.
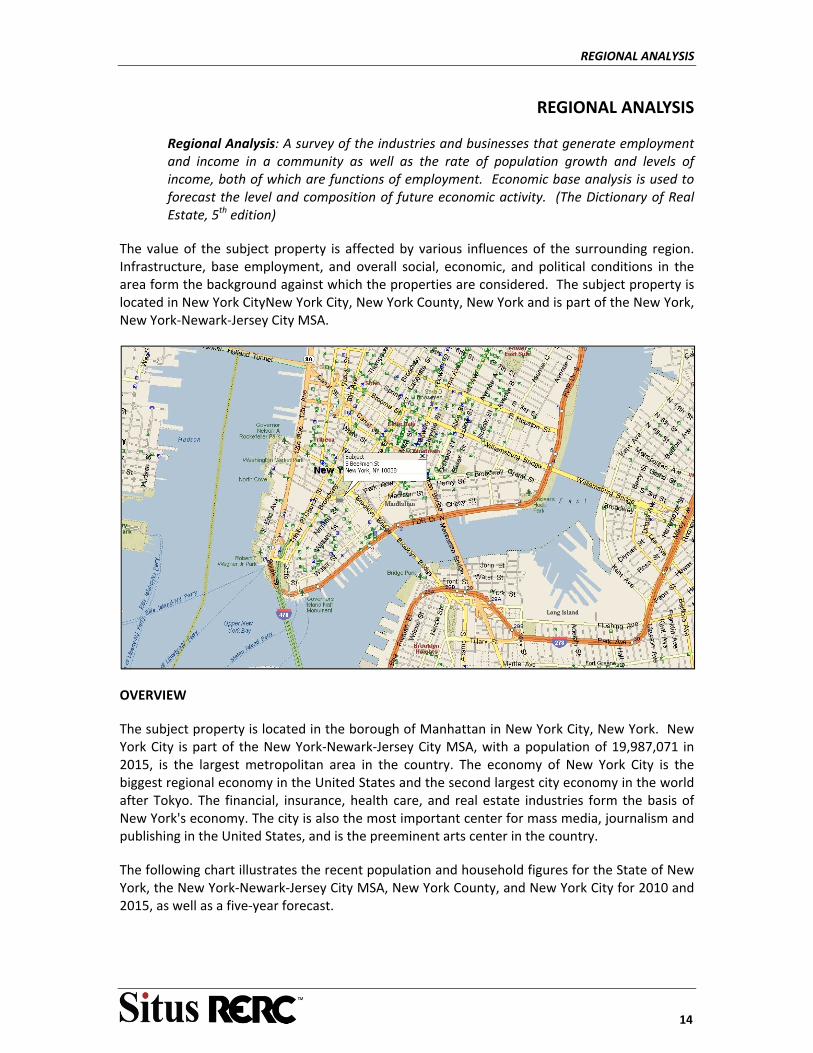
REGIONAL ANALYSIS
14
REGIONAL ANALYSIS
Regional Analysis: A survey of the industries and businesses that generate employment and income in a community as well as the rate of population growth and levels of income, both of which are functions of employment. Economic base analysis is used to forecast the level and composition of future economic activity. (The Dictionary of Real Estate, 5th edition)
The value of the subject property is affected by various influences of the surrounding region. Infrastructure, base employment, and overall social, economic, and political conditions in the area form the background against which the properties are considered. The subject property is located in New York CityNew York City, New York County, New York and is part of the New York, New York‐Newark‐Jersey City MSA.
OVERVIEW
The subject property is located in the borough of Manhattan in New York City, New York. New York City is part of the New York‐Newark‐Jersey City MSA, with a population of 19,987,071 in 2015, is the largest metropolitan area in the country. The economy of New York City is the biggest regional economy in the United States and the second largest city economy in the world after Tokyo. The financial, insurance, health care, and real estate industries form the basis of New York's economy. The city is also the most important center for mass media, journalism and publishing in the United States, and is the preeminent arts center in the country.
The following chart illustrates the recent population and household figures for the State of New York, the New York‐Newark‐Jersey City MSA, New York County, and New York City for 2010 and 2015, as well as a five‐year forecast.
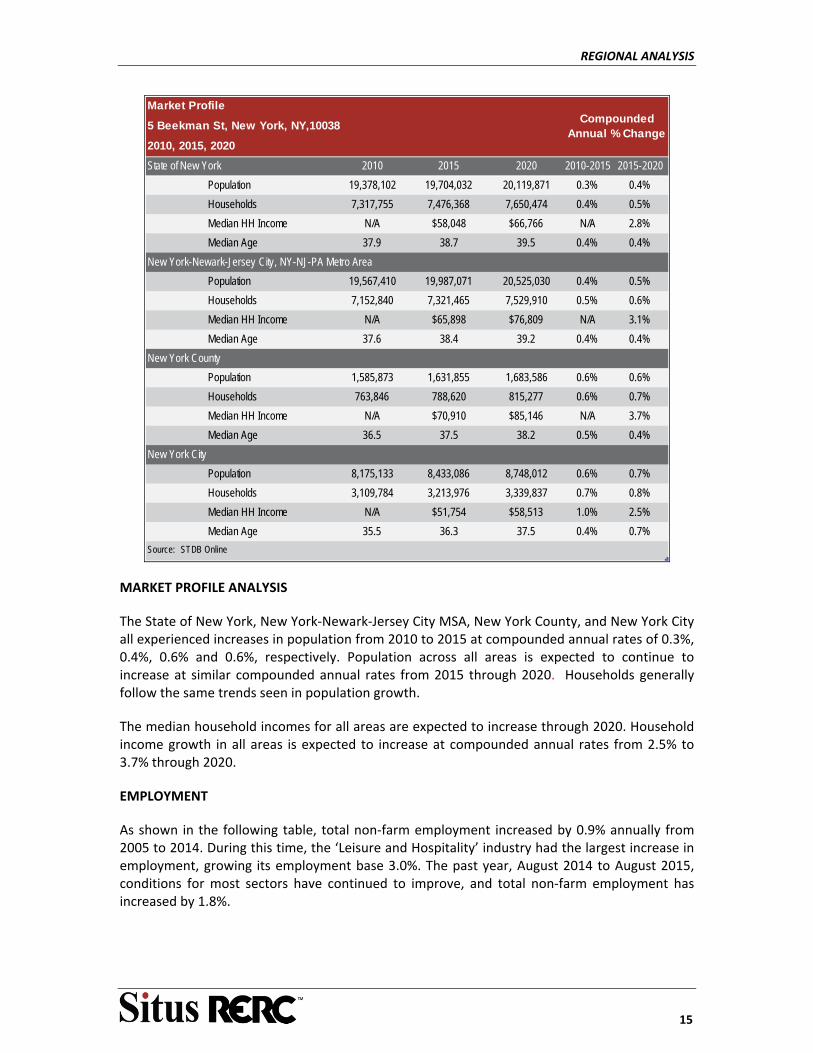
REGIONAL ANALYSIS
15
State of New York 2010 2015 2020 2010-2015 2015-2020
Population 19,378,102 19,704,032 20,119,871 0.3% 0.4%
Households 7,317,755 7,476,368 7,650,474 0.4% 0.5%
Median HH Income N/A $58,048 $66,766 N/A 2.8%
Median Age 37.9 38.7 39.5 0.4% 0.4%
New York-Newark-Jersey City, NY-NJ-PA Metro Area
Population 19,567,410 19,987,071 20,525,030 0.4% 0.5%
Households 7,152,840 7,321,465 7,529,910 0.5% 0.6%
Median HH Income N/A $65,898 $76,809 N/A 3.1%
Median Age 37.6 38.4 39.2 0.4% 0.4%
New York County
Population 1,585,873 1,631,855 1,683,586 0.6% 0.6%
Households 763,846 788,620 815,277 0.6% 0.7%
Median HH Income N/A $70,910 $85,146 N/A 3.7%
Median Age 36.5 37.5 38.2 0.5% 0.4%
New York City
Population 8,175,133 8,433,086 8,748,012 0.6% 0.7%
Households 3,109,784 3,213,976 3,339,837 0.7% 0.8%
Median HH Income N/A $51,754 $58,513 1.0% 2.5%
Median Age 35.5 36.3 37.5 0.4% 0.7%
Source: STDB Online
Market Profile
5 Beekman St, New York, NY,10038
2010, 2015, 2020
Compounded Annual % Change
MARKET PROFILE ANALYSIS
The State of New York, New York‐Newark‐Jersey City MSA, New York County, and New York City all experienced increases in population from 2010 to 2015 at compounded annual rates of 0.3%, 0.4%, 0.6% and 0.6%, respectively. Population across all areas is expected to continue to increase at similar compounded annual rates from 2015 through 2020. Households generally follow the same trends seen in population growth.
The median household incomes for all areas are expected to increase through 2020. Household income growth in all areas is expected to increase at compounded annual rates from 2.5% to 3.7% through 2020.
EMPLOYMENT
As shown in the following table, total non‐farm employment increased by 0.9% annually from 2005 to 2014. During this time, the ‘Leisure and Hospitality’ industry had the largest increase in employment, growing its employment base 3.0%. The past year, August 2014 to August 2015, conditions for most sectors have continued to improve, and total non‐farm employment has increased by 1.8%.
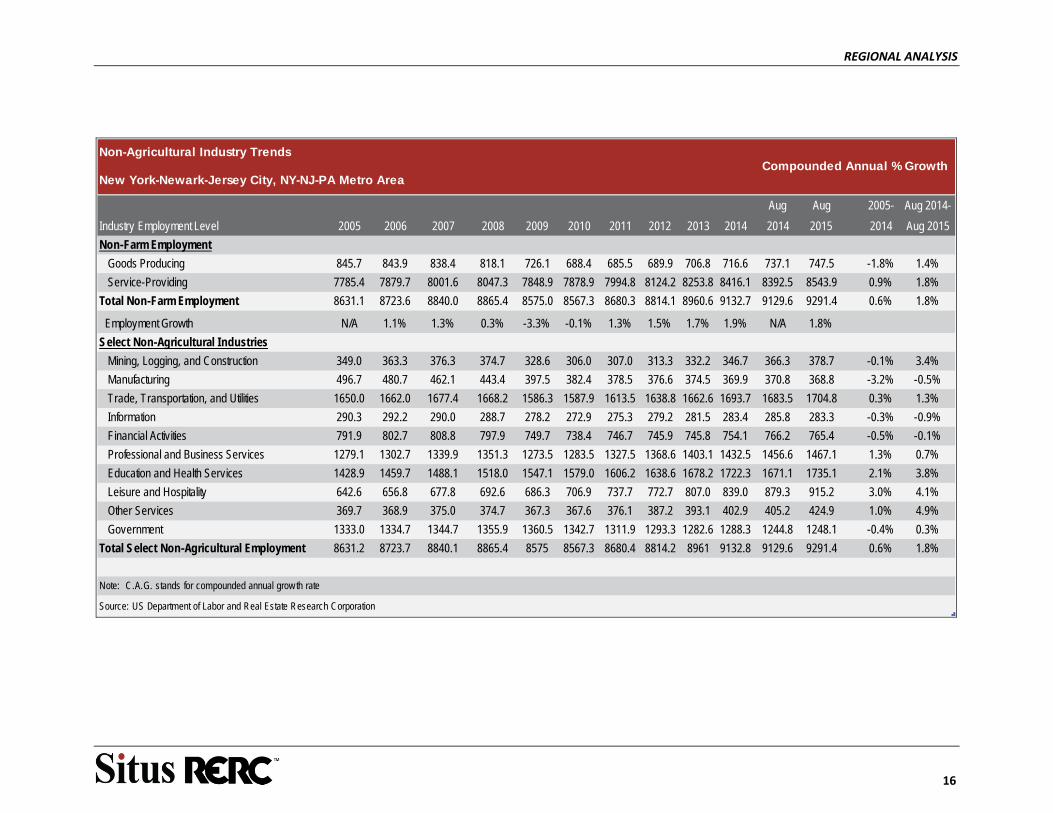
REGIONAL ANALYSIS
16
Non-Agricultural Industry Trends
New York-Newark-Jersey City, NY-NJ-PA Metro Area
Aug Aug 2005- Aug 2014-
Industry Employment Level 2005 2006 2007 2008 2009 2010 2011 2012 2013 2014 2014 2015 2014 Aug 2015
Non-Farm Employment
Goods Producing 845.7 843.9 838.4 818.1 726.1 688.4 685.5 689.9 706.8 716.6 737.1 747.5 -1.8% 1.4%
Service-Providing 7785.4 7879.7 8001.6 8047.3 7848.9 7878.9 7994.8 8124.2 8253.8 8416.1 8392.5 8543.9 0.9% 1.8%
Total Non-Farm Employment 8631.1 8723.6 8840.0 8865.4 8575.0 8567.3 8680.3 8814.1 8960.6 9132.7 9129.6 9291.4 0.6% 1.8%
Employment Growth N/A 1.1% 1.3% 0.3% -3.3% -0.1% 1.3% 1.5% 1.7% 1.9% N/A 1.8%
Select Non-Agricultural Industries
Mining, Logging, and Construction 349.0 363.3 376.3 374.7 328.6 306.0 307.0 313.3 332.2 346.7 366.3 378.7 -0.1% 3.4%
Manufacturing 496.7 480.7 462.1 443.4 397.5 382.4 378.5 376.6 374.5 369.9 370.8 368.8 -3.2% -0.5%
Trade, Transportation, and Utilities 1650.0 1662.0 1677.4 1668.2 1586.3 1587.9 1613.5 1638.8 1662.6 1693.7 1683.5 1704.8 0.3% 1.3%
Information 290.3 292.2 290.0 288.7 278.2 272.9 275.3 279.2 281.5 283.4 285.8 283.3 -0.3% -0.9%
Financial Activities 791.9 802.7 808.8 797.9 749.7 738.4 746.7 745.9 745.8 754.1 766.2 765.4 -0.5% -0.1%
Professional and Business Services 1279.1 1302.7 1339.9 1351.3 1273.5 1283.5 1327.5 1368.6 1403.1 1432.5 1456.6 1467.1 1.3% 0.7%
Education and Health Services 1428.9 1459.7 1488.1 1518.0 1547.1 1579.0 1606.2 1638.6 1678.2 1722.3 1671.1 1735.1 2.1% 3.8%
Leisure and Hospitality 642.6 656.8 677.8 692.6 686.3 706.9 737.7 772.7 807.0 839.0 879.3 915.2 3.0% 4.1%
Other Services 369.7 368.9 375.0 374.7 367.3 367.6 376.1 387.2 393.1 402.9 405.2 424.9 1.0% 4.9%
Government 1333.0 1334.7 1344.7 1355.9 1360.5 1342.7 1311.9 1293.3 1282.6 1288.3 1244.8 1248.1 -0.4% 0.3%
Total Select Non-Agricultural Employment 8631.2 8723.7 8840.1 8865.4 8575 8567.3 8680.4 8814.2 8961 9132.8 9129.6 9291.4 0.6% 1.8%
Note: C.A.G. stands for compounded annual grow th rate
Source: US Department of Labor and Real Estate Research Corporation
Compounded Annual % Growth
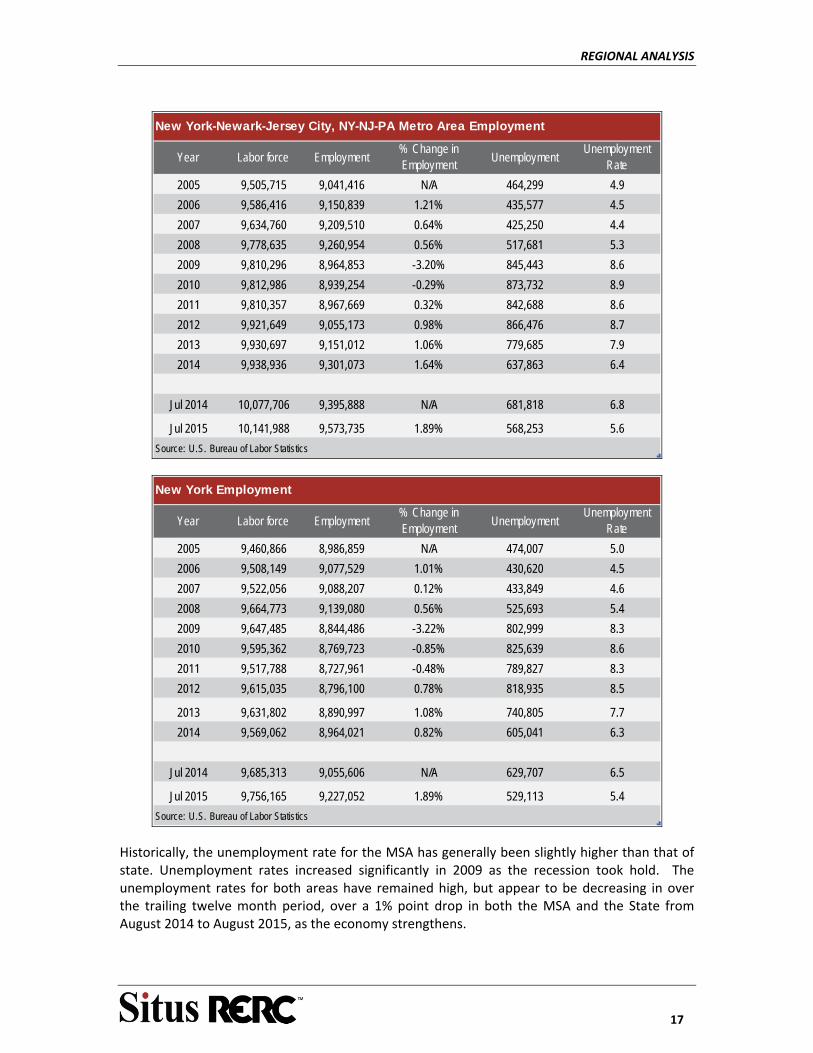
REGIONAL ANALYSIS
17
Year Labor force Employment% Change in Employment
UnemploymentUnemployment
Rate
2005 9,505,715 9,041,416 N/A 464,299 4.9
2006 9,586,416 9,150,839 1.21% 435,577 4.5
2007 9,634,760 9,209,510 0.64% 425,250 4.4
2008 9,778,635 9,260,954 0.56% 517,681 5.3
2009 9,810,296 8,964,853 -3.20% 845,443 8.6
2010 9,812,986 8,939,254 -0.29% 873,732 8.9
2011 9,810,357 8,967,669 0.32% 842,688 8.6
2012 9,921,649 9,055,173 0.98% 866,476 8.7
2013 9,930,697 9,151,012 1.06% 779,685 7.9
2014 9,938,936 9,301,073 1.64% 637,863 6.4
Jul 2014 10,077,706 9,395,888 N/A 681,818 6.8
Jul 2015 10,141,988 9,573,735 1.89% 568,253 5.6
Source: U.S. Bureau of Labor Statistics
New York-Newark-Jersey City, NY-NJ-PA Metro Area Employment
Year Labor force Employment% Change in Employment
UnemploymentUnemployment
Rate
2005 9,460,866 8,986,859 N/A 474,007 5.0
2006 9,508,149 9,077,529 1.01% 430,620 4.5
2007 9,522,056 9,088,207 0.12% 433,849 4.6
2008 9,664,773 9,139,080 0.56% 525,693 5.4
2009 9,647,485 8,844,486 -3.22% 802,999 8.3
2010 9,595,362 8,769,723 -0.85% 825,639 8.6
2011 9,517,788 8,727,961 -0.48% 789,827 8.3
2012 9,615,035 8,796,100 0.78% 818,935 8.5
2013 9,631,802 8,890,997 1.08% 740,805 7.7
2014 9,569,062 8,964,021 0.82% 605,041 6.3
Jul 2014 9,685,313 9,055,606 N/A 629,707 6.5
Jul 2015 9,756,165 9,227,052 1.89% 529,113 5.4
Source: U.S. Bureau of Labor Statistics
New York Employment
Historically, the unemployment rate for the MSA has generally been slightly higher than that of state. Unemployment rates increased significantly in 2009 as the recession took hold. The unemployment rates for both areas have remained high, but appear to be decreasing in over the trailing twelve month period, over a 1% point drop in both the MSA and the State from August 2014 to August 2015, as the economy strengthens.

REGIONAL ANALYSIS
18
Major Employers
Major employers in the New York City area are as follows:
Company Industry No. Employees
Citigroup Inc. Financial Activities 259,000
J.P.Morgan Chase & Co Financial Activities 258,965
Verizon Communications Inc. Information 183,400
Pfizer Inc Education and Health Services 91,500
Phillip Morris International Inc Other Services 87,100
Omnicom Group Inc. Other Services 71,100
MetLife Inc. Education and Health Services 64,000
American Express Co. Financial Activities 63,500
American International Group Education and Health Services 63,000
Alcoa Inc Mining & Logging 61,000
Icahn Enterpises LP Manufacturing 60,665
Morgan Stanley Financial Activities 57,061
Time Warmer Cable Inc. Other Services 51,000
L-3 Communication Holding Inc. Government 51,000
Bank of New York Mellon Corp Financial Activities 49,500
News Corp Leisure and Hospitality 48,000
Colgate-Palmolive Co Other Services 37,700
Time Warner Inc. Leisure and Hospitality 34,000
Goldman Sachs Group Inc Financial Activities 32,100
Travelers Companies Inc Financial Activities 30,500
Source: S&P Capital IQ (June 2013)
New York City Area Top Employers
REGIONAL ANALYSIS
19
ECONOMIC FORCES
The economy of New York City is the biggest regional economy in the United States and the second largest city economy in the world after Tokyo. Anchored by Wall Street, in Lower Manhattan, New York City is one of the world's two premier financial centers, alongside London and is home to the New York Stock Exchange, the world's largest stock exchange by market capitalization of its listed companies. New York is distinctive for its high concentrations of advanced service sector firms in fields such as law, accountancy, banking and management consultancy.
The financial, insurance, health care, and real estate industries form the basis of New York's economy. The city is also the most important center for mass media, journalism and publishing in the United States, and is the preeminent arts center in the country. Creative industries such as new media, advertising, fashion, design and architecture account for a growing share of employment, with New York City possessing a strong competitive advantage in these industries. Manufacturing, although declining, does still have an impact on the local economy.
The New York metropolitan area had an estimated gross metropolitan product of $1.56 trillion for 2014, the largest regional economy in the United States. The city's economy accounts for the majority of the economic activity in the states of New York and New Jersey.
Tourism
According to a February 2015 report NYC & Company, a record 56.4 million visitors arrived in New York City in 2014, surpassing the previous record of 54.3 million visitors set in 2013. New York City’s number of visitors increased consistently since 2000, with the exception of 2009. According to this report, visitors generated a record $61.3 billion in overall economic impact and supported more than 359,000 tourism‐related jobs.
The majority of arrivals, 78 percent or 44.2 million travelers, came from domestic U.S. locations while 22 percent, or 12.2 million visitors, came from abroad. The city’s top international markets were the UK, Canada, Brazil, France, China, Australia, and Germany. The report estimated that more than 740,000 visitors came from China in 2014, nearly five times as many as 2009.
The following table summarizes New York City’s major attractions:
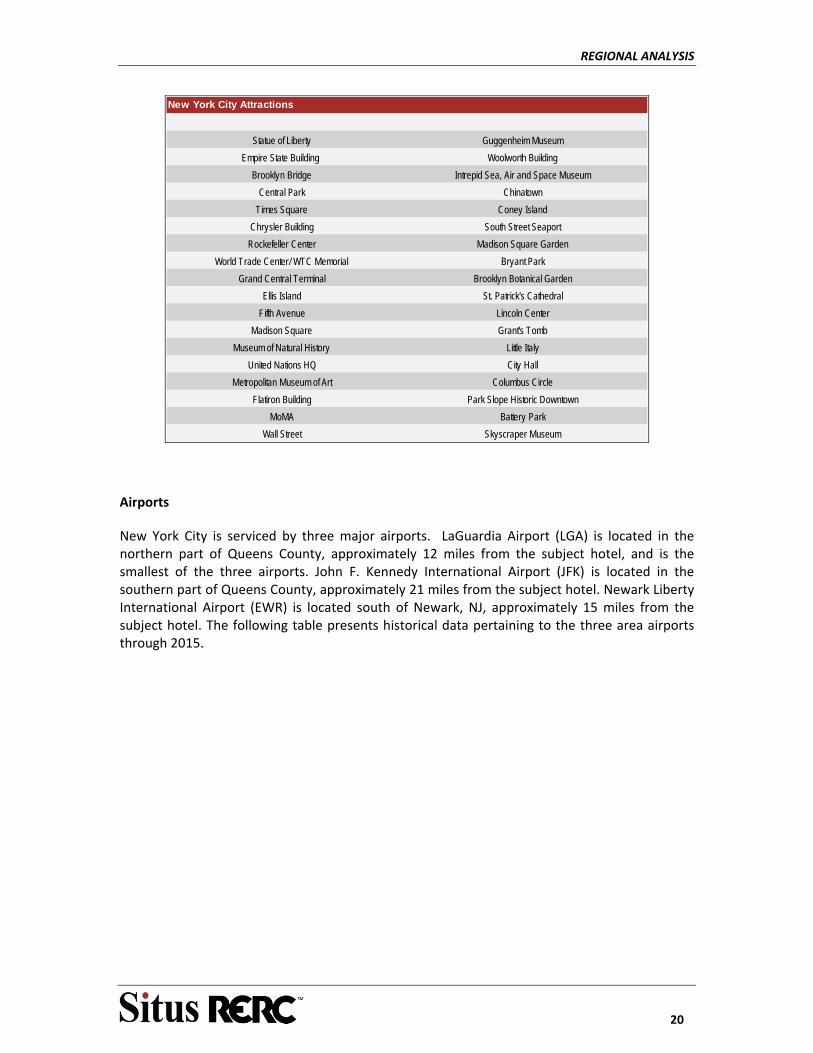
REGIONAL ANALYSIS
20
Statue of Liberty
Empire State Building
Brooklyn Bridge
Central Park
Times Square
Chrysler Building
Rockefeller Center
World Trade Center/ WTC Memorial
Grand Central Terminal
Ellis Island
Fifth Avenue
Madison Square
Museum of Natural History
United Nations HQ
Metropolitan Museum of Art
Flatiron Building
MoMA
Wall Street
New York City Attractions
Guggenheim Museum
Woolworth Building
Intrepid Sea, Air and Space Museum
Chinatown
Coney Island
South Street Seaport
Madison Square Garden
Bryant Park
Brooklyn Botanical Garden
St. Patrick's Cathedral
Lincoln Center
Battery Park
Skyscraper Museum
Grant's Tomb
Little Italy
City Hall
Columbus Circle
Park Slope Historic Downtown
Airports
New York City is serviced by three major airports. LaGuardia Airport (LGA) is located in the northern part of Queens County, approximately 12 miles from the subject hotel, and is the smallest of the three airports. John F. Kennedy International Airport (JFK) is located in the southern part of Queens County, approximately 21 miles from the subject hotel. Newark Liberty International Airport (EWR) is located south of Newark, NJ, approximately 15 miles from the subject hotel. The following table presents historical data pertaining to the three area airports through 2015.
REGIONAL ANALYSIS
21
Period Number Change Number Change Number Change Number Change
Year End
2003 $31,736,491 - $29,450,514 - $22,482,770 - $83,669,775 -2004 $37,575,457 18.4% $31,893,372 8.3% $24,453,203 8.8% $93,922,032 12.3%
2005 $40,891,965 8.8% $33,079,244 3.7% $25,889,360 5.9% $99,860,569 6.3%
2006 $42,628,882 4.2% $35,634,708 7.7% $25,810,603 -0.3% $104,074,193 4.2%
2007 $47,717,816 11.9% $36,367,210 2.1% $25,026,267 -3.0% $109,111,293 4.8%
2008 $47,803,116 0.2% $35,360,736 -2.8% $23,073,056 -7.8% $106,236,908 -2.6%
2009 $45,877,942 -4.0% $33,360,123 -5.7% $22,153,236 -4.0% $101,391,301 -4.6%
2010 $46,520,886 1.4% $33,194,190 -0.5% $23,983,082 8.3% $103,698,158 2.3%
2011 $47,644,597 2.4% $33,697,492 1.5% $24,122,478 0.6% $105,464,567 1.7%
2012 $49,274,176 3.4% $33,984,027 0.9% $25,707,784 6.6% $108,965,987 3.3%
2013 $50,450,358 2.4% $35,016,236 3.0% $26,681,100 3.8% $112,147,694 2.9%
2014 $53,254,533 5.6% $35,610,759 1.7% $26,954,588 1.0% $115,819,880 3.3%
August TTM $55,587,958 4.4% $36,606,873 2.8% $27,815,011 3.2% $120,009,842 3.6%
Source: Port Autority of NY and NJ
Total Passengers Total Passengers Total Passengers Total Passengers
New York Area Airports - Statistics
JFK Newark La Guardia All Airports
Convention Center
Located approximately 1.3 miles from the subject is the 840,000 square foot Jacob K. Javits Convention Center. The convention center features flexible exhibition space to accommodate tradeshows and conferences of all sizes. A 5‐year, $463 million renovation and expansion plan was completed in 2014, which greatly enhanced the facility’s aesthetics, sustainability and overall efficiency. The renovation featured the installation of a new façade, flooring, mechanical, technology and sustainability systems, including a 6.75‐acre green roof. During 2014, 177 events held at the Jacob K. Javits Convention Center generated $1.8 billion in annual economic activity for New York State and New York City and supported approximately 17,500 jobs. Total attendance of approximately 2 million visitors remained steady in the past three years.
CONCLUSION
The New York City MSA is the largest and most diverse center of business and employment in the country. Major industries include government, healthcare, business and professional services and financial activities. The New York City MSA population grew slightly from 2010 to 2015 and is projected to continue to grow over the next five years. New York City also benefits greatly from its vast public transportations system, including subways, taxis, buses, and airports, which support the large mass of people who live in the area. The New York MSA benefits from being the most diverse local economy in the country and is poised for continued growth.
THE NEIGHBORHOOD
22
THE NEIGHBORHOOD
OVERVIEW
The subject property is located along the southwest side of Beekman Street, between Nassau Street and Theater Alley, in Downtown Manhattan. Lower Manhattan is defined most commonly as the area delineated on the north by 14th Street, on the west by the Hudson River, on the east by the East River, and on the south by New York Harbor (also known as Upper New York Bay). When referring specifically to the Lower Manhattan business district and its immediate environs, the northern border is commonly designated by thoroughfares approximately a mile‐and‐a‐half south of 14th Street and a mile north of the island's southern tip: Chambers Street from near the Hudson east to the Brooklyn Bridge entrances and overpass. Two other major arteries are also sometimes identified as the northern border of "Lower" or "Downtown Manhattan": Canal Street, roughly half a mile north of Chambers Street, and 23rd Street, roughly half a mile north of 14th Street.
The Lower Manhattan business district forms the core of the area below Chambers Street. It includes the Financial District (often referred to as Wall Street, after its primary artery) and the World Trade Center site. At the island's southern tip is Battery Park; City Hall is just to the north of the Financial District. Also south of Chambers Street are the planned community of Battery Park City and the South Street Seaport historic area. The neighborhood of TriBeCa straddles Chambers on the west side; at the street's east end is the giant Manhattan Municipal Building. North of Chambers Street and the Brooklyn Bridge and south of Canal Street lies most of New York's oldest Chinatown neighborhood. Many court buildings and other government offices are also located in this area. The Lower East Side neighborhood straddles Canal. North of Canal Street and south of 14th Street are the neighborhoods of SoHo, the Meatpacking District, the West Village, Greenwich Village, Little Italy, Nolita, and the East Village. Between 14th and 23rd streets are lower Chelsea, Union Square, the Flatiron District, Gramercy, and the large residential development Peter Cooper Village—Stuyvesant Town.
The following table provides a brief demographic overview of the area around the subject.
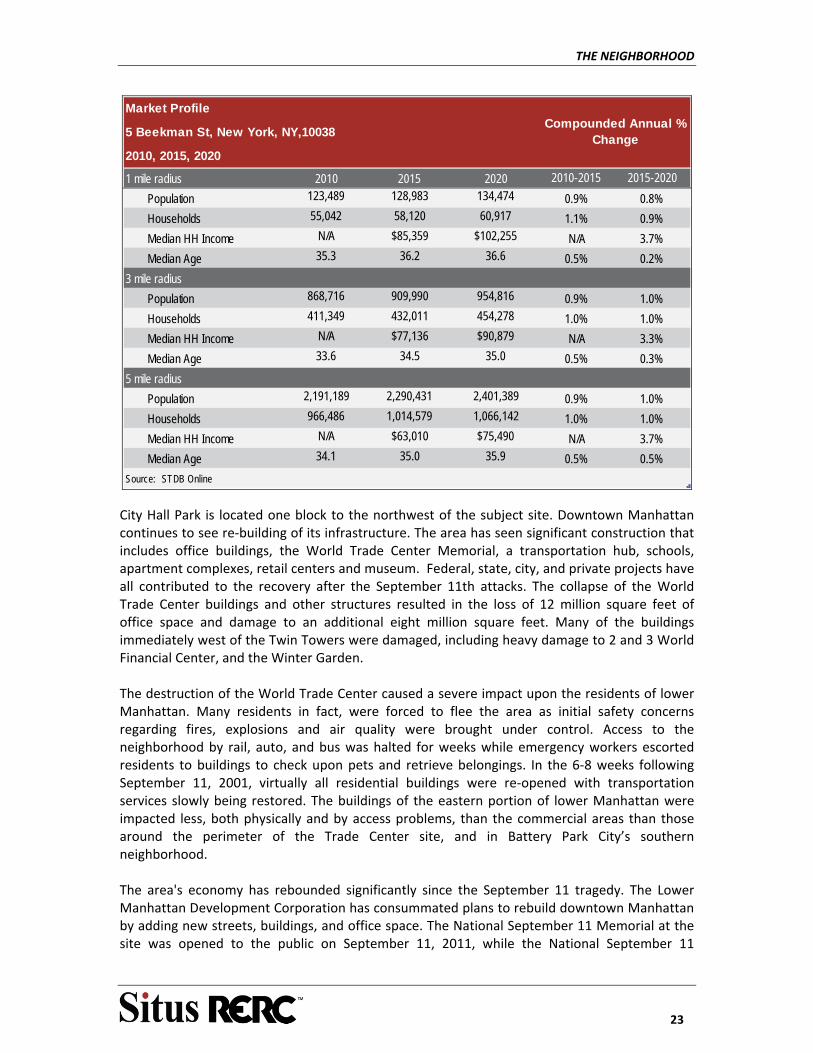
THE NEIGHBORHOOD
23
Market Profile
5 Beekman St, New York, NY,10038
2010, 2015, 2020
1 mile radius 2010 2015 2020 2010-2015 2015-2020
Population 123,489 128,983 134,474 0.9% 0.8%
Households 55,042 58,120 60,917 1.1% 0.9%
Median HH Income N/A $85,359 $102,255 N/A 3.7%
Median Age 35.3 36.2 36.6 0.5% 0.2%
3 mile radius
Population 868,716 909,990 954,816 0.9% 1.0%
Households 411,349 432,011 454,278 1.0% 1.0%
Median HH Income N/A $77,136 $90,879 N/A 3.3%
Median Age 33.6 34.5 35.0 0.5% 0.3%
5 mile radius
Population 2,191,189 2,290,431 2,401,389 0.9% 1.0%
Households 966,486 1,014,579 1,066,142 1.0% 1.0%
Median HH Income N/A $63,010 $75,490 N/A 3.7%
Median Age 34.1 35.0 35.9 0.5% 0.5%
Source: STDB Online
Compounded Annual % Change
City Hall Park is located one block to the northwest of the subject site. Downtown Manhattan continues to see re‐building of its infrastructure. The area has seen significant construction that includes office buildings, the World Trade Center Memorial, a transportation hub, schools, apartment complexes, retail centers and museum. Federal, state, city, and private projects have all contributed to the recovery after the September 11th attacks. The collapse of the World Trade Center buildings and other structures resulted in the loss of 12 million square feet of office space and damage to an additional eight million square feet. Many of the buildings immediately west of the Twin Towers were damaged, including heavy damage to 2 and 3 World Financial Center, and the Winter Garden. The destruction of the World Trade Center caused a severe impact upon the residents of lower Manhattan. Many residents in fact, were forced to flee the area as initial safety concerns regarding fires, explosions and air quality were brought under control. Access to the neighborhood by rail, auto, and bus was halted for weeks while emergency workers escorted residents to buildings to check upon pets and retrieve belongings. In the 6‐8 weeks following September 11, 2001, virtually all residential buildings were re‐opened with transportation services slowly being restored. The buildings of the eastern portion of lower Manhattan were impacted less, both physically and by access problems, than the commercial areas than those around the perimeter of the Trade Center site, and in Battery Park City’s southern neighborhood. The area's economy has rebounded significantly since the September 11 tragedy. The Lower Manhattan Development Corporation has consummated plans to rebuild downtown Manhattan by adding new streets, buildings, and office space. The National September 11 Memorial at the site was opened to the public on September 11, 2011, while the National September 11

THE NEIGHBORHOOD
24
Museum was officially inaugurated by President Barack Obama on May 15, 2014. As of the time of its opening in November 2014, the new One World Trade Center, formerly known as the Freedom Tower, is the tallest skyscraper in the Western Hemisphere and the fourth‐tallest in the world, at 1,776 feet. A 120,000 square feet One World Observatory at the 100th‐102nd floors opened to the public in May 2015. According to a 2nd quarter 2015 report by the Downtown Alliance, 2014 was a strong year for tourism in Lower Manhattan, with 12.4 million unique visitors, a 30% increase since 2013 and a 10% gain over 2012. Tourism was expected to continue growing throughout 2015, spurred in part by the recent opening of the 120,000‐square‐foot One World Observatory, as noted above. According to the report, there are currently 5,100 hotel rooms in 22 hotels throughout Lower Manhattan, representing a 25% increase in hotel rooms since 2010. In addition, there are 2,400 hotel rooms in 14 hotels are under construction, with another 1,200 hotel rooms at seven hotels in the planning stages. The following chart summarizes some of the hotels currently being developed in Lower Manhattan.
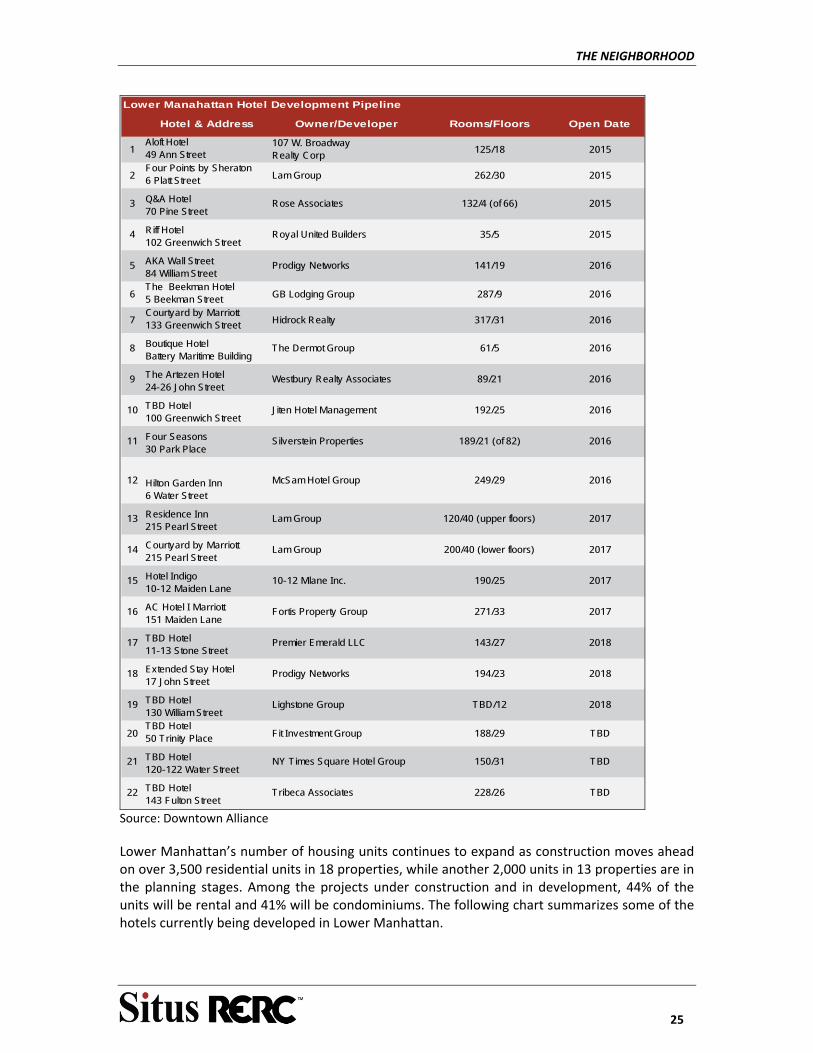
THE NEIGHBORHOOD
25
Hotel & Address Owner/Developer Rooms/Floors Open Date
1Aloft Hotel 49 Ann Street
107 W. Broadway Realty Corp
125/18 2015
2Four Points by Sheraton 6 Platt Street Lam Group 262/30 2015
3 Q&A Hotel 70 Pine Street
Rose Associates 132/4 (of 66) 2015
4 Riff Hotel 102 Greenwich Street
Royal United Builders 35/5 2015
5 AKA Wall Street 84 William Street
Prodigy Networks 141/19 2016
6The Beekman Hotel 5 Beekman Street GB Lodging Group 287/9 2016
7Courtyard by Marriott 133 Greenwich Street Hidrock Realty 317/31 2016
8 Boutique Hotel Battery Maritime Building
The Dermot Group 61/5 2016
9 The Artezen Hotel 24-26 John Street
Westbury Realty Associates 89/21 2016
10 TBD Hotel 100 Greenwich Street
Jiten Hotel Management 192/25 2016
11 Four Seasons 30 Park Place
Silverstein Properties 189/21 (of 82) 2016
12 Hilton Garden Inn 6 Water Street
McSam Hotel Group 249/29 2016
13 Residence Inn 215 Pearl Street
Lam Group 120/40 (upper floors) 2017
14 Courtyard by Marriott 215 Pearl Street
Lam Group 200/40 (lower floors) 2017
15 Hotel Indigo 10-12 Maiden Lane
10-12 Mlane Inc. 190/25 2017
16 AC Hotel I Marriott 151 Maiden Lane
Fortis Property Group 271/33 2017
17 TBD Hotel 11-13 Stone Street
Premier Emerald LLC 143/27 2018
18 Extended Stay Hotel 17 John Street
Prodigy Networks 194/23 2018
19 TBD Hotel 130 William Street
Lighstone Group TBD/12 2018
20TBD Hotel 50 Trinity Place Fit Investment Group 188/29 TBD
21 TBD Hotel 120-122 Water Street
NY Times Square Hotel Group 150/31 TBD
22 TBD Hotel 143 Fulton Street
Tribeca Associates 228/26 TBD
Lower Manahattan Hotel Development Pipeline
Source: Downtown Alliance
Lower Manhattan’s number of housing units continues to expand as construction moves ahead on over 3,500 residential units in 18 properties, while another 2,000 units in 13 properties are in the planning stages. Among the projects under construction and in development, 44% of the units will be rental and 41% will be condominiums. The following chart summarizes some of the hotels currently being developed in Lower Manhattan.
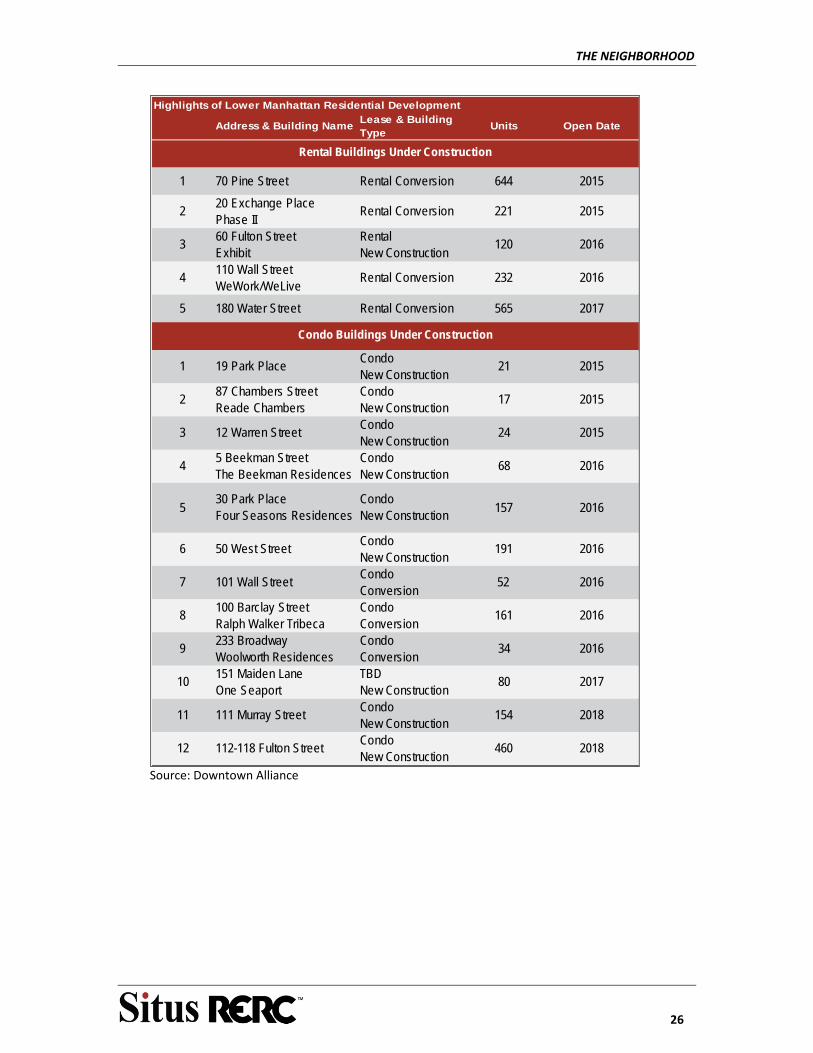
THE NEIGHBORHOOD
26
Address & Building NameLease & Building Type
Units Open Date
1 70 Pine Street Rental Conversion 644 2015
220 Exchange Place Phase II
Rental Conversion 221 2015
360 Fulton Street Exhibit
Rental New Construction
120 2016
4110 Wall Street WeWork/WeLive
Rental Conversion 232 2016
5 180 Water Street Rental Conversion 565 2017
1 19 Park PlaceCondo New Construction
21 2015
287 Chambers Street Reade Chambers
Condo New Construction
17 2015
3 12 Warren StreetCondo New Construction
24 2015
45 Beekman Street The Beekman Residences
Condo New Construction
68 2016
530 Park Place Four Seasons Residences
Condo New Construction
157 2016
6 50 West StreetCondo New Construction
191 2016
7 101 Wall StreetCondo Conversion
52 2016
8100 Barclay Street Ralph Walker Tribeca
Condo Conversion
161 2016
9233 Broadway Woolworth Residences
Condo Conversion
34 2016
10151 Maiden Lane One Seaport
TBD New Construction
80 2017
11 111 Murray StreetCondo New Construction
154 2018
12 112-118 Fulton StreetCondo New Construction
460 2018
Highlights of Lower Manhattan Residential Development
Rental Buildings Under Construction
Condo Buildings Under Construction
Source: Downtown Alliance
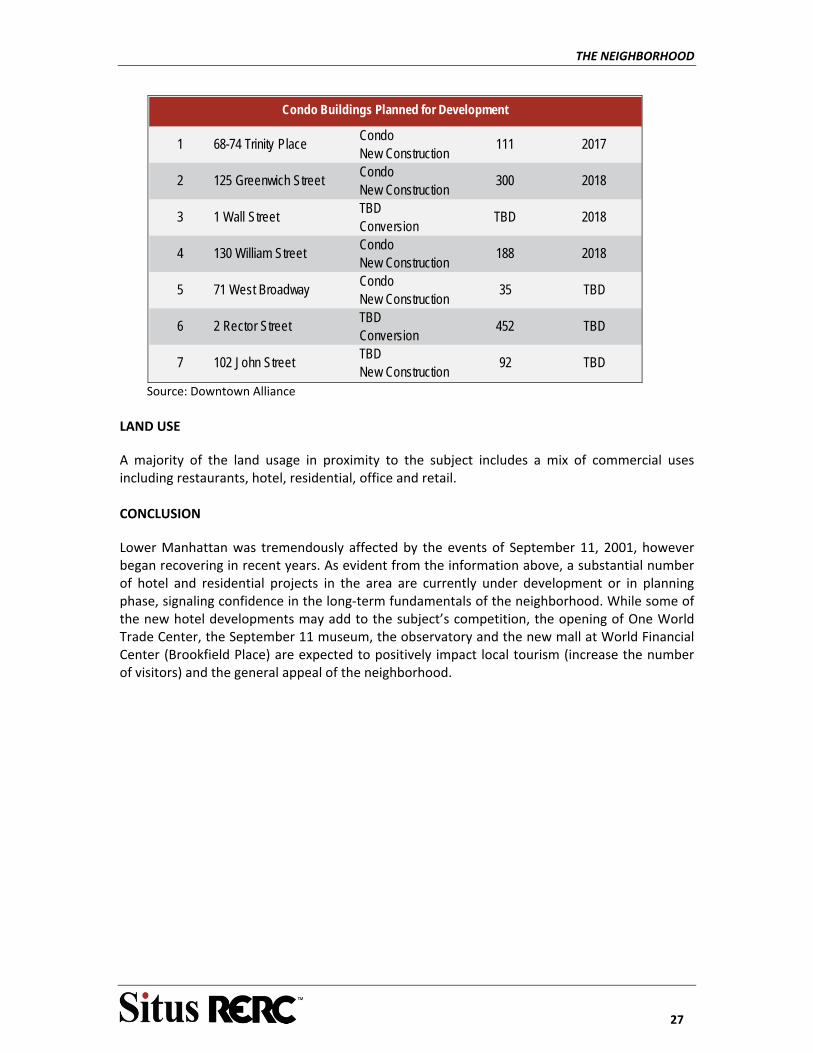
THE NEIGHBORHOOD
27
1 68-74 Trinity Place Condo New Construction
111 2017
2 125 Greenwich StreetCondo New Construction
300 2018
3 1 Wall StreetTBD Conversion
TBD 2018
4 130 William StreetCondo New Construction
188 2018
5 71 West BroadwayCondo New Construction
35 TBD
6 2 Rector StreetTBD Conversion
452 TBD
7 102 John StreetTBD New Construction
92 TBD
Condo Buildings Planned for Development
Source: Downtown Alliance
LAND USE
A majority of the land usage in proximity to the subject includes a mix of commercial uses including restaurants, hotel, residential, office and retail. CONCLUSION
Lower Manhattan was tremendously affected by the events of September 11, 2001, however began recovering in recent years. As evident from the information above, a substantial number of hotel and residential projects in the area are currently under development or in planning phase, signaling confidence in the long‐term fundamentals of the neighborhood. While some of the new hotel developments may add to the subject’s competition, the opening of One World Trade Center, the September 11 museum, the observatory and the new mall at World Financial Center (Brookfield Place) are expected to positively impact local tourism (increase the number of visitors) and the general appeal of the neighborhood.
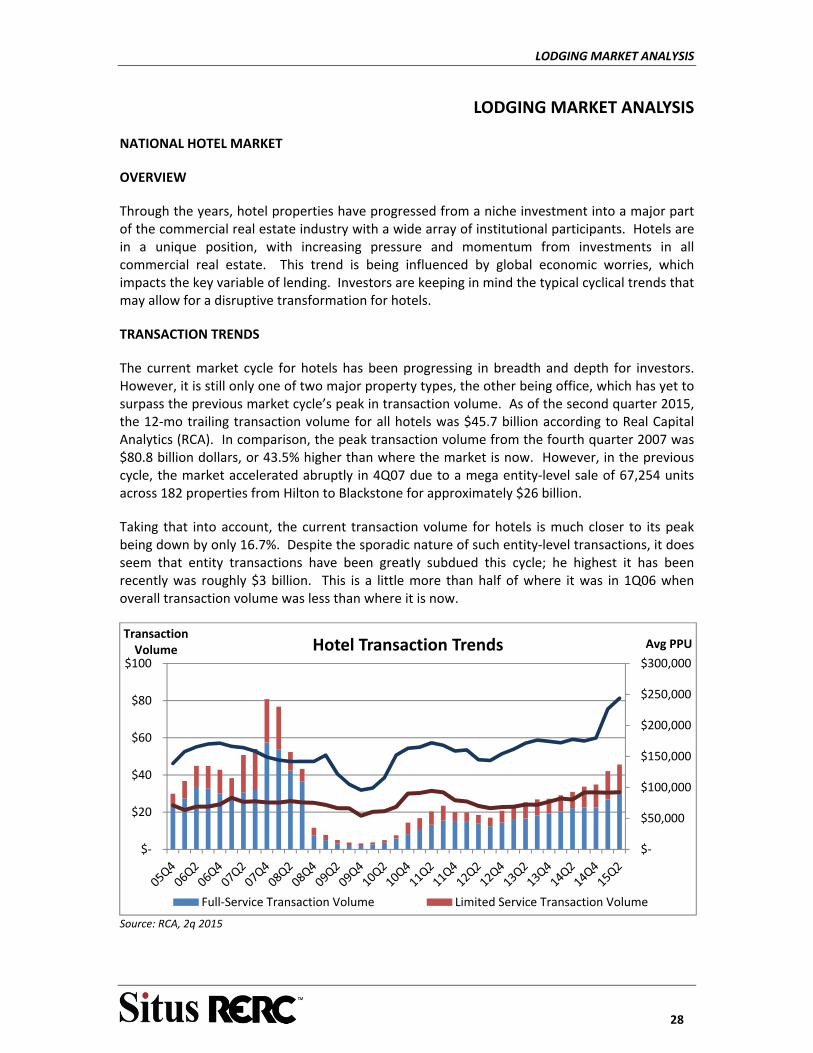
LODGING MARKET ANALYSIS
28
LODGING MARKET ANALYSIS
NATIONAL HOTEL MARKET
OVERVIEW
Through the years, hotel properties have progressed from a niche investment into a major part of the commercial real estate industry with a wide array of institutional participants. Hotels are in a unique position, with increasing pressure and momentum from investments in all commercial real estate. This trend is being influenced by global economic worries, which impacts the key variable of lending. Investors are keeping in mind the typical cyclical trends that may allow for a disruptive transformation for hotels.
TRANSACTION TRENDS
The current market cycle for hotels has been progressing in breadth and depth for investors. However, it is still only one of two major property types, the other being office, which has yet to surpass the previous market cycle’s peak in transaction volume. As of the second quarter 2015, the 12‐mo trailing transaction volume for all hotels was $45.7 billion according to Real Capital Analytics (RCA). In comparison, the peak transaction volume from the fourth quarter 2007 was $80.8 billion dollars, or 43.5% higher than where the market is now. However, in the previous cycle, the market accelerated abruptly in 4Q07 due to a mega entity‐level sale of 67,254 units across 182 properties from Hilton to Blackstone for approximately $26 billion.
Taking that into account, the current transaction volume for hotels is much closer to its peak being down by only 16.7%. Despite the sporadic nature of such entity‐level transactions, it does seem that entity transactions have been greatly subdued this cycle; he highest it has been recently was roughly $3 billion. This is a little more than half of where it was in 1Q06 when overall transaction volume was less than where it is now.
Source: RCA, 2q 2015
$‐
$50,000
$100,000
$150,000
$200,000
$250,000
$300,000
$‐
$20
$40
$60
$80
$100
Avg PPUTransaction Volume Hotel Transaction Trends
Full‐Service Transaction Volume Limited Service Transaction Volume
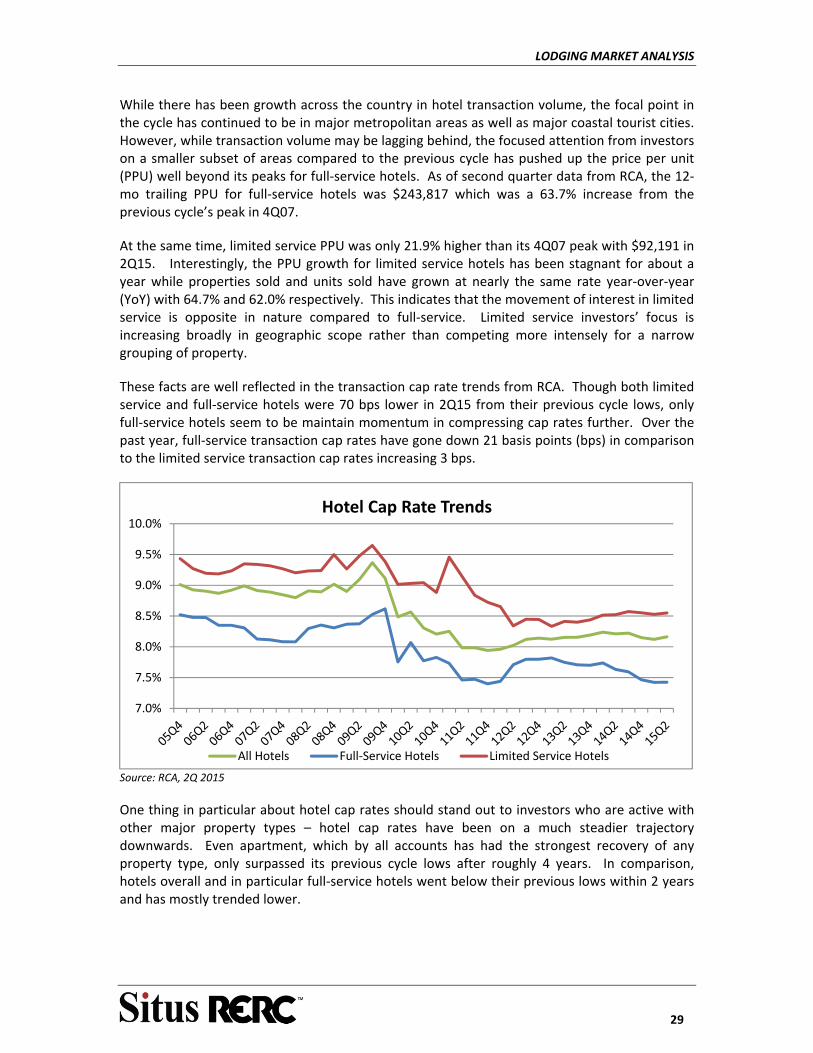
LODGING MARKET ANALYSIS
29
While there has been growth across the country in hotel transaction volume, the focal point in the cycle has continued to be in major metropolitan areas as well as major coastal tourist cities. However, while transaction volume may be lagging behind, the focused attention from investors on a smaller subset of areas compared to the previous cycle has pushed up the price per unit (PPU) well beyond its peaks for full‐service hotels. As of second quarter data from RCA, the 12‐mo trailing PPU for full‐service hotels was $243,817 which was a 63.7% increase from the previous cycle’s peak in 4Q07.
At the same time, limited service PPU was only 21.9% higher than its 4Q07 peak with $92,191 in 2Q15. Interestingly, the PPU growth for limited service hotels has been stagnant for about a year while properties sold and units sold have grown at nearly the same rate year‐over‐year (YoY) with 64.7% and 62.0% respectively. This indicates that the movement of interest in limited service is opposite in nature compared to full‐service. Limited service investors’ focus is increasing broadly in geographic scope rather than competing more intensely for a narrow grouping of property.
These facts are well reflected in the transaction cap rate trends from RCA. Though both limited service and full‐service hotels were 70 bps lower in 2Q15 from their previous cycle lows, only full‐service hotels seem to be maintain momentum in compressing cap rates further. Over the past year, full‐service transaction cap rates have gone down 21 basis points (bps) in comparison to the limited service transaction cap rates increasing 3 bps.
Source: RCA, 2Q 2015
One thing in particular about hotel cap rates should stand out to investors who are active with other major property types – hotel cap rates have been on a much steadier trajectory downwards. Even apartment, which by all accounts has had the strongest recovery of any property type, only surpassed its previous cycle lows after roughly 4 years. In comparison, hotels overall and in particular full‐service hotels went below their previous lows within 2 years and has mostly trended lower.
7.0%
7.5%
8.0%
8.5%
9.0%
9.5%
10.0%Hotel Cap Rate Trends
All Hotels Full‐Service Hotels Limited Service Hotels
LODGING MARKET ANALYSIS
30
There are a few reasons why hotel cap rates have moved this way. First off, there isn’t any other major property type with as high of a cap rate as hotel has. As of 2Q15, the closest one was office, which with a cap rate of 6.79%, is still 154 bps lower than hotel cap rates at 8.33%. This continual compression then, is going to come as a natural result of a property type that becomes less niche, more institutional, and as advanced as other property types. Additionally, investors are going to be less weary of engaging in the hotel market with the LIBOR and US 10‐yr Treasury rate at record lows. This last point has a lot of question marks surrounding its long term prospects. Yet as investors continue to live in this environment, it will normalize to them, and get cap rate for hotels closer to other property type counter parts.
One of the growing narratives around commercial real estate involves the impact of foreign capital and this is certainly true of hotel properties. With approximately $8 billion in acquisitions on a 12‐months trailing basis, data from RCA shows that cross‐border investors made up 17% of acquisitions in 15Q2. Cross‐border investors already surpassed their acquisitions from the previous cycle in 3Q14 and now are 27.9% higher. Their purchases though, are targeted at high quality hotel properties with numerous rooms. For example, Anbang Insurance Group based in Beijing, China purchased the 1,425 unit Waldorf Astoria in New York City for $1.95 billion or $1,368 per unit from Hilton World Wide.
However, with the downturn in the Chinese equity markets and crippling regulation from overdevelopment, more and more Chinese investors with commercial real estate platforms set up in the US will expand their activity over the coming years. Anon Qui, the executive managing director at TRI Commercial/CORFAC International said “This China stock market crash is a wake‐up call that one can’t put all their eggs in one basket when it comes to managing and preserving wealth.”
Additionally, as China moves to catalyze its exports to stabilize the overall economy, they’ve begun devaluing the yuan which is not good for investors in China. As such, commercial real estate in the US give an additional facet to hedge their investments with. These Chinese investors who are diversifying are still very hungry for yield which hotels can amply provide. In order to do so, they will reach out beyond the major markets.
FUNDAMENTALS
Hotels have had some of the most noticeable and impressive growth of any property type over the past few years as the economy in the US and abroad have become healthier and as such increased levels of travels for business and leisure. But that quick and pleasant recovery for hotels is also bringing a rapid peak in fundamental performance.
Halfway through 2015, PKF‐Hospitality Research reported that they expect occupancy to be 65.8% by the end of the year. That would be a 140 basis pointss increase in occupancy compared to 2014. At the same time, they expect occupancy to peak by 2016 with 66.1%. The growth in the average daily rate, projected to be 4.5% in 2015, will continue to increase through 2017 before beginning to subside. This aligns with expectations from those attending the Hunter Hotel Conference, which expect the hotel market to peak sometime between 2016 and 2019, according to Hotel News Now.
The main different between the trends of the hotel classes continues to be changes in supply and demand. From 2010 to 2014, upscale and upper midscale hotels increased the most in
LODGING MARKET ANALYSIS
31
demand with 5.4% annualized growth rate. Upper midscale, though, is forecast by PKF‐Hospital Research to substantially diminish to 2% growth compared to upscale which will still stay at a 4.1% annualized growth rate from 2016 through 2019. However, upscale hotels are having an abundance of supply coming online during the same time with an annualized growth rate in supply of 5.9%. Given their affluent customers’ tastes, these newer hotels will likely be more sought out than older upscale hotels given the right price points.
With the holidays quickly approaching, there will likely be greater expenditures on travel from the low cost of oil. Greg LaBerge, Marcus & Millichap’s national hospitality director, said that he expects $45 dollars a gallon for oil, will give each individual in the US an extra $100 per month. This will translate into some increased spending on travel and hotel usage. While Marcus & Millichap and others view the change in oil prices as something long term, it certainly isn’t guaranteed and investors would be wise to just to take this as short term for now.
Overall, the outlook is generally still good for hotels, yet there are new players in the space including Airbnb. At the previously mentioned Hunter Hotel Conference, Hotel News Now Reports that when PKF‐Hospitality Research’s Mark Woodworth went on stage and asked around 1,200 attendees if Airbnb was merely on their radar – only five hands were raised. That is a tremendous amount of confidence for investors who expect the market to begin to turn within the coming years and perhaps naivety for ignoring a growing part of the industry which is often synonymous with disruption.
It’s not exactly clear what Airbnb’s (or similar) impact will be for hotels long term, but even now it’s starting to effect hotels. A recent study by Boston University examined Airbnb’s influence on hotel revenue in Texas and found that more progressive and liberal cities like Austin experienced much more growth than more conservative areas such as Forth Worth. In those areas where Airbnb did establish a presence, it cut revenues for budget hotels by 5% from 2011 to 2013. The study expects that if the current trend continues, budget hotels will lose 10% of revenue by 2016. At the same time, luxury and upscale hotels had not yet been impacted meaningfully. This is consistent with the standard view that Airbnb’s customers are budget conscious.
Airbnb is making inroads with the business community and will begin to eat away at revenue from such travelers. Within 24 hours of launching their global travel management suite in late July, Airbnb had signed 500 companies to the program. As of late August, over a thousand businesses from roughly 40 countries signed up for it. Taking all these facts together, it would seem wise for hotel investors to at least give some thought to how a hotel property might function given the current and likely growth of Airbnb rentals in the area.
All of this is already being taken into consideration by RERC’s respondents who have had their value vs price rating. A scale from 1 to 10 where 1 (10) has very low (high) value in comparison to its price. In 3Q15 RERC’s value vs price rating was down to 4.9 for hotels, which is the lowest it has been for the property in four years, from 5.7 a year ago in 3Q14. It is worst in the West with 4.8 while it’s highest in the Midwest with 5.1. This aligns with what place have experienced the largest increases in PPU for hotel.
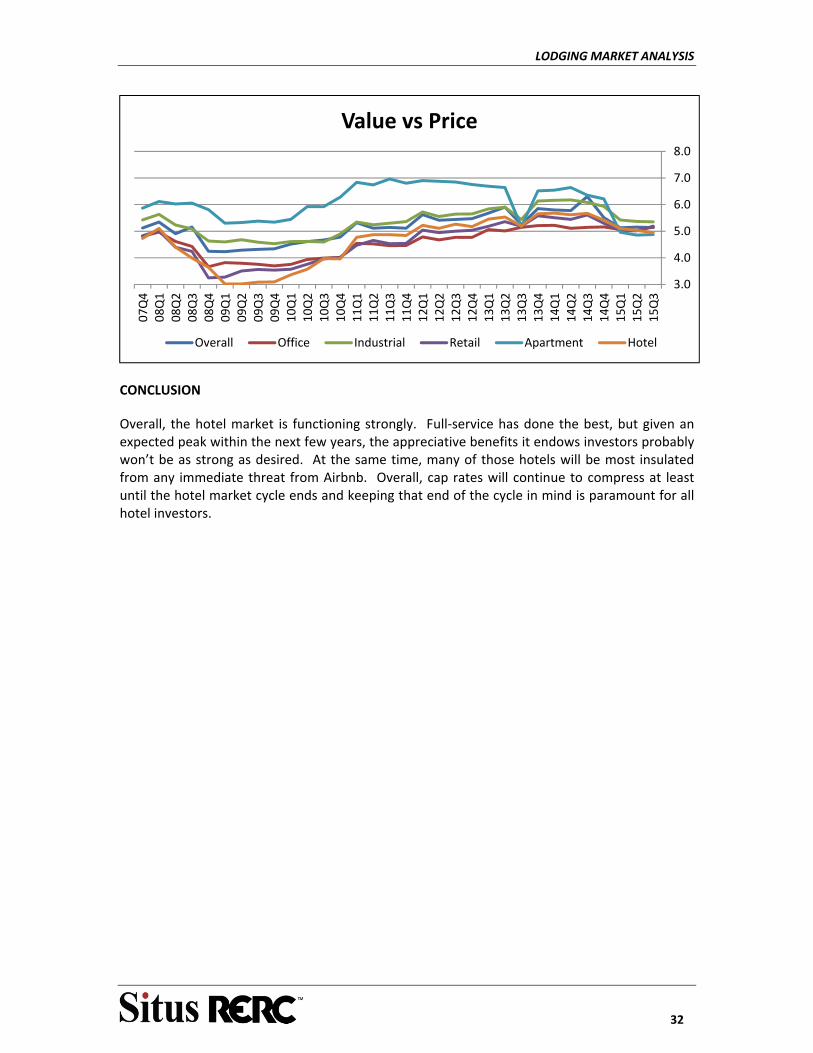
LODGING MARKET ANALYSIS
32
CONCLUSION
Overall, the hotel market is functioning strongly. Full‐service has done the best, but given an expected peak within the next few years, the appreciative benefits it endows investors probably won’t be as strong as desired. At the same time, many of those hotels will be most insulated from any immediate threat from Airbnb. Overall, cap rates will continue to compress at least until the hotel market cycle ends and keeping that end of the cycle in mind is paramount for all hotel investors.
3.0
4.0
5.0
6.0
7.0
8.0
15Q3
15Q2
15Q1
14Q4
14Q3
14Q2
14Q1
13Q4
13Q3
13Q2
13Q1
12Q4
12Q3
12Q2
12Q1
11Q4
11Q3
11Q2
11Q1
10Q4
10Q3
10Q2
10Q1
09Q4
09Q3
09Q2
09Q1
08Q4
08Q3
08Q2
08Q1
07Q4
Value vs Price
Overall Office Industrial Retail Apartment Hotel
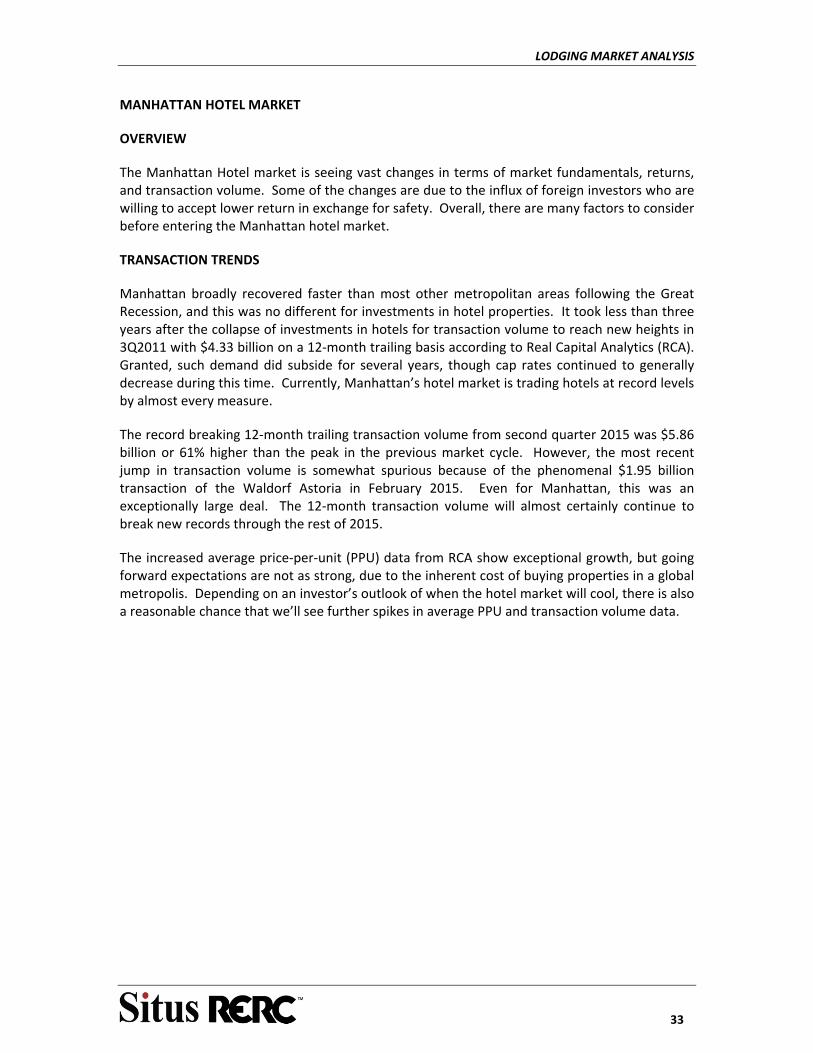
LODGING MARKET ANALYSIS
33
MANHATTAN HOTEL MARKET
OVERVIEW
The Manhattan Hotel market is seeing vast changes in terms of market fundamentals, returns, and transaction volume. Some of the changes are due to the influx of foreign investors who are willing to accept lower return in exchange for safety. Overall, there are many factors to consider before entering the Manhattan hotel market.
TRANSACTION TRENDS
Manhattan broadly recovered faster than most other metropolitan areas following the Great Recession, and this was no different for investments in hotel properties. It took less than three years after the collapse of investments in hotels for transaction volume to reach new heights in 3Q2011 with $4.33 billion on a 12‐month trailing basis according to Real Capital Analytics (RCA). Granted, such demand did subside for several years, though cap rates continued to generally decrease during this time. Currently, Manhattan’s hotel market is trading hotels at record levels by almost every measure.
The record breaking 12‐month trailing transaction volume from second quarter 2015 was $5.86 billion or 61% higher than the peak in the previous market cycle. However, the most recent jump in transaction volume is somewhat spurious because of the phenomenal $1.95 billion transaction of the Waldorf Astoria in February 2015. Even for Manhattan, this was an exceptionally large deal. The 12‐month transaction volume will almost certainly continue to break new records through the rest of 2015.
The increased average price‐per‐unit (PPU) data from RCA show exceptional growth, but going forward expectations are not as strong, due to the inherent cost of buying properties in a global metropolis. Depending on an investor’s outlook of when the hotel market will cool, there is also a reasonable chance that we’ll see further spikes in average PPU and transaction volume data.
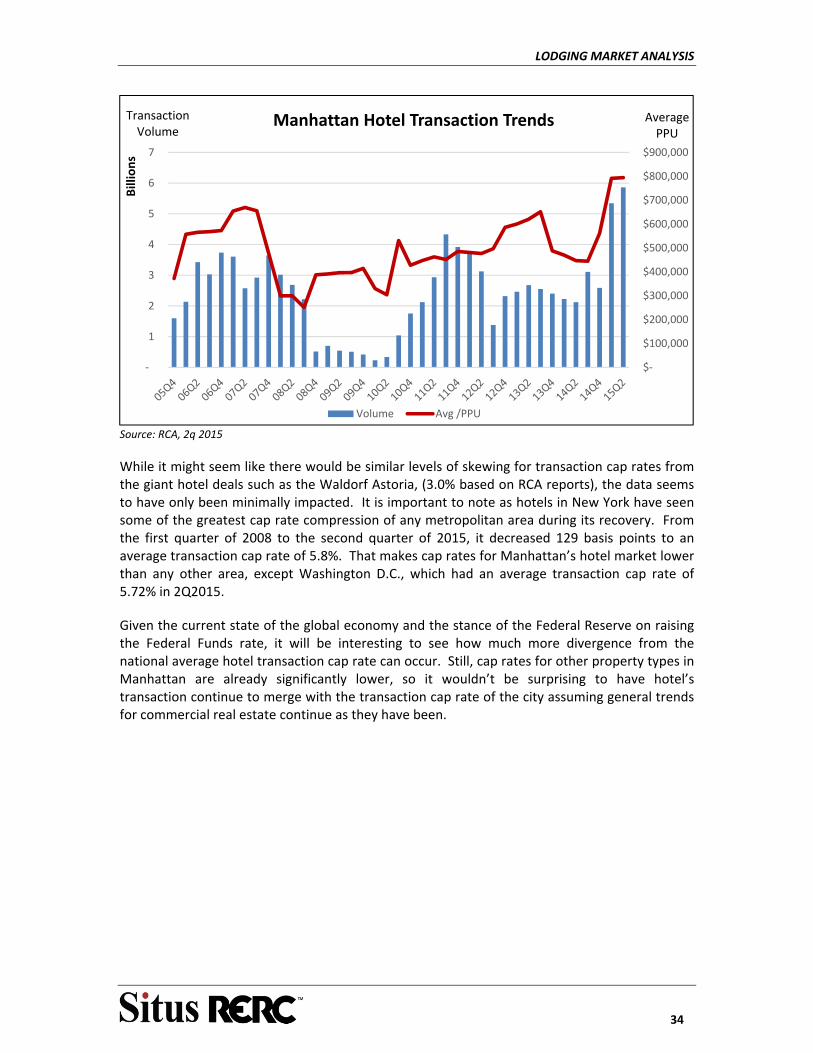
LODGING MARKET ANALYSIS
34
Source: RCA, 2q 2015
While it might seem like there would be similar levels of skewing for transaction cap rates from the giant hotel deals such as the Waldorf Astoria, (3.0% based on RCA reports), the data seems to have only been minimally impacted. It is important to note as hotels in New York have seen some of the greatest cap rate compression of any metropolitan area during its recovery. From the first quarter of 2008 to the second quarter of 2015, it decreased 129 basis points to an average transaction cap rate of 5.8%. That makes cap rates for Manhattan’s hotel market lower than any other area, except Washington D.C., which had an average transaction cap rate of 5.72% in 2Q2015.
Given the current state of the global economy and the stance of the Federal Reserve on raising the Federal Funds rate, it will be interesting to see how much more divergence from the national average hotel transaction cap rate can occur. Still, cap rates for other property types in Manhattan are already significantly lower, so it wouldn’t be surprising to have hotel’s transaction continue to merge with the transaction cap rate of the city assuming general trends for commercial real estate continue as they have been.
$‐
$100,000
$200,000
$300,000
$400,000
$500,000
$600,000
$700,000
$800,000
$900,000
‐
1
2
3
4
5
6
7
Average PPU
Transaction Volume
Billions
Manhattan Hotel Transaction Trends
Volume Avg /PPU
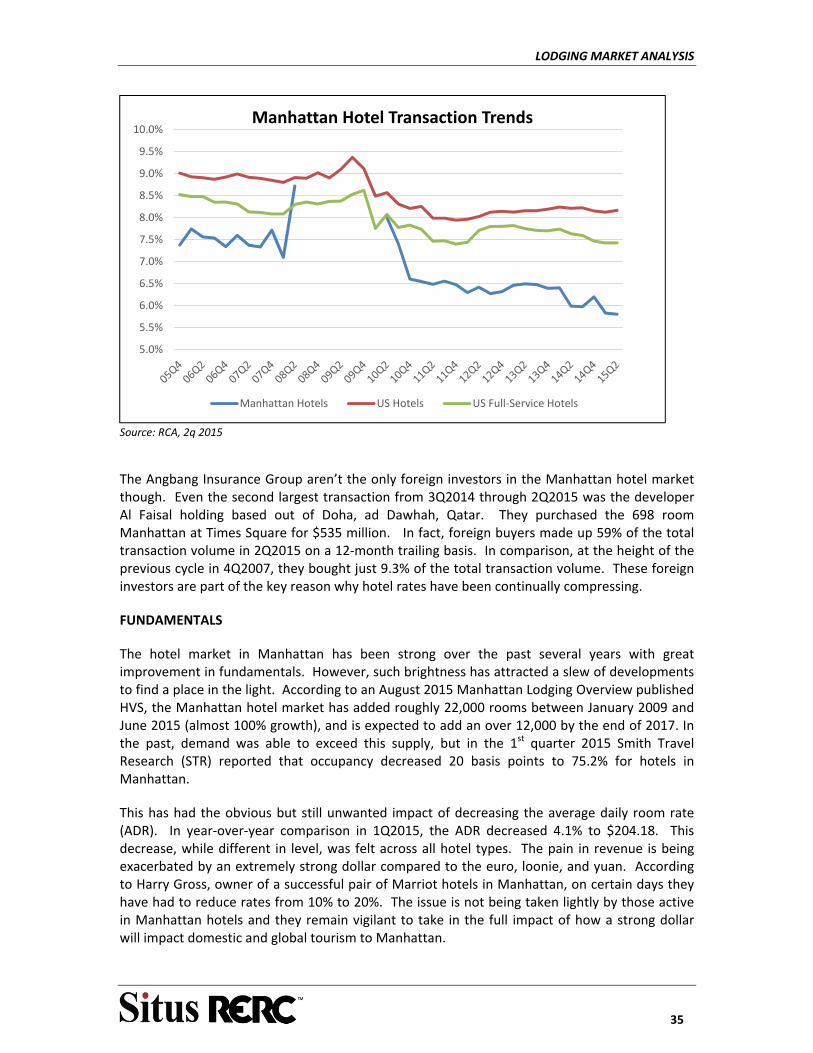
LODGING MARKET ANALYSIS
35
Source: RCA, 2q 2015
The Angbang Insurance Group aren’t the only foreign investors in the Manhattan hotel market though. Even the second largest transaction from 3Q2014 through 2Q2015 was the developer Al Faisal holding based out of Doha, ad Dawhah, Qatar. They purchased the 698 room Manhattan at Times Square for $535 million. In fact, foreign buyers made up 59% of the total transaction volume in 2Q2015 on a 12‐month trailing basis. In comparison, at the height of the previous cycle in 4Q2007, they bought just 9.3% of the total transaction volume. These foreign investors are part of the key reason why hotel rates have been continually compressing.
FUNDAMENTALS
The hotel market in Manhattan has been strong over the past several years with great improvement in fundamentals. However, such brightness has attracted a slew of developments to find a place in the light. According to an August 2015 Manhattan Lodging Overview published HVS, the Manhattan hotel market has added roughly 22,000 rooms between January 2009 and June 2015 (almost 100% growth), and is expected to add an over 12,000 by the end of 2017. In the past, demand was able to exceed this supply, but in the 1st quarter 2015 Smith Travel Research (STR) reported that occupancy decreased 20 basis points to 75.2% for hotels in Manhattan.
This has had the obvious but still unwanted impact of decreasing the average daily room rate (ADR). In year‐over‐year comparison in 1Q2015, the ADR decreased 4.1% to $204.18. This decrease, while different in level, was felt across all hotel types. The pain in revenue is being exacerbated by an extremely strong dollar compared to the euro, loonie, and yuan. According to Harry Gross, owner of a successful pair of Marriot hotels in Manhattan, on certain days they have had to reduce rates from 10% to 20%. The issue is not being taken lightly by those active in Manhattan hotels and they remain vigilant to take in the full impact of how a strong dollar will impact domestic and global tourism to Manhattan.
5.0%
5.5%
6.0%
6.5%
7.0%
7.5%
8.0%
8.5%
9.0%
9.5%
10.0%Manhattan Hotel Transaction Trends
Manhattan Hotels US Hotels US Full‐Service Hotels
LODGING MARKET ANALYSIS
36
Another issue that those active in the Manhattan hotel market should consider is the long term capability for competition from Airbnb. While many may disregard this offhand, it is a real issue for a city as dense as Manhattan. Already in places such as the East Village, Airbnb has proliferated to such an extent that 28% of apartments there are listed according to a study conducted by the groups New York Communities for Change and Real Affordability for All. In general, they found that roughly 10% of apartments are listed through the year in New York. According to a mid‐2015 Manhattan Lodging report published by Cushman and Wakefield, the number of hotel rooms increase by approximately 1% from 2014, from 86,770 rooms to 87,584 rooms, while the number of listed Airbnb units increased almost 30% at the same time, from 12,315 to 15,977. The number of Airbnb listings in mid‐2015 was almost 20% of the Manhattan hotels room supply.
As per Airbnb’s open source data, 4% to 6% of the hotel supply in the five boroughs in New York is made up of Airbnb rentals, but in Brooklyn it makes up an incredible 38%. Still, at this point in time the average rate of those rentals was 12.6% higher than that of comparative hotels nearby according to an analysis by STR. As such, they aren’t yet an urgent threat to traditional hotels, but it’s something which hotel owners and investors are monitoring especially as hotel market cycle is expected to finish within the next few years.
CONCLUSION
The Manhattan hotel market is going through a muddled metamorphosis that may only accelerate over the coming years. While the forces behind it ‐ the global economy, disruptive forces from new market participants, and the closing of a market cycle, may seem trite; their well‐worn themes hold no less truth. Anyone looking to join or exit the Manhattan hotel market will have to take these issues into consideration before making a decision.
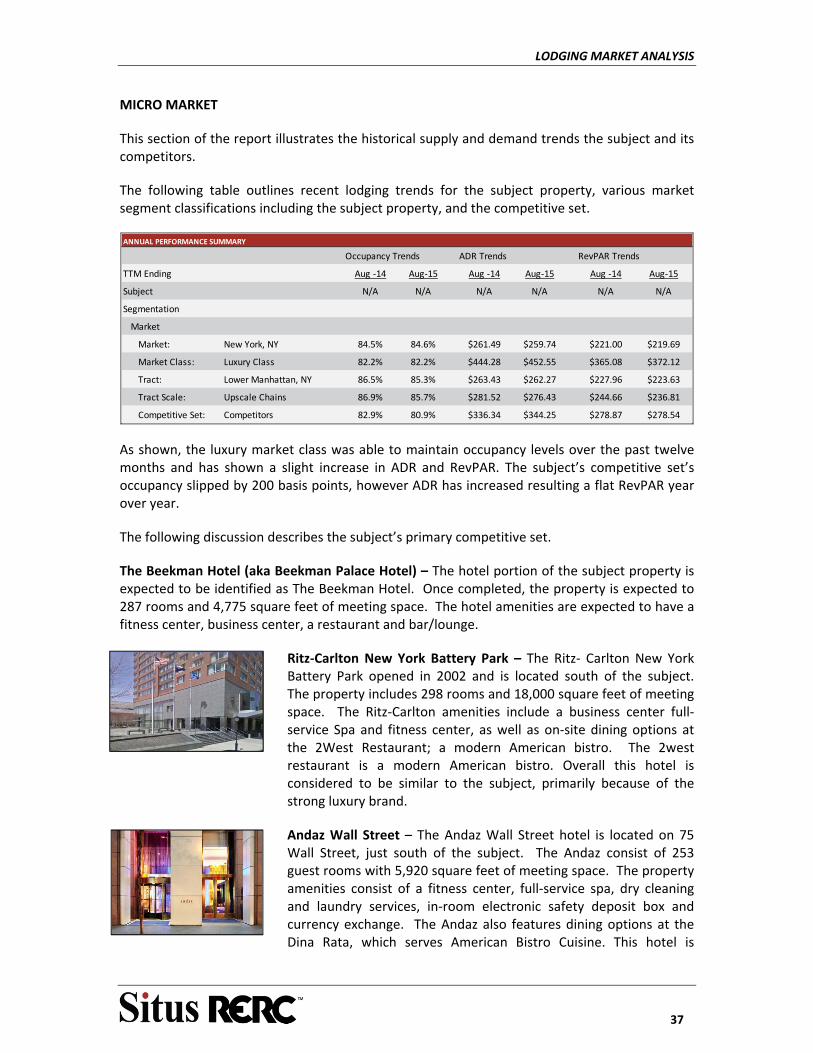
LODGING MARKET ANALYSIS
37
MICRO MARKET
This section of the report illustrates the historical supply and demand trends the subject and its competitors.
The following table outlines recent lodging trends for the subject property, various market segment classifications including the subject property, and the competitive set.
Occupancy Trends ADR Trends RevPAR Trends
TTM Ending Aug ‐14 Aug‐15 Aug ‐14 Aug‐15 Aug ‐14 Aug‐15
Subject N/A N/A N/A N/A N/A N/A
Segmentation
Market
Market: New York, NY 84.5% 84.6% $261.49 $259.74 $221.00 $219.69
Market Class: Luxury Class 82.2% 82.2% $444.28 $452.55 $365.08 $372.12
Tract: Lower Manhattan, NY 86.5% 85.3% $263.43 $262.27 $227.96 $223.63
Tract Scale: Upscale Chains 86.9% 85.7% $281.52 $276.43 $244.66 $236.81
Competitive Set: Competitors 82.9% 80.9% $336.34 $344.25 $278.87 $278.54
ANNUAL PERFORMANCE SUMMARY
As shown, the luxury market class was able to maintain occupancy levels over the past twelve months and has shown a slight increase in ADR and RevPAR. The subject’s competitive set’s occupancy slipped by 200 basis points, however ADR has increased resulting a flat RevPAR year over year.
The following discussion describes the subject’s primary competitive set.
The Beekman Hotel (aka Beekman Palace Hotel) – The hotel portion of the subject property is expected to be identified as The Beekman Hotel. Once completed, the property is expected to 287 rooms and 4,775 square feet of meeting space. The hotel amenities are expected to have a fitness center, business center, a restaurant and bar/lounge.
Ritz‐Carlton New York Battery Park – The Ritz‐ Carlton New York Battery Park opened in 2002 and is located south of the subject. The property includes 298 rooms and 18,000 square feet of meeting space. The Ritz‐Carlton amenities include a business center full‐service Spa and fitness center, as well as on‐site dining options at the 2West Restaurant; a modern American bistro. The 2west restaurant is a modern American bistro. Overall this hotel is considered to be similar to the subject, primarily because of the strong luxury brand.
Andaz Wall Street – The Andaz Wall Street hotel is located on 75 Wall Street, just south of the subject. The Andaz consist of 253 guest rooms with 5,920 square feet of meeting space. The property amenities consist of a fitness center, full‐service spa, dry cleaning and laundry services, in‐room electronic safety deposit box and currency exchange. The Andaz also features dining options at the Dina Rata, which serves American Bistro Cuisine. This hotel is
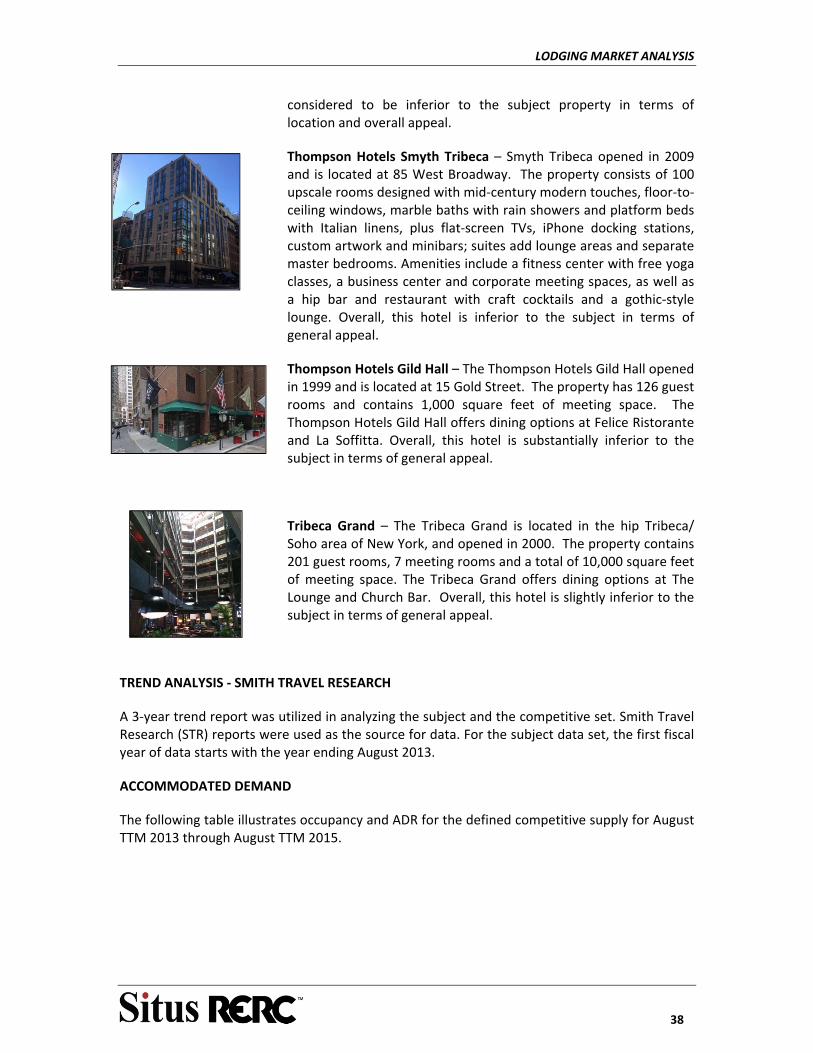
LODGING MARKET ANALYSIS
38
considered to be inferior to the subject property in terms of location and overall appeal.
Thompson Hotels Smyth Tribeca – Smyth Tribeca opened in 2009 and is located at 85 West Broadway. The property consists of 100 upscale rooms designed with mid‐century modern touches, floor‐to‐ceiling windows, marble baths with rain showers and platform beds with Italian linens, plus flat‐screen TVs, iPhone docking stations, custom artwork and minibars; suites add lounge areas and separate master bedrooms. Amenities include a fitness center with free yoga classes, a business center and corporate meeting spaces, as well as a hip bar and restaurant with craft cocktails and a gothic‐style lounge. Overall, this hotel is inferior to the subject in terms of general appeal.
Thompson Hotels Gild Hall – The Thompson Hotels Gild Hall opened in 1999 and is located at 15 Gold Street. The property has 126 guest rooms and contains 1,000 square feet of meeting space. The Thompson Hotels Gild Hall offers dining options at Felice Ristorante and La Soffitta. Overall, this hotel is substantially inferior to the subject in terms of general appeal.
Tribeca Grand – The Tribeca Grand is located in the hip Tribeca/ Soho area of New York, and opened in 2000. The property contains 201 guest rooms, 7 meeting rooms and a total of 10,000 square feet of meeting space. The Tribeca Grand offers dining options at The Lounge and Church Bar. Overall, this hotel is slightly inferior to the subject in terms of general appeal.
TREND ANALYSIS ‐ SMITH TRAVEL RESEARCH
A 3‐year trend report was utilized in analyzing the subject and the competitive set. Smith Travel Research (STR) reports were used as the source for data. For the subject data set, the first fiscal year of data starts with the year ending August 2013.
ACCOMMODATED DEMAND
The following table illustrates occupancy and ADR for the defined competitive supply for August TTM 2013 through August TTM 2015.
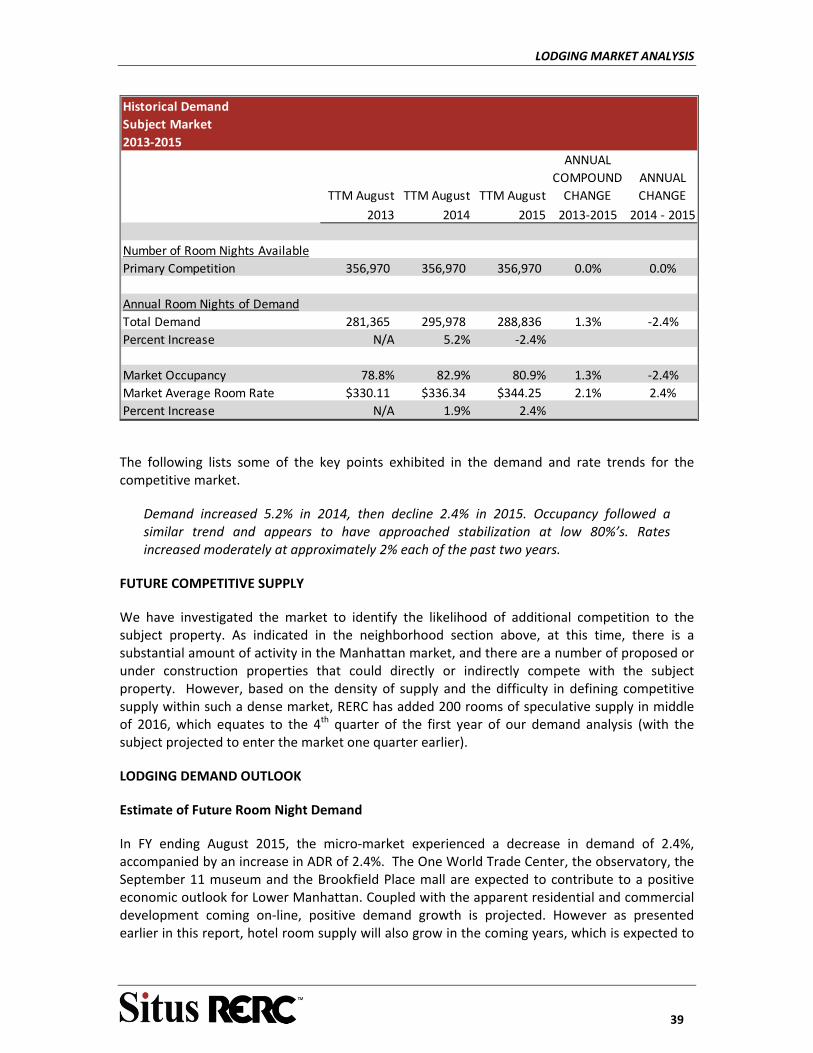
LODGING MARKET ANALYSIS
39
Historical Demand
Subject Market
2013‐2015
TTM August TTM August TTM August
ANNUAL
COMPOUND
CHANGE
ANNUAL
CHANGE
2013 2014 2015 2013‐2015 2014 ‐ 2015
Number of Room Nights Available
Primary Competition 356,970 356,970 356,970 0.0% 0.0%
Annual Room Nights of Demand
Total Demand 281,365 295,978 288,836 1.3% ‐2.4%
Percent Increase N/A 5.2% ‐2.4%
Market Occupancy 78.8% 82.9% 80.9% 1.3% ‐2.4%
Market Average Room Rate $330.11 $336.34 $344.25 2.1% 2.4%
Percent Increase N/A 1.9% 2.4%
The following lists some of the key points exhibited in the demand and rate trends for the competitive market.
Demand increased 5.2% in 2014, then decline 2.4% in 2015. Occupancy followed a similar trend and appears to have approached stabilization at low 80%’s. Rates increased moderately at approximately 2% each of the past two years.
FUTURE COMPETITIVE SUPPLY
We have investigated the market to identify the likelihood of additional competition to the subject property. As indicated in the neighborhood section above, at this time, there is a substantial amount of activity in the Manhattan market, and there are a number of proposed or under construction properties that could directly or indirectly compete with the subject property. However, based on the density of supply and the difficulty in defining competitive supply within such a dense market, RERC has added 200 rooms of speculative supply in middle of 2016, which equates to the 4th quarter of the first year of our demand analysis (with the subject projected to enter the market one quarter earlier).
LODGING DEMAND OUTLOOK
Estimate of Future Room Night Demand
In FY ending August 2015, the micro‐market experienced a decrease in demand of 2.4%, accompanied by an increase in ADR of 2.4%. The One World Trade Center, the observatory, the September 11 museum and the Brookfield Place mall are expected to contribute to a positive economic outlook for Lower Manhattan. Coupled with the apparent residential and commercial development coming on‐line, positive demand growth is projected. However as presented earlier in this report, hotel room supply will also grow in the coming years, which is expected to
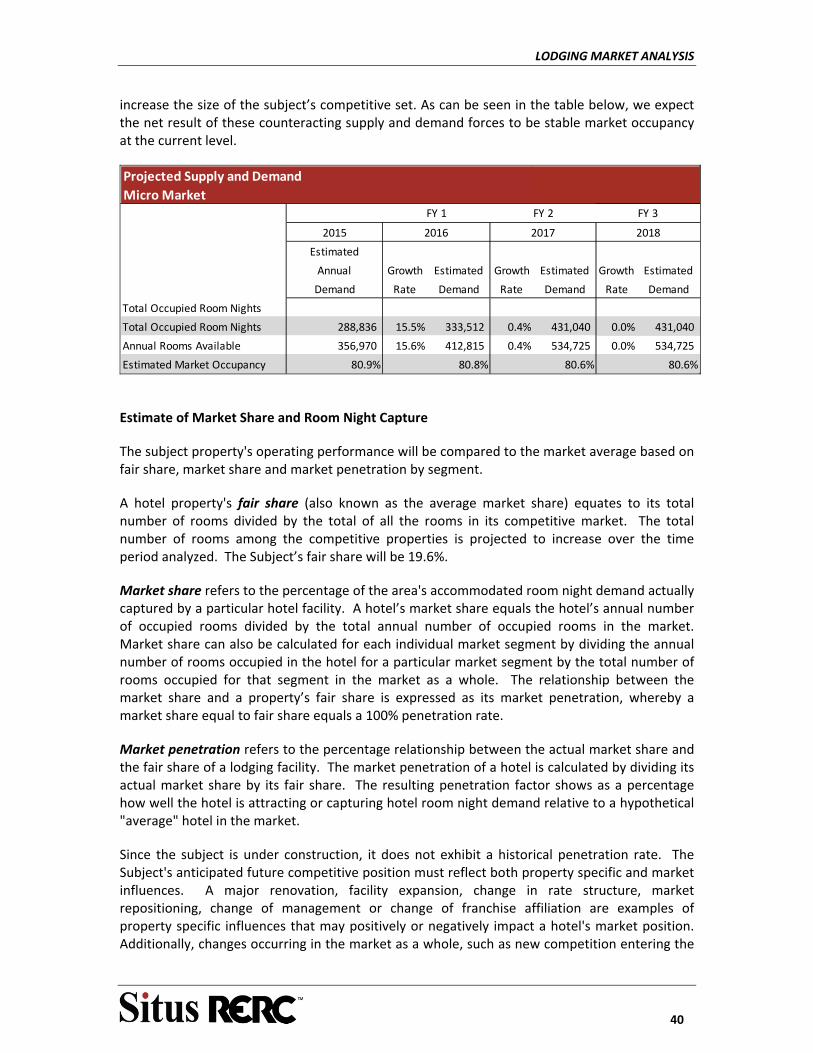
LODGING MARKET ANALYSIS
40
increase the size of the subject’s competitive set. As can be seen in the table below, we expect the net result of these counteracting supply and demand forces to be stable market occupancy at the current level.
Projected Supply and Demand
Micro Market
2015 2016 2017 2018
Estimated
Annual Growth Estimated Growth Estimated Growth Estimated
Demand Rate Demand Rate Demand Rate Demand
Total Occupied Room Nights
Total Occupied Room Nights 288,836 15.5% 333,512 0.4% 431,040 0.0% 431,040
Annual Rooms Available 356,970 15.6% 412,815 0.4% 534,725 0.0% 534,725
Estimated Market Occupancy 80.9% 80.8% 80.6% 80.6%
FY 1 FY 2 FY 3
Estimate of Market Share and Room Night Capture
The subject property's operating performance will be compared to the market average based on fair share, market share and market penetration by segment.
A hotel property's fair share (also known as the average market share) equates to its total number of rooms divided by the total of all the rooms in its competitive market. The total number of rooms among the competitive properties is projected to increase over the time period analyzed. The Subject’s fair share will be 19.6%.
Market share refers to the percentage of the area's accommodated room night demand actually captured by a particular hotel facility. A hotel’s market share equals the hotel’s annual number of occupied rooms divided by the total annual number of occupied rooms in the market. Market share can also be calculated for each individual market segment by dividing the annual number of rooms occupied in the hotel for a particular market segment by the total number of rooms occupied for that segment in the market as a whole. The relationship between the market share and a property’s fair share is expressed as its market penetration, whereby a market share equal to fair share equals a 100% penetration rate.
Market penetration refers to the percentage relationship between the actual market share and the fair share of a lodging facility. The market penetration of a hotel is calculated by dividing its actual market share by its fair share. The resulting penetration factor shows as a percentage how well the hotel is attracting or capturing hotel room night demand relative to a hypothetical "average" hotel in the market.
Since the subject is under construction, it does not exhibit a historical penetration rate. The Subject's anticipated future competitive position must reflect both property specific and market influences. A major renovation, facility expansion, change in rate structure, market repositioning, change of management or change of franchise affiliation are examples of property specific influences that may positively or negatively impact a hotel's market position. Additionally, changes occurring in the market as a whole, such as new competition entering the
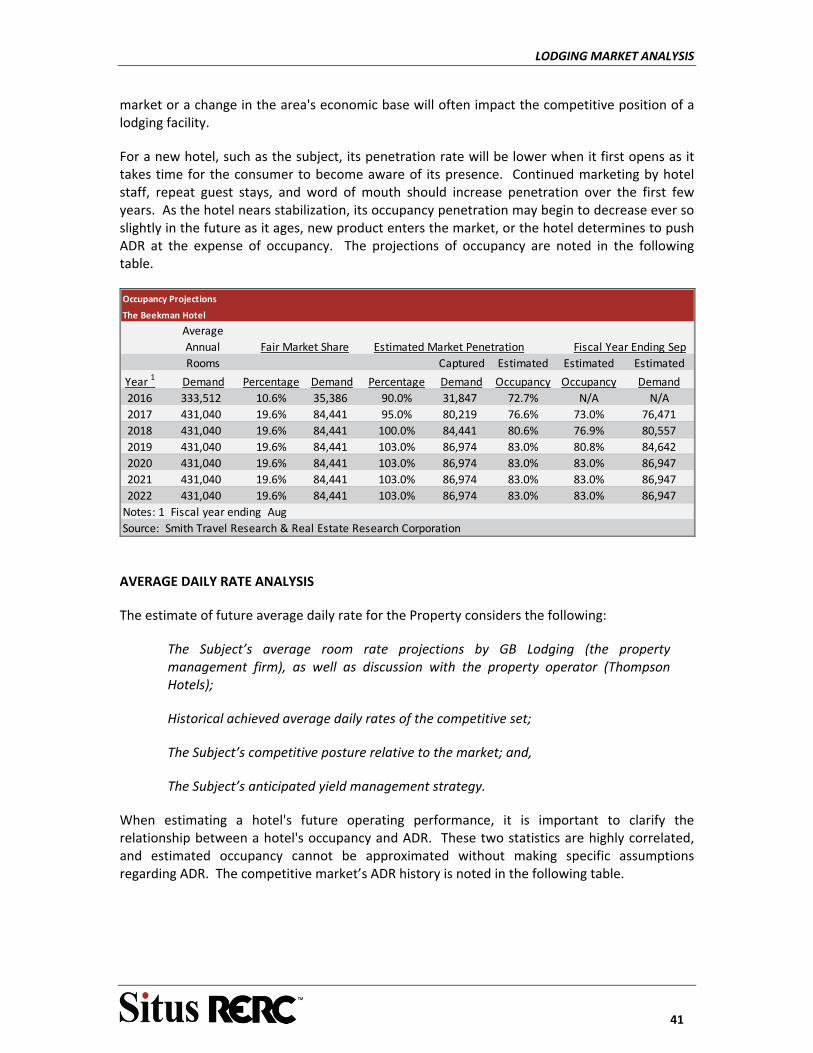
LODGING MARKET ANALYSIS
41
market or a change in the area's economic base will often impact the competitive position of a lodging facility.
For a new hotel, such as the subject, its penetration rate will be lower when it first opens as it takes time for the consumer to become aware of its presence. Continued marketing by hotel staff, repeat guest stays, and word of mouth should increase penetration over the first few years. As the hotel nears stabilization, its occupancy penetration may begin to decrease ever so slightly in the future as it ages, new product enters the market, or the hotel determines to push ADR at the expense of occupancy. The projections of occupancy are noted in the following table.
Average
Annual Fair Market Share Estimated Market Penetration Fiscal Year Ending Sep
Rooms Captured Estimated Estimated Estimated
Year 1 Demand Percentage Demand Percentage Demand Occupancy Occupancy Demand
2016 333,512 10.6% 35,386 90.0% 31,847 72.7% N/A N/A
2017 431,040 19.6% 84,441 95.0% 80,219 76.6% 73.0% 76,471
2018 431,040 19.6% 84,441 100.0% 84,441 80.6% 76.9% 80,557
2019 431,040 19.6% 84,441 103.0% 86,974 83.0% 80.8% 84,642
2020 431,040 19.6% 84,441 103.0% 86,974 83.0% 83.0% 86,947
2021 431,040 19.6% 84,441 103.0% 86,974 83.0% 83.0% 86,947
2022 431,040 19.6% 84,441 103.0% 86,974 83.0% 83.0% 86,947
Notes: 1 Fiscal year ending Aug
Source: Smith Travel Research & Real Estate Research Corporation
Occupancy Projections
The Beekman Hotel
AVERAGE DAILY RATE ANALYSIS
The estimate of future average daily rate for the Property considers the following:
The Subject’s average room rate projections by GB Lodging (the property management firm), as well as discussion with the property operator (Thompson Hotels);
Historical achieved average daily rates of the competitive set;
The Subject’s competitive posture relative to the market; and,
The Subject’s anticipated yield management strategy.
When estimating a hotel's future operating performance, it is important to clarify the relationship between a hotel's occupancy and ADR. These two statistics are highly correlated, and estimated occupancy cannot be approximated without making specific assumptions regarding ADR. The competitive market’s ADR history is noted in the following table.
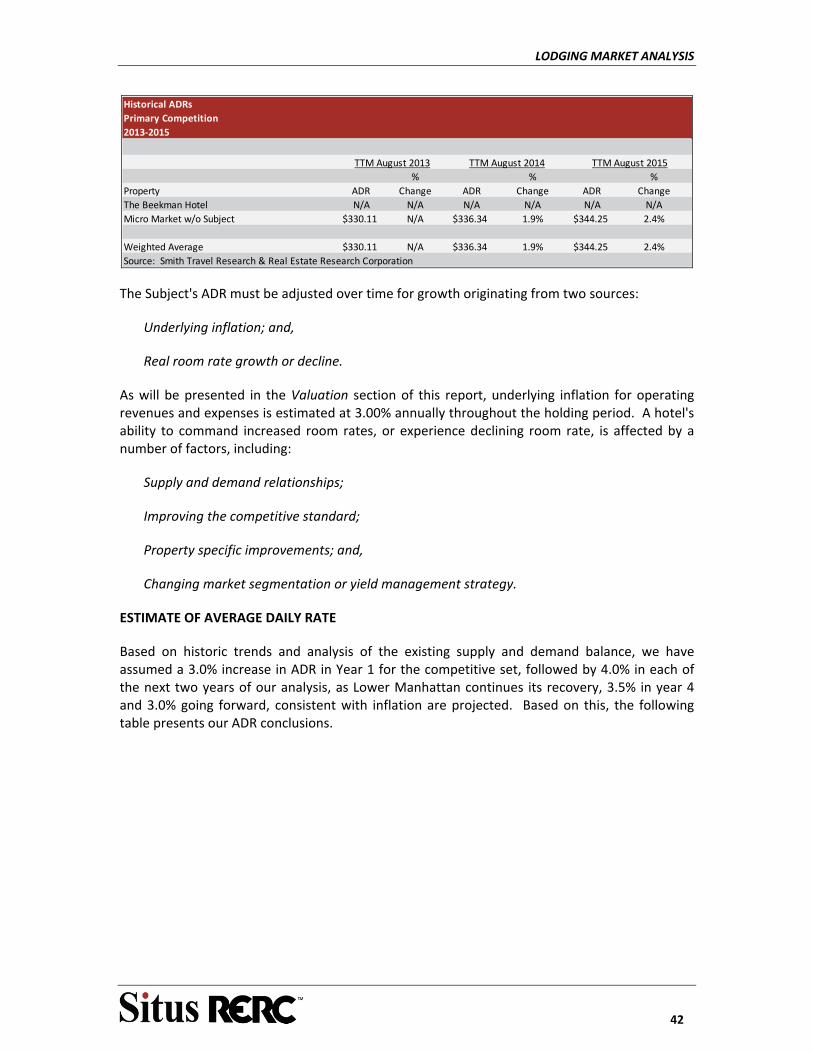
LODGING MARKET ANALYSIS
42
Historical ADRs
Primary Competition
2013‐2015
TTM August 2013 TTM August 2014 TTM August 2015
% % %
Property ADR Change ADR Change ADR Change
The Beekman Hotel N/A N/A N/A N/A N/A N/A
Micro Market w/o Subject $330.11 N/A $336.34 1.9% $344.25 2.4%
Weighted Average $330.11 N/A $336.34 1.9% $344.25 2.4%
Source: Smith Travel Research & Real Estate Research Corporation
The Subject's ADR must be adjusted over time for growth originating from two sources:
Underlying inflation; and,
Real room rate growth or decline.
As will be presented in the Valuation section of this report, underlying inflation for operating revenues and expenses is estimated at 3.00% annually throughout the holding period. A hotel's ability to command increased room rates, or experience declining room rate, is affected by a number of factors, including:
Supply and demand relationships;
Improving the competitive standard;
Property specific improvements; and,
Changing market segmentation or yield management strategy.
ESTIMATE OF AVERAGE DAILY RATE
Based on historic trends and analysis of the existing supply and demand balance, we have assumed a 3.0% increase in ADR in Year 1 for the competitive set, followed by 4.0% in each of the next two years of our analysis, as Lower Manhattan continues its recovery, 3.5% in year 4 and 3.0% going forward, consistent with inflation are projected. Based on this, the following table presents our ADR conclusions.
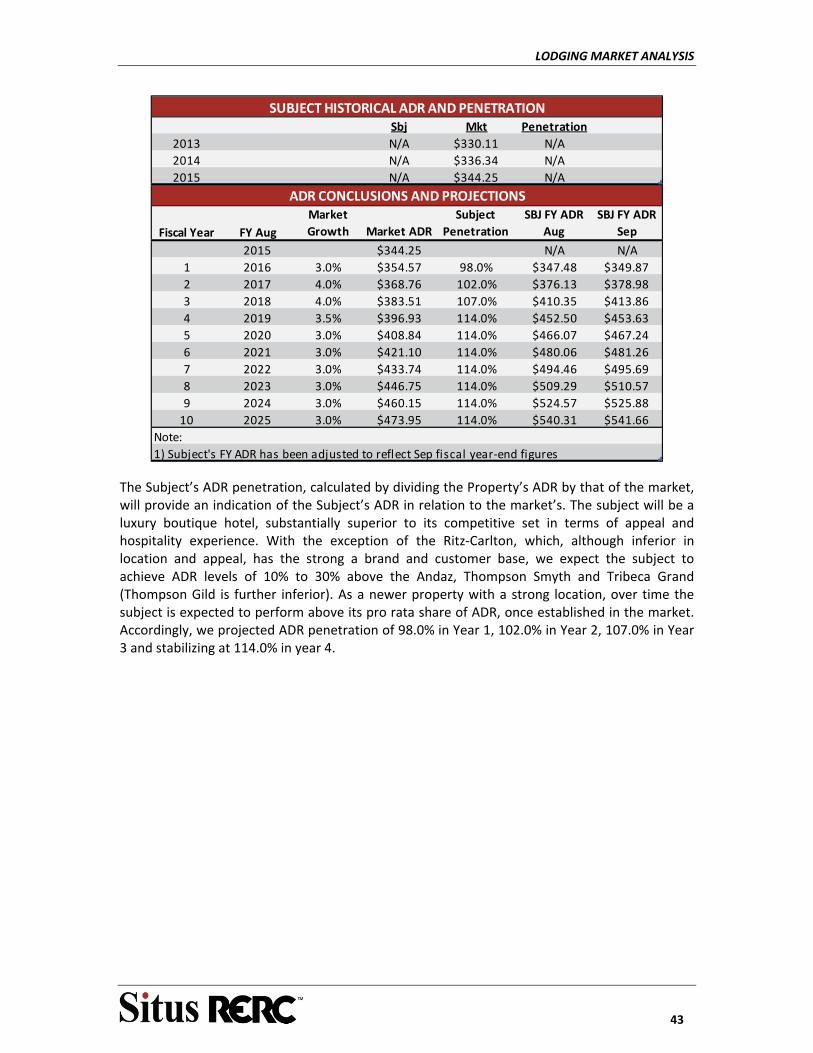
LODGING MARKET ANALYSIS
43
Sbj Mkt Penetration
2013 N/A $330.11 N/A
2014 N/A $336.34 N/A
2015 N/A $344.25 N/A
Fiscal Year FY Aug
Market
Growth Market ADR
Subject
Penetration
SBJ FY ADR
Aug
SBJ FY ADR
Sep
2015 $344.25 N/A N/A
1 2016 3.0% $354.57 98.0% $347.48 $349.87
2 2017 4.0% $368.76 102.0% $376.13 $378.98
3 2018 4.0% $383.51 107.0% $410.35 $413.86
4 2019 3.5% $396.93 114.0% $452.50 $453.63
5 2020 3.0% $408.84 114.0% $466.07 $467.24
6 2021 3.0% $421.10 114.0% $480.06 $481.26
7 2022 3.0% $433.74 114.0% $494.46 $495.69
8 2023 3.0% $446.75 114.0% $509.29 $510.57
9 2024 3.0% $460.15 114.0% $524.57 $525.88
10 2025 3.0% $473.95 114.0% $540.31 $541.66
Note:
1) Subject's FY ADR has been adjusted to reflect Sep fiscal year‐end figures
SUBJECT HISTORICAL ADR AND PENETRATION
ADR CONCLUSIONS AND PROJECTIONS
The Subject’s ADR penetration, calculated by dividing the Property’s ADR by that of the market, will provide an indication of the Subject’s ADR in relation to the market’s. The subject will be a luxury boutique hotel, substantially superior to its competitive set in terms of appeal and hospitality experience. With the exception of the Ritz‐Carlton, which, although inferior in location and appeal, has the strong a brand and customer base, we expect the subject to achieve ADR levels of 10% to 30% above the Andaz, Thompson Smyth and Tribeca Grand (Thompson Gild is further inferior). As a newer property with a strong location, over time the subject is expected to perform above its pro rata share of ADR, once established in the market. Accordingly, we projected ADR penetration of 98.0% in Year 1, 102.0% in Year 2, 107.0% in Year 3 and stabilizing at 114.0% in year 4.
THE PROPERTY
44
THE PROPERTY
DESCRIPTION OF IMPROVEMENTS
The subject property is currently under construction and is expected to be known as The Beekman Hotel. The subject property is expected to consist of 287 hotel rooms contained within floors 1 through 10 of the redeveloped and restored landmark building located at 5 Beekman Street, as well as floors 1 through 10 of the newly built tower located at 115 Nassau Street. We note that 68 condominium units will be located on floors 11 through 46 in a newly built tower located at 155 Nassau Street (which are not part of the subject of this appraisal). When completed, the property is expected to have a gross building area of 352,105, of which 179,765 square feet are associated with the hotel.
Management represented that the subject property is scheduled to be completed and fully operational by April 1, 2016.
Hotel amenities are expected to include two restaurants, a lobby lounge, approximately 4,775 square feet of dedicated meeting and banquets space, a fitness room/spa, approximately 1,000 square feet of retail space as well as a lounge with separate street access off of Theater Alley. There will also be two duplex, rooftop lofts with outdoor space located in the building’s signature turrets that can serve as either private event space or guestrooms. These suites will surround all or a portion of the atrium skylight and offer views of City Hall Park and other parts of the neighborhood. Public spaces will be located on the lobby and sub‐lobby levels and the second floor, with guestrooms located on floors two through ten.
The newly constructed tower structure will consist of 79 hotel units on floors one through ten, and 68 luxury condominium units on floors 11 through 46. The new tower will have views of City Hall Park, the East River and other surrounding attractions. The units will have access to the hotel and will be provided with hotel services, at the resident’s request. Residence owners will be able to access their units through hotel and condominium tower entrances.
CONSTRUCTION DETAIL Foundation: 5 Beekman – Reinforced concrete footings and poured concrete slab on
grade 115 Nassau – Reinforced concrete footings
Framing: 5 Beekman – Cast Iron and Masonry
115 Nassau – Cast in place concrete Floors: 5 Beekman ‐ Terracotta Arch on Steel
115 Nassau ‐ Concrete Exterior Finish: 5 Beekman – Brick/Granite/Limestone
115 Nassau – Architectural Concrete and Glass Window Wall Exterior Walls: 5 Beekman – Brick/Terracotta/Granite
115 Nassau – Poured Concrete
THE PROPERTY
45
Roof: Flat deck roof with waterproof membrane cover; slate for
mansards/turrets Windows: Thermal windows in aluminum frames
Doors: Glass, wood and metal. MECHANICAL DETAIL Heating/ Cooling System: Each residential unit and hotel guestroom is assumed to have individual
heating and air conditioning systems that can be thermostatically controlled by residents. The heating and cooling systems for the hotel, restaurant, and other common areas are assumed to be separate from the residential component of the development.
Plumbing: The plumbing system is assumed to be adequate for the proposed use
and in compliance with local law and building codes. The plumbing system will be typical of other properties in the area with a combination of PVC, steel, copper and cast iron piping throughout the building.
Electrical Service: Electricity for the building will be obtained through low voltage power
lines. Electrical Metering: Each residential apartment will be separately metered. The hotel and retail components will have their own metering system.
Elevator Service: 5 Beekman – 5 passenger elevators
115 Nassau – 2 passenger elevators The buildings will share 2 service elevators which will be housed in 115 Nassau.
Fire Protection: 100 percent sprinklered
Deferred Maintenance, Renovation and Expansion
The subject is currently under construction, therefore, there is not any significant items of deferred maintenance. Capital Expenditures for the foreseeable future, are expected to lie within the projected capital reserve allowances. We have assumed the improvements will be completed / constructed to the typical expectations in this market.
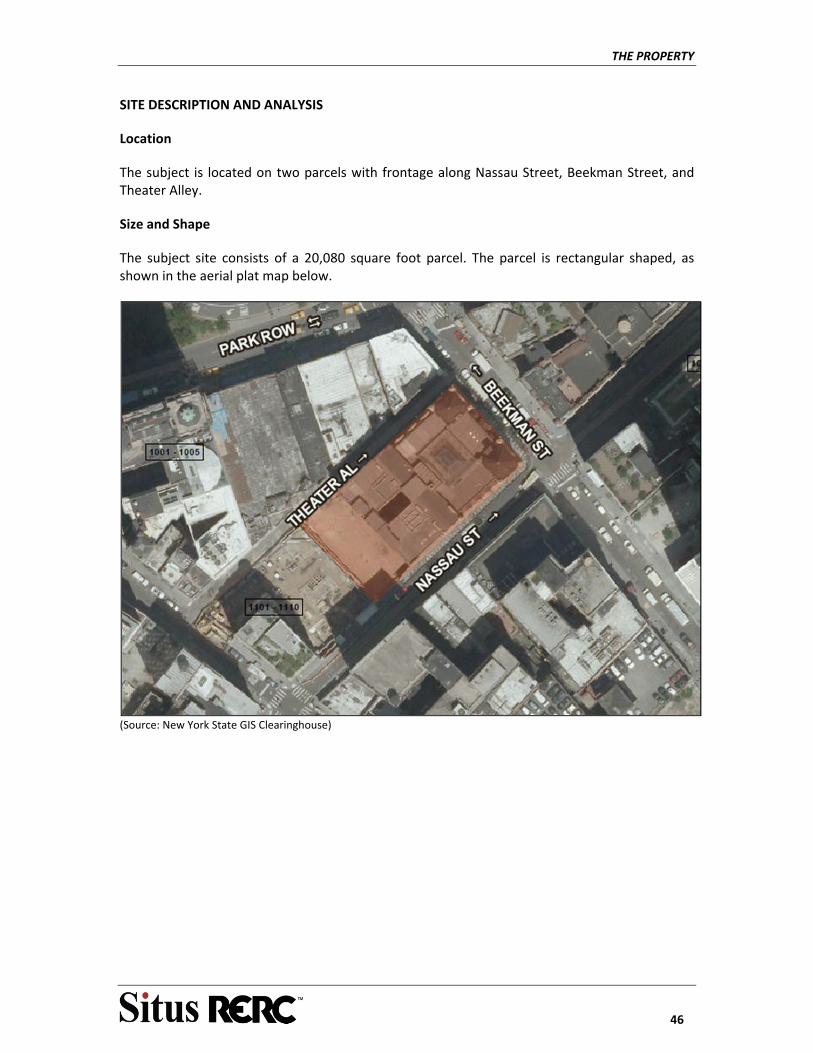
THE PROPERTY
46
SITE DESCRIPTION AND ANALYSIS
Location
The subject is located on two parcels with frontage along Nassau Street, Beekman Street, and Theater Alley.
Size and Shape
The subject site consists of a 20,080 square foot parcel. The parcel is rectangular shaped, as shown in the aerial plat map below.
(Source: New York State GIS Clearinghouse)
THE PROPERTY
47
Details regarding the characteristics of the site are noted in the following table and summarized in the narrative that follows.
Site CharacteristicsLocation: 5 Beekman Street and 115 Nassau StreetCity, State: New York, NYLegal Description: 90 / 14, 16 , 9014Size (SF): 20,080Shape: RectangularTopography: Generally LevelLandscaping: MinimalEnviornmental & Soil Conditions: Assumed NoneFlood Risk: The property is located in Zone XUtilities: All PublicWater: City of New YorkSolid Waste: City of New YorkElectricity: Consolidated Edison of New York CityNatural Gas: National GridTelephone Service: Various ProvidersAccess: Average
Frontage:Approximately 200 feet on both Nassau Street and Theater Alley, and 100 feet on Beekman Street
Zoning: C5-5
ENVIRONMENTAL AND SOIL CONDITIONS
RERC is not considered an environmental expert; likewise RERC has not received a Phase 1 environmental survey. However, we assume that there are no recognized environmental conditions in connection with the site. Any evidence indicating otherwise may impact the conclusions attained in this report.
TOPOGRAPHY
The subject site is generally flat, although no topographical information was provided to verify our visual perception.
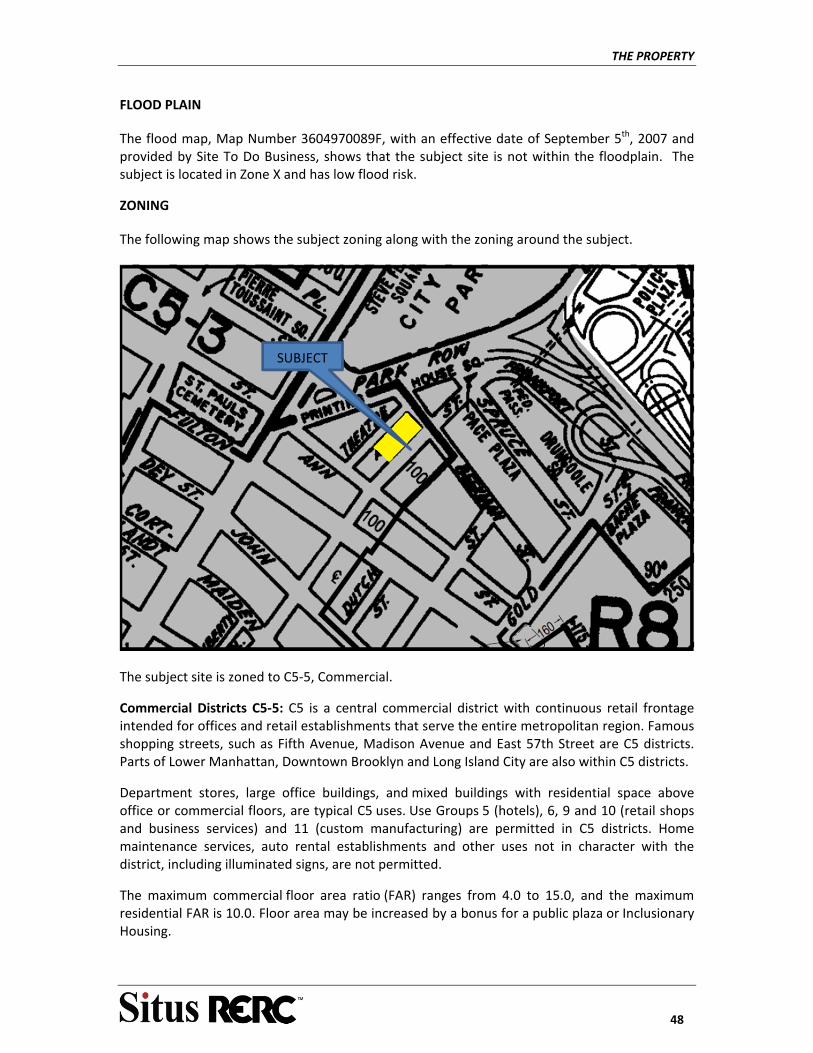
THE PROPERTY
48
FLOOD PLAIN
The flood map, Map Number 3604970089F, with an effective date of September 5th, 2007 and provided by Site To Do Business, shows that the subject site is not within the floodplain. The subject is located in Zone X and has low flood risk.
ZONING
The following map shows the subject zoning along with the zoning around the subject.
The subject site is zoned to C5‐5, Commercial.
Commercial Districts C5‐5: C5 is a central commercial district with continuous retail frontage intended for offices and retail establishments that serve the entire metropolitan region. Famous shopping streets, such as Fifth Avenue, Madison Avenue and East 57th Street are C5 districts. Parts of Lower Manhattan, Downtown Brooklyn and Long Island City are also within C5 districts.
Department stores, large office buildings, and mixed buildings with residential space above office or commercial floors, are typical C5 uses. Use Groups 5 (hotels), 6, 9 and 10 (retail shops and business services) and 11 (custom manufacturing) are permitted in C5 districts. Home maintenance services, auto rental establishments and other uses not in character with the district, including illuminated signs, are not permitted.
The maximum commercial floor area ratio (FAR) ranges from 4.0 to 15.0, and the maximum residential FAR is 10.0. Floor area may be increased by a bonus for a public plaza or Inclusionary Housing.
SUBJECT
THE PROPERTY
49
In the two contextual C5 districts—C5‐1A and C5‐2A—residential bulk and density are governed by R10A regulations. In non‐contextual C5‐2 through C5‐5 districts, a building occupied by commercial, residential and/or community facility uses may be configured as a tower. A residential tower is also allowed in C5‐1 districts. All commercial uses in C5 districts are exempt from off‐street parking requirements because public transportation is easily accessible.
Zoning Conclusion:
RERC is unaware of any deed restrictions impacting the subject. The subject’s improvements as being developed are assumed to be legally conforming to the zoning ordinance.
CONCLUSION ‐ SITE
The subject site is situated at the corner of Beekman Street and Nassau Street and Theater Alley. The surrounding area is improved with retail, office, multifamily, and other supporting commercial properties.
The size, shape, and topography of the site appear adequate to support the existing improvements. FloodScape indicates that the site is located in a low risk flood zone. All of the required utilities are available to the site.
REAL ESTATE TAXES
50
REAL ESTATE TAXES
The subject site is located within the taxing authority of New York City. Real property and personal property are taxed based on the assessments of the county. Personal property is included in the real property assessment. The assessed values used are estimated as of the effective date of January 1, 2015. Real Property and Personal Property are currently assessed at 45% of the determined "market value". According to the NYC Finance Assessor's Office, the subject's personal property assessments are included in the real property assessments.
Real property within the five boroughs of New York City is given a tax class designation by the Department of Finance in conformance with the New York State Real Property Tax Law. Each tax classification has a specific tax rate, which is established annually. The tax classes are as follows:
Class 1 ‐ Includes all primarily residential one, two and three family homes; residential condominiums of three dwelling units or less; residential condominiums of three stories or less that were originally built as condominiums; and certain vacant land zoned for residential use or adjoining improved Class 1 property.
Class 2 ‐ Includes all other primarily residential properties that are not in Class 1, including cooperatives and all other residential condominiums. This classification does not include hotels, motels or other similar property.
Class 3 ‐ Includes all utility corporations and special franchise properties, excluding land and certain buildings.
Class 4 ‐ Includes all other properties, such as stores, warehouses, hotels and vacant land not classified as class 1.
The subject lot is currently classified as a Class 4 property. The following table presents recent assessments and resulting taxes for the Subject, as well as a sample of comparable properties. Since the subject is under construction, the total appraised improvements are not yet assessed.
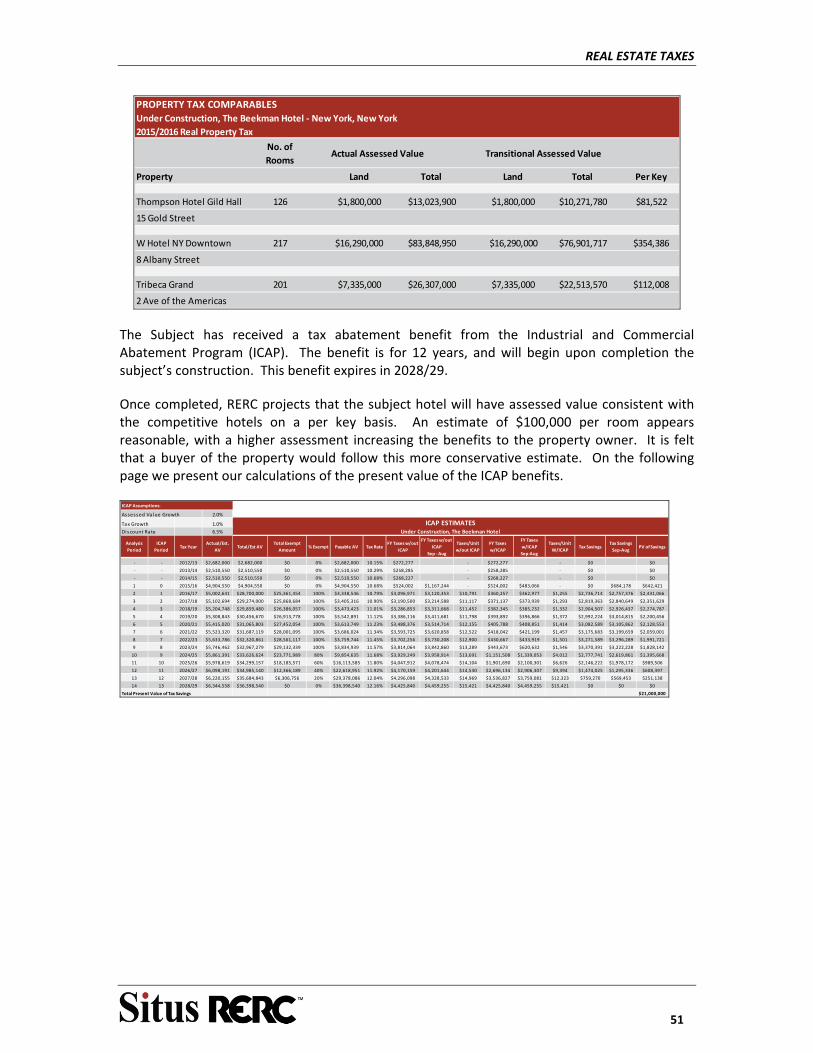
REAL ESTATE TAXES
51
PROPERTY TAX COMPARABLES
Under Construction, The Beekman Hotel ‐ New York, New York
2015/2016 Real Property Tax
No. of
RoomsActual Assessed Value Transitional Assessed Value
Property Land Total Land Total Per Key
Thompson Hotel Gild Hall 126 $1,800,000 $13,023,900 $1,800,000 $10,271,780 $81,522
15 Gold Street
W Hotel NY Downtown 217 $16,290,000 $83,848,950 $16,290,000 $76,901,717 $354,386
8 Albany Street
Tribeca Grand 201 $7,335,000 $26,307,000 $7,335,000 $22,513,570 $112,008
2 Ave of the Americas
The Subject has received a tax abatement benefit from the Industrial and Commercial Abatement Program (ICAP). The benefit is for 12 years, and will begin upon completion the subject’s construction. This benefit expires in 2028/29.
Once completed, RERC projects that the subject hotel will have assessed value consistent with the competitive hotels on a per key basis. An estimate of $100,000 per room appears reasonable, with a higher assessment increasing the benefits to the property owner. It is felt that a buyer of the property would follow this more conservative estimate. On the following page we present our calculations of the present value of the ICAP benefits.
Assessed Value Growth 2.0%
Tax Growth 1.0%
Discount Rate 6.5%
Analysis
Period
ICAP
PeriodTax Year
Actual/Est.
AVTotal/Est AV
Total Exempt
Amount% Exempt Payable AV Tax Rate
FY Taxes w/out
ICAP
FY Taxes w/out
ICAP
Sep ‐ Aug
Taxes/Unit
w/out ICAP
FY Taxes
w/ICAP
FY Taxes
w/ICAP
Sep‐Aug
Taxes/Unit
W/ICAPTax Savings
Tax Savings
Sep‐AugPV of Savings
‐ ‐ 2012/13 $2,682,000 $2,682,000 $0 0% $2,682,000 10.15% $272,277 ‐ $272,277 ‐ $0 $0
‐ ‐ 2013/14 $2,510,550 $2,510,550 $0 0% $2,510,550 10.29% $258,285 ‐ $258,285 ‐ $0 $0
‐ ‐ 2014/15 $2,510,550 $2,510,550 $0 0% $2,510,550 10.68% $268,227 ‐ $268,227 ‐ $0 $0
1 0 2015/16 $4,904,550 $4,904,550 $0 0% $4,904,550 10.68% $524,002 $1,167,244 ‐ $524,002 $483,066 ‐ $0 $684,178 $642,421
2 1 2016/17 $5,002,641 $28,700,000 $25,361,454 100% $3,338,546 10.79% $3,096,971 $3,120,353 $10,791 $360,257 $362,977 $1,255 $2,736,714 $2,757,376 $2,431,066
3 2 2017/18 $5,102,694 $29,274,000 $25,868,684 100% $3,405,316 10.90% $3,190,500 $3,214,588 $11,117 $371,137 $373,939 $1,293 $2,819,363 $2,840,649 $2,351,629
4 3 2018/19 $5,204,748 $29,859,480 $26,386,057 100% $3,473,423 11.01% $3,286,853 $3,311,668 $11,452 $382,345 $385,232 $1,332 $2,904,507 $2,926,437 $2,274,787
5 4 2019/20 $5,308,843 $30,456,670 $26,913,778 100% $3,542,891 11.12% $3,386,116 $3,411,681 $11,798 $393,892 $396,866 $1,372 $2,992,224 $3,014,815 $2,200,456
6 5 2020/21 $5,415,020 $31,065,803 $27,452,054 100% $3,613,749 11.23% $3,488,376 $3,514,714 $12,155 $405,788 $408,851 $1,414 $3,082,589 $3,105,862 $2,128,553
7 6 2021/22 $5,523,320 $31,687,119 $28,001,095 100% $3,686,024 11.34% $3,593,725 $3,620,858 $12,522 $418,042 $421,199 $1,457 $3,175,683 $3,199,659 $2,059,001
8 7 2022/23 $5,633,786 $32,320,861 $28,561,117 100% $3,759,744 11.45% $3,702,256 $3,730,208 $12,900 $430,667 $433,919 $1,501 $3,271,589 $3,296,289 $1,991,721
9 8 2023/24 $5,746,462 $32,967,279 $29,132,339 100% $3,834,939 11.57% $3,814,064 $3,842,860 $13,289 $443,673 $620,632 $1,546 $3,370,391 $3,222,228 $1,828,142
10 9 2024/25 $5,861,391 $33,626,624 $23,771,989 80% $9,854,635 11.68% $3,929,249 $3,958,914 $13,691 $1,151,508 $1,339,053 $4,012 $2,777,741 $2,619,861 $1,395,668
11 10 2025/26 $5,978,619 $34,299,157 $18,185,571 60% $16,113,585 11.80% $4,047,912 $4,078,474 $14,104 $1,901,690 $2,100,301 $6,626 $2,146,222 $1,978,172 $989,506
12 11 2026/27 $6,098,191 $34,985,140 $12,366,189 40% $22,618,951 11.92% $4,170,159 $4,201,644 $14,530 $2,696,134 $2,906,307 $9,394 $1,474,025 $1,295,336 $608,397
13 12 2027/28 $6,220,155 $35,684,843 $6,306,756 20% $29,378,086 12.04% $4,296,098 $4,328,533 $14,969 $3,536,827 $3,759,081 $12,323 $759,270 $569,453 $251,138
14 13 2028/29 $6,344,558 $36,398,540 $0 0% $36,398,540 12.16% $4,425,840 $4,459,255 $15,421 $4,425,840 $4,459,255 $15,421 $0 $0 $0
Total Present Value of Tax Savings $21,000,000
ICAP Assumptions:
ICAP ESTIMATESUnder Construction, The Beekman Hotel
HIGHEST AND BEST USE ANALYSIS
52
HIGHEST AND BEST USE ANALYSIS
According to The Appraisal of Real Estate, 5th edition, published by the Appraisal Institute, Highest and Best Use may be defined as:
The reasonably probable and legal use of vacant land or an improved property that is physically possible, appropriately supported, financially feasible, and that results in the highest value. The four criteria the highest and best use must meet are legal permissibility, physical possibility, financial feasibility, and maximum productivity. Alternatively, the probable use of land or improved property—specific with respect to the user and timing of the use—that is adequately supported and results in the highest present value.3
It is that reasonable and probable use that supports the highest present value, as defined, as of the effective date of the appraisal. The appraiser considers from the various reasonably probable and legal alternative uses which are physically possible, appropriately supported, and financially feasible that which results in the highest land value or the highest value of the property as improved. The estimated value of the property is based upon the highest and best use. Implied within this definition is the recognition of the contribution that a specific use may make to the community environment or the community development, such as a park, school or other public uses, in addition to wealth maximization of individual property owners. It must be legal and probable, not speculative or conjectural. Effective demand for the use must exist and it must yield the highest net return to the land for the longest time period.
To estimate the highest and best use, four factors are considered:
The use must be physically possible.
The use must be legally permissible.
The use must be financially feasible.
The use must produce the highest return to the property, i.e. maximally productive.
The highest and best use of the site, if vacant and available for use, may be different from the highest and best use of the property as improved. For example, this might be true when the improvement is not an appropriate use, but it continues to make a contribution to the overall value of the property in excess of the value of the site, less the cost of demolition.
HIGHEST AND BEST USE ‐ ASSUMING A VACANT SITE
1. Physically Possible Use
The first constraint on the possible use of the property is dictated by the physical aspects of the site. The physical characteristics of the site, its location and zoning and the utilities available are
3 The Appraisal of Real Estate, 5th Edition, 8 The Appraisal Institute, 1992, p.275.
HIGHEST AND BEST USE ANALYSIS
53
the most important determinants of value.
The physical attributes of the property and its neighborhood are described in detail in The Property and Neighborhood sections. A variety of uses are physically possible on the site.
2. Permissible Use
The legal restrictions that may apply to the subject are private restrictions and the public restrictions of zoning. No known private restrictions affect the property title, but RERC has not made title search. The other restrictions that exist are utility easements that do not adversely affect the development of the subject property.
The subject site is zoned and is a legally conforming use.
3. Feasible Use
Financial feasibility concerns the ability of any improvement to produce a sufficient return to attract development capital. Lodging metrics for the subject’s location are not at a level which would be required to support new hotel development on the subject site. Based on the improvement in the economy in recent years, a hotel development would be deemed the most feasible use of the site.
4. Maximally productive: Highest and Best Use As If Vacant
Several factors must be analyzed to determine which feasible use is the highest and best use. Given the current zoning of the subject, as well as the character of the surrounding development, hotel development appears to be the appropriate use. If the subject were vacant and available for use today, it is our opinion that the highest and best use would be to hold for hotel development if approvals for this type of use could be secured from the local governmental authorities.
Highest and Best Use – “As Improved”
The primary site is expected to be improved with a 287 room hotel and 68 unit condominium situated on a parcel containing 0.46 acres. As concluded above, the estimated highest and best use of the subject, as vacant, is consistent with the existing improvement type. Our review of alternative development possibilities indicates that office or retail use would present an alternative use that would not economically justify a different use or demolition of the improvements for redevelopment with an alternative use. As shown in the Income Approach section of this report, the subject is capable of producing a return that could attract investment capital as a proposed hotel development. Furthermore, it produces a value that exceeds that of the land, assumed vacant.
Taking all of the foregoing into consideration, it is our opinion that the present use generates the greatest return to the land, and therefore represents a form of the highest and best use of the site as improved.
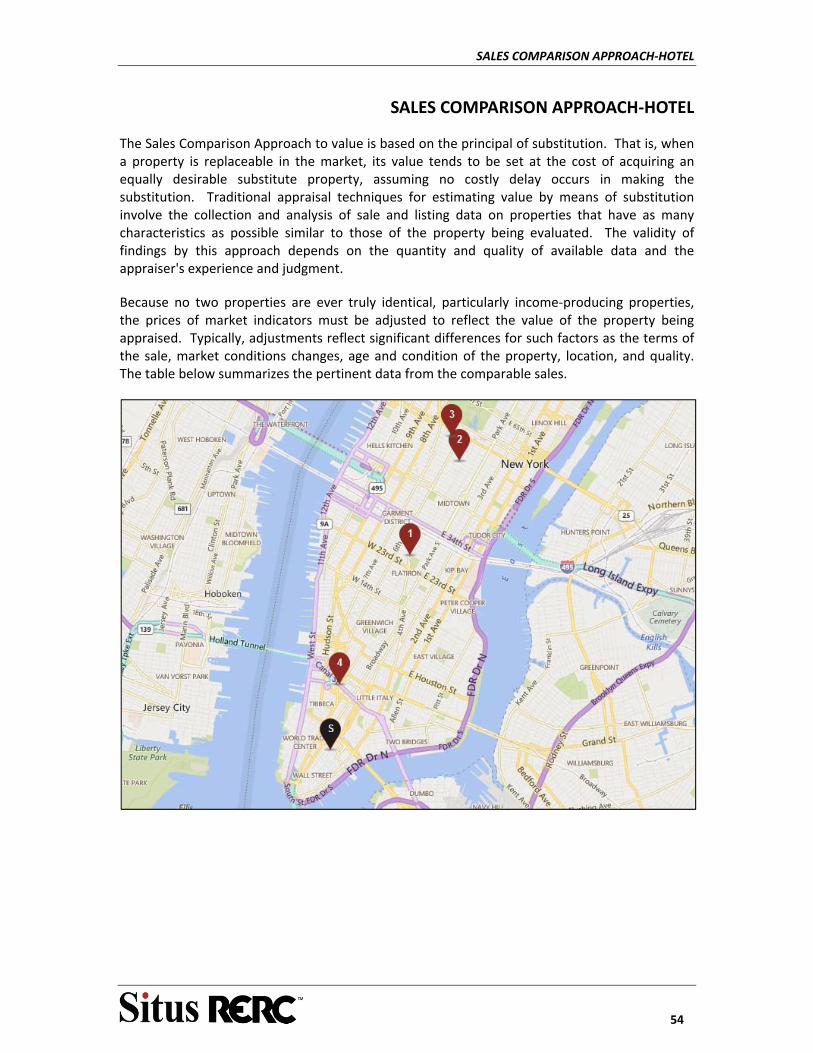
SALES COMPARISON APPROACH‐HOTEL
54
SALES COMPARISON APPROACH‐HOTEL
The Sales Comparison Approach to value is based on the principal of substitution. That is, when a property is replaceable in the market, its value tends to be set at the cost of acquiring an equally desirable substitute property, assuming no costly delay occurs in making the substitution. Traditional appraisal techniques for estimating value by means of substitution involve the collection and analysis of sale and listing data on properties that have as many characteristics as possible similar to those of the property being evaluated. The validity of findings by this approach depends on the quantity and quality of available data and the appraiser's experience and judgment.
Because no two properties are ever truly identical, particularly income‐producing properties, the prices of market indicators must be adjusted to reflect the value of the property being appraised. Typically, adjustments reflect significant differences for such factors as the terms of the sale, market conditions changes, age and condition of the property, location, and quality. The table below summarizes the pertinent data from the comparable sales.
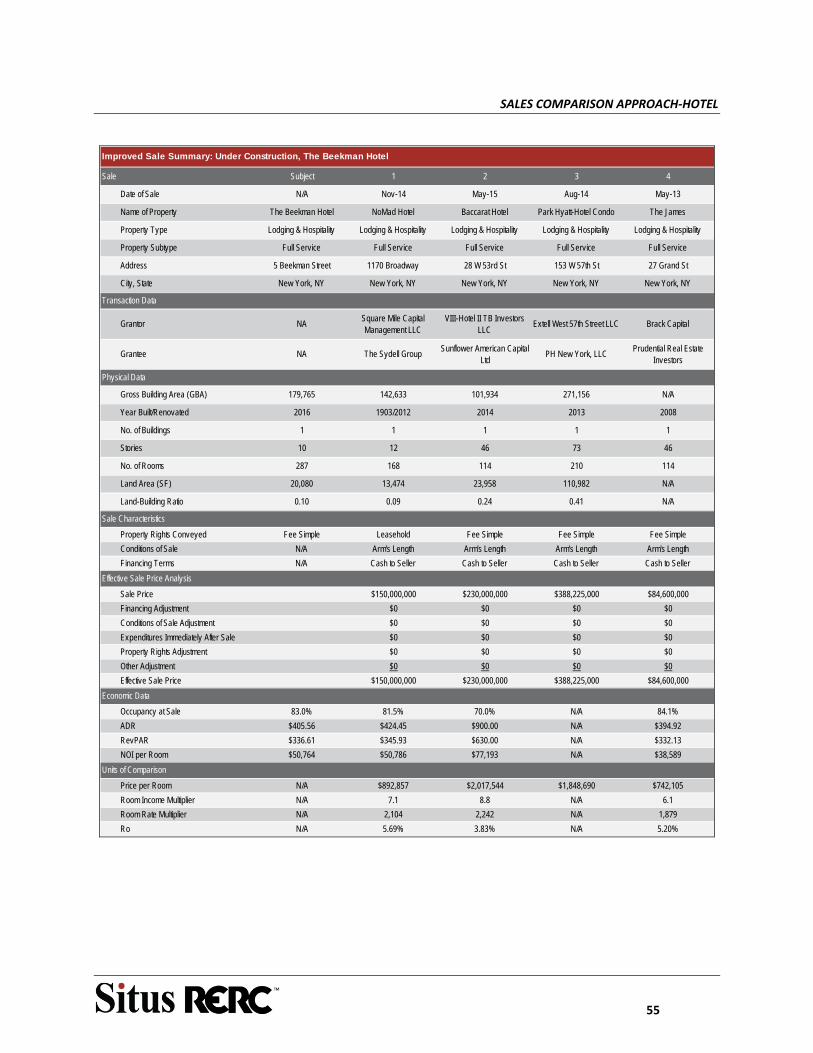
SALES COMPARISON APPROACH‐HOTEL
55
Improved Sale Summary: Under Construction, The Beekman Hotel
Sale Subject 1 2 3 4
Date of Sale N/A Nov-14 May-15 Aug-14 May-13
Name of Property The Beekman Hotel NoMad Hotel Baccarat Hotel Park Hyatt-Hotel Condo The James
Property Type Lodging & Hospitality Lodging & Hospitality Lodging & Hospitality Lodging & Hospitality Lodging & Hospitality
Property Subtype Full Service Full Service Full Service Full Service Full Service
Address 5 Beekman Street 1170 Broadway 28 W 53rd St 153 W 57th St 27 Grand St
City, State New York, NY New York, NY New York, NY New York, NY New York, NY
Transaction Data
Grantor NASquare Mile Capital Management LLC
VIII-Hotel II TB Investors LLC
Extell West 57th Street LLC Brack Capital
Grantee NA The Sydell GroupSunflower American Capital
LtdPH New York, LLC
Prudential Real Estate Investors
Physical Data
Gross Building Area (GBA) 179,765 142,633 101,934 271,156 N/A
Year Built/Renovated 2016 1903/2012 2014 2013 2008
No. of Buildings 1 1 1 1 1
Stories 10 12 46 73 46
No. of Rooms 287 168 114 210 114
Land Area (SF) 20,080 13,474 23,958 110,982 N/A
Land-Building Ratio 0.10 0.09 0.24 0.41 N/A
Sale Characteristics
Property Rights Conveyed Fee Simple Leasehold Fee Simple Fee Simple Fee Simple
Conditions of Sale N/A Arm's Length Arm's Length Arm's Length Arm's Length
Financing Terms N/A Cash to Seller Cash to Seller Cash to Seller Cash to Seller
Effective Sale Price Analysis
Sale Price $150,000,000 $230,000,000 $388,225,000 $84,600,000
Financing Adjustment $0 $0 $0 $0
Conditions of Sale Adjustment $0 $0 $0 $0
Expenditures Immediately After Sale $0 $0 $0 $0
Property Rights Adjustment $0 $0 $0 $0
Other Adjustment $0 $0 $0 $0
Effective Sale Price $150,000,000 $230,000,000 $388,225,000 $84,600,000
Economic Data
Occupancy at Sale 83.0% 81.5% 70.0% N/A 84.1%
ADR $405.56 $424.45 $900.00 N/A $394.92
RevPAR $336.61 $345.93 $630.00 N/A $332.13
NOI per Room $50,764 $50,786 $77,193 N/A $38,589
Units of Comparison
Price per Room N/A $892,857 $2,017,544 $1,848,690 $742,105
Room Income Multiplier N/A 7.1 8.8 N/A 6.1
Room Rate Multiplier N/A 2,104 2,242 N/A 1,879
Ro N/A 5.69% 3.83% N/A 5.20%
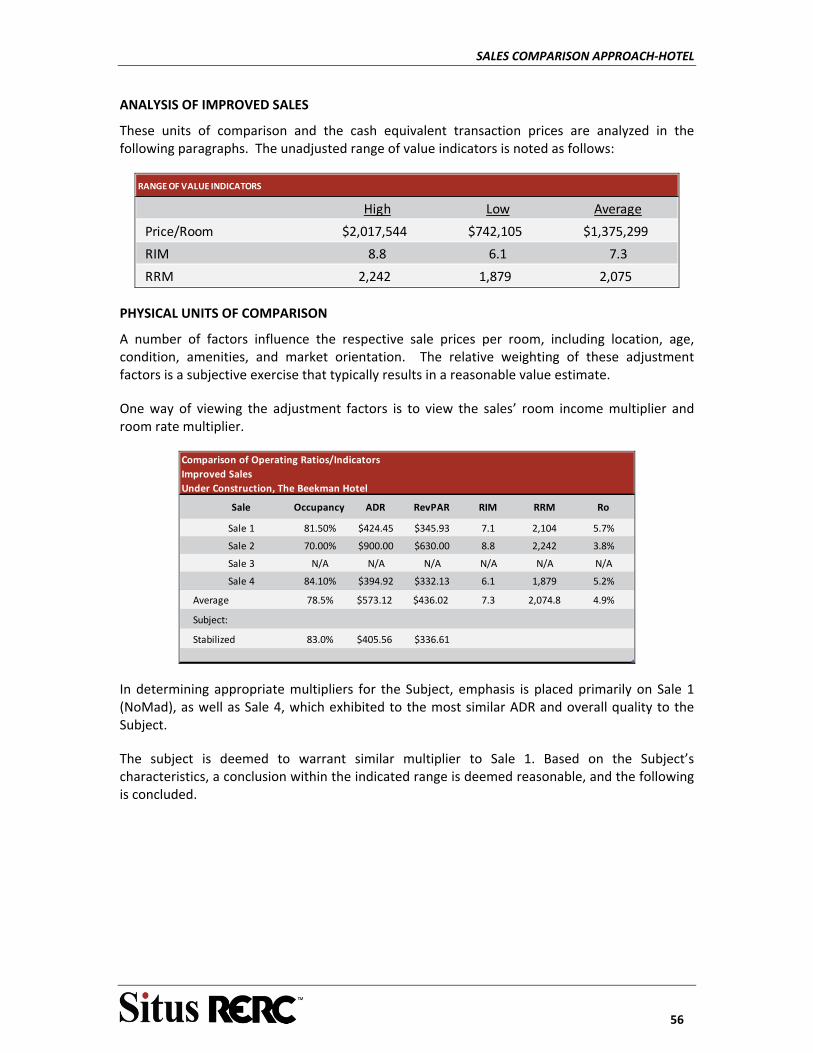
SALES COMPARISON APPROACH‐HOTEL
56
ANALYSIS OF IMPROVED SALES
These units of comparison and the cash equivalent transaction prices are analyzed in the following paragraphs. The unadjusted range of value indicators is noted as follows:
RANGE OF VALUE INDICATORS
High Low Average
Price/Room $2,017,544 $742,105 $1,375,299
RIM 8.8 6.1 7.3
RRM 2,242 1,879 2,075
PHYSICAL UNITS OF COMPARISON
A number of factors influence the respective sale prices per room, including location, age, condition, amenities, and market orientation. The relative weighting of these adjustment factors is a subjective exercise that typically results in a reasonable value estimate.
One way of viewing the adjustment factors is to view the sales’ room income multiplier and room rate multiplier.
Comparison of Operating Ratios/Indicators
Improved Sales
Under Construction, The Beekman Hotel
Sale Occupancy ADR RevPAR RIM RRM Ro
Sale 1 81.50% $424.45 $345.93 7.1 2,104 5.7%
Sale 2 70.00% $900.00 $630.00 8.8 2,242 3.8%
Sale 3 N/A N/A N/A N/A N/A N/A
Sale 4 84.10% $394.92 $332.13 6.1 1,879 5.2%
Average 78.5% $573.12 $436.02 7.3 2,074.8 4.9%
Subject:
Stabilized 83.0% $405.56 $336.61
In determining appropriate multipliers for the Subject, emphasis is placed primarily on Sale 1 (NoMad), as well as Sale 4, which exhibited to the most similar ADR and overall quality to the Subject.
The subject is deemed to warrant similar multiplier to Sale 1. Based on the Subject’s characteristics, a conclusion within the indicated range is deemed reasonable, and the following is concluded.
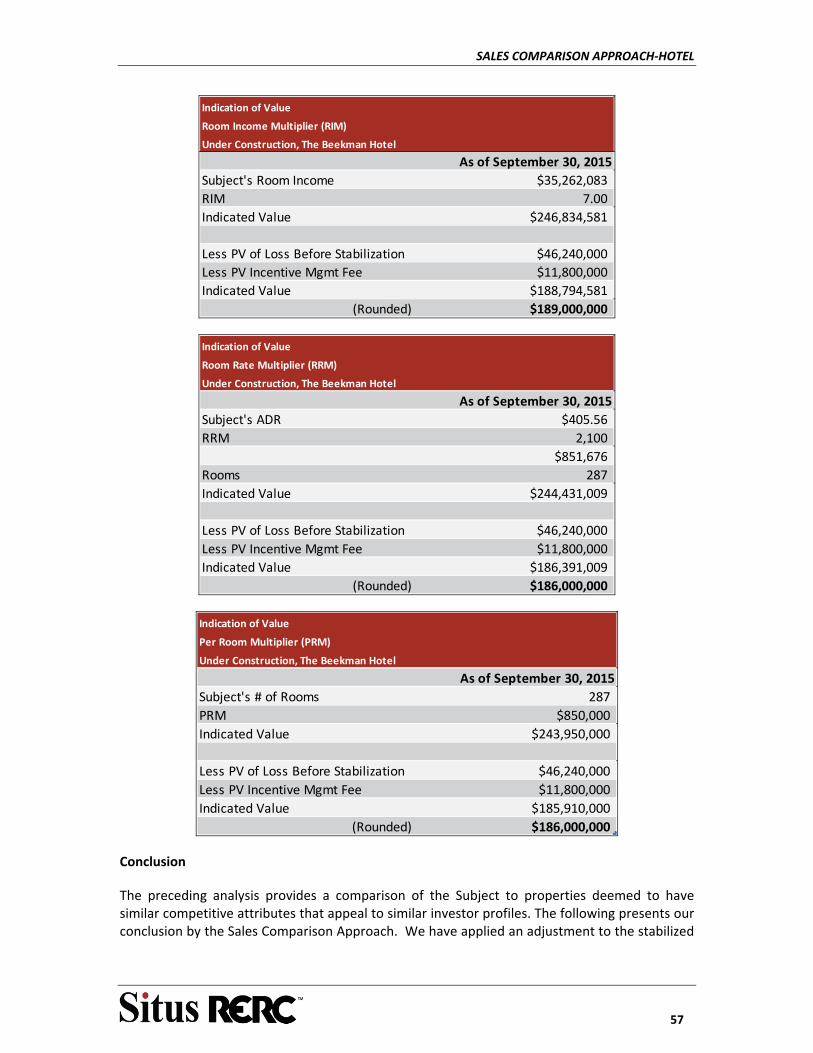
SALES COMPARISON APPROACH‐HOTEL
57
Indication of Value
Room Income Multiplier (RIM)
Under Construction, The Beekman Hotel
As of September 30, 2015
Subject's Room Income $35,262,083
RIM 7.00
Indicated Value $246,834,581
Less PV of Loss Before Stabilization $46,240,000
Less PV Incentive Mgmt Fee $11,800,000
Indicated Value $188,794,581
(Rounded) $189,000,000
Indication of Value
Room Rate Multiplier (RRM)
Under Construction, The Beekman Hotel
As of September 30, 2015
Subject's ADR $405.56
RRM 2,100
$851,676
Rooms 287
Indicated Value $244,431,009
Less PV of Loss Before Stabilization $46,240,000
Less PV Incentive Mgmt Fee $11,800,000
Indicated Value $186,391,009
(Rounded) $186,000,000
Indication of Value
Per Room Multiplier (PRM)
Under Construction, The Beekman Hotel
As of September 30, 2015
Subject's # of Rooms 287
PRM $850,000
Indicated Value $243,950,000
Less PV of Loss Before Stabilization $46,240,000
Less PV Incentive Mgmt Fee $11,800,000
Indicated Value $185,910,000
(Rounded) $186,000,000
Conclusion
The preceding analysis provides a comparison of the Subject to properties deemed to have similar competitive attributes that appeal to similar investor profiles. The following presents our conclusion by the Sales Comparison Approach. We have applied an adjustment to the stabilized
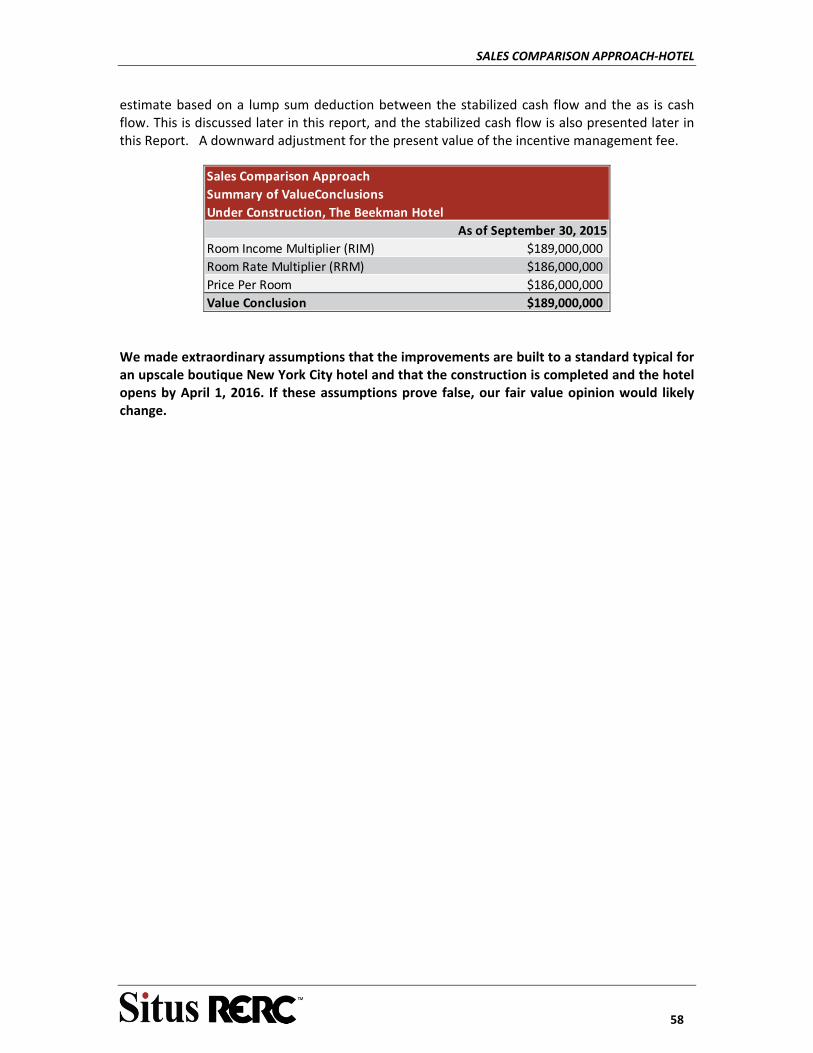
SALES COMPARISON APPROACH‐HOTEL
58
estimate based on a lump sum deduction between the stabilized cash flow and the as is cash flow. This is discussed later in this report, and the stabilized cash flow is also presented later in this Report. A downward adjustment for the present value of the incentive management fee.
Sales Comparison Approach
Summary of ValueConclusions
Under Construction, The Beekman Hotel
As of September 30, 2015
Room Income Multiplier (RIM) $189,000,000
Room Rate Multiplier (RRM) $186,000,000
Price Per Room $186,000,000
Value Conclusion $189,000,000
We made extraordinary assumptions that the improvements are built to a standard typical for an upscale boutique New York City hotel and that the construction is completed and the hotel opens by April 1, 2016. If these assumptions prove false, our fair value opinion would likely change.
INCOME APPROACH HOTEL
59
INCOME APPROACH HOTEL
INTRODUCTION
This section develops the estimated stabilized revenue and expense schedule for the subject property, followed by a capitalization of the net operating income into a value estimate. Investors typically use stabilized income as their benchmark for investment performance. It also allows for efficient analysis of comparable properties, and quantification of effective additional investment required by the investor to achieve stabilized operations if the property is currently not operating at that level.
The estimates of revenues and expenses have been based on the subject’s historical and reforecasted operating data, conversations with the property general manager at the time of inspection of the subject, and comparable operating data from similar hotels. The comparable data was analyzed and is summarized on the following page.
The expense figures from individual hotel comparables are also considered. These hotels include similar New York City, boutique luxury hotels. They are generally similar in most physical respects. The comparable data is deemed as a reasonable guideline in evaluating the appropriate expense levels for the subject.
Estimates of annual operating results for the subject were prepared for the valuation date. Expense classifications used in this report generally conform to the definitions prescribed in the American Hotel and Motel Association in the Uniform System of Accounts for Hotels (USAH). Some reorganization of the subject’s operating forecasts was necessitated.
The Subject’s budgeted and forecast operating statements were provided to RERC and summarized in the following table.
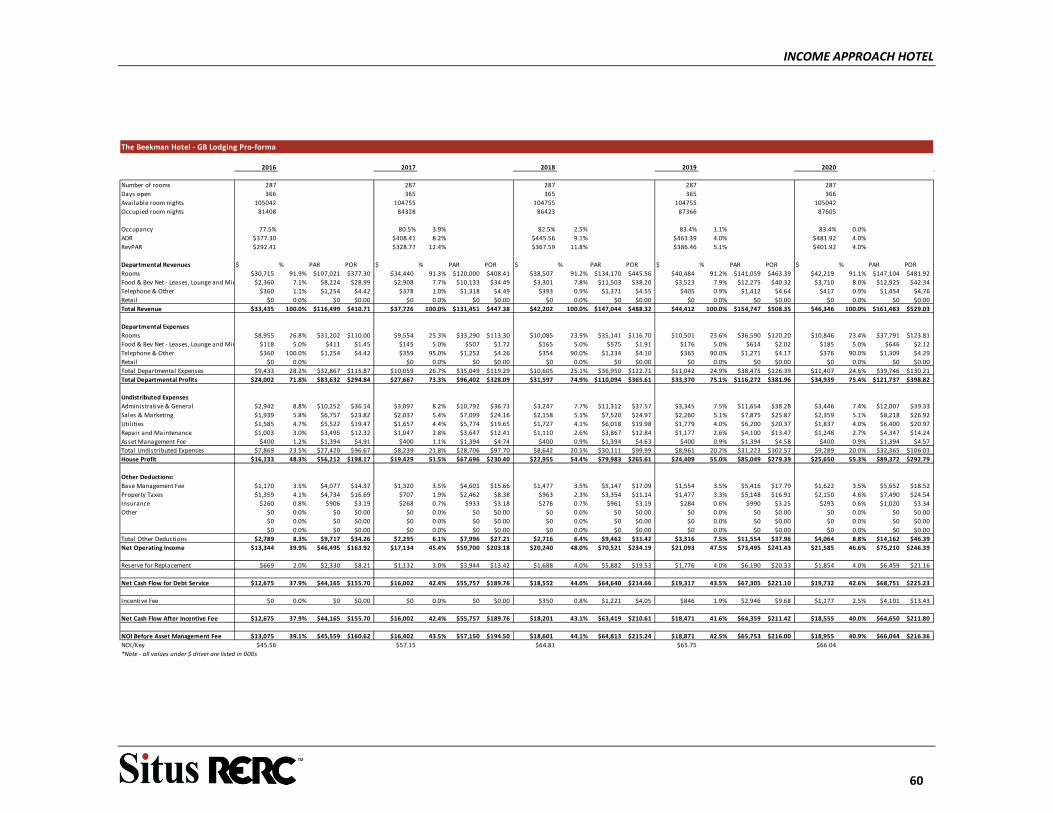
INCOME APPROACH HOTEL
60
2016 2017 2018 2019 2020
0 1 2 3 4
Number of rooms 287 287 287 287 287
Days open 366 365 365 365 366
Available room nights 105042 104755 104755 104755 105042
Occupied room nights 81408 84328 86423 87366 87605
Occupancy 77.5% 80.5% 3.9% 82.5% 2.5% 83.4% 1.1% 83.4% 0.0%
ADR $377.30 $408.41 8.2% $445.56 9.1% $463.39 4.0% $481.92 4.0%
RevPAR $292.41 $328.77 12.4% $367.59 11.8% $386.46 5.1% $401.92 4.0%
Departmental Revenues $ % PAR POR $ % PAR POR $ % PAR POR $ % PAR POR $ % PAR POR
Rooms $30,715 91.9% $107,021 $377.30 $34,440 91.3% $120,000 $408.41 $38,507 91.2% $134,170 $445.56 $40,484 91.2% $141,059 $463.39 $42,219 91.1% $147,104 $481.92
Food & Bev Net ‐ Leases, Lounge and Min $2,360 7.1% $8,224 $28.99 $2,908 7.7% $10,133 $34.49 $3,301 7.8% $11,503 $38.20 $3,523 7.9% $12,275 $40.32 $3,710 8.0% $12,925 $42.34
Telephone & Other $360 1.1% $1,254 $4.42 $378 1.0% $1,318 $4.49 $393 0.9% $1,371 $4.55 $405 0.9% $1,412 $4.64 $417 0.9% $1,454 $4.76
Retail $0 0.0% $0 $0.00 $0 0.0% $0 $0.00 $0 0.0% $0 $0.00 $0 0.0% $0 $0.00 $0 0.0% $0 $0.00
Total Revenue $33,435 100.0% $116,499 $410.71 $37,726 100.0% $131,451 $447.38 $42,202 100.0% $147,044 $488.32 $44,412 100.0% $154,747 $508.35 $46,346 100.0% $161,483 $529.03
Departmental Expenses
Rooms $8,955 26.8% $31,202 $110.00 $9,554 25.3% $33,290 $113.30 $10,085 23.9% $35,141 $116.70 $10,501 23.6% $36,590 $120.20 $10,846 23.4% $37,791 $123.81
Food & Bev Net ‐ Leases, Lounge and Min $118 5.0% $411 $1.45 $145 5.0% $507 $1.72 $165 5.0% $575 $1.91 $176 5.0% $614 $2.02 $185 5.0% $646 $2.12
Telephone & Other $360 100.0% $1,254 $4.42 $359 95.0% $1,252 $4.26 $354 90.0% $1,234 $4.10 $365 90.0% $1,271 $4.17 $376 90.0% $1,309 $4.29
Retail $0 0.0% $0 0.0% $0 $0.00 $0 0.0% $0 $0.00 $0 0.0% $0 $0.00 $0 0.0% $0 $0.00
Total Departmental Expenses $9,433 28.2% $32,867 $115.87 $10,059 26.7% $35,049 $119.29 $10,605 25.1% $36,950 $122.71 $11,042 24.9% $38,475 $126.39 $11,407 24.6% $39,746 $130.21
Total Departmental Profits $24,002 71.8% $83,632 $294.84 $27,667 73.3% $96,402 $328.09 $31,597 74.9% $110,094 $365.61 $33,370 75.1% $116,272 $381.96 $34,939 75.4% $121,737 $398.82
Undistributed Expenses
Administrative & General $2,942 8.8% $10,252 $36.14 $3,097 8.2% $10,792 $36.73 $3,247 7.7% $11,312 $37.57 $3,345 7.5% $11,654 $38.28 $3,446 7.4% $12,007 $39.33
Sales & Marketing $1,939 5.8% $6,757 $23.82 $2,037 5.4% $7,099 $24.16 $2,158 5.1% $7,520 $24.97 $2,260 5.1% $7,875 $25.87 $2,359 5.1% $8,218 $26.92
Util ities $1,585 4.7% $5,522 $19.47 $1,657 4.4% $5,774 $19.65 $1,727 4.1% $6,018 $19.98 $1,779 4.0% $6,200 $20.37 $1,837 4.0% $6,400 $20.97
Repair and Maintenance $1,003 3.0% $3,495 $12.32 $1,047 2.8% $3,647 $12.41 $1,110 2.6% $3,867 $12.84 $1,177 2.6% $4,100 $13.47 $1,248 2.7% $4,347 $14.24
Asset Management Fee $400 1.2% $1,394 $4.91 $400 1.1% $1,394 $4.74 $400 0.9% $1,394 $4.63 $400 0.9% $1,394 $4.58 $400 0.9% $1,394 $4.57
Total Undistributed Expenses $7,869 23.5% $27,420 $96.67 $8,239 21.8% $28,706 $97.70 $8,642 20.5% $30,111 $99.99 $8,961 20.2% $31,223 $102.57 $9,289 20.0% $32,365 $106.03
House Profit $16,133 48.3% $56,212 $198.17 $19,429 51.5% $67,696 $230.40 $22,955 54.4% $79,983 $265.61 $24,409 55.0% $85,049 $279.39 $25,650 55.3% $89,372 $292.79
Other Deductions:
Base Management Fee $1,170 3.5% $4,077 $14.37 $1,320 3.5% $4,601 $15.66 $1,477 3.5% $5,147 $17.09 $1,554 3.5% $5,416 $17.79 $1,622 3.5% $5,652 $18.52
Property Taxes $1,359 4.1% $4,734 $16.69 $707 1.9% $2,462 $8.38 $963 2.3% $3,354 $11.14 $1,477 3.3% $5,148 $16.91 $2,150 4.6% $7,490 $24.54
Insurance $260 0.8% $906 $3.19 $268 0.7% $933 $3.18 $276 0.7% $961 $3.19 $284 0.6% $990 $3.25 $293 0.6% $1,020 $3.34
Other $0 0.0% $0 $0.00 $0 0.0% $0 $0.00 $0 0.0% $0 $0.00 $0 0.0% $0 $0.00 $0 0.0% $0 $0.00
$0 0.0% $0 $0.00 $0 0.0% $0 $0.00 $0 0.0% $0 $0.00 $0 0.0% $0 $0.00 $0 0.0% $0 $0.00
$0 0.0% $0 $0.00 $0 0.0% $0 $0.00 $0 0.0% $0 $0.00 $0 0.0% $0 $0.00 $0 0.0% $0 $0.00
Total Other Deductions $2,789 8.3% $9,717 $34.26 $2,295 6.1% $7,996 $27.21 $2,716 6.4% $9,462 $31.42 $3,316 7.5% $11,554 $37.96 $4,064 8.8% $14,162 $46.39
Net Operating Income $13,344 39.9% $46,495 $163.92 $17,134 45.4% $59,700 $203.18 $20,240 48.0% $70,521 $234.19 $21,093 47.5% $73,495 $241.43 $21,585 46.6% $75,210 $246.39
Reserve for Replacement $669 2.0% $2,330 $8.21 $1,132 3.0% $3,944 $13.42 $1,688 4.0% $5,882 $19.53 $1,776 4.0% $6,190 $20.33 $1,854 4.0% $6,459 $21.16
Net Cash Flow for Debt Service $12,675 37.9% $44,165 $155.70 $16,002 42.4% $55,757 $189.76 $18,552 44.0% $64,640 $214.66 $19,317 43.5% $67,305 $221.10 $19,732 42.6% $68,751 $225.23
Incentive Fee $0 0.0% $0 $0.00 $0 0.0% $0 $0.00 $350 0.8% $1,221 $4.05 $846 1.9% $2,946 $9.68 $1,177 2.5% $4,101 $13.43
Net Cash Flow After Incentive Fee $12,675 37.9% $44,165 $155.70 $16,002 42.4% $55,757 $189.76 $18,201 43.1% $63,419 $210.61 $18,471 41.6% $64,359 $211.42 $18,555 40.0% $64,650 $211.80
NOI Before Asset Management Fee $13,075 39.1% $45,559 $160.62 $16,402 43.5% $57,150 $194.50 $18,601 44.1% $64,813 $215.24 $18,871 42.5% $65,753 $216.00 $18,955 40.9% $66,044 $216.36
NOI/Key $45.56 $57.15 $64.81 $65.75 $66.04
*Note ‐ all values under $ driver are listed in 000s
The Beekman Hotel ‐ GB Lodging Pro‐forma
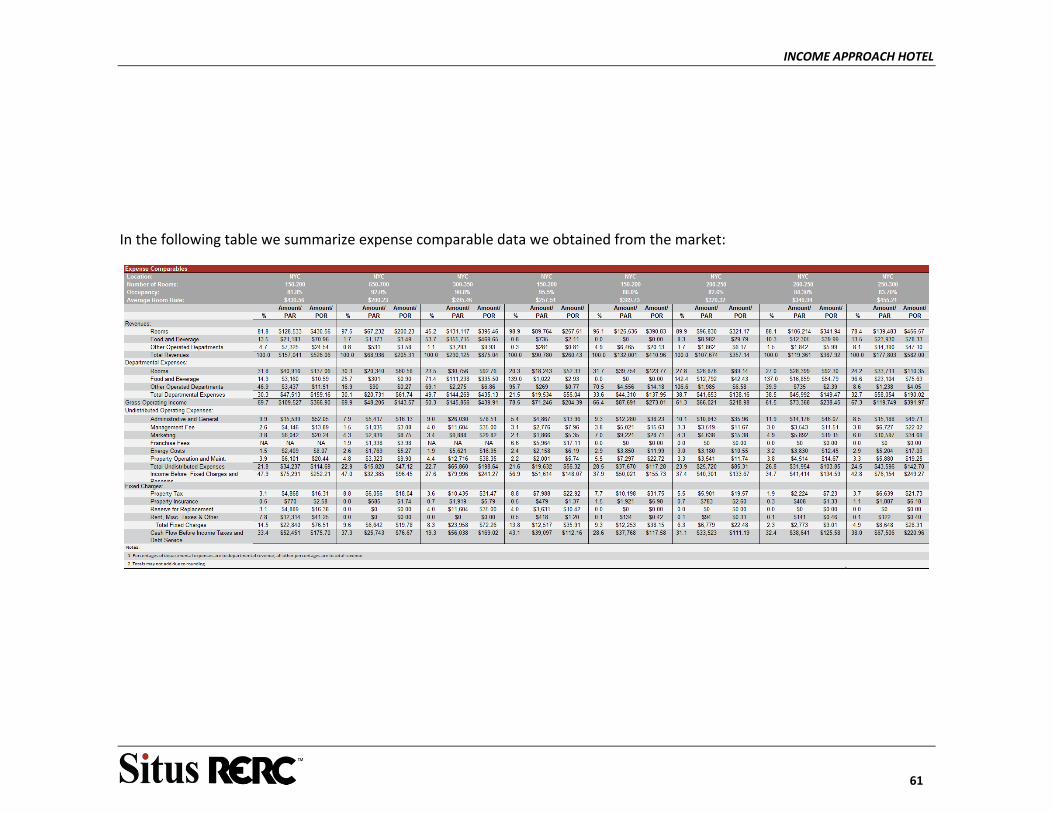
INCOME APPROACH HOTEL
61
In the following table we summarize expense comparable data we obtained from the market:
INCOME APPROACH HOTEL
62
INCOME AND EXPENSE ANALYSIS
Revenue Analysis
Room Sales are based on the anticipated occupancies multiplied by the average daily rates as shown in the Lodging Market Analysis section of the report. The conclusions for this category were an ADR of $349.87 and occupancy of 73.0% for the trailing twelve months ending September 2016, which were supported by our analysis of the market.
Food and Beverage Sales as shown in the Subject cash flows include net revenue from the two restaurants which are leased to 3rd party operators, as well as small nightclub and mini‐bar components. The two restaurants are leased famous restauranteur Keith McNally and to celebrity chef Tom Colicchio, generate most of the F&B income via fixed rent, with smaller percentage rent component.
Miscellaneous/Other Revenues This line item includes revenues from Guest Laundry, the F&B and Spa Leases, attrition penalties, conference services, telephone sales and other miscellaneous income at the subject. RERC has estimated $8.00 POR for the Subject. This item varies from property to property depending on the services offered.
Room Department Expenses consist of payroll and related expenses, credit card bank fees, guest supplies, paper goods, cleaning supplies, laundry, linen, and other items for maintaining guest rooms. This category ranged from 20.3% to 31.7% of departmental room revenues for the comparables.
Management has budgeted expenses of 26.8% in year 1, and 23.6% in stabilized year 4. RERC has projected 27.0% initially and stabilizing at 25.0% based on Management’s pro‐forma and the comparables.
Food and Beverage Expenses are typically analyzed as a percentage of food and beverage sales. However, in this case, most of the F&B revenue is net rent revenue from the restaurants leases. Accordingly, RERC has projected 5.0% on a stabilized basis of food and beverage revenues for the subject (associated with the not lease revenue components of the F&B).
Miscellaneous/Other Expenses for the subject were 90% in the pro‐forma at stabilization, but lower for the comparables. RERC projected these expenses at 60%.
Expense Analysis‐‐Undistributed Operating Expenses
Administrative and General Expenses include office payroll and related expenses for the administrative staff. Also included are bad debts, credit card commissions, general liability insurance, travel and other miscellaneous expenses as well as equipment rentals. Administrative and General tend to be a "catch all" for items that are not easily classified. Accordingly, these expenses can vary widely depending upon management philosophy and the existence of management contracts.
The expense comparables ranged from 5.4% to 11.9% with an average of 9.0% for
INCOME APPROACH HOTEL
63
administrative and general expenses as a percent of gross revenue.
The pro‐forma estimated 8.8% of gross revenue, and 7.5% by stabilization in Year 4. The amount as a percent should decrease as the Subject stabilizes. Based on this, we have projected this expense to stabilize at 9% for the Subject.
Sales and Marketing Expenses include payroll and related expenses, agency fees, chain related national advertising, media advertising, travel agent commissions, entertainment and travel. Marketing expenses for the comparables ranged from 2.1% to 7.0% with an average of 4.5%.
The subject’s ratio was 5.8% in year 1 and 5.1% in Year 3 of the pro‐forma. As a hotel stabilizes after opening, the sales and marketing expense ratio’s decrease and should stabilize and a market supported rate. We projected 6.0% in year 1 and stabilized level of 5.0% starting year 3.
Energy costs represent expenditures for electricity, fuel, water and operating supplies for this department. This expense ranged from 1.5% to 3.2% for the comparables, supporting an estimate of 3.0% of gross revenue.
Property Operation and Maintenance (POM) This expense ranged from 2.2% to 5.5% with an average of 3.9% of gross revenue. We assumed 4.0% of gross revenue.
Expense Analysis‐‐Management Fees and Fixed Charges
Base Management Fees The subject’s management fee structure includes a management fee of 3.00% of Gross Revenue, plus an incentive management fee. In estimating the fair value, passive ownership is assumed, requiring the deduction of a management fee consistent with market levels. Figures from the comparables support the concluded fee percentage as reasonable.
According to the management agreement, there is an incentive management fee of 15% of net income in excess of 12% return to the owner’s invested capital. Considering the lease up period, hurdles for incentive management fee are assumed to be met starting year 4 of the cash flow, therefore, a lump sum negative adjustment is applied to the value conclusions by the various approaches to recognize the present value of this expense over the holding period.
Property Taxes are estimated as discussed previously in the Property section of this report.
Property Insurance Expenses have been estimated at 0.7% of revenues. The individual comparables reported expenses from 0.3% to 1.5% of total revenue. The subject Budget ranged from 0.6% to 0.8% of total revenues.
Reserve for Replacement of Fixed Assets ‐ Industry standards typically allow for a reserve of 4% to 5%, with 4% being the more common figure. Many franchises require a reserve to be established that is usually in the aforementioned range. RERC has estimated reserves at 2.00% in Year 1, when many items will be under warranty, increasing to 4% by the third year of operation.
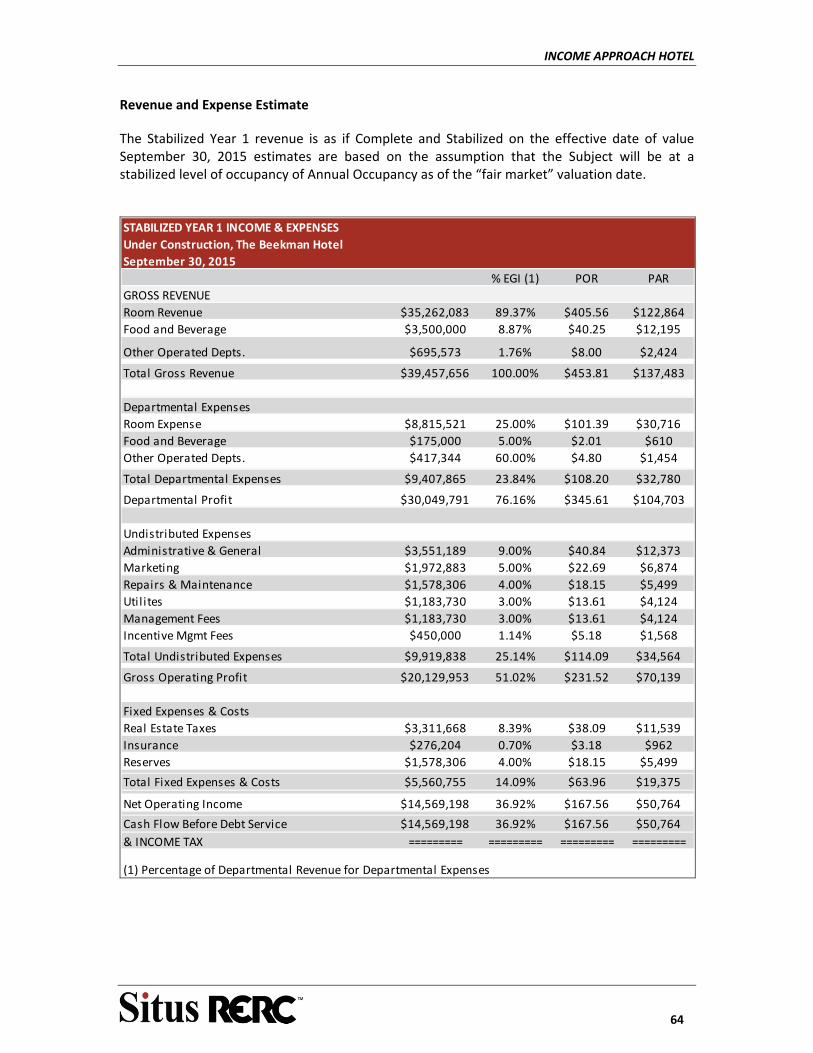
INCOME APPROACH HOTEL
64
Revenue and Expense Estimate
The Stabilized Year 1 revenue is as if Complete and Stabilized on the effective date of value September 30, 2015 estimates are based on the assumption that the Subject will be at a stabilized level of occupancy of Annual Occupancy as of the “fair market” valuation date.
% EGI (1) POR PAR
GROSS REVENUE
Room Revenue $35,262,083 89.37% $405.56 $122,864
Food and Beverage $3,500,000 8.87% $40.25 $12,195
Other Operated Depts. $695,573 1.76% $8.00 $2,424
Total Gross Revenue $39,457,656 100.00% $453.81 $137,483
Departmental Expenses
Room Expense $8,815,521 25.00% $101.39 $30,716
Food and Beverage $175,000 5.00% $2.01 $610
Other Operated Depts. $417,344 60.00% $4.80 $1,454
Total Departmental Expenses $9,407,865 23.84% $108.20 $32,780
Departmental Profit $30,049,791 76.16% $345.61 $104,703
Undistributed Expenses
Administrative & General $3,551,189 9.00% $40.84 $12,373
Marketing $1,972,883 5.00% $22.69 $6,874
Repairs & Maintenance $1,578,306 4.00% $18.15 $5,499
Util ites $1,183,730 3.00% $13.61 $4,124
Management Fees $1,183,730 3.00% $13.61 $4,124
Incentive Mgmt Fees $450,000 1.14% $5.18 $1,568
Total Undistributed Expenses $9,919,838 25.14% $114.09 $34,564
Gross Operating Profit $20,129,953 51.02% $231.52 $70,139
Fixed Expenses & Costs
Real Estate Taxes $3,311,668 8.39% $38.09 $11,539
Insurance $276,204 0.70% $3.18 $962
Reserves $1,578,306 4.00% $18.15 $5,499
Total Fixed Expenses & Costs $5,560,755 14.09% $63.96 $19,375
Net Operating Income $14,569,198 36.92% $167.56 $50,764
Cash Flow Before Debt Service $14,569,198 36.92% $167.56 $50,764
& INCOME TAX ========= ========= ========= =========
(1) Percentage of Departmental Revenue for Departmental Expenses
STABILIZED YEAR 1 INCOME & EXPENSES
Under Construction, The Beekman Hotel
September 30, 2015
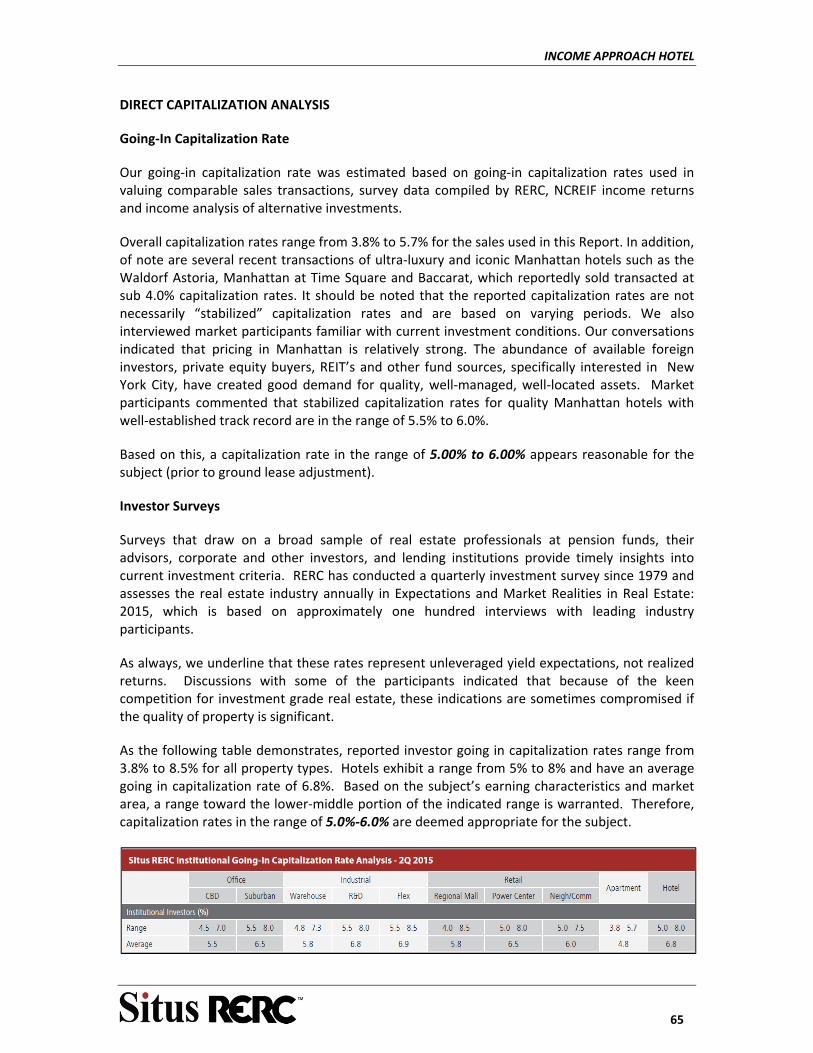
INCOME APPROACH HOTEL
65
DIRECT CAPITALIZATION ANALYSIS
Going‐In Capitalization Rate
Our going‐in capitalization rate was estimated based on going‐in capitalization rates used in valuing comparable sales transactions, survey data compiled by RERC, NCREIF income returns and income analysis of alternative investments.
Overall capitalization rates range from 3.8% to 5.7% for the sales used in this Report. In addition, of note are several recent transactions of ultra‐luxury and iconic Manhattan hotels such as the Waldorf Astoria, Manhattan at Time Square and Baccarat, which reportedly sold transacted at sub 4.0% capitalization rates. It should be noted that the reported capitalization rates are not necessarily “stabilized” capitalization rates and are based on varying periods. We also interviewed market participants familiar with current investment conditions. Our conversations indicated that pricing in Manhattan is relatively strong. The abundance of available foreign investors, private equity buyers, REIT’s and other fund sources, specifically interested in New York City, have created good demand for quality, well‐managed, well‐located assets. Market participants commented that stabilized capitalization rates for quality Manhattan hotels with well‐established track record are in the range of 5.5% to 6.0%.
Based on this, a capitalization rate in the range of 5.00% to 6.00% appears reasonable for the subject (prior to ground lease adjustment).
Investor Surveys
Surveys that draw on a broad sample of real estate professionals at pension funds, their advisors, corporate and other investors, and lending institutions provide timely insights into current investment criteria. RERC has conducted a quarterly investment survey since 1979 and assesses the real estate industry annually in Expectations and Market Realities in Real Estate: 2015, which is based on approximately one hundred interviews with leading industry participants.
As always, we underline that these rates represent unleveraged yield expectations, not realized returns. Discussions with some of the participants indicated that because of the keen competition for investment grade real estate, these indications are sometimes compromised if the quality of property is significant.
As the following table demonstrates, reported investor going in capitalization rates range from 3.8% to 8.5% for all property types. Hotels exhibit a range from 5% to 8% and have an average going in capitalization rate of 6.8%. Based on the subject’s earning characteristics and market area, a range toward the lower‐middle portion of the indicated range is warranted. Therefore, capitalization rates in the range of 5.0%‐6.0% are deemed appropriate for the subject.
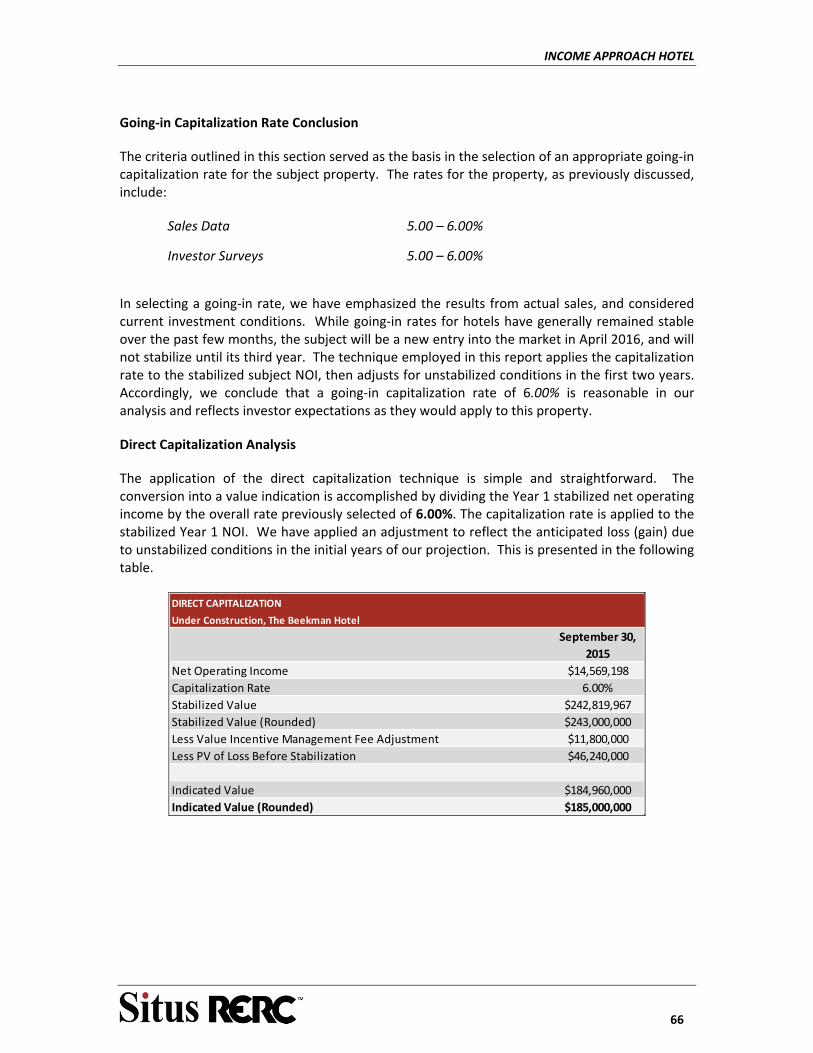
INCOME APPROACH HOTEL
66
Going‐in Capitalization Rate Conclusion
The criteria outlined in this section served as the basis in the selection of an appropriate going‐in capitalization rate for the subject property. The rates for the property, as previously discussed, include:
Sales Data 5.00 – 6.00%
Investor Surveys 5.00 – 6.00%
In selecting a going‐in rate, we have emphasized the results from actual sales, and considered current investment conditions. While going‐in rates for hotels have generally remained stable over the past few months, the subject will be a new entry into the market in April 2016, and will not stabilize until its third year. The technique employed in this report applies the capitalization rate to the stabilized subject NOI, then adjusts for unstabilized conditions in the first two years. Accordingly, we conclude that a going‐in capitalization rate of 6.00% is reasonable in our analysis and reflects investor expectations as they would apply to this property.
Direct Capitalization Analysis
The application of the direct capitalization technique is simple and straightforward. The conversion into a value indication is accomplished by dividing the Year 1 stabilized net operating income by the overall rate previously selected of 6.00%. The capitalization rate is applied to the stabilized Year 1 NOI. We have applied an adjustment to reflect the anticipated loss (gain) due to unstabilized conditions in the initial years of our projection. This is presented in the following table.
September 30,
2015
Net Operating Income $14,569,198
Capitalization Rate 6.00%
Stabilized Value $242,819,967
Stabilized Value (Rounded) $243,000,000
Less Value Incentive Management Fee Adjustment $11,800,000
Less PV of Loss Before Stabilization $46,240,000
Indicated Value $184,960,000
Indicated Value (Rounded) $185,000,000
Under Construction, The Beekman Hotel
DIRECT CAPITALIZATION
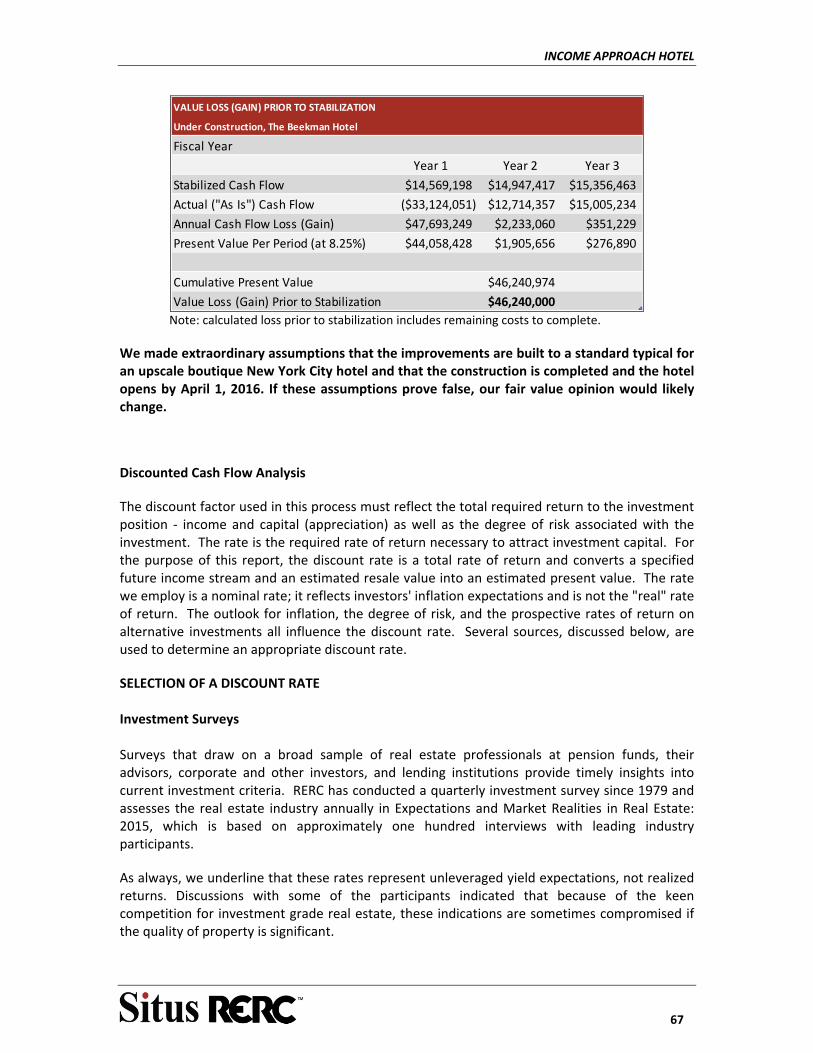
INCOME APPROACH HOTEL
67
VALUE LOSS (GAIN) PRIOR TO STABILIZATION
Under Construction, The Beekman Hotel
Fiscal Year
Year 1 Year 2 Year 3
Stabilized Cash Flow $14,569,198 $14,947,417 $15,356,463
Actual ("As Is") Cash Flow ($33,124,051) $12,714,357 $15,005,234
Annual Cash Flow Loss (Gain) $47,693,249 $2,233,060 $351,229
Present Value Per Period (at 8.25%) $44,058,428 $1,905,656 $276,890
Cumulative Present Value $46,240,974
Value Loss (Gain) Prior to Stabilization $46,240,000 Note: calculated loss prior to stabilization includes remaining costs to complete.
We made extraordinary assumptions that the improvements are built to a standard typical for an upscale boutique New York City hotel and that the construction is completed and the hotel opens by April 1, 2016. If these assumptions prove false, our fair value opinion would likely change.
Discounted Cash Flow Analysis
The discount factor used in this process must reflect the total required return to the investment position ‐ income and capital (appreciation) as well as the degree of risk associated with the investment. The rate is the required rate of return necessary to attract investment capital. For the purpose of this report, the discount rate is a total rate of return and converts a specified future income stream and an estimated resale value into an estimated present value. The rate we employ is a nominal rate; it reflects investors' inflation expectations and is not the "real" rate of return. The outlook for inflation, the degree of risk, and the prospective rates of return on alternative investments all influence the discount rate. Several sources, discussed below, are used to determine an appropriate discount rate.
SELECTION OF A DISCOUNT RATE Investment Surveys Surveys that draw on a broad sample of real estate professionals at pension funds, their advisors, corporate and other investors, and lending institutions provide timely insights into current investment criteria. RERC has conducted a quarterly investment survey since 1979 and assesses the real estate industry annually in Expectations and Market Realities in Real Estate: 2015, which is based on approximately one hundred interviews with leading industry participants.
As always, we underline that these rates represent unleveraged yield expectations, not realized returns. Discussions with some of the participants indicated that because of the keen competition for investment grade real estate, these indications are sometimes compromised if the quality of property is significant.
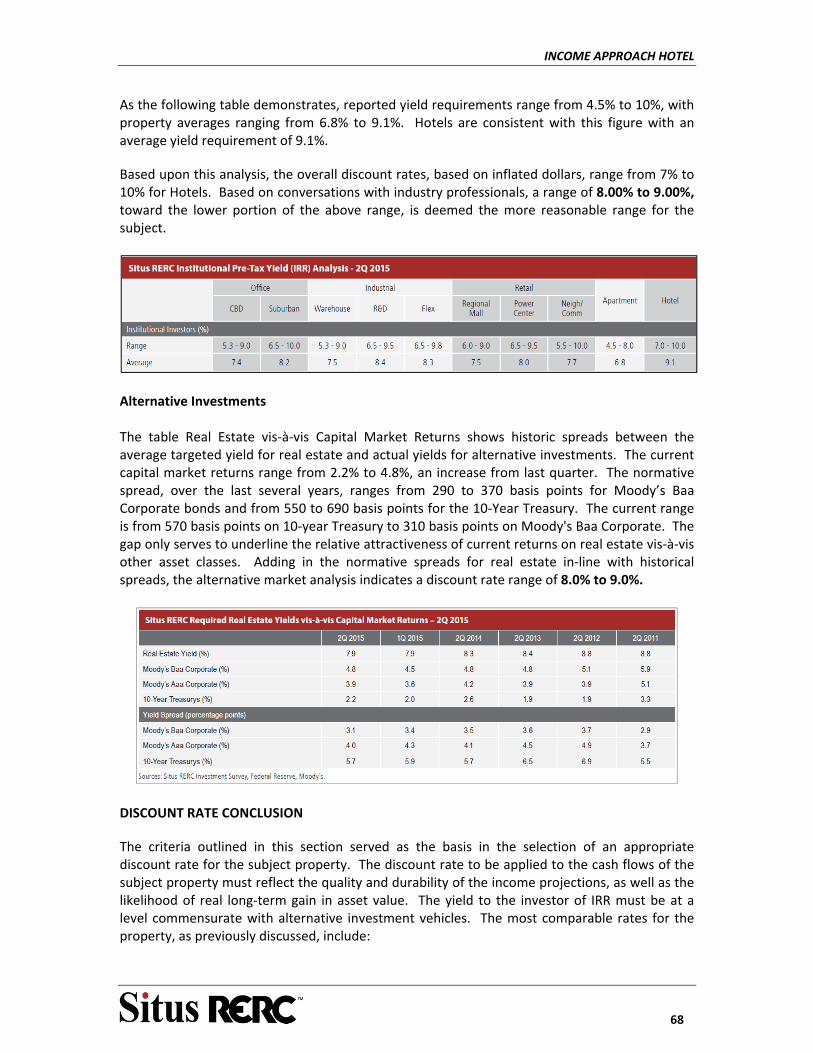
INCOME APPROACH HOTEL
68
As the following table demonstrates, reported yield requirements range from 4.5% to 10%, with property averages ranging from 6.8% to 9.1%. Hotels are consistent with this figure with an average yield requirement of 9.1%.
Based upon this analysis, the overall discount rates, based on inflated dollars, range from 7% to 10% for Hotels. Based on conversations with industry professionals, a range of 8.00% to 9.00%, toward the lower portion of the above range, is deemed the more reasonable range for the subject.
Alternative Investments The table Real Estate vis‐à‐vis Capital Market Returns shows historic spreads between the average targeted yield for real estate and actual yields for alternative investments. The current capital market returns range from 2.2% to 4.8%, an increase from last quarter. The normative spread, over the last several years, ranges from 290 to 370 basis points for Moody’s Baa Corporate bonds and from 550 to 690 basis points for the 10‐Year Treasury. The current range is from 570 basis points on 10‐year Treasury to 310 basis points on Moody's Baa Corporate. The gap only serves to underline the relative attractiveness of current returns on real estate vis‐à‐vis other asset classes. Adding in the normative spreads for real estate in‐line with historical spreads, the alternative market analysis indicates a discount rate range of 8.0% to 9.0%.
DISCOUNT RATE CONCLUSION
The criteria outlined in this section served as the basis in the selection of an appropriate discount rate for the subject property. The discount rate to be applied to the cash flows of the subject property must reflect the quality and durability of the income projections, as well as the likelihood of real long‐term gain in asset value. The yield to the investor of IRR must be at a level commensurate with alternative investment vehicles. The most comparable rates for the property, as previously discussed, include:
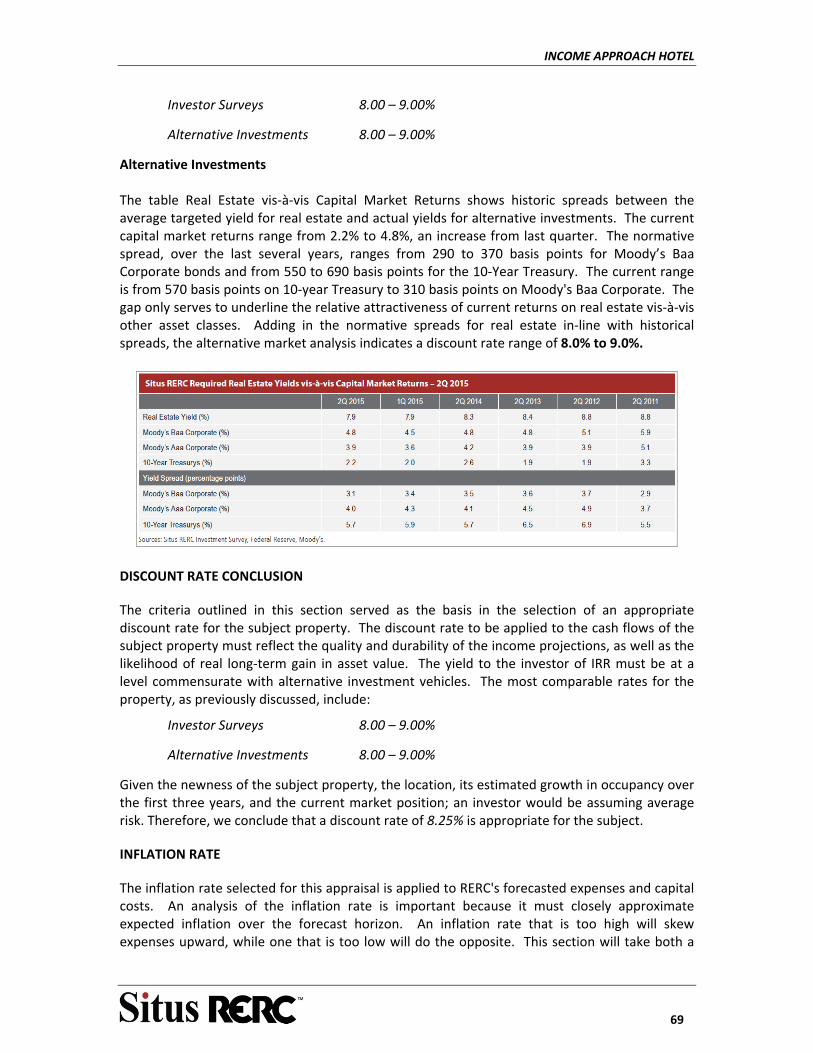
INCOME APPROACH HOTEL
69
Investor Surveys 8.00 – 9.00%
Alternative Investments 8.00 – 9.00%
Alternative Investments The table Real Estate vis‐à‐vis Capital Market Returns shows historic spreads between the average targeted yield for real estate and actual yields for alternative investments. The current capital market returns range from 2.2% to 4.8%, an increase from last quarter. The normative spread, over the last several years, ranges from 290 to 370 basis points for Moody’s Baa Corporate bonds and from 550 to 690 basis points for the 10‐Year Treasury. The current range is from 570 basis points on 10‐year Treasury to 310 basis points on Moody's Baa Corporate. The gap only serves to underline the relative attractiveness of current returns on real estate vis‐à‐vis other asset classes. Adding in the normative spreads for real estate in‐line with historical spreads, the alternative market analysis indicates a discount rate range of 8.0% to 9.0%.
DISCOUNT RATE CONCLUSION
The criteria outlined in this section served as the basis in the selection of an appropriate discount rate for the subject property. The discount rate to be applied to the cash flows of the subject property must reflect the quality and durability of the income projections, as well as the likelihood of real long‐term gain in asset value. The yield to the investor of IRR must be at a level commensurate with alternative investment vehicles. The most comparable rates for the property, as previously discussed, include:
Investor Surveys 8.00 – 9.00%
Alternative Investments 8.00 – 9.00%
Given the newness of the subject property, the location, its estimated growth in occupancy over the first three years, and the current market position; an investor would be assuming average risk. Therefore, we conclude that a discount rate of 8.25% is appropriate for the subject.
INFLATION RATE
The inflation rate selected for this appraisal is applied to RERC's forecasted expenses and capital costs. An analysis of the inflation rate is important because it must closely approximate expected inflation over the forecast horizon. An inflation rate that is too high will skew expenses upward, while one that is too low will do the opposite. This section will take both a
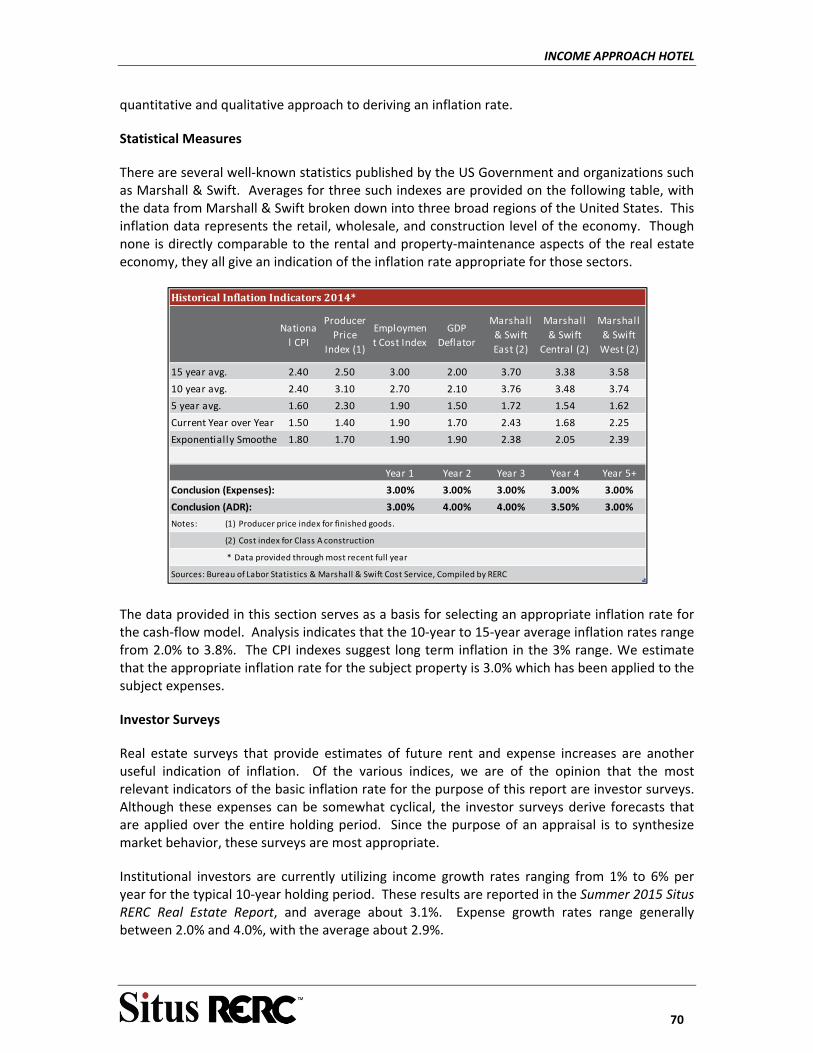
INCOME APPROACH HOTEL
70
quantitative and qualitative approach to deriving an inflation rate.
Statistical Measures
There are several well‐known statistics published by the US Government and organizations such as Marshall & Swift. Averages for three such indexes are provided on the following table, with the data from Marshall & Swift broken down into three broad regions of the United States. This inflation data represents the retail, wholesale, and construction level of the economy. Though none is directly comparable to the rental and property‐maintenance aspects of the real estate economy, they all give an indication of the inflation rate appropriate for those sectors.
The data provided in this section serves as a basis for selecting an appropriate inflation rate for the cash‐flow model. Analysis indicates that the 10‐year to 15‐year average inflation rates range from 2.0% to 3.8%. The CPI indexes suggest long term inflation in the 3% range. We estimate that the appropriate inflation rate for the subject property is 3.0% which has been applied to the subject expenses.
Investor Surveys
Real estate surveys that provide estimates of future rent and expense increases are another useful indication of inflation. Of the various indices, we are of the opinion that the most relevant indicators of the basic inflation rate for the purpose of this report are investor surveys. Although these expenses can be somewhat cyclical, the investor surveys derive forecasts that are applied over the entire holding period. Since the purpose of an appraisal is to synthesize market behavior, these surveys are most appropriate.
Institutional investors are currently utilizing income growth rates ranging from 1% to 6% per year for the typical 10‐year holding period. These results are reported in the Summer 2015 Situs RERC Real Estate Report, and average about 3.1%. Expense growth rates range generally between 2.0% and 4.0%, with the average about 2.9%.
Nationa
l CPI
Producer
Price
Index (1)
Employmen
t Cost Index
GDP
Deflator
Marshall
& Swift
East (2)
Marshall
& Swift
Central (2)
Marshall
& Swift
West (2)
15 year avg. 2.40 2.50 3.00 2.00 3.70 3.38 3.58
10 year avg. 2.40 3.10 2.70 2.10 3.76 3.48 3.74
5 year avg. 1.60 2.30 1.90 1.50 1.72 1.54 1.62
Current Year over Year 1.50 1.40 1.90 1.70 2.43 1.68 2.25
Exponentially Smoothe 1.80 1.70 1.90 1.90 2.38 2.05 2.39
Year 1 Year 2 Year 3 Year 4 Year 5+
Conclusion (Expenses): 3.00% 3.00% 3.00% 3.00% 3.00%
Conclusion (ADR): 3.00% 4.00% 4.00% 3.50% 3.00%
Notes: (1) Producer price index for finished goods.
(2) Cost index for Class A construction
* Data provided through most recent full year
Sources: Bureau of Labor Statistics & Marshall & Swift Cost Service, Compiled by RERC
HistoricalInflationIndicators2014*
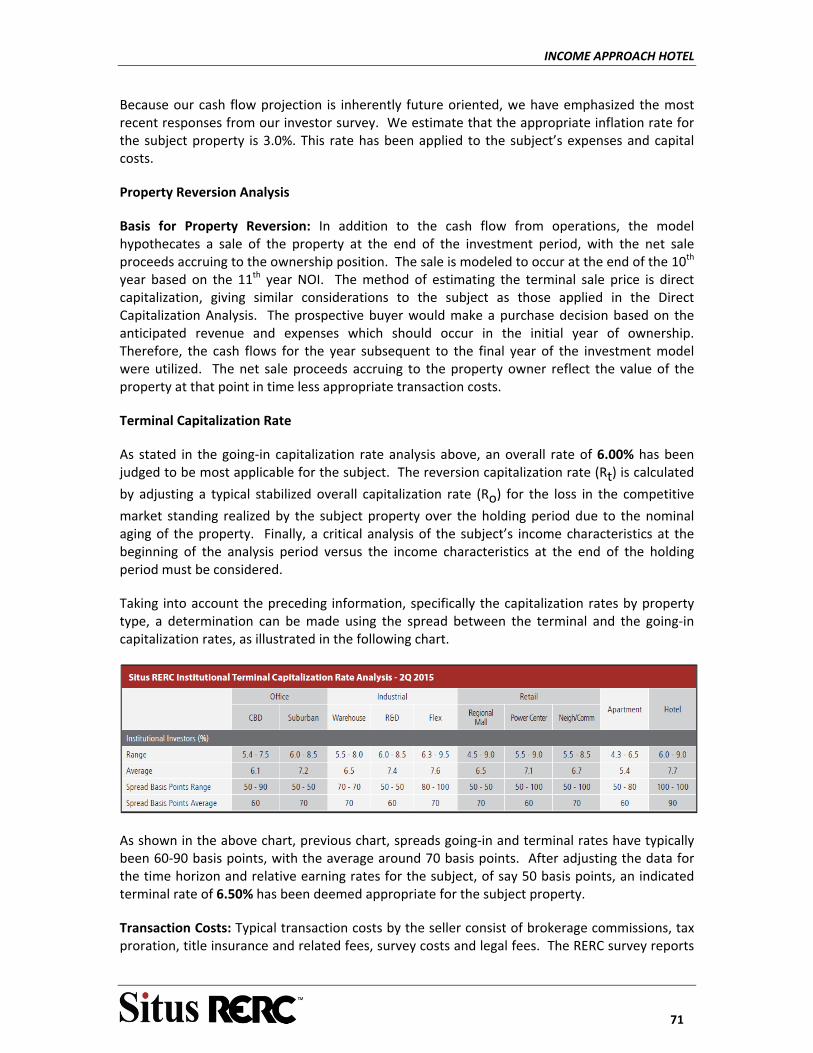
INCOME APPROACH HOTEL
71
Because our cash flow projection is inherently future oriented, we have emphasized the most recent responses from our investor survey. We estimate that the appropriate inflation rate for the subject property is 3.0%. This rate has been applied to the subject’s expenses and capital costs.
Property Reversion Analysis
Basis for Property Reversion: In addition to the cash flow from operations, the model hypothecates a sale of the property at the end of the investment period, with the net sale proceeds accruing to the ownership position. The sale is modeled to occur at the end of the 10th year based on the 11th year NOI. The method of estimating the terminal sale price is direct capitalization, giving similar considerations to the subject as those applied in the Direct Capitalization Analysis. The prospective buyer would make a purchase decision based on the anticipated revenue and expenses which should occur in the initial year of ownership. Therefore, the cash flows for the year subsequent to the final year of the investment model were utilized. The net sale proceeds accruing to the property owner reflect the value of the property at that point in time less appropriate transaction costs.
Terminal Capitalization Rate
As stated in the going‐in capitalization rate analysis above, an overall rate of 6.00% has been judged to be most applicable for the subject. The reversion capitalization rate (Rt) is calculated
by adjusting a typical stabilized overall capitalization rate (Ro) for the loss in the competitive
market standing realized by the subject property over the holding period due to the nominal aging of the property. Finally, a critical analysis of the subject’s income characteristics at the beginning of the analysis period versus the income characteristics at the end of the holding period must be considered.
Taking into account the preceding information, specifically the capitalization rates by property type, a determination can be made using the spread between the terminal and the going‐in capitalization rates, as illustrated in the following chart.
As shown in the above chart, previous chart, spreads going‐in and terminal rates have typically been 60‐90 basis points, with the average around 70 basis points. After adjusting the data for the time horizon and relative earning rates for the subject, of say 50 basis points, an indicated terminal rate of 6.50% has been deemed appropriate for the subject property.
Transaction Costs: Typical transaction costs by the seller consist of brokerage commissions, tax proration, title insurance and related fees, survey costs and legal fees. The RERC survey reports

INCOME APPROACH HOTEL
72
closing costs ranging from 1% to 3%. The size of the transaction impacts the ratio since brokers are more concerned with the gross selling commission. This analysis assumes 4.00% of the sale price for a hotel considering its New York location.
Discounted Cash Flow Analysis
This is a cash based valuation model that considers the actual timing of cash receipts and disbursements. This approach is a set of procedures in which the quantity, variability, timing and duration of periodic income, as well as the quantity and timing of reversions, are modeled and discounted to a present value at a specified yield rate. For the purpose of this analysis, we have utilized a hypothetical investment period of 10 years for the valuation.
Cash Flow Schedules for the Valuation Analyses: Based on the analysis as outlined, prospective cash flows from operations for the 10 year holding period and the year subsequent to the sale of the property have been prepared and are presented on the following pages.
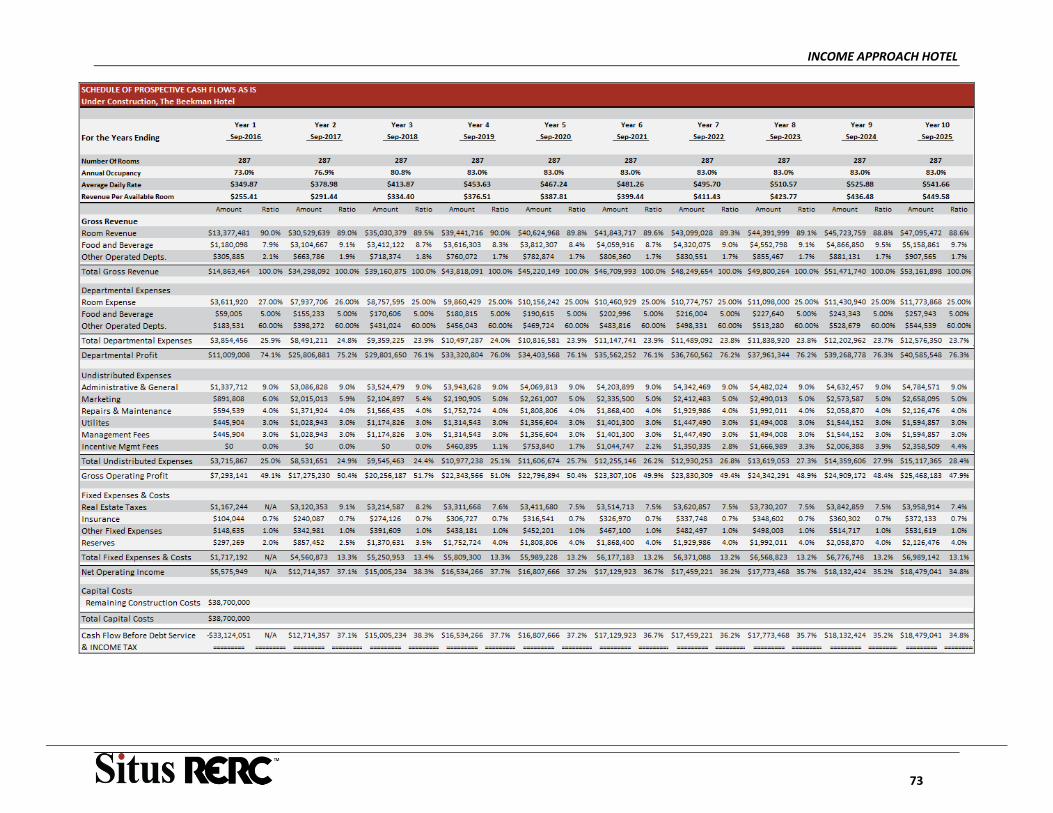
INCOME APPROACH HOTEL
73
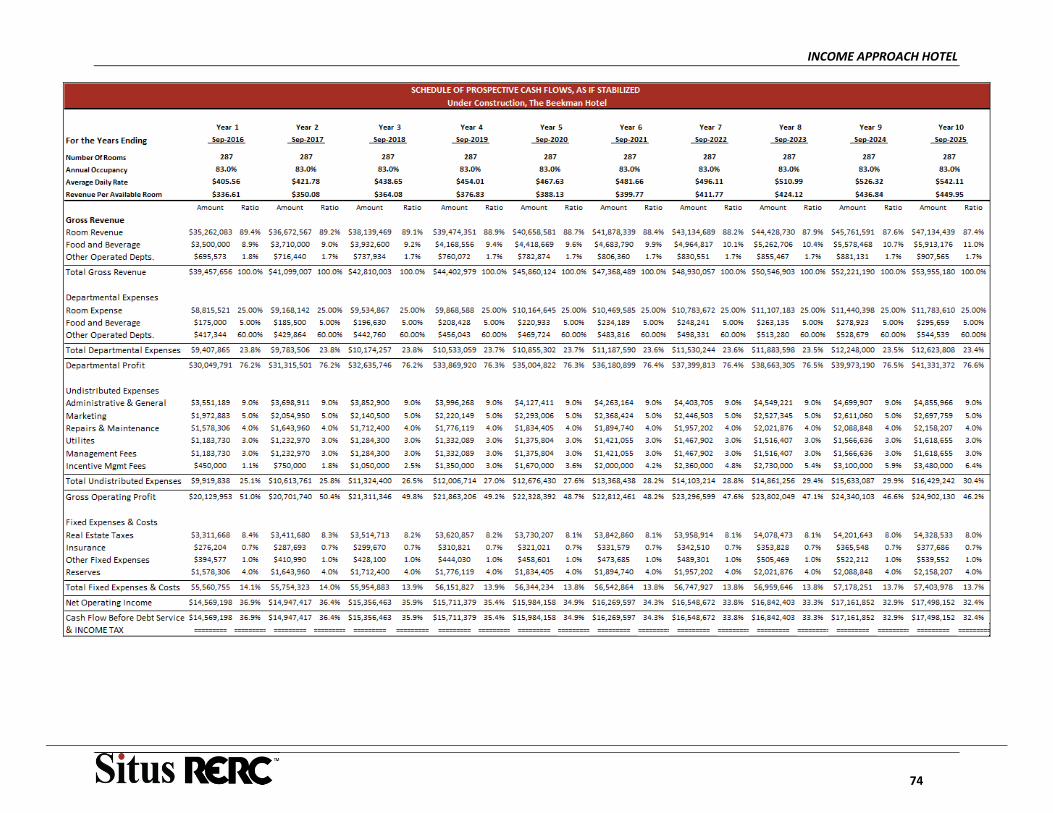
INCOME APPROACH HOTEL
74
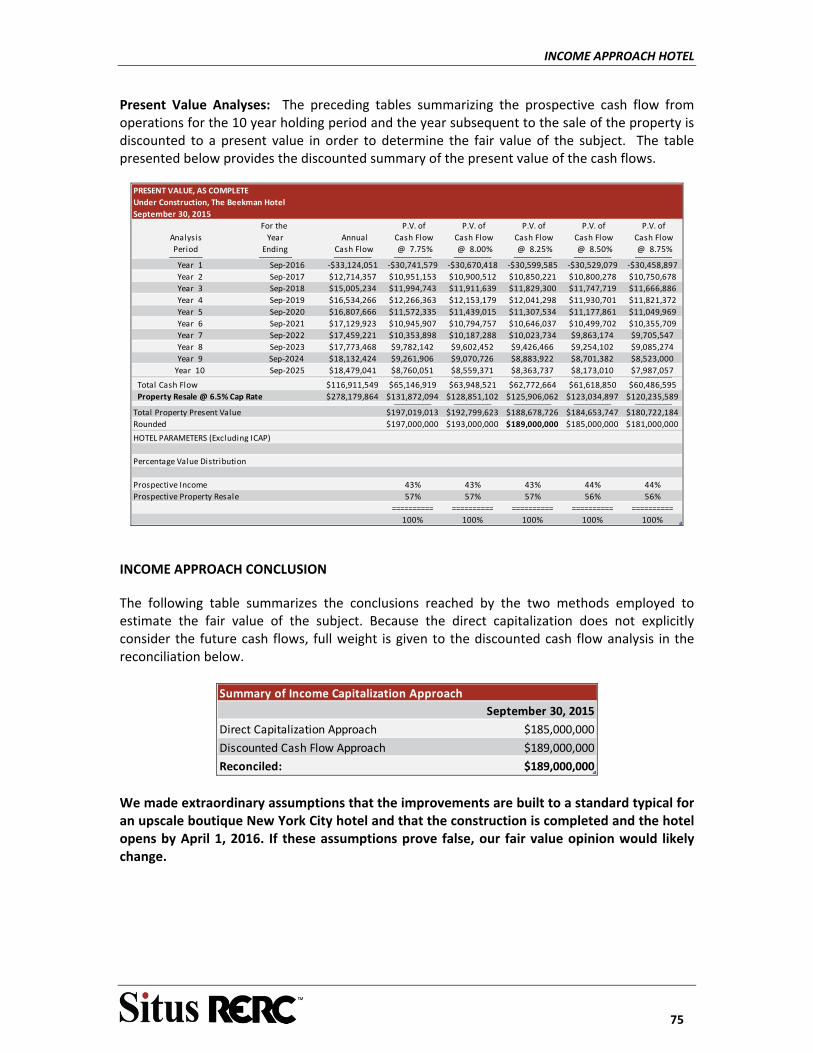
INCOME APPROACH HOTEL
75
Present Value Analyses: The preceding tables summarizing the prospective cash flow from operations for the 10 year holding period and the year subsequent to the sale of the property is discounted to a present value in order to determine the fair value of the subject. The table presented below provides the discounted summary of the present value of the cash flows.
For the P.V. of P.V. of P.V. of P.V. of P.V. of
Analysis Year Annual Cash Flow Cash Flow Cash Flow Cash Flow Cash Flow
Period Ending Cash Flow @ 7.75% @ 8.00% @ 8.25% @ 8.50% @ 8.75% ________ ________ _________ _________ _________ _________ _________ _________
Year 1 Sep‐2016 ‐$33,124,051 ‐$30,741,579 ‐$30,670,418 ‐$30,599,585 ‐$30,529,079 ‐$30,458,897
Year 2 Sep‐2017 $12,714,357 $10,951,153 $10,900,512 $10,850,221 $10,800,278 $10,750,678
Year 3 Sep‐2018 $15,005,234 $11,994,743 $11,911,639 $11,829,300 $11,747,719 $11,666,886
Year 4 Sep‐2019 $16,534,266 $12,266,363 $12,153,179 $12,041,298 $11,930,701 $11,821,372
Year 5 Sep‐2020 $16,807,666 $11,572,335 $11,439,015 $11,307,534 $11,177,861 $11,049,969
Year 6 Sep‐2021 $17,129,923 $10,945,907 $10,794,757 $10,646,037 $10,499,702 $10,355,709
Year 7 Sep‐2022 $17,459,221 $10,353,898 $10,187,288 $10,023,734 $9,863,174 $9,705,547
Year 8 Sep‐2023 $17,773,468 $9,782,142 $9,602,452 $9,426,466 $9,254,102 $9,085,274
Year 9 Sep‐2024 $18,132,424 $9,261,906 $9,070,726 $8,883,922 $8,701,382 $8,523,000
Year 10 Sep‐2025 $18,479,041 $8,760,051 $8,559,371 $8,363,737 $8,173,010 $7,987,057 _________ _________ _________ _________ _________ _________
Total Cash Flow $116,911,549 $65,146,919 $63,948,521 $62,772,664 $61,618,850 $60,486,595
Property Resale @ 6.5% Cap Rate $278,179,864 $131,872,094 $128,851,102 $125,906,062 $123,034,897 $120,235,589 _________ _________ _________ _________ _________
Total Property Present Value $197,019,013 $192,799,623 $188,678,726 $184,653,747 $180,722,184
Rounded $197,000,000 $193,000,000 $189,000,000 $185,000,000 $181,000,000
HOTEL PARAMETERS (Excluding ICAP)
Percentage Value Distribution
Prospective Income 43% 43% 43% 44% 44%
Prospective Property Resale 57% 57% 57% 56% 56%
========== ========== ========== ========== ==========
100% 100% 100% 100% 100%
PRESENT VALUE, AS COMPLETE
Under Construction, The Beekman Hotel
September 30, 2015
INCOME APPROACH CONCLUSION
The following table summarizes the conclusions reached by the two methods employed to estimate the fair value of the subject. Because the direct capitalization does not explicitly consider the future cash flows, full weight is given to the discounted cash flow analysis in the reconciliation below.
Summary of Income Capitalization Approach
September 30, 2015
Direct Capitalization Approach $185,000,000
Discounted Cash Flow Approach $189,000,000
Reconciled: $189,000,000
We made extraordinary assumptions that the improvements are built to a standard typical for an upscale boutique New York City hotel and that the construction is completed and the hotel opens by April 1, 2016. If these assumptions prove false, our fair value opinion would likely change.

RECONCILIATION OF VALUE ESTIMATES
76
RECONCILIATION OF VALUE ESTIMATES
The various approaches employed to estimate the fair value of the subject hotel component indicate the following value conclusion.
RECONCILIATION
Under Construction, The Beekman Hotel
Value Estimate
Value Estimate By Sales Comparison Approach $189,000,000
Value Estimate By The Income Approach
Direct Capitalization Approach $185,000,000
Discounted Cash Flow Approach $189,000,000
Reconciled: $189,000,000
Final Value $189,000,000
We made extraordinary assumptions that the improvements are built to a standard typical for an upscale boutique New York City hotel and that the construction is completed and the hotel opens by April 1, 2016. If these assumptions prove false, our fair value opinion would likely change.
Greatest weight has been placed on the income approach when estimating fair value for the subject property’s hotel component. Because income‐producing properties are generally purchased on the basis of their net income generation, this approach reflects the expectations of typical purchasers of investment‐grade real estate. It has been concluded that the income approach most accurately reflects the specific financial characteristics of this Property. The condominium analysis also employed a discounted cash flow, which was referred to as a discounted sellout analysis based on the nature of the method.
The sales comparison or market approach has been given secondary emphasis when estimating the fair value of the subject property’s hotel component. However, since the sales comparison approach indicates a similar value as the income approach, the choice of the most salient and relied upon approach is insignificant. Because of the great importance future income expectation has on sale prices for this type of property, unit sale prices of physically similar properties revealed a relatively a wide range. These differences were a consequence of each property's unique combination of physical, locational, and financial characteristics. The condominium analysis based the individual unit values on the sales comparison approach.
RECONCILIATION OF VALUE ESTIMATES
77
SUBJECT PROPERTY FAIR VALUE ESTIMATE:
Subject to all conditions and explanations contained in this report, and based upon our analyses of the subject property and the market, together with our experience and knowledge of the market gained in appraising similar properties, our opinion of the fair value of the fee simple estate, expressed in terms of financial arrangement equivalent to cash (including contributory value of furniture, fixtures and equipment; and the integral business value), as of September 30, 2015 was:
$189,000,000
Subject to the Certification, Standard Conditions and Special Conditions.
We made extraordinary assumptions that the improvements are built to a standard typical for an upscale boutique New York City hotel and that the construction is completed and the hotel opens by April 1, 2016. If these assumptions prove false, our fair value opinion would likely change.
The accompanying prospective financial analyses are based on estimates and assumptions developed in connection with the appraisal. However, some assumptions inevitably will not materialize, and unanticipated events and circumstances may occur; therefore, actual results achieved during the period covered by our prospective financial analyses will vary from our estimates and the variations may be material.
CERTIFICATION
78
CERTIFICATION
I certify that, to the best of my knowledge and belief: ‐ The statements of fact contained in this report are true and correct. ‐ The reported analyses, opinions, and conclusions are limited only by the reported assumptions and limiting conditions and are my personal, impartial, and unbiased professional analyses, opinions, and conclusions. ‐ We have no present or prospective interest in the property that is the subject of this report and no personal interest with respect to the parties involved. ‐ We have no bias with respect to the property that is the subject of this report or to the parties involved with this assignment. ‐ Our engagement in this assignment was not contingent upon developing or reporting predetermined results. ‐ Our compensation for completing this assignment is not contingent upon the development or reporting of a predetermined value or direction in value that favors the cause of the client, the amount of the value opinion, the attainment of a stipulated result, or the occurrence of a subsequent event directly related to the intended use of this appraisal. ‐ Lev Yagudayev, MAI has visited and observed the subject property.. ‐ Roiy Guy provided significant real property appraisal assistance to the person signing this certification. ‐ The reported analyses, opinions, and conclusions were developed, and this report has been prepared, in conformity with the Code of Professional Ethics and Standards of Professional Appraisal Practice of the Appraisal Institute, which includes the Uniform Standards of Professional Appraisal Practice. ‐ The use of this report is subject to the requirements of the Appraisal Institute relating to review by its duly authorized representatives. ‐ We have performed a previous appraisal or other real estate service related to the subject property within the three years prior to this assignment. ‐ As of the date of this report, Lev Yagudayev, MAI has completed the continuing education program for designated members of the Appraisal Institute. RERC ‐‐‐‐‐‐‐‐‐‐‐‐‐‐‐‐‐‐‐‐‐‐‐‐‐‐‐‐‐‐‐‐‐‐‐‐‐‐‐‐‐‐‐‐‐‐‐‐‐‐‐‐‐ Lev Yagudayev, MAI Director 152 East 52nd Street, Suite 4002 New York, NY 10022 (212) 294‐1376 New York Certified Appraiser License Number: 46000044217 Expiration: March 6, 2017

ADDENDA

ADDENDA
ASSUMPTIONS AND LIMITING CONDITIONS
This appraisal report has been based on, and is subject to, the following general assumptions and limiting conditions: The value reported is only applicable to the purpose, function, and terms stated in this
report and shall not be used for any other purpose.
The appraisers have assumed that the reader (s) of this report is well versed in real estate and is a sophisticated and knowledgeable business person(s).
No responsibility is assumed for the legal description provided or for matters pertaining to legal or title considerations. Title to the property is assumed to be good and marketable unless otherwise stated. The property is appraised free and clear of any or all liens or encumbrances unless otherwise stated. It is assumed that the use of the land and improvements is confined within the boundaries or property lines of the property described and that there is no encroachment or trespass unless noted in the report.
Responsible ownership and competent property management are assumed. The information furnished by others is believed to be reliable, but no warranty is given for
its accuracy. All engineering studies are assumed to be correct. The plot plans and illustrative material in
this report are included only to help the reader visualize the property. It is assumed that there are no hidden or unapparent conditions of the property, subsoil, or
structures that render it more or less valuable. No responsibility is assumed for such conditions or for obtaining the engineering studies that may be required to discover them.
It is assumed that the property is in full compliance with all applicable federal, state, and
local environmental regulations and laws unless the lack of compliance is stated, described and considered in the appraisal report. It is assumed that all required licenses, certificates of occupancy, consents, and other legislative or administrative authority from any local, state, or national government or private entity or organization have been or can be obtained or renewed for any use on which the value estimate contained in this report is based.
It is assumed that the property conforms to all applicable zoning and use regulations and
restrictions unless nonconformity has been identified, described and considered in the appraisal report.
The appraisers shall not be required to give testimony as a witness or to appear in any
capacity in any legal or administrative hearing or procedure, or to have any continued service responsibility unless compensated, by the engager of this report, in advance, according to their fee schedule then in effect.
Unless otherwise stated in this report, the existence of hazardous materials, which may or
may not be present on the property, was not observed by the appraiser. The appraiser has no knowledge of the existence of such material on or in the property. The appraiser, however is not qualified to detect such substances. The presence of substances such as asbestos, urea‐formaldehyde foam insulation, and other potentially hazardous materials may affect the value of the property. The value estimated is predicated on the assumption that there are no such material on or in the property that would cause a loss in value. No responsibility is assumed for such conditions or for any expertise or engineering knowledge required to discover them. The client is urged to retain an expert in this field, if desired.
ADDENDA
The Appraisers are not engineers, no warranties are made by references to physical
property characteristics in terms of quality, condition, cost, suitability, soil conditions, flood risk, obsolescence, etc., and no liability is assumed for any engineering‐related issues.
Possession of this report or a copy thereof does not imply right of publication, nor use for
any purpose by any other than the person to whom it is addressed, without the written consent of Real Estate Research Corporation.
The liability of Real Estate Research Corporation, and its employees is limited to the client.
This appraisal was prepared specifically for our client, to whom this appraisal was addressed.
The Client acknowledges that the Consultant is a corporation and agrees that any claim
made by the Client arising out of any act or omission of any director, officer, agent, or employee of the Consultant, in the execution or performance of its contractual or professional responsibilities shall be made solely against the Consultant in its corporate capacity and not against any such director, officer, agent or employee.
Cash flow projections are forecasts of estimated future operating characteristics and are
predicated on the information and assumptions contained within the appraisal report. The achievement of the financial projections will be affected by fluctuating economic conditions and is dependent upon other future occurrences that cannot be assured. Actual results may well vary from the projections contained herein. The appraisers do not warrant that these forecasts will occur. Projections may be affected by circumstances beyond the current realm of knowledge or control of the appraisers. The appraisers are not trying to forecast the future but rather are attempting to replicate techniques utilized by market participants for properties similar to the subject.
Notwithstanding anything to the contrary contained herein, this report may also be
provided, for information purposes only and not for reliance in decision make, to potential purchasers of the Note secured by the subject of this appraisal and used in connection with the materials offering for sale the Note or an interest in the note.
The Americans with Disabilities Act ("ADA") became effective January 26, 1992. We have not
made a specific compliance survey and analysis of this property to determine whether or not it is in conformity with the various detailed requirements of the ADA. It is possible that a compliance survey of the property, together with a detailed analysis of the requirements for the ADA, could reveal that the property is not in compliance with one or more of the requirements of the Act. If so, this fact could have a negative effect upon the value of the property. Since we have no direct evidence relating to this issue, we did not consider possible non‐compliance with the requirements of the ADA in estimating the value of the property

ADDENDA
Subject Photographs

ADDENDA
Exterior View of the Subject Exterior View of the Subject
Interior Atrium Interior Atrium
Construction Progress Hotel Rooftop Unit
ADDENDA
Management’s Proforma
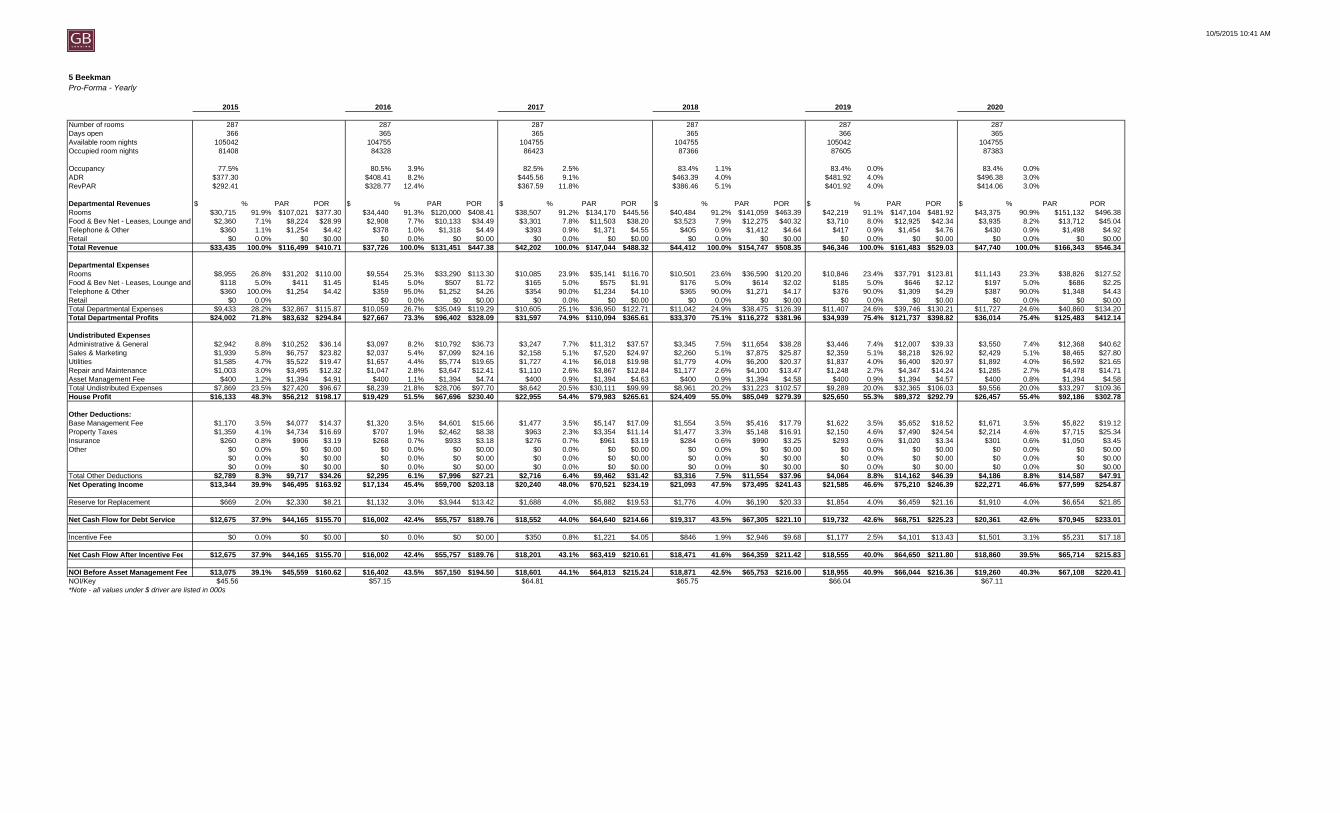
10/5/2015 10:41 AM
5 BeekmanPro-Forma - Yearly
2015 2016 2017 2018 2019 20200 1 2 3 4 5
Number of rooms 287 287 287 287 287 287Days open 366 365 365 365 366 365Available room nights 105042 104755 104755 104755 105042 104755Occupied room nights 81408 84328 86423 87366 87605 87383
Occupancy 77.5% 80.5% 3.9% 82.5% 2.5% 83.4% 1.1% 83.4% 0.0% 83.4% 0.0%ADR $377.30 $408.41 8.2% $445.56 9.1% $463.39 4.0% $481.92 4.0% $496.38 3.0%RevPAR $292.41 $328.77 12.4% $367.59 11.8% $386.46 5.1% $401.92 4.0% $414.06 3.0%
Departmental Revenues $ % PAR POR $ % PAR POR $ % PAR POR $ % PAR POR $ % PAR POR $ % PAR PORRooms $30,715 91.9% $107,021 $377.30 $34,440 91.3% $120,000 $408.41 $38,507 91.2% $134,170 $445.56 $40,484 91.2% $141,059 $463.39 $42,219 91.1% $147,104 $481.92 $43,375 90.9% $151,132 $496.38Food & Bev Net - Leases, Lounge and $2,360 7.1% $8,224 $28.99 $2,908 7.7% $10,133 $34.49 $3,301 7.8% $11,503 $38.20 $3,523 7.9% $12,275 $40.32 $3,710 8.0% $12,925 $42.34 $3,935 8.2% $13,712 $45.04Telephone & Other $360 1.1% $1,254 $4.42 $378 1.0% $1,318 $4.49 $393 0.9% $1,371 $4.55 $405 0.9% $1,412 $4.64 $417 0.9% $1,454 $4.76 $430 0.9% $1,498 $4.92Retail $0 0.0% $0 $0.00 $0 0.0% $0 $0.00 $0 0.0% $0 $0.00 $0 0.0% $0 $0.00 $0 0.0% $0 $0.00 $0 0.0% $0 $0.00Total Revenue $33,435 100.0% $116,499 $410.71 $37,726 100.0% $131,451 $447.38 $42,202 100.0% $147,044 $488.32 $44,412 100.0% $154,747 $508.35 $46,346 100.0% $161,483 $529.03 $47,740 100.0% $166,343 $546.34
Departmental ExpensesRooms $8,955 26.8% $31,202 $110.00 $9,554 25.3% $33,290 $113.30 $10,085 23.9% $35,141 $116.70 $10,501 23.6% $36,590 $120.20 $10,846 23.4% $37,791 $123.81 $11,143 23.3% $38,826 $127.52Food & Bev Net - Leases, Lounge and $118 5.0% $411 $1.45 $145 5.0% $507 $1.72 $165 5.0% $575 $1.91 $176 5.0% $614 $2.02 $185 5.0% $646 $2.12 $197 5.0% $686 $2.25Telephone & Other $360 100.0% $1,254 $4.42 $359 95.0% $1,252 $4.26 $354 90.0% $1,234 $4.10 $365 90.0% $1,271 $4.17 $376 90.0% $1,309 $4.29 $387 90.0% $1,348 $4.43Retail $0 0.0% $0 0.0% $0 $0.00 $0 0.0% $0 $0.00 $0 0.0% $0 $0.00 $0 0.0% $0 $0.00 $0 0.0% $0 $0.00Total Departmental Expenses $9,433 28.2% $32,867 $115.87 $10,059 26.7% $35,049 $119.29 $10,605 25.1% $36,950 $122.71 $11,042 24.9% $38,475 $126.39 $11,407 24.6% $39,746 $130.21 $11,727 24.6% $40,860 $134.20Total Departmental Profits $24,002 71.8% $83,632 $294.84 $27,667 73.3% $96,402 $328.09 $31,597 74.9% $110,094 $365.61 $33,370 75.1% $116,272 $381.96 $34,939 75.4% $121,737 $398.82 $36,014 75.4% $125,483 $412.14
Undistributed ExpensesAdministrative & General $2,942 8.8% $10,252 $36.14 $3,097 8.2% $10,792 $36.73 $3,247 7.7% $11,312 $37.57 $3,345 7.5% $11,654 $38.28 $3,446 7.4% $12,007 $39.33 $3,550 7.4% $12,368 $40.62Sales & Marketing $1,939 5.8% $6,757 $23.82 $2,037 5.4% $7,099 $24.16 $2,158 5.1% $7,520 $24.97 $2,260 5.1% $7,875 $25.87 $2,359 5.1% $8,218 $26.92 $2,429 5.1% $8,465 $27.80Utilities $1,585 4.7% $5,522 $19.47 $1,657 4.4% $5,774 $19.65 $1,727 4.1% $6,018 $19.98 $1,779 4.0% $6,200 $20.37 $1,837 4.0% $6,400 $20.97 $1,892 4.0% $6,592 $21.65Repair and Maintenance $1,003 3.0% $3,495 $12.32 $1,047 2.8% $3,647 $12.41 $1,110 2.6% $3,867 $12.84 $1,177 2.6% $4,100 $13.47 $1,248 2.7% $4,347 $14.24 $1,285 2.7% $4,478 $14.71Asset Management Fee $400 1.2% $1,394 $4.91 $400 1.1% $1,394 $4.74 $400 0.9% $1,394 $4.63 $400 0.9% $1,394 $4.58 $400 0.9% $1,394 $4.57 $400 0.8% $1,394 $4.58Total Undistributed Expenses $7,869 23.5% $27,420 $96.67 $8,239 21.8% $28,706 $97.70 $8,642 20.5% $30,111 $99.99 $8,961 20.2% $31,223 $102.57 $9,289 20.0% $32,365 $106.03 $9,556 20.0% $33,297 $109.36House Profit $16,133 48.3% $56,212 $198.17 $19,429 51.5% $67,696 $230.40 $22,955 54.4% $79,983 $265.61 $24,409 55.0% $85,049 $279.39 $25,650 55.3% $89,372 $292.79 $26,457 55.4% $92,186 $302.78
Other Deductions:Base Management Fee $1,170 3.5% $4,077 $14.37 $1,320 3.5% $4,601 $15.66 $1,477 3.5% $5,147 $17.09 $1,554 3.5% $5,416 $17.79 $1,622 3.5% $5,652 $18.52 $1,671 3.5% $5,822 $19.12Property Taxes $1,359 4.1% $4,734 $16.69 $707 1.9% $2,462 $8.38 $963 2.3% $3,354 $11.14 $1,477 3.3% $5,148 $16.91 $2,150 4.6% $7,490 $24.54 $2,214 4.6% $7,715 $25.34Insurance $260 0.8% $906 $3.19 $268 0.7% $933 $3.18 $276 0.7% $961 $3.19 $284 0.6% $990 $3.25 $293 0.6% $1,020 $3.34 $301 0.6% $1,050 $3.45Other $0 0.0% $0 $0.00 $0 0.0% $0 $0.00 $0 0.0% $0 $0.00 $0 0.0% $0 $0.00 $0 0.0% $0 $0.00 $0 0.0% $0 $0.00
$0 0.0% $0 $0.00 $0 0.0% $0 $0.00 $0 0.0% $0 $0.00 $0 0.0% $0 $0.00 $0 0.0% $0 $0.00 $0 0.0% $0 $0.00$0 0.0% $0 $0.00 $0 0.0% $0 $0.00 $0 0.0% $0 $0.00 $0 0.0% $0 $0.00 $0 0.0% $0 $0.00 $0 0.0% $0 $0.00
Total Other Deductions $2,789 8.3% $9,717 $34.26 $2,295 6.1% $7,996 $27.21 $2,716 6.4% $9,462 $31.42 $3,316 7.5% $11,554 $37.96 $4,064 8.8% $14,162 $46.39 $4,186 8.8% $14,587 $47.91Net Operating Income $13,344 39.9% $46,495 $163.92 $17,134 45.4% $59,700 $203.18 $20,240 48.0% $70,521 $234.19 $21,093 47.5% $73,495 $241.43 $21,585 46.6% $75,210 $246.39 $22,271 46.6% $77,599 $254.87
Reserve for Replacement $669 2.0% $2,330 $8.21 $1,132 3.0% $3,944 $13.42 $1,688 4.0% $5,882 $19.53 $1,776 4.0% $6,190 $20.33 $1,854 4.0% $6,459 $21.16 $1,910 4.0% $6,654 $21.85
Net Cash Flow for Debt Service $12,675 37.9% $44,165 $155.70 $16,002 42.4% $55,757 $189.76 $18,552 44.0% $64,640 $214.66 $19,317 43.5% $67,305 $221.10 $19,732 42.6% $68,751 $225.23 $20,361 42.6% $70,945 $233.01
Incentive Fee $0 0.0% $0 $0.00 $0 0.0% $0 $0.00 $350 0.8% $1,221 $4.05 $846 1.9% $2,946 $9.68 $1,177 2.5% $4,101 $13.43 $1,501 3.1% $5,231 $17.18
Net Cash Flow After Incentive Fee $12,675 37.9% $44,165 $155.70 $16,002 42.4% $55,757 $189.76 $18,201 43.1% $63,419 $210.61 $18,471 41.6% $64,359 $211.42 $18,555 40.0% $64,650 $211.80 $18,860 39.5% $65,714 $215.83
NOI Before Asset Management Fee $13,075 39.1% $45,559 $160.62 $16,402 43.5% $57,150 $194.50 $18,601 44.1% $64,813 $215.24 $18,871 42.5% $65,753 $216.00 $18,955 40.9% $66,044 $216.36 $19,260 40.3% $67,108 $220.41NOI/Key $45.56 $57.15 $64.81 $65.75 $66.04 $67.11*Note - all values under $ driver are listed in 000s

ADDENDA
Anticipated Cost Report (“ACR”)
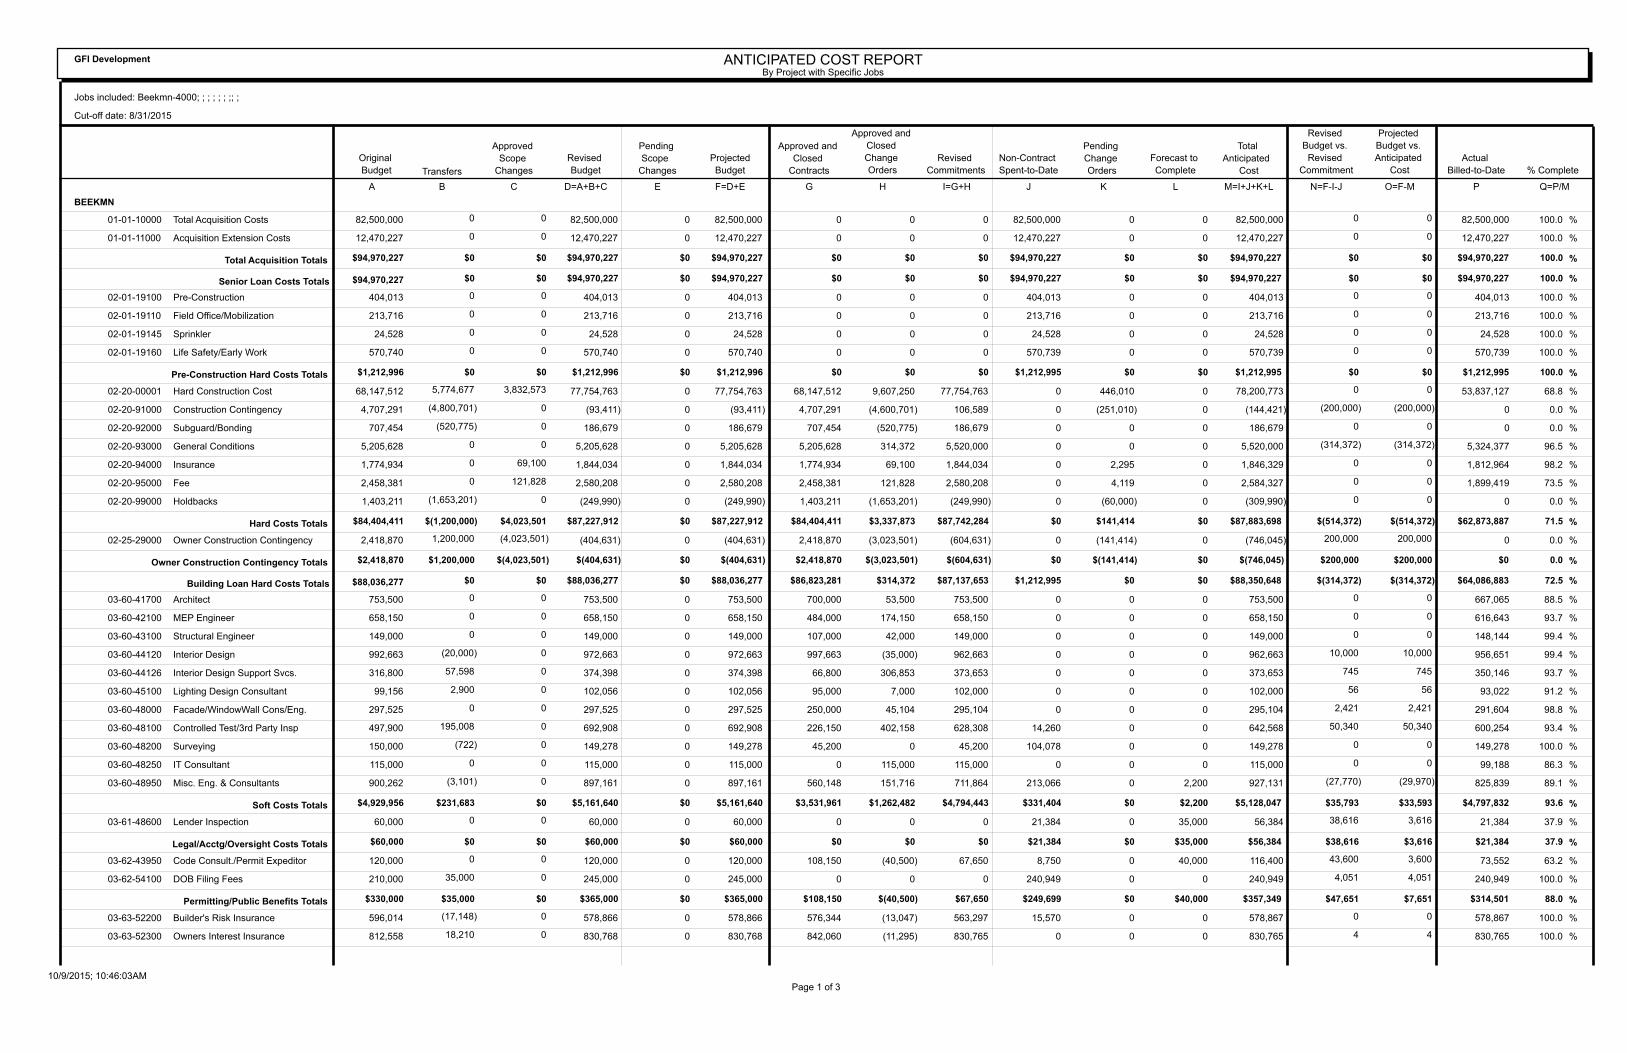
ANTICIPATED COST REPORTBy Project with Specific Jobs
GFI Development
Jobs included: Beekmn-4000; ; ; ; ; ; ;; ;
Cut-off date: 8/31/2015
Approved
Scope
ChangesTransfers
Actual
Billed-to-Date
Projected
Budget vs.
Anticipated
Cost
Revised
Budget vs.
Revised
Commitment
Revised
Commitments
Total
Anticipated
Cost
Projected
Budget
Original
Budget
Forecast to
Complete
Pending
Change
Orders
Non-Contract
Spent-to-Date
Approved and
Closed
Change
Orders
Approved and
Closed
Contracts
Pending
Scope
Changes
Revised
Budget % Complete
A B C D=A+B+C E F=D+E G H I=G+H J K L M=I+J+K+L N=F-I-J O=F-M P Q=P/M
BEEKMN
Total Acquisition Costs 82,500,000 01-01-10000 82,500,000 0 82,500,000 0 0 0 82,500,000 0 0 82,500,000 82,500,000 0 0 0 0 100.0 %
Acquisition Extension Costs 12,470,227 01-01-11000 12,470,227 0 12,470,227 0 0 0 12,470,227 0 0 12,470,227 12,470,227 0 0 0 0 100.0 %
$94,970,227 $94,970,227 $0 $94,970,227 $0 $0 $0 $94,970,227 $0 $0 $94,970,227 $94,970,227 $0 $0 $0 $0 Total Acquisition Totals 100.0 %
$94,970,227 $94,970,227 $0 $94,970,227 $0 $0 $0 $94,970,227 $0 $0 $94,970,227 $94,970,227 $0 $0 $0 $0 Senior Loan Costs Totals 100.0 %
Pre-Construction 404,013 02-01-19100 404,013 0 404,013 0 0 0 404,013 0 0 404,013 404,013 0 0 0 0 100.0 %
Field Office/Mobilization 213,716 02-01-19110 213,716 0 213,716 0 0 0 213,716 0 0 213,716 213,716 0 0 0 0 100.0 %
Sprinkler 24,528 02-01-19145 24,528 0 24,528 0 0 0 24,528 0 0 24,528 24,528 0 0 0 0 100.0 %
Life Safety/Early Work 570,740 02-01-19160 570,740 0 570,740 0 0 0 570,739 0 0 570,739 570,739 0 0 0 0 100.0 %
$1,212,996 $1,212,996 $0 $1,212,996 $0 $0 $0 $1,212,995 $0 $0 $1,212,995 $1,212,995 $0 $0 $0 $0 Pre-Construction Hard Costs Totals 100.0 %
Hard Construction Cost 68,147,512 02-20-00001 77,754,763 0 77,754,763 68,147,512 9,607,250 77,754,763 0 446,010 0 78,200,773 53,837,127 0 0 5,774,677 3,832,573 68.8 %
Construction Contingency 4,707,291 02-20-91000 (93,411) 0 (93,411) 4,707,291 (4,600,701) 106,589 0 (251,010) 0 (144,421) 0 (200,000) (200,000)(4,800,701) 0 0.0 %
Subguard/Bonding 707,454 02-20-92000 186,679 0 186,679 707,454 (520,775) 186,679 0 0 0 186,679 0 0 0 (520,775) 0 0.0 %
General Conditions 5,205,628 02-20-93000 5,205,628 0 5,205,628 5,205,628 314,372 5,520,000 0 0 0 5,520,000 5,324,377 (314,372) (314,372) 0 0 96.5 %
Insurance 1,774,934 02-20-94000 1,844,034 0 1,844,034 1,774,934 69,100 1,844,034 0 2,295 0 1,846,329 1,812,964 0 0 0 69,100 98.2 %
Fee 2,458,381 02-20-95000 2,580,208 0 2,580,208 2,458,381 121,828 2,580,208 0 4,119 0 2,584,327 1,899,419 0 0 0 121,828 73.5 %
Holdbacks 1,403,211 02-20-99000 (249,990) 0 (249,990) 1,403,211 (1,653,201) (249,990) 0 (60,000) 0 (309,990) 0 0 0 (1,653,201) 0 0.0 %
$84,404,411 $87,227,912 $0 $87,227,912 $84,404,411 $3,337,873 $87,742,284 $0 $141,414 $0 $87,883,698 $62,873,887 $(514,372) $(514,372)$(1,200,000) $4,023,501 Hard Costs Totals 71.5 %
Owner Construction Contingency 2,418,870 02-25-29000 (404,631) 0 (404,631) 2,418,870 (3,023,501) (604,631) 0 (141,414) 0 (746,045) 0 200,000 200,000 1,200,000 (4,023,501) 0.0 %
$2,418,870 $(404,631) $0 $(404,631) $2,418,870 $(3,023,501) $(604,631) $0 $(141,414) $0 $(746,045) $0 $200,000 $200,000 $1,200,000 $(4,023,501)Owner Construction Contingency Totals 0.0 %
$88,036,277 $88,036,277 $0 $88,036,277 $86,823,281 $314,372 $87,137,653 $1,212,995 $0 $0 $88,350,648 $64,086,883 $(314,372) $(314,372)$0 $0 Building Loan Hard Costs Totals 72.5 %
Architect 753,500 03-60-41700 753,500 0 753,500 700,000 53,500 753,500 0 0 0 753,500 667,065 0 0 0 0 88.5 %
MEP Engineer 658,150 03-60-42100 658,150 0 658,150 484,000 174,150 658,150 0 0 0 658,150 616,643 0 0 0 0 93.7 %
Structural Engineer 149,000 03-60-43100 149,000 0 149,000 107,000 42,000 149,000 0 0 0 149,000 148,144 0 0 0 0 99.4 %
Interior Design 992,663 03-60-44120 972,663 0 972,663 997,663 (35,000) 962,663 0 0 0 962,663 956,651 10,000 10,000 (20,000) 0 99.4 %
Interior Design Support Svcs. 316,800 03-60-44126 374,398 0 374,398 66,800 306,853 373,653 0 0 0 373,653 350,146 745 745 57,598 0 93.7 %
Lighting Design Consultant 99,156 03-60-45100 102,056 0 102,056 95,000 7,000 102,000 0 0 0 102,000 93,022 56 56 2,900 0 91.2 %
Facade/WindowWall Cons/Eng. 297,525 03-60-48000 297,525 0 297,525 250,000 45,104 295,104 0 0 0 295,104 291,604 2,421 2,421 0 0 98.8 %
Controlled Test/3rd Party Insp 497,900 03-60-48100 692,908 0 692,908 226,150 402,158 628,308 14,260 0 0 642,568 600,254 50,340 50,340 195,008 0 93.4 %
Surveying 150,000 03-60-48200 149,278 0 149,278 45,200 0 45,200 104,078 0 0 149,278 149,278 0 0 (722) 0 100.0 %
IT Consultant 115,000 03-60-48250 115,000 0 115,000 0 115,000 115,000 0 0 0 115,000 99,188 0 0 0 0 86.3 %
Misc. Eng. & Consultants 900,262 03-60-48950 897,161 0 897,161 560,148 151,716 711,864 213,066 0 2,200 927,131 825,839 (27,770) (29,970)(3,101) 0 89.1 %
$4,929,956 $5,161,640 $0 $5,161,640 $3,531,961 $1,262,482 $4,794,443 $331,404 $0 $2,200 $5,128,047 $4,797,832 $35,793 $33,593 $231,683 $0 Soft Costs Totals 93.6 %
Lender Inspection 60,000 03-61-48600 60,000 0 60,000 0 0 0 21,384 0 35,000 56,384 21,384 38,616 3,616 0 0 37.9 %
$60,000 $60,000 $0 $60,000 $0 $0 $0 $21,384 $0 $35,000 $56,384 $21,384 $38,616 $3,616 $0 $0 Legal/Acctg/Oversight Costs Totals 37.9 %
Code Consult./Permit Expeditor 120,000 03-62-43950 120,000 0 120,000 108,150 (40,500) 67,650 8,750 0 40,000 116,400 73,552 43,600 3,600 0 0 63.2 %
DOB Filing Fees 210,000 03-62-54100 245,000 0 245,000 0 0 0 240,949 0 0 240,949 240,949 4,051 4,051 35,000 0 100.0 %
$330,000 $365,000 $0 $365,000 $108,150 $(40,500) $67,650 $249,699 $0 $40,000 $357,349 $314,501 $47,651 $7,651 $35,000 $0 Permitting/Public Benefits Totals 88.0 %
Builder's Risk Insurance 596,014 03-63-52200 578,866 0 578,866 576,344 (13,047) 563,297 15,570 0 0 578,867 578,867 0 0 (17,148) 0 100.0 %
Owners Interest Insurance 812,558 03-63-52300 830,768 0 830,768 842,060 (11,295) 830,765 0 0 0 830,765 830,765 4 4 18,210 0 100.0 %
Page 1 of 310/9/2015; 10:46:03AM

ANTICIPATED COST REPORTBy Project with Specific Jobs
GFI Development
Jobs included: Beekmn-4000; ; ; ; ; ; ;; ;
Cut-off date: 8/31/2015
Approved
Scope
ChangesTransfers
Actual
Billed-to-Date
Projected
Budget vs.
Anticipated
Cost
Revised
Budget vs.
Revised
Commitment
Revised
Commitments
Total
Anticipated
Cost
Projected
Budget
Original
Budget
Forecast to
Complete
Pending
Change
Orders
Non-Contract
Spent-to-Date
Approved and
Closed
Change
Orders
Approved and
Closed
Contracts
Pending
Scope
Changes
Revised
Budget % Complete
A B C D=A+B+C E F=D+E G H I=G+H J K L M=I+J+K+L N=F-I-J O=F-M P Q=P/M
BEEKMN
$1,408,573 $1,409,635 $0 $1,409,635 $1,418,403 $(24,342) $1,394,061 $15,570 $0 $0 $1,409,631 $1,409,632 $3 $3 $1,062 $0 Insurance Costs Totals 100.0 %
Project Staffing 0 03-65-65101 0 0 0 0 0 0 0 0 0 0 0 0 0 0 0 100.0 %
$0 $0 $0 $0 $0 $0 $0 $0 $0 $0 $0 $0 $0 $0 $0 $0 Developer's Costs Totals 100.0 %
FF&E/Guest Rms., Stes. & Corr. 9,045,721 03-66-30000 8,211,990 0 8,211,990 0 0 0 6,367,857 0 1,844,133 8,211,990 6,367,857 1,844,133 0 (833,730) 0 77.5 %
$9,045,721 $8,211,990 $0 $8,211,990 $0 $0 $0 $6,367,857 $0 $1,844,133 $8,211,990 $6,367,857 $1,844,133 $0 $(833,730) $0 FF&E/Guest Rms., Stes., Corr. Totals 77.5 %
FF&E, Common Areas 3,316,347 03-67-31200 3,316,347 0 3,316,347 0 0 0 1,077,758 0 244,145 1,321,903 1,077,758 2,238,589 1,994,444 0 0 81.5 %
$3,316,347 $3,316,347 $0 $3,316,347 $0 $0 $0 $1,077,758 $0 $244,145 $1,321,903 $1,077,758 $2,238,589 $1,994,444 $0 $0 FF&E/Other Totals 81.5 %
Hotel & F&B IT 1,300,000 03-68-48940 1,300,000 0 1,300,000 0 0 0 162,459 0 1,137,541 1,300,000 162,459 1,137,541 0 0 0 12.5 %
$1,300,000 $1,300,000 $0 $1,300,000 $0 $0 $0 $162,459 $0 $1,137,541 $1,300,000 $162,459 $1,137,541 $0 $0 $0 Hotel Other Costs Totals 12.5 %
$20,390,596 $19,824,611 $0 $19,824,611 $5,058,514 $1,197,640 $6,256,154 $8,226,132 $0 $3,303,019 $17,785,304 $14,151,423 $5,342,326 $2,039,307 $(565,985) $0 Building Loan Soft Costs Totals 79.6 %
LEED/Commissioning 143,500 08-10-26014 143,500 0 143,500 107,500 36,000 143,500 0 0 0 143,500 67,213 0 0 0 0 46.8 %
Hotel OS&E Other 250,000 08-10-31400 1,083,730 0 1,083,730 0 25,000 25,000 238,918 0 819,000 1,082,918 251,418 819,812 812 833,730 0 23.2 %
Contingency 1,053,829 08-10-39000 489,195 0 489,195 0 0 0 0 0 0 0 0 489,195 489,195 (564,633) 0 0.0 %
Purchasing Agent 362,000 08-10-47400 362,000 0 362,000 310,000 52,000 362,000 0 0 0 362,000 362,000 0 0 0 0 100.0 %
Working Capital 336,582 08-10-48900 336,582 0 336,582 0 0 0 75,000 0 261,582 336,582 75,000 261,582 0 0 0 22.3 %
HistoricPreservationConsultant 95,000 08-10-48920 135,000 0 135,000 80,000 55,000 135,000 0 0 0 135,000 126,159 0 0 40,000 0 93.5 %
Hotel TSA 550,000 08-10-48930 550,000 0 550,000 550,000 0 550,000 0 0 0 550,000 550,000 0 0 0 0 100.0 %
ICAP Consultants 250,000 08-10-48940 250,000 0 250,000 122,000 0 122,000 8,996 0 100,000 230,996 110,996 119,004 19,004 0 0 48.1 %
Misc. Eng. & Cons./AS 0 08-10-48950 38,850 0 38,850 0 38,850 38,850 0 0 0 38,850 32,100 0 0 38,850 0 82.6 %
GovernmentalAffairsConsultants 75,000 08-10-48960 65,000 0 65,000 25,000 0 25,000 0 0 15,000 40,000 20,000 40,000 25,000 (10,000) 0 50.0 %
Project Accounting - 3rd Party 62,500 08-10-51550 83,570 0 83,570 0 0 0 79,108 0 0 79,108 79,108 4,463 4,463 21,070 0 100.0 %
Legal Costs - Owner 2,265,000 08-10-51600 2,315,000 0 2,315,000 0 0 0 2,306,797 0 6,000 2,312,797 2,306,797 8,203 2,203 50,000 0 99.7 %
Creative Agency Fees 100,000 08-10-52530 199,285 0 199,285 192,499 3,786 196,285 3,000 0 0 199,285 83,586 0 0 99,285 0 41.9 %
PublicRelations/Special Events 0 08-10-52550 142,500 0 142,500 142,500 0 142,500 0 0 0 142,500 50,000 0 0 142,500 0 35.1 %
Model Unit Allowance 310,000 08-10-52570 336,000 0 336,000 15,975 0 15,975 310,586 0 0 326,561 324,061 9,439 9,439 26,000 0 99.2 %
Public Benefits/Community Rel. 100,000 08-10-55100 14,449 0 14,449 0 0 0 0 0 0 0 0 14,449 14,449 (85,551) 0 0.0 %
Development Fee 3,975,287 08-10-56100 3,975,287 0 3,975,287 817,800 2,860,910 3,678,710 296,577 0 0 3,975,287 2,783,377 0 0 0 0 70.0 %
Developer's Reimbursables 175,000 08-10-56300 175,000 0 175,000 0 0 0 154,990 0 20,000 174,990 154,990 20,010 10 0 0 88.6 %
A&E Reimbursables 110,000 08-10-63000 145,000 0 145,000 0 0 0 144,470 0 530 145,000 144,470 530 0 35,000 0 99.6 %
ID Reimbursables 250,000 08-10-63010 203,000 0 203,000 0 0 0 110,897 0 0 110,897 110,897 92,103 92,103 (47,000) 0 100.0 %
Pre-Opening Costs 2,977,560 08-10-65000 2,977,560 0 2,977,560 400,000 0 400,000 819,290 0 1,618,415 2,837,705 1,215,290 1,758,269 139,854 0 0 42.8 %
Project Staffing 2,280,000 08-10-65101 2,280,000 0 2,280,000 127,500 0 127,500 1,846,475 0 306,000 2,279,975 1,951,475 306,025 25 0 0 85.6 %
Equity Owner Rep. 192,000 08-10-65201 192,000 0 192,000 268,800 (192,000) 76,800 48,000 0 50,000 174,800 124,800 67,200 17,200 0 0 71.4 %
$15,913,258 $16,492,509 $0 $16,492,509 $3,159,574 $2,879,546 $6,039,120 $6,443,105 $0 $3,196,527 $15,678,752 $10,923,738 $4,010,283 $813,756 $579,251 $0 Soft Costs Totals 69.7 %
$15,913,258 $16,492,509 $0 $16,492,509 $3,159,574 $2,879,546 $6,039,120 $6,443,105 $0 $3,196,527 $15,678,752 $10,923,738 $4,010,283 $813,756 $579,251 $0 Project Loan Soft Costs Totals 69.7 %
Pre-Development Costs 6,010,955 10-10-13500 6,010,955 0 6,010,955 0 0 0 6,010,955 0 0 6,010,955 6,010,955 0 0 0 0 100.0 %
Pre-Opening Costs 0 10-10-65000 0 0 0 0 0 0 0 0 0 0 0 0 0 0 0 0.0 %
$6,010,955 $6,010,955 $0 $6,010,955 $0 $0 $0 $6,010,955 $0 $0 $6,010,955 $6,010,955 $0 $0 $0 $0 Other Totals 100.0 %
$6,010,955 $6,010,955 $0 $6,010,955 $0 $0 $0 $6,010,955 $0 $0 $6,010,955 $6,010,955 $0 $0 $0 $0 Other Costs Totals 100.0 %
Page 2 of 310/9/2015; 10:46:16AM
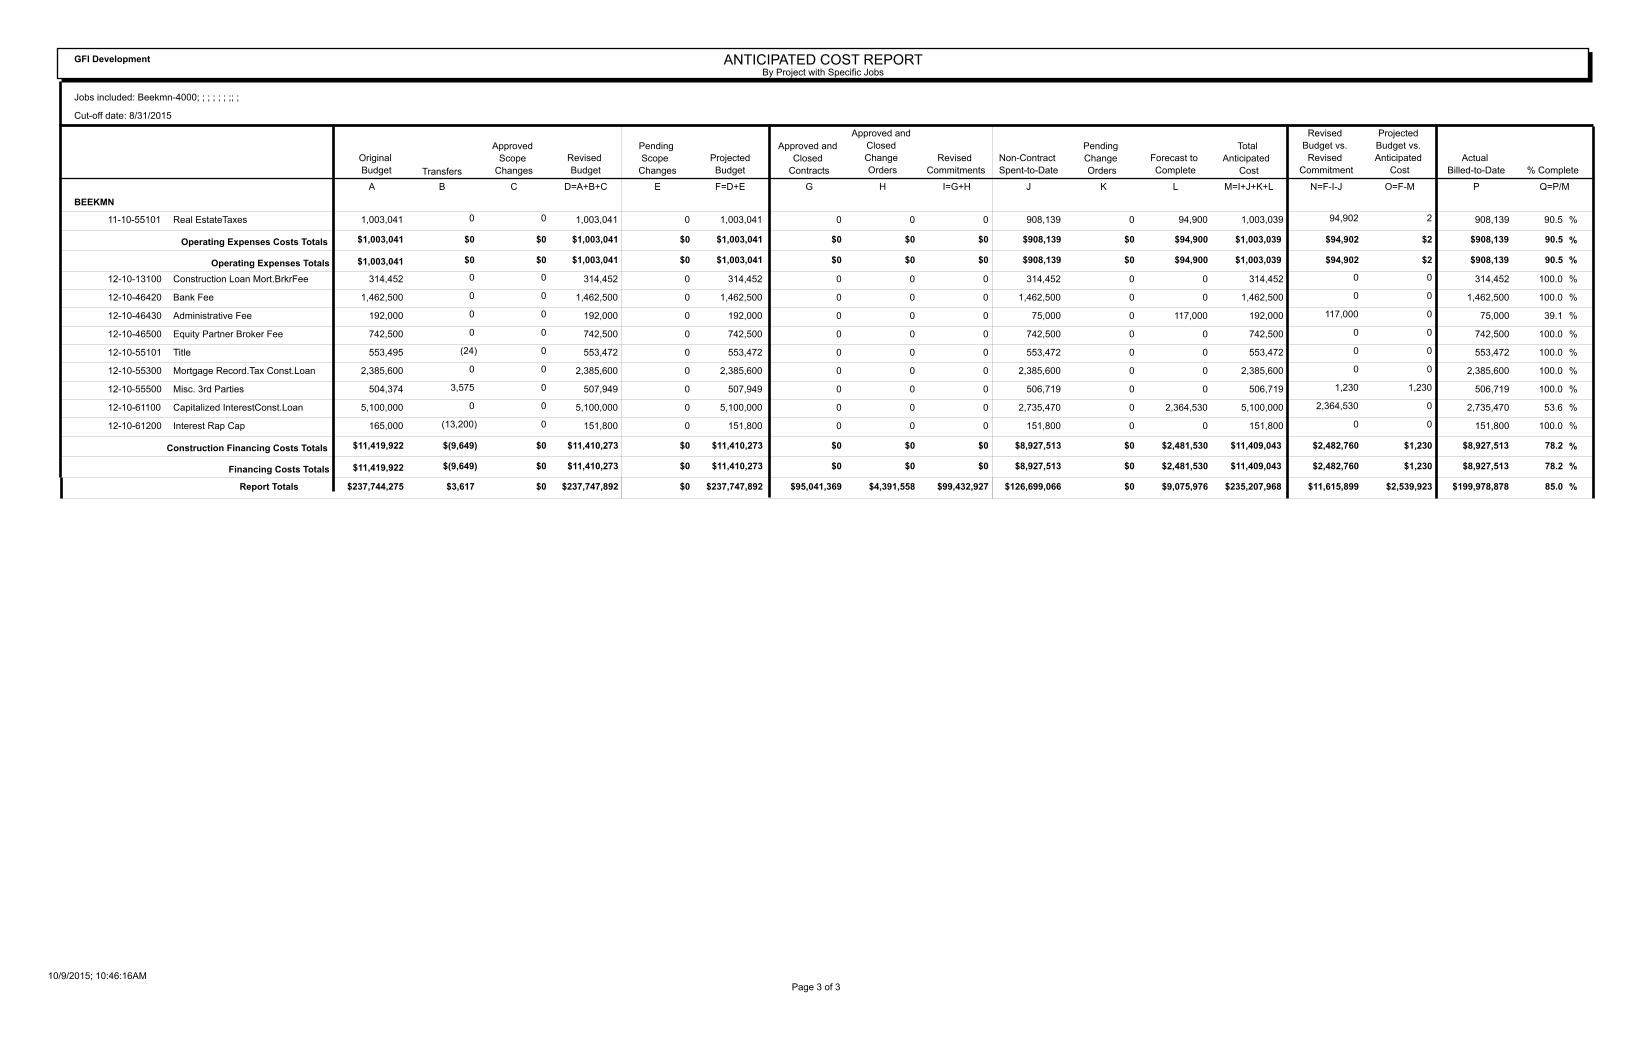
ANTICIPATED COST REPORTBy Project with Specific Jobs
GFI Development
Jobs included: Beekmn-4000; ; ; ; ; ; ;; ;
Cut-off date: 8/31/2015
Approved
Scope
ChangesTransfers
Actual
Billed-to-Date
Projected
Budget vs.
Anticipated
Cost
Revised
Budget vs.
Revised
Commitment
Revised
Commitments
Total
Anticipated
Cost
Projected
Budget
Original
Budget
Forecast to
Complete
Pending
Change
Orders
Non-Contract
Spent-to-Date
Approved and
Closed
Change
Orders
Approved and
Closed
Contracts
Pending
Scope
Changes
Revised
Budget % Complete
A B C D=A+B+C E F=D+E G H I=G+H J K L M=I+J+K+L N=F-I-J O=F-M P Q=P/M
BEEKMN
Real EstateTaxes 1,003,041 11-10-55101 1,003,041 0 1,003,041 0 0 0 908,139 0 94,900 1,003,039 908,139 94,902 2 0 0 90.5 %
$1,003,041 $1,003,041 $0 $1,003,041 $0 $0 $0 $908,139 $0 $94,900 $1,003,039 $908,139 $94,902 $2 $0 $0 Operating Expenses Costs Totals 90.5 %
$1,003,041 $1,003,041 $0 $1,003,041 $0 $0 $0 $908,139 $0 $94,900 $1,003,039 $908,139 $94,902 $2 $0 $0 Operating Expenses Totals 90.5 %
Construction Loan Mort.BrkrFee 314,452 12-10-13100 314,452 0 314,452 0 0 0 314,452 0 0 314,452 314,452 0 0 0 0 100.0 %
Bank Fee 1,462,500 12-10-46420 1,462,500 0 1,462,500 0 0 0 1,462,500 0 0 1,462,500 1,462,500 0 0 0 0 100.0 %
Administrative Fee 192,000 12-10-46430 192,000 0 192,000 0 0 0 75,000 0 117,000 192,000 75,000 117,000 0 0 0 39.1 %
Equity Partner Broker Fee 742,500 12-10-46500 742,500 0 742,500 0 0 0 742,500 0 0 742,500 742,500 0 0 0 0 100.0 %
Title 553,495 12-10-55101 553,472 0 553,472 0 0 0 553,472 0 0 553,472 553,472 0 0 (24) 0 100.0 %
Mortgage Record.Tax Const.Loan 2,385,600 12-10-55300 2,385,600 0 2,385,600 0 0 0 2,385,600 0 0 2,385,600 2,385,600 0 0 0 0 100.0 %
Misc. 3rd Parties 504,374 12-10-55500 507,949 0 507,949 0 0 0 506,719 0 0 506,719 506,719 1,230 1,230 3,575 0 100.0 %
Capitalized InterestConst.Loan 5,100,000 12-10-61100 5,100,000 0 5,100,000 0 0 0 2,735,470 0 2,364,530 5,100,000 2,735,470 2,364,530 0 0 0 53.6 %
Interest Rap Cap 165,000 12-10-61200 151,800 0 151,800 0 0 0 151,800 0 0 151,800 151,800 0 0 (13,200) 0 100.0 %
$11,419,922 $11,410,273 $0 $11,410,273 $0 $0 $0 $8,927,513 $0 $2,481,530 $11,409,043 $8,927,513 $2,482,760 $1,230 $(9,649) $0 Construction Financing Costs Totals 78.2 %
$11,419,922 $11,410,273 $0 $11,410,273 $0 $0 $0 $8,927,513 $0 $2,481,530 $11,409,043 $8,927,513 $2,482,760 $1,230 $(9,649) $0 Financing Costs Totals 78.2 %
$237,744,275 $237,747,892 Report Totals $0 $237,747,892 $95,041,369 $4,391,558 $99,432,927 $126,699,066 $0 $9,075,976 $235,207,968 $199,978,878 $11,615,899 $2,539,923 $3,617 $0 85.0 %
Page 3 of 310/9/2015; 10:46:16AM
ADDENDA
STR Report
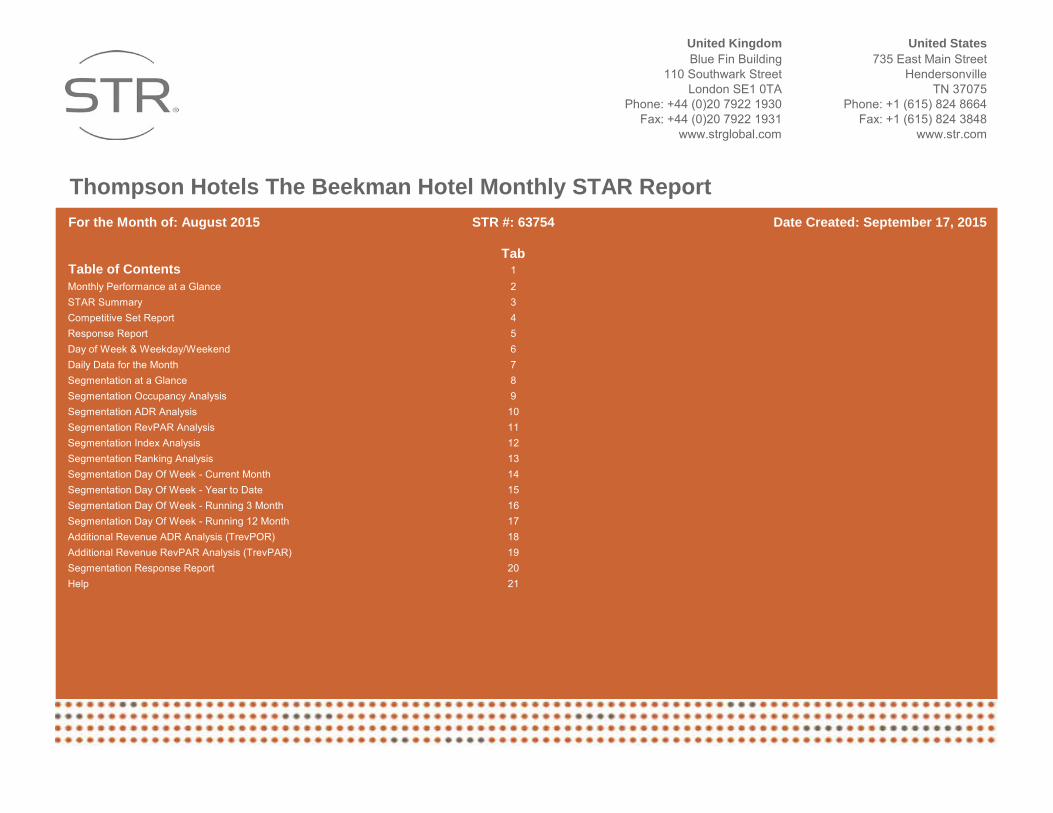
United Kingdom United StatesBlue Fin Building 735 East Main Street
110 Southwark Street HendersonvilleLondon SE1 0TA TN 37075
Phone: +44 (0)20 7922 1930 Phone: +1 (615) 824 8664Fax: +44 (0)20 7922 1931 Fax: +1 (615) 824 3848
www.strglobal.com www.str.com
Thompson Hotels The Beekman Hotel Monthly STAR Report
STR #: 63754 Date Created: September 17, 2015
TabTable of Contents 1Monthly Performance at a Glance 2STAR Summary 3Competitive Set Report 4Response Report 5Day of Week & Weekday/Weekend 6Daily Data for the Month 7Segmentation at a Glance 8Segmentation Occupancy Analysis 9Segmentation ADR Analysis 10Segmentation RevPAR Analysis 11Segmentation Index Analysis 12Segmentation Ranking Analysis 13Segmentation Day Of Week - Current Month 14Segmentation Day Of Week - Year to Date 15Segmentation Day Of Week - Running 3 Month 16Segmentation Day Of Week - Running 12 Month 17Additional Revenue ADR Analysis (TrevPOR) 18Additional Revenue RevPAR Analysis (TrevPAR) 19Segmentation Response Report 20Help 21
For the Month of: August 2015
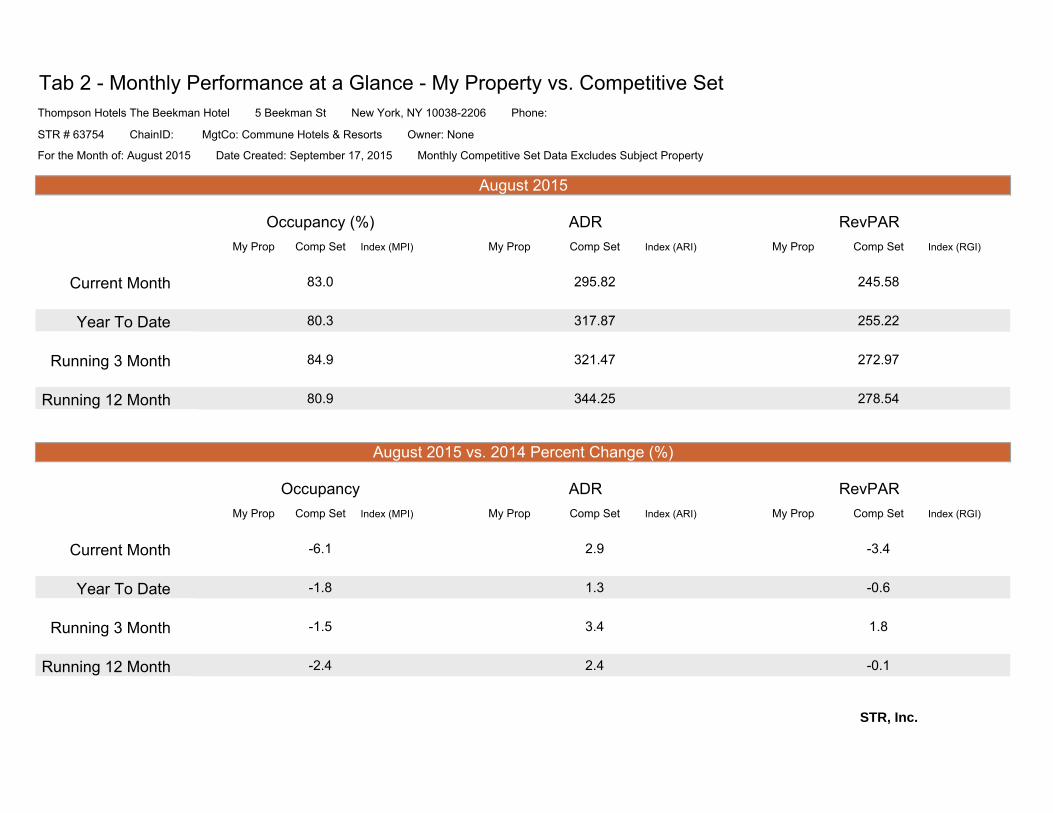
Tab 2 - Monthly Performance at a Glance - My Property vs. Competitive Set
My Prop Comp Set Index (MPI) My Prop Comp Set Index (ARI) My Prop Comp Set Index (RGI)
Current Month 83.0 295.82 245.58
Year To Date 80.3 317.87 255.22
Running 3 Month 84.9 321.47 272.97
Running 12 Month 80.9 344.25 278.54
My Prop Comp Set Index (MPI) My Prop Comp Set Index (ARI) My Prop Comp Set Index (RGI)
Current Month -6.1 2.9 -3.4
Year To Date -1.8 1.3 -0.6
Running 3 Month -1.5 3.4 1.8
Running 12 Month -2.4 2.4 -0.1
STR, Inc.
Occupancy (%) ADR RevPAR
Thompson Hotels The Beekman Hotel 5 Beekman St New York, NY 10038-2206 Phone:
STR # 63754 ChainID: MgtCo: Commune Hotels & Resorts Owner: None
For the Month of: August 2015 Date Created: September 17, 2015 Monthly Competitive Set Data Excludes Subject Property
ADR RevPAROccupancy
August 2015
August 2015 vs. 2014 Percent Change (%)
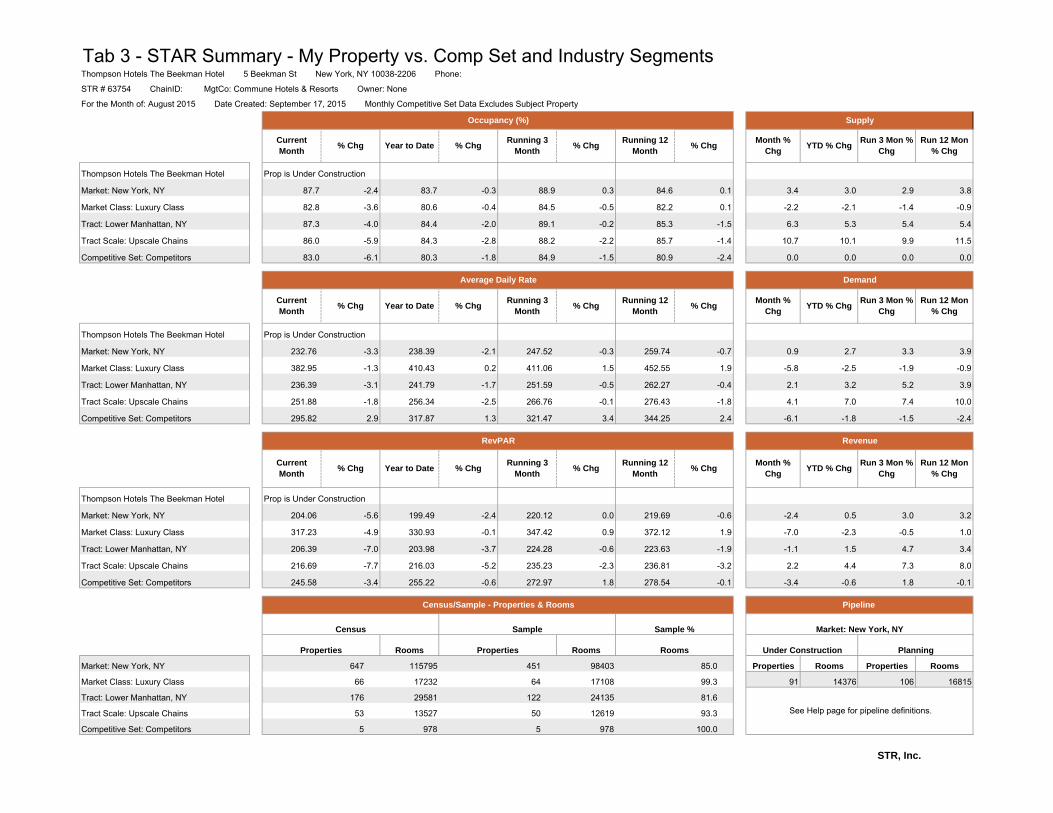
Tab 3 - STAR Summary - My Property vs. Comp Set and Industry Segments
Prop is Under Construction
87.7 -2.4 83.7 -0.3 88.9 0.3 84.6 0.1 3.4 3.0 2.9 3.8
82.8 -3.6 80.6 -0.4 84.5 -0.5 82.2 0.1 -2.2 -2.1 -1.4 -0.9
87.3 -4.0 84.4 -2.0 89.1 -0.2 85.3 -1.5 6.3 5.3 5.4 5.4
86.0 -5.9 84.3 -2.8 88.2 -2.2 85.7 -1.4 10.7 10.1 9.9 11.5
83.0 -6.1 80.3 -1.8 84.9 -1.5 80.9 -2.4 0.0 0.0 0.0 0.0
Prop is Under Construction
232.76 -3.3 238.39 -2.1 247.52 -0.3 259.74 -0.7 0.9 2.7 3.3 3.9
382.95 -1.3 410.43 0.2 411.06 1.5 452.55 1.9 -5.8 -2.5 -1.9 -0.9
236.39 -3.1 241.79 -1.7 251.59 -0.5 262.27 -0.4 2.1 3.2 5.2 3.9
251.88 -1.8 256.34 -2.5 266.76 -0.1 276.43 -1.8 4.1 7.0 7.4 10.0
295.82 2.9 317.87 1.3 321.47 3.4 344.25 2.4 -6.1 -1.8 -1.5 -2.4
Prop is Under Construction
204.06 -5.6 199.49 -2.4 220.12 0.0 219.69 -0.6 -2.4 0.5 3.0 3.2
317.23 -4.9 330.93 -0.1 347.42 0.9 372.12 1.9 -7.0 -2.3 -0.5 1.0
206.39 -7.0 203.98 -3.7 224.28 -0.6 223.63 -1.9 -1.1 1.5 4.7 3.4
216.69 -7.7 216.03 -5.2 235.23 -2.3 236.81 -3.2 2.2 4.4 7.3 8.0
245.58 -3.4 255.22 -0.6 272.97 1.8 278.54 -0.1 -3.4 -0.6 1.8 -0.1
Rooms Rooms
115795 98403 Properties
17232 17108 91
29581 24135
13527 12619
978 978
STR, Inc.
For the Month of: August 2015 Date Created: September 17, 2015 Monthly Competitive Set Data Excludes Subject Property
STR # 63754 ChainID: MgtCo: Commune Hotels & Resorts Owner: None
Thompson Hotels The Beekman Hotel 5 Beekman St New York, NY 10038-2206 Phone:
Tract Scale: Upscale Chains
Tract: Lower Manhattan, NY
Market Class: Luxury Class
Market: New York, NY
YTD % ChgRun 12 Mon
% ChgRun 3 Mon %
Chg
Tract: Lower Manhattan, NY
Market Class: Luxury Class
Market: New York, NY
Competitive Set: Competitors
Market Class: Luxury Class
Market: New York, NY
Competitive Set: Competitors
Tract Scale: Upscale Chains
Thompson Hotels The Beekman Hotel
Market: New York, NY
Competitive Set: Competitors
Tract Scale: Upscale Chains
Tract: Lower Manhattan, NY
Competitive Set: Competitors
Tract Scale: Upscale Chains
Tract: Lower Manhattan, NY
Market Class: Luxury Class 1681510614376
Rooms Properties Rooms
Market: New York, NY
Revenue
Pipeline
Month % Chg
YTD % ChgRun 3 Mon %
ChgRun 12 Mon
% Chg
Supply
Demand
Month % Chg
Month % Chg
YTD % ChgRun 3 Mon %
ChgRun 12 Mon
% ChgCurrent Month
% ChgCurrent Month
% Chg
% Chg
Average Daily Rate
Running 3 Month
% ChgRunning 12
Month
100.0
93.3
Sample %
5
647
176
53
Properties
Sample
66
See Help page for pipeline definitions.
Under ConstructionProperties
5
50
Planning
99.3
Rooms
122
64
Thompson Hotels The Beekman Hotel
Occupancy (%)
Thompson Hotels The Beekman Hotel
Year to Date % Chg
% Chg Year to Date
451
81.6
85.0
Running 3 Month
% ChgRunning 12
Month% Chg
Census/Sample - Properties & Rooms
% Chg
Census
% ChgRunning 12
Month
RevPAR
Current Month
% Chg Year to Date % ChgRunning 3
Month

Tab 4 - Competitive Set Report
Mar Apr May Jun Jul Aug Sep Oct Nov Dec Jan Feb Mar Apr May Jun Jul Aug 2013 2014 2015 2013 2014 2015 2013 2014 2015
My Property
Competitive Set 80.1 88.0 87.5 86.9 83.3 88.4 85.7 87.2 79.5 76.3 60.8 76.5 79.6 86.1 84.6 88.1 83.7 83.0 80.3 81.8 80.3 84.6 86.2 84.9 78.8 82.9 80.9
Index (MPI)
Rank
% Chg
My Property
Competitive Set 0.3 5.7 1.7 5.8 -0.4 0.5 -1.2 -1.9 -3.3 -7.7 -9.6 5.7 -0.7 -2.1 -3.3 1.4 0.5 -6.1 -0.4 1.8 -1.8 0.2 1.9 -1.5 -2.8 5.2 -2.4
Index (MPI)
Rank
Mar Apr May Jun Jul Aug Sep Oct Nov Dec Jan Feb Mar Apr May Jun Jul Aug 2013 2014 2015 2013 2014 2015 2013 2014 2015
My Property
Competitive Set 292.84 341.01 366.97 351.79 294.82 287.49 406.17 425.03 384.78 361.32 260.72 283.54 301.52 337.30 372.48 360.70 306.97 295.82 311.30 313.84 317.87 307.94 311.01 321.47 330.11 336.34 344.25
Index (ARI)
Rank
% Chg
My Property
Competitive Set -2.6 -0.6 3.0 1.0 -0.4 1.6 3.6 6.8 6.2 -0.5 -7.1 1.9 3.0 -1.1 1.5 2.5 4.1 2.9 1.1 0.8 1.3 0.4 1.0 3.4 -0.7 1.9 2.4
Index (ARI)
Rank
Mar Apr May Jun Jul Aug Sep Oct Nov Dec Jan Feb Mar Apr May Jun Jul Aug 2013 2014 2015 2013 2014 2015 2013 2014 2015
My Property
Competitive Set 234.71 299.92 321.10 305.61 245.71 254.23 348.04 370.65 305.74 275.69 158.41 216.94 239.92 290.43 315.11 317.70 257.08 245.58 250.08 256.70 255.22 260.58 268.11 272.97 260.19 278.87 278.54
Index (RGI)
Rank
% Chg
My Property
Competitive Set -2.4 5.1 4.7 6.9 -0.8 2.1 2.4 4.7 2.7 -8.2 -16.0 7.7 2.2 -3.2 -1.9 4.0 4.6 -3.4 0.7 2.6 -0.6 0.6 2.9 1.8 -3.6 7.2 -0.1
Index (RGI)
Rank
Exchange Rate STR, Inc.
For the Month of: August 2015 Date Created: September 17, 2015 Monthly Competitive Set Data Excludes Subject Property
Occupancy (%)Running 3 MonthYear To Date Running 12 Month2014
RevPAR
Running 3 Month
Running 3 Month
Year To DateADR
Year To Date
2014
2014
2015
2015
2015 Running 12 Month
Running 12 Month
Thompson Hotels The Beekman Hotel 5 Beekman St New York, NY 10038-2206 Phone: STR # 63754 ChainID: MgtCo: Commune Hotels & Resorts Owner: None
01122334455
Mar Apr May Jun Jul Aug Sep Oct Nov Dec Jan Feb Mar Apr May Jun Jul Aug
Monthly Indexes
-6-4-20246
Year to Date Running 3 Month Running 12 Month
RevPAR Percent Change
My Property Competitive Set
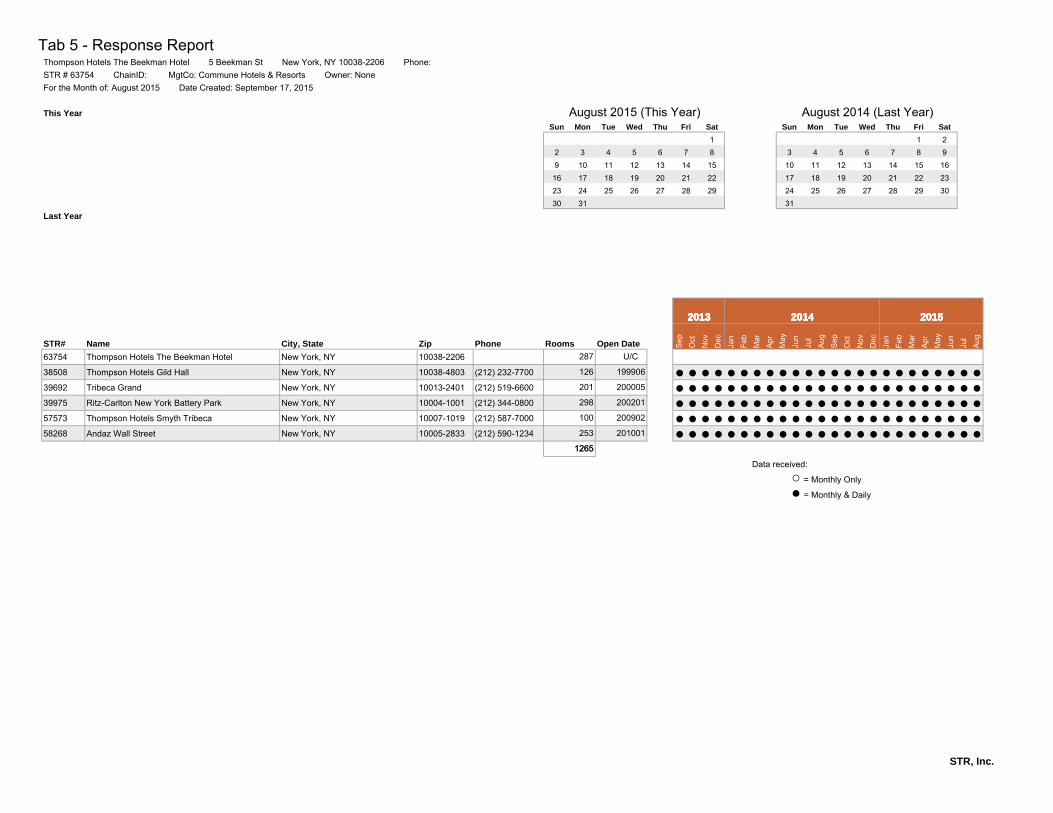
Tab 5 - Response Report
This Year
Last Year
STR# Name City, State Zip Phone Sep
Oct
Nov
Dec
Jan
Feb
Mar
Apr
May
Jun
Jul
Aug
Sep
Oct
Nov
Dec
Jan
Feb
Mar
Apr
May
Jun
Jul
Aug
63754 Thompson Hotels The Beekman Hotel New York, NY 10038-2206
38508 Thompson Hotels Gild Hall New York, NY 10038-4803 (212) 232-7700 ● ● ● ● ● ● ● ● ● ● ● ● ● ● ● ● ● ● ● ● ● ● ● ●39692 Tribeca Grand New York, NY 10013-2401 (212) 519-6600 ● ● ● ● ● ● ● ● ● ● ● ● ● ● ● ● ● ● ● ● ● ● ● ●39975 Ritz-Carlton New York Battery Park New York, NY 10004-1001 (212) 344-0800 ● ● ● ● ● ● ● ● ● ● ● ● ● ● ● ● ● ● ● ● ● ● ● ●57573 Thompson Hotels Smyth Tribeca New York, NY 10007-1019 (212) 587-7000 ● ● ● ● ● ● ● ● ● ● ● ● ● ● ● ● ● ● ● ● ● ● ● ●58268 Andaz Wall Street New York, NY 10005-2833 (212) 590-1234 ● ● ● ● ● ● ● ● ● ● ● ● ● ● ● ● ● ● ● ● ● ● ● ●
Data received:
○ = Monthly Only
● = Monthly & Daily
STR, Inc.
200201
1521 22
298
201001
1265
100 200902
253
Open Date
31
1 2
11 12
26
August 2014 (Last Year)Sun Mon Tue Wed Thu Fri Sat
104
16
24
3 6 7 8 914
27 30232017 18
5 6 7 5
18 19
8
Sun ThuWedTue
43
Fri
2
1912119 10 14
2330
August 2015 (This Year)
1SatMon
2625 2721
201
199906
287 U/C
2013
16 2215
2013
24
29
25
28 29 31
Rooms
200005
1317
28
For the Month of: August 2015 Date Created: September 17, 2015
2014 20152013 2014
126
20132013 2014 2015
STR # 63754 ChainID: MgtCo: Commune Hotels & Resorts Owner: NoneThompson Hotels The Beekman Hotel 5 Beekman St New York, NY 10038-2206 Phone:
2014 2015
1265
20152013 2014 20152013 2014 2015
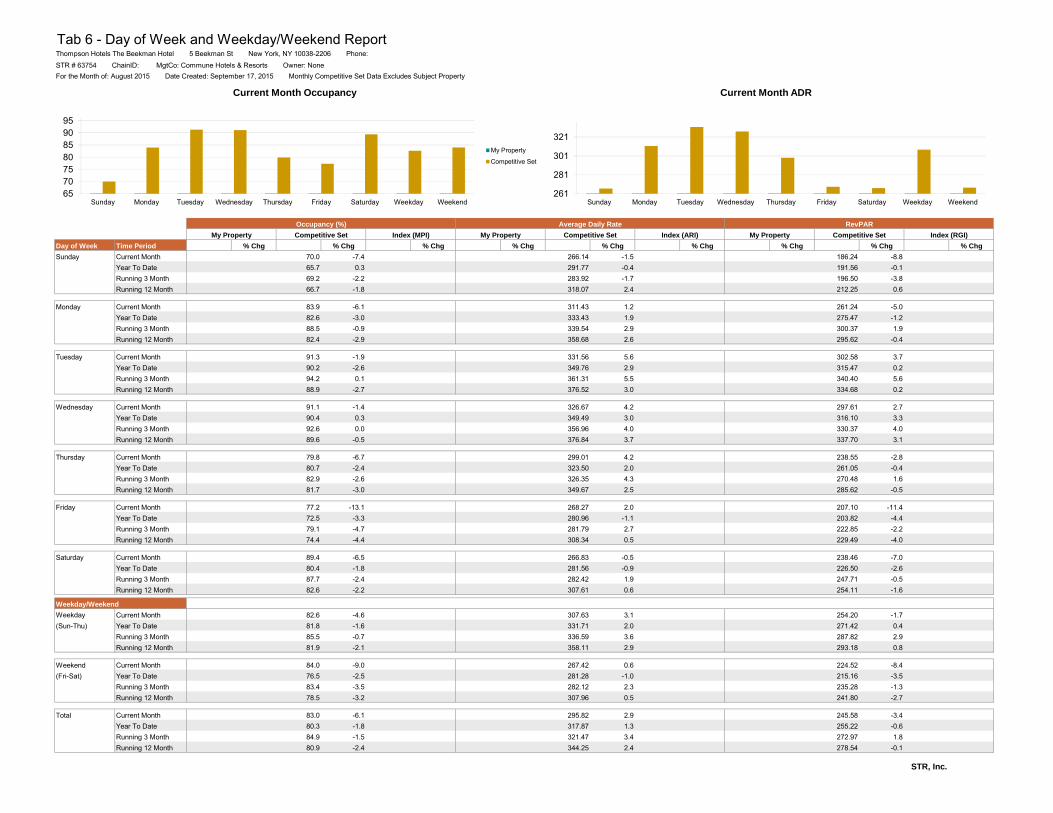
Tab 6 - Day of Week and Weekday/Weekend ReportThompson Hotels The Beekman Hotel 5 Beekman St New York, NY 10038-2206 Phone: STR # 63754 ChainID: MgtCo: Commune Hotels & Resorts Owner: NoneFor the Month of: August 2015 Date Created: September 17, 2015 Monthly Competitive Set Data Excludes Subject Property
Day of Week Time Period % Chg % Chg % Chg % Chg % Chg % Chg % Chg % Chg % Chg
Sunday Current Month 70.0 -7.4 266.14 -1.5 186.24 -8.8Year To Date 65.7 0.3 291.77 -0.4 191.56 -0.1Running 3 Month 69.2 -2.2 283.92 -1.7 196.50 -3.8Running 12 Month 66.7 -1.8 318.07 2.4 212.25 0.6
Monday Current Month 83.9 -6.1 311.43 1.2 261.24 -5.0Year To Date 82.6 -3.0 333.43 1.9 275.47 -1.2Running 3 Month 88.5 -0.9 339.54 2.9 300.37 1.9Running 12 Month 82.4 -2.9 358.68 2.6 295.62 -0.4
Tuesday Current Month 91.3 -1.9 331.56 5.6 302.58 3.7Year To Date 90.2 -2.6 349.76 2.9 315.47 0.2Running 3 Month 94.2 0.1 361.31 5.5 340.40 5.6Running 12 Month 88.9 -2.7 376.52 3.0 334.68 0.2
Wednesday Current Month 91.1 -1.4 326.67 4.2 297.61 2.7Year To Date 90.4 0.3 349.49 3.0 316.10 3.3Running 3 Month 92.6 0.0 356.96 4.0 330.37 4.0Running 12 Month 89.6 -0.5 376.84 3.7 337.70 3.1
Thursday Current Month 79.8 -6.7 299.01 4.2 238.55 -2.8Year To Date 80.7 -2.4 323.50 2.0 261.05 -0.4Running 3 Month 82.9 -2.6 326.35 4.3 270.48 1.6Running 12 Month 81.7 -3.0 349.67 2.5 285.62 -0.5
Friday Current Month 77.2 -13.1 268.27 2.0 207.10 -11.4Year To Date 72.5 -3.3 280.96 -1.1 203.82 -4.4Running 3 Month 79.1 -4.7 281.79 2.7 222.85 -2.2Running 12 Month 74.4 -4.4 308.34 0.5 229.49 -4.0
Saturday Current Month 89.4 -6.5 266.83 -0.5 238.46 -7.0Year To Date 80.4 -1.8 281.56 -0.9 226.50 -2.6Running 3 Month 87.7 -2.4 282.42 1.9 247.71 -0.5Running 12 Month 82.6 -2.2 307.61 0.6 254.11 -1.6
Weekday Current Month 82.6 -4.6 307.63 3.1 254.20 -1.7(Sun-Thu) Year To Date 81.8 -1.6 331.71 2.0 271.42 0.4
Running 3 Month 85.5 -0.7 336.59 3.6 287.82 2.9Running 12 Month 81.9 -2.1 358.11 2.9 293.18 0.8
Weekend Current Month 84.0 -9.0 267.42 0.6 224.52 -8.4(Fri-Sat) Year To Date 76.5 -2.5 281.28 -1.0 215.16 -3.5
Running 3 Month 83.4 -3.5 282.12 2.3 235.28 -1.3Running 12 Month 78.5 -3.2 307.96 0.5 241.80 -2.7
Total Current Month 83.0 -6.1 295.82 2.9 245.58 -3.4Year To Date 80.3 -1.8 317.87 1.3 255.22 -0.6Running 3 Month 84.9 -1.5 321.47 3.4 272.97 1.8Running 12 Month 80.9 -2.4 344.25 2.4 278.54 -0.1
STR, Inc.
Weekday/Weekend
My Property Competitive Set
Occupancy (%) Average Daily Rate RevPAR
My Property Competitive Set Index (MPI) My Property Index (RGI)Competitive Set Index (ARI)
65707580859095
Sunday Monday Tuesday Wednesday Thursday Friday Saturday Weekday Weekend
Current Month Occupancy
My Property
Competitive Set
261
281
301
321
Sunday Monday Tuesday Wednesday Thursday Friday Saturday Weekday Weekend
Current Month ADR
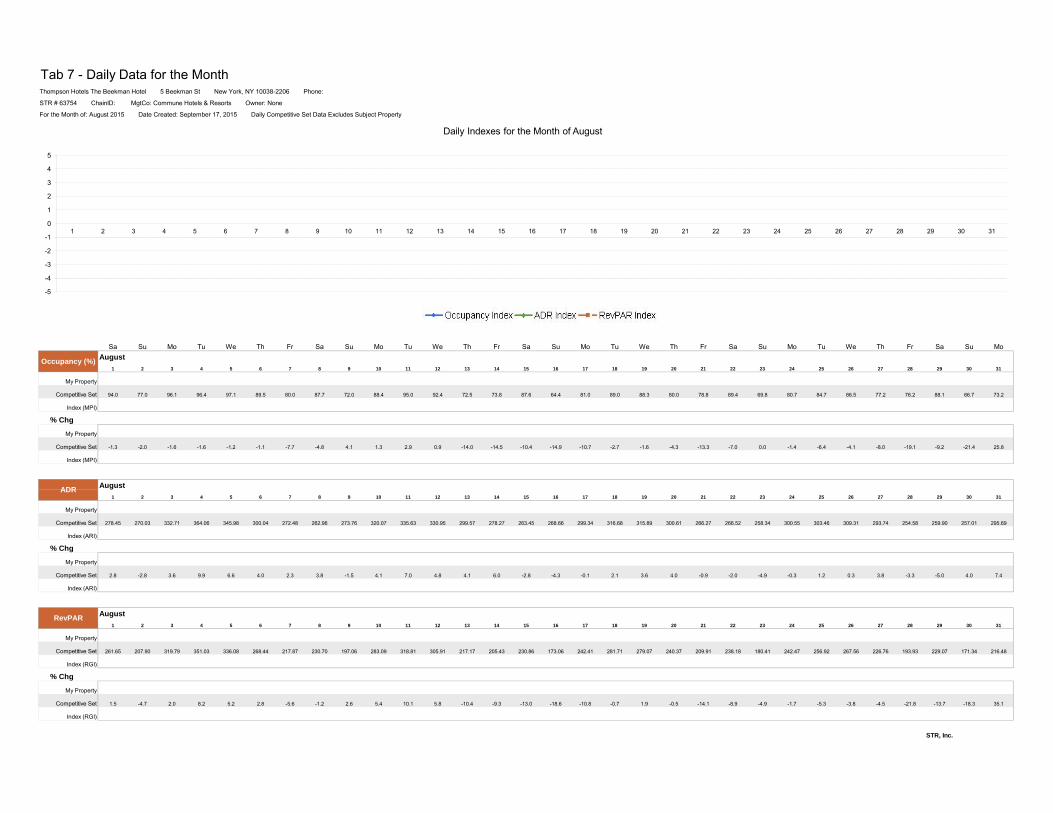
Tab 7 - Daily Data for the Month
Sa Su Mo Tu We Th Fr Sa Su Mo Tu We Th Fr Sa Su Mo Tu We Th Fr Sa Su Mo Tu We Th Fr Sa Su MoAugust
1 2 3 4 5 6 7 8 9 10 11 12 13 14 15 16 17 18 19 20 21 22 23 24 25 26 27 28 29 30 31
My Property
Competitive Set 94.0 77.0 96.1 96.4 97.1 89.5 80.0 87.7 72.0 88.4 95.0 92.4 72.5 73.8 87.6 64.4 81.0 89.0 88.3 80.0 78.8 89.4 69.8 80.7 84.7 86.5 77.2 76.2 88.1 66.7 73.2
Index (MPI)
% Chg
My Property
Competitive Set -1.3 -2.0 -1.6 -1.6 -1.2 -1.1 -7.7 -4.8 4.1 1.3 2.9 0.9 -14.0 -14.5 -10.4 -14.9 -10.7 -2.7 -1.6 -4.3 -13.3 -7.0 0.0 -1.4 -6.4 -4.1 -8.0 -19.1 -9.2 -21.4 25.8
Index (MPI)
August
1 2 3 4 5 6 7 8 9 10 11 12 13 14 15 16 17 18 19 20 21 22 23 24 25 26 27 28 29 30 31
My Property
Competitive Set 278.45 270.03 332.71 364.06 345.98 300.04 272.48 262.96 273.76 320.07 335.63 330.95 299.57 278.27 263.45 268.66 299.34 316.68 315.89 300.61 266.27 266.52 258.34 300.55 303.46 309.31 293.74 254.58 259.90 257.01 295.69
Index (ARI)
% Chg
My Property
Competitive Set 2.8 -2.8 3.6 9.9 6.6 4.0 2.3 3.8 -1.5 4.1 7.0 4.8 4.1 6.0 -2.8 -4.3 -0.1 2.1 3.6 4.0 -0.9 -2.0 -4.9 -0.3 1.2 0.3 3.8 -3.3 -5.0 4.0 7.4
Index (ARI)
August
1 2 3 4 5 6 7 8 9 10 11 12 13 14 15 16 17 18 19 20 21 22 23 24 25 26 27 28 29 30 31
My Property
Competitive Set 261.65 207.90 319.79 351.03 336.08 268.44 217.87 230.70 197.06 283.09 318.81 305.91 217.17 205.43 230.86 173.06 242.41 281.71 279.07 240.37 209.91 238.18 180.41 242.47 256.92 267.56 226.76 193.93 229.07 171.34 216.48
Index (RGI)
% Chg
My Property
Competitive Set 1.5 -4.7 2.0 8.2 5.2 2.8 -5.6 -1.2 2.6 5.4 10.1 5.8 -10.4 -9.3 -13.0 -18.6 -10.8 -0.7 1.9 -0.5 -14.1 -8.9 -4.9 -1.7 -5.3 -3.8 -4.5 -21.8 -13.7 -18.3 35.1
Index (RGI)
STR, Inc.
Occupancy (%)
ADR
STR # 63754 ChainID: MgtCo: Commune Hotels & Resorts Owner: None
RevPAR
For the Month of: August 2015 Date Created: September 17, 2015 Daily Competitive Set Data Excludes Subject Property
Thompson Hotels The Beekman Hotel 5 Beekman St New York, NY 10038-2206 Phone:
-5
-4
-3
-2
-1
0
1
2
3
4
5
1 2 3 4 5 6 7 8 9 10 11 12 13 14 15 16 17 18 19 20 21 22 23 24 25 26 27 28 29 30 31
Daily Indexes for the Month of August
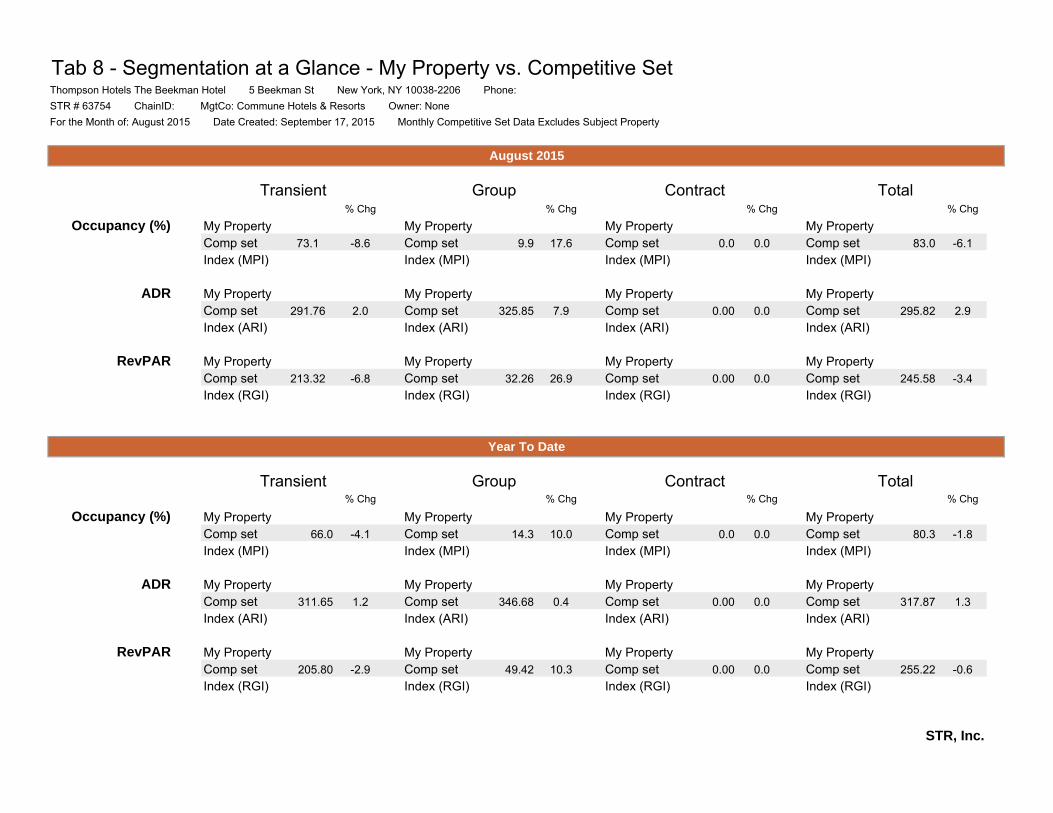
Tab 8 - Segmentation at a Glance - My Property vs. Competitive Set
% Chg % Chg % Chg % Chg
Occupancy (%) My Property My Property My Property My PropertyComp set 73.1 -8.6 Comp set 9.9 17.6 Comp set 0.0 0.0 Comp set 83.0 -6.1Index (MPI) Index (MPI) Index (MPI) Index (MPI)
ADR My Property My Property My Property My PropertyComp set 291.76 2.0 Comp set 325.85 7.9 Comp set 0.00 0.0 Comp set 295.82 2.9Index (ARI) Index (ARI) Index (ARI) Index (ARI)
RevPAR My Property My Property My Property My PropertyComp set 213.32 -6.8 Comp set 32.26 26.9 Comp set 0.00 0.0 Comp set 245.58 -3.4Index (RGI) Index (RGI) Index (RGI) Index (RGI)
% Chg % Chg % Chg % Chg
Occupancy (%) My Property My Property My Property My PropertyComp set 66.0 -4.1 Comp set 14.3 10.0 Comp set 0.0 0.0 Comp set 80.3 -1.8Index (MPI) Index (MPI) Index (MPI) Index (MPI)
ADR My Property My Property My Property My PropertyComp set 311.65 1.2 Comp set 346.68 0.4 Comp set 0.00 0.0 Comp set 317.87 1.3Index (ARI) Index (ARI) Index (ARI) Index (ARI)
RevPAR My Property My Property My Property My PropertyComp set 205.80 -2.9 Comp set 49.42 10.3 Comp set 0.00 0.0 Comp set 255.22 -0.6Index (RGI) Index (RGI) Index (RGI) Index (RGI)
STR, Inc.
Thompson Hotels The Beekman Hotel 5 Beekman St New York, NY 10038-2206 Phone:
August 2015
Year To Date
Transient Group Contract Total
For the Month of: August 2015 Date Created: September 17, 2015 Monthly Competitive Set Data Excludes Subject PropertySTR # 63754 ChainID: MgtCo: Commune Hotels & Resorts Owner: None
Transient Group Contract Total
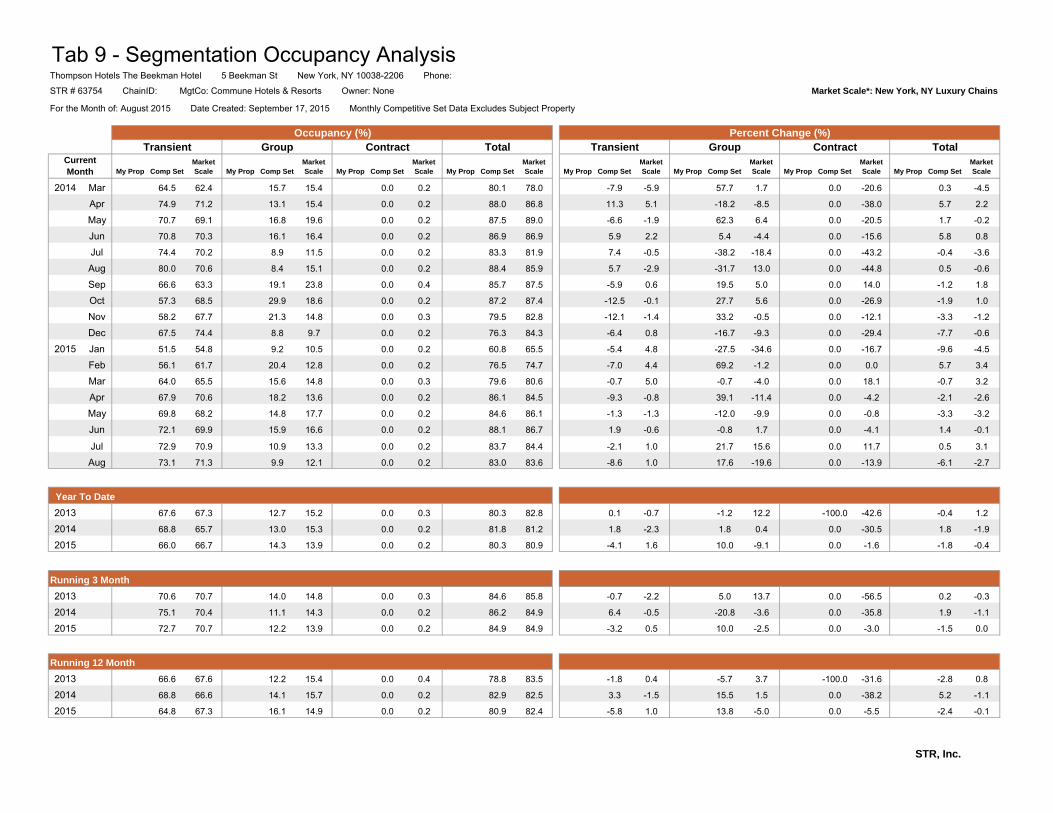
Tab 9 - Segmentation Occupancy Analysis
My Prop Comp SetMarket Scale My Prop Comp Set
Market Scale My Prop Comp Set
Market Scale My Prop Comp Set
Market Scale My Prop Comp Set
Market Scale My Prop Comp Set
Market Scale My Prop Comp Set
Market Scale My Prop Comp Set
Market Scale
2014 Mar 64.5 62.4 15.7 15.4 0.0 0.2 80.1 78.0 -7.9 -5.9 57.7 1.7 0.0 -20.6 0.3 -4.5
Apr 74.9 71.2 13.1 15.4 0.0 0.2 88.0 86.8 11.3 5.1 -18.2 -8.5 0.0 -38.0 5.7 2.2
May 70.7 69.1 16.8 19.6 0.0 0.2 87.5 89.0 -6.6 -1.9 62.3 6.4 0.0 -20.5 1.7 -0.2
Jun 70.8 70.3 16.1 16.4 0.0 0.2 86.9 86.9 5.9 2.2 5.4 -4.4 0.0 -15.6 5.8 0.8
Jul 74.4 70.2 8.9 11.5 0.0 0.2 83.3 81.9 7.4 -0.5 -38.2 -18.4 0.0 -43.2 -0.4 -3.6
Aug 80.0 70.6 8.4 15.1 0.0 0.2 88.4 85.9 5.7 -2.9 -31.7 13.0 0.0 -44.8 0.5 -0.6
Sep 66.6 63.3 19.1 23.8 0.0 0.4 85.7 87.5 -5.9 0.6 19.5 5.0 0.0 14.0 -1.2 1.8
Oct 57.3 68.5 29.9 18.6 0.0 0.2 87.2 87.4 -12.5 -0.1 27.7 5.6 0.0 -26.9 -1.9 1.0
Nov 58.2 67.7 21.3 14.8 0.0 0.3 79.5 82.8 -12.1 -1.4 33.2 -0.5 0.0 -12.1 -3.3 -1.2
Dec 67.5 74.4 8.8 9.7 0.0 0.2 76.3 84.3 -6.4 0.8 -16.7 -9.3 0.0 -29.4 -7.7 -0.6
2015 Jan 51.5 54.8 9.2 10.5 0.0 0.2 60.8 65.5 -5.4 4.8 -27.5 -34.6 0.0 -16.7 -9.6 -4.5
Feb 56.1 61.7 20.4 12.8 0.0 0.2 76.5 74.7 -7.0 4.4 69.2 -1.2 0.0 0.0 5.7 3.4
Mar 64.0 65.5 15.6 14.8 0.0 0.3 79.6 80.6 -0.7 5.0 -0.7 -4.0 0.0 18.1 -0.7 3.2
Apr 67.9 70.6 18.2 13.6 0.0 0.2 86.1 84.5 -9.3 -0.8 39.1 -11.4 0.0 -4.2 -2.1 -2.6
May 69.8 68.2 14.8 17.7 0.0 0.2 84.6 86.1 -1.3 -1.3 -12.0 -9.9 0.0 -0.8 -3.3 -3.2
Jun 72.1 69.9 15.9 16.6 0.0 0.2 88.1 86.7 1.9 -0.6 -0.8 1.7 0.0 -4.1 1.4 -0.1
Jul 72.9 70.9 10.9 13.3 0.0 0.2 83.7 84.4 -2.1 1.0 21.7 15.6 0.0 11.7 0.5 3.1
Aug 73.1 71.3 9.9 12.1 0.0 0.2 83.0 83.6 -8.6 1.0 17.6 -19.6 0.0 -13.9 -6.1 -2.7
2013 67.6 67.3 12.7 15.2 0.0 0.3 80.3 82.8 0.1 -0.7 -1.2 12.2 -100.0 -42.6 -0.4 1.2
2014 68.8 65.7 13.0 15.3 0.0 0.2 81.8 81.2 1.8 -2.3 1.8 0.4 0.0 -30.5 1.8 -1.9
2015 66.0 66.7 14.3 13.9 0.0 0.2 80.3 80.9 -4.1 1.6 10.0 -9.1 0.0 -1.6 -1.8 -0.4
2013 70.6 70.7 14.0 14.8 0.0 0.3 84.6 85.8 -0.7 -2.2 5.0 13.7 0.0 -56.5 0.2 -0.3
2014 75.1 70.4 11.1 14.3 0.0 0.2 86.2 84.9 6.4 -0.5 -20.8 -3.6 0.0 -35.8 1.9 -1.1
2015 72.7 70.7 12.2 13.9 0.0 0.2 84.9 84.9 -3.2 0.5 10.0 -2.5 0.0 -3.0 -1.5 0.0
2013 66.6 67.6 12.2 15.4 0.0 0.4 78.8 83.5 -1.8 0.4 -5.7 3.7 -100.0 -31.6 -2.8 0.8
2014 68.8 66.6 14.1 15.7 0.0 0.2 82.9 82.5 3.3 -1.5 15.5 1.5 0.0 -38.2 5.2 -1.1
2015 64.8 67.3 16.1 14.9 0.0 0.2 80.9 82.4 -5.8 1.0 13.8 -5.0 0.0 -5.5 -2.4 -0.1
STR, Inc.
Year To Date
Transient Group
For the Month of: August 2015 Date Created: September 17, 2015 Monthly Competitive Set Data Excludes Subject Property
TotalContractGroup
Running 12 Month
TransientCurrent Month
Contract Total
Running 3 Month
Thompson Hotels The Beekman Hotel 5 Beekman St New York, NY 10038-2206 Phone:
Percent Change (%)Occupancy (%)
STR # 63754 ChainID: MgtCo: Commune Hotels & Resorts Owner: None Market Scale*: New York, NY Luxury Chains
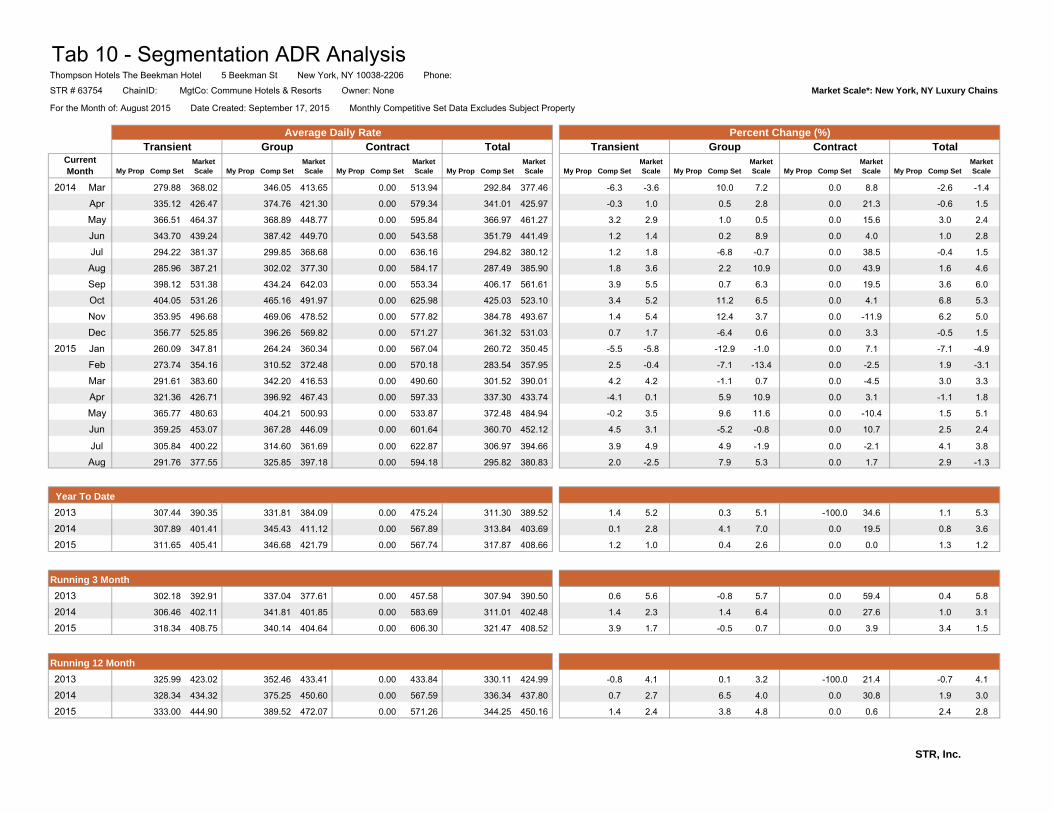
Tab 10 - Segmentation ADR Analysis
My Prop Comp SetMarket Scale My Prop Comp Set
Market Scale My Prop Comp Set
Market Scale My Prop Comp Set
Market Scale My Prop Comp Set
Market Scale My Prop Comp Set
Market Scale My Prop Comp Set
Market Scale My Prop Comp Set
Market Scale
2014 Mar 279.88 368.02 346.05 413.65 0.00 513.94 292.84 377.46 -6.3 -3.6 10.0 7.2 0.0 8.8 -2.6 -1.4
Apr 335.12 426.47 374.76 421.30 0.00 579.34 341.01 425.97 -0.3 1.0 0.5 2.8 0.0 21.3 -0.6 1.5
May 366.51 464.37 368.89 448.77 0.00 595.84 366.97 461.27 3.2 2.9 1.0 0.5 0.0 15.6 3.0 2.4
Jun 343.70 439.24 387.42 449.70 0.00 543.58 351.79 441.49 1.2 1.4 0.2 8.9 0.0 4.0 1.0 2.8
Jul 294.22 381.37 299.85 368.68 0.00 636.16 294.82 380.12 1.2 1.8 -6.8 -0.7 0.0 38.5 -0.4 1.5
Aug 285.96 387.21 302.02 377.30 0.00 584.17 287.49 385.90 1.8 3.6 2.2 10.9 0.0 43.9 1.6 4.6
Sep 398.12 531.38 434.24 642.03 0.00 553.34 406.17 561.61 3.9 5.5 0.7 6.3 0.0 19.5 3.6 6.0
Oct 404.05 531.26 465.16 491.97 0.00 625.98 425.03 523.10 3.4 5.2 11.2 6.5 0.0 4.1 6.8 5.3
Nov 353.95 496.68 469.06 478.52 0.00 577.82 384.78 493.67 1.4 5.4 12.4 3.7 0.0 -11.9 6.2 5.0
Dec 356.77 525.85 396.26 569.82 0.00 571.27 361.32 531.03 0.7 1.7 -6.4 0.6 0.0 3.3 -0.5 1.5
2015 Jan 260.09 347.81 264.24 360.34 0.00 567.04 260.72 350.45 -5.5 -5.8 -12.9 -1.0 0.0 7.1 -7.1 -4.9
Feb 273.74 354.16 310.52 372.48 0.00 570.18 283.54 357.95 2.5 -0.4 -7.1 -13.4 0.0 -2.5 1.9 -3.1
Mar 291.61 383.60 342.20 416.53 0.00 490.60 301.52 390.01 4.2 4.2 -1.1 0.7 0.0 -4.5 3.0 3.3
Apr 321.36 426.71 396.92 467.43 0.00 597.33 337.30 433.74 -4.1 0.1 5.9 10.9 0.0 3.1 -1.1 1.8
May 365.77 480.63 404.21 500.93 0.00 533.87 372.48 484.94 -0.2 3.5 9.6 11.6 0.0 -10.4 1.5 5.1
Jun 359.25 453.07 367.28 446.09 0.00 601.64 360.70 452.12 4.5 3.1 -5.2 -0.8 0.0 10.7 2.5 2.4
Jul 305.84 400.22 314.60 361.69 0.00 622.87 306.97 394.66 3.9 4.9 4.9 -1.9 0.0 -2.1 4.1 3.8
Aug 291.76 377.55 325.85 397.18 0.00 594.18 295.82 380.83 2.0 -2.5 7.9 5.3 0.0 1.7 2.9 -1.3
2013 307.44 390.35 331.81 384.09 0.00 475.24 311.30 389.52 1.4 5.2 0.3 5.1 -100.0 34.6 1.1 5.3
2014 307.89 401.41 345.43 411.12 0.00 567.89 313.84 403.69 0.1 2.8 4.1 7.0 0.0 19.5 0.8 3.6
2015 311.65 405.41 346.68 421.79 0.00 567.74 317.87 408.66 1.2 1.0 0.4 2.6 0.0 0.0 1.3 1.2
2013 302.18 392.91 337.04 377.61 0.00 457.58 307.94 390.50 0.6 5.6 -0.8 5.7 0.0 59.4 0.4 5.8
2014 306.46 402.11 341.81 401.85 0.00 583.69 311.01 402.48 1.4 2.3 1.4 6.4 0.0 27.6 1.0 3.1
2015 318.34 408.75 340.14 404.64 0.00 606.30 321.47 408.52 3.9 1.7 -0.5 0.7 0.0 3.9 3.4 1.5
2013 325.99 423.02 352.46 433.41 0.00 433.84 330.11 424.99 -0.8 4.1 0.1 3.2 -100.0 21.4 -0.7 4.1
2014 328.34 434.32 375.25 450.60 0.00 567.59 336.34 437.80 0.7 2.7 6.5 4.0 0.0 30.8 1.9 3.0
2015 333.00 444.90 389.52 472.07 0.00 571.26 344.25 450.16 1.4 2.4 3.8 4.8 0.0 0.6 2.4 2.8
STR, Inc.
TransientTransient TotalGroupCurrent Month
Thompson Hotels The Beekman Hotel 5 Beekman St New York, NY 10038-2206 Phone:
Percent Change (%)Average Daily Rate
STR # 63754 ChainID: MgtCo: Commune Hotels & Resorts Owner: None Market Scale*: New York, NY Luxury Chains
For the Month of: August 2015 Date Created: September 17, 2015 Monthly Competitive Set Data Excludes Subject Property
Contract Total Contract
Year To Date
Running 3 Month
Running 12 Month
Group
ADDENDA
Improved Sales
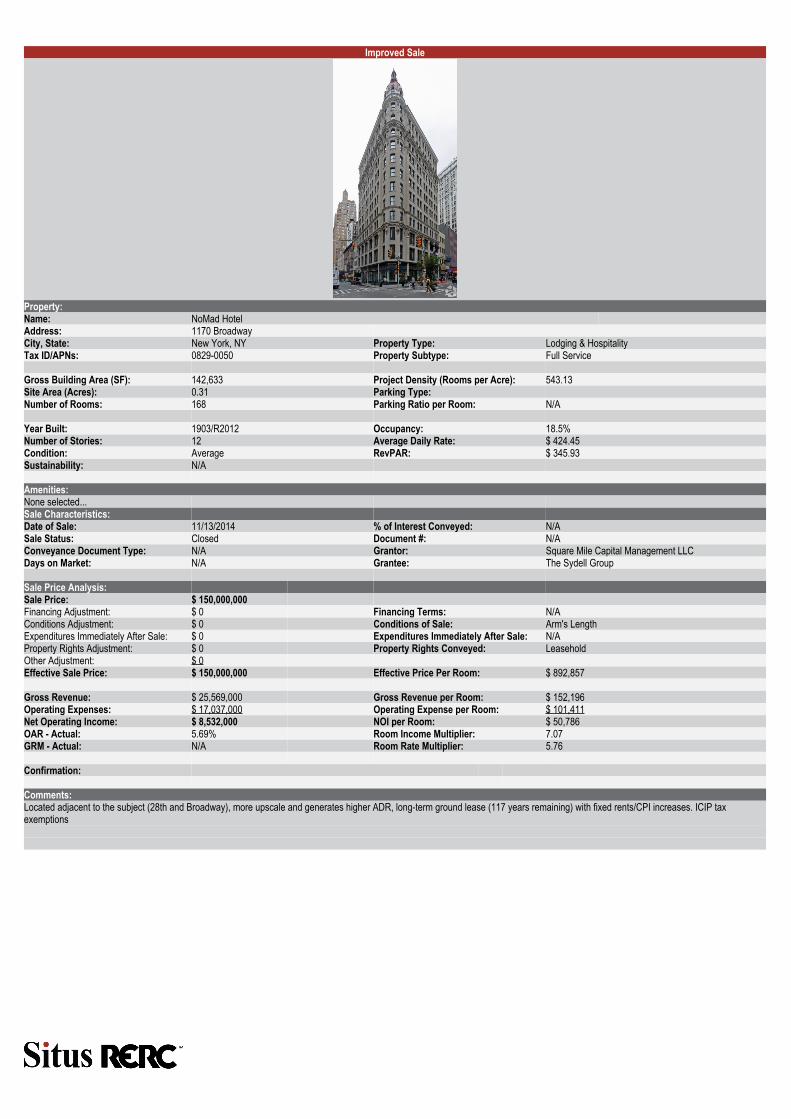
Improved Sale
Property:Name: NoMad HotelAddress: 1170 BroadwayCity, State: New York, NY Property Type: Lodging & HospitalityTax ID/APNs: 0829-0050 Property Subtype: Full Service
Gross Building Area (SF): 142,633 Project Density (Rooms per Acre): 543.13Site Area (Acres): 0.31 Parking Type:Number of Rooms: 168 Parking Ratio per Room: N/A
Year Built: 1903/R2012 Occupancy: 18.5%Number of Stories: 12 Average Daily Rate: $ 424.45Condition: Average RevPAR: $ 345.93Sustainability: N/A
Amenities:None selected...Sale Characteristics:Date of Sale: 11/13/2014 % of Interest Conveyed: N/ASale Status: Closed Document #: N/AConveyance Document Type: N/A Grantor: Square Mile Capital Management LLCDays on Market: N/A Grantee: The Sydell Group
Sale Price Analysis:Sale Price: $ 150,000,000Financing Adjustment: $ 0 Financing Terms: N/AConditions Adjustment: $ 0 Conditions of Sale: Arm's LengthExpenditures Immediately After Sale: $ 0 Expenditures Immediately After Sale: N/AProperty Rights Adjustment: $ 0 Property Rights Conveyed: LeaseholdOther Adjustment: $ 0Effective Sale Price: $ 150,000,000 Effective Price Per Room: $ 892,857
Gross Revenue: $ 25,569,000 Gross Revenue per Room: $ 152,196Operating Expenses: $ 17,037,000 Operating Expense per Room: $ 101,411Net Operating Income: $ 8,532,000 NOI per Room: $ 50,786OAR - Actual: 5.69% Room Income Multiplier: 7.07GRM - Actual: N/A Room Rate Multiplier: 5.76
Confirmation:
Comments:Located adjacent to the subject (28th and Broadway), more upscale and generates higher ADR, long-term ground lease (117 years remaining) with fixed rents/CPI increases. ICIP taxexemptions
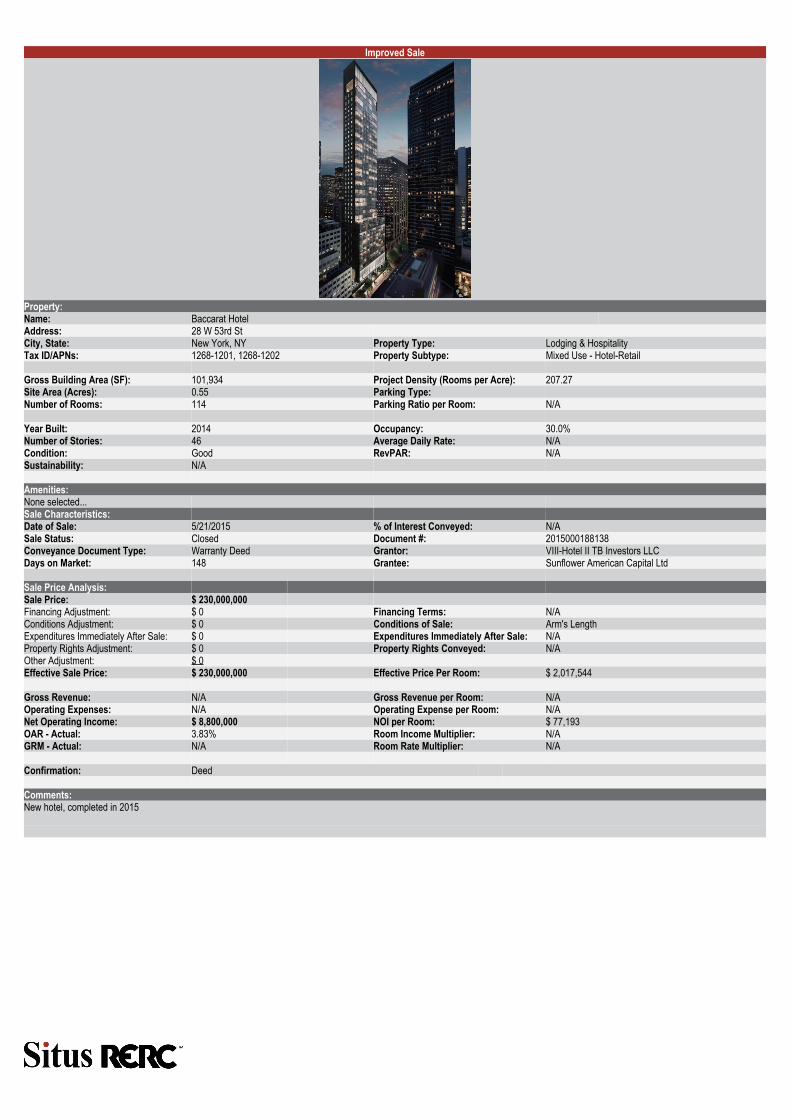
Improved Sale
Property:Name: Baccarat HotelAddress: 28 W 53rd StCity, State: New York, NY Property Type: Lodging & HospitalityTax ID/APNs: 1268-1201, 1268-1202 Property Subtype: Mixed Use - Hotel-Retail
Gross Building Area (SF): 101,934 Project Density (Rooms per Acre): 207.27Site Area (Acres): 0.55 Parking Type:Number of Rooms: 114 Parking Ratio per Room: N/A
Year Built: 2014 Occupancy: 30.0%Number of Stories: 46 Average Daily Rate: N/ACondition: Good RevPAR: N/ASustainability: N/A
Amenities:None selected...Sale Characteristics:Date of Sale: 5/21/2015 % of Interest Conveyed: N/ASale Status: Closed Document #: 2015000188138Conveyance Document Type: Warranty Deed Grantor: VIII-Hotel II TB Investors LLCDays on Market: 148 Grantee: Sunflower American Capital Ltd
Sale Price Analysis:Sale Price: $ 230,000,000Financing Adjustment: $ 0 Financing Terms: N/AConditions Adjustment: $ 0 Conditions of Sale: Arm's LengthExpenditures Immediately After Sale: $ 0 Expenditures Immediately After Sale: N/AProperty Rights Adjustment: $ 0 Property Rights Conveyed: N/AOther Adjustment: $ 0Effective Sale Price: $ 230,000,000 Effective Price Per Room: $ 2,017,544
Gross Revenue: N/A Gross Revenue per Room: N/AOperating Expenses: N/A Operating Expense per Room: N/ANet Operating Income: $ 8,800,000 NOI per Room: $ 77,193OAR - Actual: 3.83% Room Income Multiplier: N/AGRM - Actual: N/A Room Rate Multiplier: N/A
Confirmation: Deed
Comments:New hotel, completed in 2015
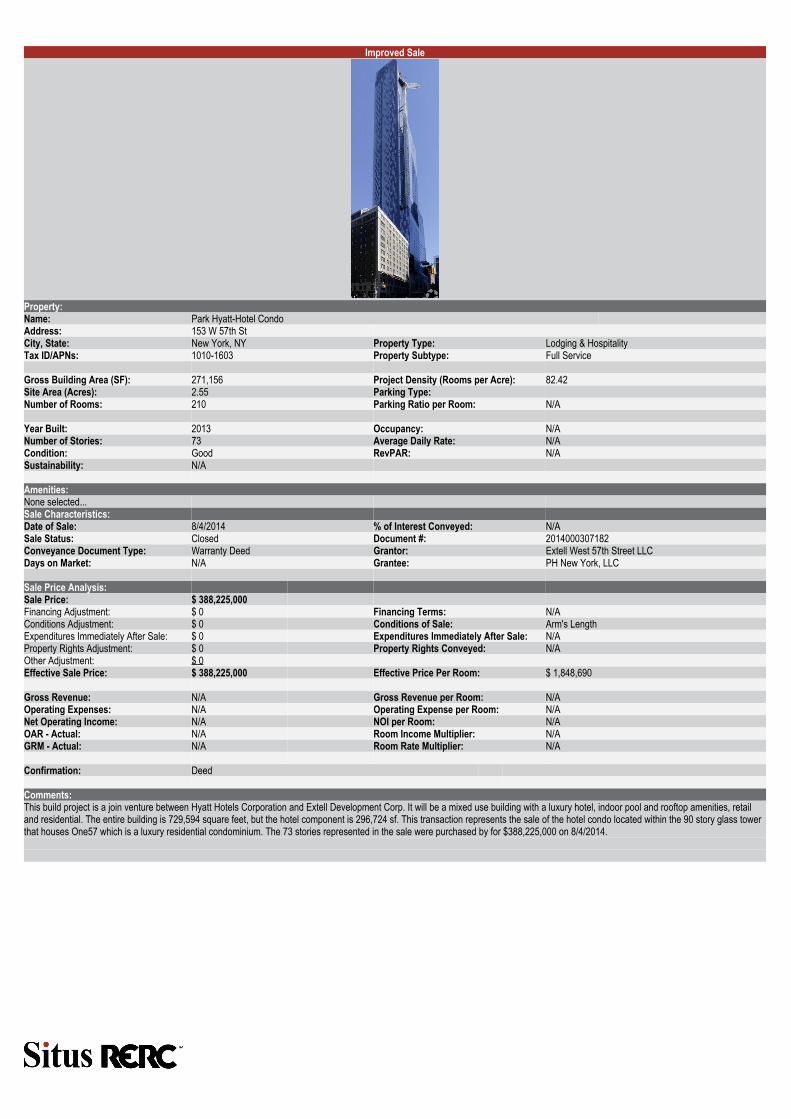
Improved Sale
Property:Name: Park Hyatt-Hotel CondoAddress: 153 W 57th StCity, State: New York, NY Property Type: Lodging & HospitalityTax ID/APNs: 1010-1603 Property Subtype: Full Service
Gross Building Area (SF): 271,156 Project Density (Rooms per Acre): 82.42Site Area (Acres): 2.55 Parking Type:Number of Rooms: 210 Parking Ratio per Room: N/A
Year Built: 2013 Occupancy: N/ANumber of Stories: 73 Average Daily Rate: N/ACondition: Good RevPAR: N/ASustainability: N/A
Amenities:None selected...Sale Characteristics:Date of Sale: 8/4/2014 % of Interest Conveyed: N/ASale Status: Closed Document #: 2014000307182Conveyance Document Type: Warranty Deed Grantor: Extell West 57th Street LLCDays on Market: N/A Grantee: PH New York, LLC
Sale Price Analysis:Sale Price: $ 388,225,000Financing Adjustment: $ 0 Financing Terms: N/AConditions Adjustment: $ 0 Conditions of Sale: Arm's LengthExpenditures Immediately After Sale: $ 0 Expenditures Immediately After Sale: N/AProperty Rights Adjustment: $ 0 Property Rights Conveyed: N/AOther Adjustment: $ 0Effective Sale Price: $ 388,225,000 Effective Price Per Room: $ 1,848,690
Gross Revenue: N/A Gross Revenue per Room: N/AOperating Expenses: N/A Operating Expense per Room: N/ANet Operating Income: N/A NOI per Room: N/AOAR - Actual: N/A Room Income Multiplier: N/AGRM - Actual: N/A Room Rate Multiplier: N/A
Confirmation: Deed
Comments:This build project is a join venture between Hyatt Hotels Corporation and Extell Development Corp. It will be a mixed use building with a luxury hotel, indoor pool and rooftop amenities, retailand residential. The entire building is 729,594 square feet, but the hotel component is 296,724 sf. This transaction represents the sale of the hotel condo located within the 90 story glass towerthat houses One57 which is a luxury residential condominium. The 73 stories represented in the sale were purchased by for $388,225,000 on 8/4/2014.

Improved SaleProperty:Name: The JamesAddress: 27 Grand StreetCity, State: New York, NY Property Type: Lodging & HospitalityTax ID/APNs: N/A Property Subtype: Full Service
Gross Building Area (SF): N/A Project Density (Rooms per Acre): 1878.15Site Area (Acres): 0.06 Parking Type:Number of Rooms: 114 Parking Ratio per Room: N/A
Year Built: 2008 Occupancy: 15.9%Number of Stories: 18 Average Daily Rate: $ 394.92Condition: N/A RevPAR: N/ASustainability: N/A
Amenities:None selected...Sale Characteristics:Date of Sale: 4/15/2013 % of Interest Conveyed: N/ASale Status: Closed Document #: N/AConveyance Document Type: N/A Grantor: BCREDays on Market: N/A Grantee: Prudential RE Investors
Sale Price Analysis:Sale Price: $ 84,600,000Financing Adjustment: $ 0 Financing Terms: N/AConditions Adjustment: $ 0 Conditions of Sale: Arm's LengthExpenditures Immediately After Sale: $ 0 Expenditures Immediately After Sale: N/AProperty Rights Adjustment: $ 0 Property Rights Conveyed: N/AOther Adjustment: $ 0Effective Sale Price: $ 84,600,000 Effective Price Per Room: $ 742,105
Gross Revenue: N/A Gross Revenue per Room: N/AOperating Expenses: N/A Operating Expense per Room: N/ANet Operating Income: N/A NOI per Room: N/AOAR - Actual: 5.20% Room Income Multiplier: N/AGRM - Actual: N/A Room Rate Multiplier: N/A
Confirmation:
Comments:

ADDENDA
State Certification

ADDENDA
Qualifications

MAILev Yagudayev
Academic Background
Employee Profile
Fordham UniversityM.B.A., finance and professional accountingHofstra UniversityB.S., biochemistry
Professional Designations and Affiliations• Appraisal Institute - MAI designation
• Certified General Real Estate Appraiser
• State of New York license number 46000044217
• State of Connecticut license number RCG.0001039
• State of New Jersey license number 42RG00208500
ExperienceLev Yagudayev serves as director of appraisal and litigation services and is the Northeast practice leader for Situs RERC’s based in the New York office. Mr. Yagudayev has over 15 years of experience in different facets of commercial real estate and is a specialist in the area of valuation for financial reporting purposes. He has valued real estate and instruments secured by real estate in nearly every major market in the U.S. and comprising most property types.
Mr. Yagudayev is responsible for managing Situs RERC’s Northeast practice and delivering the following services: portfolio valuation services, purchase price allocation studies, International Financial Reporting Standards (IFRS) valuation services, and due diligence services.
Prior to joining Situs RERC, Mr. Yagudayev worked for nine years in the real estate consulting practice at Deloitte. In his latest role, he served as senior manager and portfolio valuation services leader for the East region. While at Deloitte, Mr. Yagudayev provided valuation and due diligence services to alternative investment managers; advised and consulted clients on a variety of issues relating to commercial real estate and real estate instruments; worked with clients to improve their processes relating to valuation, financial reporting, and investor reporting; and interacted daily with senior executives and decision makers at many real estate firms.
Prior to Deloitte, Mr. Yagudayev worked at Emigrant Bank, where he focused on commercial real estate valuation, REO management/disposition, mortgage underwriting, loan origination, and foreclosures.
Mr. Yagudayev is also an adjunct professor at the Fordham Graduate School of Business where he teaches real estate finance and is a faculty advisor to the real estate club.
APPRAISAL OF
Ace Hotel 1186-1198 Broadway
New York, NY
As of September 30, 2015
Ms. Jennifer McLean
GFI Capital Holdings, LLC 140 Broadway, 41st Floor
New York, NY 10005
Prepared for
RERC
150 E 52nd St, Suite 4002 New York, NY 10022
(212) 294-1376 www.rerc.com
Prepared by
APPRAISAL REPORT
RERC is an SEC-Registered Investment Advisor
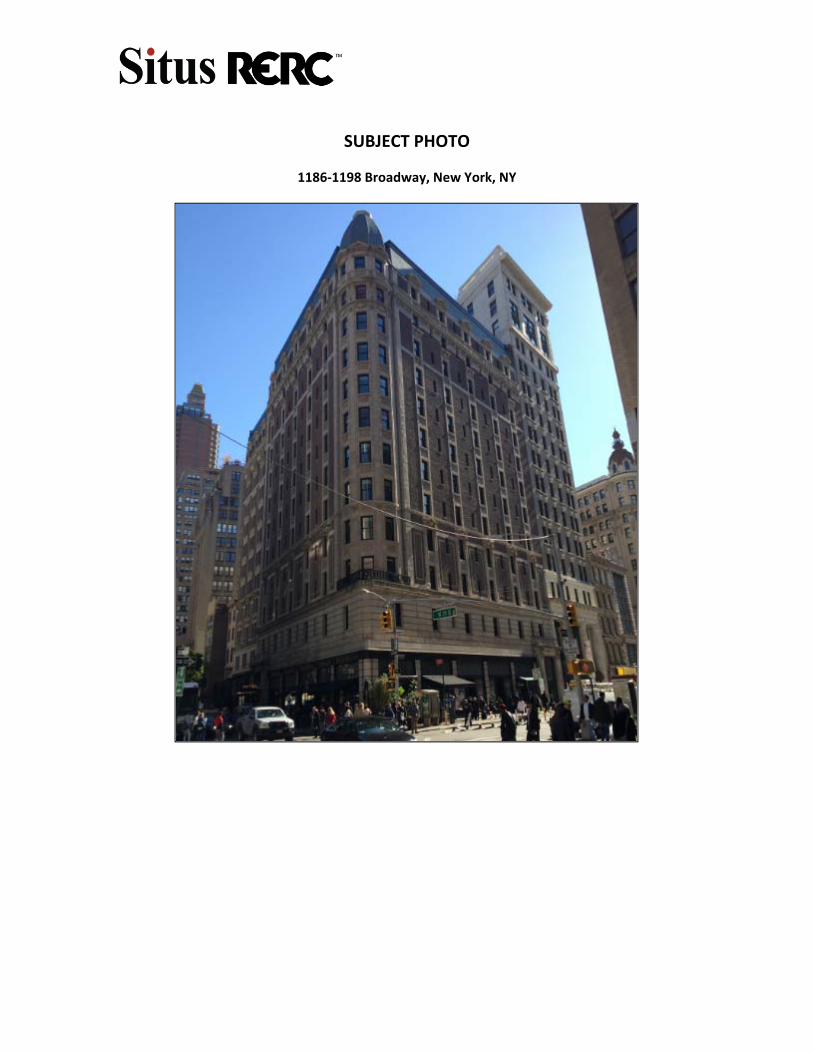
SUBJECT PHOTO
1186‐1198 Broadway, New York, NY
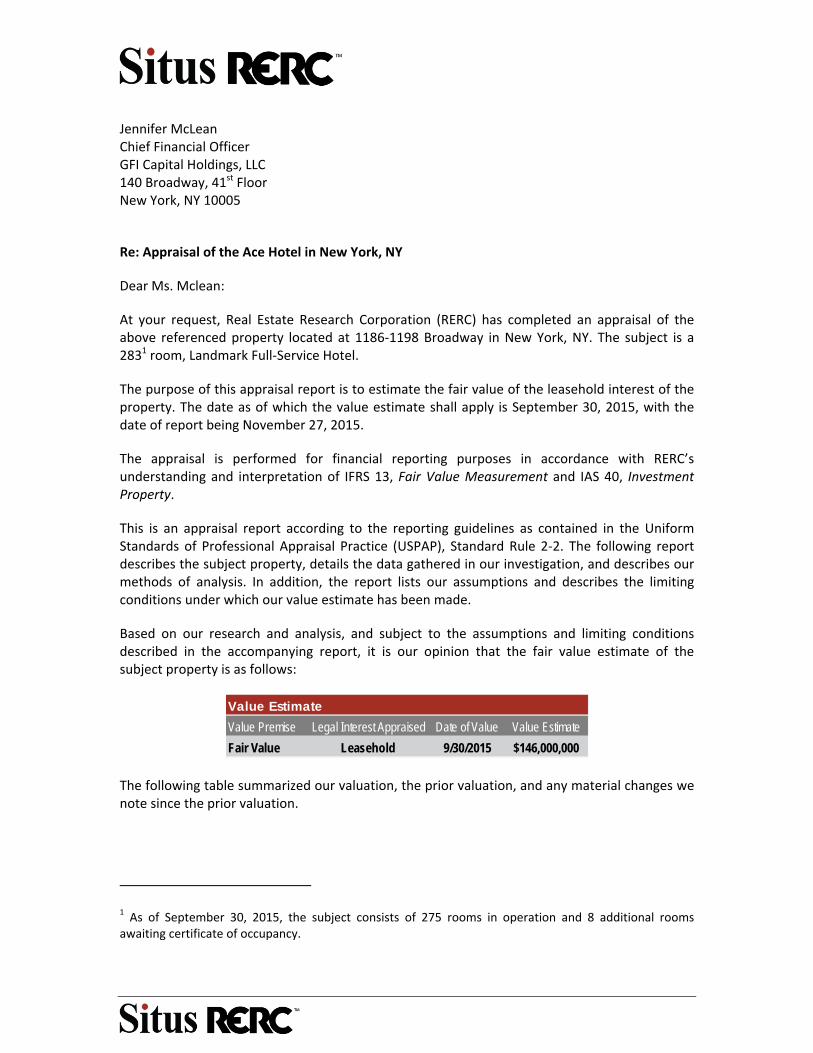
Jennifer McLean Chief Financial Officer GFI Capital Holdings, LLC 140 Broadway, 41st Floor New York, NY 10005
Re: Appraisal of the Ace Hotel in New York, NY
Dear Ms. Mclean:
At your request, Real Estate Research Corporation (RERC) has completed an appraisal of the above referenced property located at 1186‐1198 Broadway in New York, NY. The subject is a 2831 room, Landmark Full‐Service Hotel.
The purpose of this appraisal report is to estimate the fair value of the leasehold interest of the property. The date as of which the value estimate shall apply is September 30, 2015, with the date of report being November 27, 2015.
The appraisal is performed for financial reporting purposes in accordance with RERC’s understanding and interpretation of IFRS 13, Fair Value Measurement and IAS 40, Investment Property.
This is an appraisal report according to the reporting guidelines as contained in the Uniform Standards of Professional Appraisal Practice (USPAP), Standard Rule 2‐2. The following report describes the subject property, details the data gathered in our investigation, and describes our methods of analysis. In addition, the report lists our assumptions and describes the limiting conditions under which our value estimate has been made.
Based on our research and analysis, and subject to the assumptions and limiting conditions described in the accompanying report, it is our opinion that the fair value estimate of the subject property is as follows:
Value Estimate
Value Premise Legal Interest Appraised Date of Value Value Estimate
Fair Value Leasehold 9/30/2015 $146,000,000
The following table summarized our valuation, the prior valuation, and any material changes we note since the prior valuation.
1 As of September 30, 2015, the subject consists of 275 rooms in operation and 8 additional rooms awaiting certificate of occupancy.
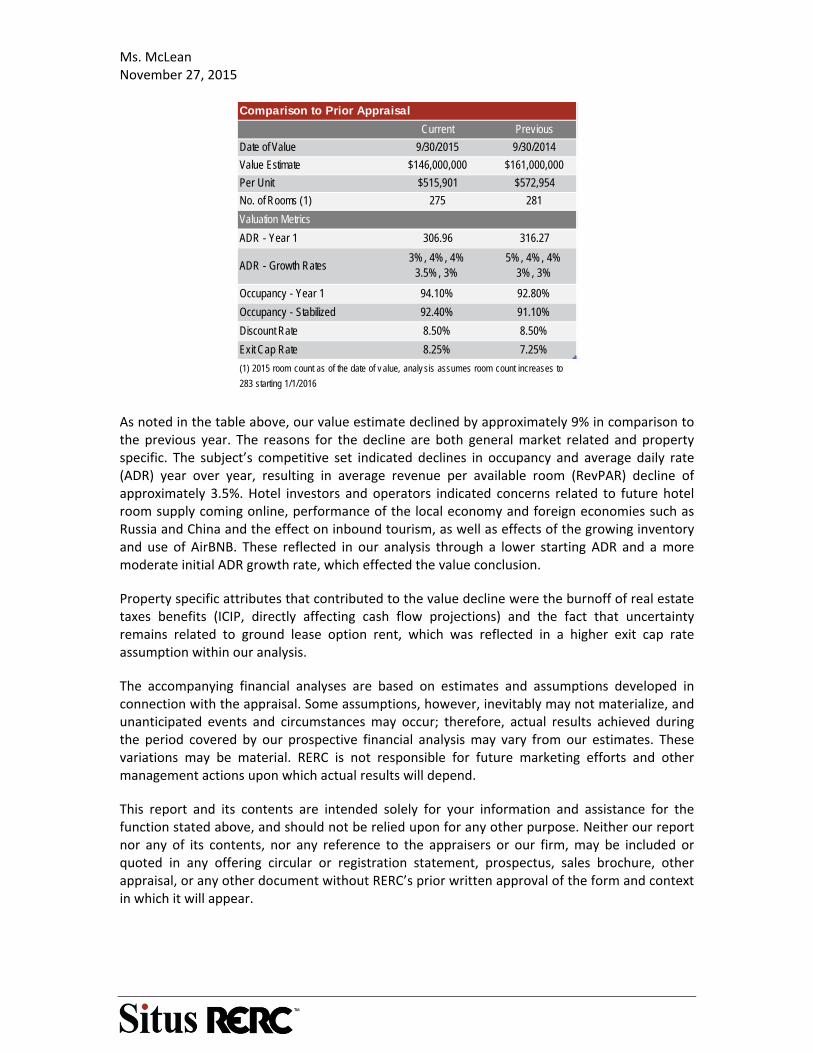
Ms. McLean November 27, 2015
Comparison to Prior Appraisal
Current Previous
Date of Value 9/30/2015 9/30/2014
Value Estimate $146,000,000 $161,000,000
Per Unit $515,901 $572,954
No. of Rooms (1) 275 281
Valuation Metrics
ADR - Year 1 306.96 316.27
ADR - Growth Rates3% , 4% , 4%
3.5%, 3%5%, 4%, 4%
3% , 3%
Occupancy - Year 1 94.10% 92.80%
Occupancy - Stabilized 92.40% 91.10%
Discount Rate 8.50% 8.50%
Exit Cap Rate 8.25% 7.25%
(1) 2015 room count as of the date of v alue, analy sis assumes room count increases to
283 starting 1/1/2016
As noted in the table above, our value estimate declined by approximately 9% in comparison to the previous year. The reasons for the decline are both general market related and property specific. The subject’s competitive set indicated declines in occupancy and average daily rate (ADR) year over year, resulting in average revenue per available room (RevPAR) decline of approximately 3.5%. Hotel investors and operators indicated concerns related to future hotel room supply coming online, performance of the local economy and foreign economies such as Russia and China and the effect on inbound tourism, as well as effects of the growing inventory and use of AirBNB. These reflected in our analysis through a lower starting ADR and a more moderate initial ADR growth rate, which effected the value conclusion.
Property specific attributes that contributed to the value decline were the burnoff of real estate taxes benefits (ICIP, directly affecting cash flow projections) and the fact that uncertainty remains related to ground lease option rent, which was reflected in a higher exit cap rate assumption within our analysis.
The accompanying financial analyses are based on estimates and assumptions developed in connection with the appraisal. Some assumptions, however, inevitably may not materialize, and unanticipated events and circumstances may occur; therefore, actual results achieved during the period covered by our prospective financial analysis may vary from our estimates. These variations may be material. RERC is not responsible for future marketing efforts and other management actions upon which actual results will depend.
This report and its contents are intended solely for your information and assistance for the function stated above, and should not be relied upon for any other purpose. Neither our report nor any of its contents, nor any reference to the appraisers or our firm, may be included or quoted in any offering circular or registration statement, prospectus, sales brochure, other appraisal, or any other document without RERC’s prior written approval of the form and context in which it will appear.
Ms. McLean November 27, 2015
RERC appreciates this opportunity to be of service to you. If you have any questions or comments about this report, please do not hesitate to call us.
Respectfully submitted,
RERC ‐‐‐‐‐‐‐‐‐‐‐‐‐‐‐‐‐‐‐‐‐‐‐‐‐‐‐‐‐‐‐‐‐‐‐‐‐‐‐‐‐‐‐‐‐‐ Lev Yagudayev, MAI Director 152 East 52nd Street, Suite 4002 New York, NY 10022 (212) 294‐1376 New York Certified Appraiser License Number: 46000044217 Expiration: March 6, 2017
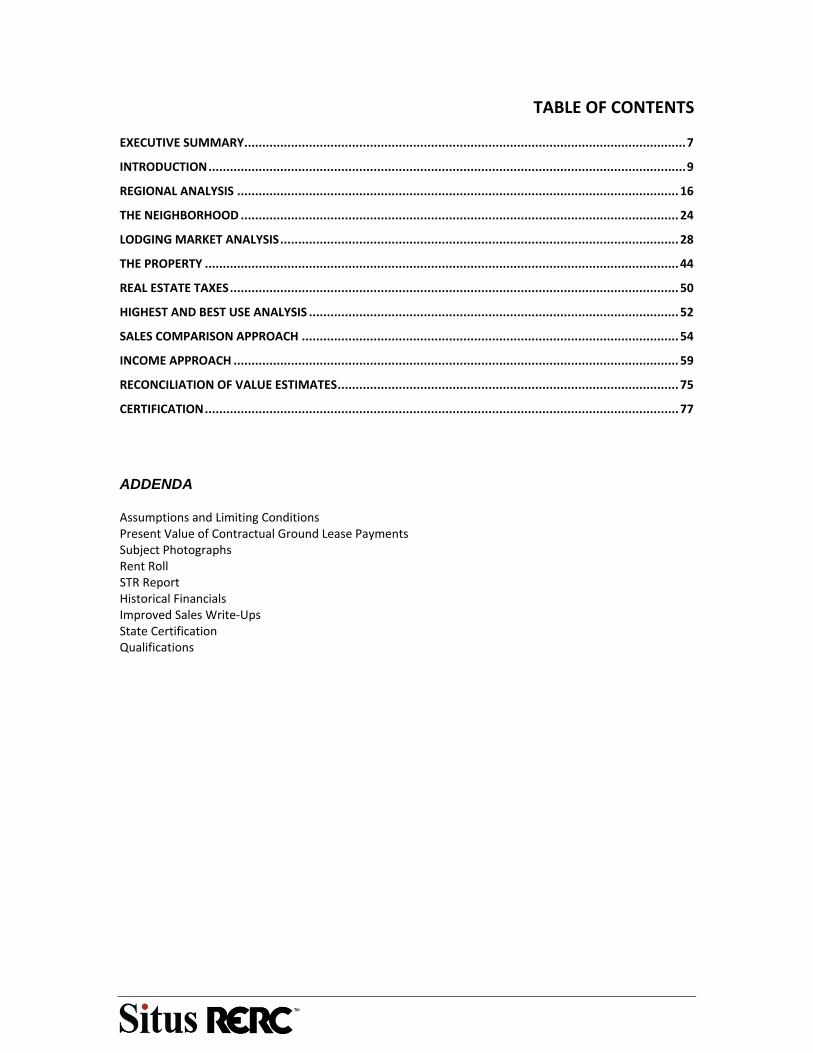
TABLE OF CONTENTS
EXECUTIVE SUMMARY ........................................................................................................................... 7
INTRODUCTION ..................................................................................................................................... 9
REGIONAL ANALYSIS ........................................................................................................................... 16
THE NEIGHBORHOOD .......................................................................................................................... 24
LODGING MARKET ANALYSIS ............................................................................................................... 28
THE PROPERTY .................................................................................................................................... 44
REAL ESTATE TAXES ............................................................................................................................. 50
HIGHEST AND BEST USE ANALYSIS ....................................................................................................... 52
SALES COMPARISON APPROACH ......................................................................................................... 54
INCOME APPROACH ............................................................................................................................ 59
RECONCILIATION OF VALUE ESTIMATES ............................................................................................... 75
CERTIFICATION .................................................................................................................................... 77
ADDENDA Assumptions and Limiting Conditions Present Value of Contractual Ground Lease Payments Subject Photographs Rent Roll STR Report Historical Financials Improved Sales Write‐Ups State Certification Qualifications
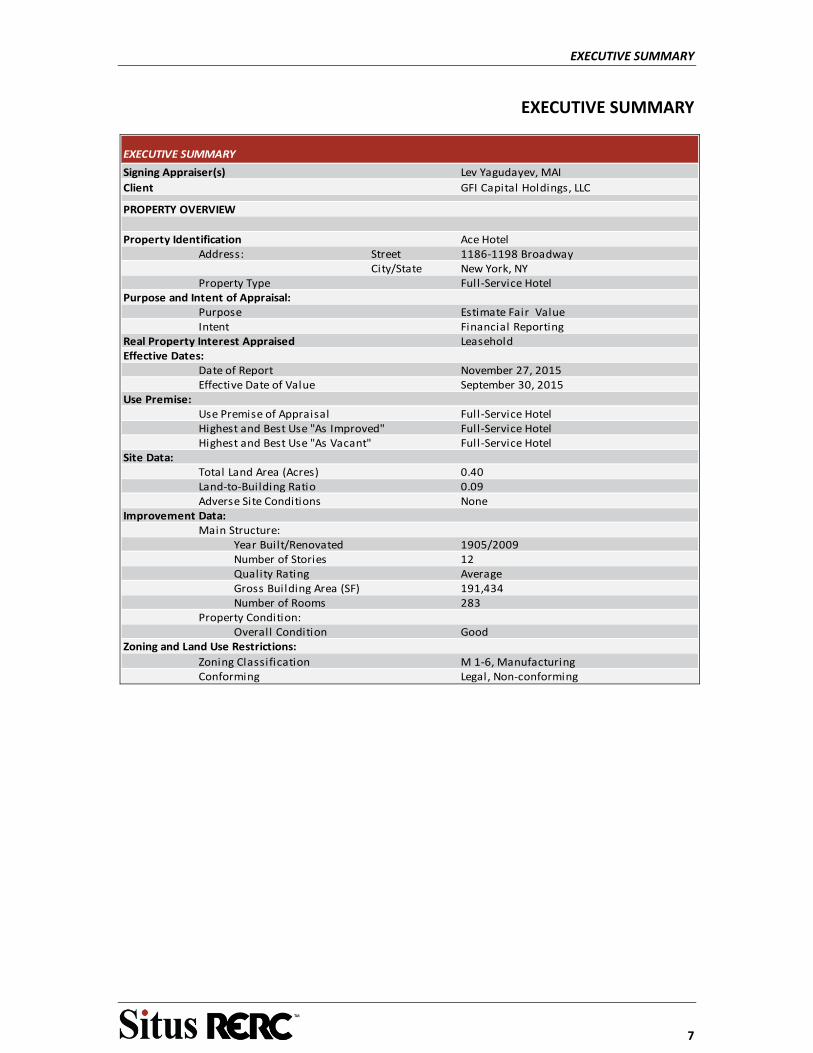
EXECUTIVE SUMMARY
7
EXECUTIVE SUMMARY
Signing Appraiser(s) Lev Yagudayev, MAI
Client GFI Capital Holdings, LLC
PROPERTY OVERVIEW
Property Identification Ace HotelAddress: Street 1186‐1198 Broadway
City/State New York, NYProperty Type Full‐Service Hotel
Purpose and Intent of Appraisal:Purpose Estimate Fair ValueIntent Financial Reporting
Real Property Interest Appraised LeaseholdEffective Dates:
Date of Report November 27, 2015Effective Date of Value September 30, 2015
Use Premise:Use Premise of Appraisal Full‐Service HotelHighest and Best Use "As Improved" Full‐Service HotelHighest and Best Use "As Vacant" Full‐Service Hotel
Site Data:Total Land Area (Acres) 0.40Land‐to‐Building Ratio 0.09Adverse Site Conditions None
Improvement Data:Main Structure:
Year Built/Renovated 1905/2009Number of Stories 12Quality Rating AverageGross Building Area (SF) 191,434Number of Rooms 283
Property Condition:Overall Condition Good
Zoning and Land Use Restrictions:
Zoning Classification M 1‐6, ManufacturingConforming Legal, Non‐conforming
EXECUTIVE SUMMARY
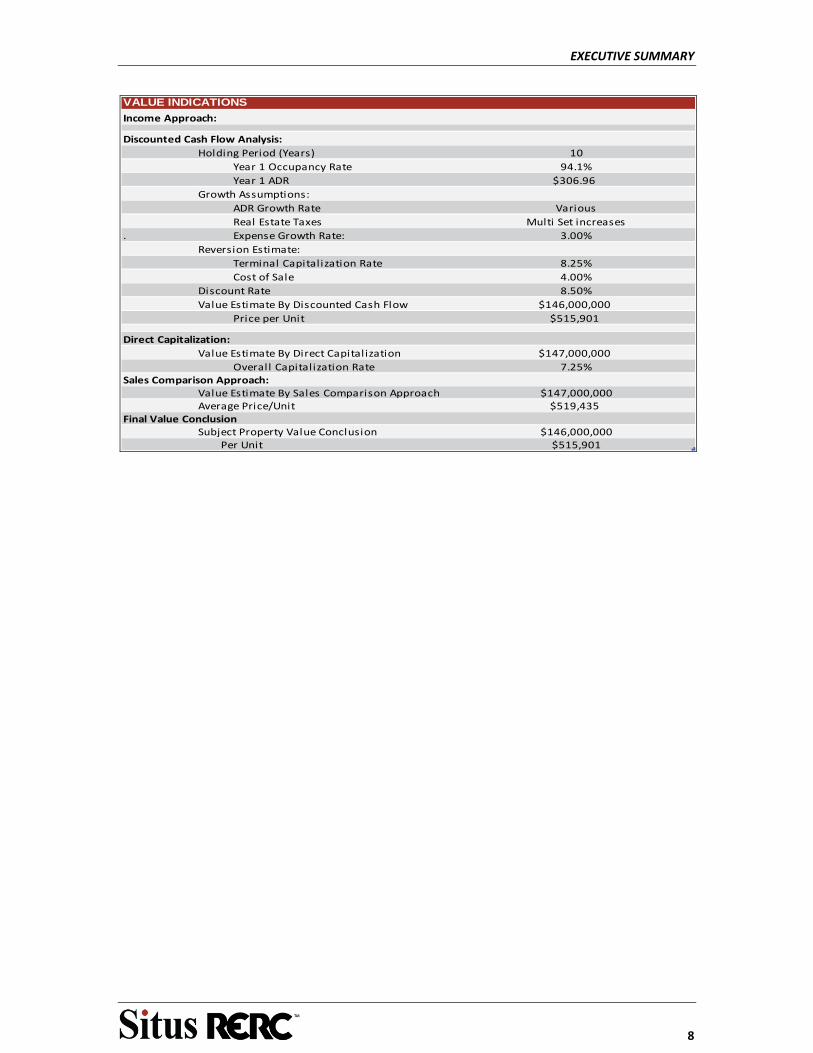
EXECUTIVE SUMMARY
8
VALUE INDICATIONS
Income Approach:
Discounted Cash Flow Analysis:
Holding Period (Years) 10
Year 1 Occupancy Rate 94.1%
Year 1 ADR $306.96
Growth Assumptions:
ADR Growth Rate Various
Real Estate Taxes Multi Set increases
. Expense Growth Rate: 3.00%
Reversion Estimate:
Terminal Capitalization Rate 8.25%
Cost of Sale 4.00%
Discount Rate 8.50%
Value Estimate By Discounted Cash Flow $146,000,000
Price per Unit $515,901
Direct Capitalization:
Value Estimate By Direct Capitalization $147,000,000
Overall Capitalization Rate 7.25%Sales Comparison Approach:
Value Estimate By Sales Comparison Approach $147,000,000Average Price/Unit $519,435
Final Value ConclusionSubject Property Value Conclusion $146,000,000
Per Unit $515,901
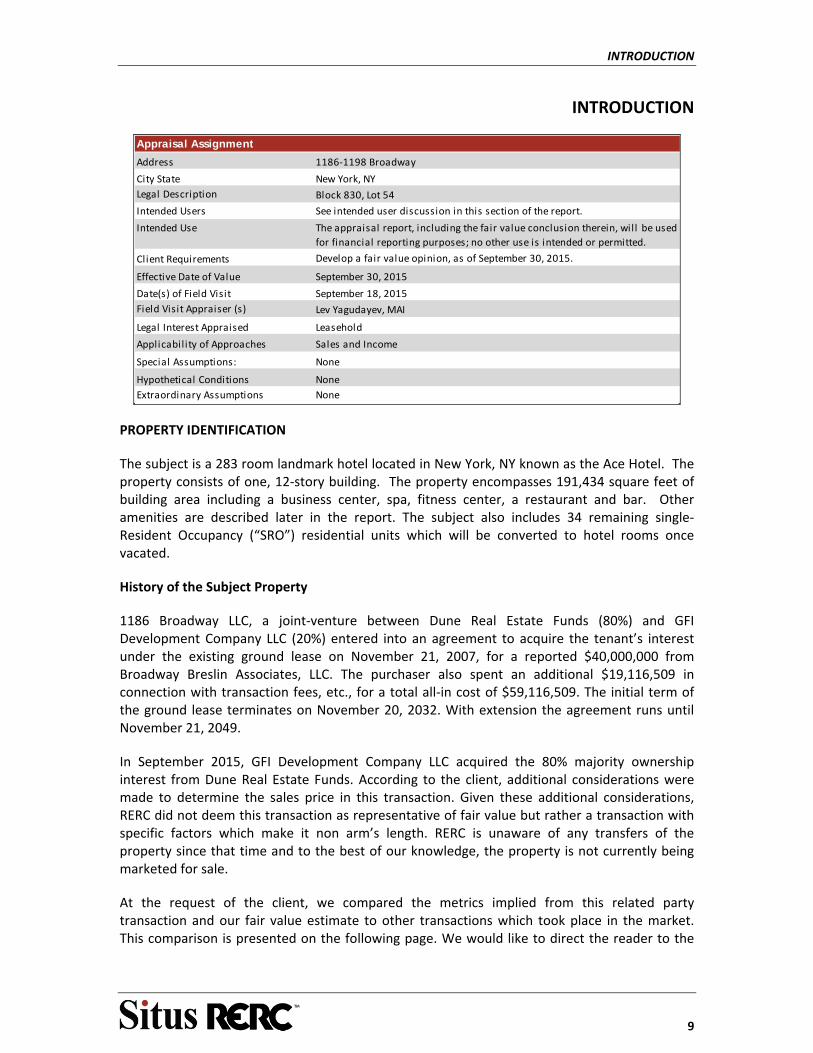
INTRODUCTION
9
INTRODUCTION
Address 1186‐1198 Broadway
City State New York, NY
Legal Description Block 830, Lot 54
Intended Users See intended user discussion in this section of the report.
Intended Use The appraisal report, including the fair value conclusion therein, will be used
for financial reporting purposes; no other use is intended or permitted.
Client Requirements Develop a fair value opinion, as of September 30, 2015.
Effective Date of Value September 30, 2015
Date(s) of Field Visit September 18, 2015
Field Visit Appraiser (s) Lev Yagudayev, MAI
Legal Interest Appraised Leasehold
Applicability of Approaches Sales and Income
Special Assumptions: None
Hypothetical Conditions None
Extraordinary Assumptions None
Appraisal Assignment
PROPERTY IDENTIFICATION
The subject is a 283 room landmark hotel located in New York, NY known as the Ace Hotel. The property consists of one, 12‐story building. The property encompasses 191,434 square feet of building area including a business center, spa, fitness center, a restaurant and bar. Other amenities are described later in the report. The subject also includes 34 remaining single‐Resident Occupancy (“SRO”) residential units which will be converted to hotel rooms once vacated.
History of the Subject Property
1186 Broadway LLC, a joint‐venture between Dune Real Estate Funds (80%) and GFI Development Company LLC (20%) entered into an agreement to acquire the tenant’s interest under the existing ground lease on November 21, 2007, for a reported $40,000,000 from Broadway Breslin Associates, LLC. The purchaser also spent an additional $19,116,509 in connection with transaction fees, etc., for a total all‐in cost of $59,116,509. The initial term of the ground lease terminates on November 20, 2032. With extension the agreement runs until November 21, 2049.
In September 2015, GFI Development Company LLC acquired the 80% majority ownership interest from Dune Real Estate Funds. According to the client, additional considerations were made to determine the sales price in this transaction. Given these additional considerations, RERC did not deem this transaction as representative of fair value but rather a transaction with specific factors which make it non arm’s length. RERC is unaware of any transfers of the property since that time and to the best of our knowledge, the property is not currently being marketed for sale.
At the request of the client, we compared the metrics implied from this related party transaction and our fair value estimate to other transactions which took place in the market. This comparison is presented on the following page. We would like to direct the reader to the

INTRODUCTION
10
average metrics presented by these recent transactions and the metrics implied by our fair value estimate.
Overall Capitalization Rate: The average overall capitalization rate implied by the recent transactions is 5.7% which is 155 basis points lower than the 7.25% cap rate implied by our fair value estimate. This is reasonable given that the subject property is on a ground lease with an expiration date in November 2049. We note that the ground lease payment is expected to be increased after November 2032 from currently $600,000 per year to approximately $10 million per year (based on our estimate). This increase in ground lease payment is expected to substantially impact the profitability of the subject property and thus justifies the 155 basis point premium.
Price per Room: The recent transactions have an average NOI per room of $31,204 and sold at an average price per room of $570,195. We estimate 2016 NOI for the subject property of $37,587 and our fair value estimate equites to $515,901 per room. There is a direct relationship between the income the property generates and the price per room it is able to achieve. In this case, the subject has a higher income generating capability than the comparables but a lower price per key. This is reasonable given that the ground lease payment is expected to be increased after November 2032 from currently $600,000 per year to approximately $10 million per year (based on our estimate). This impacts the subject’s future profitability and thus supports our price per room estimate with regards to those of the comparables.
Room Income Multiplier and Room Rate Multiplier: The average multipliers implied our fair value estimate are consistent with the average multipliers implied by recent transactions.
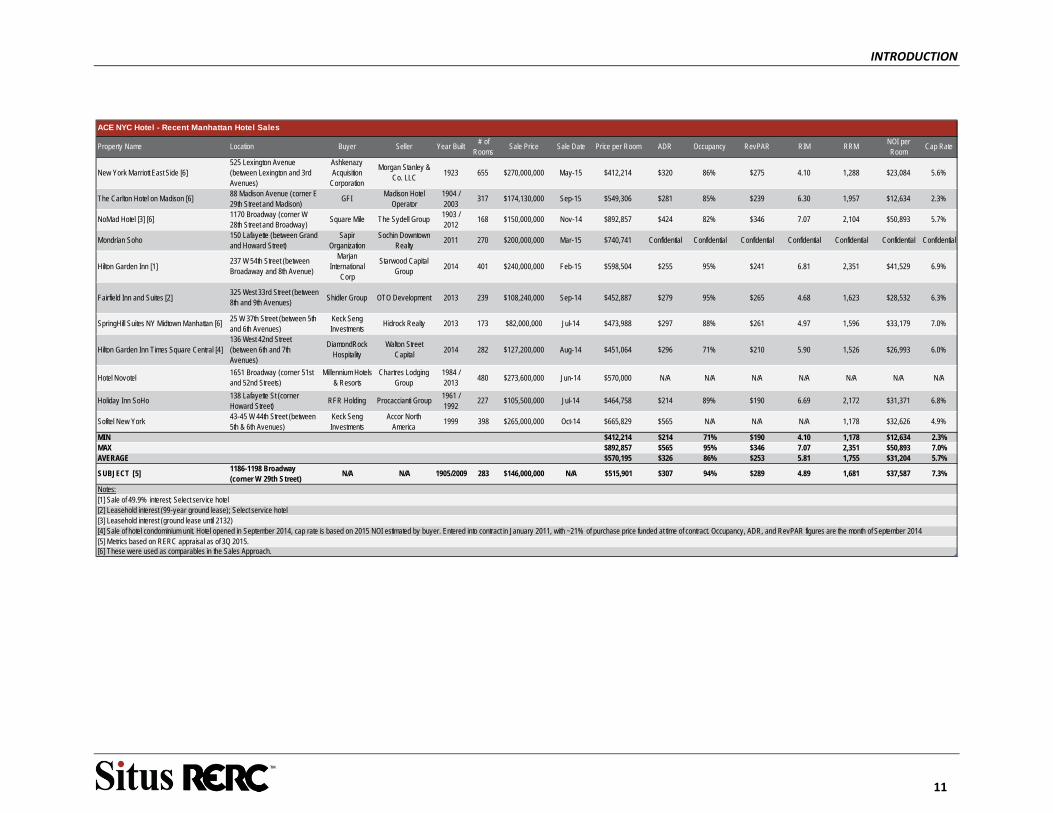
INTRODUCTION
11
Property Name Location Buyer Seller Year Built# of
RoomsSale Price Sale Date Price per Room ADR Occupancy RevPAR RIM RRM
NOI per Room
Cap Rate
New York Marriott East Side [6]525 Lexington Avenue (between Lexington and 3rd Avenues)
Ashkenazy Acquisition
Corporation
Morgan Stanley & Co. LLC
1923 655 $270,000,000 May-15 $412,214 $320 86% $275 4.10 1,288 $23,084 5.6%
The Carlton Hotel on Madison [6]88 Madison Avenue (corner E 29th Street and Madison)
GFIMadison Hotel
Operator1904 / 2003
317 $174,130,000 Sep-15 $549,306 $281 85% $239 6.30 1,957 $12,634 2.3%
NoMad Hotel [3] [6] 1170 Broadway (corner W 28th Street and Broadway)
Square Mile The Sydell Group1903 / 2012
168 $150,000,000 Nov-14 $892,857 $424 82% $346 7.07 2,104 $50,893 5.7%
Mondrian Soho150 Lafayette (between Grand and Howard Street)
Sapir Organization
Sochin Downtown Realty
2011 270 $200,000,000 Mar-15 $740,741 Confidential Confidential Confidential Confidential Confidential Confidential Confidential
Hilton Garden Inn [1]237 W 54th Street (between Broadaway and 8th Avenue)
Marjan International
Corp
Starwood Capital Group
2014 401 $240,000,000 Feb-15 $598,504 $255 95% $241 6.81 2,351 $41,529 6.9%
Fairfield Inn and Suites [2]325 West 33rd Street (between 8th and 9th Avenues)
Shidler Group OTO Development 2013 239 $108,240,000 Sep-14 $452,887 $279 95% $265 4.68 1,623 $28,532 6.3%
SpringHill Suites NY Midtown Manhattan [6]25 W 37th Street (between 5th and 6th Avenues)
Keck Seng Investments
Hidrock Realty 2013 173 $82,000,000 Jul-14 $473,988 $297 88% $261 4.97 1,596 $33,179 7.0%
Hilton Garden Inn Times Square Central [4]136 West 42nd Street (between 6th and 7th Avenues)
DiamondRock Hospitality
Walton Street Capital
2014 282 $127,200,000 Aug-14 $451,064 $296 71% $210 5.90 1,526 $26,993 6.0%
Hotel Novotel1651 Broadway (corner 51st and 52nd Streets)
Millennium Hotels & Resorts
Chartres Lodging Group
1984 / 2013
480 $273,600,000 Jun-14 $570,000 N/A N/A N/A N/A N/A N/A N/A
Holiday Inn SoHo138 Lafayette St (corner Howard Street)
RFR Holding Procaccianti Group1961 / 1992
227 $105,500,000 Jul-14 $464,758 $214 89% $190 6.69 2,172 $31,371 6.8%
Sofitel New York43-45 W 44th Street (between 5th & 6th Avenues)
Keck Seng Investments
Accor North America
1999 398 $265,000,000 Oct-14 $665,829 $565 N/A N/A N/A 1,178 $32,626 4.9%
MIN $412,214 $214 71% $190 4.10 1,178 $12,634 2.3%MAX $892,857 $565 95% $346 7.07 2,351 $50,893 7.0%AVERAGE $570,195 $326 86% $253 5.81 1,755 $31,204 5.7%
SUBJECT [5]1186-1198 Broadway (corner W 29th Street)
N/A N/A 1905/2009 283 $146,000,000 N/A $515,901 $307 94% $289 4.89 1,681 $37,587 7.3%
Notes:[1] Sale of 49.9% interest; Select service hotel[2] Leasehold interest (99-year ground lease); Select service hotel[3] Leasehold interest (ground lease until 2132)[4] Sale of hotel condominium unit. Hotel opened in September 2014, cap rate is based on 2015 NOI estimated by buyer. Entered into contract in January 2011, with ~21% of purchase price funded at time of contract. Occupancy, ADR, and RevPAR figures are the month of September 2014[5] Metrics based on RERC appraisal as of 3Q 2015.[6] These were used as comparables in the Sales Approach.
ACE NYC Hotel - Recent Manhattan Hotel Sales
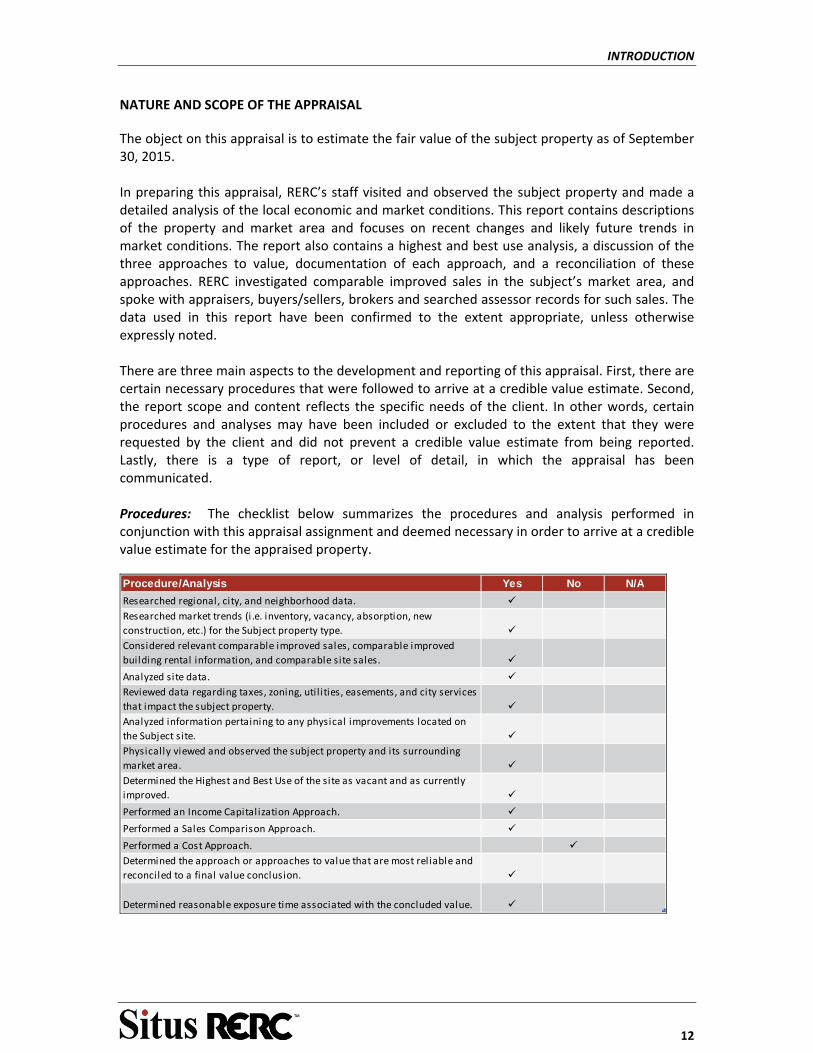
INTRODUCTION
12
NATURE AND SCOPE OF THE APPRAISAL
The object on this appraisal is to estimate the fair value of the subject property as of September 30, 2015. In preparing this appraisal, RERC’s staff visited and observed the subject property and made a detailed analysis of the local economic and market conditions. This report contains descriptions of the property and market area and focuses on recent changes and likely future trends in market conditions. The report also contains a highest and best use analysis, a discussion of the three approaches to value, documentation of each approach, and a reconciliation of these approaches. RERC investigated comparable improved sales in the subject’s market area, and spoke with appraisers, buyers/sellers, brokers and searched assessor records for such sales. The data used in this report have been confirmed to the extent appropriate, unless otherwise expressly noted. There are three main aspects to the development and reporting of this appraisal. First, there are certain necessary procedures that were followed to arrive at a credible value estimate. Second, the report scope and content reflects the specific needs of the client. In other words, certain procedures and analyses may have been included or excluded to the extent that they were requested by the client and did not prevent a credible value estimate from being reported. Lastly, there is a type of report, or level of detail, in which the appraisal has been communicated. Procedures: The checklist below summarizes the procedures and analysis performed in conjunction with this appraisal assignment and deemed necessary in order to arrive at a credible value estimate for the appraised property.
Procedure/Analysis Yes No N/A
Researched regional, city, and neighborhood data. Researched market trends (i .e. inventory, vacancy, absorption, new
construction, etc.) for the Subject property type. Considered relevant comparable improved sales, comparable improved
building rental information, and comparable site sales.
Analyzed site data. Reviewed data regarding taxes, zoning, utilities, easements, and city services
that impact the subject property. Analyzed information pertaining to any physical improvements located on
the Subject site. Physically viewed and observed the subject property and its surrounding
market area. Determined the Highest and Best Use of the site as vacant and as currently
improved.
Performed an Income Capital ization Approach.
Performed a Sales Comparison Approach.
Performed a Cost Approach. Determined the approach or approaches to value that are most reliable and
reconciled to a final value conclusion.
Determined reasonable exposure time associated with the concluded value.
INTRODUCTION
13
Report Type
The report is an Appraisal Report that complies with the reporting requirements set forth in Standards Rule 2 of the Uniform Standards of Professional Appraisal Practice. The report details the property, data gathered in our investigation and our methods of analysis. In addition, the report lists our assumptions and describes the limiting conditions under which our value opinion has been made.
INTEREST APPRAISED
The real property interest appraised is considered to be leasehold estate.
The Fifth Edition of the Dictionary of Real Estate Appraisal defines Leasehold Estate as:
“The interest held by the lessee (the tenant or renter) through a lease conveying the rights of use and occupancy for a stated term under certain conditions)." DEFINITION OF VALUE For financial reporting purposes, the type of value is fair value. Fair value is defined by IFRS 13, Fair Value Measurement, as the “price that would be received to sell an asset or paid to transfer a liability in an orderly transaction between market participants at the measurement date.”
Implicit in this definition is the definition of market value. The market value definition used in this analysis is used by agencies that regulate federally insured financial institutions in the United States. Market value means the most probable price that a property should bring in a competitive and open market under all conditions requisite to a fair sale, the buyer and seller each acting prudently and knowledgeable, and assuming the price is not affected by undue stimulus. Implicit in this definition is the consummation of a sale as of a specified date and the passing of title from seller to buyer under conditions whereby
Buyer and seller are typically motivated;
Both parties are well informed or well advised, and acting in what they consider their best interests;
A reasonable time is allowed for exposure in the open market;
Payment is made in terms of cash in U.S. dollars or in terms of financial arrangements comparable thereto; and
The price represents the normal consideration for the property sold unaffected by special or creative financing or sales concessions granted by anyone associated with the sale.2
2 (12 C.F.R Part 34.42(g); 55 Federal Register 34696, August 24, 1990, as amended at 57 Federal Register 12202, April 9, 1992; 59 Federal Register 29499, June 7, 1994)
INTRODUCTION
14
INTENDED USER As specified in the engagement agreement between RERC and GFI Capital Holdings, LLC dated October 9, 2015, the Services (defined in the engagement agreement) and the Report (defined in the engagement agreement) are for the use and benefit of, and may be relied upon solely by the GFI Capital Holdings, LLC (the “Company”), its Affiliates (defined in the engagement agreement), and GFI Real Estate Limited. The Report shall remain confidential, but for the purposes of its Intended Use (defined in the engagement agreement), RERC understands that the Report will be disclosed to the following:
a. Independent auditors, accountants, attorneys and other professionals acting on behalf of the Company its Affiliates, and GFI Real Estate Limited;
b. Governmental agencies having regulatory authority over the Company, its Affiliates, and GFI Real Estate Limited; and
c. Designated persons pursuant to an order or legal process of any court or governmental agency having jurisdiction over the Company, its Affiliates, and GFI Real Estate Limited.
RERC understands that the Report is to be used to aid GFI Capital Holdings, LLC and its Affiliates in the preparation of Financial Statements for the GFI Real Estate Limited. The Report is to be used in whole and not in part. No part of the Report shall be used in conjunction with any other analysis. Except as otherwise stated herein, the Report may not be used by any person other than the parties to whom it is addressed or for purposes other than that for which it was prepared. No part of the Report shall be conveyed to the public through advertising, or used in any sales, promotion, offering or SEC material without RERC’s prior written consent.
In providing any consent RERC will note that an appraisal: (1) is an estimate of value as of a point in time, (2) is not a guarantee of financial results, (3) is not a due diligence document beyond the estimate of value. No matter the care exercised, the results achieved in an actual transaction may be different than the appraisal results, as the appraisal is an estimate of value. Any opinion of value is inherently subjective and the results speculative, as they are based on information available at the time the value opinion was being prepared, and are influenced by matters relating to operations, projections of the future, as well as the appraisers’ interpretation of the market. As such, relying on an appraisal is subject to risks and uncertainties. The appraisal report is prepared for the specifically identified use and user and not intended, permitted, nor appropriate to be relied on for other uses or by other users. The reader and user must rely on their own due diligence and analysis of the subject property in evaluating the overall security transaction, and not rely on the appraisal for their final decision making. In addition, the reader and user is/are encouraged to refer to the definition of fair value (previously defined).
EXPOSURE PERIOD As defined by the Appraisal Standards Board of the Appraisal Foundation, the following definitions are used.
INTRODUCTION
15
Exposure Time: The estimated length of time the property interest being appraised would have been offered on the market prior to the hypothetical consummation of a sale at market value on the effective date of the appraisal; a retrospective estimate based upon an analysis of past events assuming a competitive and open market.
To determine an appropriate exposure time for the subject, marketing times for similar properties were reviewed. Marketing times look forward to how long it will take to sell a property while exposure time looks backward to how long the property was on the market before it sold. An indication of an appropriate exposure time can be seen from reviewing marketing times.
According to the second quarter 2015 RERC Real Estate Report, the marketing times for
Hotels average 5.4 months, which is a decrease of 1.2 months from the second quarter
2014 results. This survey indicates that Hotels are fourth in marketing time. Based on
this analysis and an analysis of the sales described in the sales comparison approach
section of this report, we believe that an exposure period of six to twelve months is
reasonable for the subject property.
To provide additional support to our estimate of exposure periods, we looked to survey responses of institutional investors, the likely buyers and sellers of the subject property. According to the second quarter 2015 RERC Real Estate Report, interviewees ranked Hotels third in category investment ranking. The current rating for Hotels is 6.3, which is a decrease of 0.2 points from the second quarter in 2014.
Finally, in addition to the above analyses, we have drawn upon our pension funds, banks, insurance companies, advisors and consultants throughout the country that responded to our RERC Industry Outlook: 2015. Based on the aforementioned research and analysis, we have concluded an exposure time estimate of six to twelve months for the subject is appropriate.
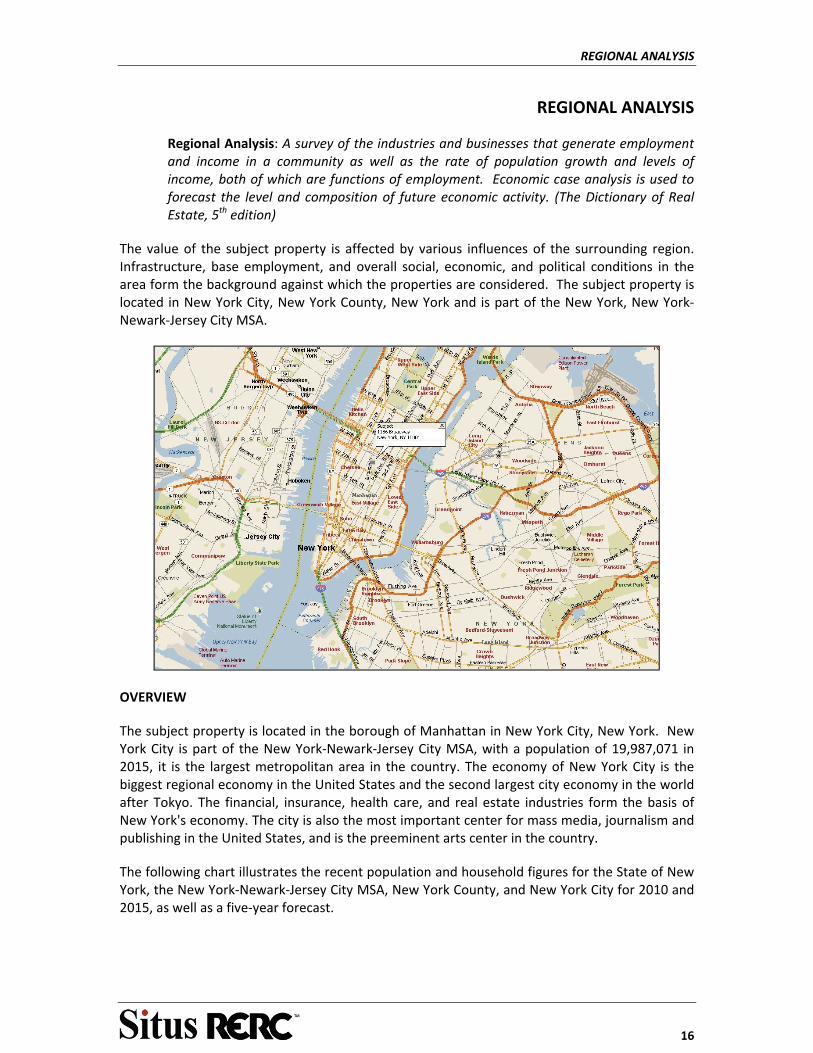
REGIONAL ANALYSIS
16
REGIONAL ANALYSIS
Regional Analysis: A survey of the industries and businesses that generate employment and income in a community as well as the rate of population growth and levels of income, both of which are functions of employment. Economic case analysis is used to forecast the level and composition of future economic activity. (The Dictionary of Real Estate, 5th edition)
The value of the subject property is affected by various influences of the surrounding region. Infrastructure, base employment, and overall social, economic, and political conditions in the area form the background against which the properties are considered. The subject property is located in New York City, New York County, New York and is part of the New York, New York‐Newark‐Jersey City MSA.
OVERVIEW
The subject property is located in the borough of Manhattan in New York City, New York. New York City is part of the New York‐Newark‐Jersey City MSA, with a population of 19,987,071 in 2015, it is the largest metropolitan area in the country. The economy of New York City is the biggest regional economy in the United States and the second largest city economy in the world after Tokyo. The financial, insurance, health care, and real estate industries form the basis of New York's economy. The city is also the most important center for mass media, journalism and publishing in the United States, and is the preeminent arts center in the country.
The following chart illustrates the recent population and household figures for the State of New York, the New York‐Newark‐Jersey City MSA, New York County, and New York City for 2010 and 2015, as well as a five‐year forecast.
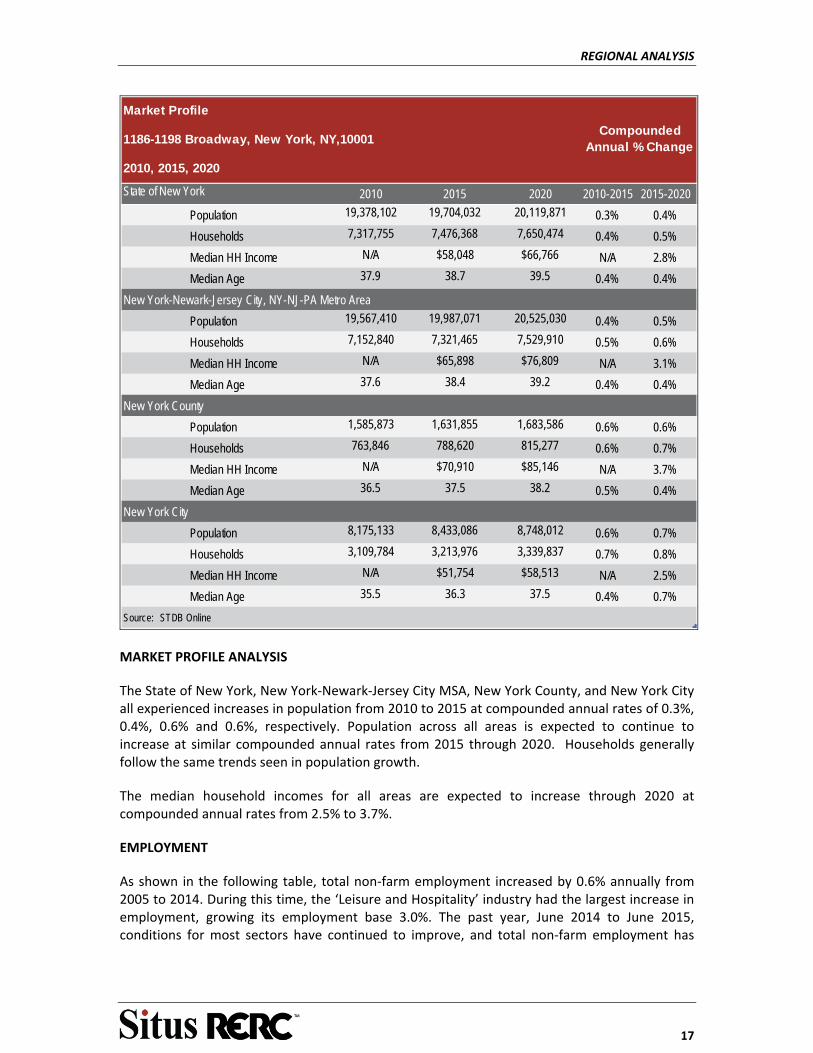
REGIONAL ANALYSIS
17
State of New York 2010 2015 2020 2010-2015 2015-2020
Population 19,378,102 19,704,032 20,119,871 0.3% 0.4%
Households 7,317,755 7,476,368 7,650,474 0.4% 0.5%
Median HH Income N/A $58,048 $66,766 N/A 2.8%
Median Age 37.9 38.7 39.5 0.4% 0.4%
New York-Newark-Jersey City, NY-NJ-PA Metro Area
Population 19,567,410 19,987,071 20,525,030 0.4% 0.5%
Households 7,152,840 7,321,465 7,529,910 0.5% 0.6%
Median HH Income N/A $65,898 $76,809 N/A 3.1%
Median Age 37.6 38.4 39.2 0.4% 0.4%
New York County
Population 1,585,873 1,631,855 1,683,586 0.6% 0.6%
Households 763,846 788,620 815,277 0.6% 0.7%
Median HH Income N/A $70,910 $85,146 N/A 3.7%
Median Age 36.5 37.5 38.2 0.5% 0.4%
New York City
Population 8,175,133 8,433,086 8,748,012 0.6% 0.7%
Households 3,109,784 3,213,976 3,339,837 0.7% 0.8%
Median HH Income N/A $51,754 $58,513 N/A 2.5%
Median Age 35.5 36.3 37.5 0.4% 0.7%
Source: STDB Online
Market Profile
1186-1198 Broadway, New York, NY,10001
2010, 2015, 2020
Compounded Annual % Change
MARKET PROFILE ANALYSIS
The State of New York, New York‐Newark‐Jersey City MSA, New York County, and New York City all experienced increases in population from 2010 to 2015 at compounded annual rates of 0.3%, 0.4%, 0.6% and 0.6%, respectively. Population across all areas is expected to continue to increase at similar compounded annual rates from 2015 through 2020. Households generally follow the same trends seen in population growth.
The median household incomes for all areas are expected to increase through 2020 at compounded annual rates from 2.5% to 3.7%.
EMPLOYMENT
As shown in the following table, total non‐farm employment increased by 0.6% annually from 2005 to 2014. During this time, the ‘Leisure and Hospitality’ industry had the largest increase in employment, growing its employment base 3.0%. The past year, June 2014 to June 2015, conditions for most sectors have continued to improve, and total non‐farm employment has

REGIONAL ANALYSIS
18
increased by 1.8%.

REGIONAL ANALYSIS
19
Non-Agricultural Industry Trends
New York-Newark-Jersey City, NY-NJ-PA Metro Area
Aug Aug 2005- Aug 2014-
Industry Employment Level 2005 2006 2007 2008 2009 2010 2011 2012 2013 2014 2014 2015 2014 Aug 2015
Non-Farm Employment
Goods Producing 845.7 843.9 838.4 818.1 726.1 688.4 685.5 689.9 706.8 716.6 737.1 747.5 -1.8% 1.4%
Service-Providing 7785.4 7879.7 8001.6 8047.3 7848.9 7878.9 7994.8 8124.2 8253.8 8416.1 8392.5 8543.9 0.9% 1.8%
Total Non-Farm Employment 8631.1 8723.6 8840.0 8865.4 8575.0 8567.3 8680.3 8814.1 8960.6 9132.7 9129.6 9291.4 0.6% 1.8%
Employment Growth N/A 1.1% 1.3% 0.3% -3.3% -0.1% 1.3% 1.5% 1.7% 1.9% N/A 1.8%
Select Non-Agricultural Industries
Mining, Logging, and Construction 349.0 363.3 376.3 374.7 328.6 306.0 307.0 313.3 332.2 346.7 366.3 378.7 -0.1% 3.4%
Manufacturing 496.7 480.7 462.1 443.4 397.5 382.4 378.5 376.6 374.5 369.9 370.8 368.8 -3.2% -0.5%
Trade, Transportation, and Utilities 1650.0 1662.0 1677.4 1668.2 1586.3 1587.9 1613.5 1638.8 1662.6 1693.7 1683.5 1704.8 0.3% 1.3%
Information 290.3 292.2 290.0 288.7 278.2 272.9 275.3 279.2 281.5 283.4 285.8 283.3 -0.3% -0.9%
Financial Activities 791.9 802.7 808.8 797.9 749.7 738.4 746.7 745.9 745.8 754.1 766.2 765.4 -0.5% -0.1%
Professional and Business Services 1279.1 1302.7 1339.9 1351.3 1273.5 1283.5 1327.5 1368.6 1403.1 1432.5 1456.6 1467.1 1.3% 0.7%
Education and Health Services 1428.9 1459.7 1488.1 1518.0 1547.1 1579.0 1606.2 1638.6 1678.2 1722.3 1671.1 1735.1 2.1% 3.8%
Leisure and Hospitality 642.6 656.8 677.8 692.6 686.3 706.9 737.7 772.7 807.0 839.0 879.3 915.2 3.0% 4.1%
Other Services 369.7 368.9 375.0 374.7 367.3 367.6 376.1 387.2 393.1 402.9 405.2 424.9 1.0% 4.9%
Government 1333.0 1334.7 1344.7 1355.9 1360.5 1342.7 1311.9 1293.3 1282.6 1288.3 1244.8 1248.1 -0.4% 0.3%
Total Select Non-Agricultural Employment 8631.2 8723.7 8840.1 8865.4 8575 8567.3 8680.4 8814.2 8961 9132.8 9129.6 9291.4 0.6% 1.8%
Note: C.A.G. stands for compounded annual grow th rate
Source: US Department of Labor and Real Estate Research Corporation
Compounded Annual % Growth

REGIONAL ANALYSIS
20
Year Labor force Employment% Change in Employment
UnemploymentUnemployment
Rate
2005 9,505,715 9,041,416 N/A 464,299 4.9
2006 9,586,416 9,150,839 1.21% 435,577 4.5
2007 9,634,760 9,209,510 0.64% 425,250 4.4
2008 9,778,635 9,260,954 0.56% 517,681 5.3
2009 9,810,296 8,964,853 -3.20% 845,443 8.6
2010 9,812,986 8,939,254 -0.29% 873,732 8.9
2011 9,810,357 8,967,669 0.32% 842,688 8.6
2012 9,921,649 9,055,173 0.98% 866,476 8.7
2013 9,930,697 9,151,012 1.06% 779,685 7.9
2014 9,938,936 9,301,073 1.64% 637,863 6.4
Aug-14 9,978,391 9,395,888 N/A 634,733 6.4
Aug-15 10,081,099 9,563,821 1.79% 517,278 5.1
Source: U.S. Bureau of Labor Statistics
New York-Newark-Jersey City, NY-NJ-PA Metro Area Employment
Year Labor force Employment% Change in Employment
UnemploymentUnemployment
Rate
2005 9,460,866 8,986,859 N/A 474,007 5.0
2006 9,508,149 9,077,529 1.01% 430,620 4.5
2007 9,522,056 9,088,207 0.12% 433,849 4.6
2008 9,664,773 9,139,080 0.56% 525,693 5.4
2009 9,647,485 8,844,486 -3.22% 802,999 8.3
2010 9,595,362 8,769,723 -0.85% 825,639 8.6
2011 9,517,788 8,727,961 -0.48% 789,827 8.3
2012 9,615,035 8,796,100 0.78% 818,935 8.5
2013 9,631,802 8,890,997 1.08% 740,805 7.7
2014 9,569,062 8,964,021 0.82% 605,041 6.3
Aug-14 9,588,843 9,000,037 N/A 588,806 6.1
Aug-15 9,696,742 9,212,040 2.36% 484,702 5.0
Source: U.S. Bureau of Labor Statistics
New York Employment
Historically, the unemployment rate for the MSA has generally been slightly higher than that of state. Unemployment rates increased significantly in 2009 as the recession took hold. The unemployment rates for both areas have remained high, but appear to be decreasing over the trailing twelve month period, with more than a 1% point drop in both the MSA and the State from August 2014 to August 2015, as the economy strengthens.
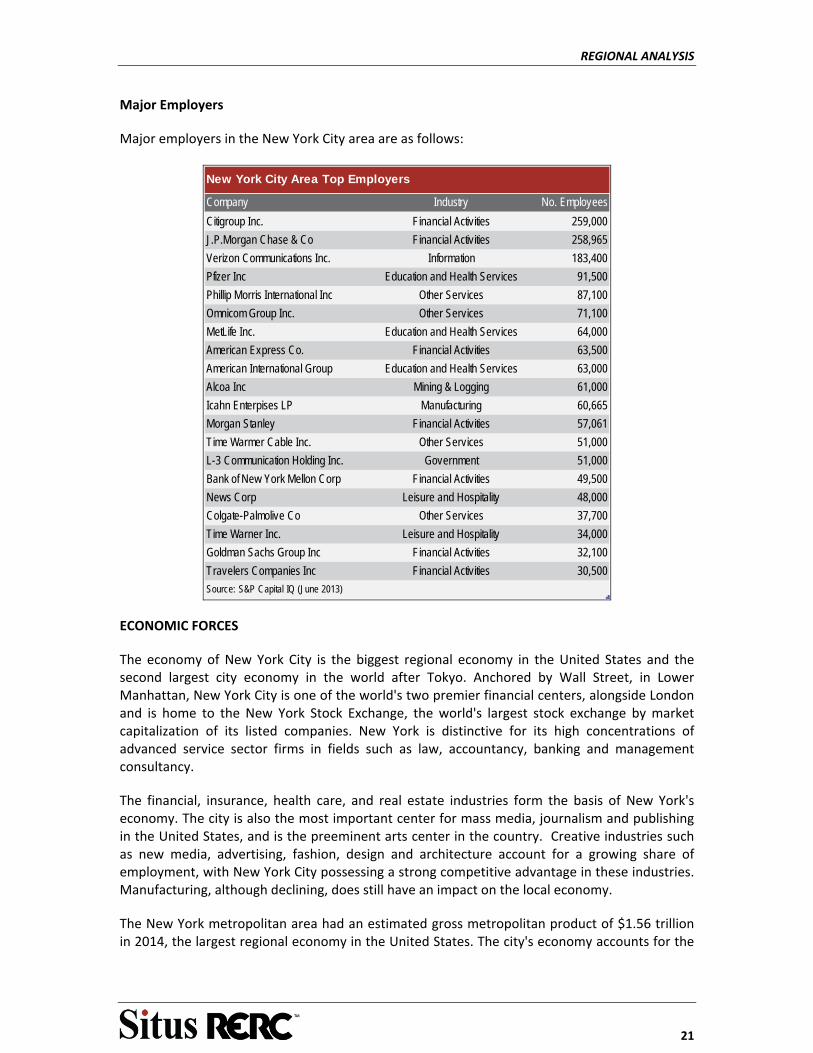
REGIONAL ANALYSIS
21
Major Employers
Major employers in the New York City area are as follows:
Company Industry No. Employees
Citigroup Inc. Financial Activities 259,000
J.P.Morgan Chase & Co Financial Activities 258,965
Verizon Communications Inc. Information 183,400
Pfizer Inc Education and Health Services 91,500
Phillip Morris International Inc Other Services 87,100
Omnicom Group Inc. Other Services 71,100
MetLife Inc. Education and Health Services 64,000
American Express Co. Financial Activities 63,500
American International Group Education and Health Services 63,000
Alcoa Inc Mining & Logging 61,000
Icahn Enterpises LP Manufacturing 60,665
Morgan Stanley Financial Activities 57,061
Time Warmer Cable Inc. Other Services 51,000
L-3 Communication Holding Inc. Government 51,000
Bank of New York Mellon Corp Financial Activities 49,500
News Corp Leisure and Hospitality 48,000
Colgate-Palmolive Co Other Services 37,700
Time Warner Inc. Leisure and Hospitality 34,000
Goldman Sachs Group Inc Financial Activities 32,100
Travelers Companies Inc Financial Activities 30,500
Source: S&P Capital IQ (June 2013)
New York City Area Top Employers
ECONOMIC FORCES
The economy of New York City is the biggest regional economy in the United States and the second largest city economy in the world after Tokyo. Anchored by Wall Street, in Lower Manhattan, New York City is one of the world's two premier financial centers, alongside London and is home to the New York Stock Exchange, the world's largest stock exchange by market capitalization of its listed companies. New York is distinctive for its high concentrations of advanced service sector firms in fields such as law, accountancy, banking and management consultancy.
The financial, insurance, health care, and real estate industries form the basis of New York's economy. The city is also the most important center for mass media, journalism and publishing in the United States, and is the preeminent arts center in the country. Creative industries such as new media, advertising, fashion, design and architecture account for a growing share of employment, with New York City possessing a strong competitive advantage in these industries. Manufacturing, although declining, does still have an impact on the local economy.
The New York metropolitan area had an estimated gross metropolitan product of $1.56 trillion in 2014, the largest regional economy in the United States. The city's economy accounts for the
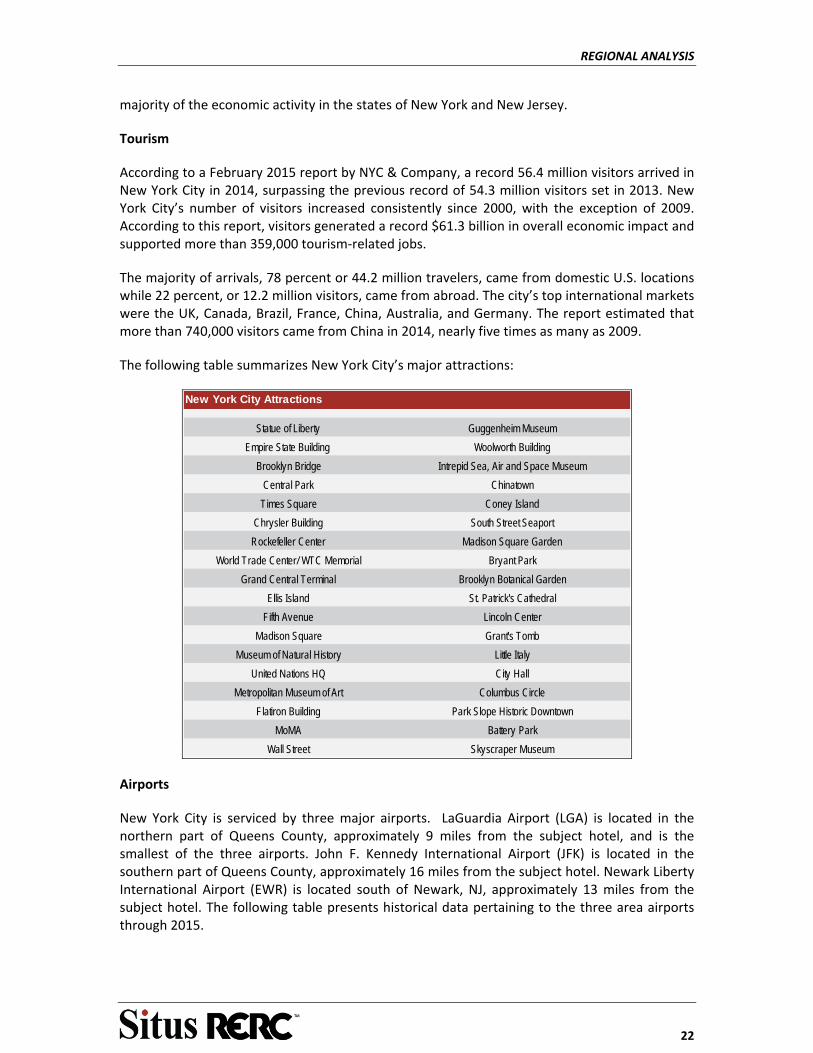
REGIONAL ANALYSIS
22
majority of the economic activity in the states of New York and New Jersey.
Tourism
According to a February 2015 report by NYC & Company, a record 56.4 million visitors arrived in New York City in 2014, surpassing the previous record of 54.3 million visitors set in 2013. New York City’s number of visitors increased consistently since 2000, with the exception of 2009. According to this report, visitors generated a record $61.3 billion in overall economic impact and supported more than 359,000 tourism‐related jobs.
The majority of arrivals, 78 percent or 44.2 million travelers, came from domestic U.S. locations while 22 percent, or 12.2 million visitors, came from abroad. The city’s top international markets were the UK, Canada, Brazil, France, China, Australia, and Germany. The report estimated that more than 740,000 visitors came from China in 2014, nearly five times as many as 2009.
The following table summarizes New York City’s major attractions:
Statue of Liberty
Empire State Building
Brooklyn Bridge
Central Park
Times Square
Chrysler Building
Rockefeller Center
World Trade Center/ WTC Memorial
Grand Central Terminal
Ellis Island
Fifth Avenue
Madison Square
Museum of Natural History
United Nations HQ
Metropolitan Museum of Art
Flatiron Building
MoMA
Wall Street
Lincoln Center
New York City Attractions
Woolworth Building
Intrepid Sea, Air and Space Museum
Guggenheim Museum
Chinatown
Coney Island
South Street Seaport
Madison Square Garden
Bryant Park
Brooklyn Botanical Garden
St. Patrick's Cathedral
Battery Park
Skyscraper Museum
Grant's Tomb
Little Italy
City Hall
Columbus Circle
Park Slope Historic Downtown
Airports
New York City is serviced by three major airports. LaGuardia Airport (LGA) is located in the northern part of Queens County, approximately 9 miles from the subject hotel, and is the smallest of the three airports. John F. Kennedy International Airport (JFK) is located in the southern part of Queens County, approximately 16 miles from the subject hotel. Newark Liberty International Airport (EWR) is located south of Newark, NJ, approximately 13 miles from the subject hotel. The following table presents historical data pertaining to the three area airports through 2015.
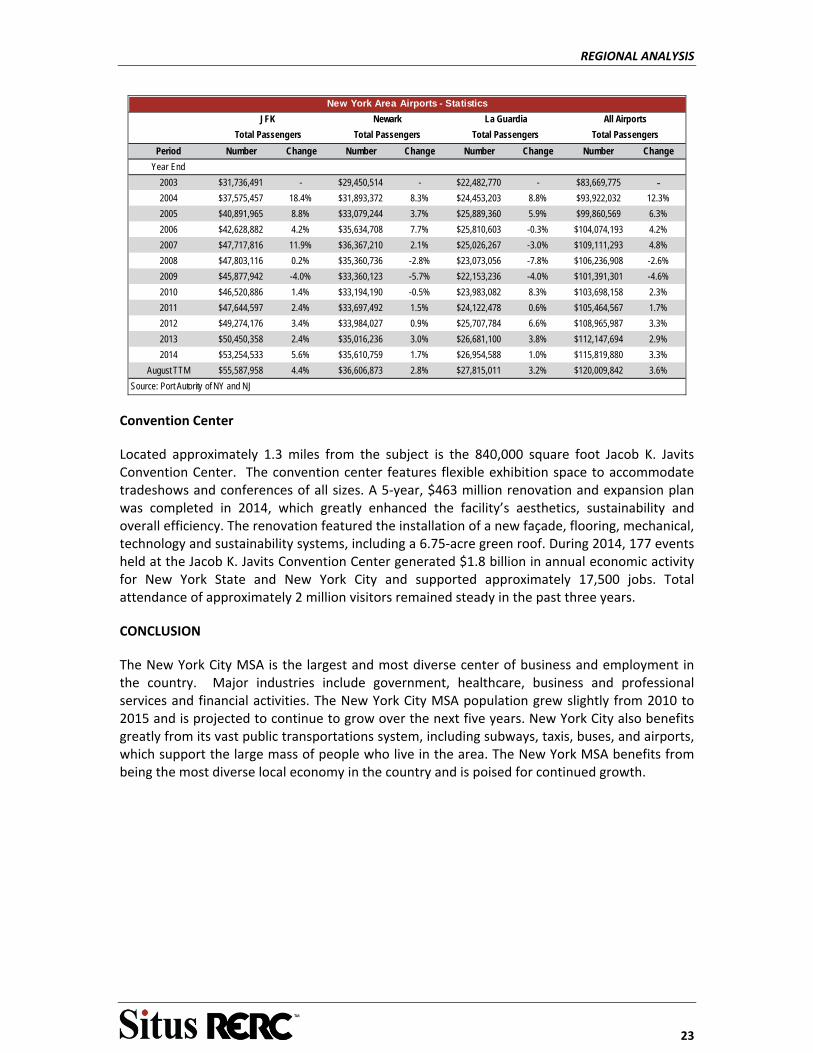
REGIONAL ANALYSIS
23
Period Number Change Number Change Number Change Number Change
Year End
2003 $31,736,491 - $29,450,514 - $22,482,770 - $83,669,775 -2004 $37,575,457 18.4% $31,893,372 8.3% $24,453,203 8.8% $93,922,032 12.3%
2005 $40,891,965 8.8% $33,079,244 3.7% $25,889,360 5.9% $99,860,569 6.3%
2006 $42,628,882 4.2% $35,634,708 7.7% $25,810,603 -0.3% $104,074,193 4.2%
2007 $47,717,816 11.9% $36,367,210 2.1% $25,026,267 -3.0% $109,111,293 4.8%
2008 $47,803,116 0.2% $35,360,736 -2.8% $23,073,056 -7.8% $106,236,908 -2.6%
2009 $45,877,942 -4.0% $33,360,123 -5.7% $22,153,236 -4.0% $101,391,301 -4.6%
2010 $46,520,886 1.4% $33,194,190 -0.5% $23,983,082 8.3% $103,698,158 2.3%
2011 $47,644,597 2.4% $33,697,492 1.5% $24,122,478 0.6% $105,464,567 1.7%
2012 $49,274,176 3.4% $33,984,027 0.9% $25,707,784 6.6% $108,965,987 3.3%
2013 $50,450,358 2.4% $35,016,236 3.0% $26,681,100 3.8% $112,147,694 2.9%
2014 $53,254,533 5.6% $35,610,759 1.7% $26,954,588 1.0% $115,819,880 3.3%
August TTM $55,587,958 4.4% $36,606,873 2.8% $27,815,011 3.2% $120,009,842 3.6%
Source: Port Autority of NY and NJ
New York Area Airports - Statistics
Total Passengers
JFK Newark
Total Passengers
La Guardia
Total Passengers
All Airports
Total Passengers
Convention Center
Located approximately 1.3 miles from the subject is the 840,000 square foot Jacob K. Javits Convention Center. The convention center features flexible exhibition space to accommodate tradeshows and conferences of all sizes. A 5‐year, $463 million renovation and expansion plan was completed in 2014, which greatly enhanced the facility’s aesthetics, sustainability and overall efficiency. The renovation featured the installation of a new façade, flooring, mechanical, technology and sustainability systems, including a 6.75‐acre green roof. During 2014, 177 events held at the Jacob K. Javits Convention Center generated $1.8 billion in annual economic activity for New York State and New York City and supported approximately 17,500 jobs. Total attendance of approximately 2 million visitors remained steady in the past three years.
CONCLUSION
The New York City MSA is the largest and most diverse center of business and employment in the country. Major industries include government, healthcare, business and professional services and financial activities. The New York City MSA population grew slightly from 2010 to 2015 and is projected to continue to grow over the next five years. New York City also benefits greatly from its vast public transportations system, including subways, taxis, buses, and airports, which support the large mass of people who live in the area. The New York MSA benefits from being the most diverse local economy in the country and is poised for continued growth.
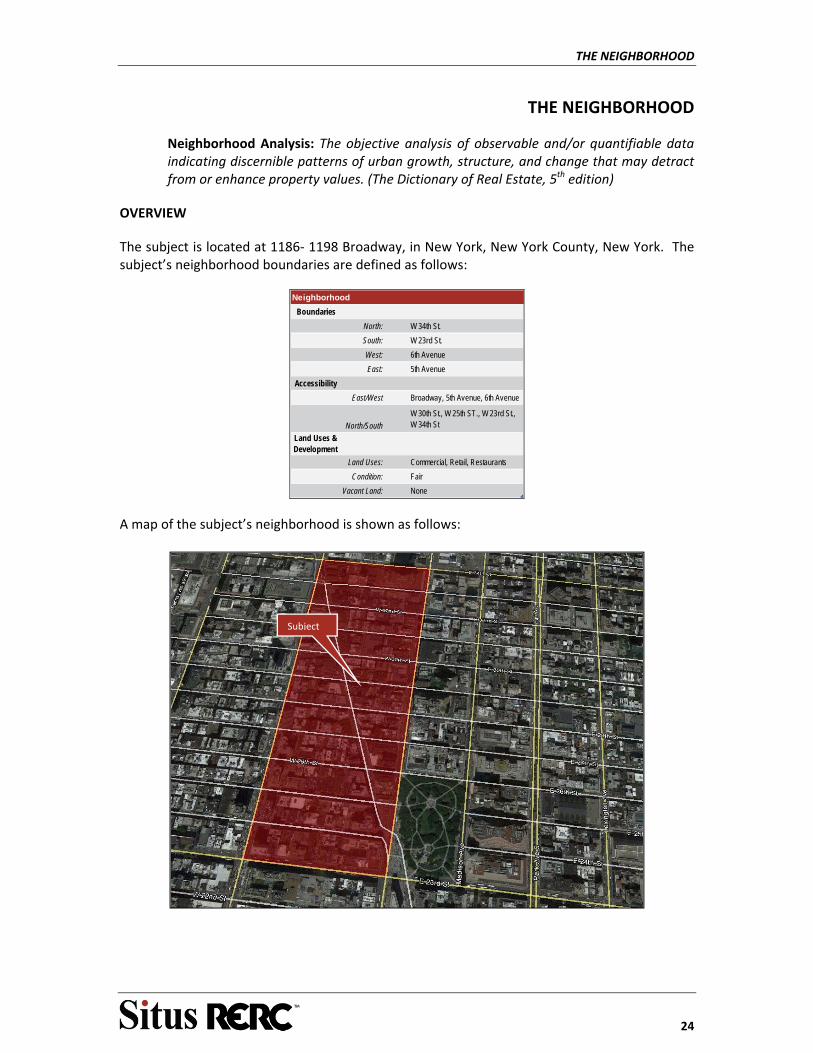
THE NEIGHBORHOOD
24
THE NEIGHBORHOOD
Neighborhood Analysis: The objective analysis of observable and/or quantifiable data indicating discernible patterns of urban growth, structure, and change that may detract from or enhance property values. (The Dictionary of Real Estate, 5th edition)
OVERVIEW
The subject is located at 1186‐ 1198 Broadway, in New York, New York County, New York. The subject’s neighborhood boundaries are defined as follows:
Boundaries
North: W 34th St.
South: W 23rd St.
West: 6th Avenue
East: 5th Avenue
Accessibility
East/West Broadway, 5th Avenue, 6th Avenue
North/South
W 30th St., W 25th ST., W 23rd St., W 34th St
Land Uses & Development
Land Uses: Commercial, Retail, Restaurants
Condition: Fair
Vacant Land: None
Neighborhood
A map of the subject’s neighborhood is shown as follows:
Subject
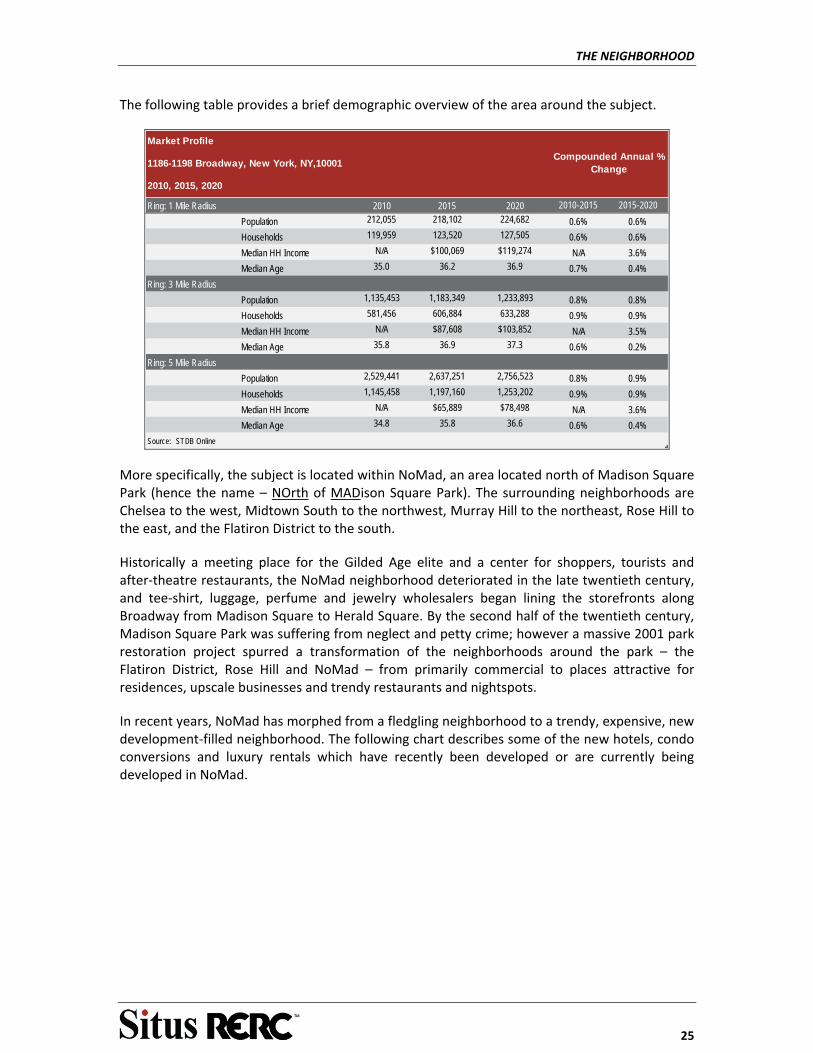
THE NEIGHBORHOOD
25
The following table provides a brief demographic overview of the area around the subject.
Market Profile
1186-1198 Broadway, New York, NY,10001
2010, 2015, 2020
Ring: 1 Mile Radius 2010 2015 2020 2010-2015 2015-2020
Population 212,055 218,102 224,682 0.6% 0.6%
Households 119,959 123,520 127,505 0.6% 0.6%
Median HH Income N/A $100,069 $119,274 N/A 3.6%
Median Age 35.0 36.2 36.9 0.7% 0.4%
Ring: 3 Mile Radius
Population 1,135,453 1,183,349 1,233,893 0.8% 0.8%
Households 581,456 606,884 633,288 0.9% 0.9%
Median HH Income N/A $87,608 $103,852 N/A 3.5%
Median Age 35.8 36.9 37.3 0.6% 0.2%
Ring: 5 Mile Radius
Population 2,529,441 2,637,251 2,756,523 0.8% 0.9%
Households 1,145,458 1,197,160 1,253,202 0.9% 0.9%
Median HH Income N/A $65,889 $78,498 N/A 3.6%
Median Age 34.8 35.8 36.6 0.6% 0.4%
Source: STDB Online
Compounded Annual % Change
More specifically, the subject is located within NoMad, an area located north of Madison Square Park (hence the name – NOrth of MADison Square Park). The surrounding neighborhoods are Chelsea to the west, Midtown South to the northwest, Murray Hill to the northeast, Rose Hill to the east, and the Flatiron District to the south.
Historically a meeting place for the Gilded Age elite and a center for shoppers, tourists and after‐theatre restaurants, the NoMad neighborhood deteriorated in the late twentieth century, and tee‐shirt, luggage, perfume and jewelry wholesalers began lining the storefronts along Broadway from Madison Square to Herald Square. By the second half of the twentieth century, Madison Square Park was suffering from neglect and petty crime; however a massive 2001 park restoration project spurred a transformation of the neighborhoods around the park – the Flatiron District, Rose Hill and NoMad – from primarily commercial to places attractive for residences, upscale businesses and trendy restaurants and nightspots.
In recent years, NoMad has morphed from a fledgling neighborhood to a trendy, expensive, new development‐filled neighborhood. The following chart describes some of the new hotels, condo conversions and luxury rentals which have recently been developed or are currently being developed in NoMad.
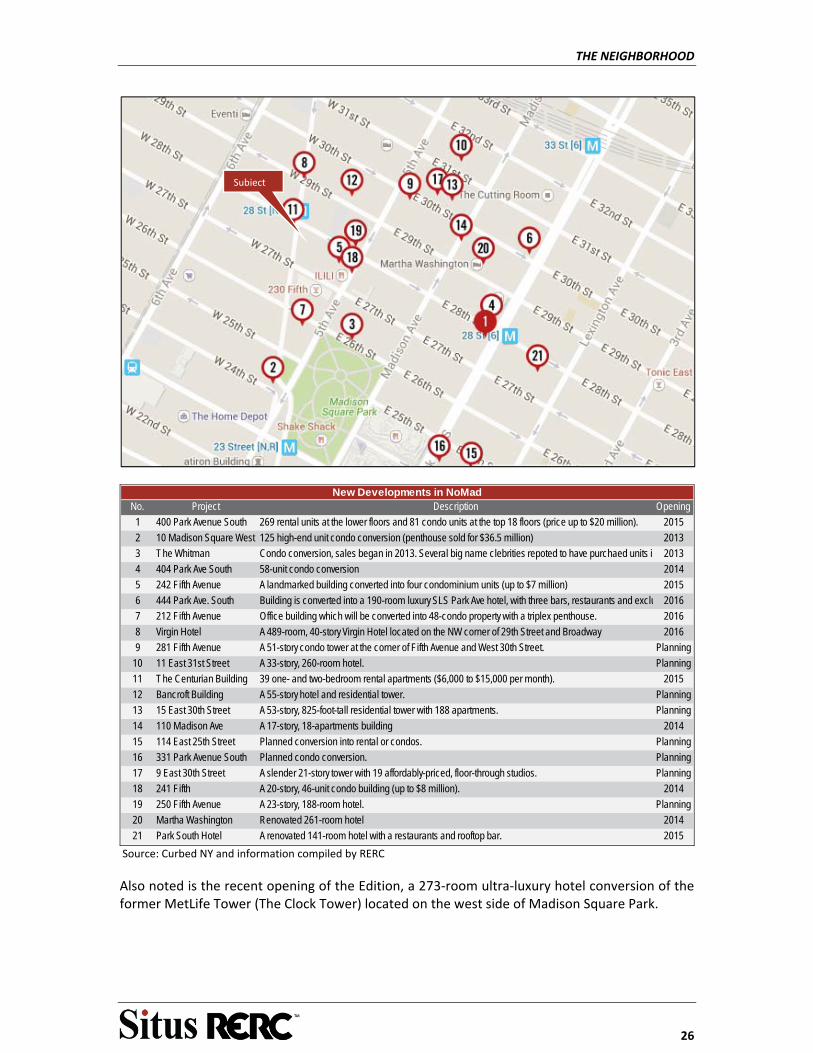
THE NEIGHBORHOOD
26
No. Project Description Opening
1 400 Park Avenue South 269 rental units at the lower floors and 81 condo units at the top 18 floors (price up to $20 million). 2015
2 10 Madison Square West 125 high-end unit condo conversion (penthouse sold for $36.5 million) 2013
3 The Whitman Condo conversion, sales began in 2013. Several big name clebrities repoted to have purchaed units in 2013
4 404 Park Ave South 58-unit condo conversion 2014
5 242 Fifth Avenue A landmarked building converted into four condominium units (up to $7 million) 2015
6 444 Park Ave. South Building is converted into a 190-room luxury SLS Park Ave hotel, with three bars, restaurants and exclu 2016
7 212 Fifth Avenue Office building which will be converted into 48-condo property with a triplex penthouse. 2016
8 Virgin Hotel A 489-room, 40-story Virgin Hotel located on the NW corner of 29th Street and Broadway 2016
9 281 Fifth Avenue A 51-story condo tower at the corner of Fifth Avenue and West 30th Street. Planning
10 11 East 31st Street A 33-story, 260-room hotel. Planning
11 The Centurian Building 39 one- and two-bedroom rental apartments ($6,000 to $15,000 per month). 2015
12 Bancroft Building A 55-story hotel and residential tower. Planning
13 15 East 30th Street A 53-story, 825-foot-tall residential tower with 188 apartments. Planning
14 110 Madison Ave A 17-story, 18-apartments building 2014
15 114 East 25th Street Planned conversion into rental or condos. Planning
16 331 Park Avenue South Planned condo conversion. Planning
17 9 East 30th Street A slender 21-story tower with 19 affordably-priced, floor-through studios. Planning
18 241 Fifth A 20-story, 46-unit condo building (up to $8 million). 2014
19 250 Fifth Avenue A 23-story, 188-room hotel. Planning
20 Martha Washington Renovated 261-room hotel 2014
21 Park South Hotel A renovated 141-room hotel with a restaurants and rooftop bar. 2015
New Developments in NoMad
Source: Curbed NY and information compiled by RERC
Also noted is the recent opening of the Edition, a 273‐room ultra‐luxury hotel conversion of the former MetLife Tower (The Clock Tower) located on the west side of Madison Square Park.
Subject
THE NEIGHBORHOOD
27
ACCESS FACILITIES
The subject neighborhood is bounded by a major thoroughfare, 5th avenue on its eastern border. The subject is accessible via 5th avenue. Broadway serves as a western ingress/egress to the subject. The subject’s neighborhood is bounded north by W 34th St and south by W 23rd St.
LAND USE
A majority of the land usage in proximity to the subject includes a mix of commercial uses including restaurants, hotel, office and retail.
CONCLUSION
The subject’s neighborhood has been going through a revitalization phase in recent years; Old dilapidated buildings are being renovated or replaced with newly built residential apartments buildings, condominium projects and luxury hotels. New hotel supply in the subject’s area will bring additional competition and may negatively influence the subject’s performance in the short‐term, however the general uplift of the neighborhood is expected positively affect the subject’s performance in the mid‐ to long‐term, attracting more visitors to the area and positioning the subject within a more luxurious competitive set.
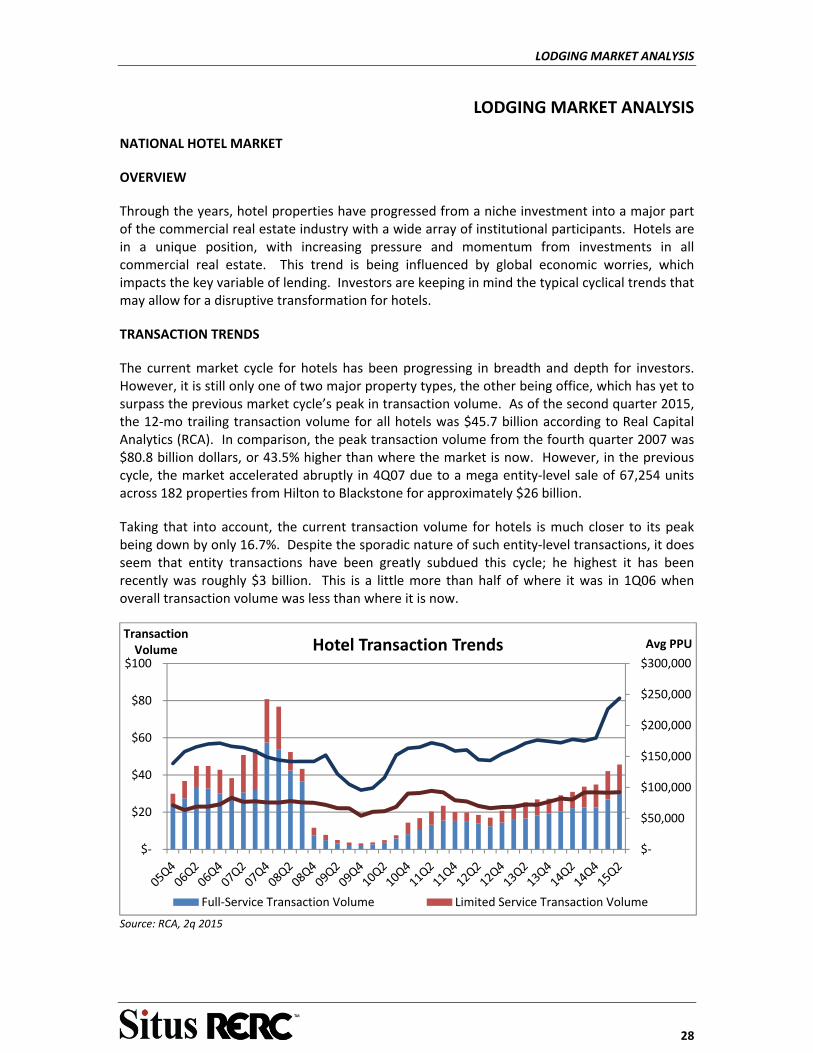
LODGING MARKET ANALYSIS
28
LODGING MARKET ANALYSIS
NATIONAL HOTEL MARKET
OVERVIEW
Through the years, hotel properties have progressed from a niche investment into a major part of the commercial real estate industry with a wide array of institutional participants. Hotels are in a unique position, with increasing pressure and momentum from investments in all commercial real estate. This trend is being influenced by global economic worries, which impacts the key variable of lending. Investors are keeping in mind the typical cyclical trends that may allow for a disruptive transformation for hotels.
TRANSACTION TRENDS
The current market cycle for hotels has been progressing in breadth and depth for investors. However, it is still only one of two major property types, the other being office, which has yet to surpass the previous market cycle’s peak in transaction volume. As of the second quarter 2015, the 12‐mo trailing transaction volume for all hotels was $45.7 billion according to Real Capital Analytics (RCA). In comparison, the peak transaction volume from the fourth quarter 2007 was $80.8 billion dollars, or 43.5% higher than where the market is now. However, in the previous cycle, the market accelerated abruptly in 4Q07 due to a mega entity‐level sale of 67,254 units across 182 properties from Hilton to Blackstone for approximately $26 billion.
Taking that into account, the current transaction volume for hotels is much closer to its peak being down by only 16.7%. Despite the sporadic nature of such entity‐level transactions, it does seem that entity transactions have been greatly subdued this cycle; he highest it has been recently was roughly $3 billion. This is a little more than half of where it was in 1Q06 when overall transaction volume was less than where it is now.
Source: RCA, 2q 2015
$‐
$50,000
$100,000
$150,000
$200,000
$250,000
$300,000
$‐
$20
$40
$60
$80
$100
Avg PPUTransaction Volume Hotel Transaction Trends
Full‐Service Transaction Volume Limited Service Transaction Volume
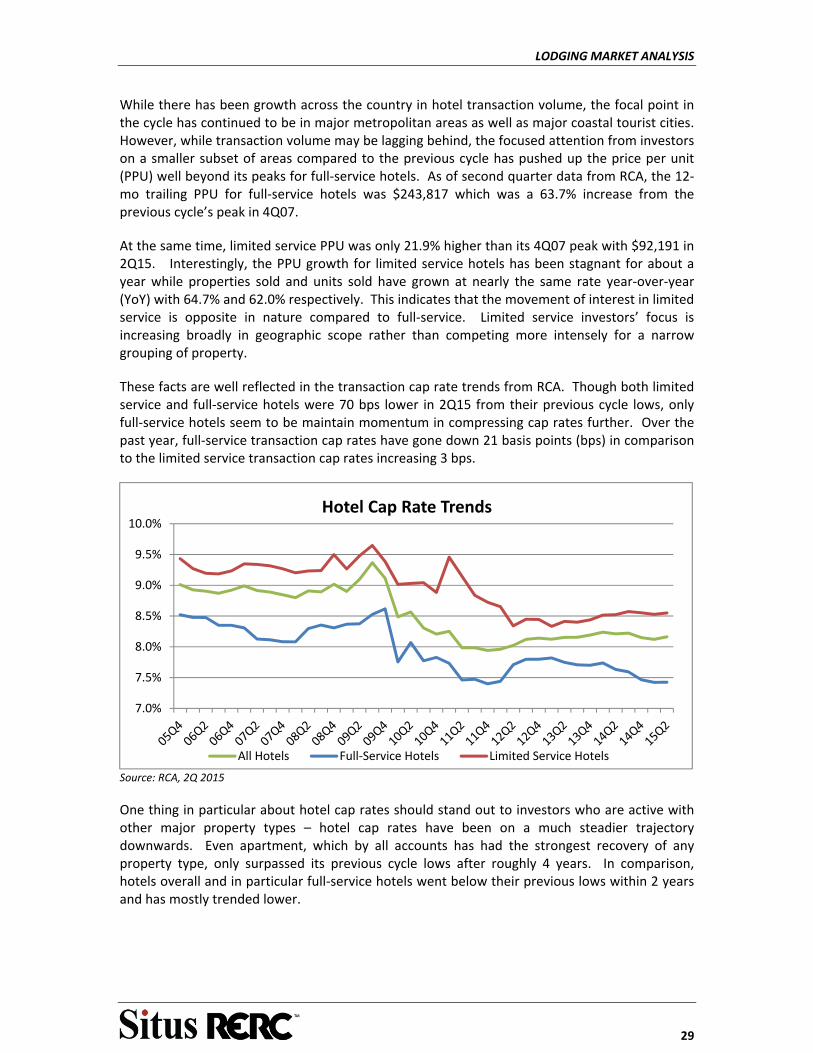
LODGING MARKET ANALYSIS
29
While there has been growth across the country in hotel transaction volume, the focal point in the cycle has continued to be in major metropolitan areas as well as major coastal tourist cities. However, while transaction volume may be lagging behind, the focused attention from investors on a smaller subset of areas compared to the previous cycle has pushed up the price per unit (PPU) well beyond its peaks for full‐service hotels. As of second quarter data from RCA, the 12‐mo trailing PPU for full‐service hotels was $243,817 which was a 63.7% increase from the previous cycle’s peak in 4Q07.
At the same time, limited service PPU was only 21.9% higher than its 4Q07 peak with $92,191 in 2Q15. Interestingly, the PPU growth for limited service hotels has been stagnant for about a year while properties sold and units sold have grown at nearly the same rate year‐over‐year (YoY) with 64.7% and 62.0% respectively. This indicates that the movement of interest in limited service is opposite in nature compared to full‐service. Limited service investors’ focus is increasing broadly in geographic scope rather than competing more intensely for a narrow grouping of property.
These facts are well reflected in the transaction cap rate trends from RCA. Though both limited service and full‐service hotels were 70 bps lower in 2Q15 from their previous cycle lows, only full‐service hotels seem to be maintain momentum in compressing cap rates further. Over the past year, full‐service transaction cap rates have gone down 21 basis points (bps) in comparison to the limited service transaction cap rates increasing 3 bps.
Source: RCA, 2Q 2015
One thing in particular about hotel cap rates should stand out to investors who are active with other major property types – hotel cap rates have been on a much steadier trajectory downwards. Even apartment, which by all accounts has had the strongest recovery of any property type, only surpassed its previous cycle lows after roughly 4 years. In comparison, hotels overall and in particular full‐service hotels went below their previous lows within 2 years and has mostly trended lower.
7.0%
7.5%
8.0%
8.5%
9.0%
9.5%
10.0%Hotel Cap Rate Trends
All Hotels Full‐Service Hotels Limited Service Hotels
LODGING MARKET ANALYSIS
30
There are a few reasons why hotel cap rates have moved this way. First off, there isn’t any other major property type with as high of a cap rate as hotel has. As of 2Q15, the closest one was office, which with a cap rate of 6.79%, is still 154 bps lower than hotel cap rates at 8.33%. This continual compression then, is going to come as a natural result of a property type that becomes less niche, more institutional, and as advanced as other property types. Additionally, investors are going to be less weary of engaging in the hotel market with the LIBOR and US 10‐yr Treasury rate at record lows. This last point has a lot of question marks surrounding its long term prospects. Yet as investors continue to live in this environment, it will normalize to them, and get cap rate for hotels closer to other property type counter parts.
One of the growing narratives around commercial real estate involves the impact of foreign capital and this is certainly true of hotel properties. With approximately $8 billion in acquisitions on a 12‐months trailing basis, data from RCA shows that cross‐border investors made up 17% of acquisitions in 15Q2. Cross‐border investors already surpassed their acquisitions from the previous cycle in 3Q14 and now are 27.9% higher. Their purchases though, are targeted at high quality hotel properties with numerous rooms. For example, Anbang Insurance Group based in Beijing, China purchased the 1,425 unit Waldorf Astoria in New York City for $1.95 billion or $1,368 per unit from Hilton World Wide.
However, with the downturn in the Chinese equity markets and crippling regulation from overdevelopment, more and more Chinese investors with commercial real estate platforms set up in the US will expand their activity over the coming years. Anon Qui, the executive managing director at TRI Commercial/CORFAC International said “This China stock market crash is a wake‐up call that one can’t put all their eggs in one basket when it comes to managing and preserving wealth.”
Additionally, as China moves to catalyze its exports to stabilize the overall economy, they’ve begun devaluing the yuan which is not good for investors in China. As such, commercial real estate in the US give an additional facet to hedge their investments with. These Chinese investors who are diversifying are still very hungry for yield which hotels can amply provide. In order to do so, they will reach out beyond the major markets.
FUNDAMENTALS
Hotels have had some of the most noticeable and impressive growth of any property type over the past few years as the economy in the US and abroad have become healthier and as such increased levels of travels for business and leisure. But that quick and pleasant recovery for hotels is also bringing a rapid peak in fundamental performance.
Halfway through 2015, PKF‐Hospitality Research reported that they expect occupancy to be 65.8% by the end of the year. That would be a 140 basis pointss increase in occupancy compared to 2014. At the same time, they expect occupancy to peak by 2016 with 66.1%. The growth in the average daily rate, projected to be 4.5% in 2015, will continue to increase through 2017 before beginning to subside. This aligns with expectations from those attending the Hunter Hotel Conference, which expect the hotel market to peak sometime between 2016 and 2019, according to Hotel News Now.
The main different between the trends of the hotel classes continues to be changes in supply and demand. From 2010 to 2014, upscale and upper midscale hotels increased the most in
LODGING MARKET ANALYSIS
31
demand with 5.4% annualized growth rate. Upper midscale, though, is forecast by PKF‐Hospital Research to substantially diminish to 2% growth compared to upscale which will still stay at a 4.1% annualized growth rate from 2016 through 2019. However, upscale hotels are having an abundance of supply coming online during the same time with an annualized growth rate in supply of 5.9%. Given their affluent customers’ tastes, these newer hotels will likely be more sought out than older upscale hotels given the right price points.
With the holidays quickly approaching, there will likely be greater expenditures on travel from the low cost of oil. Greg LaBerge, Marcus & Millichap’s national hospitality director, said that he expects $45 dollars a gallon for oil, will give each individual in the US an extra $100 per month. This will translate into some increased spending on travel and hotel usage. While Marcus & Millichap and others view the change in oil prices as something long term, it certainly isn’t guaranteed and investors would be wise to just to take this as short term for now.
Overall, the outlook is generally still good for hotels, yet there are new players in the space including Airbnb. At the previously mentioned Hunter Hotel Conference, Hotel News Now Reports that when PKF‐Hospitality Research’s Mark Woodworth went on stage and asked around 1,200 attendees if Airbnb was merely on their radar – only five hands were raised. That is a tremendous amount of confidence for investors who expect the market to begin to turn within the coming years and perhaps naivety for ignoring a growing part of the industry which is often synonymous with disruption.
It’s not exactly clear what Airbnb’s (or similar) impact will be for hotels long term, but even now it’s starting to effect hotels. A recent study by Boston University examined Airbnb’s influence on hotel revenue in Texas and found that more progressive and liberal cities like Austin experienced much more growth than more conservative areas such as Forth Worth. In those areas where Airbnb did establish a presence, it cut revenues for budget hotels by 5% from 2011 to 2013. The study expects that if the current trend continues, budget hotels will lose 10% of revenue by 2016. At the same time, luxury and upscale hotels had not yet been impacted meaningfully. This is consistent with the standard view that Airbnb’s customers are budget conscious.
Airbnb is making inroads with the business community and will begin to eat away at revenue from such travelers. Within 24 hours of launching their global travel management suite in late July, Airbnb had signed 500 companies to the program. As of late August, over a thousand businesses from roughly 40 countries signed up for it. Taking all these facts together, it would seem wise for hotel investors to at least give some thought to how a hotel property might function given the current and likely growth of Airbnb rentals in the area.
All of this is already being taken into consideration by RERC’s respondents who have had their value vs price rating. A scale from 1 to 10 where 1 (10) has very low (high) value in comparison to its price. In 3Q15 RERC’s value vs price rating was down to 4.9 for hotels, which is the lowest it has been for the property in four years, from 5.7 a year ago in 3Q14. It is worst in the West with 4.8 while it’s highest in the Midwest with 5.1. This aligns with what place have experienced the largest increases in PPU for hotel.
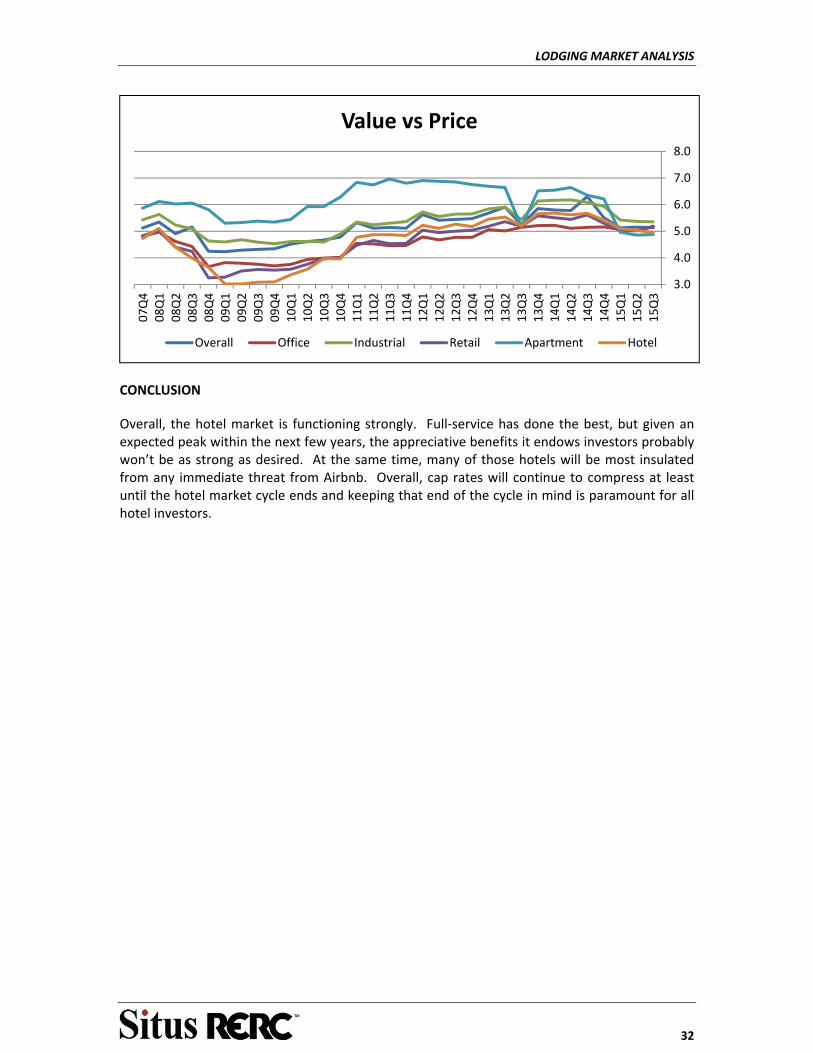
LODGING MARKET ANALYSIS
32
CONCLUSION
Overall, the hotel market is functioning strongly. Full‐service has done the best, but given an expected peak within the next few years, the appreciative benefits it endows investors probably won’t be as strong as desired. At the same time, many of those hotels will be most insulated from any immediate threat from Airbnb. Overall, cap rates will continue to compress at least until the hotel market cycle ends and keeping that end of the cycle in mind is paramount for all hotel investors.
3.0
4.0
5.0
6.0
7.0
8.0
15Q3
15Q2
15Q1
14Q4
14Q3
14Q2
14Q1
13Q4
13Q3
13Q2
13Q1
12Q4
12Q3
12Q2
12Q1
11Q4
11Q3
11Q2
11Q1
10Q4
10Q3
10Q2
10Q1
09Q4
09Q3
09Q2
09Q1
08Q4
08Q3
08Q2
08Q1
07Q4
Value vs Price
Overall Office Industrial Retail Apartment Hotel
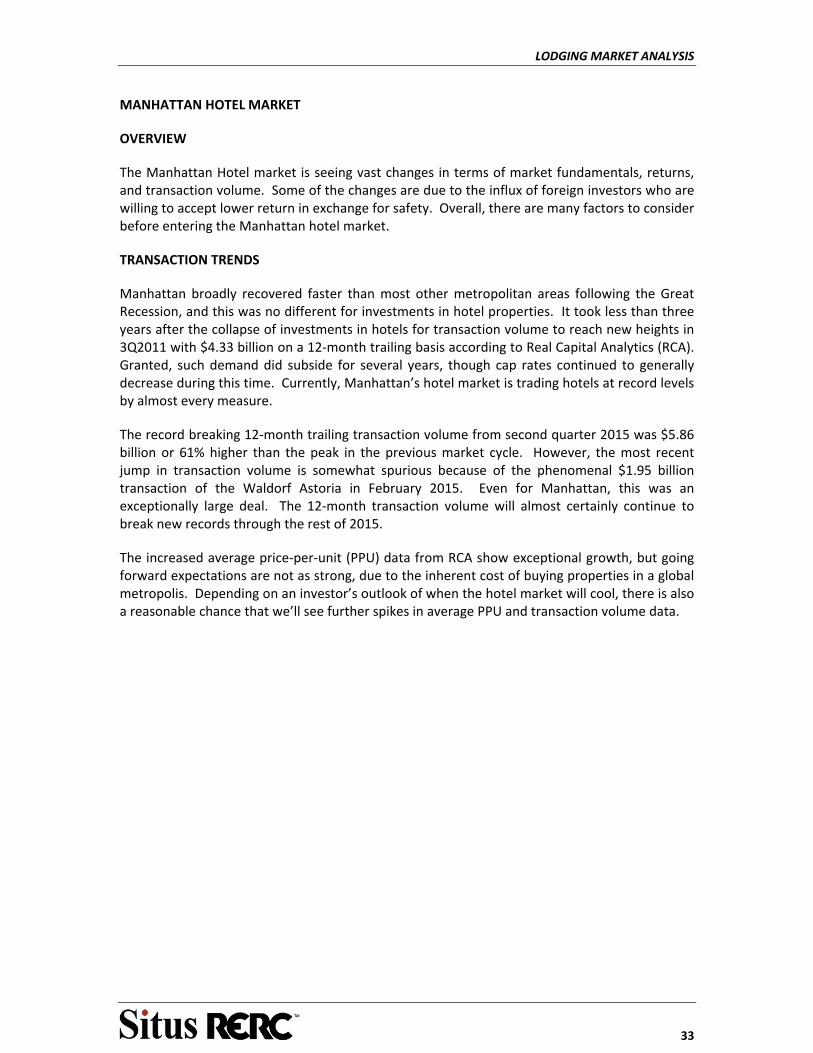
LODGING MARKET ANALYSIS
33
MANHATTAN HOTEL MARKET
OVERVIEW
The Manhattan Hotel market is seeing vast changes in terms of market fundamentals, returns, and transaction volume. Some of the changes are due to the influx of foreign investors who are willing to accept lower return in exchange for safety. Overall, there are many factors to consider before entering the Manhattan hotel market.
TRANSACTION TRENDS
Manhattan broadly recovered faster than most other metropolitan areas following the Great Recession, and this was no different for investments in hotel properties. It took less than three years after the collapse of investments in hotels for transaction volume to reach new heights in 3Q2011 with $4.33 billion on a 12‐month trailing basis according to Real Capital Analytics (RCA). Granted, such demand did subside for several years, though cap rates continued to generally decrease during this time. Currently, Manhattan’s hotel market is trading hotels at record levels by almost every measure.
The record breaking 12‐month trailing transaction volume from second quarter 2015 was $5.86 billion or 61% higher than the peak in the previous market cycle. However, the most recent jump in transaction volume is somewhat spurious because of the phenomenal $1.95 billion transaction of the Waldorf Astoria in February 2015. Even for Manhattan, this was an exceptionally large deal. The 12‐month transaction volume will almost certainly continue to break new records through the rest of 2015.
The increased average price‐per‐unit (PPU) data from RCA show exceptional growth, but going forward expectations are not as strong, due to the inherent cost of buying properties in a global metropolis. Depending on an investor’s outlook of when the hotel market will cool, there is also a reasonable chance that we’ll see further spikes in average PPU and transaction volume data.
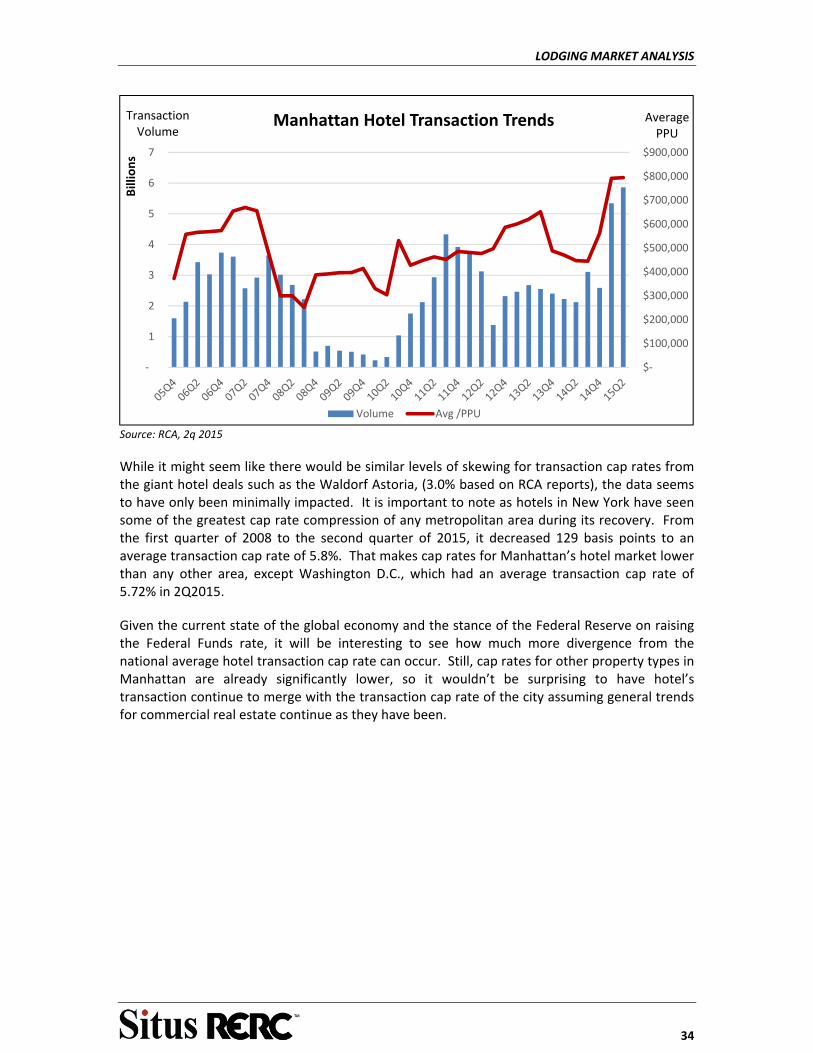
LODGING MARKET ANALYSIS
34
Source: RCA, 2q 2015
While it might seem like there would be similar levels of skewing for transaction cap rates from the giant hotel deals such as the Waldorf Astoria, (3.0% based on RCA reports), the data seems to have only been minimally impacted. It is important to note as hotels in New York have seen some of the greatest cap rate compression of any metropolitan area during its recovery. From the first quarter of 2008 to the second quarter of 2015, it decreased 129 basis points to an average transaction cap rate of 5.8%. That makes cap rates for Manhattan’s hotel market lower than any other area, except Washington D.C., which had an average transaction cap rate of 5.72% in 2Q2015.
Given the current state of the global economy and the stance of the Federal Reserve on raising the Federal Funds rate, it will be interesting to see how much more divergence from the national average hotel transaction cap rate can occur. Still, cap rates for other property types in Manhattan are already significantly lower, so it wouldn’t be surprising to have hotel’s transaction continue to merge with the transaction cap rate of the city assuming general trends for commercial real estate continue as they have been.
$‐
$100,000
$200,000
$300,000
$400,000
$500,000
$600,000
$700,000
$800,000
$900,000
‐
1
2
3
4
5
6
7
Average PPU
Transaction Volume
Billions
Manhattan Hotel Transaction Trends
Volume Avg /PPU

LODGING MARKET ANALYSIS
35
Source: RCA, 2q 2015
The Angbang Insurance Group aren’t the only foreign investors in the Manhattan hotel market though. Even the second largest transaction from 3Q2014 through 2Q2015 was the developer Al Faisal holding based out of Doha, ad Dawhah, Qatar. They purchased the 698 room Manhattan at Times Square for $535 million. In fact, foreign buyers made up 59% of the total transaction volume in 2Q2015 on a 12‐month trailing basis. In comparison, at the height of the previous cycle in 4Q2007, they bought just 9.3% of the total transaction volume. These foreign investors are part of the key reason why hotel rates have been continually compressing.
FUNDAMENTALS
The hotel market in Manhattan has been strong over the past several years with great improvement in fundamentals. However, such brightness has attracted a slew of developments to find a place in the light. According to an August 2015 Manhattan Lodging Overview published HVS, the Manhattan hotel market has added roughly 22,000 rooms between January 2009 and June 2015 (almost 100% growth), and is expected to add an over 12,000 by the end of 2017. In the past, demand was able to exceed this supply, but in the 1st quarter 2015 Smith Travel Research (STR) reported that occupancy decreased 20 basis points to 75.2% for hotels in Manhattan.
This has had the obvious but still unwanted impact of decreasing the average daily room rate (ADR). In year‐over‐year comparison in 1Q2015, the ADR decreased 4.1% to $204.18. This decrease, while different in level, was felt across all hotel types. The pain in revenue is being exacerbated by an extremely strong dollar compared to the euro, loonie, and yuan. According to Harry Gross, owner of a successful pair of Marriot hotels in Manhattan, on certain days they have had to reduce rates from 10% to 20%. The issue is not being taken lightly by those active in Manhattan hotels and they remain vigilant to take in the full impact of how a strong dollar will impact domestic and global tourism to Manhattan.
5.0%
5.5%
6.0%
6.5%
7.0%
7.5%
8.0%
8.5%
9.0%
9.5%
10.0%Manhattan Hotel Transaction Trends
Manhattan Hotels US Hotels US Full‐Service Hotels

LODGING MARKET ANALYSIS
36
Another issue that those active in the Manhattan hotel market should consider is the long term capability for competition from Airbnb. While many may disregard this offhand, it is a real issue for a city as dense as Manhattan. Already in places such as the East Village, Airbnb has proliferated to such an extent that 28% of apartments there are listed according to a study conducted by the groups New York Communities for Change and Real Affordability for All. In general, they found that roughly 10% of apartments are listed through the year in New York. According to a mid‐2015 Manhattan Lodging report published by Cushman and Wakefield, the number of hotel rooms increase by approximately 1% from 2014, from 86,770 rooms to 87,584 rooms, while the number of listed Airbnb units increased almost 30% at the same time, from 12,315 to 15,977. The number of Airbnb listings in mid‐2015 was almost 20% of the Manhattan hotels room supply.
As per Airbnb’s open source data, 4% to 6% of the hotel supply in the five boroughs in New York is made up of Airbnb rentals, but in Brooklyn it makes up an incredible 38%. Still, at this point in time the average rate of those rentals was 12.6% higher than that of comparative hotels nearby according to an analysis by STR. As such, they aren’t yet an urgent threat to traditional hotels, but it’s something which hotel owners and investors are monitoring especially as hotel market cycle is expected to finish within the next few years.
CONCLUSION
The Manhattan hotel market is going through a muddled metamorphosis that may only accelerate over the coming years. While the forces behind it ‐ the global economy, disruptive forces from new market participants, and the closing of a market cycle, may seem trite; their well‐worn themes hold no less truth. Anyone looking to join or exit the Manhattan hotel market will have to take these issues into consideration before making a decision.
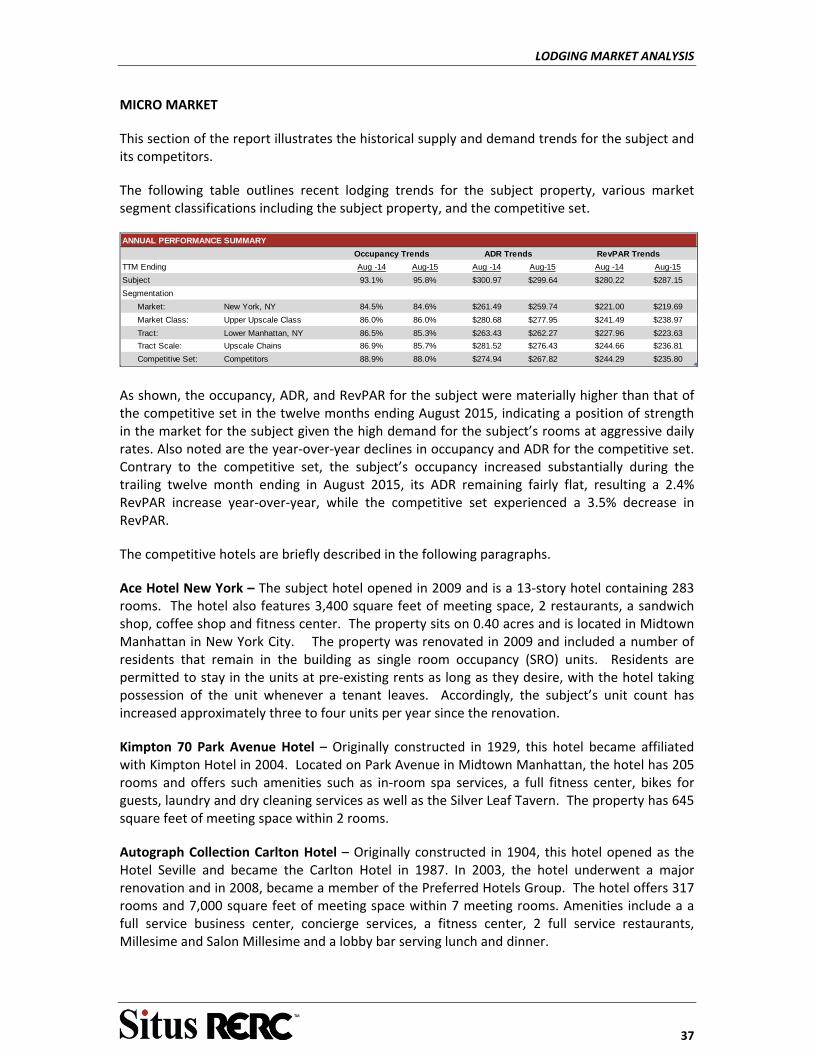
LODGING MARKET ANALYSIS
37
MICRO MARKET
This section of the report illustrates the historical supply and demand trends for the subject and its competitors.
The following table outlines recent lodging trends for the subject property, various market segment classifications including the subject property, and the competitive set.
Occupancy Trends ADR Trends RevPAR Trends
TTM Ending Aug -14 Aug-15 Aug -14 Aug-15 Aug -14 Aug-15
Subject 93.1% 95.8% $300.97 $299.64 $280.22 $287.15
Segmentation
Market: New York, NY 84.5% 84.6% $261.49 $259.74 $221.00 $219.69
Market Class: Upper Upscale Class 86.0% 86.0% $280.68 $277.95 $241.49 $238.97
Tract: Lower Manhattan, NY 86.5% 85.3% $263.43 $262.27 $227.96 $223.63
Tract Scale: Upscale Chains 86.9% 85.7% $281.52 $276.43 $244.66 $236.81
Competitive Set: Competitors 88.9% 88.0% $274.94 $267.82 $244.29 $235.80
ANNUAL PERFORMANCE SUMMARY
As shown, the occupancy, ADR, and RevPAR for the subject were materially higher than that of the competitive set in the twelve months ending August 2015, indicating a position of strength in the market for the subject given the high demand for the subject’s rooms at aggressive daily rates. Also noted are the year‐over‐year declines in occupancy and ADR for the competitive set. Contrary to the competitive set, the subject’s occupancy increased substantially during the trailing twelve month ending in August 2015, its ADR remaining fairly flat, resulting a 2.4% RevPAR increase year‐over‐year, while the competitive set experienced a 3.5% decrease in RevPAR.
The competitive hotels are briefly described in the following paragraphs.
Ace Hotel New York – The subject hotel opened in 2009 and is a 13‐story hotel containing 283 rooms. The hotel also features 3,400 square feet of meeting space, 2 restaurants, a sandwich shop, coffee shop and fitness center. The property sits on 0.40 acres and is located in Midtown Manhattan in New York City. The property was renovated in 2009 and included a number of residents that remain in the building as single room occupancy (SRO) units. Residents are permitted to stay in the units at pre‐existing rents as long as they desire, with the hotel taking possession of the unit whenever a tenant leaves. Accordingly, the subject’s unit count has increased approximately three to four units per year since the renovation.
Kimpton 70 Park Avenue Hotel – Originally constructed in 1929, this hotel became affiliated with Kimpton Hotel in 2004. Located on Park Avenue in Midtown Manhattan, the hotel has 205 rooms and offers such amenities such as in‐room spa services, a full fitness center, bikes for guests, laundry and dry cleaning services as well as the Silver Leaf Tavern. The property has 645 square feet of meeting space within 2 rooms.
Autograph Collection Carlton Hotel – Originally constructed in 1904, this hotel opened as the Hotel Seville and became the Carlton Hotel in 1987. In 2003, the hotel underwent a major renovation and in 2008, became a member of the Preferred Hotels Group. The hotel offers 317 rooms and 7,000 square feet of meeting space within 7 meeting rooms. Amenities include a a full service business center, concierge services, a fitness center, 2 full service restaurants, Millesime and Salon Millesime and a lobby bar serving lunch and dinner.

LODGING MARKET ANALYSIS
38
W Hotel New York – originally opened as the 800 room hotel; Hotel Montclair, in 1929 in midtown Manhattan. The building was renovated into the W Hotel in 1998 as a part of the Starwood Hotels and Resorts Worldwide hotel group. The property contains 696 rooms and a total of 8,868 square feet of event space. The hotel offers amenities such as a full service spa, fitness center, dry cleaning and laundry services, florist services, babysitting services, as well as on‐site dining and lounges including the Heartbeat restaurant and Whiskey Blue, a Rande Gerber bar.
The Roger Williams Hotel – The property was constructed in 1920 and is located at 131 Madison Avenue in Midtown Manhattan. The hotel has 194 guest rooms and offers approximately 800 square feet of verandah meeting space as well as a 12 person conference room. Hotel amenities include the Parlour Bistro and Lounge, fitness center, laundry and dry cleaning services, full service concierge, and 24‐hour room service.
Hudson Hotel – The property was constructed in 1928 as a clubhouse and residence for young women until its conversion to The Henry Hudson Hotel in 1941. After several renovations, the hotel was purchased in 1997 by the Morgans Hotel Group and opened as The Hudson in 2000. The hotel offers 878 rooms and over 12,000 square feet of meeting and conference space. Hotel amenities include 2 restaurants, Hudson Common and Tequila Park and 4 lounges, Sky Terrace, Half & Half, Library Bar and Hudson Lodge. Additional services include a fitness center, business center, drying cleaning service, laundry service and room service.
The major criteria to select the competitive hotels were proximity to the subject property, commonality of demand sources, rate structure, product type, product orientation, quality level and guest amenities. All of these properties rely on all three aforementioned demand segments.
TREND ANALYSIS ‐ SMITH TRAVEL RESEARCH
A 3‐year trend report was utilized in analyzing the subject and the competitive set. Smith Travel Research (STR) reports were used as the source for data. For the subject data set, the first fiscal year of data starts with the trailing twelve months (“TTM”) ending August 2013.
ACCOMMODATED DEMAND
The following table illustrates occupancy and ADR for the defined competitive supply for TTM August 2013 through TTM August 2015.
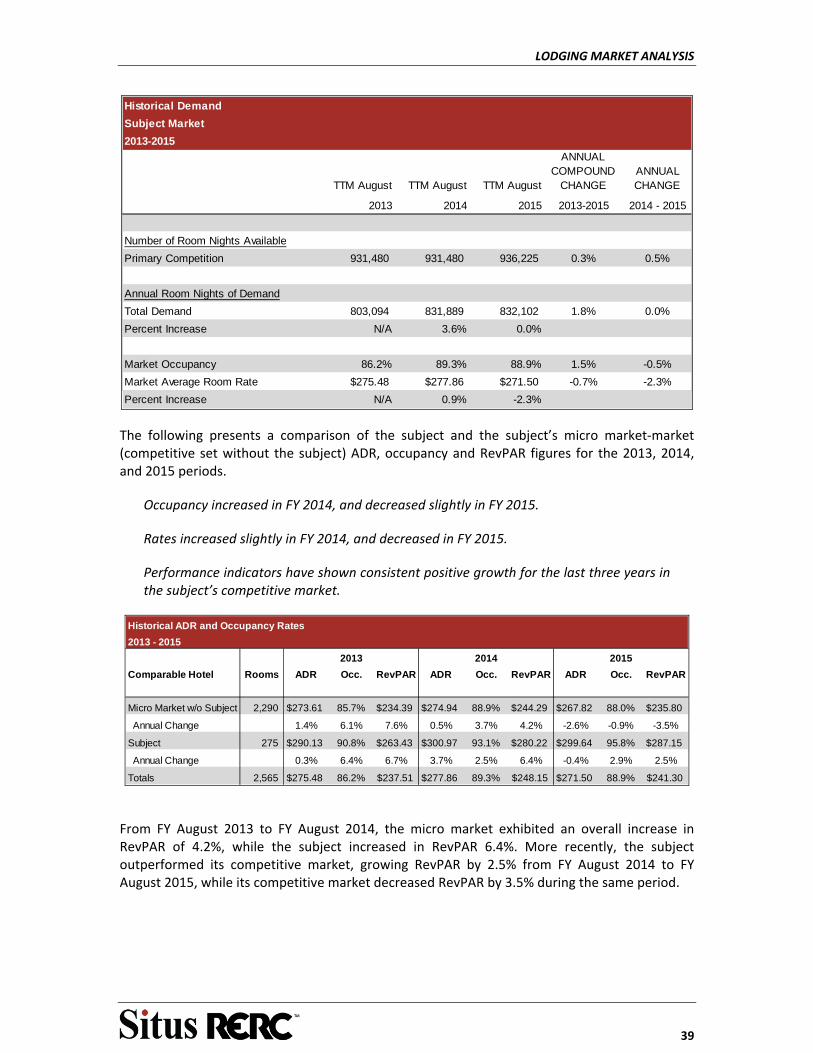
LODGING MARKET ANALYSIS
39
TTM August TTM August TTM August
ANNUAL COMPOUND
CHANGEANNUAL CHANGE
2013 2014 2015 2013-2015 2014 - 2015
Number of Room Nights Available
Primary Competition 931,480 931,480 936,225 0.3% 0.5%
Annual Room Nights of Demand
Total Demand 803,094 831,889 832,102 1.8% 0.0%
Percent Increase N/A 3.6% 0.0%
Market Occupancy 86.2% 89.3% 88.9% 1.5% -0.5%
Market Average Room Rate $275.48 $277.86 $271.50 -0.7% -2.3%
Percent Increase N/A 0.9% -2.3%
Historical Demand
Subject Market
2013-2015
The following presents a comparison of the subject and the subject’s micro market‐market (competitive set without the subject) ADR, occupancy and RevPAR figures for the 2013, 2014, and 2015 periods.
Occupancy increased in FY 2014, and decreased slightly in FY 2015.
Rates increased slightly in FY 2014, and decreased in FY 2015.
Performance indicators have shown consistent positive growth for the last three years in the subject’s competitive market.
Comparable Hotel Rooms ADR Occ. RevPAR ADR Occ. RevPAR ADR Occ. RevPAR
Micro Market w/o Subject 2,290 $273.61 85.7% $234.39 $274.94 88.9% $244.29 $267.82 88.0% $235.80
Annual Change 1.4% 6.1% 7.6% 0.5% 3.7% 4.2% -2.6% -0.9% -3.5%
Subject 275 $290.13 90.8% $263.43 $300.97 93.1% $280.22 $299.64 95.8% $287.15
Annual Change 0.3% 6.4% 6.7% 3.7% 2.5% 6.4% -0.4% 2.9% 2.5%
Totals 2,565 $275.48 86.2% $237.51 $277.86 89.3% $248.15 $271.50 88.9% $241.30
Historical ADR and Occupancy Rates
2013 - 2015
201520142013
From FY August 2013 to FY August 2014, the micro market exhibited an overall increase in RevPAR of 4.2%, while the subject increased in RevPAR 6.4%. More recently, the subject outperformed its competitive market, growing RevPAR by 2.5% from FY August 2014 to FY August 2015, while its competitive market decreased RevPAR by 3.5% during the same period.
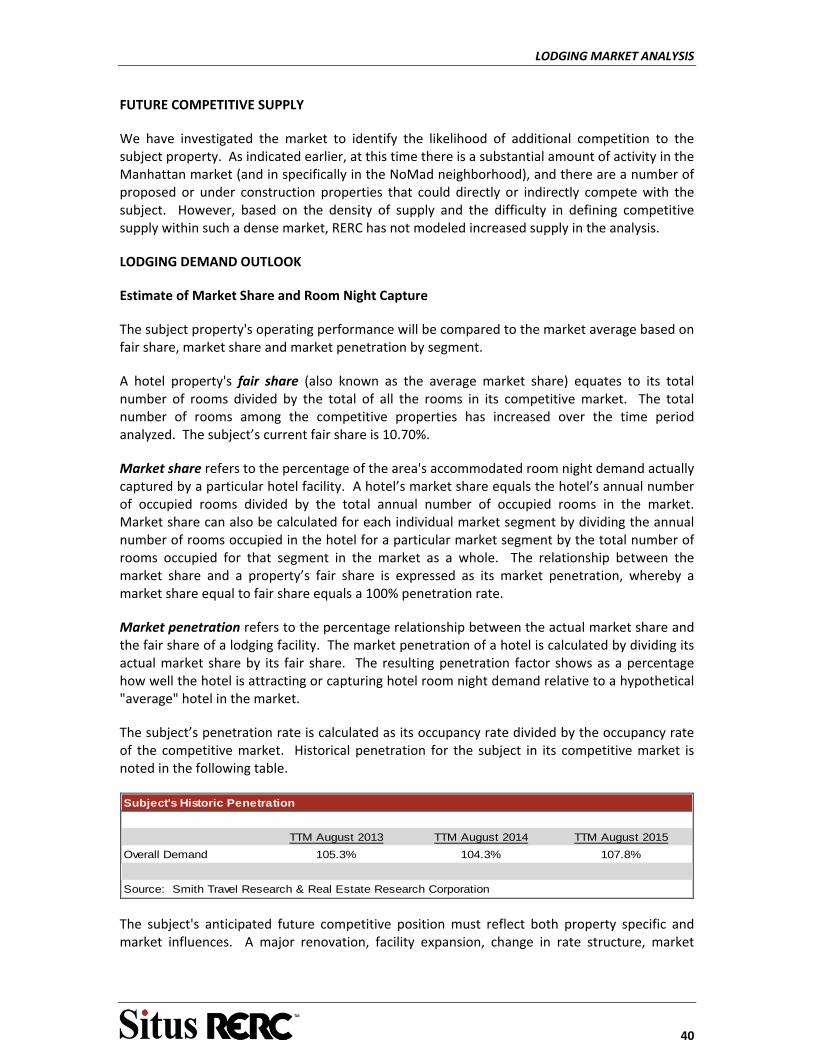
LODGING MARKET ANALYSIS
40
FUTURE COMPETITIVE SUPPLY
We have investigated the market to identify the likelihood of additional competition to the subject property. As indicated earlier, at this time there is a substantial amount of activity in the Manhattan market (and in specifically in the NoMad neighborhood), and there are a number of proposed or under construction properties that could directly or indirectly compete with the subject. However, based on the density of supply and the difficulty in defining competitive supply within such a dense market, RERC has not modeled increased supply in the analysis.
LODGING DEMAND OUTLOOK
Estimate of Market Share and Room Night Capture
The subject property's operating performance will be compared to the market average based on fair share, market share and market penetration by segment.
A hotel property's fair share (also known as the average market share) equates to its total number of rooms divided by the total of all the rooms in its competitive market. The total number of rooms among the competitive properties has increased over the time period analyzed. The subject’s current fair share is 10.70%.
Market share refers to the percentage of the area's accommodated room night demand actually captured by a particular hotel facility. A hotel’s market share equals the hotel’s annual number of occupied rooms divided by the total annual number of occupied rooms in the market. Market share can also be calculated for each individual market segment by dividing the annual number of rooms occupied in the hotel for a particular market segment by the total number of rooms occupied for that segment in the market as a whole. The relationship between the market share and a property’s fair share is expressed as its market penetration, whereby a market share equal to fair share equals a 100% penetration rate.
Market penetration refers to the percentage relationship between the actual market share and the fair share of a lodging facility. The market penetration of a hotel is calculated by dividing its actual market share by its fair share. The resulting penetration factor shows as a percentage how well the hotel is attracting or capturing hotel room night demand relative to a hypothetical "average" hotel in the market.
The subject’s penetration rate is calculated as its occupancy rate divided by the occupancy rate of the competitive market. Historical penetration for the subject in its competitive market is noted in the following table.
TTM August 2013 TTM August 2014 TTM August 2015
Overall Demand 105.3% 104.3% 107.8%
Source: Smith Travel Research & Real Estate Research Corporation
Subject's Historic Penetration
The subject's anticipated future competitive position must reflect both property specific and market influences. A major renovation, facility expansion, change in rate structure, market
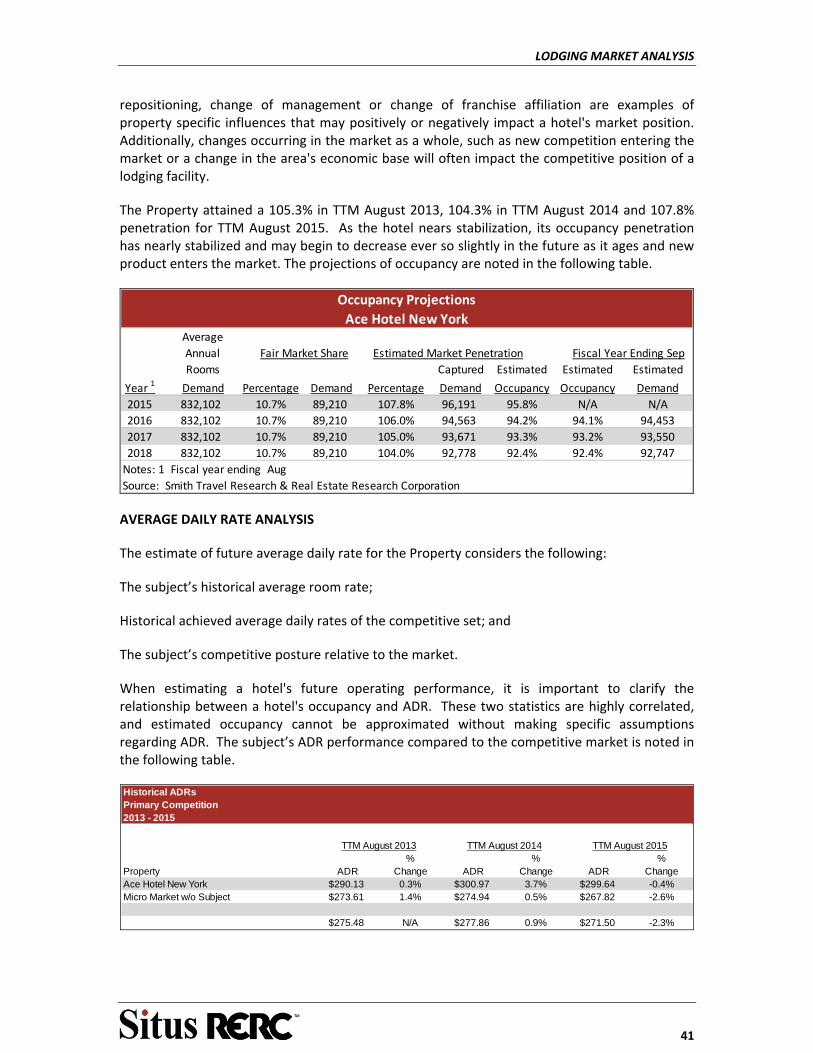
LODGING MARKET ANALYSIS
41
repositioning, change of management or change of franchise affiliation are examples of property specific influences that may positively or negatively impact a hotel's market position. Additionally, changes occurring in the market as a whole, such as new competition entering the market or a change in the area's economic base will often impact the competitive position of a lodging facility.
The Property attained a 105.3% in TTM August 2013, 104.3% in TTM August 2014 and 107.8% penetration for TTM August 2015. As the hotel nears stabilization, its occupancy penetration has nearly stabilized and may begin to decrease ever so slightly in the future as it ages and new product enters the market. The projections of occupancy are noted in the following table.
Average
Annual Fair Market Share Estimated Market Penetration Fiscal Year Ending Sep
Rooms Captured Estimated Estimated Estimated
Year 1 Demand Percentage Demand Percentage Demand Occupancy Occupancy Demand
2015 832,102 10.7% 89,210 107.8% 96,191 95.8% N/A N/A
2016 832,102 10.7% 89,210 106.0% 94,563 94.2% 94.1% 94,453
2017 832,102 10.7% 89,210 105.0% 93,671 93.3% 93.2% 93,550
2018 832,102 10.7% 89,210 104.0% 92,778 92.4% 92.4% 92,747
Notes: 1 Fiscal year ending Aug
Source: Smith Travel Research & Real Estate Research Corporation
Occupancy Projections
Ace Hotel New York
AVERAGE DAILY RATE ANALYSIS
The estimate of future average daily rate for the Property considers the following:
The subject’s historical average room rate;
Historical achieved average daily rates of the competitive set; and
The subject’s competitive posture relative to the market.
When estimating a hotel's future operating performance, it is important to clarify the relationship between a hotel's occupancy and ADR. These two statistics are highly correlated, and estimated occupancy cannot be approximated without making specific assumptions regarding ADR. The subject’s ADR performance compared to the competitive market is noted in the following table.
Historical ADRsPrimary Competition2013 - 2015
TTM August 2013 TTM August 2014 TTM August 2015% % %
Property ADR Change ADR Change ADR ChangeAce Hotel New York $290.13 0.3% $300.97 3.7% $299.64 -0.4%Micro Market w/o Subject $273.61 1.4% $274.94 0.5% $267.82 -2.6%
$275.48 N/A $277.86 0.9% $271.50 -2.3%
LODGING MARKET ANALYSIS
42
The subject's ADR must be adjusted over time for growth originating from two sources:
Underlying inflation; and,
Real room rate growth or decline.
As will be presented in the Valuation section of this report, underlying inflation for operating revenues and expenses is estimated at 3.00% annually throughout the holding period. A hotel's ability to command increased room rates, or experience declining room rate, is affected by a number of factors, including:
Supply and demand relationships;
Improving the competitive standard;
Property specific improvements; and,
Changing market segmentation or yield management strategy.
ESTIMATE OF AVERAGE DAILY RATE
The subject’s ADR decreased by 0.4% in FY ending August 2015, after increasing 3.7% in FY ending August 2014. The Competitive Set experienced a decrease in ADR of 2.6% following an increase of 0.5% over the same periods. The market focus in the near term will be to hold current occupancy levels in an attempt to maintain and maybe achieve inflationary increase in rates and maximize RevPAR. Based on this we have assumed a 3.0% change in ADR in Year 1 of our analysis. Going forward, considering the positive developments in NoMad, with new supply of luxury hotel rooms entering the market and the assumptions of slightly declining occupancy, 4.0% is estimated for Year 2‐3, followed by a 3.5% increase in year 4 and 3.0% increase thereafter, consistent with inflation. Based on this, the following table presents our ADR conclusions.
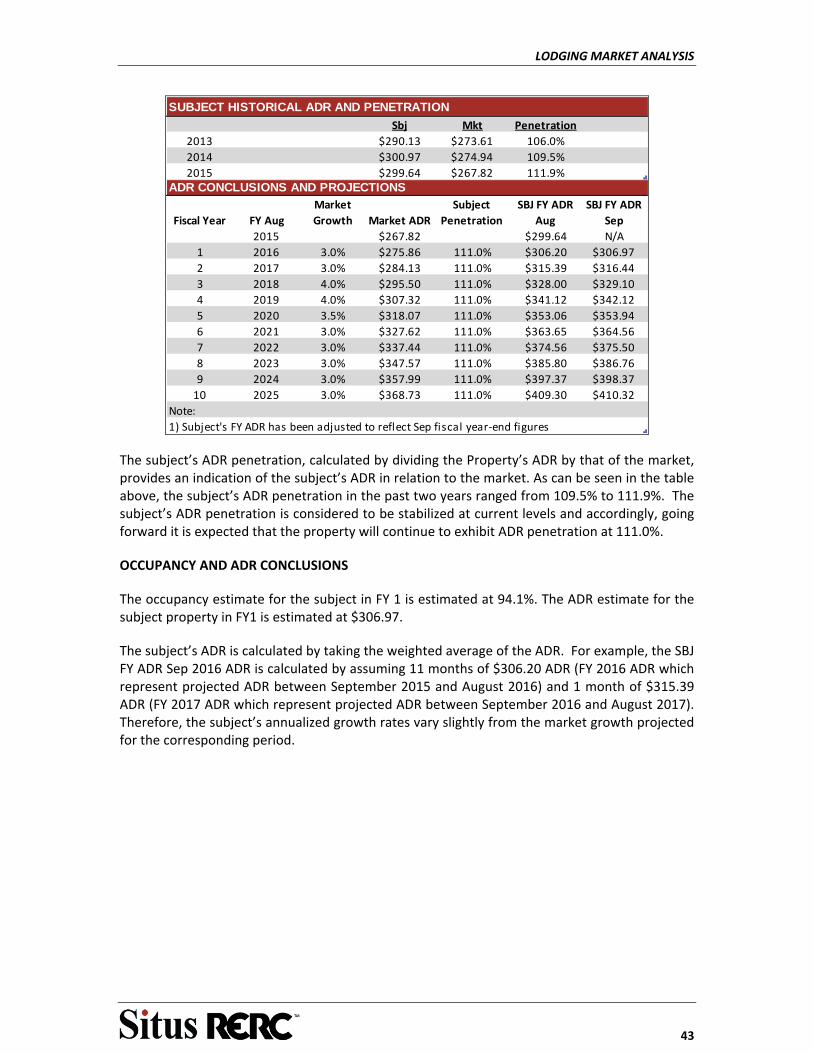
LODGING MARKET ANALYSIS
43
Sbj Mkt Penetration
2013 $290.13 $273.61 106.0%
2014 $300.97 $274.94 109.5%
2015 $299.64 $267.82 111.9%
Fiscal Year FY Aug
Market
Growth Market ADR
Subject
Penetration
SBJ FY ADR
Aug
SBJ FY ADR
Sep
2015 $267.82 $299.64 N/A
1 2016 3.0% $275.86 111.0% $306.20 $306.97
2 2017 3.0% $284.13 111.0% $315.39 $316.44
3 2018 4.0% $295.50 111.0% $328.00 $329.10
4 2019 4.0% $307.32 111.0% $341.12 $342.12
5 2020 3.5% $318.07 111.0% $353.06 $353.94
6 2021 3.0% $327.62 111.0% $363.65 $364.56
7 2022 3.0% $337.44 111.0% $374.56 $375.50
8 2023 3.0% $347.57 111.0% $385.80 $386.76
9 2024 3.0% $357.99 111.0% $397.37 $398.37
10 2025 3.0% $368.73 111.0% $409.30 $410.32
Note:
1) Subject's FY ADR has been adjusted to reflect Sep fiscal year‐end figures
SUBJECT HISTORICAL ADR AND PENETRATION
ADR CONCLUSIONS AND PROJECTIONS
The subject’s ADR penetration, calculated by dividing the Property’s ADR by that of the market, provides an indication of the subject’s ADR in relation to the market. As can be seen in the table above, the subject’s ADR penetration in the past two years ranged from 109.5% to 111.9%. The subject’s ADR penetration is considered to be stabilized at current levels and accordingly, going forward it is expected that the property will continue to exhibit ADR penetration at 111.0%.
OCCUPANCY AND ADR CONCLUSIONS
The occupancy estimate for the subject in FY 1 is estimated at 94.1%. The ADR estimate for the subject property in FY1 is estimated at $306.97.
The subject’s ADR is calculated by taking the weighted average of the ADR. For example, the SBJ FY ADR Sep 2016 ADR is calculated by assuming 11 months of $306.20 ADR (FY 2016 ADR which represent projected ADR between September 2015 and August 2016) and 1 month of $315.39 ADR (FY 2017 ADR which represent projected ADR between September 2016 and August 2017). Therefore, the subject’s annualized growth rates vary slightly from the market growth projected for the corresponding period.

THE PROPERTY
44
THE PROPERTY
DESCRIPTION OF IMPROVEMENTS
The subject improvements consist of a 13‐story landmark full‐service hotel facility containing 283 rooms. The property was converted from a hotel in 1988 into 373 residential units with 14,000 square feet of retail space. The public space, including the lobby bar, restaurant, guest registration area, lobby and all retail units, are located on the first floor.
In is noted that as of September 30, 2015, 275 rooms were in operation; 8 additional rooms located at the penthouse floor were previously renovated and operated as hotel rooms, however due to legal issues their operation was suspended. These rooms are now awaiting final certificate of occupancy before their return to operation, which is expected by the end of 2015.
Further, the subject also includes 34 SRO units that have not been recaptured by the subject’s owner. The SRO units are spread around the building, and are leased to individuals at monthly rates which are substantially below market for the area. Once an SRO unit is vacated, it is renovated as hotel room and added to the hotel room inventory.
Hotel amenities include an on‐site restaurants, on‐site bar and fitness center. There are 4,100 square feet of meeting and event space.
Standard room amenities include a flat screen television with cable, telephone, dresser, night stand, lamp, refrigerator and a work desk with chairs. Some guest rooms may feature a sofa or lounge chairs.
Property Summary
Land Area: 0.40 acres
Gross Square Footage: 191,434 SF
Total Number of Rooms: 281
Land to Building Ratio: 0.09
Construction Date: 1905/2009
Meeting/Banquet Rooms: The subject property offers approximately 4,100 square feet of meeting/banquet area.
The following summarizes the specific meeting/banquet rooms:
Size (SF)700
2,700700
4,100
Meeting and Banquet Area Summary
The BoardroomLocation
Liberty HallLoft SuitesTotal Enclosed Space
THE PROPERTY
45
Restaurants: The subject property features a few on‐site dining options, such as The Breslin Bar & Dining Room, which is located on the ground floor of the subject and serves breakfast, brunch, lunch and dinner. Another option is The John Dory Oyster Bar, which opened in 2010 and is located in the corner space of Broadway and West 29th Street. The John Dory Oyster Bar is split into two levels, the ground level showcasing the oyster bar with a seating area and the cellar level housing the main kitchen. Also, Stumptown Coffee Roasters which opened in September of 2009 and is located on the ground floor of the subject building. Lastly, No. 7 Sub Shop, which opened March 2010 and is located on the subject’s ground floor. No. 7 Sub Shop offers breakfast and lunch sandwich items.
Deferred Maintenance, Renovation and Expansion
Based on our site visit and conversations with property management, there do not appear to be any significant items of deferred maintenance, and capitals in excess of reserves are not likely to be expended for the subject. Therefore, our model only includes reserves for the subject. The Capital Expenditures for the foreseeable future, are all well within the projected capital reserve allowances.
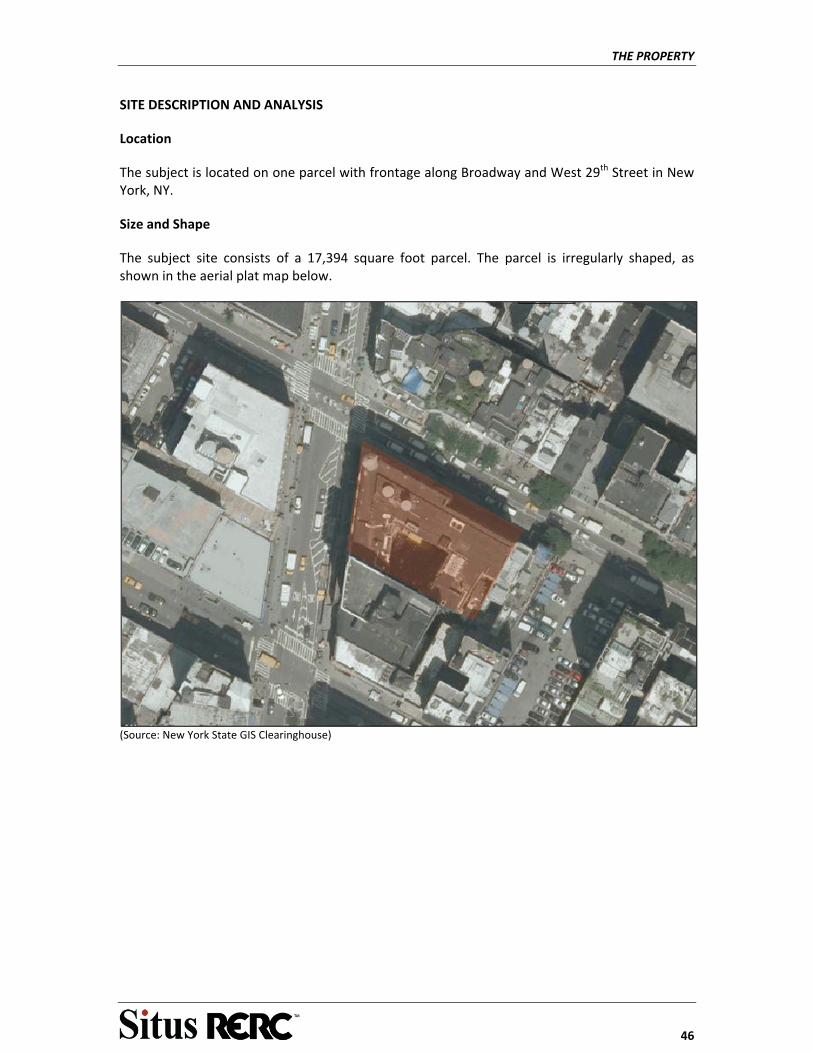
THE PROPERTY
46
SITE DESCRIPTION AND ANALYSIS
Location
The subject is located on one parcel with frontage along Broadway and West 29th Street in New York, NY.
Size and Shape
The subject site consists of a 17,394 square foot parcel. The parcel is irregularly shaped, as shown in the aerial plat map below.
(Source: New York State GIS Clearinghouse)
THE PROPERTY
47
Details regarding the characteristics of the site are noted in the following table and summarized in the narrative that follows.
Block 830, Lot 5417,394Irregular
City of New YorkCity of New York
Generally LevelMinimalAssumed NoneLowAll Public
Electricity:Natural Gas:Telephone Service:
M1-6Zoning:
Access:
Frontage:
AverageApproximately 175 feet on West 29th Street and 105 feet on Broadway
Various Providers
Consolidated Edison of New York CityNational Grid
Enviornmental & Soil Conditions:Flood Risk:Utilities:Water:Solid Waste:
Legal Description:Size (SF):Shape:Topography:Landscaping:
Location:City, State:
Site Characteristics1186-1198 BroadwayNew York, NY
ENVIRONMENTAL AND SOIL CONDITIONS
RERC is not considered an environmental expert; likewise RERC has not received a Phase 1 environmental survey. However, we assume that there are no recognized environmental conditions in connection with the site. Any evidence indicating otherwise may impact the conclusions attained in this report.
TOPOGRAPHY
The subject site is generally flat, although no topographical information was provided to verify our visual perception.
FLOOD PLAIN According to Flood Scape, a national flood map provider, the subject is not located in an active flood plain. The subject has a low flood risk.
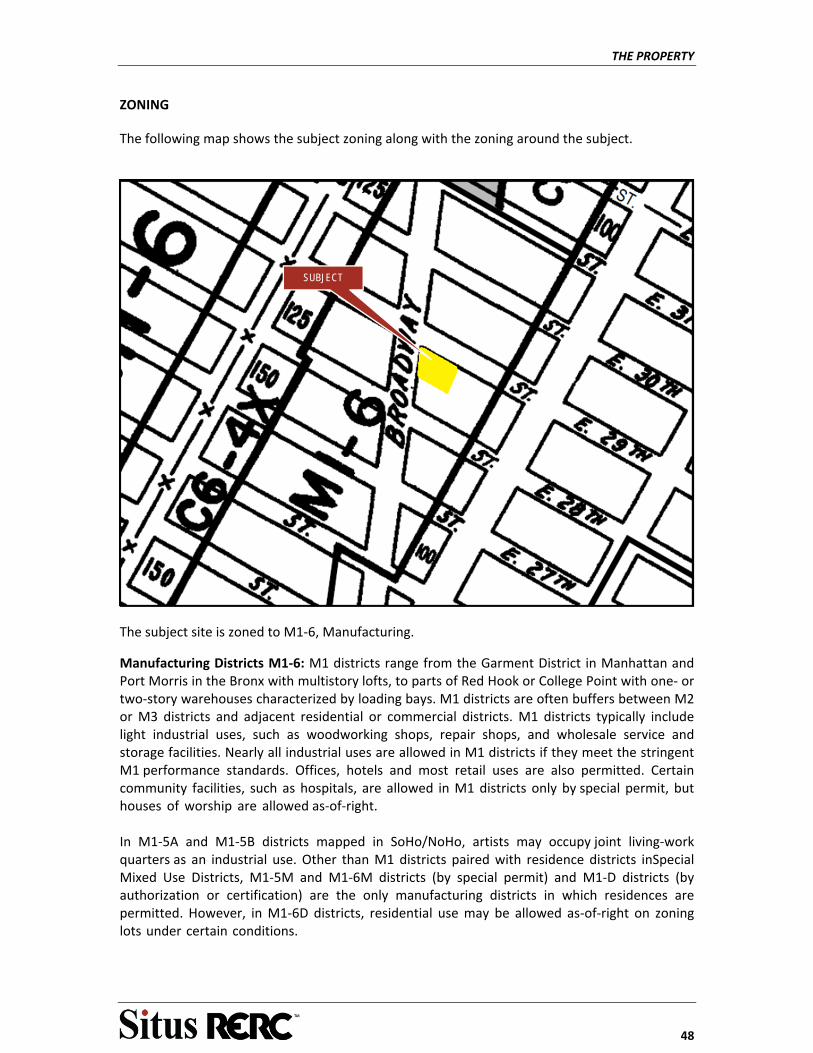
THE PROPERTY
48
ZONING
The following map shows the subject zoning along with the zoning around the subject.
The subject site is zoned to M1‐6, Manufacturing.
Manufacturing Districts M1‐6: M1 districts range from the Garment District in Manhattan and Port Morris in the Bronx with multistory lofts, to parts of Red Hook or College Point with one‐ or two‐story warehouses characterized by loading bays. M1 districts are often buffers between M2 or M3 districts and adjacent residential or commercial districts. M1 districts typically include light industrial uses, such as woodworking shops, repair shops, and wholesale service and storage facilities. Nearly all industrial uses are allowed in M1 districts if they meet the stringent M1 performance standards. Offices, hotels and most retail uses are also permitted. Certain community facilities, such as hospitals, are allowed in M1 districts only by special permit, but houses of worship are allowed as‐of‐right. In M1‐5A and M1‐5B districts mapped in SoHo/NoHo, artists may occupy joint living‐work quarters as an industrial use. Other than M1 districts paired with residence districts inSpecial Mixed Use Districts, M1‐5M and M1‐6M districts (by special permit) and M1‐D districts (by authorization or certification) are the only manufacturing districts in which residences are permitted. However, in M1‐6D districts, residential use may be allowed as‐of‐right on zoning lots under certain conditions.
SUBJECT
THE PROPERTY
49
In M1‐5M and M1‐6M districts, mapped in parts of Chelsea, space in an industrial building may be converted to residential use, provided a specified amount of floor area is preserved for particular industrial and commercial uses. Floor area ratios in M1 districts range from 1.0 to 10.0, depending on location; building height and setbacks are controlled by a sky exposure plane which may be penetrated by a tower in certain districts. Although new industrial buildings are usually low‐rise structures that fit within sky exposure planes, commercial and community facility buildings can be constructed as towers in M1‐3 through M1‐6 districts. In the highest density manufacturing district, M1‐6, mapped only in Manhattan, an FAR of 12 can be achieved with a bonus for a public plaza. Except along district boundaries, no side yards are required. Rear yards at least 20 feet deep are usually required, except within 100 feet of a corner.
Parking and loading requirements vary with district and use. M1‐1, M1‐2 and M1‐3 districts are subject to parking requirements based on the type of use and size of an establishment. For example, a warehouse in an M1‐1 district requires one off‐street parking space per 2,000 square feet of floor area or per every three employees, whichever would be less. Parking is not required in Long Island City or M1‐4, M1‐5 and M1‐6 districts, mapped mainly in Manhattan. Requirements for loading berths of specified dimensions differ according to district, size and type of use.
Zoning Conclusion:
RERC is unaware of any deed restrictions impacting the subject. The subject’s improvements appear to be pre‐existing non‐conforming to the zoning ordinance (based on allowed FAR).
CONCLUSION ‐ SITE
The subject site is situated at the corner of Broadway and West 29th Street. The surrounding area is improved with hotel, retail, office, multifamily, and other supporting commercial properties.
The size, shape, and topography of the site appear adequate to support the existing improvements. FloodScape indicates that the site is located in a low risk flood zone. All of the required utilities are available to the site.
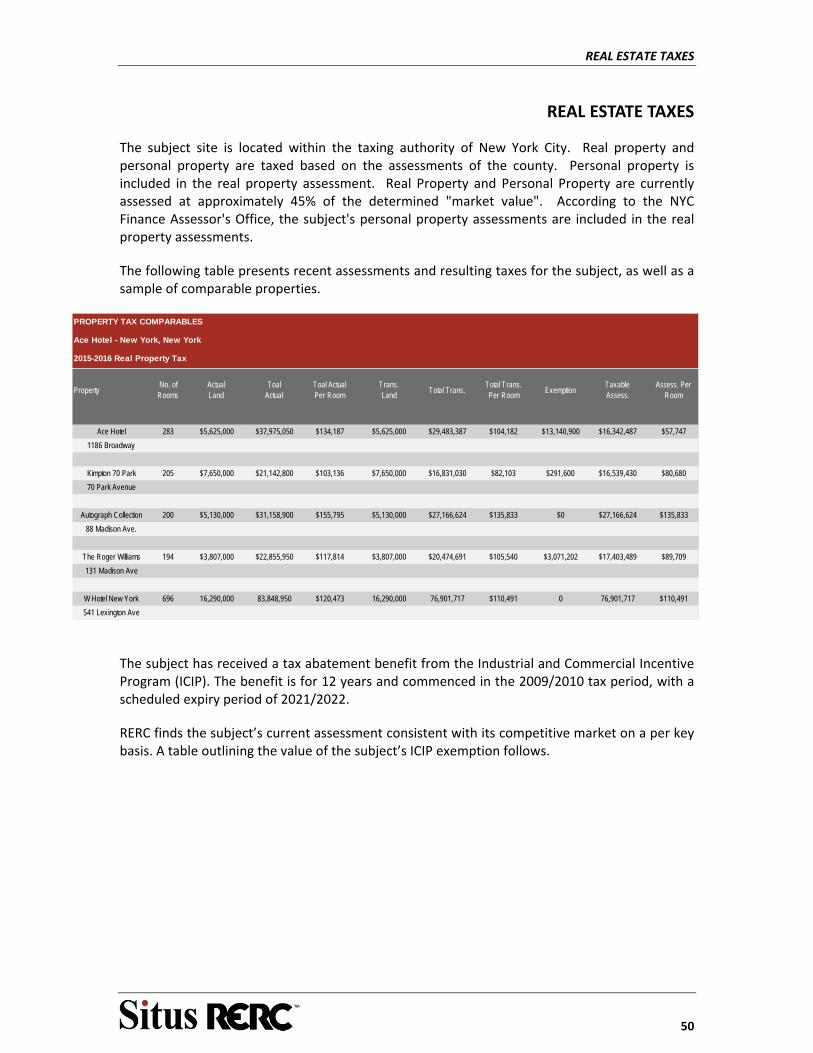
REAL ESTATE TAXES
50
REAL ESTATE TAXES
The subject site is located within the taxing authority of New York City. Real property and personal property are taxed based on the assessments of the county. Personal property is included in the real property assessment. Real Property and Personal Property are currently assessed at approximately 45% of the determined "market value". According to the NYC Finance Assessor's Office, the subject's personal property assessments are included in the real property assessments.
The following table presents recent assessments and resulting taxes for the subject, as well as a sample of comparable properties.
PropertyNo. of Rooms
Actual Land
Toal Actual
Toal Actual Per Room
Trans. Land
Total Trans.Total Trans. Per Room
ExemptionTaxable Assess.
Assess. Per Room
Ace Hotel 283 $5,625,000 $37,975,050 $134,187 $5,625,000 $29,483,387 $104,182 $13,140,900 $16,342,487 $57,747
1186 Broadway
Kimpton 70 Park 205 $7,650,000 $21,142,800 $103,136 $7,650,000 $16,831,030 $82,103 $291,600 $16,539,430 $80,680
70 Park Avenue
Autograph Collection 200 $5,130,000 $31,158,900 $155,795 $5,130,000 $27,166,624 $135,833 $0 $27,166,624 $135,833
88 Madison Ave.
The Roger Williams 194 $3,807,000 $22,855,950 $117,814 $3,807,000 $20,474,691 $105,540 $3,071,202 $17,403,489 $89,709
131 Madison Ave
W Hotel New York 696 16,290,000 83,848,950 $120,473 16,290,000 76,901,717 $110,491 0 76,901,717 $110,491
541 Lexington Ave
PROPERTY TAX COMPARABLES
Ace Hotel - New York, New York
2015-2016 Real Property Tax
The subject has received a tax abatement benefit from the Industrial and Commercial Incentive Program (ICIP). The benefit is for 12 years and commenced in the 2009/2010 tax period, with a scheduled expiry period of 2021/2022.
RERC finds the subject’s current assessment consistent with its competitive market on a per key basis. A table outlining the value of the subject’s ICIP exemption follows.
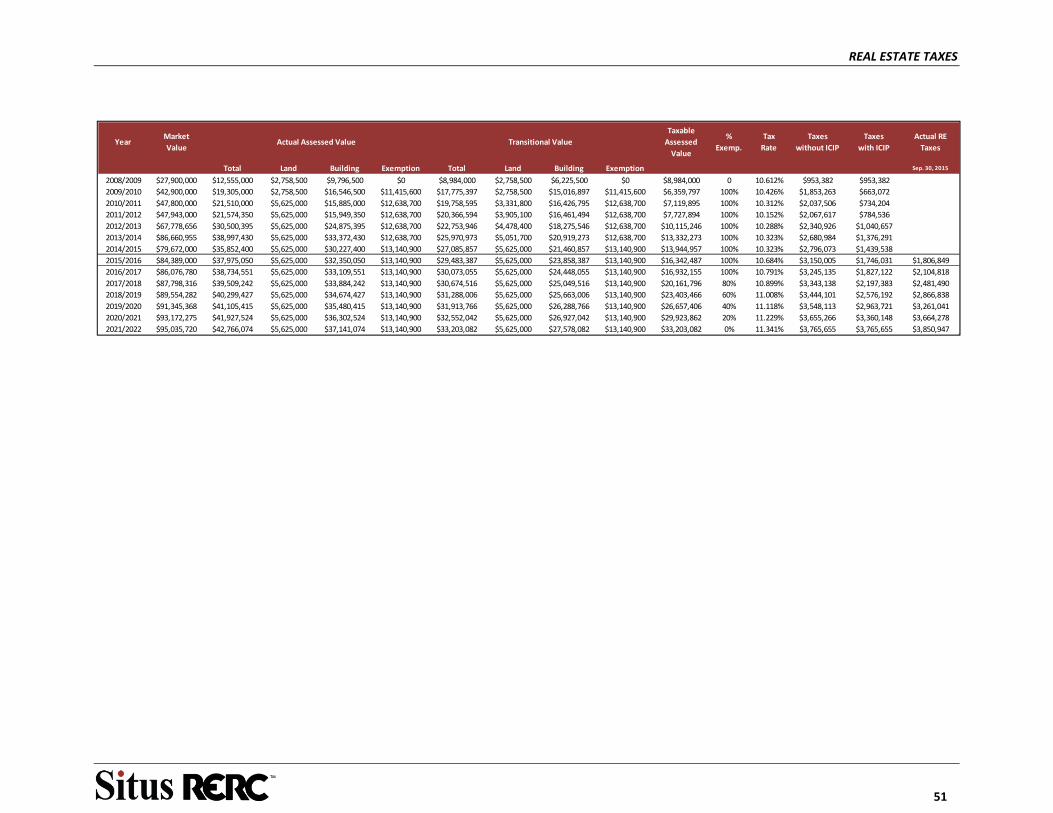
REAL ESTATE TAXES
51
YearMarket
Value
Taxable
Assessed
Value
%
Exemp.
Tax
Rate
Taxes
without ICIP
Taxes
with ICIP
Actual RE
Taxes
Total Land Building Exemption Total Land Building Exemption Sep. 30, 2015
2008/2009 $27,900,000 $12,555,000 $2,758,500 $9,796,500 $0 $8,984,000 $2,758,500 $6,225,500 $0 $8,984,000 0 10.612% $953,382 $953,382
2009/2010 $42,900,000 $19,305,000 $2,758,500 $16,546,500 $11,415,600 $17,775,397 $2,758,500 $15,016,897 $11,415,600 $6,359,797 100% 10.426% $1,853,263 $663,072
2010/2011 $47,800,000 $21,510,000 $5,625,000 $15,885,000 $12,638,700 $19,758,595 $3,331,800 $16,426,795 $12,638,700 $7,119,895 100% 10.312% $2,037,506 $734,204
2011/2012 $47,943,000 $21,574,350 $5,625,000 $15,949,350 $12,638,700 $20,366,594 $3,905,100 $16,461,494 $12,638,700 $7,727,894 100% 10.152% $2,067,617 $784,536
2012/2013 $67,778,656 $30,500,395 $5,625,000 $24,875,395 $12,638,700 $22,753,946 $4,478,400 $18,275,546 $12,638,700 $10,115,246 100% 10.288% $2,340,926 $1,040,657
2013/2014 $86,660,955 $38,997,430 $5,625,000 $33,372,430 $12,638,700 $25,970,973 $5,051,700 $20,919,273 $12,638,700 $13,332,273 100% 10.323% $2,680,984 $1,376,291
2014/2015 $79,672,000 $35,852,400 $5,625,000 $30,227,400 $13,140,900 $27,085,857 $5,625,000 $21,460,857 $13,140,900 $13,944,957 100% 10.323% $2,796,073 $1,439,538
2015/2016 $84,389,000 $37,975,050 $5,625,000 $32,350,050 $13,140,900 $29,483,387 $5,625,000 $23,858,387 $13,140,900 $16,342,487 100% 10.684% $3,150,005 $1,746,031 $1,806,849
2016/2017 $86,076,780 $38,734,551 $5,625,000 $33,109,551 $13,140,900 $30,073,055 $5,625,000 $24,448,055 $13,140,900 $16,932,155 100% 10.791% $3,245,135 $1,827,122 $2,104,818
2017/2018 $87,798,316 $39,509,242 $5,625,000 $33,884,242 $13,140,900 $30,674,516 $5,625,000 $25,049,516 $13,140,900 $20,161,796 80% 10.899% $3,343,138 $2,197,383 $2,481,490
2018/2019 $89,554,282 $40,299,427 $5,625,000 $34,674,427 $13,140,900 $31,288,006 $5,625,000 $25,663,006 $13,140,900 $23,403,466 60% 11.008% $3,444,101 $2,576,192 $2,866,838
2019/2020 $91,345,368 $41,105,415 $5,625,000 $35,480,415 $13,140,900 $31,913,766 $5,625,000 $26,288,766 $13,140,900 $26,657,406 40% 11.118% $3,548,113 $2,963,721 $3,261,041
2020/2021 $93,172,275 $41,927,524 $5,625,000 $36,302,524 $13,140,900 $32,552,042 $5,625,000 $26,927,042 $13,140,900 $29,923,862 20% 11.229% $3,655,266 $3,360,148 $3,664,278
2021/2022 $95,035,720 $42,766,074 $5,625,000 $37,141,074 $13,140,900 $33,203,082 $5,625,000 $27,578,082 $13,140,900 $33,203,082 0% 11.341% $3,765,655 $3,765,655 $3,850,947
Actual Assessed Value Transitional Value
HIGHEST AND BEST USE ANALYSIS
52
HIGHEST AND BEST USE ANALYSIS
According to The Appraisal of Real Estate, 5h Edition, published by the Appraisal Institute, Highest and Best Use may be defined as:
The reasonably probable and legal use of vacant land or an improved property that is physically possible, appropriately supported, financially feasible, and that results in the highest value. The four criteria the highest and best use must meet are legal permissibility, physical possibility, financial feasibility, and maximum productivity. Alternatively, the probable use of land or improved property‐ specific with respect to the user and timing of the use‐ that is adequately supported and results in the highest present value.3
It is that reasonable and probable use that supports the highest present value, as defined, as of the effective date of the appraisal. The appraiser considers from the various reasonably probable and legal alternative uses which are physically possible, appropriately supported, and financially feasible that which results in the highest land value or the highest value of the property as improved. The estimated fair value of the property is based upon the highest and best use. Implied within this definition is the recognition of the contribution that a specific use may make to the community environment or the community development, such as a park, school or other public uses, in addition to wealth maximization of individual property owners. It must be legal and probable, not speculative or conjectural. Effective demand for the use must exist and it must yield the highest net return to the land for the longest time period.
To estimate the highest and best use, four factors are considered:
The use must be physically possible.
The use must be legally permissible.
The use must be financially feasible.
The use must produce the highest return to the property, i.e. maximally productive.
The highest and best use of the site, if vacant and available for use, may be different from the highest and best use of the property as improved. For example, this might be true when the improvement is not an appropriate use, but it continues to make a contribution to the overall value of the property in excess of the value of the site, less the cost of demolition.
HIGHEST AND BEST USE ‐ ASSUMING A VACANT SITE
1. Physically Possible Use
The first constraint on the possible use of the property is dictated by the physical aspects of the site. The physical characteristics of the site, its location and zoning and the utilities available are
3 The Appraisal of Real Estate, 5th Edition, 8 The Appraisal Institute, 1992, p.275.
HIGHEST AND BEST USE ANALYSIS
53
the most important determinants of value.
The physical attributes of the property and its neighborhood are described in detail in The Property and Neighborhood sections. A variety of uses are physically possible on the site.
2. Permissible Use
The legal restrictions that may apply to the subject are private restrictions and the public restrictions of zoning. No known private restrictions affect the property title, but RERC has not made title search. The other restrictions that exist are utility easements that do not adversely affect the development of the subject property.
The subject site is zoned M 1‐6, Manufacturing and is a legally non‐conforming use.
3. Feasible Use
Financial feasibility concerns the ability of any improvement to produce a sufficient return to attract development capital. Lodging metrics for the subject’s location are not at a level which would be required to support new hotel development on the subject site. Based on the expected and continuing recovery in the economy in general, a hotel development is deemed the most feasible use of the site.
4. Maximally productive: Highest and Best Use As If Vacant
Several factors must be analyzed to determine which feasible use is the highest and best use. Given the current zoning of the subject, as well as the character of the surrounding development, hotel development appears to be the appropriate use. If the subject were vacant and available for use today, it is our opinion that the highest and best use would be hotel development if approvals for this type of use could be secured from the local governmental authorities.
Highest and Best Use – “As Improved”
The primary site is improved with a 283 room hotel situated on a parcel containing 0.40 acres. As concluded above, the estimated highest and best use of the subject, as vacant, is consistent with the existing improvement type. Our review of alternative development possibilities indicates that office or retail use would present an alternative use that would not economically justify a different use or demolition of the improvements for redevelopment with an alternative use. As shown in the Income Approach section of this report, the subject is capable of producing a return that could attract investment capital as a proposed development. Furthermore, it produces a value that exceeds that of the land, assumed vacant.
Taking all of the foregoing into consideration, it is our opinion that the present use generates the greatest return to the land, and therefore represents a form of the highest and best use of the site as improved.
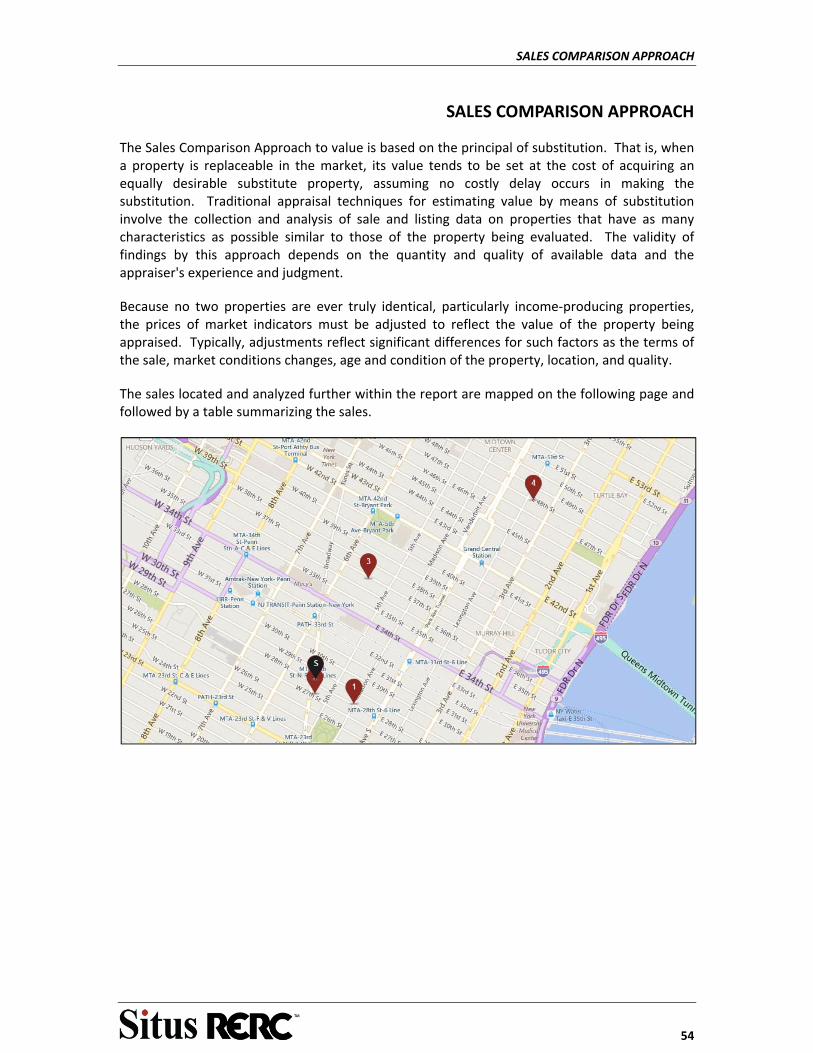
SALES COMPARISON APPROACH
54
SALES COMPARISON APPROACH
The Sales Comparison Approach to value is based on the principal of substitution. That is, when a property is replaceable in the market, its value tends to be set at the cost of acquiring an equally desirable substitute property, assuming no costly delay occurs in making the substitution. Traditional appraisal techniques for estimating value by means of substitution involve the collection and analysis of sale and listing data on properties that have as many characteristics as possible similar to those of the property being evaluated. The validity of findings by this approach depends on the quantity and quality of available data and the appraiser's experience and judgment.
Because no two properties are ever truly identical, particularly income‐producing properties, the prices of market indicators must be adjusted to reflect the value of the property being appraised. Typically, adjustments reflect significant differences for such factors as the terms of the sale, market conditions changes, age and condition of the property, location, and quality.
The sales located and analyzed further within the report are mapped on the following page and followed by a table summarizing the sales.
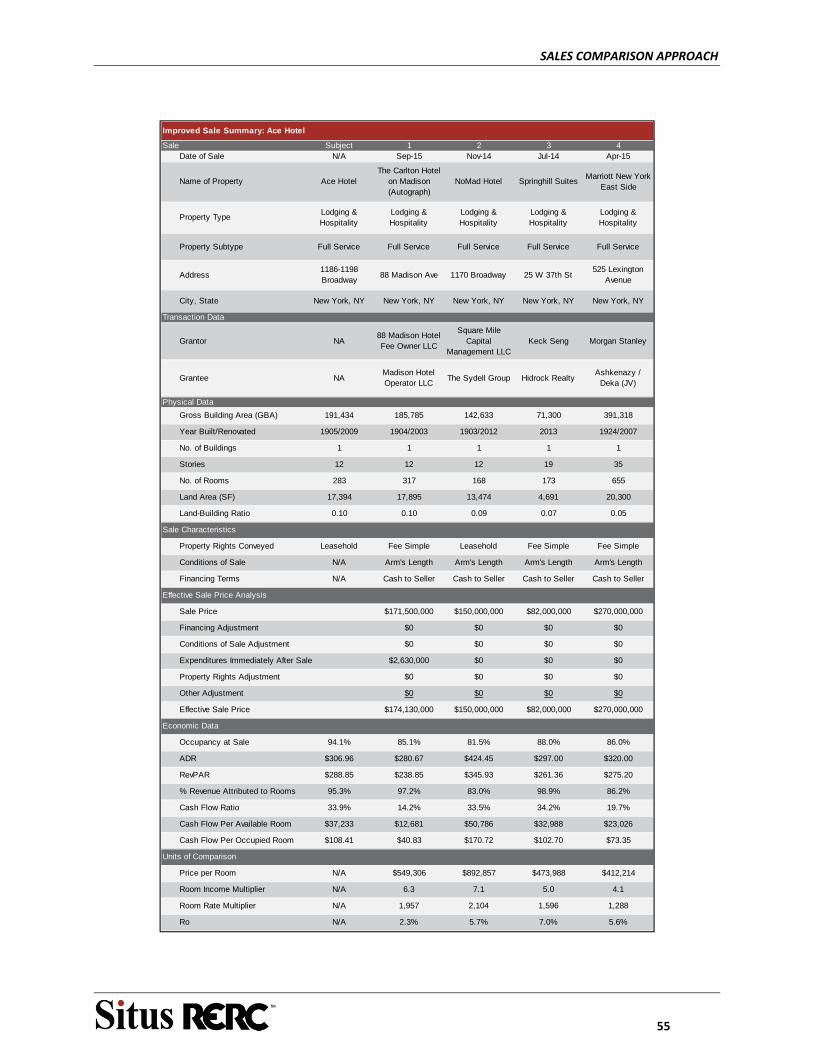
SALES COMPARISON APPROACH
55
Improved Sale Summary: Ace Hotel
Sale Subject 1 2 3 4Date of Sale N/A Sep-15 Nov-14 Jul-14 Apr-15
Name of Property Ace HotelThe Carlton Hotel
on Madison (Autograph)
NoMad Hotel Springhill SuitesMarriott New York
East Side
Property TypeLodging & Hospitality
Lodging & Hospitality
Lodging & Hospitality
Lodging & Hospitality
Lodging & Hospitality
Property Subtype Full Service Full Service Full Service Full Service Full Service
Address1186-1198 Broadway
88 Madison Ave 1170 Broadway 25 W 37th St525 Lexington
Avenue
City, State New York, NY New York, NY New York, NY New York, NY New York, NY
Transaction Data
Grantor NA88 Madison Hotel Fee Owner LLC
Square Mile Capital
Management LLCKeck Seng Morgan Stanley
Grantee NAMadison Hotel Operator LLC
The Sydell Group Hidrock RealtyAshkenazy /
Deka (JV)
Physical Data
Gross Building Area (GBA) 191,434 185,785 142,633 71,300 391,318
Year Built/Renovated 1905/2009 1904/2003 1903/2012 2013 1924/2007
No. of Buildings 1 1 1 1 1
Stories 12 12 12 19 35
No. of Rooms 283 317 168 173 655
Land Area (SF) 17,394 17,895 13,474 4,691 20,300
Land-Building Ratio 0.10 0.10 0.09 0.07 0.05
Sale Characteristics
Property Rights Conveyed Leasehold Fee Simple Leasehold Fee Simple Fee Simple
Conditions of Sale N/A Arm's Length Arm's Length Arm's Length Arm's Length
Financing Terms N/A Cash to Seller Cash to Seller Cash to Seller Cash to Seller
Effective Sale Price Analysis
Sale Price $171,500,000 $150,000,000 $82,000,000 $270,000,000
Financing Adjustment $0 $0 $0 $0
Conditions of Sale Adjustment $0 $0 $0 $0
Expenditures Immediately After Sale $2,630,000 $0 $0 $0
Property Rights Adjustment $0 $0 $0 $0
Other Adjustment $0 $0 $0 $0
Effective Sale Price $174,130,000 $150,000,000 $82,000,000 $270,000,000
Economic Data
Occupancy at Sale 94.1% 85.1% 81.5% 88.0% 86.0%
ADR $306.96 $280.67 $424.45 $297.00 $320.00
RevPAR $288.85 $238.85 $345.93 $261.36 $275.20
% Revenue Attributed to Rooms 95.3% 97.2% 83.0% 98.9% 86.2%
Cash Flow Ratio 33.9% 14.2% 33.5% 34.2% 19.7%
Cash Flow Per Available Room $37,233 $12,681 $50,786 $32,988 $23,026
Cash Flow Per Occupied Room $108.41 $40.83 $170.72 $102.70 $73.35
Units of Comparison
Price per Room N/A $549,306 $892,857 $473,988 $412,214
Room Income Multiplier N/A 6.3 7.1 5.0 4.1
Room Rate Multiplier N/A 1,957 2,104 1,596 1,288
Ro N/A 2.3% 5.7% 7.0% 5.6%
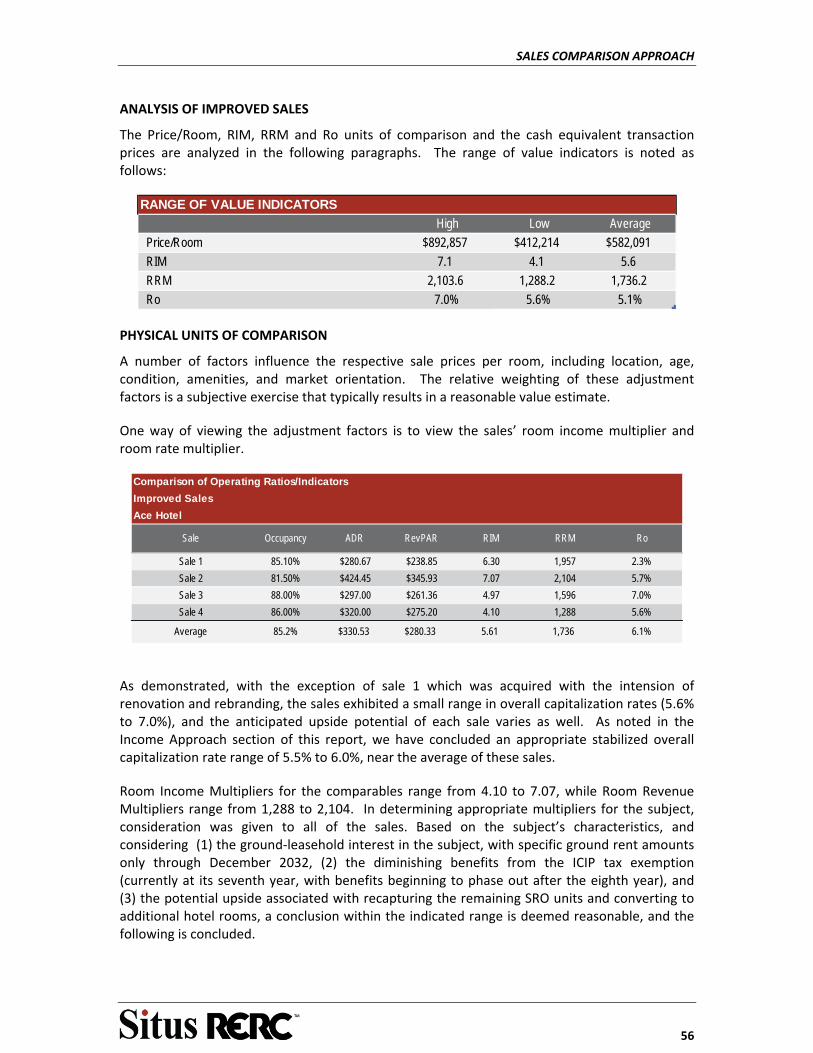
SALES COMPARISON APPROACH
56
ANALYSIS OF IMPROVED SALES
The Price/Room, RIM, RRM and Ro units of comparison and the cash equivalent transaction prices are analyzed in the following paragraphs. The range of value indicators is noted as follows:
RANGE OF VALUE INDICATORS
High Low Average
Price/Room $892,857 $412,214 $582,091
RIM 7.1 4.1 5.6
RRM 2,103.6 1,288.2 1,736.2
Ro 7.0% 5.6% 5.1%
PHYSICAL UNITS OF COMPARISON
A number of factors influence the respective sale prices per room, including location, age, condition, amenities, and market orientation. The relative weighting of these adjustment factors is a subjective exercise that typically results in a reasonable value estimate.
One way of viewing the adjustment factors is to view the sales’ room income multiplier and room rate multiplier.
Comparison of Operating Ratios/Indicators
Improved Sales
Ace Hotel
Sale Occupancy ADR RevPAR RIM RRM Ro
Sale 1 85.10% $280.67 $238.85 6.30 1,957 2.3%
Sale 2 81.50% $424.45 $345.93 7.07 2,104 5.7%
Sale 3 88.00% $297.00 $261.36 4.97 1,596 7.0%
Sale 4 86.00% $320.00 $275.20 4.10 1,288 5.6%
Average 85.2% $330.53 $280.33 5.61 1,736 6.1%
As demonstrated, with the exception of sale 1 which was acquired with the intension of renovation and rebranding, the sales exhibited a small range in overall capitalization rates (5.6% to 7.0%), and the anticipated upside potential of each sale varies as well. As noted in the Income Approach section of this report, we have concluded an appropriate stabilized overall capitalization rate range of 5.5% to 6.0%, near the average of these sales.
Room Income Multipliers for the comparables range from 4.10 to 7.07, while Room Revenue Multipliers range from 1,288 to 2,104. In determining appropriate multipliers for the subject, consideration was given to all of the sales. Based on the subject’s characteristics, and considering (1) the ground‐leasehold interest in the subject, with specific ground rent amounts only through December 2032, (2) the diminishing benefits from the ICIP tax exemption (currently at its seventh year, with benefits beginning to phase out after the eighth year), and (3) the potential upside associated with recapturing the remaining SRO units and converting to additional hotel rooms, a conclusion within the indicated range is deemed reasonable, and the following is concluded.

SALES COMPARISON APPROACH
57
As of September 30, 2015
Subject's Room Income $29,625,534
RIM 5.00
Indicated Value $148,127,670
(Rounded) $148,000,000
Indication of Value
Room Income Multiplier (RIM)
Ace Hotel
As of September 30, 2015
Subject's ADR $306.96
RRM 1,650
$506,479
Rooms 283
Indicated Value $143,333,518
(Rounded) $143,000,000
Indication of Value
Room Rate Multiplier (RRM)
Ace Hotel
As of September 30, 2015
Subject's # of Rooms 283
PKM $525,000
Indicated Value $148,575,000
(Rounded) $149,000,000
Per Key Multiplier (PKM)
Ace Hotel
Indication of Value
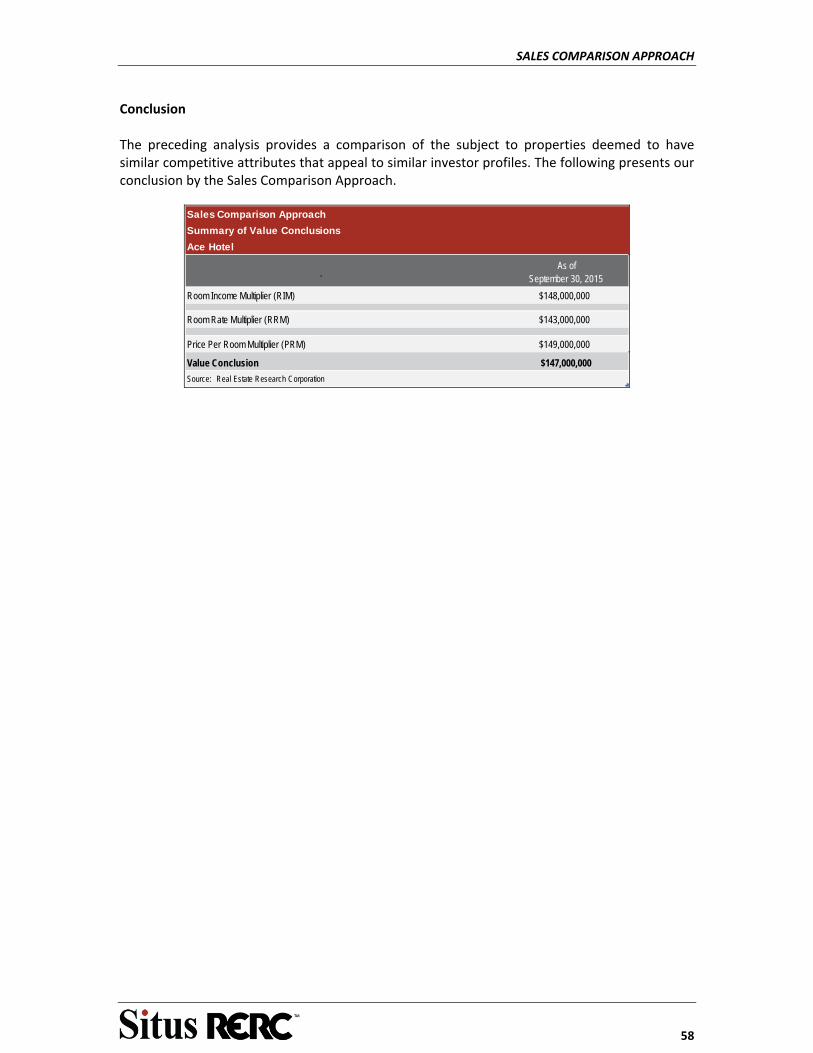
SALES COMPARISON APPROACH
58
Conclusion The preceding analysis provides a comparison of the subject to properties deemed to have similar competitive attributes that appeal to similar investor profiles. The following presents our conclusion by the Sales Comparison Approach.
`As of
September 30, 2015
Room Income Multiplier (RIM) $148,000,000
Room Rate Multiplier (RRM) $143,000,000
Price Per Room Multiplier (PRM) $149,000,000
Value Conclusion $147,000,000
Source: Real Estate Research Corporation
Sales Comparison Approach
Summary of Value Conclusions
Ace Hotel
INCOME APPROACH
59
INCOME APPROACH
INTRODUCTION
This section develops the estimated stabilized revenue and expense schedule for the subject property, followed by a capitalization of the net operating income into a value estimate. Investors typically use stabilized income as their benchmark for investment performance. It also allows for efficient analysis of comparable properties, and quantification of effective additional investment required by the investor to achieve stabilized operations if the property is currently not operating at that level.
The estimates of revenues and expenses have been based on the subject’s historical operating data, conversations with the property general manager at the time of inspection of the subject, and comparable operating data from similar hotels. The comparable data was analyzed and is summarized on the following page.
The expense figures from individual hotel comparables are also considered. These hotels include similar New York City, boutique luxury hotels. They are generally similar in most physical respects. The comparable data is deemed as a reasonable guideline in evaluating the appropriate expense levels for the subject.
Estimates of annual operating results for the subject were prepared for the “As Is” valuation date. Expense classifications used in this report generally conform to the definitions prescribed in the American Hotel and Motel Association in the Uniform System of Accounts for Hotels (USAH). Some reorganization of the subject’s operating statements was necessitated. Detailed statements were provided and adjusted as necessary.
The subject’s operating statements since 2012 were provided to RERC.
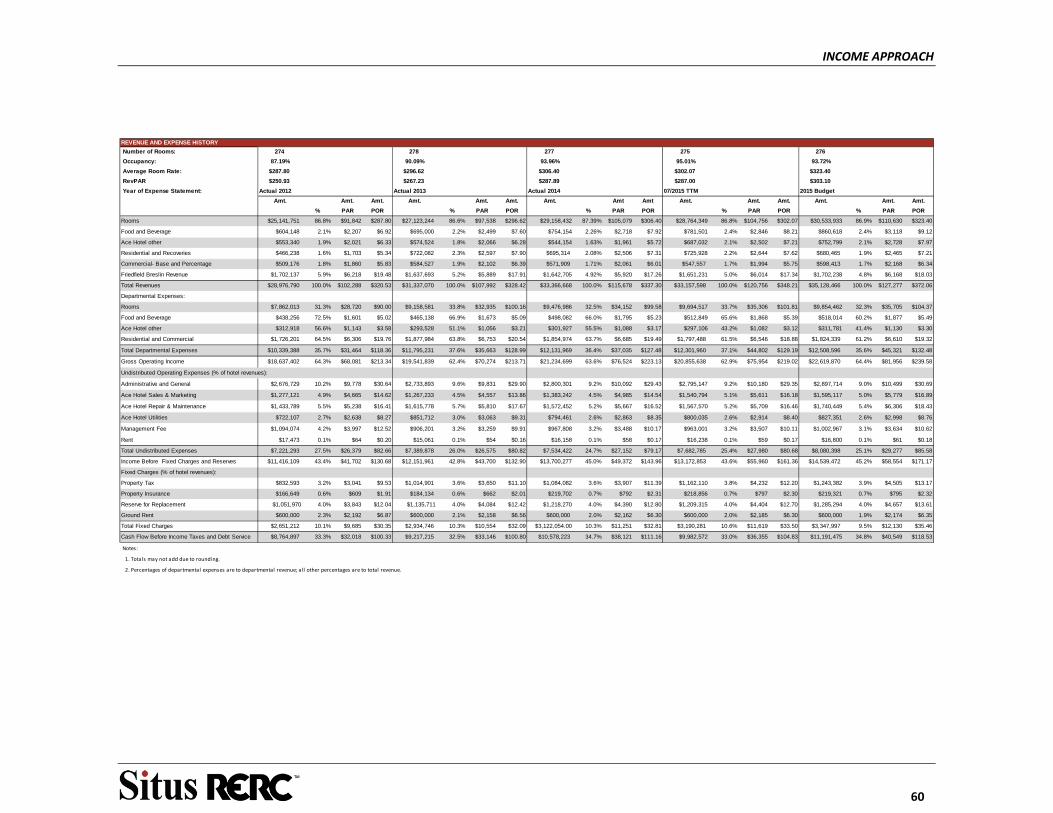
INCOME APPROACH
60
REVENUE AND EXPENSE HISTORY
Number of Rooms: 274 278 277 275 276
Occupancy: 87.19% 90.09% 93.96% 95.01% 93.72%
Average Room Rate: $287.80 $296.62 $306.40 $302.07 $323.40
RevPAR $250.93 $267.23 $287.89 $287.00 $303.10
Year of Expense Statement: Actual 2012 Actual 2013 Actual 2014 07/2015 TTM 2015 Budget
Amt. Amt. Amt. Amt. Amt. Amt. Amt. Amt Amt Amt. Amt. Amt. Amt. Amt. Amt.
% PAR POR % PAR POR % PAR POR % PAR POR % PAR POR
Rooms $25,141,751 86.8% $91,842 $287.80 $27,123,244 86.6% $97,538 $296.62 $29,158,432 87.39% $105,079 $306.40 $28,764,349 86.8% $104,756 $302.07 $30,533,933 86.9% $110,630 $323.40
Food and Beverage $604,148 2.1% $2,207 $6.92 $695,000 2.2% $2,499 $7.60 $754,154 2.26% $2,718 $7.92 $781,501 2.4% $2,846 $8.21 $860,618 2.4% $3,118 $9.12
Ace Hotel other $553,340 1.9% $2,021 $6.33 $574,524 1.8% $2,066 $6.28 $544,154 1.63% $1,961 $5.72 $687,032 2.1% $2,502 $7.21 $752,799 2.1% $2,728 $7.97
Residential and Recoveries $466,238 1.6% $1,703 $5.34 $722,082 2.3% $2,597 $7.90 $695,314 2.08% $2,506 $7.31 $725,928 2.2% $2,644 $7.62 $680,465 1.9% $2,465 $7.21
Commercial- Base and Percentage $509,176 1.8% $1,860 $5.83 $584,527 1.9% $2,102 $6.39 $571,909 1.71% $2,061 $6.01 $547,557 1.7% $1,994 $5.75 $598,413 1.7% $2,168 $6.34
Friedfield Breslin Revenue $1,702,137 5.9% $6,218 $19.48 $1,637,693 5.2% $5,889 $17.91 $1,642,705 4.92% $5,920 $17.26 $1,651,231 5.0% $6,014 $17.34 $1,702,238 4.8% $6,168 $18.03
Total Revenues $28,976,790 100.0% $102,288 $320.53 $31,337,070 100.0% $107,992 $328.42 $33,366,668 100.0% $115,678 $337.30 $33,157,598 100.0% $120,756 $348.21 $35,128,466 100.0% $127,277 $372.06
Departmental Expenses:
Rooms $7,862,013 31.3% $28,720 $90.00 $9,158,581 33.8% $32,935 $100.16 $9,476,986 32.5% $34,152 $99.58 $9,694,517 33.7% $35,306 $101.81 $9,854,462 32.3% $35,705 $104.37
Food and Beverage $438,256 72.5% $1,601 $5.02 $465,138 66.9% $1,673 $5.09 $498,082 66.0% $1,795 $5.23 $512,849 65.6% $1,868 $5.39 $518,014 60.2% $1,877 $5.49
Ace Hotel other $312,918 56.6% $1,143 $3.58 $293,528 51.1% $1,056 $3.21 $301,927 55.5% $1,088 $3.17 $297,106 43.2% $1,082 $3.12 $311,781 41.4% $1,130 $3.30
Residential and Commercial $1,726,201 64.5% $6,306 $19.76 $1,877,984 63.8% $6,753 $20.54 $1,854,974 63.7% $6,685 $19.49 $1,797,488 61.5% $6,546 $18.88 $1,824,339 61.2% $6,610 $19.32
Total Departmental Expenses $10,339,388 35.7% $31,464 $118.36 $11,795,231 37.6% $35,663 $128.99 $12,131,969 36.4% $37,035 $127.48 $12,301,960 37.1% $44,802 $129.19 $12,508,596 35.6% $45,321 $132.48
Gross Operating Income $18,637,402 64.3% $68,081 $213.34 $19,541,839 62.4% $70,274 $213.71 $21,234,699 63.6% $76,524 $223.13 $20,855,638 62.9% $75,954 $219.02 $22,619,870 64.4% $81,956 $239.58
Undistributed Operating Expenses (% of hotel revenues):
Administrative and General $2,676,729 10.2% $9,778 $30.64 $2,733,893 9.6% $9,831 $29.90 $2,800,301 9.2% $10,092 $29.43 $2,795,147 9.2% $10,180 $29.35 $2,897,714 9.0% $10,499 $30.69
Ace Hotel Sales & Marketing $1,277,121 4.9% $4,665 $14.62 $1,267,233 4.5% $4,557 $13.86 $1,383,242 4.5% $4,985 $14.54 $1,540,794 5.1% $5,611 $16.18 $1,595,117 5.0% $5,779 $16.89
Ace Hotel Repair & Maintenance $1,433,789 5.5% $5,238 $16.41 $1,615,778 5.7% $5,810 $17.67 $1,572,452 5.2% $5,667 $16.52 $1,567,570 5.2% $5,709 $16.46 $1,740,449 5.4% $6,306 $18.43
Ace Hotel Utilities $722,107 2.7% $2,638 $8.27 $851,712 3.0% $3,063 $9.31 $794,461 2.6% $2,863 $8.35 $800,035 2.6% $2,914 $8.40 $827,351 2.6% $2,998 $8.76
Management Fee $1,094,074 4.2% $3,997 $12.52 $906,201 3.2% $3,259 $9.91 $967,808 3.2% $3,488 $10.17 $963,001 3.2% $3,507 $10.11 $1,002,967 3.1% $3,634 $10.62
Rent $17,473 0.1% $64 $0.20 $15,061 0.1% $54 $0.16 $16,158 0.1% $58 $0.17 $16,238 0.1% $59 $0.17 $16,800 0.1% $61 $0.18
Total Undistributed Expenses $7,221,293 27.5% $26,379 $82.66 $7,389,878 26.0% $26,575 $80.82 $7,534,422 24.7% $27,152 $79.17 $7,682,785 25.4% $27,980 $80.68 $8,080,398 25.1% $29,277 $85.58
Income Before Fixed Charges and Reserves $11,416,109 43.4% $41,702 $130.68 $12,151,961 42.8% $43,700 $132.90 $13,700,277 45.0% $49,372 $143.96 $13,172,853 43.6% $55,960 $161.36 $14,539,472 45.2% $58,554 $171.17
Fixed Charges (% of hotel revenues):
Property Tax $832,593 3.2% $3,041 $9.53 $1,014,901 3.6% $3,650 $11.10 $1,084,082 3.6% $3,907 $11.39 $1,162,110 3.8% $4,232 $12.20 $1,243,382 3.9% $4,505 $13.17
Property Insurance $166,649 0.6% $609 $1.91 $184,134 0.6% $662 $2.01 $219,702 0.7% $792 $2.31 $218,856 0.7% $797 $2.30 $219,321 0.7% $795 $2.32
Reserve for Replacement $1,051,970 4.0% $3,843 $12.04 $1,135,711 4.0% $4,084 $12.42 $1,218,270 4.0% $4,390 $12.80 $1,209,315 4.0% $4,404 $12.70 $1,285,294 4.0% $4,657 $13.61
Ground Rent $600,000 2.3% $2,192 $6.87 $600,000 2.1% $2,158 $6.56 $600,000 2.0% $2,162 $6.30 $600,000 2.0% $2,185 $6.30 $600,000 1.9% $2,174 $6.35
Total Fixed Charges $2,651,212 10.1% $9,685 $30.35 $2,934,746 10.3% $10,554 $32.09 $3,122,054.00 10.3% $11,251 $32.81 $3,190,281 10.6% $11,619 $33.50 $3,347,997 9.5% $12,130 $35.46
Cash Flow Before Income Taxes and Debt Service $8,764,897 33.3% $32,018 $100.33 $9,217,215 32.5% $33,146 $100.80 $10,578,223 34.7% $38,121 $111.16 $9,982,572 33.0% $36,355 $104.83 $11,191,475 34.8% $40,549 $118.53
Notes:
1. Totals may not add due to rounding.
2. Percentages of departmental expenses are to departmental revenue; all other percentages are to total revenue.
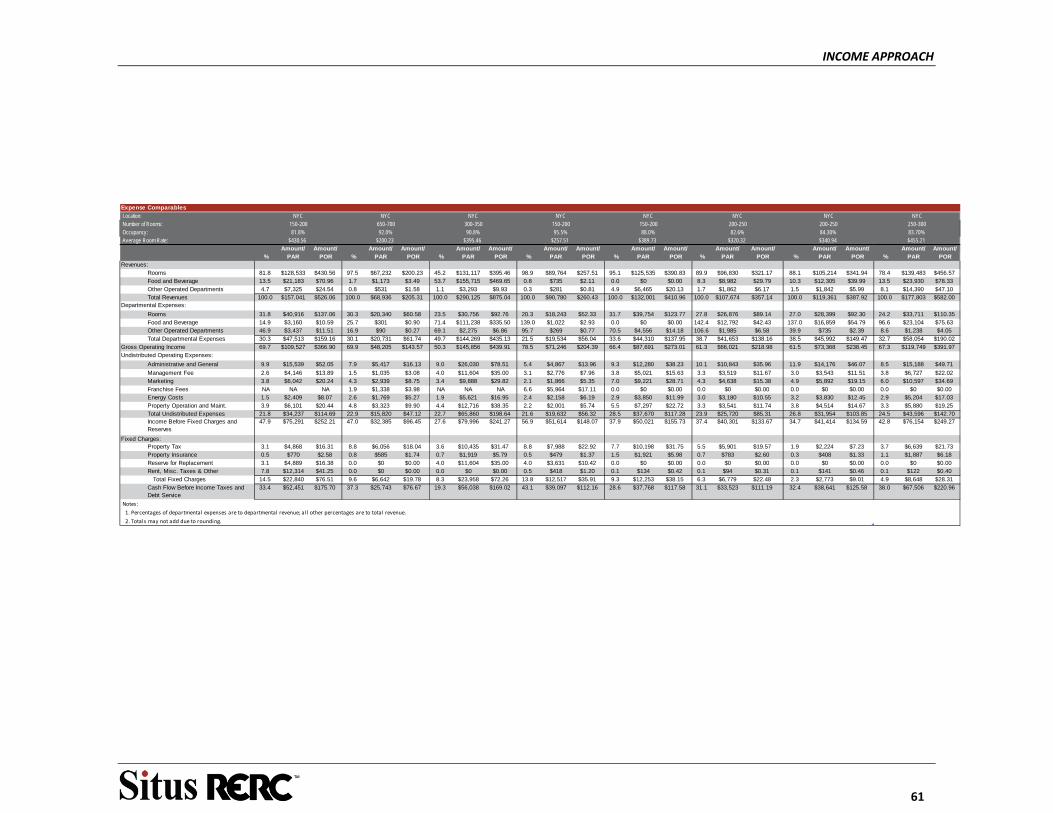
INCOME APPROACH
61
Location: Number of Rooms: Occupancy: Average Room Rate:
Amount/ Amount/ Amount/ Amount/ Amount/ Amount/ Amount/ Amount/ Amount/ Amount/ Amount/ Amount/ Amount/ Amount/ Amount/ Amount/% PAR POR % PAR POR % PAR POR % PAR POR % PAR POR % PAR POR % PAR POR % PAR POR
Revenues:Rooms 81.8 $128,533 $430.56 97.5 $67,232 $200.23 45.2 $131,117 $395.46 98.9 $89,764 $257.51 95.1 $125,535 $390.83 89.9 $96,830 $321.17 88.1 $105,214 $341.94 78.4 $139,483 $456.57Food and Beverage 13.5 $21,183 $70.96 1.7 $1,173 $3.49 53.7 $155,715 $469.65 0.8 $735 $2.11 0.0 $0 $0.00 8.3 $8,982 $29.79 10.3 $12,305 $39.99 13.5 $23,930 $78.33Other Operated Departments 4.7 $7,325 $24.54 0.8 $531 $1.58 1.1 $3,293 $9.93 0.3 $281 $0.81 4.9 $6,465 $20.13 1.7 $1,862 $6.17 1.5 $1,842 $5.99 8.1 $14,390 $47.10Total Revenues 100.0 $157,041 $526.06 100.0 $68,936 $205.31 100.0 $290,125 $875.04 100.0 $90,780 $260.43 100.0 $132,001 $410.96 100.0 $107,674 $357.14 100.0 $119,361 $387.92 100.0 $177,803 $582.00
Departmental Expenses:
Rooms 31.8 $40,916 $137.06 30.3 $20,340 $60.58 23.5 $30,756 $92.76 20.3 $18,243 $52.33 31.7 $39,754 $123.77 27.8 $26,876 $89.14 27.0 $28,399 $92.30 24.2 $33,711 $110.35Food and Beverage 14.9 $3,160 $10.59 25.7 $301 $0.90 71.4 $111,238 $335.50 139.0 $1,022 $2.93 0.0 $0 $0.00 142.4 $12,792 $42.43 137.0 $16,859 $54.79 96.6 $23,104 $75.63Other Operated Departments 46.9 $3,437 $11.51 16.9 $90 $0.27 69.1 $2,275 $6.86 95.7 $269 $0.77 70.5 $4,556 $14.18 106.6 $1,985 $6.58 39.9 $735 $2.39 8.6 $1,238 $4.05Total Departmental Expenses 30.3 $47,513 $159.16 30.1 $20,731 $61.74 49.7 $144,269 $435.13 21.5 $19,534 $56.04 33.6 $44,310 $137.95 38.7 $41,653 $138.16 38.5 $45,992 $149.47 32.7 $58,054 $190.02
Gross Operating Income 69.7 $109,527 $366.90 69.9 $48,205 $143.57 50.3 $145,856 $439.91 78.5 $71,246 $204.39 66.4 $87,691 $273.01 61.3 $66,021 $218.98 61.5 $73,368 $238.45 67.3 $119,749 $391.97Undistributed Operating Expenses:
Administrative and General 9.9 $15,539 $52.05 7.9 $5,417 $16.13 9.0 $26,030 $78.51 5.4 $4,867 $13.96 9.3 $12,280 $38.23 10.1 $10,843 $35.96 11.9 $14,176 $46.07 8.5 $15,188 $49.71
Management Fee 2.6 $4,146 $13.89 1.5 $1,035 $3.08 4.0 $11,604 $35.00 3.1 $2,776 $7.96 3.8 $5,021 $15.63 3.3 $3,519 $11.67 3.0 $3,543 $11.51 3.8 $6,727 $22.02Marketing 3.8 $6,042 $20.24 4.3 $2,939 $8.75 3.4 $9,888 $29.82 2.1 $1,866 $5.35 7.0 $9,221 $28.71 4.3 $4,638 $15.38 4.9 $5,892 $19.15 6.0 $10,597 $34.69Franchise Fees NA NA NA 1.9 $1,338 $3.98 NA NA NA 6.6 $5,964 $17.11 0.0 $0 $0.00 0.0 $0 $0.00 0.0 $0 $0.00 0.0 $0 $0.00Energy Costs 1.5 $2,409 $8.07 2.6 $1,769 $5.27 1.9 $5,621 $16.95 2.4 $2,158 $6.19 2.9 $3,850 $11.99 3.0 $3,180 $10.55 3.2 $3,830 $12.45 2.9 $5,204 $17.03Property Operation and Maint. 3.9 $6,101 $20.44 4.8 $3,323 $9.90 4.4 $12,716 $38.35 2.2 $2,001 $5.74 5.5 $7,297 $22.72 3.3 $3,541 $11.74 3.8 $4,514 $14.67 3.3 $5,880 $19.25Total Undistributed Expenses 21.8 $34,237 $114.69 22.9 $15,820 $47.12 22.7 $65,860 $198.64 21.6 $19,632 $56.32 28.5 $37,670 $117.28 23.9 $25,720 $85.31 26.8 $31,954 $103.85 24.5 $43,596 $142.70Income Before Fixed Charges and Reserves
47.9 $75,291 $252.21 47.0 $32,385 $96.45 27.6 $79,996 $241.27 56.9 $51,614 $148.07 37.9 $50,021 $155.73 37.4 $40,301 $133.67 34.7 $41,414 $134.59 42.8 $76,154 $249.27
Fixed Charges:Property Tax 3.1 $4,868 $16.31 8.8 $6,056 $18.04 3.6 $10,435 $31.47 8.8 $7,988 $22.92 7.7 $10,198 $31.75 5.5 $5,901 $19.57 1.9 $2,224 $7.23 3.7 $6,639 $21.73Property Insurance 0.5 $770 $2.58 0.8 $585 $1.74 0.7 $1,919 $5.79 0.5 $479 $1.37 1.5 $1,921 $5.98 0.7 $783 $2.60 0.3 $408 $1.33 1.1 $1,887 $6.18Reserve for Replacement 3.1 $4,889 $16.38 0.0 $0 $0.00 4.0 $11,604 $35.00 4.0 $3,631 $10.42 0.0 $0 $0.00 0.0 $0 $0.00 0.0 $0 $0.00 0.0 $0 $0.00Rent, Misc. Taxes & Other 7.8 $12,314 $41.25 0.0 $0 $0.00 0.0 $0 $0.00 0.5 $418 $1.20 0.1 $134 $0.42 0.1 $94 $0.31 0.1 $141 $0.46 0.1 $122 $0.40
Total Fixed Charges 14.5 $22,840 $76.51 9.6 $6,642 $19.78 8.3 $23,958 $72.26 13.8 $12,517 $35.91 9.3 $12,253 $38.15 6.3 $6,779 $22.48 2.3 $2,773 $9.01 4.9 $8,648 $28.31Cash Flow Before Income Taxes and Debt Service
33.4 $52,451 $175.70 37.3 $25,743 $76.67 19.3 $56,038 $169.02 43.1 $39,097 $112.16 28.6 $37,768 $117.58 31.1 $33,523 $111.19 32.4 $38,641 $125.58 38.0 $67,506 $220.96
Notes:
1. Percentages of departmental expenses are to departmental revenue; all other percentages are to total revenue.
2. Totals may not add due to rounding.
$320.3282.6%
$340.9484.30%88.0%
$389.7383.70%$455.21
Expense Comparables
250-300150-200 200-250 200-250NYC NYCNYC NYCNYC
150-200NYC
300-35081.8%
$430.56
NYC650-70092.0%
$200.2390.8%
$395.46
NYC150-20095.5%
$257.51
INCOME APPROACH
62
INCOME AND EXPENSE ANALYSIS
Revenue Analysis
Room Sales are based on the anticipated occupancies multiplied by the average daily rates as shown in the Lodging Market Analysis section of the report. The conclusions for this category were occupancy of occupancy of 94.1% and average daily rate of $306.97 for Year 1, which was supported by our analysis of the market.
Food and Beverage Sales are based on the subject’s historical operations and 2015 budget. RERC has estimated a conclusion of $8.00 POR for the subject. We note that this item includes minibar and public space revenue, however does not include restaurant revenue which is separately addressed under the fixed expenses.
Other Operated Departments Revenue: This revenue item includes revenues from guest laundry, attrition penalties, conference services, and other miscellaneous and sundry sources. The most recent historical figures are considered most applicable and led to an amount of $7.00 POR estimated for the Subject.
Room Department Expenses consist of payroll and related expenses, credit card bank fees, guest supplies, paper goods, cleaning supplies, laundry, linen, and other items for maintaining guest rooms. This category ranged from 20.3% to 31.8% of room revenue with an average of 27.1% for the comparables.
The subject exhibited a fairly narrow range of room expenses that has ranged from 31.3% to 33.8% of room revenue from 2012 to 2015. Management has budgeted expenses of 32.3% of room revenue in 2015. RERC has projected 32.0% of room revenue.
Food and Beverage Expenses are typically analyzed as a percentage of food and beverage sales. This category ranged from 71.4% to 142.4% for the comparables (some comparables indicated lower percentage, however those were skewed by net revenue from leased restaurant operations).
The subject exhibited a range of 65.6% to 72.5% of food and beverage revenues from 2012 to 2015 and Management budgeted of 60.2% for this expense. Based primarily on historical operation, RERC has projected 65.0% of food and beverage revenue for this expense.
Miscellaneous/Other Expenses are typically analyzed as a percent of miscellaneous/other income. The subject’s miscellaneous/other expense as a percent of miscellaneous/other income ranged from 43.2% to 56.6% between 2012 and 2015, with an average of 51.6%. In management’s 2015 budget, this expense is 41.4% of income. A miscellaneous/other expense of 50.0% of miscellaneous/other income has been used in our analysis based on historical performance.
INCOME APPROACH
63
Expense Analysis‐‐Undistributed Operating Expenses
Administrative and General Expenses include office payroll and related expenses for the administrative staff. Also included are bad debts, credit card commissions, general liability insurance, travel and other miscellaneous expenses as well as equipment rentals. Administrative and General tend to be a "catch all" for items that are not easily classified. Accordingly, these expenses can vary widely depending upon management philosophy and the existence of management contracts.
The expense comparables ranged from 5.4% to 11.9%, with an average of 9.0% for administrative and general expenses as a percent of gross revenue.
The subject’s history ranged from 9.2% to 10.2% between 2012 and 2015; this is slightly higher than the range reported by the comparables, but has been consistent at the subject. The 2015 budget assumes is 9.0% of gross revenue. Based on the comparables and historical performance of the subject, we estimated a general and administrative expense of 9.5% of gross revenues in our analysis.
Sales and Marketing Expenses include payroll and related expenses, agency fees, chain related national advertising, media advertising, travel agent commissions, entertainment and travel. Marketing expenses for the comparables ranged from 2.1% to 7.0% of gross revenue.
The subject’s ratio has ranged from 4.5% to 5.1% between 2012 and 2015 and was budgeted at 5.0% for 2015. Accordingly, 5.00% is projected for the subject’s sales and marketing expenses.
Utilities costs represent expenditures for electricity, fuel, water and operating supplies for this department. This expense ranged from $1,769 to $5,621 per available room (PAR) for the comparables.
The Subject reports energy costs that ranged from $2,638 to $3,063 PAR from 2012 to 2015. The 2015 forecasted budget shows a utilities expense figure of $2,998, within its range historically. With emphasis placed on the operating history of the subject and the lower end of the expense comparables, we estimated a utilities expense of $2,900 PAR in the first year of our analysis.
Repairs and Maintenance: This expense ranged widely from $2,001 to $12,716 PAR for the comparables.
The subject reports this expense at a narrow range from $5,238 to $5,810 PAR with an average of $5,606 PAR between 2012 and 2015. The subject’s 2015 budget forecast indicates a repairs & maintenance expense of $6,100 PAR. Placing greatest weight on the subject’s historical performance, we estimated $5,600 PAR for this expense.
Rent Expense is included in our year 1 operating statement for the subject at $60 PAR, in‐line with historical performance.
INCOME APPROACH
64
Expense Analysis‐‐Management Fees and Fixed Charges
Base Management Fees: The subject’s management fee expense has historically ranged from 3.2% to 4.2% from 2012 to 2015. The subject’s forecasted 2015 budget shows a management fee of 3.1%. In estimating the fair value, passive ownership is assumed, requiring the deduction of a management fee consistent with market levels. The figures from the comparables range from 1.5% to 4.0% with an average of 3.1% and support the concluded management fee of 3.0% of gross revenue as reasonable.
Property Taxes are estimated as discussed previously in the Property section of this report. Note that the table in the Property section shows calendar year tax estimates, while the property tax expenses shown in this Income Approach section of this Report are on a fiscal year basis based upon the effective date of value.
Property Insurance Expenses have been estimated at $795 PAR or approximately 0.70% of gross revenues in Year 1, based on the subject’s actual and forecasted expense. The individual comparables reported expenses from 0.3% to 1.5% of total revenue with an average of 0.8%. The subject recent history from 2014 through 2015 budget has ranged from $792 PAR to $797 PAR.
Reserves for Replacement of Fixed Assets: Industry standards typically allow for a reserve of 4% to 5%, with 4% being the more common figure. Many franchises require a reserve to be established that is usually in the aforementioned range. RERC has estimated reserves at 4.00% for its analysis, consistent with the subject’s operating history and industry standards.
Ground Rent: The subject is encumbered by a ground lease with an initial termination date of November 20, 2032. With extensions, then agreement can continue to November 21, 2049. The current rent is $600,000 per annum and shall continue to be so until May 31, 2029 when it will move to $700,000 per annum until November 30, 2032. For the extended period starting December 1, 2032, rent will be determined based on the greater of 8% of the Property’s fair market value and the annual rent payable by the tenant during the twelve month period immediately preceding the extended term.
A ground rent expense of $600,000 has been estimated during the holding period, consistent with the terms of the lease. Risk associated with ground rent adjustment during the extended period starting December 1, 2032 was considered in our exit capitalization rate assumption.
Other Fixed Expenses (negative expenses, revenue)
The subject year 1 operating statement includes revenues from The Breslin restaurant, SRO units and commercial/retail tenancy of $1,600,000, which is modeled as a negative expense to accurately reflect expenses to revenue ratios for all other items. This revenue (negative expense) item consists of net revenues from The Breslin restaurant, as well as net income from the SRO units and from commercial/retail tenant space. With regards to the SRO units, based on historical performance we assumed that two units will be recaptured by the owner each year and converted into hotel rooms. Accordingly, net income from two SRO units was deducted each year from the other fixed expenses (although those have negligible effect on net cash flow as rents are low and the SRO units generally operate at no profit).
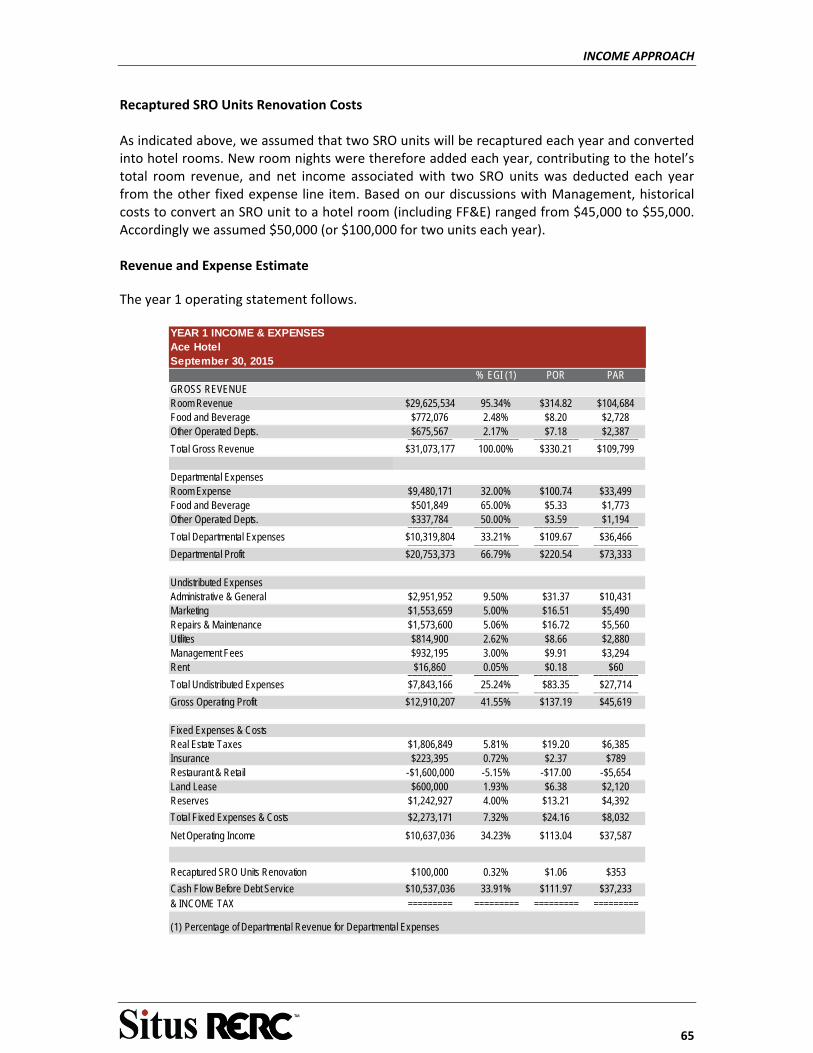
INCOME APPROACH
65
Recaptured SRO Units Renovation Costs As indicated above, we assumed that two SRO units will be recaptured each year and converted into hotel rooms. New room nights were therefore added each year, contributing to the hotel’s total room revenue, and net income associated with two SRO units was deducted each year from the other fixed expense line item. Based on our discussions with Management, historical costs to convert an SRO unit to a hotel room (including FF&E) ranged from $45,000 to $55,000. Accordingly we assumed $50,000 (or $100,000 for two units each year). Revenue and Expense Estimate
The year 1 operating statement follows.
% EGI (1) POR PARGROSS REVENUE Room Revenue $29,625,534 95.34% $314.82 $104,684Food and Beverage $772,076 2.48% $8.20 $2,728Other Operated Depts. $675,567 2.17% $7.18 $2,387_________ _________ _________ _________Total Gross Revenue $31,073,177 100.00% $330.21 $109,799
Departmental Expenses Room Expense $9,480,171 32.00% $100.74 $33,499Food and Beverage $501,849 65.00% $5.33 $1,773Other Operated Depts. $337,784 50.00% $3.59 $1,194_________ _________ _________ _________Total Departmental Expenses $10,319,804 33.21% $109.67 $36,466_________ _________ _________ _________Departmental Profit $20,753,373 66.79% $220.54 $73,333
Undistributed Expenses Administrative & General $2,951,952 9.50% $31.37 $10,431Marketing $1,553,659 5.00% $16.51 $5,490Repairs & Maintenance $1,573,600 5.06% $16.72 $5,560Utilites $814,900 2.62% $8.66 $2,880Management Fees $932,195 3.00% $9.91 $3,294Rent $16,860 0.05% $0.18 $60_________ _________ _________ _________Total Undistributed Expenses $7,843,166 25.24% $83.35 $27,714_________ _________ _________ _________Gross Operating Profit $12,910,207 41.55% $137.19 $45,619
Fixed Expenses & Costs Real Estate Taxes $1,806,849 5.81% $19.20 $6,385Insurance $223,395 0.72% $2.37 $789Restaurant & Retail -$1,600,000 -5.15% -$17.00 -$5,654Land Lease $600,000 1.93% $6.38 $2,120Reserves $1,242,927 4.00% $13.21 $4,392
Total Fixed Expenses & Costs $2,273,171 7.32% $24.16 $8,032
Net Operating Income $10,637,036 34.23% $113.04 $37,587
Recaptured SRO Units Renovation $100,000 0.32% $1.06 $353
Cash Flow Before Debt Service $10,537,036 33.91% $111.97 $37,233& INCOME TAX ========= ========= ========= =========
(1) Percentage of Departmental Revenue for Departmental Expenses
YEAR 1 INCOME & EXPENSESAce HotelSeptember 30, 2015

INCOME APPROACH
66
DIRECT CAPITALIZATION ANALYSIS
Going‐In Capitalization Rate
Our going‐in capitalization rate was estimated based on going‐in capitalization rates used in valuing comparable sales transactions, survey data compiled by RERC, NCREIF income returns and income analysis of alternative investments.
Overall capitalization rates range from 5.2% to 7.0% for the sales used in this Report. In addition, of note are several recent transactions of ultra‐luxury and iconic Manhattan hotels such as the Waldorf Astoria, Manhattan at Time Square and Baccarat, which reportedly sold transacted at sub 4.0% capitalization rates. It should be noted that the reported capitalization rates are not necessarily “stabilized” capitalization rates and are based on varying periods. We also interviewed market participants familiar with current investment conditions. Our conversations indicated that pricing in Manhattan is relatively strong. The abundance of available foreign investors, private equity buyers, REIT’s and other fund sources, specifically interested in New York City, have created good demand for quality, well‐managed, well‐located assets. Market participants commented that stabilized capitalization rates for quality Manhattan hotels with well‐established track record are in the range of 5.5% to 6.0%.
Based on this, a capitalization rate in the range of 5.25% to 6.00% appears reasonable for the subject (prior to ground lease adjustment).
Investor Surveys
Surveys that draw on a broad sample of real estate professionals at pension funds, their advisors, corporate and other investors, and lending institutions provide timely insights into current investment criteria. Real Estate Research Corporation (RERC) has conducted a quarterly investment survey since 1979 and assesses the real estate industry annually in Expectations and Market Realities in Real Estate: 2015, which is based on approximately one hundred interviews with leading industry participants.
As always, we underline that these rates represent unleveraged yield expectations, not realized returns. Discussions with some of the participants indicated that because of the keen competition for investment grade real estate, these indications are sometimes compromised if the quality of property is significant.
As the following table demonstrates, reported investor going in capitalization rates range from 3.8% to 8.5% for all property types. Hotels exhibit a range from 5% to 8% and have an average going in capitalization rate of 6.8%. Based on the subject’s earning characteristics and market area, a range toward the lower‐middle portion of the indicated range is warranted. Therefore, capitalization rates in the range of 5.0%‐6.0% are deemed appropriate for the subject (prior to ground lease adjustment).
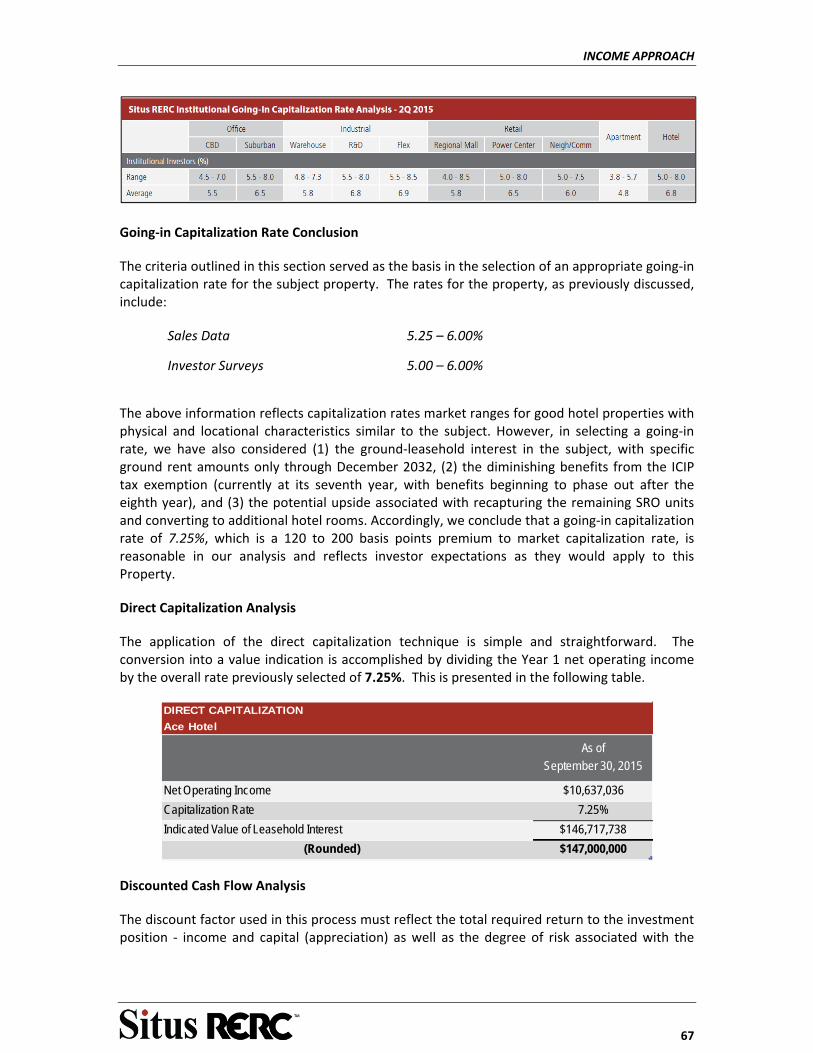
INCOME APPROACH
67
Going‐in Capitalization Rate Conclusion
The criteria outlined in this section served as the basis in the selection of an appropriate going‐in capitalization rate for the subject property. The rates for the property, as previously discussed, include:
Sales Data 5.25 – 6.00%
Investor Surveys 5.00 – 6.00%
The above information reflects capitalization rates market ranges for good hotel properties with physical and locational characteristics similar to the subject. However, in selecting a going‐in rate, we have also considered (1) the ground‐leasehold interest in the subject, with specific ground rent amounts only through December 2032, (2) the diminishing benefits from the ICIP tax exemption (currently at its seventh year, with benefits beginning to phase out after the eighth year), and (3) the potential upside associated with recapturing the remaining SRO units and converting to additional hotel rooms. Accordingly, we conclude that a going‐in capitalization rate of 7.25%, which is a 120 to 200 basis points premium to market capitalization rate, is reasonable in our analysis and reflects investor expectations as they would apply to this Property.
Direct Capitalization Analysis
The application of the direct capitalization technique is simple and straightforward. The conversion into a value indication is accomplished by dividing the Year 1 net operating income by the overall rate previously selected of 7.25%. This is presented in the following table.
As of
September 30, 2015
Net Operating Income $10,637,036
Capitalization Rate 7.25%
Indicated Value of Leasehold Interest $146,717,738
(Rounded) $147,000,000
Ace Hotel
DIRECT CAPITALIZATION
Discounted Cash Flow Analysis
The discount factor used in this process must reflect the total required return to the investment position ‐ income and capital (appreciation) as well as the degree of risk associated with the
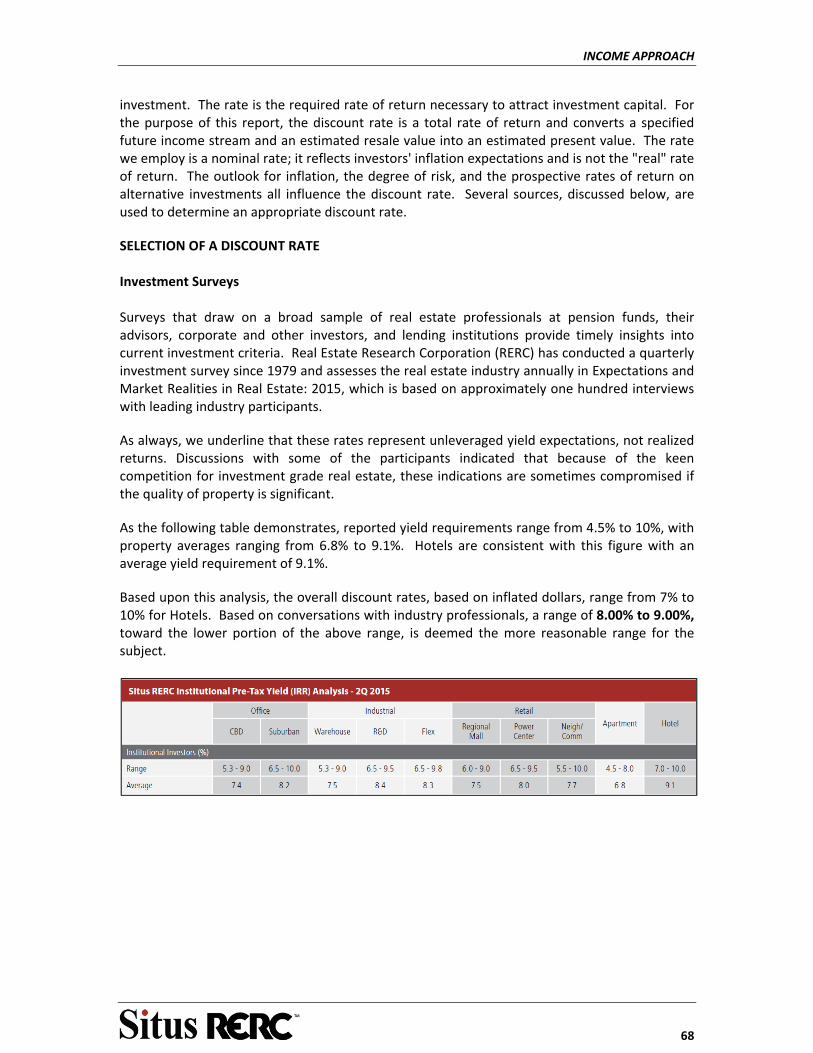
INCOME APPROACH
68
investment. The rate is the required rate of return necessary to attract investment capital. For the purpose of this report, the discount rate is a total rate of return and converts a specified future income stream and an estimated resale value into an estimated present value. The rate we employ is a nominal rate; it reflects investors' inflation expectations and is not the "real" rate of return. The outlook for inflation, the degree of risk, and the prospective rates of return on alternative investments all influence the discount rate. Several sources, discussed below, are used to determine an appropriate discount rate.
SELECTION OF A DISCOUNT RATE Investment Surveys Surveys that draw on a broad sample of real estate professionals at pension funds, their advisors, corporate and other investors, and lending institutions provide timely insights into current investment criteria. Real Estate Research Corporation (RERC) has conducted a quarterly investment survey since 1979 and assesses the real estate industry annually in Expectations and Market Realities in Real Estate: 2015, which is based on approximately one hundred interviews with leading industry participants.
As always, we underline that these rates represent unleveraged yield expectations, not realized returns. Discussions with some of the participants indicated that because of the keen competition for investment grade real estate, these indications are sometimes compromised if the quality of property is significant.
As the following table demonstrates, reported yield requirements range from 4.5% to 10%, with property averages ranging from 6.8% to 9.1%. Hotels are consistent with this figure with an average yield requirement of 9.1%.
Based upon this analysis, the overall discount rates, based on inflated dollars, range from 7% to 10% for Hotels. Based on conversations with industry professionals, a range of 8.00% to 9.00%, toward the lower portion of the above range, is deemed the more reasonable range for the subject.

INCOME APPROACH
69
Alternative Investments The table Real Estate vis‐à‐vis Capital Market Returns shows historic spreads between the average targeted yield for real estate and actual yields for alternative investments. The current capital market returns range from 2.2% to 4.8%, an increase from last quarter. The normative spread, over the last several years, ranges from 290 to 370 basis points for Moody’s Baa Corporate bonds and from 550 to 690 basis points for the 10‐Year Treasury. The current range is from 570 basis points on 10‐year Treasury to 310 basis points on Moody's Baa Corporate. The gap only serves to underline the relative attractiveness of current returns on real estate vis‐à‐vis other asset classes. Adding in the normative spreads for real estate in‐line with historical spreads, the alternative market analysis indicates a discount rate range of 8.0% to 9.0%.
DISCOUNT RATE CONCLUSION
The criteria outlined in this section served as the basis in the selection of an appropriate discount rate for the subject property. The discount rate to be applied to the cash flows of the subject property must reflect the quality and durability of the income projections, as well as the likelihood of real long‐term gain in asset value. The yield to the investor of IRR must be at a level commensurate with alternative investment vehicles. The most comparable rates for the property, as previously discussed, include:
Investor Surveys 8.00 – 9.00%
Alternative Investments 8.00 – 9.00%
Given the age of the subject property, the location, and the current market position; an investor would be assuming average risk. Therefore, we conclude that a discount rate of 8.50% is appropriate for the subject.
INFLATION RATE
The inflation rate selected for this appraisal is applied to RERC's forecasted expenses and capital costs. An analysis of the inflation rate is important because it must closely approximate expected inflation over the forecast horizon. An inflation rate that is too high will skew expenses upward, while one that is too low will do the opposite. This section will take both a quantitative and qualitative approach to deriving an inflation rate.
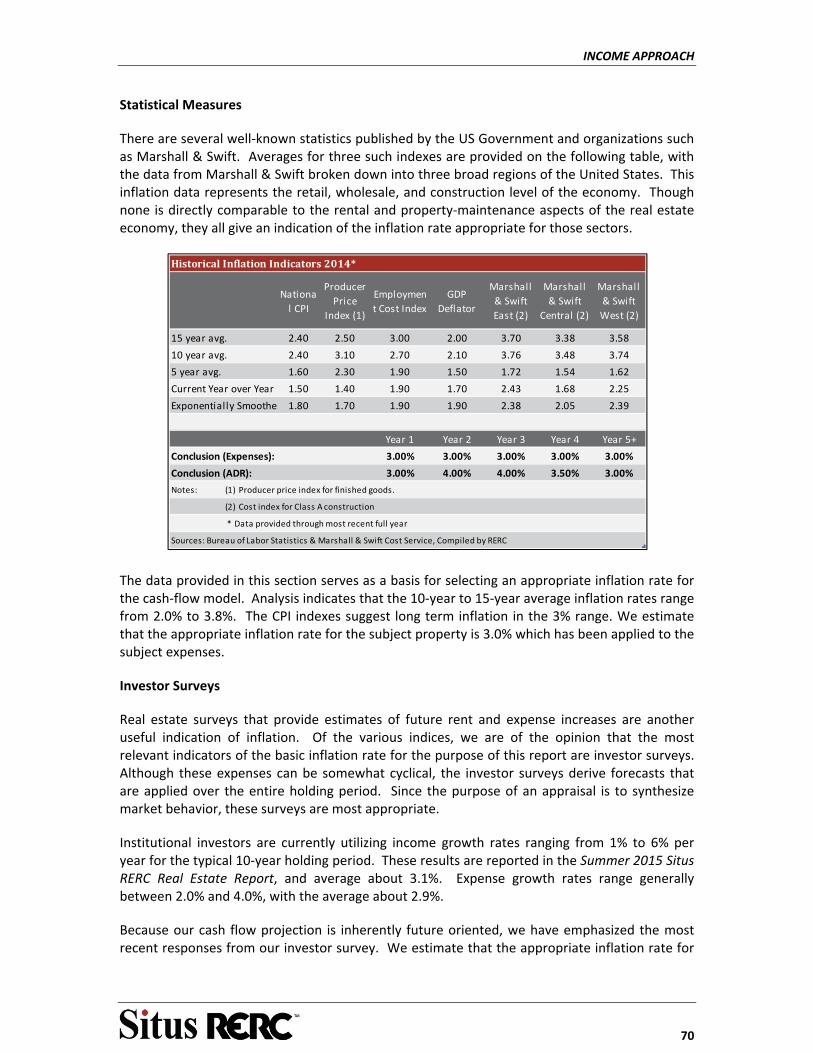
INCOME APPROACH
70
Statistical Measures
There are several well‐known statistics published by the US Government and organizations such as Marshall & Swift. Averages for three such indexes are provided on the following table, with the data from Marshall & Swift broken down into three broad regions of the United States. This inflation data represents the retail, wholesale, and construction level of the economy. Though none is directly comparable to the rental and property‐maintenance aspects of the real estate economy, they all give an indication of the inflation rate appropriate for those sectors.
The data provided in this section serves as a basis for selecting an appropriate inflation rate for the cash‐flow model. Analysis indicates that the 10‐year to 15‐year average inflation rates range from 2.0% to 3.8%. The CPI indexes suggest long term inflation in the 3% range. We estimate that the appropriate inflation rate for the subject property is 3.0% which has been applied to the subject expenses.
Investor Surveys
Real estate surveys that provide estimates of future rent and expense increases are another useful indication of inflation. Of the various indices, we are of the opinion that the most relevant indicators of the basic inflation rate for the purpose of this report are investor surveys. Although these expenses can be somewhat cyclical, the investor surveys derive forecasts that are applied over the entire holding period. Since the purpose of an appraisal is to synthesize market behavior, these surveys are most appropriate.
Institutional investors are currently utilizing income growth rates ranging from 1% to 6% per year for the typical 10‐year holding period. These results are reported in the Summer 2015 Situs RERC Real Estate Report, and average about 3.1%. Expense growth rates range generally between 2.0% and 4.0%, with the average about 2.9%.
Because our cash flow projection is inherently future oriented, we have emphasized the most recent responses from our investor survey. We estimate that the appropriate inflation rate for
Nationa
l CPI
Producer
Price
Index (1)
Employmen
t Cost Index
GDP
Deflator
Marshall
& Swift
East (2)
Marshall
& Swift
Central (2)
Marshall
& Swift
West (2)
15 year avg. 2.40 2.50 3.00 2.00 3.70 3.38 3.58
10 year avg. 2.40 3.10 2.70 2.10 3.76 3.48 3.74
5 year avg. 1.60 2.30 1.90 1.50 1.72 1.54 1.62
Current Year over Year 1.50 1.40 1.90 1.70 2.43 1.68 2.25
Exponentially Smoothe 1.80 1.70 1.90 1.90 2.38 2.05 2.39
Year 1 Year 2 Year 3 Year 4 Year 5+
Conclusion (Expenses): 3.00% 3.00% 3.00% 3.00% 3.00%
Conclusion (ADR): 3.00% 4.00% 4.00% 3.50% 3.00%
Notes: (1) Producer price index for finished goods.
(2) Cost index for Class A construction
* Data provided through most recent full year
Sources: Bureau of Labor Statistics & Marshall & Swift Cost Service, Compiled by RERC
HistoricalInflationIndicators2014*

INCOME APPROACH
71
the subject property is 3.0%. This rate has been applied to the subject’s expenses and capital costs.
Property Reversion Analysis
Basis for Property Reversion: In addition to the cash flow from operations, the model hypothecates a sale of the property at the end of the investment period, with the net sale proceeds accruing to the ownership position. The sale is modeled to occur at the end of the 10th year based on the 11th year NOI. The method of estimating the terminal sale price is direct capitalization, giving similar considerations to the subject as those applied in the Direct Capitalization Analysis. The prospective buyer would make a purchase decision based on the anticipated revenue and expenses which should occur in the initial year of ownership. Therefore, the cash flows for the year subsequent to the final year of the investment model were utilized. The net sale proceeds accruing to the property owner reflect the "as is" value of the property at that point in time less appropriate transaction costs.
Terminal Capitalization Rate
As stated in the going‐in capitalization rate analysis above, an overall rate of 7.25% has been judged to be most applicable for the subject. The reversion capitalization rate (Rt) is calculated
by adjusting a typical stabilized overall capitalization rate (Ro) for the loss in the competitive
market standing realized by the subject property over the holding period due to the nominal aging of the property. Finally, a critical analysis of the subject’s income characteristics at the beginning of the analysis period versus the income characteristics at the end of the holding period must be considered.
Taking into account the preceding information, specifically the capitalization rates by property type, a determination can be made using the spread between the terminal and the going‐in capitalization rates, as illustrated in the following chart.
As shown in the above chart, previous chart, spreads going‐in and terminal rates have typically been 60‐90 basis points, with the average around 70 basis points. After adjusting the data for the time horizon, the term of the ground leases, and relative earning rates for the subject, of say 100 basis points, an indicated terminal rate of 8.25% has been deemed appropriate for the subject property.
Transaction Costs: Typical transaction costs by the seller consist of brokerage commissions, tax proration, title insurance and related fees, survey costs and legal fees. The RERC survey reports closing costs ranging from 1% to 3%. The size of the transaction impacts the ratio since brokers
INCOME APPROACH
72
are more concerned with the gross selling commission. This analysis assumes 4.00% of the sale price for a hotel considering its New York location.
Discounted Cash Flow Analysis
This is a cash based valuation model that considers the actual timing of cash receipts and disbursements. This approach is a set of procedures in which the quantity, variability, timing and duration of periodic income, as well as the quantity and timing of reversions, are modeled and discounted to a present value at a specified yield rate. For the purpose of this analysis, we have utilized a hypothetical investment period of 10 years for the valuation.
Cash Flow Schedules for the Valuation Analyses: Based on the analysis as outlined, prospective cash flows from operations for the 10 year holding period and the year subsequent to the sale of the property have been prepared and are presented on the following pages.
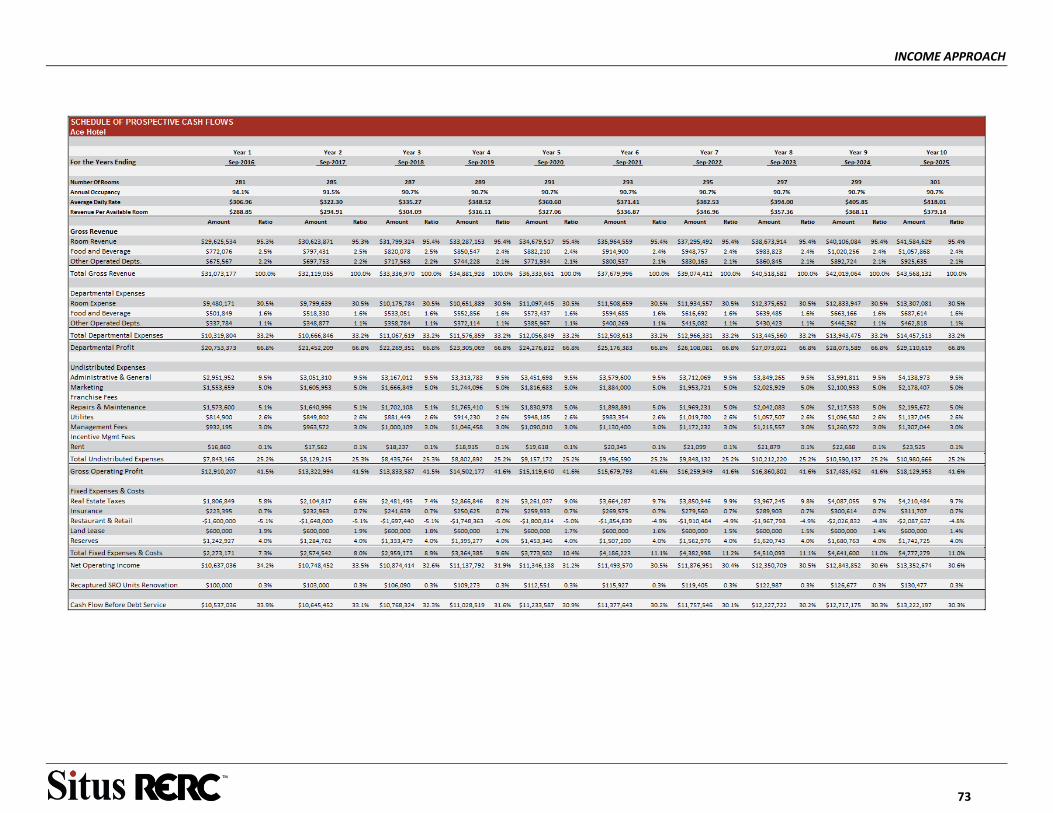
INCOME APPROACH
73
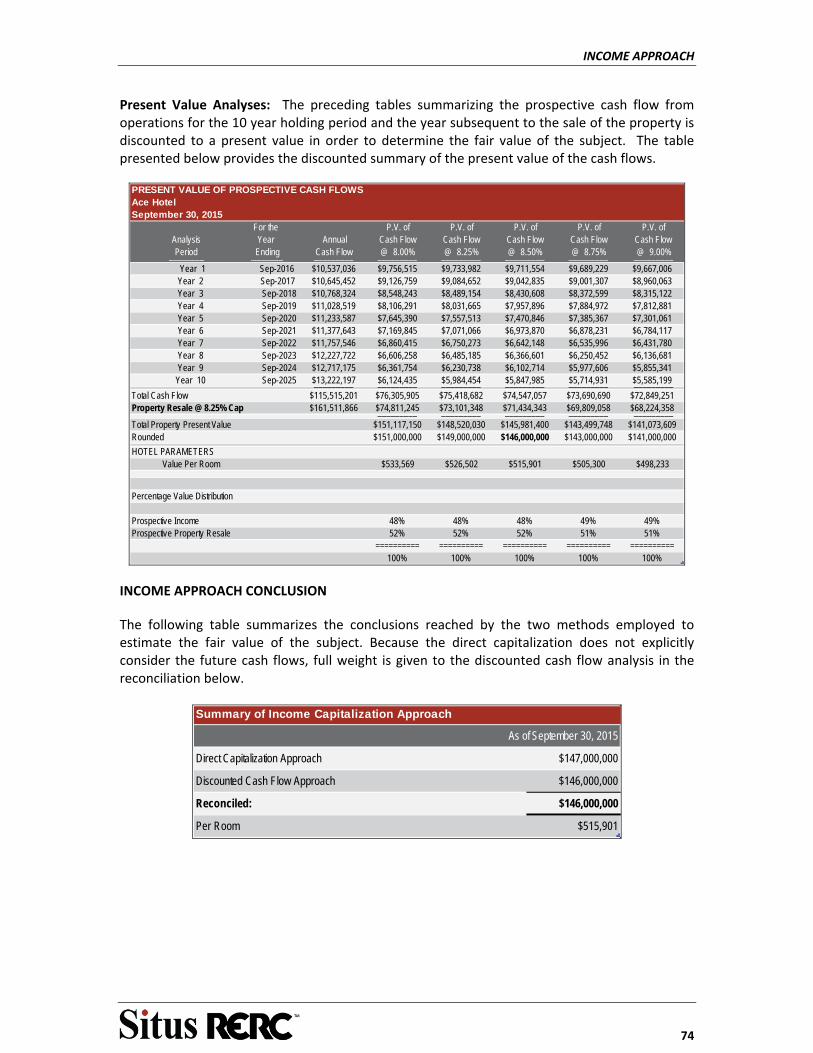
INCOME APPROACH
74
Present Value Analyses: The preceding tables summarizing the prospective cash flow from operations for the 10 year holding period and the year subsequent to the sale of the property is discounted to a present value in order to determine the fair value of the subject. The table presented below provides the discounted summary of the present value of the cash flows.
For the P.V. of P.V. of P.V. of P.V. of P.V. of Analysis Year Annual Cash Flow Cash Flow Cash Flow Cash Flow Cash Flow Period Ending Cash Flow @ 8.00% @ 8.25% @ 8.50% @ 8.75% @ 9.00%________ ________ _________ _________ _________ _________ _________ _________ Year 1 Sep-2016 $10,537,036 $9,756,515 $9,733,982 $9,711,554 $9,689,229 $9,667,006Year 2 Sep-2017 $10,645,452 $9,126,759 $9,084,652 $9,042,835 $9,001,307 $8,960,063Year 3 Sep-2018 $10,768,324 $8,548,243 $8,489,154 $8,430,608 $8,372,599 $8,315,122Year 4 Sep-2019 $11,028,519 $8,106,291 $8,031,665 $7,957,896 $7,884,972 $7,812,881Year 5 Sep-2020 $11,233,587 $7,645,390 $7,557,513 $7,470,846 $7,385,367 $7,301,061Year 6 Sep-2021 $11,377,643 $7,169,845 $7,071,066 $6,973,870 $6,878,231 $6,784,117Year 7 Sep-2022 $11,757,546 $6,860,415 $6,750,273 $6,642,148 $6,535,996 $6,431,780Year 8 Sep-2023 $12,227,722 $6,606,258 $6,485,185 $6,366,601 $6,250,452 $6,136,681Year 9 Sep-2024 $12,717,175 $6,361,754 $6,230,738 $6,102,714 $5,977,606 $5,855,341
Year 10 Sep-2025 $13,222,197 $6,124,435 $5,984,454 $5,847,985 $5,714,931 $5,585,199_________ _________ _________ _________ _________ _________Total Cash Flow $115,515,201 $76,305,905 $75,418,682 $74,547,057 $73,690,690 $72,849,251Property Resale @ 8.25% Cap $161,511,866 $74,811,245 $73,101,348 $71,434,343 $69,809,058 $68,224,358 _________ _________ _________ _________ _________Total Property Present Value $151,117,150 $148,520,030 $145,981,400 $143,499,748 $141,073,609Rounded $151,000,000 $149,000,000 $146,000,000 $143,000,000 $141,000,000
HOTEL PARAMETERSValue Per Room $533,569 $526,502 $515,901 $505,300 $498,233
Percentage Value Distribution
Prospective Income 48% 48% 48% 49% 49%Prospective Property Resale 52% 52% 52% 51% 51% ========== ========== ========== ========== ========== 100% 100% 100% 100% 100%
PRESENT VALUE OF PROSPECTIVE CASH FLOWSAce HotelSeptember 30, 2015
INCOME APPROACH CONCLUSION
The following table summarizes the conclusions reached by the two methods employed to estimate the fair value of the subject. Because the direct capitalization does not explicitly consider the future cash flows, full weight is given to the discounted cash flow analysis in the reconciliation below.
As of September 30, 2015
Direct Capitalization Approach $147,000,000
Discounted Cash Flow Approach $146,000,000
Reconciled: $146,000,000
Per Room $515,901
Summary of Income Capitalization Approach
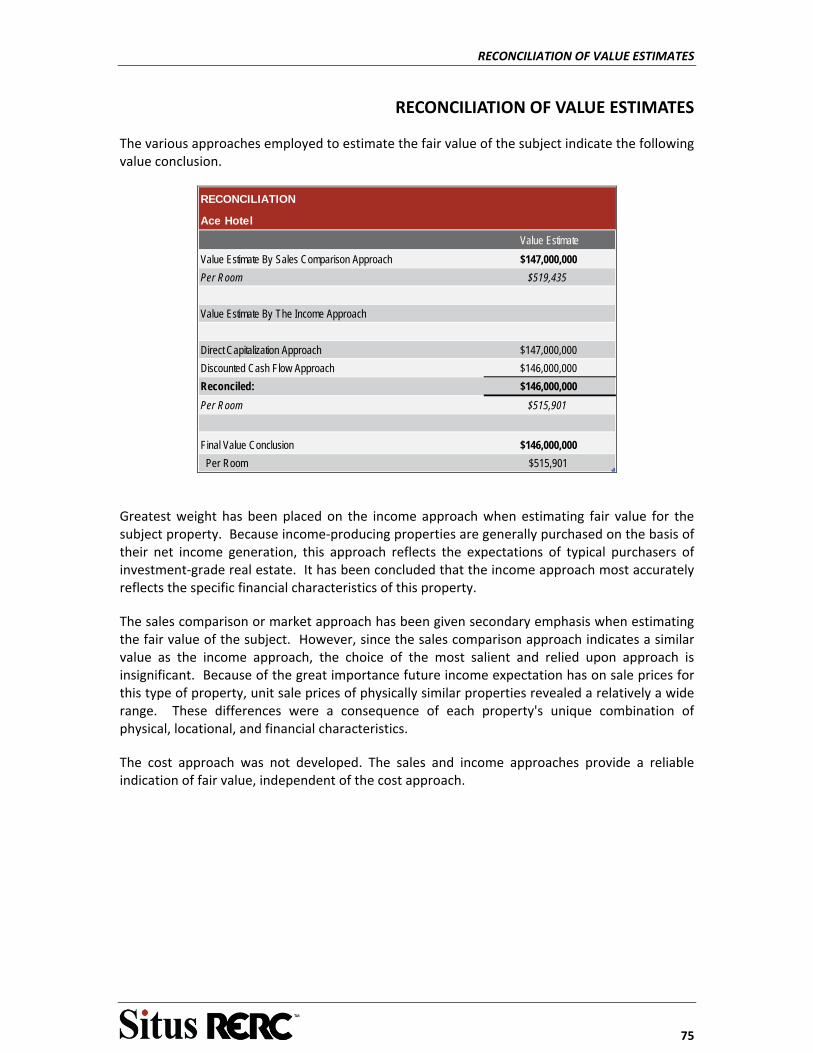
RECONCILIATION OF VALUE ESTIMATES
75
RECONCILIATION OF VALUE ESTIMATES
The various approaches employed to estimate the fair value of the subject indicate the following value conclusion.
Value Estimate
Value Estimate By Sales Comparison Approach $147,000,000
Per Room $519,435
Value Estimate By The Income Approach
Direct Capitalization Approach $147,000,000
Discounted Cash Flow Approach $146,000,000
Reconciled: $146,000,000
Per Room $515,901
Final Value Conclusion $146,000,000
Per Room $515,901
RECONCILIATION
Ace Hotel
Greatest weight has been placed on the income approach when estimating fair value for the subject property. Because income‐producing properties are generally purchased on the basis of their net income generation, this approach reflects the expectations of typical purchasers of investment‐grade real estate. It has been concluded that the income approach most accurately reflects the specific financial characteristics of this property.
The sales comparison or market approach has been given secondary emphasis when estimating the fair value of the subject. However, since the sales comparison approach indicates a similar value as the income approach, the choice of the most salient and relied upon approach is insignificant. Because of the great importance future income expectation has on sale prices for this type of property, unit sale prices of physically similar properties revealed a relatively a wide range. These differences were a consequence of each property's unique combination of physical, locational, and financial characteristics.
The cost approach was not developed. The sales and income approaches provide a reliable indication of fair value, independent of the cost approach.
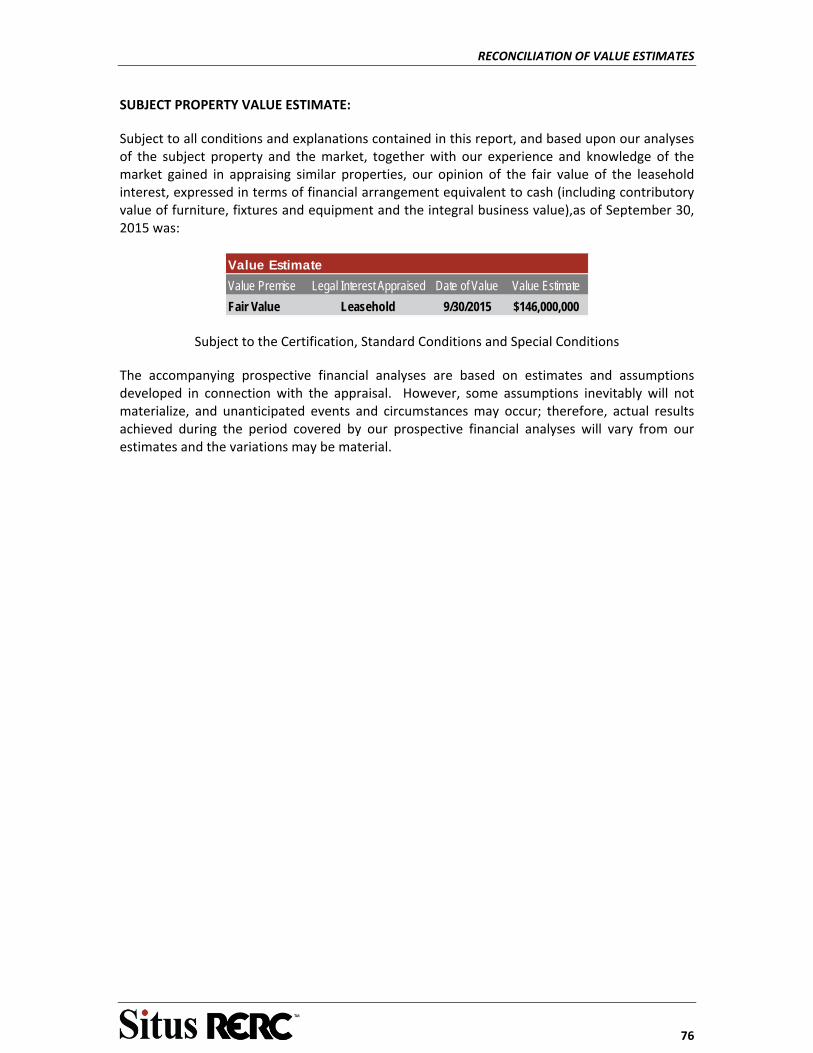
RECONCILIATION OF VALUE ESTIMATES
76
SUBJECT PROPERTY VALUE ESTIMATE:
Subject to all conditions and explanations contained in this report, and based upon our analyses of the subject property and the market, together with our experience and knowledge of the market gained in appraising similar properties, our opinion of the fair value of the leasehold interest, expressed in terms of financial arrangement equivalent to cash (including contributory value of furniture, fixtures and equipment and the integral business value),as of September 30, 2015 was:
Value Estimate
Value Premise Legal Interest Appraised Date of Value Value Estimate
Fair Value Leasehold 9/30/2015 $146,000,000
Subject to the Certification, Standard Conditions and Special Conditions
The accompanying prospective financial analyses are based on estimates and assumptions developed in connection with the appraisal. However, some assumptions inevitably will not materialize, and unanticipated events and circumstances may occur; therefore, actual results achieved during the period covered by our prospective financial analyses will vary from our estimates and the variations may be material.
CERTIFICATION
77
CERTIFICATION
I certify that, to the best of our knowledge and belief: ‐ The statements of fact contained in this report are true and correct. ‐ The reported analyses, opinions, and conclusions are limited only by the reported assumptions and limiting conditions and is my personal, impartial, and unbiased professional analyses, opinions, and conclusions. ‐ I have no present or prospective interest in the property that is the subject of this report and no personal interest with respect to the parties involved. ‐ I have no bias with respect to the property that is the subject of this report or to the parties involved with this assignment. ‐ My engagement in this assignment was not contingent upon developing or reporting predetermined results. ‐ My compensation for completing this assignment is not contingent upon the development or reporting of a predetermined value or direction in value that favors the cause of the client, the amount of the value opinion, the attainment of a stipulated result, or the occurrence of a subsequent event directly related to the intended use of this appraisal. ‐ Lev Yagudayev, MAI has visited and observed the subject property.. ‐ Roiy Guy provided significant real property appraisal assistance to the person signing this certification. ‐ The reported analyses, opinions, and conclusions were developed, and this report has been prepared, in conformity with the Code of Professional Ethics and Standards of Professional Appraisal Practice of the Appraisal Institute, which includes the Uniform Standards of Professional Appraisal Practice. ‐ The use of this report is subject to the requirements of the Appraisal Institute relating to review by its duly authorized representatives. ‐ I have not performed a previous appraisal or other real estate service related to the subject property within the three years prior to this assignment. ‐ As of the date of this report, Lev Yagudayev, MAI has completed the continuing education program for designated members of the Appraisal Institute. RERC ‐‐‐‐‐‐‐‐‐‐‐‐‐‐‐‐‐‐‐‐‐‐‐‐‐‐‐‐‐‐‐‐‐‐‐‐‐‐‐‐‐‐‐‐‐‐ Lev Yagudayev, MAI Director 152 East 52nd Street, Suite 4002 New York, NY 10022 (212) 294‐1376 New York Certified Appraiser License Number: 46000044217 Expiration: March 6, 2017

ADDENDA
ADDENDA
ASSUMPTIONS AND LIMITING CONDITIONS
This appraisal report has been based on, and is subject to, the following general assumptions and limiting conditions: The value reported is only applicable to the purpose, function, and terms stated in this
report and shall not be used for any other purpose.
The appraisers have assumed that the reader (s) of this report is well versed in real estate and is a sophisticated and knowledgeable business person(s).
No responsibility is assumed for the legal description provided or for matters pertaining to legal or title considerations. Title to the property is assumed to be good and marketable unless otherwise stated. The property is appraised free and clear of any or all liens or encumbrances unless otherwise stated. It is assumed that the use of the land and improvements is confined within the boundaries or property lines of the property described and that there is no encroachment or trespass unless noted in the report.
Responsible ownership and competent property management are assumed. The information furnished by others is believed to be reliable, but no warranty is given for
its accuracy. All engineering studies are assumed to be correct. The plot plans and illustrative material in
this report are included only to help the reader visualize the property. It is assumed that there are no hidden or unapparent conditions of the property, subsoil, or
structures that render it more or less valuable. No responsibility is assumed for such conditions or for obtaining the engineering studies that may be required to discover them.
It is assumed that the property is in full compliance with all applicable federal, state, and
local environmental regulations and laws unless the lack of compliance is stated, described and considered in the appraisal report. It is assumed that all required licenses, certificates of occupancy, consents, and other legislative or administrative authority from any local, state, or national government or private entity or organization have been or can be obtained or renewed for any use on which the value estimate contained in this report is based.
It is assumed that the property conforms to all applicable zoning and use regulations and
restrictions unless nonconformity has been identified, described and considered in the appraisal report.
The appraisers shall not be required to give testimony as a witness or to appear in any
capacity in any legal or administrative hearing or procedure, or to have any continued service responsibility unless compensated, by the engager of this report, in advance, according to their fee schedule then in effect.
Unless otherwise stated in this report, the existence of hazardous materials, which may or
may not be present on the property, was not observed by the appraiser. The appraiser has no knowledge of the existence of such material on or in the property. The appraiser, however, is not qualified to detect such substances. The presence of substances such as asbestos, urea‐formaldehyde foam insulation and other potentially hazardous materials may affect the value of the property. The value estimated is predicated on the assumption that there are no such material on or in the property that would cause a loss in value. No responsibility is assumed for such conditions or for any expertise or engineering knowledge required to discover them. The client is urged to retain an expert in this field, if desired.
ADDENDA
The Appraisers are not engineers, no warranties are made by references to physical
property characteristics in terms of quality, condition, cost, suitability, soil conditions, flood risk, obsolescence, etc., and no liability is assumed for any engineering‐related issues.
Possession of this report or a copy thereof does not imply right of publication, nor use for
any purpose by any other than the person to whom it is addressed, without the written consent of RERC.
The liability of RERC, and its employees is limited to the client. This appraisal was prepared
specifically for our client, to whom this appraisal was addressed. The Client acknowledges that the Consultant is a corporation and agrees that any claim
made by the Client arising out of any act or omission of any director, officer, agent, or employee of the Consultant, in the execution or performance of its contractual or professional responsibilities shall be made solely against the Consultant in its corporate capacity and not against any such director, officer, agent or employee.
Cash flow projections are forecasts of estimated future operating characteristics and are
predicated on the information and assumptions contained within the appraisal report. The achievement of the financial projections will be affected by fluctuating economic conditions and is dependent upon other future occurrences that cannot be assured. Actual results may well vary from the projections contained herein. The appraisers do not warrant that these forecasts will occur. Projections may be affected by circumstances beyond the current realm of knowledge or control of the appraisers. The appraisers are not trying to forecast the future but rather are attempting to replicate techniques utilized by market participants for properties similar to the subject.
Notwithstanding anything to the contrary contained herein, this report may also be
provided, for information purposes only and not for reliance in decision make, to potential purchasers of the Note secured by the subject of this appraisal and used in connection with the materials offering for sale the Note or an interest in the note.
The Americans with Disabilities Act ("ADA") became effective January 26, 1992. We have not
made a specific compliance survey and analysis of this property to determine whether or not it is in conformity with the various detailed requirements of the ADA. It is possible that a compliance survey of the property, together with a detailed analysis of the requirements for the ADA, could reveal that the property is not in compliance with one or more of the requirements of the Act. If so, this fact could have a negative effect upon the value of the property. Since we have no direct evidence relating to this issue, we did not consider possible non‐compliance with the requirements of the ADA in estimating the value of the property
ADDENDA
Present Value of Contractual Lease Payments Please note at the Client’s request we calculated the present value of the potential contractual ground lease payments. Our calculation DOES NOT necessarily represent the fair value of the leased fee interest to the land owner.
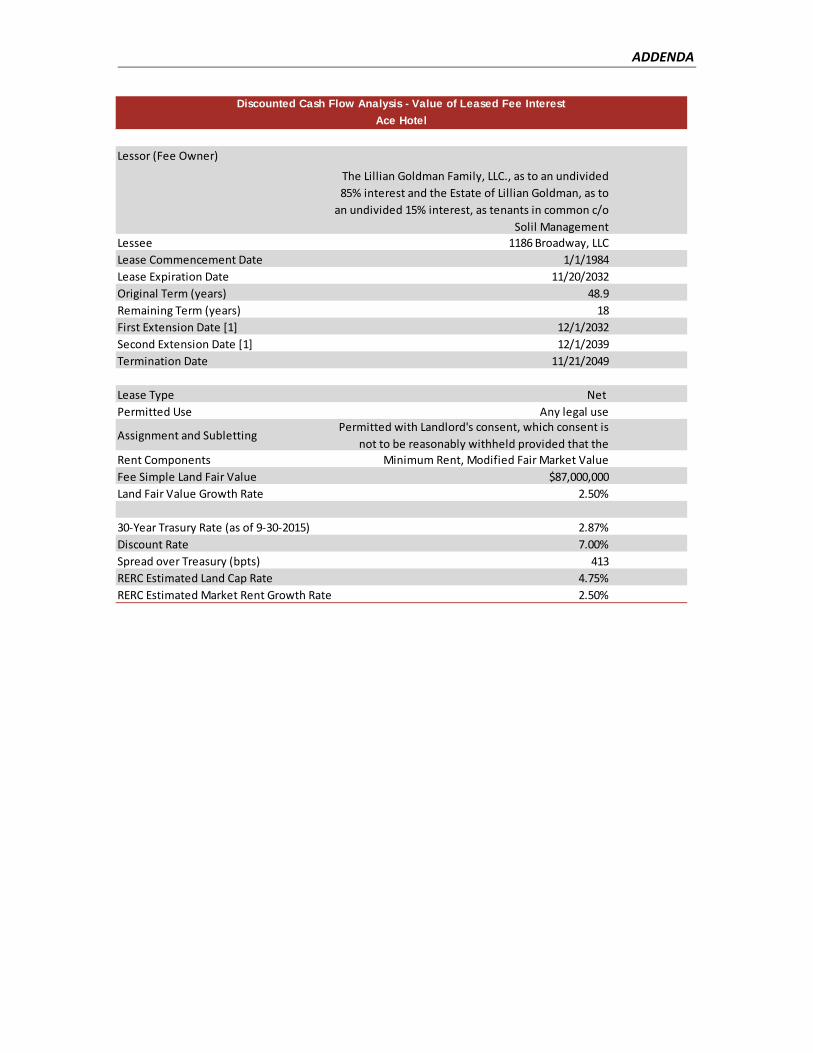
ADDENDA
Lessor (Fee Owner)
Lessee 1186 Broadway, LLC
Lease Commencement Date 1/1/1984
Lease Expiration Date 11/20/2032
Original Term (years) 48.9
Remaining Term (years) 18
First Extension Date [1] 12/1/2032
Second Extension Date [1] 12/1/2039
Termination Date 11/21/2049
Lease Type Net
Permitted Use Any legal use
Assignment and Subletting
Rent Components Minimum Rent, Modified Fair Market Value
Fee Simple Land Fair Value $87,000,000
Land Fair Value Growth Rate 2.50%
30‐Year Trasury Rate (as of 9‐30‐2015) 2.87%
Discount Rate 7.00%
Spread over Treasury (bpts) 413
RERC Estimated Land Cap Rate 4.75%
RERC Estimated Market Rent Growth Rate 2.50%
Discounted Cash Flow Analysis - Value of Leased Fee Interest
Ace Hotel
The Lillian Goldman Family, LLC., as to an undivided
85% interest and the Estate of Lillian Goldman, as to
an undivided 15% interest, as tenants in common c/o
Solil Management
Permitted with Landlord's consent, which consent is
not to be reasonably withheld provided that the
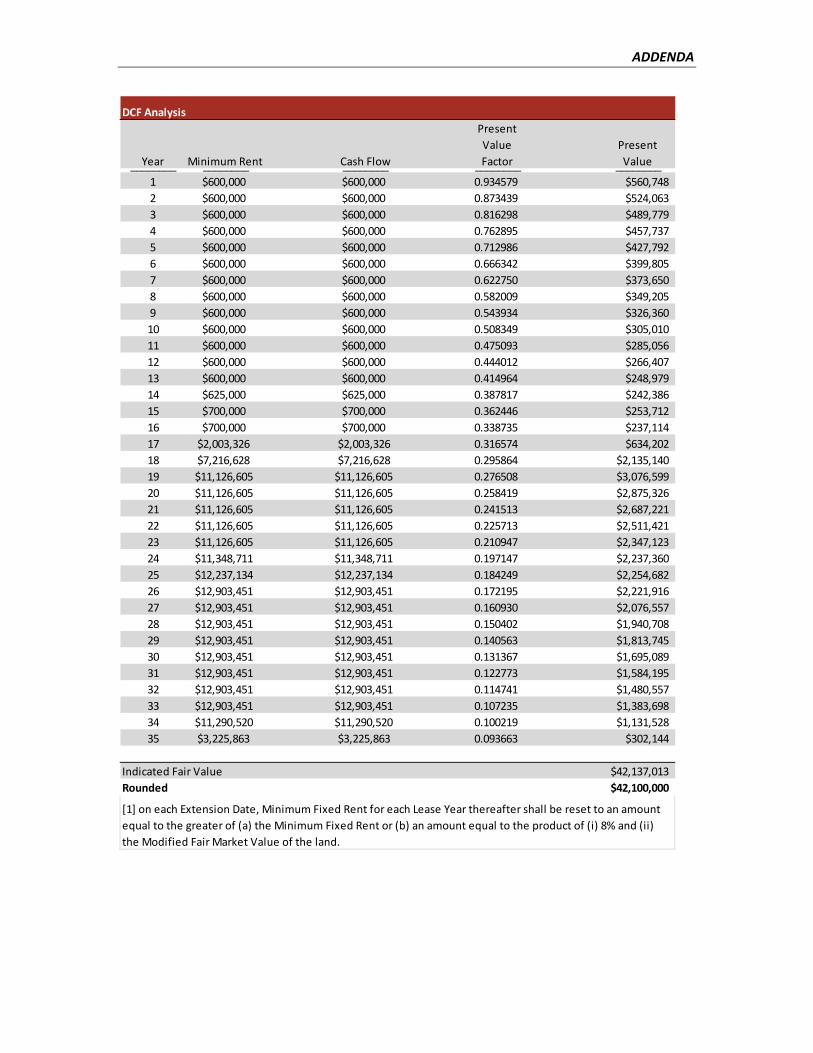
ADDENDA
DCF Analysis
Year Minimum Rent Cash Flow
Present
Value
Factor
Present
Value________ ________ ________ ________ ________
1 $600,000 $600,000 0.934579 $560,748
2 $600,000 $600,000 0.873439 $524,063
3 $600,000 $600,000 0.816298 $489,779
4 $600,000 $600,000 0.762895 $457,737
5 $600,000 $600,000 0.712986 $427,792
6 $600,000 $600,000 0.666342 $399,805
7 $600,000 $600,000 0.622750 $373,650
8 $600,000 $600,000 0.582009 $349,205
9 $600,000 $600,000 0.543934 $326,360
10 $600,000 $600,000 0.508349 $305,010
11 $600,000 $600,000 0.475093 $285,056
12 $600,000 $600,000 0.444012 $266,407
13 $600,000 $600,000 0.414964 $248,979
14 $625,000 $625,000 0.387817 $242,386
15 $700,000 $700,000 0.362446 $253,712
16 $700,000 $700,000 0.338735 $237,114
17 $2,003,326 $2,003,326 0.316574 $634,202
18 $7,216,628 $7,216,628 0.295864 $2,135,140
19 $11,126,605 $11,126,605 0.276508 $3,076,599
20 $11,126,605 $11,126,605 0.258419 $2,875,326
21 $11,126,605 $11,126,605 0.241513 $2,687,221
22 $11,126,605 $11,126,605 0.225713 $2,511,421
23 $11,126,605 $11,126,605 0.210947 $2,347,123
24 $11,348,711 $11,348,711 0.197147 $2,237,360
25 $12,237,134 $12,237,134 0.184249 $2,254,682
26 $12,903,451 $12,903,451 0.172195 $2,221,916
27 $12,903,451 $12,903,451 0.160930 $2,076,557
28 $12,903,451 $12,903,451 0.150402 $1,940,708
29 $12,903,451 $12,903,451 0.140563 $1,813,745
30 $12,903,451 $12,903,451 0.131367 $1,695,089
31 $12,903,451 $12,903,451 0.122773 $1,584,195
32 $12,903,451 $12,903,451 0.114741 $1,480,557
33 $12,903,451 $12,903,451 0.107235 $1,383,698
34 $11,290,520 $11,290,520 0.100219 $1,131,528
35 $3,225,863 $3,225,863 0.093663 $302,144
Indicated Fair Value $42,137,013
Rounded $42,100,000
[1] on each Extension Date, Minimum Fixed Rent for each Lease Year thereafter shall be reset to an amount
equal to the greater of (a) the Minimum Fixed Rent or (b) an amount equal to the product of (i) 8% and (ii)
the Modified Fair Market Value of the land.

ADDENDA
Subject Photographs

ADDENDA
Exterior View of the Subject Lobby/Bar Area
Guest Hallway Typical Staircase
Trendy Room Design Bathroom Design
ADDENDA
Residential and Commercial Rent Roll
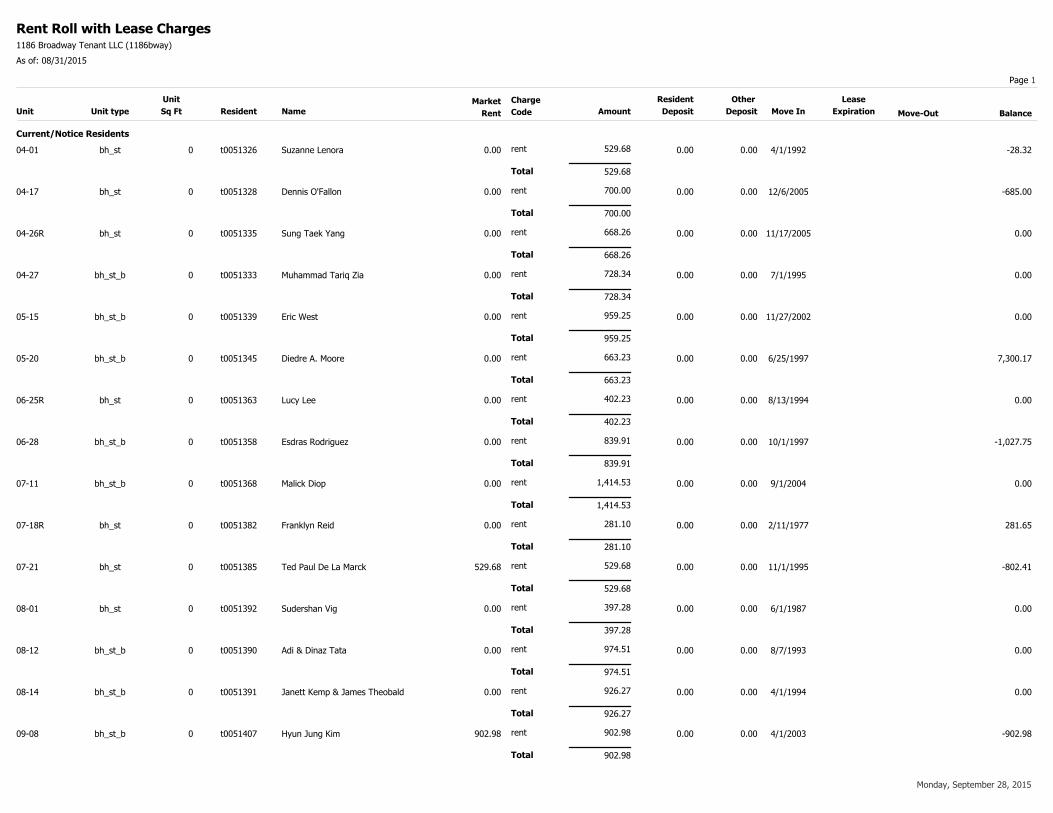
Rent Roll with Lease Charges1186 Broadway Tenant LLC (1186bway)
As of: 08/31/2015
Page 1
Move-Out
Lease
Expiration
Other
Deposit BalanceAmount
Charge
Code
Market
Rent
Unit
Sq Ft
Resident
DepositNameResidentUnit typeUnit Move In
Current/Notice Residents
04-01 bh_st t0051326 Suzanne Lenora 0 0.00 0.00 4/1/1992 0.00 -28.32 529.68rent
529.68Total
04-17 bh_st t0051328 Dennis O'Fallon 0 0.00 0.00 12/6/2005 0.00 -685.00 700.00rent
700.00Total
04-26R bh_st t0051335 Sung Taek Yang 0 0.00 0.00 11/17/2005 0.00 0.00 668.26rent
668.26Total
04-27 bh_st_b t0051333 Muhammad Tariq Zia 0 0.00 0.00 7/1/1995 0.00 0.00 728.34rent
728.34Total
05-15 bh_st_b t0051339 Eric West 0 0.00 0.00 11/27/2002 0.00 0.00 959.25rent
959.25Total
05-20 bh_st_b t0051345 Diedre A. Moore 0 0.00 0.00 6/25/1997 0.00 7,300.17 663.23rent
663.23Total
06-25R bh_st t0051363 Lucy Lee 0 0.00 0.00 8/13/1994 0.00 0.00 402.23rent
402.23Total
06-28 bh_st_b t0051358 Esdras Rodriguez 0 0.00 0.00 10/1/1997 0.00 -1,027.75 839.91rent
839.91Total
07-11 bh_st_b t0051368 Malick Diop 0 0.00 0.00 9/1/2004 0.00 0.00 1,414.53rent
1,414.53Total
07-18R bh_st t0051382 Franklyn Reid 0 0.00 0.00 2/11/1977 0.00 281.65 281.10rent
281.10Total
07-21 bh_st t0051385 Ted Paul De La Marck 0 529.68 0.00 11/1/1995 0.00 -802.41 529.68rent
529.68Total
08-01 bh_st t0051392 Sudershan Vig 0 0.00 0.00 6/1/1987 0.00 0.00 397.28rent
397.28Total
08-12 bh_st_b t0051390 Adi & Dinaz Tata 0 0.00 0.00 8/7/1993 0.00 0.00 974.51rent
974.51Total
08-14 bh_st_b t0051391 Janett Kemp & James Theobald 0 0.00 0.00 4/1/1994 0.00 0.00 926.27rent
926.27Total
09-08 bh_st_b t0051407 Hyun Jung Kim 0 902.98 0.00 4/1/2003 0.00 -902.98 902.98rent
902.98Total
Monday, September 28, 2015
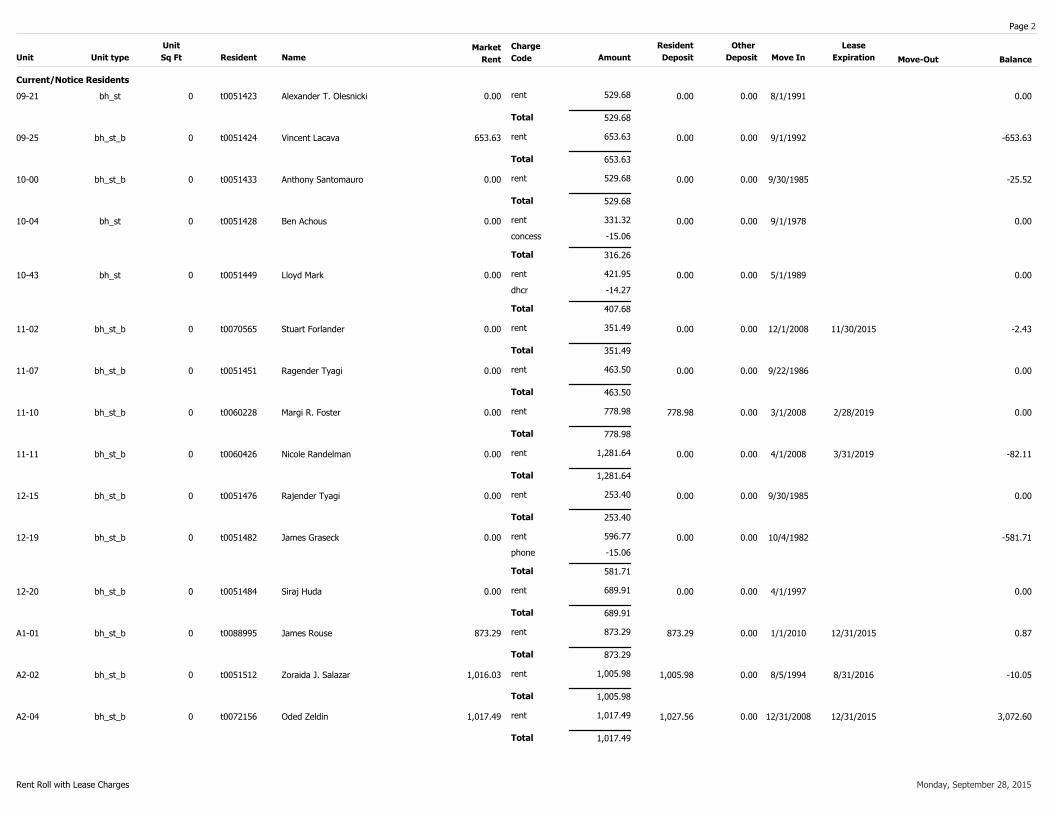
Page 2
Move-Out
Lease
Expiration
Other
Deposit BalanceAmount
Charge
Code
Market
Rent
Unit
Sq Ft
Resident
DepositNameResidentUnit typeUnit Move In
Current/Notice Residents
09-21 bh_st t0051423 Alexander T. Olesnicki 0 0.00 0.00 8/1/1991 0.00 0.00 529.68rent
529.68Total
09-25 bh_st_b t0051424 Vincent Lacava 0 653.63 0.00 9/1/1992 0.00 -653.63 653.63rent
653.63Total
10-00 bh_st_b t0051433 Anthony Santomauro 0 0.00 0.00 9/30/1985 0.00 -25.52 529.68rent
529.68Total
10-04 bh_st t0051428 Ben Achous 0 0.00 0.00 9/1/1978 0.00 0.00 331.32rent
-15.06concess
316.26Total
10-43 bh_st t0051449 Lloyd Mark 0 0.00 0.00 5/1/1989 0.00 0.00 421.95rent
-14.27dhcr
407.68Total
11-02 bh_st_b t0070565 Stuart Forlander 0 0.00 0.00 12/1/2008 11/30/2015 0.00 -2.43 351.49rent
351.49Total
11-07 bh_st_b t0051451 Ragender Tyagi 0 0.00 0.00 9/22/1986 0.00 0.00 463.50rent
463.50Total
11-10 bh_st_b t0060228 Margi R. Foster 0 0.00 778.98 3/1/2008 2/28/2019 0.00 0.00 778.98rent
778.98Total
11-11 bh_st_b t0060426 Nicole Randelman 0 0.00 0.00 4/1/2008 3/31/2019 0.00 -82.11 1,281.64rent
1,281.64Total
12-15 bh_st_b t0051476 Rajender Tyagi 0 0.00 0.00 9/30/1985 0.00 0.00 253.40rent
253.40Total
12-19 bh_st_b t0051482 James Graseck 0 0.00 0.00 10/4/1982 0.00 -581.71 596.77rent
-15.06phone
581.71Total
12-20 bh_st_b t0051484 Siraj Huda 0 0.00 0.00 4/1/1997 0.00 0.00 689.91rent
689.91Total
A1-01 bh_st_b t0088995 James Rouse 0 873.29 873.29 1/1/2010 12/31/2015 0.00 0.87 873.29rent
873.29Total
A2-02 bh_st_b t0051512 Zoraida J. Salazar 0 1,016.03 1,005.98 8/5/1994 8/31/2016 0.00 -10.05 1,005.98rent
1,005.98Total
A2-04 bh_st_b t0072156 Oded Zeldin 0 1,017.49 1,027.56 12/31/2008 12/31/2015 0.00 3,072.60 1,017.49rent
1,017.49Total
Rent Roll with Lease Charges Monday, September 28, 2015
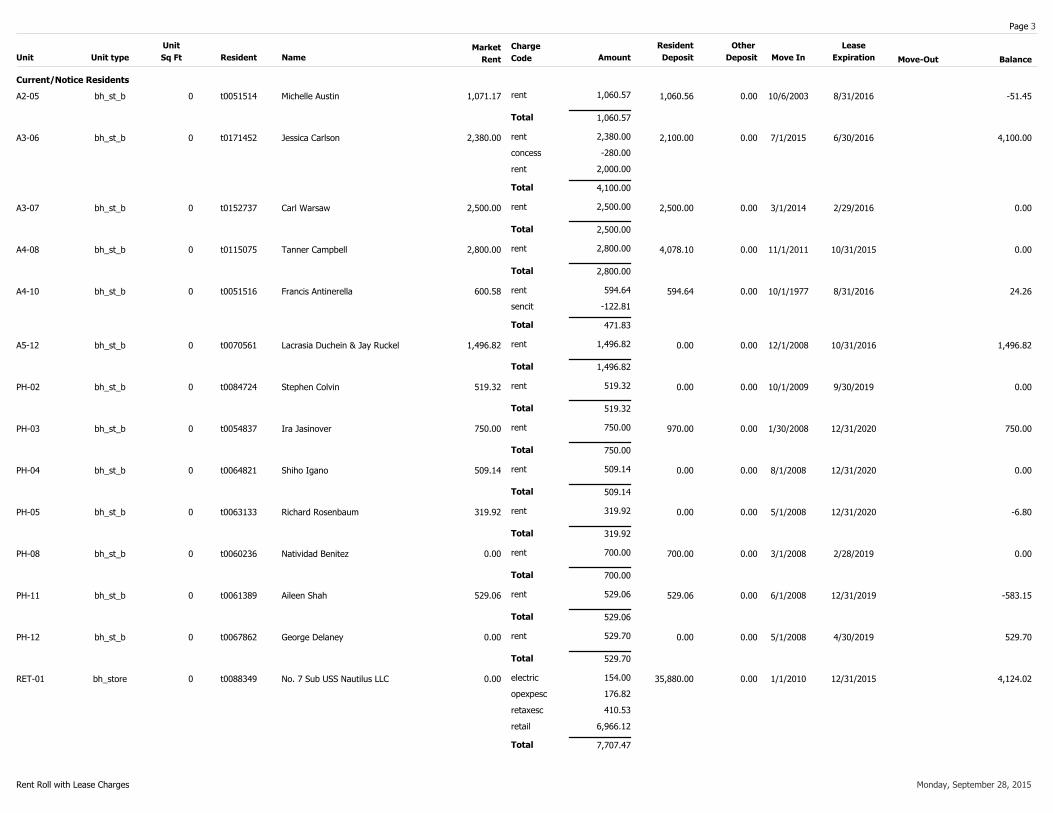
Page 3
Move-Out
Lease
Expiration
Other
Deposit BalanceAmount
Charge
Code
Market
Rent
Unit
Sq Ft
Resident
DepositNameResidentUnit typeUnit Move In
Current/Notice Residents
A2-05 bh_st_b t0051514 Michelle Austin 0 1,071.17 1,060.56 10/6/2003 8/31/2016 0.00 -51.45 1,060.57rent
1,060.57Total
A3-06 bh_st_b t0171452 Jessica Carlson 0 2,380.00 2,100.00 7/1/2015 6/30/2016 0.00 4,100.00 2,380.00rent
-280.00concess
2,000.00rent
4,100.00Total
A3-07 bh_st_b t0152737 Carl Warsaw 0 2,500.00 2,500.00 3/1/2014 2/29/2016 0.00 0.00 2,500.00rent
2,500.00Total
A4-08 bh_st_b t0115075 Tanner Campbell 0 2,800.00 4,078.10 11/1/2011 10/31/2015 0.00 0.00 2,800.00rent
2,800.00Total
A4-10 bh_st_b t0051516 Francis Antinerella 0 600.58 594.64 10/1/1977 8/31/2016 0.00 24.26 594.64rent
-122.81sencit
471.83Total
A5-12 bh_st_b t0070561 Lacrasia Duchein & Jay Ruckel 0 1,496.82 0.00 12/1/2008 10/31/2016 0.00 1,496.82 1,496.82rent
1,496.82Total
PH-02 bh_st_b t0084724 Stephen Colvin 0 519.32 0.00 10/1/2009 9/30/2019 0.00 0.00 519.32rent
519.32Total
PH-03 bh_st_b t0054837 Ira Jasinover 0 750.00 970.00 1/30/2008 12/31/2020 0.00 750.00 750.00rent
750.00Total
PH-04 bh_st_b t0064821 Shiho Igano 0 509.14 0.00 8/1/2008 12/31/2020 0.00 0.00 509.14rent
509.14Total
PH-05 bh_st_b t0063133 Richard Rosenbaum 0 319.92 0.00 5/1/2008 12/31/2020 0.00 -6.80 319.92rent
319.92Total
PH-08 bh_st_b t0060236 Natividad Benitez 0 0.00 700.00 3/1/2008 2/28/2019 0.00 0.00 700.00rent
700.00Total
PH-11 bh_st_b t0061389 Aileen Shah 0 529.06 529.06 6/1/2008 12/31/2019 0.00 -583.15 529.06rent
529.06Total
PH-12 bh_st_b t0067862 George Delaney 0 0.00 0.00 5/1/2008 4/30/2019 0.00 529.70 529.70rent
529.70Total
RET-01 bh_store t0088349 No. 7 Sub USS Nautilus LLC 0 0.00 35,880.00 1/1/2010 12/31/2015 0.00 4,124.02 154.00electric
176.82opexpesc
410.53retaxesc
6,966.12retail
7,707.47Total
Rent Roll with Lease Charges Monday, September 28, 2015

Page 4
Move-Out
Lease
Expiration
Other
Deposit BalanceAmount
Charge
Code
Market
Rent
Unit
Sq Ft
Resident
DepositNameResidentUnit typeUnit Move In
Current/Notice Residents
RET-02 1186comm t0071861 Various Projects, Inc. dba Project No. 8 0 3,550.00 10,650.00 11/26/2008 11/25/2018 0.00 60,661.29 46.86retaxesc
4,115.42retail
4,162.28Total
RET-04 1186comm t0124244 Rudy's New York LLC 0 0.00 0.00 2/1/2012 1/31/2017 0.00 8,394.25 3,108.00retail
2,000.00retail
5,108.00Total
RET-ACE 1186comm t0083701 Attn: Carrington Paek Ace Hotel New York 0 25,000.00 0.00 5/14/2009 0.00 691,763.87 101,154.83retaxesc
101,154.83Total
RET-BRES common t0088020 Breslin Bar & Dining Room 0 0.00 0.00 7/9/2008 12/1/2020 0.00 130,570.33 1,100.88retaxesc
1,100.88Total
RET-ST02 bh_store t0088777 Opening Ceremony 0 0.00 4,287.50 1/1/2010 12/31/2019 0.00 4,958.08 4,970.07retail
706.41retaxesc
5,676.48Total
RET-STMP common t0085308 Stumptown Coffee Roaster Inc 0 0.00 20,000.00 7/9/2008 8/10/2020 0.00 18,669.92 552.56retaxesc
351.64opexpesc
904.20Total
100.00
0.00
Current/Notice Res.
Future Residents/Applicants
Square
Footage
Market
Rent
Security
Deposit
Other
Deposit
# of
Units
Unit
Occupancy
Occupied Units
Vacant Units
Totals:
concess -295.06
dhcr -14.27
electric 154.00
opexpesc 528.46
87,035.67
0.00
0.00
0.00
0.00
0.00
47,019.11
0.00
50
0
100.00 50 0.00 87,035.67 47,019.11 0.00
Summary of Charges by Charge Code (Current/Notice residents only)
Lease
Charges
162,752.07
0.00
162,752.07
Balance
931,254.52
0.00
931,254.52
SqFt
Occupancy
0.00
0.00
0.00
0.00 0.00 0 0.00 0.00Total Non Rev Units
Rent Roll with Lease Charges Monday, September 28, 2015
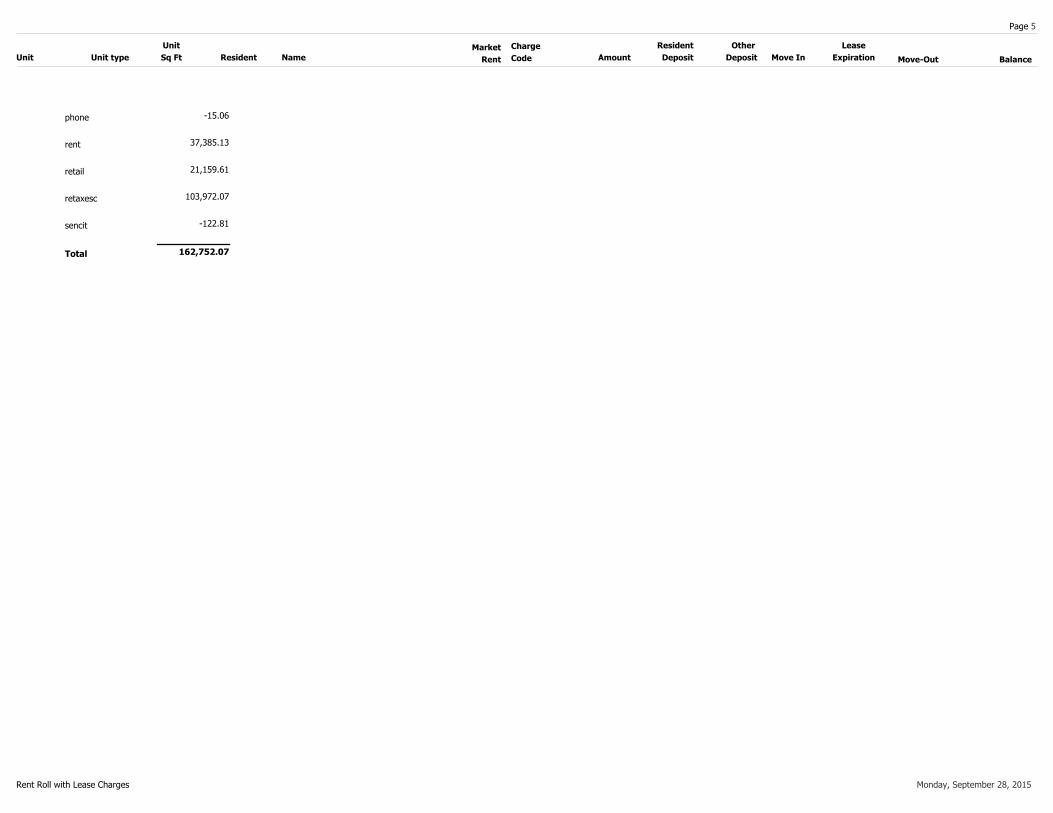
Page 5
Move-Out
Lease
Expiration
Other
Deposit BalanceAmount
Charge
Code
Market
Rent
Unit
Sq Ft
Resident
DepositNameResidentUnit typeUnit Move In
phone -15.06
rent 37,385.13
retail 21,159.61
retaxesc 103,972.07
sencit -122.81
Total 162,752.07
Rent Roll with Lease Charges Monday, September 28, 2015
ADDENDA
STR Report
United Kingdom United StatesBlue Fin Building 735 East Main Street
110 Southwark Street HendersonvilleLondon SE1 0TA TN 37075
Phone: +44 (0)20 7922 1930 Phone: +1 (615) 824 8664Fax: +44 (0)20 7922 1931 Fax: +1 (615) 824 3848
www.strglobal.com www.str.com
Ace Hotel New York Monthly STAR Report
STR #: 58097 Date Created: September 17, 2015
TabTable of Contents 1Monthly Performance at a Glance 2STAR Summary 3Competitive Set Report 4Response Report 5Day of Week & Weekday/Weekend 6Daily Data for the Month 7Segmentation at a Glance 8Segmentation Occupancy Analysis 9Segmentation ADR Analysis 10Segmentation RevPAR Analysis 11Segmentation Index Analysis 12Segmentation Ranking Analysis 13Segmentation Day Of Week - Current Month 14Segmentation Day Of Week - Year to Date 15Segmentation Day Of Week - Running 3 Month 16Segmentation Day Of Week - Running 12 Month 17Additional Revenue ADR Analysis (TrevPOR) 18Additional Revenue RevPAR Analysis (TrevPAR) 19Segmentation Response Report 20Submit Data 21Monthly Performance at a Glance - 2nd Comp 22STAR Summary - 2nd Comp 23Competitive Set Report - 2nd Comp 24Response Report - 2nd Comp 25Day of Week & Weekday/Weekend - 2nd Comp 26Daily Data for the Month - 2nd Comp 27Segmentation at a Glance - 2nd Comp 28Segmentation Occupancy Analysis - 2nd Comp 29Segmentation ADR Analysis - 2nd Comp 30Segmentation RevPAR Analysis - 2nd Comp 31Segmentation Index Analysis - 2nd Comp 32Segmentation Ranking Analysis - 2nd Comp 33Segmentation Day Of Week - Current Month - 2nd Comp 34Segmentation Day Of Week - Year to Date - 2nd Comp 35Segmentation Day Of Week - Running 3 Month - 2nd Comp 36Segmentation Day Of Week - Running 12 Month - 2nd Comp 37Additional Revenue ADR Analysis (TrevPOR) - 2nd Comp 38Additional Revenue RevPAR Analysis (TrevPAR) - 2nd Comp 39Segmentation Response Report - 2nd Comp 40Help 41
For the Month of: August 2015Competitive Set Data Includes Subject Property
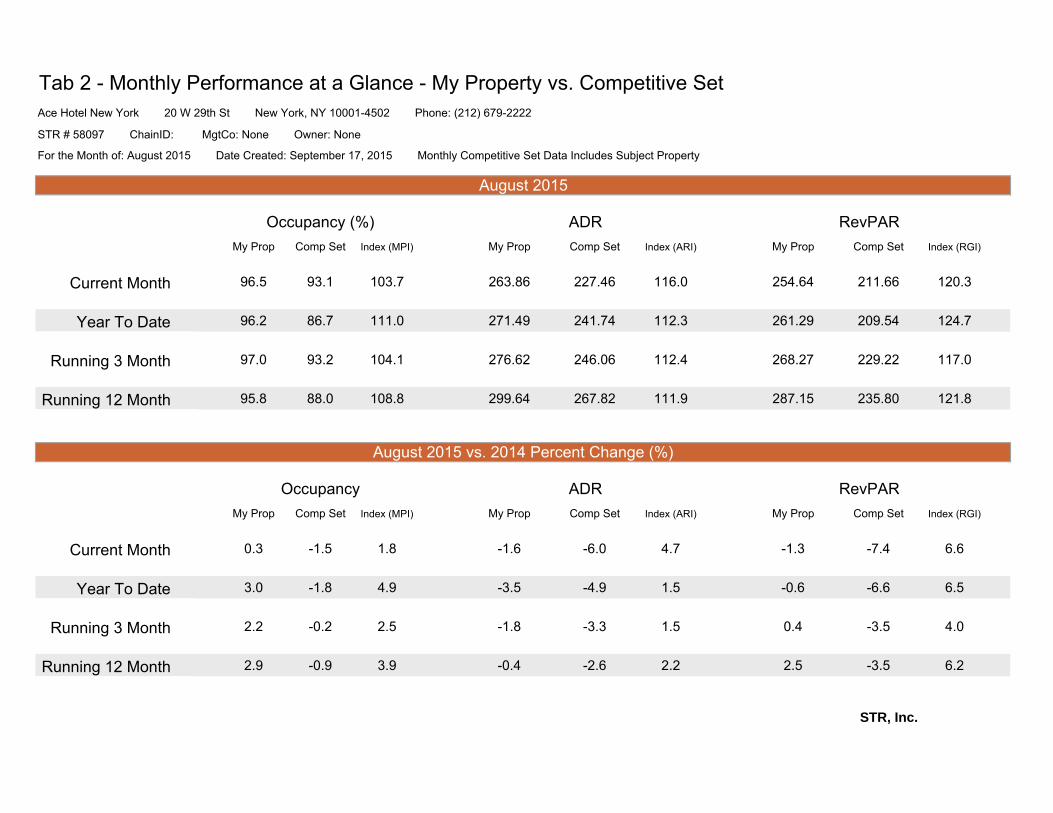
Tab 2 - Monthly Performance at a Glance - My Property vs. Competitive Set
My Prop Comp Set Index (MPI) My Prop Comp Set Index (ARI) My Prop Comp Set Index (RGI)
Current Month 96.5 93.1 103.7 263.86 227.46 116.0 254.64 211.66 120.3
Year To Date 96.2 86.7 111.0 271.49 241.74 112.3 261.29 209.54 124.7
Running 3 Month 97.0 93.2 104.1 276.62 246.06 112.4 268.27 229.22 117.0
Running 12 Month 95.8 88.0 108.8 299.64 267.82 111.9 287.15 235.80 121.8
My Prop Comp Set Index (MPI) My Prop Comp Set Index (ARI) My Prop Comp Set Index (RGI)
Current Month 0.3 -1.5 1.8 -1.6 -6.0 4.7 -1.3 -7.4 6.6
Year To Date 3.0 -1.8 4.9 -3.5 -4.9 1.5 -0.6 -6.6 6.5
Running 3 Month 2.2 -0.2 2.5 -1.8 -3.3 1.5 0.4 -3.5 4.0
Running 12 Month 2.9 -0.9 3.9 -0.4 -2.6 2.2 2.5 -3.5 6.2
STR, Inc.
Occupancy (%) ADR RevPAR
Ace Hotel New York 20 W 29th St New York, NY 10001-4502 Phone: (212) 679-2222
STR # 58097 ChainID: MgtCo: None Owner: None
For the Month of: August 2015 Date Created: September 17, 2015 Monthly Competitive Set Data Includes Subject Property
ADR RevPAROccupancy
August 2015
August 2015 vs. 2014 Percent Change (%)

Tab 3 - STAR Summary - My Property vs. Comp Set and Industry Segments
96.5 0.3 96.2 3.0 97.0 2.2 95.8 2.9 0.4 -1.7 -1.2 -1.3
87.7 -2.4 83.7 -0.3 88.9 0.3 84.6 0.1 3.4 3.0 2.9 3.8
88.5 -2.4 84.8 -0.9 90.5 0.6 86.0 -0.1 2.3 1.6 1.2 2.1
87.3 -4.0 84.4 -2.0 89.1 -0.2 85.3 -1.5 6.3 5.3 5.4 5.4
86.0 -5.9 84.3 -2.8 88.2 -2.2 85.7 -1.4 10.7 10.1 9.9 11.5
93.1 -1.5 86.7 -1.8 93.2 -0.2 88.0 -0.9 0.3 0.2 0.3 0.3
263.86 -1.6 271.49 -3.5 276.62 -1.8 299.64 -0.4 0.7 1.2 1.0 1.6
232.76 -3.3 238.39 -2.1 247.52 -0.3 259.74 -0.7 0.9 2.7 3.3 3.9
247.73 -3.0 255.00 -2.4 263.40 -0.6 277.95 -1.0 -0.2 0.7 1.8 2.0
236.39 -3.1 241.79 -1.7 251.59 -0.5 262.27 -0.4 2.1 3.2 5.2 3.9
251.88 -1.8 256.34 -2.5 266.76 -0.1 276.43 -1.8 4.1 7.0 7.4 10.0
227.46 -6.0 241.74 -4.9 246.06 -3.3 267.82 -2.6 -1.2 -1.6 0.0 -0.6
254.64 -1.3 261.29 -0.6 268.27 0.4 287.15 2.5 -0.9 -2.3 -0.8 1.2
204.06 -5.6 199.49 -2.4 220.12 0.0 219.69 -0.6 -2.4 0.5 3.0 3.2
219.22 -5.3 216.22 -3.2 238.49 0.0 238.97 -1.0 -3.1 -1.7 1.2 1.0
206.39 -7.0 203.98 -3.7 224.28 -0.6 223.63 -1.9 -1.1 1.5 4.7 3.4
216.69 -7.7 216.03 -5.2 235.23 -2.3 236.81 -3.2 2.2 4.4 7.3 8.0
211.66 -7.4 209.54 -6.6 229.22 -3.5 235.80 -3.5 -7.1 -6.4 -3.2 -3.2
Rooms Rooms
115795 98403 Properties
32153 30357 91
29581 24135
13527 12619
2565 2565
STR, Inc.
For the Month of: August 2015 Date Created: September 17, 2015 Monthly Competitive Set Data Includes Subject Property
STR # 58097 ChainID: MgtCo: None Owner: None
Ace Hotel New York 20 W 29th St New York, NY 10001-4502 Phone: (212) 679-2222
Tract Scale: Upscale Chains
Tract: Lower Manhattan, NY
Market Class: Upper Upscale Class
Market: New York, NY
YTD % ChgRun 12 Mon
% ChgRun 3 Mon %
Chg
Tract: Lower Manhattan, NY
Market Class: Upper Upscale Class
Market: New York, NY
Competitive Set: Competitors
Market Class: Upper Upscale Class
Market: New York, NY
Competitive Set: Competitors
Tract Scale: Upscale Chains
Ace Hotel New York
Market: New York, NY
Competitive Set: Competitors
Tract Scale: Upscale Chains
Tract: Lower Manhattan, NY
Competitive Set: Competitors
Tract Scale: Upscale Chains
Tract: Lower Manhattan, NY
Market Class: Upper Upscale Class 1681510614376
Rooms Properties Rooms
Market: New York, NY
Revenue
Pipeline
Month % Chg
YTD % ChgRun 3 Mon %
ChgRun 12 Mon
% Chg
Supply
Demand
Month % Chg
Month % Chg
YTD % ChgRun 3 Mon %
ChgRun 12 Mon
% ChgCurrent Month
% ChgCurrent Month
% Chg
% Chg
Average Daily Rate
Running 3 Month
% ChgRunning 12
Month
100.0
93.3
Sample %
6
647
176
53
Properties
Sample
98
See Help page for pipeline definitions.
Under ConstructionProperties
6
50
Planning
94.4
Rooms
122
88
Ace Hotel New York
Occupancy (%)
Ace Hotel New York
Year to Date % Chg
% Chg Year to Date
451
81.6
85.0
Running 3 Month
% ChgRunning 12
Month% Chg
Census/Sample - Properties & Rooms
% Chg
Census
% ChgRunning 12
Month
RevPAR
Current Month
% Chg Year to Date % ChgRunning 3
Month
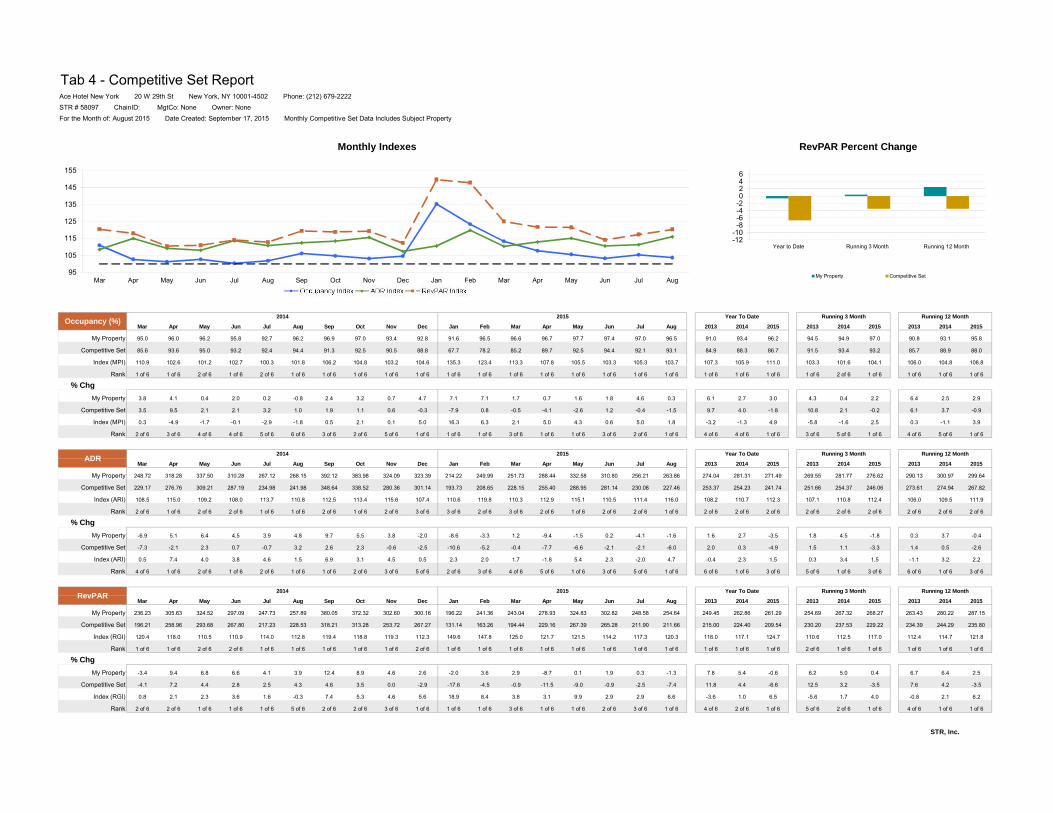
Tab 4 - Competitive Set Report
Mar Apr May Jun Jul Aug Sep Oct Nov Dec Jan Feb Mar Apr May Jun Jul Aug 2013 2014 2015 2013 2014 2015 2013 2014 2015
My Property 95.0 96.0 96.2 95.8 92.7 96.2 96.9 97.0 93.4 92.8 91.6 96.5 96.6 96.7 97.7 97.4 97.0 96.5 91.0 93.4 96.2 94.5 94.9 97.0 90.8 93.1 95.8
Competitive Set 85.6 93.6 95.0 93.2 92.4 94.4 91.3 92.5 90.5 88.8 67.7 78.2 85.2 89.7 92.5 94.4 92.1 93.1 84.9 88.3 86.7 91.5 93.4 93.2 85.7 88.9 88.0
Index (MPI) 110.9 102.6 101.2 102.7 100.3 101.8 106.2 104.8 103.2 104.6 135.3 123.4 113.3 107.8 105.5 103.3 105.3 103.7 107.3 105.9 111.0 103.3 101.6 104.1 106.0 104.8 108.8
Rank 1 of 6 1 of 6 2 of 6 1 of 6 2 of 6 1 of 6 1 of 6 1 of 6 1 of 6 1 of 6 1 of 6 1 of 6 1 of 6 1 of 6 1 of 6 1 of 6 1 of 6 1 of 6 1 of 6 1 of 6 1 of 6 1 of 6 2 of 6 1 of 6 1 of 6 1 of 6 1 of 6
% Chg
My Property 3.8 4.1 0.4 2.0 0.2 -0.8 2.4 3.2 0.7 4.7 7.1 7.1 1.7 0.7 1.6 1.8 4.6 0.3 6.1 2.7 3.0 4.3 0.4 2.2 6.4 2.5 2.9
Competitive Set 3.5 9.5 2.1 2.1 3.2 1.0 1.9 1.1 0.6 -0.3 -7.9 0.8 -0.5 -4.1 -2.6 1.2 -0.4 -1.5 9.7 4.0 -1.8 10.8 2.1 -0.2 6.1 3.7 -0.9
Index (MPI) 0.3 -4.9 -1.7 -0.1 -2.9 -1.8 0.5 2.1 0.1 5.0 16.3 6.3 2.1 5.0 4.3 0.6 5.0 1.8 -3.2 -1.3 4.9 -5.8 -1.6 2.5 0.3 -1.1 3.9
Rank 2 of 6 3 of 6 4 of 6 4 of 6 5 of 6 6 of 6 3 of 6 2 of 6 5 of 6 1 of 6 1 of 6 1 of 6 3 of 6 1 of 6 1 of 6 3 of 6 2 of 6 1 of 6 4 of 6 4 of 6 1 of 6 3 of 6 5 of 6 1 of 6 4 of 6 5 of 6 1 of 6
Mar Apr May Jun Jul Aug Sep Oct Nov Dec Jan Feb Mar Apr May Jun Jul Aug 2013 2014 2015 2013 2014 2015 2013 2014 2015
My Property 248.72 318.28 337.50 310.28 267.12 268.15 392.12 383.98 324.09 323.39 214.22 249.99 251.73 288.44 332.58 310.80 256.21 263.86 274.04 281.31 271.49 269.55 281.77 276.62 290.13 300.97 299.64
Competitive Set 229.17 276.76 309.21 287.19 234.98 241.98 348.64 338.52 280.36 301.14 193.73 208.65 228.15 255.40 288.95 281.14 230.08 227.46 253.37 254.23 241.74 251.66 254.37 246.06 273.61 274.94 267.82
Index (ARI) 108.5 115.0 109.2 108.0 113.7 110.8 112.5 113.4 115.6 107.4 110.6 119.8 110.3 112.9 115.1 110.5 111.4 116.0 108.2 110.7 112.3 107.1 110.8 112.4 106.0 109.5 111.9
Rank 2 of 6 1 of 6 2 of 6 2 of 6 1 of 6 1 of 6 2 of 6 1 of 6 2 of 6 3 of 6 3 of 6 2 of 6 3 of 6 2 of 6 1 of 6 2 of 6 2 of 6 1 of 6 2 of 6 2 of 6 2 of 6 2 of 6 2 of 6 2 of 6 2 of 6 2 of 6 2 of 6
% Chg
My Property -6.9 5.1 6.4 4.5 3.9 4.8 9.7 5.5 3.8 -2.0 -8.6 -3.3 1.2 -9.4 -1.5 0.2 -4.1 -1.6 1.6 2.7 -3.5 1.8 4.5 -1.8 0.3 3.7 -0.4
Competitive Set -7.3 -2.1 2.3 0.7 -0.7 3.2 2.6 2.3 -0.6 -2.5 -10.6 -5.2 -0.4 -7.7 -6.6 -2.1 -2.1 -6.0 2.0 0.3 -4.9 1.5 1.1 -3.3 1.4 0.5 -2.6
Index (ARI) 0.5 7.4 4.0 3.8 4.6 1.5 6.9 3.1 4.5 0.5 2.3 2.0 1.7 -1.8 5.4 2.3 -2.0 4.7 -0.4 2.3 1.5 0.3 3.4 1.5 -1.1 3.2 2.2
Rank 4 of 6 1 of 6 2 of 6 1 of 6 2 of 6 1 of 6 1 of 6 2 of 6 3 of 6 5 of 6 2 of 6 3 of 6 4 of 6 5 of 6 1 of 6 3 of 6 5 of 6 1 of 6 6 of 6 1 of 6 3 of 6 5 of 6 1 of 6 3 of 6 6 of 6 1 of 6 3 of 6
Mar Apr May Jun Jul Aug Sep Oct Nov Dec Jan Feb Mar Apr May Jun Jul Aug 2013 2014 2015 2013 2014 2015 2013 2014 2015
My Property 236.23 305.63 324.52 297.09 247.73 257.89 380.05 372.32 302.60 300.16 196.22 241.36 243.04 278.93 324.83 302.82 248.58 254.64 249.45 262.86 261.29 254.69 267.32 268.27 263.43 280.22 287.15
Competitive Set 196.21 258.96 293.68 267.80 217.23 228.53 318.21 313.28 253.72 267.27 131.14 163.26 194.44 229.16 267.39 265.28 211.90 211.66 215.00 224.40 209.54 230.20 237.53 229.22 234.39 244.29 235.80
Index (RGI) 120.4 118.0 110.5 110.9 114.0 112.8 119.4 118.8 119.3 112.3 149.6 147.8 125.0 121.7 121.5 114.2 117.3 120.3 116.0 117.1 124.7 110.6 112.5 117.0 112.4 114.7 121.8
Rank 1 of 6 1 of 6 2 of 6 2 of 6 1 of 6 1 of 6 1 of 6 1 of 6 1 of 6 2 of 6 1 of 6 1 of 6 1 of 6 1 of 6 1 of 6 1 of 6 1 of 6 1 of 6 1 of 6 1 of 6 1 of 6 2 of 6 1 of 6 1 of 6 1 of 6 1 of 6 1 of 6
% Chg
My Property -3.4 9.4 6.8 6.6 4.1 3.9 12.4 8.9 4.6 2.6 -2.0 3.6 2.9 -8.7 0.1 1.9 0.3 -1.3 7.8 5.4 -0.6 6.2 5.0 0.4 6.7 6.4 2.5
Competitive Set -4.1 7.2 4.4 2.8 2.5 4.3 4.6 3.5 0.0 -2.9 -17.6 -4.5 -0.9 -11.5 -9.0 -0.9 -2.5 -7.4 11.8 4.4 -6.6 12.5 3.2 -3.5 7.6 4.2 -3.5
Index (RGI) 0.8 2.1 2.3 3.6 1.6 -0.3 7.4 5.3 4.6 5.6 18.9 8.4 3.8 3.1 9.9 2.9 2.9 6.6 -3.6 1.0 6.5 -5.6 1.7 4.0 -0.8 2.1 6.2
Rank 2 of 6 2 of 6 1 of 6 1 of 6 1 of 6 5 of 6 2 of 6 2 of 6 3 of 6 1 of 6 1 of 6 1 of 6 3 of 6 1 of 6 1 of 6 2 of 6 3 of 6 1 of 6 4 of 6 2 of 6 1 of 6 5 of 6 2 of 6 1 of 6 4 of 6 1 of 6 1 of 6
Exchange Rate STR, Inc.
For the Month of: August 2015 Date Created: September 17, 2015 Monthly Competitive Set Data Includes Subject Property
Occupancy (%)Running 3 MonthYear To Date Running 12 Month2014
RevPAR
Running 3 Month
Running 3 Month
Year To DateADR
Year To Date
2014
2014
2015
2015
2015 Running 12 Month
Running 12 Month
Ace Hotel New York 20 W 29th St New York, NY 10001-4502 Phone: (212) 679-2222STR # 58097 ChainID: MgtCo: None Owner: None
95
105
115
125
135
145
155
Mar Apr May Jun Jul Aug Sep Oct Nov Dec Jan Feb Mar Apr May Jun Jul Aug
Monthly Indexes
-12-10-8-6-4-20246
Year to Date Running 3 Month Running 12 Month
RevPAR Percent Change
My Property Competitive Set

Tab 5 - Response Report
This Year
Last Year
STR# Name City, State Zip Phone Sep
Oct
Nov
Dec
Jan
Feb
Mar
Apr
May
Jun
Jul
Aug
Sep
Oct
Nov
Dec
Jan
Feb
Mar
Apr
May
Jun
Jul
Aug
58097 Ace Hotel New York New York, NY 10001-4502 (212) 679-2222 ● ● ● ● ● ● ● ● ● ● ● ● ● ● ● ● ● ● ● ● ● ● ● ●15418 W Hotel New York New York, NY 10022-7503 (212) 755-1200 ● ● ● ● ● ● ● ● ● ● ● ● ● ● ● ● ● ● ● ● ● ● ● ●15419 Kimpton 70 Park Avenue Hotel New York, NY 10016-2504 (212) 973-2400 ● ● ● ● ● ● ● ● ● ● ● ● ● ● ● ● ● ● ● ● ● ● ● ●20240 Autograph Collection Carlton Hotel New York, NY 10016-7412 (212) 532-4100 ● ● ● ● ● ● ● ● ● ● ● ● ● ● ● ● ● ● ● ● ● ● ● ●37055 The Roger Williams New York, NY 10016-7057 (212) 448-7000 ● ● ● ● ● ● ● ● ● ● ● ● ● ● ● ● ● ● ● ● ● ● ● ●41094 Hudson Hotel New York, NY 10019-1804 (212) 554-6000 ● ● ● ● ● ● ● ● ● ● ● ● ● ● ● ● ● ● ● ● ● ● ● ●
Data received:
○ = Monthly Only
● = Monthly & Daily
STR, Inc.
190406
1521 22
317
200010
2565
194 192006
878
Open Date
31
1 2
11 12
26
August 2014 (Last Year)Sun Mon Tue Wed Thu Fri Sat
104
16
24
3 6 7 8 914
27 30232017 18
5 6 7 5
18 19
8
Sun ThuWedTue
43
Fri
2
1912119 10 14
2330
August 2015 (This Year)
1SatMon
2625 2721
205
192606
275 200905
2013
16 2215
2013
24
29
25
28 29 31
Rooms
192906
1317
28
For the Month of: August 2015 Date Created: September 17, 2015
2014 20152013 2014
696
20132013 2014 2015
STR # 58097 ChainID: MgtCo: None Owner: NoneAce Hotel New York 20 W 29th St New York, NY 10001-4502 Phone: (212) 679-2222
2014 2015
2565
20152013 2014 20152013 2014 2015
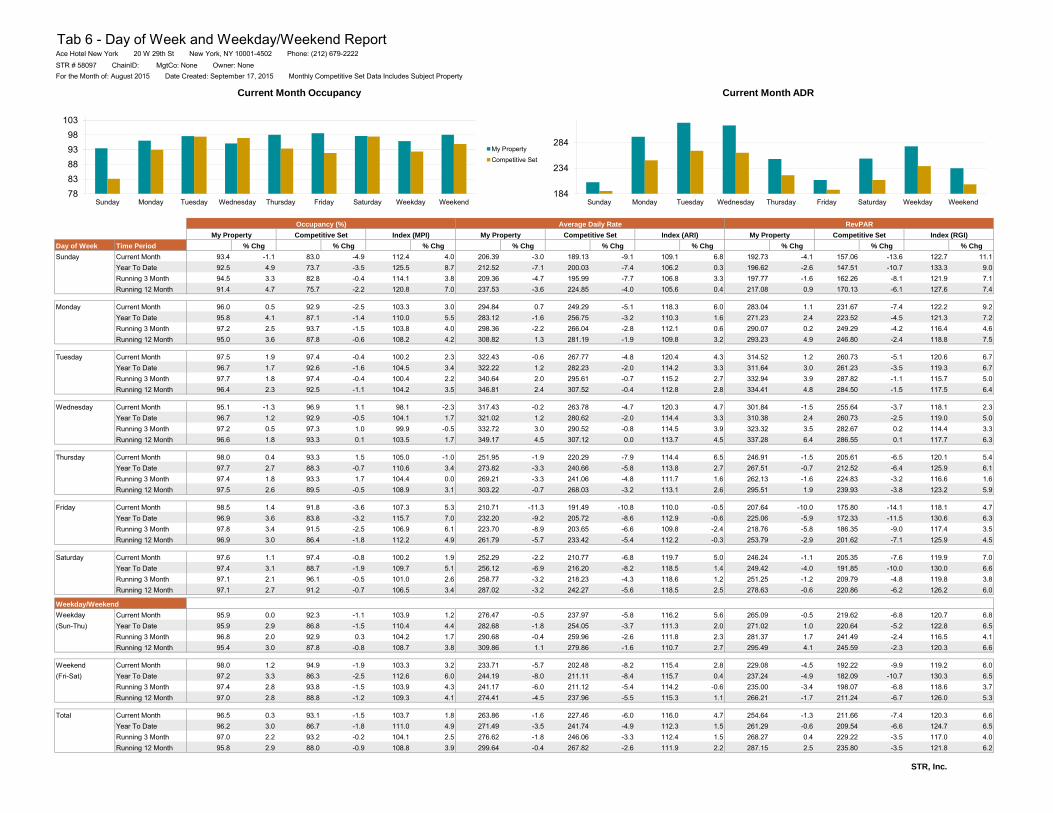
Tab 6 - Day of Week and Weekday/Weekend ReportAce Hotel New York 20 W 29th St New York, NY 10001-4502 Phone: (212) 679-2222STR # 58097 ChainID: MgtCo: None Owner: NoneFor the Month of: August 2015 Date Created: September 17, 2015 Monthly Competitive Set Data Includes Subject Property
Day of Week Time Period % Chg % Chg % Chg % Chg % Chg % Chg % Chg % Chg % Chg
Sunday Current Month 93.4 -1.1 83.0 -4.9 112.4 4.0 206.39 -3.0 189.13 -9.1 109.1 6.8 192.73 -4.1 157.06 -13.6 122.7 11.1Year To Date 92.5 4.9 73.7 -3.5 125.5 8.7 212.52 -7.1 200.03 -7.4 106.2 0.3 196.62 -2.6 147.51 -10.7 133.3 9.0Running 3 Month 94.5 3.3 82.8 -0.4 114.1 3.8 209.36 -4.7 195.99 -7.7 106.8 3.3 197.77 -1.6 162.26 -8.1 121.9 7.1Running 12 Month 91.4 4.7 75.7 -2.2 120.8 7.0 237.53 -3.6 224.85 -4.0 105.6 0.4 217.08 0.9 170.13 -6.1 127.6 7.4
Monday Current Month 96.0 0.5 92.9 -2.5 103.3 3.0 294.84 0.7 249.29 -5.1 118.3 6.0 283.04 1.1 231.67 -7.4 122.2 9.2Year To Date 95.8 4.1 87.1 -1.4 110.0 5.5 283.12 -1.6 256.75 -3.2 110.3 1.6 271.23 2.4 223.52 -4.5 121.3 7.2Running 3 Month 97.2 2.5 93.7 -1.5 103.8 4.0 298.36 -2.2 266.04 -2.8 112.1 0.6 290.07 0.2 249.29 -4.2 116.4 4.6Running 12 Month 95.0 3.6 87.8 -0.6 108.2 4.2 308.82 1.3 281.19 -1.9 109.8 3.2 293.23 4.9 246.80 -2.4 118.8 7.5
Tuesday Current Month 97.5 1.9 97.4 -0.4 100.2 2.3 322.43 -0.6 267.77 -4.8 120.4 4.3 314.52 1.2 260.73 -5.1 120.6 6.7Year To Date 96.7 1.7 92.6 -1.6 104.5 3.4 322.22 1.2 282.23 -2.0 114.2 3.3 311.64 3.0 261.23 -3.5 119.3 6.7Running 3 Month 97.7 1.8 97.4 -0.4 100.4 2.2 340.64 2.0 295.61 -0.7 115.2 2.7 332.94 3.9 287.82 -1.1 115.7 5.0Running 12 Month 96.4 2.3 92.5 -1.1 104.2 3.5 346.81 2.4 307.52 -0.4 112.8 2.8 334.41 4.8 284.50 -1.5 117.5 6.4
Wednesday Current Month 95.1 -1.3 96.9 1.1 98.1 -2.3 317.43 -0.2 263.78 -4.7 120.3 4.7 301.84 -1.5 255.64 -3.7 118.1 2.3Year To Date 96.7 1.2 92.9 -0.5 104.1 1.7 321.02 1.2 280.62 -2.0 114.4 3.3 310.38 2.4 260.73 -2.5 119.0 5.0Running 3 Month 97.2 0.5 97.3 1.0 99.9 -0.5 332.72 3.0 290.52 -0.8 114.5 3.9 323.32 3.5 282.67 0.2 114.4 3.3Running 12 Month 96.6 1.8 93.3 0.1 103.5 1.7 349.17 4.5 307.12 0.0 113.7 4.5 337.28 6.4 286.55 0.1 117.7 6.3
Thursday Current Month 98.0 0.4 93.3 1.5 105.0 -1.0 251.95 -1.9 220.29 -7.9 114.4 6.5 246.91 -1.5 205.61 -6.5 120.1 5.4Year To Date 97.7 2.7 88.3 -0.7 110.6 3.4 273.82 -3.3 240.66 -5.8 113.8 2.7 267.51 -0.7 212.52 -6.4 125.9 6.1Running 3 Month 97.4 1.8 93.3 1.7 104.4 0.0 269.21 -3.3 241.06 -4.8 111.7 1.6 262.13 -1.6 224.83 -3.2 116.6 1.6Running 12 Month 97.5 2.6 89.5 -0.5 108.9 3.1 303.22 -0.7 268.03 -3.2 113.1 2.6 295.51 1.9 239.93 -3.8 123.2 5.9
Friday Current Month 98.5 1.4 91.8 -3.6 107.3 5.3 210.71 -11.3 191.49 -10.8 110.0 -0.5 207.64 -10.0 175.80 -14.1 118.1 4.7Year To Date 96.9 3.6 83.8 -3.2 115.7 7.0 232.20 -9.2 205.72 -8.6 112.9 -0.6 225.06 -5.9 172.33 -11.5 130.6 6.3Running 3 Month 97.8 3.4 91.5 -2.5 106.9 6.1 223.70 -8.9 203.65 -6.6 109.8 -2.4 218.76 -5.8 186.35 -9.0 117.4 3.5Running 12 Month 96.9 3.0 86.4 -1.8 112.2 4.9 261.79 -5.7 233.42 -5.4 112.2 -0.3 253.79 -2.9 201.62 -7.1 125.9 4.5
Saturday Current Month 97.6 1.1 97.4 -0.8 100.2 1.9 252.29 -2.2 210.77 -6.8 119.7 5.0 246.24 -1.1 205.35 -7.6 119.9 7.0Year To Date 97.4 3.1 88.7 -1.9 109.7 5.1 256.12 -6.9 216.20 -8.2 118.5 1.4 249.42 -4.0 191.85 -10.0 130.0 6.6Running 3 Month 97.1 2.1 96.1 -0.5 101.0 2.6 258.77 -3.2 218.23 -4.3 118.6 1.2 251.25 -1.2 209.79 -4.8 119.8 3.8Running 12 Month 97.1 2.7 91.2 -0.7 106.5 3.4 287.02 -3.2 242.27 -5.6 118.5 2.5 278.63 -0.6 220.86 -6.2 126.2 6.0
Weekday Current Month 95.9 0.0 92.3 -1.1 103.9 1.2 276.47 -0.5 237.97 -5.8 116.2 5.6 265.09 -0.5 219.62 -6.8 120.7 6.8(Sun-Thu) Year To Date 95.9 2.9 86.8 -1.5 110.4 4.4 282.68 -1.8 254.05 -3.7 111.3 2.0 271.02 1.0 220.64 -5.2 122.8 6.5
Running 3 Month 96.8 2.0 92.9 0.3 104.2 1.7 290.68 -0.4 259.96 -2.6 111.8 2.3 281.37 1.7 241.49 -2.4 116.5 4.1Running 12 Month 95.4 3.0 87.8 -0.8 108.7 3.8 309.86 1.1 279.86 -1.6 110.7 2.7 295.49 4.1 245.59 -2.3 120.3 6.6
Weekend Current Month 98.0 1.2 94.9 -1.9 103.3 3.2 233.71 -5.7 202.48 -8.2 115.4 2.8 229.08 -4.5 192.22 -9.9 119.2 6.0(Fri-Sat) Year To Date 97.2 3.3 86.3 -2.5 112.6 6.0 244.19 -8.0 211.11 -8.4 115.7 0.4 237.24 -4.9 182.09 -10.7 130.3 6.5
Running 3 Month 97.4 2.8 93.8 -1.5 103.9 4.3 241.17 -6.0 211.12 -5.4 114.2 -0.6 235.00 -3.4 198.07 -6.8 118.6 3.7Running 12 Month 97.0 2.8 88.8 -1.2 109.3 4.1 274.41 -4.5 237.96 -5.5 115.3 1.1 266.21 -1.7 211.24 -6.7 126.0 5.3
Total Current Month 96.5 0.3 93.1 -1.5 103.7 1.8 263.86 -1.6 227.46 -6.0 116.0 4.7 254.64 -1.3 211.66 -7.4 120.3 6.6Year To Date 96.2 3.0 86.7 -1.8 111.0 4.9 271.49 -3.5 241.74 -4.9 112.3 1.5 261.29 -0.6 209.54 -6.6 124.7 6.5Running 3 Month 97.0 2.2 93.2 -0.2 104.1 2.5 276.62 -1.8 246.06 -3.3 112.4 1.5 268.27 0.4 229.22 -3.5 117.0 4.0Running 12 Month 95.8 2.9 88.0 -0.9 108.8 3.9 299.64 -0.4 267.82 -2.6 111.9 2.2 287.15 2.5 235.80 -3.5 121.8 6.2
STR, Inc.
Weekday/Weekend
My Property Competitive Set
Occupancy (%) Average Daily Rate RevPAR
My Property Competitive Set Index (MPI) My Property Index (RGI)Competitive Set Index (ARI)
7883889398
103
Sunday Monday Tuesday Wednesday Thursday Friday Saturday Weekday Weekend
Current Month Occupancy
My PropertyCompetitive Set
184
234
284
Sunday Monday Tuesday Wednesday Thursday Friday Saturday Weekday Weekend
Current Month ADR
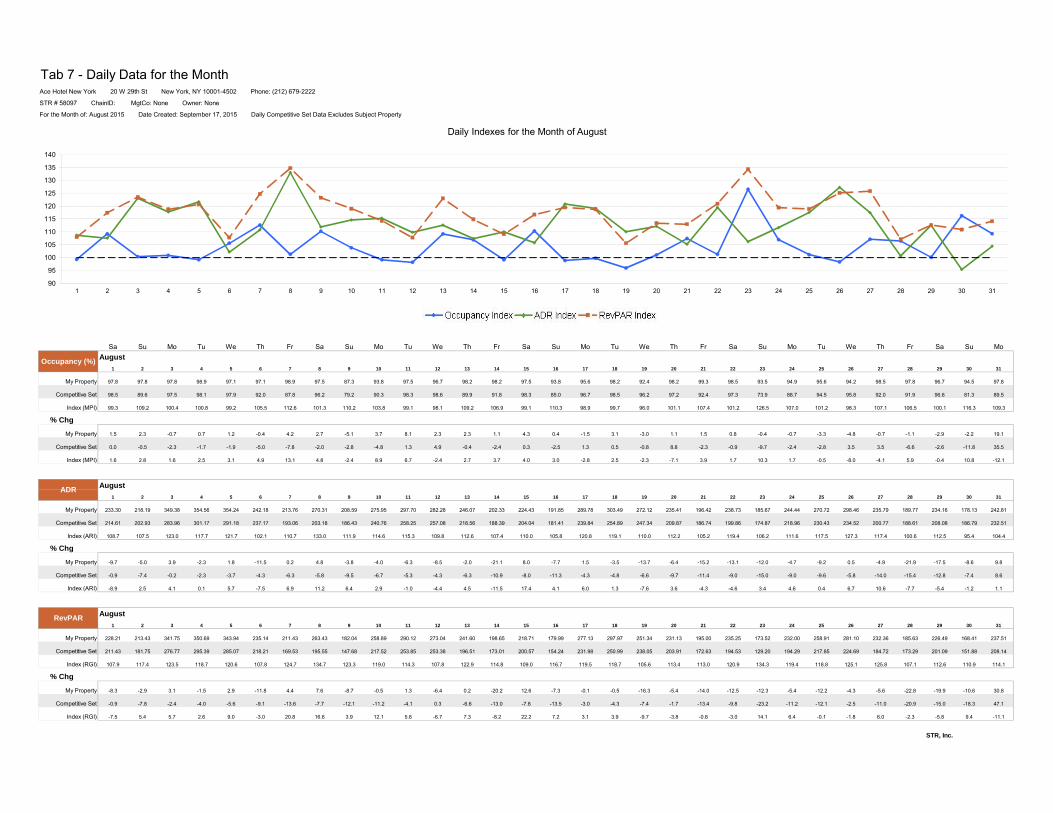
Tab 7 - Daily Data for the Month
Sa Su Mo Tu We Th Fr Sa Su Mo Tu We Th Fr Sa Su Mo Tu We Th Fr Sa Su Mo Tu We Th Fr Sa Su MoAugust
1 2 3 4 5 6 7 8 9 10 11 12 13 14 15 16 17 18 19 20 21 22 23 24 25 26 27 28 29 30 31
My Property 97.8 97.8 97.8 98.9 97.1 97.1 98.9 97.5 87.3 93.8 97.5 96.7 98.2 98.2 97.5 93.8 95.6 98.2 92.4 98.2 99.3 98.5 93.5 94.9 95.6 94.2 98.5 97.8 96.7 94.5 97.8
Competitive Set 98.5 89.6 97.5 98.1 97.9 92.0 87.8 96.2 79.2 90.3 98.3 98.6 89.9 91.8 98.3 85.0 96.7 98.5 96.2 97.2 92.4 97.3 73.9 88.7 94.5 95.8 92.0 91.9 96.6 81.3 89.5
Index (MPI) 99.3 109.2 100.4 100.8 99.2 105.5 112.6 101.3 110.2 103.8 99.1 98.1 109.2 106.9 99.1 110.3 98.9 99.7 96.0 101.1 107.4 101.2 126.5 107.0 101.2 98.3 107.1 106.5 100.1 116.3 109.3
% Chg
My Property 1.5 2.3 -0.7 0.7 1.2 -0.4 4.2 2.7 -5.1 3.7 8.1 2.3 2.3 1.1 4.3 0.4 -1.5 3.1 -3.0 1.1 1.5 0.8 -0.4 -0.7 -3.3 -4.8 -0.7 -1.1 -2.9 -2.2 19.1
Competitive Set 0.0 -0.5 -2.3 -1.7 -1.9 -5.0 -7.8 -2.0 -2.8 -4.8 1.3 4.9 -0.4 -2.4 0.3 -2.5 1.3 0.5 -0.8 8.8 -2.3 -0.9 -9.7 -2.4 -2.8 3.5 3.5 -6.6 -2.6 -11.8 35.5
Index (MPI) 1.6 2.8 1.6 2.5 3.1 4.9 13.1 4.8 -2.4 8.9 6.7 -2.4 2.7 3.7 4.0 3.0 -2.8 2.5 -2.3 -7.1 3.9 1.7 10.3 1.7 -0.5 -8.0 -4.1 5.9 -0.4 10.8 -12.1
August
1 2 3 4 5 6 7 8 9 10 11 12 13 14 15 16 17 18 19 20 21 22 23 24 25 26 27 28 29 30 31
My Property 233.30 218.19 349.38 354.56 354.24 242.18 213.76 270.31 208.59 275.95 297.70 282.28 246.07 202.33 224.43 191.85 289.78 303.49 272.12 235.41 196.42 238.73 185.67 244.44 270.72 298.46 235.79 189.77 234.16 178.13 242.81
Competitive Set 214.61 202.93 283.96 301.17 291.18 237.17 193.06 203.18 186.43 240.76 258.25 257.08 218.56 188.39 204.04 181.41 239.84 254.89 247.34 209.87 186.74 199.86 174.87 218.96 230.43 234.52 200.77 188.61 208.08 186.79 232.51
Index (ARI) 108.7 107.5 123.0 117.7 121.7 102.1 110.7 133.0 111.9 114.6 115.3 109.8 112.6 107.4 110.0 105.8 120.8 119.1 110.0 112.2 105.2 119.4 106.2 111.6 117.5 127.3 117.4 100.6 112.5 95.4 104.4
% Chg
My Property -9.7 -5.0 3.9 -2.3 1.8 -11.5 0.2 4.8 -3.8 -4.0 -6.3 -8.5 -2.0 -21.1 8.0 -7.7 1.5 -3.5 -13.7 -6.4 -15.2 -13.1 -12.0 -4.7 -9.2 0.5 -4.9 -21.9 -17.5 -8.6 9.8
Competitive Set -0.9 -7.4 -0.2 -2.3 -3.7 -4.3 -6.3 -5.8 -9.5 -6.7 -5.3 -4.3 -6.3 -10.9 -8.0 -11.3 -4.3 -4.8 -6.6 -9.7 -11.4 -9.0 -15.0 -9.0 -9.6 -5.8 -14.0 -15.4 -12.8 -7.4 8.6
Index (ARI) -8.9 2.5 4.1 0.1 5.7 -7.5 6.9 11.2 6.4 2.9 -1.0 -4.4 4.5 -11.5 17.4 4.1 6.0 1.3 -7.6 3.6 -4.3 -4.6 3.4 4.6 0.4 6.7 10.6 -7.7 -5.4 -1.2 1.1
August
1 2 3 4 5 6 7 8 9 10 11 12 13 14 15 16 17 18 19 20 21 22 23 24 25 26 27 28 29 30 31
My Property 228.21 213.43 341.75 350.69 343.94 235.14 211.43 263.43 182.04 258.89 290.12 273.04 241.60 198.65 218.71 179.99 277.13 297.97 251.34 231.13 195.00 235.25 173.52 232.00 258.91 281.10 232.36 185.63 226.49 168.41 237.51
Competitive Set 211.43 181.75 276.77 295.39 285.07 218.21 169.53 195.55 147.68 217.52 253.85 253.38 196.51 173.01 200.57 154.24 231.98 250.99 238.05 203.91 172.63 194.53 129.20 194.29 217.85 224.69 184.72 173.29 201.09 151.88 208.14
Index (RGI) 107.9 117.4 123.5 118.7 120.6 107.8 124.7 134.7 123.3 119.0 114.3 107.8 122.9 114.8 109.0 116.7 119.5 118.7 105.6 113.4 113.0 120.9 134.3 119.4 118.8 125.1 125.8 107.1 112.6 110.9 114.1
% Chg
My Property -8.3 -2.9 3.1 -1.5 2.9 -11.8 4.4 7.6 -8.7 -0.5 1.3 -6.4 0.2 -20.2 12.6 -7.3 -0.1 -0.5 -16.3 -5.4 -14.0 -12.5 -12.3 -5.4 -12.2 -4.3 -5.6 -22.8 -19.9 -10.6 30.8
Competitive Set -0.9 -7.8 -2.4 -4.0 -5.6 -9.1 -13.6 -7.7 -12.1 -11.2 -4.1 0.3 -6.6 -13.0 -7.8 -13.5 -3.0 -4.3 -7.4 -1.7 -13.4 -9.8 -23.2 -11.2 -12.1 -2.5 -11.0 -20.9 -15.0 -18.3 47.1
Index (RGI) -7.5 5.4 5.7 2.6 9.0 -3.0 20.8 16.6 3.9 12.1 5.6 -6.7 7.3 -8.2 22.2 7.2 3.1 3.9 -9.7 -3.8 -0.6 -3.0 14.1 6.4 -0.1 -1.8 6.0 -2.3 -5.8 9.4 -11.1
STR, Inc.
Occupancy (%)
ADR
STR # 58097 ChainID: MgtCo: None Owner: None
RevPAR
For the Month of: August 2015 Date Created: September 17, 2015 Daily Competitive Set Data Excludes Subject Property
Ace Hotel New York 20 W 29th St New York, NY 10001-4502 Phone: (212) 679-2222
90
95
100
105
110
115
120
125
130
135
140
1 2 3 4 5 6 7 8 9 10 11 12 13 14 15 16 17 18 19 20 21 22 23 24 25 26 27 28 29 30 31
Daily Indexes for the Month of August
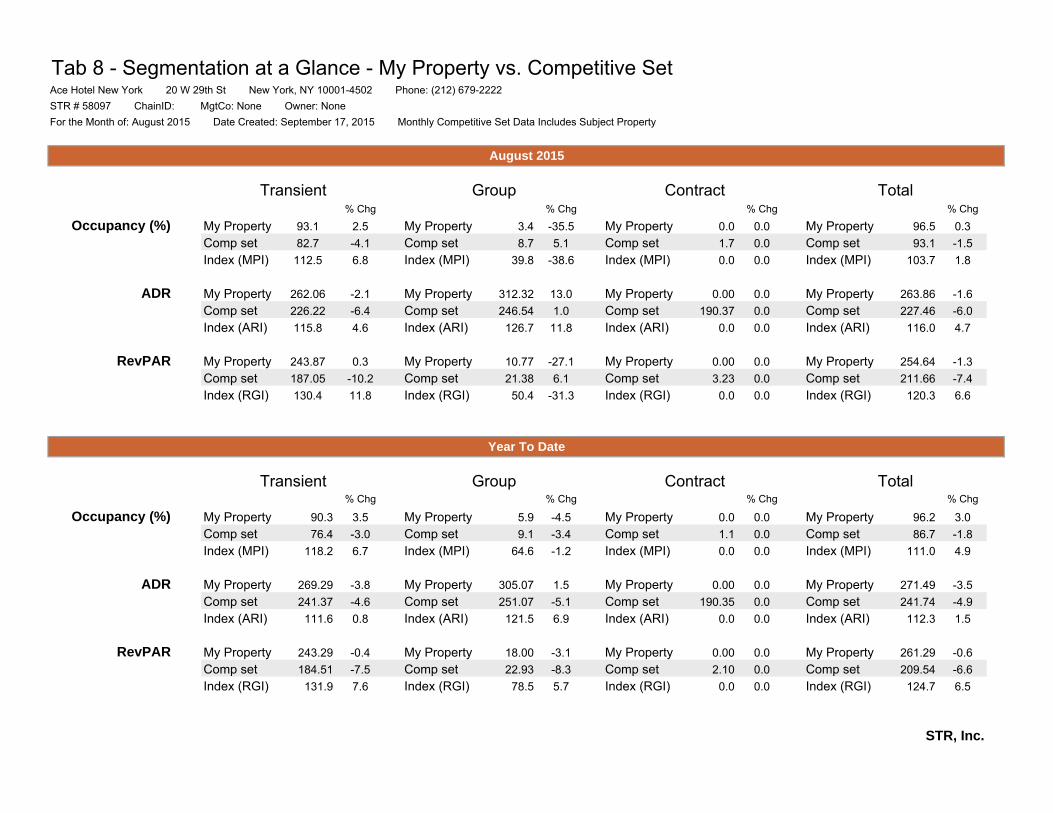
Tab 8 - Segmentation at a Glance - My Property vs. Competitive Set
% Chg % Chg % Chg % Chg
Occupancy (%) My Property 93.1 2.5 My Property 3.4 -35.5 My Property 0.0 0.0 My Property 96.5 0.3Comp set 82.7 -4.1 Comp set 8.7 5.1 Comp set 1.7 0.0 Comp set 93.1 -1.5Index (MPI) 112.5 6.8 Index (MPI) 39.8 -38.6 Index (MPI) 0.0 0.0 Index (MPI) 103.7 1.8
ADR My Property 262.06 -2.1 My Property 312.32 13.0 My Property 0.00 0.0 My Property 263.86 -1.6Comp set 226.22 -6.4 Comp set 246.54 1.0 Comp set 190.37 0.0 Comp set 227.46 -6.0Index (ARI) 115.8 4.6 Index (ARI) 126.7 11.8 Index (ARI) 0.0 0.0 Index (ARI) 116.0 4.7
RevPAR My Property 243.87 0.3 My Property 10.77 -27.1 My Property 0.00 0.0 My Property 254.64 -1.3Comp set 187.05 -10.2 Comp set 21.38 6.1 Comp set 3.23 0.0 Comp set 211.66 -7.4Index (RGI) 130.4 11.8 Index (RGI) 50.4 -31.3 Index (RGI) 0.0 0.0 Index (RGI) 120.3 6.6
% Chg % Chg % Chg % Chg
Occupancy (%) My Property 90.3 3.5 My Property 5.9 -4.5 My Property 0.0 0.0 My Property 96.2 3.0Comp set 76.4 -3.0 Comp set 9.1 -3.4 Comp set 1.1 0.0 Comp set 86.7 -1.8Index (MPI) 118.2 6.7 Index (MPI) 64.6 -1.2 Index (MPI) 0.0 0.0 Index (MPI) 111.0 4.9
ADR My Property 269.29 -3.8 My Property 305.07 1.5 My Property 0.00 0.0 My Property 271.49 -3.5Comp set 241.37 -4.6 Comp set 251.07 -5.1 Comp set 190.35 0.0 Comp set 241.74 -4.9Index (ARI) 111.6 0.8 Index (ARI) 121.5 6.9 Index (ARI) 0.0 0.0 Index (ARI) 112.3 1.5
RevPAR My Property 243.29 -0.4 My Property 18.00 -3.1 My Property 0.00 0.0 My Property 261.29 -0.6Comp set 184.51 -7.5 Comp set 22.93 -8.3 Comp set 2.10 0.0 Comp set 209.54 -6.6Index (RGI) 131.9 7.6 Index (RGI) 78.5 5.7 Index (RGI) 0.0 0.0 Index (RGI) 124.7 6.5
STR, Inc.
Ace Hotel New York 20 W 29th St New York, NY 10001-4502 Phone: (212) 679-2222
August 2015
Year To Date
Transient Group Contract Total
For the Month of: August 2015 Date Created: September 17, 2015 Monthly Competitive Set Data Includes Subject PropertySTR # 58097 ChainID: MgtCo: None Owner: None
Transient Group Contract Total
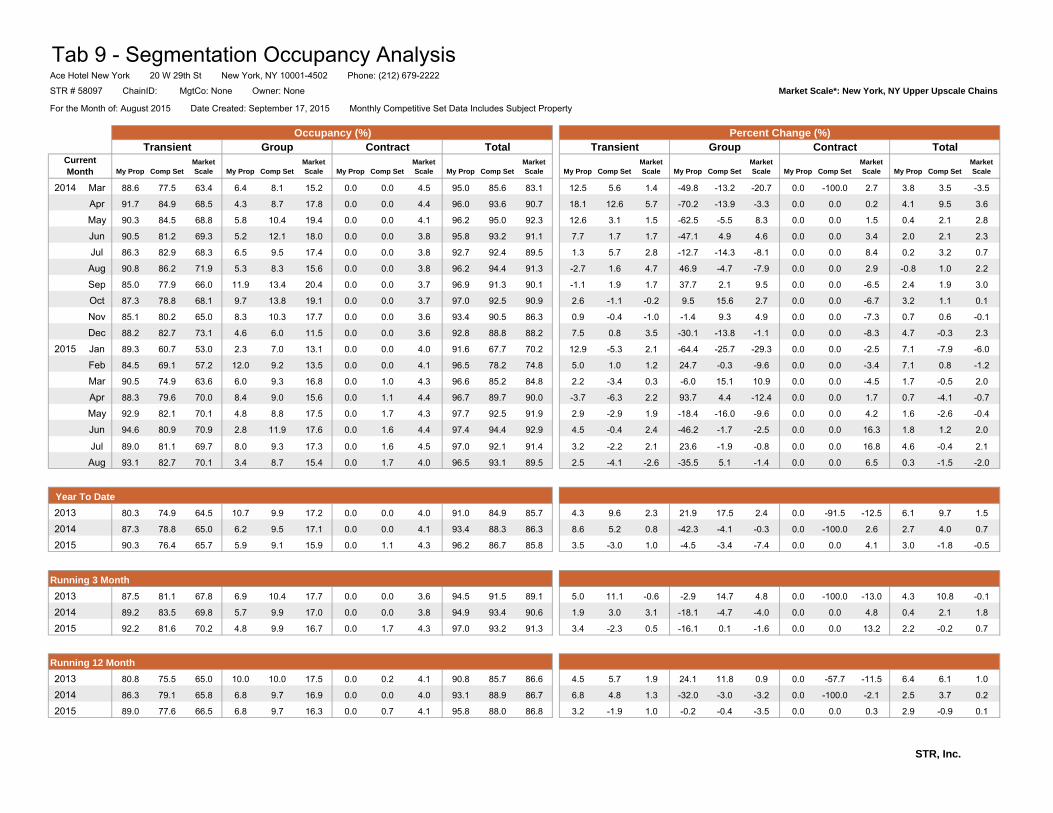
Tab 9 - Segmentation Occupancy Analysis
My Prop Comp SetMarket Scale My Prop Comp Set
Market Scale My Prop Comp Set
Market Scale My Prop Comp Set
Market Scale My Prop Comp Set
Market Scale My Prop Comp Set
Market Scale My Prop Comp Set
Market Scale My Prop Comp Set
Market Scale
2014 Mar 88.6 77.5 63.4 6.4 8.1 15.2 0.0 0.0 4.5 95.0 85.6 83.1 12.5 5.6 1.4 -49.8 -13.2 -20.7 0.0 -100.0 2.7 3.8 3.5 -3.5
Apr 91.7 84.9 68.5 4.3 8.7 17.8 0.0 0.0 4.4 96.0 93.6 90.7 18.1 12.6 5.7 -70.2 -13.9 -3.3 0.0 0.0 0.2 4.1 9.5 3.6
May 90.3 84.5 68.8 5.8 10.4 19.4 0.0 0.0 4.1 96.2 95.0 92.3 12.6 3.1 1.5 -62.5 -5.5 8.3 0.0 0.0 1.5 0.4 2.1 2.8
Jun 90.5 81.2 69.3 5.2 12.1 18.0 0.0 0.0 3.8 95.8 93.2 91.1 7.7 1.7 1.7 -47.1 4.9 4.6 0.0 0.0 3.4 2.0 2.1 2.3
Jul 86.3 82.9 68.3 6.5 9.5 17.4 0.0 0.0 3.8 92.7 92.4 89.5 1.3 5.7 2.8 -12.7 -14.3 -8.1 0.0 0.0 8.4 0.2 3.2 0.7
Aug 90.8 86.2 71.9 5.3 8.3 15.6 0.0 0.0 3.8 96.2 94.4 91.3 -2.7 1.6 4.7 46.9 -4.7 -7.9 0.0 0.0 2.9 -0.8 1.0 2.2
Sep 85.0 77.9 66.0 11.9 13.4 20.4 0.0 0.0 3.7 96.9 91.3 90.1 -1.1 1.9 1.7 37.7 2.1 9.5 0.0 0.0 -6.5 2.4 1.9 3.0
Oct 87.3 78.8 68.1 9.7 13.8 19.1 0.0 0.0 3.7 97.0 92.5 90.9 2.6 -1.1 -0.2 9.5 15.6 2.7 0.0 0.0 -6.7 3.2 1.1 0.1
Nov 85.1 80.2 65.0 8.3 10.3 17.7 0.0 0.0 3.6 93.4 90.5 86.3 0.9 -0.4 -1.0 -1.4 9.3 4.9 0.0 0.0 -7.3 0.7 0.6 -0.1
Dec 88.2 82.7 73.1 4.6 6.0 11.5 0.0 0.0 3.6 92.8 88.8 88.2 7.5 0.8 3.5 -30.1 -13.8 -1.1 0.0 0.0 -8.3 4.7 -0.3 2.3
2015 Jan 89.3 60.7 53.0 2.3 7.0 13.1 0.0 0.0 4.0 91.6 67.7 70.2 12.9 -5.3 2.1 -64.4 -25.7 -29.3 0.0 0.0 -2.5 7.1 -7.9 -6.0
Feb 84.5 69.1 57.2 12.0 9.2 13.5 0.0 0.0 4.1 96.5 78.2 74.8 5.0 1.0 1.2 24.7 -0.3 -9.6 0.0 0.0 -3.4 7.1 0.8 -1.2
Mar 90.5 74.9 63.6 6.0 9.3 16.8 0.0 1.0 4.3 96.6 85.2 84.8 2.2 -3.4 0.3 -6.0 15.1 10.9 0.0 0.0 -4.5 1.7 -0.5 2.0
Apr 88.3 79.6 70.0 8.4 9.0 15.6 0.0 1.1 4.4 96.7 89.7 90.0 -3.7 -6.3 2.2 93.7 4.4 -12.4 0.0 0.0 1.7 0.7 -4.1 -0.7
May 92.9 82.1 70.1 4.8 8.8 17.5 0.0 1.7 4.3 97.7 92.5 91.9 2.9 -2.9 1.9 -18.4 -16.0 -9.6 0.0 0.0 4.2 1.6 -2.6 -0.4
Jun 94.6 80.9 70.9 2.8 11.9 17.6 0.0 1.6 4.4 97.4 94.4 92.9 4.5 -0.4 2.4 -46.2 -1.7 -2.5 0.0 0.0 16.3 1.8 1.2 2.0
Jul 89.0 81.1 69.7 8.0 9.3 17.3 0.0 1.6 4.5 97.0 92.1 91.4 3.2 -2.2 2.1 23.6 -1.9 -0.8 0.0 0.0 16.8 4.6 -0.4 2.1
Aug 93.1 82.7 70.1 3.4 8.7 15.4 0.0 1.7 4.0 96.5 93.1 89.5 2.5 -4.1 -2.6 -35.5 5.1 -1.4 0.0 0.0 6.5 0.3 -1.5 -2.0
2013 80.3 74.9 64.5 10.7 9.9 17.2 0.0 0.0 4.0 91.0 84.9 85.7 4.3 9.6 2.3 21.9 17.5 2.4 0.0 -91.5 -12.5 6.1 9.7 1.5
2014 87.3 78.8 65.0 6.2 9.5 17.1 0.0 0.0 4.1 93.4 88.3 86.3 8.6 5.2 0.8 -42.3 -4.1 -0.3 0.0 -100.0 2.6 2.7 4.0 0.7
2015 90.3 76.4 65.7 5.9 9.1 15.9 0.0 1.1 4.3 96.2 86.7 85.8 3.5 -3.0 1.0 -4.5 -3.4 -7.4 0.0 0.0 4.1 3.0 -1.8 -0.5
2013 87.5 81.1 67.8 6.9 10.4 17.7 0.0 0.0 3.6 94.5 91.5 89.1 5.0 11.1 -0.6 -2.9 14.7 4.8 0.0 -100.0 -13.0 4.3 10.8 -0.1
2014 89.2 83.5 69.8 5.7 9.9 17.0 0.0 0.0 3.8 94.9 93.4 90.6 1.9 3.0 3.1 -18.1 -4.7 -4.0 0.0 0.0 4.8 0.4 2.1 1.8
2015 92.2 81.6 70.2 4.8 9.9 16.7 0.0 1.7 4.3 97.0 93.2 91.3 3.4 -2.3 0.5 -16.1 0.1 -1.6 0.0 0.0 13.2 2.2 -0.2 0.7
2013 80.8 75.5 65.0 10.0 10.0 17.5 0.0 0.2 4.1 90.8 85.7 86.6 4.5 5.7 1.9 24.1 11.8 0.9 0.0 -57.7 -11.5 6.4 6.1 1.0
2014 86.3 79.1 65.8 6.8 9.7 16.9 0.0 0.0 4.0 93.1 88.9 86.7 6.8 4.8 1.3 -32.0 -3.0 -3.2 0.0 -100.0 -2.1 2.5 3.7 0.2
2015 89.0 77.6 66.5 6.8 9.7 16.3 0.0 0.7 4.1 95.8 88.0 86.8 3.2 -1.9 1.0 -0.2 -0.4 -3.5 0.0 0.0 0.3 2.9 -0.9 0.1
STR, Inc.
Year To Date
Transient Group
For the Month of: August 2015 Date Created: September 17, 2015 Monthly Competitive Set Data Includes Subject Property
TotalContractGroup
Running 12 Month
TransientCurrent Month
Contract Total
Running 3 Month
Ace Hotel New York 20 W 29th St New York, NY 10001-4502 Phone: (212) 679-2222
Percent Change (%)Occupancy (%)
STR # 58097 ChainID: MgtCo: None Owner: None Market Scale*: New York, NY Upper Upscale Chains
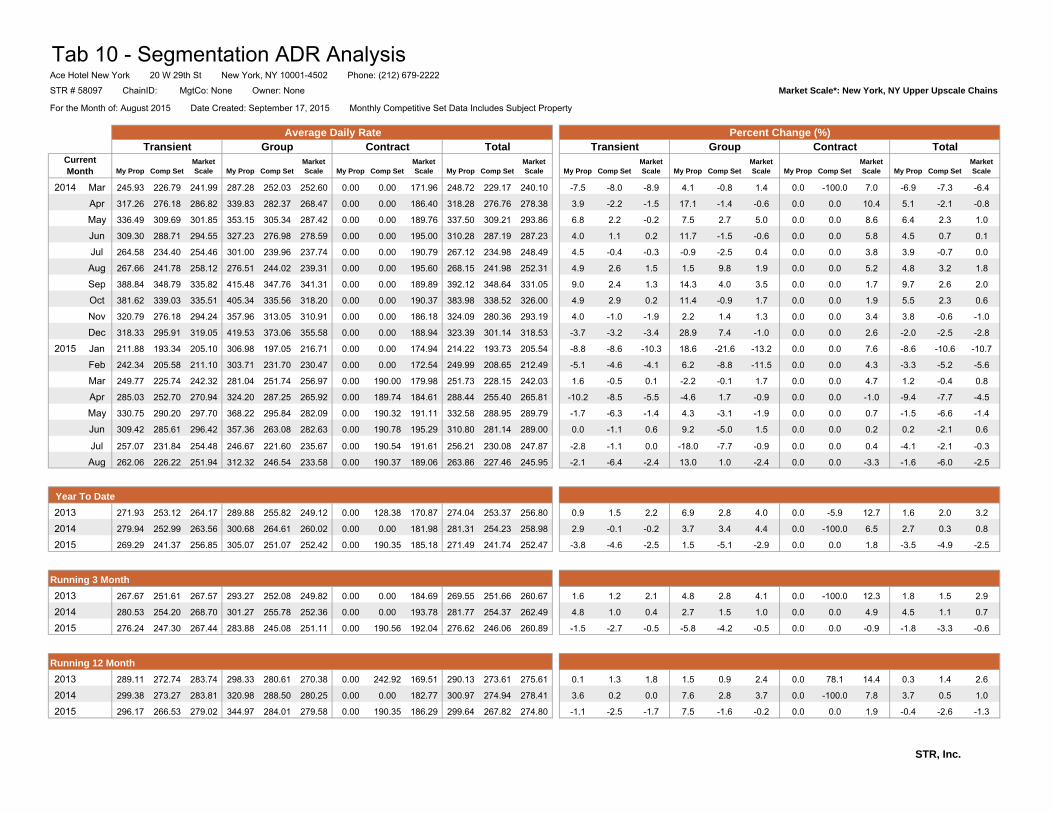
Tab 10 - Segmentation ADR Analysis
My Prop Comp SetMarket Scale My Prop Comp Set
Market Scale My Prop Comp Set
Market Scale My Prop Comp Set
Market Scale My Prop Comp Set
Market Scale My Prop Comp Set
Market Scale My Prop Comp Set
Market Scale My Prop Comp Set
Market Scale
2014 Mar 245.93 226.79 241.99 287.28 252.03 252.60 0.00 0.00 171.96 248.72 229.17 240.10 -7.5 -8.0 -8.9 4.1 -0.8 1.4 0.0 -100.0 7.0 -6.9 -7.3 -6.4
Apr 317.26 276.18 286.82 339.83 282.37 268.47 0.00 0.00 186.40 318.28 276.76 278.38 3.9 -2.2 -1.5 17.1 -1.4 -0.6 0.0 0.0 10.4 5.1 -2.1 -0.8
May 336.49 309.69 301.85 353.15 305.34 287.42 0.00 0.00 189.76 337.50 309.21 293.86 6.8 2.2 -0.2 7.5 2.7 5.0 0.0 0.0 8.6 6.4 2.3 1.0
Jun 309.30 288.71 294.55 327.23 276.98 278.59 0.00 0.00 195.00 310.28 287.19 287.23 4.0 1.1 0.2 11.7 -1.5 -0.6 0.0 0.0 5.8 4.5 0.7 0.1
Jul 264.58 234.40 254.46 301.00 239.96 237.74 0.00 0.00 190.79 267.12 234.98 248.49 4.5 -0.4 -0.3 -0.9 -2.5 0.4 0.0 0.0 3.8 3.9 -0.7 0.0
Aug 267.66 241.78 258.12 276.51 244.02 239.31 0.00 0.00 195.60 268.15 241.98 252.31 4.9 2.6 1.5 1.5 9.8 1.9 0.0 0.0 5.2 4.8 3.2 1.8
Sep 388.84 348.79 335.82 415.48 347.76 341.31 0.00 0.00 189.89 392.12 348.64 331.05 9.0 2.4 1.3 14.3 4.0 3.5 0.0 0.0 1.7 9.7 2.6 2.0
Oct 381.62 339.03 335.51 405.34 335.56 318.20 0.00 0.00 190.37 383.98 338.52 326.00 4.9 2.9 0.2 11.4 -0.9 1.7 0.0 0.0 1.9 5.5 2.3 0.6
Nov 320.79 276.18 294.24 357.96 313.05 310.91 0.00 0.00 186.18 324.09 280.36 293.19 4.0 -1.0 -1.9 2.2 1.4 1.3 0.0 0.0 3.4 3.8 -0.6 -1.0
Dec 318.33 295.91 319.05 419.53 373.06 355.58 0.00 0.00 188.94 323.39 301.14 318.53 -3.7 -3.2 -3.4 28.9 7.4 -1.0 0.0 0.0 2.6 -2.0 -2.5 -2.8
2015 Jan 211.88 193.34 205.10 306.98 197.05 216.71 0.00 0.00 174.94 214.22 193.73 205.54 -8.8 -8.6 -10.3 18.6 -21.6 -13.2 0.0 0.0 7.6 -8.6 -10.6 -10.7
Feb 242.34 205.58 211.10 303.71 231.70 230.47 0.00 0.00 172.54 249.99 208.65 212.49 -5.1 -4.6 -4.1 6.2 -8.8 -11.5 0.0 0.0 4.3 -3.3 -5.2 -5.6
Mar 249.77 225.74 242.32 281.04 251.74 256.97 0.00 190.00 179.98 251.73 228.15 242.03 1.6 -0.5 0.1 -2.2 -0.1 1.7 0.0 0.0 4.7 1.2 -0.4 0.8
Apr 285.03 252.70 270.94 324.20 287.25 265.92 0.00 189.74 184.61 288.44 255.40 265.81 -10.2 -8.5 -5.5 -4.6 1.7 -0.9 0.0 0.0 -1.0 -9.4 -7.7 -4.5
May 330.75 290.20 297.70 368.22 295.84 282.09 0.00 190.32 191.11 332.58 288.95 289.79 -1.7 -6.3 -1.4 4.3 -3.1 -1.9 0.0 0.0 0.7 -1.5 -6.6 -1.4
Jun 309.42 285.61 296.42 357.36 263.08 282.63 0.00 190.78 195.29 310.80 281.14 289.00 0.0 -1.1 0.6 9.2 -5.0 1.5 0.0 0.0 0.2 0.2 -2.1 0.6
Jul 257.07 231.84 254.48 246.67 221.60 235.67 0.00 190.54 191.61 256.21 230.08 247.87 -2.8 -1.1 0.0 -18.0 -7.7 -0.9 0.0 0.0 0.4 -4.1 -2.1 -0.3
Aug 262.06 226.22 251.94 312.32 246.54 233.58 0.00 190.37 189.06 263.86 227.46 245.95 -2.1 -6.4 -2.4 13.0 1.0 -2.4 0.0 0.0 -3.3 -1.6 -6.0 -2.5
2013 271.93 253.12 264.17 289.88 255.82 249.12 0.00 128.38 170.87 274.04 253.37 256.80 0.9 1.5 2.2 6.9 2.8 4.0 0.0 -5.9 12.7 1.6 2.0 3.2
2014 279.94 252.99 263.56 300.68 264.61 260.02 0.00 0.00 181.98 281.31 254.23 258.98 2.9 -0.1 -0.2 3.7 3.4 4.4 0.0 -100.0 6.5 2.7 0.3 0.8
2015 269.29 241.37 256.85 305.07 251.07 252.42 0.00 190.35 185.18 271.49 241.74 252.47 -3.8 -4.6 -2.5 1.5 -5.1 -2.9 0.0 0.0 1.8 -3.5 -4.9 -2.5
2013 267.67 251.61 267.57 293.27 252.08 249.82 0.00 0.00 184.69 269.55 251.66 260.67 1.6 1.2 2.1 4.8 2.8 4.1 0.0 -100.0 12.3 1.8 1.5 2.9
2014 280.53 254.20 268.70 301.27 255.78 252.36 0.00 0.00 193.78 281.77 254.37 262.49 4.8 1.0 0.4 2.7 1.5 1.0 0.0 0.0 4.9 4.5 1.1 0.7
2015 276.24 247.30 267.44 283.88 245.08 251.11 0.00 190.56 192.04 276.62 246.06 260.89 -1.5 -2.7 -0.5 -5.8 -4.2 -0.5 0.0 0.0 -0.9 -1.8 -3.3 -0.6
2013 289.11 272.74 283.74 298.33 280.61 270.38 0.00 242.92 169.51 290.13 273.61 275.61 0.1 1.3 1.8 1.5 0.9 2.4 0.0 78.1 14.4 0.3 1.4 2.6
2014 299.38 273.27 283.81 320.98 288.50 280.25 0.00 0.00 182.77 300.97 274.94 278.41 3.6 0.2 0.0 7.6 2.8 3.7 0.0 -100.0 7.8 3.7 0.5 1.0
2015 296.17 266.53 279.02 344.97 284.01 279.58 0.00 190.35 186.29 299.64 267.82 274.80 -1.1 -2.5 -1.7 7.5 -1.6 -0.2 0.0 0.0 1.9 -0.4 -2.6 -1.3
STR, Inc.
TransientTransient TotalGroupCurrent Month
Ace Hotel New York 20 W 29th St New York, NY 10001-4502 Phone: (212) 679-2222
Percent Change (%)Average Daily Rate
STR # 58097 ChainID: MgtCo: None Owner: None Market Scale*: New York, NY Upper Upscale Chains
For the Month of: August 2015 Date Created: September 17, 2015 Monthly Competitive Set Data Includes Subject Property
Contract Total Contract
Year To Date
Running 3 Month
Running 12 Month
Group

Tab 11 - Segmentation RevPAR Analysis
My Prop Comp SetMarket Scale My Prop Comp Set
Market Scale My Prop Comp Set
Market Scale My Prop Comp Set
Market Scale My Prop Comp Set
Market Scale My Prop Comp Set
Market Scale My Prop Comp Set
Market Scale My Prop Comp Set
Market Scale
2014 Mar 217.80 175.86 153.43 18.43 20.35 38.35 0.00 0.00 7.82 236.23 196.21 199.61 4.1 -2.8 -7.7 -47.7 -13.9 -19.6 0.0 -100.0 9.9 -3.4 -4.1 -9.7
Apr 290.86 234.51 196.40 14.77 24.45 47.88 0.00 0.00 8.13 305.63 258.96 252.42 22.7 10.2 4.2 -65.1 -15.1 -3.8 0.0 0.0 10.6 9.4 7.2 2.7
May 303.89 261.78 207.70 20.63 31.90 55.77 0.00 0.00 7.75 324.52 293.68 271.21 20.2 5.4 1.3 -59.7 -2.9 13.6 0.0 0.0 10.2 6.8 4.4 3.8
Jun 279.99 234.40 204.11 17.10 33.40 50.24 0.00 0.00 7.42 297.09 267.80 261.77 12.1 2.8 1.8 -40.9 3.3 4.0 0.0 0.0 9.4 6.6 2.8 2.4
Jul 228.28 194.42 173.76 19.45 22.82 41.38 0.00 0.00 7.27 247.73 217.23 222.40 5.9 5.2 2.5 -13.5 -16.4 -7.7 0.0 0.0 12.5 4.1 2.5 0.7
Aug 243.11 208.39 185.69 14.78 20.15 37.34 0.00 0.00 7.41 257.89 228.53 230.44 2.1 4.3 6.3 49.1 4.6 -6.2 0.0 0.0 8.3 3.9 4.3 4.1
Sep 330.47 271.63 221.53 49.58 46.58 69.57 0.00 0.00 7.05 380.05 318.21 298.15 7.8 4.4 3.0 57.3 6.2 13.4 0.0 0.0 -5.0 12.4 4.6 5.0
Oct 333.19 267.05 228.54 39.13 46.23 60.78 0.00 0.00 7.00 372.32 313.28 296.32 7.6 1.8 0.0 22.0 14.5 4.4 0.0 0.0 -4.8 8.9 3.5 0.7
Nov 272.99 221.63 191.27 29.61 32.09 55.06 0.00 0.00 6.65 302.60 253.72 252.99 5.0 -1.4 -2.9 0.8 10.8 6.3 0.0 0.0 -4.2 4.6 0.0 -1.1
Dec 280.70 244.81 233.37 19.46 22.46 40.89 0.00 0.00 6.77 300.16 267.27 281.03 3.5 -2.4 -0.1 -9.9 -7.4 -2.1 0.0 0.0 -6.0 2.6 -2.9 -0.5
2015 Jan 189.28 117.33 108.77 6.94 13.81 28.42 0.00 0.00 7.06 196.22 131.14 144.25 2.9 -13.4 -8.4 -57.8 -41.8 -38.6 0.0 0.0 4.9 -2.0 -17.6 -16.0
Feb 204.78 141.98 120.81 36.58 21.28 31.14 0.00 0.00 7.06 241.36 163.26 159.01 -0.3 -3.7 -3.0 32.5 -9.1 -20.0 0.0 0.0 0.8 3.6 -4.5 -6.7
Mar 226.10 169.14 154.07 16.94 23.39 43.27 0.00 1.92 7.82 243.04 194.44 205.17 3.8 -3.8 0.4 -8.1 14.9 12.8 0.0 0.0 0.0 2.9 -0.9 2.8
Apr 251.64 201.07 189.64 27.29 25.98 41.53 0.00 2.11 8.19 278.93 229.16 239.35 -13.5 -14.3 -3.4 84.8 6.2 -13.3 0.0 0.0 0.7 -8.7 -11.5 -5.2
May 307.27 238.29 208.80 17.56 25.95 49.49 0.00 3.14 8.13 324.83 267.39 266.42 1.1 -9.0 0.5 -14.9 -18.6 -11.3 0.0 0.0 4.9 0.1 -9.0 -1.8
Jun 292.78 231.00 210.27 10.04 31.18 49.69 0.00 3.11 8.64 302.82 265.28 268.60 4.6 -1.5 3.0 -41.3 -6.7 -1.1 0.0 0.0 16.4 1.9 -0.9 2.6
Jul 228.87 188.12 177.35 19.70 20.67 40.68 0.00 3.11 8.53 248.58 211.90 226.56 0.3 -3.2 2.1 1.3 -9.4 -1.7 0.0 0.0 17.3 0.3 -2.5 1.9
Aug 243.87 187.05 176.52 10.77 21.38 35.92 0.00 3.23 7.63 254.64 211.66 220.07 0.3 -10.2 -4.9 -27.1 6.1 -3.8 0.0 0.0 3.0 -1.3 -7.4 -4.5
2013 218.42 189.71 170.34 31.03 25.23 42.83 0.00 0.06 6.82 249.45 215.00 219.99 5.2 11.2 4.6 30.4 20.7 6.5 0.0 -92.0 -1.4 7.8 11.8 4.7
2014 244.29 199.39 171.36 18.57 25.01 44.58 0.00 0.00 7.45 262.86 224.40 223.38 11.8 5.1 0.6 -40.1 -0.9 4.1 0.0 -100.0 9.3 5.4 4.4 1.5
2015 243.29 184.51 168.63 18.00 22.93 40.08 0.00 2.10 7.89 261.29 209.54 216.60 -0.4 -7.5 -1.6 -3.1 -8.3 -10.1 0.0 0.0 5.9 -0.6 -6.6 -3.0
2013 234.34 203.97 181.30 20.35 26.23 44.23 0.00 0.00 6.70 254.69 230.20 232.23 6.6 12.4 1.5 1.7 17.9 9.1 0.0 -100.0 -2.2 6.2 12.5 2.7
2014 250.19 212.16 187.67 17.13 25.37 42.91 0.00 0.00 7.37 267.32 237.53 237.95 6.8 4.0 3.5 -15.8 -3.3 -3.0 0.0 0.0 10.0 5.0 3.2 2.5
2015 254.72 201.74 187.80 13.55 24.34 42.01 0.00 3.15 8.26 268.27 229.22 238.08 1.8 -4.9 0.1 -20.9 -4.1 -2.1 0.0 0.0 12.1 0.4 -3.5 0.1
2013 233.54 205.81 184.36 29.89 28.19 47.20 0.00 0.39 6.99 263.43 234.39 238.55 4.7 7.0 3.8 25.9 12.8 3.3 0.0 -24.7 1.2 6.7 7.6 3.6
2014 258.34 216.17 186.71 21.88 28.12 47.35 0.00 0.00 7.38 280.22 244.29 241.45 10.6 5.0 1.3 -26.8 -0.3 0.3 0.0 -100.0 5.6 6.4 4.2 1.2
2015 263.69 206.84 185.48 23.46 27.56 45.58 0.00 1.40 7.55 287.15 235.80 238.60 2.1 -4.3 -0.7 7.2 -2.0 -3.8 0.0 0.0 2.3 2.5 -3.5 -1.2
STR, Inc.
For the Month of: August 2015 Date Created: September 17, 2015 Monthly Competitive Set Data Includes Subject Property
Ace Hotel New York 20 W 29th St New York, NY 10001-4502 Phone: (212) 679-2222
Percent Change (%)RevPAR
STR # 58097 ChainID: MgtCo: None Owner: None Market Scale*: New York, NY Upper Upscale Chains
Transient Group Contract TotalTransient TotalContractGroup
Running 3 Month
Running 12 Month
Current Month
Year To Date

ADDENDA
Historical Financials
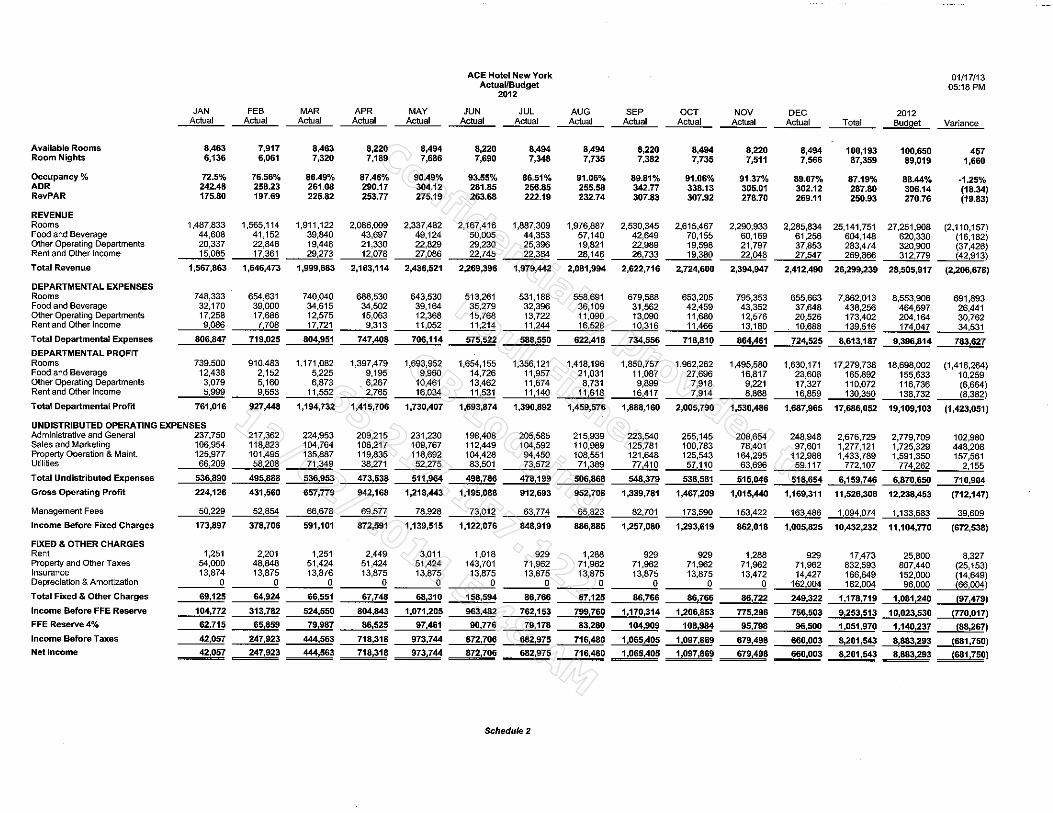
Confidentially provided to
Confidentially provided to
Confidentially provided to
Confidentially provided to
Paul Fisher
Paul Fisher
Paul Fisher
Paul Fisher
GB Lodging
GB Lodging
GB Lodging
GB Lodging
65.217.157.122
65.217.157.122
65.217.157.122
65.217.157.122
12/02/2014 5:48 AM
12/02/2014 5:48 AM
12/02/2014 5:48 AM
12/02/2014 5:48 AM
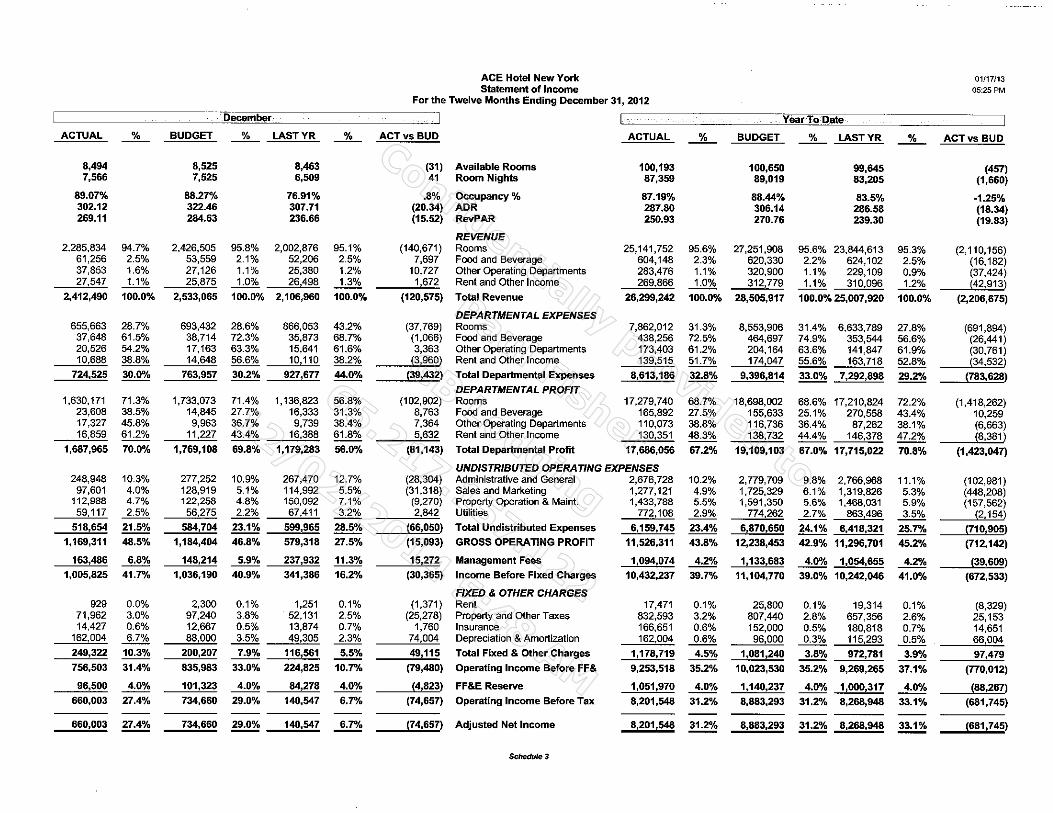
Confidentially provided to
Confidentially provided to
Confidentially provided to
Confidentially provided to
Paul Fisher
Paul Fisher
Paul Fisher
Paul Fisher
GB Lodging
GB Lodging
GB Lodging
GB Lodging
65.217.157.122
65.217.157.122
65.217.157.122
65.217.157.122
12/02/2014 5:48 AM
12/02/2014 5:48 AM
12/02/2014 5:48 AM
12/02/2014 5:48 AM
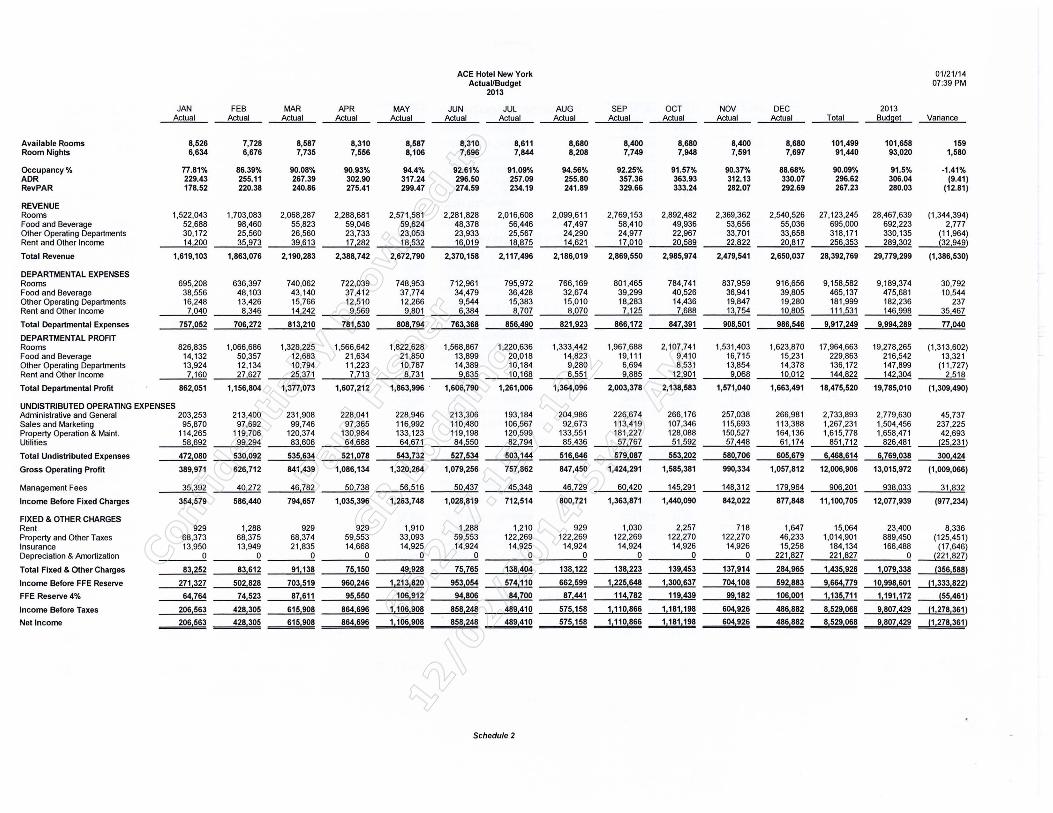
Available Rooms Room Nights
Occupancy% ADR Rev PAR
REVENUE Rooms Food and Beverage Other Operating Departments Rent and Other Income
Total Revenue
DEPARTMENTAL EXPENSES Rooms Food and Beverage Other Operating Departments Rent and Other Income
Total Departmental Expenses
DEPARTMENTAL PROFIT Rooms Food and Beverage Other Operating Departments Rent and Other Income
Total Departmental Profit
JAN Actual
8,526 6,634
77.81% 229.43 178.52
1,522,043 52,688 30,172 14 200
1,619,103
695,208 38,556 16,248 7 040
757,052
826,835 14,132 13,924 7 160
862,051
UNDISTRIBUTED OPERATING EXPENSES Administrative and General 203,253 Sales and Marketing 95,870 Property Operation & Maint. 114,265 Utilities 58 692
Total Undistributed Expenses
Gross Operating Profit
Management Fees
Income Before Fixed Charges
FIXED & OTHER CHARGES Rent Property and Other Taxes Insurance Depreciation & Amortization
Total Fixed & Other Charges
Income Before FFE Reserve
FFE Reserve 4%
Income Before Taxes
Net Income
472,080
389,971
35 392
354,579
929 68,373 13,950
0
83,252
271,327
64764
206,563
206,563
FEB Actual
7,728 6,676
86.39% 255.11 220.38
1,703,083 98,460 25,560 35 973
1,863,076
636,397 48,103 13,426 8 346
706,272
1,066,686 50,357 12,134 27 627
1,156,804
213,400 97,692
119,706 99 294
530,092
626,712
40 272
586,440
1,288 68,375 13,949
0
83 612
502,828
74 523
428,305
428,305
MAR Actual
8,587 7,735
90.08% 267.39 240.86
2,068,287 55,823 26,560 39 613
2,190,283
740,062 43,1 40 15,766 14 242
813,210
1,328,225 12,683 10,794 25 371
1,377,073
231,908 99,746
120,374 83 606
535,634
841,439
46 782
794,657
929 68,374 21,835
0
91138
703,519
87 611
615,908
615,908
APR Actual
8,310 7,556
90.93% 302.90 275.41
2,288,681 59,046 23,733 17 282
2,388,742
722,039 37,412 12,510
9 569
781,530
1,566,642 21 ,634 11,223 7 713
1,607,212
228,041 97,365
130,984 64 688
521,078
1,086,134
50 738
1,035,396
929 59,553 14,668
0
75150
960,246
95 550
864,696
864 696
MAY Actual
8,587 8,106
94.4% 317.24 299.47
2,571,581 59,624 23,Q53 18 532
2,672,790
748,953 37,774 12,266 9801
808,794
1,822,628 21,850 10,787 8 731
1,863,996 .
228,946 116,992 133,123 64 671
543,732
1,320,264
56 516
1,263,748
1,910 33,093 14,925
0
49 928
1,213,820
106,912
1,106,908
1,106,908
ACE Hotel New York Actual/Budget
2013
JUN Actual
8,310 7,696
92.61% 296.50 274.59
2,281,828 48,378 23,933 16 019
2,370,158
712,961 34,479
9,544 6 384
763,368
1,568,867 13,899 14,389 9635
1,606,790
213,306 110,480 119,198 84 550
527,534
1,079,256
50437
1,028,819
1,288 59,553 14,924
0
75 765
953,054
94,806
858,248
858,248
JUL Actual
8,611 7,844
91.09% 257.09 234.19
2,016,608 56,446 25,567 18875
2,117,496
795,972 36,428 15,383
8 707
856,490
1,220,636 20,018 10,184 10168
1,261,006
193,184 106,567 120,599 82 794
503,144
757,862
45 348
712,514
1,210 122,269
14,925 0
138,404
574110
84700
489 410
489 410
Schedule 2
AUG Actual
8,680 8,208
94.56% 255.80 241 .89
2,099,611 47,497 24,290 14 621
2,186,019
766,169 32,674 15,010
8 070
821,923
1,333,442 14,823 9,280 6 551
1,364,096
204,986 92,673
133,551 85 436
516,646
847,450
46 729
800,721
929 122,269
14,924 0
138,122
662,599
87 441
575,158
575158
SEP Actual
8,400 7,749
92.25% 357.36 329.66
2,769,153 58,410 24,977 17 010
2,869,550
801,465 39,299 18,283 7125
866,172
1,967 ,688 19,111 6,694 9 885
2,003,378
226,674 113,419 181 ,227 57 767
579,087
1,424,291
60 420
1,363,871
1,030 122,269
14,924 0
138,223
1,225,646
114 782
1,110,866
1,110,866
OCT Actual
8,680 7,948
91.57% 363.93 333.24
2,892,482 49,936 22,967 20 589
2,985,974
784,741 40,526 14,436 7 688
847 391
2,107,741 9,410 8,531
12 901
2,138,583
266,176 107,346 128,088 51 592
553,202
1,585,381
145 291
1,440,090
2,257 122,270
14,926 0
139,453
1,300,637
119,439
1,181,198
1,181,198
NOV Actual
8,400 7,591
90.37% 312.13 282.D7
2,369,362 53,656 33,701 22 822
2,479,541
837,959 36,941 19,847 13 754
908,501
1,531,403 16,715 13,854 9068
1,571,040
257,038 115,693 150,527 57 448
580,706
990,334
148 312
842,022
718 122,270
14,926 0
137 914
704,108
99,182
604,926
604,926
DEC Actual
8,680 7,697
88.68% 330.07 292.69
2,540,526 55,036 33,658 20 817
2,650,037
916,656 39,805 19,280 10805
986,546
1,623,870 15,231 14,378 10012
1,663,491
266,981 113,388 164,136 61174
605,679
1,057,812
179 964
877,848
1,647 46,233 15,258
221,827
284,965
592,883
106,001
486,882
486,882
Total
101,499 91,440
90.09% 296.62 267.23
27,123,245 695,000 318,171 256,353
28,392,769
9,158,582 465,137 181,999 111531
9,917,249
17,964,663 229,863 136,172 144 822
18,475,520
2,733,893 1,267,231 1,615,778
851 712
6,468,614
12,006,906
906 201
11,100,705
15,064 1,014,901
184,134 221,827
1,435,926
9,664,779
1,135,711
8,529,068
8,529,068
2013 Budget
101,658 93,020
91 .5% 306.04 280.03
28,467,639 692,223 330,135 289 302
29,779,299
9,189,374 475,681 182,236 146 998
9,994,289
19,278,265 216,542 147,899 142 304
19,785,010
2,779,630 1,504,456 1,658,471
826 481
6,769,038
13,015,972
938 033
12,077,939
23,400 889,450 166,488
0
1,079,338
10,998,601
1,191,172
9,807,429
9,807,429
01/21/14 07:39PM
Variance
159 1,580
·1.41% (9.41)
(12.81)
(1 ,344,394) 2,777
(11,964) (32,949)
(1,386,530)
30,792 10,544
237 35 467
77040
(1,313,602) 13,321
(11,727) 2 518
(1,309,490)
45,737 237,225 42,693
(25,231)
300 424
(1,009,066)
31 832
(977,234)
8,336 (125,451)
(17,646) (221 ,827)
(356,588)
(1 ,333,822)
(55,461)
(1,278,361)
(1,278,361)
Conf
iden
tially
pro
vide
d to
Conf
iden
tially
pro
vide
d to
Conf
iden
tially
pro
vide
d to
Conf
iden
tially
pro
vide
d to
Paul
Fis
her
Paul
Fis
her
Paul
Fis
her
Paul
Fis
her
GB L
odgi
ng
GB L
odgi
ng
GB L
odgi
ng
GB L
odgi
ng
65.2
17.1
57.1
22
65.2
17.1
57.1
22
65.2
17.1
57.1
22
65.2
17.1
57.1
22
12/0
2/20
14 5
:49
AM
12/0
2/20
14 5
:49
AM
12/0
2/20
14 5
:49
AM
12/0
2/20
14 5
:49
AM
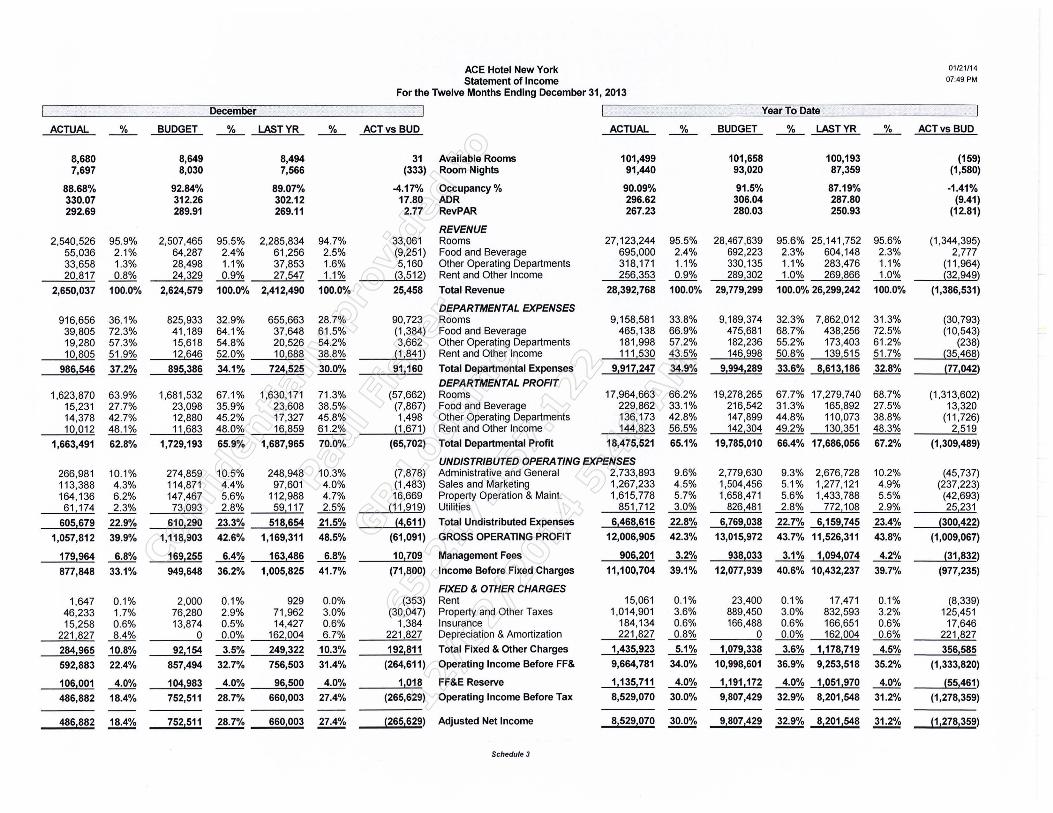
ACE Hotel New York 01121/14
Statement of Income 07:49PM
For the Twelve Months Ending December 31, 2013
December Year To Date
ACTUAL ~ BUDGET ~ LASTYR ~ ACTvs BUD ACTUAL ~ BUDGET ~ LASTYR ~ ACTvs BUD
8,680 8,649 8,494 31 Available Rooms 101,499 101,658 100,193 (159) 7,697 8,030 7,566 (333) Room Nights 91,440 93,020 87,359 (1,580)
88.68% 92.84% 89.07% -4.17% Occupancy% 90.09% 91.5% 87.19% -1.41% 330.07 312.26 302.12 17.80 ADR 296.62 306.04 287.80 (9.41) 292.69 289.91 269.11 2.77 RevPAR 267.23 280.03 250.93 (12.81)
REVENUE 2,540,526 95.9% 2,507,465 95.5% 2,285,834 94.7% 33,061 Rooms 27,123,244 95.5% 28,467.639 95.6% 25,141 ,752 95.6% (1 ,344,395)
55,036 2.1 o/o 64,287 2.4% 61 ,256 2.5% (9,251) Food and Beverage 695,000 2.4% 692,223 2.3% 604,148 2.3% 2,777 33,658 1.3% 28,498 1.1% 37,853 1.6% 5,160 Other Operating Departments 318,171 1.1% 330,135 1.1% 283,476 1.1% (11 ,964) 20,817 0.8% 24,329 0.9% 27 547 1.1% (3,512) Rent and Other Income 256,353 0.9% 289,302 1.0% 269,866 1.0% (32,949)
2,650,037 100.0% 2,624,579 100.0% 2,412,490 100.0% 25,458 Total Revenue 28,392,768 100.0% 29,779,299 100.0% 26,299,242 100.0% (1,386,531)
DEPARTMENTAL EXPENSES 916,656 36.1 o/o 825,933 32.9% 655,663 28.7% 90,723 Rooms 9,158,581 33.8% 9,189,374 32.3% 7,862,012 31.3% (30,793) 39,805 72.3% 41 '189 64.1 o/o 37,648 61.5% (1 ,384) Food and Beverage 465,138 66.9% 475,681 68.7% 438,256 72.5% (10,543) 19,280 57.3% 15,618 54.8% 20,526 54.2% 3,662 Other Operating Departments 181,998 57.2% 182,236 55.2% 173,403 61.2% (238) 10 805 51 .9% 12,646 52.0% 10 688 38.8% (1 ,841) Rent and Other Income 111 530 43.5% 146,998 50.8% 139,515 51 .7% (35,468)
986,546 37.2% 895,386 34.1% 724,525 30.0% 91,160 Total Departmental Expenses 9,917,247 34.9% 9,994,289 33.6% 8,613,186 32.8% (77,042)
DEPARTMENTAL PROFIT 1,623,870 63.9% 1,681,532 67.1% 1 ,630,171 71 .3% (57,662) Rooms 17,964,663 66.2% 19,278,265 67.7% 17,279,740 68.7% (1,313,602)
15,231 27.7% 23,098 35.9% 23,608 38.5% (7,867) Food and Beverage 229,862 33.1% 216,542 31.3% 165,892 27.5% 13,320 14,378 42.7% 12,880 45.2% 17,327 45.8% 1,498 Other Operating Departments 136,173 42.8% 147,899 44.8% 110,073 38.8% (11 ,726) 10 012 48.1% 11 683 48.0% 16 859 61 .2% (1 ,671) Rent and Other Income 144 823 56.5% 142 304 49.2% 130,351 48.3% 2 519
1,663,491 62.8% 1,729,193 65.9% 1,687,965 70.0% (65,702) Total Departmental Profit 18,475,521 65.1% 19,785,010 66.4% 17,686,056 67.2% (1,309,489)
UNDISTRIBUTED OPERATING EXPENSES 266,981 10.1% 274,859 10.5% 248,948 10.3% (7,878) Administrative and General 2,733,893 9.6% 2,779,630 9.3% 2,676,728 10.2% (45,737) 113,388 4.3% 114,871 4.4% 97,601 4.0% (1 ,483) Sales and Marketing 1,267,233 4.5% 1,504,456 5.1% 1 ,277,121 4.9% (237,223) 164,136 6.2% 147,467 5.6% 112,988 4.7% 16,669 Property Operation & Main!. 1,615,778 5. 7% 1,658,471 5.6% 1,433,788 5.5% (42,693) 61 174 2.3% 73 093 2.8% 59 117 2.5% (11,919) Utilities 851 712 3.0% 826 481 2.8% 772,108 2.9% 25 231
605,679 22.9% 610,290 23.3% 518,654 21.5% (4,611) Total Undistributed Expenses 6,468,616 22.8% 6,769,038 22.7% 6,159,745 23.4% {300,422)
1,057,812 39.9% 1,118,903 42.6% 1,169,311 48.5% (61 ,091) GROSS OPERATING PROFIT 12,006,905 42.3% 13,015,972 43.7% 11,526,311 43.8% (1,009,067)
179,964 6.8% 169,255 6.4% 163,486 6.8% 10,709 Management Fees 906,201 3.2% 938,033 3.1% 1,094,074 4.2% {31,832)
877,848 33.1% 949,648 36.2% 1,005,825 41 .7% (71,800) Income Before Fixed Charges 11,100,704 39.1% 12,077,939 40.6% 10,432,237 39.7% (977,235)
FIXED & OTHER CHARGES 1,647 0.1% 2,000 0.1 o/o 929 0.0% (353) Rent 15,061 0.1 % 23,400 0.1% 17,471 0.1% (8,339)
46,233 1.7% 76,280 2.9% 71,962 3.0% (30,047) Property and Other Taxes 1,014,901 3.6% 889,450 3.0% 832,593 3.2% 125,451 15,258 0.6% 13,874 0.5% 14,427 0.6% 1,384 Insurance 184,134 0.6% 166,488 0.6% 166,651 0.6% 17,646
221,827 8.4% 0 0.0% 162,004 6.7% 221,827 Depreciation & Amortization 221,827 0.8% 0 0.0% 162,004 0.6% 221,827
284,965 10.8% 92,154 3.5% 249,322 10.3% 192,811 Total Fixed & Other Charges 1,435,923 5.1% 1,079,338 3.6% 1,178,719 4.5% 356,585
592,883 22.4% 857,494 32.7% 756,503 31 .4% (264,611) Operating Income Before FF& 9,664,781 34.0% 10,998,601 36.9% 9,253,518 35.2% (1,333,820)
106,001 4.0% 104,983 4.0% 96,500 4.0% 1 018 FF&E Reserve 1,135,711 4.0% 1,1 91,172 4.0% 1,051,970 4.0% {55,461)
486,882 18.4% 752,511 28.7% 660,003 27.4% (265,629) Operating Income Before Tax 8,529,070 30.0% 9,807,429 32.9% 8,201,548 31.2% (1,278,359)
486,882 ..1.!!:.ili 752,511 ~ 660,003 ~ (265,629) Adjusted Net Income 8,529,070 ~ 9,807,429 ~ 8,201,548 ..lld!2 (1,278,359)
Schedule 3
Conf
iden
tially
pro
vide
d to
Conf
iden
tially
pro
vide
d to
Conf
iden
tially
pro
vide
d to
Conf
iden
tially
pro
vide
d to
Paul
Fis
her
Paul
Fis
her
Paul
Fis
her
Paul
Fis
her
GB L
odgi
ng
GB L
odgi
ng
GB L
odgi
ng
GB L
odgi
ng
65.2
17.1
57.1
22
65.2
17.1
57.1
22
65.2
17.1
57.1
22
65.2
17.1
57.1
22
12/0
2/20
14 5
:49
AM
12/0
2/20
14 5
:49
AM
12/0
2/20
14 5
:49
AM
12/0
2/20
14 5
:49
AM
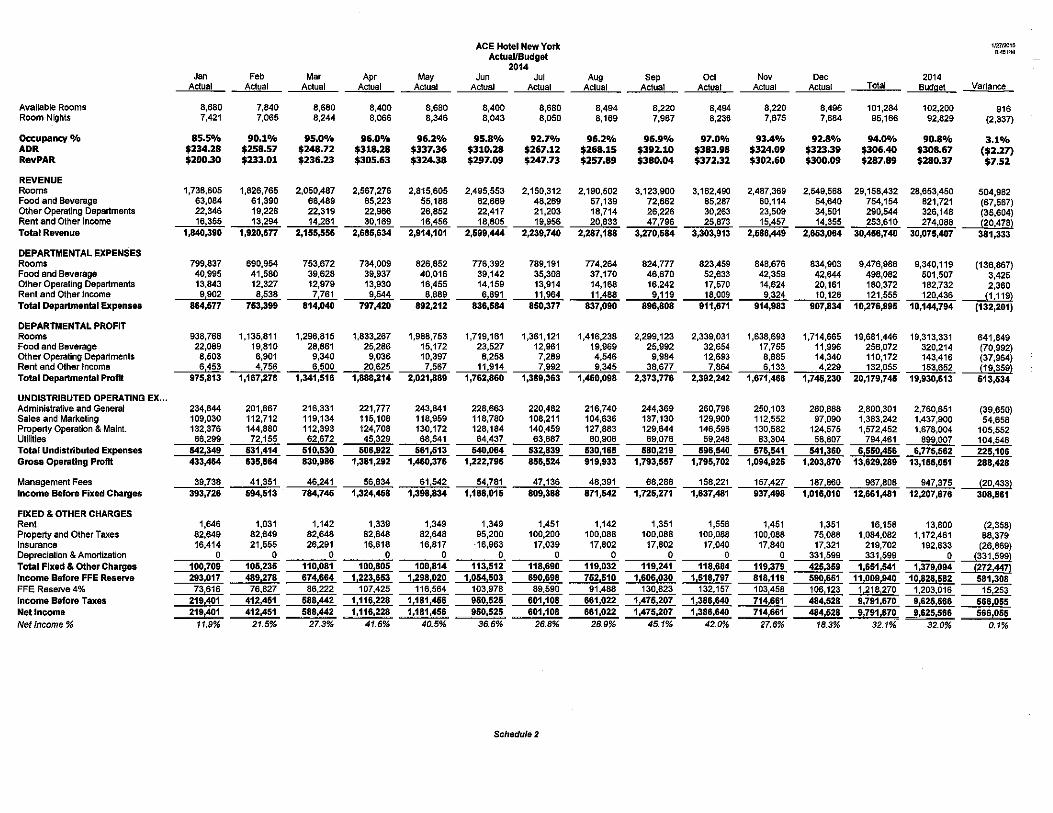
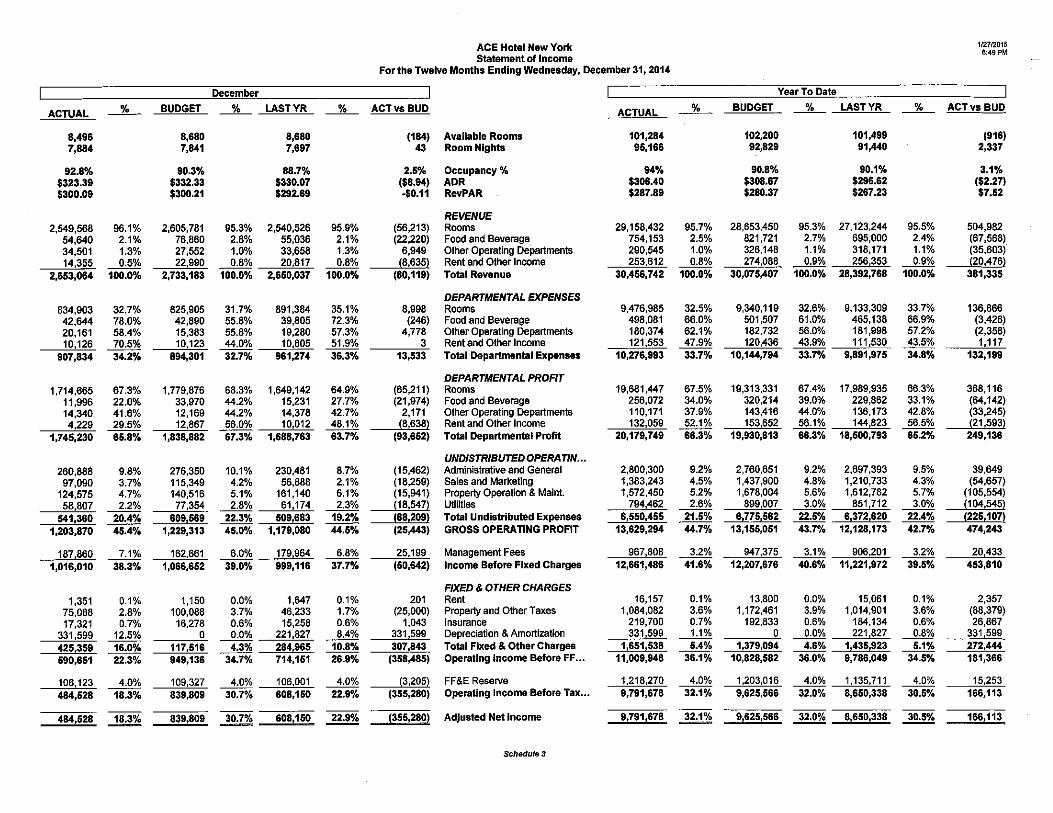
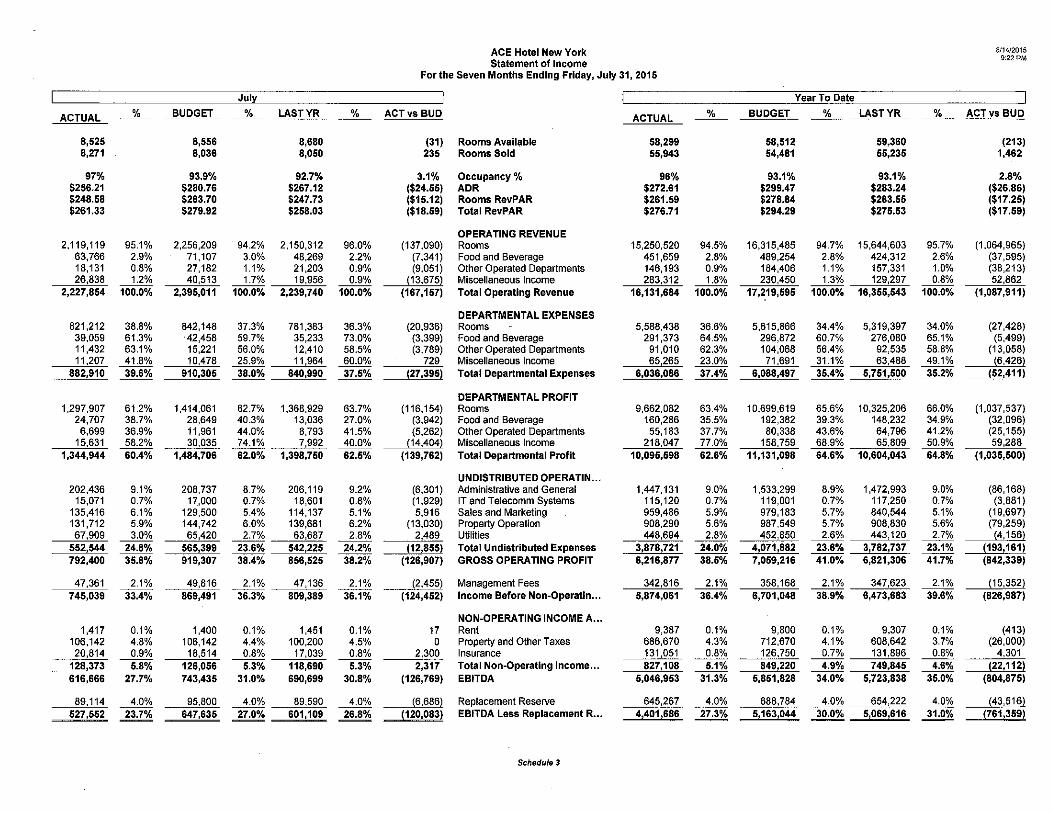
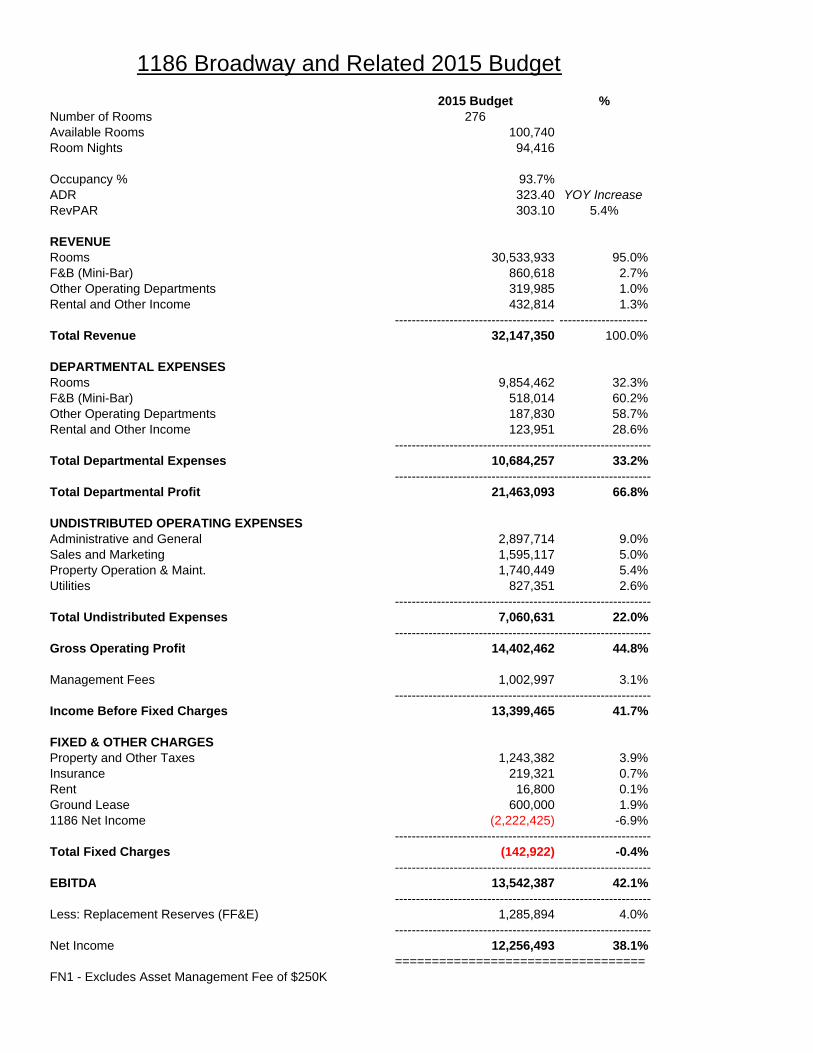
2015 Budget %Number of Rooms 276Available Rooms 100,740Room Nights 94,416
Occupancy % 93.7%ADR 323.40 YOY IncreaseRevPAR 303.10 5.4%
REVENUERooms 30,533,933 95.0%F&B (Mini-Bar) 860,618 2.7%Other Operating Departments 319,985 1.0%Rental and Other Income 432,814 1.3%
-------------------------------------- ---------------------Total Revenue 32,147,350 100.0%
DEPARTMENTAL EXPENSESRooms 9,854,462 32.3%F&B (Mini-Bar) 518,014 60.2%Other Operating Departments 187,830 58.7%Rental and Other Income 123,951 28.6%
-------------------------------------------------------------Total Departmental Expenses 10,684,257 33.2%
-------------------------------------------------------------Total Departmental Profit 21,463,093 66.8%
UNDISTRIBUTED OPERATING EXPENSESAdministrative and General 2,897,714 9.0%Sales and Marketing 1,595,117 5.0%Property Operation & Maint. 1,740,449 5.4%Utilities 827,351 2.6%
-------------------------------------------------------------Total Undistributed Expenses 7,060,631 22.0%
-------------------------------------------------------------Gross Operating Profit 14,402,462 44.8%
Management Fees 1,002,997 3.1%-------------------------------------------------------------
Income Before Fixed Charges 13,399,465 41.7%
FIXED & OTHER CHARGESProperty and Other Taxes 1,243,382 3.9%Insurance 219,321 0.7%Rent 16,800 0.1%Ground Lease 600,000 1.9%1186 Net Income (2,222,425) -6.9%
-------------------------------------------------------------Total Fixed Charges (142,922) -0.4%
-------------------------------------------------------------EBITDA 13,542,387 42.1%
-------------------------------------------------------------Less: Replacement Reserves (FF&E) 1,285,894 4.0%
-------------------------------------------------------------Net Income 12,256,493 38.1%
==================================FN1 - Excludes Asset Management Fee of $250K
1186 Broadway and Related 2015 Budget
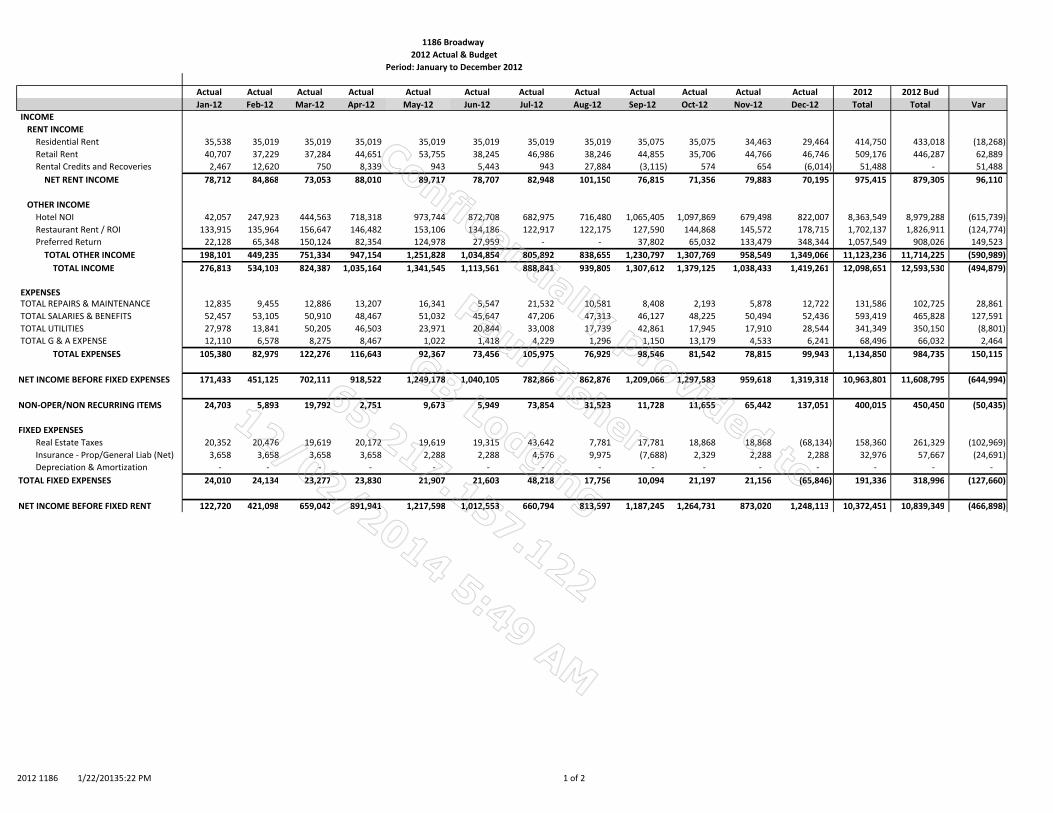
Actual Actual Actual Actual Actual Actual Actual Actual Actual Actual Actual Actual 2012 2012 BudJan‐12 Feb‐12 Mar‐12 Apr‐12 May‐12 Jun‐12 Jul‐12 Aug‐12 Sep‐12 Oct‐12 Nov‐12 Dec‐12 Total Total Var
INCOME RENT INCOME Residential Rent 35,538 35,019 35,019 35,019 35,019 35,019 35,019 35,019 35,075 35,075 34,463 29,464 414,750 433,018 (18,268) Retail Rent 40,707 37,229 37,284 44,651 53,755 38,245 46,986 38,246 44,855 35,706 44,766 46,746 509,176 446,287 62,889 Rental Credits and Recoveries 2,467 12,620 750 8,339 943 5,443 943 27,884 (3,115) 574 654 (6,014) 51,488 ‐ 51,488 NET RENT INCOME 78,712 84,868 73,053 88,010 89,717 78,707 82,948 101,150 76,815 71,356 79,883 70,195 975,415 879,305 96,110
OTHER INCOME Hotel NOI 42,057 247,923 444,563 718,318 973,744 872,708 682,975 716,480 1,065,405 1,097,869 679,498 822,007 8,363,549 8,979,288 (615,739) Restaurant Rent / ROI 133,915 135,964 156,647 146,482 153,106 134,186 122,917 122,175 127,590 144,868 145,572 178,715 1,702,137 1,826,911 (124,774) Preferred Return 22,128 65,348 150,124 82,354 124,978 27,959 ‐ ‐ 37,802 65,032 133,479 348,344 1,057,549 908,026 149,523 TOTAL OTHER INCOME 198,101 449,235 751,334 947,154 1,251,828 1,034,854 805,892 838,655 1,230,797 1,307,769 958,549 1,349,066 11,123,236 11,714,225 (590,989) TOTAL INCOME 276,813 534,103 824,387 1,035,164 1,341,545 1,113,561 888,841 939,805 1,307,612 1,379,125 1,038,433 1,419,261 12,098,651 12,593,530 (494,879)
EXPENSES TOTAL REPAIRS & MAINTENANCE 12,835 9,455 12,886 13,207 16,341 5,547 21,532 10,581 8,408 2,193 5,878 12,722 131,586 102,725 28,861 TOTAL SALARIES & BENEFITS 52,457 53,105 50,910 48,467 51,032 45,647 47,206 47,313 46,127 48,225 50,494 52,436 593,419 465,828 127,591 TOTAL UTILITIES 27,978 13,841 50,205 46,503 23,971 20,844 33,008 17,739 42,861 17,945 17,910 28,544 341,349 350,150 (8,801) TOTAL G & A EXPENSE 12,110 6,578 8,275 8,467 1,022 1,418 4,229 1,296 1,150 13,179 4,533 6,241 68,496 66,032 2,464 TOTAL EXPENSES 105,380 82,979 122,276 116,643 92,367 73,456 105,975 76,929 98,546 81,542 78,815 99,943 1,134,850 984,735 150,115
NET INCOME BEFORE FIXED EXPENSES 171,433 451,125 702,111 918,522 1,249,178 1,040,105 782,866 862,876 1,209,066 1,297,583 959,618 1,319,318 10,963,801 11,608,795 (644,994)
NON‐OPER/NON RECURRING ITEMS 24,703 5,893 19,792 2,751 9,673 5,949 73,854 31,523 11,728 11,655 65,442 137,051 400,015 450,450 (50,435)
FIXED EXPENSES Real Estate Taxes 20,352 20,476 19,619 20,172 19,619 19,315 43,642 7,781 17,781 18,868 18,868 (68,134) 158,360 261,329 (102,969) Insurance ‐ Prop/General Liab (Net) 3,658 3,658 3,658 3,658 2,288 2,288 4,576 9,975 (7,688) 2,329 2,288 2,288 32,976 57,667 (24,691) Depreciation & Amortization ‐ ‐ ‐ ‐ ‐ ‐ ‐ ‐ ‐ ‐ ‐ ‐ ‐ ‐ ‐ TOTAL FIXED EXPENSES 24,010 24,134 23,277 23,830 21,907 21,603 48,218 17,756 10,094 21,197 21,156 (65,846) 191,336 318,996 (127,660)
NET INCOME BEFORE FIXED RENT 122,720 421,098 659,042 891,941 1,217,598 1,012,553 660,794 813,597 1,187,245 1,264,731 873,020 1,248,113 10,372,451 10,839,349 (466,898)
1186 Broadway 2012 Actual & Budget
Period: January to December 2012
2012 1186 1/22/20135:22 PM 1 of 2
Confidentially provided to
Confidentially provided to
Confidentially provided to
Confidentially provided to
Paul Fisher
Paul Fisher
Paul Fisher
Paul Fisher
GB Lodging
GB Lodging
GB Lodging
GB Lodging
65.217.157.122
65.217.157.122
65.217.157.122
65.217.157.122
12/02/2014 5:49 AM
12/02/2014 5:49 AM
12/02/2014 5:49 AM
12/02/2014 5:49 AM
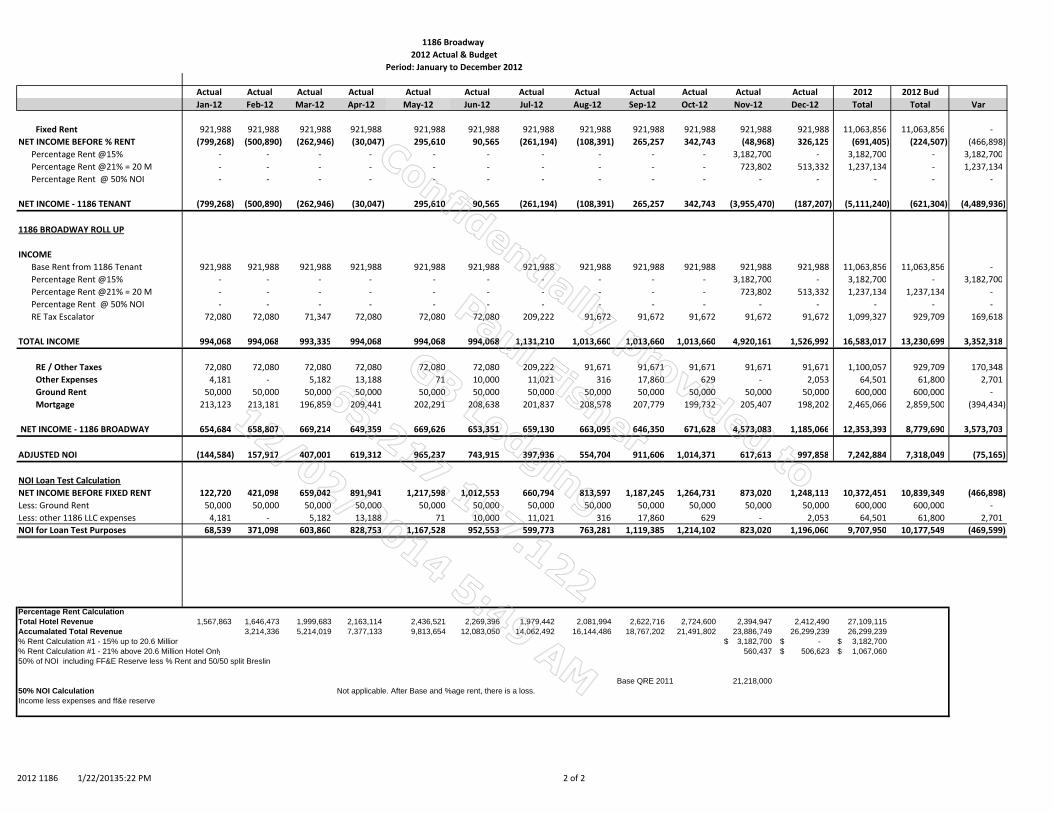
Actual Actual Actual Actual Actual Actual Actual Actual Actual Actual Actual Actual 2012 2012 BudJan‐12 Feb‐12 Mar‐12 Apr‐12 May‐12 Jun‐12 Jul‐12 Aug‐12 Sep‐12 Oct‐12 Nov‐12 Dec‐12 Total Total Var
1186 Broadway 2012 Actual & Budget
Period: January to December 2012
Fixed Rent 921,988 921,988 921,988 921,988 921,988 921,988 921,988 921,988 921,988 921,988 921,988 921,988 11,063,856 11,063,856 ‐ NET INCOME BEFORE % RENT (799,268) (500,890) (262,946) (30,047) 295,610 90,565 (261,194) (108,391) 265,257 342,743 (48,968) 326,125 (691,405) (224,507) (466,898) Percentage Rent @15% ‐ ‐ ‐ ‐ ‐ ‐ ‐ ‐ ‐ ‐ 3,182,700 ‐ 3,182,700 ‐ 3,182,700 Percentage Rent @21% = 20 M ‐ ‐ ‐ ‐ ‐ ‐ ‐ ‐ ‐ ‐ 723,802 513,332 1,237,134 ‐ 1,237,134 Percentage Rent @ 50% NOI ‐ ‐ ‐ ‐ ‐ ‐ ‐ ‐ ‐ ‐ ‐ ‐ ‐ ‐ ‐
NET INCOME ‐ 1186 TENANT (799,268) (500,890) (262,946) (30,047) 295,610 90,565 (261,194) (108,391) 265,257 342,743 (3,955,470) (187,207) (5,111,240) (621,304) (4,489,936)
1186 BROADWAY ROLL UP
INCOME Base Rent from 1186 Tenant 921,988 921,988 921,988 921,988 921,988 921,988 921,988 921,988 921,988 921,988 921,988 921,988 11,063,856 11,063,856 ‐ Percentage Rent @15% ‐ ‐ ‐ ‐ ‐ ‐ ‐ ‐ ‐ ‐ 3,182,700 ‐ 3,182,700 ‐ 3,182,700 Percentage Rent @21% = 20 M ‐ ‐ ‐ ‐ ‐ ‐ ‐ ‐ ‐ ‐ 723,802 513,332 1,237,134 1,237,134 ‐ Percentage Rent @ 50% NOI ‐ ‐ ‐ ‐ ‐ ‐ ‐ ‐ ‐ ‐ ‐ ‐ ‐ ‐ ‐ RE Tax Escalator 72,080 72,080 71,347 72,080 72,080 72,080 209,222 91,672 91,672 91,672 91,672 91,672 1,099,327 929,709 169,618
TOTAL INCOME 994,068 994,068 993,335 994,068 994,068 994,068 1,131,210 1,013,660 1,013,660 1,013,660 4,920,161 1,526,992 16,583,017 13,230,699 3,352,318
RE / Other Taxes 72,080 72,080 72,080 72,080 72,080 72,080 209,222 91,671 91,671 91,671 91,671 91,671 1,100,057 929,709 170,348 Other Expenses 4,181 ‐ 5,182 13,188 71 10,000 11,021 316 17,860 629 ‐ 2,053 64,501 61,800 2,701 Ground Rent 50,000 50,000 50,000 50,000 50,000 50,000 50,000 50,000 50,000 50,000 50,000 50,000 600,000 600,000 ‐ Mortgage 213,123 213,181 196,859 209,441 202,291 208,638 201,837 208,578 207,779 199,732 205,407 198,202 2,465,066 2,859,500 (394,434)
NET INCOME ‐ 1186 BROADWAY 654,684 658,807 669,214 649,359 669,626 653,351 659,130 663,095 646,350 671,628 4,573,083 1,185,066 12,353,393 8,779,690 3,573,703
ADJUSTED NOI (144,584) 157,917 407,001 619,312 965,237 743,915 397,936 554,704 911,606 1,014,371 617,613 997,858 7,242,884 7,318,049 (75,165)
NOI Loan Test CalculationNET INCOME BEFORE FIXED RENT 122,720 421,098 659,042 891,941 1,217,598 1,012,553 660,794 813,597 1,187,245 1,264,731 873,020 1,248,113 10,372,451 10,839,349 (466,898) Less: Ground Rent 50,000 50,000 50,000 50,000 50,000 50,000 50,000 50,000 50,000 50,000 50,000 50,000 600,000 600,000 ‐ Less: other 1186 LLC expenses 4,181 ‐ 5,182 13,188 71 10,000 11,021 316 17,860 629 ‐ 2,053 64,501 61,800 2,701 NOI for Loan Test Purposes 68,539 371,098 603,860 828,753 1,167,528 952,553 599,773 763,281 1,119,385 1,214,102 823,020 1,196,060 9,707,950 10,177,549 (469,599)
Percentage Rent CalculationTotal Hotel Revenue 1,567,863 1,646,473 1,999,683 2,163,114 2,436,521 2,269,396 1,979,442 2,081,994 2,622,716 2,724,600 2,394,947 2,412,490 27,109,115 Accumalated Total Revenue 3,214,336 5,214,019 7,377,133 9,813,654 12,083,050 14,062,492 16,144,486 18,767,202 21,491,802 23,886,749 26,299,239 26,299,239 % Rent Calculation #1 - 15% up to 20.6 Million 3,182,700$ -$ 3,182,700$ % Rent Calculation #1 - 21% above 20.6 Million Hotel Only 560,437 506,623$ 1,067,060$ 50% of NOI including FF&E Reserve less % Rent and 50/50 split Breslin
Base QRE 2011 21,218,000 50% NOI Calculation Not applicable. After Base and %age rent, there is a loss.Income less expenses and ff&e reserve
2012 1186 1/22/20135:22 PM 2 of 2
Confidentially provided to
Confidentially provided to
Confidentially provided to
Confidentially provided to
Paul Fisher
Paul Fisher
Paul Fisher
Paul Fisher
GB Lodging
GB Lodging
GB Lodging
GB Lodging
65.217.157.122
65.217.157.122
65.217.157.122
65.217.157.122
12/02/2014 5:49 AM
12/02/2014 5:49 AM
12/02/2014 5:49 AM
12/02/2014 5:49 AM
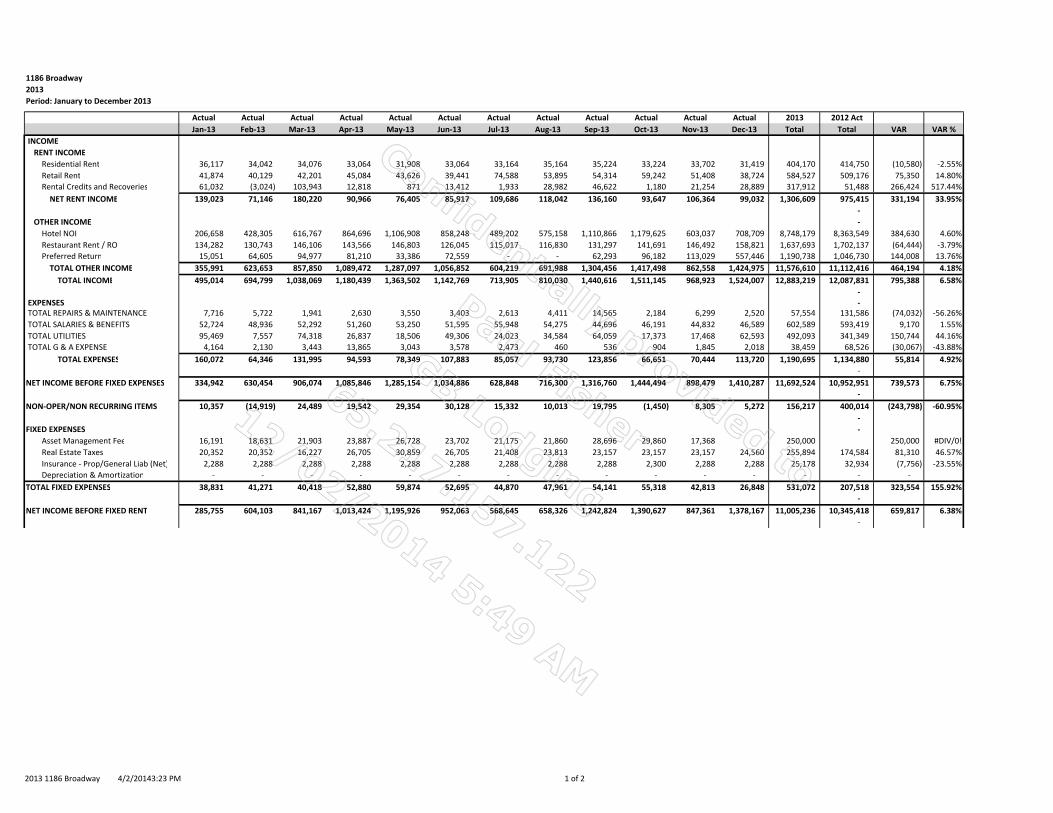
1186 Broadway 2013Period: January to December 2013
Actual Actual Actual Actual Actual Actual Actual Actual Actual Actual Actual Actual 2013 2012 ActJan‐13 Feb‐13 Mar‐13 Apr‐13 May‐13 Jun‐13 Jul‐13 Aug‐13 Sep‐13 Oct‐13 Nov‐13 Dec‐13 Total Total VAR VAR %
INCOME RENT INCOME Residential Rent 36,117 34,042 34,076 33,064 31,908 33,064 33,164 35,164 35,224 33,224 33,702 31,419 404,170 414,750 (10,580) ‐2.55% Retail Rent 41,874 40,129 42,201 45,084 43,626 39,441 74,588 53,895 54,314 59,242 51,408 38,724 584,527 509,176 75,350 14.80% Rental Credits and Recoveries 61,032 (3,024) 103,943 12,818 871 13,412 1,933 28,982 46,622 1,180 21,254 28,889 317,912 51,488 266,424 517.44% NET RENT INCOME 139,023 71,146 180,220 90,966 76,405 85,917 109,686 118,042 136,160 93,647 106,364 99,032 1,306,609 975,415 331,194 33.95%
‐ OTHER INCOME ‐ Hotel NOI 206,658 428,305 616,767 864,696 1,106,908 858,248 489,202 575,158 1,110,866 1,179,625 603,037 708,709 8,748,179 8,363,549 384,630 4.60% Restaurant Rent / ROI 134,282 130,743 146,106 143,566 146,803 126,045 115,017 116,830 131,297 141,691 146,492 158,821 1,637,693 1,702,137 (64,444) ‐3.79% Preferred Return 15,051 64,605 94,977 81,210 33,386 72,559 ‐ ‐ 62,293 96,182 113,029 557,446 1,190,738 1,046,730 144,008 13.76% TOTAL OTHER INCOME 355,991 623,653 857,850 1,089,472 1,287,097 1,056,852 604,219 691,988 1,304,456 1,417,498 862,558 1,424,975 11,576,610 11,112,416 464,194 4.18% TOTAL INCOME 495,014 694,799 1,038,069 1,180,439 1,363,502 1,142,769 713,905 810,030 1,440,616 1,511,145 968,923 1,524,007 12,883,219 12,087,831 795,388 6.58%
‐ EXPENSES ‐ TOTAL REPAIRS & MAINTENANCE 7,716 5,722 1,941 2,630 3,550 3,403 2,613 4,411 14,565 2,184 6,299 2,520 57,554 131,586 (74,032) ‐56.26% TOTAL SALARIES & BENEFITS 52,724 48,936 52,292 51,260 53,250 51,595 55,948 54,275 44,696 46,191 44,832 46,589 602,589 593,419 9,170 1.55% TOTAL UTILITIES 95,469 7,557 74,318 26,837 18,506 49,306 24,023 34,584 64,059 17,373 17,468 62,593 492,093 341,349 150,744 44.16% TOTAL G & A EXPENSE 4,164 2,130 3,443 13,865 3,043 3,578 2,473 460 536 904 1,845 2,018 38,459 68,526 (30,067) ‐43.88% TOTAL EXPENSES 160,072 64,346 131,995 94,593 78,349 107,883 85,057 93,730 123,856 66,651 70,444 113,720 1,190,695 1,134,880 55,814 4.92%
‐ NET INCOME BEFORE FIXED EXPENSES 334,942 630,454 906,074 1,085,846 1,285,154 1,034,886 628,848 716,300 1,316,760 1,444,494 898,479 1,410,287 11,692,524 10,952,951 739,573 6.75%
‐ NON‐OPER/NON RECURRING ITEMS 10,357 (14,919) 24,489 19,542 29,354 30,128 15,332 10,013 19,795 (1,450) 8,305 5,272 156,217 400,014 (243,798) ‐60.95%
‐ FIXED EXPENSES ‐ Asset Management Fee 16,191 18,631 21,903 23,887 26,728 23,702 21,175 21,860 28,696 29,860 17,368 250,000 250,000 #DIV/0! Real Estate Taxes 20,352 20,352 16,227 26,705 30,859 26,705 21,408 23,813 23,157 23,157 23,157 24,560 255,894 174,584 81,310 46.57% Insurance ‐ Prop/General Liab (Net) 2,288 2,288 2,288 2,288 2,288 2,288 2,288 2,288 2,288 2,300 2,288 2,288 25,178 32,934 (7,756) ‐23.55% Depreciation & Amortization ‐ ‐ ‐ ‐ ‐ ‐ ‐ ‐ ‐ ‐ ‐ ‐ ‐ ‐ ‐ TOTAL FIXED EXPENSES 38,831 41,271 40,418 52,880 59,874 52,695 44,870 47,961 54,141 55,318 42,813 26,848 531,072 207,518 323,554 155.92%
‐ NET INCOME BEFORE FIXED RENT 285,755 604,103 841,167 1,013,424 1,195,926 952,063 568,645 658,326 1,242,824 1,390,627 847,361 1,378,167 11,005,236 10,345,418 659,817 6.38%
‐
2013 1186 Broadway 4/2/20143:23 PM 1 of 2
Confidentially provided to
Confidentially provided to
Confidentially provided to
Confidentially provided to
Paul Fisher
Paul Fisher
Paul Fisher
Paul Fisher
GB Lodging
GB Lodging
GB Lodging
GB Lodging
65.217.157.122
65.217.157.122
65.217.157.122
65.217.157.122
12/02/2014 5:49 AM
12/02/2014 5:49 AM
12/02/2014 5:49 AM
12/02/2014 5:49 AM
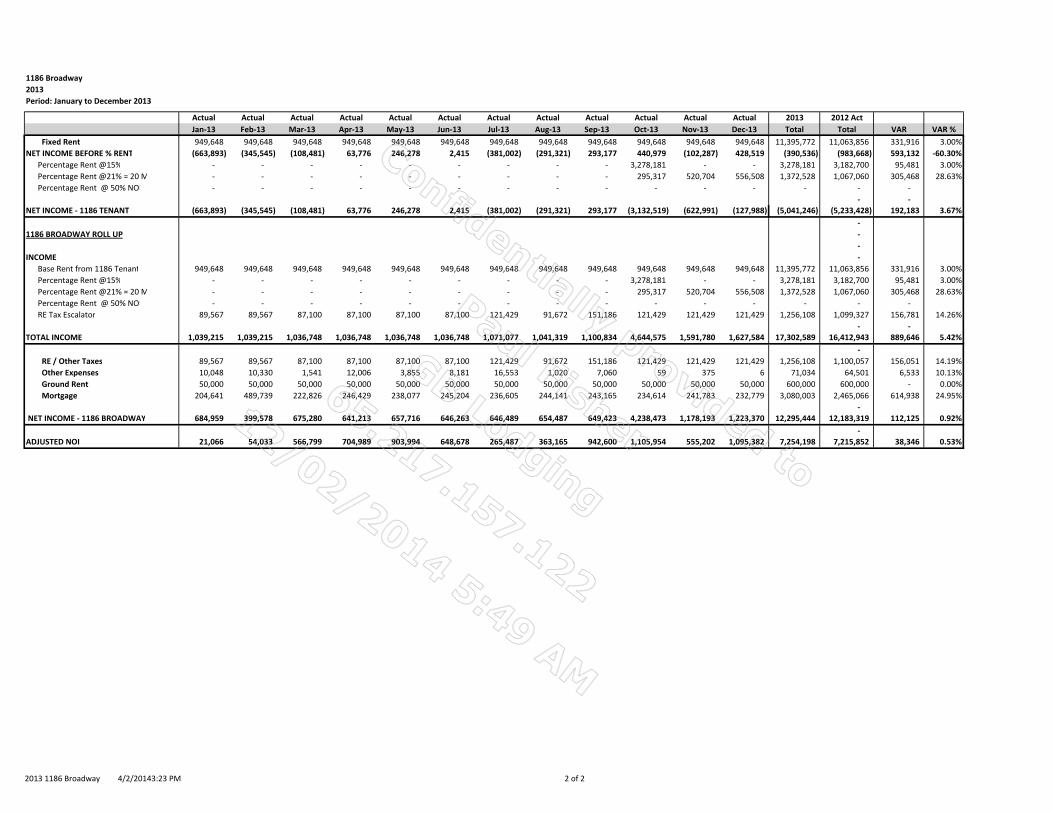
1186 Broadway 2013Period: January to December 2013
Actual Actual Actual Actual Actual Actual Actual Actual Actual Actual Actual Actual 2013 2012 ActJan‐13 Feb‐13 Mar‐13 Apr‐13 May‐13 Jun‐13 Jul‐13 Aug‐13 Sep‐13 Oct‐13 Nov‐13 Dec‐13 Total Total VAR VAR %
Fixed Rent 949,648 949,648 949,648 949,648 949,648 949,648 949,648 949,648 949,648 949,648 949,648 949,648 11,395,772 11,063,856 331,916 3.00%NET INCOME BEFORE % RENT (663,893) (345,545) (108,481) 63,776 246,278 2,415 (381,002) (291,321) 293,177 440,979 (102,287) 428,519 (390,536) (983,668) 593,132 ‐60.30% Percentage Rent @15% ‐ ‐ ‐ ‐ ‐ ‐ ‐ ‐ ‐ 3,278,181 ‐ ‐ 3,278,181 3,182,700 95,481 3.00% Percentage Rent @21% = 20 M ‐ ‐ ‐ ‐ ‐ ‐ ‐ ‐ ‐ 295,317 520,704 556,508 1,372,528 1,067,060 305,468 28.63% Percentage Rent @ 50% NOI ‐ ‐ ‐ ‐ ‐ ‐ ‐ ‐ ‐ ‐ ‐ ‐ ‐ ‐ ‐
‐ ‐ NET INCOME ‐ 1186 TENANT (663,893) (345,545) (108,481) 63,776 246,278 2,415 (381,002) (291,321) 293,177 (3,132,519) (622,991) (127,988) (5,041,246) (5,233,428) 192,183 3.67%
‐ 1186 BROADWAY ROLL UP ‐
‐ INCOME ‐ Base Rent from 1186 Tenant 949,648 949,648 949,648 949,648 949,648 949,648 949,648 949,648 949,648 949,648 949,648 949,648 11,395,772 11,063,856 331,916 3.00% Percentage Rent @15% ‐ ‐ ‐ ‐ ‐ ‐ ‐ ‐ ‐ 3,278,181 ‐ ‐ 3,278,181 3,182,700 95,481 3.00% Percentage Rent @21% = 20 M ‐ ‐ ‐ ‐ ‐ ‐ ‐ ‐ ‐ 295,317 520,704 556,508 1,372,528 1,067,060 305,468 28.63% Percentage Rent @ 50% NOI ‐ ‐ ‐ ‐ ‐ ‐ ‐ ‐ ‐ ‐ ‐ ‐ ‐ ‐ ‐ RE Tax Escalator 89,567 89,567 87,100 87,100 87,100 87,100 121,429 91,672 151,186 121,429 121,429 121,429 1,256,108 1,099,327 156,781 14.26%
‐ ‐ TOTAL INCOME 1,039,215 1,039,215 1,036,748 1,036,748 1,036,748 1,036,748 1,071,077 1,041,319 1,100,834 4,644,575 1,591,780 1,627,584 17,302,589 16,412,943 889,646 5.42%
‐ RE / Other Taxes 89,567 89,567 87,100 87,100 87,100 87,100 121,429 91,672 151,186 121,429 121,429 121,429 1,256,108 1,100,057 156,051 14.19% Other Expenses 10,048 10,330 1,541 12,006 3,855 8,181 16,553 1,020 7,060 59 375 6 71,034 64,501 6,533 10.13% Ground Rent 50,000 50,000 50,000 50,000 50,000 50,000 50,000 50,000 50,000 50,000 50,000 50,000 600,000 600,000 ‐ 0.00% Mortgage 204,641 489,739 222,826 246,429 238,077 245,204 236,605 244,141 243,165 234,614 241,783 232,779 3,080,003 2,465,066 614,938 24.95%
‐ NET INCOME ‐ 1186 BROADWAY 684,959 399,578 675,280 641,213 657,716 646,263 646,489 654,487 649,423 4,238,473 1,178,193 1,223,370 12,295,444 12,183,319 112,125 0.92%
‐ ADJUSTED NOI 21,066 54,033 566,799 704,989 903,994 648,678 265,487 363,165 942,600 1,105,954 555,202 1,095,382 7,254,198 7,215,852 38,346 0.53%
2013 1186 Broadway 4/2/20143:23 PM 2 of 2
Confidentially provided to
Confidentially provided to
Confidentially provided to
Confidentially provided to
Paul Fisher
Paul Fisher
Paul Fisher
Paul Fisher
GB Lodging
GB Lodging
GB Lodging
GB Lodging
65.217.157.122
65.217.157.122
65.217.157.122
65.217.157.122
12/02/2014 5:49 AM
12/02/2014 5:49 AM
12/02/2014 5:49 AM
12/02/2014 5:49 AM
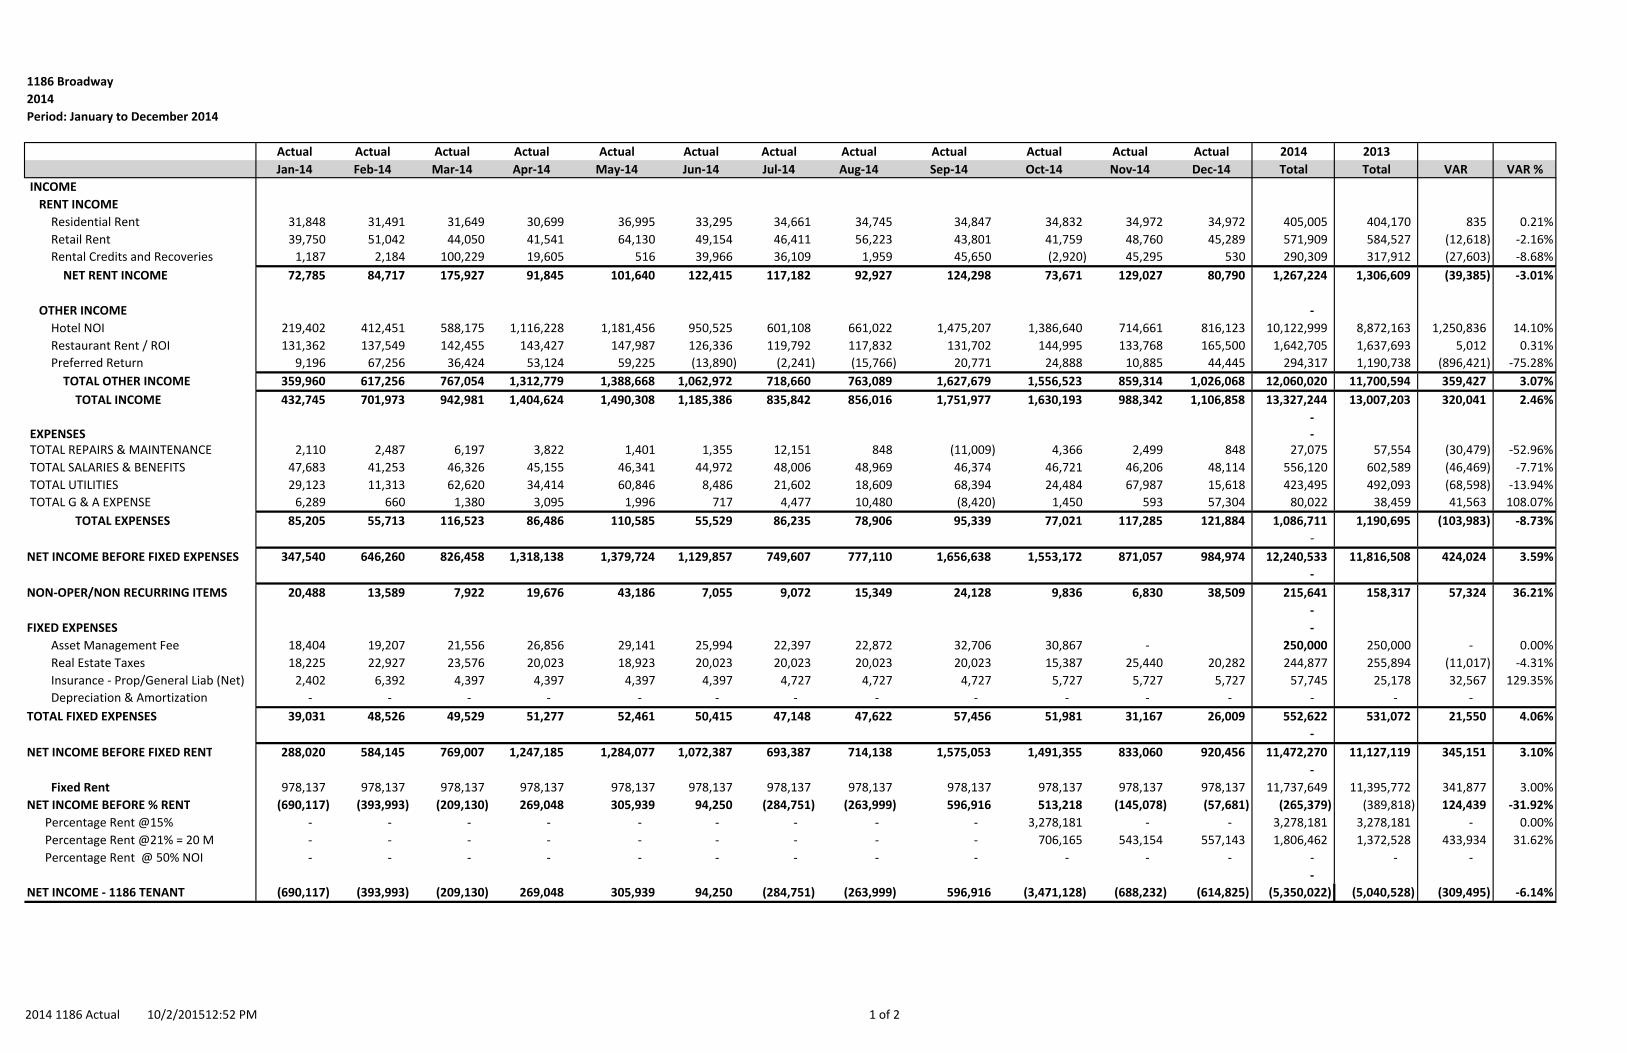
1186 Broadway
2014
Period: January to December 2014
Actual Actual Actual Actual Actual Actual Actual Actual Actual Actual Actual Actual 2014 2013
Jan‐14 Feb‐14 Mar‐14 Apr‐14 May‐14 Jun‐14 Jul‐14 Aug‐14 Sep‐14 Oct‐14 Nov‐14 Dec‐14 Total Total VAR VAR %
INCOME
RENT INCOME
Residential Rent 31,848 31,491 31,649 30,699 36,995 33,295 34,661 34,745 34,847 34,832 34,972 34,972 405,005 404,170 835 0.21%
Retail Rent 39,750 51,042 44,050 41,541 64,130 49,154 46,411 56,223 43,801 41,759 48,760 45,289 571,909 584,527 (12,618) ‐2.16%
Rental Credits and Recoveries 1,187 2,184 100,229 19,605 516 39,966 36,109 1,959 45,650 (2,920) 45,295 530 290,309 317,912 (27,603) ‐8.68%
NET RENT INCOME 72,785 84,717 175,927 91,845 101,640 122,415 117,182 92,927 124,298 73,671 129,027 80,790 1,267,224 1,306,609 (39,385) ‐3.01%
OTHER INCOME ‐
Hotel NOI 219,402 412,451 588,175 1,116,228 1,181,456 950,525 601,108 661,022 1,475,207 1,386,640 714,661 816,123 10,122,999 8,872,163 1,250,836 14.10%
Restaurant Rent / ROI 131,362 137,549 142,455 143,427 147,987 126,336 119,792 117,832 131,702 144,995 133,768 165,500 1,642,705 1,637,693 5,012 0.31%
Preferred Return 9,196 67,256 36,424 53,124 59,225 (13,890) (2,241) (15,766) 20,771 24,888 10,885 44,445 294,317 1,190,738 (896,421) ‐75.28%
TOTAL OTHER INCOME 359,960 617,256 767,054 1,312,779 1,388,668 1,062,972 718,660 763,089 1,627,679 1,556,523 859,314 1,026,068 12,060,020 11,700,594 359,427 3.07%
TOTAL INCOME 432,745 701,973 942,981 1,404,624 1,490,308 1,185,386 835,842 856,016 1,751,977 1,630,193 988,342 1,106,858 13,327,244 13,007,203 320,041 2.46%
‐ EXPENSES ‐ TOTAL REPAIRS & MAINTENANCE 2,110 2,487 6,197 3,822 1,401 1,355 12,151 848 (11,009) 4,366 2,499 848 27,075 57,554 (30,479) ‐52.96%
TOTAL SALARIES & BENEFITS 47,683 41,253 46,326 45,155 46,341 44,972 48,006 48,969 46,374 46,721 46,206 48,114 556,120 602,589 (46,469) ‐7.71%
TOTAL UTILITIES 29,123 11,313 62,620 34,414 60,846 8,486 21,602 18,609 68,394 24,484 67,987 15,618 423,495 492,093 (68,598) ‐13.94%
TOTAL G & A EXPENSE 6,289 660 1,380 3,095 1,996 717 4,477 10,480 (8,420) 1,450 593 57,304 80,022 38,459 41,563 108.07%
TOTAL EXPENSES 85,205 55,713 116,523 86,486 110,585 55,529 86,235 78,906 95,339 77,021 117,285 121,884 1,086,711 1,190,695 (103,983) ‐8.73%
‐
NET INCOME BEFORE FIXED EXPENSES 347,540 646,260 826,458 1,318,138 1,379,724 1,129,857 749,607 777,110 1,656,638 1,553,172 871,057 984,974 12,240,533 11,816,508 424,024 3.59%
‐
NON‐OPER/NON RECURRING ITEMS 20,488 13,589 7,922 19,676 43,186 7,055 9,072 15,349 24,128 9,836 6,830 38,509 215,641 158,317 57,324 36.21%
‐
FIXED EXPENSES ‐
Asset Management Fee 18,404 19,207 21,556 26,856 29,141 25,994 22,397 22,872 32,706 30,867 ‐ 250,000 250,000 ‐ 0.00%
Real Estate Taxes 18,225 22,927 23,576 20,023 18,923 20,023 20,023 20,023 20,023 15,387 25,440 20,282 244,877 255,894 (11,017) ‐4.31%
Insurance ‐ Prop/General Liab (Net) 2,402 6,392 4,397 4,397 4,397 4,397 4,727 4,727 4,727 5,727 5,727 5,727 57,745 25,178 32,567 129.35%
Depreciation & Amortization ‐ ‐ ‐ ‐ ‐ ‐ ‐ ‐ ‐ ‐ ‐ ‐ ‐ ‐ ‐
TOTAL FIXED EXPENSES 39,031 48,526 49,529 51,277 52,461 50,415 47,148 47,622 57,456 51,981 31,167 26,009 552,622 531,072 21,550 4.06%
‐
NET INCOME BEFORE FIXED RENT 288,020 584,145 769,007 1,247,185 1,284,077 1,072,387 693,387 714,138 1,575,053 1,491,355 833,060 920,456 11,472,270 11,127,119 345,151 3.10%
‐
Fixed Rent 978,137 978,137 978,137 978,137 978,137 978,137 978,137 978,137 978,137 978,137 978,137 978,137 11,737,649 11,395,772 341,877 3.00%
NET INCOME BEFORE % RENT (690,117) (393,993) (209,130) 269,048 305,939 94,250 (284,751) (263,999) 596,916 513,218 (145,078) (57,681) (265,379) (389,818) 124,439 ‐31.92%
Percentage Rent @15% ‐ ‐ ‐ ‐ ‐ ‐ ‐ ‐ ‐ 3,278,181 ‐ ‐ 3,278,181 3,278,181 ‐ 0.00%
Percentage Rent @21% = 20 M ‐ ‐ ‐ ‐ ‐ ‐ ‐ ‐ ‐ 706,165 543,154 557,143 1,806,462 1,372,528 433,934 31.62%
Percentage Rent @ 50% NOI ‐ ‐ ‐ ‐ ‐ ‐ ‐ ‐ ‐ ‐ ‐ ‐ ‐ ‐ ‐
‐
NET INCOME ‐ 1186 TENANT (690,117) (393,993) (209,130) 269,048 305,939 94,250 (284,751) (263,999) 596,916 (3,471,128) (688,232) (614,825) (5,350,022) (5,040,528) (309,495) ‐6.14%
2014 1186 Actual 10/2/201512:52 PM 1 of 2

1186 Broadway
2014
Period: January to December 2014
Actual Actual Actual Actual Actual Actual Actual Actual Actual Actual Actual Actual 2014 2013
Jan‐14 Feb‐14 Mar‐14 Apr‐14 May‐14 Jun‐14 Jul‐14 Aug‐14 Sep‐14 Oct‐14 Nov‐14 Dec‐14 Total Total VAR VAR %
‐
1186 BROADWAY ROLL UP ‐
‐
INCOME ‐
Base Rent from 1186 Tenant 978,137 978,137 978,137 978,137 978,137 978,137 978,137 978,137 978,137 978,137 978,137 978,137 11,737,649 11,395,772 341,878 3.00%
Percentage Rent @15% ‐ ‐ ‐ ‐ ‐ ‐ ‐ ‐ ‐ 3,278,181 ‐ ‐ 3,278,181 3,278,181 ‐ 0.00%
Percentage Rent @21% = 20 M ‐ ‐ ‐ ‐ ‐ ‐ ‐ ‐ ‐ 706,165 543,154 557,143 1,806,462 1,372,528 433,934 31.62%
Percentage Rent @ 50% NOI ‐ ‐ ‐ ‐ ‐ ‐ ‐ ‐ ‐ ‐ ‐ ‐ ‐ ‐ ‐
RE Tax Escalator 105,285 105,285 105,285 105,285 105,285 105,285 105,285 105,285 105,285 105,285 105,285 105,285 1,263,423 1,256,108 7,316 0.58%
‐ ‐
TOTAL INCOME 1,083,423 1,083,423 1,083,423 1,083,423 1,083,423 1,083,423 1,083,423 1,083,423 1,083,423 5,067,768 1,626,577 1,640,566 18,085,716 17,302,589 783,127 4.53%
‐
RE / Other Taxes 105,285 105,285 105,285 105,285 105,285 105,285 105,285 105,285 105,285 105,285 105,285 105,285 1,263,423 1,159,249 104,174 8.99%
Other Expenses 7,400 1,269 10,283 6,790 12,215 ‐ 9,257 1,331 12 6,665 51 8,474 63,747 71,034 (7,286) ‐10.26%
Ground Rent 50,000 50,000 50,000 50,000 50,000 50,000 50,000 50,000 50,000 50,000 50,000 50,000 600,000 600,000 ‐ 0.00%
Mortgage 239,909 235,750 219,630 237,899 229,604 236,807 228,715 235,936 235,796 227,679 234,685 226,947 2,789,358 3,080,003 (290,646) ‐9.44%
‐
NET INCOME ‐ 1186 BROADWAY 680,828 691,118 698,224 683,448 686,318 691,330 690,165 690,870 692,329 4,678,139 1,236,555 1,249,860 13,369,187 12,392,303 976,885 7.88%
‐
ADJUSTED NOI (9,289) 297,126 489,094 952,496 992,258 785,580 405,414 426,871 1,289,245 1,207,011 548,323 635,036 8,019,165 7,254,916 764,249 10.53%
2014 1186 Actual 10/2/201512:52 PM 2 of 2

1186 Broadway
2015
Period: January to December 2015
Actual Actual Actual Actual Actual Actual Actual Budget Budget Budget Budget Budget 2015 2014
Jan‐15 Feb‐15 Mar‐15 Apr‐15 May‐15 Jun‐15 Jul‐15 Aug‐15 Sep‐15 Oct‐15 Nov‐15 Dec‐15 Total Actual VAR VAR %
INCOME
RENT INCOME
Residential Rent 34,991 34,991 34,991 34,991 32,991 34,273 35,371 35,207 35,280 35,295 35,379 35,390 419,149 405,005 14,143 3.49%
Retail Rent 42,912 40,980 44,056 34,133 41,293 57,295 51,056 49,320 49,403 49,867 49,867 49,867 560,048 571,909 (11,861) ‐2.07%
Rental Credits and Recoveries 545 530 2,314 (9,801) 183,595 41,014 250 4,350 41,350 14,350 4,350 4,350 287,195 290,309 (3,114) ‐1.07%
NET RENT INCOME 78,447 76,501 81,360 59,322 257,879 132,581 86,677 88,877 126,033 99,512 89,596 89,607 1,266,393 1,267,224 (831) ‐0.07%
OTHER INCOME ‐ ‐
Hotel NOI 118,285 366,334 456,868 790,729 1,115,569 1,026,349 527,551 598,151 1,414,519 1,537,122 905,137 878,568 9,735,183 10,122,999 (387,816) ‐3.83%
Restaurant Rent / ROI 120,297 118,850 136,250 136,102 136,190 130,992 178,753 120,990 133,315 149,646 155,911 181,863 1,699,159 1,642,705 56,454 3.44%
Preferred Return (7,507) 49,204 4,258 (9,441) (18,079) (5,373) (86,691) (18,699) 21,386 47,181 69,692 135,426 181,359 294,317 (112,958) ‐38.38%
TOTAL OTHER INCOME 231,076 534,388 597,376 917,391 1,233,680 1,151,969 619,613 700,443 1,569,220 1,733,948 1,130,741 1,195,857 11,615,701 12,060,020 (444,320) ‐3.68%
TOTAL INCOME 309,523 610,889 678,736 976,713 1,491,559 1,284,550 706,290 789,320 1,695,253 1,833,460 1,220,337 1,285,463 12,882,093 13,327,244 (445,151) ‐3.34%
‐ ‐
EXPENSES ‐ ‐ TOTAL REPAIRS & MAINTENANCE 7,070 1,805 1,524 2,398 8,917 1,026 2,155 865 (11,229) 2,261 6,207 13,435 36,434 27,075 9,359 34.57%
TOTAL SALARIES & BENEFITS 47,315 43,401 48,118 47,979 48,084 45,707 50,094 49,949 47,301 47,114 41,203 42,788 559,054 556,120 2,934 0.53%
TOTAL UTILITIES 19,137 12,818 39,028 20,912 20,912 71,234 16,304 19,074 70,104 38,307 41,429 47,849 417,108 423,495 (6,388) ‐1.51%
TOTAL G & A EXPENSE 2,221 1,818 79,197 587 731 662 473 10,690 (8,589) 3,570 3,570 3,570 98,499 80,022 18,478 23.09%
TOTAL EXPENSES 75,743 59,841 167,866 71,877 78,644 118,629 69,026 80,577 97,588 91,252 92,409 107,642 1,111,094 1,086,711 24,383 2.24%
‐ ‐
NET INCOME BEFORE FIXED EXPENSES 233,780 551,047 510,870 904,836 1,412,915 1,165,922 637,264 708,743 1,597,665 1,742,208 1,127,928 1,177,822 11,770,999 12,240,533 (469,534) ‐3.84%
‐ ‐
NON‐OPER/NON RECURRING ITEMS 6,489 6,138 15,463 27,075 11,250 6,834 11,906 10,000 10,000 10,000 10,000 10,000 135,156 215,641 (80,485) ‐37.32%
‐ ‐
FIXED EXPENSES ‐ ‐
Asset Management Fee 17,665 19,585 21,907 24,104 28,696 27,080 22,279 22,183 32,047 34,453 250,000 250,000 ‐ 0.00%
Real Estate Taxes 25,440 24,888 (78,567) 25,440 25,440 25,440 27,221 27,221 27,221 27,221 27,221 27,221 211,408 244,877 (33,469) ‐13.67%
Insurance ‐ Prop/General Liab (Net) 4,963 4,963 4,963 4,963 4,963 4,963 4,963 4,963 4,963 4,963 4,963 4,963 59,560 57,745 1,815 3.14%
Depreciation & Amortization ‐ ‐ ‐
TOTAL FIXED EXPENSES 48,069 49,437 (51,696) 54,508 59,100 57,484 54,463 54,367 64,231 66,637 32,184 32,184 520,968 552,622 (31,654) ‐5.73%
‐ ‐
NET INCOME BEFORE FIXED RENT 179,222 495,472 547,103 823,253 1,342,565 1,101,604 570,895 644,375 1,523,433 1,665,571 1,085,744 1,135,637 11,114,875 11,472,270 (357,395) ‐3.12%
‐ ‐
Fixed Rent 978,137 978,137 978,137 978,137 978,137 978,137 978,137 978,137 978,137 978,137 978,137 978,137 11,737,649 11,737,649 ‐ 0.00%
NET INCOME BEFORE % RENT (798,916) (482,665) (431,035) (154,884) 364,428 123,467 (407,243) (333,762) 545,296 687,433 107,606 157,500 (622,774) (265,379) (357,395) 134.67%
Percentage Rent @15% ‐ ‐ ‐ ‐ ‐ ‐ ‐ ‐ ‐ 3,376,526 ‐ ‐ 3,376,526 3,278,181 98,345 3.00%
Percentage Rent @21% = 20 M ‐ ‐ ‐ ‐ ‐ ‐ ‐ ‐ ‐ 524,629 578,265 600,085 1,702,980 1,806,462 (103,482) ‐5.73%
Percentage Rent @ 50% NOI ‐ ‐ ‐ ‐ ‐ ‐ ‐ ‐ ‐ ‐ ‐ ‐ ‐ ‐ ‐
‐ ‐
NET INCOME ‐ 1186 TENANT (798,916) (482,665) (431,035) (154,884) 364,428 123,467 (407,243) (333,762) 545,296 (3,213,722) (470,659) (442,585) (5,702,280) (5,350,022) (352,258) ‐6.58%
2015 1186 Actual 9/1/20152:39 PM 1 of 2
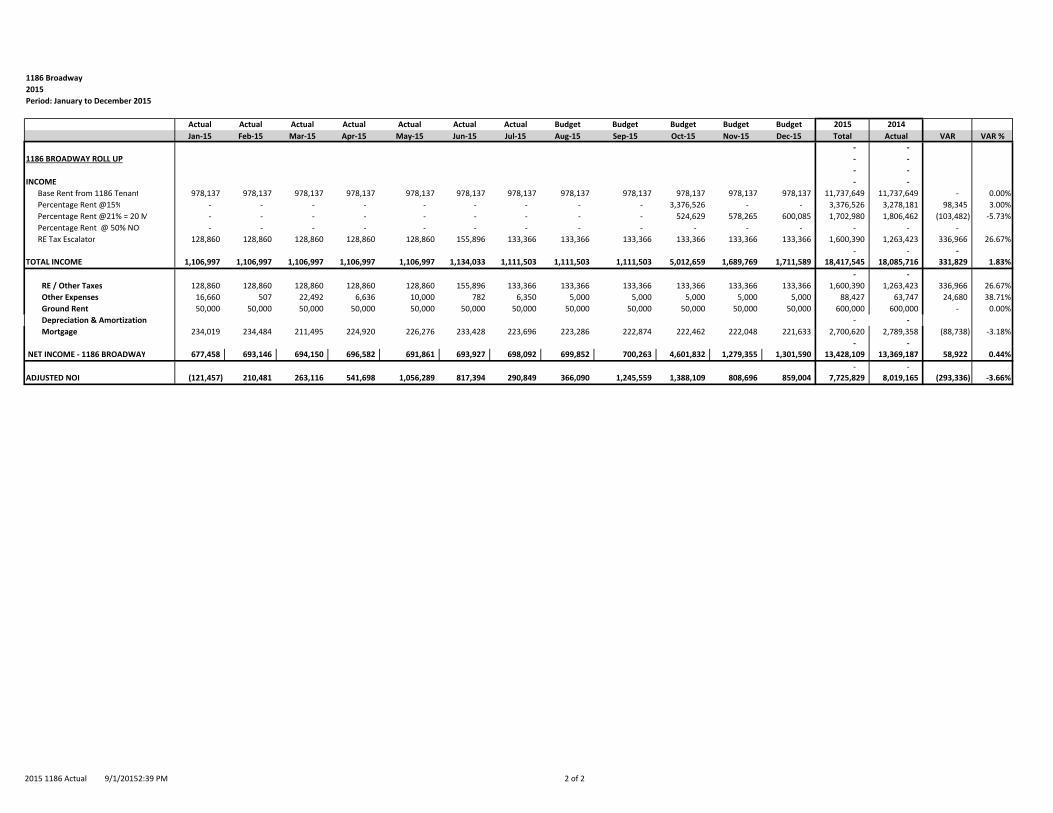
1186 Broadway
2015
Period: January to December 2015
Actual Actual Actual Actual Actual Actual Actual Budget Budget Budget Budget Budget 2015 2014
Jan‐15 Feb‐15 Mar‐15 Apr‐15 May‐15 Jun‐15 Jul‐15 Aug‐15 Sep‐15 Oct‐15 Nov‐15 Dec‐15 Total Actual VAR VAR %
‐ ‐
1186 BROADWAY ROLL UP ‐ ‐
‐ ‐
INCOME ‐ ‐
Base Rent from 1186 Tenant 978,137 978,137 978,137 978,137 978,137 978,137 978,137 978,137 978,137 978,137 978,137 978,137 11,737,649 11,737,649 ‐ 0.00%
Percentage Rent @15% ‐ ‐ ‐ ‐ ‐ ‐ ‐ ‐ ‐ 3,376,526 ‐ ‐ 3,376,526 3,278,181 98,345 3.00%
Percentage Rent @21% = 20 M ‐ ‐ ‐ ‐ ‐ ‐ ‐ ‐ ‐ 524,629 578,265 600,085 1,702,980 1,806,462 (103,482) ‐5.73%
Percentage Rent @ 50% NOI ‐ ‐ ‐ ‐ ‐ ‐ ‐ ‐ ‐ ‐ ‐ ‐ ‐ ‐ ‐
RE Tax Escalator 128,860 128,860 128,860 128,860 128,860 155,896 133,366 133,366 133,366 133,366 133,366 133,366 1,600,390 1,263,423 336,966 26.67%
‐ ‐ ‐
TOTAL INCOME 1,106,997 1,106,997 1,106,997 1,106,997 1,106,997 1,134,033 1,111,503 1,111,503 1,111,503 5,012,659 1,689,769 1,711,589 18,417,545 18,085,716 331,829 1.83%
‐ ‐
RE / Other Taxes 128,860 128,860 128,860 128,860 128,860 155,896 133,366 133,366 133,366 133,366 133,366 133,366 1,600,390 1,263,423 336,966 26.67%
Other Expenses 16,660 507 22,492 6,636 10,000 782 6,350 5,000 5,000 5,000 5,000 5,000 88,427 63,747 24,680 38.71%
Ground Rent 50,000 50,000 50,000 50,000 50,000 50,000 50,000 50,000 50,000 50,000 50,000 50,000 600,000 600,000 ‐ 0.00%
Depreciation & Amortization ‐ ‐
Mortgage 234,019 234,484 211,495 224,920 226,276 233,428 223,696 223,286 222,874 222,462 222,048 221,633 2,700,620 2,789,358 (88,738) ‐3.18%
‐ ‐
NET INCOME ‐ 1186 BROADWAY 677,458 693,146 694,150 696,582 691,861 693,927 698,092 699,852 700,263 4,601,832 1,279,355 1,301,590 13,428,109 13,369,187 58,922 0.44%
‐ ‐
ADJUSTED NOI (121,457) 210,481 263,116 541,698 1,056,289 817,394 290,849 366,090 1,245,559 1,388,109 808,696 859,004 7,725,829 8,019,165 (293,336) ‐3.66%
2015 1186 Actual 9/1/20152:39 PM 2 of 2

1186 Broadway
2015
Period: January to December 2015
Budget Budget Budget Budget Budget Budget Budget Budget Budget Budget Budget Budget 2015 2014
Jan‐15 Feb‐15 Mar‐15 Apr‐15 May‐15 Jun‐15 Jul‐15 Aug‐15 Sep‐15 Oct‐15 Nov‐15 Dec‐15 Total Forecast VAR VAR %
INCOME
RENT INCOME
Residential Rent 34,957 34,957 35,077 35,115 35,191 35,207 35,207 35,207 35,280 35,295 35,379 35,390 422,263 397,854 24,408 6.13%
Retail Rent 52,006 46,977 47,775 49,404 52,704 50,272 50,952 49,320 49,403 49,867 49,867 49,867 598,413 593,263 5,150 0.87%
Rental Credits and Recoveries 4,350 4,350 92,350 14,350 4,350 45,350 24,350 4,350 41,350 14,350 4,350 4,350 258,202 250,405 7,797 3.11%
NET RENT INCOME 91,313 86,285 175,202 98,869 92,245 130,829 110,509 88,877 126,033 99,512 89,596 89,607 1,278,878 1,241,522 37,356 3.01%
‐
OTHER INCOME ‐ ‐
Hotel NOI 219,797 409,930 513,102 1,045,301 1,305,901 1,021,836 647,708 711,842 1,528,950 1,481,073 866,916 881,712 10,634,068 10,141,148 492,920 4.86%
Restaurant Rent / ROI 120,840 143,211 146,183 145,161 152,910 128,853 123,355 120,990 133,315 149,646 155,911 181,863 1,702,238 1,677,993 24,245 1.44%
Preferred Return (3,964) 49,204 35,605 46,360 61,308 9,832 (13,211) (18,699) 21,386 47,181 69,692 135,426 440,120 437,349 2,771 0.63%
TOTAL OTHER INCOME 336,673 602,345 694,889 1,236,822 1,520,118 1,160,521 757,853 814,134 1,683,651 1,677,900 1,092,519 1,199,001 12,776,427 12,256,490 519,937 4.24%
TOTAL INCOME 427,987 688,630 870,092 1,335,691 1,612,363 1,291,350 868,362 903,012 1,809,684 1,777,412 1,182,116 1,288,608 14,055,305 13,498,013 557,292 4.13%
‐ ‐
EXPENSES ‐ ‐ TOTAL REPAIRS & MAINTENANCE 2,152 2,537 6,321 3,898 1,429 1,382 12,394 865 (11,229) 2,261 6,207 13,435 41,652 40,835 817 2.00%
TOTAL SALARIES & BENEFITS 48,637 42,078 47,253 46,058 47,268 45,871 48,966 49,949 47,301 47,114 41,203 42,788 554,486 543,613 10,872 2.00%
TOTAL UTILITIES 29,851 11,595 64,186 35,274 62,367 8,698 22,142 19,074 70,104 38,307 41,429 47,849 450,876 439,879 10,997 2.50%
TOTAL G & A EXPENSE 6,415 673 1,408 3,157 2,036 732 4,566 10,690 (8,589) 3,570 3,570 3,570 31,798 31,175 623 2.00%
TOTAL EXPENSES 87,055 56,884 119,167 88,387 113,100 56,682 88,068 80,577 97,588 91,252 92,409 107,642 1,078,812 1,055,502 23,309 2.21%
‐ ‐
NET INCOME BEFORE FIXED EXPENSES 340,932 631,746 750,925 1,247,304 1,499,263 1,234,667 780,294 822,434 1,712,096 1,686,160 1,089,707 1,180,966 12,976,493 12,442,510 533,983 4.29%
‐ ‐
NON‐OPER/NON RECURRING ITEMS 10,000 10,000 10,000 10,000 10,000 10,000 10,000 10,000 10,000 10,000 10,000 10,000 120,000 190,466 (70,466) ‐37.00%
‐ ‐
FIXED EXPENSES ‐ ‐
Asset Management Fee 19,438 20,235 22,789 27,875 30,599 27,310 23,950 24,180 33,921 19,703 250,000 250,000 ‐ 0.00%
Real Estate Taxes 25,440 25,440 25,440 25,440 25,440 25,440 27,221 27,221 27,221 27,221 27,221 27,221 315,967 276,338 39,629 14.34%
Insurance ‐ Prop/General Liab (Net) 4,963 4,963 4,963 4,963 4,963 4,963 4,963 4,963 4,963 4,963 4,963 4,963 59,560 54,745 4,815 8.80%
Depreciation & Amortization ‐ ‐ ‐ ‐ ‐ ‐ ‐ ‐ ‐ ‐ ‐ ‐ ‐ ‐ ‐
TOTAL FIXED EXPENSES 49,842 50,639 53,192 58,279 61,002 57,713 56,134 56,364 66,105 51,887 32,184 32,184 625,527 581,083 44,444 7.65%
‐ ‐
NET INCOME BEFORE FIXED RENT 281,090 571,107 687,733 1,179,025 1,428,261 1,166,954 714,159 756,070 1,635,991 1,624,272 1,047,522 1,138,781 12,230,966 11,670,962 560,005 4.80%
‐ ‐
Fixed Rent 978,137 978,137 978,137 978,137 978,137 978,137 978,137 978,137 978,137 978,137 978,137 978,137 11,737,649 11,737,649 ‐ 0.00%
NET INCOME BEFORE % RENT (697,047) (407,031) (290,405) 200,888 450,123 188,817 (263,978) (222,067) 657,854 646,135 69,385 160,644 493,317 (66,688) 560,005 ‐839.74%
Percentage Rent @15% ‐ ‐ ‐ ‐ ‐ ‐ ‐ ‐ ‐ 3,376,526 ‐ ‐ 3,376,526 3,278,181 98,345 3.00%
Percentage Rent @21% = 20 M ‐ ‐ ‐ ‐ ‐ ‐ ‐ ‐ ‐ 834,380 579,279 610,147 2,023,806 1,799,404 224,402 12.47%
Percentage Rent @ 50% NOI ‐ ‐ ‐ ‐ ‐ ‐ ‐ ‐ ‐ ‐ ‐ ‐ ‐ ‐ ‐
‐ ‐
NET INCOME ‐ 1186 TENANT (697,047) (407,031) (290,405) 200,888 450,123 188,817 (263,978) (222,067) 657,854 (3,564,772) (509,894) (449,503) (4,907,016) (5,144,273) 237,257 4.61%
2015 1186 Bugdet 9/28/20151:52 PM 1 of 2
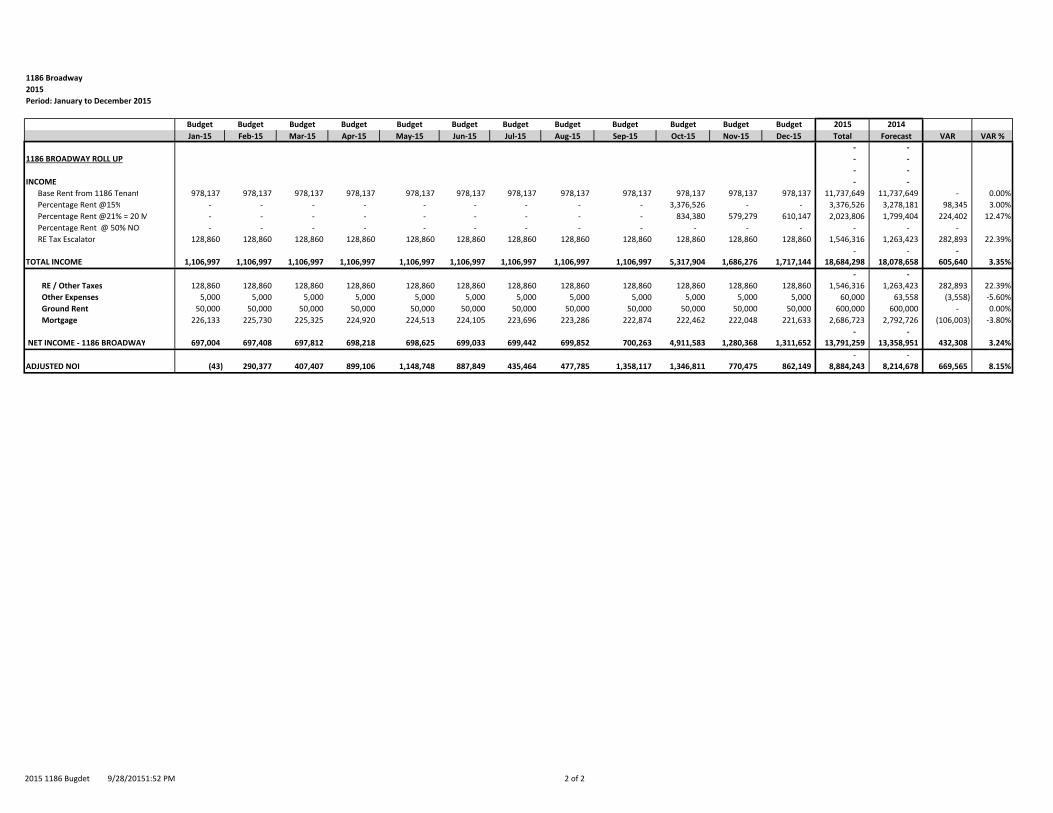
1186 Broadway
2015
Period: January to December 2015
Budget Budget Budget Budget Budget Budget Budget Budget Budget Budget Budget Budget 2015 2014
Jan‐15 Feb‐15 Mar‐15 Apr‐15 May‐15 Jun‐15 Jul‐15 Aug‐15 Sep‐15 Oct‐15 Nov‐15 Dec‐15 Total Forecast VAR VAR %
‐ ‐
1186 BROADWAY ROLL UP ‐ ‐
‐ ‐
INCOME ‐ ‐
Base Rent from 1186 Tenant 978,137 978,137 978,137 978,137 978,137 978,137 978,137 978,137 978,137 978,137 978,137 978,137 11,737,649 11,737,649 ‐ 0.00%
Percentage Rent @15% ‐ ‐ ‐ ‐ ‐ ‐ ‐ ‐ ‐ 3,376,526 ‐ ‐ 3,376,526 3,278,181 98,345 3.00%
Percentage Rent @21% = 20 M ‐ ‐ ‐ ‐ ‐ ‐ ‐ ‐ ‐ 834,380 579,279 610,147 2,023,806 1,799,404 224,402 12.47%
Percentage Rent @ 50% NOI ‐ ‐ ‐ ‐ ‐ ‐ ‐ ‐ ‐ ‐ ‐ ‐ ‐ ‐ ‐
RE Tax Escalator 128,860 128,860 128,860 128,860 128,860 128,860 128,860 128,860 128,860 128,860 128,860 128,860 1,546,316 1,263,423 282,893 22.39%
‐ ‐ ‐
TOTAL INCOME 1,106,997 1,106,997 1,106,997 1,106,997 1,106,997 1,106,997 1,106,997 1,106,997 1,106,997 5,317,904 1,686,276 1,717,144 18,684,298 18,078,658 605,640 3.35%
‐ ‐
RE / Other Taxes 128,860 128,860 128,860 128,860 128,860 128,860 128,860 128,860 128,860 128,860 128,860 128,860 1,546,316 1,263,423 282,893 22.39%
Other Expenses 5,000 5,000 5,000 5,000 5,000 5,000 5,000 5,000 5,000 5,000 5,000 5,000 60,000 63,558 (3,558) ‐5.60%
Ground Rent 50,000 50,000 50,000 50,000 50,000 50,000 50,000 50,000 50,000 50,000 50,000 50,000 600,000 600,000 ‐ 0.00%
Mortgage 226,133 225,730 225,325 224,920 224,513 224,105 223,696 223,286 222,874 222,462 222,048 221,633 2,686,723 2,792,726 (106,003) ‐3.80%
‐ ‐
NET INCOME ‐ 1186 BROADWAY 697,004 697,408 697,812 698,218 698,625 699,033 699,442 699,852 700,263 4,911,583 1,280,368 1,311,652 13,791,259 13,358,951 432,308 3.24%
‐ ‐
ADJUSTED NOI (43) 290,377 407,407 899,106 1,148,748 887,849 435,464 477,785 1,358,117 1,346,811 770,475 862,149 8,884,243 8,214,678 669,565 8.15%
2015 1186 Bugdet 9/28/20151:52 PM 2 of 2

ADDENDA
Improved Sales
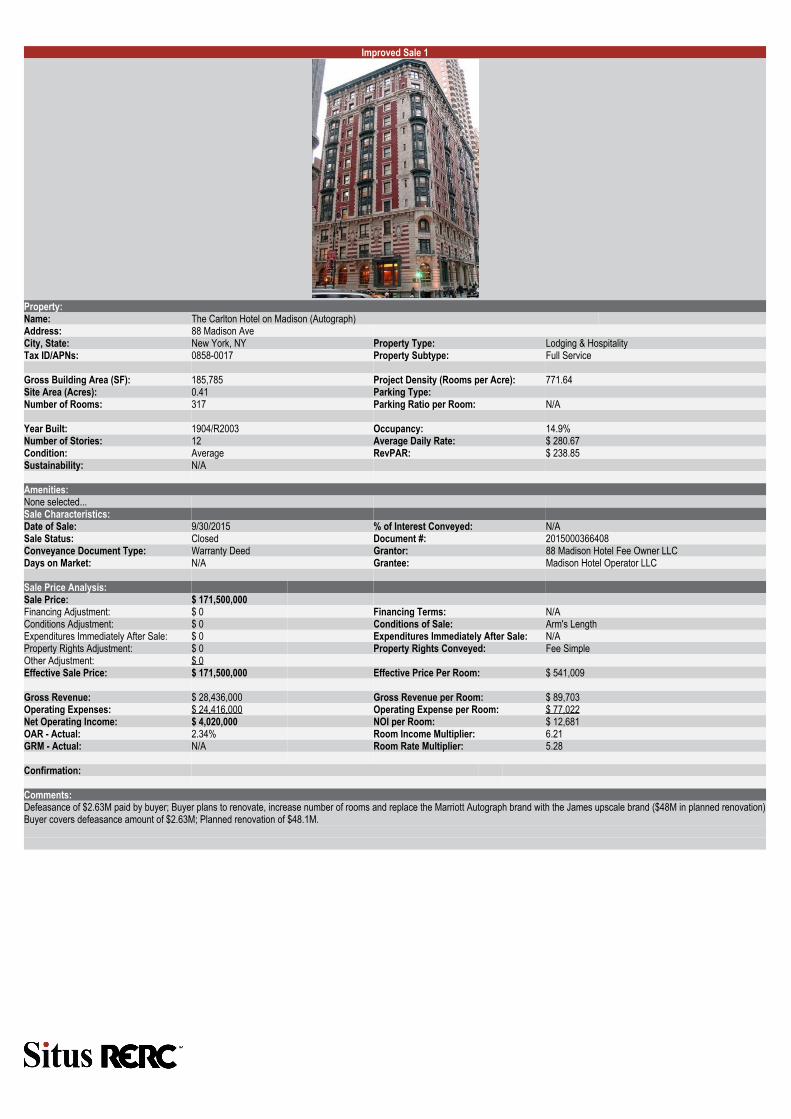
Improved Sale 1
Property:Name: The Carlton Hotel on Madison (Autograph)Address: 88 Madison AveCity, State: New York, NY Property Type: Lodging & HospitalityTax ID/APNs: 0858-0017 Property Subtype: Full Service
Gross Building Area (SF): 185,785 Project Density (Rooms per Acre): 771.64Site Area (Acres): 0.41 Parking Type:Number of Rooms: 317 Parking Ratio per Room: N/A
Year Built: 1904/R2003 Occupancy: 14.9%Number of Stories: 12 Average Daily Rate: $ 280.67Condition: Average RevPAR: $ 238.85Sustainability: N/A
Amenities:None selected...Sale Characteristics:Date of Sale: 9/30/2015 % of Interest Conveyed: N/ASale Status: Closed Document #: 2015000366408Conveyance Document Type: Warranty Deed Grantor: 88 Madison Hotel Fee Owner LLCDays on Market: N/A Grantee: Madison Hotel Operator LLC
Sale Price Analysis:Sale Price: $ 171,500,000Financing Adjustment: $ 0 Financing Terms: N/AConditions Adjustment: $ 0 Conditions of Sale: Arm's LengthExpenditures Immediately After Sale: $ 0 Expenditures Immediately After Sale: N/AProperty Rights Adjustment: $ 0 Property Rights Conveyed: Fee SimpleOther Adjustment: $ 0Effective Sale Price: $ 171,500,000 Effective Price Per Room: $ 541,009
Gross Revenue: $ 28,436,000 Gross Revenue per Room: $ 89,703Operating Expenses: $ 24,416,000 Operating Expense per Room: $ 77,022Net Operating Income: $ 4,020,000 NOI per Room: $ 12,681OAR - Actual: 2.34% Room Income Multiplier: 6.21GRM - Actual: N/A Room Rate Multiplier: 5.28
Confirmation:
Comments:Defeasance of $2.63M paid by buyer; Buyer plans to renovate, increase number of rooms and replace the Marriott Autograph brand with the James upscale brand ($48M in planned renovation)Buyer covers defeasance amount of $2.63M; Planned renovation of $48.1M.
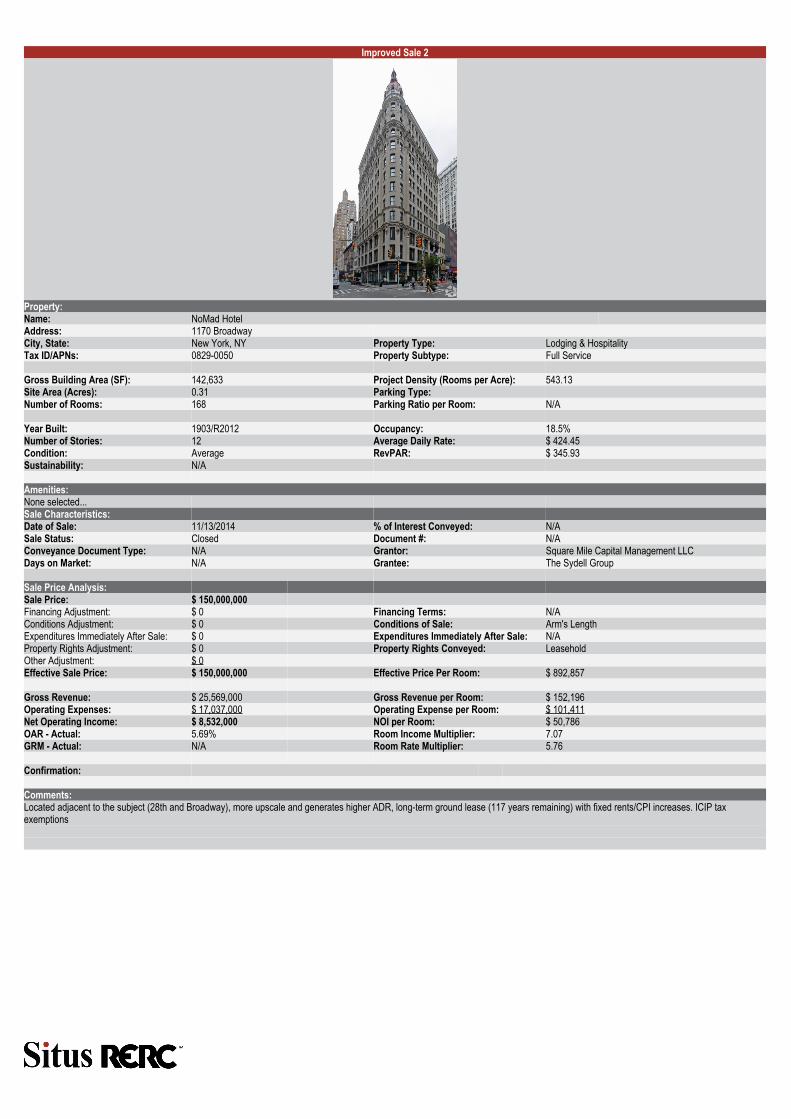
Improved Sale 2
Property:Name: NoMad HotelAddress: 1170 BroadwayCity, State: New York, NY Property Type: Lodging & HospitalityTax ID/APNs: 0829-0050 Property Subtype: Full Service
Gross Building Area (SF): 142,633 Project Density (Rooms per Acre): 543.13Site Area (Acres): 0.31 Parking Type:Number of Rooms: 168 Parking Ratio per Room: N/A
Year Built: 1903/R2012 Occupancy: 18.5%Number of Stories: 12 Average Daily Rate: $ 424.45Condition: Average RevPAR: $ 345.93Sustainability: N/A
Amenities:None selected...Sale Characteristics:Date of Sale: 11/13/2014 % of Interest Conveyed: N/ASale Status: Closed Document #: N/AConveyance Document Type: N/A Grantor: Square Mile Capital Management LLCDays on Market: N/A Grantee: The Sydell Group
Sale Price Analysis:Sale Price: $ 150,000,000Financing Adjustment: $ 0 Financing Terms: N/AConditions Adjustment: $ 0 Conditions of Sale: Arm's LengthExpenditures Immediately After Sale: $ 0 Expenditures Immediately After Sale: N/AProperty Rights Adjustment: $ 0 Property Rights Conveyed: LeaseholdOther Adjustment: $ 0Effective Sale Price: $ 150,000,000 Effective Price Per Room: $ 892,857
Gross Revenue: $ 25,569,000 Gross Revenue per Room: $ 152,196Operating Expenses: $ 17,037,000 Operating Expense per Room: $ 101,411Net Operating Income: $ 8,532,000 NOI per Room: $ 50,786OAR - Actual: 5.69% Room Income Multiplier: 7.07GRM - Actual: N/A Room Rate Multiplier: 5.76
Confirmation:
Comments:Located adjacent to the subject (28th and Broadway), more upscale and generates higher ADR, long-term ground lease (117 years remaining) with fixed rents/CPI increases. ICIP taxexemptions
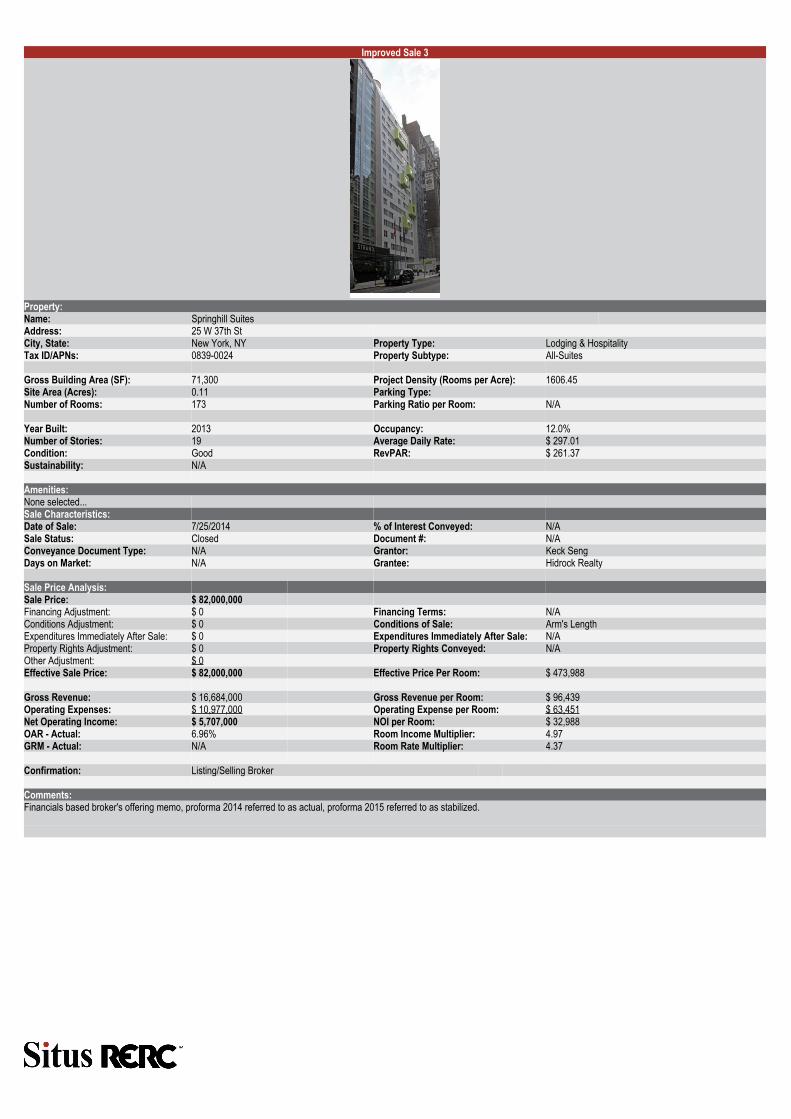
Improved Sale 3
Property:Name: Springhill SuitesAddress: 25 W 37th StCity, State: New York, NY Property Type: Lodging & HospitalityTax ID/APNs: 0839-0024 Property Subtype: All-Suites
Gross Building Area (SF): 71,300 Project Density (Rooms per Acre): 1606.45Site Area (Acres): 0.11 Parking Type:Number of Rooms: 173 Parking Ratio per Room: N/A
Year Built: 2013 Occupancy: 12.0%Number of Stories: 19 Average Daily Rate: $ 297.01Condition: Good RevPAR: $ 261.37Sustainability: N/A
Amenities:None selected...Sale Characteristics:Date of Sale: 7/25/2014 % of Interest Conveyed: N/ASale Status: Closed Document #: N/AConveyance Document Type: N/A Grantor: Keck SengDays on Market: N/A Grantee: Hidrock Realty
Sale Price Analysis:Sale Price: $ 82,000,000Financing Adjustment: $ 0 Financing Terms: N/AConditions Adjustment: $ 0 Conditions of Sale: Arm's LengthExpenditures Immediately After Sale: $ 0 Expenditures Immediately After Sale: N/AProperty Rights Adjustment: $ 0 Property Rights Conveyed: N/AOther Adjustment: $ 0Effective Sale Price: $ 82,000,000 Effective Price Per Room: $ 473,988
Gross Revenue: $ 16,684,000 Gross Revenue per Room: $ 96,439Operating Expenses: $ 10,977,000 Operating Expense per Room: $ 63,451Net Operating Income: $ 5,707,000 NOI per Room: $ 32,988OAR - Actual: 6.96% Room Income Multiplier: 4.97GRM - Actual: N/A Room Rate Multiplier: 4.37
Confirmation: Listing/Selling Broker
Comments:Financials based broker's offering memo, proforma 2014 referred to as actual, proforma 2015 referred to as stabilized.
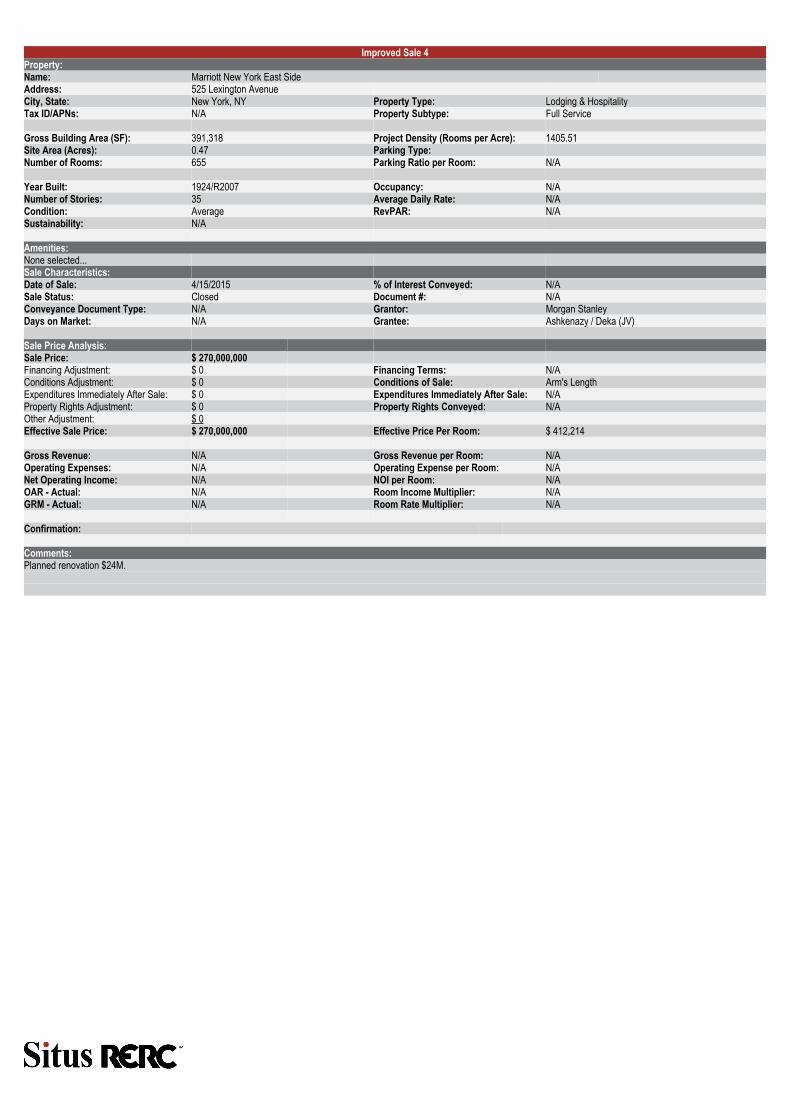
Improved Sale 4Property:Name: Marriott New York East SideAddress: 525 Lexington AvenueCity, State: New York, NY Property Type: Lodging & HospitalityTax ID/APNs: N/A Property Subtype: Full Service
Gross Building Area (SF): 391,318 Project Density (Rooms per Acre): 1405.51Site Area (Acres): 0.47 Parking Type:Number of Rooms: 655 Parking Ratio per Room: N/A
Year Built: 1924/R2007 Occupancy: N/ANumber of Stories: 35 Average Daily Rate: N/ACondition: Average RevPAR: N/ASustainability: N/A
Amenities:None selected...Sale Characteristics:Date of Sale: 4/15/2015 % of Interest Conveyed: N/ASale Status: Closed Document #: N/AConveyance Document Type: N/A Grantor: Morgan StanleyDays on Market: N/A Grantee: Ashkenazy / Deka (JV)
Sale Price Analysis:Sale Price: $ 270,000,000Financing Adjustment: $ 0 Financing Terms: N/AConditions Adjustment: $ 0 Conditions of Sale: Arm's LengthExpenditures Immediately After Sale: $ 0 Expenditures Immediately After Sale: N/AProperty Rights Adjustment: $ 0 Property Rights Conveyed: N/AOther Adjustment: $ 0Effective Sale Price: $ 270,000,000 Effective Price Per Room: $ 412,214
Gross Revenue: N/A Gross Revenue per Room: N/AOperating Expenses: N/A Operating Expense per Room: N/ANet Operating Income: N/A NOI per Room: N/AOAR - Actual: N/A Room Income Multiplier: N/AGRM - Actual: N/A Room Rate Multiplier: N/A
Confirmation:
Comments:Planned renovation $24M.

ADDENDA
State Certification


ADDENDA
Qualifications
MAILev Yagudayev
Academic Background
Employee Profile
Fordham UniversityM.B.A., finance and professional accountingHofstra UniversityB.S., biochemistry
Professional Designations and Affiliations• Appraisal Institute - MAI designation
• Certified General Real Estate Appraiser
• State of New York license number 46000044217
• State of Connecticut license number RCG.0001039
• State of New Jersey license number 42RG00208500
ExperienceLev Yagudayev serves as director of appraisal and litigation services and is the Northeast practice leader for Situs RERC’s based in the New York office. Mr. Yagudayev has over 15 years of experience in different facets of commercial real estate and is a specialist in the area of valuation for financial reporting purposes. He has valued real estate and instruments secured by real estate in nearly every major market in the U.S. and comprising most property types.
Mr. Yagudayev is responsible for managing Situs RERC’s Northeast practice and delivering the following services: portfolio valuation services, purchase price allocation studies, International Financial Reporting Standards (IFRS) valuation services, and due diligence services.
Prior to joining Situs RERC, Mr. Yagudayev worked for nine years in the real estate consulting practice at Deloitte. In his latest role, he served as senior manager and portfolio valuation services leader for the East region. While at Deloitte, Mr. Yagudayev provided valuation and due diligence services to alternative investment managers; advised and consulted clients on a variety of issues relating to commercial real estate and real estate instruments; worked with clients to improve their processes relating to valuation, financial reporting, and investor reporting; and interacted daily with senior executives and decision makers at many real estate firms.
Prior to Deloitte, Mr. Yagudayev worked at Emigrant Bank, where he focused on commercial real estate valuation, REO management/disposition, mortgage underwriting, loan origination, and foreclosures.
Mr. Yagudayev is also an adjunct professor at the Fordham Graduate School of Business where he teaches real estate finance and is a faculty advisor to the real estate club.


