Embed Size (px)
Citation preview
Clustering Web Content for Efficient Replication
Yan ChenUC Berkeley
Lili QiuMicrosoft Research
Weiyu Chen, Luan Nguyen, Randy H. KatzUC Berkeley
Abstract
Recently there has been an increasing deployment of con-tent distribution networks (CDNs) that offer hosting servicesto Web content providers. In this paper, we first compare theun-cooperative pulling of Web contents used by commercialCDNs with the cooperative pushing. Our results show that thelatter can achieve comparable users’ perceived performancewith only 4 - 5% of replication and update traffic comparedto the former scheme. Therefore we explore how to efficientlypush content to CDN nodes. Using trace-driven simulation,we show that replicating content in units of URLs can yield 60- 70% reduction in clients’ latency, compared to replicatingin units of Web sites. However, it is very expensive to performsuch a fine-grained replication.
To address this issue, we propose to replicate content inunits of clusters, each containing objects which are likely tobe requested by clients that are topologically close. To thisend, we describe three clustering techniques, and use vari-ous topologies and several large Web server traces to evalu-ate their performance. Our results show that the cluster-basedreplication achieves 40 - 60% improvement over the per Website based replication. In addition, by adjusting the numberof clusters, we can smoothly trade off the management andcomputation cost for better client performance.
To adapt to changes in users’ access patterns, we also ex-plore incremental clusterings that adaptively add new docu-ments to the existing content clusters. We examine both offlineand online incremental clusterings, where the former assumesaccess history is available while the latter predicts access pat-tern based on the hyperlink structure. Our results show thatthe offline clusterings yield close to the performance of thecomplete re-clustering at much lower overhead. The onlineincremental clustering and replication cut down the retrievalcost by 4.6 - 8 times compared to no replication and ran-dom replication, so it is especially useful to improve documentavailability during flash crowds.
1 Introduction
In the past decade, we have seen an astounding growth inthe popularity of the World Wide Web. Such growth has cre-ated a great demand for efficient Web services. One of theprimary techniques to improving Web performance is to repli-
cate content to multiple places in the Internet, and have usersget data from the closest data repository. Such replication isvery useful and complementary to caching in that (i) it im-proves document availability during flash crowds as contentare pushed out before they are accessed, and (ii) pushing con-tent to strategically selected locations (i.e., cooperative push-ing) yields significant performance benefit than pulling con-tent and passively caching them solely driven by users’ re-quest sequence (i.e., un-cooperative pulling).
A number of previous works [1, 2] have studied how toefficiently place Web server replicas on the network, and con-cluded that a greedy placement strategy, which selects replicalocations in a greedy fashion iteratively, can yield close to op-timal performance (within a factor of 1.1 - 1.5) at a low com-putational cost. Built upon the previous works, we also usethe greedy placement strategy for replicating content. In ourwork, we focus on an orthogonal issue in Web replication:what content is to be replicated.
First, we compare the traditional un-cooperative pullingvs. cooperative pushing. Simulations on a variety of networktopologies using real Web traces show that the latter schemecan yield comparable clients’ latency while only using about4-5% of the replication and update cost compared to the for-mer scheme.
Motivated by the observation, we explore how to efficientlypush content to CDN nodes. We compare the performance be-tween the per Web site-based replication (all hot data) versusthe per (hot) URL-based replication, and show the per URL-based scheme yields a 60-70% reduction in clients’ latency.However, it is very expensive to perform such a fine-grainedreplication. To address the issue, we propose several cluster-ing algorithms to group Web content based on their correla-tion, and replicate objects in units of content clusters. Simu-lation results show that the cluster-based replication schemesyield 40 - 60% improvement over the per Web site replica-tion, but only at 1% - 2% of computation and managementcost of the URL-based scheme (The management cost includecommunication overhead and state maintenance for trackingwhere content has been replicated).
Finally, as the users’ access pattern changes over time, itis important to adapt content clusters to such changes. Simu-lations show that clustering and replicating content based onold access pattern does not work well beyond one week; on theother hand, complete re-clustering and re-distribution, though
Proceedings of the 10 th IEEE International Conference on Network Protocols (ICNP’02) 1092-1648/02 $17.00 © 2002 IEEE
achieves good performance, has large overhead. To addressthe issue, we explore incremental clusterings that adaptivelyadd new documents to the existing content clusters. We exam-ine both offline and online incremental clusterings, where theformer assumes access history is available while the latter pre-dicts access pattern based on hyperlink structure. Our resultsshow that the offline clusterings yield close to the performanceof the complete re-clustering with much lower overhead. Theonline incremental clustering and replication reduce the re-trieval cost by 4.6 - 8 times compared to no replication andrandom replication, so it is very useful to improve documentavailability during flash crowds.
The rest of the paper is organized as follows. We surveyprevious work in Sec. 2, and describe our simulation method-ology in Sec. 3. We compare the un-cooperative pulling vs.the cooperative pushing in Sec. 4. Then we formulate thepush-based content placement problem in Sec. 5, and com-pare the per Web site-based replication with the per URL-based replication in Sec. 6. We describe content clusteringtechniques for efficient replication in Sec. 7, and evaluate theirperformance in Sec. 8. In Sec. 9, we examine offline and on-line incremental clusterings. Finally we conclude in Sec. 10.
2 Related Work
A number of research efforts have studied the problem ofplacing Web server replicas (or caches). Li et al. approachedthe proxy placement problem with the assumption that the un-derlying network topologies are trees, and modeled it as a dy-namic programming problem [3]. While an interesting firststep, it has an important limitation that the Internet topologyis not a tree. More recent studies [1, 2], based on evaluationusing real traces and topologies, have independently reportedthat a greedy placement algorithm can provide content distri-bution networks with close-to-optimal performance.
There is considerable work done in data clustering, such asK-means [4], HAC [5], CLANRNS [6], etc. In the Web re-search community, there have been many interesting researchstudies on clustering Web content or identifying related Webpages for pre-fetching, information retrieval, and Web pageorganization, etc. Cohen et al. [7] investigated the effectof content clustering based on temporal access patterns, andfound it effective in reducing latency, but they considered asingle server environment, and didn’t study the more accuratespatial/frequency clustering. Su et al. proposed a recursivedensity-based clustering algorithm for efficient informationretrieval on the Web [8]. As in the previous work, our con-tent clustering algorithms also try to identify groups of pageswith similar access patterns. Unlike many previous works,which are based on analysis of individual client access pat-terns, we are interested in aggregated clients’ access patterns,since content is replicated for aggregated clients. In addition,we quantify the performance of various cluster-based replica-tions by evaluating their impact on replication.
Moreover, we examine the stability of content clusters us-ing incremental clustering. Incremental clustering has beenstudied in previous work, such as [9] and [10]. However, tothe best of our knowledge, none of the previous work looksat incremental clustering as a way to facilitate content repli-cation and improve clients’ perceived performance. We areamong the first to examine clustering Web content for efficientreplication, and use both replication performance and stabilityas the metrics for evaluation of content clustering.
3 Simulation MethodologyThroughout the paper, we use trace-driven simulations to
evaluate the performance of various schemes.
3.1 Network TopologyIn our simulations, we use three random network topology
models in the GT-ITM internetwork topology generator [11]:pure random, Waxman, and Transit-Stub. We further experi-ment with various parameters for each topology model. Referto [12] for details.
In addition to using synthetic topologies, we also con-struct an AS-level Internet topology using BGP routing datacollected from seven geographically-dispersed BGP peers inApril 2000 [13]. Each BGP routing table entry specifies anAS path, AS1, AS2, ..., ASn, etc:, to a destination addressprefix block. We construct a graph, where individual clientsare mapped to their corresponding AS nodes in the graph, andevery AS pair has an edge with the weight being the shortestAS hop count between them.
3.2 Web WorkloadIn our evaluation, we use the access logs collected at the
MSNBC server site [14], which is consistently ranked amongthe busiest sites in the Web [15]. For diversity, we also use thetraces collected at NASA Kennedy Space Center [16]. Table 1shows the detailed trace information.
We use the access logs in the following way. When usingthe AS-level topology, we group clients in the traces based ontheir AS numbers. When using random topologies, we groupthe Web clients based on BGP prefixes [17]. For the NASAtraces, since most entries in the traces contain host names,we group the clients based on their domains, which we defineas the last two parts of the host names (e.g., a1.b1.com anda2.b1.com belong to the same domain).
In [12], we show that hot data remain stable to cover themajority of requests as time evolves. For instance, the top10% of objects on one day can cover over 80% requests forat least the subsequent week. Therefore it is cost-effective toonly replicate hot content, which is used throughput this paper.
We choose top 1000 client groups in the traces since theycover most of the requests (62-92%) [12], and map them to1000 nodes in the topologies. Assigning a group Ci to a nodePi in the graph means that the weight of Pi is equal to thenumber of requests generated by the group Ci.
Proceedings of the 10 th IEEE International Conference on Network Protocols (ICNP’02) 1092-1648/02 $17.00 © 2002 IEEE
Web Site Period Duration # Requests # Clients # Client Groupsavg - min - max avg - min - max avg - min - max
MSNBC 8/99 - 10/99 10 am-11 am 1.5M - 642K - 1.7M 129K - 69K - 150K 15.6K - 10K - 17KNASA 7/95 - 8/95 All day 79K - 61K - 101K 5940 - 4781 - 7671 2378 - 1784 - 3011
Table 1. Access logs used.In our simulations, we assume that replicas can be placed
on any node, where a node represents a popular IP cluster inthe MSNBC traces, or a popular domain in the NASA traces.Given the rapid growth of CDN service providers, e.g., Aka-mai (which has more than 11,000 servers in about 500 world-wide networks [18]), we believe this is a realistic assumption.Moreover, for any URL, the first replica is always at the originWeb server (a randomly selected node), as in [3, 2]. However,including or excluding the original server as a replica is not afundamental choice, and has little impact on our results.
3.3 Performance Metric
We use the average retrieval cost as our performance met-ric, where the retrieval cost of a Web request is the sum ofthe costs of all edges along the path from the source to thereplica from which the content is downloaded. In the syn-thetic topologies, the edge costs are generated by the GT-ITMtopology generator. In the AS-level Internet topology, theedge costs are all 1, so the average retrieval cost representsthe average number of AS hops a request traverses.
4 Un-cooperative Pull vs. Cooperative PushMany CDN providers (e.g., Akamai [18] and Digital Island
[19]) use un-cooperative pulling and do not replicate contentuntil there is an access. In this case, the CDN name serverdoes not record the location of replicas, and a request is di-rected to a CDN node only based on network connectivity andserver load. So the CDN nodes serve as caches and pull con-tent from the origin server when a cache miss occurs, regard-less of how the content has been replicated.
On the other hand, several recent works proposed to pro-actively push content from the origin Web server to the CDNnodes according to users’ access patterns, and have them co-operatively satisfy clients’ requests [1, 2, 20, 12]. Our trace-driven simulation shows that the cooperative pushing canyield comparable clients’ latency while only using about 4-5%of the replication and update cost compared to un-cooperativepulling. The lower cost in the pushing scheme is mainly dueto the strategic placement of replicas and cooperation amongthe replicas. Refer to [12] for further details.
In addition to the lower replication and update cost, thetraffic cost and the management cost are controllable in thepush-based scheme by clustering correlated content as we willshow later, whereas both costs are demand-driven in the pull-based scheme. Moreover, for newly created content that hasnot been accessed, the cooperative pushing is the only wayto improve document availability and performance. We willstudy such performance benefits in Section 9.2.2.
Motivated by the observations, in the rest of the paper weexplore how to effectively push contents to CDN nodes.
5 Problem FormulationWe describe the Web content placement problem as fol-
lows. Consider a popular Web site or a CDN hosting server,which aims to improve its performance by pushing its contentto some hosting server nodes. The problem is to decide whatcontent is to be replicated and where so that some objectivefunction is optimized under a given traffic pattern and a setof resource constraints. The objective function can be to min-imize either clients’ latency, or loss rate, or total bandwidthconsumption, or an overall cost function if each link is asso-ciated with a cost. Since network access bandwidth is scarceresource, we want to optimize our objective function whilebounding the replication cost.
Based on the above observations, we formulate the Webcontent placement problem as follows. Given a set of URLs Uand a set of locations L to which the URLs can be replicated,replicating a URL incurs a replication cost. A client j fetchinga URL u from the ith replica of u located at lu(i) incurs acost of Cj;lu(i) , where Cj;lu(i) denotes the distance between jand lu(i). Depending on the metric we want to optimize, thedistance between two nodes can reflect either the latency, orloss rate, or total bandwidth consumption or link cost. Theproblem is to find a replication strategy (i.e., for each URL u,we decide the set of locations lu(i) to which u is replicated)such that it minimizesX
j2CL
(Xu2Uj
(mini2 RuCj;lu(i) ))
subject to the constraint that the total replication cost isbounded by R, where CL is the set of clients, Uj is the set ofURLs requested by the j-th client, Ru is the set of locations towhich URL u has been replicated. (The total replication costis either
Pu2U juj assuming the replication cost of all URLs
is the same, orP
u2U juj � f(u) to take into account of differ-ent URL sizes, where juj is the number of different locationsto which u is replicated, f(u) is the size of URL u.)
6 Replica Placement Per Web Site vs. Per URLIn this section, we examine if replication at a fine gran-
ularity can help to improve the performance for push-basedscheme. We compare the performance of replicating allthe hot data at a Web site as one unit (i.e., per Web site-based replication, see Algorithm 1) versus replicating contentin units of individual URLs (i.e., per URL-based replication,see Algorithm 2). For simplicity, we assume the replicationcosts of all URLs are the same. We can easily incorporate dif-
Proceedings of the 10 th IEEE International Conference on Network Protocols (ICNP’02) 1092-1648/02 $17.00 © 2002 IEEE
0
50
100
150
200
250
300
350
400
450
1 2 3 4 5 6 7 8 9 10
Ave
rage
ret
rieva
l cos
t
Number of replicas per URL
Replicate per Web siteReplicate per URL
0
100
200
300
400
500
600
700
800
900
1000
1 2 3 4 5 6 7 8 9 10
Ave
rage
ret
rieva
l cos
t
Number of replicas per URL
Replicate per Web siteReplicate per URL
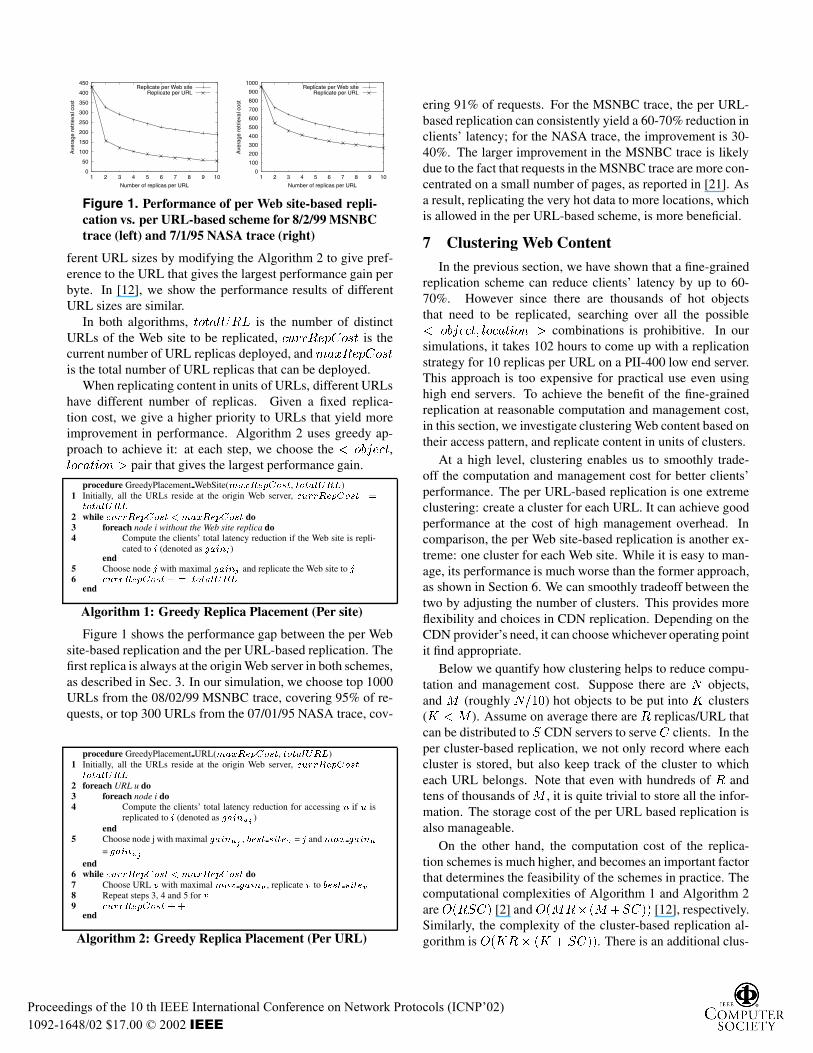
Figure 1. Performance of per Web site-based repli-cation vs. per URL-based scheme for 8/2/99 MSNBCtrace (left) and 7/1/95 NASA trace (right)
ferent URL sizes by modifying the Algorithm 2 to give pref-erence to the URL that gives the largest performance gain perbyte. In [12], we show the performance results of differentURL sizes are similar.
In both algorithms, totalURL is the number of distinctURLs of the Web site to be replicated, currRepCost is thecurrent number of URL replicas deployed, and maxRepCostis the total number of URL replicas that can be deployed.
When replicating content in units of URLs, different URLshave different number of replicas. Given a fixed replica-tion cost, we give a higher priority to URLs that yield moreimprovement in performance. Algorithm 2 uses greedy ap-proach to achieve it: at each step, we choose the < object,location > pair that gives the largest performance gain.
procedure GreedyPlacement WebSite(maxRepCost, totalURL)1 Initially, all the URLs reside at the origin Web server, currRepCost =totalURL
2 while currRepCost <maxRepCost do3 foreach node i without the Web site replica do4 Compute the clients’ total latency reduction if the Web site is repli-
cated to i (denoted as gaini)end
5 Choose node j with maximal gainj and replicate the Web site to j6 currRepCost+ = totalURL
end
Algorithm 1: Greedy Replica Placement (Per site)
Figure 1 shows the performance gap between the per Website-based replication and the per URL-based replication. Thefirst replica is always at the origin Web server in both schemes,as described in Sec. 3. In our simulation, we choose top 1000URLs from the 08/02/99 MSNBC trace, covering 95% of re-quests, or top 300 URLs from the 07/01/95 NASA trace, cov-
procedure GreedyPlacement URL(maxRepCost, totalURL)1 Initially, all the URLs reside at the origin Web server, currRepCost =totalURL
2 foreach URL u do3 foreach node i do4 Compute the clients’ total latency reduction for accessing u if u is
replicated to i (denoted as gainui )end
5 Choose node j with maximal gainuj , best siteu = j andmax gainu
= gainujend
6 while currRepCost <maxRepCost do7 Choose URL v with maximal max gainv , replicate v to best sitev8 Repeat steps 3, 4 and 5 for v9 currRepCost++
end
Algorithm 2: Greedy Replica Placement (Per URL)
ering 91% of requests. For the MSNBC trace, the per URL-based replication can consistently yield a 60-70% reduction inclients’ latency; for the NASA trace, the improvement is 30-40%. The larger improvement in the MSNBC trace is likelydue to the fact that requests in the MSNBC trace are more con-centrated on a small number of pages, as reported in [21]. Asa result, replicating the very hot data to more locations, whichis allowed in the per URL-based scheme, is more beneficial.
7 Clustering Web Content
In the previous section, we have shown that a fine-grainedreplication scheme can reduce clients’ latency by up to 60-70%. However since there are thousands of hot objectsthat need to be replicated, searching over all the possible< object; location > combinations is prohibitive. In oursimulations, it takes 102 hours to come up with a replicationstrategy for 10 replicas per URL on a PII-400 low end server.This approach is too expensive for practical use even usinghigh end servers. To achieve the benefit of the fine-grainedreplication at reasonable computation and management cost,in this section, we investigate clustering Web content based ontheir access pattern, and replicate content in units of clusters.
At a high level, clustering enables us to smoothly trade-off the computation and management cost for better clients’performance. The per URL-based replication is one extremeclustering: create a cluster for each URL. It can achieve goodperformance at the cost of high management overhead. Incomparison, the per Web site-based replication is another ex-treme: one cluster for each Web site. While it is easy to man-age, its performance is much worse than the former approach,as shown in Section 6. We can smoothly tradeoff between thetwo by adjusting the number of clusters. This provides moreflexibility and choices in CDN replication. Depending on theCDN provider’s need, it can choose whichever operating pointit find appropriate.
Below we quantify how clustering helps to reduce compu-tation and management cost. Suppose there are N objects,and M (roughly N=10) hot objects to be put into K clusters(K < M ). Assume on average there are R replicas/URL thatcan be distributed to S CDN servers to serve C clients. In theper cluster-based replication, we not only record where eachcluster is stored, but also keep track of the cluster to whicheach URL belongs. Note that even with hundreds of R andtens of thousands of M , it is quite trivial to store all the infor-mation. The storage cost of the per URL based replication isalso manageable.
On the other hand, the computation cost of the replica-tion schemes is much higher, and becomes an important factorthat determines the feasibility of the schemes in practice. Thecomputational complexities of Algorithm 1 and Algorithm 2are O(RSC) [2] and O(MR� (M+SC)) [12], respectively.Similarly, the complexity of the cluster-based replication al-gorithm is O(KR� (K + SC)). There is an additional clus-
Proceedings of the 10 th IEEE International Conference on Network Protocols (ICNP’02) 1092-1648/02 $17.00 © 2002 IEEE
Rep Scheme Manage States Computation CostPer Web Site O(R) fp �O(RSC)Per Cluster O(RK +M) fp �O(KR � (K + SC))
+ fc �O(MK)
Per URL O(RM) fp �O(MR � (M + SC))
Table 2. Overhead comparison (K < M )
tering cost, which varies with the clustering algorithm that isused. Assuming the placement adaptation frequency is fp andthe clustering frequency is fc, Table 2 summarizes the man-agement cost for the various replication schemes. As we willshow in Sec.9, the content clusters remain stable for at leastone week. Therefore fc is small, and the computational costof clustering is negligible compared to the cost of the replica-tion.
In the remaining of this section, we examine content clus-tering based on access patterns. We start by introducing ourgeneral clustering framework, and then describe the correla-tion metrics we use for clustering.
7.1 General Clustering FrameworkClustering data involves two steps. First, we define dis-
tance between every pair of URLs based on a certain correla-tion metric. Then given nURLs and their correlation distance,we apply standard clustering schemes to group them. We willdescribe our distance metrics in Section 7.2. Regardless ofhow the distance is defined, we can use the following cluster-ing algorithms to group the data.
We explore two generic clustering methods. The firstmethod aims to minimize the maximum diameter of all clus-ters while limiting the number of clusters. The diameter ofcluster i is defined as the maximum distance between anypair of URLs in cluster i. It represents the worst-case cor-relation within that cluster. We use the classical K-split algo-rithm [22]. It is a O(NK) approximation algorithm, whereN is the number of points and K is the number of clusters.It guarantees a solution within twice the optimal. The secondmethod aims to minimize the number of clusters while lim-iting the maximum diameter of all clusters. This problem isNP-complete, and we adopt the best approximation algorithmin [23] with time complexity O(N3).
We have applied both clustering algorithms, and got similarresults. So in the interest of brevity, we present the resultsobtained from using the first clustering algorithm.
7.2 Correlation DistanceIn this section, we explore three orthogonal correlation dis-
tance metrics, which are based on spatial locality, temporallocality, and popularity, respectively. We can also use correla-tion metrics based on semantics, such as hyperlink structuresor XML tags in Web pages. We will examine hyperlink struc-tures for online incremental clustering in Sec. 9.2.2, and leavethe clustering based on other metadata, such as XML tags,for future work. Another possibility is to group URLs by the
directories they reside. But we find that the performance isquite poor [12], because the directory structures do not corre-late well with the access patterns.
7.2.1 Spatial Clustering First, we look at clustering con-tent based on the spatial locality in the access patterns. Weuse BGP prefixes or domain names to partition the Internetinto different regions, as described in Section 3. We representthe access distribution of a URL using a spatial access vector,where the ith field denotes the number of accesses to the URLfrom the i-th client group. Given L client groups, each URLis uniquely identified as a point in L-dimensional space. Inour simulation, we use the top 1000 clusters (i.e., L = 1000),covering 70% - 92% of requests.
We define the correlation distance between URLs A andB in two ways: either (i) the Euclidean distance between thepoints in the L-dimension space that represent the access dis-tributions of URL A and B, or (ii) the complement of cosinevector similarity of spatial access vector A and B.correl dist(A;B) = 1� vector similarity(A;B)
= 1�
Pki=1 Ai �BiqPk
i=1(Ai)2 �Pk
i=1(Bi)2
(1)
Essentially, if we view each spatial access vector as an arrowin a high-dimension space, the vector similarity gives the co-sine of the angle formed by the two arrows.
7.2.2 Temporal Clustering In this section, we examinetemporal clustering, which clusters Web content based ontemporal locality of the access pattern. We try various ways todefine the temporal locality [12], and only show the one thatyields the best results.
Basically, URLs are considered to be correlated only if theyare requested in a short period by the same client. In partic-ular, we extend the co-occurrence based clustering by Su etal. [8]. At a high-level, the algorithm divides requests from aclient into variable length sessions, and only considers URLsrequested together during a client’s session to be related. Wemake the following enhancements: (i) we empirically deter-mine the session boundary rather than choose an arbitrary timeinterval; (ii) we quantify the similarity in documents’ tempo-ral locality using the co-occurrence frequency.
Determine session boundaries: First, we need to deter-mine user sessions, where a session refers to a sequence ofrequests initiated by a user without pro-longed pauses in be-tween. We apply the heuristic described in [24] to detect thesession boundary. Both the MSNBC and NASA traces havethe session-inactivity period of 10 - 15 minutes, so we choose12 minutes in our simulations.
Correlation in temporal locality: We compute the cor-relation distance between any two URLs based on the co-occurrence frequency (see Algorithm 3). This reflects the sim-ilarity in their temporal locality, and thus the likelihood of be-ing retrieved together. Assume that we partition the traces into
Proceedings of the 10 th IEEE International Conference on Network Protocols (ICNP’02) 1092-1648/02 $17.00 © 2002 IEEE
p sessions. The number of co-occurrences of A and B in thesession i is denoted as fi(A;B), which is calculated by count-ing the number of interleaving access pairs (not necessarilyadjacent) for A and B.
Steps 2 to 5 of Algorithm 3 computes fi(A;B). For exam-ple, if the access sequence is “ABCCA” in session i. The inter-leaving access pairs for A and B are AB and BA, so fi(A;B)= fi(B;A) = 2. Similarly, fi(A;C) = fi(C;A) = 3, fi(B;C)= fi(C;B) = 2. Note that in Step 8 and 9, since f(A;B) issymmetric, so is c(A;B). Moreover, 0 � c(A;B) � 1 andc(A;A) = 1. The larger the c(A;B), the more closely cor-related the two URLs are, and the more likely they are to beaccessed together. Step 10 reflects the property that the dis-tance decreases as the correlation increases.
procedure TemporalCorrelationDistance()1 foreach session with access sequence (s1 , s2 , . . . sn) do2 for i = 1; i� n-1; i++ do3 for j = i+1; j� n; j++ do4 if si 6= sj then fi(si , sj )++; fi(si , sj )++;5 else exit the inner for loop to avoid counting duplicate pairs
endend
end6 foreach URL A do compute the number of occurrences o(A)7 foreach pair of URLs (A, B) do8 Co-occurrence values f(A;B) =
Pp
i=1fi(A;B)
9 Co-occurrence frequency c(A;B) = f(A;B)o(A)+o(B)
10 Correlation distance correl dist(A;B) = 1 � c(A;B)end
Algorithm 3: Temporal Correlation Distance
7.2.3 Popularity-based Clustering Finally, we considerthe approach of clustering URLs by their access frequency.We consider two metrics. The first correlation distance metricis defined as
correl dist(A;B) = jaccess freq(A)� access freq(B)j
The second distance metric is even simpler. If N URLs are tobe clustered into K clusters, we sort these URLs according totheir total number of accesses, and place the URLs 1 throughbNKc into cluster 1, and the URLs bN
Kc+1 through b 2N
Kc into
cluster 2, and so on.We tested both metrics on MSNBC traces, and they yield
very similar results. Therefore we only use the simpler ap-proach for evaluation in the rest of the paper.
7.3 Traces Collection for ClusteringThe three clustering techniques all require access statistics,
which can be collected at CDN name servers or CDN servers.The popularity-based clustering needs the least amount of in-formation: only the hit counts of the popular Web objects. Incomparison, the temporal clustering requires the most fine-grained information – the number of co-occurrences of popu-lar objects, which can be calculated based on the access time,and source IP address for each request. The spatial clusteringis in between the two: for each popular Web object, it needsto know how many requests are generated from each popu-lar client group, where the client groups are determined usingBGP prefixes collected over widely dispersed routers [17].
0
50
100
150
200
250
300
350
400
450
500
1 4 7 10 13 16 19 22 25 28 31 34 37 40 43 46 49Number of replicas/URL
Ave
rag
ere
trie
valc
ost Replicate per Web site
Replicated with spatialclustering
Figure 3. Performance of cluster-based replicationfor MSNBC 8/2/1999 trace (20 clusters) with up to50 replicas/URL on pure random topology
8 Performance of Cluster-based ReplicationIn this section, we evaluate the performance of different
clustering algorithms on a variety of network topologies us-ing the real Web server traces. In our simulations, we use thetop 1000 URLs from the MSNBC traces covering 95% of re-quests, and the top 300 URLs from the NASA trace covering91% of requests. The replication algorithm we use is simi-lar to Algorithm 2 in Section 6. In the iteration step 7, wechoose the < cluster; location > pair that gives the largestperformance gain per URL.
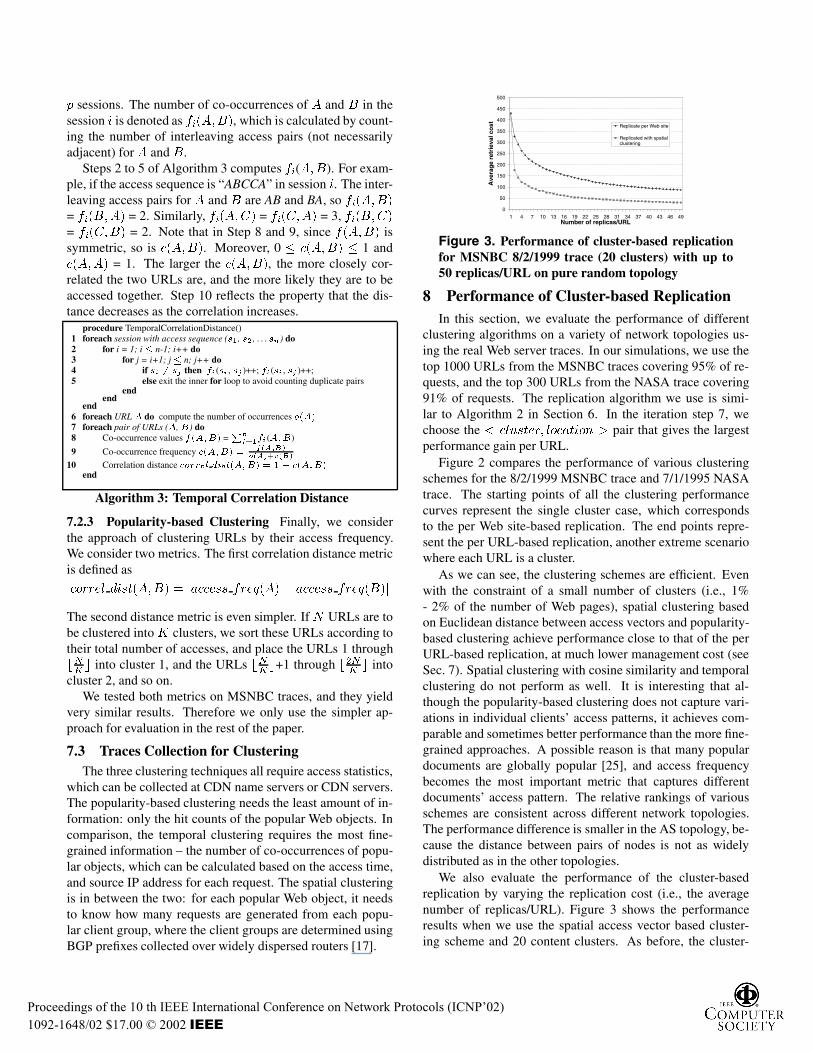
Figure 2 compares the performance of various clusteringschemes for the 8/2/1999 MSNBC trace and 7/1/1995 NASAtrace. The starting points of all the clustering performancecurves represent the single cluster case, which correspondsto the per Web site-based replication. The end points repre-sent the per URL-based replication, another extreme scenariowhere each URL is a cluster.
As we can see, the clustering schemes are efficient. Evenwith the constraint of a small number of clusters (i.e., 1%- 2% of the number of Web pages), spatial clustering basedon Euclidean distance between access vectors and popularity-based clustering achieve performance close to that of the perURL-based replication, at much lower management cost (seeSec. 7). Spatial clustering with cosine similarity and temporalclustering do not perform as well. It is interesting that al-though the popularity-based clustering does not capture vari-ations in individual clients’ access patterns, it achieves com-parable and sometimes better performance than the more fine-grained approaches. A possible reason is that many populardocuments are globally popular [25], and access frequencybecomes the most important metric that captures differentdocuments’ access pattern. The relative rankings of variousschemes are consistent across different network topologies.The performance difference is smaller in the AS topology, be-cause the distance between pairs of nodes is not as widelydistributed as in the other topologies.
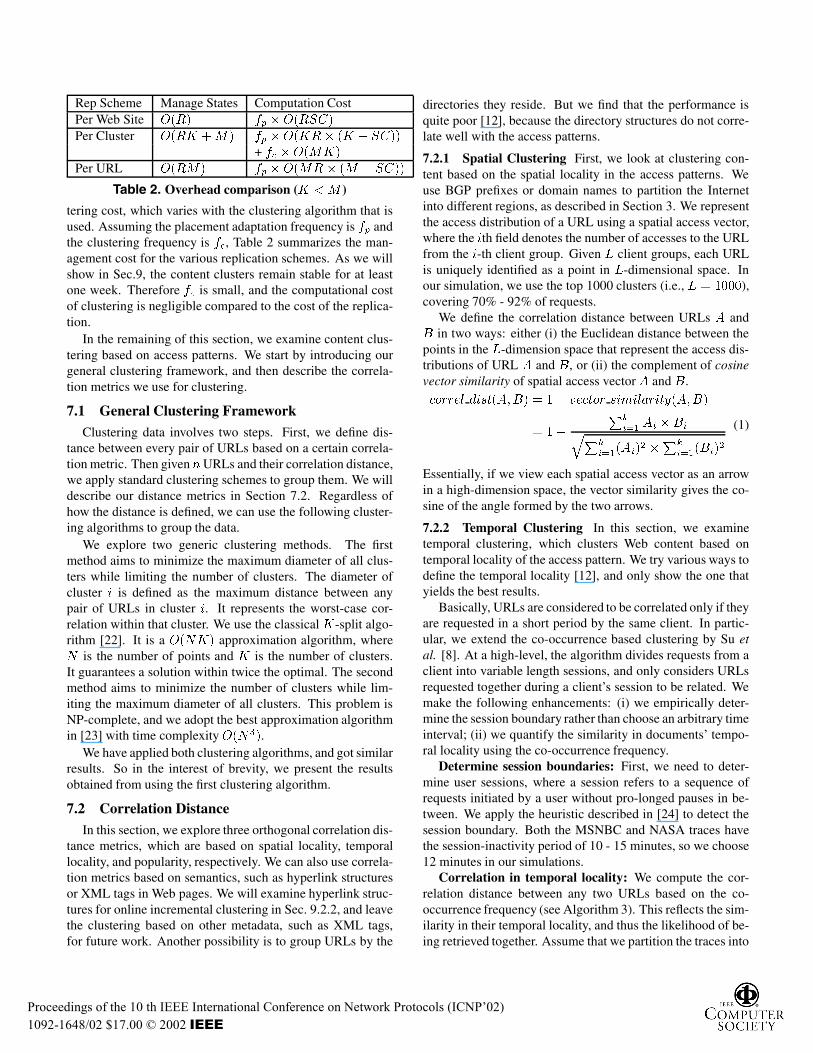
We also evaluate the performance of the cluster-basedreplication by varying the replication cost (i.e., the averagenumber of replicas/URL). Figure 3 shows the performanceresults when we use the spatial access vector based cluster-ing scheme and 20 content clusters. As before, the cluster-
Proceedings of the 10 th IEEE International Conference on Network Protocols (ICNP’02) 1092-1648/02 $17.00 © 2002 IEEE
0
100
200
300
400
500
600
1 10 100 1000
Ave
rage
ret
rieva
l cos
t
Number of clusters
Spatial clustering: Euclidean distanceSpatial clustering: cosine similarity
Access frequency clusteringTemporal clustering
0
100
200
300
400
500
600
700
1 10 100 1000
Ave
rage
ret
rieva
l cos
t
Number of clusters
Spatial clustering: Euclidean distanceSpatial clustering: cosine similarity
Access frequency clusteringTemporal clustering
(a) On a pure random topology
0
20
40
60
80
100
1 10 100 1000
Ave
rage
ret
rieva
l cos
t
Number of clusters
Spatial clustering: Euclidean distanceSpatial clustering: cosine similarity
Access frequency clusteringTemporal clustering
0
20
40
60
80
100
120
140
1 10 100 1000
Ave
rage
ret
rieva
l cos
t
Number of clusters
Spatial clustering: Euclidean distanceSpatial clustering: cosine similarity
Access frequency clusteringTemporal clustering
(b) On a transit-stub topology
0
0.2
0.4
0.6
0.8
1
1.2
1.4
1 10 100 1000
Ave
rage
ret
rieva
l cos
t
Number of clusters
Spatial clustering: Euclidean distanceSpatial clustering: cosine similarity
Access frequency clusteringTemporal clustering
0
0.2
0.4
0.6
0.8
1
1.2
1.4
1 10 100 1000
Ave
rage
ret
rieva
l cos
t
Number of clusters
Spatial clustering: Euclidean distanceSpatial clustering: cosine similarity
Access frequency clusteringTemporal clustering
(c) On an AS-level topology
Figure 2. Performance of various clustering approaches for MSNBC 8/2/1999 trace with averagely 5 replicas/URL(top) and for NASA 7/1/1995 trace with averagely 3 replicas/URL (bottom) on various topologies
based scheme out-performs the per Web site scheme by over50%. As expected, the performance gap between the per Website and the per cluster replication decreases as the numberof replicas per URL increases. Compared to the per URL-based replication, the cluster-based replication is more scal-able: it reduces running time by over 20 times, and reducesthe amount of state by orders of magnitude.
9 Incremental Clusterings
To adapt to changes in users’ access pattern, in this sectionwe examine incremental clusterings. We start by studying theperformance of static clustering, which re-distributes the ex-isting content clusters (without changing the clusters). Thenwe look at incremental clustering, which gradually puts newpopular URLs to existing clusters and replicates them. Wecompare both static and incremental clusterings with the opti-mal case, i.e., the complete re-clustering and redistribution.
9.1 Static Clustering
It is important to determine the frequency of cluster per-turbation and redistribution. If the clients’ interested URLsand access patterns change very fast, a fine-grained replicationscheme that considers how a client retrieves multiple URLstogether may require frequent adaptation. The extra mainte-nance and clustering cost may dictate that the per Web sitereplication approach be used instead. To investigate whetherthis would be a serious concern, we evaluate three methods, asshown in Table 3 using MSNBC traces: birth trace and newtrace, where the birth trace and new trace are access traces forDay 1 and Day 2, respectively (Day 2 follows Day 1 either
Methods Static 1 Static 2 OptimalTraces used for clustering birth birth newTraces used for replication birth new new
Table 3. Static and optimal clustering schemes
immediately or a few days apart).Note that in the static 1 and static 2 methods, accesses to
the URLs that are not included in the birth trace have to go tothe origin Web server, potentially incurring a higher cost. Allthree methods are evaluated using new traces. We considerthe spatial clustering based on Euclidean distance (referredas SC) and popularity (i.e., access frequency) based cluster-ing (referred as AFC), the two with the best performance inSec. 8. We simulate on pure-random, Waxman, transit-stub,and AS topologies. The results for different topologies aresimilar, and below we only present the results from transit-stub topologies.
We use the following simulation configuration throughoutthis section unless otherwise specified. We choose the top1000 client groups from the 8/2/99 MSNBC traces, and thetop 1000 URLs in our simulation. We cluster URLs into 20groups using SC or AFC. The top 1000 client groups during8/3 - 10/1 have over 70% overlap with those on 8/2.
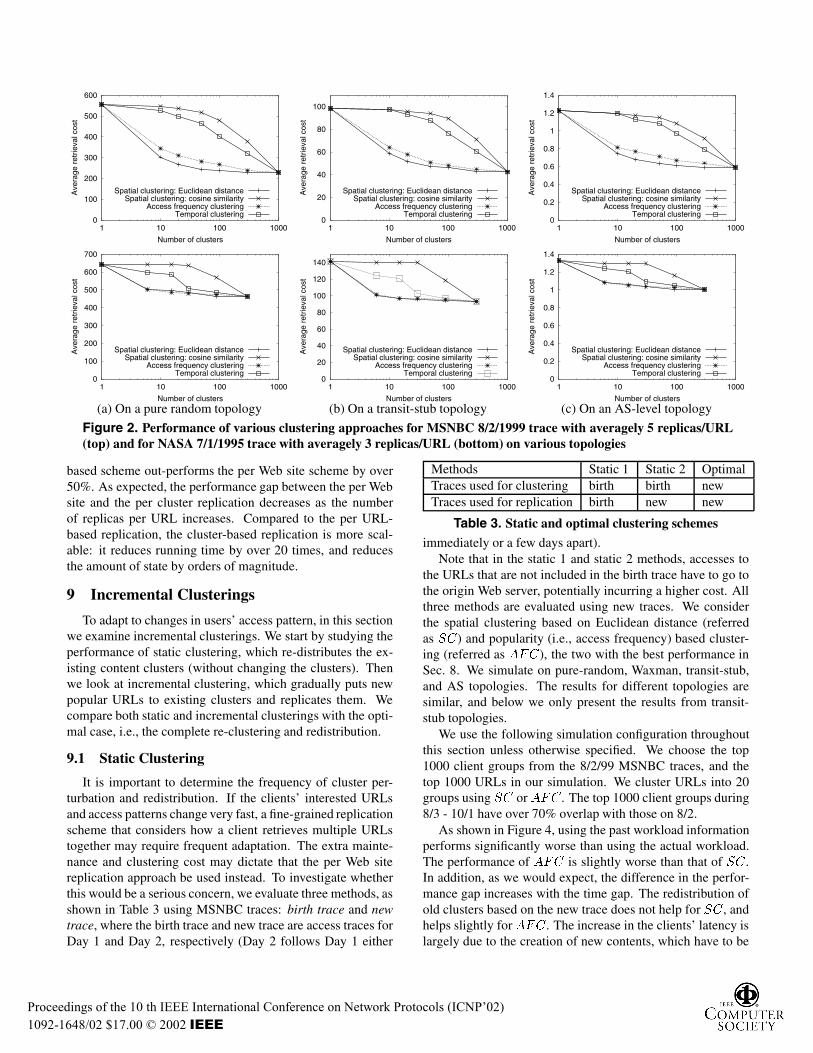
As shown in Figure 4, using the past workload informationperforms significantly worse than using the actual workload.The performance of AFC is slightly worse than that of SC.In addition, as we would expect, the difference in the perfor-mance gap increases with the time gap. The redistribution ofold clusters based on the new trace does not help for SC, andhelps slightly for AFC. The increase in the clients’ latency islargely due to the creation of new contents, which have to be
Proceedings of the 10 th IEEE International Conference on Network Protocols (ICNP’02) 1092-1648/02 $17.00 © 2002 IEEE
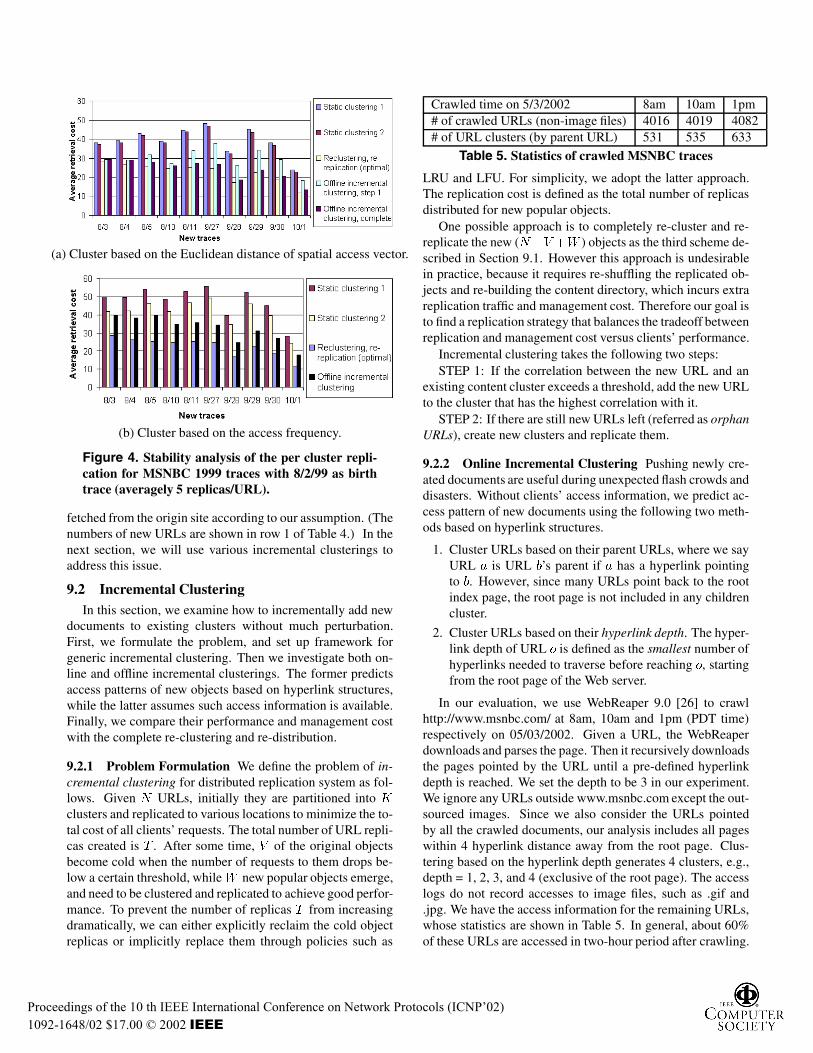
(a) Cluster based on the Euclidean distance of spatial access vector.
(b) Cluster based on the access frequency.
Figure 4. Stability analysis of the per cluster repli-cation for MSNBC 1999 traces with 8/2/99 as birthtrace (averagely 5 replicas/URL).
fetched from the origin site according to our assumption. (Thenumbers of new URLs are shown in row 1 of Table 4.) In thenext section, we will use various incremental clusterings toaddress this issue.
9.2 Incremental ClusteringIn this section, we examine how to incrementally add new
documents to existing clusters without much perturbation.First, we formulate the problem, and set up framework forgeneric incremental clustering. Then we investigate both on-line and offline incremental clusterings. The former predictsaccess patterns of new objects based on hyperlink structures,while the latter assumes such access information is available.Finally, we compare their performance and management costwith the complete re-clustering and re-distribution.
9.2.1 Problem Formulation We define the problem of in-cremental clustering for distributed replication system as fol-lows. Given N URLs, initially they are partitioned into Kclusters and replicated to various locations to minimize the to-tal cost of all clients’ requests. The total number of URL repli-cas created is T . After some time, V of the original objectsbecome cold when the number of requests to them drops be-low a certain threshold, while W new popular objects emerge,and need to be clustered and replicated to achieve good perfor-mance. To prevent the number of replicas T from increasingdramatically, we can either explicitly reclaim the cold objectreplicas or implicitly replace them through policies such as
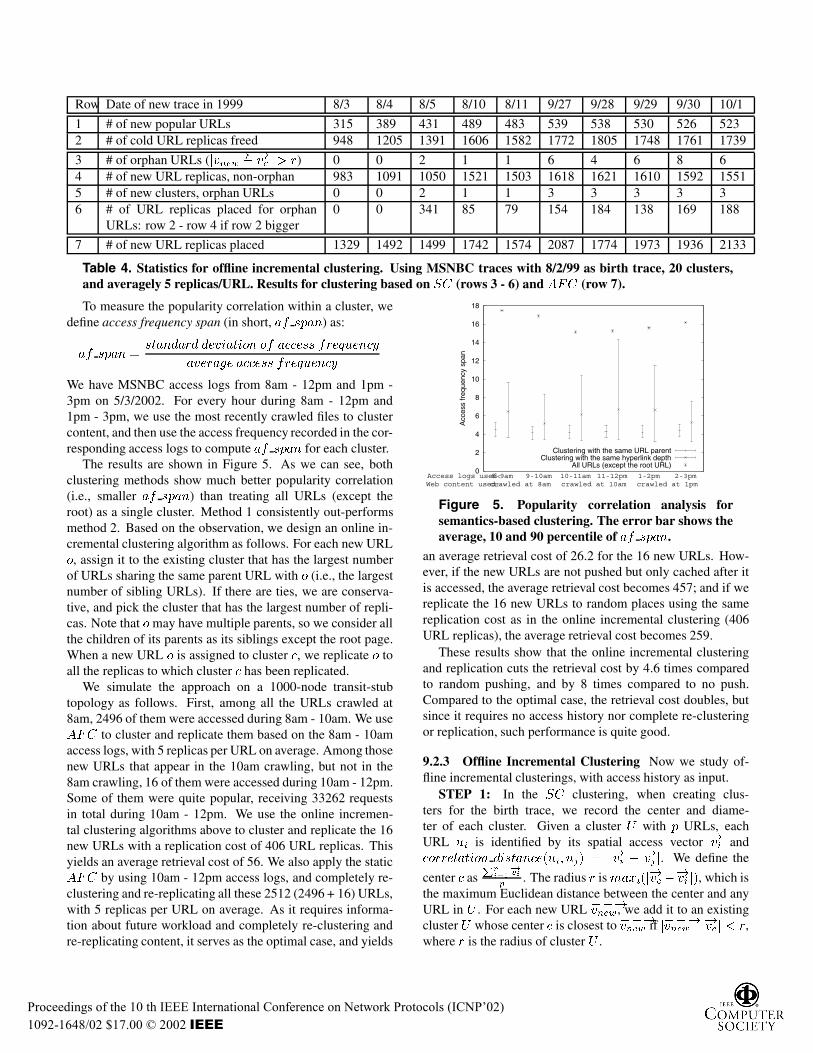
Crawled time on 5/3/2002 8am 10am 1pm# of crawled URLs (non-image files) 4016 4019 4082# of URL clusters (by parent URL) 531 535 633
Table 5. Statistics of crawled MSNBC traces
LRU and LFU. For simplicity, we adopt the latter approach.The replication cost is defined as the total number of replicasdistributed for new popular objects.
One possible approach is to completely re-cluster and re-replicate the new (N�V +W ) objects as the third scheme de-scribed in Section 9.1. However this approach is undesirablein practice, because it requires re-shuffling the replicated ob-jects and re-building the content directory, which incurs extrareplication traffic and management cost. Therefore our goal isto find a replication strategy that balances the tradeoff betweenreplication and management cost versus clients’ performance.
Incremental clustering takes the following two steps:STEP 1: If the correlation between the new URL and an
existing content cluster exceeds a threshold, add the new URLto the cluster that has the highest correlation with it.
STEP 2: If there are still new URLs left (referred as orphanURLs), create new clusters and replicate them.
9.2.2 Online Incremental Clustering Pushing newly cre-ated documents are useful during unexpected flash crowds anddisasters. Without clients’ access information, we predict ac-cess pattern of new documents using the following two meth-ods based on hyperlink structures.
1. Cluster URLs based on their parent URLs, where we sayURL a is URL b’s parent if a has a hyperlink pointingto b. However, since many URLs point back to the rootindex page, the root page is not included in any childrencluster.
2. Cluster URLs based on their hyperlink depth. The hyper-link depth of URL o is defined as the smallest number ofhyperlinks needed to traverse before reaching o, startingfrom the root page of the Web server.
In our evaluation, we use WebReaper 9.0 [26] to crawlhttp://www.msnbc.com/ at 8am, 10am and 1pm (PDT time)respectively on 05/03/2002. Given a URL, the WebReaperdownloads and parses the page. Then it recursively downloadsthe pages pointed by the URL until a pre-defined hyperlinkdepth is reached. We set the depth to be 3 in our experiment.We ignore any URLs outside www.msnbc.com except the out-sourced images. Since we also consider the URLs pointedby all the crawled documents, our analysis includes all pageswithin 4 hyperlink distance away from the root page. Clus-tering based on the hyperlink depth generates 4 clusters, e.g.,depth = 1, 2, 3, and 4 (exclusive of the root page). The accesslogs do not record accesses to image files, such as .gif and.jpg. We have the access information for the remaining URLs,whose statistics are shown in Table 5. In general, about 60%of these URLs are accessed in two-hour period after crawling.
Proceedings of the 10 th IEEE International Conference on Network Protocols (ICNP’02) 1092-1648/02 $17.00 © 2002 IEEE
Row Date of new trace in 1999 8/3 8/4 8/5 8/10 8/11 9/27 9/28 9/29 9/30 10/1
1 # of new popular URLs 315 389 431 489 483 539 538 530 526 5232 # of cold URL replicas freed 948 1205 1391 1606 1582 1772 1805 1748 1761 1739
3 # of orphan URLs (j��!vnew ��!vc j > r) 0 0 2 1 1 6 4 6 8 64 # of new URL replicas, non-orphan 983 1091 1050 1521 1503 1618 1621 1610 1592 15515 # of new clusters, orphan URLs 0 0 2 1 1 3 3 3 3 36 # of URL replicas placed for orphan
URLs: row 2 - row 4 if row 2 bigger0 0 341 85 79 154 184 138 169 188
7 # of new URL replicas placed 1329 1492 1499 1742 1574 2087 1774 1973 1936 2133
Table 4. Statistics for offline incremental clustering. Using MSNBC traces with 8/2/99 as birth trace, 20 clusters,and averagely 5 replicas/URL. Results for clustering based on SC (rows 3 - 6) and AFC (row 7).
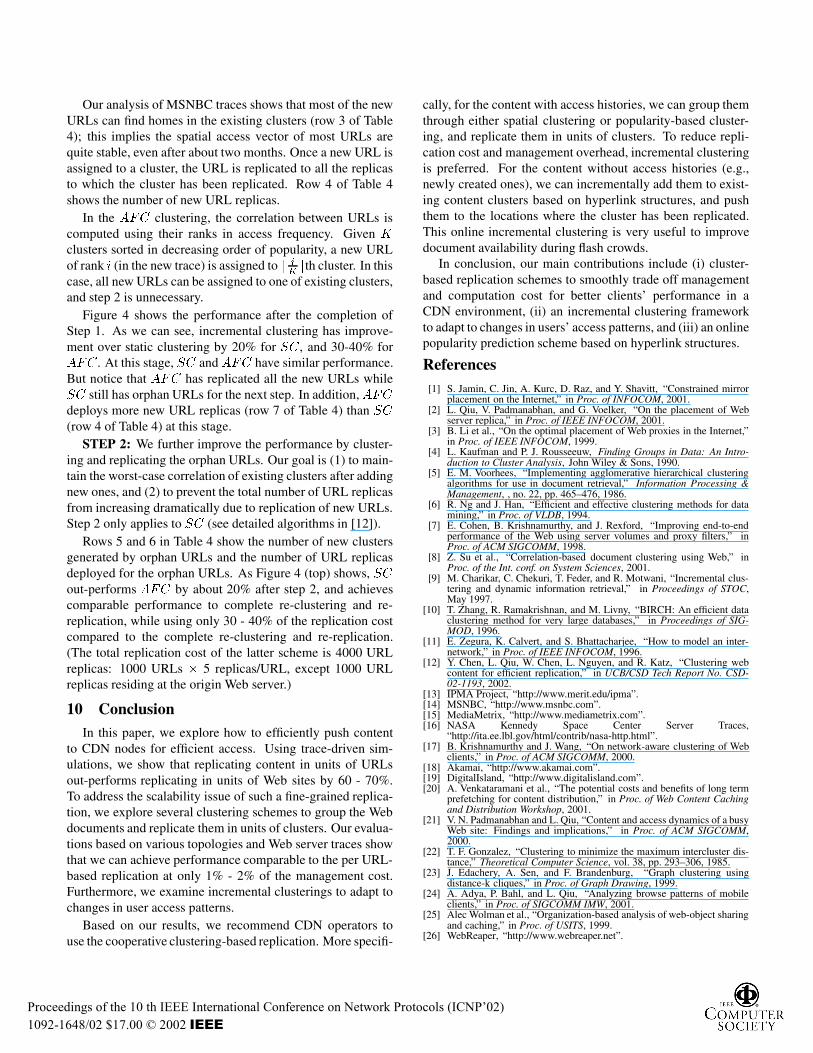
To measure the popularity correlation within a cluster, wedefine access frequency span (in short, af span) as:
af span =standard deviation of access frequency
average access frequency
We have MSNBC access logs from 8am - 12pm and 1pm -3pm on 5/3/2002. For every hour during 8am - 12pm and1pm - 3pm, we use the most recently crawled files to clustercontent, and then use the access frequency recorded in the cor-responding access logs to compute af span for each cluster.
The results are shown in Figure 5. As we can see, bothclustering methods show much better popularity correlation(i.e., smaller af span) than treating all URLs (except theroot) as a single cluster. Method 1 consistently out-performsmethod 2. Based on the observation, we design an online in-cremental clustering algorithm as follows. For each new URLo, assign it to the existing cluster that has the largest numberof URLs sharing the same parent URL with o (i.e., the largestnumber of sibling URLs). If there are ties, we are conserva-tive, and pick the cluster that has the largest number of repli-cas. Note that o may have multiple parents, so we consider allthe children of its parents as its siblings except the root page.When a new URL o is assigned to cluster c, we replicate o toall the replicas to which cluster c has been replicated.
We simulate the approach on a 1000-node transit-stubtopology as follows. First, among all the URLs crawled at8am, 2496 of them were accessed during 8am - 10am. We useAFC to cluster and replicate them based on the 8am - 10amaccess logs, with 5 replicas per URL on average. Among thosenew URLs that appear in the 10am crawling, but not in the8am crawling, 16 of them were accessed during 10am - 12pm.Some of them were quite popular, receiving 33262 requestsin total during 10am - 12pm. We use the online incremen-tal clustering algorithms above to cluster and replicate the 16new URLs with a replication cost of 406 URL replicas. Thisyields an average retrieval cost of 56. We also apply the staticAFC by using 10am - 12pm access logs, and completely re-clustering and re-replicating all these 2512 (2496 + 16) URLs,with 5 replicas per URL on average. As it requires informa-tion about future workload and completely re-clustering andre-replicating content, it serves as the optimal case, and yields
0
2
4
6
8
10
12
14
16
18
Acc
ess
freq
uenc
y sp
an
crawled at 8amAccess logs used: Web content used:
8-9am 9-10amcrawled at 10am10-11am 11-12pm
crawled at 1pm1-2pm 2-3pm
Clustering with the same URL parentClustering with the same hyperlink depth
All URLs (except the root URL)
Figure 5. Popularity correlation analysis forsemantics-based clustering. The error bar shows theaverage, 10 and 90 percentile of af span.
an average retrieval cost of 26.2 for the 16 new URLs. How-ever, if the new URLs are not pushed but only cached after itis accessed, the average retrieval cost becomes 457; and if wereplicate the 16 new URLs to random places using the samereplication cost as in the online incremental clustering (406URL replicas), the average retrieval cost becomes 259.
These results show that the online incremental clusteringand replication cuts the retrieval cost by 4.6 times comparedto random pushing, and by 8 times compared to no push.Compared to the optimal case, the retrieval cost doubles, butsince it requires no access history nor complete re-clusteringor replication, such performance is quite good.
9.2.3 Offline Incremental Clustering Now we study of-fline incremental clusterings, with access history as input.
STEP 1: In the SC clustering, when creating clus-ters for the birth trace, we record the center and diame-ter of each cluster. Given a cluster U with p URLs, eachURL ui is identified by its spatial access vector �!vi andcorrelation distance(ui; uj) = j�!vi �
�!vj j. We define the
center c asPp
i=1�!vi
p. The radius r is maxi(j
�!vc ��!vi j), which is
the maximum Euclidean distance between the center and anyURL in U . For each new URL ��!vnew, we add it to an existingcluster U whose center c is closest to ��!vnew if j��!vnew�
�!vc j < r,where r is the radius of cluster U .
Proceedings of the 10 th IEEE International Conference on Network Protocols (ICNP’02) 1092-1648/02 $17.00 © 2002 IEEE
Our analysis of MSNBC traces shows that most of the newURLs can find homes in the existing clusters (row 3 of Table4); this implies the spatial access vector of most URLs arequite stable, even after about two months. Once a new URL isassigned to a cluster, the URL is replicated to all the replicasto which the cluster has been replicated. Row 4 of Table 4shows the number of new URL replicas.
In the AFC clustering, the correlation between URLs iscomputed using their ranks in access frequency. Given Kclusters sorted in decreasing order of popularity, a new URLof rank i (in the new trace) is assigned to d i
Keth cluster. In this
case, all new URLs can be assigned to one of existing clusters,and step 2 is unnecessary.
Figure 4 shows the performance after the completion ofStep 1. As we can see, incremental clustering has improve-ment over static clustering by 20% for SC, and 30-40% forAFC. At this stage, SC and AFC have similar performance.But notice that AFC has replicated all the new URLs whileSC still has orphan URLs for the next step. In addition,AFCdeploys more new URL replicas (row 7 of Table 4) than SC(row 4 of Table 4) at this stage.
STEP 2: We further improve the performance by cluster-ing and replicating the orphan URLs. Our goal is (1) to main-tain the worst-case correlation of existing clusters after addingnew ones, and (2) to prevent the total number of URL replicasfrom increasing dramatically due to replication of new URLs.Step 2 only applies to SC (see detailed algorithms in [12]).
Rows 5 and 6 in Table 4 show the number of new clustersgenerated by orphan URLs and the number of URL replicasdeployed for the orphan URLs. As Figure 4 (top) shows, SCout-performs AFC by about 20% after step 2, and achievescomparable performance to complete re-clustering and re-replication, while using only 30 - 40% of the replication costcompared to the complete re-clustering and re-replication.(The total replication cost of the latter scheme is 4000 URLreplicas: 1000 URLs � 5 replicas/URL, except 1000 URLreplicas residing at the origin Web server.)
10 ConclusionIn this paper, we explore how to efficiently push content
to CDN nodes for efficient access. Using trace-driven sim-ulations, we show that replicating content in units of URLsout-performs replicating in units of Web sites by 60 - 70%.To address the scalability issue of such a fine-grained replica-tion, we explore several clustering schemes to group the Webdocuments and replicate them in units of clusters. Our evalua-tions based on various topologies and Web server traces showthat we can achieve performance comparable to the per URL-based replication at only 1% - 2% of the management cost.Furthermore, we examine incremental clusterings to adapt tochanges in user access patterns.
Based on our results, we recommend CDN operators touse the cooperative clustering-based replication. More specifi-
cally, for the content with access histories, we can group themthrough either spatial clustering or popularity-based cluster-ing, and replicate them in units of clusters. To reduce repli-cation cost and management overhead, incremental clusteringis preferred. For the content without access histories (e.g.,newly created ones), we can incrementally add them to exist-ing content clusters based on hyperlink structures, and pushthem to the locations where the cluster has been replicated.This online incremental clustering is very useful to improvedocument availability during flash crowds.
In conclusion, our main contributions include (i) cluster-based replication schemes to smoothly trade off managementand computation cost for better clients’ performance in aCDN environment, (ii) an incremental clustering frameworkto adapt to changes in users’ access patterns, and (iii) an onlinepopularity prediction scheme based on hyperlink structures.
References[1] S. Jamin, C. Jin, A. Kurc, D. Raz, and Y. Shavitt, “Constrained mirror
placement on the Internet,” in Proc. of INFOCOM, 2001.[2] L. Qiu, V. Padmanabhan, and G. Voelker, “On the placement of Web
server replica,” in Proc. of IEEE INFOCOM, 2001.[3] B. Li et al., “On the optimal placement of Web proxies in the Internet,”
in Proc. of IEEE INFOCOM, 1999.[4] L. Kaufman and P. J. Rousseeuw, Finding Groups in Data: An Intro-
duction to Cluster Analysis, John Wiley & Sons, 1990.[5] E. M. Voorhees, “Implementing agglomerative hierarchical clustering
algorithms for use in document retrieval,” Information Processing &Management, , no. 22, pp. 465–476, 1986.
[6] R. Ng and J. Han, “Efficient and effective clustering methods for datamining,” in Proc. of VLDB, 1994.
[7] E. Cohen, B. Krishnamurthy, and J. Rexford, “Improving end-to-endperformance of the Web using server volumes and proxy filters,” inProc. of ACM SIGCOMM, 1998.
[8] Z. Su et al., “Correlation-based document clustering using Web,” inProc. of the Int. conf. on System Sciences, 2001.
[9] M. Charikar, C. Chekuri, T. Feder, and R. Motwani, “Incremental clus-tering and dynamic information retrieval,” in Proceedings of STOC,May 1997.
[10] T. Zhang, R. Ramakrishnan, and M. Livny, “BIRCH: An efficient dataclustering method for very large databases,” in Proceedings of SIG-MOD, 1996.
[11] E. Zegura, K. Calvert, and S. Bhattacharjee, “How to model an inter-network,” in Proc. of IEEE INFOCOM, 1996.
[12] Y. Chen, L. Qiu, W. Chen, L. Nguyen, and R. Katz, “Clustering webcontent for efficient replication,” in UCB/CSD Tech Report No. CSD-02-1193, 2002.
[13] IPMA Project, “http://www.merit.edu/ipma”.[14] MSNBC, “http://www.msnbc.com”.[15] MediaMetrix, “http://www.mediametrix.com”.[16] NASA Kennedy Space Center Server Traces,
“http://ita.ee.lbl.gov/html/contrib/nasa-http.html”.[17] B. Krishnamurthy and J. Wang, “On network-aware clustering of Web
clients,” in Proc. of ACM SIGCOMM, 2000.[18] Akamai, “http://www.akamai.com”.[19] DigitalIsland, “http://www.digitalisland.com”.[20] A. Venkataramani et al., “The potential costs and benefits of long term
prefetching for content distribution,” in Proc. of Web Content Cachingand Distribution Workshop, 2001.
[21] V. N. Padmanabhan and L. Qiu, “Content and access dynamics of a busyWeb site: Findings and implications,” in Proc. of ACM SIGCOMM,2000.
[22] T. F. Gonzalez, “Clustering to minimize the maximum intercluster dis-tance,” Theoretical Computer Science, vol. 38, pp. 293–306, 1985.
[23] J. Edachery, A. Sen, and F. Brandenburg, “Graph clustering usingdistance-k cliques,” in Proc. of Graph Drawing, 1999.
[24] A. Adya, P. Bahl, and L. Qiu, “Analyzing browse patterns of mobileclients,” in Proc. of SIGCOMM IMW, 2001.
[25] Alec Wolman et al., “Organization-based analysis of web-object sharingand caching,” in Proc. of USITS, 1999.
[26] WebReaper, “http://www.webreaper.net”.
Proceedings of the 10 th IEEE International Conference on Network Protocols (ICNP’02) 1092-1648/02 $17.00 © 2002 IEEE