Embed Size (px)
Citation preview
3/11/2015
1
Chapter 2: Global Marketplaces and Business Centers
Week 2 Day 1
Su Jin Victoria Yeon, Copyright 2015
Learning Objectives
Su Jin Victoria Yeon, Copyright 2015
1. Evaluate the impact of the political and economic characteristics of the world’s various marketplaces on the opportunities available to international businesses
2. Appreciate the use of national income data in making business decisions
3. Discuss North America as a major marketplace and business center in the world economy
4. Discuss Western Europe as a major marketplace and business center in the world economy
5. Discuss Asia as a major marketplace and business center in the world economy
6. Assess the development challenges facing African, Middle Eastern, and South American countries
3/11/2015
2
Outline of Chapter 2
Su Jin Victoria Yeon, Copyright 2015
The Marketplaces of North America The United States Canada Mexico Central America and the Caribbean
The Marketplaces of Western Europe
The Marketplaces of Eastern Europe and Central Asia
The Marketplaces of Asia Japan Australia and New Zealand
The Four Tigers South Korea Taiwan Singapore Hong Kong
China India Southeast Asian Countries
The Marketplaces of Africa and the Middle East Africa Middle East
The Marketplaces of South America
Opening case – Trade is Blossoming
Su Jin Victoria Yeon, Copyright 2015
The boom in the floral industry around the world in countries including Colombia, Ecuador and China, which in turn is driving economic growth in these regions.
Key Points The growth in the floral industry is the result of technological changes and trade liberalization. The Netherlands had long been the centre of the international commercial flower industry.
FLORAHOLLAND has been the most important flower auctioneer in the world. In 2009, they had auctioned over €3.9 billion worth of plants and flowers. They used e-commerce to expand beyond their regional market. This growing trade has also impacted other industries (i.e. airline industry). These opportunities were the result of globalization and the company’s ability to obtain
market research information, which has been the key to their ability to internationalize the operations.
3/11/2015
3
The Importance of Knowledge on Global Market
Su Jin Victoria Yeon, Copyright 2015
Failure of international business Failure to obtain vital information
Basic geography, market characteristics, culture, politics etc.
Factors influencing the world pattern of trade & investment Linguistic & cultural ties Past political associations Military alliances
E.g. London’s importance as a world financial centre political & military power of the British Empire in the 19th Century
Austria: a bridge between Western & Eastern Europe geographical reason: transportation, educational and cultural linkages
The World Economy
Su Jin Victoria Yeon, Copyright 2015
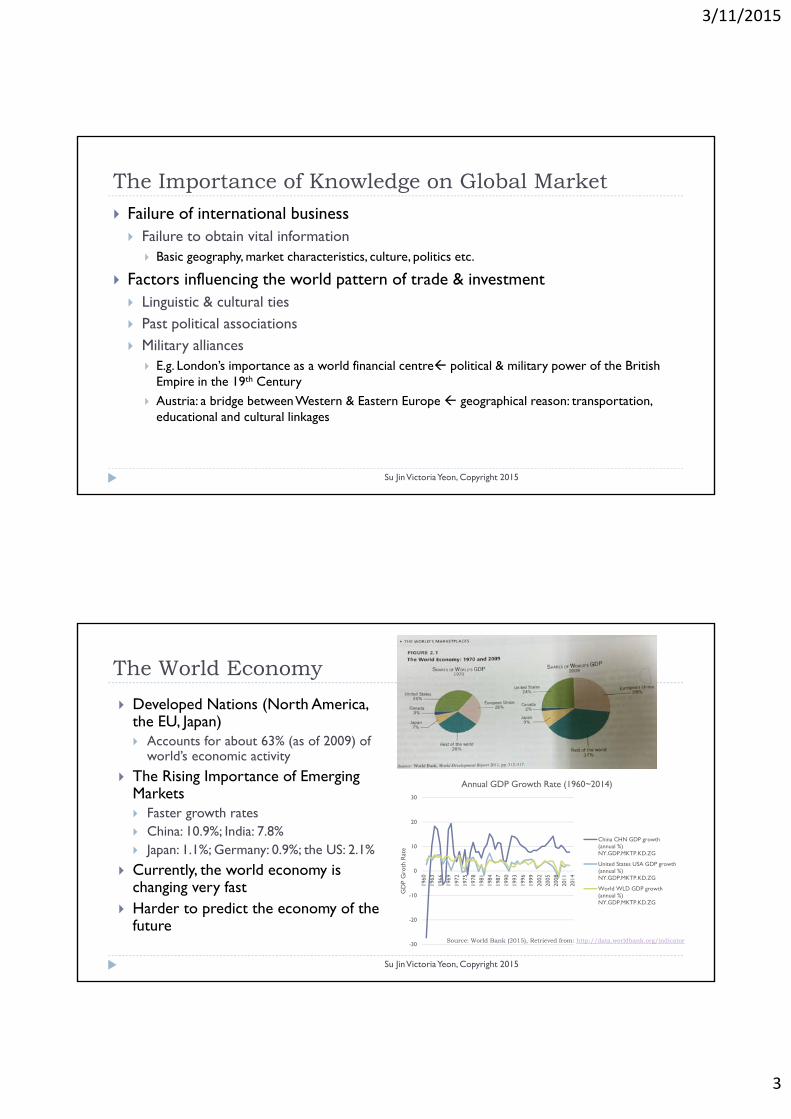
Developed Nations (North America, the EU, Japan) Accounts for about 63% (as of 2009) of
world’s economic activity
The Rising Importance of Emerging Markets Faster growth rates China: 10.9%; India: 7.8% Japan: 1.1%; Germany: 0.9%; the US: 2.1%
Currently, the world economy is changing very fast
Harder to predict the economy of the future
-30
-20
-10
0
10
20
30
1960
1963
1966
1969
1972
1975
1978
1981
1984
1987
1990
1993
1996
1999
2002
2005
2008
2011
2014
GD
P G
roth
Rat
e
Annual GDP Growth Rate (1960~2014)
China CHN GDP growth(annual %)NY.GDP.MKTP.KD.ZG
United States USA GDP growth(annual %)NY.GDP.MKTP.KD.ZG
World WLD GDP growth(annual %)NY.GDP.MKTP.KD.ZG
Source: World Bank (2015), Retrieved from: http://data.worldbank.org/indicator
3/11/2015
4
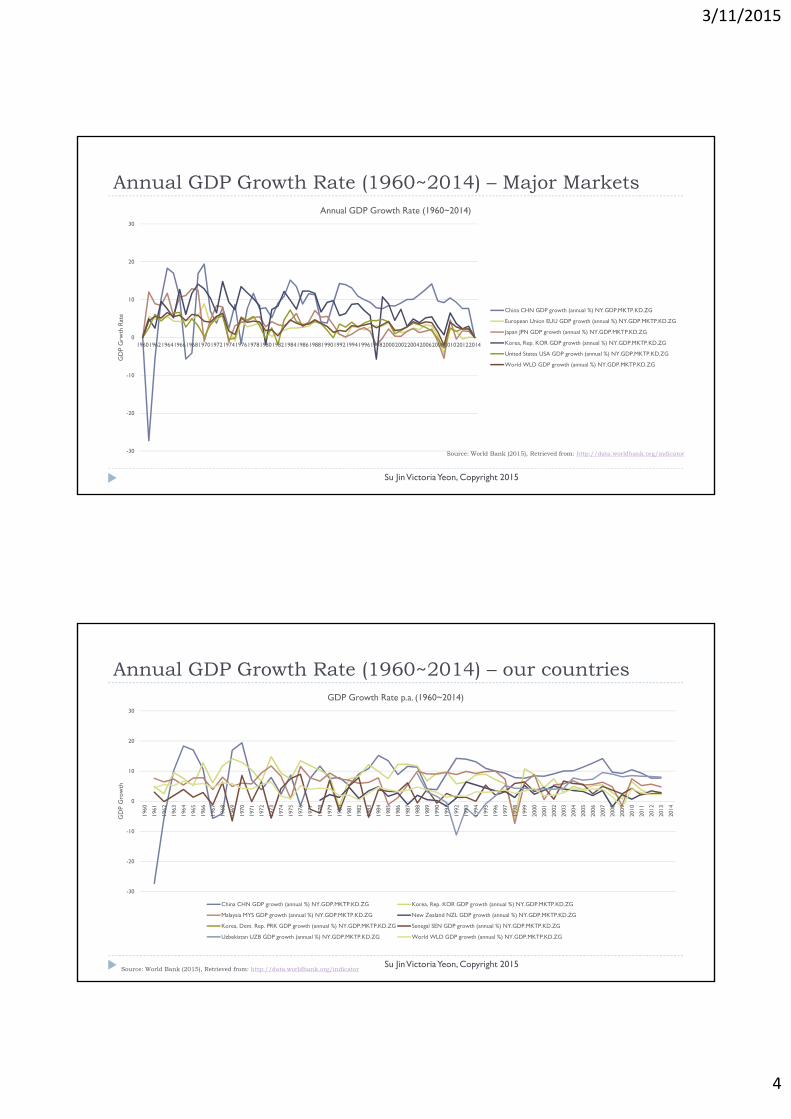
Annual GDP Growth Rate (1960~2014) – Major Markets
Su Jin Victoria Yeon, Copyright 2015
-30
-20
-10
0
10
20
30
1960196219641966196819701972197419761978198019821984198619881990199219941996199820002002200420062008201020122014
GD
P G
rwth
Rat
e
Annual GDP Growth Rate (1960~2014)
China CHN GDP growth (annual %) NY.GDP.MKTP.KD.ZG
European Union EUU GDP growth (annual %) NY.GDP.MKTP.KD.ZG
Japan JPN GDP growth (annual %) NY.GDP.MKTP.KD.ZG
Korea, Rep. KOR GDP growth (annual %) NY.GDP.MKTP.KD.ZG
United States USA GDP growth (annual %) NY.GDP.MKTP.KD.ZG
World WLD GDP growth (annual %) NY.GDP.MKTP.KD.ZG
Source: World Bank (2015), Retrieved from: http://data.worldbank.org/indicator
Annual GDP Growth Rate (1960~2014) – our countries
Su Jin Victoria Yeon, Copyright 2015
-30
-20
-10
0
10
20
30
1960
1961
1962
1963
1964
1965
1966
1967
1968
1969
1970
1971
1972
1973
1974
1975
1976
1977
1978
1979
1980
1981
1982
1983
1984
1985
1986
1987
1988
1989
1990
1991
1992
1993
1994
1995
1996
1997
1998
1999
2000
2001
2002
2003
2004
2005
2006
2007
2008
2009
2010
2011
2012
2013
2014
GD
P G
row
th
GDP Growth Rate p.a. (1960~2014)
China CHN GDP growth (annual %) NY.GDP.MKTP.KD.ZG Korea, Rep. KOR GDP growth (annual %) NY.GDP.MKTP.KD.ZG
Malaysia MYS GDP growth (annual %) NY.GDP.MKTP.KD.ZG New Zealand NZL GDP growth (annual %) NY.GDP.MKTP.KD.ZG
Korea, Dem. Rep. PRK GDP growth (annual %) NY.GDP.MKTP.KD.ZG Senegal SEN GDP growth (annual %) NY.GDP.MKTP.KD.ZG
Uzbekistan UZB GDP growth (annual %) NY.GDP.MKTP.KD.ZG World WLD GDP growth (annual %) NY.GDP.MKTP.KD.ZG
Source: World Bank (2015), Retrieved from: http://data.worldbank.org/indicator
3/11/2015
5
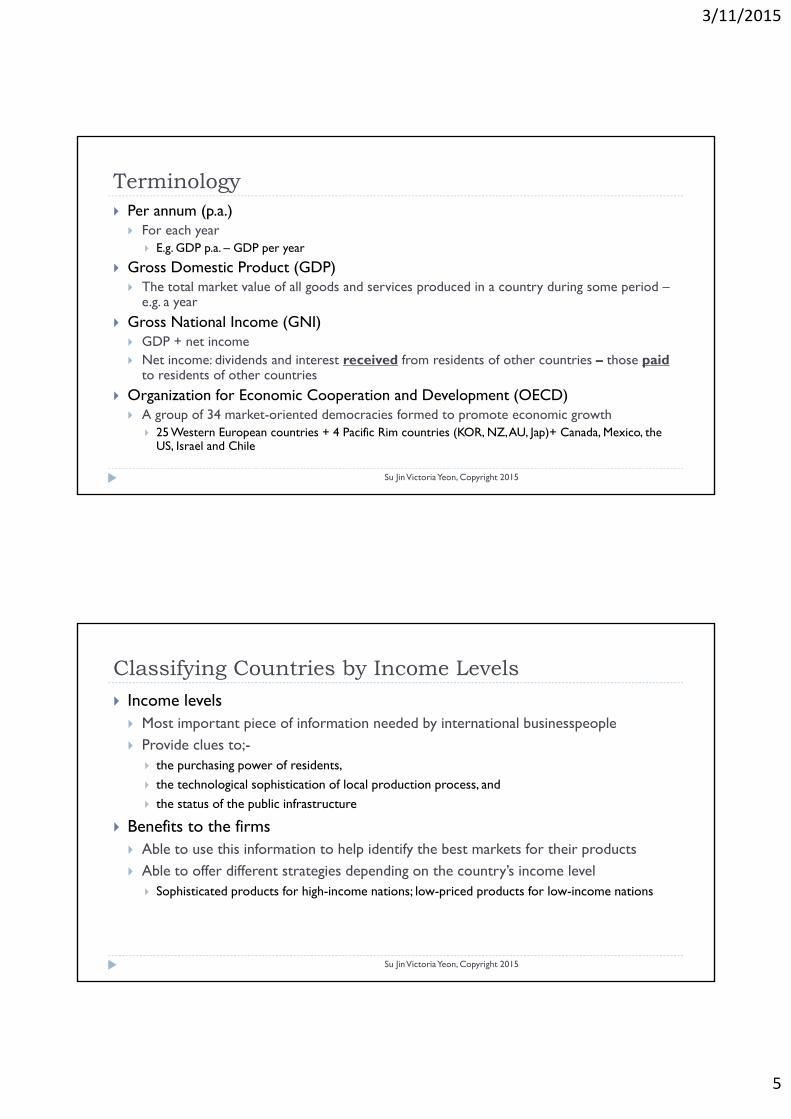
Terminology
Su Jin Victoria Yeon, Copyright 2015
Per annum (p.a.) For each year
E.g. GDP p.a. – GDP per year
Gross Domestic Product (GDP) The total market value of all goods and services produced in a country during some period –
e.g. a year
Gross National Income (GNI) GDP + net income Net income: dividends and interest received from residents of other countries – those paid
to residents of other countries
Organization for Economic Cooperation and Development (OECD) A group of 34 market-oriented democracies formed to promote economic growth
25 Western European countries + 4 Pacific Rim countries (KOR, NZ, AU, Jap)+ Canada, Mexico, the US, Israel and Chile
Classifying Countries by Income Levels
Su Jin Victoria Yeon, Copyright 2015
Income levels Most important piece of information needed by international businesspeople Provide clues to;-
the purchasing power of residents,
the technological sophistication of local production process, and
the status of the public infrastructure
Benefits to the firms Able to use this information to help identify the best markets for their products Able to offer different strategies depending on the country’s income level
Sophisticated products for high-income nations; low-priced products for low-income nations
3/11/2015
6
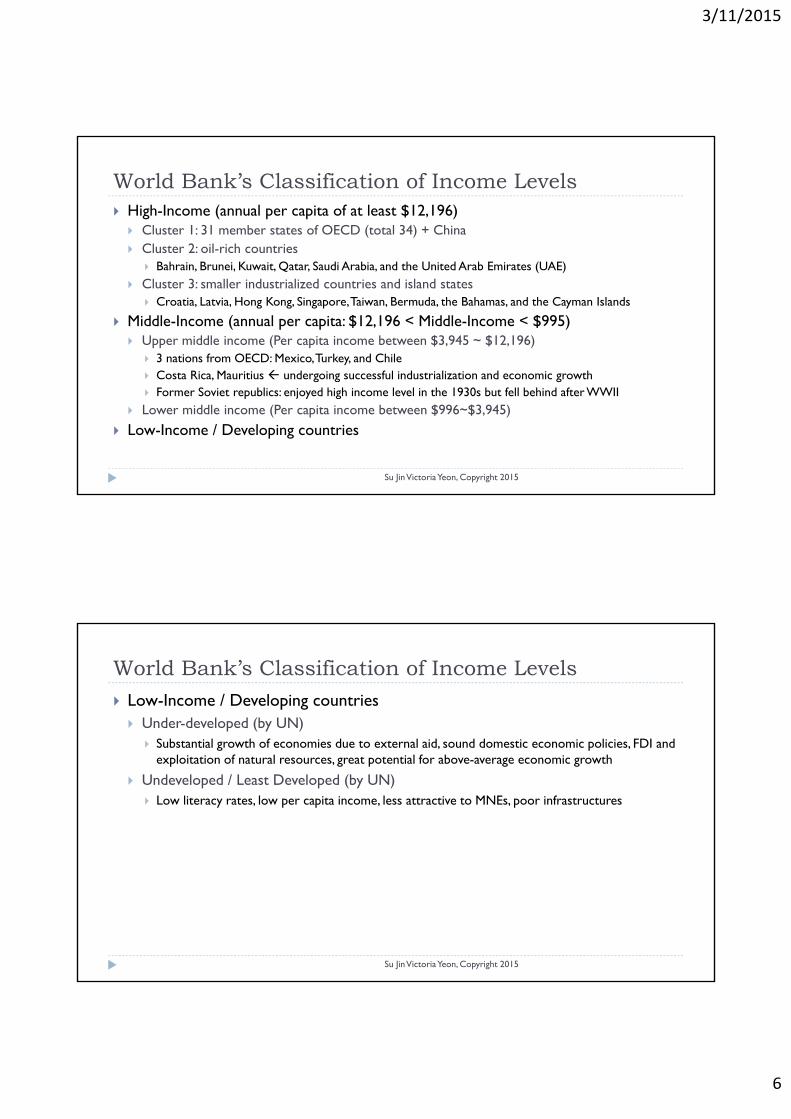
World Bank’s Classification of Income Levels
Su Jin Victoria Yeon, Copyright 2015
High-Income (annual per capita of at least $12,196) Cluster 1: 31 member states of OECD (total 34) + China Cluster 2: oil-rich countries
Bahrain, Brunei, Kuwait, Qatar, Saudi Arabia, and the United Arab Emirates (UAE) Cluster 3: smaller industrialized countries and island states
Croatia, Latvia, Hong Kong, Singapore, Taiwan, Bermuda, the Bahamas, and the Cayman Islands
Middle-Income (annual per capita: $12,196 < Middle-Income < $995) Upper middle income (Per capita income between $3,945 ~ $12,196)
3 nations from OECD: Mexico, Turkey, and Chile Costa Rica, Mauritius undergoing successful industrialization and economic growth Former Soviet republics: enjoyed high income level in the 1930s but fell behind after WWII
Lower middle income (Per capita income between $996~$3,945)
Low-Income / Developing countries
World Bank’s Classification of Income Levels
Su Jin Victoria Yeon, Copyright 2015
Low-Income / Developing countries Under-developed (by UN)
Substantial growth of economies due to external aid, sound domestic economic policies, FDI andexploitation of natural resources, great potential for above-average economic growth
Undeveloped / Least Developed (by UN) Low literacy rates, low per capita income, less attractive to MNEs, poor infrastructures
3/11/2015
7
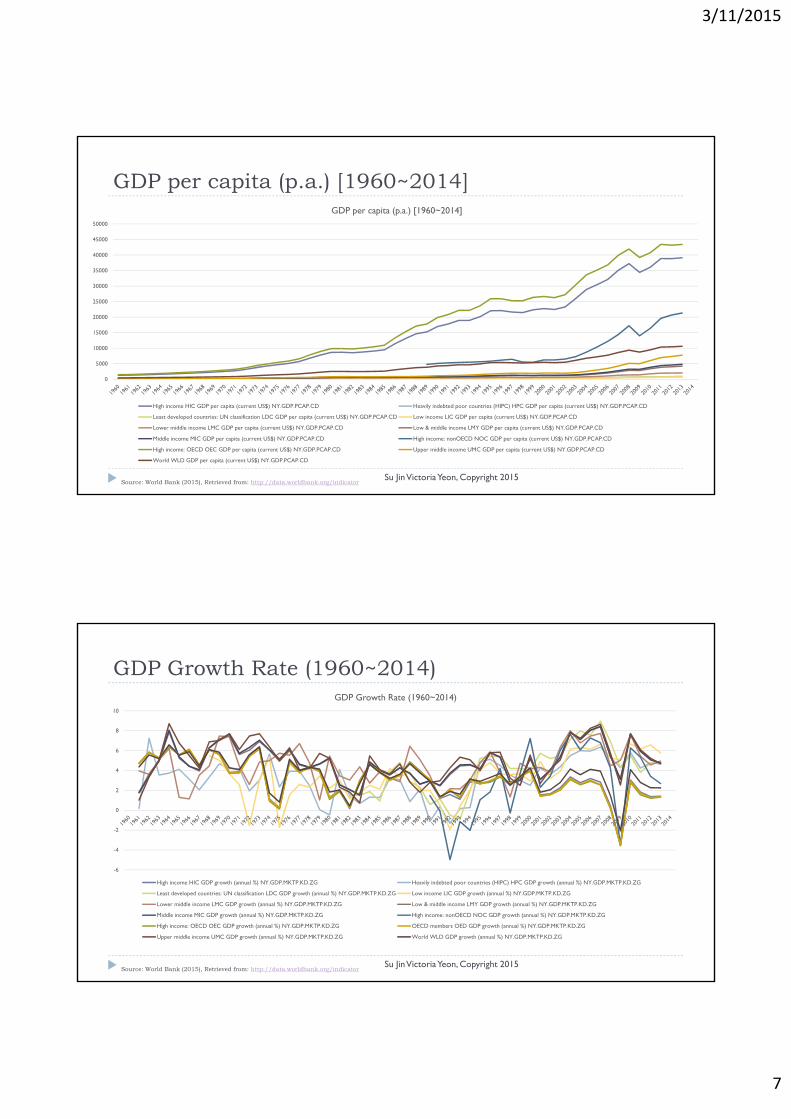
GDP per capita (p.a.) [1960~2014]
Su Jin Victoria Yeon, Copyright 2015
0
5000
10000
15000
20000
25000
30000
35000
40000
45000
50000
GDP per capita (p.a.) [1960~2014]
High income HIC GDP per capita (current US$) NY.GDP.PCAP.CD Heavily indebted poor countries (HIPC) HPC GDP per capita (current US$) NY.GDP.PCAP.CD
Least developed countries: UN classification LDC GDP per capita (current US$) NY.GDP.PCAP.CD Low income LIC GDP per capita (current US$) NY.GDP.PCAP.CD
Lower middle income LMC GDP per capita (current US$) NY.GDP.PCAP.CD Low & middle income LMY GDP per capita (current US$) NY.GDP.PCAP.CD
Middle income MIC GDP per capita (current US$) NY.GDP.PCAP.CD High income: nonOECD NOC GDP per capita (current US$) NY.GDP.PCAP.CD
High income: OECD OEC GDP per capita (current US$) NY.GDP.PCAP.CD Upper middle income UMC GDP per capita (current US$) NY.GDP.PCAP.CD
World WLD GDP per capita (current US$) NY.GDP.PCAP.CD
Source: World Bank (2015), Retrieved from: http://data.worldbank.org/indicator
GDP Growth Rate (1960~2014)
Su Jin Victoria Yeon, Copyright 2015
-6
-4
-2
0
2
4
6
8
10
GDP Growth Rate (1960~2014)
High income HIC GDP growth (annual %) NY.GDP.MKTP.KD.ZG Heavily indebted poor countries (HIPC) HPC GDP growth (annual %) NY.GDP.MKTP.KD.ZG
Least developed countries: UN classification LDC GDP growth (annual %) NY.GDP.MKTP.KD.ZG Low income LIC GDP growth (annual %) NY.GDP.MKTP.KD.ZG
Lower middle income LMC GDP growth (annual %) NY.GDP.MKTP.KD.ZG Low & middle income LMY GDP growth (annual %) NY.GDP.MKTP.KD.ZG
Middle income MIC GDP growth (annual %) NY.GDP.MKTP.KD.ZG High income: nonOECD NOC GDP growth (annual %) NY.GDP.MKTP.KD.ZG
High income: OECD OEC GDP growth (annual %) NY.GDP.MKTP.KD.ZG OECD members OED GDP growth (annual %) NY.GDP.MKTP.KD.ZG
Upper middle income UMC GDP growth (annual %) NY.GDP.MKTP.KD.ZG World WLD GDP growth (annual %) NY.GDP.MKTP.KD.ZG
Source: World Bank (2015), Retrieved from: http://data.worldbank.org/indicator
3/11/2015
8
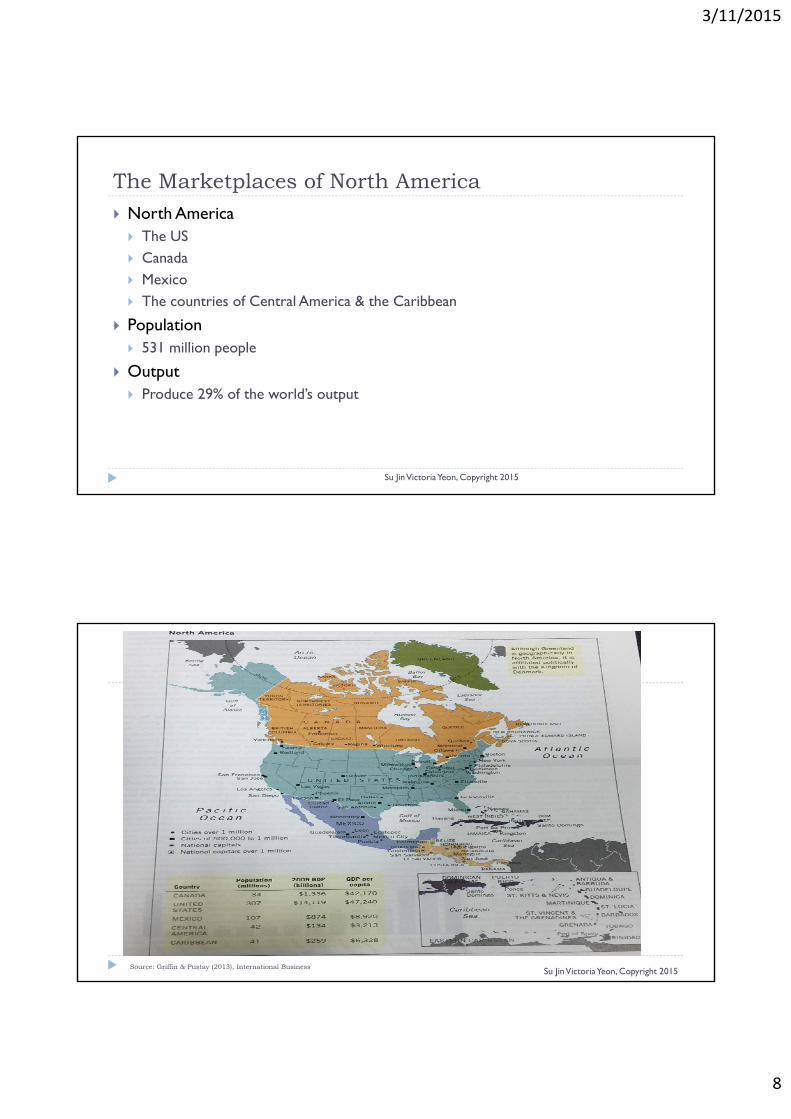
The Marketplaces of North America
Su Jin Victoria Yeon, Copyright 2015
North America The US Canada Mexico The countries of Central America & the Caribbean
Population 531 million people
Output Produce 29% of the world’s output
Su Jin Victoria Yeon, Copyright 2015Source: Griffin & Pustay (2013), International Business
3/11/2015
9
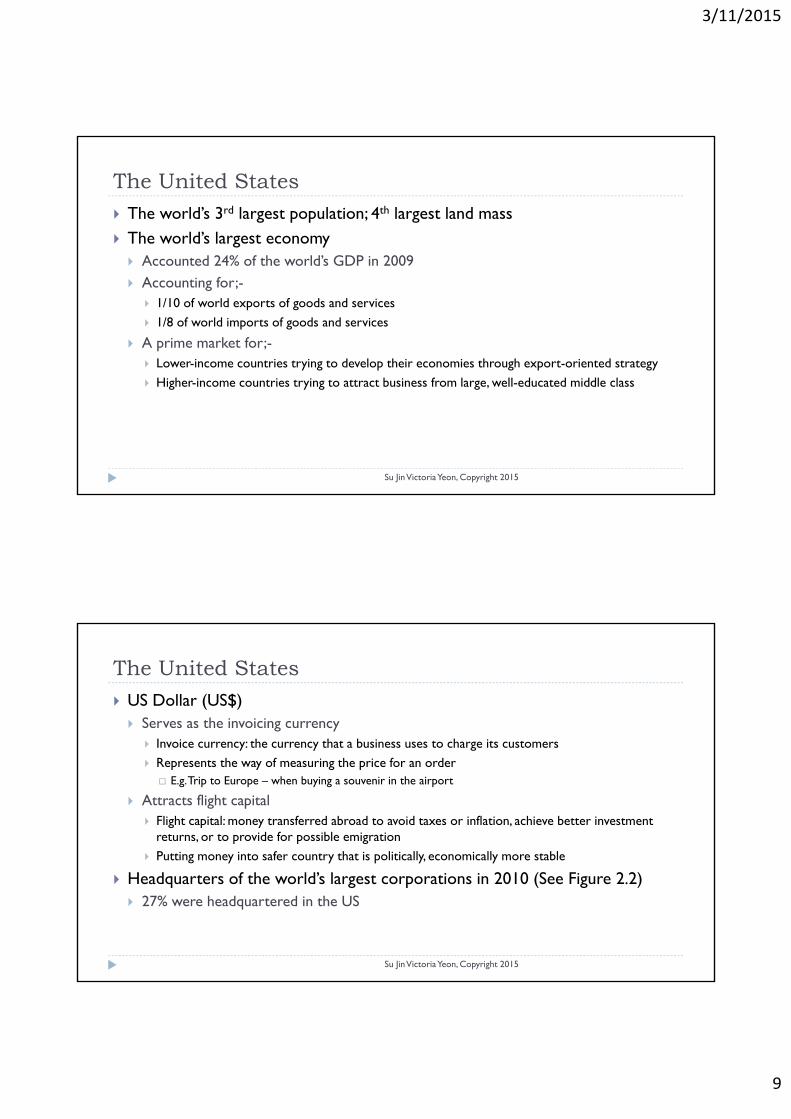
The United States
Su Jin Victoria Yeon, Copyright 2015
The world’s 3rd largest population; 4th largest land mass The world’s largest economy Accounted 24% of the world’s GDP in 2009 Accounting for;-
1/10 of world exports of goods and services
1/8 of world imports of goods and services
A prime market for;- Lower-income countries trying to develop their economies through export-oriented strategy
Higher-income countries trying to attract business from large, well-educated middle class
The United States
Su Jin Victoria Yeon, Copyright 2015
US Dollar (US$) Serves as the invoicing currency
Invoice currency: the currency that a business uses to charge its customers Represents the way of measuring the price for an order E.g. Trip to Europe – when buying a souvenir in the airport
Attracts flight capital Flight capital: money transferred abroad to avoid taxes or inflation, achieve better investment
returns, or to provide for possible emigration
Putting money into safer country that is politically, economically more stable
Headquarters of the world’s largest corporations in 2010 (See Figure 2.2) 27% were headquartered in the US
3/11/2015
10
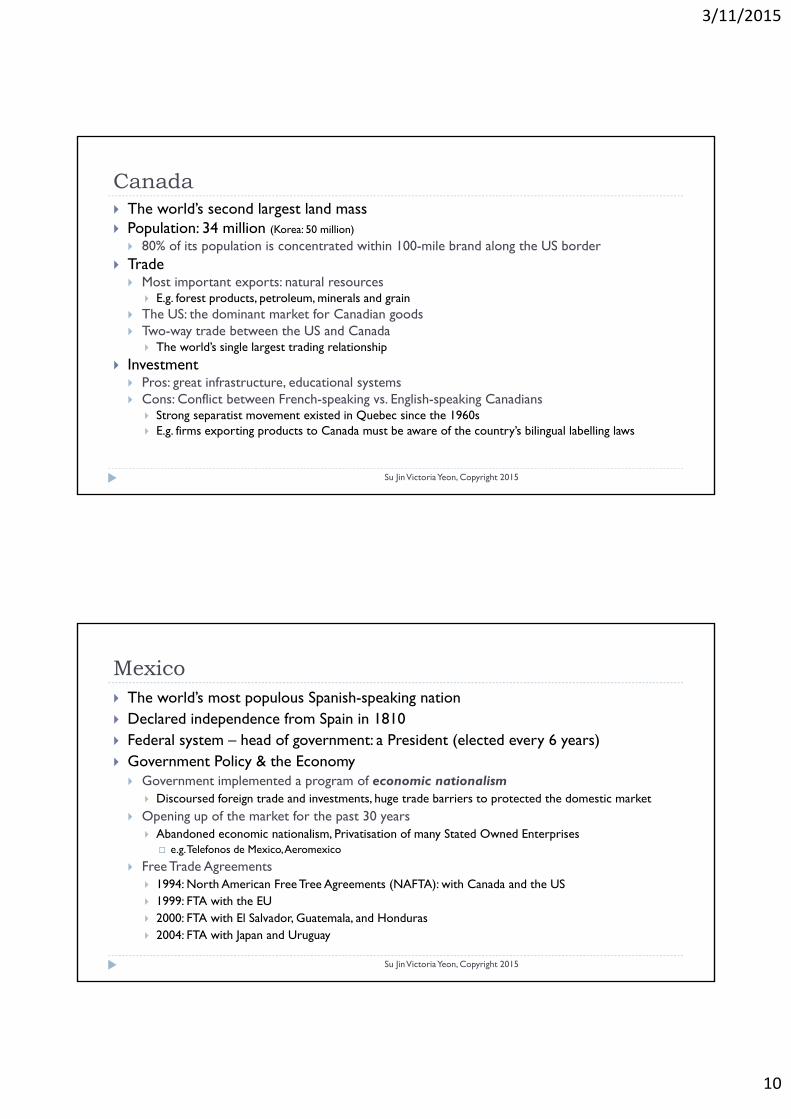
Canada
Su Jin Victoria Yeon, Copyright 2015
The world’s second largest land mass Population: 34 million (Korea: 50 million)
80% of its population is concentrated within 100-mile brand along the US border Trade Most important exports: natural resources
E.g. forest products, petroleum, minerals and grain The US: the dominant market for Canadian goods Two-way trade between the US and Canada
The world’s single largest trading relationship
Investment Pros: great infrastructure, educational systems Cons: Conflict between French-speaking vs. English-speaking Canadians
Strong separatist movement existed in Quebec since the 1960s E.g. firms exporting products to Canada must be aware of the country’s bilingual labelling laws
Mexico
Su Jin Victoria Yeon, Copyright 2015
The world’s most populous Spanish-speaking nation Declared independence from Spain in 1810 Federal system – head of government: a President (elected every 6 years) Government Policy & the Economy Government implemented a program of economic nationalism
Discoursed foreign trade and investments, huge trade barriers to protected the domestic market Opening up of the market for the past 30 years
Abandoned economic nationalism, Privatisation of many Stated Owned Enterprises e.g. Telefonos de Mexico, Aeromexico
Free Trade Agreements 1994: North American Free Tree Agreements (NAFTA): with Canada and the US 1999: FTA with the EU 2000: FTA with El Salvador, Guatemala, and Honduras 2004: FTA with Japan and Uruguay
3/11/2015
11
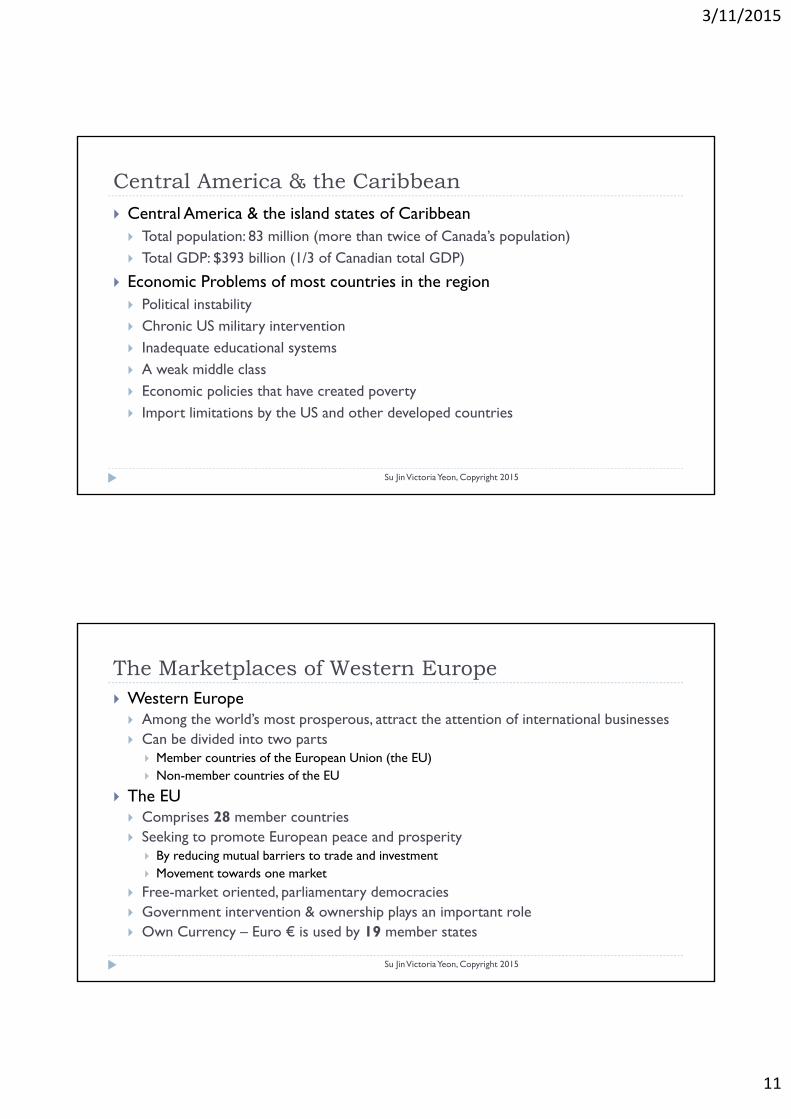
Central America & the Caribbean
Su Jin Victoria Yeon, Copyright 2015
Central America & the island states of Caribbean Total population: 83 million (more than twice of Canada’s population) Total GDP: $393 billion (1/3 of Canadian total GDP)
Economic Problems of most countries in the region Political instability Chronic US military intervention Inadequate educational systems A weak middle class Economic policies that have created poverty Import limitations by the US and other developed countries
The Marketplaces of Western Europe
Su Jin Victoria Yeon, Copyright 2015
Western Europe Among the world’s most prosperous, attract the attention of international businesses Can be divided into two parts
Member countries of the European Union (the EU) Non-member countries of the EU
The EU Comprises 28 member countries Seeking to promote European peace and prosperity
By reducing mutual barriers to trade and investment Movement towards one market
Free-market oriented, parliamentary democracies Government intervention & ownership plays an important role Own Currency – Euro € is used by 19 member states
3/11/2015
12
Su Jin Victoria Yeon, Copyright 2015
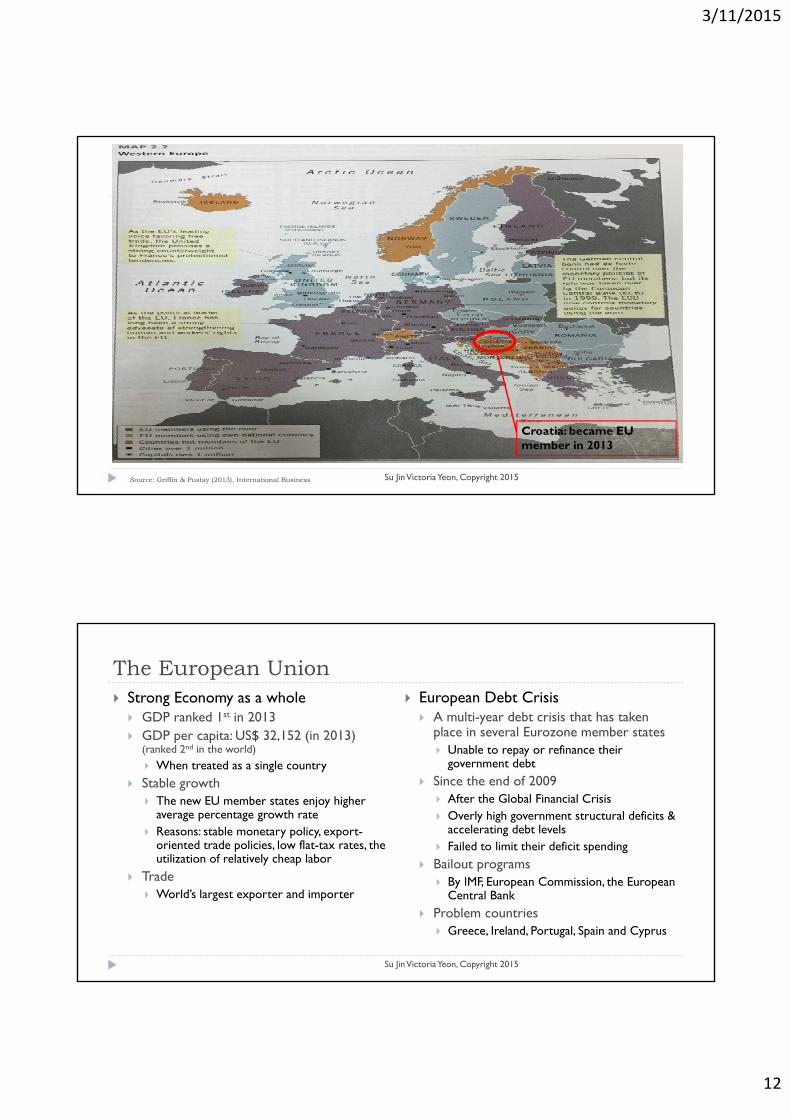
Croatia: became EU member in 2013
Source: Griffin & Pustay (2013), International Business
The European Union
Su Jin Victoria Yeon, Copyright 2015
Strong Economy as a whole GDP ranked 1st in 2013 GDP per capita: US$ 32,152 (in 2013)
(ranked 2nd in the world)
When treated as a single country Stable growth
The new EU member states enjoy higher average percentage growth rate
Reasons: stable monetary policy, export-oriented trade policies, low flat-tax rates, the utilization of relatively cheap labor
Trade World’s largest exporter and importer
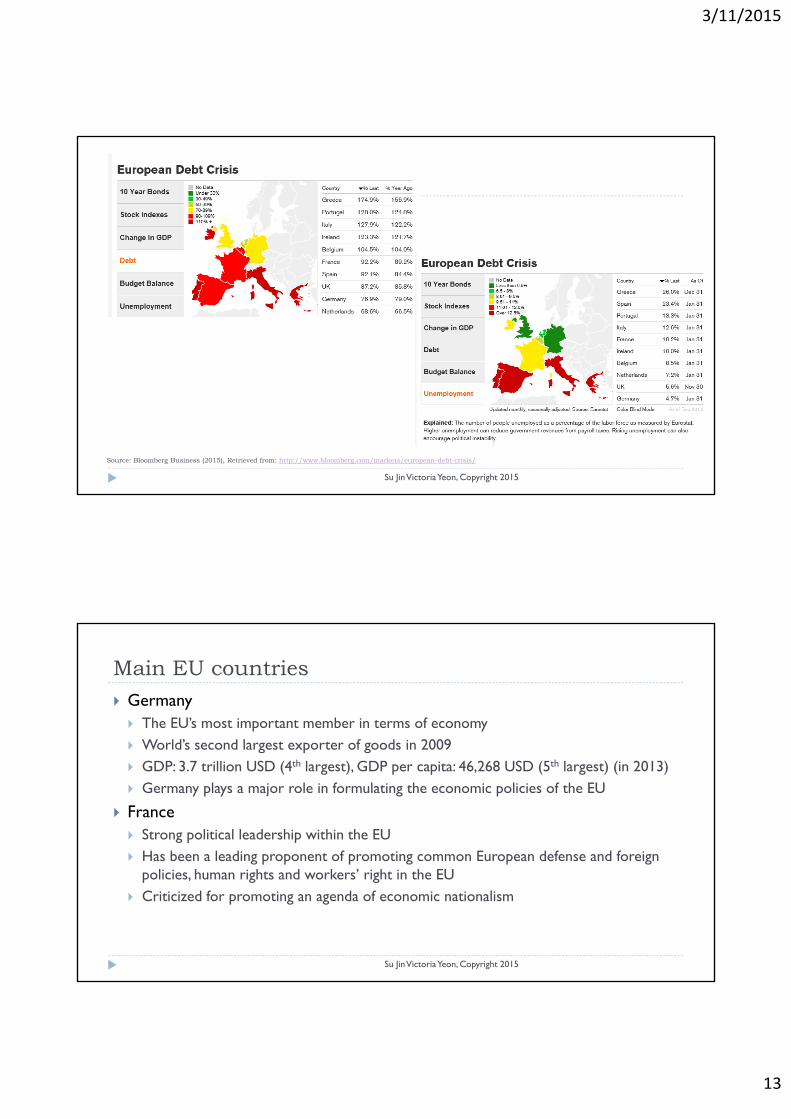
European Debt Crisis A multi-year debt crisis that has taken
place in several Eurozone member states Unable to repay or refinance their
government debt Since the end of 2009
After the Global Financial Crisis Overly high government structural deficits &
accelerating debt levels Failed to limit their deficit spending
Bailout programs By IMF, European Commission, the European
Central Bank Problem countries
Greece, Ireland, Portugal, Spain and Cyprus
3/11/2015
13
Su Jin Victoria Yeon, Copyright 2015
Source: Bloomberg Business (2015), Retrieved from: http://www.bloomberg.com/markets/european-debt-crisis/
Main EU countries
Su Jin Victoria Yeon, Copyright 2015
Germany The EU’s most important member in terms of economy World’s second largest exporter of goods in 2009 GDP: 3.7 trillion USD (4th largest), GDP per capita: 46,268 USD (5th largest) (in 2013) Germany plays a major role in formulating the economic policies of the EU
France Strong political leadership within the EU Has been a leading proponent of promoting common European defense and foreign
policies, human rights and workers’ right in the EU Criticized for promoting an agenda of economic nationalism
3/11/2015
14
Main EU countries
Su Jin Victoria Yeon, Copyright 2015
The UK Resisted many of the initiatives to broaden the EU’s powers
Uses its own currency
Strong supporter of free trade London: a major international financial center
The newest EU members Historically either part of the Soviet Union or allied with the Soviet Union Had to restructure their economies since the collapse of the Soviet Union
Movement from centrally planned communist system to decentralized market systems
Implementation of necessary political, legal and institutional reforms The process facilitated by their joining the European Union
Non-(EU)member European Nations
Su Jin Victoria Yeon, Copyright 2015
Some rich Western European countries that are not EU members Iceland, Norway, and Switzerland Andorra, Monaco, Liechtenstein European Free Trade Association (EFTA)
Iceland, Norway, Switzerland, and Liechtenstein
Free trade organization between four European countries that operates in parallel with the EU
Balkan countries Albania, Bosnia and Herzegovina, Kosovo, Macedonia, Montenegro, and Serbia
3/11/2015
15
The Marketplaces of Eastern Europe and Central Asia
Su Jin Victoria Yeon, Copyright 2015
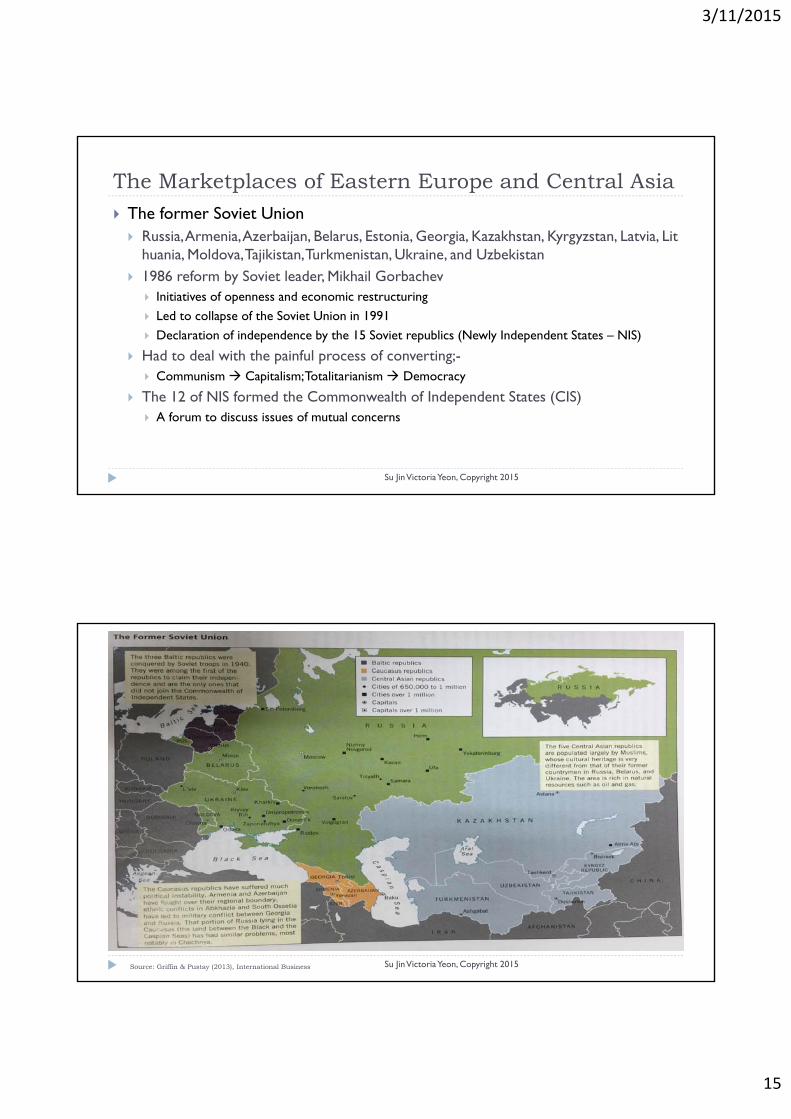
The former Soviet Union Russia, Armenia, Azerbaijan, Belarus, Estonia, Georgia, Kazakhstan, Kyrgyzstan, Latvia, Lit
huania, Moldova, Tajikistan, Turkmenistan, Ukraine, and Uzbekistan 1986 reform by Soviet leader, Mikhail Gorbachev
Initiatives of openness and economic restructuring
Led to collapse of the Soviet Union in 1991
Declaration of independence by the 15 Soviet republics (Newly Independent States – NIS)
Had to deal with the painful process of converting;- Communism Capitalism; Totalitarianism Democracy
The 12 of NIS formed the Commonwealth of Independent States (CIS) A forum to discuss issues of mutual concerns
Su Jin Victoria Yeon, Copyright 2015Source: Griffin & Pustay (2013), International Business
3/11/2015
16
Russia
Su Jin Victoria Yeon, Copyright 2015
World’s largest country in land mass (6.5 million square miles) 9th largest population (142 million) Well endowed with natural resources Gold, oil, natural gas, minerals, diamonds, and fertile farmland
Government administration The Yeltsin administration
the country’s first democratically elected president Tried privatization
Individuals were more concerned with corporate assets than companies’ economic health and performance failure Failure of the policy
Financial crises, inability to collect taxes and a political need to subsidize the inefficient state-owned enterprises The government was forced to devalue the ruble & impose a 90-day moratorium on payments to foreign
creditors The Putin administration
Quickly overhauled the country’s tax system with flat income tax of 13% Increased government revenue Benefited from increased oil price during the 2000s Annual GDP growth rate of 5.9% since 2000
Other parts of the region
Su Jin Victoria Yeon, Copyright 2015
The five Central Asian republics Kazakhstan, Uzbekistan, Tajikistan, Turkmenistan and Kyrgyzstan
Common feature The importance of Russia in their political history Muslim faith dominated the region Natural resources: fossil fuel reserves Poor people
Per capita income: USD 700 in Tajikistan ~ USD6,740 in Kazakhstan
Current Issue Conflict between Russia and Ukraine over Crimean Peninsula
The Ukrainian ambassador to Russia has been called off since March 2014, Ukrainian government declared a draft decree on suspending diplomatic relations with Russia
on Feb 2015
3/11/2015
17
The Marketplaces of Asia
Su Jin Victoria Yeon, Copyright 2015
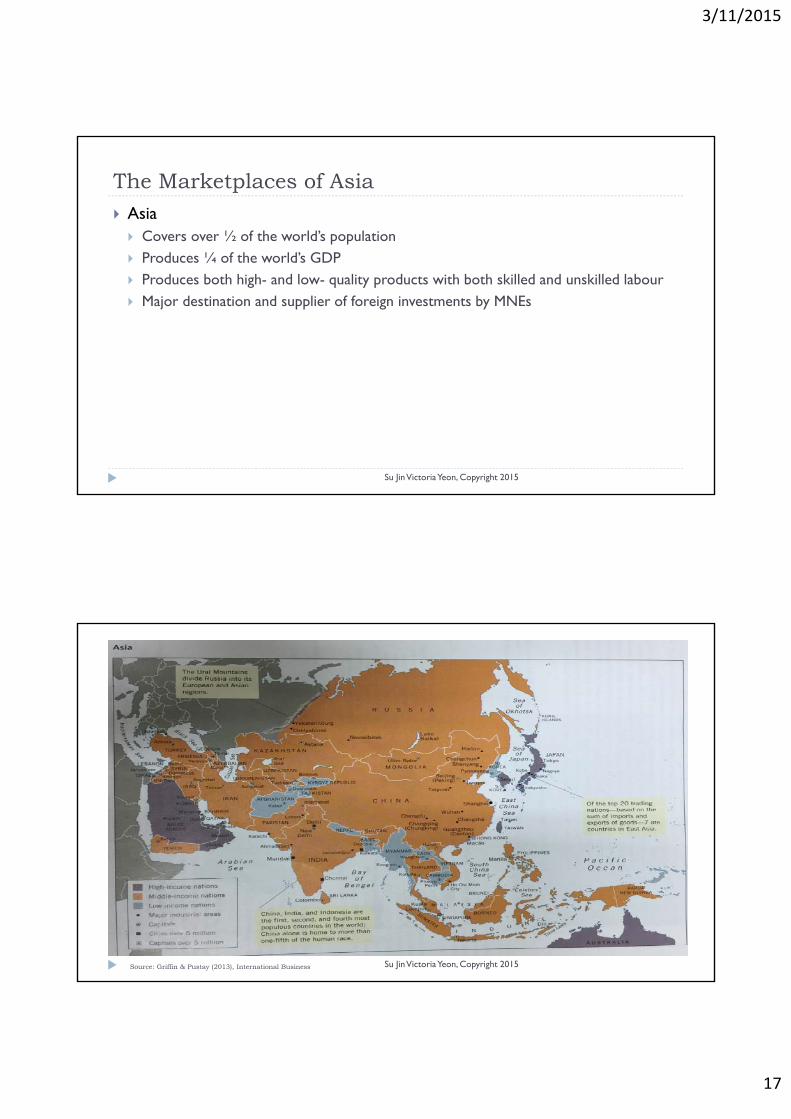
Asia Covers over ½ of the world’s population Produces ¼ of the world’s GDP Produces both high- and low- quality products with both skilled and unskilled labour Major destination and supplier of foreign investments by MNEs
Su Jin Victoria Yeon, Copyright 2015Source: Griffin & Pustay (2013), International Business
3/11/2015
18
Japan
Su Jin Victoria Yeon, Copyright 2015
Population: 126 million Economy
Became one of the world’s economic superpower since WWII GDP: US$5.1 trillion in 2009 China’s GDP surpassed Japan’s since 2010 Japan: No. 3
Ministry of International Trade and Industry (MITI) New name: Ministry of Economy, Trade, and Industry since 2001 Used its formal and informal powers to guide the production and investment strategies of country’s corporate
elite Aided by Japan’s concentrated industrial structure
Keiretsu Large families of interrelated companies Typically cantered on a major Japanese bank
The bank takes primary responsibility for meeting the keretsu’s financing needs An elaborate system of cross-ownership of shares
Keiretsu members own shares in one another’s companies Protected from hostile takeovers
Japan
Su Jin Victoria Yeon, Copyright 2015
Economic slowdown since 1990s Annual GDP growth since 2000: 1.1 %
Well below 2.9% average growth rate of world economy
Possible reasons for the economic slowdown Japanese political and economic systems have not been able to adjust quickly enough
to the changes in the world economy Growth of e-commerce, and the emerging markets
Received much international criticism for employing unfair trading practices Numerous non-tariff barriers to restrict imports
3/11/2015
19
Australia and New Zealand
Su Jin Victoria Yeon, Copyright 2015
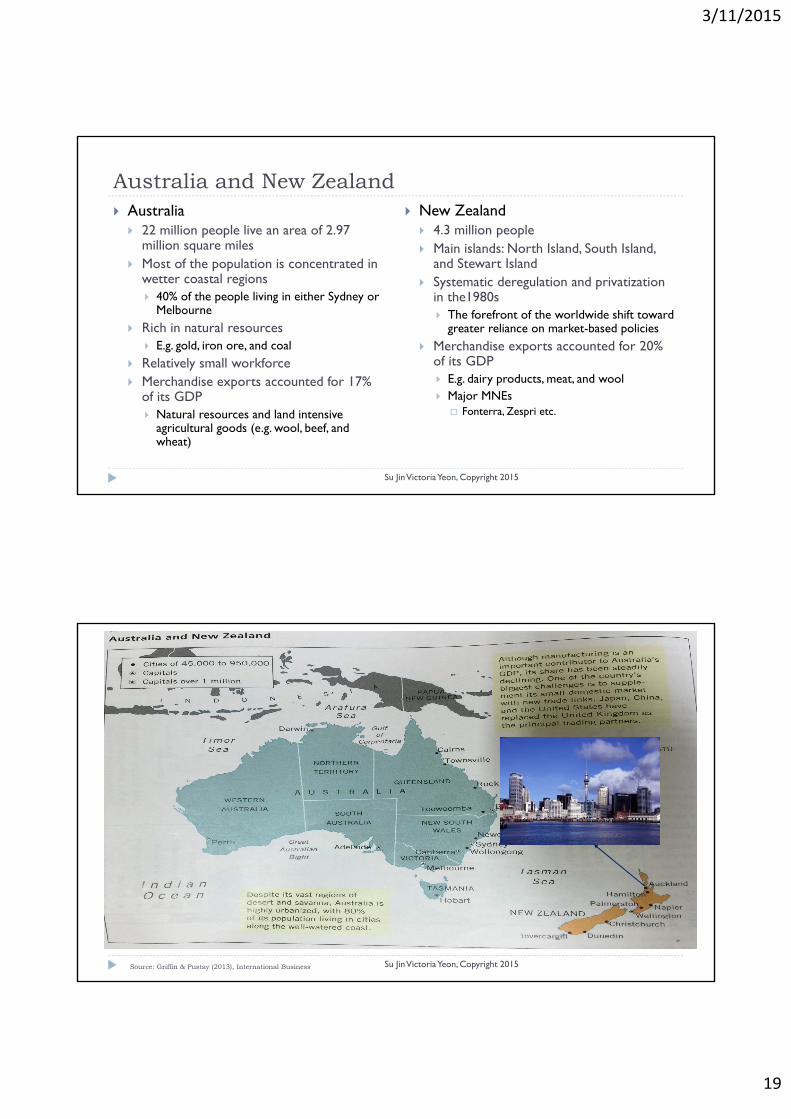
Australia 22 million people live an area of 2.97
million square miles Most of the population is concentrated in
wetter coastal regions 40% of the people living in either Sydney or
Melbourne Rich in natural resources
E.g. gold, iron ore, and coal Relatively small workforce Merchandise exports accounted for 17%
of its GDP Natural resources and land intensive
agricultural goods (e.g. wool, beef, and wheat)
New Zealand 4.3 million people Main islands: North Island, South Island,
and Stewart Island Systematic deregulation and privatization
in the1980s The forefront of the worldwide shift toward
greater reliance on market-based policies Merchandise exports accounted for 20%
of its GDP E.g. dairy products, meat, and wool Major MNEs
Fonterra, Zespri etc.
Su Jin Victoria Yeon, Copyright 2015Source: Griffin & Pustay (2013), International Business
3/11/2015
20
The Four Tigers
Su Jin Victoria Yeon, Copyright 2015
One of the world’s most rapidly industrializing regions South Korea, Taiwan, Singapore, and Hong Kong The newly industrialized countries (NICs) or economies (NIEs) Many classify those countries as “emerging markets”
But they are already classified as “high-income” countries by the World Bank for more than a decade
South Korea One of the fastest growing economies Merchandise exports accounted for 44% of its GDP in 2009 Huge growth in economy
Relied on tight cooperation between government and chaebol companies Chaebol
Privately owned, family-centred conglomerates E.g. Samsung, Hyndai, SK, LG, Daewoo (before Asian Financial Crisis) Modelled Japanese’s economic path
Discouragement of imports,
The Four Tigers
Su Jin Victoria Yeon, Copyright 2015
South Korea 1997-1998 Asian currency crisis
Due to overexpansion and the poor lending practices of Korean bank More interested in size than profitability Borrowed money to enter industries
Caused many chaebols to collapse or to face financial difficulties
Chaebols after the crisis Became stronger after restructuring E.g. Samsung – choose to concentrate the company’s resources in electronics became world market l
eader in flash memory, DRAM memory chips, flat panel displays, color laser printers and cell phones
Faced bankruptcy or sold off to foreigners E.g. Daewoo, SsangYong etc.
3/11/2015
21
The Four Tigers
Su Jin Victoria Yeon, Copyright 2015
Taiwan (the Republic of China) A small island country off the coast of mainland China Population: 23 million Born after math of the civil war between the nationalist forces by General Chiang Kai-
shek and the Chinese communists led by Mao Tse-tung Chiang Kai-shek’s government fled to Taiwan and declared the island, “the Republic of China”
Economy Redistribution of land from large estate holders to peasants increased agriculture Reliance on family-owned private businesses and export-oriented trade policies
Export: 64% of its GDP in 2009 Taiwanese businesses More focused on high-value-added industries Increasingly investing factories and assembly plants in China to access the low-wage workers
The Four Tigers
Su Jin Victoria Yeon, Copyright 2015
Singapore Former British colony - became independent in 1965 Population: 4.7 million Economy
Emphasized development of labor-intensive industries Shift to higher-value-added activities high tech industries
Suffers from labor shortage Threated by Indonesian and Honduras in the production of price-sensitive, labor intensive goods
Heavy reliance on exporting Export accounts 148% of its GDP in 2009 Re-exporting: import foreign goods and then re-export them to other countries (great port facilities)
Provides sophisticated communications and financial services for firms in Pacific Asia
3/11/2015
22
The Four Tigers
Su Jin Victoria Yeon, Copyright 2015
Hong Kong Born of the “opium war” (1839-1842) fought between the UK and China
Hong Kong was ceded to the British 1898 mainland China granted a 99-year lease on Hong Kong July, 1997 – the lease expired Hong Kong became part of China
A Special Administrative Region (SAR) until 2047 China assumed political control of Hong Kong Hong Kong enjoys a fair degree of freedom
Its own legislature, economic freedom, free-port status, and a separation of tax system
The Umbrella Revolution in 2014 Mainland China’s the Standing Committee of the National People's Congress (NPCSC) came to a decision
regarding proposed reforms to the Hong Kong electoral system. The decision was widely seen to be highly restrictive, and tantamount to Communist Party control over which
candidates would be allowed to present themselves to the Hong Kong electorate Economy
Play a role as an entry point to mainland China; act as intermediaries Highly educated, productive labour force of 7 million individuals Re-exporter: merchandise export accounts for 194% of its GDP
China
Su Jin Victoria Yeon, Copyright 2015
World’s most populous (1.3 billion) and one of the world’s oldest countries Communist forces entered since 1949 by Mao Tse-tung 1958~1960: force industrialization through the growth of small, labour-intensive
factories The program failure led to the Cultural Revolution in 1966 Youthful communist cadres purged Communist Party members suspected of deviating from Mao’s
doctrines Many of its most productive and educated members were exiled to the countryside
After 1976: government adopted limited free-market policies Agriculture returned to the private sector, entrepreneurs were allowed to start small businesses Foreign companies were permitted through Joint Ventures with Chinese firms
Tiananmen Squire in June 1989 The massacre of several thousand pro-democracy demonstrators in Beijing Chilled economic and political relations between China and the developed countries
3/11/2015
23
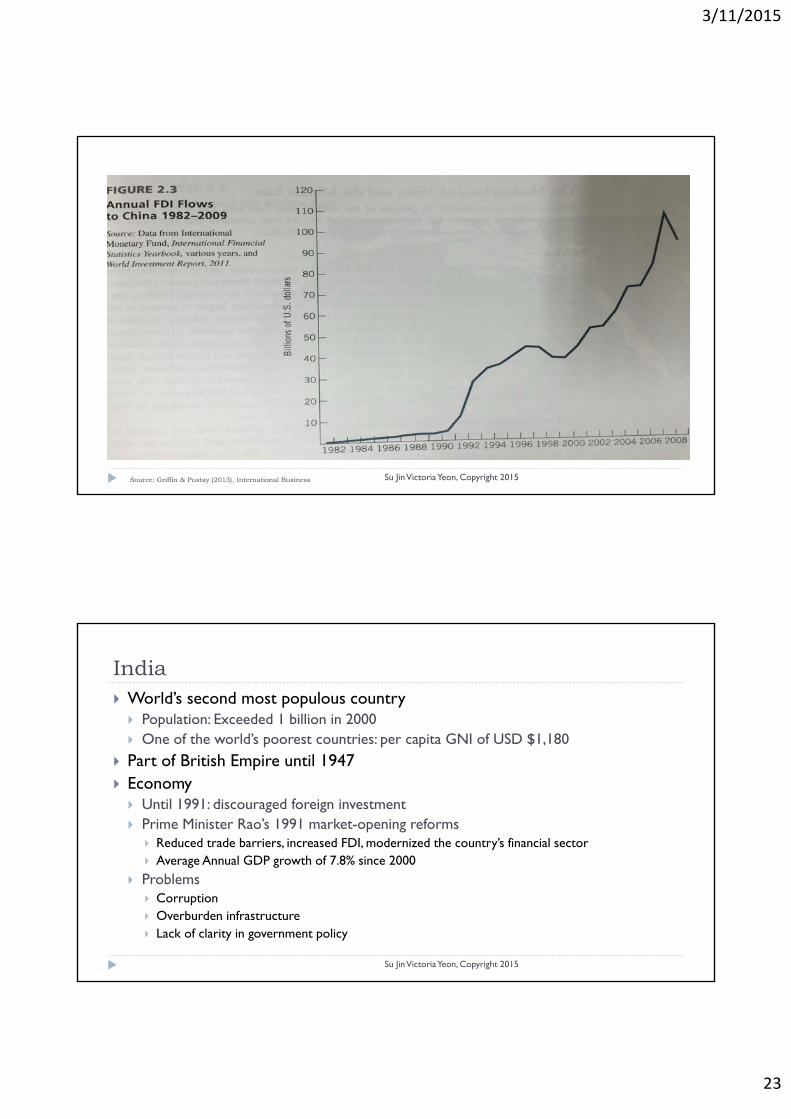
Su Jin Victoria Yeon, Copyright 2015Source: Griffin & Pustay (2013), International Business
India
Su Jin Victoria Yeon, Copyright 2015
World’s second most populous country Population: Exceeded 1 billion in 2000 One of the world’s poorest countries: per capita GNI of USD $1,180
Part of British Empire until 1947 Economy Until 1991: discouraged foreign investment Prime Minister Rao’s 1991 market-opening reforms
Reduced trade barriers, increased FDI, modernized the country’s financial sector Average Annual GDP growth of 7.8% since 2000
Problems Corruption Overburden infrastructure Lack of clarity in government policy
3/11/2015
24
Southeast Asian Countries
Su Jin Victoria Yeon, Copyright 2015
The Philippines, Malaysia, East Timor, Christmas Island, Brunei, Singapore, Cambodia, Laos, Myanmar, Thailand, Vietnam
Many of Southeast Asian countries are experiencing hung economic growth Has great potential for economic growth Growing population of young people
Thailand, Malaysia, and Indonesia Low labour cost recipients of significant FDI in the last 30 years Many Japanese MNEs have built satellite plants US & European MNEs used these countries as production platforms Economy boomed as a result of exports generated by FDI
The Marketplaces of Africa and the Middle East
Su Jin Victoria Yeon, Copyright 2015
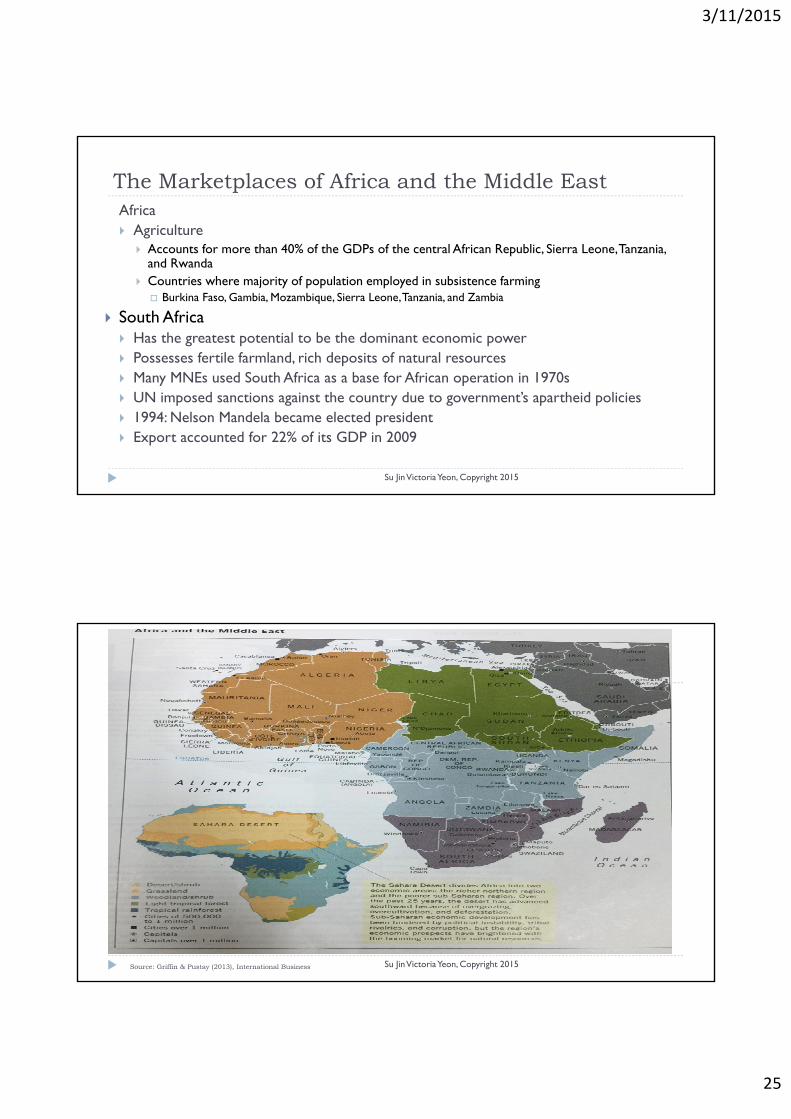
Covers 22% of the world’s total land area & rich in natural resources Africa 1 billion people, 55 countries Most African countries were colonized by Europeans in the late 19th century
By France, the UK, Germany, Belgium, Italy, Portugal and Spain Vestiges of colonialism remain in today’s Africa
Affecting IB of many African countries E.g. Chad, Niger, Ivory Coast and Senegal close economic ties with France
Currencies linked with France, follow French legal, educational and governmental procedures French manufacturers, financial institutions, and service-sector firms often dominate international commerce
Rich Natural Resources The commodity boom boosted the economies
Algeria, Angola, Gabon, Libya, and Nigeria: major exporters of oil Zambia: cooper Botswana: diamond
Challenges that governments face Leveraging the growth in their commodities sector to create broad-based economies
3/11/2015
25
The Marketplaces of Africa and the Middle East
Su Jin Victoria Yeon, Copyright 2015
Africa Agriculture
Accounts for more than 40% of the GDPs of the central African Republic, Sierra Leone, Tanzania, and Rwanda
Countries where majority of population employed in subsistence farming Burkina Faso, Gambia, Mozambique, Sierra Leone, Tanzania, and Zambia
South Africa Has the greatest potential to be the dominant economic power Possesses fertile farmland, rich deposits of natural resources Many MNEs used South Africa as a base for African operation in 1970s UN imposed sanctions against the country due to government’s apartheid policies 1994: Nelson Mandela became elected president Export accounted for 22% of its GDP in 2009
Su Jin Victoria Yeon, Copyright 2015Source: Griffin & Pustay (2013), International Business
3/11/2015
26
The Marketplaces of Africa and the Middle East
Su Jin Victoria Yeon, Copyright 2015
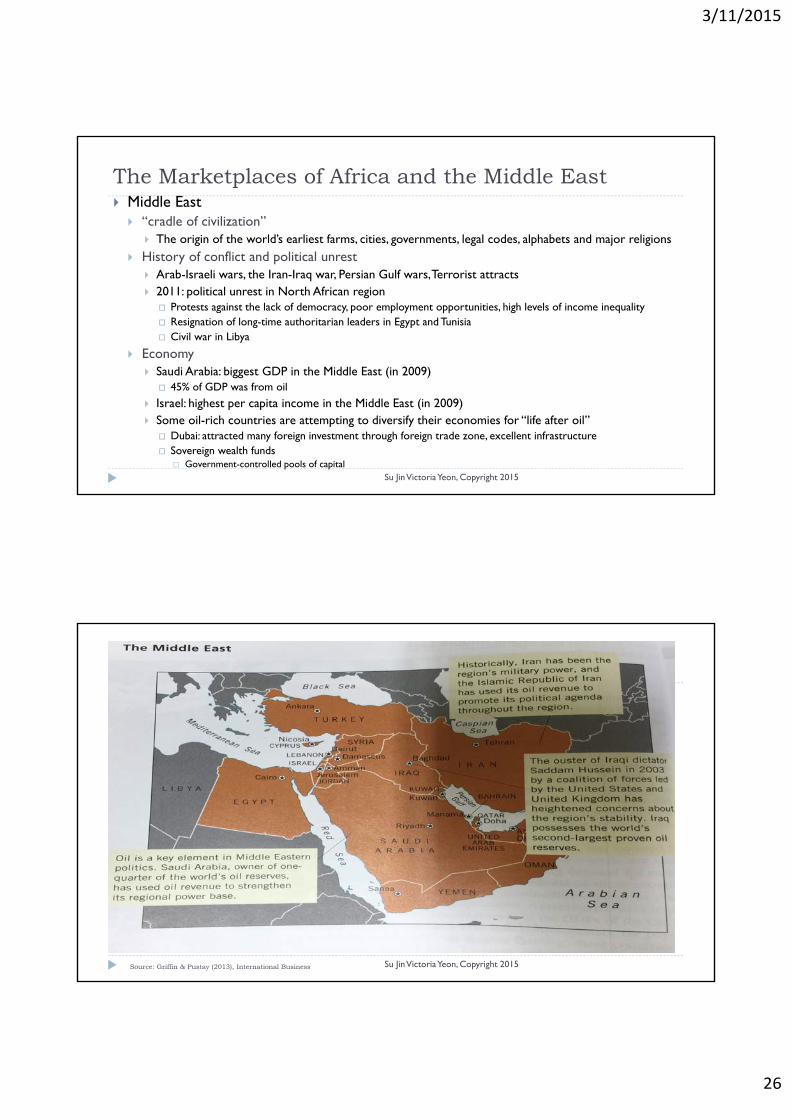
Middle East “cradle of civilization”
The origin of the world’s earliest farms, cities, governments, legal codes, alphabets and major religions History of conflict and political unrest
Arab-Israeli wars, the Iran-Iraq war, Persian Gulf wars, Terrorist attracts 2011: political unrest in North African region
Protests against the lack of democracy, poor employment opportunities, high levels of income inequality Resignation of long-time authoritarian leaders in Egypt and Tunisia Civil war in Libya
Economy Saudi Arabia: biggest GDP in the Middle East (in 2009)
45% of GDP was from oil
Israel: highest per capita income in the Middle East (in 2009) Some oil-rich countries are attempting to diversify their economies for “life after oil”
Dubai: attracted many foreign investment through foreign trade zone, excellent infrastructure Sovereign wealth funds
Government-controlled pools of capital
Su Jin Victoria Yeon, Copyright 2015Source: Griffin & Pustay (2013), International Business
3/11/2015
27
The Marketplaces of South America
Su Jin Victoria Yeon, Copyright 2015
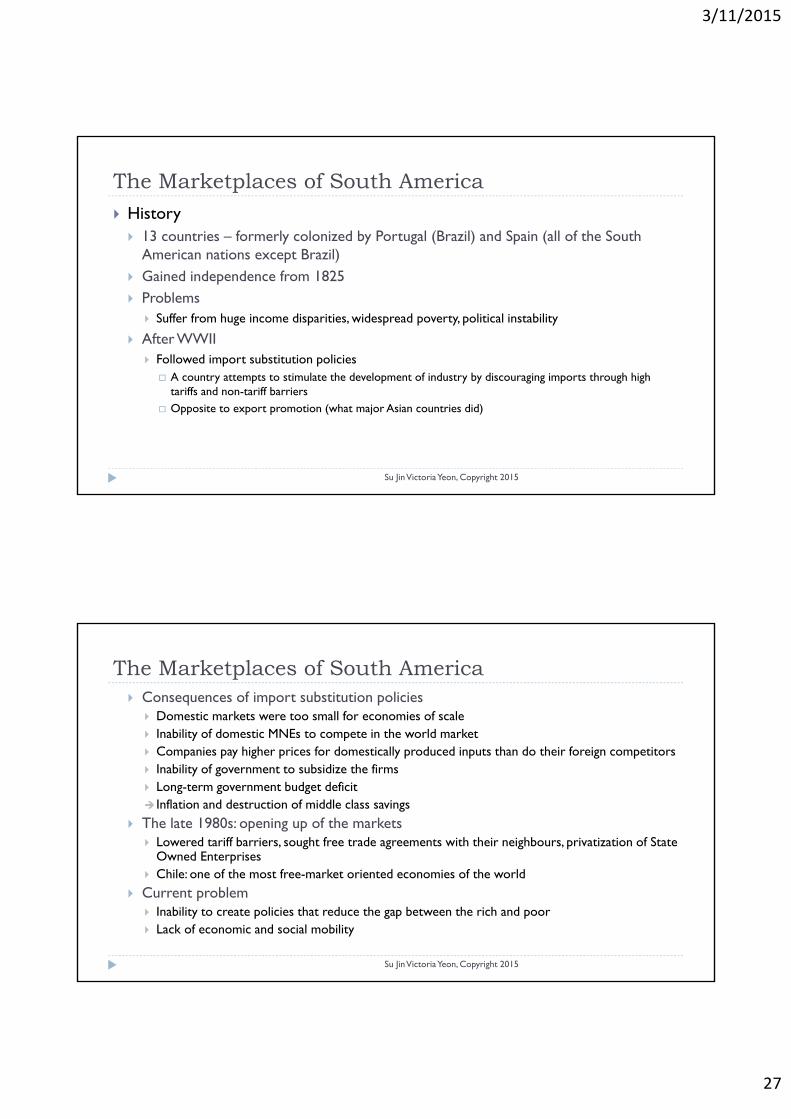
History 13 countries – formerly colonized by Portugal (Brazil) and Spain (all of the South
American nations except Brazil) Gained independence from 1825 Problems
Suffer from huge income disparities, widespread poverty, political instability
After WWII Followed import substitution policies A country attempts to stimulate the development of industry by discouraging imports through high
tariffs and non-tariff barriers Opposite to export promotion (what major Asian countries did)
The Marketplaces of South America
Su Jin Victoria Yeon, Copyright 2015
Consequences of import substitution policies Domestic markets were too small for economies of scale Inability of domestic MNEs to compete in the world market Companies pay higher prices for domestically produced inputs than do their foreign competitors Inability of government to subsidize the firms Long-term government budget deficit Inflation and destruction of middle class savings
The late 1980s: opening up of the markets Lowered tariff barriers, sought free trade agreements with their neighbours, privatization of State
Owned Enterprises Chile: one of the most free-market oriented economies of the world
Current problem Inability to create policies that reduce the gap between the rich and poor Lack of economic and social mobility
3/11/2015
28
Su Jin Victoria Yeon, Copyright 2015Source: Griffin & Pustay (2013), International Business
Homework #2 – due next Friday
Su Jin Victoria Yeon, Copyright 2015
Read the case, “China’s Quest for Natural Resources” from page 75~76 Answer the four case discussion questions in page 75 Do not spend more than 2 pages answering the questions You may use bullet points Keep your answers brief but think! Type your answers
Due date: Friday, 13th of March by 11 a.m.
3/11/2015
29
Group discussion Report #1 (due next Friday)
Su Jin Victoria Yeon, Copyright 2015
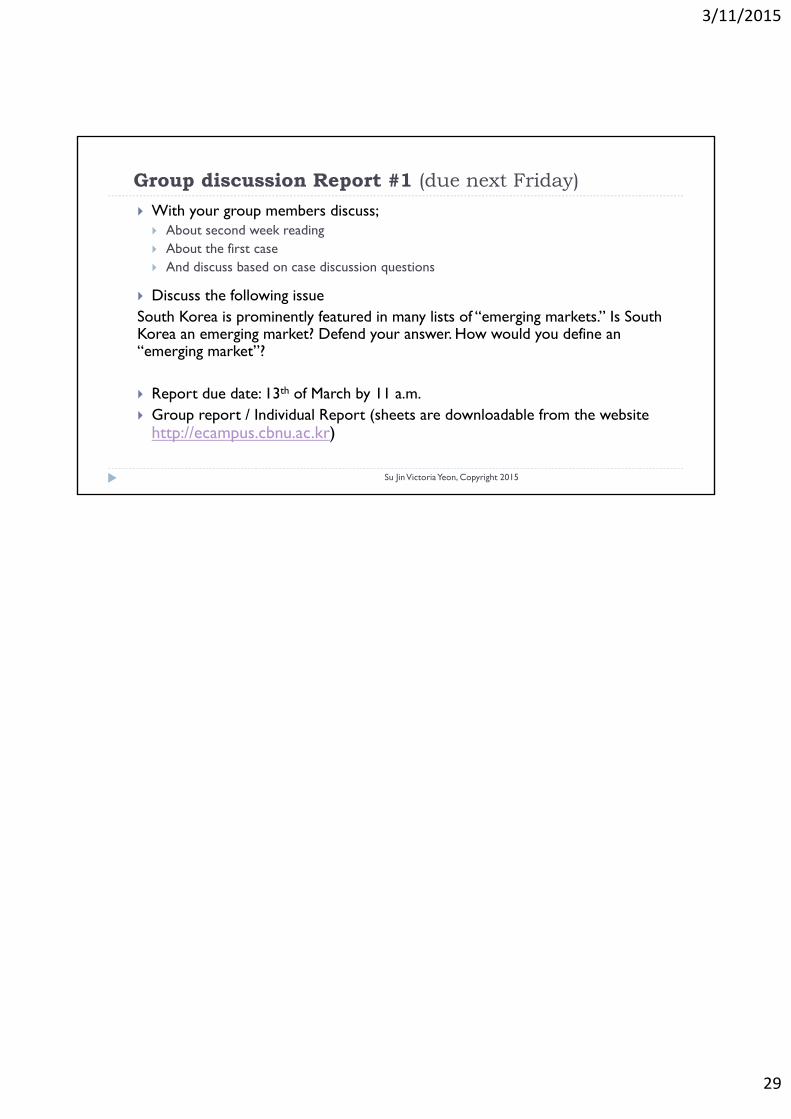
With your group members discuss; About second week reading About the first case And discuss based on case discussion questions
Discuss the following issueSouth Korea is prominently featured in many lists of “emerging markets.” Is South Korea an emerging market? Defend your answer. How would you define an “emerging market”?
Report due date: 13th of March by 11 a.m. Group report / Individual Report (sheets are downloadable from the website
http://ecampus.cbnu.ac.kr)
Case StudyChina’s Quest for Natural Resources
Week 2 Day 2
Su Jin Victoria Yeon, Copyright 2015
Learning Objectives – Chapter 2
Su Jin Victoria Yeon, Copyright 2015
1. Evaluate the impact of the political and economic characteristics of the world’s various marketplaces on the opportunities available to international businesses
2. Appreciate the use of national income data in making business decisions
3. Discuss North America as a major marketplace and business center in the world economy
4. Discuss Western Europe as a major marketplace and business center in the world economy
5. Discuss Asia as a major marketplace and business center in the world economy
6. Assess the development challenges facing African, Middle Eastern, and South American countries
Globalization
Su Jin Victoria Yeon, Copyright 2015
Discuss the following issue
South Korea is prominently featured in many lists of “emerging markets.” Is South Korea an emerging market? Defend your answer. How would you define an “emerging market”?
China’s Quest for Natural Resources
Su Jin Victoria Yeon, Copyright 2015
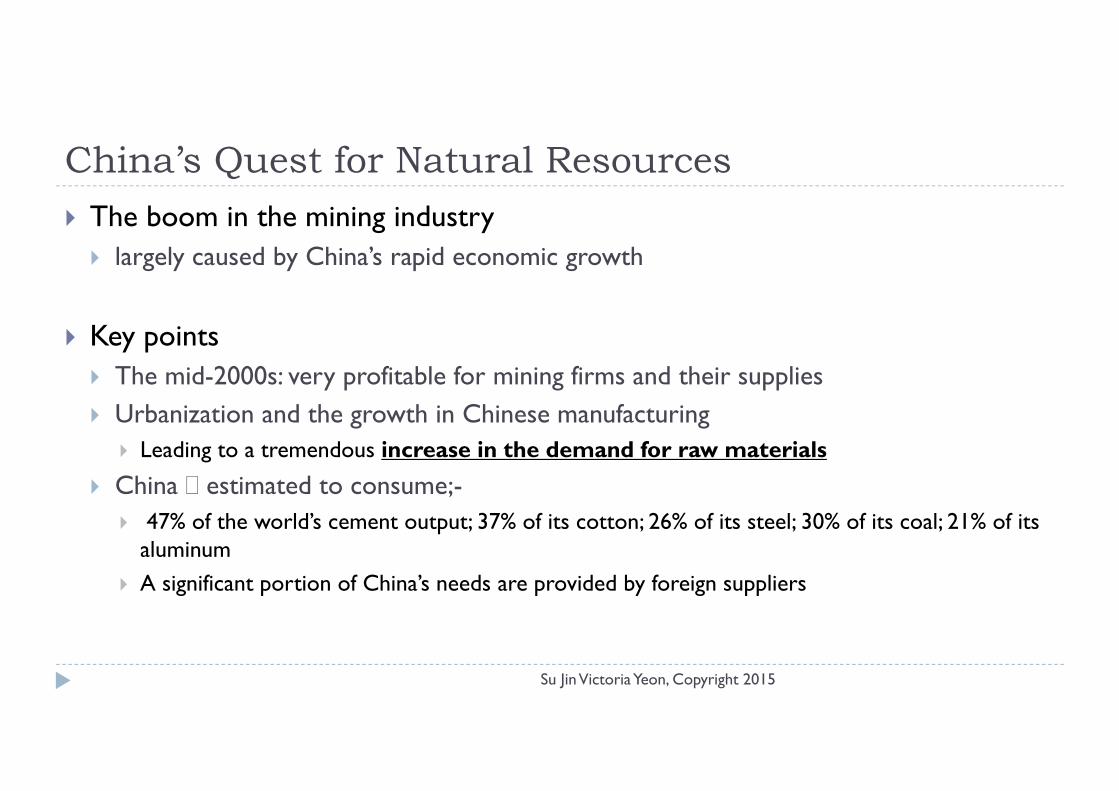
The boom in the mining industry largely caused by China’s rapid economic growth
Key points The mid-2000s: very profitable for mining firms and their supplies Urbanization and the growth in Chinese manufacturing
Leading to a tremendous increase in the demand for raw materials
China estimated to consume;- 47% of the world’s cement output; 37% of its cotton; 26% of its steel; 30% of its coal; 21% of its
aluminum
A significant portion of China’s needs are provided by foreign suppliers
China’s Quest for Natural Resources
Su Jin Victoria Yeon, Copyright 2015
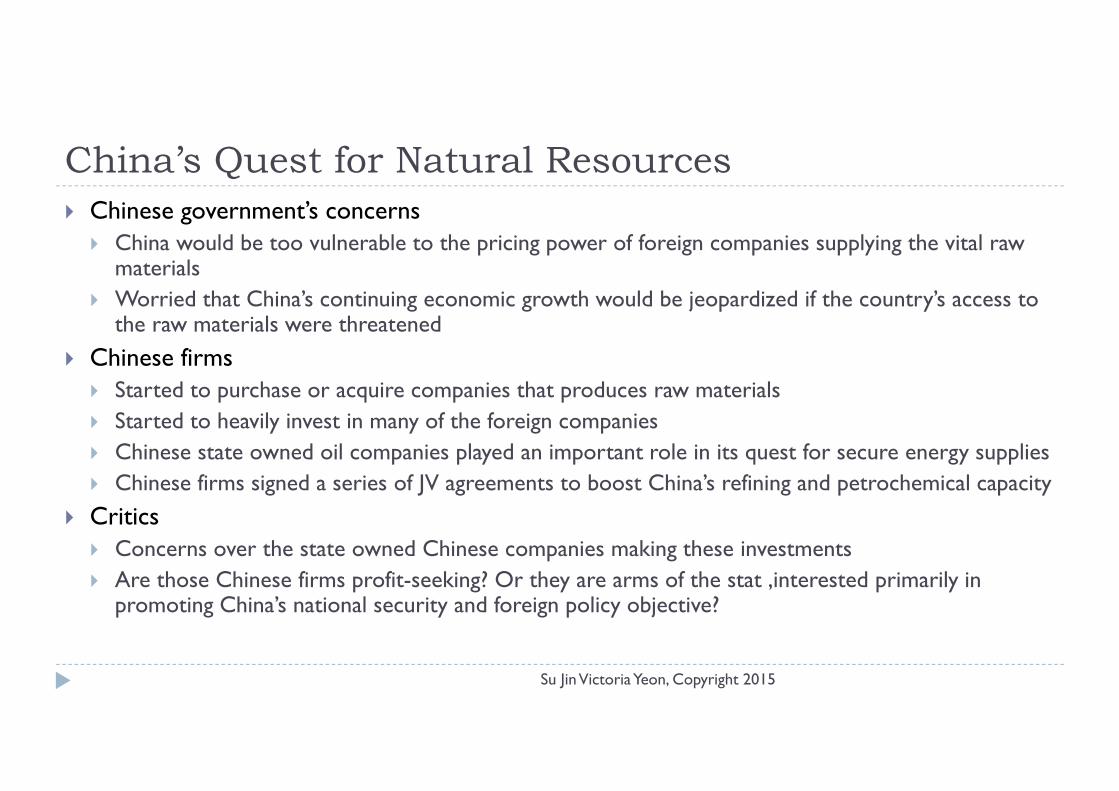
Chinese government’s concerns China would be too vulnerable to the pricing power of foreign companies supplying the vital raw
materials Worried that China’s continuing economic growth would be jeopardized if the country’s access to
the raw materials were threatened
Chinese firms Started to purchase or acquire companies that produces raw materials Started to heavily invest in many of the foreign companies Chinese state owned oil companies played an important role in its quest for secure energy supplies Chinese firms signed a series of JV agreements to boost China’s refining and petrochemical capacity
Critics Concerns over the state owned Chinese companies making these investments Are those Chinese firms profit-seeking? Or they are arms of the stat ,interested primarily in
promoting China’s national security and foreign policy objective?
China’s Quest for Natural Resources
Su Jin Victoria Yeon, Copyright 2015
How important is it for nations to control natural resources? Is China’s growth threatened if it needs to rely on foreign-owned sources of
raw materials?
China’s Quest for Natural Resources
Su Jin Victoria Yeon, Copyright 2015
Should countries have special rules for acquisitions of natural resource companies by foreign-based companies?
China’s Quest for Natural Resources
Su Jin Victoria Yeon, Copyright 2015
Should there be separate rules for state-owned acquirers like Sinopec?

China’s Quest for Natural Resources
Su Jin Victoria Yeon, Copyright 2015
If China’s growth slows, what will be the impact on commodity prices?
Homework #3 – due next Wednesday
Su Jin Victoria Yeon, Copyright 2015
Read Chapter 3 – Legal, Technological, Accounting, and Political Environments Answer following questions
1. Describe the four different types of legal systems with which international businesses must deal.2. What is extraterritoriality?3. How can an MNC affect its host country?4. How do expropriation and confiscation differ?5. Why do countries impose restrictions on foreign ownership of domestic firms?6. How do restrictions on repatriation of profits affect MNCs?7. What factors influence the accounting procedures a country adopts?8. What is the impact of differing accounting standards on the international capital market?9. What is political risk? What forms can in take?10. What is OPIC’s role in promoting international business activity?
Do not spend more than 2 pages (Type your answers) Try and keep your answers brief Due date: Wednesday, 18th of March by10 a.m.

Homework #4 – due next Friday
Su Jin Victoria Yeon, Copyright 2015
Read the case “Risky Business in Venezuela” Answer the four case discussion questions Do not spend more than 2 pages answering the questions You may use bullet points Keep your answers brief but think! Type your answers
Due date: Friday, 20th of March by 11 a.m.
Group discussion Report #2 (due next Friday)
Su Jin Victoria Yeon, Copyright 2015
With your group members discuss; About third week reading About third week case And discuss based on case discussion questions
Discuss following statement“What is the impact of vigorous enforcement of intellectual property rights on the world economy? Who gains and who loses from strict enforcement of these laws?”
Report due date: 20th of March by 11 a.m. Group report / Individual Report (sheets are downloadable from the
website http://ecampus.cbnu.ac.kr)


