Embed Size (px)
Citation preview

Optical Magnetometry with Nitrogen-Vacancy Centers in Diamond
by
Victor Marcel Acosta
A dissertation submitted in partial satisfaction of the
requirements for the degree of
Doctor of Philosophy
in
Physics
in the
Graduate Division
of the
University of California, Berkeley
Committee in charge:
Professor Dmitry Budker, Chair
Professor Irfan Siddiqi
Professor Robert Littlejohn
Professor David Attwood
Spring 2011

Optical Magnetometry with Nitrogen-Vacancy Centers in Diamond
Copyright 2011
by
Victor Marcel Acosta

1
Abstract
Optical Magnetometry with Nitrogen-Vacancy Centers in Diamond
by
Victor Marcel Acosta
Doctor of Philosophy in Physics
University of California, Berkeley
Professor Dmitry Budker, Chair
Precision measurement of magnetic elds is at the heart of many important analytictechniques in materials, geology, biology, medicine, security, space, and the physicalsciences. These applications require operation under a wide range of specicationsregarding sensitivity, spatial resolution, bandwidth, scalability, and temperature. Inthis work we have developed the enabling technology for magnetometers based onnitrogen-vacancy (NV) defects in diamond which promise to cover a wider portion ofthis parameter space than existing sensors. We have studied how to prepare diamondmaterial optimized for magnetometry, and we observed the basic optical and spinproperties of the NV centers. Using a novel scheme inspired by new information aboutNV centers gathered from these studies, we constructed a sensor which improved onthe state-of-the-art in a number of areas. Finally, we outline a plan for improving thesesensors to study micro- and nano-scale magnetic phenomena currently inaccessibleusing existing technology.

i
To my parents, Marjorie Churgin and Thomas Acosta,and my partner Andrea Lee,
for their generous love and support.

ii
Contents
List of Figures iv
List of Tables xiii
1 Physics of nitrogen-vacancy centers in diamond and overview of theeld 11.1 Introduction . . . . . . . . . . . . . . . . . . . . . . . . . . . . . . . . 1
1.1.1 Comparison with existing technologies . . . . . . . . . . . . . 21.2 Historical background . . . . . . . . . . . . . . . . . . . . . . . . . . . 3
1.2.1 ODMR in diamond . . . . . . . . . . . . . . . . . . . . . . . . 51.2.2 Single-spin ODMR . . . . . . . . . . . . . . . . . . . . . . . . 6
1.3 NV center physics . . . . . . . . . . . . . . . . . . . . . . . . . . . . . 71.3.1 Group theory and electron orbitals . . . . . . . . . . . . . . . 71.3.2 Optical selection rules . . . . . . . . . . . . . . . . . . . . . . 91.3.3 Absorption and uorescence spectra . . . . . . . . . . . . . . . 111.3.4 Intersystem crossing and optical pumping . . . . . . . . . . . 131.3.5 Ground-state level structure and ODMR based magnetometry 141.3.6 Eect of zero-eld splitting on sensitive magnetometry . . . . 171.3.7 Interaction with environment . . . . . . . . . . . . . . . . . . 18
1.4 Experimental realizations . . . . . . . . . . . . . . . . . . . . . . . . . 211.4.1 Near-eld scanning probes and single-NV magnetometry . . . 221.4.2 Far-eld sub-wavelength probes . . . . . . . . . . . . . . . . . 271.4.3 Wide-eld array magnetometers . . . . . . . . . . . . . . . . . 291.4.4 Bulk micro-magnetometers . . . . . . . . . . . . . . . . . . . . 30
1.5 Outline of remaining chapters . . . . . . . . . . . . . . . . . . . . . . 30
2 Diamonds with a high density of nitrogen-vacancy centers for mag-netometry applications 312.1 Abstract . . . . . . . . . . . . . . . . . . . . . . . . . . . . . . . . . . 312.2 Introduction . . . . . . . . . . . . . . . . . . . . . . . . . . . . . . . . 312.3 Experimental Procedure . . . . . . . . . . . . . . . . . . . . . . . . . 32
2.3.1 Sample parameters and irradiation . . . . . . . . . . . . . . . 32

iii
2.3.2 Optical characterization and annealing . . . . . . . . . . . . . 332.4 Results . . . . . . . . . . . . . . . . . . . . . . . . . . . . . . . . . . . 34
2.4.1 Proton-irradiated samples . . . . . . . . . . . . . . . . . . . . 342.4.2 Electron-irradiated samples . . . . . . . . . . . . . . . . . . . 402.4.3 Light-power dependence of NV0 and NV- concentrations . . . 502.4.4 Optically detected magnetic resonance (ODMR) . . . . . . . . 522.4.5 Prospects for ultra-sensitive magnetometry . . . . . . . . . . . 57
2.5 Conclusion . . . . . . . . . . . . . . . . . . . . . . . . . . . . . . . . . 582.6 Acknowledgements . . . . . . . . . . . . . . . . . . . . . . . . . . . . 58
3 Temperature dependence of the nitrogen-vacancy magnetic reso-nance 603.1 Abstract . . . . . . . . . . . . . . . . . . . . . . . . . . . . . . . . . . 603.2 Introduction . . . . . . . . . . . . . . . . . . . . . . . . . . . . . . . . 603.3 Experiment procedure . . . . . . . . . . . . . . . . . . . . . . . . . . 613.4 Zero-eld Hamiltonian and tting procedure . . . . . . . . . . . . . . 613.5 Results . . . . . . . . . . . . . . . . . . . . . . . . . . . . . . . . . . . 623.6 Calculation of D and its relative temperature dependence . . . . . . . 663.7 Signicance for magnetometry applications . . . . . . . . . . . . . . . 663.8 Conclusion . . . . . . . . . . . . . . . . . . . . . . . . . . . . . . . . . 673.9 Addendum . . . . . . . . . . . . . . . . . . . . . . . . . . . . . . . . . 67
4 Optical properties of the nitrogen-vacancy singlet levels in diamond 704.1 Abstract . . . . . . . . . . . . . . . . . . . . . . . . . . . . . . . . . . 704.2 Introduction . . . . . . . . . . . . . . . . . . . . . . . . . . . . . . . . 704.3 Experimental apparatus . . . . . . . . . . . . . . . . . . . . . . . . . 734.4 Optical properties, spin-dynamics and temperature-dependent lifetimes 734.5 Conclusion . . . . . . . . . . . . . . . . . . . . . . . . . . . . . . . . . 76
5 Broadband magnetometry by infrared-absorption detection of dia-mond NV centers 795.1 Abstract . . . . . . . . . . . . . . . . . . . . . . . . . . . . . . . . . . 795.2 Introduction . . . . . . . . . . . . . . . . . . . . . . . . . . . . . . . . 795.3 Fundamental limits on sensitivity . . . . . . . . . . . . . . . . . . . . 805.4 Infrared absorption technique . . . . . . . . . . . . . . . . . . . . . . 815.5 Operation as a magnetic gradiometer . . . . . . . . . . . . . . . . . . 835.6 Eliminating photon shot-noise . . . . . . . . . . . . . . . . . . . . . . 855.7 Conclusion . . . . . . . . . . . . . . . . . . . . . . . . . . . . . . . . . 85
6 Conclusion 86
Bibliography 87

iv
List of Figures
1.1 Comparison of some of the most sensitive magnetometry technologies.The points for diamond are the projected sensitivities based on Eq.(1.1), and the other points are experimental results for magnetome-ters based on vapor-cells [1, 2], Bose-Einstein Condensates (BEC) [3],low-frequency micro-SQUIDs [4], nano-SQUIDs [5], and narrowbandMRFM [6]. The lines represent the theoretical range and scaling ofthe spatial resolution for potential sensors based on these technologies(MRFM and BECs have limited range and complicated scaling andare not shown here). Note that the sensitivity scaling with size for allsensors is δB ∝ r
−3/2min (see, for example, [7]) except in the case of nano-
SQUIDs (without a pickup coil) where the scaling is δB ∝ r−5/4min [8].
The numbers are the temperature ranges (in Kelvin) for each sensoras reported in the references. . . . . . . . . . . . . . . . . . . . . . . 4
1.2 Optical microscope image of a ∼ 100 µm sized single-crystal HPHTmicrodiamond (a) after initial growth, (b) after irradiation with 8-MeVelectrons at a dose of ∼ 1019 cm−2, and (c) after annealing at 800 Cfor 2 hours. Figure courtesy of G. Balasubramanian. . . . . . . . . . 5
1.3 (a) Schematic of the NV center with nitrogen, vacancy, and threenearest-neighbor carbon atoms. The geometry and atomic labels arethose used to derive the molecular orbitals (MOs). (b) MOs of the threehighest-energy single-electron orbitals, a1, ex, and ey. The red (blue)colors denote positive (negative) contributions to the MO. Adaptedfrom [9] with author permission. (c) Schematic of the six-electron con-guration for (left) the ground, e2, and (right) rst-excited, a1e, cong-urations. The specic wavefunctions depicted here correspond to (left)| exey〉 =| 3A2,ms = +1〉 and (right) | a1ex〉 =| 3Ex,ms = +1〉. Notethat the lowest-energy level, a′1, is predicted to lie below the valenceband [10] and experiments have established that the conduction bandis well above the ex, y levels. . . . . . . . . . . . . . . . . . . . . . . 8

v
1.4 (a) Schematic illustrating the Franck-Condon principle for excitationand uorescence of the main optical transition, 3A2 ↔ 3E. Non-radiative decay is shown with dashed lines. (b) Room-temperatureoptical absorption and uorescence (excited at 532 nm) spectra for anHPHT diamond with [NV-] ≈ 15 ppm. Besides the spectral featuresattributed to the NV- center discussed in the text, the weak line at 575nm is present from the NV0 ZPL. PSBPhonon sideband, ZPLzero-phonon line. . . . . . . . . . . . . . . . . . . . . . . . . . . . . . . . . 12
1.5 Level diagram for the NV center showing spin-triplet ground and ex-cited states, as well as the singlet system involved in intersystem cross-ing. Radiative transitions are indicated by solid arrows and non-radiative transitions by dashed arrows. Only those transitions con-rmed by experiments are shown. The tentative label of the upper(lower) singlet as 1E (1A1) is based on the observed spin-selective de-cay paths (see text). Lifetimes of the excited levels are also shownas measured in [11], with the lower singlet lifetime being temperaturedependent (∼ 220 ns at room temperature and ∼ 450 ns at 5 K). . . 13
1.6 (a) Ground state level structure of the NV center under a small axialmagnetic eld. Allowed magnetic dipole transitions are shown withdouble-headed arrows. The values for the 14N hyperne splitting canbe found in Tab. 1.4. The nuclear Zeeman eect is not included and Eis taken to be zero here. (b) ODMR spectrum (excited at 532 nm) fora low-defect-density CVD diamond [12]. The 24 separate resonancescorrespond to two dierent |∆ms| = 1 transitions, four dierent NVorientations, and three dierent 14N mI levels. The spectrum for eachorientation are shifted due to an applied eld of ∼ 50 G. Arrows con-nect resonances of a given orientation. . . . . . . . . . . . . . . . . . 16
1.7 Optical and microwave spin-echo pulse sequence used for sensing anAC magnetic eld, b(t). NV centers are rst polarized into the ms = 0sublevel. A coherent superposition between the states ms = 0 andms = 1 (or alternatively ms = −1) is created by applying a microwaveπ/2 pulse tuned to this transition. The system freely evolves for aperiod of time τ/2, followed by a π refocusing pulse. After a secondτ/2 evolution period, the electronic spin state is projected onto thems = 0, 1 (or ms = 0,−1) basis by a nal π/2 pulse, at which pointthe ground state polarization is detected optically via spin-dependentuorescence. The optimal sensitivity is achieved for τ ≈ T2, mak-ing this magnetometry scheme ideal for kHz-scale AC elds. The DCmagnetic eld is adjusted to eliminate the contribution of the randomlyphased eld produced by 13C nuclear spins (Larmor period, 1/Ωn) bychoosing τ = 2n/Ωn, for integer n. . . . . . . . . . . . . . . . . . . . . 20

vi
1.8 Illustration of high-spatial-resolution magnetometry with a diamondnanocrystal. (a) The dipolar elds from spins in the sample decayrapidly with distance; only those within a distance ∼ ro contribute tothe observable signal for the point-like NV center. The inset shows howBmax (the magnetic eld produced by fully polarized nuclei) and Brms
are related; when few spins are involved, the statistical uctuationsbecome large. (b) In the presence of a magnetic-eld gradient (eldlines in grey), only the spins from a small region of the detection volumeare precessing at the frequency band center of the detector, enablingeven higher spatial resolution. Adapted from [13]. . . . . . . . . . . . 22
1.9 (a) Diagram of the magnetic eld imaging experiment in [14]. Ananoscale magnetic particle (red) is imaged with a single nitrogen-vacancy defect (green, within the blue nanocrystal) xed at the scan-ning probe tip (black). A microscope objective is used to focus lightfrom a 532 nm laser on the NV center, exciting the 3A2 → 3E transitionon the phonon sideband. The same objective collects uorescence (i.e.confocal microscopy), which is then spectrally ltered and directed tophotodetectors. (b) Fluorescence map in the vicinity of the nickel mag-net, recorded using a single NV center on the AFM tip as light sourceand magnetometer. The triangular shaped magnet is black becauselaser light is reected o the magnet and consequently no uorescenceis collected in this region. Inset (c), the uorescence signal from thescanned nitrogen-vacancy center attached to the apex of the AFM tipwhen resonant microwaves at 2.75 GHz are applied. The arrowed pointcorresponds to 5 mT resonance line with the magnetic eld tilted by45 relative to the nitrogen-vacancy axis. Adapted from [14]. . . . . 24

vii
1.10 (a) Spin-echo measurement for a single NV center more than 1 µmbelow the diamond surface. The normalized echo signal correspondsto a fractional change in the NV center's uorescence. Maximal signalcorresponds to an average of 0.03 detected photons during the 324-nsphoton counting window of a single experimental run. Collapses andrevivals are due to interactions with the 13C nuclear spin bath. Therevivals occur at half the rate of the Larmor frequency of 13C (here setby BDC = 22 G). The spin-echo signal envelope was tted with anexponential decay function modulated by a strongly interacting pair ofnearby 13C (Methods in [15]. Magnetometer sensitivity experiments areperformed at spin-echo revival peaks to maximize signal. (b) Examplesof measured spin-echo signal as a function of BAC for two operatingfrequencies, 3.15 kHz (red) and 4.21 kHz (blue), corresponding to re-vivals 1 and 2 indicated in a. Each displayed point is a result of 7×10⁵
averages of spin-echo sequences. The magnetometer is most sensitiveto variations in the AC magnetic eld amplitude (δB) at the point ofmaximum slope, with the sensitivity being limited by the uncertaintyin the spin-echo signal measurement (δS). The cosine behavior of thesignal with respect to AC magnetic eld amplitude can be changedto a sine by adjusting the phase of the third microwave pulse by 90.This change moves the point of maximum magnetometer sensitivity tonear zero AC eld amplitude. (c) Measured sensitivity of a single NVmagnetometer in a bulk diamond sample over a range of frequencies forthe external AC magnetic eld after averaging for one second. Errorbars, standard deviation (s.d.) for a sample size of 30. Also shown isthe theoretically predicted sensitivity (solid blue line), with the shadedregion representing uncertainty due to variations in photon collectioneciency. Measurements were carried out at two dierent DC elds,BDC = 13 G (red) and 22 G (green). Adapted from [15]. . . . . . . . 25
1.11 (a) Level diagram and optical transitions for the STED scheme. Agreen pump laser excites NV center's into the 3E excited state and adepletion beam at 700 nm stimulates emission, quenching uorescence.(b) Timing diagram of STED for pulsed operation. Continuous-waveoperation is also possible as shown in (c). The spatial prole of thepump and STED beams during cw excitation. The level diagrams showthat in the intense portion of the STED beam, all NV centers are in theground state, whereas at the optical vortex, a signicant population ofNV centers exists in the excited state. . . . . . . . . . . . . . . . . . . 27
1.12 Wide-eld uorescence microscope used for magnetic imaging as de-scribed in text. The sample under study would be placed in closecontact with the thin layer of NV centers. Adapted from [13]. . . . . 29

viii
2.1 (a) Monte-carlo simulation of radiation damage as a function of pene-tration depth for 2.4-MeV proton radiation, using the SRIM software.(b) Depth prole of NV- centers, taken by normalizing the integratedZPL intensity by that of a single NV center, after the rst annealing(see text). The concentrations for Sample 10 have been divided by afactor of 10 for visualization. Errors on the concentration estimates arediscussed in Sec. 2.4.2.2. (c) NV-:NV0 ZPL intensity ratio as a func-tion of depth after the rst annealing. The lightpower was 100 µW.For Sample 10, beyond a depth of ∼ 36 µm, the NV0 ZPL becameindistinguishable from the background. . . . . . . . . . . . . . . . . . 35
2.2 (a) Depth proles of the phonon-sideband PL intensity for Sample 10at a typical location (left) and at a sector boundary (right). (b) De-convolved intensity as a function of depth for Samples 1, 9, and 10(S1, S2, etc.) after the rst annealing at 700, 500, and 800 C, re-spectively. The PL intensity is normalized by the incident laser power(5, 153, and 1.9 nW for Samples 1, 9, and 10, respectively). The signalfor Sample 9 is multiplied by a factor of 100 for visualization. (c) PLdeconvolution for Sample 9 after the rst and third annealing. The PLintensity after the rst annealing has been multiplied by a factor of 30.The damped oscillations are artifacts of the signal processing causedby rapid changes in concentration. . . . . . . . . . . . . . . . . . . . . 37
2.3 Fluorescence spectrum at each stage of annealing for Sample 2 (seeTab. 2.1), as well as the spectrum of a single NV center in the ultra-pure CVD diamond used for calibrations. The measurement volumeis approximately 5.2 µm3 located ∼ 12 µm from the surface. Theimportant spectral features are labeled (as described in the text). (b)Lateral (xy) scans of the ultra-pure CVD diamond showing uorescencein the 647− 804 nm spectral region from two of the single NV centersused to determine the uorescence collection volume. The range for allof the scans is 30 µm× 30 µm . . . . . . . . . . . . . . . . . . . . . . 41
2.4 (a) NV- concentrations of electron-irradiated samples as a function ofannealing temperature. (b) NV-:NV0 ZPL intensity ratio of the samesamples as a function of annealing temperature. The data were takenduring two dierent runs on separate days. On each day the collectionlocation for each sample was the same, but in between days the locationchanged. The laser power for the data on each day is indicated in thelegend. Filled plot symbols are used for all samples with high nitrogencontent and empty symbols represent the two samples with . 1 ppmnitrogen. Error bars are not shown here but are discussed in the text. 43
2.5 NV- concentrations near the surface as a function of dose for electron-irradiated samples after the nal annealing at 1050C. The data arethe same as used in Fig. 2.4(a). . . . . . . . . . . . . . . . . . . . . . 44

ix
2.6 Room temperature transmission curves for four electron-irradiated sam-ples after the nal annealing at 1050C. The beam path (i.e. the sam-ple thickness) was 1 mm for Samples 1 and 2 (S1 and S2) and .5 mmfor S3 and S4. The ZPL at ∼ 638 nm is visible for S1 and S2 and isblown up in the inset. The dotted lines represent the baselines used forSample 1 in the eective vibrational-splitting and Huang-Rhys factorcalculations (the baseline for Sample 2 was similar). . . . . . . . . . . 46
2.7 Infrared spectra for Samples 1, 2, and Y1 after the nal annealing.Each spectrum represents averaging of 64 scans and the resolution ofthe spectrometer was set to 0.25 cm−1. The rapid oscillations aredue to etaloning at normal incidence, and they have been smoothedby a moving average (black lines) in order to quantify the peak at∼ 1130 cm−1 (see text). Features mentioned in the text are labeled bytheir wavenumbers. . . . . . . . . . . . . . . . . . . . . . . . . . . . . 49
2.8 Relative NV- and NV0 concentrations for (a) Sample 10 and (b) Sam-ple 4 after the rst annealing (700C and 800C, respectively) as afunction of incident laser power. The concentrations were obtainedfrom uorescence spectra (insets) taken at a depth of approximately36 µm, for Sample 10, and 12 µm, for Sample 4. Determination ofNV0 concentration was made by weighting the relative ZPL intensityaccording to the dierence in room-temperature Huang-Rhys factors;S ∼ 3.3 for NV0 [16] and S ∼ 4.0 for the NV− center (Sec. 2.4.2.4).The laser beam was focused to a diameter of approximately 0.5 µm forall measurements. . . . . . . . . . . . . . . . . . . . . . . . . . . . . . 51
2.9 (a) Crystallographic cell for the NV center in diamond. The centerhas C3v symmetry and the line that contains both N and V denesthe symmetry axis, of which there are four possible orientations. CCarbon, NNitrogen, VVacancy. (b) Level diagram for NV- centershowing spin-triplet ground and excited states, as well as the singletsystem responsible for intersystem crossing (see text). The transitionwavelengths are for the ZPL, with radiative transitions indicated bysolid arrows and non-radiative transitions by wavy arrows. . . . . . . 53

x
2.10 (a) ODMR spectrum for Sample 3. The 24 separate resonances cor-respond to two dierent |∆ms| = 1 transitions, four dierent NV ori-entations, and three dierent 14N hyperne transitions. The orienta-tions were split by a ∼ 50 G eld. (b) Level diagram for the ground-state magnetic dipole transitions induced by the microwave eld inthe ODMR measurements. The selection rules for these transitionsare |∆ms| = 1 and ∆mI = 0. The values for the 14N hyperne split-ting are taken from Ref. [17]. (c) Microwave-power dependence (log-scale) of the relaxation rate for Sample 4 for a laser power of 213 µW.Microwaves from a signal generator were amplied and applied witha ∼ 1-mm-diameter current loop with unmatched impedance. Themicrowave power was measured at the output of the signal genera-tor prior to the ∼ 30 dB amplier. The FWHM linewidth of each|∆ms| = 1,∆mI = 0 transition for one of the orientations was plottedas a function of microwave power. A linear t for the lowest-powerpoints (dashed line) was used to extrapolate the linewidth to zero mi-crowave power. The standard error in the t parameter serves as theuncertainty in the measurement. . . . . . . . . . . . . . . . . . . . . . 54
3.1 Zero-eld FDMR spectrum at 293 K for S3 and the corresponding tbased on Eq. 3.1 (solid green line). The six blue lines represent thetted amplitudes at each transition frequency, and the tted linewidthwas 3.3 MHz (full width at half maximum). The microwave power wasreduced to ∼ −10 dBm to resolve the hyperne structure, resulting inthe relatively small contrast of ∼ 0.6%. The best-t parameters forthis scan are E = 1.4(5) MHz and D = 2869.3(2) MHz. . . . . . . . 63
3.2 (a) Zero-eld FDMR spectra at 283 K and 326 K for S8 with ts (solidred lines). (b) Value of E for S8 as a function of temperature withlinear t (solid black line). (c) D for S8 vs. temperature with lineart. (d) dD/dT and dE/dT as a function of laser intensity for S5. Thedotted lines are the laser-intensity-independent values used in Tab. 3.1. 64
3.3 (a) Fitted value for D as a function of temperature. The microwaveeld amplitude was ∼ 3 mG and excitation was with ∼ 1 mW of 532nm light for all data in (a)-(c). Error bars from the ts in (a)-(b) aresmaller than the plotted points. (b) Fitted value of E as a function oftemperature. (c) Fitted values of dD/(DdT ) as a function of temper-ature and theoretical temperature dependence based on macroscopicthermal expansion [18], as described in the text. . . . . . . . . . . . . 68

xi
4.1 Level diagram for NV center showing spin-triplet ground and excitedstates, as well as the singlet system involved in intersystem crossing.Radiative transitions are indicated by solid arrows and non-radiativetransitions by dashed arrows. The tentative label of the upper(lower)singlet as 1E(1A1) is based on the observed spin-selective decay paths(see text). . . . . . . . . . . . . . . . . . . . . . . . . . . . . . . . . . 71
4.2 (a) Apparatus used for magnetic resonance and optical studies. MCmonochromator. (b) Fluorescence spectrum of the IR transition (exci-tation at 532 nm) at room temperature for two diamonds with dierentNV- concentrations [12] showing a ZPL at 1042.5(3) nm. The slopedbackground is due to the tail of the phonon sideband of the much-stronger 3E → 3A2 transition [19]. (c) Magnetic-resonance spectra ofsample S2 for visible (650-800 nm bandpass lter) and IR (1000 nmlongpass lter) emission at room temperature under an applied eldof ∼ 4 mT. Excitation was with ∼ 1 W of 532 nm light, polarizedin the plane of the sample surface. The variation in peak heights canbe explained by the pump-light and microwave polarization selectionrules [20]. . . . . . . . . . . . . . . . . . . . . . . . . . . . . . . . . . 72
4.3 (a) The phase shift technique. (b) Phase shift of visible (650-800 nm)and IR (1035-1045 nm) uorescence as a function of modulation fre-quency and ts (see text). (c) Lifetime of the MS as a function oftemperature as well as ts to Eq. (4.1). The values of ε and ε1,2 arethe tted phonon energies for N = 1 and N = 2 decays, respectively.Error bars represent the standard deviation of multiple measurements. 75
4.4 (a) Example magnetic-resonance spectrum for visible uorescence andtransmission of IR probe at 70 K. As the sample was [111]-oriented,one of the NV axes was normal to the sample surface. (b) Polar plot ofthe contrast of visible uorescence (left) and IR absorption (right) as afunction of light-polarization angle for both geometries (see text). Solidlines are ts to a constant and dashed lines are ts to sin2(θ−φNV )+c,where θ is the polarizer angle, φNV is the angle of z relative to thepolarizer axis, and c is an oset which takes into account imperfectionsin light polarization, beam alignment, and selection rules. For thez ⊥ k geometry, the sample and polarizer were positioned such thatwe expected φNV = 90(3), and both of the tted values of φNV agreewith this value to within the uncertainty. (c) Light-polarization axesfor allowed transitions between the singlet levels [21]. The selectionrules are identical for both absorption and emission. . . . . . . . . . . 77

xii
5.1 (a) Level structure of the NV center and allowed optical transitions.Radiative (non-radiative) transitions are represented by solid (dashed)lines. (b) IR absorption gradiometer apparatus. The green pump andIR probe beams were focused to a diameter of ∼ 30 µm near thesurface of the diamond, and two halves of the transmitted IR beamwere detected with separate photodiodes. MWmicrowave. . . . . . 81
5.2 Optically-detected magnetic resonance at 75 K using the uorescencemethod and both halves of the transmitted IR probe. The pump powerwas 0.8 W and the microwave Rabi frequency was ∼ 1.5 MHz. . . . . 82
5.3 (a) Lock-in signal for both IR magnetometer channels. (b) Time seriesmagnetometer signal, after subtraction of the static bias eld, for a1 µTrms applied eld at 109 Hz. The microwave frequency was tunedto the center of the resonance (zero-crossing in (a)). (c) Frequency-domain response of the magnetometer output in (b) revealing an IRabsorption gradiometer noise oor of 7 nTrms in 1 s of acquisition. . . 84

xiii
List of Tables
1.1 Electronic levels of the NV center in the ground (e2) and rst-excited(a1e) congurations. The wavefunctions refer to the MOs of the twounpaired electrons, with bars (lack of bars) denoting an electron inthe ms = −1/2 (ms = +1/2) state. The spin quantization axis is thesymmetry axis of the NV center, labeled z in Fig. 1.3(a). . . . . . . . 10
1.2 Light-polarization axes for allowed optical transitions. Note: A1 ↔A1 is forbidden to rst order because it would require altering theelectronic conguration twice (e2 ↔ a1a1) and A2 ↔ A2 is forbiddenbecause there is only one A2 level in the bandgap. . . . . . . . . . . . 11
1.3 Products of C3v symmetry states. . . . . . . . . . . . . . . . . . . . . 111.4 Coupling coecients for the ground-state Hamiltonian in Eq. (1.4)
at room temperature. We use units where Planck's constant, h = 1.ZFSzero-eld splitting. . . . . . . . . . . . . . . . . . . . . . . . . . 15
2.1 Sample characteristics. Initial nitrogen concentration, [N], is given asspecied by manufacturer. Each annealing was carried out for 2− 2.5hours. . . . . . . . . . . . . . . . . . . . . . . . . . . . . . . . . . . . 32
2.2 Sample Characteristics. Final NV- concentrations for the electron-irradiated samples are tabulated along with initial nitrogen content(reported by the commercial providers) and projected vacancy concen-trations. These values are used to set a lower bound on the nitrogen-to-NV- conversion eciency, as seen in the last column. The error inNV- concentration estimates, and consequently the error in conversioneciency, is a approximately a factor of two, as discussed in the text. 45

xiv
2.3 Eective transverse spin relaxation times, T ∗2 , extrapolated to zero mi-crowave power, for several electron-irradiated samples at the given laserpowers (focused to ∼ 0.5-µm diameter). For Sample 5, three locations,corresponding to spots in dierent growth-sectors, were investigated.The uncertainty estimates for all samples except Sample 3 come fromthe standard error of the linear ts, as shown in Fig. 2.10(c). For Sam-ple 3, only one low microwave power, −30 dBm before the amplier,was investigated (shown in Fig. 2.10(a)). The lower bound on T ∗2 forthis sample corresponds to one standard deviation below the statisticalaverage of the resonance widths. . . . . . . . . . . . . . . . . . . . . 56
3.1 ZFS parameters and uncertainties for four dierent samples. The val-ues of E represent the expected value of E(293 K) extrapolated fromthe linear ts, and the error bars represent the standard error fromthe t but not systematic eects due to imperfect assumptions in themodel (see text). The laser intensity was ∼ 25-50 kW/cm2 throughoutthe collection volume. Note that for the S2 spectra a magnetic eldof B⊥ ≈ 13 G was applied. This eld enabled the isolation of a singleNV orientation, and the simplied spectrum was used to verify therobustness of the model. . . . . . . . . . . . . . . . . . . . . . . . . . 65

xv
Acknowledgments
I want to thank my advisor, Dmitry Budker, for sharing his contagious love of physics.He is my favorite person to talk to about physics and research, so I am lucky that hechose to give me countless hours of his time discussing science, designing experiments,providing solutions to technical problems, and supervising manuscript preparation.Thanks also to my committee members Irfan Siddiqi and Robert Littlejohn for guidingme through this process.
I would like to express my gratitude to postdoc Micah Ledbetter who taught meall of the nuts-and-bolts of the research process, and who has helped me on virtuallyevery project I have undertaken as a graduate student. Former and current post-docs/students Derek Jackson-Kimball, Eric Corsini, James Higbie, Kostya Tsigutkin,Damon English, Todor Karaulanov, and Brian Patton have also contributed greatlyto this work helping with technical problems and discussing basic physics. Alongthe way, they became good friends and I hope these relationships continue for manyyears.
The students and postdocs who contributed the most to this work were ErikBauch, Andrey Jarmola, and Lucas Zipp. I learned a lot working with them and couldnot have obtained the results presented here without their tireless contributions. Justas important, it was a lot of fun and I hope to never forget these experiences.
Finally, I want to acknowledge the expert help of collaborators Charles Santori,Kai-Mei Fu, Paul Barclay, Ray Beausoleil, Louis Bouchard, Amir Waxman, RonFolman, Marcis Auzinsh, Heloise Linget, Wojtek Gawlik, Sergey Chemerisov, PhilHemmer, RonWalsworth, Mike Romalis, Irfan Siddiqi, Jean-Francois Treussart, Jean-Francois Roch, Vincent Jacques, Adam Gali, Alex Sushkov, Marcus Doherty, Jeron-imo Maze, Fedor Jelezko, Jeorg Wrachtrup, Lillian Childress, Gopi Balasubramanian,Neil Manson, and members of the group of Alex Pines. We entered a somewhat un-familiar territory when we started in this solid-state magnetometry work, and noneof the results presented here would have been possible without their patient adviceand essential contributions.

1
Chapter 1
Physics of nitrogen-vacancy centers in
diamond and overview of the eld
1.1 Introduction
At the core of modern-day quantum metrology is the ability to obtain long-livedcoherences, in the ensemble of spins under study. Since the 1950s, researchers haveapplied long-lived coherences in alkali vapor cells to measure magnetic elds withrecord sensitivity [7]. These vapor cell magnetometers now have achieved a better sen-sitivity [2] than the previously most sensitive superconducting quantum interferencedevices (SQUIDs) [8] under comparable conditions. These atomic magnetometershave been used to detect the nuclear spin magnetization of xenon [22], applicableto the eld of magnetic resonance imaging (MRI) of human tissue, and to locateultra-low-concentration magnetic micro- and nano-particles [23], important in ma-terials science, petrology, and security applications. Ultra sensitive magnetometershave also been used to map the magnetic elds from the human heart and even thebrain [24]. Further, remotely-detected nuclear magnetic resonance (NMR) has beendemonstrated using microuidic chips [25], and recently atomic magnetometers wereused for the study of isotropic nuclear-spin J-coupling interactions in the zero-eldenvironment [26]. Other applications of precision magnetometry include ordnanceand explosives detection for defense, space magnetometry, and fundamental physicsresearch, such as searches for permanent electric dipole moments of electrons [27],tests of local Lorentz invariance [28, 29], and the search for new elementary particlessuch as the axion [30].
Atomic magnetometry was the focus of my rst three years of graduate research[31, 32, 33, 34, 35, 36], and provided the foundation for the present work. However,there are areas where the existing technologies and approaches nd their limits. Whileatomic magnetometers can measure magnetic elds with exceptional sensitivity andwithout cryogenics, spin-altering collisions limit the sensitivity of sub-millimeter-scale

2
sensors [7]. In order to probe magnetic elds with nanometer resolution, magneticmeasurements using SQUIDS [8, 37, 38] as well as magnetic resonance force micro-scopes (MRFMs) [39, 40, 6, 41], have been performed. However, the spatial resolutionof the best SQUID sensors is still not signicantly better than a few hundred nanome-ters [5], and both sensors require cryogenic cooling to achieve high sensitivity, whichlimits the range of possible applications.
Recently, a new technique for measuring magnetic elds at the nanometer scale hasemerged based on optical detection of electron spin resonances of nitrogen-vacancy(NV) centers in diamond [14, 15, 42]. This system oers the possibility to detectmagnetic elds with an unprecedented combination of spatial resolution and magneticsensitivity [43, 41, 13, 42, 44], in a wide range of temperatures (from 0 K to wellabove 300 K), opening up new frontiers in biological [14, 45, 46] and condensed-matter [14, 47, 48] research. Over the last few years, researchers have developedtechniques for scanning magnetometry using nanoscale imaging techniques in bulkdiamond [15, 42, 49], as well as in nanodiamonds [50, 51, 52] combined with scanningprobe techniques [14, 53]. Sensors employing ensembles of NV centers promise evenhigher sensitivity and the possibility to map out all vector components of the magneticeld [13, 12], and pilot NV-ensemble magnetometers have recently been demonstratedby several groups [48, 47, 54, 44].
The development of these techniques with an eye toward applying them to imagenovel micro- and nano-scale magnetic phenomena is the focus of this chapter. Asa note of caution, we point out that this eld is currently exploding. The numberof citations to papers related to diamond NV centers has probably increased ten-fold or more over the period 2005-2010. With such a rapidly expanding eld, wecan only review a portion of the relevant literature here, and new techniques willinevitably emerge in the near future. Thus, we focus here on the history of opticalmagnetometry in diamond, the underlying physics which makes nitrogen-vacancycenters such remarkable sensors, and the basic techniques for utilizing their potential.
1.1.1 Comparison with existing technologies
Sensitivity estimates for NV-based magnetometers compare favorably with thecurrently most sensitive devices, including SQUIDs and atomic magnetometers. Whilethe ultimate verdict will come from experiments, the prospect of a robust, scalable,solid-state system with a superior operating temperature range (from 0 K to wellabove room-temperature) has many researchers chomping at the bit.
Spin-based magnetometers are fundamentally limited by the quantum noise asso-ciated with spin projection. The minimum detectable magnetic eld for a sample ofspins with density n in a volume V is given by [7, 13]:
δBq '1
γ
1√nV tmT ∗2
, (1.1)

3
where γ = 1.761× 10¹¹ s−1T−1 is the NV gyromagnetic ratio [55], T ∗2 is the electronspin dephasing time, and tm & T ∗2 is the measurement time.
Figure 1.1 compares the sensitivity and operating temperatures of the currentlymost sensitive technologies with two types of diamond sensors being developed, a∼ 50 µm-scale sensor [44] for low-eld NMR detection [25, 26] and general eld useand a 2D surface probe with a spatial resolution of ∼ 10 nm [43, 41, 13, 15, 14,42, 54, 47, 53] for condensed matter [48] and biological [45, 46, 56] applications. Atcentimeter and longer length scales, vapor-based atomic magnetometers are currentlythe most sensitive devices, but nanoscale spatial resolution is not possible due tothermal motion of the atoms. By employing a high density of a noble gas, vapor-based magnetometry with a spatial resolution of ∼ 10 µm is possible [57], but despiteimpressive results for mm-scale sensors [58, 25] the projected sensitivity for this lengthscale is exceeded by the diamond-based sensors presently proposed. Further, foroptimal operation, vapor-based cells must be heated to well above room-temperature,which increases the power consumption and limits the range of applications.
In the case of SQUIDs, signicantly better spatial resolution is possible, but theoperating temperature range is cryogenic, limiting the range of applications. Recently,an Al nano-SQUID was placed on a scanning tip, and the probe of diameter ∼ 180 nmdemonstrated a sensitivity of ∼ 100 nT/
√Hz [5]. The diamond-based sensors dis-
cussed here promise better spatial resolution and comparable magnetic sensitivitywithout cryogenic operation. MRFM and BEC magnetometers also oer impressivespatial resolution and magnetic sensitivity, however the large magnetic eld gradientsused in MRFM (approaching 106 T/m [39, 59]) and the extreme cryogenic operatingtemperatures for both BECs and MRFMs are impractical for many applications.
1.2 Historical background
The use of optically detected magnetic resonance (ODMR, dened here as thedetection of spin transitions by optical means) for precision magnetometry is notrestricted to gas phase atoms, though it did indeed begin there. The rst publishedresults related to optically detected magnetic resonance were probably experimentswith mercury vapor by Fermi and Rasetti in 1925 [60]. The topic was subsequentlyrened in a proposal by Bitter in 1949 [61] and experimental demonstrations, rstwith mercury vapor and later with various alkali vapors, by Brossel, Bitter, andothers in the early 1950s [62]. The techniques were rst applied to solids, using Cr3+
in Al2O3 (ruby), by two groups in 1959 [63, 64]. Since then, the advent of high-qualitylight sources, including modern-day diodes and diode-pumped solid state lasers, hasallowed these techniques to be applied in a wide variety of media with numerousapplications ranging from quantum information to space science.

4
ç
àó
ó
x
ì
ì
Spatial resolution [m]
Mag
neti
c se
nsit
ivit
y [T
Hz-
1/2 ]
ì diamondx MR FMó SQUIDà B E Cç vapor
10-8 10-7 10-6 10-5 10-4 10-3 10-2
10-13
10-12
10-11
10-10
10-9
10-8
10-710-6
10-14
0.3
0-20-300+
<10-60-77
400-500
0-300+K
rugged bulk sensors
ìAC
DC
10-15
ìACDC
nanoscalematerials
10-9ç10-16
Figure 1.1: Comparison of some of the most sensitive magnetometry technologies.The points for diamond are the projected sensitivities based on Eq. (1.1), andthe other points are experimental results for magnetometers based on vapor-cells[1, 2], Bose-Einstein Condensates (BEC) [3], low-frequency micro-SQUIDs [4], nano-SQUIDs [5], and narrowband MRFM [6]. The lines represent the theoretical rangeand scaling of the spatial resolution for potential sensors based on these technologies(MRFM and BECs have limited range and complicated scaling and are not shownhere). Note that the sensitivity scaling with size for all sensors is δB ∝ r
−3/2min (see,
for example, [7]) except in the case of nano-SQUIDs (without a pickup coil) wherethe scaling is δB ∝ r
−5/4min [8]. The numbers are the temperature ranges (in Kelvin)
for each sensor as reported in the references.

5
a) b) c)Figure 1.2: Optical microscope image of a ∼ 100 µm sized single-crystal HPHTmicrodiamond (a) after initial growth, (b) after irradiation with 8-MeV electrons ata dose of ∼ 1019 cm−2, and (c) after annealing at 800 C for 2 hours. Figure courtesyof G. Balasubramanian.
1.2.1 ODMR in diamond
Before ODMR, electron spin resonances (ESR) in solids were traditionally detectedby the absorption or reection of microwaves, with the rst such studies reported byZavoisky in 1945 [65]. In the 1950s this technique was applied to identify the presenceof paramagnetic centers in neutron-irradiated diamond [66, 67]. The rst specicdefect in diamond to be identied via ESR was the single substitutional nitrogencenter, known as the P1 center, which was rst observed in 1959 [68].
All-microwave ESR continues today to be a powerful analytic tool for bulk sam-ples, but is saddled with two major drawbacks for practical magnetometry. The rstis that it usually relies on the thermal Boltzmann distribution to create spin polar-ization, which means the sensing medium must be cooled and/or subjected to highmagnetic elds. For example, even in a 10 T magnetic eld, in order to get 75% offree electrons to be spin down requires cooling to about 12 K. In contrast > 99%of atomic spins can be polarized into a single spin state at room temperature andzero magnetic eld, using optical pumping techniques [69]. The second drawback isassociated with the detection of microwave photons. Owing to the ∼ f 2 frequency-dependence of blackbody and other low-energy radiation background, microwaves arenotoriously dicult to detect sensitively, compared to optical frequencies. There cur-rently does not exist a high-quantum-eciency microwave detector, as an ordinarySi photodiode provides for the optical regime. For these reasons the development ofoptical techniques has been essential for sensitive spin-based magnetometers.
At the heart of the ODMR technique is the ability to simultaneously drive strongoptical transitions (preferably those that can alter the population distribution of

6
magnetically-sensitive states) and narrow radio-frequency transitions between mag-netically sensitive states.
Optical transitions in diamond have been known to exist for centuries. Natu-rally occurring diamonds exist in many dierent colors, due to isolated defects calledcolor centers (see Fig. 1.2). The study of these color centers has been aided bytechniques to grow diamonds in the lab, either by high-pressure-high-temperaturesynthesis (HPHT, which attempts to mimic the conditions under which diamond isformed in nature) or more recently by chemical vapor deposition (CVD, which enablesgreater control over the composition and surface properties). Additionally a variety ofirradiation techniques, including bombardment by beams of electrons, ions, neutrons,and high-energy electromagnetic rays, have facilitated the production of these colorcenters in a relatively controlled manner. Indeed more than 600 optical lines havebeen characterized in Ref. [16]. Figure 1.2 depicts microscope images of a single-crystal HPHT diamond (a) after initial growth (b) after irradiation with high-energyelectrons, and (c) after annealing.
Signal enhancement beyond the thermal polarization limit of various ESR-activecolor centers in diamond under continuous optical excitation was reviewed by Loubserand van Wyck in 1978 [70]. In that work a particularly luminous color center, associ-ated with a substitutional nitrogen atom lying nearest-neighbor to a carbon vacancy(the NV center), was identied and a model for the center involving six valence elec-trons was proposed and continues to be adopted today. In the late 1980s, optically de-tected magnetic resonance was observed in high-nitrogen-density, electron-irradiateddiamonds [71, 72]. From this and earlier work, it was conrmed that the center wasthe negatively-charged NV- center, with ESR transitions occurring in the spin-tripletground state and optical transitions with an excited state with zero-phonon line at637 nm [73].
1.2.2 Single-spin ODMR
Given the ubiquity and importance of optical detection of single quantum systemstoday, it may come as a surprise that it was only rst realized in 1980, when Dehmeltand coworkers observed uorescence from a single trapped Ba ion [74]. ODMR ona single emitter did not come until 1993 when it was realized by two separate col-laborations using cryogenic pentacene molecules embedded in a solid [75, 76]. Afterthis groundbreaking work, the search was on to nd a suitable room temperature sys-tem using technologically relevant materials. In 1997 Jorg Wrachtrup and coworkersfound such a system when they performed ODMR at 300 K on single NV centers indiamond [77]. In addition to having a paramagnetic ground state and ecient opticalpumping mechanism, it was noted that, unlike most color centers, organic moleculesand semiconductor quantum dots, most NV centers in bulk diamond gave a stableuorescence signal that did not bleach or blink. This feature, combined with the lowcytotoxicity of the diamond host [78, 79, 80] makes NV centers in nanodiamonds ideal

7
candidates for uorescent markers in biological systems [81, 82, 50, 83, 84].The decade following the initial discovery was marked by major accomplishments
in optical and microwave control of the electronic and nuclear degrees of freedom ofthe NV center and neighboring spins [85, 86, 87, 88, 89, 90, 91, 92, 93, 94]. Thisprogress, combined with the realization of extremely long electron-spin coherencetimes, for condensed matter standards (T2 > 1 ms for isotopically pure diamond[42]), has quickly made the NV center a leading candidate for qubits in a solid-statequantum computer [95].
During this time, it was also realized that these properties make NV centers anideal candidate for optical magnetometry [43, 41, 13]. The rst realization of a single-spin magnetometer was simultaneously achieved by two groups, one based at Harvard[15] and the other based in Stuttgart [14]. In the last few years several more groupshave developed NV-based magnetometers using single spins in bulk diamond [15, 42],in nanodiamonds on scanning tips [14, 53], as well as large ensembles in micron-scaledevices [47, 54, 44]. We will review these developments and the underlying physics inthe remaining sections.
1.3 NV center physics
1.3.1 Group theory and electron orbitals
The NV center arises when a vacant lattice site lies nearest-neighbor to a sub-stitutional nitrogen atom in the diamond lattice [Fig. 1.3(a)]. Two types of suchcenters have been identied, the neutral NV0 center and the singly-charged NV- cen-ter (commonly referred to as the NV center). The latter is of interest to magnetometrybecause it has a spin-one ground state [70] with a long spin-coherence time 1. TheNV- center is widely believed to be comprised of six electrons. Three electrons areconsidered to come from the dangling bonds connecting the vacant site with the threenearest-neighbor (basal) C atoms, two come from the nitrogen-atom's dangling bond,and the other electron is captured from elsewhere in the crystal.
While a complete group theoretical treatment is beyond the scope of this chapter,we provide here a qualitative picture which can be used to understand the basicsymmetry and physics of the electronic levels. Using the linear combination of atomicorbitals technique [atomic orbitals labeled c1, c2, c3, and n as in Fig. 1.3(a)], itis possible to construct a set of four molecular orbitals (MOs) which transform as
1ODMR in the ground state of NV0 has so far been undetectable, perhaps due to Jahn-Tellerdistortion [96].

8
N
C1
x
y
z
(a)
a1
C2C3
ex ey
a1
a1'
ex ey
a1
a1'
ex ey
(b)
(c)Figure 1.3: (a) Schematic of the NV center with nitrogen, vacancy, and three nearest-neighbor carbon atoms. The geometry and atomic labels are those used to derivethe molecular orbitals (MOs). (b) MOs of the three highest-energy single-electronorbitals, a1, ex, and ey. The red (blue) colors denote positive (negative) contributionsto the MO. Adapted from [9] with author permission. (c) Schematic of the six-electronconguration for (left) the ground, e2, and (right) rst-excited, a1e, congurations.The specic wavefunctions depicted here correspond to (left) | exey〉 =| 3A2,ms = +1〉and (right) | a1ex〉 =| 3Ex,ms = +1〉. Note that the lowest-energy level, a′1, ispredicted to lie below the valence band [10] and experiments have established thatthe conduction band is well above the ex, y levels.

9
irreducible representations of the C3v symmetry group [97, 98, 9]:an = n
ac = c1 + c2 + c3
ex = 2c1 − c2 − c3
ey = c2 − c3,
(1.2)
where we have omitted normalization constants. The group-theory-astute readerwill notice that an and ac are invariant under all of the C3v symmetry operationsand therefore transform as the irreducible representation A1. The ex and ey MOstransform as the rank-two irreducible representation, E [21]. The Coulomb interactionbetween the electrons mixes an and ac, leading to a new basis of MOs: a′1, a1, ex, ey,where the ordering is dictated by symmetry and the Coulomb interaction [10, 9, 98]and has been conrmed by ab initio studies [99, 100, 10, 101, 102]. Figure 1.3(b)approximates the a1, ex, and ey wavefunctions using sp3 atomic orbitals taken from[9].
The six electrons ll the MOs from lowest to highest energy following Hund'srules. Figure 1.3(c) depicts the electronic conguration in the ground state, labelede2 to denote the unpaired electronic density, as well as the rst excited conguration,a1e. Higher-order excited states are theoretically possible but have so far not beenobserved in experiments [19, 11].
The total electronic wavefunctions of the coupled-electron system, including spin,are obtained by taking appropriate combinations of MOs using a Slater determinant[97, 9, 98]. The resulting states are compiled in Tab. 1.1, where we have omittedspin-orbit coupling, which is often negligible for NV centers in the presence of typicalstrain elds [103, 104, 105, 106, 92].
1.3.2 Optical selection rules
The selection rules for optical excitation can be determined by considering whichmatrix elements satisfy:
〈ψf |~d · ~E|ψi〉 6= 0, (1.3)
where ψi and ψf are, respectively, the initial and nal electronic wavefunctions, ~d isthe electric dipole moment, and ~E is the optical electric eld. The rst selection rulewhich is readily observed from Eq. (1.3) is that ψi and ψf must belong to dierentelectronic congurations (i.e. e2 ↔ a1e). This is because ~d · ~E must change one of thesingle-electron orbitals in order for the dipole moment to exist. This selection rulecan be violated in the presence of electron-vibration or spin-orbit interactions [9, 98],a topic beyond the scope of this chapter.
Another important selection rule is that the electronic spin, S, and its axial pro-jection, ms must be conserved, in the absence of spin-orbit coupling. This selection

10
Conguration C3v term Spin, S Orbit ms Wavefunction
e2
3A2 1 Singlet0 | exey〉+ | exey〉−1 | exey〉+1 | exey〉
1E 0X
0| exex〉− | eyey〉
Y | exey〉− | exey〉1A1 0 Singlet 0 | exex〉+ | eyey〉
a1e
3E 1
X0 | a1ex + a1ex〉−1 | a1ex〉+1 | a1ex〉
Y0 | a1ey〉+ | a1ey〉−1 | a1ey〉+1 | a1ey〉
1E 0X
0| a1ex〉− | a1ex〉
Y | a1ey〉− | a1ey〉
Table 1.1: Electronic levels of the NV center in the ground (e2) and rst-excited (a1e)congurations. The wavefunctions refer to the MOs of the two unpaired electrons,with bars (lack of bars) denoting an electron in the ms = −1/2 (ms = +1/2) state.The spin quantization axis is the symmetry axis of the NV center, labeled z in Fig.1.3(a).
rule may be counterintuitive to readers working with alkali atoms, in which the spin-orbit interaction can be many THz and therefore total spin projection can be alteredoptically. In the NV center, spin-orbit coupling does split the 3E orbitals by ∼ 5 GHz[106], so at low temperature and in the absence of strain ∆ms = ±1 optical transi-tions are allowed and have served as the basis of a recent spin-photon entanglementexperiment [92]. However under most operating conditions, either phonon-inducedorbital averaging in the 3E excited state [107, 106, 108] or strain shifts due to localenvironment overwhelm the spin-orbit coupling, and consequently the probability for∆ms = ±1 transitions is typically less than 1% of that of the allowed transitons[91, 92]. Another way to realize spin-non-conserving optical transitions is to tunemagnetic sublevels to a near degeneracy either in the ground state, as rst seen in[109], or in the excited state [105, 110].
Group theory gives us a convenient way to evaluate which of the rest of the matrixelements satisfy expression (1.3). Suppose ~d· ~E, ψi, and ψf transform as C3virreduciblerepresentations F , G, and H, respectively. Then expression (1.3) will only be satisedif the tensor product F⊗G⊗H includes the symmetric representation, A1. Intuitivelythis can be seen because if the inner product is an odd function then integration overall space will give zero net contribution. For C3v symmetry, the position operator ztransforms as A1, and x, y transform as Ex,y. Table 1.2 displays the optical selection

11
A1 A2 Ex Ey
A1 x yA2 x yEx x x x, z x+ yEy y y x+ y y, z
Table 1.2: Light-polarization axes for allowed optical transitions. Note: A1 ↔ A1 isforbidden to rst order because it would require altering the electronic congurationtwice (e2 ↔ a1a1) and A2 ↔ A2 is forbidden because there is only one A2 level in thebandgap.
A1 A2 EA1 A1 A2 EA2 A2 A1 EE E E A1 + A2 + E
Table 1.3: Products of C3v symmetry states.
rules for dierent light polarizations for each of the possible C3v terms, A1, A2, Ex,y.Table 1.3 shows the multiplication table used to make these calculations.
1.3.3 Absorption and uorescence spectra
Until now we have considered only radiative optical transitions. However phononsalso play an important role in both the optical transitions and spin dynamics of the NVcenter. The most obvious example is in the absorption and laser-induced-uorescencespectra shown in Fig. 1.4. It is well established that the ground state of the NVcenter is 3A2(e2) [71]. Owing to the optical selection rules discussed in Sec. 1.3.1,the only fully-allowed optical transition out of the ground state is to 3E(a1e). Thistransition can be excited resonantly at 637 nm [73], but it turns out that at roomtemperature a more ecient way to excite this transition is to use green, or evenwhite, light.
To understand why this is the case, we model the 3A2 and 3E levels as harmonicwells with discrete vibrational levels, as illustrated in Fig. 1.4(a). In thermal equilib-rium at room temperature, about 90% of NV centers will be in the lowest vibrationallevel, corresponding to an eective vibrational spacing of ∼ 50 meV 2. Accordingto the Franck-Condon principle, the most probable vertical transitions are to theturning point in the 3E harmonic well, which corresponds to about 4 vibrationalquanta (∼ 0.2 eV). Such a large shift occurs because the e2 and a1e congurations
2We say here eective energy splitting because in reality these vibrational levels are so stronglycoupled to the continuum of delocalized phonons that there are no clearly discrete levels.

12
500 550 600 650 700 750 8000
20
40
60
80
0
2
4
6
8
Wavelength (nm)A
bsor
ptio
n co
effic
ient
(cm
-1)
Fluo
resc
ence
(arb
. uni
ts)
NV- ZPL,637 nm
NV- PSB,fluorescence
NV- PSB,absorption
NV0 ZPL,575 nm
Coordinate
Ener
gy
3A2
3E
PSBexcitation
PSBfluorescence
ZPL637 nm
(a) (b)
~50 meV
Figure 1.4: (a) Schematic illustrating the Franck-Condon principle for excitation anduorescence of the main optical transition, 3A2 ↔ 3E. Non-radiative decay is shownwith dashed lines. (b) Room-temperature optical absorption and uorescence (excitedat 532 nm) spectra for an HPHT diamond with [NV-] ≈ 15 ppm. Besides the spectralfeatures attributed to the NV- center discussed in the text, the weak line at 575 nmis present from the NV0 ZPL. PSBPhonon sideband, ZPLzero-phonon line.
have signicantly dierent nuclear coordinates, which has been conrmed in ab initiostudies [111]. This accounts for the broad peak in the absorption spectrum in Fig.1.4(b) at around 560 nm. This broad peak is known as the phonon sideband (PSB),since the NV center nearly immediately decays back to the ground vibrational level in3E non-radiatively. The same principle holds for emission, producing the maximumuorescence on the PSB at ∼ 700 nm. The resonant transition occurs at 637 nmbetween the ground vibrational levels in both 3A2 and 3E, and is consequently calledthe zero-phonon line (ZPL).
Based on the absorption spectrum, it is possible to estimate the electron-phononcoupling parameter, also known as the Huang-Rhys factor [112], S = − ln(IZPL/Itot),where IZPL and Itot refer to the integrated absorption intensities after normalizationby the light frequency 3. Analysis of the data in Fig. 1.4(b) gives S = 3.9(3) [12],which is comparable to values seen elsewhere in the literature [114, 73]. The Huang-Rhys parameter physically corresponds to the mean number of vibrational quantainvolved in the optical transition.

13
3A2
3E1E
1A1
0
-1+1
1042 nm637 nm
2.87 GHz
0-1
+1
ms
~10 ns
d1 ns
~150 - 450 ns
Figure 1.5: Level diagram for the NV center showing spin-triplet ground and excitedstates, as well as the singlet system involved in intersystem crossing. Radiative tran-sitions are indicated by solid arrows and non-radiative transitions by dashed arrows.Only those transitions conrmed by experiments are shown. The tentative label of theupper (lower) singlet as 1E (1A1) is based on the observed spin-selective decay paths(see text). Lifetimes of the excited levels are also shown as measured in [11], with thelower singlet lifetime being temperature dependent (∼ 220 ns at room temperatureand ∼ 450 ns at 5 K).
1.3.4 Intersystem crossing and optical pumping
One of the crucial features of nitrogen-vacancy centers for practical magnetometryis that they can be optically pumped and interrogated using visible light over a broadrange of wavelengths (∼ 480-640 nm). Figure 1.5 shows the level diagram withenergy levels and allowed transitions labeled according to a recently proposed model[19, 102, 11]. As discussed in Sec. 1.3.3, the center's ground state is a 3A2 spintriplet and optical transitions are with a spin-triplet excited state, 3E, with ZPLat 637 nm. In thermal equilibrium at temperatures above ∼ 1 K, the ground statesublevels are nearly equally populated. After interaction with suciently intense lightexciting the 3A2 → 3E transition, the ms = ±1 sublevels become depopulated, andeventually 80% or more of the total population accumulates in the ms = 0 groundstate [115, 55, 89, 116, 117].
This occurs because at least one singlet level lies close in energy to 3E, and spin-orbit coupling induces triplet-singlet intersystem crossing (ISC). Experiments haveshown that NV centers in the ms = ±1 magnetic sublevels have signicantly higher
3While this relationship is only strictly correct at zero-temperature where quadratic electron-phonon coupling is suppressed, it was shown in Ref. [112] that, for NV- centers, the temperature-dependence of S is weak. The ZPL does narrow considerably, eventually reaching the limit set bythe spontaneous emission rate, ∼ 13 MHz [113], but the integrated area remains roughly the same.

14
probability to undergo ISC [19, 11, 44, 117]. NV centers which undergo ISC thendecay to another, longer-lived singlet level (ZPL at 1042 nm) [19, 11, 44], after whichthey cross over predominately to the ms = 0 sublevel of the 3A2 ground state.
By determining the optical polarization selection rules (Tab. 1.2), experiments[11] have shown that the levels involved in the ISC include 1E and 1A1
4. Howeverthe ordering of these levels is still under debate. If the ISC involves only symmetricvibrations (i.e. phonons that transform as A1), the observed spin polarization inms = 0 leads to the prediction that the lower, longer-lived singlet is 1A1. This isbecause ms = 0 transforms as A2, while singlets transform as A1, and, in the group-theoretic language of Sec. 1.3.1, 〈3A2,ms = 0 | A1 | 1A1〉 6= 0 because (A2⊗A2)⊗A1⊗(A1⊗A1) = A1. Similarly, ms = ±1 transform as E, so 〈3A2,ms = ±1 | A1 | 1A1〉 = 0because (A2⊗E)⊗A1⊗(A1⊗A1) = E. The reader can verify that if the lower singletwere 1E then spin polarization would be in ms = ±1 under the same symmetricphonon assumption. This ordering of levels is supported by some recent ab initiocalculations [102]. However, the ordering is still debated because it is known thattransverse phonons (which transform as E) do play a role in the NV center's spindynamics [108], and some theoretical calculations predict the 1A1 singlet to lie closestin energy to 3E [101, 9].
Regardless, it is clear that optical excitation results in spin polarization into ms =0. Furthermore, as the ISC mechanism is mostly non-radiative [19, 11], NV centersin ms = 0 have a higher probability (per excitation cycle) for uorescence than thosein ms = ±1. For dilute samples this uorescence contrast can be as high as 30%,limited by the dierence in branching ratios between ms = 0 and ms = ±1 into andout of the singlet system [104, 14]. This spin-selective uorescence serves as the basisfor optical readout in most magnetometry schemes to date [14, 15, 42, 54, 47, 53, 48].
1.3.5 Ground-state level structure and ODMR based magne-tometry
The level structure in the 3A2 ground state is governed by the Hamiltonian Htot =HS + HSI + HI , where HS refers to the part which aects only the electronic spin(S = 1), HSI is the hyperne coupling to the nitrogen nucleus (I = 1 for 14N) 5, and
4We note that there exists some evidence that a third level may be involved in the ISC, thoughthe nature of this level is still unknown [11, 117].
5In natural abundance, nitrogen is composed of 99.6% of 14N, with spin I = 1, and 0.4% of 15N,with spin I = 1/2. We choose to treat only the more naturally abundant 14N nuclei, though therehas been some work related to selective implantation and growth of 15NV centers [17].

15
HI is the nuclear portion. These terms can be written as 6:HS = DS2
z + E(S2x − S2
y) + gsµB ~B · ~SHSI = A‖SzIz + A⊥(SxIx + SyIy)
HI = PI2z − gIµN ~B · ~S,
(1.4)
where µB is the Bohr magneton, µN is the nuclear magneton, and the other coecientsare dened in Tab. 1.4, along with experimental values.
Coecient Description Value Ref.D axial ZFS parameter 2.87 GHz [118]E transverse ZFS parameter kHz−MHz [77, 118]gs electron-spin g-factor 2.003 [55]A‖ axial hyperne constant −2.16 MHz [119]A⊥ transverse hyperne constant −2.7 MHz [55]P quadrupole splitting parameter −4.95 MHz [119, 120]gI nuclear-spin g-factor 0.403 [55]
Table 1.4: Coupling coecients for the ground-state Hamiltonian in Eq. (1.4) atroom temperature. We use units where Planck's constant, h = 1. ZFSzero-eldsplitting.
Figure 1.6(a) displays the ne and hyperne structure of the 3A2 ground state.The ground state is split by D ≈ 2.87 GHz due to spin-spin interaction between theunpaired electrons [70, 118]. Here we take E = 0, conserving perfect C3v symmetry,and discuss the eect of non-zero E in Sec. 1.3.6. In the presence of a small axialmagnetic eld, Bz << D/(gsµB), the |ms = ±1〉 levels split, each one shifting bymsgSµBBz. Additional structure due to coupling to 14N nucleus is shown withmI = 0level separated from mI = ±1 by P ± A⊥.
The selection rules for magnetic dipole transitions are ∆ms = ±1 and ∆mI = 0.These transitions can be driven by an oscillating magnetic eld oriented perpendic-ular to the NV axis. For a single NV center, there are six allowed transitions, asindicated in Fig. 1.6(a). For ensembles, there are four dierent NV orientations and,since only the projection of a small magnetic eld on the N-V axis aects the tran-sition frequency, this leads to four shifted copies of the single spectrum. For specialmagnetic eld orientations (i.e. along the [100] crystal orientation), Bz is the samefor all four NV orientations, producing only six resonances. However for most eldorientations, Bz is dierent for each N-V orientation, and consequently there are 24
6While, in natural abundance, 98.9% of C atoms are 12C (I = 0), some NV centers also have anearby 13C atom, and consequently further level structure can exist and has been studied extensively[70, 10, 55]. We will not consider these special centers here, instead focusing on decoherence andline broadening due to coupling to the bath of randomly located 13C spins in Sec. 1.3.7.

16
(a)
Microwave frequency [GHz]
% C
han
ge
in fl
uo
resc
ence
2.80 2.85 2.90 2.95
D
0
-0.1
-0.2
-0.3
-0.4
-0.5
spin-spin
|mI=+−1>
2gs ΜBBz|mI=0>|mI=+1>|mI=-1>
|mI=0>Zeeman
|ms=+1>
|ms=-1>
|ms=+−1>
|ms=0>14N hyperfine
|2A||||P-A|||
|P-A||||2A|||
|P|
|mI=0>|mI=-1>|mI=+1>
(b)
Figure 1.6: (a) Ground state level structure of the NV center under a small axialmagnetic eld. Allowed magnetic dipole transitions are shown with double-headedarrows. The values for the 14N hyperne splitting can be found in Tab. 1.4. Thenuclear Zeeman eect is not included and E is taken to be zero here. (b) ODMRspectrum (excited at 532 nm) for a low-defect-density CVD diamond [12]. The 24separate resonances correspond to two dierent |∆ms| = 1 transitions, four dierentNV orientations, and three dierent 14N mI levels. The spectrum for each orientationare shifted due to an applied eld of ∼ 50 G. Arrows connect resonances of a givenorientation.

17
dierent resonances. This feature makes diamond magnetometers fundamentally vec-tor magnetic sensors, enabling measurement of not only the magnitude but also thedirection of an external magnetic eld [20, 13, 121, 47, 54].
A uorescence detected magnetic resonance spectrum of such a scenario is shownin Fig. 1.6(b). When the microwave frequency is o resonance, optical transitionsare predominately from | 3A2,ms = 0〉 ↔| 3E,ms = 0〉 and the uorescence is atmaximum intensity. When the microwaves are tuned to resonance, population istransferred to ms = ±1, resulting in non-radiative ISC and consequently diminisheduorescence intensity. This is the basic principle of operation of most diamond-basedmagnetometers to date [14, 15, 42, 54, 47, 44, 48, 53].
1.3.6 Eect of zero-eld splitting on sensitive magnetometry
As seen in Tab. 1.4, the largest term in H is given by the axial zero-eld splittingparameter, D. The origin of D is expected to be predominately due to dipolar spin-spin coupling between the two unpaired electrons forming the center [70, 97, 122, 118],
D ∝ 〈(r212 − 3z2
12)/r512〉, (1.5)
where r12 is the displacement between the two spins, and z12 is the component of r12
along the N-V symmetry axis.Recently [118], it was discovered that D is highly dependent on temperature near
room temperature with a slope dD/dT ≈ −75 kHz/K. In that work, it was proposedthat a likely mechanism for the temperature variation is local lattice expansion, whicheectively changes the displacement of the electronic spins, r12. The sharp temper-ature dependence of D presents a technical challenge for room-temperature magne-tometry. Even if the ambient temperature can be controlled at the 1-mK level, thiswould lead to uctuations in the resonance frequency of 80 Hz corresponding to amagnetic-eld variation of 3 nT. Monitoring both of the ∆ms = ±1 resonances couldprovide a mechanism for controlling this eect, since the energy dierence betweenthese resonances depends only on the magnetic eld projection and not depend on D.Alternatively, using two phase synchronized microwave tones [92] to produce coher-ence and observe precession directly amongst the ms = ±1 levels could be employed7.
The presence of non-zero transverse splitting parameter, E, produces anotherchallenge for sensitive magnetometry. The E parameter arises from interaction withstray electric elds in the lattice. A slight mixing in the ground state with Ex and Eyexcited-state orbitals produces a transverse dipole moment of order 10 Hz/(V/cm)
7While these schemes would mitigate deleterious eects of non-zero dD/dT , any temperaturevariation in gs would still produce magnetometer noise, particularly in applications which look forsmall deviations on top of a large DC eld. While dgs/dT has not yet been studied, recent NV-ensemble magnetometry results [44] demonstrating ∼ 10 nT/
√Hz sensitivity under a 4 mT bias eld
are promising.

18
[123]. Neglecting interaction with the nitrogen nucleus, and diagonalizing HS undera small axial magnetic eld, Bz, the allowed microwave transition frequencies, ν±, areobtained:
ν± = D ±√E2 + (gsµBBz)2. (1.6)
From this equation, we can see that transition frequencies are only quadratic in themagnetic eld for |Bz| . E/(gsµB). In order to measure small variations in magneticeld, it is therefore necessary to apply an axial bias eld, |Bz| >> E/(gsµB).
In high-purity samples that have not undergone irradiation or implantation, thelocal electric elds can be relatively small, corresponding to kHz-scale E values [106,124]. In such samples, which are best suited for single-NV magnetometers, only amoderate 100 µT-scale bias eld is necessary to reinforce magnetometer linearity.Using a current source with a stability of ppm/
√Hz would be sucient to achieve
the sub-nT/√
Hz required for many applications 8.In high-defect-density samples necessary for ultra-sensitive ensemble magnetome-
ters [12], typical E values are MHz-scale and highly variable from center-to-center,leading to inhomogenous broadening of the magnetic-resonance lines and quadraticeld sensitivity for small elds. In this case the bias eld typically needs to be of order1 mT. Such bias elds are dicult to control at the sub-nT/
√Hz level, and ultra-low-
noise current sources [125] may be required. Alternatively, gradiometry techniques[44] which cancel common-mode magnetic noise can be employed to overcome thisproblem.
1.3.7 Interaction with environment
The NV center's spin is largely decoupled from the lattice, and the main sourcesof decoherence (characterized by T2 and T ∗2 timescales) are from the paramagnetic-impurity spin bath (which dominates for high nitrogen concentration) and interactionswith spin-1/2 13C nuclei [13, 126, 127, 128, 42, 12]. Population decay (characteristictimescale T1) is primarily dominated by interaction with lattice phonons [129, 127].Under most doping conditions, T1 >> T2 >> T ∗2 , in stark contrast to dense alkalivapor where these timescales are often nearly equal. Below, we give a brief overviewof contributions to dephasing and techniques to reach the T2 and even T1 limit.
1.3.7.1 Contributions to T ∗2
A well-known cause of spin dephasing is due to dipolar hyperne coupling withnearby 13C nuclear spins (natural 1.1% abundance s). These nuclear spins are largely
8In fact, if ODMR linewidths are suciently narrow, such that hyperne structure can be re-solved, one can do away with the bias eld almost entirely. This is because themI = ±1 sublevels areinsensitive to strain and do split linearly with magnetic eld even near zero eld [124]. In this case,a zero-eld magnetometer could be realized by using circularly polarized microwaves to selectivelyexcite the relevant ∆ms = ±1 coherences [20].

19
unpolarized [130] and produce dierent eective magnetic elds at the site of each NVcenter, leading to inhomogenous broadening of ensemble resonances. Even single NVcenters are aected by the 13C spin bath since the unpolarized nuclei precess in thepresence of applied or nearby-defect-induced elds, producing a superposition of time-varying magnetic elds with random phase [126]. Based on experiments with singleNV centers, this contribution to the spin relaxation rate is γC ≈ 106 s−1 [87, 128, 42],and similar results have been reported for ensembles [12, 55]. At very low magneticelds, |Bz| << E/(gsµB), the NV center is relatively immune to Zeeman shifts (Sec.1.3.6), and extremely long values of T ∗2 ≈ 40 µs have been observed formI = 0 nuclearspin sublevels in single NV centers [124]. Unfortunately this regime is not suitable formagnetometry for the same reason T ∗2 is long (i.e. insensitivity to magnetic elds).A more promising route is to fabricate isotopically pure diamond, where even longerT ∗2 times are possible [128, 42].
For dilute samples, the contribution of NV-NV- dipolar interactions to the magnetic-resonance broadening can be approximated by assuming that each NV- center couplesto only the nearest-neighboring NV- center. For an ensemble, this dipolar couplingleads to a spin-relaxation contribution on the order of γNV ≈ (gsµB)2nNV , wherenNV is the NV- concentration [13, 12]. For [NV-] = 15 ppm, this corresponds toγNV ≈ 106 s−1 ≈ γC . For ensemble magnetometry using natural-carbon-abundancematerial, it is worth noting that increasing [NV -] beyond this level would not improvemagnetometer sensitivity, since now 1/T ∗2 ∝ nNV [recall Eq. (1.1)].
A gure of merit for fabricating optimized diamond samples for ensemble work isthe nitrogen-to-NV- conversion eciency. It is generally assumed that two nitrogenatoms are required to form an NV- center, one to contribute the actual atom andthe other to serve as the donor [131, 12]. The remaining N+ is not paramagnetic,but the NV centers and any unconverted nitrogen atoms are. For suciently highnitrogen concentration and nitrogen-to-NV- conversion eciency of less than 33%,unconverted nitrogen is the main source of NV- dephasing and dominates over γC .Similarly to the estimate for NV-NV- interactions, the characteristic timescale forthis dephasing is γN ≈ (gsµB)2nN , where we ignore the small dierence in g-factorsbetween NV- and nitrogen [70]. Conversion eciencies of ∼ 20% [12, 132] are nowroutine for large ensembles, and even higher conversion eciencies are possible undersome conditions [133].
1.3.7.2 Refocusing the dephasing
Coherent-control techniques can improve the sensitivity for kHz-scale AC elds.As nuclear spins are well-protected from the environment, the characteristic corre-lation times for nuclear spin ips are long compared to T2 of the NV center. Aspin-echo pulse sequence [134] can be employed to remove the eect of these slowly-varying environmental perturbations. Figure 1.7 shows a timing diagram for such apulse sequence. NV center are rst prepared in the ms = 0 state and then precess due

20
π/2 π/2π
polarize detect
b(t)=b0Sin(2πt/τ)AC field
Light
Microwaves τ/2τ/2
Nuclear field 1/Ωn
Figure 1.7: Optical and microwave spin-echo pulse sequence used for sensing an ACmagnetic eld, b(t). NV centers are rst polarized into the ms = 0 sublevel. Acoherent superposition between the states ms = 0 and ms = 1 (or alternativelyms = −1) is created by applying a microwave π/2 pulse tuned to this transition.The system freely evolves for a period of time τ/2, followed by a π refocusing pulse.After a second τ/2 evolution period, the electronic spin state is projected onto thems = 0, 1 (or ms = 0,−1) basis by a nal π/2 pulse, at which point the groundstate polarization is detected optically via spin-dependent uorescence. The optimalsensitivity is achieved for τ ≈ T2, making this magnetometry scheme ideal for kHz-scale AC elds. The DC magnetic eld is adjusted to eliminate the contribution ofthe randomly phased eld produced by 13C nuclear spins (Larmor period, 1/Ωn) bychoosing τ = 2n/Ωn, for integer n.

21
to a resonant π/2 microwave pulse9. During this precession window, the nuclear spinsalso precess, in the presence of a bias magnetic eld, with random phase at angularfrequency Ωn. If this precession is not synchronized with the echo sequence then itleads to a time-varying magnetic eld which dephases the NV center. However, if theecho sequence is timed such that the interval between pulses, τ/2 is commensuratewith an integral number of nuclear spin Larmor periods, the overall phase accumu-lation due to the nuclear eld is refocused leading to a revival in the NV coherence[135]. We note that to realize maximum refocusing, it is necessary to position the biaseld along the NV axis to within a few degrees to ensure that nuclear spins precessuniformly [86, 126, 56].
In essence, the spin echo technique enables extension of the interrogation timefrom the limit set by T ∗2 up to a value T2 that is close to the intrinsic spin coherencetime, at the cost of reduced bandwidth and insensitivity to magnetic eld frequencies. 1/T2. These techniques have been used to improve the sensitivity of diamondmagnetometers by more than an order of magnitude to kHz-scale AC elds of knownphase [14, 15, 42, 56] as well as more modest improvements in sensitivity to randomlyuctuating elds [136, 137].
Other pulse sequences can be used to further decouple the NV center from its envi-ronment. Examples include Manseld, Rhim, Ellis and Vaughan (MREV) sequencesto refocus NVNV coupling [13, 138] and Carr-Purcell-Meiboom-Gill (CPMG) orUhrig dynamic decoupling (UDD) pulse sequences to further reduce coupling to allenvironmental spins [13, 136, 139, 140]. Using these techniques, room-temperatureT2 times of a few ms have been realized using ultrapure diamond [139, 140] and afew hundred µs for nitrogen-rich HPHT diamond [101]. The ultimate limit, of course,is T1 relaxation due to interaction with the lattice. In most samples, at room tem-perature, T1 ≈ 10 ms, but it is highly temperature dependent [129, 115, 127], andlow-temperature devices with coherence times of seconds, or even minutes, may bepossible.
1.4 Experimental realizations
Most demonstrations of diamond magnetometry to date can be grouped intothe following categories: near-eld scanning probes, far-eld sub-wavelength probes,wide-eld array magnetometers, and bulk micron-scale sensors. For the remainder ofthis chapter, we review the state of the art and discuss magnetometer design princi-ples.
9For completeness, we must mention that if one considers all three levels in the ground state, thispulse is really not a π/2 pulse. It is only a π/2 pulse in a reduced space which includes only thems = 0 and one of the ms = ±1 levels. Confusion over this language prompted Maurice Goldman,one of the pioneers of magnetic resonance, to call such a pulse a so-called π/2 pulse.

22
(a) (b)
Figure 1.8: Illustration of high-spatial-resolution magnetometry with a diamondnanocrystal. (a) The dipolar elds from spins in the sample decay rapidly withdistance; only those within a distance ∼ ro contribute to the observable signal for thepoint-like NV center. The inset shows how Bmax (the magnetic eld produced by fullypolarized nuclei) and Brms are related; when few spins are involved, the statisticaluctuations become large. (b) In the presence of a magnetic-eld gradient (eld linesin grey), only the spins from a small region of the detection volume are precessingat the frequency band center of the detector, enabling even higher spatial resolution.Adapted from [13].
1.4.1 Near-eld scanning probes and single-NV magnetome-try
Perhaps the most conceptually simple implementation of a nanoscale magnetome-ter is using a near-eld scanning-probe technique. A nanodiamond with a single NVcenter is placed at, for example, the end of an atomic-force microscope (AFM) and theresonance frequency (or for AC measurements, the spin echo amplitude) is monitoredusing the ODMR techniques described in Sec. 1.3. The probe is scanned laterallyjust above the sample of interest in order to produce a multi-dimensional map of themagnetic eld produced by spins in the sample. In some situations it may also bepossible to attach the sample on the probe and scan over the surface of the diamond.Such a system is called near-eld because its spatial resolution is limited only bythe distance between the NV center and the object of study, not by the diractionlimit set by the wavelength of the uorescence light.
One of the primary goals of these near-eld scanning probes is to detect the signalfrom a small ensemble of nuclear or electronic spins in the sample of interest. The ul-timate limit would be to detect the signal from a single electronic spin [39], or perhapseventually a single nuclear spin [41, 13]. To see how this may be possible, consider amaterial with a varying nuclear spin density ns(~r) that is brought in close proximity(distance ∼ r0) to the NV center [Fig. 1.8(a)]. Even at cryogenic temperatures, thethermal nuclear spin polarization of the material is small. However, because only a

23
few spins are involved, the distribution of spin congurations leads to an appreciablevariance in the spin polarization [141], proportional to
√N , where N ≈ r0
3ns is thenumber of nuclear spins which the sensor is able to detect.
More precisely, this statistical polarization produces a substantial, albeit randomlyoriented, magnetic eld with projection along the NV axis of [41]:
Brms ≈γn2
∫d3~r
ns(~r)(1− 3 cos θ(~r))
|~r|6
1/2
, (1.7)
where γn is the nuclear gyromagnetic ratio, θ(~r) is the angle between r and theNV axis at location r, and we have assumed the nuclei are protons (spin I = 1/2).In a typical organic molecule the protons are separated by about one angstrom, sons ≈ 1023 cm−3. If the NV center could be positioned r0 = 20 nm from the molecule,the magnetic signal calculated from Eq. (1.7) would be Brms ≈ 100 nT, which isequivalent to the eld from ∼ 300 proton magnetic moments located 20 nm fromthe NV center. Such a uctuating eld amplitude is theoretically detectable by asingle-NV magnetometer with less than one millisecond of signal averaging (see Fig.1.1) using an appropriate detection scheme [13, 45, 136, 137].
Further spatial resolution, potentially down to the single-spin level is possible byemploying a large magnetic-eld gradient, to encode spatial information spectrally, asis commonly employed in conventional MRI. Using similar techniques to those used inmagnetic resonance force microscopy [59], a magnet near the surface of a substrate canproduce gradient elds of order dB
dr≈ 106 T/m [Fig. 1.8(b)]. The narrow kHz-scale
bandwidth of an AC diamond magnetometer (∼ 1/T2) [15], enables it to spectrallydistinguish two protons separated by a magnetic-eld dierence of ∆B ≈ 0.1 mT,corresponding to physical separation of dB
dr∆B≈ 0.1 nm. This implies that individual
proton detection may be possible even in organic and biological molecules.In one of the rst demonstrations of the near-eld approach performed at Stuttgart
[14], a nanodiamond was attached to the tip of an AFM tip [shown schematically inFig. 1.9(a)], and uorescence was collected by confocal microscopy using light from a532 nm laser (coming from below the substrate). A nickel micro-magnet [optical imagein Fig. 1.9(b)] was placed on a clear substrate and the near-eld diamond nanoscopewas scanned in the two lateral dimensions. A microwave eld with frequency 2.75 GHzwas applied, and the NV− uorescence was recorded. The nickel magnet produceda large eld gradient such that the microwaves were only on resonance with the NVcenter's ms = 0 ↔ ms = −1 transition in a narrow (∼ 20 nm wide) region near themagnet, producing a thin dark region in uorescence as NV centers in this regionwere driven to the darker ms = −1 sublevel [Fig. 1.9(c). In the same work, gradientimaging was performed where the magnet was scanned rather than the diamond,producing resonance rings ∼ 4 nm wide.
At the same time, work was performed at Harvard in AC magnetometry withsingle NV centers both in bulk as well as in nanodiamonds. There, the principle of

24
(a)
(b)
(c)
Figure 1.9: (a) Diagram of the magnetic eld imaging experiment in [14]. A nanoscalemagnetic particle (red) is imaged with a single nitrogen-vacancy defect (green, withinthe blue nanocrystal) xed at the scanning probe tip (black). A microscope objectiveis used to focus light from a 532 nm laser on the NV center, exciting the 3A2 → 3Etransition on the phonon sideband. The same objective collects uorescence (i.e. con-focal microscopy), which is then spectrally ltered and directed to photodetectors.(b) Fluorescence map in the vicinity of the nickel magnet, recorded using a singleNV center on the AFM tip as light source and magnetometer. The triangular shapedmagnet is black because laser light is reected o the magnet and consequently nouorescence is collected in this region. Inset (c), the uorescence signal from thescanned nitrogen-vacancy center attached to the apex of the AFM tip when resonantmicrowaves at 2.75 GHz are applied. The arrowed point corresponds to 5 mT reso-nance line with the magnetic eld tilted by 45 relative to the nitrogen-vacancy axis.Adapted from [14].

25
(a)
(b)
(c)
Figure 1.10: (a) Spin-echo measurement for a single NV center more than 1 µm belowthe diamond surface. The normalized echo signal corresponds to a fractional changein the NV center's uorescence. Maximal signal corresponds to an average of 0.03detected photons during the 324-ns photon counting window of a single experimentalrun. Collapses and revivals are due to interactions with the 13C nuclear spin bath.The revivals occur at half the rate of the Larmor frequency of 13C (here set byBDC = 22 G). The spin-echo signal envelope was tted with an exponential decayfunction modulated by a strongly interacting pair of nearby 13C (Methods in [15].Magnetometer sensitivity experiments are performed at spin-echo revival peaks tomaximize signal. (b) Examples of measured spin-echo signal as a function of BAC
for two operating frequencies, 3.15 kHz (red) and 4.21 kHz (blue), corresponding torevivals 1 and 2 indicated in a. Each displayed point is a result of 7 × 10⁵ averagesof spin-echo sequences. The magnetometer is most sensitive to variations in the ACmagnetic eld amplitude (δB) at the point of maximum slope, with the sensitivitybeing limited by the uncertainty in the spin-echo signal measurement (δS). The cosinebehavior of the signal with respect to AC magnetic eld amplitude can be changed toa sine by adjusting the phase of the third microwave pulse by 90. This change movesthe point of maximum magnetometer sensitivity to near zero AC eld amplitude.(c) Measured sensitivity of a single NV magnetometer in a bulk diamond sampleover a range of frequencies for the external AC magnetic eld after averaging for onesecond. Error bars, standard deviation (s.d.) for a sample size of 30. Also shown is thetheoretically predicted sensitivity (solid blue line), with the shaded region representinguncertainty due to variations in photon collection eciency. Measurements werecarried out at two dierent DC elds, BDC = 13 G (red) and 22 G (green). Adaptedfrom [15].

26
AC magnetometry was demonstrated, based on spin-echo sequences (Sec. 1.3.7.2).The echo signal as a function of delay time between pump and probe pulses, τ , for asingle NV center deep into a bulk crystal is shown in Fig. 1.10(a). An AC magneticeld was then applied, and the time between pumping and probing, τ , was tunedto coincide with one of the revivals in signal due to the nuclear spin bath. Figure1.10(b) shows the echo signal as a function of AC eld amplitude for two magneticeld frequencies, 3.15 and 4.21 kHz. Optimal magnetic sensitivity occurs where theecho signal has maximum slope, and this point can be chosen to coincide with zeroAC eld by altering the relative microwave pulse phases. Figure 1.10(c) displays themaximum magnetic sensitivity, which peaks at ∼ 30 nT/
√Hz, for this NV center as
a function of eld frequency. 10
In subsequent work at Stuttgart [42] using isotopically pure diamond, a sensitivityof ∼ 4 nT/
√Hz to AC elds and ∼ 0.5 µT/
√Hz to DC elds was demonstrated for
a single NV center deep in the lattice. Recently, a broadband magnetometer using asingle NV center in a nanodiamond on an AFM tip was demonstrated using frequencymodulation techniques combined with real-time feedback [53]. The sensitivity wasonly a few µT/
√Hz, but a bandwidth from DC to ∼ 0.3 MHz was shown to be
possible, which is an important feature for many applications.
1.4.1.1 Sensitivity and limitations
The primary limitation in all uorescence based magnetometers is uorescencecollection eciency and limited signal contrast. For suciently low measurementcontrast, R (relative dierence in detected signal depending on spin-projection), thesensitivity using the uorescence technique can be estimated [13, 12, 44] by modifyingEq. (1.1) as δBfl ≈ δBq/(R
√η), where η is the detection eciency and δBq is the
spin-projection-noise-limited minimum magnetic eld. Recent single-NV experiments[14, 15, 42] yielded typical values of R ∼ 0.2 and η ∼ 0.001, making the best possiblesensitivity, in the absence of excess technical noise or other broadening mechanisms,2-3 orders of magnitude worse than the spin-projection-noise limit. For ensemblesthe contrast is even worse (R ∼ 0.04) owing to background uorescence from centersbelonging to other orientations or charge states which are out of resonance [47, 54, 44].The contrast is limited by non-ideal branching ratios into and out of the dark singletstates [104, 19, 11, 117], while η is limited by the eld of view of the detection opticsand sub-unity quantum eciency of the detected transition [142, 52].
There has been signicant eort in the last few years to increase the collectioneciency by engineering nanoscale waveguides [143, 52, 144], using solid-immersionlenses made of diamond [145, 146, 147], or even coupling to metal plasmons [148,149, 150]. While some of these techniques appear promising for future applications,
10In work with nanodiamonds, it was seen that T2 times were only a few µs, and consequentlyrevivals due to the nuclear bath were not observed. Nonetheless a eld sensitivity of ∼ 0.5 µT/
√Hz
to 380 kHz AC elds was demonstrated for a ∼ 30 nm nanodiamond.

27
Pump532 nm
STED700 nm
Pump
STED
Detect
rmin<50 nm
3E
3A
a) b) c)
Figure 1.11: (a) Level diagram and optical transitions for the STED scheme. A greenpump laser excites NV center's into the 3E excited state and a depletion beam at700 nm stimulates emission, quenching uorescence. (b) Timing diagram of STEDfor pulsed operation. Continuous-wave operation is also possible as shown in (c).The spatial prole of the pump and STED beams during cw excitation. The leveldiagrams show that in the intense portion of the STED beam, all NV centers are inthe ground state, whereas at the optical vortex, a signicant population of NV centersexists in the excited state.
there are still several orders of magnitude room for improvement before reachingfundamental sensitivity limits.
Another challenge is to obtain long coherence times for NV centers near to thediamond surface. Currently T2 in nanodiamonds or implanted NV centers within∼ 10 nm from the surface is just a few µs, limiting the fundamental sensitivity. Assuch NV centers are necessary to realize the impressive spatial resolution promised inFig. 1.1, a major eort to understand the eect of surface charges and related defectson the NV spin is necessary.
1.4.2 Far-eld sub-wavelength probes
1.4.2.1 RESOLFT and STED techniques
In order to achieve nanoscale resolution without the technical challenge of con-trolling a near-eld probe, techniques are needed to bypass the diraction limit ofthe excitation light (∼ 300 nm). The most straightforward and mature technologyfor such sub-wavelength imaging is the STimulated Emission Depletion (STED) tech-nique, where recent nanoscopy measurements in bulk diamond have achieved a spatialresolution of better than 6 nm [151]. The STED technique, which belongs to a fam-ily of sub-wavelength techniques based on Reversible Saturable Optical FluorescenceTransitions (RESOLFT), uses an intense, shaped laser beam to deplete the excitedstate via stimulated emission. Provided that this STED beam has greater intensitythan the saturation threshold, no uorescence is observed.

28
Figure 1.11(a) illustrates the necessary optical transitions schematically for anensemble of NV centers. Figure 1.11(b) displays the timing diagram for pulsed oper-ation. A short (. 10 ns) pulse of 532 nm pump light excites NV centers into the 3Eexcited state. The spatial mode of a second pulse of light tuned somewhere within thephonon-sideband (here at 700 nm) is shaped by a helical phase plate such that thereis a dark region in the center of the beam due to the induced optical vortex. Due tothe donut-shaped intensity prole of this laser beam, NV centers falling outside of theoptical vortex immediately return to the ground state without emitting uorescencedue to depletion via stimulated emissionhence the name STED beam. NV centersin the center of the vortex, however, are relatively unaected by the STED beam andstill uoresce. As the dark region at the middle of the optical vortex is signicantlysmaller than the wavelength of the light (limited by the intensity of the STED beam),sub-wavelength spatial resolution in the lateral dimensions is realized 11. The sameeect can be achieved using cw light, and is illustrated in Fig. 1.11(c).
In the case of diamond nanoscopy with an ensemble of NV centers, the lateralresolution of STED, rmin, can be related to the power of the STED laser light, ISTED,and the saturation power of the ensemble, Isat, by [151]:
rmin ≈λ
2NA
1√1 + ISTED/Isat
, (1.8)
where λ = 532nm is the excitation wavelength, and NA ≈ 1 is the numerical apertureof the microscope objective. A STED beam intensity of ISTED ≈ 100MW/cm2 atthe focal point, which is well below the damage threshold of the crystal [151], isroutinely realized using a high-NA objective to focus a 100-mW laser beam down toa sub-micron spot. The saturation intensity near the peak of the phonon sidebandis Isat ≈ hc
λστES≈ 300 kW/cm2, where h is Planck's constant, c is the speed of light,
σ ≈ 10−16 cm2 is the excitation cross section [151], and τES ≈ 12 ns is the excited-state lifetime [153]. Inserting these values into Eq. 1.8, the fundamental limit onlateral resolution is rmin ≈ 5 nm.
For biological applications it is often necessary to use much lower light intensitiesto avoid damaging the sample under study. In some cases, this can be accomplished bytransferring centers into a metastable dark state instead of the ground state [142, 49].This dark state eventually decays to a bright state, but at a much slower rate thantypical radiative decay. In this case the equations for resolution enhancement areidentical, except τES is replaced by the time the NV centers remain in the dark state.In a recent demonstration of a technique called spin-RESOLFT, the eective dark-state lifetime was limited only by T1 ∼ 10 ms [49]. There a spatial resolution of 38 nmnm was achieved using microsecond pulses of light [peak power 2 mW (3 MW/cm2)],and sub-wavelength magnetometry was demonstrated. Another promising technique
11Depth resolution of . 20 nm is also possible by using a thin layer of NV centers or by longitudinalshaping of the STED beam [152].

29
Figure 1.12: Wide-eld uorescence microscope used for magnetic imaging as de-scribed in text. The sample under study would be placed in close contact with thethin layer of NV centers. Adapted from [13].
is to drive NV centers into a dierent trapped state (lifetime >> 1 s for ultrapureCVD diamond) using red excitation. Using this scheme researchers have achieved 12nm spatial resolution with 16 mW (12 MW/cm2) of light. The exact nature of thistrapped state requires further investigation, but it results in [154] are consistent withit being the NV0 charge states.
1.4.3 Wide-eld array magnetometers
One of the features, which makes magnetic sensing with diamond NV centersmost promising is the possibility for variable spatial resolution combined with broadmeasurement bandwidth. So far we have considered single NV magnetometers whichoer the best spatial resolution, but ensembles of NV centers can be used to makemagnetic eld images of much wider elds of view with even greater sensitivity.
Figure 1.12 depicts a technique using a wide-eld uorescence microscope to ac-quire such an image. A green pump laser beam is focused onto a diamond samplewith a thin layer of NV centers. The thickness of the layer is chosen to be roughlythe desired spatial resolution (typically a few hundred nanometers to a micron). Thefocal point is either a few Rayleigh ranges before (to produce a negative image) orafter (positive image) the layer of NV centers and the illuminated region of the NVlayer denes the eld of view (typically order ∼ 100 µm). The uorescence is col-lected from the same objective, spectrally ltered and directed to a charge-coupleddevice (CCD) for post processing. This proof of principle of this scheme was recently

30
demonstrated [54]. There a eld of view of ∼ 60 µm was realized with a spatialresolution of ∼ 500 µm, using a high-numerical aperture oil-immersion objective.
1.4.4 Bulk micro-magnetometers
As discussed in Sec. 1.4.1.1, the sensitivity of uorescence-based diamond magne-tometers is limited due to poor light collection eciency and diminished measurementcontrast. For larger, micro-scale devices, one avenue around this problem may be touse optical rotation [91] or absorption of a probe beam for spin-state detection, isthat transmitted light can be easily collected. Unfortunately, the weak spin-orbitcoupling in the excited state and the presence of strain in the crystal, make the spin-nonconserving transitions necessary for optical rotation negligible, at least for largeensembles at room temperature. However, recently, a technique was demonstratedusing infrared (IR) absorption on the 1A1 ↔ 1E transition [44] which circumventssome of the photon shot-noise problems associated with other techniques. This workis covered extensively in Chapter 5.
1.5 Outline of remaining chapters
The remainder of this dissertation is separated into four chapters. In the Chapter2, the basic design principles for fabricating diamond optimized for high-spin-densitymagnetometry are discussed. In the Chapters 3 and 4, the underlying physical proper-ties of the NV center are discussed and novel techniques for maximizing magnetometerperformance based on this basic physics are presented. Finally, in Chapter 5 we dis-cuss implementation of these techniques in an ensemble magnetometer which is thecurrent state-of-the-art in terms of sensitivity and bandwidth.

31
Chapter 2
Diamonds with a high density of
nitrogen-vacancy centers for
magnetometry applications
This chapter was previously published in Ref. [12] and is republished here, withminor changes, with permission.
2.1 Abstract
Nitrogen-vacancy (NV) centers in millimeter-scale diamond samples were pro-duced by irradiation and subsequent annealing under varied conditions. The opticaland spin relaxation properties of these samples were characterized using confocalmicroscopy, visible and infrared absorption, and optically detected magnetic res-onance. The sample with the highest NV- concentration, approximately 16 ppm(2.8 × 1018 cm−3), was prepared with no observable traces of neutrally-charged va-cancy defects. The eective transverse spin-relaxation time for this sample wasT ∗2 = 118(48) ns, predominately limited by residual paramagnetic nitrogen whichwas determined to have a concentration of 49(7) ppm. Under ideal conditions, theshot-noise limited sensitivity is projected to be ∼ 150 fT/
√Hz for a 100 µm-scale
magnetometer based on this sample. Other samples with NV- concentrations from.007 to 12 ppm and eective relaxation times ranging from 27 to over 291 ns wereprepared and characterized.
2.2 Introduction
Optical magnetometers based on alkali vapor cells can measure magnetic eldswith exceptional sensitivity and without cryogenics; however spin-altering collisionslimit the sensitivity of small sensors [7]. Paramagnetic impurities in diamond, on the

32
other hand, are a promising system for millimeter- and micrometer-scale magnetome-ters, because they exhibit long spin coherence times (several ms [42]) over tempera-tures ranging from liquid helium to well above room temperature. Nitrogen-vacancy(NV) centers are particularly promising because they have a spin-triplet ground stateand convenient optical transitions, allowing for ecient optical pumping and magneticsensitivity. Recently, single NV-centers were used for nanometer-scale magnetome-try [15, 14] and magnetometry based on high-density ensembles of NV- centers wasproposed [13]. Here we discuss preparation of diamond samples with parametersoptimized for room-temperature, optical NV-ensemble magnetometers.
The parameters for sample preparation most relevant to magnetometry are theconcentration and homogeneity of the NV- centers, as well as the abundance of otherimpurities such as neutral nitrogen-vacancy centers (NV0) and substitutional nitrogenin the lattice. There is a wealth of techniques for growth, irradiation, and annealingof diamonds that can be considered (see, for example, Refs. [155, 156, 157, 158] andreferences therein). In this work, we prepared ten samples under dierent conditionsand observed the optical properties at each stage of development using confocal mi-croscopy, visible and infrared absorption, and optically detected magnetic resonance(ODMR). The results form an initial matrix that will help identify the most importantvariables and pinpoint optimal ranges in the sample preparation process.
2.3 Experimental Procedure
2.3.1 Sample parameters and irradiation
# Company Synthesis [N] (ppm) Ion Dose (cm−2) Anneal Temp.(C)1 Sumitomo HPHT . 100 e- 4.0× 10¹⁸ [700,875,1050]2 Sumitomo HPHT . 100 e- 9.8× 1018 "3 Element-6 CVD . 1 e- 4.0× 1017 "4 Element-6 CVD . 1 e- 8.0× 1016 "5 Element-6 HPHT . 200 e- 8.2× 1018 "6 Element-6 HPHT . 200 e- 9.8× 1018 "7 Sumitomo HPHT . 100 e- 9.8× 1018 "8 Element-6 HPHT . 100 e- 4.0× 1017 "9 Element-6 HPHT . 100 H+ 1.0× 10¹⁶ [500,875,1050]10 Element-6 HPHT . 100 H+ 1.0× 10¹⁶ [800,875,1050]
Table 2.1: Sample characteristics. Initial nitrogen concentration, [N], is given asspecied by manufacturer. Each annealing was carried out for 2− 2.5 hours.
Ten diamonds were fabricated commercially by Sumitomo and Element-6 usingeither chemical-vapor deposition (CVD) or high-pressure, high-temperature (HPHT)

33
synthesis. The samples are millimeter-sized diamond crystals with an initial con-centration of nitrogen impurities ranging from less than 1 ppm to 200 ppm (1 ppmcorrsponds to 1.76×1017 cm−3 in diamond). In the case of the HPHT samples, growthsectors with high and low nitrogen concentrations were identied and three of thesesectors in Sample 5 were studied separately (see Sec. 2.4.4). The crystals were sub-jected to either proton or electron irradiation at varying doses. Electron irradiationwas done at Argonne National Laboratory using 3.0-MeV electrons (e-) from a Vande Graa generator. Thermal contact with a water-cooled copper target was usedto keep the temperature of the samples below 150C during the irradiation processin order to reduce vacancy-carbon recombinations [159]. The irradiation doses werechosen so that the resulting vacancy concentrations would be within two orders ofmagnitude of the initial nitrogen concentration, as discussed in Sec. 2.4.2.3. Theproton irradiation was performed at the Conditions Extrêmes et Matériaux: HauteTempérature et Irradiation (CEMHTI) laboratory using 2.4-MeV protons (H+), andthe samples were maintained below 80C during irradiation. Table 2.1 shows thespecic conditions under which each sample was prepared.
2.3.2 Optical characterization and annealing
After the irradiation, optical characterization of each electron-irradiated samplewas performed using confocal-microscopy at room temperature [105]. Light from acommercial solid-state 532-nm laser was spatially ltered using a single-mode ber,collimated, spectrally ltered, and combined into the collection path by a dichroicbeamsplitter, exciting an optical transition associated with the NV- center's 3Eexcited-state manifold [104]. The excitation beam was focused to a sub-micron spotusing a 0.6-numerical-aperture microscope objective with 40x magnication. Theresulting photoluminescence (PL) was collected through the same objective, spec-trally ltered to remove reected laser light, imaged onto a pinhole, and analyzed.For spatial imaging, the microscope objective was mounted on a closed-loop triple-axis piezoelectric translation stage, and the collected photoluminescence was detectedusing a silicon avalanche photodiode, with lters used to select the NV- phonon side-bands (PSB) in the spectral range ∼ 647-804 nm. For spectroscopy, the collectedphotoluminescence was sent to a spectrometer incorporating a cooled CCD detector,where the spectrum was recorded for various locations throughout each sample. TheNV0 and NV- zero-phonon lines (ZPL) were t to Gaussian lineshapes after subtract-ing the local linear background. Imaging tests on single NV centers in an ElectronicGrade ultra-pure CVD diamond purchased from Element-Six indicated an eectivemeasurement volume of 5.2 µm3, and the single-center uorescence spectrum pro-vided the absolute scale for determining the NV- concentrations in the higher NV-
density samples.Following irradiation and after the initial round of PL measurements, the eight
electron-irradiated samples were subjected to thermal annealing at 700C in the pres-

34
ence of a forming gas (0.96 atm Ar, 0.04 atm H2), in order to prevent surface oxidation,for 2− 2.5 hours. The two proton-irradiated samples were annealed for two hours invacuum, one sample at a temperature of 800C (Sample 10) and the other at 500C(Sample 9). Afterwards, each sample was analyzed with confocal spectroscopy atroom temperature. This process was repeated for nine of the samples at an annealingtemperature of 875C and then 1050C in the presence of the same forming gas. Afterthe nal annealing, a Varian Cary 50 UV-VIS spectrometer and Nicolet Magna IR-750 Fourier-transform infrared (FTIR) spectrometer were used to measure visible andinfrared absorption spectra for some of the electron-irradiated samples. Additionally,confocal microscopy was used for ODMR measurements and the eective transversespin-relaxation times were determined.
2.4 Results
2.4.1 Proton-irradiated samples
Development of micro-magnetometers in certain geometries may benet from theuse of proton irradiation, where damage is conned to a smaller volume than withelectron irradiation. In this section we present results of the optical characterizationof two identical proton-irradiated samples (Samples 9 and 10).
2.4.1.1 Stopping Range of Ions in Matter (SRIM) and spectroscopic mea-surements
When charged particles traversing a medium come near to rest, the stoppingpower dramatically increases, causing a thin layer of radiation damage to develop.This eect is pronounced for non-relativistic ions in diamond. The ionization losseslimit penetration to a thin layer near the surface, where radiation-induced vacanciesin the carbon lattice are formed. In contrast, relativistic electrons make it through the0.5− 1 mm thick samples, and, consequently, the vacancies are distributed relativelyevenly.
Figure 2.1(a) shows the results of proton-irradiation Monte-Carlo simulationsmade using the Stopping and Range of Ions in Matter (SRIM) software [160]. Thediamond sample was modeled as a pure 12C layer with density 3.52 g/cm3 and dis-placement energy 45 eV [161, 162, 163]. For the H+ energy of 2.4 MeV, the simulationspredict a dense layer of vacancies, recoiled interstitial carbon atoms, and stopped H+
ions at a depth of ∼ 35 µm, and almost no radiation damage deeper into the sample.If vacancy-to-NV conversion is relatively even throughout the sample, then one mightexpect a similar depth prole of NV concentration.
Figure 2.1(b) shows the estimated NV- concentration, taken by normalizing theintegrated ZPL intensity by that of a single NV center, as a function of depth forthe proton-irradiated samples after the rst annealing. Figure 2.1(c) displays the

35
(a)
(b) (c)
Figure 2.1: (a) Monte-carlo simulation of radiation damage as a function of penetra-tion depth for 2.4-MeV proton radiation, using the SRIM software. (b) Depth proleof NV- centers, taken by normalizing the integrated ZPL intensity by that of a singleNV center, after the rst annealing (see text). The concentrations for Sample 10 havebeen divided by a factor of 10 for visualization. Errors on the concentration estimatesare discussed in Sec. 2.4.2.2. (c) NV-:NV0 ZPL intensity ratio as a function of depthafter the rst annealing. The lightpower was 100 µW. For Sample 10, beyond a depthof ∼ 36 µm, the NV0 ZPL became indistinguishable from the background.

36
NV-:NV0 ZPL intensity ratio under the same conditions as Fig. 2.1(b) and is discussedlater in Sec. 2.4.1.3. In Fig. 2.1(b), Sample 9 (after annealing at 500C) shows a thinlayer of NV- emission with a small peak at ∼ 35 µm, followed by a rapid decreasein concentration with depth. The peak intensity, however, is not nearly as dramaticas in the vacancy prole predicted by SRIM. Sample 10 (after the rst annealing at800C) shows a sharp, monotonic decrease throughout the rst 35 µm that is not at allconsistent with the vacancy prole predicted by SRIM. Upon further measurements(see Fig. 2.2(a) in Sec. 2.4.1.2), it was seen that the qualitative features in the depthproles of Sample 10 varied greatly for dierent locations. It is worth mentioning thatin this sample the NV- concentration varied by more than an order of magnitude fordierent locations all at a depth of ∼ 12 µm from the surface. There was one locationthat had a concentration nearly three orders of magnitude lower than the mean.As shown in the next section, these spatial inhomogeneities in NV- concentrationare related to the presence of multiple growth sectors, with widely varying nitrogenconcentrations, in these HPHT-synthesized diamonds.
2.4.1.2 Photoluminescence depth proles
The spectroscopic measurements were followed by spatially resolved PL measure-ments where the position of the focus was varied by translating the microscope ob-jective with a closed-loop, triple-axis piezoelectric stage and the uorescence, in the647-804 nm range, was collected. Figure 2.2(a) shows examples of raw data both fora typical scan (left side) and one around a sector boundary (right). After averagingover the lateral dimension, x, the resulting depth prole was deconvolved using asimilarly-processed prole from a sample containing a very thin layer (. 200 nm) ofNV centers as the response function, in conjunction with an optimized Wiener lter[164]. Figure 2.2(b) shows the results for three dierent samples: both of the proton-irradiated samples as well as Sample 1, a high nitrogen-content electron-irradiatedsample, for comparison. These proles were taken after the nal annealing at 1050Cand were post-selected to ensure that they were from a single growth-sector. As ex-pected for relativistic-electron irradiation, Sample 1 has a relatively even depth prolethroughout the sample. The gradual decrease in intensity with depth is consistentwith absorption of the 532 nm laser light, as seen in Sec. 2.4.2.4. Samples 9 and 10,on the other hand, exhibit emission only from a thin layer of NV- centers near thesurface. The edge of this layer is at approximately the same depth as the edge in thevacancy prole predicted by SRIM, ∼ 35 µm from the surface, but the sharp peak atthe end of the layer is absent. Figure 2.2(c) shows the depth prole in a single-sectorregion for Sample 9 after both the rst and nal annealing; the results are discussedbelow.

37
sectorboundary
(b) (c)
y x
z
40 µmS10
diamond surface(a)
z
x
z
x
0
40
Figure 2.2: (a) Depth proles of the phonon-sideband PL intensity for Sample 10 ata typical location (left) and at a sector boundary (right). (b) Deconvolved intensityas a function of depth for Samples 1, 9, and 10 (S1, S2, etc.) after the rst annealingat 700, 500, and 800 C, respectively. The PL intensity is normalized by the incidentlaser power (5, 153, and 1.9 nW for Samples 1, 9, and 10, respectively). The signalfor Sample 9 is multiplied by a factor of 100 for visualization. (c) PL deconvolutionfor Sample 9 after the rst and third annealing. The PL intensity after the rstannealing has been multiplied by a factor of 30. The damped oscillations are artifactsof the signal processing caused by rapid changes in concentration.

38
2.4.1.3 Discussion of uorescence depth proles
There could be several potential explanations for the deviation of the observedNV- uorescence depth proles from the vacancy distribution predicted by SRIM:
1. The ZPL intensity and the integrated PSB uorescence are poor indicators ofthe actual NV- concentration.
2. The vacancies diuse tens of µm during annealing.
3. The concentration of nitrogen is insucient to convert most of the vacancies toNV- centers at the stopping peak.
4. Other products of the irradiation, either the interstitial carbon, stopped H+ ions,or the vacancies themselves, inhibit NV- formation by forming stable defectswith the vacancies.
We now briey discuss each of these possibilities and show that the rst threeexplanations are not supported by our observations.
1. In the He+ ion implantation work of Ref. [158], a similar deviation from theSRIM vacancy proles was seen in the NV- ZPL intensities for various radiation doses.The primary cause posited in that work was radiation absorption by vacancies andgraphitization defects. In order to set a limit on the absorption by such defects inour samples, we monitored the intensity of the diamond's rst-order Raman peakat 573 nm during the spectroscopic measurements whenever it was distinguishablefrom the background. In every instance, the 573 nm peak intensity did not changeby more than a factor of two over the rst ∼ 100 µm of the sample, and at leastsome of this attenuation was due to absorption by the NV- centers themselves (seeSec. 2.4.2.4). To our knowledge, there is no defect present in large concentrations inthese samples that absorbs strongly in the NV- uorescence region but not at 573 nm.The neutral vacancy center, GR1, for example, absorbs roughly equally in these twospectral regions [165, 166]. Therefore a factor of approximately two is the maximumpossible attenuation of the NV- uorescence due to absorption by other defects. The35-µm peak height predicted by the SRIM vacancy depth prole is several orders ofmagnitude larger than the peak heights of the NV- depth proles in Figs. 2.1(b) and2.2(b), so radiation absorption cannot explain this deviation.
2. The results shown in Fig. 2.2(c) give evidence that vacancy diusion cannotexplain the deviation from the SRIM vacancy depth prole. The magnitude of NV-
uorescence in the depth prole for Sample 9 exhibits an increase of approximately afactor of 35 between measurements taken after the rst and third annealing, signifyingthat vacancies are diusing to form NV- centers during the second and/or thirdannealing. However, based on the shape of these depth proles, and taking intoaccount the artifacts introduced by the deconvolution, a limit of δr . 1.5 µm can beplaced on the spatial range of diusion of vacancies in this sample during annealing

39
at 875C and 1050C for a time of t = 2 hours each. This is not enough diusionto account for the large dierence in peak height predicted by the SRIM vacancydepth prole. Assuming the diusion coecient at 875C is smaller than that at1050 and that the vacancies are not annihilated by other processes during annealing,this corresponds to an upper bound on the diusion coecient at 1050C of DV ≈(δr)2/(4t) . 4× 10⁻¹³ cm2/s.
3. To address the possibility that insucient nitrogen levels limit the overall NV-
concentration at the stopping peak, a rough measurement of the levels of substitu-tional nitrogen available for NV formation was made by monitoring the ZPL of theneutral NV0 center at 575 nm. Substitutional nitrogen is a donor in diamond, believedto be responsible for the negative charge on the NV- center, and consequently a short-age of nitrogen leads to a greater proportion of neutral NV0 centers [167, 158, 168].Figure 2.1(c) shows the NV-:NV0 ZPL intensity ratio for Samples 9 and 10 for thesame depths as in Fig. 2.1(b). The high ratio for Sample 10 is inconsistent withdonor depletion. The ratio for Sample 9 is lower compared to that of similar sam-ples irradiated at lower doses (NV- : NV0 ≈ 1− 40 (see Fig. 2.4(b)), but the absenceof a sharp dip near 35 µm suggests that electron depletion cannot account for thedeviation from the SRIM vacancy depth prole.
4. The possibility that other radiation damage inhibits NV formation cannot beveried in this study, but it is not inconsistent with our observations. As seen inFigure 2.1(a), the recoiled carbon atoms are the most abundant defect present in thediamond, with more than 30 times the nitrogen concentration. The deposited H+
also comprise over ve times the nitrogen concentration. At these levels, it is morelikely that during annealing the diusing vacancies will recombine, or form othercolor centers, with these interstitial atoms before they encounter a nitrogen atom.ESR measurements of the interstitial carbon color center, R2, suggest that somerecombination occurs during irradiation unless the diamond is cooled well below roomtemperature [169, 159] (not the case here), and that during annealing the remainingR2 centers become mobile at a threshold temperature in the 400− 700C range [169,166, 159]. Samples 9 and 10 are actually two halves of the same diamond, but theirrst annealing was done at dierent temperatures: 500C and 800C, respectively.The temperature of these samples was maintained below 80C during irradiation, yettheir depth proles after these dierent annealing temperatures show similar deviationfrom SRIM vacancy proles. This suggests that, if interstitial recombination is themechanism responsible for this deviation, the onset of self-interstitial mobility occursat or below an annealing temperature of 500C. This limit still falls within the 400−700C range of values for the onset of self-interstitial mobility found in the literature.
In addition to recombination with interstitial carbon atoms, vacancies are alsoknown to combine with hydrogen atoms to form VH- [170] and NVH- [171] defects.As we were not setup to observe ESR where these paramagnetic centers are bestdetected, they were not studied here, but they may limit NV formation and dephaseNV- spins in magnetometry applications.

40
In summary, the proton-irradiation and annealing produced NV centers in a con-ned volume of depth ∼ 35 µm. The depth proles of the NV- center concentrationsshowed a signicant deviation from the expected damage proles. We consideredpossible causes of such a deviation and surmised that excess radiation damage likelyinhibited NV formation. The resulting [NV-] distributions may actually be better forsome micro-magnetometer congurations, but more work is required to understandthe details of the radiation damage.
2.4.2 Electron-irradiated samples
In contrast to proton irradiation, irradiation with electrons leaves a relatively evendistribution of damage throughout the sample, enabling the preparation of millimeter-sized samples for ultra-sensitive magnetometry. Here we present and discuss the opti-cal and magnetic-resonance characterization of electron-irradiated samples (Samples1-8) prepared under varied conditions.
2.4.2.1 Fluorescence spectra and calibrations
Figure 2.3(a) shows the room-temperature 532-nm laser-induced uorescence spec-trum for Sample 2, a 2×2×1 mm3 Sumitomo HPHT sample irradiated with electronsat a dose of 9.8 × 1018 cm−2 (see Table 2.1), for each stage of annealing, as well asthe spectrum for a single NV in a non-irradiated Electronic Grade ultra-pure CVDdiamond. The collection volume was located near the surface of the sample in orderto minimize the eects of laser and uorescence absorption. Before annealing, themain spectral feature is a sharp peak at 573 nm which is the rst-order Raman peakof the pure diamond lattice. Additionally, the broad second-order Raman feature isvisible for the single-NV center in the 600−625 nm region. After annealing, the muchbrighter NV0 and NV- zero-phonon lines, at 575 nm and 638 nm, respectively, withlinewidths of approximately 1.5 nm full width at half maximum, become prominentfeatures in the spectrum. The monotonically increasing background is due to theoverlapping broad phonon sidebands. For more details on the spectral features, see,for example, Ref. [16].
In order to quantify the NV concentrations, the uorescence collection volumewas determined by taking several lateral scans of the ultra-pure CVD diamond atdierent depths and recording the 647− 804 nm uorescence of single NVs, as illus-trated in Fig. 2.3(b). A collection volume of ∼ 5.2 µm3 was calculated from thesescans. This value, together with the integrated ZPL intensity at 638 nm from thespectrum of one of the single NV centers (Fig. 2.3(a)), were used to determine theNV concentrations throughout this work. We note that concentrations obtained inthis way are expected to be a lower bound, as the laser power used for these single NVscans was just above saturation, and the eects of PL quenching due to non-radiativeenergy transfer to nearby impurities [172] were not quantied. Nonetheless, as will

41
580 600 620 640 660 680
0.001
0.1
10
1000
Wavelength [nm]
Cou
nts/
µW/s
single NV
700° C
pre-anneal
875° C
1050° C(a)
(b)surface 2.4 µm 4.8 µm 7.2 µm 9.6 µm 12 µm 14.4 µm
NV0 ZPL
NV- ZPL1st order Raman
2nd order Raman
15 µm
Figure 2.3: Fluorescence spectrum at each stage of annealing for Sample 2 (see Tab.2.1), as well as the spectrum of a single NV center in the ultra-pure CVD diamond usedfor calibrations. The measurement volume is approximately 5.2 µm3 located ∼ 12 µmfrom the surface. The important spectral features are labeled (as described in thetext). (b) Lateral (xy) scans of the ultra-pure CVD diamond showing uorescence inthe 647−804 nm spectral region from two of the single NV centers used to determinethe uorescence collection volume. The range for all of the scans is 30 µm× 30 µm.

42
be shown in Sec. 2.4.2.4 and 2.4.2.5, this method produced concentrations valuesthat are in close agreement with absorption-based methods [173, 131]. Furthermore,a uorescence-based approach enables the measurement of NV concentrations in op-tically thin samples.
2.4.2.2 NV concentrations
Figure 2.4(a) shows the NV- concentration for all of the electron-irradiated sam-ples after each stage of annealing. All concentrations were determined by normalizingthe integrated ZPL intensity by that of a single NV center, and the collection volumewas ∼ 12 µm from the surface. For the samples with high nitrogen content, the NV-
concentration was already near, or at, its maximum value after the rst annealingat 700 C. The samples with . 1 ppm nitrogen did not reach a maximum until the875 C annealing. We note that since we do not completely distinguish betweenthe eects of annealing time and temperature, it is possible that annealing the lownitrogen-content samples at 700C for twice as long would produce the same eect.
In order to test reproducibility, the data were taken on two dierent days, usingdierent lateral locations in the sample, and in between days the mirrors and samplemount had been adjusted. The samples were analyzed after the 700C (but beforethe 875C) annealing on both days. The discontinuity seen in Fig. 2.4(a) betweendays shows that the uncertainty in determination of the NV- concentrations is abouta factor of two, caused by the aforementioned conditions. We estimate that thetotal systematic uncertainty due to radiation absorption, uncertainty in the collectionvolume, etc. is less than the spread in concentration due to spatial inhomogeneity.
The NV-:NV0 ZPL intensity ratio is plotted as a function of annealing temperaturein Fig. 2.4(b). The ZPL intensity ratio can be converted to a concentration ratioby using the dierence in the Huang-Rhys factors (Sec. 2.4.3) for the two chargestates (NV-:NV0 ZPL intensity ratio is approximately a factor of two smaller thanthe corresponding concentration ratio). The ratio does not appear to have a strongtemperature dependence, but it varies strongly as a function of position in the sampleand/or laser power, as evidenced by the large discontinuity between the two dierentdays (corresponding to two dierent locations and laser powers). The incident laserpowers are shown in the legend of Fig. 2.4(b) because, as will be discussed in Sec.2.4.3, changes in power lead to varying degrees of photo-ionization, which, dependingon the individual sample characteristics, aects the ratio by an order of magnitudeor more.
The very high NV-:NV0 ratio for Samples 1 and 2 provides evidence that manyof the nitrogen atoms had not been converted to NV centers, since if this were thecase, there would not be enough donors for making the negative charge state (Sec.2.4.1.3). Conversely, the data in Fig. 2.4(b) show the eects of electron depletionon the low nitrogen-content samples, leading to a signicantly lower NV-:NV0 ratio.Since the specic collection location and laser power between days were dierent,

43
ò
ò
ò
ìì
á
á
§
øø
ª
ææ
before 700
0.1
0.51.0
5.010.0
50.0
NV
-:N
V0
ZPL
Rat
io
æ S8: 100, 1ª S7: 100, n/aø S6: 100, 1§ S5: 100, 1á S4: 100, 100<ç S3: 100, 100<ì S2: 100, 1<ò S1: 100, 1 mW
Sample: Day 1, Day 2
ø
ò
ò ò
ì
ì ì
ç
ç ç
áá
á
§ § §ø
øææ æ
700 875 1050Annealing temperature [0 C]
b)
ò
ò
ì
ì
ç
ç
á
á§
§øø
ª
ª
æ
æ
before 7001013
1014
1015
1016
1017
1018
1019
NV
-C
once
ntra
tion
[cm
-3]
Day 1
ò ò òì ìì
ç
ç ç
á
áá
§ §§
øø
ø
ææ æ
700 875 1050
Day 2
a)
Annealing temperature [0 C]
Figure 2.4: (a) NV- concentrations of electron-irradiated samples as a function ofannealing temperature. (b) NV-:NV0 ZPL intensity ratio of the same samples as afunction of annealing temperature. The data were taken during two dierent runs onseparate days. On each day the collection location for each sample was the same, butin between days the location changed. The laser power for the data on each day isindicated in the legend. Filled plot symbols are used for all samples with high nitrogencontent and empty symbols represent the two samples with . 1 ppm nitrogen. Errorbars are not shown here but are discussed in the text.

44
òò
ìì
çç
áá
§§øø
ææ
1 ´ 1017 2 ´ 1017 5 ´ 1017 1 ´ 1018 2 ´ 1018 5 ´ 1018 1 ´ 1019
1015
1016
1017
1018
Radiation Dose @cm-2D
Fina
lNV
-C
once
ntra
tion
@cm-
3 D
æ S8
ø S6
§ S5
á S4
ç S3
ì S2
ò S1
Figure 2.5: NV- concentrations near the surface as a function of dose for electron-irradiated samples after the nal annealing at 1050C. The data are the same as usedin Fig. 2.4(a).
there is a large degree of uncertainty in the absolute values of the NV-:NV0 ratiofor each sample. However, for a given day and a given sample, the laser power andcollection location were constant, so it can be concluded from the at temperaturedependence seen in Fig. 2.4(b) for Day 2, and to a lesser extent also on Day 1, thatthe NV-:NV0 ratio is not strongly aected by annealing.
Figure 2.5 shows the NV- concentrations obtained after the nal annealing at1050C as a function of radiation dose. As expected, the higher radiation dose gen-erally leads to larger NV- concentrations. The initial nitrogen content is also animportant factor, as evidenced by the factor of ∼ 25 dierence between concentra-tions for Samples 3 and 8. These samples were subjected to the same radiation dosebut their initial nitrogen concentration diered by approximately a factor of 100.
In conclusion, the doses and annealing temperatures listed in Tab. 2.1 were suf-cient to create samples with a wide range of NV- concentrations. Annealing at700 C was sucient to obtain the maximum NV- yield for samples with high nitrogencontent, while an additional annealing at 875 C was required for the low-nitrogen-content samples. The high-nitrogen samples exhibited a large NV-:NV0 ratio, whilethe low-nitrogen samples had a signicantly lower ratio. Lastly, the concentration-measurement technique based on photoluminescence was reproducible to within ap-proximately a factor of two even when dierent lateral positions in the sample wereused.

45
2.4.2.3 Nitrogen-to-NV- conversion
# [N] (ppm) post-irrad. [Vacancies] (ppm) nal [NV-] (ppm) [NV-]:[N]1 . 100 45 10 & 10%2 . 100 110 16 & 16%3 . 1 5 .012 & 1%4 . 1 1 .007 & 1%5 . 200 90 12 & 6%6 . 200 110 8 & 4%8 . 100 5 .3 & 0.3%
Table 2.2: Sample Characteristics. Final NV- concentrations for the electron-irradiated samples are tabulated along with initial nitrogen content (reported bythe commercial providers) and projected vacancy concentrations. These values areused to set a lower bound on the nitrogen-to-NV- conversion eciency, as seen in thelast column. The error in NV- concentration estimates, and consequently the errorin conversion eciency, is a approximately a factor of two, as discussed in the text.
A gure of merit for sensitive high-density magnetometry is the conversion e-ciency of substitutional nitrogen to NV- centers, because any remaining paramagneticnitrogen accelerates the rate of spin decoherence (see Sec. 2.4.4.4). For irradiationtemperatures around those used in this work (. 150C), the rate of vacancy produc-tion for 2-MeV electrons throughout millimeter-thick samples was determined exper-imentally to be ∼ 1.25 vacancies/e-/cm in Ref. [159] and ∼ 1.5 vacancies/e-/cm inRef. [169] and theoretically to be ∼ 2.2 vacancies/e-/cm [174]. Since the electronsare relativistic, the dierence in vacancy production between 2- and 3-MeV electronsis small [174], so we assume a vacancy production for the 3-MeV electrons used inthis work of ∼ 2 vacancies/e-/cm. Using this value, along with irradiation doses fromTab. 2.1, Tab. 2.2 displays approximate initial concentrations of vacancies beforeannealing. The initial nitrogen concentrations reported by the manufacturers andthe nal NV- concentrations from Fig. 2.5 are also shown and these values are usedto set a lower bound on the nitrogen-to-NV- conversion eciency. Sample 2, havingconverted & 16% of the initial nitrogen into NV- centers, shows the most promisingconditions for high conversion eciency. For this sample, the initial nitrogen concen-tration was . 100 ppm and the irradiation dose was 9.8× 1018 cm−2, correspondingto ∼ 110 ppm vacancies. As discussed in Sec. 2.4.2.4, it is likely this dose wasinsucient to maximize NV- formation.
2.4.2.4 Visible absorption
Optical magnetometry with spin ensembles requires that the samples be reason-ably transparent over the spectral range of interest. In diamond magnetometry based

46
400 500 600 700 800 900 1000 1100
0.001
0.01
0.1
1
Wavelength [nm]
Tran
smis
sion
630 635 640 6450.01
0.1
S4
S3
S2
S1
Figure 2.6: Room temperature transmission curves for four electron-irradiated sam-ples after the nal annealing at 1050C. The beam path (i.e. the sample thickness)was 1 mm for Samples 1 and 2 (S1 and S2) and .5 mm for S3 and S4. The ZPL at∼ 638 nm is visible for S1 and S2 and is blown up in the inset. The dotted linesrepresent the baselines used for Sample 1 in the eective vibrational-splitting andHuang-Rhys factor calculations (the baseline for Sample 2 was similar).
on NV- centers, zero-phonon optical transitions at 638 nm and 1042 nm [19], as wellas their broad phonon sidebands, provide possible channels for detection. To measurethe opacity in this range, a Cary 50 spectrophotometer was used to obtain transmis-sion spectra for four of the electron-irradiated samples (Samples 1− 4) after the nalannealing at 1050C. The visible spectra for a subset of these samples were also mea-sured after the rst annealing, and no signicant dierences in the spectra betweenthese stages of annealing were observed.
Figure 2.6 shows the room-temperature transmission curves for these samples.For all four samples, the transmission in the wavelength region ∼ 700-1100 nm isapproximately 66%. The loss of light can be accounted for by Fresnel reection; theindex of refraction of diamond is 2.4, which corresponds to a reection of 17% o ofeach diamond surface for light at normal incidence in air.
In the wavelength region to the red of the ZPL and below∼ 700 nm, Samples 1 and2 exhibit absorption that increases rapidly with decreasing wavelength. Absorptionat these wavelengths is due to the signicant population of NV- centers in the excitedvibrational states at room temperature. After subtraction of the overall backgroundand absorption due to the ZPL (baselines in Fig. 2.6), the ratio of the integrated

47
absorption in this spectral region (638-700 nm) to the total integrated absorption is∼ 11(2)% for Sample 1 and ∼ 13(2)% for Sample 2. If these values are taken to be theBoltzmann-distributed occupancy of excited vibrational states at room temperature,they would give a rough estimate for the eective ground-state vibrational-energysplitting [175] of 56(4) and 52(4) meV for the NV− center, respectively. These valuesare in tolerable agreement with previous measurements based on emission spectra,where the eective vibrational-spacing in the 3A2 ground state of the NV- center wasestimated to be ∼ 60 meV [73, 114].
In the region around ∼ 628 − 648 nm, inset in Fig. 2.6, the NV- ZPL appearsprominently in the spectrum for Samples 1 and 2, where at the peak of absorption ap-proximately 98% of the light is absorbed. This corresponds to four absorption lengthsfor this 1-mm path length, with approximately one absorption length attributed tojust the ZPL and the other three due to overlap of the PSB. To the blue of the ZPL,at ∼ 450 − 638 nm, resides a broad feature which is a combination of the NV0 andNV- phonon sidebands. The ZPL for NV0 at 575 nm is obscured by this stronglyabsorbing region. For Samples 3 and 4, there are no visible spectral features, due tothe low NV concentrations in these samples (see Tab. 2.2).
Based on the absorption data, it is possible to estimate the electron-phonon cou-pling parameter, also known as the Huang-Rhys factor [112], S = − ln(IZPL/Itot),where IZPL and Itot refer to the integrated absorption intensities after normaliza-tion by the light frequency. While this relationship is only strictly correct at zero-temperature where quadratic electron-phonon coupling is suppressed, it was shownin Ref. [112] that, in NV- centers, the temperature-dependence of S is weak. In thatwork it was reported that S increases by less than 30% from 2 to 350 K. Analysis ofthe data in Fig. 2.6 gives, after subtracting the linear background (dashed lines inthe gure), S ≈ 3.9 for Sample 1 and 4.0 for Sample 2, which is within the range ofvalues in the literature for NV- centers at or below 80 K (4.8, 4.3, 2.8 in Ref. [114],and 3.7 in Ref. [73]). The value used for Itot is a slight over-estimate, as the phononsideband from the NV0 centers overlaps, but this eect is small (. 2%) since theconcentration of NV0 was small compared to that of NV- for both samples (see Sec.2.4.2.2).
Another important observation from Fig. 2.6 is the absence of an absorptionfeature at 741 nm, the wavelength of the ZPL of the neutral vacancy center, GR1.The neutral vacancy concentration has previously been calibrated based on the GR1integrated ZPL in absorption [131, 176]. Based on this calibration and the lack ofan identiable ZPL, a conservative upper bound of 1 ppm can be placed on theconcentration of neutral vacancy centers for Samples 1 and 2. This suggests that theNV conversion eciency for these samples may be limited by the number of vacanciespresent after irradiation. Recall from Tab. 2.2 that the vacancy concentration waspredicted to be slightly larger than the nitrogen concentration for Sample 2. Sinceall of the neutral vacancies are gone after the nal annealing, it is likely that there isa competing process to the vacancy capture by the substitutional nitrogen atoms.

48
We also considered the possibility that many vacancies remain after annealing,but the vast majority of remaining vacancies were actually negatively charged, dueto the high concentration of nitrogen donors, and therefore do not contribute to theGR1 absorption. The negatively charged vacancy center, ND1, is not visible in theabsorption spectra because its ZPL is at 396 nm [16]. This wavelength coincides withthe large background absorption, presumably due to photo-ionization of the substitu-tional nitrogen, prohibiting a direct measurement of the negatively charged vacancyconcentration. However, as will be shown in Sec. 2.4.2.5, the concentration of posi-tively charged nitrogen, the likely product of ND1 formation, can be measured frominfrared absorption spectra and was found to be 15(3) and 19(4) ppm after the nalannealing for Samples 1 and 2, respectively. Since much of this concentration can beattributed to nitrogen's role as a donor in NV- formation (recall that the NV- con-centrations were approximately 10 and 16 ppm for Samples 1 and 2, respectively), aconservative upper bound of 10 ppm can be placed on the negatively charged vacancyconcentration in both samples. Since this upper bound represents a small fraction ofthe estimated initial vacancy concentration (Tab. 2.2), it remains likely that in orderto maximize the NV conversion eciency higher radiation doses should be explored.
For Samples 1 and 2, the visible-absorption measurements can also be used as across-check on the NV- concentrations determined from the PL spectra (Sec. 2.4.2.2)[173, 131]. Using the calibration published in Ref. [131], the integrated ZPLs forSamples 1 and 2 correspond to NV- concentrations of 8 and 10 ppm, respectively,which is in tolerable agreement with the concentrations measured from the PL spec-tra (10 and 16 ppm, respectively). As the calibration established in that work wasintended for low-temperature absorption, the somewhat lower [NV-] values can bepartly attributed to the slightly lower Huang-Rhys factor at room-temperature [112].
In summary, visible-absorption measurements establish that even at high radia-tion doses the dominant source of absorption in the visible and near-infrared is due toNV centers, and not other radiation damage. The absence of GR1 absorption suggeststhat higher radiation doses should be explored for optimizing NV yield. The absorp-tion spectra were also used to conrm the NV- ground vibrational-state occupancyand Huang-Rhys factors from the literature and the NV- concentrations determinedfrom the absorption ZPL provide good agreement with those determined from the PLspectra in Sec. 2.4.2.2.
2.4.2.5 Infrared absorption
The presence of paramagnetic nitrogen has important implications for magne-tometry, as discussed below in Sec. 2.4.4.4. Infrared absorption measurements weremade with a Nicolet Magna IR-750 FTIR spectrometer to measure the leftover ni-trogen concentration after the nal annealing (Fig. 2.7). Nitrogen-rich diamondsdisplay a broad vibrational absorption band peaking around 1130 cm−1 [177] thathas been calibrated with respect to the substitutional nitrogen concentration using

49
1130 1344
1450
13321355,1358
Y1
S2
S1
Wavenumber [cm-1]
Abs
orpt
ion
Coe
ffici
ent [
cm-1
]
1000 1100 1200 1300 1400 1500 1600
1
2
3
4
5
6
7
1000 1100 1200 1300 1400 1500 1600
1
2
3
4
5
6
7
1000 1100 1200 1300 1400 1500 1600
1
2
3
4
5
6
7
Figure 2.7: Infrared spectra for Samples 1, 2, and Y1 after the nal annealing. Eachspectrum represents averaging of 64 scans and the resolution of the spectrometer wasset to 0.25 cm−1. The rapid oscillations are due to etaloning at normal incidence, andthey have been smoothed by a moving average (black lines) in order to quantify thepeak at ∼ 1130 cm−1 (see text). Features mentioned in the text are labeled by theirwavenumbers.

50
ESR and inert-gas fusion techniques [178, 179]. According to this calibration, an ab-sorption coecient of 1 cm−1 corresponds to a substitutional nitrogen concentrationof approximately 22 ppm [179]. Figure 2.7 shows the infrared spectra for Samples 1and 2 after the nal annelaing, and a third Sumitomo HPHT diamond (Y1) withvery similar specications that had not been irradiated or annealed. Based on thespectral feature at ∼ 1130 cm−1, the nitrogen content for Samples 1, 2, and Y1were 58(8), 49(7), and 146(20) ppm, respectively, where the uncertainty is based onthe spread of the calibration values in the literature [178, 179]. The sharp spectralfeature at 1344 cm−1 present in all three samples is also associated with the singlesubstitutional nitrogen [177]. Both of these peaks are more intense for Sample Y1,presumably because Samples 1 and 2 contain NV centers and other nitrogen-relatedcenters formed during irradiation and annealing. The most prominent feature in theFTIR spectra for Samples 1 and 2 is at 1450 cm−1, which was tentatively assigned toa vibrational mode of interstitial nitrogen [180, 181]. The smaller features at 1355 and1358 cm−1 may also be related to this defect [182]. The production of this interstitialdefect may be due to irradiation, since these features are not present in Sample Y1.
The spectral feature at 1332 cm−1, present only in Samples 1 and 2, has been linkedto positively charged substitutional nitrogen, N+ (Ref. [131]). In that work, it wasargued that because of nitrogen's role as a donor in NV- formation, the concentrationof N+ after the nal annealing should be roughly equal to the concentration of NV-.Using the calibration of the 1332 cm−1 peak from that work (1 cm−1 of absorptioncorresponds to 5.5±1 ppm of N+), the NV- concentrations for Samples 1 and 2 wouldbe 15(3) and 19(4) ppm. Since nitrogen is a donor in the formation of other centers,such as the negatively charged vacancy (Sec. 2.4.2.4), it can be expected that [N+]would be somewhat higher than [NV-]. Thus these values for [NV-] are in excellentagreement with the values (10 and 16 ppm, respectively) measured using PL spectrain this work.
In conclusion, the FTIR measurements indicate that a large concentration of para-magnetic nitrogen remains in the samples even after the highest irradiation doses andannealing temperatures studied here. The absorption of the 1332 cm−1 peak wasfound to be in excellent agreement with the NV- concentrations determined from PLspectra.
2.4.3 Light-power dependence of NV0 and NV- concentrations
The neutral NV center, NV0 presents a similar problem to ultra-sensitive magne-tometry as the remaining substitutional nitrogen, since it is also paramagnetic [96]and therefore limits NV- dephasing times. Further, since the emission spectrum ofNV0 partly overlaps with the phonon sideband of the NV− defect, the presence ofNV0 leads to a background uorescence signal that reduces measurement contrast.In previous work [183, 184], it was shown that the NV- and NV0 concentrations canchange upon illumination by light in a range of wavelengths including 532 nm, the

51
ààààà
ççççç
0 200 400 600 800 10000.0
0.2
0.4
0.6
0.8
1.0
Laser Power [µW]
Frac
tiona
l con
cent
ratio
n
580 600 620 640 66010- 1
100
Wavelength [nm]
Sample 4
Cou
nts/
µW/s
.323.210321001000 µW
NV0
NV-
0.003 ppm
0.0005 ppm
à
à
à
à
ààà
à
à
à
à
à
àààà
0 5 10 150.0
0.2
0.4
0.6
0.8
1.0
Laser Power [µW]
Frac
tiona
l con
cent
ratio
n
580 600 620 640 660101
102
103
104
Wavelength [nm]
Sample 10
Cou
nts/
µW/s
.006
.019
.06
.19
.61.9619 µW
17 ppm
7 ppmNV0
NV-
a)
b)
Figure 2.8: Relative NV- and NV0 concentrations for (a) Sample 10 and (b) Sample4 after the rst annealing (700C and 800C, respectively) as a function of incidentlaser power. The concentrations were obtained from uorescence spectra (insets)taken at a depth of approximately 36 µm, for Sample 10, and 12 µm, for Sample 4.Determination of NV0 concentration was made by weighting the relative ZPL intensityaccording to the dierence in room-temperature Huang-Rhys factors; S ∼ 3.3 for NV0
[16] and S ∼ 4.0 for the NV− center (Sec. 2.4.2.4). The laser beam was focused to adiameter of approximately 0.5 µm for all measurements.

52
wavelength used for excitation in this work. In particular, in Ref. [183] it was re-ported that the NV-:NV0 ratio dropped with increasing laser power and identieddirect photo-ionization of the NV- center and ionization of nearby potential nitrogendonors as the primary causes.
Figure 2.8 shows the relative NV- and NV0 concentrations determined from thePL spectra (Sec. 2.4.2.1) for (a) Sample 10 and (b) Sample 4 as a function of incidentlaser power. By relative, we mean that the NV- and NV0 concentrations have beennormalized such that, at any given laser power, their sum is 1. In order to determinethe NV0 concentration, the dierence in Huang-Rhys factors for NV0 and NV- wereused for normalization, since the NV0 ZPL for the single NV center (Fig. 2.3(a))was not visible in the spectrum. As seen in Fig. 2.8, the laser-light intensity has asignicant eect on the NV charge state for the high-nitrogen-concentration Sample10, but does not aect the low-nitrogen-concentration Sample 4. Since at very lowlight power Sample 10 has a large [NV-]:[NV0] ratio and Sample 4 has a very low ratio,the results in Fig. 2.8 can be interpreted as a small fraction of NV- being convertedto NV0 due to the laser light until the ratio reaches some minimum saturation level.Note that the range of laser powers explored for Sample 4 was higher than that ofSample 10, due to the low overall NV concentration in this sample. Similar plots weremade after each annealing, but further annealing was found to have no measurableimpact. While the mechanism for changing the NV charge state (i.e. one- or two-photon process) cannot be conrmed from this data set, the results indicate thatsensitive magnetometry requires careful optimization of the laser light power.
2.4.4 Optically detected magnetic resonance (ODMR)
2.4.4.1 NV- electronic structure
One of the crucial features of nitrogen-vacancy ensembles for practical magne-tometry is that the NV- centers can be optically pumped and interrogated usingvisible light over a broad range of wavelengths (see Fig. 2.6). Figure 2.9(a) shows thecrystallographic cell for the trigonal NV- center in one of four possible orientations,corresponding to the N-V axis along each of the dangling bonds. Figure 2.9(b) showsthe level diagram with energy levels and allowed transitions labeled according to themost current model posited in Refs. [19, 107]. Based on C3v symmetry [73] andresults from early electron-spin-resonance (ESR) [70] and hole-burning experiments[71], it is known that the center's ground state is a 3A2 spin-triplet and the state whichcan be directly accessed by an electric dipole transition is 3E. The ground state issplit by 2.88 GHz due to the strong spin-spin interaction arising from the electroncharge distribution being highly localized near each of the three carbon atoms [70].At low temperature the 3E state is an orbital doublet split by transverse strain, butat room temperature the orbital components appear to average [107], and thus it isrepresented by a single orbital with spin-spin splitting of 1.42 GHz [106]. The 3A2

53
spin-spin
3E
1A1
3A2
2.88 GHz|ms=
638 nm
1046 nm
1E1.42 GHz
+−1>|ms=0>
|ms= +−1>|ms=0>
a) b)
Figure 2.9: (a) Crystallographic cell for the NV center in diamond. The center hasC3v symmetry and the line that contains both N and V denes the symmetry axis, ofwhich there are four possible orientations. CCarbon, NNitrogen, VVacancy. (b)Level diagram for NV- center showing spin-triplet ground and excited states, as wellas the singlet system responsible for intersystem crossing (see text). The transitionwavelengths are for the ZPL, with radiative transitions indicated by solid arrows andnon-radiative transitions by wavy arrows.
ground state has a single non-degenerate electronic orbital and thus is immune torst-order shifts due to strain.
In thermal equilibrium, the ground state sublevels are nearly equally populated,but after interaction with light resonant with the 3A2 → 3E transition (excited hereon the phonon sideband at 532 nm), the |ms = ±1〉 sublevels become depopulatedand the |ms = 0〉 sublevel eventually takes on the excess. Theoretical considerationsand spin-dependent lifetime measurements suggest that the process responsible forthe ground-state polarization is the decay, due to spin-orbit interaction, from the|ms = ±1〉 sublevels of the 3E to a singlet state(s) with lower energy [185, 104, 153].Pulsed-pump transient measurements have shown that the |ms = ±1〉 can decay backto the |ms = 0〉 through the singlet system after approximately 300 ns [104]. As thisdecay is mostly non-radiative, optical pumping into the |ms = 0〉 sublevel results inan increase in uorescence with a contrast as high as 30%, limited by the branchingratio of approximately 0.5 for the |ms = ±1〉 sublevels decay to the singlet system[14]. Until very recently this singlet system, thought to be 1A and/or 1E from C3v
group theory considerations [104, 19], had not been directly detected. Weak infraredemission at 1042 nm was nally observed in Ref. [19] and the magnetic-eld andstrain dependence of the uorescence spectra indicate that the emission is indeedinvolved in the optical pumping mechanism.

54
(a)
(b) (c)
Figure 2.10: (a) ODMR spectrum for Sample 3. The 24 separate resonances cor-respond to two dierent |∆ms| = 1 transitions, four dierent NV orientations, andthree dierent 14N hyperne transitions. The orientations were split by a ∼ 50 Geld. (b) Level diagram for the ground-state magnetic dipole transitions induced bythe microwave eld in the ODMR measurements. The selection rules for these tran-sitions are |∆ms| = 1 and ∆mI = 0. The values for the 14N hyperne splitting aretaken from Ref. [17]. (c) Microwave-power dependence (log-scale) of the relaxationrate for Sample 4 for a laser power of 213 µW. Microwaves from a signal generatorwere amplied and applied with a ∼ 1-mm-diameter current loop with unmatchedimpedance. The microwave power was measured at the output of the signal generatorprior to the ∼ 30 dB amplier. The FWHM linewidth of each |∆ms| = 1,∆mI = 0transition for one of the orientations was plotted as a function of microwave power.A linear t for the lowest-power points (dashed line) was used to extrapolate thelinewidth to zero microwave power. The standard error in the t parameter serves asthe uncertainty in the measurement.

55
2.4.4.2 Optically detected magnetic resonance technique
The transverse spin relaxation time, T ∗2 , is critically important for spin-precessionmagnetometry, as it places bounds on both the minimum sensitivity and laser powerof broadband sensors (Sec. 2.4.5). In order to measure T ∗2 , the technique of ODMRwas employed after the nal annealing. In this technique, a microwave eld is tunedto the ground-state ESR frequency of the NV- center and the uorescence resultingfrom illumination by light exciting the 3A2 → 3E transition is monitored [70, 122].Optical pumping transfers the NV- centers to the |ms = 0〉 ground state. An externalmagnetic eld is applied, and the electronic spin sublevels |ms = ±1〉 couple tothe component Bz along the N-V axis, leading to Zeeman energy shifts of ∆E =msgsµBBz, where gs = 2.0028 is the NV- electronic Landé factor [70] and µB ≈1.40 MHz/G is the Bohr magneton. When the oscillating magnetic eld has frequencyequal to the splitting between the |ms = 0〉 and |ms = ±1〉 magnetic sublevels,the component transverse to the N-V axis drives the magnetic dipole transition andrepopulates the |ms = ±1〉magnetic sublevels, counteracting the anisotropy producedby optical pumping. With the pump light still on, the increase in population in|ms = ±1〉 leads to non-radiative decay through the singlet system, reducing theuorescence emitted by the center. Thus the ESR signal is the change in uorescenceregistered when scanning the frequency of the microwave eld.
An example of an ODMR spectrum is shown in Fig. 2.10(a). An additional layerof complexity in the spectrum is the presence of the hyperne interaction with thenuclear-spin-one 14N nucleus, which splits each |∆ms| = 1 resonance into three hyper-ne peaks (∆mI = 0) with an equal spacing of 2.3 MHz at zero-magnetic eld [122].Figure 2.10(b) shows the level diagram for the allowed ground-state transitions. Thefour dierent orientations of the NV- center are degenerate in the absence of mag-netic eld, but this degeneracy was removed with a static magnetic eld of magnitude≈ 50 G, applied using a permanent magnet. Both ts to the data and numerical di-agonalization of the 9× 9 spin hamiltonian [17] conrmed that the spin-state mixingdue to this applied eld, particularly the component perpendicular to the N-V axes,causes the hyperne splitting to vary by . 0.1 MHz.
2.4.4.3 Results of ODMR measurements
The resonance prole corresponding to each N-V orientation and |∆ms| = 1 coher-ence was t with three Lorentzian functions of equal amplitude and equal linewidth,γ, given as full-width at half maximum (FWHM). Equal spacings between the centersof adjacent Lorentzians of 2.2 MHz were used, even when the 14N hyperne splittingcould not be resolved. The eective transverse spin relaxation times, T ∗2 = 1/(πγ),and associated uncertainties were obtained from the ODMR spectra by extrapolatingγ to zero microwave power (Fig. 2.10(c)) with a linear t. Density-matrix calcu-lations conrmed that γ is, to lowest order, linear in the microwave power. The

56
Sample # [N] (ppm) nal [NV-] (ppm) Laser Power (µW) T ∗2 (ns)1 . 100 10 5 66(8)2 . 100 16 188 118(48)3 . 1 .012 130 & 2914 . 1 .007 213 222(11)
5 (spot 1) . 200 1.0 24 27(4)5 (spot 2) . 200 .02 100 128(64)5 (spot 3) . 200 2.5 240 145(63)
8 . 100 .3 188 114(25)
Table 2.3: Eective transverse spin relaxation times, T ∗2 , extrapolated to zero mi-crowave power, for several electron-irradiated samples at the given laser powers (fo-cused to ∼ 0.5-µm diameter). For Sample 5, three locations, corresponding to spotsin dierent growth-sectors, were investigated. The uncertainty estimates for all sam-ples except Sample 3 come from the standard error of the linear ts, as shown in Fig.2.10(c). For Sample 3, only one low microwave power, −30 dBm before the amplier,was investigated (shown in Fig. 2.10(a)). The lower bound on T ∗2 for this samplecorresponds to one standard deviation below the statistical average of the resonancewidths.
resulting T ∗2 times are tabulated in Tab. 2.3 for each sample at the given laser power.The laser-power dependence was not studied here though the light power was variedfrom sample to sample in order to maximize the signal on the photon counter. Thisdependence will be investigated in future work.
2.4.4.4 Contributions to T ∗2
For the HPHT-synthesized Sample 5, ODMR spectra at three dierent locations,corresponding to sectors with very dierent initial nitrogen concentrations, were ob-served, and the NV- concentrations at these locations were estimated based on theintegrated ZPL, as described in Secs. 2.4.2.1 and 2.4.2.2. Since the irradiation wasuniform throughout the sample, the wide variation of T ∗2 , from 27 ns to 145 ns is prob-ably not due to vacancy-related defects other than NV centers, unless the formationof such centers is strongly correlated with the local concentration of nitrogen.
For dilute spins, the contribution of NV-NV- dipolar interactions to the magnetic-resonance broadening can be approximated by assuming that each NV- center couplesto only the nearest-neighboring NV- center. For an ensemble, this dipolar couplingleads to a spin-relaxation contribution on the order of TNV ≈ 1/[(gsµB)2nNV ], wherenNV is the NV- concentration [13]. For Sample 2, this corresponds to TNV ≈ 1 µs,meaning that NV-NV- coupling is signicant but not necessarily the primary sourceof relaxation. For Sample 5, spot 3 has a much higher NV- concentration but similar

57
T ∗2 to spot 2, providing evidence that NV-NV- relaxation is not the dominant sourceof relaxation in this sample.
For nitrogen-to-NV- conversion eciency of less than 50%, the contribution ofsubstitutional-nitrogen dipolar interactions to NV- decoherence is expected to be evenlarger, as the paramagnetic nitrogen has similar coupling strength. Similarly to theestimate for NV-NV- interactions, the characteristic timescale for this decoherenceis TN ≈ 1/((gsµB)2nN), where we ignore the small dierence in g-factors between NV-
and nitrogen [70]. Recall from Sec. 2.4.2.5 that Samples 1 and 2 had nal nitrogenconcentrations on the order of 50 ppm, giving a value of TN ≈ 300 ns. Samples 1,2, and 5-8 all had similar initial concentration of nitrogen (. 100 ppm). Since theirradiation and annealing process converted no more than 16 ppm of nitrogen intoNV- centers, it is likely that relaxation due to remaining paramagnetic nitrogen isthe dominant cause of relaxation in all of these samples.
Another well-known cause for relaxation is inhomogenous broadening due to dipo-lar hyperne coupling of nearby 13C nuclear spins (natural 1.1% abundance in allsamples). Based on experiments on single NV centers, this spin-relaxation contribu-tion is in the range TCexp ≈ 0.3− 1.5 µs [87, 128, 42]. Those experimental values arenot too far from the T ∗2 seen for Samples 3 and 4, where the nitrogen content was lowenough that 13C is likely a major source of inhomogenous broadening due to dipolarcoupling.
In conclusion, dipolar broadening due to paramagnetic nitrogen is predicted tobe the dominant dephasing mechanism in the high-nitrogen-concentration samples,followed closely by dephasing due to other NV centers and 13C nuclear spins. For thelow-nitrogen-concentration ([N]. 1 ppm) samples, dephasing due to the 13C nuclearspins was likely the dominant form of relaxation.
2.4.5 Prospects for ultra-sensitive magnetometry
The performance of a magnetometer based on electronic spins is, in principle,limited by the spin-projection noise. The minimum detectable magnetic eld, δB, is[7]:
δB ' 1
gsµB
1
R√η
1√NtT ∗2
, (2.1)
where R is the measurement contrast, η is the detection eciency, N is the number ofspin centers, and t is the integration time. It is interesting to estimate the magneticsensitivity of a sensor based under ideal conditions. We choose Sample 2, as it hasthe highest product of density and T ∗2 , and we speculate that improved experimen-tal techniques will allow the signal from nearly all NV centers to be collected withcontrast R ∼ 0.3 and eciency η ∼ 0.1. Using these values the quantum shot-noiselimited sensitivity would be ∼ 150 fT/
√Hz for a 100 µm-scale magnetometer based
on this sample. This approaches the sensitivity of superconducting quantum inter-ference devices (SQUIDs) with similar spatial resolution [8]. Moreover, the isotropy

58
of the system makes it easily size scalable, and the advantage of a such a compactdevice working in a broad range of temperaturesfrom room temperature down toliquid helium temperaturesmakes NV-ensembles an attractive candidate for manytypes of magnetic-sensing applications. Of course, much work needs to be done toexperimentally realize the shot-noise limit, including thorough analysis and mitiga-tion of sources of decoherence and improved experimental techniques. In particular,we note that the optimal optical pumping rate for this model magnetometer is onthe order of NNV /T
∗2 = 2.8× 10¹²/(118 ns). This corresponds to approximately 8 W
for 532 nm laser light. Thus, lengthening the eective relaxation time is essential inorder to improve sensitivity while maintaining practical light powers.
2.5 Conclusion
Proposals for high-density ensemble magnetometers predict sensitivities rivalingthe most sensitive atomic and superconducting magnetometers [13]. Developmentof such magnetometers requires reliable production of diamond samples with controlover the NV- concentration as well as other defects which may contribute to spinrelaxation. In this work, ten diamond samples were prepared under very dierentconditions and their optical and spin-relaxation properties were characterized. Thecompiled results show that electron-irradiated samples annealed at 700C for twohours can have NV- concentrations on the order of 10 ppm, a reasonable benchmarkfor 100 µm-scale magnetometry at the 100 fT/
√Hz sensitivity level. For samples with
large initial nitrogen concentrations approaching 100 ppm, the highest irradiation doseused in this work, ∼ 1019 e-/cm2, was still insucient for maximum nitrogen-to-NV-
conversion. Nitrogen concentrations on the order of 50 ppm remain in the samples,so in order to maximize the conversion eciency, higher doses will be explored infuture work. Conveniently, the irradiated samples remained mostly transparent inthe spectral region of interestabsorption in the visible and near-infrared spectrumwas due almost entirely to NV centers. Eective relaxation times above 100 ns havebeen observed for some of the high-NV- concentration samples, likely limited byremaining paramagnetic nitrogen. A 100 µm-sized magnetic sensor based on thissample operating under ideal conditions should achieve a sensitivity of∼ 150 fT/
√Hz.
In order to improve on this limit, future work is necessary to mitigate the dominantcauses of relaxation.
2.6 Acknowledgements
The authors would like to thank B. Patton and S. Rochester for help with modelingand data visualization, T. Sauvage for proton irradiation, and P. Hemmer for extensivecomments and suggestions. We also thank V. Bouchiat, C. Hovde, D. Twitchen, andR. Walsworth for providing helpful comments, R. Segalman and J. Sun for providing

59
the Cary 50 spectrometer, and M. Donaldson and W. Vining for help with FTIRmeasurements. This work was supported by ONR-MURI and the Polish Ministry ofScience (grant NN 505 0920 33).
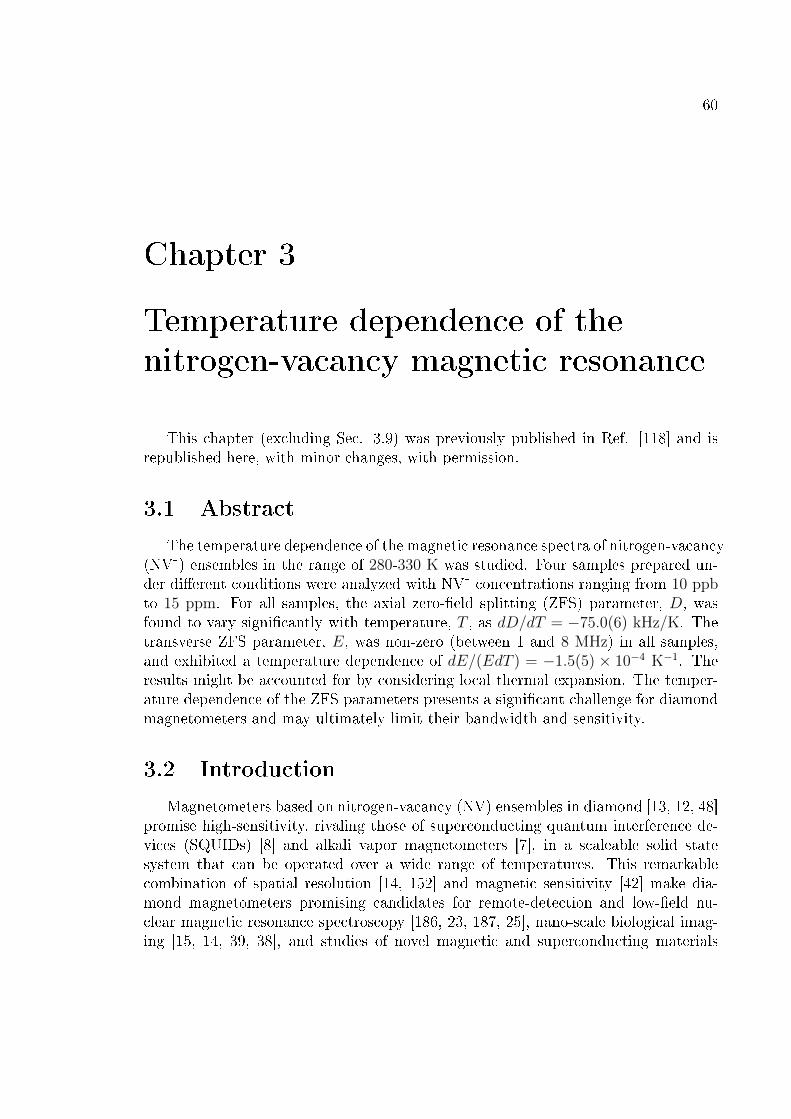
60
Chapter 3
Temperature dependence of the
nitrogen-vacancy magnetic resonance
This chapter (excluding Sec. 3.9) was previously published in Ref. [118] and isrepublished here, with minor changes, with permission.
3.1 Abstract
The temperature dependence of the magnetic resonance spectra of nitrogen-vacancy(NV-) ensembles in the range of 280-330 K was studied. Four samples prepared un-der dierent conditions were analyzed with NV- concentrations ranging from 10 ppbto 15 ppm. For all samples, the axial zero-eld splitting (ZFS) parameter, D, wasfound to vary signicantly with temperature, T , as dD/dT = −75.0(6) kHz/K. Thetransverse ZFS parameter, E, was non-zero (between 1 and 8 MHz) in all samples,and exhibited a temperature dependence of dE/(EdT ) = −1.5(5) × 10−4 K−1. Theresults might be accounted for by considering local thermal expansion. The temper-ature dependence of the ZFS parameters presents a signicant challenge for diamondmagnetometers and may ultimately limit their bandwidth and sensitivity.
3.2 Introduction
Magnetometers based on nitrogen-vacancy (NV) ensembles in diamond [13, 12, 48]promise high-sensitivity, rivaling those of superconducting quantum interference de-vices (SQUIDs) [8] and alkali vapor magnetometers [7], in a scaleable solid statesystem that can be operated over a wide range of temperatures. This remarkablecombination of spatial resolution [14, 152] and magnetic sensitivity [42] make dia-mond magnetometers promising candidates for remote-detection and low-eld nu-clear magnetic resonance spectroscopy [186, 23, 187, 25], nano-scale biological imag-ing [15, 14, 39, 38], and studies of novel magnetic and superconducting materials

61
[188, 48]. Until now, the temperature dependence of the magnetic resonance spectrahas not been systematically studied and has only briey been mentioned in the lit-erature [77, 48]. In this chapter, we report a striking temperature dependence of themagnetic-resonance spectra of NV- ensembles in diamond over the temperature rangeof 280-330 K. These ndings have important implications for the design of diamondmagnetometers and may ultimately limit their sensitivity.
3.3 Experiment procedure
The resonance spectra were recorded using the continuous-wave Fluorescence De-tected Magnetic Resonance (FDMR) method [122, 77]. Light from a 514-nm Argon-ion laser was focused with a 2.5 cm focal length lens onto the diamond samples,exciting the NV- centers' 3A2 → 3E optical transition via a phonon sideband [104].The same lens was used to collect uorescence from the diamond which was thenpassed through a dichroic mirror and a 650-800 nm bandpass lter and detected witha photodiode. Noise due to laser power uctuations was reduced by normalizingthe uorescence signal to a reference photodiode which monitored the incident laserpower. The output of a microwave signal generator was amplied, passed througha straight ∼ 200-µm diameter copper wire of length ∼ 5 mm placed within 500 µmof the focused light beam, and terminated with 50-Ω impedance. For temperaturecontrol, the diamond was thermally connected to a copper heatsink and placed insidean insulated aluminum housing. The temperatures of the heat sink and housing werecontrolled with separate thermoelectric (TE) elements. Unless otherwise stated, theresults reported in this Letter were obtained with a magnetic eld of . 1 G, laser-lightpower of ∼ 150 mW, and microwave power (after the wire) of ∼ 10 dBm.
For temperature scans, the temperature of the copper plate in direct thermalcontact with the diamond was monitored with an AD590 sensor. The FDMR spectrawere recorded with the temperature stabilized so that temperature excursions wereless than 0.05 K over 5 min. In order to avoid stray magnetic elds when recordingthe spectrum, the currents supplied to both TE elements were chopped at a frequencyof 2 Hz using photoMOS circuits, and the spectra were recorded only when the TEcurrents were o. The process was repeated until the temperature had been scannedthrough the 280-330 K range several times in both directions.
3.4 Zero-eld Hamiltonian and tting procedure
The NV-ensemble magnetic-resonance spectroscopy has been described, for ex-ample, in Refs. [70, 122, 20, 121, 12]) and is only briey summarized here. Opticalpumping via a spin-selective decay path collects NV centers (total spin S = 1) in the|ms = 0〉 ground-state magnetic sublevel [104]. In the absence of external elds, the|ms = 0〉 and |ms = ±1〉 levels are split by an energy equal to the axial zero-eld

62
splitting (ZFS) parameter, D ≈ 2.87 GHz. For perfect C3v symmetry, the transverseZFS parameter is E = 0 and the |ms = ±1〉 levels remain degenerate. When thefrequency of a microwave eld that is transverse to the symmetry axis is tuned to theenergy splitting between the |ms = 0〉 and |ms = ±1〉 levels, NV centers are trans-ferred to the |ms = ±1〉 sublevels, resulting in diminished uorescence with a contrastas high as 30% [14]. In the presence of an applied magnetic eld, B, the |ms = ±1〉levels split, revealing resonances separated by 2gNV µBB, where gNV = 2.003 is theNV- Landé factor [70, 55] and µB is the Bohr magneton. For ensembles, there arefour dierent NV orientations and, provided that gNV µB|B| D, only the projectionof the magnetic eld on the N-V axis aects the transition frequencies [121].
The zero-eld Hamiltonian for the ground state, including hyperne coupling tothe 14N nucleus (spin I = 1), can be written as:
H0 ≈ DS2z + E(S2
x − S2y) + A‖SzIz + A⊥(SxIx + SyIy), (3.1)
where A‖ = −2.1 MHz and A⊥ = −2.7 MHz are, respectively, the axial and trans-verse hyperne constants [55]. Analysis of this Hamiltonian reveals six allowed mi-crowave transitions for each N-V orientation. The relative intensities can be cal-culated by treating the interaction with the microwave eld, ~B1 as a perturbation,H1 = gNV µB ~B1 · ~S, with matrix elements that depend on the alignment of the mi-crowave radiation with respect to the symmetry and strain axes of each N-V center.However, since the exact geometry and the number of NV- centers of each orienta-tion were not known a priori, Gaussian functions with variable amplitudes and equalwidths, centered about these transition frequencies, were t to the spectra. Includingresidual magnetic elds, measured by a commercial uxgate magnetometer to be lessthan 1 G, into the model did not signicantly inuence the ts.
3.5 Results
Four single-crystal samples of mm-scale dimensions were studied, which were la-beled S2, S3, S5, and S8 and characterized in Ref. [12]. Figure 3.1 shows the FDMRspectrum at 293 K for S3, a sample synthesized by chemical vapor deposition (CVD)with [NV-]− ≈ 10 ppb [12]. As there was no applied magnetic eld, the splittingbetween resonance peaks is due to non-zero E, induced by local strain [14, 189, 121].This feature is present in varying magnitudes for all four samples. Even though allfour NV orientations are present, the spectra are reasonably well-described by justsix broad transitions, suggesting that the strain splittings are spatially inhomogenous[77, 190]. As no correlation with NV- concentration was observed (see Tab. 3.1),further work is necessary to determine the exact strain mechanism.
During each temperature scan, the spectrum was t to an empirical functionsimilar to the one described above, and the ZFS parameters were extracted. Figure3.2(a) displays the spectra at two dierent temperatures for another sample, S8, a

63
2.855 2.860 2.865 2.870 2.875 2.880
0.9940.9950.9960.9970.9980.9991.000
Microwave frequency [GHz]
Fluo
resc
ence
(nor
m.)
Figure 3.1: Zero-eld FDMR spectrum at 293 K for S3 and the corresponding tbased on Eq. 3.1 (solid green line). The six blue lines represent the tted amplitudesat each transition frequency, and the tted linewidth was 3.3 MHz (full width athalf maximum). The microwave power was reduced to ∼ −10 dBm to resolve thehyperne structure, resulting in the relatively small contrast of ∼ 0.6%. The best-tparameters for this scan are E = 1.4(5) MHz and D = 2869.3(2) MHz.

64
L aser intensity [kW/cm2]
kHz/
K dE /dT
dD/dT
d)
b)
c)
a)
Microwave frequency [GHz]
Flu
ores
cenc
e (n
orm
.)
T emperature [K ]
E [
MH
z]
ààààààààààà
àààààà
à ààà àà
à
à à
ààààà
à
àààà
àààà
àà
àà
àà
àà
ààà
àààà
à
à
à
àà
ààà
à
àà
àà
àà
à
à
à
à
àààà à
280 290 300 310 320 3302864
2865
2866
2867
T emperature [K ]
D [
MH
z]
çççççç
ç
çççç çç
çççç
ç
ç
ç
ç
ç
ççç
ççç
çç
ççççç
ç
ç
ç
çç
ççç
ç
ççç
çç
ç
ç
ç
ç
çç
ç
ç
ç
ç
çççç
çç
çç
çç
ç
ççççç
ç
ç
çç
280 290 300 310 320 3305.0
5.1
5.2
5.3
0.85
0.90
0.95
1.00
à
à à à à
ç
ç ç ç ç
0 10 20 30 40 50 60-80-60-40-20
020
326 K283 K
2.85 2.86 2.87 2.88 2.89
Figure 3.2: (a) Zero-eld FDMR spectra at 283 K and 326 K for S8 with ts (solidred lines). (b) Value of E for S8 as a function of temperature with linear t (solidblack line). (c) D for S8 vs. temperature with linear t. (d) dD/dT and dE/dT as afunction of laser intensity for S5. The dotted lines are the laser-intensity-independentvalues used in Tab. 3.1.

65
high-pressure, high-temperature (HPHT) synthesized diamond with [NV-] ≈ 0.3 ppm,as well as the empirical ts based on Eq. 3.1. Figures 3.2(b) and (c) show the ZFSparameters as a function of temperature for this sample. Linear least-squares tsyield dE/dT = −0.4(2) kHz/K and dD/dT = −76(1) kHz/K. Figure 3.2(d) displaysthe laser-intensity dependence for S5, an HPHT diamond with [NV-] ≈ 12 ppm.Linear ts (not shown) determined that any dependence of dD/dT or dE/dT on laserintensity is not statistically signicant. Additional tests for dependence on microwavepower, external magnetic eld, and sample positioning also did not show statisticallysignicant eects.
A similar procedure was performed for the three other samples: S2, an HPHTdiamond with [NV-] ≈ 16 ppm, as well as S3 and S5 (already mentioned). Table
# [NV-](ppm) dDdT
(kHz/K) E(MHz) 1EdEdT
(10−4K−1)S2 16 −71(1) 2.7(6) −5(2)S3 0.01 −74(4) 1.4(5) −40(40)S5 12 −78(1) 8(1) −5(1)S8 0.3 −76(1) 2.6(4) −0.4(5)
Table 3.1: ZFS parameters and uncertainties for four dierent samples. The valuesof E represent the expected value of E(293 K) extrapolated from the linear ts, andthe error bars represent the standard error from the t but not systematic eectsdue to imperfect assumptions in the model (see text). The laser intensity was ∼25-50 kW/cm2 throughout the collection volume. Note that for the S2 spectra amagnetic eld of B⊥ ≈ 13 G was applied. This eld enabled the isolation of a singleNV orientation, and the simplied spectrum was used to verify the robustness of themodel.
3.1 displays the temperature dependence of the ZFS parameters for each of thesesamples. The temperature dependence of D is similar for each sample, indicatingthat the mechanism responsible for this temperature variation is intrinsic to the NVcenters themselves. Taking a weighted average over all samples gives dD/dT =−75.0(6) kHz/K and, using the tted room-temperature values for each sample(D ≈ 2869(1) MHz), this corresponds to a fractional temperature dependence ofdD/(DdT ) = −2.61(2) × 10−5 K−1. The weighted average over samples of the frac-tional variation of E with temperature (nal column of Tab. 3.1) is also statisticallysignicant, dE/(EdT ) = −1.5(5)×10−4 K−1, but further work is necessary to under-stand the nature of E.

66
3.6 Calculation of D and its relative temperature de-
pendence
The origin of D is expected to be predominately due to dipolar spin-spin couplingbetween the two unpaired electrons forming the center [70, 97, 122]. This suggests aa likely mechanism for the temperature variation is local lattice expansion. Assumingthat the angular electronic wavefunctions are temperature-independent and that Dis entirely due to dipolar coupling, the eect of lattice expansion on D is:
1
D
dD
dT≈ 1
D
d〈(r212 − 3z2
12)/r512〉
dR
dR
dT, (3.2)
where r12 is the displacement between the two spins, z12 is the component of r12 alongthe N-V symmetry axis, and R is the distance between two basal carbon nuclei. Theeect of thermal expansion on 〈(r2
12 − 3z212)/r5
12〉 can be estimated by treating spins,localized near the basal carbon atoms [122, 10], with p-orbitals [122, 55] orientedalong axes 110 apart [99], and calculating the integral for neighboring values ofR. Using the room-temperature values for bulk diamond of R = 0.252 nm anddR/dT = 2.52× 10⁻⁵ nm/K [18], we calculate D = 2.66 GHz, which is within 10% ofthe experimental value, and dD/(DdT ) = −5.8× 10⁻⁶ K−1, which is about a factorof 4.5 smaller than the experimental value from this work. The latter discrepancysuggests that the macroscopic thermal expansion is not a good description of dR/dTin the immediate vicinity of the defect. Ab initio calculations [97, 99, 100, 10, 191]which include the determination of local thermal expansion eects would give a moreaccurate prediction of dD/dT .
3.7 Signicance for magnetometry applications
The sharp temperature dependence of D presents a technical challenge for room-temperature diamond magnetometry. Even if the ambient temperature can be con-trolled at the 1-mK level, this would lead to uctuations in the resonance frequencyof 80 Hz corresponding to a magnetic-eld variation of 3 nT. Monitoring both of the∆ms = ±1 resonances could provide a feedback mechanism for controlling this eectfor slow drifts, since the energy dierence between these resonances does not dependon D.
Higher-frequency temperature uctuations due to, for example, laser-intensitynoise, present an additional complication for magnetometry in the high-density limit.Consider the case of a Ramsey-type magnetometer making use of repeated lightpulses [13, 15, 14, 42] which transfer an energy to the diamond on the order ofEp ≈ ∆ε[NV-]V , where ∆ε ≈ 0.6 eV is the dierence in energy between absorbed andradiated photons, V is the eective volume being heated, and we have conservatively

67
neglected non-radiative transfer from the NV- singlet decay path [19] and other im-purities [172]. If the pulses are separated in time by a precession window, τ , then
in steady state the diamond temperature is modulated at a ratedT
dt≈ EpV cτ
, where
c = 1.8 J/cm3/K is the volumetric specic heat of diamond [192]. Integration over the
precession window yields a magnetometer oset of Boff ≈π∆ε[NV-]gNV µBc
dD
dT≈ −80 nT
at room temperature for [NV-] = 1 ppm. This oset makes the magnetometer sen-sitive to laser-pulse uctuations. Uncorrelated, normally-distributed uctuations inEp by a fraction χ produce magnetic eld noise-per-unit-bandwidth at the level ofχ|Boff |/
√τ ≈ 1 pT/
√Hz, using χ = 0.01 and τ = 1 µs. We note that this magne-
tometer noise is directly correlated with laser-intensity noise and therefore monitoringthe incident laser intensity could signicantly reduce this eect.
3.8 Conclusion
In this work, we have measured the temperature dependence of the ZFS parame-ters of four diamond samples covering a wide range of NV- concentrations. We havefound a signicant variation of the axial ZFS, D, with temperature and surmise thatit is due to local thermal expansion. We also present evidence of a non-zero trans-verse ZFS, E, and measure a small fractional temperature dependence just above theexperimental uncertainty. The results have a major impact on the performance of NV-ensemble magnetometers and may ultimately limit their sensitivity and bandwidth.We expect that proper feedback mechanisms, such as monitoring laser intensity uc-tuations and observing both ∆ms = 1 coherences simultaneously, will help to partiallymitigate these eects.
The authors are grateful to A. Gali, C. Santori, P. Hemmer, F. Jelezko, E. Corsini,and O. Sushkov for valuable discussions and R. Folman for support. This work wassupported by NSF grant PHY-0855552 and ONR-MURI.
3.9 Addendum
Recently [118] it was shown that D is strongly temperature dependent for thetemperature range 280-330 K. It was shown that the experimental value of D ≈2.87 GHz could be theoretically accounted for by pure dipolar coupling between theunpaired electrons. However estimates for dD/(Dd)T based on the thermal expansioncoecient of bulk diamond predicted a value that was ∼ 4.5 times smaller than theexperimental value.
In order to gain further insight into the temperature dependence, we measuredo-resonant zero-eld ODMR spectra in visible uorescence for a much wider temper-ature range, 5-400 K. The position of the dips were determined by quadratic ts and

68
àààà à à à à à à àà
àà
à
à
à
à
à
à
à
à
286528702875
D (M
Hz)
polynomial fit
point dipole (g=3)Ref. [23] (g=3.8)
àààà à àà à à à
à à à à à à à à à à à à
0 100 200 30001234
Temperature (K)
E (M
Hz)
a)
b)
c)
0 50 100 150 200 250 300 350-40
-30
-20
-10
0
10
Temperature [K]
dD/(D
dT)
[ppm
/K]
àà
à à à à
à
à
àà
àà
à
à
à
à
à
à
à
àà
Figure 3.3: (a) Fitted value for D as a function of temperature. The microwaveeld amplitude was ∼ 3 mG and excitation was with ∼ 1 mW of 532 nm light forall data in (a)-(c). Error bars from the ts in (a)-(b) are smaller than the plottedpoints. (b) Fitted value of E as a function of temperature. (c) Fitted values ofdD/(DdT ) as a function of temperature and theoretical temperature dependencebased on macroscopic thermal expansion [18], as described in the text.
used to extract the ZFS parameters. Figures 3.3(b) and (c) show the temperature-dependence of the tted values of D and E, respectively. We note that the room-temperature values for the ZFS parameters are shifted by ∼ 2 MHz from those for S2in Ref. [118], and we attribute this discrepancy to an error in the tting procedurein that work. However, upon re-analysis of the raw spectra in Ref. [118], the tem-perature dependence of both parameters, remained the same to within the quoteduncertainty.
No temperature dependence for E is evident from the data in Fig. 3.3(b), forexample a t to a line sets a limit of dE/(EdT ) < 30 ppm/K. Figure 3.3(c) plotsdD/(DdT ) as a function of temperature. These data were calculated by taking thederivative of nearest-lying points in Fig. 3.3(a). As seen in Fig. 3.3(c), the valuemeasured for dD/(DdT ) is −21(4) ppm/K at 283 K and −28(3) ppm/K at 320K. These values are in excellent agreement with Ref. [118], where dD/(DdT ) =−26.1(2) ppm/K in the temperature range 280-330 K was reported.
The solid and dashed lines in Fig. 3.3(c) come from assuming a form dD/(DdT ) =−gα(T )/D, where α(T ) is the thermal expansion coecient for bulk diamond [α(295 K) ≈1 ppm/K, Ref. [18]] and g is a coecient which describes the strength of the dipolarinteraction. For a pure point-dipole interaction, D ∝ r−3, where r is the separationbetween unpaired electrons. Thus we expect g = 3 if r follows the same thermal ex-pansion as bulk diamond. Assuming the unpaired electrons are conned to p-orbitalsalong the dangling bonds (see Ref. [118]), and that the positions of the dangling

69
bonds follow the same thermal expansion as bulk diamond, we expect g ≈ 3.8. At to a fth order polynomial, consistent with the polynomial order used to t thethermal expansion coecient in Ref. [18], is shown in Fig. 3.3(c).

70
Chapter 4
Optical properties of the
nitrogen-vacancy singlet levels in
diamond
This chapter was previously published in Ref. [11] and is republished here, withminor changes, with permission.
4.1 Abstract
We report measurements of the optical properties of the 1042 nm transition ofnegatively-charged Nitrogen-Vacancy (NV) centers in type 1b diamond. The resultsindicate that the upper level of this transition couples to the ms = ±1 sublevels ofthe 3E excited state and is short-lived, with a lifetime of . 1 ns. The lower level isshown to have a temperature-dependent lifetime of 462(10) ns at 4.4 K and 219(3) nsat 295 K. The light-polarization dependence of 1042 nm absorption conrms that thetransition is between orbitals of A1 and E character. The results shed new light onthe NV level structure and optical pumping mechanism.
4.2 Introduction
The negatively-charged Nitrogen-Vacancy (NV) center in diamond has receivedconsiderable attention in recent years for its unique optical and spin properties. Thecenter has a paramagnetic ground state with long coherence times (& 1 ms [42]), andspin levels can be initialized and detected by optical excitation in a broad range ofwavelengths (450-650 nm) [112, 129, 122, 77] and manipulated on sub-nanosecondtimescales [90] by microwave (MW) excitation, all at room temperature. Thesetraits, coupled with the excellent thermal, electrical, and mechanical properties of

71
3A2
3E1E
1A1
0
-1+1
1042 nm637 nm
2.87 GHz
0-1
+1
ms
~10 ns
d1 ns
~150 - 450 ns
Figure 4.1: Level diagram for NV center showing spin-triplet ground and excitedstates, as well as the singlet system involved in intersystem crossing. Radiative tran-sitions are indicated by solid arrows and non-radiative transitions by dashed arrows.The tentative label of the upper(lower) singlet as 1E(1A1) is based on the observedspin-selective decay paths (see text).
the diamond host, make NV centers promising candidates for quantum computing[85, 86, 87, 88, 89, 92] and ultra-sensitive metrology [13, 14, 15, 12, 47, 54].
The NV center is now among the most widely studied defects in a solid [185],but there still exist open questions regarding its electronic level structure, and themechanism by which optical excitation produces high spin polarization (& 80% evenat room temperature) [115, 55, 89] is not fully understood. The ordering and relativeenergies of all four singlet levels predicted by group theory [97] have not been exper-imentally veried, and current theories disagree [104, 101, 102]. Since some of theselevels are responsible for the optical pumping mechanism of the NV center, a fullcharacterization of their properties is necessary before applications can reach theirfull potential.
Recently an infrared (IR) zero-phonon line (ZPL) at ∼ 1042 nm was observedafter optical excitation at 532 nm [19, 193]. The transition was characterized as asinglet-singlet transition involved in the optical pumping mechanism, but attemptsto excite it on the phonon sideband were unsuccessful. In this chapter, we study the1042 nm transition using laser light tuned to the ZPL. We determine the lifetimesof both singlet levels involved in the transition and infer their symmetry characterfrom observed light-polarization selection rules. The results conrm the role of thetransition in optical pumping of the center and give new information on the relativeordering and energies of the singlet levels.
Figure 4.1 depicts the energy level diagram of the NV center. Only experimentallyveried levels are shown, though two additional singlet levels have been theoreticallypredicted [97, 104]. Transitions from the 3A2 ground state to the 3E state can beexcited optically with ZPL at 637 nm. At least one singlet level lies close in energy

72
pump
probe1042 nm
diamond
photodiode
MWwire
a)
b)1000 1020 1040 1060 1080 1100
1.2
1.4
1.6
2.0
Wavelength [nm]
Fluo
resc
ence
inte
nsity
[arb
.]
1.8
0
S2: [NV-]~16 ppm
S6: [NV-]~8 ppm
ZPL: 1042.5(3) nm
c)cryostat
2750 2800 2850 2900 2950 3000 30500.98
0.99
1.00
1.01
1.02
Microwave frequency [MHz]
IRVisible
Fluo
resc
ence
[nor
mal
ized
]MC
or filters
Figure 4.2: (a) Apparatus used for magnetic resonance and optical studies. MCmonochromator. (b) Fluorescence spectrum of the IR transition (excitation at 532nm) at room temperature for two diamonds with dierent NV- concentrations [12]showing a ZPL at 1042.5(3) nm. The sloped background is due to the tail of thephonon sideband of the much-stronger 3E → 3A2 transition [19]. (c) Magnetic-resonance spectra of sample S2 for visible (650-800 nm bandpass lter) and IR (1000nm longpass lter) emission at room temperature under an applied eld of ∼ 4 mT.Excitation was with ∼ 1 W of 532 nm light, polarized in the plane of the sample sur-face. The variation in peak heights can be explained by the pump-light and microwavepolarization selection rules [20].
to 3E, and spin-orbit coupling induces triplet-singlet intersystem crossing (ISC). NVcenters in the ms = ±1 magnetic sublevels have signicantly higher probability toundergo ISC [122, 77], and, from symmetry considerations, this suggests that theclosest lying singlet is 1E [104, 194, 102]. NV centers which undergo ISC then decayto another, longer-lived singlet level [19] (ZPL at 1042 nm), after which they crossover predominately to the ms = 0 sublevel of the 3A2 ground state [104, 102]. Sym-metry considerations predict that this metastable singlet (MS) is 1A1 [104], but recenttheoretical calculations [101, 9] contradict this assignment.

73
4.3 Experimental apparatus
Figure 4.2(a) illustrates the experimental apparatus used for optical characteri-zation of the 1042 nm transition. Two laser beams, a pump (514, 532, or 637 nm)and IR probe (∼ 10 mW at 1042.4 nm), were overlapped and focused with a 1/2"-focal-length lens onto the surface of a diamond housed in a liquid-helium cryostat(Janis ST-500). The temperature was measured by a diode located at the base of thecryostat's sample holder. The diamonds used in this work [12], grown under high-pressure-high-temperature conditions (HPHT), were irradiated with 3-MeV electronsand annealed at 750 C for two hours, after which they contain ∼ 8-16 ppm of NV-
and ∼ 50 ppm of unconverted nitrogen. For absorption measurements, the transmis-sion of the probe beam was spectrally ltered and detected with a Si photodiode.The same detection scheme was employed for uorescence measurements, except theprobe beam was blocked and dierent spectral lters were used, as appropriate. Fig-ure 4.2(b) shows the room-temperature uorescence spectra for two dierent high-NV-density HPHT samples, S2 and S6, recorded using a monochromator. For thesamples and temperature range (∼ 4.4-300 K) explored here, we measure the ZPLto be at 1042.5(3) nm. The IR emission is predominately concentrated in the ZPL[19], but the integrated intensity is less than visible emission (650-800 nm) by a factorof around 1000, presumably due to competition with a non-radiative decay process[19, 102].
4.4 Optical properties, spin-dynamics and temperature-
dependent lifetimes
Here we describe measurements made on S2. Figure 4.2(c) shows room-temperaturemagnetic-resonance spectra detected in visible and IR emission with a 532 nm pumpbeam. These spectra can be understood as follows. Optical pumping collects NVcenters in the ms = 0 ground-state sublevel. When the frequency of an applied MWeld coincides with one of the eight ground-state magnetic-resonance transition fre-quencies (see, for example, Refs. [20, 12, 121, 47, 54, 118]), population is transferredto an ms = ±1 sublevel. Under continuous optical excitation, this results in moreNV centers undergoing ISC to the singlet levels, resulting in a decrease in visibleuorescence and an increase in IR uorescence. Due to a combination of backgrounduorescence from the phonon sideband of the 3E → 3A2 transition, imperfect spinpolarization, and non-zero branching ratio from ms = 0, the contrast of the IR uo-rescence magnetic-resonance spectra is only a few percent.
To verify the model in Fig. 4.1, wherein the upper singlet is populated indirectlyby decay from the ms = ±1 sublevels of 3E, we observed, via uorescence, magneticresonance spectra while pumping resonantly (637 nm) and non-resonantly (514 nm)at 70 K. The pump intensities were kept relatively low (. 1 kW/cm2) in order to

74
minimize bleaching [195, 142]. Under both pumping conditions, we found that theintensity ratio of visible emission (650-800 nm) to infrared emission (1000+ nm)was the same (3(1)× 103), conrming that the upper singlet is populated via the 3E.Further, the shape and contrast of the IR uorescence spectra were similar under bothpumping conditions, indicating that decay is primarily from the ms = ±1 sublevels.
In order to determine lifetimes of the upper singlet and 3E excited state, uo-rescence lifetime measurements were carried out for both the IR and visible emis-sion using the phase-shift technique [196] (Fig. 4.3(a)). When the intensity of thepump beam is modulated sinusoidally with frequency f , the time-dependent uo-rescence oscillates with a relative phase shift, φ. For decay described by a singletime-constant, τ , which was used to model the visible emission [197], this phase shiftis φ = arctan(2πfτ). For the cascade decay expected for IR uorescence (Fig. 4.1),we assume that the upper singlet level (lifetime, τ0) is populated only by the ms = ±1
sublevels in 3E (lifetime, τ1 ≈ 7.8 ns [153]), and nd φ = arctan( 2πf(τ1+τ0)1−(2πf)2τ1τ0
).Figure 4.3(b) shows results of the lifetime measurements at zero magnetic eld for
visible and IR emission, respectively. The pump (514 nm) modulation-frequency wasvaried and both the pump and uorescence intensities were simultaneously recordedon separate detectors. The relative phase was determined by tting both signalsand correcting for time delays due to the detection scheme. For visible emission, theensemble-averaged decay time is found to be 10.0(3) ns. For IR emission, the ttedlifetime of the upper singlet is τ0 = 0.9(5) ns, which is consistent with the decay beingdominated by a non-radiative channel [19]. No temperature dependence was observedfor either visible or IR uorescence lifetimes in the range explored here (4.4-70 K).
The lifetime of the MS level was measured by recording the transmission of 1042.4nm light after abruptly turning the pump beam o (fall time . 20 ns), and tting toa single exponential. Laser-intensity-dependent eects were determined to be smallerthan the statistical uncertainty by varying both pump and probe laser powers. Figure4.3(c) shows the lifetime as a function of temperature, along with ts to the modeldescribed below. A substantial temperature dependence is observed; the MS lifetimeis determined to be 462(10) ns at 4.4 K and decreases to 219(3) ns at 295 K and142(6) ns at 450 K. The timescale of this decay is in agreement with the observedtimescale for ISC to the ground state [185, 104], conrming that the lower-energylevel of the 1042 nm transition is indeed the metastable state which governs spindynamics under optical excitation.
As the spontaneous emission rate is independent of temperature, a likely mecha-nism for temperature-dependent decay is emission stimulated by lattice phonons. As-suming a simple model where decay is dominated by a single channel, the temperature-dependent rate for the N -phonon decay is then given by [198]:
1
τ [T ]=
1
τ [0]
N∏i=1
(1 + ni[T ]), (4.1)

75
á
t
Φ=arctan(2ΠfΤ)
pumpresponse
a)
0 2 4 6 8 10 12 140.0
0.2
0.4
0.6
0.81.0
Modulation frequency [MHz]
∆φ [r
ad.]
visible emission:Τ=10.0(3) ns
IR emission:Τ0=0.9(5) nsT=4.4 K
ç
ç
ç
ç
ç
ç
ç ç
ç
ç
0 100 200 300 400 5000
100
200
300
400
500
Temperature [K]
Abs
orpt
ion
deca
y tim
e [n
s]
One phononTwo phonons
Ε=15 meV
Ε1=16 meV,Ε2=102 meV
metastablesinglet lifetime
b)
c)
á
á
áá
á
á
á
áá
á
á
á
á
á
á
çç
ç
ç
çç
ç
ç
ç
çç
ç
ç
ç
ç
ç ç
Local modes
Figure 4.3: (a) The phase shift technique. (b) Phase shift of visible (650-800 nm) andIR (1035-1045 nm) uorescence as a function of modulation frequency and ts (seetext). (c) Lifetime of the MS as a function of temperature as well as ts to Eq. (4.1).The values of ε and ε1,2 are the tted phonon energies for N = 1 and N = 2 decays,respectively. Error bars represent the standard deviation of multiple measurements.

76
where ni[T ] = (eεi/(kBT ) − 1)−1 is the Bose occupancy for the phonon mode withenergy εi, and kB is the Boltzmann constant. Figure 4.3(c) shows ts of Eq. (4.1)for N = 1 and 2. The t parameters indicate that the total energy gap betweenthe MS and nal state,
∑i εi, is 15(1) meV for N = 1 and 118(30) meV for N = 2.
We also t the data to the dominant local phonon modes [19], modifying Eq. (4.1)as 1/τ [T ] = 1/τ [0]
∏2i=1(1 + ni[T ])N [εi], where εi = 43, 137 meV are the phonon
energies, and N [εi] are the respective degeneracies. While the t is not as good, itsuggests a similarly small energy gap of 129 meV (N [43 meV] = 3 and N [137 meV] =0). Such a small energy gap is not predicted by current models, where the MS isexpected to lie ∼ 700 meV above the 3A2 ground state [19, 101, 102], so further workis necessary to resolve this.
In order to determine the orbital character of the two singlets, we studied thelight-polarization selection rules for excitation. A magnetic eld was applied whichsplit the resonances belonging to each orientation, allowing us to observe the opticalresponse of each NV orientation (Fig. 4.4(a)). We modied the apparatus illustratedin Fig. 4.2(a), inserting separate linear polarizers for both resonant pump (637.7 nm)and probe (1042.4 nm) beams. Figure 4.4(b) shows the light-polarization-dependenceof the magnetic-resonance contrast under two geometric congurations; where the NVaxis, z, was normal to or lying in the plane of polarization, dened by the normalvector, k. For z ‖ k, the contrast of visible uorescence, Rvis, is independent ofpump polarization angle, and for z ⊥ k, Rvis approaches zero for polarization alongz. This behavior is consistent with the expected polarization selection rules for aE ↔ A2 transition [199, 20, 200], where excitation with x and y polarized light isequally allowed and z polarization is forbidden. With pump polarization now heldconstant at an angle which excited all orientations, we observed the contrast of IRabsorption, Rir, with varying probe polarization. The results demonstrate that Rir
has a similar polarization dependence to Rvis, indicating that both transitions obeythe same polarization selection rules. This observation conrms that the 1042 nmtransition involves E and A1 orbitals, as the other possible combinations of singletlevels have dierent polarization selection rules [21] (Fig. 4.4(c)).
4.5 Conclusion
We have measured optical properties of the 1042 nm transition of the NV centerand determined that the transition plays an important role in the optical pumpingmechanism. This knowledge can be used to improve NV-based applications; for ex-ample, 1042 nm absorption was recently used in a magnetometer which demonstratedabout an order of magnitude improvement in sensitivity compared to uorescence-based techniques [44]. Further work is necessary to determine the relative energies ofall four singlet levels and to understand the role of non-radiative decay.
The authors are grateful to A. Gali, N. Manson, L. Rogers, M. Doherty, P. Hem-

77
2.70 2.75 2.80 2.85 2.90 2950 3.00 3.05
0.985
0.990
0.995
1.000
Microwave frequency [GHz]
Sign
al [n
orm
aliz
ed]
T=70 K IR transmissionVisible fluorescence
Rvis
Rira)
æ
æ
æ
æææææ
æ
æ
æ
æ
æ
æ
æ æ æ æ
æ
ææææ
æçççç
çççç
ç
ç
çç
ç
ççççç
ç
ç
ç
ç
ç
ç
b) 0o
180o
90o270o
0o
180o
90o270o
z k
z ||kRvis Rir
x,y,zx,y
x,yzA1
A1
E
Ec)
á
ááá
á
á
áá
áá
ááá
áááá
á
á
á á
áááá
àààà
à
à
à
à
à
ààà
àà
à
à
à
à
à
à
à
à
à àà
à
à
à
zΦNV
Θ
z surface
Figure 4.4: (a) Example magnetic-resonance spectrum for visible uorescence andtransmission of IR probe at 70 K. As the sample was [111]-oriented, one of the NVaxes was normal to the sample surface. (b) Polar plot of the contrast of visibleuorescence (left) and IR absorption (right) as a function of light-polarization anglefor both geometries (see text). Solid lines are ts to a constant and dashed linesare ts to sin2(θ − φNV ) + c, where θ is the polarizer angle, φNV is the angle of zrelative to the polarizer axis, and c is an oset which takes into account imperfectionsin light polarization, beam alignment, and selection rules. For the z ⊥ k geometry,the sample and polarizer were positioned such that we expected φNV = 90(3), andboth of the tted values of φNV agree with this value to within the uncertainty. (c)Light-polarization axes for allowed transitions between the singlet levels [21]. Theselection rules are identical for both absorption and emission.

78
mer, E. Corsini, B. Patton, M. Ledbetter, and L. Zipp for valuable discussions. Thiswork was supported by NSF grant PHY-0855552.

79
Chapter 5
Broadband magnetometry by
infrared-absorption detection of
diamond NV centers
This chapter was previously published in Ref. [44] and is republished here, withminor changes, with permission.
5.1 Abstract
We demonstrate magnetometry by detection of the spin state of high-densitynitrogen-vacancy (NV) ensembles in diamond using optical absorption at 1042 nm.With this technique, measurement contrast and collection eciency can approachunity, leading to an increase in magnetic sensitivity compared to the more commonmethod of collecting red uorescence. Working at 75 K with a sensor with eectivevolume 50 × 50 × 300 µm3, we project photon shot-noise limited sensitivity of 5 pTin one second of acquisition and bandwidth from DC to a few MHz. Operation in agradiometer conguration yields a noise oor of 7 nTrms at ∼ 110 Hz in one secondof acquisition.
5.2 Introduction
Recently, a technique for measuring magnetic elds at the micro- and nanometerscale has emerged based on nitrogen-vacancy (NV) electron spin resonances in dia-mond [14, 15]. This technique oers an exceptional combination of sensitivity andspatial resolution in a wide temperature range, from 0 K to above room temperature.Sensors employing ensembles of NV centers promise the highest sensitivity [13, 12]and have recently been demonstrated [48, 54, 47]. These rst-generation magne-tometers have measured sub-micron-scale elds, but their sensitivity was limited by

80
background uorescence and poor photon collection eciency.In this Chapter, we demonstrate a technique to read out the NV spin state us-
ing infrared (IR) absorption at 1042 nm [19, 11]. With this technique, measurementcontrast and collection eciency can approach unity, leading to an overall increase inmagnetic sensitivity. We perform measurements at 45-75 K on a sensor with activevolume ∼ 50×50×300 µm3, revealing magnetic resonances with amplitude and widthcorresponding to a shot-noise-limited sensitivity of 5 pT in one second of acquisitionand a measurement bandwidth from DC up to a few MHz. We demonstrate operationin a gradiometer conguration, with a sensitivity of 7 nTrms in one second of acqui-sition at ∼ 110 Hz bandwidth, and outline a design for a room-temperature deviceemploying a low-nesse optical cavity with sensitivity approaching the spin-projectionnoise limit.
5.3 Fundamental limits on sensitivity
Spin-based magnetometers are fundamentally limited by the quantum noise asso-ciated with spin projection. The minimum detectable magnetic eld for a sample ofspins with density n in a volume V is given by [7, 13]:
δBq '1
γ
1√nV tmT ∗2
, (5.1)
where γ = 1.761×10¹¹ s−1T−1 is the NV gyromagnetic ratio [70] and T ∗2 is the electronspin dephasing time, and tm & T ∗2 is the measurement time. The sample [12] used inthis work (labeled S2), contains an NV density of n = 7× 1017 cm−3 for each of thefour crystallographic orientations and typically exhibits T ∗2 = 0.15 µs. With optimaldetection the magnetic sensitivity approaches the limit set by Eq. (5.1), and we ndthe noise oor in this sample of ∼ 20 pT/µm3/2 for tm = 1 s, or ∼ 10 fT for the activevolume used here.
However, reaching this level of sensitivity requires an improvement over the com-monly used technique of detecting spin selective uorescence [72, 185]. For sucientlylow measurement contrast, R (relative dierence in detected signal depending on spin-projection), the sensitivity using the uorescence technique can be estimated [13, 12]by modifying Eq. (5.1) as δBfl ≈ δBq/(R
√η), where η is the detection eciency. Re-
cent experiments [54, 47] yielded typical values of R ∼ 0.03 and η ∼ 0.001, making thebest possible sensitivity, in the absence of excess technical noise or other broadeningmechanisms, about three orders of magnitude worse than the spin-projection-noiselimit. The contrast is limited by non-ideal branching ratios to the dark singlet states[104, 19] and high background uorescence from defects which do not contribute tothe magnetometer signal [20], while η is limited by the eld of view of the detectionoptics and sub-unity quantum eciency of the detected transition [142, 52].

81
3A2
3E
ms=0
-1+1
1042nm
metastablesingletD
2 z
0-1+1
pump,532 nm
probe1042 nm
diamond
Ch. 1
MWwire
(a)
Ch. 2
cryostat
(b)Red
fluorescence
0 20 40 60 80 100 120 1401
2
5
10
20
50
100
Frequency [Hz]
Bz [
nTrm
s] fo
r 1 s
acqu
isiti
on
IR Ch. 1 (45 K)Red fluorescence (300 K)
(c)IR Ch. 2 (45 K)IR gradiometer (45 K)
7 nT
Figure 5.1: (a) Level structure of the NV center and allowed optical transitions.Radiative (non-radiative) transitions are represented by solid (dashed) lines. (b) IRabsorption gradiometer apparatus. The green pump and IR probe beams were focusedto a diameter of ∼ 30 µm near the surface of the diamond, and two halves of thetransmitted IR beam were detected with separate photodiodes. MWmicrowave.
5.4 Infrared absorption technique
By using IR absorption detection, we circumvent most of these problems andachieve considerably higher sensitivity. Figure 5.1(a) displays the level structure ofthe NV center with allowed radiative and non-radiative transitions. The center hasa paramagnetic (S = 1) ground state, with a zero-eld splitting of D ≈ 2.87 GHz atroom-temperature [118]. At low magnetic eld (<< 0.1 T), the magnetic sublevelsshift by ∆z ≈ γmsBz/(2π), where Bz is the projection of the magnetic eld alongthe NV axis. Optical pumping via a spin-selective decay path [104, 19, 11] involvinga 1042 nm transition, populates NV centers in the ms = 0 ground-state sublevel.The same decay path is also responsible for the drop in uorescence upon applicationof resonant microwaves, which is the principle of operation of recent magnetometrydemonstrations [14, 15, 42, 48, 47, 54].
The apparatus is illustrated in Fig. 5.1(b). Pump (532 nm) and probe (1042 nm)beams were overlapped and focused to a waist of ∼ 30 µm diameter, approximately0.5 mm before the diamond surface. The diverging beam had a diameter of ∼ 50 µmas it passed through the diamond, and was suciently far from the focal point (morethan one Rayleigh range) that it exhibited far-eld diraction. Fluorescence wascollected via the same lens, spectrally ltered to pass 650-800 nm light, and detected

82
2.7 2.8 2.9 3.07.2
7.3
7.4
7.5
7.6
0.295
0.290
0.285
Microwave frequency [GHz]IR
tran
smis
sion
[mW
]
Red
fluo
resc
ence
[mW
]
T=75 KIR Ch. 2IR Ch. 1Red fluorescence
Figure 5.2: Optically-detected magnetic resonance at 75 K using the uorescencemethod and both halves of the transmitted IR probe. The pump power was 0.8 Wand the microwave Rabi frequency was ∼ 1.5 MHz.
by a photodiode. The transmitted probe beam was split in two halves by a sharp-edge mirror and detected with separate photodiodes. The diamond was housed ina liquid-helium cryostat (Janis ST-500) and microwaves were delivered via a wireplaced ∼ 2 mm from the illuminated region. No magnetic shielding was used.
The principle behind our technique is the following: under continuous opticalpumping, we detect the population of NV centers in the metastable singlet (MS) bymonitoring the transmission of the 1042 nm probe beam and use this to read out thespin polarization of the ensemble. In the absence of resonant microwaves, NV centersare pumped into the ms = 0 ground-state sublevel and there is reduced populationin the MS corresponding to maximum probe transmission. Under application ofmicrowaves with frequency D± γBzi/(2π), where Bzi is the magnetic eld projectionalong the i'th NV orientation, population is transferred to the ms = ±1 sublevel,resulting in greater population in the MS and lower probe transmission.
Magnetic-resonance spectra, detected by both uorescence and IR-transmission,are shown in Fig. 5.2. A bias magnetic eld of ∼ 4 mT, produced by a permanentmagnet, was directed such that each of the four NV orientations had dierent Bzi ,resulting in eight resolved resonances. The contrast of both uorescence and IR-transmission resonances depends on the change in the MS population, which saturateswhen the pump rate is Ωp & 1/τMS, where τMS ≈ 0.3 µs is the MS lifetime [11]. Thiscondition was satised without signicant power broadening for the pump power usedhere, 0.8 W.
For the IR-transmission resonances, the contrast also depends on the probe's op-tical depth. At room temperature, we nd R ∼ 0.003, limited by the weak oscillatorstrength of the transition [19, 11] and homogenous broadening of the IR absorptionline [19, 11]. The maximum contrast (R ∼ 0.03) occurs in the 45-75 K tempera-ture range, where the homogenous and inhomogenous contributions to the linewidthare approximately equal [108]. This contrast is, coincidentally, nearly the same as

83
the maximum contrast obtained using uorescence detection, but the signal is muchlarger due to the higher collected light intensity.
5.5 Operation as a magnetic gradiometer
Operation of the device as a magnetometer was accomplished by phase-sensitivedetection. An oscillating magnetic eld (frequency 40 kHz, amplitude ∼ 0.1 mT) wasapplied and the resulting photodiode signals were demodulated at the rst harmonicusing lock-in electronics. In order to maximize the contrast, we used the ∆ms = −1resonance corresponding to NV orientation normal to the light polarization vectors[20, 11]. Lock-in signals as a function of microwave frequency are shown in Fig. 5.3(a)for both IR channels. The small dierence in magnetic response of the two channels,due to inhomogeneity in the pump and microwave elds, was compensated for byadjusting the light levels hitting the photodiodes.
Tuning the microwaves to the center of the resonance, where the lock-in signalcrosses zero, gave the highest magnetic response. Figure 5.3(b) shows the time-series response of both magnetometer channels when an additional AC magnetic eld(frequency 109 Hz, amplitude 1 µTrms) was applied. The magnetometer was alsooperated at 26 and 426 Hz with a similar magnetic response. The measurementbandwidth in this work was limited by the lock-in time constant, but in principlethis technique can be used to detect elds with angular frequency approaching themaximum spin polarization rate, ∼ 1/τMS, without degradation in sensitivity.
The Fourier transform of the time-series response for the 109 Hz applied eld, Fig.5.3(c), reveals a noise oor for each channel of ∼ 15 nTrms in 1 s of acquisition for ∼110 Hz frequencies. For comparison, we also plot the noise spectrum for uorescence-based magnetometer at room temperature, showing a noise oor of ∼ 60 nTrms in 1s of acquisition.
Taking the dierence of the two IR channels' magnetometer signals gives a noiseoor of ∼ 7 nTrms in 1 s of acquisition for ∼ 110 Hz frequencies. Since these signalscorrespond to light that has interacted with spatially separate parts of the diamond,the dierence-signal measures the magnetic eld gradient across the beam (eectivebaseline ∼ 25 µm). The benet of this gradiometric approach is that technical noisecommon to both channels, such as laser intensity and ambient eld uctuations, iscanceled. The cancelation here was imperfect, as the dominant contributions to thenoise oor were uncompensated intensity uctuations of both pump and probe lasers,as determined by blocking the pump laser and/or turning o the modulation eld.

84
0 20 40 60 80 100 120 1401
2
5
10
20
50
100
Frequency [Hz]
Bz [
nTrm
s] fo
r 1 s
acqu
isiti
on
IR Ch. 1 (45 K)Red fluorescence (300 K)
IR Ch. 2 (45 K)IR gradiometer (45 K)
7 nT
0 20 40 60 80 100-3-2-10123
Time [ms]
Bz [
µT]
IR Ch. 2
Bz~4 mTT~45 K
IR Ch. 1
2.73 2.75 2.77 2.79-4-2024
Microwave frequency [GHz]
Lock
-in si
gnal
[V]
IR Ch. 2IR Ch. 1
(a) (b)
(c)
Figure 5.3: (a) Lock-in signal for both IR magnetometer channels. (b) Time seriesmagnetometer signal, after subtraction of the static bias eld, for a 1 µTrms appliedeld at 109 Hz. The microwave frequency was tuned to the center of the resonance(zero-crossing in (a)). (c) Frequency-domain response of the magnetometer output in(b) revealing an IR absorption gradiometer noise oor of 7 nTrms in 1 s of acquisition.

85
5.6 Eliminating photon shot-noise
In the absence of technical noise, our technique is limited by photon shot-noise,given by:
δBp '1
γ
ΓmrR
√EpPtm
, (5.2)
where Γmr is the magnetic-resonance linewidth, Ep is the photon energy, and P isthe detected optical power. Analyzing the highest-contrast resonances in Fig. 5.2, weproject a photon shot-noise limited sensitivity of ∼ 40 pT for uorescence collectionand ∼ 5 pT for the sum of both IR absorption channels at tm = 1 s. The latter cor-responds to approximately an order of magnitude better sensitivity-per-root-volumethan the photon shot-noise limit of recent uorescence-based demonstrations [47, 54].
Here we were limited by the available laser diode power, but if the 1042 nmtransition is closed, we may be able to increase the probe power without adverseeects, making the photon shot-noise negligibly low, and leaving only the quantum-shot-noise-limited sensitivity. In this case, the number of NV centers that enters Eq.(5.1) would be the change in the MS population on and o resonance.
5.7 Conclusion
The present technique can be extended to room-temperature operation by em-ploying a cavity to increase the optical depth at 1042 nm. We estimate that a cavitywith nesse of ∼ 200 will optimize the magnetometer response. Using two parallelmicro-cavities should permit gradiometry with sensitivity approaching the quantumshot-noise limit of ∼ 10 fT in one second of acquisition. Such a device would be idealfor low-eld NMR detection [26] in, for example, microuidic devices [25].
The authors thank B. Patton, E. Corsini, and the group of A. Pines for helpfulcomments. This work was supported by NSF.

86
Chapter 6
Conclusion
In this dissertation, the basic history and physics behind optical magnetometrywith nitrogen vacancy centers in diamond was discussed. The focus was on high-spin-density ensembles for ultra-sensitive, high-bandwidth, variable-temperature magne-tometry at the micrometer scale. First we identied important parameters in thefabrication process and showed how to produce optimized material for ensemble mag-netometry. Next we studied the temperature dependence of the ground-state mag-netic resonance and discussed its impact on the performance of ultra-sensitive devices.Then we discussed optical properties of a singlet-singlet transition and showed thatthis transition can be used for high sensitivity spin-state readout. Finally we pre-sented a magnetometer prototype which incorporated ideas learned from these basicstudies and improved on the state-of-the-art in several key areas.

87
Bibliography
[1] W. C. Grith, S. Knappe, and J. Kitching, Opt. Express 18, 27167 (2010).
[2] H. B. Dang, A. C. Maloof, and M. V. Romalis, Applied Physics Letters 97,151110 (2010).
[3] M. Vengalattore, J. M. Higbie, S. R. Leslie, J. Guzman, L. E. Sadler, and D. M.Stamper-Kurn, Physical Review Letters 98, (2007).
[4] J. R. Kirtley, M. B. Ketchen, K. G. Stawiasz, J. Z. Sun, W. J. Gallagher, S. H.Blanton, and S. J. Wind, Applied Physics Letters 66, 1138 (1995).
[5] A. Finkler, Y. Segev, Y. Myasoedov, M. L. Rappaport, L. Ne'eman, D.Vasyukov, E. Zeldov, M. E. Huber, J. Martin, and A. Yacoby, Nano Letters10, 1046 (2010).
[6] H. J. Mamin, T. H. Oosterkamp, M. Poggio, C. L. Degen, C. T. Rettner, andD. Rugar, Nano Letters 9, 3020 (2009).
[7] D. Budker and M. Romalis, Nature Physics 3, 227 (2007).
[8] J. Clarke and A. I. Braginski, The SQUID Handbook (Wiley-VCH, Weinheim,2004), Vol. 1.
[9] M. W. Doherty, N. B. Manson, P. Delaney, and L. C. L. Hollenberg, NewJournal of Physics 13, 025019 (2011).
[10] A. Gali, M. Fyta, and E. Kaxiras, Physical Review B 77, (2008).
[11] V. M. Acosta, A. Jarmola, E. Bauch, and D. Budker, Physical Review B 82,201202 (2010).
[12] V. M. Acosta, E. Bauch, M. P. Ledbetter, C. Santori, K. M. C. Fu, P. E.Barclay, R. G. Beausoleil, H. Linget, J. F. Roch, F. Treussart, S. Chemerisov,W. Gawlik, and D. Budker, Physical Review B 80, 115202 (2009).
[13] J. M. Taylor, P. Cappellaro, L. Childress, L. Jiang, D. Budker, P. R. Hemmer,A. Yacoby, R. Walsworth, and M. D. Lukin, Nat Phys 4, 810 (2008).

88
[14] G. Balasubramanian, I. Y. Chan, R. Kolesov, M. Al-Hmoud, J. Tisler, C. Shin,C. Kim, A. Wojcik, P. R. Hemmer, A. Krueger, T. Hanke, A. Leitenstorfer, R.Bratschitsch, F. Jelezko, and J. Wrachtrup, Nature 455, 648 (2008).
[15] J. R. Maze, P. L. Stanwix, J. S. Hodges, S. Hong, J. M. Taylor, P. Cappellaro,L. Jiang, M. V. G. Dutt, E. Togan, A. S. Zibrov, A. Yacoby, R. L. Walsworth,and M. D. Lukin, Nature 455, 644 (2008).
[16] A. M. Zaitsev, Optical Poperties of Diamond: A Data Handbook (Springer-Verlag, Berlin Heidelberg, 2001).
[17] J. R. Rabeau, P. Reichart, G. Tamanyan, D. N. Jamieson, S. Prawer, F. Jelezko,T. Gaebel, I. Popa, M. Domhan, and J. Wrachtrup, Applied Physics Letters88, 023113 (2006).
[18] T. Sato, K. Ohashi, T. Sudoh, K. Haruna, and H. Maeta, Physical Review B65, 092102 (2002).
[19] L. G. Rogers, S. Armstrong, M. J. Sellars, and N. B. Manson, New Journal ofPhysics 10, 103024 (2008).
[20] T. P. M. Alegre, C. Santori, G. Medeiros-Ribeiro, and R. G. Beausoleil, PhysicalReview B 76, 165205 (2007).
[21] M. S. Dresselhaus, G. Dresselhaus, and A. Jorio, Group theory: Applications tothe physics of condensed matter (Springer, Heidelberg, 2008).
[22] V. V. Yashchuk, J. Granwehr, D. F. Kimball, S. M. Rochester, A. H.Trabesinger, J. T. Urban, D. Budker, and A. Pines, Physical Review Letters93, 160801 (2004).
[23] S. J. Xu, V. V. Yashchuk, M. H. Donaldson, S. M. Rochester, D. Budker, andA. Pines, Proceedings of the National Academy of Sciences of the United Statesof America 103, 12668 (2006).
[24] H. Xia, A. B. A. Baranga, D. Homan, and M. V. Romalis, Applied PhysicsLetters 89, (2006).
[25] M. P. Ledbetter, I. M. Savukov, D. Budker, V. Shah, S. Knappe, J. Kitching,D. J. Michalak, S. Xu, and A. Pines, Proceedings of the National Academy ofSciences of the United States of America 105, 2286 (2008).
[26] M. P. Ledbetter, C. W. Crawford, A. Pines, D. E. Wemmer, S. Knappe, J.Kitching, and D. Budker, Journal of Magnetic Resonance 199, 25 (2009).

89
[27] S. A. Murthy, D. Krause, Z. L. Li, and L. R. Hunter, Physical Review Letters63, 965 (1989).
[28] C. J. Berglund, L. R. Hunter, D. Krause, E. O. Prigge, M. S. Ronfeldt, andS. K. Lamoreaux, Physical Review Letters 75, 1879 (1995).
[29] J. M. Brown, S. J. Smullin, T. W. Kornack, and M. V. Romalis, Physical ReviewLetters 105, 151604 (2010).
[30] A. N. Youdin, D. Krause, K. Jagannathan, L. R. Hunter, and S. K. Lamoreaux,Physical Review Letters 77, 2170 (1996).
[31] V. Acosta, M. P. Ledbetter, S. M. Rochester, D. Budker, D. F. J. Kimball, D. C.Hovde, W. Gawlik, S. Pustelny, J. Zachorowski, and V. V. Yashchuk, PhysicalReview A 73, 053404 (2006).
[32] V. M. Acosta, M. Auzinsh, W. Gawlik, P. Grisins, J. M. Higbie, D. F. J. Kimball,L. Krzemien, M. P. Ledbetter, S. Pustelny, S. M. Rochester, V. V. Yashchuk,and D. Budker, Optics Express 16, 11423 (2008).
[33] M. P. Ledbetter, V. M. Acosta, S. M. Rochester, D. Budker, S. Pustelny, andV. V. Yashchuk, Physical Review A (Atomic, Molecular, and Optical Physics)75, 023405 (2007).
[34] M. P. Ledbetter, I. M. Savukov, V. M. Acosta, D. Budker, and M. V. Romalis,Physical Review A 77, 033408 (2008).
[35] K. Jensen, V. M. Acosta, J. M. Higbie, M. P. Ledbetter, S. M. Rochester, andD. Budker, Physical Review A (Atomic, Molecular, and Optical Physics) 79,023406 (2009).
[36] V. M. Acosta and et al., New Journal of Physics 12, 083054 (2010).
[37] M. Jamet, W. Wernsdorfer, C. Thirion, D. Mailly, V. Dupuis, P. Melinon, andA. Perez, Physical Review Letters 86, 4676 (2001).
[38] J. P. Cleuziou, W.Wernsdorfer, V. Bouchiat, T. Ondarcuhu, and M. Monthioux,Nat Nano 1, 53 (2006).
[39] D. Rugar, R. Budakian, H. J. Mamin, and B. W. Chui, Nature 430, 329 (2004).
[40] H. J. Mamin, M. Poggio, C. L. Degen, and D. Rugar, Nat Nano 2, 301 (2007).
[41] C. L. Degen, Applied Physics Letters 92, 243111 (2008).

90
[42] G. Balasubramanian, P. Neumann, D. Twitchen, M. Markham, R. Kolesov, N.Mizuochi, J. Isoya, J. Achard, J. Beck, J. Tissler, V. Jacques, P. R. Hemmer,F. Jelezko, and J. Wrachtrup, Nat Mater 8, 383 (2009).
[43] B. M. Chernobrod and G. P. Berman, Journal of Applied Physics 97, 014903(2005).
[44] V. M. Acosta, E. Bauch, A. Jarmola, L. J. Zipp, M. P. Ledbetter, and D.Budker, Applied Physics Letters 97, 174104 (2010).
[45] L. T. Hall, J. H. Cole, C. D. Hill, and L. C. L. Hollenberg, Physical ReviewLetters 103, 220802 (2009).
[46] L. T. Hall, C. D. Hill, J. H. Cole, B. Stadler, F. Caruso, P. Mulvaney, J.Wrachtrup, and L. C. L. Hollenberg, Proceedings of the National Academy ofSciences 107, 18777 (2010).
[47] B. J. Maertz, A. P. Wijnheijmer, G. D. Fuchs, M. E. Nowakowski, and D. D.Awschalom, Applied Physics Letters 96, 092504 (2010).
[48] L. S. Bouchard, E. Bauch, V. M. Acosta, and D. Budker, New Journal of Physics13, 025017 (2011).
[49] P. C. Maurer, J. R. Maze, P. L. Stanwix, L. Jiang, A. V. Gorshkov, A. A.Zibrov, B. Harke, J. S. Hodges, A. S. Zibrov, A. Yacoby, D. Twitchen, S. W.Hell, R. L. Walsworth, and M. D. Lukin, Nature Physics 6, 912 (2010).
[50] B. R. Smith, D. W. Inglis, B. Sandnes, J. R. Rabeau, A. V. Zvyagin, D. Gruber,C. J. Noble, R. Vogel, E. Osawa, and T. Plakhotnik, Small 5, 1649 (2009).
[51] C. Bradac, T. Gaebel, N. Naidoo, J. R. Rabeau, and A. S. Barnard, NanoLetters 9, 3555 (2009).
[52] T. M. Babinec, B. J. M. Hausmann, M. Khan, Y. Zhang, J. R. Maze, P. R.Hemmer, and M. Loncar, Nat Nano 5, 195 (2010).
[53] R. S. Schoenfeld and W. Harneit, Physical Review Letters 106, 030802 (2011).
[54] S. Steinert, F. Dolde, P. Neumann, A. Aird, B. Naydenov, G. Balasubrama-nian, F. Jelezko, and J. Wrachtrup, Review of Scientic Instruments 81, 043705(2010).
[55] S. Felton, A. M. Edmonds, M. E. Newton, P. M. Martineau, D. Fisher, D. J.Twitchen, and J. M. Baker, Physical Review B (Condensed Matter and Mate-rials Physics) 79, 075203 (2009).

91
[56] P. L. Stanwix, L. M. Pham, J. R. Maze, D. Le Sage, T. K. Yeung, P. Cappellaro,P. R. Hemmer, A. Yacoby, M. D. Lukin, and R. L. Walsworth, Physical ReviewB 82, 201201 (2010).
[57] E. E. Mikhailov, I. Novikova, M. D. Havey, and F. A. Narducci, Opt. Lett. 34,3529 (2009).
[58] V. Shah, S. Knappe, P. D. D. Schwindt, and J. Kitching, Nat Photon 1, 649(2007).
[59] C. L. Degen, M. Poggio, H. J. Mamin, C. T. Rettner, and D. Rugar, Proceedingsof the National Academy of Sciences 106, 1313 (2009).
[60] E. Fermi and F. Rasetti, Zeitschrift fur Physik A Hadrons and Nuclei 33, 246(1925).
[61] F. Bitter, Physical Review 76, 833 (1949).
[62] J. Brossel and F. Bitter, Physical Review 86, 308 (1952).
[63] S. Geschwind, R. J. Collins, and A. L. Schawlow, Physical Review Letters 3,545 (1959).
[64] I. Wieder, Physical Review Letters 3, 468 (1959).
[65] Y. K. Zavoisky, J. Phys. USSR 9, 245 (1945).
[66] J. H. E. Griths, J. Owen, and I. M. Ward, Nature 173, 439 (1954).
[67] J. H. Griths, J. Owen, and I. M. Ward, in Defects in Crystalline Solids (ThePhysical Society, London, ADDRESS, 1955), pp. 8187.
[68] W. V. Smith, P. P. Sorokin, I. L. Gelles, and G. J. Lasher, Physical Review115, 1546 (1959).
[69] W. Happer, Reviews of Modern Physics 44, 169 (1972).
[70] J. Loubser and J. A. van Wyk, Reports on Progress in Physics 41, 1201 (1978).
[71] N. R. S. Reddy, N. B. Manson, and E. R. Krausz, Journal of Luminescence 38,46 (1987).
[72] E. van Oort, N. B. Manson, and M. Glasbeek, Journal of Physics C-Solid StatePhysics 21, 4385 (1988).
[73] G. Davies and M. F. Hamer, Proceedings of the Royal Society of London Seriesa-Mathematical Physical and Engineering Sciences 348, 285 (1976).

92
[74] W. Neuhauser, M. Hohenstatt, P. E. Toschek, and H. Dehmelt, Physical ReviewA 22, 1137 (1980).
[75] J. Kohler, J. A. J. M. Disselhorst, M. C. J. M. Donckers, E. J. J. Groenen, J.Schmidt, and W. E. Moerner, Nature 363, 242 (1993).
[76] J. Wrachtrup, C. von Borczyskowski, J. Bernard, M. Orritt, and R. Brown,Nature 363, 244 (1993).
[77] A. Gruber, A. Drabenstedt, C. Tietz, L. Fleury, J. Wrachtrup, and C. vonBorczyskowski, Science 276, 2012 (1997).
[78] S.-J. Yu, M.-W. Kang, H.-C. Chang, K.-M. Chen, and Y.-C. Yu, Journal of theAmerican Chemical Society 127, 17604 (2005).
[79] A. M. Schrand, H. Huang, C. Carlson, J. J. Schlager, E. ÃÅsawa, S. M.Hussain, and L. Dai, The Journal of Physical Chemistry B 111, 2 (2007).
[80] Y.-R. Chang, H.-Y. Lee, K. Chen, C.-C. Chang, D.-S. Tsai, C.-C. Fu, T.-S. Lim,Y.-K. Tzeng, C.-Y. Fang, C.-C. Han, H.-C. Chang, and W. Fann, Nat Nano 3,284 (2008).
[81] F. Neugart, A. Zappe, F. Jelezko, C. Tietz, J. P. Boudou, A. Krueger, and J.Wrachtrup, Nano Letters 7, 3588 (2007).
[82] O. Faklaris, D. Garrot, V. Joshi, F. Druon, J.-P. Boudou, T. Sauvage, P.Georges, P. A. Curmi, and F. Treussart, Small 4, 2236 (2008).
[83] J. Tisler, G. Balasubramanian, B. Naydenov, R. Kolesov, B. Grotz, R. Reuter,J.-P. Boudou, P. A. Curmi, M. Sennour, A. Thorel, M. Borsch, K. Aulenbacher,R. Erdmann, P. R. Hemmer, F. Jelezko, and J. Wrachtrup, ACS Nano 3, 1959(2009).
[84] C. Bradac, T. Gaebel, N. Naidoo, M. J. Sellars, J. Twamley, L. J. Brown, A. S.Barnard, T. Plakhotnik, A. V. Zvyagin, and J. R. Rabeau, Nat Nano 5, 345(2010).
[85] F. Jelezko, T. Gaebel, I. Popa, A. Gruber, and J. Wrachtrup, Physical ReviewLetters 92, 076401 (2004).
[86] L. Childress, M. V. G. Dutt, J. M. Taylor, A. S. Zibrov, F. Jelezko, J.Wrachtrup, P. R. Hemmer, and M. D. Lukin, Science 314, 281 (2006).
[87] M. V. G. Dutt, L. Childress, L. Jiang, E. Togan, J. Maze, F. Jelezko, A. S.Zibrov, P. R. Hemmer, and M. D. Lukin, Science 316, 1312 (2007).

93
[88] P. Neumann, N. Mizuochi, F. Rempp, P. Hemmer, H. Watanabe, S. Yamasaki,V. Jacques, T. Gaebel, F. Jelezko, and J. Wrachtrup, Science 320, 1326 (2008).
[89] P. Neumann, R. Kolesov, B. Naydenov, J. Beck, F. Rempp, M. Steiner, V.Jacques, G. Balasubramanian, M. L. Markham, D. J. Twitchen, S. Pezzagna,J. Meijer, J. Twamley, F. Jelezko, and J. Wrachtrup, Nat Phys 6, 249 (2010).
[90] G. D. Fuchs, V. V. Dobrovitski, D. M. Toyli, F. J. Heremans, and D. D.Awschalom, Science 326, 1520 (2009).
[91] B. B. Buckley, G. D. Fuchs, L. C. Bassett, and D. D. Awschalom, Science1196436 (2010).
[92] E. Togan, Y. Chu, A. S. Trifonov, L. Jiang, J. Maze, L. Childress, M. V. G.Dutt, A. S. Sorensen, P. R. Hemmer, A. S. Zibrov, and M. D. Lukin, Nature466, 730 (2010).
[93] P. Neumann, J. Beck, M. Steiner, F. Rempp, H. Fedder, P. R. Hemmer, J.Wrachtrup, and F. Jelezko, Science 329, 542 (2010).
[94] G. de Lange, Z. H. Wang, D. Riste, V. V. Dobrovitski, and R. Hanson, Science330, 60 (2010).
[95] P. Hemmer and J. Wrachtrup, Science 324, 473 (2009).
[96] S. Felton, A. M. Edmonds, M. E. Newton, P. M. Martineau, D. Fisher, andD. J. Twitchen, Physical Review B 77, (2008).
[97] A. Lenef and S. C. Rand, Physical Review B 53, 13441 (1996).
[98] J. Maze, A. Gali, E. Togan, Y. Chu, A. S. Trifonov, E. Kaxiras, and M. D.Lukin, New Journal of Physics 13, 025025 (2011).
[99] J. P. Goss, R. Jones, S. J. Breuer, P. R. Briddon, and S. Oberg, Physical ReviewLetters 77, 3041 (1996).
[100] M. Luszczek, R. Laskowski, and P. Horodecki, Physica B-Condensed Matter348, 292 (2004).
[101] P. Delaney, J. C. Greer, and J. A. Larsson, Nano Letters 10, 610 (2010).
[102] Y. Ma, M. Rohlng, and A. Gali, Physical Review B 81, 041204 (2010).
[103] E. van Oort, B. Vanderkamp, R. Sitters, and M. Glasbeek, Journal of Lumines-cence 48-9, 803 (1991).

94
[104] N. B. Manson, J. P. Harrison, and M. J. Sellars, Physical Review B 74, 104303(2006).
[105] C. Santori, D. Fattal, S. M. Spillane, M. Fiorentino, R. G. Beausoleil, A. D.Greentree, P. Olivero, M. Draganski, J. R. Rabeau, P. Reichart, B. C. Gibson,S. Rubanov, D. N. Jamieson, and S. Prawer, Optics Express 14, 7986 (2006).
[106] A. Batalov, V. Jacques, F. Kaiser, P. Siyushev, P. Neumann, L. J. Rogers,R. L. McMurtrie, N. B. Manson, F. Jelezko, and J. Wrachtrup, Physical ReviewLetters 102, 195506 (2009).
[107] L. J. Rogers, R. L. McMurtrie, S. Armstrong, M. J. Sellars, and N. B. Manson,New Journal of Physics 11, 063007 (2009).
[108] K.-M. C. Fu, C. Santori, P. E. Barclay, L. J. Rogers, N. B. Manson, and R. G.Beausoleil, Physical Review Letters 103, 256404 (2009).
[109] P. R. Hemmer, A. V. Turukhin, M. S. Shahriar, and J. A. Musser, Opt. Lett.26, 361 (2001).
[110] C. Santori, P. Tamarat, P. Neumann, J. Wrachtrup, D. Fattal, R. G. Beausoleil,J. Rabeau, P. Olivero, A. D. Greentree, S. Prawer, F. Jelezko, and P. Hemmer,Physical Review Letters 97, (2006).
[111] A. Gali, T. Simon, and J. E. Lowther, New Journal of Physics 13, 025016(2011).
[112] G. Davies, Journal of Physics C-Solid State Physics 7, 3797 (1974).
[113] P. Tamarat, N. B. Manson, J. P. Harrison, R. L. McMurtrie, A. Nizovtsev, C.Santori, R. G. Beausoleil, P. Neumann, T. Gaebel, F. Jelezko, P. Hemmer, andJ. Wrachtrup, New Journal of Physics 10, (2008).
[114] S. Y. Kilin, A. P. Nizovtsev, T. M. Maevskaya, A. Drabenstedt, and J.Wrachtrup, Journal of Luminescence 86, 201 (2000).
[115] J. Harrison, M. J. Sellars, and N. B. Manson, Diamond and Related Materials15, 586 (2006).
[116] G. D. Fuchs, V. V. Dobrovitski, D. M. Toyli, F. J. Heremans, C. D. Weis, T.Schenkel, and D. D. Awschalom, Nat Phys 6, 668 (2010).
[117] L. Robledo, H. Bernien, T. van der Sar, and R. Hanson, New Journal of Physics13, 025013 (2011).
[118] V. M. Acosta, E. Bauch, M. P. Ledbetter, A. Waxman, L. S. Bouchard, and D.Budker, Physical Review Letters 104, 070801 (2010).

95
[119] B. Smeltzer, J. McIntyre, and L. Childress, Physical Review A 80, 050302(2009).
[120] M. Steiner, P. Neumann, J. Beck, F. Jelezko, and J. Wrachtrup, Physical ReviewB 81, 035205 (2010).
[121] N. D. Lai, D. Zheng, F. Jelezko, F. Treussart, and J.-F. Roch, Applied PhysicsLetters 95, 133101 (2009).
[122] X. F. He, N. B. Manson, and P. T. H. Fisk, Physical Review B 47, 8816 (1993).
[123] E. van Oort and M. Glasbeek, Chemical Physics Letters 168, 529 (1990).
[124] F. Dolde, H. Fedder, M. W. Doherty, T. Nobauer, F. Rempp, G. Balasubrama-nian, T. Wolf, F. Reinhard, L. C. L. Hollenberg, F. Jelezko, and J. Wrachtrup,Nature Physics (2011).
[125] S. J. Smullin, I. M. Savukov, G. Vasilakis, R. K. Ghosh, and M. V. Romalis,Physical Review A 80, 033420 (2009).
[126] J. R. Maze, J. M. Taylor, and M. D. Lukin, Physical Review B 78, 094303(2008).
[127] S. Takahashi, R. Hanson, J. van Tol, M. S. Sherwin, and D. D. Awschalom,Physical Review Letters 101, 047601 (2008).
[128] N. Mizuochi, P. Neumann, F. Rempp, J. Beck, V. Jacques, P. Siyushev, K.Nakamura, D. J. Twitchen, H. Watanabe, S. Yamasaki, F. Jelezko, and J.Wrachtrup, Physical Review B 80, 041201 (2009).
[129] D. A. Redman, S. Brown, R. H. Sands, and S. C. Rand, Physical Review Letters67, 3420 (1991).
[130] J. P. King, P. J. Coles, and J. A. Reimer, Physical Review B 81, 073201 (2010).
[131] S. C. Lawson, D. Fisher, D. C. Hunt, and M. E. Newton, Journal of Physics-Condensed Matter 10, 6171 (1998).
[132] I. Aharonovich, C. Santori, B. A. Fairchild, J. Orwa, K. Ganesan, K.-M. C. Fu,R. G. Beausoleil, A. D. Greentree, and S. Prawer, Journal of Applied Physics106, 124904 (2009).
[133] B. Naydenov, V. Richter, J. Beck, M. Steiner, P. Neumann, G. Balasubra-manian, J. Achard, F. Jelezko, J. Wrachtrup, and R. Kalish, Applied PhysicsLetters 96, 163108 (2010).
[134] E. L. Hahn, Physical Review 80, 580 (1950).

96
[135] E. Van Oort and M. Glasbeek, Chemical Physics 143, 131 (1990).
[136] G. De Lange, D. Riste, V. V. Dobrovitski, and R. Hanson, Physical ReviewLetters 106, 080802 (2011).
[137] A. Laraoui, J. S. Hodges, and C. A. Meriles, Applied Physics Letters 97, 143104(2010).
[138] P. Cappellaro and M. D. Lukin, Physical Review A 80, 032311 (2009).
[139] C. A. Ryan, J. S. Hodges, and D. G. Cory, Physical Review Letters 105, 200402(2010).
[140] B. Naydenov, F. Dolde, L. T. Hall, C. Shin, H. Fedder, L. C. L. Hollenberg, F.Jelezko, J. Wrachtrup, ouml, and rg, Physical Review B 83, 081201 (2011).
[141] H. J. Mamin, R. Budakian, B. W. Chui, and D. Rugar, Physical Review B 72,024413 (2005).
[142] K. Y. Han, S. K. Kim, C. Eggeling, and S. W. Hell, Nano Letters 10, 3199(2010).
[143] C. Santori, P. E. Barclay, . K.-M. C. Fu, R. G. Beausoleil, S. Spillane, and M.Fisch, Nanotechnology 21, 274008 (2010).
[144] A. Faraon, P. E. Barclay, C. Santori, . K.-M. C. Fu, and R. G. Beausoleil,Nature Photonics (2011).
[145] J. P. Hadden, J. P. Harrison, A. C. Stanley-Clarke, L. Marseglia, Y. L. D. Ho,B. R. Patton, J. L. O'Brien, and J. G. Rarity, Applied Physics Letters 97,241901 (2010).
[146] P. Siyushev, F. Kaiser, V. Jacques, I. Gerhardt, S. Bischof, H. Fedder, J. Dod-son, M. Markham, D. Twitchen, F. Jelezko, and J. Wrachtrup, Applied PhysicsLetters 97, 241902 (2010).
[147] L. Marseglia, J. P. Hadden, A. C. Stanley-Clarke, J. P. Harrison, B. Patton,Y.-L. D. Ho, B. Naydenov, F. Jelezko, J. Meijer, P. R. Dolan, J. M. Smith, J. G.Rarity, and J. L. O'brien, Nano-fabricated solid immersion lenses registered tosingle emitters in diamond, 2010, arXiv:1012.1135v2 [quant-ph].
[148] S. Schietinger, M. Barth, T. Aichele, and O. Benson, Nano Letters 9, 1694(2009).
[149] R. Kolesov, B. Grotz, G. Balasubramanian, R. J. Stohr, A. A. L. Nicolet, P. R.Hemmer, F. Jelezko, and J. Wrachtrup, Nature Physics 5, 470 (2009).

97
[150] A. Huck, S. Kumar, A. Shakoor, and U. L. Andersen, Physical Review Letters106, 096801 (2011).
[151] E. Rittweger, D. Wildanger, and S. W. Hell, European Physics Letters 86,14001 (2009).
[152] K. Y. Han, K. I. Willig, E. Rittweger, F. Jelezko, C. Eggeling, and S. W. Hell,Nano Letters 9, 3323 (2009).
[153] A. Batalov, C. Zierl, T. Gaebel, P. Neumann, I. Y. Chan, G. Balasubramanian,P. R. Hemmer, F. Jelezko, and J. Wrachtrup, Physical Review Letters 100,077401 (2008).
[154] G. Waldherr, J. Beck, M. Steiner, P. Neumann, A. Gali, F. Jelezko, and J.Wrachtrup, Physical Review Letters (2011).
[155] H. Kanda and T. Sekine, in Properties, Growth, and Applications of Diamond,edited by M. H. Nazare (INSPEC, London, 2000), pp. 247255.
[156] P. Bachmann, in Properties and Growth of Diamond, edited by G. Davies (IN-SPEC, London, 1994), pp. 354363.
[157] D. W. Palmer, in Properties and Growth of Diamond, edited by G. Davies(INSPEC, London, 1994), pp. 143158.
[158] F. C. Waldermann, P. Olivero, J. Nunn, K. Surmacz, Z. Y. Wang, D. Jaksch,R. A. Taylor, I. A. Walmsley, M. Draganski, P. Reichart, A. D. Greentree, D. N.Jamieson, and S. Prawer, Diamond and Related Materials 16, 1887 (2007).
[159] M. E. Newton, B. A. Campbell, D. J. Twitchen, J. M. Baker, and T. R. Anthony,Diamond and Related Materials 11, 618 (2002).
[160] J. F. Ziegler, J. P. Biersack, and U. Littmark, The Stopping Range of Ions inMatter (SRIM, Co., Chester, MD, USA, 2008).
[161] J. C. Bourgoin and B. Massarani, Physical Review B 14, 3690 (1976).
[162] J. Koike, D. M. Parkin, and T. E. Mitchell, Applied Physics Letters 60, 1450(1992).
[163] D. Saada, J. Adler, and R. Kalish, International Journal of Modern Physics C9, 61 (1998).
[164] W. H. Press, S. A. Teukolsky, W. T. Vetterling, and B. P. Flannery, Numericalrecipes in C (2nd ed.): the art of scientic computing (Cambridge UniversityPress, New York, 1992).

98
[165] A. T. Collins, Journal of Physics C-Solid State Physics 14, 289 (1981).
[166] L. Allers, A. T. Collins, and J. Hiscock, Diamond and Related Materials 7, 228(1998).
[167] Y. Mita, Physical Review B 53, 11360 (1996).
[168] C. Santori, P. E. Barclay, K. M. C. Fu, and R. G. Beausoleil, Physical ReviewB 79, 125313 (2009).
[169] D. C. Hunt, D. J. Twitchen, M. E. Newton, J. M. Baker, T. R. Anthony, W. F.Banholzer, and S. S. Vagarali, Physical Review B 61, 3863 (2000).
[170] C. Glover, M. E. Newton, P. M. Martineau, S. Quinn, and D. J. Twitchen,Physical Review Letters 92, 135502 (2004).
[171] C. Glover, M. E. Newton, P. Martineau, D. J. Twitchen, and J. M. Baker,Physical Review Letters 90, 185507 (2003).
[172] G. Davies and M. Crosseld, Journal of Physics C-Solid State Physics 6, L104(1973).
[173] G. Davies, S. C. Lawson, A. T. Collins, A. Mainwood, and S. J. Sharp, PhysicalReview B 46, 13157 (1992).
[174] B. Campbell and A. Mainwood, Physica Status Solidi a-Applications and Ma-terials Science 181, 99 (2000).
[175] We say here eective energy splitting because in reality these vibrational levelsare so strongly coupled to the continuum of delocalized phonons that there areno clear resonances.
[176] D. J. Twitchen, D. C. Hunt, V. Smart, M. E. Newton, and J. M. Baker, Diamondand Related Materials 8, 1572 (1999).
[177] A. T. Collins and G. S. Woods, Philosophical Magazine B 46, 77 (1982).
[178] R. M. Chrenko, H. M. Strong, and R. E. Tuft, Philosophical Magazine 23, 313(1971).
[179] G. S. Woods, J. A. Vanwyk, and A. T. Collins, Philosophical Magazine B-Physics of Condensed Matter Statistical Mechanics Electronic Optical and Mag-netic Properties 62, 589 (1990).
[180] G. S. Woods and A. T. Collins, Journal of Physics C-Solid State Physics 15,L949 (1982).

99
[181] I. Kiawi, A. Mainwood, H. Kanda, and D. Fisher, Physical Review B 54, 16719(1996).
[182] A. T. Collins, M. Stanley, and G. S. Woods, Journal of Physics D-AppliedPhysics 20, 969 (1987).
[183] N. B. Manson and J. P. Harrison, Diamond and Related Materials 14, 1705(2005).
[184] T. Gaebel, M. Domhan, C. Wittmann, I. Popa, F. Jelezko, J. Rabeau, A.Greentree, S. Prawer, E. Trajkov, P. R. Hemmer, and J. Wrachtrup, AppliedPhysics B-Lasers and Optics 82, 243 (2006).
[185] F. Jelezko and J. Wrachtrup, Physica Status Solidi a-Applications and MaterialsScience 203, 3207 (2006).
[186] S. K. Lee, M. Mossle, W. Myers, N. Kelso, A. H. Trabesinger, A. Pines, and J.Clarke, Magnetic Resonance in Medicine 53, 9 (2005).
[187] I. M. Savukov, S. J. Seltzer, and M. V. Romalis, Journal of Magnetic Resonance185, 214 (2007).
[188] J. R. Kirtley, A. C. Mota, M. Sigrist, and T. M. Rice, Journal of Physics-Condensed Matter 10, L97 (1998).
[189] G. D. Fuchs, V. V. Dobrovitski, R. Hanson, A. Batra, C. D. Weis, T. Schenkel,and D. D. Awschalom, Physical Review Letters 101, 117601 (2008).
[190] A. P. Nizovtsev, S. Y. Kilin, C. Tietz, F. Jelezko, and J. Wrachtrup, PhysicaB: Condensed Matter 308-310, 608 (2001).
[191] A. Gali, E. Janzen, P. Deak, G. Kresse, and E. Kaxiras, Physical Review Letters103, 186404 (2009).
[192] A. C. Victor, The Journal of Chemical Physics 36, 1903 (1962).
[193] For both of the samples studied in this work, we nd the transition to occurat 1042.5(3) nm. In Ref. [26], the authors reported the ZPL to be at 1046 nm,but, according to private communication with the authors, this was a misprint.
[194] N. B. Manson and R. L. McMurtrie, Journal of Luminescence 127, 98 (2007).
[195] A. Drabenstedt, L. Fleury, C. Tietz, F. Jelezko, S. Kilin, A. Nizovtzev, and J.Wrachtrup, Physical Review B 60, 11503 (1999).
[196] J. Lakowicz, Principles of Fluorescence Spectroscopy, 3rd ed. (Springer, NewYork, 2006).

100
[197] Because measurements were made in high-defect-density samples, where eachNV center experiences a dierent local environment, we neglect the dierencein lifetimes between ms = ±1 and ms = 0 sublevels.
[198] W. D. Partlow and H. W. Moos, Physical Review 157, 251 (1967).
[199] R. J. Epstein, F. M. Mendoza, Y. K. Kato, and D. D. Awschalom, Nat Phys 1,94 (2005).
[200] F. M. Hossain, M. W. Doherty, H. F. Wilson, and L. C. L. Hollenberg, PhysicalReview Letters 101, 226403 (2008).


