Embed Size (px)
Citation preview

CATALYTIC HYDROGENATION OF AROMATIC
KETONES IN MULTIPHASE REACTORS: CATALYSIS AND REACTION ENGINEERING STUDIES
A THESIS
SUBMITTED TO THE
UNIVERSITY OF PUNE
FOR THE DEGREE OF
DOCTOR OF PHILOSOPHY
IN
CHEMISTRY
BY
SUJU P. MATHEW
AT HOMOGENEOUS CATALYSIS DIVISION NATIONAL CHEMICAL LABORATORY
PUNE 411 008 INDIA
MAY 2001

Dedicated To Janja and Mummy

FORM ‘A’ Certified that the work incorporated in the thesis entitled: “CATALYTIC
HYDROGENATION OF AROMATIC KETONES IN MULTIPHASE
REACTORS: CATALYSIS AND REACTION ENGINEERING STUDIES”,
submitted by Mr. Suju P. Mathew was carried under my supervision. Such material as
has been obtained from other sources has been duly acknowledged in the thesis.
May, 2001 Dr. R. V. Chaudhari
Pune (Supervisor/Research Guide)

List Of Contents
Description Page
No.
List of Tables i
List of Figures iv
Summary and Conclusions xii
Chapter 1 Introduction and Literature Survey
1.0 General introduction 1
1.1 Hydrogenation of aromatic ketones 3
1.1.1 Hydrogenation of acetophenone and p-isobutyl
acetophenone
8
1.2 Multiphase reactors for hydrogenation 14
1.2.1 Agitated slurry reactors 14
1.2.1.1 Models for semi-batch slurry reactor 16
1.2.1.1.1 Non-isothermal effects in slurry reactors 18
1.2.2 Bubble column slurry reactors 19
1.2.3 Loop reactors 20
1.2.4 Fixed bed reactors 22
1.2.4.1 Trickle bed reactors 24
1.2.4.1.1 Flow regimes 24
1.2.4.1.2 Catalyst wetting efficiency 25

1.2.4.1.2.1 Internal wetting efficiency 25
1.2.4.1.2.2 External wetting efficiency 25
1.2.4.1.3 Modelling of fixed bed reactors 26
1.2.4.1.3.1 Reactor performance and model evaluation studies in
TBR
28
1.2.4.2 Fixed bed reactor with co-current up-flow 35
1.2.4.2.1 Up-flow reactor studies and model evaluation 36
1.2.4.3 Comparison of down-flow and up-flow mode of
operation
38
1.3 Scope and objectives 40
Notations 41
References 42
Chapter 2
Part - A
Hydrogenation of acetophenone using
supported ruthenium catalyst: kinetics,
intraparticle diffusion and non-isothermal
effects
2 (A). 0 Introduction 50
2 (A). 1 Experimental 52
2 (A). 1.1 Reactor set-up 52
2 (A). 1.2 Catalyst preparation 53
2 (A). 1.3 Experimental procedure for carrying out reaction 53
2 (A). 1.4 Experimental procedure for solubility measurement 54

2 (A). 2 Results and discussion 55
2 (A). 2.1 Product identification and distribution 55
2 (A). 2. 2 Catalyst recycle 56
2 (A). 2. 3 Effect of water 57
2 (A). 2. 4 Initial rate data and analysis of mass transfer 57
2 (A). 2. 5 Solubility of hydrogen in mixture of methanol and
acetophenone
61
2 (A). 2. 6 Kinetic study 62
2 (A). 2.6.1 Assumptions and simplification of reaction scheme 62
2 (A). 2.6.2 Derivation of rate models 63
2 (A). 2.7 Modeling of a basket type of reactor 68
2 (A). 2.7.1 Analysis of external mass transfer 68
2 (A). 2.7.2 Analysis of intraparticle diffusional effects for liquid
phase components
68
2 (A). 2.7.3 Modeling and simulation 69
2 (A). 2.7.4 Prediction of bulk concentrations 70
2 (A). 2.7.5 Effectiveness factor 72
2 (A). 2.7.6 Pellet dynamics 73
2 (A). 2.8 Non-isothermal effects in a semi-batch slurry reactor 76
2 (A). 2.9 Non-isothermal model for a stirred basket type
reactor
82
2 (A). 3 Conclusion 84

Chapter 2
Part – B
Hydrogenation of p-isobutyl acetophenone
using a Ru/Al2O3 catalyst: reaction kinetics
and modelling of a semi batch slurry
reactor
2 (B). 0 Introduction 86
2 (B). 1 Experimental 86
2 (B). 2 Results and discussion 87
2 (B). 2.1 Experimental results 87
2 (B). 2.2 Analysis of initial rate 89
2 (B). 2.3 Kinetic modeling 91
2 (B). 3 Conclusion 97
Notations for part - A 97
Notations for part - B 99
References 99
Chapter 3 Performance of a trickle bed reactor for
the hydrogenation of acetophenone using
supported ruthenium catalysts
3.0 Introduction 102
3.1 Experimental 104
3.1.1 Materials 104
3.1.2 Equipment 105

3.1.3 Experimental procedure 106
3.2 Reactor model 107
3.2.1 Intrinsic kinetics 107
3.2.2 Trickle bed reactor model 110
3.2.2.1 Mass balance for gaseous and liquid phase
components
113
3.2.3 Effect of reaction conditions on the properties of gas
and liquids
116
3.3 Results and discussion 119
3.3.1 Flow regime analysis 119
3.3.2 Effect of inlet liquid velocity 120
3.3.3 Effect of inlet substrate concentration and pressure 124
3.3.4 Effect of gas flow rate 127
3.3.5 Effect of reaction parameters on selectivity 132
3.4. Conclusion 133
Notations 134
References 136
Chapter 4 Hydrogenation of acetophenone in a fixed
bed up-flow reactor using supported
ruthenium catalyst
4.0 Introduction 139
4.1 Experimental 140

4.1.1 Materials 140
4.1.2 Equipment 140
4.1.3 Experimental procedure 141
4.2 Model for up-flow reactor 142
4.3 Results and discussion 142
4.3.1 Effect of liquid velocity 144
4.3.2 Effect of Inlet substrate concentration and pressure 147
4.3.3 Effect of gas flow rate 151
4.3.4 Selectivity behavior 154
4.3.5 Comparison of down-flow and up-flow performance 155
4.3.6 Dynamic behavior of up-flow reactor 159
4.3.6.1 Reactor model 160
4.3.6.1.1 Model assumptions 160
4.3.6.1.2 Mass balance 160
4.3.6.1.3 Heat balance 161
4.4 Conclusion 165
Notations 165
References 167
Chapter – 5 Hydrogenation of acetophenone using
supported ruthenium catalysts: activity-
selectivity studies
5.0 Introduction 168

5.1 Experimental 168
5.1.1 Preparation of supported ruthenium catalysts:
precipitation method
168
5.1.2 Preparation of supported ruthenium catalyst by
impregnation method
169
5.1.3 Preparation of palladium supported on carbon
catalyst
169
5.1.4 Preparation of Ni supported on carbon catalyst 169
5.1.5 X-Ray photoelectron spectroscopy 170
5.1.6 X-Ray diffraction 170
5.1.7 Transmission electron microscopy 170
5.2 Results and discussion 171
5.2.1 Catalyst characterization 171
5.2.1.1 XPS measurements 171
5.2.1.2 XRD measurements 175
5.2.1.3 Transmission electron micrographs 177
5.2.2 Solvent effects 178
5.2.3 Hydrogenation of acetophenone in a four phase
system
187
5.2.4 Effect of activation temperature of catalyst 189
5.2.5 Effect of supports 190
5.2.6 Effect of metal loading 191
5.2.7 Effect of catalyst preparation method 192

5.2.8 Effect of Promoters 193
5.2.9 Screening of other supported metal catalysts 195
5.3 Conclusions 197
References
List of Publications
198
199

i
List of Tables
Table No. Description Page No.
1.1 Examples of aromatic ketone hydrogenations reported in
the literature
4
1.2 Literature reports on hydrogenation of acetophenone and
p-isobutyl acetophenone using supported metal catalysts
8
1.3 Summary of reactor modeling and reaction engineering
studies in semi-batch slurry reactor
17
1.4 Dimensionless parameters used in continuous reactor
models
27
1.5 Investigations of TBR and fixed bed up-flow reactor
(UFR) performance along with model validation
30
2.1 Range of operating conditions 54
2.2 Range of values of α1, α2 and φexp for experiments at
423 K
60
2.3 Values of Henry's constant at different temperatures for
various mixtures of ACPH and methanol
62
2.4 Values of rate and adsorption constants 67
2.5 Values of rate and adsorption constants at 373 K and it’s
temperature dependencies
81
2.6 Range of parameters 87

ii
2.7 Comparison of various models for hydrogenation of p-
isobutyl acetophenone
93
2.8 Solubility of H2 in p-IBAP and methanol mixtures 94
2.9 Values of ∆H and ∆S 96
3.1 Catalyst characteristics 104
3.2 Reactor characteristics 105
3.3 Range of operating conditions 107
3.4 Rate parameters and it's temperature dependency 109
3.5 Dimensionless parameters used in the model 112
3.6 List of correlations used for predicting TBR performance 118
4.1 Range of operating conditions 141
4.2 Correlations for model parameters for fixed bed up-flow
reactor
143
4.3 Rate parameters and it's temperature dependency 160
5.1 Conversion and selectivity with various alcoholic
solvents
179
5.2: Conversion and selectivity with various non-polar
solvents
184
5.3 Selective hydrogenation of ACPH to CHET 187
5.4 Conversion and selectivity distribution for fresh and
recycle experiments
188
5.5 Effect of activation temperature of catalyst 189
5.6 Effect of various supports 190

iii
5.7 Surface area of various supported ruthenium catalysts 191
5.8 Rate and selectivity distribution for various metal
loadings
192
5.9 Rate and selectivity distribution for catalysts prepared by
precipitation and impregnation techniques
193
5.10 Effect of promoters 194
5.11 Screening of supported transition metal catalysts with
solvent methanol
195
5.12 Screening of supported transition metal catalysts with
cyclohexane as solvent
196

iv
List of Figures
Figure No. Description Page No.
1.1 Reaction scheme for aromatic ketone hydrogenation 3
1.2 Conventional Boots route and the catalytic Hoechst-
Celanese route
7
1.3 Mechanically agitated slurry reactor 15
1.4 Stirred reactor with multiple impellers and gas injection
points
15
1.5 Bubble column reactor 20
1.6 Jet loop reactors with internal and external
recirculation
21
1.7 Buss jet loop reactor 22
1.8 Fixed bed reactors (a) trickle bed reactor (b)
countercurrent reactor and (c) up-flow or packed
bubble column reactor
23
1.9 The flow regimes in a trickle bed reactor 24
1.10 Flow regimes in fixed bed up-flow reactor 36
2.1 Schematic of the reactor setup 52
2.2 Concentration – time profile at 398 K 55
2.3 Reaction scheme for hydrogenation of acetophenone
using 2%Ru/Al2O3
56
2.4 Initial rates with fresh and recycled catalysts 56
2.5 Effect of catalyst loading on initial rate of reaction 58
2.6 Effect of acetophenone concentration on initial rate of
reaction
60

v
2.7 Effect of hydrogen partial pressure on initial rate of
reaction
61
2.8 Simplified reaction scheme 63
2.9 Adsorption of functional groups on different sites 63
2.10 Concentration – time profile at 373 K 67
2.11 Concentration – Time Profile at 398 K 68
2.12 Predicted and experimental concentration - time
profiles for the bulk liquid
71
2.13 Predicted and experimental concentration - time
profiles for the bulk liquid
71
2.14 Variation of ηC with Time for a pellet diameter
2 x10⁻³ m
72
2.15 Variation of effectiveness factor with the Thiele
modulus
73
2.16 Concentration profile of hydrogen inside the pellet
during initial period
74
2.17 Concentration profile of ACPH inside the pellet during
initial period
74
2.18 Distribution of dimensionless concentration of phenyl
ethanol and hydrogen at various positions inside the
pellet during the entire course of reaction
75
2.19 Comparison of concentration - time profile predicted in
the bulk phase along within the pellet with and without
taking in to consideration the diffusional effects of
liquid phase components
76
2.20 Temperature profile and hydrogen consumption with
time under non-isothermal conditions when methanol
was used as a solvent in a slurry reactor
78
vi
2.21 Reaction scheme when n-decane was used as the
solvent
79
2.22 Concentration – time profile when n-decane was used
as a solvent
80
2.23 Temperature profile and hydrogen consumption with
time under non-isothermal conditions when n-decane
was used as a solvent in a slurry reactor
81
2.24 Temperature profile and hydrogen consumption with
time under non-isothermal conditions when n-decane
was used as a solvent in a stirred basket type reactor
83
2.25 The temperature profile inside the pellet when the
temperature of the bulk liquid was maximum.
84
2.26 Concentration – time profile at 398 K. 88
2.27 Reaction scheme for hydrogenation of p-IBAP using
2%Ru/Al2O3 catalyst
88
2.28 Effect of H2 partial pressure on initial rate of reaction 90
2.29 Effect of p-IBAP concentration on initial rate of
reaction
90
2.30 Simplified reaction scheme 91
2.31 Concentration – time profile at 373 K 95
2. 32 Concentration – time profile at 386 K 95
2.33 Temperature dependence of rate constants 96
2. 34 Temperature dependence of adsorption constants 96
3.1 Schematic diagram of the trickle bed reactor used 105
3.2 Concentration – time profile at 398 K 109
3.3 Concentration – time profile at 423 K 110
3.4 Flow regime in a trickle bed reactor used for this study 119

vii
3.5 Effect of liquid velocity on rate of hydrogenation 121
3.6 Effect of liquid velocity on fw and klab 121
3.7 Effect of liquid velocity on temperature across the
catalyst bed
122
3.8 Inlet temperature of the catalyst bed for different liquid
velocities
122
3.9 Model prediction of the effect of liquid velocity at
constant inlet catalyst bed temperature
123
3.10 Variation of rate of hydrogenation with inlet substrate
concentration
124
3.11 Variation temperature rise across the catalyst bed with
inlet substrate concentration
125
3.12 Variation of rate of hydrogenation with pressure 126
3.13 Variation of temperature rise across the catalyst bed
with pressure
126
3.14 Conversion at the exit vs. gas velocity at different
pressures
127
3.15 Rate of hydrogenation vs. gas velocity at different
pressures.
127
3.16 Effect of gas velocity on klab and fw 128
3.17 Liquid velocity distribution along the length of the
catalyst bed for various gas velocities at 52 atm
129
3.18 Temperature distribution along the length of the
catalyst bed for various gas velocities at 52 atm
130
3.19 Temperature rise for various gas velocities at different
pressures
130
3.20 Inlet temperature of the catalyst bed for different gas
velocities
131

viii
3.21 Model prediction of temperature rise with gas velocity
at constant inlet catalyst bed temperature
131
3.22 Effect of liquid velocity and ACPH concentration on
conversion of ACPH and selectivity to PHET and
CHET
132
3.23 Effect of liquid velocity and ACPH concentration on
conversion of ACPH and selectivity to PHET and
CHET
132
3.24 Effect of pressure and temperature on conversion of
ACPH and selectivity to PHET and CHET
133
3.25 Effect of pressure and temperature on conversion of
ACPH and selectivity to PHET and CHET
133
4.1 Schematic of the fixed bed reactor with cocurrent up-
flow
141
4.2 Effect of liquid velocity on conversion 145
4.3 Effect of liquid velocity on rate of hydrogenation 145
4.4 Effect of liquid velocity on temperature rise 146
4.5 Inlet temperature of the catalyst bed for different liquid
Velocities
146
4.6 Theoretical predictions of temperature rise at constant
catalyst bed inlet temperature
147
4.7 Conversions at varying inlet substrate concentration 148
4.8 Variation of global rate of hydrogenation with varying
inlet substrate concentration
148
4.9 Temperature rise with varying inlet ACPH
concentrations
149
4.10 Conversion at the exit with varying pressure 150
4.11 Variation of rate of hydrogenation with pressure 150

ix
4.12 Variation in temperature rise at the exit with pressure 151
4.13 Conversion at the exit vs gas velocity at different
pressures
152
4.14 Variation of rate of hydrogenation with gas
velocity at different pressures
152
4. 15 Temperature distribution along the length of the bed for
various gas velocities at 52 atm
153
4.16 Liquid velocity distribution along the length of the bed
for various gas velocities at 52 atm
153
4.17 Effect of liquid velocity on conversion of ACPH and
selectivity to PHET and CHET
154
4.18 Effect of ACPH concentration on conversion of ACPH
and selectivity to PHET and CHET
154
4.19 Effect of pressure on conversion of ACPH and
selectivity to PHET and CHET
155
4.20 Effect of temperature on conversion of ACPH and
selectivity to PHET and CHET
155
4.21 Effect of liquid velocity on up-flow and TBR
performance
156
4.22 Effect of inlet ACPH concentration on up-flow and
TBR performance
157
4.23 Effect of Pressure on Up-flow and TBR performance 157
4.24 Effect of Gas Velocity on Rate of Hydrogenation in
Up-flow and Down-Flow Mode of Operations
158

x
Up-flow and Down-Flow Mode of Operations
4.25 Distribution of ACPH along the length of the bed under
initial transient conditions
163
4.26 Distribution of PHET along the length of the bed in
initial period
163
4.27 Distribution of temperature along the length of the bed
under initial transient conditions
164
4.28 Distribution of various liquid phase components at the
exit of the reactor
164
5.1 XPS peaks corresponding to Al in Al2O3 172
5.2 XPS peaks corresponding to chlorine present on the
catalyst surface
172
5.3 XPS peaks corresponding to Ru 3d3/2 - 5/2 and C 1s 173
5.4 XPS peaks for Ru 3P3/2 174
5.5 XPS peaks for oxygen present in Al2O3 174
5.6 XPS of Ru catalysts prepared by impregnation method
using ethanol and water as the impregnation solvents
175
5.7 The XRD spectra of γ-alumina 176
5.8 The XRD spectra of 2%Ru/Al2O3 176
5.9 The XRD spectra of 5%Ru/Al2O3 176
5. 10 TEM photographs of 2%Ru/Al2O3 catalyst prepared by
precipitation technique
177
5. 11 TEM photographs of 2%Ru/Al2O3 catalyst prepared by
impregnation technique
178

xi
impregnation technique
5.12 Effect of alcoholic solvents on TOF based on
consumption of hydrogen
179
5.13 Concentration – time profile with methanol as solvent 180
5.14 Concentration – time profile with ethanol as solvent 181
5.15 Concentration – time profile with i-propanol as solvent 181
5.16 Selectivity to CHMK and PHET at 40% conversion
when different alcoholic solvents were used
182
5.17 Effect of non-polar Solvents on reaction rate 183
5.18 Concentration – time profile with i-dodecane as solvent 184
5.19 Concentration – time profile with cyclohexane as
solvent
185
5.20 Selectivity to CHMK and PHET at 40% conversion
when methanol, i-propanol and i-dodecane were used
as solvents
186
5.21 Catalyst activity in terms of TOF for fresh and recycle
experiments for the four-phase system
188

xii
Summary and Conclusions
Hydrogenation of organic compounds has wide ranging applications in the
manufacture of fine chemicals and pharmaceuticals. Since most of the products in this
category are non-volatile complex molecules, the hydrogenation reactions are usually
carried out in liquid phase using soluble or supported metal catalysts. These reactions are
generally carried out in multiphase reactors in which the catalyst is either suspended in
liquid phase as fine particles (slurry reactors) or supported as a fixed bed with cocurrent
down flow (trickle bed reactor) or up flow of gas and the liquid phases. The catalytic
hydrogenation processes are gaining particular attention as they provide cleaner synthetic
routes for fine chemicals and pharmaceuticals as against the multi step organic synthetic
routes based on stoichiometric reagents, which generate large quantities of inorganic salts
and byproducts posing environmental problems. Therefore, research on multiphase
catalytic reactions/reactors is extremely important in developing cleaner and
economically improved processes for a wide variety of industrial products. The overall
performance of such processes depends not only on the catalytic chemistry but also on
the suitable choice of the reactor. A systematic study of the fundamental principles in
catalysis and reaction engineering is necessary to develop optimum processes. The
subject of multiphase catalysis and reaction engineering is also of generic importance to
several other reactions like alkylation, oxidation, carbonylation, hydroformylation,
petroleum refining etc. The aim of this thesis was to investigate catalysis and reaction
engineering aspects of hydrogenation of aromatic ketones in multiphase slurry and fixed
bed reactors. The reaction systems chosen itself are industrially relevant as the products
of hydrogenation of acetophenone, 1-phenylethanol is an intermediate for the production
of styrene and is also used in pharmaceutical industry and another product 1-
cyclohexylethanol is extensively used in the manufacture of polyvinyl cyclohexane, a
high temperature resistant polymer. The product of hydrogenation of p-isobutyl
acetophenone, p-isobutyl phenylethanol, is an important intermediate in the synthesis of
ibuprofen, a non-steroidal, anti-inflammatory drug.1 Also, the reactions provide
interesting examples of multistep catalytic reactions allowing us to investigate important
issues such as catalyst activity, selectivity, reaction kinetics and reactor performance.
The following specific problems were chosen for the present work

xiii
§ Kinetics and modelling of semi-batch slurry and basket reactors under isothermal
and non-isothermal conditions for hydrogenation of acetophenone using
supported Ru catalysts.
§ Reaction kinetics and modelling of a semi batch slurry reactor for hydrogenation
of p-isobutyl acetophenone using a Ru/Al2O3 catalyst.
§ Experimental and theoretical investigations on performance of a trickle bed
reactor for the hydrogenation of acetophenone using supported Ru catalysts
§ Experimental and theoretical investigations on performance of a fixed bed three
phase reactor with co-current up-flow of gas and liquid phase for the
hydrogenation of acetophenone and its comparison with trickle bed reactor
performance.
§ Activity and selectivity studies using various supported metal catalysts for
hydrogenation of acetophenone.
The thesis will be presented in five chapters, the synopsis of which is presented
here.
In chapter 1, literature review on catalytic hydrogenation of aromatic ketones and
particularly acetophenone and p-isobutyl acetophenone has been presented. The type of
catalysts used, their activity, selectivity, kinetic modeling and reaction engineering
aspects has been discussed. Hydrogenations of aromatic ketones are known to give
essential products as shown in the scheme below, (Figure 1) with acetophenone as an
example.
O OH
O OH
ACPH PHET ETBE
ETCHCHETCHMK
Figure 1. Reaction scheme for hydrogenation of acetophenone

xiv
However, the selectivity is dependant on the type of catalyst used. Catalysts consisting of
supported Pt, Pd, Ru, Rh and Cu catalysts are known in the literature for the
hydrogenation of acetophenone. The investigations on activity and selectivity of these
catalysts and surface characterizations have been reviewed.2,3 The kinetic modeling of
hydrogenation of acetophenone and p-isobutyl acetophenone was studied by Isabelle et
al.4 and Rajasekharam et al.3 respectively using supported Rh and Ni catalysts. Ru
catalysts can provide an alternative to Pt and Rh based systems, particularly to achieve
high selectivity to 1-cyclohexylethanol. No detailed reports of kinetics on these reactions
have been published with Ru catalysts. The reaction engineering aspects, including
analysis of external and intraparticle mass transfer effects, modelling of semi-batch slurry
and fixed bed reactors and experimental verification for hydrogenation of aromatic
ketones and for other important reaction systems have also been discussed and scope for
the present thesis outlined.
In Chapter 2, a detailed study on the liquid phase hydrogenation of acetophenone
in a semi-batch slurry and basket type of reactors using 2%Ru/Al2O3 is presented. The
effect of agitation speed, catalyst loading, initial acetophenone concentration and H2
partial pressure was studied experimentally over a temperature range of 373–423 K. For
the purpose of kinetic parameter estimation a semi-batch slurry reactor model was
developed, which was used in combination with an optimisation routine to evaluate
different type of rate models. A Langmuir-Hinshelwood type rate model based on non-
competitive adsorption of hydrogen and liquid phase components and different
adsorption sites for the adsorption of different functional groups could explain well the
intrinsic kinetics obtained from slurry reactor. In order to investigate the intraparticle
diffusional effects, experiments were conducted in a basket type reactor. These data’s
were analysed using a dynamic model for semi-batch basket type reactor in which the
intraparticle diffusion with reaction of various reactants and intermediates were
considered. Further, the non-isothermal behaviour of the semi batch slurry reactor was
studied, in which experimental concentration-time as well as temperature-time profiles
were obtained. Mathematical model for a semi-batch slurry reactor was developed
incorporating the non-isothermal effects, which was found to predict the observed
experimental data satisfactorily.

xv
Kinetics of hydrogenation of p-isobutyl acetophenone using a 2%Ru/Al2O3
catalyst in a semi-batch slurry reactor over a temperature range of 373-398 K is also
presented in Chapter 2. The effect of catalyst loading, H2 partial pressure and p-isobutyl
acetophenone concentration on concentration-time and H2 consumption profiles was
studied. A rate equation has been proposed based on a Langmuir-Hinshelwood type
mechanism in which reaction between non-dissociative adsorption of hydrogen and
different liquid phase components are assumed to be rate determining. The kinetic
parameters were evaluated by fitting the integral batch reactor data at different
temperatures. The activation energies, heat of adsorption and the entropy of adsorption of
hydrogen and various liquid phase components were evaluated.
In Chapter 3, hydrogenation of acetophenone using a supported ruthenium
catalyst was studied in a trickle bed reactor. Increase in liquid velocity in the trickle bed
reactor resulted in lower conversions of acetophenone considerably but had marginal
effect on rate of hydrogenation. Of the main factors contributing to the reactor
performance, the gas to solid mass transfer and gas to liquid mass transfer were found to
be important. Increasing the inlet concentration of acetophenone resulted in marginal
increase in rate of hydrogenation. The rate of hydrogenation varied almost linearly with
the partial pressure of hydrogen proving the importance of gas phase reactant limitation.
Increase in gas velocity was found to increase the conversion and rate of hydrogenation
marginally. A plug flow model incorporating the mass transfer effects, partial wetting,
non-isothermal effects and solvent evaporation effects was found to explain well the
observed reactor performance. PHET was found to be the major product under the range
of conditions studied. CHET formation increased with increase in residence of liquid
phase and with increase in reactor pressure.
In Chapter 4, hydrogenation of acetophenone using 2%Ru/Al2O3 catalyst was
investigated in a fixed bed reactor with cocurrent up-flow. It was observed that gas
velocity, liquid velocity and inlet concentration of ACPH had only a mild influence on
the reaction rates, while with respect to hydrogen partial pressure and temperature the
rates increased significantly. In order to explain these results theoretical models for
steady state conditions as well as dynamic analysis were developed. The model
predictions agreed well for almost all the experimental data indicating that detailed

xvi
theoretical models can be reliably used for predicting the reactor performance. The
literature correlations were found to be satisfactory. The temperature rise observed was
not very large, but within the range of model predictions. Finally the experimental data
from the up-flow reactor were compared with the corresponding results in a trickle bed
reactor and observed that under conditions of low liquid velocity TBR outperformed up-
flow reactor, where as at higher liquid velocities the rates were almost similar in both
cases.
In Chapter 5, a detailed investigation on the hydrogenation of acetophenone using
supported Ru catalysts has been reported. Supported ruthenium catalysts prepared by
precipitation technique and impregnation technique showed the presence of some extent
of ruthenium oxide even after activation at 573 K. With methanol as solvent, CHET
formation took place mainly through PHET as the intermediate for supported ruthenium
catalysts. With higher alcohols, CHET formation through CHMK and PHET as the
intermediates in almost equal amounts was observed and with non-polar hydrocarbon
solvents, reaction proceeded mainly through CHMK as the intermediate. With non-polar
hydrocarbon solvents, 99% selectivity towards CHET was obtained where as with
alcoholic solvents considerable amount of the side product, ethyl benzene, formation was
observed. Studies with water as the immiscible phase with acetophenone was found to
give high rates and high selectivity (> 98%) towards CHET. The catalysts were found to
remain in the aqueous phase, which was recycled successfully four times, and in all the
recycles the rates were found to be similar and the selectivity towards CHET was
maintained. Ruthenium supported on NaY was found to give the maximum reaction rates
owing to its high surface area. Catalysts prepared by impregnation technique were found
to give a better activity than the catalysts prepared by precipitation technique and ethanol
as the impregnation solvent was found to be better rates than water as the impregnation
solvent. Addition of basic promoters like NaOH and triethylamine was found to suppress
the formation of the side product, ethyl benzene, with ruthenium as catalyst and methanol
as the solvent. Screening of other supported metal catalysts showed that Ni and Pd
catalysts gave better selectivity towards PHET.

xvii
References 1. Sheldon R.A., Chem. Ind., 7 December, p. 903, 1992
2. Kluson P. and Cerveny L., Applied catalysis A: General, 128, 13, 1995
3. Rajashekharam M.V., Thesis submitted to the university of pune, India, 1997
4. Bergault I., Fouilloux P., Joly-Vuillemin C. and Delmas H., Kinetics and Intraparticle Diffusion
Modelling of a complex Multistep Reaction: Hydrogenation of Acetophenone over a Rhodium Catalyst, J.
Cata., 175, 328, 1998

Chapter 1
Introduction and Literature Survey

1.0 General Introduction
Catalysis forms an inseparable part of chemical industry in the modern world.
Most industrial reactions and almost all biological reactions are catalytic in nature. The
value of products made in United States in processes that involve catalysis is around a
trillion dollar annually.1 End products of catalytic processes include food, clothing, drugs,
plastics, detergents and fuels. It also forms an integral part of environmental protection
and emission control. Therefore, catalyst manufacture is a major industrial operation and
catalysts worth 2-3 billion dollars are sold annually in US.1 In most industrial catalytic
reactions, the catalysts used may be supported metals/metal oxides or metal complexes
along with one or more promoters/cocatalysts. Many important discoveries in catalysis
have revolutionized technologies for the manufacture of pharmaceuticals and fine
chemicals. Some examples are: synthesis of ibuprofen by catalytic
hydrogenation/carbonylation, hydroxylation of phenol to hydroquinone and catechol
using ZSM-5 catalyst, auto-oxidation of para-diisopropylbenzene to hydroquinone,
oxidative carbonylation of methanol to dimethyl carbonate, catalytic asymmetric
hydrogenation etc.2 All these catalytic routes provide more economical and
environmentally benign processes.
Most of the catalytic reactions involve gas, liquid and/or solid (catalyst) phases
resulting in multiphase catalytic systems. The performance of the multiphase catalytic
systems depends not only on the catalytic chemistry associated with the reactions
occurring on the solid surface, but also on the reaction engineering aspects relating the
kinetics of catalytic reactions coupled with interphase and intraparticle diffusional
effects. Therefore, to achieve a complete understanding of the multiphase catalytic
reactions, both catalysis and reaction engineering aspects have to be investigated. While
in the literature, several examples have addressed these aspects in isolation, there are only
limited reports on complex multiphase catalytic reactions. Multiphase reaction
engineering aspects for fine chemicals and pharmaceuticals have been reviewed by
Ramachandran and Chaudhari,3 Doraiswamy and Sharma,4 Mills et al.,5 Mills and
Chaudhari,2 Mills and Chaudhari,6 and Carpenter.7 Extensive work on theoretical
development of reaction rate/reactor performance models has been carried out but the
experimental validation of models were limited to model reaction systems.

Hydrogenation of organic compounds has wide ranging applications in the
manufacture of fine chemicals and pharmaceuticals. Since most of the products in this
category are non-volatile complex molecules, the hydrogenation reactions are usually
carried out in a liquid phase using soluble or supported metal catalysts. Even though
hydrogenation reactions involving molecules with only one functional group is common,
selective hydrogenation of one functional group in the presence of other functional
groups still pose considerable challenge to researchers. Many of the industrially
important reactions involve complex reaction networks and hence achieving selectivity to
one particular product is still a difficult task. These reactions are generally carried out in
multiphase reactors in which the catalyst is either suspended in liquid phase as fine
particles (slurry reactors) or supported as a fixed bed with cocurrent down-flow (trickle
bed reactor) or up-flow of gas and the liquid phases. The catalytic hydrogenation
processes are gaining particular attention as they provide cleaner synthetic routes for fine
chemicals and pharmaceuticals as against the multi step organic synthetic routes based on
stoichiometric reagents, which generate large quantities of inorganic salts and byproducts
posing environmental problems. Therefore, research on multiphase catalytic
reactions/reactors is extremely important in developing cleaner and economically viable
processes for a wide variety of industrial products. The subject of multiphase catalysis
and reaction engineering is also of generic importance to several other reactions like
alkylation, oxidation, carbonylation, hydroformylation, petroleum refining etc. The aim
of this thesis was to investigate catalysis and reaction engineering aspects of
hydrogenation of aromatic ketones in multiphase slurry and fixed bed reactors. The
reaction systems chosen itself are industrially relevant as the products of hydrogenation
of acetophenone, 1-phenylethanol is used in perfumery and in pharmaceutical industry
and another product 1-cyclohexylethanol is extensively used in the manufacture of
polyvinyl cyclohexane, a high temperature resistant polymer. Hydrogenation of another
related aromatic ketone, p-isobutyl acetophenone, to p-isobutyl phenylethanol, is a key
intermediate in the synthesis of ibuprofen, a non-steroidal, anti-inflammatory drug.8
These reactions provide interesting examples of multistep catalytic reactions allowing us
to investigate important issues such as catalyst activity, selectivity, reaction kinetics and
reactor performance.

In the present chapter, a literature review on the catalysis and reaction engineering
aspects of hydrogenation of aromatic ketones has been presented. In addition a detailed
literature review on the analysis and design of multiphase catalytic reactors with special
emphasis on batch slurry and down-flow and up-flow fixed bed reactors is presented.
1.1 Hydrogenation of Aromatic Ketones
Hydrogenation of aromatic ketones constitutes an important class of
hydrogenation reactions. Majority of the products formed find applications in fine
chemical and pharmaceutical industry. Aromatic ketones can undergo hydrogenation in
two paths. One is the hydrogenation of only the ketonic functional group resulting in the
formation of corresponding alcohol and other involves hydrogenation of the aromatic
ring, giving rise to saturated alcohol or ketone. In general the reaction scheme involved
can be represented as (Figure 1.1):
O OH
O OH
R R R
R R R
Figure 1.1: Reaction Scheme for Aromatic Ketone Hydrogenation
Examples of aromatic ketone hydrogenations and corresponding products formed are
given in Table 1.1, with diverse industrial applications.

Table 1.1: Examples of Aromatic Ketone Hydrogenations Reported in the Literature
S. No. Substrate Product/Application Catalyst System/
Reference
(1) (2) (3) (4)
1
O
CF3
OH
CF3
Agriculture and Pharmaceutical Industry
Pt/Alumina9
2
O
COOMe
COOMe
OH
Fine chemical
Ru/Zeolite10
3 O
O
CH3
O
OH
CH3
5%Pd/C11

(1) (2) (3) (4)
4
O O
NH NH
O
O
NH NH
OH O
Pharmaceutical
5%Pd/C12
5
O O OH OH
Platinum oxide,
acetic acid13
6
O
OH
Pharmaceuticals
Ni/SiO214
7 N
O
N
OH
5%Pd/C15

(1) (2) (3) (4)
8
CH3 CH2COOH
O
CH3
CH2COOH
10%Pd/C, ethanol,
H2SO416
9
MeO
OH
CH3
COOCH3
CH2COOCH3
MeO
CH3
COOCH3
CH2COOCH3
O
30% Pd/Stroncium
carbonate, ethyl
acetate17
10
O CH2N(CH3)2
CH2N(CH3)2OH
Platinum oxide,
acidic buffer of
ammonium acetate
and acetic acid18
11
O
COOH
O
O
Raney Ni19

For the present investigation, acetophenone (ACPH) was chosen as the model
system as it represents an interesting case of a complex multistep reaction with
challenges in selectivity and reactor design. Another system studied is the hydrogenation
of p-isobutyl acetophenone (p-IBAP), which a key intermediate in the manufacture of
ibuprofen and this new catalytic route20 is considered as a major innovation in ibuprofen
technology both from environmental as well as economic point of view, as it eliminates
the conventional stoichiometric synthetic routes, which produce a large amount of salts as
by-products.
OAc2O
AlCl3
O
CO2Et
CHO
H2O/H+
NH2OH
NOH
CN
-H2O
BootsO
OH
OHCOH2O/H+
H2(Pd/C)
Catalytichydrogenation
CO Pd
Catalytic carbonylation
Hoechst-Celanese
Ibuprofen
HF
Ac2O
Figure 1.2: Conventional Boots Route and the Catalytic Hoechst-Celanese Route

1.1.1 Hydrogenation of Acetophenone and p-Isobutyl Acetophenone
Hydrogenation of acetophenone represents a complex reaction network with
considerable exothermicity and the product distribution of hydrogenation depend on the
catalyst type used. The catalysts used can be classified into two different categories: (a)
One, which hydrogenate only the ketonic group and (b) the other, hydrogenating both
ketonic group as well as the aromatic ring. The reaction mainly proceeds through two
intermediates, (i) 1-phenylethanol (PHET) and (ii) cyclohexylmethylketone (CHMK). 1-
cyclohexylethanol (CHET) is the end product in both these cases and ethylbenzene
(ETBE) and ethylcyclohexane (ETCH) are obtained as undesired side products. The main
emphasis of the earlier studies was to get selective formation of 1- phenyl ethanol or 1-
cyclohexyl ethanol. Reports on hydrogenation of acetophenone using various metal
catalysts are summarized in Table 1.2.
Table 1.2: Literature Reports on Hydrogenation of Acetophenone and p-Isobutyl Acetophenone Using Supported Metal Catalysts
S.
No.
Substrate /
Catalyst
Reaction
Conditions
Conversion
%
Product /
Selectivity
%
Reference
(1) (2) (3) (4) (5) (6)
1
ACPH /
Flourinated Pt
(5-10%)
supported on
alumina
155-1900C/ 20-
30 atm - CHET
Serebryakov et
al.21
2
ACPH /
1%Ru/TiO2
(Activated at
773 K)
300C, 1 atm,
Solvent:
Cyclohexane
50% PHET/ 50 Wismeijer et
al.22

(1) (2) (3) (4) (5) (6)
3 ACPH / 0.1-1%
Ru/Support
80-1600C, 200-
350 atm,
Fixed bed
- CHET/ 96.4 Otte and
Nehring 23
4 ACPH / Pd/C
and LiOH
1500C, 20 atm,
2hrs 99% PHET/ 96 Too et al.24
5 ACPH / 5:5 Rh-
Sn/Al2O3 Solvent: H2O PHET/ 82.3
Zakumbaeva et
al.25
6 ACPH / Raney
Ni
800C, 9 atm,
Solvent:
cyclohexane,
Time: 1.83hrs
100 PHET/ 70
CHET/ 10 Masson et al.26
7 ACPH / NiCr1.5
800C, 9 atm,
Solvent:
cyclohexane,
Time: 1.83hrs
99.3 PHET/ 89
CHET/ 4.9 Masson et al.27
8 ACPH /
2.5%Ru/TiO2
300C, 1atm,
Solvent:
isopropanol
- PHET/73 Kluson et al. 28
9 ACPH /
2%Ru/Al2O3
300C, 1atm,
Solvent:
isopropanol
52 PHET/78 Kluson et al. 28
10 ACPH / Ir/Al2O3
Room temp., 1
atm, Solvent:
water, Time:
24hrs
100 PHET/ 68
CHET/ 32
Rocchini et
al.29
11 ACPH /
Rh/Al2O3
Room temp., 1
atm, Solvent:
water, Time:
24hrs
100 PHET/ 100
Rocchini et
al.29

(1) (2) (3) (4) (5) (6)
12 ACPH / Pt/C
Room temp., 1
atm, Solvent:
water, Time:
24hrs
100 PHET/ 59
CHET/ 41
Rocchini et
al.29
13
ACPH / Silica
supporting
CuO.CuCr2O4
(CuO 3.6%,
Cr2O3 3.4%)
1300C, 2 atm,
Time: 2hrs 75.4 PHET/ 99.1 Masaya et al.30
14
ACPH / Silica
supporting
CuO.CuCr2O4
(CuO: 15.3%,
Cr2O3:14.7%)
1300C, 2 atm,
Time: 2hrs 72.9 PHET/ 96.9 Masaya et al.30
15 ACPH / CuO-
Silica pellet
1300C, 2atm,
Fixed bed PHET/ 99.5 Masaya et al.31
16
ACPH / Cu-ZnO
with alk. earth
carbonates and
alkali metal salts
1800C, 2 atm,
Time: 46 min 75.0 PHET/ 97.6 Masaya et al.32
17
ACPH / Rh/C
Solvent:
cyclohexane
800C, 25 atm 100 CHET/ 100 Bergault et
al.33
18
ACPH / acid
modified Ru/C,
solvent:
isopropanol,
800C / 60 atm
Time: 6hrs 100 CHET/ 95 Itoi 34

(1) (2) (3) (4) (5) (6)
19 p-IBAP / Ru/C 1200C, 4 atm,
Time: 5hrs 97 p-IBPE Tadashi et al.35
20 p-IBAP / Raney
Ni
1400C, 68.03
atm, Time: 4hs 87 p-IBPE Yoshiyaki36
21 p-IBAP / Pd/C 300C, 6.8 atm,
Time: 1hr 99 p-IBPE / 97 Elango37
22
p-IBAP /
Activated Ni
sponge
600C, 17 atm,
Time: 1.5hrs 99 p-IBPE Ryan 38
23 p-IBAP /
Pd/CaCO3
600C, 8.6 atm,
Time: 18hrs 85 p-IBPE / 100 Saeki and
Takashi39
24 p-IBAP / Pd/C 600C, 8.6atm,
Time: 1hr 97 p-IBPE / 100 Saeki and
Shima40
25 p-IBAP /
10%Ni/HY
1000C, 30 atm,
Time: 2hrs 75 p-IBPE / 75
Rajashekharam
and
Chaudhari41
Most of the studies on the selective synthesis of 1-phenylethanol and 1-
cyclohexylethanol are patented. Earlier work for the selective synthesis of PHET was
based on Raney Ni, Pd, Ru and Pt catalysts. The earlier work on hydrogenation of
acetophenone using supported metal catalysts is summarized here. Wismeijer et al.42 that
found Ru/TiO2 gives higher selectivity to PHET compared to Ru supported on SiO2 and
C. These catalysts were activated at 773 K before using for the hydrogenation of ACPH.
The high selectivity was attributed to the metal support interaction between Ru and TiO2
at 773 K while with other supports the metal support interaction doesn’t occur at that
temperature. With Ru/TiO2 catalyst activated at a lower temperature (473 K) the
selectivity obtained for PHET was found to be lower. At lower catalyst activation

temperatures, the metal support interaction is not expected and hence the lower
selectivity. In metal support interaction, metal particles of the catalysts are decorated with
titania sub-oxides generating new stable active sites for selective carbonyl group
hydrogenation which is a possible explanation for the higher selectivity.43 Masson et al.26
investigated the influence of temperature, pressure and the nature of the solvent on the
activity and selectivity of Raney Ni catalysts for hydrogenation of ACPH to PHET. In
cyclohexane as the solvent, low temperature and high pressures were found to give 85%
selectivity towards the formation of PHET. Lower alcohols as solvents gave higher
selectivity to PHET (> 92%), which is explained as a result of inhibition of ring
hydrogenation by polar molecules and has a correlation with dielectric constant of the
solvent. Masson et al27 investigated kinetics of acetophenone hydrogenation using Cr
promoted Raney Ni catalysts in cyclohexane as the solvent. In the presence of Cr, the
hydrogenation of the C=O bond is favored with respect to two side reactions: the
hydrogenation of aromatic ring and the hydrogenolysis of the C-OH bond. Kluson et al.28
have investigated the effect of supports and method of preparation and conditions of
catalyst activation on hydrogenation of acetophenone using Ru supported catalysts. It was
concluded that the catalyst prepared by impregnation technique with ethanol as the
impregnating solvent gave better rates and selectivity for PHET. Ethanol has weaker
complexing ability than water and accordingly the activity of the ruthenium catalysts
prepared in ethanol medium was higher due to the inclusion of the impregnating solvent
in the catalyst after activation. Rocchini et al.29 showed that, in the hydrogenation of
acetophenone molecules inserted in cyclodextrins with Ir, Rh and Pt supported catalysts
ring hydrogenation was minimum. Organic compounds are known to form 1:1 adducts
with cyclodextrins, if they possess a suitable hydrophobic group that can fit in its cavity.
By the incorporation of acetophenone molecules in cyclodextrins, the phenyl ring of the
acetophenone is inserted in the cyclodextrin cavity thus inhibiting its reduction. The
adduct will approach the metallic surface from the side of the carbonyl group, thereby
giving aromatic alcohol as the product.
Recent investigations on hydrogenation of acetophenone reveal that cheaper
catalysts like copper based catalysts can be used for the selective synthesis of PHET. Ito
Masaya et al.30,31,32 have patented Cu based catalysts for the selective formation of PHET

from ACPH as mentioned in Table 1.2. Rajasekharam44 investigated in detail the
hydrogenation of ACPH using Ni/HY catalysts. FT-IR investigation of the acetophenone
adsorbed catalysts showed that C=O bond is activated due to its interaction with the
zeolite protons resulting in the weakening of C=O bond. He also observed that the acidic
sites present on the support facilitated the formation of ether, 1-phenylethylmethyl ether,
by the reaction between 1-phenyl ethanol and the solvent methanol. Rajasekharam et al.45
studied the kinetics of hydrogenation of acetophenone using 10%Ni/HY catalyst with
methanol as the solvent over a temperature range of 353-393 K. The effect of hydrogen
partial pressure, initial concentration of acetophenone and temperature on the
concentration-time profiles in a semi-batch slurry reactor was investigated. It was found
that, water, a side product formed during the reaction had a strong inhibitory effect on
hydrogenation activity. Liquid phase hydrogenation of acetophenone using Rh/C catalyst
was studied by Bergault et al.46 in trickle bed reactor and slurry airlift reactor and the
performance of these two reactors were compared in terms of productivity and yield.
Bergault et al.33 investigated the kinetics of hydrogenation of acetophenone using
3%Rh/C catalyst with cyclohexane as the solvent. Various possible Langmuir-
Hinshelwood type of rate models were considered and a rate model based on non-
dissociative adsorption of hydrogen and non-competitive adsorption of the liquid phase
components and the gaseous hydrogen was found to fit well the experimentally observed
concentration-time profiles.
Most of the earlier literature on hydrogenation of p-isobutyl acetophenone
(p-IBAP) is patented and there are only a few reports, dealing with the catalytic reaction
mechanism, kinetic modeling and reaction engineering aspects. The previous work on
hydrogenation of p-IBAP is also summarized in Table 1.2. The reaction scheme follows a
path similar as shown in Figure 1.1. Detailed investigation on the hydrogenation of p-
IBAP has been very limited in the literature. Rajashekharam and Chaudhari41 investigated
the kinetics of hydrogenation of p-IBAP using 10%Ni/HY catalyst in a semi-batch slurry
reactor for a temperature range of 373-413 K. The effect of hydrogen partial pressure,
initial concentration of p-IBAP, catalyst loading and catalyst pellet size on the
concentration-time profiles was investigated. A Langmuir-Hinshelwood type of rate
model based on non-dissociatively adsorbed hydrogen reacting directly with the organic

species present in the liquid phase was found to explain well the experimentally observed
results. The kinetic parameters and activation energies were estimated.
1.2 Multiphase Reactors for Hydrogenation
Hydrogenation of organic compounds often involves multiphase catalytic
reactions in which contacting of a gas (H2), liquid (organic substrate) and solid (catalyst)
phases are involved. The most common hydrogenations fall into the category of three
phase (gas-liquid-solid) reactions. These processes are carried out in slurry or fixed bed
reactors in a batch or continuous operation. The overall performance of these reactors
depends on the inter phase mass transfer, intrinsic kinetics of reaction, physicochemical
properties and mixing of the fluid phases. A theoretical analysis of the kinetic model,
overall rate of reaction incorporating contribution of external as well as intraparticle mass
transfer as well as reactor models has been extensively studied and the details are
available in monographs by Ramachandran and Chaudhari3 and Shah47 and in reviews by
Chaudhari and Ramachandran,48 Doraiswamy and Sharma,4 Chaudhari et al.49, Mills et
al.5 and Mills and Chaudhari.2 In this part, a brief review of the principal multiphase
reactor types and current state of development on modeling of multiphase slurry and
fixed bed reactors has been presented including experimental validation of reactor
performance models.
1.2.1 Agitated Slurry Reactors
The agitated slurry reactors are most commonly used in industrial scales in liquid
phase hydrogenation processes. In agitated reactors, the catalyst particles are used in a
powder form and kept in suspension by means of mechanical agitation (Figure 1.3). Due to
smaller catalyst particle size, intraparticle diffusional effects are negligible in these reactors.
Also the overall mass and heat transfer efficiency is better than fixed bed reactors and these
reactor are preferred for mass transfer limited reactions and those with high level of
exothermicity.

Gas inlet Gas outlet
Liquid in
Liquid out
Figure 1.3: Mechanically Agitated Slurry Reactor
Many variation of these agitated slurry reactors are used in industry such as stirred reactors
with multiple impellers and multiple gas injection points as shown in Figure 1.4. This is to
ensure good mixing of reactants with minimum gas voidage.
Figure 1.4: Stirred Reactor with Multiple Impellers and Gas Injection Points
The processes for small volume specialty chemicals are often operated in a batch mode.
A dead-end operation with no discharge of hydrogen is very common for safety reasons
and convenience. The agitated slurry reactors can also be operated in a semi-batch or
continuous mode depending on the process requirement. The important design

parameters for agitated slurry reactors are selection of an agitator type, size, point of gas
injection and the mode of heat removal which have a direct influence on gas-liquid and
liquid-solid mass transfer and overall heat transfer efficiencies. It is also important to
ensure that the catalyst particles are kept in complete and uniform suspension. Several
correlations have been proposed for the estimation of mass transfer and heat transfer
parameters, the details of which have been reviewed by Chaudhari and Ramachandran 48
and Ramachandran and Chaudhari.3
1.2.1.1 Models for Semi-batch Slurry Reactor
In a semi-batch operation of a three-phase reactor, the gas phase flow
continuously through the system, while there is no net inflow or outflow of the liquid
phase. These reactors find application in the manufacture of fine chemicals and
pharmaceuticals where, small volume batch processes are involved. Also, these reactors
are widely used for evaluating the catalyst performance of a three phase catalytic reaction
and to obtain reliable data on the kinetics of a particular reaction. The design problem in
a semi-batch slurry reactor is to predict the conversion of the liquid phase reactant as a
function of time, so that the batch time of operation of such reactors can be fixed.
Theoretical analysis of semi-batch slurry reactors was earlier presented by Chaudhari and
Ramachandran,48 Ramachandran and Chaudhari3 for (1,0), (1,1) order kinetics and also
in general for m-nth order kinetics. The equations for (1,1) order are:
e
pli
psBl*
BlB
DwA
IRB
ak
1 +
ak
1
A
XB = t
i
*
2
3][
ρν
+ (1.1)
Where,
]X-1 - X-1X-1
- [
2 = I
BoiBoiBoi
oioioi
2oi φφφ
φφφφ sinhcosh
sinhcoshln (1. 2)
with φoi, the Thiele modulus based on the initial concentration of B is given as,
]D
Bk[ R = 1/2
e
l11p
oi
iρ
φ (1.3)
Some semi-batch reactor modeling and reaction engineering studies of complex
hydrogenation reactions are summarized in Table 1.3.

Table 1.3: Summary of Reactor Modeling and Reaction Engineering Studies in Semi-batch Slurry Reactor
S. No. Hydrogenation system Catalyst Remarks Reference
1 Crotonaldehyde Pd/Al2O3 Catalyst effectiveness factor determined Kenney and Sedriks50
2 Chlorobenzene Pt/C Gas-liquid mass transfer important Kawakami and Kusunoki51
3 Phenylacetylene 0.5%Pt/Al2O3 Reactor modeling with intraparticle
diffusional effects
Kawakami and Kusunoki52
4 Dimethylnitrobenzene Pd/C Kinetics and reactor modeling Kut et al.53
5 Butenediol Pd-Zn-CaCO3 Kinetics and batch reactor modeling Chaudhari et al.54
6 Phenylacetylene Pd/C Kinetics and reactor modeling Chaudhari et al.55
7 Buytnediol Pd/C Kinetics and reactor modeling Chaudhari et al.56
8 2-ethyl- 5,6,7,8 tetrahy
-droanthraquinone
Pd/Al2O3 Reactor model incorporating both internal
and external mass transfer resistance
Santacesaria et al.57
9 Furan amines Rh/Al2O3 Kinetics and reactor design Holm et al.58
10 Benzene Ni Kinetics, reactor modeling with
intraparticle diffusion
Toppinen et al.59
11 1,5,9-
cyclododecatriene
Pd/Al2O3 Kinetic modeling taking into consideration
various isomers of the products
Benaissa et al.60
12 Acetophenone 3%Rh/C Reactor modeling with intraparticle
diffusional effects
Bergault et al.33
13 2,4-dinitrotoluene 10%Ni/HY Intrinsic kinetics and reactor modeling Rajashekharam and Chaudhari61

1.2.1.1.1 Non-Isothermal Effects in Slurry Reactors
Many industrially important hydrogenation reactions are exothermic in nature and
hence understanding the non-isothermal behavior of slurry reactors is important for
carrying out these reactions. In most of the reactions, the intraparticle temperature
gradients and the temperature gradients between the catalyst and the gas-liquid phases
may not be significant. However, the bulk liquid temperature is expected to change with
residence time, thus affecting the rate of reaction due to changes in the kinetic
parameters, solubility of the gas and other physical properties of the system. For a semi-
batch reactor with reaction between a gas phase reactant A and liquid phase reactant B,
and assuming that intraparticle diffusion effects are negligible, the following equation can
be used to represent the material and heat balances.3
1
2 )()(* −=− ]
BTWk
1 +
ak
1 +
ak
1[ TA R =
td
Bd
lpsBlA
l νν (1. 4)
and
=+−−+dt
dTCwVC
wVCV psRPll
pgRPggRg ))1(( ρ
ρερε
)()()(
)(*)( 1
2gpgggWWW
lpsBlR TTCQTTAU]
BTWk
1 +
ak
1 +
ak
1[TAVH −−−−∆− − ρ (1. 5)
The initial conditions are, at t = 0, Bl = Bli and T = Ti. The above equations can be solved
numerically for Bl and T as a function of time. If the temperature change is large, the
variation of kL and kS with temperature must also be considered. Non-isothermal
modeling of semi-batch slurry reactors for exothermic reactions is rare in literature. Non-
isothermal effects in slurry reactors have been reviewed by Ramachandran and
Chaudhari.3 Hydrogenation of m-nitrochlorobenzene to m-chloroaniline using sulphided
platinum on carbon catalyst was studied by Rode and Chaudhari62 in a semi-batch slurry
reactor. It was observed that the rate of reaction was first order with respect to hydrogen
partial pressure and was independent of the substrate concentration. At higher
temperatures, gas-liquid mass transfer was found to be significant and the rate equations
were solved incorporating the mass transfer effects. Experiments were carried out under
non-isothermal conditions and hydrogen consumption-time profiles were found to match
with a non-isothermal semi-batch reactor model developed. Another study under non-

isothermal conditions was for the hydrogenation of 2,4-dinitrotoluene using Pd/Al2O3 by
Rajasekharam et al.63 Apart from a detailed kinetic study, a non-isothermal slurry reactor
model was developed to predict the H2 consumption-time and temperature profile and
compared with the experimental observations.
Jaganathan et al.64 studied the hydrogenation of p-nitrocumene to p-cumidine over
supported palladium catalyst in a laboratory-scale slurry reactor with the objective to
demonstrate the methodology for development of a slurry reactor model that could
predict either isothermal or non-isothermal performance using intrinsic kinetic and
transport parameters that were determined from independent data and engineering
correlations. The initial rate data showed that both the kinetic and mass-transfer
resistances were important for higher temperatures, while the kinetic regime was
controlling at lower temperatures. A Langmuir-Hinshelwood (L-H) model was proposed
based on the rate data in the kinetic regime. The rate model was suitably modified to
account for combined transport-kinetics resistances at higher temperatures. Using a
basket reactor, intraparticle diffusion effects were also studied by transforming the
catalyst powder used for the kinetic study into catalyst pellets. Equations for an overall
catalyst effectiveness factor were derived for the L-H type rate model. The experimental
data for different catalyst particles agreed well with the model predictions. To verify the
applicability of the kinetic model over a wide range of conditions, a slurry reactor model
was also developed for both isothermal and non-isothermal conditions.
1.2.2 Bubble Column Slurry Reactors In the case of bubble column slurry reactors the particles are suspended by gas-
induced agitation (Figure 1.5). The gas is dispersed through the liquid containing finely
suspended catalyst particles. The reactor may be operated in a semi-batch manner for
conversion of a liquid reactant or for continuous reaction between gaseous and liquid
reactant. The advantages of these reactors include absence of moving parts, minimum
maintenance, smaller floor space compared to agitated reactor and high liquid circulation
rates leading to more efficient rates of heat transfer than in fixed beds. In addition, power
consumption required is less than agitated reactors.

Gas inlet
Gas outlet
Liquid in
Liquid out
Figure 1.5: Bubble Column Reactor
As small particles sizes can be used, the intraparticle diffusional resistance is minimized
and hence maximum utilization of the catalyst is possible. The disadvantages include the
considerable back mixing of the liquid phase resulting in poorer reactor performance and
when the gas is passed at atmospheric pressure, additional energy has to be spent to
overcome the pressure drop in the column.3 Ohorodnik et al.65designed a bubble column
reactor for continuous operation with facilities for catalyst separation. Pruden and
Weber66 designed a bubble column reactor where catalyst and the liquid are recycled in
the reactor by means of an external pump.
1.2.3 Loop Reactors
Loop reactors have been found to be attractive because of their high heat and
mass transfer rates. These reactors find its application in hydrogenation of organic
compounds and biochemical processes. Various types of loop reactors exist and its
hydrodynamics and mass transfer have been reviewed by Blenke,67 Chaudhari and Shah68
and Chaudhari et al.49 Loop reactors are mainly of two types (a) internal recirculation
type and (b) external recirculation type49 as shown in Figure 1.6.
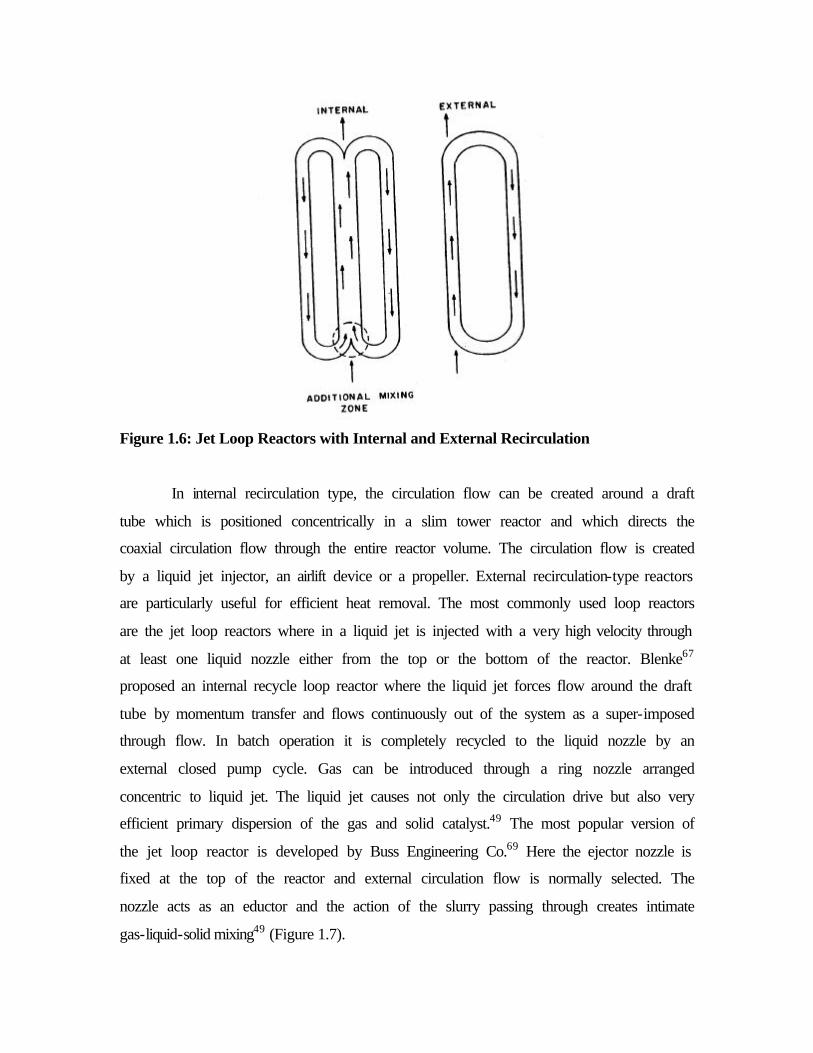
Figure 1.6: Jet Loop Reactors with Internal and External Recirculation
In internal recirculation type, the circulation flow can be created around a draft
tube which is positioned concentrically in a slim tower reactor and which directs the
coaxial circulation flow through the entire reactor volume. The circulation flow is created
by a liquid jet injector, an airlift device or a propeller. External recirculation-type reactors
are particularly useful for efficient heat removal. The most commonly used loop reactors
are the jet loop reactors where in a liquid jet is injected with a very high velocity through
at least one liquid nozzle either from the top or the bottom of the reactor. Blenke67
proposed an internal recycle loop reactor where the liquid jet forces flow around the draft
tube by momentum transfer and flows continuously out of the system as a super-imposed
through flow. In batch operation it is completely recycled to the liquid nozzle by an
external closed pump cycle. Gas can be introduced through a ring nozzle arranged
concentric to liquid jet. The liquid jet causes not only the circulation drive but also very
efficient primary dispersion of the gas and solid catalyst.49 The most popular version of
the jet loop reactor is developed by Buss Engineering Co.69 Here the ejector nozzle is
fixed at the top of the reactor and external circulation flow is normally selected. The
nozzle acts as an eductor and the action of the slurry passing through creates intimate
gas-liquid-solid mixing49 (Figure 1.7).

Figure 1.7: Buss Jet Loop Reactor
The chemical reaction take place mainly inside the nozzle and the autoclave acts mainly
as a holding vessel. By means of a external heat exchanger, uniform temperature can be
maintained, even for highly exothermic reactions.
1.2.4 Fixed Bed Reactors
In this type of reactors, the gas and the liquid phase flow over a fixed bed of
catalysts. The fixed bed reactors can be classified into mainly three types (i) co-current
down-flow of both gas and liquid phase (ii) downward flow of liquid with gas in the
countercurrent upward direction and (iii) co-current up-flow of gas and liquid and these
reactors are shown in Figure 1.8. Reactors with co-current down-flow of gas and liquid is
called as trickle bed reactors (TBR) and the co-current up-flow reactors are also referred
to as packed bubble column reactors.
Trickle bed reactors, wherein, the liquid reactant trickles down concurrently along
with the gaseous reactant, over a fixed bed of catalyst pellets finds its application in wide
variety of chemical, petrochemical and biochemical processes along with its application
in waste water treatment. The examples of application of trickle bed reactors are given in

detail in several monographs.70,71,72,73 This include oxidation, hydrogenation,
isomerisation, hydrodesulfurisation, hydroprocessing, decomposition of hydrogen
peroxide, deuterium exchange between hydrogen and water to produce heavy water, 74
adsorption of benzene from water on activated carbon particles,75 hydration, catalytic
dewaxing of lube stock 76 etc.
Gas
LiquidGas
Liquid
Catalyst
Gas
LiquidGas
Liquid
Catalyst
Gas
Liquid
Gas
Liquid
(a) (b) (c)
Figure 1.8: Fixed Bed Reactors (a) Trickle Bed Reactor (b) Countercurrent Reactor
and (c) Up-flow or Packed Bubble Column Reactor
Fixed bed up-flow reactors, wherein, gaseous and liquid reactants co-currently
flow upwards over a fixed bed of solid catalysts finds its application in wide variety of
industrial processes. This include hydrodesulfurization of petroleum fractions, liquid
phase hydrocracking, hydrogenation of nitro compounds, amination of alcohols,
ethynylation of formaldehyde in butynediol synthesis, waste water treatment etc.3,77 This
type of reactor is mainly used when comparatively small amount of gas has to be
processed with large amount of liquid and when a higher residence time for the liquid
phase is required. The fixed bed up-flow reactor has the advantage of completely wetted
catalysts due to its high liquid holdup. This can provide a better mass transfer and heat
transfer between the liquid phase and the solid catalyst though it has the disadvantage of
enhanced external mass transfer resistance. Various parameters affecting the reactor

performance of trickle bed reactors and fixed bed up-flow reactors and the details of
reactor design will be discussed in later sections.
1.2.4.1 Trickle Bed Reactors
Of the various hydrodynamic, mass and heat transfer parameters that influence the
trickle bed reactor performance, the flow regimes existing and the partial wetting of the
catalysts inside the reactor constitute the special characteristic of the reactor.
1.2.4.1.1 Flow Regimes
The flow pattern in a trickle bed reactor can be identified as four regimes: (i)
trickling flow, (ii) pulsing flow, (iii) spray flow and (iv) bubble flow and has been
diagrammatically represented by Ng and Chu78 as shown in Figure-1.9.
Figure 1.9: The Flow Regimes in a Trickle Bed Reactor
The trickling flow regime is observed at low gas (0.02 to 0.45 m/s) and liquid velocities
(10-4 to 3 x10⁻³ m/s), where the liquid flow down the bed over the catalyst particles in the
form of rivulets and films and the gas phase occupies the remaining space (Figure 1.9.
(a)). Pulsing flow regime occurs at relatively high gas and liquid velocities and is

represented by formation of liquid slugs that have higher liquid content than the
remainder of the bed. In columns of small diameter, the liquid slug and gas pulses pass
down the column (Figure 1.9. (b)). The liquid slugs contain gas bubbles and the gas
pulses contain some amount of liquid in it. There exists an exchange of mass between the
liquid slug and gas pulse. In the case of large columns, multiple slugs are observed
(Figure 1.9. (c)). Spray flow regime is observed at high gas velocities and low liquid
velocities. The liquid phase in this regime is carried down the bed in the form of droplets
by the continuous gas phase (Figure 1.9. (d)). At high liquid velocities and low gas
velocities, the bed is filled with liquid and the gas phase passes down in the form of
elongated bubbles and is called as bubble flow regime (Figure 1.9. (e)).
1.2.4.1.2 Catalyst Wetting Efficiency
Catalyst wetting efficiency is one of the most important parameters in the
designing of trickle bed reactors, since it represents the extent of utilization of the catalyst
particles. Wetting efficiency of catalyst particles can be of two types; (i) internal wetting
efficiency and (ii) external wetting efficiency
1.2.4.1.2.1 Internal Wetting Efficiency
This is the measure of the amount of internal area of the catalyst available for the
liquid reactants. Colombo et al.79 measured the internally wetted area of the catalyst
particles and concluded that even at lower liquid velocities like 5.0 x10⁻⁴ m/s, the catalyst
are internally wetted by the capillary forces. But this won’t be the case for reactors with
poor liquid distributor, where channeling and liquid maldistribution can lead to lower
internal wetting.
1.2.4.1.2.2 External Wetting Efficiency
This is the area of the catalysts wetted externally by the liquid. The reaction rates
under conditions of partially wetted catalysts can be higher or lower than under
conditions of full catalyst wetting depending on whether the gas phase or the liquid phase
components are rate limiting. Under conditions of gaseous phase limitations, the partial
wetting of the catalysts results in enhancement in reaction rates, by the direct mass
transfer from the gaseous phase to the solid catalyst, thereby eliminating the external

mass transfer resistances. If the reaction is limited by liquid phase and the liquid phase is
non-volatile, then decrease in liquid-solid contacting will reduce the surface area for
liquid-solid mass transfer and thus reduce the reaction rates. But, if the liquid reactants
are volatile and significant heat effects are also present, then a gas phase reaction can
occur in the dry catalyst part triggering up the reaction rates. Many correlations exist in
literature for the determination of wetting efficiency of the catalyst and have been
reviewed by Satterfield,70 Shah Y.T.,71 Herskowitz and Smith,80 Ramachandran and
Chaudhari,3 Gianetto and Specchia,81 Saroha and Nigam73 and Al-Dahhan et al.72 Recent
studies are focused on incorporating the effect of pressure on the catalyst wetting
efficiency. Al-Dahhan and Dudukovic82 investigated the effect of pressure on the wetting
characteristics and developed a semi-empirical model, incorporating the effect of reactor
pressure and gas velocity and can be given as:
91
],)/)/(1
[31
)'(Re104.1LGa
gLZPLwf
ρ∆+= (1. 6)
It was found that for a constant liquid velocity, higher pressure and higher gas flow rates
improves the wetting efficiency. This is due to the improved spreading of the liquid hold
up over the external packing area as a result of the increase in the shear stress on the gas-
liquid interface by means of higher pressure or gas velocity.
Other important parameters which influence the reactor performance include,
pressure drop, liquid holdup, gas-liquid mass transfer coefficient, liquid-solid mass
transfer coefficient and the heat transfer parameters such as effective thermal
conductivity and bed to wall heat transfer coefficient. Various correlations exist in the
literature for calculating all these parameters and have been reviewed from time to time
in various monographs like Satterfield,70 Hofman,119 Shah Y.T.,71 Herskowitz and
Smith,80 Ramachandran and Chaudhari,3 Gianetto and Specchia,81 Saroha and Nigam73
and Al-Dahhan et al.72 Recently, Lamine et al.83 have published a detailed investigation
on the heat transfer properties of both up-flow and down-flow mode of operations.
1.2.4.1.3 Modelling of Fixed Bed Reactors
For the purpose of modelling of continuous reactors, in addition to chemical
reaction and transport effects, the variation of the reactant / product concentration along

the length of the reactor and the degree of mixing of the two phases have to be
considered. Also, additional complexities can exist in trickle beds due to incomplete
wetting of catalyst particles. In this section, modelling of continuous reactors has been
presented assuming complete wetting of catalyst particles and uniform distribution of the
catalyst.
For a psuedo-first order reaction, when one of the reactant concentrations is in
excess and while the rate is first order with respect to the limiting reactant (A) and for
constant gas phase concentration, the following equation represents the mass balance for
A.3
a = )a - a( = )a - (1 + dzda - )
dz
ad(P
1scrslgslgl
l
2
l2
e
ηααα (1. 7)
The characteristic dimensionless parameters are given in Table 1.4.
Table 1.4: Dimensionless Parameters Used in Continuous Reactor Models
Parameter
Notation
Definition Gas to liquid mass transfer coefficient
αgl
klaBL / ul
Liquid to solid mass transfer coefficient
αls
ksapL / ul
Reaction rate constant for an m-nth order reaction following power law
αr
wkmn(A*)m-1(Bli)
n L / ul
Dimensionless concentration
al
Αl / A*
Back mixing of the phase
Pe
Ul L/Del
As Pe tends to infinity, the model reduces to a case of plug flow of liquid phase. The
above equation then reduces to,
αβα glllsgll = a) + ( +
dzda (1. 8)
with the boundary conditions given as,
at, z = 0 al = ali
The solution of equation for the plug flow model can be given as,

) +
- a()z] + [-( + ) + (
= alsgl
gllilsgl
lsgl
gll βα
αβαβα
αexp (1. 9)
Where αηα
ααηβ
rcls
lsrcls +
= (1. 10)
The case when Pe tends to zero represents the situation where the liquid phase is
completely back mixed. Here, the liquid concentration is uniform throughout the reactor
and may be assumed to be constant and equal to the outlet concentration, Alf. The mass
balance for species A for the liquid phase can now be written as,
AkWV = )A - A(akV = )A - A(akV + )A - A(Q s1cRslfpsRlf*
BlRlflilη (1. 11)
Eliminating As from the above equation and solving the resultant equation for Alf and
non-dimensionlising, we obtain the back mixed model.
Theoretical analysis for the constant gas phase concentration with the limiting
reactant in the liquid phase and varying gas phase concentration with limiting reactant in
gas phase as well as for the liquid phase have been addressed in detail by Ramachandran
and Chaudhari.3 These authors have developed equations for the calculation of the reactor
efficiency for plug flow as well as back mixed case for co-current as well as counter
current operation in continuous reactors. A review of previous work on trickle bed reactor
modeling is presented in Chapter 3, Section 3.0.
1.2.4.1.3.1 Reactor Performance and Model Evaluation Studies in TBR
Many of the industrially important reactions involve complex reaction network
and may also be highly exothermic. Hence, detailed investigation of such complex multi
step reactions and other reactor parameters which influence reactor performance for such
reactions are looked forward. Most of the trickle bed reactor performance studies
reported in literature are under isothermal conditions and involve simple reaction
schemes. Investigation of TBR performance along with model validation for important
complex multi step reactions is scarce in literature.84,85,86,87 Recent investigations into
performance studies and model validation are presented in the Table 1.5. Most of the
studies were carried out under isothermal conditions and have considered pseudo-
homogeneous model or heterogeneous models with plug flow of both gas and liquid
phases. In most of the trickle bed reactor studies carried out at low liquid velocities,

partial wetting of the catalyst was observed resulting in enhanced rates by the direct
transfer of gaseous limiting reactant from the gas phase to the internally wet catalyst
particles.86,88 It was observed generally that under conditions of gas phase reactant
limitation, the rates decreased with increase in liquid velocity due to higher catalyst
wetting at higher liquid velocities and hence reduced direct gas-solid mass transfer.
Under conditions of liquid phase reactant limitation, the rates were found to decrease
with lower wetting due to decrease in effective liquid-solid contacting. Al-Dahhan and
Dudukovic107 achieved an improvement in the performance of trickle bed reactor
operating under conditions where limiting reactant is in the liquid phase by the use of
fines. The addition of fines improved the liquid-solid contacting efficiency and a
corresponding increase in the rate was observed. Rajasekharam et al.89 investigated the
importance of static liquid holdup in determining the reactor performance and found that
the effect is not predominant. Other reactor models used for predicting the reactor
performance include mixing cell model 90,91 and cross-flow model.3
Some recent studies and observations in trickle bed reactors where performance
studies and model evaluation have been carried out are summarized in the sections below.
Hydrogenation of benzaldehyde to benzyl alcohol was studied in a slurry reactor
using nickel catalysts by Herskowitz92 and the Langmuir – Hinshelwood type of kinetic
model developed was used to predict the performance of a trickle bed reactor for the
above mentioned reaction. A completely wetted catalyst model was developed and all the
mass transfer resistances were considered in the model assuming that hydrogen is the rate
limiting reactant. The study was carried out for a varying range of gas velocity,
temperature and pressure. The effectiveness factor was found to be very low indicating
the presence of strong intraparticle mass transfer resistance. The gas-liquid mass transfer
was found to be important, whereas the liquid-solid mass transfer was found to be
negligible. It was concluded that slurry reactor was a better choice than a trickle bed
reactor for such high rate reactions.


Table 1.5: Investigations of TBR and Fixed Bed Up-Flow Reactor (UFR) Performance Along with Model Validation
S. No. Reaction / Reactor Rate Analysis Model Assumptions Reference
1 H2O2 decomposition / TBR Linear kinetics Isothermal, partial wetting, 2-
region cell model
Sims et al.93
2 Hydrogenation of C4 olefins
/UFR
L-H kinetics Isothermal, plug flow Vergel et al.94
3 Hydrogenation of 3-
hydroxypropanal /TBR
L-H kinetics Isothermal, plug flow, partial
wetting, heat balance
Valerius et al.95
4 Hydrotreating of vacuum
gas oil /TBR
L-H kinetics Isothermal, plug flow, partial
wetting
Korsten and Hoffmann96
6 Hydrogenation of α-methyl
styrene /TBR
L-H kinetics Isothermal, plug flow, partial
wetting, high pressure
Khadilkar et al.88
7 Selective hydrogenation of
1,5,9-cyclododecatriene /
UFR
Linear kinetics Isothermal, axial dispersion,
high pressure/temperature
Stuber et al.97
8 SO2 oxidation /TBR L-H kinetics Isothermal, full wetting Ravindra et al.98
9 SO2 oxidation/ TBR/ UFR L-H kinetics Isothermal, partial wetting,
axial dispersion, static-
dynamic
Iliuta and Iliuta 99

10 Phenol oxidation /TBR L-H kinetics Isothermal, full wetting, plug
flow, high pressure/ temp.
Pintar et al.100
13 Hydrogenation of α-methyl
styrene /TBR
Linear kinetics Isothermal, plug flow, partial
wetting
Castellari et al.101
14 Hydrogenation of
acetophenone /TBR
L-H kinetics Non-isothermal, plug flow, full
wetting, high pressure/temp.
Bergault et al.46
15 Hydrogenation of
unsaturated ketones in
supercritical CO2 /TBR
Power law kinetics Non-isothermal, plug flow, full
wetting
Devetta et al.102
16 Hydrogenation of 3-
hydroxy propanal
L-H kinetics Non-isothermal, deactivation,
partial wetting, plug flow
Zhu and Hofmann103
17 Hydrogenation of 2,4-
dinitrotoluene /TBR
L-H kinetics Non-isothermal, plug flow,
partial wetting, stagnant liquid
Rajasekharam et al.89
18 Hydrogenation of α-
nitromethyl-2-
furanmethanol /TBR
L-H kinetics Isothermal, plug flow, partial
wetting
Jiang et al.104
19 Oxidation of substituted
phenols /TBR
Linear kinetics Isothermal, plug flow Tukac and Hanika105
21 Hydrogenation of maleic
anhydride / UFR
L-H kinetics Isothermal, axial dispersion,
full wetting
Herrmann and Emig106

The impact of partial external wetting and liquid-vapor phase equilibrium on the
catalyst performance was investigated for the hydrogenation of naphthalene over
Pt/Al2O3 catalyst in a trickle bed reactor by Huang and Kang86 using solvents of varying
volatility. When the gas-liquid flow ratio was increased, the wetting efficiency of the
catalyst particles decreased thus enhancing the reaction rates through direct gas-solid
mass transfer. In order to understand the effect of solvent volatility on the reactor
performance, naphthalene was dissolved in various solvents like n-hexadecane, n-
dodecane and n-octane and the effect of gas velocity on the reactor performance under
varying gas velocities were studied and observed that the rate of hydrogenation increased
with increasing hydrogen flow rate. It was proved experimentally as well as theoretically
that the lighter the solvent feed, more the extent of solvent evaporation with increasing
gas flow rate. However it was found that the concentration of hydrogen in the liquid
phase is nearly independent of the gas flow rate.
In an effort to represent the performance of a trickle bed reactor for the
hydrogenation of 3-hydroxypropanal to 1,3-propanediol, Valerius et al.95 considered two
different approximations of the overall catalyst effectiveness factor. (1) the effectiveness
factors of dry, half wetted and totally wetted slabs were weighted as proposed by
Beaudry et al.107 and (2) a new cylinder shell model was used, leading to one-dimensional
mass balance equations inside the porous catalyst particle for all possible values of the
external wetting efficiency on the particle scale. The aim of the investigation was to study
the role of mass transfer and degree of wetting on the trickle bed reactor performance. It
was found that, both the above mentioned parameters affect the reaction rates. For both
the two models, parametric values of fw = 0.6 - 1.0 lead to a higher pressure dependence
and on increasing the liquid velocity a maximum in the reaction rate was observed. A
three-phase reactor model for hydrotreating reactions in a pilot trickle bed reactor was
developed by Korsten and Hoffmann.96 The model based on the two-film theory, was
tested with regard to the hydrodesulfurization of vacuum gas oil in a high pressure pilot
plant reactor under isothermal conditions. The axial dispersion in both phases were found
to be negligible and various mass transfer coefficients, gas solubility and other properties
of the gas as well as the liquid phases were determined using various correlations. The
kinetics of the reaction was represented by a Langmuir-Hinshelwood model and the

intraparticle mass transfer within the catalyst pellets were represented by catalyst
effectiveness factor. The sulfur content of the product oil was found to depend strongly
on the gas/oil flow ratio within the reactor. The poor conversion observed was explained
with regard to the incomplete catalyst wetting properties. The simulation showed good
agreement with the experimental values for a wide range of temperature, pressure, space
velocity and gas/oil ratio.
Castellari et al.101 studied the hydrogenation of α-methyl styrene to cumene over
Pd/Al2O3 in a laboratory trickle bed reactor operated at low liquid velocities. Under these
conditions, the catalyst pellets were incompletely wetted and also vaporization of liquid
phase reactants was observed. The presence of gas-solid catalysis enhanced the reaction
rate significantly. To improve the mass transfer between the phases, the length of inert
post packing section was increased and the inert phase acted as an absorber of cumene
produced in gas-phase. Experimental global rates determined from the liquid cumene
concentrations varied with the post packing length. A one dimensional model taking into
consideration three different zones, first pre-packing inert zone where H2 getting
saturated with α-methyl styrene, catalytic bed and post packing inert section acting as an
absorber of the gas phase cumene produced, was found to agree well with the observed
experimental results.
Liquid phase hydrogenation of acetophenone using Rh/C catalyst was studied by
Bergault et al.46 in trickle bed reactor and slurry airlift reactor and the performance of
these two reactors were compared in terms of productivities and yields. For modeling
trickle bed reactor performance, a non-isothermal plug flow reactor model incorporating
the external and intraparticle mass transfer effects was developed. It was assumed that the
catalyst was fully wetted and the mass and heat transfer correlations were estimated using
various correlations available in the literature. It was concluded that the available
correlations for gas-liquid mass transfer are not satisfactory and catalyst wetting is an
important process that cannot be neglected in the modeling and intraparticle diffusional
effects played an important role in determining the reactor efficiency.
Rajasekharam et al.89 reported the experimental verification for a non-isothermal
trickle bed reactor model for the hydrogenation of 2,4-dinitrotoluene using 5%Pd/Al2O3
catalyst, incorporating the partial wetting of the catalyst as well as the stagnant liquid

hold up. It was assumed that the catalyst can be divided into three zones, where the
catalyst is exposed to dynamic liquid flow, static liquid pockets and exposed to gas phase.
The external mass transfer effects and intraparticle diffusional effects of the gaseous
reactant hydrogen was taken into consideration in the model and a Langmuir-
Hinshelwood type of rate model was used to describe the intrinsic kinetics of the
reaction. The effect of various parameters like liquid velocity, gas velocity, temperature
and catalyst particle size on rate of hydrogenation, conversion and temperature rise inside
the reactor was investigated. It was found that on increasing the liquid velocity, even
though the conversion became low, the global rate of hydrogenation increased. The effect
of gas velocity on the reactor performance was found to be negligible. The sensitivity of
the model to gas-solid mass transfer, gas-liquid mass transfer, liquid-solid mass transfer
and the role of stagnant liquid pockets were also investigated. It was found that the
importance of parameters in the descending order was gas-solid > gas-liquid > liquid-
solid and also concluded that the contribution by stagnant liquid pockets was negligible.
Another detailed study of a complex hydrogenation in a trickle bed reactor is the
manufacture of a herbicide intermediate α-aminomethyl-2-furanmethanol from α-
nitromethyl-2-furanmethanol using Raney nickel catalysts presented in two parts by Jiang
et al.104 and Khadilkar et al.85 The first part deals with the experimental investigation of
the effect of operating parameters on yields and productivity in a trickle bed reactor. It
was found that liquid trickle flow pattern was preferable in getting the desired product,
due to its high ratio of catalyst to liquid volume. For the given catalyst and under a
particular operating pressure, the yield of the desired product improved by decreasing the
feed concentration of substrate and by decreasing the liquid flow rate. Lower
temperatures also lead to improvement in desired product selectivity and diluting the bed
with solid fine particles resulted in a better utilization of the catalyst. In the second part, a
kinetic scheme for the complicated reaction was developed and based on a trickle bed
reactor model and parameter optimization programs, kinetic constants were obtained
using the experimental data obtained.
Enhancing the reactor performance by using various techniques have been of
great research interest in recent years. The periodic operation of liquid in trickle bed
reactor has shown to enhance the reaction rate in the case of a gas limited reaction.108 The

liquid flow on switching off, results in draining of the catalyst bed and thus reducing the
mass transfer resistance offered by the liquid phase and facilitates the direct mass transfer
from the gas phase to solid phase. The effect of such a periodic flow reversal for the
oxidation of SO2 under conditions of gas limitations were studied by Haure et al109 and
found an increase in reaction rate in the range of 30-40%. If the reaction is exothermic,
such a break in liquid flow results in poor heat dissipation resulting in a temperature rise
in bed thus further enhancing the reaction rate.110 By exploiting the exothermicity of the
reaction, Castellari and Haure111 were able to get a drastic increase of about 400% in rate
for hydrogenation for alpha methyl styrene (AMS) over palladium catalyst. Formation of
controlled hotspots and evaporation of liquid phase leading to partial gas phase reaction
were responsible for such a rate enhancement. Al-Dahhan and Dudukovic112 achieved an
improvement in the performance of trickle bed reactor operating under conditions where
limiting reactant is in the liquid phase by the use of fines. The addition of fines improved
the liquid-solid contacting efficiency and a corresponding increase in the rate was
observed.
1.2.4.2 Fixed Bed Reactor with Co-Current Up-Flow
In fixed bed reactors with co-current up-flow of gas and liquid, the existence of
different flow regimes was first indicated by Eisenklam and Ford.113 They distinguished
between two main flow regimes (i) single-phase pore flow at low gas flow rates and (ii)
two-phase pore flow at higher gas flow rates. Turpin and Huntington114 showed the
existence of three distinct flow regimes (i) spray flow (ii) bubble flow and (iii) slug flow.
The spray flow regime occurs at low liquid to gas flow rates and represents the condition
where gas is the continuous phase and liquid is the dispersed phase. The bubble flow is
characterized by the continuous flow of gas bubbles through the liquid and slug flow is
characterized by alternate portions of more dense and less dense phases passing through
the column which occurs generally for gas velocities higher than 7-10 x10-2 m/s.
Specchia et al.115 also identified these flow regimes. Fukushima and Kusaka116 suggested
more flow regimes for packed bed with co-current up-flow. The main difference between
this and the flow regimes suggested by Turpin and Huntington114 was that the transition
regimes were also identified. Iliuta and Thyrion117 studied the flow regime transition for

up-flow reactors and suggested that the transition between the bubble and pulse flow
regimes is unclear. The flow regime transition they observed and that superimposed on
the flow regime diagram suggested by Turpin and Huntington114 is shown in Figure 1.12.
Figure 1.12: Flow Regimes in Fixed Bed Up-Flow Reactor (Iliuta and Thyrion117)
The wetting efficiency of the catalysts in an up-flow reactor is assumed to be one.
There are also reports where wetting efficiency of the catalyst was assumed less than
one.118 In such cases it was assumed that some part of the gas, which passes through the
reactor, comes into direct contact with the catalyst particles and direct transfer of mass
from the gas phase to the catalyst particle takes place. Various correlations exist in the
literature for calculating other important parameters which influences the reactor
performance and they include, pressure drop, liquid holdup, gas-liquid mass transfer
coefficient, liquid-solid mass transfer coefficient and the heat transfer parameters which
had been reviewed by Hofmann,119 Shah Y.T.71 and Ramachandran and Chaudhari.3
Unlike trickle bed reactors detailed review on fixed bed up-flow reactors, covering the
hydrodynamic, mass and heat transfer parameters is missing in the recent literature.
1.2.4.2.1 Up-Flow Reactor Studies and Model Evaluation
Reactor performance studies in fixed bed up-flow reactors are less compared to
that of trickle bed reactor studies. Some of the studies carried out are enlisted in Table

1.6. The fixed bed up-flow reactor has the advantage of completely wetted catalysts due
to its high liquid holdup. But it has the disadvantage of enhanced external mass transfer
resistance. Al-Dahhan and Dudukovic112 and Wu et al.133 has shown that under conditions
of liquid phase reactant limitation up-flow reactor outperform trickle bed reactor due to
it’s efficient liquid-solid contact. This higher liquid holdup and liquid-solid effective
contact also results in a better heat dissipation in case of exothermic reactions and can be
advantageous in reactions where temperature dependence of selectivity is sensitive.
For better catalyst life and cycle efficiency, up-flow reactor can be used in view
of effective temperature control due to it’s better heat transfer properties as shown by
Ragaini and Tine120 for the hydrogenation of diolefin compounds in pyrolysis gasoline.
Mochizuki and Matsui121 studied the selective hydrogenation of phenyl acetylene and
styrene in an up-flow reactor using supported palladium catalyst and also investigated the
various parametric effects like substrate concentration, temperature and pressure on the
reactor performance. It was found that hydrogen was rate controlling in most cases and
diffusional effects of phenyl acetylene was also important at it’s lower concentrations.
Herrmann and Emig106 investigated the liquid phase hydrogenation of maleic anhydride
using various copper based catalysts and a three-phase reactor model was developed to
explain the influence of temperature, pressure, liquid feed rate, size of catalyst pellets and
inlet feed concentrations on the reactor performance. Stuber et al97 studied the partial
hydrogenation of 1,5,9-cyclododecatriene in a fixed bed up-flow reactor and found that
by increasing the gas flow rate, increased g-l mass transfer and also efficient heat transfer
was possible. Higher reactor length was simulated by splitting up the process in two steps
resulting in the significant improvement in selectivity. Van Gelder et al.122,123 described a
reactor model for the hydrogenation of 2,4,6- trinitrotoluene in an up-flow reactor in the
presence of an evaporating solvent to absorb the heat of reaction. It was shown that a
model incorporating dispersion of gas phase represents the experimental data better
compared to a plug flow model.
Design aspects of co-current up-flow reactors were reviewed by Hofmann,119
Ramachandran and Chaudhari3 and Shah.47 The generally used reactor model for fixed
bed up-flow reactor is steady state, isothermal, heterogeneous, one dimensional model
taking into consideration the back mixing of the phases involved. Dynamic models,

which can predict the startup and sudden changes in the reaction parameters on the
performance of the reactors, applied for industrially important reactions are rare. Julcour
et al.124 have investigated the dynamic aspects for the hydrogenation of 1,5,9-
cyclododecatriene using a Pd/Al2O3 catalyst incorporating resistance to heat and mass
transfer at the gas-liquid and liquid-solid interfaces and the model predictions were
compared with the experimental observations under varying gas and liquid velocities.
Visser et al.125 had investigated the influence of forced periodic oscillations of the gas
phase component for the hydrogenation of phenyl acetylene based on a heterogeneous
model considering both the transient mass balance over the reactor length as well as
accumulation inside the catalyst pellets.
1.2.4.3 Comparison of Down-flow and Up-flow Mode of Operation
There are only few comparison studies on performances of up-flow and down-
flow mode of operations applied to industrially important reactions. Goto et al.126,118
studied successively the oxidation of ethanol and the hydration of an olefin at
atmospheric pressure in the down-flow and up-flow modes. They concluded that the
trickle-bed is more efficient at low gas and liquid velocities, because of the partial
catalyst wetting leading to an enhanced transfer of the gaseous reactant. de Wind et al.127
have evaluated the performance of hydrotreating catalysts in up-flow and down-flow
fixed bed reactors. They found that the catalyst utilization was poor in bench sale reactors
compared to commercial reactors, due to the lower mass velocities of liquid in the test
reactors (bench scale). They also found that up-flow operation resulted in a better
utilization of the catalyst, comparable to those in commercial reactors. Larachi et al.128
have measured the liquid saturation in fixed bed reactors operated under higher pressures
in concurrent up-flow and down-flow fixed bed reactors. They found that for up-flow,
the saturation was greater than for the down-flow regardless of the operating pressure.
However, in the pulsing flow regime an asymptotic value was observed for both flows.
For a given mass flow rate, the liquid saturation increased with pressure but decreased
when the liquid viscosity was decreased independently of the direction of flow or
operating pressure. Yang et al.129 have compared the hydrodynamics of up-flow and
down-flow packed bed reactors and concluded that the hydrodynamic characteristics such

as pressure drop, and liquid hold up are similar for both up-flow and down-flow reactors
in the high interaction regime. Vergel130 investigated the selective hydrogenation of
butadiene in a C4 olefinic cut in trickle-bed and up-flow reactors of 5.5 cm diameter. The
author noticed that the selectivity remains stable in the flooded-bed in a wide range of
fluid velocities, but decreases in the trickle-bed at low liquid velocities. This low
selectivity was explained by segregation phenomena inside the down-flow reactor.
Mills et al.131 examined the productivity of packed beds with down-flow, up-flow
and countercurrent flow of gas and liquid for a gas-limited reaction (the hydrogenation of
α-methylstyrene in hexane). They obtained similar conversions for cocurrent down-flow
and countercurrent modes in the low interaction regime, while the cocurrent up-flow
generally yielded lower values. For the same reaction system, Khadilkar et al.88
compared both reactors over a wide range of operating pressures (from 30 to 200 psig).
They related the observed performance to the type of reaction system used (gas-limited or
liquid-limited). When the reaction is gas-limited at low pressure and high liquid feed
concentration, trickle-bed reactor outperforms the up-flow reactor due to ready access of
the gas to the incompletely externally wetted catalyst. At high pressure and low liquid
feed concentration, the reaction becomes liquid-limited and up-flow reactor performs
better. In a recent report, Julcour et al.132 investigated the hydrogenation of 1,5,9–
cyclododecatriene and observed that the rate of hydrogenation was higher for the up-flow
mode compared to down-flow in contrast to earlier reports. This can be due to the bigger
dimension of the reactor used, where in the down-flow mode of operation, the catalyst
may not be completely wetted internally.
In many of the studies in trickle bed reactor it was found that the partial wetting of
the catalyst particle has a decisive role in determining the reactor efficiency. Catalyst bed
dilution using fine particles was suggested by Al-Dahhan and Dudukovic112 to improve
the catalyst wetting efficiency in trickle bed reactor. The effect of fines on the catalyst
wetting efficiency as well as on pressure drop and liquid holdup was investigated using
tracer technique. The catalyst bed dilution using fines was found to give reliable and
reproducible results. Wu et al.133 investigated the performance of up-flow and down-flow
reactors with and with out fines. Hydrogenation of α-methyl styrene to cumene with
2.5%Pd/Al2O3 as the catalyst and n-hexane as the solvent was chosen for this study. It

was shown that trickle bed reactor outperform up-flow reactors under conditions of
catalyst partial wetting and gas phase reactant limitation, due to elimination of external
mass transfer resistances at the no-wetted catalyst portions. Under conditions of liquid
phase reactant limitation, it was found that up-flow reactor gave a better performance
than the trickle bed reactor due to efficient catalyst wetting and hence availability of
limiting reactant is enhanced. Performance of both the reactors at different pressures,
liquid phase reactant feed concentrations and gas flow rates are compared and explained
on the basis of shifting from the gas to liquid limitation. Experiments on dilution of bed
with solid fines in both mode of operation gave identical reactor performances and
showed that hydrodynamics and kinetics can be decoupled by the use of fines.
1.3 Scope and Objectives
It is evident from the literature review presented here that even though extensive
work on theoretical development of reaction rate/reactor performance models has been
carried out, the experimental validation of models were limited to model reaction
systems. Particularly, the focus to analyze multistep, complex multiphase reactions has
been inadequate. Considering the increasing importance of catalysis in complex catalytic
reactions for fine chemicals, pharmaceuticals and specialty products, there is a need to
investigate case studies on catalysis and reaction engineering aspects. Such information
would be immensely valuable for process optimization as well as for designing of
multiphase catalytic reactors. Hydrogenation of aromatic ketones constitutes an important
class of hydrogenation reactions since majority of the products formed find applications
in fine chemical and pharmaceutical industry. These reactions provide interesting
examples of multistep catalytic reactions allowing us to investigate important issues such
as catalyst activity, selectivity, reaction kinetics and reactor performance. Considering the
importance of catalysis and reaction engineering studies in hydrogenation reactions with
complex reaction pathway, the following specific problems were chosen for the present
work

§ Kinetics and modelling of semi-batch slurry and basket reactors under isothermal
and non-isothermal conditions for hydrogenation of acetophenone using
supported Ru catalysts.
§ Reaction kinetics and modelling of a semi batch slurry reactor for hydrogenation
of p-isobutyl acetophenone using a Ru/Al2O3catalyst.
§ Experimental and theoretical investigations on performance of a trickle bed
reactor for the hydrogenation of acetophenone using supported Ru catalysts
§ Experimental and theoretical investigations on performance of a fixed bed three-
phase reactor with co-current up-flow of gas and liquid phases for the
hydrogenation of acetophenone and its comparison with trickle bed reactor
performance.
§ Activity and selectivity studies using supported ruthenium catalysts for
hydrogenation of acetophenone.
Notations A* saturation solubility of gas A, kmol/m3
Bli concentration of component B at t=0, kmol/m3
Cpg specific heat capacity of gas, kJ/kg.K
Cp specific heat capacity of catalyst pellet, kJ/kg.K
Cpl specific heat capacity of liquid, kJ/kg.K
g gravitational acceleration, kg/m2
Ga’L dimensionless liquid Galileo number, 32
323
)1(BL
BLPgd
εµερ
−
∆H heat of reaction, kJ/kmol
kLab gas-liquid mass transfer coefficient, s -1
ks ap liquid-solid mass transfer coefficient, s -1
ki reaction rate constants (m3/kg)(m3/kmol.s)
∆P/Z Pressure drop, Pa, m-1
Re’L Dimensionless liquid Reynolds number, )1(
BL
PLLdU
εµρ−
T temperature, K
Tg temperature of incoming gas, K

Tw temperature of the wall, K UW overall wall heat transfer coefficient, kJ/m2.Sec.K
VL liquid volume, m3
VR reactor volume, m3
w catalyst weight, kg/m3
ρ l density of liquid, kg/m3
ρg density of gas, kg/m3
ρp catalyst pellet density, kg/m3
ηc effectiveness factor of the catalyst
References 1. Kirk Othmer encyclopedia, Section: Catalysis, P. 320, 1993
2. Mills P. L. and Chaudhari R. V., Multiphase catalytic reactor engineering and design for pharmaceuticals
and fine chemicals, Catalysis Today, 37, 367, 1997
3. Ramachandran P. A. and Chaudhari R. V., Three phase catalytic reactors, Gorden breach science
publishers, New York, 1983
4. Doraiswamy L. K. and Sharma M. M., Heterogeneous reactions, vol.2 Wiley, New York, 1984
5. Mills P. L., Ramachandran P. A. and Chaudhari R. V., Rev. Chem. Eng., 8, 1, 1992
6. Mills P. L., Chaudhari R. V., Reaction engineering of emerging oxidation processes, Catalysis Today,
48, 17, 1999
7. Carpenter K. J., Chemical reaction engineering aspects of fine chemicals manufacture, Chemical
Engineering Science, 56, 305, 2001
8. Sheldon R. A., Chem. Ind., 7 December, p. 903, 1992
9. Bodmer M., Mallat T. and Backer A., Enantioselective hydrogenation of trifluroacetophenone over
Pt/Al2O3, Catalysis of organic reactions, edited by Herkes F.E, Marcel Dekker Inc., New York, p.75, 1988
10. Caman S., Bendic C., Hillebrand M., Angelescu E., Parvulescu V. I., Petricle A. and Banciu M.,
Diastereoselective hydrogenation of cyclic β-ketoesters over modified Ru/zeolite catalysts, Marcel Dekker
Inc., New York, p.169, 1988
11. Maryanoff C. A., Mills M. E., Stanzione R. C. and Hortenstine Jr. J. T., Catalysis from the perspective
of an organic chemist; commom problems and possible solution, Catalysis of organic reactions, edited by
Rylander P.N., Greenfield H. and Augustine R.L., Marcel Dekker Inc., New York, p.359, 1988
12. Hiskey R. G. and Northrop R. C., J. Am. Chem. Soc., 83, 4798, 1961
13. Linstead R. R. and Levine P., The stereochemistry of catalytic hydrogenation VII, The complete
hydrogenation of Phenanthraquinone, J. Am. Chem. Soc., 64, 2022, 1942
14. Kumbar P. S. and Rajadhyaksha R. A., Liquid phase catalytic hydrogenation of benzophenone: Role of
metal support interaction, bimetallic catalysts, solvents and additives, Stud. Surf. Sci. Cat., 78, 251, 1993

15. Freifelder M., Hydrogenation in the pyridine series I. Catalytic hydrogenation of the isomeric
acetylpyridines, J. Org. Chem., 295, 2895, 1964
16. Wilt J. W. and Schneider C. A., Ring size effects in the neophyl rearrangement II the decarbonylation
of (1-methylindanyl) acetaldehyde, J. Org. Chem., 26, 4196, 1961
17. Linstead R. P. and Thomas S. L. S, Dehydrogenation part II. The elimination and migration of methyl
groups from a quarternary carbon atoms during catalytic dehydrogenation, J. Chem. Soc., p.1127, 1940
18. Murphy J. G., Synthesis of aminohydrophenanthrene analogs of morphine, J. Org. Chem., 26, 3104,
1961
19. Huisgen R. and Rauenbusch E., Ann. Chem., 51, 641, 1961
20. Elango V., Method for producing ibuprofen, Eur Pat., 400,892, (Cl.C07c57/30), CA :114: 206780, to
Hoest Celanese and boots 1990
21. Serebryakov B. R., Smirnova N. A., Edigarova E. I. and Adamyan V. L., U.S.S.R. SU 1011625 A1 15
Apr 1983
22. Wismeijer A. A., Kieboom A. P. G. and van Bekkum H., Improved selectivity in carbon-oxygen double
bond hydrogenation with Ru/TiO2, React. Kinet. Catal. Lett., 29(2), 311, 1985
23. Otte W. and Nehring R., Preparation of cyclohexyl compounds, DE 3537228 A1 23 Apr 1987
24. Yasuhiko T. and Seiji I., JP 01272540, 1989
25. Zakumbaeva G. D., Beketaeva L. A., Aitmagambetova S. Z., and Vozdvizhenskii V. F., Zh. Prikl.
Khim., 62(8), 1809, 1989
26. Masson J., Cividino P., Bonnier J.M. and Fouilloux P., Selective hydrogenation of acetophenone on
unpromoted Raney Ni: Influence of reaction conditions, Heterogeneous Catalysis and Fine Chemicals II,
Stud. Surf. Sci. Catal., 245, 1991
27. Masson J., Vidal S., Cividino P., Fouilloux P. and Court J., Selective hydrogenation of acetophenone on
chromium promoted Raney nickel catalysts. II. Catalytic properties in the hydrogenation of acetophenone,
determination of the reactivity ratios as selectivity criteria, Appl. Cata. A: General, 99, 147, 1993
28. Kluson P., Cerveny L. and Had J., Preparation and properties of ruthenium supported catalysts, Cat.
Lett., 23, 299, 1994
29. Rocchini E., Spogliarich R. and Graziani M., Catalytic hydrogenation of aromatic ketones in the
presence of cyclodextrines, J. Mol. Cat., 91, L313 -L318, 1994
30. Masaya I., Masaru I. and Takao H., JP 08198788, 1996
31. Masaya I., Takao H. and Noriaki O. and Masaru I., JP 09249599, 1996
32. Masaya I. and Takao H., JP 09077711, 1997
33. Bergault I., Fouilloux P., Joly-Vuillemin C. and Delmas H., Kinetics and Intraparticle Diffusion
Modelling of a complex Multistep Reaction: Hydrogenation of Acetophenone over a Rhodium Catalyst J.
Cat., 175, 328, 1998
34. Itoi Y., Hydrogenation of aromatic carbonyl compounds and catalysts for it, JP 2000103753 A2 11 Apr
2000

35. Tadashi Y., Yukituro Y. and Sangi Y., A process for preparation of 1-(1-hydroxy ethyl) alkyl
cyclohexanes by catalytic hydrogenation of alkyl acetophenones, Jpn. Kokai Tokkyo Koho JP 62,185,032,
108: 167018, to Takiho Pharmaceutical company, 1987
36. Yoshiyaki H., Hydrogenation of aromatic ketones with Raney Ni- amine catalyst, Jpn. Jpn.Kokai
Tokkyo Koho JP. 63630432,(Cl.C07C33/20), CA : 110 : 7852 , to Daicel Chemical Ind. Ltd., 1988
37. Elango V., Method for producing ibuprofen, Eur Pat., 400,892, (Cl.C07c57/30), CA :114: 206780, to
Hoest Celanese and boots, 1990
38. Ryan D. A., Method for producing 1-(4-isobutyl phenyl) ethanol, Eur. Pat. 358,420, (Cl.c07c33/20),
CA : 113 : 77897, to Hoest Celanese and Boots, 1990
39. Saeki K. and Takashi U., preparation of aromatic carbinols Jpn.Kokai Tokkyo Koho JP. 02,73,027, CA:
113: 58673, to Daicel Chemical Ind. Ltd., 1990.
40. Saeki K. and Shima K., preparation of aromatic carbinols from aromatic ketones,, Jpn.Kokai Tokkyo
Koho JP. 02,62,837,(Cl.C07C33/20), CA : 113 : 58672, to Daicel Chemical Ind.Ltd., 1990
41. Rajasekharam M. V. and Chaudhari R. V., Kinetics of hydrogenation of p-isobutyl acetophenone using
a supported Ni catalyst a slurry reactor, Chem. Eng. Sci., 51(10), 1663, 1996
42. Wismeijer A. A., Kieboom A. P. G and van Bekkum H., Improved selectivity in carbon-oxygen double
bond hydrogenation with Ru/TiO2, React. Kinet. Catal. Lett., 29(2), 311, 1985
43. Kluson P. and Cerveny L., Selective hydrogenation over ruthenium catalysts, Applied catalysis A:
general 128, 13-31, 1995
44. Rajashekharam M. V., Thesis submitted to the university of Pune, India (1997)
45. Rajasekharam M. V., Bergault I., Fouilloux P., Schweich D., Delmas H. and Chaudhari R. V.,
Hydrogenation of acetophenone using 10%Ni supported on zeolites Y catalyst: Kinetics and reaction
mechanism, Catalysis Today, 48, 83, 1999
46. Bergault I., Rajashekharam M. V., Chaudhari R. V., Schweich D. and Delmas H., Modelling of
comparison of acetophenone hydrogenation in trickle-bed and slurry airlift reactors, Chem. Eng. Sci., 52
(21/22), 4033, 1997
47. Shah Y. T., Gas-Liquid-Solid reactor design, McGraw-Hill, New York, 1979
48. Chaudhari R. V. and Ramachandran P. A., Three phase slurry reactors, AIChE J., 26 (2), 177, 1980
49. Chaudhari R. V., Shah Y. T. and Foster N.R., Novel gas-liquid-solid reactors, Catal. Rev. - Sci. Eng.,
28(4), 431, 1986
50. Kenney C. N. and Sedriks W., Effectiveness factors in a three-phase slurry reactor: the reduction of
crotonaldehyde over a palladium catalyst, Chem. Eng. Sci., 27, 2029, 1972
51. Kawakami K. and Kusunoki K., Selectivity in consecutive hydrogenation of chlorobenzene in liquid
phase, Kagaku Kogaku Ronbunshu, 1, 559, 1975
52. Kawakami K. and Kusunoki K., The effects of Intraparticle diffusion on the yield of the liquid phase
hydrogenation of phenylacetylene in a stirred basket reactor, J. Chem. Eng. Japan, 9 (6), 469, 1976

53. Kut O. M., Gut G., Buehlmann T. and Lussy A., Mass transfer with chemical reaction in multiphase
systems, Ed. Alper E., (NATO series), Martinus Nijhoff Publishers, The Hauge, 2, 228, 1983.
54. Chaudhari R. V., Parande M. G., Ramachandran P. A., Brahme P. H., Vadgaonkar H. G. and
Jaganathan R., Hydrogenation of butynediol to cis -butenediol catalyzed by Pd-Zn-CaCO3, Reaction
kinetics and modeling of a batch slurry reactor, AIChE J., 31, 1891, 1985
55. Chaudhari R. V., Jaganathan R., Kohle D. S., Emig G. and Hofmann H., Kinetic modeling of a
complex consecutive reaction in a slurry reactor: Hydrogenation of phenyl acetylene, Chem. Eng. Sci., 41,
3073, 1986
56. Chaudhari R. V., Jaganathan R., Kohle D. S., Emig G. and Hofmann H., Kinetic modeling of
hydrogenation of butynediol using a 0.2%Pd/C catalyst in a slurry reactor, Appl. Catal., 29, 141, 1987
57. Santacesaria E., Di Serio M., Velotti R. and Leone U., Kinetics, mass transfer and palladium catalyst
deactivation in the hydrogenation step of the hydrogen peroxide synthesis via anthraquinone, Ind. Eng.
Chem. Res., 33, 2349, 1995
58. Holm D. R., Hill Jr. C. G. and Connor A. H., Kinetics of liquid phase hydrogenations of furan amines,
Ind. Eng. Chem. Res., 34, 2349, 1995
59. Toppinen S., Rantakyla T. K., Salmi T. and Aittamaa J., Kinetics of the liquid phase hydrogenation of
benzene and some mono substituted alkylbenzenes over a nickel catalyst, Ind. Eng. Chem. Res., 35, 1824,
1996
60. Benaissa M., Le Roux G. C., Joulia X., Chaudhari R. V. and Delmas H., Kinetic modeling of the
hydrogenation of the hydrogenation of 1,5,9-Cyclododecatriene on Pd/Al2O3 catalyst including
isomerization, Ind. Eng. Chem. Res., 35, 2091, 1996
61. Rajasekharam M.V. and Chaudhari R.V., Hydrogenation of 2,4-dinitrotoloune using a supported Ni
catalyst: Reaction kinetics and semibatch slurry reactor modeling, Ind. Eng. Chem. Res., 38, 906, 1999
62. Rode C. V. and Chaudhari R. V., Hydrogenation of m-nitrochlorobenzene to m-chloroaniline: reaction
kinetics and modelling of a non-isothermal slurry reactor, Ind. Eng. Chem. Res. 33,1645, 1994
63. Rajashekharam M. V., Nikhalje D. D., Jaganathan R. and Chaudhari R. V., Hydrogenation of 2,4-
Dinitrotoluene using a Pd/Al2O3 catalyst in a slurry reactor: A molecular level approach to kinetic
modelling and nonisothermal effects, Ind. Eng. Chem. Res., 35, 1824, 1996
64. Jaganathan R., Ghugikar V. G., Gholap R. V., Chaudhari R. V and Mills P. L., Catalytic hydrogenation
of p-nitrocumene in a slurry reactor, Ind. Eng. Chem. Res., 38, 4634, 1999
65. Ohorodnik A., Sennewald K., Hindeck J. and Statzke P., Apparatus for the continuous carrying out
heterogeneous catalytic reaction in liquid phase, U.S. Patent 3,901,660, 1975
66. Pruden B. B. and Weber M. E., Evaluation of three-phase catalytic reactor, Can. J. Chem. Eng., 48,
162, 1970
67. Blenke H., Adv. Biochem. Eng., 13, 122, 1979
68. Chaudhari R. V. and Shah Y. T., International Reactor Design Conference, Santa Fe, Argentine, August
1983.

69. Leuteritz G. M., Process Eng., 54, 62, 1973
70. Satterfield C. N., Trickle-bed reactors, AIChE J., 21(2), 209, 1975
71. Shah Y. T., Ga s-Liquid-Solid reactor design, McGraw-Hill, New York, 1979
72. Al-Dahhan M. H., Larachi F., Dudukovic M. P. and Laurent A., High-pressure trickle-bed reactors: A
review, Ind. Eng. Chem. Res., 36, 3292, 1997
73. Saroha A. K. and Nigam K. D. P., Trickle bed reactors, Rev. Chem. Eng., 12(3-4), 1996
74. Enright J. T. and Chuang T. T., Deuterium exchange between hydrogen and water in a trickle bed
reactor, Canad. J. Chem. Eng., 56, 246, 1978
75. Seirafi H. A. and Smith J. M., Mass transfer and adsorption in liquid full and trickle beds, AIChE. J.,
26, 711, 1980
76. Meyers R. A., Handbook of petroleum refining processes, 2nd ed., McGraw-Hill, New York, 1996
77. Hofmann H. P., Multiphase catalytic packed bed reactors, Catal. Rev. Sci. Eng., 17(1), 71, 1978
78. Ng K. M. and Chu C. F., Trickle-bed reactors, Chem. Eng. Prog. 55, Nov., 1987
79. Colombo A. J., Baldi G. and Sicardi S., Solid-liquid contacting effectiveness in trickle bed reactors,
Chem. Eng. Sci., 31, 1101, 1976
80. Herskowitz M. and Smith J. M., Trickle bed reactors: A review, AIChE J.,29, 1, 1983
81. Gianetto A. and Specchia V., Trickle-bed reactors: State of art and perspectives, Chem. Eng. Sci., 47,
3197, 1992
82. Al-Dahhan M. H., and Dudukovic M. P., Catalyst wetting Efficiency In trickle-bed Reactors at high
pressure, Chem. Eng. Sci., 50 (15), 2377, 1995
83. Lamine A. S., Gerth L., Le Gall H. and Wild G., Heat transfer in a packed bed reactor with cocurrent
downflow of a gas and a liquid, Chem. Eng. Sci., 51(15), 3813, 1996
84. Rajashekharam M. V., Jaganathan R. and Chaudhari R. V., A trickle-bed reactor model for
hydrogenation of 2,4 dinitrotoluene: experimental verification., Chem. Eng. Sci., 53(4), 787, 1998
85. Khadilkar M. R., Jiang Y., Al-Dahhan M., Dudukovic M. P., Chou S. K., Ahmed G. and Kahney R.,
Investigations of a complex reaction network: I Experiments in a high-pressure trickle bed reactor, AIChE
J., 44 (4), 912, 1998
86. Huang T. and Kang B., Naphthalene hydrogenation over Pt/Al2O3 catalyst in a trickle bed reactor, Ind.
Eng. Chem. Res., 34, 2349, 1995
87. Bergault I., Rajashekharam M. V., Chaudhari R. V., Schweich D. and Delmas H., Modelling of
comparison of acetophenone hydrogenation in trickle-bed and slurry airlift reactors, Chem. Eng. Sci., 52
(21/22), 4033, 1997
88. Khadilkar, M. R., Wu Y. X., Al-Dahhan M. H. and Dudukovic M. P., Comparison of trickle bed and
upflow reactor performance at high pressure: Model prediction and experimental observations, Chem. Eng.
Sci., 51 (10), 2139, 1996
89. Rajashekharam M. V., Jaganathan R. and Chaudhari R. V., A trickle-bed reactor model for
hydrogenation of 2,4 dinitrotoluene: experimental verification. Chem. Eng. Sci., 53(4), 787, 1998

90. Jaganathan R., Gholap R. V., Brahme P. H. and Chaudhari R.V, Performance of a continuous bubble
column slurry reactor for hydrogenation of butynediol.Proceedings of ICREC 2, NCL, India II 141, 1987
91. Barhme P. H., Chaudhari R. V. and Ramachandran P. A., Modelling of hydrogenation of glucose in a
continuous slurry reactor, Ind. Eng. Chem. Proc. Des. Dev., 23, 57, 1984
92. Herskowitz M., Hydrogenation of benzaldehyde to benzyl alcohol in a slurry and fixed-bed reactor,
Stud. Surf. Sci. Catal., 59 (Heterog. Catal. Fine Chem. 2), 105, 1991
93. Sims B. W., Gaskey S. W. and Luss D., Effect of flow regime and liquid velocity on conversion in a
trickle bed reactor, Ind. Eng. Chem. Res., 30, 2530, 1994
94. Vergel C., Euzen J. P., Trambouze P. and Wauquier J. P., Two-phase flow catalytic reactors, influence
of hydrodynamics on selectivity, Chem. Eng. Sci., 50, 3303, 1995
95. Valerius G., Zhu X., Hofmann H., Arntz D. and Haas T., Modelling of a trickle-bed reactor II. The
hydrogenation of 3-hydroxypropanal to 1,3-propanediol, Chem. Eng. Proc., 35, 11, 1996
96. Korsten H. and Hoffmann U., Three phase reactor model for hydrotreating in pilot plant trickle-bed
reactors, AIChE J., 42(5), 1350, 1996
97. Stuber F., Benaissa M. and Delmas H., Partial hydrogenation of 1,5,9-cyclododecatriene in three phase
catalytic reactors, Catalysis Today, 24, 95, 1995
98. Ravindra P. V., Rao D. P. and Rao M. S., A model for the oxidation of sulfur dioxide in a trickle bed
reactor, Ind. Eng. Chem. Res., 36, 5125, 1997
99. Iliuta I. and Iliuta M. C., Comparison of two-phase upflow and downflow fixed bed reactors
performance: Catalytic SO2 oxidation, Chem. Eng. Technol., 20, 455, 1997
100. Pintar A., Bercic G. and Levec J., Catalytic liquid-phase oxidation of aqueous phenol solutions in a
trickle bed reactor, Chem. Eng. Sci., 52, 4143, 1997
101. Castellari A. T., Cechini J. O., Gabarian L. J., and Haure P. M., Gas-phase reaction in a trickle-bed
reactor operated al low liquid flow rates, AIChE J., 43(7), 1813, 1997
102. Devetta L., Canu P., Bertucco A., and Steiner K., Modeling of a trickle-bed reactor for a catalytic
hydrogenation in supercritical CO2, Chem. Eng. Sci., 52(21/22), 4163, 1997
103. Zhu X. D. and Hofman H, Hydrogenation of 3-hydroxy -propanal in trickle beds- experimental and
modeling, Chem. Eng. Technol., 20, 131, 1997
104. Jiang Y., Khadilkar M. R., Al-Dahhan M. H., Dudukovic M. P., Chou S. K., Ahmed G. and Kahney
R., Investigations of a complex reaction network: II Kinetics, mechanism and parameter estimation, AIChE
J., 44(4), 921, 1998
105. Tukac V. and Hanika J., Catalytic wet oxidation of substituted phenols in the trickle bed reactor,
Chem. Eng. Technol., 21, 262, 1998
106. Herrmann U. and Emig G., Liquid phase hydrogenation of maleic anhydride to 1-4, butanediol in a
packed bubble column reactor, Ind. Eng. Chem. Res., 37, 759, 1998

107. Beaudry E. G., Dudukovic M. P. and Mills P. L., Trickle-bed reactors: liquid diffusional effects in a
gas-limited reaction, AIChE J., 33, 1435, 1987
108. Silveston P., Hudgins R. R. and Renken A., Periodic operation of catalytic reactors – introduction and
overview, Catalysis Today, 25, 91, 1995
109. Haure P. M., Hudgins R. R., Silveston P., Periodic operation of a trickle bed reactor, AIChE J., 35(9),
1437, 1989
110. Gabarain L., Cechini J. and Haure P., Effect of variables on the Periodic Operation of a Trickle Bed
Reactor, Dynamics of Surfaces and Reaction Kinetics in Heterogeneous Catalysis, Edited by Froment G.F.
and Waugh K.C., Elsevier Science, 1997
111. Castellari A. T., and Haure P. M., Experimental study of the periodic operation of a trickle bed
reactor, AIChE J., 41(6), 1995
112. Al-Dahhan M. H. and Dudukovic M. P., Catalyst Bed Dilution for improving catalyst wetting in
laboratory trickle bed reactors, AIChE J., 42(9), 2595, 1996
113. Eisenklam P. and Ford L. H., Flow regimes in fixed bed reactors with cocurrent upflow, Proceedings
of symposium on the interaction of fluids and solids, Instn. Chem. Engrs., 333, 1962
114. Turpin J. L., and Huntington, R. L. Prediction of pressure drop for two phase, two component
cocurrent flow in packed beds, AIChE J. 13, 1196, 1967
115. Specchia V., Sicardi S. and Gianetto A., Absorption in packed towers with cocurrent flow, AIChE J.,
20, 646, 1974
116. Fukushima S. and Kusaka K., Gas-liquid mass transfer and hydrodynamic flow region in packed
columns with cocurrent upward flow, J. Chem. Eng. Japan, 12(4), 296, 1979
117. Iliuta I. and Thyrion F. C., Flow regimes, liquid holdups and two-phase pressure drop for two-phase
cocurrent downflow and upflow through packed beds: air/Newtonian and non-Newtonian liquid systems,
Chem. Eng. Sci., 52 (21/22), 4045, 1997
118. Goto S., Chatani T. and Matouq M. H., Hydration of 2-methyl-2-butene in gas-liquid cocurrent upflow
and downflow reactors, Can. J. Chem. Eng., 71, 821, 1993
119. Hofmann H. P., Multiphase catalytic packed bed reactors, Catal. Rev. Sci. Eng., 17(1), 71, 1978
120. Ragaini V. and Tine C., Upflow reactor for the selective hydrogenation of pyrolysis gasoline:
Comparative study with respect to down flow, Appl. Catal., 10, 43, 1984
121. Mochizuki S. and Matsui T., Selective hydrogenation and mass transfer in a fixed bed catalytic reactor
with gas-liquid concurrent upflow, AIChE J., 22(.5), 904, 1976
122. Van Gelder, K. B., Damhof J. K., Krouenga P. J. and Westertrep K. R., Three phase packed bed
reactor with an evaporating solvent I: Experimental: The hydrogenation of 2,4,6 - trinitrotoluene in
methanol, Chem. Eng. Sci., 45, 3159, 1990
123. Van Gelder, K. B., Borman P. C., Weenink R. E., and Westertrep K. R., Three phase packed bed
reactor with an evaporating solvent II: Modelling the reactor, Chem. Eng. Sci., 45, 3171, 1990

124. Julcour C., Stuber F., Le Lann J. M., Wilhelm A. M. and Delmas H., Dynamics of a three-phase
upflow fixed-bed catalytic reactor, Chem. Eng. Sci., 54, 2391, 1999
125. Visser J. B. M., Stankiewicz A., van Dierendonck L. L., Manna L., Sicardi S. and Baldi G., Dynamic
operation of a three-phase upflow reactor for the hydrogenation of phenyl acetylene, Catalysis Today 20,
485, 1994
126. Goto S. and Mabuchi K., Oxidation of ethanol in gas-liquid cocurrent upflow and downflow reactors,
Can. J. Chem. Eng., 62, 865, 1984
127. de Wind et al. Upflow versus downflow testing of hydrotreating catalysts. Applied Catalysis. 43, 239,
1988
128. Larachi F., Laurent A., Wild G. and Midoux N., Some experimental liquid saturation results in fixed
bed reactors operated under elevated pressure in cocurrent upflow and downflow of the gas and the liquid,
Ind. Eng. Chem. Res., 30, 2404, 1991
129. Yang X. L., Wild G. and Euzen J. P., A comparison of hydrodynamics between packed-bed reactors
with cocurrent upflow and downflow of gas and liquid, Chem. Eng. Sci., 47, 1323, 1992
130. Vergel H., Les reacteurs a lit fixe avec ecoulement de gaz et de liquide. Comparaison sur le plan
theorique et experimental de la performance du reacteur dans differents sens d’ecoulement. These de
Doctorat de l’INP Lorraine, 1993
131. Mills, P. L., Beaudry, E. G. and Dudukovic, M. P., Comparison and prediction of reactor performance
for packed beds with two-phase flow : downflow, upflow and countercurrent flow. I. Chem. E. Symp. Ser.,
87, 527, 1984
132. Julcour C., Jaganathan R., Chaudhari R. V., Wilhelm A. M. and Delmas H., Selective Hydrogenation
of 1,5,9-cyclododecatrien in up flow and down flow fixed bed reactors, experimental observations and
modeling, Chem. Eng. Sci., 56, 557, 2001
133. Wu Y., Khadilkar M. R., Al-Dahhan M. H. and Dudukovic M. P., Comparison of upflow and
downflow two-phase flow packed bed reactors with and without fines: Experimental observations, Ind.
Eng. Chem. Res. 35, 397, 1996

Chapter 2
Part – A
Hydrogenation of Acetophenone Using Supported
Ruthenium Catalyst: Kinetics, Intraparticle
Diffusion and Non-Isothermal Effects
2 (A). 0 Introduction
Multiphase reactions when carried out in a slurry reactor have many advantages
over the fixed bed reactors, due to its high efficiency for mass and heat transfer. Three-
phase catalytic hydrogenation of organic compounds is widely used in several industrial
processes and hydrogenation of acetophenone (ACPH) using supported metal catalysts is
an example of such a reaction, since one of the products, 1-phenylethanol (PHET) is
important in perfumery and pharmaceutical industry and another product 1-
cyclohexylethanol (CHET) is used in the manufacture of polyvinylcyclohexane, a high
temperature resistant polymer. Two types of catalysts are known for hydrogenation of
acetophenone. (a) Catalysts for selective hydrogenation of the carbonyl group to PHET
and (b) catalysts, which hydrogenate the ring as well as the carbonyl group to give
CHET. The catalysts commonly used for the hydrogenation of ACPH to PHET are Raney
Ni,1 Raney Ni-Co catalysts,2 Raney Ni-Cr catalysts,3 supported Pd catalysts,4,5 Co based
catalysts, bimetallic Cu-Cr catalysts6,7 and tri-metallic Cu-Cr-Ba catalysts.8,9 The other
type of catalysts used for the production of CHET include, supported Ru, Rh and Pt.10,11,5
The details of earlier studies on hydrogenation of acetophenone have been given in
Chapter 1. Even though many reports are published on the selective synthesis of 1-
phenylethanol, literature on selective formation of 1-cyclohexylethanol is limited. The
literature on selective synthesis of 1-cyclohexylethanol reveals that the catalysts used are
mainly rhodium-based catalysts. Ruthenium is also known for such reactions, but needs
further investigation as it has a potential in developing a more economical process due to
its lower cost.
When catalyst particles of very small size are used, under conditions of negligible
external mass transfer, the multiphase reactions are kinetically controlled and complete
utilisation of catalyst is possible. The intrinsic kinetics thus obtained can be useful in
explaining the apparent kinetics observed when catalyst particles of bigger size are used,
as in the case of a basket type reactor. Modelling of intraparticle diffusional effects for
multi-component system is a difficult task due to complexities in solving the model
equations for simultaneous diffusion with reactions. Usually under conditions of higher
liquid phase substrate concentration, the diffusional effects of the liquid substrate can be
neglected with only the dissolved gas as a limiting reactant. But when the concentration

of liquid phase components is lower and comparable with the gas phase component
solubility, the diffusional effects of liquid phase substrate and intermediates in the
catalyst pellet becomes important and need to be considered to account for intraparticle
diffusional effects. The problem is even more complex if the reaction involves
considerable exothermicity and carried out under non-isothermal conditions. The
temperature rise can alter the solubility, the effective diffusivity of different components
and also the rate parameters. In most cases, for the analysis of non-isothermal catalytic
liquid phase reactions, it is assumed that no temperature gradient exists within the
catalyst pellets. Even though this is true in the case of reactions with mild exothermicity,
for reactions with high exothermicity, analysis of intraparticle temperature gradient
should be accounted for. Analysis of intraparticle diffusion effects for complex reactions
are rare in literature. Kawakami and Kusunoki12 studied the hydrogenation of
phenylacetylene using 0.5%Pt/Al2O3 catalyst and found that with catalyst pellets of larger
size, the reaction rates and yield were significantly influenced by diffusional effects. The
liquid-phase hydrogenation kinetics of benzene and three mono substituted
alkylbenzenes, toluene, ethylbenzene, and cumene, was studied by Toppinen et al.13 in a
semi-batch slurry reactor and the analysis of the data with a reaction-diffusion model
revealed that the kinetics was influenced by pore diffusion. Bergault et al.14 studied the
effect of intraparticle diffusion for hydrogenation of acetophenone using 3%Rh/C catalyst
with cyclohexane as the solvent. Julcour et al.15 investigated dynamic and pseudo-steady
state diffusion-reaction models for the three-phase consecutive hydrogenation of 1,5,9-
cyclododecatriene using Pd/Al2O3 catalyst in order to examine the time evolution of
concentration profiles inside the catalyst pellet. It was concluded that the diffusion of
organic species could control the reaction rate only for lower concentrations of organic
species and higher pressures of hydrogen.
Even though the kinetics of hydrogenation of acetophenone have been studied
using Raney Ni-Cr catalyst and supported Ni and Rh catalysts, detailed analysis of
mechanistic models and reaction engineering aspects of hydrogenation of acetophenone
using supported ruthenium catalyst have not been reported. In this chapter, a detailed
study on intrinsic kinetics of hydrogenation of acetophenone using 2%Ru on alumina
catalyst with methanol as a solvent has been presented. A semi-batch slurry reactor model

was developed to predict the experimentally observed concentration - time profiles. The
activation energies and heat of adsorption were evaluated from the temperature
dependencies of rate parameters. A basket type reactor model was derived for the above
system incorporating diffusional effects of gaseous as well as liquid phase components
and the resulting set of non-linear partial differential equations were solved by orthogonal
collocation method. A theoretical analysis is also extended to study the dynamic
behaviour of the concentration profiles inside the pellet. The concentration-time profiles
of bulk liquid phase components were simulated and compared with the experimentally
observed values. Non-isothermal effects were studied for slurry and basket type reactors
with n-decane as the solvent and the temperature-time profile in the bulk was compared
with the experimental values.
2 (A). 1 Experimental
2 (A). 1.1 Reactor Set-up All the hydrogenation experiments were carried out in a 3 x 10⁻⁴ m3 capacity stirred
autoclave reactor made of SS 316 and supplied by Parr Instrument Co., USA, with provision
for operation up to 523 K and 10 MPa pressure (Figure 2.1).
PR
PRStrip Chart Recorder
Reservoir
PI
TIg T Ig
CPR
12
3
45 6
7
PI
TI
TR2 PR2 TRg PR1 TR1
Control Panel
(1) Reactor, (2) Stirrer shaft, (3) Impeller, (4) cooling water, (5) sampling Valve, (6) Magneticstirrer, (7) Furnace, TI : Thermocouple, PI : Pressure Transducer, CPR : Constant PressureRegulator, PR : Pressure Regulator, TRI : Reactor Temperature Indicator, TRG : GasTemperature Indicator, PRI : Reactor Pressure Indicator, PR2 : Resorvoir Pressure Indicator,TR2 : Reservoir Temperature Indicator
H2
N2
Figure 2.1: Schematic of the Reactor Setup

It was equipped with facilities such as automatic temperature control, gas inlet/outlet,
sampling of the liquid contents, variable agitation speed, safety rupture disc and pressure
transducer. A storage reservoir for H2 gas was used along with a constant pressure regulator
to determine H2 consumption as a function of time, while maintaining the reactor at a
constant desired pressure.
2 (A). 1.2 Catalyst Preparation
The catalyst, 2%Ru/Al2O3 was prepared in our own laboratory by precipitation
technique. Required amount of support (alumina) was charged in water and the slurry was
stirred for 2 hrs in a round bottom flask fitted with half moon stirrer, condenser and an
addition funnel on a water bath (temperature ~368 K). Required amount of ruthenium
trichloride dissolved in distilled water was added to the stirred suspension. After stirring
for three hours, aqueous ammonia solution was added drop wise until the solution
became strongly alkaline. The solution was then allowed to stir for 3-4 hrs. The contents
were then filtered, washed using hot distilled water and dried in an oven at 393 K for 8
hrs and then activated in a furnace at 573 K for 7 hrs under hydrogen flow. After
activation, the catalyst was brought to room temperature, flushed with nitrogen and used
for reaction. Catalyst particles of larger size were made by pelletising the powder catalyst
and sieving through standard sieves to get particles in different size ranges.
2 (A). 1.3 Experimental Procedure for Carrying Out Reaction
In a typical experiment, desired amount of acetophenone (Aldrich, U.S.A) was
charged into the reactor along with the catalyst and solvent methanol, to make up a total
volume of 1 x 10⁻⁴ m3. The reactor was flushed using nitrogen, 2-3 times, at room
temperature and the contents were heated to a desired temperature and then pressurised
with hydrogen. The reaction was started by switching the stirrer on. The hydrogen
consumption was monitored from the pressure drop in the hydrogen reservoir vessel as a
function of time. Liquid samples were withdrawn at regular intervals of time and analysed
by gas chromatographic technique using a HP-6890 Gas chromatograph fitted with a HP-
FFAP capillary column (30 m x 0.53 µm x 0.1 mm film thickness on polyethylene glycol

stationary phase). The conditions of GC analysis were: FID temperature: 573 K, column
temperature: 373-458 K (Programmed at 30 K/min), injection temperature: 523 K, carrier
gas: He. A few samples were also analysed and confirmed by a Shimadzu GC-MS QP
2000A.The range of operating conditions for which the kinetic study was carried out is
given in Table 2. 1.
Table 2.1: Range of Operating Conditions
Catalyst loading : 10-40 kg/m3
Agitation speed : 7.5-15 Hz
H2 pressure : 14 - 62 atm
ACPH concentration : 0.8-2.5 kmol/m3
Temperature : 398-423 K
2 (A). 1.4 Experimental Procedure for Solubility Measurement
For interpretation of kinetic data, knowledge of concentration of the gaseous
reactants in the reaction medium (solubility) is essential. The solubility of H2 in
ACPH/methanol mixtures was determined experimentally at 373, 398 and 423 K, using a
method described by Purwanto et al.16 The solubility measurement was conducted in 6.0
x 10-4 m3 capacity stirred autoclave supplied by Parr Instrument Company, USA designed
for 250 atm pressure. The equipment was provided with automatic temperature control
and a pressure recording system. The temperature of the liquid in the reactor was
controlled within ±1 K. A pressure transducer having a precession of ± 0.01 atm was
used to measure the autoclave pressure.
In a typical experiment for the measurement of solubility of H2, a known volume
(300 ml) of liquid mixture was introduced into the autoclave and the contents were heated
to the desired temperature after flushing with nitrogen. After the thermal equilibrium was
attained, the void space in the reactor was pressurised with H2 to the level required. The
contents were then stirred for about ten minutes to equilibrate the liquid phase with the
solute gas. In general, it required, about 2-5 minutes to saturate the liquid phase. The
change in the pressure in the autoclave was recorded on-line as a function of time till it
remained constant, indicating the saturation of the liquid phase.

2 (A). 2 Results and Discussion
2 (A). 2.1 Product Identification and Distribution
The various products formed during the course of hydrogenation reaction include
1-phenylethanol (PHET) and ethylbenzene (ETBE) along with the ring hydrogenated
products such as cyclohexylmethylketone (CHMK), 1-cyclohexylethanol (CHET) and
ethyl cyclohexane (ETCH). Typical concentration-time profile obtained at 398 K is
shown in Figure 2.2. Based on the products identified and characterised by GC and GC-
MS, the reaction scheme shown in Figure 2.3 has been proposed for hydrogenation of
acetophenone using 2% Ru/Al2O3 catalyst. Due to the acidic sites on the catalyst, PHET
also undergoes dehydration to give styrene, which on further hydrogenation gives ethyl
benzene (ETBE), and ethyl cyclohexane (ETCH). The observed concentration of styrene
in the reactor mixture was negligible (< 1.0 %). On further continuation of the
hydrogenation, formation of ETCH from CHET was not observed. Also, the rate of
formation of CHET from CHMK was found to be very slow.
0 20 40 60 80 100 120
0.0
0.2
0.4
0.6
0.8
1.0
ACPH
CHMK
PHET
CHET ETBE
ETCH
Con
cent
rati
on, k
mol
/m3
Time, min
0.0
0.5
1.0
1.5
2.0
2.5
3.0
H2
H2 c
onsu
med
, km
ol
Figure 2.2: Concentration – Time Profile at 398 K
Reaction Conditions: Concentration of ACPH: 0.84 kmol/m3, Catalyst Loading: 10 kg/m3, PH2: 47.6 atm, Solvent: Methanol, Agitation Speed: 15 Hz

O OH
O OH
ACPH PHET ETBE
CHMK CHET ETCH
3H2 3H2
H2
3H2
H2
H2
Figure 2.3: Reaction Scheme for Hydrogenation of Acetophenone Using 2%Ru/Al2O3 ACPH: Acetophenone, PHET: 1-Phenylethanol, ETBE: Ethyl Benzene, CHMK: Cyclohexyl Methylketone, CHET: 1-Cyclohexylethanol, ETCH: Ethyl Cyclohexane
2 (A). 2. 2 Catalyst Recycle
In order to check the deactivation of the catalyst, recycle study was done without
exposing the catalyst to air (Figure 2.4).
Fresh Recycle-1 Recycle-2 Recycle-20.0
0.5
1.0
1.5
2.0
Init
ial r
ate
of r
eact
ion
x104 , k
mol
/m3 /s
Figure 2.4: Initial Rates with Fresh and Recycled Catalysts

For this, first a reaction was carried out for 2 hours and then the reaction mixture was
cooled to room temperature, H2 released and known amount of acetophenone was added
through the dip tube of the reactor and reaction was continued after pressurisation to
original level used in the first reaction. The initial rate of reactions based on ACPH
consumption, for fresh and the recycled reactions were found to be similar (Figure 2.4)
confirming that the catalyst was not getting deactivated during the reaction.
2 (A). 2. 3 Effect of Water
In order to understand the effect of water (a side product formed during the
reaction), reactions were carried out with known amount of water along with
acetophenone, solvent and catalyst at the beginning of reaction. The concentration of
water was varied from 0.1 - 0.25 kmol/m3 and found that the initial rate does not vary
with water concentration showing that water has no influence on the reaction rate, at least
in the concentration range studied.
2 (A). 2. 4 Initial Rate Data and Analysis of Mass Transfer
It is important to investigate whether external and intraparticle mass transfer is rate
limiting under conditions used for kinetic study and this was done based on overall
hydrogen consumption rates. In most experiments, H2 consumption vs. time was observed
(See Figure 2.2) along with liquid phase reactant/product concentration profiles. The H2
consumption vs. time data observed under different conditions were fitted by a second order
polynomial as
Y = a + bt + ct2 (2. 1)
Where Y is the hydrogen consumed in kmol/m3; t, the reaction time in sec; and a, b and c
are constants. The rate of reaction at any time can be calculated as
RH2 = dY/dt = b + 2ct (2. 2)
Then, initial rate of hydrogenation can be calculated at t = 0 from the above equation as
RA = [ dY/dt]t=0 = b (2. 3)
The initial rate also can be calculated based on ACPH consumption in the similar way.
For determining the effect of catalyst loading, partial pressure of hydrogen and initial
ACPH concentration on the initial rate of reaction, the initial rates were calculated based
on ACPH consumption. The effect of catalyst loading on the initial rate was found to be

linearly dependent (Figure 2.5) and the agitation speed also showed no influence on the
initial rate, beyond a speed of 11 Hz suggesting that the external mass transfer (gas-
liquid, liquid-solid) resistances can be neglected.
0 10 20 30 40
0
2
4
6
8
10
12
14
373 K 398 K
423 K
Init
ial r
ate
of r
ecat
ion
x10-4
, km
ol/m
3 /s
Catalyst loading, kg/m3
Figure 2.5: Effect of Catalyst Loading on Initial Rate of Reaction
Reaction Conditions: Concentration of ACPH: 0.84 kmol/m3, PH2: 47.6 atm, Solvent: Methanol, Agitation Speed: 15 Hz
However, a detailed analysis to check for the role of external and intraparticle mass
transfer is necessary before proceeding to kinetic study. The criteria involves evaluation
of factors α1, α2 and φexp17 which are defined as the ratio of observed rate of
hydrogenation to the maximum rates of gas-liquid mass transfer, liquid-solid mass
transfer and intraparticle mass transfer respectively. The criteria for kinetic control as
suggested by Ramachandran and Chaudhari17 are:
(a) Gas-liquid mass transfer is unimportant, if
1.0*1 <=
HCbalk
AR
α (2. 4)
(b) Liquid-Solid mass transfer resistance negligible, if

1.0*2 <=
HCpask
AR
α (2.5)
Where p
dp
wpa
ρ
6= (2. 6)
(3) Pore diffusion is negligible, if
2.0*6
exp
5.0
<=
HC
eDw
AR
ppd ρ
φ (2. 7)
Where, De represents the effective diffusivity, which is given as
De= DM ε / τ (2. 8)
The molecular diffusivity, DM, was evaluated from the correlation proposed by Wilke and
Chang.18 In the present case, since the catalyst pellets were made by pelletising the
powder catalyst, the pores were assumed to be much bigger in size. Hence the tortousity
value (τ) chosen was 1.25 19,20 and the porosity of the catalyst pellet (ε) was assumed to
be 0.6.
The gas-liquid mass transfer coefficient, kLab, was evaluated from the correlation
proposed by Bern et al.21 for a stirred tank reactor as:
52.032.0797.116.1210099.1 −−=
LV
gu
IdNx
ba
lk
(2. 9)
For the calculation of liquid-solid mass transfer coefficient, ks, the correlation proposed by
Sano et al. 22 was used.
333.025.0
3
34
4.02
+=
MD
L
L
L
Lpde
cDF
pdsk
ρ
µ
µ
ρ (2. 10)
Where Fc is the shape factor, assumed to be unity for spherical particles and e, the energy
supplied to the liquid, was calculated by the procedure described by Calderbank.23
Calculations done for the highest possible reaction rates showed that gas-liquid, liquid-
solid and intraparticle mass transfer resistances were negligible, as evident from the
values of α1, α2 and φexp given in Table 2.2

Table 2.2: Range of Values of αα 1, αα 2 and φ φ exp for Experiments at 423 K
Range of α1 0.008 – 0.043
Range of α2 1.8 x10⁻⁵ - 5.3 x10⁻⁵
Range of φexp 0.006 – 0.015
From the above analysis it was concluded that the data obtained in the range of
conditions shown in Table 2.1 were in the kinetic regime and can be used to determine
the intrinsic kinetic parameters of the reaction.
The effect of acetophenone concentration on initial rate of reaction showed a first
order tending to zero order dependence (Figure 2.6) whereas, the initial rate varied
linearly with H2 partial pressure (Figure 2. 7).
0.0 0.5 1.0 1.5
0.0
0.5
1.0
1.5
2.0
2.5
3.0
3.5
373K
398K
423K
Initi
al r
ate
of r
eact
ion
x104 , k
mol
/m3 /s
Initial ACPH concentration, kmol/m3
Figure 2.6: Effect of Acetophenone Concentration on Initial Rate of Reaction
Reaction Conditions: PH2: 47.6 atm, Solvent: Methanol, Catalyst Loading: 10 kg/m3, Agitation Speed: 15 Hz

0 1 2 3 4 5 6 7
0
1
2
3
4
5 373K
398K 423K
Init
ial r
ate
of r
eact
ion
x104 , k
mol
/m3 /s
Partial pressure of H2, MPa
Figure 2.7: Effect of Hydrogen Partial Pressure on Initial Rate of Reaction
Reaction Conditions: Concentration of ACPH: 0.84 kmol/m3, Solvent: Methanol, Catalyst Loading: 10kg/m3, Agitation Speed: 15 Hz
2 (A). 2.5 Solubility of Hydrogen in Mixture of Methanol and Acetophenone
Solubility data for H2 in liquid medium is most essential for interpretation of
kinetics and mass transfer effects. The solubility of hydrogen in methanol (CH*) is
expressed by Henry's relation as:
CH* = He PH2 (2. 11)
Where He is the Henry's constant, kmol/m3.atm and PH2 is the partial pressure of
hydrogen, atm. The value of Henry’s constant at different temperatures and for various
mixtures of acetophenone and methanol were determined experimentally (Section 2 (A).
1.4.) and given in Table 2.3.
The solvent vapour pressure at different temperatures was calculated using the
relation
log(Pv) = (-0.2185 A / T) +B (2. 12)
Where A and B are constants and for methanol,24 A=8978.8 and B=8.639821; T is the
temperature in K.

Table 2.3: Values of Henry's Constant at Different Temperatures for Various Mixtures of ACPH and Methanol
He Values for Mixtures of ACPH + MeOH (%V/V) x103,
kmol/m3.atm
S.
No.
Temp., K
5% ACPH 10% ACPH 20% ACPH
1 373 5.01 4.7 4.2
2 398 5.06 5.2 4.6
3 423 5.5 5.65 5.015
2 (A). 2. 6 Kinetic Study
For kinetic study, several experiments were carried out in which concentration-
time profiles were observed over a range of conditions given in Table 2.1. The mass
transfer analysis showed that the data were obtained in kinetic regime. Therefore the
experimental data can be used for kinetic analysis and evaluation of intrinsic kinetic
parameters.
2 (A). 2.6.1 Assumptions and Simplification of Reaction Scheme
♦ The formation of ETCH was found to be negligible in most of the experiments, and
hence not taken into account for kinetic modelling.
♦ It was assumed that CHET is essentially formed from PHET hydrogenation and since
the rate of formation of CHET by hydrogenation of CHMK was very low, CHET
formation from CHMK was assumed to be negligible.
♦ The rate of surface reaction is rate limiting and rates of adsorption and desorption are
high compared to the reaction rate. All species concentrations are in equilibrium with
concentrations of adsorbed species.
♦ Only the reactive species are chemisorbed on active sites and solvent moieties do not
occupy the active sites.
♦ The adsorption of saturated product, CHET was assumed to be negligible due to its
weak adsorption characteristics.25

♦ The adsorption of ETBE was not taken into account, due to its lower concentration
level.
The simplified reaction scheme is shown in Figure 2.8.
ACPH PHET
CHMK CHET
ETBE
[C]
[D]
[E]
[F]
r1
r2
r3
r4
[B]
Figure 2.8: Simplified Reaction Scheme
2 (A). 2.6.2 Derivation of Rate Models
Different mechanisms were considered for the derivation of Langmuir-
Hinshelwood type of rate models to explain the observed trends and the concentration -
time profiles. Keeping in mind the simultaneous hydrogenation of both ketonic and
aromatic ring, different type of active sites on the catalyst surface was considered (see
Figure 2.9). Two types of sites were assumed, one where ketonic group and the alcoholic
group getting attached to the catalyst surface through site SX and the other type of site
where, aromatic ring getting attached through the site SY. A similar type of model was
considered earlier by Neri et al.25
Y
F
X
F
F =O
,OH
Figure 2.9: Adsorption of Functional Groups on Different Sites
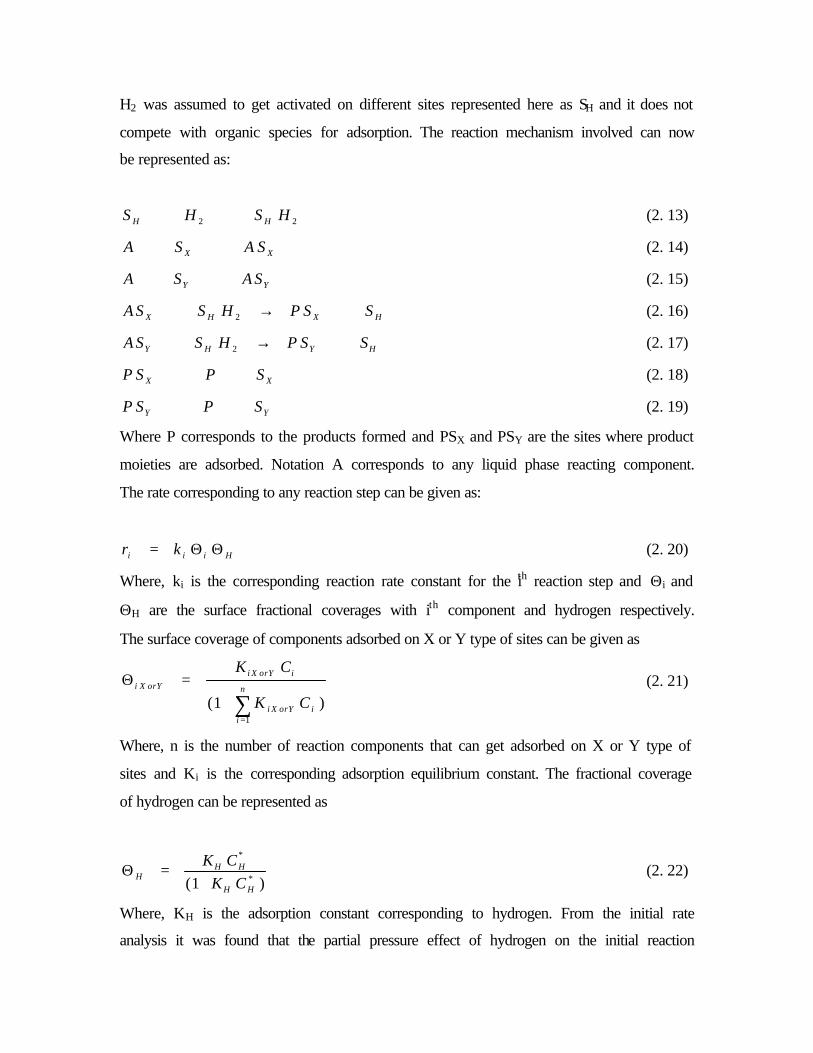
H2 was assumed to get activated on different sites represented here as SH and it does not
compete with organic species for adsorption. The reaction mechanism involved can now
be represented as:
22 HSHS HH ⇔+ (2. 13)
XX SASA ⇔+ (2. 14)
YY SASA ⇔+ (2. 15)
HXHX SSPHSSA +→+ 2 (2. 16)
HYHY SSPHSSA +→+ 2 (2. 17)
XX SPSP +⇔ (2. 18)
YY SPSP +⇔ (2. 19)
Where P corresponds to the products formed and PSX and PSY are the sites where product
moieties are adsorbed. Notation A corresponds to any liquid phase reacting component.
The rate corresponding to any reaction step can be given as:
Hiii kr ΘΘ= (2. 20)
Where, ki is the corresponding reaction rate constant for the ith reaction step and Θi and
ΘH are the surface fractional coverages with ith component and hydrogen respectively.
The surface coverage of components adsorbed on X or Y type of sites can be given as
∑=
+=Θ
n
iiYorXi
iYorXi
YorXi
CK
CK
1
)1( (2. 21)
Where, n is the number of reaction components that can get adsorbed on X or Y type of
sites and Ki is the corresponding adsorption equilibrium constant. The fractional coverage
of hydrogen can be represented as
)1( *
*
HH
HHH
CK
CK
+=Θ (2. 22)
Where, KH is the adsorption constant corresponding to hydrogen. From the initial rate
analysis it was found that the partial pressure effect of hydrogen on the initial reaction

rate was linear and hence we assume that the adsorption term corresponding to hydrogen
is negligible compared to unity (ie. KH CH << 1) and hence
*HHH CK=Θ (2. 23)
The reaction rate can now be expressed as
)1(
*
∑+=
iYorXi
HHiYorXii
iCK
CKCKkwr (2. 24)
We represent ki KH = k’i and the final rate form can be given as
)1(
*'
∑+=
iYorXi
HiYorXii
iCK
CCKkwr (2. 25)
In general, the rate equations corresponding to reaction steps involving ring
hydrogenation can be written as
∑+
=
i iCiYK
iCH
CiY
Ki
w k
ir )1(
*'
(2. 26)
and the rate equations for reaction step involving ketonic group can be written as
∑+=
i iCiXK
iCH
CiX
Ki
w k
ir )1(
*'
(2. 27)
Since the hydrogenation of acetophenone involves multi step reactions, integral
concentration-time data in a semi-batch slurry reactor have to be simulated. The change
in concentration with time can be represented by the following equations:
)1(
*'2
)1(
*'1
31
DC
DXKBC
BXK
BCH
CBX
Kw k
DCDYKBCBYK
BCH
CBY
Kw k
BR
dtBdC
+++
++==− (2 .28)
)1(
*'1
31
DCDYKBCBYK
BCH
CBY
Kw k
CR
dtCdC
++== (2. 29)
)1(
)'4
'2
(*
)1(
*'3
31
DC
DXKBC
BXK
DCDX
KkBCBX
KkH
Cw
DCDYKBCBYK
DCH
CBY
Kw k
DR
dtDdC
++
−+
++−== (2.
30)
)1(
*'3
31
DCDYKBCBYK
DCH
CBY
Kw k
ER
dtEdC
++== (2. 31)
)1(
*'4
DC
DXKBC
BXK
DCH
CDX
Kkw
FR
dtFdC
++== (2. 32)
The initial conditions are
At t =0, CB = CB0 and CC = CD = CD =CE = 0 (2. 33)
The total rate of hydrogenation at any point is given by
4321
2
rrrrHR +++= (2. 34)
A non-linear least square regression analysis was used to obtain the best-fit values of the
parameters. For this purpose, an optimization program based on Marquarts method
combined with a Runge-Kutta method was used to solve the above set of equations.
The model parameters were estimated by minimizing the following objective function:
φ m i n ( )e x p m o d
= ∑ −= =
∑i i
i i
nY Y
1
5
1
2 (2.35)
Where Yiexp is the measured concentration of component i, Yimod is the calculated
concentration of component i and n is the number of samples. The rate parameters
estimated are given in Table 2.4. The experimental and the predicted concentration - time
data were found to agree well within 5-8% error as shown in Figures 2.10 and 2.11, for
rate equations (2.28) to (2.32).
From the temperature dependence of rate parameters, the activation energies of
various reaction steps were calculated. These values of activation energies for steps (1) to
(4) in Figure 2.8 were found to be 49, 50, 63 and 57 kJ/mol respectively. The enthalpies

of adsorption corresponding to adsorption constants KBX, KBY, KDX and KDY were
calculated as 24, 22, 15 and 30.6 kJ/mol respectively.
Table 2.4: Values of Rate and Adsorption Constants
Rate Constants x104 Adsorption Constants Temp.,
K k’1 k’2 k’3 k’4 KBX KBY KDX KDY
373
398
423
2.25
3.81
5.69
1.94
3.22
5.51
4.20
9.70
14.17
0.38
0.82
1.88
5.50
3.37
2.20
3.19
2.38
1.35
1.63
1.03
0.51
0.28
0.23
0.16
0 15 30 45 60 75 90 105 120 135 150
0.0
0.2
0.4
0.6
0.8 ACPH CHMK PHET CHET
-- predicted
Con
cent
rati
on, k
mol
/ m 3
Time, min
Figure 2.10: Concentration – Time Profile at 373 K Reaction Conditions: Concentration of ACPH: 0.85 kmol/m3, Catalyst Loading: 10 kg/m3, PH2: 47.6 atm, Solvent: Methanol, Agitation Speed: 15 Hz

0 20 40 60 80 1 0 0 1 2 0
0.0
0.2
0.4
0.6
0.8 A C P H
C H M K
P H E T
C H E T
E T B E
__ predicted
Con
cent
rati
on, k
mol
/m3
Time, min
Figure 2.11: Concentration – Time Profile at 398 K Reaction Conditions: Concentration of ACPH: 0.85 kmol/m3, Catalyst Loading: 10 kg/m3, PH2: 47.6 atm, Solvent: Methanol, Agitation Speed: 15 Hz
2 (A). 2.7 Modeling of a Basket Type of Reactor
The reactions were carried out using catalyst particles of various diameters
ranging from 1-4 mm. Known amount of catalyst was placed in the basket attached to the
dip tube and precaution was taken to ensure that the catalyst particles are immersed well
within the liquid mixture. In order to confirm that the intraparticle mass transfer
resistance is the rate-limiting step it was necessary to analyse the role of external mass
transfer effects on the reaction.
2 (A). 2.7.1 Analysis of External Mass Transfer
External mass transfer analysis was done to confirm that gas-liquid and liquid-
solid mass transfer is not influencing the reaction rate as described in the earlier section.
2(A).2.7.2 Analysis of Intraparticle Diffusional Effects for Liquid Phase
Components
To check whether the diffusional effects of liquid phase components were also
important, the criteria proposed by Ramachandran and Chaudhari17 was used. According
to this criteria, the intraparticle diffusional effects of the liquid phase components can be
neglected only if the ratio of the product of effective diffusivity of liquid phase
components and its concentration to that of product of effective diffusivity of hydrogen
and its concentration in equilibrium with the liquid phase is greater than 10.
10*
>AeA
iei
CD
CD
ν (2. 36)
It was found that at lower initial substrate concentrations (~ < 0.6 kmol/m3), the
diffusional effects of liquid phase components could be significant. In order to account
for simultaneous diffusion of all the liquid phase reactants/intermediates along with
dissolved H2, a detailed theoretical model was developed as described here.
. 2 (A). 2.7.3 Modelling and Simulation The mass balance for any component in a spherical particle can be written in the
dimensionless form to represent simultaneous diffusion with reaction in catalyst pores.
+
∂∂
∂∂=
∂∂
iieii R
r
cr
rR
D
t
c 222
)( φε (2.37)
For hydrogen
'4
'3
'2
'1
rrrrRi +++= (2.38)
∑+=
''1
''1'
iCXorYiK
icHcikir (2.39)
where
''1
''
1 kk
k ii = and XorYiii Kkk ''' = , liXorYiXorYi BKK =' , liii BCC =' , liHH BCC =' (2.40)
e
Bli
D
RCk 212 ρφ = (2.41)

Boundary conditions are
At time t = 0 and r = 1, C’H = CH*/Bli (2.42)
t ≤ 0 and 0 ≤ r not defined at the end ≥ 1 C’B =1, C’c = C’d = C’e = C’f = 0 (2.43)
At t = 0 and r < 1, C’H = 0 (2.44)
For t > 0
At r = 0, i.e. at the centre of the pellet,
00
=
∂∂
=r
i
r
C (2.45)
At r = 1, i.e., at the surface of the catalyst, concentration of components will be same as
that of the bulk concentration, since external mass transfer is assumed to be negligible.
C’H = CH*/ Bli and C’i = C’il (2.46)
Where C*H is the saturation solubility of hydrogen and C’il is the concentration of ith
component in the liquid phase.
The variation of bulk liquid concentration can be related to the flux at the catalyst surface
as
12
3
=
∂∂
=r
i
p
eii
r
c
R
Dw
td
cd
ρ (2.47)
For a semi-batch reactor, due to continuous feed of hydrogen, the external hydrogen
concentration at the particle surface remains same as that of solubility. Above equations
were solved simultaneously to obtain the concentration distribution in the pellet as well
as in the bulk liquid stream using orthogonal collocation method.
2 (A). 2.7.4 Prediction of Bulk Concentrations
Experimental results showed that the rate of reaction decreases with increasing
particle size due to intraparticle diffusional effects. The simulated results were found to
agree well with the observed experimental results (Figures 2.12 and 2.13). As the
concentration in bulk varied with time, the boundary conditions change and hence the

concentration profile of various liquid phase components inside the particle also changed
with time.
0 20 40 60 80 100 120
0.0
0.2
0.4
0.6
0.8
1.0 ACPH
CHMK
PHET
C H E T
ETBE
Predicted
Dim
ensi
onle
ss c
once
ntra
tion
Time, min
Figure 2.12: Predicted and Experimental Concentration - Time Profiles for the Bulk Liquid. Reaction Conditions: Pellet Diameter: 2x10⁻³ m, Temperature: 398 K, Initial Substrate Concentration: 0.84 kmol/m3, PH2: 47.6 atm, Catalyst Loading: 10 kg/m3
0 2 0 4 0 6 0 8 0 100 120
0.0
0.2
0.4
0.6
0.8
1.0
A C P H
C H M K
PHET
C H E T
ETBE
Predicted
Dim
ensi
onle
ss c
once
ntra
tion
Time, min
Figure 2.13: Predicted and Experimental Concentration - Time Profiles for the Bulk Liquid Reaction Conditions: Pellet Diameter: 2x10⁻³ m, Temperature: 423 K, Initial Substrate Concentration: 0.8 kmol/m3, PH2: 47.6 atm, Catalyst Loading: 10 kg/m3

2 (A). 2.7.5 Effectiveness Factor
Since, the reactions were carried out under conditions of negligible external mass
transfer, catalyst effectiveness factor can be used instead of overall effectiveness factor to
explain the performance of the reactor. Effectiveness factor is the average rate of reaction
with diffusion effects inside the pellet divided by average rate of reaction evaluated based
on surface concentrations. Effectiveness factor was calculated from the following
equation for a spherical particle26
21
3
φη =∂
∂
= rr
c
(2.48)
The variation of effectiveness factor with time obtained for pellets of 2mm size at
different temperatures is shown in Figure 2.14, which was found to decrease with
increase in temperature.
0 20 40 60 80 100 120
0.40
0.45
0.50
0.55
0.60
0.65
0.70 373 K
398 K
423 K
Eff
ecti
vene
ss f
acto
r
Time, min
Figure 2.14: Variation of ηη C with Time for a Pellet Size 2x10⁻³ m

Similarly, as the pellet size decreases, the effectiveness factor tends to unity showing that
no intraparticle diffusional effects exist at very low particle radii (~10-5m). The variation
of effectiveness factor as a function of the square of Theile modulus is shown in Figure
2.15.
0.1 1 10 100 10000.01
0.1
1
3 9 8 K
4 2 3 K
3 7 3 Kηη
φφ2
Figure 2.15: Variation of Effectiveness Factor with the Thiele Modulus
2 (A). 2.7.6 Pellet Dynamics
The dynamic behaviour of the concentration profiles inside the pellet was
obtained by assuming the initial concentration of liquid phase components (except
acetophenone) and hydrogen as zero inside the pellet. For acetophenone it was assumed
that, at the starting of reaction the dimensionless concentration was one throughout the
pellet radius. The concentration profile inside the pellet for hydrogen and acetophenone
from the very beginning (t = 0) till steady state, are shown in Figures 2.16 and 2.17
respectively. The dynamics were obtained assuming that within such a short time period,
the bulk concentration change is negligible compared to the total reaction time. Due to
the higher diffusivity values of hydrogen, it was observed that the steady state for
hydrogen reached within a comparatively shorter period (10-15 sec) than that of
acetophenone (30-40s).

0.2 0.4 0.6 0.8 1.0
0.00
0.05
0.10
0.15
0.20
0.25
0.30
0.35
Time, sec
0.25
1
2
5
10
20
40
60
80
100
Dim
ensi
onle
ss H
2 con
cent
ratio
n
Dimensionless distance inside the pellet
Figure 2.16: Concentration profile of Hydrogen Inside the Pellet During Initial Period Reaction Conditions: Pellet Diameter: 2mm, Temperature: 398K, PH2: 47.6 atm, Initial Substrate Concentration: 0.8 kmol/m3, Solvent: Methanol
0.2 0.4 0.6 0.8 1.0
0.5
0.6
0.7
0.8
0.9
1.0
Time, sec
0.25
2
5
10
20
40
60
80
100
Dim
ensi
onle
ss A
CP
H c
once
ntra
tion
Dimensionless distance inside pellet
Figure 2.17: Concentration Profile of ACPH Inside the Pellet During Initial Period
Reaction Conditions: Pellet Diameter: 2mm, Temperature: 398K, PH2: 47.6 atm, Initial Substrate Concentration: 0.8 kmol/m3, Solvent: Methanol, Catalyst Loading: 10kg/m3

It was observed that, in the initial course of reaction, when acetophenone and hydrogen
are the only reacting species, the reaction inside the pellet was limited by hydrogen. As
the reaction proceeds, 1-phenylethanol is produced, which further undergoes
hydrogenation to give 1-cyclohexylethanol or ethyl benzene. In the initial stages, the
concentration of 1-phenylethanol is very low and can be rate limiting since the hydrogen
concentration is higher.
The concentration profile of PHET and hydrogen inside the particle and in the
bulk liquid during the entire reaction time was simulated to check when PHET will be
rate limiting and at what positions inside the pellet and is given in Figure 2.18.
0 20 40 60 80 100 120 140
0.00
0.05
0.10
0.15
0.20
0.25
0.30
0.35
0.40
0.45
Concentration of H2
at dimensionless positions
0.5384
0.9062
1.0
Concentration of PHET
at dimensionless positions
0.5384
0.9062
1.0
Dim
ensi
onle
ss c
once
ntra
tion
Time, min
Figure 2.18: Distribution of Dimensionless Concentration of Phenyl Ethanol and Hydrogen at Various Positions Inside the Pellet During the Entire Course of Reaction Reaction Conditions: Pellet Diameter: 2x10⁻³ m, Temperature: 398 K, Initial Substrate Concentration: 0.84 kmol/m3, PH2: 47.6 atm, Catalyst Weight: 10 kg/m3, Solvent: Methanol From Figure 2.18 it can be seen that at dimensionless position 0.9062, PHET is rate
limiting in the initial period (till 6-7 minutes). Also it becomes limiting reactant towards
the end of reaction time (100-120 minutes). When we consider an interior dimensionless
pellet position (0.5384), hydrogen is the limiting reactant almost during the entire course
of reaction. Similarly for acetophenone also, at times when its concentration is very low
(i.e. towards the end of reaction) it was found to be limiting. To see how important is the

liquid diffusional effects of the intermediates, the concentration distribution of PHET
inside the pellet as well as in bulk liquid was investigated, under two conditions (i) when
liquid component diffusion is taken into consideration along with that of gaseous
hydrogen and (ii) when only diffusion of hydrogen is considered (This was done by
multiplying the diffusivity of liquid phase component by factor of 10). The simulated
results are shown in Figure 2.19. It can be seen from the graph that when diffusion of
liquid phase is not considered the external as well as the concentration at the internal
points remain the same, where as there is a considerable difference between the external
concentration of PHET and that inside the pellet in presence of liquid diffusional effects.
0 20 40 60 80 100 120
0.00
0.05
0.10
0.15
0.20
0.25
0.30
0.35
0.40
0.45
0.50
With l iquid diffusional effects
Dimensioless position 0.53846
0.90617 External
With out l iquid diffusional effects
Dimensioless position 0.53846
0 .906 External
Dim
ensi
onle
ss c
once
ntr
atio
n o
f P
HE
T
Time, min
Figure 2.19: Comparison of Concentration - Time Profile Predicted in the Bulk Phase and within the Pellet With and Without Taking in to Consideration the Diffusional Effects of Liquid Phase Components Reaction Conditions: Pellet Diameter: 2x10⁻³ m, Temperature: 398 K, Initial Substrate Concentration: 0.84 kmol/m3, PH2: 47.6 atm, Catalyst Loading: 10 kg/m3
2 (A). 2.8 Non-Isothermal Effects in a Semi-batch Slurry Reactor
Even though the formation of PHET from ACPH is not a highly exothermic reaction
(∆Hr = -59.3 kJ/mol), the formation of ring hydrogenated products are comparatively
exothermic (∆Hr = -202.2 kJ/mol for ACPH → CHMK, and ∆Hr = -195.5 kJ/mol for
PHET → CHET). The temperature rise in the reactor under non-isothermal conditions
can lead to changes in rate parameters, solubility of gaseous reactant, molecular

diffusivity of reaction components etc. Non-isothermal modeling of semi-batch slurry
reactor has been reported earlier for different reaction systems.27,28 Here we present a
detailed non-isothermal modelling of slurry reactor and a basket type reactor for the
ACPH hydrogenation using 2%Ru/Al2O3 catalyst. Reaction conditions were chosen in
such a way that the reaction was almost completed within 30min to get a reasonable
temperature rise in the reactor.
The net heat balance can be written as
)()()())1(( gggWWWRiiPllgRPggRg TTQTTAUVrHdt
dTCVCV −−−−∆−=−+ ∑ ρρερε (2.49)
Where gT is the inlet gas temperature, WT is the temperature of the outer jacket, PgC
and PlC are the specific heats of gas and liquid respectively, WU is the overall heat
transfer coefficient, WA is the wall heat transfer area, gε is the gas holdup, iH∆ is the
heat of reaction for ith reaction step, RV is the volume of gas-liquid dispersion. The value
of the overall heat transfer parameter, WU , is specific to reactor configuration and a value
of 0.08 kJ/m2.sec.K was reported for the same reactor by Rode and Chaudhari28 and this
value was used in this case also. The effect of temperature variation on various
parameters affecting the reaction rate was taken into consideration. The variation of rate
constants and adsorption constants with temperature can be given as
−
−
= 0
1 11
0'' exp)()( TTR
E
TiTi kk (2.50)
−
∆−
= 0
1 11
0'' exp)()( TTR
H
TYoriXTYoriX KK (2.51)
The variation in Henry’s constant with temperature was determined by extrapolating the
known values in the same range. The change in the vapour pressure of the solvent was
calculated based on the equation 2.12 and the change in solubility of H2 due to solvent
evaporation could be accounted as:
[ ] TTsolH HePPC )()(* −= (2.52)
The mass balance equations incorporating the various temperature dependencies are:
))()(1(
)(*)()('2
))()(1(
)(*)()('1
3
1
DCT
DXKBCT
BXK
BCTH
CTBX
KTwk
DCTDYKBCTBYK
BCTH
CTBY
KTwk
dtBdC
+++
++=− (2.53)

))()(1(
)(*)()('1
31
DCTDYKBCTBYK
BCTH
CTBY
KTw k
dtCdC
++= (2.54)
))()(1(
))()('4
)()('2
()(*
))()(1(
)(*)()('3
31
DCT
DXKBCT
BXK
DCTDX
KTkBCTBX
KTkTH
Cw
DCTDYKBCTBYK
DCTH
CTBY
KTwk
dtDdC
++
−+
++−= (2.55)
))()(1(
)(*)()('3
31
DCTDYKBCTBYK
DCTH
CTBY
KTw k
dtEdC
++= (2.56)
))()(1(
)(*)()('4
DCT
DXKBCT
BXK
DCTH
CTDX
KTkw
FR
dtFdC
++== (2.57)
The initial conditions are
At t =0, CB = CB0, T=T0 and CC = CD = CD =CE = 0
The mass and heat balance equations were solved using a fourth order Runge-Kutta
method.
The theoretically predicted results were compared with the experimentally
observed values, when methanol was used as a solvent and is shown in Figure 2. 20.
0 5 10 15 20 25 30
398
400
402
404
406
408
H2 c
onsu
med
, km
ol Temperature,K experimental
Temperature,K predicted
Tem
pera
ture
insi
de re
acto
r, K
Time, min
0
1
2
3
4
5
H2 consumed experimental
H2 consumed predicted
Figure 2.20: Temperature Profile and Hydrogen Consumption with Time Under Non-Isothermal Conditions when Methanol was Used as a Solvent in a Slurry Reactor Reaction Conditions: Concentration of ACPH: 1.211 kmol/m3, Catalyst Loading: 30 kg/m3, PH2: 47.6 atm, Solvent: Methanol, Initial Temperature: 398 K, Agitation Speed: 15 Hz

It was observed that the temperature rise in the reactor was not in accordance with the
model prediction. This may be due to the heat removal by the low boiling solvent
evaporation. The heat of evaporation of methanol is very high (32.5 kJ/mol), compared to
other non-polar solvents and hence will significantly affect the temperature profile.
In order to understand the performance of the reactor under non-isothermal
condition when considerable ring hydrogenation occurs and in the absence of solvent
evaporation, a solvent with very high boiling point is necessary. Hence n-decane with a
boiling range of 171-176oC was chosen as the solvent. Since, it was found that the
reaction path changes drastically, when n-decane was used as a solvent, the kinetic
parameters for n-decane solvent was re-determined. When n-decane was used, mainly
ring hydrogenation took place in the initial period leading to the formation of CHMK.
Formation of PHET was much less compared to methanol as the solvent. Also, the
formation of CHET from CHMK was found to be significant, which was negligible in the
methanol system. The formation of ETBE from CHET was negligible, may be due to the
non-polar nature of the solvent hydrocarbon. The new reaction scheme is shown below in
Figure 2. 21.
ACPH PHET
CHMK CHET
[B]
[C]
[D]
[E]
r1
r2
r3
r4
Figure 2.21: Reaction Scheme when n-Decane was Used as the Solvent
A few experiments were carried out with n-decane as a solvent to determine the intrinsic
kinetics. The same model equations used with methanol as solvent were found to explain
the observed trends and concentration time profiles as shown in Figure 2.22. The new
addition to the reaction steps considered was the formation of CHET from CHMK. For
this step, the rate constant k’4 and a new adsorption constant KCX corresponding to the

ketonic group adsorption of CHMK was included in the model in place of the formation
of ETBE which was found to be negligible in this case. The mass balance of different
components can be written as for a semi-batch slurry reactor.
0 10 20 30 40
0.0
0.2
0.4
0.6
0.8
1.0
1.2
1.4 ACPH
C H M K
P H E T
C H E T
--- predicted
Con
cent
ratio
n, k
mol
/m3
Time, min
Figure 2.22: Concentration – Time Profile when n-Decane was Used as a Solvent Reaction Conditions: Temperature: 413 K, Concentration of ACPH: 1.243 kmol/m3, Catalyst Loading: 5 kg/m3, PH2: 47.6 atm, Solvent: n-Decane, Agitation Speed: 15 Hz
)1(
*'2
)1(
*'1
31
CC
CXKBC
BXK
BCH
CBX
Kw k
DCDYKBCBYK
BCH
CBY
Kw k
BR
dtBdC
+++
++==− (2.58)
)1(
*'4
)1(
*'1
31
CCX CKBCBXK
BCH
CCX
Kw k
DCDYKBCBYK
BCH
CBY
Kw k
CR
dtCdC
++−
++== (2.59)
)1(
'2
*
)1(
*'3
31
CC
CXKBC
BXK
BCBX
KkH
Cw
DCDYKBCBYK
DCH
CBY
Kw k
DR
dtDdC
+++
++−== (2.60)
)1(
'4
*
)1(
*'3
31
CC
CXKBC
BXK
BCCX
KkH
Cw
DCDYKBCBYK
DCH
CBY
Kw k
ER
dtEdC
+++
++== (2.61)
The initial conditions are

At t =0, CB = CB0 and CC = CD = CD =CE = 0 (2.62)
The total rate of hydrogenation is given by
43
321
32
rrrrHR +++= (2.63)
The optimised rate parameters for three temperatures 373, 393 and 143 K were obtained
for reaction in n-decane in the same manner as in the case of methanol system and the
temperature dependencies of these rate parameters were determined and are given in
Table 2. 5.
Table 2.5: Values of Rate and Adsorption Constants at 373 K and it’s Temperature Dependencies
Combined
Rate
Constant
Value at 373 K
x 103
∆E,
kJ/mol
Adsorption
Constant
Value at 373 K Heat of
Adsorption,
∆H, kJ/mol
k’1 2.29 40 KBY 3.140 17.20
k’2 4.69 47 KBX 0.042 21.52
k’3 6.81 55 KDY 1.002 35.53
k’4 5.32 50 KCX 0.039 14.13
0 5 10 15 20 25 30
398
400
402
404
406
408
Temperature predicted
Temperature experimental
Tem
pera
ture
insi
de r
eact
or, K
Time, min
0
1
2
3
4
5
H2 c
onsu
med
, km
ol
H2 Consumed experimental H
2 Consumed predicted
Figure 2.23: Temperature Profile and Hydrogen Consumption with Time Under Non-Isothermal Conditions when n-Decane was Used as a Solvent Reaction Conditions: Concentration of ACPH: 1.25 kmol/m3, Catalyst Loading: 10 kg/m3, PH2: 47.6 atm, Solvent: n-Decane, Initial Temperature: 398 K, Agitation Speed: 15 Hz

The reaction rate was found to be very high compared to the methanol system. The non-
isothermal effects for the present system was predicted using the same heat balance
equation explained above and was found to agree well with the experimentally observed
values as shown in Figure 2. 23. It was also found that the hydrogen consumption as well
as the temperature-time profiles predicted by the model was in good agreement with the
experimental data.
2 (A). 2.9 Non-isothermal Model for a Basket Type Reactor
In this study we have tried to understand the intraparticle temperature gradient
within individual catalyst pellet as well as the external bulk liquid temperature variation
with time. It was assumed that the temperature at the surface of the catalyst was the same
as that of the bulk liquid i.e. no solid-liquid heat transfer resistance exists. The
dimensionless heat balance within a catalyst pellet can be given as:
0
2
2
2
)(
TC
rH
rRCt p
ii
pp
e ∑ ∆−+
∂Θ∂=
∂Θ∂
ρλ
(2.64)
Where ii rH∆ represents the heat generated for a particular reaction step i, Θ is the
dimensionless temperature, pρ and pC are the density and specific heat of catalyst pellet
respectively, eλ is the thermal conductivity and the value was taken as 0.15 W/m.K.13
The boundary condition at the surface of the catalyst particle is:
lrTT =
=1 (2.65)
Where Tl is the bulk liquid temperature. At the centre of the particle, we have
00
=∂∂
=rr
T (2.66)
The heat flux from the catalyst surface can be given in dimensionless form as
12
03
=
Θ
rp
le
rd
d
R
TVw
ρλ
(2.67)
This will act as the heat source for the bulk phase and heat dissipation terms all remain
the same as discussed earlier. So the final heat balance for the basket type reactor can be
written in the dimensionless form as

)()1(3
))1((0
01
20
00 T
TTQTAU
rd
d
R
TVw
dt
d
TC
CTCV g
ggoWW
rp
le
lpl
pgggglplR −Θ−−Θ−Θ=Θ+−
=
ρρλ
ρρε
ερ (2.68)
The above equation along with the heat balance in the pellet and the equations
representing temperature dependence of various parameters were solved using the same
numerical treatment carried out for solving the isothermal basket type reactor model.
Here, at time t=0, it was assumed that at all points inside the pellet as well as in the bulk
liquid, the temperature was T0. The temperature profile predicted for the bulk reaction
mixture was compared with the experimental values and was found to agree well as
shown in Figure 2.24. It should be noted that the catalyst loadings used for methanol and
n-decane as solvents were different and hence the temperature rise almost same. The
temperature profile inside the pellet when the temperature of the bulk liquid was
maximum is shown in Figure 2.25. It was found that the maximum temperature gradient
existing between the pellet centre and the substrate was about 0.05 K and is negligible.
0 5 10 15 20 25 30
398
399
400
401
402
403
404
405
H2 c
onsu
med
, km
ol
Tem
pera
ture
, K
Time, min
0.0
0.5
1.0
1.5
2.0
2.5
3.0
3.5
4.0
4.5 experimental predicted
Figure 2.24: Temperature profile and Hydrogen Consumption with Time Under Non-Isothermal Conditions when n-Decane was Used as a Solvent in a Basket Type Reactor Reaction Conditions: Catalyst Particle Size: 10-3m, Concentration of ACPH: 1.25 kmol/m3, Catalyst Loading: 22.02 kg/m3, PH2: 47.6 atm, Initial Temperature: 398 K, Agitation Speed: 15 Hz
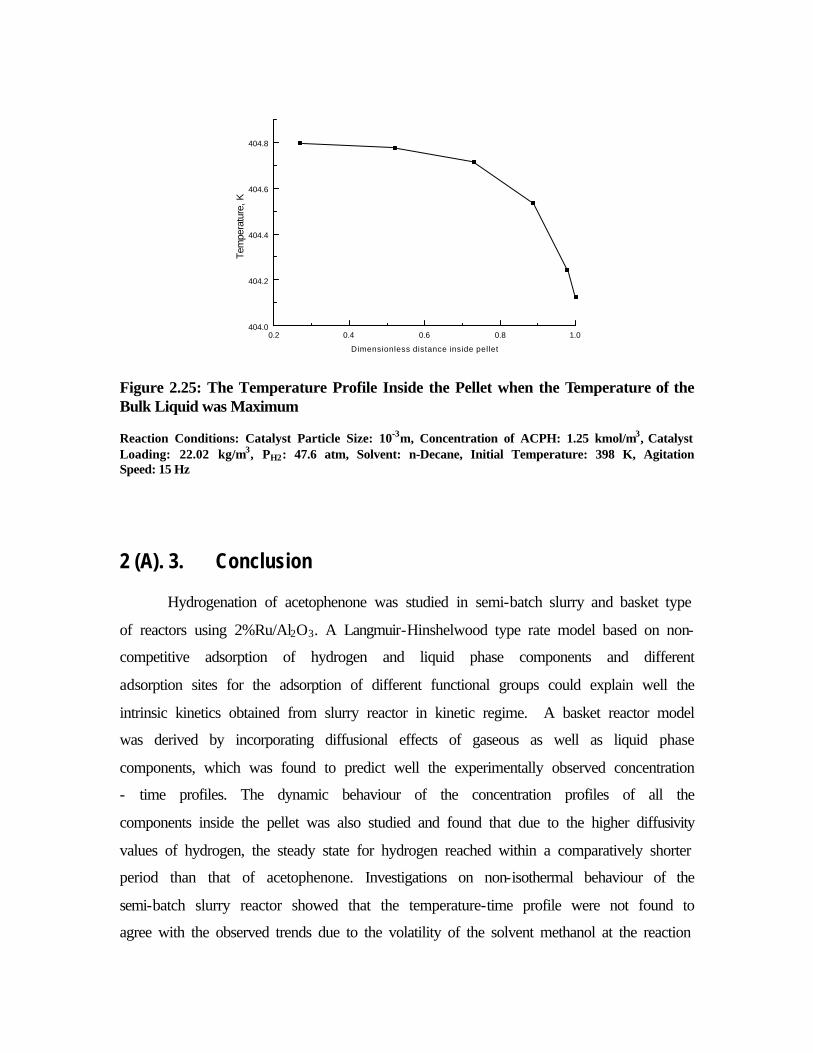
0.2 0.4 0.6 0.8 1.0404.0
404.2
404.4
404.6
404.8
Tem
pera
ture
, K
Dimensionless distance inside pellet
Figure 2.25: The Temperature Profile Inside the Pellet when the Temperature of the Bulk Liquid was Maximum Reaction Conditions: Catalyst Particle Size: 10-3m, Concentration of ACPH: 1.25 kmol/m3, Catalyst Loading: 22.02 kg/m3, PH2: 47.6 atm, Solvent: n-Decane, Initial Temperature: 398 K, Agitation Speed: 15 Hz
2 (A). 3. Conclusion
Hydrogenation of acetophenone was studied in semi-batch slurry and basket type
of reactors using 2%Ru/Al2O3. A Langmuir-Hinshelwood type rate model based on non-
competitive adsorption of hydrogen and liquid phase components and different
adsorption sites for the adsorption of different functional groups could explain well the
intrinsic kinetics obtained from slurry reactor in kinetic regime. A basket reactor model
was derived by incorporating diffusional effects of gaseous as well as liquid phase
components, which was found to predict well the experimentally observed concentration
- time profiles. The dynamic behaviour of the concentration profiles of all the
components inside the pellet was also studied and found that due to the higher diffusivity
values of hydrogen, the steady state for hydrogen reached within a comparatively shorter
period than that of acetophenone. Investigations on non-isothermal behaviour of the
semi-batch slurry reactor showed that the temperature-time profile were not found to
agree with the observed trends due to the volatility of the solvent methanol at the reaction

conditions. However, the data in a non-volatile solvent n-decane agreed very well with
model predictions. The temperature-time profiles observed in a basket type reactor were
also found to agree well with the experimental data. Thus this investigation represents a
systematic study of a complex multistep, multiphase catalytic reaction including intrinsic
kinetics, intraparticle diffusion and non-isothermal effects.

Chapter 2
Part – B
Hydrogenation of p-Isobutyl Acetophenone Using
a Ru/Al2O3 Catalyst: Reaction Kinetics and
Modelling of a Semi Batch Slurry Reactor

2 (B). 0 Introduction
Hydrogenation of p-isobutyl acetophenone (p-IBAP) is an important step in a new
catalytic route developed for Ibuprofen, a non-steroidal, anti-inflammatory drug. This
new catalytic route29 is considered as a major innovation in Ibuprofen technology both
from environmental as well as economic point of view, as it eliminates the conventional
stoichiometric synthetic routes, which produce a large amount of salts as by-products.
Moreover, this reaction is an excellent example of a complex multistep catalytic
hydrogenation leading to a variety of products. Most of the earlier literature on this
reaction is patented and there are only a few reports, which deal with the catalytic reaction
mechanism, kinetic modelling and reaction engineering aspects.
The reduction of a carbonyl group is known to be catalysed by a variety of supported
metal catalysts such as Pd, Ni and Ru. During this reaction, along with the reduction of
carbonyl group the reduction of benzene ring can also occur leading to a variety of products
and hence, understanding of the selectivity behaviour is important. Most of the previous
work has reported investigations on the activity and selectivity of the catalysts and some
aspects of reaction mechanism using Ni and Pd catalysts. No detailed investigations have
been published using Ru catalysed hydrogenation of p-IBAP. In this chapter, kinetic
modelling of hydrogenation of p-IBAP using 2%Ru/Al2O3 as a catalyst has been reported.
The effect of catalyst loading, partial pressure of hydrogen and initial substrate
concentration on the hydrogen consumption as well as the concentration - time behaviour in
a semi batch slurry reactor has been studied. Based on these data, rate equations have been
proposed, based on a model discrimination procedure and rate parameter evaluated.
2 (B). 1 Experimental
The catalyst used was same, as that used in the study of hydrogenation of
acetophenone and the experimental methods were also the same. The liquid samples in this
case was analysed by gas chromatographic technique using a HP-6890 Gas chromatograph
fitted with a HP-FFAP capillary column (30 m x 0.53 µm x 0.1 mm film thickness on
polyethylene glycol stationary phase). The conditions of GC analysis were as follows: FID
temperature: 573 K, column temperature: 438-463 K (Programmed at 25 K/min), injection

temperature: 523 K, carrier gas: N2. A few samples were analysed by GC-MS (Shimadzu
QP 2000A). The range of operating conditions used in this work is given in Table 2.6.
Table 2.6: Range of Parameters
Catalyst loading 2.5 - 10 kg/m3
Agitation speed 7.5-15 Hz
H2 partial pressure 34 - 62 atm
p-IBAP concentration 0.25 - 1.1 kmol/m3
Temperature 373 - 398 K
Volume of liquid 10-4 m3
2 (B). 2 Results and Discussion
2 (B). 2.1 Experimental Results
The main objective of this work was to study (a) intrinsic kinetics of hydrogenation
of p-IBAP using a 2% Ru/Al2O3 catalyst in a slurry reactor and (b) performance of a semi-
batch slurry reactor under isothermal conditions. For this purpose, a few experiments were
first carried out to confirm the product distribution and define a reaction scheme. Catalyst
recycle experiments were also carried out without exposing the catalyst to atmosphere, as
done for the case of acetophenone, and it was found that the activity remains constant during
the course of a batch experiment.
A typical concentration - time profile of various components involved in the
hydrogenation of p-IBAP using 2%Ru/Al2O3 is shown in Figure 2.26. It was observed that
in the initial stages, p-IBAP undergoes hydrogenation through two different path ways: (i)
hydrogenation of a carbonyl group to give p-isobutyl phenyl 2-ethanol (p-IBPE) and (ii) ring
hydrogenation of p-IBAP to 4-isobutyl cyclohexyl methylketone (4-IBCMK). The
formation of p-IBPE was much higher compared to the ring hydrogenated product 4-
IBCMK. During the course of reaction p-IBPE also undergoes ring hydrogenation to give 4-
isobutyl cyclohexyl 2-ethanol (4-IBCHE) where as the formation of 4-IBCHE by ketonic
hydrogenation of 4-IBCMK is comparatively very slow.

0 20 40 60 80 100 1200.0
0.1
0.2
0.3
0.4
0.5
0.6
p-IBAP
4-IBCMK
p-IBPE
4-IBCHE p-IBEB
-- predictedC
once
ntra
tion
, km
ol/m
3
Time, min
Figure 2.26: Concentration – Time Profile at 398 K Reaction Conditions: Concentration of p-IBAP: 0.53 kmol/m3, Catalyst Loading: 5 kg/m3, PH2: 46.7 atm, Solvent: Methanol, Agitation Speed: 15 Hz
O
H 2
OH
OH
_
3H2
3H2
H 2
_ H2 Op-IBAP p-IBPE
4-IBCHE
p-IBEB
4-IBECH
3H2
O
H 2
4-IBCMK
Figure 2.27: Reaction Scheme for Hydrogenation of p-IBAP Using 2%Ru/Al2O3 Catalyst

p-IBPE undergoes dehydration to form p-isobutyl styrene(p-IBSTY) which on further
hydrogenation gives p-isobutyl ethyl benzene(p-IBEB). In the range of conditions
studied, the formation of p-IBSTY was very negligible and hence is not included in the
reaction scheme. Ring hydrogenated product of p-IBEB, 4-isobutyl ethyl cyclohexane (4-
IBECH) was found to be less than 3%. Based on the products identified and
characterised by GC and GC-MS, the reaction scheme is shown in Figure 2. 27.
2 (B). 2.2 Analysis of Initial Rate
The initial rate of reaction was calculated from substrate and hydrogen consumption
data under different conditions. To ensure that the rate data obtained for kinetic analysis
were obtained under conditions of chemical reaction control and mass transfer limitations
are not significant, the values of α1, α2 and φexp were calculated as described earlier for all
temperatures and found to be below 0.05, 0.0003 and 0.08 respectively showing that these
mass transfer effects are negligible. For particle size dp > 5 x 10⁻⁴ m, intraparticle diffusion
effects were found to be significant. The initial rates were found to be independent of
stirring speed beyond 600 rpm. Also, the initial rates at different catalyst loadings showed a
linear dependence. This further supports our conclusion that the gas-liquid mass transfer
resistance is not significant.
The general trends observed for the variation of initial rates with different
parameters were: (i) the rate of reaction was linearly dependent on H2 pressure in low-
pressure range and tending towards zero order at higher pressures (Figure 2.28.) (ii) the
rate vs p-IBAP concentration passed through a maxima indicating substrate inhibition
beyond 0.7 kmol/m3 concentration (Figure 2.29). These data, however, represent only the
reactions in the initial stages and hence are not useful to develop kinetic models. For this
purpose integral concentration - time profiles under different initial conditions should be
considered.

0 10 20 30 40 50 60 700
2
4
6
8
10
12 373 K
386 K
398 K
Inti
al r
ate
of h
ydro
gena
tion
x10-5
, km
ol/m
3 /sec
Pressure, atm
Figure 2.28: Effect of H2 Partial Pressure on Initial Rate of Reaction
Reaction Conditions: Concentration of p-IBAP: 0.53 kmol/m3, Solvent: Methanol, Catalyst Loading: 5 kg/m3, Agitation Speed: 15 Hz
0.0 0.2 0.4 0.6 0.8 1.0 1.2
0
4
8
12
16
20
24
28
32 373 K386 K398 K
Initi
al r
ate
of h
ydro
gena
tion
x10-5
, km
ol/m
3 /sec
p-IBAP concentration, kmol/m3
Figure 2.29: Effect of p-IBAP Concentration on Initial Rate of Reaction
Reaction Conditions: PH2: 46.7 atm, Solvent: Methanol, Catalyst Loading: 5 kg/m3, Agitation Speed: 15 Hz

2 (B). 2.3 Kinetic Modelling
The experimental concentration-time data in the kinetic regime were used to
evaluate the different rate equations. Since, the formation of 4-IBECH was negligible in
most of the experiments, the reaction scheme shown in Figure 2.28 was simplified as
shown below (Figure 2.30).
p-IBAP p-IBPE
4-IBCMK 4-IBCHE
p-IBEB
[C2]
[C3]
[C4]
[C5]
r1
r2
r3
r4
[C1]
Figure 2.30: Simplified Reaction Scheme
In this scheme, it was assumed that 4-IBCHE is essentially formed from p-IBPE
hydrogenation and the rate of hydrogenation of 4-IBCMK is negligible. This is consistent
with our observation that after p-IBPE concentration depletes significantly no further
increase in 4-IBCHE formation was observed even though the concentration of 4-
IBCMK was significant. In order to develop the rate equations, several assumptions were
made: (i) the rate of surface reaction is rate limiting and rate of adsorption and desorption
is very high compared to the reaction rate (ii) only the reactive species are adsorbed on
active sites and sites occupied by solvent are negligible (iii) the adsorption of saturated
product, 4-IBCHE was assumed to be negligible due to weak adsorption characteristics.25
The adsorption of p-IBEB was not taken into account, due to its lower concentration and
also was observed only in the final stages of the reaction, but the adsorption of 4-IBCMK
was taken into account.
The following reaction mechanisms were considered to derive rate equations:
(i) reaction between associatively adsorbed hydrogen and adsorbed liquid phase
components on two different type of sites
(ii) reaction between adsorbed hydrogen (associatively) and adsorbed liquid phase
components on the same site
(iii) reaction between dissociatively adsorbed hydrogen and adsorbed liquid phase
components on the same site.

In order to test the applicability of these equations (see Table 2.7) a semi-batch reactor
model was used under isothermal conditions. The material balances of different
components are given below for model (ii) as an example:
dC
dtr r
w KH CH K k C k C
KH CH j K j C j
11 2
1 1 1 2 1
1 12
= − + = −+
+ + ∑ =
( )
* ( )
( *,3 )
(2.69)
dC2dt
r1w k1 KH K1 C H
* C1
( 1 KH C H*
j 1,3 K j C j )2= =
+ + ∑ =
(2.70)
2)3,1
*1(
)334333112
(*
4323
jC
jK
jHC
HK
CKkCKkCKkH
CH
Kwrrr
dt
dC
=∑++
−−−=−−= (2.71)
dC
dtr
w k K H K CH C
KH CH j K j C j
43
3 3 3
1 12
= =+ + ∑ =
*
( *,3 )
(2.72)
dC
dtr
w k K H CH K C
KH CH j K j C j
54
4 3 3
1 12
= =+ + ∑ =
*
( *,3 )
(2.73)
The initial conditions are
At t =0, C1 = C10 and C2 = C3 = C4 =C5 = 0, (2.74)
Here k1, k2, k3, k4 represent the rate constants of steps r1,r2,r3 and r4 respectively in the
scheme shown in Fig. 3. KH, K1, K2 and K3 represent the adsorption constants of various
components and CH* , C1, C2 and C3 their concentrations respectively.
The total rate of hydrogenation is given by
RH r r r r2
3 1 2 3 3 2 4= + + + (2.75)
In order to select a suitable rate equation, a non-linear least square regression analysis
was used for each rate equation to obtain the best fit values of the parameters. For this
purpose, an optimisation program based on Marquarts method combined with a Runge
Kutta method was used. The solubilities of hydrogen for different p-IBAP concentrations
were determined experimentally at different temperatures and are presented in Table 2.8.

Table 2.8: Solubility of H2 in p-IBAP and Methanol Mixtures
Temperature, K Henry’s constant x 103, kmol/m3/atm
5%p-IBAP +
95%MeOH
10%p-IBAP +
90%MeOH
15% p-IBAP + 85%
MeOH
373 4.388 4.748 5.324
386 5.084 6.035 6.073
398 6.631 7.578 7.219
The model parameters were estimated by minimizing the objective function:
φmin ( )exp mod
= ∑ −= =
∑i i
i i
nY Y
1
5
1
2 (2.76)
Where Yiexp is the measured concentration of component i, Yimod is the calculated
concentration of component i and n is the number of samples. The rate parameters
estimated and φmin values are given in Table 2.7. Out of the three models considered,
models (i) and (iii) gave negative values for some constants and therefore were rejected.
Model (ii) was found to be the best to represent the kinetics of hydrogenation of p-IBAP
using 2%Ru/Al2O3 catalyst. The experimental and the predicted concentration - time data
were found to agree within 5-8% error as shown in Figures 2.31 and 2.32.
From the temperature dependence of rate parameters (Figure 2.33 and 2.34), the
activation energies of various reaction steps were calculated. Thee values of activation
energies for steps r1, r2, r3 and r4 were found to be 46.57, 42.24, 43.82 and 56.8 kJ/mol
respectively. The enthalpy of adsorption and the entropy of adsorption of hydrogen and
various liquid components were also calculated (see Table 2.9) as follows,30
K KH
RTi i
i= −0 exp ( )∆
(2.77)
KS
Ri
i0 = exp( )
∆ (2.78)
Ki0 , ∆H and ∆S represent the pre-exponential factor, enthalpy and entropy of
adsorption respectively. The observation of adsorption enthalpy -∆H > 0 and -∆S > 0,
also indicate that the rate parameters obey the Arrhenius temperature dependence.

93
Table 2.7: Comparison of Various Models for Hydrogenation of p-Isobutyl Acetophenone
S. No.
Model Temp., K
Rate Constants x 100 Adsorption constants φφ min x 104
k1 k2 k3 k4 KH K1 K2 K3 1
)3,11()*1(
*
jCjKjHCHK
HCjCjKHKik
ir
=∑++=
373
386
398
0.0128
0.0213
0.0058
0.0342
0.0231
0.0166
0.1211
0.0189
0.0304
0.157
0.0361
0.0784
0.2739
1.9079
0.6552
8.7646
8.9866
7.6712
0.3311
-7.5938
-19.560
2.9057
2.0907
4.3798
2.37
0.13
0.21
2
2)3,1*1(
*
jCjKjHCHK
HCjCjKHKik
ir
=∑++=
373
386
398
0.5000
1.0470
1.5192
0.8588
1.3525
2.0219
1.8224
3.0736
4.4193
0.141
0.203
0.272
0.0281
0.0226
0.0201
4.5312
4.289
4.1263
0.2137
1.1720
1.2600
2.5493
2.3524
2.1335
0.11
0.23
0.14
3
2)3,12/1)*(1(
2/1)*(2/1)(
jCjKjHCHK
HCjCjKHKik
ir
=∑++=
373
386
398
0.0247
1.2873
0.0123
0.0397
1.3399
0.0384
0.2576
2.1422
0.0576
0.0331
-0.5478
0.0163
0.242
-0.011
0.4260
9.0544
6.1884
5.4702
0.5033
-2.5160
-5.9806
1.2717
3.0693
3.5582
0.22
2.37
0.13

93
0 20 40 60 80 100 1200.00
0.05
0.10
0.15
0.20
0.25
0.30
p-IBAP
4-IBCMK
p-IBPE
4-IBCHE
p-IBEB
-- predicted
Con
cent
rati
on, k
mol
/m3
Time, min
Figure 2.31: Concentration – Time Profile at 373 K Reaction Conditions: Concentration of p-IBAP: 0.27 kmol/m3, Catalyst Loading: 5 kg/m3, PH2: 46.7 atm, Solvent: Methanol, Agitation Speed: 15 Hz
0 20 40 60 80 100 1200.0
0.1
0.2
0.3
0.4
0.5
0.6
p-IBAP
4-IBCMK
p-IBPE
4-IBCHE
p-IBEB
-- predicted
Con
cent
rati
on, k
mol
/m3
Time, min
Figure 2. 32: Concentration – Time Profile at 386 K Reaction Conditions: Concentration of p-IBAP: 0.53 kmol/m3, Catalyst Loading: 5 kg/m3, PH2: 46.7 atm, Solvent: Methanol, Agitation Speed: 15 Hz

93
Table 2.9: Values of ∆∆ H and ∆∆ S
Adsorbing species -∆H, kJ/mol -∆S, J/mol K
H2 16.69 74.57
p-IBAP 4.63 4.97
4-IBCMK 25.9 82.9
p-IBPE 8.75 15.65
Figure 2.33: Temperature Dependence of Rate Constants
Figure 2. 34: Temperature Dependence of Adsorption Constants

93
2 (B). 3 Conclusion
Hydrogenation of p-IBAP using a 2%Ru/Al2O3 catalyst was studied in a slurry
reactor for a temperature range of 373-398 K. The products p-Isobutyl phenyl 2-ethanol,
4-isobutyl cyclohexyl methyl ketone, 4-isobutyl cyclohexyl 2-ethanol, p-isobutyl ethyl
benzene and 4-isobutyl ethyl cyclohexane were characterised by GC-MS. The effect of
catalyst loading, p-isobutyl acetophenone concentration and H2 pressure on concentration
- time profile was studied and a detailed kinetic analysis has also been presented. The
accuracy of rate model and discrimination of various rate models are discussed. A rate
model based on competitive, non-dissociative adsorption of hydrogen and different liquid
phase components followed by surface reaction was found to fit well the concentration -
time profile at all temperatures. The rate parameters were determined and activation
energies calculated corresponding to each rate constant. Similarly, from the temperature
dependence of adsorption constants, heat of adsorption and entropy values were also
evaluated.
Notations for part - A
AW wall heat transfer area, m2
CH* saturation solubility of H2, kmol/m3
Bli concentration of acetophenone at t=0, kmol/m3
Ci concentration of component i, kmol/m3
Cp specific heat capacity of catalyst pellet, kJ/kg.K
Cpl specific heat capacity of liquid, kJ/kg.K
Cpg specific heat capacity of gas, kJ/kg.K
dp catalyst particle diameter, m
dI diameter of the impeller, m
e energy supplied (by the agitator) to the liquid per unit mass, m2/s3
Fc shape factor of the catalyst
DM molecular diffusivity, m2/sec
De effective diffusivity, m2/sec
∆E activation energy, kJ/mol
∆Hi heat of reaction for step i, kJ/mol

93
He Henry’s constant, kmol/m3/atm
k’1, k’2, k’3, k’4 reaction rate constants (m3/kg)(m3/kmol.sec)
KBX, KBY, KDX, KDY adsorption equilibrium constants, m3/kmol
KH adsorption equilibrium constant for hydrogen, m3/kmol
kLab gas-liquid mass transfer coefficient, s -1
ksap liquid-solid mass transfer coefficient, s -1
N agitation speed, Hz
PH 2 partial pressure of hydrogen, atm
Psol vapour pressure of solvent, atm
Qg volumetric gas flow rate, m3/s
r ratio of distance from the centre to the radius of the pellet
r1 to r4 reaction rates of respective steps in Figure 2.8, kmol/m3/s
R catalyst pellet radius
RH2 total rate of hydrogenation, kmol/m3/s
RA initial rate of hydrogenation, kmol/m3/s
Si adsorption site for component i
T temperature, K
T0 reference temperature (taken as the external wall temperature), K
Tgi temperature of incoming gas, K
Tw temperature of the wall, K
UW overall wall heat transfer coefficient, kJ/m2.sec.K
Ug gas velocity, m/s
VL liquid volume,m3
VR reactor volume, m3
w catalyst weight, kg/m3
Greek
α1 parameter defined in Equation 2.4
α2 parameter defined in Equation 2.5
φexp parameter defined in Equation 2.6
φmin parameter defined in Equation 2.35
µ l viscosity of liquid, P
εp porosity of the catalyst particle
εg gas hold up
ρp catalyst pellet density, kg/m3
ρ l liquid density, kg/m3
φ defined in equation (2.41)

93
ρg density of gas, kg/m3
ρL density of liquid, kg/m3
λe thermal conductivity, kJ/sec.m.K
τ tortousity factor
η effectiveness factor as defined by equation (2.48)
ΘiXorY surface coverage of component i on X or Y type of site
ΘH surface coverage of hydrogen
Θ dimensionless temperature
Notations for part - B
CH2* saturation solubility of H2, kmol/m3
C1,0 concentration of p-isobutyl acetophenone at t=0 ,kmol/m3
C1 concentration of p-isobutyl acetophenone, kmol/m3
C2 concentration of 4-isobutyl cyclohexyl methyl ketone, kmol/m3
C3 concentration of p-isobutyl phenyl ethanol, kmo l/m3
C4 concentration of 4-isobutyl cyclohexyl ethanol, kmol/m3
C5 concentration of p-isobutyl ethyl benzene, kmol/m3
k1, k2, k3, k4 reaction rate constants (m3/kg)(m3/kmol.sec)
K1, K2, K3 adsorption equilibrium constants, m3/kmol
KH adsorption equilibrium constant for hydrogen, m3/kmol
r1 to r4 reaction rates of respective steps in Figure (2.30), kmol/m3/s
RH2 total rate of hydrogenation, kmol/m3/s
∆S entropy change, J/mol.K
References 1. Masson J., Cividino P., Bonnier J. M. and Fouilloux P., Selective hydrogenation of acetophenone on
unpromoted Raney Ni: Influence of reaction conditions, Heterogeneous Catalysis and Fine Chemicals II,
Stud. Surf. Sci. Catal., 245, 1991
2. Zakumbaeva G. D., Urumbaeva S. U. and Dautkulov A. B., Hydrogenation of acetophenone on cobalt
catalysts, Zhurnal Prikladnoi Khimii, 65, 1349, 1992
3. Hamer-Thibault S., Masson J., Fouilloux P., and Court J., Selective hydrogenation of acetophenone on
chromium promoted Raney nickel catalysts. I. Characterization of the catalysts, Appl. Catal. A : General,
99, 131, 1993

93
4. Barinov N. S., Lebedeva E. G. and Mushenko D. V., Comparative study of the catalytic properties of Pt,
Pd, Rh and Ni in hydrogenation of acetophenone in solvents, Zhurnal Prikladnoi Khimii, 42, 2613, 1969
5. Mushenko D. V., Barinov N. S. and Lebedeva E. G., Kinetics of hydrogenation of acetophenone on Ni,
Pt and Pd catalysts in solvent, Zhurnal Organicheskoi Khimii, 7, 314, 1971
6. Csomontanyi G., Netta M. and Balmez M., Hydrogenation Catalytique de 1’acetophenone, Revue
roumaine de chimie, 18, 1367, 1973
7. Ziyatdinov A. S., Stepanenko V. V., Chernykh I. S., Leonova E. B., Pisarenko V. N. and Kafarov V. V.,
Kinetics of hydrogenation of acetophenone to methyl carbinol on KGA -43 copper-chromium catalyst,
Zhurnal Prikladnoi Khimii, 61, 565, 1988
8. Garbuzov V. G., Serebyrakov B. R., Grishkan I. A. and Smirnova N. A., Kinetics of acetophenone
hydrogenation on a copper-chromium-barium catalyst, Azerb.Khim. Zh., 3, 7, 1976
9. Del Amo, Kinetic model of the hydrogenation of acetophenone, Ingeneria Quimica (Madrid), 23, 115,
1991
10. Barinov N. S., Mushenko D. V. and Lebedeva E. G., Conversions of acetophenone during
hydrogenation on Ru catalyst, Zhurnal Prikladnoi Khimii, 39, 2599, 1966
11. Barinov N. S. and Mushenko D. V., Kinetics of hydrogenation of acetophenone, Zhurnal Prikladnoi
Khimii, 42, 2613, 1973
12. Kawakami K. and Kusunoki K., The effects of Intraparticle diffusion on the yield of the liquid phase
hydrogenation of phenylacetylene in a stirred basket reactor, J. Chem. Eng. Japan, 9 (6), 469, 1976
13. Toppinen S., Rantakyla T. K., Salmi T. and Aittamaa J., Kinetics of the liquid phase hydrogenation of
benzene and some monosubstituted alkylbenzenes over a nickel catalyst, Ind. Eng. Chem. Res., 35 1824,
1996
14. Bergault I., Fouilloux P., Joly-Vuillemin C. and Delmas H., Kinetics and Intraparticle Diffusion
Modelling of a complex Multistep Reaction: Hydrogenation of Acetophenone over a Rhodium Catalyst, J.
Cata., 175, 328, 1998
15. Julcour C., Le Lann J. M., Wilhelm A. M. and Delmas H., Dynamics of internal diffusion during the
hydrogenation of 1,5,9-cyclododecatriene on Pd/Al2O3, Catalysis Today, 48(1-4), 147, 1999
16. Purvanto P., Deshpande R. M., Chaudhari R. V. and Delmas H., J. Chem. Eng. Data, 41, 1996, 1414
17. Ramachandran P. A. and Chaudhari R.V., ‘Three phase catalytic reactors’, Gorden breach science
publishers, New York, 1983
18. Wilke C. R. and Chang P., Correlation of diffusion co-efficients in dilute solutions, AIChE J. 1, 264,
1955
19. Xu Z. P. and Chuang K. T, Effect of internal diffusion on heterogeneous catalytic esterification of
acetic acid, Chem. Eng. Sci., 52(17), 3011, 1997
20. Satterfield C. N., Mass Transfer in Heterogeneous Catalysis, M.I.T press, London.

93
21. Bern L., Hell M. and Schoon N. H., Kinetics of hydrogenation of rapeseed oil: Rate equations of
chemical reactions, J. Am. Oil. Chem. Soc., 52, 391, 1975
22. Sano Y., Yamaguchi N. and Adachi T., Mass transfer coefficients for suspended particles in agitated
vessels and bubble columns, J. Chem. Eng. Japan., 1, 255, 1974
23. Calderbank P. H., physical rate processes in industrial fermentation Part I. The interfacial area in gas-
liquid contacting with mechanical agitation, Trans. Inst. Chem. Eng., 36, 443, 1958.
24. Schlessinger G. G., Vapor pressure of organic compounds, Handbook of chemistry and Physics,
Chemical Rubber Co., (CRC), D155, 1970
25. Neri G. and Bonaccorsi L., Kinetic Analysis of cinnamaldehyde hydrogenation over alumina-Supported
ruthenium Catalysts, Ind. Eng. Chem. Res., 36, 3554, 1997
26. Finlayson B. A., Non-linear Analysis in Chemical Engineering, McGraw-Hill Chemical Engineering
Series, US, 1980
27. Rajashekharam M. V., Nikhalje D. D., Jaganathan R. and Chaudhari R. V., Hydrogenation of 2,4-
Dinitrotoluene using a Pd/Al2O3 catalyst in a slurry reactor: A molecular level approach to kinetic
modelling and non-isothermal effects, Ind. Eng. Chem. Res., 35, 1824, 1996
28. Rode C. V. and Chaudhari R. V., Hydrogenation of m-nitrochlorobenzene to m-chloroaniline: reaction
kinetics and modelling of a non-isothermal slurry reactor, Ind. Eng. Chem. Res., 33, 1645, 1994
29. Elango V., Method for producing ibuprofen, Eur Pat., 400,892, (Cl.C07c57/30), CA :114: 206780, to
Hoest Celanese and boots 1990
30. Zhu X. D., Valerius G., Hofmann H., Haas T. and Arntz D., Intrinsic Kinetics of 3-Hydroxypropanal
Hydrogenation over Ni/SiO2/Al2O3 Catalyst, Ind. Eng. Chem. Res., 36, 2897, 1997

Chapter 3
Performance of a Trickle Bed Reactor for the
Hydrogenation of Acetophenone Using Supported
Ruthenium Catalysts
3.0 Introduction Three phase fixed bed catalytic reactors such as trickle bed reactors (TBR) where
liquid reactants as well as gaseous reactant flow downward co-currently over a fixed bed
of catalyst particles finds applications in a wide range of industrial processes. This
includes petroleum refining, oxidation processes, effluent treatment, hydrogenation
processes etc.1,2 Many of the industrially important reactions involve complex reaction
network and may also be highly exothermic. Detailed investigation of such complex
multi step reactions and other reactor design parameters, which influence the reactor
performance, is necessary to understand reactor design and scale up. Most of the earlier
studies on modeling of multiphase reactors were based on simple reaction systems3,4 with
only limited efforts on modeling and experimental verification of industrially important
complex reactions with considerable exothermicity.5,6,7,8 A review of previous work on
trickle bed reactor modeling and related experimental studies has been presented in
Chapter 1, Section 1.2.4.1.3.1.
The models proposed for the performance of trickle reactors range from simple
psuedo homogeneous models to more detailed heterogeneous models incorporating
partial wetting phenomena, external and intraparticle mass transfer limitations, axial
mixing of both gas and liquid phases and non-isothermal effects. The models for TBR’s
were mainly focused on analysis of the partial wetting effect on reactor performance. The
simplest models involve empirical description of the dependency of conversion on liquid
hourly space velocity (LHSV), length of the reactor, particle size and catalyst
effectiveness factor.9,10 However, these models were applicable to specific systems and
therefore more detailed models incorporating the various complexities of mass transfer,
mixing and wetting characteristics were also developed. Ramachandran and Smith11
analyzed the performance of a trickle bed reactor using a mixing cell approach in which
the three-phase reactor was visualized as a number of mixing cells in series. A cross flow
dispersion model was suggested by Hinduja et al.12 which takes into account the axial and
radial dispersion and can be solved using only initial conditions. In order to predict the
overall effectiveness factor for a partially wetted catalysts, Ramachandran and Smith13
represented the catalyst by an infinitely long rectangular slab with three sides

impermeable to the reactants and the fourth side covered by liquid up to some distance
and some distance with gas and proposed approximate solution for the partially wetted
catalyst. Dudukovic14 proposed a similar method for calculation of the effectives factor
for the partially wetted catalyst in which the limiting reactant is present in the liquid
phase and solid-liquid mass transfer is not rate limiting. This model takes into
consideration effects of both internal and external partial wetting. Mills and Dudukovic15
obtained dual series solution to catalyst effectiveness factor in trickle bed reactors for
isothermal, irreversible, first-order reactions with respect to the non-volatile liquid phase
reactant for various geometries of catalyst particles (slab, cylinder and sphere). Mills and
Dudukovic16 later extended the study to all cases of interest such as gas or liquid limiting
reactant, finite or negligible external surface resistance and volatile or non-volatile
liquids. Herskowitz et al.17 modelled the problem by assuming that the catalyst shape is a
cube and one or more faces of this cube is covered by gas or liquid and the differential
equations were solved analytically by superposition theory. Goto et al.18 have studied the
effect of partial wetting on the overall effectiveness factor for an nth order reaction. Two
cases of the limiting reactants being present either in a gas or in a liquid phase have been
considered and approximate solutions for the effectiveness factor for the partially wetted
catalyst was derived using Bischoff’s approximation.19 Tan and Smith20 suggested that
the overall effectiveness factor under conditions of partial wetting can be given as a sum
of the weighted averages of the effectiveness factors in the wetted part and in the un-
wetted part. Beaudry et al.21 developed a model for predicting the performance of a
partially wetted trickle bed reactor for a gas limiting reaction of order less than or equal
to one and showed that under certain conditions the liquid reactant may affect the
reaction rate due to its inability to rapidly diffuse to catalyst areas that are in direct
contact with the gas. Hydrogenation of α-methylstyrene and maleic acid were used as the
systems to predict the experimental results and a criteria to predict the importance of
liquid phase reactant limitations was also suggested. Khadilkar et al.22 proposed a
rigorous model for the solution of the reactor and pellet scale flow-reaction-transport
phenomena based on multicomponent diffusion theory in which Stefan-Maxwell
formulations were used to model interphase and intra particle mass transport.
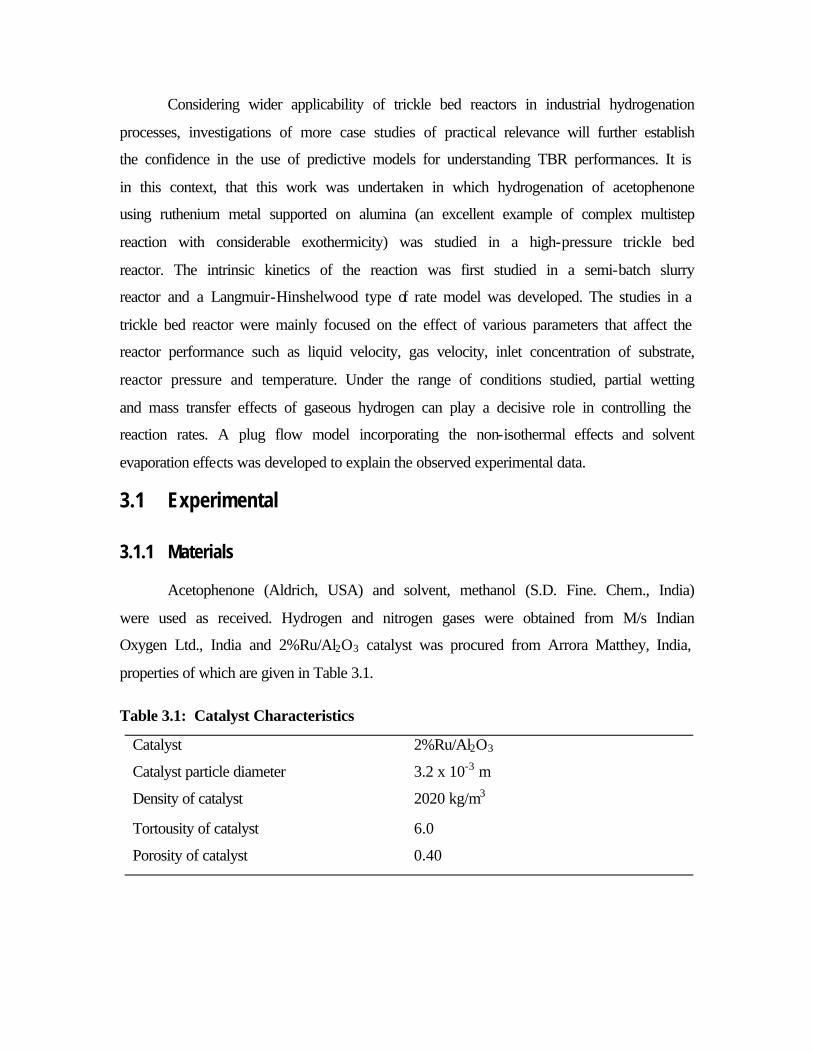
Considering wider applicability of trickle bed reactors in industrial hydrogenation
processes, investigations of more case studies of practical relevance will further establish
the confidence in the use of predictive models for understanding TBR performances. It is
in this context, that this work was undertaken in which hydrogenation of acetophenone
using ruthenium metal supported on alumina (an excellent example of complex multistep
reaction with considerable exothermicity) was studied in a high-pressure trickle bed
reactor. The intrinsic kinetics of the reaction was first studied in a semi-batch slurry
reactor and a Langmuir-Hinshelwood type of rate model was developed. The studies in a
trickle bed reactor were mainly focused on the effect of various parameters that affect the
reactor performance such as liquid velocity, gas velocity, inlet concentration of substrate,
reactor pressure and temperature. Under the range of conditions studied, partial wetting
and mass transfer effects of gaseous hydrogen can play a decisive role in controlling the
reaction rates. A plug flow model incorporating the non-isothermal effects and solvent
evaporation effects was developed to explain the observed experimental data.
3.1 Experimental
3.1.1 Materials
Acetophenone (Aldrich, USA) and solvent, methanol (S.D. Fine. Chem., India)
were used as received. Hydrogen and nitrogen gases were obtained from M/s Indian
Oxygen Ltd., India and 2%Ru/Al2O3 catalyst was procured from Arrora Matthey, India,
properties of which are given in Table 3.1.
Table 3.1: Catalyst Characteristics
Catalyst 2%Ru/Al2O3
Catalyst particle diameter 3.2 x 10⁻³ m
Density of catalyst 2020 kg/m3
Tortousity of catalyst 6.0
Porosity of catalyst 0.40

3.1.2 Equipment
The experiments were carried out in a high-pressure trickle bed reactor supplied
by “Vinci Technologies”, France and the reactor characteristics are given in Table 3.2.
The unit consists of four parts (Figure 3.1).
Table 3.2: Reactor Characteristics
Reactor length 53 x 10-2 m Weight of catalyst 52.4 x10⁻³ Kg
Catalyst packing length 23.85 x 10⁻² m Reactor inner diameter 1.9 x10⁻² m
Reactor area 2.33 x 10⁻⁴ m2 Bed voidage 0.53
Thermo well inner diameter 8 x10⁻³ m
Thermocouples inside the reactor
Wall thermocouples
Condensor
g-l seperatorLiquid collectorLiquid feed
TE5
TE4
H2
N2
TE1
TE2
TE3
TE6
Weighing balance
Outlet gas flow meter
Figure 3.1: Schematic Diagram of the Trickle Bed Reactor Used
(i) The Reactor
The reactor used was 53 cm long and 1.9 cm diameter divided into three zones: (a) the
first zone of 17.4 cm, filled with inert Si-C pellets, (b) the second section of 23.85 cm
filled with catalyst and (c) the third section 11.6 cm again filled with inert Si-C.

Characteristics of the reactor are given in Table 3.2. The gas and liquid flows were mixed
before entering the reactor. The reactor could be operated at a maximum pressure of 15
MPa and a temperature of 823 K. The heating of the three zones of the reactor was
independent with its own temperature control. The reactor was provided with three
thermocouples axially placed along the reactor length in a thermo well.
(ii) Liquid Feed
The liquid feed from a storage, consisting of a glass vessel (5 litre capacity) was
introduced into the reactor using a high-pressure liquid feed pump with a maximum
capacity of 2.5 lit/hour. The glass feed vessel was kept on a weighing balance with an
accuracy of 0.5 gm, which allowed measurement of flow rate precisely.
(iii) Gas Feed
This section consists of a hydrogen inlet stop valve, a filter and a nitrogen inlet valve.
The mass flow controller was adjusted to set inlet gas flow rate and the outgoing gas flow
rate was measured by a wet gas flow meter. For quick pressurization of the unit, the mass
flow controller was by-passed by a manual valve. Nitrogen was used to flush the reactor
before each run. Tuning a new set point on the electronic rack can attain accurate control
of hydrogen flow rate. A maximum gas flow rate of 1000 Nl/h could be attained by this
set up.
(iv) Outlet
It consists of a condenser and a high-pressure gas-liquid separator and accumulator with
one gas outlet line and a liquid outlet. The gas outlet line is equipped with a backpressure
controller, which ensures a constant pressure in the unit by continuous pressure release. A
wet gas flow meter measures the total gas outflow. The liquid outlet line is equipped with
a filter, a manual stop valve and a drain valve to withdraw liquid continuously.
3.1.3 Experimental Procedure
The lines of the reactor were flushed with the liquid feed before the start of any
experiment. In the beginning, the reactor was flushed with nitrogen and the wall
temperatures of the different zones were set to the desired limits. The liquid flow was

started after adjusting the required flow rate. Once the temperature of the wall was
attained and the temperature inside the reactor was stable, the reactor was pressurized
with hydrogen after setting the gas flow rate. The temperatures were monitored at three
positions inside the reactor. The catalyst was filled in such a way that the first
thermocouple was at the inlet of the catalyst bed, second one at the middle of the catalyst
bed and the third thermocouple at the exit of the catalyst bed. Following this procedure,
experiments were carried out at different inlet conditions and steady state performance of
the reactor was observed by analysis of reactants and products in the exit streams. The
range of operating conditions for which the present study was carried out is given in
Table 3.3. Liquid samples withdrawn at regular intervals of time were analyzed by gas
chromatographic technique using a HP-6890 Gas chromatograph fitted with a HP-FFAP
capillary column (30 m x 0.53 µm x 0.1 mm film thickness on polyethylene glycol
stationary phase). The conditions of GC analysis were same as that mentioned in Chapter 2.
Table 3.3: Range of Operating Conditions
Inlet concentration of ACPH 0.84 - 2.5 kmol/m3
Reactor pressure 20 – 70 atm
Liquid flow rate 0.54 – 2.4 x 10⁻³ m/s
Gas flow rate 30 – 600 Nl/h
Temperature 353 - 423 K
3.2 Reactor Model
3.2.1 Intrinsic Kinetics
The catalysts used for the intrinsic kinetic study in Chapter 2 were pelletized and
on packing the bed, found to be not suitable for TBR studies due to poor strength. Hence,
catalyst pellets with same metal loading were procured from Arrora Matthey, India for
trickle bed experiments. Since the source and batch of catalysts used for trickle bed
reactor performance were different, kinetic experiments were carried out again to correct
the rate parameters using the same model equations as described in Chapter 2. The

kinetic trends observed was similar to that observed earlier and hence the same model
was used. The rate equations corresponding to reaction steps involving ring
hydrogenation can be written as
∑+
=
i lIiYK
lIl
AiY
Ki
wk
ir )1(
*'
(3.1)
and the rate equations for reaction step involving ketonic group can be written as
∑+=
i lIiXK
lIl
AiX
Ki
wk
ir )1(
*'
(3.2)
Where, *l
A is the hydrogen saturation solubility in kmol/m3 and lI is the concentration of
ith component in the liquid phase in kmol/m3. Since the hydrogenation of acetophenone
involved multi step reactions, integral concentration-time data in a semi-batch slurry
reactor had to be simulated. The change in concentration with time can be represented by
the following equations:
)1(
*'2
)1(
*'1
31
lD
DXK
lB
BXK
lB
lA
BXKwk
lDDYK
lBBYK
lB
lA
BYKwk
BR
dtl
Bd
+++
++==− (3.3)
)1(
*'1
31
lDDYKlBBYK
lBl
ABY
Kwk
CR
tdlCd
++== (3.4)
)1(
)'4
'2
(*
)1(
*'3
31
lDDX
KlBBX
K
lDDX
KklBBX
Kkl
Aw
lDDYKlBBYK
lDl
ABY
Kwk
DR
dtldD
++
−+
++−== (3.5)
)1(
*'3
31
lDDYKlBBYK
lDl
ABY
Kwk
ER
dtldE
++== (3.6)
)1(
*'4
lDDX
KlBBX
K
lDl
ADX
Kkw
FR
dtldF
++== (3.7)
The initial conditions are
At t =0, Bl = Bl,0 and Cl = Dl = El = Fl = 0 (3.8)
The total rate of hydrogenation at any point is given by

4321
2
rrrrHR +++= (3.9)
Where 1r ,
2r ,
3r and
4r represents the reaction rates corresponding to the reaction steps
shown in Figure 2.8 (Chapter 2). The values of the rate parameters were determined by
optimization of concentration-time data (Figure 3.2 and 3.3) for three temperatures (373
K, 398 K and 423 K) and the corresponding activation energies and heat of adsorptions
are given below in Table 3.4.
Table 3.4: Rate Parameters and it's Temperature Dependency
Rate constants at 398K Activation
energy, kJ/mol
Adsorption constants at 398 K
Heat of adsorption,
kJ/mol
k'1 = 2.42 x10⁻⁴
k'2 = 1.05 x 10⁻⁴
k'3 = 1.26 x 10⁻⁴
k’4 = 1.48 x10⁻⁴
53
52
57
55
KBX = 1.12
K'BY = 3.04
KDX = 7.8
K'DY = 0.40
-10.4
-23.16
-15.77
-11.43
0 20 40 60 80 100
0.0
0.2
0.4
0.6
0.8
1.0
1.2
1.4
ACPH
CHMK
PHET
CHET
ETBE
Predicted
Con
cent
rati
on, k
mol
/m3
Time, min
Figure 3.2: Concentration – Time Profile at 398 K
Reaction Conditions: Concentration of ACPH: 1.27 kmol/m3, Catalyst Loading: 20 kg/m3, PH2: 47 atm, Solvent: Methanol, Agitation Speed: 15 Hz

0 20 40 60 80
0.0
0.2
0.4
0.6
0.8
1.0
1.2
1.4
ACPH
CHMK
PHET
CHET
ETBE
Predicted
Con
cent
rati
on, k
mol
/m3
Time, min
Figure 3.3: Concentration – Time Profile at 423 K
Reaction Conditions: Concentration of ACPH: 1.27 kmol/m3, Catalyst Loading: 20 kg/m3, PH2: 45 atm, Solvent: Methanol, Agitation Speed: 15 Hz
3.2.2 Trickle Bed Reactor Model
The model described here is basically an extension of the approach used by
Rajashekharam et al.5 by incorporating the solvent evaporation effects for the
hydrogenation of acetophenone with 2%Ru/Al2O3 as the catalyst and methanol as the
solvent. The assumptions made in derivation of reactor model are: (1) gas and liquid are
in plug flow, (2) external as well as intraparticle mass transfer effects of liquid phase
components can be neglected, (3) the contribution by stagnant liquid pockets can be
neglected, (4) no radial concentration and temperature gradients exist within the reactor,
(5) there is no heat conduction in the axial direction, (6) the liquid phase reactants are
non-volatile and (7) the gas phase behaves ideally.
The total amount of reaction for a partially wetted catalyst particle can be
represented as sum of the contributions due to mass transfer of reactants to the liquid
covered and gas covered outer surfaces. The contribution to the liquid covered surface
can be assumed to be equal to the amount of reaction if the entire surface was covered by

liquid multiplied by the wetted fraction (fw). The contribution from gas covered surface
can also be calculated in a similar way. The overall effectiveness factor (η) can be given
as20
gwlw ff ηηη )1( −+= (3.10)
lη is the overall effectiveness factor for the liquid covered surface and gη that
corresponding to the dry zone in direct contact with the gas phase.
Under the conditions of significant intraparticle gradients for the gas-phase
reactant (H2) and when the liquid-phase reactant was in excess, the overall rate of
hydrogenation can be expressed as
++
++
++
+=
)l
DE
Kl
BC
K1(
)l
D4
kl
B2
(k
)l
DD
Kl
BB
K1(
)lD3k1(k
AR lB
AH
gAwη (3.11)
Where, ηη is given by eq. (3.10) and lη and gη can be given by the following expression
for a spherical catalyst particle:
+
=
L
c
lcl
N
a2
1φη
ηη and
+
=
G
c
g
cg
N
a2
1φη
ηη
Where, AHgiA
lA
la/
= and giA
gA
ga = ,
lA is the liquid phase hydrogen concentration at
any point inside the reactor, gi
A is the gas phase hydrogen concentration at the inlet, g
A
is the gas phase hydrogen concentration at any point inside the reactor and l
Ag
A
AH = at
equilibrium, LN and GN are the Nusselt numbers for the liquid covered and gas covered
zones respectively and are defined in Table 3.5.

Table 3.5: Dimensionless Parameters Used in the Model
Mass transfer parameters
Gas-liquid mass transfer lBlgl ULak /=α
Liquid-solid mass transfer lpsls ULak /=α
Gas-solid mass transfer lpgsgs ULak /=α
Nusselt number in dynamic zone esL DRkNd
3/=
Nusselt number in dry zone egG DRkNs
3/=
Heat transfer parameters
Thermicity parameter
+
∆−=
lpl
gpglpo
l
l
g
l
i
CUCU
CT
BH
ρρ
ρβ
'''1
)(1
Bed-to-wall heat transfer
+
=
lpl
gpglplT
w
l
g
l CUCU
CUd
LU
ρρ
ρβ
'''1
42
Parameter for heat transfer by
Solvent evaporation
+
∆=
lpl
gpg
ev
l
g
CUCULH
lplCl
UT ρρ
ρ
β'''
10
3
The catalytic effectiveness factor ( cη ) applicable to hydrogenation of ACPH was
developed following the well-known approaches of Bischoff19 and Ramachandran and
Chaudhari23, and can be given as
−=
φφ
φη
31
3coth1
c (3.12)
Where φ is the Thiele parameter and can be defined as:
2
1
lElC
l4l2
lDlB
l31
)DKBK1(
)DkB(k
)DKBK1(
)Dk(k
3
++
++
+++
= l
e
P B
D
R ρφ (3.13)

or in dimensionless form as :
21
)l
dE
kl
bC
k1(
)l
d41
kl
b21
(k
)l
dD
kl
bB
k1(
)l
d31
kl
(b0Ö
++
++
++
+= φ (3.14)
2
1
10 3
=
e
lp
D
BkR iρ
φ (3.15)
3.2.2.1 Mass Balance for Gaseous and Liquid Phase Components
For hydrogen in liquid phase the dimensionless mass balance can be given as
)()( slalalswflag
agldzlda
−=−+− αα (3.16)
and
]2
1[
)(
LNc
law
f
RAkrcwfslalalswfΦ
+
=−η
αηα (3.17)
Where ])ldEklbCk1(
)ld41klb21(k
)ldDklbBk1(
)ld31kl(b[
++
++
++
+=
RAK ,
lUliBLwk
r1=α , glα and
lsα are the dimensionless gas-liquid and liquid-solid mass transfer coefficients and are
defined in Table 3.5. sla is the dimensionless hydrogen concentration at the catalyst
surface covered by the flowing liquid.
For liquid phase components
)1(21
)1( ldE
klbCkB
qAlbk
rc
ldDklbBkB
qAlb
rcdz
ldb
+++
++=−
χαηχαη (3.18)
]2
1[]2
1[
)1(
LNc
ladf
gNc
ga
wf
A Φ+
+Φ
+
−=
ηηχ and qB = Bli / (Ag/HA) (3.19)

)1( ldDklbBkB
qAlb
rcdz
ldc
++=
χαη (3.20)
)1(31
)1(
)4121
(
ldDklbBkB
qAldk
rc
ld
EklbCk
Bq
Aldklbk
rcdz
ldd
+++
++
−=
χαηχαη (3.21)
)1(31
ldDklbBkB
qAldk
rcdz
lde
++=
χαη (3.22)
)1(41
ld
EklbCk
Bq
Aldk
rcdz
ldf
++=
χαη (3.23)
The variation of hydrogen concentration in the gas phase can be given as:
)(')1(
)('
sgag
aA
Hgsw
f
lag
aA
Hglw
f
dz
gda−
−−−−=
αα (3.24)
Where, sga is the dimensionless hydrogen concentration at the catalyst surface exposed
to direct gas phase and can be given as AHgiA
sgA
sga/
= , gU
LB
aL
k
gl='α ,
gU
Lpagk
gs='α .
The dimensionless gas phase solvent concentration ( gsol ) can be given as
gTransg
gSol
UL
dz
sold,ρ
−= (3.25)
Where gTransSol , is the moles of solvent getting transferred to the gas phase per unit
volume of the reactor per unit time and is given by gTransSol , = totg
g
a
solφ .
totφ is the net molar flow rate of the gas phase in kmol/m3/sec, and gsol is the
dimensionless gas phase concentration of the solvent which also varies along the bed
length.

The variation in liquid velocity in the dimensionless form can be given as:
gTrans
liMeOH
l SolU
L
dz
Ud,
0.32'
ρ−= (3.26)
Where lU ' is the dimensionless liquid velocity given as li
ll U
UU =' , in which, lU is the
liquid velocity at any point inside the reactor and liU is the velocity at the inlet of the
catalyst bed.
The variation of gas velocity along the bed length is
( ) gTransgGasMeOH
lgAH
glwg SolU
Laa
H
f
dz
Ud,
,2
0.32'0.2'
ρρα
+−−= ( )sggAH
gswaa
H
f−
−−
2
')1(0.2
ρα
(3.27)
The total molar flow rate of gas at any point inside the reactor can be given in
kmol/m3/sec as:
L
SolU
L
AU gggg
tot +=φ (3.28)
Where gU is the gas velocity in m/s, gA is the hydrogen concentration in gas phase in
kmol/m3 and gSol is the gas phase solvent concentration in kmol/m3.
The heat balance can be given as
]
]2
1[]2
1[
)1([1)'''(
dNc
lawf
gNc
wf
Bq
RAkwkciH
dXb
dTgpgCgUlplClU
Φ+
+Φ
+
−∆−=+
ηη
ηρρ
T
wbw
d
TTU )(4 −− - gTransev SolH ,∆
(3.29)
Where solgsolpgsolgHgpHHggpgg CUCUCU ,,,,,''' ρρρ += (3.30)

The dimensionless heat balance can be given as:
gTransSolwb
dNc
ldawf
gNc
wf
BqRAkrc
dzb
d,3)(2]
]2
1[]2
1[
)1([13
ββηη
αηβ−Θ−Θ−
Φ+
+Φ
+
−=
Θ (3.31)
bΘ is the dimensionless catalyst bed temperature given as
I
bb T
T=Θ , where bT is the
bed temperature and IT is the catalyst bed inlet temperature. 1β , 2β and 3β are the
dimensionless heat parameters as defined in Table 3.5.
Differential equations 3.16, 3.18, 3.20 – 3.27 and 3.31 were solved numerically using a
fourth order Runge-Kutta method by applying the following initial conditions to obtain
the axial concentration distribution of each component as well as the temperature
distribution.
At z =0, bl = al = 1, cl = dl = el = fl = 0, gU ' = lU ' = ga = gsol = θ = 1 (3.32)
Since the liquid velocity changes along the bed length, the new inlet substrate
concentration correspondingly will be:
l
inletlinletlili
U
UBB ,,= (3.33)
This new liB was used for dimensionlising various parameters discussed earlier. In
calculating the term for solvent removal by solvent evaporation, gTransSol , , the solvent
vaporized for the differential element was directly used.
3.2.3 Effect of Reaction Conditions on the Properties of Gas and Liquids
The variation of vapor pressure of the solvent, methanol, with temperature can be
correlated by
log (Pv) = (-0.2185 A / T) +B (3.34)

where A and B are constants for methanol24 (A=8978.8 and B=8.639821); T is the
temperature in K.
The viscosity of methanol at different temperatures were taken from literature25
and fitted using the polynomial to obtain the relation
2810535855.2
51069153.10025.0 xTxxTx
−−−+−=µ (3.35)
The molecular diffusivity, DM, was evaluated based on the correlation proposed by
Wilke and Chang.26
The temperature dependency of Henry's constant was taken into account by
extrapolating the values given in Chapter 2, Section 2 (A). 2. 5 (Table 2.3). The
temperature dependency of rate constants can be given as
−=
θ1
1exp)()(0
0 TR
ETkTk i
ii (3.36)
The temperature dependency adsorption constants was calculated as
−
∆=
θ1
1exp)()(0
0 TR
HTKTK i
ii (3.37)
The hydrodynamic, mass and heat transfer parameters needed for the prediction of
reactor performance was calculated using various correlations in the literature and those
correlations were chosen which gave a better prediction of the experimental observations.
The values of bed to wall heat transfer coefficient calculated using the correlation
suggested by Specchia and Baldi30 was found to be high and multiplying it by a factor of
0.25 was found to predict the experimental values observed for the whole range of
operating condition. The list of various correlations used in this study is given in Table
3.6.

Table 3.6: List of Correlations Used for Predicting TBR Performance
Parameter
Correlation
Reference
Gas-liquid mass transfer
coefficient
2.05.0
2.073.0
2.0
2 ReRe2)/1(
=
− T
p
L
LGL
p
p
BL
pBL
d
d
Dd
S
D
daK
ρµ
εε
Fukushima and Kusaka 27
Liquid-Solid mass
transfer coefficient
333.0
822.0Re815.0
=
Da
a
D
dK
L
LL
p
Wps
ρµ
Satterfield et al. 28
Total liquid holdup
15.020.0
15;0
Re
22.1)1(log
GL
Ll
X
We−=−ε
Larachi et al. 29
Bed to wall heat transfer
coefficient 3/1
09.0
PrRe
057.0 LL
L
L
pW dU
=
ελ
Specchia and Baldi 30
Pressure drop
( ) ( )
+
=∆
4
12
3
41
2
Re
3.173.31
Re
2
LLGLLGK
gg
WeXWeXd
U
Z
P ρ
Larachi et al. 29
Wetting efficiency [ ] 9/1
3/1 /)/(1Re104.1
∆+=
L
LLw Ga
gZPf
ρ
Al-Dahhan and Dudukovic 31

3.3 Results and Discussion
3.3.1 Flow Regime Analysis
It is important to analyze the flow regimes in a trickle bed reactor since the mass transfer,
wetting efficiency and heat transfer parameters are strongly dependent on the flow
regime. To check the flow regime existing at different gas and liquid velocities studied,
the correlation proposed by Charpentier and Favier32 was used (Figure 3.4). The results in
Figure 3.4 showing a plot of liquid mass flow rate (L, kg/m2/sec) vs. gas mass flow rate
(G, kg/m2/sec) indicate the ranges for trickle flow and pulse flow regimes. It is evident
that below a liquid mass flow rate of 1.75 kg/m2/sec (~2.4 x10⁻³ m/s) trickle flow regime
(low interaction regime) prevails under the conditions used in this work. Hence, the
liquid velocity range used was kept to a limit of 2.4 x10⁻³ m/s so that all the experiments
carried out were in trickle flow regime and for calculation of various parameters, the
correlations corresponding to this regime was used.
0.0 0.5 1.0 1.5 2.0 2.5 3.0
0.00
0.02
0.04
0.06
0.08
0.10
0.12
Pulse flowTrickle flow
Experimental pointsGas
mas
s fl
ow r
ate,
kg/
m2 /s
ec
Liquid mass flow rate, kg/m 2/sec
Figure 3.4: Flow Regime in a Trickle Bed Reactor Used for this Study (Predicted
from Charpentier and Favier32)

Experiments were carried out over wide ranging conditions (Table 3.3) and the
results are discussed in terms of rate of hydrogenation, conversion of acetophenone,
product distribution at the exit of the reactor and temperature rise at steady state
conditions. The rate of total hydrogenation was calculated as:
( )lllll
A FEDCL
UR 243 +++= (3.38)
Where, l
U is the liquid velocity in m/s, L is the length of the catalyst bed in m,
llll FandEDC ,, are the concentrations of CHMK, PHET, CHET and ETBE
respectively in the liquid phase at the exit of the reactor in kmol/m3.
The conversion of acetophenone was calculated as:
100)1( xbX lACPH −= (3.39)
Where bl is the dimensionless concentration of acetophenone at the reactor outlet. The
selectivity towards a particular product was defined as:
100.
.% ×=
convertedsubstrateofmolesofNo
formedproductofmolesofNoySelectivit (3.40)
The temperature rise (∆T) across the catalyst bed was calculated as
∆T = T exit – T inlet (3.41)
3.3.2 Effect of Inlet Liquid Velocity
The Effect of liquid velocity on rate of hydrogenation is shown in Figure 3.5 for 373,
398 and 423 K. The rate of hydrogenation was found to decrease marginally with
increase in liquid velocity. With increase in liquid velocity, one expects increase in the
wetted fraction of the catalyst as well as increase in the gas-liquid and liquid-solid mass
transfer coefficients. The variation of gas-liquid mass transfer and wetting efficiency for
the liquid velocity range considered was estimated using the correlations suggested by
Fukushima and Kusaka27 and Al-Dahhan and Dudukovic31 respectively and is shown in
Figure 3.6. At lower liquid velocities, catalyst particles are partially wetted (fw = 0.47 for
a liquid velocity of 5.4 x10⁻⁴ m/s) and under these conditions, the rate increases due to
direct transfer of gas phase reactant to the catalyst surface (already wetted internally due
to capillary forces). Hence, with increase in liquid velocity, increase in wetted fraction is

expected to retard the rate of reaction, while increase in external mass transfer
coefficients will enhance the rate, resulting in opposing effects.
0.0 0 .5 1 .0 1 .5 2 .0 2 .5
0 .0
0 .6
1 .2
1 .8
2 .4
3 .0
3 .6
4 .2
Experimental Predicted 373 K
398 K 423 K
Rat
e of
hyd
roge
natio
n x1
03 , km
ol/m
3 /sec
Inlet liquid velocity x103, m/s
Figure 3.5: Effect of Liquid Velocity on Rate of Hydrogenation Reaction Conditions: Reactor Pressure: 52 atm, Temperature: 398 K, Inlet ACPH Concentration: 1.27 kmol/m3, Gas Flow Rate: 30 Nl/h
0.0 0.5 1.0 1.5 2.0 2.5
0.0
0.2
0.4
0.6
0.8
g-l m
ass
tran
sfer
coe
ffic
ient
x10
2 , s-1
kLaB , s-1
Wetting eff iciency
Wet
ting
effic
ienc
y, f
w
Liquid velocity x103, ms
-1
1.00
1.25
1.50
1.75
2.00
Figure 3.6: Effect of Liquid Velocity on fw (Al-Dahhan and Dudukovic31) and kLaB (Fukushima and Kusaka27) Reaction Conditions: Reactor Pressure: 52 atm, Temperature: 398 K, Inlet ACPH Concentration: 1.27 kmol/m3, Gas Flow Rate: 30 Nl/h

0.0 0.5 1.0 1.5 2.0 2.5
0
4
8
12
16
20
Experimental Predicted
373 K
398 K
423 K
TE
xit -
T I
nle
t
Liquid velocity x103, m/s
Figure 3.7: Effect of Liquid Velocity on Temperature Rise Across the Catalyst Bed Reaction Conditions: Reactor Pressure: 52 atm, Inlet ACPH Concentration: 1.27 kmol/m3, Gas Flow Rate: 30 Nl/h
0.0 0.5 1.0 1.5 2.0 2.5
360
370
380
390
400
410
420 Wall temperature
373 K
398 K
423 K
Inle
t tem
pera
ture
of t
he c
atal
yst b
ed, K
Liquid velocity x103, m/s
Figure 3.8: Inlet Temperature of the Catalyst Bed for Different Liquid Velocities Reaction Conditions: Reactor Pressure: 52 atm, Inlet ACPH Concentration: 1.27 kmol/m3, Gas Flow Rate: 30 Nl/h

0.0 0.5 1.0 1.5 2.0 2.5
0
2
4
6
8
1 0
Wall temperature, K
373 K
398 K
423 K
T exit -
Tin
let, K
Liquid velocity x103, m/s
Figure 3.9: Model Prediction of the Temperature Rise with Liquid Velocity at Constant Inlet Catalyst Bed Temperature Reaction Conditions: Reactor Pressure: 52 atm, Inlet ACPH Concentration: 1.27 kmol/m3, Gas Flow Rate: 30 Nl/h
In order to assess the relative importance of gas-liquid and liquid-solid mass transfer
contribution the total rate of hydrogenation was compared with maximum rates of gas-
liquid and liquid-solid mass transfer (given as klab Agi/HA and ksap Agi/HA respectively
based on inlet conditions). These ratios were found to be 0.76 and 0.06 respectively,
which indicated that the gas-liquid mass transfer was rate limiting while liquid-solid mass
transfer was not significant. The temperature rise observed across the catalyst bed with
increase in liquid velocity shows an increase in ∆T with liquid velocity as shown in
Figure 3.7. While considering the non-isothermal effects, one important point to be
mentioned is that at higher liquid velocities, the temperature at the inlet of the catalyst
bed was found to be lower than that for lower the liquid velocities (Figure 3.8). For the
experimental setup used, at higher liquid velocities, the temperature of liquid feed at
catalyst bed inlet does not attain equilibrium with the set wall temperature and hence the
results in Figure 3.7 represent data at a fixed wall temperature but a variable inlet catalyst
bed temperature (observed experimentally). The temperature gradient, ∆T vs. liquid
velocity shown in Figure 3.7 is a result of this limitation accompanied with

hydrogenation reaction. It is important to note that the model predictions agreed well for
these data also with appropriate initial conditions. Some theoretical results were also
predicted assuming that the inlet catalyst bed temperature was constant (same as the wall
temperature) for all liquid velocities and the model predictions showed that the
temperature rise in the reactor drops sharply with increase in liquid flow rate (Figure 3.9).
The lowering of temperature rise with increase in liquid velocity is a result of higher rate
of heat dissipation at higher liquid velocities compared to heat generated due to reaction.
3.3.3 Effect of Inlet Substrate Concentration and Pressure
On increasing the inlet concentration of ACPH from 0.84 – 2.34 kmol/m3, the
global rate of hydrogenation increased marginally (Figure 3.10) and was in accordance
with the intrinsic kinetics (Chapter 2, Section 2 (A). 2. 4). With increase in temperature
from 398 K to 423 K the increase in rate of hydrogenation was lower than the case when
the temperature was increased from 373 K to 398 K (Figure 3.10).
0.0 0.5 1.0 1.5 2.0 2.5
0.0
0.5
1.0
1.5
2.0
2.5
3.0
3.5
4.0
4.5
Experimental Predicted 373 K 398 K 423 K R
ate
of h
ydro
gena
tion
x10
3 , km
ol/m
3
Inlet ACPH concentration, kmol/m3
Figure 3.10: Variation of Rate of Hydrogenation with Inlet Substrate Concentration. Reaction Conditions: Ul = 5.4 x10⁻⁴ m/s, Gas Flow Rate: 30 Nl/h, Reactor pressure: 52 atm

0.0 0.4 0.8 1.2 1.6 2.0 2.4
0
4
8
12
16
20
Experimental Predicted 373 K 398 K
423 K
TE
xit -
T I
nlet, K
Inlet ACPH concentration, kmol/m3
Figure 3.11: Variation Temperature Rise Across the Catalyst Bed with Inlet Substrate Concentration. Reaction Conditions: Ul = 5.4 x10⁻⁴ m/s, Gas Flow Rate: 30 Nl/h, Reactor Pressure: 52 atm This observation was a result of relative contribution of chemical reaction and mass
transfer rates. Since under the conditions used in this work, both external as well as
intraparticle mass transfer limitations are significant (as indicated by liquid velocity and
gas velocity effects (Figures 3.5 and 3.15)) one expects a mild temperature dependence as
observed. The results shown in Figures 3.10 and 3.11 also indicate, a mild effect of
temperature on both rate of hydrogenation as well as temperature rise. With increase in
temperature, the solvent evaporation reduced the effective partial pressure of hydrogen
and hence the rate enhancement with temperature was less than expected. For example, in
the present case for a total reactor pressure of 52 atm, with increase in temperature from
373 to 423 K, the solvent vapor pressure increased from 3.4 atm to 13.61 atm and the
corresponding hydrogen partial pressures were 48.6 and 38.9 atm respectively. The trends
observed (See Figures 3.10 and 3.11) and the predictions are a consequence of this
phenomenon in addition to the usual effect of temperature on model parameters. The rate
of hydrogenation was found to increase with increase in hydrogen pressure (Figure 3.12)
with almost a linear dependence. The temperature rise observed with increase in pressure

was higher than the corresponding temperature rise due to variation in any other
parameter (Figure 3.13).
0 1 0 2 0 3 0 4 0 5 0 6 0 7 0
0
1
2
3
4
5
6
Experimental Predicted 373 K
398 K 423 K
Rat
e of
hyd
roge
nati
on x
103 , k
mol
/m3 /s
ec
Reactor pressure, atm
Figure 3.12: Variation of Rate of Hydrogenation with Pressure
Reaction Conditions: Ul = 5.4 x10⁻⁴ m/s, Gas Flow Rate: 30 Nl/h, Inlet Acetophenone Concentration: 1.27 kmol/m3
0 10 20 30 40 50 60 70
0
2
4
6
8
10
12
14
16
18
20
22 Experimental Predicted
373 K 398 K 423 K
TE
xit -
T I
nlet
, K
Reactor pressure, atm
Figure 3.13: Variation of Temperature Rise Across the Catalyst Bed with
Pressure
Reaction Conditions: Ul = 5.4 x10⁻⁴ m/s, Gas Flow Rate: 30 Nl/h, Inlet Acetophenone Concentration: 1.27 kmol/m3

3.3.4 Effect of Gas Flow Rate
The effect of gas flow rate was investigated by varying the gas velocity from
0.035 m/s to 0.71 m/s at 398 K and at three pressures (52, 35 and 20 atm) and the results
are shown in Figures 3.14 and 3.15.
0.0 0.2 0.4 0.6 0.8
20
30
40
50
60
70
80
90
100
R e a c t o r p r e s s u r e
P r e d i c t e d E x p e r i m e n t a l
5 2 a t m
3 5 a t m
2 0 a t m
Con
vers
ion,
%
Ug(based on reactor inlet), m/sec
Figure 3.14: Conversion at the Exit vs. Gas Velocity at Different Pressures
Reaction Condition: Ul = 5.4 x10⁻⁴ m/s, Substrate Concentration: 1.27 kmol/m3, Wall Temperature: 398 K
0.0 0.1 0.2 0.3 0.4 0.5 0.6 0.7 0.80
1
2
3
4
5
6 Reactor pressure
Predicted Experimental
52 a tm
35 a tm
20 a tm
Rat
e of
hyd
roge
nat
ion
x10
3 , km
ol/m
3 /sec
Ug(based on reactor inlet), m/sec
Figure 3.15: Rate of Hydrogenation vs. Gas Velocity at Different Pressures.
Reaction Condition: Ul = 5.4 x10⁻⁴ m/s, Substrate Concentration: 1.27 kmol/m3, Wall Temperature:
398 K

There was only marginal increase in the conversion as well as rate of hydrogenation with
increase in gas velocity. Since the reaction under consideration was limited by gas-liquid
mass transfer, one would have expected a stronger effect of gas velocity on the rate of
hydrogenation. The variation of gas-liquid mass transfer coefficient (kLaB) and the
wetting efficiency at the exit of the catalyst bed (since both change along the bed length
also) with gas velocity calculated theoretically using the correlations suggested by
Fukushima and Kusaka27 and Al-Dahhan and Dudukovic31 respectively is shown in
Figure 3.16. It can be seen that on increasing the gas velocity from 0.035 m/s to 0.23 m/s,
value of kLaB increases from 1.88 x10⁻² sec-1 to 2.48 x10⁻² sec-1, but on further increase in
the gas velocity, the increase in the value of kLaB is not significant. This is because at
higher gas velocities (> 0.4 m/s), the liquid velocity decreases considerably inside the
reactor due to solvent evaporation and this lowering of liquid velocity nullifies the
increase in gas-liquid mass transfer coefficient due to increase in gas velocity. The
variation of liquid velocity along the catalyst bed for different gas velocities at 398 K and
52 atm pressure is shown in Figure 3.17. The wetting efficiency calculated theoretically
at the exit of the catalyst bed for various gas velocities at 398 K and 52 atm pressure
(Figure 3.16) show a marginal decrease, which can result in an increase in the rate of
hydrogenation. But at higher gas velocities, the temperature inside the catalyst bed was
found to be lower than that for lower gas velocities.
0.0 0.1 0.2 0.3 0.4 0.5 0.6 0.7 0.8
0.0
0.5
1.0
1.5
2.0
2.5
Gas-liquid mass transfer coefficient
Gas
-liq
uid
mas
s tr
ansf
er c
oeff
icie
nt x
102 , s
ec-1
Ug(based on reactor in le t )
0.0
0.1
0.2
0.3
0.4
0.5
Wet
ting
eff
icie
ncy,
f w
Wetting efficiency
Figure 3.16: Effect of Gas Velocity on kLaB (Fukushima and Kusaka27) and fw (Al-Dahhan and Dudukovic31) Reaction Conditions: Reactor Pressure: 52 atm, Wall Temperature: 398K, Inlet ACPH Concentration: 1.27 kmol/m3, Ul: 5.4 x10⁻⁴ m/s

0.0 0.2 0.4 0.6 0.8 1.00.0
0.6
1.2
1.8
2.4
3.0
3.6
4.2
4.8
5.4
U g x103 m/s
3 . 576
23 .82
47 .68
71 .53
Liq
uid
velo
city
x10
4 , m/s
Dimensionless axial length
Figure 3.17: Liquid Velocity Distribution Along the Length of the Catalyst Bed for Various Gas Velocities at 52 atm Reaction Condition: Ul (Inlet of the Reactor) = 5.4 x10⁻⁴ m/s, Substrate Concentration: 1.27 kmol/m3, Wall Temperature: 398 K The temperature distribution inside the catalyst bed for various gas velocities at 398 K
and 52 atm pressure is shown in Figure 3.18. In general, when solvent evaporation was
significant, it had a direct influence on the gas phase concentration, gas velocity, liquid
velocity, wetting efficiency and mass and heat transfer parameters. The opposing effect
of these parameters on the rate of hydrogenation explains the mild variation of rates of
hydrogenation with gas velocity. The effect of gas velocity on the temperature across the
catalyst bed is shown in Figure 3.19. Here also at higher gas velocities, the temperature at
the inlet of the catalyst bed was found to be lower than the inlet temperature for lower gas
velocities (Figure 3.20). The lower temperature existed at the inlet of the catalyst bed can
be attributed to the heat removal by the flowing gas along with the heat removal by the
evaporation of the volatile solvent. Here also the model predictions agreed well for these
data with appropriate initial conditions. Some theoretical results were also predicted
assuming that the inlet catalyst bed temperature was constant (same as the wall
temperature) for all gas velocities and the model predictions showed that the temperature
rise in the reactor drops after initial rise with increase in gas flow rate (Figure 3.21). The
initial increase in temperature rise was in accordance with the increase in global rate of
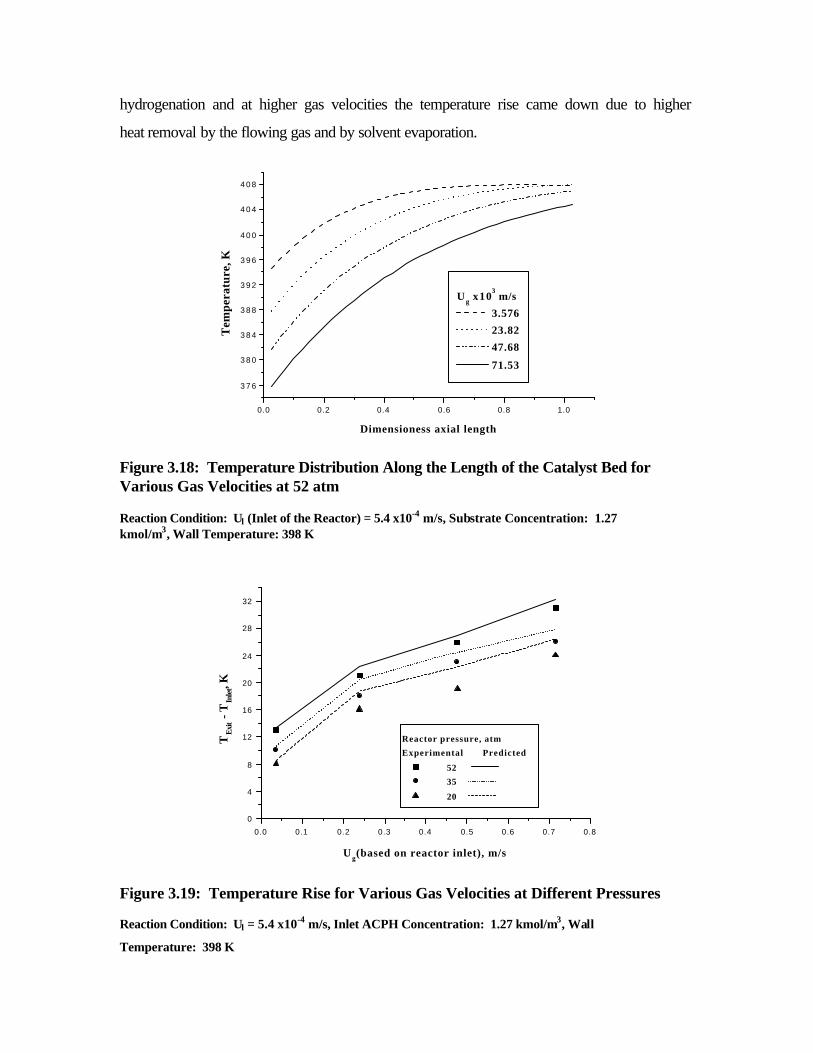
hydrogenation and at higher gas velocities the temperature rise came down due to higher
heat removal by the flowing gas and by solvent evaporation.
0.0 0.2 0.4 0.6 0.8 1.0
3 7 6
3 8 0
3 8 4
3 8 8
3 9 2
3 9 6
4 0 0
4 0 4
4 0 8
U g x103 m/s
3.576
23.82
47.68
71.53
Tem
pera
ture
, K
Dimensioness axial length
Figure 3.18: Temperature Distribution Along the Length of the Catalyst Bed for Various Gas Velocities at 52 atm Reaction Condition: Ul (Inlet of the Reactor) = 5.4 x10⁻⁴ m/s, Substrate Concentration: 1.27 kmol/m3, Wall Temperature: 398 K
0.0 0.1 0.2 0.3 0.4 0.5 0.6 0.7 0.8
0
4
8
12
16
20
24
28
32
Reactor pressure, atm
Experimental Predicted
52 35 20
TE
xit -
TIn
let,
K
U g(based on reactor inlet), m/s
Figure 3.19: Temperature Rise for Various Gas Velocities at Different Pressures Reaction Condition: Ul = 5.4 x10⁻⁴ m/s, Inlet ACPH Concentration: 1.27 kmol/m3, Wall
Temperature: 398 K

0.0 0 .1 0 .2 0 .3 0 .4 0 .5 0 .6 0 .7 0 .8
365
370
375
380
385
390
395 Reactor pressure, atm 52
35 20
Inle
t cat
alys
t bed
tem
pera
ture
, K
Ug (based on reactor inlet), m/s
Figure 3.20: Inlet Temperature of the Catalyst Bed for Different Gas Velocities Reaction conditions: Ul: 5.4 x10⁻⁴ m/s, Inlet ACPH Concentration: 1.27 kmol/m3, Wall Temperature:
398 K
0.0 0.1 0.2 0.3 0.4 0.5 0.6 0.7 0.8
0
2
4
6
8
10
12Reactor pressure, atm
52
35
20
Tex
it -
Tin
let,
K
Ug (Based on reactor inlet), m/s
Figure 3.21: Model Prediction of Temperature Rise with Gas Velocity at Constant Inlet Catalyst Bed Temperature Reaction conditions: Ul: 5.4 x10⁻⁴ m/s, Inlet ACPH Concentration: 1.27 kmol/m3, Wall Temperature:
398 K

3.3.5 Effect of Reaction Parameters on Selectivity The effect of various reaction parameters on the conversion of acetophenone and
the product selectivity to 1-phenylethanol and 1-cyclohexylethanol (at 398 K) is shown in
Figures 3.22 - 3.25 and are compared with the model predictions. It was found that, under
the range of conditions studied the major product was PHET along with considerable
amount of CHET. At higher liquid velocities, when the conversions of ACPH was low (~
30%), PHET selectivity was high (~ 78 - 80%) and at lower liquid velocities (when
conversions were high), the selectivity towards CHET increased (~ 9% at a conversion of
30% and 16% at a conversion of 62%). At low inlet concentration of ACPH the amount
of CHET observed was comparatively high (for an initial ACPH concentration of 0.85
kmol/m3 the CHET formed was ~22 % where as for an initial concentration of 1.27
kmol/m3 it was ~16%). The formation of CHET was higher at higher pressures (26%
CHET at a pressure of 72 atm and at a temperature of 398 K and liquid velocity of 5.4
x10-4 m/s where as at 35 atm it was only ~10%). With increase in temperature the
increase in formation of CHET was marginal (~11 % CHET at 373 K and ~19% at 423 K
at a reactor pressure of 52 atm and liquid velocity 5.4 x10⁻⁴ m/s)
0.0 0.5 1.0 1.5 2.0 2.50
10
20
30
40
50
60
70
80
Conversion, exp
PHET, exp
CHET, exp
Predicted
Con
vers
ion/
Sele
ctiv
ity, %
Liquid velocity x103, m/s
0.0 0.5 1.0 1.5 2.0 2.50
10
20
30
40
50
60
70
80
90
Conversion, exp
PHET, exp
CHET, exp
Predicted
Con
vers
ion/
Sele
ctiv
ity, %
Inlet ACPH concentration, kmol/m3
Figures 3.22, 3.23: Effect of Liquid Velocity and ACPH Concentration on
Conversion of ACPH and Selectivity to PHET and CHET
Fig. 3.22: Reaction Conditions: Temp.: 398 K, PH2: 52 atm, Substrate Concentration: 1.27 kmol/m3, Gas Flow Rate: 30 Nl/hr
Fig. 3.23: Reaction Conditions: Temp.: 398 K, PH2: 52 atm, Ul = 5.4 x10⁻⁴ m/s, Gas Flow Rate: 30
Nl/hr

0 10 20 30 40 50 60 70 80
0
10
20
30
40
50
60
70
80
90
Conversion, exp PHET, exp
CHET, exp Predicted
Con
vers
ion/
Sele
ctiv
ity, %
Reactor pressure, atm
370 380 390 400 410 420 4300
10
20
30
40
50
60
70
80
Conversion, exp
PHET, exp CHET, exp Predicted
Con
vers
ion/
Sele
ctiv
ity,
%
Temperature , K
Figures 3.24, 3.25: Effect of Pressure and Temperature on Conversion of ACPH and Selectivity to PHET and CHET. Fig. 3.24: Reaction Conditions: Temp.: 398 K, Ul = 5.4 x10⁻⁴ m/s, Substrate Concentration: 1.27 kmol/m3, Gas Flow Rate: 30 Nl/hr
Fig. 3.25: Reaction Conditions: PH2: 52 atm, Substrate Concentration: 1.27 kmol/m3, Ul = 5.4 x10⁻⁴ m/s, Gas Flow Rate: 30 Nl/hr
3.4. Conclusion
Hydrogenation of acetophenone using a supported ruthenium catalyst was studied
in a trickle bed reactor. The intrinsic kinetics was studied separately in a semi-batch
slurry reactor and a Langmuir-Hinshelwood model considering different adsorption sites
for aromatic and non-aromatic functional groups was found to explain the experimentally
observed concentration-time profile. Increase in liquid velocity in the trickle bed reactor
resulted in lower conversions of acetophenone considerably but had marginal effect on
rate of hydrogenation. Of the main factors contributing to the reactor performance, the
gas to solid mass transfer and gas to liquid mass transfer were found to be important.
Increasing the inlet concentration of acetophenone resulted in marginal increase in rate of
hydrogenation. The rate of hydrogenation varied almost linearly with the partial pressure
of hydrogen proving the importance of gas phase reactant limitation. Increase in gas
velocity was found to increase the conversion and rate of hydrogenation marginally. A
plug flow model incorporating the mass transfer effects, partial wetting, non-isothermal
effects and solvent evaporation effects was found to explain well the observed reactor

performance. PHET was found to be the major product under the range of conditions
studied. CHET formation increased with increase in residence of liquid phase and with
increase in reactor pressure.
Notations asg dimensionless concentration of hydrogen in catalyst phase exposed to gas
asl dimensionless concentration of hydrogen in catalyst phase exposed to flowing liquid
ap external surface area of the pellet, [6 (1-εB) / dp] , m-1
at packing external surface area of the per unit volume of reactor
[Sex (1-εB) / VB], m-1
aw catalyst area wetted, m-1
Bli inlet substrate concentration, kmol/m3
CAl concentration of hydrogen, kmol/m3
CA* saturation solubility of H2, kmol/m3
CAsg concentration of hydrogen on the catalyst surface covered by gas phase, kmol/m3
CAsl concentration of hydrogen on the catalyst surface covered by liquid phase, kmol/m3
Cil concentration of ith component in liquid phase, kmol/m3
Cpg specific heat capacity of gas, kJ / kg K
Cpl specific heat capacity of liquid, kJ / kg K
De effective diffusivity of hydrogen, m2/sec
DM molecular diffusivity, m2/sec
dp catalyst particle diameter, m
dT reactor diameter, m
fw externally wetted fraction of catalyst
g gravitational acceleration, kg/m2
G Gas superficial mass flow rate, kg m-2 s -1
Ga’L dimensionless liquid Galileo number, 32
323
)1( BL
BLP gd
εµερ
−
He Henry’s constant, kmol/m3/atm
∆Hsol,ev heat removed by solvent evaporation, kJ/m3/s
∆Hev heat of evaporation of the solvent, kJ/kmol
il dimensionless concentration of ith component in liquid phase
KA adsorption constant of hydrogen, m3/kmol
KBX adsorption constants of ACPH on X type of sites, m3/kmol
K'BY adsorption constants of ACPH on y type of sites, m3/kmol
KDX adsorption constant of CHET on X type of sites, m3/kmol
kgap gas-solid mass transfer coefficient, s -1

kI clubbed rate constant for corresponding reaction step in simplified reaction scheme
ki' rate constant for corresponding reaction step in simplified reaction scheme, (m3/kg)(m3/kmol/sec)
ki1 dimensionless rate constants
kj dimensionless adsorption constants, j = B, C, D
kLaB gas-liquid mass transfer coefficient, s -1
ksap liquid-solid mass transfer coefficient, s -1
L liquid superficial mass flow rate, kg m-2 s -1
Msol the molar flow of solvent in kmol/s
MH2 H2 molar flow in kmol/s
2HP hydrogen partial pressure, atm
Psol solvent vapor pressure, atm
Ptot total reactor pressure, atm
Prl Prandtl number of the liquid (µlCpl / λl)
qB stoichiometric coefficient, Bli / CA*
R catalyst pellet radius, m
Re’L dimensionless liquid Reynolds number, )1( BL
PLL dU
εµρ−
ReL liquid Reynold’s number, L
PdL
µ
ReG gas Reynold’s number, G
PdG
µ
RH2 rate of hydrogenation, kmol/m3/sec
rI rate of corresponding steps as shown in simplified reaction scheme
Scl Schmidt number, le
L
D ρµ
Sp geometric surface area of the particle, m2
T inlet temperature, K
Tb temperature of the bed, K
Tw temperature of the wall, K
Ug superficial gas velocity, m/s
Ul superficial liquid velocity, m/s
Uw bed to wall heat transfers coefficient, kJ/m2/K/sec
W weight of catalyst, kg/m3
Wel liquid Weber number, L2dP/(σl ρ l)
x axial distance of the catalyst bed, m
Xsol mole fraction of solvent in the gas phase

XG modified Lockhart-Martinelli parameter
φ0 defined by eq. 3.15
φ theile modulus
φsol number of moles of solvent getting transferred to the gas phase, kmol/m3/s
totφ total molar flow rate of gas in kmol/m3/s at any point inside the reactor
τ tortousity factor
β1 defined by equation
β2 defined by equation
χA defined by eq. 3.19
εB bed porosity
θb dimensionless temperature of the bed
θw dimensionless temperature of the wall
ηc total effectiveness factor of the catalyst
ηcg effectiveness factor of the catalyst covered by gas phase
ηcl effectiveness factor of the catalyst covered by liquid phase
ρg density of gas, kg/m3
αgl dimensionless g-l mass transfer coefficient
∆Hi heat of reaction per mole of hydrogen for the step i in the simplified reaction scheme, kJ/mol
ρ l density of liquid, kg/m3
εl liquid holdup
αls dimensionless l-s mass transfer coefficient
ρp catalyst pellet density, kg/m3
∆P/Z pressure drop, Pa, m-1
αr dimensionless reaction rate constant
αsg dimensionless g-s mass transfer coefficient
λl liquid thermal conductivity, W/mK
References 1. Al-Dahhan M. H., Larachi F., Dudukovic M. P. and Laurent A., High Pressure Trickle-Bed Reactors: A
Review, Ind. Eng. Chem. Res., 36, 3292, 1997
2. Al-Dahhan M. H and Dudukovic M. P., Catalyst Bed Dilution for improving catalyst wetting in
laboratory trickle bed reactors, AIChE J., 42 (9), 2595, 1996

3. Valerius G., Zhu X., Hofmann H., Arntz D. and Haas T., Modelling of a trickle-bed reactor II. The
hydrogenation of 3-hydroxypropanal to 1,3-propanediol, Chem. Eng. Proc., 35, 11, 1996
4. Castellari A. T., Cechini J. O., Gabarian L. J. and Haure P. M., Gas-phase reaction in a trickle-bed
reactor operated al low liquid flow rates, AIChE J., 43, 7, P. 1813, 1997
5. Rajashekharam M. V., Jaganathan R. and Chaudhari R. V., A trickle-bed reactor model for
hydrogenation of 2,4 dinitrotoluene: experimental verification, Chem. Eng. Sci., 53(4), 787, 1998
6. Khadilkar M. R., Jiang Y., Al-Dahhan M., Dudukovic M. P., Chou S. K., Ahmed G. and Kahney R.,
Investigations of a complex reaction network: I Experiments in a high-pressure trickle bed reactor, AIChE
J., 44 (4), 912, 1998
7. Huang T. and Kang B., Naphthalene Hydrogenation over Pt/Al2O3 Catalyst in a Trickle Bed Reactor,
Ind. Eng. Chem. Res., 34, 2349, 1995
8. Bergault I., Rajashekharam M. V., Chaudhari R. V., Schweich D. and Delmas H., Modelling of
comparison of acetophenone hydrogenation in trickle-bed and slurry airlift reactors, Chem. Eng. Sci., 52
(21/22), 4033, 1997
9. Mears D., The role of liquid holdup and effective wetting in the performance of trickle bed reactors,
Adv. Chem. Ser. No. 133, North Holland Publishing Co., Amstredam, 1974
10. Henry H. C. and Gilbert J. B., Scale-up of pilot-plant data for catalytic hydroprocessing, Ind. Eng.
Chem. Proc. Des. Dev., 12, 328, 1973
11. Ramachandran P. A. and Smith J. M., Mixing cell model for design of trickle bed reactor, Chem. Eng.
J., 17, 91, 1979
12. Hinduja M. J., Sundaresan S. and Jackson R., A crossflow model of dispersion in packed bed reactors,
AIChE J., 26(2), 274, 1980
13. Ramachandran P. A. and Smith J. M., Effectiveness factors in trickle-bed reactors, AIChE J., 25, 538,
1979
14. Dudukovic M. P., Catalyst effectiveness factor and contacting efficiency in trickle-bed reactors, AIChE
J., 23, 940, 1977
15. Mills P. L. and Dudukovic M. P., A dual series solution for the effectiveness factor of partially wetted
catalysts in trickle bed reactors, Ind. Eng. Chem. Fundam., 18, 139, 1979
16. Mills P. L. and Dudukovic M. P., Analysis of catalyst effectiveness in trickle-bed reactors processing
volatile or nonvolatile reactants, Chem. Eng. Sci., 35, 2267, 1980
17. Herskowitz M., carbonell R. G. and Smith J. M., Effectiveness factors and mass transfer in trickle-bed
reactors, AIChE J., 25, 272, 1979
18. Goto S., Lakota A. and Levec J., Effectiveness factors of nth order kinetics in trickle bed reactors,
Chem. Eng. Sci., 36, 157, 1981
19. Bischoff K. B., Effectiveness factors for general reaction rate forms. AIChE J., 11, 351, 1965
20. Tan C. S., and Smith J. M., Catalyst particle effectiveness with unsymmetrical boundary conditions,
Chem. Eng.Sci., 35, 1601, 1980

21. Beaudry E. G., Dudukovic M. P. and Mills P. L., Trickle-bed reactors: liquid diffusional effects in a
gas-limited reaction, AIChE J., 33(9), 1435, 1987
22. Khadilkar M. R., Mills P. L. and Dudukovic M. P., Trickle-bed reactor models for systems with a
volatile liquid phase, Chem. Eng. Sci., 54, 2421, 1999
23. Ramachandran P. A. and Chaudhari R. V., Three phase catalytic reactors, Gorden breach science
publishers, New York, 1983
24. Schlessinger G. G., Vapor pressure of organic compounds, Handbook of chemistry and Physics,
Chemical Rubber Co., (CRC), D155, 1970
25. Perry's Chemical Engineering Hand Book (sixth edition), Robert H. Perry and Don Green, Mcgraw-Hill
International editions, Chemical Engineering Series (1984)
26. Wilke C. R. and Chang P., Correlation for diffusion coefficients in dilute solutions, AIChE J., 1, 264,
1955
27. Fukushima S. and Kusaka K., Liquid Phase volumetric and mass transfer coefficient, and boundary of
hydrodynamic flow region in packed column with cocurrent downward flow, J. Chem. Eng. Japan, 10 (6),
468, 1977
28. Satterfield C. N., Vab Eek M. W. and Bliss G. S., Liquid-solid mass transfer in packed beds with down
flow cocurrent gas-liquid flow, AIChE. J, 24, 709, 1978
29. Larachi F., Laurent A., Midoux N. and Wild G., Experimental Study of a Trickle-Bed Reactor
Operating at High Pressure: Two-phase Pressure Drop and Liquid Saturation, Chem. Eng. Sci., 46 (5/6),
1233, 1991
30. Specchia V. and Baldi G., Heat transfer in trickle bed reactors, Chem. Eng. Commun., 3, 483, 1979
31. Al-Dahhan M. H., and Dudukovic M. P., Catalyst wetting Efficiency In trickle-bed Reactors at high
pressure, Chem. Eng. Sci., 50 (15), 2377, 1995
32. Charpentier J. C. and Favier M., Some liquid holdup experimental data in trickle bed reactors for
foaming and no-foaming hydrocarbons. AIChE J., 21, 1213, 1975

Chapter 4
Hydrogenation of Acetophenone in a Fixed Bed
Up-Flow Reactor Using Supported
Ruthenium Catalyst

4.0 Introduction
Fixed bed gas-liquid-solid reactors, wherein gaseous and liquid reactants co-
currently flow upwards over a catalyst bed find applications in a wide variety of
industrial processes. These include hydrodesulfurization of petroleum fractions,
hydrocracking, hydrogenation of nitro compounds, amination of alcohols, ethynylation of
formaldehyde to butynediol and waste water treatment.1,2 The conditions around the
catalyst particles are more uniformly maintained in the up-flow operation compared to
trickle bed. The higher liquid holdup and effective liquid-solid contact results in better
heat dissipation in case of exothermic reactions and can be advantageous for reactions
where the temperature dependence of selectivity is sensitive. Design aspects of co-current
up-flow reactors were reviewed by Hofmann1 and Shah,3 while a comparison of
correlations for mass transfer and hydrodynamic parameters is given by Ramachandran
and Chaudhari.2 The generally used reactor model is a one-dimensional heterogeneous
model taking into consideration the back mixing of gas and liquid phases.
Several reports on reactor performance in up-flow reactors for hydrogenation
reactions are published,4,5,9 and most of these studies were carried out under isothermal
conditions. Liquid phase hydrogenation of maleic anhydride was investigated by
Herrmann and Emig5 in a fixed bed up-flow reactor using copper based catalysts. The
effect of reaction parameters on the selectivity of γ-butyrolactone was studied. They
reported that at higher concentrations of maleic anhydride (0.5 mol/L) and at higher
temperature (> 500 K) the selectivity for γ-butyrolactone increased but with increase in
pressure, the selectivity for 1,4-butanedoil was found to increase. They proposed a
theoretical model based on these results, which was used to predict reactor performance
behavior beyond the limits of the apparatus, and the reaction conditions used. van Gelder
et al.6,7 described a reactor model for the hydrogenation of 2,4,6- trinitrotoluene in an up-
flow reactor in the presence of an evaporating solvent to absorb the heat of reaction.
Details of the investigations on fixed bed up-flow reactor performance studies have been
discussed in Chapter 1, Section 1.2.4.2.1.
Comparison of the performance for up-flow and down-flow fixed bed multiphase
reactors is of interest to understand clearly the distinguishing features of these two
modes. Studies on comparison of up and down-flow modes involving both theoretical

and experimental aspects reported in literature2,8,9,10,11 are discussed in Chapter 1, Section
1.2.4.3.
In this chapter, an experimental study on the hydrogenation of acetophenone
using ruthenium supported on alumina catalyst in a high-pressure fixed bed up-flow
reactor is presented. Reactor performance was investigated over a wide range of
operating conditions such as liquid velocity, inlet concentration of substrate, reactor
pressure, gas velocity and temperature. A theoretical plug flow model has been developed
for predicting the steady state reactor performance under non-isothermal conditions,
incorporating the mass transfer effects of the gaseous hydrogen and evaporation effects of
the volatile solvent. A comparison of the steady state performances of fixed bed up-flow
and trickle bed reactors operated under identical reaction conditions was done. In order to
explain the concentration and temperature profiles observed in the fixed bed up-flow
reactor during the start-up transient period, a dynamic non-isothermal three-phase
heterogeneous model taking into consideration the axial mixing of the liquid phase was
also developed.
4.1 Experimental
4.1.1 Materials
Acetophenone (Aldrich, USA) and methanol (S.D. Fine. Chem., India) were used
as procured. Hydrogen and nitrogen were obtained from M/s Indian Oxygen Ltd., India
and 2%Ru/Al2O3 pellets were procured from Arrorey Mathey, India and the
specifications of the catalyst are same as given in Chapter 3, Section 3.1.1.
4.1.2 Equipment
The experiments were carried out in the reactor setup described in Chapter 3,
Section 3.1.2 for trickle bed studies with appropriate modifications for up-flow operation
of gas and liquid feeds as shown in Figure 4.1.

Thermocouples inside the reactor
Wall thermocouples
Condensor
g-l seperatorLiquid collectorLiquid feed
TE5
TE4
H2
N2
TE1
TE2
TE3
TE6
Weighing balance
Outlet gas flow meter
Figure 4.1: Schematic of the Fixed Bed Reactor with Cocurrent Up-flow
4.1.3 Experimental Procedure
The experimental procedure followed for up-flow reactor performance studies were
similar to that for trickle bed studies as described in Chapter 3, Section 3.1.3 except that
gas and liquid feeds were introduced in a co-current up-flow mode. The range of
operating conditions studied is given in Table 4.1.
Table 4.1: Range of Operating Conditions
Inlet concentration of ACPH 0.84 - 2.5 kmol/m3
Reactor pressure 20 – 72 atm
Liquid velocity 0.54 x 10⁻³ – 2.4 x 10⁻³ m/s
Temperature
Gas flow rate
373 - 423 K
30 – 600 Nl/h
The details of the analysis method used were the same as described in Chapter 2, Section
2 (A). 1.3 as reaction system investigated was the same.

4.2 Model for Up-flow Reactor
The basic differences in the trickle bed and up-flow reactors were that in the latter
case, catalyst particles are completely wetted with liquid (wetting efficiency, fw = 1) and
the mass transfer, heat transfer and hydrodynamic parameters would be different. The
mass and heat balance equations described in Chapter 3 for the trickle bed reactor was
used for up-flow reactor with fw = 1 and appropriate correlations used for estimating the
various mass and heat transfer parameters. The correlations used for evaluation of
hydrodynamic and mass and heat transfer parameters for the up-flow mode are presented
in Table 4.2. With these correlations, theoretical predictions for up-flow reactor were
made following the procedure described in Chapter 3.
4.3 Results and Discussion Hydrogenation experiments were carried out at different reaction conditions to
observe total rate of hydrogenation, conversion of acetophenone, product distribution at
exit of the reactor and temperature rise across the catalyst bed. The experiments were
carried out for a time duration of 1-3 hours to ensure steady state operation as indicated
by constant exit concentrations. For the range in which experimental data were observed,
the steady state reactor performance was also predicted using the theoretical model
described above.
The total rate of hydrogenation was calculated as:
( )lllll
A FEDCL
UR 243 +++= (4.1)
Where, l
U is the liquid velocity in m/s, L is the length of the catalyst bed in m,
llll FandEDC ,, are the concentrations of CHMK, PHET, CHET and ETBE respectively
in the liquid phase at the exit of the reactor in kmol/m3.
The conversion of acetophenone was calculated as:
100)1( xbX lACPH −= (4.2)
where bl is the dimensionless concentration of acetophenone at the reactor outlet.

Table 4.2: Correlations for Model Parameters for Fixed Bed Up-flow Reactor
Parameter Correlation Reference
Gas-liquid mass transfer
coefficient, kLaB [ ] 5.031048.5 gllBL Uxak δ−= Reiss 12
Pressure drop per unit
length of reactor, glδδ [ ]
pe
gggl
gl d
Uf ρδ
25.0 2
= Turpin and Huntington 13
Liquid-solid mass transfer
coefficient, ks pL
G
L
Gs
d
ShDk 012
222
3.0Re
10Reln03.0
Re
10Reln48.0
−
−
=
Specchia et al.14
Molecular diffusivity, DM
6.0
21
8 )(104.7
ML
WM
V
xMTxD
µ
−
=
Wilke and Chang 15
Liquid hold up, ε l ( ) 41.019.011.0 ReRe47.1 −−= ppGlBl daεε Stiegel and Shah 16
Pectlet number for liquid
phase, PeL
( ) 53.016.0245.0 ReRe128.0 ppGllL daPe −= ε Stiegel and Shah 16
Bed to wall heat transfer
coefficient
3/143.0 PrRe'26.0 LlL
ecW dU =λ
Sokolov et al.17


The selectivity towards a particular product was defined as:
100.
.% ×=
convertedsubstrateofmolesofNo
formedproductofmolesofNoySelectivit (4.3)
The temperature rise, ∆T, across the catalyst bed was calculated as:
∆T = T exit – T inlet (4.4)
4.3.1 Effect of Liquid Velocity
The Effect of liquid velocity on conversion and rate of hydrogenation are shown
in Figures 4.2 and 4.3. It was found that the conversion decreases with increasing liquid
velocity as expected in accordance with the residence time of the liquid phase. Increasing
liquid velocity was found to have almost no effect on rate of hydrogenation. The
observed mild dependence of rate on Ul indicates that the external mass transfer (gas-
liquid and liquid-solid) resistances may be negligible. To ensure this, the observed rate
was compared with the maximum rates of gas-liquid and liquid-solid mass transfer (given
as klab Agi/HA and ksap Agi/HA respectively based on inlet conditions). The ratio of rate of
hydrogenation to the maximum rate of gas-liquid mass transfer was found to be in the
range of 0.26 – 0.15 for a corresponding liquid velocity from 5.4 x10⁻⁴m/s to 2.36 x10⁻³
m/s. The corresponding range for the ratio of rate of hydrogenation to maximum liquid-
solid mass transfer rates was 0.075 – 0.068, indicating that the effects of both gas-liquid
and liquid-solid mass transfer on the reaction rates were low. The temperature rise across
the catalyst bed was found to increase with increase in liquid velocity as shown in Figure
4.4. This is because, at higher liquid velocities, the temperature of the inlet of catalyst bed
was lower than that at lower liquid velocities. For the experimental set up used, at higher
liquid velocities, the temperature of liquid feed at catalyst bed inlet does not attain the set
wall temperature. The experimentally observed temperature at the inlet of the catalyst bed
for the various liquid velocities studied is shown in Figure 4.5 (these values were used as
the inlet catalyst bed temperature for model predictions). This explains the trends
observed in Figure 4.4 and the predicted temperature rise was also found to agree well
with the experimental values with appropriate initial conditions.

0.0 0.4 0.8 1.2 1.6 2.0 2.4
0
10
20
30
40
50
60
70 Experimental Predicted 373 K 398 K 423 K
Con
vers
ion,
%
Inlet liquid velocity x103, m/s
Figure 4.2: Effect of Liquid Velocity on Conversion Reaction Conditions: Reactor Pressure: 52 atm, Inlet ACPH Concentration: 1.27kmol/m3, Gas Flow Rate: 30 Nl/h
0.0 0.4 0.8 1.2 1.6 2.0 2.4
0.0
0.5
1.0
1.5
2.0
2.5
3.0
3.5
Experimental Predicted
373 K 398 K 423 K
Rat
e of
hyd
roge
nati
on x
103 , k
mol
/m3 /s
Inlet liquid velocity x103, m/s
Figure 4.3: Effect of Liquid Velocity on Rate of Hydrogenation Reaction Conditions: Reactor Pressure: 52 atm, Inlet ACPH Concentration: 1.27 kmol/m3, Gas Flow Rate: 30 Nl/h

0.0 0.4 0.8 1.2 1.6 2.0 2.4
0.0
2.5
5.0
7.5
10.0
12.5
15.0
17.5
20.0Experimental Predicted
373 K 398 K
423 K T
inle
t-Tex
it, K
Inlet liquid velocity x103, m/s
Figure 4.4: Effect of Liquid Velocity on Temperature Rise Across Catalyst Bed Reaction Conditions: Reactor Pressure: 52 atm, Inlet ACPH Concentration: 1.27kmol/m3, Gas Flow Rate: 30 Nl/h
0.0 0.4 0.8 1.2 1.6 2.0 2.4
3 6 5
3 7 0
3 7 5
3 8 0
3 8 5
3 9 0
3 9 5
4 0 0
4 0 5
4 1 0
4 1 5
4 2 0
Wall temperature 373 398
423
Inle
t tem
pera
ture
of t
he c
atal
yst b
ed, K
Liquid velocity x103, m/s
Figure 4.5: Inlet Temperature of the Catalyst Bed for Different Liquid Velocities Reaction conditions: Reactor Pressure: 52 atm, Inlet ACPH Concentration: 1.27kmol/m3, Gas Flow Rate: 30 Nl/h

Model predictions assuming inlet catalyst bed temperature same as the wall temperature
showed a decrease in the temperature rise with increasing liquid velocity as shown in
Figure 4.6. The decrease in temperature rise with liquid velocity at constant inlet bed
temperature was due to efficient heat removal by the flowing liquid at higher liquid
velocities. At higher liquid velocities, the heat transfer across the reactor wall was also
found to be more efficient. The bed to wall heat transfer coefficient was found to increase
from 0.113 to 0.1965 kJ/m2/K/sec when the liquid velocity was increased from 5.4 x10⁻⁴
m/s to 2.36 x10⁻³ m/s at a wall temperature of 398 K, as calculated by the correlation
suggested by Sokolov et al.17
0.0 0.4 0.8 1.2 1.6 2.0 2.4
0
1
2
3
4
5
6
Inlet bed temperature, K
373
398
423
Tin
let -
Tou
tlet, K
Liquid velocity x103, m/s
Figure 4.6: Theoretical Predictions of Temperature Rise at Constant Catalyst Bed Inlet Temperature Reaction Conditions: Reactor Pressure: 52 atm, Inlet ACPH Concentration: 1.27kmol/m3, Gas Flow Rate: 30 Nl/h
4.3.2 Effect of Inlet substrate concentration and pressure
On increasing the inlet concentration of ACPH from 0.84 – 2.34 kmol/m3, the
conversion decreased where as the rate of hydrogenation showed a marginal increase
(Figures 4.7, 4.8). These observations agreed well with the model predictions and the

mild dependence of the rate of hydrogenation on inlet acetophenone concentration was in
accordance with the intrinsic kinetics (See Chapter 2, Section: 2 (A). 2. 4.).
0.0 0.5 1.0 1.5 2.0 2.5
20
30
40
50
60
70
80
90
Experimental Predicted
373 K 398 K 423 K
Con
vers
ion
, %
Inlet ACPH concentration, kmol/m3
Figure 4.7: Conversions at Varying Inlet Substrate Concentrations Reaction Conditions: Ul: 5.4 x10⁻⁴ m/s, Gas Flow Rate: 30 Nl/h, Reactor Pressure: 52 atm
0.0 0.4 0.8 1.2 1.6 2.0 2.4
0.0
0.5
1.0
1.5
2.0
2.5
3.0
3.5
Experimental Predicted
373 K
398 K
423 K
Rat
e of
hyd
roge
natio
n x1
03 , km
ol/m
3 /s
Inlet ACPH concentration, kmol/m3
Figure 4.8: Variation of Global Rate of Hydrogenation with Inlet Substrate Concentration Reaction Conditions: Ul: 5.4 x10⁻⁴ m/s, Gas Flow Rate: 30 Nl/h, Reactor Pressure: 52 atm

0.0 0.4 0.8 1.2 1.6 2.0 2.4
0
2
4
6
8
10
12
Experimental Predicted
373 K 398 K
423 K T
inle
t-Tex
it, K
Inlet ACPH concentration, kmol/m3
Figure 4.9: Temperature Rise with Varying Inlet ACPH Concentrations Reaction Conditions: Ul: 5.4 x10⁻⁴ m/s, Gas Flow Rate: 30 Nl/h, Reactor Pressure: 52 atm
The temperature rise observed for different inlet concentrations of ACPH and at various
temperatures is given in Figure 4.9 and it was found that the temperature rise was not
significant at high concentration and was in accordance with the marginal increase in rate
of hydrogenation. The increase in rate of hydrogenation on increasing the temperature
from 398 K to 423 K was lower than the increase in rate on raising the temperature from
373 K to 398 K. The lowering of hydrogen partial pressures at higher temperatures due to
the increased contribution of solvent vapor pressure to the total reactor pressure can be
the reason for this. For a total reactor pressure of 52 atm, the partial pressures of
hydrogen (PH2) at 373, 398 and 423 K were 48.6, 45.20 and 38.39 atm respectively,
showing the decreased contribution of PH2 at the highest temperature, 423 K.
The conversion as well as rate of hydrogenation was found to increase with
increase in hydrogen pressure (Figures 4.10 and 4.11). From the marginal effect of inlet
ACPH concentration on rate of hydrogenation and almost a linear dependence on
hydrogen partial pressure, it is clear that gaseous hydrogen is the limiting reactant. The

temperature rise across the catalyst bed was found to increase with pressure (Figure
4.12).
0.0 7.5 15.0 22.5 30.0 37.5 45.0 52.5 60.0 67.5 75.0
0
10
20
30
40
50
60
70
80
90 Experimental Predicted
373 K 398 K 423 K
Con
vers
ion,
%
Reactor pressure, atm
Figure 4.10: Conversion at the Exit with Varying Pressure Reaction Conditions: Ul: 5.4 x10⁻⁴ m/s, Gas Flow Rate: 30 Nl/h, Inlet ACPH Concentration: 1.27 kmol/m3
0.0 7.5 15.0 22.5 30.0 37.5 45.0 52.5 60.0 67.5 75.0
0.0
0.5
1.0
1.5
2.0
2.5
3.0
3.5
4.0
4.5
5.0 Exper imenta l Predicted
373 K 398 K 423 K
Rat
e of
hyd
roge
natio
n x1
03 , km
ol/m
3 /s
Reactor pressure, atm
Figure 4.11: Variation of Rate of Hydrogenation with Pressure Reaction Conditions: Ul: 5.4 x10⁻⁴ m/s, Gas Flow Rate: 30 Nl/h, Inlet ACPH Concentration: 1.27 kmol/m3

0.0 7.5 15.0 22.5 30.0 37.5 45.0 52.5 60.0 67.5 75.0
0
3
6
9
12
15Experimental Predicted
373 K
398 K 423 K
Tin
let-T
exit, K
Reactor pressure, atm
Figure 4.12: Variation in Temperature Rise with Pressure Reaction Conditions: Ul: 5.4 x10⁻⁴ m/s, Gas Flow Rate: 30 Nl/h, Inlet ACPH Concentration: 1.27 kmol/m3
4.3.3 Effect of Gas Flow Rate
In order to study the effect of gas velocity on the reactor performance, the gas
flow rate was varied from 30 Nl/h to 600 Nl/h. The conversion as well as rate of
hydrogenation was found to increase marginally with increase in gas velocity at 398 K
and 52 atm pressure, whereas the gas velocity was found to have almost no effect at
lower pressures at 398 K (Figure 4.13 and 4.14). This mild effect of gas velocity on the
rates indicates the low influence of the external mass transfer effects on the reactor
performance. In the case of up-flow reactor also, the inlet temperature of the catalyst bed
was found to be lower than the wall temperature at high gas velocities due to the heat
removal by the flowing gas and by solvent evaporation. The temperature distribution
inside the catalyst bed, predicted theoretically, at 398 K and 52 atm, for different gas
velocities is shown in Figure 4.15. In accordance with the temperature distribution and
gas velocities inside the reactor, the liquid velocity will also change along the catalyst
bed length. The model prediction on the variation in liquid velocity along the bed length
for various gas velocities at 398 K and 52 atm is given in Figure 4.16.

0 .00 0 .15 0 .30 0 .45 0 .60 0 .75
0
10
20
30
40
50
60
70
80
Experimental Predicted
20 atm 35 atm
52 atm
Con
vers
ion,
%
Ug (based on reactor inlet), m/s
Figure 4.13: Conversion at the Exit vs Gas Velocity at Different Pressures Reaction Conditions: Ul = 5.4 x10⁻⁴ m/s, Substrate Concentration: 1.27 kmol/m3, Wall Temperature: 398 K
0.0 0 .2 0 .4 0 .6 0 .8
0 .0
0 .5
1 .0
1 .5
2 .0
2 .5
3 .0
3 .5
4 .0 Experimental Predicted
20 atm 35 atm 52 atm
Rat
e of
hyd
roge
natio
n x1
03 , km
ol/m
3 /sec
Ug (based on reactor inlet), m/s
Figure 4.14: Variation of Rate of Hydrogenation with Gas Velocity at Different Pressures Reaction Conditions: Ul = 5.4 x10⁻⁴ m/s, Substrate Concentration: 1.27 kmol/m3, Wall Temperature: 398 K

.
0.0 0.2 0.4 0.6 0.8 1.0
386
388
390
392
394
396
398
400
402
404
U g x102 m/s
3.576
23.82
47.68
71.53
Tem
pera
ture
, K
Dimensionless axial length
Figure 4. 15: Temperature Distribution Along the Length of the Catalyst Bed for Various Gas Velocities at 52 atm Reaction conditions: Ul: 5.4 x10⁻⁴ m/s, Sub. Con.: 1.27 kmol/m3, Wall temperature: 398 K
0.0 0.2 0.4 0.6 0.8 1.0
0.0
0.6
1.2
1.8
2.4
3.0
3.6
4.2
4.8
5.4
U g x102 m/s
3.576
23.82
47.68
71.53Liq
uid
velo
city
x10
4 , m/s
Dimensionless axial length
Figure 4.16: Liquid Velocity Distribution Along the Length of the Catalyst Bed for Various Gas Velocities at 52 atm Reaction Conditions: Ul: 5.4 x10⁻⁴ m/s, Sub. Con.: 1.27 kmol/m3, Wall temperature: 398 K

4.3.4 Selectivity Behavior
The effect of various reaction parameters on the conversion of acetophenone and
the product selectivity to the two important products 1-phenylethanol and 1-
cyclohexylethanol determined are shown in Figures 4.17 to 4.20 along with theoretical
predictions, using the model developed for up-flow reactor. It was found that, under the
range of conditions studied, the major product found in the up-flow reactor was PHET
along with considerable amount of CHET and ETBE. At lower conversions of ACPH (~
35%), PHET selectivity was high (79 - 82%) and as the residence time of the liquid
increased, the selectivity towards CHET increased (~ 8% at a conversion of 25% and
18% at a conversion of 64%) as expected, since it was formed by the hydrogenation of
PHET. The formation of CHET was higher at higher pressures (12 and 25% for reactor
pressures 35 and 72 atm respectively at 423 K and at a liquid velocity of 5.4 x10⁻⁴m/s).
On increasing the reaction temperature, even though the selectivity to CHET increased,
the formation of the side product ETBE was also higher (13 and 25% selectivity to CHET
at 373 and 423 K respectively for a reactor pressure of 72 atm and at a liquid velocity of
5.4 x10⁻⁴m/s and the selectivity to ETBE under similar conditions were 1.4 and 8.2 %
respectively).
0.0005 0.0010 0.0015 0.0020 0.0025 0.00300
15
30
45
60
75
90
Converion of acph-exp Selectivity to phet-exp Selectivity to chet-exp Predicted
Con
vers
ion,
Sel
ectiv
ity, %
Liquid velocity, m/s
0.5 1.0 1.5 2.0 2.50
15
30
45
60
75
90
Converion of acph-exp
Selectivity to phet-exp
Selectivity to chet-exp
Predicted
Con
vers
ion,
Sel
ectiv
ity, %
Inlet acph concentration, kmol/m3
Figures 4.17, 4.18: Effect of Liquid Velocity and ACPH Concentration on Conversion of ACPH and Selectivity to PHET and CHET Figure 4.17: Reaction conditions: Temperature: 398 K, Reactor Pressure: 52 atm, Inlet ACPH Concentration: 1.27 kmol/m3, Gas Flow Rate: 30 Nl/hr Figure 4.18: Reaction conditions: Temperature: 398 K, Reactor Pressure: 52 atm, Ul = 5.4 x10⁻⁴ m/s, Gas Flow Rate: 30 Nl/hr

20 25 30 35 40 45 500
15
30
45
60
75
90
Converion of acph-exp Selectivity to phet-exp Selectivity to chet-exp Predicted
Con
vers
ion,
Sel
ectiv
ity, %
Reactor pressure, bar
370 380 390 400 410 420 4300
20
40
60
80
Converion of acph-exp
Selectivity to phet-exp
Selectivity to chet-exp
Predicted
Con
vers
ion,
Sel
ectiv
ity, %
Temperature, 0C
Figures 4.19, 4.20: Effect of Pressure and Temperature on Conversion of ACPH and Selectivity to PHET and CHET Figure 4.19: Reaction conditions: Temperature: 398 K, Ul = 5.4 x10⁻⁴ m/s, Inlet ACPH Concentration: 1.27 kmol/m3, Gas Flow Rate: 30 Nl/hr Figure 4.20: Reaction conditions: Reactor Pressure: 52 atm, Inlet ACPH Concentration: 1.27 kmol/m3, Ul = 5.4 x10⁻⁴ m/s, Gas Flow Rate: 30 Nl/hr On comparison of these results with TBR performance, it was found that under similar
reaction conditions, even though conversion of acetophenone was less in up-flow reactor,
the selectivity towards PHET was higher and selectivity to CHET was lower in the up-
flow reactor (~70 and 76% selectivity to PHET in TBR and up-flow respectively at 398
K, 52 atm reactor pressure and liquid velocity, 5.4 x10⁻⁴m/s and the corresponding
selectivity to CHET under similar conditions in the up-flow and down-flow mode were
13 and 16% respectively). This is expected, as the rate of hydrogenation is high in the
case of TBR reactor due to external catalyst partial wetting.
4.3.5 Comparison of Down-flow and Up-flow Performance
For comparing the performance of up-flow and down-flow mode of operations,
data at one temperature (398 K) was considered. On increasing the liquid velocity from
5.4 x10⁻⁴m/s to 2.36 x10⁻³m/s, it was found that the rate of hydrogenation increased
marginally (from 2.4 x10⁻³ to 2.8 x10⁻³kmol/m3/sec) for the up-flow mode whereas for
down-flow it decreased marginally (3.1 x10⁻³ to 2.7 x10⁻³m/s) (Figure 4.21). In the up-
flow mode, catalyst particles are completely covered by liquid, whereas in the trickle bed,
a significant partial wetting exists in the range of Ul studied. The higher rate for the
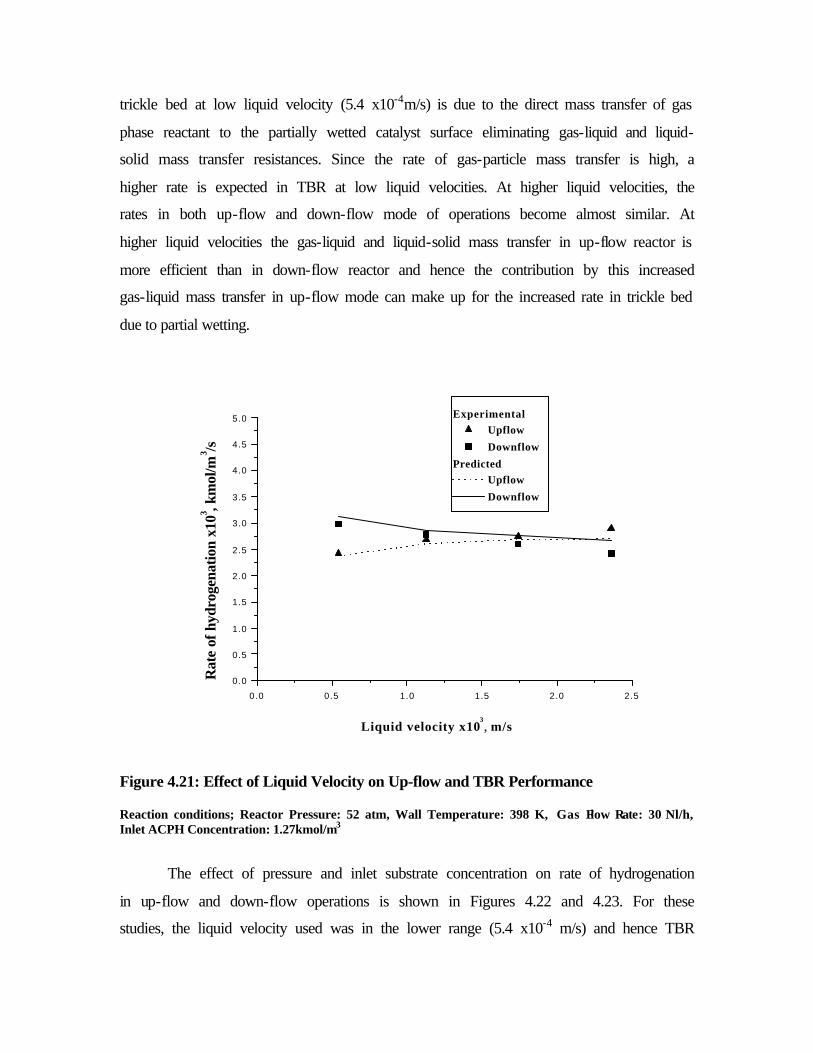
trickle bed at low liquid velocity (5.4 x10⁻⁴m/s) is due to the direct mass transfer of gas
phase reactant to the partially wetted catalyst surface eliminating gas-liquid and liquid-
solid mass transfer resistances. Since the rate of gas-particle mass transfer is high, a
higher rate is expected in TBR at low liquid velocities. At higher liquid velocities, the
rates in both up-flow and down-flow mode of operations become almost similar. At
higher liquid velocities the gas-liquid and liquid-solid mass transfer in up-flow reactor is
more efficient than in down-flow reactor and hence the contribution by this increased
gas-liquid mass transfer in up-flow mode can make up for the increased rate in trickle bed
due to partial wetting.
0.0 0.5 1.0 1.5 2.0 2.5
0.0
0.5
1.0
1.5
2.0
2.5
3.0
3.5
4.0
4.5
5.0 Experimental
Upflow
Downflow
Predicted
Upflow
Downflow
Rat
e of
hyd
roge
nati
on x
103 , k
mol
/m3 /s
Liquid velocity x103, m/s
Figure 4.21: Effect of Liquid Velocity on Up-flow and TBR Performance Reaction conditions; Reactor Pressure: 52 atm, Wall Temperature: 398 K, Gas Flow Rate: 30 Nl/h, Inlet ACPH Concentration: 1.27kmol/m3
The effect of pressure and inlet substrate concentration on rate of hydrogenation
in up-flow and down-flow operations is shown in Figures 4.22 and 4.23. For these
studies, the liquid velocity used was in the lower range (5.4 x10⁻⁴ m/s) and hence TBR

outperformed the up-flow reactor due to higher contribution by direct gas-solid mass
transfer for partially wetted catalysts.
0 1 0 2 0 3 0 4 0 5 0 6 0 7 0
0.0
0.5
1.0
1.5
2.0
2.5
3.0
3.5
4.0
4.5
5.0
5.5 Experimental
Upflow
Downflow
Predicted
Upflow
Downflow
Rat
e of
hyd
roge
nat
ion
x10
3 , km
ol/m
3 /s
Pressure, atm
Figure 4.22: Effect of Inlet ACPH Concentration on Up-flow and TBR Performance Reaction conditions: Ul: 5.4 x10⁻⁴ m/s, Inlet ACPH Concentration: 1.27kmol/m3, Wall Temperature: 398 K, Gas Flow Rate: 30 Nl/h
0.8 1.0 1.2 1.4 1.6 1.8 2.0 2.2 2.4 2.6
2.0
2.5
3.0
3.5
4.0 Experimental
Downflow
Upf low
Predicted
Downflow
Upf low
Rat
e of
hyd
roge
nat
ion
x10
3 , k
mol
/m3 /s
Inlet ACPH concentration, kmol/m3
Figure 4.23: Effect of Pressure on Up-flow and TBR Performance Reaction conditions: Ul : 5.4 x10⁻⁴ m/s, Gas Flow Rate: 30 Nl/h, Wall Temperature: 398 K, Reactor Pressure: 52 atm

The higher rate in TBR was also due to the higher temperature rise observed in TBR
compared to the up-flow reactor under similar reaction conditions. For example, the
temperature rise across the catalyst bed in a TBR for the reaction conditions: wall
temperature; 398 K, inlet ACPH concentration; 1.27 kmol/m3, pressure; 52 atm and
liquid velocity; 5.4 x10⁻⁴m/s was ~15 K whereas the corresponding temperature rise in an
up-flow reactor under identical condition was ~7 K. The low temperature rise in an up-
flow reactor can be attributed to the better heat dissipation due to higher liquid holdup.
In order to compare the effect of gas velocity on the reactor performance of both
up-flow and down-flow mode of operation, the change in rate of hydrogenation on
increasing the gas velocity from 35.4 x10⁻³ to 71.53 x10⁻² m/s (calculated based on
reactor inlet conditions) was considered and is shown in Figure 4.24. It can be seen that
the rates are higher in a trickle bed reactor, than in an up-flow reactor under identical
reaction conditions. In TBR, as the gas velocity was increased, more solvent got
vaporized and the liquid velocity came down leading to more catalyst getting exposed to
the gas phase and hence enhanced rate.
0.0 0.1 0.2 0.3 0.4 0.5 0.6 0.7 0.8
0
1
2
3
4
5
Experimental
Down-flow
Up-flow
Predicted
Down-flow
Up-flow
Rat
e of
hyd
roge
natio
n x1
03 , km
ol/m
3 /sec
Ug(based on reactor inlet), m/s
Figure 4.24: Effect of Gas Velocity on Rate of Hydrogenation in Up-flow and Down-Flow Mode of Operations Reaction Conditions: Ul (inlet of the reactor): 5.4 x10⁻⁴ m/s, Inlet ACPH Concentration: 1.27 kmol/m3, Wall Temperature: 398 K, Reactor Pressure: 52 atm

As shown in the earlier sections, temperature rise observed in an up-flow reactor
was considerably lower than the corresponding temperature rise in a TBR. The higher
temperature rise observed in a TBR can be due to the inefficient heat transfer across the
reactor wall due to liquid flow maldistribution. In an up-flow reactor due to the higher
liquid holdup, the heat transfer properties are more efficient and results in a better
dissipation of heat than in a TBR (the bed to wall heat transfer coefficient in a TBR for
reaction conditions: wall temperature; 398 K, inlet ACPH concentration; 1.27 kmol/m3,
pressure; 52 atm and liquid velocity; 5.4 x10⁻⁴ m/s was 0.07 kJ/m2/K/sec and the
corresponding value for the up-flow reactor under identical reaction conditions was 0.12
kJ/m2/K/sec). It can be concluded that in reactions were temperature plays a major role in
the selectivity distribution of the desired products and also in cases where there is a
chance of catalyst deactivation due to temperature rise, an up-flow reactor can be
preferred over a TBR due to its efficient heat removal properties.
4.3.6 Dynamic Behavior of Up-flow Reactor
In order to understand the dynamic behavior of the reactor in the startup period,
concentration and temperature profiles with time, before reaching steady state, was
investigated. Since the reactor was having provision for sampling only at the exit,
samples were taken at the exit every 2 minutes till reaching steady state and analyzed. In
order to explain the observed concentration and temperature profiles, a dynamic non-
isothermal three-phase heterogeneous model taking into consideration the axial mixing of
the liquid phase was developed. In an up flow reactor, since the catalysts are completely
wetted, for a more accurate prediction of the dynamic behavior of the reactor, an apparent
kinetics was made use of. The apparent kinetics of the reaction under conditions of
complete catalyst wetting was studied in a basket type of reactor in absence of external
mass transfer resistances (gas-liquid and liquid-solid mass transfer resistances). The
apparent kinetics trends observed were similar to that observed for the intrinsic kinetic
studies and hence the same model was used. The optimized rate constants represent the
product of intrinsic kinetic rate constants and the catalyst effectiveness factor; ηc. The
values of the rate parameters were obtained by optimization at three temperatures (373 K,
398 K and 423 K) and from its temperature dependency, the activation energies for the

rate constants and heat of adsorption for the corresponding adsorption constants were
determined and are given in Table 3.
Table 4.3: Rate Parameters and it's Temperature Dependency
Rate constants at 398K Activation
energy, kJ/mol
Adsorption
constants at 398 K
Heat of adsorption,
kJ/mol
k'1 = 4.67 x10⁻⁶
k'2 = 1.62 x 10⁻⁵
k'3 = 11.83x 10⁻⁵
k’4 = 1.59 x10⁻⁵
24.9
19.10
24.16
27.03
KBX = 12.27
K'BY = 4.24
KDX = 1.49
K’DY = 0.86
-2.9
-1.5
-3.6
-2.8
4.3.6.1 Reactor Model
4.3.6.1.1 Model Assumptions
1. Solvent vaporization effects were assumed to be negligible
2. The concentration variation of hydrogen in the gas phase along the length of
catalyst bed was negligible 2
3. At the catalyst bed inlet, the substrate solution was assumed to be saturated with
hydrogen.
4. The radial gradients for concentration as well as temperature were assumed to be
negligible.
5. The solid-liquid mass transfer resistance of liquid phase reactants and products
were neglected
6. The heat transfer resistance between the gas, liquid and catalyst phases was
assumed to be negligible and was assumed to exist at the same temperature.
7. The specific heat capacity of liquid phase components was assumed to be constant
through out the length of the catalyst bed.
4.3.6.1.2 Mass Balance
Hydrogen in liquid phase
)()( ,,,*,
2
,2
,sHlHpslHHBL
lHl
lHell
lHl CCakCCak
x
CU
x
CD
t
C−−−+
∂∂
−∂
∂=
∂∂
εε (4.5)

and HsHlHps RwCCak =− )( ,, (4.6)
For liquid phase components
ilI
llI
elllI
l Rwx
CU
x
CD
t
C+
∂∂
−∂
∂=
∂∂ ,
2
,2
, εε (4.7)
The mass balance in the dimensionless form for hydrogen can be written as
)]()1([ ,,,,
2
,2
,shlh
l
pslh
l
BLlhlh
l
l
l
llh CCU
LakC
U
Lak
z
C
z
C
PeL
U
t
C−−−+
∂∂
−∂
∂=
∂∂ ε
ε (4.8)
Where L
xz = and
*
,,
H
lhlh
C
CC =
For liquid phase components
]['
,
2
,2
,
l
ilhli
l
l
l
lli
U
RwL
z
C
z
C
PeL
U
t
C+
∂∂
−∂
∂=
∂∂ ε
ε (4.9)
Whereil
lIli B
CC
,
,, = and '
iR is the dimensionless rate of formation of component i.
Boundary conditions
For both hydrogen and liquid phase components
At z=0, )( ,, inletilielli CCP
z
C−=
∂∂
ε (4.10)
At z=1, 0=
∂∂
z
C i (4.11)
4.3.6.1.3 Heat Balance
For liquid phase
( )Wl
R
iil
lPlll
ll
lPll TTV
AhRH
x
TCU
x
T
x
TC −−∆−
∂∂
−∂∂
=∂∂ ∑,2
2
, ρλρε (4.12)
This can be written in the dimensionless form as,

( )
−Θ−∆−
∂Θ∂
−∂
Θ∂=
∂Θ∂ ∑ 1
,
'
,2
2
,l
RlPll
wii
IlPll
ll
lPll
l
l
Ll
VCU
ALURH
TCU
L
zzLCUL
U
t ρρρλ
ε (4.13)
Boundary conditions
At z =0, ( )lL
Pllll LCU
zΘ−=
∂Θ∂
1λρ
(4.14)
At z=1, 0=∂Θ∂z
l (4.15)
The set of partial differential equations were converted to ordinary differential equations
by discretization of spatial derivatives using finite difference and solved using LSODE.18
The correlations used for determining various reaction parameters are same as in Table 2.
The un-steady state performance of the reactor for the present system was studied
for few experiments. The distribution of ACPH, PHET and temperature along the length
of the bed under transient conditions is shown in the Figures 4.25 to 4.27. It was found
that the steady state was reached in 7-8 minutes. At the initial condition, it was assumed
that the reactor was saturated with the substrate before the starting of the reaction. Since
the concentration as well as temperature gradients were not steep at any point inside the
reactor the number of grid points N = 10 was found to explain the observed concentration
as well as temperature profile. The variation of concentration of various liquid phase
components at the outlet with varying reaction time is shown in the Figure 4.28 and was
found to agree well with the model predictions.
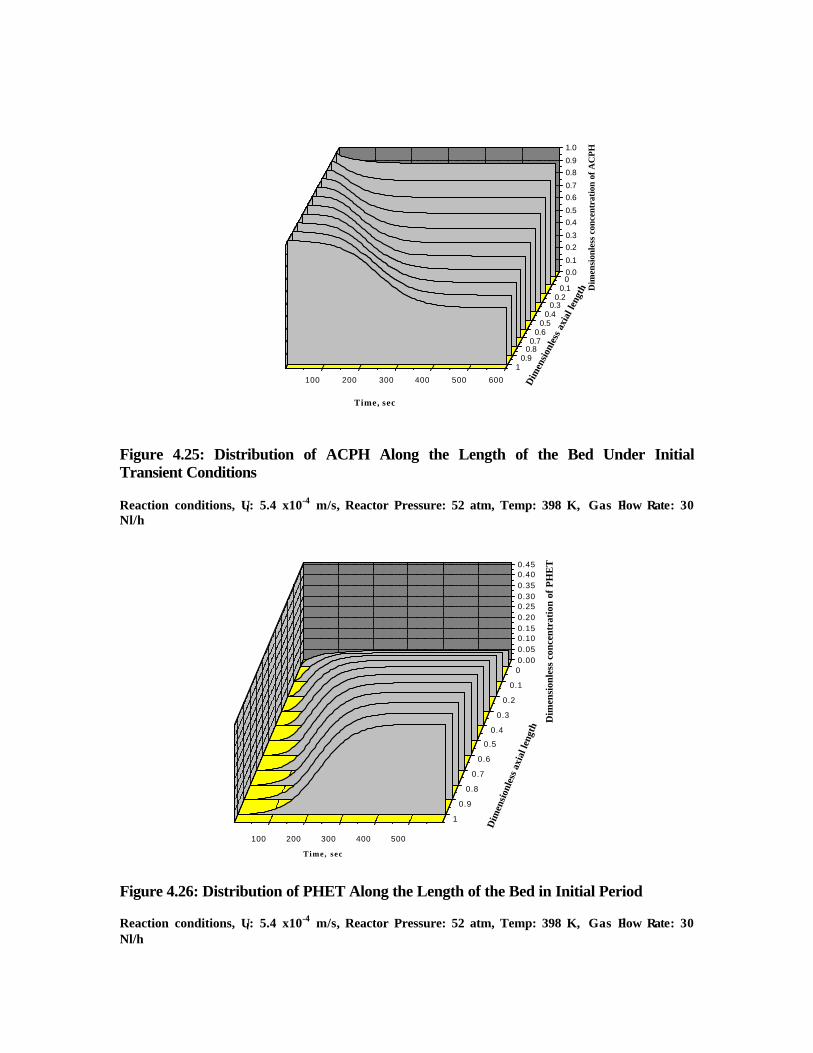
100 200 300 400 500 600
0.0
0.1
0.2
0.3
0.4
0.5
0.6
0.7
0.8
0.9
1.0
00.1
0.20.3
0.40.5
0.60.7
0.80.9
1
Dim
ensi
onle
ss a
xial
leng
th
Time, sec
Dim
ensi
onle
ss c
once
ntra
tion
of
AC
PH
Figure 4.25: Distribution of ACPH Along the Length of the Bed Under Initial Transient Conditions Reaction conditions, Ul: 5.4 x10⁻⁴ m/s, Reactor Pressure: 52 atm, Temp: 398 K, Gas Flow Rate: 30 Nl/h
100 200 300 400 500
0.000.050.100.150.200.250.300.350.400.45
0
0.1
0.2
0.3
0.4
0.5
0.6
0.7
0.8
0.9
1
Time, sec
Dim
ensi
onle
ss a
xial
leng
th
Dim
ensi
onle
ss c
once
ntra
tion
of
PH
ET
Figure 4.26: Distribution of PHET Along the Length of the Bed in Initial Period Reaction conditions, Ul: 5.4 x10⁻⁴ m/s, Reactor Pressure: 52 atm, Temp: 398 K, Gas Flow Rate: 30 Nl/h

100 200 300 400 500 600
398
399
400
401
402
00.1
0.2
0.3
0.40.5
0.6
0.70.8
0.9
1
Time, sec
Dim
ensio
nles
s axia
l len
gth
Tem
pera
ture
, K
Figure 4.27: Distribution of Temperature Along the Length of the Bed Under Initial Transient Conditions Reaction conditions, Ul: 5.4 x10⁻⁴ m/s, Reactor Pressure: 52 atm, Temp: 398 K, Gas Flow Rate: 30 Nl/h
0 1 0 0 2 0 0 3 0 0 4 0 0 5 0 0 6 0 0
0.0
0.1
0.2
0.3
0.4
0.5
0.6
0.7
0.8
0.9
1.0
Experimental Predicted
ACPH
PHET
C H M K
CHET
ETBE
Dim
ensi
onle
ss c
once
ntr
atio
n a
t th
e ex
it
Time, sec
Figure 4.28: Distribution of Various Liquid Phase Components at the Exit of the Reactor Reaction conditions, Ul: 5.4 x10⁻⁴ m/s, Reactor Pressure: 52 atm, Temp: 398 K, Gas Flow Rate: 30 Nl/h
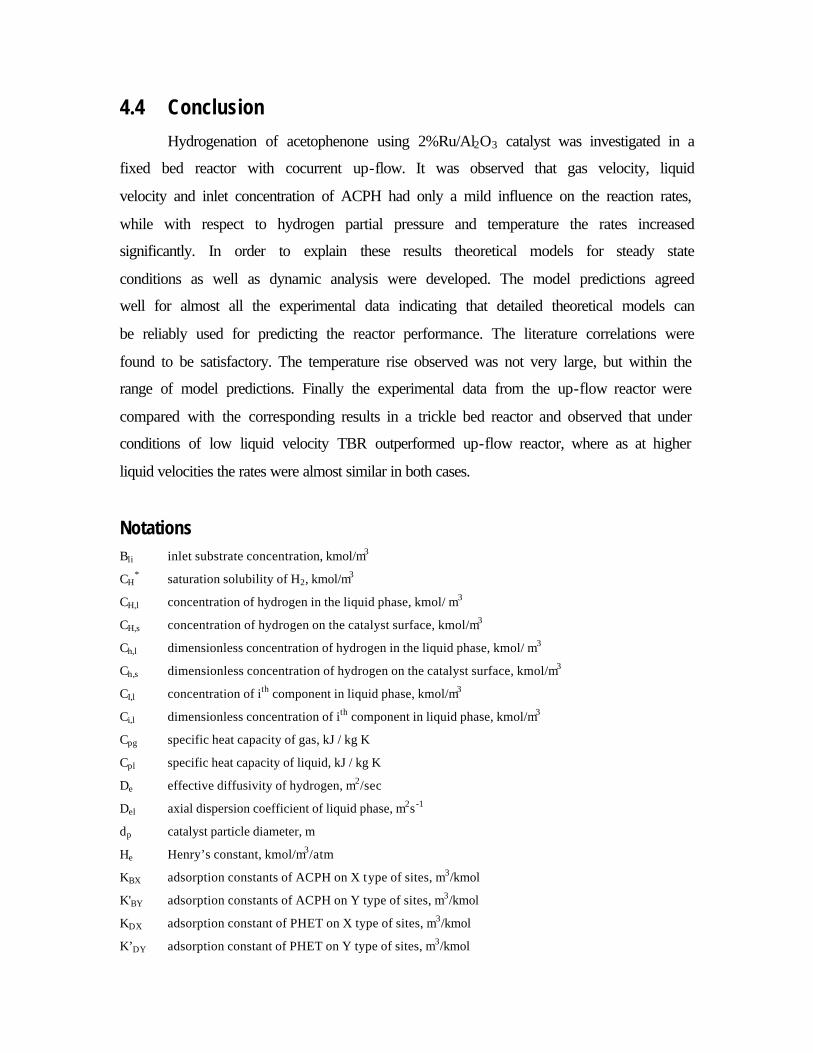
4.4 Conclusion
Hydrogenation of acetophenone using 2%Ru/Al2O3 catalyst was investigated in a
fixed bed reactor with cocurrent up-flow. It was observed that gas velocity, liquid
velocity and inlet concentration of ACPH had only a mild influence on the reaction rates,
while with respect to hydrogen partial pressure and temperature the rates increased
significantly. In order to explain these results theoretical models for steady state
conditions as well as dynamic analysis were developed. The model predictions agreed
well for almost all the experimental data indicating that detailed theoretical models can
be reliably used for predicting the reactor performance. The literature correlations were
found to be satisfactory. The temperature rise observed was not very large, but within the
range of model predictions. Finally the experimental data from the up-flow reactor were
compared with the corresponding results in a trickle bed reactor and observed that under
conditions of low liquid velocity TBR outperformed up-flow reactor, where as at higher
liquid velocities the rates were almost similar in both cases.
Notations Bli inlet substrate concentration, kmol/m3
CH* saturation solubility of H2, kmol/m3
CH,l concentration of hydrogen in the liquid phase, kmol/ m3
CH,s concentration of hydrogen on the catalyst surface, kmol/m3
Ch,l dimensionless concentration of hydrogen in the liquid phase, kmol/ m3
Ch,s dimensionless concentration of hydrogen on the catalyst surface, kmol/m3
CI,l concentration of ith component in liquid phase, kmol/m3
Ci,l dimensionless concentration of ith component in liquid phase, kmol/m3
Cpg specific heat capacity of gas, kJ / kg K
Cpl specific heat capacity of liquid, kJ / kg K
De effective diffusivity of hydrogen, m2/sec
Del axial dispersion coefficient of liquid phase, m2s -1
dp catalyst particle diameter, m
He Henry’s constant, kmol/m3/atm
KBX adsorption constants of ACPH on X type of sites, m3/kmol
K'BY adsorption constants of ACPH on Y type of sites, m3/kmol
KDX adsorption constant of PHET on X type of sites, m3/kmol
K’DY adsorption constant of PHET on Y type of sites, m3/kmol

ki' rate constant for corresponding reaction step in simplified reaction scheme, (m3/kg)(m3/kmol/sec)
kLaB gas-liquid mass transfer coefficient, s -1
ksap liquid-solid mass transfer coefficient, s -1
L Catalyst bed length
PeL Peclet number, el
l
D
UL
2HP hydrogen partial pressure, atm
qB stoichiometric coefficient, Bli / CA*
R catalyst pellet radius, m
Re’L dimensionless liquid Reynolds number, )1( BL
PLL dUεµ
ρ−
ReL liquid Reynold’s number, L
PdLµ
RH2 rate of hydrogenation, kmol/m3/sec
RI rate of corresponding steps as shown in simplified reaction scheme
Scl Schmidt number, le
L
D ρµ
Tl temperature of liquid phase, K
Tw temperature of the wall, K
Ug superficial gas velocity, m/s
Ul superficial liquid velocity, m/s
Uw bed to wall heat transfer coefficient, kJ/m2/K/sec
W weight of catalyst, kg/m3
x axial distance of the catalyst bed, m
z dimensionless axial distance
εB bed porosity
θ dimensionless temperature
ρg density of gas, kg/m3
∆Hi heat of reaction per mole of hydrogen for the step i in the simplified reaction scheme, kJ/mol
ρ l density of liquid, kg/m3
εl liquid holdup
ρp catalyst pellet density, kg/m3
∆P/Z pressure drop, Pa, m-1
µ viscosity of liquid, Pa s

References 1. Hofmann H. P., Multi phase catalytic packed-bed reactors, Catal. Rev.-Sci. Eng., 17(1), 71-117, 1978
2. Ramachandran P. A., and Chaudhari R. V., ‘Three phase catalytic reactors’, Gorden breach science
publishers, New York, (1983)
3. Shah Y.T., Gas-Liquid-Solid reactor design, McGraw-Hill, New York (1979)
4. Mochizuki S. and Matsui T., Selective hydrogenation and mass transfer in a fixed bed catalytic reactor
with gas-liquid concurrent upflow, AIChE J., 22 (5), 904, 1976
5. Herrmann U. and Emig G., Liquid phase hydrogenation of maleic anhydride to 1-4, butanediol in a
packed bubble column reactor, Ind. Eng. Chem. Res., 37, 759 1998
6. Van Gelder K. B., Damhof J. K., Krouenga P. J. and Westertrep K. R., Three phase packed bed reactor
with an evaporating solvent I: Experimental: The hydrogenation of 2,4,6 - trinitrotoluene in methanol ,
Chem. Eng. Sci., 45, 3159, 1990
7. Van Gelder, K. B., Borman P. C., Weenink R. E. and Westertrep K. R., Three phase packed bed reactor
with an evaporating solvent II: Modelling the reactor, Chem. Eng. Sci., 45, 3171, 1990
8. Wind et al. Upflow versus downflow testing of hydrotreating catalysts. Applied Catalysis. 43, 239, 1988
9. Goto S. and Mabuchi K., Oxidation of ethanol in gas-liquid cocurrent up-flow and downflow reactors,
Can. J. Chem. Eng., 62, 865, 1984
10. Mills P. L., Beaudry E. G. and Dudukovic M. P., Comparison and prediction of reactor performance for
packed beds with two-phase flow : downflow, upflow and countercurrent flow, I. Chem. Eng. Symp. Ser.,
87, 527, 1984
11. Leung P., Zorrillla C., Recasens F. and Smith J.M., Hydration of isobutene in liquid-full and trickle bed
reactors , AIChE J., 32 (11), 1839, 1986
12. Reiss L. P., Cocurrent Gas-Liquid contacting in packed columns, Ind. Eng. Chem. Proc. Des. Dev., 6,
486, 1967
13. Turpin J. L., Huntington R. L., Prediction of pressure drop for two-phase, two-component concurrent
flow in packed beds, AIChE J., 13, 1196, 1967
14. Specchia V., Baldi G. and Gianetto A., Solid-Liquid mass transfer in cocurrent two-phase flow packed
beds, Ind. Eng. Chem. Proc. Des. Dev., 17, 362, 1978
15. Wilke C. R. and Chang P., Correlation of diffusion co-efficients in dilute solutions, AIChE J., 1, 264,
1955
16. Stiegel G. J., and Shah Y. T., Backmixing and liquid holdup in a gas-liquid cocurrent upflow packed
bubble column, Ind. Eng. Chem. Proc. Des. Dev., 16, 37, 1977
17. Sokolov V. N., Yablokova M. A. and Krylov V. N., Heat transfer to the wall in a gas-liquid reactor with
stationary granular bed, J. Appl. Chem. USSR (Zh. Khim.), 56, 554, 1983
18. Hindmarsh A., ODEPACK, a systematized collection of collection of ODE solvers. In scientific
Computing edited by Stepleman J.S. et al., IMACS North-Holland, Amstredam, 1983

Chapter – 5
Hydrogenation of Acetophenone Using Supported
Ruthenium Catalysts: Activity-Selectivity Studies

5.0 Introduction
As seen in Chapter 1, Section 1.1, most of the works on acetophenone
hydrogenation are patented and detailed investigations on various aspects that influence
the reaction rates and selectivity of this industrially important reaction system are scarce.
Even though many catalysts exist for the selective hydrogenation of ACPH to PHET, the
literature on selective synthesis of 1-cyclohexylethanol reveals that the catalysts mainly
used are rhodium-based catalysts. The potential of ruthenium as an alternative catalyst
has not been exploited despite the fact that ruthenium is much cheaper than other
transition metal catalysts like rhodium, palladium and platinum. In this chapter, a detailed
investigation on the hydrogenation of acetophenone using supported Ru catalysts has
been reported. The influence of various parameters like solvents, catalyst activation
temperature, metal loading, supports and method of catalyst preparation on activity and
selectivity are investigated. Also, the effect of various promoters on the activity and
selectivity has been studied. Screening of various supported transition metal catalysts was
also done. Conditions were optimized to get selective formation of PHET and CHET with
high reaction rates. The various supported Ru catalysts were characterized using surface
characterization techniques like BET surface area measurements, XRD, XPS and TEM.
5.1 Experimental
The hydrogenation experiments were carried out in semi-batch slurry reactor, the
details of which along with experimental procedure and the analytical details are given in
Chapter-2, Section 2 (A). 1.3.
5.1.1 Preparation of Supported Ruthenium Catalysts: Precipitation Method
Required amount of support was charged along with distilled water and the slurry
was stirred for 2 hrs in a round bottom flask fitted with a half moon stirrer, condenser and
an addition funnel in a water bath maintained at ~ 368 K. Required amount of ruthenium
trichloride dissolved in distilled water was added drop wise. After stirring for three hours,
aqueous ammonia solution was added drop wise to the stirring solution until the solution
became strongly alkaline (PH = ~10) to precipitate RuCl3 as ruthenium hydroxide. The
solution was then allowed to stir for 3-4 hrs. The contents were then filtered, washed
using hot distilled water and dried in an oven at 393 K for 8 hrs and then activated at 573
K for 7 hrs under hydrogen flow. After activation, the catalyst was brought to room
temperature, flushed with nitrogen and used for reaction.
5.1.2 Preparation of Supported Ruthenium Catalyst by Impregnation Method
Known amount of support was dispersed in a solvent used for impregnation and the
suspension was stirred for 3 hrs. Required amount of ruthenium trichloride dissolved in
the same solvent was added drop wise to the suspension using an addition funnel. After
addition was complete, the solution was stirred for 4 hrs more and then the solvent was
evaporated in a rotavapor with a high rotation speed. The catalyst precursor thus
impregnated on the support was dried in an oven at 393 K for 7 hrs and then activated at
573 K for 7 hrs under hydrogen flow. After activation, the catalyst was brought to room
temperature and flushed with nitrogen and used for reaction. The solvents used for
impregnation were water and ethanol.
5.1.3 Preparation of Palladium Supported on Carbon Catalyst
For the preparation of 3% Pd/C, a solution of palladium (II) chloride in HCl (1 N)
was obtained by warming for 2 hrs. This solution was added drop-wise to a stirred hot
(353K) suspension of activated charcoal in water and stirred for 5-6 hrs until the
supernatant solution became colorless. Formaldehyde was then added, followed by 30%
NaOH solution sufficient to make the suspension strongly alkaline and kept under stirring
for 2-3 hrs. The catalyst was then filtered, washed with distilled water (until the pH
became neutral) and dried under vacuum at 333 K.
5.1.4 Preparation of Ni Supported on Carbon Catalyst
A slurry of activated carbon in water was stirred for 2 hrs in a round bottom flask
fitted with half moon stirrer, condenser and an addition funnel in a water bath maintained
at ~ 368 K. To this, aqueous solution of Ni (NO3) 2.6H2O was added drop wise. After
stirring for 5 hrs, 10% ammonium carbonate solution was added drop wise and the
addition continued till a pH value of 10 was attained and the stirring was continued for 2

hrs. The slurry was filtered to obtain a black cake and the colorless filtrate confirmed the
complete precipitation of Ni as Ni carbonate. The cake was dried overnight at 393 K and
calcined in activation furnace at 673 K under N2 flow for 10 hrs. The calcined catalyst
was then reduced under H2 flow at 773 K for 10 hrs. The catalyst was passivated under
N2 flow for 2 hrs before using for hydrogenation.
3%Rh/C used in this study was procured from Degussa, Germany.
5.1.5 X-Ray Photoelectron Spectroscopy
The X-Ray Photoelectron Spectroscopy (XPS) measurements were carried out on
a VG MicroTech ESCA 3000 instrument using un-monochromatized Mg Kα radiation
(photon energy = 1253.6 eV) at a pass energy of 50 eV and electron takeoff angle (angle
between electron emission direction and surface plane) of 60o. The overall resolution was
~ 1 eV for the XPS measurements. The sample was placed in a container and mounted on
the sample probe. The sample was subjected to evacuation at 10-8 torr during data
collection. C1S spectra was used as a reference with a binding energy value of 284.6 eV
and the spectra of different samples were corrected for surface charging.
5.1.6 X-Ray Diffraction
The XRD analysis of the catalyst samples were carried out on Philips model No.
1730 using Ni filtered Cu Kα radiation and a proportional counter detector at a scan rate
of 40/min. The samples were placed in geometrically equal holders having the same
weight and were uniformly prepared.
5.1.7 Transmission Electron Microscopy
The TEM measurements were carried out on a Jeol Model 1200EX instrument
operated at an accelerating voltage of 120 kV. The catalyst powder was dispersed in
isopropyl alcohol and the suspension was deposited on a copper grid.

5.2 Results and Discussion
Studies were carried out to investigate the effect of different parameters that affect
the rate of hydrogenation and selectivity distribution of products in the hydrogenation of
acetophenone. The activity of a particular catalyst was evaluated in terms of turn over
frequency, defined as:
12 ,.
. −
×= hr
hoursintimecatalystofmolesofNo
consumedHofmolesofNoTOF
The conversion of the substrate was calculated as:
100% ×−
=substrateofionconcentratInitial
substrateofionconcentratFinalsubstrateofionconcentratInitialConversion
The selectivity towards a particular product was defined as:
100.
.% ×=
convertedsubstrateofmolesofNo
formedproductofmolesofNoySelectivit
5.2.1 Catalyst Characterization 5.2.1.1 XPS Measurements
XPS spectra of the 2%Ru/Al2O3 catalyst activated at 373 K and 573 K and the
non-activated catalysts were recorded and the peaks observed at different binding
energies were used to interpret the nature of the catalysts and other species present on the
catalyst surface. The various peaks observed in different ranges and the corresponding
binding energy values are given in Figures 5.1 – 5.5. The binding energy (B.E) peaks
present at ~74 eV correspond to Al in Al2O3 (Figure 5.1). For the catalysts activated at
higher temperature, there was a slight shift in the maxima towards the higher B.E. This
can be attributed to the loss of water of hydration present as Al2O3.nH2O to Al2O3. As
shown in Figure 5.2, the binding energy values ~200 eV show the presence of residual
chlorine present and the peaks correspond to Cl 2p. The increase in intensity of the
chloride peaks at higher temperature can be due to the segregation of chloride ions on the

surface at higher temperatures. The residual chlorine remaining on the catalyst surface is
in the unreacted form.
40 50 60 70 80
0
5000
10000
15000
20000
25000
30000
35000
40000
activated at 573K
activated at 373K
not activatedInte
nsity
B.E., eV
Figure 5.1: XPS Peaks Corresponding to Al in Al2O3
185 190 195 200 205
10000
10500
11000
11500
12000
12500
13000
13500
activated at 573K
activated at 373K
Not activated
Inte
nsity
B.E., eV
Figure 5.2: XPS Peaks Corresponding to Chlorine Present on the Catalyst Surface

270 275 280 285 290 295 300
10000
12000
14000
16000
18000
20000
22000
24000
activated at 573K
activated at 373K
Not activated
Inte
nsity
B.E., eV
Figure 5.3: XPS Peaks Corresponding to Ru 3d3/2 - 5/2 and C 1s The XPS peak corresponding to Ru 3d5/2 binding energy come in the region 279-282 eV
(Figure 5.3) and the value of 279.2 eV can be assigned to Ru0, 279.8 eV to Ru in RuO2
and 281.8 eV corresponds to Ru in RuO3.1 It was concluded that the amount of RuO3 was
very less in all the three catalysts. The amount of RuO2 present in the non-activated
catalyst was found to be very high. For catalysts activated under hydrogen atmosphere at
higher temperatures, a peak at 279.2 was observed which was more pronounced for the
catalyst activated at 573 K. Tsisun et al.2 have found that treatment of supported
ruthenium catalyst at 573 K under hydrogen atmosphere will result in 70% Ru reduction.
The Ru 3d3/2 component is hidden by C 1s peak from the hydrocarbon contaminant in the
spectrometer. Another characteristic ruthenium peak corresponding to Ru 3p3/2 comes in
the region of 462-465 eV (Figure 5.4). The binding energy values of Ru 3p3/2 was found
to be 465.3, 464.6 and 463 eV corresponding to the catalyst which was non-activated,
activated at 373 K and that activated at 573 K, respectively showing a change in the
oxidation state. This was in accordance with trend observed by Tsisun et al.2

459 462 465 468 471 474
16500
17000
17500
18000
18500
19000
19500
20000
20500
activated at 573K
activated at 373K
Not activated
Inte
nsity
B.E., eV
Figure 5.4: XPS Peaks for Ru 3P3/2
525 530 535 540
0
40000
80000
120000
160000
200000
240000 activated at 573K
activated at 373K
Not activated
Inte
nsity
B.E., eV
Figure 5.5: XPS Peaks for Oxygen Present in Al2O3

The peak observed at ~532.0 eV in the spectrum (Figure 5.5) corresponds to the oxygen
present in the support, Al2O3, for non-activated catalyst and a slight increment in binding
energies with increase in activation temperatures can be attributed to the loss of hydroxyl
groups at high temperatures. In conclusion, in all the samples, Al2O3 remains as the same
with no change in the structure. Only Ru is undergoing a change in oxidation states with
increase in temperature.
The XPS spectra of catalysts prepared by impregnation technique followed by
activation at 573 K under hydrogen atmosphere (Figure 5.6) showed similar XPS spectra
of characteristics Ru peaks in the range of 263 –266 eV.
459 460 461 462 463 464 465 466 467 468
35000
36000
37000
38000
39000
40000
41000
42000
43000
Impregnation - water as solvent
Impregnation - ethanol as solvent
Inte
nsity
B.E., eV
Figure 5.6: XPS of Ru Catalysts Prepared by Impregnation Method Using Ethanol and Water as the Impregnation Solvents
5.2.1.2 XRD measurements
The XRD spectra of γ-alumina, 2%Ru/Al2O3 and 5% Ru/Al2O3 are shown in
Figures 5.7, 5.8 and 5.9. The spectra of γ-alumina and 2%Ru/Al2O3 were identical
indicating that the peaks corresponding to Ru are not detected at 2% metal loading. Even
at a slower scanning rate of 0.20/min, Ru peaks were not detected for 2% Ru loading. The
spectra of 5% Ru/Al2O3 showed the characteristic Ru peaks indicating that the XRD
patterns are detectable only at higher metal loadings.

Figure 5.7: The XRD Spectra of γγ -alumina
Figure 5.8: The XRD Spectra of 2%Ru/Al2O3
Figure 5.9: The XRD Spectra of 5%Ru/Al2O3

The characteristic Ru peaks were observed at 2θ values of 43.890 (100% Intensity) and
42.190 (32% intensity) corresponding to Ru 101 and 002 planes. Alumina peaks
overlapped the peak at a 2θ value of 38.380 corresponding to Ru 101 plane. The absence
of peaks corresponding to RuO2 species confirmed that most of the Ru species existed in
Ru0 state.
5.2.1.3 Transmission Electron Micrographs
The TEM micrograph for the 2%Ru/Al2O3 catalyst prepared by precipitation
technique is shown in Figure 5.10. Metal clusters on the support were not in uniform size
and some of the agglomerates were of bigger size in the range of ~30 nm, where as
smaller metal clusters of ~10-12 nm were also present. The TEM micrographs of the
2%Ru/Al2O3 catalyst prepared using ethanol as the impregnation solvent were more
uniform in size and bigger clusters were not found. The sizes of the clusters observed
varied from 9 – 16 nm as shown in Figure 5.11.
Figure 5. 10: TEM Photographs of 2%Ru/Al2O3 Catalyst Prepared by Precipitation
Technique

Figure 5. 11: TEM Photographs of 2%Ru/Al2O3 Catalyst Prepared by Impregnation Technique 5.2.2 Solvent Effects
In order to study the influence of solvents on the reaction rates and selectivity
distribution, various polar alcoholic and non-polar hydrocarbon solvents were screened.
In polar solvents, C1-C6 alcohols were screened and the reaction rates calculated in terms
of TOF are given in Figure 5.12. It was observed that ethanol, isopropanol and 1-heptanol
gave the highest rates of hydrogenation. The conversion and selectivity distribution when
different alcohols were used as solvents is given in Table 5.1. It was observed that with
methanol as the solvent the formation of CHMK was low (~15%), whereas it was one of
the major products with higher alcohols (~36% with iso-propanol) as solvents. Since
almost all the studies reported in earlier chapters were done with methanol as the solvent,
PHET was considered as the major intermediate for the formation of CHET from ACPH
and this is true as the percentage of PHET formed was very high in methanol (~58% at
40% conversion), whereas that of CHMK was low (~15%).

M e O H EtOH i -PrOH 1-BuOH 1-PeOH 1-HeOH0
500
1000
1500
2000
2500
TO
F, h
r-1
Solvent
Figure 5.12: Effect of Alcoholic Solvents on TOF Based on Consumption of Hydrogen Reaction Conditions: Catalyst: 2%Ru/Al2O3 (prepared by precipitation method), ACPH Concentration: 0.841 kmol/m3, Temp: 398 K, PH2: 47.6 atm, Cat. Wt.: 3 kg/m3, Reaction Time: 2 hrs
Table 5.1: Conversion and Selectivity with Various Alcoholic Solvents
Selectivity, % Solvent Conversion,
% CHMK PHET CHET ETBE
MeOH 70.65 15.30 42.97 15.14 26.58
EtOH 99.55 28.69 5.91 55.66 9.74
i-PrOH 98.31 35.83 6.46 51.99 5.72
1-BuOH 70.53 30.59 34.45 31.46 3.50
1-PeOH 85.85 33.83 16.20 38.37 11.60
1-HepOH 98.56 36.27 11.01 50.57 2.25
Reaction Conditions: Catalyst: 2%Ru/Al2O3 (Prepared by Precipitation Method), ACPH Concentration: 0.841 kmol/m3, Temp: 398 K, PH2: 47.6 atm, Cat. Wt.: 3 kg/m3, Reaction Time: 2 hrs

Since the formation of CHMK was high (28-36%) when higher alcohols were used as
solvents, it was concluded that the alkyl group of the solvents played an important role in
determining the reaction intermediates for the formation of CHET from ACPH. The
concentration-time profiles when methanol, ethanol and iso-propanol were used as
solvents are given in Figures 5.13 – 5.15. With ethanol and iso-propanol as the solvents,
the CHMK formation was much higher than that with methanol. In order to compare and
understand the main intermediates contributing to the formation of CHET from ACPH,
when different alcohols were used as solvents, the selectivity towards the formation of
PHET and CHMK at 40% conversion of acetophenone was considered and plotted along
with the dielectric constant corresponding to each alcohol (Figure 5.16). With methanol
as the solvent, the selectivity towards CHMK was only 17% and with ethanol it was 27%.
For higher alcohols it was observed that both PHET and CHMK were contributing almost
equally for the formation of CHET (35-40% of both PHET and CHMK).
0 20 40 60 80 100 120
0.0
0.1
0.2
0.3
0.4
0.5
0.6
0.7
0.8
0.9
ACPH
C H M K
PHET
CHET
ETBE
Con
cent
ratio
n, k
mol
/m3
Time, min
Figure 5.13: Concentration – Time Profile with Methanol as Solvent Reaction Conditions: Catalyst: 2%Ru/Al2O3 (Prepared by Precipitation Method), ACPH Concentration: 0.841 kmol/m3, Temp: 398 K, PH2: 47.6 atm, Cat. Wt.: 3 kg/m3, Reaction Time: 2 hrs

0 20 40 60 80 100 120
0.0
0.1
0.2
0.3
0.4
0.5
0.6
0.7
0.8
0.9 ACPH
CHMK
PHET
CHET
ETBEC
once
ntra
tion
, km
ol/m
3
Time, min
Figure 5.14: Concentration – Time Profile with Ethanol as Solvent Reaction Conditions: Catalyst: 2%Ru/Al2O3 (Prepared by Precipitation Method), ACPH Concentration: 0.841 kmol/m3, Temp: 398 K, PH2: 47.6 atm, Cat. Wt.: 3 kg/m3, Reaction Time: 2 hrs
0 20 40 60 80 100 120
0.0
0.1
0.2
0.3
0.4
0.5
0.6
0.7
0.8
0.9
ACPH
CHMK
PHET
CHET
ETBE
Con
cent
rati
on, k
mol
/m3
Time, min
Figure 5.15: Concentration – Time Profile with i-Propanol as Solvent Reaction Conditions: Catalyst: 2%Ru/Al2O3 (Prepared by Precipitation Method), ACPH Concentration: 0.841 kmol/m3, Temp: 398 K, PH2: 47.6 atm, Cat. Wt.: 3 kg/m3, Reaction Time: 2 hrs

MeOH EtOH i-PrOH 1-BuOH 1-PeOH 1-HeOH0
10
20
30
40
50
60
70
80
90
100
Die
lect
ric
cons
tant
CHMK
PHET
Sele
ctiv
ity,
%
Solvent
12
16
20
24
28
32
36
Dielectric Constant
Figure 5.16: Selectivity to CHMK and PHET at 40% Conversion when Different Alcoholic Solvents were Used Reaction Conditions: Catalyst: 2%Ru/Al2O3 (Prepared by Precipitation Method), ACPH Concentration: 0.841 kmol/m3, Temp: 398 K, PH2: 47.6 atm, Cat. Wt.: 3 kg/m3
With lower alcohols, the higher selectivity to PHET can be explained on the basis of
inhibition of ring hydrogenation by polar solvent molecules and has a correlation with
dielectric constant of the solvent.3 The polar solvent molecules surrounding the catalyst
particles inhibit the less polar aromatic ring from getting adsorbed on the catalyst surface,
whereas the adsorption of polar ketone moiety is favored. From the values of dielectric
constant for alcoholic solvents given in Figure 5.16, it is seen that for higher alcohols, the
dielectric constant values are low and hence higher formation of CHMK. Another
important conclusion made was that the formation of the side product ethyl benzene was
higher (~26% at 71% conversion) when methanol was used as the solvent (See Table
5.1). With ethanol even though the formation of ethyl benzene was considerable, while
with higher alcoholic solvents its formation was comparatively low (5-10%). This is
expected, as with higher alcohols, the formation of PHET is lower and hence ETBE
formation was also low.

When non-polar hydrocarbons were used as the solvents, the reaction rates were
higher compared to that of methanol and were in the range of rates observed with ethanol
and isopropanol as solvents as shown in Figure 5.17.
i-dodecane cyclohexane n-hexane n-decane0
500
1000
1500
2000
2500
TO
F, h
r-1
Solvent
Figure 5.17: Effect of Non-Polar Solvents on Reaction Rate Reaction Conditions: Catalyst: 2%Ru/Al2O3 (Prepared by Precipitation Method), ACPH Concentration: 0.841 kmol/m3, Temp: 398 K, PH2: 47.6 atm, Cat. Wt.: 3 kg/m3, Reaction Time: 2 hrs
The rate behavior observed with hydrocarbon solvents was in accordance with hydrogen
solubility in these solvents. These solvents were also found to be excellent for the
selective hydrogenation of acetophenone to 1-cyclohexylethanol (Table 5.2). With these
solvents, the amount of PHET formed (2-16%) during the reaction course was very low
in comparison with CHMK (~60%) formation. Another noticeable feature when non-
polar hydrocarbons were used as the solvents was the low formation of the side product
ethyl benzene (2-4%). Since ETBE is formed from PHET by dehydration (to give
styrene) followed by subsequent hydrogenation of the styrene the low formation of PHET
during the reaction course lead to the low formation of ETBE. Thus, a non-polar
hydrocarbon solvent can be used for the selective formation of 1-cyclohexylethanol from
acetophenone with high reaction rates.
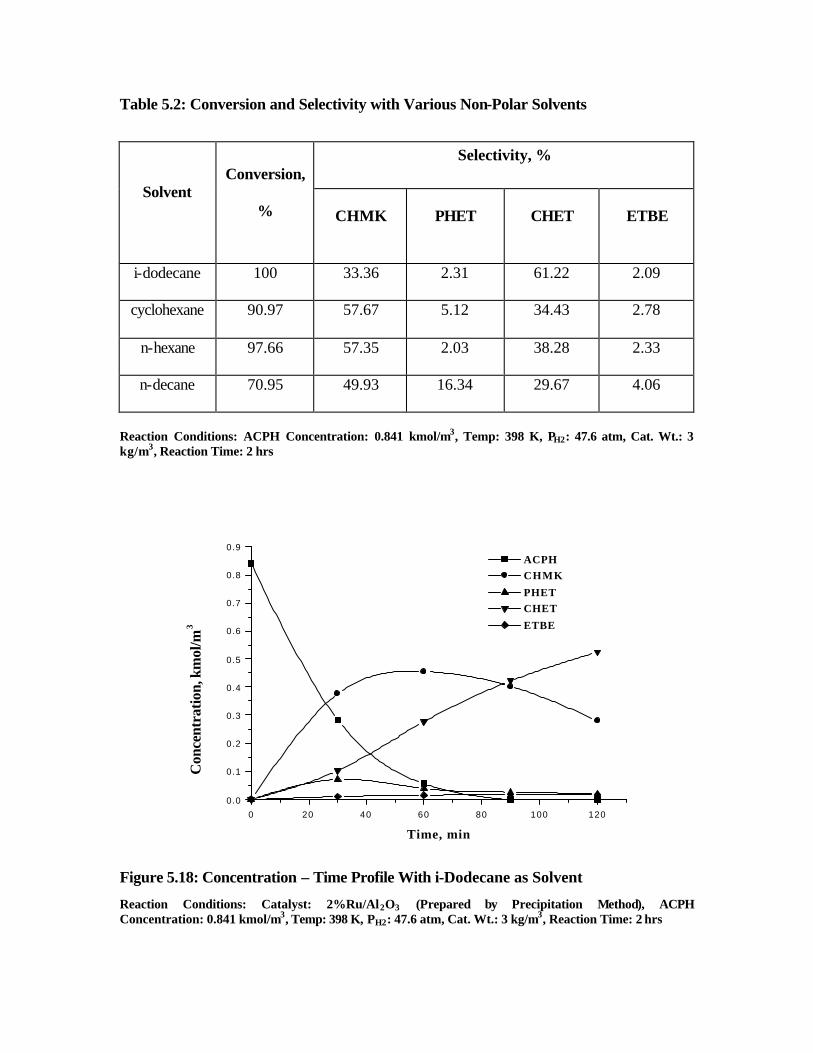
Table 5.2: Conversion and Selectivity with Various Non-Polar Solvents
Selectivity, %
Solvent Conversion,
% CHMK PHET CHET ETBE
i-dodecane 100 33.36 2.31 61.22 2.09
cyclohexane 90.97 57.67 5.12 34.43 2.78
n-hexane 97.66 57.35 2.03 38.28 2.33
n-decane 70.95 49.93 16.34 29.67 4.06
Reaction Conditions: ACPH Concentration: 0.841 kmol/m3, Temp: 398 K, PH2: 47.6 atm, Cat. Wt.: 3 kg/m3, Reaction Time: 2 hrs
0 20 40 60 80 100 120
0.0
0.1
0.2
0.3
0.4
0.5
0.6
0.7
0.8
0.9
ACPH
CHMK
PHET
CHET
ETBE
Con
cent
rati
on, k
mol
/m3
Time, min
Figure 5.18: Concentration – Time Profile With i-Dodecane as Solvent
Reaction Conditions: Catalyst: 2%Ru/Al2O3 (Prepared by Precipitation Method), ACPH Concentration: 0.841 kmol/m3, Temp: 398 K, PH2: 47.6 atm, Cat. Wt.: 3 kg/m3, Reaction Time: 2 hrs

0 20 40 60 80 100 120
0.0
0.1
0.2
0.3
0.4
0.5
0.6
0.7
0.8
0.9
ACPH
CHMK
PHET
CHET
ETBE
Con
cent
rati
on, k
mol
/m3
Time, min
Figure 5.19: Concentration – Time Profile with Cyclohexane as Solvent
Reaction Conditions: Catalyst: 2%Ru/Al2O3 (Prepared by Precipitation Method), ACPH Concentration: 0.841 kmol/m3, Temp: 398 K, PH2: 47.6 atm, Cat. Wt.: 3 kg/m3, Reaction Time: 2 hrs In order to understand the main reaction scheme operating for the formation of CHET,
with non-polar hydrocarbons as the solvent, the concentration-time profiles obtained with
iso-dodecane and cyclohexane as the solvents were considered (Figures 5.18 and 5.19).
With non-polar hydrocarbon solvents, the reaction pathway for CHET formation shifted
entirely from PHET (when methanol was used) as the intermediate to CHMK. In order to
explain the shift in the reaction scheme (the reaction scheme is shown in Chapter 2,
Figure 2.3), the value of the dielectric constants of all the hydrocarbon solvents used were
compared and all the values were found to be very low (~2.0) and thus as explained in the
previous section, the non-polar solvents facilitate the adsorption of the less polar aromatic
ring of ACPH on the catalyst surface resulting in ring hydrogenation.
In order to get a clearer picture of the shift in reaction path way when methanol, a
higher alcohol and a non-polar hydrocarbon were used as the solvents, the selectivity
towards the formation of two intermediates PHET and CHMK were considered at 40%
conversions for reactions carried out with these solvents under identical reaction
conditions (Figure 5.20).

MeOH i-propanol i-Dodecane0
10
20
30
40
50
60
70
80
Sele
ctiv
ity,
%
Solvent
PHET
CHMK
Figure 5.20: Selectivity to CHMK and PHET at 40% Conversion when Methanol, i-Propanol and i-Dodecane were Used as Solvents Reaction Conditions: Catalyst: 2%Ru/Al2O3 (Prepared by Precipitation Method), ACPH Concentration: 0.841 kmol/m3, Temp: 398 K, PH2: 47.6 atm, Cat. Wt.: 3 kg/m3
It was observed that the main intermediate for the formation of CHET shifted from PHET
to CHMK by the change in solvents from methanol to i-dodecane. The dielectric constant
corresponding to these three solvents were in the decreasing order of 32.63, 18.30 and
2.014, thus clearly explaining the shift in the reaction scheme from PHET to CHMK.
Since selective formation of CHET was one of our main aims, reactions were
carried out with non-polar hydrocarbon solvents with higher catalyst loading and the
reactions were taken to completion. It was found that CHET was formed selectively with
100% conversion of acetophenone (Table 5.3). In conclusion, for the selective formation
of CHET, non-polar solvents like cyclohexane should be preferred to a polar solvent like
methanol and reaction parameters should be adjusted so that higher reaction rates are
obtained.

Table 5.3: Selective Hydrogenation of ACPH to CHET
Solvent Reaction
Time, min
Conversion, % CHET, % TOF. H2 (hr-1)
n-hexane 40 100 99.55 3685
Cyclohexane 35 100 98.07 4332
Reaction Conditions: Catalyst: 2%Ru/Al2O3 (Prepared by Precipitation Method), ACPH concentration: 1.27 kmol/m3, Temp: 398 K, PH2 : 47.6 atm, Cat. Wt. : 10 kg/m3
5.2.3 Hydrogenation of Acetophenone in a Four Phase System
Investigations were further extended to a four-phase system for the selective
synthesis of CHET from acetophenone. Water was selected as the second liquid phase as
acetophenone and 1-cyclohexyl ethanol are not soluble in water. The main advantage of
this particular system is that the 2%Ru/Al2O3 catalyst remains in the aqueous phase and
the liquid reactant and products remain in the organic phase. The aqueous phase
containing catalyst can be efficiently recycled and thus catalyst filtration can be avoided.
Experiments were carried out in a batch slurry reactor using such a four-phase system.
After the first experiment, the reaction contents were brought to room temperature, the
gas was released and the aqueous and the organic layers were separated using a
separation funnel. The aqueous dense layer remained as the bottom layer along with the
catalyst particles. The higher affinity of the inorganic metal supported catalyst to water
can be due to higher polarity of water. Thus, for recycle studies, the aqueous phase
containing catalyst was recovered by phase separation and was again charged into the
reactor with fresh acetophenone and the reaction was continued. It was found that even
after four recycles, there was no loss in the catalyst activity (Figure 5.21). The conversion
of ACPH and selectivity of various components obtained in these experiments are given
in Table 5.4. It was observed, with water as a second liquid phase, selective formation of
CHET was possible without compromising the reaction rates. The small amount of
CHMK remaining in the reaction mixture would also have been converted to CHET, if
reaction would have been continued for more time. This system can be of great
advantage, if operated in a continuous stirred tank reactor, since the product formed
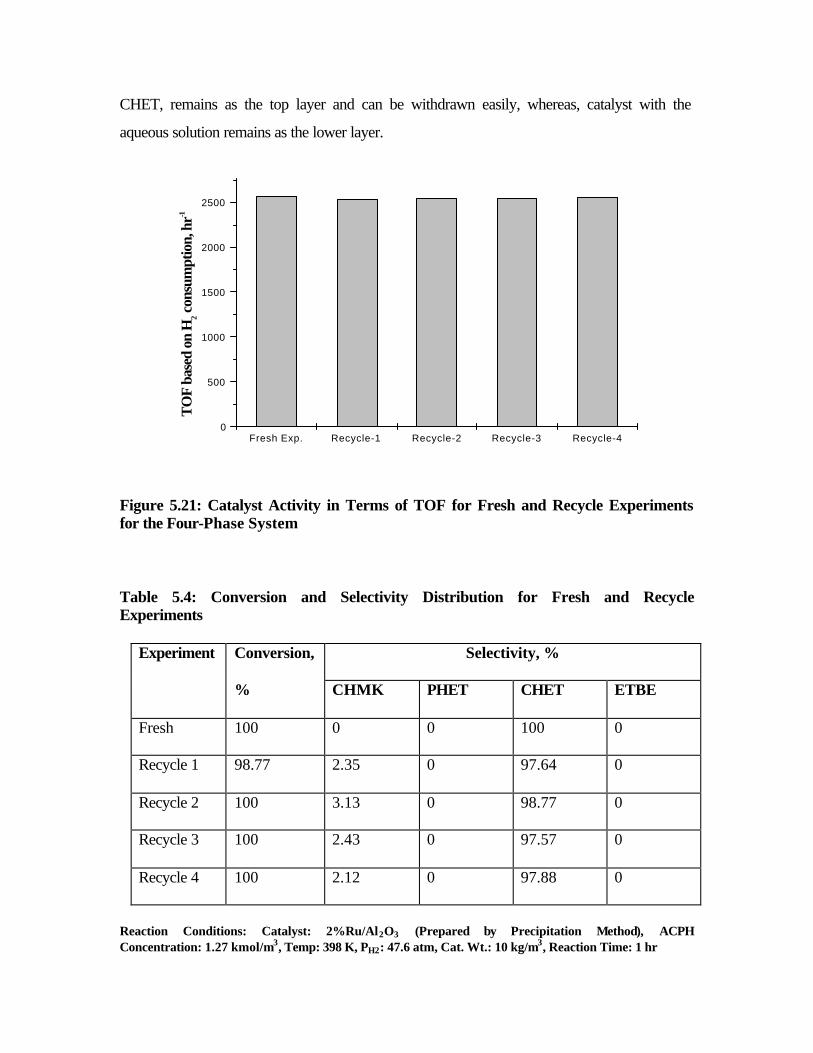
CHET, remains as the top layer and can be withdrawn easily, whereas, catalyst with the
aqueous solution remains as the lower layer.
Fresh Exp. Recycle-1 Recycle-2 Recycle-3 Recycle-40
500
1000
1500
2000
2500
TO
F ba
sed
on H
2 con
sum
ptio
n, h
r-1
Figure 5.21: Catalyst Activity in Terms of TOF for Fresh and Recycle Experiments for the Four-Phase System Table 5.4: Conversion and Selectivity Distribution for Fresh and Recycle Experiments
Selectivity, % Experiment Conversion,
% CHMK PHET CHET ETBE
Fresh 100 0 0 100 0
Recycle 1 98.77 2.35 0 97.64 0
Recycle 2 100 3.13 0 98.77 0
Recycle 3 100 2.43 0 97.57 0
Recycle 4 100 2.12 0 97.88 0
Reaction Conditions: Catalyst: 2%Ru/Al2O3 (Prepared by Precipitation Method), ACPH Concentration: 1.27 kmol/m3, Temp: 398 K, PH2: 47.6 atm, Cat. Wt.: 10 kg/m3, Reaction Time: 1 hr

5.2.4 Effect of Activation Temperature of Catalyst
In order to study the effect of the catalyst reduction temperature under hydrogen
atmosphere, the catalyst (2%Ru/Al2O3) was reduced under hydrogen atmosphere at
different temperatures ranging from 373 K to 673 K. There was not much change in the
formation of the side product ethyl benzene with catalysts activated at different
temperatures as shown in Table 5.5.
Table 5.5: Effect of Activation Temperature of Catalyst
Reaction Conditions: Catalyst: 2%Ru/Al2O3 (Prepared by Precipitation Method), ACPH Concentration: 0.841 kmol/m3, Solvent: Methanol, Temp: 398 K, PH2: 47.6 atm, Cat. Wt.: 3 kg/m3 The XPS analysis of the samples (Section 5.2.1.1) showed that there was a change in the
oxidation states of Ru when activated at higher temperatures. The binding energy values
of the Ru 3P3/2 was found to be 465.32, 464.62 and 463 eV corresponding to non-
activated, catalyst activated at 373 K and that activated at 573 K showing a change in the
oxidation state. Since the reaction takes place even with the non-activated catalysts, it can
be concluded that not only Ru0 but also Ru existing as oxides also catalyses the reaction.
The maximum rate was observed with the catalyst activated at 473 K.
Selectivity, % Catalyst
activation
Conversion,
% CHMK PHET CHET ETBE
TOF,
hr-1
No
activation 52.75 13.98 56.57 9.74 19.69 660
1000C 62.41 15.19 49.33 14.93 20.55 865
2000C 93.73 17.18 22.06 31.36 29.39 1693
3000C 70.65 15.30 42.97 15.14 26.58 1014
4000C 73.59 16.97 39.64 19.36 29.04 1126

5.2.5 Effect of Supports
Since support can play an important role in many hydrogenation reactions
catalyzed by supported metal catalysts, ruthenium catalysts on various supports such as
Al2O3, TiO2, activated carbon and NaY were prepared by precipitation technique. All the
catalysts were activated at 573 K for 7hrs and the results are presented in Table 5.6. It
was observed that the observed rates were maximum with NaY as the support followed
by activated carbon (Table 5.6). With NaY and carbon as supports, considerable amount
of ethyl cyclohexane formation (5-10%) was observed due to the hydrogenation of ethyl
benzene.
Table 5.6: Effect of Various Supports
Selectivity, % Support
Conversion,
% CHMK PHET CHET ETBE
TOF, hr-1
Alumina 70.65 15.30 42.97 15.14 26.58 1014
TiO2 49.89 11.40 47.91 15.02 25.66 683
C** 92.22 8.75 40.04 12.74 33.46 1268
NaY* 100 4.44 0 77.76 7.71 2760
Reaction Conditions: ACPH Concentration: 0.841 kmol/m3, Solvent: Methanol, Temp: 398 K, PH2:
47.6 atm, Cat. Wt.: 3 kg/m3
** Ethyl Cyclohexane formed with a selectivity of 5.03 %
*Ethyl Cyclohexane formed with a selectivity of 10.08 %
It is well known that titania supported ruthenium catalysts show enhanced selectivity
towards the carbonyl group with respect to the hydrogenation of aromatic ring, due to the
metal support interaction.4 Strong metal support interactions are usually observed with
titania supported catalysts activated at high temperatures like 773 K. For the catalysts
activated at lower temperatures, the metal support interaction will be less effective
compared to that activated at higher temperatures. In the present case since the catalyst

was activated at a lower temperature (573 K) the effect of metal support interaction was
not very predominant. The percentage of PHET formed with TiO2, as support was not
very high compared with other supports as shown in Table 5.6. Among the various
supported catalysts used in the present work, the surface area of the 2%Ru/Al2O3 catalyst
was found to be very high. The observed trends in the reaction rates can be explained on
the basis of the surface area distribution of the various supported catalysts given in Table
5.7.
Table 5.7: Surface Area of Various Supported Ruthenium Catalysts
Support used Surface area, m2/gm
Al2O3 160.8
TiO2 13.1
C 274.6
NaY 396.4
5.2.6 Effect of Metal Loading
To study the effect of metal loading on the reaction rates and selectivity, catalysts
were prepared with 2, 3 and 5% ruthenium on alumina by precipitation technique, as the
support. The maximum catalyst activity was observed with 2% Ru loading and beyond
which, the TOF was found to decrease (Table 5.8). By increasing the metal loading it is
not necessary that all the metal will be utilized for reaction. The dispersion of the metal
plays a major role in determining the catalyst activity. With higher metal loading, the
formation of side product ethyl benzene was found to be less as shown in Table 5.8.

Table 5.8: Rate and Selectivity Distribution for Various Metal Loadings
Selectivity, % % of
Ru
Conversion,
% CHMK PHET CHET ETBE
TOF, hr-1
2%Ru 70.65 15.30 42.97 15.14 26.58 1014
3%Ru* 99.3 17.24 2.89 53.05 8.17 800
5%Ru 97.51 23.92 43.05 23.10 9.92 635
Reaction Conditions: Catalyst Support: Al2O3, ACPH Concentration: 0.841 kmol/m3, Solvent:
Methanol, Temp: 398 K, PH2: 47.6 atm, Cat. Wt.: 3 kg/m3
* Ethyl Cyclohexane was observed with a selectivity of 17.13 %
5.2.7 Effect of Catalyst Preparation Method
Apart from the catalysts prepared by precipitation technique, catalysts were also
prepared by impregnation method as described in the experimental section. Water and
ethanol were used as the solvents for preparing catalysts by impregnation method. The
aim for preparing catalysts with ethanol and with water was to check whether the
impregnation solvent medium plays any role in determining the catalyst properties. The
XPS pattern of both the catalysts prepared by impregnation techniques were found to be
similar. Kluson et al.5 made a similar observation for ruthenium catalyst prepared from
the same solvents. The activity and selectivity behavior observed for the catalysts
prepared by impregnation technique along with that of the catalysts prepared by
precipitation technique are shown in Table 5.9. The higher activity observed for the
catalysts prepared by the impregnation technique may be due to a better dispersion of the
catalyst particles as shown in the TEM Figures 5.7 and 5.8. In case of impregnation
method, the catalysts prepared using ethanol as the impregnating solvent showed higher
activity compared to that with the catalysts prepared by water as the impregnating
solvent.

Table 5.9: Rate and Selectivity Distribution for Catalysts Prepared by Precipitation and Impregnation Techniques
Selectivity, % Method of Prep.
Conv.,
% CHMK PHET CHET ETBE
TOF, hr-1
Precipitation 70.65 15.30 42.97 15.14 26.58 1014
Impregnation
(Solvent: water) 84.19 11.14 52.29 15.33 18.23 1110
Impregnation
(Solvent: ethanol) 96.10 10.10 56.54 15.14 17.61 1254
Reaction Conditions: Catalyst: 2%Ru/Al2O3, ACPH Concentration: 0.841 kmol/m3, Solvent: Methanol, Temp: 398 K, PH2: 47.6 atm, Cat. Wt.: 3 kg/m3
The higher rates observed for the catalysts prepared with ethanol as the impregnating
solvent than water as the impregnating solvent can be explained on the basis of the
coordinating ability of the impregnation solvent. Ethanol has weaker complexing ability
than water and accordingly the activity of the alcohol prepared ruthenium catalysts were
higher due to the inclusion of the impregnating solvent in the catalyst after the
activation.5 A similar result was obtained for the hydrogenation of benzene to
cyclohexene using supported ruthenium catalysts.5 Another important point to be noted
from the selectivity point of view is that the selectivity for PHET in reactions carried out
with the catalysts prepared by impregnation technique was comparatively higher than that
with the catalysts prepared by precipitation technique. The amount of CHET formed was
less in the case of these catalysts, where as the formation of the side product ethyl
benzene was almost similar in all the cases.
5.2.8 Effect of Promoters
The effect of promoters on ruthenium-catalyzed hydrogenation of acetophenone
was studied to understand its effect on the selectivity distribution and rates as given in
Table 5.10.

Table 5.10: Effect of Promoters
Selectivity, % S.
No. Promoter
Conversion
% CHMK PHET CHET ETBE
TOF,
hr-1
1 0.5 ml, 1 N
NaOH 2.71 0 100 0 0 25
2 1.2 ml, 0.02 N
NaOH 85.69 27.03 58.28 12.67 2.00 606
3 0.5 ml Et3N 41.98 11.42 81.74 6.4 0.43 423
4 1.2 ml, 0.02 N
NaOH + 0.5 ml
Et3N
66.48 12.48 79.65 7.51 0.36 696
5 1.5 ml ammonia 26.22 7.01 88.84 4.14 0.0 234
6 0.1gm ZnCl2 0 0 0 0 0 0
7 30 mg ZnCl2 7.98 14.69 65.97 8.87 10.46 113
Reaction Conditions: Catalyst: 2%Ru/Al2O3 (Prepared by Precipitation Method), ACPH Concentration: 0.841 kmol/m3, Solvent: Methanol, Temp: 398 K, PH2: 47.6 atm, Cat. Wt.: 3 kg/m3
The addition of NaOH (1.2 ml, 0.02 N) was found to drastically reduce the formation of
the side product, ethyl benzene (Table 5.10, S. No. 2). The presence of NaOH in
methanol would have generated sodium methoxide making the reaction medium alkaline.
The basic nature of the medium can arrest other side reactions, which involve
hydrogenolysis and dehydration of the secondary alcohol derivative, and the arrest of
these reactions by NaOH may be the probable reason for high selectivity towards PHET.6
Addition of organic promoter base like triethyl amine with a lone pair of electrons on the
nitrogen atom was also found to reduce the formation of ethyl benzene (Table 5.10, S.
No. 3). The basic triethyl amine may be blocking the sites responsible for dehydration of
the alcohol. But addition of these modifiers in higher concentrations was found to reduce

the reaction rates considerably, which can be an indirect evidence for the fact that these
modifiers are blocking the active sites of the catalyst (Table 5.10, S. No. 1 & 5). Addition
of alkaline ammonia solution (contains ~25% NH3) was also found to reduce the
formation of ethyl benzene (Table 5.10, S. No. 5). But none of these modifiers were
found to block the active sites responsible for the aromatic ring hydrogenation alone. The
addition of inorganic metal salts like ZnCl2 was found to have almost no effect on
selectivity and higher concentration of ZnCl2 found to stop the reaction (Table 5.10, S.
No. 6).
5.2.9 Screening of Other Supported Metal Catalysts
Other supported metal catalysts were also screened with the view of selecting
suitable catalysts for the synthesis of PHET and CHET. The screened catalysts include
Ni, Pd and Rh along with ruthenium. Carbon was chosen as the support in order to avoid
any interaction of support in the reaction.
Table 5.11: Screening of Supported Transition Metal Catalysts with Solvent Methanol
Selectivity, % Catalyst
Conversion,
% CHMK PHET CHET ETBE
TOF,
hr-1
3%Ru/C 96.56 8.75 36.04 29.74 25.46 1460
3%Ni/C* 19.13 0 88.28 0 1.2 72
3%Pd/C** 100 0 71.19 0 18.58 920
3%Rh/C*** 100 1.44 67.62 1.54 27.41 863
Reaction Conditions: ACPH Concentration: 0.841 kmol/m3, Solvent: Methanol, Temp: 398 K, PH2: 47.6 atm, Cat. Wt.: 3 kg/m3
*1-phenethylmethylether formation with selectivity of 10.52%
** 1-phenethylmethylether formation with selectivity of 10.22%
*** 1-phenethylmethylether formation with selectivity of 2.52%

Studies were carried out with both methanol and cyclohexane as solvents since it is
known that the solvent influences the reaction schemes considerably in many cases. The
results of the catalyst screening carried out with methanol as a solvent are given in Table
5.11. Pd and Ni supported catalysts were found to give a better selectivity towards PHET
in comparison with Rh and Ru supported catalysts. Even though Rh is known to give
ring-hydrogenated products, only small amount of ring-hydrogenated products were
observed with methanol as the solvent. In the case of Ni supported catalysts, the reaction
was found to be very slow, but selectivity towards PHET was high. With supported Ni
and Pd catalysts considerable amount of 1-phenethylmethylether was formed. It is known
that in presence of Ni and Pd catalysts PHET form ether by the interaction with
methanol.6 The acidic protonic sites present on the catalyst surface are responsible for the
formation of 1-phenethylmethylether formation.6
Screening of above mentioned catalysts were also done with cyclohexane as the
solvent to avoid any type of solvent interaction in the reaction and the results are given in
Table 5.12.
Table 5.12: Screening of Supported Transition Metal Catalysts with Cyclohexane as Solvent
Selectivity, % Catalyst
Conversion,
% CHMK PHET CHET ETBE
TOF,
hr-1
3%Ru/C* 98.49 46.73 1.74 48.68 1.36 1867
3%Ni/C 3.78 0 100 0 0.0 10.37
3%Pd/C 87.76 0 85.81 0 14.19 663
3%Rh/C** 78.67 6.38 71.47 8.64 10.45 812
Reaction Conditions: ACPH Concentration: 0.841 kmol/m3, Solvent: Methanol, Temp: 398 K, PH2: 47.6 atm, Cat. Wt.: 3 kg/m3 * Ethyl Cyclohexane was observed with a selectivity of 1.47 %
**Ethyl Cyclohexane was observed with a selectivity of 3.96 %

With Cyclohexane as the solvent, the reaction rate for Ni catalyst was found to be very
low. In all the cases, the formation of ethyl benzene was found to be less than methanol
as the solvent indicating that methanol plays a role in the formation of ethyl benzene.
Even though the selectivity for PHET with Ni and Pd catalysts was high with
cyclohexane as solvent, the reaction rates were found to be lower than that observed for
methanol as the solvent.
5.3 Conclusions
Supported ruthenium catalysts prepared by precipitation technique and
impregnation technique showed the presence of some extent of ruthenium oxide even
after activation at 573 K. With methanol as solvent, CHET formation took place mainly
through PHET as the intermediate for supported ruthenium catalysts. With higher
alcohols, CHET formation through CHMK and PHET as the intermediates in almost
equal amounts was observed and with non-polar hydrocarbon solvents, reaction
proceeded mainly through CHMK as the intermediate. With non-polar hydrocarbon
solvents, 99% selectivity towards CHET was obtained where as with alcoholic solvents
considerable amount of the side product, ethyl benzene, formation was observed. Studies
with water as the immiscible phase with acetophenone was found to give high rates and
high selectivity (> 98%) towards CHET. The catalysts were found to remain in the
aqueous phase, which was recycled successfully four times, and in all the recycles the
rates were found to be similar and the selectivity towards CHET was maintained.
Ruthenium supported on NaY was found to give the maximum reaction rates owing to its
high surface area. Catalysts prepared by impregnation technique were found to give a
better activity than the catalysts prepared by precipitation technique and ethanol as the
impregnation solvent was found to be better rates than water as the impregnation solvent.
Addition of basic promoters like NaOH and triethylamine was found to suppress the
formation of the side product, ethyl benzene, with ruthenium as catalyst and methanol as
the solvent. Screening of other supported metal catalysts showed that Ni and Pd catalysts
gave better selectivity towards PHET.

References
1. Nagai M., Koizumi K. and Omi S., NH3-TDP and XPS studies of Ru/Al2O3 catalyst and HDS activity,
Catalysis Today, 35, 393, 1997
2. Tsisun E.L., Nefedov B.K., Shpiro E.S., Antoshin G.V. and Minachev Kh. M., XPS studies of Ru in γ-
Al2O3 supported catalysts
3. Masson J., Cividino P., Bonnier J.M., and Fouilloux P., Selective hydrogenation of acetophenone on
unpromoted Raney Ni: Influence of reaction conditions, Heterogeneous Catalysis and Fine Chemicals II,
Stud. Surf. Sci. Catal., 245, 1991
4. Kluson P. and Cerveny L., Selective hydrogenation over ruthenium catalysts, Applied catalysis A:
General, 128, 13, 1995
5. Kluson P., Cerveny L., and Had J., Preparation and properties of ruthenium supported catalysts, Cat.
Lett., 23, 299, 1994
6. Rajashekharam M.V., Thesis submitted to the university of Pune, India (1997)

199
List of Publications Based on Present Work
1. Supported Ni and Ru catalysts for hydrogenation of p-Isobutyl acetophenone: a
catalyst comparison study
S.P. Mathew. M.V. Rajashekharam and R.V. Chaudhari
Studies in Surface Science and catalysis, 113 (1998), P. 349
2. Hydrogenation of p-isobutyl acetophenone using a Ru/Al2O3 catalyst: Reaction
kinetics and modeling of a semi batch slurry reactor
S.P. Mathew, M.V. Rajashekharam and R.V. Chaudhari
Catalysis Today 49 (1999), P. 49
3. Hydrogenation of Acetophenone Using Supported Ruthenium Catalysts:
Kinetics, Intraparticle Diffusional and Non-isothermal effects
S.P. Mathew, P.R. Gunjal and R.V. Chaudhari, ready for communication
4. Hydrogenation of Acetophenone Using Ru/Al2O3 Catalyst in a Trickle Bed
Reactor
S.P. Mathew, P.L. Mills and R.V. Chaudhari, ready for communication
5. Hydrogenation of Acetophenone in a Packed Bubble Column Reactor: Reactor
Performance and Comparison with Downflow Operation
S.P. Mathew and R.V. Chaudhari., ready for communication
6. Solvent effects in hydrogenation of aromatic ketons with ruthenium supported
catalysts
S.P. Mathew and R.V. Chaudhari, ready for communication

200
Papers / Posters presented Based on Present Work
1. Supported Ni and Ru catalysts for hydrogenation of p-Isobutyl acetophenone: a
catalyst comparison study
S.P. Mathew, M.V. Rajashekharam and R.V. Chaudhari (Presented at National
symposium on catalysis, Dehradun, India, 1998
2. Hydrogenation of p-isobutyl acetophenone using a Ru/Al2O3 catalyst : Reaction
kinetics and modeling of a semi batch slurry reactor
S.P. Mathew, M.V. Rajashekharam and R.V. Chaudhari (Presented at IPCAT-1,
Cape Town, South Africa, 1999)
3. Hydrogenation of Acetophenone Using Ru/Al2O3 Catalyst in a Trickle Bed
Reactor, S.P. Mathew, P. Gunjal, R.V. Chaudhari and P.L. Mills, (Presented at
AIChE Annual Meeting at USA during October 31–November 5, 1999).
4. Selective Hydrogenation of Acetophenone to 1-Phenylethanol and 1-
Cyclohexylethanol Using Supported Metal Catalysts, S.P. Mathew and R.V.
Chaudhari, (Presented at IPCAT-2, Pune, India, 2001)