Embed Size (px)
Citation preview
1
Development of a biocatalytic production process for
(S)--hydroxy ketones
Inaugural-Dissertation
zur Erlangung des Doktorgrades
der Mathematisch-Naturwissenschaftlichen Fakultät
der Heinrich-Heine-Universität Düsseldorf
vorgelegt von
Álvaro Gómez Baraibar
aus Madrid
Jülich, October 2013
2
aus dem Institut für Bio-und Geowissenschaften
der Heinrich-Heine Universität Düsseldorf
Gedruckt mit der Genehmigung der
Mathematisch-Naturwissenschaftlichen Fakultät der
Heinrich-Heine-Universität Düsseldorf
Referent: Prof. Martina Pohl
Korreferent: Prof. Vlada Urlacher
Tag der mündlichen Prüfung: 06.11.2013

3
“And remember, the only difference between science and fooling around is to
write everything down!”
The Mythbusters
For my family. The whole of it.
4
Abstract
Enantiomerically pure α-hydroxy ketones are versatile building blocks for the pharmaceutical
industry. Since the highly chemo- and stereoselctive synthesis of these compounds is very
challenging with traditional chemical synthesis, the use of biocatalysis for the α-hydroxy
ketone production is an interesting alternative. One of the most promising alternatives is the
use of thiamine diphosphate (ThDP)-dependent enzymes, which are able to produce these
hydroxy ketones by carboligation of two inexpensive aldehydes. The enzyme toolbox
available in the Biocatalysis & Biosensors group at IBG-1, Forschungszentrum Jülich GmbH,
includes numerous ThDP-dependent enzymes, which are able to synthesise a wide palette of
hydroxy ketones with high selectivity. However, most of the wild-type enzymes are (R)-
selective for the carboligation if at least one of the aldehydes used for the carboligation is
aromatic, making the synthesis of aromatic and mixed aliphatic/aromatic (S)-hydroxy
ketones more challenging. In this work, with the Acetobacter pasteurianus pyruvate
decarboxylase variant E469G (ApPDCE469G), one of the few designed (S)-selective variants,
a lab scale production process for (S)-phenyl propionyl carbinol (PPC) has been developed. In
order to do this, several tasks have been performed:
- Reaction characterization and optimization: By combining appropriate choice of
substrates and solvent as well as reaction engineering the specific space-time-yield
could be increased up to 61 fold, proving the immense impact of suitable reaction
condition on both, catalyst productivity and selectivity. Further, the enantiomeric
excess of the product could be improved from 89 % up to 98 % (S)-PPC. Especially
avoidance of organic co-solvents, used as substrate solubility enhancers, as well as
the exchange of the donor aldehyde by its corresponding α-keto acid, which is
decarboxylated to the aldehyde prior to carboligation by the same enzyme, were
essential for the enhancement.
- Use of whole cell: alternatively to purified enzyme, the use of whole cells for the
production of (S)-PPC has also been evaluated and optimized. Recyclabillity of the
cells was determined and the reaction was scaled up in a 500 mL stirred tank reactor
with a substrate fed, achieving product concentrations over 10 g/L/d. The drawbacks
of the whole cell catalysis were a slighly lower enantiomeric excess of the product
compared with pure enzyme and the occurrence of a new by-product. This procedure
was also successfully tested for the production of (S)-phenylacetylcarbinol from
pyruvate and benzaldehyde in order to verify that the process extrapolation to other
(S)-hydroxy ketones is possible.
- Development of an enantiomeric excess enhancement strategy: In order to make use
of the easy applicable whole cell catalysis and to overcome the drawback of only
moderate stereoselectivity, a new strategy to increase stereoselctivity, called `chiral
polishing´ was invented. By using a second, strictly (R)-selective ThDP-dependent
enzyme, which is able to cleave (R)-α-hydroxy ketones into aldehydes but does not
except the (S)-enantiomer the undesired (R)-enantiomer can be removed and the
5
aldehydes formed are again available for the carboligation step by the ApPDCE469G
yielding a highly (S)-selective product.
6
Kurzfassung.
Enantiomerenreine α-Hydroxyketone sind vielseitige Bausteine für die pharmazeutische
Industrie. Da hoch chemo- und stereoselektive Synthesen dieser Verbindungen mit
herkömmlichen, chemischen Verfahren sehr schwierig sind, bietet der Einsatz von
Biokatalysatoren bei der Produktion von α-Hydroxyketonen eine interessante Alternative.
Thiamin-Diphosphat (ThDP)-abhängige Enzymen sind in der Lage, α-Hydroxyketone durch
Carboligation zweier kostengünstigen Aldehyden herzustellen. In der Arbeitsgruppe
Biokatalyse und Biosensoren (IBG -1, Forschungszentrum Jülich GmbH) um Prof. Pohl und Dr.
Rother gibt es eine Enzym-Toolbox, die zahlreiche ThDP-abhängige Enzyme umfasst. Durch
dieses Spektrum an Enzymen kann eine breite Plattform an α-Hydroxyketonen mit hohen
Reinheiten hergestellt werden. Allerdings sind die meisten der Wildtyp-Enzyme (R)-selektiv
für die Carboligation, wenn mindestens einer der für die Carboligation verwendeten
Aldehyde aromatisch ist. Die Synthese von aromatischen und aromatisch-aliphatischen
Hydroxyketonen in (S)-Konfiguration ist daher schwieriger. In dieser Arbeit wurde mit der
Variante E469G der Pyruvatdecarboxylase aus Acetobacter pasteurianus (ApPDCE469G)
eines der wenigen (S)-selektiven Enzyme verwendet, um ein Verfahren zur Produktion von
(S)-Phenylpropionylcarbinol (PPC) im Labormaßstab zu entwickeln. Für diesen Prozess
wurden folgenden Ziele erreicht:
- Reaktionscharakterisierung und -optimierung: Durch eine Kombination aus der Wahl
von Substraten und Lösungsmitteln mit einer umfassenden Reaktionsoptimierung,
konnte die spezifische Raum-Zeit-Ausbeute des Prozesses um das 61-fache erhöht
werden. Das beweist, dass eine Optimierung von Reaktionsbedingungen einen
immensen Einfluss auf die Produktivität und die Selektivität des Katalysators haben.
Ferner konnte die Enantiomerenreinheit des Produkts von 89 % auf 98 % (S)-PPC
verbessert werden. Die Vermeidung von organischen Lösungsmitteln (zur Erhöhung
der Substratlöslichkeit) und die Verwendung eine α-Ketosäure anstelle des Donor-
Aldehyds, trugen wesentlich zu dem verbesserten Reaktionsprozess bei.
- Verwendung von ganzen Zellen: alternativ zu gereinigten Enzymen, wurde die
Verwendung von ganzen Zellen bei der Herstellung von (S)-PPC untersucht und
optimiert. Die Rezyklierbarkeit der Zellen wurde bestimmt und die Reaktion in einem
500 mL Reaktionsgefäß mit einer kontinuierlichen Substratzugabe durchgeführt.
Dabei konnte eine Produkt-Konzentrationen von über 10 g / L / d erreicht werden.
Als Nachteile der Ganzzelle-Biokatalyse ist zu nennen, dass das Produkt einen leicht
verringerten Enantiomerenüberschuss im Vergleich zum Verfahren mit gereinigtem
Enzym hatte und dass ein noch unbekanntes Nebenprodukt auftrat. Des Weiteren
wurde das Ganzzell-Verfahren erfolgreich auch für die Herstellung von
(S)-Phenylacetylcarbinol (aus Pyruvat und Benzaldehyd) getestet. Damit konnte
generell gezeigt werden, dass der Prozess auch analog auf die Synthese von anderen
(S)-konfigurierten Hydroxyketonen übertragbar ist.
- Entwicklung einer Strategie zur Steigerung der Enantiomerenreinheit: Um das leicht
anwendbare Ganzzell-Katalyse Verfahren anwendbar zu machen und um den

7
Nachteil der nur moderate Stereoselektivität zu überwinden, wurde eine neue
Strategie zur Steigerung der Enantiomerenreinheit erfunden. Durch die Verwendung
eines zweiten, rein (R)-selektiven ThDP-abhängiges Enzyms, das in der Lage ist, (R)-α-
Hydroxyketone in Aldehyde zu spalten, wird das entsprechende (S)-konfigurierte
Enantiomer angereichert. Die gebildeten Aldehyde stehen darüber hinaus wieder für
die von der ApPDCE469G katalysierten Carboligation zur Verfügung, was sowohl die
Ausbeute wie auch die Enantiomerenreinheit des (S)-konfigurierten Produkts weiter
erhöht.

8
List of publications
- Álvaro Gómez Baraibar, Eric von Lieres, Wolfgang Wiechert, Martina Pohl, and Dörte
Rother: Effective production of (S)--hydroxy ketones: an reaction engineering approach. In
press
- Dörte Rother, Martina Pohl, Torsten Sehl and Álvaro Gómez Baraibar: 2-Schritt Synthese zur
Herstellung von (1S,2S)-Norpseudoephedrin (Cathine) durch Kopplung einer (S)-selektiven
Lyase und einer (S)-selektiven Transaminase. Patent application.
9
Acknowledgements
The three years of my PhD have been one of the most enriching periods of my life. I have learned and
struggled through mental and academic challenges that have helped to shape my point of view.
Nevertheless, this was not a solo effort. I would like to thank all the people who have guided and
supported me across the conversion from a college graduate to a professional scientist:
I will start with my supervisors Martina Pohl and Dörte Rother, whose kind and professional
supervision have made this transition much easier. My colleagues were also nice.
I should also thank my cooperation partners, Eric von Lieres and Pär Tuffvesson for their help, and
Leonardo Garma, who put a lot of effort in a project which finally did not produce clear results, but
which helped me to understand more in detail the secrets behind the mechanistic models. Also to
Lukas Berlinghoff who did an excellent job in the lab during his Bachelor thesis.
Another kind thanks goes for my friends on Jülich and especially to my girlfriend, who played an
important role preventing me from metal collapse for living in the middle of nowhere.
Most of all, to my parents and family in Spain, who have relentlessly supported their son in the exile
for more than five years.
Finally, some people who do not know me also have helped. Special thanks for the engineers in Jasco
and Agilent, whose incompetence have helped me to become an expert in HPLC disassembling and
troubleshooting. And of course to the European Union for funding..
10
Contents Abbreviations: ....................................................................................................................................... 12
1. Introduction ................................................................................................................................... 14
1.1. History of biocatalysis............................................................................................................ 14
1.2. Enzyme sources ..................................................................................................................... 15
1.3. Advantages of biocatalysis over traditional chemical production ........................................ 16
1.4. Biocatalytic process development ........................................................................................ 18
1.4.1. Upstream ....................................................................................................................... 19
1.4.2 Reaction ......................................................................................................................... 20
1.4.3. Downstream processing ................................................................................................ 23
1.4.4. Process feasibility analysis:............................................................................................ 24
1.5. -Hydroxy ketones ................................................................................................................ 25
1.5.1. Chemical production ..................................................................................................... 27
1.5.2. Biocatalytic production ................................................................................................. 27
1.6. ThDP dependent enzymes ..................................................................................................... 28
1.6.1. Chemoselectivity ........................................................................................................... 30
1.6.2. Stereoselectivity ............................................................................................................ 31
1.7. ApPDCE469G ......................................................................................................................... 32
1.8. Aim of the project.................................................................................................................. 35
2. Materials and methods ................................................................................................................. 37
2.1. Chemicals ............................................................................................................................... 37
2.2. Cost calculation ..................................................................................................................... 37
2.3. Catalyst preparation .............................................................................................................. 38
2.3.1. Protein production ........................................................................................................ 38
2.3.2. Protein purification and storage ......................................................................................... 38
2.4. Analytic setup ........................................................................................................................ 39
2.4.1. HPLC ............................................................................................................................... 39
2.4.2. GC ........................................................................................................................................ 39
2.4.3. Protein concentration determination ........................................................................... 40
2.5. Production of reference compounds .................................................................................... 40
2.6. Protein expression optimization ........................................................................................... 40
2.7. Standard experimental reaction conditions .......................................................................... 41
2.7.1. Substrate characterization ............................................................................................ 41
2.7.2. Reaction kinetics ............................................................................................................ 41
2.7.3. Effect of DMSO .............................................................................................................. 41
11
2.7.4. Reaction optimization ................................................................................................... 42
2.7.5. Whole cell biotransformations ...................................................................................... 42
2.7.5.1. Optimal cell load ........................................................................................................ 43
2.7.5.2. Influence of ThDP ...................................................................................................... 43
2.7.5.3. Optimization of the KBA concentration .................................................................... 43
2.7.5.4. Optimization of the benzaldehyde concentration .................................................... 44
2.7.5.5. Optimal pH ................................................................................................................ 44
2.7.5.6. Optimal temperature ................................................................................................ 44
2.7.6. Whole cell recyclability .................................................................................................. 44
2.7.7. Scale-up ......................................................................................................................... 45
2.7.8. Fed-batch mode ............................................................................................................ 45
2.7.9. Chiral polishing .............................................................................................................. 46
3. Results and discussion ................................................................................................................... 46
3.1. Protein expression optimization and catalyst production .................................................... 46
3.2. Reaction optimization for (S)-PPC production using pure enzyme ....................................... 50
3.2.1. Choice of donor substrate ................................................................................................. 50
3.2.2. Solvent choice................................................................................................................ 56
3.2.3. Optimization of the reaction conditions ....................................................................... 59
3.3. Whole cell biocatalysis for (S)-PPC and (S)-PAC production ................................................. 64
3.3.1. Whole cell reaction setup .............................................................................................. 65
3.3.2. Reaction optimization ................................................................................................... 66
3.3.2.1. ThDP dependence ..................................................................................................... 66
3.3.2.2. Substrate optimization .............................................................................................. 67
3.3.2.3. Optimal pH ................................................................................................................ 71
3.3.2.4. Temperature effect ................................................................................................... 72
3.3.3. Catalyst recyclability ...................................................................................................... 72
3.3.4. Scale up.......................................................................................................................... 75
3.3.5. Fed batch ....................................................................................................................... 76
3.4. Chiral polishing ...................................................................................................................... 79
3.5. Process metrics and cost calculations ................................................................................... 81
4. Conclusions and future perspectives ............................................................................................ 83
5. References: .................................................................................................................................... 85
Annex ..................................................................................................................................................... 93
12
Abbreviations:
AI: Auto induction media
ApPDC: Acetobacter pasteurianus pyruvate decarboxylase
BA: Benzaldehyde
BSA: Bovine serum albumin
BZ: Benzoin
DOE: Design of Experiments
DNA: Deoxyribonucleic acid
EcSucA: subunit of -ketoglutarate dehydrogenase from Escherichia coli
ee: enantiomeric excess
IPTG: Isopropyl β-D-1-thiogalactopyranoside
KBA: 2-ketobutyric acid
HBP: 2-Hydroxy butyrophenone
HK: alpha-Hydroxy ketone
HPP: Hydroxy propiophenone
KP: Potassium phosphate buffer
LB: Luria Bertani Broth
NMR: Nuclear magnetic resonance
PAC: Phenyl acetyl carbinol
PfBAL: Benzaldehyde lyase from Pseudomonas fluorescens
PFR: Plug flow reactor
PPC: Phenyl propionyl carbinol
PpBFD : Benzoylformate decarboxylase from Pseudomonas putida
PROP: Propanal
PYR: Pyruvate
SFC/MS: Super critical fluid chromatography/mass spectrometry
13
SSTY: Specific space time yield
STR: Stirred tank reactor
STY: Space time yield
ThDP: Thiamine diphosphate
ZmPDC: pyruvate decarboxylase from Zymomonas mobilis
14
1. Introduction
1.1. History of biocatalysis
Even though human kind has used and modified living beings since prehistoric times, like the
creation of crops during the agricultural revolution in Mesopotamia, the use of enzymes as a
catalyst (biocatalysis) and specially its understanding is relatively new.
The word enzyme, from the Greek “within yeast”, was first used by the German scientist
Kühne in 1876 [1], giving a name for all non-living extracts catalyzing a chemical reaction.
Some years later, in 1894, Fischer [2] realized that these enzymes were responsible for the
optical selectivity presented by living microorganisms which had been previously described
by Louis Pasteur in 1848 [3]. Even though the mechanism behind this selectivity was not fully
understood, the enzymatic synthesis started being used empirically for biocatalytic
production processes, like the synthesis of (R)-mandelonitrile using plant extract [4]. The
explanation of the enzyme nature was a matter of strong debate, until the crystallization of
urease by Summer in 1926 [5] proved that these enzymes were in fact of proteins. This
observation granted him the Nobel Prize in chemistry in 1946. During the 20th century, the
use of biocatalysis continued growing with more applications mainly for the production of
natural compounds, such as steroids [6], until the use of protein engineering enabled the
possibilities to improve catalysts [7] and modifying them to accept non-natural substrates.
This revolution, enabled by the discovery of the DNA structure by Watson and Crick in 1953
[8], is considered the 2nd wave of biocatalysis [9] and expanded the use of biotechnology for
the production of pharmaceutical intermediates and fine chemicals.
During the first and second waves of biocatalysis, biocatalytical production processes were
designed taking into account the limitations of the enzyme [10], but once the combination
of protein engineering via site-directed mutagenesis, directed evolution, gen synthesis and
bioinformatics allowed more reliable protein modification, the enzymes could be modified
and adopted to practically any production process [11-14]. This state of the art is considered
the current third wave of biocatalysis [9].
Apart from the mentioned use for production of natural compounds [15], one of the main
applications of biocatalysis is the synthesis of pharmaceuticals [16-18]. About 50 % of the
drugs used nowadays are chiral compounds and over 90 % of them are used as racemic
mixtures [19]. Due to the different pharmacological activity of the enantiomers, the use of
these racemic mixtures can have a negative influence on the pharmacological effect of the
drug as well as be the cause of undesired side effects [20]. In order to produce
enantiomerically pure drugs by traditional chemical synthesis, multi-step syntheses including
an appropriate protection group strategy are usually required [21, 22]. Since this option is
inefficient, expensive and often environmentally harmful [23, 24], there has been a trend to
develop more sustainable production processes (i.e. green chemistry) [25], with high atom
efficiency and low environmental impact. Due to the high selectivity displayed by the
15
enzymes and their renewable nature, the use of biocatalysis for single enantiomer drug
production is one of the most promising options to achieve this ambitious goals [9, 26-28].
In the future of this field is aiming for the use of multi-step syntheses [29], combining
engineered enzymes and green chemistry approaches in order to produce new synthetic
pathways converting inexpensive raw materials into highly complex molecules with
applications in diverse fields, like specialty chemicals [11, 30], bio-plastics [31, 32] or biofuels
[33]. Even though nowadays the use of biocatalysis is still small compared with traditional
petrochemical production processes, the field is growing steadily and the perspectives for
the next decades are highly positive [34, 35].
1.2. Enzyme sources
Enzymes are classified according to the Enzyme Commission (EC) enzymes according to the
type of reaction catalyzed (Table 1).
Table 1: Enzyme types classification
EC number
Name Function
EC 1 Oxidoreductases Redox reactions
EC 2 Transferases Transfer of a functional group
EC 3 Hydrolases Bond hydrolysis
EC 4 Lyases Bond cleavage without hydrolysis or redox reaction
EC 5 Isomerases Isomerization of single molecules
EC 6 Ligases Covalent bond creation using energy (ATP-dependent)
In order to obtain a specific enzyme for the production of a desired product there are
different possibilities available:
- Database mining: by using databases such as BLAST [36, 37] it is possible to find
candidates which might fit to the process needs. This can be done by searching
proteins with relevant similarities to known useful catalysts.
- Exploiting enzyme promiscuity: the use of well-known enzymes for catalysis of other
reactions than the physiological ones is another possibility [38].
- Creation of metagenomic libraries: only a small percentage of the organism present
in nature would grow in an axenic culture [39]. By using a metagenomic approach,
the whole proteome diversity of a sample can be revealed increasing the number of
candidates for your optimal catalyst, provided that the respective genes can be
expressed in the chosen host organism [40, 41]. Also, sequencing of microorganisms
from extremophiles, is gaining importance for the discovery of active catalyst at
conditions such as high temperatures, high salt concentrations or extreme pH-values
[42].
16
- Directed evolution: the introduction of random changes into the coding gene and the
subsequent screening of respective variants in order to find improved variants has
been possible since the 70´s when whole organisms were treated with different
chemicals or UV light in order to induce mutations [43]. After the invention of the
PCR, directed evolution of enzymes became possible in the 90´s [44-47]. Even though
this technique has produced several successful results [48], the use of random
mutagenesis is not very efficient since a high percentage of the mutations produce
inactive proteins or show no effect [49]. Modern techniques like site-saturation
mutagenesis [50] or combinatorial active site saturation [51] allow a more efficient
evolution, but usually require some knowledge about the protein.
- Rational or semi-rational design: when the knowledge about a catalyst is advanced
enough (usually by knowing the sequence, structure and the function) chances to
predict the effects of mutagenesis increase, especially if the mechanism of an
enzyme is well understood [52]. This technique has been proven useful to enhance
promiscuous activity in enzymes [53], to modify the enantioselectivity [54-56], and to
increase its stability and activity [57]. The development of new in silico simulation
techniques is becoming a powerful tool to enhance this strategy [58-60].
1.3. Advantages of biocatalysis over traditional chemical production
The use of biocatalysis in industrial syntheses has several advantages over traditional
chemical approaches:
- High selectivity and effectivity: the turnover numbers of enzymes are usually orders
of magnitudes higher than for organometallic catalyst [61]. Further, enzymes usually
present excellent selectivity, being able to catalyse the synthesis of specific isomers
or enantiomers in high purities. Also the big variety of enzymes and the possibility of
modifying them in order to increase the available reactions makes possible to have
an enzyme performing virtually every possible reaction that can be done chemically.
- Mild reaction conditions: even though the new protein engineering techniques
allows the modification of enzymes to adopt to non-physiological reaction
conditions, the classic enzyme catalysis is conducted in aqueous buffer at neutral pH,
with mild temperature and without organic solvents or heavy metals. Due to this
characteristic, strong acidic or basic conditions or toxic compounds are reduced or
completely eliminated, making biocatalysis an environmentally friendly alternative to
organic chemical synthesis [62]. Also the lower temperature required compared to
traditional chemical approaches decreases the amount of energy needed, making the
process energetically cheaper and reducing CO2 production [63]. This feature
converts enzymes in one of the most promising actors in the green chemistry field
[23, 64].
17
- Renewable and biodegradable: the production of enzymes is done by cultivation.
Even though this process requires energy [65], no petrol derivate chemicals are
usually employed, making the catalyst production potentially entirely renewable.
Also the enzymes can be easily biodegraded, reducing costs of waste treatment and
its environmental impact.
Despite the mentioned advantages, biocatalysis has still some drawbacks which are
hindering its application in industrial processes:
- Low stability of the catalyst under process conditions: Chemical processes often run
under conditions far from physiological values which can have a negative impact on
the enzyme stability [13]. Since the cost of the catalyst is a big contributor to the
overall process costs (especially when is used in pure form) [66] each gram of catalyst
must be used as effectively and as long as possible. Due to this fact, often biocatalytic
processes are performed under non-optimal conditions in order to avoid catalyst
inactivation. Even though there are techniques to increase the stability of enzymes,
like immobilization or protein engineering [7], they usually do not achieve the
required values for being cost effective.
- Absence of appropriate catalysts and long development time: even though it is
theoretically possible to catalyze practically any organic reaction by an enzyme, the
catalyst discovery and development can require iterative engineering rounds which
may significantly increase the time that the process needs to be market ready [16].
Due to the short life of patents in pharmaceutical industry, this can be a major hurdle
for the application of biocatalysis in industrial scale [16]. One of the options to
overcome this challenge is the creation of enzyme toolboxes consisting of collections
of well characterized enzymes. Screening of such toolboxes for approriate enzymes
may significantly reduce the number of steps needed to identify the right catalyst.
- High water requirement: the production of protein via cultivation requires high
amounts of water due to the inability of the bacteria for growing over certain cell
densities. The amount of energy and the resources (glucose) used for fermentation
makes this step the main contributor to the environmental impact of the biocatalyst
production [65]. Also since the process is usually done with genetically modified
organisms, the treatment of the waste water can prevent its reutilization [21].
- Competition with industrial chemistry: even if the biocatalytic alternative is cost
effective and environmentally friendly, companies have to invest large amounts of
money in order to reengineer their production processes. Due to this reason,
biocatalysis has been limited to processes where no chemical alternative was feasible
or where the chemical reaction was much more expensive e.g. due to the number of
steps. Even though the adaptation of enzymes by protein- and reaction engineering
to process requirements can overcome this problem in the future. Further, if new
production sites are built, biocatalytic alternatives can be taken into account.
18
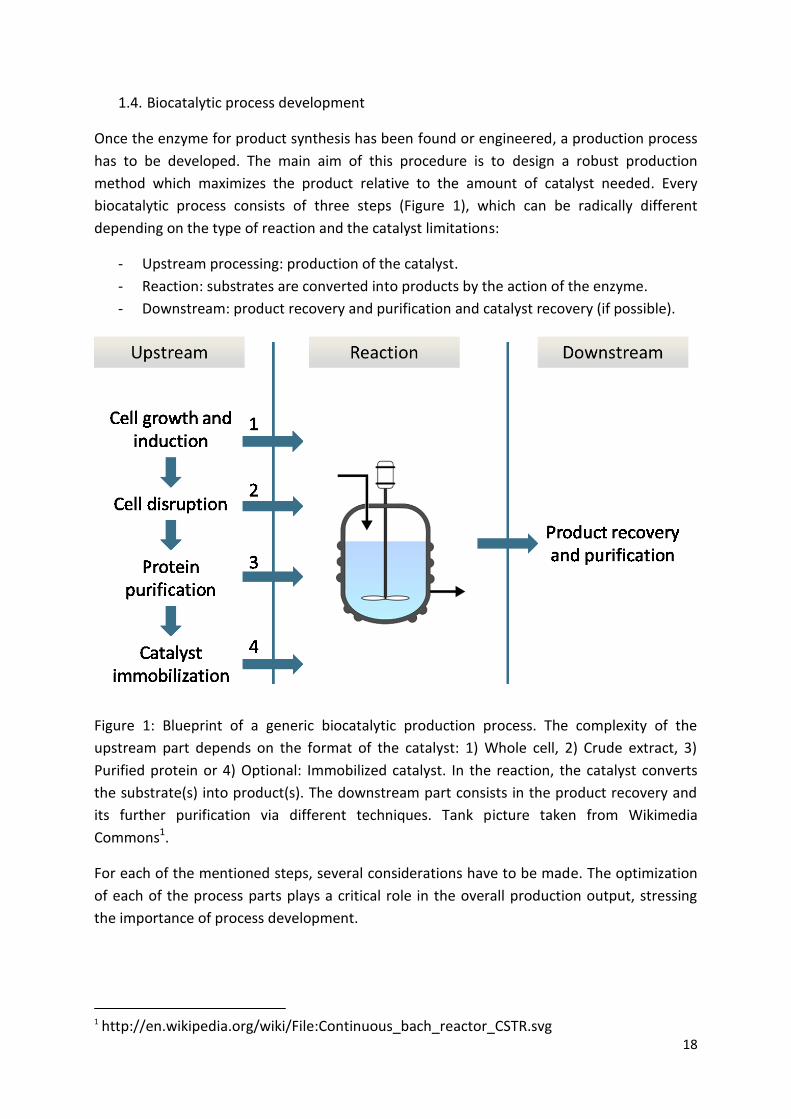
1.4. Biocatalytic process development
Once the enzyme for product synthesis has been found or engineered, a production process
has to be developed. The main aim of this procedure is to design a robust production
method which maximizes the product relative to the amount of catalyst needed. Every
biocatalytic process consists of three steps (Figure 1), which can be radically different
depending on the type of reaction and the catalyst limitations:
- Upstream processing: production of the catalyst.
- Reaction: substrates are converted into products by the action of the enzyme.
- Downstream: product recovery and purification and catalyst recovery (if possible).
Figure 1: Blueprint of a generic biocatalytic production process. The complexity of the
upstream part depends on the format of the catalyst: 1) Whole cell, 2) Crude extract, 3)
Purified protein or 4) Optional: Immobilized catalyst. In the reaction, the catalyst converts
the substrate(s) into product(s). The downstream part consists in the product recovery and
its further purification via different techniques. Tank picture taken from Wikimedia
Commons1.
For each of the mentioned steps, several considerations have to be made. The optimization
of each of the process parts plays a critical role in the overall production output, stressing
the importance of process development.
1 http://en.wikipedia.org/wiki/File:Continuous_bach_reactor_CSTR.svg
19
In some cases, steps can be integrated. These options can have a positive impact on the
process complexity as well as solve some problems that are associated with certain
reactions:
- Fermentation: the biotransformation is carried out in a stirred tank reactor by the
growing cells, integrating upstream and reaction in one pot. This option eliminates
the time and costs required for catalyst purification and its re-buffering. It can be
used when the metabolism of the growing cell does not interfere with the reaction
by substrate or product degradation or by-product formation and also when the
substrate and the product are not inhibiting the cell growth. Even though the
production by fermentation can be useful for process simplification, separation of
upstream and reaction step enables to modify and control the catalyst and substrates
concentrations more accurately [16]. Also, the reaction has to be compatible with the
whole cell catalyst, as will be explained in the upstream section.
- In situ product removal: The product is removed from the reaction while it is still
running [67]. This can be done by different methods, like adsorption on resins [68],
pervaporization or extraction into a second organic phase. It is a useful alternative in
those cases where the catalyst is inhibited by high concentrations of products or the
equilibrium is not favored [67].
1.4.1. Upstream
The upstream part of the process involves the preparation of the catalyst, its recovery and
modifications if required. In order to do this, the encoding gene has to be cloned, and an
appropriate recombinant host has to express the protein. Expression optimization is a critical
step in process development since it determines the catalyst availability. In order to increase
the amount of active protein produced by the host, several parameters have to be
optimized, like the concentration of the inducing agent (usually IPTG or lactose), the
temperature or the cultivation media. Once this is done the catalyst can be used in three
different formats:
- Whole cell: The whole cell is used as catalyst without any further treatment. This is
considered to be the cheapest catalyst format [66, 69] since its recovery can be done
by inexpensive methods such as centrifugation or filtration. But whole cell
biocatalysis can have some drawbacks like side reactions by the cell proteins,
interaction with the metabolism or mass transfer problems due to the cell
membrane. The cells can be used as catalyst during fermentation integrating
upstream and biotransformation steps (see above) or as “resting” cells. For the latter
mode, cells are separated from the cultivation vessel and resuspended in an
appropriate reaction medium for the reaction step, where the lack of nutrients leaves
the cells metabolically inactive. This procedure has the advantage of avoiding
interactions between the cell metabolism and the biocatalytic reaction. Another
20
advantage of whole cell catalysis is that no extra cofactors or the addition of extra
enzymes for their regeneration is usually needed, making this catalyst format
extremely useful for reactions where expensive cofactors are needed, (i.e. redox
reactions or oxidations) [29, 70, 71]. Also, using metabolic engineering, multi-step
synthesis can be carried out in whole cell, reducing dramatically the catalyst
production costs [10].
- Crude extract: cells are disrupted before the reaction step. The destruction of the
membrane eliminates possible mass transfer problems between the inside of the cell
and the reaction media. Another possible advantage is that this method allows a
better control of the enzyme environment since this is no longer operating in inside
the cell [72].
- Pure enzyme: the use of pure enzyme eliminates problems associated with the other
proteins present in the cell as well as any mass transfer problems related to the
membrane. The catalyst can be produced in an expression host or in a cell-free
system [72, 73] and then purified by different methods. However, the use of pure
enzyme is usually avoided in industrial applications due to the high costs for the
purification step.
Another interesting option to be considered during upstream development is the
immobilization of the catalyst [74]. This procedure is used to increases the stability and the
recyclability of the catalyst and can be very useful for enzymes with short half-life in non-
immobilized form [75]. The main drawbacks of this process are reduction of activity and the
increment of catalyst costs [66].
1.4.2 Reaction
The reaction is the core of the biocatalytic process. In this step the substrates are converted
into products by the biocatalyst. The reaction is usually carried in aqueous buffer but there
are other options in non-conventional media [76]:
- Organic solvents: the reaction can be performed either in pure organic solvent, a
biphasic system of buffer and solvent or in a monophasic mixture of some water
soluble organic solvent and buffer. This option can be used in order to increase
substrate or product solubility, reduce side reactions, in situ feed or in situ product
removal or biocatalyst stabilization. Nevertheless, the use of organic solvents may
alter the enzyme stability and its performance as well as has a negative impact on the
environmental friendliness of the process, if the organic solvent cannot be fully
recycled.
- Ionic liquids: ionic liquids are considered to be a green alternative to organic solvents
because they have no vapor pressure. The advantages and drawbacks are the same
as with organic solvents [77].
21
- Neat substrate systems: in some cases the reaction can be carried out in pure
substrate. This option can be used when the substrate is liquid, is not toxic for the
catalyst, and there is no substrate inhibition. The advantage of this reaction media is
the highest product concentrations that can be achieved [78, 79].
- Supercritical fluids: the use of supercritical fluids such as CO2 is considered to be a
green alternative to organic solvents. It increases the solubility and the diffusion of
substrates and products and it can be converted into a non-toxic gas just by
recovering atmospheric pressure and temperature [80].
- Gas phase: when the substrates are highly volatile, substrate saturated gas can be
used as reaction media by flowing through the immobilized catalyst [81].
The performance of a biocatalytic reaction is influenced by several different factors which
should be taken into account when a production process is being designed.
- Substrate concentration: This is one of the most critical parameters. If the production
of high product product concentrations is intended, the substrate present in a
reaction is going to be the limiting factor. Therefore, addition of high substrate
concentrations is necessary but there are some cases where this can be a problem:
substrate inhibition and low substrate solubility. Usually, the enzymatic reaction
speed increases with increased substrate concentration until the maximal velocity
(Vmax) is reached, but some enzymes are inhibited by certain substrates. Also, the
substrate can produce an emulsion when concentrations over its solubility limit are
reached. This would generate a second phase which deactivates many enzymes due
to interphase toxicity.
- Temperature: the reaction speed is usually enhanced with increasing temperature,
until thermal denaturation overcomes activation. Due to these contradictory trends,
the optimal temperature should be chosen in order to maximize the productivity and
to minimize denaturation taking into account the catalyst activity during the applied
reaction time.
- pH: Another crucial parameter is the pH-value. Every enzymatic reaction has an
optimal pH value where it runs at maximal speed. Also the pH can affect the
biocatalyst stability and in some cases it is involved in background reactions. Further,
the pH-value can also be important in low-water reaction systems. Due to the pH-
memory effect an enzyme “remembers” the last pH if “saw”, e.g. in the last
purification step before lyophilization. Using this effect, the activity of enzymes may
be tuned in non-conventional media.
- Buffer salt: In order to keep a constant pH, an appropriate buffer salt has to be
chosen. Some of these compounds can have a negative effect on the catalyst activity
or its stability, so a buffer screening is usually one of the first steps in catalyst
characterization. Also the temperature at which the reaction is going to take place
should be considered since changes in the temperature can produce variations in the
pH depending on the used buffer salt. In some cases, buffers can also be involved in
background reactions [82]. Another aspect which has to be taken into account is the
22
price of the salt, especially in industrial processes since it can be a big contributor to
the final product price.
- Ionic strength: the salt concentration (mainly buffer) may have a strong effect on the
catalyst solubility and has to be in a range which allows an optimal catalyst load.
- Enzyme concentration: the importance of this parameter is more economical than
scientific, since the catalyst cost is one of the main contributors to the final product
costs [66]. Therefore, the enzyme concentration should be kept as low as possible
meanwhile keeping the productivity over certain limits.
The biocatalytic reaction takes place in a reaction vessel and can be run in different modes
of operation depending on the reaction specifications. There are three types of reaction
modes (Figure 2):
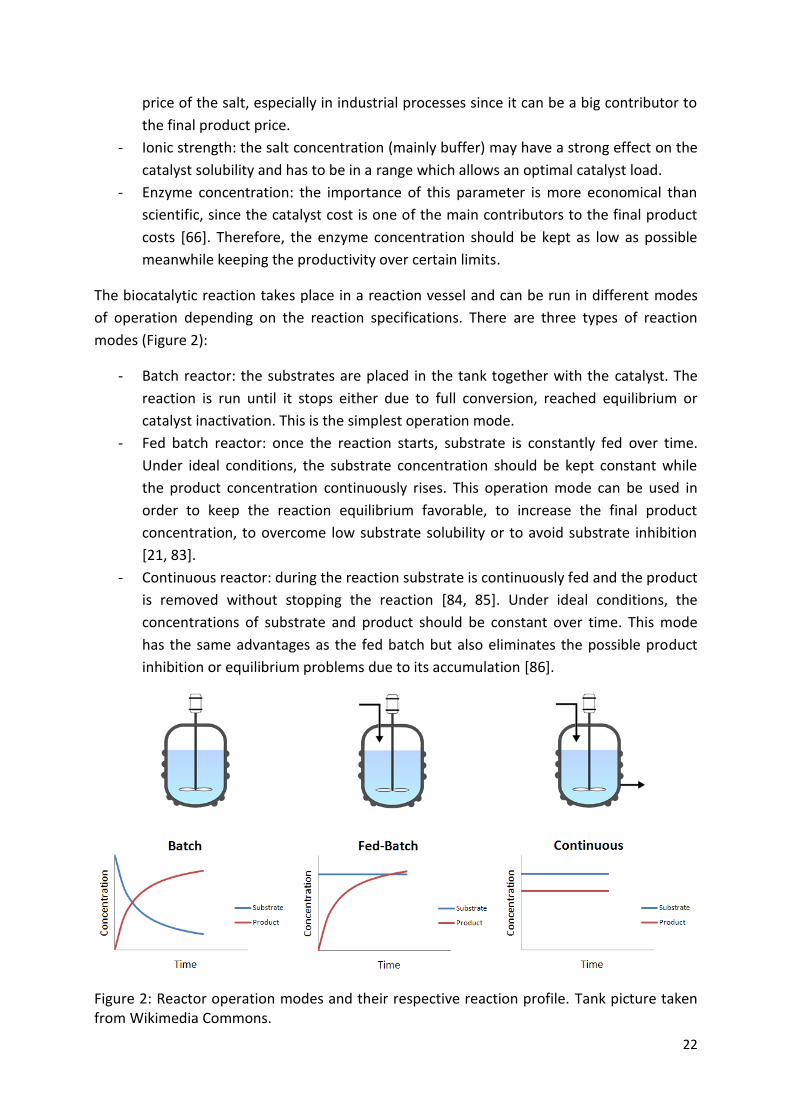
- Batch reactor: the substrates are placed in the tank together with the catalyst. The
reaction is run until it stops either due to full conversion, reached equilibrium or
catalyst inactivation. This is the simplest operation mode.
- Fed batch reactor: once the reaction starts, substrate is constantly fed over time.
Under ideal conditions, the substrate concentration should be kept constant while
the product concentration continuously rises. This operation mode can be used in
order to keep the reaction equilibrium favorable, to increase the final product
concentration, to overcome low substrate solubility or to avoid substrate inhibition
[21, 83].
- Continuous reactor: during the reaction substrate is continuously fed and the product
is removed without stopping the reaction [84, 85]. Under ideal conditions, the
concentrations of substrate and product should be constant over time. This mode
has the same advantages as the fed batch but also eliminates the possible product
inhibition or equilibrium problems due to its accumulation [86].
Figure 2: Reactor operation modes and their respective reaction profile. Tank picture taken from Wikimedia Commons.
23
Depending on the reaction type, the reaction media, the biocatalyst format and the chosen
mode of operation, the reaction can be carried out in different types of reactors. Even
though there are many different reactor types, they are usually variation of only two
principles, which will be discussed on the examples of the stirred tank reactor and the plug
flow reactor (Figure 3):
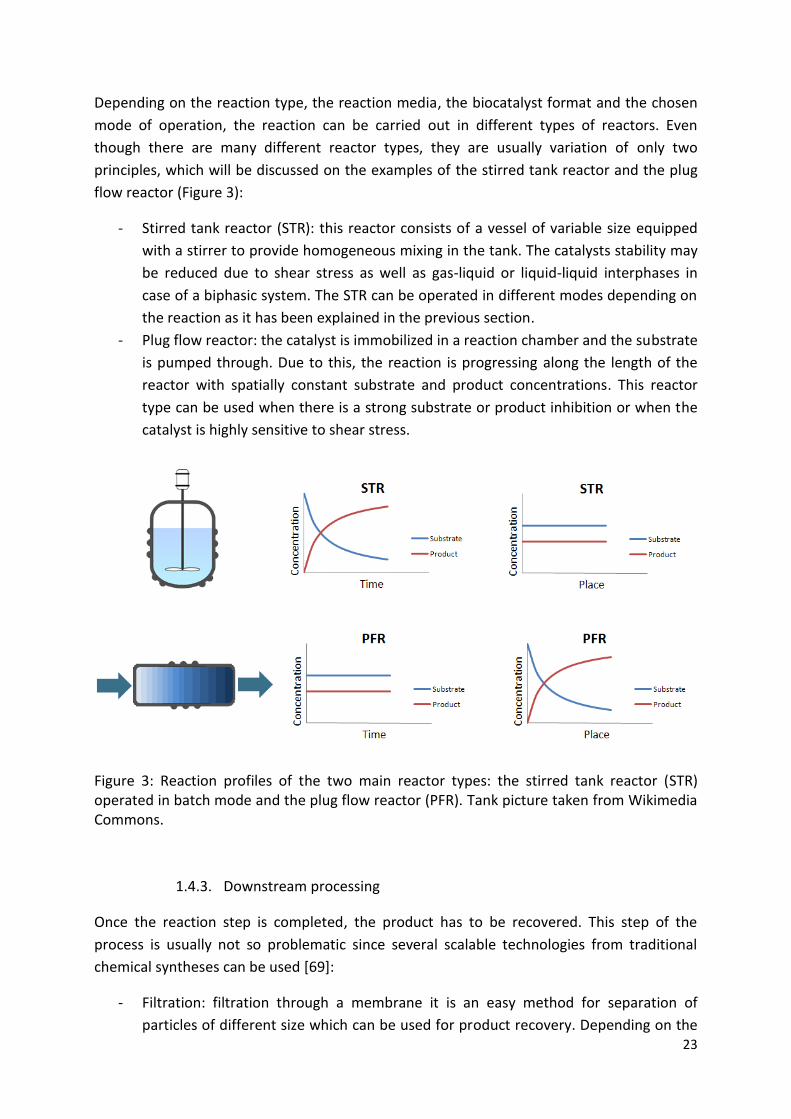
- Stirred tank reactor (STR): this reactor consists of a vessel of variable size equipped
with a stirrer to provide homogeneous mixing in the tank. The catalysts stability may
be reduced due to shear stress as well as gas-liquid or liquid-liquid interphases in
case of a biphasic system. The STR can be operated in different modes depending on
the reaction as it has been explained in the previous section.
- Plug flow reactor: the catalyst is immobilized in a reaction chamber and the substrate
is pumped through. Due to this, the reaction is progressing along the length of the
reactor with spatially constant substrate and product concentrations. This reactor
type can be used when there is a strong substrate or product inhibition or when the
catalyst is highly sensitive to shear stress.
Figure 3: Reaction profiles of the two main reactor types: the stirred tank reactor (STR) operated in batch mode and the plug flow reactor (PFR). Tank picture taken from Wikimedia Commons.
1.4.3. Downstream processing
Once the reaction step is completed, the product has to be recovered. This step of the
process is usually not so problematic since several scalable technologies from traditional
chemical syntheses can be used [69]:
- Filtration: filtration through a membrane it is an easy method for separation of
particles of different size which can be used for product recovery. Depending on the
24
pore size of the membrane, it can be used either for separating solid product (which
has precipitated or crystallized) or for separation of the catalyst from the reaction
media. This technique is also an interesting option for in situ product removal in a
continuously operated tank. If the product is extracted by a concentration gradient
without applying extra pressure on the membrane, the process is called dialysis. This
method can be enhanced by the use of an electric field (electrodialysis), which is a
useful method for separation of charged molecules like lactic acid [87].
- Extraction: the most widespread method for product recovery in biocatalysis is the
liquid-liquid extraction of the aqueous reaction system with an organic solvent that is
not water miscible. Even though this is a cost-efficient and effective method, it may
decreases the environmental friendliness of the production process, if the organic
solvent cannot be fully recycled and if waste water is contaminated. Subsequently,
the products must further be purified either using chromatography (see below) or by
distillation or crystallization.
- Adsorption: the product can be absorbed onto a resin or activated carbon. Different
types of resins can have affinity for different types of product, like ions or
hydrophobic compounds.
- Chromatography: chromatography includes an extend variety of separation methods
which can be used for separation of practically all types of molecules. It can be used
for product recovery or for product purification after an extraction step.
1.4.4. Process feasibility analysis:
As it was stated previously, an efficient biocatalytic process is generally more environmental
friendly than the competing chemical production but the production costs are usually higher.
In order to evaluate the economic viability of a process, several critical parameters which
can have a strong impact on the final product costs have to be carefully analyzed:
- Catalyst availability: catalyst costs are one of the main contributors to the final
product costs in a biocatalytic process. Therefore, the production of active catalyst
has to be as efficient as possible, taking into account the amount of biocatalyst
obtained per gram of cell as well as the specific activity. In order to do this,
characteristics like host, expression vector, growth, and induction method have to be
optimized. Another critical aspect is the recyclability of the catalyst and its stability.
In order to improve these parameters, immobilization can be an interesting option. In
any case, this method increases the catalyst costs, so it has to be planned carefully
[66].
- Gram of product per gram of catalyst: due to the high costs of the catalyst, the
amount of product obtained per gram of enzyme has to be maximized in order to
keep the process cost low. This value varies by orders of magnitude depending on the
catalyst format, due to the difference in upstream costs. Apart of achieving high
25
yields, in order to increase the product obtained per gram of catalyst, the
recyclability of the catalyst is critical [88].
- Specific space time yield (SSTY): defined as the amount of product that can be obtain
per mg catalyst in a period of time. The SSTY is one of the most critical parameters of
the process. In order to increase it, the reaction conditions have to be optimized.
- Final product concentration: in order to keep the downstream process cost effective,
the final concentration of the product is critical. Low product concentration can be
due to unfavorable reaction equilibrium, product inhibition or low substrate
solubility. The different strategies to overcome these problems are listed in Table 2.
- Conversion: in order to keep high atom economy, this parameter should be as high as
possible. Conversion can also have a high impact in the downstream processing cost,
since low conversion means that the product has to be separated from the substrate.
- Stereoselectivity: as it was stated in Chapter 1.3, one of the main advantages of
biocatalysis is the possibility to produce chiral compounds. This is of capital
importance in pharmaceutical industry since the FDA and other regulatory
organizations require any impurities, such as an unwanted enantiomer, to be below
1 %. This means that without any other contaminant present, the concentration of
the desired stereoisomer of a drug should be over 98 %.
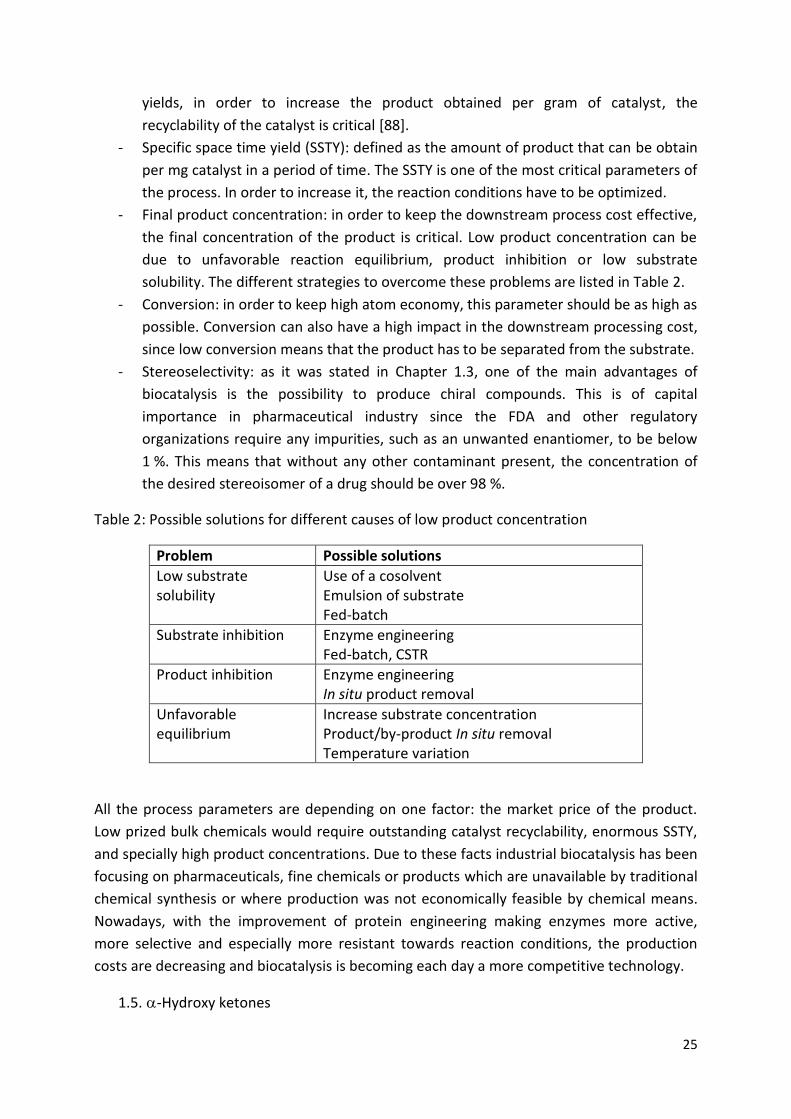
Table 2: Possible solutions for different causes of low product concentration
Problem Possible solutions
Low substrate solubility
Use of a cosolvent Emulsion of substrate Fed-batch
Substrate inhibition Enzyme engineering Fed-batch, CSTR
Product inhibition Enzyme engineering In situ product removal
Unfavorable equilibrium
Increase substrate concentration Product/by-product In situ removal Temperature variation
All the process parameters are depending on one factor: the market price of the product.
Low prized bulk chemicals would require outstanding catalyst recyclability, enormous SSTY,
and specially high product concentrations. Due to these facts industrial biocatalysis has been
focusing on pharmaceuticals, fine chemicals or products which are unavailable by traditional
chemical synthesis or where production was not economically feasible by chemical means.
Nowadays, with the improvement of protein engineering making enzymes more active,
more selective and especially more resistant towards reaction conditions, the production
costs are decreasing and biocatalysis is becoming each day a more competitive technology.
1.5. -Hydroxy ketones
26
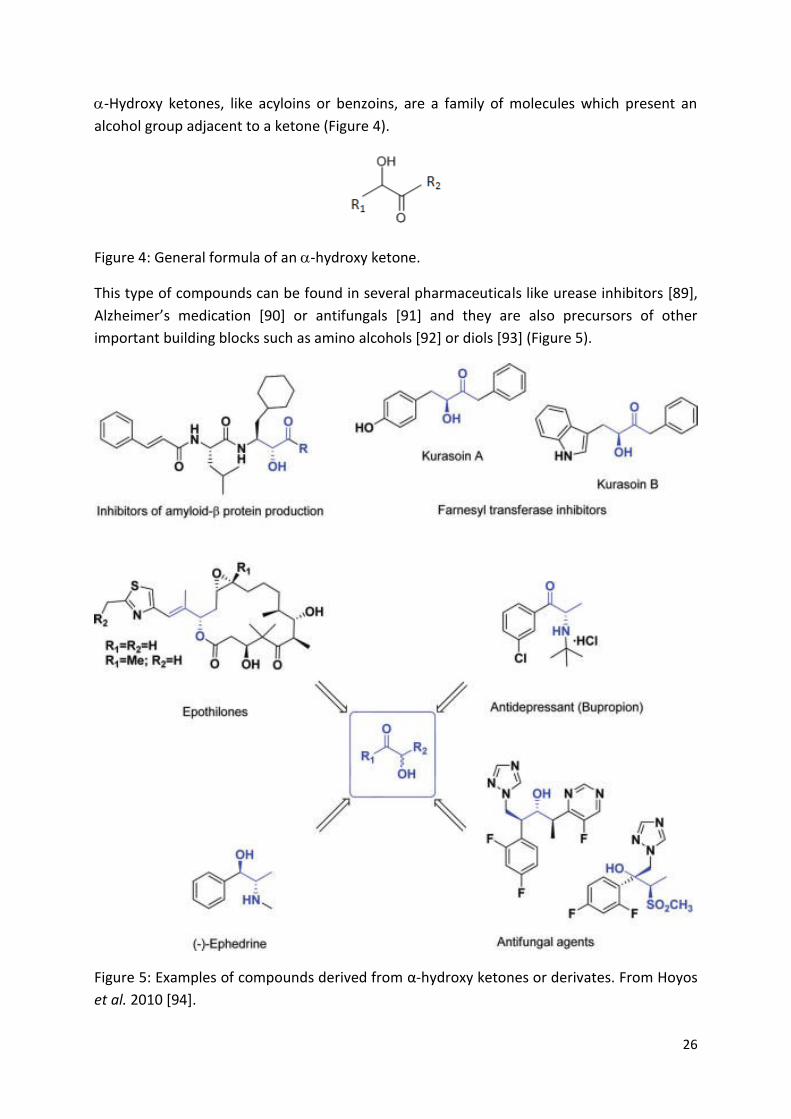
-Hydroxy ketones, like acyloins or benzoins, are a family of molecules which present an
alcohol group adjacent to a ketone (Figure 4).
Figure 4: General formula of an -hydroxy ketone.
This type of compounds can be found in several pharmaceuticals like urease inhibitors [89],
Alzheimer’s medication [90] or antifungals [91] and they are also precursors of other
important building blocks such as amino alcohols [92] or diols [93] (Figure 5).
Figure 5: Examples of compounds derived from α-hydroxy ketones or derivates. From Hoyos
et al. 2010 [94].
27
1.5.1. Chemical production
Due to the chiral nature of the OH group, the production of enantiomerically pure α-hydroxy
ketones can be challenging but there are still several ways of producing these compounds by
traditional chemical synthesis:
- -Hydroxylation: by using a chiral oxidant, a ketone can be hydroxylated producing
an α-hydroxy ketone [95].
- Ketohydroxylation: an oleofin is oxidized by a strong oxidant yielding an α-hydroxy
ketone [96].
- Asymmetric oxidation/reduction: enol ethers [97] or enolates, diols [98] or diketones
can be used as substrates for asymmetric oxidation/reduction using a chiral oxidant.
- Oxidative kinetic resolution: racemic α-hydroxy ketones can be resolved by oxidation
using a pro-chiral catalyst and molecular oxygen [99, 100].
- Asymmetric condensation: the acyloin condensation of two aldehydes has been
known for more than a century [101]. Nowadays, this reaction is conducted in a
biomimetic way by using thiazolium salts as catalysts [102, 103].
Even though there are some examples of successful chemical synthesis of α-hydroxy
ketones, usually multiple reaction steps, low yields and especially low chemo- and enantio-
selectivity are very common drawbacks of these production methods [104]. The use of a
biocatalytic approach can overcome these hurdles.
1.5.2. Biocatalytic production
Apart from the described chemical synthetic routes, a biocatalytic approach is possible [94].
There are mainly three enzymatic methods available:
- Redox reactions: enantiomerically pure -hydroxy ketone can be produced either by
oxidation of -diols or by reduction of -diketones. Since redox reactions require the
regeneration of expensive cofactors, this processes can be best performed using
either whole cell catalysis or multi-enzymatic systems with the addition of extra
ketones, alcohols or sugars in order to regenerate the cofactors.
- Dynamic kinetic resolution using hydrolases: another option is the use of kinetic
resolution of racemic -hydroxy ketones. This step can be easily catalyzed by a lipase,
but it has the disadvantage of having a maximum yield of 50 % of the starting
compound. In order to overcome this limitation, racemization of the remaining
substrate can be performed either enzymatically or chemically.
- Carboligation of aldehydes or -ketoacids using thiamine diphosphate (ThDP)
dependent enzymes: as it will be further discussed in the following section, ThDP-
dependent enzymes are able to produce enantiomerically pure -hydroxy ketones by
carboligation of two inexpensive aldehydes or the corresponding -ketoacids. This
option combines cost-effective substrates with the theoretical yield of 100 % [105]

28
1.6. ThDP dependent enzymes
ThDP-dependent enzymes are a very well-known family of enzymes which use the ThDP (the
biologically active form of vitamin B1) (Figure 6) as cofactor in order to catalyze a broad
range of C-C, C-N, C-S, C-O ligase and cleavage reactions [106]. Due to their ligase activity,
this family of enzymes has a strong potential for industrial application, therefore there has
been an intense effort in understanding the 3D structure of several ThDP-dependent
enzymes. The sequences of these proteins are compiled in the ThDP-dependent Enzyme
Engineering Database (TEED) [107] and a numbering system for a clear identification of
structurally equivalent amino acid residues in the enzymes has been proposed [108].
Figure 6: Ylide form of the ThDP.
ThDP-dependent enzymes are able to catalyze several C-C-ligase reactions using aldehydes
or ketones [106] as substrate like the Stetter like 1,4 addition of aldehydes [109], but one of
the best described reactions is the C-C formation by a benzoin condensation-like reaction of
two aldehydes yielding an -hydroxy ketone [109-111]. The reaction mechanism is one of
the best understood examples of umpolung chemistry (Figure 7). The charged ylide form of
ThDP may nucleophilically attack an aldehyde forming a carbanion-enamine, which may
subsequently reaction with a second aldehyde yielding the -hydroxy ketone. Without any
enzyme present, ThDP itself is able to catalyze these reactions but at extremely slow speed
[112].
29
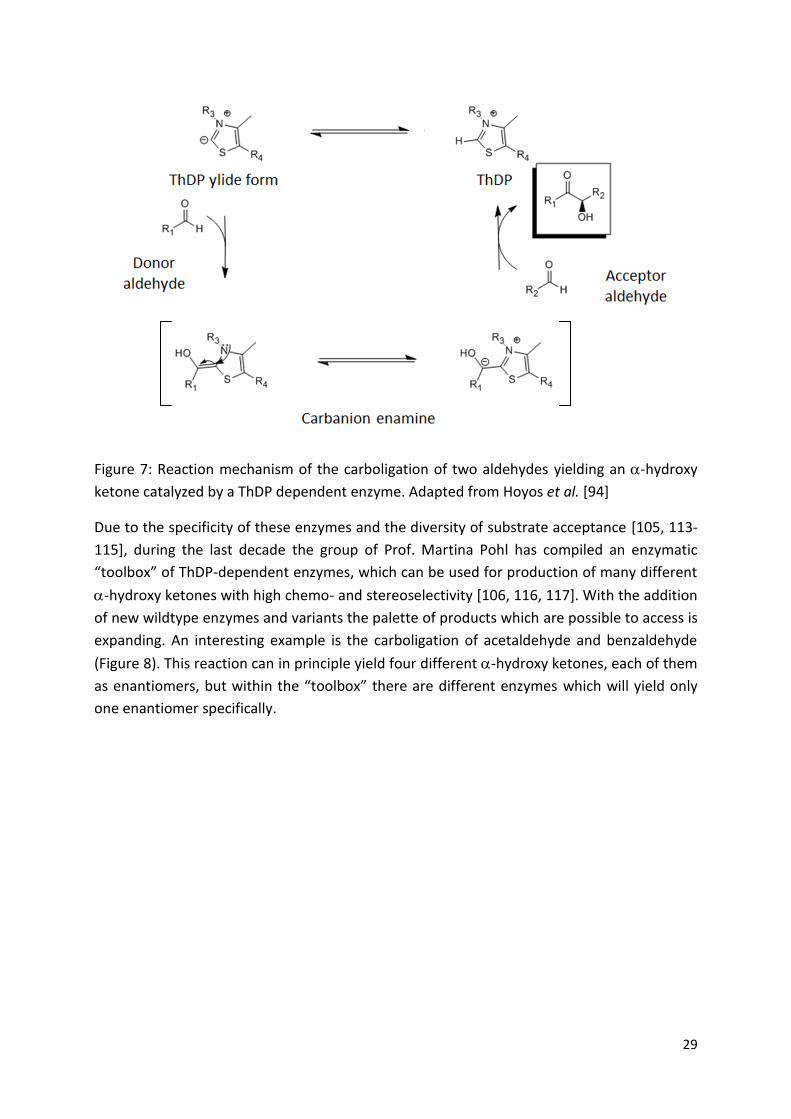
Figure 7: Reaction mechanism of the carboligation of two aldehydes yielding an -hydroxy
ketone catalyzed by a ThDP dependent enzyme. Adapted from Hoyos et al. [94]
Due to the specificity of these enzymes and the diversity of substrate acceptance [105, 113-
115], during the last decade the group of Prof. Martina Pohl has compiled an enzymatic
“toolbox” of ThDP-dependent enzymes, which can be used for production of many different
-hydroxy ketones with high chemo- and stereoselectivity [106, 116, 117]. With the addition
of new wildtype enzymes and variants the palette of products which are possible to access is
expanding. An interesting example is the carboligation of acetaldehyde and benzaldehyde
(Figure 8). This reaction can in principle yield four different -hydroxy ketones, each of them
as enantiomers, but within the “toolbox” there are different enzymes which will yield only
one enantiomer specifically.
30
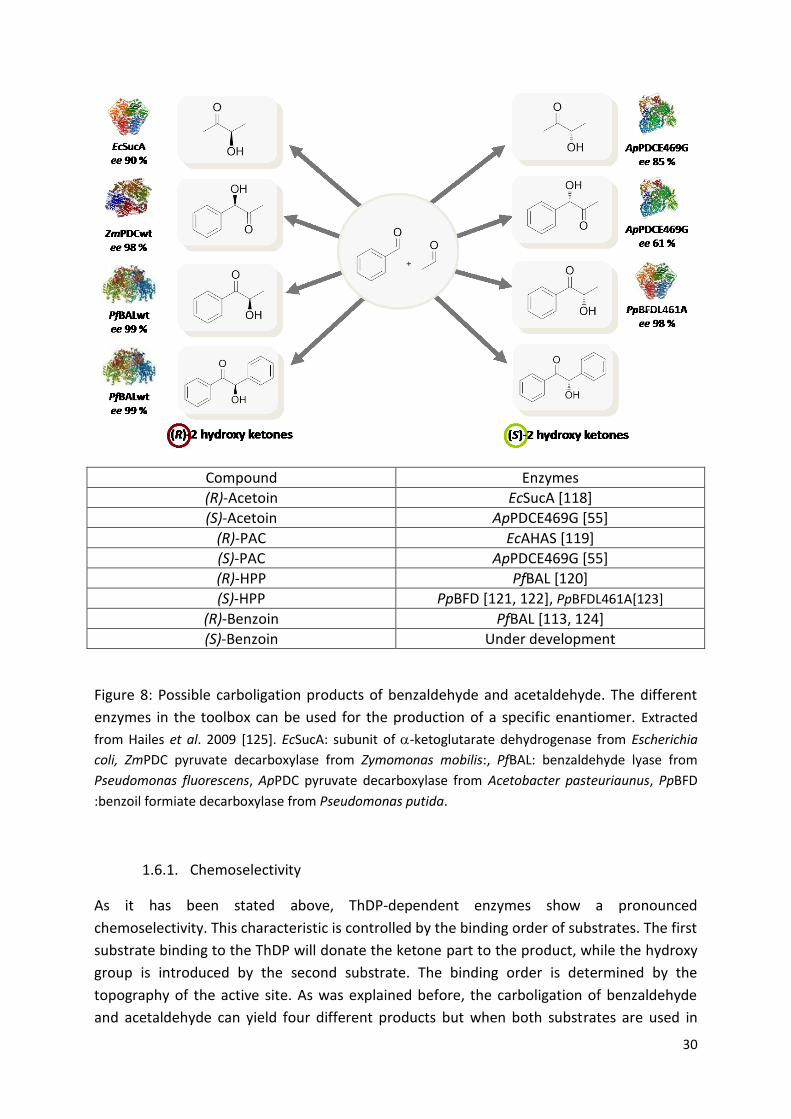
Compound Enzymes
(R)-Acetoin EcSucA [118]
(S)-Acetoin ApPDCE469G [55]
(R)-PAC EcAHAS [119]
(S)-PAC ApPDCE469G [55]
(R)-HPP PfBAL [120]
(S)-HPP PpBFD [121, 122], PpBFDL461A[123]
(R)-Benzoin PfBAL [113, 124]
(S)-Benzoin Under development
Figure 8: Possible carboligation products of benzaldehyde and acetaldehyde. The different
enzymes in the toolbox can be used for the production of a specific enantiomer. Extracted
from Hailes et al. 2009 [125]. EcSucA: subunit of -ketoglutarate dehydrogenase from Escherichia
coli, ZmPDC pyruvate decarboxylase from Zymomonas mobilis:, PfBAL: benzaldehyde lyase from
Pseudomonas fluorescens, ApPDC pyruvate decarboxylase from Acetobacter pasteuriaunus, PpBFD
:benzoil formiate decarboxylase from Pseudomonas putida.
1.6.1. Chemoselectivity
As it has been stated above, ThDP-dependent enzymes show a pronounced
chemoselectivity. This characteristic is controlled by the binding order of substrates. The first
substrate binding to the ThDP will donate the ketone part to the product, while the hydroxy
group is introduced by the second substrate. The binding order is determined by the
topography of the active site. As was explained before, the carboligation of benzaldehyde
and acetaldehyde can yield four different products but when both substrates are used in
31
presence of ApPDC, the products would be only phenylacetylcarbinol (PAC) and acetoin
since the active site of the this enzyme is too small for fitting the benzaldehyde in the donor
position. On the other hand, BAL presents a larger donor binding site and when this enzyme
is used, benzaldehyde is the preferred donor, yielding 2-hydroxypropiophenone (HPP) and
benzoin (Figure 9).
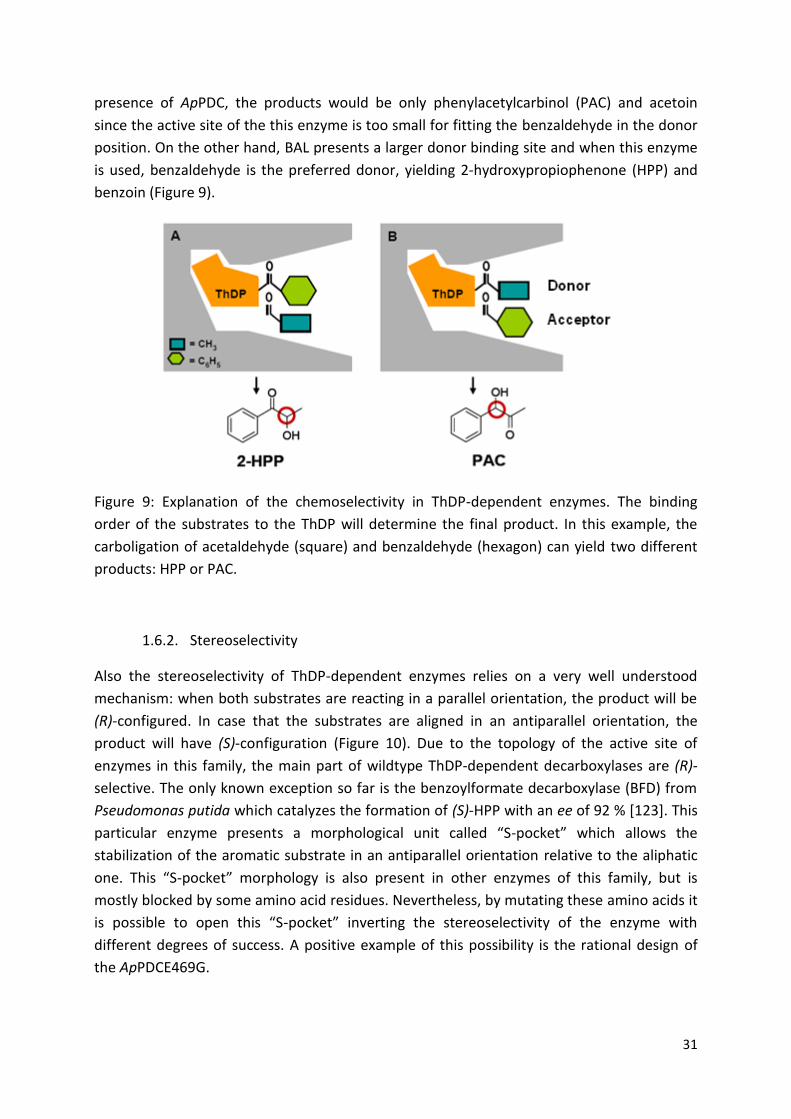
Figure 9: Explanation of the chemoselectivity in ThDP-dependent enzymes. The binding
order of the substrates to the ThDP will determine the final product. In this example, the
carboligation of acetaldehyde (square) and benzaldehyde (hexagon) can yield two different
products: HPP or PAC.
1.6.2. Stereoselectivity
Also the stereoselectivity of ThDP-dependent enzymes relies on a very well understood
mechanism: when both substrates are reacting in a parallel orientation, the product will be
(R)-configured. In case that the substrates are aligned in an antiparallel orientation, the
product will have (S)-configuration (Figure 10). Due to the topology of the active site of
enzymes in this family, the main part of wildtype ThDP-dependent decarboxylases are (R)-
selective. The only known exception so far is the benzoylformate decarboxylase (BFD) from
Pseudomonas putida which catalyzes the formation of (S)-HPP with an ee of 92 % [123]. This
particular enzyme presents a morphological unit called “S-pocket” which allows the
stabilization of the aromatic substrate in an antiparallel orientation relative to the aliphatic
one. This “S-pocket” morphology is also present in other enzymes of this family, but is
mostly blocked by some amino acid residues. Nevertheless, by mutating these amino acids it
is possible to open this “S-pocket” inverting the stereoselectivity of the enzyme with
different degrees of success. A positive example of this possibility is the rational design of
the ApPDCE469G.
32
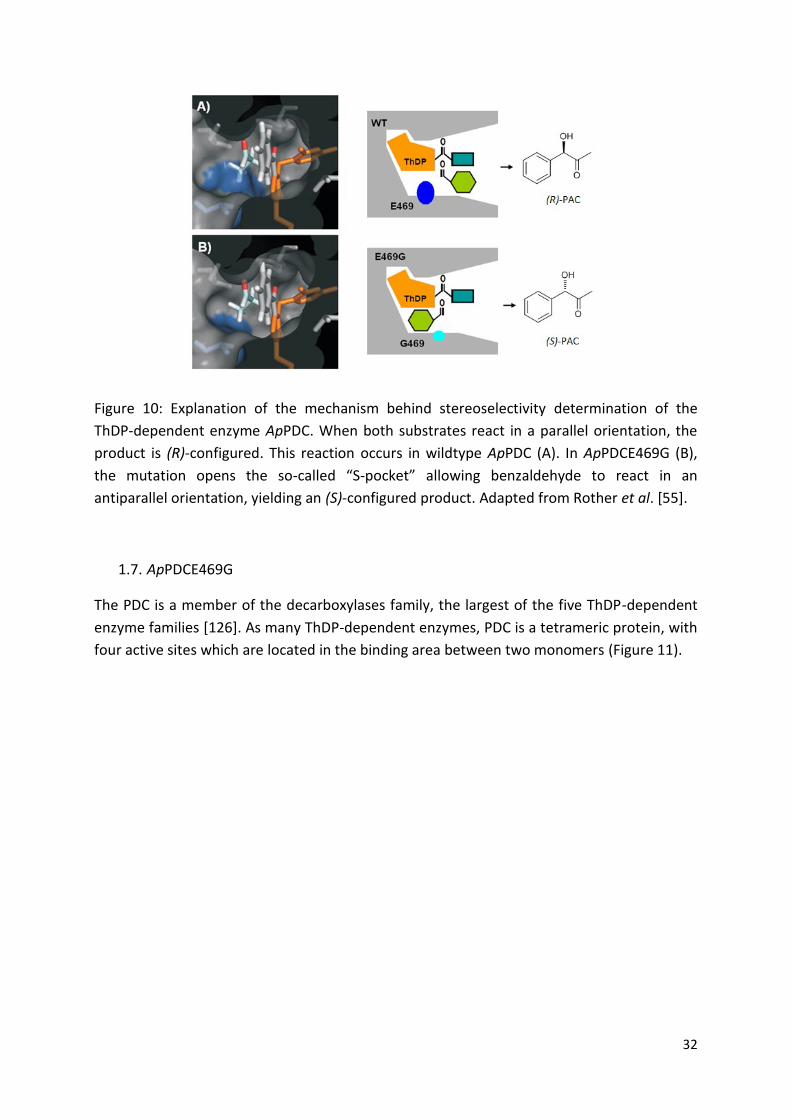
Figure 10: Explanation of the mechanism behind stereoselectivity determination of the
ThDP-dependent enzyme ApPDC. When both substrates react in a parallel orientation, the
product is (R)-configured. This reaction occurs in wildtype ApPDC (A). In ApPDCE469G (B),
the mutation opens the so-called “S-pocket” allowing benzaldehyde to react in an
antiparallel orientation, yielding an (S)-configured product. Adapted from Rother et al. [55].
1.7. ApPDCE469G
The PDC is a member of the decarboxylases family, the largest of the five ThDP-dependent
enzyme families [126]. As many ThDP-dependent enzymes, PDC is a tetrameric protein, with
four active sites which are located in the binding area between two monomers (Figure 11).

33
Figure 11: 3D structure of ApPDC. From RCSB database. PDB code: 2BVI.
In Acetobacter pasteurianus PDC plays a central role for the oxidative metabolism. Its
physiological function is the decarboxylation of pyruvate to acetaldehyde in the aerobic
metabolism of lactate (Figure 12)[127], whereas in other organisms the PDC is usually
involved in ethanol synthesis.
Figure 12: Proposed role of PDC in the oxidative metabolism of Acetobacter sp. L/D –lactate is oxidized by L- and D- lactate dehydrogenases (LDH) to pyruvate which is further decarboxylated by the ApPDC (red box) into acetaldehyde. This acetaldehyde is further oxidized to acetate by different aldehyde dehydrogenases (ALD). Refined from Raj et al. 2001 [127].
34
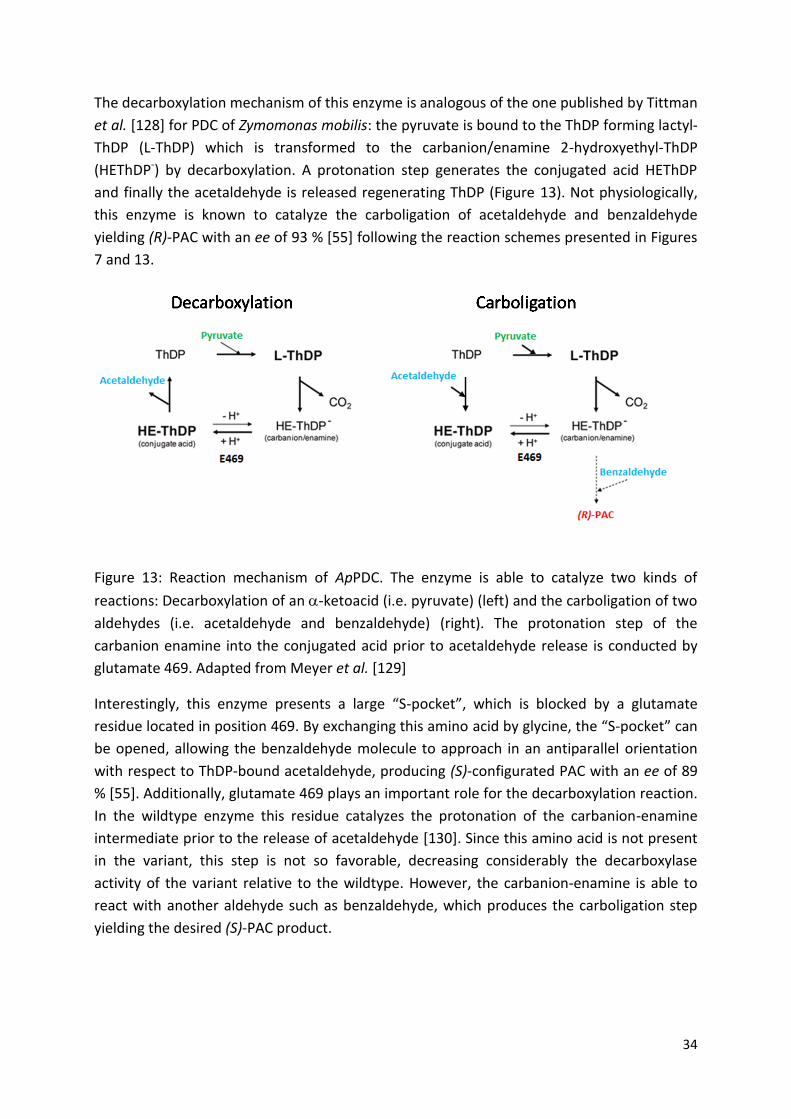
The decarboxylation mechanism of this enzyme is analogous of the one published by Tittman
et al. [128] for PDC of Zymomonas mobilis: the pyruvate is bound to the ThDP forming lactyl-
ThDP (L-ThDP) which is transformed to the carbanion/enamine 2-hydroxyethyl-ThDP
(HEThDP-) by decarboxylation. A protonation step generates the conjugated acid HEThDP
and finally the acetaldehyde is released regenerating ThDP (Figure 13). Not physiologically,
this enzyme is known to catalyze the carboligation of acetaldehyde and benzaldehyde
yielding (R)-PAC with an ee of 93 % [55] following the reaction schemes presented in Figures
7 and 13.
Figure 13: Reaction mechanism of ApPDC. The enzyme is able to catalyze two kinds of
reactions: Decarboxylation of an -ketoacid (i.e. pyruvate) (left) and the carboligation of two
aldehydes (i.e. acetaldehyde and benzaldehyde) (right). The protonation step of the
carbanion enamine into the conjugated acid prior to acetaldehyde release is conducted by
glutamate 469. Adapted from Meyer et al. [129]
Interestingly, this enzyme presents a large “S-pocket”, which is blocked by a glutamate
residue located in position 469. By exchanging this amino acid by glycine, the “S-pocket” can
be opened, allowing the benzaldehyde molecule to approach in an antiparallel orientation
with respect to ThDP-bound acetaldehyde, producing (S)-configurated PAC with an ee of 89
% [55]. Additionally, glutamate 469 plays an important role for the decarboxylation reaction.
In the wildtype enzyme this residue catalyzes the protonation of the carbanion-enamine
intermediate prior to the release of acetaldehyde [130]. Since this amino acid is not present
in the variant, this step is not so favorable, decreasing considerably the decarboxylase
activity of the variant relative to the wildtype. However, the carbanion-enamine is able to
react with another aldehyde such as benzaldehyde, which produces the carboligation step
yielding the desired (S)-PAC product.
35
1.8. Aim of the project
Even though the palette of -hydroxy ketones, which is possible to produce, is increasing
due to the enlargement of the ThDP-dependent enzymes in the toolbox, there are certain
products which are still challenging to produce. One of the best examples is the production
of the (S)-enantiomers of the already mentioned PAC and its derivates which are not
accessible by chemical approaches. Also the biocatalytic production presents challenges:
When one of the substrates for the carboligation has an aromatic ring, most of the described
wildtype enzymes from the structural family of decarboxylases are (R)-selective, making the
production of aromatic (S)-configured -hydroxy ketones more difficult. The ApPDCE469G
variant described before is the only designed enzyme so far being able to catalyze the
formation of (S)-PAC derivatives by carboligation of benzaldehyde and an aliphatic aldehyde
(Figure 14). The production of these specific compounds is of special interest since (R)-PAC is
currently used as precursor for several pharmaceuticals such as ephedrine, pseudoephedrine
or norephedrine [131]. The access to the (S)-configured PAC would lead to the production of
the complementary enantiomers which can have distinct physiological effects as the ones
currently used.
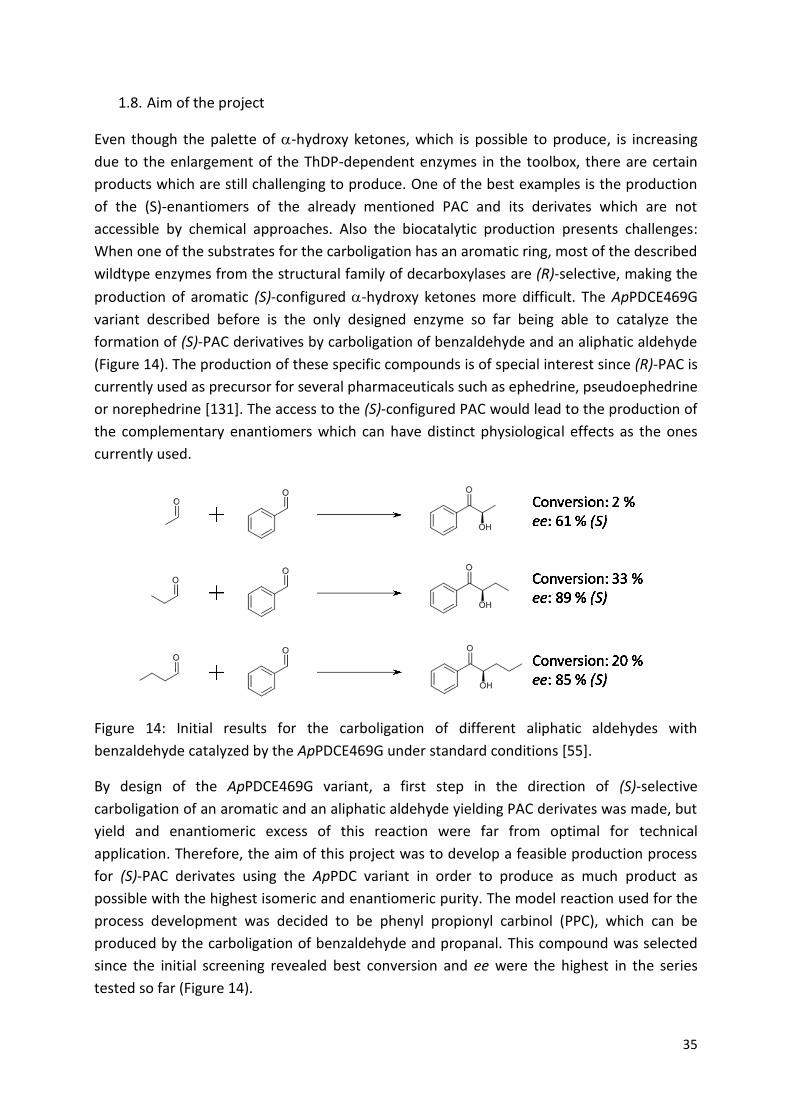
Figure 14: Initial results for the carboligation of different aliphatic aldehydes with
benzaldehyde catalyzed by the ApPDCE469G under standard conditions [55].
By design of the ApPDCE469G variant, a first step in the direction of (S)-selective
carboligation of an aromatic and an aliphatic aldehyde yielding PAC derivates was made, but
yield and enantiomeric excess of this reaction were far from optimal for technical
application. Therefore, the aim of this project was to develop a feasible production process
for (S)-PAC derivates using the ApPDC variant in order to produce as much product as
possible with the highest isomeric and enantiomeric purity. The model reaction used for the
process development was decided to be phenyl propionyl carbinol (PPC), which can be
produced by the carboligation of benzaldehyde and propanal. This compound was selected
since the initial screening revealed best conversion and ee were the highest in the series
tested so far (Figure 14).
36
The described ApPDCE469G variant is considered to be the best catalyst currently available
for this reaction. Due to this, further protein modification was considered to be out of the
scope of this work which will be focused on the production process development. Instead, a
biocatalytic production process of (S)-PPC was developed and optimized.
Even though the use of pure enzymes is the most widespread in academia, industry tends
more to the use of whole cell catalysis due to easier production and lower costs. Therefore,
both approaches, biotransformation with purified enzyme as well as whole cell catalysis
should be analyzed and advantadges and drawbacks of them compared.
In order to obtain maximal specific space time yields with the highest degree of purity, the
reaction conditions should be optimal. Optimization should include all factors which affect
the outcome of the reaction: the concentrations of catalyst, substrate(s), product(s), as well
as the reaction medium including all reaction conditions. Therefore the following aspects of
reaction optimization as well as process designs had to be in focus to reach the aim of
gaining a technically useful process with high productivity and excellent stereoselctivity:
- ApPDCE469G is able to catalyze the carboligation reaction by using either two
aldehydes or an aldehyde and an -ketoacid which is decarboxylated prior to C-C
bond formation. Due to this characteristic of the enzyme, propanal or the
corresponding -ketoacid, -ketobutyric acid (KBA) can be used as donor for the
carboligation with benzaldehyde. The use of both donors should be compared in
terms of reaction kinetics, product yield, enantiomeric excess and by-product
production.
- The use of organic cosolvents is a very common to increase the solubility of
hardly water-soluble substrates. One of the most common solvents used to
increase benzaldehyde solubility is DMSO [132], but Gerhards et al. determined
that the addition of this compound can decrease both productivity and ee of the
product when the ApPDCE469G is catalyzing a carboligation reaction between
acetaldehyde and benzaldehyde. Since the reaction studied in this recent work
was different, the use of DMSO had also to be assessed.
- Several parameters involved in reaction performance (temperature, pH, substrate
concentration, and enzyme concentration) should be optimized in order to
achieve the highest possible productivity and enantiomeric purity. Here classical
reaction optimization processes should be compared to iterative processes.
- Once the reaction is optimized the possibility of an scale-up should be assessed.
In order to do this, several parameters like the reactor type and operation mode
have to be carefully evaluated. Concerning the downstream step, in order to
recover and purify the product, an easy laboratory scale method should be
developed.
37
Once the process is outlined a feasibility analysis should be performed in order to assess its
potential industrial production process. Additionally, this analysis could also help to identify
possible bottlenecks were future research efforts should focus.
Finally, the production of different (S)-hydroxy ketones should be evaluated in order to
assess how transferable the process is and which key experiments should be done in order
to adapt it to the production of different compounds.
2. Materials and methods
2.1. Chemicals
All chemicals, except propioin, were purchased from Sigma Aldrich in the maximum grade of
purity available. Propioin was purchased from TCI Europe.
2.2. Cost calculation
In order to calculate the economic costs of certain parts of the process, the prices used as
reference were the ones given by Sigma Aldrich in the highest purity available. In order to
have a closer value to the bulk product price, the price for the largest trading unit provided
was chosen. The prices of all the compounds were annotated at the same day (16th of August
2013) in order to avoid price fluctuations.
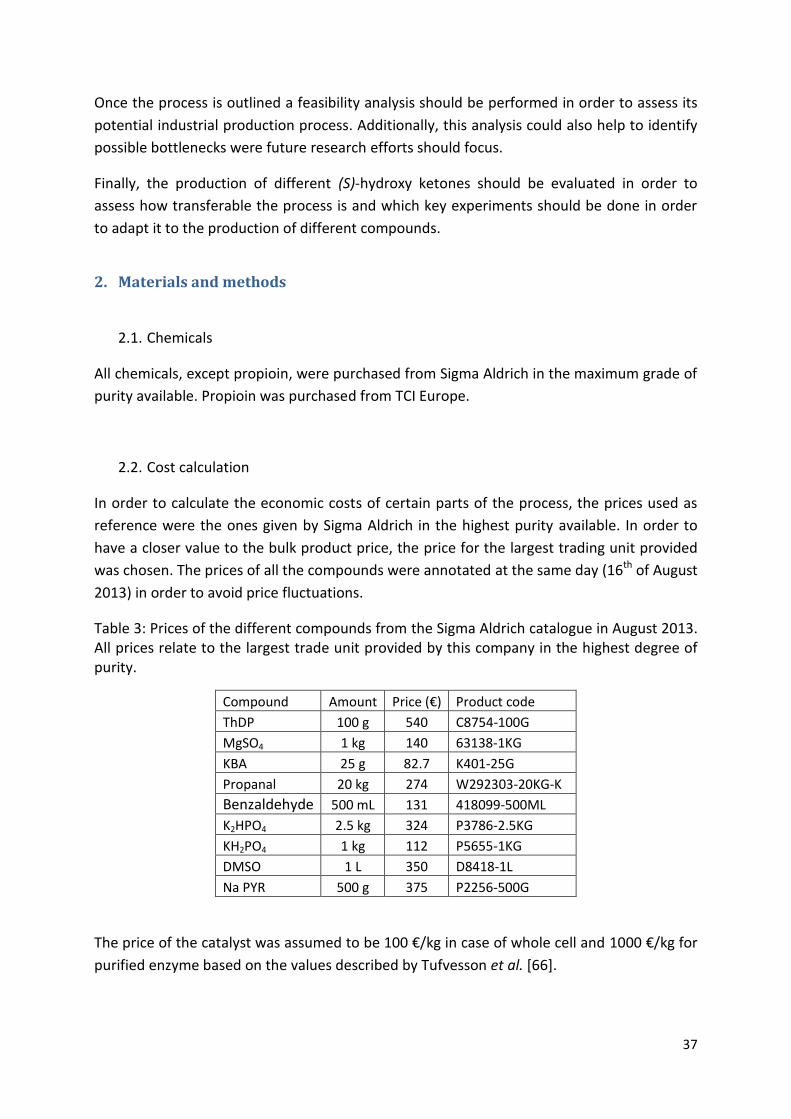
Table 3: Prices of the different compounds from the Sigma Aldrich catalogue in August 2013. All prices relate to the largest trade unit provided by this company in the highest degree of purity.
Compound Amount Price (€) Product code
ThDP 100 g 540 C8754-100G
MgSO4 1 kg 140 63138-1KG
KBA 25 g 82.7 K401-25G
Propanal 20 kg 274 W292303-20KG-K
Benzaldehyde 500 mL 131 418099-500ML
K2HPO4 2.5 kg 324 P3786-2.5KG
KH2PO4 1 kg 112 P5655-1KG
DMSO 1 L 350 D8418-1L
Na PYR 500 g 375 P2256-500G
The price of the catalyst was assumed to be 100 €/kg in case of whole cell and 1000 €/kg for
purified enzyme based on the values described by Tufvesson et al. [66].
38
2.3. Catalyst preparation
2.3.1. Protein production
The ApPDCE469G gen was cloned into a pET22b (Novagen) (EMD Milipore, USA) vector and
transformed into Escherichia coli BL21 (DE3) (Novagen) (EMD Milipore, USA) as described
elsewhere [55]. Bacteria were cultivated in auto induction (AI) medium (described in Table 4)
over 48 hours. Cells were harvested by centrifugation and the supernatant was removed.
The resulting pellet was frozen at -20°C. These frozen cells were used as catalyst in whole
cell experiments.
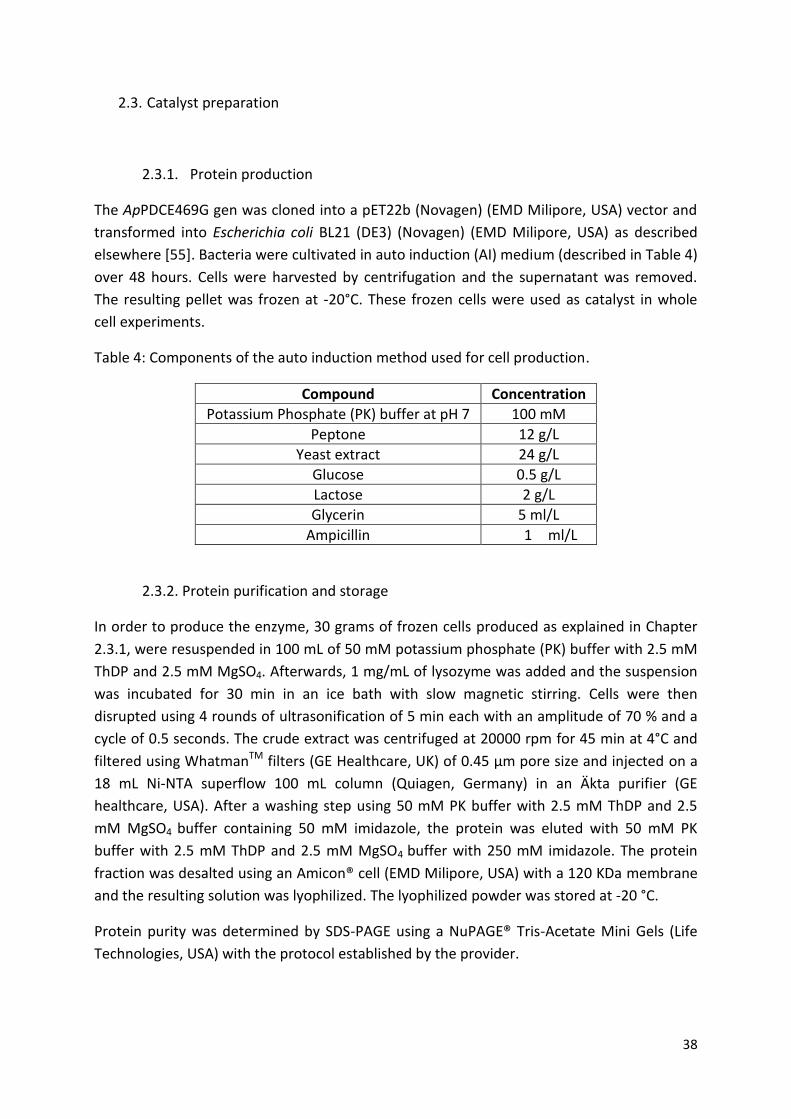
Table 4: Components of the auto induction method used for cell production.
Compound Concentration
Potassium Phosphate (PK) buffer at pH 7 100 mM
Peptone 12 g/L
Yeast extract 24 g/L
Glucose 0.5 g/L
Lactose 2 g/L
Glycerin 5 ml/L
Ampicillin 1 ml/L
2.3.2. Protein purification and storage
In order to produce the enzyme, 30 grams of frozen cells produced as explained in Chapter
2.3.1, were resuspended in 100 mL of 50 mM potassium phosphate (PK) buffer with 2.5 mM
ThDP and 2.5 mM MgSO4. Afterwards, 1 mg/mL of lysozyme was added and the suspension
was incubated for 30 min in an ice bath with slow magnetic stirring. Cells were then
disrupted using 4 rounds of ultrasonification of 5 min each with an amplitude of 70 % and a
cycle of 0.5 seconds. The crude extract was centrifuged at 20000 rpm for 45 min at 4°C and
filtered using WhatmanTM filters (GE Healthcare, UK) of 0.45 µm pore size and injected on a
18 mL Ni-NTA superflow 100 mL column (Quiagen, Germany) in an Äkta purifier (GE
healthcare, USA). After a washing step using 50 mM PK buffer with 2.5 mM ThDP and 2.5
mM MgSO4 buffer containing 50 mM imidazole, the protein was eluted with 50 mM PK
buffer with 2.5 mM ThDP and 2.5 mM MgSO4 buffer with 250 mM imidazole. The protein
fraction was desalted using an Amicon® cell (EMD Milipore, USA) with a 120 KDa membrane
and the resulting solution was lyophilized. The lyophilized powder was stored at -20 °C.
Protein purity was determined by SDS-PAGE using a NuPAGE® Tris-Acetate Mini Gels (Life
Technologies, USA) with the protocol established by the provider.
39
2.4. Analytic setup
2.4.1. HPLC
Product concentration was determined by HPLC analysis using a Hewlett Packard 1100 series
(Hewlett Packard, USA) device with an ID column provided by Chiral Technologies Europe
(France). The measurements were done by taking 50 µL of reaction media which were
diluted 1:10 in acetonitrile in order to stop the reaction. This step was producing also
enzyme precipitation and the samples were centrifuged at 14000 rpm in an Eppendorf
centrifugue during 3 minutes. Then the upper 100 µL of the mixture was taken into an HPLC
vial with a micro insert and analyzed by HPLC. The method consisted of an isocratic elution
with 35% acetonitrile and 65% deionized water with a flow of 1 mL/min for 20 minutes. The
method was calibrated for an injection volume of 20 µL.
Since this column enables the determination of product concentration and enantiomeric
excess, it was possible to substitute the previous analytic method consisting of a
measurement with a Hibar 250-4 Lichrospher 100 rp-8 (5 µm) (Merk Milipore, USA) column
in reverse phase for concentration determination and a second measurement using a chiral
OD column provided by Chiral Technologies Europe (France) for determination of
enantiomeric excess. Also, the Hibar column was not able to produce complete peak
separation when whole cell catalysis was used, as it is described in the Results chapter.
The use of 4-hydroxy acetophenone as injection standard was initially assessed but due to
the accuracy of the HPLC injection system which become obvious after performing several
experiments, it was considered as unnecessary.
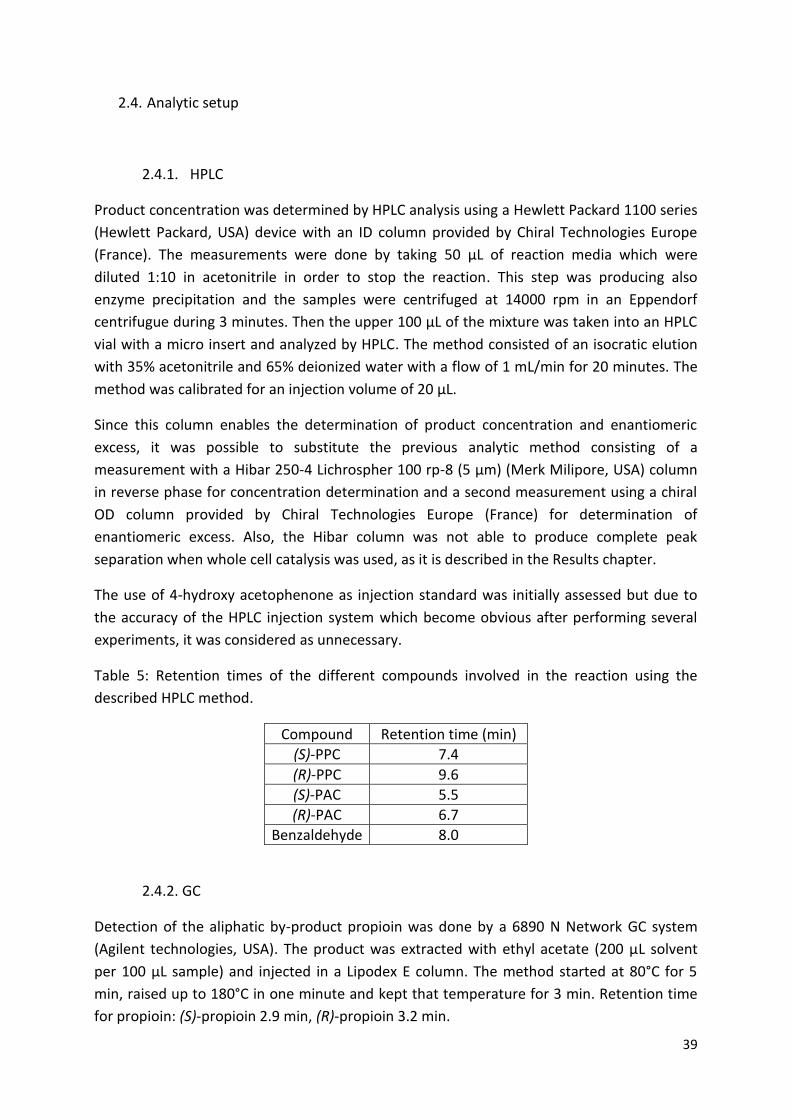
Table 5: Retention times of the different compounds involved in the reaction using the
described HPLC method.
Compound Retention time (min)
(S)-PPC 7.4
(R)-PPC 9.6
(S)-PAC 5.5
(R)-PAC 6.7
Benzaldehyde 8.0
2.4.2. GC
Detection of the aliphatic by-product propioin was done by a 6890 N Network GC system
(Agilent technologies, USA). The product was extracted with ethyl acetate (200 µL solvent
per 100 µL sample) and injected in a Lipodex E column. The method started at 80°C for 5
min, raised up to 180°C in one minute and kept that temperature for 3 min. Retention time
for propioin: (S)-propioin 2.9 min, (R)-propioin 3.2 min.
40
2.4.3. Protein concentration determination
The protein concentration was determined by the Bradford test [133] using BSA as standard
in the main part of the experiments. In the test related to chiral polishing, the protein
concentration was determined with a Direct detect device (Merck Milipore, USA).
2.5. Production of reference compounds
Some of the α-hydroxy ketones studied in this work are not commercially available and they
were synthetized in the laboratory.
(S)-PAC was produced enzymatically using ApPDCE469G by carboligation of benzaldehyde
and pyruvate. 50 mM benzaldehyde and 400 mM pyruvate were added in a 50 mL shake
flask with variable amounts of enzyme (usually 0.1 mg/mL) in 50 mM PK buffer at pH 7 with
0.1 mM of ThDP and 2.5 mM MgSO4. The reaction was monitored by HPLC and it was run
until the conversion exceeded 80 %. Then extra benzaldehyde was added up to a 50 mM
concentration. Once the reaction stopped, the product was extracted three times with ethyl
acetate, dried using anhydrous NaSO4 and concentrated using a rotatory evaporator.
Afterwards, the product was purified by flash chromatography using silica gel 60 (Roth,
Germany) as stationary phase in variable volume depending on the amount of product to
purify. The mobile phase consisted of 80 vol% petrol ether and 20 vol% ethyl acetate. After
this step, the product was concentrated one more time with the rotatory evaporator. The
pure compound was stored under argon at 4 °C. The purity determination was done by 1H-
NMR [55].
(S)-PPC was also enzymatically produced using the same procedure as described for (S)-PAC
but with α-ketobutyrate (KBA) instead of pyruvate. The product was extracted 3 times with
ethyl acetate, dried using anhydrous NaSO4 and concentrated using a rotatory evaporator.
Afterwards, the product was purified by flash chromatography with a mobile phase
consisting in 85 vol% petrol ether and 15 vol% ethyl acetate and concentrated one more
time. The pure compound was stored under argon at 4 °C.
2.6. Protein expression optimization
In order to maximize the protein amount obtained by cell cultivation, different induction
strategies were tested. The cells were produced using autoinduction medium or Luria-
Bertani broth (LB) with different amounts of IPTG (0.5 or 1 mM) which was added once the
culture was over 0.6 OD, temperatures (20 or 30 °C) and cultivation times (24 or 48 h). After
harvesting, the different cultures were diluted to an OD of 1 in a volume of 40 mL in order
to obtain the same amount of cells in each sample. The cells were centrifuged and the
supernatant was removed.
41
Finally, the amount of protein was measured by a carboligation test: the cells were re-
buffered in 50 mM PK buffer at pH 7 with 0.1 mM ThDP, 2.5 mM of MgSO4, with 15 mM of
benzaldehyde and 150 mM of KBA. After 6 hours of incubation at 30°C the amount of PPC
was measured by HPLC.
2.7. Standard experimental reaction conditions
Unless otherwise specified, all tests were performed in 1.5 mL glass vials with a reaction
volume of 1 mL containing 50 mM PK buffer, pH 7 with 0.1 mM ThDP, 2.5 mM of MgSO4 and
0.1 mg/mL of enzyme. The incubation conditions were 30°C and 1000 rpm in a Thermomixer
comfort shaker (Eppendorf, Germany).
2.7.1. Substrate characterization
The reaction was run at standard conditions with benzaldehyde concentrations between 10
and 20 mM. Each vial contained either propanal or KBA in a concentration between 40 and
100 mM. The reaction was incubated during 24 hours and measurements with HPLC and GC
were done at times 0, 8 and 24 h. All tests were done in duplicate.
2.7.2. Reaction kinetics
In order to determine the kinetic parameters of the carboligation using KBA and
benzaldehyde as substrates, two different experiments were done: First, the reaction was
run at a fixed concentration of benzaldehyde (30 mM) and varying KBA concentrations
between 10 and 300 mM. Second, the reaction was run at a fixed concentration of KBA (300
mM) and varying benzaldehyde concentrations between 4.5 and 45 mM. In both cases, the
reaction was run in 50 mM PK buffer, pH 7, 0.1 mM ThDP, 2.5 mM of MgSO4 and 0.05 mg/mL
of enzyme over 30 min at 30°C and 500 rpm. Measurements were performed at times 0, 5,
10, 15, 20 and 30 min and the samples were analyzed by HPLC with the method explained in
Chapter 2.4.1. From these data, the initial reaction rate was calculated, plotted and kinetic
parameters were calculated using Origin. The experiments were done in triplicate.
2.7.3. Effect of DMSO
The reaction was run with different concentrations of DMSO from 0 % (buffer control) to 30
% v/v. The reaction took place in 50 mM PK buffer, pH 7 with 0.1 mM ThDP, 2.5 mM of
MgSO4 150 mM of KBA, 30 mM of benzaldehyde and 0.1 mg/mL of enzyme at 30°C and 500
rpm. Measurements were done at times 0 and 17 hours and samples were analyzed by HPLC
and GC with the methods explained in Chapter 2.4.1. and 2.4.2. in order to determine
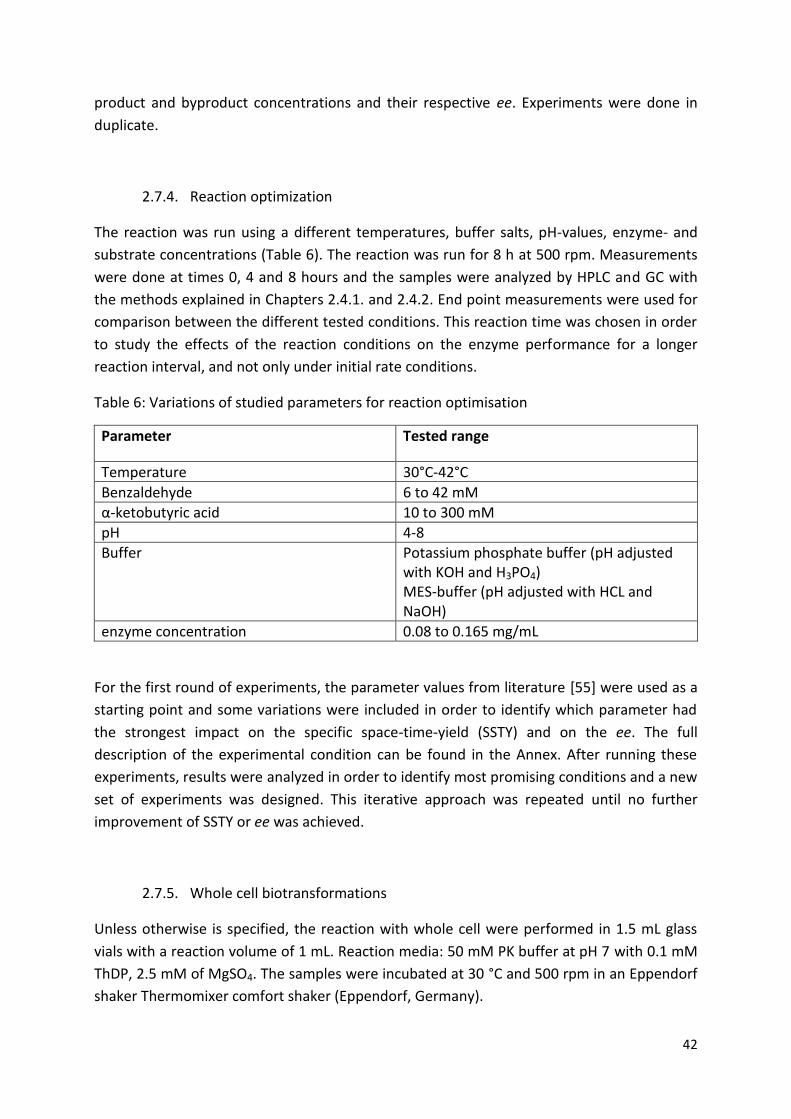
42
product and byproduct concentrations and their respective ee. Experiments were done in
duplicate.
2.7.4. Reaction optimization
The reaction was run using a different temperatures, buffer salts, pH-values, enzyme- and
substrate concentrations (Table 6). The reaction was run for 8 h at 500 rpm. Measurements
were done at times 0, 4 and 8 hours and the samples were analyzed by HPLC and GC with
the methods explained in Chapters 2.4.1. and 2.4.2. End point measurements were used for
comparison between the different tested conditions. This reaction time was chosen in order
to study the effects of the reaction conditions on the enzyme performance for a longer
reaction interval, and not only under initial rate conditions.
Table 6: Variations of studied parameters for reaction optimisation
Parameter Tested range
Temperature 30°C-42°C
Benzaldehyde 6 to 42 mM
α-ketobutyric acid 10 to 300 mM
pH 4-8
Buffer Potassium phosphate buffer (pH adjusted with KOH and H3PO4) MES-buffer (pH adjusted with HCL and NaOH)
enzyme concentration 0.08 to 0.165 mg/mL
For the first round of experiments, the parameter values from literature [55] were used as a
starting point and some variations were included in order to identify which parameter had
the strongest impact on the specific space-time-yield (SSTY) and on the ee. The full
description of the experimental condition can be found in the Annex. After running these
experiments, results were analyzed in order to identify most promising conditions and a new
set of experiments was designed. This iterative approach was repeated until no further
improvement of SSTY or ee was achieved.
2.7.5. Whole cell biotransformations
Unless otherwise is specified, the reaction with whole cell were performed in 1.5 mL glass
vials with a reaction volume of 1 mL. Reaction media: 50 mM PK buffer at pH 7 with 0.1 mM
ThDP, 2.5 mM of MgSO4. The samples were incubated at 30 °C and 500 rpm in an Eppendorf
shaker Thermomixer comfort shaker (Eppendorf, Germany).
43
2.7.5.1. Optimal cell load
The reaction was run in 50 mM PK buffer at pH 7 with 0.1 mM ThDP, 2.5 mM of MgSO4 at
30°C and 500 rpm. Different amounts of wet cells were added as catalyst from 0 (negative
control) to 100 mg/mL. The substrate concentration was 30 mM benzaldehyde and 150 mM
KBA. The reaction was studied during 4 hours and samples were taken at times 0, 1, 2, 3 and
4 hours. Samples were analyzed by HPLC with the method explained in Chapter 2.4.1.
An experiment comparing wet cells and crude extract was done by running the reaction 50
mM PK buffer at pH 7 with 5 mM of MgSO4, 150 mM of KBA and 30 mM of benzaldehyde at
30°C and 500 rpm. 20 mg/mL of wet cell were used as catalyst but for one of the reaction
vials the cells were previously disrupted by using 4 rounds of ultrasounds of 5 min each with
amplitude of 70 % and a cycle of 0.5 seconds. This process lysates the cell producing crude
extract which was used as catalyst (without further processing) in the second set of
reactions. The reaction was studied in duplicate for 24 hours and measurements were taken
at time 0, 0.5, 1, 1.5, 2 and 24 hours. Samples were analyzed by HPLC with the method
explained in Chapter 2.4.1.
Comparison between wet cell and lyophilized cell was done by running the reaction in 50
mM PK buffer at pH 7 with 5 mM of MgSO4, 150 mM of KBA and 30 mM of benzaldehyde at
30°C and 500 rpm. Some frozen cells were lyophilized, which results in a reduction of weight
of 75 %. Due to this, in order to have similar catalyst load, the reaction with wet cell was run
with 10 mg/mL of catalyst and the reaction with lyophilized cells with a catalyst
concentration of 2.5 mg/mL. The reaction was studied in duplicate during 18 hours and
measurements were taken at time 0, 0.45, 1.5, 2.25 and 18 hours. Samples were analyzed by
HPLC with the method explained in Chapter 2.4.1.
2.7.5.2. Influence of ThDP
The reaction was run with different amounts of ThDP between 0 mM (negative control) and
1 mM in 50 mM PK buffer at pH 7 with 5 mM of MgSO4, 150 mM of KBA and 30 mM of
benzaldehyde at 30°C and 500 rpm with a cell concentration of 10 mg/mL of wet cells. The
reaction was studied for 3 hours with measurements at time 0, 1, 2, and 3 hours. Data were
analyzed by HPLC with the method explained in Chapter 2.4.1.
2.7.5.3. Optimization of the KBA concentration
The reaction was run at different KBA concentrations between 10 mM and 600 mM in 50
mM PK buffer at pH 7, with 2.5 mM of MgSO4, 0.1 mM ThDP, and 30 mM of benzaldehyde,
30°C and 500 rpm with a wet cell concentration of 10 mg/mL. The reaction was studied
44
during 20 hours with measurements at time 0, 1, 2, 3 and 20 hours. The data was analyzed
by HPLC.
2.7.5.4. Optimization of the benzaldehyde concentration
The reaction was run at different benzaldehyde concentrations between 5 mM and 200 mM
in 50 mM PK buffer at pH 7, with 2.5 mM of MgSO4, 0.1 mM ThDP, and 300 mM of KBA, 30°C
and 500 rpm with a cell concentration of 10 mg/mL of wet cell. The reaction was studied for
18 hours with measurements at time 0, 1, 2, 3 and 18 hours. Data were analyzed by HPLC.
2.7.5.5. Optimal pH
The reaction was run at different pH values between 6 and 8 in 50 mM PK buffer with 2.5
mM of MgSO4, 0.1 mM ThDP, 150 mM of KBA and 30 mM of benzaldehyde at 30°C and 500
rpm with a cell concentration of 10 mg/mL of wet cell. The reaction was studied for 3 hours
with measurements at time 0, 1, 2, and 3 hours. Data were analyzed by HPLC.
2.7.5.6. Optimal temperature
The reaction was run at different temperatures between 20°C to 40°C in 50 mM PK buffer at
pH 7, with 2.5 mM of MgSO4, 0.1 mM ThDP, 150 mM of KBA and 30 mM of benzaldehyde
and 500 rpm with a cell concentration of 10 mg/mL of wet cell. The reaction was studied for
20 hours with measurements at time 0, 1, 2, 3 and 20 hours. Data were analyzed by HPLC.
2.7.6. Whole cell recyclability
The reaction was run with different substrate concentrations as specified in Table 7 in 50
mM PK buffer at pH 7, with 2.5 mM of MgSO4, 0.1 mM ThDP, and 500 rpm with a cell
concentration of 15 mg/mL of wet cell. The reaction was run during 24 hours and the cells
were recovered by centrifugation (2 min 14000 rpm). The supernatant was analyzed by
HPLC, the cells were washed in buffer 2 times and the reaction was restarted by adding fresh
substrate. The cycle was repeated 5 times.
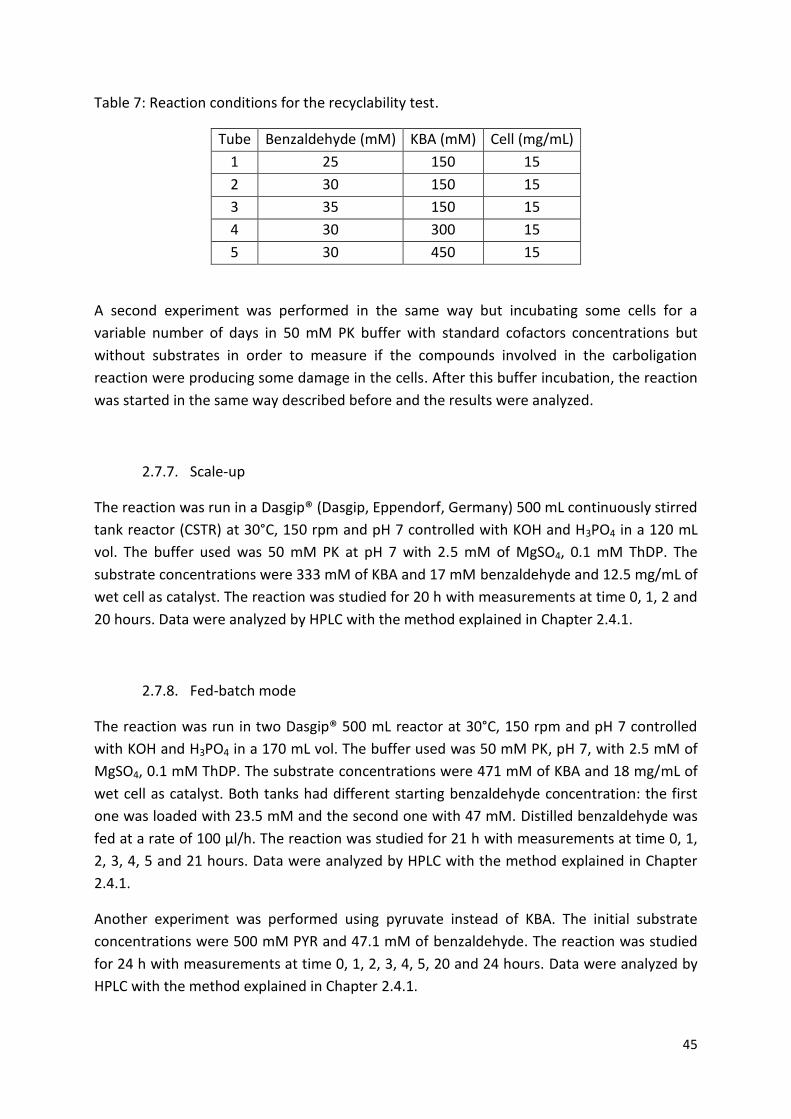
45
Table 7: Reaction conditions for the recyclability test.
Tube Benzaldehyde (mM) KBA (mM) Cell (mg/mL)
1 25 150 15
2 30 150 15
3 35 150 15
4 30 300 15
5 30 450 15
A second experiment was performed in the same way but incubating some cells for a
variable number of days in 50 mM PK buffer with standard cofactors concentrations but
without substrates in order to measure if the compounds involved in the carboligation
reaction were producing some damage in the cells. After this buffer incubation, the reaction
was started in the same way described before and the results were analyzed.
2.7.7. Scale-up
The reaction was run in a Dasgip® (Dasgip, Eppendorf, Germany) 500 mL continuously stirred
tank reactor (CSTR) at 30°C, 150 rpm and pH 7 controlled with KOH and H3PO4 in a 120 mL
vol. The buffer used was 50 mM PK at pH 7 with 2.5 mM of MgSO4, 0.1 mM ThDP. The
substrate concentrations were 333 mM of KBA and 17 mM benzaldehyde and 12.5 mg/mL of
wet cell as catalyst. The reaction was studied for 20 h with measurements at time 0, 1, 2 and
20 hours. Data were analyzed by HPLC with the method explained in Chapter 2.4.1.
2.7.8. Fed-batch mode
The reaction was run in two Dasgip® 500 mL reactor at 30°C, 150 rpm and pH 7 controlled
with KOH and H3PO4 in a 170 mL vol. The buffer used was 50 mM PK, pH 7, with 2.5 mM of
MgSO4, 0.1 mM ThDP. The substrate concentrations were 471 mM of KBA and 18 mg/mL of
wet cell as catalyst. Both tanks had different starting benzaldehyde concentration: the first
one was loaded with 23.5 mM and the second one with 47 mM. Distilled benzaldehyde was
fed at a rate of 100 µl/h. The reaction was studied for 21 h with measurements at time 0, 1,
2, 3, 4, 5 and 21 hours. Data were analyzed by HPLC with the method explained in Chapter
2.4.1.
Another experiment was performed using pyruvate instead of KBA. The initial substrate
concentrations were 500 mM PYR and 47.1 mM of benzaldehyde. The reaction was studied
for 24 h with measurements at time 0, 1, 2, 3, 4, 5, 20 and 24 hours. Data were analyzed by
HPLC with the method explained in Chapter 2.4.1.
46
2.7.9. Chiral polishing
The chiral polishing reaction was studied using 10 or 20 mM of (S)-PAC with an ee of 68 %.
BAL and ApPDCE469G were added in concentrations of 2.2 and 2.1 mg/mL respectively
(concentrations determined by the Direct detect device). Also pyruvate was added in a
concentration 20 times higher than PAC (200 mM and 400 mM, respectively). The reaction
media was 50 mM PK buffer at pH 7 with 0.1 mM ThDP, 2.5 mM of MgSO4 at 30°C and 500
rpm. The reaction was studied for 24 h with measurements at time 0, 3.3, 17.3 and 24 hours.
Data were analyzed by HPLC with the method explained in Chapter 2.4.1.
To find optimize the concentrations of BAL and ApPDCE469G for the chiral polishing, a
second test was done. The reaction was performed in 50 mM PK buffer at pH 7 with 0.1 mM
ThDP, 2.5 mM of MgSO4 at 30°C and 500 rpm. The substrate concentration was 17 mM of
(S)-PAC with a 68 % ee and 100 mM pyruvate. Enzymes were used in different
concentrations as explained in Table 8. The reaction was studied for 24 h with
measurements at time 0, 3, 5, 20 and 24 hours. Data were analyzed by HPLC. The
experiment was performed in duplicate.
Table 8: Protein concentrations in the different experiments for the chiral polishing experiment
Tube BAL
(mg/mL) ApPDCE469G (mg/mL)
1 0.80 0.40
2 0.80 0.80
3 0.40 0.80
3. Results and discussion
3.1. Protein expression optimization and catalyst production
In order to obtain as much overexpressed active protein as possible from the minimum
amount of cell, an induction optimization experiment was performed. Two different media
were used: auto induction media (AI) and Luria Broth (LB) media containing different
amounts of isopropyl β-D-1-thiogalactopyranoside (IPTG). The cultivation took place at
different temperatures for 24 or 48 h. The conditions of the experiment are described in
Table 9.
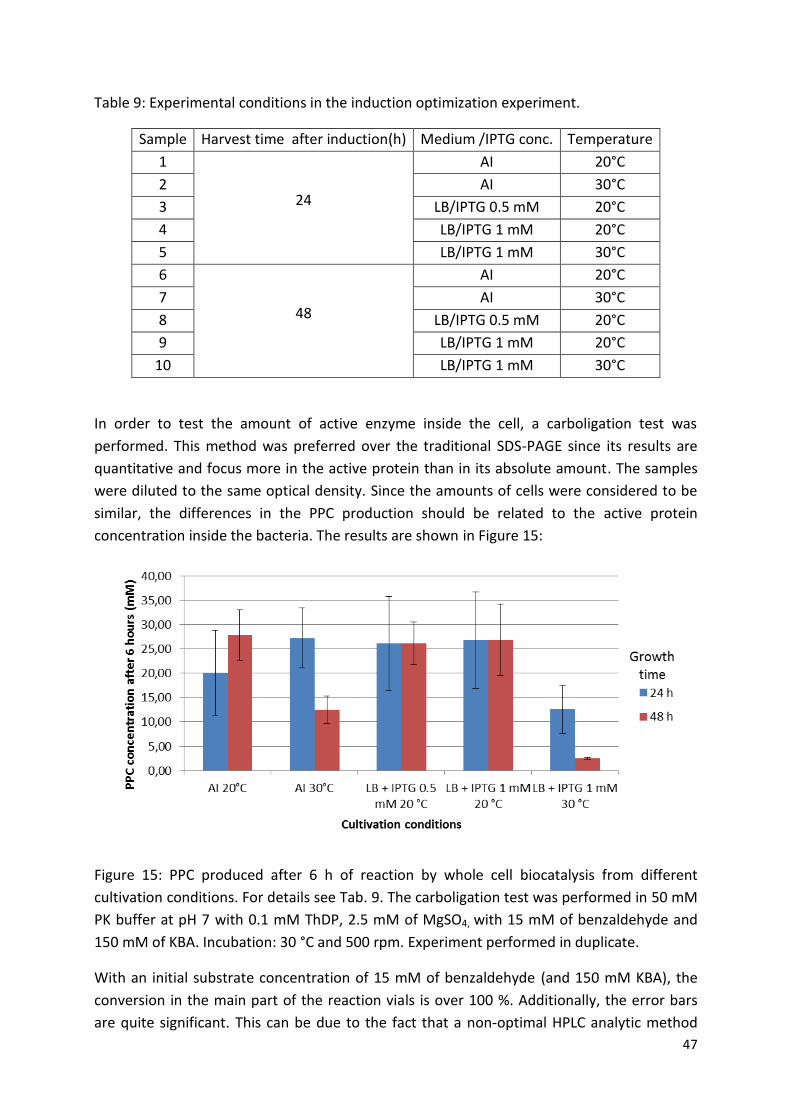
47
Table 9: Experimental conditions in the induction optimization experiment.
Sample Harvest time after induction(h) Medium /IPTG conc. Temperature
1
24
AI 20°C
2 AI 30°C
3 LB/IPTG 0.5 mM 20°C
4 LB/IPTG 1 mM 20°C
5 LB/IPTG 1 mM 30°C
6
48
AI 20°C
7 AI 30°C
8 LB/IPTG 0.5 mM 20°C
9 LB/IPTG 1 mM 20°C
10 LB/IPTG 1 mM 30°C
In order to test the amount of active enzyme inside the cell, a carboligation test was
performed. This method was preferred over the traditional SDS-PAGE since its results are
quantitative and focus more in the active protein than in its absolute amount. The samples
were diluted to the same optical density. Since the amounts of cells were considered to be
similar, the differences in the PPC production should be related to the active protein
concentration inside the bacteria. The results are shown in Figure 15:
Figure 15: PPC produced after 6 h of reaction by whole cell biocatalysis from different
cultivation conditions. For details see Tab. 9. The carboligation test was performed in 50 mM
PK buffer at pH 7 with 0.1 mM ThDP, 2.5 mM of MgSO4, with 15 mM of benzaldehyde and
150 mM of KBA. Incubation: 30 °C and 500 rpm. Experiment performed in duplicate.
With an initial substrate concentration of 15 mM of benzaldehyde (and 150 mM KBA), the
conversion in the main part of the reaction vials is over 100 %. Additionally, the error bars
are quite significant. This can be due to the fact that a non-optimal HPLC analytic method
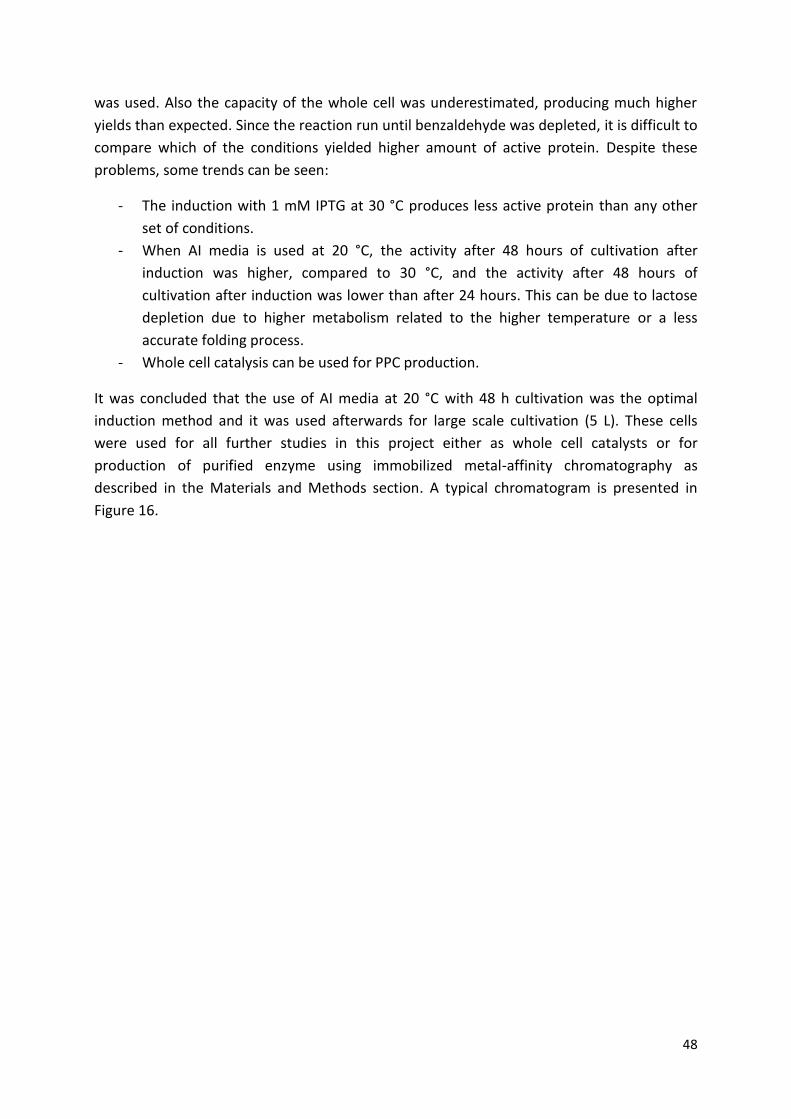
48
was used. Also the capacity of the whole cell was underestimated, producing much higher
yields than expected. Since the reaction run until benzaldehyde was depleted, it is difficult to
compare which of the conditions yielded higher amount of active protein. Despite these
problems, some trends can be seen:
- The induction with 1 mM IPTG at 30 °C produces less active protein than any other
set of conditions.
- When AI media is used at 20 °C, the activity after 48 hours of cultivation after
induction was higher, compared to 30 °C, and the activity after 48 hours of
cultivation after induction was lower than after 24 hours. This can be due to lactose
depletion due to higher metabolism related to the higher temperature or a less
accurate folding process.
- Whole cell catalysis can be used for PPC production.
It was concluded that the use of AI media at 20 °C with 48 h cultivation was the optimal
induction method and it was used afterwards for large scale cultivation (5 L). These cells
were used for all further studies in this project either as whole cell catalysts or for
production of purified enzyme using immobilized metal-affinity chromatography as
described in the Materials and Methods section. A typical chromatogram is presented in
Figure 16.
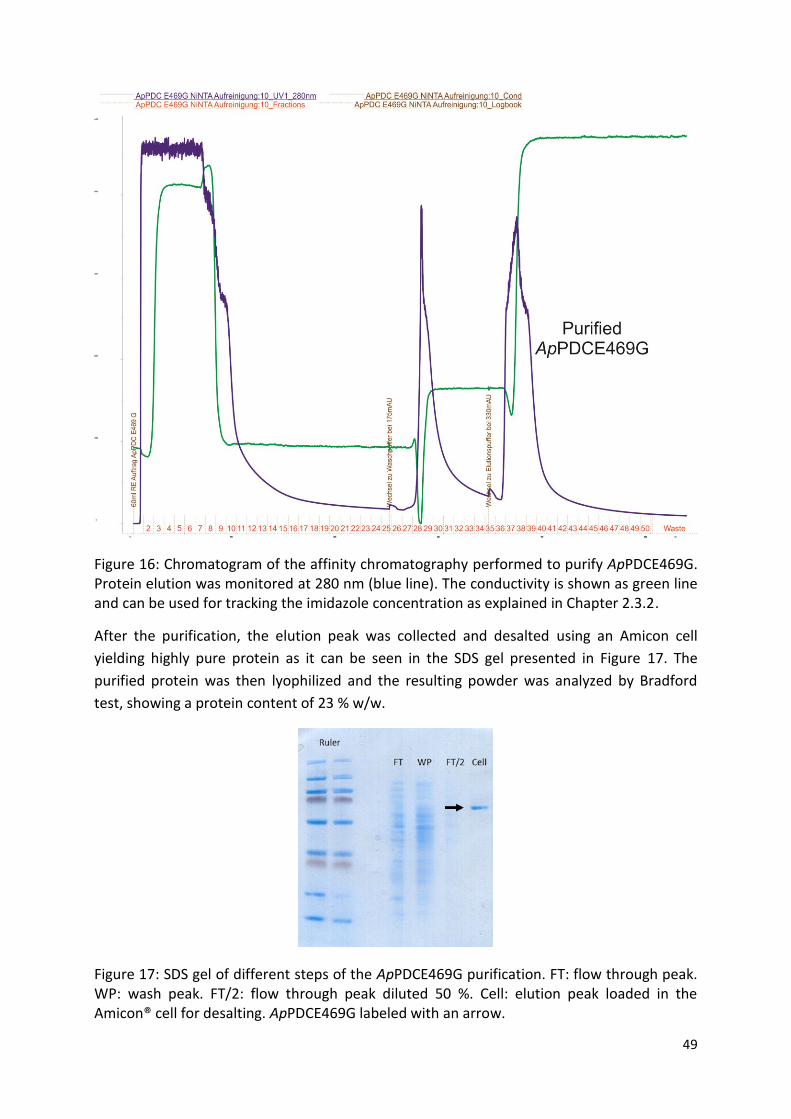
49
Figure 16: Chromatogram of the affinity chromatography performed to purify ApPDCE469G. Protein elution was monitored at 280 nm (blue line). The conductivity is shown as green line and can be used for tracking the imidazole concentration as explained in Chapter 2.3.2.
After the purification, the elution peak was collected and desalted using an Amicon cell
yielding highly pure protein as it can be seen in the SDS gel presented in Figure 17. The
purified protein was then lyophilized and the resulting powder was analyzed by Bradford
test, showing a protein content of 23 % w/w.
Figure 17: SDS gel of different steps of the ApPDCE469G purification. FT: flow through peak. WP: wash peak. FT/2: flow through peak diluted 50 %. Cell: elution peak loaded in the Amicon® cell for desalting. ApPDCE469G labeled with an arrow.
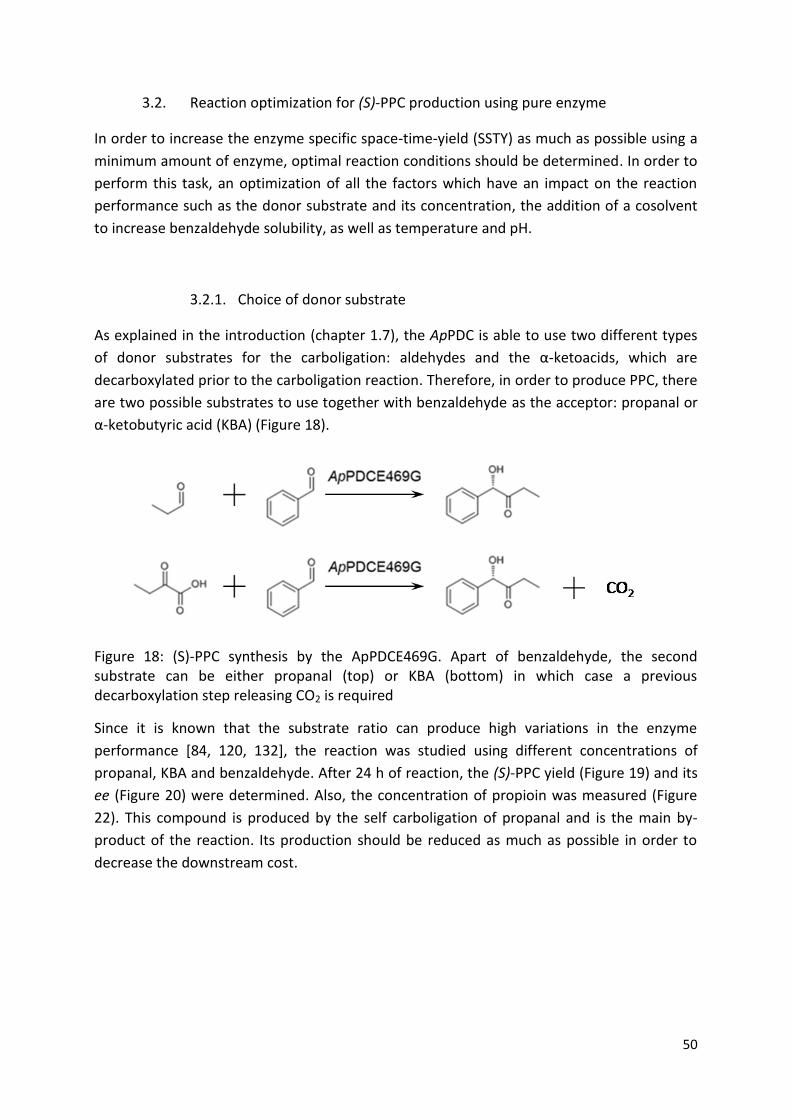
50
3.2. Reaction optimization for (S)-PPC production using pure enzyme
In order to increase the enzyme specific space-time-yield (SSTY) as much as possible using a
minimum amount of enzyme, optimal reaction conditions should be determined. In order to
perform this task, an optimization of all the factors which have an impact on the reaction
performance such as the donor substrate and its concentration, the addition of a cosolvent
to increase benzaldehyde solubility, as well as temperature and pH.
3.2.1. Choice of donor substrate
As explained in the introduction (chapter 1.7), the ApPDC is able to use two different types
of donor substrates for the carboligation: aldehydes and the α-ketoacids, which are
decarboxylated prior to the carboligation reaction. Therefore, in order to produce PPC, there
are two possible substrates to use together with benzaldehyde as the acceptor: propanal or
α-ketobutyric acid (KBA) (Figure 18).
Figure 18: (S)-PPC synthesis by the ApPDCE469G. Apart of benzaldehyde, the second substrate can be either propanal (top) or KBA (bottom) in which case a previous decarboxylation step releasing CO2 is required
Since it is known that the substrate ratio can produce high variations in the enzyme
performance [84, 120, 132], the reaction was studied using different concentrations of
propanal, KBA and benzaldehyde. After 24 h of reaction, the (S)-PPC yield (Figure 19) and its
ee (Figure 20) were determined. Also, the concentration of propioin was measured (Figure
22). This compound is produced by the self carboligation of propanal and is the main by-
product of the reaction. Its production should be reduced as much as possible in order to
decrease the downstream cost.
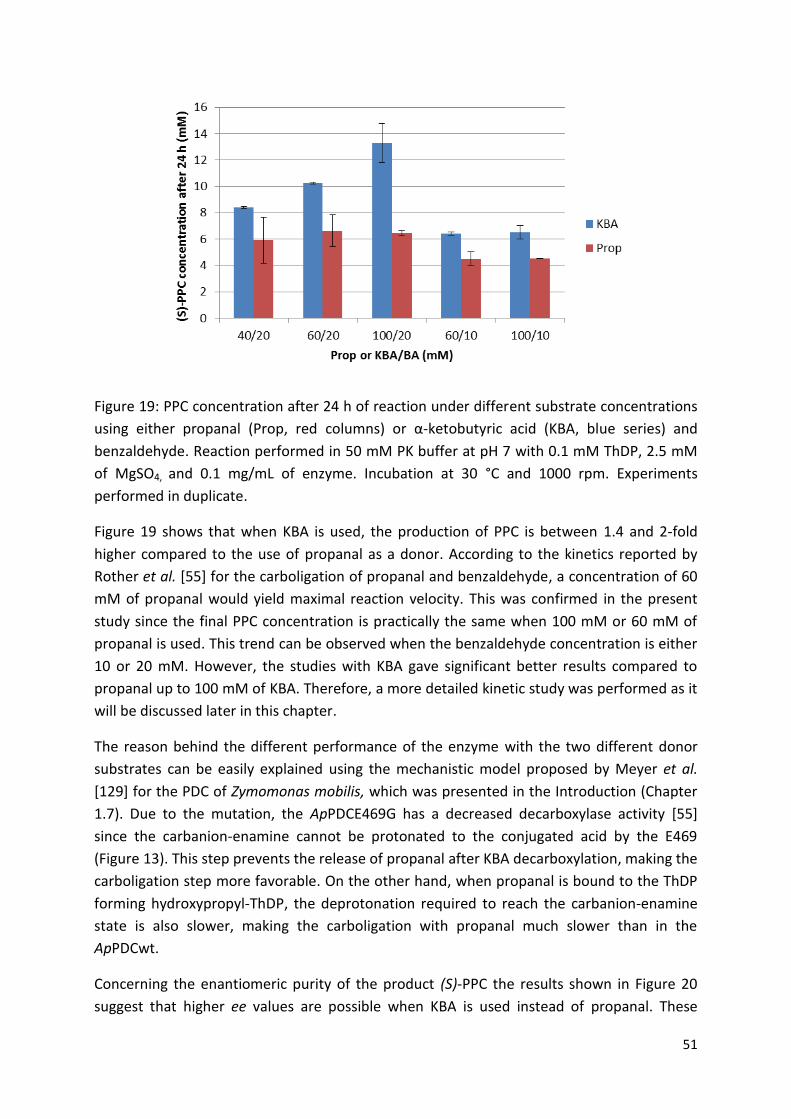
51
Figure 19: PPC concentration after 24 h of reaction under different substrate concentrations
using either propanal (Prop, red columns) or α-ketobutyric acid (KBA, blue series) and
benzaldehyde. Reaction performed in 50 mM PK buffer at pH 7 with 0.1 mM ThDP, 2.5 mM
of MgSO4, and 0.1 mg/mL of enzyme. Incubation at 30 °C and 1000 rpm. Experiments
performed in duplicate.
Figure 19 shows that when KBA is used, the production of PPC is between 1.4 and 2-fold
higher compared to the use of propanal as a donor. According to the kinetics reported by
Rother et al. [55] for the carboligation of propanal and benzaldehyde, a concentration of 60
mM of propanal would yield maximal reaction velocity. This was confirmed in the present
study since the final PPC concentration is practically the same when 100 mM or 60 mM of
propanal is used. This trend can be observed when the benzaldehyde concentration is either
10 or 20 mM. However, the studies with KBA gave significant better results compared to
propanal up to 100 mM of KBA. Therefore, a more detailed kinetic study was performed as it
will be discussed later in this chapter.
The reason behind the different performance of the enzyme with the two different donor
substrates can be easily explained using the mechanistic model proposed by Meyer et al.
[129] for the PDC of Zymomonas mobilis, which was presented in the Introduction (Chapter
1.7). Due to the mutation, the ApPDCE469G has a decreased decarboxylase activity [55]
since the carbanion-enamine cannot be protonated to the conjugated acid by the E469
(Figure 13). This step prevents the release of propanal after KBA decarboxylation, making the
carboligation step more favorable. On the other hand, when propanal is bound to the ThDP
forming hydroxypropyl-ThDP, the deprotonation required to reach the carbanion-enamine
state is also slower, making the carboligation with propanal much slower than in the
ApPDCwt.
Concerning the enantiomeric purity of the product (S)-PPC the results shown in Figure 20
suggest that higher ee values are possible when KBA is used instead of propanal. These
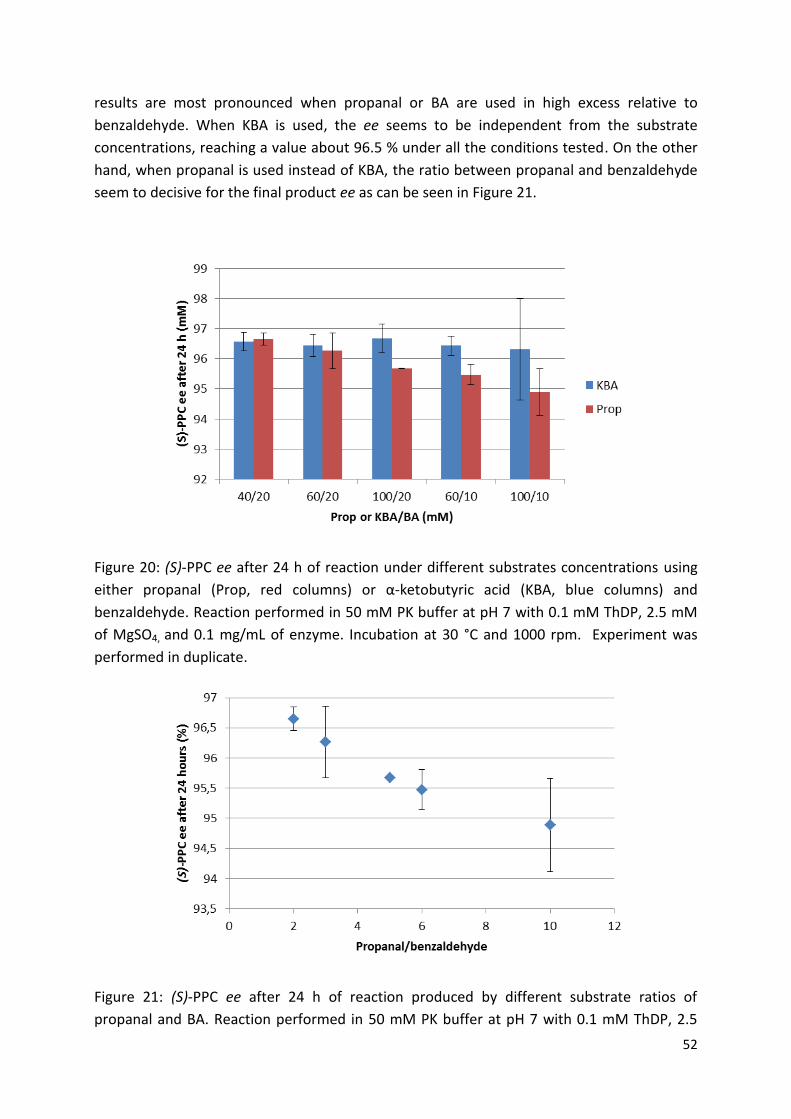
52
results are most pronounced when propanal or BA are used in high excess relative to
benzaldehyde. When KBA is used, the ee seems to be independent from the substrate
concentrations, reaching a value about 96.5 % under all the conditions tested. On the other
hand, when propanal is used instead of KBA, the ratio between propanal and benzaldehyde
seem to decisive for the final product ee as can be seen in Figure 21.
Figure 20: (S)-PPC ee after 24 h of reaction under different substrates concentrations using
either propanal (Prop, red columns) or α-ketobutyric acid (KBA, blue columns) and
benzaldehyde. Reaction performed in 50 mM PK buffer at pH 7 with 0.1 mM ThDP, 2.5 mM
of MgSO4, and 0.1 mg/mL of enzyme. Incubation at 30 °C and 1000 rpm. Experiment was
performed in duplicate.
Figure 21: (S)-PPC ee after 24 h of reaction produced by different substrate ratios of
propanal and BA. Reaction performed in 50 mM PK buffer at pH 7 with 0.1 mM ThDP, 2.5
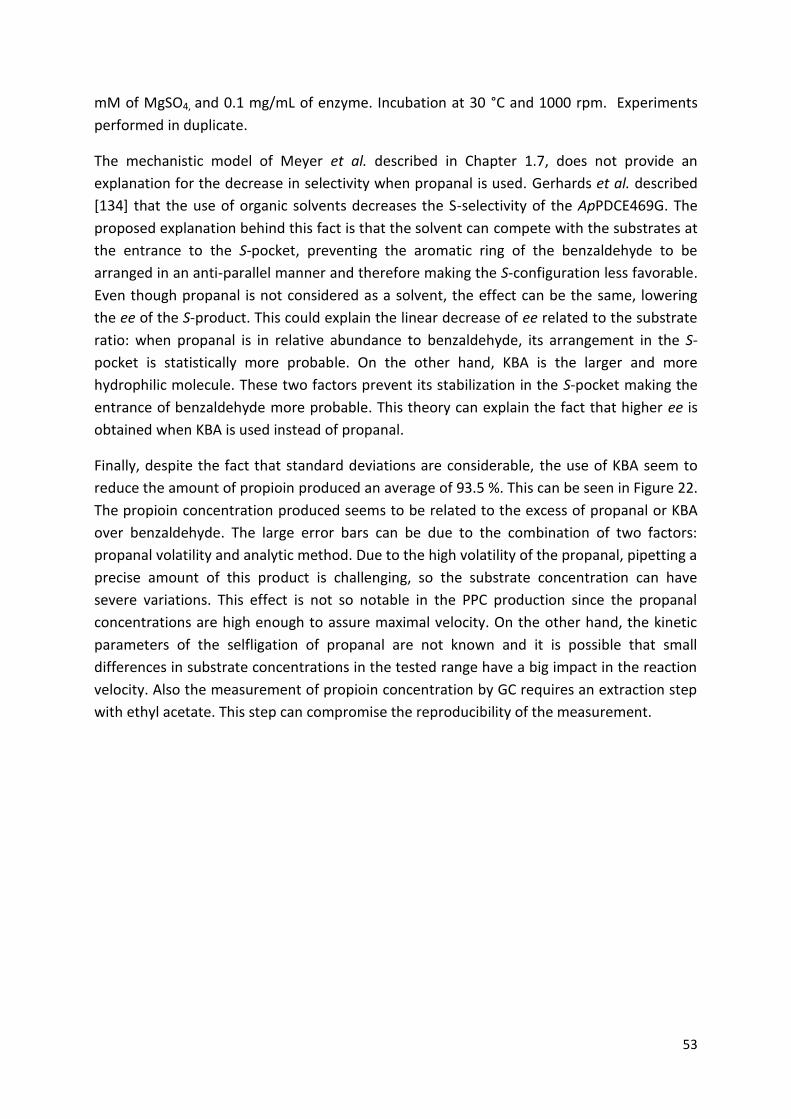
53
mM of MgSO4, and 0.1 mg/mL of enzyme. Incubation at 30 °C and 1000 rpm. Experiments
performed in duplicate.
The mechanistic model of Meyer et al. described in Chapter 1.7, does not provide an
explanation for the decrease in selectivity when propanal is used. Gerhards et al. described
[134] that the use of organic solvents decreases the S-selectivity of the ApPDCE469G. The
proposed explanation behind this fact is that the solvent can compete with the substrates at
the entrance to the S-pocket, preventing the aromatic ring of the benzaldehyde to be
arranged in an anti-parallel manner and therefore making the S-configuration less favorable.
Even though propanal is not considered as a solvent, the effect can be the same, lowering
the ee of the S-product. This could explain the linear decrease of ee related to the substrate
ratio: when propanal is in relative abundance to benzaldehyde, its arrangement in the S-
pocket is statistically more probable. On the other hand, KBA is the larger and more
hydrophilic molecule. These two factors prevent its stabilization in the S-pocket making the
entrance of benzaldehyde more probable. This theory can explain the fact that higher ee is
obtained when KBA is used instead of propanal.
Finally, despite the fact that standard deviations are considerable, the use of KBA seem to
reduce the amount of propioin produced an average of 93.5 %. This can be seen in Figure 22.
The propioin concentration produced seems to be related to the excess of propanal or KBA
over benzaldehyde. The large error bars can be due to the combination of two factors:
propanal volatility and analytic method. Due to the high volatility of the propanal, pipetting a
precise amount of this product is challenging, so the substrate concentration can have
severe variations. This effect is not so notable in the PPC production since the propanal
concentrations are high enough to assure maximal velocity. On the other hand, the kinetic
parameters of the selfligation of propanal are not known and it is possible that small
differences in substrate concentrations in the tested range have a big impact in the reaction
velocity. Also the measurement of propioin concentration by GC requires an extraction step
with ethyl acetate. This step can compromise the reproducibility of the measurement.
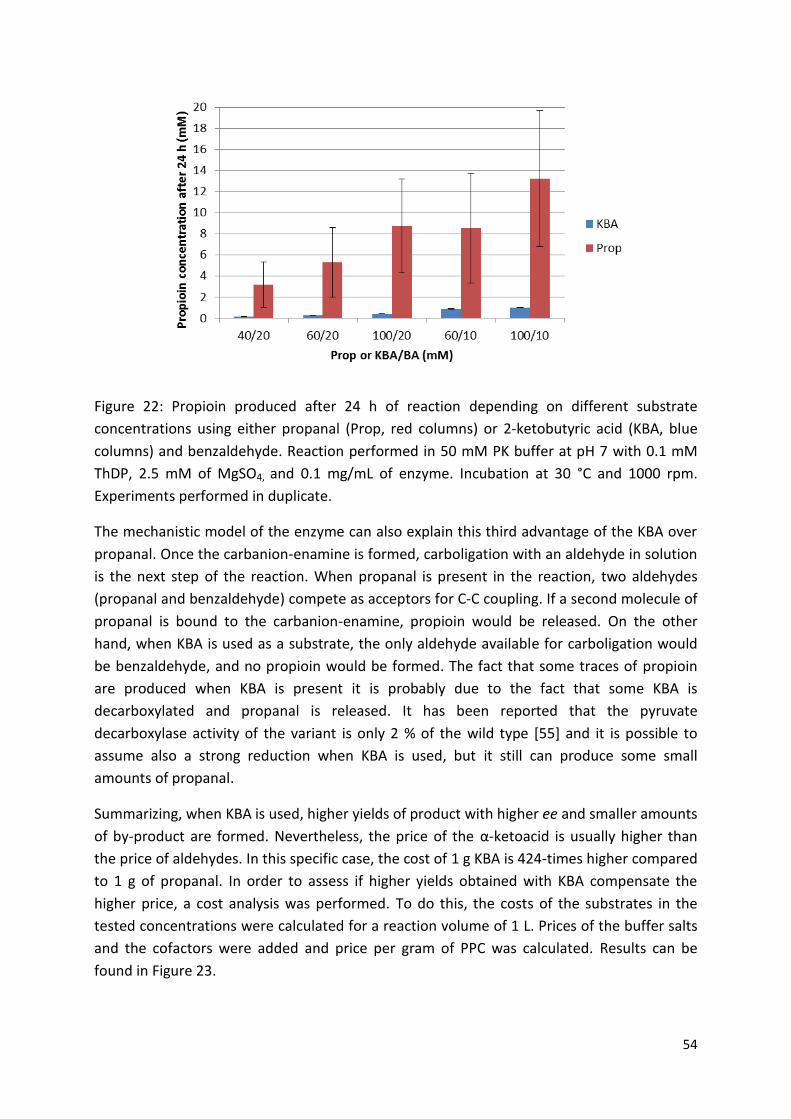
54
Figure 22: Propioin produced after 24 h of reaction depending on different substrate
concentrations using either propanal (Prop, red columns) or 2-ketobutyric acid (KBA, blue
columns) and benzaldehyde. Reaction performed in 50 mM PK buffer at pH 7 with 0.1 mM
ThDP, 2.5 mM of MgSO4, and 0.1 mg/mL of enzyme. Incubation at 30 °C and 1000 rpm.
Experiments performed in duplicate.
The mechanistic model of the enzyme can also explain this third advantage of the KBA over
propanal. Once the carbanion-enamine is formed, carboligation with an aldehyde in solution
is the next step of the reaction. When propanal is present in the reaction, two aldehydes
(propanal and benzaldehyde) compete as acceptors for C-C coupling. If a second molecule of
propanal is bound to the carbanion-enamine, propioin would be released. On the other
hand, when KBA is used as a substrate, the only aldehyde available for carboligation would
be benzaldehyde, and no propioin would be formed. The fact that some traces of propioin
are produced when KBA is present it is probably due to the fact that some KBA is
decarboxylated and propanal is released. It has been reported that the pyruvate
decarboxylase activity of the variant is only 2 % of the wild type [55] and it is possible to
assume also a strong reduction when KBA is used, but it still can produce some small
amounts of propanal.
Summarizing, when KBA is used, higher yields of product with higher ee and smaller amounts
of by-product are formed. Nevertheless, the price of the α-ketoacid is usually higher than
the price of aldehydes. In this specific case, the cost of 1 g KBA is 424-times higher compared
to 1 g of propanal. In order to assess if higher yields obtained with KBA compensate the
higher price, a cost analysis was performed. To do this, the costs of the substrates in the
tested concentrations were calculated for a reaction volume of 1 L. Prices of the buffer salts
and the cofactors were added and price per gram of PPC was calculated. Results can be
found in Figure 23.
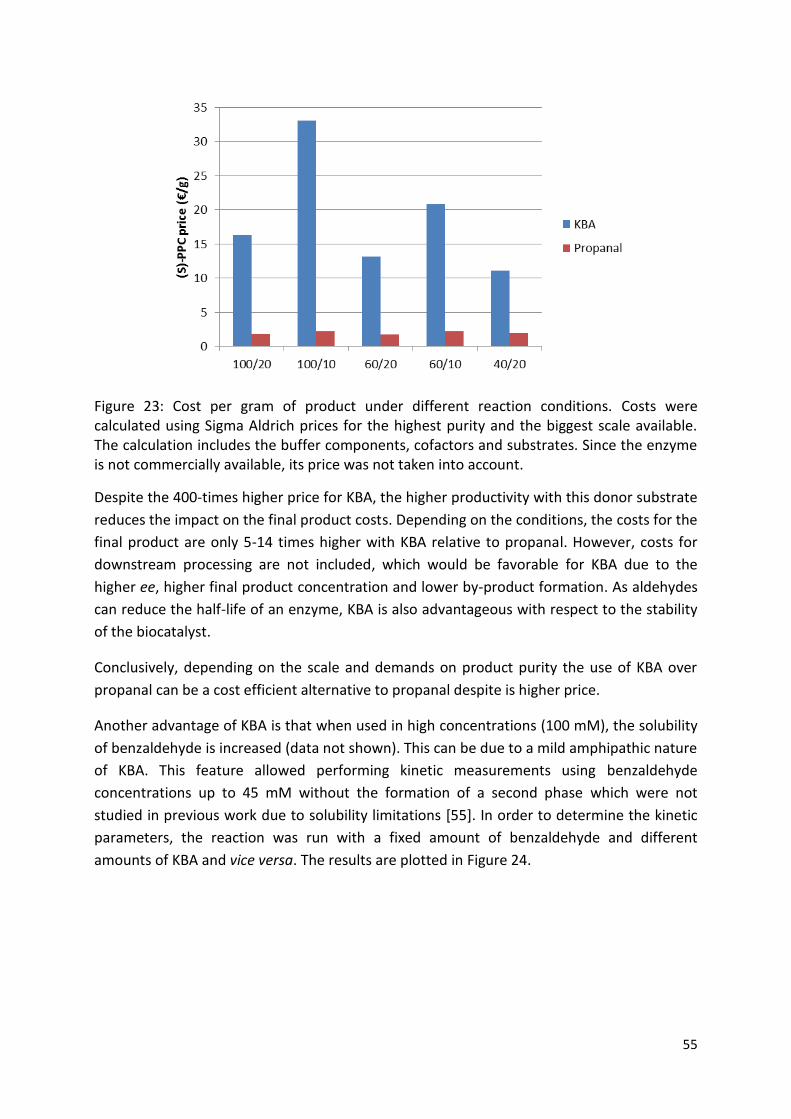
55
Figure 23: Cost per gram of product under different reaction conditions. Costs were calculated using Sigma Aldrich prices for the highest purity and the biggest scale available. The calculation includes the buffer components, cofactors and substrates. Since the enzyme is not commercially available, its price was not taken into account.
Despite the 400-times higher price for KBA, the higher productivity with this donor substrate
reduces the impact on the final product costs. Depending on the conditions, the costs for the
final product are only 5-14 times higher with KBA relative to propanal. However, costs for
downstream processing are not included, which would be favorable for KBA due to the
higher ee, higher final product concentration and lower by-product formation. As aldehydes
can reduce the half-life of an enzyme, KBA is also advantageous with respect to the stability
of the biocatalyst.
Conclusively, depending on the scale and demands on product purity the use of KBA over
propanal can be a cost efficient alternative to propanal despite is higher price.
Another advantage of KBA is that when used in high concentrations (100 mM), the solubility
of benzaldehyde is increased (data not shown). This can be due to a mild amphipathic nature
of KBA. This feature allowed performing kinetic measurements using benzaldehyde
concentrations up to 45 mM without the formation of a second phase which were not
studied in previous work due to solubility limitations [55]. In order to determine the kinetic
parameters, the reaction was run with a fixed amount of benzaldehyde and different
amounts of KBA and vice versa. The results are plotted in Figure 24.
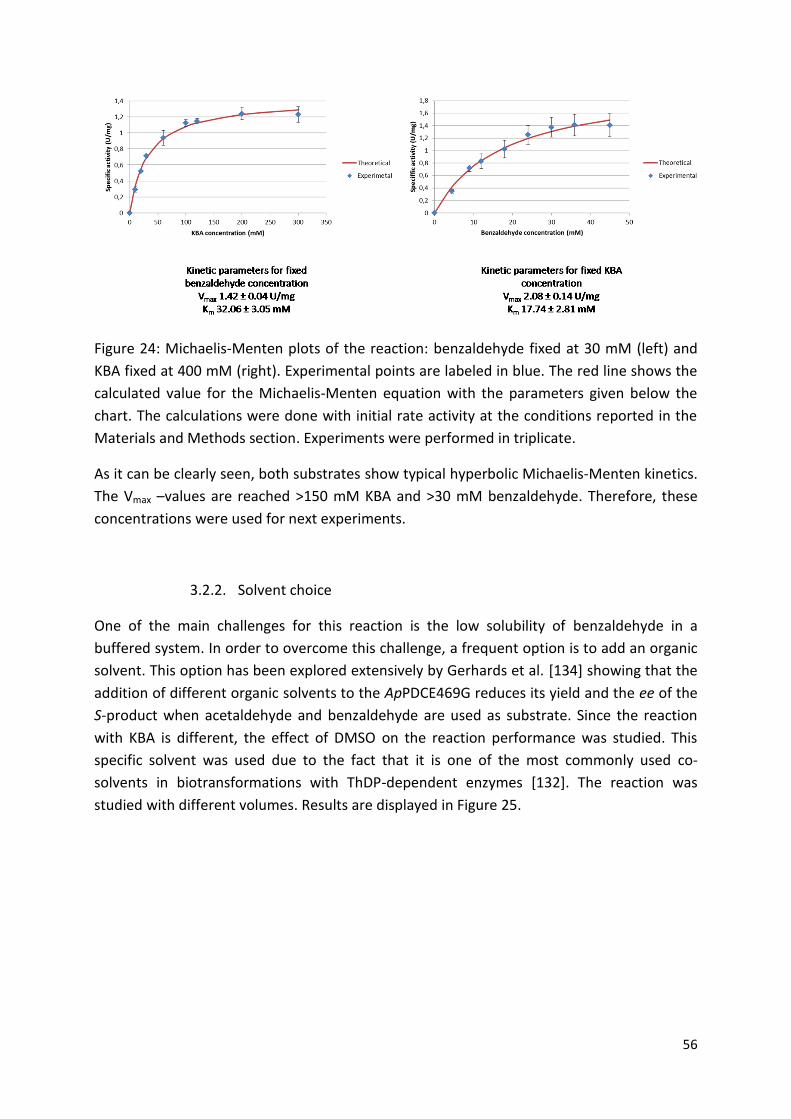
56
Figure 24: Michaelis-Menten plots of the reaction: benzaldehyde fixed at 30 mM (left) and
KBA fixed at 400 mM (right). Experimental points are labeled in blue. The red line shows the
calculated value for the Michaelis-Menten equation with the parameters given below the
chart. The calculations were done with initial rate activity at the conditions reported in the
Materials and Methods section. Experiments were performed in triplicate.
As it can be clearly seen, both substrates show typical hyperbolic Michaelis-Menten kinetics.
The Vmax –values are reached >150 mM KBA and >30 mM benzaldehyde. Therefore, these
concentrations were used for next experiments.
3.2.2. Solvent choice
One of the main challenges for this reaction is the low solubility of benzaldehyde in a
buffered system. In order to overcome this challenge, a frequent option is to add an organic
solvent. This option has been explored extensively by Gerhards et al. [134] showing that the
addition of different organic solvents to the ApPDCE469G reduces its yield and the ee of the
S-product when acetaldehyde and benzaldehyde are used as substrate. Since the reaction
with KBA is different, the effect of DMSO on the reaction performance was studied. This
specific solvent was used due to the fact that it is one of the most commonly used co-
solvents in biotransformations with ThDP-dependent enzymes [132]. The reaction was
studied with different volumes. Results are displayed in Figure 25.
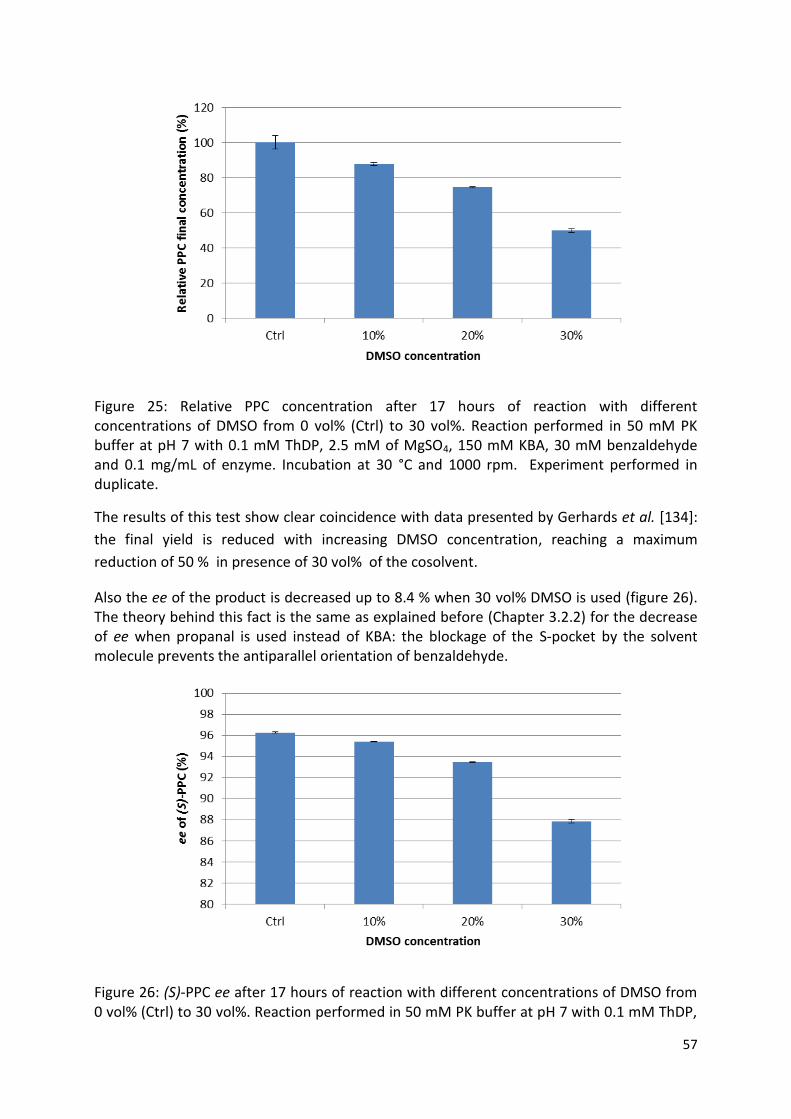
57
Figure 25: Relative PPC concentration after 17 hours of reaction with different concentrations of DMSO from 0 vol% (Ctrl) to 30 vol%. Reaction performed in 50 mM PK buffer at pH 7 with 0.1 mM ThDP, 2.5 mM of MgSO4, 150 mM KBA, 30 mM benzaldehyde and 0.1 mg/mL of enzyme. Incubation at 30 °C and 1000 rpm. Experiment performed in duplicate.
The results of this test show clear coincidence with data presented by Gerhards et al. [134]:
the final yield is reduced with increasing DMSO concentration, reaching a maximum
reduction of 50 % in presence of 30 vol% of the cosolvent.
Also the ee of the product is decreased up to 8.4 % when 30 vol% DMSO is used (figure 26). The theory behind this fact is the same as explained before (Chapter 3.2.2) for the decrease of ee when propanal is used instead of KBA: the blockage of the S-pocket by the solvent molecule prevents the antiparallel orientation of benzaldehyde.
Figure 26: (S)-PPC ee after 17 hours of reaction with different concentrations of DMSO from 0 vol% (Ctrl) to 30 vol%. Reaction performed in 50 mM PK buffer at pH 7 with 0.1 mM ThDP,
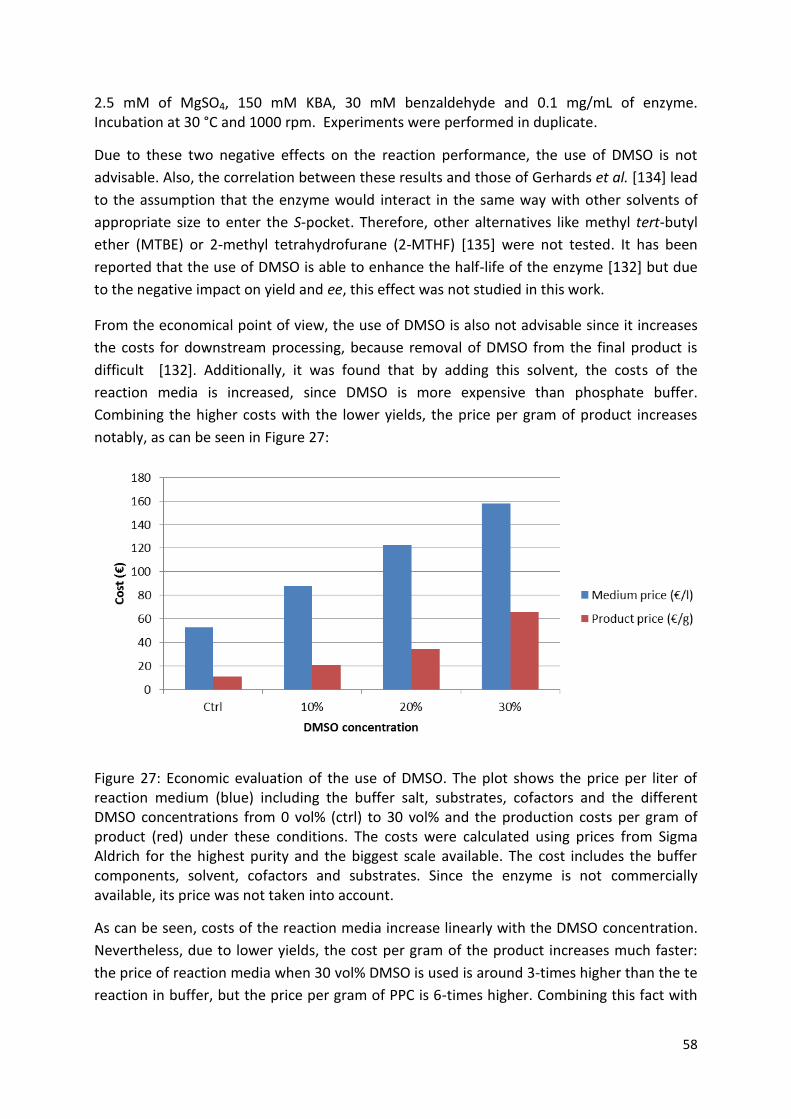
58
2.5 mM of MgSO4, 150 mM KBA, 30 mM benzaldehyde and 0.1 mg/mL of enzyme. Incubation at 30 °C and 1000 rpm. Experiments were performed in duplicate.
Due to these two negative effects on the reaction performance, the use of DMSO is not
advisable. Also, the correlation between these results and those of Gerhards et al. [134] lead
to the assumption that the enzyme would interact in the same way with other solvents of
appropriate size to enter the S-pocket. Therefore, other alternatives like methyl tert-butyl
ether (MTBE) or 2-methyl tetrahydrofurane (2-MTHF) [135] were not tested. It has been
reported that the use of DMSO is able to enhance the half-life of the enzyme [132] but due
to the negative impact on yield and ee, this effect was not studied in this work.
From the economical point of view, the use of DMSO is also not advisable since it increases
the costs for downstream processing, because removal of DMSO from the final product is
difficult [132]. Additionally, it was found that by adding this solvent, the costs of the
reaction media is increased, since DMSO is more expensive than phosphate buffer.
Combining the higher costs with the lower yields, the price per gram of product increases
notably, as can be seen in Figure 27:
Figure 27: Economic evaluation of the use of DMSO. The plot shows the price per liter of reaction medium (blue) including the buffer salt, substrates, cofactors and the different DMSO concentrations from 0 vol% (ctrl) to 30 vol% and the production costs per gram of product (red) under these conditions. The costs were calculated using prices from Sigma Aldrich for the highest purity and the biggest scale available. The cost includes the buffer components, solvent, cofactors and substrates. Since the enzyme is not commercially available, its price was not taken into account.
As can be seen, costs of the reaction media increase linearly with the DMSO concentration.
Nevertheless, due to lower yields, the cost per gram of the product increases much faster:
the price of reaction media when 30 vol% DMSO is used is around 3-times higher than the te
reaction in buffer, but the price per gram of PPC is 6-times higher. Combining this fact with
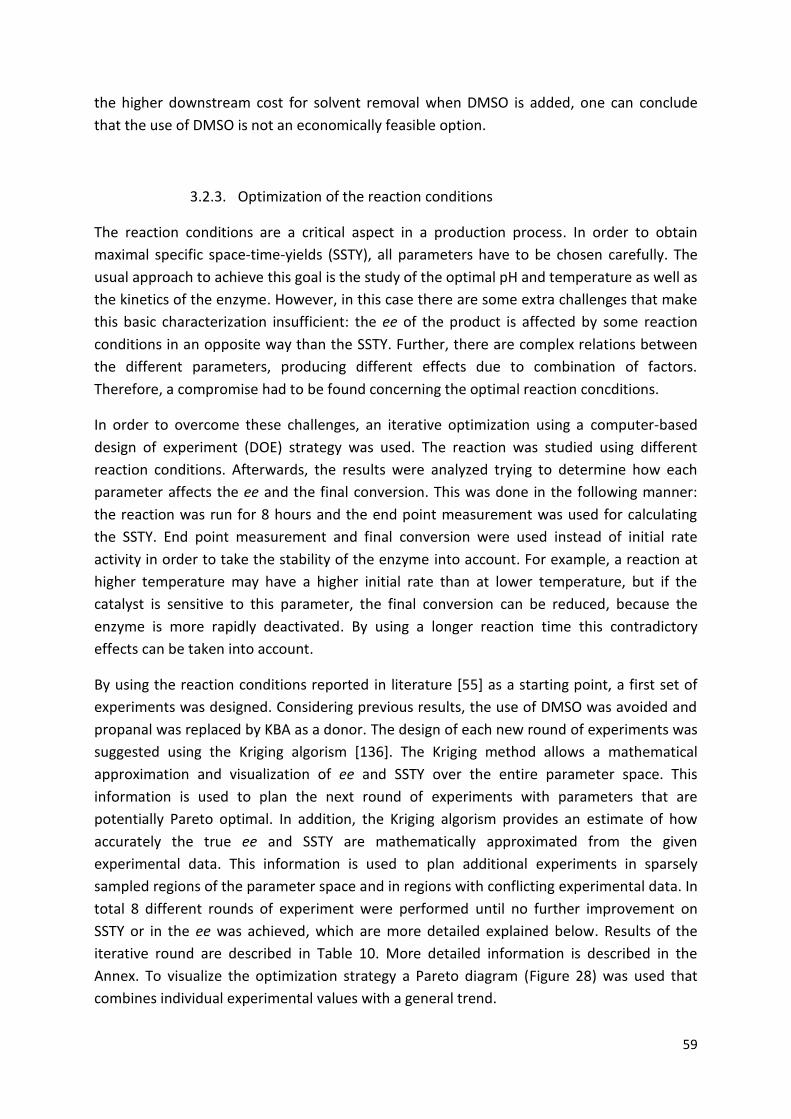
59
the higher downstream cost for solvent removal when DMSO is added, one can conclude
that the use of DMSO is not an economically feasible option.
3.2.3. Optimization of the reaction conditions
The reaction conditions are a critical aspect in a production process. In order to obtain
maximal specific space-time-yields (SSTY), all parameters have to be chosen carefully. The
usual approach to achieve this goal is the study of the optimal pH and temperature as well as
the kinetics of the enzyme. However, in this case there are some extra challenges that make
this basic characterization insufficient: the ee of the product is affected by some reaction
conditions in an opposite way than the SSTY. Further, there are complex relations between
the different parameters, producing different effects due to combination of factors.
Therefore, a compromise had to be found concerning the optimal reaction concditions.
In order to overcome these challenges, an iterative optimization using a computer-based
design of experiment (DOE) strategy was used. The reaction was studied using different
reaction conditions. Afterwards, the results were analyzed trying to determine how each
parameter affects the ee and the final conversion. This was done in the following manner:
the reaction was run for 8 hours and the end point measurement was used for calculating
the SSTY. End point measurement and final conversion were used instead of initial rate
activity in order to take the stability of the enzyme into account. For example, a reaction at
higher temperature may have a higher initial rate than at lower temperature, but if the
catalyst is sensitive to this parameter, the final conversion can be reduced, because the
enzyme is more rapidly deactivated. By using a longer reaction time this contradictory
effects can be taken into account.
By using the reaction conditions reported in literature [55] as a starting point, a first set of
experiments was designed. Considering previous results, the use of DMSO was avoided and
propanal was replaced by KBA as a donor. The design of each new round of experiments was
suggested using the Kriging algorism [136]. The Kriging method allows a mathematical
approximation and visualization of ee and SSTY over the entire parameter space. This
information is used to plan the next round of experiments with parameters that are
potentially Pareto optimal. In addition, the Kriging algorism provides an estimate of how
accurately the true ee and SSTY are mathematically approximated from the given
experimental data. This information is used to plan additional experiments in sparsely
sampled regions of the parameter space and in regions with conflicting experimental data. In
total 8 different rounds of experiment were performed until no further improvement on
SSTY or in the ee was achieved, which are more detailed explained below. Results of the
iterative round are described in Table 10. More detailed information is described in the
Annex. To visualize the optimization strategy a Pareto diagram (Figure 28) was used that
combines individual experimental values with a general trend.
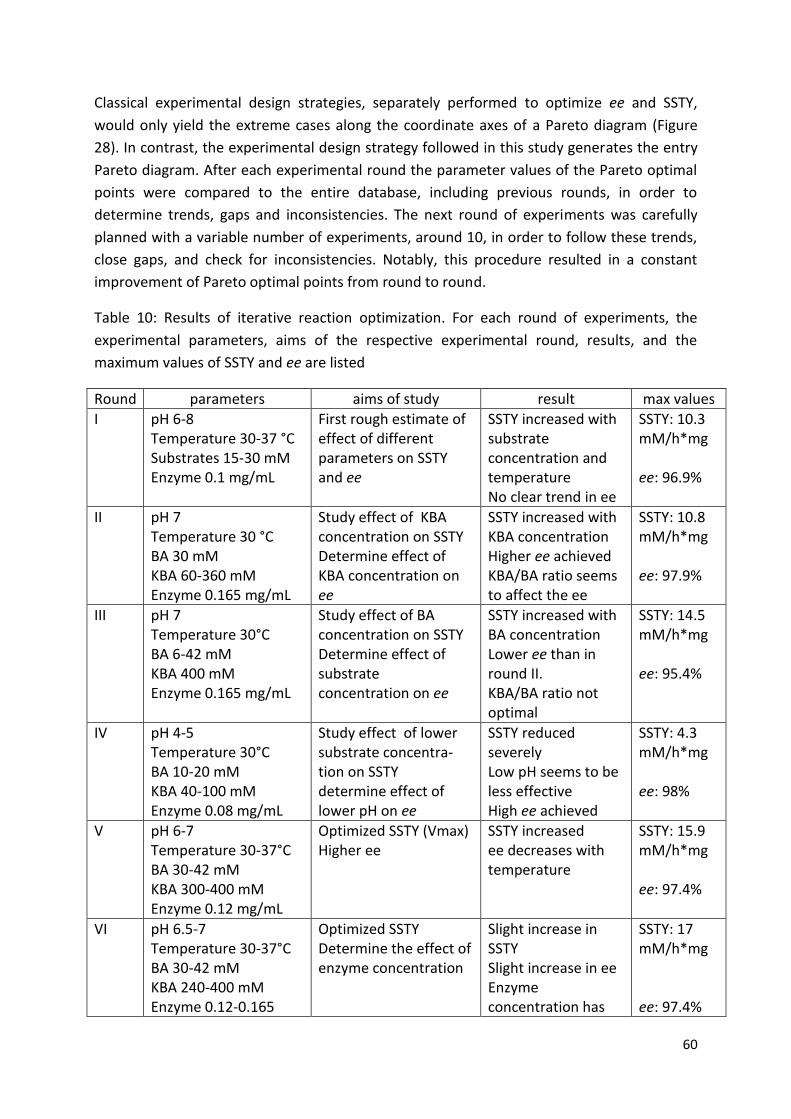
60
Classical experimental design strategies, separately performed to optimize ee and SSTY,
would only yield the extreme cases along the coordinate axes of a Pareto diagram (Figure
28). In contrast, the experimental design strategy followed in this study generates the entry
Pareto diagram. After each experimental round the parameter values of the Pareto optimal
points were compared to the entire database, including previous rounds, in order to
determine trends, gaps and inconsistencies. The next round of experiments was carefully
planned with a variable number of experiments, around 10, in order to follow these trends,
close gaps, and check for inconsistencies. Notably, this procedure resulted in a constant
improvement of Pareto optimal points from round to round.
Table 10: Results of iterative reaction optimization. For each round of experiments, the
experimental parameters, aims of the respective experimental round, results, and the
maximum values of SSTY and ee are listed
Round parameters aims of study result max values
I pH 6-8 Temperature 30-37 °C Substrates 15-30 mM Enzyme 0.1 mg/mL
First rough estimate of effect of different parameters on SSTY and ee
SSTY increased with substrate concentration and temperature No clear trend in ee
SSTY: 10.3 mM/h*mg ee: 96.9%
II pH 7 Temperature 30 °C BA 30 mM KBA 60-360 mM Enzyme 0.165 mg/mL
Study effect of KBA concentration on SSTY Determine effect of KBA concentration on ee
SSTY increased with KBA concentration Higher ee achieved KBA/BA ratio seems to affect the ee
SSTY: 10.8 mM/h*mg ee: 97.9%
III pH 7 Temperature 30°C BA 6-42 mM KBA 400 mM Enzyme 0.165 mg/mL
Study effect of BA concentration on SSTY Determine effect of substrate concentration on ee
SSTY increased with BA concentration Lower ee than in round II. KBA/BA ratio not optimal
SSTY: 14.5 mM/h*mg ee: 95.4%
IV pH 4-5 Temperature 30°C BA 10-20 mM KBA 40-100 mM Enzyme 0.08 mg/mL
Study effect of lower substrate concentra-tion on SSTY determine effect of lower pH on ee
SSTY reduced severely Low pH seems to be less effective High ee achieved
SSTY: 4.3 mM/h*mg ee: 98%
V pH 6-7 Temperature 30-37°C BA 30-42 mM KBA 300-400 mM Enzyme 0.12 mg/mL
Optimized SSTY (Vmax) Higher ee
SSTY increased ee decreases with temperature
SSTY: 15.9 mM/h*mg ee: 97.4%
VI pH 6.5-7 Temperature 30-37°C BA 30-42 mM KBA 240-400 mM Enzyme 0.12-0.165
Optimized SSTY Determine the effect of enzyme concentration
Slight increase in SSTY Slight increase in ee Enzyme concentration has
SSTY: 17 mM/h*mg ee: 97.4%

61
mg/mL no effect
VII pH 7 Temperature 30°C BA 10-30 mM KBA 10-100 mM Enzyme 0.165 mg/mL
Lower SSTY due to lower substrate concentration Higher ee by optimal KBA/BA ratio
No increase in SSTY High ee but far below the Pareto line
SSTY: 3.7 mM/h*mg ee: 97.9%
VIII pH 7 Temperature 42°C BA 25-35 mM KBA 120-420 mM Enzyme 0.165 g/mL
High temperature should increase SSTY Lower ee
Reduced SSTY High temperature decrease enzymes stability Ee was low, but not as low as expected
SSTY: 10.6 mM/h*mg ee: 96.4%
Due to the amount of data and the competing trend between SSTY and ee, it was not
possible to obtain an absolute maximum for both SSTY and ee. In order to visualize this fact,
the results were plotted in a Pareto chart [137] (Figure 28):
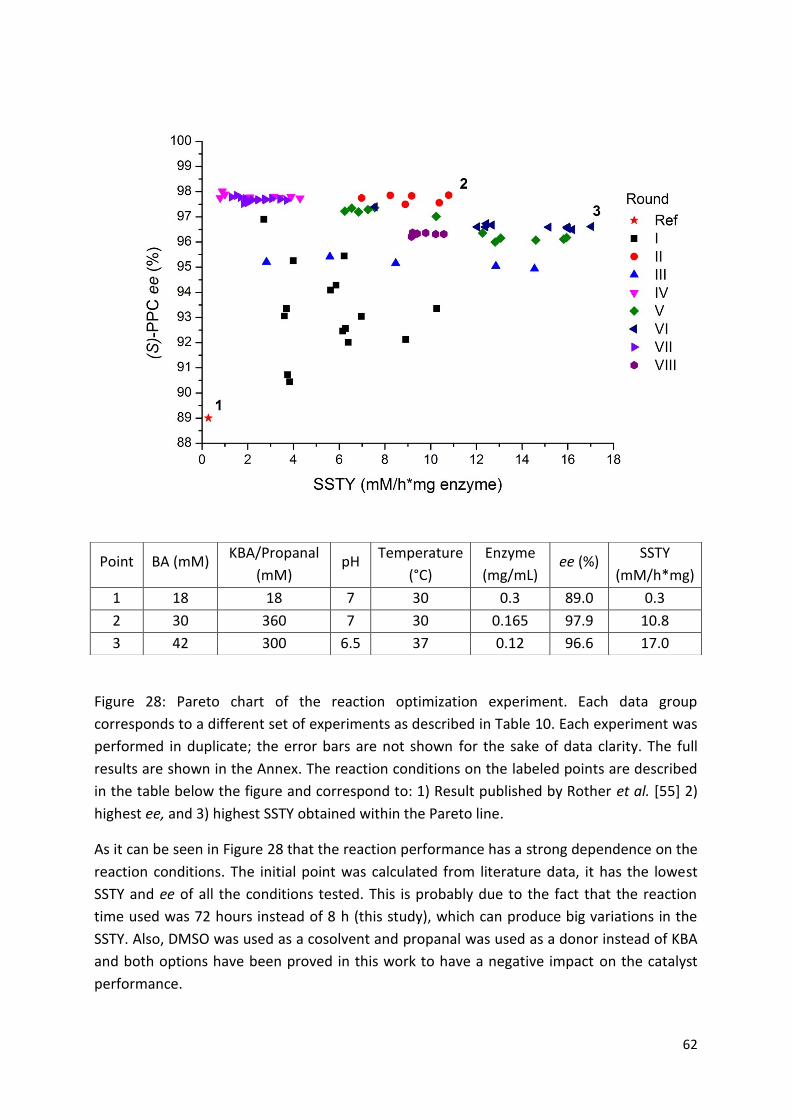
62
Figure 28: Pareto chart of the reaction optimization experiment. Each data group
corresponds to a different set of experiments as described in Table 10. Each experiment was
performed in duplicate; the error bars are not shown for the sake of data clarity. The full
results are shown in the Annex. The reaction conditions on the labeled points are described
in the table below the figure and correspond to: 1) Result published by Rother et al. [55] 2)
highest ee, and 3) highest SSTY obtained within the Pareto line.
As it can be seen in Figure 28 that the reaction performance has a strong dependence on the
reaction conditions. The initial point was calculated from literature data, it has the lowest
SSTY and ee of all the conditions tested. This is probably due to the fact that the reaction
time used was 72 hours instead of 8 h (this study), which can produce big variations in the
SSTY. Also, DMSO was used as a cosolvent and propanal was used as a donor instead of KBA
and both options have been proved in this work to have a negative impact on the catalyst
performance.
Point BA (mM) KBA/Propanal
(mM) pH
Temperature
(°C)
Enzyme
(mg/mL) ee (%)
SSTY
(mM/h*mg)
1 18 18 7 30 0.3 89.0 0.3
2 30 360 7 30 0.165 97.9 10.8
3 42 300 6.5 37 0.12 96.6 17.0

63
Overall, a maximal ee of 98 % could be achieved. Increasing this value further would
probably require a modification of the catalyst. The point number 2 (Figure 28) gives the
highest SSTY for this ee. Every set of parameters with higher SSTY shows a decrease in ee.
Looking at the data more closely, the interplay between the parameters makes it difficult to
analyze their isolated effect on the reaction but, nevertheless, it is possible to determine
some trends:
- Substrate concentrations have a strong influence on the SSTY. As can be infered from
the kinetic data, maximal SSTY were obtained under high substrate loads of both
substrates (over 200 mM KBA and over 30 mM BA). On the other hand, when the
reaction is not running at saturated KBA concentrations, low benzaldehyde
concentrations (under 30 mM) limit the SSTY and seem to reduce also the ee of the
product.
- pH values outside the range from 6 to 7.5 are not optimal since either the SSTY or the
ee are reduced.
- Temperature has a positive impact on SSTY until 40 °C. Above this value the effect is
reversed, probably due to enzyme inactivation. Concerning the ee, lower
temperatures (30 °C) where observed to be optimal.
- The enzyme concentration has no impact on the ee. Even though higher enzyme
concentrations speed up the reaction and thus increase the final product
concentration, the SSTY is not affected in the tested concentration values [138].
After the 8 rounds of optimization, the enzyme performance was highly improved compared
to the starting point. The SSTY was increased 61.3 fold according to the literature data [55]
up to a value of 17 mM/(h*mg enzyme). Also the ee was enhanced up to a 98 %, which is 9 %
higher than for the earlier reported conditions. This is of special importance since the
increment of ee at values over 95 % requires higher free Gibbs energy than at lower ee
values due to the logarithmic relation between these two factors [134] (Figure 29).
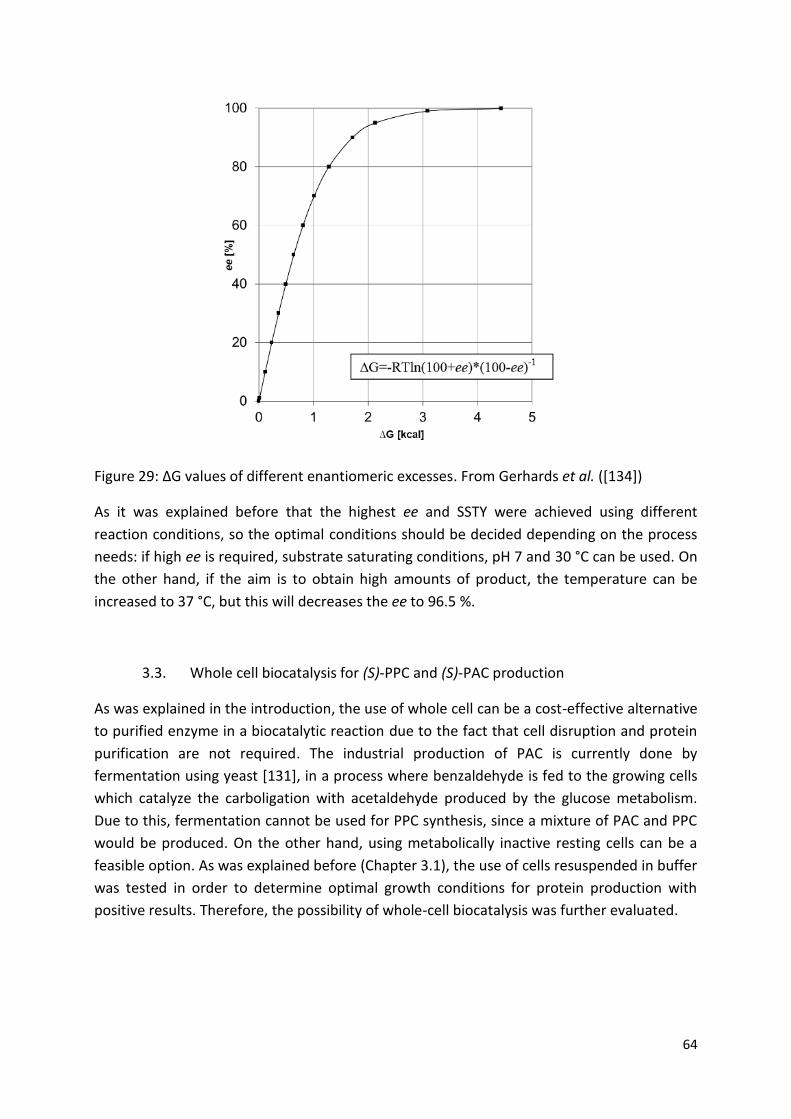
64
Figure 29: ∆G values of different enantiomeric excesses. From Gerhards et al. ([134])
As it was explained before that the highest ee and SSTY were achieved using different
reaction conditions, so the optimal conditions should be decided depending on the process
needs: if high ee is required, substrate saturating conditions, pH 7 and 30 °C can be used. On
the other hand, if the aim is to obtain high amounts of product, the temperature can be
increased to 37 °C, but this will decreases the ee to 96.5 %.
3.3. Whole cell biocatalysis for (S)-PPC and (S)-PAC production
As was explained in the introduction, the use of whole cell can be a cost-effective alternative
to purified enzyme in a biocatalytic reaction due to the fact that cell disruption and protein
purification are not required. The industrial production of PAC is currently done by
fermentation using yeast [131], in a process where benzaldehyde is fed to the growing cells
which catalyze the carboligation with acetaldehyde produced by the glucose metabolism.
Due to this, fermentation cannot be used for PPC synthesis, since a mixture of PAC and PPC
would be produced. On the other hand, using metabolically inactive resting cells can be a
feasible option. As was explained before (Chapter 3.1), the use of cells resuspended in buffer
was tested in order to determine optimal growth conditions for protein production with
positive results. Therefore, the possibility of whole-cell biocatalysis was further evaluated.
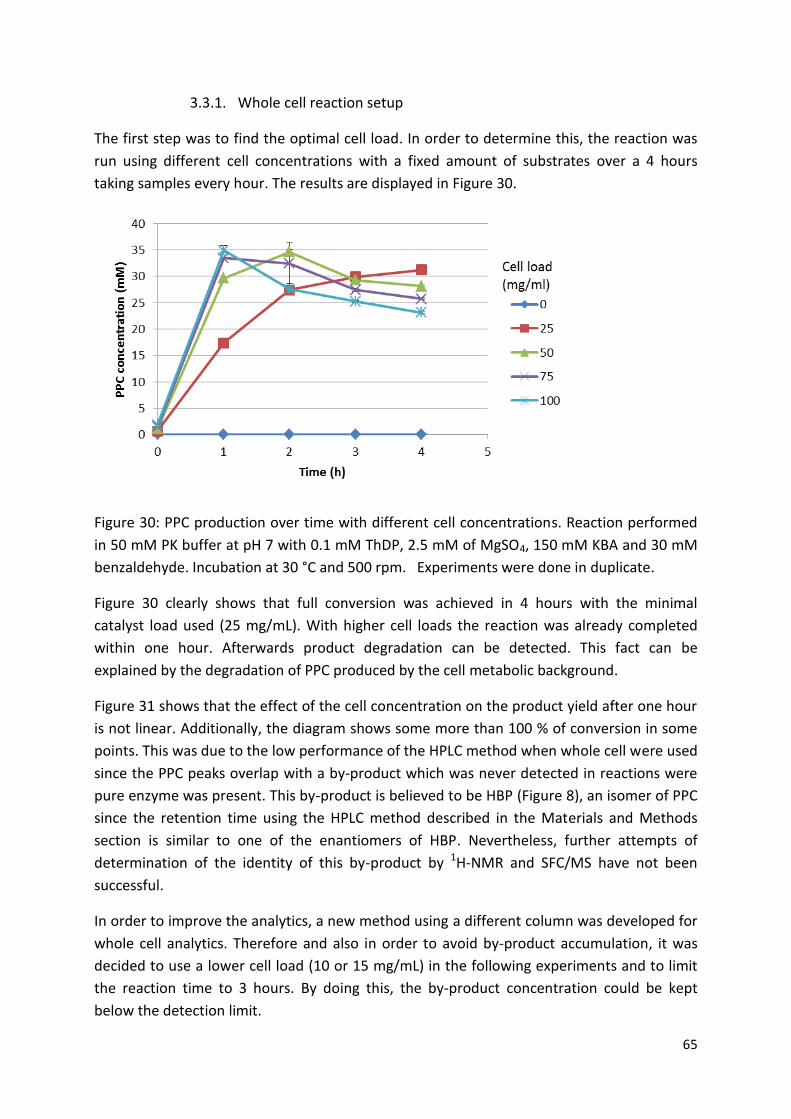
65
3.3.1. Whole cell reaction setup
The first step was to find the optimal cell load. In order to determine this, the reaction was
run using different cell concentrations with a fixed amount of substrates over a 4 hours
taking samples every hour. The results are displayed in Figure 30.
Figure 30: PPC production over time with different cell concentrations. Reaction performed
in 50 mM PK buffer at pH 7 with 0.1 mM ThDP, 2.5 mM of MgSO4, 150 mM KBA and 30 mM
benzaldehyde. Incubation at 30 °C and 500 rpm. Experiments were done in duplicate.
Figure 30 clearly shows that full conversion was achieved in 4 hours with the minimal
catalyst load used (25 mg/mL). With higher cell loads the reaction was already completed
within one hour. Afterwards product degradation can be detected. This fact can be
explained by the degradation of PPC produced by the cell metabolic background.
Figure 31 shows that the effect of the cell concentration on the product yield after one hour
is not linear. Additionally, the diagram shows some more than 100 % of conversion in some
points. This was due to the low performance of the HPLC method when whole cell were used
since the PPC peaks overlap with a by-product which was never detected in reactions were
pure enzyme was present. This by-product is believed to be HBP (Figure 8), an isomer of PPC
since the retention time using the HPLC method described in the Materials and Methods
section is similar to one of the enantiomers of HBP. Nevertheless, further attempts of
determination of the identity of this by-product by 1H-NMR and SFC/MS have not been
successful.
In order to improve the analytics, a new method using a different column was developed for
whole cell analytics. Therefore and also in order to avoid by-product accumulation, it was
decided to use a lower cell load (10 or 15 mg/mL) in the following experiments and to limit
the reaction time to 3 hours. By doing this, the by-product concentration could be kept
below the detection limit.
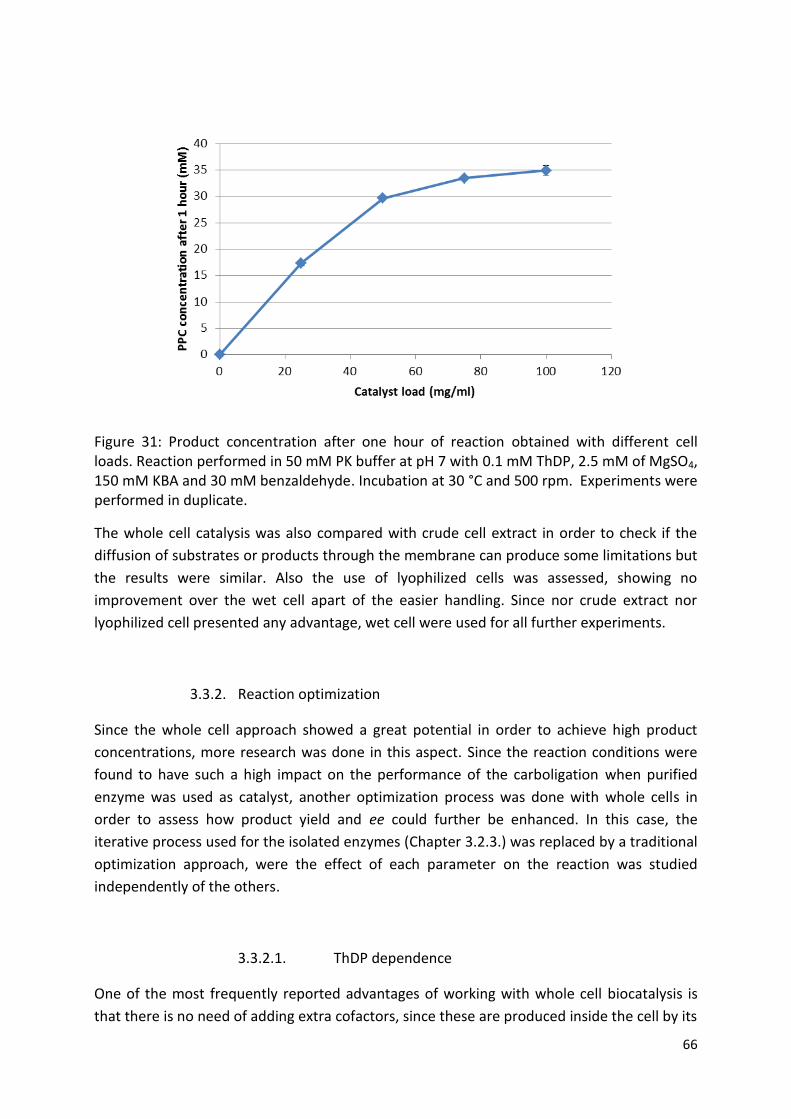
66
Figure 31: Product concentration after one hour of reaction obtained with different cell loads. Reaction performed in 50 mM PK buffer at pH 7 with 0.1 mM ThDP, 2.5 mM of MgSO4, 150 mM KBA and 30 mM benzaldehyde. Incubation at 30 °C and 500 rpm. Experiments were performed in duplicate.
The whole cell catalysis was also compared with crude cell extract in order to check if the
diffusion of substrates or products through the membrane can produce some limitations but
the results were similar. Also the use of lyophilized cells was assessed, showing no
improvement over the wet cell apart of the easier handling. Since nor crude extract nor
lyophilized cell presented any advantage, wet cell were used for all further experiments.
3.3.2. Reaction optimization
Since the whole cell approach showed a great potential in order to achieve high product
concentrations, more research was done in this aspect. Since the reaction conditions were
found to have such a high impact on the performance of the carboligation when purified
enzyme was used as catalyst, another optimization process was done with whole cells in
order to assess how product yield and ee could further be enhanced. In this case, the
iterative process used for the isolated enzymes (Chapter 3.2.3.) was replaced by a traditional
optimization approach, were the effect of each parameter on the reaction was studied
independently of the others.
3.3.2.1. ThDP dependence
One of the most frequently reported advantages of working with whole cell biocatalysis is
that there is no need of adding extra cofactors, since these are produced inside the cell by its
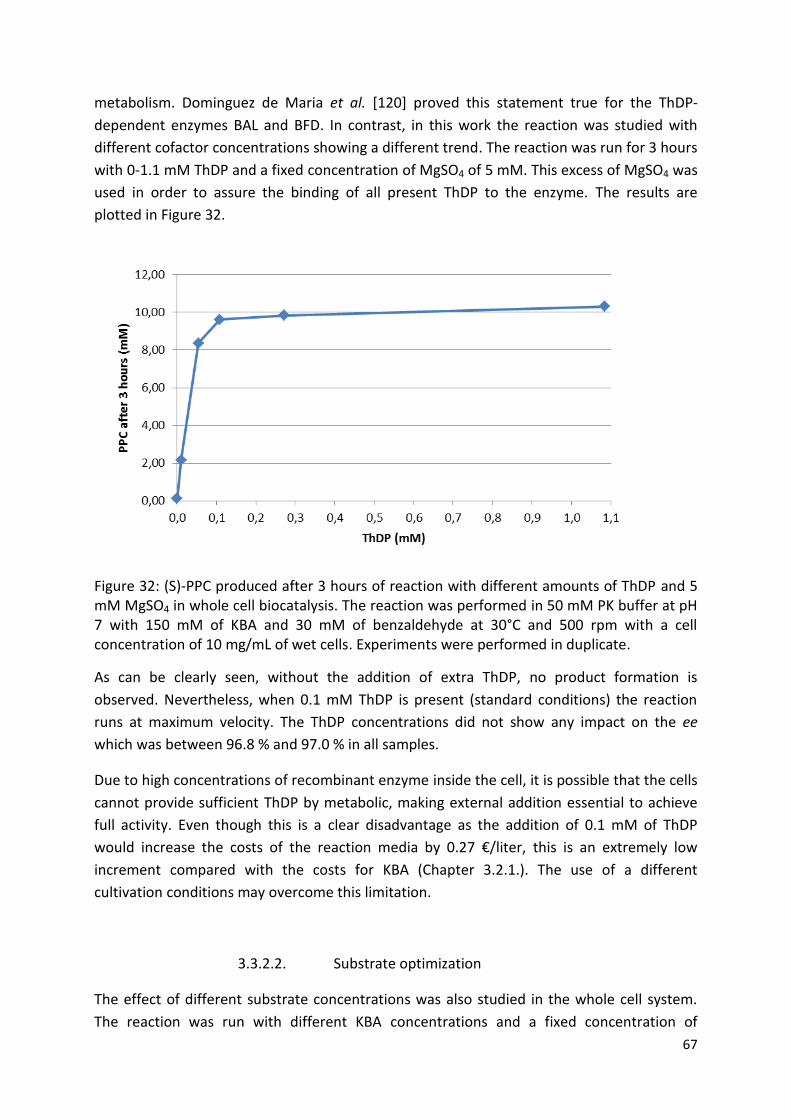
67
metabolism. Dominguez de Maria et al. [120] proved this statement true for the ThDP-
dependent enzymes BAL and BFD. In contrast, in this work the reaction was studied with
different cofactor concentrations showing a different trend. The reaction was run for 3 hours
with 0-1.1 mM ThDP and a fixed concentration of MgSO4 of 5 mM. This excess of MgSO4 was
used in order to assure the binding of all present ThDP to the enzyme. The results are
plotted in Figure 32.
Figure 32: (S)-PPC produced after 3 hours of reaction with different amounts of ThDP and 5 mM MgSO4 in whole cell biocatalysis. The reaction was performed in 50 mM PK buffer at pH 7 with 150 mM of KBA and 30 mM of benzaldehyde at 30°C and 500 rpm with a cell concentration of 10 mg/mL of wet cells. Experiments were performed in duplicate.
As can be clearly seen, without the addition of extra ThDP, no product formation is
observed. Nevertheless, when 0.1 mM ThDP is present (standard conditions) the reaction
runs at maximum velocity. The ThDP concentrations did not show any impact on the ee
which was between 96.8 % and 97.0 % in all samples.
Due to high concentrations of recombinant enzyme inside the cell, it is possible that the cells
cannot provide sufficient ThDP by metabolic, making external addition essential to achieve
full activity. Even though this is a clear disadvantage as the addition of 0.1 mM of ThDP
would increase the costs of the reaction media by 0.27 €/liter, this is an extremely low
increment compared with the costs for KBA (Chapter 3.2.1.). The use of a different
cultivation conditions may overcome this limitation.
3.3.2.2. Substrate optimization
The effect of different substrate concentrations was also studied in the whole cell system.
The reaction was run with different KBA concentrations and a fixed concentration of
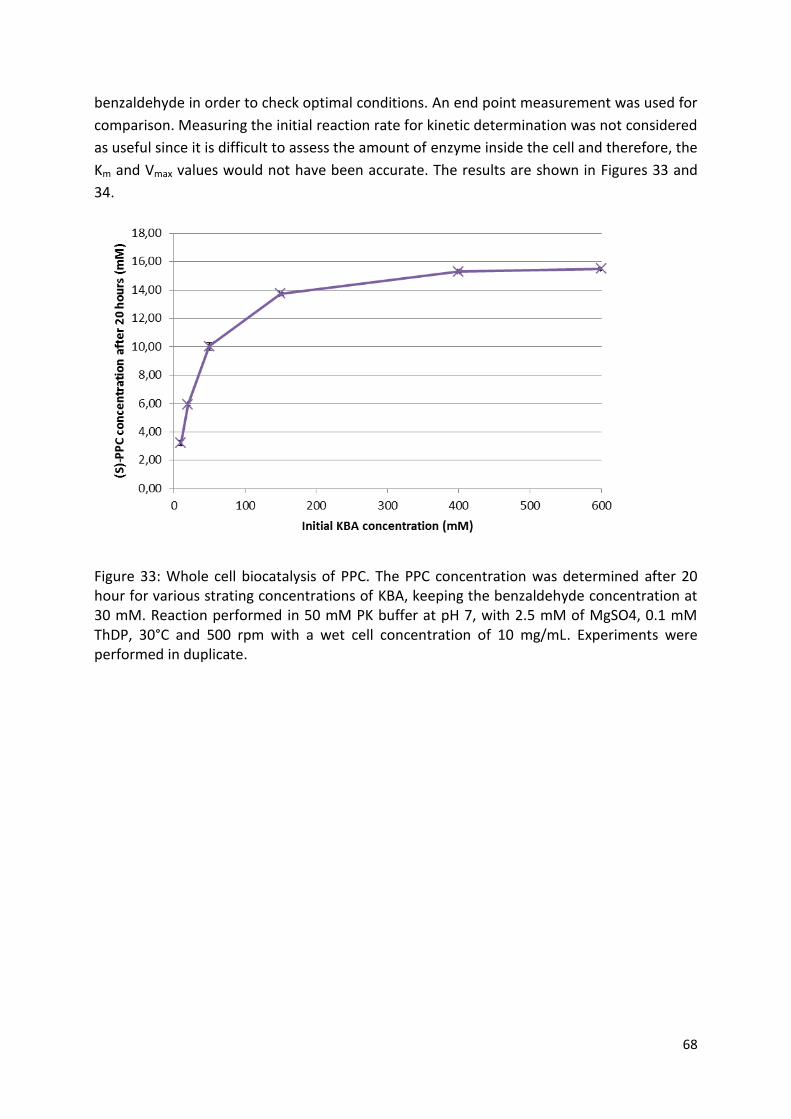
68
benzaldehyde in order to check optimal conditions. An end point measurement was used for
comparison. Measuring the initial reaction rate for kinetic determination was not considered
as useful since it is difficult to assess the amount of enzyme inside the cell and therefore, the
Km and Vmax values would not have been accurate. The results are shown in Figures 33 and
34.
Figure 33: Whole cell biocatalysis of PPC. The PPC concentration was determined after 20 hour for various strating concentrations of KBA, keeping the benzaldehyde concentration at 30 mM. Reaction performed in 50 mM PK buffer at pH 7, with 2.5 mM of MgSO4, 0.1 mM ThDP, 30°C and 500 rpm with a wet cell concentration of 10 mg/mL. Experiments were performed in duplicate.
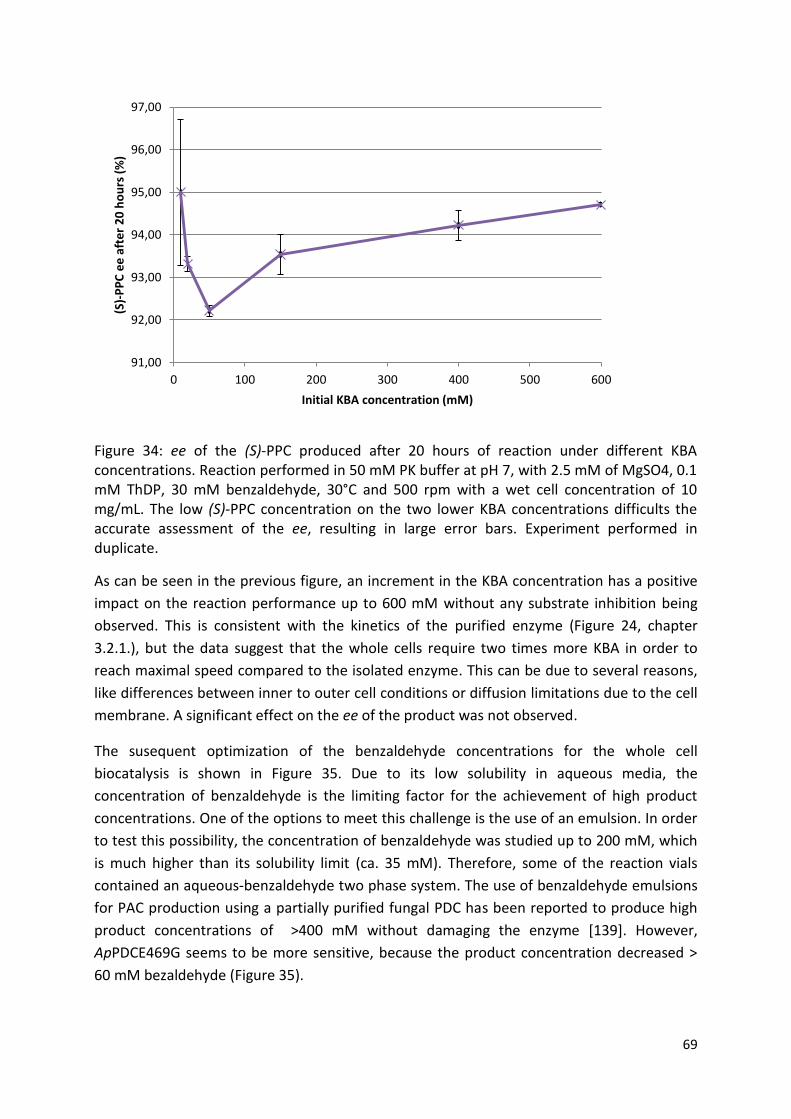
69
Figure 34: ee of the (S)-PPC produced after 20 hours of reaction under different KBA concentrations. Reaction performed in 50 mM PK buffer at pH 7, with 2.5 mM of MgSO4, 0.1 mM ThDP, 30 mM benzaldehyde, 30°C and 500 rpm with a wet cell concentration of 10 mg/mL. The low (S)-PPC concentration on the two lower KBA concentrations difficults the accurate assessment of the ee, resulting in large error bars. Experiment performed in duplicate.
As can be seen in the previous figure, an increment in the KBA concentration has a positive
impact on the reaction performance up to 600 mM without any substrate inhibition being
observed. This is consistent with the kinetics of the purified enzyme (Figure 24, chapter
3.2.1.), but the data suggest that the whole cells require two times more KBA in order to
reach maximal speed compared to the isolated enzyme. This can be due to several reasons,
like differences between inner to outer cell conditions or diffusion limitations due to the cell
membrane. A significant effect on the ee of the product was not observed.
The susequent optimization of the benzaldehyde concentrations for the whole cell
biocatalysis is shown in Figure 35. Due to its low solubility in aqueous media, the
concentration of benzaldehyde is the limiting factor for the achievement of high product
concentrations. One of the options to meet this challenge is the use of an emulsion. In order
to test this possibility, the concentration of benzaldehyde was studied up to 200 mM, which
is much higher than its solubility limit (ca. 35 mM). Therefore, some of the reaction vials
contained an aqueous-benzaldehyde two phase system. The use of benzaldehyde emulsions
for PAC production using a partially purified fungal PDC has been reported to produce high
product concentrations of >400 mM without damaging the enzyme [139]. However,
ApPDCE469G seems to be more sensitive, because the product concentration decreased >
60 mM bezaldehyde (Figure 35).
91,00
92,00
93,00
94,00
95,00
96,00
97,00
0 100 200 300 400 500 600
(S)-
PP
C e
e a
fte
r 2
0 h
ou
rs (
%)
Initial KBA concentration (mM)
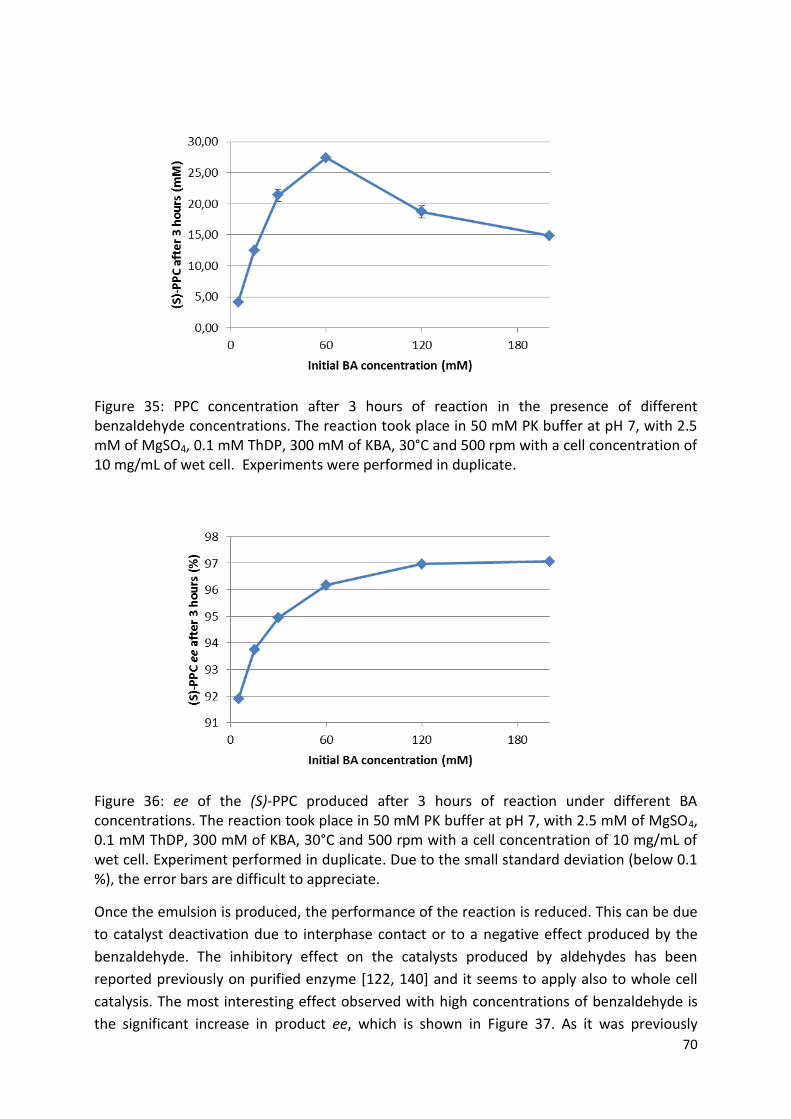
70
Figure 35: PPC concentration after 3 hours of reaction in the presence of different benzaldehyde concentrations. The reaction took place in 50 mM PK buffer at pH 7, with 2.5 mM of MgSO4, 0.1 mM ThDP, 300 mM of KBA, 30°C and 500 rpm with a cell concentration of 10 mg/mL of wet cell. Experiments were performed in duplicate.
Figure 36: ee of the (S)-PPC produced after 3 hours of reaction under different BA concentrations. The reaction took place in 50 mM PK buffer at pH 7, with 2.5 mM of MgSO4, 0.1 mM ThDP, 300 mM of KBA, 30°C and 500 rpm with a cell concentration of 10 mg/mL of wet cell. Experiment performed in duplicate. Due to the small standard deviation (below 0.1 %), the error bars are difficult to appreciate.
Once the emulsion is produced, the performance of the reaction is reduced. This can be due
to catalyst deactivation due to interphase contact or to a negative effect produced by the
benzaldehyde. The inhibitory effect on the catalysts produced by aldehydes has been
reported previously on purified enzyme [122, 140] and it seems to apply also to whole cell
catalysis. The most interesting effect observed with high concentrations of benzaldehyde is
the significant increase in product ee, which is shown in Figure 37. As it was previously
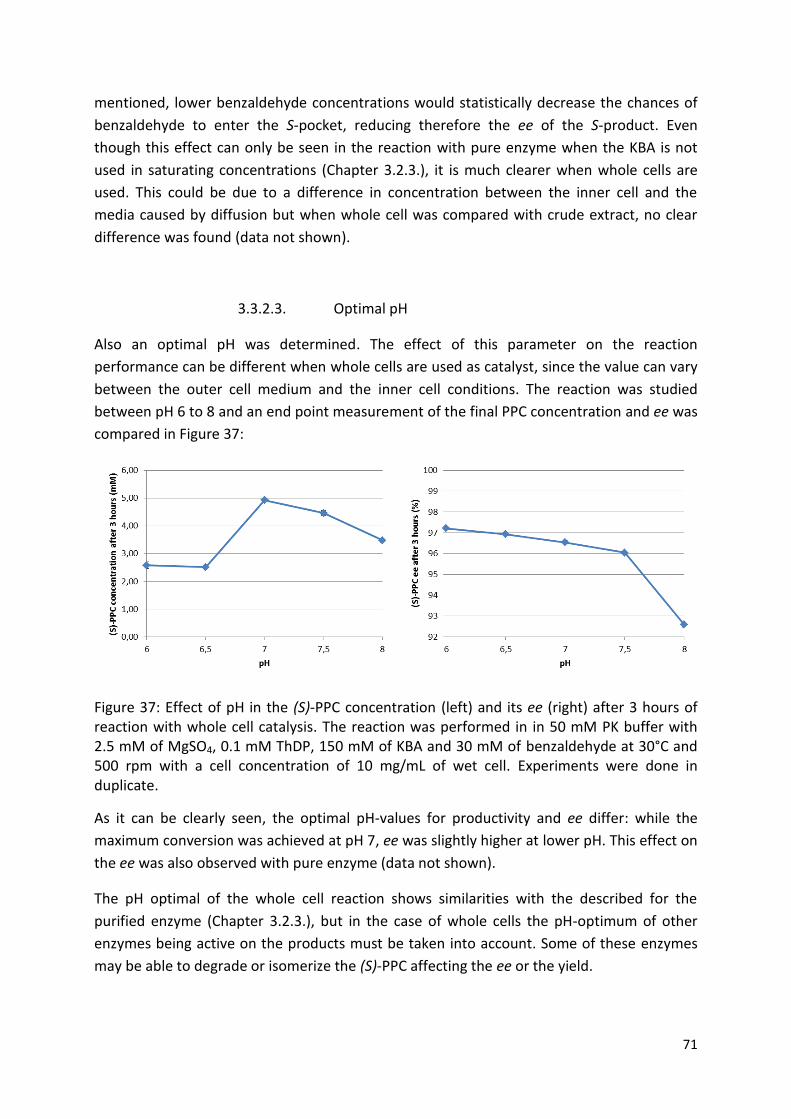
71
mentioned, lower benzaldehyde concentrations would statistically decrease the chances of
benzaldehyde to enter the S-pocket, reducing therefore the ee of the S-product. Even
though this effect can only be seen in the reaction with pure enzyme when the KBA is not
used in saturating concentrations (Chapter 3.2.3.), it is much clearer when whole cells are
used. This could be due to a difference in concentration between the inner cell and the
media caused by diffusion but when whole cell was compared with crude extract, no clear
difference was found (data not shown).
3.3.2.3. Optimal pH
Also an optimal pH was determined. The effect of this parameter on the reaction
performance can be different when whole cells are used as catalyst, since the value can vary
between the outer cell medium and the inner cell conditions. The reaction was studied
between pH 6 to 8 and an end point measurement of the final PPC concentration and ee was
compared in Figure 37:
Figure 37: Effect of pH in the (S)-PPC concentration (left) and its ee (right) after 3 hours of reaction with whole cell catalysis. The reaction was performed in in 50 mM PK buffer with 2.5 mM of MgSO4, 0.1 mM ThDP, 150 mM of KBA and 30 mM of benzaldehyde at 30°C and 500 rpm with a cell concentration of 10 mg/mL of wet cell. Experiments were done in duplicate.
As it can be clearly seen, the optimal pH-values for productivity and ee differ: while the
maximum conversion was achieved at pH 7, ee was slightly higher at lower pH. This effect on
the ee was also observed with pure enzyme (data not shown).
The pH optimal of the whole cell reaction shows similarities with the described for the
purified enzyme (Chapter 3.2.3.), but in the case of whole cells the pH-optimum of other
enzymes being active on the products must be taken into account. Some of these enzymes
may be able to degrade or isomerize the (S)-PPC affecting the ee or the yield.
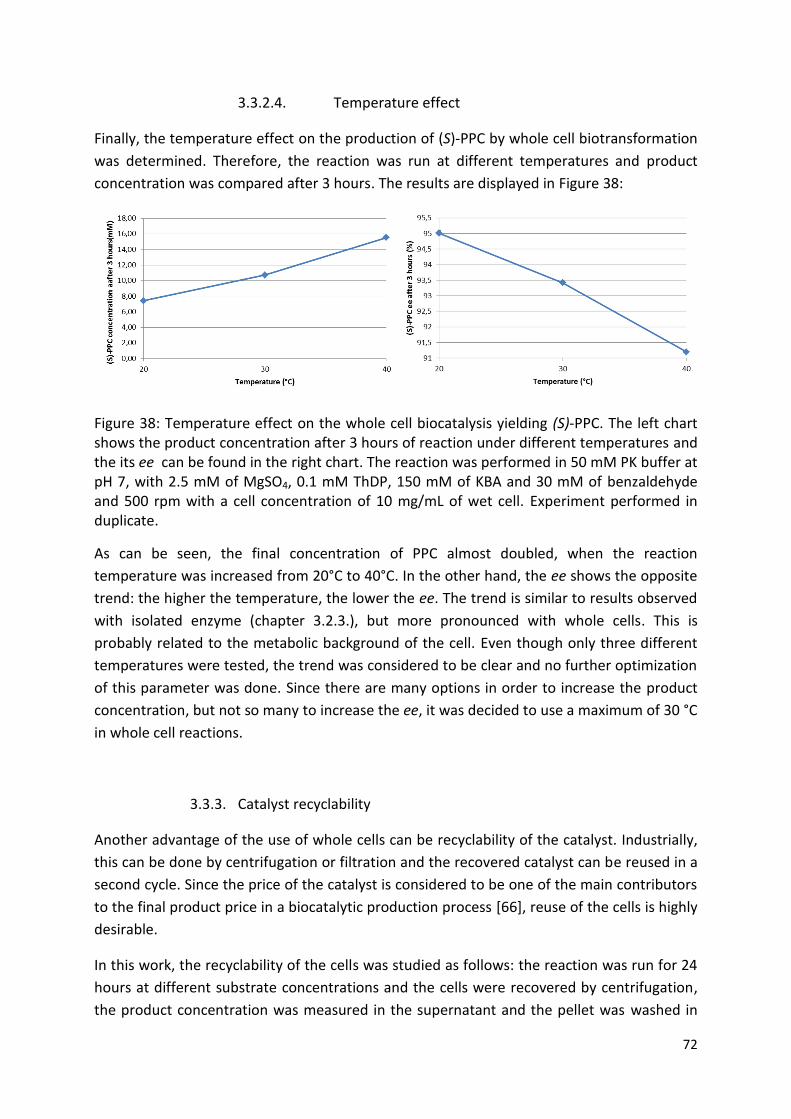
72
3.3.2.4. Temperature effect
Finally, the temperature effect on the production of (S)-PPC by whole cell biotransformation
was determined. Therefore, the reaction was run at different temperatures and product
concentration was compared after 3 hours. The results are displayed in Figure 38:
Figure 38: Temperature effect on the whole cell biocatalysis yielding (S)-PPC. The left chart shows the product concentration after 3 hours of reaction under different temperatures and the its ee can be found in the right chart. The reaction was performed in 50 mM PK buffer at pH 7, with 2.5 mM of MgSO4, 0.1 mM ThDP, 150 mM of KBA and 30 mM of benzaldehyde and 500 rpm with a cell concentration of 10 mg/mL of wet cell. Experiment performed in duplicate.
As can be seen, the final concentration of PPC almost doubled, when the reaction
temperature was increased from 20°C to 40°C. In the other hand, the ee shows the opposite
trend: the higher the temperature, the lower the ee. The trend is similar to results observed
with isolated enzyme (chapter 3.2.3.), but more pronounced with whole cells. This is
probably related to the metabolic background of the cell. Even though only three different
temperatures were tested, the trend was considered to be clear and no further optimization
of this parameter was done. Since there are many options in order to increase the product
concentration, but not so many to increase the ee, it was decided to use a maximum of 30 °C
in whole cell reactions.
3.3.3. Catalyst recyclability
Another advantage of the use of whole cells can be recyclability of the catalyst. Industrially,
this can be done by centrifugation or filtration and the recovered catalyst can be reused in a
second cycle. Since the price of the catalyst is considered to be one of the main contributors
to the final product price in a biocatalytic production process [66], reuse of the cells is highly
desirable.
In this work, the recyclability of the cells was studied as follows: the reaction was run for 24
hours at different substrate concentrations and the cells were recovered by centrifugation,
the product concentration was measured in the supernatant and the pellet was washed in
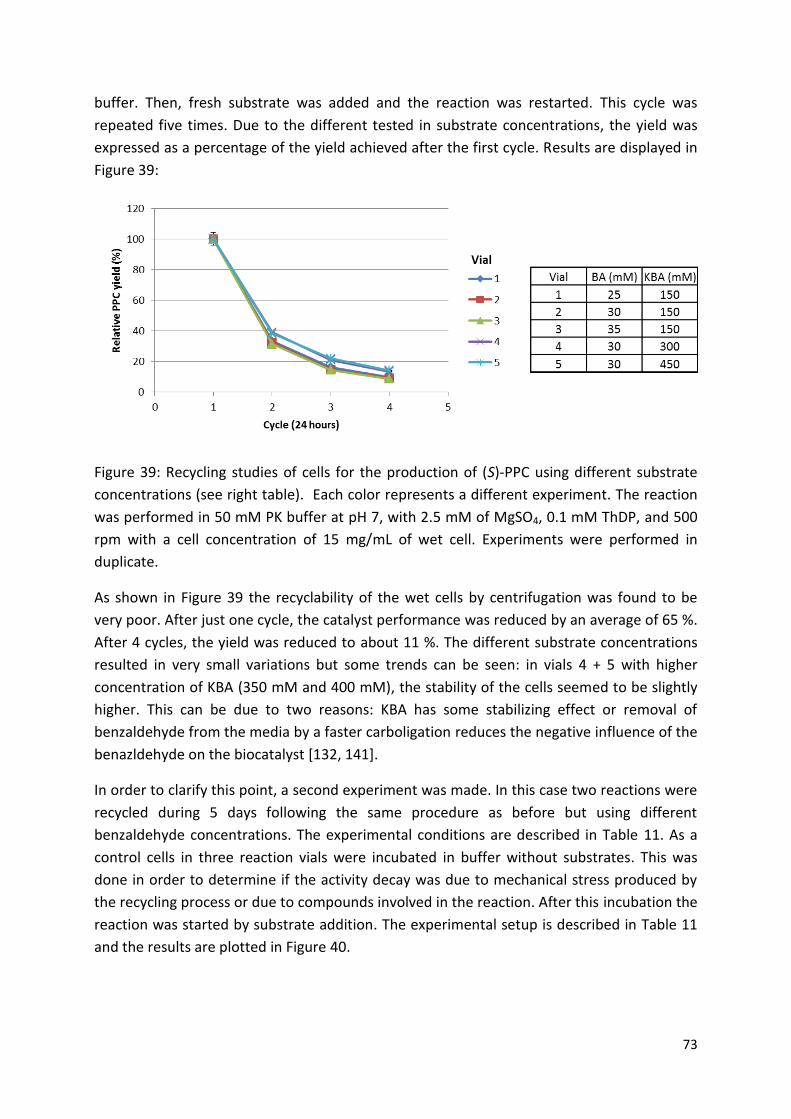
73
buffer. Then, fresh substrate was added and the reaction was restarted. This cycle was
repeated five times. Due to the different tested in substrate concentrations, the yield was
expressed as a percentage of the yield achieved after the first cycle. Results are displayed in
Figure 39:
Figure 39: Recycling studies of cells for the production of (S)-PPC using different substrate
concentrations (see right table). Each color represents a different experiment. The reaction
was performed in 50 mM PK buffer at pH 7, with 2.5 mM of MgSO4, 0.1 mM ThDP, and 500
rpm with a cell concentration of 15 mg/mL of wet cell. Experiments were performed in
duplicate.
As shown in Figure 39 the recyclability of the wet cells by centrifugation was found to be
very poor. After just one cycle, the catalyst performance was reduced by an average of 65 %.
After 4 cycles, the yield was reduced to about 11 %. The different substrate concentrations
resulted in very small variations but some trends can be seen: in vials 4 + 5 with higher
concentration of KBA (350 mM and 400 mM), the stability of the cells seemed to be slightly
higher. This can be due to two reasons: KBA has some stabilizing effect or removal of
benzaldehyde from the media by a faster carboligation reduces the negative influence of the
benazldehyde on the biocatalyst [132, 141].
In order to clarify this point, a second experiment was made. In this case two reactions were
recycled during 5 days following the same procedure as before but using different
benzaldehyde concentrations. The experimental conditions are described in Table 11. As a
control cells in three reaction vials were incubated in buffer without substrates. This was
done in order to determine if the activity decay was due to mechanical stress produced by
the recycling process or due to compounds involved in the reaction. After this incubation the
reaction was started by substrate addition. The experimental setup is described in Table 11
and the results are plotted in Figure 40.
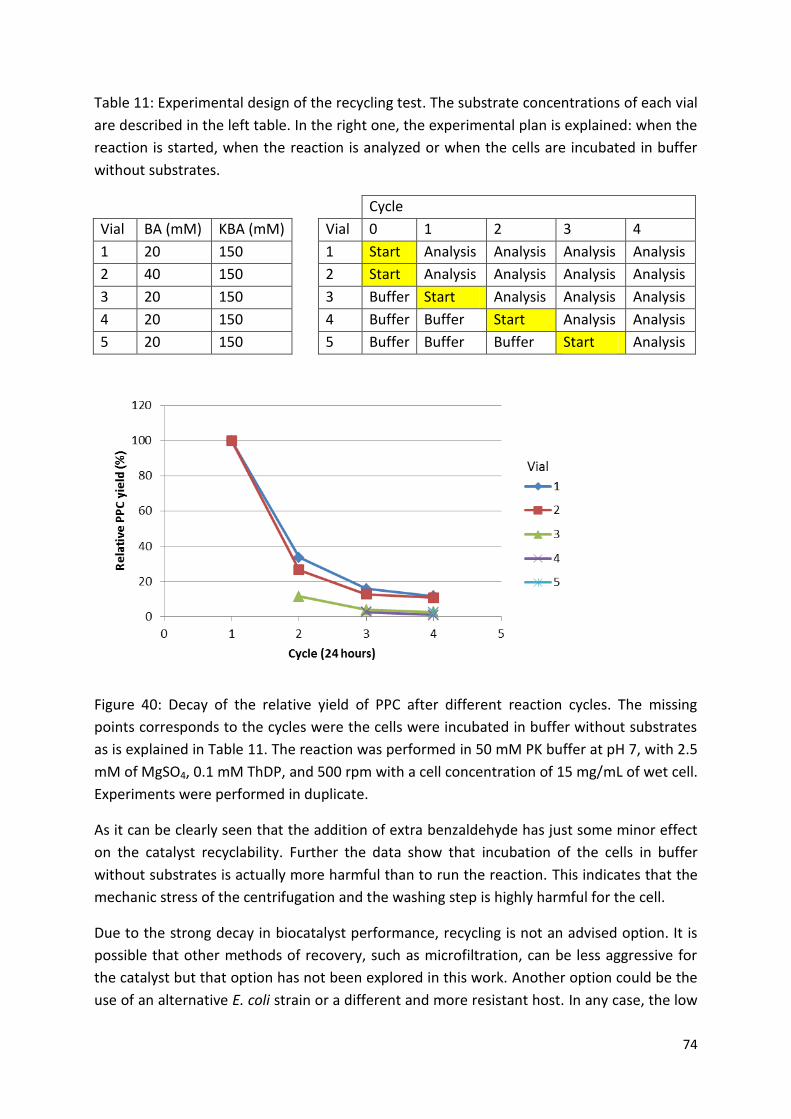
74
Table 11: Experimental design of the recycling test. The substrate concentrations of each vial
are described in the left table. In the right one, the experimental plan is explained: when the
reaction is started, when the reaction is analyzed or when the cells are incubated in buffer
without substrates.
Cycle
Vial BA (mM) KBA (mM)
Vial 0 1 2 3 4
1 20 150
1 Start Analysis Analysis Analysis Analysis
2 40 150
2 Start Analysis Analysis Analysis Analysis
3 20 150
3 Buffer Start Analysis Analysis Analysis
4 20 150
4 Buffer Buffer Start Analysis Analysis
5 20 150
5 Buffer Buffer Buffer Start Analysis
Figure 40: Decay of the relative yield of PPC after different reaction cycles. The missing
points corresponds to the cycles were the cells were incubated in buffer without substrates
as is explained in Table 11. The reaction was performed in 50 mM PK buffer at pH 7, with 2.5
mM of MgSO4, 0.1 mM ThDP, and 500 rpm with a cell concentration of 15 mg/mL of wet cell.
Experiments were performed in duplicate.
As it can be clearly seen that the addition of extra benzaldehyde has just some minor effect
on the catalyst recyclability. Further the data show that incubation of the cells in buffer
without substrates is actually more harmful than to run the reaction. This indicates that the
mechanic stress of the centrifugation and the washing step is highly harmful for the cell.
Due to the strong decay in biocatalyst performance, recycling is not an advised option. It is
possible that other methods of recovery, such as microfiltration, can be less aggressive for
the catalyst but that option has not been explored in this work. Another option could be the
use of an alternative E. coli strain or a different and more resistant host. In any case, the low
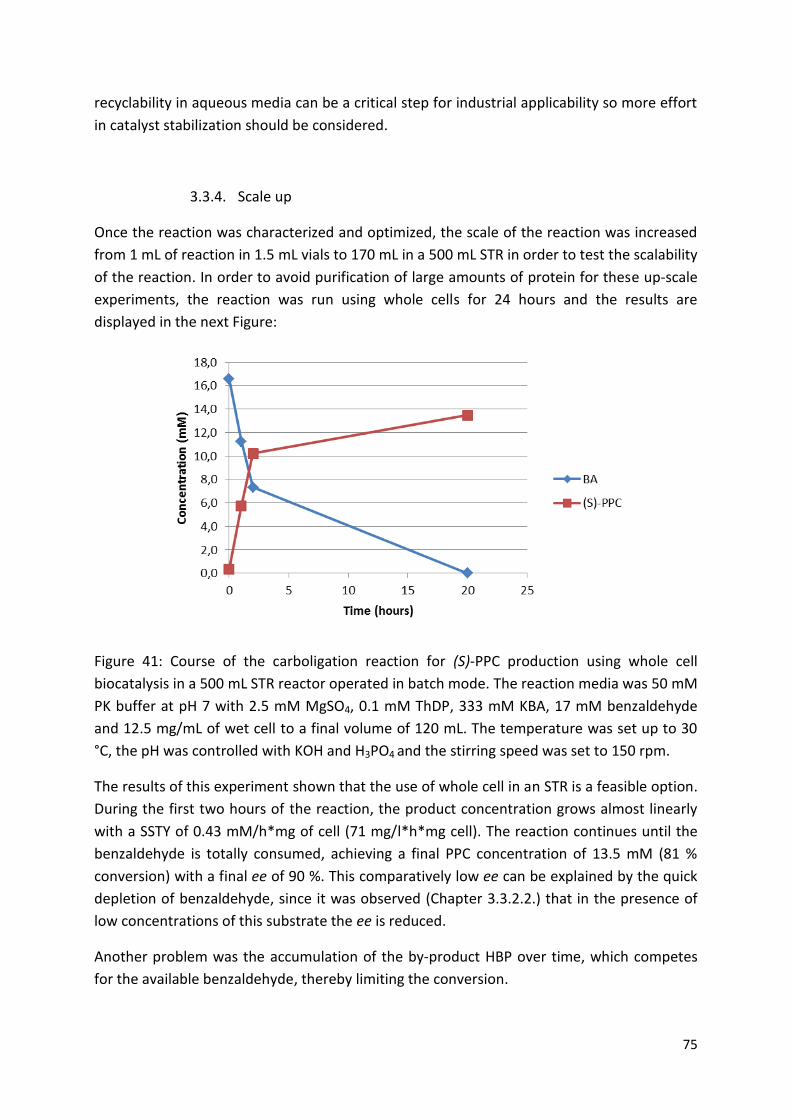
75
recyclability in aqueous media can be a critical step for industrial applicability so more effort
in catalyst stabilization should be considered.
3.3.4. Scale up
Once the reaction was characterized and optimized, the scale of the reaction was increased
from 1 mL of reaction in 1.5 mL vials to 170 mL in a 500 mL STR in order to test the scalability
of the reaction. In order to avoid purification of large amounts of protein for these up-scale
experiments, the reaction was run using whole cells for 24 hours and the results are
displayed in the next Figure:
Figure 41: Course of the carboligation reaction for (S)-PPC production using whole cell
biocatalysis in a 500 mL STR reactor operated in batch mode. The reaction media was 50 mM
PK buffer at pH 7 with 2.5 mM MgSO4, 0.1 mM ThDP, 333 mM KBA, 17 mM benzaldehyde
and 12.5 mg/mL of wet cell to a final volume of 120 mL. The temperature was set up to 30
°C, the pH was controlled with KOH and H3PO4 and the stirring speed was set to 150 rpm.
The results of this experiment shown that the use of whole cell in an STR is a feasible option.
During the first two hours of the reaction, the product concentration grows almost linearly
with a SSTY of 0.43 mM/h*mg of cell (71 mg/l*h*mg cell). The reaction continues until the
benzaldehyde is totally consumed, achieving a final PPC concentration of 13.5 mM (81 %
conversion) with a final ee of 90 %. This comparatively low ee can be explained by the quick
depletion of benzaldehyde, since it was observed (Chapter 3.3.2.2.) that in the presence of
low concentrations of this substrate the ee is reduced.
Another problem was the accumulation of the by-product HBP over time, which competes
for the available benzaldehyde, thereby limiting the conversion.
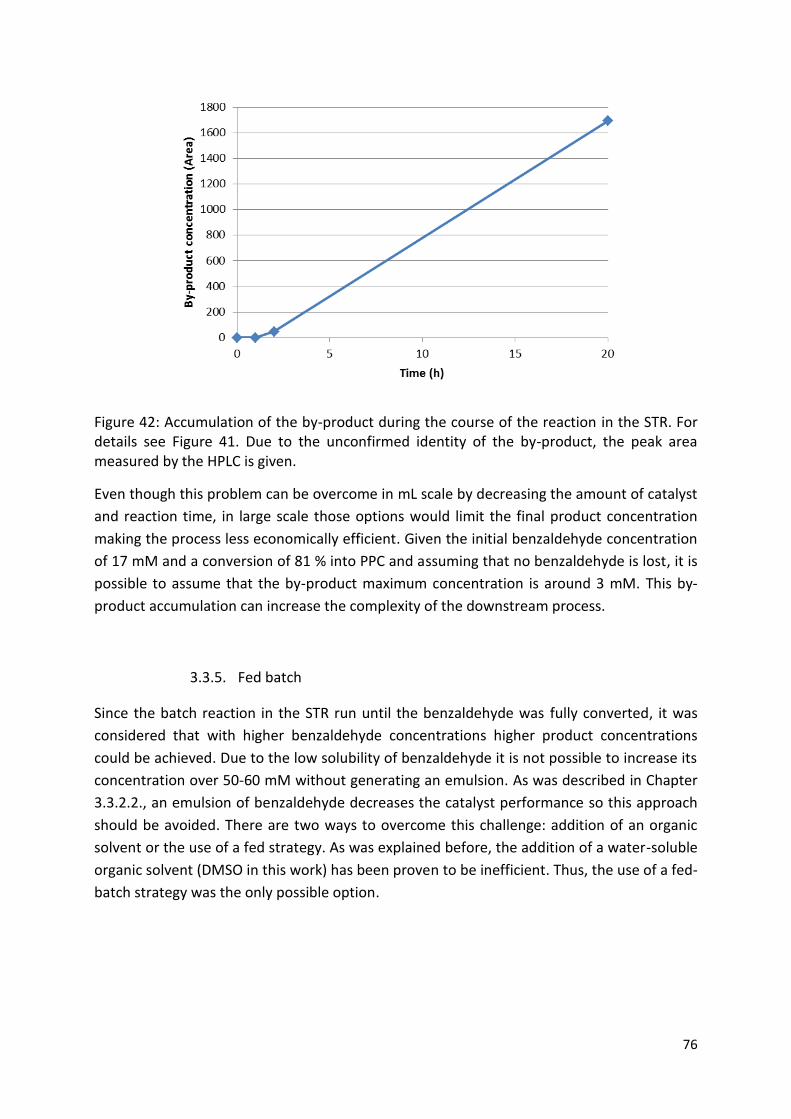
76
Figure 42: Accumulation of the by-product during the course of the reaction in the STR. For details see Figure 41. Due to the unconfirmed identity of the by-product, the peak area measured by the HPLC is given.
Even though this problem can be overcome in mL scale by decreasing the amount of catalyst
and reaction time, in large scale those options would limit the final product concentration
making the process less economically efficient. Given the initial benzaldehyde concentration
of 17 mM and a conversion of 81 % into PPC and assuming that no benzaldehyde is lost, it is
possible to assume that the by-product maximum concentration is around 3 mM. This by-
product accumulation can increase the complexity of the downstream process.
3.3.5. Fed batch
Since the batch reaction in the STR run until the benzaldehyde was fully converted, it was
considered that with higher benzaldehyde concentrations higher product concentrations
could be achieved. Due to the low solubility of benzaldehyde it is not possible to increase its
concentration over 50-60 mM without generating an emulsion. As was described in Chapter
3.3.2.2., an emulsion of benzaldehyde decreases the catalyst performance so this approach
should be avoided. There are two ways to overcome this challenge: addition of an organic
solvent or the use of a fed strategy. As was explained before, the addition of a water-soluble
organic solvent (DMSO in this work) has been proven to be inefficient. Thus, the use of a fed-
batch strategy was the only possible option.
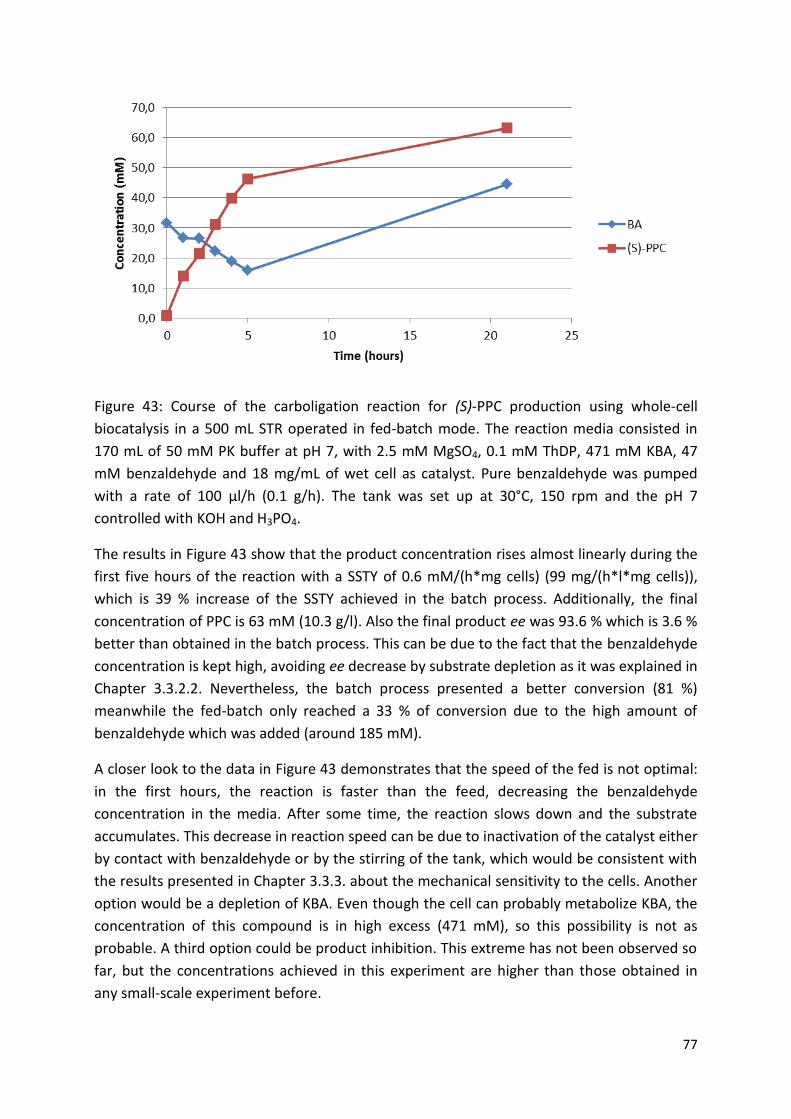
77
Figure 43: Course of the carboligation reaction for (S)-PPC production using whole-cell
biocatalysis in a 500 mL STR operated in fed-batch mode. The reaction media consisted in
170 mL of 50 mM PK buffer at pH 7, with 2.5 mM MgSO4, 0.1 mM ThDP, 471 mM KBA, 47
mM benzaldehyde and 18 mg/mL of wet cell as catalyst. Pure benzaldehyde was pumped
with a rate of 100 µl/h (0.1 g/h). The tank was set up at 30°C, 150 rpm and the pH 7
controlled with KOH and H3PO4.
The results in Figure 43 show that the product concentration rises almost linearly during the
first five hours of the reaction with a SSTY of 0.6 mM/(h*mg cells) (99 mg/(h*l*mg cells)),
which is 39 % increase of the SSTY achieved in the batch process. Additionally, the final
concentration of PPC is 63 mM (10.3 g/l). Also the final product ee was 93.6 % which is 3.6 %
better than obtained in the batch process. This can be due to the fact that the benzaldehyde
concentration is kept high, avoiding ee decrease by substrate depletion as it was explained in
Chapter 3.3.2.2. Nevertheless, the batch process presented a better conversion (81 %)
meanwhile the fed-batch only reached a 33 % of conversion due to the high amount of
benzaldehyde which was added (around 185 mM).
A closer look to the data in Figure 43 demonstrates that the speed of the fed is not optimal:
in the first hours, the reaction is faster than the feed, decreasing the benzaldehyde
concentration in the media. After some time, the reaction slows down and the substrate
accumulates. This decrease in reaction speed can be due to inactivation of the catalyst either
by contact with benzaldehyde or by the stirring of the tank, which would be consistent with
the results presented in Chapter 3.3.3. about the mechanical sensitivity to the cells. Another
option would be a depletion of KBA. Even though the cell can probably metabolize KBA, the
concentration of this compound is in high excess (471 mM), so this possibility is not as
probable. A third option could be product inhibition. This extreme has not been observed so
far, but the concentrations achieved in this experiment are higher than those obtained in
any small-scale experiment before.
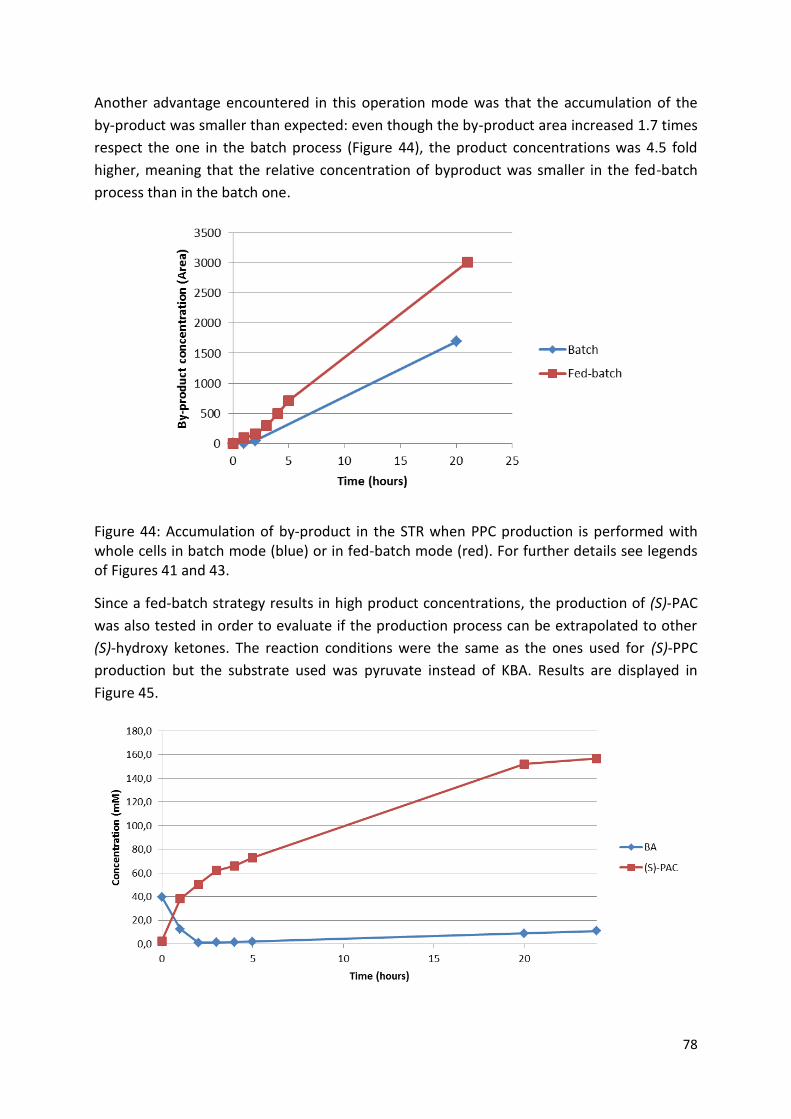
78
Another advantage encountered in this operation mode was that the accumulation of the
by-product was smaller than expected: even though the by-product area increased 1.7 times
respect the one in the batch process (Figure 44), the product concentrations was 4.5 fold
higher, meaning that the relative concentration of byproduct was smaller in the fed-batch
process than in the batch one.
Figure 44: Accumulation of by-product in the STR when PPC production is performed with whole cells in batch mode (blue) or in fed-batch mode (red). For further details see legends of Figures 41 and 43.
Since a fed-batch strategy results in high product concentrations, the production of (S)-PAC
was also tested in order to evaluate if the production process can be extrapolated to other
(S)-hydroxy ketones. The reaction conditions were the same as the ones used for (S)-PPC
production but the substrate used was pyruvate instead of KBA. Results are displayed in
Figure 45.
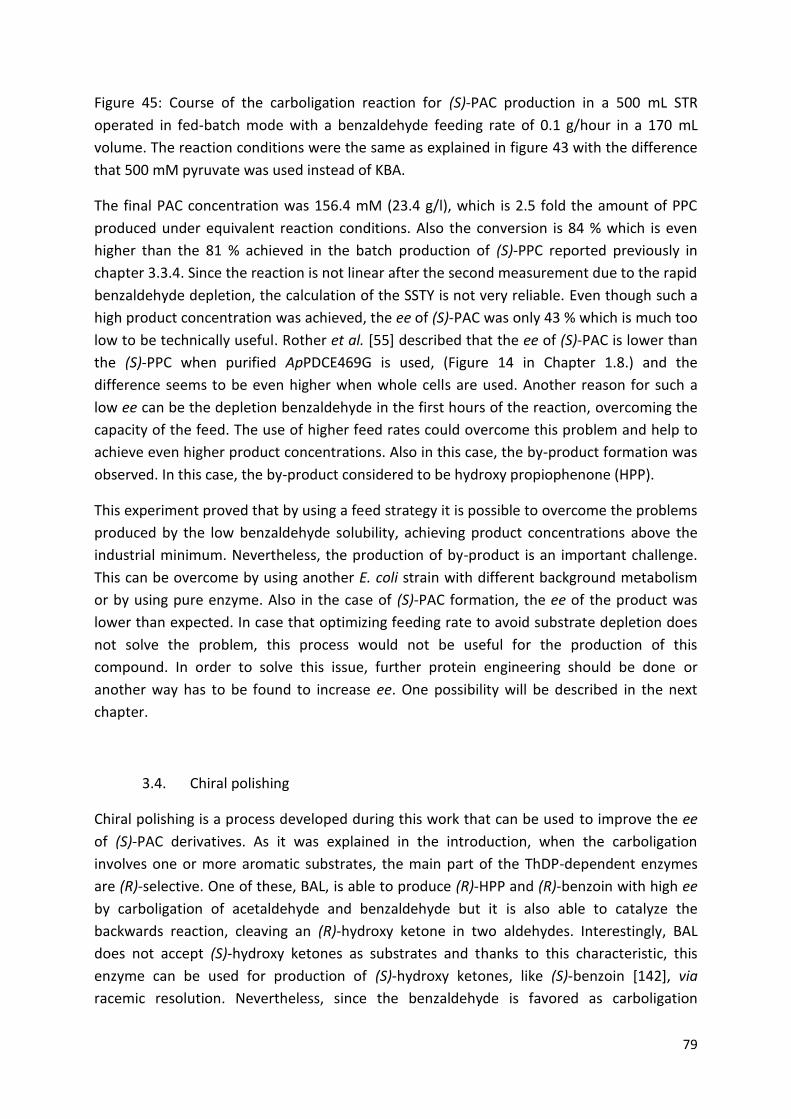
79
Figure 45: Course of the carboligation reaction for (S)-PAC production in a 500 mL STR
operated in fed-batch mode with a benzaldehyde feeding rate of 0.1 g/hour in a 170 mL
volume. The reaction conditions were the same as explained in figure 43 with the difference
that 500 mM pyruvate was used instead of KBA.
The final PAC concentration was 156.4 mM (23.4 g/l), which is 2.5 fold the amount of PPC
produced under equivalent reaction conditions. Also the conversion is 84 % which is even
higher than the 81 % achieved in the batch production of (S)-PPC reported previously in
chapter 3.3.4. Since the reaction is not linear after the second measurement due to the rapid
benzaldehyde depletion, the calculation of the SSTY is not very reliable. Even though such a
high product concentration was achieved, the ee of (S)-PAC was only 43 % which is much too
low to be technically useful. Rother et al. [55] described that the ee of (S)-PAC is lower than
the (S)-PPC when purified ApPDCE469G is used, (Figure 14 in Chapter 1.8.) and the
difference seems to be even higher when whole cells are used. Another reason for such a
low ee can be the depletion benzaldehyde in the first hours of the reaction, overcoming the
capacity of the feed. The use of higher feed rates could overcome this problem and help to
achieve even higher product concentrations. Also in this case, the by-product formation was
observed. In this case, the by-product considered to be hydroxy propiophenone (HPP).
This experiment proved that by using a feed strategy it is possible to overcome the problems
produced by the low benzaldehyde solubility, achieving product concentrations above the
industrial minimum. Nevertheless, the production of by-product is an important challenge.
This can be overcome by using another E. coli strain with different background metabolism
or by using pure enzyme. Also in the case of (S)-PAC formation, the ee of the product was
lower than expected. In case that optimizing feeding rate to avoid substrate depletion does
not solve the problem, this process would not be useful for the production of this
compound. In order to solve this issue, further protein engineering should be done or
another way has to be found to increase ee. One possibility will be described in the next
chapter.
3.4. Chiral polishing
Chiral polishing is a process developed during this work that can be used to improve the ee
of (S)-PAC derivatives. As it was explained in the introduction, when the carboligation
involves one or more aromatic substrates, the main part of the ThDP-dependent enzymes
are (R)-selective. One of these, BAL, is able to produce (R)-HPP and (R)-benzoin with high ee
by carboligation of acetaldehyde and benzaldehyde but it is also able to catalyze the
backwards reaction, cleaving an (R)-hydroxy ketone in two aldehydes. Interestingly, BAL
does not accept (S)-hydroxy ketones as substrates and thanks to this characteristic, this
enzyme can be used for production of (S)-hydroxy ketones, like (S)-benzoin [142], via
racemic resolution. Nevertheless, since the benzaldehyde is favored as carboligation
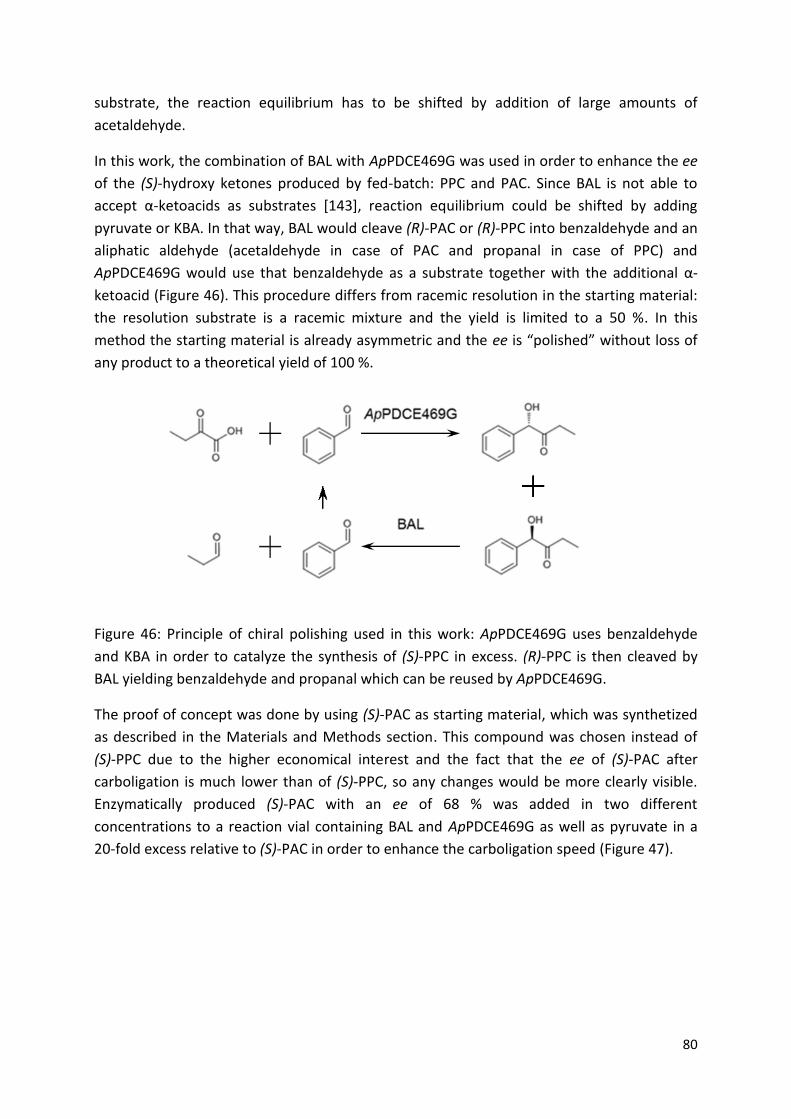
80
substrate, the reaction equilibrium has to be shifted by addition of large amounts of
acetaldehyde.
In this work, the combination of BAL with ApPDCE469G was used in order to enhance the ee
of the (S)-hydroxy ketones produced by fed-batch: PPC and PAC. Since BAL is not able to
accept α-ketoacids as substrates [143], reaction equilibrium could be shifted by adding
pyruvate or KBA. In that way, BAL would cleave (R)-PAC or (R)-PPC into benzaldehyde and an
aliphatic aldehyde (acetaldehyde in case of PAC and propanal in case of PPC) and
ApPDCE469G would use that benzaldehyde as a substrate together with the additional α-
ketoacid (Figure 46). This procedure differs from racemic resolution in the starting material:
the resolution substrate is a racemic mixture and the yield is limited to a 50 %. In this
method the starting material is already asymmetric and the ee is “polished” without loss of
any product to a theoretical yield of 100 %.
Figure 46: Principle of chiral polishing used in this work: ApPDCE469G uses benzaldehyde
and KBA in order to catalyze the synthesis of (S)-PPC in excess. (R)-PPC is then cleaved by
BAL yielding benzaldehyde and propanal which can be reused by ApPDCE469G.
The proof of concept was done by using (S)-PAC as starting material, which was synthetized
as described in the Materials and Methods section. This compound was chosen instead of
(S)-PPC due to the higher economical interest and the fact that the ee of (S)-PAC after
carboligation is much lower than of (S)-PPC, so any changes would be more clearly visible.
Enzymatically produced (S)-PAC with an ee of 68 % was added in two different
concentrations to a reaction vial containing BAL and ApPDCE469G as well as pyruvate in a
20-fold excess relative to (S)-PAC in order to enhance the carboligation speed (Figure 47).
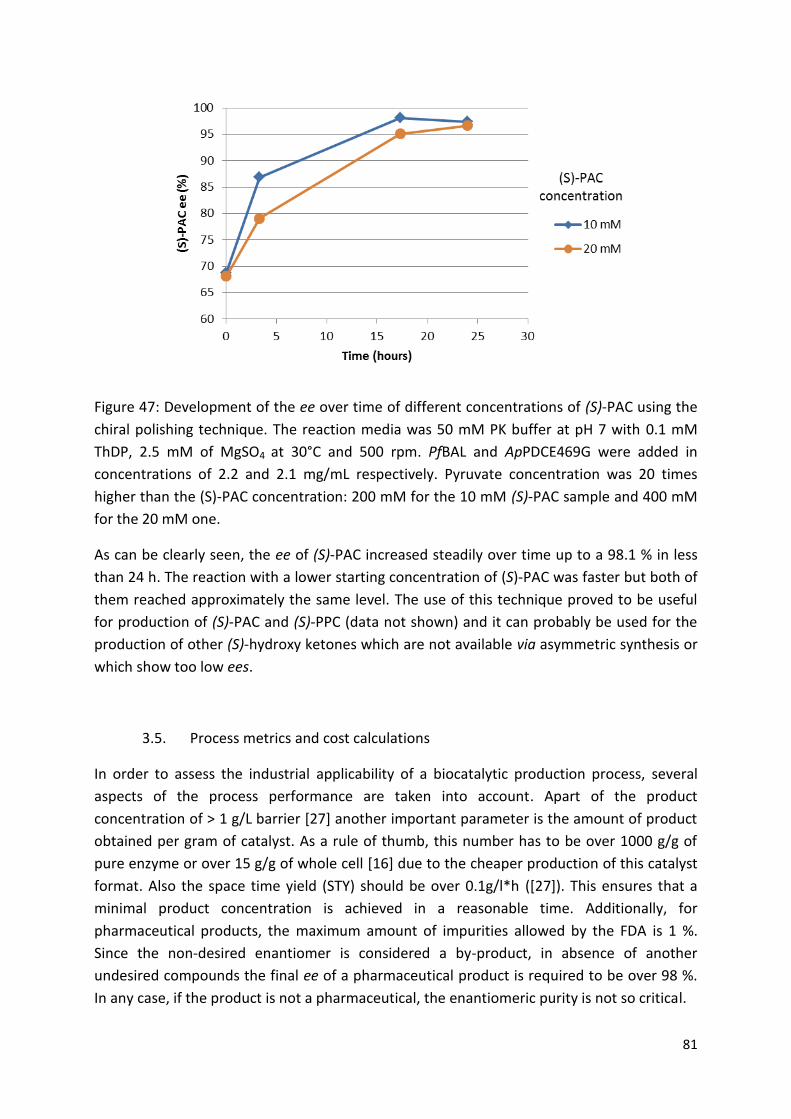
81
Figure 47: Development of the ee over time of different concentrations of (S)-PAC using the
chiral polishing technique. The reaction media was 50 mM PK buffer at pH 7 with 0.1 mM
ThDP, 2.5 mM of MgSO4 at 30°C and 500 rpm. PfBAL and ApPDCE469G were added in
concentrations of 2.2 and 2.1 mg/mL respectively. Pyruvate concentration was 20 times
higher than the (S)-PAC concentration: 200 mM for the 10 mM (S)-PAC sample and 400 mM
for the 20 mM one.
As can be clearly seen, the ee of (S)-PAC increased steadily over time up to a 98.1 % in less
than 24 h. The reaction with a lower starting concentration of (S)-PAC was faster but both of
them reached approximately the same level. The use of this technique proved to be useful
for production of (S)-PAC and (S)-PPC (data not shown) and it can probably be used for the
production of other (S)-hydroxy ketones which are not available via asymmetric synthesis or
which show too low ees.
3.5. Process metrics and cost calculations
In order to assess the industrial applicability of a biocatalytic production process, several
aspects of the process performance are taken into account. Apart of the product
concentration of > 1 g/L barrier [27] another important parameter is the amount of product
obtained per gram of catalyst. As a rule of thumb, this number has to be over 1000 g/g of
pure enzyme or over 15 g/g of whole cell [16] due to the cheaper production of this catalyst
format. Also the space time yield (STY) should be over 0.1g/l*h ([27]). This ensures that a
minimal product concentration is achieved in a reasonable time. Additionally, for
pharmaceutical products, the maximum amount of impurities allowed by the FDA is 1 %.
Since the non-desired enantiomer is considered a by-product, in absence of another
undesired compounds the final ee of a pharmaceutical product is required to be over 98 %.
In any case, if the product is not a pharmaceutical, the enantiomeric purity is not so critical.
82
In order to calculate this, the data from the fed-batch experiment were used since running
the reaction in a 0.5 L STR is the closest experiment to a pilot plant that has been performed
in this work. Due to the low recyclability shown by the cells, it was considered that only one
batch was run with one cell batch, and then the catalyst was discarded. The results were
calculated for (S)-PAC and (S)-PPC and the results are compiled in Table 12.
Table 12: Comparison of productivity data from 0.5 L STR data for the production of (S)-PAC and (S)-PPC with minimal metric values for production of fine chemicals.
Parameter Minimal value for industrial feasibility (S)-PAC (S)-PPC
Product concentration 1 g/L [27] 23.4 g/l 10.3 g/l
Product per catalyst 15 g/g (whole cell) [16] 1.3 g/g 0.6 g/g
ee 98 % 43 % 93.6 %
STY 0.1 g/l*h [27] 1 g/l*h 0.5 g/l*h
Using the presented method, the final product concentration and STY achieved are several
times higher than the minimum required for industrial production of fine chemicals.
Nevertheless, there are still two points where the prerequisites are not met:
- Product per catalyst: in both cases (PAC and PPC), the amount of product obtained
from a gram of catalyst is one or two orders of magnitude below the minimum
required. In order to overcome this critical problem, the feeding speed of
benzaldehyde can be optimized in order to produce higher yields and the catalyst
should be recycled. Due to the strong inactivation of the whole cells (chapter
3.3.2.2.), which was mainly caused by the treatment of the cells during recovery, a
less inactivating catalyst recovery should be used. Therefore, whole cell coating
and/or immobilization should be evaluated to increase the catalyst half-life.
- ee: As was explained in the Introduction (Chapter 1.4.4.), the minimal ee required for
a pharmaceutical product is 98 %. Since none of the produced compounds is known
to be used as drug, this limitation should not be applied. If the product is used as a
building block (as the PAC is used for pseudoephedrine production), the ee of the
final product will depend on how efficient the subsequent steps of the drug synthesis
are. In any case, as it was mentioned before, the ee of the (S)-PAC can probably be
enhanced by optimizing the feeding speed, but is probably never going to reach
values over 98 % due to the limitations of the catalyst. An efficient downstream
method, like the chiral polishing method (chapter 3.4.), can overcome this problem
but a more cost efficient solution would be to modify the catalyst by enzyme
engineering or the development of new variants of different ThDP dependent
enzymes such as Escherichia coli 2-succinyl-5-enolpyruvyl-6-hydroxy-3-cyclohexene-
1-carboxylate synthase (MenD) [144].
83
The data from the pure enzyme was not taken into account for the metrics calculations due
to several reasons: the reaction always took place in batch mode, the longest reaction time
measured at optimal conditions was 8 hours, and due to the lack of immobilization, enzyme
recovery would have been challenging. Nevertheless, the ee of the (S)-PPC produced by pure
enzyme was clearly higher and no by-product was detected, which are two advantages
which may contribute to compensate for the higher production cost for a pure enzyme.
Despite the huge improvement in (S)-PAC derivatives production achieved in this work, there
are still two factors which should be further improved for full industrial feasibility. Due to the
unavailability of the produced compounds, this method seems to be an interesting option
for lab scale production of (S)-PAC derivatives. Further enzyme modification, the
development of an efficient catalyst recyclability method and optimization of the feeding
rate for benzaldehyde could overcome the mentioned hurdles and bring this production
process closer to market.
Using the data obtained from the fed batch experiments, the product price per gram was
calculated in 13.7 €/g for the PPC and 1.7 €/g for the PAC. This calculation only takes into
account the costs for the buffer salts, the cofactors, and the substrates. If the price of the
catalyst is assumed to be a maximum of 100 € for kg of whole cell [66], the catalyst price
would increase the product price by 0.17 € for PPC and 0.08 € for PAC, making the α-
ketoacid the main contributor to the product cost (95 % of the PPC and 81 % of the PAC final
costs).
The product costs in industrial scale could be significantly lower than described in this work,
since all costs were calculated based on Sigma Aldrich prices and bulk chemicals can be
remarkably cheaper. Even though this calculations do not take into account equipment
costs, the energy or the labor used, the market prices for these specific α-hydroxy ketones
are in the several hundred euros per gram range (i.e. (S)-benzoin provided by Sigma Aldrich
1920 €/g), giving plenty of space for cost effective production.
4. Conclusions and future perspectives
In this work, all the different parts of a biocatalytic production process for (S)-2-hydroxy
ketones have been assessed on the example of (S)-selective PPC synthesis.
Upstream: the catalyst availability is a critical point in the process applicability. Therefore,
protein expression was optimized, finding the optimal cultivation conditions to be 20 °C in
autoinduction medium for 48 hours. Compared with the previously published cultivation
procedure [55], the use of these optimized conditions increased the enzyme yield 27-fold.
84
Even though the catalyst production was clearly enhanced, the use of other induction
conditions could be useful to increase also the production of intracellular ThDP. This would
solve the problem of cofactor scarcity and decrease the production costs by making external
cofactor addition unnecessary.
Carboligation reaction: the use of an α-ketoacid instead of an aldehyde for the production of
(S)-hydroxy ketones has been proven to be an interesting option since it results in higher
product yields, higher ee, and decreases the formation of aliphatic α-hydroxy ketones
(acetoin, propioin) as by-products. Using α-ketobutyric acid, the reaction conditions for the
production of (S)-PPC were optimized using an iterative approach. The result of this
procedure was an increment in 10 % of the ee up to a 98 % and an increase in the SSTY over
60-fold compared to published data [55].
Also the use of whole cells was assessed, proving to be an extremely productive option. The
reaction with this format of catalyst was optimized and scaled up into a 500 mL STR. It was
proven that the use of a fed-batch strategy with continuous feed of benzaldehyde
overcomes the problem of its low solubility, increasing the product yield over the 10 g/L
barrier in less than 24 h, thereby keeping the ee of the product (S)-PPC over 90 %. This
technique was used also for the production of (S)-PAC producing even higher yields (over 20
g/L). Nevertheless, the ee of this product was with 43 % far from optimal.
Even though a lot of work has been done for reaction optimization, there are still some
options which can be highly positive for the overall production. The use of faster
benzaldehyde feed rates can probably enhance both yield and ee of the products.
Additionally, by running the reaction at lower temperature, the ee of the product could be
increased. This option can be especially interesting for the PAC production, helping to
enhance low enantiomeric purity.
Downstream: a combination of product extraction by using an organic phase and a
subsequent flash chromatography for purification, have been proven to be a useful recovery
method for the laboratory scale. Nevertheless, other techniques can be more suitable for
larger production scales.
A new approach to increase the ee of (S)-hydroxy ketones was developed, using a
combination of two ThDP-dependent enzymes. This method is similar to dynamic kinetic
resolution, but the substrate has a low ee and is not a racemic mixture. One of the enzymes
(BAL) cleaves the unwanted (R)-enantiomer into the original substrates (benzaldehyde and
acetaldehyde/propanal), and the second enzyme (ApPDCE469G) uses them for production of
the desired (S)-enantiomer. This technique has been applied successfully to (S)-PAC,
increasing the ee from a 68 % up to a 98 % in less than 24 h. A further optimization of this
procedure as well as the use of whole cell catalysts could be extremely interesting. Also the
application for the production of different (S)-α-hydroxy ketones can broaden the product
platform accessible by the ThDP dependent enzymes.
85
Further, recycling of the whole cell biocatalyst was tested, but the stability of the cells was
proved to be quite low, with a decrease of a 65 % of activity in just one reaction cycle. Here
further investigations including the coating and/or immobilization of the cells are necessary.
This particular point is of special interest since the recyclability of the catalyst is a key point
for the development of a cost-effective biocatalytic production process.
Econometric evaluation of the process has shown that even though major improvements on
productivity had been achieved, like product concentrations over 10 g/L, some parameters
still need to be improved in order to produce an industrially ready production process.
Probably the most critical point is the amount of product obtained per gram of catalyst,
which due to the low recyclability of the cells, is below the industrial requirements (see
Table 12). As was mentioned before, in order to overcome this hurdle, a better recycling
system and catalyst stabilization should be explored. Nevertheless, due to difficulties of the
synthesis of these (S)-α-hydroxy ketones, this process is a good starting point for lab scale
production.
In conclusion, the synthesis of (S)-α-hydroxy ketones with the developed production process
was shown to be feasible in laboratory scale. There are several potent options to increase
the process output without further protein modification. As a general conclusion, the use of
an α-ketoacid instead of the corresponding aldehyde as donor and high concentrations of
benzaldehyde as the acceptor in a fed-batch reactor using whole cells is probably the most
efficient option for the production of this family of compounds.
5. References:
1. Kühne, W., Über das Verhalten verschiedener organisirter und sogen. ungeformter Fermente. Verhandlungen des naturhistorisch-medicinischen Vereins zu Heidelberg. Neue Folge, 1876. 1(3): p. 190-193.
2. Fischer, E., Einfluss der Configuration auf die Wirkung der Enzyme. Berichte der deutschen chemischen Gesellschaft, 1894. 27(3): p. 2985-2993.
3. Pasteur, L., Researches on the molecular asymmetry of natural organic products. 1905. 4. Rosenthaler, L., Durch enzyme bewirkte asymmetrische synthesen. Biochem. Z, 1908. 14: p.
238-253. 5. Sumner, J.B., The isolation and crystallization of the enzyme urease. Preliminary paper.
Journal of Biological Chemistry, 1926. 69(2): p. 435-441. 6. Sedlaczek, L. and L.L. Smith, Biotransformations of steroids. Critical reviews in biotechnology,
1988. 7(3): p. 187-236. 7. Estell, D.A., T.P. Graycar, and J.A. Wells, Engineering an Enzyme by Site-Directed Mutagenesis
to Be Resistant to Chemical Oxidation. Journal of Biological Chemistry, 1985. 260(11): p. 6518-6521.
8. Watson, J.D. and F.H. Crick, Molecular structure of nucleic acids. Nature, 1953. 171(4356): p. 737-738.
9. Bornscheuer, U.T., G.W. Huisman, R.J. Kazlauskas, S. Lutz, J.C. Moore, and K. Robins, Engineering the third wave of biocatalysis. Nature, 2012. 485(7397): p. 185-194.
86
10. Woodley, J.M., Choice of biocatalyst form for scalable processes. Biochemical Society Transactions, 2006. 34: p. 301-303.
11. Nestl, B.M., B.A. Nebel, and B. Hauer, Recent progress in industrial biocatalysis. Current Opinion in Chemical Biology, 2011. 15(2): p. 187-193.
12. Strohmeier, G.A., H. Pichler, O. May, and M. Gruber-Khadjawi, Application of designed enzymes in organic synthesis. Chemical Reviews, 2011. 111(7): p. 4141-4164.
13. Woodley, J.M., Protein engineering of enzymes for process applications. Current Opinion in Chemical Biology, 2013. 17(2): p. 310-316.
14. Burton, S.G., D.A. Cowan, and J.M. Woodley, The search for the ideal biocatalyst. Nature Biotechnology, 2002. 20(1): p. 37-45.
15. Walsh, C.T. and M.A. Fischbach, Natural products version 2.0: connecting genes to molecules. Journal of the American Chemical Society, 2010. 132(8): p. 2469-2493.
16. Pollard, D.J. and J.M. Woodley, Biocatalysis for pharmaceutical intermediates: the future is now. TRENDS in Biotechnology, 2007. 25(2): p. 66-73.
17. Buckland, B.C., D.K. Robinson, and M. Chartrain, Biocatalysis for pharmaceuticals—status and prospects for a key technology. Metabolic engineering, 2000. 2(1): p. 42-48.
18. Tao, J. and J.-H. Xu, Biocatalysis in development of green pharmaceutical processes. Current Opinion in Chemical Biology, 2009. 13(1): p. 43-50.
19. Nguyen, L.A., H. He, and C. Pham-Huy, Chiral drugs: an overview. International journal of biomedical science: IJBS, 2006. 2(2): p. 85.
20. Smith, S.W., Chiral Toxicology: It's the Same Thing...Only Different. Toxicological Sciences, 2009. 110(1): p. 4-30.
21. Schmid, A., J.S. Dordick, B. Hauer, A. Kiener, M. Wubbolts, and B. Witholt, Industrial biocatalysis today and tomorrow. Nature, 2001. 409(6817): p. 258-268.
22. Young, I.S. and P.S. Baran, Protecting-group-free synthesis as an opportunity for invention. Nature Chemistry, 2009. 1(3): p. 193-205.
23. Poliakoff, M., J.M. Fitzpatrick, T.R. Farren, and P.T. Anastas, Green chemistry: Science and politics of change. Science, 2002. 297(5582): p. 807-810.
24. Constable, D.J.C., P.J. Dunn, J.D. Hayler, G.R. Humphrey, J.L. Leazer, R.J. Linderman, K. Lorenz, J. Manley, B.A. Pearlman, A. Wells, A. Zaks, and T.Y. Zhang, Key green chemistry research areas - a perspective from pharmaceutical manufacturers. Green Chemistry, 2007. 9(5): p. 411-420.
25. Anastas, P. and N. Eghbali, Green Chemistry: Principles and Practice. Chemical Society Reviews, 2010. 39(1): p. 301-312.
26. Wohlgemuth, R., Biocatalysis - key to sustainable industrial chemistry. Current Opinion in Biotechnology, 2010. 21(6): p. 713-724.
27. Wenda, S., S. Illner, A. Mell, and U. Kragl, Industrial biotechnology-the future of green chemistry? Green Chemistry, 2011. 13(11): p. 3007-3047.
28. Li, C.J. and B.M. Trost, Green chemistry for chemical synthesis. Proceedings of the National Academy of Sciences of the United States of America, 2008. 105(36): p. 13197-13202.
29. Zhang, Y.H.P., S. Myung, C. You, Z.G. Zhu, and J.A. Rollin, Toward low-cost biomanufacturing through in vitro synthetic biology: bottom-up design. Journal of Materials Chemistry, 2011. 21(47): p. 18877-18886.
30. Straathof, A.J.J., S. Panke, and A. Schmid, The production of fine chemicals by biotransformations. Current Opinion in Biotechnology, 2002. 13(6): p. 548-556.
31. Hiraishi, T. and S. Taguchi, Protein Engineering of Enzymes Involved in Bioplastic Metabolism. 2013.
32. Philp, J.C., R.J. Ritchie, and K. Guy, Biobased plastics in a bioeconomy. TRENDS in Biotechnology, 2013. 31(2): p. 65-67.
33. Atsumi, S., T. Hanai, and J.C. Liao, Non-fermentative pathways for synthesis of branched-chain higher alcohols as biofuels. Nature, 2008. 451(7174): p. 86-U13.
87
34. Philp, J.C., R.J. Ritchie, and J.E.M. Allan, Biobased chemicals: the convergence of green chemistry with industrial biotechnology. TRENDS in Biotechnology, 2013. 31(4): p. 219-222.
35. Wohlgemuth, R., The locks and keys to industrial biotechnology. New Biotechnology, 2009. 25(4): p. 204-213.
36. Altschul, S.F., T.L. Madden, A.A. Schäffer, J. Zhang, Z. Zhang, W. Miller, and D.J. Lipman, Gapped BLAST and PSI-BLAST: a new generation of protein database search programs. Nucleic acids research, 1997. 25(17): p. 3389-3402.
37. Altschul, S.F., W. Gish, W. Miller, E.W. Myers, and D.J. Lipman, Basic local alignment search tool. Journal of molecular biology, 1990. 215(3): p. 403-410.
38. Bornscheuer, U.T. and R.J. Kazlauskas, Catalytic promiscuity in biocatalysis: using old enzymes to form new bonds and follow new pathways. Angewandte Chemie International Edition, 2004. 43(45): p. 6032-6040.
39. Handelsman, J., Metagenomics: Application of genomics to uncultured microorganisms. Microbiology and Molecular Biology Reviews, 2004. 68(4): p. 669-+.
40. Lorenz, P. and J. Eck, Metagenomics and industrial applications. Nature Reviews Microbiology, 2005. 3(6): p. 510-516.
41. Lorenz, P., K. Liebeton, F. Niehaus, and J. Eck, Screening for novel enzymes for biocatalytic processes: accessing the metagenome as a resource of novel functional sequence space. Current Opinion in Biotechnology, 2002. 13(6): p. 572-577.
42. Schiraldi, C. and M. De Rosa, The production of biocatalysts and biomolecules from extremophiles. TRENDS in Biotechnology, 2002. 20(12): p. 515-521.
43. Francis, J.C. and P.E. Hansche, Directed Evolution of Metabolic Pathways in Microbial Populations .1. Modification of Acid-Phosphatase Ph Optimum in S-Cerevisiae. Genetics, 1972. 70(1): p. 59-&.
44. Arnold, F.H., Design by directed evolution. Accounts of chemical research, 1998. 31(3): p. 125-131.
45. Crameri, A., S.-A. Raillard, E. Bermudez, and W.P.C. Stemmer, DNA shuffling of a family of genes from diverse species accelerates directed evolution. Nature, 1998. 391(6664): p. 288-291.
46. Arnold, F.H., When blind is better: Protein design by evolution. Nature Biotechnology, 1998. 16(7): p. 617-618.
47. Reetz, M.T., Controlling the enantioselectivity of enzymes by directed evolution: practical and theoretical ramifications. Proceedings of the National Academy of Sciences of the United States of America, 2004. 101(16): p. 5716-5722.
48. Lingen, B., D. Kolter-Jung, P. Dunkelmann, R. Feldmann, J. Grotzinger, M. Pohl, and M. Müller, Alteration of the substrate specificity of benzoylformate decarboxylase from Pseudomonas putida by directed evolution. Chembiochem, 2003. 4(8): p. 721-726.
49. Guo, H.H., J. Choe, and L.A. Loeb, Protein tolerance to random amino acid change. Proceedings of the National Academy of Sciences of the United States of America, 2004. 101(25): p. 9205-9210.
50. Zheng, L., U. Baumann, and J.-L. Reymond, An efficient one-step site-directed and site-saturation mutagenesis protocol. Nucleic acids research, 2004. 32(14): p. e115.
51. Reetz, M.T., L.W. Wang, and M. Bocola, Directed Evolution of Enantioselective Enzymes: Iterative Cycles of CASTing for Probing Protein‐Sequence Space. Angewandte Chemie, 2006. 118(8): p. 1258-1263.
52. Lutz, S., Beyond directed evolution-semi-rational protein engineering and design. Current Opinion in Biotechnology, 2010. 21(6): p. 734-743.
53. Kazlauskas, R.J., Enhancing catalytic promiscuity for biocatalysis. Current Opinion in Chemical Biology, 2005. 9(2): p. 195-201.
54. Otten, L.G., F. Hollmann, and I.W.C.E. Arends, Enzyme engineering for enantioselectivity: from trial-and-error to rational design? TRENDS in Biotechnology, 2010. 28(1): p. 46-54.
88
55. Rother, D., G. Kolter, T. Gerhards, C.L. Berthold, E. Gauchenova, M. Knoll, J. Pleiss, M. Müller, G. Schneider, and M. Pohl, S-Selective Mixed Carboligation by Structure-Based Design of the Pyruvate Decarboxylase from Acetobacter pasteurianus. Chemcatchem, 2011. 3(10): p. 1587-1596.
56. DeSantis, G., K. Wong, B. Farwell, K. Chatman, Z. Zhu, G. Tomlinson, H. Huang, X. Tan, L. Bibbs, and P. Chen, Creation of a productive, highly enantioselective nitrilase through gene site saturation mutagenesis (GSSM). Journal of the American Chemical Society, 2003. 125(38): p. 11476-11477.
57. Morley, K.L. and R.J. Kazlauskas, Improving enzyme properties: when are closer mutations better? TRENDS in Biotechnology, 2005. 23(5): p. 231-237.
58. Arnold, F.H., Combinatorial and computational challenges for biocatalyst design. Nature, 2001. 409(6817): p. 253-257.
59. Höhne, M., S. Schätzle, H. Jochens, K. Robins, and U.T. Bornscheuer, Rational assignment of key motifs for function guides in silico enzyme identification. Nature Chemical Biology, 2010. 6(11): p. 807-813.
60. Bommarius, A.S., J.K. Blum, and M.J. Abrahamson, Status of protein engineering for biocatalysts: how to design an industrially useful biocatalyst. Current Opinion in Chemical Biology, 2011. 15(2): p. 194-200.
61. Walsh, C., Enabling the chemistry of life. Nature, 2001. 409(6817): p. 226-231. 62. Desai, A.A., Sitagliptin manufacture: a compelling tale of green chemistry, process
intensification, and industrial asymmetric catalysis. Angewandte Chemie International Edition, 2011. 50(9): p. 1974-1976.
63. Woodley, J.M., New opportunities for biocatalysis: making pharmaceutical processes greener. TRENDS in Biotechnology, 2008. 26(6): p. 321-327.
64. Anastas, P.T. and M.M. Kirchhoff, Origins, current status, and future challenges of green chemistry. Accounts of chemical research, 2002. 35(9): p. 686-694.
65. Nielsen, P.H., K.M. Oxenboll, and H. Wenzel, Cradle-to-gate environmental assessment of enzyme products produced industrially in Denmark by Novozymes A/S. International Journal of Life Cycle Assessment, 2007. 12(6): p. 432-438.
66. Tufvesson, P., J. Lima-Ramos, M. Nordblad, and J.M. Woodley, Guidelines and Cost Analysis for Catalyst Production in Biocatalytic Processes. Organic Process Research & Development, 2011. 15(1): p. 266-274.
67. Lye, G.J. and J.M. Woodley, Application of in situ product-removal techniques to biocatalytic processes. TRENDS in Biotechnology, 1999. 17(10): p. 395-402.
68. Vicenzi, J.T., M.J. Zmijewski, M.R. Reinhard, B.E. Landen, W.L. Muth, and P.G. Marler, Large-scale stereoselective enzymatic ketone reduction with< i> in situ</i> product removal via polymeric adsorbent resins. Enzyme and Microbial Technology, 1997. 20(7): p. 494-499.
69. Meyer, H.P., E. Eichhorn, S. Hanlon, S. Lutz, M. Schurmann, R. Wohlgemuth, and R. Coppolecchia, The use of enzymes in organic synthesis and the life sciences: perspectives from the Swiss Industrial Biocatalysis Consortium (SIBC). Catalysis Science & Technology, 2013. 3(1): p. 29-40.
70. Hilker, I., C. Baldwin, V. Alphand, R. Furstoss, J. Woodley, and R. Wohlgemuth, On the influence of oxygen and cell concentration in an SFPR whole cell biocatalytic Baeyer–Villiger oxidation process. Biotechnology and Bioengineering, 2006. 93(6): p. 1138-1144.
71. Julsing, M.K., S. Cornelissen, B. Buhler, and A. Schmid, Heme-iron oxygenases: powerful industrial biocatalysts? Current Opinion in Chemical Biology, 2008. 12(2): p. 177-186.
72. Swartz, J.R., Transforming Biochemical Engineering with Cell-Free Biology. Aiche Journal, 2012. 58(1): p. 5-13.
73. Hardie, D.G., D. Carling, and M. Carlson, The AMP-activated/SNF1 protein kinase subfamily: metabolic sensors of the eukaryotic cell? Annual review of biochemistry, 1998. 67(1): p. 821-855.
89
74. Cao, L., Immobilised enzymes: science or art? Current Opinion in Chemical Biology, 2005. 9(2): p. 217-226.
75. Sheldon, R.A., Enzyme immobilization: The quest for optimum performance. Advanced Synthesis & Catalysis, 2007. 349(8-9): p. 1289-1307.
76. Cantone, S., U. Hanefeld, and A. Basso, Biocatalysis in non-conventional media—ionic liquids, supercritical fluids and the gas phase. Green Chemistry, 2007. 9(9): p. 954-971.
77. van Rantwijk, F. and R.A. Sheldon, Biocatalysis in ionic liquids. Chemical Reviews, 2007. 107(6): p. 2757-2785.
78. Kuhl, S., D. Zehentgruber, M. Pohl, M. Müller, and S. Lutz, Process development for enzyme catalysed asymmetric C-C-bond formation. Chemical Engineering Science, 2007. 62(18-20): p. 5201-5205.
79. Jakoblinnert, A., R. Mladenov, A. Paul, F. Sibilla, U. Schwaneberg, M.B. Ansorge-Schumacher, and P.D. de María, Asymmetric reduction of ketones with recombinant E. coli whole cells in neat substrates. Chemical Communications, 2011. 47(44): p. 12230-12232.
80. Mesiano, A.J., E.J. Beckman, and A.J. Russell, Supercritical biocatalysis. Chemical Reviews, 1999. 99(2): p. 623-633.
81. Lamare, S. and M.-D. Legoy, Biocatalysis in the gas phase. TRENDS in Biotechnology, 1993. 11(10): p. 413-418.
82. Smith, M.E.B., K. Smithies, T. Senussi, P.A. Dalby, and H.C. Hailes, The first mimetic of the transketolase reaction. European Journal of Organic Chemistry, 2006(5): p. 1121-1123.
83. Kim, P.Y., D.J. Pollard, and J.M. Woodley, Substrate supply for effective biocatalysis. Biotechnology Progress, 2007. 23(1): p. 74-82.
84. Goetz, G., P. Iwan, B. Hauer, M. Breuer, and M. Pohl, Continuous production of (R)-phenylacetylcarbinol in an enzyme-membrane reactor using a potent mutant of pyruvate decarboxylase from Zymomonas mobilis. Biotechnology and Bioengineering, 2001. 74(4): p. 317-325.
85. Rao, N.N., S. Lutz, K. Wurges, and D. Minor, Continuous Biocatalytic Processes. Organic Process Research & Development, 2009. 13(3): p. 607-616.
86. Stillger, T., M. Pohl, C. Wandrey, and A. Liese, Reaction engineering of benzaldehyde lyase from Pseudomonas fluorescens catalyzing enantioselective C-C bond formation. Organic Process Research & Development, 2006. 10(6): p. 1172-1177.
87. Boyaval, P., C. Corre, and S. Terre, Continuous Lactic-Acid Fermentation with Concentrated Product Recovery by Ultrafiltration and Electrodialysis. Biotechnology Letters, 1987. 9(3): p. 207-212.
88. Tufvesson, P., W.J. Fu, J.S. Jensen, and J.M. Woodley, Process considerations for the scale-up and implementation of biocatalysis. Food and Bioproducts Processing, 2010. 88(C1): p. 3-11.
89. Tanaka, T., M. Kawase, and S. Tani, alpha-hydroxyketones as inhibitors of urease. Bioorganic & Medicinal Chemistry, 2004. 12(2): p. 501-505.
90. Wallace, O.B., D.W. Smith, M.S. Deshpande, C. Polson, and K.M. Felsenstein, Inhibitors of A beta production: Solid-phase synthesis and SAR of alpha-hydroxycarbonyl derivatives. Bioorganic & Medicinal Chemistry Letters, 2003. 13(6): p. 1203-1206.
91. Gala, D., D.J. DiBenedetto, J.E. Clark, B.L. Murphy, D.P. Schumacher, and M. Steinman, Preparations of antifungal Sch 42427/SM 9164: Preparative chromatographic resolution, and total asymmetric synthesis via enzymatic preparation of chiral α-hydroxy arylketones. Tetrahedron Letters, 1996. 37(5): p. 611-614.
92. Sehl, T., H.C. Hailes, J.M. Ward, R. Wardenga, E. von Lieres, H. Offermann, R. Westphal, M. Pohl, and D. Rother, Two Steps in One Pot: Enzyme Cascade for the Synthesis of Nor(pseudo)ephedrine from Inexpensive Starting Materials. Angewandte Chemie-International Edition, 2013. 52(26): p. 6772-6775.
93. Kulig, J., A. Frese, W. Kroutil, M. Pohl, and D. Rother, Biochemical characterization of an alcohol dehydrogenase from Ralstonia sp. Biotechnology and Bioengineering, 2013. 110(7): p. 1838-1848.
90
94. Hoyos, P., J.V. Sinisterra, F. Molinari, A.R. Alcantara, and P.D. De Maria, Biocatalytic Strategies for the Asymmetric Synthesis of alpha-Hydroxy Ketones. Accounts of chemical research, 2010. 43(2): p. 288-299.
95. Chen, C., X. Feng, G. Zhang, Q. Zhao, and G. Huang, An Efficient Method for the Synthesis of α-Hydroxyalkyl Aryl Ketones. Synthesis, 2008. 2008(20): p. 3205-3208.
96. Plietker, B. and M. Niggemann, RuCl3/CeCl3/NaIO4: A new bimetallic oxidation system for the mild and efficient dihydroxylation of unreactive olefins. Journal of Organic Chemistry, 2005. 70(6): p. 2402-2405.
97. Adam, W., R.T. Fell, C.R. Saha-Möller, and C.-G. Zhao, Synthesis of optically active α-hydroxy ketones by enantioselective oxidation of silyl enol ethers with a fructose-derived dioxirane. Tetrahedron: Asymmetry, 1998. 9(3): p. 397-401.
98. Onomura, O., H. Arimoto, Y. Matsumura, and Y. Demizu, Asymmetric oxidation of 1,2-diols using N-bromosuccinimide in the presence of chiral copper catalyst. Tetrahedron Letters, 2007. 48(49): p. 8668-8672.
99. Alamsetti, S.K., P. Muthupandi, and G. Sekar, Chiral Cobalt-Catalyzed Enantiomer-Differentiating Oxidation of Racemic Benzoins by Using Molecular Oxygen as Stoichiometric Oxidant. Chemistry-a European Journal, 2009. 15(22): p. 5424-5427.
100. Muthupandi, P., S.K. Alamsetti, and G. Sekar, Chiral iron complex catalyzed enantioselective oxidation of racemic benzoins. Chemical Communications, 2009(22): p. 3288-3290.
101. Wohler, F. and J. Liebig, Unter suchengen über das Radikal der Benzosäure. Ann. Pharm, 1832. 3: p. 249-82.
102. O'Toole, S.E., C.A. Rose, S. Gundala, K. Zeitler, and S.J. Connon, Highly Chemoselective Direct Crossed Aliphatic-Aromatic Acyloin Condensations with Triazolium-Derived Carbene Catalysts. Journal of Organic Chemistry, 2011. 76(2): p. 347-357.
103. Rose, C.A., S. Gundala, S.J. Connon, and K. Zeitler, Chemoselective Crossed Acyloin Condensations: Catalyst and Substrate Control. Synthesis-Stuttgart, 2011(2): p. 190-198.
104. Busygin, I., A. Taskinen, V. Nieminen, E. Toukoniitty, T. Stillger, R. Leino, and D.Y. Murzin, Experimental and Theoretical Analysis of Asymmetric Induction in Heterogeneous Catalysis: Diastereoselective Hydrogenation of Chiral alpha-Hydroxyketones over Pt Catalyst. Journal of the American Chemical Society, 2009. 131(12): p. 4449-4462.
105. de Maria, P.D., M. Pohl, D. Gocke, H. Groger, H. Trauthwein, T. Stillger, L. Walter, and M. Müller, Asymmetric synthesis of aliphatic 2-hydroxy ketones by enzymatic carboligation of aldehydes. European Journal of Organic Chemistry, 2007(18): p. 2940-2944.
106. Müller, M., D. Gocke, and M. Pohl, Thiamin diphosphate in biological chemistry: exploitation of diverse thiamin diphosphate-dependent enzymes for asymmetric chemoenzymatic synthesis. Febs Journal, 2009. 276(11): p. 2894-2904.
107. Widmann, M., R. Radloff, and J. Pleiss, The Thiamine diphosphate dependent Enzyme Engineering Database: A tool for the systematic analysis of sequence and structure relations. Bmc Biochemistry, 2010. 11.
108. Vogel, C., M. Widmann, M. Pohl, and J. Pleiss, A standard numbering scheme for thiamine diphosphate-dependent decarboxylases. Bmc Biochemistry, 2012. 13.
109. Müller, M., G.A. Sprenger, and M. Pohl, C-C bond formation using ThDP-dependent lyases. Current Opinion in Chemical Biology, 2013. 17(2): p. 261-270.
110. Kokova, M., M. Zavrel, K. Tittmann, A.C. Spiess, and M. Pohl, Investigation of the carboligase activity of thiamine diphosphate-dependent enzymes using kinetic modeling and NMR spectroscopy. Journal of Molecular Catalysis B-Enzymatic, 2009. 61(1-2): p. 73-79.
111. Brovetto, M., D. Gamenara, P.S. Mendez, and G.A. Seoane, C-C Bond-Forming Lyases in Organic Synthesis. Chemical Reviews, 2011. 111(7): p. 4346-4403.
112. Kluger, R. and K. Tittmann, Thiamin diphosphate catalysis: Enzymic and nonenzymic covalent intermediates. Chemical Reviews, 2008. 108(6): p. 1797-1833.
91
113. Gocke, D., T. Graf, H. Brosi, I. Frindi-Wosch, L. Walter, M. Müller, and M. Pohl, Comparative characterisation of thiamin diphosphate-dependent decarboxylases. Journal of Molecular Catalysis B-Enzymatic, 2009. 61(1-2): p. 30-35.
114. Andrews, F.H. and M.J. McLeish, Substrate specificity in thiamin diphosphate-dependent decarboxylases. Bioorganic Chemistry, 2012. 43: p. 26-36.
115. Schörken, U. and G.A. Sprenger, Thiamin-dependent enzymes as catalysts in chemoenzymatic syntheses. Biochimica et Biophysica Acta (BBA)-Protein Structure and Molecular Enzymology, 1998. 1385(2): p. 229-243.
116. Cosp, A., C. Dresen, M. Pohl, L. Walter, C. Rohr, and M. Müller, alpha,beta-unsaturated aldehydes as substrates for asymmetric C-C bond forming reactions with thiamin diphosphate (ThDP)-dependent enzymes. Advanced Synthesis & Catalysis, 2008. 350(5): p. 759-771.
117. Pohl, M., G.A. Sprenger, and M. Müller, A new perspective on thiamine catalysis. Current Opinion in Biotechnology, 2004. 15(4): p. 335-342.
118. Beigi, M., S. Loschonsky, P. Lehwald, V. Brecht, S.L.A. Andrade, F.J. Leeper, W. Hummel, and M. Müller, alpha-Hydroxy-beta-keto acid rearrangement-decarboxylation: impact on thiamine diphosphate-dependent enzymatic transformations. Organic & Biomolecular Chemistry, 2013. 11(2): p. 252-256.
119. Engel, S., M. Vyazmensky, S. Geresh, Z. Barak, and D.M. Chipman, Acetohydroxyacid synthase: A new enzyme for chiral synthesis of R-phenylacetylcarbinol. Biotechnology and Bioengineering, 2003. 83(7): p. 833-840.
120. de Maria, P.D., T. Stillger, M. Pohl, M. Kiesel, A. Liese, H. Groger, and H. Trauthwein, Enantioselective C-C bond ligation using recombinant Escherichia coli-whole-cell biocatalysts. Advanced Synthesis & Catalysis, 2008. 350(1): p. 165-173.
121. Kara, S., W.S. Long, M. Berheide, S. Peper, B. Niemeyer, and A. Liese, Influence of reaction conditions on the enantioselectivity of biocatalyzed C-C bond formations under high pressure conditions. Journal of Biotechnology, 2011. 152(3): p. 87-92.
122. Shin, H.S. and P.L. Rogers, Biotransformation of benzeldehyde to L-phenylacetylcarbinol, an intermediate in L-ephedrine production, by immobilized Candida utilis. Applied Microbiology and Biotechnology, 1995. 44(1-2): p. 7-14.
123. Gocke, D., L. Walter, E. Gauchenova, G. Kolter, M. Knoll, C.L. Berthold, G. Schneider, J. Pleiss, M. Müller, and M. Pohl, Rational protein design of ThDP-Dependent enzymes-engineering stereoselectivity. Chembiochem, 2008. 9(3): p. 406-412.
124. Janzen, E., M. Müller, D. Kolter-Jung, M.M. Kneen, M.J. McLeish, and M. Pohl, Characterization of benzaldehyde lyase from Pseudomonas fluorescens: A versatile enzyme for asymmetric C-C bond formation. Bioorganic Chemistry, 2006. 34(6): p. 345-361.
125. Hailes, H.C., D. Rother, M. Müller, R. Westphal, J.M. Ward, J. Pleiss, C. Vogel, and M. Pohl, Engineering stereoselectivity of ThDP‐dependent enzymes. FEBS Journal, 2013.
126. Duggleby, R.G., Domain relationships in thiamine diphosphate-dependent enzymes. Accounts of chemical research, 2006. 39(8): p. 550-557.
127. Raj, K.C., L.O. Ingram, and J.A. Maupin-Furlow, Pyruvate decarboxylase: a key enzyme for the oxidative metabolism of lactic acid by Acetobacter pasteurianus. Archives of Microbiology, 2001. 176(6): p. 443-451.
128. Tittmann, K., K. Mesch, M. Pohl, and G. Hubner, Activation of thiamine diphosphate in pyruvate decarboxylase from Zymomonas mobilis. Febs Letters, 1998. 441(3): p. 404-406.
129. Meyer, D., L. Walter, G. Kolter, M. Pohl, M. Müller, and K. Tittmann, Conversion of Pyruvate Decarboxylase into an Enantioselective Carboligase with Biosynthetic Potential. Journal of the American Chemical Society, 2011. 133(10): p. 3609-3616.
130. Meyer, D., P. Neumann, C. Parthier, R. Friedemann, N. Nemeria, F. Jordan, and K. Tittmann, Double Duty for a Conserved Glutamate in Pyruvate Decarboxylase: Evidence of the Participation in Stereoelectronically Controlled Decarboxylation and in Protonation of the Nascent Carbanion/Enamine Intermediate. Biochemistry, 2010. 49(37): p. 8197-8212.
92
131. Shukla, V.B. and P.R. Kulkarni, L-Phenylacetylcarbinol (L-PAC): biosynthesis and industrial applications. World Journal of Microbiology & Biotechnology, 2000. 16(6): p. 499-506.
132. de Maria, P.D., T. Stillger, M. Pohl, S. Wallert, K. Drauz, H. Groger, H. Trauthwein, and A. Liese, Preparative enantio selective synthesis of benzoins and (R)-2-hydroxy-1-phenylpropanone using benzaldehyde lyase. Journal of Molecular Catalysis B-Enzymatic, 2006. 38(1): p. 43-47.
133. Bradford, M.M., Rapid and Sensitive Method for Quantitation of Microgram Quantities of Protein Utilizing Principle of Protein-Dye Binding. Analytical Biochemistry, 1976. 72(1-2): p. 248-254.
134. Gerhards, T., U. Mackfeld, M. Bocola, E. von Lieres, W. Wiechert, M. Pohl, and D. Rother, Influence of Organic Solvents on Enzymatic Asymmetric Carboligations. Advanced Synthesis & Catalysis, 2012. 354(14-15): p. 2805-2820.
135. Shanmuganathan, S., D. Natalia, A. van den Wittenboer, C. Kohlmann, L. Greiner, and P.D. de Maria, Enzyme-catalyzed C-C bond formation using 2-methyltetrahydrofuran (2-MTHF) as (co)solvent: efficient and bio-based alternative to DMSO and MTBE. Green Chemistry, 2010. 12(12): p. 2240-2245.
136. Cressie, N., The origins of kriging. Mathematical Geology, 1990. 22(3): p. 239-252. 137. Wilkinson, L., Revising the Pareto chart. American Statistician, 2006. 60(4): p. 332-334. 138. Leksawasdi, N., Y.Y.S. Chow, M. Breuer, B. Hauer, B. Rosche, and P.L. Rogers, Kinetic analysis
and modelling of enzymatic (R)-phenylacetylcarbinol batch biotransformation process. Journal of Biotechnology, 2004. 111(2): p. 179-189.
139. Rosche, B., N. Leksawasdi, V. Sandford, M. Breuer, B. Hauer, and P. Rogers, Enzymatic (R)-phenylacetylcarbinol production in benzaldehyde emulsions. Applied Microbiology and Biotechnology, 2002. 60(1-2): p. 94-100.
140. Rosche, B., M. Breuer, B. Hauer, and P.L. Rogers, Screening of yeasts for cell-free production of (R)-phenylacetylcarbinol. Biotechnology Letters, 2003. 25(11): p. 841-845.
141. Shin, H.S. and P.L. Rogers, Production of L-phenylacetylcarbinol (L-PAC) from benzaldehyde using partially purified pyruvate decarboxylase (PDC). Biotechnology and Bioengineering, 1996. 49(1): p. 52-62.
142. Demir, A.S., M. Pohl, E. Janzen, and M. Müller, Enantioselective synthesis of hydroxy ketones through cleavage and formation of acyloin linkage. Enzymatic kinetic resolution via C–C bond cleavage. Journal of the Chemical Society, Perkin Transactions 1, 2001(7): p. 633-635.
143. Janzen, E., M. Müller, D. Kolter-Jung, M.M. Kneen, M.J. McLeish, and M. Pohl, Characterization of benzaldehyde lyase from< i> Pseudomonas fluorescens</i>: A versatile enzyme for asymmetric C–C bond formation. Bioorganic chemistry, 2006. 34(6): p. 345-361.
144. Westphal, R., S. Waltzer, U. Mackfeld, M. Widmann, J. Pleiss, M. Beigi, M. Müller, D. Rother, and M. Pohl, (S)-Selective MenD variants from Escherichia coli provide access to new functionalized chiral α-hydroxy ketones. Chemical Communications, 2013. 49(20): p. 2061-2063.
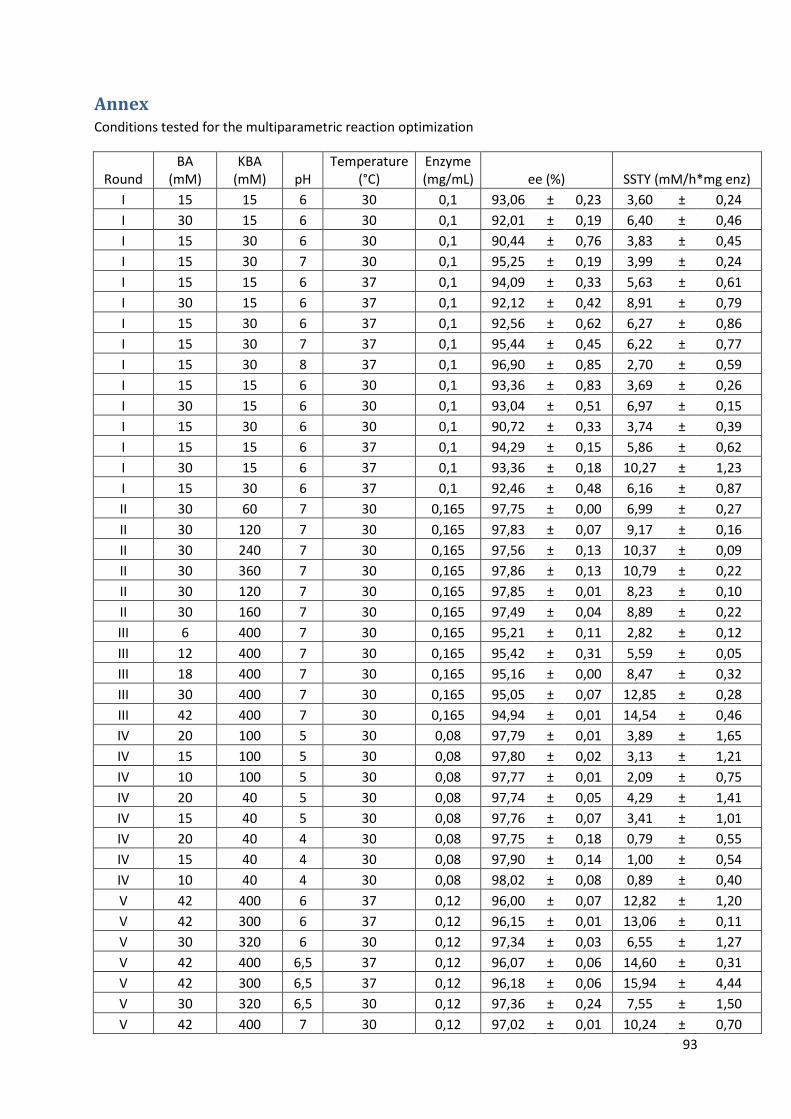
93
Annex Conditions tested for the multiparametric reaction optimization
Round BA
(mM) KBA
(mM) pH Temperature
(°C) Enzyme (mg/mL) ee (%) SSTY (mM/h*mg enz)
I 15 15 6 30 0,1 93,06 ± 0,23 3,60 ± 0,24
I 30 15 6 30 0,1 92,01 ± 0,19 6,40 ± 0,46
I 15 30 6 30 0,1 90,44 ± 0,76 3,83 ± 0,45
I 15 30 7 30 0,1 95,25 ± 0,19 3,99 ± 0,24
I 15 15 6 37 0,1 94,09 ± 0,33 5,63 ± 0,61
I 30 15 6 37 0,1 92,12 ± 0,42 8,91 ± 0,79
I 15 30 6 37 0,1 92,56 ± 0,62 6,27 ± 0,86
I 15 30 7 37 0,1 95,44 ± 0,45 6,22 ± 0,77
I 15 30 8 37 0,1 96,90 ± 0,85 2,70 ± 0,59
I 15 15 6 30 0,1 93,36 ± 0,83 3,69 ± 0,26
I 30 15 6 30 0,1 93,04 ± 0,51 6,97 ± 0,15
I 15 30 6 30 0,1 90,72 ± 0,33 3,74 ± 0,39
I 15 15 6 37 0,1 94,29 ± 0,15 5,86 ± 0,62
I 30 15 6 37 0,1 93,36 ± 0,18 10,27 ± 1,23
I 15 30 6 37 0,1 92,46 ± 0,48 6,16 ± 0,87
II 30 60 7 30 0,165 97,75 ± 0,00 6,99 ± 0,27
II 30 120 7 30 0,165 97,83 ± 0,07 9,17 ± 0,16
II 30 240 7 30 0,165 97,56 ± 0,13 10,37 ± 0,09
II 30 360 7 30 0,165 97,86 ± 0,13 10,79 ± 0,22
II 30 120 7 30 0,165 97,85 ± 0,01 8,23 ± 0,10
II 30 160 7 30 0,165 97,49 ± 0,04 8,89 ± 0,22
III 6 400 7 30 0,165 95,21 ± 0,11 2,82 ± 0,12
III 12 400 7 30 0,165 95,42 ± 0,31 5,59 ± 0,05
III 18 400 7 30 0,165 95,16 ± 0,00 8,47 ± 0,32
III 30 400 7 30 0,165 95,05 ± 0,07 12,85 ± 0,28
III 42 400 7 30 0,165 94,94 ± 0,01 14,54 ± 0,46
IV 20 100 5 30 0,08 97,79 ± 0,01 3,89 ± 1,65
IV 15 100 5 30 0,08 97,80 ± 0,02 3,13 ± 1,21
IV 10 100 5 30 0,08 97,77 ± 0,01 2,09 ± 0,75
IV 20 40 5 30 0,08 97,74 ± 0,05 4,29 ± 1,41
IV 15 40 5 30 0,08 97,76 ± 0,07 3,41 ± 1,01
IV 20 40 4 30 0,08 97,75 ± 0,18 0,79 ± 0,55
IV 15 40 4 30 0,08 97,90 ± 0,14 1,00 ± 0,54
IV 10 40 4 30 0,08 98,02 ± 0,08 0,89 ± 0,40
V 42 400 6 37 0,12 96,00 ± 0,07 12,82 ± 1,20
V 42 300 6 37 0,12 96,15 ± 0,01 13,06 ± 0,11
V 30 320 6 30 0,12 97,34 ± 0,03 6,55 ± 1,27
V 42 400 6,5 37 0,12 96,07 ± 0,06 14,60 ± 0,31
V 42 300 6,5 37 0,12 96,18 ± 0,06 15,94 ± 4,44
V 30 320 6,5 30 0,12 97,36 ± 0,24 7,55 ± 1,50
V 42 400 7 30 0,12 97,02 ± 0,01 10,24 ± 0,70
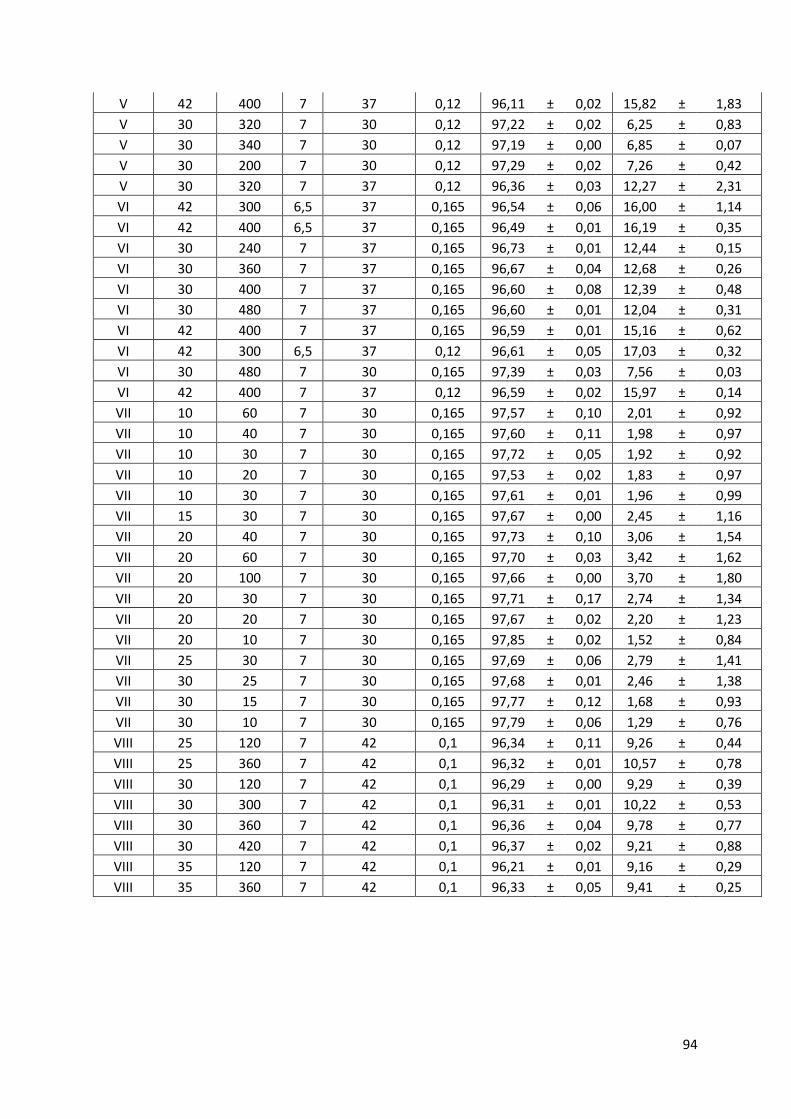
94
V 42 400 7 37 0,12 96,11 ± 0,02 15,82 ± 1,83
V 30 320 7 30 0,12 97,22 ± 0,02 6,25 ± 0,83
V 30 340 7 30 0,12 97,19 ± 0,00 6,85 ± 0,07
V 30 200 7 30 0,12 97,29 ± 0,02 7,26 ± 0,42
V 30 320 7 37 0,12 96,36 ± 0,03 12,27 ± 2,31
VI 42 300 6,5 37 0,165 96,54 ± 0,06 16,00 ± 1,14
VI 42 400 6,5 37 0,165 96,49 ± 0,01 16,19 ± 0,35
VI 30 240 7 37 0,165 96,73 ± 0,01 12,44 ± 0,15
VI 30 360 7 37 0,165 96,67 ± 0,04 12,68 ± 0,26
VI 30 400 7 37 0,165 96,60 ± 0,08 12,39 ± 0,48
VI 30 480 7 37 0,165 96,60 ± 0,01 12,04 ± 0,31
VI 42 400 7 37 0,165 96,59 ± 0,01 15,16 ± 0,62
VI 42 300 6,5 37 0,12 96,61 ± 0,05 17,03 ± 0,32
VI 30 480 7 30 0,165 97,39 ± 0,03 7,56 ± 0,03
VI 42 400 7 37 0,12 96,59 ± 0,02 15,97 ± 0,14
VII 10 60 7 30 0,165 97,57 ± 0,10 2,01 ± 0,92
VII 10 40 7 30 0,165 97,60 ± 0,11 1,98 ± 0,97
VII 10 30 7 30 0,165 97,72 ± 0,05 1,92 ± 0,92
VII 10 20 7 30 0,165 97,53 ± 0,02 1,83 ± 0,97
VII 10 30 7 30 0,165 97,61 ± 0,01 1,96 ± 0,99
VII 15 30 7 30 0,165 97,67 ± 0,00 2,45 ± 1,16
VII 20 40 7 30 0,165 97,73 ± 0,10 3,06 ± 1,54
VII 20 60 7 30 0,165 97,70 ± 0,03 3,42 ± 1,62
VII 20 100 7 30 0,165 97,66 ± 0,00 3,70 ± 1,80
VII 20 30 7 30 0,165 97,71 ± 0,17 2,74 ± 1,34
VII 20 20 7 30 0,165 97,67 ± 0,02 2,20 ± 1,23
VII 20 10 7 30 0,165 97,85 ± 0,02 1,52 ± 0,84
VII 25 30 7 30 0,165 97,69 ± 0,06 2,79 ± 1,41
VII 30 25 7 30 0,165 97,68 ± 0,01 2,46 ± 1,38
VII 30 15 7 30 0,165 97,77 ± 0,12 1,68 ± 0,93
VII 30 10 7 30 0,165 97,79 ± 0,06 1,29 ± 0,76
VIII 25 120 7 42 0,1 96,34 ± 0,11 9,26 ± 0,44
VIII 25 360 7 42 0,1 96,32 ± 0,01 10,57 ± 0,78
VIII 30 120 7 42 0,1 96,29 ± 0,00 9,29 ± 0,39
VIII 30 300 7 42 0,1 96,31 ± 0,01 10,22 ± 0,53
VIII 30 360 7 42 0,1 96,36 ± 0,04 9,78 ± 0,77
VIII 30 420 7 42 0,1 96,37 ± 0,02 9,21 ± 0,88
VIII 35 120 7 42 0,1 96,21 ± 0,01 9,16 ± 0,29
VIII 35 360 7 42 0,1 96,33 ± 0,05 9,41 ± 0,25
95
Die vorliegende Dissertation habe ich vollständig und ohne unerlaubte Hilfe angefertigt. Die Dissertation wurde in der vorgelegten oder in ähnlicher Form noch bei keiner anderen Institution eingereicht. Ich habe bisher keine erfolglosen Promotionsversuche unternommen. Jülich, den 13. Oktober 2013


