Embed Size (px)
Citation preview

sciences économiques et de gestion
PEGE
61, avenue de la Forêt Noire 67085 STRASBOURG Cedex
Tél. : (33) 03 90 24 21 52 Fax : (33) 03 90 24 21 51
www-ulp.u-strasbg.fr/large
Laboratoire de Recherche
en Gestion & Economie
Faculté des
LARGELARGE
PapierPapiern° 59
Can Mergers in Europe Help Banks Hedge Against Macroeconomic Risk
Pierre-Guillaume Méon / Laurent Weill
Septembre 2003

Can Mergers in Europe Help Banks Hedge
Against Macroeconomic Risk?
Pierre-Guillaume Méon Laurent Weill
Assistant Professor of Economics Assistant Professor of Economics
(Corresponding author)
LARGE,
Institut d’Etudes Politiques, Université Robert Schuman,
47 avenue de la Forêt-Noire, 67082 Strasbourg Cedex, France.
Phone: 33 3 88 41 77 21 ; Fax: 33 3 88 41 77 78
E-mail : [email protected] Keywords: bank mergers, risk diversification, European integration.
JEL Classification: F15, G11, G21, G34. Abstract
This paper investigates the motive of geographic risk diversification in the loan activity for
bank mergers in the EU on a sample of large banking groups. Geographic diversification
should allow banks to reduce their risk. We observe that the loan portfolios of European
banks are home-biased. We apply the portfolio approach to explore the risk-return efficiency
of the locations of banks’ activities. We also study mergers between pairs of banks. We
provide evidence on the sub-optimality of the loan portfolios of European banks in terms of
geographic risk diversification and on the existence of potential gains from inter-country pair
mergers.
1

Can Mergers in Europe Help Banks Hedge Against Macroeconomic Risk?
1. Introduction
Since the beginning of the 1990s, an increasing wave of mergers is observable in
European banking. A prime aim of research on bank mergers has therefore been to identify
motives for bank mergers in the European Union. These motives, such as economies of scale
or scope (Altunbas and Molyneux, 1996) and managerial efficiency (Vander Vennet, 1996),
have already been studied in European bank mergers. The risk diversification motive, which
can be summarized by the adage “don’t put all your eggs in one basket”, has however been
given less attention. This may in fact justify two different strategies: on the one hand, the
diversification of activities between sectors of activity, for instance by creating a financial
conglomerate including banking and insurance activities; on the other hand, geographic
diversification. This strategy is based upon the fact that a company that operates in several
countries can substantially limit its exposure to economic shocks and thereby reduce the risk
associated with its activity.
The case of geographic diversification is especially relevant in banking, as bank
performance is directly connected with economic activity. This relationship has been
empirically illustrated in the literature. Clark and Wheelock (1997) for instance find that U.S.
banks’ earnings are strongly influenced by the economic growth of the states where they are
located. Huh and Kim (1994) moreover observe that the bad loan rate is anticyclical in Japan
and Korea. This also makes sense on a practical ground, as the 5th C of the 5Cs of
creditworthiness used by bank credit analysts is “conditions”, defined as economic conditions
that affect the borrower’s ability to repay the loan.
Consequently, as a bank’s lending environment is heavily influenced by economic
activity within the bank’s operating environment, there is scope for risk reduction through
geographic diversification of lending activities. Indeed, as Berger (2000) points out, banks
may diversify risks because the returns of loans issued in different countries may have
relatively low covariation. This is precisely this aspect of bank mergers that we investigate in
2

this paper. Indeed our aim here is to evaluate the importance of the motive of geographic
diversification of risk in the loan activity for European bank mergers.
The basic idea of our methodology is based on a representation of banks’ lending
environment that is obtained by forming country portfolios for European banking
organizations based on the extent of their presence in different states. In the spirit of Gunther
and Robinson (1999), we therefore use the portfolio approach to evaluate the relevance of the
geographic diversification motive in European bank mergers.
These authors analyze the risk of US banks’ loan portfolios by considering the mix of
economic activities of the states in which they operate. They resort to the analogy between
financial assets and industries in a portfolio analysis where the growth rate of an industry and
the variance of its growth rate are the analogues to expected return and risk in financial
portfolios. Each state is then considered as a collection of industries, and banks consequently
build up industry portfolios by operating in different states. A bank’s risk diversification is
subsequently measured by the coefficient of variation of its industry portfolio. Gunther and
Robinson demonstrate that this measure of risk diversification is positively correlated with the
probability of bank failure, proving thereby the relevance of their approach.
However our methodology differs from Gunther and Robinson’s in two important
respects. Firstly, unlike these authors, we directly consider that countries are the basic assets
of a bank’s loan portfolio. By operating in a country, a banking group takes a participation in
an asset that is described by its growth rate and the variance of its growth rate. This
specification seems more appealing because in the first place it is simpler. Indeed as the
evolution of a GDP results from the addition of the evolution of all industries in a country,
measuring diversification directly at the country level avoids unnecessary computations.
More to the point, as Gunther and Robinson compute industry performance at the
federal level, they blur the effects of regional economic policies. Contrarywise, our
methodology allows us to take into account the differences in national policies across EU
members. The same method can be found in Goldberg and Levi (2000), who apply the
portfolio approach to a set of countries considered as financial assets. However their aim is
radically different, as they explore the potential diversification benefits of the European
Union.
Secondly, we measure risk diversification by estimating a risk-return efficiency
frontier, allowing to compare the effective risk to the optimal risk for a given level of return.
This approach has two advantages over the coefficient of variation used by Gunther and
Robinson. On one hand, it provides a benchmark measure. On the other hand, it takes into
3

consideration the concavity of the risk-return efficiency frontier. Indeed, the drawback of
Gunther and Robinson’s risk diversification measure is that it does not allow to discriminate
between a portfolio that is located on the efficient frontier and another portfolio with half as
much risk and return, although the latter is unambiguously farther from the frontier than the
former hence less efficient.
In this aim, we use macroeconomic data for all EU countries for the period 1960-1995
and accounting data for the 52 biggest European banking groups and their subsidiaries. This
application of the portfolio approach to European banking raises four fundamental questions.
Q1: Could European banks have diversified their macroeconomic risk?
More precisely, we aim to know if business cycles are correlated across European
countries. Indeed a perfect correlation between countries would result in the absence of
opportunities for risk diversification. We then observe that such opportunities exist.
Q2: Have European banks diversified their macroeconomic risk?
Provided diversification opportunities exist, the point is to know whether European
banks have taken advantage of these opportunities during our period of study. We observe
that loan portfolios are clearly home-biased and conclude that European banks did not exploit
these opportunities. However this observation does not mean that banks made inefficient
decisions about the location of their activities in terms of risk-return management.
Q3: Were European banks risk-return efficient?
Using the portfolio approach, we show that the actual locations of the activities of
European banks were not optimal, insofar as those groups could have benefited from a lower
risk for the same expected return of their loan portfolio. Finally, as diversification is typically
envisaged through mergers of pairs of banks, we come to the following question.
Q4: Could have mergers improved banks’ risk-return efficiency?
We show that in general inter-country pairwise mergers of banks would have
improved the risk-return efficiency of the banks involved.
The paper is organized so as to answer each question in turn. Namely, section 2
answers questions Q1 and Q2, while sections 3 and 4 respectively address questions Q3 and
Q4. Section 5 concludes.
4

2. Could European banks have diversified their macroeconomic risk? Have they?
In this section, we describe the data used in this study. In so doing, we ascertain that
business cycles are not perfectly correlated across Europe and that there therefore exist
opportunities for risk diversification. We subsequently observe a striking home bias in the
activities of banking groups.
2.1. Correlation analysis of business cycles
To study the co-movements of business cycles across countries we compute the
correlation of annual real GDP growth rates across the fifteen member countries of the
European Union. Our data stem from the OECD Economic Outlook database. They cover the
1960-1995 period.
More specifically, we compute the contemporaneous correlation of GDP growth for
each pair of countries. If business cycles are perfectly correlated between two countries, the
coefficient of correlation of their GDP growth rates is equal to one and there does not exist
any possibility of diversification. Therefore, the lower the coefficient of correlation, the
greater the opportunities of diversification will be. Table 1 below displays our results.
Table 1: Coefficients of correlation between growth rates
AT BE DE DK ES FI FR GB GR IE IT LU NL PT AT 1.000 BE 0.708 1.000 DE 0.672 0.739 1.000 DK 0.444 0.523 0.674 1.000 ES 0.592 0.727 0.572 0.417 1.000 FI 0.418 0.529 0.415 0.361 0.470 1.000 FR 0.747 0.865 0.754 0.579 0.815 0.538 1.000 GB 0.236 0.318 0.416 0.486 0.320 0.473 0.413 1.000 GR 0.517 0.562 0.619 0.511 0.572 0.428 0.654 0.400 1.000 IE -0.056 0.027 -0.007 -0.088 0.036 0.113 0.000 0.088 0.047 1.000 IT 0.595 0.748 0.579 0.425 0.708 0.452 0.783 0.321 0.478 -0.016 1.000 LU 0.275 0.363 0.432 0.298 0.219 0.193 0.240 0.413 0.107 0.041 0.145 1.000 NL 0.549 0.726 0.702 0.549 0.478 0.240 0.711 0.318 0.392 0.082 0.511 0.325 1.000 PT 0.640 0.676 0.561 0.336 0.560 0.327 0.713 0.429 0.462 -0.012 0.654 0.166 0.544 1.000SE 0.425 0.669 0.521 0.476 0.594 0.734 0.649 0.444 0.512 0.048 0.591 0.074 0.516 0.330
AT Austria, BE Belgium, DE Germany, DK Denmark, ES Spain, FI Finland, FR France, GB United Kingdom, GR Greece, IE Ireland, IT Italy, LU Luxembourg, NL Netherlands, PT Portugal, SE Sweden. Significant coefficients at the 10% level are in bold.
5

A quick glance at table 1 shows that most coefficients of correlation are significant at
the ten percent level of confidence. On the other side all significant coefficients of correlation
are positive. This means that no country has a business cycle negatively correlated with
another country’s. However, all significant coefficients of correlation are noticeably smaller
than one for all pairs of countries. In other words, business cycles were not perfectly
correlated across Europe over our period of study.1 Our study confirms the results of the
literature devoted to the assessment of the convergence of business cycles across European
countries. (see e.g. Cohen and Wyplosz, 1989, or Weber, 1991, and, for a survey, Frankel and
Rose, 1998).
The preliminary conclusion that we can therefore draw from table 1 is that, as business
cycles differ across Europe, the geographic diversification of a banking group’s activities
would have resulted in the diversification of its macroeconomic risk.2 The question that
consequently arises is whether banking groups have taken those risk diversification
possibilities into account in their decisions to develop cross-border activities. The following
subsection provides a tentative answer.
2.2. Geographic diversification of bank loans
The second question of our analysis is to know whether European banks hold
diversified loan portfolios. Our analysis concentrates on large banking groups - defined as
groups whose consolidated assets are greater than 50 billion US dollars in 1997 - from EU
countries. We decide to focus on large banking groups because their activities are on average
more diversified between industries than those of other banks. Consequently, the use of these
groups is consistent with the key assumption of our methodology according to which the
return of a bank’s loan portfolio in one country is measured by the growth rate of this country.
We also choose to concentrate on loans as a measure of bank operations. The reason is
again our key assumption to approximate the return of a bank’s loan portfolio in one country
by the growth rate of that country. Indeed it makes sense to believe that the return and the risk
of a portfolio of loans granted in a country are directly correlated with that country’s growth
rate: the better the economic situation, the lower the volume of non-performing loans.
Our analysis of the risk of loan portfolios for large European banking groups requires
the aggregation of the loan portfolios of all the components of each group. We choose to
adopt a control criterion to define the banks taken into account as components of a banking
group.3 We assume that each bank controlled by a banking group for at least 30% is part of
6

the banking group for our computation of the loan portfolios. Furthermore, we focus on banks
in which banking groups’ participations are as follows. When the parent company of the
group is not a holding bank, we only take into account the participations directly for at least
30% of the banking group. When the parent company is a holding bank, we add another level
of aggregation to include both direct participations from the holding bank and from the main
banks of the group.4 We include the whole volume of loans of each bank taken into account in
the loan portfolios of banking groups.
These choices are motivated by the problems that arise when consolidating banking
groups. If we had not limited the level of control, the complexity of this procedure would
have increased to a great extent because of never-ending indirect participations, and, on the
other hand, of the crossed participations of some major banks that would result from the
complex pattern of banking groups’ ownership.
Information on bank ownership and individual bank loans in 1997 is extracted from
the "Bankscope" database of IBCA. Our sample includes 52 banking groups5 that are listed in
annex. Breakdown of the sample of banking groups by nationality shows 14 German, 9
French, 9 British, 7 Italian, 4 Dutch, 2 Spanish, 2 Swedish, 2 Belgian, 1 Austrian, 1 Danish,
and 1 Finnish. We can thus observe that the four most populated EU countries clearly
dominate our sample.
A remark has here to be made about nationality: the nationality of each banking group
has to be known to define whether a participation is domestic or not. In this aim, our general
rule is to consider the nationality of the parent company of the group, following the criteria of
IBCA: the legal location of the parent company. However, two banking groups, Dexia and
Fortis, do not have such a well-specified nationality as they were established as a partnership
between two banks with different nationalities. We then consider these banks as follows:
when computing diversification indices, we include loans from both their home countries as
domestic loans. However, when presenting loans by country, we consider the Fortis group as
a Belgian group and the Dexia Group as a French group. The criterion for this choice – that
only influences the presentation of the results and not the results themselves – is the country
where the group has the biggest volume of loans.
We compute two indices of diversification based on bank loans data. Firstly, we
measure the relative share of loans of the banking group in the home country of the group
(“Home Share”). This basic indicator informs us directly on the loan activities of the group
abroad. Secondly, we compute the Herfindahl indices for all banking groups. The Herfindahl
index is calculated as the sum of the squared relative shares of loans in each country for every
7

banking group. It takes into account the relative size and distribution of the relative shares in a
portfolio and approaches zero when the loan portfolio consists of a large number of relative
shares of loans by country of relatively equal size. Consequently, in comparison with the
“Home Share” index, the Herfindahl index provides information about the dispersion and size
of loan shares abroad.
Table 2 displays both indices of diversification alongside with the main statistics and
gathers banking groups by country.6 The main result of the table is the weak diversification of
loan portfolios of large European banking groups across European countries. Banking groups
own on average almost 93% of their loans in their home country. Individual diversification
indices corroborate this diagnosis, as only 10 banking groups hold less than 90% of their
loans in their home country. Mean Herfindahl index of 88.56% for the whole sample confirms
this result, as it shows that loans abroad are not dispersed between numerous countries.7
Analysis by country suggests a higher diversification of loan portfolios for banks
originating from small countries. Indeed Belgian, Dutch and Finnish banking groups have
mean Herfindahl indices that are clearly lower than 80%. However this is not verified in all
cases, as Spanish banking groups are more diversified than Danish or Swedish ones.
The main conclusion of this subsection is that large European banking groups have not
diversified their loan portfolios on a geographic basis. They hold a dominant share of their
loans in their home country. Cross-border mergers were still very limited in European
banking in 1997, date of our study. Cybo-Ottone and Murgia (2000) confirmed this result in
their study of large listed bank merger deals that happened in Europe between 1988 and 1997.
They found that more than 80% of analyzed bank-to-bank deals were domestic.
We reached two major conclusions in this section. Firstly, business cycles are not
perfectly correlated between EU member countries. As a consequence, there exist
opportunities for risk diversification of European banks. The answer to question Q1 is then
clearly positive. However we observe that major European banking groups do not hold
diversified loan portfolios across European countries. It therefore seems that they have not
taken advantage of the opportunities for risk diversification that exist in Europe. We
consequently provide a negative answer to question Q2. The next section aims at assessing the
optimality of the choices of European banking groups.
8
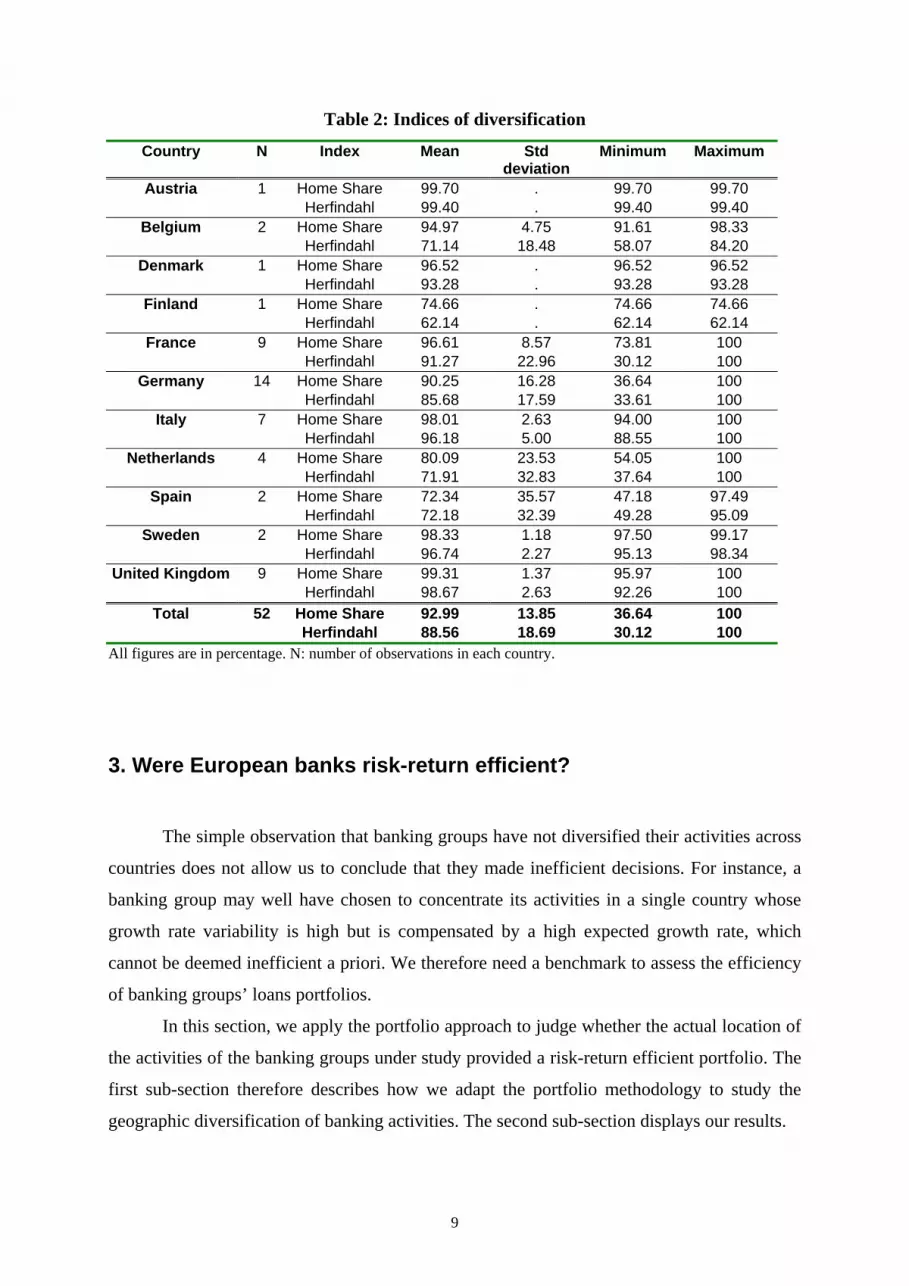
Table 2: Indices of diversification
Country
N Index Mean Std deviation
Minimum Maximum
Austria 1 Home Share 99.70 . 99.70 99.70 Herfindahl 99.40 . 99.40 99.40
Belgium 2 Home Share 94.97 4.75 91.61 98.33 Herfindahl 71.14 18.48 58.07 84.20
Denmark 1 Home Share 96.52 . 96.52 96.52 Herfindahl 93.28 . 93.28 93.28
Finland 1 Home Share 74.66 . 74.66 74.66 Herfindahl 62.14 . 62.14 62.14
France 9 Home Share 96.61 8.57 73.81 100 Herfindahl 91.27 22.96 30.12 100
Germany 14 Home Share 90.25 16.28 36.64 100 Herfindahl 85.68 17.59 33.61 100
Italy 7 Home Share 98.01 2.63 94.00 100 Herfindahl 96.18 5.00 88.55 100
Netherlands 4 Home Share 80.09 23.53 54.05 100 Herfindahl 71.91 32.83 37.64 100
Spain 2 Home Share 72.34 35.57 47.18 97.49 Herfindahl 72.18 32.39 49.28 95.09
Sweden 2 Home Share 98.33 1.18 97.50 99.17 Herfindahl 96.74 2.27 95.13 98.34
United Kingdom 9 Home Share 99.31 1.37 95.97 100 Herfindahl 98.67 2.63 92.26 100
Total 52 Home Share 92.99 13.85 36.64 100 Herfindahl 88.56 18.69 30.12 100
All figures are in percentage. N: number of observations in each country.
3. Were European banks risk-return efficient?
The simple observation that banking groups have not diversified their activities across
countries does not allow us to conclude that they made inefficient decisions. For instance, a
banking group may well have chosen to concentrate its activities in a single country whose
growth rate variability is high but is compensated by a high expected growth rate, which
cannot be deemed inefficient a priori. We therefore need a benchmark to assess the efficiency
of banking groups’ loans portfolios.
In this section, we apply the portfolio approach to judge whether the actual location of
the activities of the banking groups under study provided a risk-return efficient portfolio. The
first sub-section therefore describes how we adapt the portfolio methodology to study the
geographic diversification of banking activities. The second sub-section displays our results.
9

3.1. Methodology
As our paper rests on the application of the portfolio method, we must describe the
assets of which the portfolios we study consist and determine the weight of each asset in those
portfolios. Accordingly, and following Goldberg and Levi (2000), we suppose that European
countries are the basic assets that make up a portfolio. Furthermore, each country is described
by its average annual growth rate, which is the analogue to the expected return of a financial
return, and the variability of its annual growth rate, which is the equivalent of the risk
associated with a financial asset.
Secondly, we suppose that the weight of a country in the portfolio of a banking group
is given by the share of the banking group’s total loans in that country. The basic rationale for
that assumption is that loans are, among all bank activities, the one that is most correlated
with the level of macroeconomic activity, because of the relationship between the business
cycle and the bad loan rate (see e.g. Huh and Kim, 1994). Finally, as we only focus on large
banks, their activities are not restricted to a particular industry and consequently depend on
the general macroeconomic context of the country where they take place.
Consequently, the share αij of a country i (i = 1,…,15) in banking group j’s portfolio is
given by:
∑=
= 15
1i
ij
icountryinjbankbygrantedloans
icountryinjbankbygrantedloansα (1)
A similar method was adapted by Gunther and Robinson (1999) who considered
portfolios of industries instead of portfolios of countries to study the risk exposure of
American banking groups.
Once each country’s risk and return have been defined, the overall return of a banking
group’s portfolio is readily obtained by weighting each country’s growth rate by the relative
importance of that country in the portfolio of the banking group. Accordingly, group j’s
return, which we denote Gj, is given by:
∑=
⋅=15
1iiijj gG α (2)
where gi is country i’s average annual growth rate.
Similarly, the standard deviation of the return of a group’s portfolio is obtained thanks
to the following formula:
10

∑∑= =
=15
1
15
1,,,
i kkjjkjijstde ωαα (3)
In the above expression, ωi, k denotes the covariance of country i’s growth rate with
country k’s. However, whenever i = k, ωi, k simply denotes the variance of country i’s growth
rate.
With these definitions in mind, the application of the portfolio method is
straightforward. The final step of our analysis is to assess the risk-return efficiency of a
bank’s portfolio. We therefore determine each bank’s efficient portfolio, which is defined as
the combination of loans that would produce the same return as the bank’s actual portfolio but
with a least return variability. We accordingly determine the optimal standard deviation of a
group j’s portfolio, which we denote stdoj.8
Finally, we measure the risk-return efficiency of a loan portfolio by computing an
efficiency score which is simply given by:
j
jj stde
stdoscore = (4)
In other words, a bank j’s score is the ratio of the minimum risk it could have taken
had its loan portfolio been efficient to the risk it has in fact taken. A bank’s score is by
construction positive and smaller than one. A score equal to one denotes a perfectly efficient
portfolio. On the other hand, a bank’s score that is close to zero means that that bank could
have reduced the variance of its portfolio to a great extent while keeping its expected return
constant.
3.2. Results
Table 3 summarizes our results by country. The number of banking groups that were
included in our sample in each country is displayed.9 Scores are averaged by country.
Whenever relevant, the minimum and maximum scores are provided, as well as the standard
deviation of the scores in each country.
A first glance at table 3 reveals that scores are quite low, meaning that sizeable
reductions in risk could be obtained1. Their overall average amounts to 58.05%. However
significant discrepancies are observable. Broadly speaking, average risk-return efficiency
scores range from 42.33% for the Finish bank to 62.02% for the Austrian one. In the mean
1 It should be stressed that as we do no take exchange-rate risk into account, our methodology tends to underestimate overall risk, hence the benefits of diversification.
11

time the banking groups originating from countries such as Denmark, Spain or Italy could
have almost halved their risks. On the other hand, banking groups from Germany, France or
the United Kingdom could have (only) cut their risks by 40%.
Table 3: Risk-return efficiency scores by country
Country
N Mean Minimum Maximum Std Deviation
Austria 1 62.02 . . . Belgium 2 58.26 58.04 58.48 0.32 Denmark 1 51.23 . . . Finland 1 42.33 . . . France 9 59.35 59.08 60.68 0.51
Germany 14 60.45 57.19 82.28 6.59 Italy 7 52.29 51.92 53.03 0.44
Netherlands 4 60.33 57.66 64.78 3.41 Spain 2 51.12 48.69 53.55 3.44
Sweden 2 55.70 55.41 55.99 0.41 United Kingdom 9 60.56 60.49 60.83 0.12
Total 52 58.05 42.33 82.28 5.31 All figures are in percentage. N: number of observations in each country.
Owing to the weak diversification of banking groups, the main factor that explains
those differences lies in the risk-return performance of their home countries. For instance,
appendix A.2 reveals that Austria and Finland exhibit comparable average annual growth
rates, but that growth was much more volatile in Finland over our period of study.
Moreover, the intra-country dispersion of scores visibly differs between countries.
This is due to the differences in the diversification policies of banking groups of the same
country. Thus, these groups may exhibit various degrees of diversification or be diversified
among different countries.
Closer scrutiny of individual efficiency scores allows a more finely grained
explanation of the differences in scores.10 On the extremes, German Depfa could hardly
reduce its risk exposure by 17.7% whereas Finnish MeritaNordBanken may more than halve
it. Those results are readily explained once one remarks that the former is already somewhat
diversified, whereas the latter keeps three quarters of its loans in Finland, which has an
unsatisfactory risk-return performance as was already mentioned, and has concentrated the
rest of its activities in a highly correlated economy (i.e. Sweden).
Those results clearly stress that banking groups could have benefited from an efficient
reduction in the risk of their environment if they had diversified their activities over our
period of study. In other words, banking groups did not take advantage of the possibilities of
12

risk diversification in Europe (and for some of them, no advantage at all). The answer to
question Q3 is consequently clearly negative.
4. Could have mergers improved banks’ risk-return efficiency?
The results of section 3 show that large European banking groups do not have optimal
loan portfolios in terms of geographic risk diversification. The analysis concluded to the sub-
optimality of loan portfolios and, as a result, to the existence of potential gains in risk
diversification for European banking groups.
However, it can be argued that optimal loan portfolios may imply a very dispersed
presence of banking groups across Europe. These efficient portfolios may simply be
unfeasible, due to the impossibility to merge a large number of banks together. Indeed,
because of the costs involved by any merger deal, realistic mergers would only be operations
between two banks.
Our aim in this section is to simulate hypothetical mergers between pairs of large
European banking groups to observe if these mergers improve the risk-return efficiency of
these groups.11 We then provide a realistic answer to the question of knowing whether
European banking groups would have been able to improve their risk-return efficiency thanks
to geographic diversification.
4.1. Methodology
The simulations of mergers are conducted on all 52 banking groups, by making pairs
of groups. 1326 merged pairings were generated. The key assumption of the simulations is
that the hypothetically merged banking group is simply the aggregation of the two individual
banking groups. Thus, the loans of the new entity are the sum of the loans of both partners in
the merger.
We measure the risk-return efficiency of hypothetically merged banking groups
following the same methodology as in section 3. We compute the return and the risk of each
new entity, by calculating the relative shares of loans resulting from the merger. The risk-
return efficiency score is then once again obtained, by comparing the optimal risk to the
effective risk of the entity for the same level of return, according to expression 4. We can then
13

observe if any improvement in risk-return efficiency can be obtained for each partner in the
merger.
The large number of banking groups in the sample precluded individual examination
of all possible mergers. Instead we summarize the outcome of the study by providing results
by country. It provides information about the existence of gains for banking groups from one
country to merge with groups from another country. Moreover, we also examine three pairs of
banking groups that merged subsequent to the estimation period. We observe if those mergers
would have improved each partner’s risk-return efficiency.
4.2 Exhaustive bank pairings
Table 4 shows results for the simulations of mergers. It gathers results by country to
summarize the whole dataset of simulated mergers. Each case of the table includes two
figures. The figure in bold (italic) letters indicates the mean variation (standard deviation) of
efficiency scores for banking groups originating from the country mentioned at the beginning
of the line when merging with banking groups originating from the country mentioned at the
beginning of the column.12
Let us for instance consider the case at the intersection between the GER line and the
FR column. The figure in bold letters of the case is 2.01. This is the positive mean variation of
scores for German banking groups when merging with French banking groups. For each
German banking group, we computed the variation of its score when merging with each
French banking group, and then we obtained the average variation of this German banking
group when merging with French banking groups. The mean of the average variation of all
German banking groups when merging with French banking groups was then computed.
The striking feature of table 4 is the majority of positive mean variations in the table.
This means that, in most cases, European banking groups would have improved their risk-
return efficiency scores if they had merged with foreign banking groups. The scarce negative
mean variations were observed for groups merging with Spanish groups or with the Finnish
one. Consequently, most banking groups would be able to improve their risk-return efficiency
by proceeding to cross-border mergers.
Two main factors explain the magnitude of the variations in efficiency that result from
mergers. The first element is the correlation between the business cycles of the banking
groups’ home countries, that was presented in table 1. Due to the weak diversification of
banking groups, their loan portfolios are based mostly in their home country. Consequently,
14

the correlation between the home countries of both partners of the merger has an impact on
the variation of efficiency scores: the higher the correlation, the lower the gains of the merger,
as the banking groups involved hold loan portfolios with related movements. This fact is a
well-known result of the portfolio theory: to be hedged against risk, a well-diversified
portfolio must include financial assets that are not correlated.
The second element is the relative size of each partner in the merger. A banking group
becomes more diversified when it merges with a foreign group of comparable size than when
it merges with a partner that is an order of magnitude smaller or bigger than itself. A third
factor also plays a role in the way mergers affect efficiency, though in a lesser way here: the
diversification of each partner prior to the merger. However, we have shown above that only a
few banking groups of our sample do hold diversified loan portfolios. Consequently, this
factor does not play a major role in the interpretation of country means, but it does for a few
specific mergers.
Further examination of table 4 shows strong discrepancies in mean variations of scores
between countries. On one side, the nationalities of the merging partners have a deep impact
on the mean variation. This finding results from the differences in the inter-country
correlation of business cycles and in the average size of banking groups between countries.
For instance, merging with British banking groups is very profitable for all countries’ banking
groups, mainly because of the low correlation of the British economy with the other EU
members.
Next to the influence of the inter-country correlation, the average size of a country’s
banking groups plays a major role here. Thus, the Finnish banking group is a very bad partner,
especially for Danish and Swedish groups. This result stems from the fact that the Finnish
group is larger than the Danish and Swedish ones. As a consequence, merging with the
Finnish group leads these groups to turn to a banking group largely dominated by Finnish
loans.
Furthermore, the intensity of potential gains varies a lot between countries. This is
mainly the result of differences in inter-country correlations: the higher a country’s
correlation with other EU countries, the lower the gains for its banking groups will be. Thus,
French and German banking groups reap proportionally lower gains than groups from other
countries, while the Finnish banking group benefits a lot from any merger with another
country, having a benefit ranging from 8.74 to 13.23 points, excluding the Nordic countries.
15

Table 4: Results of simulated mergers by country Country AT BE DK FI FR GER IT NL SE SP UK
AT . 2.68 1.52 -7.15 2.27 2.96 1.35 4.44 6.37 -2.04 12.00
. . . . . . . . . . . BE 6.44 0.29 1.09 -4.79 2.37 3.69 0.89 2.58 3.44 -1.66 12.06
0.64 0.32 0.38 2.01 0.35 0.52 0.35 1.12 0.12 0.66 0.23 DK 12.30 8.12 . -7.80 8.87 9.72 2.93 9.96 6.40 0.80 10.50
. . . . . . . . . . . FI 12.54 11.14 1.11 . 12.09 13.23 8.74 12.97 4.84 8.95 12.54 . . . . . . . . . . .
FR 4.95 1.28 0.76 -4.93 0.12 3.11 -0.17 3.02 2.79 -2.99 8.95 0.72 0.56 0.26 2.20 0.15 0.37 0.56 0.28 0.40 0.86 0.55
GER 4.53 1.50 0.50 -4.89 2.01 -0.95 1.15 1.89 3.88 -1.73 7.47 4.07 5.26 0.34 9.06 5.16 4.90 5.30 4.59 5.42 6.38 6.05
IT 11.08 6.86 1.86 -1.22 6.88 9.31 0.02 8.96 6.16 1.26 13.71 1.35 0.70 0.70 1.90 0.72 0.77 0.26 0.74 0.71 0.42 0.86
NL 6.14 0.52 0.87 -5.02 2.04 2.01 0.93 -0.68 2.59 -1.28 8.19 4.18 3.79 0.54 9.86 4.21 3.58 5.86 2.94 4.61 6.64 5.48
SE 12.69 5.99 1.93 -8.53 6.43 8.63 2.75 7.22 -0.01 -1.12 12.01 0.14 0.30 0.06 0.40 0.28 0.29 0.32 0.28 0.41 0.42 0.25
SP 8.86 5.48 0.91 0.16 5.24 7.60 2.43 7.93 3.47 0.66 10.56 1.06 1.44 0.01 1.74 1.57 1.21 2.84 1.21 0.51 3.44 0.35
UK 13.46 9.76 1.17 -5.69 7.74 7.36 5.44 7.96 7.15 1.11 0.01 1.41 0.68 0.47 3.04 0.65 0.34 0.84 0.32 0.58 1.89 0.06
AT Austria, BE Belgium, DK Denmark, FI Finland, FR France, GER Germany, GR Greece, IE Ireland, IT Italy, LU Luxembourg, NL Netherlands, PT Portugal, SE Sweden, SP Spain, UK United Kingdom. All figures are in percentage.
Additionally, the mean variations that appear on the first diagonal, representing the
results of domestic mergers, are very close to zero. This is a logical consequence of the weak
diversification of banking groups, which causes domestic mergers to increase the size of their
portfolios without modifying the relative shares of loans in European countries. Above and
beyond, it is of the highest interest to observe that domestic mergers may even result in
significant losses in risk diversification. For instance, domestic mergers in Germany or Spain
lead to negative changes in mean efficiency scores for more than one observation. This is an
important result, as instead of concluding to the neutrality of domestic mergers in terms of
risk diversification, we can then observe that the motive of geographic risk diversification
leads not to undertake domestic mergers.
Finally, the low standard deviation in most cells of table 4 is also a result of the weak
diversification of banking groups. As all groups from one country have very similar loan
portfolios in terms of loan shares by country, the effects of mergers are similar for all banking
groups from the same country.
16

4.3. A few specific bank pairings
We now focus our analysis on three bank pairings that occurred after our period of
study: the French domestic merger between BNP and Paribas, the Italian domestic merger
between Banca di Roma and San Paolo IMI, the Austrian-German cross-border merger
between Bank Austria and Bayerische Hypo-und Vereinsbank. Our objective here is to check
if these mergers may have improved the risk diversification of the loan portfolio of each
partner of the merger. In this aim, we look at the variation of the risk-return efficiency scores
of each partner in the merger.
Table 5: Changes in risk diversification for recent bank mergers
Merger Banking group Pre-merger
score
Post-merger
score
Change
BNP-Paribas BNP 59.31 59.33 +0.02
Paribas 59.36 59.33 -0.03
Banca di Roma – Banca di Roma 52.30 52.64 +0.34
San Paolo IMI San Paolo IMI 52.79 52.64 -0.15
Bayerische Hypo Bayerische Hypo 58.79 62.34 +3.55
-Bank Austria Bank Austria 62.02 62.34 +0.32
All scores in percentage.
Table 5 displays the results of these mergers. Changes in scores for both domestic
mergers are very weak, because of the high similarity of the country composition of loan
portfolios of both merging partners. Variations are negative for Paribas and San Paolo IMI but
positive for BNP and Banca di Roma. It is noteworthy that in both mergers, the more
diversified bank benefits from a gain in risk diversification. The cross-border merger provides
a stronger variation at least for one bank: Bayerische Hypo-und Vereinsbank faces a strong
increase in its efficiency score from 58.79% to 62.34%, while Bank Austria only benefits
from a small improvement (+0.32). Consequently, and as expected, this cross-border merger
provides strong gains in risk diversification for at least one partner.
This section analyzed the risk diversification effects of mergers between all pairings of
European banking groups. Our results can be summarized in two main conclusions.
Firstly, cross-border mergers provide better gains in risk diversification than domestic
mergers: on one hand, table 4 shows that on average cross-border mergers generally increase
risk-return efficiency scores, while domestic mergers do not have a significant impact on
17

these scores. On the other hand, among the three recent mergers to which we gave a closer
look, only the cross-border one provides large gains to one partner. Accordingly, the answer
to question Q4 is undoubtedly positive.
Secondly, domestic mergers may have markedly reduced risk diversification. Indeed
we have observed that some domestic mergers would have resulted in negative changes in
efficiency scores for more than one observation. Consequently, we provide evidence against
domestic bank mergers according to the geographic risk diversification motive.
5. Conclusion
Our aim in this paper was to analyze the motive of geographic diversification of risk in
the loan activity for bank mergers in the European Union. Our conclusions clearly support the
existence of potential gains in risk diversification from mergers involving partners with
different nationalities. Indeed we have observed the existence of opportunities for geographic
diversification in the European Union as business cycles are not perfectly correlated across
EU members. Nonetheless, the largest European banking groups do not hold diversified loan
portfolios, which means that their portfolios are not optimal in terms of risk diversification.
We have then provided evidence about the existence of potential gains in risk diversification
from cross-border mergers. In the mean time, we have also observed that domestic mergers
may in fact worsen loan portfolios’ risk diversification. Consequently, the major normative
conclusion of this paper is that the motive of geographic risk diversification is a valid
argument in favor of cross-border mergers, which was still not exploited by large European
banking groups in 1997.
With so unambiguous evidence on the gains in risk diversification from cross-border
bank mergers, we may wonder why these mergers did not happen, in other words why banks
kept home-biased loan portfolios. A first reason is that bank managers do not fully take this
argument into account. Thus, Rose (1989) observed on a sample of US mergers that when
banks managers involved in mergers were asked upon their motives to merge, risk reduction
was one of the least frequently mentioned answers.
A second reason is the persistence of political barriers that prevented cross-border
mergers. However, as suggested by Boot (1999, p.610), “the domestic banks in Europe were -
and are- protected as domestic flagships”. Next to preventing cross-border mergers, this
18

argument also plays a role in justifying domestic mergers in the aim of creating big national
champions, less threatened by a foreign takeover.
However these barriers may disappear with the implementation of a totally integrated
European banking market. With the last steps towards full integration, a wave of cross-border
mergers may occur and, regardless of their motivations, result in gains in risk diversification.
References Altunbas, Y. and P. Molyneux, 1996, Cost Economies in EU Banking Systems, Journal of Economics and
Business 48, 3, 217-230.
Altunbas, Y., P. Molyneux and J. Thornton, 2000, Big-Bank Efficiency in Europe: An Analysis of the Cost
Implications, Economica 64, 317-329.
Berger, A, 2000, The Big Picture of Bank Diversification, Presentation at the Conference on Bank Structure and
Competition, Federal Reserve of Chicago.
Boot, A., 1999, European Lessons on Consolidation in Banking, Journal of Banking and Finance 23, 609-613.
Clark Neely, M. and D. Wheelock, 1997, Why Does Bank Performance Vary Across States ?, Review, Federal
Reserve Bank of Saint-Louis, 79, Q2, 27-40.
Cohen, D. and C. Wyplosz, 1989, The European Monetary Union: An Agnostic Evaluation, in Macroeconomic
Policies in an Interdependent World (Editors: D. Currie, J. Frenkel, P. Masson and R. Portes), Washington DC,
Brookings, 311-37, 1989.
Copeland, T.E. and J.F. Weston, 1988, Financial Theory and Corporate Policy, Addison-Wesley Publishing
Company, Reading, MA.
Craig, B. and J. Cabral Dos Santos, 1997, The Risk Effects of Bank Acquisitions, Economic Review, Federal
Reserve Bank of Cleveland, Q2, 25-35.
Cybo-Ottone, A. and M. Murgia, 2000, Mergers and Shareholder Wealth in European Banking, Journal of
Banking and Finance 24, 831-859.
Fatas, A., 1997, EMU: Countries or Regions? Lessons from the EMS Experience, European Economic Review
41 (1997), 743-751.
Frankel, J.A. and A.K. Rose, 1998, The Endogeneity of the Optimum Currency Area Criteria, Economic Journal
108, 1009-1025.
Goldberg, M. and M. Levi, 2000, The European Union as a Country Portfolio, European Journal of Political
Economy 16, 411-427.
Gunther, J. and K. Robinson, 1999, Industry Mix and Lending Environment Variability: What Does the Average
Bank Face ?, Economic and Financial Review, Federal Reserve Bank of Dallas, Q2, 24-31.
Huh, C. and S Kim., 1994, Financial Regulation and Banking Sector Performance: A Comparison of Bad Loan
Problems in Japan and Korea, Economic Review, Federal Reserve Bank of San Francisco, 0, 2, 18-29.
Jacquillat, B. and B. Solnik, 1978, Multinationals are Poor Tools for Diversification, Journal of Portfolio
Management 4, 2, 8-12.
Rose, P.S., 1989, Profiles of U.S. Merging Banks and the Performance Outcomes and Motivations for Recent
19

Mergers, in Bank Mergers: Current Issues and Perspectives (Editor: B. E. Gup), Kluwer, 3-28.
Reichert, A.K. and L.D. Wall, 2000, The Potential for Portfolio Diversification in Financial Services, Federal
Reserve Bank of Atlanta Economic Review 85 Q3, 35-51.
Shaffer, S., 1993, Can Megamergers Improve Bank Efficiency ?, Journal of Banking and Finance 17, 423-436.
Vander Vennet, R., 1996, The Effect of Mergers and Acquisitions on the Efficiency and Profitability of EC
Credit Institutions, Journal of Banking and Finance 20, 1531-1558.
Weber, A., 1991, EMU and Asymmetries and Adjustment Problems in the EMS - Some Empirical Evidence,
European Economy 1, 187-207.
Appendix A.1: Sample of banks
Abbey National, ABN Amro, Almanij, Banca Commerciale Italiana, Banca di Roma, Banca
Intesa, Banca Nazionale del Lavoro, Banco Bilbao Vizcaya, Banco Santander Central
Hispano, Bank Austria, Bankgesellschaft Berlin, Bank Nederlandse Gemeenten (BNG), Bank
of Scotland, BNP, Barclays, Bayerische Hypo-und Vereinsbank, Bayerische Landesbank
Girozentrale, BHW, Commerzbank, Crédit Agricole, Crédit Lyonnais, Crédit Mutuel, Credito
Italiano, Depfa, Deutsche Bank, Deutsche Genossenschaftsbank, Dexia, Dresdner Bank,
Foereningssparbanken, Fortis, Groupe Banques Populaires, Groupe Caisses d’Epargne,
Halifax, HSBC, ING, Kreditanstalt für Wiederaufbau (KFW), Landesbank Baden-
Württemberg, Landesbank Hessen, Lloyd TSB, MeritaNordBanken, Natwest, Nationwide
Building Society, Norddeutsche Landesbank Girozentrale, Nykredit, Paribas, Rabobank,
Royal Bank of Scotland, San Paolo IMI, Société Générale, Svenska Handelsbanken,
Unicredito Italia, Westdeutsche Landesbank Girozentrale
20

Appendix A.2: Descriptive statistics for growth rates
Country Mean Standard dev. Minimum Maximum Austria 0.0329 0.0200 -0.0036 0.0713Belgium 0.0302 0.0222 -0.0150 0.0694Denmark 0.0280 0.0235 -0.0094 0.0927Finland 0.0321 0.0324 -0.0707 0.0960France 0.0323 0.0208 -0.0129 0.0699Germany 0.0288 0.0208 -0.0125 0.0746Greece 0.0420 0.0359 -0.0363 0.1116Ireland 0.0457 0.0259 -0.0044 0.1115Italy 0.0339 0.0243 -0.0215 0.0821Luxembourg 0.0382 0.0343 -0.0656 0.1042Netherlands 0.0322 0.0213 -0.0116 0.0827Portugal 0.0421 0.0326 -0.0434 0.1120Spain 0.0416 0.0310 -0.0113 0.1184Sweden 0.0250 0.0215 -0.0222 0.0683United Kingdom 0.0233 0.0201 -0.0198 0.0672
Appendix A.3: Volumes of loans of banking groups by country
Country N Mean Std Deviation Austria 1 78 617 381.03 . Belgium 2 97 138 129.94 28 160 136.96 Denmark 1 5 490 482.42 . Finland 1 132 485 202.33 . France 9 123 299 270.43 50 444 477.80
Germany 14 158 485 309.55 151 010 688.63 Italy 7 76 330 061.25 31 229 473.82
Netherlands 4 102 659 548.88 79 666 478.98 Spain 2 99 866 702.54 10 270 860.25
Sweden 2 64 134 304.81 3 081 393.96 United Kingdom 9 115 429 264.53 51 222 437.70
N: number of observations in each country.
21

Notes 1 We were concerned that convergence among European economies may bias our results. We consequently
performed the same correlation analysis on two sub-periods (1960-1977 and 1978-1995). We observed no
common trend in the evolution of the coefficients of correlation. 2 For a more comprehensive study of the impact of European integration on risk diversification, the interested
reader may refer to Goldberg and Levi (2000). 3 An alternative would have been to consider all loans from each bank in which the group owns any
participation, and then to weight this loan volume by the ownership percentage of the group to compute the
whole loan portfolio. This approach was not followed however, mainly because of the difficulties involved by
the aggregation of loans with such a scenario. In particular it would be impossible to manage indirect
participations beyond the third level of control. 4 The motivation for this choice is the fact that holding banks do not in general hold significant volumes of loans. 5 Appendix A.1 lists the banking groups included in the sample. Appendix A.3 presents the descriptive statistics
for the volumes of loans by country. 6 As an example, on the ‘DE’ line, the German banking groups have a mean Herfindahl index of 85.68% with a
standard deviation of 17.59%. 7 Observe that if a bank with a home share of 93%, the mean home share of our sample, has all its loans abroad
in the same country, it has a Herfindahl index for (93%)²+(7%)²=86.98%. As the mean Herfindahl index of our
sample is 88.56%, we can then conclude that the dispersion of loans abroad is very weak. 8 To determine an efficient portfolio, we must define the share of each country in that portfolio. We do so under
the assumption that no risk-free asset is available, which is justified in our framework as no country can provide
a constant growth rate, and by imposing the constraint that the volume of loans in any given country cannot be
negative. For conciseness, we do not further develop the portfolio theory here. The interested reader may
however refer to chapter 6 of Copeland and Weston (1988) for an exposition of the determination of efficient
portfolios. 9 Our sample contains no banking group whose home country is either Greece, Ireland, Luxembourg or Portugal.
It must nevertheless be stressed that these countries were included as potential assets when optimal portfolios
were formed. Furthermore some banking groups of our sample hold loans in these countries. 10 Individual efficiency scores are available on request. 11 Simulations of mergers were also performed by Shaffer (1993) on US data and Altunbas, Molyneux and
Thornton (1997) on European data to study the predicted impact of mergers on bank costs. However these works
have not investigated the risk diversification implied by mergers. 12 Table 4 is not symmetric, as the variation of scores is computed in comparison with the banking groups whose
nationality is at the beginning of the line. Consequently, the variations of scores differ for German and French
banking groups when merging with one another, as their pre-merger scores are different. We of course do not
include mergers of banking groups with themselves, and there is no mean variation of scores on the first diagonal
for countries with only one banking group. Furthermore the standard deviation is not mentioned, whenever there
is only one banking group in the analyzed country (as in Austria, Denmark, Finland).
22


